UNITED STATES
SECURITIES AND EXCHANGE COMMISSION
Washington, D.C. 20549
FORM N-CSR
CERTIFIED SHAREHOLDER REPORT OF REGISTERED MANAGEMENT INVESTMENT COMPANIES
Investment Company Act File Number 811-21726
(Exact name of registrant as specified in charter)
4300 Shawnee Mission Parkway, Suite 100, Fairway, KS | 66205 |
(Address of principal executive offices) | (Zip code) |
The Corporation Trust Company
Corporation Trust Center
1209 Orange St.
Wilmington, DE 19801
(Name and address of agent for service)
With Copies To:
John H. Lively
Practus, LLP
11300 Tomahawk Creek Parkway, Suite 310
Leawood, KS 66211
Registrant’s telephone number, including area code: 877-244-6235
Date of fiscal year end: 09/30/2019
Date of reporting period: 09/30/2019
ITEM 1. REPORTS TO SHAREHOLDERS
The Annual report to Shareholders of the EAS Crow Point Alternatives Fund (the “EAS Fund”), Crow Point Global Tactical Allocation Fund (the “Global Fund”) and Crow Point Alternative Income Fund (the “Income Fund”), each a series of the 360 Funds (the “registrant”), for the year ended September 30, 2019 pursuant to Rule 30e-1 under the Investment Company Act of 1940 (the “1940 Act”) (17 CFR 270.30e-1), as amended, is filed herewith.

EAS Crow Point Alternatives Fund
Investor Class Shares (Ticker Symbol: EASAX)
Institutional Class Shares (Ticker Symbol: EASIX)
Crow Point Global Tactical Allocation Fund
Investor Class Shares (Ticker Symbol: CGHAX)
Institutional Class Shares (Ticker Symbol: CGHIX)
Crow Point Alternative Income Fund
Investor Class Shares (Ticker Symbol: AAIFX)
Institutional Class Shares (Ticker Symbol: AIIFX)
Series of the
360 Funds
ANNUAL REPORT
September 30, 2019
Investment Adviser:
Crow Point Partners, LLC
280 Summer Street, Suite M1
Boston, MA 02210
1-877-327-0757
www.crowpointfunds.com
Distributed by Matrix 360 Distributors, LLC
Member FINRA
This report is authorized for distribution only to shareholders and to others who have received a copy of the Funds’ prospectus.
IMPORTANT NOTE: Beginning on January 1, 2021, as permitted by regulations adopted by the SEC, paper copies of the Crow Point Funds’ shareholder reports will no longer be sent by mail unless you specifically request paper copies of the reports from a Crow Point Fund or from your financial intermediary, such as a broker-dealer or bank. Instead, the reports will be made available on a website, and you will be notified by mail each time a report is posted and provided with a website link to access the report. If you already elected to receive shareholder reports electronically, you will not be affected by this change and you need not take any action. You may elect to receive all future reports in paper free of charge. You can inform a Crow Point Fund or your financial intermediary that you wish to continue receiving paper copies of your shareholder reports by calling or sending an e-mail request. Your election to receive reports in paper will apply to all funds held with the Crow Point Funds complex/your financial intermediary.
TABLE OF CONTENTS
Dear Shareholders:
We are pleased to present you with the annual report for the Crow Point family of mutual funds for the year ended September 30, 2019. Last year, we consolidated our three alternative mutual funds, the Crow Point Global Tactical Allocation Fund (the “Global Fund”), the Crow Point Alternative Income Fund (the “Income Fund”) and the EAS Crow Point Alternatives Fund (the “EAS Fund”), (collectively, the “Funds”) around a common reporting date for the Funds’ fiscal year ends.
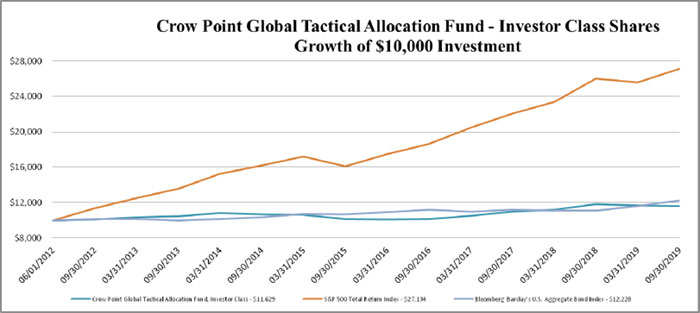
Global Fund – Year to date as of 9/30/2019, the Global Fund was up approximately 10%, which is slightly better than the Morningstar Tactical peer group. However, as a result of the extraordinary volatility experienced in markets during the fourth quarter of 2018, the Global Fund fell by 1.68%, net of all expenses, for the one-year period ended 9/30/2019. For the one-year period, the Global Fund underperformed major market indices such as the S&P 500® Total Return Index and Bloomberg Barclay’s U.S. Aggregate Bond Index which returned 4.25% and 10.30%, respectively. Although the risk tenor of the portfolio does change based on our viewpoint of market opportunities, overall, the Global Fund looks to maintain a moderate risk profile which it did over the past year. The greatest source of the underperformance came from investments in small cap stocks which proved to be underperforming assets relative to large cap stocks. The underperformance of small cap stocks relative to large caps during periods of high volatility is a historical anomaly and we expect small cap stocks to gain relative performance against large caps in the months ahead. Additionally, underweighting diversification assets such as long-term treasury bonds also negatively impacted portfolio returns. Long-term government bonds had their best risk adjusted return in decades last year, and we therefore expect a reversion to the mean in 2020 for treasuries. In as much as the Global Fund underperformed indices and peer groups over the one-year period, over a three-year period the Global Fund has outperformed its peer group, Morningstar Tactical Allocation, by over 2.6% annually net of all fees.
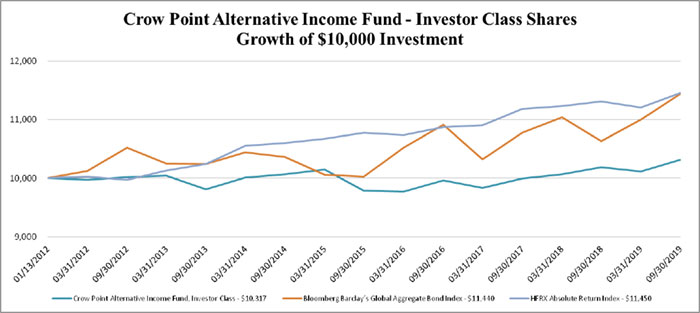
Income Fund – Year-to-date as of 9/30/2019, the Income Fund returned 6.74% and performed well relative to peers in the Morningstar Non-Traditional Bond category. For the one-year period ended 9/30/2019, the Income Fund rose by 1.31%, net of all expenses. The Income Fund’s performance was mixed versus its benchmarks, the Bloomberg Barclay's Global Aggregate Bond Index and the HFRX Absolute Return Index which returned 7.60% and 1.23% for the one-year period, respectively. The Income Fund is designed to be low risk and counter cyclical to the bond market by mitigating most forms of interest rate risk and it engages in other strategies to generate higher levels of yield while it seeks to avoid the duration risk commonly found in traditional bond funds. Most of the source of the underperformance this year relative to the traditional bond market can be attributed to the fourth quarter of 2018 when the Income Fund fell over 3.7% due to underperformance of risk assets such as high yield and hedged equities. In spite of the 4q 2018 underperformance, the overall risk levels have remained low and in line with the Income Fund’s mandate. The Income Fund’s annual volatility statistics are in line with traditional bond investments.
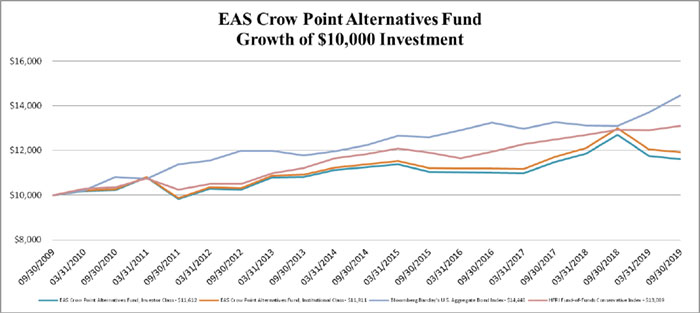
EAS Fund – The EAS Fund completed a very poor fiscal year. For the year ended 9/30/2019, the EAS Fund returned (8.34)% versus 10.30% for its benchmark, the Bloomberg Barclay’s U.S. Aggregate Bond Index. Last year, which was a very strong performance year for the EAS Fund, we wrote: “. . .We know we will be on the other side of this performance curve from time-to-time. . .” Well, this year we experienced precisely that.
In 2018, the EAS Fund benefitted from an over-allocation to small cap growth stocks and the exceptionally good performance of our small cap growth PM team, who beat their index handily. In 2019, we maintained that overweight and it hurt performance as small-cap growth stocks significantly underperformed large-caps. We have written about how small-caps have historically outperformed large caps during periods of high volatility (https://blog.cppinvest.com/large-vs-small-cap-divergences), and we saw no reason for that not to continue this year, yet it did not. Further, while they have consistently outperformed their benchmarks for long periods of time, our small-cap portfolio team underperformed in 2019. While disappointed by 2019’s performance in the EAS Fund, we are seeing signs of a turnaround in our favored sectors like small-cap and we have maintained those positions.
Late last year we believed we were entering into a period where markets would be characterized by much higher volatility (but also higher returns) and we selectively added to the EAS Fund’s risk exposure when markets periodically sold off. In 2019, we also continued to allocate away from bonds and to cash and we sold into bond rallies. Clearly, we sold too soon as bonds have had a very strong performance year so far in 2019.
Outside the U.S., economic growth prospects remain mixed, however, we are seeing signs of global growth stabilizing and improving in previously turbulent areas. Political rancor across several emerging economies as well as concerns over restrictions in global trade continue to diminish and global and emerging market stocks are starting to rally again. We have increased our exposures to both developed and emerging international markets.
The risk to our outlook remains in the realm of U.S. fiscal policy and politics. To date, economic policies out of Washington have been very beneficial to economic and investment decision makers. To the extent that the policy environment dramatically changes to the negative, over trade or regulation or taxes, our viewpoint on risk assets would need to change. Yes, this upcoming election could have a profound effect on markets and we are watching developments closely.
Going forward, Crow Point Partners’ economic and market viewpoints continue to be constructive towards risk investments, particularly U.S. equities. We believe domestic growth prospects could further expand due to a favorable backdrop for rates (low) and consumer credit (abundant). As long as credit continues to flow, U.S. growth (and global growth) should continue to expand.
Thank you for being a shareholder of the Crow Point Funds.
Sincerely,
Crow Point Partners.
See following for important disclosures.
Before investing in the Funds, you should carefully consider the Funds’ investment objectives, risks, charges, and expenses. For a current Prospectus, which contain this and other important information, visit cppfunds.com. Please read the Prospectus carefully before investing.
The Funds’ returns stated above represent the performance of the Global Fund’s and EAS Fund’s Institutional Shares and the Income Fund’s Investor Shares. Please see the following Investment Highlights pages for performance of all share classes. Performance data quoted represents past performance. Past performance is no guarantee of future results and investment returns and principal value of the Funds will fluctuate so that shares, when redeemed, may be worth more or less than their original cost. Current performance may be higher or lower than the performance quoted. Call 1-877-244-6235 for current month end performance.
Positive performance of holdings does not indicate positive portfolio returns.
The S&P 500® Total Return Index is a broad unmanaged index of 500 stocks, which is widely recognized as representative of the equity market in general.
The Bloomberg Barclay’s U.S. Aggregate Bond Index is a broad-based flagship benchmark that measures the investment grade, US dollar-denominated, fixed-rate taxable bond market. The index includes Treasuries, government-related and corporate securities, MBS (agency fixed-rate and hybrid ARM passthroughs), ABS and CMBS (agency and non-agency).
The Bloomberg Barclay’s Global Aggregate Bond Index is a flagship measure of global investment grade debt from twenty-four local currency markets. This multi-currency benchmark includes treasury, government-related, corporate and securitized fixed-rate bonds from both developed and emerging markets issuers.
The HFRX Absolute Return Index is designed to be representative of the overall composition of the hedge fund universe. It is comprised of all eligible hedge fund strategies; including but not limited to convertible arbitrage, distressed securities, equity hedge, equity market neutral, event driven, macro, merger arbitrage, and relative value arbitrage. As a component of the optimization process, the index selects constituents which characteristically exhibit lower volatilities and lower correlations to standard directional benchmarks of equity market and hedge fund industry performance.
HFRI Fund of Funds Conservative Index (the “Index”) is an unmanaged index. Funds in the Index generally seek consistent returns by primarily investing in funds that generally engage in more conservative strategies such as equity market neutral, fixed income arbitrage and convertible arbitrage.
Index returns assume reinvestment of dividends. Investors may not invest in the Index directly; unlike the Funds’ returns, the Index does not reflect any fees or expenses.
The Funds’ portfolio may differ significantly from the securities held in the Index. You cannot invest directly in an Index, therefore its performance does not reflect the expenses associated with the active management of an actual portfolio. Current and future holdings are subject to risk.
Fund distributed by Matrix 360 Distributors, LLC.
| Crow Point Funds | ANNUAL REPORT |
| INVESTMENT HIGHLIGHTS | |
| EAS Crow Point Alternatives Fund | |
| September 30, 2019 (Unaudited) | |
Returns as of September 30, 2019 | One year ended
September 30, 2019 | Five years ended
September 30, 2019 | Ten years ended
September 30, 2019 |
| EAS Crow Point Alternatives Fund Investor Class | (8.61)% | 0.65% | 1.50% |
| EAS Crow Point Alternatives Fund Institutional Class | (8.34)% | 0.93% | 1.76% |
| Bloomberg Barclay’s U.S. Aggregate Bond Index | 10.30% | 3.38% | 3.75% |
| HFRI Fund-of-Funds Conservative Index | 1.18% | 2.04% | 2.73% |
The performance information quoted in this annual report assumes the reinvestment of all dividend and capital gain distributions, if any, and represents past performance, which is not a guarantee of future results. The returns shown do not reflect taxes that a shareholder would pay on Fund distributions or on the redemption of Fund shares. The investment return and principal value of an investment will fluctuate and, therefore, an investor’s shares, when redeemed, may be worth more or less than their original cost. Updated performance data current to the most recent month-end can be obtained by calling 1-877-244-6235.
The above graph depicts the performance of the EAS Crow Point Alternatives Fund versus the Bloomberg Barclay’s U.S. Aggregate Bond Index (the “Barclay’s Index”) and the HFRI Fund-of-Funds Conservative Index (the “HFRI Index”). The Barclay’s Index provides a measure of the performance of the U.S. investment grade bonds market, which includes investment grade U.S. Government bonds, investment grade corporate bonds, mortgage pass-through securities, and asset-backed securities that are publicly offered for sale in the United States. The securities in the Barclay’s Index must have at least 1 year remaining to maturity. In addition, the securities must be denominated in U.S. dollars and must be fixed-rate, nonconvertible and taxable. The HFRI Index is an unmanaged index. Funds in the HFRI Index generally seek consistent returns by primarily investing in funds that generally engage in more conservative strategies such as equity market neutral, fixed income arbitrage and convertible arbitrage. Index returns assume reinvestment of dividends. Investors may not invest in any Index directly; unlike the EAS Crow Point Alternatives Fund’s returns, an Index does not reflect any fees or expenses.
| Crow Point Funds | ANNUAL REPORT |
| INVESTMENT HIGHLIGHTS | |
| EAS Crow Point Alternatives Fund | |
| September 30, 2019 (Unaudited) | |
The investment objective of the EAS Crow Point Alternatives Fund (the “EAS Fund”) is preservation and growth of capital.
Crow Point Partners, LLC’s (the “Adviser”) investment philosophy centers on the preservation and growth of capital through both good and bad markets. The Adviser believes that for most shareholders, investment success is about growing capital over time while protecting it at all times, not about beating a market index which can frequently involve losses while still meeting the objective. Thus, the Adviser follows an absolute return approach in managing the Fund, as defined below. In executing its strategy, the Adviser attempts to generate consistent, positive returns regardless of market conditions by allocating the EAS Fund’s investments among multiple alternative investment styles. The goal of the Adviser in managing the Fund’s assets is to construct a portfolio of assets that exhibit low correlation with and downside capture of the stock market.
The EAS Fund pursues its absolute return objective by tactically allocating its capital among multiple potential alternative investment classes, including investments in private funds. The EAS Fund may, generally, pursue investments among the following alternative investment classes or strategies: Long-Short Equity, Long-Short Credit, Asset Backed Securities, Arbitrage, Commodities, Convertibles, Floating Rate Debt, Currencies, Emerging Market Bonds, Emerging Market Equities, High Yield, Managed Futures, and Real Estate (primarily through real estate investment trusts). The EAS Fund may invest directly or through other mutual funds, exchange traded funds (“ETFs”), closed-end funds and private funds, including hedge funds (“Underlying Funds”) across these alternative investment classes. An ETF is an investment company that typically seeks to track the performance of an index by holding in its portfolio either the contents of the index or a representative sample of the securities in the index. The Adviser may invest a portion of the EAS Fund’s assets in other mutual funds that are also advised by the Adviser. The Adviser will adjust the asset allocation among each alternative investment class based on its assessment of market conditions and investment opportunities. Depending on market conditions, the core of the EAS Fund’s investments will ordinarily be in long-short equity and long-short credit strategies managed by the Adviser. The Adviser also expects to utilize other alternative asset classes to round out portfolio allocations, some of which may also be managed by the Adviser, others may be managed by a Sub-adviser. The Adviser will execute a portion of the EAS Fund’s strategy by investing in a wholly owned and controlled subsidiary (the “Subsidiary”). The Subsidiary invests the majority of its assets in commodities, commodity-linked derivative investments and other futures contracts. The Subsidiary is subject to the same investment restrictions as the Fund, when viewed on a consolidated basis.
Allocation of Portfolio Holdings
| Asset Class | | Percentage of Net Assets |
| Mutual Funds | | 36.35% |
| Partnerships | | 19.85% |
| Common Stock | | 14.50% |
| Hedge Fund | | 11.19% |
| Senior Loans | | 2.77% |
| Exchange-Traded Funds | | 0.97% |
| Closed-End Funds | | 0.08% |
| Asset Backed Securities | | 0.03% |
| Other, Cash and Cash Equivalents | | 14.26% |
| | | 100.00% |
The percentages in the above table are based on the portfolio holdings of the EAS Fund as of September 30, 2019 and are subject to change. For a detailed break-out of holdings by industry and investment type, please refer to the Consolidated Schedule of Investments.
| Crow Point Funds | ANNUAL REPORT |
| INVESTMENT HIGHLIGHTS | |
| Crow Point Global Tactical Allocation Fund | |
| September 30, 2019 (Unaudited) | |
Returns as of September 30, 2019 | One year ended
September 30, 2019 | Five years ended
September 30, 2019 | Commencement of
Operations through
September 30, 2019* |
| Crow Point Global Tactical Allocation Fund Investor Class | (1.86)% | 1.74% | 2.08% |
Crow Point Global Tactical Allocation Fund Institutional Class | (1.68)% | 2.03% | 1.95% |
| S&P 500® Total Return Index | 4.25% | 10.83% | 14.58% |
| Bloomberg Barclay’s U.S. Aggregate Bond Index | 10.30% | 3.38% | 2.78% |
* The Crow Point Global Tactical Allocation Fund Investor Class shares commenced operations on June 1, 2012. The Crow Point Global Tactical Allocation Fund Institutional Class shares commenced operations on April 10, 2013. Commencement of Operations returns for the S&P 500® Total Return Index and the Bloomberg Barclay’s U.S. Aggregate Bond Index assume an inception date of June 1, 2012.
The performance information quoted in this annual report assumes the reinvestment of all dividend and capital gain distributions, if any, and represents past performance, which is not a guarantee of future results. The returns shown do not reflect taxes that a shareholder would pay on Fund distributions or on the redemption of Fund shares. The investment return and principal value of an investment will fluctuate and, therefore, an investor’s shares, when redeemed, may be worth more or less than their original cost. Updated performance data current to the most recent month-end can be obtained by calling 1-877-244-6235.
The above graphs depict the performance of the Crow Point Global Tactical Allocation Fund’s Investor Class shares versus the S&P 500® Total Return Index (“S&P 500”) and the Bloomberg Barclay’s U.S. Aggregate Bond Index (the “Barclay’s Index”). The S&P 500 is a broad unmanaged index of 500 stocks, which is widely recognized as representative of the equity market in general. Index returns assume reinvestment of dividends. The Barclay’s Index provides a measure of the performance of the U.S. investment grade bonds market, which includes investment grade U.S. Government bonds, investment grade corporate bonds, mortgage passthrough securities, and asset-backed securities that are publicly offered for sale in the United States. The securities in the Barclay’s Index must have at least 1 year remaining to maturity. In addition, the securities must be denominated in U.S. dollars and must be fixed-rate, nonconvertible and taxable. Investors may not invest in any index directly; unlike the Crow Point Global Tactical Allocation Fund’s returns, an Index does not reflect any fees or expenses. The Fund will generally not invest in all the securities comprising each index.
| Crow Point Funds | ANNUAL REPORT |
| INVESTMENT HIGHLIGHTS | |
| Crow Point Global Tactical Allocation Fund | |
| September 30, 2019 (Unaudited) | |
The investment objective of the Crow Point Global Tactical Allocation Fund (the “Global Fund”) is to seek income with long-term growth of capital as a secondary objective.
The Global Fund intends to achieve its investment objective by utilizing an asset allocation strategy to invest in a global portfolio of uncorrelated assets that can include exposure, through underlying vehicles, to common stocks and other investments. The Global Fund will invest primarily in common stocks of all issuers, exchange-traded funds (“ETFs”) and actively managed open-end registered investment companies (“open-end funds”), as well as actively managed closed-end registered investment companies (“closed-end funds”). The Global Fund, through underlying vehicles and securities in which it invests, may invest in non-U.S. companies (including those in emerging markets). The Global Fund may also invest directly in debt securities.
The Global Fund may, but is not required to: (i) enter into equity, total return and currency swap agreements, futures contracts and options on futures contracts (including with respect to index and commodities) and forward currency contracts; and (ii) write put and covered call options on securities (including ETFs and exchange-traded notes (“ETNs”)), indexes and currencies, in each case for hedging purposes or to seek to increase returns, including as a substitute for purchasing an underlying vehicle. The Global Fund may, but is not required to, effect short sales of securities. A short sale involves the sale of a security that the Global Fund does not own in the expectation of purchasing the same security (or a security exchangeable therefor) at a later date and at a lower price and profiting from the price decline. Similarly, when taking short positions with respect to securities through investments in derivative instruments, the Adviser is expecting the value of such securities to fall during the period of the Global Fund’s investment exposure.
Allocation of Portfolio Holdings
| Asset Class/Industry Sector | | Percentage of Net Assets* |
| Exchange-Traded Funds | | 67.00% |
| Partnerships | | 12.35% |
| Closed-End Funds | | 7.10% |
| Mutual Funds | | 2.75% |
| Call Options Purchased | | 0.18% |
| Put Options Purchased | | 0.18% |
| Asset Backed Securities | | 0.04% |
| Mortgage Backed Securities | | 0.03% |
| Common Stock | | (1.14)% |
| Cash and Cash Equivalents | | 11.51% |
| | | 100.00% |
* The percentages in the above table are based on the portfolio holdings of the Global Fund as of September 30, 2019 and are subject to change. For a detailed break-out of holdings by industry and investment type, please refer to the Schedule of Investments.
| Crow Point Funds | ANNUAL REPORT |
| INVESTMENT HIGHLIGHTS | |
| Crow Point Alternative Income Fund | |
| September 30, 2019 (Unaudited) | |
Returns as of September 30, 2019 | One year ended
September 30, 2019 | Five years ended
September 30, 2019 | Commencement of
Operations through
September 30, 2019* |
| Crow Point Alternative Income Fund Investor Class | 1.31% | 0.49% | 0.41% |
| Crow Point Alternative Income Fund Institutional Class | N/A | N/A | 2.89% |
| Bloomberg Barclay's Global Aggregate Bond Index | 7.60% | 1.99% | 1.76% |
| HFRX Absolute Return Index | 1.23% | 1.55% | 1.77% |
* The Crow Point Alternative Income Fund Investor Class shares commenced operations on January 13, 2012. The Crow Point Alternative Income Fund Institutional Class shares commenced operations on February 12, 2019.
The performance information quoted in this annual report assumes the reinvestment of all dividend and capital gain distributions, if any, and represents past performance, which is not a guarantee of future results. The returns shown do not reflect taxes that a shareholder would pay on Fund distributions or on the redemption of Fund shares. The investment return and principal value of an investment will fluctuate and, therefore, an investor’s shares, when redeemed, may be worth more or less than their original cost. Updated performance data current to the most recent month-end can be obtained by calling 1-877-244-6235.
The above graph depicts the performance of the Crow Point Alternative Income Fund’s Investor Class shares versus the Bloomberg Barclay’s Global Aggregate Bond Index (the “Barclay’s Global Index”) and the HFRX Absolute Return Index (the “HFRX Index”). The Barclay’s Global Index is a flagship measure of global investment grade debt from twenty-four local currency markets. This multi-currency benchmark includes treasury, government related, corporate and securitized fixed-rate bonds from both developed and emerging markets issuers. The HFRX Index is designed to be representative of the overall composition of the hedge fund universe. It is comprised of all eligible hedge fund strategies; including but not limited to convertible arbitrage, distressed securities, equity hedge, equity market neutral, event driven, macro, merger arbitrage, and relative value arbitrage. As a component of the optimization process, the index selects constituents which characteristically exhibit lower volatilities and lower correlations to standard directional benchmarks of equity market and hedge fund industry performance. Index returns assume reinvestment of dividends. Investors may not invest in any Index directly; unlike the Crow Point Alternative Income Fund’s returns, an Index does not reflect any fees or expenses.
| Crow Point Funds | ANNUAL REPORT |
| INVESTMENT HIGHLIGHTS | |
| Crow Point Alternative Income Fund | |
| September 30, 2019 (Unaudited) | |
The investment objective of the Crow Point Alternative Income Fund (the “Income Fund”) is to seek above-average total returns over a complete market cycle primarily through capital appreciation and income generation.
The Income Fund seeks to achieve its investment objective under normal market conditions of providing shareholders with above-average total returns over a complete market cycle primarily through capital appreciation and income generation by allocating assets among credit related instruments such as corporate bonds, municipal bonds, mortgage and asset-backed securities, and floating rate securities. The Income Fund considers “above-average total returns” to be returns that are uncorrelated to, and greater than, the Income Fund’s primary benchmark. The Income Fund may invest in investment grade as well as below investment grade securities (also known as “junk bonds”). The Income Fund may invest without regard to maturity. The Income Fund may also invest in equity securities including those of private issuers, debt securities of private issuers, non-publicly traded real estate investments trusts (“REITs”), exchange-traded-notes (ETNs”), exchange-traded funds (“ETFs”), mutual funds and publicly traded and non-publicly traded business development companies (“BDCs”). In regard to investments in equity securities, the Income Fund may invest without regard to market capitalization.
Allocation of Portfolio Holdings
| Asset Class/Industry Sector | | Percentage of Net Assets |
| Corporate Bonds | | 35.89% |
| Exchange-Traded Funds | | 33.98% |
| Partnerships | | 11.08% |
| Closed-End Funds | | 8.12% |
| Asset Backed Securities | | 2.53% |
| Preferred Stock | | 0.51% |
| Mortgage Backed Securities | | 0.19% |
| Call Options Purchased | | 0.18% |
| Put Options Purchased | | 0.13% |
| Common Stock | | (0.46)% |
| Other, Cash and Cash Equivalents | | 7.85% |
| | | 100.00% |
The percentages in the above table are based on the portfolio holdings of the Income Fund as of September 30, 2019 and are subject to change. For a detailed break-out of holdings by industry and investment type, please refer to the Schedule of Investments.
| EAS CROW POINT ALTERNATIVES FUND | | | | | | |
| CONSOLIDATED SCHEDULE OF INVESTMENTS | | | | | | |
| September 30, 2019 | | ANNUAL REPORT | |
| | | | | | | |
| COMMON STOCK - 18.88% | | Shares | | | Value | |
| | | | | | | |
| Aerospace & Defense - 0.11% | | | | | | | | |
| Raytheon Co. | | | 185 | | | $ | 36,295 | |
| | | | | | | | | |
| Airlines - 0.20% | | | | | | | | |
| Spirit Airlines, Inc. (a) | | | 704 | | | | 25,555 | |
| United Airlines Holdings, Inc. (a) | | | 477 | | | | 42,172 | |
| | | | | | | | 67,727 | |
| Apparel - 0.24% | | | | | | | | |
| Columbia Sportswear Co. (b) | | | 863 | | | | 83,616 | |
| | | | | | | | | |
| Auto Parts & Equipment - 0.18% | | | | | | | | |
| Methode Electronics, Inc. | | | 1,860 | | | | 62,570 | |
| | | | | | | | | |
| Banks - 1.02% | | | | | | | | |
| Cadence BanCorp | | | 1,812 | | | | 31,782 | |
| Cathay General Bancorp | | | 2,024 | | | | 70,304 | |
| First Choice Bancorp | | | 3,217 | | | | 68,586 | |
| Old Line Bancshares, Inc. | | | 1,651 | | | | 47,896 | |
| PacWest Bancorp | | | 1,107 | | | | 40,228 | |
| Signature Bank/New York, NY | | | 764 | | | | 91,084 | |
| | | | | | | | 349,880 | |
| Biotechnology - 0.65% | | | | | | | | |
| Amarin Corp. PLC -ADR (a) | | | 2,823 | | | | 42,797 | |
| Arcturus Therapeutics Holdings, Inc. (a) | | | 2,500 | | | | 25,675 | |
| Biogen, Inc. (a) | | | 202 | | | | 47,030 | |
| Exact Sciences Corp. (a) | | | 373 | | | | 33,708 | |
| Mainstay Medical International PLC (a) (b) | | | 21,429 | | | | 67,737 | |
| PolarityTE, Inc. (a) (b) | | | 2,500 | | | | 8,075 | |
| | | | | | | | 225,022 | |
| Building Materials - 0.46% | | | | | | | | |
| MDU Resources Group, Inc. | | | 2,848 | | | | 80,285 | |
| Patrick Industries, Inc. (a) | | | 725 | | | | 31,088 | |
| PGT Innovations, Inc. (a) | | | 2,627 | | | | 45,368 | |
| | | | | | | | 156,741 | |
| Chemicals - 0.14% | | | | | | | | |
| CF Industries Holdings, Inc. | | | 1,011 | | | | 49,741 | |
| | | | | | | | | |
| Commercial Services - 0.73% | | | | | | | | |
| Automatic Data Processing, Inc. | | | 93 | | | | 15,012 | |
| Chegg, Inc. (a) | | | 517 | | | | 15,484 | |
| CoreLogic, Inc./United States (a) | | | 925 | | | | 42,800 | |
| PayPal Holdings, Inc. (a) | | | 324 | | | | 33,563 | |
| Quanta Services, Inc. (b) | | | 2,854 | | | | 107,881 | |
| WEX, Inc. (a) | | | 185 | | | | 37,383 | |
| | | | | | | | 252,123 | |
| Computers - 0.27% | | | | | | | | |
| Apple, Inc. | | | 412 | | | | 92,276 | |
| EAS CROW POINT ALTERNATIVES FUND | | | | |
| CONSOLIDATED SCHEDULE OF INVESTMENTS | | | | |
| September 30, 2019 | | ANNUAL REPORT |
| | | | | |
| COMMON STOCK - 18.88% (continued) | | | Shares | | | | Value | |
| | | | | | | | | |
| Cosmetics & Personal Care - 0.21% | | | | | | | | |
| Estee Lauder Cos., Inc. | | | 362 | | | $ | 72,020 | |
| | | | | | | | | |
| Distribution & Wholesale - 0.11% | | | | | | | | |
| IAA, Inc. (a) | | | 891 | | | | 37,181 | |
| | | | | | | | | |
| Diversified Financial Services - 0.74% | | | | | | | | |
| Encore Capital Group, Inc. (a) (b) | | | 2,989 | | | | 99,608 | |
| Mastercard, Inc. - Class A | | | 275 | | | | 74,682 | |
| Visa, Inc. - Class A | | | 464 | | | | 79,813 | |
| | | | | | | | 254,103 | |
| Electric - 1.08% | | | | | | | | |
| Black Hills Corp. | | | 811 | | | | 62,228 | |
| El Paso Electric Co. | | | 1,649 | | | | 110,615 | |
| PNM Resources, Inc. | | | 1,723 | | | | 89,734 | |
| Vistra Energy Corp. | | | 4,132 | | | | 110,448 | |
| | | | | | | | 373,025 | |
| Electronical Components & Equipment - 0.25% | | | | | | | | |
| Universal Display Corp. | | | 520 | | | | 87,308 | |
| | | | | | | | | |
| Electronics - 0.32% | | | | | | | | |
| Keysight Technologies, Inc. (a) (b) | | | 1,149 | | | | 111,740 | |
| | | | | | | | | |
| Engineering & Construction - 1.19% | | | | | | | | |
| Construction Partners, Inc. - Class A (a) | | | 4,031 | | | | 62,803 | |
| Infrastructure and Energy Alternatives, Inc. (a) | | | 23,163 | | | | 108,171 | |
| MasTec, Inc. (a) (b) | | | 2,492 | | | | 161,806 | |
| Primoris Services Corp. | | | 3,824 | | | | 74,989 | |
| | | | | | | | 407,769 | |
| Healthcare - Services - 0.11% | | | | | | | | |
| Molina Healthcare, Inc. (a) (b) | | | 349 | | | | 38,292 | |
| | | | | | | | | |
| Home Builders - 0.24% | | | | | | | | |
| NVR, Inc. (a) | | | 8 | | | | 29,739 | |
| TRI Pointe Group, Inc. (a) | | | 3,532 | | | | 53,121 | |
| | | | | | | | 82,860 | |
| Home Furnishings - 0.11% | | | | | | | | |
| Sonos, Inc. (a) | | | 2,785 | | | | 37,347 | |
| | | | | | | | | |
| Insurance - 1.16% | | | | | | | | |
| American Financial Group, Inc. | | | 577 | | | | 62,229 | |
| Aon PLC | | | 372 | | | | 72,008 | |
| Arch Capital Group Ltd. (a) (b) | | | 2,280 | | | | 95,714 | |
| Heritage Insurance Holdings, Inc. | | | 5,041 | | | | 75,363 | |
| National General Holdings Corp. | | | 4,001 | | | | 92,103 | |
| | | | | | | | 397,417 | |
| Internet - 0.81% | | | | | | | | |
| Alphabet, Inc. - Class A (a) | | | 46 | | | | 56,172 | |
| Anaplan, Inc. (a) | | | 1,779 | | | | 83,613 | |
| Cardlytics, Inc. (a) | | | 923 | | | | 30,939 | |
| eBay, Inc. | | | 1,599 | | | | 62,329 | |
| Twitter, Inc. (a) | | | 1,121 | | | | 46,185 | |
| | | | | | | | 279,238 | |
| EAS CROW POINT ALTERNATIVES FUND | | | | | | |
| CONSOLIDATED SCHEDULE OF INVESTMENTS | | | | | | |
| September 30, 2019 | | ANNUAL REPORT | |
| | | | | | | |
| COMMON STOCK - 18.88% (continued) | | Shares | | | Value | |
| | | | | | | |
| Investment Companies - 0.77% | | | | | | | | |
| Ares Capital Corp. (b) | | | 5,302 | | | $ | 98,803 | |
| Compass Diversified Holdings | | | 1,835 | | | | 36,168 | |
| TCG BDC, Inc. (b) | | | 9,063 | | | | 130,507 | |
| | | | | | | | 265,478 | |
| Iron & Steel - 0.22% | | | | | | | | |
| Carpenter Technology Corp. (b) | | | 1,460 | | | | 75,424 | |
| | | | | | | | | |
| Lodging - 0.55% | | | | | | | | |
| Target Hospitality Corp. (a) | | | 5,772 | | | | 39,307 | |
| Wyndham Hotels & Resorts, Inc. (b) | | | 2,893 | | | | 149,684 | |
| | | | | | | | 188,991 | |
| Machinery - Diversified - 0.23% | | | | | | | | |
| Flowserve Corp. | | | 1,668 | | | | 77,912 | |
| | | | | | | | | |
| Metal Fabricate & Hardware - 0.19% | | | | | | | | |
| Timken Co. | | | 1,504 | | | | 65,439 | |
| | | | | | | | | |
| Mining - 0.24% | | | | | | | | |
| Compass Minerals International, Inc. | | | 1,306 | | | | 73,776 | |
| Royal Gold, Inc. | | | 84 | | | | 10,350 | |
| | | | | | | | 84,126 | |
| Miscellaneous Manufacturing - 0.31% | | | | | | | | |
| General Electric Co. (b) | | | 12,000 | | | | 107,280 | |
| | | | | | | | | |
| Oil & Gas - 0.44% | | | | | | | | |
| Parsley Energy, Inc. - Class A | | | 2,655 | | | | 44,604 | |
| PBF Energy, Inc. - Class A | | | 1,206 | | | | 32,791 | |
| Phillips 66 | | | 707 | | | | 72,397 | |
| | | | | | | | 149,792 | |
| Oil & Gas Services - 0.09% | | | | | | | | |
| National Oilwell Varco, Inc. | | | 1,390 | | | | 29,468 | |
| | | | | | | | | |
| Packaging & Containers - 0.16% | | | | | | | | |
| Berry Global Group, Inc. (a) | | | 1,422 | | | | 55,842 | |
| | | | | | | | | |
| Pharmaceuticals - 0.40% | | | | | | | | |
| AmerisourceBergen Corp. | | | 156 | | | | 12,843 | |
| DexCom, Inc. (a) (b) | | | 719 | | | | 107,304 | |
| Nabriva Therapeutics PLC (a) | | | 8,500 | | | | 17,000 | |
| | | | | | | | 137,147 | |
| Private Equity - 0.46% | | | | | | | | |
| Kennedy-Wilson Holdings, Inc. (b) | | | 4,922 | | | | 107,890 | |
| KKR & Co., Inc. - Class A | | | 1,849 | | | | 49,646 | |
| | | | | | | | 157,536 | |
| REITS - 2.16% | | | | | | | | |
| Blackstone Mortgage Trust, Inc. - Class A (b) | | | 3,608 | | | | 129,347 | |
| Crown Castle International Corp. (b) | | | 733 | | | | 101,894 | |
| Digital Realty Trust, Inc. | | | 371 | | | | 48,160 | |
| Gladstone Commercial Corp. (b) | | | 4,846 | | | | 113,881 | |
| Starwood Property Trust, Inc. | | | 5,189 | | | | 125,678 | |
| Sun Communities, Inc. | | | 519 | | | | 77,046 | |
| TPG RE Finance Trust, Inc. (b) | | | 7,480 | | | | 148,403 | |
| | | | | | | | 744,409 | |
| EAS CROW POINT ALTERNATIVES FUND | | | | | | |
| CONSOLIDATED SCHEDULE OF INVESTMENTS | | | | | | |
| September 30, 2019 | | ANNUAL REPORT | |
| | | | | | | |
| COMMON STOCK - 18.88% (continued) | | Shares | | | Value | |
| | | | | | | |
| Retail - 0.48% | | | | | | | | |
| Casey's General Stores, Inc. | | | 437 | | | $ | 70,427 | |
| Dollar General Corp. | | | 426 | | | | 67,708 | |
| FirstCash, Inc. | | | 277 | | | | 25,393 | |
| | | | | | | | 163,528 | |
| Semiconductors - 0.62% | | | | | | | | |
| MKS Instruments, Inc. (b) | | | 864 | | | | 79,730 | |
| NVIDIA Corp. (b) | | | 767 | | | | 133,512 | |
| | | | | | | | 213,242 | |
| Software - 1.00% | | | | | | | | |
| Activision Blizzard, Inc. | | | 465 | | | | 24,608 | |
| Akamai Technologies, Inc. (a) | | | 552 | | | | 50,442 | |
| Fiserv, Inc. (a) | | | 898 | | | | 93,024 | |
| HubSpot, Inc. (a) | | | 200 | | | | 30,322 | |
| Veeva Systems, Inc. Class A (a) (b) | | | 941 | | | | 143,681 | |
| | | | | | | | 342,077 | |
| Telecommunications - 0.23% | | | | | | | | |
| Ciena Corp. (a) | | | 2,046 | | | | 80,265 | |
| | | | | | | | | |
| | | | | | | | | |
| TOTAL COMMON STOCK (Cost $6,815,316) | | | | | | | 6,492,247 | |
| | | | | | | | | |
| CLOSED-END FUNDS - 0.08% | | | | | | | | |
| | | | | | | | | |
| Eaton Vance Limited Duration Income Fund | | | 1,299 | | | | 16,238 | |
| MFS Multimarket Income Trust | | | 1,963 | | | | 11,601 | |
| | | | | | | | 27,839 | |
| | | | | | | | | |
| TOTAL CLOSED-END FUNDS (Cost $27,908) | | | | | | | 27,839 | |
| | | | | | | | | |
| EXCHANGE TRADED FUNDS - 1.21% | | | | | | | | |
| | | | | | | | | |
| Debt Funds - 0.32% | | | | | | | | |
| iShares Core U.S. Aggregate Bond ETF | | | 212 | | | | 23,992 | |
| SPDR Bloomberg Barclay’s High Yield Bond ETF | | | 401 | | | | 43,605 | |
| VanEck Vectors J.P. Morgan EM Local Currency Bond ETF | | | 1,277 | | | | 42,141 | |
| | | | | | | | 109,738 | |
| Equity Funds - 0.89% | | | | | | | | |
| iShares Core MSCI Emerging Markets ETF | | | 849 | | | | 41,618 | |
| iShares MSCI ACWI ETF | | | 1,782 | | | | 131,423 | |
| iShares MSCI Europe Financials ETF | | | 2,465 | | | | 43,384 | |
| iShares MSCI Germany ETF | | | 1,595 | | | | 42,921 | |
| iShares MSCI Netherlands ETF | | | 723 | | | | 22,673 | |
| VelocityShares Daily 2x VIX Short Term ETN (a) | | | 1,699 | | | | 23,106 | |
| | | | | | | | 305,125 | |
| | | | | | | | | |
| TOTAL EXCHANGE TRADED FUNDS (Cost $424,912) | | | | | | | 414,863 | |
| EAS CROW POINT ALTERNATIVES FUND | | | | | | |
| CONSOLIDATED SCHEDULE OF INVESTMENTS | | | | | | |
| September 30, 2019 | | ANNUAL REPORT | |
| | | | | | | |
| MUTUAL FUNDS - 36.35% | | Shares | | | Value | |
| | | | | | | |
| Asset Allocation Funds - 10.48% | | | | | | | | |
| Crow Point Alternative Income Fund - Investor Class (c) | | | 421,688 | | | $ | 3,605,430 | |
| | | | | | | | | |
| Equity Fund - 25.87% | | | | | | | | |
| Crow Point Small-Cap Growth Fund - Institutional Class (a) (c) | | | 723,142 | | | | 5,582,652 | |
| LS Opportunity Fund | | | 30,769 | | | | 447,998 | |
| RVX Emerging Markets Equity Fund - Institutional Class (c) | | | 331,642 | | | | 2,865,383 | |
| | | | | | | | 8,896,033 | |
| | | | | | | | | |
| TOTAL MUTUAL FUNDS (Cost $13,348,523) | | | | | | | 12,501,463 | |
| | | | | | | | | |
| HEDGE FUND - 11.19% | | | | | | | | |
| | | | | | | | | |
| ACA Master Select Fund LP (a) (e) | | | 36,932 | | | | 3,846,960 | |
| | | | | | | | | |
| TOTAL HEDGE FUND (Cost $3,771,057) | | | | | | | 3,846,960 | |
| BONDS & NOTES - 2.80% | | Principal Amount | | | | |
| | | | | | | |
| ASSET BACKED SECURITIES - 0.03% | | | | | | | | |
| | | | | | | | | |
| Commercial MBS - 0.03% | | | | | | | | |
| Morgan Stanley Capital I Trust 2006-IQ11, 6.278%, due 10/15/2042 (b) (d) | | $ | 9,991 | | | | 9,993 | |
| | | | | | | | | |
| Home Equity ABS - 0.00% | | | | | | | | |
| RASC Series 2003-KS4 Trust, 3.87%, due 05/25/2033 (b) | | | 721 | | | | 731 | |
| | | | | | | | | |
| TOTAL ASSET BACKED SECURITIES (Cost $10,922) | | | | | | | 10,724 | |
| | | | | | | | | |
| SENIOR LOANS - 2.77% | | | | | | | | |
| | | | | | | | | |
| CCS-CMGC Holdings, Inc., 7.544% (Coupon rate 5.50% + 1 Month LIBOR rate), due 10/1/2025 (g) | | | 248,125 | | | | 244,817 | |
| Concrete Pumping Holdings, Inc., 8.087% (Coupon rate 6.00% + 3 Month LIBOR rate), due 12/6/2025 (g) | | | 243,750 | | | | 239,180 | |
| Fogo de Chao LLC, 6.294% (Coupon rate 4.25% + 1 Month LIBOR rate), due 4/5/2025 (g) | | | 241,030 | | | | 241,633 | |
| LightstoneHoldco LLC Term B, 5.794% (Coupon rate 3.75% + 1 Month LIBOR rate), due 1/30/2024 (g) | | | 225,932 | | | | 216,294 | |
| LightstoneHoldco LLC Term C, 5.794% (Coupon rate 3.75% + 1 Month LIBOR rate), due 1/30/2024 (g) | | | 12,743 | | | | 12,199 | |
| | | | | | | | 954,123 | |
| | | | | | | | | |
| TOTAL SENIOR LOANS (Cost $949,119) | | | | | | | 954,123 | |
| | | | | | | | | |
| TOTAL BONDS & NOTES (Cost $960,041) | | | | | | | 964,847 | |
| PARTNERSHIPS - 19.85% | | Shares | | | | |
| | | | | | | |
| Cedar Fair LP | | | 1,995 | | | | 116,428 | |
| Galaxy Plus Fund - Cane Global Macro Feeder Fund (546) LLC (a) (i) | | | 5,000,000 | | | | 5,263,191 | |
| Global Partners LP (b) | | | 20,032 | | | | 392,828 | |
| K-20 Education Partners LP (a) (h) | | | 1,000,000 | | | | 1,053,985 | |
| | | | | | | | 6,826,432 | |
| | | | | | | | | |
| TOTAL PARTNERSHIPS (Cost $6,501,337) | | | | | | | 6,826,432 | |
EAS CROW POINT ALTERNATIVES FUND
CONSOLIDATED SCHEDULE OF INVESTMENTS
| September 30, 2019 | ANNUAL REPORT |
| | |
| PUT OPTIONS PURCHASED - 0.00% | | | | | Notional | | | Exercise | | | | | | | |
| | | Contracts 1 | | | Amount | | | Price | | | Expiration | | | Value | |
| | | | | | | | | | | | | | | | |
| Amarin Corp. PLC - ADR | | | 170 | | | $ | 204,000 | | | $ | 12.00 | | | | 10/18/2019 | | | $ | 850 | |
| TOTAL PUT OPTIONS PURCHASED (Cost $6,120) | | | | | | | | | | | | | | | | | | | 850 | |
| SHORT-TERM INVESTMENT - 4.93% | | Shares | | | | |
| | | | | | | |
| Federated Government Obligations Fund - Institutional Class, 1.85% (f) | | | 1,693,938 | | | | 1,693,938 | |
| | | | | | | | | |
| TOTAL SHORT-TERM INVESTMENT (Cost $1,693,938) | | | | | | | 1,693,938 | |
| | | | | | | | | |
| TOTAL INVESTMENTS (Cost $33,549,152) – 95.29% | | | | | | | 32,769,439 | |
| | | | | | | | | |
| SECURITIES SOLD SHORT (Proceeds $1,645,126) - (4.62%) | | | | | | | (1,589,432 | ) |
| | | | | | | | | |
| OPTIONS WRITTEN (Premiums received $340) - (0.00%) | | | | | | | (340 | ) |
| | | | | | | | | |
| OTHER ASSETS IN EXCESS OF LIABILITIES, NET - 9.33% | | | | | | | 3,210,098 | |
| | | | | | | | | |
| NET ASSETS - 100% | | | | | | $ | 34,389,765 | |
(a) Non-income producing security.
(b) All or a portion of the security is segregated as collateral for put options written and securities sold short.
(c) Affiliated investment company.
(d) Variable rate security - Interest rate shown represents the rate on September 30, 2019.
(e) Private equity fund purchased on March 1, 2016 that invests in the DCM Multi-Manager Fund, LLC (Series A) and the DCM Multi-Manager Fund, LLC (Series D). Redemptions may be made monthly upon 30 days written notice. There were no unfunded commitments as of September 30, 2019. This investment is valued using the practical expedient. For more information on the practical expedient, please refer to the security valuation section on Note 3 of the accompanying notes to the financial statements.
(f) Rate shown represents the 7-day effective yield at September 30, 2019, is subject to change and resets daily.
(g) Variable or step coupon security - Interest rate shown represents the rate on September 30, 2019. The 3 Month and 1 Month LIBOR rates were 2.085% and 2.016%, respectively, on September 30, 2019.
(h) Private equity fund purchased on February 11, 2019 that seeks to capture the opportunity presented by the education sector by investing long and short in a concentrated portfolio of public and private equity and debt securities. Withdrawals may be made quarterly upon 45 days written notice, commencing 12 months after making the initial capital contribution. There were no unfunded commitments as of September 30, 2019. This investment is valued using the practical expedient. For more information on the practical expedient, please refer to the security valuation section on Note 3 of the accompanying notes to the financial statements.
(i) Private equity fund purchased on December 5, 2018 by the CPAS Fund Ltd., a wholly owned subsidiary of the EAS Crow Point Alternatives Fund (See Note 2). The private equity fund serves as a platform for a variety of third-party professional investment advisers in an investment environment that facilitates access to varying investment and trading strategies with the different investment advisers. Withdraws can be made as of: (i) the first business day of any calendar month; or (ii) as of each Monday, except in instances in which the Monday is the first business day before or after a calendar month-end. This investment is valued using the practical expedient. For more information on the practical expedient, please refer to the security valuation section on Note 3 of the accompanying notes to the financial statements.
1 Each option contract is equivalent to 100 shares of the underlying common stock. All options are non-income producing.
ADR - American Depositary Receipt
ETF - Exchange Traded Fund
ETN - Exchange Traded Note
LLC - Limited Liability Company
LP - Limited Partnership
PLC - Public Limited Company
REITS - Real Estate Investment Trusts
The accompanying notes are an integral part of these financial statements.
| EAS CROW POINT ALTERNATIVES FUND | | | | | | |
| CONSOLIDATED SCHEDULE OF INVESTMENTS - SECURITIES SOLD SHORT | | | |
| September 30, 2019 | ANNUAL REPORT | |
| | | | | | | |
| SECURITIES SOLD SHORT - (4.62)% | | | | | | | | |
| | | | | | | | | |
| COMMON STOCK - (4.38)% | | | Shares | | | | Value | |
| | | | | | | | | |
| Auto Manufacturers - (2.80)% | | | | | | | | |
| Tesla, Inc. | | | 4,000 | | | $ | 963,480 | |
| | | | | | | | | |
| Banks - (0.43)% | | | | | | | | |
| Bank of New York Mellon Corp. | | | 461 | | | | 20,842 | |
| Bank of Nova Scotia | | | 322 | | | | 18,306 | |
| Canadian Imperial Bank of Commerce | | | 93 | | | | 7,678 | |
| Goldman Sachs Group, Inc. | | | 93 | | | | 19,272 | |
| Hanmi Financial Corp. | | | 1,375 | | | | 25,823 | |
| Itau Unibanco Holding SA - ADR | | | 1,388 | | | | 11,673 | |
| Regions Financial Corp. | | | 916 | | | | 14,491 | |
| Sumitomo Mitsui Financial Group, Inc. - ADR | | | 4,632 | | | | 31,683 | |
| | | | | | | | 149,768 | |
| Computers - (0.08)% | | | | | | | | |
| Accenture PLC - Class A | | | 138 | | | | 26,544 | |
| | | | | | | | | |
| Diversified Financial Services - (0.06)% | | | | | | | | |
| Evercore, Inc. | | | 276 | | | | 22,108 | |
| | | | | | | | | |
| Internet - (0.91)% | | | | | | | | |
| Netflix, Inc. | | | 1,165 | | | | 311,777 | |
| | | | | | | | | |
| Oil & Gas - (0.10)% | | | | | | | | |
| Exxon Mobil Corp. | | | 464 | | | | 32,763 | |
| | | | | | | | | |
| TOTAL COMMON STOCK (Proceeds $1,561,152) | | | | | | | 1,506,440 | |
| | | | | | | | | |
| EXCHANGE TRADED FUNDS - (0.24)% | | | | | | | | |
| | | | | | | | | |
| Equity Funds - (0.24)% | | | | | | | | |
| iShares China Large-Cap ETF | | | 693 | | | | 27,581 | |
| iShares MSCI Japan ETF | | | 463 | | | | 26,271 | |
| SPDR S&P Regional Banking ETF | | | 552 | | | | 29,140 | |
| | | | | | | | 82,992 | |
| | | | | | | | | |
| TOTAL EXCHANGE TRADED FUNDS (Proceeds $83,974) | | | | | | | 82,992 | |
| | | | | | | | | |
| TOTAL SECURITIES SOLD SHORT (Proceeds $1,645,126) | | | | | | $ | 1,589,432 | |
ADR - American Depositary Receipt
ETF - Exchange Traded Fund
PLC - Public Limited Company
The accompanying notes are an integral part of these financial statements.
EAS CROW POINT ALTERNATIVES FUND
CONSOLIDATED SCHEDULE OF INVESTMENTS - WRITTEN OPTIONS
| September 30, 2019 | ANNUAL REPORT |
| OPTIONS WRITTEN - (0.00)% | | | | | | | | | | | | | | | |
| | | | | | Notional | | | Exercise | | | | | | | |
| PUT OPTIONS WRITTEN - (0.00)% | | Contracts 1 | | | Amount | | | Price | | | Expiration | | | Value | |
| | | | �� | | | | | | | | | | | | |
| Amarin Corp. PLC - ADR | | | 170 | | | $ | 170,000 | | | $ | 10.00 | | | | 10/18/2019 | | | $ | 340 | |
| TOTAL PUT OPTIONS WRITTEN (Premiums received $340) | | | | | | | | | | | | | | | | | | | 340 | |
| | | | | | | | | | | | | | | | | | | | | |
| TOTAL OPTIONS WRITTEN (Premiums received $340) | | | | | | | | | | | | | | | | | | $ | 340 | |
1 Each option contract is equivalent to 100 shares of the underlying common stock. All options are non-income producing.
ADR - American Depositary Receipt
PLC - Public Limited Company
The accompanying notes are an integral part of these financial statements.
| CROW POINT GLOBAL TACTICAL ALLOCATION FUND | | | | | | |
| SCHEDULE OF INVESTMENTS | | | | | | |
| September 30, 2019 | | ANNUAL REPORT | |
| | | | | | | |
| CLOSED-END FUNDS - 7.10% | | Shares | | | Value | |
| | | | | | | |
| Eaton Vance Limited Duration Income Fund (b) | | | 30,570 | | | $ | 382,125 | |
| MFS Multimarket Income Trust (b) | | | 46,250 | | | | 273,337 | |
| Royce Value Trust, Inc. | | | 72,750 | | | | 1,001,040 | |
| | | | | | | | | |
| TOTAL CLOSED-END FUNDS (Cost $1,682,805) | | | | | | | 1,656,502 | |
| | | | | | | | | |
| EXCHANGE TRADED FUNDS - 72.11% | | | | | | | | |
| | | | | | | | | |
| Debt Funds - 13.48% | | | | | | | | |
| iShares Core U.S. Aggregate Bond ETF | | | 5,000 | | | | 565,850 | |
| iShares Floating Rate Bond ETF (b) | | | 11,100 | | | | 565,767 | |
| SPDR Bloomberg Barclay’s High Yield Bond ETF | | | 9,432 | | | | 1,025,636 | |
| VanEck Vectors J.P. Morgan EM Local Currency Bond ETF | | | 30,000 | | | | 990,000 | |
| | | | | | | | 3,147,253 | |
| Equity Funds - 58.63% | | | | | | | | |
| iShares Core MSCI Emerging Markets ETF | | | 19,970 | | | | 978,929 | |
| iShares Core S&P Small-Cap ETF | | | 25,000 | | | | 1,946,000 | |
| iShares Edge MSCI USA Value Factor ETF | | | 8,000 | | | | 656,320 | |
| iShares MSCI ACWI ETF | | | 41,900 | | | | 3,090,125 | |
| iShares MSCI Europe Financials ETF | | | 57,910 | | | | 1,019,216 | |
| iShares MSCI Germany ETF | | | 37,479 | | | | 1,008,560 | |
| iShares MSCI Netherlands ETF | | | 16,972 | | | | 532,242 | |
| SPDR S&P 500 ETF Trust (b) | | | 15,000 | | | | 4,451,550 | |
| | | | | | | | 13,682,942 | |
| | | | | | | | | |
| TOTAL EXCHANGE TRADED FUNDS (Cost $16,328,580) | | | | | | | 16,830,195 | |
| | | | | | | | | |
| MUTUAL FUNDS - 2.75% | | | | | | | | |
| | | | | | | | | |
| Equity Fund - 2.75% | | | | | | | | |
| RVX Emerging Markets Equity Fund - Institutional Class (a) (d) | | | 74,369 | | | | 642,550 | |
| | | | | | | | | |
| TOTAL MUTUAL FUNDS (Cost $741,382) | | | | | | | 642,550 | |
| | | | | | | | | |
| BONDS & NOTES - 0.07% | | Principal Amount | | | | | |
| | | | | | | | | |
| Asset Backed Securities - 0.04% | | | | | | | | |
| Countrywide Asset-Backed Certificates, 4.686%, due 10/25/2017 (b) (e) | | $ | 2,330 | | | | 2,423 | |
| Equity One Mortgage Pass-Through Trust 2003-4, 4.326%, 10/25/2034 (b) (e) | | | 5,950 | | | | 6,105 | |
| RASC Series 2003-KS4 Trust, 3.870%, due 05/25/2033 (b) | | | 901 | | | | 914 | |
| Total Asset Backed Securities (Cost $8,971) | | | | | | | 9,442 | |
| | | | | | | | | |
| Mortgage Backed Securities - 0.03% | | | | | | | | |
| Banc of America Funding 2006-2 Trust, 5.750%, due 03/25/2036 (b) | | | 2,776 | | | | 2,722 | |
| Washington Mutual Mortgage Pass-Through Certificates WMALT Series 2006-7 Trust, 4.259%, 09/25/2036 (b) (e) | | | 7,962 | | | | 3,737 | |
| Total Mortgage Backed Securities (Cost $6,151) | | | | | | | 6,459 | |
| | | | | | | | | |
| TOTAL BONDS & NOTES (Cost $15,122) | | | | | | | 15,901 | |
| | | | | | | | | | | | | | | | |
| CROW POINT GLOBAL TACTICAL ALLOCATION FUND | | | | | | | | | | | | | | | |
| SCHEDULE OF INVESTMENTS | | | | | | | | | | | | | | | |
| September 30, 2019 | | | | | | | | | ANNUAL REPORT | |
| | | | | | | | | | | | | | | | | | | | | |
| PARTNERSHIP - 12.35% | | | | | | | | | | | | | | Shares | | | | Value | |
| | | | | | | | | | | | | | | | | | | | | |
| K-20 Partners Fund, LP (a) (f) | | | | | | | | | | | | | | | 2,750,000 | | | $ | 2,881,337 | |
| | | | | | | | | | | | | | | | | | | | | |
| TOTAL PARTNERSHIP (Cost $2,750,000) | | | | | | | | | | | | | | | | | | | 2,881,337 | |
| OPTIONS PURCHASED - 0.36% | | | | | | | | | | | | | | | | | | | | |
| | | | | | | | | | | | | | | | | | | | | |
| CALL OPTIONS PURCHASED - 0.18% | | | | | | Notional | | | Exercise | | | | | | | | | |
| | | Contracts 1 | | | Amount | | | Price | | | Expiration | | | | | |
| | | | | | | | | | | | | | | | | | | | | |
| iPath Series B S&P 500 VIX Short-Term Futures ETN | | | 100 | | | $ | 220,000 | | | $ | 22.00 | | | | 10/18/2019 | | | | 23,700 | |
| iPath Series B S&P 500 VIX Short-Term Futures ETN | | | 200 | | | $ | 500,000 | | | $ | 25.00 | | | | 10/18/2019 | | | | 19,200 | |
| | | | | | | | | | | | | | | | | | | | 42,900 | |
| | | | | | | | | | | | | | | | | | | | | |
| TOTAL CALL OPTIONS PURCHASED (Cost $40,548) | | | | | | | | | | | | | | | 42,900 | |
| | | | | | | | | | | | | | | | | | | | | |
| PUT OPTIONS PURCHASED - 0.18% | | | | | | | | | | | | | | | | | | | | |
| | | | | | | | | | | | | | | | | | | | | |
| iShares 20+ Year Treasury Bond ETF | | | 120 | | | $ | 1,704,000 | | | $ | 142.00 | | | | 12/20/2019 | | | | 41,400 | |
| | | | | | | | | | | | | | | | | | | | | |
| TOTAL PUT OPTIONS PURCHASED (Cost $50,670) | | | | | | | | | | | 41,400 | |
| | | | | | | | | | | | | | | | | | | | | |
| TOTAL OPTIONS PURCHASED (Cost $91,218) | | | | | | | | | | | 84,300 | |
| | | | | | | | | | | | | | | | | | | | | |
| SHORT-TERM INVESTMENT - 4.56% | | | | | | | | | | | | | | | | | | | | |
| | | | | | | | | | | | | | | | | | | | | |
| Federated Government Obligations Fund - Institutional Class, 1.85% (c) | | | | | 1,064,945 | | | | 1,064,945 | |
| | | | | | | | | | | | | | | | | | | | | |
| TOTAL SHORT-TERM INVESTMENT (Cost $1,064,945) | | | | | | | | | | | | | | 1,064,945 | |
| | | | | | | | | | | | | | | | | | | | | |
| TOTAL INVESTMENTS (Cost $22,674,052) – 99.30% | | | | | | | | | | | | | | 23,175,730 | |
| | | | | | | | | | | | | | | | | | | | | |
| SECURITIES SOLD SHORT (Proceeds $1,493,479) - (6.25%) | | | | | | | | | | | | | | (1,457,457 | ) |
| | | | | | | | | | | | | | | | | | | | | |
| OTHER ASSETS IN EXCESS OF LIABILITIES, NET - 6.95% | | | | | | | | | | | | | | 1,621,632 | |
| | | | | | | | | | | | | | | | | | | | | |
| NET ASSETS - 100% | | | | | | | | | | | | | $ | 23,339,905 | |
| (a) Non-income producing security. | | | | | | | | | | |
| (b) All or a portion of the security is segregated as collateral for securities sold short. | | | | |
| (c) Rate shown represents the 7-day effective yield at September 30, 2019, is subject to change and resets daily. |
| (d) Affiliated investment company. | | | | | | | | | | |
| (e) Variable rate security - Interest rate shown represents the rate on September 30, 2019. | | | | |
| (f) Private equity fund purchased on February 11, 2019, April 11, 2019 and July 19, 2019 that seeks to capture the opportunity presented by the education sector by investing long and short in a concentrated portfolio of public and private equity and debt securities. Withdrawals may be made quarterly upon 45 days written notice, commencing 12 months after making the initial capital contribution. There were no unfunded commitments as of September 30, 2019. This investment is valued using the practical expedient. For more information on the practical expedient, please refer to the security valuation section on Note 3 of the accompanying notes to the financial statements. |
| 1 Each option contract is equivalent to 100 shares of the underlying ETF/ETN. All options are non-income producing. |
| | | | | | | | | | | | |
| ETF - Exchange Traded Fund | | | | | | | | | | |
| ETN - Exchange Traded Note | | | | | | | | | | |
| LP - Limited Partnership | | | | | | | | | | |
The accompanying notes are an integral part of these financial statements.
| CROW POINT GLOBAL TACTICAL ALLOCATION FUND | | | | | | |
| SCHEDULE OF INVESTMENTS - SECURITIES SOLD SHORT | | | | | | |
| September 30, 2019 | | ANNUAL REPORT | |
| | | | | | | |
| SECURITIES SOLD SHORT - (6.25)% | | | | | | |
| | | | | | | |
| COMMON STOCK - (1.14)% | | Shares | | | Value | |
| | | | | | | |
| Auto Manufacturers - (1.14)% | | | | | | | | |
| Tesla, Inc. | | | 1,100 | | | $ | 264,957 | |
| | | | | | | | | |
| TOTAL COMMON STOCK (Proceeds $297,611) | | | | | | | 264,957 | |
| | | | | | | | | |
| EXCHANGE-TRADED FUNDS - (5.11)% | | | | | | | | |
| | | | | | | | | |
| Equity Fund - (5.11)% | | | | | | | | |
| iShares Edge MSCI USA Momentum Factor ETF | | | 10,000 | | | | 1,192,500 | |
| | | | | | | | | |
| TOTAL EXCHANGE-TRADED FUNDS (Proceeds $1,195,868) | | | | | | | 1,192,500 | |
| | | | | | | | | |
| TOTAL SECURITIES SOLD SHORT (Proceeds $1,493,479) | | | | | | $ | 1,457,457 | |
ETF - Exchange Traded Fund
The accompanying notes are an integral part of these financial statements.
| CROW POINT ALTERNATIVE INCOME FUND | | | | | | |
| SCHEDULE OF INVESTMENTS | | | | | | |
| September 30, 2019 | | ANNUAL REPORT | |
| | | | | | | |
| PREFERRED STOCK - 0.51% | | Shares | | | | Value | |
| | | | | | | | | |
| Banks - 0.41% | | | | | | | | |
| Bank of America Corp., 6.20% | | | 1,900 | | | $ | 49,115 | |
| | | | | | | | | |
| Diversified Financial Services - 0.10% | | | | | | | | |
| Legg Mason, Inc., 6.375% | | | 400 | | | | 11,136 | |
| | | | | | | | | |
| TOTAL PREFERRED STOCK (Cost $60,843) | | | | | | | 60,251 | |
| | | | | | | | | |
| CLOSED-END FUNDS - 8.12% | | | | | | | | |
| | | | | | | | | |
| Eaton Vance Limited Duration Income Fund | | | 35,475 | | | | 443,437 | |
| MFS Multimarket Income Trust | | | 30,500 | | | | 180,255 | |
| Royce Value Trust, Inc. | | | 25,000 | | | | 344,000 | |
| | | | | | | | 967,692 | |
| | | | | | | | | |
| TOTAL CLOSED END FUNDS (Cost $1,006,827) | | | | | | | 967,692 | |
| | | | | | | | | |
| EXCHANGE-TRADED FUNDS - 35.74% | | | | | | | | |
| | | | | | | | | |
| Debt Funds - 35.74% | | | | | | | | |
| Invesco Senior Loan ETF (b) | | | 35,000 | | | | 790,650 | |
| iShares 0-5 Year High Yield Corporate Bond ETF | | | 2,140 | | | | 99,489 | |
| iShares Core U.S. Aggregate Bond ETF (b) | | | 10,000 | | | | 1,131,700 | |
| iShares JP Morgan EM Local Currency Bond ETF | | | 7,500 | | | | 331,575 | |
| SPDR Bloomberg Barclay’s High Yield Bond ETF (b) | | | 8,000 | | | | 869,920 | |
| SPDR Portfolio Short Term Corporate Bond ETF | | | 3,250 | | | | 100,263 | |
| VanEck Vectors Fallen Angel High Yield Bond ETF | | | 15,000 | | | | 439,800 | |
| VanEck Vectors J.P. Morgan EM Local Currency Bond ETF | | | 15,000 | | | | 495,000 | |
| | | | | | | | 4,258,397 | |
| | | | | | | | | |
| TOTAL EXCHANGE-TRADED FUNDS (Cost $4,262,245) | | | | | | | 4,258,397 | |
| BONDS & NOTES - 38.61% | | Principal Amount | | | | |
| | | | | | | |
| Asset Backed Securities - 2.53% | | | | | | | | |
| Ameriquest Mortgage Securities, Inc. Asset-Backed Pass-Through Certificates Series 2003-11, 5.083%, due 12/25/2033 (d) | | $ | 1,467 | | | | 1,490 | |
| Countrywide Asset-Backed Certificates, 4.686%, due 10/25/2017 (d) | | | 6,991 | | | | 7,270 | |
| Equity One Mortgage Pass-Through Trust 2003-4, 4.326%, due 10/25/2034 (d) | | | 17,851 | | | | 18,316 | |
| Fremont Home Loan Trust 2005-B, 2.723% (Coupon rate 0.71% + 1 Month LIBOR rate), due 04/25/2035 (d) | | | 40,064 | | | | 40,139 | |
| GE Capital Mortgage Services, Inc. 1999-HE1 Trust, 6.265%, due 04/25/2029 | | | 684 | | | | 700 | |
| RAMP Series 2005-RS1 Trust, 4.713%, due 11/25/2034 | | | 978 | | | | 982 | |
| RASC Series 2003-KS4 Trust, 3.870%, due 05/25/2033 | | | 2,704 | | | | 2,741 | |
| Structured Asset Securities Corp. Mortgage Loan Trust 2006-AM1, 2.178% (Coupon rate 0.34% + 1 Month LIBOR rate), due 04/25/2036 (d) | | | 37,208 | | | | 37,171 | |
| Structured Asset Securities Corp. Mortgage Loan Trust 2006-WF1, 2.528% (Coupon rate 0.16% + 1 Month LIBOR rate), due 02/25/2036 (d) | | | 193,024 | | | | 193,130 | |
| Total Asset Backed Securities (Cost $275,836) | | | | | | | 301,939 | |
| | | | | | | | | |
| Corporate Bonds - 35.89% | | | | | | | | |
| | | | | | | | | |
| Airlines - 2.57% | | | | | | | | |
| Continental Airlines 2007-1 Class B Pass Through Trust, 6.903%, due 10/19/2023 | | | 100,028 | | | | 103,489 | |
| Delta Air Lines, Inc., 3.400%, due 04/19/2021 | | | 200,000 | | | | 202,793 | |
| | | | | | | | 306,282 | |
| CROW POINT ALTERNATIVE INCOME FUND | | | | | | |
| SCHEDULE OF INVESTMENTS | | | | | | |
| September 30, 2019 | | ANNUAL REPORT | |
| | | | | | | |
| BONDS & NOTES - 38.61% (continued) | | Principal Amount | | | Value | |
| | | | | | | |
| Corporate Bonds - 35.89% (continued) | | | | | | | | |
| | | | | | | | | |
| Auto Manufacturers - 1.69% | | | | | | | | |
| Ford Motor Credit Co. LLC, 3.336%, due 03/18/2021 | | $ | 200,000 | | | $ | 200,934 | |
| | | | | | | | | |
| Banks - 3.02% | | | | | | | | |
| CIT Group, Inc., 5.000%, due 08/01/2023 | | | 150,000 | | | | 159,750 | |
| Deutsche Bank AG/New York, NY, 2.700%, due 07/13/2020 | | | 200,000 | | | | 199,591 | |
| | | | | | | | 359,341 | |
| Chemicals - 2.61% | | | | | | | | |
| Methanex Corp., 3.250%, due 12/15/2019 | | | 100,000 | | | | 100,197 | |
| Olin Corp., 5.500%, due 08/15/2022 | | | 200,000 | | | | 211,000 | |
| | | | | | | | 311,197 | |
| Commercial Services - 2.16% | | | | | | | | |
| Service Corp. International, 5.375%, due 05/15/2024 | | | 250,000 | | | | 258,010 | |
| | | | | | | | | |
| Computers - 2.10% | | | | | | | | |
| EMC Corp., 3.375%, due 06/01/2023 | | | 250,000 | | | | 250,025 | |
| | | | | | | | | |
| Diversified Financial Services - 4.79% | | | | | | | | |
| AerCap Ireland Capital DAC / AerCap Global Aviation Trust, 4.500%, due 05/15/2021 | | | 200,000 | | | | 206,476 | |
| Aircastle Ltd., 4.400%, due 09/25/2023 | | | 200,000 | | | | 210,384 | |
| Ally Financial, Inc., 4.125%, due 02/13/2022 | | | 150,000 | | | | 153,375 | |
| | | | | | | | 570,235 | |
| Electric - 1.67% | | | | | | | | |
| Edison International, 2.125%, due 04/15/2020 | | | 200,000 | | | | 199,610 | |
| | | | | | | | | |
| Electronics - 1.79% | | | | | | | | |
| ADT Security Corp., 6.250%, due 10/15/2021 | | | 200,000 | | | | 213,000 | |
| | | | | | | | | |
| Insurance - 1.30% | | | | | | | | |
| Radian Group, Inc., 4.500%,due 10/01/2024 | | | 150,000 | | | | 154,500 | |
| | | | | | | | | |
| Internet - 1.33% | | | | | | | | |
| Netflix, Inc., 5.500%, due 02/15/2022 | | | 150,000 | | | | 159,000 | |
| | | | | | | | | |
| Mining - 1.67% | | | | | | | | |
| Freeport-McMoRan, Inc., 3.550%, due 03/01/2022 | | | 198,000 | | | | 198,495 | |
| | | | | | | | | |
| Oil & Gas - 3.90% | | | | | | | | |
| Petrobras Global Finance BV, 5.375%, due 01/27/2021 | | | 250,000 | | | | 258,375 | |
| Petroleos Mexicanos, 5.500%, due 01/21/2021 | | | 200,000 | | | | 205,976 | |
| | | | | | | | 464,351 | |
| REITS - 4.41% | | | | | | | | |
| Equinix, Inc., 5.375%, 04/01/2023 | | | 200,000 | | | | 204,440 | |
| Iron Mountain, Inc., 6.000%, due 08/15/2023 | | | 100,000 | | | | 102,360 | |
| MGM Growth Properties Operating Partnership LP / MGP Finance Co-Issuer, Inc., 5.625%, due 05/01/2024 | | | 200,000 | | | | 219,250 | |
| | | | | | | | 526,050 | |
| Telecommunications - 0.88% | | | | | | | | |
| CenturyLink, Inc., 5.800%, due 03/15/2022 | | | 100,000 | | | | 105,375 | |
| | | | | | | | | |
| Total Corporate Bonds (Cost $4,253,285) | | | | | | | 4,276,405 | |
| | | | | | | | | |
| Mortgage Backed Securities - 0.19% | | | | | | | | |
| Adjustable Rate Mortgage Trust 2005-5, 2.578% (Coupon rate 0.28% + 1 Month LIBOR rate), due 09/25/2035 (d) | | | 3,361 | | | | 3,360 | |
| Banc of America Funding 2006-2 Trust, 5.750%, due 03/25/2036 | | | 8,315 | | | | 8,152 | |
| Washington Mutual Mortgage Pass-Through Certificates WMALT Series 2006-7 Trust, 4.259%, due 09/25/2036 (d) | | | 23,885 | | | | 11,210 | |
| Total Mortgage Backed Securities (Cost $21,578) | | | | | | | 22,722 | |
| | | | | | | | | |
| TOTAL BONDS & NOTES (Cost $4,550,699) | | | | | | | 4,601,066 | |
| CROW POINT ALTERNATIVE INCOME FUND | | | | | | | | | | | | | | | |
| SCHEDULE OF INVESTMENTS | | | | | | | | | | | | | | | |
| September 30, 2019 | | | | | | | | | | | ANNUAL REPORT | |
| | | | | | | | | | | | | | | | |
| PARTNERSHIP - 11.08% | | | | | | | | | | | Shares | | | Value | |
| | | | | | | | | | | | | | | | |
| K-20 Education Partners LP (a) (e) | | | | | | | | | | | | | | | 1,261,250 | | | $ | 1,319,721 | |
| | | | | | | | | | | | | | | | | | | | | |
| TOTAL PARTNERSHIP (Cost $1,261,250) | | | | | | | | | | | | | | | | | | | 1,319,721 | |
| | | | | | | | | | | | | | | | | | | | | |
| OPTIONS PURCHASED - 0.31% | | | | | | | | | | | | | | | | | | | | |
| | | | | | | | | | | | | | | | | | | | | |
| CALL OPTIONS PURCHASED - 0.18% | | | | | | Notional | | | Exercise | | | | | | | | | |
| | | Contracts 1 | | | Amount | | | Price | | | Expiration | | | | | |
| | | | | | | | | | | | | | | | | | | | | |
| iPath Series B S&P 500 VIX Short-Term Futures ETN | | | 50 | | | $ | 110,000 | | | $ | 22.00 | | | | 10/18/2019 | | | | 11,850 | |
| iPath Series B S&P 500 VIX Short-Term Futures ETN | | | 100 | | | $ | 250,000 | | | $ | 25.00 | | | | 10/18/2019 | | | | 9,600 | |
| TOTAL CALL OPTIONS PURCHASED (Cost $22,766) | | | | | | | | | | | | | | | | | | | 21,450 | |
| | | | | | | | | | | | | | | | | | | | | |
| PUT OPTIONS PURCHASED - 0.13% | | | | | | | | | | | | | | | | | | | | |
| | | | | | | | | | | | | | | | | | | | | |
| iShares 20+ Year Treasury Bond ETF | | | 45 | | | $ | 639,000 | | | $ | 142.00 | | | | 12/20/2019 | | | | 15,525 | |
| | | | | | | | | | | | | | | | | | | | | |
| TOTAL PUT OPTIONS PURCHASED (Cost $18,992) | | | | | | | | | | | | | | 15,525 | |
| | | | | | | | | | | | | | | | | | | | | |
| TOTAL OPTIONS PURCHASED (Cost $41,758) | | | | | | | | | | | | | | 36,975 | |
| | | | | | | | | | | | | | | | | | | | | |
| SHORT-TERM INVESTMENT - 5.15% | | | | | | | | | | | | | | | | | | | | |
| | | | | | | | | | | | | | | | | | | | | |
| Federated Government Obligations Fund - Institutional Class, 1.85% (c) | | | | | | | | | 613,993 | | | | 613,993 | |
| | | | | | | | | | | | | | | | | | | | | |
| TOTAL SHORT-TERM INVESTMENT (Cost $613,993) | | | | | | | | | | | | | 613,993 | |
| | | | | | | | | | | | | | | | | | | | | |
| TOTAL INVESTMENTS (Cost $11,797,615) - 99.52% | | | | | | | | | | | | | 11,858,095 | |
| | | | | | | | | | | | | | | | | | | | | |
| SECURITIES SOLD SHORT (Proceeds $275,996) - (2.22%) | | | | | | | | | | | | | (264,364 | ) |
| | | | | | | | | | | | | | | | | | | | | |
| OTHER ASSETS IN EXCESS OF LIABILITIES, NET - 2.70% | | | | | | | | | | | | | 321,871 | |
| | | | | | | | | | | | | | | | | | | | | |
| NET ASSETS - 100% | | | | | | | | | | | | $ | 11,915,602 | |
| | | | | | | | | | | | |
| (a) Non-income producing security. | | | | | | | | | | |
| (b) All or a portion of the security is segregated as collateral for securities sold short. | | | |
| (c) Rate shown represents the 7-day effective yield at September 30, 2019, is subject to change and resets daily. |
| (d) Variable rate security - Interest rate shown represents the rate on September 30, 2019. | | |
| (e) Private equity fund purchased on February 11, 2019, April 11, 2019 and July 19, 2019 that seeks to capture the opportunity presented by the education sector by investing long and short in a concentrated portfolio of public and private equity and debt securities. Withdrawals may be made quarterly upon 45 days written notice, commencing 12 months after making the initial capital contribution. There were no unfunded commitments as of September 30, 2019. This investment is valued using the practical expedient. For more information on the practical expedient, please refer to the security valuation section on Note 3 of the accompanying notes to the financial statements. |
| 1 Each option contract is equivalent to 100 shares of the underlying ETN/ETF. All options are non-income producing. |
| | |
| ETF - Exchange Traded Fund | | | | | | | | | | |
| ETN - Exchange Traded Note | | | | | | | | | | |
| LP - Limited Partnership | | | | | | | | | | |
| REITS - Real Estate Investment Trusts | | | | | | | | | | |
The accompanying notes are an integral part of these financial statements.
| CROW POINT ALTERNATIVE INCOME FUND | | | | | | |
| SCHEDULE OF INVESTMENTS - SECURITIES SOLD SHORT | | | | | | |
| September 30, 2019 | | ANNUAL REPORT | |
| | | | | | | |
| SECURITIES SOLD SHORT - (2.22)% | | | | | | |
| | | | | | | |
| COMMON STOCK - (0.46)% | | Shares | | | Value | |
| | | | | | | |
| Auto Manufacturers - (0.46)% | | | | | | | | |
| Tesla, Inc. | | | 225 | | | $ | 54,196 | |
| | | | | | | | | |
| TOTAL COMMON STOCK (Proceeds $61,117) | | | | | | | 54,196 | |
| | | | | | | | | |
| EXCHANGE-TRADED FUNDS - (1.76)% | | | | | | | | |
| | | | | | | | | |
| Debt Fund - (1.76)% | | | | | | | | |
| iShares Core S&P Small-Cap ETF | | | 2,700 | | | | 210,168 | |
| | | | | | | | | |
| TOTAL EXCHANGE-TRADED FUNDS (Proceeds $214,879) | | | | | | | 210,168 | |
| | | | | | | | | |
| TOTAL SECURITIES SOLD SHORT (Proceeds $275,996) | | | | | | $ | 264,364 | |
ETF - Exchange Traded Fund
The accompanying notes are an integral part of these financial statements.
| CROW POINT FUNDS | |
| STATEMENTS OF ASSETS AND LIABILITIES | |
| | |
| September 30, 2019 | ANNUAL REPORT |
| | EAS Crow Point Alternatives Fund (a) | | Crow Point Global Tactical Allocation Fund | | Crow Point Alternative Income Fund | |
| Assets: | | | | | | |
| Investment securities: | | | | | | | | | |
| Unaffiliated Securities at Cost | $ | 20,626,918 | | $ | 21,932,670 | | $ | 11,797,615 | |
| Affiliated Securities at Cost | | 12,922,234 | | | 741,382 | | | — | |
| Total Securities at Cost | | 33,549,152 | | | 22,674,052 | | | 11,797,615 | |
| Unaffiliated Securities at Value | | 20,715,974 | | | 22,533,180 | | | 11,858,095 | |
| Affiliated Securities at Value | | 12,053,465 | | | 642,550 | | | — | |
| Deposits at broker | | 2,637,366 | | | 1,584,546 | | | 260,492 | |
| Due from adviser | | 71,899 | | | 8,319 | | | 12,407 | |
| Due from administrator | | — | | | 792 | | | — | |
| Receivables: | | | | | | | | | |
| Interest | | 22,013 | | | 1,328 | | | 56,561 | |
| Dividends | | 14,423 | | | 20,754 | | | 736 | |
| Investment securities sold | | 492,093 | | | — | | | — | |
| Prepaid expenses and other assets | | 24,045 | | | 8,303 | | | 3,229 | |
| Total assets | | 36,031,278 | | | 24,799,772 | | | 12,191,520 | |
| | | | | | | | | | |
| Liabilities: | | | | | | | | | |
| Securities sold short and options written: | | | | | | | | | |
| Proceeds from securities sold short | | 1,645,126 | | | 1,493,479 | | | 275,996 | |
| Premiums received from options written | | 340 | | | — | | | — | |
| Total proceeds and premiums from securities sold short and options written | | 1,645,466 | | | 1,493,479 | | | 275,996 | |
| Securities sold short at value | | 1,589,432 | | | 1,457,457 | | | 264,364 | |
| Options written at value | | 340 | | | — | | | — | |
| Total securities sold short and options written at value | | 1,589,772 | | | 1,457,457 | | | 264,364 | |
| Payables: | | | | | | | | | |
| Investment securities purchased | | 29,573 | | | — | | | — | |
| Dividend expense from securities sold short | | 319 | | | — | | | — | |
| Accrued distribution (12b-1) fees | | 1,591 | | | 210 | | | 5,948 | |
| Due to administrator | | 15,951 | | | — | | | 2,656 | |
| Accrued expenses | | 4,307 | | | 2,200 | | | 2,950 | |
| Total liabilities | | 1,641,513 | | | 1,459,867 | | | 275,918 | |
| Net Assets | $ | 34,389,765 | | $ | 23,339,905 | | $ | 11,915,602 | |
| | | | | | | | | | |
| Sources of Net Assets: | | | | | | | | | |
| Paid-in capital | $ | 36,424,010 | | $ | 23,715,066 | | $ | 13,250,169 | |
| Total accumulated losses | | (2,034,245 | ) | | (375,161 | ) | | (1,334,567 | ) |
| Total Net Assets | $ | 34,389,765 | | $ | 23,339,905 | | $ | 11,915,602 | |
| | | | | | | | | | |
| Investor Class Shares: | | | | | | | | | |
| Net assets | $ | 1,616,941 | | $ | 550,751 | | $ | 11,872,581 | |
| Shares Outstanding ($0 par value, Unlimited shares of beneficial interest authorized) | | 178,953 | | | 61,478 | | | 1,391,451 | |
| Net Asset Value, Offering and Redemption Price Per Share | $ | 9.04 | | $ | 8.96 | | $ | 8.53 | |
| | | | | | | | | | |
| Institutional Class Shares: | | | | | | | | | |
| Net assets | $ | 32,772,824 | | $ | 22,789,154 | | $ | 43,021 | |
| Shares Outstanding ($0 par value, Unlimited shares of beneficial interest authorized) | | 3,586,379 | | | 2,520,085 | | | 5,036 | |
| Net Asset Value, Offering and Redemption Price Per Share | $ | 9.14 | | $ | 9.04 | | $ | 8.54 | |
(a) Amounts for the EAS Crow Point Alternatives Fund are consolidated.
The accompanying notes are an integral part of these financial statements.
| CROW POINT FUNDS | |
| STATEMENTS OF OPERATIONS | |
| | |
| September 30, 2019 | ANNUAL REPORT |
| | EAS Crow Point Alternatives Fund (a) | | Crow Point Global Tactical Allocation Fund | | Crow Point Alternative Income Fund | |
| | | | | | | |
| | For the | | For the | | For the | |
| | Year Ended | | Year Ended | | Year Ended | |
| | September 30, 2019 | | September 30, 2019 | | September 30, 2019 | |
| | | | | | | |
| | | | | | | |
| Investment income: | | | | | | | | | |
| Dividends (net of foreign withholding taxes of $7,831, $8,828 and $0, respectively) | $ | 120,218 | | $ | 372,326 | | $ | 295,937 | |
| Dividends from affiliated funds | | 94,523 | | | 32,938 | | | — | |
| Interest | | 125,805 | | | 53,986 | | | 115,048 | |
| Total investment income | | 340,546 | | | 459,250 | | | 410,985 | |
| | | | | | | | | | |
| Expenses: | | | | | | | | | |
| Management fees (Note 7) | | 348,751 | | | 171,580 | | | 110,909 | |
| Distribution (12b-1) fees - Investor Class | | 4,973 | | | 2,708 | | | 27,620 | |
| Distribution (12b-1) fees - Class C | | 2,669 | | | — | | | — | |
| Accounting and transfer agent fees and expenses | | 171,556 | | | 109,577 | | | 75,243 | |
| Dividends on securities sold short | | 48,077 | | | 15,901 | | | 11,067 | |
| Miscellaneous | | 31,392 | | | 20,735 | | | 19,060 | |
| Registration and filing fees | | 31,367 | | | 18,702 | | | 12,599 | |
| Legal fees | | 34,155 | | | 37,349 | | | 41,633 | |
| Trustee fees and expenses | | 23,814 | | | 22,478 | | | 24,895 | |
| Audit fees | | 21,020 | | | 22,353 | | | 15,700 | |
| Pricing fees | | 18,411 | | | 14,500 | | | 11,218 | |
| Compliance officer fees | | 15,691 | | | 15,000 | | | 15,000 | |
| Non-12b-1 shareholder servicing expense | | 15,328 | | | 9,200 | | | 17,750 | |
| Custodian fees | | 14,619 | | | 7,691 | | | 4,733 | |
| Interest expense | | 4,213 | | | 2,527 | | | 1,369 | |
| Reports to shareholders | | 2,063 | | | 1,148 | | | 1,490 | |
| Insurance | | 2,006 | | | 1,323 | | | 1,847 | |
| Brokerage account fees | | — | | | 633 | | | 139 | |
| Total expenses | | 790,105 | | | 473,405 | | | 392,272 | |
| Less expense reimbursement: | | | | | | | | | |
| Fees paid indirectly (Note 2) | | (22,796 | ) | | (10,351 | ) | | — | |
| Fees waived/reimbursed by Adviser | | (127,652 | ) | | (181,052 | ) | | (123,012 | ) |
| Fees waived by Adviser for affiliated holdings | | (81,980 | ) | | (13,101 | ) | | (304 | ) |
| Fees waived by administrator | | (9,583 | ) | | (7,500 | ) | | (7,500 | ) |
| Net expenses | | 548,094 | | | 261,401 | | | 261,456 | |
| | | | | | | | | | |
| Net investment income (loss) | | (207,548 | ) | | 197,849 | | | 149,529 | |
| | | | | | | | | | |
| Realized and unrealized gain (loss): | | | | | | | | | |
| Net realized gain (loss) on: | | | | | | | | | |
| Unaffiliated Investments | | (698,676 | ) | | (21,714 | )(b) | | 58,598 | |
| Affiliated Investments | | (98,388 | ) | | (16,234 | ) | | 3,500 | |
| Foreign currency transactions | | (9 | ) | | — | | | — | |
| Options written | | (55,922 | ) | | (182,683 | ) | | (63,790 | ) |
| Securities sold short | | 764,167 | | | 35,026 | | | (4,365 | ) |
| Net realized loss on investments, foreign currency transactions, options written and securities sold short | | (88,828 | ) | | (185,605 | ) | | (6,057 | ) |
| | | | | | | | | | |
| Net change in unrealized appreciation (depreciation) on: | | | | | | | | | |
| Unaffiliated Investments | | (1,205,464 | ) | | (230,719 | ) | | (6,672 | ) |
| Affiliated Investments | | (1,529,363 | ) | | (41,725 | ) | | (3,500 | ) |
| Foreign currency translations | | (389 | ) | | (271 | ) | | — | |
| Options written | | 2,600 | | | (17,050 | ) | | (4,990 | ) |
| Securities sold short | | 60,672 | | | 12,323 | | | 2,653 | |
| Net change in unrealized appreciation (depreciation) on investments, foreign currency translations, options written and securities sold short | | (2,671,944 | ) | | (277,442 | ) | | (12,509 | ) |
| | | | | | | | | | |
| Net loss on investments, foreign currency transactions, options written and securities sold short | | (2,760,772 | ) | | (463,047 | ) | | (18,566 | ) |
| | | | | | | | | | |
| Net increase (decrease) in net assets resulting from operations | $ | (2,968,320 | ) | $ | (265,198 | ) | $ | 130,963 | |
| (a) Amounts for the EAS Crow Point Alternatives Fund are consolidated. |
| (b) Includes capital gains distributions from underlying investments of $13,280. |
The accompanying notes are an integral part of these financial statements.
| CROW POINT FUNDS | |
| STATEMENTS OF CHANGES IN NET ASSETS | |
| | |
| September 30, 2019 | ANNUAL REPORT |
| | EAS Crow Point Alternatives Fund | |
| | | | | | | | | | |
| | | For the Year Ended September 30, 2019 (a) | | | For the Period Ended September 30, 2018 (b) | | | For the Year Ended April 30, 2018 | |
| | | | | | | | | | |
| Increase (decrease) in net assets from: | | | | | | | | | |
| Operations: | | | | | | | | | |
| Net investment loss | $ | (207,548 | ) | $ | (146,839 | ) | $ | (236,577 | ) |
| Net realized gain (loss) from investments, foreign currency transactions, options written and securities sold short | | (88,828 | ) | | 1,070,359 | | | 1,553,918 | |
| Net change in unrealized appreciation (depreciation) on investments, foreign currency translations, options written and securities sold short | | (2,671,944 | ) | | 1,186,201 | | | 372,892 | |
| Net increase (decrease) in net assets resulting from operations | | (2,968,320 | ) | | 2,109,721 | | | 1,690,233 | |
| | | | | | | | | | |
| Distributions to shareholders from: | | | | | | | | | |
| Total distributable earnings - Investor Class | | (5,096 | ) | | — | | | (17,465 | )(c) |
| Total distributable earnings - Class C | | (2,318 | ) | | — | | | (458 | )(c) |
| Total distributable earnings - Institutional Class | | (85,577 | ) | | — | | | (113,800 | )(c) |
| Total distributions | | (92,991 | ) | | — | | | (131,723 | ) |
| | | | | | | | | | |
| From shares of beneficial interest: | | | | | | | | | |
| Proceeds from shares sold: | | | | | | | | | |
| Investor Class | | 824,450 | | | 5,200 | | | 134,893 | |
| Class C | | — | | | 28,000 | | | 4,000 | |
| Institutional Class | | 10,284,109 | | | 17,498,537 | | | 9,960,572 | |
| Net asset value of shares issued in reinvestment of distributions to shareholders: | | | | | | | | | |
| Investor Class | | 4,770 | | | — | | | 15,347 | |
| Class C | | 2,254 | | | — | | | 428 | |
| Institutional Class | | 70,014 | | | — | | | 111,539 | |
| Payments for shares redeemed: | | | | | | | | | |
| Investor Class | | (1,101,689 | ) | | (855,606 | ) | | (10,107,175 | ) |
| Class C | | (811,844 | ) | | (13,498 | ) | | (171,481 | ) |
| Institutional Class | | (4,928,962 | ) | | (6,069,711 | ) | | (9,310,754 | ) |
| Increase (decrease) in net assets from transactions in shares of beneficial interest | | 4,343,102 | | | 10,592,922 | | | (9,362,631 | ) |
| | | | | | | | | | |
| Increase (decrease) in net assets | | 1,281,791 | | | 12,702,643 | | | (7,804,121 | ) |
| | | | | | | | | | |
| Net Assets: | | | | | | | | | |
| Beginning of year/period | | 33,107,974 | | | 20,405,331 | | | 28,209,452 | |
| | | | | | | | | | |
| End of year/period | $ | 34,389,765 | | $ | 33,107,974 | (d) | $ | 20,405,331 | (d) |
| | | | | | | | | | |
| Capital share activity: | | | | | | | | | |
| Investor Class: | | | | | | | | | |
| Shares Sold | | 91,363 | | | 546 | | | 14,767 | |
| Shares Reinvested | | 551 | | | — | | | 1,679 | |
| Shares Redeemed | | (120,264 | ) | | (91,132 | ) | | (1,136,016 | ) |
| Net decrease in shares of beneficial interest outstanding | | (28,350 | ) | | (90,586 | ) | | (1,119,570 | ) |
| Class C: | | | | | | | | | |
| Shares Sold | | — | | | 2,950 | | | 446 | |
| Shares Reinvested | | 270 | | | — | | | 48 | |
| Shares Redeemed | | (93,274 | ) | | (1,451 | ) | | (19,881 | ) |
| Net increase (decrease) in shares of beneficial interest outstanding | | (93,004 | ) | | 1,499 | | | (19,387 | ) |
| Institutional Class: | | | | | | | | | |
| Shares Sold | | 1,090,402 | | | 1,829,979 | | | 1,090,024 | |
| Shares Reinvested | | 8,020 | | | — | | | 12,111 | |
| Shares Redeemed | | (526,780 | ) | | (631,396 | ) | | (1,009,516 | ) |
| Net increase in shares of beneficial interest outstanding | | 571,642 | | | 1,198,583 | | | 92,619 | |
| (a) Amounts for the year ended September 30, 2019 are consolidated. | | |
| (b) Represents the period from May 1, 2018 through September 30, 2018. | | |
| (c) Current year presentation of distributions conforms with S-X Disclosure Simplification. Distributions for the year ended April 30, 2018 were $17,465, $458 and $113,800 from net investment income for Investor Class, Class C and Institutional Class, respectively, and have been consolidated to conform with S-X Disclosure Simplification. |
| (d) Includes $(102,853) and $(102,853) of accumulated net investment losses for the period ended September 30, 2018 and the year ended April 30, 2018, respectively. The SEC eliminated the requirement to disclose undistributed (accumulated) net investment income (loss) in 2018. |
The accompanying notes are an integral part of these financial statements.
| CROW POINT FUNDS | |
| STATEMENTS OF CHANGES IN NET ASSETS | |
| | |
| September 30, 2019 | ANNUAL REPORT |
| | Crow Point Global Tactical Allocation Fund | |
| | | | | | | | | | |
| | For the | | For the | | For the | |
| | Year Ended | | Period Ended | | Year Ended | |
| | September 30, 2019 | | September 30, 2018 (a) | | May 31, 2018 | |
| | | | | | | | | | |
| Increase (decrease) in net assets from: | | | | | | | | | |
| Operations: | | | | | | | | | |
| Net investment income | $ | 197,849 | | $ | 53,053 | | $ | 139,407 | |
| Net realized gain (loss) from investments, foreign currency transactions, option written and securities sold short | | (185,605 | ) | | 160,637 | | | 1,062,097 | |
| Net change in unrealized appreciation (depreciation) on investments, foreign currency translations, options written and securities sold short | | (277,442 | ) | | 484,129 | | | (313,584 | ) |
| Net increase (decrease) in net assets resulting from operations | | (265,198 | ) | | 697,819 | | | 887,920 | |
| | | | | | | | | | |
| Distributions to shareholders from: | | | | | | | | | |
| Total distributable earnings - Investor Class | | (8,006 | ) | | — | | | (43,883 | )(b) |
| Total distributable earnings - Institutional Class | | (130,253 | ) | | — | | | (74,894 | )(b) |
| Total distributions | | (138,259 | ) | | — | | | (118,777 | ) |
| | | | | | | | | | |
| From shares of beneficial interest: | | | | | | | | | |
| Proceeds from shares sold: | | | | | | | | | |
| Investor Class | | 30,200 | | | 100 | | | 1,040,198 | |
| Institutional Class | | 8,194,895 | | | 6,289,883 | | | 15,313,850 | |
| Net asset value of shares issued in reinvestment of distributions: | | | | | | | | | |
| Investor Class | | 6,676 | | | — | | | 41,930 | |
| Institutional Class | | 22,321 | | | — | | | 46,699 | |
| Redemption fee proceeds: | | | | | | | | | |
| Investor Class | | — | | | — | | | 1,773 | |
| Institutional Class | | — | | | 302 | | | 3,348 | |
| Payments for shares redeemed: | | | | | | | | | |
| Investor Class | | (1,168,742 | ) | | (764,684 | ) | | (3,407,587 | ) |
| Institutional Class | | (1,502,898 | ) | | (413,683 | ) | | (9,490,978 | ) |
| | | | | | | | | | |
| Increase in net assets from transactions in shares of beneficial interest | | 5,582,452 | | | 5,111,918 | | | 3,549,233 | |
| | | | | | | | | | |
| Increase in net assets | | 5,178,995 | | | 5,809,737 | | | 4,318,376 | |
| | | | | | | | | | |
| Net Assets: | | | | | | | | | |
| Beginning of year/period | | 18,160,910 | | | 12,351,173 | | | 8,032,797 | |
| | | | | | | | | | |
| End of year/period | $ | 23,339,905 | | $ | 18,160,910 | (c) | $ | 12,351,173 | (c) |
| | | | | | | | | | |
| Capital share activity: | | | | | | | | | |
| Investor Class: | | | | | | | | | |
| Shares Sold | | 3,294 | | | 11 | | | 121,704 | |
| Shares Reinvested | | 819 | | | — | | | 4,844 | |
| Shares Redeemed | | (131,405 | ) | | (86,513 | ) | | (385,679 | ) |
| Net decrease in shares of beneficial interest outstanding | | (127,292 | ) | | (86,502 | ) | | (259,131 | ) |
| Institutional Class: | | | | | | | | | |
| Shares Sold | | 911,915 | | | 700,675 | | | 1,734,305 | |
| Shares Reinvested | | 2,732 | | | — | | | 5,281 | |
| Shares Redeemed | | (165,179 | ) | | (46,255 | ) | | (1,050,506 | ) |
| Net increase in shares of beneficial interest outstanding | | 749,468 | | | 654,420 | | | 689,080 | |
| (a) Represents the period from June 1, 2018 through September 30, 2018. | |
| (b) Current year presentation of distributions conforms with S-X Disclosure Simplification. Distributions for the year ended May 31, 2018 were $43,883 and $74,894 from net investment income for the Investor Class and Institutional Class, respectively, and have been consolidated to conform with S-X Disclosure Simplification. |
| (c) Includes $73,120 and $14,935 of undistributed net investment income for the period ended September 30, 2018 and year ended May 31, 2018, respectively. The SEC eliminated the requirement to disclose undistributed (accumulated) net investment income (loss) in 2018. |
The accompanying notes are an integral part of these financial statements.
| CROW POINT FUNDS | |
| STATEMENTS OF CHANGES IN NET ASSETS | |
| | |
| September 30, 2019 | ANNUAL REPORT |
| | Crow Point Alternative Income Fund | |
| | | | | | | |
| | For the | | For the | |
| | Year Ended | | Year Ended | |
| | September 30, 2019 | | September 30, 2018 | |
| | | | | | | |
| Increase (decrease) in net assets from: | | | | | | |
| Operations: | | | | | | |
| Net investment income | $ | 149,529 | | $ | 13,517 | |
| Net realized gain (loss) from investments, foreign currency transactions, options written and securities sold short | | (6,057 | ) | | 329,150 | |
| Net change in unrealized appreciation (depreciation) on investments, foreign currency translations, options written and securities sold short | | (12,509 | ) | | (27,579 | ) |
| Net increase in net assets resulting from operations | | 130,963 | | | 315,088 | |
| | | | | | | |
| Distributions to shareholders from: | | | | | | |
| Total distributable earnings - Investor Class | | (26,240 | ) | | (18,527 | )(a) |
| Total distributions | | (26,240 | ) | | (18,527 | ) |
| | | | | | | |
| From shares of beneficial interest: | | | | | | |
| Proceeds from shares sold: | | | | | | |
| Investor Class | | 4,038,174 | | | 14,624,493 | |
| Institutional Class | | 75,000 | | | — | |
| Net asset value of shares issued in reinvestment of distributions: | | | | | | |
| Investor Class | | 14,311 | | | 12,755 | |
| Institutional Class | | — | | | — | |
| Payments for shares redeemed: | | | | | | |
| Investor Class | | (2,265,361 | ) | | (12,799,380 | ) |
| Institutional Class | | (34,000 | ) | | — | |
| Increase in net assets from transactions in shares of beneficial interest | | 1,828,124 | | | 1,837,868 | |
| | | | | | | |
| Increase in net assets | | 1,932,847 | | | 2,134,429 | |
| | | | | | | |
| Net Assets: | | | | | | |
| Beginning of year | | 9,982,755 | | | 7,848,326 | |
| | | | | | | |
| End of year | $ | 11,915,602 | | $ | 9,982,755 | (b) |
| | | | | | | |
| Capital share activity: | | | | | | |
| Investor Class: | | | | | | |
| Shares Sold | | 476,334 | | | 1,746,456 | |
| Shares Reinvested | | 1,796 | | | 1,509 | |
| Shares Redeemed | | (269,703 | ) | | (1,511,960 | ) |
| Net increase in shares of beneficial interest outstanding | | 208,427 | | | 236,005 | |
| Institutional Class: | | | | | | |
| Shares Sold | | 9,036 | | | — | |
| Shares Redeemed | | (4,000 | ) | | — | |
| Net increase in shares of beneficial interest outstanding | | 5,036 | | | — | |
(a) Current year presentation of distributions conforms with S-X Disclosure Simplification. Prior year distributions for the year ended September 30, 2018 were $18,527 from net investment income for the Investor Class and have been consolidated to conform with S-X Disclosure Simplification.
(b) Includes $(13,991) of accumulated net investment loss for the year ended September 30, 2018. The SEC eliminated the requirement to disclose undistributed (accumulated) net investment income (loss) in 2018.
The accompanying notes are an integral part of these financial statements.
| CROW POINT FUNDS | | |
| FINANCIAL HIGHLIGHTS | | |
| | | | |
| September 30, 2019 | ANNUAL REPORT | |
| | | | |
| The following tables set forth the per share operating performance data for a share of beneficial interest outstanding, total return, ratios to average net assets and other supplemental data for each of the years or period indicated. |
| | | EAS Crow Point Alternatives Fund | |
| | | | | | | | | | | | | | | | | | | |
| | | | Investor Class | |
| | | For the | | | For the | | | For the | | | For the | | | For the | | | For the | |
| | | Year Ended | | | Period Ended | | | Year Ended | | | Year Ended | | | Year Ended | | | Year Ended | |
| | | September 30, 2019 (a) | | | September 30, 2018 (b) | | | April 30, 2018 | | | April 30, 2017 | | | April 30, 2016 | | | April 30, 2015 | |
| | | | | | | | | | | | | | | | | | | | | | | | | |
| | | | | | | | | | | | | | | | | | | | | | | | | |
| Net Asset Value, Beginning of Year/Period | | $ | 9.92 | | | $ | 9.20 | | | $ | 8.64 | | | $ | 8.59 | | | $ | 9.18 | | | $ | 8.85 | |
| | | | | | | | | | | | | | | | | | | | | | | | | |
| Investment Operations: | | | | | | | | | | | | | | | | | | | | | | | | |
| Net investment income (loss) (1) | | | (0.08 | ) | | | (0.06 | ) | | | (0.11 | ) | | | (0.02 | ) | | | 0.08 | | | | 0.09 | |
| Net realized and unrealized gain (loss) on investments | | | (0.77 | ) | | | 0.78 | | | | 0.71 | | | | 0.09 | | | | (0.62 | ) | | | 0.33 | |
| Total from investment operations | | | (0.85 | ) | | | 0.72 | | | | 0.60 | | | | 0.07 | | | | (0.54 | ) | | | 0.42 | |
| | | | | | | | | | | | | | | | | | | | | | | | | |
| Distributions: | | | | | | | | | | | | | | | | | | | | | | | | |
| From net investment income | | | — | | | | — | | | | (0.04 | ) | | | (0.02 | ) | | | (0.06 | ) | | | (0.09 | ) |
| From net realized capital gains | | | (0.03 | ) | | | — | | | | — | | | | — | | | | — | | | | — | |
| Total distributions | | | (0.03 | ) | | | — | | | | (0.04 | ) | | | (0.02 | ) | | | (0.06 | ) | | | (0.09 | ) |
| | | | | | | | | | | | | | | | | | | | | | | | | |
| Paid in capital from redemption fees | | | — | | | | — | | | | — | | | | 0.00 | (7) | | | 0.01 | | | | 0.00 | (7) |
| | | | | | | | | | | | | | | | | | | | | | | | | |
| Net Asset Value, End of Year/Period | | $ | 9.04 | | | $ | 9.92 | | | $ | 9.20 | | | $ | 8.64 | | | $ | 8.59 | | | $ | 9.18 | |
| | | | | | | | | | | | | | | | | | | | | | | | | |
| Total Return (2) | | | (8.61 | )%(8) | | | 7.83 | %(5) | | | 6.99 | %(8) | | | 0.80 | % | | | (5.75 | )% | | | 4.78 | % |
| | | | | | | | | | | | | | | | | | | | | | | | | |
| Ratios/Supplemental Data | | | | | | | | | | | | | | | | | | | | | | | | |
| Net assets, end of year/period (in 000's) | | $ | 1,617 | | | $ | 2,056 | | | $ | 2,742 | | | $ | 12,253 | | | $ | 22,830 | | | $ | 11,122 | |
| | | | | | | | | | | | | | | | | | | | | | | | | |
| Ratios of expenses to average net assets (3): | | | | | | | | | | | | | | | | | | | | | | | | |
| Before fees waived and expenses reimbursed | | | 2.49 | % | | | 3.17 | %(6) | | | 3.54 | % | | | 2.54 | % | | | 3.20 | % | | | 3.01 | % |
| After fees waived and expenses reimbursed | | | 1.80 | % | | | 2.11 | %(6) | | | 2.26 | % | | | 2.18 | % | | | 2.62 | % | | | 2.83 | % |
| | | | | | | | | | | | | | | | | | | | | | | | | |
| Ratios of expenses to average net assets (excluding dividends and interest on margin account) (3): | | | | | | | | | | | | | | | | | | | | | | | | |
| Before fees waived and expenses reimbursed | | | 2.34 | % | | | 2.78 | %(6) | | | 3.00 | % | | | 2.31 | % | | | 2.53 | % | | | 2.12 | % |
| After fees waived and expenses reimbursed | | | 1.65 | % | | | 1.72 | %(6) | | | 1.71 | % | | | 1.95 | % | | | 1.95 | % | | | 1.95 | % |
| | | | | | | | | | | | | | | | | | | | | | | | | |
| Ratios of net investment income (loss) to average net assets (3) (4) | | | (0.82 | )% | | | (1.53 | )%(6) | | | (1.27 | )% | | | (0.19 | )% | | | 0.86 | % | | | 1.02 | % |
| | | | | | | | | | | | | | | | | | | | | | | | | |
| Portfolio turnover rate | | | 147 | % | | | 66 | %(5) | | | 165 | % | | | 138 | % | | | 149 | % | | | 136 | % |
| (a) | Amounts for the year ended September 30, 2019 are consolidated. | | | | | |
| (b) | Represents the period from May 1, 2018 through September 30, 2018. | | | | | |
| | | | | | | | | | | | | | | |
| (1) | Per share amounts calculated using the average shares method, which more appropriately presents the per share data for the year. |
| (2) | Total Return represents the rate that the investor would have earned or lost on an investment in the Fund, assuming reinvestment of dividends. Total returns shown exclude the effect of applicable sales loads/redemption fees. |
| (3) | The ratios of expenses and net investment income (loss) to average net assets do not reflect the expenses of the underlying investment companies in which the Fund invests. |
| (4) | Recognition of net investment income (loss) by the Fund is affected by the timing and declaration of dividends by the underlying investment companies in which the Fund invests. |
| (5) | Not annualized | | | | | | | |
| (6) | Annualized | | | | | | | | | | | | | |
| (7) | Resulted in less than $0.01 per share. | | | | | | | |
| (8) | Includes adjustments in accordance with accounting principles generally accepted in the United States of America and, consequently, the net asset values for financial reporting purposes and the returns based upon those net asset values may differ from the net asset values and returns for shareholder transactions. |
The accompanying notes are an integral part of these financial statements.
| CROW POINT FUNDS | | |
| FINANCIAL HIGHLIGHTS | | |
| | | | |
| September 30, 2019 | ANNUAL REPORT | |
| | | | |
| The following tables set forth the per share operating performance data for a share of beneficial interest outstanding, total return, ratios to average net assets and other supplemental data for each of the years or period indicated. |
| | | EAS Crow Point Alternatives Fund | |
| | | | | | | | | | | | | | | | | | | |
| | | | Institutional Class | |
| | | For the | | | For the | | | For the | | | For the | | | For the | | | For the | |
| | | Year Ended | | | Period Ended | | | Year Ended | | | Year Ended | | | Year Ended | | | Year Ended | |
| | | September 30, 2019 (a) | | | September 30, 2018 (b) | | | April 30, 2018 | | | April 30, 2017 | | | April 30, 2016 | | | April 30, 2015 | |
| | | | | | | | | | | | | | | | | | | | | | | | | |
| | | | | | | | | | | | | | | | | | | | | | | | | |
| Net Asset Value, Beginning of Year/Period | | $ | 10.00 | | | $ | 9.28 | | | $ | 8.72 | | | $ | 8.65 | | | $ | 9.24 | | | $ | 8.90 | |
| | | | | | | | | | | | | | | | | | | | | | | | | |
| Investment Operations: | | | | | | | | | | | | | | | | | | | | | | | | |
| Net investment income (loss) (1) | | | (0.05 | ) | | | (0.05 | ) | | | (0.08 | ) | | | 0.01 | | | | 0.10 | | | | 0.12 | |
| Net realized and unrealized gain (loss) on investments | | | (0.78 | ) | | | 0.77 | | | | 0.71 | | | | 0.10 | | | | (0.61 | ) | | | 0.33 | |
| Total from investment operations | | | (0.83 | ) | | | 0.72 | | | | 0.63 | | | | 0.11 | | | | (0.51 | ) | | | 0.45 | |
| | | | | | | | | | | | | | | | | | | | | | | | | |
| Distributions: | | | | | | | | | | | | | | | | | | | | | | | | |
| From net investment income | | | — | | | | — | | | | (0.07 | ) | | | (0.04 | ) | | | (0.08 | ) | | | (0.11 | ) |
| From net realized capital gains | | | (0.03 | ) | | | — | | | | — | | | | — | | | | — | | | | — | |
| Total distributions | | | (0.03 | ) | | | — | | | | (0.07 | ) | | | (0.04 | ) | | | (0.08 | ) | | | (0.11 | ) |
| | | | | | | | | | | | | | | | | | | | | | | | | |
| Paid in capital from redemption fees | | | — | | | | — | | | | — | | | | 0.00 | (8) | | | 0.00 | (8) | | | 0.00 | (8) |
| | | | | | | | | | | | | | | | | | | | | | | | | |
| Net Asset Value, End of Year/Period | | $ | 9.14 | | | $ | 10.00 | | | $ | 9.28 | | | $ | 8.72 | | | $ | 8.65 | | | $ | 9.24 | |
| | | | | | | | | | | | | | | | | | | | | | | | | |
| Total Return (2) | | | (8.34 | )%(7) | | | 7.76 | %(5) | | | 7.20 | %(7) | | | 1.25 | % | | | (5.50 | )% | | | 5.13 | % |
| | | | | | | | | | | | | | | | | | | | | | | | | |
| Ratios/Supplemental Data | | | | | | | | | | | | | | | | | | | | | | | | |
| Net assets, end of year/period (in 000's) | | $ | 32,773 | | | $ | 30,160 | | | $ | 16,846 | | | $ | 15,024 | | | $ | 13,095 | | | $ | 18,089 | |
| | | | | | | | | | | | | | | | | | | | | | | | | |
| Ratios of expenses to average net assets (3): | | | | | | | | | | | | | | | | | | | | | | | | |
| Before fees waived and expenses reimbursed | | | 2.24 | % | | | 2.92 | %(6) | | | 3.19 | % | | | 2.32 | % | | | 3.13 | % | | | 2.75 | % |
| After fees waived and expenses reimbursed | | | 1.55 | % | | | 1.86 | %(6) | | | 2.02 | % | | | 1.97 | % | | | 2.44 | % | | | 2.58 | % |
| | | | | | | | | | | | | | | | | | | | | | | | | |
| Ratios of expenses to average net assets (excluding dividends and interest on margin account) (3): | | | | | | | | | | | | | | | | | | | | | | | | |
| Before fees waived and expenses reimbursed | | | 2.09 | % | | | 2.53 | %(6) | | | 2.65 | % | | | 2.04 | % | | | 2.39 | % | | | 1.87 | % |
| After fees waived and expenses reimbursed | | | 1.40 | % | | | 1.47 | %(6) | | | 1.46 | % | | | 1.70 | % | | | 1.70 | % | | | 1.70 | % |
| | | | | | | | | | | | | | | | | | | | | | | | | |
| Ratios of net investment income (loss) to average net assets (3) (4) | | | (0.57 | )% | | | (1.28 | )%(6) | | | (0.91 | )% | | | 0.07 | % | | | 1.07 | % | | | 1.28 | % |
| | | | | | | | | | | | | | | | | | | | | | | | | |
| Portfolio turnover rate | | | 147 | % | | | 66 | %(5) | | | 165 | % | | | 138 | % | | | 149 | % | | | 136 | % |
| (a) | Amounts for the year ended September 30, 2019 are consolidated. | | | | | |
| (b) | Represents the period from May 1, 2018 through September 30, 2018. | | | | | |
| | | | | | | | | | | | | | | |
| (1) | Per share amounts calculated using the average shares method, which more appropriately presents the per share data for the year. |
| (2) | Total Return represents the rate that the investor would have earned or lost on an investment in the Fund, assuming reinvestment of dividends. Total returns shown exclude the effect of applicable redemption fees. |
| (3) | The ratios of expenses and net investment income (loss) to average net assets do not reflect the Fund's proportionate share of expenses of underlying investment companies in which the Fund invests. |
| (4) | Recognition of net investment income (loss) by the Fund is affected by the timing and declaration of dividends by the underlying investment companies in which the Fund invests. |
| (5) | Not annualized | | | | | | | | | | | | | |
| (6) | Annualized | | | | | | | | | | | | | |
| (7) | Includes adjustments in accordance with accounting principles generally accepted in the United States of America and, consequently, the net asset values for financial reporting purposes and the returns based upon those net asset values may differ from the net asset values and returns for shareholder transactions. |
| (8) | Resulted in less than $0.01 per share. | | | | | | | |
The accompanying notes are an integral part of these financial statements.
| CROW POINT FUNDS | | |
| FINANCIAL HIGHLIGHTS | | |
| | | | |
| September 30, 2019 | ANNUAL REPORT | |
| | | | |
| The following tables set forth the per share operating performance data for a share of beneficial interest outstanding, total return, ratios to average net assets and other supplemental data for each of the years or period indicated. |
| | | Crow Point Global Tactical Allocation Fund | |
| | | | | | | | | | | | | | | | | | | |
| | | | Investor Class | |
| | | For the | | | For the | | | For the | | | For the | | | For the | | | For the | |
| | | Year Ended | | | Period Ended | | | Year Ended | | | Year Ended | | | Year Ended | | | Year Ended | |
| | | September 30, 2019 | | | September 30, 2018 (a) | | | May 31, 2018 | | | May 31, 2017 | | | May 31, 2016 | | | May 31, 2015 | |
| | | | | | | | | | | | | | | | | | | | | | | | | |
| | | | | | | | | | | | | | | | | | | | | | | | | |
| Net Asset Value, Beginning of Year/Period | | $ | 9.18 | | | $ | 8.81 | | | $ | 8.33 | | | $ | 8.20 | | | $ | 9.81 | | | $ | 10.35 | |
| | | | | | | | | | | | | | | | | | | | | | | | | |
| Investment Operations: | | | | | | | | | | | | | | | | | | | | | | | | |
| Net investment income (1) | | | 0.09 | | | | 0.02 | | | | 0.12 | | | | 0.32 | | | | 0.39 | | | | 0.53 | |
| Net realized and unrealized gain (loss) on investments | | | (0.27 | ) | | | 0.35 | | | | 0.45 | | | | 0.13 | | | | (1.18 | ) | | | (0.56 | ) |
| Total from investment operations | | | (0.18 | ) | | | 0.37 | | | | 0.57 | | | | 0.45 | | | | (0.79 | ) | | | (0.03 | ) |
| | | | | | | | | | | | | | | | | | | | | | | | | |
| Distributions: | | | | | | | | | | | | | | | | | | | | | | | | |
| From net investment income | | | (0.04 | ) | | | — | | | | (0.09 | ) | | | (0.21 | ) | | | (0.27 | ) | | | (0.48 | ) |
| From return of capital | | | — | | | | — | | | | — | | | | (0.11 | ) | | | (0.57 | ) | | | (0.03 | ) |
| Total distributions | | | (0.04 | ) | | | — | | | | (0.09 | ) | | | (0.32 | ) | | | (0.84 | ) | | | (0.51 | ) |
| | | | | | | | | | | | | | | | | | | | | | | | | |
| Paid in capital from redemption fees | | | — | | | | 0.00 | (8) | | | — | | | | 0.00 | (8) | | | 0.02 | | | | 0.00 | (8) |
| | | | | | | | | | | | | | | | | | | | | | | | | |
| Net Asset Value, End of Year/Period | | $ | 8.96 | | | $ | 9.18 | | | $ | 8.81 | | | $ | 8.33 | | | $ | 8.20 | | | $ | 9.81 | |
| | | | | | | | | | | | | | | | | | | | | | | | | |
| Total Return (2) | | | (1.86 | )%(10) | | | 4.20 | %(5) | | | 6.86 | % | | | 5.57 | %(7) | | | (7.84 | )% | | | (0.24 | )% |
| | | | | | | | | | | | | | | | | | | | | | | | | |
| Ratios/Supplemental Data | | | | | | | | | | | | | | | | | | | | | | | | |
| Net assets, end of year/period (in 000's) | | $ | 551 | | | $ | 1,733 | | | $ | 2,425 | | | $ | 4,450 | | | $ | 11,133 | | | $ | 3,839 | |
| | | | | | | | | | | | | | | | | | | | | | | | | |
| Ratios of expenses to average net assets (3): | | | | | | | | | | | | | | | | | | | | | | | | |
| Before fees waived and expenses reimbursed | | | 2.66 | % | | | 2.94 | %(6) | | | 3.77 | % | | | 3.68 | % | | | 4.14 | % | | | 3.21 | % |
| After fees waived and expenses reimbursed | | | 1.57 | % | | | 1.32 | %(6) | | | 1.32 | % | | | 1.26 | % | | | 1.29 | % | | | 1.25 | %(9) |
| | | | | | | | | | | | | | | | | | | | | | | | | |
| Ratios of expenses to average net assets (excluding dividends and interest on margin account) (3): | | | | | | | | | | | | | | | | | | | | | | | | |
| Before fees waived and expenses reimbursed | | | 2.57 | % | | | 2.79 | %(6) | | | 3.67 | % | | | 3.68 | % | | | 4.10 | % | | | 3.21 | % |
| After fees waived and expenses reimbursed | | | 1.48 | % | | | 1.17 | %(6) | | | 1.22 | % | | | 1.26 | % | | | 1.25 | % | | | 1.25 | %(9) |
| | | | | | | | | | | | | | | | | | | | | | | | | |
| Ratios of net investment income to average net assets (3) (4) | | | 1.00 | % | | | 0.71 | %(6) | | | 1.38 | % | | | 3.92 | % | | | 4.53 | % | | | 5.30 | % |
| | | | | | | | | | | | | | | | | | | | | | | | | |
| Portfolio turnover rate | | | 176 | % | | | 73 | %(5) | | | 324 | % | | | 101 | % | | | 160 | % | | | 113 | % |
| (a) | Represents the period from June 1, 2018 through September 30, 2018 | | | | | | |
| | | | | | | | | | | | | | | |
| (1) | Per share amounts calculated using the average shares method, which more appropriately presents the per share data for the period. |
| (2) | Total Return represents the rate that the investor would have earned or lost on an investment in the Fund, assuming reinvestment of dividends, if any. Total returns shown exclude the effect of applicable sales loads/redemption fees. |
| (3) | The ratios of expenses and net investment income to average net assets do not reflect the Fund's proportionate share of expenses of underlying investment companies in which the Fund invests. |
| (4) | Recognition of net investment income by the Fund is affected by the timing and declaration of dividends by the underlying investment companies in which the Fund invests. |
| (5) | Not annualized | | | | | | | | | | | | | |
| (6) | Annualized | | | | | | | | | | | | | |
| (7) | As a result of a trade error, Crow Point Global Tactical Allocation Fund experienced a loss of $10,469 for the year ended May 31, 2017, which was reimbursed by the Adviser. There was no effect on total return due to the trade error. |
| (8) | Amount represents less than $0.01 per share. |
| (9) | Includes commission recapture. Excluding commission recapture, the ratio of net expenses to average net assets would have been 1.30% for the year ended May 31, 2015. |
| (10) | Includes adjustments in accordance with accounting principles generally accepted in the United States of America and, consequently, the net asset values for financial reporting purposes and the returns based upon those net asset values may differ from the net asset values and returns for shareholder transactions. |
The accompanying notes are an integral part of these financial statements.
| CROW POINT FUNDS | |
| FINANCIAL HIGHLIGHTS | |
| | |
| September 30, 2019 | ANNUAL REPORT |
The following tables set forth the per share operating performance data for a share of beneficial interest outstanding, total return, ratios to average net assets and other supplemental data for each of the years or period indicated.
| | | | | | | | | | | | | | | | | | | |
| | | Crow Point Global Tactical Allocation Fund | |
| | | | | | | | | | | | | | | | | | | |
| | | Institutional Class | |
| | | For the
Year Ended
September 30, 2019 | | | For the
Period Ended
September 30, 2018 (a) | | | For the
Year Ended
May 31, 2018 | | | For the
Year Ended
May 31, 2017 | | | For the
Year Ended
May 31, 2016 | | | For the
Year Ended
May 31, 2015 | |
| | | | | | | | | | | | | | | | | | | |
| Net Asset Value, Beginning of Year/Period | | $ | 9.28 | | | $ | 8.89 | | | $ | 8.39 | | | $ | 8.26 | | | $ | 9.90 | | | $ | 10.44 | |
| | | | | | | | | | | | | | | | | | | | | | | | | |
| Investment Operations: | | | | | | | | | | | | | | | | | | | | | | | | |
| Net investment income (1) | | | 0.09 | | | | 0.03 | | | | 0.10 | | | | 0.36 | | | | 0.38 | | | | 0.56 | |
| Net realized and unrealized gain (loss) on investments | | | (0.25 | ) | | | 0.36 | | | | 0.49 | | | | 0.11 | | | | (1.14 | ) | | | (0.56 | ) |
| Total from investment operations | | | (0.16 | ) | | | 0.39 | | | | 0.59 | | | | 0.47 | | | | (0.76 | ) | | | — | |
| | | | | | | | | | | | | | | | | | | | | | | | | |
| Distributions: | | | | | | | | | | | | | | | | | | | | | | | | |
| From net investment income | | | (0.08 | ) | | | — | | | | (0.10 | ) | | | (0.22 | ) | | | (0.29 | ) | | | (0.52 | ) |
| From return of capital | | | — | | | | — | | | | — | | | | (0.12 | ) | | | (0.59 | ) | | | (0.02 | ) |
| Total distributions | | | (0.08 | ) | | | — | | | | (0.10 | ) | | | (0.34 | ) | | | (0.88 | ) | | | (0.54 | ) |
| | | | | | | | | | | | | | | | | | | | | | | | | |
| Paid in capital from redemption fees | | | — | | | | 0.00 | (8) | | | 0.01 | | | | 0.00 | (8) | | | 0.00 | (8) | | | 0.00 | (8) |
| | | | | | | | | | | | | | | | | | | | | | | | | |
| Net Asset Value, End of Year/Period | | $ | 9.04 | | | $ | 9.28 | | | $ | 8.89 | | | $ | 8.39 | | | $ | 8.26 | | | $ | 9.90 | |
| | | | | | | | | | | | | | | | | | | | | | | | | |
| Total Return (2) | | | (1.68 | )%(10) | | | 4.39 | %(5) | | | 7.22 | % | | | 5.82 | %(7) | | | (7.61 | )% | | | 0.06 | % |
| | | | | | | | | | | | | | | | | | | | | | | | | |
| Ratios/Supplemental Data | | | | | | | | | | | | | | | | | | | | | | | | |
| Net assets, end of year/period (in 000’s) | | $ | 22,789 | | | $ | 16,428 | | | $ | 9,926 | | | $ | 3,583 | | | $ | 1,105 | | | $ | 6,223 | |
| | | | | | | | | | | | | | | | | | | | | | | | | |
| Ratios of expenses to average net assets (3): | | | | | | | | | | | | | | | | | | | | | | | | |
| Before fees waived and expenses reimbursed | | | 2.41 | % | | | 2.69 | %(6) | | | 3.55 | % | | | 3.75 | % | | | 4.88 | % | | | 2.95 | % |
| After fees waived and expenses reimbursed | | | 1.32 | % | | | 1.07 | %(6) | | | 1.14 | % | | | 1.05 | % | | | 1.04 | % | | | 1.00 | %(9) |
| | | | | | | | | | | | | | | | | | | | | | | | | |
| Ratios of expenses to average net assets (excluding dividends and interest on margin account) (3): | | | | | | | | | | | | | | | | | | | | | | | | |
| Before fees waived and expenses reimbursed | | | 2.32 | % | | | 2.54 | %(6) | | | 3.41 | % | | | 3.75 | % | | | 4.84 | % | | | 2.95 | % |
| After fees waived and expenses reimbursed | | | 1.23 | % | | | 0.92 | %(6) | | | 1.00 | % | | | 1.05 | % | | | 1.00 | % | | | 1.00 | %(9) |
| | | | | | | | | | | | | | | | | | | | | | | | | |
| Ratios of net investment income to average net assets (3) (4) | | | 1.01 | % | | | 0.96 | %(6) | | | 1.16 | % | | | 4.36 | % | | | 4.19 | % | | | 5.55 | % |
| | | | | | | | | | | | | | | | | | | | | | | | | |
| Portfolio turnover rate | | | 176 | % | | | 73 | %(5) | | | 324 | % | | | 101 | % | | | 160 | % | | | 113 | % |
| (a) | Represents the period from June 1, 2018 through September 30, 2018 |
| | |
| (1) | Per share amounts calculated using the average shares method, which more appropriately presents the per share data for the period. |
| (2) | Total Return represents the rate that the investor would have earned or lost on an investment in the Fund, assuming reinvestment of dividends, if any. Total returns shown exclude the effect of applicable redemption fees. |
| (3) | The ratios of expenses and net investment income to average net assets do not reflect the Fund’s proportionate share of expenses of underlying investment companies in which the Fund invests. |
| (4) | Recognition of net investment income by the Fund is affected by the timing and declaration of dividends by the underlying investment companies in which the Fund invests. |
| (5) | Not annualized |
| (6) | Annualized |
| (7) | As a result of a trade error, Crow Point Global Tactical Allocation Fund experienced a loss of $10,469 for the year ended May 31, 2017, which was reimbursed by the Adviser. There was no effect on total return due to the trade error. |
| (8) | Amount represents less than $0.01 per share. |
| (9) | Includes commission recapture. Excluding commission recapture, the ratio of net expenses to average net assets would have been 1.04% for the year ended May 31, 2015. |
| (10) | Includes adjustments in accordance with accounting principles generally accepted in the United States of America and, consequently, the net asset values for financial reporting purposes and the returns based upon those net asset values may differ from the net asset values and returns for shareholder transactions. |
The accompanying notes are an integral part of these financial statements.
| CROW POINT FUNDS | |
| FINANCIAL HIGHLIGHTS | |
| | |
| September 30, 2019 | ANNUAL REPORT |
The following tables set forth the per share operating performance data for a share of beneficial interest outstanding, total return, ratios to average net assets and other supplemental data for each of the years indicated.
| | | | | | | | | | | | | | | | |
| | | Crow Point Alternative Income Fund | |
| | | | | | | | | | | | | | | | |
| | | Investor Class | |
| | | For the
Year Ended
September 30, 2019 | | | For the
Year Ended
September 30, 2018 | | | For the
Year Ended
September 30, 2017 | | | For the
Year Ended
September 30, 2016 | | | For the
Year Ended
September 30, 2015 | |
| | | | | | | | | | | | | | | | |
| Net Asset Value, Beginning of Year | | $ | 8.44 | | | $ | 8.29 | | | $ | 8.44 | | | $ | 8.47 | | | $ | 8.84 | |
| | | | | | | | | | | | | | | | | | | | | |
| Investment Operations: | | | | | | | | | | | | | | | | | | | | |
| Net investment income (1) | | | 0.11 | | | | 0.01 | | | | 0.06 | | | | 0.10 | | | | 0.11 | |
| Net realized and unrealized gain (loss) on investments | | | — | | | | 0.15 | | | | (0.04 | ) | | | 0.04 | | | | (0.35 | ) |
| Total from investment operations | | | 0.11 | | | | 0.16 | | | | 0.02 | | | | 0.14 | | | | (0.24 | ) |
| | | | | | | | | | | | | | | | | | | | | |
| Distributions: | | | | | | | | | | | | | | | | | | | | |
| From net investment income | | | (0.02 | ) | | | (0.01 | ) | | | (0.17 | ) | | | (0.17 | ) | | | (0.13 | ) |
| Total distributions | | | (0.02 | ) | | | (0.01 | ) | | | (0.17 | ) | | | (0.17 | ) | | | (0.13 | ) |
| | | | | | | | | | | | | | | | | | | | | |
| Net Asset Value, End of Year | | $ | 8.53 | | | $ | 8.44 | | | $ | 8.29 | | | $ | 8.44 | | | $ | 8.47 | |
| | | | | | | | | | | | | | | | | | | | | |
| Total Return (2) | | | 1.31 | %(6) | | | 1.93 | % | | | 0.32 | %(5) | | | 1.76 | % | | | (2.81 | )% |
| | | | | | | | | | | | | | | | | | | | | |
| Ratios/Supplemental Data | | | | | | | | | | | | | | | | | | | | |
| Net assets, end of year (in 000’s) | | $ | 11,873 | | | $ | 9,983 | | | $ | 7,848 | | | $ | 6,691 | | | $ | 8,211 | |
| | | | | | | | | | | | | | | | | | | | | |
| Ratios of expenses to average net assets (3): | | | | | | | | | | | | | | | | | | | | |
| Before fees waived and expenses reimbursed | | | 3.54 | % | | | 3.34 | % | | | 4.25 | % | | | 3.67 | % | | | 4.34 | % |
| After fees waived and expenses reimbursed | | | 2.36 | % | | | 2.26 | % | | | 2.25 | % | | | 2.27 | % | | | 3.33 | % |
| | | | | | | | | | | | | | | | | | | | | |
| Ratios of expenses to average net assets (excluding dividends and interest on margin account) (3): | | | | | | | | | | | | | | | | | | | | |
| Before fees waived and expenses reimbursed | | | 3.43 | % | | | 3.33 | % | | | 4.24 | % | | | 3.65 | % | | | 3.26 | % |
| After fees waived and expenses reimbursed | | | 2.25 | % | | | 2.25 | % | | | 2.25 | % | | | 2.25 | % | | | 2.25 | % |
| | | | | | | | | | | | | | | | | | | | | |
| Ratios of net investment income to average net assets (3) (4) | | | 1.35 | % | | | 0.12 | % | | | 0.76 | % | | | 1.20 | % | | | 1.21 | % |
| | | | | | | | | | | | | | | | | | | | | |
| Portfolio turnover rate | | | 169 | % | | | 301 | % | | | 268 | % | | | 162 | % | | | 999 | % |
| (1) | Per share amounts calculated using the average shares method, which more appropriately presents the per share data for the year. |
| (2) | Total Return represents the rate that the investor would have earned or lost on an investment in the Fund, assuming reinvestment of dividends. Total returns shown exclude the effect of applicable redemption fees. |
| (3) | The ratios of expenses to average net assets and net investment income to average net assets do not reflect the expenses of the underlying investment companies in which the Fund invests. |
| (4) | Recognition of net investment income by the Fund is affected by the timing and declaration of dividends by the underlying investment companies in which the Fund invests. |
| (5) | As a result of a trade error, Crow Point Alternative Income Fund experienced a loss of $3,364 for the year ended September 30, 2017, which was reimbursed by the Adviser. There was no effect on total return due to the trade error. |
| (6) | Includes adjustments in accordance with accounting principles generally accepted in the United States of America and, consequently, the net asset values for financial reporting purposes and the returns based upon those net asset values may differ from the net asset values and returns for shareholder transactions. |
The accompanying notes are an integral part of these financial statements.
| CROW POINT FUNDS | |
| FINANCIAL HIGHLIGHTS | |
| | |
| September 30, 2019 | ANNUAL REPORT |
The following tables set forth the per share operating performance data for a share of beneficial interest outstanding, total return, ratios to average net assets and other supplemental data for the period indicated.
| | | Crow Point Alternative Income Fund | |
| | | | |
| | | Institutional Class | |
| | | For the
Period Ended
September 30, 2019 (a) | |
| | | | | |
| Net Asset Value, Beginning of Period | | $ | 8.30 | |
| | | | | |
| Investment Operations: | | | | |
| Net investment income (1) | | | 0.07 | |
| Net realized and unrealized gain on investments(8) | | | 0.17 | |
| Total from investment operations | | | 0.24 | |
| | | | | |
| Net Asset Value, End of Period | | $ | 8.54 | |
| | | | | |
| Total Return (2) | | | 2.89 | %(5)(7) |
| | | | | |
| Ratios/Supplemental Data | | | | |
| Net assets, end of period (in 000’s) | | $ | 43 | |
| | | | | |
| Ratios of expenses to average net assets (3): | | | | |
| Before fees waived and expenses reimbursed | | | 3.29 | %(6) |
| After fees waived and expenses reimbursed | | | 2.11 | %(6) |
| | | | | |
| Ratios of expenses to average net assets (excluding dividends and interest on margin account) (3): | | | | |
| Before fees waived and expenses reimbursed | | | 3.18 | %(6) |
| After fees waived and expenses reimbursed | | | 2.00 | %(6) |
| | | | | |
| Ratios of net investment income to average net assets (3) (4) | | | 1.42 | %(6) |
| | | | | |
| Portfolio turnover rate | | | 169 | %(5) |
| (a) | The Crow Point Alternative Income Fund Institutional Shares commenced operations on February 12, 2019. |
| | |
| (1) | Per share amounts calculated using the average shares method, which more appropriately presents the per share data for the period. |
| (2) | Total Return represents the rate that the investor would have earned or lost on an investment in the Fund, assuming reinvestment of dividends. Total returns shown exclude the effect of applicable redemption fees. |
| (3) | The ratios of expenses to average net assets and net investment income to average net assets do not reflect the expenses of the underlying investment companies in which the Fund invests. |
| (4) | Recognition of net investment income by the Fund is affected by the timing and declaration of dividends by the underlying investment companies in which the Fund invests. |
| (5) | Not annualized |
| (6) | Annualized |
| (7) | Includes adjustments in accordance with accounting principles generally accepted in the United States of America and, consequently, the net asset values for financial reporting purposes and the returns based upon those net asset values may differ from the net asset values and returns for shareholder transactions. |
| (8) | The amount of net realized and unrealized gain on investment per share for the period, does not accord with the amounts in the Statements of Operations due to the timing of purchases and sales of Fund shares in relation to fluctuating market values. |
The accompanying notes are an integral part of these financial statements.
| Crow Point Funds | ANNUAL REPORT |
NOTES TO THE FINANCIAL STATEMENTS (CONSOLIDATED WHERE NOTED)
September 30, 2019
The EAS Crow Point Alternatives Fund (the “EAS Fund”) was organized on October 13, 2017, and the Crow Point Global Tactical Allocation Fund (the “Global Fund”), formerly the Crow Point Defined Risk Global Equity Income Fund, and the Crow Point Alternative Income Fund (the “Income Fund”) (collectively, the “Funds”) were organized on October 6, 2017 as separate diversified series of 360 Funds (the “Trust”). The Trust was organized on February 24, 2005 as a Delaware statutory trust. The Trust is registered as an open-end management investment company under the Investment Company Act of 1940, as amended (the “1940 Act”). The EAS Fund’s investment objective is preservation and growth of capital. The Global Fund’s investment objective is to seek income with long-term growth of capital as a secondary objective. The Income Fund’s investment objective is to provide shareholders with above-average total returns over a complete market cycle primarily through capital appreciation and income generation. The Funds’ investment adviser is Crow Point Partners, LLC (the “Adviser”).
Each Fund offers two classes of shares, Investor Class and Institutional Class. The EAS Fund also offered Class C shares. Effective January 28, 2019, the Class A and Class I shares were renamed to Investor Class and Institutional Class, respectively, the EAS Fund’s Class C shares were exchanged for the EAS Fund’s Investor Class shares and the Class C shares are no longer offered for purchase. Income and realized/unrealized gains or losses are allocated to each class based on relative net assets.
| 2. | SIGNIFICANT ACCOUNTING POLICIES |
The following is a summary of the significant accounting policies followed by the Funds in the preparation of their financial statements and are in conformity with accounting principles generally accepted in the United States of America (“GAAP”). The Funds are investment companies that follow the accounting and reporting guidance of Accounting Standards Codification Topic 946 applicable to investment companies.
a) Security Valuation – All investments in securities are recorded at their estimated fair value, as described in note 3.
b) Short Sales – The Funds may sell securities short. A short sale is a transaction in which a Fund sells a security it does not own or have the right to acquire (or that it owns but does not wish to deliver) in anticipation that the market price of that security will decline.
When Funds make a short sale, the broker-dealer through which the short sale is made must borrow the security sold short and deliver it to the party purchasing the security. Funds are required to make a margin deposit in connection with such short sales; the Funds may have to pay a fee to borrow particular securities and will often be obligated to pay over any dividends and accrued interest on borrowed securities.
If the price of the security sold short increases between the time of the short sale and the time the Funds cover their short positions, the Funds will incur a loss; conversely, if the price declines, the Funds will realize a capital gain. Any gain will be decreased, and any loss increased, by the transaction costs described above. The successful use of short selling may be adversely affected by imperfect correlation between movements in the price of the security sold short and the securities being hedged.
To the extent the Funds sell securities short, they will provide collateral to the broker-dealer and (except in the case of short sales "against the box") will maintain additional asset coverage in the form of cash, U.S. government securities or other liquid securities with its Custodian in a segregated account in an amount at least equal to the difference between the current market value of the securities sold short and any amounts required to be deposited as collateral with the selling broker (not including the proceeds of the short sale).
c) Investment Companies – The Funds may invest in investment companies such as open-end funds (mutual funds), including exchange-traded funds (“ETFs”) and closed-end funds (“CEFs”) (also referred to as "Underlying Funds") subject to limitations as defined in the 1940 Act. Your cost of investing in the Funds will generally be higher than the cost of investing directly in the Underlying Funds. By investing in the Funds, you will indirectly bear fees and expenses charged by the Underlying Funds in which the Funds invest in addition to the Funds’ direct fees and expenses. Also, with respect to dividends paid by the Underlying Funds, it is possible for these dividends to exceed the underlying investments' taxable earnings and profits resulting in the excess portion of such dividends being designated as a return of capital. Distributions received from investments in securities that represent a return of capital or capital gains are recorded as a reduction of the cost of investments or as a realized gain, respectively.
| Crow Point Funds | ANNUAL REPORT |
NOTES TO THE FINANCIAL STATEMENTS
September 30, 2019
| 2. | SIGNIFICANT ACCOUNTING POLICIES (continued) |
d) Options – The Funds may purchase and write (i.e., sell) put and call options. Such options may relate to particular securities or stock indices, and may or may not be listed on a domestic or foreign securities exchange and may or may not be issued by the Options Clearing Corporation. Options trading is a highly specialized activity that entails greater than ordinary investment risk. Options may be more volatile than the underlying instruments, and therefore, on a percentage basis, an investment in options may be subject to greater fluctuation than an investment in the underlying instruments themselves.
A call option for a particular security gives the purchaser of the option the right to buy, and the writer (seller) the obligation to sell, the underlying security at the stated exercise price at any time prior to the expiration of the option, regardless of the market price of the security. The premium paid to the writer is in consideration for undertaking the obligation under the option contract. A put option for a particular security gives the purchaser the right to sell, and the writer (seller) the obligation to buy the security at the stated exercise price at any time prior to the expiration date of the option, regardless of the market price of the security.
If an option purchased by the Funds expires unexercised, the Funds realize a loss equal to the premium paid. If the Funds enter into a closing sale transaction on an option purchased by it, the Funds will realize a gain if the premium received by the Funds on the closing transaction is more than the premium paid to purchase the option or a loss if it is less. If an option written by the Funds expires on the stipulated expiration date or if the Funds enter into a closing purchase transaction, they will realize a gain (or loss if the cost of a closing purchase transaction exceeds the net premium received when the option is sold). If a call option written by the Funds is exercised, the proceeds of the sale will be increased by the net premium originally received and the Funds will realize a gain or loss. If a put option written by the Funds is exercised, the cost of the purchase will be decreased by the net premium originally received.
e) Wholly Owned Subsidiary – The EAS Fund may invest up to 25% of its total assets in a wholly owned and controlled Cayman Islands subsidiary (the “Subsidiary”), which is expected to invest in one or a combination of (i) options, (ii) futures, (iii) forwards, (iv) spot contracts, or (v) swap contracts, each of which may be tied to (i) commodities, (ii) financial indices and instruments, (iii) foreign currencies, or (iv) equity indices. The consolidated Schedule of Investments, Statement of Assets and Liabilities, Statement of Operations, Statements of Changes in Net Assets and Financial Highlights of the EAS Fund include the accounts of the Subsidiary. All inter-company accounts and transactions have been eliminated in the consolidation for the Fund. The Subsidiary is advised by the Adviser and acts as an investment vehicle in order to effect certain investments consistent with the EAS Fund’s investment objectives and policies specified in the EAS Fund’s prospectus and statement of additional information. The inception date of the Subsidiary was December 1, 2018. As of September 30, 2019, total net assets of the EAS Fund were $34,389,765, of which $5,263,191, or approximately 15.30%, represented the EAS Fund’s ownership of the shares of the Subsidiary.
f) Federal Income Taxes – The Funds have qualified and intend to continue to qualify as regulated investment companies under Subchapter M of the Internal Revenue Code of 1986, as amended (the “Code”). It is the policy of the Funds to comply with the requirements of the Code applicable to regulated investment companies and to distribute substantially all of their net investment company taxable income and net capital gains. The Funds also intend to distribute sufficient net investment income and net capital gains, if any, so that they will not be subject to excise tax on undistributed income and gains. Therefore, no federal income tax or excise tax provision is required.
As of and during year ended September 30, 2019, the Funds did not have a liability for any unrecognized tax expenses. The Funds recognize interest and penalties, if any, related to unrecognized tax liability as income tax expense in the statements of operations. During the year ended September 30, 2019, the Funds did not incur any interest or penalties. The Funds identify their major tax jurisdictions as U.S. Federal and Delaware state.
In addition, accounting principles generally accepted in the United States of America (“GAAP”) requires management of the Funds to analyze all open tax years, as defined by IRS statute of limitations for all major jurisdictions, including federal tax jurisdictions and certain state tax jurisdictions. As of and during the years ended April 30, 2016, April 30, 2017 and April 30, 2018, the period ended September 30, 2018 and the year ended September 30, 2019 for the EAS Fund; and the years ended May 31, 2016, May 31, 2017 and May 31, 2018, the period ended September 30, 2018 and the year ended September 30, 2019 for the Global Fund; and the years ended September 30, 2016 through September 30, 2019 for the Income Fund, the Funds did not have a liability for any unrecognized tax benefits. The Funds have no examinations in progress and are not aware of any tax positions for which it is reasonably possible that the total amounts of unrecognized tax benefits will significantly change in the next twelve months.
| Crow Point Funds | ANNUAL REPORT |
NOTES TO THE FINANCIAL STATEMENTS
September 30, 2019
| 2. | SIGNIFICANT ACCOUNTING POLICIES (continued) |
g) Distributions to Shareholders – Dividends from net investment income and distributions of net realized capital gains, if any, will be declared and paid at least annually. Income and capital gain distributions, which are determined in accordance with income tax regulations, are recorded on the ex-dividend date. GAAP requires that permanent financial reporting differences relating to shareholder distributions be reclassified to paid-in capital or net realized gains.
h) Use of Estimates – The preparation of financial statements in conformity with GAAP requires management to make estimates and assumptions that affect the reported amounts of assets and liabilities and disclosure of contingent assets and liabilities at the date of the financial statements and the reported amounts of revenues and expenses during the reporting period. Actual results could differ from those estimates.
i) Other – Investment and shareholder transactions are recorded on trade date. The Funds determine the gain or loss realized from the investment transactions by comparing the original cost of the security lot sold with the net sales proceeds. Dividend income and expense are recognized on the ex-dividend date or as soon as information is available to the Funds and interest income is recognized on an accrual basis. Withholding taxes on foreign dividends have been provided for in accordance with the Funds’ understanding of the applicable country’s tax rules and rates.
(j) Expenses – Expenses incurred by the Trust that do not relate to a specific Fund of the Trust may be allocated equally across the Funds, or to the individual Funds based on each Funds relative net assets or another basis (as determined by the Board), whichever method is deemed appropriate as stated in the Trusts expense allocation policy. Expenses incurred specific to a particular Fund are allocated entirely to that Fund.
(k) Commission Recapture – During the year ended September 30, 2019, certain Funds had portfolio trades executed with a certain broker pursuant to a commission recapture agreement under which the broker returned a portion of the Funds' brokerage commissions on the Funds' behalf. Such amounts, under such commission recapture agreement, are included in fees paid indirectly in the Funds’ Statements of Operations and were paid directly by the broker to the Funds. For the year ended September 30, 2019, the EAS Fund and the Global Fund received $22,796 and $10,351, respectively under this arrangement.
Processes and Structure
The Funds’ Board of Trustees has adopted guidelines for valuing securities and other derivative instruments including in circumstances in which market quotes are not readily available, and has delegated authority to the Adviser to apply those guidelines in determining fair value prices, subject to review by the Board of Trustees.
Hierarchy of Fair Value Inputs
The Funds utilize various methods to measure the fair value of their investments on a recurring basis. GAAP establishes a hierarchy that prioritizes inputs to valuation techniques used to measure fair value. The three levels of inputs are as follows:
| • | Level 1 – Unadjusted quoted prices in active markets for identical assets or liabilities that the Fund has the ability to access. |
| • | Level 2 – Observable inputs other than quoted prices included in level 1 that are observable for the asset or liability either directly or indirectly. These inputs may include quoted prices for the identical instrument on an inactive market, prices for similar instruments, interest rates, prepayment speeds, credit risk, yield curves, default rates, and similar data. |
| • | Level 3 – Unobservable inputs for the asset or liability to the extent that relevant observable inputs are not available, representing the Fund’s own assumptions about the assumptions that a market participant would use in valuing the asset or liability, and that would be based on the best information available. |
The availability of observable inputs can vary from security to security and is affected by a wide variety of factors, including, for example, the type of security, whether the security is new and not yet established in the marketplace, the liquidity of markets, and other characteristics particular to the security. To the extent that valuation is based on models or inputs that are less observable or unobservable in the market, the determination of fair value requires more judgment. Accordingly, the degree of judgment exercised in determining fair value is greatest for instruments categorized in level 3.
The inputs used to measure fair value may fall into different levels of the fair value hierarchy. In such cases, for disclosure purposes, the level in the fair value hierarchy within which the fair value measurement falls in its entirety is determined based on the lowest level input that is significant to the fair value measurement in its entirety. The inputs or methodologies used for valuing securities are not necessarily an indication of the risks associated with investing in these securities.
Fair Value Measurements
A description of the valuation techniques applied to the Trust's major categories of assets and liabilities measured at fair value on a recurring basis follows.
| Crow Point Funds | ANNUAL REPORT |
NOTES TO THE FINANCIAL STATEMENTS
September 30, 2019
| 3. | SECURITIES VALUATIONS (continued) |
Equity securities (common stock, ETFs, mutual funds and CEFs) – Securities traded on a national securities exchange (or reported on the NASDAQ national market) are stated at the last reported sales price on the day of valuation. To the extent these securities are actively traded, and valuation adjustments are not applied, they are categorized in level 1 of the fair value hierarchy. Certain foreign securities may be fair valued using a pricing service that considers the correlation of the trading patterns of the foreign security to the intraday trading in the U.S. markets for investments such as American Depositary Receipts, financial futures, Exchange Traded Funds, and the movement of the certain indexes of securities based on a statistical analysis of the historical relationship and are categorized in level 2. Preferred stock and other equities traded on inactive markets or valued by reference to similar instruments are also categorized in level 2.
Money market funds – Money market funds are valued at their net asset value per share and are categorized as level 1.
Derivative instruments – Listed derivatives, including options, that are actively traded, are valued based on quoted prices from the exchange and categorized in level 1 of the fair value hierarchy. Options held by the Funds for which no current quotations are readily available and which are not traded on the valuation date are valued at the mean price and are categorized within level 2 of the fair value hierarchy. Over-the-counter (OTC) derivative contracts include forward, swap, and option contracts related to interest rates; foreign currencies; credit standing of reference entities; equity prices; or commodity prices, and warrants on exchange-traded securities. Depending on the product and terms of the transaction, the fair value of the OTC derivative products can be modeled taking into account the counterparties' creditworthiness and using a series of techniques, including simulation models. Many pricing models do not entail material subjectivity because the methodologies employed do not necessitate significant judgments, and the pricing inputs are observed from actively quoted markets, as is the case of interest rate swap and option contracts. OTC derivative products valued using pricing models are categorized within level 2 of the fair value hierarchy.
In accordance with the Trust’s good faith pricing guidelines, the Adviser is required to consider all appropriate factors relevant to the value of securities for which it has determined other pricing sources are not available or reliable as described above. No single standard exists for determining fair value, because fair value depends upon the circumstances of each individual case. As a general principle, the current fair value of an issue of securities being valued by the Adviser would appear to be the amount which the owner might reasonably expect to receive for them upon their current sale. Methods which are in accordance with this principle may, for example, be based on (i) a multiple of earnings; (ii) a discount from market of a similar freely traded security (including a derivative security or a basket of securities traded on other markets, exchanges or among dealers); or (iii) yield to maturity with respect to debt issues, or a combination of these and other methods. Good faith pricing is permitted if, in the Adviser’s opinion, the validity of market quotations appears to be questionable based on factors such as evidence of a thin market in the security based on a small number of quotations, a significant event occurs after the close of a market but before the Funds’ NAV calculations that may affect a security’s value, or the Adviser is aware of any other data that calls into question the reliability of market quotations. Good faith pricing may also be used in instances when the bonds in which the Funds invest may default or otherwise cease to have market quotations readily available.
The Trustees of the 360 Funds adopted the M3Sixty Consolidated Valuation Procedures, which established a Valuation Committee to work with the Adviser and report to the Board of Trustees (the “Board”) on securities being fair valued or manually priced. The Independent Chairman and Trustee of the 360 Funds, along with the Trust’s Principal Financial Officer and Chief Compliance Officer are members of the Valuation Committee which meets at least monthly or, as required, to review the interim actions and coordination with the Adviser in pricing fair valued securities, and consideration of any unresolved valuation issues or a request to change the methodology for manually pricing a security. In turn, the Independent Chairman provides updates to the Board at the regularly scheduled board meetings as well as interim updates to the board members on substantive changes in a daily valuation or methodology issue.
If the Adviser decides that a price provided by the pricing service does not accurately reflect the fair value of the securities, when prices are not readily available from a pricing service, or when certain restricted or illiquid securities are being valued, securities are valued at fair value as determined in good faith by the Adviser, in conformity with guidelines adopted by and subject to review of the Board and the Fair Valuation Committee. These securities will be categorized as level 3 securities.
| Crow Point Funds | ANNUAL REPORT |
NOTES TO THE FINANCIAL STATEMENTS
September 30, 2019
| 3. | SECURITIES VALUATIONS (continued) |
The following tables summarize the inputs used to value the Funds’ assets and liabilities measured at fair value as of September 30, 2019.
EAS Fund:
Financial Instruments – Assets
| Classification | | Level 1 | | | Level 2 | | | Level 3 | | | Totals | |
| Common Stock (1) | | $ | 6,424,510 | | | $ | 67,737 | | | $ | — | | | $ | 6,492,247 | |
| Hedge Fund measured at net asset value (2) | | | — | | | | — | | | | — | | | | 3,846,960 | |
| Exchange-Traded Funds (1) | | | 414,863 | | | | — | | | | — | | | | 414,863 | |
| Mutual Funds (1) | | | 12,053,465 | | | | 447,998 | | | | — | | | | 12,501,463 | |
| Closed-End Funds (1) | | | 27,839 | | | | — | | | | — | | | | 27,839 | |
| Asset Backed Securities | | | — | | | | 10,724 | | | | — | | | | 10,724 | |
| Partnerships | | | 509,256 | | | | — | | | | — | | | | 509,256 | |
| Partnerships measured at net asset value (2) | | | — | | | | — | | | | — | | | | 6,317,176 | |
| Put Options Purchased | | | 850 | | | | — | | | | — | | | | 850 | |
| Senior Loans | | | — | | | | 954,123 | | | | — | | | | 954,123 | |
| Short-Term Investment | | | 1,693,938 | | | | — | | | | — | | | | 1,693,938 | |
| Total Assets | | $ | 21,124,721 | | | $ | 1,480,582 | | | $ | — | | | $ | 32,769,439 | |
| | | | | | | | | | | | | | | | | |
| Financial Instruments – Liabilities | | | | | | | | | | | | |
| Classification | | Level 1 | | | Level 2 | | | Level 3 | | | Totals | |
| Common Stock (1) | | $ | 1,506,440 | | | $ | — | | | $ | — | | | $ | 1,506,440 | |
| Exchange-Traded Funds (1) | | | 82,992 | | | | — | | | | — | | | | 82,992 | |
| Put Options Written | | | 340 | | | | — | | | | — | | | | 340 | |
| Total Liabilities | | $ | 1,589,772 | | | $ | — | | | $ | — | | | $ | 1,589,772 | |
| | | | | | | | | | | | | | | | | |
(1) For a detailed break-out of common stock, ETFs, CEFs and mutual funds by industry or asset class, please refer to the Consolidated Schedule of Investments.
(2) In accordance with Subtopic 820-10, certain investments that are measured at fair value using the net asset value per share (or its equivalent) practical expedient have not been classified in the fair value hierarchy. The fair value amounts presented in this table are intended to permit reconciliation of the fair value hierarchy to the amounts presented in the Consolidated Schedule of Investments.
| Crow Point Funds | ANNUAL REPORT |
NOTES TO THE FINANCIAL STATEMENTS
September 30, 2019
| 3. | SECURITIES VALUATIONS (continued) |
Global Fund:
Financial Instruments – Assets
| Security Classification | | Level 1 | | | Level 2 | | | Level 3 | | | Totals | |
| Closed-End Funds (1) | | $ | 1,656,502 | | | $ | — | | | $ | — | | | $ | 1,656,502 | |
| Exchange-Traded Funds (1) | | | 16,830,195 | | | | — | | | | — | | | | 16,830,195 | |
| Mutual Funds (1) | | | 642,550 | | | | — | | | | — | | | | 642,550 | |
| Asset Backed Securities | | | — | | | | 9,442 | | | | — | | | | 9,442 | |
| Mortgage Backed Securities | | | — | | | | 6,459 | | | | — | | | | 6,459 | |
| Partnership measured at net asset value (2) | | | — | | | | — | | | | — | | | | 2,881,337 | |
| Call Options Purchased | | | 42,900 | | | | — | | | | — | | | | 42,900 | |
| Put Options Purchased | | | 41,400 | | | | — | | | | — | | | | 41,400 | |
| Short-Term Investment | | | 1,064,945 | | | | — | | | | — | | | | 1,064,945 | |
| Total Assets | | $ | 20,278,492 | | | $ | 15,901 | | | $ | — | | | $ | 23,175,730 | |
| | | | | | | | | | | | | | | | | |
| Financial Instruments – Liabilities | | | | | | | | | | | | |
| Security Classification | | Level 1 | | | Level 2 | | | Level 3 | | | Totals | |
| Common Stock (1) | | $ | 264,957 | | | $ | — | | | $ | — | | | $ | 264,957 | |
| Exchange-Traded Funds (1) | | | 1,192,500 | | | | — | | | | — | | | | 1,192,500 | |
| Total Liabilities | | $ | 1,457,457 | | | $ | — | | | $ | — | | | $ | 1,457,457 | |
| | | | | | | | | | | | | | | | | |
(1) For a detailed break-out of common stock, CEFs, ETFs and mutual funds by industry or asset class, please refer to the Schedule of Investments.
(2) In accordance with Subtopic 820-10, certain investments that are measured at fair value using the net asset value per share (or its equivalent) practical expedient have not been classified in the fair value hierarchy. The fair value amounts presented in this table are intended to permit reconciliation of the fair value hierarchy to the amounts presented in the Schedule of Investments.
Income Fund: Financial Instruments – Assets | | | | | | | | | | | | |
| Security Classification | | Level 1 | | | Level 2 | | | Level 3 | | | Totals | |
| Preferred Stock (1) | | $ | 60,251 | | | $ | — | | | $ | — | | | $ | 60,251 | |
| Closed-End Funds (1) | | | 967,692 | | | | — | | | | — | | | | 967,692 | |
| Exchange-Traded Funds (1) | | | 4,258,397 | | | | — | | | | — | | | | 4,258,397 | |
| Asset Backed Securities | | | — | | | | 301,939 | | | | — | | | | 301,939 | |
| Corporate Bonds (1) | | | — | | | | 4,276,405 | | | | — | | | | 4,276,405 | |
| Mortgage Backed Securities | | | — | | | | 22,722 | | | | — | | | | 22,722 | |
| Partnership measured at net asset value (2) | | | — | | | | — | | | | — | | | | 1,319,721 | |
| Call Options Purchased | | | 21,450 | | | | — | | | | — | | | | 21,450 | |
| Put Options Purchased | | | 15,525 | | | | — | | | | — | | | | 15,525 | |
| Short-Term Investment | | | 613,993 | | | | — | | | | — | | | | 613,993 | |
| Total Assets | | $ | 5,937,308 | | | $ | 4,601,066 | | | $ | — | | | $ | 11,858,095 | |
| | | | | | | | | | | | | | | | | |
| Crow Point Funds | ANNUAL REPORT |
NOTES TO THE FINANCIAL STATEMENTS
September 30, 2019
| 3. | SECURITIES VALUATIONS (continued) |
| Financial Instruments – Liabilities | | | | | | | | | | | | |
| Security Classification | | Level 1 | | | Level 2 | | | Level 3 | | | Totals | |
| Common Stock (1) | | $ | 54,196 | | | $ | — | | | $ | — | | | $ | 54,196 | |
| Exchange-Traded Funds (1) | | | 210,168 | | | | — | | | | — | | | | 210,168 | |
| Total Liabilities | | $ | 264,364 | | | $ | — | | | $ | — | | | $ | 264,364 | |
| | | | | | | | | | | | | | | | | |
(1) For a detailed break-out of common stock, preferred stock, ETFs, CEFs and corporate bonds by industry or asset class, please refer to the Schedule of Investments.
(2) In accordance with Subtopic 820-10, certain investments that are measured at fair value using the net asset value per share (or its equivalent) practical expedient have not been classified in the fair value hierarchy. The fair value amounts presented in this table are intended to permit reconciliation of the fair value hierarchy to the amounts presented in the Schedule of Investments.
Following is a reconciliation of investments in which significant unobservable inputs (Level 3) were used in determining fair value for the Income Fund:
| | Balance as of September 30, 2018 | Realized gain (loss) | Amortization | Change in unrealized appreciation (depreciation) | Purchases | Sales | Transfers into Level 3 | Transfers out of Level 3 | Balance as of
September 30, 2019 |
| Private Investment | | $ | 365,826 | | | $ | 150,000 | | | $ | — | | | $ | (65,826 | ) | | $ | — | | | $ | (450,000 | ) | | $ | — | | | $ | — | | | $ | — | |
| Total | | $ | 365,826 | | | $ | 150,000 | | | $ | — | | | $ | (65,826 | ) | | $ | — | | | $ | (450,000 | ) | | $ | — | | | $ | — | | | $ | — | |
The Private Investment was sold on April 8, 2019.
| 4. | DERIVATIVES TRANSACTIONS |
As of September 30, 2019, portfolio securities valued at $1,817,163, $2,720,980 and $1,705,751 were held in escrow by the custodian as collateral for securities sold short and options written by the EAS Fund, Global Fund and Income Fund, respectively.
As of September 30, 2019, the location on the Statements of Assets and Liabilities for financial derivative instrument fair values is as follows:
| EAS Fund: | | | | | |
| Assets | | Location | | Equity Contracts | |
| Put options purchased | | Unaffiliated securities, at value | | $ | 850 | |
| Total Assets | | | | $ | 850 | |
| Liabilities | | Location | | Equity Contracts | |
| Put options written | | Options written, at value | | $ | 340 | |
| Total Liabilities | | | | $ | 340 | |
| Crow Point Funds | ANNUAL REPORT |
NOTES TO THE FINANCIAL STATEMENTS
September 30, 2019
| 4. | DERIVATIVES TRANSACTIONS (continued) |
| Global Fund: | | | | | |
| Assets | | Location | | Equity Contracts | |
| Call options purchased | | Unaffiliated securities, at value | | $ | 42,900 | |
| Put options purchased | | Unaffiliated securities, at value | | | 41,400 | |
| Total Assets | | | | $ | 84,300 | |
| Income Fund: | | | | | |
| Assets | | Location | | Equity Contracts | |
| Call options purchased | | Unaffiliated securities, at value | | $ | 21,450 | |
| Put options purchased | | Unaffiliated securities, at value | | | 15,525 | |
| Total Assets | | | | $ | 36,975 | |
Realized and unrealized gains and losses on derivatives contracts entered into by the Funds during the year ended September 30, 2019, are recorded in the following locations in the Consolidated Statement of Operations for the EAS Fund and the Statements of Operations for the Global Fund and the Income Fund:
| EAS Fund: | | | | | |
Net change in unrealized appreciation/(depreciation) on: | | Location | | Equity Contracts | |
| Call options purchased | | Unaffiliated Investments | | $ | (636,100 | ) |
| Put options purchased | | Unaffiliated Investments | | | 102,712 | |
| Call options written | | Options written | | | 2,600 | |
| Put options written | | Options written | | | — | |
| | | | | $ | (530,788 | ) |
| Net realized gain (loss) on: | | Location | | Equity Contracts | |
| Call options purchased | | Unaffiliated Investments | | $ | 334,746 | |
| Put options purchased | | Unaffiliated Investments | | | (148,174 | ) |
| Call options written | | Options written | | | (75,027 | ) |
| Put options written | | Options written | | | 19,105 | |
| | | | | $ | 130,650 | |
| Global Fund: | | | | | |
| | | | | | |
Net change in unrealized appreciation/(depreciation) on: | | Location | | Equity Contracts | |
| Call options purchased | | Unaffiliated Investments | | $ | 2,352 | |
| Put options purchased | | Unaffiliated Investments | | | (5,679 | ) |
| Call options written | | Options written | | | 4,477 | |
| Put options written | | Options written | | | (21,527 | ) |
| | | | | $ | (20,377 | ) |
| Crow Point Funds | ANNUAL REPORT |
NOTES TO THE FINANCIAL STATEMENTS
September 30, 2019
| 4. | DERIVATIVES TRANSACTIONS (continued) |
| Net realized gain (loss) on: | | Location | | Equity Contracts | |
| Call options purchased | | Unaffiliated Investments | | $ | (94,391 | ) |
| Put options purchased | | Unaffiliated Investments | | | 49,807 | |
| Call options written | | Options written | | | (181,277 | ) |
| Put options written | | Options written | | | (1,406 | ) |
| | | | | $ | (227,267 | ) |
| Income Fund: | | | | | |
Net change in unrealized appreciation/(depreciation) on: | | Location | | Equity Contracts | |
| Call options purchased | | Unaffiliated Investments | | $ | (1,316 | ) |
| Put options purchased | | Unaffiliated Investments | | | (928 | ) |
| Call options written | | Options written | | | (2,645 | ) |
| Put option written | | Options written | | | (2,345 | ) |
| | | | | $ | (7,234 | ) |
| Net realized gain (loss) on: | | Location | | Equity Contracts | |
| Call options purchased | | Unaffiliated Investments | | $ | (13,397 | ) |
| Put options purchased | | Unaffiliated Investments | | | 20,760 | |
| Call options written | | Options written | | | (62,670 | ) |
| Put options written | | Options written | | | (1,120 | ) |
| | | | | $ | (56,427 | ) |
The amounts realized and changes in unrealized gains and losses on derivative instruments during the year ended September 30, 2019 as disclosed above and within the Consolidated Statement of Operations for the EAS Fund and Statements of Operations for the Global Fund and the Income Fund serve as indicators of the volume of derivative activity for the Funds.
| 5. | INVESTMENT TRANSACTIONS |
For the year ended September 30, 2019, aggregate purchases and sales of investment securities (excluding short-term investments) for the Fund were as follows:
| | | | Purchases | | | Sales | |
| | EAS Fund | | | $ | 48,378,241 | | | $ | 46,522,378 | |
| | Global Fund | | | | 37,698,343 | | | | 29,651,157 | |
| | Income Fund | | | | 18,435,104 | | | | 15,751,363 | |
There were no Government securities purchased or sold during the period.
| 6. | INVESTMENTS IN AFFILIATED COMPANIES |
An affiliated company is a company in which the Funds have ownership of at least 5% of the voting securities or of common management. Companies which are affiliates of the Funds at September 30, 2019, are noted in the EAS Fund’s Consolidated Schedule of Investments and the Global Fund’s Schedule of Investments. The Income Fund, Crow Point Small-Cap Growth Fund (the “Growth Fund”), Eagle Rock Floating Rate Fund (the “Eagle Rock Fund”) and RVX Emerging Markets Equity Fund (the “RVX Fund”) are mutual funds which are considered affiliates because they are also of common management of the Adviser.
| Crow Point Funds | ANNUAL REPORT |
| NOTES TO THE FINANCIAL STATEMENTS | |
September 30, 2019
6. INVESTMENTS IN AFFILIATED COMPANIES (continued)
Transactions with affiliated companies during the year ended September 30, 2019 were as follows:
| EAS Fund: | | Value as of September 30,
2018 | | Realized gain
(loss) | | Change in
unrealized appreciation (depreciation) | | Purchases | | Sales | | Value as of September 30,
2019 | | Income received | |
| Income Fund | | $ | 4,156,271 | | $ | 15,981 | | $ | 38,178 | | $ | — | | $ | (605,000 | ) | $ | 3,605,430 | | $ | 9,422 | |
| Growth Fund | | | 6,938,283 | | | (30,730 | ) | | (1,449,901 | ) | | 500,000 | | | (375,000 | ) | | 5,582,652 | | | — | |
| Eagle Rock Fund | | | 2,267,010 | | | (49,309 | ) | | (17,010 | ) | | 304,453 | | | (2,505,144 | ) | | — | | | 52,703 | |
| RVX Fund | | | 3,017,945 | | | (34,330 | ) | | (100,630 | ) | | 282,398 | | | (300,000 | ) | | 2,865,383 | | | 32,398 | |
| Total | | $ | 16,379,509 | | $ | (98,388 | ) | $ | (1,529,363 | ) | $ | 1,086,851 | | $ | (3,785,144 | ) | $ | 12,053,465 | | $ | 94,523 | |
| Global Fund: | | Value as of September 30,
2018 | | Realized gain
(loss) | | Change in
unrealized appreciation (depreciation) | | Purchases | | Sales | | Value as of September 30,
2019 | | Income received | |
| RVX Fund | | $ | 670,676 | | $ | — | | $ | (34,726 | ) | $ | 6,600 | | $ | — | | $ | 642,550 | | $ | 6,600 | |
| Eagle Rock Fund | | | 1,007,000 | | | (16,234 | ) | | (6,999 | ) | | 278,088 | | | (1,261,855 | ) | | — | | | 26,338 | |
| Total | | $ | 1,677,676 | | $ | (16,234 | ) | $ | (41,725 | ) | $ | 284,688 | | $ | (1,261,855 | ) | $ | 642,550 | | $ | 32,938 | |
| Income Fund: | | Value as of September 30,
2018 | | Realized gain
(loss) | | Change in
unrealized appreciation (depreciation) | | Purchases | | Sales | | Value as of September 30,
2019 | | Income received | |
| Eagle Rock Fund | | $ | 503,500 | | $ | 3,500 | | $ | (3,500 | ) | $ | — | | $ | (503,500 | ) | $ | — | | $ | — | |
| Total | | $ | 503,500 | | $ | 3,500 | | $ | (3,500 | ) | $ | — | | $ | (503,500 | ) | $ | — | | $ | — | |
| Crow Point Funds | ANNUAL REPORT |
| NOTES TO THE FINANCIAL STATEMENTS | |
September 30, 2019
7. ADVISORY FEES AND OTHER RELATED PARTY TRANSACTIONS
The Funds have entered into Investment Advisory Agreements (the “Advisory Agreements”) with the Adviser. Under the Advisory Agreements, the Adviser, under the supervision of the Board, agrees to invest the assets of the Funds in accordance with applicable law and the investment objectives, policies and restrictions set forth in the Funds’ current Prospectuses and Statements of Additional Information, and subject to such further limitations as the Trust may from time to time impose by written notice to the Adviser. The Adviser shall act as the investment advisor to the Funds and, as such shall (i) obtain and evaluate such information relating to the economy, industries, business, securities markets and securities as it may deem necessary or useful in discharging its responsibilities here under, (ii) formulate a continuing program for the investment of the assets of the Funds in a manner consistent with their investment objectives, policies and restrictions, and (iii) determine from time to time securities to be purchased, sold, retained or lent by the Funds, and implement those decisions, including the selection of entities with or through which such purchases, sales or loans are to be effected; provided, that the Adviser will place orders pursuant to its investment determinations either directly with the issuer or with a broker or dealer, and if with a broker or dealer, (a) will attempt to obtain the best price and execution of its orders, and (b) may nevertheless in its discretion purchase and sell portfolio securities from and to brokers who provide the Adviser with research, analysis, advice and similar services and pay such brokers in return a higher commission or spread than may be charged by other brokers.
Under the terms of the Advisory Agreement with the Funds, the Adviser receives a monthly management fee equal to annual rates of the Funds’ net assets as follows:
| | Management Fee Rates |
| EAS Fund | 1.00% |
| Global Fund | 0.88% |
| Income Fund | 1.00% |
For the year ended September 30, 2019, the Adviser earned management fees as follows:
| | Management Fees | |
| EAS Fund | | $ | 348,751 | |
| Global Fund | | | 171,580 | |
| Income Fund | | | 110,909 | |
The Adviser has contractually agreed to waive or reduce its fees and to assume other expenses of the Funds, if necessary, in an amount that limits “Total Annual Fund Operating Expenses” (exclusive of interest, expenses incurred under a plan of distribution adopted pursuant to Rule 12b-1 under the 1940 Act, taxes, acquired fund fees and expenses, brokerage commissions, dividend expenses on securities sold short and other expenditures which are capitalized in accordance with GAAP and other extraordinary expenses not incurred in the ordinary course of such Funds’ business) to not more than 1.70% of the average daily net assets of each share class of the EAS Fund, 1.35% of the average daily net assets of each share class of the Global Fund and 2.00% of the average daily net assets of each share class of the Income Fund through January 31, 2020. These operating expense limitation agreements can be terminated only by, or with the consent of, the Board of Trustees.
| Crow Point Funds | ANNUAL REPORT |
| NOTES TO THE FINANCIAL STATEMENTS | |
September 30, 2019
7. ADVISORY FEES AND OTHER RELATED PARTY TRANSACTIONS (continued)
For the year ended September 30, 2019, the Adviser waived advisory fees and reimbursed expenses as follows:
| | | Advisory Fees Waived | | Expenses Reimbursed | |
| EAS Fund | | $ | 127,652 | | $ | — | |
| Global Fund | | | 171,580 | | | 9,472 | |
| Income Fund | | | 110,909 | | | 12,103 | |
The Funds invested a portion of their assets in the Income Fund, Growth Fund, Eagle Rock Fund and RVX Fund, which are affiliated Funds (Note 6). As such, the Adviser has agreed to waive its advisory fees on the portion of the Funds’ assets that are invested in the Income Fund, Growth Fund, Eagle Rock Fund and RVX Fund. For the year ended September 30, 2019, the Adviser waived advisory fees related to assets invested in the affiliated funds as follows:
| | | Affiliated Funds Advisory Fees Waived | |
| EAS Fund | | $ | 81,980 | |
| Global Fund | | | 13,101 | |
| Income Fund | | | 304 | |
These waivers are in addition to amounts waived pursuant to the contractual expense limitations detailed in the above paragraphs and are not recoupable.
Expense waivers and reimbursements are subject to possible recoupment from the Funds in future years on a rolling three year basis (within the three years after the fees have been waived or reimbursed) if such recoupment can be achieved within the foregoing expense limits. Expense waivers and reimbursements made by the Predecessor Income Fund were also subject to possible recoupment from the Predecessor Fund under the same terms. As of September 30, 2019, the total amount of expenses waived/reimbursed subject to recapture and their expiration dates, pursuant to the waiver agreements, was as follows:
| | Amount Subject to Recoupment | Expiration Dates |
| EAS Fund | $ 100,591 | April 30, 2020 |
| EAS Fund | 175,252 | April 30, 2021 |
| EAS Fund | 74,935 | September 30, 2021 |
| EAS Fund | 127,652 | September 30, 2022 |
| Global Fund | 205,491 | May 31, 2020 |
| Global Fund | 233,525 | May 31, 2021 |
| Global Fund | 79,439 | September 30, 2021 |
| Global Fund | 181,052 | September 30, 2022 |
| Income Fund | 130,930 | September 30, 2020 |
| Income Fund | 80,949 | September 30, 2021 |
| Income Fund | 123,012 | September 30, 2022 |
The Funds have entered into an Investment Company Services Agreement (“ICSA”) with M3Sixty Administration, LLC (“M3Sixty”). Pursuant to the ICSA, M3Sixty is responsible for a wide variety of functions, including but not limited to: (a) Fund accounting services; (b) financial statement preparation; (c) valuation of the Funds’ portfolio securities; (d) pricing the Funds’ shares; (e) assistance in preparing tax returns; (f) preparation and filing of required regulatory reports; (g) communications with shareholders; (h) coordination of Board and shareholder meetings; (i) monitoring the Funds’ legal compliance; and (j) maintaining shareholder account records.
| Crow Point Funds | ANNUAL REPORT |
| NOTES TO THE FINANCIAL STATEMENTS | |
September 30, 2019
7. ADVISORY FEES AND OTHER RELATED PARTY TRANSACTIONS (continued)
For the year ended September 30, 2019, M3Sixty earned fees pursuant to the ICSA as follows:
| | | ICSA Fees | |
| EAS Fund | | $ | 171,556 | |
| Global Fund | | | 109,577 | |
| Income Fund | | | 75,243 | |
The Funds have also entered into a Chief Compliance Officer Service Agreement (“CCO Agreement”) with M3Sixty. Pursuant to the CCO Agreement, M3Sixty agrees to provide a Chief Compliance Officer (“CCO”), as described in Rule 38a-l of the 1940 Act, to the Funds for the year and on the terms and conditions set forth in the CCO Agreement.
For the year ended September 30, 2019, M3Sixty earned fees pursuant to the CCO Agreement as follows:
| | | CCO Agreement Fees | |
| EAS Fund | | $ | 15,691 | |
| Global Fund | | | 15,000 | |
| Income Fund | | | 15,000 | |
M3Sixty has also agreed to voluntarily waive certain fees until certain thresholds are met by the Funds. During the year ended September 30, 2019, M3Sixty waived fees as follows:
| | | ICSA Fees Waived | |
| EAS Fund | | $ | 9,583 | |
| Global Fund | | | 7,500 | |
| Income Fund | | | 7,500 | |
Certain officers of the Funds are also employees or officers of M3Sixty and are not paid any fees directly by the Funds for serving in such capacities.
Matrix 360 Distributors, LLC (the “Distributor”) acts as the principal underwriter and distributor (the “Distributor”) of each Fund’s shares for the purpose of facilitating the registration of shares of the Funds under state securities laws and to assist in sales of the Funds’ shares pursuant to a Distribution Agreement (the “Distribution Agreement”) approved by the Trustees. The Distribution Agreement between the Funds and the Distributor requires the Distributor to use all reasonable efforts in connection with the distribution of the Funds’ shares. However, the Distributor has no obligation to sell any specific number of shares and will only sell shares for orders it receives.
The Distributor is an affiliate of M3Sixty.
The Funds have adopted a Distribution Plans (“Plans”) pursuant to Rule 12b-1 under the 1940 Act for their Investor Class shares. Under the Plans, the Funds may use 12b-1 fees to compensate broker-dealers (including, without limitation, the Distributor) for sales of Fund shares, or for other expenses associated with distributing Fund shares. The Funds may expend up to 0.25% for Investor Class shares of the Funds’ average daily net assets annually to pay for any activity primarily intended to result in the sale of Investor Class shares of the Funds and the servicing of shareholder accounts, provided that the Trustees have approved the category of expenses for which payment is being made.
The EAS Fund had adopted a Distribution Plan pursuant to Rule 12b-1 under the 1940 Act for its Class C shares. Under the Distribution Plan, The Fund used 12b-1 fees to compensate broker-dealers dealers (including, without limitation, the Distributor) for sales of the EAS Fund’s Class C shares, or for other expenses associated with distributing the EAS Fund’s Class C shares. The EAS Fund expended up to 1.00% for Class C shares of the EAS Fund’s average daily net assets annually to pay for any activity primarily intended to result in the sale of Class C shares of the EAS Fund and the servicing of shareholder accounts, provided that the Trustees had approved the category of expenses for which payment is being made. Effective January 28, 2019, the EAS Fund’s Class C shares were exchanged for the EAS Fund’s Investor Class shares and the Class C shares are no longer offered for purchase. Upon completion of the exchange, the Distribution Plan for the EAS Fund’s Class C shares was terminated.
| Crow Point Funds | ANNUAL REPORT |
| NOTES TO THE FINANCIAL STATEMENTS | |
September 30, 2019
7. ADVISORY FEES AND OTHER RELATED PARTY TRANSACTIONS (continued)
The Plan for the EAS Fund took effect October 14, 2017. The Plans for the Global Fund and the Income Fund took effect October 7, 2017. For the year ended September 30, 2019, the Fund accrued 12b-1 expenses attributable to Investor Class and Class C shares as follows:
| | | Investor Class | | Class C | |
| EAS Fund | | $ | 4,973 | | $ | 2,669 | |
| Global Fund | | | 2,708 | | | N/A | |
| Income Fund | | | 27,620 | | | N/A | |
8. DISTRIBUTIONS TO SHAREHOLDERS AND TAX MATTERS
The tax character of distributions during the year ended September 30, 2019 was as follows:
| | | Ordinary Income | | Long-Term Capital Gains | |
| EAS Fund | | $ | 92,991 | | $ | — | |
| Global Fund | | | 138,259 | | | — | |
| Income Fund | | | 26,240 | | | — | |
The tax character of distributions during the periods/year ended September 30, 2018 was as follows:
| | | Ordinary Income | | Long-Term Capital Gains | |
| EAS Fund | | $ | — | | $ | — | |
| Global Fund | | | — | | | — | |
| Income Fund | | | 18,527 | | | — | |
The tax character of distributions during the year ended April 30, 2018 for the EAS Fund and during the year ended May 31, 2018 for the Global Fund was as follows:
| | | Ordinary Income | | Long-Term Capital Gains | |
| EAS Fund | | $ | 131,723 | | $ | — | |
| Global Fund | | | 118,777 | | | — | |
The tax character of distributable earnings (accumulated losses) at September 30, 2019 was as follows:
| | | Undistributed Ordinary Income | | Post-October Loss and Late Year Loss | | Capital Loss Carry Forwards | | Other Book/Tax Differences | | Unrealized Appreciation/ (Depreciation) | | Total Accumulated Losses | |
| EAS Fund | | $ | — | | $ | (1,256,967 | ) | $ | (52,604 | ) | $ | (39,510 | ) | $ | (685,164 | ) | $ | (2,034,245 | ) |
| Global Fund | | | 142,376 | | | (91,591 | ) | | (785,892 | ) | | — | | | 359,946 | | | (375,161 | ) |
| Income Fund | | | 96,436 | | | (30,292 | ) | | (1,478,979 | ) | | (12,229 | ) | | 90,497 | | | (1,334,567 | ) |
The difference between book basis and tax basis undistributed net investment income (loss), accumulated net realized loss, and unrealized appreciation from investments is primarily attributable to the tax deferral of losses on wash sales and straddles, and adjustments for partnerships, real estate investment trusts, grantor trusts and C-Corporation return of capital distributions. In addition, the amount listed under other book/tax differences for the Fund is primarily attributable to the tax deferral of losses on straddles and adjustments for constructive sales of securities held short.
| Crow Point Funds | ANNUAL REPORT |
| NOTES TO THE FINANCIAL STATEMENTS | |
September 30, 2019
8. DISTRIBUTIONS TO SHAREHOLDERS AND TAX MATTERS (continued)
Capital losses incurred after October 31 and ordinary losses incurred after December 31within the fiscal year are deemed to arise on the first business day of the following fiscal year for tax purposes. At September 30, 2019, the Funds deferred capital and ordinary losses as follows:
| | | Post-October Capital Losses | | Late Year Ordinary Losses | |
| EAS Fund | | $ | 517,386 | | $ | 739,581 | |
| Global Fund | | | 91,591 | | | — | |
| Income Fund | | | 30,292 | | | — | |
At September 30, 2019, the Fund had capital loss carry forwards for federal income tax purposes available to offset future capital gains as follows:
| | | Non-Expiring Short-Term | | Non-Expiring Long-Term | | Total | |
| EAS Fund | | $ | 52,604 | | $ | — | | $ | 52,604 | |
| Global Fund | | | 785,890 | | | 2 | | | 785,892 | |
| Income Fund | | | 1,437,495 | | | 41,484 | | | 1,478,979 | |
Permanent book and tax differences, primarily attributable to the book/tax basis treatment of foreign currency gains/(losses), and adjustments for paydowns, C-Corporation return of capital distributions, real estate investment trusts, grantor trusts, partnerships, and the capitalization of in lieu dividend payments, resulted in reclassifications for the year ended September 30, 2019 as follows:
| | | Paid-in Capital | | Total Accumulated Losses | |
| EAS Fund | | $ | (92,991 | ) | $ | 92,991 | |
| Global Fund | | | — | | | — | |
| Income Fund | | | — | | | — | |
For U.S. Federal income tax purposes, the cost of securities owned, gross appreciation, gross depreciation, and net unrealized appreciation/(depreciation) of investments at September 30, 2019 were as follows:
| | | Cost | | Gross Appreciation | | Gross Depreciation | | Net Appreciation/ (Depreciation) | |
| EAS Fund | | $ | 31,864,831 | | $ | 958,773 | | $ | (1,643,937 | ) | $ | (685,164 | ) |
| Global Fund | | | 21,358,327 | | | 763,582 | | | (403,636 | ) | | 359,946 | |
| Income Fund | | | 11,503,234 | | | 215,334 | | | (124,837 | ) | | 90,497 | |
The difference between book basis and tax basis unrealized appreciation (depreciation) from investments is primarily attributable to the tax deferral of losses on wash sales and straddles, and adjustments for partnerships, real estate investment trusts, grantor trusts and C-Corporation return of capital distributions.
9. COMMITMENTS AND CONTINGENCIES
In the normal course of business, the Trust may enter into contracts that may contain a variety of representations and warranties and provide general indemnifications. The Trust’s maximum exposure under these arrangements is dependent on future claims that may be made against the Funds and, therefore, cannot be estimated; however, management considers the risk of loss from such claims to be remote.
10. SUBSEQUENT EVENTS
On December 27, 2019, the EAS Fund declared an ordinary income distribution of $40,589, which was payable on December 27, 2019. On December 27, 2019, the Global Fund declared an ordinary income distribution of $235,919, which was payable on December 27, 2019. On December 27, 2019, the Income Fund declared an ordinary income distribution of $184,930, which was payable on December 27, 2019.
In accordance with GAAP, Management has evaluated the impact of all subsequent events on the Funds through the date the financial statements were issued, and has determined that there were no other subsequent events requiring recognition or disclosure in the financial statements.
| Crow Point Funds | ANNUAL REPORT |
| NOTES TO THE FINANCIAL STATEMENTS | |
September 30, 2019
11. RECENT ACCOUNTING PRONOUNCEMENTS
In August 2018, the Financial Accounting Standards Board (“FASB”) issued Accounting Standards Update (ASU) No. 2018-13 “Fair Value Measurement (Topic 820): Disclosure Framework – Changes to the Disclosure Requirements for Fair Value Measurement” (“ASU 2018-13”) which includes amendments intended to improve the effectiveness of disclosures in the notes to financial statements. For example, ASU 2018-13 includes additional disclosures regarding the range and weighted average of significant unobservable inputs used to develop Level 3 fair value measurements, and clarifications to the narrative description of measurement uncertainty disclosures. ASU 2018-13 is effective for interim and annual periods beginning after December 15, 2019. Management has evaluated the implications of certain provisions of ASU 2018-13 and has elected to early adopt all aspects of the amendments effective with the Funds’ financial statements within this Annual Report.
The SEC has adopted changes to Regulation S-X to simplify the reporting of information by registered investment companies on financial statements. The amendments to Rule 6-04 remove the requirement to breakout the components of distributable earnings on the Statement of Assets and Liabilities. The amendments to Rule 6-09 remove the requirement for parenthetical disclosure of undistributed net investment income and separate disclosure of distributions paid to shareholders on the Statements of Changes in Net Assets. These Regulation S-X amendments became effective on November 5, 2018 and are reflected in the Funds’ financial statements for the year ended September 30, 2019.

REPORT OF INDEPENDENT REGISTERED PUBLIC ACCOUNTING FIRM
To the Board of Trustees of 360 Funds
and the Shareholders of EAS Crow Point Alternatives Fund,
Crow Point Global Tactical Allocation Fund, and Crow Point Alternative Income Fund
Opinion on the Financial Statements
We have audited the accompanying consolidated (where noted) statements of assets and liabilities of EAS Crow Point Alternatives Fund (“EAS Fund”), Crow Point Global Tactical Allocation Fund (“Global Fund”), and Crow Point Alternative Income Fund (“Income Fund”), each a series of shares of beneficial interest in 360 Funds (the “Funds”), including the consolidated (where noted) schedules of investments, as of September 30, 2019, and the related consolidated (where noted) statements of operations for the year then ended and the consolidated (where noted) statements of changes in net assets and the consolidated (where noted) financial highlights as noted in the table below, and the related notes (collectively referred to as the “financial statements”). In our opinion, the financial statements present fairly, in all material respects, the consolidated (where noted) financial position of the Funds and the consolidated (where noted) changes in their net assets and their consolidated (where noted) financial highlights as noted in the table below, in conformity with accounting principles generally accepted in the United States of America.
| Fund | Statements of Changes in Net Assets and Financial Highlights |
| EAS Fund | For the consolidated (where noted) Statements of Changes in Net Assets and Financial Highlights for the year ended September 30, 2019, the period from May 1, 2018 through September 30, 2018 and the year ended April 30, 2018 |
| Global Fund | For the Statements of Changes in Net Assets and Financial Highlights for the year ended September 30, 2019, the period from June 1, 2018 through September 30, 2018 and the year ended May 31, 2018 |
| Income Fund | For the Statements of Changes in Net Assets for each of the years in the two-year period ended September 30, 2019 For the Financial Highlights for each of the years in the five-year period ended September 30, 2019 |
The financial highlights for each of the years in the three-year period ended April 30, 2017 for the EAS Fund were audited by other auditors, whose report dated June 29, 2017, expressed an unqualified opinion on such financial highlights. The financial highlights for each of the years in the three-year period ended May 31, 2017 for the Global Fund were audited by other auditors, whose report dated July 31, 2017, expressed an unqualified opinion on such financial highlights.
Basis for Opinion
These financial statements are the responsibility of the Funds' management. Our responsibility is to express an opinion on the Funds’ financial statements based on our audits. We are a public accounting firm registered with the Public Company Accounting Oversight Board (United States) (“PCAOB”) and are required to be independent with respect to the Funds in accordance with the U.S. federal securities law and the applicable rules and regulations of the Securities and Exchange Commission and the PCAOB.
We conducted our audits in accordance with the standards of the PCAOB. Those standards require that we plan and perform the audits to obtain reasonable assurance about whether the financial statements are free of material misstatement, whether due to error or fraud. The Funds are not required to have, nor were we engaged to perform, an audit of their internal control over financial reporting. As part of our audits we are required to obtain an understanding of internal control over financial reporting but not for the purpose of expressing an opinion on the effectiveness of the Funds’ internal control over financial reporting. Accordingly, we express no such opinion.
Our audits included performing procedures to assess the risk of material misstatement of the financial statements, whether due to error or fraud, and performing procedures that respond to those risks. Such procedures included examining, on a test basis, evidence regarding the amounts and disclosures in the financial statements. Our procedures included confirmation of securities owned as of September 30, 2019 by correspondence with the custodian, brokers and other parties, or by other appropriate auditing procedures where replies from brokers were not received. Our audits also included evaluating the accounting principles used and significant estimates made by management, as well as evaluating the overall presentation of the financial statements. We believe that our audits provide a reasonable basis for our opinion.

BBD, LLP
We have served as the auditor of one or more of the Funds in the 360 Funds since 2018.
Philadelphia, Pennsylvania
January 28, 2020
| Crow Point Funds | ANNUAL REPORT |
ADDITIONAL INFORMATION September 30, 2019 (Unaudited) | |
The Funds file their complete schedules of portfolio holdings with the Securities and Exchange Commission (the “Commission”) for the first and third quarters of each fiscal year on Forms N-Q. The Funds’ Forms N-Q are available on the Commission’s website at http://www.sec.gov. The Funds’ Forms N-Q may be reviewed and copied at the Commission’s Public Reference Room in Washington, DC. Information on the operation of the Commission’s Public Reference Room may be obtained by calling 1-800-SEC-0330.
A description of the policies and procedures that the Funds uses to determine how to vote proxies relating to portfolio securities is available without charge, upon request, by calling 1-877-244-6235; and on the Commission’s website at http://www.sec.gov.
Information regarding how the Funds voted proxies relating to portfolio securities during the most recent 12-month period ended June 30th is available without charge, upon request, by calling 1-877-244-6235; and on the Commission’s website at http://www.sec.gov.
Shareholder Tax Information - The Funds are required to advise you within 60 days of the Funds’ fiscal year end regarding the federal tax status of distributions received by shareholders during the fiscal year. The EAS Fund paid $92,991 of ordinary income during the year ended September 30, 2019. The Global Fund paid $138,259 of ordinary income during the year ended September 30, 2019. The Income Fund paid $26,240 of ordinary income distributions during the year ended September 30, 2019.
Tax information is reported from the Funds’ fiscal year and not calendar year, therefore, shareholders should refer to their Form 1099-DIV or other tax information which will be mailed in 2020 to determine the calendar year amounts to be included on their 2019 tax returns. Shareholders should consult their own tax advisors.
On June 12, 2019, a Special Meeting of Shareholders of the Trust was held for the purpose of voting on the following proposals:
Proposal 1: To approve a new investment sub-advisory agreement between Crow Point Partners, LLC and Winthrop Capital Management, LLC, on behalf of the Income Fund.
Proposal 2: To transact such other business as may properly come before the Special Meeting and any postponement or adjournment thereof.
The total number of shares of the Income Fund present in person or by proxy represented approximately 51.58% of the Income Fund’s shares entitled to vote at the Special Meeting. The shareholders of the Income Fund voted to approve Proposal 1 and Proposal 2. The votes cast by the Income Fund’s shareholders with respect to Proposal 1 and Proposal 2 were as follows:
| For | Against | Abstain |
| 648,178 | — | — |
| Crow Point Funds | ANNUAL REPORT |
ADDITIONAL INFORMATION September 30, 2019 (Unaudited) | |
BOARD OF TRUSTEES, OFFICERS AND PRINCIPAL SHAREHOLDERS - (Unaudited)
The Trustees are responsible for the management and supervision of the Funds. The Trustees approve all significant agreements between the Trust, on behalf of the Funds, and those companies that furnish services to the Funds; review performance of the Funds; and oversee activities of the Funds. The Statement of Additional Information of the Trust includes additional information about the Funds’ Trustees and is available upon request, without charge, by calling (877) 244-6235.
Trustees and Officers. Following are the Trustees and Officers of the Trust, their age and address, their present position with the Trust or the Funds, and their principal occupation during the past five years. Each of the Trustees of the Trust will generally hold office indefinitely. The Officers of the Trust will hold office indefinitely, except that: (1) any Officer may resign or retire and (2) any Officer may be removed any time by written instrument signed by at least two-thirds of the number of Trustees prior to such removal. In case a vacancy or an anticipated vacancy on the Board of Trustees shall for any reason exist, the vacancy shall be filled by the affirmative vote of a majority of the remaining Trustees, subject to certain restrictions under the 1940 Act. Those Trustees who are “interested persons” (as defined in the 1940 Act) by virtue of their affiliation with either the Trust or the Adviser, are indicated in the table. The address of each trustee and officer is 4300 Shawnee Mission Parkway, Suite 100, Fairway, KS 66205.
| Name, Address and Year of Birth (“YOB”) | Position(s) Held with Trust | Length of Service | Principal Occupation(s) During Past 5 Years | Number of Series Overseen | Other Directorships During Past 5 Years |
| Independent Trustees |
Arthur Q. Falk YOB : 1937 | Trustee | Since 2011 | Retired. President, Murray Hill Financial Marketing, (financial marketing consultant) (1990–2012). | Ten | None |
Tom M. Wirtshafter YOB : 1954 | Trustee | Since 2011 | Senior Vice President, American Portfolios Financial Services, (broker-dealer), American Portfolios Advisors (investment adviser) (2009-Present). | Ten | None |
Gary W. DiCenzo YOB: 1962 | Trustee and Independent Chairman | Since 2014 Since 2019 | Chief Executive Officer, Cognios Capital (investment management firm) (2015-present); President and CEO, IMC Group, LLC (asset management firm consultant) (2010-2015). | Ten | FNEX Ventures (2018-present) |
Steven D. Poppen YOB : 1968 | Trustee | Since 2018 | Executive Vice President and Chief Financial Officer, Minnesota Vikings (professional sports organization) (1999-present). | Ten | M3Sixty Funds Trust (3 portfolios) (2015 – present); FNEX Ventures (2018- present) |
Thomas J. Schmidt YOB: 1963 | Trustee | Since 2018 | Principal, Tom Schmidt & Associates Consulting, LLC (2015-Present); Vice President of the Mutual Fund and Alternative Investment Full Service Transfer Agent (1986-2014). | Ten | FNEX Ventures (2018-present) |
| Interested Trustee* | | | | | |
Randall K. Linscott YOB: 1971 | President | Since 2013 | Chief Executive Officer, M3Sixty Administration, LLC (2013 – present); Chief Operating Officer, M3Sixty Administration LLC (2011-2013); Division Vice President, Boston Financial Data Services, (2005-2011). | Ten | M3Sixty Funds Trust (3 portfolios) (2015 – present) |
* The Interested Trustee is an Interested Trustee because he is an officer and principal owner of the Administrator.
| Crow Point Funds | ANNUAL REPORT |
ADDITIONAL INFORMATION September 30, 2019 (Unaudited) | |
BOARD OF TRUSTEES, OFFICERS AND PRINCIPAL SHAREHOLDERS - (Unaudited) (continued)
| Name, Address and Year of Birth (“YOB”) | Position(s) Held with Trust | Length of Service | Principal Occupation(s) During Past 5 Years | Number of Series Overseen | Other Directorships During Past 5 Years |
Officers | | | | | |
Andras P. Teleki YOB: 1971 | Chief Compliance Officer and Secretary | Since 2015 | Chief Legal Officer, M3Sixty Administration, LLC, M3Sixty Holdings, LLC, Matrix 360 Distributors, LLC and M3Sixty Advisors, LLC (2015-present); Chief Compliance Officer and Secretary, M3Sixty Funds Trust (2016-present); Chief Compliance Officer and Secretary, WP Trust (2016-present); Secretary and Assistant Treasurer, Capital Management Investment Trust (2015); Partner, K&L Gates (2009-2015). | N/A | N/A |
Brandon J. Byrd YOB: 1981 | Assistant Secretary and Anti-Money Laundering Officer Vice President | Since 2013 Since 2018 | Chief Operating Officer, M3Sixty Administration, LLC (2013-present); Anti-Money Laundering Compliance Officer, Monteagle Funds (2015-2016); Division Manager - Client Service Officer, Boston Financial Data Services (mutual find service provider) (2010-2012). | N/A | N/A |
Larry E. Beaver, Jr.** YOB: 1969 | Assistant Treasurer | Since 2017 | Fund Accounting, Administration and Tax Officer, M3Sixty Administration, LLC (2017-Present); Director of Fund Accounting & Administration, M3Sixty Administration, LLC (2005-2017); Chief Accounting Officer, Amidex Funds, Inc. (2003-Present); Assistant Treasurer, Capital Management Investment Trust (July 2017-Present); Assistant Treasurer, M3Sixty Funds Trust (July 2017-Present; Assistant Treasurer, WP Funds Trust (July 2017-Present); Treasurer and Assistant Secretary, Capital Management Investment Trust (2008-July 2017); Treasurer, 360 Funds Trust (2007-2017); Treasurer, M3Sixty Funds Trust (2015-July 2017); Treasurer, WP Trust (2015-July 2017); Treasurer and Chief Financial Officer, Monteagle Funds (2008-2016). | N/A | N/A |
John H. Lively YOB: 1969 | Assistant Secretary | Since 2017 | Attorney, Practus, LLP (law firm) (2010-present). | N/A | N/A |
Ted L. Akins YOB: 1974 | Assistant Secretary | Since 2018 | Vice President of Operations, M3Sixty Administration, LLC (2012-present). | N/A | N/A |
** Effective December 28, 2018, Larry E. Beaver, Jr. was assigned as Interim Treasurer until a new Treasurer is appointed by the Board.
| Crow Point Funds | ANNUAL REPORT |
ADDITIONAL INFORMATION September 30, 2019 (Unaudited) | |
BOARD OF TRUSTEES, OFFICERS AND PRINCIPAL SHAREHOLDERS - (Unaudited) (continued)
Remuneration Paid to Trustees and Officers - Officers of the Trust and Trustees who are “interested persons” of the Trust or the Adviser will receive no salary or fees from the Trust. Officers of the Trust and interested Trustees do receive compensation directly from certain service providers to the Trust, including Matrix 360 Distributors, LLC and M3Sixty Administration LLC. Effective April 25, 2019, each Trustee who is not an “interested person” receives a fee of $5,000 each year, plus a fee of $1,500 per Fund each year, and $200 per Fund per Board or committee meeting attended. Prior to April 25, 2019, each Trustee who is not an “interested person” received a fee of $1,500 each year plus $200 per Board or committee meeting attended. The Trust reimburses each Trustee and officer for his or her travel and other expenses relating to attendance at such meetings.
| Name of Trustee1 | Aggregate Compensation From each Fund2 | Pension or Retirement Benefits Accrued As Part of Portfolio Expenses | Estimated Annual Benefits Upon Retirement | Total Compensation From the Funds Paid to Trustees2 |
| Independent Trustees |
| Arthur Q. Falk | $ 2,929 | None | None | $ 8,787 |
| Tom M. Wirtshafter | $ 2,530 | None | None | $ 7,590 |
| Gary W. DiCenzo | $ 2,929 | None | None | $ 8,787 |
| Steven D. Poppen | $ 2,530 | None | None | $ 7,590 |
| Thomas J. Schmidt | $ 2,929 | None | None | $ 8,787 |
| Interested Trustees and Officers |
| Randall K. Linscott | None | Not Applicable | Not Applicable | None |
| 1 | Each of the Trustees serves as a Trustee to each Series of the Trust. The Trust currently offers ten (10) series of shares. |
| 2 | Figures are for the year ended September 30, 2019. |
| Crow Point Funds | ANNUAL REPORT |
Information About Your Funds’ Expenses – (Unaudited)
As a shareholder of the Funds, you incur two types of costs: (1) transaction costs, such as the sales charge (load) imposed on certain subscriptions and the contingent deferred sales charge (“CDSC”) and redemption fees imposed on certain short-term redemptions; and (2) ongoing costs, including management fees, distribution and/or service (12b-1) fees; and other Fund expenses. The example below is intended to help you understand your ongoing costs (in dollars) of investing in the Funds and to compare these costs with the ongoing costs of investing in other mutual funds.
The example is based on an investment of $1,000 invested at the beginning of the period and held for the entire period as indicated below.
Actual Expenses – The first section of the table provides information about actual account values and actual expenses (relating to the example $1,000 investment made at the beginning of the period). You may use the information in this section, together with the amount you invested, to estimate the expenses that you paid over the period. Simply divide your account value by $1,000 (for example, an $8,600 account value divided by $1,000 = 8.6), then multiply the result by the number in the first section under the heading entitled “Expenses Paid During Period” to estimate the expenses you paid on your account during this period.
Hypothetical Example for Comparison Purposes – The second section of the table provides information about the hypothetical account values and hypothetical expenses based on the Funds’ actual expense ratios and an assumed rate of return of 5% per year before expenses, which is not the Funds’ actual return. The hypothetical account values and expenses may not be used to estimate the actual ending account balance or expenses you paid for the period. You may use this information to compare the ongoing costs of investing in the Funds to other funds. To do so, compare this 5% hypothetical example with the 5% hypothetical examples that appear in the shareholder reports of the other funds.
Please note that the expenses shown in the table are meant to highlight your ongoing costs only and do not reflect any transactional costs, such as sales charges (loads), CDSC fees, or exchange fees. Therefore, the second section of the table is useful in comparing ongoing costs only, and will not help you determine the relative total costs of owning different funds. In addition, if these transactional costs were included, your costs would have been higher. For more information on transactional costs, please refer to the Funds’ prospectuses.
| Expenses and Value of a $1,000 Investment for the period from 04/01/19 through 09/30/19 |
| EAS Fund: | Beginning Account
Value (04/01/2019) | Annualized Expense
Ratio for the Period | Ending Account
Value (09/30/2019) | Expenses Paid
During Period (a) |
| Actual Fund Return (in parentheses) | | | |
| Class A (-1.20%) | $1,000.00 | 1.80% | $ 988.00 | $ 8.97 |
| Class I (-1.08%) | $1,000.00 | 1.55% | $ 989.20 | $ 7.73 |
| Hypothetical 5% Return | | | |
| Class A | $1,000.00 | 1.80% | $1,016.00 | $ 9.10 |
| Class I | $1,000.00 | 1.55% | $1,017.30 | $ 7.84 |
| Global Fund: | Beginning Account
Value (04/01/2019) | Annualized Expense
Ratio for the Period | Ending Account
Value (09/30/2019) | Expenses Paid
During Period (a) |
| Actual Fund Return (in parentheses) | | | |
| Investor Class (+0.00%) | $1,000.00 | 1.71% | $1,000.00 | $ 8.57 |
| Institutional Class (+0.11%) | $1,000.00 | 1.46% | $1,001.10 | $ 7.32 |
| Hypothetical 5% Return | | | |
| Investor Class | $1,000.00 | 1.71% | $1,016.50 | $ 8.64 |
| Institutional Class | $1,000.00 | 1.46% | $1,017.70 | $ 7.38 |
| Crow Point Funds | ANNUAL REPORT |
Information About Your Funds’ Expenses – (Unaudited) (continued)
| Expenses and Value of a $1,000 Investment for the period from 04/01/19 through 09/30/19 |
| Income Fund: | Beginning Account
Value (04/01/2019) | Annualized Expense
Ratio for the Period | Ending Account
Value (09/30/2019) | Expenses Paid
During Period (a) |
| Actual Fund Return (in parentheses) | | | |
| Investor Class (+2.03%) | $1,000.00 | 2.45% | $1,020.30 | $12.41 |
| Institutional Class (+2.15%) | $1,000.00 | 2.20% | $1,021.50 | $11.15 |
| Hypothetical 5% Return | | | |
| Investor Class | $1,000.00 | 2.45% | $1,012.80 | $12.36 |
| Institutional Class | $1,000.00 | 2.20% | $1,014.00 | $11.11 |
| | | | | |
| (a) | Expenses are equal to the Funds’ annualized expense ratios, multiplied by the average account value over the period, multiplied by 183/365 to reflect the one-half year period. |
For more information on Fund expenses, please refer to the Funds’ prospectus, which can be obtained from your investment representative or by calling 1-877-244-6235. Please read them carefully before you invest or send money.
Total EAS Fund operating expense ratios as stated in the current EAS Fund prospectus dated January 28, 2019 for the EAS Fund were as follows: |
| EAS Crow Point Alternatives Fund Investor Class, gross of fee waivers or expense reimbursements | 4.34% |
| EAS Crow Point Alternatives Fund Investor Class, after waiver and reimbursement* | 3.51% |
| EAS Crow Point Alternatives Fund Institutional Class, gross of fee waivers or expense reimbursements | 4.09% |
| EAS Crow Point Alternatives Fund Institutional Class, after waiver and reimbursement* | 3.26% |
* Pursuant to an operating expense limitation agreement between the Adviser and the EAS Fund, the Adviser has agreed to waive or reduce its fees and to assume other expenses of the Fund, if necessary, in an amount that limits “Total Annual Fund Operating Expenses” (exclusive of interest, expenses incurred under a plan of distribution adopted pursuant to Rule 12b-1 under the Investment Company Act of 1940, as amended (the “1940 Act”), taxes, acquired fund fees and expenses, brokerage commissions, dividend expenses on short sales and other expenditures which are capitalized in accordance with generally accepted accounting principles and other extraordinary expenses not incurred in the ordinary course of such EAS Fund’s business) to not more than 1.70% of the average daily net assets of each share class of the EAS Fund through January 31, 2020. This operating expense limitation agreement can be terminated only by, or with the consent of, the Board of Trustees. Each waiver or reimbursement of an expense by the Adviser is subject to repayment by the EAS Fund within three fiscal years following the fiscal year in which the expense was incurred, provided that the EAS Fund is able to make the repayment without exceeding the expense limitation in place at the time of the waiver or reimbursement and at the time the waiver or reimbursement is recouped. Total Gross Operating Expenses during the year ended September 30, 2019 were 2.49% and 2.24% for the EAS Fund Investor Class and Institutional Class shares, respectively. Please see the Information About Your Fund’s Expenses, the Financial Highlights and Notes to Financial Statements (Note 7) sections of this report for expense related disclosures during the year ended September 30, 2019. |
| Crow Point Funds | ANNUAL REPORT |
Information About Your Funds’ Expenses – (Unaudited) (continued)
Total Global Fund operating expense ratios as stated in the current Global Fund prospectus dated January 28, 2019 were as follows: |
| Crow Point Global Tactical Allocation Fund Investor Class, gross of fee waivers or expense reimbursements | 3.27% |
| Crow Point Global Tactical Allocation Fund Investor Class, after waiver and reimbursement* | 2.08% |
| Crow Point Global Tactical Allocation Fund Institutional Class, gross of fee waivers or expense reimbursements | 3.02% |
| Crow Point Global Tactical Allocation Fund Institutional Class, after waiver and reimbursement* | 1.83% |
* Pursuant to an operating expense limitation agreement between the Adviser and the Global Fund, the Adviser has agreed to waive or reduce its fees and to assume other expenses of the Global Fund, if necessary, in an amount that limits “Total Annual Fund Operating Expenses” (exclusive of interest, expenses incurred under a plan of distribution adopted pursuant to Rule 12b-1 under the 1940 Act, taxes, acquired fund fees and expenses, brokerage commissions, dividend expenses on short sales and other expenditures which are capitalized in accordance with generally accepted accounting principles and other extraordinary expenses not incurred in the ordinary course of such Global Fund’s business) to not more than 1.35% of the average daily net assets of each share class of the Global Fund through January 31, 2020. This operating expense limitation agreement can be terminated only by, or with the consent of, the Board of Trustees. Each waiver or reimbursement of an expense by the Adviser is subject to repayment by the Global Fund within three fiscal years following the fiscal year in which the expense was incurred, provided that the Global Fund is able to make the repayment without exceeding the expense limitation in place at the time of the waiver or reimbursement and at the time the waiver or reimbursement is recouped. Total Gross Operating Expenses during the year ended September 30, 2019 were 2.66% and 2.41% for the Crow Point Global Tactical Allocation Fund Investor Class and Institutional Class shares, respectively. Please see the Information About Your Fund’s Expenses, the Financial Highlights and Notes to Financial Statements (Note 7) sections of this report for expense related disclosures during the year ended September 30, 2019. |
Total Income Fund operating expense ratios as stated in the current Income Fund prospectus dated January 28, 2019 for the Income Fund were as follows: |
| Crow Point Alternative Income Fund Investor Class, gross of fee waivers or expense reimbursements | 3.60% |
| Crow Point Alternative Income Fund Investor Class, after waiver and reimbursement* | 2.52% |
| Crow Point Alternative Income Fund Institutional Class, gross of fee waivers or expense reimbursements | 3.35% |
| Crow Point Alternative Income Fund Institutional Class, after waiver and reimbursement* | 2.27% |
* Pursuant to an operating expense limitation agreement between the Adviser and the Income Fund, the Adviser has agreed to waive or reduce its fees and to assume other expenses of the Income Fund, if necessary, in an amount that limits “Total Annual Fund Operating Expenses” (exclusive of interest, expenses incurred under a plan of distribution adopted pursuant to Rule 12b-1 under the 1940 Act, taxes, acquired fund fees and expenses, brokerage commissions, dividend expenses on short sales and other expenditures which are capitalized in accordance with generally accepted accounting principles and other extraordinary expenses not incurred in the ordinary course of such Income Fund’s business) to not more than 2.00% of the average daily net assets of each share class of the Income Fund through January 31, 2020. This operating expense limitation agreement can be terminated only by, or with the consent of, the Board of Trustees. Each waiver or reimbursement of an expense by the Adviser is subject to repayment by the Income Fund within three fiscal years following the fiscal year in which the expense was incurred, provided that the Income Fund is able to make the repayment without exceeding the expense limitation in place at the time of the waiver or reimbursement and at the time the waiver or reimbursement is recouped. Total Gross Operating Expenses during the year/period ended September 30, 2019 were 3.54% and 3.29% for the Crow Point Alternative Income Fund Investor Class and Institutional Class shares, respectively. Please see the Information About Your Fund’s Expenses, the Financial Highlights and Notes to Financial Statements (Note 7) sections of this report for expense related disclosures during the year/period ended September 30, 2019. |
| Crow Point Funds | ANNUAL REPORT |
Approval of the Investment Advisory Agreement Renewal for the Crow Point Alternative Income Fund, EAS Crow Point Alternatives Fund and Crow Point Global Tactical Allocation Fund (Unaudited)
At a meeting held on July 17, 2019, the Board of Trustees (the “Board”) considered the renewal of the Investment Advisory Agreements (the “Agreements”) between the Trust, on behalf of each of the Crow Point Alternative Income Fund (the “Alternative Income Fund”), the EAS Crow Point Alternatives Fund (the “EAS Fund”) and the Crow Point Global Tactical Allocation Fund (the “Global Tactical Fund, together with the Alternative Income Fund and the EAS Fund, the “Crow Point Funds”), and Crow Point Partners, LLC (the “Adviser”).
Counsel reviewed with the Board the memorandum that summarized, among other things, the fiduciary duties and responsibilities of the Board in reviewing and approving the renewal of the Investment Advisory Agreement (the “Advisory Agreement”) between the Trust and the Adviser. A copy of this memorandum was circulated to the Trustees in advance of the Meeting. Counsel discussed with the Trustees the types of information and factors that should be considered by the Board in order to make an informed decision regarding the approval of the continuation of the Advisory Agreement, including the following material factors: (i) the nature, extent and quality of the services provided by the Adviser; (ii) the investment performance of the Crow Point Funds; (iii) the costs of the services provided and profits realized by the Adviser from its relationships with the Crow Point Funds; (iv) the extent to which economies of scale would be realized if the Crow Point Funds grow and whether advisory fee levels reflect those economies of scale for the benefit of the Crow Point Funds’ investors; and (v) the Adviser’s practices regarding possible conflicts of interest.
In assessing these factors and reaching its decisions, the Board took into consideration information furnished for the Board’s review and consideration throughout the year at regular Board meetings, as well as information specifically prepared and/or presented in connection with the annual renewal process, including information presented to the Board in the Adviser’s presentation earlier in the Meeting. The Board requested and was provided with information and reports relevant to the annual renewal of the Advisory Agreement, including: (i) reports regarding the services and support provided to the Crow Point Funds and their shareholders by the Adviser; (ii) quarterly assessments of the investment performance of the Crow Point Funds from the Adviser; (iii) periodic commentary on the reasons for the performance by the Adviser; (iv) presentations by Crow Point Funds’ management addressing the Adviser’s investment philosophy, investment strategy, personnel, and operations; (v) compliance and audit reports concerning the Crow Point Funds and the Adviser; (vi) disclosure information contained in the registration statement of the Trust and the Form ADV of the Adviser; and (vii) a memorandum from Counsel that summarized the fiduciary duties and responsibilities of the Board in reviewing and approving the Advisory Agreement, including the material factors set forth above and the types of information included in each factor that should be considered by the Board in order to make an informed decision.
The Board also requested and received various informational materials including, without limitation: (i) documents containing information about the Adviser, including financial information, a description of personnel and the services provided to the Crow Point Funds, information on investment advice, performance, summaries of Crow Point Funds’ expenses, compliance program, current legal matters and other general information; (ii) comparative expense and performance information for other mutual funds with strategies similar to the Crow Point Funds; and (iii) benefits to be realized by the Adviser from its relationship with the Crow Point Funds. The Board did not identify any information that was most relevant to its consideration to approve the Advisory Agreement and each Trustee may have afforded different weight to the various factors.
| (1) | The nature, extent, and quality of the services provided by the Adviser. |
In this regard, the Board considered the responsibilities the Adviser has under the Advisory Agreement for each of the Crow Point Funds. The Board reviewed the services provided by the Adviser to the Crow Point Funds, including, without limitation: its processes for formulating investment recommendations and assuring compliance with the Crow Point Funds’ investment objectives and limitations; its coordination of services for the Crow Point Funds among the Crow Point Funds’ service providers; and its efforts to promote the Crow Point Funds, grow assets and assist in the distribution of Crow Point Funds’ shares. The Board considered the Adviser’s staffing, personnel, and methods of operating; the education and experience of their personnel; and their compliance program. After reviewing the foregoing and further information from the Adviser, the Board concluded that the nature, extent, and quality of the services provided by the Adviser to the Crow Point Funds was satisfactory.
| (2) | Investment Performance of the Crow Point Funds. |
In considering the investment performance of the Crow Point Funds, the Trustees compared the short- and long-term performance of each Crow Point Fund with the performance of its benchmark index, or indices, as applicable, comparable funds with similar objectives and size managed by other investment advisers, and comparable peer group indices (e.g., Morningstar category averages). The Trustees also considered the consistency of the Adviser’s management of each Crow Point Fund with its investment objective and policies.
| Crow Point Funds | ANNUAL REPORT |
Approval of the Investment Advisory Agreement Renewal for the Crow Point Alternative Income Fund, EAS Crow Point Alternatives Fund and Crow Point Global Tactical Allocation Fund (Unaudited) (continued)
For the EAS Fund, the Board noted that the EAS Fund underperformed its primary benchmark, the Bloomberg Barclay’s U.S. Aggregate Bond Index, and its secondary benchmark, the HFRI Fund-of-Funds Conservative Index, for the one, three, and five-year periods ended May 31, 2019. The Board also noted that the EAS Fund beat the average and median of the Morningstar US OE Multi-alternative category for the three-year period and lagged or was equal to the category average and median for one and five-year periods, each ended June 30, 2019.
For the Global Tactical Fund, the Board noted that it underperformed its primary benchmark, the S&P 500® Total Return Index for the one, three, and five-year periods ended May 31, 2019, but beat its secondary index, the Bloomberg Barclay’s U.S. Aggregate Bond Index, for the three-year period. The Board also noted that the Global Tactical Fund beat the average and median of the Morningstar US OE Tactical Allocation category for the one, three, and five-year periods ended June 30, 2019.
For the Alternative Income Fund, the Board noted that it underperformed its primary benchmark, the Bloomberg Barclay’s Global Aggregate Bond Index for the one, three, and five-year periods, but beat its secondary benchmark, the HFRX Absolute Return Index, for the one and three-year periods, each ended May 31, 2019. The Board also noted that the Alternative Income Fund lagged the average and median return for the Morningstar US OE Nontraditional Bond Category for the one, three, and five-year periods, ended June 30, 2019, but that the fund’s performance was within the category’s range.
Based on the preceding, the Board concluded that the investment performance information presented for the Crow Point Funds was satisfactory.
| (3) | The costs of the services provided, and profits realized by the Adviser from the relationship with the Crow Point Funds. |
In considering the costs of the services provided and profits realized by the Adviser from its relationship with the Crow Point Funds, the Trustees considered: the Adviser’s staffing, personnel and methods of operating; the financial condition of the Adviser and its level of commitment to the Crow Point Funds; the asset levels of the Crow Point Funds; and the overall expenses of the Crow Point Funds. The Trustees considered the financial statements of the Adviser and the financial stability and productivity of the firm.
The Trustees considered the fees and expenses of the EAS Fund (including the management fee) relative to its category group as of June 30, 2019. The Trustees noted that the management fee for the EAS Fund was equal to the average and median management fee for the category. The Trustees further noted that the net expense ratio of the EAS Fund was higher than the average and median for the category but was within the categories range.
The Trustees next considered the fees and expenses of the Global Tactical Fund (including the management fee) relative to its peer group median as of June 30, 2019. The Trustees noted that the management fee was slightly above the category average and median. The Trustees further noted that the net expense ratio of the Global Tactical Fund was lower than the average and median for the category.
The Trustees next considered the fees and expenses of the Alternative Income Fund (including the management fee) relative to its category average and median as of June 30, 2019. The Trustees noted that the management fee was above the category average and median but was within the category range. The Trustees further noted that the net expense ratio of the Alternative Income Fund was higher than the average and median for the category but was within the category range.
The Trustee further noted that with regard to each of the Crow Point Funds, the Adviser has entered into an expense limitation agreement pursuant to which the Adviser has agreed to waive or reduce its fees and to assume other expenses of each Crow Point Fund, if necessary, to limit each Fund’s annual operating expenses (with industry-standard exceptions), through January 31, 2020 for EAS Fund, Global Tactical Fund and Alternative Income Fund to not more than following percentages: 1.70% for the EAS Fund, 1.35% for the Global Tactical Fund and 2.00% for the Alternative Income Fund. The Board also noted that the Adviser realizes a reasonable profit for its management of all the Crow Point Funds. Following this analysis and upon further consideration and discussion of the preceding, the Board concluded that the fees paid to the Adviser by each of the Crow Point Funds were fair and reasonable.
| Crow Point Funds | ANNUAL REPORT |
Approval of the Investment Advisory Agreement Renewal for the Crow Point Alternative Income Fund, EAS Crow Point Alternatives Fund and Crow Point Global Tactical Allocation Fund (Unaudited) (continued)
| (4) | The extent to which economies of scale would be realized if the Crow Point Funds grow and whether advisory fee levels reflect these economies of scale for the benefit of the Crow Point Funds’ investors. |
In this regard, the Board considered the Crow Point Funds’ fee arrangements with the Adviser. The Trustees determined that although the management fee would stay the same as asset levels increased, the shareholders of the Crow Point Funds would benefit from the expense limitation arrangement for each Crow Point Fund. The Trustees noted that while a breakpoint schedule in an advisory agreement would be beneficial, such a feature only had benefits if the fund’s assets were enough to trigger the breakpoint. The Trustees noted that lower expenses for the Crow Point Funds’ shareholders are realized immediately with the expense limitation arrangements with the Adviser. The Trustees noted that the Crow Point Funds’ assets were at such levels that the expense limitation arrangements were providing benefits to the Crow Point Funds’ shareholders currently. The Trustees also noted that the Crow Point Funds would benefit from economies of scale under its agreements with some of its service providers other than the Adviser as fees that were in place with those other service providers were either fixed or essentially semi-fixed, and the Board considered the Adviser’s efforts to work with M3Sixty to secure such arrangements for the Crow Point Funds. Following further discussion of the Crow Point Funds’ asset levels, expectations for growth and levels of fees, the Board determined that the Crow Point Funds’ fee arrangements, in light of all the facts and circumstances, were fair and reasonable and that the expense limitation arrangement provided savings and protection for the benefit of the Crow Point Funds’ investors.
| (5) | Possible conflicts of interest and benefits derived by the Adviser. |
In considering the Adviser’s practices regarding conflicts of interest, the Trustees evaluated the potential for conflicts of interest and considered such matters as: the experience and ability of the advisory and compliance personnel assigned to the Crow Point Funds; the soft dollar procedures adopted by the Adviser that govern its use of soft dollars; the basis of decisions to buy or sell securities for the Crow Point Funds; and the substance and administration of the Adviser’s code of ethics.
One point of consideration was the purchase by certain Crow Point Funds of other funds advised by the Adviser in order to gain investment exposure that such other funds offer. The Trustees noted that, in such instances, the policy of the Crow Point Funds is to waive any duplicative advisory fees. The Board also considered the Adviser’s efforts to continually review and improve its compliance infrastructure in response to new regulations and changing market conditions and practices. Based on the foregoing, the Board determined that the Adviser’s standards and practices relating to the identification and mitigation of possible conflicts of interest were satisfactory. It was noted that the Adviser does not manage any other accounts in similar strategies.
After additional consideration of the factors delineated in the memorandum provided by Counsel and further discussion among the Board, the Board determined that the compensation payable under the Advisory Agreements with respect to each of the Crow Point Funds was fair, reasonable and within a range of what could have been negotiated at arms-length in light of all the surrounding circumstances, and they resolved to approve the Advisory Agreements with respect to each of the Crow Point Funds.
Approval of the Investment Sub-Advisory Agreement for the Crow Point Alternative Income Fund (Unaudited)
At a meeting held on April 25, 2019, the Board considered the approval of the Sub-Advisory Agreement (the “Sub-Advisory Agreement”) between Crow Point and Winthrop Capital Management, LLC (“Winthrop”) in regard to the Alternative Income Fund.
The Board reflected on its discussions with the representatives from Crow Point and Winthrop regarding the proposed Sub-Advisory Agreement between Crow Point and Winthrop and the manner in which the Alternative Income Fund is to be managed. Counsel referred the Board to a memorandum from Counsel addressing the duties of the Trustees regarding the approval of the proposed Sub-Advisory Agreement, Winthrop’s responses to a letter requesting information, a copy of Winthrop’s financial information and the proposed Sub-Advisory Agreement. Counsel reviewed with the Board the memorandum from Counsel and the proposed Sub-Advisory Agreement. Counsel outlined the various factors the Board should consider in deciding whether to approve the Sub-Advisory Agreement, including: (i) the nature, extent and quality of the services to be provided by Winthrop; (ii) the investment performance of the Alternative Income Fund and Winthrop; (iii) the costs of the services to be provided and profits to be realized by Winthrop from the relationship with the Alternative Income Fund; (iv) the extent to which economies of scale would be realized if the Alternative Income Fund grows and whether advisory fee levels reflect those economies of scale for the benefit of the Alternative Income Fund’s shareholders; and (v) Winthrop’s practices regarding possible conflicts of interest and other benefits derived by Winthrop.
| Crow Point Funds | ANNUAL REPORT |
Approval of the Investment Sub-Advisory Agreement for the Crow Point Alternative Income Fund (Unaudited) (continued)
In assessing these factors and reaching its decisions, the Board took into consideration information specifically prepared and/or presented in connection with the approval process with respect to the Alternative Income Fund, including information presented to the Board by representatives from Crow Point and Winthrop. The Board requested and/or was provided with information and reports relevant to the approval of the Sub-Advisory Agreement, including: (i) reports regarding the services and support to be provided to the Alternative Income Fund and its shareholders; (ii) presentations by management of Winthrop addressing the investment philosophy, investment strategy, personnel and operations to be utilized in managing the Alternative Income Fund; (iii) disclosure information contained in the registration statement of the Trust on behalf of the Alternative Income Fund and the Form ADV and/or policies and procedures of Winthrop; and (iv) the memorandum from Counsel that summarized the fiduciary duties and responsibilities of the Board in reviewing and approving the Sub-Advisory Agreement, including the material factors set forth above and the types of information included in each factor that should be considered by the Board in order to make an informed decision.
The Board did not identify any particular information that was most relevant to its consideration to approve the Sub-Advisory Agreement and each Trustee may have afforded different weight to the various factors. In deciding whether to approve the Sub-Advisory Agreement, the Trustees considered numerous factors, including:
| (1) | The nature, extent and quality of the services to be provided by Winthrop. |
In this regard, the Board considered the responsibilities Winthrop would have under the Sub-Advisory Agreement. The Board reviewed the services to be provided by Winthrop to the Alternative Income Fund, including, without limitation, Winthrop’s procedures for formulating investment recommendations and assuring compliance with the Alternative Income Fund’s investment objectives and limitations and its anticipated efforts to promote the Alternative Income Fund, grow its assets and assist in the distribution of the Alternative Income Fund’s shares. The Board also considered: Winthrop’s staffing, personnel and methods of operating; the education and experience of Winthrop’s personnel; and Winthrop’s compliance program, policies and procedures. After reviewing the foregoing and further information from Winthrop, the Board concluded that the nature, extent and quality of the services to be provided by Winthrop were satisfactory and adequate for the Alternative Income Fund.
| (2) | Investment Performance of the Alternative Income Fund. |
The Board noted that Winthrop had not commenced managing the Alternative Income Fund and therefore a consideration of the Alternative Income Fund’s performance was not relevant to this factor. The Board considered the historical efforts of Winthrop personnel to manage similar strategies to the Alternative Income Fund. Based on these considerations, the Board determined that the information presented regarding the performance of Winthrop in managing similar accounts was satisfactory.
| (3) | The costs of services to be provided and profits to be realized by Winthrop from the relationship with the Alternative Income Fund. |
In considering the costs of the services to be provided and profits to be realized by Winthrop from the relationship with the Alternative Income Fund, the Trustees considered: Winthrop’s staffing, personnel and methods of operating; the financial condition of Winthrop and the level of commitment to the Alternative Income Fund by Winthrop and its principals; the current asset levels of the Alternative Income Fund; and the projected overall expenses of the Alternative Income Fund. The Trustees considered financial statements of Winthrop and discussed the financial stability and profitability of the firm. The Trustees noted that Winthrop is currently profitable. The Trustees considered the portion of the management fee that would be received by Winthrop. The Trustees noted that the advisory fees to be paid to Winthrop with respect to its services to be provided to the Alternative Income Fund were generally less than those charged to Winthrop’s separate account clients. The Trustees determined that in light of the services to be provided by Winthrop to the Alternative Income Fund, the management fee was fair and reasonable and could have been negotiated at arms-length in light of all of the surrounding circumstances.
| Crow Point Funds | ANNUAL REPORT |
Approval of the Investment Sub-Advisory Agreement for the Crow Point Alternative Income Fund (Unaudited) (continued)
| (4) | The extent to which economies of scale would be realized as the Alternative Income Fund grows and whether advisory fee levels reflect these economies of scale for the benefit of the Alternative Income Fund’s investors. |
In this regard, the Board considered the Alternative Income Fund’s fee arrangements with respect to Winthrop. The Trustees noted that although the management fee would stay the same as asset levels increased, the sub-advisory fee to be paid to Winthrop by Crow Point would have a breakpoint as assets increased. The Trustees noted that currently, the Alternative Income Fund’s assets were relatively low and that shareholders of the Alternative Income Fund were experiencing the benefit of the expense limitation arrangements in place for the Alternative Income Fund for which Winthrop has agreed to share responsibility with Crow Point. The Trustees expressed the view that benefits associated with the expense limitation arrangements were of significant value to shareholders while assets were at lower levels, in that each dollar invested benefits from this commitment to contain costs, whereas breakpoint structures typically require a fund to reach significant asset levels in order to realize lower costs. Following further discussion of the Alternative Income Fund’s expected asset levels, expectations for growth and levels of fees, the Board determined that Crow Point’s fee arrangement with Winthrop was fair and reasonable in relation to the nature and quality of the services to be provided by Winthrop.
| (5) | Possible conflicts of interest and other benefits. |
In considering Winthrop’s practices regarding conflicts of interest, the Trustees evaluated the potential for conflicts of interest and considered such matters as: the experience and ability of the advisory and compliance personnel assigned to the Alternative Income Fund; the fact that Winthrop does not use soft dollars; the basis of decisions to buy or sell securities for the Alternative Income Fund and/or Winthrop’s other accounts; and the substance and administration of Winthrop’s code of ethics. Based on the foregoing, the Board determined that Winthrop’s standards and practices relating to the identification and mitigation of possible conflicts of interest were satisfactory.
After additional consideration of the factors delineated in the memorandum provided by Counsel and further discussion among the Board, the Board determined that the compensation payable under the Sub-Advisory Agreement with respect to the Alternative Income Fund was fair, reasonable and within a range of what could have been negotiated at arms-length in light of all the surrounding circumstances, and they resolved to approve the Sub-Advisory Agreements with respect to the Alternative Income Fund.
360 FUNDS
4300 Shawnee Mission Pkwy
Suite 100
Fairway, KS 66205
INVESTMENT ADVISER
Crow Point Partners, LLC
280 Summer Street
Suite M1
Boston, MA 02210
ADMINISTRATOR & TRANSFER AGENT
M3Sixty Administration, LLC
4300 Shawnee Mission Pkwy
Suite 100
Fairway, KS 66205
DISTRIBUTOR
Matrix 360 Distributors, LLC
4300 Shawnee Mission Pkwy
Suite 100
Fairway, KS 66205
INDEPENDENT REGISTERED PUBLIC ACCOUNTING FIRM
BBD, LLP
1835 Market Street
3rd Floor
Philadelphia, PA 19103
LEGAL COUNSEL
Practus, LLP
11300 Tomahawk Creek Parkway
Suite 310
Leawood, KS 66211
CUSTODIAN BANK
Fifth Third Bank
Fifth Third Center
38 Fountain Square Plaza
Cincinnati, OH 45263
ITEM 2.
CODE OF ETHICS.
(a) | The registrant has, as of the end of the period covered by this report, adopted a code of ethics that applies to the registrant’s principal executive officer, principal financial officer, and principal accounting officer or controller, or persons performing similar functions, regardless of whether these individuals are employed by the registrant or a third party. |
(b) | During the period covered by this report, there were no amendments to any provision of the code of ethics. |
(c) | During the period covered by this report, there were no waivers or implicit waivers of a provision of the code of ethics. |
(d) | The registrant’s Code of Ethics is filed herewith. |
ITEM 3.
AUDIT COMMITTEE FINANCIAL EXPERT.
| The registrant’s Board of Trustees has determined that Tom Wirtshafter serves on its audit committee as the “audit committee financial expert” as defined in Item 3. |
ITEM 4.
PRINCIPAL ACCOUNTANT FEES AND SERVICES.
(a) | Audit Fees. The aggregate fees billed for each of the fiscal year ended September 30, 2019, the period ended September 30, 2018 and the fiscal year ended April 30, 2018 for professional services rendered by the principal accountants for the audit of the EAS Fund’s annual financial statements or for services that are normally provided by the accountant in connection with statutory and regulatory filings or engagements were and $12,700 with respect to the registrant’s fiscal year ended September 30, 2019, $8,900 with respect to the period ended September 30, 2018 and $12,700 with respect to the registrant’s fiscal year ended April 30, 2018. |
| The aggregate fees billed for the each of the fiscal year ended September 30, 2019, the period ended September 30, 2018 and the fiscal year ended May 31, 2018 for professional services rendered by the principal accountants for the audit of the Global Fund’s annual financial statements or for services that are normally provided by the accountant in connection with statutory and regulatory filings or engagements were $12,700 with respect to the registrant’s fiscal year ended September 30, 2019, $8,900 with respect to the period ended September 30, 2018 and $12,700 with respect to the registrant’s fiscal year ended May 31, 2018. The aggregate fees billed for each of the last two fiscal years ended September 30, 2019 and September 30, 2018 for professional services rendered by the principal accountants for the audit of the Income Fund’s annual financial statements or for services that are normally provided by the accountant in connection with statutory and regulatory filings or engagements were $12,700 with respect to the fiscal year ended September 30, 2019 and $12,700 with respect to the registrant’s fiscal year ended September 30, 2018. |
(b) | Audit-Related Fees. There were no fees billed during the last two fiscal years/periods for assurances and related services by the principal accountants that are reasonably related to the performance of the audit of the registrant’s financial statements and are not reported under paragraph (a) of this item. |
(c) | Tax Fees. The aggregate fees billed for each of the fiscal year ended September 30, 2019, period ended September 30, 2018 and the fiscal year ended April 30, 2018 for professional services rendered by the principal accountant to the EAS Fund for tax compliance, tax advice and tax planning were $3,000 with respect to the fiscal year ended September 30, 2019, $3,000 with respect to the period ended September 30, 2018 and $3,000 with respect to the fiscal year ended April 30, 2018. The services comprising these fees are the preparation of the registrant’s federal and state income tax returns, review of calculations of required excise distributions and preparation of federal excise tax returns. The aggregate fees billed for each of the fiscal year ended September 30, 2019, period ended September 30, 2018 and the fiscal year ended May 31, 2018 for professional services rendered by the principal accountant to the Global Fund for tax compliance, tax advice and tax planning were $3,000 with respect to the fiscal year ended September 30, 2019, $3,000 with respect to the period ended September 30, 2018 and $3,000 with respect to the fiscal year ended May 31, 2019. The services comprising these fees are the preparation of the registrant’s federal and state income tax returns, review of calculations of required excise distributions and preparation of federal excise tax returns. The aggregate fees billed for each of the last two fiscal years ended September 30, 2018 and September 30, 2019 for professional services rendered by the principal accountant to the Income Fund for tax compliance, tax advice and tax planning were $3,000 with respect to the period ended September 30, 2019 and $3,000 with respect to the fiscal year ended September 30, 2018. The services comprising these fees are the preparation of the registrant’s federal and state income tax returns, review of calculations of required excise distributions and preparation of federal excise tax returns. |
(d) | All Other Fees. The aggregate fees billed in the fiscal year ended September 30, 2019, period ended September 30, 2018 and the fiscal year ended April 30, 2018 for the EAS Fund; in the fiscal year ended September 30, 2019, period ended September 30, 2018 and the fiscal year ended May 31, 2018 for the Global Fund; and for the last two fiscal years ended September 30, 2019 and September 30, 2018 for the Income Fund for products and services provided by the registrant’s principal accountant, other than the services reported in paragraphs (a) through (c) of this item were $0 for all periods and fiscal years mentioned above. |
(e)(1) | The audit committee does not have pre-approval policies and procedures. Instead, the audit committee or audit committee chairman approves on a case-by-case basis each audit or non-audit service before the principal accountant is engaged by the registrant. |
(e)(2) | There were no services described in each of paragraphs (b) through (d) of this Item that were approved by the audit committee pursuant to paragraph (c)(7)(i)(C) of Rule 2-01 of Regulation S-X |
f) | Not applicable. The percentage of hours expended on the principal accountant’s engagement to audit the registrant’s financial statements for the most recent fiscal year that were attributed to work performed by persons other than the principal accountant’s full-time, permanent employees was zero percent (0%). |
(g) | All non-audit fees billed by the registrant’s principal accountant for services rendered to the registrant for the fiscal year ended September 30, 2019, period ended September 30, 2018 and the fiscal year ended April 30, 2018 for the EAS Fund; in the fiscal year ended September 30, 2019, period ended September 30, 2018 and the fiscal year ended May 31, 2018 for the Global Fund; and for the last two fiscal years ended September 30, 2019 and September 30, 2018 are disclosed in (b)-(d) above. There were no audit or non-audit services performed by the registrant’s principal accountant for the registrant’s adviser during the periods and fiscal years mentioned above. |
(h) | There were no non-audit services rendered to the registrant’s investment adviser. |
ITEM 5.
AUDIT COMMITTEE OF LISTED REGISTRANTS.
Not applicable
ITEM 6.
SCHEDULES OF INVESTMENTS
Included in annual report to shareholders filed under item 1 of this Form.
ITEM 7.
DISCLOSURE OF PROXY VOTING POLICIES AND PROCEDURES FOR CLOSED-END MANAGEMENT INVESTMENT COMPANIES.
Not applicable as the Funds are open-end management investment companies.
ITEM 8.
PORTFOLIO MANAGERS OF CLOSED-END MANAGEMENT INVESTMENT COMPANIES
Not applicable as the Funds are open-end management investment companies.
ITEM 9.
PURCHASES OF EQUITY SECURITIES BY CLOSED-END MANAGEMENT INVESTMENT COMPANY AND AFFILIATED PURCHASERS.
Not applicable as the Funds are open-end management investment companies.
ITEM 10.
SUBMISSION OF MATTERS TO A VOTE OF SECURITY HOLDERS.
Not applicable at this time.
ITEM 11.
CONTROLS AND PROCEDURES.
| (a) | The registrant’s principal executive and principal financial officers, or persons performing similar functions, have concluded that the registrant’s disclosure controls and procedures (as defined in Rule 30a-3(c) under the 1940 Act, are effective, as of a date within 90 days of the filing date of this report, based on the evaluation of these controls and procedures required by Rule 30a-3(b) under the 1940 Act and Rule 15d-15(b) under the Securities Exchange Act of 1934, as amended. |
| (b) | There were no changes in the registrant’s internal control over financial reporting (as defined in Rule 30a-3(d) under the 1940 Act) that occurred during the period covered by this report that have materially affected, or are reasonably likely to materially affect, the registrant’s internal control over financial reporting. |
ITEM 12.
DISCLOSURE OF SECURITIES LENDING ACTIVITIES FOR CLOSED-END MANAGEMENT INVESTMENT COMPANIES.
Not applicable as the Funds are open-end management investment companies.
ITEM 13.
EXHIBITS
SIGNATURES
Pursuant to the requirements of the Securities Exchange Act of 1934 and the Investment Company Act of 1940, the registrant has duly caused this report to be signed on its behalf by the undersigned, thereunto duly authorized.
360 Funds
/s/ Randy Linscott | |
By Randy Linscott | |
Principal Executive Officer, |
Date: January 28, 2020 | |
Pursuant to the requirements of the Securities Exchange Act of 1934 and the Investment Company Act of 1940, this report has been signed below by the following person on behalf of the registrant and in the capacities and on the date indicated.
/s/ Larry E. Beaver, Jr. | |
By Larry E. Beaver, Jr. | |
Assistant Treasurer and Acting Principal Financial Officer |
Date: January 28, 2020 | |