UNITED STATES
SECURITIES AND EXCHANGE COMMISSION
Washington, D.C. 20549
FORM N-CSR
CERTIFIED SHAREHOLDER REPORT OF REGISTERED MANAGEMENT INVESTMENT COMPANIES
Investment Company Act File Number811-21726
360 Funds
(Exact name of registrant as specified in charter)
| 4300 Shawnee Mission Parkway, Suite 100 Fairway, KS | 66205 |
| (Address of principal executive offices) | (Zip code) |
The Corporation Trust Company
Corporation Trust Center
1209 Orange St.
Wilmington, DE 19801
(Name and address of agent for service)
With Copies To:
John H. Lively
Practus, LLP
11300 Tomahawk Creek Parkway, Suite 310
Leawood, KS 66211
Registrant's telephone number, including area code:877-244-6235
Date of fiscal year end:11/30/2019
Date of reporting period:11/30/2019
| ITEM 1. | REPORTS TO SHAREHOLDERS |
The Annual report to Shareholders of the FinTrust Income and Opportunity Fund, formerly, the HedgeRow Income and Opportunity Fund, a series of the 360 Funds (the “registrant”), for the year ended November 30, 2019 pursuant to Rule 30e-1 under the Investment Company Act of 1940 (the “1940 Act”), as amended (17 CFR 270.30e-1) is filed herewith.

FinTrust Income and Opportunity Fund
Class A Shares (Ticker Symbol: HROAX) Institutional Class Shares (Ticker Symbol: HIOIX)
A Series of the 360 Funds
|
ANNUAL REPORT
November 30, 2019
Investment Adviser:
FinTrust Capital Advisors, LLC
124 Verdae Boulevard, Suite 504
Greenville, SC 29607
IMPORTANT NOTE: Beginning on January 1, 2021, as permitted by regulations adopted by the SEC, paper copies of the FinTrust Funds’ shareholder reports will no longer be sent by mail unless you specifically request paper copies of the reports from a FinTrust Fund or from your financial intermediary, such as a broker-dealer or bank. Instead, the reports will be made available on a website, and you will be notified by mail each time a report is posted and provided with a website link to access the report. If you already elected to receive shareholder reports electronically, you will not be affected by this change and you need not take any action. You may elect to receive all future reports in paper free of charge. You can inform a FinTrust Fund or your financial intermediary that you wish to continue receiving paper copies of your shareholder reports by calling or sending an e-mail request. Your election to receive reports in paper will apply to all funds held with the FinTrust Fund complex/your financial intermediary.
TABLE OF CONTENTS
| FinTrust Income and Opportunity Fund | ANNUAL REPORT |
LETTER TO SHAREHOLDERS (Unaudited)
November 30, 2019
Dear Shareholders,
Performance
In the twelve months ended November 30, 2019, the Institutional Class of our FinTrust Income and Opportunity Fund (the “Fund”) gained 5.57%, while the Class A shares before sales charges gained 5.32%(a), the S&P 500® Total Return Index(b)(“S&P 500”) gained 16.11% and the Morningstar Long-Short Equity Category(c) gained 5.37%.
The Economic Climate
Fiscal Policy – All Responsible Adults Have Left Washington, D.C.
While the reduction in corporate tax rates from 34% to 20% has increased the cashflow available to investors, the tax stimulus has blown a historically large hole in the federal budget. The Federal Reserve’s willingness, however, to monetize debt at historically low interest rates has eliminated the need for any fiscal responsibility from our politicians. While deficit spending does increase GDP and the economic boom, we do find ourselves worrying at times about the long-term consequences of the debt.
Monetary Policy - All Responsible Adults Have Also Left the Marriner Eccles Building
In last year’s letter, we wrote the following:
“In our opinion, investors may have been etherized and learned bad investing habits following 10 years of federal government stimulus.” Well, what’s a kid to do when they just keep spiking the punch bowl.
In 2018, as the Federal Reserve raised interest rates to a miniscule 2.5% (an interest rate level last pegged during World War II), money began to leave the equity markets. In the fourth quarter of 2018, the S&P 500 declined 13.52% while our Fund declined 7.05% by comparison, as we took defensive measures. Unfortunately, 2018’s fourth quarter’s equity market decline caused the Federal Reserve to panic. The Fed quickly ended its “neutral policy”, and once again returned to spiking the punch bowl by cutting interest rates three times in 2019. The 30% cut in short-term interest rates from 2.25% to 1.5% has led the S&P 500 to a 31.49% rebound in 2019, despite earnings being flat for the year.
Valuations – A Bifurcated Marketplace
There is no question that today’s high equity valuations are due in large part to historically low interest rates. In fact, according to Bloomberg, there were recently over $15 trillion of negative yielding bonds globally. As a result, the investment environment continues to be one characterized by equity valuations which are in the very upper percentiles of historical averages. In November 2018, when the S&P 500 Index was trading at lower price levels, Goldman Sachs looked at the United States equity markets on nine valuation metrics. Goldman found the market averages to be in the 83rd percentile of valuations, while the median stock appeared to be in the 95% percentile of valuations. The only valuation measured by which stocks looked undervalued in the Goldman Sachs study was stock valuations compared to bond yields. Goldman Sachs found that stocks were in the 32nd percentile of valuations when compared to bonds yields.
While stock returns where highly positive in 2019, valuation measures deteriorated due to the run up in prices. Fidelity recently estimated that the stocks are now in the 60th percentile of valuations when compared to bonds. In addition, our annual Ben Graham (Warren Buffet’s mentor) analysis of the 30 Dow Jones Industrial Average stocks continues to suggest stocks offer slightly worse than average valuations and returns versus history. Stock return estimates, however, continue to look favorable relative to the returns available from cash and fixed income.
A Balanced Approach Toward Investing in A Yield Starved World
As a result of today’s valuation extremes, we are currently taking a balanced approach toward the risk return trade-off.In times past, investors might seek to balance the need for income and return against risks by investing in a balanced portfolio of blue-chip, dividend paying stocks and investment grade bonds which paid reasonable amounts of interest. Today, such a portfolio would produce a combined yield of less than 2%, as modern markets have three distinguishing characteristics:
| 1) | Regular, technology driven disruption. Even Blue-Chip companies are being challenged by regular, technology driven disruption of business models. It wasn’t that long ago that Eastman Kodak, a Dow Jones Industrial Average stock fell into bankruptcy after its business was disrupted by the camera phone. |
| 2) | Lack of Dividends. Blue-chip companies are increasingly choosing to re-invest or hoard cash, or at best return it in the form of modest dividends and uncertain buyback activities. Of the 10 largest companies in the S&P 500 as of September 30, five do not pay a dividend, and only two have dividend yields higher than short-term interest rates. |
1
| FinTrust Income and Opportunity Fund | ANNUAL REPORT |
LETTER TO SHAREHOLDERS (Unaudited) (continued)
November 30, 2019
| 3) | Historically low interest rates. As of the end of November 2019, investment grade bond investors find that the benchmark 10-year Treasury bond yields 1.77%. |
Identifying and investing in a diversified portfolio of great businesses at reasonable prices is still a sound, long-term investment philosophy, but we believe it does require some modernization of investment processes and techniques for balanced investors and those that need income from their portfolios.
Investment Philosophy
We believe that intellectual property is the key driver of business value in the modern economy. In order to identify high quality businesses and avoid technology driven disruption, it is critical that the modern analyst understand, measure, and value the intangible assets of a company relative to its competitors. The valuation of intangibles requires an analysis of patents, trademarks, copyrights, and brands. Companies that look expensive on traditional metrics, might in fact be cheap, when one considers the strategic value of intangibles. Conversely, other companies might appear cheap relative to history when they are, in fact, expensive due to their economic positioning.
We also believe in building a diversified portfolio across economic sectors. This is a plausible method of diversification because intellectual property is not just a technology industry story. Patents and intellectual property are playing an increasing role throughout the economy.
Third, we recognize that regular cashflow may help to buffer stormy markets or provide income to investors. We believe, however, that utilizing the listed options markets is a better way to create cashflow streams and control risk than relying solely on dividend paying stocks and low yielding bonds.
Outlook & Approach
In our view, markets can only do three things:
| 1) | they may go up in value, |
| 2) | they may go down in value, or |
| 3) | they may trade back and forth in a limited trading range. |
At any given moment, various factors may make one market environment more likely than the others, but we do not believe we have any particularly special talent for making that call. As a result, we believe in taking a methodical approach to portfolio construction, risk management, and security selection. Our goal is to create a portfolio that balances the risk return trade-off in an acceptable way for all three market environments.
First, we seek to participate in strongly trending up markets like the one we experienced in 2019. We, however, are also mindful about the need to prudently manage risk. We believe 2018’s fourth quarter decline was a good test of our risk management strategies, as the Fund lost 7.05% while the market lost 13.52% during that period. Finally, we believe the Fund’s option strategies are capable of producing results in a trading range market, but we are yet to experience this type of market.
We believe that if we properly structure the portfolio and manage risk, investments in companies with great intellectual property and good management teams will reward us over time.
Asset Allocation
As of November 30, 2019, the portfolio consisted of 63.27% of net assets invested in common stocks (longs), (0.59)% of net assets in common stocks (short), 25.42% of net assets invested in 2-year United States Treasury Notes and money market funds, 0.03% of net assets invested in purchased put option contracts, and 3.65% of the Fund was invested in purchased call options on equity securities. The Fund collected premiums of $149,295 (1.44% in net assets) from written option contracts open at November 30, 2019, as part of our strategy to enhance the long-term cash flow generation of the portfolio, while buffering market volatility through the writing of call and put options. This collected premium should provide income beyond the dividends and capital gains generated by the stock positions owned by the Fund. As the option contracts expire and the cash is realized over the next year, these funds will be sources for incremental distributions for investors. This strategy also helps to buffer the downside market exposure of the Fund over time.
2
| FinTrust Income and Opportunity Fund | ANNUAL REPORT |
LETTER TO SHAREHOLDERS (Unaudited) (continued)
November 30, 2019
Sector Weightings
The portfolio weightings by sector, excluding purchased and written options are outlined below:
| Sector Diversification | % of Market Value |
| Communication Services | 16.09% |
| Consumer Discretionary | 13.05% |
| Healthcare | 10.80% |
| Information Technology | 10.40% |
| Financial Services | 5.61% |
| Industrials | 4.89% |
| Basic Materials | 3.74% |
| Energy | 1.90% |
| Consumer Defensive | 0.91% |
Conclusion
Thank you for investing and joining us as fellow shareholders in the FinTrust Income and Opportunity Fund. We continue to work hard to justify your confidence and trust in our stewardship of your hard-earned savings. We also remain dedicated to providing you with the information we would like to have if our roles were reversed. This is so you will be able to make an informed decision about whether this Fund remains an appropriate investment for you and your family.
Shape the future,
Allen R. Gillespie, CFA
Managing Partner of Investments
(a)The performance information shown for the Fund’s Class A shares does not reflect any front-end sales load. Please see the Total Return Table on the following pages for performance information on the Fund’s Class A shares (with sales load). The performance quoted assumes the reinvestment of all dividend and capital gain distributions, if any, and represents past performance, which is not a guarantee of future results. The returns shown do not reflect taxes that a shareholder would pay on Fund distributions or on the redemption of Fund shares. The investment return and principal value of an investment will fluctuate and, therefore, an investor’s shares, when redeemed, may be worth more or less than their original cost. Updated performance data current to the most recent month-end can be obtained by calling 1-877-244-6235. Investors should consider the investment objectives, risks, charges and expenses carefully before investing or sending money. This and other important information about the Fund can be found in the Fund’s prospectus. Please read it carefully before investing.
(b)The S&P 500® Total Return Index is a broad unmanaged index of 500 stocks, which is widely recognized as representative of the equity market in general. Please note that indices do not take into account any fees and expenses of investing in the individual securities that they track and individuals cannot invest directly in any index.
(c)TheMorningstar Category Average is the average return for the peer group based on the returns of each individual fund within the group, for the period shown. This average assumes reinvestment of dividends.TheMorningstar Long-Short Equity Categoryrepresent funds that hold sizeable stakes in both long and short positions in equities and related derivatives. Some funds that fall into this category will shift their exposure to long and short positions depending on their macro outlook or the opportunities they uncover through bottom-up research. Some funds may simply hedge long stock positions through exchange traded funds or derivatives. At least 75% of the assets are in equity securities or derivatives. The information contained herein is proprietary to Morningstar and/or its content providers; may not be copied or distributed; and is not warranted to be accurate, complete or timely. Neither Morningstar not its content providers are responsible for any damages or losses arising from any use of this information.
3
| FinTrust Income and Opportunity Fund | ANNUAL REPORT |
INVESTMENT HIGHLIGHTS (Unaudited)
November 30, 2019
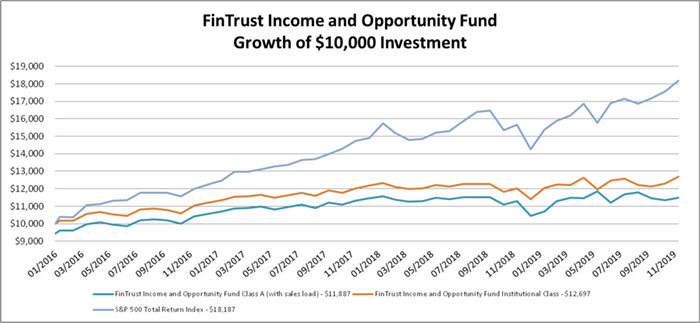
Returns as of November 30, 2019 | One Year ended | Since Inception from November 30, 2019 | ||
| FinTrust Income and Opportunity Fund Class A shares without sales charge | 5.32% | 6.12% | ||
| FinTrust Income and Opportunity Fund Class A shares with sales charge | (0.47)% | 4.58% | ||
| FinTrust Income and Opportunity Fund Institutional Class shares | 5.57% | 6.38% | ||
| S&P 500 Total Return Index | 16.11% | 16.76% |
The performance information quoted in this annual report assumes the reinvestment of all dividend and capital gain distributions, if any, and represents past performance, which is not a guarantee of future results. The returns shown do not reflect taxes that a shareholder would pay on Fund distributions or on the redemption of Fund shares. The investment return and principal value of an investment will fluctuate and, therefore, an investor’s shares, when redeemed, may be worth more or less than their original cost. Updated performance data current to the most recent month-end can be obtained by calling 1-877-244-6235.
The above graph depicts the performance of the FinTrust Income and Opportunity Fund versus the S&P 500 Total Return Index. The S&P 500 Total Return Index is a broad unmanaged index of 500 stocks, which is widely recognized as representative of the equity market in general. Please note that indices do not take into account any fees and expenses of investing in the individual securities that they track and individuals cannot invest directly in any index.
As with any fund, save an index fund, that commonly compares its performance to the S&P 500 Total Return Index, such a comparison may be said to be inappropriate because of the dissimilarity between the Fund’s investments and the securities comprising the index; so too with the FinTrust Income and Opportunity Fund, which will generally not invest in all the securities comprising the index.
4
| FinTrust Income and Opportunity Fund | ANNUAL REPORT |
INVESTMENT HIGHLIGHTS (Unaudited)
November 30, 2019
The investment objective of the FinTrust Income and Opportunity Fund (the “Fund”) is total return comprised of income and capital appreciation. To meet its investment objective, the Fund will invest primarily in domestic equity securities that in the opinion of FinTrust Capital Advisors, LLC (the “Adviser”) have above average intellectual property portfolios and other characteristics, like strong earnings and dividend growth that are members of the S&P 1500 Composite, relative to their sector competitors.
The Fund will typically invest in issuers that have established markets and operations and generate excess cash flow. The Fund looks for stocks with attributes which suggest they will thrive in good markets and survive potential economic setbacks. The Fund employs detailed quantitative assessments to construct its equity portfolio. Portfolio parameters include, but are not limited to, a quantitative valuation of the strength of the company’s intellectual property portfolio, steady growing earnings, dividend yield with a tendency to raise such yield and availability at reasonable price-earnings ratios. The Fund seeks to invest in stocks that are undervalued by the market, but with strong business models, which may provide for lower levels of market volatility or non-correlated volatility, The Fund also prefers to invest in equity stocks that have options traded on them.
The Fund may also invest in companies that are experiencing a “special situation” that makes them undervalued relative to their long-term potential. Developments creating special situations may include new intellectual property developments, intellectual property licensing deals, mergers, spin-offs, litigation resolutions, new products or management changes. The Fund may also invest in convertible securities. The Fund also seeks to generate income for shareholders by selling options against the risk taken by owning common stocks. For example, the Fund intends to sell covered call options on a portion of its stock holdings. This income is designed to, over time, add to portfolio stability and improve returns. The Fund uses an options strategy to limit market exposure and volatility. The extent of option selling will depend upon market conditions and the Adviser’s judgment of the advantages of selling call options on the Fund’s equity investments. Additionally, the Fund will enter into call spreads. A spread is an options position established by purchasing one option and selling another option of the same class, but of a different series.
The Fund may be appropriate for investors with long-term time horizons who are not sensitive to short-term losses and want to participate in the long-term growth of the financial markets. The Fund seeks to avoid or minimize the effects of inflation on the portfolio.
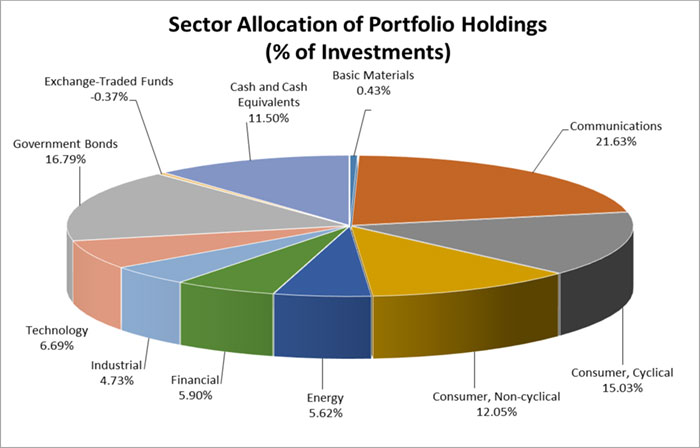
The percentages in the above graph are based on the portfolio holdings of the Fund as of November 30, 2019 and are subject to change. For a detailed break-out of holdings by industry and investment type, please refer to the Schedule of Investments and Schedule of Written Options.
5
| FINTRUST INCOME AND OPPORTUNITY FUND | |
| SCHEDULE OF INVESTMENTS | |
| November 30, 2019 | ANNUAL REPORT |
| COMMON STOCK - 63.27% | Shares | Value | ||||||
| Airlines - 3.86% | ||||||||
| Delta Air Lines, Inc. | 7,000 | $ | 401,170 | |||||
| Building Materials - 3.55% | ||||||||
| Eagle Materials, Inc.(d) | 4,000 | 368,120 | ||||||
| Commercial Services - 0.87% | ||||||||
| HMS Holdings Corp. (a) (e) | 3,000 | 90,600 | ||||||
| Computers - 1.77% | ||||||||
| Lumentum Holdings, Inc.(a) | 2,500 | 184,150 | ||||||
| Energy - Alternate Sources - 3.30% | ||||||||
| First Solar, Inc.(a) | 6,200 | 342,488 | ||||||
| Healthcare - Products - 1.03% | ||||||||
| Inspire Medical Systems, Inc.(a) (d) | 1,500 | 106,440 | ||||||
| Healthcare - Services - 4.22% | ||||||||
| IQVIA Holdings, Inc.(a) (d) | 3,000 | 437,940 | ||||||
| Home Builders - 1.60% | ||||||||
| DR Horton, Inc.(d) | 3,000 | 166,050 | ||||||
| Insurance - 3.75% | ||||||||
| Athene Holding Ltd.(a) | 3,000 | 135,060 | ||||||
| First American Financial Corp.(e) | 4,000 | 254,480 | ||||||
| 389,540 | ||||||||
| Internet - 17.36% | ||||||||
| Alibaba Group Holding Ltd.(a) (d) | 2,000 | 400,000 | ||||||
| Alphabet, Inc. - Class C(a) | 300 | 391,488 | ||||||
| eBay, Inc.(e) | 9,250 | 328,560 | ||||||
| Facebook, Inc. - Class A(a) (d) | 3,000 | 604,920 | ||||||
| Twitter, Inc.(a) (d) | 2,500 | 77,275 | ||||||
| 1,802,243 | ||||||||
| Leisure Time - 1.84% | ||||||||
| YETI Holdings, Inc.(a) (d) | 6,000 | 190,920 | ||||||
| Oil & Gas - 1.80% | ||||||||
| BP PLC - ADR | 5,000 | 187,100 | ||||||
| Pharmaceuticals - 4.12% | ||||||||
| Coherus Biosciences, Inc.(a) | 10,000 | 179,900 | ||||||
| Merck & Co., Inc. | 1,700 | 148,206 | ||||||
| Tilray, Inc.(a) | 5,000 | 99,200 | ||||||
| 427,306 | ||||||||
| Private Equities - 1.57% | ||||||||
| Blackstone Group, Inc./The(d) | 3,000 | 162,660 | ||||||
| Retail - 2.77% | ||||||||
| Restaurant Brands International, Inc. | 2,000 | 131,260 | ||||||
| Walgreens Boots Alliance, Inc. | 1,500 | 89,400 | ||||||
| Yum China Holdings, Inc. | 1,500 | 66,780 | ||||||
| 287,440 | ||||||||
6
| FINTRUST INCOME AND OPPORTUNITY FUND | |
| SCHEDULE OF INVESTMENTS | |
| November 30, 2019 | ANNUAL REPORT |
| COMMON STOCK - 63.27% (continued) | Shares | Value | ||||||
| Semiconductors - 0.56% | ||||||||
| NXP Semiconductors NV | 500 | $ | 57,790 | |||||
| Software - 4.48% | ||||||||
| Activision Blizzard, Inc.(d) | 3,000 | 164,490 | ||||||
| Electronic Arts, Inc.(a) | 1,500 | 151,515 | ||||||
| Splunk, Inc.(a) | 1,000 | 149,220 | ||||||
| 465,225 | ||||||||
| Telecommunications - 2.19% | ||||||||
| Ciena Corp.(a) (d) (e) | 6,000 | 227,760 | ||||||
| Toys, Games & Hobbies - 1.86% | ||||||||
| Nintendo Co. Ltd. - ADR(e) | 4,000 | 193,560 | ||||||
| Transportation - 0.77% | ||||||||
| FedEx Corp.(d) | 500 | 80,025 | ||||||
| TOTAL COMMON STOCK (Cost $6,479,541) | 6,568,527 | |||||||
| Principal | ||||||||
| GOVERNMENT BONDS - 15.08% | ||||||||
| U.S. Treasury Note, 2.875%, due 10/31/2020(e) | $ | 1,300,000 | 1,313,711 | |||||
| U.S. Treasury Note, 2.25%, due 03/31/2021(e) | 250,000 | 251,836 | ||||||
| TOTAL GOVERNMENT BONDS (Cost $1,554,625) | 1,565,547 | |||||||
| OPTIONS PURCHASED - 3.68% | ||||||||
| Notional | Exercise | |||||||||||||||||||
| CALL OPTIONS PURCHASED - 3.65% | Contracts1 | Amount | Price | Expiration | Value | |||||||||||||||
| American Express Co. | 5 | $ | 57,500 | $ | 115.00 | 12/20/19 | $ | 2,790 | ||||||||||||
| Boyd Gaming Corp. | 100 | 200,000 | 20.00 | 3/20/20 | 96,500 | |||||||||||||||
| DuPont de Nemours, Inc. | 25 | 137,500 | 55.00 | 1/17/20 | 462 | |||||||||||||||
| Eastman Chemical Co. | 40 | 280,000 | 70.00 | 3/20/20 | 39,200 | |||||||||||||||
| Gilead Sciences, Inc. | 30 | 172,500 | 57.50 | 1/15/21 | 37,425 | |||||||||||||||
| Inspire Medical Systems, Inc. | 20 | 120,000 | 60.00 | 2/21/20 | 25,400 | |||||||||||||||
| MGM Resorts International | 100 | 250,000 | 25.00 | 3/20/20 | 72,750 | |||||||||||||||
| Norwegian Cruise Line Holdings Ltd. | 30 | 150,000 | 50.00 | 1/17/20 | 13,350 | |||||||||||||||
| Occidental Petroleum Corp. | 30 | 150,000 | 50.00 | 1/17/20 | 420 | |||||||||||||||
| Palo Alto Networks, Inc. | 20 | 420,000 | 210.00 | 1/17/20 | 39,100 | |||||||||||||||
| SPDR Gold Shares | 100 | 1,380,000 | 138.00 | 3/20/20 | 35,000 | |||||||||||||||
| Tandem Diabetes Care, Inc. | 10 | 60,000 | 60.00 | 5/15/20 | 16,000 | |||||||||||||||
| TOTAL CALL OPTIONS PURCHASED (Cost $526,184) | 378,397 | |||||||||||||||||||
7
| FINTRUST INCOME AND OPPORTUNITY FUND | |
| SCHEDULE OF INVESTMENTS | |
| November 30, 2019 | ANNUAL REPORT |
OPTIONS PURCHASED - 3.68% (continued)
| Notional | Exercise | |||||||||||||||||||
| PUT OPTIONS PURCHASED - 0.03% | Contracts1 | Amount | Price | Expiration | Value | |||||||||||||||
| Invesco QQQ Trust Series 1 | 100 | $ | 1,850,000 | $ | 185.00 | 12/31/19 | $ | 3,400 | ||||||||||||
| TOTAL PUT OPTIONS PURCHASED (Cost $63,911) | 3,400 | |||||||||||||||||||
| TOTAL OPTIONS PURCHASED (Cost $590,095) | 381,797 | |||||||||||||||||||
| Shares | ||||||||
| SHORT-TERM INVESTMENTS - 10.34% | ||||||||
| Federated Government Obligations Fund - Institutional Shares, 1.53%(b) | 1,073,347 | 1,073,347 | ||||||
| TOTAL SHORT-TERM INVESTMENTS (Cost $1,073,347) | 1,073,347 | |||||||
| TOTAL INVESTMENTS, AT VALUE (Cost $9,697,608) – 92.37% | $ | 9,589,218 | ||||||
| SECURITIES SOLD SHORT - (0.59%) | ||||||||
| Computers - (0.59%) | ||||||||
| CyberArk Software Ltd.(a) | 500 | (61,275 | ) | |||||
| TOTAL SECURITIES SOLD SHORT, AT VALUE (Proceeds $61,244) | (61,275 | ) | ||||||
| OPTIONS WRITTEN, AT VALUE (Premiums $149,295) - (1.96%)(c) | (203,500 | ) | ||||||
| OTHER ASSETS IN EXCESS OF LIABILITIES, NET - 10.18% | 1,057,288 | |||||||
| NET ASSETS - 100% | $ | 10,381,731 | ||||||
| (a) | Non-income producing security. |
| (b) | Rate shown represents the 7-day effective yield at November 30, 2019, is subject to change and resets daily. |
| (c) | Please refer to the Schedule of Options Written for details of options written. |
| (d) | Subject to call options written by the Fund. |
| (e) | All or a portion of the security is segregated as collateral for options written. |
| 1 | Each option contract is equivalent to 100 shares of the underlying common stock or exchange-traded fund. All options are non-income producing. |
ADR - American Depositary Receipt
Ltd. - Limited
NV - Naamloze Vennootschap (Dutch Public Company)
PLC - Public Limited Company
The accompanying notes are an integral part of these financial statements.
8
| FINTRUST INCOME AND OPPORTUNITY FUND | |
| SCHEDULE OF OPTIONS WRITTEN | |
| November 30, 2019 | ANNUAL REPORT |
OPTIONS WRITTEN - (1.96)%
| Notional | Exercise | |||||||||||||||||||
| CALL OPTIONS WRITTEN - (1.74)% | Contracts1 | Amount | Price | Expiration | Value | |||||||||||||||
| Activision Blizzard, Inc. | 10 | $ | 57,500 | $ | 57.50 | 2/21/2020 | $ | 2,260 | ||||||||||||
| Alibaba Group Holding Ltd. | 5 | 97,500 | 195.00 | 1/17/2020 | 5,475 | |||||||||||||||
| American Express Co. | 5 | 57,500 | 115.00 | 12/20/2019 | 2,790 | |||||||||||||||
| Blackstone Group, Inc./The | 15 | 82,500 | 55.00 | 1/17/2020 | 2,070 | |||||||||||||||
| Ciena Corp. | 20 | 80,000 | 40.00 | 1/17/2020 | 2,690 | |||||||||||||||
| CyberArk Software Ltd. | 5 | 62,500 | 125.00 | 12/20/2019 | 6,325 | |||||||||||||||
| CyberArk Software Ltd. | 5 | 60,000 | 120.00 | 12/20/2019 | 2,625 | |||||||||||||||
| DR Horton, Inc. | 10 | 57,500 | 57.50 | 1/17/2020 | 1,150 | |||||||||||||||
| Eagle Materials, Inc. | 10 | 92,500 | 92.50 | 12/20/2019 | 2,200 | |||||||||||||||
| Eagle Materials, Inc. | 10 | 95,000 | 95.00 | 12/20/2019 | 1,100 | |||||||||||||||
| Facebook, Inc. - Class A | 10 | 210,000 | 210.00 | 1/17/2020 | 3,500 | |||||||||||||||
| Facebook, Inc. - Class A | 10 | 200,000 | 200.00 | 12/20/2019 | 5,450 | |||||||||||||||
| FedEx Corp. | 5 | 80,000 | 160.00 | 1/17/2020 | 3,675 | |||||||||||||||
| Inspire Medical Systems, Inc. | 5 | 36,250 | 72.50 | 2/21/2020 | 2,525 | |||||||||||||||
| Inspire Medical Systems, Inc. | 5 | 31,250 | 62.50 | 12/20/2019 | 4,900 | |||||||||||||||
| Invesco QQQ Trust Series 1 | 90 | 1,782,000 | 198.00 | 12/20/2019 | 72,900 | |||||||||||||||
| IQVIA Holdings, Inc. | 10 | 150,000 | 150.00 | 1/17/2020 | 3,100 | |||||||||||||||
| IQVIA Holdings, Inc. | 10 | 155,000 | 155.00 | 2/21/2020 | 3,670 | |||||||||||||||
| Microsoft Corp. | 5 | 72,500 | 145.00 | 1/17/2020 | 4,225 | |||||||||||||||
| Shopify, Inc. | 10 | 315,000 | 315.00 | 1/17/2020 | 34,580 | |||||||||||||||
| Sony Corp. | 20 | 125,000 | 62.50 | 1/17/2020 | 5,680 | |||||||||||||||
| Tandem Diabetes Care, Inc. | 10 | 95,000 | 95.00 | 5/15/2020 | 3,300 | |||||||||||||||
| Twitter, Inc. | 5 | 15,000 | 30.00 | 12/20/2019 | 670 | |||||||||||||||
| YETI Holdings, Inc. | 20 | 70,000 | 35.00 | 2/21/2020 | 4,200 | |||||||||||||||
| TOTAL CALL OPTIONS WRITTEN (Premiums $126,916) | 181,060 | |||||||||||||||||||
| PUT OPTIONS WRITTEN - (0.22)% | ||||||||||||||||||||
| Activision Blizzard, Inc. | 20 | 105,000 | 52.50 | 2/21/2020 | 4,140 | |||||||||||||||
| EOG Resources, Inc. | 20 | 140,000 | 70.00 | 1/17/2020 | 5,860 | |||||||||||||||
| NXP Semiconductors NV | 10 | 110,000 | 110.00 | 1/17/2020 | 2,740 | |||||||||||||||
| Restaurant Brands International, Inc. | 20 | 140,000 | 70.00 | 12/20/2019 | 9,700 | |||||||||||||||
| TOTAL PUT OPTIONS WRITTEN (Premiums $22,379) | 22,440 | |||||||||||||||||||
| TOTAL OPTIONS WRITTEN (Premiums $149,295) | $ | 203,500 | ||||||||||||||||||
| 1 | Each option contract is equivalent to 100 shares of common stock or exchange-traded fund. All options are non-income producing. |
Ltd. - Limited
NV - Naamloze Vennootschap (Dutch Public Company)
The accompanying notes are an integral part of these financial statements.
| 9 |
| FINTRUST INCOME AND OPPORTUNITY FUND | |
| STATEMENT OF ASSETS AND LIABILITIES | |
| November 30, 2019 | ANNUAL REPORT |
| Assets: | ||||
| Total Investments, at cost | $ | 9,697,608 | ||
| Investments, at value | $ | 9,589,218 | ||
| Due from Adviser | 12,678 | |||
| Receivables: | ||||
| Interest | 5,134 | |||
| Dividends | 6,405 | |||
| Investment securities sold | 2,431,619 | |||
| Prepaid expenses | 4,335 | |||
| Total assets | 12,049,389 | |||
| Liabilities: | ||||
| Premiums from options written | $ | 149,295 | ||
| Proceeds of securities sold short | 61,244 | |||
| Options written, at value | $ | 203,500 | ||
| Securities sold short, at value | 61,275 | |||
| Cash due to broker | 24,400 | |||
| Cash due to custodian | 7,629 | |||
| Payables: | ||||
| Investment securities purchased | 1,361,646 | |||
| Accrued distribution (12b-1) fees | 20 | |||
| Due to administrator | 3,344 | |||
| Accrued expenses | 5,844 | |||
| Total liabilities | 1,667,658 | |||
| Net Assets | $ | 10,381,731 | ||
| Sources of Net Assets: | ||||
| Paid-in capital | $ | 10,160,190 | ||
| Total distributable earnings | 221,541 | |||
| Total Net Assets | $ | 10,381,731 | ||
| Class A Shares: | ||||
| Net Assets | $ | 96,706 | ||
| Shares Outstanding (Unlimited shares of $0 par value beneficial interest authorized) | 9,030 | |||
| Net Asset Value Per Share | $ | 10.71 | ||
| Maximum Offering Price Per Share(a) | $ | 11.33 | ||
| Minimum Redemption Price Per Share(b) | $ | 10.60 | ||
| Institutional Class Shares: | ||||
| Net Assets | $ | 10,285,025 | ||
| Shares Outstanding (Unlimited shares of $0 par value beneficial interest authorized) | 950,713 | |||
| Net Asset Value, Offering and Redemption Price Per Share | $ | 10.82 | ||
(a)A maximum sales charge of 5.50% is imposed on Class A shares.
(b)Investments in Class A shares made at or above the $1 million breakpoint are not subject to an initial sales charge and may be subject to a 1.00% contingent deferred sales charge ("CDSC") on shares redeemed within one year from the date of purchase.
The accompanying notes are an integral part of these financial statements.
10
| FINTRUST INCOME AND OPPORTUNITY FUND | |
| STATEMENT OF OPERATIONS | |
| November 30, 2019 | ANNUAL REPORT |
| For the | ||||
| Year Ended | ||||
| November 30, 2019 | ||||
| Investment income: | ||||
| Dividends (net of foreign withholding taxes of $1,118) | $ | 95,216 | ||
| Interest | 47,918 | |||
| Total investment income | 143,134 | |||
| Expenses: | ||||
| Management fees (Note 6) | 112,070 | |||
| Distribution (12b-1) fees - Class A (Note 6) | 232 | |||
| Accounting and transfer agent fees and expenses (Note 6) | 71,294 | |||
| Legal fees | 22,084 | |||
| Reports to shareholders | 10,710 | |||
| Trustee fees and expenses | 23,449 | |||
| Audit fees | 14,500 | |||
| Custodian fees | 14,272 | |||
| Pricing fees | 13,241 | |||
| Miscellaneous | 8,431 | |||
| Dealer network fees | 8,108 | |||
| Registration and filing fees | 3,117 | |||
| Insurance | 2,067 | |||
| Interest expense | 2,042 | |||
| Total expenses | 305,617 | |||
| Less: fees waived and expenses absorbed (Note 6) | (128,536 | ) | ||
| Net expenses | 177,081 | |||
| Net investment loss | (33,947 | ) | ||
| Realized and unrealized gain (loss): | ||||
| Net realized gain on: | ||||
| Investments | 205,188 | |||
| Options written | 209,979 | |||
| Securities sold short | 18,772 | |||
| Net realized gain on investments, options written and securities sold short | 433,939 | |||
| Net change in unrealized appreciation (depreciation) on: | ||||
| Investments | 109,699 | |||
| Options written | 4,934 | |||
| Securities sold short | (31 | ) | ||
| Net change in unrealized appreciation on investments, options written and securities sold short | 114,602 | |||
| Net realized and unrealized gain on investments, options written and securities sold short | 548,541 | |||
| Net increase in net assets resulting from operations | $ | 514,594 | ||
The accompanying notes are an integral part of these financial statements.
11
| FINTRUST INCOME AND OPPORTUNITY FUND | ||
| STATEMENTS OF CHANGES IN NET ASSETS | ||
| November 30, 2019 | ANNUAL REPORT |
| For the | For the | |||||||
| Year Ended | Year Ended | |||||||
| November 30, 2019 | November 30, 2018 | |||||||
| Increase (decrease) in net assets from: | ||||||||
| Operations: | ||||||||
| Net investment loss | $ | (33,947 | ) | $ | (14,218 | ) | ||
| Net realized gain on investments, options written and securities sold short | 433,939 | 314,408 | ||||||
| Net change in unrealized appreciation (depreciation) on investments, options written and securities sold short | 114,602 | (289,628 | ) | |||||
| Net increase in net assets resulting from operations | 514,594 | 10,562 | ||||||
| Distributions to shareholders from: | ||||||||
| Total distributable earnings - Class A | (4,448 | ) | (40,850 | ) | ||||
| Total distributable earnings - Institutional Class | (309,072 | ) | (563,465 | ) | ||||
| Total distributions | (313,520 | ) | (604,315 | ) | ||||
| Capital share transactions (Note 4): | ||||||||
| Increase in net assets from capital share transactions | 4,408,857 | 389,080 | ||||||
| Increase (decrease) in net assets | 4,609,931 | (204,673 | ) | |||||
| Net Assets: | ||||||||
| Beginning of year | 5,771,800 | 5,976,473 | ||||||
| End of year | $ | 10,381,731 | $ | 5,771,800 | ||||
The accompanying notes are an integral part of these financial statements.
12
| FINTRUST INCOME AND OPPORTUNITY FUND | |
| FINANCIAL HIGHLIGHTS | |
| November 30, 2019 | ANNUAL REPORT |
The following tables set forth the per share operating performance data for a share of beneficial interest outstanding, total return, ratios to average net assets and other supplemental data for the years or period indicated.
| Class A | |||||||||||||||||
| For the | For the | For the | For the | ||||||||||||||
| Year Ended | Year Ended | Year Ended | Period Ended | ||||||||||||||
| November 30, 2019 | November 30, 2018 | November 30, 2017 | November 30, 2016(a) | ||||||||||||||
| Net Asset Value, Beginning of Year/Period | $ | 10.73 | $ | 11.97 | $ | 11.03 | $ | 10.00 | |||||||||
| Investment Operations: | |||||||||||||||||
| Net investment loss(b) | (0.06 | ) | (0.05 | ) | (0.08 | ) | (0.11 | ) | |||||||||
| Net realized and unrealized gain on investments, options written and securities sold short | 0.56 | 0.04 | 1.03 | 1.14 | |||||||||||||
| Total from investment operations | 0.50 | (0.01 | ) | 0.95 | 1.03 | ||||||||||||
| Distributions: | |||||||||||||||||
| From net realized capital gains | (0.52 | ) | (1.23 | ) | (0.01 | ) | — | ||||||||||
| Total distributions | (0.52 | ) | (1.23 | ) | (0.01 | ) | — | ||||||||||
| Net Asset Value, End of Year/Period | $ | 10.71 | $ | 10.73 | $ | 11.97 | $ | 11.03 | |||||||||
| Total Return(c) | 5.32 | % | (0.31 | )% | 8.61 | % | 10.30 | %(d) | |||||||||
| Ratios/Supplemental Data | |||||||||||||||||
| Net assets, end of year/period (in 000's) | $ | 97 | $ | 92 | $ | 398 | $ | 370 | |||||||||
| Ratios of expenses to average net assets: | |||||||||||||||||
| Before fees waived and expenses absorbed | 3.66 | %(f) | 4.57 | % | 4.52 | %(f) | 7.31 | %(e) (f) | |||||||||
| After fees waived and expenses absorbed | 2.22 | %(f) | 2.20 | % | 2.26 | %(f) | 2.30 | %(e) (f) | |||||||||
| Ratios of net investment loss: | |||||||||||||||||
| Before fees waived and expenses absorbed | (2.06 | )%(f) | (2.84 | )% | (2.99 | )%(f) | (6.26 | )%(e) (f) | |||||||||
| After fees waived and expenses absorbed | (0.63 | )%(f) | (0.47 | )% | (0.73 | )%(f) | (1.24 | )%(e) (f) | |||||||||
| Portfolio turnover rate | 192.88 | % | 280.78 | % | 94.23 | % | 29.55 | %(d) | |||||||||
| (a) | The FinTrust Income and Opportunity Fund commenced operations on January 21, 2016. |
| (b) | Net investment loss per share is based on average shares outstanding. |
| (c) | Total Return represents the rate that the investor would have earned or lost on an investment in the Fund, assuming reinvestment of dividends and does not reflect the impact of sales charges. |
| (d) | Not annualized. |
| (e) | Annualized. |
| (f) | The ratios include 0.02% of interest expense during the year ended November 30, 2019, 0.06% of interest expense during the year ended November 30, 2017 and 0.10% of interest expense during the period ended November 30, 2016. |
The accompanying notes are an integral part of these financial statements.
13
| FINTRUST INCOME AND OPPORTUNITY FUND | |
| FINANCIAL HIGHLIGHTS | |
| November 30, 2019 | ANNUAL REPORT |
The following tables set forth the per share operating performance data for a share of beneficial interest outstanding, total return, ratios to average net assets and other supplemental data for the years or period indicated.
| Institutional Class | |||||||||||||||||
| For the | For the | For the | For the | ||||||||||||||
| Year Ended | Year Ended | Year Ended | Period Ended | ||||||||||||||
| November 30, 2019 | November 30, 2018 | November 30, 2017 | November 30, 2016(a) | ||||||||||||||
| Net Asset Value, Beginning of Year/Period | $ | 10.81 | $ | 12.02 | $ | 11.05 | $ | 10.00 | |||||||||
| Investment Operations: | |||||||||||||||||
| Net investment loss(b) | (0.04 | ) | (0.02 | ) | (0.05 | ) | (0.09 | ) | |||||||||
| Net realized and unrealized gain on investments, options written and securities sold short | 0.57 | 0.04 | 1.03 | 1.14 | |||||||||||||
| Total from investment operations | 0.53 | 0.02 | 0.98 | 1.05 | |||||||||||||
| Distributions: | |||||||||||||||||
| From net realized capital gains | (0.52 | ) | (1.23 | ) | (0.01 | ) | — | ||||||||||
| Total distributions | (0.52 | ) | (1.23 | ) | (0.01 | ) | — | ||||||||||
| Net Asset Value, End of Year/Period | $ | 10.82 | $ | 10.81 | $ | 12.02 | $ | 11.05 | |||||||||
| Total Return(c) | 5.57 | % | (0.03 | )%(g) | 8.86 | % | 10.50 | %(d) | |||||||||
| Ratios/Supplemental Data | |||||||||||||||||
| Net assets, end of year/period (in 000's) | $ | 10,285 | $ | 5,680 | $ | 5,578 | $ | 3,741 | |||||||||
| Ratios of expenses to average net assets: | |||||||||||||||||
| Before fees waived and expenses absorbed | 3.41 | %(f) | 4.32 | % | 4.27 | %(f) | 7.06 | %(e) (f) | |||||||||
| After fees waived and expenses absorbed | 1.97 | %(f) | 1.95 | % | 2.01 | %(f) | 2.05 | %(e) (f) | |||||||||
| Ratios of net investment loss: | |||||||||||||||||
| Before fees waived and expenses absorbed | (1.81 | )%(f) | (2.59 | )% | (2.74 | )%(f) | (6.01 | )%(e) (f) | |||||||||
| After fees waived and expenses absorbed | (0.38 | )%(f) | (0.22 | )% | (0.48 | )%(f) | (0.99 | )%(e) (f) | |||||||||
| Portfolio turnover rate | 192.88 | % | 280.78 | % | 94.23 | % | 29.55 | %(d) | |||||||||
| (a) | The FinTrust Income and Opportunity Fund commenced operations on January 21, 2016. |
| (b) | Net investment loss per share is based on average shares outstanding. |
| (c) | Total Return represents the rate that the investor would have earned or lost on an investment in the Fund, assuming reinvestment of dividends. |
| (d) | Not annualized. |
| (e) | Annualized. |
| (f) | The ratios include 0.02% of interest expense during the year ended November 30, 2019, 0.06% of interest expense during the year ended November 30, 2017 and 0.10% of interest expense during the period ended November 30, 2016. |
| (g) | Total return does not correlate to the total from investment operations due to the timing of certain subscriptions and redemptions in the Fund. |
The accompanying notes are an integral part of these financial statements.
14
| FinTrust Income and Opportunity Fund | ANNUAL REPORT |
NOTES TO THE FINANCIAL STATEMENTS
November 30, 2019
| 1. | ORGANIZATION AND SIGNIFICANT ACCOUNTING POLICIES |
The FinTrust Income and Opportunity Fund (the “Fund”), is a series of 360 Funds (the “Trust”). The Trust was organized on February 24, 2005 as a Delaware statutory trust. The Trust is registered as an open-end management investment company under the Investment Company Act of 1940 (the “1940 Act”). The Fund is a non-diversified Fund. As a non-diversified Fund, it may invest a significant portion of its assets in a small number of companies. The Fund’s investment objective is total return comprised of income and capital appreciation. The Fund’s investment adviser is FinTrust Capital Advisors, LLC (the “Adviser”). The Fund offers two classes of shares, Class A and Institutional Class shares. Each class of shares commenced operations on January 21, 2016. Each class differs as to sales and redemption charges and ongoing fees. Income and expenses (other than class specific), and realized/unrealized gains or losses are allocated to each class based on their relative net asset values.
The following is a summary of the significant accounting policies followed by the Fund in the preparation of its financial statements. The Fund is an investment company that follows the accounting and reporting guidance of Accounting Standards Codification Topic 946 applicable to investment companies.
a) Security Valuation – All investments in securities are recorded at their estimated fair value, as described in Note 2.
b) Options – The Fund uses an option strategy in an effort to limit market exposure and volatility. The extent of option selling will depend upon market conditions and the Adviser’s judgment of the advantages of selling call options on the Fund’s equity investments. The sale of put options generates income for the Fund, but exposes it to the risk of declines in the value of the underlying assets. The risk in purchasing options is limited to the premium paid by the Fund for the options. The sale of call options generates income for the Fund, but may limit the Fund’s participation in equity market gains. The Fund’s investment adviser seeks to reduce the overall volatility of returns for the Fund by managing a portfolio of options. When the Fund writes or purchases an option, an amount equal to the premium received or paid by the Fund is recorded as a liability or an asset and is subsequently adjusted to the current market value of the option written or purchased. Premiums received or paid from writing or purchasing options which expire unexercised are treated by the Fund on the expiration date as realized gains or losses. The difference between the premium and the amount paid or received on effecting a closing purchase or sale transaction, including brokerage commissions, is also treated as a realized gain or loss. If an option is exercised, the premium paid or received is added to the cost of the purchase or proceeds from the sale in determining whether the Fund has realized a gain or a loss on investment transactions.
Purchasing and writing put and call options are highly specialized activities and entail greater than ordinary investment risks. The successful use of options depends in part on the ability of the Adviser to manage future price fluctuations and the degree of correlation between the options and securities markets. By writing put options on equity securities, the Fund gives up the opportunity to benefit from potential increases in the value of the underlying securities above the strike prices of the written put options, but continues to bear the risk of declines in the value of underlying securities held by the Fund. The Fund will receive a premium from writing a covered call option that it retains whether or not the option is exercised. The premium received from the written options may not be sufficient to offset any losses sustained from the volatility of the underlying equity securities over time.
c) Federal Income Taxes – The Fund has qualified and intends to continue to qualify as a regulated investment company under Subchapter M of the Internal Revenue Code of 1986, as amended (the “Code”). It is the policy of the Fund to comply with the requirements of the Code applicable to regulated investment companies and to distribute substantially all of its net investment company taxable income and net capital gains. The Fund also intends to distribute sufficient net investment income and net capital gains, if any, so that it will not be subject to excise tax on undistributed income and gains. Therefore, no federal income tax or excise provision is required.
As of the year ended November 30, 2019, the Fund did not have a liability for any unrecognized tax expenses. The Fund recognizes interest and penalties, if any, related to unrecognized tax liability as income tax expense in the Statement of Operations. For the year ended November 30, 2019, the Fund did not incur any interest or penalties. The Fund identifies its major tax jurisdiction as U.S. Federal.
In addition, accounting principles generally accepted in the United States of America (“GAAP”) requires management of the Fund to analyze all open tax years, as defined by the Internal Revenue Service statute of limitations for all major jurisdictions, including federal tax authorities and certain state tax authorities. As of and for the year ended November 30, 2019, and for all other open tax years and period (years ended November 30, 2018 and 2017 and the period from January 26, 2016, commencement of operations, through November 30, 2016), the Fund did not have a liability for any unrecognized tax benefits. The Fund has no examinations in progress and is not aware of any tax positions for which it is reasonably possible that the total tax amounts of unrecognized tax benefits will significantly change in the next twelve months.
14
| FinTrust Income and Opportunity Fund | ANNUAL REPORT |
NOTES TO THE FINANCIAL STATEMENTS
November 30, 2019
| 1. | ORGANIZATION AND SIGNIFICANT ACCOUNTING POLICIES (continued) |
d) Distributions to Shareholders – Dividends from net investment income and distributions of net realized capital gains, if any, will be declared and paid at least annually. Income and capital gain distributions, which are determined in accordance with income tax regulations, are recorded on the ex-dividend date. GAAP requires that permanent financial reporting differences relating to shareholder distributions be reclassified to paid-in capital.
e) Use of Estimates – The preparation of financial statements in conformity with GAAP requires management to make estimates and assumptions that affect the reported amounts of assets and liabilities and disclosure of contingent assets and liabilities at the date of the financial statements and the reported amounts of revenues and expenses during the reporting period. Actual results could differ from those estimates.
f) Non-Diversified Fund – The Fund is a non-diversified fund. In general, a non-diversified fund may invest a greater percentage of its assets in a particular issue and may own fewer securities than other mutual funds. Accordingly, a non-diversified fund is generally subject to the risk that a large loss in an individual issue will cause a greater loss for the fund than it would if the fund was required to hold a larger number of securities or smaller positions.
g) Sales Charges – A maximum sales charge of 5.50% is imposed on certain purchases of Class A shares. A contingent deferred sales charge (“CDSC”) is imposed upon certain redemptions of Class A shares purchased at net asset value in amounts totaling $1 million if the dealer’s commission was paid by the underwriter and the shares are redeemed within one year from the date of purchase. The CDSC will be paid to the Distributor and will be equal to 1.00% of the lesser of (1) the net asset value at the time of purchase of the Class A shares being redeemed; or (2) the net asset value of such shares at the time of redemption. There were no CDSC Fees paid to the Distributor for the year ended November 30, 2019.
h) Expenses – Expenses incurred by the Trust that do not relate to a specific fund of the Trust are allocated to the individual funds based on each fund’s relative net assets or another appropriate basis as determined by the Board.
i) Other – Investment and shareholder transactions are recorded on trade date. The Fund determines the gain or loss realized from the investment transactions by comparing the original cost of the security lot sold with the net sales proceeds. Dividend income is recognized on the ex-dividend date or as soon as information is available to the Fund and interest income is recognized on an accrual basis. Withholding taxes on foreign dividends have been provided for in accordance with the Fund’s understanding of the applicable country’s tax rules and rates.
| 2. | SECURITIES VALUATIONS |
Processes and Structure
The Fund’s Board of Trustees (the “Board”) has adopted guidelines for valuing securities and other derivative instruments including in circumstances in which market quotes are not readily available, and has delegated authority to the Adviser to apply those guidelines in determining fair value prices, subject to review by the Board.
Hierarchy of Fair Value Inputs
The Fund utilizes various methods to measure the fair value of most of its investments on a recurring basis. GAAP establishes a hierarchy that prioritizes inputs to valuation techniques used to measure fair value. The three levels of inputs are as follows:
| ● | Level 1 – Unadjusted quoted prices in active markets for identical assets or liabilities that the Fund has the ability to access. |
| �� | Level 2 – Observable inputs other than quoted prices included in Level 1 that are observable for the asset or liability either directly or indirectly. These inputs may include quoted prices for the identical instrument on an inactive market, prices for similar instruments, interest rates, prepayment speeds, credit risk, yield curves, default rates, and similar data. |
| ● | Level 3 – Unobservable inputs for the asset or liability to the extent that relevant observable inputs are not available, representing the Fund’s own assumptions about the assumptions that a market participant would use in valuing the asset or liability, and that would be based on the best information available. |
15
| FinTrust Income and Opportunity Fund | ANNUAL REPORT |
NOTES TO THE FINANCIAL STATEMENTS
November 30, 2019
| 2. | SECURITIES VALUATIONS (continued) |
The availability of observable inputs can vary from security to security and is affected by a wide variety of factors, including, for example, the type of security, whether the security is new and not yet established in the marketplace, the liquidity of markets, and other characteristics particular to the security. To the extent that valuation is based on models or inputs that are less observable or unobservable in the market, the determination of fair value requires more judgment. Accordingly, the degree of judgment exercised in determining fair value is greatest for instruments categorized in Level 3.
The inputs used to measure fair value may fall into different levels of the fair value hierarchy. In such cases, for disclosure purposes, the level in the fair value hierarchy within which the fair value measurement falls in its entirety is determined based on the lowest level input that is significant to the fair value measurement in its entirety.
Fair Value Measurements
A description of the valuation techniques applied to the Trust’s major categories of assets and liabilities measured at fair value on a recurring basis are as follows:
Equity securities (common stock) – Securities traded on a national securities exchange (or reported on the NASDAQ national market) are stated at the last reported sales price on the day of valuation. To the extent these securities are actively traded, and valuation adjustments are not applied, they are categorized in Level 1 of the fair value hierarchy. Certain foreign securities may be fair valued using a pricing service that considers the correlation of the trading patterns of the foreign security to the intraday trading in the U.S. markets for investments such as American Depositary Receipts, financial futures, Exchange-Traded Funds, and the movement of the certain indexes of securities based on a statistical analysis of the historical relationship and are categorized in Level 2. Preferred stock and other equities traded on inactive markets or valued by reference to similar instruments are also categorized in Level 2.
Money market funds – Money market funds are valued at their net asset value and are categorized as Level 1.
Derivative instruments – Listed derivatives, including options, that are actively traded, are valued based on quoted prices from the exchange and categorized in Level 1 of the fair value hierarchy. Options held by the Fund for which no current quotations are readily available and which are not traded on the valuation date are valued at the mean price and are categorized within Level 2 of the fair value hierarchy. Over-the-counter (OTC) derivative contracts include forward, swap, and option contracts related to interest rates; foreign currencies; credit standing of reference entities; equity prices; or commodity prices, and warrants on exchange-traded securities. Depending on the product and terms of the transaction, the fair value of the OTC derivative products can be modeled taking into account the counterparties’ creditworthiness and using a series of techniques, including simulation models. Many pricing models do not entail material subjectivity because the methodologies employed do not necessitate significant judgments, and the pricing inputs are observed from actively quoted markets, as is the case of interest rate swap and option contracts. OTC derivative products valued using pricing models are categorized within Level 2 of the fair value hierarchy.
If the Adviser decides that a price provided by the pricing service does not accurately reflect the fair value of the securities, when prices are not readily available from a pricing service, or when certain restricted or illiquid securities are being valued, securities are valued at fair value as determined in good faith by the Adviser, in conformity with guidelines adopted by and subject to review of the Board and the Fair Valuation Committee. These securities will be categorized as Level 3 securities.
The following tables summarize the inputs used to value the Fund’s assets and liabilities measured at fair value as of November 30, 2019.
| Financial Instruments – Assets | ||||||||||||||||
| Security Classification(1) | Level 1 | Level 2 | Level 3 | Totals | ||||||||||||
| Common Stock(2) | $ | 6,568,527 | $ | — | $ | — | $ | 6,568,527 | ||||||||
| Government Bonds | — | 1,565,547 | — | 1,565,547 | ||||||||||||
| Call Options Purchased | 77,310 | 301,087 | — | 378,397 | ||||||||||||
| Put Options Purchased | 3,400 | — | — | 3,400 | ||||||||||||
| Short-Term Investments | 1,073,347 | — | — | 1,073,347 | ||||||||||||
| Total Assets | $ | 7,722,584 | $ | 1,866,634 | $ | — | $ | 9,589,218 | ||||||||
16
| FinTrust Income and Opportunity Fund | ANNUAL REPORT |
NOTES TO THE FINANCIAL STATEMENTS
November 30, 2019
| 2. | SECURITIES VALUATIONS (continued) |
| Derivative and Financial Instruments – Liabilities | ||||||||||||||||
| Security Classification(1) | Level 1 | Level 2 | Level 3 | Totals | ||||||||||||
| Call Options Written | $ | 166,545 | $ | 14,515 | $ | — | $ | 181,060 | ||||||||
| Securities Sold Short | 61,275 | — | — | 61,275 | ||||||||||||
| Put Options Written | 10,000 | 12,440 | — | 22,440 | ||||||||||||
| Total Liabilities | $ | 237,820 | $ | 26,955 | $ | — | $ | 264,775 | ||||||||
(1) As of and for the year ended November 30, 2019, the Fund held no securities that were considered to be “Level 3” securities (those valued using significant unobservable inputs). Therefore, a reconciliation of assets in which significant unobservable inputs (Level 3) were used in determining fair value is not applicable.
(2) All common stock held in the Fund are Level 1 securities. For a detailed break-out of common stock by industry, please refer to the Schedule of Investments.
There were no transfers into and out of any level for the year ended November 30, 2019. It is the Fund’s policy to recognize transfers between levels at the end of the reporting period.
| 3. | DERIVATIVE TRANSACTIONS |
As of November 30, 2019, the location on the Statement of Assets and Liabilities for financial derivative instrument fair values is as follows:
| Assets | Location | Equity Contracts | |||||
| Call options purchased | Investments, at value | $ | 378,397 | ||||
| Put options purchased | Investments, at value | 3,400 | |||||
| Total Assets | $ | 381,797 | |||||
| Liabilities | Location | Equity Contracts | |||||
| Call options written | Options written, at value | $ | 181,060 | ||||
| Put options written | Options written, at value | 22,440 | |||||
| Total Liabilities | $ | 203,500 | |||||
Realized and unrealized gains and losses on derivatives contracts entered into by the Fund for the year ended November 30, 2019, are recorded in the following locations in the Statement of Operations:
| Net change in unrealized appreciation (depreciation) on: | Location | Equity Contracts | |||||
| Call options purchased | Investments | $ | (155,102 | ) | |||
| Put options purchased | Investments | (40,212 | ) | ||||
| Call options written | Options written | 11,099 | |||||
| Put options written | Options written | (6,165 | ) | ||||
| $ | (190,380 | ) | |||||
17
| FinTrust Income and Opportunity Fund | ANNUAL REPORT |
NOTES TO THE FINANCIAL STATEMENTS
November 30, 2019
| 3. | DERIVATIVES TRANSACTIONS (continued) |
| Net realized gain on: | Location | Equity Contracts | |||||
| Call options purchased | Investments | $ | 227,022 | ||||
| Put options purchased | Investments | (29,729 | ) | ||||
| Call options written | Options written | (18,236 | ) | ||||
| Put options written | Options written | 228,215 | |||||
| $ | 407,272 | ||||||
For the year ended November 30, 2019, the total amount of all options, as presented in the Schedule of Investments and Schedule of Options Written, is representative of the volume of activity for these derivative types. For the year ended November 30, 2019, the average month-end notional value of purchased and written option contracts for the Fund was $6,290,365 and ($4,265,123), respectively. The primary risk category for all open options positions during the fiscal year was equity risk.
| 4. | CAPITAL SHARE TRANSACTIONS |
Transactions in shares of capital stock for the year ended November 30, 2019 were as follows:
| Sold | Redeemed | Reinvested | Net Increase | |||||||||||||
| Class A | ||||||||||||||||
| Shares | 24 | (13 | ) | 472 | 483 | |||||||||||
| Value | $ | 250 | $ | (138 | ) | $ | 4,448 | $ | 4,560 | |||||||
| Institutional Class | ||||||||||||||||
| Shares | 473,668 | (81,069 | ) | 32,534 | 425,133 | |||||||||||
| Value | $ | 4,935,547 | $ | (840,322 | ) | $ | 309,072 | $ | 4,404,297 | |||||||
Transactions in shares of capital stock for the year ended November 30, 2018 were as follows:
| Sold | Redeemed | Reinvested | Net Increase (Decrease) | |||||||||||||
| Class A | ||||||||||||||||
| Shares | 2,839 | (31,319 | ) | 3,734 | (24,746 | ) | ||||||||||
| Value | $ | 30,733 | $ | (343,330 | ) | $ | 40,850 | $ | (271,747 | ) | ||||||
| Institutional Class | ||||||||||||||||
| Shares | 160,413 | (145,493 | ) | 46,532 | 61,452 | |||||||||||
| Value | $ | 1,756,287 | $ | (1,606,845 | ) | $ | 511,385 | $ | 660,827 | |||||||
| 5. | INVESTMENT TRANSACTIONS |
For the year ended November 30, 2019, aggregate purchases and sales of investment securities (excluding short-term investments and U.S. Government securities) for the Fund were as follows:
| Purchases | Sales | ||||
| $ | 16,620,032 | $ | 15,111,252 | ||
The cost of purchases and proceeds from sales of U.S. government securities during the year ended November 30, 2019 were $1,357,144 and $302,640, respectively.
18
| FinTrust Income and Opportunity Fund | ANNUAL REPORT |
NOTES TO THE FINANCIAL STATEMENTS
November 30, 2019
| 6. | ADVISORY FEES AND OTHER RELATED PARTY TRANSACTIONS |
The Fund has entered into an Investment Advisory Agreement (the “Advisory Agreement”) with the Adviser. Pursuant to the Advisory Agreement, the Adviser manages the operations of the Fund and manages the Fund’s investments in accordance with the stated policies of the Fund. As compensation for the investment advisory services provided to the Fund, the Adviser will receive a monthly management fee equal to an annual rate of 1.25% of the Fund’s net assets. For the year ended November 30, 2019, the Adviser earned $112,070 of management fees.
The Adviser has entered into an Expense Limitation Agreement with the Fund under which it has agreed to waive or reduce its fees and to assume other expenses of the Fund, if necessary, in an amount that limits the Fund’s annual operating expenses (excluding interest, distribution fees pursuant to Rule 12b-1 Plans, taxes, acquired fund fees and expenses, brokerage commissions, dividend expenses on short sales, and other expenditures which are capitalized in accordance with generally accepted accounting principles and other extraordinary expenses not incurred in the ordinary course of such Fund’s business) to not more than 1.95% of the Fund’s average daily net assets. The current contractual agreement cannot be terminated prior to at least one year after the effective date without the Board of Trustees’ approval. For the year ended November 30, 2019, the Adviser waived advisory fees of $112,070 and reimbursed expenses of $16,466.
Subject to approval by the Fund’s Board, any waiver under the Expense Limitation Agreement is subject to repayment by the Fund within the three fiscal years following the year in which such waiver occurred, if the Fund is able to make the payment without exceeding the 1.95% expense limitation. The cumulative unreimbursed amount paid and/or waived by the Adviser on behalf of the Fund is $192,223, of which $63,687 and $128,536 can be recouped no later than November 30, 2021 and November 30, 2022, respectively.
The Fund has entered into an Investment Company Services Agreement (“ICSA”) with M3Sixty Administration, LLC (“M3Sixty”). Pursuant to the ICSA, M3Sixty will provide day-to-day operational services to the Fund including, but not limited to: (a) Fund accounting services; (b) financial statement preparation; (c) valuation of the Fund’s portfolio securities; (d) pricing the Fund’s shares; (e) assistance in preparing tax returns; (f) preparation and filing of required regulatory reports; (g) communications with shareholders; (h) coordination of Board and shareholder meetings; (i) monitoring the Fund’s legal compliance; (j) maintaining shareholder account records.
For the year ended November 30, 2019 M3Sixty earned $71,294, including out of pocket expenses.
Certain officers and an interested Trustee of the Trust are also employees and/or officers of M3Sixty.
The Fund has entered into a Distribution Agreement with Matrix 360 Distributors, LLC (“M3SixtyD” or the “Distributor”). Pursuant to the Distribution Agreement, the Distributor provides distribution services to the Fund. The Distributor served as underwriter/distributor of the Fund. M3SixtyD may receive commissions from the sale of Class A shares. During the year ended November 30, 2019, no commissions were paid to the Distributor. M3SixtyD is an affiliate of M3Sixty.
The Fund has adopted a Distribution Plan (“Plan”) pursuant to Rule 12b-1 under the Investment Company Act of 1940 for its Class A shares. The Fund may expend up to 0.25% for Class A shares of the Fund’s average daily net assets annually to pay for any activity primarily intended to result in the sale of shares of the Fund and the servicing of shareholder accounts, provided that the Trustees have approved the category of expenses for which payment is being made.
The distribution plan for the Class A shares of the Fund took effect January 21, 2016. For the year ended November 30, 2019, the Fund accrued $232 in 12b-1 expenses attributable to Class A shares.
19
| FinTrust Income and Opportunity Fund | ANNUAL REPORT |
NOTES TO THE FINANCIAL STATEMENTS
November 30, 2019
| 7. | TAX MATTERS |
For U.S. Federal income tax purposes, the cost of securities owned, gross appreciation, gross depreciation, and net unrealized appreciation/(depreciation) of investments, excluding written options and securities sold short, at November 30, 2019 were as follows:
| Cost | Gross Appreciation | Gross Depreciation | Net Depreciation | |||||||||||
| $ | 9,718,281 | $ | 362,670 | $ | (491,733 | ) | $ | (129,063 | ) | |||||
The difference between book basis and tax basis unrealized appreciation (depreciation) is primarily attributable to the tax deferral of losses on wash sales.
The Fund’s tax basis distributable earnings are determined at the end of each fiscal year. The tax character of distributable earnings (deficit) at November 30, 2019, the Fund’s most recent fiscal year end, is as follows:
Unrealized | Undistributed Ordinary Income | Undistributed Long-Term Capital Gains | Capital Loss Carry Forwards | Post-October Loss and Late Year Loss | Total Distributable Earnings | |||||||||||||||||
| $ | (183,299 | ) | $ | 362,575 | $ | 42,265 | $ | - | $ | - | $ | 221,541 | ||||||||||
Under current tax law, net capital losses realized after October 31st and net ordinary losses incurred after December 31st may be deferred and treated as occurring on the first day of the following fiscal year. As of November 30, 2019, the Fund did not elect to defer any losses.
In accordance with accounting pronouncements, the Fund may record reclassifications in the capital accounts. These reclassifications have no impact on the net asset value of the Fund and are designed generally to present distributable earnings on a tax basis which is considered to be more informative to the shareholder. As of November 30, 2019, the Fund did not record any reclassifications to capital accounts.
Under the Regulated Investment Company Modernization Act of 2010 (the “Act”), net capital losses recognized after December 31, 2010, may be carried forward indefinitely, and their character is retained as short-term and/or long-term. As of November 30, 2019, the Fund had no capital loss carryforwards for federal income tax purposes.
For the year ended November 30, 2019, the Fund distributed, on a tax basis, $313,520 of ordinary income.
For the year ended November 30, 2018, the Fund distributed, on a tax basis, $393,866 of ordinary income and $210,449 of long-term capital gains.
| 8. | BENEFICIAL OWNERSHIP |
The beneficial ownership, either directly or indirectly, of more than 25% of the voting securities of a fund creates a presumption of control of the fund, under Section 2(a)(9) of the Investment Company Act of 1940. As of November 30, 2019, Charles Schwab and Co., Inc. held 75.16% of the Fund’s shares in omnibus accounts for the sole benefit of its customers. The Trust does not know whether any of the underlying beneficial shareholders of the omnibus accounts held by Charles Schwab and Co., Inc. own more than 25% of the voting securities of the Fund.
| 9. | COMMITMENTS AND CONTINGENCIES |
In the normal course of business, the Trust may enter into contracts that may contain a variety of representations and warranties and provide general indemnifications. The Trust’s maximum exposure under these arrangements is dependent on future claims that may be made against the Fund and, therefore, cannot be estimated; however, management considers the risk of loss from such claims to be remote.
20
| FinTrust Income and Opportunity Fund | ANNUAL REPORT |
NOTES TO THE FINANCIAL STATEMENTS
November 30, 2019
| 10. | RECENT ACCOUNTING PRONOUNCEMENTS |
In August 2018, the Financial Accounting Standards Board (“FASB”) issued Accounting Standards Update (ASU) No. 2018-13 “Fair Value Measurement (Topic 820): Disclosure Framework – Changes to the Disclosure Requirements for Fair Value Measurement” (“ASU 2018-13”) which includes amendments intended to improve the effectiveness of disclosures in the notes to financial statements. For example, ASU 2018-13 includes additional disclosures regarding the range and weighted average of significant unobservable inputs used to develop Level 3 fair value measurements, and clarifications to the narrative description of measurement uncertainty disclosures. ASU 2018-13 is effective for interim and annual periods beginning after December 15, 2019. Management has evaluated the implications of certain provisions of ASU 2018-13 and has elected to early adopt all aspects of the amendments effective with the Fund’s financial statements within this Annual Report.
| 11. | SUBSEQUENT EVENTS |
On December 20, 2019, the Fund declared an ordinary income distribution of $362,575 and a long-term capital gain distribution of $42,265, which were payable on December 20, 2019.
In accordance with GAAP, Management has evaluated the impact of all subsequent events on the Fund through the date the financial statements were issued, and has determined that there were no other subsequent events requiring recognition or disclosure in the financial statements.
21

REPORT OF INDEPENDENT REGISTERED PUBLIC ACCOUNTING FIRM
To the Board of Trustees of 360 Funds
and the Shareholders of FinTrust Income and Opportunity Fund
Opinion on the Financial Statements
We have audited the accompanying statement of assets and liabilities of FinTrust Income and Opportunity Fund, a series of shares of beneficial interest in 360 Funds (the“Fund”), including the schedule of investments, as of November 30, 2019, and the related statement of operations for the year then ended and the statements of changes in net assets and the financial highlights for each of the years in the two-year period then ended, and the related notes (collectively referred to as the“financial statements”). In our opinion, the financial statements present fairly, in all material respects, the financial position of the Fund as of November 30, 2019, and the results of its operations for the year then ended, and the changes in its net assets and its financial highlights for each of the years in the two-year period then ended, in conformity with accounting principles generally accepted in the United States of America. The financial highlights for the year ended November 30, 2017 and for the period January 21, 2016 (commencement of operations) through November 30, 2016 were audited by other auditors, whose report dated January 26, 2018, expressed an unqualified opinion on such financial statements and financial highlights.
Basis for Opinion
These financial statements are the responsibility of the Fund' management. Our responsibility is to express an opinion on the Fund's financial statements based on our audits. We are a public accounting firm registered with the Public Company Accounting Oversight Board (United States) (“PCAOB”) and are required to be independent with respect to the Fund in accordance with the U.S. federal securities law and the applicable rules and regulations of the Securities and Exchange Commission and the PCAOB.
We conducted our audits in accordance with the standards of the PCAOB. Those standards require that we plan and perform the audit to obtain reasonable assurance about whether the financial statements are free of material misstatement, whether due to error or fraud. The Fund is not required to have, nor were we engaged to perform, an audit of its internal control over financial reporting. As part of our audit we are required to obtain an understanding of internal control over financial reporting but not for the purpose of expressing an opinion on the effectiveness of the Fund’s internal control over financial reporting. Accordingly, we express no such opinion.
22
Our audits included performing procedures to assess the risk of material misstatement of the financial statements, whether due to error or fraud, and performing procedures that respond to those risks. Such procedures included examining, on a test basis, evidence regarding the amounts and disclosures in the financial statements. Our procedures included confirmation of securities owned as of November 30, 2019 by correspondence with the custodian and brokers. Our audits also included evaluating the accounting principles used and significant estimates made by management, as well as evaluating the overall presentation of the financial statements. We believe that our audits provide a reasonable basis for our opinion.

BBD, LLP
We have served as the auditor of one or more of the Funds in the 360 Funds since 2018.
Philadelphia, Pennsylvania
February 10, 2020
23
| FinTrust Income and Opportunity Fund | ANNUAL REPORT |
November 30, 2019 (Unaudited)
The Fund files its complete schedules of portfolio holdings with the Securities and Exchange Commission (the “Commission”) for the first and third quarters of each fiscal year on Form N-Q. The Fund’s Forms N-Q are available on the Commission’s website athttp://www.sec.gov. The Fund’s Forms N-Q may be reviewed and copied at the Commission’s Public Reference Room in Washington, DC. Information on the operation of the Commission’s Public Reference Room may be obtained by calling 1-800-SEC-0330.
A description of the policies and procedures that the Fund uses to determine how to vote proxies relating to portfolio securities is available without charge, upon request, by calling 1-877-244-6235; and on the Commission’s website athttp://www.sec.gov.
Information regarding how the Fund voted proxies relating to portfolio securities during the most recent 12-month period ended June 30th is available without charge, upon request, by calling 1-877-244-6235; and on the Commission’s website athttp://www.sec.gov.
Shareholder Tax Information - The Fund is required to advise you within 60 days of the Fund’s fiscal year end regarding the federal tax status of distributions received by shareholders during the fiscal year. The Fund paid $313,520 of ordinary income for the year ended November 30, 2019.
Tax information is reported from the Fund’s fiscal year and not calendar year, therefore, shareholders should refer to their Form 1099-DIV or other tax information which will be mailed in 2020 to determine the calendar year amounts to be included on their 2019 tax returns. Shareholders should consult their own tax advisors.
24
| FinTrust Income and Opportunity Fund | ANNUAL REPORT |
ADDITIONAL INFORMATION
November 30, 2019 (Unaudited)
BOARD OF TRUSTEES, OFFICERS AND PRINCIPAL SHAREHOLDERS - (Unaudited)
The Trustees are responsible for the management and supervision of the Fund. The Trustees approve all significant agreements between the Trust, on behalf of the Fund, and those companies that furnish services to the Fund; review performance of the Fund; and oversee activities of the Fund. The Statement of Additional Information of the Trust includes additional information about the Fund’s Trustees and is available upon request, without charge, by calling (877) 244-6235
Trustees and Officers. Following are the Trustees and Officers of the Trust, their age and address, their present position with the Trust or the Fund, and their principal occupation during the past five years. Each of the Trustees of the Trust will generally hold office indefinitely. The Officers of the Trust will hold office indefinitely, except that: (1) any Officer may resign or retire and (2) any Officer may be removed any time by written instrument signed by at least two-thirds of the number of Trustees prior to such removal. In case a vacancy or an anticipated vacancy on the Board of Trustees shall for any reason exist, the vacancy shall be filled by the affirmative vote of a majority of the remaining Trustees, subject to certain restrictions under the 1940 Act. Those Trustees who are “interested persons” (as defined in the 1940 Act) by virtue of their affiliation with either the Trust or the Adviser, are indicated in the table. The address of each trustee and officer is 4300 Shawnee Mission Parkway, Suite 100, Fairway, KS 66205.
| Name, Address and Year of Birth (“YOB”) | Position(s) Held with Trust | Length of Service | Principal Occupation(s) During Past 5 Years | Number of Series Overseen | Other Directorships During Past 5 Years |
| Independent Trustees | |||||
Arthur Q. Falk YOB : 1937 | Trustee | Since 2011 | Retired. President, Murray Hill Financial Marketing, (financial marketing consultant) (1990–2012). | Ten | None |
Tom M. Wirtshafter YOB : 1954 | Trustee | Since 2011 | Senior Vice President, American Portfolios Financial Services, (broker-dealer), American Portfolios Advisors (investment adviser) (2009-Present). | Ten | None |
Gary W. DiCenzo YOB: 1962 | Trustee and Independent Chairman | Since 2014 Since 2019 | Partner, Cognios Capital (investment management firm) (2015-present) Chief Executive officer 2015-2019; President and CEO, IMC Group, LLC (asset management firm consultant) (2010-2015). | Ten | FNEX Ventures (2018-present) |
Steven D. Poppen YOB : 1968 | Trustee
| Since 2018
| Executive Vice President and Chief Financial Officer, Minnesota Vikings (professional sports organization) (1999-present). | Ten | M3Sixty Funds Trust (3 portfolios) (2015 – present); FNEX Ventures (2018- present) |
Thomas J. Schmidt YOB: 1963 | Trustee | Since 2018 | Principal, Tom Schmidt & Associates Consulting, LLC (2015-Present); Vice President of the Mutual Fund and Alternative Investment Full Service Transfer Agent (1986-2014). | Ten | FNEX Ventures (2018-present) |
| Interested Trustee* | |||||
Randall K. Linscott YOB: 1971 | President | Since 2013 | Chief Executive Officer, M3Sixty Administration, LLC (2013 – present); Chief Operating Officer, M3Sixty Administration LLC (2011-2013); Division Vice President, Boston Financial Data Services, (2005-2011). | Ten | M3Sixty Funds Trust (3 portfolios) (2015 – present) |
* The Interested Trustee is an Interested Trustee
25
| FinTrust Income and Opportunity Fund | ANNUAL REPORT |
ADDITIONAL INFORMATION
November 30, 2019 (Unaudited)
BOARD OF TRUSTEES, OFFICERS AND PRINCIPAL SHAREHOLDERS - (Unaudited) (continued)
| Name, Address and Year of Birth (“YOB”) | Position(s) Held with Trust | Length of Service | Principal Occupation(s) During Past 5 Years | Number of Series Overseen | Other Directorships During Past 5 Years |
Officers | |||||
Andras P. Teleki YOB: 1971 | Chief Compliance Officer and Secretary | Since 2015 | Chief Legal Officer, M3Sixty Administration, LLC, M3Sixty Holdings, LLC, Matrix 360 Distributors, LLC and M3Sixty Advisors, LLC (2015-present); Chief Compliance Officer and Secretary, M3Sixty Funds Trust (2016-present); Chief Compliance Officer and Secretary, WP Trust (2016-present); Secretary and Assistant Treasurer, Capital Management Investment Trust (2015); Partner, K&L Gates (2009-2015). | N/A | N/A |
Brandon J. Byrd YOB: 1981 | Assistant Secretary and Anti-Money Laundering Officer
Vice President | Since 2013 Since 2018 | Chief Operating Officer, M3Sixty Administration, LLC (2013-present); Anti-Money Laundering Compliance Officer, Monteagle Funds (2015-2016); Division Manager - Client Service Officer, Boston Financial Data Services (mutual find service provider) (2010-2012). | N/A | N/A |
Larry E. Beaver, Jr.** YOB: 1969 | Assistant Treasurer | Since 2017 | Fund Accounting, Administration and Tax Officer, M3Sixty Administration, LLC (2017-Present); Director of Fund Accounting & Administration, M3Sixty Administration, LLC (2005-2017); Chief Accounting Officer, Amidex Funds, Inc. (2003-Present); Assistant Treasurer, Capital Management Investment Trust (July 2017-Present); Assistant Treasurer, M3Sixty Funds Trust (July 2017-Present; Assistant Treasurer, WP Funds Trust (July 2017-Present); Treasurer and Assistant Secretary, Capital Management Investment Trust (2008-July 2017); Treasurer, 360 Funds Trust (2007-2017); Treasurer, M3Sixty Funds Trust (2015-July 2017); Treasurer, WP Trust (2015-July 2017); Treasurer and Chief Financial Officer, Monteagle Funds (2008-2016). | N/A | N/A |
John H. Lively YOB: 1969
| Assistant Secretary | Since 2017 | Attorney, Practus, LLP (law firm) (May 2018-present); Attorney, The Law Offices of John H. Lively & Associates, Inc. (law firm) (2010-May 2018). | N/A | N/A |
Ted L. Akins YOB: 1974 | Assistant Secretary | Since 2018 | Vice President of Operations, M3Sixty Administration, LLC (2012-present). | N/A | N/A |
** Effective December 28, 2018, Larry E. Beaver, Jr. was assigned as Interim Treasurer until a new Treasurer is appointed by the Board.
26
| FinTrust Income and Opportunity Fund | ANNUAL REPORT |
ADDITIONAL INFORMATION
November 30, 2019 (Unaudited)
BOARD OF TRUSTEES, OFFICERS AND PRINCIPAL SHAREHOLDERS - (Unaudited) (continued)
Remuneration Paid to Trustees and Officers - Officers of the Trust and Trustees who are “interested persons” of the Trust or the Adviser will receive no salary or fees from the Trust. Officers of the Trust and interested Trustees do receive compensation directly from certain service providers to the Trust, including Matrix 360 Distributors, LLC and M3Sixty Administration, LLC. Each Trustee who is not an “interested person” received a fee of $1,500 each year plus $200 per Board or committee meeting attended. Effective April 25, 2019, each Trustee who is not an “interested person” (an “Independent Trustee”) will receive a $5,000 annual retainer (paid quarterly). In addition, each Independent Trustee will receive, on a per fund basis: (i) a fee of $1,500 per fund each year (paid quarterly); (ii) a fee of $200 per Board meeting attended; and (iii) a fee of $200 per committee meeting attended. The Trust will also reimburse each Trustee for travel and other expenses incurred in connection with, and/or related to, the performance of their obligations as a Trustee. Officers of the Trust will also be reimbursed for travel and other expenses relating to their attendance at Board meetings.
| Name of Trustee1 | Aggregate Compensation From each Fund2 | Pension or Retirement of Portfolio Expenses | Estimated Annual Benefits Upon Retirement | Total Compensation From the Fund Paid to Trustees2 | ||||||||
| Independent Trustees | ||||||||||||
| Arthur Q. Falk | $ | 2,654 | None | None | $ | 2,654 | ||||||
| Tom M. Wirtshafter | $ | 2,654 | None | None | $ | 2,654 | ||||||
| Gary W. DiCenzo | $ | 2,654 | None | None | $ | 2,654 | ||||||
| Steven D. Poppen | $ | 2,654 | None | None | $ | 2,654 | ||||||
| Thomas J. Schmidt | $ | 2,654 | None | None | $ | 2,654 | ||||||
| Interested Trustees and Officers | ||||||||||||
| Randall K. Linscott | None | Not Applicable | Not Applicable | None | ||||||||
1Each of the Trustees serves as a Trustee to each Series of the Trust. The Trust currently offers ten (10) series of shares.
2Figures are for the year ended November 30, 2019.
27
| FinTrust Income and Opportunity Fund | ANNUAL REPORT |
Information About Your Fund’s Expenses – (Unaudited)
As a shareholder of the Fund, you incur two types of costs: (1) transaction costs, such as the sales charge (load) imposed on certain subscriptions and the contingent deferred sales charge (“CDSC”) imposed on certain short-term redemptions; and (2) ongoing costs, including management fees, distribution and/or service (12b-1) fees; and other Fund expenses. The example below is intended to help you understand your ongoing costs (in dollars) of investing in the Fund and to compare these costs with the ongoing costs of investing in other mutual funds.
The example is based on an investment of $1,000 invested at the beginning of the period and held for the entire period as indicated below.
Actual Expenses – The first section of the table provides information about actual account values and actual expenses (relating to the example $1,000 investment made at the beginning of the period). You may use the information in this section, together with the amount you invested, to estimate the expenses that you paid over the period. Simply divide your account value by $1,000 (for example, an $8,600 account value divided by $1,000 = 8.6), then multiply the result by the number in the first section under the heading entitled “Expenses Paid During Period” to estimate the expenses you paid on your account during this period.
Hypothetical Example for Comparison Purposes – The second section of the table provides information about the hypothetical account values and hypothetical expenses based on the Fund’s actual expense ratios and an assumed rate of return of 5% per year before expenses, which is not the Fund’s actual return. The hypothetical account values and expenses may not be used to estimate the actual ending account balance or expenses you paid for the period. You may use this information to compare the ongoing costs of investing in the Fund to other funds. To do so, compare this 5% hypothetical example with the 5% hypothetical examples that appear in the shareholder reports of the other funds.
Please note that the expenses shown in the table are meant to highlight your ongoing costs only and do not reflect any transactional costs, such as sales charges (loads), CDSC fees, or exchange fees. Therefore, the second section of the table is useful in comparing ongoing costs only, and will not help you determine the relative total costs of owning different funds. In addition, if these transactional costs were included, your costs would have been higher. For more information on transactional costs, please refer to the Fund’s prospectus.
| Expenses and Value of a $1,000 Investment for the period from 05/31/19 through 11/30/19 | ||||||||||||||||
| Beginning Account Value (05/31/2019) | Annualized Expense Ratio for the Period | Ending Account Value (11/30/2019) | Expenses Paid During Period(a) | |||||||||||||
| Actual Fund Return (in parentheses) | ||||||||||||||||
| Class A (6.04%) | $ | 1,000.00 | 2.24 | % | $ | 1,060.40 | $ | 11.57 | ||||||||
| Institutional Class (6.18%) | $ | 1,000.00 | 1.99 | % | $ | 1,061.80 | $ | 10.29 | ||||||||
| Hypothetical 5% Return | ||||||||||||||||
| Class A | $ | 1,000.00 | 2.24 | % | $ | 1,013.80 | $ | 11.31 | ||||||||
| Institutional Class | $ | 1,000.00 | 1.99 | % | $ | 1,015.10 | $ | 10.05 | ||||||||
| (a) | Expenses are equal to the Fund’s annualized expense ratios, multiplied by the average account value over the period, multiplied by 183/365 to reflect the one-half year period. |
For more information on Fund expenses, please refer to the Fund’s prospectus, which can be obtained from your investment representative or by calling 1-877-244-6235. Please read it carefully before you invest or send money.
28
| FinTrust Income and Opportunity Fund | ANNUAL REPORT |
Information About Your Fund’s Expenses – (Unaudited) (continued)
Total Fund operating expense ratios as stated in the current Fund prospectus dated March 29, 2019 for the Fund were as follows:
| |
| FinTrust Income and Opportunity Fund Class A, gross of fee waivers or expense reimbursements | 4.59% |
| FinTrust Income and Opportunity Fund Class A, after waiver and reimbursement* | 2.22% |
| FinTrust Income and Opportunity Fund Institutional Class, gross of fee waivers or expense reimbursements | 4.34% |
| FinTrust Income and Opportunity Fund Institutional Class, after waiver and reimbursement* | 1.97% |
* FinTrust Capital Advisors, LLC (the “Adviser”) has entered into an Expense Limitation Agreement with the Fund under which it has agreed to waive or reduce its fees and to assume other expenses of the Fund, if necessary, in an amount that limits the Fund’s annual operating expenses (excluding interest, distribution fees pursuant to Rule 12b-1 Plans, taxes, acquired fund fees and expenses, brokerage commissions, dividend expenses on short sales, and other expenditures which are capitalized in accordance with generally accepted accounting principles and other extraordinary expenses not incurred in the ordinary course of such Fund’s business) to not more than 1.95%. The Expense Limitation Agreement covers the period during which the Interim Investment Advisory Agreement was in place and the period following shareholder approval of the new Investment Advisory Agreement through at least March 31, 2020. Subject to approval by the Fund’s Board, any waiver under the Expense Limitation Agreement is subject to repayment by the Fund within the three fiscal years following the year in which such waiver occurred, if the Fund is able to make the payment without exceeding the 1.95% expense limitation. The current contractual agreement cannot be terminated prior to at least one year after the effective date without the Board of Trustees’ approval. Total Gross Operating Expenses for the year ended November 30, 2019 were 3.66% and 3.41% for the FinTrust Income and Opportunity Fund Class A shares and FinTrust Income and Opportunity Fund Institutional Class shares, respectively. Please see the Information About Your Fund’s Expenses, the Financial Highlights and Notes to Financial Statements (Note 6) sections of this report for expense related disclosures for the year ended November 30, 2019. | |
29
360 FUNDS
4300 Shawnee Mission Pkwy
Suite 100
Fairway, KS 66205
INVESTMENT ADVISER
FinTrust Capital Advisors, LLC
124 Verdae Boulevard
Suite 504
Greenville, SC 29607
ADMINISTRATOR & TRANSFER AGENT
M3Sixty Administration, LLC
4300 Shawnee Mission Parkway
Suite 100
Fairway, KS 66205
DISTRIBUTOR
Matrix 360 Distributors, LLC
4300 Shawnee Mission Parkway
Suite 100
Fairway, KS 66205
INDEPENDENT REGISTERED PUBLIC ACCOUNTING FIRM
BBD, LLP
1835 Market Street
3rdFloor
Philadelphia, PA 19103
LEGAL COUNSEL
Practus, LLP
11300 Tomahawk Creek Parkway
Suite 310
Leawood, KS 66211
CUSTODIAN BANK
Fifth Third Bank
Fifth Third Center
38 Fountain Square Plaza
Cincinnati, OH 45263
Fairway, KS 66205
30
| ITEM 2. | CODE OF ETHICS. |
| (a) | The registrant has, as of the end of the period covered by this report, adopted a code of ethics that applies to the registrant's principal executive officer, principal financial officer, and principal accounting officer or controller, or persons performing similar functions, regardless of whether these individuals are employed by the registrant or a third party. |
| (b) | During the period covered by this report, there were no amendments to any provision of the code of ethics. |
| (c) | During the period covered by this report, there were no waivers or implicit waivers of a provision of the code of ethics.
|
| (d) | The registrant’s Code of Ethics is filed herewith. |
| ITEM 3. | AUDIT COMMITTEE FINANCIAL EXPERT. |
| The Registrant's Board of Trustees has determined that Tom Wirtshafter serves on its audit committee as the "audit committee financial expert" as defined in Item 3. |
| ITEM 4. | PRINCIPAL ACCOUNTANT FEES AND SERVICES. |
(a)
| Audit Fees. The aggregate fees billed for professional services rendered by the principal accountant for the audit of the registrant’s annual financial statements or for services that are normally provided by the accountant in connection with statutory and regulatory filings or engagements were $12,000 with respect to the registrant’s fiscal year ended November 30, 2019 and $12,000 with respect to the registrant’s fiscal year ended November 30, 2018 for the FinTrust Income and Opportunity Fund. The November 30, 2019 and November 30, 2018 audit fees were paid to BBD, LLP. |
| (b) | Audit-Related Fees. There were no fees billed during the fiscal year for assurances and related services by the principal accountant that are reasonably related to the performance of the audit of the registrant’s financial statements and are not reported under paragraph (a) of this item. |
| (c) | Tax Fees. The aggregate fees billed in the last fiscal year for professional services rendered by the principal accountant for tax compliance, tax advice and tax planning were $2,500 with respect to the registrant’s fiscal year ended November 30, 2019 and $2,500 with respect to the registrant’s fiscal year ended November 30, 2018 for the FinTrust Income and Opportunity Fund. The services comprising these fees are the preparation of the registrant’s federal income and excise tax returns. The November 30, 2019 and November 30, 2018 tax fees were paid to BBD, LLP. |
| (d) | All Other Fees. The aggregate fees billed in last fiscal year for products and services provided by the registrant’s principal accountant, other than the services reported in paragraphs (a) through (c) of this item were $0 for the fiscal year ended November 30, 2019 and $0 for the fiscal year ended November 30, 2018 for the FinTrust Income and Opportunity Fund.
|
| (e)(1) | The audit committee does not have pre-approval policies and procedures. Instead, the audit committee or audit committee chairman approves on a case-by-case basis each audit or non-audit service before the principal accountant is engaged by the registrant. |
| (e)(2) | There were no services described in each of paragraphs (b) through (d) of this Item that were approved by the audit committee pursuant to paragraph (c)(7)(i)(C) of Rule 2-01 of Regulation S-X.
|
| f) | Not applicable. The percentage of hours expended on the principal accountant's engagement to audit the registrant's financial statements for the most recent fiscal year that were attributed to work performed by persons other than the principal accountant's full-time, permanent employees was zero percent (0%).
|
| (g) | All non-audit fees billed by the registrant's principal accountant for services rendered to the registrant for the for the fiscal year ended November 30, 2019 and the fiscal year ended November 30, 2018 for the FinTrust Income and Opportunity Fund, are disclosed in (b)-(d) above. There were no audit or non-audit services performed by the registrant's principal accountant for the registrant's adviser.
|
| (h) | There were no non-audit services rendered to the registrant’s investment adviser. |
| ITEM 5. | AUDIT COMMITTEE OF LISTED REGISTRANTS. |
Not applicable
| ITEM 6. | SCHEDULES OF INVESTMENTS |
Included in annual report to shareholders filed under item 1 of this form.
| ITEM 7. | DISCLOSURE OF PROXY VOTING POLICIES AND PROCEDURES FOR CLOSED-END MANAGEMENT INVESTMENT COMPANIES. |
Not applicable as the Fund is an open-end management investment company.
| ITEM 8. | PORTFOLIO MANAGERS OF CLOSED-END MANAGEMENT INVESTMENT COMPANIES |
Not applicable as the Fund is an open-end management investment company.
| ITEM 9. | PURCHASES OF EQUITY SECURITIES BY CLOSED-END MANAGEMENT INVESTMENT COMPANY AND AFFILIATED PURCHASERS. |
Not applicable as the Fund is an open-end management investment company.
| ITEM 10. | SUBMISSION OF MATTERS TO A VOTE OF SECURITY HOLDERS. |
Not applicable at this time.
| ITEM 11. | CONTROLS AND PROCEDURES. |
| (a) | The registrant's principal executive and principal financial officers, or persons performing similar functions, have concluded that the registrant's disclosure controls and procedures (as defined in Rule 30a-3(c) under the 1940 Act, are effective, as of a date within 90 days of the filing date of this report, based on the evaluation of these controls and procedures required by Rule 30a-3(b) under the 1940 Act and Rule 15d-15(b) under the Securities Exchange Act of 1934, as amended. |
| (b) | There were no changes in the registrant's internal control over financial reporting (as defined in Rule 30a-3(d) under the 1940 Act) that occurred during the period covered by this report that have materially affected, or are reasonably likely to materially affect, the registrant's internal control over financial reporting. |
| ITEM 12. | DISCLOSURE OF SECURITIES LENDING ACTIVITIES FOR CLOSED-END MANAGEMENT INVESTMENT COMPANIES. |
Not applicable as the Fund is an open-end management investment company.
| ITEM 13. | EXHIBITS |
| (1) | Code of Ethics for Principal Executive and Senior Financial Officers is attached hereto. |
| (2) | Certifications pursuant to Section 302 of the Sarbanes-Oxley Act of 2002 are filed herewith. |
| (3) | Certifications pursuant to Section 906 of the Sarbanes-Oxley Act of 2002 are filed herewith. |
SIGNATURES
Pursuant to the requirements of the Securities Exchange Act of 1934 and the Investment Company Act of 1940, the registrant has duly caused this report to be signed on its behalf by the undersigned, thereunto duly authorized.
360 Funds
| By: Randy Linscott | /s/ Randy Linscott | |
| Principal Executive Officer, | ||
| Date: February 6, 2020 | ||
Pursuant to the requirements of the Securities Exchange Act of 1934 and the Investment Company Act of 1940, this report has been signed below by the following person on behalf of the registrant and in the capacities and on the date indicated.
| By Randy Linscott | /s/ Randy Linscott | |
| Principal Executive Officer | ||
| Date: February 6, 2020 | ||
Pursuant to the requirements of the Securities Exchange Act of 1934 and the Investment Company Act of 1940, this report has been signed below by the following person on behalf of the registrant and in the capacities and on the date indicated.
| By Larry E. Beaver, Jr. | /s/ Larry E. Beaver, Jr. | |
| Assistant Treasurer and Acting Principal Financial Officer | ||
| Date: February 6, 2020 | ||