UNITED STATES
SECURITIES AND EXCHANGE COMMISSION
Washington, D.C. 20549
FORM N-CSR
CERTIFIED SHAREHOLDER REPORT OF REGISTERED MANAGEMENT INVESTMENT COMPANIES
Investment Company Act File Number 811-21726
360 Funds
(Exact name of registrant as specified in charter)
| 4300 Shawnee Mission Parkway, Suite 100 Fairway, KS | 66205 |
| (Address of principal executive offices) | (Zip code) |
The Corporation Trust Company
Corporation Trust Center
1209 Orange St.
Wilmington, DE 19801
(Name and address of agent for service)
With Copies To:
Bo J. Howell
FinTech Law, LLC
6224 Turpin Hills Dr.
Cincinnati, Ohio 45244
Registrant’s telephone number, including area code: 877-244-6235
Date of fiscal year end: 11/30/2022
Date of reporting period: 11/30/2022
| ITEM 1. | REPORTS TO SHAREHOLDERS |
The Annual report to Shareholders of the FinTrust Income and Opportunity Fund, a series of the 360 Funds (the “registrant”), for the year ended November 30, 2022 pursuant to Rule 30e-1 under the Investment Company Act of 1940 (the “1940 Act”) (17 CFR 270.30e-1), as amended, is filed herewith.

FinTrust Income and Opportunity Fund
Class A Shares (Ticker Symbol: HROAX)
Institutional Class Shares (Ticker Symbol: HIOIX)
A Series of the
360 Funds
ANNUAL REPORT
November 30, 2022
Investment Adviser:
FinTrust Capital Advisors, LLC
124 Verdae Boulevard, Suite 504
Greenville, SC 29607
IMPORTANT NOTE: As permitted by regulations adopted by the SEC, paper copies of the Fund’s shareholder reports will no longer be sent by mail unless you specifically request paper copies of the reports from the Fund or from your financial intermediary, such as a broker-dealer or bank. Instead, the reports will be made available on a website, and you will be notified by mail each time a report is posted and provided with a website link to access the report. You may elect to receive all future reports in paper free of charge. You can inform the Fund or your financial intermediary that you wish to continue receiving paper copies of your shareholder reports by calling or sending an e-mail request. Your election to receive reports in paper will apply to all funds held with the Fund complex/your financial intermediary.
TABLE OF CONTENTS
| FinTrust Income and Opportunity Fund | ANNUAL REPORT |
LETTER TO SHAREHOLDERS (Unaudited)
November 30, 2022
Dear Shareholders,
Performance
In the twelve months ended November 30, 2022, the Institutional Class of our FinTrust Income and Opportunity Fund (the “Fund”) declined (3.68)%(a),, while the Class A shares before sales charges declined (3.94)%(a), the S&P 500® Total Return Index(b) (“S&P 500”) declined (9.21)% (b) and the Morningstar Long-Short Equity Category fell (3.10)%(c).
The Economic Climate
Downside Convergence
In last year’s letter, we highlighted the growing number of divergences we were seeing within the equity markets. In 2022, those divergences collapsed to the downside, as there were broad-based declines across asset classes including stocks, bonds, cryptocurrencies, and previous market generals. Prior to 2022, inflation had been rebounding as the economy re-opened from the Covid shutdowns which was aided by the largest fiscal stimulus since World War II. The outbreak of the Ukrainian Russian war caused reflating commodities prices to accelerate higher. Specifically, crude oil futures reached prices above $120 a barrel before heavy selling by the United States’ strategic petroleum reserve helped ease market supply concerns. Higher inflationary readings in turn forced bond prices lower and interest rates higher, and the Federal Reserve was eventually forced to follow market rates higher. By November, the Federal Reserve had raised the Fed Funds rates by 3.78%. The current pace of Federal Reserve tightening is one of the fastest on record, exceeded by only a few occasions back in the 1980s and 1970s when base rates were much higher.
For most of the year, our models have helped us protect value in a difficult tape. Our models have highlighted that there exists a negative correlation between the Fed Funds rate and many long-dated assets like equities, and that large growth stocks might be the most sensitive area of the equity markets. At the same time, there is a positive correlation between longer-dated asset returns and the beginning level of interest rates, so we expect better days ahead after this period of transition.
We believe it is important to remember during these inflationary times that companies must eventually pass through all their costs, otherwise they will go out of business. As a result, the long-term record suggests that equity markets have traditionally outpaced inflation, cash and cash equivalents, and bonds over time.
During the year, the Fund was more active in its trading as we sought to control risk throughout a difficult climate. At the same time, we believe equity market valuations are improving and are gradually becoming more reflective of the risks. While we would like to be able to report a positive return, we are pleased with the recent performance as we think we are striking the right balance of protecting value during a difficult market while maintaining exposure to longer term opportunities. We believe most of the factors impacting the portfolio are transitory and less important to long-term performance than the strength of a company’s intellectual property and today’s improving demographics.
We mentioned in our last shareholder letter that we expected large company growth stocks to eventually deflate, and that is indeed was what happened during 2022. Last year we wrote the following: “In our data, the divergence between smaller capitalization companies, economically sensitive, and international stock performance relative to mega capitalization U.S. growth stock performance has not been this wide since the last days of the internet bubble (1999-2002).”
At the time, we thought the low bond rates might allow for an internal stock market rotation. In retrospect, as the Federal Reserve raised interest rates, money returned to the treasury market from bond market proxies in the stock market. As a result, the entire spectrum of equities has been under pressure. Our data still suggests that a great rotation could occur due to generational demographics.
What Might Cause the Rotation
We believe markets have begun pricing in a mild inflationary driven recession. Inflation typically hurts profit margins initially as costs rise faster than companies can reprice their goods and contracts. We believe there have been three forces behind today’s inflationary forces: the Covid stimulus and recovery, millennial demographics, and Green New Deal policies, which fundamentally seek to raise energy prices in order to encourage substitution and conservation. At this point, we believe the sharp Covid recovery and associated supply chain issues have corrected. We also believe companies are slowing adjusting to the country’s new demographics, but we believe this will be a four year process as the peak baby boom years were 1957-1961 and the peak millennial birth years were 1989-1993. We also believe the recent Congressional elections will moderate Green New Deal policies.
While we expect an inflation induced slowdown in 2023, we believe much of this risk is already priced into smaller capitalization companies.
| FinTrust Income and Opportunity Fund | ANNUAL REPORT |
LETTER TO SHAREHOLDERS (Unaudited) (continued)
November 30, 2022
An Important Note About This Recessionary Recovery and the Future
As of 2019, the millennial generation (1981-1996) became the largest living generation. This is an economic reality that will be with the markets for the rest of our careers. This is the first time there has been an economic recovery whereby there is a generation larger than the baby boom generation. Generation X (1965-1980) is not expected to exceed the size of the baby boomer generation until 2028. Economically, households reach their peak spending when the head of the household is approximately 50 years old. 2022/23 would represent 50 years from the lowest point in immigration adjusted U.S. births (1972-1973) as well as 65 years past the peak in baby boomer births in 1957. As a result, the shape of the recovery and economy will increasingly be driven by the political and economic choices of a younger demographic.
We believe 2022 ushered in a glimpse of this demographic turning. In 2022, the markets slumped on the higher inflation that had been led by increased goods demand. The year 2022 also brought a bust in many emerging trends like cryptocurrencies, non-fungible tokens and meme stocks. Each generation creates its own trends and has to learn which are fads and which represent sustainable opportunities. The boomers early learning experienced involved the boom, bust, and recovery around the 1987 crash. Generation X rode the boom, bust, and boom of the internet. Now the millennials are launching us into their workings and spending years. Over time, we think the millennials will learn, as we did, that great intellectual property can help identify and separate sustainable growth businesses from the wild speculations and tired ideas.
There will still be economic expansion and contractions, but we believe this generational turn will support our investment thesis for investing in younger companies with compelling intellectual property for a long time to come.
In conclusion
In last year’s letter, we wrote the following:
“In our opinion, investors may have been etherized and learned bad investing habits following 10 years of federal government stimulus. What’s a kid to do when they just keep spiking the punch bowl?” Well, the only thing we would change from last year’s letter is that we now say 11 years. This year, we would simply update the statement to 12 years.” In 2022, the Federal Reserve finally took the spiked punch bowl away, and investors began learning some long forgotten lessons. As long as the inflation rate remains above current interest rates, we believe there is risk in the market. Once the inflation rate declines below the prevailing interest rates, investors might have a brief panic on recessionary fears, but we believe it will mark an important sign of stabilization.
In conducting our annual Ben Graham (Warren Buffet’s mentor) analysis of the 30 Dow Jones Industrial Average stocks this year, we noticed that valuations have returned to historical averages. The question we must answer, of course, is whether we currently have average conditions. While fixed income returns seem more certain and are certainly more competitive against stocks than in the recent past, we continue to believe that equity markets will offer real returns (“meaning the return after inflation”) sooner than bond markets. The combination of average valuations along with real return potential makes us more constructive on the equity markets for 2023 than we have been for some time.
Asset Allocation
As of November 30, 2022, the portfolio consisted of 75.21% of net assets invested in common and preferred stocks and exchange traded funds, 20.11% of net assets invested in money market funds, 0.34% of net assets invested in put option contracts, and 1.45% of the Fund was invested in call options on equity securities.
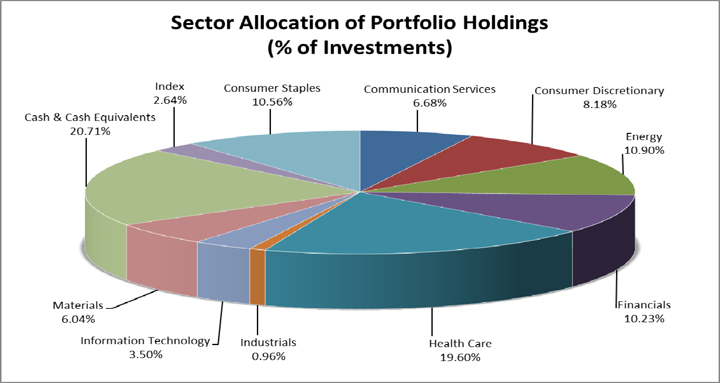
Sector Weightings (as of November 30, 2022)
The portfolio weightings by sector on a market value basis outlined below:
| Sector Diversification | % of Market Value |
| Basic Materials | 6.0% |
| Communication Services | 6.7% |
| Consumer Discretionary | 8.2% |
| Consumer Staples | 10.6% |
| Energy | 10.9% |
| Financials | 10.2% |
| Healthcare | 19.6% |
| Index | 2.6% |
| Industrials | 1.0% |
| Information Technology | 3.5% |
| Money Market | 20.7% |
| FinTrust Income and Opportunity Fund | ANNUAL REPORT |
LETTER TO SHAREHOLDERS (Unaudited) (continued)
November 30, 2022
Conclusion
Thank you for investing and joining us as fellow shareholders in the FinTrust Income and Opportunity Fund. We continue to work hard to justify your confidence and trust in our stewardship of your hard-earned savings. We also remain dedicated to providing you with the information we would like to have if our roles were reversed.
Shape the future,
Allen R. Gillespie, CFA
Managing Partner of Investments
(a) The performance quoted assumes the reinvestment of all dividend and capital gain distributions, if any, and represents past performance, which is not a guarantee of future results. The returns shown do not reflect taxes that a shareholder would pay on Fund distributions or on the redemption of Fund shares. The investment return and principal value of an investment will fluctuate and, therefore, an investor’s shares, when redeemed, may be worth more or less than their original cost. The performance information shown for the Fund’s Class A shares does not reflect any front-end sales load. Please see the Total Return Table on the following pages for performance information on the Fund’s Class A shares (with sales load). Updated performance data current to the most recent month-end can be obtained by calling 1-877-244-6235. Investors should consider the investment objectives, risks, charges and expenses carefully before investing or sending money. This and other important information about the Fund can be found in the Fund’s prospectus. Please read it carefully before investing.
(b) The S&P 500® Total Return Index is a broad unmanaged index of 500 stocks, which is widely recognized as representative of the equity market in general. Please note that indices do not take into account any fees and expenses of investing in the individual securities that they track and individuals cannot invest directly in any index.
(c) The Morningstar Category Average is the average return for the peer group based on the returns of each individual fund within the group, for the period shown. This average assumes reinvestment of dividends. The Morningstar Long-Short Category represent funds that hold sizeable stakes in both long and short positions in equities and related derivatives. Some funds that fall into this category will shift their exposure to long and short positions depending on their macro outlook or the opportunities they uncover through bottom-up research. Some funds may simply hedge long stock positions through exchange traded funds or derivatives. At least 75% of the assets are in equity securities or derivatives. The information contained herein is proprietary to Morningstar and/or its content providers; may not be copied or distributed; and is not warranted to be accurate, complete or timely. Neither Morningstar not its content providers are responsible for any damages or losses arising from any use of this information.
| FinTrust Income and Opportunity Fund | ANNUAL REPORT |
INVESTMENT HIGHLIGHTS (Unaudited)
November 30, 2022

| Returns as of November 30, 2022 | | One Year ended
November 30, 2022 | Five Years ended
November 30, 2022 | | Since Inception from
January 21, 2016
through
November 30, 2022 |
| FinTrust Income and Opportunity Fund Class A shares without sales charge | | (3.94)% | 2.57% | | 4.58% |
| FinTrust Income and Opportunity Fund Class A shares with sales charge | | (9.23)% | 1.41% | | 3.72% |
| FinTrust Income and Opportunity Fund Institutional Class shares | | (3.68)% | 2.83% | | 4.84% |
| S&P 500® Total Return Index | | (9.21)% | 10.97% | | 14.16% |
The performance information quoted in this annual report assumes the reinvestment of all dividend and capital gain distributions, if any, and represents past performance, which is not a guarantee of future results. The returns shown do not reflect taxes that a shareholder would pay on Fund distributions or on the redemption of Fund shares. The investment return and principal value of an investment will fluctuate and, therefore, an investor’s shares, when redeemed, may be worth more or less than their original cost. Updated performance data current to the most recent month-end can be obtained by calling 1-877-244-6235.
The above graph depicts the performance of the FinTrust Income and Opportunity Fund versus the S&P 500® Total Return Index. The S&P 500® Total Return Index is a broad unmanaged index of 500 stocks, which is widely recognized as representative of the equity market in general. Please note that indices do not take into account any fees and expenses of investing in the individual securities that they track and individuals cannot invest directly in any index.
As with any fund, save an index fund, that commonly compares its performance to the S&P 500® Total Return Index, such a comparison may be said to be inappropriate because of the dissimilarity between the Fund’s investments and the securities comprising the index; so too with the FinTrust Income and Opportunity Fund, which will generally not invest in all the securities comprising the index.
| FinTrust Income and Opportunity Fund | ANNUAL REPORT |
INVESTMENT HIGHLIGHTS (Unaudited) (continued)
November 30, 2022
The investment objective of the FinTrust Income and Opportunity Fund (the “Fund”) is total return comprised of income and capital appreciation. To meet its investment objective, the Fund will invest primarily in domestic equity securities that in the opinion of FinTrust Capital Advisors, LLC (the “Adviser”) have above average intellectual property portfolios and other characteristics, like strong earnings and dividend growth that are members of the S&P 1500 Composite, relative to their sector competitors.
The Fund will typically invest in issuers that have established markets and operations and generate excess cash flow. The Fund looks for stocks with attributes which suggest they will thrive in good markets and survive potential economic setbacks. The Fund employs detailed quantitative assessments to construct its equity portfolio. Portfolio parameters include, but are not limited to, a quantitative valuation of the strength of the company’s intellectual property portfolio, steady growing earnings, dividend yield with a tendency to raise such yield and availability at reasonable price-earnings ratios. The Fund seeks to invest in stocks that are undervalued by the market, but with strong business models, which may provide for lower levels of market volatility or non-correlated volatility, The Fund also prefers to invest in equity stocks that have options traded on them. The Fund will rebalance and adjust its equity portfolio as the Adviser deems necessary and appropriate.
The Fund may also invest in companies that are experiencing a “special situation” that makes them undervalued relative to their long-term potential. Developments creating special situations may include new intellectual property developments, intellectual property licensing deals, mergers, spin-offs, litigation resolutions, new products or management changes. The Fund may also invest in convertible securities. The Fund also seeks to generate income for shareholders by selling options against the risk taken by owning common stocks. For example, the Fund intends to sell covered call options on a portion of its stock holdings. This income is designed to, over time, add to portfolio stability and improve returns. The Fund uses an options strategy to limit market exposure and volatility. The extent of option selling will depend upon market conditions and the Adviser’s judgment of the advantages of selling call options on the Fund’s equity investments. Additionally, the Fund will enter into call spreads. A spread is an options position established by purchasing one option and selling another option of the same class, but of a different series.
The Fund is non-diversified, which means that compared to a diversified fund, the Fund can invest a greater percentage of its assets in a small group of issuers or any one issuer. The Fund may be appropriate for investors with long-term time horizons who are not sensitive to short-term losses and want to participate in the long-term growth of the financial markets. The Fund seeks to avoid or minimize the effects of inflation on the portfolio.
The percentages in the above graph are based on the portfolio holdings of the Fund as of November 30, 2022 and are subject to change. For a detailed break-out of holdings by industry and investment type, please refer to the Schedule of Investments.
FINTRUST INCOME AND OPPORTUNITY FUND
SCHEDULE OF INVESTMENTS
| November 30, 2022 | ANNUAL REPORT |
| COMMON STOCK - 66.95% | | | | | | | | | | | Shares | | | Value | |
| | | | | | | | | | | | | | | | |
| Agriculture - 2.66% | | | | | | | | | | | | | | | | | | | | |
| Darling Ingredients, Inc.(a) | | | | | | | | | | | | | | | 6,300 | | | $ | 452,529 | |
| | | | | | | | | | | | | | | | | | | | | |
| Auto Manufacturers - 0.92% | | | | | | | | | | | | | | | | | | | | |
| Volkswagen AG - Germany - ADR | | | | | | | | | | | | | | | 8,140 | | | | 156,614 | |
| | | | | | | | | | | | | | | | | | | | | |
| Auto Parts & Equipment - 1.65% | | | | | | | | | | | | | | | | | | | | |
| Goodyear Tire & Rubber Co.(a) | | | | | | | | | | | | | | | 25,000 | | | | 280,500 | |
| | | | | | | | | | | | | | | | | | | | | |
| Beverages - 1.44% | | | | | | | | | | | | | | | | | | | | |
| Celsius Holdings, Inc.(a) | | | | | | | | | | | | | | | 2,200 | | | | 244,948 | |
| | | | | | | | | | | | | | | | | | | | | |
| Biotechnology - 5.28% | | | | | | | | | | | | | | | | | | | | |
| Amgen, Inc. | | | | | | | | | | | | | | | 1,700 | | | | 486,880 | |
| Regeneron Pharmaceuticals, Inc.(a) | | | | | | | | | | | | | | | 550 | | | | 413,435 | |
| | | | | | | | | | | | | | | | | | | | 900,315 | |
| Building Materials - 0.93% | | | | | | | | | | | | | | | | | | | | |
| PGT Innovations, Inc.(a) | | | | | | | | | | | | | | | 8,000 | | | | 158,320 | |
| | | | | | | | | | | | | | | | | | | | | |
| Chemicals - 3.90% | | | | | | | | | | | | | | | | | | | | |
| AdvanSix, Inc. | | | | | | | | | | | | | | | 10,441 | | | | 429,752 | |
| Chemours Co. | | | | | | | | | | | | | | | 3,500 | | | | 108,675 | |
| Huntsman Corp. | | | | | | | | | | | | | | | 4,527 | | | | 125,760 | |
| | | | | | | | | | | | | | | | | | | | 664,187 | |
| Distribution & Wholesale - 1.99% | | | | | | | | | | | | | | | | | | | | |
| Sendas Distribuidora SA - Brazil - ADR | | | | | | | | | | | | | | | 17,500 | | | | 338,625 | |
| | | | | | | | | | | | | | | | | | | | | |
| Energy - Alternate Sources - 1.20% | | | | | | | | | | | | | | | | | | | | |
| JinkoSolar Holding Co. Ltd. - China - ADR(a) | | | | | | | | | | | | | | | 4,000 | | | | 205,120 | |
| | | | | | | | | | | | | | | | | | | | | |
| Food - 1.02% | | | | | | | | | | | | | | | | | | | | |
| Lamb Weston Holdings, Inc. | | | | | | | | | | | | | | | 2,000 | | | | 173,800 | |
| | | | | | | | | | | | | | | | | | | | | |
| Healthcare - Products - 2.58% | | | | | | | | | | | | | | | | | | | | |
| Haemonetics Corp.(a) | | | | | | | | | | | | | | | 2,000 | | | | 170,620 | |
| Inmode Ltd. - Israel(a) | | | | | | | | | | | | | | | 7,000 | | | | 268,730 | |
| | | | | | | | | | | | | | | | | | | | 439,350 | |
| Healthcare - Services - 0.77% | | | | | | | | | | | | | | | | | | | | |
| Centene Corp.(a) | | | | | | | | | | | | | | | 1,500 | | | | 130,575 | |
| | | | | | | | | | | | | | | | | | | | | |
| Insurance - 6.85% | | | | | | | | | | | | | | | | | | | | |
| Brighthouse Financial, Inc.(a) | | | | | | | | | | | | | | | 11,500 | | | | 641,010 | |
| Jackson Financial, Inc. - Class A | | | | | | | | | | | | | | | 9,000 | | | | 336,150 | |
| W. R. Berkley Corp. | | | | | | | | | | | | | | | 2,500 | | | | 190,700 | |
| | | | | | | | | | | | | | | | | | | | 1,167,860 | |
FINTRUST INCOME AND OPPORTUNITY FUND
SCHEDULE OF INVESTMENTS
| November 30, 2022 | ANNUAL REPORT |
| COMMON STOCK - 66.95% (continued) | | | | | | | | | | | | | | Shares | | | Value | |
| | | | | | | | | | | | | | | | | | | | | |
| Internet - 9.65% | | | | | | | | | | | | | | | | | | | | |
| Alphabet, Inc. - Class C (a) | | | | | | | | | | | | | | | 7,000 | | | $ | 710,150 | |
| Booking Holdings, Inc.(a) | | | | | | | | | | | | | | | 101 | | | | 210,024 | |
| eBay, Inc. | | | | | | | | | | | | | | | 7,863 | | | | 357,295 | |
| Meta Platforms, Inc. - Class A(a) | | | | | | | | | | | | | | | 3,100 | | | | 366,110 | |
| | | | | | | | | | | | | | | | | | | | 1,643,579 | |
| Leisure Time - 2.04% | | | | | | | | | | | | | | | | | | | | |
| Carnival Corp.(a) | | | | | | | | | | | | | | | 35,000 | | | | 347,550 | |
| | | | | | | | | | | | | | | | | | | | | |
| Mining - 1.75% | | | | | | | | | | | | | | | | | | | | |
| MP Materials Corp.(a) | | | | | | | | | | | | | | | 9,000 | | | | 299,250 | |
| | | | | | | | | | | | | | | | | | | | | |
| Oil & Gas - 6.85% | | | | | | | | | | | | | | | | | | | | |
| APA Corp. | | | | | | | | | | | | | | | 11,700 | | | | 548,145 | |
| Devon Energy Corp. | | | | | | | | | | | | | | | 3,500 | | | | 239,820 | |
| Marathon Oil Corp. | | | | | | | | | | | | | | | 5,000 | | | | 153,150 | |
| TotalEnergies SE - France - ADR | | | | | | | | | | | | | | | 2,000 | | | | 124,840 | |
| YPF S.A. - Argentina -ADR(a) | | | | | | | | | | | | | | | 12,000 | | | | 100,680 | |
| | | | | | | | | | | | | | | | | | | | 1,166,635 | |
| Pharmaceuticals - 10.40% | | | | | | | | | | | | | | | | | | | | |
| AstraZeneca PLC - Great Britain - ADR | | | | | | | | | | | | | | | 8,800 | | | | 598,136 | |
| Canopy Growth Corp. - Canada(a) | | | | | | | | | | | | | | | 30,000 | | | | 108,600 | |
| Merck & Co., Inc. NJ | | | | | | | | | | | | | | | 6,100 | | | | 671,732 | |
| Neurocrine Biosciences, Inc.(a) | | | | | | | | | | | | | | | 2,500 | | | | 317,650 | |
| Pacira BioSciences, Inc.(a) | | | | | | | | | | | | | | | 1,561 | | | | 75,318 | |
| | | | | | | | | | | | | | | | | | | | 1,771,436 | |
| Pipelines - 3.74% | | | | | | | | | | | | | | | | | | | | |
| Cheniere Energy, Inc. | | | | | | | | | | | | | | | 2,500 | | | | 438,400 | |
| Transportadora de Gas del Sur S.A. - Argentina - ADR | | | | | | | | | | | | | | | 20,000 | | | | 197,800 | |
| | | | | | | | | | | | | | | | | | | | 636,200 | |
| Retail - 1.33% | | | | | | | | | | | | | | | | | | | | |
| BJ’s Wholesale Club Holdings, Inc.(a) | | | | | | | | | | | | | | | 3,000 | | | | 225,720 | |
| | | | | | | | | | | | | | | | | | | | | |
| TOTAL COMMON STOCK (Cost $11,567,638) | | | | | | | | | | | | | | | | | | | 11,403,113 | |
| | | | | | | | | | | | | | | | | | | | | |
| PREFERRED STOCK - 3.08% | | | | | | | | | | | | | | | | | | | | |
| | | | | | | | | | | | | | | | | | | | | |
| Banks - 3.08% | | | | | | | | | | | | | | | | | | | | |
| United Community Banks, Inc., 6.875% - Series I(c) | | | | | | | | | | | | | | | 21,000 | | | | 523,950 | |
| | | | | | | | | | | | | | | | | | | | | |
| TOTAL PREFERRED STOCK (Cost $529,751) | | | | | | | | | | | | | | | | | | | 523,950 | |
| | | | | | | | | | | | | | | | | | | | | |
| EXCHANGE-TRADED FUNDS - 5.18% | | | | | | | | | | | | | | | | | | | | |
| | | | | | | | | | | | | | | | | | | | | |
| Equity Funds - 5.18% | | | | | | | | | | | | | | | | | | | | |
| AdvisorShares Pure U.S. Cannabis ETF(a) | | | | | | | | | | | | | | | 26,000 | | | | 310,440 | |
| ARK Innovation ETF | | | | | | | | | | | | | | | 10,000 | | | | 374,800 | |
| iShares MSCI Emerging Markets ETF | | | | | | | | | | | | | | | 5,000 | | | | 197,600 | |
| | | | | | | | | | | | | | | | | | | | | |
| TOTAL EXCHANGE-TRADED FUNDS (Cost $855,848) | | | | | | | | | | | | | | | | | | | 882,840 | |
FINTRUST INCOME AND OPPORTUNITY FUND
SCHEDULE OF INVESTMENTS
| November 30, 2022 | ANNUAL REPORT |
| OPTIONS PURCHASED - 1.79% | | | | | | | | | | | | | | | | | | | | |
| | | | | | | Notional | | | Exercise | | | | | | | | | |
| CALL OPTIONS PURCHASED - 1.45% | | Contracts 1 | | | Amount | | | Price | | | Expiration | | | Value | |
| iShares Russell 2000 ETF | | | 200 | | | $ | 3,720,000 | | | $ | 186.00 | | | | 12/9/2022 | | | $ | 75,400 | |
| Invesco QQQ Trust Series 1 | | | 125 | | | | 3,587,500 | | | | 287.00 | | | | 12/9/2022 | | | | 107,375 | |
| Meta Platforms Inc | | | 30 | | | | 330,000 | | | | 110.00 | | | | 12/16/2022 | | | | 29,490 | |
| SPDR Gold Shares | | | 50 | | | | 800,000 | | | | 160.00 | | | | 1/20/2023 | | | | 35,250 | |
| | | | | | | | | | | | | | | | | | | | | |
| TOTAL CALL OPTIONS PURCHASED (Cost $213,145) | | | | | | | | | | | | | | | | | | | 247,515 | |
| | | | | | | | | | | | | | | | | | | | | |
| PUT OPTIONS PURCHASED - 0.34% | | | | | | | | | | | | | | | | | | | | |
| SPDR S&P 500 ETF Trust | | | 150 | | | | 5,250,000 | | | | 350.00 | | | | 12/30/2022 | | | | 5,700 | |
| Starbucks Corp. | | | 30 | | | | 247,500 | | | | 82.50 | | | | 1/20/2023 | | | | 1,140 | |
| SPDR S&P 500 ETF Trust | | | 150 | | | | 5,025,000 | | | | 335.00 | | | | 3/31/2023 | | | | 50,850 | |
| | | | | | | | | | | | | | | | | | | | | |
| TOTAL PUT OPTIONS PURCHASED (Cost $410,428) | | | | | | | | | | | | | | | | | | | 57,690 | |
| | | | | | | | | | | | | | | | | | | | | |
| TOTAL OPTIONS PURCHASED (Cost $623,573) | | | | | | | | | | | | | | | | | | | 305,205 | |
| SHORT-TERM INVESTMENTS - 20.11% | | | | | | | | | | | | | | Shares | | | | | |
| Federated Hermes Government Obligations Fund - Institutional Shares, 3.61% (b) | | | | | | | | | | 3,425,631 | | | | 3,425,631 | |
| | | | | | | | | | | | | | | | | | | | | |
| SHORT-TERM INVESTMENTS (Cost $3,425,631) | | | | | | | | | | | | | | 3,425,631 | |
| | | | | | | | | | | | | | | | | | | | | |
| INVESTMENTS AT VALUE (Cost $17,002,441) - 97.11% | | | | | | | | | | | | | $ | 16,540,739 | |
| | | | | | | | | | | | | | | | | | | | | |
| OTHER ASSETS IN EXCESS OF LIABILITIES, NET - 2.89% | | | | | | | | | | | | | | 492,229 | |
| | | | | | | | | | | | | | | | | | | | | |
| NET ASSETS - 100.00% | | | | | | | | | | | | | $ | 17,032,968 | |
Percentages are stated as a percent of net assets.
(a) Non-income producing security.
(b) Rate shown represents the 7-day effective yield at November 30, 2022, is subject to change and resets daily.
(c) Affiliated company. See Investments In Affiliated Companies (Note 10) section of the accompanying footnotes.
1 Each option contract is equivalent to 100 shares of the underlying common stock or exchange-traded fund. All options are non-income producing.
The following abbreviations are used in this portfolio:
ADR - American Depositary Receipt
AG - Aktiengesellschaft (German Public Limited Company)
ETF - Exchange-Traded Fund
Ltd. - Limited
PLC - Public Limited Company
S.A. - Sociedad Anónima (Spanish Public Limited Company)
SA - Sociedade Anonima (Brazilian Public Limited Company)
The accompanying notes are an integral part of these financial statements.
| FINTRUST INCOME AND OPPORTUNITY FUND | |
| STATEMENT OF ASSETS AND LIABILITIES | |
| | |
| November 30, 2022 | ANNUAL REPORT |
| Assets: | | | |
| | | | |
| Unaffiliated Investments, at cost | | $ | 16,472,690 | |
| Affiliated Investments, at cost | | | 529,751 | |
| Total Investments, at cost | | | 17,002,441 | |
| Unaffiliated Investments, at value | | | 16,016,789 | |
| Affiliated Investments, at value | | | 523,950 | |
| Total Investments, at value | | | 16,540,739 | |
| Receivables: | | | | |
| Interest | | | 10,511 | |
| Dividends | | | 20,816 | |
| Investment securities sold | | | 651,402 | |
| Prepaid expenses | | | 2,813 | |
| Total assets | | $ | 17,226,281 | |
| | | | | |
| Liabilities: | | | | |
| Cash due to broker | | $ | 22,263 | |
| Payables: | | | | |
| Investment securities purchased | | | 150,338 | |
| Fund shares redeemed | | | 4,900 | |
| Due to adviser | | | 3,757 | |
| Accrued distribution (12b-1) fees | | | 183 | |
| Due to administrator | | | 8,690 | |
| Accrued expenses | | | 3,182 | |
| Total liabilities | | | 193,313 | |
| Net Assets | | $ | 17,032,968 | |
| | | | | |
| Sources of Net Assets: | | | | |
| Paid-in capital | | $ | 18,633,744 | |
| Total accumulated deficit | | | (1,600,776 | ) |
| Total Net Assets | | $ | 17,032,968 | |
| | | | | |
| Class A Shares: | | | | |
| Net Assets | | $ | 158,410 | |
| Shares Outstanding (Unlimited shares of $0 par value beneficial interest authorized) | | | 15,977 | |
| Net Asset Value Per Share | | $ | 9.91 | |
| | | | | |
| Maximum Offering Price Per Share(a) | | $ | 10.49 | |
| | | | | |
| Minimum Redemption Price Per Share(b) | | $ | 9.81 | |
| | | | | |
| Institutional Class Shares: | | | | |
| Net Assets | | $ | 16,874,558 | |
| Shares Outstanding (Unlimited shares of $0 par value beneficial interest authorized) | | | 1,669,188 | |
| Net Asset Value, Offering and Redemption Price Per Share | | $ | 10.11 | |
(a) A maximum sales charge of 5.50% is imposed on Class A shares.
(b) Investments in Class A shares made at or above the $1 million breakpoint are not subject to an initial sales charge and may be subject to a 1.00% contingent deferred sales charge (“CDSC”) on shares redeemed within one year from the date of purchase.
The accompanying notes are an integral part of these financial statements.
| FINTRUST INCOME AND OPPORTUNITY FUND | | |
| STATEMENT OF OPERATIONS | | ANNUAL REPORT |
| | | For the | |
| | | Year Ended | |
| | | November 30, 2022 | |
| Investment income: | | | | |
| Dividends (net of foreign withholding taxes of $4,714) | | $ | 170,350 | |
| Dividends from affiliates (Note 10) | | | 36,094 | |
| Interest | | | 30,594 | |
| Total investment income | | | 237,038 | |
| | | | | |
| Expenses: | | | | |
| Management fees (Note 6) | | | 223,691 | |
| Distribution (12b-1) fees - Class A (Note 6) | | | 369 | |
| Accounting and transfer agent fees and expenses (Note 6) | | | 96,252 | |
| Interest expense | | | 29,360 | |
| Trustee fees and expenses | | | 22,912 | |
| Reports to shareholders | | | 19,174 | |
| Legal fees | | | 18,602 | |
| Audit fees | | | 14,500 | |
| Miscellaneous | | | 14,407 | |
| Dividends on securities sold short | | | 13,540 | |
| Pricing fees | | | 13,470 | |
| Custodian fees | | | 11,043 | |
| Compliance officer fees (Note 6) | | | 9,164 | |
| Insurance | | | 3,779 | |
| Registration and filing fees | | | 3,558 | |
| Total expenses | | | 493,821 | |
| Less: fees waived (Note 6) | | | (101,595 | ) |
| Net expenses | | | 392,226 | |
| | | | | |
| Net investment loss | | | (155,188 | ) |
| | | | | |
| Realized and unrealized gain (loss): | | | | |
| Net realized gain (loss) on: | | | | |
| Unaffiliated Investments | | | (2,420,540 | ) |
| Options written | | | 1,906,618 | |
| Securities sold short | | | (148,655 | ) |
| Net realized loss on investments, options written and securities sold short | | | (662,577 | ) |
| | | | | |
| Net change in unrealized appreciation (depreciation) on: | | | | |
| Unaffiliated Investments | | | (279,833 | ) |
| Affiliated Investments | | | (47,250 | ) |
| Options written | | | 62,184 | |
| Securities sold short | | | 74,343 | |
| Net change in unrealized depreciation on investments, options written and securities sold short | | | (190,556 | ) |
| | | | | |
| Net realized and unrealized loss on investments, options written and securities sold short | | | (853,133 | ) |
| | | | | |
| Net decrease in net assets resulting from operations | | $ | (1,008,321 | ) |
The accompanying notes are an integral part of these financial statements.
| FINTRUST INCOME AND OPPORTUNITY FUND | |
| STATEMENTS OF CHANGES IN NET ASSETS | ANNUAL REPORT |
| | | For the | | | For the | |
| | | Year Ended | | | Year Ended | |
| | | November 30, 2022 | | | November 30, 2021 | |
| Increase (decrease) in net assets from: | | | | | | | | |
| Operations: | | | | | | | | |
| Net investment loss | | $ | (155,188 | ) | | $ | (309,588 | ) |
| Net realized gain (loss) on investments, options written and securities sold short | | | (662,577 | ) | | | 1,355,174 | |
| Net change in unrealized depreciation on investments, options written and securities sold short | | | (190,556 | ) | | | (964,925 | ) |
| Net increase (decrease) in net assets resulting from operations | | | (1,008,321 | ) | | | 80,661 | |
| | | | | | | | | |
| Distributions to shareholders from: | | | | | | | | |
| Total distributable earnings - Class A | | | (4,443 | ) | | | (4,673 | ) |
| Total distributable earnings - Institutional Class | | | (1,288,850 | ) | | | (1,003,570 | ) |
| Total distributions | | | (1,293,293 | ) | | | (1,008,243 | ) |
| | | | | | | | | |
| Capital share transactions (Note 4): | | | | | | | | |
| Increase (decrease) in net assets from capital share transactions | | | (4,166,285 | ) | | | 6,345,882 | |
| | | | | | | | | |
| Increase (decrease) in net assets | | | (6,467,899 | ) | | | 5,418,300 | |
| | | | | | | | | |
| Net Assets: | | | | | | | | |
| Beginning of year | | | 23,500,867 | | | | 18,082,567 | |
| | | | | | | | | |
| End of year | | $ | 17,032,968 | | | $ | 23,500,867 | |
The accompanying notes are an integral part of these financial statements.
FINTRUST INCOME AND OPPORTUNITY FUND
| FINANCIAL HIGHLIGHTS | ANNUAL REPORT |
The following tables set forth the per share operating performance data for a share of beneficial interest outstanding, total return, ratios to average net assets and other supplemental data for the years indicated.
| | | Class A | |
| | | | | | | | | | | | | | | | | | | | | |
| | | For the | | | For the | | | For the | | | For the | | | For the | |
| | | Year Ended | | | Year Ended | | | Year Ended | | | Year Ended | | | Year Ended | |
| | | November 30, 2022 | | | November 30, 2021 | | | November 30, 2020 | | | November 30, 2019 | | | November 30, 2018 | |
| Net Asset Value, Beginning of Year | | $ | 10.96 | | | $ | 11.19 | | | $ | 10.71 | | | $ | 10.73 | | | $ | 11.97 | |
| | | | | | | | | | | | | | | | | | | | | |
| Investment Operations: | | | | | | | | | | | | | | | | | | | | |
| Net investment loss(a) | | | (0.10 | ) | | | (0.18 | ) | | | (0.15 | ) | | | (0.06 | ) | | | (0.05 | ) |
| Net realized and unrealized gains (losses) on investments, options written and securities sold short | | | (0.32 | ) | | | 0.58 | | | | 1.05 | | | | 0.56 | | | | 0.04 | |
| Total from investment operations | | | (0.42 | ) | | | 0.40 | | | | 0.90 | | | | 0.50 | | | | (0.01 | ) |
| | | | | | | | | | | | | | | | | | | | | |
| Distributions: | | | | | | | | | | | | | | | | | | | | |
| From net realized capital gains | | | (0.63 | ) | | | (0.63 | ) | | | (0.42 | ) | | | (0.52 | ) | | | (1.23 | ) |
| Total distributions | | | (0.63 | ) | | | (0.63 | ) | | | (0.42 | ) | | | (0.52 | ) | | | (1.23 | ) |
| | | | | | | | | | | | | | | | | | | | | |
| Net Asset Value, End of Year | | $ | 9.91 | | | $ | 10.96 | (d) | | $ | 11.19 | | | $ | 10.71 | | | $ | 10.73 | |
| | | | | | | | | | | | | | | | | | | | | |
| Total Return(b) | | | (3.94 | )% | | | 3.57 | % | | | 8.68 | % | | | 5.32 | % | | | (0.31 | )% |
| | | | | | | | | | | | | | | | | | | | | |
| Ratios/Supplemental Data | | | | | | | | | | | | | | | | | | | | |
| Net assets, end of year (in 000’s) | | $ | 158 | | | $ | 82 | | | $ | 83 | | | $ | 97 | | | $ | 92 | |
| | | | | | | | | | | | | | | | | | | | | |
| Ratios of expenses to average net assets: | | | | | | | | | | | | | | | | | | | | |
| Before fees waived and expenses absorbed | | | 3.01 | %(c) | | | 2.62 | %(c) | | | 3.29 | %(c) | | | 3.66 | %(c) | | | 4.57 | % |
| After fees waived and expenses absorbed | | | 2.44 | %(c) | | | 2.35 | %(c) | | | 2.35 | %(c) | | | 2.22 | %(c) | | | 2.20 | % |
| | | | | | | | | | | | | | | | | | | | | |
| Ratios of net investment loss: | | | | | | | | | | | | | | | | | | | | |
| Before fees waived and expenses absorbed | | | (1.68 | )%(c) | | | (1.77 | )%(c) | | | (2.35 | )%(c) | | | (2.06 | )%(c) | | | (2.84 | )% |
| After fees waived and expenses absorbed | | | (1.11 | )%(c) | | | (1.50 | )%(c) | | | (1.41 | )%(c) | | | (0.63 | )%(c) | | | (0.47 | )% |
| | | | | | | | | | | | | | | | | | | | | |
| Portfolio turnover rate | | | 1194.80 | %(e) | | | 395.29 | % | | | 271.84 | % | | | 192.88 | % | | | 280.78 | % |
| (a) | Net investment loss per share is based on average shares outstanding. |
| (b) | Total Return represents the rate that the investor would have earned or lost on an investment in the Fund, assuming reinvestment of dividends and does not reflect the impact of sales charges. |
| (c) | The ratios include 0.16% of interest expense and 0.08% of dividend expense during the year ended November 30, 2022, 0.13% of interest expense and 0.02% of dividend expense during the year ended November 30, 2021, 0.15% of interest expense during the year ended November 30, 2020 and 0.02% of interest expense during the year ended November 30, 2019. |
| (d) | The Net Asset Value differs from the traded NAV on November 30, 2021 due to financial statement adjustments. |
| (e) | The increase in portfolio turnover for the year ended November 30, 2022 was the result of certain market conditions occurring throughout the year which led to more active trading by the portfolio manager. |
The accompanying notes are an integral part of these financial statements.
FINTRUST INCOME AND OPPORTUNITY FUND
| FINANCIAL HIGHLIGHTS | ANNUAL REPORT |
The following tables set forth the per share operating performance data for a share of beneficial interest outstanding, total return, ratios to average net assets and other supplemental data for the years indicated.
| | | | Institutional Class | |
| | | | | | | | | | | | | | | | | | | | | |
| | | For the | | | For the | | | For the | | | For the | | | For the | |
| | | Year Ended | | | Year Ended | | | Year Ended | | | Year Ended | | | Year Ended | |
| | | November 30, 2022 | | | November 30, 2021 | | | November 30, 2020 | | | November 30, 2019 | | | November 30, 2018 | |
| | | | | | | | | | | | | | | | | | | | | |
| Net Asset Value, Beginning of Year | | $ | 11.14 | | | $ | 11.34 | | | $ | 10.82 | | | $ | 10.81 | | | $ | 12.02 | |
| | | | | | | | | | | | | | | | | | | | | |
| Investment Operations: | | | | | | | | | | | | | | | | | | | | |
| Net investment loss(a) | | | (0.08 | ) | | | (0.15 | ) | | | (0.12 | ) | | | (0.04 | ) | | | (0.02 | ) |
| Net realized and unrealized gains (losses) on investments, options written and securities sold short | | | (0.32 | ) | | | 0.58 | | | | 1.06 | | | | 0.57 | | | | 0.04 | |
| Total from investment operations | | | (0.40 | ) | | | 0.43 | | | | 0.94 | | | | 0.53 | | | | 0.02 | |
| | | | | | | | | | | | | | | | | | | | | |
| Distributions: | | | | | | | | | | | | | | | | | | | | |
| From net realized capital gains | | | (0.63 | ) | | | (0.63 | ) | | | (0.42 | ) | | | (0.52 | ) | | | (1.23 | ) |
| Total distributions | | | (0.63 | ) | | | (0.63 | ) | | | (0.42 | ) | | | (0.52 | ) | | | (1.23 | ) |
| | | | | | | | | | | | | | | | | | | | | |
| Net Asset Value, End of Year | | $ | 10.11 | | | $ | 11.14 | (d) | | $ | 11.34 | | | $ | 10.82 | | | $ | 10.81 | |
| | | | | | | | | | | | | | | | | | | | | |
| Total Return(b) | | | (3.68 | )% | | | 3.79 | % | | | 8.97 | % | | | 5.57 | % | | | (0.03 | )%(e) |
| | | | | | | | | | | | | | | | | | | | | |
| Ratios/Supplemental Data | | | | | | | | | | | | | | | | | | | | |
Net assets, end of year
(in 000’s) | | $ | 16,875 | | | $ | 23,418 | | | $ | 17,999 | | | $ | 10,285 | | | $ | 5,680 | |
| | | | | | | | | | | | | | | | | | | | | |
| Ratios of expenses to average net assets: | | | | | | | | | | | | | | | | | | | | |
| Before fees waived and expenses absorbed | | | 2.76 | %(c) | | | 2.37 | %(c) | | | 3.04 | %(c) | | | 3.41 | %(c) | | | 4.32 | % |
| After fees waived and expenses absorbed | | | 2.19 | %(c) | | | 2.10 | %(c) | | | 2.10 | %(c) | | | 1.97 | %(c) | | | 1.95 | % |
| | | | | | | | | | | | | | | | | | | | | |
| Ratios of net investment loss: | | | | | | | | | | | | | | | | | | | | |
| Before fees waived and expenses absorbed | | | (1.43 | )%(c) | | | (1.52 | )%(c) | | | (2.10 | )%(c) | | | (1.81 | )%(c) | | | (2.59 | )% |
| After fees waived and expenses absorbed | | | (0.86 | )%(c) | | | (1.25 | )%(c) | | | (1.16 | )%(c) | | | (0.38 | )%(c) | | | (0.22 | )% |
| | | | | | | | | | | | | | | | | | | | | |
| Portfolio turnover rate | | | 1194.80 | %(f) | | | 395.29 | % | | | 271.84 | % | | | 192.88 | % | | | 280.78 | % |
| (a) | Net investment loss per share is based on average shares outstanding. |
| (b) | Total Return represents the rate that the investor would have earned or lost on an investment in the Fund, assuming reinvestment of dividends and does not reflect the impact of sales charges. |
| (c) | The ratios include 0.16% of interest expense and 0.08% of dividend expense during the year ended November 30, 2022, 0.13% of interest expense and 0.02% of dividend expense during the year ended November 30, 2021, 0.15% of interest expense during the year ended November 30, 2020 and 0.02% of interest expense during the year ended November 30, 2019. |
| (d) | The Net Asset Value differs from the traded NAV on November 30, 2021 due to financial statement adjustments. |
| (e) | Total return does not correlate to the total from investment operations due to the timing of certain subscriptions and redemptions in the Fund. |
| (f) | The increase in portfolio turnover for the year ended November 30, 2022 was the result of certain market conditions occurring throughout the year which led to more active trading by the portfolio manager. |
The accompanying notes are an integral part of these financial statements.
| FinTrust Income and Opportunity Fund | ANNUAL REPORT |
NOTES TO THE FINANCIAL STATEMENTS
November 30, 2022
| 1. | ORGANIZATION AND SIGNIFICANT ACCOUNTING POLICIES |
The FinTrust Income and Opportunity Fund (the “Fund”), is a series of 360 Funds (the “Trust”). The Trust was organized on February 24, 2005 as a Delaware statutory trust. The Trust is registered as an open-end management investment company under the Investment Company Act of 1940 (the “1940 Act”). The Fund is a non-diversified fund. As a non-diversified fund, the Fund may invest a significant portion of its assets in a small number of companies. The Fund’s investment objective is total return comprised of income and capital appreciation. The Fund’s investment adviser is FinTrust Capital Advisors, LLC (the “Adviser”). The Fund offers two classes of shares: Class A and Institutional Class shares. Each class of shares commenced operations on January 21, 2016. Each class differs as to sales and redemption charges and ongoing fees. Income and expenses (other than class specific), and realized/unrealized gains or losses are allocated to each class based on their relative net asset values. Each class represents an ownership interest in the same investment portfolio and has equal voting rights.
The following is a summary of the significant accounting policies followed by the Fund in the preparation of its financial statements. The Fund is an investment company that follows the accounting and reporting guidance of Accounting Standards Codification Topic 946 applicable to investment companies.
a) Security Valuation – All investments in securities are recorded at their estimated fair value, as described in Note 2.
b) Options – The Fund uses an option strategy in an effort to limit market exposure and volatility. The extent of option selling will depend upon market conditions and the Adviser’s judgment of the advantages of selling call options on the Fund’s equity investments. The sale of put options generates income for the Fund, but exposes it to the risk of declines in the value of the underlying assets. The risk in purchasing options is limited to the premium paid by the Fund for the options. The sale of call options generates income for the Fund, but may limit the Fund’s participation in equity market gains. The Fund’s investment adviser seeks to reduce the overall volatility of returns for the Fund by managing a portfolio of options. When the Fund writes or purchases an option, an amount equal to the premium received or paid by the Fund is recorded as a liability or an asset and is subsequently adjusted to the current market value of the option written or purchased. Premiums received or paid from writing or purchasing options which expire unexercised are treated by the Fund on the expiration date as realized gains or losses. The difference between the premium and the amount paid or received on effecting a closing purchase or sale transaction, including brokerage commissions, is also treated as a realized gain or loss. If an option is exercised, the premium paid or received is added to the cost of the purchase or proceeds from the sale in determining whether the Fund has realized a gain or a loss on investment transactions.
Purchasing and writing put and call options are highly specialized activities and entail greater than ordinary investment risks. The successful use of options depends in part on the ability of the Adviser to manage future price fluctuations and the degree of correlation between the options and securities markets. By writing put options on equity securities, the Fund gives up the opportunity to benefit from potential increases in the value of the underlying securities above the strike prices of the written put options, but continues to bear the risk of declines in the value of underlying securities held by the Fund. The Fund will receive a premium from writing a covered call option that it retains whether or not the option is exercised. The premium received from the written options may not be sufficient to offset any losses sustained from the volatility of the underlying equity securities over time.
c) Exchange-Traded Funds (“ETFs”) – The Fund may invest in ETFs. An ETF is a fund that holds a portfolio of common stocks or bonds designed to track the performance of a securities index or sector of an index. ETFs are traded on a securities exchange based on their market value. An ETF portfolio holds the same stocks or bonds as the index it tracks, so its market price reflects the value of the index at any given time. ETFs are registered investment companies and incur fees and expenses such as operating expenses, licensing fees, registration fees, trustees’ fees, and marketing expenses, and ETF shareholders, such as the Fund, pay their proportionate share of these expenses. Your cost of investing in the Fund will generally be higher than the cost of investing directly in ETFs. By investing in the Fund, you will indirectly bear fees and expenses charged by the underlying ETFs in which the Fund invests in addition to the Fund’s direct fees and expenses.
d) Federal Income Taxes – The Fund has qualified and intends to continue to qualify as a regulated investment company under Subchapter M of the Internal Revenue Code of 1986, as amended (the “Code”). It is the policy of the Fund to comply with the requirements of the Code applicable to regulated investment companies and to distribute substantially all of its net investment company taxable income and net capital gains. The Fund also intends to distribute sufficient net investment income and net capital gains, if any, so that it will not be subject to excise tax on undistributed income and gains. Therefore, no federal income tax or excise provision is required.
| FinTrust Income and Opportunity Fund | ANNUAL REPORT |
NOTES TO THE FINANCIAL STATEMENTS
November 30, 2022
| 1. | ORGANIZATION AND SIGNIFICANT ACCOUNTING POLICIES (continued) |
As of and for the year ended November 30, 2022, the Fund did not have a liability for any unrecognized tax expenses. The Fund recognizes interest and penalties, if any, related to unrecognized tax liability as income tax expense in the Statement of Operations. For the year ended November 30, 2022, the Fund did not incur any interest or penalties. The Fund identifies its major tax jurisdiction as U.S. Federal.
In addition, accounting principles generally accepted in the United States of America (“GAAP”) requires management of the Fund to analyze all open tax years, as defined by the Internal Revenue Service statute of limitations for all major jurisdictions, including federal tax authorities and certain state tax authorities. As of the year ended November 30, 2022, and for all other open tax years (years ended November 30, 2021, November 30, 2020, and November 30, 2019), the Fund did not have a liability for any unrecognized tax benefits. The Fund has no examinations in progress and is not aware of any tax positions for which it is reasonably possible that the total tax amounts of unrecognized tax benefits will significantly change in the next 12 months.
e) Distributions to Shareholders – Dividends from net investment income and distributions of net realized capital gains, if any, will be declared and paid at least annually. Income and capital gain distributions, which are determined in accordance with income tax regulations, are recorded on the ex-dividend date. GAAP requires that permanent financial reporting differences relating to shareholder distributions be reclassified to paid-in capital.
f) Use of Estimates – The preparation of financial statements in conformity with GAAP requires management to make estimates and assumptions that affect the reported amounts of assets and liabilities and disclosure of contingent assets and liabilities at the date of the financial statements and the reported amounts of revenues and expenses during the reporting period. Actual results could differ from those estimates.
g) Non-Diversified Fund – The Fund is a non-diversified fund. In general, a non-diversified fund may invest a greater percentage of its assets in a particular issue and may own fewer securities than other mutual funds. Accordingly, a non-diversified fund is generally subject to the risk that a large loss in an individual issue will cause a greater loss for the fund than it would if the fund was required to hold a larger number of securities or smaller positions.
h) Sales Charges – A maximum sales charge of 5.50% is imposed on certain purchases of Class A shares. A contingent deferred sales charge (“CDSC”) is imposed upon certain redemptions of Class A shares purchased at net asset value in amounts totaling $1 million if the dealer’s commission was paid by the underwriter and the shares are redeemed within one year from the date of purchase. The CDSC will be paid to the Distributor and will be equal to 1.00% of the lesser of (1) the net asset value at the time of purchase of the Class A shares being redeemed; or (2) the net asset value of such shares at the time of redemption. There were no CDSC Fees paid to the Distributor for the year ended November 30, 2022.
i) Expenses – Expenses incurred by the Trust that do not relate to a specific fund of the Trust are allocated to the individual funds based on each fund’s relative net assets or another appropriate basis as determined by the Board.
j) Other – Investment and shareholder transactions are recorded on trade date. The Fund determines the gain or loss realized from the investment transactions by comparing the original cost of the security lot sold with the net sales proceeds. Dividend income is recognized on the ex-dividend date or as soon as information is available to the Fund and interest income is recognized on an accrual basis. Withholding taxes on foreign dividends have been provided for in accordance with the Fund’s understanding of the applicable country’s tax rules and rates. Discounts and premiums on securities purchased ae accreted and amortized over the lives of the respective securities.
Processes and Structure
The Fund’s Board of Trustees (the “Board”) has adopted guidelines for valuing securities and other derivative instruments including in circumstances in which market quotes are not readily available, and has delegated authority to the Adviser to apply those guidelines in determining fair value prices, subject to review by the Board.
| FinTrust Income and Opportunity Fund | ANNUAL REPORT |
NOTES TO THE FINANCIAL STATEMENTS
November 30, 2022
| 2. | SECURITIES VALUATIONS (continued) |
Hierarchy of Fair Value Inputs
The Fund utilizes various methods to measure the fair value of most of its investments on a recurring basis. GAAP establishes a hierarchy that prioritizes inputs to valuation techniques used to measure fair value. The three levels of inputs are as follows:
| ● | Level 1 – Unadjusted quoted prices in active markets for identical assets or liabilities that the Fund has the ability to access. |
| ● | Level 2 – Observable inputs other than quoted prices included in Level 1 that are observable for the asset or liability either directly or indirectly. These inputs may include quoted prices for the identical instrument on an inactive market, prices for similar instruments, interest rates, prepayment speeds, credit risk, yield curves, default rates, and similar data. |
| ● | Level 3 – Unobservable inputs for the asset or liability to the extent that relevant observable inputs are not available, representing the Fund’s own assumptions about the assumptions that a market participant would use in valuing the asset or liability, and that would be based on the best information available. |
The availability of observable inputs can vary from security to security and is affected by a wide variety of factors, including, for example, the type of security, whether the security is new and not yet established in the marketplace, the liquidity of markets, and other characteristics particular to the security. To the extent that valuation is based on models or inputs that are less observable or unobservable in the market, the determination of fair value requires more judgment. Accordingly, the degree of judgment exercised in determining fair value is greatest for instruments categorized in Level 3.
The inputs used to measure fair value may fall into different levels of the fair value hierarchy. In such cases, for disclosure purposes, the level in the fair value hierarchy within which the fair value measurement falls in its entirety is determined based on the lowest level input that is significant to the fair value measurement in its entirety.
Fair Value Measurements
A description of the valuation techniques applied to the Trust’s major categories of assets and liabilities measured at fair value on a recurring basis are as follows:
Equity securities (common stock, preferred stock and ETFs) – Securities traded on a national securities exchange (or reported on the NASDAQ national market) are stated at the last reported sales price on the day of valuation. To the extent these securities are actively traded, and valuation adjustments are not applied, they are categorized in Level 1 of the fair value hierarchy. Certain foreign securities may be fair valued using a pricing service that considers the correlation of the trading patterns of the foreign security to the intraday trading in the U.S. markets for investments such as American Depositary Receipts, financial futures, ETFs, and the movement of the certain indexes of securities based on a statistical analysis of the historical relationship and are categorized in Level 2. Preferred stock and other equities traded on inactive markets or valued by reference to similar instruments are also categorized in Level 2.
Money market funds – Money market funds are valued at their net asset value and are categorized as Level 1.
Derivative instruments – Listed derivatives, including options, that are actively traded, are valued based on quoted prices from the exchange and categorized in Level 1 of the fair value hierarchy. Options held by the Fund for which no current quotations are readily available and which are not traded on the valuation date are valued at the mean price and are categorized within Level 2 of the fair value hierarchy. Over-the-counter (“OTC”) derivative contracts include forward, swap, and option contracts related to interest rates; foreign currencies; credit standing of reference entities; equity prices; or commodity prices, and warrants on exchange-traded securities. Depending on the product and terms of the transaction, the fair value of the OTC derivative products can be modeled taking into account the counterparties’ creditworthiness and using a series of techniques, including simulation models. Many pricing models do not entail material subjectivity because the methodologies employed do not necessitate significant judgments, and the pricing inputs are observed from actively quoted markets, as is the case of interest rate swap and option contracts. OTC derivative products valued using pricing models are categorized within Level 2 of the fair value hierarchy.
| FinTrust Income and Opportunity Fund | ANNUAL REPORT |
NOTES TO THE FINANCIAL STATEMENTS
November 30, 2022
| 2. | SECURITIES VALUATIONS (continued) |
The SEC recently adopted Rule 2a-5 under the 1940 Act, which establishes an updated regulatory framework for registered investment company fair valuation practices. The rule became effective on September 8, 2022. Under the new rule a greater number of the Fund’s securities may be subject to fair value pricing. The Fund’s fair value policies and procedures and valuation practices were updated to comply with Rule 2a-5. Specifically, the Board designated the Adviser as the Fund’s “Valuation Designee” to make fair value determinations. The Adviser acts through its Rule 2a-5 Committee (the “Valuation Committee”) in accordance with the Trust’s and the Adviser’s policies and procedures (collectively, the “Valuation Procedures”). While fair value determinations will be based upon all available factors that the Valuation Designee deems relevant at the time of the determination, fair value represents only a good faith approximation of the value of an asset or liability.
The Fund’s policies regarding fair value pricing are intended to result in a calculation of a Fund’s net asset value that fairly reflects portfolio security values as of the time of pricing. A portfolio security’s fair value price may differ from the price next available for that portfolio security using a Fund’s normal pricing procedure, and may differ substantially from the price at which the portfolio security may ultimately be traded or sold. If such fair value price differs from the price that would have been determined using a Fund’s normal pricing procedures, a shareholder may receive more or less proceeds or shares from redemptions or purchases of Fund shares, respectively, than a shareholder would have otherwise received if the portfolio security was priced using a Fund’s normal pricing procedures. The performance of a Fund may also be affected if a portfolio security’s fair value price were to differ from the security’s price using a Fund’s normal pricing procedures.
Pursuant to policies adopted by the Board, the Valuation Designee reports all fair valued securities to the Board at least quarterly. The Board monitors and evaluates the Fund’s use of fair value pricing. These securities will be categorized as Level 3 securities.
The following tables summarize the inputs used to value the Fund’s assets and liabilities measured at fair value as of November 30, 2022.
| Financial Instruments – Assets | | | | | | | | | | | | |
| Security Classification(1) | | Level 1 | | | Level 2 | | | Level 3 | | | Totals | |
| Common Stock(2) | | $ | 11,403,113 | | | $ | — | | | $ | — | | | $ | 11,403,113 | |
| Preferred Stock(2) | | | 523,950 | | | | — | | | | — | | | | 523,950 | |
| Exchange-Traded Funds(2) | | | 882,840 | | | | — | | | | — | | | | 882,840 | |
| Call Options Purchased | | | 247,515 | | | | — | | | | — | | | | 247,515 | |
| Put Options Purchased | | | 57,690 | | | | — | | | | — | | | | 57,690 | |
| Short-Term Investments | | | 3,425,631 | | | | — | | | | — | | | | 3,425,631 | |
| Total Assets | | $ | 16,540,739 | | | $ | — | | | $ | — | | | $ | 16,540,739 | |
(1) As of and for the year November 30, 2022, the Fund held no securities that were considered to be “Level 3” securities (those valued using significant unobservable inputs). Therefore, a reconciliation of assets in which significant unobservable inputs (Level 3) were used in determining fair value is not applicable.
(2) All common stock, ETFs and preferred stock held in the Fund are Level 1 securities. For a detailed break-out of common stock and preferred stock by industry and ETFs by investment type, please refer to the Schedule of Investments.
| 3. | DERIVATIVE TRANSACTIONS |
As of November 30, 2022, the location on the Statement of Assets and Liabilities for financial derivative instrument fair values is as follows:
| Assets | | Location | | | Equity Contracts | |
| Call options purchased | | Investments, at value | | | $ | 247,515 | |
| Put options purchased | | Investments, at value | | | | 57,690 | |
| Total Assets | | | | | $ | 305,205 | |
| FinTrust Income and Opportunity Fund | ANNUAL REPORT |
NOTES TO THE FINANCIAL STATEMENTS
November 30, 2022
| 3. | DERIVATIVES TRANSACTIONS (continued) |
Realized and unrealized gains and losses on derivatives contracts entered into by the Fund for the year ended November 30, 2022, are recorded in the following locations in the Statement of Operations:
| Net change in unrealized appreciation (depreciation) on: | | Location | | Equity Contracts | |
| Call options purchased | | Unaffiliated Investments | | $ | 116,026 | |
| Put options purchased | | Unaffiliated Investments | | | 468,745 | |
| Call options written | | Options written | | | 3,758 | |
| Put options written | | Options written | | | 58,426 | |
| | | | | $ | 646,955 | |
| Net realized gain (loss) on: | | Location | | Equity Contracts | |
| Call options purchased | | Unaffiliated Investments | | $ | 38,447 | |
| Put options purchased | | Unaffiliated Investments | | | 203,981 | |
| Call options written | | Options written | | | 1,747,453 | |
| Put options written | | Options written | | | 159,165 | |
| | | | | $ | 2,149,046 | |
For the year ended November 30, 2022, the average month-end notional value of purchased and written option contracts for the Fund was $9,949,538 and ($2,463,273), respectively. The primary risk category for all open options positions during the period was equity risk.
| 4. | CAPITAL SHARE TRANSACTIONS |
Transactions in shares of capital stock for the year ended November 30, 2022, were as follows:
| | | Sold | | | Redeemed | | | Reinvested | | | Net Increase | |
| Class A | | | | | | | | | | | | | | | | |
| Shares | | | 12,344 | | | | (4,329 | ) | | | 441 | | | | 8,456 | |
| Value | | $ | 126,373 | | | $ | (41,774 | ) | | $ | 4,443 | | | $ | 89,042 | |
| Institutional Class | | | | | | | | | | | | | | | | |
| Shares | | | 248,460 | | | | (807,393 | ) | | | 125,864 | | | | (433,069 | ) |
| Value | | $ | 2,357,664 | | | $ | (7,901,841 | ) | | $ | 1,288,850 | | | $ | (4,255,327 | ) |
Transactions in shares of capital stock for the year ended November 30, 2021, were as follows:
| | | Sold | | | Redeemed | | | Reinvested | | | Net Increase | |
| Class A | | | | | | | | | | | | | | | | |
| Shares | | | 209 | | | | (557 | ) | | | 427 | | | | 79 | |
| Value | | $ | 2,367 | | | $ | (6,090 | ) | | $ | 4,673 | | | $ | 950 | |
| Institutional Class | | | | | | | | | | | | | | | | |
| Shares | | | 777,211 | | | | (352,734 | ) | | | 90,412 | | | | 514,889 | |
| Value | | $ | 9,472,759 | | | $ | (4,131,397 | ) | | $ | 1,003,570 | | | $ | 6,344,932 | |
| FinTrust Income and Opportunity Fund | ANNUAL REPORT |
NOTES TO THE FINANCIAL STATEMENTS
November 30, 2022
| 5. | INVESTMENT TRANSACTIONS |
For the year ended November 30, 2022, aggregate purchases and sales of investment securities (excluding short-term investments and U.S. Government securities) for the Fund were as follows:
| Purchases | | Sales | |
| $ | 197,135,228 | | $ | 202,982,839 | |
The cost of purchases and proceeds from sales of U.S. Government securities during the year ended November 30, 2022, were $0 and $1,815,000, respectively.
| 6. | ADVISORY FEES AND OTHER RELATED PARTY TRANSACTIONS |
The Fund has entered into an Investment Advisory Agreement (the “Advisory Agreement”) with the Adviser. Pursuant to the Advisory Agreement, the Adviser manages the operations of the Fund and manages the Fund’s investments in accordance with the stated policies of the Fund. As compensation for the investment advisory services provided to the Fund, the Adviser will receive a monthly management fee equal to an annual rate of 1.25% of the Fund’s net assets, less any fee waivers. For the year ended November 30, 2022, the Adviser earned $223,691 of management fees.
The Adviser has entered into an Expense Limitation Agreement with the Fund under which it has agreed to waive or reduce its fees and to assume other expenses of the Fund, if necessary, in an amount that limits the Fund’s annual operating expenses (excluding interest, distribution fees pursuant to Rule 12b-1 Plans, taxes, acquired fund fees and expenses, brokerage commissions, dividend expenses on short sales, and other expenditures which are capitalized in accordance with generally accepted accounting principles and other extraordinary expenses not incurred in the ordinary course of such Fund’s business) to not more than 1.95% of the Fund’s average daily net assets. The current contractual agreement cannot be terminated before March 31, 2023, without the Board’s approval. For the year ended November 30, 2022, the Adviser waived advisory fees of $101,595.
Subject to approval by the Fund’s Board, any waiver under the Expense Limitation Agreement is subject to repayment by the Fund within the three years following the month in which such waiver or reimbursement occurred, if the Fund can make the payment without exceeding the 1.95% expense limitation. The cumulative reimbursement is $298,724, of which $128,993, $68,136 and $101,595 can be recouped no later than November 30, 2023, November 30, 2024 and November 30, 2025, respectively.
The Fund has entered into an Investment Company Services Agreement (“ICSA”) with M3Sixty Administration, LLC (“M3Sixty”). Pursuant to the ICSA, M3Sixty will provide daily operational services to the Fund including, but not limited to: (a) Fund accounting services; (b) financial statement preparation; (c) valuation of the Fund’s portfolio securities; (d) pricing the Fund’s shares; (e) assistance in preparing tax returns; (f) preparation and filing of required regulatory reports; (g) communications with shareholders; (h) coordination of Board and shareholder meetings; (i) monitoring the Fund’s legal compliance; (j) maintaining shareholder account records.
For the year ended November 30, 2022, M3Sixty earned $96,252, including out of pocket expenses, pursuant to the ICSA.
The Fund has also entered into a Chief Compliance Officer Service Agreement (“CCO Agreement”) with M3Sixty. Pursuant to the CCO Agreement, M3Sixty agrees to provide a Chief Compliance Officer (“CCO”), as described in Rule 38a-1 of the 1940 Act, to the Fund for the year and on the terms and conditions set forth in the CCO Agreement.
For the year ended November 30, 2022, M3Sixty earned $9,164 of fees pursuant to the CCO Agreement.
Certain officers and an interested Trustee of the Trust are also employees or officers of M3Sixty.
The Fund has entered into a Distribution Agreement with Matrix 360 Distributors, LLC (“M3SixtyD” or the “Distributor”). Pursuant to the Distribution Agreement, the Distributor provides distribution services to the Fund. The Distributor serves as the principal underwriter of the Fund. M3SixtyD may receive commissions from the sale of Class A shares. During the year ended November 30, 2022, $732 of commissions were paid to the Distributor. M3SixtyD is an affiliate of M3Sixty.
| FinTrust Income and Opportunity Fund | ANNUAL REPORT |
NOTES TO THE FINANCIAL STATEMENTS
November 30, 2022
| 6. | ADVISORY FEES AND OTHER RELATED PARTY TRANSACTIONS (continued) |
The Fund has adopted a Distribution Plan (“Plan”) pursuant to Rule 12b-1 under the Investment Company Act of 1940 for its Class A shares. The Fund may expend up to 0.25% for Class A shares of the Fund’s average daily net assets annually to pay for any activity primarily intended to result in the sale of shares of the Fund and the servicing of shareholder accounts, provided that the Trustees have approved the category of expenses for which payment is being made.
The distribution plan for the Class A shares of the Fund took effect January 21, 2016. For the year ended November 30, 2022, the Fund accrued $369 in 12b-1 expenses attributable to Class A shares.
For U.S. Federal income tax purposes, the cost of securities owned, gross appreciation, gross depreciation, and net unrealized appreciation/(depreciation) of investments, including written options and securities sold short, at November 30, 2022 were as follows:
| Cost | | | Gross Appreciation | | | Gross Depreciation | | | Net Depreciation | |
| $ | 17,164,280 | | | $ | 670,961 | | | $ | (1,294,502 | ) | | $ | (623,541 | ) |
The difference between book basis and tax basis unrealized appreciation (depreciation) is primarily attributable to the tax deferral of losses on wash sales.
The Fund’s tax basis distributable earnings are determined at the end of each fiscal year. The tax character of distributable earnings (deficit) at November 30, 2022, the Fund’s most recent fiscal year end, is as follows:
Unrealized Depreciation | | | Undistributed Ordinary Income | | | Undistributed Long-Term Capital Gains | | | Capital Loss Carry Forwards | | | Post-October Loss and Late Year Loss | | | Other Book/Tax Differences | | | Total Distributable Earnings | |
| $ | (623,541 | ) | | $ | — | | | $ | — | | | $ | (840,737 | ) | | $ | (136,498 | ) | | $ | — | | | $ | (1,600,776 | ) |
Under current tax law, net capital losses realized after October 31st and net ordinary losses incurred after December 31st may be deferred and treated as occurring on the first day of the following fiscal year. As of November 30, 2022, the Fund elected to defer $136,498 of post-December ordinary losses.
��
In accordance with accounting pronouncements, the Fund may record reclassifications in the capital accounts. These reclassifications have no impact on the net asset value of the Fund and are designed generally to present distributable earnings on a tax basis which is considered to be more informative to the shareholder. Permanent book and tax differences, primarily attributable to the reclassifications of net investment losses and distributions to paid-in-capital, resulted in reclassifications for the year ended November 30, 2022, as follows:
| Distributable Earnings | | | Paid-in Capital | |
| $ | 8,915 | | | $ | (8,915 | ) |
Under the Regulated Investment Company Modernization Act of 2010 (the “Act”), net capital losses recognized after December 31, 2010, may be carried forward indefinitely, and their character is retained as short-term and/or long-term. As of November 30, 2022, the Fund had $840,737 of non-expiring short-term capital loss carryforwards for federal income tax purposes available to offset future capital gains.
For the year ended November 30, 2022, the Fund distributed, on a tax basis, $485,367 of ordinary income and $807,926 of long-term capital gains.
For the year ended November 30, 2021, the Fund distributed, on a tax basis, $844,228 of ordinary income and $164,015 of long-term capital gains.
| FinTrust Income and Opportunity Fund | ANNUAL REPORT |
NOTES TO THE FINANCIAL STATEMENTS
November 30, 2022
The beneficial ownership, either directly or indirectly, of more than 25% of the voting securities of a fund creates a presumption of control of the fund, under Section 2(a)(9) of the Investment Company Act of 1940. As of November 30, 2022, Charles Schwab and Co., Inc. held 61.98% and National Financial Services, LLC held 37.70% of the Fund’s shares in omnibus accounts for the sole benefit of their customers. The Trust does not know whether any of the underlying beneficial shareholders of the omnibus accounts held by Charles Schwab and Co., Inc. or National Financial Services, LLC own more than 25% of the voting securities of the Fund.
| 9. | COMMITMENTS AND CONTINGENCIES |
In the normal course of business, the Trust may enter into contracts that may contain a variety of representations and warranties and provide general indemnifications. The Trust’s maximum exposure under these arrangements is dependent on future claims that may be made against the Fund and, therefore, cannot be estimated; however, management considers the risk of loss from such claims to be remote.
| 10. | INVESTMENTS IN AFFILIATED COMPANIES |
An affiliated company is a company in which the Fund has ownership of at least 5% of the voting securities or is of common management. Companies which are affiliates of the Fund at November 30, 2022, are noted in the Fund’s Schedule of Investments. United Community Banks, Inc., 6.875% - Series I preferred stock (“UCBIO”) is considered an affiliated investment because it is of common management of the Adviser. At November 30, 2022, the Fund held 21,000 shares of UCBIO.
Transactions with affiliated companies during the year ended November 30, 2022 were as follows:
| Value as of November 30, 2021 | Realized gain (loss) | Change in unrealized appreciation (depreciation) | Purchases | Sales | Value as of November 30, 2022 | Income earned |
| UCBIO | $ 571,200 | $ — | $ (47,250) | $ — | $ — | $ 523,950 | $ 36,094 |
| Total | $ 571,200 | $ — | $ (47,250) | $ — | $ — | $ 523,950 | $ 36,094 |
In accordance with GAAP, Management has evaluated the impact of all subsequent events on the Fund through the date the financial statements were issued, and has determined that there were no subsequent events requiring recognition or disclosure in the financial statements.
| 12. | NEW ACCOUNTING PRONOUNCEMENTS |
In June 2022, FASB issued Accounting Standards Update No. 2022-03, “Fair Value Measurement of Equity Securities Subject to Contractual Sale Restrictions” (“ASU 2022-03”). ASU 2022-03 clarifies the guidance in ASC 820, related to the measurement of the fair value of an equity security subject to contractual sale restrictions, where it eliminates the ability to apply a discount to fair value of these securities, and introduces disclosure requirements related to such equity securities. The guidance is effective for fiscal years, and interim periods within those fiscal years, beginning after December 15, 2023, and allows for early adoption. For RICs, such as the Fund, ASU 2022-03 will be applicable to equity securities with contractual sale restrictions executed, or modified, after the date of adoption. Management has reviewed the requirements and believes the adoption of this ASU will not have a material impact on the financial statements.

REPORT OF INDEPENDENT REGISTERED PUBLIC ACCOUNTING FIRM
To the Board of Trustees of 360 Funds
and the Shareholders of FinTrust Income and Opportunity Fund
Opinion on the Financial Statements
We have audited the accompanying statement of assets and liabilities of FinTrust Income and Opportunity Fund, a series of shares of beneficial interest in 360 Funds (the “Fund”), including the schedule of investments, as of November 30, 2022, and the related statement of operations for the year then ended, the statements of changes in net assets for each of the years in the two-year period then ended and the financial highlights for each of the years in the five-year period then ended, and the related notes (collectively referred to as the “financial statements”). In our opinion, the financial statements present fairly, in all material respects, the financial position of the Fund as of November 30, 2022, and the results of its operations for the year then ended, the changes in its net assets for each of the years in the two-year period then ended and its financial highlights for each of the years in the five-year period then ended, in conformity with accounting principles generally accepted in the United States of America.
Basis for Opinion
These financial statements are the responsibility of the Fund’s management. Our responsibility is to express an opinion on the Fund’s financial statements based on our audits. We are a public accounting firm registered with the Public Company Accounting Oversight Board (United States) (“PCAOB”) and are required to be independent with respect to the Fund in accordance with the U.S. federal securities law and the applicable rules and regulations of the Securities and Exchange Commission and the PCAOB.
We conducted our audits in accordance with the standards of the PCAOB. Those standards require that we plan and perform the audits to obtain reasonable assurance about whether the financial statements are free of material misstatement, whether due to error or fraud. The Fund is not required to have, nor were we engaged to perform, an audit of its internal control over financial reporting. As part of our audits we are required to obtain an understanding of internal control over financial reporting but not for the purpose of expressing an opinion on the effectiveness of the Fund’s internal control over financial reporting. Accordingly, we express no such opinion.
Our audits included performing procedures to assess the risk of material misstatement of the financial statements, whether due to error or fraud, and performing procedures that respond to those risks. Such procedures included examining, on a test basis, evidence regarding the amounts and disclosures in the financial statements. Our procedures included confirmation of securities owned as of November 30, 2022 by correspondence with the custodian and brokers. Our audits also included evaluating the accounting principles used and significant estimates made by management, as well as evaluating the overall presentation of the financial statements. We believe that our audits provide a reasonable basis for our opinion.

BBD, LLP
We have served as the auditor of one or more of the Funds in the 360 Funds since 2018.
Philadelphia, Pennsylvania
January 27, 2023
| FinTrust Income and Opportunity Fund | ANNUAL REPORT |
ADDITIONAL INFORMATION
November 30, 2022 (Unaudited)
The Fund files its complete schedules of portfolio holdings with the Securities and Exchange Commission (the “Commission”) for the first and third quarters of each fiscal year on Form N-PORT. The Fund’s Forms N-PORT are available on the Commission’s website at http://www.sec.gov. The Fund’s Forms N-PORT may be reviewed and copied at the Commission’s Public Reference Room in Washington, DC. Information on the operation of the Commission’s Public Reference Room may be obtained by calling 1-800-SEC-0330.
Prior to March 31, 2020, the Fund filed its complete schedules of portfolio holdings with the Commission for the first and third quarters of each fiscal year on Form N-Q. The Fund’s Forms N-Q are available on the Commission’s website at http://www.sec.gov.
A description of the policies and procedures that the Fund uses to determine how to vote proxies relating to portfolio securities is available without charge, upon request, by calling 1-877-244-6235; and on the Commission’s website at http://www.sec.gov.
Information regarding how the Fund voted proxies relating to portfolio securities during the most recent 12-month period ended June 30th is available without charge, upon request, by calling 1-877-244-6235; and on the Commission’s website at http://www.sec.gov.
Shareholder Tax Information - The Fund is required to advise you within 60 days of the Fund’s fiscal year end regarding the federal tax status of distributions received by shareholders during the fiscal year. The Fund paid $485,367 of ordinary income and $807,926 of long-term capital gain distributions during the year ended November 30, 2022.
Tax information is reported from the Fund’s fiscal year and not calendar year, therefore, shareholders should refer to their Form 1099-DIV or other tax information which will be mailed in 2023 to determine the calendar year amounts to be included on their 2022 tax returns. Shareholders should consult their own tax advisors.
| FinTrust Income and Opportunity Fund | ANNUAL REPORT |
ADDITIONAL INFORMATION
November 30, 2022 (Unaudited)
BOARD OF TRUSTEES, OFFICERS AND PRINCIPAL SHAREHOLDERS - (Unaudited)
The Trustees are responsible for the management and supervision of the Fund. The Trustees approve all significant agreements between the Trust, on behalf of the Fund, and those companies that furnish services to the Fund; review performance of the Fund; and oversee activities of the Fund. The Statement of Additional Information of the Trust includes additional information about the Fund’s Trustees and is available upon request, without charge, by calling (877) 244-6235.
Trustees and Officers. Following are the Trustees and Officers of the Trust, their age and address, their present position with the Trust or the Funds, and their principal occupation during the past five years. Each of the Trustees of the Trust will generally hold office indefinitely. The Officers of the Trust will hold office indefinitely, except that: (1) any Officer may resign or retire and (2) any Officer may be removed any time by written instrument signed by at least two-thirds of the number of Trustees prior to such removal. In case a vacancy or an anticipated vacancy on the Board of Trustees shall for any reason exist, the vacancy shall be filled by the affirmative vote of a majority of the remaining Trustees, subject to certain restrictions under the 1940 Act. Those Trustees who are “interested persons” (as defined in the 1940 Act) by virtue of their affiliation with either the Trust or the Adviser, are indicated in the table. The address of each trustee and officer is 4300 Shawnee Mission Parkway, Suite 100, Fairway, KS 66205.
| Name, Address and Year of Birth (“YOB”) | Position(s) Held with Trust | Length of Service | Principal Occupation(s) During Past 5 Years | Number of Series Overseen | Other Directorships During Past 5 Years |
| Independent Trustees |
Arthur Q. Falk YOB: 1937 | Trustee | Since 2011 | Retired. | Six | None |
Tom M. Wirtshafter YOB: 1954 | Trustee | Since 2011 | Senior Vice President, American Portfolios Financial Services, (broker-dealer), American Portfolios Advisors (investment Advisor) (2009–Present). | Six | None |
Steven D. Poppen YOB: 1968 | Trustee | Since 2018 | Executive Vice President and Chief Financial Officer, Minnesota Vikings (professional sports organization) (1999–present). | Six | IDX Funds, formerly, M3Sixty Funds Trust (1 portfolio) (2015 –2021); FNEX Ventures (1 portfolio) (2018-2020) |
Thomas J. Schmidt YOB: 1963 | Trustee and Independent Chairman | Since 2018 Since 2021 | Principal, Tom Schmidt & Associates Consulting, LLC (2015–Present) | Six | Lind Capital Partners Municipal Credit Income Fund (1portfolio) (2021–present); FNEX Ventures (1 portfolio)(2018-2020) |
| Interested Trustee* | | | | | |
Randall K. Linscott YOB: 1971 | President | Since 2013 | Chief Executive Officer, M3Sixty Administration, LLC (2013–present) | Six | IDX Funds, formerly, M3Sixty Funds Trust (1 portfolio) (2015 –2021) |
| | | | | | | |
* The Interested Trustee is an Interested Trustee because he is an officer and principal owner of the Administrator.
| FinTrust Income and Opportunity Fund | ANNUAL REPORT |
ADDITIONAL INFORMATION
November 30, 2022 (Unaudited) (continued)
BOARD OF TRUSTEES, OFFICERS AND PRINCIPAL SHAREHOLDERS - (Unaudited)
| Name, Address and Year of Birth (“YOB”) | Position(s) Held with Trust | Length of Service | Principal Occupation(s) During Past 5 Years | Number of Series Overseen | Other Directorships During Past 5 Years |
Officers | | | | | |
Richard Yates YOB: 1965 | Chief Compliance Officer and Secretary | Since 2021 | Of Counsel, McElroy Deutsch (2020–present); Head of Compliance, M3Sixty Administration, LLC (2021–present); Chief Compliance Officer and Secretary, M3Sixty Funds Trust (2021–present); Founder, The Yates Law Firm (2018–2020); Chief Legal Officer, Manning & Napier, Inc. (2000–2018). | N/A | N/A |
Larry E. Beaver, Jr. YOB: 1969 | Treasurer | Since 2021 | Fund Accounting, Administration and Tax Officer, M3Sixty Administration, LLC (2017–Present); Director of Fund Accounting & Administration, M3Sixty Administration, LLC (2005–2017); Assistant Treasurer, 360 Funds Trust (2017–2021); Chief Accounting Officer, Amidex Funds, Inc. (2003–2020); Assistant Treasurer, Capital Management Investment Trust (2017–2018); Assistant Treasurer, IDX Funds (2017–2021); Assistant Treasurer, WP Funds Trust (2017–2021). | N/A | N/A |
Tony DeMarino YOB: 1970 | Anti-Money Laundering (“AML”) Officer | Since 2022 | Principal Executive Officer, Matrix 360 Distributors, LLC (2022–present); Partner, Primark Capital (2020–2022); Head of Distribution, Cognios Capital, LLC (2016–2020). | N/A | N/A |
| FinTrust Income and Opportunity Fund | ANNUAL REPORT |
ADDITIONAL INFORMATION
November 30, 2022 (Unaudited) (continued)
BOARD OF TRUSTEES, OFFICERS AND PRINCIPAL SHAREHOLDERS - (Unaudited)
Remuneration Paid to Trustees and Officers - Officers of the Trust and Trustees who are “interested persons” of the Trust or the Adviser will receive no salary or fees from the Trust. Officers of the Trust and interested Trustees do receive compensation directly from certain service providers to the Trust, including Matrix 360 Distributors, LLC and M3Sixty Administration, LLC. Each Trustee who is not an “interested person” (an “Independent Trustee”) receives a $5,000 annual retainer (paid quarterly). In addition, each Independent Trustee receives, on a per fund basis: (i) a fee of $1,500 per fund each year (paid quarterly); (ii) a fee of $200 per Board meeting attended; and (iii) a fee of $200 per committee meeting attended. The Trust will also reimburse each Trustee for travel and other expenses incurred in connection with, and/or related to, the performance of their obligations as a Trustee. Officers of the Trust will also be reimbursed for travel and other expenses relating to their attendance at Board meetings.
| Name of Trustee1 | Aggregate Compensation From each Fund2 | Pension or Retirement Benefits Accrued As Part of Portfolio Expenses | Estimated Annual Benefits Upon Retirement | Total Compensation From the Fund Paid to Trustees2 |
| Independent Trustees |
| Arthur Q. Falk | $ 3,533 | None | None | $ 3,533 |
| Tom M. Wirtshafter | $ 3,533 | None | None | $ 3,533 |
| Gary W. DiCenzo3 | $ 2,750 | None | None | $ 2,750 |
| Steven D. Poppen | $ 3,533 | None | None | $ 3,533 |
| Thomas J. Schmidt | $ 3,533 | None | None | $ 3,533 |
| Interested Trustees and Officers |
| Randall K. Linscott | None | Not Applicable | Not Applicable | None |
| | | | | | |
1 Each of the Trustees serves as a Trustee to each Series of the Trust. The Trust currently offers six (6) series of shares.
2 Figures are for the year ended November 30, 2022.
3 Gary W. DiCenzo resigned as Trustee effective October 25, 2022.
| FinTrust Income and Opportunity Fund | ANNUAL REPORT |
Information About Your Fund’s Expenses – (Unaudited)
November 30, 2022
As a shareholder of the Fund, you incur two types of costs: (1) transaction costs, such as the sales charge (load) imposed on certain subscriptions and the contingent deferred sales charge (“CDSC”) imposed on certain short-term redemptions; and (2) ongoing costs, including management fees, distribution and/or service (12b-1) fees; and other Fund expenses. The example below is intended to help you understand your ongoing costs (in dollars) of investing in the Fund and to compare these costs with the ongoing costs of investing in other mutual funds.
The example is based on an investment of $1,000 invested at the beginning of the period and held for the entire period as indicated below.
Actual Expenses – The first section of the table provides information about actual account values and actual expenses (relating to the example $1,000 investment made at the beginning of the period). You may use the information in this section, together with the amount you invested, to estimate the expenses that you paid over the period. Simply divide your account value by $1,000 (for example, an $8,600 account value divided by $1,000 = 8.6), then multiply the result by the number in the first section under the heading entitled “Expenses Paid During Period” to estimate the expenses you paid on your account during this period.
Hypothetical Example for Comparison Purposes – The second section of the table provides information about the hypothetical account values and hypothetical expenses based on the Fund’s actual expense ratios and an assumed rate of return of 5% per year before expenses, which is not the Fund’s actual return. The hypothetical account values and expenses may not be used to estimate the actual ending account balance or expenses you paid for the period. You may use this information to compare the ongoing costs of investing in the Fund to other funds. To do so, compare this 5% hypothetical example with the 5% hypothetical examples that appear in the shareholder reports of the other funds.
Please note that the expenses shown in the table are meant to highlight your ongoing costs only and do not reflect any transactional costs, such as sales charges (loads), CDSC fees, or exchange fees. Therefore, the second section of the table is useful in comparing ongoing costs only, and will not help you determine the relative total costs of owning different funds. In addition, if these transactional costs were included, your costs would have been higher. For more information on transactional costs, please refer to the Fund’s prospectus.
| | Expenses and Value of a $1,000 Investment for the period from 05/31/22 through 11/30/22 | |
| | | |
| | Beginning Account
Value (05/31/22) | Annualized Expense
Ratio for the Period | Ending Account
Value (11/30/22) | Expenses Paid
During Period (a) | |
| Actual Fund Return (in parentheses) | | | | |
| Class A (+3.99%) | $1,000.00 | 2.43% | $1,039.90 | $ 12.43 | |
| Institutional Class (+4.23%) | $1,000.00 | 2.18% | $1,042.30 | $ 11.16 | |
| Hypothetical 5% Return | | | | |
| Class A | $1,000.00 | 2.43% | $1,012.90 | $ 12.26 | |
| Institutional Class | $1,000.00 | 2.18% | $1,014.10 | $ 11.01 | |
| | | | | | | |
| (a) | Expenses are equal to the Fund’s annualized expense ratios, multiplied by the average account value over the period, multiplied by 183/365 to reflect the one-half year period. |
For more information on Fund expenses, please refer to the Fund’s prospectus, which can be obtained from your investment representative or by calling 1-877-244-6235. Please read it carefully before you invest or send money.
| FinTrust Income and Opportunity Fund | ANNUAL REPORT |
Information About Your Fund’s Expenses – (Unaudited) (continued)
November 30, 2022
Total Fund operating expense ratios as stated in the current Fund prospectus dated March 30, 2022 for the Fund were as follows: |
| FinTrust Income and Opportunity Fund Class A, gross of fee waivers or expense reimbursements | 2.65% |
| FinTrust Income and Opportunity Fund Class A, after waiver and reimbursement* | 2.38% |
| FinTrust Income and Opportunity Fund Institutional Class, gross of fee waivers or expense reimbursements | 2.40% |
| FinTrust Income and Opportunity Fund Institutional Class, after waiver and reimbursement* | 2.13% |
* FinTrust Capital Advisors, LLC (the “Adviser”) has entered into an Expense Limitation Agreement with the Fund under which it has agreed to waive or reduce its fees and to assume other expenses of the Fund, if necessary, in an amount that limits the Fund’s annual operating expenses (excluding interest, distribution fees pursuant to Rule 12b-1 Plans, taxes, acquired fund fees and expenses, brokerage commissions, dividend expenses on short sales, and other expenditures which are capitalized in accordance with generally accepted accounting principles and other extraordinary expenses not incurred in the ordinary course of such Fund’s business) to not more than 1.95% of the Fund’s average daily net assets. The current contractual agreement cannot be terminated before March 31, 2023 without the Board’s approval. Subject to approval by the Fund’s Board, any waiver or reimbursement under the Expense Limitation Agreement is subject to repayment by the Fund within the three years following the month in which such waiver or reimbursement occurred, if the Fund can make the payment without exceeding the 1.95% expense limitation. Total Gross Operating Expenses for the year ended November 30, 2022 were 2.94% and 2.69% for the FinTrust Income and Opportunity Fund Class A shares and FinTrust Income and Opportunity Fund Institutional Class shares, respectively. Please see the Information About Your Fund’s Expenses, the Financial Highlights and Notes to Financial Statements (Note 6) sections of this report for expense related disclosures for the year ended November 30, 2022. |
360 FUNDS
4300 Shawnee Mission Pkwy
Suite 100
Fairway, KS 66205
INVESTMENT ADVISER
FinTrust Capital Advisors, LLC
124 Verdae Boulevard
Suite 504
Greenville, SC 29607
ADMINISTRATOR & TRANSFER AGENT
M3Sixty Administration, LLC
4300 Shawnee Mission Parkway
Suite 100
Fairway, KS 66205
DISTRIBUTOR
Matrix 360 Distributors, LLC
4300 Shawnee Mission Parkway
Suite 100
Fairway, KS 66205
INDEPENDENT REGISTERED PUBLIC ACCOUNTING FIRM
BBD, LLP
1835 Market Street
3rd Floor
Philadelphia, PA 19103
LEGAL COUNSEL
FinTech Law, LLC
6224 Turpin Hills Dr.
Cincinnati, Ohio 45244
CUSTODIAN BANK
Fifth Third Bank
Fifth Third Center
38 Fountain Square Plaza
Cincinnati, OH 45263
| | (a) | The registrant has, as of the end of the period covered by this report, adopted a code of ethics that applies to the registrant’s principal executive officer, principal financial officer, and principal accounting officer or controller, or persons performing similar functions, regardless of whether these individuals are employed by the registrant or a third party. |
| | | |
| | (b) | During the period covered by this report, there were no amendments to any provision of the code of ethics. |
| | | |
| | (c) | During the period covered by this report, there were no waivers or implicit waivers of a provision of the code of ethics. |
| | | |
| | (d) | The registrant’s Code of Ethics is filed herewith. |
| ITEM 3. | AUDIT COMMITTEE FINANCIAL EXPERT. |
The Registrant’s Board of Trustees has determined that Tom Wirtshafter serves on its audit committee as the “audit committee financial expert” as defined in Item 3.
| ITEM 4. | PRINCIPAL ACCOUNTANT FEES AND SERVICES. |
| | (a) | Audit Fees. The aggregate fees billed for professional services rendered by the principal accountant for the audit of the registrant’s annual financial statements or for services that are normally provided by the accountant in connection with statutory and regulatory filings or engagements were $12,000 with respect to the registrant’s fiscal year ended November 30, 2022 and $12,000 with respect to the registrant’s fiscal year ended November 30, 2021 for the FinTrust Income and Opportunity Fund. The November 30, 2022 and November 30, 2021 audit fees were paid to BBD, LLP. |
| | | |
| | (b) | Audit-Related Fees. There were no fees billed during the fiscal year for assurances and related services by the principal accountant that are reasonably related to the performance of the audit of the registrant’s financial statements and are not reported under paragraph (a) of this item. |
| | | |
| | (c) | Tax Fees. The aggregate fees billed in the last fiscal year for professional services rendered by the principal accountant for tax compliance, tax advice and tax planning were $3,000 with respect to the registrant’s fiscal year ended November 30, 2022 and $2,500 with respect to the registrant’s fiscal year ended November 30, 2021 for the FinTrust Income and Opportunity Fund. The services comprising these fees are the preparation of the registrant’s federal income and excise tax returns. The November 30, 2022 and November 30, 2021 tax fees were paid to BBD, LLP. |
| | | |
| | (d) | All Other Fees. The aggregate fees billed in last fiscal year for products and services provided by the registrant’s principal accountant, other than the services reported in paragraphs (a) through (c) of this item were $0 for the fiscal year ended November 30, 2022 and $0 for the fiscal year ended November 30, 2021 for the FinTrust Income and Opportunity Fund. |
| | | |
| | (e)(1) | The audit committee does not have pre-approval policies and procedures. Instead, the audit committee or audit committee chairman approves on a case-by-case basis each audit or non-audit service before the principal accountant is engaged by the registrant. |
| | (e)(2) | There were no services described in each of paragraphs (b) through (d) of this Item that were approved by the audit committee pursuant to paragraph (c)(7)(i)(C) of Rule 2-01 of Regulation S-X. |
| | (f) | Not applicable. The percentage of hours expended on the principal accountant’s engagement to audit the registrant’s financial statements for the most recent fiscal year that were attributed to work performed by persons other than the principal accountant’s full-time, permanent employees was zero percent (0%). |
| | (g) | All non-audit fees billed by the registrant’s principal accountant for services rendered to the registrant for the for the fiscal year ended November 30, 2022 and the fiscal year ended November 30, 2021 for the FinTrust Income and Opportunity Fund, are disclosed in (b)-(d) above. There were no audit or non-audit services performed by the registrant’s principal accountant for the registrant’s adviser. |
| | (h) | There were no non-audit services rendered to the registrant’s investment adviser. |
| ITEM 5. | AUDIT COMMITTEE OF LISTED REGISTRANTS. |
Not applicable
| ITEM 6. | SCHEDULES OF INVESTMENTS |
Included in annual report to shareholders filed under item 1 of this form.
| ITEM 7. | DISCLOSURE OF PROXY VOTING POLICIES AND PROCEDURES FOR CLOSED-END MANAGEMENT INVESTMENT COMPANIES. |
Not applicable as the Fund is an open-end management investment company.
| ITEM 8. | PORTFOLIO MANAGERS OF CLOSED-END MANAGEMENT INVESTMENT COMPANIES |
Not applicable as the Fund is an open-end management investment company.
| ITEM 9. | PURCHASES OF EQUITY SECURITIES BY CLOSED-END MANAGEMENT INVESTMENT COMPANY AND AFFILIATED PURCHASERS. |
Not applicable as the Fund is an open-end management investment company.
| ITEM 10. | SUBMISSION OF MATTERS TO A VOTE OF SECURITY HOLDERS. |
Not applicable at this time.
| ITEM 11. | CONTROLS AND PROCEDURES. |
| (a) | The registrant’s principal executive and principal financial officers, or persons performing similar functions, have concluded that the registrant’s disclosure controls and procedures (as defined in Rule 30a-3(c) under the 1940 Act, are effective, as of a date within 90 days of the filing date of this report, based on the evaluation of these controls and procedures required by Rule 30a-3(b) under the 1940 Act and Rule 15d-15(b) under the Securities Exchange Act of 1934, as amended. |
| (b) | There were no changes in the registrant’s internal control over financial reporting (as defined in Rule 30a-3(d) under the 1940 Act) that occurred during the period covered by this report that have materially affected, or are reasonably likely to materially affect, the registrant’s internal control over financial reporting. |
| ITEM 12. | DISCLOSURE OF SECURITIES LENDING ACTIVITIES FOR CLOSED-END MANAGEMENT INVESTMENT COMPANIES. |
Not applicable as the Fund is an open-end management investment company.