UNITED STATES
SECURITIES AND EXCHANGE COMMISSION
Washington, D.C. 20549
FORM N-CSR
CERTIFIED SHAREHOLDER REPORT OF REGISTERED MANAGEMENT INVESTMENT COMPANIES
Investment Company Act File Number 811-21726
360 Funds
(Exact name of registrant as specified in charter)
| 4300 Shawnee Mission Parkway, Suite 100, Fairway, KS | 66205 |
| (Address of principal executive offices) | (Zip code) |
The Corporation Trust Company
Corporation Trust Center
1209 Orange St.
Wilmington, DE 19801
(Name and address of agent for service)
With Copies To:
Bo J. Howell
FinTech Law, LLC
6224 Turpin Hills Dr.
Cincinnati, Ohio 45244
Registrant's telephone number, including area code: 877-244-6235
Date of fiscal year end: 02/28/2023
Date of reporting period: 02/28/2023
| ITEM 1. | REPORTS TO SHAREHOLDERS |
The Annual report to Shareholders of the Stringer Growth Fund, a series of the 360 Funds (the “registrant”), for the fiscal year ended February 28, 2023 pursuant to Rule 30e-1 under the Investment Company Act of 1940, as amended (the “1940 Act”) (17 CFR 270.30e-1) is filed herewith.

Stringer Growth Fund
Class A Shares (Ticker Symbol: SRGAX)
Class C Shares (Ticker Symbol: SRGCX)
Institutional Class Shares (Ticker Symbol: SRGIX)
A series of the
360 Funds
ANNUAL REPORT
FEBRUARY 28, 2023
Investment Adviser
Stringer Asset Management, LLC
5050 Poplar Avenue, Suite 1103
Memphis, TN 38157
IMPORTANT NOTE: As permitted by regulations adopted by the SEC, paper copies of the Fund’s shareholder reports will no longer be sent by mail unless you specifically request paper copies of the reports from the Fund or from your financial intermediary, such as a broker-dealer or bank. Instead, the reports will be made available on a website, and you will be notified by mail each time a report is posted and provided with a website link to access the report. You may elect to receive all future reports in paper free of charge. You can inform the Fund or your financial intermediary that you wish to continue receiving paper copies of your shareholder reports by calling or sending an e-mail request. Your election to receive reports in paper will apply to all funds held with the Fund complex/your financial intermediary.
TABLE OF CONTENTS

Mangement's Discussion of Fund Performance
Dear Shareholders:
In our view geopolitical, economic, and financial market risks continue to build. During the past year, our view shifted in that we now expect the U.S. economy to join the Eurozone in recession in 2023. However, we expect the U.S. recession to be rather short-lived and mild by recent historical comparisons. Meanwhile, we also look forward to the beginning of the next business cycle which should be fundamentally stronger than anything we have seen in recent decades.
Our near-term concerns are centered on the Federal Reserve’s (“Fed”) policy response to inflation. In our view, excess fiscal and monetary stimulus have been the primary drivers of inflation. Stimulus increased the amount of money, as measured by M2, in our economic system. The economy does need money growth in order to function properly, but our work suggests that government stimulus increased M2 to approximately $4.5 trillion more than necessary.
Changes in monetary policy impact the economy with about a 12-month lag. This excess money injected into the U.S. financial system propelled demand at a much faster rate than the previous business cycle and faster than the economy’s ability to create supplies to meet that demand. Strong inflationary pressure followed.
As a result, the Fed’s reversal of these policies has been equally as aggressive and their patience similarly lacking. The Fed’s need to continue to tighten monetary policy in response to heightened inflationary pressures has resulted in the growth rate of money falling into negative territory. There is less money in the U.S. financial system today than there was a year ago. With the Fed continuing to tighten despite weakening economic measures, such as negative money growth and other declining leading economic indicators, we expect a recession this year.
However, we remain optimistic and excited about the longer-term prospects for the U.S. economy and financial markets. The U.S. private sector financial conditions and demographics point to a bright future for the U.S. economy over the coming decade. Household and corporate balance sheets overall are in excellent shape relative to history and labor force trends point to long-term growth as younger workers mature into their prime years.
Though we expect near-term challenges to financial markets, our expectations for future returns are bright. We are finding compelling valuations that can lead to impressive long-term investment results, especially in Treasury bonds, which we think are more attractive than at any other time since 2007. The Stringer Growth Fund (the “Fund”) is underweight equities, both domestic and foreign, with the current equity allocation favoring defensive sectors such as health care and consumer staples.
During the fiscal year ended February 28, 2023, the Fund had a return of -10.42%(a) versus -8.26% for the MSCI AC World Net Total Return Index(b). The Fund was ahead of the benchmark, providing downside protection, until the equity market began to rally last fall. Given our expectations for recession ahead, we maintain our more conservative positioning for the time being and look forward to the new opportunities that we think the next business cycle will present.
We actively managed losses to offset realized gains during the year with a focus on tax efficiency. As a result, the Fund distributed a relatively small capital gain compared to many peers that distributed much larger gains.
Stringer Asset Management, LLC | 5050 Poplar Avenue, Suite 1103 | Memphis, TN 38157 | 901-800-2956 | info@stringeram.com
Thank you for your continued trust and support. Please let us know if there is anything we can do to help you.
Respectfully,

Gary Stringer, CFA
President of Stringer Asset Management, LLC
March 29, 2023
(a) The performance information shown is for the Fund’s Institutional Class shares. Please see the Total Return Table on the following pages for performance information on the Fund’s Class A and Class C shares. The performance information quoted assumes the reinvestment of all dividend and capital gain distributions, if any, and represents past performance, which is not a guarantee of future results. The returns shown do not reflect taxes that a shareholder would pay on Fund distributions or on the redemption of Fund shares. The investment return and principal value of an investment will fluctuate and, therefore, an investor’s shares, when redeemed, may be worth more or less than their original cost. Updated performance data current to the most recent month-end can be obtained by calling 1-877-244-6235. Investors should consider the investment objectives, risks, charges, and expenses carefully before investing or sending money. This and other important information about the Fund can be found in the Fund’s prospectus. Please read it carefully before investing.
(b) MSCI AC World Net Total Return Index is a free-float weighted equity index that includes both emerging and developed world markets. Please note that indices do not take into account any fees and expenses of investing in the individual securities that they track, and individuals cannot invest directly in any index.
Stringer Asset Management, LLC | 5050 Poplar Avenue, Suite 1103 | Memphis, TN 38157 | 901-800-2956 | info@stringeram.com
| Stringer Growth Fund | ANNUAL REPORT |
INVESTMENT HIGHLIGHTS
February 28, 2023 (Unaudited)
The investment objective of the Stringer Growth Fund (the “Fund”) is long-term growth of capital. To meet its investment objective, the Fund will invest primarily in unaffiliated exchange-traded funds (“ETFs”). The underlying ETFs will invest in various securities including, but not limited to, domestic equity securities (including large-, mid-and small-cap stocks), stocks offered in international markets, including emerging markets, domestic fixed income securities, foreign debt securities, and cash or cash equivalents. The Fund may also invest in alternative sector ETFs, such as commodity and real estate ETFs, as well as exchange-traded notes (“ETNs”). ETNs are unsecured debt obligations of investment banks which are traded on exchanges and the returns of which are linked to the performance of market indices. The Fund will generally invest in ETNs which are linked to commodities indices; however, investing in ETNs is not equivalent to investing directly in index components or the relevant index itself. The Fund may also invest directly in domestic equity securities (including large-, small-and mid-cap stocks), stocks offered in international markets, including emerging markets, and unaffiliated open-end investment companies.
The Fund is designed to meet investor needs for a diversified portfolio solution with a defined risk objective of long-term growth through a fully managed investment policy utilizing primarily ETFs as well as United States and foreign equity securities, debt and money market securities, the combination of which will be varied from time to time both with respect to types of securities and markets in response to changing market and economic trends. The portfolio is built around a strategic allocation which allocates the portfolio’s investments to large cap stocks, small-and mid-cap stocks, international securities (including emerging markets), and other investments, primarily through investments in ETFs.
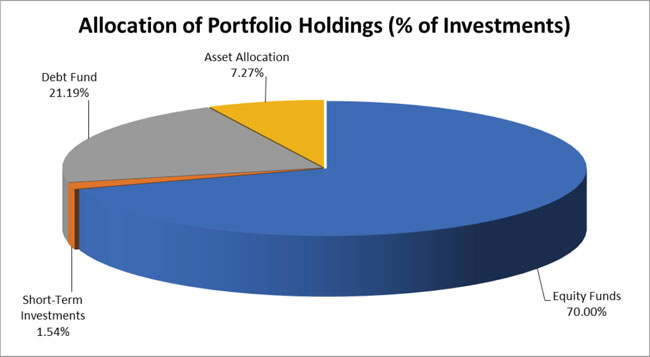
The percentages in the above graph are based on the portfolio holdings of the Fund as of February 28, 2023 and are subject to change.
| Stringer Growth Fund | ANNUAL REPORT |
INVESTMENT HIGHLIGHTS
February 28, 2023 (Unaudited)
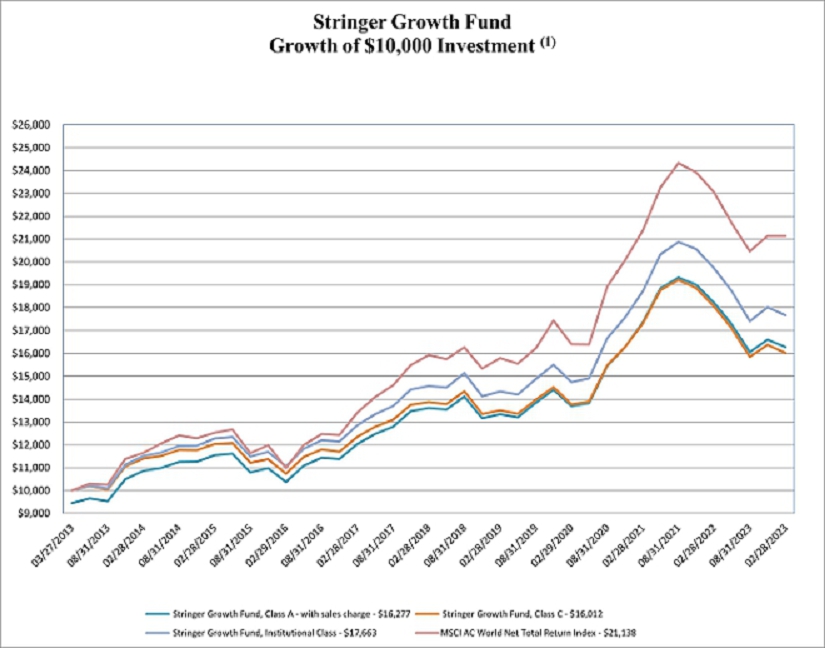
(1) The minimum initial investment for the Institutional Class shares is $1,000,000.
Returns as of February 28, 2023 | | One Year Ended February 28, 2023 | | Five Years Ended February 28, 2023 | | Since Inception of March 27, 2013 through February 28, 2023 |
| Stringer Growth Fund Class A without sales charge | | (10.63)% | | 3.65% | | 5.63% |
| Stringer Growth Fund Class A with sales charge | | (15.55)% | | 2.48% | | 5.03% |
| Stringer Growth Fund Class C without CDSC | | (11.28)% | | 2.91% | | 4.86% |
| Stringer Growth Fund Institutional Class | | (10.42)% | | 3.92% | | 5.90% |
| MSCI AC World Net Total Return Index | | (8.26)% | | 5.82% | | 7.83% |
The performance information quoted in this annual report assumes the reinvestment of all dividend and capital gain distributions, if any, and represents past performance, which is not a guarantee of future results. The returns shown do not reflect taxes that a shareholder would pay on Fund distributions or on the redemption of Fund shares. The investment return and principal value of an investment will fluctuate and, therefore, an investor’s shares, when redeemed, may be worth more or less than their original cost. Updated performance data current to the most recent month-end can be obtained by calling 1-877-244-6235.
The above graph depicts the performance of the Stringer Growth Fund versus the MSCI AC World Net Total Return Index. The MSCI AC World Net Total Return Index is a free-float weighted equity index that includes both emerging and developed world markets. Please note that indices do not take into account any fees and expenses of investing in the individual securities that they track and individuals cannot invest directly in any index.
As with any fund, save an index fund, that commonly compares its performance to the MSCI AC World Net Total Return Index, such a comparison may be said to be inappropriate because of the dissimilarity between the Fund’s investments and the securities comprising the index; so too with the Stringer Growth Fund, which will generally not invest in all the securities comprising this index.
STRINGER GROWTH FUND
SCHEDULE OF INVESTMENTS
| February 28, 2023 | ANNUAL REPORT |
| EXCHANGE-TRADED FUNDS - 98.38% | | Shares | | | Value | |
| | | | | | | |
| Asset Allocation Fund - 7.27% | | | | | | | | |
| WisdomTree International Quality Dividend Growth Fund | | | 23,342 | | | $ | 747,177 | |
| WisdomTree Managed Futures Strategy Fund | | | 32,125 | | | | 1,045,026 | |
| | | | | | | | 1,792,203 | |
| | | | | | | | | |
| Debt Funds - 21.17% | | | | | | | | |
| iShares 10-20 Year Treasury Bond ETF | | | 20,351 | | | | 2,222,940 | |
| iShares Fallen Angels USD Bond ETF | | | 78,991 | | | | 1,973,985 | |
| WisdomTree Floating Rate Treasury Fund | | | 20,390 | | | | 1,025,413 | |
| | | | | | | | 5,222,338 | |
| | | | | | | | | |
| Equity Funds - 69.94% | | | | | | | | |
| Financial Select Sector SPDR Fund | | | 28,679 | | | | 1,024,414 | |
| Global X MLP ETF | | | 24,432 | | | | 1,027,610 | |
| Goldman Sachs ActiveBeta International Equity ETF | | | 24,947 | | | | 754,397 | |
| Health Care Select Sector SPDR Fund | | | 7,763 | | | | 987,221 | |
| Invesco Russell 1000 Dynamic Multifactor ETF | | | 78,101 | | | | 3,592,646 | |
| iShares MSCI International Momentum Factor ETF | | | 31,918 | | | | 1,009,566 | |
| iShares MSCI International Quality Factor ETF | | | 59,236 | | | | 2,002,177 | |
| iShares MSCI USA Momentum Factor ETF | | | 19,528 | | | | 2,719,665 | |
| iShares MSCI USA Value Factor ETF | | | 8,103 | | | | 759,494 | |
| Overlay Shares Large Cap Equity ETF | | | 40,071 | | | | 1,273,292 | |
| Technology Select Sector SPDR Fund | | | 7,636 | | | | 1,042,467 | |
| Vanguard Growth ETF | | | 4,553 | | | | 1,055,795 | |
| | | | | | | | 17,248,744 | |
| | | | | | | | | |
| TOTAL EXCHANGE-TRADED FUNDS (Cost $24,343,463) | | | | | | | 24,263,285 | |
| | | | | | | | | |
| SHORT-TERM INVESTMENTS - 1.53% | | | | | | | | |
| Federated Hermes Government Obligations Fund - Institutional Shares, 4.40% (a) | | | 378,108 | | | | 378,108 | |
| | | | | | | | | |
| SHORT-TERM INVESTMENTS (Cost $378,108) | | | | | | | 378,108 | |
| | | | | | | | | |
| INVESTMENTS AT VALUE (Cost $24,721,571) - 99.91% | | | | | | $ | 24,641,393 | |
| | | | | | | | | |
| OTHER ASSETS IN EXCESS OF LIABILITIES, NET - 0.09% | | | | | | | 22,731 | |
| | | | | | | | | |
| NET ASSETS - 100.00% | | | | | | $ | 24,664,124 | |
Percentages are stated as a percent of net assets.
(a) Rate shown represents the 7-day yield at February 28, 2023, is subject to change and resets daily.
ETF - Exchange-Traded Fund
MLP - Master Limited Partnerships
MSCI - Morgan Stanley Capital International
SPDR - Standard & Poor's Depositary Receipts
The accompanying notes are an integral part of these financial statements.
STRINGER GROWTH FUND
STATEMENT OF ASSETS AND LIABILITIES
| February 28, 2023 | ANNUAL REPORT |
| Assets: | | | |
| Investments, at cost | | $ | 24,721,571 | |
| Investments, at value | | $ | 24,641,393 | |
| Due from Adviser | | | 15,591 | |
| Receivables: | | | | |
| Interest | | | 1,846 | |
| Investment securities sold | | | 1,996,350 | |
| Prepaid expenses | | | 27,403 | |
| Total assets | | | 26,682,583 | |
| | | | | |
| Liabilities: | | | | |
| Payables: | | | | |
| Investment securities purchased | | | 1,978,037 | |
| Fund shares redeemed | | | 2,653 | |
| Accrued distribution (12b-1) fees | | | 4,703 | |
| Due to administrator | | | 12,306 | |
| Accrued expenses | | | 20,760 | |
| Total liabilities | | | 2,018,459 | |
| Net Assets | | $ | 24,664,124 | |
| | | | | |
| Sources of Net Assets: | | | | |
| Paid-in beneficial interest | | $ | 27,099,575 | |
| Total accumulated deficit | | | (2,435,451 | ) |
| Total Net Assets (Unlimited $0 par value shares of beneficial interest authorized) | | $ | 24,664,124 | |
| | | | | |
| Class A Shares: | | | | |
| Net assets | | $ | 5,037,677 | |
| Shares Outstanding (Unlimited $0 par value shares of beneficial interest authorized) | | | 465,164 | |
| Net Asset Value Per Share | | $ | 10.83 | |
| | | | | |
| Maximum Offering Price Per Share (a) | | $ | 11.46 | |
| | | | | |
| Minimum Redemption Price Per Share (b) | | $ | 10.72 | |
| | | | | |
| Class C Shares: | | | | |
| Net assets | | $ | 4,551,325 | |
| Shares Outstanding (Unlimited $0 par value shares of beneficial interest authorized) | | | 425,687 | |
| Net Asset Value and Offering Price Per Share | | $ | 10.69 | |
| | | | | |
| Minimum Redemption Price Per Share (c) | | $ | 10.58 | |
| | | | | |
| Institutional Class Shares: | | | | |
| Net assets | | $ | 15,075,122 | |
| Shares Outstanding (Unlimited $0 par value shares of beneficial interest authorized) | | | 1,389,158 | |
| Net Asset Value, Offering and Redemption Price Per Share | | $ | 10.85 | |
| (a) | A maximum sales charge of 5.50% is imposed on Class A shares. |
| (b) | Investments in Class A shares made at or above the $1 million breakpoint are not subject to an initial sales charge and may be subject to a 1.00% contingent deferred sales charge (“CDSC”) on shares redeemed within one year from the date of purchase. |
| (c) | A contingent deferred sales charge (“CDSC”) of 1.00% is imposed in the event of certain Class C redemption transactions made within one year from the date of purchase. |
The accompanying notes are an integral part of these financial statements.
STRINGER GROWTH FUND
STATEMENT OF OPERATIONS
| | | For the | |
| | | Year Ended | |
| | | February 28, 2023 | |
| Investment income: | | | | |
| Dividends | | $ | 703,082 | |
| Interest | | | 30,776 | |
| Total investment income | | | 733,858 | |
| | | | | |
| Expenses: | | | | |
| Advisory fees (Note 5) | | | 298,868 | |
| Distribution (12b-1) fees - Class A (Note 5) | | | 10,445 | |
| Distribution (12b-1) fees - Class C (Note 5) | | | 63,903 | |
| Accounting and transfer agent fees and expenses (Note 5) | | | 149,185 | |
| Registration and filing fees | | | 40,126 | |
| Trustee fees and expenses | | | 22,492 | |
| Legal fees | | | 22,283 | |
| Reports to shareholders | | | 20,314 | |
| Miscellaneous | | | 15,737 | |
| Audit fees | | | 13,500 | |
| Custodian fees | | | 9,307 | |
| Insurance | | | 6,081 | |
| Pricing fees | | | 3,666 | |
| Non-12b-1 shareholder servicing expense | | | 903 | |
| Total expenses | | | 676,810 | |
| | | | | |
| Less: fees waived (Note 5) | | | (272,136 | ) |
| Net expenses | | | 404,674 | |
| | | | | |
| Net investment income | | | 329,184 | |
| | | | | |
| Realized and unrealized loss: | | | | |
| Net realized loss on: | | | | |
| Investments | | | (1,938,644 | ) |
| Reimbursement from affiliate (Note 5) | | | - | |
| Net realized loss on investments | | | (1,938,644 | ) |
| | | | | |
| Net change in unrealized depreciation on: | | | | |
| Investments | | | (2,610,791 | ) |
| Net change in unrealized depreciation | | | (2,610,791 | ) |
| | | | | |
| Net realized and unrealized loss on investments | | | (4,549,435 | ) |
| | | | | |
| Net decrease in net assets resulting from operations | | $ | (4,220,251 | ) |
The accompanying notes are an integral part of these financial statements.
STRINGER GROWTH FUND
STATEMENTS OF CHANGES IN NET ASSETS
| | | For the | | | For the | |
| | | Year Ended | | | Year Ended | |
| | | February 28, 2023 | | | February 28, 2022 | |
| Increase in net assets from: | | | | | | | | |
| Operations: | | | | | | | | |
| Net investment income | | $ | 329,184 | | | $ | 153,522 | |
| Net realized gain (loss) on investments | | | (1,938,644 | ) | | | 3,463,630 | |
| Net change in unrealized depreciation on investments | | | (2,610,791 | ) | | | (2,426,572 | ) |
| Net increase (decrease) in net assets resulting from operations | | | (4,220,251 | ) | | | 1,190,580 | |
| | | | | | | | | |
| Distributions to shareholders from: | | | | | | | | |
| Distributable earnings - Class A | | | (140,491 | ) | | | (578,243 | ) |
| Distributable earnings - Class C | | | (96,644 | ) | | | (1,299,324 | ) |
| Distributable earnings - Institutional Class | | | (538,029 | ) | | | (3,653,376 | ) |
| Total distributions | | | (775,164 | ) | | | (5,530,943 | ) |
| | | | | | | | | |
| Beneficial interest transactions (Note 3): | | | | | | | | |
| Increase (decrease) in net assets from beneficial interest transactions | | | (9,398,529 | ) | | | 13,130,078 | |
| | | | | | | | | |
| Increase (decrease) in net assets | | | (14,393,944 | ) | | | 8,789,715 | |
| | | | | | | | | |
| Net Assets: | | | | | | | | |
| Beginning of year | | | 39,058,068 | | | | 30,268,353 | |
| | | | | | | | | |
| End of year | | $ | 24,664,124 | | | $ | 39,058,068 | |
The accompanying notes are an integral part of these financial statements.
STRINGER GROWTH FUND
FINANCIAL HIGHLIGHTS
The following tables set forth the per share operating performance data for a share of beneficial interest outstanding, total return, ratios to average net assets and other supplemental data for the years indicated.
| | | Class A | |
| | | For the | | | For the | | | For the | | | For the | | | For the | |
| | | Year Ended | | | Year Ended | | | Year Ended | | | Year Ended | | | Year Ended | |
| | | February 28, 2023 | | | February 28, 2022 | | | February 28, 2021 | | | February 29, 2020 | | | February 28, 2019 | |
| Net Asset Value, Beginning of Year | | $ | 12.49 | | | $ | 13.64 | | | $ | 11.42 | | | $ | 11.28 | | | $ | 12.65 | |
| | | | | | | | | | | | | | | | | | | | | |
| Investment Operations: | | | | | | | | | | | | | | | | | | | | |
| Net investment income | | | 0.13 | (d) | | | 0.07 | (d) | | | 0.07 | (d) | | | 0.09 | (d) | | | 0.12 | |
| Net realized and unrealized gain (loss) on investments | | | (1.46 | ) | | | 0.78 | | | | 2.94 | | | | 0.23 | | | | (0.47 | ) |
| Total from investment operations | | | (1.33 | ) | | | 0.85 | | | | 3.01 | | | | 0.32 | | | | (0.35 | ) |
| | | | | | | | | | | | | | | | | | | | | |
| Distributions: | | | | | | | | | | | | | | | | | | | | |
| From net investment income | | | (0.11 | ) | | | (0.05 | ) | | | (0.07 | ) | | | (0.10 | ) | | | (0.09 | ) |
| From net realized capital gains | | | (0.22 | ) | | | (1.95 | ) | | | (0.72 | ) | | | (0.08 | ) | | | (0.93 | ) |
| Total distributions | | | (0.33 | ) | | | (2.00 | ) | | | (0.79 | ) | | | (0.18 | ) | | | (1.02 | ) |
| | | | | | | | | | | | | | | | | | | | | |
| Net Asset Value, End of Year | | $ | 10.83 | | | $ | 12.49 | | | $ | 13.64 | | | $ | 11.42 | | | $ | 11.28 | |
| | | | | | | | | | | | | | | | | | | | | |
| Total Return (a) | | | (10.63 | )% | (e) | | 5.01 | % | | | 26.60 | % | | | 2.70 | % | | | (1.97 | )% |
| | | | | | | | | | | | | | | | | | | | | |
| Ratios/Supplemental Data | | | | | | | | | | | | | | | | | | | | |
| Net assets, end of year/(in 000’s) | | $ | 5,038 | | | $ | 3,953 | | | $ | 4,028 | | | $ | 3,730 | | | $ | 4,355 | |
| | | | | | | | | | | | | | | | | | | | | |
| Ratio of expenses to average net assets: | | | | | | | | | | | | | | | | | | | | |
| Before fees waived and expenses absorbed (b) | | | 2.17 | % | | | 1.98 | % | | | 2.16 | % | | | 1.86 | % | | | 1.70 | % |
| After fees waived and expenses absorbed (b) | | | 1.30 | % | | | 1.30 | % | | | 1.30 | % | | | 1.30 | % | | | 1.30 | % |
| | | | | | | | | | | | | | | | | | | | | |
| Ratio of net investment income (loss): | | | | | | | | | | | | | | | | | | | | |
| Before fees waived and expenses absorbed (b) (c) | | | 0.27 | % | | | (0.18 | )% | | | (0.27 | )% | | | 0.19 | % | | | 0.39 | % |
| After fees waived and expenses absorbed (b) (c) | | | 1.13 | % | | | 0.50 | % | | | 0.60 | % | | | 0.75 | % | | | 0.79 | % |
| | | | | | | | | | | | | | | | | | | | | |
| Portfolio turnover rate | | | 103 | % | | | 105 | % | | | 212 | % | | | 68 | % | | | 68 | % |
| (a) | Total Return represents the rate that the investor would have earned or lost on an investment in the Fund, assuming reinvestment of dividends. Had the Adviser not waived fees/reimbursed expenses, total returns would have been lower. The returns shown exclude the impact of any sales loads and contingent deferred sales charges. |
| (b) | These ratios exclude the impact of the expenses of the underlying investment companies in which the Fund invests. |
| (c) | Recognition of net investment income (loss) by the Fund is affected by the timing of the declaration of dividends by the underlying investment companies in which the Fund invests. |
| (d) | Net investment income per share is based on average shares outstanding for the years ended February 28, 2023, February 28, 2022, February 28, 2021 and February 29, 2020. |
| | (e) | During the year ended February 28, 2023, 0.00% of the Fund’s total return consists of a voluntary reimbursement by the administrator for a loss incurred on a NAV error. Excluding these items, total return would have been (10.63)%. |
The accompanying notes are an integral part of these financial statements.
STRINGER GROWTH FUND
FINANCIAL HIGHLIGHTS
The following tables set forth the per share operating performance data for a share of beneficial interest outstanding, total return, ratios to average net assets and other supplemental data for the years indicated.
| | | Class C | |
| | | For the | | | For the | | | For the | | | For the | | | For the | |
| | | Year Ended | | | Year Ended | | | Year Ended | | | Year Ended | | | Year Ended | |
| | | February 28, 2023 | | | February 28, 2022 | | | February 28, 2021 | | | February 29, 2020 | | | February 28, 2019 | |
| Net Asset Value, Beginning of Year | | $ | 12.30 | | | $ | 13.51 | | | $ | 11.34 | | | $ | 11.19 | | | $ | 12.55 | |
| | | | | | | | | | | | | | | | | | | | | |
| Investment Operations: | | | | | | | | | | | | | | | | | | | | |
| Net investment income (loss) | | | 0.03 | (e) | | | (0.04 | ) (e) | | | (0.02 | ) (e) | | | 0.00 | (a)(e) | | | 0.00 | (a) |
| Net realized and unrealized gain (loss) on investments | | | (1.42 | ) | | | 0.78 | | | | 2.91 | | | | 0.23 | | | | (0.43 | ) |
| Total from investment operations | | | (1.39 | ) | | | 0.74 | | | | 2.89 | | | | 0.23 | | | | (0.43 | ) |
| | | | | | | | | | | | | | | | | | | | | |
| Distributions: | | | | | | | | | | | | | | | | | | | | |
| From net realized capital gains | | | (0.22 | ) | | | (1.95 | ) | | | (0.72 | ) | | | (0.08 | ) | | | (0.93 | ) |
| Total distributions | | | (0.22 | ) | | | (1.95 | ) | | | (0.72 | ) | | | (0.08 | ) | | | (0.93 | ) |
| | | | | | | | | | | | | | | | | | | | | |
| Net Asset Value, End of Year | | $ | 10.69 | | | $ | 12.30 | | | $ | 13.51 | | | $ | 11.34 | | | $ | 11.19 | |
| | | | | | | | | | | | | | | | | | | | | |
| Total Return (b) | | | (11.28 | )% | | | 4.29 | % | | | 25.69 | % | | | 1.99 | % | | | (2.68 | )% |
| | | | | | | | | | | | | | | | | | | | | |
| Ratios/Supplemental Data | | | | | | | | | | | | | | | | | | | | |
| Net assets, end of year/(in 000’s) | | $ | 4,551 | | | $ | 8,840 | | | $ | 9,924 | | | $ | 8,380 | | | $ | 11,094 | |
| | | | | | | | | | | | | | | | | | | | | |
| Ratio of expenses to average net assets: | | | | | | | | | | | | | | | | | | | | |
| Before fees waived and expenses absorbed (c) | | | 2.92 | % | | | 2.73 | % | | | 2.91 | % | | | 2.61 | % | | | 2.45 | % |
| After fees waived and expenses absorbed (c) | | | 2.05 | % | | | 2.05 | % | | | 2.05 | % | | | 2.05 | % | | | 2.05 | % |
| | | | | | | | | | | | | | | | | | | | | |
| Ratio of net investment income (loss): | | | | | | | | | | | | | | | | | | | | |
| Before fees waived and expenses absorbed (c) (d) | | | (0.60 | )% | | | (0.95 | )% | | | (1.02 | )% | | | (0.53 | )% | | | (0.33 | )% |
| After fees waived and expenses absorbed (c) (d) | | | 0.27 | % | | | (0.27 | )% | | | (0.16 | )% | | | 0.03 | % | | | 0.07 | % |
| | | | | | | | | | | | | | | | | | | | | |
| Portfolio turnover rate | | | 103 | % | | | 105 | % | | | 212 | % | | | 68 | % | | | 68 | % |
| (a) | Net investment income (loss) per share was less than $0.01 per share for the years ended February 29, 2020 and February 28, 2019. |
| (b) | Total Return represents the rate that the investor would have earned or lost on an investment in the Fund, assuming reinvestment of dividends. Had the Adviser not waived fees/reimbursed expenses, total returns would have been lower. The returns shown exclude the impact of any contingent deferred sales charges. |
| (c) | These ratios exclude the impact of the expenses of the underlying investment companies in which the Fund invests. |
| (d) | Recognition of net investment income (loss) by the Fund is affected by the timing of the declaration of dividends by the underlying investment companies in which the Fund invests. |
| (e) | Net investment income (loss) per share is based on average outstanding shares for the years ended February 28, 2023, February 28, 2022, February 28, 2021 and February 29, 2020. |
The accompanying notes are an integral part of these financial statements.
STRINGER GROWTH FUND
FINANCIAL HIGHLIGHTS
The following tables set forth the per share operating performance data for a share of beneficial interest outstanding, total return, ratios to average net assets and other supplemental data for the years indicated.
| | | Institutional Class | |
| | | For the | | | For the | | | For the | | | For the | | | For the | |
| | | Year Ended | | | Year Ended | | | Year Ended | | | Year Ended | | | Year Ended | |
| | | February 28, 2023 | | | February 28, 2022 | | | February 28, 2021 | | | February 29, 2020 | | | February 28, 2019 | |
| Net Asset Value, Beginning of Year | | $ | 12.51 | | | $ | 13.65 | | | $ | 11.42 | | | $ | 11.29 | | | $ | 12.68 | |
| | | | | | | | | | | | | | | | | | | | | |
| Investment Operations: | | | | | | | | | | | | | | | | | | | | |
| Net investment income | | | 0.14 | (d) | | | 0.10 | (d) | | | 0.10 | (d) | | | 0.12 | (d) | | | 0.14 | |
| Net realized and unrealized gain (loss) on investments | | | (1.45 | ) | | | 0.79 | | | | 2.95 | | | | 0.22 | | | | (0.46 | ) |
| Total from investment operations | | | (1.31 | ) | | | 0.89 | | | | 3.05 | | | | 0.34 | | | | (0.32 | ) |
| | | | | | | | | | | | | | | | | | | | | |
| Distributions: | | | | | | | | | | | | | | | | | | | | |
| From net investment income | | | (0.13 | ) | | | (0.08 | ) | | | (0.10 | ) | | | (0.13 | ) | | | (0.14 | ) |
| From net realized capital gains | | | (0.22 | ) | | | (1.95 | ) | | | (0.72 | ) | | | (0.08 | ) | | | (0.93 | ) |
| Total distributions | | | (0.35 | ) | | | (2.03 | ) | | | (0.82 | ) | | | (0.21 | ) | | | (1.07 | ) |
| | | | | | | | | | | | | | | | | | | | | |
| Net Asset Value, End of Year | | $ | 10.85 | | | $ | 12.51 | | | $ | 13.65 | | | $ | 11.42 | | | $ | 11.29 | |
| | | | | | | | | | | | | | | | | | | | | |
| Total Return (a) | | | (10.42 | )% | | | 5.34 | % | | | 26.98 | % | | | 2.86 | % | | | (1.69 | )% |
| | | | | | | | | | | | | | | | | | | | | |
| Ratios/Supplemental Data | | | | | | | | | | | | | | | | | | | | |
| Net assets, end of year/(in 000’s) | | $ | 15,075 | | | $ | 26,265 | | | $ | 16,316 | | | $ | 13,575 | | | $ | 15,485 | |
| | | | | | | | | | | | | | | | | | | | | |
| Ratio of expenses to average net assets: | | | | | | | | | | | | | | | | | | | | |
| Before fees waived and expenses absorbed (b) | | | 1.92 | % | | | 1.73 | % | | | 1.91 | % | | | 1.61 | % | | | 1.45 | % |
| After fees waived and expenses absorbed (b) | | | 1.05 | % | | | 1.05 | % | | | 1.05 | % | | | 1.05 | % | | | 1.05 | % |
| | | | | | | | | | | | | | | | | | | | | |
| Ratio of net investment income (loss): | | | | | | | | | | | | | | | | | | | | |
| Before fees waived and expenses absorbed (b) (c) | | | 0.40 | % | | | 0.04 | % | | | (0.03 | )% | | | 0.46 | % | | | 0.79 | % |
| After fees waived and expenses absorbed (b) (c) | | | 1.27 | % | | | 0.72 | % | | | 0.83 | % | | | 1.02 | % | | | 1.19 | % |
| | | | | | | | | | | | | | | | | | | | | |
| Portfolio turnover rate | | | 103 | % | | | 105 | % | | | 212 | % | | | 68 | % | | | 68 | % |
| (a) | Total Return represents the rate that the investor would have earned or lost on an investment in the Fund, assuming reinvestment of dividends. Had the Adviser not waived fees/reimbursed expenses, total returns would have been lower. |
| (b) | These ratios exclude the impact of the expenses of the underlying investment companies in which the Fund invests. |
| (c) | Recognition of net investment income (loss) by the Fund is affected by the timing of the declaration of dividends by the underlying investment companies in which the Fund invests. |
| (d) | Net investment income per share is based on average shares outstanding for the years ended February 28, 2023, February 28, 2022, February 28, 2021 and February 29, 2020. |
The accompanying notes are an integral part of these financial statements.
| Stringer Growth Fund | ANNUAL REPORT |
NOTES TO THE FINANCIAL STATEMENTS
February 28, 2023
| 1. | ORGANIZATION AND SIGNIFICANT ACCOUNTING POLICIES |
The Stringer Growth Fund (the “Fund”) is a series of 360 Funds (the “Trust”). The Trust was organized on February 24, 2005 as a Delaware statutory trust. The Trust is registered as an open-end management investment company under the Investment Company Act of 1940 (the “1940 Act”). The Fund is a diversified fund. The Fund’s investment objective is long-term growth of capital. The Fund’s investment adviser is Stringer Asset Management, LLC (the “Adviser”). The Fund offers three classes of shares, Class A, Class C and Institutional Class shares. Each class of shares commenced operations on March 27, 2013. Each class differs as to sales and redemption charges and ongoing fees. Income and realized/unrealized gains or losses are allocated to each class based on relative net assets.
The following is a summary of the significant accounting policies followed by the Fund in the preparation of its financial statements. The Fund is an investment company that follows the accounting and reporting guidance of Accounting Standards Codification Topic 946 applicable to investment companies.
a) Security Valuation – All investments in securities are recorded at their estimated fair value, as described in Note 2.
b) Exchange-Traded Funds – The Fund may invest in Exchange-Traded Funds (“ETFs”). ETFs are registered investment companies and incur fees and expenses such as operating expenses, licensing fees, registration fees, trustees fees, and marketing expenses, and ETF shareholders, such as the Fund, pay their proportionate share of these expenses. Your cost of investing in the Fund will generally be higher than the cost of investing directly in ETFs. By investing in the Fund, you will indirectly bear fees and expenses charged by the underlying ETFs in which the Fund invests in addition to the Fund’s direct fees and expenses.
c) Federal Income Taxes – The Fund has qualified and intends to continue to qualify as a regulated investment company under Subchapter M of the Internal Revenue Code of 1986, as amended (the “Code”). It is the policy of the Fund to comply with the requirements of the Code applicable to regulated investment companies and to distribute substantially all of its net investment company taxable income and net capital gains. Therefore, no provision for federal income taxes is required.
As of and during the year ended February 28, 2023, the Fund did not have a liability for any unrecognized tax expenses. The Fund recognizes interest and penalties, if any, related to unrecognized tax liability as income tax expense in the Statement of Operations. During the year ended February 28, 2023, the Fund did not incur any interest or penalties. The Fund identifies its major tax jurisdictions as U.S. Federal and Delaware State. As required by accounting principles generally accepted in the United States of America (“GAAP”), ASC 740, management has analyzed the Fund’s tax positions taken on Federal income tax returns for all open tax years (tax years ended 2020, 2021 and 2022) and for the year ended February 28, 2023 and has concluded that no provision for income tax is required in these financial statements.
d) Distributions to Shareholders – Dividends from net investment income and distributions of net realized capital gains, if any, will be declared and paid at least annually. Income and capital gain distributions, which are determined in accordance with income tax regulations, are recorded on the ex-dividend date. GAAP requires that permanent financial reporting differences relating to shareholder distributions be reclassified to paid-in beneficial interest. There were no reclassifications necessary for the year ended February 28, 2023.
e) Use of Estimates – The preparation of financial statements in conformity with GAAP requires management to make estimates and assumptions that affect the reported amounts of assets and liabilities and disclosure of contingent assets and liabilities at the date of the financial statements and the reported amounts of revenues and expenses during the reporting period. Actual results could differ from those estimates.
f) Other – Investment and shareholder transactions are recorded on trade date. The Fund determines the gain or loss realized from the investment transactions by comparing the original cost of the security lot sold with the net sales proceeds. Dividend income is recognized on the ex-dividend date or as soon as information is available to the Fund and interest income is recognized on an accrual basis. Withholding taxes on foreign dividends have been provided for in accordance with the Fund’s understanding of the applicable country’s tax rules and rates.
| Stringer Growth Fund | ANNUAL REPORT |
NOTES TO THE FINANCIAL STATEMENTS
February 28, 2023
| 1. | ORGANIZATION AND SIGNIFICANT ACCOUNTING POLICIES (continued) |
g) Contingent Deferred Sales Charges – For initial purchases of Class A shares of the Fund of $1 million or more, a broker-dealer’s commission (equal to 1.00% of such purchases over $1 million) may be paid by the Adviser to participating unaffiliated broker-dealers through whom such purchases are effected. A contingent deferred sales charge (“CDSC”) may be imposed upon certain redemptions of Class A shares purchased at net asset value in amounts totaling $1 million or more if the dealer’s commission described above was paid by the Adviser and the shares are redeemed within one year from the date of purchase. The Adviser may advance a commission to a dealer that sells such Class A shares and any CDSC will be reimbursed to the Adviser and will be equal to 1.00% of the lesser of (1) the net asset value at the time of purchase of the Class A shares being redeemed; or (2) the net asset value of such shares at the time of redemption. There were no CDSC fees from Class A redemptions reimbursed to the Adviser during the year ended February 28, 2023.
For initial purchases of Class C shares of the Fund, a broker-dealer’s commission (equal to 1.00% of such purchases) may be paid by the Adviser to participating unaffiliated broker-dealers through whom such purchases are effected. A CDSC of 1.00% may be imposed on certain redemptions of Class C shares that are redeemed within one year from the date of purchase. The Adviser may advance a commission to a dealer that sells Class C shares and any CDSC will be reimbursed to the Adviser and will be a percentage of the dollar amount of shares redeemed and will be assessed on an amount equal to the net asset value at the time of purchase of the Class C shares being redeemed. During the year ended February 28, 2023, CDSC fees paid from Class C redemptions of $1,284 were reimbursed to the Adviser by the Fund.
Processes and Structure
The Fund’s Board of Trustees (the “Board”) has adopted guidelines for valuing securities and other derivative instruments including in circumstances in which market quotes are not readily available, and has delegated authority to the Adviser to apply those guidelines in determining fair value prices, subject to review by the Board.
Hierarchy of Fair Value Inputs
The Fund utilizes various methods to measure the fair value of its investments on a recurring basis. GAAP establishes a hierarchy that prioritizes inputs to valuation techniques used to measure fair value. The three levels of inputs are as follows:
| ● | Level 1 – Unadjusted quoted prices in active markets for identical assets or liabilities that the Fund has the ability to access. |
| ● | Level 2 – Observable inputs other than quoted prices included in level 1 that are observable for the asset or liability either directly or indirectly. These inputs may include quoted prices for the identical instrument on an inactive market, prices for similar instruments, interest rates, prepayment speeds, credit risk, yield curves, default rates, and similar data. |
| ● | Level 3 – Unobservable inputs for the asset or liability to the extent that relevant observable inputs are not available, representing the Fund’s own assumptions about the assumptions that a market participant would use in valuing the asset or liability, and that would be based on the best information available. |
The availability of observable inputs can vary from security to security and is affected by a wide variety of factors, including, for example, the type of security, whether the security is new and not yet established in the marketplace, the liquidity of markets, and other characteristics particular to the security. To the extent that valuation is based on models or inputs that are less observable or unobservable in the market, the determination of fair value requires more judgment. Accordingly, the degree of judgment exercised in determining fair value is greatest for instruments categorized in Level 3.
The inputs used to measure fair value may fall into different levels of the fair value hierarchy. In such cases, for disclosure purposes, the level in the fair value hierarchy within which the fair value measurement falls in its entirety is determined based on the lowest level input that is significant to the fair value measurement in its entirety.
| Stringer Growth Fund | ANNUAL REPORT |
NOTES TO THE FINANCIAL STATEMENTS
February 28, 2023
| 2. | SECURITIES VALUATIONS (continued) |
Fair Value Measurements
A description of the valuation techniques applied to the Fund’s major categories of assets and liabilities measured at fair value on a recurring basis follows.
Equity securities (common stock and ETFs) – Securities traded on a national securities exchange (or reported on the NASDAQ national market) are stated at the last reported sales price on the day of valuation. To the extent these securities are actively traded, and valuation adjustments are not applied, they are categorized in Level 1 of the fair value hierarchy. Certain foreign securities may be fair valued using a pricing service that considers the correlation of the trading patterns of the foreign security to the intraday trading in the U.S. markets for investments such as American Depositary Receipts, financial futures, ETFs, and the movement of the certain indexes of securities based on a statistical analysis of the historical relationship and that are categorized in Level 2. Preferred stock and other equities traded on inactive markets or valued by reference to similar instruments are also categorized in Level 2.
Money market funds – Money market funds are valued at their net asset value of $1.00 per share and are categorized as Level 1.
The following table summarizes the inputs used to value the Fund’s assets and liabilities measured at fair value as of February 28, 2023.
| Financial Instruments – Assets | | | | | | | | | | | | |
| | | | | | | | | | | | | |
| Security Classification (1) | | Level 1 | | | Level 2 | | | Level 3 | | | Totals | |
| Exchange-Traded Funds (2) | | $ | 24,263,285 | | | $ | — | | | $ | — | | | $ | 24,263,285 | |
| Short-Term Investments | | | 378,108 | | | | — | | | | — | | | | 378,108 | |
| Total Assets | | $ | 24,641,393 | | | $ | — | | | $ | — | | | $ | 24,641,393 | |
(1) As of and during the year ended February 28, 2023, the Fund held no securities that were considered to be “Level 3” securities (those valued using significant unobservable inputs). Therefore, a reconciliation of assets in which significant unobservable inputs (Level 3) were used in determining fair value is not applicable.
(2) All ETFs held in the Fund are Level 1 securities. For a detailed break-out of ETFs by investment type, please refer to the Schedule of Investments.
During the year ended February 28, 2023, no securities were valued using alternative procedures approved by the Board. The Fund began complying with Rule 2a-5 effective September 8, 2022. Effective on that date, securities for which market quotations are not readily available (as defined in Rule 2a-5) will have a fair value determined by the Valuation Designee (also as defined by Rule 2a-5) in accordance with the fair value policies and procedures adopted by the Board and the Adviser. The Board will oversee the Valuation Designee’s fair value determinations.
| 3. | BENEFICIAL INTEREST TRANSACTIONS |
Transactions in shares of beneficial interest for the Fund for the year ended February 28, 2023 were as follows:
| | | Sold | | | Redeemed | | | Reinvested | | | Net Increase (Decrease) | |
| Class A | | | | | | | | | | | | | | | | |
| Shares | | | 228,054 | | | | (92,381 | ) | | | 12,961 | | | | 148,634 | |
| Value | | $ | 2,544,142 | | | $ | (1,044,315 | ) | | $ | 136,483 | | | $ | 1,636,310 | |
| Class C | | | | | | | | | | | | | | | | |
| Shares | | | 15,365 | | | | (317,689 | ) | | | 9,168 | | | | (293,156 | ) |
| Value | | $ | 165,947 | | | $ | (3,502,161 | ) | | $ | 95,443 | | | $ | (3,240,771 | ) |
| Stringer Growth Fund | ANNUAL REPORT |
NOTES TO THE FINANCIAL STATEMENTS
February 28, 2023
| 3. | BENEFICIAL INTEREST TRANSACTIONS (continued) |
| | | Sold | | | Redeemed | | | Reinvested | | | Net Increase (Decrease) | |
| Institutional Class | | | | | | | | | | | | | | | | |
| Shares | | | 288,490 | | | | (1,046,650 | ) | | | 47,477 | | | | (710,683 | ) |
| Value | | $ | 3,289,578 | | | $ | (11,584,531 | ) | | $ | 500,885 | | | $ | (7,794,068 | ) |
Transactions in shares of beneficial interest for the Fund for the year ended February 28, 2022 were as follows:
| | | Sold | | | Redeemed | | | Reinvested | | | Net Increase (Decrease) | |
| Class A | | | | | | | | | | | | | | | | |
| Shares | | | 24,018 | | | | (40,819 | ) | | | 37,921 | | | | 21,120 | |
| Value | | $ | 353,379 | | | $ | (574,885 | ) | | $ | 514,967 | | | $ | 293,461 | |
| Class C | | | | | | | | | | | | | | | | |
| Shares | | | 17,597 | | | | (124,440 | ) | | | 91,072 | | | | (15,771 | ) |
| Value | | $ | 253,038 | | | $ | (1,731,638 | ) | | $ | 1,219,448 | | | $ | (259,152 | ) |
| Institutional Class | | | | | | | | | | | | | | | | |
| Shares | | | 901,586 | | | | (252,370 | ) | | | 255,170 | | | | 904,386 | |
| Value | | $ | 13,320,892 | | | $ | (3,692,886 | ) | | $ | 3,467,763 | | | $ | 13,095,769 | |
| 4. | INVESTMENT TRANSACTIONS |
For the year ended February 28, 2023, aggregate purchases and sales of investment securities (excluding short-term investments) for the Fund were as follows:
| Purchases | | Sales | |
| $ | 31,080,049 | | $ | 40,088,823 | |
There were no government securities purchased or sold during the period.
| 5. | ADVISORY FEES AND OTHER RELATED PARTY TRANSACTIONS |
The Fund has entered into an Investment Advisory Agreement (the “Advisory Agreement”) with the Adviser. Pursuant to the Advisory Agreement, the Adviser manages the operations of the Fund and manages the Fund’s investments in accordance with the stated policies of the Fund. As compensation for the investment advisory services provided to the Fund, the Adviser will receive a monthly management fee equal to an annual rate of 0.95% of the Fund’s net assets.
The Adviser has entered into an Expense Limitation Agreement with the Fund under which it has agreed to waive or reduce its fees and to assume other expenses of the Fund, if necessary, in an amount that limits the Fund’s annual operating expenses (but excluding interest, borrowing expenses, distribution fees pursuant to Rule 12b-1 Plans, taxes, acquired fund fees and expenses, brokerage fees and commissions, dividend expenses on short sales, litigation expenses, expenditures which are capitalized in accordance with generally accepted accounting principles and, other extraordinary expenses not incurred in the ordinary course of such Fund’s business) to not more than 1.05% until and through at least June 30, 2023. The current contractual agreement cannot be terminated before June 30, 2023 without the Board’s approval. Please see the table below for information regarding the management fees earned, fee waivers and expenses reimbursed during the year ended February 28, 2023, as well as amounts due to (from) the Adviser at February 28, 2023.
| Advisory fees earned | | $ | 298,868 | |
| Fees waived and reimbursed | | | 272,136 | |
| Payable to (Due from) Adviser | | | (15,591 | ) |
| Stringer Growth Fund | ANNUAL REPORT |
NOTES TO THE FINANCIAL STATEMENTS
February 28, 2023
| 5. | ADVISORY FEES AND OTHER RELATED PARTY TRANSACTIONS (continued) |
Subject to approval by the Fund’s Board, any waiver or reimbursement under the Expense Limitation Agreement is subject to repayment by the Fund within the three years following the month in which such waiver or reimbursement occurred, but only if the Fund can make the payment without exceeding the 1.05% expense limitation. The amounts subject to repayment by the Fund, pursuant to the aforementioned conditions, are as follows:
| February 29, 2024 | | | February 28, 2025 | | | February 28, 2026 | | | Totals | |
| $ | 236,559 | | | $ | 247,755 | | | $ | 272,136 | | | $ | 756,450 | |
The Fund has entered into an Investment Company Services Agreement (“ICSA”) with M3Sixty Administration, LLC (“M3Sixty”). Pursuant to the ICSA, M3Sixty will provide day-to-day operational services to the Fund including, but not limited to: (a) Fund accounting services; (b) financial statement preparation; (c) valuation of the Fund’s portfolio securities; (d) pricing the Fund’s shares; (e) assistance in preparing tax returns; (f) preparation and filing of required regulatory reports; (g) communications with shareholders; (h) coordination of Board and shareholder meetings; (i) monitoring the Fund’s legal compliance; and (j) maintaining shareholder account records.
For the year ended February 28, 2023, the Fund accrued servicing fees, including out of pocket expenses, and have amounts payable to M3Sixty as follows.
| Service fees accrued | | $ | 149,185 | |
| Service fees payable | | | 12,306 | |
During the year ended February 28, 2023, M3Sixty also reimbursed the Fund's Class A shares $3,516 for a loss incurred on a NAV error.
Certain officers and a Trustee of the Fund are also employees of M3Sixty.
The Fund has entered into a Distribution Agreement with Matrix 360 Distributors, LLC (“M3SixtyD”). Pursuant to the Distribution Agreement, M3SixtyD provides distribution services to the Fund. M3SixtyD serves as underwriter/distributor of the Fund. During the year ended February 28, 2023, commissions of $368 were paid to M3SixtyD.
M3SixtyD is an affiliate of M3Sixty.
The Fund has adopted a Distribution Plan (“Plan”) pursuant to Rule 12b-1 under the 1940 Act for each class of shares. The Fund may expend up to 1.00% for Class C shares and up to 0.25% for Class A shares of the Fund’s average daily net assets annually to pay for any activity primarily intended to result in the sale of shares of the Fund and the servicing of shareholder accounts, provided that the Trustees have approved the category of expenses for which payment is being made.
The distribution plans for the Class A and Class C shares of the Fund took effect March 27, 2013. For the year ended February 28, 2023, the Fund accrued 12b-1 expenses attributable to Class A shares and Class C shares as follows.
| Class A | | Class C | |
| $ | 10,445 | | $ | 63,903 | |
For U.S. Federal income tax purposes, the cost of securities owned, gross appreciation, gross depreciation, and net unrealized appreciation/(depreciation) of the Fund’s investments at February 28, 2023 were as follows:
| Cost | | | Gross Appreciation | | | Gross Depreciation | | | Net Depreciation | |
| $ | 24,865,767 | | | $ | 640,870 | | | $ | (865,244 | ) | | $ | (224,374 | ) |
The difference between book basis unrealized depreciation and tax-basis unrealized depreciation for the Fund is attributable primarily to the tax deferral of losses on wash sales.
| Stringer Growth Fund | ANNUAL REPORT |
NOTES TO THE FINANCIAL STATEMENTS
February 28, 2023
| 6. | TAX MATTERS (continued) |
The tax character of distributions paid by the Fund during the fiscal year ended February 28, 2023 were as follows:
| Long-Term Capital Gains | | Ordinary Income | |
| $ | 526,803 | | $ | 248,361 | |
The tax character of distributions paid by the Fund during the fiscal year ended February 28, 2022 were as follows:
| Long-Term Capital Gains | | Ordinary Income | |
| $ | 1,629,827 | | $ | 3,901,116 | |
As of February 28, 2023, the components of distributable earnings presented on an income tax basis were as follows:
| Undistributed Ordinary Income | | | Undistributed Long-Term
Capital Gains | | | Capital Loss Carryforwards | | | Post-October Capital Losses & Post-December Ordinary Loss | | | Net Unrealized Depreciation | | | Total Distributable Earnings | |
| $ | 19,123 | | | $ | — | | | $ | (1,824,715 | ) | | $ | (405,485 | ) | | $ | (224,374 | ) | | $ | (2,435,451 | ) |
| | | | | | | | | | | | | | | | | | | | | | | |
Under current tax law, net capital losses realized after October 31st and net ordinary losses incurred after December 31st may be deferred and treated as occurring on the first day of the following fiscal year. The Fund’s carryforward losses, post-October losses and post-December losses are determined only at the end of each fiscal year. As of February 28, 2023, the Fund elected to defer net capital losses and net ordinary losses as indicated in the chart below:
| | Post-October Losses Deferred | | | | | | Post-December Losses Deferred | | | |
| $ | 392,140 | | | | | $ | 13,345 | | | |
| 7. | COMMITMENTS AND CONTINGENCIES |
In the normal course of business, the Trust may enter into contracts that may contain a variety of representations and warranties and provide general indemnifications. The Trust’s maximum exposure under these arrangements is dependent on future claims that may be made against the Fund and, therefore, cannot be estimated; however, management considers the risk of loss from such claims to be remote.
In accordance with GAAP, Management has evaluated the impact of all subsequent events of the Fund through the date the financial statements were issued, and has determined that there were no subsequent events requiring recognition or disclosure in the financial statements.

REPORT OF INDEPENDENT REGISTERED PUBLIC ACCOUNTING FIRM
To the Shareholders of the Stringer Growth Fund and
Board of Trustees of 360 Funds
Opinion on the Financial Statements
We have audited the accompanying statement of assets and liabilities, including the schedule of investments, of Stringer Growth Fund (the “Fund”), a series of 360 Funds, as of February 28, 2023, and the related statements of operations and changes in net assets, the related notes, and the financial highlights for the year then ended (collectively referred to as the “financial statements”). In our opinion, the financial statements present fairly, in all material respects, the financial position of the Fund as of February 28, 2023, and the results of its operations, the changes in net assets, and the financial highlights for the year then ended, in conformity with accounting principles generally accepted in the United States of America.
The Fund’s financial statements and financial highlights for the years ended February 28, 2022, and prior, were audited by other auditors whose report dated April 28, 2022, expressed an unqualified opinion on those financial statements and financial highlights.
Basis for Opinion
These financial statements are the responsibility of the Fund’s management. Our responsibility is to express an opinion on the Fund’s financial statements based on our audit. We are a public accounting firm registered with the Public Company Accounting Oversight Board (United States) (“PCAOB”) and are required to be independent with respect to the Fund in accordance with the U.S. federal securities laws and the applicable rules and regulations of the Securities and Exchange Commission and the PCAOB.
We conducted our audit in accordance with the standards of the PCAOB. Those standards require that we plan and perform the audit to obtain reasonable assurance about whether the financial statements are free of material misstatement whether due to error or fraud.
Our audit included performing procedures to assess the risks of material misstatement of the financial statements, whether due to error or fraud, and performing procedures that respond to those risks. Such procedures included examining, on a test basis, evidence regarding the amounts and disclosures in the financial statements. Our procedures included confirmation of securities owned as of February 28, 2023, by correspondence with the custodian and broker. Our audit also included evaluating the accounting principles used and significant estimates made by management, as well as evaluating the overall presentation of the financial statements. We believe that our audit provides a reasonable basis for our opinion.
We have served as the Fund’s auditor since 2023.

COHEN & COMPANY, LTD.
Philadelphia, Pennsylvania
April 28, 2023

| Stringer Growth Fund | ANNUAL REPORT |
ADDITIONAL INFORMATION
February 28, 2023
The Fund files its complete schedules of portfolio holdings with the Securities and Exchange Commission (the “Commission”) for the first and third quarters of each fiscal year on Form N-PORT. The Fund’s Forms N-PORT are available on the Commission’s website at http://www.sec.gov. The Fund’s Forms N-PORT may be reviewed and copied at the Commission’s Public Reference Room in Washington, DC. Information on the operation of the Commission’s Public Reference Room may be obtained by calling 1-800-SEC-0330.
A description of the policies and procedures that the Fund uses to determine how to vote proxies relating to portfolio securities is available without charge, upon request, by calling 1-877-244-6235; and on the Commission’s website at http://www.sec.gov.
Information regarding how the Fund voted proxies relating to portfolio securities during the most recent 12-month period ended June 30th is available without charge, upon request, by calling 1-877-244-6235; and on the Commission’s website at http://www.sec.gov.
Shareholder Tax Information - For the year ended February 28, 2023, the Fund distributed $248,361 as ordinary income and $526,803 as long-term capital gains. Tax information is reported from the Fund’s fiscal year and not calendar year, therefore, shareholders should refer to their Form 1099-DIV or other tax information which will be mailed in 2023 to determine the calendar year amounts to be included on their 2023 tax returns. Shareholders should consult their own tax advisors.
Change in Independent Registered Public Accounting Firm
Effective March 6, 2023 , BBD LLP (“BBD”) ceased to serve as the independent registered public accounting firm of the Fund, a series of 360 Funds (the “registrant”). The Audit Committee of the Board approved the replacement of BBD as a result of Cohen & Company, Ltd.’s (“Cohen”) acquisition of BBD’s investment management group.
The report of BBD on the financial statements of the Fund as of and for the fiscal years ended February 28, 2022 and February 28, 2021 did not contain an adverse opinion or a disclaimer of opinion, and were not qualified or modified as to uncertainties, audit scope or accounting principles. During the fiscal years ended February 28, 2022 and February 28, 2021, and during the subsequent interim period through March 6, 2023: (i) there were no disagreements between the registrant and BBD on any matter of accounting principles or practices, financial statement disclosure, or auditing scope or procedure, which disagreements, if not resolved to the satisfaction of BBD, would have caused it to make reference to the subject matter of the disagreements in its report on the financial statements of the Fund for such years or interim period; and (ii) there were no “reportable events,” as defined in Item 304(a)(1)(v) of Regulation S-K under the Securities Exchange Act of 1934, as amended.
The registrant requested that BBD furnish it with a letter addressed to the U.S. Securities and Exchange Commission stating that it agrees with the above statements. A copy of such letter is filed as an exhibit hereto.
Effective March 6, 2023, the Audit Committee of the Board also recommended and approved the appointment of Cohen as the Fund’s independent registered public accounting firm for the fiscal year ending February 28, 2023.
During the fiscal years ended February 28, 2022 and February 28, 2021, and during the subsequent interim period through March 6, 2023, neither the registrant, nor anyone acting on its behalf, consulted with Cohen on behalf of the Fund regarding the application of accounting principles to a specified transaction (either completed or proposed), the type of audit opinion that might be rendered on the Fund’s financial statements, or any matter that was either: (i) the subject of a "disagreement," as defined in Item 304(a)(1)(iv) of Regulation S-K and the instructions thereto; or (ii) "reportable events," as defined in Item 304(a)(1)(v) of Regulation S-K.
| Stringer Growth Fund | ANNUAL REPORT |
ADDITIONAL INFORMATION
February 28, 2023
BOARD OF TRUSTEES, OFFICERS AND PRINCIPAL SHAREHOLDERS - (Unaudited)
The Trustees are responsible for the management and supervision of the Fund. The Trustees approve all significant agreements between the Trust, on behalf of the Fund, and those companies that furnish services to the Fund; review performance of the Fund; and oversee activities of the Fund. This section provides information about the persons who serve as Trustees and Officers to the Trust and Fund, respectively, as well as the entities that provide services to the Fund. The Statement of Additional Information of the Trust includes additional information about the Fund’s Trustees and is available upon request, without charge, by calling (877) 244-6235.
Trustees and Officers. Following are the Trustees and Officers of the Trust, their age and address, their present position with the Trust or the Fund, and their principal occupation during the past five years. Each of the Trustees of the Trust will generally hold office indefinitely. The Officers of the Trust will hold office indefinitely, except that: (1) any Officer may resign or retire and (2) any Officer may be removed any time by written instrument signed by at least two-thirds of the number of Trustees prior to such removal. In case a vacancy or an anticipated vacancy on the Board shall for any reason exist, the vacancy shall be filled by the affirmative vote of a majority of the remaining Trustees, subject to certain restrictions under the 1940 Act. Those Trustees who are “interested persons” (as defined in the 1940 Act) by virtue of their affiliation with either the Trust or the Adviser, are indicated in the table. The address of each trustee and officer is 4300 Shawnee Mission Parkway, Suite 100, Fairway, KS 66205.
* The Interested Trustee is an Interested Trustee because he is Chief Executive Officer and principal owner of M3Sixty Administration, LLC, the Fund’s administrator and transfer agent.
| Name, Address and Year of Birth (“YOB”) | Position(s) Held with Trust | Length of Service | Principal Occupation(s) During Past 5 Years | Number of Series Overseen | Other Directorships During Past 5 Years |
| Independent Trustees |
Tom M. Wirtshafter YOB : 1954 | Trustee | Since 2011 | Senior Vice President, American Portfolios Financial Services, (broker-dealer), American Portfolios Advisors (investment Advisor) (2009–Present). | Six | None |
Steven D. Poppen YOB : 1968 | Trustee | Since 2018 | Executive Vice President and Chief Financial Officer, Minnesota Vikings (professional sports organization) (1999–present). | Six | IDX Funds, formerly, M3Sixty Funds Trust (1 portfolio) (2015 –2021); FNEX Ventures (1 portfolio) (2018-2020) |
Thomas J. Schmidt YOB: 1963 | Trustee and Independent Chairman | Since 2018 Since 2021 | Principal, Tom Schmidt & Associates Consulting, LLC (2015–Present) | Six | Lind Capital Partners Municipal Credit Income Fund (1portfolio) (2021–present); FNEX Ventures (1 portfolio)(2018-2020) |
| Interested Trustee* | | | | | |
Randall K. Linscott YOB: 1971 | President | Since 2013 | Chief Executive Officer, M3Sixty Administration, LLC (2013–present) | Six | IDX Funds, formerly, M3Sixty Funds Trust (1 portfolio) (2015 - 2021) |
* The Interested Trustee is an Interested Trustee because he is an officer and principal owner of the Administrator.
| Stringer Growth Fund | ANNUAL REPORT |
ADDITIONAL INFORMATION
February 28, 2023
BOARD OF TRUSTEES, OFFICERS AND PRINCIPAL SHAREHOLDERS - (Unaudited) (continued)
| Name, Address and Year of Birth (“YOB”) | Position(s) Held with Trust | Length of Service | Principal Occupation(s) During Past 5 Years | Number of Series Overseen | Other Directorships During Past 5 Years |
Officers | | | | | |
Richard Yates YOB: 1965 | Chief Compliance Officer and Secretary | Since 2021 | Of Counsel, McElroy Deutsch (2020–present); Head of Compliance, M3Sixty Administration, LLC (2021–present); Chief Compliance Officer and Secretary, M3Sixty Funds Trust (2021–present); Founder, The Yates Law Firm (2018–2020); Chief Legal Officer, Manning & Napier, Inc. (2000–2018). | N/A | N/A |
Larry E. Beaver, Jr. YOB: 1969 | Treasurer | Since 2021 | Fund Accounting, Administration and Tax Officer, M3Sixty Administration, LLC (2017–Present); Director of Fund Accounting & Administration, M3Sixty Administration, LLC (2005–2017); Assistant Treasurer, 360 Funds Trust (2017–2021); Chief Accounting Officer, Amidex Funds, Inc. (2003–2020); Assistant Treasurer, Capital Management Investment Trust (2017–2018); Assistant Treasurer, IDX Funds (2017–2021; Assistant Treasurer, WP Funds Trust (2017–2021). | N/A | N/A |
Tony DeMarino YOB: 1970 | Anti-Money Laundering (“AML”) Officer | Since 2022 | Principal Executive Officer, Matrix 360 Distributors, LLC (2022–present); Partner, Primark Capital (2020–2022); Head of Distribution, Cognios Capital, LLC (2016–2020) | N/A | N/A |
Remuneration Paid to Trustees and Officers - Officers of the Trust and Trustees who are “interested persons” of the Trust or the Adviser will receive no salary or fees from the Trust. Officers of the Trust and Interested Trustees do receive compensation directly from certain service providers to the Trust, including M3SixtyD and M3Sixty. Each Trustee who is not an “interested person” (an “Independent Trustee”) receives a $5,000 annual retainer (paid quarterly). In addition, each Independent Trustee receives, on a per fund basis: (i) a fee of $1,500 per fund each year (paid quarterly); (ii) a fee of $200 per Board meeting attended; and (iii) a fee of $200 per committee meeting attended. The Trust will also reimburse each Trustee for travel and other expenses incurred in connection with, and/or related to, the performance of their obligations as a Trustee. Officers of the Trust will also be reimbursed for travel and other expenses relating to their attendance at Board meetings.
| Name of Trustee1 | | Aggregate Compensation From the Fund2 | | | Pension or Retirement Benefits Accrued As Part of Portfolio Expenses | | Estimated Annual Benefits Upon Retirement | | Total Compensation From the Fund Paid to Trustees2 | |
| Independent Trustees |
| Gary W. DiCenzo (3) | | $ | 1,767 | | | None | | None | | $ | 1,767 | |
| Arthur Q. Falk (4) | | $ | 3,333 | | | None | | None | | $ | 3,333 | |
| Tom M. Wirtshafter | | $ | 3,333 | | | None | | None | | $ | 3,333 | |
| Steven D. Poppen | | $ | 3,333 | | | None | | None | | $ | 3,333 | |
| Thomas J. Schmidt | | $ | 3,333 | | | None | | None | | $ | 3,333 | |
| Interested Trustees |
| Randall K. Linscott | | | None | | | Not Applicable | | Not Applicable | | | None | |
1 Each of the Trustees serves as a Trustee to the six series of the Trust.
2 Figures are for the year ended February 28, 2023.
3 Gary W. DiCenzo resigned as Trustee effective October 25, 2022.
4 Arthur Q. Falk retired as Trustee effective January 24, 2023.
| Stringer Growth Fund | ANNUAL REPORT |
February 28, 2023
Information About Your Fund’s Expenses - (Unaudited)
As a shareholder of the Fund, you incur two types of costs: (1) transaction costs, such as the sales charge (load) imposed on certain subscriptions and the contingent deferred sales charge (“CDSC”) imposed on certain short-term redemptions; and (2) ongoing costs, including management fees, distribution and/or service (12b-1) fees; and other Fund expenses. The example below is intended to help you understand your ongoing costs (in dollars) of investing in the Fund and to compare these costs with the ongoing costs of investing in other mutual funds.
The example is based on an investment of $1,000 invested at the beginning of the period and held for the entire period as indicated below.
Actual Expenses – The first section of the table provides information about actual account values and actual expenses (relating to the example $1,000 investment made at the beginning of the period). You may use the information in this section, together with the amount you invested, to estimate the expenses that you paid over the period. Simply divide your account value by $1,000 (for example, an $8,600 account value divided by $1,000 = 8.6), then multiply the result by the number in the first section under the heading entitled “Expenses Paid During Period” to estimate the expenses you paid on your account during this period.
Hypothetical Example for Comparison Purposes – The second section of the table provides information about the hypothetical account values and hypothetical expenses based on the Fund’s actual expense ratios and an assumed rate of return of 5% per year before expenses, which is not the Fund’s actual return. The hypothetical account values and expenses may not be used to estimate the actual ending account balance or expenses you paid for the period. You may use this information to compare the ongoing costs of investing in the Fund to other funds. To do so, compare this 5% hypothetical example with the 5% hypothetical examples that appear in the shareholder reports of the other funds.
Please note that the expenses shown in the table are meant to highlight your ongoing costs only and do not reflect any transactional costs, such as sales charges (loads), CDSC fees, or exchange fees. Therefore, the second section of the table is useful in comparing ongoing costs only, and will not help you determine the relative total costs of owning different funds. In addition, if these transactional costs were included, your costs would have been higher. For more information on transactional costs, please refer to the Fund’s prospectus.
| Expenses and Value of a $1,000 Investment for the period from 09/01/22 through 02/28/23 |
| |
| | | Beginning Account
Value (09/01/2022) | | | Annualized Expense
Ratio for the Period | | | Ending Account
Value (02/28/2023) | | | Expenses Paid
During Period(a) | |
| Actual Fund Return (in parentheses) | | | | | | | | | |
| Class A (+1.38%) | | $ | 1,000.00 | | | | 1.30 | % | | $ | 1,013.80 | | | $ | 6.49 | |
| Class C (+1.04%) | | $ | 1,000.00 | | | | 2.05 | % | | $ | 1,010.40 | | | $ | 10.22 | |
| Institutional Class (+1.50%) | | $ | 1,000.00 | | | | 1.05 | % | | $ | 1.015.00 | | | $ | 5.25 | |
| Hypothetical 5% Fund Return | | | | | | | | | | | | | | | | |
| Class A | | $ | 1,000.00 | | | | 1.30 | % | | $ | 1,018.30 | | | $ | 6.51 | |
| Class C | | $ | 1,000.00 | | | | 2.05 | % | | $ | 1,014.60 | | | $ | 10.24 | |
| Institutional Class | | $ | 1,000.00 | | | | 1.05 | % | | $ | 1,019.60 | | | $ | 5.26 | |
| (a) | Expenses are equal to the Fund’s annualized expense ratios, multiplied by the average account value over the period, multiplied by 181/365 to reflect the one-half year period. |
| Stringer Growth Fund | ANNUAL REPORT |
February 28, 2023
Information About Your Fund’s Expenses - (Unaudited)(continued)
For more information on Fund expenses, please refer to the Fund’s prospectus, which can be obtained from your investment representative or by calling 1-877-244-6235. Please read it carefully before you invest or send money.
Total Fund operating expense ratios as stated in the current Fund prospectus dated June 30, 2022 were as follows: |
| Stringer Growth Fund Class A, gross of fee waivers or expense reimbursements | 2.31% |
| Stringer Growth Fund Class A, after waiver and reimbursement* | 1.63% |
| Stringer Growth Fund Class C, gross of fee waivers or expense reimbursements | 3.06% |
| Stringer Growth Fund Class C, after waiver and reimbursement* | 2.38% |
| Stringer Growth Fund Institutional Class, gross of fee waivers or expense reimbursements | 2.06% |
| Stringer Growth Fund Institutional Class, after waiver and reimbursement* | 1.38% |
* Stringer Asset Management, LLC (the “Adviser”) has entered into an Expense Limitation Agreement with the Fund under which it has agreed to waive or reduce its fees and to assume other expenses of the Fund, if necessary, in an amount that limits the Fund’s annual operating expenses (exclusive of interest, taxes, brokerage fees and commissions, other expenditures that are capitalized in accordance with generally accepted accounting principles, acquired funds fees and expenses, other extraordinary expenses not incurred in the ordinary course of the Fund’s business, interest and dividend expense on securities sold short, and amounts, if any, payable pursuant to a plan adopted in accordance with Rule 12b-1 of the Investment Company Act of 1940, as amended (the “1940 Act”)) to not more than 1.05% until and through at least June 30, 2023. Subject to approval by the Fund’s Board, any waiver under the Expense Limitation Agreement is subject to repayment by the Fund within the three fiscal years following the year in which such waiver occurred, if the Fund is able to make the payment without exceeding the 1.05% expense limitation. The current contractual agreement cannot be terminated prior to at least one year after the effective date without the Board of Trustees’ approval. Total Gross Operating Expenses (Annualized) during the year ended February 28, 2023 were 2.17%, 2.92% and 1.92% for the Class A, Class C and Institutional Class shares, respectively. Please see the Information About Your Fund’s Expenses, the Financial Highlights and Notes to Financial Statements (Note 5) sections of this report for gross and net expense related disclosures during the year ended February 28, 2023. |
Board Approval of Renewal of Investment Advisory Agreement (Unaudited)
At a meeting held on January 24, 2023 (the “Meeting”), the Board of Trustees (the “Board”) considered the approval of the renewal of the Investment Advisory Agreement (the “Advisory Agreement”) between the Trust and Stringer Asset Management, LLC (the “Adviser”) for the Stringer Growth Fund (the “Stringer Fund”).
Legal counsel (“Counsel”) reviewed with the Board a memorandum from Counsel and addressed to the Trustees that summarized, among other things, the fiduciary duties and responsibilities of the Board in reviewing and approving the renewal of the Investment Advisory Agreement (the “Advisory Agreement”) between the Trust and Stringer (the “Adviser,” solely for this portion of the minutes) concerning the Stringer Fund. A copy of this memorandum was circulated to the Trustees in advance of the Meeting and is included in the meeting materials. Counsel discussed with the Trustees the types of information and factors that should be considered by the Board to make an informed decision regarding the approval of the continuation of the Advisory Agreement, including the following material factors: (i) the nature, extent, and quality of the services provided by the Adviser; (ii) the investment performance of the Stringer Fund; (iii) the costs of the services provided and profits realized by the Adviser from the relationship with the Stringer Fund; (iv) the extent to which economies of scale would be realized if the Stringer Fund grows and whether advisory fee levels reflect those economies of scale for the benefit of the Stringer Fund’ investors; and (v) the Adviser’s practices regarding possible conflicts of interest.
In assessing these factors and reaching its decisions, the Board took into consideration information furnished for the Board’s review and consideration throughout the year at regular Board meetings, as well as information prepared or presented in connection with the annual renewal process, including information submitted to the Board in the Adviser’s presentation earlier in the Meeting. The Board requested and was provided with information and reports that are in the meeting materials relevant to the annual renewal of the Advisory Agreement, including: (i) reports regarding the services and support provided to the Stringer Fund and its shareholders by the Adviser; (ii) quarterly assessments of the investment performance of the Stringer Fund from the Adviser; (iii) periodic commentary on the reasons for the performance; (iv) presentations by Stringer Fund’s management addressing the Adviser’s investment philosophy, investment strategy, personnel, and operations; (v) compliance and audit reports concerning the Stringer Fund and the Adviser; (vi) disclosure information contained in the registration statement of the Trust; and (vii) a memorandum from Counsel that summarized the fiduciary duties and responsibilities of the Board in reviewing and approving the Advisory Agreement, including the material factors set forth above and the types of information included in each factor that should be considered by the Board to make an informed decision.
The Board also requested and received various informational materials including, without limitation: (i) documents containing information about the Adviser, including financial information, a description of personnel and the services provided to the Stringer Fund, information on investment advice, performance, summaries of Stringer Fund’s expenses, compliance program, current legal matters, and other general information; (ii) comparative expense and performance information for other mutual funds with strategies similar to the Stringer Fund; and (iii) benefits to be realized by the Adviser from its relationship with the Stringer Fund. In addition, the Board had an extensive discussion with the Adviser regarding the matters discussed below.
| (1) | The nature, extent, and quality of the services provided by the Adviser. |
The Board considered the responsibilities the Adviser has under the Advisory Agreement for the Stringer Fund. The Board reviewed the services provided by the Adviser to the Stringer Fund including, without limitation: its processes for formulating investment recommendations and assuring compliance with the Stringer Fund’s investment objectives and limitations; its coordination of services for the Stringer Fund among the Stringer Fund’s service providers; and its efforts to promote the Stringer Fund, grow assets and assist in the distribution of Stringer Fund’s shares. The Board considered the Adviser’s personnel and methods of operating; succession plans; the education and experience of the Adviser’s staff; and its compliance program. The Board also considered the Adviser’s commitment to dedicating appropriate resources to support the Stringer Fund’s operations. After reviewing the preceding and further information, including the expanded ownership program at the Adviser, from the Adviser, the Board concluded that the nature, extent, and quality of the services provided by the Adviser was satisfactory and adequate for the Stringer Fund.
Board Approval of Renewal of Investment Advisory Agreement (Unaudited) (continued)
| (2) | Investment Performance of the Stringer Fund and the Adviser. |
The Board compared the short- and long-term performance of the Stringer Fund to its benchmark, comparable funds with similar objectives and size managed by other investment advisers, and peer group indices (e.g., Morningstar category averages). The Board also considered the consistency of the Adviser’s management of the Stringer Fund with its investment objective and policies. The Board noted that the Stringer Fund had underperformed its benchmark for the 1, 3, 5, 7, and since inceptions periods. Relative to its category—US OE Allocation (85%+ Equity)—the Stringer Fund had competitive performance over the one-, three-, and five-year periods. The Board also considered the performance of the Stringer Fund relative that of the composites representing separate accounts managed by the Adviser having substantially similar strategies as the Stringer Fund. The Trustees noted that the performance of the Stringer Fund and the separate accounts has been similar and considered the Adviser’s expressed belief that the outperformance by the separate accounts is mostly a result of the higher expenses associated with the management and distribution of the Stringer Fund. Based on the preceding, the Board concluded that the investment performance information presented for the Stringer Fund was satisfactory.
| (3) | The costs of the services provided, and profits realized, by the Adviser from the relationship with the Stringer Fund. |
The Board considered: the Adviser’s operations and financial condition and its level of commitment to the Stringer Fund’s operations; the asset levels of the Stringer Fund; and the overall expenses of the Stringer Fund. The Board considered the financial statements of the Adviser and its profitability. In considering the Stringer Fund’s fees and expenses (including the management fee) relative to its peer group, the Board noted that the management fee and net expense ratio were above the peer group’s average and median, but within a reasonable range given the services provided by the Adviser. The Board also noted that the Stringer Fund was substantially smaller than most of its peers, which affects the net expense ratio of the fund.
The Trustees noted that regarding the Stringer Fund, the Adviser has entered into an expense limitation agreement according to which the Adviser has agreed to waive or reduce its fees and to assume other expenses of the Stringer Fund, if necessary, to limit each Fund’s annual operating expenses (with industry-standard exceptions) to not more than 1.05% through June 30, 2024. The Board also considered the Adviser’s management fees on separate accounts with strategies similar to the Stringer Fund and observed that the fees for such clients were generally lower than those assessed to the Stringer Fund. In this regard, the Board considered the Adviser’s representation that the Stringer Fund’s fees are higher, in general, due to the administrative and compliance burdens associated with the management of mutual funds. The Board also noted that the Adviser realized a reasonable profit for its management of the Fund. Following this analysis and upon further consideration and discussion of the preceding, the Board concluded that the fees paid to the Adviser by each of the Stringer Fund were fair and reasonable.
Board Approval of Renewal of Investment Advisory Agreement (Unaudited) (continued)
| (4) | The extent to which economies of scale would be realized if the Stringer Fund grows and whether advisory fee levels reflect these economies of scale for the benefit of the Stringer Fund’s investors. |
The Board considered the Stringer Fund’s fee arrangements with the Adviser. The Trustees determined that although the management fee would stay the same as asset levels increased, the shareholders of the Stringer Fund would benefit from the expense limitation arrangement for each of the Stringer Fund. The Board noted that while a breakpoint schedule in an advisory agreement would be beneficial, such a feature only had benefits if the Stringer Fund’s assets were enough to realize the effect of the breakpoint. The Board noted that lower expenses for the Stringer Fund’s shareholders are realized immediately with the expense limitation arrangements with the Adviser. The Board further noted that the Stringer Fund’s assets were at such levels that the expense limitation arrangement was providing benefits to the Stringer Fund’s shareholders. The Board also noted that the Stringer Fund would benefit from economies of scale under its agreements with other service providers, which the Adviser had helped to negotiate on behalf of the Stringer Fund. Following further discussion of the Stringer Fund’s asset levels, expectations for growth, and expense structure, the Board determined that the Stringer Fund’s fee arrangements, considering all the facts and circumstances, were fair and reasonable and that the expense limitation arrangement provided savings and protection for the benefit of the Stringer Fund’s investors.
| (5) | Possible conflicts of interest and benefits derived by the Adviser. |
The Board evaluated the potential for conflicts of interest and considered such matters as: the experience and ability of the advisory and compliance personnel assigned to the Stringer Fund; the fact that the Adviser does not utilize soft dollars; the basis of decisions to buy or sell securities for the Stringer Fund; and the substance and administration of the Adviser’s code of ethics. Based on the preceding, the Board determined that the Adviser’s standards and practices relating to the identification and mitigation of possible conflicts of interest were satisfactory. It was noted that the Adviser indicated that the ability to place investors in the Stringer Fund, who did not meet the Adviser’s minimum separate account size, was an indirect benefit to the Adviser.
After additional consideration and discussion among the Board, it determined that the compensation payable under the Advisory Agreement with respect to the Stringer Fund was fair, reasonable and within a range of what could have been negotiated at arms-length considering all the surrounding circumstances, and they approved the renewal of the Advisory Agreement for the Stringer Fund.
360 FUNDS
4300 Shawnee Mission Parkway
Suite 100
Fairway, KS 66205
INVESTMENT ADVISER
Stringer Asset Management, LLC
5050 Poplar Avenue
Suite 1103
Memphis, TN 38157
ADMINISTRATOR & TRANSFER AGENT
M3Sixty Administration, LLC
4300 Shawnee Mission Parkway
Suite 100
Fairway, KS 66205
DISTRIBUTOR
Matrix 360 Distributors, LLC
4300 Shawnee Mission Parkway
Suite 100
Fairway, KS 66205
INDEPENDENT REGISTERED PUBLIC ACCOUNTING FIRM
Cohen & Company, Ltd.
1835 Market Street
Suite 310
Philadelphia, PA 19103
LEGAL COUNSEL
FinTech Law, LLC
6224 Turpin Hills Dr.
Cincinnati, Ohio 45244
CUSTODIAN BANK
Fifth Third Bank
Fifth Third Center
38 Fountain Square Plaza
Cincinnati, OH 45263
| (a) | The registrant has, as of the end of the period covered by this report, adopted a code of ethics that applies to the registrant's principal executive officer, principal financial officer, and principal accounting officer or controller, or persons performing similar functions, regardless of whether these individuals are employed by the registrant or a third party. |
| (b) | During the period covered by this report, there were no amendments to any provision of the code of ethics. |
| (c) | During the period covered by this report, there were no waivers or implicit waivers of a provision of the code of ethics. |
| (d) | The registrant’s Code of Ethics is filed herewith. |
| ITEM 3. | AUDIT COMMITTEE FINANCIAL EXPERT. |
| | The registrant's Board of Trustees has determined that Tom M. Wirtshafter serves on its audit committee as the "audit committee financial expert" as defined in Item 3 of Form N-CSR. |
| ITEM 4. | PRINCIPAL ACCOUNTANT FEES AND SERVICES. |
(a) | Audit Fees. The aggregate fees billed for each of the last two fiscal years for professional services rendered by the principal accountant for the audit of the registrant’s annual financial statements or for services that are normally provided by the accountant in connection with statutory and regulatory filings or engagements were $11,000 with respect to the registrant’s fiscal year ended February 28, 2023 and $11,000 with respect to the registrant’s fiscal year ended February 28, 2022. The February 28, 2023 fees were paid to Cohen & Company, Ltd. and the February 28, 2022 fees were paid to BBD, LLP. |
| | |
| (b) | Audit-Related Fees. There were no fees billed during the last two fiscal years for assurances and related services by the principal accountant that are reasonably related to the performance of the audit of the registrant’s financial statements and are not reported under paragraph (a) of this Item 4 of Form N-CSR. |
| (c) | Tax Fees. The aggregate fees billed in each of the last two fiscal years for professional services rendered by the principal accountant for tax compliance, tax advice and tax planning were $2,500 with respect to the registrant’s fiscal year ended February 28, 2023 and $2,500 with respect to the registrant’s fiscal year ended February 28, 2022. The services comprising these fees were the preparation of the registrant’s federal income and excise tax returns. The February 28, 2023 fees were paid to Cohen & Company, Ltd. and the February 28, 2022 fees were paid to BBD, LLP. |
| (d) | All Other Fees. The aggregate fees billed in last two fiscal years for products and services provided by the registrant’s principal accountant, other than the services reported in paragraphs (a) through (c) of this Item 4 of Form N-CSR were $0 for the fiscal year ended February 28, 2023 and $0 for the fiscal year ended February 28, 2022. |
| (e)(1) | The audit committee does not have pre-approval policies and procedures. Instead, the audit committee or audit committee chairman approves on a case-by-case basis each audit or non-audit service before the principal accountant is engaged by the registrant. |
| (e)(2) | There were no services described in each of paragraphs (b) through (d) of this Item 4 of Form N-CSR that were approved by the audit committee pursuant to paragraph (c)(7)(i)(C) of Rule 2-01 of Regulation S-X |
| (f) | Not applicable. |
| (g) | All non-audit fees billed by the registrant's principal accountant for services rendered to the registrant for the last two fiscal years ended February 28, 2023 and February 28, 2022 are disclosed in paragraphs (b) through (c) above. There were no audit or non-audit services performed by the registrant's principal accountant for the registrant's adviser during the last two fiscal years. |
| (h) | There were no non-audit services rendered to the registrant’s investment adviser. |
| ITEM 5. | AUDIT COMMITTEE OF LISTED REGISTRANTS. |
Not applicable to the registrant.
Included in the Annual Report to Shareholders filed under Item 1 of this Form N-CSR.
| ITEM 7. | DISCLOSURE OF PROXY VOTING POLICIES AND PROCEDURES FOR CLOSED-END MANAGEMENT INVESTMENT COMPANIES. |
Not applicable as the Fund is an open-end management investment company.
| ITEM 8. | PORTFOLIO MANAGERS OF CLOSED-END MANAGEMENT INVESTMENT COMPANIES |
Not applicable as the Fund is an open-end management investment company.
| ITEM 9. | PURCHASES OF EQUITY SECURITIES BY CLOSED-END MANAGEMENT INVESTMENT COMPANY AND AFFILIATED PURCHASERS. |
Not applicable as the Fund is an open-end management investment company.
| ITEM 10. | SUBMISSION OF MATTERS TO A VOTE OF SECURITY HOLDERS. |
Not applicable.
| ITEM 11. | CONTROLS AND PROCEDURES. |
| (a) | The registrant's principal executive and principal financial officers, or persons performing similar functions, have concluded that the registrant's disclosure controls and procedures (as defined in Rule 30a-3(c) under the 1940 Act, are effective, as of a date within 90 days of the filing date of this report, based on the evaluation of these controls and procedures required by Rule 30a-3(b) under the 1940 Act and Rule 15d-15(b) under the Securities Exchange Act of 1934, as amended. |
| (b) | There were no changes in the registrant's internal control over financial reporting (as defined in Rule 30a-3(d) under the 1940 Act) that occurred during the period covered by this report that have materially affected, or are reasonably likely to materially affect, the registrant's internal control over financial reporting. |
| ITEM 12. | DISCLOSURE OF SECURITIES LENDING ACTIVITIES FOR CLOSED-END MANAGEMENT INVESTMENT COMPANIES. |
Not applicable as the Fund is an open-end management investment company.
SIGNATURES
Pursuant to the requirements of the Securities Exchange Act of 1934 and the Investment Company Act of 1940, the registrant has duly caused this report to be signed on its behalf by the undersigned, thereunto duly authorized.
360 Fund
| By: Randy Linscott | /s/ Randy Linscott | |
| Principal Executive Officer |
| Date: May 8, 2023 | |
Pursuant to the requirements of the Securities Exchange Act of 1934 and the Investment Company Act of 1940, this report has been signed below by the following person on behalf of the registrant and in the capacities and on the date indicated.
| By Randy Linscott | /s/ Randy Linscott | |
| Principal Executive Officer |
| Date: May 8, 2023 | |
Pursuant to the requirements of the Securities Exchange Act of 1934 and the Investment Company Act of 1940, this report has been signed below by the following person on behalf of the registrant and in the capacities and on the date indicated.
| By Larry E. Beaver, Jr. | /s/ Larry E. Beaver, Jr. | |
| Treasurer and Principal Financial Officer |
| Date: May 8, 2023 | |