Washington, D.C. 20549
Matrix 360 Administration, LLC.
The Semi-Annual report to Shareholders of the Foundry Partners, LLC Funds, a series of funds that are part of the 360 Funds, for the period ended June 30, 2015 pursuant to Rule 30e-1 under the Investment Company Act of 1940 (the “1940 Act”), as amended (17 CFR 270.30e-1) is filed herewith.
SEMI-ANNUAL REPORT
June 30, 2015
Investment Adviser:
Foundry Partners, LLC
510 First Avenue North,
Suite 409
Minneapolis, MN 55403
TABLE OF CONTENTS
| INVESTMENT HIGHLIGHTS | x |
| SCHEDULES OF INVESTMENTS | x |
| STATEMENTS OF ASSETS AND LIABILITIES | x |
| STATEMENTS OF OPERATIONS | x |
| STATEMENTS OF CHANGES IN NET ASSETS | x |
| FINANCIAL HIGHLIGHTS | x |
| NOTES TO FINANCIAL STATEMENTS | x |
| ADDITIONAL INFORMATION | xx |
| EXPENSE EXAMPLES | xx |
| Foundry Partners, LLC Funds | SEMI-ANNUAL REPORT |
Foundry Micro Cap Value Fund
INVESTMENT HIGHLIGHTS
June 30, 2015 (Unaudited)
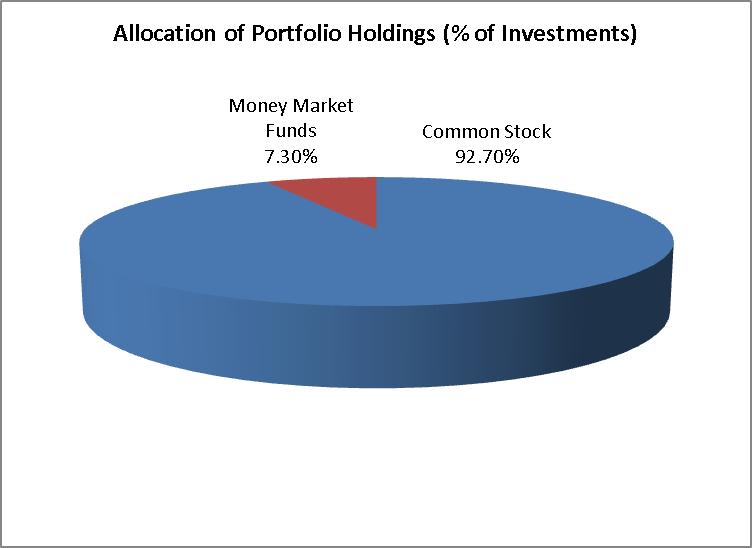
The investment objective of the Foundry Micro Cap Value Fund (the “Micro Cap Fund”) is capital appreciation. To meet the investment objective of this Fund, the Fund will invest at least 80% of its assets in equity securities of micro-cap companies. Micro-cap companies are those companies contained within the Russell Microcap® Value Index, or companies with similar size characteristics. Equity securities consist of common stock and securities convertible into common stock.
As of June 30, 2015, the median market capitalization of companies included in the Russell Microcap® Value Index was approximately $231 million; the average market capitalization for companies contained within the Russell Microcap® Value Index was approximately $492 million; and the largest stock in the index had a market capitalization of $3.867 billion.
The Micro Cap Fund seeks to provide broad exposure to micro-cap domestic equity securities and seeks to outperform the Russell Microcap® Value Index after fees over a long-term investment horizon. The Adviser seeks to invest in companies that it considers to be “statistically cheap” (based on factors which may include, for example, low ratio of price to earnings, price to cash flow, price to book value, and price to sales). The Adviser also looks for companies that it believes are undervalued relative to their earning power and long term earnings growth prospects, adjusted for risk. The Adviser may filter less attractive companies by analyzing cash flows, evaluating financial strength, performing earnings analysis and reviewing purchase and sale activity in company shares by company executives, and through fundamental analysis, which may include a review of assets, earnings, sales, products, markets, and management, among other indicators. Ideally, after filtering out companies that do not meet the Adviser’s criteria above, the Adviser looks for companies that have a positive catalyst, (e.g., new products, management changes, acquisition, etc.).
The Adviser also utilizes a sell discipline and may consider selling a security when: it becomes fully valued in the Adviser’s opinion or less attractive to the Adviser; one of the Fund’s holdings has performed well and reached or approached the Adviser’s price target; a company fails to pass the Adviser’s investment screens; or there is deterioration in a company’s fundamentals, management or financial reporting.
The Adviser will look to manage risk through several strategies, which typically include: maintaining minimum and maximum sector weightings relative to the Russell Microcap Value Index; monitoring risk statistics relative to the Russell Microcap® Value Index; and, monitoring trade volume.
The percentages in the above graph are based on the portfolio holdings of the Fund as of June 30, 2015 and are subject to change. For a detailed break-out of holdings by industry, please refer to the Schedules of Investments.
| Foundry Partners, LLC Funds | SEMI-ANNUAL REPORT |
Foundry Small Cap Value Fund
INVESTMENT HIGHLIGHTS
June 30, 2015 (Unaudited)
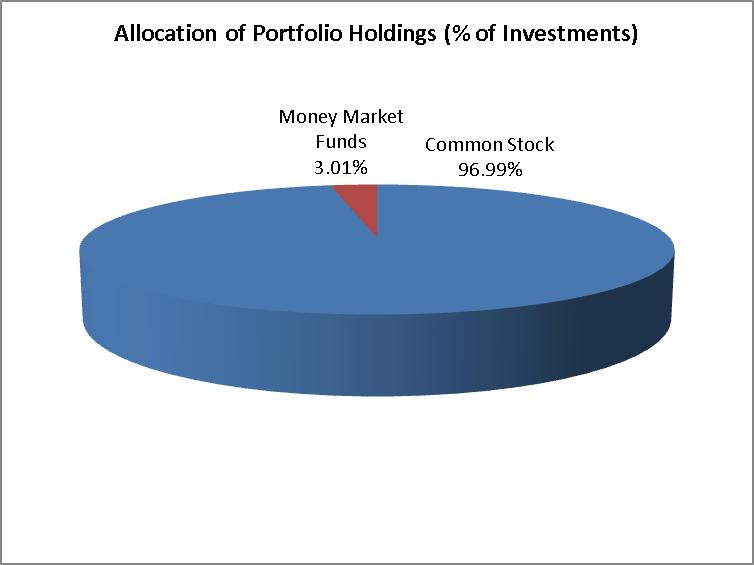
The investment objective of the Foundry Small Cap Value Fund (the “Small Cap Fund”) is capital appreciation. The Fund plans to meet its investment objective by investing at least 80% of its assets in the equity securities of small cap companies. Small cap companies are defined as those companies included in the Russell 2000® Value Index and companies with similar market capitalizations. Market capitalization, a common measure of the size of a company, is the market price of a share of a company’s stock multiplied by the number of shares that are outstanding. Equity securities consist of common stock and securities convertible into common stock.
As of June 30, 2015, the median market capitalization of companies included in the Russell 2000® Value Index was approximately $639 million; the average market capitalization for companies contained within the Russell 2000® Value Index was approximately $1.727 billion; and the largest stock in the index had a market capitalization of $4.914 billion.
The Small Cap Fund seeks to outperform the Russell 2000® Value Index after fees over a long-term investment horizon. The Adviser seeks to invest in companies that it considers to be “statistically cheap” (based on factors which may include, for example, low ratio of price to earnings, price to cash flow, price to book value, and price to sales). The Adviser also looks for companies that it believes are undervalued relative to their earning power and long term earnings growth prospects, adjusted for risk. The Adviser may filter less attractive companies by analyzing cash flows, evaluating financial strength, performing earnings analysis and reviewing purchase and sale activity in company shares by company executives, and through fundamental analysis. Ideally, attractive companies will have a positive catalyst (e.g., new products, management changes, acquisition, etc.).
The Adviser also utilizes a sell discipline and may consider selling a security when: it becomes fully valued in the Adviser’s opinion or less attractive to the Adviser; one of the Fund’s holdings has performed well and reached or approached the Adviser’s price target; a company fails to pass the Adviser’s investment screens; or there is a deterioration in a company’s fundamentals, management or financial reporting.
The Adviser will look to manage risk through several strategies, which typically include maintaining minimum and maximum sector weightings relative to the Russell 2000® Value Index and monitoring risk statistics relative to the Russell 2000® Value Index.
The percentages in the above graph are based on the portfolio holdings of the Fund as of June 30, 2015 and are subject to change. For a detailed break-out of holdings by industry, please refer to the Schedules of Investments.
FOUNDRY PARTNERS, LLC FUNDS
FOUNDRY MICRO CAP VALUE FUND
SCHEDULE OF INVESTMENTS
| June 30, 2015 (Unaudited) | | SEMI-ANNUAL REPORT | |
| | | | | | | |
| COMMON STOCKS - 97.64% | | SHARES | | | FAIR VALUE | |
| | | | | | | |
| Aerospace & Defense - 1.20% | | | | | | |
Ducommun, Inc. (a) | | | 725 | | | $ | 18,611 | |
| | | | | | | | | |
| Apparel - 0.79% | | | | | | | | |
Perry Ellis International, Inc. (a) | | | 515 | | | | 12,242 | |
| | | | | | | | | |
| Auto Parts & Equipment - 1.14% | | | | | | | | |
| Spartan Motors, Inc. | | | 3,880 | | | | 17,770 | |
| | | | | | | | | |
| Banks - 15.61% | | | | | | | | |
| Bank of Commerce Holdings | | | 1,125 | | | | 6,446 | |
| Bar Harbor Bankshares | | | 190 | | | | 6,732 | |
| Capital City Bank Group, Inc. | | | 1,225 | | | | 18,706 | |
| Financial Institutions, Inc. | | | 585 | | | | 14,531 | |
| First Bancorp, Inc. | | | 380 | | | | 7,387 | |
| First Financial Corp. | | | 550 | | | | 19,668 | |
| First Internet Bancorp. | | | 655 | | | | 16,047 | |
First NBC Bank Holding Co. (a) | | | 505 | | | | 18,180 | |
| Hanmi Financial Corp. | | | 820 | | | | 20,369 | |
| Horizon Bancorp | | | 485 | | | | 12,106 | |
| Independent Bank Corp. | | | 1,270 | | | | 17,221 | |
| MainSource Financial Group, Inc. | | | 1,070 | | | | 23,487 | |
| Monarch Financial Holdings, Inc. | | | 675 | | | | 8,471 | |
| Northrim BanCorp, Inc. | | | 335 | | | | 8,586 | |
| Sierra Bancorp. | | | 670 | | | | 11,598 | |
| Towne Bank - Portsmouth, VA | | | 975 | | | | 15,883 | |
| Washington Trust Bancorp, Inc. | | | 440 | | | | 17,371 | |
| | | | | | | | 242,789 | |
| Biotechnology - 0.79% | | | | | | | | |
Harvard Bioscience, Inc. (a) | | | 2,150 | | | | 12,255 | |
| | | | | | | | | |
| Building Materials - 1.86% | | | | | | | | |
Gibraltar Industries, Inc. (a) | | | 1,100 | | | | 22,407 | |
| LSI Industries, Inc. | | | 700 | | | | 6,538 | |
| | | | | | | | 28,945 | |
| Chemicals - 0.71% | | | | | | | | |
| American Vanguard Corp. | | | 800 | | | | 11,040 | |
| | | | | | | | | |
| Commercial Services - 6.30% | | | | | | | | |
| Barrett Business Services, Inc. | | | 510 | | | | 18,523 | |
CBIZ, Inc. (a) | | | 1,930 | | | | 18,605 | |
CRA International, Inc. (a) | | | 430 | | | | 11,984 | |
Cross Country Healthcare, Inc. (a) | | | 1,510 | | | | 19,147 | |
Global Cash Access Holdings, Inc. (a) | | | 2,385 | | | | 18,460 | |
Great Lakes Dredge & Dock Corp. (a) | | | 1,895 | | | | 11,294 | |
| | | | | | | | 98,013 | |
| Computers - 0.56% | | | | | | | | |
| Computer Task Group, Inc. | | | 1,130 | | | | 8,724 | |
FOUNDRY PARTNERS, LLC FUNDS
FOUNDRY MICRO CAP VALUE FUND
SCHEDULE OF INVESTMENTS
| June 30, 2015 (Unaudited) | | SEMI-ANNUAL REPORT | |
| | | | | | | |
| COMMON STOCKS - 97.64% (Continued) | | SHARES | | | FAIR VALUE | |
| | | | | | | |
| Diversified Financial Services - 2.21% | | | | | | |
| Federal Agricultural Mortgage Corp. | | | 565 | | | $ | 16,419 | |
| Gain Capital Holdings, Inc. | | | 1,885 | | | | 18,021 | |
| | | | | | | | 34,440 | |
| Electrical Components - 0.84% | | | | | | | | |
| Powell Industries, Inc. | | | 370 | | | | 13,013 | |
| | | | | | | | | |
| Electronics - 0.60% | | | | | | | | |
Electro Scientific Industries, Inc. (a) | | | 1,760 | | | | 9,275 | |
| | | | | | | | | |
| Energy - Alternate Services - 0.65% | | | | | | | | |
Pacific Ethanol, Inc. (a) | | | 975 | | | | 10,062 | |
| | | | | | | | | |
| Engineering & Construction - 5.12% | | | | | | | | |
| Comfort Systems USA, Inc. | | | 995 | | | | 22,835 | |
Hill International, Inc. (a) | | | 4,600 | | | | 24,196 | |
Orion Marine Group, Inc. (a) | | | 2,530 | | | | 18,267 | |
Sterling Construction Co., Inc. (a) | | | 3,575 | | | | 14,300 | |
| | | | | | | | 79,598 | |
| Environmental Control - 1.09% | | | | | | | | |
| Ceco Environmental Corp. | | | 1,500 | | | | 16,995 | |
| | | | | | | | | |
| Hand & Machine Tools - 0.90% | | | | | | | | |
| Hardinge, Inc. | | | 1,425 | | | | 14,036 | |
| | | | | | | | | |
| Healthcare - Products - 1.85% | | | | | | | | |
| Digirad Corp. | | | 2,150 | | | | 9,331 | |
Exactech, Inc. (a) | | | 395 | | | | 8,228 | |
Synergetics USA, Inc. (a) | | | 2,385 | | | | 11,209 | |
| | | | | | | | 28,768 | |
| Healthcare - Services - 1.18% | | | | | | | | |
Almost Family, Inc. (a) | | | 460 | | | | 18,359 | |
| | | | | | | | | |
| Home Builders - 2.73% | | | | | | | | |
Century Communities, Inc. (a) | | | 950 | | | | 19,123 | |
WCI Communities, Inc. (a) | | | 960 | | | | 23,414 | |
| | | | | | | | 42,537 | |
| Home Furnishings - 0.92% | | | | | | | | |
| Daktronics, Inc. | | | 1,205 | | | | 14,291 | |
| | | | | | | | | |
| Insurance - 1.21% | | | | | | | | |
| United Insurance Holdings Corp. | | | 1,215 | | | | 18,881 | |
| | | | | | | | | |
| Internet - 1.93% | | | | | | | | |
Safeguard Scientifics, Inc. (a) | | | 950 | | | | 18,487 | |
TeleCommunication Systems, Inc. (a) | | | 3,480 | | | | 11,519 | |
| | | | | | | | 30,006 | |
FOUNDRY PARTNERS, LLC FUNDS
FOUNDRY MICRO CAP VALUE FUND
SCHEDULE OF INVESTMENTS
| June 30, 2015 (Unaudited) | | SEMI-ANNUAL REPORT | |
| | | | | | | |
| COMMON STOCKS - 97.64% (Continued) | | SHARES | | | FAIR VALUE | |
| | | | | | | |
| Investment Companies - 0.63% | | | | | | |
| Saratoga Investment Corp. | | | 570 | | | $ | 9,787 | |
| | | | | | | | | |
| Iron & Steel - 1.50% | | | | | | | | |
| Schnitzer Steel Industries, Inc. | | | 640 | | | | 11,181 | |
Universal Stainless & Alloy Products, Inc. (a) | | | 615 | | | | 12,085 | |
| | | | | | | | 23,266 | |
| Lodging - 1.27% | | | | | | | | |
Century Casinos, Inc. (a) | | | 3,125 | | | | 19,687 | |
| | | | | | | | | |
| Machinery - Diversified - 0.76% | | | | | | | | |
| Columbus McKinnon Corp. | | | 475 | | | | 11,875 | |
| | | | | | | | | |
| Metal Fabricate & Hardware - 1.85% | | | | | | | | |
Northwest Pipe Co. (a) | | | 320 | | | | 6,518 | |
| Olympic Steel, Inc. | | | 1,275 | | | | 22,236 | |
| | | | | | | | 28,754 | |
| | | | | | | | | |
| Mining - 0.87% | | | | | | | | |
Ring Energy, Inc. (a) | | | 1,210 | | | | 13,540 | |
| | | | | | | | | |
| Miscellaneous Manufacturing - 0.80% | | | | | | | | |
| FreightCar America, Inc. | | | 600 | | | | 12,528 | |
| | | | | | | | | |
| Oil & Gas - 0.63% | | | | | | | | |
PetroQuest Energy, Inc. (a) | | | 4,990 | | | | 9,880 | |
| | | | | | | | | |
| Oil & Gas Services - 1.11% | | | | | | | | |
| Gulf Island Fabrication, Inc. | | | 605 | | | | 6,758 | |
| Tesco Corp. | | | 965 | | | | 10,518 | |
| | | | | | | | 17,276 | |
| Real Estate - 1.30% | | | | | | | | |
Community Healthcare Trust, Inc. (a) | | | 1,055 | | | | 20,309 | |
| | | | | | | | | |
| Real Estate Investment Trusts - 2.23% | | | | | | | | |
| Independence Realty Trust, Inc. | | | 2,105 | | | | 15,851 | |
| Monmouth Real Estate Investment Corp. | | | 1,110 | | | | 10,789 | |
| Sotherly Hotels, Inc. | | | 1,150 | | | | 8,130 | |
| | | | | | | | 34,770 | |
| Retail - 9.15% | | | | | | | | |
Christopher & Banks Corp. (a) | | | 3,190 | | | | 12,792 | |
Destination XL Group, Inc. (a) | | | 2,775 | | | | 13,903 | |
| Haverty Furniture Cos., Inc. | | | 575 | | | | 12,431 | |
New York & Co., Inc. (a) | | | 2,895 | | | | 7,759 | |
Ruby Tuesday, Inc. (a) | | | 2,665 | | | | 16,710 | |
| Stage Stores, Inc. | | | 1,075 | | | | 18,845 | |
| Stein Mart, Inc. | | | 1,700 | | | | 17,799 | |
Systemax, Inc. (a) | | | 1,115 | | | | 9,634 | |
TravelCenters of America LLC (a) | | | 1,040 | | | | 15,444 | |
West Marine, Inc. (a) | | | 1,770 | | | | 17,063 | |
| | | | | | | | 142,380 | |
FOUNDRY PARTNERS, LLC FUNDS
FOUNDRY MICRO CAP VALUE FUND
SCHEDULE OF INVESTMENTS
| June 30, 2015 (Unaudited) | | SEMI-ANNUAL REPORT | |
| | | | | | | |
| COMMON STOCKS - 97.64% (Continued) | | SHARES | | | FAIR VALUE | |
| | | | | | | |
| Savings & Loans - 10.51% | | | | | | |
| Banc of California, Inc. | | | 1,585 | | | $ | 21,794 | |
| Berkshire Hills Bancorp, Inc. | | | 610 | | | | 17,373 | |
| Dime Community Bancshares, Inc. | | | 1,100 | | | | 18,634 | |
| ESSA Bancorp, Inc. | | | 955 | | | | 12,281 | |
HomeStreet, Inc. (a) | | | 770 | | | | 17,571 | |
HomeTrust Bancshares, Inc. (a) | | | 915 | | | | 15,335 | |
| Meta Financial Group, Inc. | | | 520 | | | | 22,318 | |
| SI Financial Group, Inc. | | | 640 | | | | 7,450 | |
| Territorial Bancorp, Inc. | | | 810 | | | | 19,651 | |
| United Community Financial Corp. | | | 2,085 | | | | 11,155 | |
| | | | | | | | 163,562 | |
| Semiconductors - 3.88% | | | | | | | | |
| IXYS Corp. | | | 1,035 | | | | 15,836 | |
Photronics, Inc. (a) | | | 1,460 | | | | 13,885 | |
Rudolph Technologies, Inc. (a) | | | 1,105 | | | | 13,271 | |
Xcerra Corp. (a) | | | 2,295 | | | | 17,373 | |
| | | | | | | | 60,365 | |
| Software - 3.15% | | | | | | | | |
| American Software, Inc. | | | 1,740 | | | | 16,530 | |
| Concurrent Computer Corp. | | | 1,815 | | | | 11,253 | |
Seachange International, Inc. (a) | | | 1,735 | | | | 12,162 | |
| Wayside Technology Group, Inc. | | | 455 | | | | 9,018 | |
| | | | | | | | 48,963 | |
| Telecommunications - 4.00% | | | | | | | | |
| Black Box Corp. | | | 650 | | | | 13,000 | |
EXFO, Inc. (a) | | | 1,815 | | | | 5,935 | |
Premiere Global Services, Inc. (a) | | | 1,705 | | | | 17,544 | |
| Silicom Ltd. | | | 350 | | | | 12,898 | |
| Spok Holdings, Inc. | | | 520 | | | | 8,757 | |
Westell Technologies, Inc. (a) | | | 4,100 | | | | 4,059 | |
| | | | | | | | 62,193 | |
| Transportation - 3.81% | | | | | | | | |
| Aegean Marine Petroleum Network, Inc. | | | 1,395 | | | | 17,242 | |
| Celadon Group, Inc. | | | 835 | | | | 17,268 | |
Covenant Transportation Group, Inc. (a) | | | 405 | | | | 10,149 | |
| Marten Transport Ltd. | | | 675 | | | | 14,647 | |
| | | | | | | | 59,306 | |
| | | | | | | | | |
| Total Common Stocks (Cost $1,489,022) | | | | | | | 1,519,091 | |
| | | | | | | | | |
| MONEY MARKET FUND - 7.69% | | | | | | | | |
First American Prime Obligations Fund Class Z, 0.03% (b) (Cost $119,604) | | | 119,604 | | | | 119,604 | |
| | | | | | | | | |
| Total Investments at Fair Value - 105.33% (Cost $1,608,626) | | | | | | | 1,638,695 | |
| | | | | | | | | |
| Liabilities in Excess of Other Assets, Net - (5.33)% | | | | | | | (82,937 | ) |
| | | | | | | | | |
| Net Assets - 100.00% | | | | | | $ | 1,555,758 | |
(a) | Non-income producing security. |
(b) | Rate shown represents the 7-day yield at June 30, 2015, is subject to change and resets daily. |
The accompanying notes are an integral part of these financial statements.
FOUNDRY PARTNERS, LLC FUNDS
FOUNDRY SMALL CAP VALUE FUND
SCHEDULE OF INVESTMENTS
| June 30, 2015 (Unaudited) | | SEMI-ANNUAL REPORT | |
| | | | | | | |
| COMMON STOCKS - 97.38% | | SHARES | | | FAIR VALUE | |
| | | | | | | |
| Agriculture - 1.37% | | | | | | |
| Andersons, Inc. | | | 400 | | | $ | 15,600 | |
| | | | | | | | | |
| Banks - 15.60% | | | | | | | | |
| Banner Corp. | | | 440 | | | | 21,089 | |
| Financial Institutions, Inc. | | | 620 | | | | 15,401 | |
| First Financial Corp. | | | 530 | | | | 18,953 | |
First NBC Bank Holding Co. (a) | | | 517 | | | | 18,612 | |
| Hanmi Financial Corp. | | | 835 | | | | 20,741 | |
| Independent Bank Corp. - Rockland, MA | | | 460 | | | | 21,569 | |
| MainSource Financial Group, Inc. | | | 1,000 | | | | 21,950 | |
| Old National Bancorp | | | 1,320 | | | | 19,087 | |
| Towne Bank - Portsmouth VA | | | 1,205 | | | | 19,629 | |
| | | | | | | | 177,031 | |
| Building Materials - 1.98% | | | | | | | | |
Gibraltar Industries, Inc. (a) | | | 1,105 | | | | 22,509 | |
| | | | | | | | | |
| Commercial Services - 3.70% | | | | | | | | |
| Aaron's, Inc. | | | 630 | | | | 22,812 | |
CBIZ, Inc. (a) | | | 1,995 | | | | 19,232 | |
| | | | | | | | 42,044 | |
| Computers - 2.63% | | | | | | | | |
| Mentor Graphics Corp. | | | 705 | | | | 18,633 | |
| Synaptics, Inc. (a) | | | 130 | | | | 11,276 | |
| | | | | | | | 29,909 | |
| Diversified Financial Services - 2.52% | | | | | | | | |
| Federal Agricultural Mortgage Corp. | | | 555 | | | | 16,128 | |
| GAIN Capital Holdings, Inc. | | | 1,300 | | | | 12,428 | |
| | | | | | | | 28,556 | |
| | | | | | | | | |
| Electric - 1.26% | | | | | | | | |
| Portland General Electric Co. | | | 430 | | | | 14,259 | |
| | | | | | | | | |
| Electrical Components & Equipment - 3.77% | | | | | | | | |
| Encore Wire Corp. | | | 450 | | | | 19,931 | |
| EnerSys | | | 200 | | | | 14,058 | |
| Powell Industries, Inc. | | | 250 | | | | 8,793 | |
| | | | | | | | 42,782 | |
| Electronics - 2.22% | | | | | | | | |
| AVX Corp. | | | 875 | | | | 11,778 | |
Plexus Corp. (a) | | | 305 | | | | 13,383 | |
| | | | | | | | 25,161 | |
| Engineering & Construction - 1.97% | | | | | | | | |
| Comfort Systems USA, Inc. | | | 975 | | | | 22,376 | |
| | | | | | | | | |
| Environmental Control - 1.25% | | | | | | | | |
| Ceco Environmental Corp. | | | 1,250 | | | | 14,163 | |
| | | | | | | | | |
| Food - 0.79% | | | | | | | | |
| SpartanNash Co. | | | 275 | | | | 8,949 | |
| | | | | | | | | |
| Forest Products & Paper - 1.34% | | | | | | | | |
| Deltic Timber Corp. | | | 225 | | | | 15,219 | |
FOUNDRY PARTNERS, LLC FUNDS
FOUNDRY SMALL CAP VALUE FUND
SCHEDULE OF INVESTMENTS
| June 30, 2015 (Unaudited) | | SEMI-ANNUAL REPORT | |
| | | | | | | |
| COMMON STOCKS - 97.38% (Continued) | | SHARES | | | FAIR VALUE | |
| | | | | | | |
| Gas - 0.94% | | | | | | |
| ONE Gas, Inc. | | | 250 | | | $ | 10,640 | |
| | | | | | | | | |
| Healthcare - Services - 1.52% | | | | | | | | |
LHC Group, Inc. (a) | | | 450 | | | | 17,214 | |
| | | | | | | | | |
| Home Builders - 3.17% | | | | | | | | |
TRI Pointe Group, Inc. (a) | | | 1,100 | | | | 16,830 | |
WCI Communities, Inc. (a) | | | 785 | | | | 19,146 | |
| | | | | | | | 35,976 | |
| Home Furnishings - 1.81% | | | | | | | | |
| La-Z-Boy, Inc. | | | 780 | | | | 20,545 | |
| | | | | | | | | |
| Insurance - 3.66% | | | | | | | | |
| Fidelity & Guaranty Life | | | 610 | | | | 14,414 | |
| Horace Mann Educators Corp. | | | 350 | | | | 12,733 | |
| United Insurance Holdings Corp. | | | 925 | | | | 14,375 | |
| | | | | | | | 41,522 | |
| Iron & Steel - 2.17% | | | | | | | | |
| Carpenter Technology Corp. | | | 365 | | | | 14,118 | |
| Schnitzer Steel Industries, Inc. | | | 600 | | | | 10,482 | |
| | | | | | | | 24,600 | |
| | | | | | | | | |
| Machinery - Diversified - 1.34% | | | | | | | | |
| Columbus McKinnon Corp. | | | 610 | | | | 15,250 | |
| | | | | | | | | |
| Miscellaneous Manufacturing - 1.20% | | | | | | | | |
| FreightCar America, Inc. | | | 655 | | | | 13,676 | |
| | | | | | | | | |
| Office Furnishing - 1.61% | | | | | | | | |
| Herman Miller, Inc. | | | 630 | | | | 18,226 | |
| | | | | | | | | |
| Oil & Gas - 1.52% | | | | | | | | |
| California Resources Corp. | | | 1,475 | | | | 8,909 | |
PetroQuest Energy, Inc. (a) | | | 4,230 | | | | 8,375 | |
| | | | | | | | 17,284 | |
| Oil & Gas Services - 1.50% | | | | | | | | |
Helix Energy Solutions Group, Inc. (a) | | | 475 | | | | 5,999 | |
Matrix Service Co. (a) | | | 600 | | | | 10,968 | |
| | | | | | | | 16,967 | |
| Real Estate - 0.90% | | | | | | | | |
Forestar Group, Inc. (a) | | | 780 | | | | 10,265 | |
| | | | | | | | | |
| Real Estate Investment Trusts - 6.78% | | | | | | | | |
| Agree Realty Corp. | | | 325 | | | | 9,480 | |
| Brandywine Realty Trust | | | 797 | | | | 10,584 | |
| DiamondRock Hospitality Co. | | | 775 | | | | 9,928 | |
| Hersha Hospitality Trust | | | 513 | | | | 13,153 | |
| LaSalle Hotel Properties | | | 385 | | | | 13,652 | |
| Lexington Realty Trust | | | 1,255 | | | | 10,642 | |
| LTC Properties, Inc. | | | 230 | | | | 9,568 | |
| | | | | | | | 77,007 | |
FOUNDRY PARTNERS, LLC FUNDS
FOUNDRY SMALL CAP VALUE FUND
SCHEDULE OF INVESTMENTS
| June 30, 2015 (Unaudited) | | SEMI-ANNUAL REPORT | |
| | | | | | | |
| COMMON STOCKS - 97.38% (Continued) | | SHARES | | | FAIR VALUE | |
| | | | | | | |
| Retail - 9.45% | | | | | | |
Ascena Retail Group, Inc. (a) | | | 1,225 | | | $ | 20,402 | |
| Big Lots, Inc. | | | 260 | | | | 11,697 | |
| Bloomin' Brands, Inc. | | | 885 | | | | 18,895 | |
Ruby Tuesday, Inc. (a) | | | 2,060 | | | | 12,916 | |
| Stage Stores, Inc. | | | 700 | | | | 12,271 | |
| Stein Mart, Inc. | | | 1,550 | | | | 16,230 | |
TravelCenters of America LLC (a) | | | 1,000 | | | | 14,850 | |
| | | | | | | | 107,261 | |
| Savings & Loans - 6.48% | | | | | | | | |
| Banc of California, Inc. | | | 1,500 | | | | 20,625 | |
| Berkshire Hills Bancorp, Inc. | | | 680 | | | | 19,366 | |
BofI Holding, Inc. (a) | | | 210 | | | | 22,199 | |
HomeTrust Bancshares, Inc. (a) | | | 680 | | | | 11,397 | |
| | | | | | | | 73,587 | |
| Semiconductors - 5.51% | | | | | | | | |
Entegris, Inc. (a) | | | 1,010 | | | | 14,716 | |
Photronics, Inc. (a) | | | 1,300 | | | | 12,363 | |
QLogic Corp. (a) | | | 880 | | | | 12,487 | |
Rudolph Technologies, Inc. (a) | | | 1,000 | | | | 12,010 | |
Xcerra Corp. (a) | | | 1,455 | | | | 11,014 | |
| | | | | | | | 62,590 | |
| Software - 1.36% | | | | | | | | |
Allscripts Healthcare Solutions, Inc. (a) | | | 1,130 | | | | 15,458 | |
| | | | | | | | | |
| Telecommunications - 2.23% | | | | | | | | |
| Black Box Corp. | | | 530 | | | | 10,600 | |
Premiere Global Services, Inc. (a) | | | 1,425 | | | | 14,663 | |
| | | | | | | | 25,263 | |
| Transportation - 3.83% | | | | | | | | |
| Aegean Marine Petroleum Network, Inc. | | | 1,175 | | | | 14,523 | |
| Celadon Group, Inc. | | | 750 | | | | 15,510 | |
| Con-way, Inc. | | | 350 | | | | 13,430 | |
| | | | | | | | 43,463 | |
| | | | | | | | | |
| Total Common Stocks (Cost $1,041,228) | | | | | | | 1,105,352 | |
| | | | | | | | | |
| MONEY MARKET FUND - 3.02% | | | | | | | | |
First American Prime Obligations Fund Class Z, 0.03% (b) (Cost $34,324) | | | 34,324 | | | | 34,324 | |
| | | | | | | | | |
| Total Investments at Fair Value - 100.40% (Cost $1,075,552) | | | | | | | 1,139,676 | |
| | | | | | | | | |
| Liabilities in Excess of other Assets, Net - (0.40%) | | | | | | | (4,585 | ) |
| | | | | | | | | |
| Net Assets - 100.00% | | | | | | $ | 1,135,091 | |
(a) | Non-income producing security. |
(b) | Rate shown represents the 7-day yield at June 30, 2015, is subject to change and resets daily. |
The accompanying notes are an integral part of these financial statements.
FOUNDRY PARTNERS, LLC FUNDS
FOUNDRY MICRO CAP VALUE FUND
STATEMENT OF ASSETS AND LIABILITIES
| June 30, 2015 (Unaudited) | SEMI-ANNUAL REPORT | |
| Assets: | | | |
| Investments, at value (identified cost $1,608,626) | | $ | 1,638,695 | |
| Due from advisor | | | 13,205 | |
| Receivables: | | | | |
| Interest | | | 1 | |
| Dividends | | | 1,612 | |
| Prepaid expenses | | | 1,581 | |
| Total assets | | | 1,655,094 | |
| | | | | |
| Liabilities: | | | | |
| Payables: | | | | |
| Investment securities purchased | | | 76,628 | |
| Due to administrator | | | 5,313 | |
| Due to trustees | | | 372 | |
| Accrued expenses | | | 17,023 | |
| Total liabilities | | | 99,336 | |
| Net Assets | | $ | 1,555,758 | |
| | | | | |
| Sources of Net Assets: | | | | |
| Paid-in capital | | $ | 1,429,840 | |
| Accumulated net realized gain on investments | | | 91,593 | |
| Undistributed net investment income | | | 4,256 | |
| Net unrealized appreciation on investments | | | 30,069 | |
| Total Net Assets (Unlimited shares of beneficial interest authorized) | | $ | 1,555,758 | |
| | | | | |
| Institutional Class Shares: | | | | |
| Net assets applicable to 142,178 shares outstanding | | $ | 1,555,758 | |
| Net Asset Value, Offering and Redemption Price Per Share | | $ | 10.94 | |
Minimum Redemption Price Per Share (a) | | $ | 10.72 | |
(a) | A 2.00% redemption fee is assessed on redemption transactions of shares that are held for 90 days or less. |
The accompanying notes are an integral part of these financial statements.
FOUNDRY PARTNERS, LLC FUNDS
FOUNDRY MICRO CAP VALUE FUND
STATEMENT OF OPERATIONS
| June 30, 2015 (Unaudited) | SEMI-ANNUAL REPORT | |
| | | | |
| | | For the | |
| | | Six Month Period Ended | |
| | | June 30, 2015 | |
| | | (Unaudited) | |
| Investment income: | | | |
| Dividends (net of foreign withholding taxes of $14) | | $ | 17,364 | |
| Interest | | | 5 | |
| Total investment income | | | 17,369 | |
| | | | | |
| Expenses: | | | | |
| Management fees (Note 5) | | | 7,494 | |
| Accounting and transfer agent fees and expenses | | | 18,976 | |
| Audit fees | | | 7,687 | |
| Legal fees | | | 5,951 | |
| Custodian fees | | | 4,959 | |
| Miscellaneous | | | 6,279 | |
| Trustee fees and expenses | | | 2,910 | |
| Pricing fees | | | 4,711 | |
| Insurance | | | 143 | |
| Reports to shareholders | | | 248 | |
| Registration and filing fees | | | 477 | |
| Total expenses | | | 59,835 | |
| Less: fees waived and expenses absorbed | | | (46,722 | ) |
| Net expenses | | | 13,113 | |
| | | | | |
| Net investment income | | | 4,256 | |
| | | | | |
| Realized and unrealized gain (loss): | | | | |
| Net realized gain on: | | | | |
| Investments | | | 52,963 | |
| Net realized gain on investments | | | 52,963 | |
| | | | | |
| Net change in unrealized depreciation on: | | | | |
| Investments | | | (33,352 | ) |
| Net change in unrealized depreciation | | | (33,352 | ) |
| | | | | |
| Net gain on investments | | | 19,611 | |
| | | | | |
| Net increase in net assets resulting from operations | | $ | 23,867 | |
The accompanying notes are an integral part of these financial statements.
FOUNDRY PARTNERS, LLC FUNDS
FOUNDRY MICRO CAP VALUE FUND
STATEMENT OF CHANGES IN NET ASSETS
| June 30, 2015 | | SEMI-ANNUAL REPORT | |
| | | | | | | |
| | | For the | | | | |
| | | Six Month Period Ended | | | | |
| | | June 30, 2015 | | | December 31, 2014 (a) | |
| | | (Unaudited) | | | | |
| Increase (decrease) in net assets from: | | | | | | |
| Operations: | | | | | | |
| Net investment income (loss) | | $ | 4,256 | | | $ | (3,437 | ) |
| Net realized gain on investments | | | 52,963 | | | | 71,586 | |
| Net unrealized appreciation (depreciation) on investments | | | (33,352 | ) | | �� | 63,421 | |
| Net increase in net assets resulting from operations | | | 23,867 | | | | 131,570 | |
| | | | | | | | | |
| Distributions to shareholders from: | | | | | | | | |
| Net realized capital gains | | | - | | | | (29,519 | ) |
| Decrease in net assets resulting from distributions | | | - | | | | (29,519 | ) |
| | | | | | | | | |
| Capital share transactions (Note 3): | | | | | | | | |
| Increase in net assets from capital share transactions | | | 45,439 | | | | 1,384,401 | |
| | | | | | | | | |
| Increase in net assets | | | 69,306 | | | | 1,486,452 | |
| | | | | | | | | |
| Net Assets: | | | | | | | | |
| Beginning of period | | | 1,486,452 | | | | - | |
| | | | | | | | | |
| End of period | | $ | 1,555,758 | | | $ | 1,486,452 | |
| Undistributed net investment income | | $ | 4,256 | | | $ | - | |
(a) | The Foundry Micro Cap Value Fund commenced operations on January 30, 2014. |
The accompanying notes are an integral part of these financial statements.
FOUNDRY PARTNERS, LLC FUNDS
FOUNDRY MICRO CAP VALUE FUND
FINANCIAL HIGHLIGHTS
| June 30, 2015 (Unaudited) | | SEMI-ANNUAL REPORT |
| | | | | | | | | |
| The following tables set forth the per share operating performance data for a share of capital stock outstanding, total return ratios to average net assets and other supplemental data for the period indicated. |
| | | FOUNDRY MICRO CAP VALUE FUND | | |
| | | For the | | | | | | |
| | | Six Month Period Ended | | | | | | |
| | | June 30, 2015 | | | | December 31, 2014 (a) | | |
| | | (Unaudited) | | | | | | |
| | | | | | | | | |
| Net Asset Value, Beginning of Period | | $ | 10.78 | | | | $ | 10.00 | | |
| | | | | | | | | | | |
| Investment Operations: | | | | | | | | | | |
| Net investment income (loss) | | | 0.03 | | | | | (0.02 | ) | |
| Net realized and unrealized gain on investments | | | 0.13 | | | | | 1.02 | | |
| Total from investment operations | | | 0.16 | | | | | 1.00 | | |
| | | | | | | | | | | |
| Distributions: | | | | | | | | | | |
| From net realized capital gains | | | - | | | | | (0.22 | ) | |
| Total distributions | | | - | | | | | (0.22 | ) | |
| | | | | | | | | | | |
| Net Asset Value, End of Year/Period | | $ | 10.94 | | | | $ | 10.78 | | |
| | | | | | | | | | | |
Total Return (b) | | | 1.48 | % | (c) | | | 10.03 | % | (c)(d) |
| | | | | | | | | | | |
| Ratios/Supplemental Data | | | | | | | | | | |
| Net assets, end of period (in 000's) | | $ | 1,556 | | | | $ | 1,486 | | |
| | | | | | | | | | | |
| Ratio of expenses to average net assets: | | | | | | | | | | |
| Before fees waived and expenses absorbed | | | 7.99 | % | (f) | | | 12.51 | % | (e)(f) |
| After fees waived and expenses absorbed | | | 1.75 | % | (f) | | | 1.75 | % | (e)(f) |
| | | | | | | | | | | |
| Ratio of net investment income (loss): | | | | | | | | | | |
| Before fees waived and expenses absorbed | | | (5.67 | )% | (f) | | | (11.18 | )% | (e)(f) |
| After fees waived and expenses absorbed | | | 0.57 | % | (f) | | | (0.42 | )% | (e)(f) |
| | | | | | | | | | | |
| Portfolio turnover rate | | | 33 | % | (c) | | | 58 | % | (c) |
(a) | The Foundry Micro Cap Value Fund commenced operations on January 30, 2014. |
(b) | Total Return represents the rate that the investor would have earned or lost on an investment in the Fund, assuming reinvestment of dividends. |
(d) | Total Return is for the period from January 30, 2014, the date of initial portfolio trades, through December 31, 2014. |
(e) | Ratios are for the period from January 30, 2014, the date of initial expense accruals, through December 31, 2014. |
The accompanying notes are an integral part of these financial statements.
FOUNDRY PARTNERS, LLC FUNDS
FOUNDRY SMALL CAP VALUE FUND
STATEMENT OF ASSETS AND LIABILITIES
| June 30, 2015 (Unaudited) | SEMI-ANNUAL REPORT | |
| Assets: | | | |
| Investments, at value (identified cost $1,075,552) | | $ | 1,139,676 | |
| Due from advisor | | | 14,266 | |
| Receivables: | | | | |
| Dividends | | | 2,176 | |
| Investment securities sold | | | 1,678 | |
| Prepaid expenses | | | 1,581 | |
| Total assets | | | 1,159,377 | |
| | | | | |
| Liabilities: | | | | |
| Payables: | | | | |
| Due to administrator | | | 5,272 | |
| Due to trustees | | | 372 | |
| Accrued expenses | | | 18,642 | |
| Total liabilities | | | 24,286 | |
| Net Assets | | $ | 1,135,091 | |
| | | | | |
| Sources of Net Assets: | | | | |
| Paid-in capital | | $ | 1,069,992 | |
| Accumulated net realized loss on investments | | | (5,300 | ) |
| Undistributed net investment income | | | 6,275 | |
| Net unrealized appreciation on investments | | | 64,124 | |
| Total Net Assets (Unlimited shares of beneficial interest authorized) | | $ | 1,135,091 | |
| | | | | |
| Institutional Class Shares: | | | | |
| Net assets applicable to 108,176 shares outstanding | | $ | 1,135,091 | |
| Net Asset Value and Offering Price Per Share | | $ | 10.49 | |
Minimum Redemption Price Per Share (a) | | $ | 10.28 | |
(a) | A 2.00% redemption fee is assessed on redemption transactions of shares that are held for 90 days or less. |
The accompanying notes are an integral part of these financial statements.
FOUNDRY PARTNERS, LLC FUNDS
FOUNDRY SMALL CAP VALUE FUND
STATEMENT OF OPERATIONS
| June 30, 2015 (Unaudited) | SEMI-ANNUAL REPORT | |
| | | | |
| | | For the | |
| | | Six Month Period Ended | |
| | | June 30, 2015 | |
| | | (Unaudited) | |
| Investment income: | | | |
| Dividends (net of foreign withholding taxes of $0) | | $ | 14,592 | |
| Interest | | | 3 | |
| Total investment income | | | 14,595 | |
| | | | | |
| Expenses: | | | | |
| Management fees (Note 5) | | | 4,437 | |
| Accounting and transfer agent fees and expenses | | | 18,684 | |
| Audit fees | | | 7,687 | |
| Legal fees | | | 5,951 | |
| Miscellaneous | | | 6,279 | |
| Trustee fees and expenses | | | 2,910 | |
| Custodian fees | | | 4,959 | |
| Pricing fees | | | 3,472 | |
| Insurance | | | 143 | |
| Reports to shareholders | | | 248 | |
| Registration and filing fees | | | 477 | |
| Total expenses | | | 55,247 | |
| Less: fees waived and expenses absorbed | | | (46,927 | ) |
| Net expenses | | | 8,320 | |
| | | | | |
| Net investment income | | | 6,275 | |
| | | | | |
| Realized and unrealized gain (loss): | | | | |
| Net realized gain on: | | | | |
| Investments | | | 15,531 | |
| Net realized gain on investments | | | 15,531 | |
| | | | | |
| Net change in unrealized depreciation on: | | | | |
| Investments | | | (6,028 | ) |
| Net change in unrealized depreciation | | | (6,028 | ) |
| | | | | |
| Net gain on investments | | | 9,503 | |
| | | | | |
| Net increase in net assets resulting from operations | | $ | 15,778 | |
The accompanying notes are an integral part of these financial statements.
FOUNDRY PARTNERS, LLC FUNDS
FOUNDRY SMALL CAP VALUE FUND
STATEMENT OF CHANGES IN NET ASSETS
| June 30, 2015 | | SEMI-ANNUAL REPORT | |
| | | | | | | |
| | | For the | | | | |
| | | Six Month Period Ended | | | | |
| | | June 30, 2015 | | | December 31, 2014 (a) | |
| | | (Unaudited) | | | | |
| Increase (decrease) in net assets from: | | | | | | |
| Operations: | | | | | | |
| Net investment income (loss) | | $ | 6,275 | | | $ | (1,673 | ) |
| Net realized gain on investments | | | 15,531 | | | | 3,599 | |
| Net unrealized appreciation (depreciation) on investments | | | (6,028 | ) | | | 70,152 | |
| Net increase in net assets resulting from operations | | | 15,778 | | | | 72,078 | |
| | | | | | | | | |
| Distributions to shareholders from: | | | | | | | | |
| Net realized capital gains | | | - | | | | (22,757 | ) |
| Decrease in net assets resulting from distributions | | | - | | | | (22,757 | ) |
| | | | | | | | | |
| Capital share transactions (Note 3): | | | | | | | | |
| Increase in net assets from capital share transactions | | | 4,579 | | | | 1,065,413 | |
| | | | | | | | | |
| Increase in net assets | | | 20,357 | | | | 1,114,734 | |
| | | | | | | | | |
| Net Assets: | | | | | | | | |
| Beginning of period | | | 1,114,734 | | | | - | |
| | | | | | | | | |
| End of period | | $ | 1,135,091 | | | $ | 1,114,734 | |
| Undistributed net investment income | | $ | 6,275 | | | $ | - | |
(a) | The Foundry Small Cap Value Fund commenced operations on January 30, 2014. |
The accompanying notes are an integral part of these financial statements.
FOUNDRY PARTNERS, LLC FUNDS
FOUNDRY SMALL CAP VALUE FUND
FINANCIAL HIGHLIGHTS
| June 30, 2015 (Unaudited) | | SEMI-ANNUAL REPORT |
| | | | | | | | | | |
| The following tables set forth the per share operating performance data for a share of capital stock outstanding, total return ratios to average net assets and other supplemental data for the period indicated. |
| | | FOUNDRY SMALL CAP VALUE FUND | | |
| | | For the | | | | | | |
| | | Six Month Period Ended | | | | | | |
| | | June 30, 2015 | | | | December 31, 2014 (a) | | |
| | | (Unaudited) | | | | | | |
| | | | | | | | | |
| Net Asset Value, Beginning of Period | | $ | 10.35 | | | | $ | 10.00 | | |
| | | | | | | | | | | |
| Investment Operations: | | | | | | | | | | |
| Net investment loss | | | 0.06 | | | | | (0.02 | ) | |
| Net realized and unrealized gain on investments | | | 0.08 | | | | | 0.59 | | |
| Total from investment operations | | | 0.14 | | | | | 0.57 | | |
| | | | | | | | | | | |
| Distributions: | | | | | | | | | | |
| From net realized capital gains | | | - | | | | | (0.22 | ) | |
| Total distributions | | | - | | | | | (0.22 | ) | |
| | | | | | | | | | | |
| Net Asset Value, End of Year/Period | | $ | 10.49 | | | | $ | 10.35 | | |
| | | | | | | | | | | |
Total Return (b) | | | 1.35 | % | (c) | | | 5.71 | % | (c)(d) |
| | | | | | | | | | | |
| Ratios/Supplemental Data | | | | | | | | | | |
| Net assets, end of period (in 000's) | | $ | 1,135 | | | | $ | 1,115 | | |
| | | | | | | | | | | |
| Ratio of expenses to average net assets: | | | | | | | | | | |
| Before fees waived and expenses absorbed | | | 9.96 | % | (f) | | | 11.34 | % | (e)(f) |
| After fees waived and expenses absorbed | | | 1.50 | % | (f) | | | 1.50 | % | (e)(f) |
| | | | | | | | | | | |
| Ratio of net investment income (loss): | | | | | | | | | | |
| Before fees waived and expenses absorbed | | | (7.33 | )% | (f) | | | (10.03 | )% | (e)(f) |
| After fees waived and expenses absorbed | | | 1.13 | % | (f) | | | (0.19 | )% | (e)(f) |
| | | | | | | | | | | |
| Portfolio turnover rate | | | 31 | % | (c) | | | 75 | % | (c) |
(a) | The Foundry Small Cap Value Fund commenced operations on January 30, 2014. |
(b) | Total Return represents the rate that the investor would have earned or lost on an investment in the Fund, assuming reinvestment of dividends. |
(d) | Total Return is for the period from January 30, 2014, the date of initial portfolio trades, through December 31, 2014. |
(e) | Ratios are for the period from January 30, 2014, the date of initial expense accruals, through December 31, 2014. |
The accompanying notes are an integral part of these financial statements.
| Foundry Partners, LLC Funds | SEMI-ANNUAL REPORT |
NOTES TO THE FINANCIAL STATEMENTS
June 30, 2015 (Unaudited)
| 1. | ORGANIZATION AND SIGNIFICANT ACCOUNTING POLICIES |
The Foundry Partners, LLC Funds (the “Funds”) are series of 360 Funds (the “Trust”). The Trust was organized on February 24, 2005 as a Delaware statutory trust. The Trust is registered as an open-end management investment company under the Investment Company Act of 1940 (the “1940 Act”). The following series of funds advised by Foundry Partners LLC: (i) Foundry Micro Cap Value Fund (“Micro Cap Value Fund”), and (ii) Foundry Small Cap Value Fund (“Small Cap Value Fund”), (each a “Fund” and collectively, the “Funds”) are each an open end management investment company and separate series of the Trust. The investment objective of the Foundry Micro Cap Value Fund is capital appreciation. The investment objective of the Foundry Small Cap Value Fund is capital appreciation. The Funds are diversified Funds. The Funds’ investment adviser is Foundry Partners LLC (the “Adviser”). The Funds each have one class of shares, Institutional Class Shares. The Institutional Class Shares commenced operations on January 30, 2014.
a) Security Valuation – All investments in securities are recorded at their estimated fair value, as described in note 2.
b) Exchange Traded Funds – The Funds may invest in Exchange Traded Funds (“ETFs”). ETFs are registered investment companies and incur fees and expenses such as operating expenses, licensing fees, registration fees, trustees fees, and marketing expenses, and ETF shareholders, such as a Fund, pay their proportionate share of these expenses. Your cost of investing in a Fund will generally be higher than the cost of investing directly in ETFs. By investing in a Fund, you will indirectly bear fees and expenses charged by the underlying ETFs in which a Fund invests in addition to a Fund's direct fees and expenses.
c) Federal Income Taxes – The Funds have qualified and intend to continue to qualify as regulated investment companies under Subchapter M of the Internal Revenue Code of 1986, as amended (the “Code”). It is the policy of the Funds to comply with the requirements of the Code applicable to regulated investment companies and to distribute substantially all of their net investment company taxable income and net capital gains. Therefore, no provision for federal income taxes is required.
As of and during the six month period ended June 30, 2015, the Funds did not have a liability for any unrecognized tax expenses. The Funds recognize interest and penalties, if any, related to unrecognized tax liability as income tax expense in the statements of operations. During the six month period ended June 30, 2015, the Funds did not incur any interest or penalties. The Funds identify their major tax jurisdictions as U.S. Federal and Delaware state.
d) Distributions to Shareholders – Dividends from net investment income and distributions of net realized capital gains, if any, will be declared and paid at least annually. Income and capital gain distributions, which are determined in accordance with income tax regulations, are recorded on the ex-dividend date. Accounting principles generally accepted in the United States of America (“GAAP”) requires that permanent financial reporting differences relating to shareholder distributions be reclassified to paid-in capital or net realized gains. There were no reclassifications made during the six month period ended June 30, 2015.
e) Use of Estimates – The preparation of financial statements in conformity with GAAP requires management to make estimates and assumptions that affect the reported amounts of assets and liabilities and disclosure of contingent assets and liabilities at the date of the financial statements and the reported amounts of revenues and expenses during the reporting period. Actual results could differ from those estimates.
f) Other – Investment and shareholder transactions are recorded on trade date. The Funds determine the gain or loss realized from the investment transactions by comparing the original cost of the security lot sold with the net sales proceeds. Dividend income is recognized on the ex-dividend date or as soon as information is available to the Funds and interest income is recognized on an accrual basis. Withholding taxes on foreign dividends have been provided for in accordance with the Funds’ understanding of the applicable country’s tax rules and rates.
| Foundry Partners, LLC Funds | SEMI-ANNUAL REPORT |
NOTES TO THE FINANCIAL STATEMENTS
June 30, 2015 (Unaudited)
| 1. | ORGANIZATION AND SIGNIFICANT ACCOUNTING POLICIES (continued) |
g) Investments in Small-Cap Companies and Micro-Cap Companies – A Fund may invest a significant portion of its assets in securities of companies with small market capitalizations or micro market capitalizations. Certain small-cap companies and micro-cap companies may offer greater potential for capital appreciation than larger companies. However, investors should note that this potential for greater capital appreciation is accompanied by a substantial risk of loss and that, by their very nature, investments in small-cap companies and micro-cap companies tend to be very volatile and speculative. Small-cap companies and micro-cap companies may have a small share of the market for their products or services, their businesses may be limited to regional markets, or they may provide goods and services for a limited market. For example, they may be developing or marketing new products or services for markets that are not yet established or may never become established. In addition, small-cap companies and micro-cap companies may have or will develop only a regional market for products or services and thus be affected by local or regional market conditions. In addition, small-cap companies and micro-cap companies may lack depth of management or they may be unable to generate funds necessary for growth or potential development, either internally or through external financing on favorable terms. Such companies may also be insignificant in their industries and be subject to or become subject to intense competition from larger companies. Due to these and other factors, a Fund’s investments in small-cap companies and micro-cap companies may suffer significant losses. Further, there is typically a smaller market for the securities of a small-cap company or micro-cap company than for securities of a large company. Therefore, investments in small-cap companies and micro-cap companies may be less liquid and subject to significant price declines that result in losses for a Fund.
h) Redemption fees - Shareholders that redeem shares within 90 days of purchase will be assessed a redemption fee of 2.00% of the amount redeemed. The redemption fee is paid directly to and retained by the Funds, and is designed to deter excessive short-term trading and to offset brokerage commissions, market impact and other costs that may be associated with short-term money movement in and out of the Funds. No redemption fees were paid to the Funds during the six month period ended June 30, 2015.
Processes and Structure
The Funds’ Board of Trustees has adopted guidelines for valuing securities and other derivative instruments including in circumstances in which market quotes are not readily available, and has delegated authority to the Adviser to apply those guidelines in determining fair value prices, subject to review by the Board of Trustees.
Hierarchy of Fair Value Inputs
The company utilizes various methods to measure the fair value of most of its investments on a recurring basis. GAAP establishes a hierarchy that prioritizes inputs to valuation techniques used to measure fair value. The three levels of inputs are as follows:
| • | Level 1 – Unadjusted quoted prices in active markets for identical assets or liabilities that the company has the ability to access. |
| • | Level 2 – Observable inputs other than quoted prices included in Level 1 that are observable for the asset or liability either directly or indirectly. These inputs may include quoted prices for the identical instrument on an inactive market, prices for similar instruments, interest rates, prepayment speeds, credit risk, yield curves, default rates, and similar data. |
| • | Level 3 – Unobservable inputs for the asset or liability to the extent that relevant observable inputs are not available, representing the company's own assumptions about the assumptions that a market participant would use in valuing the asset or liability, and that would be based on the best information available. |
The availability of observable inputs can vary from security to security and is affected by a wide variety of factors, including, for example, the type of security, whether the security is new and not yet established in the marketplace, the liquidity of markets, and other characteristics particular to the security. To the extent that valuation is based on models or inputs that are less observable or unobservable in the market, the determination of fair value requires more judgment. Accordingly, the degree of judgment exercised in determining fair value is greatest for instruments categorized in Level 3.
| Foundry Partners, LLC Funds | SEMI-ANNUAL REPORT |
NOTES TO THE FINANCIAL STATEMENTS
June 30, 2015 (Unaudited)
| 2. | SECURITIES VALUATIONS (continued) |
The inputs used to measure fair value may fall into different levels of the fair value hierarchy. In such cases, for disclosure purposes, the level in the fair value hierarchy within which the fair value measurement falls in its entirety is determined based on the lowest level input that is significant to the fair value measurement in its entirety.
Fair Value Measurements
A description of the valuation techniques applied to the company's major categories of assets and liabilities measured at fair value on a recurring basis follows.
Equity securities (common stock and ETFs) – Securities traded on a national securities exchange (or reported on the NASDAQ national market) are stated at the last reported sales price on the day of valuation. To the extent these securities are actively traded, and valuation adjustments are not applied, they are categorized in Level 1 of the fair value hierarchy. Certain foreign securities may be fair valued using a pricing service that considers the correlation of the trading patterns of the foreign security to the intraday trading in the U.S. markets for investments such as American Depositary Receipts, financial futures, Exchange Traded Funds, and the movement of the certain indexes of securities based on a statistical analysis of the historical relationship and that are categorized in Level 2. Preferred stock and other equities traded on inactive markets or valued by reference to similar instruments are also categorized in Level 2.
Money market funds – Money market funds are valued at their net asset value of $1.00 per share and are categorized as Level 1.
The following table summarizes the inputs used to value the Funds’ assets and liabilities measured at fair value as of June 30, 2015:
Categories (a) | | Level 1 | | | Level 2 | | | Level 3 | | | Total | |
Micro Cap Value Fund: | | | | | | | | | | | | |
Common Stock (b) | | $ | 1,519,091 | | | | - | | | | - | | | $ | 1,519,091 | |
| Money market funds | | | 119,604 | | | | - | | | | - | | | | 119,604 | |
| Total Investments in Securities | | $ | 1,638,695 | | | | - | | | | - | | | $ | 1,638,695 | |
| Small Cap Value Fund: | | | | | | | | | | | | | | | | |
Common Stock (b) | | $ | 1,105,352 | | | | - | | | | - | | | $ | 1,105,352 | |
| Money market funds | | | 34,324 | | | | - | | | | - | | | | 34,324 | |
| Total Investments in Securities | | $ | 1,139,676 | | | | - | | | | - | | | $ | 1,139,676 | |
(a) | As of and during the six month period ended June 30, 2015, the Funds held no securities that were considered to be “Level 3” securities (those valued using significant unobservable inputs). Therefore, a reconciliation of assets in which significant unobservable inputs (Level 3) were used in determining fair value is not applicable. |
(b) | All common stock held in the Funds are Level 1 securities. For a detailed break-out of common stock by industry, please refer to the Schedules of Investments. |
The Funds recognize transfers, if any, between fair value hierarchy levels at the reporting period end. There were no transfers between levels as of June 30, 2015, from the valuation input levels used on December 31, 2014.
During the six month period ended June 30, 2015, no securities were fair valued.
| Foundry Partners, LLC Funds | SEMI-ANNUAL REPORT |
NOTES TO THE FINANCIAL STATEMENTS
June 30, 2015 (Unaudited)
| 3. | CAPITAL SHARE TRANSACTIONS |
Transactions in shares of capital stock for the Funds during the six month period ended June 30, 2015 were as follows:
| MicroCap Value Fund: | | Sold | | | Redeemed | | | Reinvested | | | Net Increase | |
| Institutional Class Shares | | | | | | | | | | | | |
| Shares | | | 11,681 | | | | (7,379 | ) | | | - | | | | 4,302 | |
| Value | | $ | 127,423 | | | $ | (81,984 | ) | | | - | | | $ | 45,439 | |
| Small Cap Value Fund: | | Sold | | | Redeemed | | | Reinvested | | | Net Increase | |
| Institutional Class Shares | | | | | | | | | | | | |
| Shares | | | 1,674 | | | | (1,229 | ) | | | - | | | | 445 | |
| Value | | $ | 17,326 | | | $ | (12,747 | ) | | | - | | | $ | 4,579 | |
Transactions in shares of capital stock for the Funds during the period since inception from January 30, 2014 through December 31, 2014 were as follows:
| MicroCap Value Fund: | | Sold | | | Redeemed | | | Reinvested | | | Net Increase | |
| Institutional Class Shares | | | | | | | | | | | | |
| Shares | | | 140,143 | | | | (5,062 | ) | | | 2,795 | | | | 137,876 | |
| Value | | $ | 1,406,000 | | | $ | (51,118 | ) | | | 29,519 | | | $ | 1,384,401 | |
| Small Cap Value Fund: | | Sold | | | Redeemed | | | Reinvested | | | Net Increase | |
| Institutional Class Shares | | | | | | | | | | | | |
| Shares | | | 110,625 | | | | (5,143 | ) | | | 2,249 | | | | 107,731 | |
| Value | | $ | 1,094,642 | | | $ | (51,986 | ) | | | 22,757 | | | $ | 1,065,413 | |
| 4. | INVESTMENT TRANSACTIONS |
For the six month period ended June 30, 2015, aggregate purchases and sales of investment securities (excluding short-term investments) were as follows:
| Fund | | Purchases | | | Sales | |
| Micro Cap Value Fund | | $ | 547,028 | | | $ | 479,805 | |
| Small Cap Value Fund | | | 334,099 | | | | 334,095 | |
There were no government securities purchased or sold during the period.
| Foundry Partners, LLC Funds | SEMI-ANNUAL REPORT |
NOTES TO THE FINANCIAL STATEMENTS
June 30, 2015 (Unaudited)
| 5. | ADVISORY FEES AND OTHER RELATED PARTY TRANSACTIONS |
The Funds have entered into an Investment Advisory Agreement (the “Advisory Agreement”) with the Adviser. Pursuant to the Advisory Agreement, the Adviser manages the operations of the Funds and manages the Funds’ investments in accordance with the stated policies of the Funds. As compensation for the investment advisory services provided to the Funds, Adviser will receive a monthly management fee equal to an annual rate of each Fund’s net assets for Institutional Class shares as follows:
| Fund | | Management Fee Rate | | | Accrued | |
| Micro Cap Value Fund: | | | 1.00 | % | | $ | 7,494 | |
| Small Cap Value Fund | | | 0.80 | % | | | 4,437 | |
The Adviser and the Funds have entered into an Expense Limitation Agreement (“Expense Agreements”) under which the Adviser has agreed to waive or reduce its fees and to assume other expenses of each Fund, if necessary, in an amount that limits annual operating expenses (exclusive of interest, taxes, brokerage fees and commissions, acquired fund fees and expenses, shareholder servicing fees, extraordinary expenses, dividend and interest expenses in connection with securities sold short and payments, if any, under the Rule 12b-1 Plan) to not more than the following average daily net assets of each of the Funds through April 30, 2016:
Fund | | Expense Limitation | | | Management Fees Waived | | | Expenses Reimbursed | |
| Micro Cap Value Fund: | | | 1.75 | % | | $ | 7,494 | | | $ | 39,228 | |
| Small Cap Value Fund | | | 1.50 | % | | | 4,437 | | | | 42,490 | |
If, at any time, the annualized expenses of Funds were less than the annualized expense ratios, the Funds would reimburse the Adviser for any fees previously waived and/or expenses previously assumed; provided, however, that repayment would be payable only to the extent that it (a) can be made during the three (3) years following the time at which the adviser waived fees or assumed expenses for the Funds, and (b) can be repaid without causing the expenses of Funds to exceed the annualized expense ratios.
At June 30, 2015, the cumulative unreimbursed amount paid and/or waived by the Adviser on behalf of the Funds that may be recouped no later than the dates stated below:
| Fund | | December 31, 2017 | | | December 31, 2018 | | | Totals | |
| Micro Cap Value Fund: | | $ | 89,103 | | | $ | 46,722 | | | $ | 135,825 | |
| Small Cap Value Fund | | | 83,230 | | | | 46,927 | | | | 130,157 | |
The Funds have entered into an Investment Company Services Agreement (“Services Agreement”) with Matrix 360 Administration, LLC (“M3Sixty”). Under the Services Agreement, M3Sixty is responsible for a wide variety of functions, including but not limited to: (a) Fund accounting services; (b) financial statement preparation; (c) valuation of the Funds’ portfolio securities; (d) pricing the Funds’ shares; (e) assistance in preparing tax returns; (f) preparation and filing of required regulatory reports; (g) communications with shareholders; (h) coordination of Board and shareholder meetings; (i) monitoring the Funds’ legal compliance; (j) maintaining shareholder account records.
For the six month period ended June 30, 2015, the Funds accrued fees pursuant to the Services Agreement as follows:
| Fund | | Service Fees | |
| Micro Cap Value Fund: | | $ | 18,976 | |
| Small Cap Value Fund | | | 18,684 | |
Certain officers and a Trustee of the Funds are also employees of M3Sixty.
| Foundry Partners, LLC Funds | SEMI-ANNUAL REPORT |
NOTES TO THE FINANCIAL STATEMENTS
June 30, 2015 (Unaudited)
| 5. | ADVISORY FEES AND OTHER RELATED PARTY TRANSACTIONS (continued) |
The Funds have entered into a Distribution Agreement with Matrix Capital Group, Inc. (the “Distributor”). Pursuant to the Distribution Agreement, the Distributor will provide distribution services to the Funds. The Distributor serves as underwriter/distributor of the Funds. Under the Distribution Agreement, for each Fund, the Distributor shall be paid an annual fee of $9,000. The annual fee above includes the first share class of the each Fund; the Distributor shall receive $1,500 annually for each additional class. The Distributor shall also receive an annualized amount equal to 1.25 bps (0.000125%) of the average assets of each Fund.
The Distributor is not affiliated with the Adviser. The Distributor is an affiliate of M3Sixty.
For U.S. Federal income tax purposes, the cost of securities owned, gross appreciation, gross depreciation, and net unrealized appreciation/(depreciation) of investments at June 30, 2015 were as follows:
Fund | | Tax Cost | | | Gross Unrealized Appreciation | | | Gross Unrealized Depreciation | | | Net Unrealized Appreciation | |
| Micro Cap Value Fund: | | $ | 1,612,749 | | | $ | 136,474 | | | $ | (110,528 | ) | | $ | 25,946 | |
| Small Cap Value Fund | | | 1,076,387 | | | | 118,163 | | | | (54,874 | ) | | | 63,289 | |
The difference between book basis unrealized appreciation and tax-basis unrealized appreciation for the Funds is attributable primarily to the tax deferral of losses on wash sales.
The Funds’ tax basis distributable earnings are determined only at the end of each fiscal year. The tax character of distributable earnings (deficit) at December 31, 2014, the Funds’ most recent fiscal year end, was as follows:
Fund | | Unrealized Appreciation (Depreciation) | | | Undistributed Ordinary Income | | | Undistributed Capital Gains | | | Post-October Losses | | | Total Distributable Earnings | |
| Micro Cap Value Fund: | | $ | 61,007 | | | $ | 40,686 | | | $ | 358 | | | $ | - | | | $ | 102,051 | |
| Small Cap Value Fund | | | 68,882 | | | | 285 | | | | 75 | | | | (19,921 | ) | | | 49,321 | |
The undistributed ordinary income and capital gains shown above differ from corresponding accumulated net investment income and accumulated net realized gain (loss) figures reported in the statements of assets and liabilities due to differing book/tax treatment of short-term capital gains, and certain temporary book/tax differences due to the tax deferral of losses on wash sales.
Under current tax law, net capital losses realized after October 31st and net ordinary losses incurred after December 31st may be deferred and treated as occurring on the first day of the following fiscal year. The Funds’ carryforward losses, post-October losses and post-December losses are determined only at the end of each fiscal year. As of December 31, 2014, the Funds elected to defer net ordinary losses as indicated in the chart below.
| | | Post-October Losses | | | Post-December Losses | |
| Fund | | Deferred | | | Utilized | | | Deferred | | | Utilized | |
| Micro Cap Value Fund: | | $ | - | | | $ | - | | | $ | - | | | $ | - | |
| Small Cap Value Fund | | | 19,921 | | | | - | | | | - | | | | - | |
Under the Regulated Investment Company Modernization Act of 2010 (the Act), net capital losses recognized after December 31, 2010, may be carried forward indefinitely, and their character is retained as short-term and/or long-term. As of December 31, 2014, the Funds had no capital loss carryforwards for federal income tax purposes.
| Foundry Partners, LLC Funds | SEMI-ANNUAL REPORT |
NOTES TO THE FINANCIAL STATEMENTS
June 30, 2015 (Unaudited)
The tax character of distributions paid during the period since inception from January 30, 2014 through December 31, 2014 by the Funds were as follows.
| Fund | | Long-term Capital Gain | | | Ordinary Income | |
| Micro Cap Value Fund: | | $ | 20 | | | $ | 29,499 | |
| Small Cap Value Fund | | | 11 | | | | 22,746 | |
There were no distributions paid by the Funds during the six month period ended June 30, 2015.
The beneficial ownership, either directly or indirectly, of more than 25% of the voting securities of a fund creates a presumption of control of the fund, under Section 2(a)(9) of the Investment Company Act of 1940. As of June 30, 2015, Reliance Trust Co. held 48% and 75% of the Micro Cap Value Fund’s Institutional Class Shares and Small Cap Value Fund’s Institutional Class Shares outstanding, respectively.
| 8. | COMMITMENTS AND CONTINGENCIES |
In the normal course of business, the Trust may enter into contracts that may contain a variety of representations and warranties and provide general indemnifications. The Trust’s maximum exposure under these arrangements is dependent on future claims that may be made against the Funds and, therefore, cannot be estimated; however, management considers the risk of loss from such claims to be remote.
In accordance with GAAP, Management has evaluated the impact of all subsequent events of the Funds through the date the financial statements were issued, and has determined that there were no other subsequent events requiring recognition or disclosure in the financial statements.
| Foundry Partners, LLC Funds | SEMI-ANNUAL REPORT |
ADDITIONAL INFORMATION
June 30, 2015 (Unaudited)
The Funds file their complete schedule of portfolio holdings with the Securities and Exchange Commission (the “Commission”) for the first and third quarters of each fiscal year on Form N-Q. The Funds’ Forms N-Q are available on the Commission’s website at http://www.sec.gov. The Funds’ Forms N-Q may be reviewed and copied at the Commission’s Public Reference Room in Washington, DC. Information on the operation of the Commission’s Public Reference Room may be obtained by calling 1-800-SEC-0330.
A description of the policies and procedures that the Funds use to determine how to vote proxies relating to portfolio securities is available without charge, upon request, by calling 1-877-244-6235; and on the Commission’s website at http://www.sec.gov.
Information regarding how the Funds voted proxies relating to portfolio securities during the most recent 12-month period ended June 30th is available without charge, upon request, by calling 1-877-244-6235; and on the Commission’s website at http://www.sec.gov.
The Funds did not pay any distributions during the six month period ended June 30, 2015. Distributions, if any, will be paid in December. Complete information will be computed and reported in conjunction with your 2015 Form 1099-DIV.
Shareholders should refer to their Form 1099-DIV or other tax information which will be mailed in 2016 to determine the calendar year amounts to be included on their 2015 tax returns. Shareholders should consult their own tax advisors.
| Foundry Partners, LLC Funds | SEMI-ANNUAL REPORT |
ADDITIONAL INFORMATION
June 30, 2015 (Unaudited)
TRUSTEES AND OFFICERS INFORMATION (Unaudited)
Remuneration Paid to Trustees and Officers - Officers of the Trust and Trustees who are “interested persons” of the Trust or the Adviser will receive no salary or fees from the Trust. Officers of the Trust and interested Trustees do receive compensation directly from certain service providers to the Trust. Each Trustee who is not an “interested person” receives a fee of $1,000 each year plus $125 per Board or committee meeting attended in person and $100 per meeting attended by telephone. The Trust reimburses each Trustee and officer for his or her travel and other expenses relating to attendance at such meetings.
Name of Trustee1 | Aggregate Compensation From Each Foundry Fund2 | Pension or Retirement Benefits Accrued As Part of Portfolio Expenses | Estimated Annual Benefits Upon Retirement | Total Compensation From the Foundry Funds Paid to Trustees2 |
| Independent Trustees |
| Art Falk | $750 | None | None | $1,500 |
| Thomas Krausz | $750 | None | None | $1,500 |
| Tom M. Wirtshafter | $750 | None | None | $1,500 |
| Gary DiCenzo | $750 | None | None | $1,500 |
| Interested Trustees |
| Randall K. Linscott | None | None | None | None |
1 | Each of the Trustees serves as a Trustee to each Series of the Trust. The Trust currently offers fourteen (14) series of shares. |
2 | Figures are for the six month period ended June 30, 2015. |
| Foundry Partners, LLC Funds | SEMI-ANNUAL REPORT |
Information About Your Funds’ Expenses - (Unaudited)
As a shareholder of the Funds, you incur two types of costs: (1) transaction costs, such as the sales charge (load) imposed on certain subscriptions and the contingent deferred sales charge (“CDSC”) imposed on certain short-term redemptions; and (2) ongoing costs, including management fees, distribution and/or service (12b-1) fees; and other Funds expenses. The example below is intended to help you understand your ongoing costs (in dollars) of investing in the Funds and to compare these costs with the ongoing costs of investing in other mutual funds.
The example is based on an investment of $1,000 invested at the beginning of the period and held for the entire period as indicated below.
Actual Expenses – The first section of the table provides information about actual account values and actual expenses (relating to the example $1,000 investment made at the beginning of the period). You may use the information in this section, together with the amount you invested, to estimate the expenses that you paid over the period. Simply divide your account value by $1,000 (for example, an $8,600 account value divided by $1,000 = 8.6), then multiply the result by the number in the first section under the heading entitled “Expenses Paid During Period” to estimate the expenses you paid on your account during this period.
Hypothetical Example for Comparison Purposes – The second section of the table provides information about the hypothetical account values and hypothetical expenses based on the Funds’ actual expense ratio and an assumed rate of return of 5% per year before expenses, which are not the Funds’ actual return. The hypothetical account values and expenses may not be used to estimate the actual ending account balance or expenses you paid for the period. You may use this information to compare the ongoing costs of investing in the Funds to other funds. To do so, compare this 5% hypothetical example with the 5% hypothetical examples that appear in the shareholder reports of the other funds.
Please note that the expenses shown in the table are meant to highlight your ongoing costs only and do not reflect any transactional costs, such as sales charges (loads), CDSC fees, or exchange fees. Therefore, the second section of the table is useful in comparing ongoing costs only, and will not help you determine the relative total costs of owning different funds. In addition, if these transactional costs were included, your costs would have been higher. For more information on transactional costs, please refer to the Funds’ prospectus.
Expenses and Value of a $1,000 Investment for the six month period from 12/31/14 through 06/30/15
Micro Cap Value Fund: | Beginning Account
Value (12/31/2014) | Annualized Expense
Ratio for the Period | Ending Account
Value (06/30/2015) | Expenses Paid
During Period |
| Actual Fund Return (in parentheses) | | | |
| Institutional Class Shares (+1.48%) | $1,000.00 | 1.75% | $1,014.80 | $8.74 (a) |
| Hypothetical 5% Fund Return | | | |
| Institutional Class Shares | $1,000.00 | 1.75% | $1,016.10 | $8.75 (a) |
Small Cap Value Fund: | | | | |
| Actual Fund Return (in parentheses) | | | |
| Institutional Class Shares (+1.35%) | $1,000.00 | 1.50% | $1,013.50 | $7.49 (a) |
| Hypothetical 5% Fund Return | | | |
| Institutional Class Shares | $1,000.00 | 1.50% | $1,017.40 | $7.50 (a) |
| (a) | Expenses are equal to the Funds’ annualized expense ratios, multiplied by the average account value over the period, multiplied by 181/365 to reflect the one-half year period. |
For more information on Funds’ expenses, please refer to the Funds’ prospectus, which can be obtained from your investment representative or by calling 1-877-244-6235. Please read it carefully before you invest or send money.
| Foundry Partners, LLC Funds | SEMI-ANNUAL REPORT |
Information About Your Funds’ Expenses - (Unaudited)(continued)
Total Fund operating expense ratios as stated in the current Fund prospectus dated April 30, 2015 for the Funds were as follows: |
| Foundry Micro Cap Value Fund Institutional Class Shares, gross of fee waivers or expense reimbursements | 12.53% |
| Foundry Micro Cap Value Fund Institutional Class Shares, fee waivers or expense reimbursements | 1.77% |
| Foundry Small Cap Value Fund Institutional Class Shares, gross of fee waivers or expense reimbursements | 11.35% |
| Foundry Small Cap Value Fund Institutional Class Shares, after fee waivers or expense reimbursements | 1.51% |
Foundry Partners, LLC (the “Adviser”) has entered into an Expense Limitation Agreement with the Funds under which it has agreed to waive or reduce its fees and to assume other expenses of the Funds, if necessary, in an amount that limits the Funds’ annual operating expenses (exclusive of interest, taxes, brokerage fees and commissions, acquired funds fees and expenses, extraordinary expenses, dividend and interest expenses related to short investments) to not more than 1.75% and 1.50%, of the Foundry Micro Cap Value Fund and the Foundry Small Cap Value Fund, respectively, through at least April 30, 2016. Subject to approval by the Funds’ Board, any waiver under the Expense Limitation Agreement is subject to repayment by the Funds within the three fiscal years following the year in which such waiver occurred, if the Funds are able to make the payment without exceeding the expense limitation. The current contractual agreement cannot be terminated prior to at least one year after the effective date without the Board of Trustees’ approval. Total Gross Operating Expenses (Annualized) during the six month period ended June 30, 2015 were 7.99% and 9.96% for the Foundry Micro Cap Value Fund Institutional Class shares and the Foundry Small Cap Value Institutional Class shares, respectively. Please see the Information About Your Funds’ Expenses, the Financial Highlights and Notes to Financial Statements (Note 5) sections of this report for expense related disclosures during the six month period ended June 30, 2015. |
360 FUNDS
4520 Main Street
Suite 1425
Kansas City, MO 64111
INVESTMENT ADVISER
Foundry Partners, LLC
510 First Avenue North,
Suite 409
Minneapolis, MN 55403
ADMINISTRATOR & TRANSFER AGENT
Matrix 360 Administration, LLC
4520 Main Street
Suite 1425
Kansas City, MO 64111
DISTRIBUTOR
Matrix Capital Group, Inc.
419 Lafayette Street
New York, NY 10003
INDEPENDENT REGISTERED PUBLIC ACCOUNTING FIRM
Cohen Fund Audit Services, Ltd.
1350 Euclid Ave., Suite 800
Cleveland, OH 44115
LEGAL COUNSEL
Graydon Head & Ritchey LLP
15 West Center Street
Lawrenceburg, IN 47025
CUSTODIAN BANK
U.S. Bank, N.A
425 Walnut Street
Cincinnati, OH 45202
Not applicable at this time.
Not applicable at this time.
Not applicable at this time.
Included in semi-annual report to shareholders filed under item 1 of this form.
Not applicable at this time.
Pursuant to the requirements of the Securities Exchange Act of 1934 and the Investment Company Act of 1940, the registrant has duly caused this report to be signed on its behalf by the undersigned, thereunto duly authorized.
Pursuant to the requirements of the Securities Exchange Act of 1934 and the Investment Company Act of 1940, this report has been signed below by the following person on behalf of the registrant and in the capacities and on the date indicated.
Pursuant to the requirements of the Securities Exchange Act of 1934 and the Investment Company Act of 1940, this report has been signed below by the following person on behalf of the registrant and in the capacities and on the date indicated.