UNITED STATES
SECURITIES AND EXCHANGE COMMISSION
Washington, D.C. 20549
FORM N-CSR
CERTIFIED SHAREHOLDER REPORT OF
REGISTERED MANAGEMENT INVESTMENT COMPANIES
Investment Company Act File Number 811-21726
360 Funds
(Exact name of registrant as specified in charter)
| 4300 Shawnee Mission Pkwy, Suite 100 Fairway, KS | 66205 |
| (Address of principal executive offices) | (Zip code) |
The Corporation Trust Company
Corporation Trust Center
1209 Orange St.
Wilmington, DE 19801
(Name and address of agent for service)
With Copies To:
Bo J. Howell
FinTech Law, LLC
6224 Turpin Hills Dr.
Cincinnati, Ohio 45244
Registrant’s telephone number, including area code: 877-244-6235
Date of fiscal year end: 09/30/2024
Date of reporting period: 09/30/2024
| ITEM 1. | REPORTS TO SHAREHOLDERS |
The Annual report to Shareholders of the Timber Point Global Allocations Fund (the “Global Fund”) and the Timber Point Alternative Income Fund (the “Income Fund”), each a series of the 360 Funds (the “registrant”) for the year ended September 30, 2024 pursuant to Rule 30e-1 under the Investment Company Act of 1940 (the “1940 Act”), as amended (17 CFR 270.30e-1) is filed herewith.
| Timber Point Global Allocations Fund | ANNUAL REPORT |
Institutional Class (CGHIX)
September 30, 2024
This annual report to shareholders contains important information of the Timber Point Global Allocations Fund (the “Global Fund”) for the year ended September 30, 2024. You can find the Global Fund’s prospectus, financial information on Form N-CSR, holdings, proxy voting information and other information at www.timberpointcapital.com. You can also request this information without charge by contacting the Fund at (877) 244-6235.
What were the Fund costs for the year? (based on a hypothetical $10,000 investment)
| | Costs of a $10,000 investment | Costs paid as a percentage of a $10,000 investment |
| Institutional Class shares | $176 | 1.59% |
How has the Fund performed during the past 10 years?
| Cumulative Performance of a Hypothetical $10,000 Investment as-of September 30, 2024 |
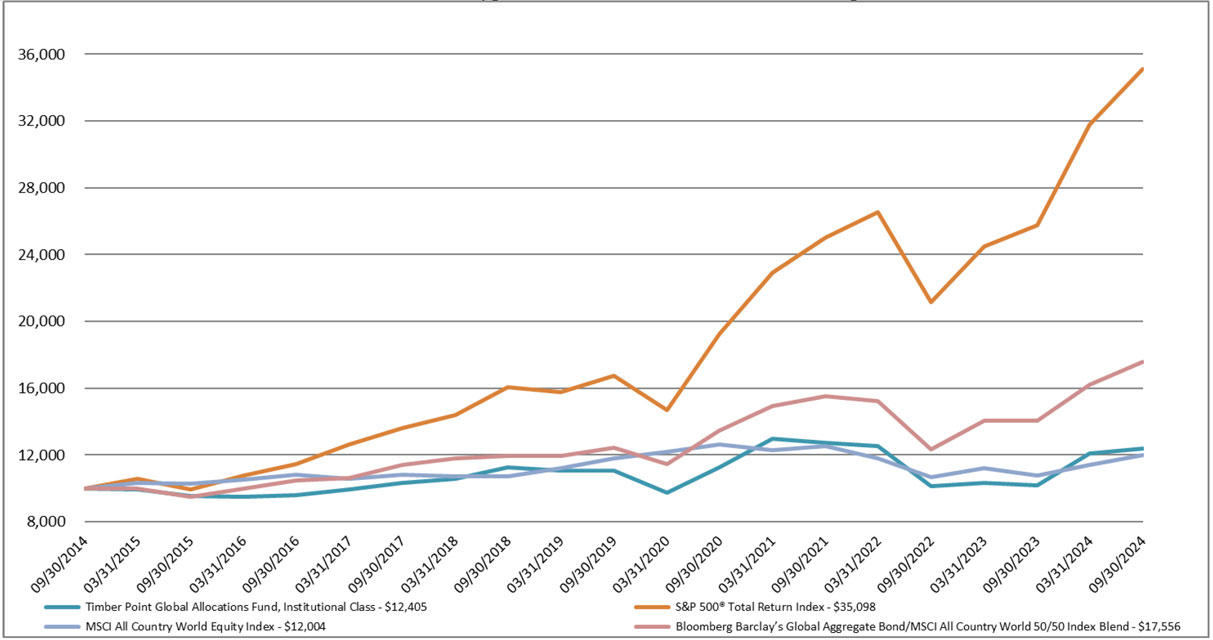
| | Timber Point Global Allocations Fund, Institutional Class | S&P 500® Total Return Index | MSCI All Country World Equity Index | Bloomberg Barclay’s Global Aggregate Bond/MSCI All Country World 50/50 Index Blend |
| 09/30/2014 | 10,000.00 | 10,000.00 | 10,000.00 | 10,000.00 |
| 03/31/2015 | 9,954.50 | 10,593.01 | 10,342.99 | 9,989.51 |
| 09/30/2015 | 9,538.31 | 9,938.55 | 10,294.08 | 9,503.99 |
| 03/31/2016 | 9,517.53 | 10,781.87 | 10,545.74 | 9,988.37 |
| 09/30/2016 | 9,583.91 | 11,472.11 | 10,828.61 | 10,489.35 |
| 03/31/2017 | 9,925.05 | 12,633.36 | 10,592.20 | 10,630.91 |
| 09/30/2017 | 10,342.57 | 13,606.99 | 10,836.47 | 11,397.52 |
| 03/31/2018 | 10,592.11 | 14,400.99 | 10,719.63 | 11,817.24 |
| 09/30/2018 | 11,234.42 | 16,044.06 | 10,704.69 | 11,935.03 |
| 03/31/2019 | 11,045.05 | 15,768.58 | 11,199.93 | 11,965.83 |
| 09/30/2019 | 11,057.28 | 16,726.55 | 11,806.86 | 12,418.58 |
| 03/31/2020 | 9,729.84 | 14,668.26 | 12,200.51 | 11,438.76 |
| 09/30/2020 | 11,248.58 | 19,260.47 | 12,631.53 | 13,483.31 |
| 03/31/2021 | 12,969.03 | 22,934.07 | 12,287.16 | 14,924.21 |
| 09/30/2021 | 12,733.00 | 25,039.57 | 12,518.46 | 15,520.54 |
| 03/31/2022 | 12,534.24 | 26,522.29 | 11,776.98 | 15,218.94 |
| 09/30/2022 | 10,136.71 | 21,165.43 | 10,690.82 | 12,327.36 |
| 03/31/2023 | 10,336.93 | 24,472.53 | 11,213.65 | 14,052.96 |
| 09/30/2023 | 10,186.21 | 25,740.83 | 10,759.71 | 14,033.71 |
| 03/31/2024 | 12,101.14 | 31,785.20 | 11,404.06 | 16,184.17 |
| 09/30/2024 | 12,404.62 | 35,098.03 | 12,004.45 | 17,555.91 |
| Average Annual Total Returns |
| | 1 Year | 5 Years | 10 Years |
| Institutional Class Shares | 21.78% | 2.33% | 2.18% |
| S&P 500® Total Return Index (“S&P 500”) | 36.35% | 15.96% | 13.37% |
| Bloomberg Barclays U.S. Aggregate Bond Index | 11.57% | 0.33% | 1.84% |
| Bloomberg Barclays Global Aggregate Bond/MSCI ACWI Net Total Return USD 50/50 Index Blend | 21.87% | 6.46% | 5.78% |
The above graphs depict the performance of the Global Fund versus the S&P 500® Total Return Index, the Bloomberg Barclays U.S. Aggregate Bond Index and the Bloomberg Barclays Global Aggregate Bond/MSCI ACWI Net Total Return USD 50/50 Index Blend. The performance information quoted in this annual report assumes the reinvestment of all dividend and capital gain distributions, if any, and represents past performance, which is not a guarantee of future results. Index returns do not include expenses, which are deducted from Fund returns. The returns shown do not reflect taxes that a shareholder would pay on Fund distributions or on the redemption of Fund shares. The investment return and principal value of an investment will fluctuate and, therefore, an investor’s shares, when redeemed, may be worth more or less than their original cost. Updated performance data current to the most recent month-end can be obtained by calling (877) 244-6235.
| Timber Point Global Allocations Fund | ANNUAL REPORT |
Institutional Class (CGHIX)
September 30, 2024 (continued)
How did the Fund perform last year?
The Global Fund performed well over the fiscal year ended September 30, 2024, rising 21.78%. While it modestly underperformed the blended benchmark, it significantly exceeded the target return of U.S. Treasury Bills plus 600 basis points. Due to its diversified investment approach, the Global Fund did lag the S&P 500’s 36.35% return. Throughout the past twelve months, our outlook was generally positive, as we believed that the macroeconomic backdrop, outlined above, would provide a highly favorable investment environment.
What factors influenced performance during the past year?
| ● | The largest contributor to positive returns over the fiscal year was the Global Fund’s exposure to equity market risk, particularly U.S. equities, despite a weak outlook and sentiment from many institutional investors and strategists. Broad U.S. large-cap equity exposure was implemented through several exchange-traded securities, including SPY, RSP, and SPXL. The Global Fund also held significant exposure to U.S. small- and mid-cap stocks through exchange-traded securities like IJR, IJH, and VO. While small- and mid-cap stocks underperformed large caps, they still posted strong absolute returns. |
| ● | Tactical and opportunistic investments that contributed positively included Aerospace and Defense companies, primarily through the exchange-traded fund (“ETF”) PPA. The war in Ukraine and rising hostilities in the Middle East have led to diminished armament stockpiles that need replenishing. Additionally, the Global Fund initiated a position in cryptocurrency through the ETF HODL, which benefited performance as Bitcoin steadily increased throughout the year. An investment in private credit securities through the business development company BXSL also proved highly beneficial. |
| ● | Despite maintaining a broad global viewpoint, the Global Fund held very underweight positions in non-U.S. investments, as we found the prospects for international growth and investing unattractive. Geographically, the Global Fund has been almost entirely allocated to U.S. investment opportunities. |
| ● | Positions that detracted from Global Fund returns were primarily in the biotech sector. Both ETFs and specific companies, such as VKTX and IMMX, were negative contributors over the period. |
| ● | The twelve months ended September 30, 2024, proved very beneficial for investors, as the U.S. economy continued a path of strong growth while inflationary pressures eased significantly. Over this period, the Federal Reserve shifted its monetary policy stance from restrictive to neutral and ultimately reduced the target funds rate to 5% in September. This created an exceptionally favorable macroeconomic environment for investors, spurring a strong rally across most asset classes and investment types. Additionally, alongside this positive macro backdrop, the growing recognition and adoption of artificial intelligence (AI) across businesses and consumer segments ignited another technological breakthrough, leading to increased capital spending, productivity gains, and improved corporate earnings. Many technology stocks, especially those tied to AI, benefited significantly from this secular trend. |
Positioning
The Global Fund is a directional, global multi-asset strategy investing across global equities, debt, commodities, currencies, and market hedging tools. The Global Fund seeks superior risk-adjusted returns with a targeted annualized 5-year net return of 600 basis points over Treasury Bills while maintaining moderate levels of total portfolio volatility.
What are some Fund statistics?
| Fund Statistics |
| Total Net Assets | $19,878,101 | Investment Advisory Fees Paid | $46,054 |
| Number of Portfolio Holdings | 40 | Portfolio Turnover Rate | 187% |
What did the Fund invest in?
| Sector Allocation (as a % of Portfolio) |
| Equity Funds | 57.72% | Consumer, Non-cyclical | 1.57% |
| Asset Allocation Fund | 11.44% | Commodity Fund | 1.06% |
| Debt Funds | 10.85% | Communications | 0.97% |
| Cash and Cash Equivalents | 7.31% | Consumer, Cyclical | 0.62% |
| Financials | 6.29% | Asset-backed and Mortgage-backed securities | 0.01% |
| Asset Allocation Fund | 2.17% | | |
| Timber Point Global Allocations Fund | ANNUAL REPORT |
Institutional Class (CGHIX)
September 30, 2024 (continued)
| Top Ten Holdings (as a % of Net Assets) |
SPDR S&P 500 ETF Trust | 12.99% | iShares Core S&P Mid-Cap ETF | 4.23% |
| Timber Point Alternative Income Fund | 11.43% | iShares 1-3 Year Treasury Bond ETF | 4.18% |
| Federated Hermes Government Obligation Fund | 7.31% | Direxion Daily S&P 500 Bull 3X Shares | 4.12% |
| iShares 7-10 Year Treasury Bond ETF | 5.43% | iShares Core S&P Small-Cap ETF | 4.12% |
| Invesco Aerospace & Defense ETF | 4.77% | Vanguard U.S. Value Factor ETF | 3.94% |
Material Fund Changes
Effective October 22, 2024, the Global Fund added the Bloomberg Barclays Global Aggregate Bond/MSCI ACWI Net Total Return USD 50/50 Index Blend as a new benchmark. Timber Point Capital Management, LLC, the Global Fund’s investment adviser, believes it more representative of the Global Fund’s directional, global, multi-asset strategy approach which incorporates global equities, debt, commodities, currencies and market hedging tools in its portfolio construction.
Change in and Disagreements with Accountants
The Audit Committee of 360 Funds (the “Trust”) has approved and recommended to the Board of Trustees (the “Board”), and the Board has approved Tait, Weller & Baker, LLP (“Tait”) to replace Cohen & Company, Ltd. (“Cohen”) as the Global Fund’s independent registered public accounting firm for the Global Fund’s fiscal year ended September 30, 2024. Through the past fiscal year and through the date of Cohen’s replacement as auditor of the Global Fund, the Global Fund had no disagreements with Cohen on any matter of accounting principles or practices, financial statement disclosure or auditing scope or procedures, which, if not resolved to the satisfaction of Cohen would have caused Cohen to make reference to the disagreement in a Cohen report, and there were no reportable events of the kind described in Item 304(a)(1)(v) of Regulation S-K under the Securities Exchange Act of 1934.
With respect to the Global Fund, Cohen’s audit opinions, including for the fiscal year ended September 30, 2023, did not contain either an adverse opinion or disclaimer of opinion, nor were they qualified or modified as to uncertainty, audit scope or accounting principles. During the last fiscal year of the Global Fund, neither the Global Fund nor anyone on its behalf has consulted Tait on items concerning the application of accounting principles to a specified transaction (either completed or proposed) or the type of audit opinion that might be rendered on the Global Fund’s financial statements, or concerning the subject of a disagreement of the kind described in Item 304(a)(1)(iv) of Regulation S-K or reportable events of the kind described in Item 304(a)(1)(v) of Regulation S-K.
The Global Fund requested Cohen to furnish it with a letter addressed to the SEC stating whether or not it agrees with the above statements. A copy of such letter will be filed as an Exhibit to the Form N-CSR filing.
Availability of Additional Information
You can find additional information about the Global Fund such as the prospectus, financial information, fund holdings and proxy voting information at www.timberpointcapital.com. You can also request this information by contacting us at (877) 244-6235.
Householding
To reduce Global Fund expenses, only one copy of most shareholder documents may be mailed to shareholders with multiple accounts at the same address (Householding). If you would prefer that your Global Fund documents not be householded, please contact the Global Fund at (877) 244-6235 or contact your financial intermediary. Your instructions will typically be effective within 30 days of receipt by the Global Fund.
| Timber Point Alternative Income Fund | ANNUAL REPORT |
Institutional Class (AIIFX)
September 30, 2024
This annual report to shareholders contains important information of the Timber Point Alternative Income Fund (the “Income Fund”) for the year ended September 30, 2024. You can find the Income Fund’s prospectus, financial information on Form N-CSR, holdings, proxy voting information and other information at www.timberpointcapital.com. You can also request this information without charge by contacting the Income Fund at (877) 244-6235.
What were the Fund costs for the year? (based on a hypothetical $10,000 investment)
| | Costs of a $10,000 investment | Costs paid as a percentage of a $10,000 investment |
| Institutional Class shares | $194 | 1.82% |
How has the Fund performed during the past 10 years?
| Cumulative Performance of a Hypothetical $10,000 Investment as-of September 30, 2024 |
| | Timber Point Alternative Income Fund, Institutional Class | Bloomberg Barclays Global Aggregate Bond Index | HFRX Absolute Return Index |
| 09/30/2014 | 10,000.00 | 10,000.00 | 10,000.00 |
| 03/31/2015 | 10,076.52 | 9,706.13 | 10,066.65 |
| 09/30/2015 | 9,719.48 | 9,673.51 | 10,161.50 |
| 03/31/2016 | 9,702.91 | 10,149.49 | 10,125.35 |
| 09/30/2016 | 9,890.40 | 10,528.08 | 10,251.10 |
| 03/31/2017 | 9,763.96 | 9,956.37 | 10,281.79 |
| 09/30/2017 | 9,922.09 | 10,395.60 | 10,547.98 |
| 03/31/2018 | 9,993.45 | 10,650.60 | 10,592.88 |
| 09/30/2018 | 10,113.28 | 10,258.62 | 10,666.98 |
| 03/31/2019 | 10,041.64 | 10,610.06 | 10,568.45 |
| 09/30/2019 | 10,269.86 | 11,037.98 | 10,798.49 |
| 03/31/2020 | 9,418.81 | 11,055.28 | 10,331.95 |
| 09/30/2020 | 10,137.71 | 11,726.37 | 11,019.59 |
| 03/31/2021 | 10,438.02 | 11,571.26 | 11,339.52 |
| 09/30/2021 | 10,674.96 | 11,619.58 | 11,471.92 |
| 03/31/2022 | 10,392.87 | 10,830.38 | 11,516.02 |
| 09/30/2022 | 9,390.38 | 9,245.62 | 11,636.60 |
| 03/31/2023 | 9,784.03 | 9,956.77 | 11,577.80 |
| 09/30/2023 | 9,692.95 | 9,452.83 | 11,785.99 |
| 03/31/2024 | 10,527.77 | 10,005.70 | 12,163.80 |
| 09/30/2024 | 10,993.60 | 10,586.07 | 12,426.55 |
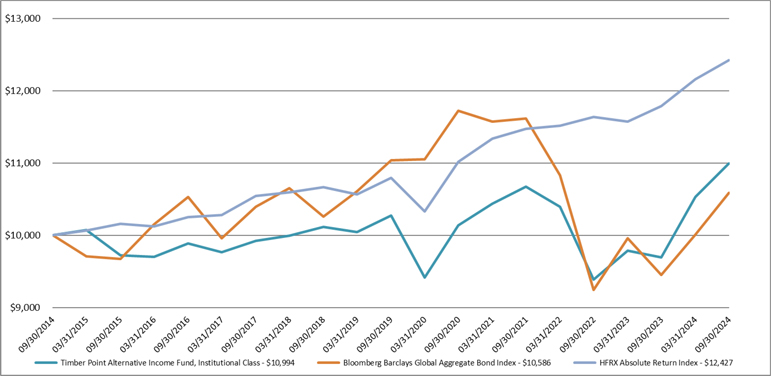
| Average Annual Total Returns |
| | 1 Year | 5 Years | 10 Years |
| Institutional Class shares | 13.42% | 1.37% | 0.95% |
| Bloomberg Barclay’s Global Aggregate Bond Index | 11.99% | (0.83)% | 0.57% |
| HFRX Absolute Return Index | 5.43% | 2.86% | 2.20% |
The above graphs depict the performance of the Income Fund versus the the Bloomberg Barclays Global Aggregate Bond Index and the and the HFRX Absolute Return Index. The performance information quoted in this annual report assumes the reinvestment of all dividend and capital gain distributions, if any, and represents past performance, which is not a guarantee of future results. Index returns do not include expenses, which are deducted from Fund returns. The returns shown do not reflect taxes that a shareholder would pay on Fund distributions or on the redemption of Fund shares. The investment return and principal value of an investment will fluctuate and, therefore, an investor’s shares, when redeemed, may be worth more or less than their original cost. Updated performance data current to the most recent month-end can be obtained by calling (877) 244-6235.
How did the Fund perform last year?
The Income Fund delivered strong absolute and relative returns over the fiscal year ended September 30, 2024, rising 13.42% compared to index returns of 11.99%. Sharply falling inflation and the shift in monetary policy expectations from restrictive to accommodative drove bond returns higher.
| Timber Point Alternative Income Fund | ANNUAL REPORT |
Institutional Class (AIIFX)
September 30, 2024 (continued)
What factors influenced performance during the past year?
| ● | The Income Fund focused on corporate credit investments over the past year, particularly high-yield bonds across various maturities. Specifically, it held exchange-traded funds JNK and SJNK. Credit markets in general, and high-yield bonds specifically, posted strong excess returns, significantly contributing to the portfolio's performance. Additionally, the Income Fund invested in private credit through the business development company BXSL, which proved beneficial. The positive economic backdrop led us to favor credit over pure interest rate risk. |
| ● | Given our positive economic outlook, the Income Fund held a small allocation to broad U.S. equity investments, which contributed positively to performance. This included broad market exposure via exchange-traded funds (“ETFs”) such as RSP and SPXL, as well as dividend and income-oriented equities like Real Estate Investment Trusts, utilities, and other higher-yielding equity types. |
| ● | In the third quarter, the Income Fund increased its exposure to more interest rate-sensitive investments as the market began pricing in a shift in monetary policy, causing a sharp decline in interest rates. The Income Fund held exchange-traded positions such as AGG, BND, TLT, and IEF. |
| ● | The Income Fund also initiated a position in cryptocurrency through the ETF HODL, which added to performance as Bitcoin rose steadily throughout the year. |
| ● | Despite holding a diverse range of investments, the Income Fund’s overall realized volatility remained lower than that of its benchmarks. |
| ● | The twelve months ended September 30, 2024, proved very beneficial for investors, as the U.S. economy continued a path of strong growth while inflationary pressures eased significantly. Over this period, the Federal Reserve shifted its monetary policy stance from restrictive to neutral and ultimately reduced the target funds rate to 5% in September. This created an exceptionally favorable macroeconomic environment for investors, spurring a strong rally across most asset classes and investment types. Additionally, alongside this positive macro backdrop, the growing recognition and adoption of artificial intelligence (AI) across businesses and consumer segments ignited another technological breakthrough, leading to increased capital spending, productivity gains, and improved corporate earnings. Many technology stocks, especially those tied to AI, benefited significantly from this secular trend. |
Positioning
The Income Fund is a fixed income diversification strategy which seeks higher yields and returns by allocating to non-traditional sectors of the bond market, particularly sectors where interest rate risk is not the primary source of return. The Income Fund targets an annualized 5-year net return of 150 basis points over the Bloomberg Barclays U.S. Aggregate Bond Index while maintaining low levels of portfolio volatility, consistent with that of bond investments.
What are some Fund statistics?
| Fund Statistics |
| Total Net Assets | $18,829,919 | Investment Advisory Fees Paid | $42,170 |
| Number of Portfolio Holdings | 27 | Portfolio Turnover Rate | 122% |
What did the Fund invest in?
| Sector Allocation (as a % of Portfolio) |
| Debt Funds | 79.35% | Cash and Cash Equivalents | 4.66% |
| Equity Funds | 8.60% | Alternative Fund | 1.26% |
| Financials | 6.07% | Asset-backed and Mortgage-backed securities | 0.06% |
| Top Ten Holdings (as a % of Net Assets) |
| SPDR Portfolio Aggregate Bond ETF | 14.51% | iShares 7-10 Year Treasury Bond ETF | 4.69% |
| SPDR Doubleline Total Return Tactical ETF | 12.99% | iShares 20+ Yr Treasury Bond ETF | 4.69% |
| SPDR Bloomberg Short Term High Yield Bond ETF | 10.11% | Federated Hermes Government Obligations Fund | 4.65% |
| SPDR Portfolio Corporate Bond ETF | 9.31% | iShares Core U.S. Aggregate Bond ETF | 4.57% |
| SPDR Bloomberg High Yield Bond ETF | 6.65% | Vanguard Total Bond Market ETF | 4.55% |
| | | | |
| Timber Point Alternative Income Fund | ANNUAL REPORT |
Institutional Class (AIIFX)
September 30, 2024 (continued)
Material Fund Changes
The Fund did not have any material changes that occurred since the beginning of the reporting period.
Change in and Disagreements with Accountants
The Audit Committee of 360 Funds (the “Trust”) has approved and recommended to the Board of Trustees (the “Board”), and the Board has approved Tait, Weller & Baker, LLP (“Tait”) to replace Cohen & Company, Ltd. (“Cohen”) as the Income Fund’s independent registered public accounting firm for the Income Fund’s fiscal year ended September 30, 2024. Through the past fiscal year and through the date of Cohen’s replacement as auditor of the Income Fund, the Income Fund had no disagreements with Cohen on any matter of accounting principles or practices, financial statement disclosure or auditing scope or procedures, which, if not resolved to the satisfaction of Cohen would have caused Cohen to make reference to the disagreement in a Cohen report, and there were no reportable events of the kind described in Item 304(a)(1)(v) of Regulation S-K under the Securities Exchange Act of 1934.
With respect to the Income Fund, Cohen’s audit opinions, including for the fiscal year ended September 30, 2023, did not contain either an adverse opinion or disclaimer of opinion, nor were they qualified or modified as to uncertainty, audit scope or accounting principles. During the last fiscal year of the Income Fund, neither the Income Fund nor anyone on its behalf has consulted Tait on items concerning the application of accounting principles to a specified transaction (either completed or proposed) or the type of audit opinion that might be rendered on the Income Fund’s financial statements, or concerning the subject of a disagreement of the kind described in Item 304(a)(1)(iv) of Regulation S-K or reportable events of the kind described in Item 304(a)(1)(v) of Regulation S-K.
The Income Fund requested Cohen to furnish it with a letter addressed to the SEC stating whether or not it agrees with the above statements. A copy of such letter will be filed as an Exhibit to the Form N-CSR filing.
Availability of Additional Information
You can find additional information about the Income Fund such as the prospectus, financial information, fund holdings and proxy voting information at www.timberpointcapital.com. You can also request this information by contacting us at (877) 244-6235.
Householding
To reduce Income Fund expenses, only one copy of most shareholder documents may be mailed to shareholders with multiple accounts at the same address (Householding). If you would prefer that your Income Fund documents not be householded, please contact the Income Fund at (877) 244-6235 or contact your financial intermediary. Your instructions will typically be effective within 30 days of receipt by the Income Fund.
| (a) | The registrant has, as of the end of the period covered by this report, adopted a code of ethics that applies to the registrant’s principal executive officer, principal financial officer, and principal accounting officer or controller, or persons performing similar functions, regardless of whether these individuals are employed by the registrant or a third party. |
| (b) | During the period covered by this report, there were no amendments to any provision of the code of ethics. |
| (c) | During the period covered by this report, there were no waivers or implicit waivers of a provision of the code of ethics. |
| | |
| (d) | The registrant’s Code of Ethics is filed herewith. |
| ITEM 3. | AUDIT COMMITTEE FINANCIAL EXPERT. |
| | The registrant’s Board of Trustees has determined that Tom Wirtshafter serves on its audit committee as the “audit committee financial expert” as defined in Item 3. |
| ITEM 4. | PRINCIPAL ACCOUNTANT FEES AND SERVICES. |
(a) | Audit Fees. The aggregate fees billed for professional services rendered by the principal accountant for the audit of the registrant’s annual financial statements or for services that are normally provided by the accountant in connection with statutory and regulatory filings or engagements were $20,000 and $28,800 with respect to the registrant’s fiscal years ended September 30, 2024 and September 30, 2023, respectively. The September 30, 2024 fees were paid to Tait Weller & Baker, LLP and the September 30, 2023 fees were paid to Cohen and Company, Ltd.. |
| | |
| (b) | Audit-Related Fees. There were no fees billed during the last two fiscal years for assurances and related services by the principal accountant that are reasonably related to the performance of the audit of the registrant’s financial statements and are not reported under paragraph (a) of this item. |
| (c) | Tax Fees. The aggregate fees billed in the last two fiscal years for professional services rendered by the principal accountant for tax compliance, tax advice and tax planning were $3,000 and $6,800 with respect to the registrant’s fiscal years ended September 30, 2024 and September 30, 2023, respectively. The services comprising these fees are the preparation of the registrant’s 2024 federal income and excise tax returns. The September 30, 2024 fees were paid to Tait Weller & Baker, LLP and the September 30, 2023 fees were paid to Cohen & Company, Ltd. |
| | |
| (d) | All Other Fees. The aggregate fees billed in last fiscal year for products and services provided by the registrant’s principal accountant, other than the services reported in paragraphs (a) through (c) of this item were $0 for the fiscal year ended September 30, 2024 and $0 for the fiscal year ended September 30, 2023 for the Global Fund and the Income Fund. |
| | |
| (e)(1) | The audit committee does not have pre-approval policies and procedures. Instead, the audit committee or audit committee chairman approves on a case-by-case basis each audit or non-audit service before the principal accountant is engaged by the registrant. |
| (e)(2) | There were no services described in each of paragraphs (b) through (d) of this Item that were approved by the audit committee pursuant to paragraph (c)(7)(i)(C) of Rule 2-01 of Regulation S-X. |
| | |
| (f) | Not applicable. The percentage of hours expended on the principal accountant’s engagement to audit the registrant’s financial statements for the most recent fiscal year that were attributed to work performed by persons other than the principal accountant’s full-time permanent employees was zero percent (0%). |
| | |
| (g) | All non-audit fees billed by the registrant’s principal accountant for services rendered to the registrant for the last two fiscal years ended September 30, 2024 and September 30, 2023 are disclosed in (b)-(d) above. There were no audit or non-audit services performed by the registrant’s principal accountant for the registrant’s adviser. |
| | |
| (h) | There were no non-audit services rendered to the registrant’s investment adviser. |
| ITEM 5. | AUDIT COMMITTEE OF LISTED REGISTRANTS. |
Not applicable
| ITEM 6. | SCHEDULES OF INVESTMENTS |
Included in annual financial statements and other information filed under item 7 of this form.
| ITEMS 7-11. | FINANCIAL STATEMENTS AND OTHER INFORMATION FILES |

Timber Point Global Allocations Fund
Institutional Class Shares (Ticker Symbol: CGHIX)
Timber Point Alternative Income Fund
Institutional Class Shares (Ticker Symbol: AIIFX)
Series of the
360 Funds
ANNUAL FINANCIAL STATEMENTS AND OTHER INFORMATION
September 30, 2024
Investment Adviser:
Timber Point Capital Management, LLC
555 Pleasantville Road, Suite N202
Briarcliff Manor, NY 10510
1-877-244-6235
www.timberpointcapital.com
Distributed by Matrix 360 Distributors, LLC
Member FINRA
This report is authorized for distribution only to shareholders and to others who have received a copy of the Funds’ prospectus.
IMPORTANT NOTE: The Securities and Exchange Commission (the “SEC”) adopted rule and form amendments which have resulted in changes to the design and delivery of annual and semi-annual reports (the “Reports”). The Reports are now streamlined to highlight key information about the Funds. Certain information previously included in the Reports, including the Funds' financial statements, will no longer appear in the Reports, but will be available online within the Annual and Semi-Annual Financial Statements and Other Information, delivered free of charge, and filed with the SEC.
TABLE OF CONTENTS
Item 7. Financial Statements and Financial Highlights for Open-End Management Investment Companies:
| TIMBER POINT GLOBAL ALLOCATIONS FUND | |
| SCHEDULE OF INVESTMENTS |
| September 30, 2024 | ANNUAL REPORT |
| COMMON STOCK 7.66% | | Shares | | | Value | |
| | | | | | | |
| Banks - 3.18% | | | | | | | | |
| JPMorgan Chase & Co. | | | 3,000 | | | $ | 632,580 | |
| | | | | | | | | |
| Biotechnology - 1.50% | | | | | | | | |
| Immix Biopharma, Inc. (a) | | | 30,000 | | | | 44,700 | |
| Viking Therapeutics, Inc. (a) | | | 4,000 | | | | 253,240 | |
| | | | | | | | 297,940 | |
| Diversified Financial Services - 1.79% | | | | | | | | |
| Charles Schwab Corp. | | | 5,500 | | | | 356,455 | |
| | | | | | | | | |
| Media - 0.97% | | | | | | | | |
| Walt Disney Co. | | | 2,000 | | | | 192,380 | |
| | | | | | | | | |
| Pharmaceuticals - 0.07% | | | | | | | | |
| Inhibikase Therapeutics, Inc. (a) | | | 11,000 | | | | 14,300 | |
| | | | | | | | | |
| Real Estate - 0.00% | | | | | | | | |
| Harbor Custom Development, Inc. (a) (f) | | | 7,500 | | | | — | |
| | | | | | | | | |
| Retail - 0.15% | | | | | | | | |
| FAT Brands, Inc. - Class A | | | 6,000 | | | | 29,520 | |
| | | | | | | | | |
| TOTAL COMMON STOCK (Cost $1,923,243) | | | | | | | 1,523,175 | |
| | | | | | | | | |
| PREFERRED STOCK - 0.47% | | | | | | | | |
| | | | | | | | | |
| Real Estate - 0.00% | | | | | | | | |
| Harbor Custom Development, Inc. - Series A, 8.00% (a) (f) | | | 5,714 | | | | — | |
| | | | | | | | | |
| Retail - 0.47% | | | | | | | | |
| FAT Brands, Inc. - Series B, 8.25% | | | 9,451 | | | | 92,903 | |
| | | | | | | | | |
| TOTAL PREFERRED STOCK (Cost $326,906) | | | | | | | 92,903 | |
| | | | | | | | | |
| CLOSED-END FUND - 1.32% | | | | | | | | |
| | | | | | | | | |
| Equity Fund - 1.32% | | | | | | | | |
| Royce Small-Cap Trust, Inc. | | | 16,668 | | | | 261,688 | |
| | | | | | | | | |
| TOTAL CLOSED-END FUND (Cost $249,972) | | | | | | | 261,688 | |
| | | | | | | | | |
| EXCHANGE-TRADED FUNDS - 68.61% | | | | | | | | |
| | | | | | | | | |
| Alternative Fund - 2.17% | | | | | | | | |
| VanEck Bitcoin ETF/U.S. (a) | | | 6,000 | | | | 430,980 | |
| | | | | | | | | |
| Commodity Fund - 1.05% | | | | | | | | |
| United States Oil Fund LP (a) | | | 3,000 | | | | 209,760 | |
| | | | | | | | | |
| Debt Funds - 10.85% | | | | | | | | |
| iShares 1-3 Year Treasury Bond ETF | | | 10,000 | | | | 831,500 | |
| iShares 20+ Year Treasury Bond ETF | | | 2,500 | | | | 245,250 | |
| iShares 7-10 Year Treasury Bond ETF | | | 11,000 | | | | 1,079,320 | |
| | | | | | | | 2,156,070 | |
| TIMBER POINT GLOBAL ALLOCATIONS FUND | |
| SCHEDULE OF INVESTMENTS |
| September 30, 2024 | ANNUAL REPORT |
| EXCHANGE-TRADED FUNDS - 68.61% (continued) | | Shares | | | Value | |
| | | | | | | |
| Equity Funds - 54.54% | | | | | | | | |
| Dimensional U.S. Small Cap ETF | | | 5,000 | | | $ | 324,300 | |
| Direxion Daily FTSE Europe Bull 3x Shares | | | 9,848 | | | | 287,934 | |
| Direxion Daily S&P 500 Bull 3X Shares | | | 5,000 | | | | 819,750 | |
| Direxion Daily Small Cap Bull 3X Shares | | | 15,000 | | | | 665,100 | |
| Invesco Aerospace & Defense ETF | | | 8,250 | | | | 948,503 | |
| Invesco S&P 500 Equal Weight ETF | | | 2,500 | | | | 447,900 | |
| iShares Biotechnology ETF | | | 1,750 | | | | 254,800 | |
| iShares Core S&P Mid-Cap ETF | | | 13,500 | | | | 841,320 | |
| iShares Core S&P Small-Cap ETF | | | 7,000 | | | | 818,720 | |
| SPDR S&P 500 ETF Trust | | | 4,500 | | | | 2,581,920 | |
| SPDR S&P 600 Small Cap Growth ETF | | | 5,000 | | | | 465,550 | |
| SPDR S&P Biotech ETF | | | 3,500 | | | | 345,800 | |
| SPDR S&P Regional Banking ETF | | | 6,000 | | | | 339,600 | |
| Vanguard Mid-Cap ETF | | | 2,000 | | | | 527,660 | |
| Vanguard Real Estate ETF | | | 4,000 | | | | 389,680 | |
| Vanguard U.S. Value Factor ETF | | | 6,500 | | | | 783,510 | |
| | | | | | | | 10,842,047 | |
| | | | | | | | | |
| TOTAL EXCHANGE-TRADED FUNDS (Cost $12,352,982) | | | | | | | 13,638,857 | |
| | | | | | | | | |
| MUTUAL FUNDS - 14.60% | | | | | | | | |
| | | | | | | | | |
| Asset Allocation Fund - 11.43% | | | | | | | | |
| Timber Point Alternative Income Fund - Institutional Class (e) | | | 275,180 | | | | 2,272,984 | |
| | | | | | | | | |
| Equity Fund - 3.17% | | | | | | | | |
| LS Opportunity Fund - Institutional Class (a) | | | 33,212 | | | | 629,694 | |
| | | | | | | | | |
| TOTAL MUTUAL FUNDS (Cost $2,685,178) | | | | | | | 2,902,678 | |
| | | | | | | | | |
| WARRANTS - 0.00% | | | | | | | | |
| | | | | | | | | |
| Harbor Custom Development, Inc., $100.00, 06/10/2026 (a) (f) | | | 22,500 | | | | — | |
| Harbor Custom Development, Inc., $59.40, 10/05/2026 (a) (f) | | | 12,500 | | | | — | |
| | | | | | | | | |
| TOTAL WARRANTS (Cost $350) | | | | | | | — | |
| | | | | | | | | |
| BONDS & NOTES - 0.02% | | | | | | | | |
| ASSET-BACKED SECURITIES - 0.01% | | Principal Amount | | | | |
| Countrywide Asset-Backed Certificates, 3.796%, 10/25/2017 (c) (d) | | $ | 1,088 | | | | 972 | |
| | | | | | | | | |
| Total Asset Backed Securities (Cost $1,088) | | | | | | | 972 | |
| | | | | | | | | |
| MORTGAGE-BACKED SECURITIES - 0.01% | | | | | | | | |
| Banc of America Funding 2006-2 Trust, 5.750%, due 03/25/2036 | | | 742 | | | | 641 | |
Washington Mutual Mortgage Pass-Through Certificates WMALT Series 2006-7 Trust, 4.022%,
09/25/2036 (c) | | | 6,285 | | | | 1,714 | |
| | | | | | | | | |
| Total Mortgage-Backed Securities (Cost $3,974) | | | | | | | 2,355 | |
| | | | | | | | | |
| TOTAL BONDS & NOTES (Cost $5,062) | | | | | | | 3,327 | |
| TIMBER POINT GLOBAL ALLOCATIONS FUND | |
| SCHEDULE OF INVESTMENTS |
| September 30, 2024 | ANNUAL REPORT |
| SHORT-TERM INVESTMENT - 7.31% | | Shares | | | Value | |
| | | | | | | |
| Federated Hermes Government Obligations Fund - Institutional Shares, 4.79% (b) | | | 1,452,569 | | | $ | 1,452,569 | |
| | | | | | | | | |
| TOTAL SHORT-TERM INVESTMENT (Cost $1,452,569) | | | | | | | 1,452,569 | |
| | | | | | | | | |
| INVESTMENTS AT VALUE (Cost $18,996,262) - 99.99% | | | | | | $ | 19,875,197 | |
| | | | | | | | | |
| OTHER ASSETS IN EXCESS OF LIABILITIES, NET - 0.01% | | | | | | | 2,904 | |
| | | | | | | | | |
| NET ASSETS - 100.00% | | | | | | $ | 19,878,101 | |
Percentages are stated as a percent of net assets.
(a) Non-income producing security.
(b) Rate shown represents the 7-day effective yield at September 30, 2024, is subject to change and resets daily.
(c) Variable rate security - Interest rate shown represents the rate on September 30, 2024.
(d) Principal payments are still being received, not yet matured.
(e) Affiliated investment company. See Investments in Affiliated Companies section of the accompanying notes.
(f) These securities are currently valued by the Adviser using fair valuation procedures approved by the Board of Trustees under the oversight of the Fair Valuation Committee. These securities have a total value of $0 which is 0.00% of the Fund's net assets.
The following abbreviations are used in this portfolio:
ETF - Exchange-Traded Fund
FTSE - Financial Times Stock Exchange
LP - Limited Partnership
SPDR - Standard & Poor's Depositary Receipts
The accompanying notes are an integral part of these financial statements.
| TIMBER POINT ALTERNATIVE INCOME FUND |
| SCHEDULE OF INVESTMENTS |
| September 30, 2024 | ANNUAL REPORT |
| COMMON STOCK - 1.95% | | Shares | | | Value | |
| | | | | | | |
| Investment Companies - 1.95% | | | | | | | | |
| Blackstone Secured Lending Fund | | | 12,500 | | | $ | 366,125 | |
| | | | | | | | | |
| TOTAL COMMON STOCK (Cost $311,469) | | | | | | | 366,125 | |
| | | | | | | | | |
| PREFERRED STOCK - 0.00% | | | | | | | | |
| | | | | | | | | |
| Real Estate - 0.00% | | | | | | | | |
| Harbor Custom Development, Inc. - Series A, 8.000% (a) (e) | | | 4,286 | | | | — | |
| | | | | | | | | |
| TOTAL PREFERRED STOCK (Cost $60,019) | | | | | | | — | |
| | | | | | | | | |
| CLOSED-END FUNDS - 4.11% | | | | | | | | |
| | | | | | | | | |
| Asset Allocation Fund - 2.03% | | | | | | | | |
| RiverNorth/DoubleLine Strategic Opportunity Fund, Inc. | | | 42,175 | | | | 382,738 | |
| | | | | | | | | |
| Equity Fund - 2.08% | | | | | | | | |
| Royce Small-Cap Trust, Inc. | | | 24,975 | | | | 392,108 | |
| | | | | | | | | |
| TOTAL CLOSED END FUNDS (Cost $714,886) | | | | | | | 774,846 | |
| | | | | | | | | |
| EXCHANGE-TRADED FUNDS - 88.99% | | | | | | | | |
| | | | | | | | | |
| Alternative Fund - 1.26% | | | | | | | | |
| VanEck Bitcoin ETF/U.S.(a) | | | 3,300 | | | | 237,039 | |
| | | | | | | | | |
| Debt Funds - 79.15% | | | | | | | | |
| iShares 1-3 Year Treasury Bond ETF | | | 6,500 | | | | 540,475 | |
| iShares 20+ Year Treasury Bond ETF | | | 9,000 | | | | 882,900 | |
| iShares 7-10 Year Treasury Bond ETF | | | 9,000 | | | | 883,080 | |
| iShares Core U.S. Aggregate Bond ETF | | | 8,500 | | | | 860,795 | |
| SPDR Bloomberg High Yield Bond ETF | | | 12,800 | | | | 1,251,712 | |
| SPDR Bloomberg Short Term High Yield Bond ETF | | | 73,900 | | | | 1,902,925 | |
| SPDR Doubleline Total Return Tactical ETF | | | 59,100 | | | | 2,446,740 | |
| SPDR Portfolio Aggregate Bond ETF | | | 104,500 | | | | 2,731,630 | |
| SPDR Portfolio Corporate Bond ETF | | | 58,400 | | | | 1,753,752 | |
| Vanguard Short-Term Corporate Bond ETF | | | 10,000 | | | | 794,200 | |
| Vanguard Total Bond Market ETF | | | 11,400 | | | | 856,254 | |
| | | | | | | | 14,904,463 | |
| Equity Funds - 8.58% | | | | | | | | |
| Direxion Daily S&P 500 Bull 3X Shares | | | 1,000 | | | | 163,950 | |
| Invesco S&P 500 Equal Weight ETF | | | 4,500 | | | | 806,220 | |
| SPDR S&P Regional Banking ETF | | | 5,700 | | | | 322,620 | |
| Utilities Select Sector SPDR Fund | | | 4,000 | | | | 323,120 | |
| | | | | | | | 1,615,910 | |
| | | | | | | | | |
| TOTAL EXCHANGE-TRADED FUNDS (Cost $15,916,693) | | | | | | | 16,757,412 | |
| | | | | | | | | |
| WARRANTS - 0.00% | | | | | | | | |
| | | | | | | | | |
| Harbor Custom Development, Inc., $59.40, 10/05/2026 (a) (e) | | | 37,500 | | | | — | |
| | | | | | | | | |
| TOTAL WARRANTS (Cost $375) | | | | | | | — | |
| TIMBER POINT ALTERNATIVE INCOME FUND |
| SCHEDULE OF INVESTMENTS |
| September 30, 2024 | ANNUAL REPORT |
BONDS & NOTES - 0.06%
| ASSET-BACKED SECURITIES - -99.98% | | Principal Amount | | | Value | |
Ameriquest Mortgage Securities, Inc. Asset-Backed Pass-Through Certificates
Series 2003-11, 5.427%, due 12/25/2033 (c) | | $ | 57 | | | $ | 93 | |
| Countrywide Asset-Backed Certificates, 3.796%, due 10/25/2017 (c) (d) | | | 3,265 | | | | 2,915 | |
| GE Capital Mortgage Services, Inc. 1999-HE1 Trust, 6.265%, due 04/25/2029 | | | 10 | | | | 10 | |
| | | | | | | | | |
| Total Asset Backed Securities (Cost $3,331) | | | | | | | 3,018 | |
| | | | | | | | | |
| MORTGAGE-BACKED SECURITIES - 0.04% | | | | | | | | |
| Banc of America Funding 2006-2 Trust, 5.750%, due 03/25/2036 | | | 2,227 | | | | 1,922 | |
| Washington Mutual Mortgage Pass-Through Certificates WMALT Series 2006-7 Trust, 4.022%, due 09/25/2036 (c) | | | 18,857 | | | | 5,143 | |
| | | | | | | | | |
| Total Mortgage-Backed Securities (Cost $11,858) | | | | | | | 7,065 | |
| | | | | | | | | |
| TOTAL BONDS & NOTES (Cost $15,189) | | | | | | | 10,083 | |
| SHORT-TERM INVESTMENT - 4.65% | | Shares | | | | |
| | | | | | | |
| Federated Hermes Government Obligations Fund - Institutional Shares, 4.79% (b) | | | 875,553 | | | | 875,553 | |
| | | | | | | | | |
| SHORT TERM INVESTMENT (Cost $875,553) | | | | | | | 875,553 | |
| | | | | | | | | |
| INVESTMENTS AT VALUE (Cost $17,894,184) - 99.76% | | | | | | $ | 18,784,019 | |
| | | | | | | | | |
| OTHER ASSETS IN EXCESS OF LIABILITIES, NET - 0.24% | | | | | | | 45,900 | |
| | | | | | | | | |
| NET ASSETS - 100.00% | | | | | | $ | 18,829,919 | |
Percentages are stated as a percent of net assets.
(a) Non-income producing security.
(b) Rate shown represents the 7-day effective yield at September 30, 2024, is subject to change and resets daily.
(c) Variable rate security - Interest rate shown represents the rate on September 30, 2024.
(d) Principal payments are still being received, not yet matured.
(e) These securities are currently valued by the Adviser using fair valuation procedures approved by the Board of Trustees under the oversight of the Fair Valuation Committee. These securities have a total value of $0 which is 0.00% of the Fund's net assets.
The following abbreviations are used in this portfolio:
ETF - Exchange-Traded Fund
SPDR - Standard & Poor's Depositary Receipts
The accompanying notes are an integral part of these financial statements.
| TIMBER POINT FUNDS | |
| STATEMENTS OF ASSETS AND LIABILITIES | |
| | |
| September 30, 2024 | ANNUAL REPORT |
| | | Timber Point Global Allocations Fund | | | Timber Point Alternative Income Fund | |
| Assets: | | | | | | | | |
| Investment securities: | | | | | | | | |
| Unaffiliated Securities at Cost | | $ | 16,876,347 | | | $ | 17,894,184 | |
| Affiliated Securities at Cost | | | 2,119,915 | | | | — | |
| Total Securities at Cost | | | 18,996,262 | | | | 17,894,184 | |
| Unaffiliated Securities at Value | | | 17,602,213 | | | | 18,784,019 | |
| Affiliated Securities at Value | | | 2,272,984 | | | | — | |
| Total Securities at Value | | | 19,875,197 | | | | 18,784,019 | |
| Receivables: | | | | | | | | |
| Interest | | | 7,384 | | | | 3,729 | |
| Dividends | | | 13,561 | | | | 9,818 | |
| Fund shares sold | | | 16 | | | | 52,733 | |
| Prepaid expenses and other assets | | | 3,393 | | | | 3,512 | |
| Total assets | | | 19,899,551 | | | | 18,853,811 | |
| | | | | | | | | |
| Liabilities: | | | | | | | | |
| Payables: | | | | | | | | |
| Fund shares redeemed | | | — | | | | 743 | |
| Due to adviser | | | 6,783 | | | | 8,808 | |
| Due to administrator | | | 9,743 | | | | 9,440 | |
| Accrued Trustee fees | | | 1,254 | | | | 1,254 | |
| Accrued expenses | | | 3,670 | | | | 3,647 | |
| Total liabilities | | | 21,450 | | | | 23,892 | |
| Net Assets | | $ | 19,878,101 | | | $ | 18,829,919 | |
| | | | | | | | | |
| Sources of Net Assets: | | | | | | | | |
| Paid-in capital | | $ | 24,769,670 | | | $ | 20,988,962 | |
| Total accumulated losses | | | (4,891,569 | ) | | | (2,159,043 | ) |
| Total Net Assets | | $ | 19,878,101 | | | $ | 18,829,919 | |
| | | | | | | | | |
| Institutional Class Shares: | | | | | | | | |
| Net assets | | $ | 19,878,101 | | | $ | 18,829,919 | |
| Shares Outstanding ($0 par value, Unlimited shares of beneficial interest authorized) | | | 2,027,046 | | | | 2,280,714 | |
| Net Asset Value, Offering and Redemption Price Per Share | | $ | 9.81 | | | $ | 8.26 | |
The accompanying notes are an integral part of these financial statements.
| TIMBER POINT FUNDS | |
| STATEMENTS OF OPERATIONS | |
| | |
| September 30, 2024 | ANNUAL REPORT |
| | | Timber Point Global Allocations Fund | | | Timber Point Alternative Income Fund | |
| | | | | | | |
| | | | For the Year Ended September 30, 2024 | | | | For the Year Ended September 30, 2024 | |
| | | | | | | | | |
| Investment income: | | | | | | | | |
| Dividends (net of foreign withholding taxes of $472 and $0, respectively) | | $ | 260,479 | | | $ | 634,343 | |
| Dividends from affiliated funds | | | 48,601 | | | | — | |
| Interest | | | 51,655 | | | | 31,107 | |
| Total investment income | | | 360,735 | | | | 665,450 | |
| | | | | | | | | |
| Expenses: | | | | | | | | |
| Management fees (Note 6) | | | 159,313 | | | | 116,630 | |
| Accounting and transfer agent fees and expenses | | | 98,502 | | | | 90,410 | |
| Legal fees | | | 19,275 | | | | 19,451 | |
| Audit fees | | | 19,100 | | | | 18,500 | |
| Non-12b-1 shareholder servicing expense | | | 16,931 | | | | 17,569 | |
| Trustee fees and expenses | | | 16,661 | | | | 16,661 | |
| Compliance officer fees | | | 16,570 | | | | 16,570 | |
| Reports to shareholders | | | 14,180 | | | | 13,915 | |
| Miscellaneous | | | 8,995 | | | | 9,105 | |
| Pricing fees | | | 7,650 | | | | 7,891 | |
| Custodian fees | | | 6,129 | | | | 5,273 | |
| Insurance | | | 5,780 | | | | 4,905 | |
| Registration and filing fees | | | 5,516 | | | | 2,998 | |
| Total expenses | | | 394,602 | | | | 339,878 | |
| Less: | | | | | | | | |
| Fees waived by Adviser (Note 6) | | | (94,435 | ) | | | (74,460 | ) |
| Fees waived by Adviser for affiliated holdings (Note 6) | | | (18,844 | ) | | | — | |
| Net expenses | | | 281,323 | | | | 265,418 | |
| | | | | | | | | |
| Net investment income | | | 79,412 | | | | 400,032 | |
| | | | | | | | | |
| Realized and unrealized gain: | | | | | | | | |
| Net realized gain on: | | | | | | | | |
| Unaffiliated Investments | | | 1,582,149 | | | | 201,064 | |
| | | | | | | | | |
| Net realized gain on investments | | | 1,582,149 | | | | 201,064 | |
| | | | | | | | | |
| Net change in unrealized appreciation on: | | | | | | | | |
| Unaffiliated Investments | | | 1,518,665 | | | | 1,225,502 | |
| Affiliated Investments | | | 221,856 | | | | — | |
| | | | | | | | | |
| Net change in unrealized appreciation on investments | | | 1,740,521 | | | | 1,225,502 | |
| | | | | | | | | |
| Net realized & unrealized gain on investments | | | 3,322,670 | | | | 1,426,566 | |
| | | | | | | | | |
| Net increase in net assets resulting from operations | | $ | 3,402,082 | | | $ | 1,826,598 | |
The accompanying notes are an integral part of these financial statements.
| TIMBER POINT FUNDS | |
| STATEMENTS OF CHANGES IN NET ASSETS | |
| | ANNUAL REPORT |
| | | Timber Point Global Allocations Fund | |
| | | | | | | | | |
| | | For the Year Ended September 30, 2024 | | | For the Year Ended September 30, 2023 | |
| | | | | | | | | |
| Increase (decrease) in net assets from: | | | | | | | | |
| Operations: | | | | | | | | |
| Net investment income | | $ | 79,412 | | | $ | 203,789 | |
| Net realized gain (loss) from investments and securities sold short | | | 1,582,149 | | | | (892,894 | ) |
| Net change in unrealized appreciation on investments | | | 1,740,521 | | | | 763,843 | |
| Net increase in net assets resulting from operations | | | 3,402,082 | | | | 74,738 | |
| | | | | | | | | |
| Distributions to shareholders from: | | | | | | | | |
| Total distributable earnings - Institutional Class | | | (115,475 | ) | | | (202,941 | ) |
| Total distributions | | | (115,475 | ) | | | (202,941 | ) |
| | | | | | | | | |
| From shares of beneficial interest: | | | | | | | | |
| Proceeds from shares sold: | | | | | | | | |
| Institutional Class | | | 2,085,923 | | | | 3,447,378 | |
| Net asset value of shares issued in reinvestment of distributions: | | | | | | | | |
| Institutional Class | | | 92,843 | | | | 165,586 | |
| Payments for shares redeemed: | | | | | | | | |
| Institutional Class | | | (1,273,193 | ) | | | (9,343,307 | ) |
| Increase (decrease) in net assets from transactions in shares of beneficial interest | | | 905,573 | | | | (5,730,343 | ) |
| | | | | | | | | |
| Increase (decrease) in net assets | | | 4,192,180 | | | | (5,858,546 | ) |
| | | | | | | | | |
| Net Assets: | | | | | | | | |
| Beginning of year | | | 15,685,921 | | | | 21,544,467 | |
| | | | | | | | | |
| End of year | | $ | 19,878,101 | | | $ | 15,685,921 | |
| | | | | | | | | |
| Capital share activity: | | | | | | | | |
| Institutional Class: | | | | | | | | |
| Shares Sold | | | 222,940 | | | | 405,641 | |
| Shares Reinvested | | | 10,443 | | | | 20,570 | |
| Shares Redeemed | | | (139,573 | ) | | | (1,133,390 | ) |
| Net increase (decrease) in shares of beneficial interest outstanding | | | 93,810 | | | | (707,179 | ) |
The accompanying notes are an integral part of these financial statements.
| TIMBER POINT FUNDS | |
| STATEMENTS OF CHANGES IN NET ASSETS | |
| | ANNUAL REPORT |
| | | Timber Point Alternative Income Fund | |
| | | | | | | | | |
| | | For the Year Ended September 30, 2024 | | | For the Year Ended September 30, 2023 | |
| | | | | | | | | |
| Increase (decrease) in net assets from: | | | | | | | | |
| Operations: | | | | | | | | |
| Net investment income | | $ | 400,032 | | | $ | 394,726 | |
| Net realized gain (loss) from investments and securities sold short | | | 201,064 | | | | (282,601 | ) |
| Net change in unrealized appreciation on investments | | | 1,225,502 | | | | 284,095 | |
| Net increase in net assets resulting from operations | | | 1,826,598 | | | | 396,220 | |
| | | | | | | | | |
| Distributions to shareholders from: | | | | | | | | |
| Total distributable earnings - Institutional Class | | | (309,993 | ) | | | (355,286 | ) |
| Total distributions | | | (309,993 | ) | | | (355,286 | ) |
| | | | | | | | | |
| From shares of beneficial interest: | | | | | | | | |
| Proceeds from shares sold: | | | | | | | | |
| Institutional Class | | | 5,612,069 | | | | 4,270,253 | |
| Net asset value of shares issued in reinvestment of distributions: | | | | | | | | |
| Institutional Class | | | 304,799 | | | | 347,896 | |
| Payments for shares redeemed: | | | | | | | | |
| Institutional Class | | | (2,413,472 | ) | | | (3,559,170 | ) |
| | | | | | | | | |
| Increase in net assets from transactions in shares of beneficial interest | | | 3,503,396 | | | | 1,058,979 | |
| | | | | | | | | |
| Increase in net assets | | | 5,020,001 | | | | 1,099,913 | |
| | | | | | | | | |
| Net Assets: | | | | | | | | |
| Beginning of year | | | 13,809,918 | | | | 12,710,005 | |
| | | | | | | | | |
| End of year | | $ | 18,829,919 | | | $ | 13,809,918 | |
| | | | | | | | | |
| Capital share activity: | | | | | | | | |
| Institutional Class: | | | | | | | | |
| Shares Sold | | | 704,519 | | | | 564,981 | |
| Shares Reinvested | | | 39,177 | | | | 47,920 | |
| Shares Redeemed | | | (316,190 | ) | | | (476,385 | ) |
| Net increase in shares of beneficial interest outstanding | | | 427,506 | | | | 136,516 | |
The accompanying notes are an integral part of these financial statements.
| TIMBER POINT FUNDS | | |
| FINANCIAL HIGHLIGHTS | | |
| | | |
| | ANNUAL REPORT | |
| | | |
The following tables set forth the per share operating performance data for a share of beneficial interest outstanding, total return, ratios to average net assets and other supplemental data for each of the years indicated.
| | | | | | | | | | | | | | | | |
| | | Timber Point Global Allocations Fund | |
| | | | | | | | | | | | | | | | |
| | | Institutional Class | |
| | | For the
Year Ended
September 30, 2024 | | | For the
Year Ended
September 30, 2023 | | | For the
Year Ended
September 30, 2022 (a) | | | For the
Year Ended
September 30, 2021 (a) | | | For the
Year Ended
September 30, 2020 (a) | |
| Net Asset Value, Beginning of Year | | $ | 8.11 | | | $ | 8.16 | | | $ | 10.25 | | | $ | 9.11 | | | $ | 9.04 | |
| | | | | | | | | | | | | | | | | | | | | |
| Investment Operations: | | | | | | | | | | | | | | | | | | | | |
| Net investment income (loss) (1) | | | 0.04 | | | | 0.10 | | | | 0.04 | | | | (0.04 | ) | | | 0.03 | |
| Net realized and unrealized gain (loss) on investments | | | 1.72 | | | | (0.06 | ) | | | (2.13 | ) | | | 1.24 | | | | 0.13 | (6) |
| Total from investment operations | | | 1.76 | | | | 0.04 | | | | (2.09 | ) | | | 1.20 | | | | 0.16 | |
| | | | | | | | | | | | | | | | | | | | | |
| Distributions: | | | | | | | | | | | | | | | | | | | | |
| From net investment income | | | (0.06 | ) | | | (0.09 | ) | | | — | | | | (0.06 | ) | | | (0.09 | ) |
| Total distributions | | | (0.06 | ) | | | (0.09 | ) | | | — | | | | (0.06 | ) | | | (0.09 | ) |
| | | | | | | | | | | | | | | | | | | | | |
| Net Asset Value, End of Year | | $ | 9.81 | | | $ | 8.11 | | | $ | 8.16 | | | $ | 10.25 | | | $ | 9.11 | |
| | | | | | | | | | | | | | | | | | | | | |
| Total Return (2) | | | 21.78 | % | | | 0.49 | % | | | (20.39 | )% | | | 13.20 | % | | | 1.73 | % (5) |
| | | | | | | | | | | | | | | | | | | | | |
| Ratios/Supplemental Data | | | | | | | | | | | | | | | | | | | | |
| Net assets, end of year (in 000’s) | | $ | 19,878 | | | $ | 15,686 | | | | 21,544 | | | $ | 35,239 | | | $ | 38,588 | |
| | | | | | | | | | | | | | | | | | | | | |
| Ratios of expenses to average net assets (3): | | | | | | | | | | | | | | | | | | | | |
| Before fees waived and expenses reimbursed | | | 2.23 | % | | | 2.32 | % | | | 2.00 | % | | | 1.79 | % | | | 2.23 | % |
| After fees waived and expenses reimbursed | | | 1.59 | % | | | 1.47 | % | | | 1.55 | % | | | 1.58 | % | | | 1.46 | % |
| | | | | | | | | | | | | | | | | | | | | |
| Ratios of expenses to average net assets (excluding dividends on securities sold short and interest on margin account) (3): | | | | | | | | | | | | | | | | | | | | |
| Before fees waived and expenses reimbursed | | | 2.23 | % | | | 2.32 | % | | | 1.95 | % | | | 1.72 | % | | | 2.13 | % |
| After fees waived and expenses reimbursed | | | 1.59 | % | | | 1.47 | % | | | 1.50 | % | | | 1.50 | % | | | 1.36 | % |
| | | | | | | | | | | | | | | | | | | | | |
| Ratios of net investment income (loss) to average net assets (3) (4) | | | 0.45 | % | | | 1.17 | % | | | 0.39 | % | | | (0.42 | )% | | | 0.31 | % |
| | | | | | | | | | | | | | | | | | | | | |
| Portfolio turnover rate | | | 187 | % | | | 257 | % | | | 351 | % | | | 374 | % | | | 385 | % |
| (a) | Amounts for the years ended September 30, 2020, September 30, 2021 and September 30, 2022 are consolidated. |
| | |
| (1) | Per share amounts calculated using the average shares method, which more appropriately presents the per share data for the year. |
| (2) | Total Return represents the rate that the investor would have earned or lost on an investment in the Fund, assuming reinvestment of dividends, if any. Total returns shown exclude the effect of applicable redemption fees. |
| (3) | The ratios of expenses and net investment income (loss) to average net assets do not reflect the Fund’s proportionate share of expenses of underlying investment companies in which the Fund invests. |
| (4) | Recognition of net investment income (loss) by the Fund is affected by the timing and declaration of dividends by the underlying investment companies in which the Fund invests. |
| (5) | Includes adjustments in accordance with accounting principles generally accepted in the United States of America and, consequently, the net asset values for financial reporting purposes and the returns based upon those net asset values may differ from the net asset values and returns for shareholder transactions. |
| (6) | The amount of net realized and unrealized gain on investment per share for the year ended September 30, 2020, does not accord with the amounts in the Consolidated Statements of Operations due to the timing of purchases and sales of Fund shares in relation to fluctuating market values. |
The accompanying notes are an integral part of these financial statements.
| TIMBER POINT FUNDS | | |
| FINANCIAL HIGHLIGHTS | | |
| | | |
| | ANNUAL REPORT | |
The following tables set forth the per share operating performance data for a share of beneficial interest outstanding, total return, ratios to average net assets and other supplemental data for the years indicated.
| | | Timber Point Alternative Income Fund | |
| | | | | | | | | | | | | | | | |
| | | Institutional Class | |
| | | For the
Year Ended
September 30, 2024 | | | For the
Year Ended
September 30, 2023 | | | For the
Year Ended
September 30, 2022 | | | For the
Year Ended
September 30, 2021 | | | For the
Year Ended
September 30, 2020 | |
| Net Asset Value, Beginning of Year | | $ | 7.45 | | | $ | 7.40 | | | $ | 8.56 | | | $ | 8.32 | | | $ | 8.54 | |
| | | | | | | | | | | | | | | | | | | | | |
| Investment Operations: | | | | | | | | | | | | | | | | | | | | |
| Net investment income (1) | | | 0.21 | | | | 0.21 | | | | 0.14 | | | | 0.18 | | | | 0.09 | |
| Net realized and unrealized gain (loss) on investments | | | 0.78 | | | | 0.02 | | | | (1.15 | ) | | | 0.26 | | | | (0.19 | ) |
| Total from investment operations | | | 0.99 | | | | 0.23 | | | | (1.01 | ) | | | 0.44 | | | | (0.10 | ) |
| | | | | | | | | | | | | | | | | | | | | |
| Distributions: | | | | | | | | | | | | | | | | | | | | |
| From net investment income | | | (0.18 | ) | | | (0.18 | ) | | | (0.15 | ) | | | (0.20 | ) | | | (0.12 | ) |
| Total distributions | | | (0.18 | ) | | | (0.18 | ) | | | (0.15 | ) | | | (0.20 | ) | | | (0.12 | ) |
| | | | | | | | | | | | | | | | | | | | | |
| Net Asset Value, End of Year | | $ | 8.26 | | | $ | 7.45 | | | $ | 7.40 | | | $ | 8.56 | | | $ | 8.32 | |
| | | | | | | | | | | | | | | | | | | | | |
| Total Return (2) | | | 13.42 | % | | | 3.22 | % | | | (12.03 | )% | | | 5.30 | % | | | (1.17 | )% (5) |
| | | | | | | | | | | | | | | | | | | | | |
| Ratios/Supplemental Data | | | | | | | | | | | | | | | | | | | | |
| Net assets, end of year (in 000’s) | | $ | 18,830 | | | $ | 13,810 | | | $ | 12,710 | | | $ | 17,419 | | | $ | 16,801 | |
| | | | | | | | | | | | | | | | | | | | | |
| Ratios of expenses to average net assets (3): | | | | | | | | | | | | | | | | | | | | |
| Before fees waived and expenses reimbursed | | | 2.33 | % | | | 2.40 | % | | | 2.33 | % | | | 2.28 | % | | | 2.97 | % |
| After fees waived and expenses reimbursed | | | 1.82 | % | | | 1.70 | % | | | 1.73 | % | | | 1.78 | % | | | 2.04 | % |
| | | | | | | | | | | | | | | | | | | | | |
| Ratios of expenses to average net assets (excluding dividends on securities sold short and interest on margin account) (3): | | | | | | | | | | | | | | | | | | | | |
| Before fees waived and expenses reimbursed | | | 2.33 | % | | | 2.40 | % | | | 2.30 | % | | | 2.25 | % | | | 2.79 | % |
| After fees waived and expenses reimbursed | | | 1.82 | % | | | 1.70 | % | | | 1.70 | % | | | 1.75 | % | | | 1.86 | % |
| | | | | | | | | | | | | | | | | | | | | |
| Ratios of net investment income to average net assets (3) (4) | | | 2.74 | % | | | 2.75 | % | | | 1.75 | % | | | 2.09 | % | | | 1.11 | % |
| | | | | | | | | | | | | | | | | | | | | |
| Portfolio turnover rate | | | 122 | % | | | 130 | % | | | 348 | % | | | 194 | % | | | 287 | % |
| (1) | Per share amounts calculated using the average shares method, which more appropriately presents the per share data for the year. |
| (2) | Total Return represents the rate that the investor would have earned or lost on an investment in the Fund, assuming reinvestment of dividends. |
| (3) | The ratios of expenses to average net assets and net investment income to average net assets do not reflect the expenses of the underlying investment companies in which the Fund invests. |
| (4) | Recognition of net investment income by the Fund is affected by the timing and declaration of dividends by the underlying investment companies in which the Fund invests. |
| (5) | Includes adjustments in accordance with accounting principles generally accepted in the United States of America and, consequently, the net asset values for financial reporting purposes and the returns based upon those net asset values may differ from the net asset values and returns for shareholder transactions. |
The accompanying notes are an integral part of these financial statements.
| Timber Point Funds | ANNUAL REPORT |
NOTES TO THE FINANCIAL STATEMENTS
September 30, 2024
The Timber Point Global Allocations Fund (the “Global Fund”) and the Timber Point Alternative Income Fund (the “Income Fund”) (collectively, the “Funds”) were organized on October 6, 2017 as separate diversified series of 360 Funds (the “Trust”) and are successors by merger to the respective series of Northern Lights Fund Trust II. The Trust was organized on February 24, 2005 as a Delaware statutory trust. The Trust is registered as an open-end management investment company under the Investment Company Act of 1940, as amended (the “1940 Act”). The Global Fund’s investment objective is to seek superior risk adjusted total returns by investing across a wide variety of global assets. The Income Fund’s investment objective is to seek superior risk adjusted returns by investing in income oriented securities.
Each Fund offers one class of shares, Institutional Class.
| 2. | SIGNIFICANT ACCOUNTING POLICIES |
The following is a summary of the significant accounting policies followed by the Funds in the preparation of their financial statements and are in conformity with accounting principles generally accepted in the United States of America (“GAAP”). The Funds are investment companies that follow the accounting and reporting guidance of Accounting Standards Codification Topic 946 applicable to investment companies.
a) Security Valuation – All investments in securities are recorded at their estimated fair value, as described in note 3.
b) Short Sales – The Funds may sell securities short. A short sale is a transaction in which a Fund sells a security it does not own or have the right to acquire (or that it owns but does not wish to deliver) in anticipation that the market price of that security will decline.
When Funds make a short sale, the broker-dealer through which the short sale is made must borrow the security sold short and deliver it to the party purchasing the security. Funds are required to make a margin deposit in connection with such short sales; the Funds may have to pay a fee to borrow particular securities and will often be obligated to pay over any dividends and accrued interest on borrowed securities.
If the price of the security sold short increases between the time of the short sale and the time the Funds cover their short positions, the Funds will incur a loss; conversely, if the price declines, the Funds will realize a capital gain. Any gain will be decreased, and any loss increased, by the transaction costs described above. The successful use of short selling may be adversely affected by imperfect correlation between movements in the price of the security sold short and the securities being hedged.
To the extent the Funds sell securities short, they will provide collateral to the broker-dealer and (except in the case of short sales “against the box”) will maintain additional asset coverage in the form of cash, U.S. government securities or other liquid securities with its custodian in a segregated account in an amount at least equal to the difference between the current market value of the securities sold short and any amounts required to be deposited as collateral with the selling broker (not including the proceeds of the short sale).
c) Investment Companies – The Funds may invest in investment companies such as open-end funds (mutual funds), exchange-traded funds (“ETFs”) and closed-end funds (“CEFs”) (also referred to as “Underlying Funds”) subject to limitations as defined in the 1940 Act. Your cost of investing in the Funds will generally be higher than the cost of investing directly in the Underlying Funds. By investing in the Funds, you will indirectly bear fees and expenses charged by the Underlying Funds in which the Funds invest in addition to the Funds’ direct fees and expenses. Also, with respect to dividends paid by the Underlying Funds, it is possible for these dividends to exceed the underlying investments’ taxable earnings and profits resulting in the excess portion of such dividends being designated as a return of capital. Distributions received from investments in securities that represent a return of capital or capital gains are recorded as a reduction of the cost of investments or as a realized gain, respectively.
d) Federal Income Taxes – The Funds have qualified and intend to continue to qualify as regulated investment companies under Subchapter M of the Internal Revenue Code of 1986, as amended (the “Code”). It is the policy of the Funds to comply with the requirements of the Code applicable to regulated investment companies and to distribute substantially all of their net investment company taxable income and net capital gains. The Funds also intend to distribute sufficient net investment income and net capital gains, if any, so that they will not be subject to excise tax on undistributed income and gains. Therefore, no federal income tax or excise tax provision is required.
| Timber Point Funds | ANNUAL REPORT |
NOTES TO THE FINANCIAL STATEMENTS
September 30, 2024
| 2. | SIGNIFICANT ACCOUNTING POLICIES (continued) |
As of and during the year ended September 30, 2024, the Funds did not have a liability for any unrecognized tax expenses. The Funds recognize interest and penalties, if any, related to unrecognized tax liability as income tax expense in the statements of operations. During the year ended September 30, 2024, the Funds did not incur any interest or penalties. The Funds identify their major tax jurisdictions as U.S. Federal and Delaware state.
In addition, GAAP requires management of the Funds to analyze all open tax years, as defined by Internal Revenue Service statute of limitations for all major jurisdictions, including federal tax jurisdictions and certain state tax jurisdictions. As of and during the years ended September 30, 2021 through September 30, 2024, the Funds did not have a liability for any unrecognized tax benefits. The Funds have no examinations in progress and are not aware of any tax positions for which it is reasonably possible that the total amounts of unrecognized tax benefits will significantly change in the next twelve months.
e) Distributions to Shareholders – Dividends from net investment income and distributions of net realized capital gains, if any, will be declared and paid at least annually. Income and capital gain distributions, which are determined in accordance with income tax regulations, are recorded on the ex-dividend date. GAAP requires that permanent financial reporting differences relating to shareholder distributions be reclassified to paid-in capital or net realized gains. There were no reclassifications necessary during the year ended September 30, 2024.
f) Use of Estimates – The preparation of financial statements in conformity with GAAP requires management to make estimates and assumptions that affect the reported amounts of assets and liabilities and disclosure of contingent assets and liabilities at the date of the financial statements and the reported amounts of increases and decreases in net assets during the reporting period. Actual results could differ from those estimates.
g) Other – Investment and shareholder transactions are recorded on trade date. The Funds determine the gain or loss realized from the investment transactions by comparing the original cost of the security lot sold with the net sales proceeds. Dividend income and expenses are recognized on the ex-dividend date or as soon as information is available to the Funds and interest income is recognized on an accrual basis. Withholding taxes on foreign dividends have been provided for in accordance with the Funds’ understanding of the applicable country’s tax rules and rates.
| 3. | SECURITIES VALUATION AND FAIR VALUE MEASUREMENTS |
Processes and Structure
The Funds’ Board of Trustees (the “Board”) has adopted guidelines for valuing securities and other derivative instruments including in circumstances in which market quotes are not readily available, and has delegated authority to the Valuation Designee (as described below) to apply those guidelines in determining fair value prices, subject to review by the Board.
Hierarchy of Fair Value Inputs
The Funds utilize various methods to measure the fair value of their investments on a recurring basis. GAAP establishes a hierarchy that prioritizes inputs to valuation techniques used to measure fair value. The three levels of inputs are as follows:
| ● | Level 1 – Unadjusted quoted prices in active markets for identical assets or liabilities that the Fund has the ability to access. |
| ● | Level 2 – Observable inputs other than quoted prices included in level 1 that are observable for the asset or liability either directly or indirectly. These inputs may include quoted prices for the identical instrument on an inactive market, prices for similar instruments, interest rates, prepayment speeds, credit risk, yield curves, default rates, and similar data. |
| ● | Level 3 – Unobservable inputs for the asset or liability to the extent that relevant observable inputs are not available, representing the Fund’s own assumptions about the assumptions that a market participant would use in valuing the asset or liability, and that would be based on the best information available. |
| Timber Point Funds | ANNUAL REPORT |
NOTES TO THE FINANCIAL STATEMENTS
September 30, 2024
| 3. | SECURITIES VALUATION AND FAIR VALUE MEASUREMENTS (continued) |
The availability of observable inputs can vary from security to security and is affected by a wide variety of factors, including, for example, the type of security, whether the security is new and not yet established in the marketplace, the liquidity of markets, and other characteristics particular to the security. To the extent that valuation is based on models or inputs that are less observable or unobservable in the market, the determination of fair value requires more judgment. Accordingly, the degree of judgment exercised in determining fair value is greatest for instruments categorized in level 3.
The inputs used to measure fair value may fall into different levels of the fair value hierarchy. In such cases, for disclosure purposes, the level in the fair value hierarchy within which the fair value measurement falls in its entirety is determined based on the lowest level input that is significant to the fair value measurement in its entirety.
Fair Value Measurements
Securities and assets for which representative market quotations are not readily available or that cannot be accurately valued using a fund’s normal pricing procedures are valued at fair value as determined in good faith under policies approved by the Board. Fair value pricing may be used, for example, in situations where (i) a portfolio security, such as a small-cap stock, is so thinly traded that there have been no transactions for that stock over an extended period of time or the validity of a market quotation received is questionable; (ii) the exchange on which the portfolio security is principally traded closes early; (iii) trading of the particular portfolio security is halted; (iv) the security is a restricted security not registered under federal securities laws purchased through a private placement not eligible for resale; or (v) the security is purchased on a foreign exchange.
A description of the valuation techniques applied to the Trust’s major categories of assets and liabilities measured at fair value on a recurring basis follows.
Equity securities (common stock, preferred stock, warrants, ETFs and CEFs) – Securities traded on a national securities exchange (or reported on the NASDAQ national market) are stated at the last reported sales price on the day of valuation. To the extent these securities are actively traded, and valuation adjustments are not applied, they are categorized in level 1 of the fair value hierarchy. Certain foreign securities may be fair valued using a pricing service that considers the correlation of the trading patterns of the foreign security to the intraday trading in the U.S. markets for investments such as American Depositary Receipts, financial futures, ETFs, and the movement of the certain indexes of securities based on a statistical analysis of the historical relationship and are categorized in level 2. Preferred stock and other equities traded on inactive markets or valued by reference to similar instruments are also categorized in level 2.
Money market funds and mutual funds – Money market funds and mutual funds are valued at their net asset value per share and are categorized as level 1.
Fixed income securities (asset-backed securities (“ABS”) and mortgage-backed securities (“MBS”) - Securities valued using market quotations in an active market, will be categorized as Level 2 securities. However, they may be valued on the basis of prices furnished by a pricing service when the Adviser believes such prices more accurately reflect the fair value of such securities. A pricing service utilizes electronic data processing techniques based on yield spreads relating to securities with similar characteristics to determine prices for normal institutional-size trading units of debt securities without regard to sale or bid prices. These securities will generally be categorized as Level 2 securities. If the Adviser decides that a price provided by the pricing service does not accurately reflect the fair value of the securities, when prices are not readily available from a pricing service, or when certain restricted or illiquid securities are being valued, securities are valued at fair value as determined in good faith by the Adviser, in conformity with guidelines adopted by and subject to review of the Board and the Fair Valuation Committee. These securities will be categorized as Level 3 securities. The Adviser may use inputs such as evaluated broker quotes in inactive markets, actual trade prices in inactive markets, present value of expected future cash flows, terms of expected bond restructurings, and yields on similar securities in determining the fair value of such Level 3 securities.
The SEC adopted Rule 2a-5 under the 1940 Act, which established an updated regulatory framework for registered investment company fair valuation practices. Under the new rule a greater number of the Funds’ securities may be subject to fair value pricing. The Funds’ fair value policies and procedures and valuation practices were updated to comply with Rule 2a-5. Specifically, the Board designated Timber Point Capital Management, LLC (the “Adviser”) as the Funds’ “Valuation Designee” to make fair value determinations. The Adviser acts through its Rule 2a-5 Committee (the “Valuation Committee”) in accordance with the Trust’s and the Adviser’s policies and procedures (collectively, the “Valuation Procedures”). While fair value determinations will be based upon all available factors that the Valuation Designee deems relevant at the time of the determination, fair value represents only a good faith approximation of the value of an asset or liability.
| Timber Point Funds | ANNUAL REPORT |
NOTES TO THE FINANCIAL STATEMENTS
September 30, 2024
| 3. | SECURITIES VALUATION AND FAIR VALUE MEASUREMENTS (continued) |
The Funds’ policies regarding fair value pricing are intended to result in a calculation of a Fund’s net asset value that fairly reflects portfolio security values as of the time of pricing. A portfolio security’s fair value price may differ from the price next available for that portfolio security using a Fund’s normal pricing procedure, and may differ substantially from the price at which the portfolio security may ultimately be traded or sold. If such fair value price differs from the price that would have been determined using a Fund’s normal pricing procedures, a shareholder may receive more or less proceeds or shares from redemptions or purchases of Fund shares, respectively, than a shareholder would have otherwise received if the portfolio security was priced using a Fund’s normal pricing procedures. The performance of a Fund may also be affected if a portfolio security’s fair value price were to differ from the security’s price using a Fund’s normal pricing procedures.
Pursuant to policies adopted by the Board, the Valuation Designee reports all fair valued securities to the Board at least quarterly. The Board monitors and evaluate the Funds’ use of fair value pricing. These securities will be categorized as level 3 securities.
The following tables summarize the inputs used to value the Funds’ assets and liabilities measured at fair value as of September 30, 2024.
Global Fund: | | | | | | | | | | | | |
| Financial Instruments - Assets Classification | | Level 1 | | | Level 2 | | | Level 3 | | | Totals | |
| Common Stock (1) (2) | | $ | 1,523,175 | | | $ | — | | | $ | — | | | $ | 1,523,175 | |
| Preferred Stock (1) (2) | | | 92,903 | | | | — | | | | — | | | | 92,903 | |
| Closed-End Fund (1) | | | 261,688 | | | | — | | | | — | | | | 261,688 | |
| Exchange-Traded Funds (1) | | | 13,638,857 | | | | — | | | | — | | | | 13,638,857 | |
| Mutual Funds (1) | | | 2,902,678 | | | | — | | | | — | | | | 2,902,678 | |
| Asset Backed Securities | | | — | | | | 972 | | | | — | | | | 972 | |
| Mortgage Backed Securities | | | — | | | | 2,355 | | | | — | | | | 2,355 | |
| Warrants (2) | | | — | | | | — | | | | — | | | | — | |
| Short-Term Investment | | | 1,452,569 | | | | — | | | | — | | | | 1,452,569 | |
| Total Assets | | $ | 19,871,870 | | | $ | 3,327 | | | $ | — | | | $ | 19,875,197 | |
Income Fund: | | | | | | | | | |
| Financial Instruments – Assets Classification | | Level 1 | | | Level 2 | | | Level 3 | | | Totals | |
| Common Stock (1) | | $ | 366,125 | | | $ | — | | | $ | — | | | $ | 366,125 | |
| Preferred Stock (2) | | | — | | | | — | | | | — | | | | — | |
| Closed-End Funds (1) | | | 774,846 | | | | — | | | | — | | | | 774,846 | |
| Exchange-Traded Funds (1) | | | 16,757,412 | | | | — | | | | — | | | | 16,757,412 | |
| Asset Backed Securities | | | — | | | | 3,018 | | | | — | | | | 3,018 | |
| Mortgage Backed Securities | | | — | | | | 7,065 | | | | — | | | | 7,065 | |
| Warrants (2) | | | — | | | | — | | | | — | | | | — | |
| Short-Term Investment | | | 875,553 | | | | — | | | | — | | | | 875,553 | |
| Total Assets | | $ | 18,773,936 | | | $ | 10,083 | | | $ | — | | | $ | 18,784,019 | |
| | | | | | | | | | | | | | | | | |
(1) For a detailed break-out of common stock, preferred stock, closed-end funds, ETFs and mutual funds by industry or asset class, please refer to the Schedule of Investments.
(2) Investments in Harbor Custom Development, Inc. common stock, preferred stock and warrants are being valued at zero by the Adviser using Level 3 inputs.
| Timber Point Funds | ANNUAL REPORT |
NOTES TO THE FINANCIAL STATEMENTS
September 30, 2024
NOTE 3. SECURITIES VALUATION AND FAIR VALUE MEASUREMENTS (continued)
Following is a reconciliation of the Harbor Custom Development, Inc. investments in which significant unobservable inputs (Level 3) were used in determining fair values in the Funds:
| Global Fund | | Balance as of September 30,
2023 | | | Realized
gain (loss) | | | Change in
unrealized
appreciation (depreciation) | | | Purchases | | | Sales | | | Transfers
into
Level 3 | | | Transfers
out of
Level 3 | | | Balance as of September 30,
2024 | |
| Common Stock | | $ | — | | | $ | — | | | $ | — | | | $ | — | | | $ | — | | | $ | — | | | $ | — | | | $ | — | |
| Preferred Stock | | | — | | | | — | | | | — | | | | — | | | | — | | | | — | | | | — | | | | — | |
| Warrants | | | — | | | | — | | | | — | | | | — | | | | — | | | | — | | | | — | | | | — | |
| TOTALS | | | — | | | | — | | | | — | | | | — | | | | — | | | | — | | | | — | | | | — | |
| Income Fund | | Balance as of September 30,
2023 | | | Realized
gain (loss) | | | Change in
unrealized
appreciation (depreciation) | | | Purchases | | | Sales | | | Transfers
into
Level 3 | | | Transfers
out of
Level 3 | | | Balance as of September 30,
2024 | |
| Preferred Stock | | $ | — | | | $ | — | | | $ | — | | | $ | — | | | $ | — | | | $ | — | | | $ | — | | | $ | — | |
| Warrants | | | — | | | | — | | | | — | | | | — | | | | — | | | | — | | | | — | | | | — | |
| TOTALS | | | — | | | | — | | | | — | | | | — | | | | — | | | | — | | | | — | | | | — | |
The following is a quantitative summary of the techniques and inputs used to fair value the Level 3 securities as of September 30, 2024:
Quantitative information about Level 3 fair value measurements |
| |
| Global Fund | | Fair value at
09/30/2024 | | Valuation
technique(s) | | Unobservable input | | Range | |
| Common Stock | | $ | — | | Adviser | | Estimated proceeds from bankruptcy reorganization (1) | | $ | — | |
| Preferred Stock | | | — | | Adviser | | Estimated proceeds from bankruptcy reorganization (1) | | | — | |
| Warrants | | | — | | Adviser | | Estimated proceeds from bankruptcy reorganization (1) | | | — | |
| Income Fund | | Fair value at
09/30/2024 | | Valuation
technique(s) | | Unobservable input | | Range | |
| Preferred Stock | | $ | — | | Adviser | | Estimated proceeds from bankruptcy reorganization (1) | | $ | — | |
| Warrants | | | — | | Adviser | | Estimated proceeds from bankruptcy reorganization (1) | | | — | |
(1) A significant increase in this input in isolation would result in a significantly higher fair value measurement. Unobservable inputs from the broker quotes were not included because the Income Fund does not develop the quantitative inputs and they are not readily available.
The total change in unrealized appreciation attributable to Level 3 investments still held at September 30, 2024 is shown below.
| | | Total Change in Unrealized Appreciation | |
| Global Fund | | $ | — | |
| Income Fund | | $ | — | |
| Timber Point Funds | ANNUAL REPORT |
NOTES TO THE FINANCIAL STATEMENTS
September 30, 2024
| 4. | INVESTMENT TRANSACTIONS |
For the year ended September 30, 2024, aggregate purchases and sales of investment securities (excluding short-term investments) for the Funds were as follows:
| | | | Purchases | | | Sales | |
| Global Fund | | | $ | 32,772,472 | | | $ | 31,420,402 | |
| Income Fund | | | | 22,232,786 | | | | 17,079,009 | |
There were no U.S. Government securities purchased or sold during the period by the Funds.
| 5. | INVESTMENTS IN AFFILIATED COMPANIES |
An affiliated company is a company in which the Funds have ownership of at least 5% of the voting securities or of common management. Companies which are affiliates of the Funds at September 30, 2024, are noted in the Global Fund’s Schedule of Investments. The Income Fund is a mutual fund which is considered affiliated because it is of common management of the Adviser. As of September 30, 2024, the Income Fund is the only affiliated fund of the Global Fund. The Income Fund was not invested in any affiliated funds at September 30, 2024.
Transactions with affiliated companies during the year ended September 30, 2024 were as follows:
| Global Fund: | | | Value as of September 30,
2023 | | | Shares held
as of September 30,
2023 | | | Realized
gain (loss) | | | Change in unrealized appreciation (depreciation) | | | Purchases | | | Sales | | | Value as of September 30,
2024 | | | Shares held
as of
September 30,
2024 | | | Income
received | |
| Income Fund | | | $ | 2,026,634 | | | | 272,031 | | | $ | — | | | $ | 221,856 | | | $ | 24,494 (1) | | | $ | — | | | $ | 2,272,984 | | | | 275,180 | | | $ | 48,601 | |
| Total | | | $ | 2,026,634 | | | | 272,031 | | | $ | — | | | $ | 221,856 | | | $ | 24,494 (1) | | | $ | — | | | $ | 2,272,984 | | | | 275,180 | | | $ | 48,601 | |
| (1) | Represents dividends reinvested. |
| 6. | ADVISORY FEES AND OTHER RELATED PARTY TRANSACTIONS |
The Funds have entered into an Investment Advisory Agreement (the “Advisory Agreement”) with the Adviser. Under the Advisory Agreement, the Adviser, under the supervision of the Board, agrees to invest the assets of the Funds in accordance with applicable law and the investment objectives, policies and restrictions set forth in the Funds’ current Prospectus and Statement of Additional Information, and subject to such further limitations as the Trust may from time to time impose by written notice to the Adviser. The Adviser shall act as the investment adviser to the Funds and, as such shall (i) obtain and evaluate such information relating to the economy, industries, business, securities markets and securities as it may deem necessary or useful in discharging its responsibilities here under, (ii) formulate a continuing program for the investment of the assets of the Funds in a manner consistent with their investment objectives, policies and restrictions, and (iii) determine from time to time securities to be purchased, sold, retained or lent by the Funds, and implement those decisions, including the selection of entities with or through which such purchases, sales or loans are to be effected; provided, that the Adviser will place orders pursuant to its investment determinations either directly with the issuer or with a broker or dealer, and if with a broker or dealer, (a) will attempt to obtain the best price and execution of its orders, and (b) may nevertheless in its discretion purchase and sell portfolio securities from and to brokers who provide the Adviser with research, analysis, advice and similar services and pay such brokers in return a higher commission or spread than may be charged by other brokers.
Under the terms of the Advisory Agreement with the Funds, the Adviser receives a monthly management fee equal to annual rates of the Funds’ net assets as follows:
| | | Management Fee Rates | |
| Global Fund | | | 0.90 | % |
| Income Fund | | | 0.80 | % |
For the year ended September 30, 2024, the Adviser earned management fees as follows:
| | | Management Fees | |
| Global Fund | | $ | 159,313 | |
| Income Fund | | | 116,630 | |
| Timber Point Funds | ANNUAL REPORT |
NOTES TO THE FINANCIAL STATEMENTS
September 30, 2024
| 6. | ADVISORY FEES AND OTHER RELATED PARTY TRANSACTIONS (continued) |
The Adviser has contractually agreed to waive its fees and to assume other expenses of the Funds, if necessary, in an amount that limits the Total Annual Fund Operating Expenses (but excluding interest, borrowing expenses, distribution fees pursuant to Rule 12b-1 Plans, shareholder services fees pursuant to a Shareholder Services Plan, taxes, acquired fund fees and expenses, brokerage fees and commissions, dividend expenses on short sales, litigation expenses, expenditures which are capitalized in accordance with generally accepted accounting principles and, other extraordinary expenses not incurred in the ordinary course of such Fund’s business) to not more than 1.60% of the average daily net assets of the Global Fund and 1.70% of the average daily net assets of the Income Fund through January 31, 2025. The expense limitation agreement can be terminated only by, or with the consent of, the Board.
For the year ended September 30, 2024, the Adviser waived advisory fees and reimbursed expenses as follows:
| | | | Advisory
Fees Waived | | | Expenses
Reimbursed | |
| Global Fund | | | $ | 94,435 | | | $ | — | |
| Income Fund | | | | 74,460 | | | | — | |
The Global Fund invested a portion of its assets in the Income Fund, which is an affiliated Fund (Note 5). As such, the Adviser has agreed to waive its advisory fees on the portions of the Global Fund’s assets that are invested in the Income Fund.
For the year ended September 30, 2024, the Adviser waived advisory fees related to assets invested in the affiliated funds as follows:
| | | Affiliated Funds Advisory Fees Waived | |
| Global Fund | | $ | 18,844 | |
These waivers are in addition to amounts waived pursuant to the contractual expense limitations detailed in the above paragraphs and are not recoupable.
Expense waivers and reimbursements are subject to possible recoupment from the Funds in future years on a rolling three year basis (within the three years after the fees have been waived or reimbursed) if such recoupment can be achieved within the expenses limits in place at the time of the waiver or reimbursement and the recoupment. Expense waivers and reimbursements made by the Funds’ prior investment adviser are also subject to possible recoupment by the Adviser under the same terms. As of September 30, 2024, the total amount of expenses waived/reimbursed subject to recapture and their expiration dates, pursuant to the waiver agreements, was as follows:
| | | Amount Subject
to Recoupment | | | Expiration Dates |
| Global Fund | | | 100,226 | | | September 30, 2025 |
| Global Fund | | | 125,587 | | | September 30, 2026 |
| Global Fund | | | 94,435 | | | September 30, 2027 |
| Income Fund | | | 96,422 | | | September 30, 2025 |
| Income Fund | | | 100,077 | | | September 30, 2026 |
| Income Fund | | | 74,460 | | | September 30, 2027 |
The Funds have entered into an Investment Company Services Agreement (“ICSA”) with M3Sixty Administration, LLC (“M3Sixty”). Pursuant to the ICSA, M3Sixty is responsible for a wide variety of functions, including but not limited to: (a) Fund accounting services; (b) financial statement preparation; (c) valuation of the Funds’ portfolio securities; (d) pricing the Funds’ shares; (e) assistance in preparing tax returns; (f) preparation and filing of required regulatory reports; (g) communications with shareholders; (h) coordination of Board and shareholder meetings; (i) monitoring the Funds’ legal compliance; and (j) maintaining shareholder account records.
For the year ended September 30, 2024, M3Sixty earned fees pursuant to the ICSA as follows:
| | | ICSA Fees | |
| Global Fund | | $ | 98,502 | |
| Income Fund | | | 90,410 | |
| Timber Point Funds | ANNUAL REPORT |
NOTES TO THE FINANCIAL STATEMENTS
September 30, 2024
| 6. | ADVISORY FEES AND OTHER RELATED PARTY TRANSACTIONS (continued) |
The Funds have also entered into a Chief Compliance Officer Service Agreement (“CCO Agreement”) with M3Sixty. Pursuant to the CCO Agreement, M3Sixty agrees to provide a Chief Compliance Officer (“CCO”), as described in Rule 38a-l of the 1940 Act, to the Funds for the year and on the terms and conditions set forth in the CCO Agreement.
For the year ended September 30, 2024, M3Sixty earned fees pursuant to the CCO Agreement as follows:
| | | CCO Agreement Fees | |
| Global Fund | | $ | 16,570 | |
| Income Fund | | | 16,570 | |
Certain officers of the Funds are also employees or officers of M3Sixty.
Matrix 360 Distributors, LLC (the “Distributor”) acts as the principal underwriter and distributor (the “Distributor”) of each Fund’s shares for the purpose of facilitating the registration of shares of the Funds under state securities laws and to assist in sales of the Funds’ shares pursuant to a Distribution Agreement (the “Distribution Agreement”) approved by the Trustees. The Distribution Agreement between the Funds and the Distributor requires the Distributor to use all reasonable efforts in connection with the distribution of the Funds’ shares. However, the Distributor has no obligation to sell any specific number of shares and will only sell shares for orders it receives.
The Distributor is an affiliate of M3Sixty.
| 7. | DISTRIBUTIONS TO SHAREHOLDERS AND TAX MATTERS |
The tax character of distributions during the year ended September 30, 2024, was as follows:
| | | | Ordinary Income | | | Long-Term
Capital Gains | |
| Global Fund | | | $ | 115,475 | | | $ | — | |
| Income Fund | | | | 309,993 | | | | — | |
The tax character of distributions during the year ended September 30, 2023, was as follows:
| | | | Ordinary Income | | | Long-Term
Capital Gains | |
| Global Fund | | | $ | 202,941 | | | $ | — | |
| Income Fund | | | | 355,286 | | | | — | |
The Funds’ tax basis distributable earnings are determined only at the end of each fiscal year. The tax character of distributable earnings (deficit) at September 30, 2024, the Funds’ most recent fiscal year end, was as follows:
| | | | Undistributed Ordinary Income | | | Post-October Loss and Late Year Loss | | | Capital Loss Carry Forwards | | | Other Book/Tax Differences | | | Unrealized
Appreciation/ (Depreciation) | | | Total Accumulated Losses | |
| Global Fund | | | $ | 26,940 | | | $ | — | | | $ | (5,627,172 | ) | | $ | — | | | $ | 708,663 | | | $ | (4,891,569 | ) |
| Income Fund | | | | 336,948 | | | | — | | | | (3,347,073 | ) | | | (3,794 | ) | | | 854,876 | | | | (2,159,043 | ) |
The difference between book basis and tax basis undistributed net investment income (loss), accumulated net realized loss, and unrealized appreciation/(depreciation) from investments is primarily attributable to the tax deferral of losses on wash sales. In addition, the amount listed under other book/tax differences for the Income Fund is primarily attributable to unamortized organization expenses.
Capital losses incurred after October 31 and ordinary losses incurred after December 31 within the fiscal year are deemed to arise on the first business day of the following fiscal year for tax purposes. At September 30, 2024, the Funds did not defer any capital or ordinary losses.
| Timber Point Funds | ANNUAL REPORT |
NOTES TO THE FINANCIAL STATEMENTS
September 30, 2024
| 7. | DISTRIBUTIONS TO SHAREHOLDERS AND TAX MATTERS (continued) |
At September 30, 2024, the Funds had capital loss carry forwards for federal income tax purposes available to offset future capital gains as follows:
| | | Non-Expiring
Short-Term | | | Non-Expiring
Long-Term | | | Total | |
| Global Fund | | $ | 4,579,922 | | | $ | 1,047,250 | | | $ | 5,627,172 | |
| Income Fund | | | 3,087,159 | | | | 259,914 | | | | 3,347,073 | |
During the year ended September 30, 2024, the Global Fund utilized $58,820 of short-term capital loss and $1,498,345 of long-term capital loss carryforwards and the Income Fund utilized $235,090 of short-term capital loss carryforwards. The Income Fund did not utilize any long-term capital loss carryforwards.
There were no permanent book and tax differences that resulted in reclassifications to paid-in capital for the year ended September 30, 2024.
For U.S. Federal income tax purposes, the cost of securities owned, gross appreciation, gross depreciation, and net unrealized appreciation/(depreciation) of investments at September 30, 2024, were as follows:
| | | | Cost | | | Gross Appreciation | | | Gross Depreciation | | | Net Appreciation | |
| Global Fund | | | $ | 19,166,534 | | | $ | 1,519,420 | | | $ | (810,757 | ) | | $ | 708,663 | |
| Income Fund | | | | 17,929,143 | | | | 931,852 | | | | (76,976 | ) | | | 854,876 | |
The difference between book basis and tax basis unrealized appreciation (depreciation) from investments is primarily attributable to the tax deferral of losses on wash sales.
The beneficial ownership, either directly or indirectly, of more than 25% of the voting securities of a fund creates a presumption of control of the fund, under Section 2(a)(9) of the 1940 Act. As of September 30, 2024, National Financial Services, LLC held 52.66% of the Global Fund’s shares and 58.80% of the Income Fund’s shares in omnibus accounts for the sole benefit of their customers. Charles Schwab and Co. held 35.00% of the Income Fund’s shares in omnibus accounts for the sole benefit of their customers. The Trust does not know whether any of the underlying beneficial shareholders of the omnibus accounts held by National Financial Services, LLC own more than 25% of the voting securities of the Funds.
| 9. | COMMITMENTS AND CONTINGENCIES |
In the normal course of business, the Trust may enter into contracts that may contain a variety of representations and warranties and provide general indemnifications. The Trust’s maximum exposure under these arrangements is dependent on future claims that may be made against the Funds and, therefore, cannot be estimated; however, management considers the risk of loss from such claims to be remote.
| 10. | RECENT AND SUBSEQUENT EVENTS |
In accordance with GAAP, Management has evaluated the impact of all subsequent events on the Funds through the date the financial statements were issued, and has determined that there were no subsequent events requiring recognition or disclosure in the financial statements.
| 11. | NEW ACCOUNTING PRONOUNCEMENTS AND REGULATORY UPDATES |
In September 2023, the SEC adopted a final rule relating to “Names Rule” under the 1940 Act. The amendments expanded the rule to require more funds to adopt an 80 percent investment policy, including funds with names suggesting a focus in investments with particular characteristics (e.g., growth or value) or with terms that reference a thematic investment focus (e.g., environmental, social, or governance factors). The amendments will require that a fund review its name for compliance with the rule. If needed, a fund may need to adopt an 80 percent investment policy and review its portfolio assets’ treatment under such policy at least quarterly. The rule also requires additional prospectus disclosure and reporting and record keeping requirements. Depending on the size of the fund, the rule will take effect about 24 to 36 months after its publication date. For funds with less than $1 billion in net assets, such as the Funds, the compliance date is June 11, 2026. Management has evaluated the amendments and determined that they do not require the Funds to make changes to their name or investment strategies.

taitweller.com
REPORT OF INDEPENDENT REGISTERED PUBLIC ACCOUNTING FIRM
To the Shareholders of
Timber Point Global Allocations Fund,
Timber Point Alternative Income Fund and the
Board of Trustees of 360 Funds
Opinion on the Financial Statements
We have audited the accompanying statements of assets and liabilities of Timber Point Global Allocations Fund and Timber Point Alternative Income Fund (the “Funds”), each a series of 360 Funds (the “Trust”), including the schedules of investments, as of September 30, 2024, the related statements of operations, the statements of changes in net assets and the financial highlights for the year then ended, and the related notes (collectively referred to as the “financial statements”). In our opinion, the financial statements present fairly, in all material respects, the financial position of the Funds as of September 30, 2024, the results of their operations, the changes in their net assets and their financial highlights for the year then ended, in conformity with accounting principles generally accepted in the United States of America.
The statements of changes in net assets for the year ended September 30, 2023, and the financial highlights for each of the four years in the period then ended were audited by other auditors, whose reports dated November 29, 2023 and November 28, 2022 expressed an unqualified opinion on those financial statements and financial highlights.
Basis for Opinion
These financial statements are the responsibility of the Funds’ management. Our responsibility is to express an opinion on the Funds’ financial statements based on our audits. We are a public accounting firm registered with the Public Company Accounting Oversight Board (United States) (“PCAOB”) and are required to be independent with respect to the Funds in accordance with the U.S. federal securities laws and the applicable rules and regulations of the Securities and Exchange Commission and the PCAOB. We have served as the auditor of one or more of the Funds in the Trust since 2023.
We conducted our audits in accordance with the standards of the PCAOB. Those standards require that we plan and perform the audits to obtain reasonable assurance about whether the financial statements are free of material misstatement, whether due to error or fraud. The Funds are not required to have, nor were we engaged to perform, an audit of their internal control over financial reporting. As part of our audits we are required to obtain an understanding of internal control over financial reporting, but not for the purpose of expressing an opinion on the effectiveness of the Funds’ internal control over financial reporting. Accordingly, we express no such opinion.
Our audits included performing procedures to assess the risks of material misstatement of the financial statements, whether due to error or fraud, and performing procedures that respond to those risks. Such procedures included examining, on a test basis, evidence regarding the amounts and disclosures in the financial statements. Our audits also included evaluating the accounting principles used and significant estimates made by management, as well as evaluating the overall presentation of the financial statements. Our procedures included confirmation of securities owned as of September 30, 2024 by correspondence with the custodian. We believe that our audits provide a reasonable basis for our opinion.
TAIT, WELLER & BAKER LLP
Philadelphia, Pennsylvania
November 27, 2024
| Timber Point Funds | ANNUAL REPORT |
OTHER INFORMATION (Unaudited)
September 30, 2024
The Trust, on behalf of the Funds, files a complete statement of investments with the SEC for the first and third quarters of each fiscal year as an exhibit to its report on Form N-PORT. Shareholders may view the filed Forms N-PORT by visiting the SEC’s website at http://www.sec.gov. The filed forms may also be viewed and copied at the SEC’s Public Reference Room in Washington, DC. Information regarding the operations of the Public Reference Room may be obtained by calling 1-800-SEC-0330.
A description of the policies and procedures that the Funds use to determine how to vote proxies relating to portfolio securities is available without charge, upon request, by calling 1-877-244-6235; and on the SEC’s website at http://www.sec.gov.
Information regarding how the Funds voted proxies relating to portfolio securities during the most recent 12-month period ended June 30th is available without charge, upon request, by calling 1-877-244-6235; and on the SEC’s website at http://www.sec.gov.
Shareholder Tax Information – The Funds are required to advise you within 60 days of the Funds’ fiscal year end regarding the federal tax status of distributions received by shareholders during the fiscal year. The Global Fund paid $115,475 of ordinary income distributions during the year ended September 30, 2024. The Income Fund paid $309,993 of ordinary income distributions during the year ended September 30, 2024.
Tax information is reported from the Funds’ fiscal year and not calendar year, therefore, shareholders should refer to their Form 1099-DIV or other tax information which will be mailed in 2025 to determine the calendar year amounts to be included on their 2024 tax returns. Shareholders should consult their own tax advisors.
Board Review of Liquidity Risk Management Program
As required by Rule 22e-4 under the Investment Company Act of 1940, as amended (the “Liquidity Rule”), at a meeting held on August 8, 2024, M3Sixty presented an annual report to the Board that addressed the operation of the Trust’s Liquidity Risk Management Program (the “Liquidity Program”). The report evaluated the adequacy and effectiveness of the Liquidity Program, including any material changes to the Liquidity Program and the operation of the highly liquid investment minimum.
The annual assessment, covering the period from December 1, 2022 through December 31, 2023, concluded that no illiquid investments exceeded the 15% threshold for any Fund. In addition, there were no reportable liquidity warning threshold reporting events during the review period. In instances where a security did not have readily available market liquidity risk indicators from the third-party data vendor, the conclusion reached by the respective Fund’s fair value designator was used as the basis for establishing and inputting the liquidity risk indicators.
Records appear to be maintained in accordance with the Liquidity Program’s requirements, including retention of policies and procedures, monthly liquidity risk management system reports, regulatory filings, and reports provided to the Fund Board.
During the review period, each Fund maintained adequate levels of cash and highly liquid investments to meet increasing shareholder redemption activities, in accordance with the Fund’s prospectus and within the requirements of the Liquidity Rule. Therefore, none of the Funds experienced unusual stress or disruption to their operations related to purchase and redemption activity.
M3Sixty concluded and reported to the Board that the Liquidity Program operated adequately and effectively and is reasonably designed to assess and manage each Fund’s liquidity risk.
| Timber Point Funds | ANNUAL REPORT |
OTHER INFORMATION
September 30, 2024
BOARD OF TRUSTEES, OFFICERS AND PRINCIPAL SHAREHOLDERS - (Unaudited)
The Trustees are responsible for the management and supervision of the Funds. The Trustees approve all significant agreements between the Trust, on behalf of the Funds, and those companies that furnish services to the Funds; review performance of the Funds; and oversee activities of the Funds. The Statement of Additional Information of the Trust includes additional information about the Funds’ Trustees and is available upon request, without charge, by calling (877) 244-6235.
Trustees and Officers. Following are the Trustees and Officers of the Trust, their year of birth and address, their present position with the Trust or the Funds, and their principal occupation during the past five years. Each of the Trustees of the Trust will generally hold office indefinitely. The Officers of the Trust will hold office indefinitely, except that: (1) any Officer may resign or retire and (2) any Officer may be removed any time by written instrument signed by at least two-thirds of the number of Trustees prior to such removal. In case a vacancy or an anticipated vacancy on the Board of Trustees shall for any reason exist, the vacancy shall be filled by the affirmative vote of a majority of the remaining Trustees, subject to certain restrictions under the 1940 Act. Those Trustees who are “interested persons” (as defined in the 1940 Act) by virtue of their affiliation with either the Trust or the Adviser, are indicated in the table. The address of each trustee and officer is 4300 Shawnee Mission Parkway, Suite 100, Fairway, KS 66205.
| Name and Year of Birth (“YOB”) | Position(s)
Held with
Trust | Length of
Service | Principal Occupation(s) During Past 5 Years | Number of Series Overseen | Other Directorships
During Past 5 Years |
| Independent Trustees |
Tom M. Wirtshafter YOB: 1954 | Trustee | Since 2011 | Retired (2024-present); Senior Vice President, American Portfolios Financial Services, (broker-dealer), American Portfolios Advisors (investment adviser) (2009–2024) | Eight | None |
Steven D. Poppen YOB: 1968 | Trustee | Since 2018 | Executive Vice President and Chief Business Administration Officer, Minnesota Vikings (professional sports organization) (1999–present); Executive Vice President and Chief Financial Officer, MV Ventures, LLC (real estate developer) (2016-present) | Eight | IDX Funds (2015 –2021); FNEX Ventures
(2018-2020) |
Thomas J. Schmidt YOB: 1963 | Trustee and Independent Chairman | Since 2018 Since 2022 | Principal, Tom Schmidt & Associates Consulting, LLC (2015–present) | Eight | Lind Capital Partners Municipal Credit Income Fund (2021–present); FNEX Ventures (2018-2020) |
| Interested Trustee* | | | | | |
Randall K. Linscott YOB: 1971 | President | Since 2013 | Chief Executive Officer, M3Sixty Administration, LLC (2013–present); Chairman, M3Sixty Capital, LLC (investment adviser) (2023-present) | Eight | IDX Funds
(2015 - 2021) |
* The Interested Trustee is an Interested Trustee because he is an officer and principal owner of the M3Sixty.
| Timber Point Funds | ANNUAL REPORT |
OTHER INFORMATION
September 30, 2024
BOARD OF TRUSTEES, OFFICERS AND PRINCIPAL SHAREHOLDERS - (Unaudited) (continued)
| Name and Year of Birth (“YOB”) | Position(s) Held
with Trust | Length of Service | Principal Occupation(s) During Past 5 Years | Number
of Series Overseen | Other Directorships
During Past 5 Years |
Officers | | | | | |
Gary W. DiCenzo YOB: 1962 | Vice President | Since 2024 | Chief Executive Officer, M3Sixty Capital, LLC (2023-present); Partner, Cognios Capital (investment management firm) (2015-2020), Chief Executive Officer (2015-2019); Founder, IMC Group, LLC (2010-2022) | N/A | 360 Funds Trust (2014–2022); FNEX Ventures (2018–2020); Volt ETF Trust (2021-2022) |
Richard Yates YOB: 1965 | Chief Compliance Officer and Secretary | Since 2021 | President, M3Sixty Enterprises, LLC (2024-present); Chief Legal Officer and Chief Compliance Officer, M3Sixty Capital (2024-present); Of Counsel, McElroy Deutsch (2020–2024); Head of Compliance, M3Sixty Administration, LLC (2021–present); Chief Compliance Officer and Secretary, IDX Funds (2021–2022); Founder, The Yates Law Firm (2018–2020) | N/A | N/A |
Larry E. Beaver, Jr. YOB: 1969 | Treasurer | Since 2021 | Head of Operations, M3Sixty Administration, LLC (2021-present); Fund Accounting, Administration and Tax Officer, M3Sixty Administration, LLC (2017–2021); Treasurer, Tactical Investment Series Trust (2022-present); Assistant Treasurer, 360 Funds Trust (2017–2021); Chief Accounting Officer, Amidex Funds, Inc. (2003–2020); Assistant Treasurer, IDX Funds (2017–2021; Assistant Treasurer, WP Funds Trust (2017–2021) | N/A | N/A |
Tim Easton YOB: 1968 | Anti-Money Laundering (“AML”) Officer | Since 2024 | Chief Operating Officer, Matrix 360 Distributors, LLC (2024 –present); Head of Transfer Agency, M3Sixty Administration, LLC (2022 – present); Self Employed (2020 – 2022); Head of Sales, M3Sixty Administration, LLC (2019 – 2020) | N/A | N/A |
Item 8. Changes in and Disagreements with Accountants for Open-End Management Investment Companies.
The Audit Committee of 360 Funds (the “Trust”) has approved and recommended to the Board of Trustees (the “Board”), and the Board has approved Tait, Weller & Baker, LLP (“Tait”) to replace Cohen & Company, Ltd. (“Cohen”) as the Funds’ independent registered public accounting firm for the Funds’ fiscal year ended September 30, 2024. Through the past fiscal year and through the date of Cohen’s replacement as auditor of the Funds, the Funds had no disagreements with Cohen on any matter of accounting principles or practices, financial statement disclosure or auditing scope or procedures, which, if not resolved to the satisfaction of Cohen would have caused Cohen to make reference to the disagreement in a Cohen report, and there were no reportable events of the kind described in Item 304(a)(1)(v) of Regulation S-K under the Securities Exchange Act of 1934.
With respect to the Funds, Cohen’s audit opinions, including for the fiscal year ended September 30, 2023, did not contain either an adverse opinion or disclaimer of opinion, nor were they qualified or modified as to uncertainty, audit scope or accounting principles. During the last fiscal year of the Funds, neither the Funds nor anyone on their behalf has consulted Tait on items concerning the application of accounting principles to a specified transaction (either completed or proposed) or the type of audit opinion that might be rendered on the Funds’ financial statements, or concerning the subject of a disagreement of the kind described in Item 304(a)(1)(iv) of Regulation S-K or reportable events of the kind described in Item 304(a)(1)(v) of Regulation S-K.
The Funds requested Cohen to furnish it with a letter addressed to the SEC stating whether or not it agrees with the above statements. A copy of such letter will be filed as an Exhibit to the Form N-CSR filing.
Item 9. Proxy Disclosures for Open-End Management Investment Companies.
N/A
Item 10. Remuneration Paid to Directors, Officers, and Others of Open-End Management Investment Companies.
Trustee fees paid by the Funds are within Item 7. Statements of Operations as Trustee fees and expenses.
Item 11. Statement Regarding Basis for Approval of Investment Advisory Contract.
At a meeting held on April 24, 2024 (the “Meeting”), the Board considered the approval of the renewal of the Investment Advisory Agreement (the “Advisory Agreement”) between the Trust and Timber Point Capital Management (the “Adviser” or “Timber Point”) for the Timber Point Global Allocations Fund (the “Global Fund”) and the Timber Point Alternative Income Fund (the “Income Fund” and collectively with the Global Fund, the “Funds”).
Legal counsel (“Counsel”) reviewed with the Board a memorandum that summarized, among other things, the fiduciary duties and responsibilities of the Board in reviewing and approving the renewal of the Advisory Agreement between the Trust and the Adviser concerning the Funds. Counsel discussed with the Trustees the types of information and factors that they should consider to make an informed decision regarding the approval of the continuation of the Advisory Agreement, including the following material factors: (i) the nature, extent, and quality of the services provided by the Adviser; (ii) the investment performance of the Funds and the Adviser; (iii) the costs of the services provided and profits realized by the Adviser from the relationship with the Funds; (iv) the extent to which economies of scale would be realized if the Funds grow and whether advisory fee levels reflect those economies of scale for the benefit of the Funds’ investors; and (v) the Adviser’s practices regarding possible conflicts of interest (the “Material Factors”). Counsel noted that in response to a questionnaire sent by Counsel, the Adviser provided information to the Board about Timber Point’s business personnel, resources, investment strategy, and management of the Funds’ portfolios and operations.
In assessing these factors and reaching its decisions, the Board considered information furnished for its review and consideration throughout the year at Board meetings, as well as information prepared or presented in connection with the annual renewal process, including information in the Adviser’s presentation during the Meeting. The Board requested and was provided with information and reports relevant to the annual renewal of the Advisory Agreement, including (i) reports regarding the services and support provided to the Funds and their shareholders by the Adviser; (ii) quarterly assessments of the investment performance of the Funds from the Adviser; (iii) periodic commentary on the Funds’ performance; (iv) presentations about the Adviser’s investment philosophy, investment strategy, personnel, and operations; (v) compliance and audit reports concerning the Funds and the Adviser; (vi) disclosure information contained in the registration statement of the Trust; and (vii) a memorandum from Counsel that summarized the fiduciary duties and responsibilities of the Board in reviewing and approving the Advisory Agreement, including the Material Factors set forth above and the types of information included in each factor that should be considered by the Board to make an informed decision.
Item 11. Statement Regarding Basis for Approval of Investment Advisory Contract (continued)
The Board also requested and received various informational materials including, without limitation: (i) documents about the Adviser, including its financial condition, a description of personnel and the services provided to the Funds, information on investment advice, performance, summaries of the Funds’ expenses, compliance program, current legal matters, and other general information; (ii) comparative expense and performance information for other mutual funds with strategies similar to the Funds; and (iii) benefits to be realized by the Adviser from its relationship with the Funds. In addition, the Board had an extensive discussion with the Adviser regarding the matters discussed below.
(1) The nature, extent, and quality of the Adviser’s services.
The Board considered the Adviser’s contractual duties and responsibilities. The Board reviewed the services provided by the Adviser to the Funds, including, without limitation, the Adviser’s processes for formulating investment recommendations and assuring compliance with the Funds’ investment objectives and limitations; its coordination of services for the Funds among the Funds’ service providers; and its efforts to promote the Funds, grow assets, and assist in the distribution of the Funds’ shares. The Board considered the Adviser’s personnel and methods of operating, succession plans, the education and experience of its staff, and its compliance program. The Board also considered the Adviser’s commitment to dedicating appropriate resources to support the Funds’ operations. After reviewing the preceding and further information, including the expanded ownership program at the Adviser, the Board concluded that the nature, extent, and quality of the services provided by the Adviser were satisfactory and adequate for the Funds.
(2) Investment Performance of the Funds and the Adviser.
The Board compared the short- and long-term performance of the Funds to their benchmarks, comparable funds with similar objectives and size managed by other investment advisers (its “peer group”), and category indices (e.g., Morningstar category). The Board also considered the consistency of the Adviser’s management of the Funds with its investment objective and policies.
The Board considered the peer, benchmark, and category performance of each Fund over various periods. Relative to its benchmark, the Global Fund underperformed the S&P 500® Index for all periods, and the Income Fund overperformed the Bloomberg Barclays U.S. Aggregate Bond® Index for the one-, three- and five-year periods and underperformed for the ten-year period each ending March 31, 2024. Relative to their peer groups, the Global Fund outperformed most of the group for all periods, while the Income Fund was above the peer group median for all periods. Relative to their category averages and medians, both Funds overperformed during the one year but underperformed for the three and five years, each ended March 31, 2024. After considering the Funds’ performance, as presented at the Meeting, the Board concluded that the Funds’ performance was within a reasonable range of its category. Based on the preceding, the Board concluded that the investment performance information presented for the Funds was satisfactory.
(3) The costs of the services provided and profits realized by the Adviser from the relationship with the Funds.
The Board considered the Adviser’s staffing, personnel, and operating methods; the Adviser’s financial condition and its level of commitment to the Funds; the asset levels of the Funds; and the overall expenses of the Funds. The Trustees considered the financial statements of the Adviser and the financial stability and productivity of the firm. The Board considered the Adviser’s strategic plans to manage costs related to its operations. The Trustees considered the fees and expenses of the Funds (including the management fee) relative to their categories as of March 31, 2024. The Board noted that the Funds’ management fee and net expense ratios were above their respective category averages and median but substantially below the maximum and, therefore, within a reasonable range. The Trustees recognized that the Funds are smaller than most of their peers by a magnitude of over 10 times, which affects the net expense ratios of the Funds and the Adviser’s ability to provide breakpoints in its management fee.
The Trustees acknowledged that the Adviser has entered into an expense limitation agreement (“ELA”) according to which it has agreed to waive or reduce its fees and to assume other expenses of the Funds, if necessary, to limit their annual operating expenses (with industry-standard exceptions) to not more than 1.60% for the Global Fund and 1.70% for the Income Fund through January 31, 2026. The Board also noted that the Adviser does not realize any profit for managing the Funds and is waiving most of its management fee. Following this analysis, further consideration, and discussion of the preceding, the Board concluded that the management fee and the Adviser’s profitability were fair and reasonable.
Item 11. Statement Regarding Basis for Approval of Investment Advisory Contract (continued)
| (4) | The extent to which economies of scale would be realized if the Funds grow and whether advisory fee levels reflect these economies of scale for the benefit of the Funds’ investors. |
The Board considered the Funds’ fee arrangements with the Adviser. The Trustees determined that although the management fee would stay the same as asset levels increase, the shareholders of the Funds would benefit from the ELA. The Board noted that while a breakpoint schedule in the Advisory Agreement would be beneficial, such a feature only has benefits if the Funds’ assets were enough to realize the effect of the breakpoint. The Board further noted that lower expenses for the Funds’ shareholders are realized immediately with the ELA with the Adviser. The Board further noted that the Funds’ assets were at such levels that the ELA was providing benefits to the Funds’ shareholders. Following further discussion of the Funds’ asset levels, expectations for growth, and expense structure, the Board determined that the Funds’ fee arrangements, considering all the facts and circumstances, were fair and reasonable and that the ELA provided savings and protection for the benefit of the Funds’ investors.
(5) Possible conflicts of interest and benefits derived by the Adviser.
The Board evaluated the potential for conflicts of interest and considered such matters as the experience and ability of the advisory and compliance personnel assigned to the Funds, the fact that the Adviser does utilize soft dollars, the basis of decisions to buy or sell securities for the Funds; and the substance and administration of the Adviser’s code of ethics. Based on the preceding, the Board determined that the Adviser’s standards and practices relating to identifying and mitigating possible conflicts of interest were satisfactory.
After additional consideration and discussion among the Trustees, the Board determined that the compensation payable under the Advisory Agreement for each Fund was fair, reasonable, and within a range of what could have been negotiated at arms-length considering all the surrounding circumstances, and they approved the renewal of the Advisory Agreement for the Funds.
360 FUNDS
4300 Shawnee Mission Pkwy
Suite 100
Fairway, KS 66205
INVESTMENT ADVISER
Timber Point Capital Management, LLC
555 Pleasantville Road
Suite N202
Briarcliff Manor, NY 10510
ADMINISTRATOR & TRANSFER AGENT
M3Sixty Administration, LLC
4300 Shawnee Mission Pkwy
Suite 100
Fairway, KS 66205
DISTRIBUTOR
Matrix 360 Distributors, LLC
4300 Shawnee Mission Pkwy
Suite 100
Fairway, KS 66205
INDEPENDENT REGISTERED PUBLIC ACCOUNTING FIRM
Tait, Weller & Baker, LLP
Two Liberty Place
50 South 16th Street
Suite 2900
Philadelphia, PA 19102-2529
LEGAL COUNSEL
FinTech Law, LLC
6224 Turpin Hills Dr.
Cincinnati, Ohio 45244
CUSTODIAN BANK
Fifth Third Bank
Fifth Third Center
38 Fountain Square Plaza
Cincinnati, OH 45263
| ITEM 12. | DISCLOSURE OF PROXY VOTING POLICIES AND PROCEDURES FOR CLOSED-END MANAGEMENT INVESTMENT COMPANIES. |
Not applicable Funds are open-end management investment companies
| ITEM 13. | PORTFOLIO MANAGERS OF CLOSED-END MANAGEMENT INVESTMENT COMPANIES |
Not applicable Funds are open-end management investment companies
| ITEM 14. | PURCHASES OF EQUITY SECURITIES BY CLOSED-END MANAGEMENT INVESTMENT COMPANY AND AFFILIATED PURCHASERS. |
Not applicable Funds are open-end management investment companies
| ITEM 15. | SUBMISSION OF MATTERS TO A VOTE OF SECURITY HOLDERS. |
Not applicable at this time
| ITEM 16. | CONTROLS AND PROCEDURES. |
| (a) | The registrant’s principal executive and principal financial officers, or persons performing similar functions, have concluded that the registrant’s disclosure controls and procedures (as defined in Rule 30a-3(c) under the 1940 Act, are effective, as of a date within 90 days of the filing date of this report, based on the evaluation of these controls and procedures required by Rule 30a-3(b) under the 1940 Act and Rule 15d-15(b) under the Securities Exchange Act of 1934, as amended. |
| (b) | There were no changes in the registrant’s internal control over financial reporting (as defined in Rule 30a-3(d) under the 1940 Act) that occurred during the period covered by this report that have materially affected, or are reasonably likely to materially affect, the registrant’s internal control over financial reporting. |
| ITEM 17. | DISCLOSURE OF SECURITIES LENDING ACTIVITIES FOR CLOSED-END MANAGEMENT INVESTMENT COMPANIES. |
Not applicable, Funds are open-end management investment companies
| ITEM 18. | RECOVERY OF ERRONEOUSLY AWARDED COMPENSATION. |
Not applicable at this time
SIGNATURES
Pursuant to the requirements of the Securities Exchange Act of 1934 and the Investment Company Act of 1940, the registrant has duly caused this report to be signed on its behalf by the undersigned, thereunto duly authorized.
360 Funds
| By: Randy Linscott | /s/ Randy Linscott | |
| Principal Executive Officer, |
| Date: December 04, 2024 | | |
Pursuant to the requirements of the Securities Exchange Act of 1934 and the Investment Company Act of 1940, this report has been signed below by the following person on behalf of the registrant and in the capacities and on the date indicated.
| By Randy Linscott | /s/ Randy Linscott | |
| Principal Executive Officer |
| Date: December 04, 2024 | | |
Pursuant to the requirements of the Securities Exchange Act of 1934 and the Investment Company Act of 1940, this report has been signed below by the following person on behalf of the registrant and in the capacities and on the date indicated.
| By Larry E. Beaver, Jr. | /s/ Larry E. Beaver, Jr. | |
| Treasurer and Principal Financial Officer |
| Date: December 04, 2024 | | |