
FinTrust Income and Opportunity Fund
Class A Shares (Ticker Symbol: HROAX)
Institutional Class Shares (Ticker Symbol: HIOIX)
A Series of the
360 Funds
ANNUAL REPORT
November 30, 2023
Investment Adviser:
FinTrust Capital Advisors, LLC
124 Verdae Boulevard, Suite 504
Greenville, SC 29607
IMPORTANT NOTE: Effective January 24, 2023, the SEC adopted rule and form amendments to require open-end mutual funds and ETFs to transmit concise, visually engaging, and streamlined annual and semi-annual reports to shareholders that highlight key information. Other information, including financial statements, will no longer appear in a streamlined shareholder report but will be available online and filed semi-annually on Form N-CSR; you can also request a copy be delivered to you free of charge. The rule and form amendments have a compliance date of July 24, 2024. Prior to this compliance date and as permitted by current SEC regulations, paper copies of the Funds’ shareholder reports will no longer be sent by mail unless you specifically request paper copies of the reports from the Funds or from your financial intermediary, such as a broker-dealer or bank. Instead, the reports will be made available on a website, and you will be notified by mail each time a report is posted and provided with a website link to access the report. You may elect to receive all future reports in paper free of charge. You can inform the Funds or your financial intermediary that you wish to continue receiving paper copies of your shareholder reports by calling or sending an e-mail request. Your election to receive reports in paper will apply to all funds held with the Fund complex/your financial intermediary.
TABLE OF CONTENTS
| FinTrust Income and Opportunity Fund | ANNUAL REPORT |
INVESTMENT HIGHLIGHTS (Unaudited)
November 30, 2023
Dear Shareholders,
Performance
In the twelve months ended November 30, 2023, the Institutional Class of our FinTrust Income and Opportunity Fund (the “Fund”) gained 3.07%(a),, while the Class A shares before sales charges gained 2.72%(a), the S&P 500® Total Return Index(b) (“S&P 500”) gained 13.84%(b), and the Morningstar Long-Short Equity Category gained 4.10%(c). For the trailing year, the Fund trailed its category, as we maintained a diversified portfolio. Our constructive investment outlook led to investments in large capitalization growth stocks as well as small capitalization companies, international stocks, and cyclical companies. We also did not overwrite option premium as regularly, as we did not want to limit the fund’s potential upside should the market rally.
During the period, the 10 largest contributors to performance, as calculated based on gain versus initial fund equity, were well diversified. Seven of the top 10 performers were equity long positions, 1 top performer was a gold focused position, and 2 of the top ten position performers were equity short positions. Specifically, the long related top contributors to performance were travel related company Expedia (0.97%), social media company Meta (0.73%), Chinese e-commerce platform PDD Holdings (0.69%), cybersecurity company Palo Alto Networks (0.56%), streaming platform Netflix (0.52%), biotech company Regeneron Pharmaceuticals (0.36%), SPDR Gold shares (0.31%), and Verizon Communications (0.28%). The two short positions which contributed to top 10 performance were both short trades in vaccine manufacturer Moderna (0.40%) and (0.28%).
A full discussion regarding the short position in Moderna could fill a book, but briefly, while we were initially excited by the potential intracellar nature of the drug delivery technology, we do not think the safety and efficacy profile is properly understood. Given the expedited nature of the vaccine rollouts, we do not believe that the safety profile was adequately studied, and hence the broad-based immunity for the manufacturers. In fact, Pfizer had requested 75 years to release certain data. In addition to inadequate safety testing of the technology, we also suspect there were basic manufacturing issues at facilities which were unlikely to have had traditional pre-drug rollout inspections due to Covid. We had noticed specific problem batches in Japan were reportedly traced to specific facilities in Spain. Beyond technology and manufacturing issues, we believe the Covid period has also led to a significant breakdown of medical ethics. We would not be surprised to find years from now that there are blind batch tests being conducted, or that will be able to be conducted, by batch number. All of this data will have been obtained without the informed consent of the trial participant.
When reviewing the 10 largest detractors from performance, two hailed from the automotive sector: General Motors (-0.43%) and Volkswagen AG (-0.51%). We believe the automotive market is experiencing numerous confusing trends which will clear with time. First, there is the fundamental shift toward electric vehicles, but buyer charging anxiety, costs, and other factors like Tesla’s first mover advantage have created some buyer reluctance and confusion. Secondly, the automotive supply chain was highly disrupted due to the Covid shutdown. A third factor, which has specifically impacted Volkswagen was the Ukraine war which spiked European energy prices, and finally there have been issues with labor unions in the U.S.
Another large detractor on two separate trades was Darling Ingredients (-0.66%) and (-0.31%), a leader in rendering and recycling cooking oils into fuels. The stock was impacted by declining prices and questions regarding the economics associated with various ESG companies. We believe cooking oil rendering is a permanent part of the energy infrastructure as circular supply chains are economic. As an example, a key customer win for the company was with the privately held Chick-fil-a.
Our largest performance detractor was in AdvanSix (-1.13%), a somewhat cyclical business that makes engineered resins used to produce plastics, fibers, filaments and films which go into a large number of products and industries. Another chemical related business that was a detractor for the fund was Olin Corp (-0.43%), which we purchased as a hedge against political instability given that it is a manufacturer of ammunition.
Chinese e-commerce company Alibaba (-0.24%) also detracted from performance, as the stock remains under pressure as Chinese regulators seek to break-up the company. We believe the situation is analogous to the break-up of AT&T in the U.S. in 1984.
Canopy Growth Corp. (-0.38%) was another top 10 detractor from performance. While we are skeptical regarding the potential reach of the recreational cannabis market and cognizant of the negative side effects of recreational use, we believe cannabis has the opportunity to cannibalize a large portion of the opioid market if it can receive federal approval. Cannabis legalization is increasing at a state level, but the federal authorities continue to take a very gradual approach. In addition, California’s high home grower rules have led to pricing declines for regulated manufacturers in that very large potential market.
Our final two top detractors were market related hedging positions in S&P 500 put options (-0.37%) and short positions in the Nasdaq 100 (-0.23%).
| FinTrust Income and Opportunity Fund | ANNUAL REPORT |
INVESTMENT HIGHLIGHTS (Unaudited) (continued)
November 30, 2023
The Economic Climate
In last year’s letter, we wrote the following:
“We believe markets have begun pricing in a mild inflationary driven recession. Inflation typically hurts profit margins initially as costs rise faster than companies can reprice their goods and contracts. We believe there have been three forces behind today’s inflation: the Covid stimulus and recovery, millennial demographics, and Green New Deal policies, which fundamentally seek to raise energy prices in order to encourage substitution and conservation. At this point, we believe the sharp Covid recovery and associated supply chain issues have corrected. We also believe companies are slowly adjusting to the country’s new demographics, but we believe this will be a four-year process as the peak baby boom years were 1957-1961 and the peak millennial birth years were 1989-1993. We also believe the recent Congressional elections will moderate Green New Deal policies.”
“While we expect an inflation induced slowdown in 2023, we believe much of this risk is already priced into smaller capitalization companies.”
We continued and wrote:
“We believe it is important to remember during these inflationary times that companies must eventually pass through all their costs, otherwise they will go out of business. As a result, the long-term record suggests that equity markets have traditionally outpaced inflation, cash and cash equivalents, and bonds over time.”
Small-Caps Rally at the Finish
It took slightly longer than we expected, but here towards the close of 2023, small-capitalization stocks finally began an accelerated rally. The removal of the two negatives of higher energy prices and higher interest rates has spurred a significant broad-based equity market rally here in the fourth quarter of 2023. The rally began in conjunction with the peak in energy prices and the events in Israel. Energy prices have dropped significantly since oil’s September 29th high. In addition, the market now anticipates that the Federal Reserve will be cutting short-term interest rates in the new year.
Our Current Outlook
Many markets and economic data series have returned toward historical averages. For example, since the creation of OPEC, the average inflation adjusted price of oil is $23.74, which equates to about $72.90 a barrel today. In November, the twelve-month Consumer Price Index inflation reading was 3.14% verse its 100 plus year average of 3%. Meanwhile, in the fixed income markets, the yield on Moody’s AAA corporate bonds averaged 5.28% in November verse a 100-year average of 5.64%.
Similarly, in conducting our annual Ben Graham (Warren Buffet’s mentor) analysis of the 30 Dow Jones Industrial Average stocks this year, we noticed that equity valuations are just slightly above historical averages. While fixed income returns seem more certain and are certainly more competitive against stocks than in the recent past, we continue to believe that equity markets will offer real returns (“meaning the return after inflation”). The question we must always answer, however, is whether we currently have average conditions.
Budget Deficits, The Yield Curve Challenge, and Election Year Dynamics
Today’s average valuations make us constructive on the equity markets for 2024, but we do not believe it will be turbulence free sailing for investors. First, the yield curve remains inverted, meaning that long-term interest rates remain below short-term interest rates. Bond investors seem confident that the highs are in for interest rates for this cycle. Cyclically, this may be true, but on a longer-term basis, we remain concerned about the secular level of interest rates given that the Congressional Budget Office is projecting deficits of between 5-7% of GDP for the next decade. Historically, the deficit and the inflation rate are correlated. If that remains the case, then bond yields lower than these levels must be viewed with some caution.
We believe fixed income investors are anticipating a return to “normal” when they really should be pricing in higher for longer inflation rates. We believe the interest rate mispricing could appear once the Federal Reserve stops acting “hawkish” and cuts rates. Even a slight short-term interest rate cut, in our opinion, could lead to a dramatic rise in long-term interest rates.
In fact, the last time the yield curve had its current shape was during the election cycle of (1979-1980). During that election year, the yield curve dramatically straightened out during the first half of the year. We think that a rise in long-term interest rates could cause a sharp, quick but brief equity market decline.
| FinTrust Income and Opportunity Fund | ANNUAL REPORT |
INVESTMENT HIGHLIGHTS (Unaudited) (continued)
November 30, 2023
China and Energy – It only recently re-opened from Covid
Historically, oil prices top 4-5 months before the top of a business cycle and bottom 6-7 months after the trough in economic activity. At this point the high for energy prices was June of 2022 and the most recent low was May of 2023. Investors seem to be forgetting that China only began reopening its economy from Covid in early 2023. As a result, we believe energy prices are unlikely to fall further, and they may begin to strengthen again in 2024 as economic activity in China begins to rebound.
Asset Allocation
As of November 30, 2023, the portfolio consisted of 86.46% of total market value invested in common and preferred stocks and exchange traded funds, 1.85% invested in money market funds, 5.86% invested in U.S. Treasury Securities, 0.94% invested in put option contracts, and 4.89% was invested in call options on equity securities.
Sector Weightings (as of November 30, 2023)
The portfolio weightings by sector on a market value basis are outlined below:
| Sector Diversification | % of Market Value |
| Basic Materials | 4.37% |
| Communication Services | 15.41% |
| Consumer Discretionary | 23.23% |
| Consumer Staples | 10.73% |
| Energy | 1.60% |
| Financials | 7.47% |
| Healthcare | 12.33% |
| Index | 7.08% |
| Industrials | 3.15% |
| Information Technology | 6.89% |
| Utilities | 0.03% |
| Money Market Funds | 1.85% |
| U.S. Treasury Securities | 5.86% |
Conclusion
Thank you for investing and joining us as fellow shareholders in the FinTrust Income and Opportunity Fund. We continue to work hard to justify your confidence and trust in our stewardship of your hard-earned savings. We also remain dedicated to providing you with the information we would like to have if our roles were reversed.
Shape the future,
Allen R. Gillespie, CFA
Chief Investment Officer
| FinTrust Income and Opportunity Fund | ANNUAL REPORT |
INVESTMENT HIGHLIGHTS (Unaudited) (continued)
November 30, 2023
(a) The performance quoted assumes the reinvestment of all dividend and capital gain distributions, if any, and represents past performance, which is not a guarantee of future results. The returns shown do not reflect taxes that a shareholder would pay on Fund distributions or on the redemption of Fund shares. The investment return and principal value of an investment will fluctuate and, therefore, an investor’s shares, when redeemed, may be worth more or less than their original cost. The performance information shown for the Fund’s Class A shares does not reflect any front-end sales load. Please see the Total Return Table on the following pages for performance information on the Fund’s Class A shares (with sales load). Updated performance data current to the most recent month-end can be obtained by calling 1-877-244-6235. Investors should consider the investment objectives, risks, charges and expenses carefully before investing or sending money. This and other important information about the Fund can be found in the Fund’s prospectus. Please read it carefully before investing.
(b) The S&P 500® Total Return Index is a broad unmanaged index of 500 stocks, which is widely recognized as representative of the equity market in general. Please note that indices do not take into account any fees and expenses of investing in the individual securities that they track and individuals cannot invest directly in any index.
(c) The Morningstar Long-Short Category represents funds that hold sizeable stakes in both long and short positions in equities, exchange traded funds, and related derivatives. Some funds that fall into this category will shift their exposure to long and short positions depending on their macro outlook or the opportunities they uncover through bottom-up research. At least 75% of the assets are in equity securities or derivatives, and funds in the category will typically have beta values to relevant benchmarks of between 0.3 and 0.8. The information contained herein is proprietary to Morningstar and/or its content providers; may not be copied or distributed; and is not warranted to be accurate, complete or timely. Neither Morningstar not its content providers are responsible for any damages or losses arising from any use of this information.
| FinTrust Income and Opportunity Fund | ANNUAL REPORT |
INVESTMENT HIGHLIGHTS (Unaudited)
November 30, 2023
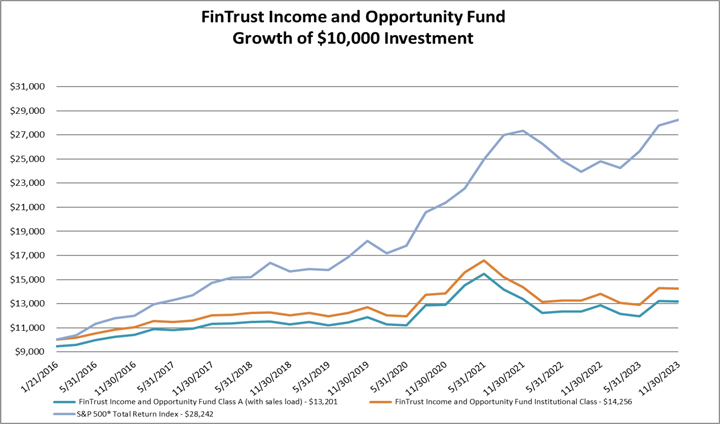
| Returns as of November 30, 2023 | | One Year ended November 30, 2023 | Five Years ended November 30, 2023 | | Since Inception from January 21, 2016 through November 30, 2023 |
| FinTrust Income and Opportunity Fund Class A shares without sales charge | | 2.72% | 3.18% | | 4.34% |
| FinTrust Income and Opportunity Fund Class A shares with sales charge | | (2.93)% | 2.02% | | 3.60% |
| FinTrust Income and Opportunity Fund Institutional Class shares | | 3.07% | 3.46% | | 4.61% |
| S&P 500® Total Return Index | | 13.84% | 12.51% | | 14.12% |
The performance information quoted in this annual report assumes the reinvestment of all dividend and capital gain distributions, if any, and represents past performance, which is not a guarantee of future results. The returns shown do not reflect taxes that a shareholder would pay on Fund distributions or on the redemption of Fund shares. The investment return and principal value of an investment will fluctuate and, therefore, an investor’s shares, when redeemed, may be worth more or less than their original cost. Updated performance data current to the most recent month-end can be obtained by calling 1-877-244-6235.
The above graph depicts the performance of the FinTrust Income and Opportunity Fund versus the S&P 500® Total Return Index. The S&P 500® Total Return Index is a broad unmanaged index of 500 stocks, which is widely recognized as representative of the equity market in general. Please note that indices do not take into account any fees and expenses of investing in the individual securities that they track and individuals cannot invest directly in any index.
As with any fund, save an index fund, that commonly compares its performance to the S&P 500® Total Return Index, such a comparison may be said to be inappropriate because of the dissimilarity between the Fund’s investments and the securities comprising the index; so too with the FinTrust Income and Opportunity Fund, which will generally not invest in all the securities comprising the index.
| FinTrust Income and Opportunity Fund | ANNUAL REPORT |
INVESTMENT HIGHLIGHTS (Unaudited) (continued)
November 30, 2023
The investment objective of the FinTrust Income and Opportunity Fund (the “Fund”) is total return comprised of income and capital appreciation. To meet its investment objective, the Fund will invest primarily in domestic equity securities that in the opinion of FinTrust Capital Advisors, LLC (the “Adviser”) have above average intellectual property portfolios and other characteristics, like strong earnings and dividend growth that are members of the S&P 1500 Composite. The S&P 1500 Composite combines the S&P 500, an index of large-capitalization issuers, the S&P Midcap 400, and the S&P Small Cap 600 to cover approximately 90% of the U.S. market capitalization. The Fund also engages in short selling to the extent permitted under the Investment Company Act of 1940 (the “1940 Act”). The Fund may invest in the securities of other investment companies, including exchange-traded funds (“ETFs”), to the extent that such investments are consistent with the Fund’s investment objective and the policies are permissible under the 1940 Act. The Fund will seek to produce income through dividends paid on securities and options (e.g., premium income on the sale of an option), and total return through an options strategy.
The Fund will typically invest in issuers that have established markets and operations and generate excess cash flow. The Fund looks for stocks with attributes which suggest they will thrive in good markets and survive potential economic setbacks. The Fund employs detailed quantitative assessments to construct its equity portfolio. Portfolio parameters include, but are not limited to, a quantitative valuation of the strength of the company’s intellectual property portfolio, steady growing earnings, dividend yield with a tendency to raise such yield and availability at reasonable price-earnings ratios. The Fund seeks to invest in stocks that are undervalued by the market, but with strong business models, which may provide for lower levels of market volatility or non-correlated volatility. The Fund also prefers to invest in equity stocks that have options traded on them. The Fund will rebalance and adjust its equity portfolio as the Adviser deems necessary and appropriate.
The Fund may also invest in companies that are experiencing a “special situation” that makes them undervalued relative to their long-term potential. Developments creating special situations may include new intellectual property developments, intellectual property licensing deals, mergers, spin-offs, litigation resolutions, new products or management changes. The Fund may also invest in convertible securities. The Fund also seeks to generate income for shareholders by selling options against the risk taken by owning common stocks. For example, the Fund intends to sell covered call options on a portion of its stock holdings. This income is designed to, over time, add to portfolio stability and improve returns. The Fund also uses options to limit market exposure and volatility. The extent of option selling will depend upon market conditions and the Adviser’s judgment as to the advantages of selling call options on the Fund’s equity investments.
The Fund is non-diversified - which means that it can invest a greater percentage of its assets in a small group of issuers or any one issuer than a diversified fund can. The Fund may be appropriate for investors with long-term time horizons who are not sensitive to short-term losses and want to participate in the long-term growth of the financial markets. The Fund seeks to avoid or minimize the effects of inflation on the portfolio.
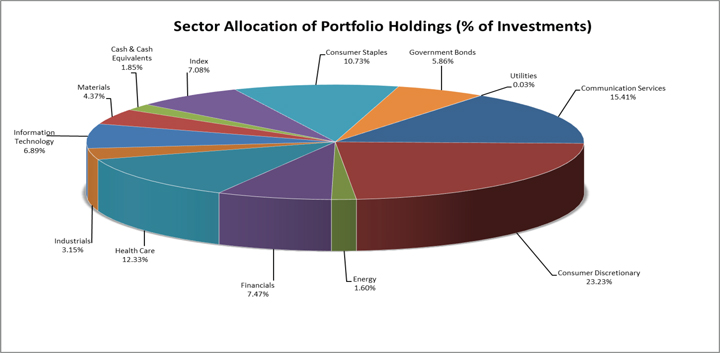
The percentages in the above graph are based on the portfolio holdings of the Fund as of November 30, 2023 and are subject to change. For a detailed break-out of holdings by industry and investment type, please refer to the Schedule of Investments.
| FINTRUST INCOME AND OPPORTUNITY FUND | |
| SCHEDULE OF INVESTMENTS | |
| November 30, 2023 | ANNUAL REPORT |
| COMMON STOCK - 76.85% | | Shares | | | Value | |
| | | | | | | |
| Aerospace & Defense - 0.92% | | | | | | | | |
| RTX Corp. | | | 2,000 | | | $ | 162,960 | |
| | | | | | | | | |
| Agriculture - 4.47% | | | | | | | | |
| Archer-Daniels-Midland Co. | | | 7,000 | | | | 516,110 | |
| Darling Ingredients, Inc. (a) | | | 6,300 | | | | 276,381 | |
| | | | | | | | 792,491 | |
| Apparel - 0.93% | | | | | | | | |
| NIKE, Inc. - Class B | | | 1,500 | | | | 165,405 | |
| | | | | | | | | |
| Auto Manufacturers - 9.01% | | | | | | | | |
| General Motors Co. | | | 10,000 | | | | 316,000 | |
| Tesla, Inc. (a) | | | 4,000 | | | | 960,320 | |
| Volkswagen AG - Germany - ADR | | | 25,000 | | | | 322,248 | |
| | | | | | | | 1,598,568 | |
| Beverages - 5.50% | | | | | | | | |
| Coca-Cola Co. | | | 10,000 | | | | 584,400 | |
| Molson Coors Beverage Co. - Class B | | | 5,000 | | | | 307,700 | |
| Safety Shot, Inc. (a) | | | 18,800 | | | | 84,224 | |
| | | | | | | | 976,324 | |
| Biotechnology - 9.22% | | | | | | | | |
| Amgen, Inc. | | | 1,700 | | | | 458,388 | |
| Exelixis, Inc. (a) | | | 20,000 | | | | 436,200 | |
| Regeneron Pharmaceuticals, Inc. (a) | | | 900 | | | | 741,429 | |
| | | | | | | | 1,636,017 | |
| Chemicals - 4.20% | | | | | | | | |
| AdvanSix, Inc. | | | 10,441 | | | | 272,823 | |
| Olin Corp. | | | 10,000 | | | | 471,400 | |
| | | | | | | | 744,223 | |
| Commercial Services - 1.30% | | | | | | | | |
| PayPal Holdings, Inc. (a) | | | 4,000 | | | | 230,440 | |
| | | | | | | | | |
| Diversified Financial Services - 0.96% | | | | | | | | |
| American Express Co. | | | 1,000 | | | | 170,770 | |
| | | | | | | | | |
| Energy - Alternate Sources - 0.23% | | | | | | | | |
| Plug Power, Inc. (a) | | | 10,000 | | | | 40,400 | |
| | | | | | | | | |
| Insurance - 1.19% | | | | | | | | |
| Loews Corp. | | | 3,000 | | | | 210,870 | |
| FINTRUST INCOME AND OPPORTUNITY FUND | |
| SCHEDULE OF INVESTMENTS | |
| November 30, 2023 | ANNUAL REPORT |
| COMMON STOCK - 76.85% (continued) | | Shares | | | Value | |
| | | | | | | |
| Internet - 23.11% | | | | | | | | |
| Alibaba Group Holding Ltd. - China - ADR (a) | | | 10,000 | | | $ | 748,800 | |
| Alphabet, Inc. - Class C (a) | | | 4,500 | | | | 602,640 | |
| Baidu, Inc. - China - ADR (a) | | | 3,000 | | | | 355,980 | |
| Expedia Group, Inc. (a) | | | 5,000 | | | | 680,900 | |
| JD.com, Inc. - China - ADR | | | 9,000 | | | | 246,870 | |
| Meta Platforms, Inc. - Class A (a) | | | 1,000 | | | | 327,150 | |
| Netflix, Inc. (a) | | | 1,000 | | | | 473,970 | |
| Palo Alto Networks, Inc. (a) | | | 1,000 | | | | 295,090 | |
| PDD Holdings, Inc. - Ireland - ADR (a) | | | 2,500 | | | | 368,600 | |
| | | | | | | | 4,100,000 | |
| Machinery - Construction & Mining - 1.10% | | | | | | | | |
| Oshkosh Corp. | | | 2,000 | | | | 194,580 | |
| | | | | | | | | |
| Pharmaceuticals - 4.06% | | | | | | | | |
| Canopy Growth Corp. - Canada (a) | | | 125,000 | | | | 70,000 | |
| Cardinal Health, Inc. | | | 1,500 | | | | 160,620 | |
| Merck & Co., Inc. | | | 2,500 | | | | 256,200 | |
| Neurocrine Biosciences, Inc. (a) | | | 2,000 | | | | 233,180 | |
| | | | | | | | 720,000 | |
| | | | | | | | | |
| Pipelines - 1.54% | | | | | | | | |
| Cheniere Energy, Inc. | | | 1,500 | | | | 273,225 | |
| | | | | | | | | |
| Retail - 0.66% | | | | | | | | |
| Nordstrom, Inc. | | | 7,500 | | | | 117,150 | |
| | | | | | | | | |
| Semiconductors - 3.96% | | | | | | | | |
| NVIDIA Corp. | | | 1,500 | | | | 701,550 | |
| | | | | | | | | |
| Software - 2.33% | | | | | | | | |
| Electronic Arts, Inc. | | | 3,000 | | | | 414,030 | |
| | | | | | | | | |
| Telecommunications - 2.16% | | | | | | | | |
| Verizon Communications, Inc. | | | 10,000 | | | | 383,300 | |
| | | | | | | | | |
| TOTAL COMMON STOCK (Cost $13,742,094) | | | | | | | 13,632,303 | |
| | | | | | | | | |
| PREFERRED STOCK - 2.63% | | | | | | | | |
| | | | | | | | | |
| Banks - 2.63% | | | | | | | | |
| United Community Banks, Inc., 6.875% - Series I (b) (d) | | | 21,000 | | | | 467,040 | |
| | | | | | | | | |
| TOTAL PREFERRED STOCK (Cost $529,751) | | | | | | | 467,040 | |
| FINTRUST INCOME AND OPPORTUNITY FUND | |
| SCHEDULE OF INVESTMENTS | |
| November 30, 2023 | ANNUAL REPORT |
| EXCHANGE-TRADED FUNDS - 5.32% | | Shares | | | Value | |
| | | | | | | |
| Commodity Fund - 5.32% | | | | | | | | |
| SPDR Gold Shares (a) | | | 5,000 | | | $ | 943,750 | |
| | | | | | | | | |
| TOTAL EXCHANGE-TRADED FUNDS (Cost $890,480) | | | | | | | 943,750 | |
| | | | | | | | | |
| GOVERNMENT BONDS - 5.63% | | | | | | | | |
| U.S. Treasury Note, 4.750% due 07/31/2025 (b) | | $ | 1,000,000 | | | | 998,320 | |
| | | | | | | | | |
| TOTAL GOVERNMENT BONDS (Cost $998,384) | | | | | | | 998,320 | |
| OPTIONS PURCHASED - 5.64% |
| | | | | | Notional | | | Exercise | | | | | | | |
| CALL OPTIONS PURCHASED - 4.74% | | Contracts 1 | | | Amount | | | Price | | | Expiration | | | | |
| Alphabet, Inc. - Class C | | | 30 | | | $ | 360,000 | | | $ | 120.00 | | | | 12/15/2023 | | | | 40,410 | |
| Boeing Co. | | | 30 | | | | 570,000 | | | | 190.00 | | | | 1/19/2024 | | | | 127,950 | |
| Charles Schwab Corp. | | | 50 | | | | 250,000 | | | | 50.00 | | | | 1/19/2024 | | | | 60,000 | |
| Charles Schwab Corp. | | | 50 | | | | 275,000 | | | | 55.00 | | | | 1/19/2024 | | | | 37,650 | |
| Eli Lilly & Co. | | | 10 | | | | 590,000 | | | | 590.00 | | | | 4/19/2024 | | | | 50,580 | |
| Goldman Sachs Group, Inc. | | | 20 | | | | 600,000 | | | | 300.00 | | | | 1/19/2024 | | | | 96,100 | |
| iShares Russell 2000 ETF | | | 70 | | | | 1,190,000 | | | | 170.00 | | | | 2/16/2024 | | | | 92,050 | |
| Meta Platforms, Inc. - Class A | | | 15 | | | | 510,000 | | | | 340.00 | | | | 3/15/2024 | | | | 27,960 | |
| NVIDIA Corp. | | | 18 | | | | 846,000 | | | | 470.00 | | | | 2/16/2024 | | | | 57,960 | |
| NVIDIA Corp. | | | 15 | | | | 750,000 | | | | 500.00 | | | | 3/15/2024 | | | | 43,650 | |
| QUALCOMM, Inc. | | | 30 | | | | 360,000 | | | | 120.00 | | | | 2/16/2024 | | | | 38,850 | |
| SPDR Gold Shares | | | 50 | | | | 900,000 | | | | 180.00 | | | | 3/15/2024 | | | | 62,950 | |
| SPDR Gold Shares | | | 30 | | | | 540,000 | | | | 180.00 | | | | 5/17/2024 | | | | 44,850 | |
| SPDR Gold Shares | | | 30 | | | | 540,000 | | | | 180.00 | | | | 12/15/2023 | | | | 27,450 | |
| Tesla, Inc. | | | 18 | | | | 414,000 | | | | 230.00 | | | | 12/29/2023 | | | | 32,580 | |
| | | | | | | | | | | | | | | | | | | | | |
| TOTAL CALL OPTIONS PURCHASED (Cost $788,029) | | | | | | | | | | | | | | | | | | | 840,990 | |
| OPTIONS PURCHASED - 5.64% (continued) |
| | | | | | Notional | | | Exercise | | | | | | | |
| PUT OPTIONS PURCHASED - 0.90% | | Contracts 1 | | | Amount | | | Price | | | Expiration | | | | |
| Apple, Inc. | | | 33 | | | $ | 561,000 | | | $ | 170.00 | | | | 12/15/2023 | | | $ | 429 | |
| Caterpillar, Inc. | | | 30 | | | | 720,000 | | | | 240.00 | | | | 1/19/2024 | | | | 11,670 | |
| Costco Wholesale Corp. | | | 20 | | | | 1,180,000 | | | | 590.00 | | | | 6/21/2024 | | | | 59,600 | |
| Hawaiian Electric Industries, Inc. | | | 500 | | | | 500,000 | | | | 10.00 | | | | 12/15/2023 | | | | 5,000 | |
| Microsoft Corp. | | | 26 | | | | 975,000 | | | | 375.00 | | | | 2/16/2024 | | | | 35,750 | |
| Moderna, Inc. | | | 30 | | | | 180,000 | | | | 60.00 | | | | 1/19/2024 | | | | 2,370 | |
| Moderna, Inc. | | | 30 | | | | 210,000 | | | | 70.00 | | | | 12/15/2023 | | | | 2,130 | |
| Moderna, Inc. | | | 40 | | | | 300,000 | | | | 75.00 | | | | 12/15/2023 | | | | 8,000 | |
| Invesco QQQ Trust Series 1 | | | 45 | | | | 1,530,000 | | | | 340.00 | | | | 3/15/2024 | | | | 11,700 | |
| Invesco QQQ Trust Series 1 | | | 30 | | | | 1,104,000 | | | | 368.00 | | | | 3/15/2024 | | | | 19,650 | |
| Invesco QQQ Trust Series 1 | | | 30 | | | | 1,065,000 | | | | 355.00 | | | | 12/15/2023 | | | | 690 | |
| Invesco QQQ Trust Series 1 | | | 50 | | | | 1,830,000 | | | | 366.00 | | | | 12/15/2023 | | | | 2,500 | |
| SPDR S&P 500 ETF Trust | | | 50 | | | | 2,195,000 | | | | 439.00 | | | | 12/1/2023 | | | | 50 | |
| SPDR S&P 500 ETF Trust | | | 40 | | | | 1,520,000 | | | | 380.00 | | | | 12/29/2023 | | | | 560 | |
| | | | | | | | | | | | | | | | | | | | | |
| TOTAL PUT OPTIONS PURCHASED (Cost $444,895) | | | | | | | | | | | | | | | | | | | 160,099 | |
| | | | | | | | | | | | | | | | | | | | | |
| TOTAL OPTIONS PURCHASED (Cost $1,232,924) | | | | | | | | | | | | | | | | | | | 1,001,089 | |
| FINTRUST INCOME AND OPPORTUNITY FUND | |
| SCHEDULE OF INVESTMENTS | |
| November 30, 2023 | ANNUAL REPORT |
| | | Shares | | | Value | |
| SHORT-TERM INVESTMENTS - 1.78% | | | | | | | | |
| Federated Hermes Government Obligations Fund - Institutional Shares, 5.23% (c) | | | 315,500 | | | $ | 315,500 | |
| | | | | | | | | |
| SHORT-TERM INVESTMENTS (Cost $315,500) | | | | | | | 315,500 | |
| | | | | | | | | |
| INVESTMENTS AT VALUE (Cost $17,709,133) - 97.85% | | | | | | $ | 17,358,002 | |
| | | | | | | | | |
| TOTAL SECURITIES SOLD SHORT, AT VALUE (Proceeds $301,109) - (1.75)% | | | | | | $ | (310,800 | ) |
| | | | | | | | | |
| TOTAL OPTIONS WRITTEN, AT VALUE (Premiums $13,937) - (0.04)% | | | | | | | (7,260 | ) |
| | | | | | | | | |
| OTHER ASSETS IN EXCESS OF LIABILITIES, NET - 3.94% | | | | | | | 699,676 | |
| | | | | | | | | |
| NET ASSETS - 100.00% | | | | | | $ | 17,739,618 | |
Percentages are stated as a percent of net assets.
(a) Non-income producing security.
(b) All or a portion of the security is segregated as collateral for options written and securities sold short.
(c) Rate shown represents the 7-day effective yield at November 30, 2023, is subject to change and resets daily.
(d) Affiliated company. See Investments in Affiliated Companies section of the accompanying footnotes.
1 Each option contract is equivalent to 100 shares of the underlying common stock or exchange-traded fund. All options are non-income producing.
The following abbreviations are used in this portfolio:
ADR - American Depositary Receipt
AG - Aktiengesellschaft (German Public Limited Company)
ETF - Exchange-Traded Fund
Ltd. - Limited
The accompanying notes are an integral part of these financial statements.
| FINTRUST INCOME AND OPPORTUNITY FUND | |
| SCHEDULE OF INVESTMENTS - SECURITIES SOLD SHORT |
| November 30, 2023 | ANNUAL REPORT |
| SECURITIES SOLD SHORT - (1.75)% | | Shares | | | Value | |
| | | | | | | |
| COMMON STOCK SOLD SHORT - (1.75)% | | | | | | | | |
| | | | | | | | | |
| Biotechnology - (1.75)% | | | | | | | | |
| Moderna, Inc. (a) | | | 4,000 | | | $ | 310,800 | |
| | | | | | | | | |
| TOTAL COMMON STOCK SOLD SHORT (Proceeds $301,109) | | | | | | | 310,800 | |
| | | | | | | | | |
| TOTAL SECURITIES SOLD SHORT, AT VALUE (Proceeds $301,109) | | | | | | $ | 310,800 | |
Percentages are stated as a percent of net assets.
(a) Non-income producing security.
The accompanying notes are an integral part of these financial statements.
| FINTRUST INCOME AND OPPORTUNITY FUND | |
| SCHEDULE OF OPTIONS WRITTEN | |
| November 30, 2023 | ANNUAL REPORT |
| OPTIONS WRITTEN - (0.04)% | | | | | | | | | | | | | | | |
| | | | | | Notional | | | Exercise | | | | | | | |
| CALL OPTIONS WRITTEN - (0.04)% | | Contracts 1 | | | Amount | | | Price | | | Expiration | | | Value | |
| Moderna, Inc. | | | 30 | | | $ | 240,000 | | | $ | 80.00 | | | | 12/15/2023 | | | $ | 7,260 | |
| | | | | | | | | | | | | | | | | | | | | |
| TOTAL CALL OPTIONS WRITTEN (Premiums $13,937) | | | | | | | | | | | | | | | | | | | 7,260 | |
| | | | | | | | | | | | | | | | | | | | |
| TOTAL OPTIONS WRITTEN (Premiums $13,937) | | | | | | | | | | | | | | | | | | $ | 7,260 | |
Percentages are stated as a percent of net assets.
1 Each option contract is equivalent to 100 shares of the underlying stock. All options are non-income producing.
The accompanying notes are an integral part of these financial statements.
FINTRUST INCOME AND OPPORTUNITY FUND
STATEMENT OF ASSETS AND LIABILITIES
| November 30, 2023 | | ANNUAL REPORT |
| Assets: | | | |
| | | | |
| Unaffiliated Investments, at cost | | $ | 17,179,382 | |
| Affiliated Investments, at cost | | | 529,751 | |
| Total Investments, at cost | | | 17,709,133 | |
| Unaffiliated Investments, at value | | | 16,890,962 | |
| Affiliated Investments, at value | | | 467,040 | |
| Total Investments, at value | | | 17,358,002 | |
| Deposits at broker for options written and securities sold short | | | | |
| Interactive Brokers, LLC | | | 1,435,281 | |
| Receivables: | | | | |
| Interest | | | 26,823 | |
| Dividends | | | 24,132 | |
| Investment securities sold | | | 363,527 | |
| Prepaid expenses | | | 1,394 | |
| Total assets | | | 19,209,159 | |
| | | | | |
| Liabilities: | | | | |
| Premiums from options written | | $ | 13,937 | |
| Proceeds of securities sold short | | | 301,109 | |
| Options written, at value | | | 7,260 | |
| Securities sold short, at value | | | 310,800 | |
| Payables: | | | | |
| Investment securities purchased | | | 1,117,896 | |
| Fund shares redeemed | | | 9,323 | |
| Due to adviser | | | 11,306 | |
| Accrued distribution (12b-1) fees | | | 266 | |
| Due to administrator | | | 8,906 | |
| Accrued Trustee fees | | | 983 | |
| Accrued expenses | | | 2,801 | |
| Total liabilities | | | 1,469,541 | |
| Net Assets | | $ | 17,739,618 | |
| | | | | |
| Sources of Net Assets: | | | | |
| Paid-in capital | | $ | 18,760,769 | |
| Total accumulated deficit | | | (1,021,151 | ) |
| Total Net Assets | | $ | 17,739,618 | |
| | | | | |
| Class A Shares: | | | | |
| Net Assets | | $ | 52,120 | |
| Shares Outstanding (Unlimited shares of $0 par value beneficial interest authorized) | | | 5,118 | |
| Net Asset Value Per Share | | $ | 10.18 | |
| | | | | |
| Maximum Offering Price Per Share (a) | | $ | 10.77 | |
| | | | | |
| Minimum Redemption Price Per Share (b) | | $ | 10.08 | |
| | | | | |
| Institutional Class Shares: | | | | |
| Net Assets | | $ | 17,687,498 | |
| Shares Outstanding (Unlimited shares of $0 par value beneficial interest authorized) | | | 1,697,973 | |
| Net Asset Value, Offering and Redemption Price Per Share | | $ | 10.42 | |
(a) A maximum sales charge of 5.50% is imposed on Class A shares.
(b) Investments in Class A shares made at or above the $1 million breakpoint are not subject to an initial sales charge and may be subject to a 1.00% contingent deferred sales charge (“CDSC”) on shares redeemed within one year from the date of purchase.
The accompanying notes are an integral part of these financial statements.
FINTRUST INCOME AND OPPORTUNITY FUND
STATEMENT OF OPERATIONS | ANNUAL REPORT |
| | | For the | |
| | | Year Ended | |
| | | November 30, 2023 | |
| | | | |
| Investment income: | | | | |
| Dividends (net of foreign withholding taxes of $6,117) | | $ | 168,104 | |
| Dividends from affiliates (Note 10) | | | 36,094 | |
| Interest | | | 153,062 | |
| Total investment income | | | 357,260 | |
| | | | | |
| Expenses: | | | | |
| Management fees (Note 6) | | | 201,277 | |
| Distribution (12b-1) fees - Class A (Note 6) | | | 275 | |
| Accounting and transfer agent fees and expenses (Note 6) | | | 98,393 | |
| Legal fees | | | 25,447 | |
| Reports to shareholders | | | 20,589 | |
| Trustee fees and expenses | | | 20,551 | |
| Audit fees | | | 14,500 | |
| Miscellaneous | | | 13,718 | |
| Compliance officer fees (Note 6) | | | 12,900 | |
| Custodian fees | | | 10,088 | |
| Pricing fees | | | 9,428 | |
| Insurance | | | 6,104 | |
| Interest expense | | | 3,563 | |
| Registration and filing fees | | | 1,578 | |
| Dividends on securities sold short | | | 365 | |
| Total expenses | | | 438,776 | |
| Less: fees waived (Note 6) | | | (120,587 | ) |
| Net expenses | | | 318,189 | |
| | | | | |
| Net investment lncome | | | 39,071 | |
| | | | | |
| Realized and unrealized gain (loss): | | | | |
| Net realized gain (loss) on: | | | | |
| Unaffiliated Investments | | | (360,289 | ) |
| Options written | | | 300,368 | |
| Securities sold short | | | 381,802 | |
| Net realized gain on investments, options written and securities sold short | | | 321,881 | |
| | | | | |
| Net change in unrealized appreciation (depreciation) on: | | | | |
| Unaffiliated Investments | | | 167,481 | |
| Affiliated Investments | | | (56,910 | ) |
| Options written | | | 6,677 | |
| Securities sold short | | | (9,691 | ) |
| Net change in unrealized appreciation on investments, options written and securities sold short | | | 107,557 | |
| | | | | |
| Net realized and unrealized gain on investments, options written and securities sold short | | | 429,438 | |
| | | | | |
| Net increase in net assets resulting from operations | | $ | 468,509 | |
The accompanying notes are an integral part of these financial statements.
FINTRUST INCOME AND OPPORTUNITY FUND
STATEMENTS OF CHANGES IN NET ASSETS | ANNUAL REPORT |
| | | For the | | | For the | |
| | | Year Ended | | | Year Ended | |
| | | November 30, 2023 | | | November 30, 2022 | |
| | | | | | | |
| Increase (decrease) in net assets from: | | | | | | | | |
| Operations: | | | | | | | | |
| Net investment income (loss) | | $ | 39,071 | | | $ | (155,188 | ) |
| Net realized gain (loss) on investments, options written and securities sold short | | | 321,881 | | | | (662,577 | ) |
| Net change in unrealized appreciation (depreciation) on investments, options written and securities sold short | | | 107,557 | | | | (190,556 | ) |
| Net increase (decrease) in net assets resulting from operations | | | 468,509 | | | | (1,008,321 | ) |
| | | | | | | | | |
| Distributions to shareholders from: | | | | | | | | |
| Total distributable earnings - Class A | | | — | | | | (4,443 | ) |
| Total distributable earnings - Institutional Class | | | — | | | | (1,288,850 | ) |
| Total distributions | | | — | | | | (1,293,293 | ) |
| | | | | | | | | |
| Capital share transactions (Note 4): | | | | | | | | |
| Increase (decrease) in net assets from capital share transactions | | | 238,141 | | | | (4,166,285 | ) |
| | | | | | | | | |
| Increase (decrease) in net assets | | | 706,650 | | | | (6,467,899 | ) |
| | | | | | | | | |
| Net Assets: | | | | | | | | |
| Beginning of year | | | 17,032,968 | | | | 23,500,867 | |
| | | | | | | | | |
| End of year | | $ | 17,739,618 | | | $ | 17,032,968 | |
The accompanying notes are an integral part of these financial statements.
FINTRUST INCOME AND OPPORTUNITY FUND
FINANCIAL HIGHLIGHTS | ANNUAL REPORT |
The following tables set forth the per share operating performance data for a share of beneficial interest outstanding, total return, ratios to average net assets and other supplemental data for the years indicated.
| | | Class A | |
| | | | | | | | | | | | | | | | | | | | | |
| | | For the | | | For the | | | For the | | | For the | | | For the | |
| | | Year Ended | | | Year Ended | | | Year Ended | | | Year Ended | | | Year Ended | |
| | | November 30, 2023 | | | November 30, 2022 | | | November 30, 2021 | | | November 30, 2020 | | | November 30, 2019 | |
| | | | | | | | | | | | | | | | | | | | | |
| Net Asset Value, Beginning of Year | | $ | 9.91 | | | $ | 10.96 | | | $ | 11.19 | | | $ | 10.71 | | | $ | 10.73 | |
| | | | | | | | | | | | | | | | | | | | | |
| Investment Operations: | | | | | | | | | | | | | | | | | | | | |
| Net investment Income (loss) (a) | | | 0.01 | | | | (0.10 | ) | | | (0.18 | ) | | | (0.15 | ) | | | (0.06 | ) |
| Net realized and unrealized gains (losses) on investments, options written and securities sold short | | | 0.26 | | | | (0.32 | ) | | | 0.58 | | | | 1.05 | | | | 0.56 | |
| Total from investment operations | | | 0.27 | | | | (0.42 | ) | | | 0.40 | | | | 0.90 | | | | 0.50 | |
| | | | | | | | | | | | | | | | | | | | | |
| Distributions: | | | | | | | | | | | | | | | | | | | | |
| From net realized capital gains | | | — | | | | (0.63 | ) | | | (0.63 | ) | | | (0.42 | ) | | | (0.52 | ) |
| Total distributions | | | — | | | | (0.63 | ) | | | (0.63 | ) | | | (0.42 | ) | | | (0.52 | ) |
| | | | | | | | | | | | | | | | | | | | | |
| Net Asset Value, End of Year | | $ | 10.18 | | | $ | 9.91 | | | $ | 10.96 | (d) | | $ | 11.19 | | | $ | 10.71 | |
| | | | | | | | | | | | | | | | | | | | | |
| Total Return (b) | | | 2.72 | % | | | (3.94 | )% | | | 3.57 | % | | | 8.68 | % | | | 5.32 | % |
| | | | | | | | | | | | | | | | | | | | | |
| Ratios/Supplemental Data | | | | | | | | | | | | | | | | | | | | |
| Net assets, end of year (in 000’s) | | $ | 52 | | | $ | 158 | | | $ | 82 | | | $ | 83 | | | $ | 97 | |
| | | | | | | | | | | | | | | | | | | | | |
| Ratios of expenses to average net assets: | | | | | | | | | | | | | | | | | | | | |
| Before fees waived and expenses absorbed (c) | | | 2.97 | % | | | 3.01 | % | | | 2.62 | % | | | 3.29 | % | | | 3.66 | % |
| After fees waived and expenses absorbed (c) | | | 2.22 | % | | | 2.44 | % | | | 2.35 | % | | | 2.35 | % | | | 2.22 | % |
| | | | | | | | | | | | | | | | | | | | | |
| Ratios of net investment income (loss): | | | | | | | | | | | | | | | | | | | | |
| Before fees waived and expenses absorbed (c) | | | (0.75 | )% | | | (1.68 | )% | | | (1.77 | )% | | | (2.35 | )% | | | (2.06 | )% |
| After fees waived and expenses absorbed (c) | | | 0.00 | % | | | (1.11 | )% | | | (1.50 | )% | | | (1.41 | )% | | | (0.63 | )% |
| | | | | | | | | | | | | | | | | | | | | |
| Portfolio turnover rate | | | 739.85 | % | | | 1194.80 | %(e) | | | 395.29 | % | | | 271.84 | % | | | 192.88 | % |
| (a) | Net investment loss per share is based on average shares outstanding. |
| (b) | Total Return represents the rate that the investor would have earned or lost on an investment in the Fund, assuming reinvestment of dividends and does not reflect the impact of sales charges. |
| (c) | The ratios include 0.02% of interest expense and 0.00% of dividend expense for the year ended November 30, 2023, 0.16% of interest expense and 0.08% of dividend expense during the year ended November 30, 2022, 0.13% of interest expense and 0.02% of dividend expense during the year ended November 30, 2021, 0.15% of interest expense during the year ended November 30, 2020 and 0.02% of interest expense during the year ended November 30, 2019. |
| (d) | The Net Asset Value differs from the traded NAV on November 30, 2021 due to financial statement adjustments. |
| (e) | The increase in portfolio turnover for the year ended November 30, 2022 was the result of certain market conditions occurring throughout the year which led to more active trading by the portfolio manager. |
The accompanying notes are an integral part of these financial statements.
FINTRUST INCOME AND OPPORTUNITY FUND
FINANCIAL HIGHLIGHTS | ANNUAL REPORT |
The following tables set forth the per share operating performance data for a share of beneficial interest outstanding, total return, ratios to average net assets and other supplemental data for the years indicated.
| | | Institutional Class | |
| | | | | | | | | | | | | | | | | | | | | |
| | | For the | | | For the | | | For the | | | For the | | | For the | |
| | | Year Ended | | | Year Ended | | | Year Ended | | | Year Ended | | | Year Ended | |
| | | November 30, 2023 | | | November 30, 2022 | | | November 30, 2021 | | | November 30, 2020 | | | November 30, 2019 | |
| | | | | | | | | | | | | | | | | | | | | |
| Net Asset Value, Beginning of Year | | $ | 10.11 | | | $ | 11.14 | | | $ | 11.34 | | | $ | 10.82 | | | $ | 10.81 | |
| | | | | | | | | | | | | | | | | | | | | |
| Investment Operations: | | | | | | | | | | | | | | | | | | | | |
| Net investment income (loss) (a) | | | 0.02 | | | | (0.08 | ) | | | (0.15 | ) | | | (0.12 | ) | | | (0.04 | ) |
| Net realized and unrealized gains (losses) on investments, options written and securities sold short | | | 0.29 | | | | (0.32 | ) | | | 0.58 | | | | 1.06 | | | | 0.57 | |
| Total from investment operations | | | 0.31 | | | | (0.40 | ) | | | 0.43 | | | | 0.94 | | | | 0.53 | |
| | | | | | | | | | | | | | | | | | | | | |
| Distributions: | | | | | | | | | | | | | | | | | | | | |
| From net realized capital gains | | | — | | | | (0.63 | ) | | | (0.63 | ) | | | (0.42 | ) | | | (0.52 | ) |
| Total distributions | | | — | | | | (0.63 | ) | | | (0.63 | ) | | | (0.42 | ) | | | (0.52 | ) |
| | | | | | | | | | | | | | | | | | | | | |
| Net Asset Value, End of Year | | $ | 10.42 | (d) | | $ | 10.11 | | | $ | 11.14 | (d) | | $ | 11.34 | | | $ | 10.82 | |
| | | | | | | | | | | | | | | | | | | | | |
| Total Return (b) | | | 3.07 | % | | | (3.68 | )% | | | 3.79 | % | | | 8.97 | % | | | 5.57 | % |
| | | | | | | | | | | | | | | | | | | | | |
| Ratios/Supplemental Data | | | | | | | | | | | | | | | | | | | | |
| Net assets, end of year (in 000’s) | | $ | 17,687 | | | $ | 16,875 | | | $ | 23,418 | | | $ | 17,999 | | | $ | 10,285 | |
| | | | | | | | | | | | | | | | | | | | | |
| Ratios of expenses to average net assets: | | | | | | | | | | | | | | | | | | | | |
| Before fees waived and expenses absorbed (c) | | | 2.72 | % | | | 2.76 | % | | | 2.37 | % | | | 3.04 | % | | | 3.41 | % |
| After fees waived and expenses absorbed (c) | | | 1.97 | % | | | 2.19 | % | | | 2.10 | % | | | 2.10 | % | | | 1.97 | % |
| | | | | | | | | | | | | | | | | | | | | |
| Ratios of net investment income (loss): | | | | | | | | | | | | | | | | | | | | |
| Before fees waived and expenses absorbed (c) | | | (0.50 | )% | | | (1.43 | )% | | | (1.52 | )% | | | (2.10 | )% | | | (1.81 | )% |
| After fees waived and expenses absorbed (c) | | | 0.25 | % | | | (0.86 | )% | | | (1.25 | )% | | | (1.16 | )% | | | (0.38 | )% |
| | | | | | | | | | | | | | | | | | | | | |
| Portfolio turnover rate | | | 739.85 | % | | | 1194.80 | %(e) | | | 395.29 | % | | | 271.84 | % | | | 192.88 | % |
| (a) | Net investment loss per share is based on average shares outstanding. |
| (b) | Total Return represents the rate that the investor would have earned or lost on an investment in the Fund, assuming reinvestment of dividends and does not reflect the impact of sales charges. |
| (c) | The ratios include 0.02% of interest expense and 0.00% of dividend expense for the year ended November 30, 2023, 0.16% of interest expense and 0.08% of dividend expense during the year ended November 30, 2022, 0.13% of interest expense and 0.02% of dividend expense during the year ended November 30, 2021, 0.15% of interest expense during the year ended November 30, 2020 and 0.02% of interest expense during the year ended November 30, 2019. |
| (d) | The Net Asset Value differs from the traded NAV on November 30, 2023 and November 30, 2021 due to financial statement adjustments. |
| (e) | The increase in portfolio turnover for the year ended November 30, 2022 was the result of certain market conditions occurring throughout the year which led to more active trading by the portfolio manager. |
The accompanying notes are an integral part of these financial statements.
| FinTrust Income and Opportunity Fund | ANNUAL REPORT |
NOTES TO THE FINANCIAL STATEMENTS
November 30, 2023
| 1. | ORGANIZATION AND SIGNIFICANT ACCOUNTING POLICIES |
The FinTrust Income and Opportunity Fund (the “Fund”), is a series of 360 Funds (the “Trust”). The Trust was organized on February 24, 2005 as a Delaware statutory trust, and is registered as an open-end management investment company under the 1940 Act. The Fund is a non-diversified fund. As a non-diversified fund, it may invest a significant portion of its assets in a small number of companies. The Fund’s investment objective is total return comprised of income and capital appreciation. The Fund’s investment adviser is FinTrust Capital Advisors, LLC (the “Adviser”). The Fund offers two classes of shares: Class A and Institutional Class. Each class of shares commenced operations on January 21, 2016. Each class differs as to sales and redemption charges and ongoing fees. Income and expenses (other than class specific), and realized/unrealized gains or losses are allocated to each class based on their relative net asset values. Each class represents an ownership interest in the same investment portfolio and has equal voting rights.
The following is a summary of the significant accounting policies followed by the Fund in the preparation of its financial statements. The Fund is an investment company that follows the accounting and reporting guidance of Accounting Standards Codification Topic 946 applicable to investment companies.
a) Security Valuation – All investments in securities are recorded at their estimated fair value, as described in Note 2.
b) Options – The Fund uses an option strategy in an effort to limit market exposure and volatility. The extent of option selling will depend upon market conditions and the Adviser’s judgment of the advantages of selling call options on the Fund’s equity investments. The sale of put options generates income for the Fund, but exposes it to the risk of declines in the value of the underlying assets. The risk in purchasing options is limited to the premium paid by the Fund for the options. The sale of call options generates income for the Fund, but may limit the Fund’s participation in equity market gains. The Fund’s investment adviser seeks to reduce the overall volatility of returns for the Fund by managing a portfolio of options. When the Fund writes or purchases an option, an amount equal to the premium received or paid by the Fund is recorded as a liability or an asset and is subsequently adjusted to the current market value of the option written or purchased. Premiums received or paid from writing or purchasing options which expire unexercised are treated by the Fund on the expiration date as realized gains or losses. The difference between the premium and the amount paid or received on effecting a closing purchase or sale transaction, including brokerage commissions, is also treated as a realized gain or loss. If an option is exercised, the premium paid or received is added to the cost of the purchase or proceeds from the sale in determining whether the Fund has realized a gain or a loss on investment transactions.
Purchasing and writing put and call options are highly specialized activities and entail greater than ordinary investment risks. The successful use of options depends in part on the ability of the Adviser to manage future price fluctuations and the degree of correlation between the options and securities markets. By writing put options on equity securities, the Fund gives up the opportunity to benefit from potential increases in the value of the underlying securities above the strike prices of the written put options, but continues to bear the risk of declines in the value of underlying securities held by the Fund. The Fund will receive a premium from writing a covered call option that it retains whether or not the option is exercised. The premium received from the written options may not be sufficient to offset any losses sustained from the volatility of the underlying equity securities over time.
c) Exchange-Traded Funds (“ETFs”) – The Fund may invest in ETFs. An ETF is a fund that holds a portfolio of common stocks or bonds designed to track the performance of a securities index or sector of an index. ETFs are traded on a securities exchange based on their market value. An ETF portfolio holds the same stocks or bonds as the index it tracks, so its market price reflects the value of the index at any given time. ETFs are registered investment companies and incur fees and expenses such as operating expenses, licensing fees, registration fees, trustees’ fees, and marketing expenses, and ETF shareholders, such as the Fund, pay their proportionate share of these expenses. Your cost of investing in the Fund will generally be higher than the cost of investing directly in ETFs. By investing in the Fund, you will indirectly bear fees and expenses charged by the underlying ETFs in which the Fund invests in addition to the Fund’s direct fees and expenses.
d) Federal Income Taxes – The Fund has qualified and intends to continue to qualify as a regulated investment company under Subchapter M of the Internal Revenue Code of 1986, as amended (the “Code”). It is the policy of the Fund to comply with the requirements of the Code applicable to regulated investment companies and to distribute substantially all of its net investment company taxable income and net capital gains. The Fund also intends to distribute sufficient net investment income and net capital gains, if any, so that it will not be subject to excise tax on undistributed income and gains. Therefore, no federal income tax or excise provision is required.
| FinTrust Income and Opportunity Fund | ANNUAL REPORT |
NOTES TO THE FINANCIAL STATEMENTS
November 30, 2023
| 1. | ORGANIZATION AND SIGNIFICANT ACCOUNTING POLICIES (continued) |
As of and for the year ended November 30, 2023, the Fund did not have a liability for any unrecognized tax expenses. The Fund recognizes interest and penalties, if any, related to unrecognized tax liability as income tax expense in the Statement of Operations. For the year ended November 30, 2023, the Fund did not incur any interest or penalties. The Fund identifies its major tax jurisdiction as U.S. Federal.
In addition, accounting principles generally accepted in the United States of America (“GAAP”) requires management of the Fund to analyze all open tax years, as defined by the Internal Revenue Service statute of limitations for all major jurisdictions, including federal tax authorities and certain state tax authorities. As of the year ended November 30, 2023 and for all other open tax years (years ended November 30, 2022, November 30, 2021 and November 30, 2020), the Fund did not have a liability for any unrecognized tax benefits. The Fund has no examinations in progress and is not aware of any tax positions for which it is reasonably possible that the total tax amounts of unrecognized tax benefits will significantly change in the next 12 months.
e) Distributions to Shareholders – Dividends from net investment income and distributions of net realized capital gains, if any, will be declared and paid at least annually. Income and capital gain distributions, which are determined in accordance with income tax regulations, are recorded on the ex-dividend date. GAAP requires that permanent financial reporting differences relating to shareholder distributions be reclassified to paid-in capital.
f) Use of Estimates – The preparation of financial statements in conformity with GAAP requires management to make estimates and assumptions that affect the reported amounts of assets and liabilities and disclosure of contingent assets and liabilities at the date of the financial statements and the reported amounts of revenues and expenses during the reporting period. Actual results could differ from those estimates.
g) Non-Diversified Fund – The Fund is a non-diversified fund. In general, a non-diversified fund may invest a greater percentage of its assets in a particular issue and may own fewer securities than other mutual funds. Accordingly, a non-diversified fund is generally subject to the risk that a large loss in an individual issue will cause a greater loss for the fund than it would if the fund was required to hold a larger number of securities or smaller positions.
h) Sales Charges – A maximum sales charge of 5.50% is imposed on certain purchases of Class A shares. A contingent deferred sales charge (“CDSC”) is imposed upon certain redemptions of Class A shares purchased at net asset value in amounts totaling $1 million if the dealer’s commission was paid by the underwriter and the shares are redeemed within one year from the date of purchase. The CDSC will be paid to the Distributor and will be equal to 1.00% of the lesser of (1) the net asset value at the time of purchase of the Class A shares being redeemed; or (2) the net asset value of such shares at the time of redemption. There were no CDSC Fees paid to the Distributor for the year ended November 30, 2023.
i) Expenses – Expenses incurred by the Trust that do not relate to a specific fund of the Trust are allocated to the individual funds based on each fund’s relative net assets or another appropriate basis as determined by the Board.
j) Other – Investment and shareholder transactions are recorded on trade date. The Fund determines the gain or loss realized from the investment transactions by comparing the original cost of the security lot sold with the net sales proceeds. Dividend income is recognized on the ex-dividend date or as soon as information is available to the Fund and interest income is recognized on an accrual basis. Withholding taxes on foreign dividends have been provided for in accordance with the Fund’s understanding of the applicable country’s tax rules and rates. Discounts and premiums on securities purchased are accreted and amortized over the lives of the respective securities.
Processes and Structure
The Fund��s Board of Trustees (the “Board”) adopted guidelines for valuing securities and other derivative instruments including in circumstances in which market quotes are not readily available, and has delegated authority to the Adviser to apply those guidelines in determining fair value prices, subject to review by the Board.
| FinTrust Income and Opportunity Fund | ANNUAL REPORT |
NOTES TO THE FINANCIAL STATEMENTS
November 30, 2023
| 2. | SECURITIES VALUATIONS (continued) |
Hierarchy of Fair Value Inputs
The Fund utilizes various methods to measure the fair value of most of its investments on a recurring basis. GAAP establishes a hierarchy that prioritizes inputs to valuation techniques used to measure fair value. The three levels of inputs are as follows:
| ● | Level 1 – Unadjusted quoted prices in active markets for identical assets or liabilities that the Fund has the ability to access. |
| ● | Level 2 – Observable inputs other than quoted prices included in Level 1 that are observable for the asset or liability either directly or indirectly. These inputs may include quoted prices for the identical instrument on an inactive market, prices for similar instruments, interest rates, prepayment speeds, credit risk, yield curves, default rates, and similar data. |
| ● | Level 3 – Unobservable inputs for the asset or liability to the extent that relevant observable inputs are not available, representing the Fund’s own assumptions about the assumptions that a market participant would use in valuing the asset or liability, and that would be based on the best information available. |
The availability of observable inputs can vary from security to security and is affected by a wide variety of factors, including, for example, the type of security, whether the security is new and not yet established in the marketplace, the liquidity of markets, and other characteristics particular to the security. To the extent that valuation is based on models or inputs that are less observable or unobservable in the market, the determination of fair value requires more judgment. Accordingly, the degree of judgment exercised in determining fair value is greatest for instruments categorized in Level 3.
The inputs used to measure fair value may fall into different levels of the fair value hierarchy. In such cases, for disclosure purposes, the level in the fair value hierarchy within which the fair value measurement falls in its entirety is determined based on the lowest level input that is significant to the fair value measurement in its entirety.
Fair Value Measurements
A description of the valuation techniques applied to the Trust’s major categories of assets and liabilities measured at fair value on a recurring basis are as follows:
Equity securities (common stock, preferred stock and ETFs) – Securities traded on a national securities exchange (or reported on the NASDAQ national market) are stated at the last reported sales price on the day of valuation. To the extent these securities are actively traded, and valuation adjustments are not applied, they are categorized in Level 1 of the fair value hierarchy. Certain foreign securities may be fair valued using a pricing service that considers the correlation of the trading patterns of the foreign security to the intraday trading in the U.S. markets for investments such as American Depositary Receipts, financial futures, ETFs, and the movement of the certain indexes of securities based on a statistical analysis of the historical relationship and are categorized in Level 2. Preferred stock and other equities traded on inactive markets or valued by reference to similar instruments are also categorized in Level 2.
Money market funds – Money market funds are valued at their net asset value and are categorized as Level 1.
Derivative instruments – Listed derivatives, including options, that are actively traded, are valued based on quoted prices from the exchange and categorized in Level 1 of the fair value hierarchy. Options held by the Fund for which no current quotations are readily available and which are not traded on the valuation date are valued at the mean price and are categorized within Level 2 of the fair value hierarchy. Over-the-counter (“OTC”) derivative contracts include forward, swap, and option contracts related to interest rates; foreign currencies; credit standing of reference entities; equity prices; or commodity prices, and warrants on exchange-traded securities. Depending on the product and terms of the transaction, the fair value of the OTC derivative products can be modeled taking into account the counterparties’ creditworthiness and using a series of techniques, including simulation models. Many pricing models do not entail material subjectivity because the methodologies employed do not necessitate significant judgments, and the pricing inputs are observed from actively quoted markets, as is the case of interest rate swap and option contracts. OTC derivative products valued using pricing models are categorized within Level 2 of the fair value hierarchy.
| FinTrust Income and Opportunity Fund | ANNUAL REPORT |
NOTES TO THE FINANCIAL STATEMENTS
November 30, 2023
| 2. | SECURITIES VALUATIONS (continued) |
The SEC adopted Rule 2a-5 under the 1940 Act, which established an updated regulatory framework for registered investment company fair valuation practices. Under the rule a greater number of the Fund’s securities may be subject to fair value pricing. The Fund’s fair value policies and procedures and valuation practices were updated to comply with Rule 2a-5. Specifically, the Board designated the Adviser as the Fund’s “Valuation Designee” to make fair value determinations. The Adviser acts through its Rule 2a-5 Committee (the “Valuation Committee”) in accordance with the Trust’s and the Adviser’s policies and procedures (collectively, the “Valuation Procedures”). While fair value determinations will be based upon all available factors that the Valuation Designee deems relevant at the time of the determination, fair value represents only a good faith approximation of the value of an asset or liability.
The Fund’s policies regarding fair value pricing are intended to result in a calculation of a Fund’s net asset value (“NAV”) that fairly reflects portfolio security values as of the time of pricing. A portfolio security’s fair value price may differ from the price next available for that portfolio security using a Fund’s normal pricing procedure, and may differ substantially from the price at which the portfolio security may ultimately be traded or sold. If such fair value price differs from the price that would have been determined using a Fund’s normal pricing procedures, a shareholder may receive more or less proceeds or shares from redemptions or purchases of Fund shares, respectively, than a shareholder would have otherwise received if the portfolio security was priced using a Fund’s normal pricing procedures. The performance of a Fund may also be affected if a portfolio security’s fair value price were to differ from the security’s price using a Fund’s normal pricing procedures.
Pursuant to policies adopted by the Board, the Valuation Designee reports all fair valued securities to the Board at least quarterly. The Board monitors and evaluates the Fund’s use of fair value pricing. These securities will be categorized as Level 3 securities.
The following tables summarize the inputs used to value the Fund’s assets and liabilities measured at fair value as of November 30, 2023.
| | | | | | | | | | | | | | | | | |
| Financial Instruments – Assets | | | | | | | | | | | | | | | | |
| Security Classification (1) | | Level 1 | | | Level 2 | | | Level 3 | | | Totals | |
| Common Stock (2) | | $ | 13,632,303 | | | $ | — | | | $ | — | | | $ | 13,632,303 | |
| Preferred Stock (2) | | | 467,040 | | | | — | | | | — | | | | 467,040 | |
| Exchange-Traded Funds (2) | | | 943,750 | | | | — | | | | — | | | | 943,750 | |
| Government Bonds | | | — | | | | 998,320 | | | | — | | | | 998,320 | |
| Call Options Purchased | | | 748,940 | | | | 92,050 | | | | — | | | | 840,990 | |
| Put Options Purchased | | | 160,099 | | | | — | | | | — | | | | 160,099 | |
| Short-Term Investments | | | 315,500 | | | | — | | | | — | | | | 315,500 | |
| Total Assets | | $ | 16,267,632 | | | $ | 1,090,370 | | | $ | — | | | $ | 17,358,002 | |
| Derivative and Financial Instruments – Liabilities | | | | | | | | | | | | | | | | |
| Security Classification (1) | | Level 1 | | | Level 2 | | | Level 3 | | | Totals | |
| Common Stock (2) | | $ | 310,800 | | | $ | — | | | $ | — | | | $ | 310,800 | |
| Call Options Written | | | 7,260 | | | | | | | | | | | | 7,260 | |
| Total Liabilities | | $ | 318,060 | | | $ | — | | | $ | — | | | $ | 318,060 | |
(1) As of and for the year ended November 30, 2023, the Fund held no securities that were considered to be “Level 3” securities (those valued using significant unobservable inputs). Therefore, a reconciliation of assets in which significant unobservable inputs (Level 3) were used in determining fair value is not applicable.
(2) All common stock, ETFs and preferred stock held in the Fund are Level 1 securities. For a detailed break-out of common stock and preferred stock by industry and ETFs by investment type, please refer to the Schedule of Investments.
| FinTrust Income and Opportunity Fund | ANNUAL REPORT |
NOTES TO THE FINANCIAL STATEMENTS
November 30, 2023
| 3. | DERIVATIVE TRANSACTIONS |
As of November 30, 2023, the location on the Statement of Assets and Liabilities for financial derivative instrument fair values is as follows:
| Assets | | Location | | Equity Contracts | |
| Call options purchased | | Investments, at value | | $ | 840,990 | |
| Put options purchased | | Investments, at value | | | 160,099 | |
| Total Assets | | | | $ | 1,001,089 | |
| Liabilities | | Location | | Equity Contracts | |
| Call options written | | Options written, at value | | $ | 7,260 | |
| Total Assets | | | | $ | 7,260 | |
Realized and unrealized gains and losses on derivatives contracts entered into by the Fund for the year ended November 30, 2023, are recorded in the following locations in the Statement of Operations:
| Net change in unrealized appreciation (depreciation) on: | | Location | | Equity Contracts | |
| Call options purchased | | Unaffiliated Investments | | $ | 18,591 | |
| Put options purchased | | Unaffiliated Investments | | | 67,942 | |
| Call options written | | Options written | | | 6,677 | |
| | | | | $ | 93,210 | |
| Net realized gain (loss) on: | | Location | | Equity Contracts | |
| Call options purchased | | Unaffiliated Investments | | $ | (121,747 | ) |
| Put options purchased | | Unaffiliated Investments | | | (338,267 | ) |
| Call options written | | Options written | | | 202,885 | |
| Put options written | | Options written | | | 97,483 | |
| | | | | $ | (159,646 | ) |
For the year ended November 30, 2023, the average month-end notional value of purchased and written option contracts for the Fund was $10,989,892 and ($370,462), respectively. The primary risk category for all open options positions during the period was equity risk.
| 4. | CAPITAL SHARE TRANSACTIONS |
Transactions in shares of capital stock for the year ended November 30, 2023, were as follows:
| | | Sold | | | Redeemed | | | Reinvested | | | Net Increase / (Decrease) | |
| Class A | | | | | | | | | | | | | | | | |
| Shares | | | — | | | | (10,859 | ) | | | — | | | | (10,859 | ) |
| Value | | $ | — | | | $ | (107,290 | ) | | $ | — | | | $ | (107,290 | |
| Institutional Class | | | | | | | | | | | | | | | | |
| Shares | | | 238,572 | | | | (209,787 | ) | | | — | | | | 28,785 | |
| Value | | $ | 2,367,474 | | | $ | (2,022,043 | ) | | $ | — | | | $ | 345,431 | |
| FinTrust Income and Opportunity Fund | ANNUAL REPORT |
NOTES TO THE FINANCIAL STATEMENTS
November 30, 2023
| 4. | CAPITAL SHARE TRANSACTIONS (continued) |
Transactions in shares of capital stock for the year ended November 30, 2022, were as follows:
| | | Sold | | | Redeemed | | | Reinvested | | | Net Increase | |
| Class A | | | | | | | | | | | | | | | | |
| Shares | | | 12,344 | | | | (4,329 | ) | | | 441 | | | | 8,456 | |
| Value | | $ | 126,373 | | | $ | (41,774 | ) | | $ | 4,443 | | | $ | 89,042 | |
| Institutional Class | | | | | | | | | | | | | | | | |
| Shares | | | 248,460 | | | | (807,393 | ) | | | 125,864 | | | | (433,069 | ) |
| Value | | $ | 2,357,664 | | | $ | (7,901,841 | ) | | $ | 1,288,850 | | | $ | (4,255,327 | ) |
| 5. | INVESTMENT TRANSACTIONS |
For the year ended November 30, 2023, aggregate purchases and sales of investment securities (excluding short-term investments and U.S. Government securities) for the Fund were as follows:
| Purchases | | | Sales | |
| $ | 101,112,096 | | | $ | 99,006,786 | |
The cost of purchases and proceeds from sales of U.S. Government securities during the year ended November 30, 2023, were $1,974,470 and $0, respectively.
| 6. | ADVISORY FEES AND OTHER RELATED PARTY TRANSACTIONS |
The Fund has entered into an Investment Advisory Agreement (the “Advisory Agreement”) with the Adviser. Pursuant to the Advisory Agreement, the Adviser manages the operations of the Fund and manages the Fund’s investments in accordance with the stated policies of the Fund. As compensation for the investment advisory services provided to the Fund, the Adviser will receive a monthly management fee equal to an annual rate of 1.25% of the Fund’s net assets, less any fee waivers. For the year ended November 30, 2023, the Adviser earned $201,277 of management fees.
The Adviser has entered into an Expense Limitation Agreement with the Fund under which it has agreed to waive or reduce its fees and to assume other expenses of the Fund, if necessary, in an amount that limits the Fund’s annual operating expenses (excluding interest, distribution fees pursuant to Rule 12b-1 Plans, taxes, acquired fund fees and expenses, brokerage commissions, dividend expenses on short sales, and other expenditures which are capitalized in accordance with generally accepted accounting principles and other extraordinary expenses not incurred in the ordinary course of such Fund’s business) to not more than 1.95% of the Fund’s average daily net assets. The current contractual agreement cannot be terminated before March 31, 2025, without the Board’s approval. For the year ended November 30, 2023, the Adviser waived advisory fees of $120,587.
Subject to approval by the Fund’s Board, any waiver under the Expense Limitation Agreement is subject to repayment by the Fund within the three years following the month in which such waiver or reimbursement occurred, if the Fund can make the payment without exceeding the 1.95% expense limit. The cumulative reimbursement is $290,318, of which $68,136, $101,595 and $120,587 can be recouped no later than November 30, 2024, November 30, 2025 and November 30, 2026, respectively.
The Fund has entered into an Investment Company Services Agreement (“ICSA”) with M3Sixty Administration, LLC (“M3Sixty”). Pursuant to the ICSA, M3Sixty will provide daily operational services to the Fund including, but not limited to: (a) Fund accounting services; (b) financial statement preparation; (c) valuation of the Fund’s portfolio securities; (d) pricing the Fund’s shares; (e) assistance in preparing tax returns; (f) preparation and filing of required regulatory reports; (g) communications with shareholders; (h) coordination of Board and shareholder meetings; (i) monitoring the Fund’s legal compliance; (j) maintaining shareholder account records.
| FinTrust Income and Opportunity Fund | ANNUAL REPORT |
NOTES TO THE FINANCIAL STATEMENTS
November 30, 2023
| 6. | ADVISORY FEES AND OTHER RELATED PARTY TRANSACTIONS (continued) |
For the year ended November 30, 2023, M3Sixty earned $98,393, including out of pocket expenses, pursuant to the ICSA.
The Fund has also entered into a Chief Compliance Officer Service Agreement (“CCO Agreement”) with M3Sixty. Pursuant to the CCO Agreement, M3Sixty agrees to provide a Chief Compliance Officer (“CCO”), as described in Rule 38a-1 of the 1940 Act, to the Fund for the year and on the terms and conditions set forth in the CCO Agreement.
For the year ended November 30, 2023, M3Sixty earned $12,900 of fees pursuant to the CCO Agreement.
Certain officers and an interested Trustee of the Trust are also employees or officers of M3Sixty.
The Fund has entered into a Distribution Agreement with M3Sixty Distributors, LLC (“M3SixtyD” or the “Distributor”). Pursuant to the Distribution Agreement, the Distributor provides distribution services to the Fund. The Distributor serves as the principal underwriter of the Fund. M3SixtyD may receive commissions from the sale of Class A shares. During the year ended November 30, 2023, no commissions were paid to the Distributor. M3SixtyD is an affiliate of M3Sixty.
The Fund has adopted a Distribution Plan (“Plan”) pursuant to Rule 12b-1 under the Investment Company Act of 1940 for its Class A shares. The Fund may expend up to 0.25% for Class A shares of the Fund’s average daily net assets annually to pay for any activity primarily intended to result in the sale of shares of the Fund and the servicing of shareholder accounts, provided that the Trustees have approved the category of expenses for which payment is being made.
The distribution plan for the Class A shares of the Fund took effect January 21, 2016. For the year ended November 30, 2023, the Fund accrued $275 in 12b-1 expenses attributable to Class A shares.
For U.S. Federal income tax purposes, the cost of securities owned, gross appreciation, gross depreciation, and net unrealized appreciation/(depreciation) of investments, including written options and securities sold short, at November 30, 2023 were as follows:
| Cost | | | Gross Appreciation | | | Gross Depreciation | | | Net Depreciation | |
| $ | 17,588,866 | | | $ | 1,049,298 | | | $ | (1,598,222 | ) | | $ | (548,924 | ) |
The difference between book basis and tax basis unrealized appreciation (depreciation) is primarily attributable to the tax deferral of losses on wash sales.
The Fund’s tax basis distributable earnings are determined at the end of each fiscal year. The tax character of distributable earnings (deficit) at November 30, 2023, the Fund’s most recent fiscal year end, is as follows:
Unrealized Depreciation | | | Undistributed Ordinary Income | | | Undistributed Long-Term Capital Gains | | | Capital Loss Carry Forwards | | | Post-October Loss and Late Year Loss | | | Other Book/Tax Differences | | | Total Distributable Earnings | |
| $ | (548,924 | ) | | $ | — | | | $ | — | | | $ | (472,227 | ) | | $ | — | | | $ | — | | | $ | (1,021,151 | ) |
Under current tax law, net capital losses realized after November 30th and net ordinary losses incurred after December 31st may be deferred and treated as occurring on the first day of the following fiscal year. As of November 30, 2023, the Fund had no post-November capital losses or post-December losses to defer.
In accordance with accounting pronouncements, the Fund may record reclassifications in the capital accounts. These reclassifications have no impact on the net asset value of the Fund and are designed generally to present distributable earnings on a tax basis which is considered to be more informative to the shareholder. Permanent book and tax differences, primarily attributable to the reclassifications of net investment losses and distributions to paid-in-capital, resulted in reclassifications for the year ended November 30, 2023, as follows:
| Distributable Earnings | | | Paid-in Capital | |
| $ | 111,116 | | | $ | (111,116 | ) |
| FinTrust Income and Opportunity Fund | ANNUAL REPORT |
NOTES TO THE FINANCIAL STATEMENTS
November 30, 2023
| 7. | TAX MATTERS (continued) |
Under the Regulated Investment Company Modernization Act of 2010 (the “Act”), net capital losses recognized after December 31, 2010, may be carried forward indefinitely, and their character is retained as short-term and/or long-term. As of November 30, 2023, the Fund had $316,353 of non-expiring short-term capital loss carryforwards and $155,874 of non-expiring long-term capital loss carryforwards for federal income tax purposes available to offset future capital gains.
For the year ended November 30, 2023, the Fund distributed no ordinary income or long-term capital gains.
For the year ended November 30, 2022, the Fund distributed, on a tax basis, $485,367 of ordinary income and $807,926 of long-term capital gains.
The beneficial ownership, either directly or indirectly, of more than 25% of the voting securities of a fund creates a presumption of control of the fund, under Section 2(a)(9) of the 1940 Act. As of November 30, 2023, Charles Schwab and Co., Inc. held 60.50% and National Financial Services, LLC held 39.19% of the Fund’s shares in omnibus accounts for the sole benefit of their customers. The Trust does not know whether any of the underlying beneficial shareholders of the omnibus accounts held by Charles Schwab and Co., Inc. or National Financial Services, LLC own more than 25% of the voting securities of the Fund.
| 9. | COMMITMENTS AND CONTINGENCIES |
In the normal course of business, the Trust may enter into contracts that may contain a variety of representations and warranties and provide general indemnifications. The Trust’s maximum exposure under these arrangements is dependent on future claims that may be made against the Fund and, therefore, cannot be estimated; however, management considers the risk of loss from such claims to be remote.
| 10. | INVESTMENTS IN AFFILIATED COMPANIES |
An affiliated company is a company in which the Fund has ownership of at least 5% of the voting securities or is of common management. Companies which are affiliates of the Fund at November 30, 2023, are noted in the Fund’s Schedule of Investments. United Community Banks, Inc., 6.875% - Series I preferred stock (“UCBIO”) is considered an affiliated investment because it is of common management of the Adviser. At November 30, 2023, the Fund held 21,000 shares of UCBIO.
Transactions with affiliated companies during the year ended November 30, 2023 were as follows:
| Value as of November 30, 2022 | Realized gain (loss) | Change in unrealized appreciation (depreciation) | Purchases | Sales | Value as of November 30, 2023 | Income earned |
| UCBIO | $ 523,950 | $ — | $ (56,910) | $ — | $ — | $ 467,040 | $ 36,094 |
| Total | $ 523,950 | $ — | $ (56,910) | $ — | $ — | $ 467,040 | $ 36,094 |
In accordance with GAAP, Management has evaluated the impact of all subsequent events on the Fund through the date the financial statements were issued, and has determined that there were no subsequent events requiring recognition or disclosure in the financial statements.
| 12. | NEW ACCOUNTING PRONOUNCEMENTS AND REGULATORY UPDATES |
In June 2022, FASB issued Accounting Standards Update No. 2022-03, “Fair Value Measurement of Equity Securities Subject to Contractual Sale Restrictions” (“ASU 2022-03”). ASU 2022-03 clarifies the guidance in ASC 820, related to the measurement of the fair value of an equity security subject to contractual sale restrictions, where it eliminates the ability to apply a discount to fair value of these securities, and introduces disclosure requirements related to such equity securities. The guidance is effective for fiscal years, and interim periods within those fiscal years, beginning after December 15, 2023, and allows for early adoption. For RICs, such as the Fund, ASU 2022-03 will be applicable to equity securities with contractual sale restrictions executed, or modified, after the date of adoption. Management has reviewed the requirements and believes the adoption of this ASU will not have a material impact on the financial statements.
| FinTrust Income and Opportunity Fund | ANNUAL REPORT |
NOTES TO THE FINANCIAL STATEMENTS
November 30, 2023
| 12. | NEW ACCOUNTING PRONOUNCEMENTS AND REGULATORY UPDATES (continued) |
In December 2022, the FASB issued an Accounting Standards Update, ASU 2022-06, Reference Rate Reform (Topic 848) – Deferral of the Sunset Date of Topic 848 (“ASU 2022-06”). ASU 2022-06 is an amendment to ASU 2020-04, which provided optional guidance to ease the potential accounting burden due to the discontinuation of the LIBOR and other interbank-offered based reference rates and which was effective as of March 12, 2020, through December 31, 2022. ASU 2022-06 extends the effective period through December 31, 2024. Management is currently evaluating the impact, if any, of applying ASU 2022-06.
In October 2022, the SEC adopted a final rule relating to Tailored Shareholder Reports for Mutual Funds and Exchange-Traded Funds; Fee Information in Investment Company Advertisements. The rule and form amendments will, among other things, require the Funds to transmit concise and visually engaging shareholder reports that highlight key information. The amendments will require that funds tag information in a structured data format and that certain more in-depth information be made available online and for delivery free of charge to investors on request. The amendments became effective January 24, 2023. There is an 18-month transition period after the effective date of the amendment. Management is currently evaluating the impact of the new rule.
In September 2023, the SEC adopted a final rule relating to “Names Rule” under the 1940 Act. The amendments expanded the rule to require more funds to adopt an 80 percent investment policy, including funds with names suggesting a focus in investments with particular characteristics (e.g., growth or value) or with terms that reference a thematic investment focus (e.g., environmental, social, or governance factors). The amendments will require that a fund review its name for compliance with the rule. If needed, a fund may need to adopt an 80 percent investment policy and review its portfolio assets’ treatment under such policy at least quarterly. The rule also requires additional prospectus disclosure and reporting and record keeping requirements. Depending on the size of the fund, the rule will take effect about 24 to 36 months after its publication date.
 | taitweller.com |
REPORT OF INDEPENDENT REGISTERED PUBLIC ACCOUNTING FIRM
To the Shareholders of
FinTrust Income and Opportunities Fund and the
Board of Trustees of 360 Funds
Opinion on the Financial Statements
We have audited the accompanying statement of assets and liabilities of FinTrust Income and Opportunities Fund (the “Fund”), a series of series of 360 Funds (the “Trust”), including the schedule of investments, as of November 30, 2023, the related statement of operations, the statement of changes in net assets and the financial highlights for the year then ended, and the related notes (collectively referred to as the “financial statements”). In our opinion, the financial statements present fairly, in all material respects, the financial position of the Fund as of November 30, 2023, the results of its operations, the changes in its net assets and the financial highlights for the year then ended, in conformity with accounting principles generally accepted in the United States of America.
The statement of changes in net assets for the year ended November 30, 2022 and the financial highlights for each of the four years in the period ended November 30, 2022, have been audited by other auditors, whose report dated January 27, 2023 expressed unqualified opinions on such statement and financial highlights.
Basis for Opinion
These financial statements are the responsibility of the Fund’s management. Our responsibility is to express an opinion on the Fund’s financial statements based on our audit. We are a public accounting firm registered with the Public Company Accounting Oversight Board (United States) (“PCAOB”) and are required to be independent with respect to the Fund in accordance with the U.S. federal securities laws and the applicable rules and regulations of the Securities and Exchange Commission and the PCAOB. We have served as the auditor of one or more of the Funds in the Trust since 2018.
We conducted our audit in accordance with the standards of the PCAOB. Those standards require that we plan and perform the audit to obtain reasonable assurance about whether the financial statements are free of material misstatement, whether due to error or fraud. The Fund is not required to have, nor were we engaged to perform, an audit of its internal control over financial reporting. As part of our audit we are required to obtain an understanding of internal control over financial reporting, but not for the purpose of expressing an opinion on the effectiveness of the Fund’s internal control over financial reporting. Accordingly, we express no such opinion.
Our audit included performing procedures to assess the risks of material misstatement of the financial statements, whether due to error or fraud, and performing procedures that respond to those risks. Such procedures included examining, on a test basis, evidence regarding the amounts and disclosures in the financial statements. Our audit also included evaluating the accounting principles used and significant estimates made by management, as well as evaluating the overall presentation of the financial statements. Our procedures included confirmation of securities owned as of November 30, 2023 by correspondence with the custodian and brokers; when replies were not received from brokers, we performed other auditing procedures. We believe that our audit provides a reasonable basis for our opinion.
Philadelphia, Pennsylvania
January 29, 2024
| FinTrust Income and Opportunity Fund | ANNUAL REPORT |
ADDITIONAL INFORMATION
November 30, 2023 (Unaudited)
The Fund files its complete schedules of portfolio holdings with the Securities and Exchange Commission (the “Commission”) for the first and third quarters of each fiscal year on Form N-PORT. The Fund’s Forms N-PORT are available on the Commission’s website at http://www.sec.gov. The Fund’s Forms N-PORT may be reviewed and copied at the Commission’s Public Reference Room in Washington, DC. Information on the operation of the Commission’s Public Reference Room may be obtained by calling 1-800-SEC-0330.
A description of the policies and procedures that the Fund uses to determine how to vote proxies relating to portfolio securities is available without charge, upon request, by calling 1-877-244-6235; and on the Commission’s website at http://www.sec.gov.
Information regarding how the Fund voted proxies relating to portfolio securities during the most recent 12-month period ended June 30th is available without charge, upon request, by calling 1-877-244-6235; and on the Commission’s website at http://www.sec.gov.
Shareholder Tax Information - The Fund is required to advise you within 60 days of the Fund’s fiscal year end regarding the federal tax status of distributions received by shareholders during the fiscal year. The Fund had no ordinary income or long-term capital gain distributions during the year ended November 30, 2023.
Tax information is reported from the Fund’s fiscal year and not calendar year, therefore, shareholders should refer to their Form 1099-DIV or other tax information which will be mailed in 2024 to determine the calendar year amounts to be included on their 2023 tax returns. Shareholders should consult their own tax advisors.
Change in Independent Registered Public Accounting Firm
The Audit Committee of the Board has approved and selected (and the Board has approved) Tait Weller & Baker, LLP (“Tait”) to replace BBD, LLP (“BBD”) as the Fund’s independent registered public accounting firm for the Fund’s fiscal year ended November 30, 2023. Through the past fiscal year and through the date of BBD’s replacement as auditor of the Fund, the Fund had no disagreements with BBD on any matter of accounting principles or practices, financial statement disclosure or auditing scope or procedures, which, if not resolved to the satisfaction of BBD would have caused BBD to make reference to the disagreement in a BBD report, and there were no reportable events of the kind described in Item 304(a)(1)(v) of Regulation S-K under the Securities Exchange Act of 1934.
With respect to the Fund, BBD’s audit opinions, including for the fiscal years ended November 30, 2021 through November 30, 2022, have not contained either an adverse opinion or disclaimer of opinion, nor were they qualified or modified as to uncertainty, audit scope or accounting principles. During the last fiscal year of the Fund, neither the Fund nor anyone on their behalf has consulted Tait on items concerning the application of accounting principles to a specified transaction (either completed or proposed) or the type of audit opinion that might be rendered on the Fund’s financial statements, or concerning the subject of a disagreement of the kind described in Item 304(a)(1)(iv) of Regulation S-K or reportable events of the kind described in Item 304(a)(1)(v) of Regulation S-K.
The Fund requested BBD to furnish it with a letter addressed to the SEC stating whether or not it agrees with the above statements. A copy of such letter will be filed as an Exhibit to the Form N-CSR filing.
| FinTrust Income and Opportunity Fund | ANNUAL REPORT |
ADDITIONAL INFORMATION
November 30, 2023
BOARD OF TRUSTEES, OFFICERS AND PRINCIPAL SHAREHOLDERS - (Unaudited)
The Trustees are responsible for the management and supervision of the Fund. The Trustees approve all significant agreements between the Trust, on behalf of the Fund, and those companies that furnish services to the Fund; review performance of the Fund; and oversee activities of the Fund. The Statement of Additional Information of the Trust includes additional information about the Fund’s Trustees and is available upon request, without charge, by calling (877) 244-6235.
Trustees and Officers. Following are the Trustees and Officers of the Trust, their age and address, their present position with the Trust or the Funds, and their principal occupation during the past five years. Each of the Trustees of the Trust will generally hold office indefinitely. The Officers of the Trust will hold office indefinitely, except that: (1) any Officer may resign or retire and (2) any Officer may be removed any time by written instrument signed by at least two-thirds of the number of Trustees prior to such removal. In case a vacancy or an anticipated vacancy on the Board of Trustees shall for any reason exist, the vacancy shall be filled by the affirmative vote of a majority of the remaining Trustees, subject to certain restrictions under the 1940 Act. Those Trustees who are “interested persons” (as defined in the 1940 Act) by virtue of their affiliation with either the Trust or the Adviser, are indicated in the table. The address of each trustee and officer is 4300 Shawnee Mission Parkway, Suite 100, Fairway, KS 66205.
Name, Address and Year of Birth (“YOB”) | Position(s) Held with Trust | Length of Service | Principal Occupation(s) During Past 5 Years | Number of Series Overseen | Other Directorships During Past 5 Years |
| Independent Trustees |
Tom M. Wirtshafter YOB : 1954 | Trustee | Since 2011 | Senior Vice President, American Portfolios Financial Services, (broker-dealer), American Portfolios Advisors (investment Advisor) (2009–Present). | Seven | None |
Steven D. Poppen YOB : 1968 | Trustee | Since 2018 | Executive Vice President and Chief Business Administration Officer, Minnesota Vikings (professional sports organization) (1999–present); Executive Vice President and Chief Financial Officer, MV Ventures, LLC (real estate developer) (2016-present) | Seven | IDX Funds (2015 –2021); FNEX Ventures (2018-2020) |
Thomas J. Schmidt YOB: 1963 | Trustee and Independent Chairman | Since 2018 Since 2022 | Principal, Tom Schmidt & Associates Consulting, LLC (2015–Present) | Seven | Lind Capital Partners Municipal Credit Income Fund (2021–present); FNEX Ventures (2018-2020) |
| Interested Trustee* | | | | | |
Randall K. Linscott YOB: 1971 | President | Since 2013 | Chief Executive Officer, M3Sixty Administration, LLC (2013–present) | Seven | IDX Funds (2015 - 2021) |
* The Interested Trustee is an Interested Trustee because he is an officer and principal owner of the Administrator.
| FinTrust Income and Opportunity Fund | ANNUAL REPORT |
ADDITIONAL INFORMATION
November 30, 2023
BOARD OF TRUSTEES, OFFICERS AND PRINCIPAL SHAREHOLDERS - (Unaudited) (continued)
Name, Address and Year of Birth (“YOB”) | Position(s) Held with Trust | Length of Service | Principal Occupation(s) During Past 5 Years | Number of Series Overseen | Other Directorships During Past 5 Years |
Officers | | | | | |
Richard Yates YOB: 1965 | Chief Compliance Officer and Secretary | Since 2021 | Of Counsel, McElroy Deutsch (2020–present); Head of Compliance, M3Sixty Administration, LLC (2021–present); Chief Compliance Officer and Secretary, IDX Funds (2021–2022); Founder, The Yates Law Firm (2018–2020). | N/A | N/A |
Larry E. Beaver, Jr. YOB: 1969 | Treasurer | Since 2021 | Head of Operations, M3Sixty Administration, LLC (2021-present); Fund Accounting, Administration and Tax Officer, M3Sixty Administration, LLC (2017–2021); Assistant Treasurer, 360 Funds Trust (2017-2021); Chief Accounting Officer, Amidex Funds, Inc. (2003-2020); Assistant Treasurer, IDX Funds (2017-2021); Assistant Treasurer, WP Funds Trust (2017-2021). | N/A | N/A |
Tony DeMarino YOB: 1970 | Anti-Money Laundering (“AML”) Officer | Since 2022 | Principal Executive Officer, M3Sixty Distributors, LLC (2022–present); Partner, Primark Capital (2020–2022); Head of Distribution, Cognios Capital, LLC (2016–2020). | N/A | N/A |
| FinTrust Income and Opportunity Fund | ANNUAL REPORT |
ADDITIONAL INFORMATION
November 30, 2023
BOARD OF TRUSTEES, OFFICERS AND PRINCIPAL SHAREHOLDERS - (Unaudited) (continued)
Remuneration Paid to Trustees and Officers - Officers of the Trust and Trustees who are “interested persons” of the Trust or the Adviser will receive no salary or fees from the Trust. Officers of the Trust and interested Trustees do receive compensation directly from certain service providers to the Trust, including Matrix 360 Distributors, LLC and M3Sixty Administration, LLC. Each Trustee who is not an “interested person” (an “Independent Trustee”) receives a $5,000 annual retainer (paid quarterly). In addition, each Independent Trustee receives, on a per fund basis: (i) a fee of $1,500 per fund each year (paid quarterly); (ii) a fee of $200 per Board meeting attended; and (iii) a fee of $200 per committee meeting attended. The Trust will also reimburse each Trustee for travel and other expenses incurred in connection with, and/or related to, the performance of their obligations as a Trustee. Officers of the Trust will also be reimbursed for travel and other expenses relating to their attendance at Board meetings.
| Name of Trustee1 | Aggregate Compensation From each Fund2 | Pension or Retirement Benefits Accrued As Part of Portfolio Expenses | Estimated Annual Benefits Upon Retirement | Total Compensation From the Fund Paid to Trustees2 |
| Independent Trustees |
| Arthur Q. Falk 3 | $ 983 | None | None | $ 983 |
| Tom M. Wirtshafter | $ 3,704 | None | None | $ 3,704 |
| Steven D. Poppen | $ 3,704 | None | None | $ 3,704 |
| Thomas J. Schmidt | $ 3,704 | None | None | $ 3,704 |
| Interested Trustees and Officers |
| Randall K. Linscott | None | Not Applicable | Not Applicable | None |
1 Each of the Trustees serves as a Trustee to each Series of the Trust. The Trust currently offers seven series of shares.
2 Figures are for the year ended November 30, 2023.
3 Arthur Q. Falk resigned as Trustee effective January 24, 2023.
| FinTrust Income and Opportunity Fund | ANNUAL REPORT |
INFORMATION ABOUT YOUR FUND’S EXPENSES
November 30, 2023 (Unaudited)
As a shareholder of the Fund, you incur two types of costs: (1) transaction costs, such as the sales charge (load) imposed on certain subscriptions and the contingent deferred sales charge (“CDSC”) imposed on certain short-term redemptions; and (2) ongoing costs, including management fees, distribution and/or service (12b-1) fees; and other Fund expenses. The example below is intended to help you understand your ongoing costs (in dollars) of investing in the Fund and to compare these costs with the ongoing costs of investing in other mutual funds.
The example is based on an investment of $1,000 invested at the beginning of the period and held for the entire period as indicated below.
Actual Expenses – The first section of the table provides information about actual account values and actual expenses (relating to the example $1,000 investment made at the beginning of the period). You may use the information in this section, together with the amount you invested, to estimate the expenses that you paid over the period. Simply divide your account value by $1,000 (for example, an $8,600 account value divided by $1,000 = 8.6), then multiply the result by the number in the first section under the heading entitled “Expenses Paid During Period” to estimate the expenses you paid on your account during this period.
Hypothetical Example for Comparison Purposes – The second section of the table provides information about the hypothetical account values and hypothetical expenses based on the Fund’s actual expense ratios and an assumed rate of return of 5% per year before expenses, which is not the Fund’s actual return. The hypothetical account values and expenses may not be used to estimate the actual ending account balance or expenses you paid for the period. You may use this information to compare the ongoing costs of investing in the Fund to other funds. To do so, compare this 5% hypothetical example with the 5% hypothetical examples that appear in the shareholder reports of the other funds.
Please note that the expenses shown in the table are meant to highlight your ongoing costs only and do not reflect any transactional costs, such as sales charges (loads), CDSC fees, or exchange fees. Therefore, the second section of the table is useful in comparing ongoing costs only, and will not help you determine the relative total costs of owning different funds. In addition, if these transactional costs were included, your costs would have been higher. For more information on transactional costs, please refer to the Fund’s prospectus.
| Expenses and Value of a $1,000 Investment for the period from 05/31/23 through 11/30/23 |
| |
| | Beginning Account
Value (05/31/23) | Annualized Expense
Ratio for the Period | Ending Account
Value (11/30/23) | Expenses Paid
During Period (a) |
| Actual Fund Return (in parentheses) | | | |
| Class A (+10.29%) | $1,000.00 | 2.24% | $1,102.90 | $ 11.81 |
| Institutional Class (+10.50%) | $1,000.00 | 1.99% | $1,104.99 | $ 10.50 |
| Hypothetical 5% Return | | | |
| Class A | $1,000.00 | 2.24% | $1,013.80 | $ 11.31 |
| Institutional Class | $1,000.00 | 1.99% | $1,015.10 | $ 10.05 |
| | | | | |
| (a) | Expenses are equal to the Fund’s annualized expense ratios, multiplied by the average account value over the period, multiplied by 183/365 to reflect the one-half year period. |
For more information on Fund expenses, please refer to the Fund’s prospectus, which can be obtained from your investment representative or by calling 1-877-244-6235. Please read it carefully before you invest or send money.
| FinTrust Income and Opportunity Fund | ANNUAL REPORT |
INFORMATION ABOUT YOUR FUND’S EXPENSES
November 30, 2023 (Unaudited) (continued)
Total Fund operating expense ratios as stated in the current Fund prospectus dated March 30, 2023 for the Fund were as follows: |
| FinTrust Income and Opportunity Fund Class A, gross of fee waivers or expense reimbursements | 3.07% |
| FinTrust Income and Opportunity Fund Class A, after waiver and reimbursement* | 2.50% |
| FinTrust Income and Opportunity Fund Institutional Class, gross of fee waivers or expense reimbursements | 2.82% |
| FinTrust Income and Opportunity Fund Institutional Class, after waiver and reimbursement* | 2.25% |
| | |
* The Adviser has entered into an Expense Limitation Agreement with the fund under which it has agreed to waive or reduce its fees and assume other expenses of the fund, if necessary, in an amount that limits the fund’s annual operating expenses (excluding interest, distribution fees pursuant to Rule 12B-1 Plans, taxes, acquired fund fees and expenses, brokerage commissions, dividend expenses on short sales, and other expenditures which are capitalized in accordance with generally accepted accounting principles and other extraordinary expenses not incurred in the ordinary course of such fund’s business) to not more than 1.95% through at least March 31, 2025. Subject to approval by the Fund’s Board, any waiver or reimbursement under the Expense Limitation Agreement is subject to repayment by the Fund within the three years following the month in which such waiver or reimbursement occurred, if the Fund can make the payment without exceeding the 1.95% expense limitation. The current contractual agreement cannot be terminated prior to at least one year after the effective date without the Board of Trustees’ approval. Total Gross Operating Expenses for the year ended November 30, 2023 were 2.97% and 2.72% for the FinTrust Income and Opportunity Fund Class A shares and FinTrust Income and Opportunity Fund Institutional Class shares, respectively. Please see the Information About Your Fund’s Expenses, the Financial Highlights and Notes to Financial Statements (Note 6) sections of this report for expense related disclosures for the year ended November 30, 2023. |
| FinTrust Income and Opportunity Fund | ANNUAL REPORT |
November 30, 2023 (Unaudited)
Renewal of the investment advisory agreement
At a meeting held on July 25, 2023 (the “Meeting”), the Board considered the approval of the renewal of the Advisory Agreement between the Trust and the Adviser, concerning the Fund.
Legal counsel (“Counsel”) reviewed with the Board a memorandum from Counsel and addressed to the Trustees that summarized, among other things, the fiduciary duties and responsibilities of the Board in reviewing and approving the renewal of the Advisory Agreement (the “Counsel’s Memorandum”). Counsel discussed with the Trustees the factors that should be considered by the Board to make an informed decision regarding the approval of the continuation of the Advisory Agreement, including the following material factors: (i) the nature, extent, and quality of the services provided by the Adviser; (ii) the investment performance of the Fund; (iii) the costs of the services provided and profits realized by the Adviser from the relationship with the Fund; (iv) the extent to which economies of scale would be realized if the Fund grows and whether advisory fee levels reflect those economies of scale for the benefit of the Fund’s investors; and (v) the Adviser’s practices regarding possible conflicts of interest.
In assessing these factors and reaching its decisions, the Board took into consideration information furnished for the Board’s review and consideration throughout the year at regular Board meetings, as well as information prepared or presented in connection with the annual renewal process, including information submitted to the Board in the Adviser’s presentation earlier in the meeting. The Board requested and was provided with information and reports that are included in the meeting materials relevant to the annual renewal of the Advisory Agreement, including: (i) reports regarding the services and support provided to the Fund and its shareholders by the Adviser; (ii) quarterly assessments of the investment performance of the Fund from the Adviser; (iii) periodic commentary on the Fund’s performance; (iv) presentations by the Fund’s management addressing the Adviser’s investment philosophy, investment strategy, personnel, and operations; (v) compliance and audit reports concerning the Fund and the Adviser; (vi) disclosure information contained in the registration statement of the Trust; and (vii) Counsel’s Memorandum.
The Board also requested and received various informational materials including, without limitation: (i) documents containing information about the Adviser, including financial information, a description of personnel and the services provided to the Fund, information on investment advice, performance, summaries of the Fund’s expenses, compliance program, current legal matters, and other general information; (ii) comparative expense and performance information for other mutual funds with strategies similar to the Fund; and (iii) benefits to be realized by the Adviser from its relationship with the Fund. In addition, the Board had an extensive discussion with the Adviser regarding the matters discussed below.
| (1) | The nature, extent, and quality of the services provided by the Adviser. |
The Board considered the responsibilities the Adviser has under the Advisory Agreement for the Fund. The Board reviewed the services provided by the Adviser to the Fund including, without limitation: its processes for formulating investment recommendations and assuring compliance with the Fund’s investment objectives and limitations; its coordination of services for the Fund among the Fund’s service providers; and its efforts to promote the Fund, grow assets and assist in the distribution of the Fund’s shares. The Board considered the Adviser’s personnel and methods of operating; succession plans; the education and experience of the Adviser’s staff; and its compliance program. The Board also considered the Adviser’s commitment to dedicating appropriate resources to support the Fund’s operations. The Board noted the impact of recent SEC rules on the Fund and the Adviser, including Rules 2a-5 and 18f-4. After reviewing the preceding and further information, including the expanded ownership program at the Adviser, the Board concluded that the nature, extent, and quality of the services provided by the Adviser was satisfactory and adequate for the Fund.
| (2) | Investment Performance of the Fund and the Adviser. |
The Board compared the short- and long-term performance of the Fund to its benchmark, comparable funds with similar objectives and size managed by other investment advisers, and peer group indices (e.g., Morningstar category averages). The Board also considered the consistency of the Adviser’s management of the Fund with its investment objective and policies.
The Board considered the peer, benchmark, and category performance of the Fund over various periods. Relative to its benchmark, the S&P 500® Total Return Index, the Fund underperformed for the one-, three-, and five-year periods, each ended June 30, 2023. The Board noted that the Fund had beat its category average and median for the one-year period but lagged the category average and median for the three and five-year periods, each for the period ended June 30, 2023. The Board concluded that overall, the Fund’s performance was within a reasonable range of its category. The Board considered the Adviser’s representation that the Fund’s underperformance was due in part to the Adviser’s performance, the Fund’s small size, which results in higher expenses, and the recent SEC Rule 18f-4, which affected the Adviser’s ability to deploy the Fund’s investment strategy. Based on the preceding, the Board concluded that the investment performance information presented for the Fund was satisfactory.
| FinTrust Income and Opportunity Fund | ANNUAL REPORT |
November 30, 2023 (Unaudited)
RENEWAL OF THE INVESTMENT ADVISORY AGREEMENT (continued)
| (3) | The costs of the services provided, and profits realized, by the Adviser from the relationship with the Fund. |
The Trustees considered: the Adviser’s staffing, personnel, and methods of operating; the financial condition of the Adviser and its level of commitment to the Fund; the asset levels of the Fund; and the overall expenses of the Fund. The Trustees considered the financial statements of the Adviser and the financial stability and productivity of the firm. The Board considered the Adviser’s strategic plans to manage costs related to its operations. The Trustees considered the fees and expenses of the Fund (including the management fee) relative to its category as of June 30, 2023. The Trustees noted that the Fund’s management fee and net expense ratio were above their respective category averages and medians, but within a reasonable range within the category. The Trustees concluded that both the net expense ratio and management fee of the Fund were within a reasonable range for their respective categories.
The Trustees recognized that the Fund is smaller than most of its peers, which affects the net expense ratio of the Fund and the Adviser’s ability to provide breakpoints in its management fee. The Trustees noted that regarding the Fund, the Adviser has entered into an expense limitation agreement according to which the Adviser has agreed to waive or reduce its fees and to assume other expenses of the Fund, if necessary, to limit the Fund’s annual operating expenses (with industry-standard exceptions) through March 31, 2025. The Board also noted that the Adviser realizes a reasonable profit for its management of the Fund. Following this analysis and upon further consideration and discussion of the preceding, the Board concluded that the fees paid to the Adviser by the Fund were fair and reasonable.
| (4) | The extent to which economies of scale would be realized if the Fund grows and whether advisory fee levels reflect these economies of scale for the benefit of the Fund’s investors. |
The Board considered the Fund’s fee arrangements with the Adviser. The Trustees determined that although the management fee would stay the same as asset levels increase, the shareholders of the Fund would benefit from the expense limitation arrangement for the Fund. The Board noted that while a breakpoint schedule in the Advisory Agreement would be beneficial, such a feature only has benefits if the Fund’s assets were enough to realize the effect of the breakpoint. The Board noted that lower expenses for the Fund’s shareholders are realized immediately with the expense limitation arrangement with the Adviser. The Board further noted that the Fund’s assets were at such levels that the expense limitation arrangement was providing benefits to the Fund’s shareholders. Following further discussion of the Fund’s asset levels, expectations for growth, and expense structure, the Board determined that the Fund’s fee arrangements, considering all the facts and circumstances, were fair and reasonable and that the expense limitation arrangement provided savings and protection for the benefit of the Fund’s investors.
| (5) | Possible conflicts of interest and benefits derived by the Adviser. |
The Board evaluated the potential for conflicts of interest and considered such matters as: the experience and ability of the advisory and compliance personnel assigned to the Fund; the fact that the Adviser does not utilize soft dollars; the basis of decisions to buy or sell securities for the Fund; and the substance and administration of the Adviser’s code of ethics. Based on the preceding, the Board determined that the Adviser’s standards and practices relating to the identification and mitigation of possible conflicts of interest were satisfactory.
After additional consideration and discussion among the Board, it determined that the compensation payable under the Advisory Agreement with respect to the Fund was fair, reasonable and within a range of what could have been negotiated at arms-length considering all the surrounding circumstances, and they approved the renewal of the Advisory Agreement for the Fund.
360 FUNDS
4300 Shawnee Mission Pkwy
Suite 100
Fairway, KS 66205
INVESTMENT ADVISER
FinTrust Capital Advisors, LLC
124 Verdae Boulevard
Suite 504
Greenville, SC 29607
ADMINISTRATOR & TRANSFER AGENT
M3Sixty Administration, LLC
4300 Shawnee Mission Parkway
Suite 100
Fairway, KS 66205
DISTRIBUTOR
M3Sixty Distributors, LLC
4300 Shawnee Mission Parkway
Suite 100
Fairway, KS 66205
INDEPENDENT REGISTERED PUBLIC ACCOUNTING FIRM
Tait Weller & Baker, LLP
Two Liberty Place
50 South 16th Street
Suite 2900
Philadelphia, PA 19102-2529
LEGAL COUNSEL
FinTech Law, LLC
6224 Turpin Hills Dr.
Cincinnati, Ohio 45244
CUSTODIAN BANK
Fifth Third Bank
Fifth Third Center
38 Fountain Square Plaza
Cincinnati, OH 45263