UNITED STATES
SECURITIES AND EXCHANGE COMMISSION
Washington, D.C. 20549
FORM N-CSR
CERTIFIED SHAREHOLDER REPORT OF REGISTERED MANAGEMENT INVESTMENT COMPANIES
Investment Company Act File Number 811-21726
| 360 Funds |
| (Exact name of registrant as specified in charter) |
| 4300 Shawnee Mission Parkway, Suite 100 Fairway, KS | | 66205 |
| (Address of principal executive offices) | | (Zip code) |
The Corporation Trust Company
Corporation Trust Center
1209 Orange St.
Wilmington, DE 19801 |
| (Name and address of agent for service) |
With Copies To:
Bo J. Howell
FinTech Law, LLC
6224 Turpin Hills Dr.
Registrant’s telephone number, including area code: 877-244-6235
Date of fiscal year end: 11/30/2024
Date of reporting period: 05/31/2024
| ITEM 1. | REPORTS TO SHAREHOLDERS. |
| | |
| | The Semi-Annual report to Shareholders of the FinTrust Income and Opportunity Fund (the “Fund”), a series of the 360 Funds (the “registrant”), for the period ended May 31, 2024 pursuant to Rule 30e-1 under the Investment Company Act of 1940, as amended (the “1940 Act”) (17 CFR 270.30e-1) is filed herewith. |
| | |
| FinTrust Income and Opportunity Fund | SEMI-ANNUAL REPORT |
Institutional Class (HIOIX) (Unaudited)
May 31, 2024
This semi-annual report to shareholders contains important information of the FinTrust Income and Opportunity Fund (the “Fund”) for the six months ended May 31, 2024. You can find the Fund’s prospectus, financial information on Form N-CSR, holdings, proxy voting information and other information at https://fintrustfunds.com/. You can also request this information without charge by contacting the Fund at (877) 244-6235.
semi-annual shareholder report
What were the Fund costs for the six months? (based on a hypothetical $10,000 investment)
| | Costs of a $10,000 investment | Costs paid as a percentage of a $10,000 investment |
| Institutional Class shares | $106 | 2.04% |
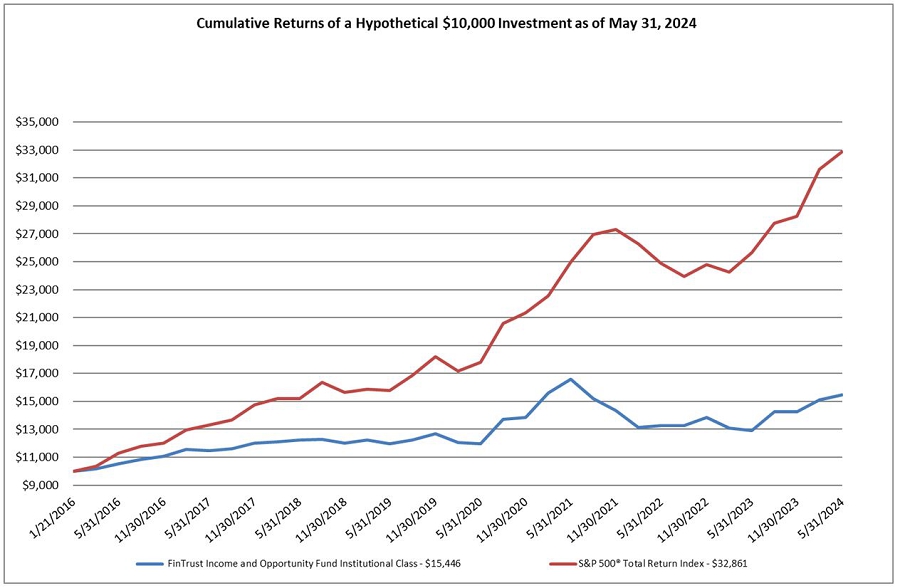
How has the Fund performed?
| Date | FinTrust Income and Opportunity Fund Institutional Class | S&P 500® Total Return Index |
| 01/21/2016 | 10,000 | 10,000 |
| 05/31/2016 | 10,550 | 11,315 |
| 11/30/2016 | 11,050 | 11,995 |
| 05/31/2017 | 11,479 | 13,292 |
| 11/30/2017 | 12,030 | 14,739 |
| 5/31/2018 | 12,216 | 15,204 |
| 11/30/2018 | 12,026 | 15,663 |
| 5/31/2019 | 11,958 | 15,779 |
| 11/30/2019 | 12,697 | 18,187 |
| 5/31/2020 | 11,957 | 17,804 |
| 11/30/2020 | 13,836 | 21,361 |
| 05/31/2021 | 16,578 | 24,983 |
| 11/30/2021 | 14,361 | 27,326 |
| 05/31/2022 | 13,271 | 24,908 |
| 11/30/2022 | 13,832 | 24,809 |
| 05/31/2023 | 12,901 | 25,636 |
| 11/30/2023 | 14,256 | 28,242 |
| 05/31/2024 | 15,446 | 32,861 |
| Average Annual Total Returns |
| | 1 Year | 5 Years | Since Inception (a) | |
| Institutional Class shares | 19.72% | 5.25% | 5.34% | |
| S&P 500® Total Return Index | 28.19% | 15.79% | 15.28% | |
| (a) | | The Fund commenced operation on January 21, 2016. |
The above line graph shows the value of a hypothetical $10,000 investment in the Fund’s Institutional Class shares versus the S&P 500® Total Return Index, the Fund’s regulatory benchmark. The S&P 500® Total Return Index is a broad unmanaged index of 500 stocks, which is widely recognized as representative of the equity market in general. Please note that indices do not take into account any fees and expenses of investing in the individual securities that they track and individuals cannot invest directly in any index.
| FinTrust Income and Opportunity Fund | SEMI-ANNUAL REPORT |
Institutional Class (HIOIX) (Unaudited)
May 31, 2024
The performance information quoted in this semi-annual report assumes the reinvestment of all dividend and capital gain distributions, if any, and represents past performance, which is not a guarantee of future results. The returns shown do not reflect taxes that a shareholder would pay on Fund distributions or on the redemption of Fund shares. The investment return and principal value of an investment will fluctuate and, therefore, an investor’s shares, when redeemed, may be worth more or less than their original cost.
Updated performance data current to the most recent month-end can be obtained by calling (877) 244-6235.
What are some Fund statistics?
| Fund Statistics |
| Total Net Assets | $18,194,386 | Investment Advisory Fees Paid | $59,693 |
| Number of Portfolio Holdings | 71 | Portfolio Turnover Rate | 197.05% |
What did the Fund invest in?
| Sector Allocation (as a % of Portfolio) |
| Consumer Discretionary | 21.57% | Industrials | 5.82% |
| Information Technology | 17.17% | Government Bonds | 5.24% |
| Cash and Cash Equivalents | 10.70% | Consumer Staples | 3.48% |
| Financials | 10.26% | Materials | 2.83% |
| Health Care | 9.86% | Index | 2.00% |
| Communication Services | 9.65% | Energy | 1.42% |
| Top Ten Holdings (as a % of Net Assets) |
| Federated Hermes Gov’t. Obligations Fund - Institutional Shares | 11.18% | Alibaba Group Holding Ltd. | 4.31% |
| NVIDIA Corp. | 9.04% | Amazon.com, Inc. | 4.13% |
| Super Micro Computer, Inc. | 5.61% | Tesla, Inc. | 3.95% |
| U.S. Treasury Note, 4.750% due 07/31/2025 | 5.47% | Expedia Group, Inc. | 3.45% |
| Regeneron Pharmaceuticals, Inc. | 4.85% | JetBlue Airways Corp. | 3.07% |
How has the Fund changed?
At a Special Meeting of the Board held on July 31, 2024 (the “Special Meeting”), the Board was notified that another investment adviser was acquiring the Adviser and the transaction’s closing date is expected to be on August 31, 2024 (the "Closing Date"). Upon closing, the Investment Advisory Agreement between the Fund and the Adviser will terminate because of a change in control of the Adviser that resulted in the assignment of the Advisory Agreement under federal securities laws. The Adviser has recommended that M3Sixty Capital, LLC (“M3Sixty Capital") take over management of the Fund under a new investment advisory agreement, effective on the Closing Date, or that the Fund be liquidated on that date. The Board considered the Fund’s options and voted unanimously to approve a New Investment Advisory Agreement (the “New Agreement”) with M3Sixty Capital, subject to shareholder approval.
At the Special Meeting, the Board also approved a New Expense Limitation Agreement for the Fund and authorized the solicitation of shareholder approval for the new agreements. A special meeting of shareholders is expected to be held on August 30 to approve the New Agreement and New Expense Limitation Agreement and to conduct any other business that may lawfully be presented at such meeting.
Householding
To reduce Fund expenses, only one copy of most shareholder documents may be mailed to shareholders with multiple accounts at the same address (Householding). If you would prefer that your Fund documents not be householded, please contact the Fund at (877) 244-6235 or contact your financial intermediary. Your instructions will typically be effective within 30 days of receipt by the Fund.
| FinTrust Income and Opportunity Fund | SEMI-ANNUAL REPORT |
Class A (HROAX) (Unaudited)
May 31, 2024
This semi-annual report to shareholders contains important information of the FinTrust Income and Opportunity Fund (the “Fund”) for the six months ended May 31, 2024. You can find the Fund’s prospectus, financial information on Form N-CSR, holdings, proxy voting information and other information at https://fintrustfunds.com/. You can also request this information without charge by contacting the Fund at (877) 244-6235.
semi-annual shareholder report
What were the Fund costs for the six months? (based on a hypothetical $10,000 investment)
| | Costs of a $10,000 investment | Costs paid as a percentage of a $10,000 investment |
| Class A shares | $119 | 2.29% |
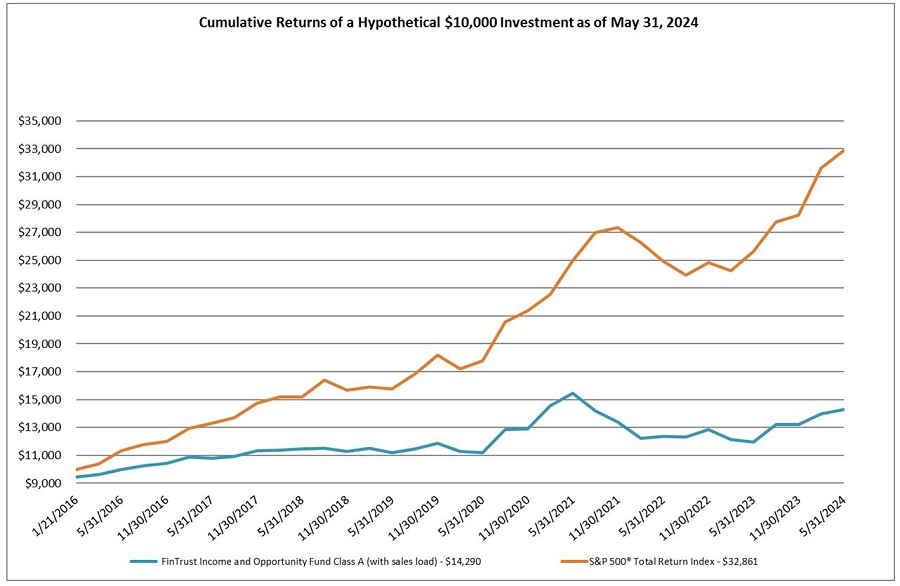
How has the Fund performed?
| Date | FinTrust Income and Opportunity Fund Class A (with sales load) | S&P 500 Total Return Index |
| 01/21/2016 | 9,450 | 10,000 |
| 02/29/2016 | 9,601 | 10,369 |
| 05/31/2016 | 9,960 | 11,315 |
| 08/31/2016 | 10,253 | 11,779 |
| 11/30/2016 | 10,423 | 11,995 |
| 02/28/2017 | 10,886 | 12,959 |
| 05/31/2017 | 10,810 | 13,292 |
| 08/31/2017 | 10,914 | 13,691 |
| 11/30/2017 | 11,321 | 14,739 |
| 2/28/2018 | 11,370 | 15,175 |
| 5/31/2018 | 11,475 | 15,204 |
| 8/31/2018 | 11,528 | 16,383 |
| 11/30/2018 | 11,286 | 15,663 |
| 2/28/2019 | 11,487 | 15,885 |
| 5/31/2019 | 11,210 | 15,779 |
| 8/31/2019 | 11,454 | 16,862 |
| 11/30/2019 | 11,887 | 18,187 |
| 2/29/2020 | 11,279 | 17,186 |
| 5/31/2020 | 11,186 | 17,804 |
| 8/31/2020 | 12,849 | 20,561 |
| 11/30/2020 | 12,918 | 21,361 |
| 02/28/2021 | 14,538 | 22,564 |
| 05/31/2021 | 15,466 | 24,983 |
| 08/31/2021 | 14,184 | 26,969 |
| 11/30/2021 | 13,379 | 27,326 |
| 02/28/2022 | 12,241 | 26,262 |
| 05/31/2022 | 12,358 | 24,908 |
| 08/31/2022 | 12,332 | 23,941 |
| 11/30/2022 | 12,851 | 24,809 |
| 02/28/2023 | 12,151 | 24,242 |
| 05/31/2023 | 11,969 | 25,636 |
| 08/31/2023 | 13,227 | 27,758 |
| 11/30/2023 | 13,201 | 28,242 |
| 02/29/2024 | 13,966 | 31,625 |
| 05/31/2024 | 14,290 | 32,861 |
| Average Annual Total Returns |
| | 1 Year | 5 Years | Since Inception (a) | |
| Class A shares without sales charge | 19.39% | 4.98% | 5.07% | |
| Class A shares with sales charge | 12.83% | 3.80% | 4.36% | |
| S&P 500® Total Return Index | 28.19% | 15.79% | 15.28% | |
| (a) | | The Fund commenced operation on January 21, 2016. |
The above line graph shows the value of a hypothetical $10,000 investment in the Fund’s Class A shares versus the S&P 500® Total Return Index, the Fund’s regulatory benchmark. The S&P 500® Total Return Index is a broad unmanaged index of 500 stocks, which is widely recognized as representative of the equity market in general. Please note that indices do not take into account any fees and expenses of investing in the individual securities that they track and individuals cannot invest directly in any index.
| FinTrust Income and Opportunity Fund | SEMI-ANNUAL REPORT |
Class A (HROAX) (Unaudited)
May 31, 2024
The performance information quoted in this semi-annual report assumes the reinvestment of all dividend and capital gain distributions, if any, and represents past performance, which is not a guarantee of future results. The returns shown do not reflect taxes that a shareholder would pay on Fund distributions or on the redemption of Fund shares. The investment return and principal value of an investment will fluctuate and, therefore, an investor’s shares, when redeemed, may be worth more or less than their original cost.
Updated performance data current to the most recent month-end can be obtained by calling (877) 244-6235.
What are some Fund statistics?
| Fund Statistics |
| Total Net Assets | $18,194,386 | Investment Advisory Fees Paid | $59,693 |
| Number of Portfolio Holdings | 71 | Portfolio Turnover Rate | 197.05% |
What did the Fund invest in?
| Sector Allocation (as a % of Portfolio) |
| Consumer Discretionary | 21.57% | Industrials | 5.82% |
| Information Technology | 17.17% | Government Bonds | 5.24% |
| Cash and Cash Equivalents | 10.70% | Consumer Staples | 3.48% |
| Financials | 10.26% | Materials | 2.83% |
| Health Care | 9.86% | Index | 2.00% |
| Communication Services | 9.65% | Energy | 1.42% |
| Top Ten Holdings (as a % of Net Assets) |
| Federated Hermes Gov’t. Obligations Fund - Institutional Shares | 11.18% | Alibaba Group Holding Ltd. | 4.31% |
| NVIDIA Corp. | 9.04% | Amazon.com, Inc. | 4.13% |
| Super Micro Computer, Inc. | 5.61% | Tesla, Inc. | 3.95% |
| U.S. Treasury Note, 4.750% due 07/31/2025 | 5.47% | Expedia Group, Inc. | 3.45% |
| Regeneron Pharmaceuticals, Inc. | 4.85% | JetBlue Airways Corp. | 3.07% |
How has the Fund changed?
At a Special Meeting of the Board held on July 31, 2024 (the “Special Meeting”), the Board was notified that another investment adviser was acquiring the Adviser and the transaction’s closing date is expected to be on August 31, 2024 (the "Closing Date"). Upon closing, the Investment Advisory Agreement between the Fund and the Adviser will terminate because of a change in control of the Adviser that resulted in the assignment of the Advisory Agreement under federal securities laws. The Adviser has recommended that M3Sixty Capital, LLC (“M3Sixty Capital") take over management of the Fund under a new investment advisory agreement, effective on the Closing Date, or that the Fund be liquidated on that date. The Board considered the Fund’s options and voted unanimously to approve a New Investment Advisory Agreement (the “New Agreement”) with M3Sixty Capital, subject to shareholder approval.
At the Special Meeting, the Board also approved a New Expense Limitation Agreement for the Fund and authorized the solicitation of shareholder approval for the new agreements. A special meeting of shareholders is expected to be held on August 30 to approve the New Agreement and New Expense Limitation Agreement and to conduct any other business that may lawfully be presented at such meeting.
Householding
To reduce Fund expenses, only one copy of most shareholder documents may be mailed to shareholders with multiple accounts at the same address (Householding). If you would prefer that your Fund documents not be householded, please contact the Fund at (877) 244-6235 or contact your financial intermediary. Your instructions will typically be effective within 30 days of receipt by the Fund.

FinTrust Income and Opportunity Fund Class A Shares (Ticker Symbol: HROAX) Institutional Class Shares (Ticker Symbol: HIOIX) A Series of the 360 Funds |
SEMI-ANNUAL REPORT
May 31, 2024
Investment Adviser:
FinTrust Capital Advisors, LLC
124 Verdae Boulevard, Suite 504
Greenville, SC 29607
IMPORTANT NOTE: Effective January 24, 2023, the SEC adopted rule and form amendments to require open-end mutual funds and ETFs to transmit concise, visually engaging, and streamlined annual and semi-annual reports to shareholders that highlight key information. Other information, including financial statements, will no longer appear in a streamlined shareholder report but will be available online and filed semi-annually on Form N-CSR; you can also request a copy be delivered to you free of charge. The rule and form amendments have a compliance date of July 24, 2024. Prior to this compliance date and as permitted by current SEC regulations, paper copies of the Funds’ shareholder reports will no longer be sent by mail unless you specifically request paper copies of the reports from the Funds or from your financial intermediary, such as a broker-dealer or bank. Instead, the reports will be made available on a website, and you will be notified by mail each time a report is posted and provided with a website link to access the report. You may elect to receive all future reports in paper free of charge. You can inform the Funds or your financial intermediary that you wish to continue receiving paper copies of your shareholder reports by calling or sending an e-mail request. Your election to receive reports in paper will apply to all funds held with the Fund complex/your financial intermediary.
TABLE OF CONTENTS
| FinTrust Income and Opportunity Fund | SEMI-ANNUAL REPORT |
INVESTMENT HIGHLIGHTS (Unaudited)
May 31, 2024
The investment objective of the FinTrust Income and Opportunity Fund (the “Fund”) is total return comprised of income and capital appreciation. To meet its investment objective, the Fund will invest primarily in domestic equity securities that in the opinion of FinTrust Capital Advisors, LLC (the “Adviser”) have above average intellectual property portfolios and other characteristics, like strong earnings and dividend growth that are members of the S&P 1500 Composite. The S&P 1500 Composite combines the S&P 500, an index of large-capitalization issuers, the S&P Midcap 400, and the S&P Small Cap 600 to cover approximately 90% of the U.S. market capitalization. The Fund also engages in short selling to the extent permitted under the Investment Company Act of 1940 (the “1940 Act”). The Fund may invest in the securities of other investment companies, including exchange-traded funds (“ETFs”), to the extent that such investments are consistent with the Fund’s investment objective and the policies are permissible under the 1940 Act. The Fund will seek to produce income through dividends paid on securities and options (e.g., premium income on the sale of an option), and total return through an options strategy.
The Fund will typically invest in issuers that have established markets and operations and generate excess cash flow. The Fund looks for stocks with attributes which suggest they will thrive in good markets and survive potential economic setbacks. The Fund employs detailed quantitative assessments to construct its equity portfolio. Portfolio parameters include, but are not limited to, a quantitative valuation of the strength of the company’s intellectual property portfolio, steady growing earnings, dividend yield with a tendency to raise such yield and availability at reasonable price-earnings ratios. The Fund seeks to invest in stocks that are undervalued by the market, but with strong business models, which may provide for lower levels of market volatility or non-correlated volatility. The Fund also prefers to invest in equity stocks that have options traded on them. The Fund will rebalance and adjust its equity portfolio as the Adviser deems necessary and appropriate.
The Fund may also invest in companies that are experiencing a “special situation” that makes them undervalued relative to their long-term potential. Developments creating special situations may include new intellectual property developments, intellectual property licensing deals, mergers, spin-offs, litigation resolutions, new products or management changes. The Fund may also invest in convertible securities. The Fund also seeks to generate income for shareholders by selling options against the risk taken by owning common stocks. For example, the Fund intends to sell covered call options on a portion of its stock holdings. This income is designed to, over time, add to portfolio stability and improve returns. The Fund also uses options to limit market exposure and volatility. The extent of option selling will depend upon market conditions and the Adviser’s judgment as to the advantages of selling call options on the Fund’s equity investments.
The Fund is non-diversified - which means that it can invest a greater percentage of its assets in a small group of issuers or any one issuer than a diversified fund can. The Fund may be appropriate for investors with long-term time horizons who are not sensitive to short-term losses and want to participate in the long-term growth of the financial markets. The Fund seeks to avoid or minimize the effects of inflation on the portfolio.
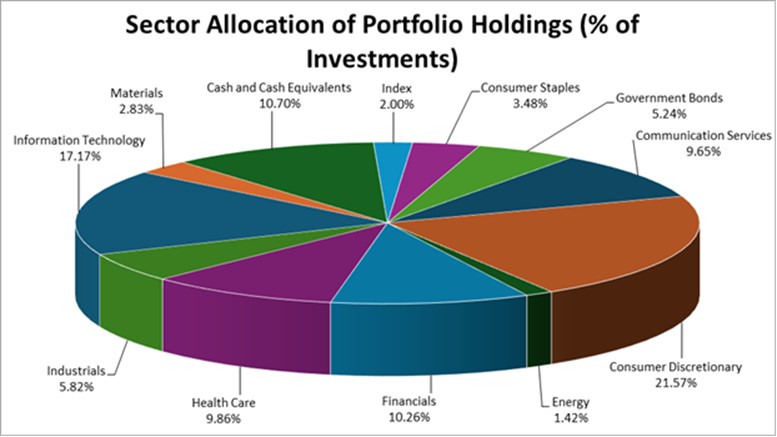
The percentages in the above graph are based on the portfolio holdings of the Fund as of May 31, 2024 and are subject to change. For a detailed break-out of holdings by industry and investment type, please refer to the Schedule of Investments.
| FINTRUST INCOME AND OPPORTUNITY FUND |
| SCHEDULE OF INVESTMENTS |
| May 31, 2024 (Unaudited) | | SEMI-ANNUAL REPORT | |
| | | | | | | |
| COMMON STOCK - 79.58% | | Shares | | | Value | |
| | | | | | | |
| Aerospace & Defense - 2.93% | | | | | | | | |
| Boeing Co. (a) | | | 3,000 | | | $ | 532,830 | |
| | | | | | | | | |
| Agriculture - 1.03% | | | | | | | | |
| Archer-Daniels-Midland Co. | | | 3,000 | | | | 187,320 | |
| | | | | | | | | |
| Airlines - 3.07% | | | | | | | | |
| JetBlue Airways Corp. (a) | | | 100,000 | | | | 559,000 | |
| | | | | | | | | |
| Auto Manufacturers - 8.34% | | | | | | | | |
| General Motors Co. | | | 10,000 | | | | 449,900 | |
| Tesla, Inc. (a) | | | 4,000 | | | | 712,320 | |
| Volkswagen AG - Germany - ADR | | | 25,000 | | | | 355,750 | |
| | | | | | | | 1,517,970 | |
| Beverages - 1.51% | | | | | | | | |
| Molson Coors Beverage Co. - Class B | | | 5,000 | | | | 274,050 | |
| | | | | | | | | |
| Biotechnology - 7.71% | | | | | | | | |
| Amgen, Inc. | | | 1,700 | | | | 519,945 | |
| Regeneron Pharmaceuticals, Inc. (a) | | | 900 | | | | 882,144 | |
| | | | | | | | 1,402,089 | |
| Chemicals - 2.96% | | | | | | | | |
| Olin Corp. | | | 10,000 | | | | 537,600 | |
| | | | | | | | | |
| Commercial Services - 1.38% | | | | | | | | |
| PayPal Holdings, Inc. (a) | | | 4,000 | | | | 251,960 | |
| | | | | | | | | |
| Computers - 5.61% | | | | | | | | |
| Super Micro Computer, Inc. (a) | | | 1,300 | | | | 1,019,863 | |
| | | | | | | | | |
| Diversified Financial Services - 3.03% | | | | | | | | |
| Charles Schwab Corp. | | | 3,500 | | | | 256,480 | |
| Nasdaq, Inc. | | | 5,000 | | | | 295,150 | |
| | | | | | | | 551,630 | |
| Energy - Alternate Sources - 0.19% | | | | | | | | |
| Gevo, Inc. (a) | | | 50,000 | | | | 34,185 | |
| | | | | | | | | |
| Food - 1.09% | | | | | | | | |
| Hershey Co. | | | 1,000 | | | | 197,830 | |
| | | | | | | | | |
| Healthcare - Products - 0.74% | | | | | | | | |
| Sensus Healthcare, Inc. (a) | | | 25,000 | | | | 135,500 | |
| | | | | | | | | |
| Insurance - 2.67% | | | | | | | | |
| Brighthouse Financial, Inc. (a) | | | 5,000 | | | | 222,550 | |
| Hanover Insurance Group, Inc. | | | 2,000 | | | | 263,860 | |
| | | | | | | | 486,410 | |
| FINTRUST INCOME AND OPPORTUNITY FUND |
| SCHEDULE OF INVESTMENTS |
| May 31, 2024 (Unaudited) | SEMI-ANNUAL REPORT |
| COMMON STOCK - 79.58% (continued) | | Shares | | | Value | |
| | | | | | | | | |
| Internet - 20.80% | | | | | | | | |
| Alibaba Group Holding Ltd. - China - ADR | | | 10,000 | | | $ | 783,400 | |
| Alphabet, Inc. - Class C (a) | | | 1,500 | | | | 260,940 | |
| Amazon.com, Inc. (a) | | | 4,000 | | | | 705,760 | |
| Baidu, Inc. - China - ADR (a) | | | 3,000 | | | | 291,600 | |
| Expedia Group, Inc. (a) | | | 5,000 | | | | 564,300 | |
| Meta Platforms, Inc. - Class A | | | 1,000 | | | | 466,830 | |
| PDD Holdings, Inc. - Ireland - ADR (a) | | | 2,500 | | | | 374,450 | |
| Sea Ltd. - Singapore - ADR (a) | | | 5,000 | | | | 337,600 | |
| | | | | | | | 3,784,880 | |
| Media - 0.86% | | | | | | | | |
| Walt Disney Co. | | | 1,500 | | | | 155,865 | |
| | | | | | | | | |
| Pharmaceuticals - 1.24% | | | | | | | | |
| Canopy Growth Corp. - Canada (a) | | | 26,500 | | | | 226,045 | |
| | | | | | | | | |
| Pipelines - 1.30% | | | | | | | | |
| Cheniere Energy, Inc. | | | 1,500 | | | | 236,685 | |
| | | | | | | | | |
| Semiconductors - 9.04% | | | | | | | | |
| NVIDIA Corp. | | | 1,500 | | | | 1,644,495 | |
| | | | | | | | | |
| Software - 4.08% | | | | | | | | |
| DocuSign, Inc. (a) | | | 5,000 | | | | 273,700 | |
| Oracle Corp. | | | 2,000 | | | | 234,380 | |
| Yalla Group Ltd. - ADR - UAE (a) | | | 50,000 | | | | 235,000 | |
| | | | | | | | 743,080 | |
| | | | | | | | | |
| TOTAL COMMON STOCK (Cost $14,134,460) | | | | | | | 14,479,287 | |
| | | | | | | | | |
| PREFERRED STOCK - 2.75% | | | | | | | | |
| | | | | | | | | |
| Banks - 2.75% | | | | | | | | |
| United Community Banks, Inc., 6.875% - Series I (b) (d) | | | 21,000 | | | | 499,590 | |
| | | | | | | | | |
| TOTAL PREFERRED STOCK (Cost $529,751) | | | | | | | 499,590 | |
| FINTRUST INCOME AND OPPORTUNITY FUND |
| SCHEDULE OF INVESTMENTS |
| May 31, 2024 (Unaudited) | SEMI-ANNUAL REPORT |
| GOVERNMENT BONDS - 5.47% | | Principal | | | Value | |
| | | | | | | | | |
| U.S. Treasury Note, 4.750% due 07/31/2025 (b) | | $ | 1,000,000 | | | $ | 995,586 | |
| | | | | | | | | |
| TOTAL GOVERNMENT BONDS (Cost $998,838) | | | | | | | 995,586 | |
| | | | | | | | | |
| EXCHANGE-TRADED FUND - 0.63% | | | Shares | | | | | |
| | | | | | | | | |
| Asset Allocation Fund - 0.63% | | | | | | | | |
| ProShares Ultra Euro ETF (a) | | | 10,000 | | | | 114,872 | |
| | | | | | | | | |
| TOTAL EXCHANGE-TRADED FUND (Cost $113,777) | | | | | | | 114,872 | |
| OPTIONS PURCHASED - 4.96% | | | | | | | | | | | | | | | |
| | | | | | Notional | | | Exercise | | | | | | | |
| CALL OPTIONS PURCHASED - 3.74% | | Contracts 1 | | | Amount | | | Price | | | Expiration | | | | |
| Advanced Micro Devices, Inc. | | 30 | | | $ | 510,000 | | | $ | 170.00 | | | | 9/20/2024 | | | | 49,050 | |
| Amazon.com, Inc. | | 20 | | | | 320,000 | | | | 160.00 | | | | 9/20/2024 | | | | 45,200 | |
| Biogen, Inc. | | 10 | | | | 200,000 | | | | 200.00 | | | | 1/17/2025 | | | | 40,600 | |
| Boeing Co. | | 10 | | | | 190,000 | | | | 190.00 | | | | 1/17/2025 | | | | 15,500 | |
| Eli Lilly & Co. | | 10 | | | | 800,000 | | | | 800.00 | | | | 9/20/2024 | | | | 71,400 | |
| Expedia Group, Inc. | | 15 | | | | 187,500 | | | | 125.00 | | | | 1/17/2025 | | | | 12,855 | |
| Expedia Group, Inc. | | 20 | | | | 220,000 | | | | 110.00 | | | | 1/16/2026 | | | | 50,000 | |
| iShares Silver Trust | | 100 | | | | 220,000 | | | | 22.00 | | | | 9/20/2024 | | | | 60,200 | |
| Nasdaq, Inc. | | 50 | | | | 250,000 | | | | 50.00 | | | | 9/20/2024 | | | | 52,750 | |
| Netflix,Inc. | | 15 | | | | 892,500 | | | | 595.00 | | | | 6/21/2024 | | | | 67,290 | |
| Oracle Corp. | | 20 | | | | 200,000 | | | | 100.00 | | | | 12/20/2024 | | | | 42,500 | |
| PayPal Holdings, Inc. | | 70 | | | | 350,000 | | | | 50.00 | | | | 6/21/2024 | | | | 84,350 | |
| PayPal Holdings, Inc. | | 30 | | | | 187,500 | | | | 62.50 | | | | 1/17/2025 | | | | 24,750 | |
| SPDR Gold Shares | | 18 | | | | 360,000 | | | | 200.00 | | | | 12/20/2024 | | | | 39,672 | |
| Tesla, Inc. | | 10 | | | | 200,000 | | | | 200.00 | | | | 7/19/2024 | | | | 5,550 | |
| Walt Disney Co. | | 30 | | | | 330,000 | | | | 110.00 | | | | 1/17/2025 | | | | 19,500 | |
| | | | | | | | | | | | | | | | | | | | |
| TOTAL CALL OPTIONS PURCHASED (Cost $840,489) | | | | | | | | | | | | | | | | 681,167 | |
| | | | | | | | | | | | | | | | | | | | |
| PUT OPTIONS PURCHASED - 1.22% | | | | | | | | | | | | | | | | | | | |
| Costco Wholesale Corp. | | 20 | | | | 1,150,000 | | | | 575.00 | | | | 6/21/2024 | | | | 1,000 | |
| Costco Wholesale Corp. | | 8 | | | | 588,000 | | | | 735.00 | | | | 6/21/2024 | | | | 568 | |
| Invesco QQQ Trust Series 1 | | 30 | | | | 1,260,000 | | | | 420.00 | | | | 6/21/2024 | | | | 2,100 | |
| Invesco QQQ Trust Series 1 | | 30 | | | | 1,289,340 | | | | 429.78 | | | | 6/21/2024 | | | | 4,860 | |
| Invesco QQQ Trust Series 1 | | 20 | | | | 870,000 | | | | 435.00 | | | | 6/21/2024 | | | | 3,800 | |
| Invesco QQQ Trust Series 1 | | 30 | | | | 1,274,340 | | | | 424.78 | | | | 6/28/2024 | | | | 4,680 | |
| Invesco QQQ Trust Series 1 | | 50 | | | | 2,250,000 | | | | 450.00 | | | | 8/16/2024 | | | | 54,250 | |
| Invesco QQQ Trust Series 1 | | 24 | | | | 1,044,000 | | | | 435.00 | | | | 9/20/2024 | | | | 20,400 | |
| SPDR S&P 500 ETF Trust | | 50 | | | | 2,275,000 | | | | 455.00 | | | | 6/21/2024 | | | | 950 | |
| SPDR S&P 500 ETF Trust | | 30 | | | | 1,380,000 | | | | 460.00 | | | | 6/21/2024 | | | | 510 | |
| SPDR S&P 500 ETF Trust | | 40 | | | | 2,088,000 | | | | 522.00 | | | | 6/28/2024 | | | | 17,080 | |
| SPDR S&P 500 ETF Trust | | 30 | | | | 1,572,000 | | | | 524.00 | | | | 7/31/2024 | | | | 21,030 | |
| SPDR S&P 500 ETF Trust | | 30 | | | | 1,569,000 | | | | 523.00 | | | | 8/30/2024 | | | | 27,930 | |
| SPDR S&P 500 ETF Trust | | 30 | | | | 1,425,000 | | | | 475.00 | | | | 9/20/2024 | | | | 8,400 | |
| Wingstop, Inc. | | 20 | | | | 760,000 | | | | 380.00 | | | | 7/19/2024 | | | | 54,200 | |
| | | | | | | | | | | | | | | | | | | | |
| TOTAL PUT OPTIONS PURCHASED (Cost $685,047) | | | | | | | | | | | | | | | | 221,758 | |
| | | | | | | | | | | | | | | | | | | | |
| TOTAL OPTIONS PURCHASED (Cost $1,525,536) | | | | | | | | | | | | | | | | 902,925 | |
| FINTRUST INCOME AND OPPORTUNITY FUND |
| SCHEDULE OF INVESTMENTS |
| May 31, 2024 (Unaudited) | SEMI-ANNUAL REPORT |
| | | Shares | | | Value | |
| SHORT-TERM INVESTMENTS - 11.18% | | | | | | | | |
| Federated Hermes Government Obligations Fund - Institutional Shares, 5.19% (c) | | | 2,033,423 | | | $ | 2,033,423 | |
| | | | | | | | | |
| SHORT-TERM INVESTMENTS (Cost $2,033,423) | | | | | | | 2,033,423 | |
| | | | | | | | | |
| INVESTMENTS AT VALUE (Cost $19,335,785) - 104.57% | | | | | | $ | 19,025,683 | |
| | | | | | | | | |
| TOTAL OPTIONS WRITTEN, AT VALUE (Premiums $27,002) - (0.08)% | | | | | | | (14,600 | ) |
| | | | | | | | | |
| LIABILITIES IN EXCESS OF OTHER ASSETS, NET - (4.49)% | | | | | | | (816,697 | ) |
| | | | | | | | | |
| NET ASSETS - 100.00% | | | | | | $ | 18,194,386 | |
Percentages are stated as a percent of net assets.
(a) Non-income producing security.
(b) All or a portion of the security is segregated as collateral for options written and securities sold short.
(c) Rate shown represents the 7-day effective yield at May 31, 2024, is subject to change and resets daily.
(d) Affiliated company. See Investments In Affiliated Companies section of the accompanying footnotes.
1 Each option contract is equivalent to 100 shares of the underlying common stock or exchange-traded fund. All options are non-income producing.
The following abbreviations are used in this portfolio:
ADR - American Depositary Receipt
AG - Aktiengesellschaft (German Public Limited Company)
ETF - Exchange-Traded Fund
Ltd. - Limited
SPDR - Standard & Poor’s Depositary Receipts
UAE - United Arab Emirates
The accompanying notes are an integral part of these financial statements.
| FINTRUST INCOME AND OPPORTUNITY FUND |
| SCHEDULE OF OPTIONS WRITTEN |
| May 31, 2024 (Unaudited) | SEMI-ANNUAL REPORT |
| OPTIONS WRITTEN - (0.08)% | | | | | | | | | | | | | | | |
| | | | | | Notional | | | Exercise | | | | | | | |
| CALL OPTIONS WRITTEN - (0.08)% | | Contracts 1 | | | Amount | | | Price | | | Expiration | | | Value | |
| Moderna, Inc. | | | 10 | | | $ | 150,000 | | | $ | 150.00 | | | | 6/7/2024 | | | $ | 2,000 | |
| Wingstop, Inc. | | | 15 | | | | 570,000 | | | | 380.00 | | | | 6/21/2024 | | | | 12,600 | |
| | | | | | | | | | | | | | | | | | | | | |
| TOTAL CALL OPTIONS WRITTEN (Premiums $27,002) | | | | | | | | | | | | | | | | 14,600 | |
| | | | | | | | | | | | | | | | | | | | | |
| TOTAL OPTIONS WRITTEN (Premiums $27,002) | | | | | | | | | | | | | | | $ | 14,600 | |
Percentages are stated as a percent of net assets.
1 Each option contract is equivalent to 100 shares of the underlying common stock. All options are non-income producing.
The accompanying notes are an integral part of these financial statements.
| FINTRUST INCOME AND OPPORTUNITY FUND |
| STATEMENT OF ASSETS AND LIABILITIES |
| May 31, 2024 (Unaudited) | SEMI-ANNUAL REPORT |
| Assets: | | | |
| | | | |
| Unaffiliated Investments, at cost | | $ | 18,806,034 | |
| Affiliated Investments, at cost | | | 529,751 | |
| Total Investments, at cost | | | 19,335,785 | |
| Unaffiliated Investments, at value | | | 18,526,093 | |
| Affiliated Investments, at value | | | 499,590 | |
| Total Investments, at value | | | 19,025,683 | |
| Receivables: | | | | |
| Interest | | | 25,820 | |
| Dividends | | | 35,471 | |
| Investment securities sold | | | 113,084 | |
| Prepaid expenses | | | 5,263 | |
| Total assets | | | 19,205,321 | |
| | | | | |
| Liabilities: | | | | |
| Premiums from options written | | $ | 27,002 | |
| Options written, at value | | | 14,600 | |
| Cash due to broker | | | 499,955 | |
| Payables: | | | | |
| Investment securities purchased | | | 472,518 | |
| Due to administrator | | | 9,576 | |
| Due to adviser | | | 8,544 | |
| Accrued expenses | | | 2,894 | |
| Accrued Trustee fees | | | 2,576 | |
| Accrued distribution (12b-1) fees | | | 272 | |
| Total liabilities | | | 1,010,935 | |
| Net Assets | | $ | 18,194,386 | |
| | | | | |
| Sources of Net Assets: | | | | |
| Paid-in capital | | $ | 17,769,949 | |
| Total distributable earnings | | | 424,437 | |
| Total Net Assets | | $ | 18,194,386 | |
| | | | | |
| Class A Shares: | | | | |
| Net Assets | | $ | 56,390 | |
| Shares Outstanding (Unlimited shares of $0 par value beneficial interest authorized) | | | 5,118 | |
| Net Asset Value Per Share | | $ | 11.02 | |
| | | | | |
| Maximum Offering Price Per Share (a) | | $ | 11.66 | |
| | | | | |
| Minimum Redemption Price Per Share (b) | | $ | 10.91 | |
| | | | | |
| Institutional Class Shares: | | | | |
| Net Assets | | $ | 18,137,996 | |
| Shares Outstanding (Unlimited shares of $0 par value beneficial interest authorized) | | | 1,607,360 | |
| Net Asset Value, Offering and Redemption Price Per Share | | $ | 11.28 | |
(a) A maximum sales charge of 5.50% is imposed on Class A shares.
(b) Investments in Class A shares made at or above the $1 million breakpoint are not subject to an initial sales charge and may be subject to a 1.00% contingent deferred sales charge (“CDSC”) on shares redeemed within one year from the date of purchase.
The accompanying notes are an integral part of these financial statements.
| FINTRUST INCOME AND OPPORTUNITY FUND |
| STATEMENT OF OPERATIONS | SEMI-ANNUAL REPORT |
| | | For the | |
| | | Six Months Ended | |
| | | May 31, 2024 | |
| | | (Unaudited) | |
| Investment income: | | | | |
| Dividends (net of foreign withholding taxes of $6,360) | | $ | 79,898 | |
| Dividends from affiliates (Note 10) | | | 18,047 | |
| Interest | | | 65,661 | |
| Total investment income | | | 163,606 | |
| | | | | |
| Expenses: | | | | |
| Management fees (Note 6) | | | 113,845 | |
| Distribution (12b-1) fees - Class A (Note 6) | | | 69 | |
| Accounting and transfer agent fees and expenses (Note 6) | | | 51,265 | |
| Legal fees | | | 12,501 | |
| Reports to shareholders | | | 12,501 | |
| Trustee fees and expenses | | | 9,251 | |
| Audit fees | | | 6,729 | |
| Miscellaneous | | | 6,711 | |
| Compliance officer fees (Note 6) | | | 5,750 | |
| Custodian fees | | | 5,250 | |
| Pricing fees | | | 4,751 | |
| Interest expense | | | 3,139 | |
| Insurance | | | 2,804 | |
| Registration and filing fees | | | 392 | |
| Total expenses | | | 234,958 | |
| Less: fees waived (Note 6) | | | (54,152 | ) |
| Net expenses | | | 180,806 | |
| | | | | |
| Net investment loss | | | (17,200 | ) |
| | | | | |
| Realized and unrealized gain (loss): | | | | |
| Net realized gain (loss) on: | | | | |
| Unaffiliated Investments | | | 1,582,354 | |
| Options written | | | 271,461 | |
| Securities sold short | | | (447,472 | ) |
| Net realized gain on investments, options written and securities sold short | | | 1,406,343 | |
| | | | | |
| Net change in unrealized appreciation on: | | | | |
| Unaffiliated Investments | | | 8,479 | |
| Affiliated Investments | | | 32,550 | |
| Options written | | | 5,725 | |
| Securities sold short | | | 9,691 | |
| Net change in unrealized appreciation on investments, options written and securities sold short | | | 56,445 | |
| | | | | |
| Net realized and unrealized gain on investments, options written and securities sold short | | | 1,462,788 | |
| | | | | |
| Net increase in net assets resulting from operations | | $ | 1,445,588 | |
The accompanying notes are an integral part of these financial statements.
| FINTRUST INCOME AND OPPORTUNITY FUND |
| STATEMENTS OF CHANGES IN NET ASSETS | SEMI-ANNUAL REPORT |
| | | For the | | | For the | |
| | | Six Months Ended | | | Year Ended | |
| | | May 31, 2024 | | | November 30, 2023 | |
| | | (Unaudited) | | | | | |
| Increase (decrease) in net assets from: | | | | | | | | |
| Operations: | | | | | | | | |
| Net investment income (loss) | | $ | (17,200 | ) | | $ | 39,071 | |
| Net realized gain on investments, options written and securities sold short | | | 1,406,343 | | | | 321,881 | |
| Net change in unrealized appreciation on investments, options written and securities sold short | | | 56,445 | | | | 107,557 | |
| Net increase in net assets resulting from operations | | | 1,445,588 | | | | 468,509 | |
| | | | | | | | | |
| Capital share transactions (Note 4): | | | | | | | | |
| Increase (decrease) in net assets from capital share transactions | | | (990,820 | ) | | | 238,141 | |
| | | | | | | | | |
| Increase in net assets | | | 454,768 | | | | 706,650 | |
| | | | | | | | | |
| Net Assets: | | | | | | | | |
| Beginning of year/period | | | 17,739,618 | | | | 17,032,968 | |
| | | | | | | | | |
| End of year/period | | $ | 18,194,386 | | | $ | 17,739,618 | |
The accompanying notes are an integral part of these financial statements.
| FINTRUST INCOME AND OPPORTUNITY FUND |
| FINANCIAL HIGHLIGHTS | SEMI-ANNUAL REPORT |
The following tables set forth the per share operating performance data for a share of beneficial interest outstanding, total return, ratios to average net assets and other supplemental data for the year/period indicated.
| | | Class A | |
| | | | For the | | | | For the | | | | For the | | | | For the | | | | For the | | | | For the | |
| | | | Six Months Ended | | | | Year Ended | | | | Year Ended | | | | Year Ended | | | | Year Ended | | | | Year Ended | |
| | | | May 31, 2024 | | | | November 30, 2023 | | | | November 30, 2022 | | | | November 30, 2021 | | | | November 30, 2020 | | | | November 30, 2019 | |
| | | | (Unaudited) | | | | | | | | | | | | | | | | | | | | | |
| | | | | | | | | | | | | | | | | | | | | | | | | |
| Net Asset Value, Beginning of Year/Period | | $ | 10.18 | | | $ | 9.91 | | | $ | 10.96 | | | $ | 11.19 | | | $ | 10.71 | | | $ | 10.73 | |
| | | | | | | | | | | | | | | | | | | | | | | | | |
| Investment Operations: | | | | | | | | | | | | | | | | | | | | | | | | |
| Net investment Income (loss) (a) | | | (0.02 | ) | | | 0.01 | | | | (0.10 | ) | | | (0.18 | ) | | | (0.15 | ) | | | (0.06 | ) |
| Net realized and unrealized gains (losses) on investments, options written and securities sold short | | | 0.86 | | | | 0.26 | | | | (0.32 | ) | | | 0.58 | | | | 1.05 | | | | 0.56 | |
| Total from investment operations | | | 0.84 | | | | 0.27 | | | | (0.42 | ) | | | 0.40 | | | | 0.90 | | | | 0.50 | |
| | | | | | | | | | | | | | | | | | | | | | | | | |
| Distributions: | | | | | | | | | | | | | | | | | | | | | | | | |
| From net realized capital gains | | | — | | | | — | | | | (0.63 | ) | | | (0.63 | ) | | | (0.42 | ) | | | (0.52 | ) |
| Total distributions | | | — | | | | — | | | | (0.63 | ) | | | (0.63 | ) | | | (0.42 | ) | | | (0.52 | ) |
| | | | | | | | | | | | | | | | | | | | | | | | | |
| Net Asset Value, End of Year/Period | | $ | 11.02 | | | $ | 10.18 | | | $ | 9.91 | | | $ | 10.96 | (d) | | $ | 11.19 | | | $ | 10.71 | |
| | | | | | | | | | | | | | | | | | | | | | | | | |
| Total Return (b) | | | 8.25 | %(f) | | | 2.72 | % | | | (3.94 | )% | | | 3.57 | % | | | 8.68 | % | | | 5.32 | % |
| | | | | | | | | | | | | | | | | | | | | | | | | |
| Ratios/Supplemental Data | | | | | | | | | | | | | | | | | | | | | | | | |
| Net assets, end of year/period (in 000’s) | | $ | 56 | | | $ | 52 | | | $ | 158 | | | $ | 82 | | | $ | 83 | | | $ | 97 | |
| | | | | | | | | | | | | | | | | | | | | | | | | |
| Ratios of expenses to average net assets: | | | | | | | | | | | | | | | | | | | | | | | | |
| Before fees waived and expenses absorbed (c) | | | 2.83 | %(g) | | | 2.97 | % | | | 3.01 | % | | | 2.62 | % | | | 3.29 | % | | | 3.66 | % |
| After fees waived and expenses absorbed (c) | | | 2.23 | %(g) | | | 2.22 | % | | | 2.44 | % | | | 2.35 | % | | | 2.35 | % | | | 2.22 | % |
| | | | | | | | | | | | | | | | | | | | | | | | | |
| Ratios of net investment income (loss): | | | | | | | | | | | | | | | | | | | | | | | | |
| Before fees waived and expenses absorbed (c) | | | (1.03 | )%(g) | | | (0.75 | )% | | | (1.68 | )% | | | (1.77 | )% | | | (2.35 | )% | | | (2.06 | )% |
| After fees waived and expenses absorbed (c) | | | (0.44 | )%(g) | | | 0.00 | % | | | (1.11 | )% | | | (1.50 | )% | | | (1.41 | )% | | | (0.63 | )% |
| | | | | | | | | | | | | | | | | | | | | | | | | |
| Portfolio turnover rate | | | 197.05 | %(f) | | | 739.85 | % | | | 1194.80 | %(e) | | | 395.29 | % | | | 271.84 | % | | | 192.88 | % |
| (a) | Net investment loss per share is based on average shares outstanding. |
| (b) | Total Return represents the rate that the investor would have earned or lost on an investment in the Fund, assuming reinvestment of dividends and does not reflect the impact of sales charges. |
| (c) | The ratios include 0.03% of interest expense and 0.00% of dividend expense for the six months ended May 31, 2024, 0.02% of interest expense and 0.00% of dividend expense for the year ended November 30, 2023, 0.16% of interest expense and 0.08% of dividend expense during the year ended November 30, 2022, 0.13% of interest expense and 0.02% of dividend expense during the year ended November 30, 2021, 0.15% of interest expense during the year ended November 30, 2020 and 0.02% of interest expense during the year ended November 30, 2019. |
| (d) | The Net Asset Value differs from the traded NAV on November 30, 2021 due to financial statement adjustments. |
| (e) | The increase in portfolio turnover for the year ended November 30, 2022 was the result of certain market conditions occurring throughout the year which led to more active trading by the portfolio manager. |
The accompanying notes are an integral part of these financial statements.
| FINTRUST INCOME AND OPPORTUNITY FUND |
| FINANCIAL HIGHLIGHTS | SEMI-ANNUAL REPORT |
The following tables set forth the per share operating performance data for a share of beneficial interest outstanding, total return, ratios to average net assets and other supplemental data for the year/period indicated.
| | | Institutional Class | |
| | | | For the | | | | For the | | | | For the | | | | For the | | | | For the | | | | For the | |
| | | | Six Months Ended | | | | Year Ended | | | | Year Ended | | | | Year Ended | | | | Year Ended | | | | Year Ended | |
| | | | May 31, 2024 | | | | November 30, 2023 | | | | November 30, 2022 | | | | November 30, 2021 | | | | November 30, 2020 | | | | November 30, 2019 | |
| | | | (Unaudited) | | | | | | | | | | | | | | | | | | | | | |
| | | | | | | | | | | | | | | | | | | | | | | | | |
| Net Asset Value, Beginning of Year/Period | | $ | 10.42 | | | $ | 10.11 | | | $ | 11.14 | | | $ | 11.34 | | | $ | 10.82 | | | $ | 10.81 | |
| | | | | | | | | | | | | | | | | | | | | | | | | |
| Investment Operations: | | | | | | | | | | | | | | | | | | | | | | | | |
| Net investment income (loss) (a) | | | (0.01 | ) | | | 0.02 | | | | (0.08 | ) | | | (0.15 | ) | | | (0.12 | ) | | | (0.04 | ) |
| Net realized and unrealized gains (losses) on investments, options written and securities sold short | | | 0.87 | | | | 0.29 | | | | (0.32 | ) | | | 0.58 | | | | 1.06 | | | | 0.57 | |
| Total from investment operations | | | 0.86 | | | | 0.31 | | | | (0.40 | ) | | | 0.43 | | | | 0.94 | | | | 0.53 | |
| | | | | | | | | | | | | | | | | | | | | | | | | |
| Distributions: | | | | | | | | | | | | | | | | | | | | | | | | |
| From net realized capital gains | | | — | | | | — | | | | (0.63 | ) | | | (0.63 | ) | | | (0.42 | ) | | | (0.52 | ) |
| Total distributions | | | — | | | | — | | | | (0.63 | ) | | | (0.63 | ) | | | (0.42 | ) | | | (0.52 | ) |
| | | | | | | | | | | | | | | | | | | | | | | | | |
| Net Asset Value, End of Year/Period | | $ | 11.28 | (d) | | $ | 10.42 | (d) | | $ | 10.11 | | | $ | 11.14 | (d) | | $ | 11.34 | | | $ | 10.82 | |
| | | | | | | | | | | | | | | | | | | | | | | | | |
| Total Return (b) | | | 8.25 | %(f) | | | 3.07 | % | | | (3.68 | )% | | | 3.79 | % | | | 8.97 | % | | | 5.57 | % |
| | | | | | | | | | | | | | | | | | | | | | | | | |
| Ratios/Supplemental Data | | | | | | | | | | | | | | | | | | | | | | | | |
| Net assets, end of year/period (in 000’s) | | $ | 18,138 | | | $ | 17,687 | | | $ | 16,875 | | | $ | 23,418 | | | $ | 17,999 | | | $ | 10,285 | |
| | | | | | | | | | | | | | | | | | | | | | | | | |
| Ratios of expenses to average net assets: | | | | | | | | | | | | | | | | | | | | | | | | |
| Before fees waived and expenses absorbed (c) | | | 2.58 | %(g) | | | 2.72 | % | | | 2.76 | % | | | 2.37 | % | | | 3.04 | % | | | 3.41 | % |
| After fees waived and expenses absorbed (c) | | | 1.98 | %(g) | | | 1.97 | % | | | 2.19 | % | | | 2.10 | % | | | 2.10 | % | | | 1.97 | % |
| | | | | | | | | | | | | | | | | | | | | | | | | |
| Ratios of net investment income (loss): | | | | | | | | | | | | | | | | | | | | | | | | |
| Before fees waived and expenses absorbed (c) | | | (0.78 | )%(g) | | | (0.50 | )% | | | (1.43 | )% | | | (1.52 | )% | | | (2.10 | )% | | | (1.81 | )% |
| After fees waived and expenses absorbed (c) | | | (0.19 | )%(g) | | | 0.25 | % | | | (0.86 | )% | | | (1.25 | )% | | | (1.16 | )% | | | (0.38 | )% |
| | | | | | | | | | | | | | | | | | | | | | | | | |
| Portfolio turnover rate | | | 197.05 | %(f) | | | 739.85 | % | | | 1194.80 | %(e) | | | 395.29 | % | | | 271.84 | % | | | 192.88 | % |
| (a) | Net investment loss per share is based on average shares outstanding. |
| (b) | Total Return represents the rate that the investor would have earned or lost on an investment in the Fund, assuming reinvestment of dividends and does not reflect the impact of sales charges. |
| (c) | The ratios include 0.03% of interest expense and 0.00% of dividend expense for the six months ended May 31, 2024, 0.02% of interest expense and 0.00% of dividend expense for the year ended November 30, 2023, 0.16% of interest expense and 0.08% of dividend expense during the year ended November 30, 2022, 0.13% of interest expense and 0.02% of dividend expense during the year ended November 30, 2021, 0.15% of interest expense during the year ended November 30, 2020 and 0.02% of interest expense during the year ended November 30, 2019. |
| (d) | The Net Asset Value differs from the traded NAV on May 31, 2024, November 30, 2023 and November 30, 2021 due to financial statement adjustments. |
| (e) | The increase in portfolio turnover for the year ended November 30, 2022 was the result of certain market conditions occurring throughout the year which led to more active trading by the portfolio manager. |
The accompanying notes are an integral part of these financial statements.
| FinTrust Income and Opportunity Fund | SEMI-ANNUAL REPORT |
NOTES TO THE FINANCIAL STATEMENTS
May 31, 2024 (Unaudited)
| 1. | ORGANIZATION AND SIGNIFICANT ACCOUNTING POLICIES |
The FinTrust Income and Opportunity Fund (the “Fund”), is a series of 360 Funds (the “Trust”). The Trust was organized on February 24, 2005 as a Delaware statutory trust, and is registered as an open-end management investment company under the 1940 Act. The Fund is a non-diversified fund meaning it may invest a significant portion of its assets in a small number of companies. The Fund’s investment objective is total return comprised of income and capital appreciation. The Fund’s investment adviser is FinTrust Capital Advisors, LLC (the “Adviser”). The Fund offers two classes of shares: Class A and Institutional Class. Each class of shares commenced operations on January 21, 2016. Each class differs as to sales and redemption charges and ongoing fees. Income and expenses (other than class specific), and realized/unrealized gains or losses are allocated to each class based on their relative net asset values. Each class represents an ownership interest in the same investment portfolio and has equal voting rights.
The following is a summary of the significant accounting policies followed by the Fund in the preparation of its financial statements. The Fund is an investment company that follows the accounting and reporting guidance of Accounting Standards Codification Topic 946 applicable to investment companies.
a) Security Valuation – All investments in securities are recorded at their estimated fair value, as described in Note 2.
b) Options – The Fund uses an option strategy in an effort to limit market exposure and volatility. The extent of option selling will depend upon market conditions and the Adviser’s judgment of the advantages of selling call options on the Fund’s equity investments. The sale of put options generates income for the Fund, but exposes it to the risk of declines in the value of the underlying assets. The risk in purchasing options is limited to the premium paid by the Fund for the options. The sale of call options generates income for the Fund, but may limit the Fund’s participation in equity market gains. The Fund’s investment adviser seeks to reduce the overall volatility of returns for the Fund by managing a portfolio of options. When the Fund writes or purchases an option, an amount equal to the premium received or paid by the Fund is recorded as a liability or an asset and is subsequently adjusted to the current market value of the option written or purchased. Premiums received or paid from writing or purchasing options which expire unexercised are treated by the Fund on the expiration date as realized gains or losses. The difference between the premium and the amount paid or received on effecting a closing purchase or sale transaction, including brokerage commissions, is also treated as a realized gain or loss. If an option is exercised, the premium paid or received is added to the cost of the purchase or proceeds from the sale in determining whether the Fund has realized a gain or a loss on investment transactions.
Purchasing and writing put and call options are highly specialized activities and entail greater than ordinary investment risks. The successful use of options depends in part on the ability of the Adviser to manage future price fluctuations and the degree of correlation between the options and securities markets. By writing put options on equity securities, the Fund gives up the opportunity to benefit from potential increases in the value of the underlying securities above the strike prices of the written put options, but continues to bear the risk of declines in the value of underlying securities held by the Fund. The Fund will receive a premium from writing a covered call option that it retains whether or not the option is exercised. The premium received from the written options may not be sufficient to offset any losses sustained from the volatility of the underlying equity securities over time.
c) Exchange-Traded Funds (“ETFs”) – The Fund may invest in ETFs. An ETF is a fund that holds a portfolio of common stocks or bonds designed to track the performance of a securities index or sector of an index. ETFs are traded on a securities exchange based on their market value. An ETF portfolio holds the same stocks or bonds as the index it tracks, so its market price reflects the value of the index at any given time. ETFs are registered investment companies and incur fees and expenses such as operating expenses, licensing fees, registration fees, trustees’ fees, and marketing expenses, and ETF shareholders, such as the Fund, pay their proportionate share of these expenses. Your cost of investing in the Fund will generally be higher than the cost of investing directly in ETFs. By investing in the Fund, you will indirectly bear fees and expenses charged by the underlying ETFs in which the Fund invests in addition to the Fund’s direct fees and expenses.
d) Federal Income Taxes – The Fund has qualified and intends to continue to qualify as a regulated investment company under Subchapter M of the Internal Revenue Code of 1986, as amended (the “Code”). It is the policy of the Fund to comply with the requirements of the Code applicable to regulated investment companies and to distribute substantially all of its net investment company taxable income and net capital gains. The Fund also intends to distribute sufficient net investment income and net capital gains, if any, so that it will not be subject to excise tax on undistributed income and gains. Therefore, no federal income tax or excise provision is required.
| FinTrust Income and Opportunity Fund | SEMI-ANNUAL REPORT |
NOTES TO THE FINANCIAL STATEMENTS
May 31, 2024 (Unaudited)
| 1. | ORGANIZATION AND SIGNIFICANT ACCOUNTING POLICIES (continued) |
As of and for the six months ended May 31, 2024, the Fund did not have a liability for any unrecognized tax expenses. The Fund recognizes interest and penalties, if any, related to unrecognized tax liability as income tax expense in the Statement of Operations. For the six months ended May 31, 2024, the Fund did not incur any interest or penalties. The Fund identifies its major tax jurisdiction as U.S. Federal.
In addition, accounting principles generally accepted in the United States of America (“GAAP”) requires management of the Fund to analyze all open tax years, as defined by the Internal Revenue Service statute of limitations for all major jurisdictions, including federal tax authorities and certain state tax authorities. As of the six months ended May 31, 2024 and for all other open tax years (years ended November 30, 2023, November 30, 2022 and November 30, 2021), the Fund did not have a liability for any unrecognized tax benefits. The Fund has no examinations in progress and is not aware of any tax positions for which it is reasonably possible that the total tax amounts of unrecognized tax benefits will significantly change in the next 12 months.
e) Distributions to Shareholders – Dividends from net investment income and distributions of net realized capital gains, if any, will be declared and paid at least annually. Income and capital gain distributions, which are determined in accordance with income tax regulations, are recorded on the ex-dividend date. GAAP requires that permanent financial reporting differences relating to shareholder distributions be reclassified to paid-in capital.
f) Use of Estimates – The preparation of financial statements in conformity with GAAP requires management to make estimates and assumptions that affect the reported amounts of assets and liabilities and disclosure of contingent assets and liabilities at the date of the financial statements and the reported amounts of revenues and expenses during the reporting period. Actual results could differ from those estimates.
g) Non-Diversified Fund – The Fund is a non-diversified fund. In general, a non-diversified fund may invest a greater percentage of its assets in a particular issue and may own fewer securities than other mutual funds. Accordingly, a non-diversified fund is generally subject to the risk that a large loss in an individual issue will cause a greater loss for the fund than it would if the fund was required to hold a larger number of securities or smaller positions.
h) Sales Charges – A maximum sales charge of 5.50% is imposed on certain purchases of Class A shares. A contingent deferred sales charge (“CDSC”) is imposed upon certain redemptions of Class A shares purchased at net asset value in amounts totaling $1 million if the dealer’s commission was paid by the underwriter and the shares are redeemed within one year from the date of purchase. The CDSC will be paid to the Distributor and will be equal to 1.00% of the lesser of (1) the net asset value at the time of purchase of the Class A shares being redeemed; or (2) the net asset value of such shares at the time of redemption. There were no CDSC Fees paid to the Distributor for the six months ended May 31, 2024.
i) Expenses – Expenses incurred by the Trust that do not relate to a specific fund of the Trust are allocated to the individual funds based on each fund’s relative net assets or another appropriate basis as determined by the Board.
j) Other – Investment and shareholder transactions are recorded on trade date. The Fund determines the gain or loss realized from the investment transactions by comparing the original cost of the security lot sold with the net sales proceeds. Dividend income is recognized on the ex-dividend date or as soon as information is available to the Fund and interest income is recognized on an accrual basis. Withholding taxes on foreign dividends have been provided for in accordance with the Fund’s understanding of the applicable country’s tax rules and rates. Discounts and premiums on securities purchased are accreted and amortized over the lives of the respective securities.
Processes and Structure
The Fund’s Board of Trustees (the “Board”) adopted guidelines for valuing securities and other derivative instruments including in circumstances in which market quotes are not readily available, and has delegated authority to the Adviser to apply those guidelines in determining fair value prices, subject to review by the Board.
| FinTrust Income and Opportunity Fund | SEMI-ANNUAL REPORT |
NOTES TO THE FINANCIAL STATEMENTS
May 31, 2024 (Unaudited)
| 2. | SECURITIES VALUATIONS (continued) |
Hierarchy of Fair Value Inputs
The Fund utilizes various methods to measure the fair value of most of its investments on a recurring basis. GAAP establishes a hierarchy that prioritizes inputs to valuation techniques used to measure fair value. The three levels of inputs are as follows:
| ● | Level 1 – Unadjusted quoted prices in active markets for identical assets or liabilities that the Fund has the ability to access. |
| ● | Level 2 – Observable inputs other than quoted prices included in Level 1 that are observable for the asset or liability either directly or indirectly. These inputs may include quoted prices for the identical instrument on an inactive market, prices for similar instruments, interest rates, prepayment speeds, credit risk, yield curves, default rates, and similar data. |
| ● | Level 3 – Unobservable inputs for the asset or liability to the extent that relevant observable inputs are not available, representing the Fund’s own assumptions about the assumptions that a market participant would use in valuing the asset or liability, and that would be based on the best information available. |
The availability of observable inputs can vary from security to security and is affected by a wide variety of factors, including, for example, the type of security, whether the security is new and not yet established in the marketplace, the liquidity of markets, and other characteristics particular to the security. To the extent that valuation is based on models or inputs that are less observable or unobservable in the market, the determination of fair value requires more judgment. Accordingly, the degree of judgment exercised in determining fair value is greatest for instruments categorized in Level 3.
The inputs used to measure fair value may fall into different levels of the fair value hierarchy. In such cases, for disclosure purposes, the level in the fair value hierarchy within which the fair value measurement falls in its entirety is determined based on the lowest level input that is significant to the fair value measurement in its entirety.
Fair Value Measurements
A description of the valuation techniques applied to the Trust’s major categories of assets and liabilities measured at fair value on a recurring basis are as follows:
Equity securities (common stock, preferred stock and ETFs) – Securities traded on a national securities exchange (or reported on the NASDAQ national market) are stated at the last reported sales price on the day of valuation. To the extent these securities are actively traded, and valuation adjustments are not applied, they are categorized in Level 1 of the fair value hierarchy. Certain foreign securities may be fair valued using a pricing service that considers the correlation of the trading patterns of the foreign security to the intraday trading in the U.S. markets for investments such as American Depositary Receipts, financial futures, ETFs, and the movement of the certain indexes of securities based on a statistical analysis of the historical relationship and are categorized in Level 2. Preferred stock and other equities traded on inactive markets or valued by reference to similar instruments are also categorized in Level 2.
Money market funds – Money market funds are valued at their net asset value and are categorized as Level 1.
Derivative instruments – Listed derivatives, including options, that are actively traded, are valued based on quoted prices from the exchange and categorized in Level 1 of the fair value hierarchy. Options held by the Fund for which no current quotations are readily available and which are not traded on the valuation date are valued at the mean price and are categorized within Level 2 of the fair value hierarchy. Over-the-counter (“OTC”) derivative contracts include forward, swap, and option contracts related to interest rates; foreign currencies; credit standing of reference entities; equity prices; or commodity prices, and warrants on exchange-traded securities. Depending on the product and terms of the transaction, the fair value of the OTC derivative products can be modeled taking into account the counterparties’ creditworthiness and using a series of techniques, including simulation models. Many pricing models do not entail material subjectivity because the methodologies employed do not necessitate significant judgments, and the pricing inputs are observed from actively quoted markets, as is the case of interest rate swap and option contracts. OTC derivative products valued using pricing models are categorized within Level 2 of the fair value hierarchy.
| FinTrust Income and Opportunity Fund | SEMI-ANNUAL REPORT |
NOTES TO THE FINANCIAL STATEMENTS
May 31, 2024 (Unaudited)
| 2. | SECURITIES VALUATIONS (continued) |
The SEC adopted Rule 2a-5 under the 1940 Act, which established an updated regulatory framework for registered investment company fair valuation practices. Under the rule a greater number of the Fund’s securities may be subject to fair value pricing. The Fund’s fair value policies and procedures and valuation practices were updated to comply with Rule 2a-5. Specifically, the Board designated the Adviser as the Fund’s “Valuation Designee” to make fair value determinations. The Adviser acts through its Rule 2a-5 Committee (the “Valuation Committee”) in accordance with the Trust’s and the Adviser’s policies and procedures (collectively, the “Valuation Procedures”). While fair value determinations will be based upon all available factors that the Valuation Designee deems relevant at the time of the determination, fair value represents only a good faith approximation of the value of an asset or liability.
The Fund’s policies regarding fair value pricing are intended to result in a calculation of a Fund’s net asset value (“NAV”) that fairly reflects portfolio security values as of the time of pricing. A portfolio security’s fair value price may differ from the price next available for that portfolio security using a Fund’s normal pricing procedure, and may differ substantially from the price at which the portfolio security may ultimately be traded or sold. If such fair value price differs from the price that would have been determined using a Fund’s normal pricing procedures, a shareholder may receive more or less proceeds or shares from redemptions or purchases of Fund shares, respectively, than a shareholder would have otherwise received if the portfolio security was priced using a Fund’s normal pricing procedures. The performance of a Fund may also be affected if a portfolio security’s fair value price were to differ from the security’s price using a Fund’s normal pricing procedures.
Pursuant to policies adopted by the Board, the Valuation Designee reports all fair valued securities to the Board at least quarterly. The Board monitors and evaluates the Fund’s use of fair value pricing. These securities will be categorized as Level 3 securities.
The following tables summarize the inputs used to value the Fund’s assets and liabilities measured at fair value as of May 31, 2024.
| Financial Instruments – Assets | | | | | | | | | | | | | | | | |
| Security Classification (1) | | Level 1 | | | Level 2 | | | Level 3 | | | Totals | |
| Common Stock (2) | | $ | 14,479,287 | | | $ | — | | | $ | — | | | $ | 14,479,287 | |
| Preferred Stock (2) | | | 499,590 | | | | — | | | | — | | | | 499,590 | |
| Exchange-Traded Funds (2) | | | 114,872 | | | | — | | | | — | | | | 114,872 | |
| Government Bonds | | | — | | | | 995,586 | | | | — | | | | 995,586 | |
| Call Options Purchased | | | 587,817 | | | | 93,350 | | | | — | | | | 681,167 | |
| Put Options Purchased | | | 220,758 | | | | 1,000 | | | | — | | | | 221,758 | |
| Short-Term Investments | | | 2,033,423 | | | | — | | | | — | | | | 2,033,423 | |
| Total Assets | | $ | 17,935,747 | | | $ | 1,089,936 | | | $ | — | | | $ | 19,025,683 | |
| Derivative and Financial Instruments – Liabilities | | | | | | | | | | | | | | | | |
| Security Classification (1) | | Level 1 | | | Level 2 | | | Level 3 | | | Totals | |
| Call Options Written | | $ | 14,600 | | | | — | | | | — | | | $ | 14,600 | |
| Total Liabilities | | $ | 14,600 | | | $ | — | | | $ | — | | | $ | 14,600 | |
(1) As of and for the six months ended May 31, 2024, the Fund held no securities that were considered to be “Level 3” securities (those valued using significant unobservable inputs). Therefore, a reconciliation of assets in which significant unobservable inputs (Level 3) were used in determining fair value is not applicable.
(2) All common stock, ETFs and preferred stock held in the Fund are Level 1 securities. For a detailed break-out of common stock and preferred stock by industry and ETFs by investment type, please refer to the Schedule of Investments.
| FinTrust Income and Opportunity Fund | SEMI-ANNUAL REPORT |
NOTES TO THE FINANCIAL STATEMENTS
May 31, 2024 (Unaudited)
| 3. | DERIVATIVE TRANSACTIONS |
As of May 31, 2024, the location on the Statement of Assets and Liabilities for financial derivative instrument fair values is as follows:
| Assets | | Location | | | Equity Contracts | |
| Call options purchased | | Investments, at value | | | $ | 681,167 | |
| Put options purchased | | Investments, at value | | | | 221,758 | |
| Total Assets | | | | | $ | 902,925 | |
| Liabilities | | Location | | | Equity Contracts | |
| Call options written | | Options written, at value | | | $ | 14,600 | |
| Total Assets | | | | | $ | 14,600 | |
Realized and unrealized gains and losses on derivatives contracts entered into by the Fund for the six months ended May 31, 2024, are recorded in the following locations in the Statement of Operations:
| Net change in unrealized appreciation (depreciation) on: | | Location | | | Equity Contracts | |
| Call options purchased | | Unaffiliated Investments | | | $ | (212,282 | ) |
| Put options purchased | | Unaffiliated Investments | | | | (178,493 | ) |
| Call options written | | Options written | | | | 5,725 | |
| | | | | | $ | (385,050 | ) |
| Net realized gain (loss) on: | | Location | | | Equity Contracts | |
| Call options purchased | | Unaffiliated Investments | | | $ | 971,807 | |
| Put options purchased | | Unaffiliated Investments | | | | (528,793 | ) |
| Call options written | | Options written | | | | 151,793 | |
| Put options written | | Options written | | | | 119,668 | |
| | | | | | $ | 714,475 | |
For the six months ended May 31, 2024, the average month-end notional value of purchased and written option contracts for the Fund was $23,916,323 and ($546,500), respectively. The primary risk category for all open options positions during the period was equity risk.
| 4. | CAPITAL SHARE TRANSACTIONS |
Transactions in shares of capital stock for the six months ended May 31, 2024, were as follows:
| | | Sold | | | Redeemed | | | Reinvested | | | Net Increase / (Decrease) | |
| Class A | | | | | | | | | | | | | | | | |
| Shares | | | — | | | | — | | | | — | | | | — | |
| Value | | $ | — | | | $ | — | | | $ | — | | | $ | — | |
| Institutional Class | | | | | | | | | | | | | | | | |
| Shares | | | 22,767 | | | | (113,380 | ) | | | — | | | | (90,613 | ) |
| Value | | $ | 251,877 | | | $ | (1,242,697 | ) | | $ | — | | | $ | (990,820 | ) |
| FinTrust Income and Opportunity Fund | SEMI-ANNUAL REPORT |
NOTES TO THE FINANCIAL STATEMENTS
May 31, 2024 (Unaudited)
| 4. | CAPITAL SHARE TRANSACTIONS (continued) |
Transactions in shares of capital stock for the year ended November 30, 2023, were as follows:
| | | Sold | | | Redeemed | | | Reinvested | | | Net Increase / (Decrease) | |
| Class A | | | | | | | | | | | | | | | | |
| Shares | | | — | | | | (10,859 | ) | | | — | | | | (10,859 | ) |
| Value | | $ | — | | | $ | (107,290 | ) | | $ | — | | | $ | (107,290 | ) |
| Institutional Class | | | | | | | | | | | | | | | | |
| Shares | | | 238,572 | | | | (209,787 | ) | | | — | | | | 28,785 | |
| Value | | $ | 2,367,474 | | | $ | (2,022,043 | ) | | $ | — | | | $ | 345,431 | |
| 5. | INVESTMENT TRANSACTIONS |
For the six months ended May 31, 2024, aggregate purchases and sales of investment securities (excluding short-term investments and U.S. Government securities) for the Fund were as follows:
| Purchases | | | Sales | |
| $ | 31,532,204 | | | $ | 33,096,574 | |
There were no purchases or sales of U.S. Government securities during the six months ended May 31, 2024.
| 6. | ADVISORY FEES AND OTHER RELATED PARTY TRANSACTIONS |
The Fund has entered into an Investment Advisory Agreement (the “Advisory Agreement”) with the Adviser. Pursuant to the Advisory Agreement, the Adviser manages the operations of the Fund and manages the Fund’s investments in accordance with the stated policies of the Fund. As compensation for the investment advisory services provided to the Fund, the Adviser will receive a monthly management fee equal to an annual rate of 1.25% of the Fund’s net assets, less any fee waivers. For the six months ended May 31, 2024, the Adviser earned $113,845 of management fees.
The Adviser has entered into an Expense Limitation Agreement with the Fund under which it has agreed to waive or reduce its fees and to assume other expenses of the Fund, if necessary, in an amount that limits the Fund’s annual operating expenses (excluding interest, distribution fees pursuant to Rule 12b-1 Plans, taxes, acquired fund fees and expenses, brokerage commissions, dividend expenses on short sales, and other expenditures which are capitalized in accordance with GAAP and other extraordinary expenses not incurred in the ordinary course of such Fund’s business) to not more than 1.95% of the Fund’s average daily net assets. The current contractual agreement cannot be terminated before March 31, 2025, without the Board’s approval. For the six months ended May 31, 2024, the Adviser waived advisory fees of $54,152.
Subject to approval by the Fund’s Board, any waiver under the Expense Limitation Agreement is subject to repayment by the Fund within the three years following the month in which such waiver or reimbursement occurred, if the Fund can make the payment without exceeding the 1.95% expense limit. The cumulative reimbursement is $344,470, of which $68,136, $101,595, $120,587 and $54,152 can be recouped no later than November 30, 2024, November 30, 2025, November 30, 2026 and November 30, 2027, respectively.
The Fund has entered into an Investment Company Services Agreement (“ICSA”) with M3Sixty Administration, LLC (“M3Sixty”). Pursuant to the ICSA, M3Sixty will provide daily operational services to the Fund including, but not limited to: (a) Fund accounting services; (b) financial statement preparation; (c) valuation of the Fund’s portfolio securities; (d) pricing the Fund’s shares; (e) assistance in preparing tax returns; (f) preparation and filing of required regulatory reports; (g) communications with shareholders; (h) coordination of Board and shareholder meetings; (i) monitoring the Fund’s legal compliance; (j) maintaining shareholder account records.
For the six months ended May 31, 2024, M3Sixty earned $51,265, including out of pocket expenses, pursuant to the ICSA.
| FinTrust Income and Opportunity Fund | SEMI-ANNUAL REPORT |
NOTES TO THE FINANCIAL STATEMENTS
May 31, 2024 (Unaudited)
| 6. | ADVISORY FEES AND OTHER RELATED PARTY TRANSACTIONS (continued) |
The Fund has also entered into a Chief Compliance Officer Service Agreement (“CCO Agreement”) with M3Sixty. Pursuant to the CCO Agreement, M3Sixty agrees to provide a Chief Compliance Officer (“CCO”), as described in Rule 38a-1 of the 1940 Act, to the Fund for the year and on the terms and conditions set forth in the CCO Agreement.
For the six months ended May 31, 2024, M3Sixty earned $5,750 of fees pursuant to the CCO Agreement.
Certain officers and an interested Trustee of the Trust are also employees or officers of M3Sixty.
The Fund has entered into a Distribution Agreement with Matrix 360 Distributors, LLC (“M3SixtyD” or the “Distributor”). Pursuant to the Distribution Agreement, the Distributor provides distribution services to the Fund. The Distributor serves as the principal underwriter of the Fund. M3SixtyD may receive commissions from the sale of Class A shares. During the six months ended May 31, 2024, no commissions were paid to the Distributor. M3SixtyD is an affiliate of M3Sixty.
The Fund has adopted a Distribution Plan (“Plan”) pursuant to Rule 12b-1 under the 1940 Act for its Class A shares. The Fund may expend up to 0.25% for Class A shares of the Fund’s average daily net assets annually to pay for any activity primarily intended to result in the sale of shares of the Fund and the servicing of shareholder accounts, provided that the Trustees have approved the category of expenses for which payment is being made.
The distribution plan for the Class A shares of the Fund took effect January 21, 2016. For the six months ended May 31, 2024, the Fund accrued $69 in 12b-1 expenses attributable to Class A shares.
For U.S. Federal income tax purposes, the cost of securities owned, gross appreciation, gross depreciation, and net unrealized appreciation/(depreciation) of investments, including written options and securities sold short, at May 31, 2024 were as follows:
| Cost | | | Gross Appreciation | | | Gross Depreciation | | | Net Depreciation | |
| $ | 19,593,492 | | | $ | 1,439,460 | | | $ | (2,021,869 | ) | | $ | (582,409 | ) |
The difference between book basis and tax basis unrealized appreciation (depreciation) is primarily attributable to the tax deferral of losses on wash sales.
The Fund’s tax basis distributable earnings are determined at the end of each fiscal year. The tax character of distributable earnings (deficit) at November 30, 2023, the Fund’s most recent fiscal year end, is as follows:
Unrealized Depreciation | | | Undistributed Ordinary Income | | | Undistributed Long-Term Capital Gains | | | Capital Loss Carry Forwards | | | Post-October Loss and Late Year Loss | | | Other Book/Tax Differences | | | Total Distributable Earnings | |
| $ | (548,924 | ) | | $ | — | | | $ | — | | | $ | (472,227 | ) | | $ | — | | | $ | — | | | $ | (1,021,151 | ) |
Under current tax law, net capital losses realized after November 30th and net ordinary losses incurred after December 31st may be deferred and treated as occurring on the first day of the following fiscal year. As of November 30, 2023, the Fund had no post-November capital losses or post-December losses to defer.
In accordance with accounting pronouncements, the Fund may record reclassifications in the capital accounts. These reclassifications have no impact on the net asset value of the Fund and are designed generally to present distributable earnings on a tax basis which is considered to be more informative to the shareholder. Permanent book and tax differences, primarily attributable to the reclassifications of net investment losses and distributions to paid-in-capital, resulted in reclassifications for the year ended November 30, 2023, as follows:
| Distributable Earnings | | | Paid-in Capital | |
| $ | 111,116 | | | $ | (111,116 | ) |
| FinTrust Income and Opportunity Fund | SEMI-ANNUAL REPORT |
NOTES TO THE FINANCIAL STATEMENTS
May 31, 2024 (Unaudited)
| 7. | TAX MATTERS (continued) |
Under the Regulated Investment Company Modernization Act of 2010, net capital losses recognized after December 31, 2010, may be carried forward indefinitely, and their character is retained as short-term and/or long-term. As of November 30, 2023, the Fund had $316,353 of non-expiring short-term capital loss carryforwards and $155,874 of non-expiring long-term capital loss carryforwards for federal income tax purposes available to offset future capital gains.
For the six months ended May 31, 2024, the Fund distributed no ordinary income or long-term capital gains.
For the year ended November 30, 2023, the Fund distributed no ordinary income or long-term capital gains.
The beneficial ownership, either directly or indirectly, of more than 25% of the voting securities of a fund creates a presumption of control of the fund, under Section 2(a)(9) of the 1940 Act. As of May 31, 2024, Charles Schwab and Co., Inc. held 62.35% and National Financial Services, LLC held 37.33% of the Fund’s shares in omnibus accounts for the sole benefit of their customers. The Trust does not know whether any of the underlying beneficial shareholders of the omnibus accounts held by Charles Schwab and Co., Inc. or National Financial Services, LLC own more than 25% of the voting securities of the Fund.
| 9. | COMMITMENTS AND CONTINGENCIES |
In the normal course of business, the Trust may enter into contracts that may contain a variety of representations and warranties and provide general indemnifications. The Trust’s maximum exposure under these arrangements is dependent on future claims that may be made against the Fund and, therefore, cannot be estimated; however, management considers the risk of loss from such claims to be remote.
| 10. | INVESTMENTS IN AFFILIATED COMPANIES |
An affiliated company is a company in which the Fund has ownership of at least 5% of the voting securities or is of common management. Companies which are affiliates of the Fund at May 31, 2024, are noted in the Fund’s Schedule of Investments. United Community Banks, Inc., 6.875% - Series I preferred stock (“UCBIO”) is considered an affiliated investment because it is of common management of the Adviser. At May 31, 2024, the Fund held 21,000 shares of UCBIO.
Transactions with affiliated companies during the six months ended May 31, 2024 were as follows:
| Value as of November 30, 2023 | Realized gain (loss) | Change in unrealized appreciation (depreciation) | Purchases | Sales | Value as of May 31, 2024 | Income earned |
| UCBIO | $ 467,040 | $ — | $ 32,550 | $ — | $ — | $ 499,590 | $ 18,047 |
| Total | $ 467,040 | $ — | $ 32,550 | $ — | $ — | $ 499,590 | $ 18,047 |
At a Special Meeting of the Board held on July 31, 2024 (the “Special Meeting”), the Board was notified that another investment adviser was acquiring the Adviser and the transaction’s closing date is expected to be on August 31, 2024 (the "Closing Date"). Upon closing, the Investment Advisory Agreement between the Fund and the Adviser will terminate because of a change in control of the Adviser that resulted in the assignment of the Advisory Agreement under federal securities laws. The Adviser has recommended that M3Sixty Capital, LLC (“M3Sixty Capital") take over management of the Fund under a new investment advisory agreement, effective on the Closing Date, or that the Fund be liquidated on that date.
On August 8, 2024, the Board will consider the Fund’s options, including approving a New Investment Advisory Agreement and Expense Limitation Agreement with M3Sixty Capital, subject to shareholder approval.
| FinTrust Income and Opportunity Fund | SEMI-ANNUAL REPORT |
NOTES TO THE FINANCIAL STATEMENTS
May 31, 2024 (Unaudited)
| 11. | SUBSEQUENT EVENTS (continued) |
In accordance with GAAP, management has evaluated the impact of all subsequent events on the Fund through the date the financial statements were issued and has determined that there were no other subsequent events requiring recognition or disclosure in the financial statements.
| 12. | NEW ACCOUNTING PRONOUNCEMENTS AND REGULATORY UPDATES |
In June 2022, FASB issued Accounting Standards Update No. 2022-03, “Fair Value Measurement of Equity Securities Subject to Contractual Sale Restrictions” (“ASU 2022-03”). ASU 2022-03 clarifies the guidance in ASC 820, related to the measurement of the fair value of an equity security subject to contractual sale restrictions, where it eliminates the ability to apply a discount to fair value of these securities, and introduces disclosure requirements related to such equity securities. The guidance is effective for fiscal years, and interim periods within those fiscal years, beginning after December 15, 2023, and allows for early adoption. For RICs, such as the Fund, ASU 2022-03 will be applicable to equity securities with contractual sale restrictions executed, or modified, after the date of adoption. Management has reviewed the requirements and believes the adoption of this ASU will not have a material impact on the financial statements.
In December 2022, the FASB issued an Accounting Standards Update, ASU 2022-06, Reference Rate Reform (Topic 848) – Deferral of the Sunset Date of Topic 848 (“ASU 2022-06”). ASU 2022-06 is an amendment to ASU 2020-04, which provided optional guidance to ease the potential accounting burden due to the discontinuation of the London Interbank Offered Rate (“LIBOR”) and other interbank-offered based reference rates and which was effective as of March 12, 2020, through December 31, 2022. ASU 2022-06 extends the effective period through December 31, 2024. Management is currently evaluating the impact, if any, of applying ASU 2022-06.
In October 2022, the SEC adopted a final rule relating to Tailored Shareholder Reports for Mutual Funds and Exchange-Traded Funds; Fee Information in Investment Company Advertisements. The rule and form amendments will, among other things, require the Funds to transmit concise and visually engaging shareholder reports that highlight key information. The amendments will require that funds tag information in a structured data format and that certain more in-depth information be made available online and for delivery free of charge to investors on request. The amendments became effective January 24, 2023. There is an 18-month transition period after the effective date of the amendment. Management is currently evaluating the impact of the new rule.
In September 2023, the SEC adopted a final rule relating to “Names Rule” under the 1940 Act. The amendments expanded the rule to require more funds to adopt an 80 percent investment policy, including funds with names suggesting a focus in investments with particular characteristics (e.g., growth or value) or with terms that reference a thematic investment focus (e.g., environmental, social, or governance factors). The amendments will require that a fund review its name for compliance with the rule. If needed, a fund may need to adopt an 80 percent investment policy and review its portfolio assets’ treatment under such policy at least quarterly. The rule also requires additional prospectus disclosure and reporting and record keeping requirements. Depending on the size of the fund, the rule will take effect about 24 to 36 months after its publication date. For funds with less than $1 billion in net assets, such as the Fund, the compliance date is June 11, 2026. Management has evaluated the amendments and determine that they do not require the Fund to make changes to its name or investment strategies.
| FinTrust Income and Opportunity Fund | SEMI-ANNUAL REPORT |
ADDITIONAL INFORMATION
May 31, 2024 (Unaudited)
The Fund files its complete schedules of portfolio holdings with the Securities and Exchange Commission (the “Commission”) for the first and third quarters of each fiscal year on Form N-PORT. The Fund’s Forms N-PORT are available on the Commission’s website at http://www.sec.gov. The Fund’s Forms N-PORT may be reviewed and copied at the Commission’s Public Reference Room in Washington, DC. Information on the operation of the Commission’s Public Reference Room may be obtained by calling 1-800-SEC-0330.
A description of the policies and procedures that the Fund uses to determine how to vote proxies relating to portfolio securities is available without charge, upon request, by calling 1-877-244-6235; and on the Commission’s website at http://www.sec.gov.
Information regarding how the Fund voted proxies relating to portfolio securities during the most recent 12 months ended June 30th is available without charge, upon request, by calling 1-877-244-6235; and on the Commission’s website at http://www.sec.gov.
Shareholder Tax Information - The Fund is required to advise you within 60 days of the Fund’s fiscal year end regarding the federal tax status of distributions received by shareholders during the fiscal year. The Fund had no ordinary income or long-term capital gain distributions during the six months ended May 31, 2024.
Tax information is reported from the Fund’s fiscal year and not calendar year, therefore, shareholders should refer to their Form 1099-DIV or other tax information which will be mailed in 2025 to determine the calendar year amounts to be included on their 2024 tax returns. Shareholders should consult their own tax advisors.
| FinTrust Income and Opportunity Fund | SEMI-ANNUAL REPORT |
ADDITIONAL INFORMATION
May 31, 2024 (Unaudited)
BOARD OF TRUSTEES, OFFICERS AND PRINCIPAL SHAREHOLDERS
The Trustees are responsible for the management and supervision of the Fund. The Trustees approve all significant agreements between the Trust, on behalf of the Fund, and those companies that furnish services to the Fund; review performance of the Fund; and oversee activities of the Fund. The Statement of Additional Information of the Trust includes additional information about the Fund’s Trustees and is available upon request, without charge, by calling (877) 244-6235.
Trustees and Officers. Following are the Trustees and Officers of the Trust, their age and year of birth, their present position with the Trust or the Funds, and their principal occupation during the past five years. Each of the Trustees of the Trust will generally hold office indefinitely. The Officers of the Trust will hold office indefinitely, except that: (1) any Officer may resign or retire and (2) any Officer may be removed any time by written instrument signed by at least two-thirds of the number of Trustees prior to such removal. In case a vacancy or an anticipated vacancy on the Board of Trustees shall for any reason exist, the vacancy shall be filled by the affirmative vote of a majority of the remaining Trustees, subject to certain restrictions under the 1940 Act. Those Trustees who are “interested persons” (as defined in the 1940 Act) by virtue of their affiliation with either the Trust or the Adviser, are indicated in the table. The address of each trustee and officer is 4300 Shawnee Mission Parkway, Suite 100, Fairway, KS 66205.
| Name and Year of Birth (“YOB”) | Position(s) Held with Trust | Length of Service | Principal Occupation(s) During Past 5 Years | Number of Series Overseen | Other Directorships During Past 5 Years |
| Independent Trustees |
Tom M. Wirtshafter YOB : 1954 | Trustee | Since 2011 | Retired (2024-present); Senior Vice President, American Portfolios Financial Services, (broker-dealer), American Portfolios Advisors (investment advisor) (2009–2024) | Seven | None |
Steven D. Poppen YOB : 1968 | Trustee | Since 2018 | Executive Vice President and Chief Business Administration Officer, Minnesota Vikings (professional sports organization) (1999–present); Executive Vice President and Chief Financial Officer, MV Ventures, LLC (real estate developer) (2016-present) | Seven | IDX Funds (2015 –2021); FNEX Ventures (2018-2020) |
Thomas J. Schmidt YOB: 1963 | Trustee and Independent Chairman | Since 2018 Since 2022 | Principal, Tom Schmidt & Associates Consulting, LLC (2015–Present) | Seven | Lind Capital Partners Municipal Credit Income Fund (2021–present); FNEX Ventures (2018-2020) |
| Interested Trustee* | | | | | |
Randall K. Linscott YOB: 1971 | President | Since 2013 | Chief Executive Officer, M3Sixty Administration, LLC (2013–present); Chairman, M3Sixty Capital (investment advisor) (2023-present) | Seven | IDX Funds (2015 - 2021) |
| | | | | | |
* The Interested Trustee is an Interested Trustee because he is an officer and principal owner of the Administrator.
| FinTrust Income and Opportunity Fund | SEMI-ANNUAL REPORT |
ADDITIONAL INFORMATION
May 31, 2024 (Unaudited)
BOARD OF TRUSTEES, OFFICERS AND PRINCIPAL SHAREHOLDERS - (continued)
| Name and Year of Birth (“YOB”) | Position(s) Held with Trust | Length of Service | Principal Occupation(s) During Past 5 Years | Number of Series Overseen | Other Directorships During Past 5 Years |
Officers | | | | | |
Gary W. DiCenzo YOB: 1962 | Vice President | Since 2023 | Chief Executive Officer, M3Sixty Capital, LLC (2023-Present); Partner, Cognios Capital (investment management firm) (2015-2020), Chief Executive Officer (2015-2019); Founder, IMC Group, LLC (2010-2022) | N/A | 360 Funds Trust (2014–2022); FNEX Ventures (2018–2020); Volt ETF Trust (2021-2022) |
Richard Yates YOB: 1965 | Chief Compliance Officer and Secretary | Since 2021 | President, M3Sixty Enterprises (2024-present); Chief Legal Officer and Chief Compliance Officer, M3Sixty Capital (2024-present); Of Counsel, McElroy Deutsch (2020–2024); Head of Compliance, M3Sixty Administration, LLC (2021–present); Chief Compliance Officer and Secretary, IDX Funds (2021–2022); Founder, The Yates Law Firm (2018–2020) | N/A | N/A |
Larry E. Beaver, Jr. YOB: 1969 | Treasurer | Since 2021 | Head of Operations, M3Sixty Administration, LLC (2021-present); Fund Accounting, Administration and Tax Officer, M3Sixty Administration, LLC (2017–2021); Treasurer, Tactical Investment Series Trust (2022-present); Assistant Treasurer, 360 Funds Trust (2017–2021); Chief Accounting Officer, Amidex Funds, Inc. (2003–2020); Assistant Treasurer, IDX Funds (2017–2021; Assistant Treasurer, WP Funds Trust (2017–2021) | N/A | N/A |
Tim Easton YOB: 1968 | Anti-Money Laundering (“AML”) Officer | Since 2024 | Chief Operating Officer, M3Sixty Distributors, LLC (2024 –present); Head of Transfer Agency, M3Sixty Administration, LLC (2022 – present); Self Employed (2020 – 2022); Head of Sales, M3Sixty Administration, LLC (2019 – 2020) | N/A | N/A |
| FinTrust Income and Opportunity Fund | SEMI-ANNUAL REPORT |
ADDITIONAL INFORMATION
May 31, 2024 (Unaudited)
BOARD OF TRUSTEES, OFFICERS AND PRINCIPAL SHAREHOLDERS - (continued)
Remuneration Paid to Trustees and Officers - Officers of the Trust and Trustees who are “interested persons” of the Trust or the Adviser will receive no salary or fees from the Trust. Officers of the Trust and interested Trustees do receive compensation directly from certain service providers to the Trust, including Matrix 360 Distributors, LLC and M3Sixty Administration, LLC. Each Trustee who is not an “interested person” (an “Independent Trustee”) receives a $5,000 annual retainer (paid quarterly). In addition, each Independent Trustee receives, on a per fund basis: (i) a fee of $1,500 per fund each year (paid quarterly); (ii) a fee of $200 per Board meeting attended; and (iii) a fee of $200 per committee meeting attended. The Trust will also reimburse each Trustee for travel and other expenses incurred in connection with, and/or related to, the performance of their obligations as a Trustee. Officers of the Trust will also be reimbursed for travel and other expenses relating to their attendance at Board meetings.
| Name of Trustee1 | Aggregate Compensation From each Fund2 | Pension or Retirement Benefits Accrued As Part of Portfolio Expenses | Estimated Annual Benefits Upon Retirement | Total Compensation From the Fund Paid to Trustees2 |
| Independent Trustees |
| Tom M. Wirtshafter | $ 1,707 | None | None | $ 1,707 |
| Steven D. Poppen | $ 1,707 | None | None | $ 1,707 |
| Thomas J. Schmidt | $ 1,707 | None | None | $ 1,707 |
| Interested Trustees and Officers |
| Randall K. Linscott | None | Not Applicable | Not Applicable | None |
| | | | | | |
1 Each of the Trustees serves as a Trustee to each Series of the Trust. The Trust currently offers seven Series of the Trust.
2 Figures are for the six months ended May 31, 2024.
| FinTrust Income and Opportunity Fund | SEMI-ANNUAL REPORT |
INFORMATION ABOUT YOUR FUND’S EXPENSES
May 31, 2024 (Unaudited)
As a shareholder of the Fund, you incur two types of costs: (1) transaction costs, such as the sales charge (load) imposed on certain subscriptions and the contingent deferred sales charge (“CDSC”) imposed on certain short-term redemptions; and (2) ongoing costs, including management fees, distribution and/or service (12b-1) fees; and other Fund expenses. The example below is intended to help you understand your ongoing costs (in dollars) of investing in the Fund and to compare these costs with the ongoing costs of investing in other mutual funds.
The example is based on an investment of $1,000 invested at the beginning of the period and held for the entire period as indicated below.
Actual Expenses – The first section of the table provides information about actual account values and actual expenses (relating to the example $1,000 investment made at the beginning of the period). You may use the information in this section, together with the amount you invested, to estimate the expenses that you paid over the period. Simply divide your account value by $1,000 (for example, an $8,600 account value divided by $1,000 = 8.6), then multiply the result by the number in the first section under the heading entitled “Expenses Paid During Period” to estimate the expenses you paid on your account during this period.
Hypothetical Example for Comparison Purposes – The second section of the table provides information about the hypothetical account values and hypothetical expenses based on the Fund’s actual expense ratios and an assumed rate of return of 5% per year before expenses, which is not the Fund’s actual return. The hypothetical account values and expenses may not be used to estimate the actual ending account balance or expenses you paid for the period. You may use this information to compare the ongoing costs of investing in the Fund to other funds. To do so, compare this 5% hypothetical example with the 5% hypothetical examples that appear in the shareholder reports of the other funds.
Please note that the expenses shown in the table are meant to highlight your ongoing costs only and do not reflect any transactional costs, such as sales charges (loads), CDSC fees, or exchange fees. Therefore, the second section of the table is useful in comparing ongoing costs only, and will not help you determine the relative total costs of owning different funds. In addition, if these transactional costs were included, your costs would have been higher. For more information on transactional costs, please refer to the Fund’s prospectus.
Expenses and Value of a $1,000 Investment for the period from 11/30/23 through 05/31/24
| | | Beginning Account
Value (11/30/23) | | | Annualized Expense
Ratio for the Period | | | Ending Account
Value (05/31/24) | | | Expenses Paid
During Period (a) | |
| Actual Fund Return (in parentheses) | | | | | | | | | |
| Class A (+8.25%) | | $ | 1,000.00 | | | | 2.29 | % | | $ | 1,082.50 | | | $ | 11.92 | |
| Institutional Class (+8.25%) | | $ | 1,000.00 | | | | 2.04 | % | | $ | 1,082.53 | | | $ | 10.62 | |
| Hypothetical 5% Return | | | | | | | | | | | | | | | | |
| Class A | | $ | 1,000.00 | | | | 2.29 | % | | $ | 1,013.60 | | | $ | 11.53 | |
| Institutional Class | | $ | 1,000.00 | | | | 2.04 | % | | $ | 1,014.80 | | | $ | 10.28 | |
| (a) | Expenses are equal to the Fund’s annualized expense ratios, multiplied by the average account value over the period, multiplied by 183/366 to reflect the one-half year period. |
For more information on Fund expenses, please refer to the Fund’s prospectus, which can be obtained from your investment representative or by calling 1-877-244-6235. Please read it carefully before you invest or send money.
| FinTrust Income and Opportunity Fund | SEMI-ANNUAL REPORT |
INFORMATION ABOUT YOUR FUND’S EXPENSES
May 31, 2024 (Unaudited)
Total Fund operating expense ratios as stated in the current Fund prospectus dated March 29, 2024 for the Fund were as follows: |
| FinTrust Income and Opportunity Fund Class A, gross of fee waivers or expense reimbursements | 3.01% |
| FinTrust Income and Opportunity Fund Class A, after waiver and reimbursement* | 2.26% |
| FinTrust Income and Opportunity Fund Institutional Class, gross of fee waivers or expense reimbursements | 2.76% |
| FinTrust Income and Opportunity Fund Institutional Class, after waiver and reimbursement* | 2.01% |
* The Adviser has entered into an Expense Limitation Agreement with the Fund under which it has agreed to waive or reduce its fees and assume other expenses of the Fund, if necessary, in an amount that limits the Fund’s annual operating expenses (excluding interest, distribution fees pursuant to Rule 12B-1 Plans, taxes, acquired fund fees and expenses, brokerage commissions, dividend expenses on short sales, and other expenditures which are capitalized in accordance with GAAP and other extraordinary expenses not incurred in the ordinary course of such fund’s business) to not more than 1.95% through at least March 31, 2025. Subject to approval by the Fund’s Board, any waiver or reimbursement under the Expense Limitation Agreement is subject to repayment by the Fund within the three years following the month in which such waiver or reimbursement occurred, if the Fund can make the payment without exceeding the 1.95% expense limitation. The current contractual agreement cannot be terminated before March 31, 2025, without the Board of Trustees’ approval. Total Gross Operating Expenses for the six months ended May 31, 2024 were 2.89% and 2.64% for the FinTrust Income and Opportunity Fund Class A shares and FinTrust Income and Opportunity Fund Institutional Class shares, respectively. Please see the Information About Your Fund’s Expenses, the Financial Highlights and Notes to Financial Statements (Note 6) sections of this report for expense related disclosures for the six months ended May 31, 2024. |
360 FUNDS
4300 Shawnee Mission Pkwy
Suite 100
Fairway, KS 66205
INVESTMENT ADVISER
FinTrust Capital Advisors, LLC
124 Verdae Boulevard
Suite 504
Greenville, SC 29607
ADMINISTRATOR & TRANSFER AGENT
M3Sixty Administration, LLC
4300 Shawnee Mission Parkway
Suite 100
Fairway, KS 66205
DISTRIBUTOR
Matrix 360 Distributors, LLC
4300 Shawnee Mission Parkway
Suite 100
Fairway, KS 66205
INDEPENDENT REGISTERED PUBLIC ACCOUNTING FIRM
Tait Weller & Baker, LLP
Two Liberty Place
50 South 16th Street
Suite 2900
Philadelphia, PA 19102-2529
LEGAL COUNSEL
FinTech Law, LLC
6224 Turpin Hills Dr.
Cincinnati, Ohio 45244
CUSTODIAN BANK
Fifth Third Bank
Fifth Third Center
38 Fountain Square Plaza
Cincinnati, OH 45263
| ITEM 2. | CODE OF ETHICS. |
| | |
| | Not applicable at this time. |
| | |
| ITEM 3. | AUDIT COMMITTEE FINANCIAL EXPERT. |
| | |
| | Not applicable at this time. |
| | |
| ITEM 4. | PRINCIPAL ACCOUNTANT FEES AND SERVICES. |
| | |
| | Not applicable at this time. |
| | |
| ITEM 5. | AUDIT COMMITTEE OF LISTED REGISTRANTS. |
| | |
| | Not applicable |
| | |
| ITEM 6. | SCHEDULE OF INVESTMENTS. |
| | |
| | Included in Semi-Annual Report to shareholders filed under Item 1 of this Form. |
| | |
| ITEM 7. | DISCLOSURE OF PROXY VOTING POLICIES AND PROCEDURES FOR CLOSED-END MANAGEMENT INVESTMENT COMPANIES. |
| | |
| | Not applicable as the Fund is an open-end management investment company. |
| | |
| ITEM 8. | PORTFOLIO MANAGERS OF CLOSED-END MANAGEMENT INVESTMENT COMPANIES. |
| | |
| | Not applicable as the Fund is an open-end management investment company. |
| | |
| ITEM 9. | PURCHASES OF EQUITY SECURITIES BY CLOSED-END MANAGEMENT INVESTMENT COMPANY AND AFFILIATED PURCHASERS. |
| | |
| | Not applicable as the Fund is an open-end management investment company. |
| | |
| ITEM 10. | SUBMISSION OF MATTERS TO A VOTE OF SECURITY HOLDERS. |
| | |
| | Not applicable at this time. |
| | |
| ITEM 11. | CONTROLS AND PROCEDURES. |
| | |
| | (a) | The registrant’s principal executive and principal financial officers, or persons performing similar functions, have concluded that the registrant's disclosure controls and procedures (as defined in Rule 30a-3(c) under the 1940 Act, are effective, as of a date within 90 days of the filing date of this report, based on the evaluation of these controls and procedures required by Rule 30a-3(b) under the 1940 Act and Rule 15d-15(b) under the Securities Exchange Act of 1934, as amended. |
| | | |
| | (b) | There were no changes in the registrant’s internal control over financial reporting (as defined in Rule 30a-3(d) under the 1940 Act) that occurred during the period covered by this report that have materially affected, or are reasonably likely to materially affect, the registrant's internal control over financial reporting. |
SIGNATURES
Pursuant to the requirements of the Securities Exchange Act of 1934 and the Investment Company Act of 1940, the registrant has duly caused this report to be signed on its behalf by the undersigned, thereunto duly authorized.
360 Funds
| /s/ Randy Linscott | |
| By: Randy Linscott | |
| Principal Executive Officer | |
| | |
| Date: August 8, 2024 | |
Pursuant to the requirements of the Securities Exchange Act of 1934 and the Investment Company Act of 1940, this report has been signed below by the following person on behalf of the registrant and in the capacities and on the date indicated.
| /s/ Larry E. Beaver, Jr. | |
| By: Larry E. Beaver, Jr. | |
| Treasurer and Principal Financial Officer | |
| | |
| Date: August 8, 2024 | |