UNITED STATES
SECURITIES AND EXCHANGE COMMISSION
Washington, D.C. 20549
FORM N-CSR
CERTIFIED SHAREHOLDER REPORT OF REGISTERED MANAGEMENT INVESTMENT COMPANIES
Investment Company Act file number 811-21727
First Trust Mortgage Income Fund
(Exact name of registrant as specified in charter)
120 East Liberty Drive, Suite 400
Wheaton, IL 60187
(Address of principal executive offices) (Zip code)
W. Scott Jardine, Esq.
First Trust Portfolios L.P.
120 East Liberty Drive, Suite 400
Wheaton, IL 60187
(Name and address of agent for service)
Registrant’s telephone number, including area code: 630-765-8000
Date of fiscal year end: October 31
Date of reporting period: April 30, 2022
Form N-CSR is to be used by management investment companies to file reports with the Commission not later than 10 days after the transmission to stockholders of any report that is required to be transmitted to stockholders under Rule 30e-1 under the Investment Company Act of 1940 (17 CFR 270.30e-1). The Commission may use the information provided on Form N-CSR in its regulatory, disclosure review, inspection, and policymaking roles.
A registrant is required to disclose the information specified by Form N-CSR, and the Commission will make this information public. A registrant is not required to respond to the collection of information contained in Form N-CSR unless the Form displays a currently valid Office of Management and Budget (“OMB”) control number. Please direct comments concerning the accuracy of the information collection burden estimate and any suggestions for reducing the burden to Secretary, Securities and Exchange Commission, 100 F Street, NE, Washington, DC 20549. The OMB has reviewed this collection of information under the clearance requirements of 44 U.S.C. § 3507.
Item 1. Reports to Stockholders.
| (a) | The Report to Shareholders is attached herewith. |


| 1 | |
| 2 | |
| 3 | |
| 6 | |
| 13 | |
| 14 | |
| 15 | |
| 16 | |
| 17 | |
| 24 |

| Fund Statistics | |
| Symbol on New York Stock Exchange | FMY |
| Common Share Price | $11.68 |
| Common Share Net Asset Value (“NAV”) | $13.02 |
| Premium (Discount) to NAV | (10.29)% |
| Net Assets Applicable to Common Shares | $54,864,550 |
| Current Distribution per Common Share(1) | $0.0550 |
| Current Annualized Distribution per Common Share | $0.6600 |
| Current Distribution Rate on Common Share Price(2) | 5.65% |
| Current Distribution Rate on NAV(2) | 5.07% |

| Performance | |||||
| Average Annual Total Returns | |||||
| 6 Months Ended 4/30/22 | 1 Year Ended 4/30/22 | 5 Years Ended 4/30/22 | 10 Years Ended 4/30/22 | Inception (5/25/05) to 4/30/22 | |
| Fund Performance(3) | |||||
| NAV | -4.09% | -3.63% | 1.83% | 3.12% | 4.70% |
| Market Value | -12.58% | -9.74% | 1.58% | 0.84% | 3.75% |
| Index Performance | |||||
| Bloomberg U.S. Mortgage Backed Securities (MBS) Index | -8.48% | -8.76% | 0.51% | 1.27% | 3.10% |
| Portfolio Characteristics | |
| Weighted Average Effective Duration | 3.0 Years |
| Weighted Average Effective Maturity | 6.7 Years |
| Fund Allocation | % of Net Assets |
| Mortgage-Backed Securities | 50.6% |
| U.S. Government Agency Mortgage-Backed Securities | 41.0 |
| Asset-Backed Securities | 3.2 |
| Net Other Assets and Liabilities(4) | 5.2 |
| Total | 100.0% |
| Credit Quality(5) | % of Total Fixed-Income Investments |
| AAA | 6.2% |
| AA+ | 2.6 |
| AA | 0.3 |
| AA- | 1.2 |
| A+ | 0.8 |
| A | 0.2 |
| BBB | 0.2 |
| BBB- | 5.4 |
| BB | 2.5 |
| B | 1.5 |
| CCC | 0.0* |
| CCC- | 0.1 |
| CC | 4.8 |
| Not Rated | 32.5 |
| Government | 35.5 |
| Cash & Cash Equivalents | 6.2 |
| Total | 100.0% |
| * | Amount is less than 0.05%. |
| (1) | Most recent distribution paid or declared through April 30, 2022. Subject to change in the future. |
| (2) | Distribution rates are calculated by annualizing the most recent distribution paid or declared through the report date and then dividing by Common Share Price or NAV, as applicable, as of April 30, 2022. Subject to change in the future. |
| (3) | Total return is based on the combination of reinvested dividend, capital gain, and return of capital distributions, if any, at prices obtained by the Dividend Reinvestment Plan and changes in NAV per share for NAV returns and changes in Common Share Price for market value returns. Total returns do not reflect sales load and are not annualized for periods of less than one year. Past performance is not indicative of future results. |
| (4) | Includes variation margin on futures contracts. |
| (5) | The credit quality and ratings information presented above reflect the ratings assigned by one or more nationally recognized statistical rating organizations (NRSROs), including S&P Global Ratings, Moody’s Investors Service, Inc., Fitch Ratings or a comparably rated NRSRO. For situations in which a security is rated by more than one NRSRO and the ratings are not equivalent, the highest rating is used. Sub-investment grade ratings are those rated BB+/Ba1 or lower. Investment grade ratings are those rated BBB-/Baa3 or higher. The credit ratings shown relate to the creditworthiness of the issuers of the underlying securities in the Fund, and not to the Fund or its shares. U.S. Treasury, U.S. Agency and U.S. Agency mortgage-backed securities appear under “Government.” Credit ratings are subject to change. |
| Performance | |||||
| Average Annual Total Returns | |||||
| 6 Months Ended 4/30/22 | 1 Year Ended 4/30/22 | 5 Years Ended 4/30/22 | 10 Years Ended 4/30/22 | Inception (5/25/05) to 4/30/22 | |
| Fund Performance* | |||||
| NAV | -4.09% | -3.63% | 1.83% | 3.12% | 4.70% |
| Market Value | -12.58% | -9.74% | 1.58% | 0.84% | 3.75% |
| Index Performance | |||||
| Bloomberg U.S. Mortgage Backed Securities (MBS) Index | -8.48% | -8.76% | 0.51% | 1.27% | 3.10% |
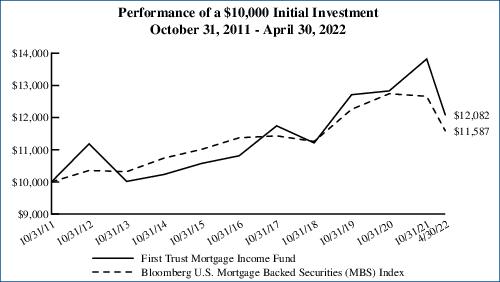
Performance figures assume reinvestment of all distributions and do not reflect the deduction of taxes that a shareholder would pay on Fund distributions or the redemption or sale of Fund shares. An index is a statistical composite that tracks a specified financial market or sector. Unlike the Fund, the index does not actually hold a portfolio of securities and therefore does not incur the expenses incurred by the Fund. These expenses negatively impact the performance of the Fund. The Fund’s past performance does not predict future performance. Performance in securitized product investment strategies can be impacted from the benefits of purchasing odd lot positions. The impact of these investments can be particularly meaningful when funds have limited assets under management and may not be a sustainable source of performance as a fund grows in size.
| Principal Value | Description | Stated Coupon | Stated Maturity | Value | ||||
| MORTGAGE-BACKED SECURITIES – 50.6% | ||||||||
| Collateralized Mortgage Obligations – 29.4% | ||||||||
| ACE Securities Corp. Home Equity Loan Trust | ||||||||
| $701,543 | Series 2006-ASAP6, Class A2D, 1 Mo. LIBOR + 0.44% (a) | 1.11% | 12/25/36 | $299,574 | ||||
| Banc of America Mortgage Trust | ||||||||
| 45,279 | Series 2002-L, Class 1A1 (b) | 2.98% | 12/01/32 | 37,885 | ||||
| Chase Mortgage Finance Trust | ||||||||
| 48,282 | Series 2007-A1, Class 1A3 (b) | 2.35% | 02/01/37 | 48,147 | ||||
| Citigroup Mortgage Loan Trust | ||||||||
| 92,125 | Series 2005-6, Class A1, US Treasury Yield Curve Rate T Note Constant Maturity 1 Year + 2.10% (a) | 2.19% | 09/01/35 | 94,553 | ||||
| 18,617 | Series 2009-10, Class 1A1 (b) (c) | 2.52% | 09/01/33 | 18,677 | ||||
| 199,929 | Series 2012-7, Class 10A2 (b) (c) | 2.26% | 09/01/36 | 178,124 | ||||
| Connecticut Avenue Securities Trust | ||||||||
| 1,000,000 | Series 2021-R01, Class 1B2, 30 Day Avg. SOFR + 6.00% (a) (c) | 6.29% | 10/25/41 | 926,653 | ||||
| 1,000,000 | Series 2022-R02, Class 2M2, 30 Day Avg. SOFR + 3.00% (a) (c) | 3.29% | 01/25/42 | 987,029 | ||||
| Countrywide Home Loan Mortgage Pass-Through Trust | ||||||||
| 148,030 | Series 2006-21, Class A8 | 5.75% | 02/01/37 | 90,130 | ||||
| 265,880 | Series 2006-HYB5, Class 3A1A (b) | 2.73% | 09/01/36 | 249,399 | ||||
| Credit Suisse Commercial Mortgage Securities Corp. Pass-Through Certificates | ||||||||
| 1,000,000 | Series 2020-UNFI, Class A, 1 Mo. LIBOR + 3.67%, 4.17% minimum (a) (c) | 4.22% | 12/15/22 | 995,798 | ||||
| Credit Suisse Mortgage Trust | ||||||||
| 304,216 | Series 2017-FHA1, Class A1 (c) | 3.25% | 04/01/47 | 291,538 | ||||
| DSLA Mortgage Loan Trust | ||||||||
| 297,165 | Series 2004-AR3, Class 2A2A, 1 Mo. LIBOR + 0.74% (a) | 1.29% | 07/19/44 | 282,990 | ||||
| GSR Mortgage Loan Trust | ||||||||
| 3,218 | Series 2003-10, Class 1A12 (b) | 2.39% | 10/01/33 | 3,210 | ||||
| 126,573 | Series 2005-AR1, Class 4A1 (b) | 2.82% | 01/01/35 | 119,387 | ||||
| IXIS Real Estate Capital Trust | ||||||||
| 1,007,746 | Series 2007-HE1, Class A3, 1 Mo. LIBOR + 0.16% (a) | 0.83% | 05/25/37 | 310,807 | ||||
| JP Morgan Mortgage Trust | ||||||||
| 247,273 | Series 2006-A2, Class 4A1 (b) | 2.22% | 08/01/34 | 256,820 | ||||
| 57,278 | Series 2006-A2, Class 5A3 (b) | 2.28% | 11/01/33 | 57,469 | ||||
| 34,800 | Series 2014-2, Class 1A1 (c) | 3.00% | 06/01/29 | 33,696 | ||||
| MASTR Alternative Loan Trust | ||||||||
| 3,555,180 | Series 2006-2, Class 2A3, 1 Mo. LIBOR + 0.35% (a) | 1.02% | 03/25/36 | 329,292 | ||||
| MASTR Asset Backed Securities Trust | ||||||||
| 620,168 | Series 2006-HE5, Class A3, 1 Mo. LIBOR + 0.16% (a) | 0.83% | 11/25/36 | 440,185 | ||||
| 1,060,555 | Series 2006-NC2, Class A3, 1 Mo. LIBOR + 0.22% (a) | 0.89% | 08/25/36 | 507,696 | ||||
| 484,093 | Series 2006-NC2, Class A5, 1 Mo. LIBOR + 0.48% (a) | 1.15% | 08/25/36 | 233,381 | ||||
| MASTR Asset Securitization Trust | ||||||||
| 267 | Series 2003-11, Class 5A2 | 5.25% | 12/01/23 | 269 | ||||
| 25,838 | Series 2003-11, Class 6A16 | 5.25% | 12/01/33 | 25,222 | ||||
| MortgageIT Trust | ||||||||
| 84,534 | Series 2005-2, Class 2A, 1 Mo. LIBOR + 1.65% (a) | 2.11% | 05/01/35 | 83,762 | ||||
| New Residential Mortgage Loan Trust | ||||||||
| 241,360 | Series 2014-2A, Class A2 (c) | 3.75% | 05/01/54 | 234,538 | ||||
| Pretium Mortgage Credit Partners I LLC | ||||||||
| 1,000,000 | Series 2021-NPL2, Class A2 (c) (d) | 3.84% | 06/27/60 | 947,407 | ||||
| PRKCM Trust | ||||||||
| 1,000,000 | Series 2021-AFC1, Class B2 (c) | 3.95% | 08/01/56 | 814,181 | ||||
| Residential Accredit Loans, Inc. | ||||||||
| 84,594 | Series 2006-QO1, Class 2A1, 1 Mo. LIBOR + 0.54% (a) | 1.21% | 02/25/46 | 56,917 | ||||
| 796,974 | Series 2006-QS6, Class 1AV, IO (b) | 0.77% | 06/01/36 | 17,172 | ||||
| Principal Value | Description | Stated Coupon | Stated Maturity | Value | ||||
| MORTGAGE-BACKED SECURITIES (Continued) | ||||||||
| Collateralized Mortgage Obligations (Continued) | ||||||||
| Residential Asset Securitization Trust | ||||||||
| $21,569 | Series 2004-A3, Class A7 | 5.25% | 06/01/34 | $21,447 | ||||
| Roc Mortgage Trust | ||||||||
| 1,000,000 | Series 2021-RTL1, Class M (c) | 5.68% | 08/25/26 | 945,276 | ||||
| RUN Trust | ||||||||
| 990,193 | Series 2022-NQM1, Class A1 (c) | 4.00% | 03/01/67 | 978,058 | ||||
| Saxon Asset Securities Trust | ||||||||
| 626,837 | Series 2007-2, Class A2D, 1 Mo. LIBOR + 0.30% (a) | 0.97% | 05/25/47 | 515,198 | ||||
| Starwood Mortgage Residential Trust | ||||||||
| 1,000,000 | Series 2022-3, Class A1 (c) (e) | 4.16% | 03/01/67 | 993,304 | ||||
| Structured Asset Securities Corp. Mortgage Pass-Through Certificates | ||||||||
| 15,504 | Series 2001-SB1, Class A2 | 3.38% | 08/01/31 | 15,324 | ||||
| VCAT LLC | ||||||||
| 1,000,000 | Series 2021-NPL5, Class A2 (c) (d) | 3.84% | 08/25/51 | 940,836 | ||||
| 1,000,000 | Series 2021-NPL6, Class A2 (c) (d) | 3.97% | 09/25/51 | 927,476 | ||||
| Vendee Mortgage Trust | ||||||||
| 42,291,745 | Series 2010-1, Class DI, IO (b) | 0.26% | 04/01/40 | 321,020 | ||||
| VOLT CI LLC | ||||||||
| 1,000,000 | Series 2021-NP10, Class A2 (c) (d) | 4.83% | 05/25/51 | 940,662 | ||||
| Wachovia Mortgage Loan Trust, LLC | ||||||||
| 39,852 | Series 2006-A, Class 3A1 (b) | 3.10% | 05/01/36 | 39,128 | ||||
| WaMu Mortgage Pass-Through Certificates | ||||||||
| 98,304 | Series 2003-AR5, Class A7 (b) | 2.63% | 06/01/33 | 98,134 | ||||
| 172,243 | Series 2004-AR13, Class A1A, 1 Mo. LIBOR + 0.72% (a) | 1.39% | 11/25/34 | 166,996 | ||||
| 23,607 | Series 2004-AR3, Class A2 (b) | 2.68% | 06/01/34 | 23,393 | ||||
| Washington Mutual Alternative Mortgage Pass-Through Certificates | ||||||||
| 11,482 | Series 2007-5, Class A11, 1 Mo. LIBOR x -6 + 39.48% (f) | 35.47% | 06/25/37 | 16,523 | ||||
| WinWater Mortgage Loan Trust | ||||||||
| 249,357 | Series 2015-3, Class B1 (b) (c) | 3.87% | 03/01/45 | 239,449 | ||||
| 16,154,132 | ||||||||
| Commercial Mortgage-Backed Securities – 21.2% | ||||||||
| Benchmark Mortgage Trust | ||||||||
| 1,000,000 | Series 2020-IG2. Class UBRD (b) (c) | 3.63% | 09/01/48 | 929,098 | ||||
| Citigroup Commercial Mortgage Trust | ||||||||
| 4,308,065 | Series 2015-GC29, Class XA (b) | 1.16% | 04/01/48 | 106,238 | ||||
| 9,087,493 | Series 2016-GC37, Class XA (b) | 1.84% | 04/01/49 | 468,111 | ||||
| 5,722,289 | Series 2016-P4, Class XA (b) | 2.05% | 07/01/49 | 352,046 | ||||
| COMM Mortgage Trust | ||||||||
| 513,320 | Series 2013-LC13, Class XA (b) | 1.17% | 08/01/46 | 5,212 | ||||
| 22,601,232 | Series 2013-LC6, Class XA (b) | 1.40% | 01/01/46 | 70,389 | ||||
| 122,774,000 | Series 2014-UBS6, Class XB (b) (c) | 0.11% | 12/01/47 | 196,267 | ||||
| 3,829,000 | Series 2015-CCRE26, Class XD (b) (c) | 1.38% | 10/01/48 | 142,349 | ||||
| 16,266,349 | Series 2015-LC21, Class XA (b) | 0.82% | 07/01/48 | 272,762 | ||||
| Credit Suisse Mortgage Capital Certificates | ||||||||
| 1,000,000 | Series 2021-980M, Class G (b) (c) | 3.65% | 07/15/31 | 791,890 | ||||
| Credit Suisse Mortgage Trust | ||||||||
| 1,000,000 | Series 2022-CNTR, Class A, 1 Mo. Term SOFR + 3.94% (a) (c) | 4.45% | 01/15/24 | 954,816 | ||||
| GS Mortgage Securities Corp Trust | ||||||||
| 1,000,000 | Series 2018-3PCK, Class C, 1 Mo. LIBOR + 3.25% (a) (c) | 3.80% | 09/15/31 | 955,154 | ||||
| GS Mortgage Securities Trust | ||||||||
| 1,000,000 | Series 2012-GCJ9, Class D (b) (c) | 4.90% | 11/01/45 | 990,756 | ||||
| Houston Galleria Mall Trust | ||||||||
| 1,000,000 | Series 2015-HGLR, Class D (c) | 3.98% | 03/01/37 | 925,351 | ||||
| Principal Value | Description | Stated Coupon | Stated Maturity | Value | ||||
| MORTGAGE-BACKED SECURITIES (Continued) | ||||||||
| Commercial Mortgage-Backed Securities (Continued) | ||||||||
| Hudsons Bay Simon JV Trust | ||||||||
| $510,000 | Series 2015-HBFL, Class DFL, 1 Mo. LIBOR + 3.90% (a) (c) | 4.34% | 08/05/34 | $380,505 | ||||
| JP Morgan Chase Commercial Mortgage Securities Trust | ||||||||
| 3,200,739 | Series 2016-JP4, Class XA (b) | 0.73% | 12/01/49 | 64,798 | ||||
| LSTAR Commercial Mortgage Trust | ||||||||
| 1,500,000 | Series 2017-5, Class D (b) (c) | 4.83% | 03/01/50 | 1,313,405 | ||||
| 21,042,380 | Series 2017-5, Class X (b) (c) | 0.94% | 03/01/50 | 529,481 | ||||
| MBRT | ||||||||
| 1,000,000 | Series 2019-MBR, Class H1, 1 Mo. LIBOR + 4.25% (a) (c) | 4.80% | 11/15/36 | 977,974 | ||||
| Morgan Stanley Bank of America Merrill Lynch Trust | ||||||||
| 500,000 | Series 2013-C7, Class B | 3.77% | 02/01/46 | 494,757 | ||||
| 22,999,770 | Series 2014-C16, Class XA (b) | 1.11% | 06/01/47 | 306,861 | ||||
| 1,974,372 | Series 2014-C19, Class XA (b) | 1.10% | 12/01/47 | 37,682 | ||||
| 5,632,500 | Series 2014-C19, Class XE (b) (c) | 1.32% | 12/01/47 | 159,223 | ||||
| 467,862 | Series 2016-C31, Class XA (b) | 1.43% | 11/01/49 | 20,361 | ||||
| Morgan Stanley Capital I Trust | ||||||||
| 2,180,000 | Series 2016-UBS9, Class XD (b) (c) | 1.76% | 03/01/49 | 120,292 | ||||
| Wells Fargo Commercial Mortgage Trust | ||||||||
| 1,374,064 | Series 2015-C26, Class XA (b) | 1.34% | 02/01/48 | 37,693 | ||||
| 11,603,471 | ||||||||
Total Mortgage-Backed Securities | 27,757,603 | |||||||
| (Cost $30,631,956) | ||||||||
| U.S. GOVERNMENT AGENCY MORTGAGE-BACKED SECURITIES – 41.0% | ||||||||
| Collateralized Mortgage Obligations – 25.4% | ||||||||
| Federal Home Loan Mortgage Corp. | ||||||||
| 1,632 | Series 1394, Class ID, ECOFIN x -4.67 + 44.56%, Capped at 9.57% (f) | 9.57% | 10/15/22 | 1,654 | ||||
| 5,056 | Series 2303, Class SW, IO, ECOFIN x -15.87 + 121.11%, Capped at 10.00% (f) | 10.00% | 03/01/24 | 340 | ||||
| 41,173 | Series 2334, Class QS, 1 Mo. LIBOR x -3.5 + 28.18% (f) | 26.24% | 07/15/31 | 49,398 | ||||
| 160,863 | Series 2439, Class XI, IO, if 1 Mo. LIBOR x -1 + 7.74% is less than 7.50%, then 6.50%, otherwise 0.00% (f) | 6.50% | 03/01/32 | 24,050 | ||||
| 330,289 | Series 2807, Class SB, IO, 1 Mo. LIBOR x -1 + 7.45% (f) | 6.90% | 11/15/33 | 45,391 | ||||
| 698,962 | Series 2975, Class SJ, IO, 1 Mo. LIBOR x -1 + 6.65% (f) | 6.10% | 05/15/35 | 94,102 | ||||
| 190,819 | Series 3012, Class GK, 1 Mo. LIBOR x -4.5 + 24.75% (f) | 22.26% | 06/15/35 | 249,070 | ||||
| 72,464 | Series 3410, Class HC | 5.50% | 02/01/38 | 77,830 | ||||
| 30,793 | Series 3451, Class SB, IO, 1 Mo. LIBOR x -1 + 6.03% (f) | 5.48% | 05/15/38 | 2,725 | ||||
| 268,988 | Series 3471, Class SD, IO, 1 Mo. LIBOR x -1 + 6.08% (f) | 5.53% | 12/15/36 | 36,010 | ||||
| 250,000 | Series 3797, Class KB | 4.50% | 01/01/41 | 266,027 | ||||
| 38,930 | Series 3985, Class GI, IO | 3.00% | 10/01/26 | 237 | ||||
| 20,215 | Series 4021, Class IP, IO | 3.00% | 03/01/27 | 944 | ||||
| 316,773 | Series 4057, Class YI, IO | 3.00% | 06/01/27 | 15,904 | ||||
| 615,069 | Series 4082, Class PI, IO | 3.00% | 06/01/27 | 30,451 | ||||
| 3,189,404 | Series 4142, Class IO, IO | 3.00% | 12/01/27 | 163,579 | ||||
| 352,441 | Series 4206, Class IA, IO | 3.00% | 03/01/33 | 34,633 | ||||
| 2,670,536 | Series 4459, Class EI, IO | 6.00% | 06/01/36 | 308,104 | ||||
| 303,985 | Series 4615, Class GT, 1 Mo. LIBOR x -4 + 16.00%, Capped at 4.00% (f) | 4.00% | 10/15/42 | 241,985 | ||||
| 3,896,824 | Series 4938, Class IB, IO | 4.00% | 07/01/49 | 539,068 | ||||
| Federal Home Loan Mortgage Corp. STACR REMIC Trust | ||||||||
| 1,000,000 | Series 2020-DNA2, Class B2, 1 Mo. LIBOR + 4.80% (a) (c) | 5.47% | 02/25/50 | 908,859 | ||||
| Federal Home Loan Mortgage Corp. STACR Trust | ||||||||
| 1,000,000 | Series 2018-HQA2, Class B2, 1 Mo. LIBOR + 11.00% (a) (c) | 11.67% | 10/25/48 | 1,122,683 | ||||
| Principal Value | Description | Stated Coupon | Stated Maturity | Value | ||||
| U.S. GOVERNMENT AGENCY MORTGAGE-BACKED SECURITIES (Continued) | ||||||||
| Collateralized Mortgage Obligations (Continued) | ||||||||
| Federal Home Loan Mortgage Corp. STACR Trust (Continued) | ||||||||
| $1,000,000 | Series 2019-HQA3, Class B2, 1 Mo. LIBOR + 7.50% (a) (c) | 8.17% | 09/25/49 | $990,780 | ||||
| Federal Home Loan Mortgage Corp. Structured Pass-Through Certificates | ||||||||
| 46,268 | Series T-56, Class APO | (g) | 05/01/43 | 44,288 | ||||
| Federal Home Loan Mortgage Corp., STRIPS | ||||||||
| 38,216 | Series 177, IO | 7.00% | 07/01/26 | 3,601 | ||||
| 609,648 | Series 243, Class 2, IO | 5.00% | 11/01/35 | 89,392 | ||||
| 2,282,525 | Series 303, Class C17, IO | 3.50% | 01/01/43 | 368,933 | ||||
| 878,771 | Series 324, Class C21, IO | 6.00% | 06/01/39 | 251,686 | ||||
| Federal National Mortgage Association | ||||||||
| 31,317 | Series 1996-46, Class ZA | 7.50% | 11/01/26 | 33,129 | ||||
| 70,105 | Series 1997-85, Class M, IO | 6.50% | 12/01/27 | 2,476 | ||||
| 25,746 | Series 2002-80, Class IO, IO | 6.00% | 09/01/32 | 2,122 | ||||
| 56,141 | Series 2003-15, Class MS, IO, 1 Mo. LIBOR x -1 + 8.00% (f) | 7.33% | 03/25/33 | 8,539 | ||||
| 72,519 | Series 2003-44, Class IU, IO | 7.00% | 06/01/33 | 12,847 | ||||
| 307,506 | Series 2004-49, Class SN, IO, 1 Mo. LIBOR x -1 + 7.10% (f) | 6.43% | 07/25/34 | 36,288 | ||||
| 10,675 | Series 2004-74, Class SW, 1 Mo. LIBOR x -2 + 15.50% (f) | 14.39% | 11/25/31 | 12,026 | ||||
| 273,214 | Series 2005-122, Class SN, 1 Mo. LIBOR x -4 + 28.60% (f) | 25.93% | 01/25/36 | 331,835 | ||||
| 33,699 | Series 2005-59 Class SU, 1 Mo. LIBOR x -5 + 25.50% (f) | 22.16% | 06/25/35 | 41,319 | ||||
| 72,021 | Series 2005-6, Class SE, IO, 1 Mo. LIBOR x -1 + 6.70% (f) | 6.03% | 02/25/35 | 9,116 | ||||
| 33,801 | Series 2007-100, Class SM, IO, 1 Mo. LIBOR x -1 + 6.45% (f) | 5.78% | 10/25/37 | 5,007 | ||||
| 196,205 | Series 2007-37, Class SB, IO, 1 Mo. LIBOR x -1 + 6.75% (f) | 6.08% | 05/25/37 | 29,034 | ||||
| 294,177 | Series 2008-17, Class BE | 5.50% | 10/01/37 | 317,074 | ||||
| 753,168 | Series 2010-103, Class ID, IO | 5.00% | 09/01/40 | 135,606 | ||||
| 397,100 | Series 2010-59, Class EI, IO | 6.00% | 06/01/40 | 74,055 | ||||
| 47,352 | Series 2010-99, Class SG, 1 Mo. LIBOR x -5 + 25.00% (f) | 22.72% | 09/01/40 | 64,198 | ||||
| 737,498 | Series 2011-81, Class PI, IO | 3.50% | 08/01/26 | 33,546 | ||||
| 67,312 | Series 2012-111, Class B | 7.00% | 10/01/42 | 74,722 | ||||
| 418,764 | Series 2012-112, Class BI, IO | 3.00% | 09/01/31 | 13,262 | ||||
| 1,580,815 | Series 2012-125, Class MI, IO | 3.50% | 11/01/42 | 230,982 | ||||
| 16,897 | Series 2013-132, Class SW, 1 Mo. LIBOR x -2.67 + 10.67% (f) | 9.45% | 01/01/44 | 16,228 | ||||
| 826,187 | Series 2013-32, Class IG, IO | 3.50% | 04/01/33 | 102,993 | ||||
| 254,888 | Series 2013-51, Class PI, IO | 3.00% | 11/01/32 | 25,342 | ||||
| 1,648,697 | Series 2015-20, Class ES, IO, 1 Mo. LIBOR x -1 + 6.15% (f) | 5.48% | 04/25/45 | 240,970 | ||||
| 147,444 | Series 2015-76, Class BI, IO | 4.00% | 10/01/39 | 11,030 | ||||
| 519,482 | Series 2015-97, Class AI, IO | 4.00% | 09/01/41 | 9,301 | ||||
| 168,142 | Series 2016-74, Class LI, IO | 3.50% | 09/01/46 | 47,535 | ||||
| 3,266,381 | Series 2017-109, Class SJ, IO, 1 Mo. LIBOR x -1+ 6.20% (f) | 5.53% | 01/25/48 | 534,630 | ||||
| 1,500,011 | Series 5112, Class ID, IO | 7.00% | 01/01/30 | 182,892 | ||||
| Federal National Mortgage Association, STRIPS | ||||||||
| 26,609 | Series 305, Class 12, IO (h) | 6.50% | 12/01/29 | 2,957 | ||||
| 38,500 | Series 355, Class 18, IO | 7.50% | 11/01/33 | 6,682 | ||||
| 1,234,785 | Series 387, Class 10, IO | 6.00% | 04/01/38 | 336,739 | ||||
| 538,864 | Series 406, Class 6, IO (h) | 4.00% | 01/01/41 | 89,751 | ||||
| 504,619 | Series 413, Class 173, IO (h) | 4.50% | 07/01/42 | 88,234 | ||||
| Government National Mortgage Association | ||||||||
| 262,174 | Series 2004-95, Class QZ | 4.50% | 11/01/34 | 267,923 | ||||
| 143,618 | Series 2005-33, Class AY | 5.50% | 04/01/35 | 149,453 | ||||
| 51,677 | Series 2005-68, Class DP, 1 Mo. LIBOR x -2.41 + 16.43% (f) | 15.00% | 06/17/35 | 54,573 | ||||
| 191,007 | Series 2005-68, Class KI, IO, 1 Mo. LIBOR x -1 + 6.30% (f) | 5.71% | 09/20/35 | 25,026 | ||||
| 30,664 | Series 2006-28, Class VS, 1 Mo. LIBOR x -13 + 87.10% (f) | 79.37% | 06/20/36 | 62,264 | ||||
| 161,808 | Series 2007-68, Class PI, IO, 1 Mo. LIBOR x -1 + 6.65% (f) | 6.06% | 11/20/37 | 12,136 | ||||
| 100,000 | Series 2008-2, Class HB | 5.50% | 01/01/38 | 105,208 | ||||
| 304,000 | Series 2008-32, Class JD | 5.50% | 04/01/38 | 318,479 | ||||
| Principal Value | Description | Stated Coupon | Stated Maturity | Value | ||||
| U.S. GOVERNMENT AGENCY MORTGAGE-BACKED SECURITIES (Continued) | ||||||||
| Collateralized Mortgage Obligations (Continued) | ||||||||
| Government National Mortgage Association (Continued) | ||||||||
| $139,651 | Series 2008-73, Class SK, IO, 1 Mo. LIBOR x -1 + 6.74% (f) | 6.15% | 08/20/38 | $13,712 | ||||
| 108,232 | Series 2009-12, Class IE, IO | 5.50% | 03/01/39 | 10,603 | ||||
| 150,562 | Series 2009-79, Class PZ | 6.00% | 09/01/39 | 175,686 | ||||
| 2,869,053 | Series 2010-57, Class TI, IO | 5.00% | 05/01/40 | 562,504 | ||||
| 280,509 | Series 2013-104, Class YS, IO, 1 Mo. LIBOR x -1 + 6.15% (f) | 5.56% | 07/16/43 | 32,458 | ||||
| 132,841 | Series 2014-41, Class ST, 1 Mo. LIBOR x -2.67 + 11.47% (f) | 9.88% | 11/20/42 | 98,963 | ||||
| 4,300,216 | Series 2015-158, Class KS, IO, 1 Mo. LIBOR x -1 + 6.25% (f) | 5.66% | 11/20/45 | 671,953 | ||||
| 74,588 | Series 2016-139, Class MZ | 1.50% | 07/01/45 | 58,350 | ||||
| 154,486 | Series 2017-4, Class CZ | 3.00% | 01/01/47 | 141,458 | ||||
| 123,407 | Series 2017-H18, Class DZ (h) | 4.62% | 09/01/67 | 128,493 | ||||
| 12,225,598 | Series 2020-13, Class BT, IO, 1 Mo. LIBOR x -1 + 6.20%, Capped at 0.50% (f) | 0.50% | 11/20/45 | 263,330 | ||||
| 4,148,241 | Series 2020-146, Class CI, IO | 2.50% | 10/01/50 | 533,776 | ||||
| 5,619,995 | Series 2021-23, Class BI, IO | 2.00% | 02/01/51 | 632,724 | ||||
| 3,412,892 | Series 2021-69, Class IX, IO | 3.00% | 04/01/51 | 519,856 | ||||
| 13,963,119 | ||||||||
| Commercial Mortgage-Backed Securities – 14.2% | ||||||||
| Federal Home Loan Mortgage Corp. Multifamily Structured Pass-Through Certificates | ||||||||
| 4,000,000 | Series K110, Class X3, IO (b) | 3.52% | 06/01/48 | 857,958 | ||||
| 3,330,000 | Series K112, Class X3, IO (b) | 3.11% | 07/01/48 | 641,943 | ||||
| 4,605,411 | Series K115, Class X3, IO (b) | 3.06% | 09/01/48 | 873,290 | ||||
| 4,326,216 | Series K118, Class X3, IO (b) | 2.79% | 10/25/48 | 762,294 | ||||
| 1,900,000 | Series K122, Class X3, IO (b) | 2.72% | 01/01/49 | 328,432 | ||||
| 5,000,000 | Series K124, Class X3, IO (b) | 2.71% | 02/01/49 | 882,715 | ||||
| 3,343,856 | Series K128, Class X3, IO (b) | 2.88% | 04/01/31 | 635,802 | ||||
| 1,831,144 | Series K739, Class X3, IO (b) | 2.90% | 11/25/48 | 227,390 | ||||
| 4,571,896 | Series KG06, Class X3, IO (b) | 2.83% | 10/01/31 | 880,346 | ||||
| Federal National Mortgage Association, ACES | ||||||||
| 13,100,000 | Series 2019-M29, Class X4, IO | 0.70% | 03/01/29 | 464,105 | ||||
| Freddie Mac Multiclass Certificates | ||||||||
| 6,254,165 | Series 2021-P011, Class X1, IO (b) | 1.84% | 09/01/45 | 886,834 | ||||
| FREMF Mortgage Trust | ||||||||
| 252,010,105 | Series 2013-K27, Class X2B, IO (c) | 0.10% | 01/01/46 | 145,284 | ||||
| Government National Mortgage Association | ||||||||
| 2,336,437 | Series 2016-11, Class IO (h) | 0.84% | 01/01/56 | 93,869 | ||||
| 2,450,160 | Series 2016-166, Class IO (h) | 0.92% | 04/01/58 | 117,818 | ||||
| 7,798,080 | ||||||||
| Pass-through Security – 1.4% | ||||||||
| Federal Home Loan Mortgage Corp. | ||||||||
| 375,614 | Pool K36017 | 5.00% | 09/01/47 | 384,279 | ||||
| Federal National Mortgage Association | ||||||||
| 363,124 | Pool AB5688 | 3.50% | 07/01/37 | 360,340 | ||||
| 744,619 | ||||||||
Total U.S. Government Agency Mortgage-Backed Securities | 22,505,818 | |||||||
| (Cost $25,142,875) | ||||||||
| ASSET-BACKED SECURITIES – 3.2% | ||||||||
| AMSR Trust | ||||||||
| 750,000 | Series 2019-SFR1, Class I (c) | 8.98% | 01/19/39 | 773,330 | ||||
| CoreVest American Finance Trust | ||||||||
| 9,928,146 | Series 2021-3, Class XA (b) (c) | 2.54% | 10/01/54 | 777,981 | ||||
| Principal Value | Description | Stated Coupon | Stated Maturity | Value | ||||
| ASSET-BACKED SECURITIES (Continued) | ||||||||
| Mid-State Capital Corp. Trust | ||||||||
| $193,259 | Series 2005-1, Class A | 5.75% | 01/01/40 | $193,315 | ||||
Total Asset-Backed Securities | 1,744,626 | |||||||
| (Cost $1,906,300) | ||||||||
Total Investments – 94.8% | 52,008,047 | ||
| (Cost $57,681,131) | |||
Net Other Assets and Liabilities – 5.2% | 2,856,503 | ||
Net Assets – 100.0% | $54,864,550 |
| Futures Contracts | Position | Number of Contracts | Expiration Date | Notional Value | Unrealized Appreciation (Depreciation)/ Value | |||||
| U.S. Treasury Long Bond Futures | Long | 11 | Jun 2022 | $ 1,547,563 | $(24,753) |
| (a) | Floating or variable rate security. |
| (b) | Collateral Strip Rate security. Coupon is based on the weighted net interest rate of the investment’s underlying collateral. The interest rate resets periodically. |
| (c) | This security, sold within the terms of a private placement memorandum, is exempt from registration upon resale under Rule 144A of the Securities Act of 1933, as amended, and may be resold in transactions exempt from registration, normally to qualified institutional buyers. Pursuant to procedures adopted by the Fund’s Board of Trustees, this security has been determined to be liquid by First Trust Advisors L.P., the Fund’s investment advisor. Although market instability can result in periods of increased overall market illiquidity, liquidity for each security is determined based on security specific factors and assumptions, which require subjective judgment. At April 30, 2022, securities noted as such amounted to $25,478,180 or 46.4% of net assets. |
| (d) | Step-up security. A security where the coupon increases or steps up at a predetermined date. Interest rate shown reflects the rate in effect at April 30, 2022. |
| (e) | This security is fair valued by the Advisor’s Pricing Committee in accordance with procedures adopted by the Fund’s Board of Trustees, and in accordance with the provisions of the Investment Company Act of 1940, as amended. At April 30, 2022, securities noted as such are valued at $993,304 or 1.8% of net assets. |
| (f) | Inverse floating rate security. |
| (g) | Zero coupon security. |
| (h) | Weighted Average Coupon security. Coupon is based on the blended interest rate of the underlying holdings, which may have different coupons. The coupon may change in any period. |
| ACES | Alternative Credit Enhancement Securities |
| ECOFIN | Enterprise 11th District COFI Institutional Replacement Index |
| IO | Interest-Only Security - Principal amount shown represents par value on which interest payments are based. |
| LIBOR | London Interbank Offered Rate |
| SOFR | Secured Overnight Financing Rate |
| STRIPS | Separate Trading of Registered Interest and Principal of Securities |
| ASSETS TABLE | ||||
| Total Value at 4/30/2022 | Level 1 Quoted Prices | Level 2 Significant Observable Inputs | Level 3 Significant Unobservable Inputs | |
Mortgage-Backed Securities | $ 27,757,603 | $ — | $ 27,757,603 | $ — |
U.S. Government Agency Mortgage-Backed Securities | 22,505,818 | — | 22,505,818 | — |
Asset-Backed Securities | 1,744,626 | — | 1,744,626 | — |
Total Investments | $ 52,008,047 | $— | $ 52,008,047 | $— |
| LIABILITIES TABLE | ||||
| Total Value at 4/30/2022 | Level 1 Quoted Prices | Level 2 Significant Observable Inputs | Level 3 Significant Unobservable Inputs | |
Futures Contracts | $ (24,753) | $ (24,753) | $ — | $ — |
| ASSETS: | |
Investments, at value (Cost $57,681,131) | $ 52,008,047 |
Cash | 3,430,106 |
Restricted Cash | 50,245 |
Interest receivable | 514,854 |
Prepaid expenses | 16,172 |
Total Assets | 56,019,424 |
| LIABILITIES: | |
| Payables: | |
Investment securities purchased | 997,003 |
Audit and tax fees | 56,419 |
Investment advisory fees | 38,527 |
Variation margin | 24,753 |
Administrative fees | 14,471 |
Transfer agent fees | 11,372 |
Shareholder reporting fees | 5,916 |
Legal fees | 2,595 |
Trustees’ fees and expenses | 1,542 |
Custodian fees | 883 |
Financial reporting fees | 771 |
Other liabilities | 622 |
Total Liabilities | 1,154,874 |
NET ASSETS | $54,864,550 |
| NET ASSETS consist of: | |
Paid-in capital | $ 64,666,396 |
Par value | 42,131 |
Accumulated distributable earnings (loss) | (9,843,977) |
NET ASSETS | $54,864,550 |
NET ASSET VALUE, per Common Share (par value $0.01 per Common Share) | $13.02 |
Number of Common Shares outstanding (unlimited number of Common Shares has been authorized) | 4,213,115 |
| INVESTMENT INCOME: | ||
Interest | $ 1,111,122 | |
Other | 219,387 | |
Total investment income | 1,330,509 | |
| EXPENSES: | ||
Investment advisory fees | 240,683 | |
Audit and tax fees | 35,665 | |
Administrative fees | 32,854 | |
Transfer agent fees | 16,995 | |
Listing expense | 12,702 | |
Shareholder reporting fees | 12,656 | |
Trustees’ fees and expenses | 9,531 | |
Financial reporting fees | 4,625 | |
Custodian fees | 3,457 | |
Legal fees | 1,816 | |
Other | 11,429 | |
Total expenses | 382,413 | |
NET INVESTMENT INCOME (LOSS) | 948,096 | |
| NET REALIZED AND UNREALIZED GAIN (LOSS): | ||
| Net realized gain (loss) on: | ||
Investments | (36,887) | |
Futures contracts | 127,697 | |
Net realized gain (loss) | 90,810 | |
| Net change in unrealized appreciation (depreciation) on: | ||
Investments | (3,405,491) | |
Futures contracts | (25,378) | |
Net change in unrealized appreciation (depreciation) | (3,430,869) | |
NET REALIZED AND UNREALIZED GAIN (LOSS) | (3,340,059) | |
NET INCREASE (DECREASE) IN NET ASSETS RESULTING FROM OPERATIONS | $(2,391,963) | |
| Six Months Ended 4/30/2022 (Unaudited) | Year Ended 10/31/2021 | ||
| OPERATIONS: | |||
Net investment income (loss) | $ 948,096 | $ 1,861,053 | |
Net realized gain (loss) | 90,810 | (29,104) | |
Net change in unrealized appreciation (depreciation) | (3,430,869) | (1,029,335) | |
Net increase (decrease) in net assets resulting from operations | (2,391,963) | 802,614 | |
| DISTRIBUTIONS TO SHAREHOLDERS FROM: | |||
Investment operations | (1,390,328) | (1,462,301) | |
Return of capital | — | (1,571,142) | |
Total distributions to shareholders | (1,390,328) | (3,033,443) | |
Total increase (decrease) in net assets | (3,782,291) | (2,230,829) | |
| NET ASSETS: | |||
Beginning of period | 58,646,841 | 60,877,670 | |
End of period | $ 54,864,550 | $ 58,646,841 | |
| COMMON SHARES: | |||
Common Shares at end of period | 4,213,115 | 4,213,115 |
| Six Months Ended 4/30/2022 (Unaudited) | Year Ended October 31, | |||||||||||
| 2021 | 2020 | 2019 | 2018 | 2017 | ||||||||
Net asset value, beginning of period | $ 13.92 | $ 14.45 | $ 14.91 | $ 14.96 | $ 15.47 | $ 15.53 | ||||||
| Income from investment operations: | ||||||||||||
Net investment income (loss) | 0.23 | 0.44 | 0.44 | 0.34 | 0.45 | 0.18 | ||||||
Net realized and unrealized gain (loss) | (0.80) | (0.25) | (0.18) | 0.33 | (0.21) | 0.54 | ||||||
Total from investment operations | (0.57) | 0.19 | 0.26 | 0.67 | 0.24 | 0.72 | ||||||
| Distributions paid to shareholders from: | ||||||||||||
Net investment income | (0.33) | (0.35) | (0.63) | (0.50) | (0.42) | (0.46) | ||||||
Return of capital | — | (0.37) | (0.09) | (0.22) | (0.33) | (0.32) | ||||||
Total distributions paid to Common Shareholders | (0.33) | (0.72) | (0.72) | (0.72) | (0.75) | (0.78) | ||||||
Net asset value, end of period | $13.02 | $13.92 | $14.45 | $14.91 | $14.96 | $15.47 | ||||||
Market value, end of period | $11.68 | $13.70 | $13.40 | $13.99 | $13.01 | $14.39 | ||||||
Total return based on net asset value (a) | (4.09)% | 1.51% | 2.12% | 5.08% | 2.13% | 5.25% | ||||||
Total return based on market value (a) | (12.58)% | 7.74% | 0.93% | 13.37% | (4.52)% | 8.60% | ||||||
| Ratios to average net assets/supplemental data: | ||||||||||||
Net assets, end of period (in 000’s) | $ 54,865 | $ 58,647 | $ 60,878 | $ 62,832 | $ 63,047 | $ 65,196 | ||||||
Ratio of total expenses to average net assets | 1.35% (b) | 1.31% | 1.33% | 1.33% | 1.59% | 1.25% | ||||||
Ratio of net investment income (loss) to average net assets | 3.35% (b) | 3.11% | 3.03% | 2.29% | 2.95% | 1.12% | ||||||
Portfolio turnover rate | 18% | 67% | 28% | 69% | 30% | 27% | ||||||
| (a) | Total return is based on the combination of reinvested dividend, capital gain and return of capital distributions, if any, at prices obtained by the Dividend Reinvestment Plan, and changes in net asset value per share for net asset value returns and changes in Common Share Price for market value returns. Total returns do not reflect sales load and are not annualized for periods of less than one year. Past performance is not indicative of future results. |
| (b) | Annualized. |
| 1) | benchmark yields; |
| 2) | reported trades; |
| 3) | broker/dealer quotes; |
| 4) | issuer spreads; |
| 5) | benchmark securities; |
| 6) | bids and offers; and |
| 7) | reference data including market research publications. |
| 1) | the credit conditions in the relevant market and changes thereto; |
| 2) | the liquidity conditions in the relevant market and changes thereto; |
| 3) | the interest rate conditions in the relevant market and changes thereto (such as significant changes in interest rates); |
| 4) | issuer-specific conditions (such as significant credit deterioration); and |
| 5) | any other market-based data the Advisor’s Pricing Committee considers relevant. In this regard, the Advisor’s Pricing Committee may use last-obtained market-based data to assist it when valuing portfolio securities using amortized cost. |
| 1) | the fundamental business data relating to the issuer; |
| 2) | an evaluation of the forces which influence the market in which these securities are purchased and sold; |
| 3) | the type, size and cost of the security; |
| 4) | the financial statements of the issuer; |
| 5) | the credit quality and cash flow of the issuer, based on the Advisor’s or external analysis; |
| 6) | the information as to any transactions in or offers for the security; |
| 7) | the price and extent of public trading in similar securities (or equity securities) of the issuer/borrower, or comparable companies; |
| 8) | the coupon payments; |
| 9) | the quality, value and salability of collateral, if any, securing the security; |
| 10) | the business prospects of the issuer, including any ability to obtain money or resources from a parent or affiliate and an assessment of the issuer’s management; |
| 11) | the prospects for the issuer’s industry, and multiples (of earnings and/or cash flows) being paid for similar businesses in that industry; and |
| 12) | other relevant factors. |
| • | Level 1 – Level 1 inputs are quoted prices in active markets for identical investments. An active market is a market in which transactions for the investment occur with sufficient frequency and volume to provide pricing information on an ongoing basis. |
| • | Level 2 – Level 2 inputs are observable inputs, either directly or indirectly, and include the following: |
| o | Quoted prices for similar investments in active markets. |
| o | Quoted prices for identical or similar investments in markets that are non-active. A non-active market is a market where there are few transactions for the investment, the prices are not current, or price quotations vary substantially either over time or among market makers, or in which little information is released publicly. |
| o | Inputs other than quoted prices that are observable for the investment (for example, interest rates and yield curves observable at commonly quoted intervals, volatilities, prepayment speeds, loss severities, credit risks, and default rates). |
| o | Inputs that are derived principally from or corroborated by observable market data by correlation or other means. |
| • | Level 3 – Level 3 inputs are unobservable inputs. Unobservable inputs may reflect the reporting entity’s own assumptions about the assumptions that market participants would use in pricing the investment. |
| Distributions paid from: | |
Ordinary income | $1,462,301 |
Capital gains | — |
Return of capital | 1,571,142 |
Undistributed ordinary income | $— |
Undistributed capital gains | — |
Total undistributed earnings | — |
Accumulated capital and other losses | (1,615,306) |
Net unrealized appreciation (depreciation) | (4,446,380) |
Total accumulated earnings (losses) | (6,061,686) |
Other | — |
Paid-in capital | 64,708,527 |
Total net assets | $58,646,841 |
| Tax Cost | Gross Unrealized Appreciation | Gross Unrealized (Depreciation) | Net Unrealized Appreciation (Depreciation) | |||
| $57,681,131 | $406,572 | $(6,104,409) | $(5,697,837) |
| Asset Derivatives | Liability Derivatives | |||||||||
| Derivative Instrument | Risk Exposure | Statement of Assets and Liabilities Location | Value | Statement of Assets and Liabilities Location | Value | |||||
| Futures | Interest Rate Risk | Unrealized appreciation on futures contracts | $ — | Unrealized depreciation on futures contracts | $ (24,753) | |||||
| Statement of Operations Location | |
| Interest Rate Risk Exposure | |
| Net realized gain (loss) on futures contracts | $127,697 |
| Net change in unrealized appreciation (depreciation) on futures contracts | (25,378) |
| (1) | If Common Shares are trading at or above net asset value (“NAV”) at the time of valuation, the Fund will issue new shares at a price equal to the greater of (i) NAV per Common Share on that date or (ii) 95% of the market price on that date. |
| (2) | If Common Shares are trading below NAV at the time of valuation, the Plan Agent will receive the dividend or distribution in cash and will purchase Common Shares in the open market, on the NYSE or elsewhere, for the participants’ accounts. It is possible that the market price for the Common Shares may increase before the Plan Agent has completed its purchases. Therefore, the average purchase price per share paid by the Plan Agent may exceed the market price at the time of valuation, resulting in the purchase of fewer shares than if the dividend or distribution had been paid in Common Shares issued by the Fund. The Plan Agent will use all dividends and distributions received in cash to purchase Common Shares in the open market within 30 days of the valuation date except where temporary curtailment or suspension of purchases is necessary to comply with federal securities laws. Interest will not be paid on any uninvested cash payments. |
| • | Issuer Risk. The value of fixed-income securities may decline for a number of reasons which directly relate to the issuer, such as management performance, leverage and reduced demand for the issuer’s goods and services. In addition, an issuer of fixed-income securities may default on its obligation to pay interest and repay principal. |
| • | Prepayment Risk. Prepayment risk is the risk that the issuer of a debt security will repay principal prior to the scheduled maturity date. During periods of declining interest rates, the issuer of a security may exercise its option to prepay principal earlier than scheduled, forcing the Fund to reinvest the proceeds from such prepayment in lower yielding securities, which may result in a decline in the Fund’s income and distributions to common shareholders. |
| • | Reinvestment Risk. Reinvestment risk is the risk that income from the Fund’s portfolio will decline if the Fund invests the proceeds from matured, traded or called securities or loans at market interest rates that are below the Fund portfolio’s current earnings rate. |
FUND ACCOUNTANT,
AND CUSTODIAN
PUBLIC ACCOUNTING FIRM
| (b) | Not applicable. |
Item 2. Code of Ethics.
Not applicable.
Item 3. Audit Committee Financial Expert.
Not applicable.
Item 4. Principal Accountant Fees and Services.
Not applicable.
Item 5. Audit Committee of Listed Registrants.
Not applicable.
Item 6. Investments.
| (a) | Schedule of Investments in securities of unaffiliated issuers as of the close of the reporting period is included as part of the report to shareholders filed under Item 1 of this form. |
| (b) | Not applicable. |
Item 7. Disclosure of Proxy Voting Policies and Procedures for Closed-End Management Investment Companies.
Not applicable.
Item 8. Portfolio Managers of Closed-End Management Investment Companies.
| (a) | Not applicable. |
| (b) | There has been no change, as of the date of this filing, in any of the portfolios managers identified in response to paragraph (a)(1) of this Item in the registrant’s most recently filed annual report on Form N-CSR. |
Item 9. Purchases of Equity Securities by Closed-End Management Investment Company and Affiliated Purchasers.
Not applicable.
Item 10. Submission of Matters to a Vote of Security Holders.
There have been no material changes to the procedures by which the shareholders may recommend nominees to the registrant’s board of directors, where those changes were implemented after the registrant last provided disclosure in response to the requirements of Item 407(c)(2)(iv) of Regulation S-K (17 CFR 229.407) (as required by Item 22(b)(15) of Schedule 14A (17 CFR 240.14a-101)), or this Item.
Item 11. Controls and Procedures.
| (a) | The registrant’s principal executive and principal financial officers, or persons performing similar functions, have concluded that the registrant’s disclosure controls and procedures (as defined in Rule 30a-3(c) under the Investment Company Act of 1940, as amended (the “1940 Act”) (17 CFR 270.30a-3(c))) are effective, as of a date within 90 days of the filing date of the report that includes the disclosure required by this paragraph, based on their evaluation of these controls and procedures required by Rule 30a-3(b) under the 1940 Act (17 CFR 270.30a-3(b)) and Rules 13a-15(b) or 15d-15(b) under the Securities Exchange Act of 1934, as amended (17 CFR 240.13a-15(b) or 240.15d-15(b)). |
| (b) | There were no changes in the registrant’s internal control over financial reporting (as defined in Rule 30a-3(d) under the 1940 Act (17 CFR 270.30a-3(d)) that occurred during the period covered by this report that has materially affected, or is reasonably likely to materially affect, the registrant’s internal control over financial reporting. |
Item 12. Disclosure of Securities Lending Activities For Closed-End Management Investment Companies.
| (a) | Not applicable. |
| (b) | Not applicable. |
Item 13. Exhibits.
| (a)(1) | Not applicable. |
| (a)(2) | Certifications pursuant to Rule 30a-2(a) under the 1940 Act and Section 302 of the Sarbanes-Oxley Act of 2002 are attached hereto. |
| (a)(3) | Not applicable. |
| (a)(4) | Not applicable. |
| (b) | Certifications pursuant to Rule 30a-2(b) under the 1940 Act and Section 906 of the Sarbanes- Oxley Act of 2002 are attached hereto. |
SIGNATURES
Pursuant to the requirements of the Securities Exchange Act of 1934 and the Investment Company Act of 1940, the registrant has duly caused this report to be signed on its behalf by the undersigned, thereunto duly authorized.
| (registrant) | First Trust Mortgage Income Fund |
| By (Signature and Title)* | /s/ James M. Dykas | |
| James M. Dykas, President and Chief Executive Officer (principal executive officer) |
| Date: | June 30, 2022 |
Pursuant to the requirements of the Securities Exchange Act of 1934 and the Investment Company Act of 1940, this report has been signed below by the following persons on behalf of the registrant and in the capacities and on the dates indicated.
| By (Signature and Title)* | /s/ James M. Dykas | |
| James M. Dykas, President and Chief Executive Officer (principal executive officer) |
| Date: | June 30, 2022 |
| By (Signature and Title)* | /s/ Donald P. Swade | |
| Donald P. Swade, Treasurer, Chief Financial Officer and Chief Accounting Officer (principal financial officer) |
| Date: | June 30, 2022 |
* Print the name and title of each signing officer under his or her signature.