UNITED STATES
SECURITIES AND EXCHANGE COMMISSION
Washington, D.C. 20549
FORM N-CSR
CERTIFIED SHAREHOLDER REPORT OF REGISTERED
MANAGEMENT INVESTMENT COMPANIES
Investment Company Act file number | 811-21724 |
|
AllianzGI International & Premium Strategy Fund |
(Exact name of registrant as specified in charter) |
|
1633 Broadway, New York, New York | | 10019 |
(Address of principal executive offices) | | (Zip code) |
|
Lawrence G. Altadonna — 1633 Broadway, New York, New York 10019 |
(Name and address of agent for service) |
|
Registrant’s telephone number, including area code: | 212-739-3371 | |
|
Date of fiscal year end: | February 28 | |
|
Date of reporting period: | August 31, 2013 | |
| | | | | | | | |
ITEM 1. REPORT TO SHAREHOLDERS
AllianzGI International & Premium Strategy Fund
Semi-Annual Report
August 31, 2013
Letter from Chairman of the Board & President
Dear Shareholder:
While global economic growth was far from robust, there were signs of improvement in a number of countries during the fiscal six-month reporting period ended August 31, 2013. Global equities generated positive results, while bond prices were pressured by rising interest rates. Six Months in Review through August 31, 2013 For the six-month fiscal reporting period ended August 31, 2013, AllianzGI International & Premium Strategy Fund (the “Fund”) returned 0.22% on net asset value (“NAV”) and 1.52% on market price. The unmanaged MSCI EAFE Index, generally representative of stocks in developed countries outside the US, rose 3.71% in US dollar terms. The Standard & Poor’s 500 Index, an unmanaged index representative of the US stock market, advanced 8.95% and the Barclays Credit Investment Grade Index declined 3.53% during the six-month reporting period. | | 
Hans W. Kertess Chairman |
While a number of structural issues and challenges remain, there are signs that the euro-zone’s economy may be turning the corner. After six consecutive quarters of negative growth, the euro zone finally emerged from recession. Gross domestic product (“GDP”), the value of goods and services produced in a country or region, the broadest measure of economic activity and the principal indicator of economic performance, grew at an annual pace of 0.3% during the second quarter of 2013. Although a number of headwinds remain, including continued high unemployment, this marked the end of the longest recession in continental Europe in more than 40 years. Supporting the region’s economy has been continued support by the European Central Bank (“ECB”). In addition to pursuing a number of programs to help support economic growth, in May 2013, the ECB reduced its benchmark rate from 0.75% to 0.50%, a record low. | | 
Brian S. Shlissel President & CEO |
There was also positive economic news from the United Kingdom during the reporting period. After contracting 0.2% during the fourth quarter of 2012, GDP growth registered 0.3% and 0.7%, respectively, during the first and second quarters of 2013. There was also encouraging news in terms of housing and retail sales. During the reporting period, the Bank of England maintained interest rates on hold at a record low 0.50% and voted to maintain its monetary stimulus program.
Elsewhere, while growth in Japan moderated somewhat, it remained better than most other developed countries. After 1.0% expansion during the first three months of 2013, GDP growth in Japan was estimated at 0.9% in the second quarter of 2013. In January 2013, the Bank of Japan announced that it would raise its target for annual inflation from 1% to 2% and the Japanese government introduced a ¥10.3 trillion (approximately $116 billion) stimulus package to support
August 31, 2013 | Semi-Annual Report 1
the economy. These initiatives have shown early positive results, as evident by the country’s economic rebound and signs that its length deflationary cycle may finally be over.
Outlook
While the ECB had its benchmark rate on hold during its last meeting, the central bank’s President Mario Draghi left open the possibility for future cuts, indicating he was “very, very cautious” about the prospects for growth and that “these shoots are still very, very green.” The ECB forecasts that GDP growth in the region will be 1.0% in 2014. We expect to see a gradual normalization of private sector private investment in the euro zone, assuming ongoing progress on financing conditions. In addition, while healing of the financial sector is far more advanced in the US, significant progress has been also made in Europe.
After a slow and deliberate transition, China is set for a better quality growth path, to which it will take time to adjust. The government has declared war on formalism, bureaucracy, hedonism and extravagance and clearly now wants to share its economic prowess across more of its population. While concerns regarding China’s economy persists, we are encouraged by recent data that suggests that the country’s economy is regaining some momentum, based upon positive data on factory output, manufacturing, industrial profits and retail sales.
With respect to the US economy, an important factor going forward will be consumer spending, as it comprises in excess of two-thirds of GDP. While the global financial crisis of 2008-2009 has had a significant impact on consumers mindset, auto and retail sales have been generally solid. In addition, it appears that as the employment situation improves, consumer confidence will likely rise with spending to follow. This could help drive the economy during the remainder of the year and into 2014.
For specific information on the Fund and its performance, please refer to the following pages. If you have any questions regarding the information provided, we encourage you to contact your financial advisor or call the Fund’s shareholder servicing agent at (800) 254-5197.
Sincerely,

| | 
|
| | |
Hans W. Kertess | | Brian S. Shlissel |
Chairman of the Board of Trustees | | President & Chief Executive Officer |
2 Semi-Annual Report | August 31, 2013
Fund Insights
AllianzGI International & Premium Strategy Fund
August 31, 2013 (unaudited)
For the period of March 1, 2013 through August 31, 2013 as provided by Steven Tael, CFA, Portfolio Manager.
For the fiscal reporting period ended August 31, 2013, the AllianzGI International & Premium Strategy Fund returned 0.22% on net asset value (“NAV”) and 1.52% on market price compared to 3.71% for the MSCI EAFE Index.
Market Environment
During the semiannual reporting period, non-US developed market equities experienced moderate levels of volatility, driven by macroeconomic factors including the potential for divergent growth among regions and expectations that the US Federal Reserve would begin tapering its quantitative easing program. Stock market performance was mixed, with the MSCI EAFE Index posting positive gains in three of the six month reporting period.
Stocks advanced broadly in March and April 2013 as investors focused on attractive growth and valuation prospects with Europe and Asia. Specifically, Japan was at the forefront of investor attention, with government policies aimed at weakening the yen, resulting in expectations of increased profit growth for export-driven corporations. Stock advancement was reversed in May and June as investors digested the potential for slowing economic growth in China, alongside the suggestion that the US Federal Reserve would put an end to its quantitative easing program in the coming quarters. Equities rallied in July thanks to improved investor sentiment, particularly within Europe, while increasing instability in the Middle East led in part to a decline in August.
During the reporting period, there were notable return differences within regions. European stocks were among the best performers, led by double-digit gains in the Netherlands and Ireland. Larger index weights, including France, Germany and the United Kingdom each posted positive single digit results. Japanese stocks rallied due to expansionary government policies and improving investor sentiment. Conversely, Australian stocks were among the largest underperformers during the six-month period, hit hard by the combination of an increase in the unemployment rate, a slowdown in consumer growth, and declining commodity prices. Other Asia-ex Japan equities also declined with New Zealand, Singapore and Hong Kong posting losses. Sector performance for the benchmark index was decidedly positive, with the Telecommunication Services and Consumer Discretionary sectors each up double-digits, followed by Utilities, Health Care and Industrials. Materials were the only sector in the Fund’s portfolio to post losses for the reporting period.
From an options perspective, levels of implied volatility, as measured by the EURO STOXX 50 Volatility Index, were muted compared to recent years. The index began the reporting period at 21.0 and trading between 15.0 and 26.0 during the reporting period. Equity volatility eased into May coinciding with a move higher in European equities. Investor sentiment shifted after the Fed introduced stimulus tapering commentary, which
August 31, 2013 | Semi-Annual Report 3
prompted an upward trend in the index. After peaking at 25.3 in late June, volatility retreated and continued to decline into August. By mid-August, the index had bottomed just above 16.0 and began to rise as investors speculated on the timing of monetary stimulus tapering. On August 31, 2013, volatility rose to 23.5.
Portfolio Specifics
In the international equity sleeve, stock selection lagged the MSCI EAFE Index in the reporting period. In particular, stock selections in Hong Kong detracted from results due to a relative overweighting coupled with selections which trailed the index. Stockpicking in Germany, Norway and Switzerland also hindered results. A relative overweight and positive stock selection within Japan enhanced results during the period. An underweight allocation to Australia also proved advantageous due to performance challenges in the country.
From a sector perspective, an overweight allocation to the Materials sector proved challenging, particularly within chemicals. Bottom-up stock selection in Financials detracted from performance, as did an underweighting to Health Care. Conversely, a sizeable overweighting to Telecommunication Services added to performance, particularly within the wireless industry, as did a relative underweighting to Consumer Staples.
Our strategic approach resulted in no international options being written during the reporting period.
4 Semi-Annual Report | August 31, 2013
Performance & Statistics
AllianzGI International & Premium Strategy Fund
August 31, 2013 (unaudited)
Total Return(1) | | Market Price | | NAV |
Six Month | | 1.52% | | 0.22% |
1 Year | | 0.18% | | 9.91% |
5 Year | | 1.64% | | -0.11% |
Commencement of Operations (4/29/05) to 8/31/13 | | 2.32% | | 3.00% |
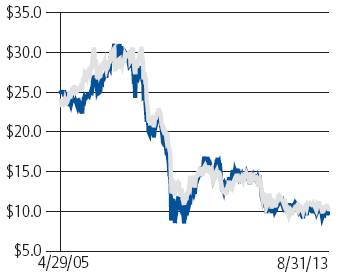
Market Price/NAV Performance | | Market Price/NAV |
Commencement of Operations (4/29/05) to 8/31/13 | | Market Price | | $9.67 |
| | NAV | | $10.21 |
 NAV NAV
| | Discount to NAV | | (5.29)% |
 Market Price Market Price
| | Market Price Yield(2) | | 8.15% |
| | | | |
| | 
|
(1) Past performance is no guarantee of future results. Total return is calculated by determining the percentage change in NAV or market price (as applicable) in the specified period. The calculation assumes that all dividends and distributions, if any, have been reinvested. Total return does not reflect broker commissions or sales charges in connection with the purchase or sale of Fund shares. Total return for a period of less than one year is not annualized. Total return for a period of more than one year represents the average annual total return.
Performance at market price will differ from results at NAV. Although market price returns typically reflect investment results over time, during shorter periods returns at market price can also be influenced by factors such as changing views about the Fund, market conditions, supply and demand for the Fund ‘s shares, or changes in the Fund’s dividends.
An investment in the Fund involves risk, including the loss of principal. Total return, market price, market price yield and NAV will fluctuate with changes in market conditions. This data is provided for information purposes only and is not intended for trading purposes. Closed-end funds, unlike open-end funds, are not continuously offered. There is a one time public offering and once issued, shares of closed-end funds are traded in the open market through a stock exchange. NAV is equal to total assets less total liabilities divided by the number of shares outstanding. Holdings are subject to change daily.
(2) Market Price Yield is determined by dividing the portion of the annualized current quarterly dividend per share that is comprised of net investment income and net short-term capital gains, if any, by the market price per share at August 31, 2013.
August 31, 2013 | Semi-Annual Report 5
Schedule of Investments
August 31, 2013 (unaudited)
AllianzGI International & Premium Strategy Fund
Shares | | | | Value | |
COMMON STOCK - 96.9% | | | |
| | | |
Australia - 3.1% | | | |
55,687 | | BHP Billiton Ltd. | | $1,761,031 | |
189,217 | | Downer EDI Ltd. | | 695,223 | |
18,601 | | Newcrest Mining Ltd. | | 218,539 | |
9,801 | | Rio Tinto Ltd. | | 504,612 | |
| | | | 3,179,405 | |
Belgium - 0.7% | | | |
27,391 | | Euronav NV (c) | | 150,959 | |
25,259 | | Tessenderlo Chemie NV | | 608,678 | |
| | | | 759,637 | |
China - 4.3% | | | |
2,361,000 | | China Citic Bank Corp. Ltd., Class H | | 1,123,331 | |
1,316,000 | | China Minsheng Banking Corp. Ltd., Class H | | 1,408,746 | |
1,556,000 | | PetroChina Co., Ltd., Class H | | 1,691,564 | |
465,000 | | Real Nutriceutical Group Ltd. | | 123,662 | |
| | | | 4,347,303 | |
Denmark - 0.6% | | | |
9,950 | | FLSmidth & Co. A/S | | 542,547 | |
4,800 | | Vestas Wind Systems A/S (c) | | 89,776 | |
| | | | 632,323 | |
Finland - 0.7% | | | |
178,126 | | Nokia Oyj (c) | | 691,095 | |
France - 6.4% | | | |
19,616 | | Alstom S.A. | | 690,776 | |
27,495 | | BNP Paribas S.A. | | 1,723,843 | |
9,219 | | Electricite de France S.A. | | 258,240 | |
118,394 | | Orange S.A. | | 1,201,832 | |
14,943 | | Peugeot S.A. (c) | | 212,265 | |
36,497 | | Total S.A. | | 2,021,054 | |
22,107 | | Vivendi S.A. | | 448,433 | |
| | | | 6,556,443 | |
Germany - 4.5% | | | |
11,500 | | Aixtron SE N.A. (c) | | 179,939 | |
21,187 | | Daimler AG | | 1,453,807 | |
15,459 | | Deutsche Boerse AG | | 1,083,786 | |
38,991 | | E.ON SE | | 617,007 | |
34,176 | | K&S AG | | 831,916 | |
16,213 | | RWE AG | | 445,289 | |
| | | | 4,611,744 | |
Greece - 0.0% | | | |
2,901 | | National Bank of Greece S.A. (c) | | 11,611 | |
Hong Kong - 2.2% | | | |
425,000 | | Cathay Pacific Airways Ltd. | | 730,057 | |
159,500 | | Kerry Properties Ltd. | | 644,690 | |
586,000 | | New World Development Co., Ltd. | | 817,585 | |
| | | | 2,192,332 | |
Ireland - 0.0% | | | |
48,618 | | Permanent TSB Group Holdings PLC (c) | | 2,442 | |
Italy - 2.4% | | | |
271,908 | | Enel SpA | | 896,542 | |
66,956 | | Eni SpA | | 1,525,108 | |
| | | | 2,421,650 | |
Japan - 32.8% | | | |
109,000 | | Ajinomoto Co., Inc. | | 1,394,013 | |
684,000 | | ANA Holdings, Inc. | | 1,388,823 | |
20,400 | | Central Japan Railway Co. | | 2,322,604 | |
88,500 | | Daiei, Inc. (c) | | 302,373 | |
72,000 | | Daihatsu Motor Co., Ltd. | | 1,343,897 | |
6
19,700 | | Daiichi Sankyo Co., Ltd. | | 337,018 | |
29,500 | | Daikin Industries Ltd. | | 1,412,406 | |
197,900 | | ITOCHU Corp. | | 2,227,805 | |
133,000 | | Kawasaki Kisen Kaisha Ltd. | | 297,638 | |
23,800 | | KDDI Corp. | | 1,131,414 | |
64,000 | | Kinden Corp. | | 627,874 | |
34,000 | | Kirin Holdings Co., Ltd. | | 464,845 | |
147,000 | | Mitsui OSK Lines Ltd. (c) | | 576,428 | |
27,300 | | Mitsumi Electric Co., Ltd. (c) | | 197,972 | |
22,000 | | Nikon Corp. | | 369,654 | |
1,300 | | Nintendo Co., Ltd. | | 146,995 | |
48,700 | | Nippon Telegraph & Telephone Corp. | | 2,470,632 | |
450,000 | | Nippon Yusen KK | | 1,272,629 | |
1,537 | | NTT DoCoMo, Inc. | | 2,457,092 | |
10,900 | | Oriental Land Co., Ltd. | | 1,755,168 | |
62,200 | | Otsuka Holdings Co., Ltd. | | 1,921,688 | |
81,900 | | Resona Holdings, Inc. | | 388,622 | |
36,200 | | Sankyo Co., Ltd. | | 1,679,761 | |
36,500 | | Shima Seiki Manufacturing Ltd. | | 699,981 | |
545,900 | | Sojitz Corp. | | 969,597 | |
87,500 | | Sumitomo Corp. | | 1,102,317 | |
16,700 | | Sumitomo Mitsui Financial Group, Inc. | | 734,062 | |
29,200 | | Tokai Rika Co., Ltd. | | 575,756 | |
48,300 | | Toyota Motor Corp. | | 2,905,312 | |
| | | | 33,474,376 | |
Norway - 2.5% | | | |
63,200 | | Yara International ASA | | 2,498,142 | |
Singapore - 0.7% | | | |
99,000 | | Singapore Airlines Ltd. | | 733,735 | |
Spain - 6.4% | | | |
5,517 | | ACS Actividades de Construccion y Servicios S.A. | | 155,179 | |
260,361 | | Banco Santander S.A. | | 1,839,772 | |
162,409 | | Iberdrola S.A. | | 860,695 | |
226,669 | | Mapfre S.A. | | 763,423 | |
216,087 | | Telefonica S.A. (c) | | 2,937,597 | |
| | | | 6,556,666 | |
Sweden - 1.7% | | | |
95,400 | | Nordea Bank AB | | 1,109,179 | |
20,850 | | Oriflame Cosmetics S.A., SDR | | 610,226 | |
| | | | 1,719,405 | |
Switzerland - 2.6% | | | |
101,818 | | ABB Ltd. (c) | | 2,177,665 | |
6,148 | | Nestle S.A. | | 402,351 | |
331 | | Zurich Insurance Group AG (c) | | 82,315 | |
| | | | 2,662,331 | |
United Kingdom - 25.3% | | | |
17,062 | | Alent PLC | | 93,877 | |
32,097 | | Anglo American PLC | | 736,330 | |
56,269 | | BAE Systems PLC | | 379,345 | |
98,123 | | Barclays PLC | | 429,838 | |
67,080 | | BHP Billiton PLC | | 1,951,048 | |
302,677 | | BP PLC | | 2,092,956 | |
12,796 | | GlaxoSmithKline PLC | | 326,343 | |
53,500 | | ICAP PLC | | 304,682 | |
26,250 | | Imperial Tobacco Group PLC | | 867,933 | |
625,260 | | Old Mutual PLC | | 1,754,773 | |
22,080 | | Rio Tinto PLC | | 996,907 | |
13,344 | | Royal Bank of Scotland Group PLC (c) | | 68,936 | |
76,148 | | Royal Dutch Shell PLC, Class A | | 2,462,777 | |
64,079 | | Royal Dutch Shell PLC, Class B | | 2,156,770 | |
265,208 | | Stagecoach Group PLC | | 1,312,638 | |
73,357 | | Standard Chartered PLC | | 1,639,290 | |
213,520 | | Standard Life PLC | | 1,097,016 | |
17,062 | | Vesuvius PLC | | 122,121 | |
1,536,950 | | Vodafone Group PLC | | 4,951,309 | |
462,495 | | WM Morrison Supermarkets PLC | | 2,080,847 | |
| | | | 25,825,736 | |
Total Common Stock (cost-$187,386,816) | | 98,876,376 | |
7
RIGHTS - 0.0% | | | |
| | | |
Hong Kong - 0.0% | | | |
7,325 | | New Hotel, expires 12/31/13 (b)(c) (cost-$0) | | —(d) | |
| | | | | |
Principal | | | | | | |
Amount | | | | | | |
(000s) | | | | | | |
Repurchase Agreements - 2.9% | | | |
$2,980 | | State Street Bank and Trust Co.,
dated 8/30/13, zero coupon, due 9/3/13, proceeds $2,980,000; collateralized by U.S. Treasury Notes, 0.25%, due 8/15/15, valued at $3,041,494 including accrued interest (cost-$2,980,000) | | 2,980,000 | |
| | | |
Total Investments (cost-$190,366,816) (a)-99.8% | | 101,856,376 | |
Other assets less liabilities-0.2% | | 163,132 | |
Net Assets-100.0% | | $102,019,508 | |
8
Notes to Schedule of Investments:
(a) Securities with an aggregate value of $98,722,975, representing 96.8% of net assets, were valued utilizing modeling tools provided by a third-party vendor. See Note 1(a) and Note 1(b) in the Notes to Financial Statements.
(b) Fair-Valued—Security with a value of $0. See Note 1(a) and Note 1(b) in the Notes to Financial Statements.
(c) Non-income producing.
(d) Security fair-valued at $0.
(e) Fair Value Measurements-See Note 1(b) in the Notes to Financial Statements.
| | | | Level 2 - | | Level 3 - | | | |
| | | | Other Significant | | Significant | | | |
| | Level 1 - | | Observable | | Unobservable | | Value at | |
| | Quoted Prices | | Inputs | | Inputs | | 8/31/13 | |
Investments in Securities - Assets | | | | | | | | | |
Common Stock: | | | | | | | | | |
Belgium | | $150,959 | | $608,678 | | $— | | $759,637 | |
Ireland | | 2,442 | | — | | — | | 2,442 | |
All Other | | — | | 98,114,297 | | — | | 98,114,297 | |
Rights | | — | | — | | —† | | —† | |
Repurchase Agreements | | — | | 2,980,000 | | — | | 2,980,000 | |
Totals | | $153,401 | | $101,702,975 | | $—† | | $101,856,376 | |
At August 31, 2013, there were no transfers between Levels 1 and 2.
The industry classification of portfolio holdings and other assets less liabilities shown as a percentage of net assets as of August 31, 2013 were as follows:
Oil, Gas & Consumable Fuels | | 11.9 | % |
Commercial Banks | | 10.3 | % |
Wireless Telecommunication Services | | 8.4 | % |
Diversified Telecommunication Services | | 6.9 | % |
Metals & Mining | | 6.0 | % |
Automobiles | | 5.7 | % |
Trading Companies & Distributors | | 4.2 | % |
Chemicals | | 4.0 | % |
Insurance | | 3.6 | % |
Road & Rail | | 3.6 | % |
Electrical Equipment | | 2.9 | % |
Airlines | | 2.8 | % |
Pharmaceuticals | | 2.5 | % |
Marine | | 2.1 | % |
Food & Staples Retailing | | 2.0 | % |
Leisure Equipment & Products | | 2.0 | % |
Electric Utilities | | 1.9 | % |
Food Products | | 1.8 | % |
Hotels, Restaurants & Leisure | | 1.7 | % |
Real Estate Management & Development | | 1.5 | % |
Building Products | | 1.4 | % |
Construction & Engineering | | 1.3 | % |
Diversified Financial Services | | 1.1 | % |
Multi-Utilities | | 1.0 | % |
Tobacco | | 0.8 | % |
Machinery | | 0.8 | % |
Personal Products | | 0.7 | % |
Commercial Services & Supplies | | 0.7 | % |
Communications Equipment | | 0.7 | % |
Auto Components | | 0.6 | % |
Beverages | | 0.5 | % |
Aerospace & Defense | | 0.4 | % |
Capital Markets | | 0.3 | % |
Multi-line Retail | | 0.3 | % |
Electronic Equipment, Instruments & Components | | 0.2 | % |
Semiconductors & Semiconductor Equipment | | 0.2 | % |
Software | | 0.1 | % |
Repurchase Agreements | | 2.9 | % |
Other assets less liabilities | | 0.2 | % |
| | 100.0 | % |
† Security fair-valued at $0.
Glossary:
SDR - Swedish Depository Receipt
See accompanying Notes to Financial Statements
9
AllianzGI International & Premium Strategy Fund
Statement of Assets and Liabilities
August 31, 2013 (unaudited)
Assets: | | | |
Investments, at value (cost-$190,366,816) | | $101,856,376 | |
Cash | | 838 | |
Foreign currency, at value (cost-$1,724) | | 1,729 | |
Dividends and interest receivable (net of foreign taxes) | | 208,879 | |
Tax reclaims receivable | | 118,346 | |
Prepaid expenses | | 8,585 | |
Total Assets | | 102,194,753 | |
| | | |
Liabilities: | | | |
Investment management fees payable | | 80,327 | |
Accrued expenses | | 94,918 | |
Total Liabilities | | 175,245 | |
Net Assets | | $102,019,508 | |
| | | |
Composition of Net Assets: | | | |
Common Shares: | | | |
Par value ($0.00001 per share, applicable to 9,991,367 shares issued and outstanding) | | $100 | |
Paid-in-capital in excess of par | | 192,204,633 | |
Dividends in excess of net investment income | | (3,991,285 | ) |
Accumulated net realized gain | | 2,319,698 | |
Net unrealized depreciation | | (88,513,638 | ) |
Net Assets | | $102,019,508 | |
Net Asset Value Per Share | | $10.21 | |
AllianzGI International & Premium Strategy Fund Semi-Annual Report | 8.31.13 | See accompanying Notes to Financial Statements
10
AllianzGI International & Premium Strategy Fund
Statement of Operations
Six Months ended August 31, 2013 (unaudited)
Investment Income: | | | |
| | | |
Dividends (net of foreign withholding taxes of $225,235) | | $2,339,969 | |
Interest | | 192 | |
Total Investment Income | | 2,340,161 | |
| | | |
Expenses: | | | |
| | | |
Investment management | | 530,472 | |
Custodian and accounting agent | | 75,912 | |
Legal | | 31,059 | |
Audit and tax services | | 15,000 | |
Shareholder communications | | 15,000 | |
Transfer agent | | 12,834 | |
New York Stock Exchange listing | | 12,665 | |
Trustees | | 2,721 | |
Insurance | | 2,450 | |
Miscellaneous | | 1,765 | |
Total Expenses | | 699,878 | |
Less: investment management fees waived | | (35,360 | ) |
Net Expenses | | 664,518 | |
Net Investment Income | | 1,675,643 | |
| | | |
Realized and Change in Unrealized Gain (Loss): | | | |
| | | |
Net realized gain (loss) on: | | | |
Investments | | 2,471,998 | |
Foreign currency transactions | | (29,043 | ) |
Net change in unrealized appreciation/depreciation of: | | | |
Investments | | (3,814,433 | ) |
Foreign currency transactions | | 1,828 | |
Net Realized and Change in Unrealized Loss | | (1,369,650 | ) |
Net Increase in Net Assets Resulting from Investment Operations | | $305,993 | |
AllianzGI International & Premium Strategy Fund Semi-Annual Report | 8.31.13 | See accompanying Notes to Financial Statements
11
AllianzGI International & Premium Strategy Fund
Statement of Changes in Net Assets
| | | | |
| | Six Months ended | | |
| | August 31, 2013 | | Year ended |
| | (unaudited) | | February 28, 2013 |
| | | | |
Investment Operations: | | | | |
| | | | |
Net investment income | | $1,675,643 | | $2,807,249 |
Net realized gain | | 2,442,955 | | 826,810 |
Net change in unrealized appreciation/depreciation | | (3,812,605) | | (194,577) |
Net increase in net assets resulting from investment operations | | 305,993 | | 3,439,482 |
| | | | |
| | | | |
Dividends to Shareholders from: | | | | |
| | | | |
Net investment income | | (5,495,252) | | (2,908,409) |
Return of capital | | – | | (10,570,947) |
Total dividends and distributions to shareholders | | (5,495,252) | | (13,479,356) |
| | | | |
Share Transactions: | | | | |
| | | | |
Reinvestment of dividends and distributions | | – | | 111,371 |
Total decrease in net assets | | (5,189,259) | | (9,928,503) |
| | | | |
Net Assets: | | | | |
| | | | |
Beginning of period | | 107,208,767 | | 117,137,270 |
End of period* | | $102,019,508 | | $107,208,767 |
*Including dividends in excess of net investment income of: | | $(3,991,285) | | $(171,676) |
| | | | |
| | | | |
Shares Issued in Reinvestment of Dividends | | – | | 11,229 |
AllianzGI International & Premium Strategy Fund Semi-Annual Report | 8.31.13 | See accompanying Notes to Financial Statements
12
AllianzGI International & Premium Strategy Fund Notes to Financial Statements
August 31, 2013 (unaudited)
1. Organization and Significant Accounting Policies
AllianzGI International & Premium Strategy Fund (the “Fund”) was organized as a Massachusetts business trust on February 24, 2005. Prior to commencing operations on April 29, 2005, the Fund had no operations other than matters relating to its organization and registration as a diversified, closed-end management investment company registered under the Investment Company Act of 1940 and the rules and regulations thereunder, as amended. Allianz Global Investors Fund Management LLC (the “Investment Manager”) and Allianz Global Investors U.S. LLC (the “Sub-Adviser”) serve as the Fund’s investment manager and sub-adviser, respectively, and are indirect, wholly-owned subsidiaries of Allianz Asset Management of America L.P. (“AAM”). AAM is an indirect, wholly-owned subsidiary of Allianz SE, a publicly traded European insurance and financial services company. The Fund has authorized an unlimited amount of common shares with $0.00001 par value.
The Fund’s investment objective is to seek total return comprised of current income, current gains and long-term capital appreciation. Under normal market conditions the Fund pursues its investment objective by investing in a diversified portfolio of equity securities of companies located outside of the United States. The Fund also employs a strategy of writing (selling) call options on stocks held in the international equity portfolio and on equity indexes in an attempt to generate gains from option premiums. The extent of the Fund’s use of the option strategy will vary depending on market conditions and other factors, and the Fund may determine from to write call options on only a portion, or none, of the stocks in its international equity portfolio. There can be no assurance that the Fund will meet its stated objective.
The preparation of the Fund’s financial statements in accordance with accounting principles generally accepted in the United States of America requires the Fund’s management to make estimates and assumptions that affect the reported amounts and disclosures in the Fund’s financial statements. Actual results could differ from those estimates.
In the normal course of business, the Fund enters into contracts that contain a variety of representations that provide general indemnifications. The Fund’s maximum exposure under these arrangements is unknown as this would involve future claims that may be made against the Fund that have not yet occurred.
The following is a summary of significant accounting policies consistently followed by the Fund:
(a) Valuation of Investments
Portfolio securities and other financial instruments for which market quotations are readily available are stated at market value. Market value is generally determined on the basis of last reported sales prices, or if no sales are reported, on the basis of quotes obtained from a quotation reporting system, established market makers, or independent pricing services. The Fund’s investments are valued daily using prices supplied by an independent pricing service or dealer quotations, or by using the last sale price on the exchange that is the primary market for such securities, or the mean between the last quoted bid and ask price. Independent pricing services use information provided by market makers or estimates of market values obtained from yield data relating to investments or securities with similar characteristics.
The Board of Trustees (the “Board”) has adopted procedures for valuing portfolio securities and other financial derivative instruments in circumstances where market quotes are not readily available, and has delegated the responsibility for applying the valuation methods to the Investment Manager and Sub-Adviser. The Fund’s Valuation Committee was established by the Board to oversee the implementation of the Fund’s valuation methods and to make fair value determinations on behalf of the Board, as instructed. The Sub-Adviser monitors the continued appropriateness of methods applied and determines if adjustments should be made in light of market changes, events affecting the issuer, or other factors. If the Sub-Adviser determines that a valuation method may no longer be appropriate, another valuation method may be selected, or the Valuation Committee will be convened to consider the matter and take any appropriate action in accordance with procedures set forth by the Board. The Board shall review the appropriateness of the valuation methods and these methods may be amended or supplemented from time to time by the Valuation Committee.
Short-term securities maturing in 60 days or less are valued at amortized cost, if their original term to maturity was 60 days or less, or by amortizing their value on the 61st day prior to maturity, if the original term to maturity exceeded 60 days.
Investments initially valued in currencies other than the U.S. dollar are converted to the U.S. dollar using exchange rates obtained from pricing services. As a result, the net asset value (“NAV”) of the Fund’s shares may be affected by changes in the value of currencies in relation to the U.S. dollar. The value of securities traded in markets outside the United States or denominated in currencies other than the U.S. dollar may be affected significantly on a day that the New York Stock Exchange (“NYSE”) is closed.
13
AllianzGI International & Premium Strategy Fund Notes to Financial Statements
August 31, 2013 (unaudited) (continued)
The prices used by the Fund to value investments may differ from the value that would be realized if the investments were sold, and these differences could be material to the Fund’s financial statements. The Fund’s NAV is normally determined as of the close of regular trading (normally, 4:00 p.m. Eastern time) on the NYSE on each day the NYSE is open for business.
The prices of certain portfolio securities or financial instruments may be determined at a time prior to the close of regular trading on the NYSE. When fair-valuing the securities, the Fund may, among other things, consider significant events (which may be considered to include changes in the value of U.S. securities or securities indices) that occur after the close of the relevant market and before the time the Fund’s NAV is calculated. With respect to certain foreign securities, the Fund may fair-value securities using modeling tools provided by third-party vendors. The Fund has retained a statistical research service to assist in determining the fair value of foreign securities. This service utilizes statistics and programs based on historical performance of markets and other economic data to assist in making fair value estimates. Fair value estimates used by the Fund for foreign securities may differ from the value realized from the sale of those securities and the difference could be material to the Fund’s financial statements. Fair value pricing may require subjective determinations about the value of a security or other assets, and fair values used to determine the Fund’s NAV may differ from quoted or published prices, or from prices that are used by others, for the same investments. In addition, the use of fair value pricing may not always result in adjustments to the prices of securities or other assets held by the Fund.
(b) Fair Value Measurements
Fair value is defined as the price that would be received to sell an asset or paid to transfer a liability (i.e. the “exit price”) in an orderly transaction between market participants. The three levels of the fair value hierarchy are described below:
· Level 1 – quoted prices in active markets for identical investments that the Fund has the ability to access
· Level 2 – valuations based on other significant observable inputs, which may include, but are not limited to, quoted prices for similar assets or liabilities, interest rates, yield curves, volatilities, prepayment speeds, loss severities, credit risks and default rates or other market corroborated inputs
· Level 3 – valuations based on significant unobservable inputs (including the Sub-Adviser’s or Valuation Committee’s own assumptions and securities whose price was determined by using a single broker’s quote)
The inputs or methodology used for valuing securities are not necessarily an indication of the risk associated with investing in those securities. The following are certain inputs and techniques that the Fund generally uses to evaluate how to classify each major category of assets and liabilities for Level 2 and Level 3, in accordance with Generally Accepted Accounting Principles (“GAAP”).
The valuation techniques used by the Fund to measure fair value during the six months ended August 31, 2013 were intended to maximize the use of observable inputs and to minimize the use of unobservable inputs.
The Fund’s policy is to recognize transfers between levels at the end of the reporting period. An investment asset’s or liability’s levels within the fair value hierarchy is based on the lowest level input, individually or in aggregate, that is significant to the fair value measurement. The objective of fair value measurement remains the same even when there is a significant decrease in the volume and level of activity for an asset or liability and regardless of the valuation techniques used. Investments categorized as Level 1 or 2 as of period end may have been transferred between Levels 1 and 2 since the prior period due to changes in the valuation method utilized in valuing the investments.
Equity Securities (Common and Preferred Stock) — Equity securities traded in inactive markets and certain foreign equity securities are valued using inputs which include broker-dealer quotes, recently executed transactions adjusted for changes in the benchmark index, or evaluated price quotes received from independent pricing services that take into account the integrity of the market sector and issuer, the individual characteristics of the security, and information received from broker-dealers and other market sources pertaining to the issuer or security. To the extent that these inputs are observable, the values of equity securities are categorized as Level 2. To the extent that these inputs are unobservable, the values are categorized as Level 3.
Option Contracts — Option contracts traded over-the-counter (“OTC”) and FLexible EXchange (“FLEX”) options are valued by independent pricing services based on pricing models that incorporate various inputs such as interest rates, credit spreads, currency exchange rates and volatility measurements for in-the-money, at-the-money, and out-of-the-money contracts based
14
AllianzGI International & Premium Strategy Fund Notes to Financial Statements
August 31, 2013 (unaudited) (continued)
on a given strike price. To the extent that these inputs are observable, the values of OTC and FLEX option contracts are categorized as Level 2. To the extent that these inputs are unobservable, the values are categorized as Level 3.
(c) Investment Transactions and Investment Income
Investment transactions are accounted for on the trade date. Realized gains and losses on investments are determined on an identified cost basis. Interest income adjusted for the accretion of discount and amortization of premiums is recorded on an accrual basis. Dividend income is recorded on the ex-dividend date, except for certain dividends from foreign securities where the ex-dividend date may have passed, and then are recorded as soon after the ex-dividend date as the Fund, using reasonable diligence, becomes aware of such dividends.
(d) Federal Income Taxes
The Fund intends to distribute all of its taxable income and to comply with the other requirements of Subchapter M of the U.S. Internal Revenue Code of 1986, as amended, applicable to regulated investment companies. Accordingly, no provision for U.S. federal income taxes is required.
Accounting for uncertainty in income taxes establishes for all entities, including pass-through entities such as the Fund, a minimum threshold for financial statement recognition of the benefit of positions taken in filing tax returns (including whether an entity is taxable in a particular jurisdiction), and requires certain expanded tax disclosures. Fund’s management has determined that its evaluation of the positions taken in the tax returns has resulted in no material impact to the Fund’s financial statements at August 31, 2013. The federal income tax returns for the prior three years remain subject to examination by the Internal Revenue Service.
(e) Dividends and Distributions
The Fund declares dividends and distributions on a quarterly basis. These dividends and distributions may be comprised in varying proportions of net investment income, gains from option premiums and the sale of portfolio securities and return of capital. The Fund records dividends and distributions on the ex-dividend date. The amount of dividends from net investment income and distributions from net realized capital gains is determined in accordance with federal income tax regulations, which may differ from GAAP. These “book-tax” differences are considered either temporary or permanent in nature. To the extent these differences are permanent in nature, such amounts are reclassified within the capital accounts based on their federal income tax treatment; temporary differences do not require reclassification. To the extent dividends and/or distributions exceed current and accumulated earnings and profits for federal income tax purposes, they are reported as dividends and/or distributions to shareholders from return of capital. At August 31, 2013, it is anticipated that the Fund will have a return of capital at fiscal year-end.
(f) Foreign Currency Translation
The Fund’s accounting records are maintained in U.S. dollars as follows: (1) the foreign currency market value of investments and other assets and liabilities denominated in foreign currencies are translated at the prevailing exchange rate at the end of the period; and (2) purchases and sales, income and expenses are translated at the prevailing exchange rate on the respective dates of such transactions. The resulting net foreign currency gain (loss) is included in the Fund’s Statement of Operations.
The Fund does not generally isolate that portion of the results of operations arising as a result of changes in foreign currency exchange rates from the fluctuations arising from changes in the market prices of securities. Accordingly, such foreign currency gain (loss) is included in net realized and unrealized gain (loss) on investments. However, the Fund does isolate the effect of fluctuations in foreign currency exchange rates when determining the gain (loss) upon the sale or maturity of foreign currency denominated debt obligations pursuant to U.S. federal income tax regulations; such amount is categorized as foreign currency gain (loss) for both financial reporting and income tax reporting purposes.
(g) Repurchase Agreements
The Fund is a party to Master Repurchase Agreements (“Master Repo Agreements”) with select counterparties. The Master Repo Agreements maintain provisions for initiation, income payments, events of default, and maintenance of collateral. At August 31, 2013, it is anticipated that the Fund will have a return of capital at fiscal year-end.
The Fund enters into transactions, under the Master Repo Agreements, with its custodian bank or securities brokerage firms whereby it purchases securities under agreements to resell such securities at an agreed upon price and date (“repurchase
15
AllianzGI International & Premium Strategy Fund Notes to Financial Statements
August 31, 2013 (unaudited) (continued)
agreements”). The Fund, through its custodian, takes possession of securities collateralizing the repurchase agreement. Such agreements are carried at the contract amount in the financial statements, which is considered to represent fair value. Collateral pledged (the securities received), which consists primarily of U.S. government obligations and asset-backed securities, is held by the custodian bank for the benefit of the Fund until maturity of the repurchase agreement. Provisions of the repurchase agreements and the procedures adopted by the Fund require that the market value of the collateral, including accrued interest thereon, be sufficient in the event of default by the counterparty. If the counterparty defaults under the Master Repo Agreements and the value of the collateral declines or if the counterparty enters an insolvency proceeding, realization of the collateral by the Fund may be delayed or limited. At August 31, 2013, the Fund had investments in repurchase agreements with a gross value of $2,980,000 on the Schedule of Investments. The value of the related collateral exceeded the value of the repurchase agreements at August 31, 2013.
(h) Custody Credits on Cash Balances
The Fund may benefit from an expense offset arrangement with its custodian bank, whereby uninvested cash balances may earn credits that reduce monthly custodian and accounting agent expenses. Had these cash balances been invested in income-producing securities, they would have generated income for the Fund. Cash overdraft charges, if any, are included in custodian and accounting agent fees.
2. Principal Risks
In the normal course of business, the Fund trades financial instruments and enters into financial transactions where risk of potential loss exists due to, among other things, changes in the market (market risk) or failure of the other party to a transaction to perform (counterparty risk). The Fund is also exposed to other risks such as, but not limited to, foreign currency and credit risks.
To the extent the Fund directly invests in foreign currencies or in securities that trade in, and receive revenues in, foreign currencies, or in derivatives that provide exposure to foreign currencies, it will be subject to the risk that those currencies will decline in value relative to the U.S. dollar, or, in the case of hedging positions, that the U.S. dollar will decline in value relative to the currency being hedged. Currency rates in foreign countries may fluctuate significantly over short periods of time for a number of reasons, including economic growth, inflation, changes in interest rates, intervention (or the failure to intervene) by U.S. or foreign governments, central banks or supranational entities such as the International Monetary Fund, or the imposition of currency controls or other political developments in the United States or abroad. As a result, the Fund’s investments in foreign currency-denominated securities may reduce the returns of the Fund.
The Fund is subject to elements of risk not typically associated with investments in the U.S., due to concentrated investments in foreign issuers located in a specific country or region. Such concentrations will subject the Fund to additional risks resulting from future political or economic conditions in such country or region and the possible imposition of adverse governmental laws or currency exchange restrictions affecting such country or region, which could cause the securities and their markets to be less liquid and prices more volatile than those of comparable U.S. companies.
The market values of securities may decline due to general market conditions (market risk) which are not specifically related to a particular company, such as real or perceived adverse economic conditions, changes in the general outlook for corporate earnings, changes in interest or currency rates or adverse investor sentiment. They may also decline due to factors that affect a particular industry or industries, such as labor shortages or increased production costs and competitive conditions within an industry. Equity securities and equity-related investments generally have greater market price volatility than fixed income securities.
The Fund is exposed to counterparty risk, or the risk that an institution or other entity with which the Fund has unsettled or open transactions will default. The potential loss to the Fund could exceed the value of the financial assets recorded in the Fund’s financial statements. Financial assets, which potentially expose the Fund to counterparty risk, consist principally of cash due from counterparties and investments. The Sub-Adviser seeks to minimize the Fund’s counterparty risk by performing reviews of each counterparty and by minimizing concentration of counterparty risk by undertaking transactions with multiple customers and counterparties on recognized and reputable exchanges. Delivery of securities sold is only made once the Fund has received payment. Payment is made on a purchase once the securities have been delivered by the counterparty. The trade will fail if either party fails to meet its obligation.
16
AllianzGI International & Premium Strategy Fund Notes to Financial Statements
August 31, 2013 (unaudited) (continued)
The Fund is party to International Swaps and Derivatives Association, Inc. Master Agreements (“ISDA Master Agreements”) with select counterparties that govern transactions, over-the-counter derivatives and foreign exchange contracts entered into by the Fund and those counterparties. The ISDA Master Agreements contain provisions for general obligations, representations, agreements, collateral and events of default or termination. Events of termination include conditions that may entitle counterparties to elect to terminate early and cause settlement of all outstanding transactions under the applicable ISDA Master Agreement. Any election to terminate early could be material to the financial statements of the Fund.
3. Financial Derivative Instruments
Disclosure about derivatives and hedging activities requires qualitative disclosure regarding objectives and strategies for using derivatives, quantitative disclosure about fair value amounts of gains and losses on derivatives, and disclosure about credit-risk-related contingent features in derivative agreements. The disclosure requirements distinguish between derivatives, which are accounted for as “hedges”, and those that do not qualify for such accounting. Although the Fund at times uses derivatives for hedging purposes, the Fund reflects derivatives at fair value and recognizes changes in fair value through the Fund’s Statement of Operations, and such derivatives do not qualify for hedge accounting treatment.
(a) Option Transactions
The Fund may write (sell) put and call options on securities and indices to earn premiums, for hedging purposes, risk management purposes or otherwise as part of its investment strategies. When an option is written, the premium received is recorded as an asset with an equal liability that is subsequently marked to market to reflect the market value of the option written. These liabilities, if any, are reflected as options written in the Fund’s Statement of Assets and Liabilities. Premiums received from writing options which expire unexercised are recorded on the expiration date as a realized gain. The difference between the premium received and the amount paid on effecting a closing purchase transaction, including brokerage commissions, is also treated as a realized gain, or if the premium is less than the amount paid for the closing purchase transaction, as a realized loss. If a call option written is exercised, the premium is added to the proceeds from the sale of the underlying security in determining whether there has been a realized gain or loss. If a put option written is exercised, the premium reduces the cost basis of the security. In writing an option, the Fund bears the market risk of an unfavorable change in the price of the security underlying the written option. Exercise of a written option could result in the Fund purchasing a security at a price different from its current market value. There were no option transactions during the period ended August 31, 2013.
4. Investment Manager/Sub-Adviser
The Fund has an Investment Management Agreement (the “Agreement”) with the Investment Manager. Subject to the supervision of the Fund’s Board, the Investment Manager is responsible for managing, either directly or through others selected by it, the Fund’s investment activities, business affairs and administrative matters. Pursuant to the Agreement, the Investment Manager receives an annual fee, payable monthly, at an annual rate of 1.00% of the Fund’s average daily total managed assets. Total managed assets refer to the total assets of the Fund (including assets attributable to any borrowings that may be outstanding) minus accrued liabilities (other than liabilities representing borrowings). The Investment Manager voluntarily agreed to waive a portion of its fee at an annual rate of 0.05% of the Fund’s average daily total managed assets for the period July 1, 2012 through June 30, 2013. The Investment Manager voluntarily agreed to waive a portion of its fee at an annual rate of 0.10% of the Fund’s average daily total managed assets for the period July 1, 2013 through June 30, 2014.
The Investment Manager has retained the Sub-Adviser to manage the Fund’s investments. Subject to the supervision of the Investment Manager, the Sub-Adviser is responsible for making all of the Fund’s investment decisions. The Investment Manager, not the Fund, pays a portion of the fees it receives as Investment Manager to the Sub-Adviser in return for its services.
Effective July 1, 2013, the Investment Manager entered into an Amended and Restated Portfolio Management Agreement with the Sub-Adviser with respect to the Fund (the “Amended Agreement”). The Amended Agreement reflects recent changes in the names of the Fund and the Sub-Adviser. The Amended Agreement is otherwise substantially identical to the previous Portfolio Management Agreement.
5. Investments in Securities
For the six months ended August 31, 2013, purchases and sales of investments, other than short-term securities were $30,468,383 and $30,459,401, respectively.
17
AllianzGI International & Premium Strategy Fund Notes to Financial Statements
August 31, 2013 (unaudited) (continued)
6. Income Tax Information
At August 31, 2013, the cost basis of portfolio securities of $190,366,816 was substantially the same for both federal income tax and book purposes. Gross unrealized appreciation was $15,351; gross unrealized depreciation was $88,525,791; net unrealized depreciation was $88,510,440.
7. Subsequent Events
In preparing these financial statements, the Fund’s management has evaluated events and transactions for potential recognition or disclosure through the date the financial statements were issued.
On September 6, 2013, a quarterly dividend of $0.275 per share was declared to shareholders, payable September 26, 2013 to shareholders of record on September 16, 2013.
At a meeting held on September 18, 2013, the Fund’s Board of Trustees approved a Plan of Liquidation and Termination for the Fund. The Fund’s Plan of Liquidation and Termination became effective on October16, 2013. Subsequent to that date, the Fund began the orderly liquidation of its assets, and has begun to determine and pay, or set aside in cash or cash equivalents, an amount at least equal to all known or reasonably ascertainable liabilities and obligations of the Fund. The Fund has fixed the close of business on October 16, 2013 as the record date for determining the common shareholders of the Fund entitled to receive liquidating distributions. As of that time, the share transfer books of the Fund closed, and the trading of the Fund’s shares on the New York Stock Exchange was suspended. The Fund made its final liquidating distribution to common shareholders and was wound up and liquidated on October 25, 2013.
There were no other subsequent events identified that require recognition or disclosure.
18
AllianzGI International & Premium Strategy Fund
Financial Highlights
For a share outstanding throughout each period:
| | Six Months
ended August
31, 2013 | | Year ended February 28, |
| | (unaudited) | | 2013 | | 2012 | | 2011 | | 2010 | | 2009 |
Net asset value, beginning of period | | $10.73 | | $11.74 | | $14.64 | | $14.26 | | $11.23 | | $21.75 |
Investment Operations: | | | | | | | | | | | | |
Net investment income | | 0.17 | | 0.28 | | 0.38 | | 0.26 | | 0.31 | | 0.48 |
Net realized and change in unrealized gain (loss) | | (0.14) | | 0.06 | | (1.68) | | 1.84 | | 4.56 | | (8.93) |
Total from investment operations | | 0.03 | | 0.34 | | (1.30) | | 2.10 | | 4.87 | | (8.45) |
Dividends and Distributions to Shareholders from: | | | | | | | | | | | | |
Net investment income | | (0.55) | | (0.29) | | (0.38) | | (0.36) | | (0.31) | | (0.46) |
Net realized gains | | — | | — | | (0.06) | | (0.11) | | (0.62) | | (1.61) |
Return of capital | | — | | (1.06) | | (1.16) | | (1.25) | | (0.91) | | — |
Total dividends and distributions to shareholders | | (0.55) | | (1.35) | | (1.60) | | (1.72) | | (1.84) | | (2.07) |
Net asset value, end of period | | $10.21 | | $10.73 | | $11.74 | | $14.64 | | $14.26 | | $11.23 |
Market price, end of period | | $9.67 | | $10.07 | | $11.14 | | $14.61 | | $14.89 | | $9.48 |
Total Investment Return(1) | | 1.52% | | 2.87% | | (12.75)% | | 10.91% | | 80.96% | | (48.14)% |
RATIOS/SUPPLEMENTAL DATA: | | | | | | | | | | | | |
Net assets, end of period (000s) | | $102,020 | | $107,209 | | $117,137 | | $145,633 | | $140,359 | | $109,823 |
Ratio of expenses to average net assets | | 1.25%(3)(4) | | 1.32%(2)(4) | | 1.32% | | 1.27%(2) | | 1.32%(2) | | 1.32%(2) |
Ratio of net investment income to average net assets | | 3.16%(3)(4) | | 2.68%(4) | | 3.07% | | 1.84% | | 2.11% | | 2.70% |
Portfolio turnover rate | | 30% | | 19% | | 17% | | 47% | | 36% | | 152% |
(1) Total investment return is calculated assuming a purchase of a share at the market price on the first day and a sale of a share at the market price on the last day of each period reported. Dividends and distributions, if any, are assumed, for purposes of this calculation, to be reinvested at prices obtained under the Fund’s dividend reinvestment plan. Total investment return does not reflect brokerage commissions or sales charges in connection with the purchase or sale of Fund shares. Total investment return for a period less than one year is not annualized.
(2) Inclusive of expenses offset by custody credits earned on cash balances at the custodian bank (See note 1(h) in Notes to Financial Statements).
(3) Annualized.
(4) During the periods indicated above, the Investment Manager waived a portion of its investment management fee. The effect of such waiver relative to the average net assets of shareholders was 0.07% (annualized) and 0.03% for the six months ended August 31, 2013 and the year ended February 28, 2013, respectively.
AllianzGI International & Premium Strategy Fund Semi-Annual Report | 8.31.13 | See accompanying Notes to Financial Statements
19
AllianzGI International & Premium Strategy Fund
Notes to Financial Statements Annual Shareholder Meeting Results/Proxy Voting Policies & Procedures (unaudited)
Annual Shareholder Meeting Results:
The Fund held its annual meeting of shareholders on July 17, 2013. Shareholders voted as indicated below:
| | Affirmative | | Withheld
Authority |
Relection of Deborah A. Decotis — Class II to serve until the Annual Meeting for 2016-2017 fiscal year | | 8,273,287 | | 607,540 |
Relection of James A. Jacobson — Class II to serve until the Annual Meeting for 2016-2017 fiscal year | | 8,282,064 | | 598,763 |
Re-election of Bradford K. Gallagher — Class II to serve until the Annual Meeting for 2016-2017 fiscal year | | 8,314,027 | | 566,800 |
The other members of the Board of Directors at the time of the meeting, namely, Hans W. Kertess, William B. Ogden, IV, John C. Maney† and Alan Rappaport, continued to serve as Trustees.
_________________________________________
† Interested Trustee
Proxy Voting Policies & Procedures:
A description of the policies and procedures that the Fund has adopted to determine how to vote proxies relating to portfolio securities and information about how the Fund voted proxies relating to portfolio securities held during the most recent twelve month period ended June 30 is available (i) without charge, upon request, by calling the Fund’s shareholder servicing agent at (800) 254-5197; (ii) on the Fund’s website at us.allianzgi.com/closedendfunds; and (iii) on the Securities and Exchange Commission website at www.sec.gov.
20
AllianzGI International & Premium Strategy Fund
Matters Relating to the Trustees’ Consideration of the Investment Management & Portfolio Management Agreements (unaudited)
The Investment Company Act of 1940, as amended, requires that both the full Board of Trustees (the “Trustees”) and a majority of the non-interested Trustees (the “Independent Trustees”), voting separately, approve the Fund’s Management Agreement with the Investment Manager (the “Advisory Agreement”) and Portfolio Management Agreement between the Investment Manager and the Sub-Adviser (the “Sub-Advisory Agreement,”, and together with the Advisory Agreement, the “Agreements”). The Trustees met telephonically on June 10, 2013 and in person on June 25, 2013 (the “contract review meetings”) for the specific purpose of considering whether to approve the continuation of the Advisory Agreement and the Sub-Advisory Agreement. The Independent Trustees were assisted in their evaluation of the Agreements by independent legal counsel, from whom they received separate legal advice and with whom they met separately from Fund management during the contract review meeting.
In connection with their deliberations regarding the continuation of the Agreements, the Trustees, including the Independent Trustees, considered such information and factors as they believed, in light of the legal advice furnished to them and their own business judgment, to be relevant. As described below, the Trustees considered the nature, quality, and extent of the various investment management, administrative and other services performed by the Investment Manager or the Sub-Adviser under the applicable Agreement.
In connection with their contract review meetings, the Trustees received and relied upon materials provided by the Investment Manager which included, among other items: (i) information provided by Lipper Inc. (“Lipper”), an independent third party, on the total return investment performance (based on net assets) of the Fund for various time periods, the investment performance of a group of funds with investment classifications/objectives comparable to those of the Fund identified by Lipper (the “Lipper performance universe”) and the performance of an applicable benchmark index, (ii) information provided by Lipper on the Fund’s management fees and other expenses and the management fees and other expenses of comparable funds identified by Lipper, (iii) information regarding the investment performance and management fees for other funds managed by the Investment Manager and the Sub-Adviser with strategies that have similarities (but are not substantially similar) to those of the Fund, (iv) the estimated profitability to the Investment Manager from its relationship with the Fund for the one year period ended December 31, 2012, (v) descriptions of various functions performed by the Investment Manager and the Sub-Adviser for the Fund, such as portfolio management, compliance monitoring and portfolio trading practices, and (vi) information regarding the overall organization of the Investment Manager and the Sub-Adviser, including information regarding senior management, portfolio managers and other personnel providing investment management, administrative and other services to the Fund.
The Trustees’ conclusions as to the continuation of the Agreements were based on a comprehensive consideration of all information provided to the Trustees and were not the result of any single factor. Some of the factors that figured particularly in the Trustees’ deliberations are described below, although individual Trustees may have evaluated the information presented differently from one another, attributing different weights to various factors. The Trustees recognized that the fee arrangements for the Fund are the result of review and discussion in prior years between the Independent Trustees and the Investment Manager, that certain aspects of such arrangements may receive greater scrutiny in some years than in others, and that the Trustees’ conclusions may be based, in part, on their consideration of these same arrangements during the course of the year and in prior years.
Fund-specific performance results for the Fund reviewed by the Trustees are discussed below. The comparative performance information was prepared and provided by Lipper and was not independently verified by the Trustees. The Trustees reviewed, among other information, comparative information showing performance of the Fund against its respective Lipper performance universe for the one-year, three-year and five-year periods ended March 31, 2013.
In addition, it was noted that the Trustees considered matters bearing on the Fund and its advisory arrangements at their meetings throughout the year, including a review of performance data at each regular meeting.
21
AllianzGI International & Premium Strategy Fund
Matters Relating to the Trustees’ Consideration of the Investment Management & Portfolio Management Agreements (unaudited)
As part of their review, the Trustees examined the Investment Manager’s and the Sub-Adviser’s abilities to provide high quality investment management and other services to the Fund. Among other information, the Trustees considered the investment philosophy and research and decision-making processes of the Sub-Adviser; the experience of key advisory personnel of the Sub-Adviser responsible for portfolio management of the Fund; the ability of the Investment Manager and the Sub-Adviser to attract and retain capable personnel; and the capability of the senior management and staff of the Investment Manager and the Sub-Adviser. In addition, the Trustees reviewed the quality of the Investment Manager’s and the Sub-Adviser’s services with respect to regulatory compliance and compliance with the investment policies of the Fund; the nature and quality of certain administrative services the Investment Manager is responsible for providing to the Fund; and conditions that might affect the Investment Manager’s or the Sub-Adviser’s ability to provide high quality services to the Fund in the future under the Agreements, including each organization’s respective financial condition and operational stability. Based on the foregoing, the Trustees concluded that the Sub-Adviser’s investment process, research capabilities and philosophy were well suited to the Fund given its investment objective and policies, and that the Investment Manager and the Sub-Adviser would be able to continue to meet any reasonably foreseeable obligations under the Agreements.
In assessing the reasonableness of the Fund’s fees under the Agreements, the Trustees considered, among other information, the Fund’s management fee and its total expense ratio as a percentage of average net assets attributable to common shares and the management fee and total expense ratios of peer expense groups of funds based on information provided by Lipper. The Fund-specific fee and expense results discussed below were prepared and provided by Lipper and were not independently verified by the Trustees.
The Trustees specifically took note of how the Fund compared to its Lipper peers as to performance and management fee and total net expenses. The Trustees noted that while the Fund is not charged a separate administration fee (recognizing that its management fee includes a component for administrative services), it was not clear in all cases whether the peer funds in the Lipper categories were separately charged such a fee by their investment managers, so that the total expense ratio (rather than any individual expense component) represented the most relevant comparison. It was noted that the total expense ratio comparisons reflect the effect of expense waivers/reimbursements.
The Trustees noted that the expense group for the Fund provided by Lipper consisted of a total of eight closed-end funds, including the Fund. The Trustees noted that only non-leveraged closed-end funds were considered for inclusion in the group. The Trustees also noted that average net assets of the common shares of the funds in the expense group ranged from $83.4 million to $1.351 billion, and that six of the funds are larger in asset size than the Fund. The Trustees also noted that the Fund was ranked seventh of eight funds in the expense group for total expense ratio based on common share assets and fourth out of eight funds in the expense group in actual management fees based on common share assets (with funds ranked first having the lowest fees/expenses and ranked eighth having the highest fees/expenses in the expense group). The Trustees also considered the Investment Manager’s agreement to voluntarily waive 0.10% of the Fund’s management fee payable for the one-year period commencing July 1, 2013, representing a 0.05% increase in the waiver observed by the Investment Manager for the year ended June 30, 2013.
With respect to Fund total return performance relative to its Lipper performance universe (based on net asset value), the Trustees noted that the Fund had fifth quintile performance for the one-year, three-year and five-year periods ended March 31, 2013.
In addition to their review of Fund performance based on net asset value, the Trustees also considered the market value performance of the Fund’s common shares and related share price premium and/or discount information based on the materials provided by Lipper and management.
22
AllianzGI International & Premium Strategy Fund
Matters Relating to the Trustees’ Consideration of the Investment Management & Portfolio Management Agreements (unaudited)
The Trustees were advised that the Investment Manager and the Sub-Adviser do not manage any funds or accounts, including institutional or separate accounts, with investment strategies and return profiles similar to those of the Fund. However, the Trustees considered the management fees charged by the Investment Manager and the Sub-Adviser to other open-end funds with strategies that have similarities (but are not substantially similar) to those of the Fund. The Trustees noted that the management fees paid by the Fund are generally higher than the fees paid by the open-end funds offered for comparison but were advised by the Sub-Adviser that there are additional portfolio management challenges in managing the Fund, such as those associated with attempting to meet a regular dividend.
Based on a profitability analysis provided by the Investment Manager, the Trustees also considered the estimated profitability to the Investment Manager from its relationship with the Fund and determined that such profitability did not appear to be excessive.
The Trustees also took into account that, as a closed-end investment companies, the Fund does not currently intend to raise additional assets, so the assets of the Fund will grow (if at all) only through the investment performance of the Fund. Therefore, the Trustees did not consider potential economies of scale as a principal factor in assessing the fee rates payable under the Agreements.
Additionally, the Trustees considered so-called “fall-out benefits” to the Investment Manager and the Sub-Adviser, such as reputational value derived from serving as Investment Manager and Sub-Adviser to the Fund.
After reviewing these and other factors described herein, the Trustees concluded with respect to the Fund, within the context of their overall conclusions regarding the Agreements and based on the information provided and related representations made by management, that they were satisfied with the Investment Manager’s and the Sub-Adviser’s responses and efforts relating to the investment performance of the Fund. The Trustees also concluded that the fees payable under each Agreement represent reasonable compensation in light of the nature, extent and quality of services provided by the Investment Manager or Sub-Adviser, as the case may be. Based on their evaluation of factors that they deemed to be material, including those factors described above, the Trustees, including the Independent Trustees, unanimously concluded that the continuation of the Agreements was in the interests of the Fund and its shareholders, and should be approved.
23
Trustees | | Investment Manager |
Hans W. Kertess | | Allianz Global Investors Fund Management LLC |
Chairman of the Board of Trustees | | 1633 Broadway |
Deborah A. DeCotis | | New York, NY 10019 |
Bradford K. Gallagher | | |
James A. Jacobson | | Sub-Adviser |
John C. Maney | | Allianz Global Investors U.S. LLC |
William B. Ogden, IV | | 1633 Broadway |
Alan Rappaport | | New York, NY 10019 |
| | |
Fund Officers | | Custodian & Accounting Agent |
Brian S. Shlissel | | State Street Bank & Trust Co. |
President & Chief Executive Officer | | 225 Franklin Street |
Lawrence G. Altadonna | | Boston, MA 02110 |
Treasurer, Principal Financial & Accounting Officer | | |
Thomas J. Fuccillo | | Transfer Agent, Dividend Paying Agent and Registrar |
Vice President, Secretary & Chief Legal Officer | | American Stock Transfer & Trust Company, LLC |
Scott Whisten | | 6201 15th Avenue |
Assistant Treasurer | | Brooklyn, NY 11219 |
Richard J. Cochran | | |
Assistant Treasurer | | Independent Registered Public Accounting Firm |
Orhan Dzemaili | | PricewaterhouseCoopers LLP |
Assistant Treasurer | | 300 Madison Avenue |
Thomas L. Harter | | New York, NY 10017 |
Chief Compliance Officer | | |
Lagan Srivastava | | Legal Counsel |
Assistant Secretary | | Ropes & Gray LLP |
| | Prudential Tower |
| | 800 Boylston Street Boston, MA 02199 |
This report, including the financial information herein, is transmitted to the shareholders of AllianzGI International & Premium Strategy Fund for their information. It is not a prospectus, circular or representation intended for use in the purchase of shares of the Fund or any securities mentioned in this report.
The financial information included herein is taken from the records of the Fund without examination by an independent registered public accounting firm, who did not express an opinion herein.
Notice is hereby given in accordance with Section 23(c) of the Investment Company Act of 1940, as amended, that from time to time the Fund may purchase their common shares in the open market.
The Fund files its complete schedule of portfolio holdings with the Securities and Exchange Commission (“SEC”) for the first and third quarters of its fiscal year on Form N-Q. The Fund’s Form N-Q is available on the SEC’s website at www.sec.gov and may be reviewed and copied at the SEC’s Public Reference Room in Washington, D.C. Information on the operation of the Public Reference Room may be obtained by calling (800) SEC-0330. The information on Form N-Q is also available on the Fund’s website at us.allianzgi.com/closedendfunds.
Information on the Fund is available at us.allianzgi.com/closedendfunds or by calling the Fund’s shareholder servicing agent at (800) 254-5197.
AZ604SA_083113
AGI-2013-09-04-7657
24
ITEM 2. CODE OF ETHICS
(a) Not required in this filing.
ITEM 3. AUDIT COMMITTEE FINANCIAL EXPERT
Not required in this filing.
ITEM 4. PRINCIPAL ACCOUNTANT FEES AND SERVICES
Not required in this filing.
ITEM 5. AUDIT COMMITTEE OF LISTED REGISTRANT
Not required in this filing
ITEM 6. SCHEDULE OF INVESTMENTS
(a) Schedule of Investments is included as part of the report to shareholders filed under Item 1 of this form.
(b) Not applicable.
ITEM 7. DISCLOSURE OF PROXY VOTING POLICIES AND PROCEDURES FOR CLOSED-END MANAGEMENT INVESTMENT COMPANIES
Not required in this filing
ITEM 8. PORTFOLIO MANAGERS OF CLOSED-END MANAGEMENT INVESTMENT COMPANIES
Not required in this filing
ITEM 9. PURCHASES OF EQUITY SECURITIES BY CLOSED-END MANAGEMENT INVESTMENT COMPANY AND AFFILIATED COMPANIES.
Not required in this filing
ITEM 10. SUBMISSION OF MATTERS TO A VOTE OF SECURITY HOLDERS
There were no material changes to the procedures by which shareholders may recommend nominees to the Fund’s Board of Trustees since the Fund’s last provided disclosure in response to this item.
ITEM 11. CONTROLS AND PROCEDURES
(a) The registrant’s President and Treasurer, Principal Financial & Accounting Officer have concluded that the registrant’s disclosure controls and procedures (as defined in Rule 30a-3(c) under the Act (17 CFR 270.30a-3(c))), are effective based on their evaluation of these controls and procedures as of a date within 90 days of the filing date of this document.
(b) There were no significant changes in the registrant’s internal control over financial reporting (as defined in Rule 30a-3(d) under the Act (17 CFR 270.30a-3(d))) that occurred during the second fiscal quarter of the period covered by this report that has materially affected, or is reasonably likely to materially affect, the registrant’s internal control over financial reporting.
ITEM 12. EXHIBITS
(a) (1) Not required in this filing.
(a) (2) Exhibit 99.302 Cert. — Certification pursuant to Section 302 of the Sarbanes-Oxley Act of 2002
(a) (3) Not applicable
(b) Exhibit 99.906 Cert. — Certification pursuant to Section 906 of the Sarbanes-Oxley Act of 2002
Signatures
Pursuant to the requirements of the Securities Exchange Act of 1934 and the Investment Company Act of 1940, the registrant has duly caused this report to be signed on its behalf by the undersigned, thereunto duly authorized.
| AllianzGI International & Premium Strategy Fund | | |
| | | |
By: | /s/ Brian S. Shlissel | | |
| Brian S. Shlissel | | |
President and Chief Executive Officer | | |
Date: | October 30, 2013 | | |
| | | |
By: | /s/ Lawrence G. Altadonna | | |
| Lawrence G. Altadonna | | |
Treasurer, Principal Financial & Accounting Officer | | |
Date: | October 30, 2013 | | |
Pursuant to the requirements of the Securities Exchange Act of 1934 and the Investment Company Act of 1940, this report has been signed below by the following persons on behalf of the registrant and in the capacities and on the dates indicated.
By: | /s/ Brian S. Shlissel | | |
| Brian S. Shlissel | | |
President and Chief Executive Officer | | |
Date: | October 30, 2013 | | |
| | | |
By: | /s/ Lawrence G. Altadonna | | |
| Lawrence G. Altadonna | | |
Treasurer, Principal Financial & Accounting Officer | | |
Date: | October 30, 2013 | | |