There were no significant transfers between Levels 1 and 2 during the six months ended August 31, 2010.
Investment transactions are accounted for on the trade date. Realized gains and losses on investments are determined on an identified cost basis. Dividend income is recorded on the ex-dividend date except for certain dividends from foreign securities where the ex-dividend date may have passed, and then are recorded as soon after the ex-dividend date of the Fund, using reasonable diligence, becomes aware of such dividends. Interest income adjusted for the accretion of discount and amortization of premiums is recorded on an accrual basis.
The Fund intends to distribute all of its taxable income and to comply with the other requirements of the U.S. Internal Revenue Code of 1986, as amended, applicable to regulated investment companies. Accordingly, no provision for U.S. federal income taxes is required.
Accounting for uncertainty in income taxes establishes for all entities, including pass-through entities such as the Fund, a minimum threshold for financial statement recognition of the benefit of positions taken in filing tax returns (including whether an entity is taxable in a particular jurisdiction), and requires certain expanded tax disclosures. The Fund’s management has determined that its evaluation has resulted in no material impact to the Fund’s financial statements at August 31, 2010. The Fund’s federal tax returns for the prior three years remain subject to examination by the Internal Revenue Service.
The Fund declares quarterly dividends and distributions from net investment income and gains from option premiums and the sale of portfolio securities. The Fund records dividends and distributions to its shareholders on the ex-dividend date. The amount of dividend and distributions from net investment income and net realized capital gains are determined in accordance with federal income tax regulations, which may differ from GAAP. These “book-tax” differences are considered either temporary or permanent in nature. To the extent these differences are permanent in nature, such amounts are reclassified within the capital accounts based on their federal income tax treatment. Temporary differences do not require reclassification. To the extent that dividends and/or distributions exceed current and accumulated earnings and profits for federal income tax purposes, they are reported as dividend and/or distributions to shareholders from return of capital. At August 31, 2010, it is anticipated that the Fund will have a return of capital at year end.
The Fund’s accounting records are maintained in U.S. dollars as follows: (1) the foreign currency market value of investments and other assets and liabilities denominated in foreign currency are translated at the prevailing exchange rate at the end of the period; and (2) purchases and sales, income and expenses are translated at the prevailing exchange
| |
AGIC International & Premium Strategy Fund | Notes to Financial Statements |
August 31, 2010 (unaudited) | |
| | |
1. Organization and Significant Accounting Policies (continued)
rate on the respective dates of such transactions. The resulting net foreign currency gain (loss) is included in the Fund’s Statement of Operations.
The Fund does not generally isolate that portion of the results of operations arising as a result of changes in the foreign currency exchange rates from the fluctuations arising from changes in the market prices of securities. Accordingly, such foreign currency gain (loss) is included in net realized and unrealized gain (loss) on investments.
Net foreign currency gain (loss) from valuing foreign currency denominated assets and liabilities at period-end exchange rates is reflected as a component of net unrealized appreciation (depreciation) of investments, options written and foreign currency transactions. Net realized foreign currency gain (loss) is treated as ordinary income (loss) for income tax reporting purposes.
(g) Repurchase Agreements
The Fund enters into transactions with its custodian bank or securities brokerage firms whereby it purchases securities under agreements to resell such securities at an agreed upon price and date (“repurchase agreements”). The Fund, through its custodian, takes possession of securities collateralizing the repurchase agreement. Such agreements are carried at the contract amount in the financial statements, which is considered to represent fair-value. Collateral pledged (the securities received), which consists primarily of U.S. government obligations and asset-backed securities, are held by the custodian bank for the benefit of the Fund until maturity of the repurchase agreement. Provisions of the repurchase agreements and the procedures adopted by the Fund require that the market value of the collateral, including accrued interest thereon, be sufficient in the event of default by the counterparty. If the counterparty defaults and the value of the collateral declines or if the counterparty enters an insolvency proceeding, realization of the collateral by the Fund may be delayed or limited.
(h) Custody Credits on Cash Balances
The Fund benefits from an expense offset arrangement with its custodian bank, whereby uninvested cash balances earn credits which reduce monthly custodian and accounting agent expenses. Had these cash balances been invested in income-producing securities, they would have generated income for the Fund.
2. Principal Risks
In the normal course of business, the Fund trades financial instruments and enters into financial transactions where risk of potential loss exists due to, among other things, changes in the market (market risk) or failure of the other party to a transaction to perform (counterparty risk). The Fund also is exposed to various risks such as, but not limited to, foreign currency and credit risks.
To the extent the Fund invests directly in foreign currencies or in securities that trade in, and receive revenues in, foreign currencies, or in derivatives that provide exposure to foreign currencies, it will be subject to the risk that those currencies will decline in value relative to the U.S. dollar, or, in the case of hedging positions, that the U.S. dollar will decline in value relative to the currency being hedged. Currency rates in foreign countries may fluctuate significantly over short periods of time for a number of reasons, including economic growth, inflation, changes in interest rates, intervention (or the failure to intervene) by U.S. or foreign governments, central banks or supranational entities such as the International Monetary Fund, or by the imposition of currency controls or other political developments in the United States or abroad. As a result, the Fund’s investments in foreign currency-denominated securities may reduce the returns of the Fund.
The Fund is subject to elements of risk not typically associated with investments in the U.S., due to concentrated investments in specific industries or investments in foreign issuers located in a specific country or region. Such concentrations will subject the Fund to additional risks resulting from future political or economic conditions in such country or region and the possible imposition of adverse governmental laws or currency exchange restrictions affecting such country or region, which could cause the securities and their markets to be less liquid and prices more volatile than those of comparable U.S. companies.
The market values of equity securities, such as common and preferred stock, or equity-related investments, such as options, may decline due to general market conditions which are not specifically related to a particular company, such as real or perceived adverse economic conditions, changes in the general outlook for corporate earnings, changes in interest or currency rates or adverse investor sentiment. They may also decline due to factors which affect a particular industry or industries, such as labor shortages or increased production costs and competitive conditions within an industry. Equity securities and equity related investments generally have greater market price volatility than fixed income securities.
The Fund is exposed to credit risk which is the risk of losing money if the issuer or guarantor of a fixed income security is unable or unwilling, or is perceived (whether by market participants, rating agencies, pricing services or otherwise) as
18 AGIC International & Premium Strategy Fund Semi-Annual Report | 8.31.10 |
| |
AGIC International & Premium Strategy Fund | Notes to Financial Statements |
August 31, 2010 (unaudited) | |
| |
2. Principal Risks (continued)
unable or unwilling, to make timely principal and/or interest payments, or to otherwise honor its obligations. Securities are subject to varying degrees of credit risk, which are often reflected in credit ratings.
The Fund is exposed to counterparty risk, or the risk that an institution or other entity with which the Fund has unsettled or open transactions will default. The potential loss to the Fund could exceed the value of the financial assets recorded in the Fund’s financial statements. Financial assets, which potentially expose the Fund to counterparty risk, consist principally of cash due from counterparties and investments. The Fund’s sub-adviser, Allianz Global Investors Capital LLC (“AGIC” or the “Sub-Adviser”), an affiliate of the Investment Manager, seeks to minimize the Fund’s counterparty risk by performing reviews of each counterparty and by minimizing concentration of counterparty risk by undertaking transactions with multiple customers and counterparties on recognized and reputable exchanges. Delivery of securities sold is only made once the Fund has received payment. Payment is made on a purchase once the securities have been delivered by the counterparty. The trade will fail if either party fails to meet its obligation.
The Fund is party to International Swaps and Derivatives Association, Inc. Master Agreements (“ISDA Master Agreements”) with select counterparties that govern transactions, over-the-counter derivative and foreign exchange contracts, entered into by the Fund and those counterparties. The ISDA Master Agreements contain provisions for general obligations, representations, agreements, collateral and events of default or termination. Events of termination include conditions that may entitle counterparties to elect to terminate early and cause settlement of all outstanding transactions under the applicable ISDA Master Agreement. Any election to terminate early could be material to the financial statements of the Fund.
3. Financial Derivative Instruments
Disclosure about derivative instruments and hedging activities requires qualitative disclosure regarding objectives and strategies for using derivatives, quantitative disclosure about fair value amounts of gains and losses on derivative instruments, and disclosure about credit-risk-related contingent features in derivative agreements. The disclosure requirements distinguish between derivatives which are accounted for as “hedges” and those that do not qualify for such accounting. Although the Fund sometimes uses derivatives for hedging purposes, the Fund reflects derivatives at fair value and recognizes changes in fair value through the Fund’s Statement of Operations, and such derivatives do not qualify for hedge accounting treatment. Derivative contract amounts and values as of August 31, 2010, which are disclosed in the accompanying Notes to Financial Statements, are indicative of the volume of the Fund’s derivatives activities during the reporting period.
|
(a) Option Transactions |
The Fund purchases and writes (sells) put and call options on securities and indices to earn premiums, for hedging purposes, risk management purposes or otherwise as part of its investment strategies. The risk associated with purchasing an option is that the Fund pays a premium whether or not the option is exercised. Additionally, the Fund bears the risk of loss of premiums and changes in market value should the counterparty not perform under the contract. Put and call options purchased are accounted for in the same manner as portfolio securities. The cost of securities acquired through the exercise of call options is increased by the premiums paid. The proceeds from securities sold through the exercise of put options are decreased by the premiums paid. |
When an option is written, the premium received is recorded as an asset with an equal liability which is subsequently marked to market to reflect the market value of the option written. These liabilities are reflected as options written in the Fund’s Statement of Assets and Liabilities. Premiums received from writing options which expire unexercised are recorded on the expiration date as a realized gain. The difference between the premium received and the amount paid on effecting a closing purchase transaction, including brokerage commissions, is also treated as a realized gain, or if the premium is less than the amount paid for the closing purchased transactions, as a realized loss. If a call option written is exercised, the premium is added to the proceeds from the sale of the underlying security in determining whether there has been a realized gain or loss. If a put option written is exercised, the premium reduces the cost basis of the security. In writing an option, the Fund bears the market risk of an unfavorable change in the price of the security underlying the written option. Exercise of a written option could result in the Fund purchasing a security at a price different from its current market value.
Fair Value of Derivative Instruments at August 31, 2010
The following is a summary of the fair valuation of the Fund’s derivative instruments categorized by risk exposure.
| 8.31.10 | AGIC International & Premium Strategy Fund Semi-Annual Report 19
| |
AGIC International & Premium Strategy Fund | Notes to Financial Statements |
August 31, 2010 (unaudited) | |
| |
3. Financial Derivative Instruments (continued)
The effect of derivative instruments on the Fund’s Statement of Assets and Liabilities at August 31, 2010:
| | | | | |
Location | | Market
Price | |
| | | | |
Liability derivatives: | | | | | |
Call options written, at value | | $ | (167,136 | ) | |
| | | | | | |
The effect of derivative instruments on the Fund’s Statement of Operations for the six months ended August 31, 2010:
| | | | | |
Location | | Market
Price | |
| | | | |
Net realized loss on: | | | | | |
Call options written | | $ | (163,576 | ) | |
| | | | | | |
Net change in unrealized appreciation/depreciation of: | | | | | |
Call options written | | | $(77,309 | ) | |
| | | | | | |
|
4. Investment Manager/Sub-Adviser |
The Fund has an Investment Management Agreement (the “Agreement”) with the Investment Manager. Subject to the supervision of the Fund’s Board of Trustees, the Investment Manager is responsible for managing, either directly or through others selected by it, the Fund’s investment activities, business affairs and administrative matters. Pursuant to the Agreement, the Investment Manager receives an annual fee, payable monthly, at the annual rate of 1.00% of the Fund’s average daily total managed assets. Total managed assets refer to the total assets of the Fund (including assets attributable to any borrowings that may be outstanding) minus accrued liabilities (other than liabilities representing borrowings). |
|
The Investment Manager has retained the Sub-Adviser to manage the Fund’s investments. Subject to the supervision of the Investment Manager, the Sub-Adviser is responsible for making all of the Fund’s investment decisions. The Investment Manager, and not the Fund, pays a portion of the fees it receives as Investment Manager to the Sub-Adviser in return for its services. |
|
Effective August 25, 2010, the Sub-Advisory Agreement between the Investment Manager and Nicholas-Applegate Capital Management LLC (“NACM”) was novated from NACM to AGIC, the indirect parent of NACM. |
|
The novation coincided with a larger corporate reorganization transferring the advisory business of NACM and Oppenheimer Capital LLC (“OCC”) to AGIC. Since 2009, AGIC has assumed a number of non-advisory functions from both NACM and OCC, and the transaction in August 2010 marked the last step in the full integration of these business under a single name and corporate entity. |
|
5. Investments in Securities |
Purchases and sales of investments, other than short-term securities for the six months ended August 31, 2010, were $16,725,472 and $26,941,471, respectively. |
|
(a) Transactions in options written for the six months ended August 31, 2010: |
| | | | | | | | | |
| | Contracts | | Premiums | |
| | | | | | |
Options outstanding, February 28, 2010 | | | 239,390 | | | $ | 333,292 | | |
Options written | | | 597,185 | | | | 1,422,470 | | |
Options terminated in closing purchase transactions | | | (87,175 | ) | | | (856,106 | ) | |
Options expired | | | (550,045 | ) | | | (551,471 | ) | |
| | | | | | | | | | |
Options outstanding, August 31, 2010 | | | 199,355 | | | $ | 348,185 | | |
| | | | | | | | | | |
|
6. Income Tax Information |
The cost basis of portfolio securities of $218,503,995 is substantially the same for both federal income tax purposes and financial reporting purposes. Aggregate gross unrealized appreciation for securities in which there is an excess of value over tax cost is $6,919; aggregate gross unrealized depreciation for securities in which there is an excess of tax cost over value is $91,594,655; and net unrealized depreciation for federal income tax purposes is $91,587,736. |
20 AGIC International & Premium Strategy Fund Semi-Annual Report | 8.31.10 |
| |
AGIC International & Premium Strategy Fund | Notes to Financial Statements/ |
August 31, 2010 (unaudited) | Changes to Investment Policy |
| |
|
7. Legal Proceedings |
In June and September 2004, the Investment Manager and certain of its affiliates (including PEA Capital LLC (“PEA”), Allianz Global Investors Distributors LLC and Allianz Global Investors of America, L.P.), agreed to settle, without admitting or denying the allegations, claims brought by the Securities and Exchange Commission (“SEC”) and the New Jersey Attorney General alleging violations of federal and state securities laws with respect to certain open-end funds for which the Investment Manager serves as investment adviser. The settlements related to an alleged “market timing” arrangement in certain open-end funds formerly sub-advised by PEA. The Investment Manager and its affiliates agreed to pay a total of $68 million to settle the claims. In addition to monetary payments, the settling parties agreed to undertake certain corporate governance, compliance and disclosure reforms related to market timing, and consented to cease and desist orders and censures. Subsequent to these events, PEA deregistered as an investment adviser and dissolved. None of the settlements alleged that any inappropriate activity took place with respect to the Fund. |
|
Since February 2004, the Investment Manager and certain of its affiliates and their employees have been named as defendants in a number of pending lawsuits concerning “market timing,” which allege the same or similar conduct underlying the regulatory settlements discussed above. The market timing lawsuits have been consolidated in a multi-district litigation proceeding in the U.S. District Court for the District of Maryland (the “MDL Court”). After a number of claims in the lawsuits were dismissed by the MDL Court, the parties entered into a stipulation of settlement, which was publicly filed with the MDL Court in April 2010, resolving all remaining claims, but the settlement remains subject to the approval of the MDL Court. |
|
The Investment Manager and the Sub Adviser believe that these matters are not likely to have a material adverse effect on the Fund or on their ability to perform their respective investment advisory activities relating to the Fund. |
|
8. Subsequent Events |
On September 10, 2010, a quarterly dividend of $0.40 per share was declared to shareholders, payable on September 29, 2010 to shareholders of record on September 20, 2010. |
|
| |
Changes to Investment Policy
On June 29, 2010 the Fund announced certain changes with respect to the Fund’s option writing strategy (the “Option Strategy”). Specifically, in implementing the Fund’s option writing strategies, the Sub-Adviser will “sell” or “write” call options on stocks held in the Fund’s international equity portfolio and on equity indexes. When the Fund writes a call option on an individual stock held in the international equity portfolio, it will generally do so with respect to approximately 70% of the value of the position, and when it writes a call option on an equity index, the face or notional amount of the index subject to the option will generally be equal to approximately 70% of the value of the corresponding securities in the international equity portfolio. Therefore, if the Fund determines to write call options on all or substantially all of the securities held in the international equity portfolio, it is expected that the Fund will have written call options positions with respect to approximately 70% of the aggregate value of the international equity portfolio. However, the extent of the Fund’s use of the Option Strategy will vary depending on market conditions and other factors, and the Fund may determine from time to time to write call options (whether they be on individual stocks and/or or on equity indexes) with respect to only a portion, or none, of the securities held in the international equity portfolio.
The Fund’s Option Strategy, to the extent utilized, is designed to generate gains from option premiums in an attempt to enhance distributions payable to the Fund’s shareholders and to reduce overall portfolio risk. However, there is no assurance that the Fund’s Option Strategy will achieve its objectives.
There are various risks associated with the Option Strategy, including that the Fund forgoes, during the life of a written call option, the opportunity to profit from increases in the market value of the underlying security or securities held by the Fund (in the case of an index option, to the extent the performance of the index is correlated with the corresponding securities held by the Fund) with respect to which the option was written above the sum of the premium and the strike price of the call. Therefore, the Option Strategy generally limits the Fund’s ability to benefit from the full upside potential of its equity holdings, while the Fund retains the risk of loss (net of premiums received) should the price of the Fund’s portfolio securities decline. The use of written call options by the Fund also potentially involves correlation, liquidity, valuation, tax and other risks.
| 8.31.10 | AGIC International & Premium Strategy Fund Semi-Annual Report 21
| |
AGIC International & Premium Strategy Fund | Financial Highlights |
For a share outstanding throughout each period: |
|
| | | | | | | | | | | | | | | | | | | | | | | | |
| | Six Months
ended
August 31, 2010
(unaudited) | | | | | | | | | | | | | | For the Period
April 29, 2005*
through
February 28, 2006 |
| | | Year ended | | |
| | | February 28,
2010 | | February 28,
2009 | | February 29,
2008 | | February 28,
2007 | |
| | | | | | |
Net asset value, beginning of period | | | $14.26 | | | | $11.23 | | | | $21.75 | | | | $28.52 | | | | $27.35 | | | | $23.88 | ** |
Investment Operations: | | | | | | | | | | | | | | | | | | | | | | | | |
Net investment income | | | 0.20 | | | | 0.31 | | | | 0.48 | | | | 0.49 | | | | 0.33 | | | | 0.16 | |
Net realized and change in unrealized | | | | | | | | | | | | | | | | | | | | | | | | |
gain (loss) on investments, call options | | | | | | | | | | | | | | | | | | | | | | | | |
written and foreign currency transactions | | | (0.69 | ) | | | 4.56 | | | | (8.93 | ) | | | (1.48 | ) | | | 4.77 | | | | 4.81 | |
Total from investment operations | | | (0.49 | ) | | | 4.87 | | | | (8.45 | ) | | | (0.99 | ) | | | 5.10 | | | | 4.97 | |
Dividends and Distributions to | | | | | | | | | | | | | | | | | | | | | | | | |
Shareholders from: | | | | | | | | | | | | | | | | | | | | | | | | |
Net investment income | | | (0.92 | ) | | | (0.31 | ) | | | (0.46 | ) | | | (0.48 | ) | | | (1.11 | ) | | | (0.12 | ) |
Net realized gains | | | — | | | | (0.62 | ) | | | (1.61 | ) | | | (5.29 | ) | | | (2.82 | ) | | | (1.33 | ) |
Return of capital | | | — | | | | (0.91 | ) | | | — | | | | (0.01 | ) | | | — | | | | — | |
Total dividends and distributions | | | | | | | | | | | | | | | | | | | | | | | | |
to shareholders | | | (0.92 | ) | | | (1.84 | ) | | | (2.07 | ) | | | (5.78 | ) | | | (3.93 | ) | | | (1.45 | ) |
Common Share Transactions: | | | | | | | | | | | | | | | | | | | | | | | | |
Offering costs charged to paid-in | | | | | | | | | | | | | | | | | | | | | | | | |
capital in excess of par | | | — | | | | — | | | | — | | | | — | | | | — | | | | (0.05 | ) |
Net asset value, end of period | | | $12.85 | | | | $14.26 | | | | $11.23 | | | | $21.75 | | | | $28.52 | | | | $27.35 | |
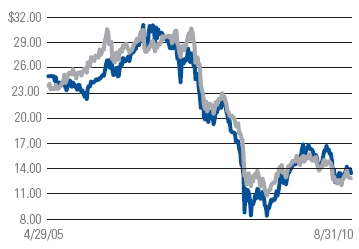
Market price, end of period | | | $13.48 | | | | $14.89 | | | | $9.48 | | | | $20.81 | | | | $30.45 | | | | $24.64 | |
Total Investment Return(1) | | | (3.30 | )% | | | 80.96 | % | | | (48.14 | )% | | | (14.25 | )% | | | 42.23 | % | | | 4.66 | % |
RATIOS/SUPPLEMENTAL DATA: | | | | | | | | | | | | | | | | | | | | | | | | |
Net assets, end of period (000s) | | | $127,310 | | | | $140,359 | | | | $109,823 | | | | $212,627 | | | | $277,930 | | | | $262,668 | |
Ratio of expenses to average | | | | | | | | | | | | | | | | | | | | | | | | |
net assets (2) | | | 1.29 | %(3) | | | 1.32 | % | | | 1.32 | % | | | 1.25 | % | | | 1.22 | % | | | 1.19 | %(3) |
Ratio of net investment income to | | | | | | | | | | | | | | | | | | | | | | | | |
average net assets | | | 2.93 | %(3) | | | 2.11 | % | | | 2.70 | % | | | 1.78 | % | | | 1.12 | % | | | 0.79 | %(3) |
Portfolio turnover | | | 13 | % | | | 36 | % | | | 152 | % | | | 179 | % | | | 203 | % | | | 192 | % |
| |
* | Commencement of operations. |
** | Initial public offering price of $25.00 per share less underwriting discount of $1.125 per share. |
(1) | Total investment return is calculated assuming a purchase of a common share at the current market price on the first day and a sale of a common share at the current market price on the last day of each period reported. Dividends and distributions are assumed, for purposes of this calculation, to be reinvested at prices obtained under the Fund’s dividend reinvestment plan. Total investment return does not reflect brokerage commissions or sales charges. Total investment return for a period of less than one year is not annualized. |
(2) | Inclusive of expenses offset by custody credits earned on cash balances at the custodian bank. (See note 1(h) in Notes to Financial Statements). |
(3) | Annualized. |
22 AGIC International & Premium Strategy Fund Semi-Annual Report | 8.31.10 | See accompanying Notes to Financial Statements
| |
AGIC International & Premium Strategy Fund | Annual Shareholder Meeting
Results/Changes to Board of
Trustees/Proxy Voting Policies
& Procedures (unaudited) |
Annual Shareholder Meeting Results:
The Fund held its annual meeting of shareholders on July 21, 2010. Shareholders voted as indicated below:
| | | | | | | |
| | Affirmative | | Withheld
Authority | |
|
Election of James A. Jacobson - Class II to serve until 2013 | | | 8,600,899 | | | 104,752 | |
Re-election of R. Peter Sullivan III* - Class II to serve until 2013 | | | 8,594,306 | | | 111,345 | |
Election of Alan Rappaport - Class III to serve until 2011 | | | 8,595,662 | | | 109,989 | |
Messrs. Paul Belica, Hans E. Kertess, John C. Maney† and William B. Ogden, IV continue to serve as Trustees of the Fund.
| | |
* | R. Peter Sullivan III retired from the Fund’s Board of Trustees effective July 31, 2010. |
† | Interested Trustee. |
|
|
Changes to Board of Trustees:
|
Robert E. Connor served as a Trustee of the Fund until his death on April 8, 2010. |
|
Effective June 22, 2010, the Fund’s Board of Trustees appointed Alan Rappaport as a Trustee. |
|
R. Peter Sullivan, III retired from the Fund’s Board of Trustees effective July 31, 2010. |
|
Effective September 21, 2010, the Fund’s Board of Trustees appointed Bradford K. Gallagher as a Class II Trustee to serve until 2011. |
|
Proxy Voting Policies & Procedures:
A description of the policies and procedures that the Fund has adopted to determine how to vote proxies relating to portfolio securities and information about how the Fund voted proxies relating to portfolio securities held during the most recent twelve month period ended June 30 is available (i) without charge, upon request, by calling the Fund’s shareholder servicing agent at (800) 254-5197; (ii) on the Fund’s website at www.allianzinvestors.com/closedendfunds; and (iii) on the Securities and Exchange Commission website at www.sec.gov
| 8.31.10 | AGIC International & Premium Strategy Fund Semi-Annual Report 23
| |
AGIC International & Premium Strategy Fund | Matters Relating to the Trustees’
Consideration of the Investment
Management & Portfolio Management
Agreements (unaudited) |
The Investment Company Act of 1940 requires that both the full Board of Trustees (the “Trustees”) and a majority of the non-interested Trustees (the “Independent Trustees”), voting separately, annually approve the continuance of the Fund’s Management Agreements with the Investment Manager (the “Advisory Agreement”) and Portfolio Management Agreement (the “Sub-Advisory Agreement”, and together with the Advisory Agreement, the “Agreements”) between the Investment in Manager and the Sub-Adviser. The Trustees met in person on June 22-23, 2010 (the “contract review meeting”) for the specific purpose of considering whether to approve the continuation of the Advisory Agreement and the Sub-Advisory Agreement. The Independent Trustees were assisted in their evaluation of the Agreements by independent legal counsel, from whom they received separate legal advice and with whom they met separately from Fund management during the contract review meeting.
Based on their evaluation of factors that they deemed to be material, including those factors described below, the Board of Trustees, including a majority of the Independent Trustees, concluded that the continuation of the Fund’s Advisory Agreement and the Sub-Advisory Agreement should be approved for a one-year period commencing July 1, 2010.
In connection with their deliberations regarding the continuation of the Agreements, the Trustees, including the Independent Trustees, considered such information and factors as they believed, in light of the legal advice furnished to them and their own business judgment, to be relevant. As described below, the Trustees considered the nature, quality, and extent of the various investment management, administrative and other services performed by the Investment Manager or the Sub-Adviser under the applicable Agreements.
In connection with the contract review meeting, the Trustees received and relied upon materials provided by the Investment Manager which included, among other items: (i) information provided by Lipper Inc. (“Lipper”) on the total return investment performance (based on net assets) of the Fund for various time periods, the investment performance of a group of funds with substantially similar investment classifications/objectives as the Fund identified by Lipper and the performance of applicable benchmark indices, (ii) information provided by Lipper on the Fund’s management fees and other expenses and the management fees and other expenses of comparable funds identified by Lipper, (iii) information regarding the investment performance and management fees of comparable portfolios of other clients of the Sub-Advisers, including institutional separate accounts and other clients, (iv) the profitability to the Investment Manager and the Sub-Adviser from their relationship with the Fund for the one year period ended March 31, 2010, (v) descriptions of various functions performed by the Investment Manager and the Sub-Adviser for the Fund, such as portfolio management, compliance monitoring and portfolio trading practices, and (vi) information regarding the overall organization of the Investment Manager and the Sub-Adviser, including information regarding senior management, portfolio managers and other personnel providing investment management, administrative and other services to the Fund.
The Trustees’ conclusions as to the continuation of the Agreements were based on a comprehensive consideration of all information provided to the Trustees and were not the result of any single factor. Some of the factors that figured particularly in the Trustees’ deliberations are described below, although individual Trustees may have evaluated the information presented differently from one another, giving different weights to various factors.
As part of their review, the Trustees examined the Investment Manager’s and the Sub-Adviser’s abilities to provide high quality investment management and other services to the Fund. The Trustees considered the investment philosophy and research and decision-making processes of the Sub-Adviser; the experience of key advisory personnel of the Sub-Adviser responsible for portfolio management of the Fund; the ability of the Investment Manager and the Sub-Adviser to attract and retain capable personnel; the capability and integrity of the senior management and staff of the Investment Manager and the Sub-Adviser; and the level of skill required to manage the Fund. In addition, the Trustees reviewed the quality of the Investment Manager’s and the Sub-Adviser’s services with respect to regulatory compliance and compliance with the investment policies of the Fund; the nature and quality of certain administrative services the Investment Manager is responsible for providing to the Fund; and conditions that might affect the Investment Manager’s or the Sub-Adviser’s ability to provide high quality services to the Fund in the future under the Agreements, including each organization’s respective business reputation, financial condition and operational stability. Based on the foregoing, the Trustees concluded that the Sub-Adviser’s investment process, research capabilities and philosophy were well suited to the Fund given its investment objective and policies, and that the Investment Manager and the Sub-Adviser would be able to continue to meet any reasonably foreseeable obligations under the Agreements.
Based on information provided by Lipper, the Trustees also reviewed the Fund’s total return investment performance as well as the performance of comparable funds identified by Lipper. In the course of their deliberations, the Trustees took
24 AGIC International & Premium Strategy Fund Semi-Annual Report | 8.31.10 |
| |
AGIC International & Premium Strategy Fund | Matters Relating to the Trustees’
Consideration of the Investment
Management & Portfolio Management
Agreements (unaudited) (continued) |
into account information provided by the Investment Manager in connection with the contract review meeting, as well as during investment review meetings conducted with portfolio management personnel during the course of the year regarding the Fund’s performance.
In assessing the reasonableness of the Fund’s fees under the Agreements, the Trustees considered, among other information, the Fund’s management fee and the total expense ratio as a percentage of average net assets attributable to common shares and the management fee and total expense ratios of comparable funds identified by Lipper.
The Trustees specifically took note of how the Fund compared to its Lipper peers as to performance, management fee expense and total expenses. The Trustees noted that the Investment Manager had provided a memorandum containing comparative information on the performance and expenses information of the Fund compared to the its Lipper peer categories. The Trustees noted that while the Fund is not charged a separate administration fee, it was not clear whether the peer funds in the Lipper categories were charged such a fee by their investment managers.
The Trustees noted that the expense group for the Fund provided by Lipper is small, consisting of a total of four non-leveraged closed-end funds, not including the Fund. The Trustees also noted that average net assets of the common shares of the funds in the peer group ranged from $71 million to $137.8 million, and that all of the funds are smaller in asset size than the Fund. The Trustees also noted that the Fund was ranked third out of four funds in the expense peer group for actual management fees and fourth out of four funds for actual total expenses (with funds ranked first having the lowest fees/expenses and ranked fourth having the highest fees/expenses in the peer group).
With respect to performance, the Trustees also noted that the Fund outperformed its benchmark and had second quintile performance for the one-year period ended March 31, 2010 against a peer group of thirty seven funds. The Trustees also noted that the Fund had fifth quintile performance for the three-year period ended March 31, 2010 against a peer group of thirty one funds.
At the request of the Trustees, the Investment Manager and Sub-Adviser agreed to provide performance information related to the Fund on a monthly basis.
After reviewing these and related factors, the Trustees concluded, within the context of their overall conclusions regarding the Agreement, that they were satisfied with the Investment Manager’s and the Sub-Adviser’s responses and efforts to continue to improve the Fund’s investment performance. The Trustees agreed to reassess the services provided by the Investment Manager and Sub-Adviser under the Agreements in light of the Fund’s ongoing performance at each quarterly Board meeting.
The Trustees also considered the management fees charged by the Sub-Adviser to other clients, including institutional separate accounts with investment strategies similar to those of the Funds. Regarding the institutional separate accounts, they noted that the management fees paid by the Fund are generally higher than the fees paid by these clients of the Sub-Adviser, but the Trustees were advised by the Sub-Adviser that the administrative burden for the Investment Manager and the Sub-Adviser with respect to the Fund is also relatively higher, due in part to the more extensive regulatory regime to which the Fund is subject in comparison to institutional separate accounts. The Trustees noted that the management fees paid by the Fund is generally higher than the fees paid by the open-end funds offered for comparison but were advised that there are additional portfolio management challenges in managing the Fund, such as meeting a regular dividend.
Based on a profitability analysis provided by the Investment Manager, the Trustees also considered the profitability of the Investment Manager and the Sub-Adviser from their relationship with the Fund and determined that such profitability was not excessive.
The Trustees also took into account that, as a closed-end investment company, the Fund does not currently intend to raise additional assets, so the assets of the Fund will grow (if at all) only through the investment performance of the Fund. Therefore, the Trustees did not consider potential economies of scale as a principal factor in assessing the fee rates payable under the Agreements.
Additionally, the Trustees considered so-called “fall-out benefits” to the Investment Manager and the Sub-Adviser, such as reputational value derived from serving as Investment Manager and Sub-Adviser to the Fund.
| 8.31.10 | AGIC International & Premium Strategy Fund Semi-Annual Report 25
| |
AGIC International & Premium Strategy Fund | Matters Relating to the Trustees’
Consideration of the Investment
Management & Portfolio Management
Agreements (unaudited) (continued) |
| |
After reviewing these and other factors described herein, the Trustees concluded with respect to the Fund, within the context of their overall conclusions regarding the Agreements that the fees payable under the Agreements represent reasonable compensation in light of the nature and quality of the services being provided by the Investment Manager and Sub-Adviser to the Fund.
26 AGIC International & Premium Strategy Fund Semi-Annual Report | 8.31.10 |
(This Page Intentionally Left Blank)
(This Page Intentionally Left Blank)
| |
Trustees | Fund Officers |
Hans W. Kertess | Brian S. Shlissel |
Chairman of the Board of Trustees | President & Chief Executive Officer |
Paul Belica | Lawrence G. Altadonna |
Bradford K. Gallagher | Treasurer, Principal Financial & Accounting Officer |
James A. Jacobson | Thomas J. Fuccillo |
John C. Maney | Vice President, Secretary & Chief Legal Officer |
William B. Ogden, IV | Scott Whisten |
Alan Rappaport | Assistant Treasurer |
| Richard J. Cochran |
| Assistant Treasurer |
| Youse E. Guia |
| Chief Compliance Officer |
| Kathleen A. Chapman |
| Assistant Secretary |
| Lagan Srivastava |
| Assistant Secretary |
|
Investment Manager |
Allianz Global Investors Fund Management LLC
1345 Avenue of the Americas
New York, NY 10105 |
|
Sub-Adviser |
Allianz Global Investors Capital LLC
600 West Broadway, 30th Floor
San Diego, CA 92101 |
|
Custodian & Accounting Agent |
State Street Bank & Trust Co.
225 Franklin Street
Boston, MA 02110 |
|
Transfer Agent, Dividend Paying Agent and Registrar |
BNY Mellon
P.O. Box 43027
Providence, RI 02940-3027 |
|
Independent Registered Public Accounting Firm |
PricewaterhouseCoopers LLP
300 Madison Avenue
New York, NY 10017 |
|
Legal Counsel |
Ropes & Gray LLP
Prudential Tower
800 Boylston Street
Boston, MA 02199 |
This report, including the financial information herein, is transmitted to the shareholders of AGIC International & Premium Strategy Fund for their information. It is not a prospectus, circular or representation intended for use in the purchase of shares of the Fund or any securities mentioned in this report.
The financial information included herein is taken from the records of the Fund without examination by an independent registered public accounting firm, who did not express an opinion herein.
Notice is hereby given in accordance with Section 23(c) of the Investment Company Act of 1940, as amended, that from time to time the Fund may purchase its common shares in the open market.
The Fund files its complete schedule of portfolio holdings with the Securities and Exchange Commission (“SEC”) for the first and third quarters of its fiscal year on Form N-Q. The Fund’s Form N-Q is available on the SEC’s website at www.sec.gov and may be reviewed and copied at the SEC’s Public Reference Room in Washington, D.C. Information on the operation of the Public Reference Room may be obtained by calling (800) SEC-0330. The information on Form N-Q is also available on the Fund’s website at www.allianzinvestors.com/closedendfunds.
Information on the Fund is available at www.allianzinvestors.com/closedendfunds or by calling the Fund’s shareholder servicing agent at (800) 254-5197.

Receive this report electronically and eliminate paper mailings. To enroll, go to www.allianzinvestors.com/edelivery.
AZ604SA_083110
Table of Contents
ITEM 2. CODE OF ETHICS
(A) N/A
(B) The CODE OF ETHICS PURUANT TO SECTION 406 OF THE SARBANES-OXLEY ACT OF 2002 FOR PRINICIPAL EXECUTIVE AND SENIOR FINANCIAL OFFICERS (THE “Code”) was updated to remove interested trustees from being subject to the Code, which is not required under Section 406 of the Sarbanes-Oxley Act of 2002. The Code also was updated to remove examples of specific conflict of interest situations and to add an annual certification requirement for Covered Officers. In addition, the approval or ratification process for material amendments to the Code was clarified to include approval by a majority of the independent trustees. The registrant undertakes to provide a copy of such code of ethics to any person upon request, without charge, by calling 1-800-254-5197. The Investment Manager’s code of ethics is included as an exhibit Exhibit 99.CODE ETH hereto.
ITEM 3. AUDIT COMMITTEE FINANCIAL EXPERT
Not required in this filing.
ITEM 4. PRINCIPAL ACCOUNTANT FEES AND SERVICES
Not required in this filing.
ITEM 5. AUDIT COMMITTEE OF LISTED REGISTRANT
Not required in this filing.
ITEM 6. SCHEDULE OF INVESTMENTS
(a) The registrant’s Schedule of Investments is included as part of the report to Shareholders filed under Item 1 of this form.
(b) Not Applicable due to no such divestments during the semi-annual period covered since the previous Form N-CSR filing.
| |
ITEM 7. | DISCLOSURE OF PROXY VOTING POLICIES AND PROCEDURES FOR CLOSED-END MANAGEMENT INVESTMENT COMPANIES. |
Not required in this filing.
| |
ITEM 8. | PORTFOLIO MANAGERS OF CLOSED-END MANAGEMENT INVESTMENT COMPANIES |
Not required in this filing.
Table of Contents
| |
ITEM 9. | PURCHASE OF EQUITY SECURITIES BY CLOSED-END MANAGEMENT INVESTMENT COMPANY AND AFFILIATED COMPANIES |
None
ITEM 10. SUBMISSION OF MATTERS TO A VOTE OF SECURITY HOLDERS
There have been no material changes to the procedures by which shareholders may recommend nominees to the Fund’s Board of Trustees since the Fund last provided disclosure in response to this item.
ITEM 11. CONTROLS AND PROCEDURES
(a) The registrant’s President and Chief Executive Officer and Treasurer, Principal Financial and Accounting Officer have concluded that the registrant’s disclosure controls and procedures (as defined in Rule 30a-2(c) under the Act (17 CFR 270.30a-3(c))), as amended are effective based on their evaluation of these controls and procedures as of a date within 90 days of the filing date of this document.
(b) There were no significant changes over financial reporting (as defined in Rule 30a-3(d) under the Act (17 CFR 270.30a-3(d))) that occurred during the second fiscal quarter of the period covered by this report that has materially affected, or is reasonably likely to materially affect, the registrants control over financial reporting.
ITEM 12. EXHIBITS
(a) (1) Exhibit 99.CODE ETH — Code of Ethics
(a) (2) Exhibit 99.302 — Cert. — Certification pursuant to section 302 of the Sarbanes-Oxley Act of 2002
(a) (3) Not Applicable
(b) Exhibit 99.906 Cert. — Certification pursuant to Section 906 of the Sarbanes-Oxley Act of 2002
Signature
Pursuant to the requirements of the Securities Exchange Act of 1934 and the Investment Company Act of 1940, the registrant has duly caused this report to be signed on its behalf by the undersigned, thereunto duly authorized.
| |
(Registrant) AGIC International & Premium Strategy Fund |
| |
By | /s/ Brian S. Shlissel |
| |
President and Chief Executive Officer |
| |
Date October 29, 2010 |
| |
| |
By | /s/ Lawrence G. Altadonna |
| |
Treasurer, Principal Financial & Accounting Officer |
| |
Date October 29, 2010 |
| |
Pursuant to the requirements of the Securities Exchange Act of 1934 and the Investment Company Act of 1940, this report has been signed below by the following persons on behalf of the registrant and in the capacities and on the dates indicated.
| |
By | /s/ Brian S. Shlissel |
| |
President and Chief Executive Officer |
| |
Date October 29, 2010 |
| |
| |
By | /s/ Lawrence G. Altadonna |
| |
Treasurer, Principal Financial & Accounting Officer |
| |
Date October 29, 2010 |
| |