Washington, D.C. 20549
Insert cover  page graphic here
Company at a Glance
| • | A pioneering closed-end investment company investing primarily in equity securities of Master Limited Partnerships (MLPs) operating energy infrastructure assets |
| • | Objectives: Yield, Growth, Quality |
About Master Limited Partnerships
MLPs are limited partnerships whose units trade on public exchanges such as the New York Stock Exchange (NYSE), the American Stock Exchange (AMEX) and the NASDAQ. Buying MLP units makes an investor a limited partner in the MLP. There are currently more than 50 MLPs in the market, mostly in industries related to energy, natural resources and real estate.
Investment Objectives: Yield, Growth and Quality
Tortoise Capital invests primarily in MLPs in the energy infrastructure sector. Our goal is to provide our stockholders with a high level of total return with an emphasis on current distributions paid to stockholders. Energy infrastructure MLPs are engaged in the transportation, storage and processing of crude oil, natural gas, and refined products from production points to the end users. Our investments are primarily in mid-stream (mostly pipeline) operations, which typically produce steady cash flows with less exposure to commodity prices than many alternative investments in the broader energy industry. With the growth potential of this sector along with our disciplined investment approach, we endeavor to generate a predictable and increasing dividend stream for our investors.
Tortoise Capital Investment Versus a Direct Investment in MLPs
Tortoise Capital provides its stockholders with an efficient alternative to investing directly in MLPs. A direct investment in an MLP offers the opportunity to receive an attractive distribution that is approximately 80 percent tax deferred, with a historically low correlation to returns on stocks and bonds. However, the tax characteristics of a direct MLP investment are generally undesirable for tax-exempt investors such as retirement plans. Tortoise Capital is structured as a C Corporation — accruing federal and state income taxes, based on taxable earnings and profits. Because of this innovative structure, pioneered by Tortoise Capital Advisors, institutions and retirement accounts are able to join individual stockholders as investors in MLPs.
Additional features of Tortoise Capital include:
| • | One Form 1099 per stockholder at the end of the year, thus avoiding multiple K-1s and multiple state filings for individual partnership investments; |
| • | A professional management team, with nearly 100 years combined investment experience, to select and manage the portfolio on your behalf; |
| • | The ability to access investment grade credit markets to enhance the dividend rate; and |
| • | Access to direct placements and other investments not available through the public markets. |
July 14, 2006
DEAR FELLOW STOCKHOLDERS,
We are pleased to submit the Tortoise Energy Capital Corp. (Tortoise Capital) report for the quarter ended May 31, 2006.
Performance Review
For the quarter ended May 31, 2006, we declared a $0.375 per share dividend. On an annualized basis, this equates to a six percent yield on our IPO price of $25.00. The proceeds from the Money Market Preferred Shares offering have been invested, and the second quarter dividend reflects full investment of the company’s assets, including leverage. Approximately 52 percent of total assets were invested through direct placements or IPOs of MLPs or their affiliates.
We expect to deliver on our commitment to steadily grow dividends, and expect that a significant portion of dividends paid in 2006 will be treated as return of capital for income tax purposes.
More than 80 percent of our MLP investments increased their distributions during this quarter. We are pleased with the investment performance of our holdings, and believe we are well positioned to benefit from demand for energy.
MLP Overview and Investment Outlook
The MLP market continues to grow and produce strong results with MLP market capitalization of approximately $76 billion at May 31, 2006. MLP companies reported strong results in the first quarter of 2006, resulting from internal growth projects, prior acquisitions, and a natural increase in demand. Based upon our current portfolio, we expect distribution growth from our portfolio holdings of approximately 4 percent for the remainder of this year. Long-term, we expect growth of at least 4 percent per annum.
Between 2006 and 2008, MLPs are expected to invest more than $13 billion on internal growth projects such as construction of new pipelines and storage tanks, as well as expanding existing facilities. The financing of these projects through debt and equity offerings could create some short-term price volatility as investors digest the increased supply of offerings. Over the long-term we expect these projects to lead to increased growth of our dividends.
Acquisition activity remains strong in 2006 with over $5 billion of mainly natural gas assets entering the MLP sector. We believe acquisitions will also drive future distribution growth since MLPs currently own 50 percent or less of the refined product, crude oil, and natural gas assets in the United States.
MLP revenue is primarily based upon volumes, which are also expected to increase. The Energy Information Administration projects an average annual growth rate of 1 percent for natural gas and petroleum over the next 25 years. We continue to monitor how rising interest rates may impact borrowing costs, and high oil and natural gas prices may impact demand.
Conclusion
In our view, a TYY investment offers investors the potential for attractive returns through a combination of a high current yield and distribution growth, generated from a portfolio of quality investments in energy infrastructure assets. When compared to similar investment alternatives like REITs and utilities, we believe a TYY investment offers superior returns with less risk.
Thank you for entrusting us with your investment. As always, we will strive to deliver a rewarding return.
Sincerely,
The Managing Directors
Tortoise Capital Advisors, L.L.C.
| /s/H. Kevin Birzer | | /s/Zachary A. Hamel | | /s/Kenneth P. Malvey |
| H. Kevin Birzer | | Zachary A. Hamel | | Kenneth P. Malvey |
| | | | | |
| | | | | |
| /s/Terry Matlack | | /s/David J. Schulte | | |
| Terry Matlack | | David J. Schulte | | |
| | | | | |
…Steady WinsTM
2 Tortoise Energy Capital Corp.
SUMMARY FINANCIAL INFORMATION
| | | Six Months Ended | |
| | | May 31, 2006 | |
| | | | |
| Market value per share | $ | 22.40 | |
| Net asset value per share | | 24.38 | |
| Total net assets | | 389,304,556 | |
| Unrealized appreciation of investments (excluding | | | |
interest rate swap contracts) before deferred taxes | | 48,513,750 | |
| Unrealized appreciation of investments and | | | |
interest rate swap contracts after deferred taxes | | 34,470,147 | |
| Net investment loss | | (3,049,921 | ) |
| Total realized gain after deferred taxes | | 650,003 | |
| Total return (based on market value) | | 4.55 | % |
| Net operating expenses before leverage costs and | | | |
taxes as a percent of average total assets(1) | | 1.09 | % |
Distributable cash flow as a percent of average net assets(2) | | 6.35 | % |
| | | | |
(1) Annualized. Represents expenses after fee reimbursement, excluding leverage costs and taxes.
(2) Annualized. See Key Financial Data which illustrates the calculation of distributable cash flow.
KEY FINANCIAL DATA (Unaudited)
(dollar amounts in thousands unless otherwise indicated)
| | | 2005 | | 2005 | | 2006 | |
| | | May 31, 2005(1) | | Q3(2) | | Q4(2) | | Q1(2) | | Q2(2) | |
| | | | | | | | | | | | |
Total Distributions Received from Investments | | | | | | | | | | | |
Distributions received from master limited partnerships | | $ | — | | $ | 1,928 | | $ | 5,058 | | $ | 7,537 | | $ | 8,436 | |
Dividends paid in stock | | | — | | | 1,464 | | | 1,549 | | | 1,580 | | | 1,454 | |
Short-term interest and dividend income | | | — | | | 1,578 | | | 494 | | | 311 | | | 182 | |
| | | | | | | | | | | | | | | | | |
Total from investments | | | — | | | 4,970 | | | 7,101 | | | 9,428 | | | 10,072 | |
Operating Expenses Before Leverage Costs and Current Taxes | | | | | | | | | | | | | | | | |
Advisory fees | | | — | | | 848 | | | 939 | | | 1,193 | | | 1,318 | |
Other operating expenses | | | — | | | 254 | | | 211 | | | 287 | | | 281 | |
| — | | | | | | 1,102 | | | 1,150 | | | 1,480 | | | 1,599 | |
| | | | | | | | | | | | | | | | | |
Distributable cash flow before leverage costs and current taxes | | | — | | | 3,868 | | | 5,951 | | | 7,948 | | | 8,473 | |
Leverage Costs(3) | | | — | | | — | | | 372 | | | 1,935 | | | 2,530 | |
Current income tax expense | | | — | | | — | | | — | | | 17 | | | 4 | |
Distributable Cash Flow | | $ | — | | $ | 3,868 | | $ | 5,579 | | $ | 5,996 | | $ | 5,939 | |
| | | | | | | | | | | | | | | | | |
| Dividends paid on common stock | | $ | — | | $ | 3,739 | | $ | 5,423 | | $ | 5,742 | | $ | 5,989 | |
| Dividends paid on common stock per share | | | — | | | 0.235 | | | 0.34 | | | 0.36 | | | 0.375 | |
Payout percentage for period (4) | | | — | | | 96.7 | % | | 97.2 | % | | 95.8 | % | | 100.8 | % |
| Total assets, end of period | | | 334,464 | | | 392,059 | | | 494,402 | | | 580,569 | | | 607,064 | |
Average total assets during period (5) | | | — | | | 372,229 | | | 425,085 | | | 545,374 | | | 591,705 | |
| Leverage (Tortoise Notes and Preferred Stock) | | | — | | | — | | | 120,000 | | | 190,000 | | | 190,000 | |
| Leverage as a percent of total assets | | | — | | | — | | | 24.3 | % | | 32.7 | % | | 31.3 | % |
| Unrealized appreciation (depreciation) net of deferred taxes, end of period | | | — | | | 6,105 | | | (813 | ) | | 8,716 | | | 33,657 | |
| Net assets, end of period | | | 333,648 | | | 381,490 | | | 370,455 | | | 372,568 | | | 389,305 | |
Average net assets during period (6) | | | — | | | 371,678 | | | 381,915 | | | 373,251 | | | 380,117 | |
| Net asset value per common share | | | 23.79 | | | 23.98 | | | 23.23 | | | 23.36 | | | 24.38 | |
| Market value per share | | | 24.69 | | | 25.12 | | | 22.09 | | | 22.90 | | | 22.40 | |
| Shares outstanding | | | 14,023 | | | 15,910 | | | 15,951 | | | 15,951 | | | 15,971 | |
| | | | | | | | | | | | | | | | | |
Selected Operating Ratios (7) | | | | | | | | | | | | | | | | |
As a Percent of Average Total Assets | | | | | | | | | | | | | | | | |
Total distributions received from investments | | | — | | | 5.30 | % | | 6.70 | % | | 7.01 | % | | 6.75 | % |
Net operating expenses before leverage costs and current taxes | | | — | | | 1.17 | % | | 1.09 | % | | 1.10 | % | | 1.07 | % |
Distributable cash flow before leverage costs and current taxes | | | — | | | 4.12 | % | | 5.61 | % | | 5.91 | % | | 5.68 | % |
| | | | | | | | | | | | | | | | | |
As a Percent of Average Net Assets | | | | | | | | | | | | | | | | |
Distributable cash flow | | | — | | | 4.13 | % | | 5.86 | % | | 6.51 | % | | 6.20 | % |
| | | | | | | | | | | | | | | | | |
(1) | Commencement of Operations. |
(2) | Q1 is the period from December through February. Q2 is the period from March through May. Q3 is the period from June through August. Q4 is the period from September through November. |
(3) | Leverage costs include interest expense, auction agent fees, interest rate swap expenses and preferred dividends. |
(4) | Dividends paid as a percentage of Distributable Cash Flow. |
(5) | Computed by averaging month-end values within each period. |
(6) | Computed by averaging daily values within each period. |
4 - 5 Tortoise Energy Capital Corp.
MANAGEMENT’S DISCUSSION
The information contained in this section should be read in conjunction with our Financial Statements and the Notes thereto. In addition, this report contains certain forward-looking statements. These statements include the plans and objectives of management for future operations and financial objectives and can be identified by the use of forward-looking terminology such as “may,” “will,” “expect,” “intend,” “anticipate,” “estimate,” or “continue” or the negative thereof or other variations thereon or comparable terminology. These forward-looking statements are subject to the inherent uncertainties in predicting future results and conditions. Certain factors that could cause actual results and conditions to differ materially from those projected in these forward-looking statements are set forth in the “Risk Factors” section of our public filings with the SEC.
Overview
Tortoise Capital’s goal is to provide a growing dividend stream to our investors, and when combined with MLP growth prospects, the investment offers the opportunity for an attractive total return. We seek to provide our stockholders with an efficient vehicle to invest in the energy infrastructure sector. While we are a registered investment company under the Investment Company Act of 1940, we are not a “regulated investment company” for federal tax purposes. Our dividends do not generate unrelated business taxable income (UBTI) and our stock may therefore be suitable for holding by pension funds, IRAs and mutual funds as well as taxable accounts.
We invest primarily in MLPs through private and public market purchases. MLPs are publicly traded partnerships whose equity interests are traded in the form of units on public exchanges, such as the NYSE. Our private finance activity principally involves providing financing directly to an MLP through private placement equity investments. Our private financing is generally used to fund growth, acquisitions, recapitalizations, debt repayments and bridge financings. We generally invest in companies that are publicly reporting, but for which a private financing offers advantages.
Critical Accounting Policies
The financial statements are based on the selection and application of critical accounting policies, which require management to make significant estimates and assumptions. Critical accounting policies are those that are both important to the presentation of our financial condition and results of operations and require management’s most difficult, complex, or subjective judgments. Our critical accounting policies are those applicable to the valuation of investments and certain revenue recognition matters as discussed below.
Note 2 in the Notes to Financial Statements included in this report discloses the significant accounting policies of Tortoise Capital.
Determining Dividends Distributed to Stockholders
Our portfolio generates cash flow from which we pay dividends to stockholders. We pay dividends out of our distributable cash flow (“DCF”), which is simply our distributions received from our investments less our total expenses. The total distributions received from our investments includes the amount received by us as cash distributions from MLPs, paid-in-kind distributions, and interest payments.
6 Tortoise Energy Capital Corp
MANAGEMENT’S DISCUSSION
(Continued)
The total expenses include current or anticipated operating expenses, total leverage costs and current income taxes on our operating income. Each are summarized for you in the table on pages 4 and 5 and are discussed in more detail below. We intend to reinvest the after-tax proceeds of sales of investments in order to maintain and grow our dividend rate.
Our Board of Directors reviews the dividend rate quarterly, and may adjust the quarterly dividend throughout the year. Our goal is to declare what we believe to be sustainable regular quarterly dividends. We have targeted to pay at least 95 percent of DCF on an annualized basis.
Distributions Received from Investments
Our ability to generate cash is dependent on the ability of our portfolio of investments to generate cash flow from their operations. In order to maintain and grow our dividend to our stockholders, we evaluate each holding based upon its contribution to our investment income, our expectation for its growth rate, and its risk relative to other potential investments.
We concentrate on MLPs with an increasing demand for services from economic and population growth. We utilize our disciplined investment process to select well-managed businesses with real, hard assets and stable recurring revenue streams.
Our focus remains primarily on investing in fee-based service providers that operate long-haul, interstate pipelines. We further diversify among issuers, geographies and energy commodities to achieve a dividend yield equivalent to a direct investment in energy infrastructure MLPs. In addition, most energy infrastructure companies are regulated and utilize an inflation escalator index that factors in inflation as a cost pass-through. So, over the long-term, we believe MLPs will outpace interest rate increases and produce positive returns.
Total distributions received from our investments relating to DCF for the quarter ended May 31, 2006 was approximately $10.1, million representing a 7 percent increase as compared to 1st quarter 2006. This change reflects a full quarter of earnings on the Money Market Preferred Shares (“MMP Shares”) issued in the 1st quarter and continuing distribution increases from a majority of our MLP investments. Total distributons received from investments represented 6.75 percent of average total assets for the 2nd quarter 2006, as compared to 7.01 percent for 1st quarter 2006. This change reflects the impact of earnings from the leverage issuance and rising distributions in the numerator of this calculation, as well as a substantial increase in our average total assets from leverage issuance and increasing market value of our investments in the denominator.
Expenses
We incur two types of expenses: (1) operating expenses, consisting primarily of the advisory fee; and (2) leverage costs. On a percentage basis, net operating expenses before leverage costs were an annualized 1.07 percent of average total assets for 2nd quarter 2006, a slight decrease from 1.10 percent for 1st quarter 2006. The net operating expenses before leverage costs for 2nd quarter 2006 increased $119,000 as compared to 1st quarter 2006, primarily as a result of increased average total assets of $46.3 million as compared to the prior quarter, which resulted in an increase in the asset based advisory fees.
MANAGEMENT’S DISCUSSION
(Continued)
Leverage costs consist of four major components: (1) the direct interest expense, which will vary from period to period, as all of our Tortoise Notes have variable rates of interest; (2) the auction agent fees, which are the marketing costs for the variable rate leverage; (3) the realized gain or loss on our swap arrangements; and (4) our preferred dividends, which also carry a variable rate dividend. We have now locked-in our cost of capital through interest rate swap agreements, converting our variable rate obligations to fixed rate obligations for the term of the swap agreements. With very little short-term interest rate risk in Tortoise Capital, we now have an all-in weighted average cost of debt of 5.33 percent. Details of the swaps are disclosed in Note 10 of our Notes to Financial Statements.
As indicated in Note 10, Tortoise Capital has agreed to pay U.S. Bank a fixed rate while receiving a floating rate based upon the 1 month U.S. Dollar London Interbank Offered Rate (“LIBOR”). LIBOR is the primary global benchmark or reference rate for short-term interest rates, and is intended to approximate our variable rate payment obligation. The spread between the fixed rate and floating LIBOR rate is reflected in our statement of operations as a realized gain when the LIBOR rate exceeds the fixed rate (U.S. Bank pays Tortoise Capital the net difference) or loss when the fixed rate exceeds LIBOR rate (Tortoise Capital pays U.S. Bank the net difference).
Under the terms of the Tortoise Notes and MMP Shares, the rate on our leverage is determined by auction every 28 days. The spread between the winning auction rate and LIBOR is a variable component of total leverage costs. When the spread is negative (auction rate is less than LIBOR) total leverage costs are less than our fixed rate, with the opposite true if the spread is positive. Our spread to LIBOR has usually been between a negative 4 basis points (-0.04 percent) and positive 6 basis points (0.06 percent).
Leverage costs were $2.5 million in 2nd quarter 2006, as compared to $1.9 million in 1st quarter 2006, due to the increased amount of leverage outstanding during the 2nd quarter and full implementation of the swap agreements.
Distributable Cash Flow
Our 2nd quarter 2006, DCF was $5.9 million, a decrease of $57,000 or 1 percent as compared to 1st quarter 2006. The decrease is attributable to the timing of the $70 million leverage issuance during the 1st quarter. Tortoise Capital was able to invest the leverage and capture a full quarter distribution from MLPs while only paying dividends on the full amount of leverage for approximately 30 days. The 2nd quarter reflects full investment of the company’s assets, including leverage. From this, we paid a dividend of $6 million, or 100.8 percent of DCF. On a per share basis, we declared a $0.375 dividend on May 12, 2006, an increase of 4.2 percent from 1st quarter 2006. The annualized run-rate of $1.50 per share equates to a 6 percent yield on our IPO price of $25. With the growth in distributions from the master limited partnerships in which we invest, we expect the dividend to grow at least 4 percent annually.
8 Tortoise Energy Capital Corp.
MANAGEMENT’S DISCUSSION
(Continued)
Taxation of our Distributions
We invest in partnerships which generally have larger distributions of cash than the accounting income which they generate. Accordingly, the distributions include a return of capital component for accounting and tax purposes on our books. Dividends declared and paid by Tortoise Capital in a year generally differ from taxable income for that year, as such dividends may include the distribution of current year taxable income or return of capital.
The taxability of the dividend you receive depends on whether Tortoise Capital has annual earnings and profits. If so, those earnings and profits are first allocated to the preferred shares, and then to the common shares. Because most of the distributions we have received from MLP’s are not income for tax purposes, we currently have very little income to offset against our expenses.
In the future, however, Tortoise Capital could have earnings and profits. That would make our dividend like any other corporate dividend and taxable at the 15 percent qualified dividend rate. Our dividend would include a taxable component for either of two reasons: first, the tax characterization of the distributions we receive from MLPs could change and become less return of capital and more in the form of income. Second, and most likely, we could sell an MLP investment in which Tortoise Capital has a gain. The unrealized gain we have in the portfolio is reflected in the statement of assets and liabilities. Tortoise Capital’s investments at value at May 31, 2006, was $592.6 million, with a cost of $544.0 million. The $48.6 million difference is gain that would be recognized if those investments were sold at those values. A sale would most likely give rise to earnings and profits in that period and make the distributions taxable qualified dividends. Note, however, that the statement of assets and liabilities reflects as a deferred tax liability the possible future tax liability we would pay if all investments were liquidated at their indicated value. It is for these two reasons that we inform you of the tax treatment after the close of each year because both of these items are unpredictable until the year is over. We currently expect that our estimated annual taxable income for 2006 will be less than 20 percent of our estimated dividend distributions to shareholders in 2006, although the ultimate determination will not be made until January 2007.
Liquidity and Capital Resources
Tortoise Capital had total assets of $607 million at quarter end. Our total assets reflect the value of our investments, which are itemized in the schedule of investments. It also reflects cash, interest and other receivables and any expenses that may have been prepaid from time to time. During 2nd quarter 2006, total assets grew from $581 million to $607 million, an increase of $26 million or 4.5 percent. This growth was primarily a result of an increase in unrealized appreciation of investments during the quarter.
Total leverage outstanding as of May 31, 2006 is $190 million, representing 31.3 percent of total assets, which is close to our target for leverage of approximately 33 percent of total assets.
While we currently have no plans to do so, we may in the future raise new debt and equity capital from time to time in order to fund investments we believe are beneficial to our shareholders.
SCHEDULE OF INVESTMENTS (Unaudited)
| | | May 31, 2006 | |
| | | Shares | | Value | |
| | | | | | |
Master Limited Partnerships and | | | | | |
Related Companies — 150.2%(1) | | | | | |
| | | | | | |
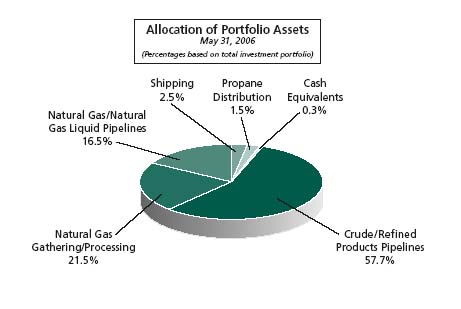
Crude/Refined Products Pipelines — 87.8%(1) | | | | | |
| Buckeye Partners, L.P. | | | 207,191 | | $ | 9,004,521 | |
| Enbridge Energy Partners, L.P. | | | 860,700 | | | 37,457,664 | |
| Holly Energy Partners, L.P. | | | 49,215 | | | 1,974,506 | |
Kinder Morgan Management, LLC(3) | | | 1,827,862 | | | 79,457,161 | |
| Magellan Midstream Partners, L.P. | | | 952,429 | | | 32,992,140 | |
| Pacific Energy Partners, L.P. | | | 1,612,700 | | | 50,477,510 | |
| Plains All American Pipeline, L.P. | | | 560,600 | | | 27,189,100 | |
Plains All American Pipeline, L.P.(2) | | | 65,971 | | | 3,071,610 | |
| Sunoco Logistics Partners, L.P. | | | 848,860 | | | 36,458,537 | |
| TEPPCO Partners, L.P. | | | 755,898 | | | 28,452,001 | |
| Valero, L.P. | | | 682,209 | | | 35,120,119 | |
| | | | | | | 341,654,869 | |
| | | | | | | | |
Natural Gas/Natural Gas Liquid Pipelines — 25.2%(1) | | | | | | | |
| DCP Midstream Partners, L.P. | | | 323,250 | | | 9,186,765 | |
| Enterprise Products Partners, L.P. | | | 2,956,496 | | | 74,503,699 | |
| ONEOK Partners, L.P. | | | 289,050 | | | 14,365,785 | |
| | | | | | | 98,056,249 | |
| | | | | | | | |
Natural Gas Gathering/Processing — 32.8%(1) | | | | | | | |
| Boardwalk Pipeline Partners, L.P. | | | 754,760 | | | 17,487,789 | |
| Copano Energy, LLC | | | 531,701 | | | 24,809,168 | |
| Crosstex Energy, L.P. | | | 1,269,913 | | | 43,634,211 | |
| Energy Transfer Partners, L.P. | | | 662,720 | | | 29,981,453 | |
| Hiland Partners, L.P. | | | 2,200 | | | 93,038 | |
| Regency Energy Partners, L.P. | | | 471,720 | | | 10,519,356 | |
| Williams Partners, L.P. | | | 32,335 | | | 1,116,204 | |
| | | | | | | 127,641,219 | |
| | | | | | | | |
10 Tortoise Energy Capital Corp.
SCHEDULE OF INVESTMENTS (Unaudited)
(Continued)
| | | May 31, 2006 | |
| | | Shares | | Value | |
| | | | | | |
Shipping — 2.2%(1) | | | | | |
| K-Sea Transportation Partners, L.P. | | | 280,910 | | $ | 8,736,301 | |
Propane Distribution — 2.2%(1) | | | | | | | |
| Inergy, L.P. | | | 330,229 | | | 8,734,557 | |
| Total Master Limited Partnerships and | | | | | | | |
Related Companies (Cost $536,208,268) | | | | | | 584,823,195 | |
| | | | | | | | |
Promissory Note — 1.6%(1) | | | Principal | | | | |
| | | | Amount | | | | |
Shipping — 1.6%(1) | | | | | | | |
| E.W. Transportation, LLC — Unregistered, 8.80%, Due 3/31/2009 | | | | | | | |
(Cost $6,189,833)(2) (4) | | $ | 6,227,571 | | | 6,189,833 | |
| | | | | | | | |
Short-Term Investments — 0.4%(1) | | | | | | | |
| | | | Shares | | | | |
Investment Companies — 0.4%(1) | | | | | | | |
| First American Prime Obligations Money Market Fund — | | | | | | | |
Class Y, 4.69%(5) | | | 795,161 | | | 795,161 | |
| First American Treasury Obligations Money Market Fund — | | | | | | | |
Class Y, 4.61%(5) | | | 795,160 | | | 795,160 | |
| Total Short-Term Investments (Cost $1,590,321) | | | | | | 1,590,321 | |
Total Investments — 152.2%(1) | | | | | | | |
(Cost $543,988,422) | | | | | | 592,603,349 | |
Auction Rate Senior Notes — (30.8%)(1) | | | | | | (120,000,000 | ) |
Interest Rate Swap Contracts — 1.7%(1) | | | | | | | |
$190,000,000 notional — Unrealized Appreciation(6) | | | | | | 6,520,678 | |
Liabilities in Excess of Cash and Other Assets — (5.1%)(1) | | | | | | (19,819,471 | ) |
Preferred Shares at Redemption Value — (18.0%)(1) | | | | | | (70,000,000 | ) |
Total Net Assets Applicable to Common | | | | | | | |
Stockholders — 100.0%(1) | | | | | $ | 389,304,556 | |
| | | | | | | | |
(1) Calculated as a percentage of net assets applicable to common stockholders.
(2) Fair valued securities represent a total market value of $9,261,443 which represents 2.4% of net assets.
These securities are deemed to be restricted; see Note 6 for further disclosure.
(3) Security distributions are paid in kind. Related company of a master limited partnership.
(4) Security is a variable rate instrument. Interest rate is as of May 31, 2006.
(5) Rate indicated is the 7-day effective yield.
(6) See Note 10 for further disclosure.
See Accompanying Notes to the Financial Statements.
STATEMENT OF ASSETS & LIABILITIES (Unaudited)
| | | May 31, 2006 | |
| | | | |
Assets | | | |
Investments at value (cost $543,988,422) | | $ | 592,603,349 | |
Cash | | | 6,144,538 | |
Interest receivable | | | 34,015 | |
Unrealized appreciation on interest rate swap contracts | | | 6,520,678 | |
Prepaid expenses and other assets | | | 1,761,399 | |
Total assets | | | 607,063,979 | |
| | | | | |
Liabilities | | | | |
Payable to Adviser | | | 883,448 | |
Dividend payable on common shares | | | 5,989,145 | |
Dividend payable on preferred shares | | | 79,024 | |
Accrued expenses and other liabilities | | | 475,421 | |
Current tax liability | | | 20,925 | |
Deferred tax liability | | | 20,311,460 | |
Auction rate senior notes payable: | | | | |
Series A, due November 14, 2045 | | | 60,000,000 | |
Series B, due November 14, 2045 | | | 60,000,000 | |
Total liabilities | | | 147,759,423 | |
| | | | | |
Preferred Shares | | | | |
$25,000 liquidation value per share applicable to 2,800 outstanding | | | | |
shares (7,500 shares authorized) | | | 70,000,000 | |
Net assets applicable to common stockholders | | $ | 389,304,556 | |
| | | | | |
Net Assets Applicable to Common Stockholders Consist of | | | | |
Capital stock, $0.001 par value; 15,971,053 shares issued and | | | | |
outstanding (100,000,000 shares authorized) | | $ | 15,971 | |
Additional paid-in capital | | | 358,031,947 | |
Accumulated net investment loss, net of deferred tax benefit | | | (3,049,921 | ) |
Accumulated realized gain, net of deferred tax expense | | | 649,687 | |
Net unrealized gain on investments and interest rate swap contracts, | | | | |
net of deferred tax expense | | | 33,656,872 | |
Net assets applicable to common stockholders | | $ | 389,304,556 | |
Net Asset Value per common share outstanding (net assets applicable | | | | |
to common shares, divided by common shares outstanding) | | $ | 24.38 | |
| | | | | |
See Accompanying Notes to the Financial Statements.
12 Tortoise Energy Capital Corp.
STATEMENT OF OPERATIONS (Unaudited)
| | | Period from | |
| | | December 1, 2005 | |
| | | through | |
| | | May 31, 2006 | |
| | | | |
Investment Income | | | |
Distributions received from master limited partnerships | | $ | 15,972,843 | |
Less return of capital on distributions | | | (15,124,821 | ) |
| | | | | |
Distribution income from master limited partnerships | | | 848,022 | |
Dividends from money market mutual funds | | | 82,878 | |
Interest | | | 410,542 | |
| | | | | |
Total Investment Income | | | 1,341,442 | |
| | | | | |
Expenses | | | | |
Advisory fees | | | 2,510,723 | |
Administrator fees | | | 180,977 | |
Professional fees | | | 137,604 | |
Reports to stockholders | | | 66,726 | |
Directors’ fees | | | 58,741 | |
Fund accounting fees | | | 29,770 | |
Custodian fees and expenses | | | 24,270 | |
Registration fees | | | 25,148 | |
Stock transfer agent fees | | | 7,048 | |
Other expenses | | | 37,474 | |
| | | | | |
Total Expenses before Interest Expense and Auction Agent Fees | | | 3,078,481 | |
| | | | | |
Interest expense | | | 3,043,441 | |
Auction agent fees | | | 198,466 | |
| | | | | |
Total Interest Expense and Auction Agent Fees | | | 3,241,907 | |
| | | | | |
Total Expenses | | | 6,320,388 | |
| | | | | |
Net Investment Loss, before income taxes | | | (4,978,946 | ) |
Current tax expense | | | (20,925 | ) |
Deferred tax benefit | | | 1,949,950 | |
Income tax benefit | | | 1,929,025 | |
| | | | | |
Net Investment Loss | | | (3,049,921 | ) |
| | | | | |
STATEMENT OF OPERATIONS (Unaudited)
(Continued)
| | | Period from | |
| | | December 1, 2005 | |
| | | through | |
| | | May 31, 2006 | |
| | | | |
Realized and Unrealized Gain (Loss) on Investments | | | |
Net realized gain on investments, before deferred tax expense | | | 1,174,399 | |
Net realized loss on interest rate swap settlements | | | (108,821 | ) |
| | | | | |
Net realized gain, before deferred tax expense | | | 1,065,578 | |
Deferred tax expense | | | (415,575 | ) |
| | | | | |
Net realized gain on investments | | | 650,003 | |
| | | | | |
Net unrealized appreciation of investments | | | 48,513,750 | |
Net unrealized appreciation of interest rate swap contracts | | | 7,994,694 | |
| | | | | |
Net unrealized appreciation, before deferred tax expense | | | 56,508,444 | |
Deferred tax expense | | | (22,038,297 | ) |
| | | | | |
Net unrealized appreciation of investments and | | | | |
interest rate swap contracts | | | 34,470,147 | |
| | | | | |
Net Realized and Unrealized Gain on Investments | | | 35,120,150 | |
| | | | | |
Dividends to Preferred Stockholders | | | (1,117,292 | ) |
| | | | | |
Net Increase in Net Assets Applicable to Common Stockholders | | | | |
Resulting from Operations | | $ | 30,952,937 | |
| | | | | |
See Accompanying Notes to the Financial Statements.
14 Tortoise Energy Capital Corp.
STATEMENT OF CHANGES IN NET ASSETS
| | | Period from | | Period from | |
| | | December 1, 2005 | | May 31, 2005(1) | |
| | | through | | through | |
| | | May 31, 2006 | | November 30, 2005 | |
| | | (Unaudited) | | | |
Operations | | | | | |
| Net investment income (loss) | | $ | (3,049,921 | ) | $ | 574,502 | |
| Net realized gain (loss) on investments | | | 650,003 | | | (316 | ) |
| Net unrealized appreciation (depreciation) of | | | | | | | |
| investments and interest rate swap contracts | | | 34,470,147 | | | (813,275 | ) |
| Dividends to preferred stockholders | | | (1,117,292 | ) | | — | |
| | | | | | | | |
| Net increase (decrease) in net assets applicable to | | | | | | | |
| common stockholders resulting from operations | | | 30,952,937 | | | (239,089 | ) |
| | | | | | | | |
Dividends and Distributions to | | | | | | | |
Common Stockholders | | | | | | | |
| Net investment income | | | — | | | (512,594 | ) |
| Return of capital | | | (11,731,383 | ) | | (8,649,370 | ) |
| | | | | | | | |
| Total dividends to common stockholders | | | (11,731,383 | ) | | (9,161,964 | ) |
| | | | | | | | |
Capital Share Transactions | | | | | | | |
| Proceeds from initial public offering of | | | | | | | |
| 14,000,000 common shares | | | — | | | 350,000,000 | |
| Proceeds from issuance of 1,887,000 common shares in | | | | | | | |
| connection with exercising an overallotment option | | | | | | | |
| granted to underwriters of the initial public offering | | | — | | | 47,175,000 | |
| Underwriting discounts and offering expenses associated | | | | | | | |
| with the issuance of common shares | | | — | | | (18,780,799 | ) |
| Underwriting discounts and offering expenses associated | | | | | | | |
| with the issuance of preferred shares | | | (848,812 | ) | | — | |
| Issuance of 20,392 and 41,131 common shares from | | | | | | | |
| reinvestment of dividend distributions to stockholders | | | 476,372 | | | 986,298 | |
| | | | | | | | |
| Net increase (decrease) in net assets, applicable | | | | | | | |
| to common stockholders, from capital | | | | | | | |
| share transactions | | | (372,440 | ) | | 379,380,499 | |
| | | | | | | | |
| Total increase in net assets applicable to | | | | | | | |
| common stockholders | | | 18,849,114 | | | 369,979,446 | |
Net Assets | | | | | | | |
| Beginning of period | | | 370,455,442 | | | 475,996 | |
| End of period | | $ | 389,304,556 | | $ | 370,455,442 | |
| Accumulated net investment loss | | | | | | | |
| at the end of the period | | $ | (3,049,921 | ) | $ | — | |
| | | | | | | | |
(1) Commencement of Operations.
See Accompanying Notes to the Financial Statements.
STATEMENT OF CASH FLOWS (Unaudited)
| | | Period from | |
| | | December 1, 2005 | |
| | | through | |
| | | May 31, 2006 | |
Cash Flows From Operating Activities | | | |
Distributions received from master limited partnerships | | $ | 15,972,843 | |
Interest and dividend income received | | | 537,108 | |
Purchases of long-term investments | | | (82,636,822 | ) |
Proceeds from sale of long-term investments | | | 11,009,049 | |
Proceeds from sale of short-term investments, net | | | 6,117,508 | |
Payments on interest rate swap contracts, net | | | (108,821 | ) |
Interest expense paid | | | (3,227,145 | ) |
Operating expenses paid | | | (2,915,501 | ) |
| | | | | |
Net cash used in operating activities | | | (55,251,781 | ) |
| | | | | |
Cash Flows From Financing Activities | | | | |
Issuance of preferred stock | | | 70,000,000 | |
Advances from revolving line of credit | | | 48,000,000 | |
Repayments on revolving line of credit | | | (48,000,000 | ) |
Preferred stock issuance costs | | | (848,812 | ) |
Debt issuance costs | | | (360,966 | ) |
Dividends paid to common stockholders | | | (6,457,129 | ) |
Dividends paid to preferred stockholders | | | (1,038,268 | ) |
| | | | | |
Net cash provided by financing activities | | | 61,294,825 | |
| | | | | |
Net increase in cash | | | 6,043,044 | |
Cash — beginning of period | | | 101,494 | |
Cash — end of period | | $ | 6,144,538 | |
| | | | | |
16 Tortoise Energy Capital Corp.
STATEMENT OF CASH FLOWS (Unaudited)
(Continued)
| | | Period from | |
| | | December 1, 2005 | |
| | | through | |
| | | May 31, 2006 | |
Reconciliation of net increase in net assets applicable to | | | |
common stockholders resulting from operations to net | | | |
cash used in operating activities | | | |
Net increase in net assets applicable to common stockholders | | | |
resulting from operations | | $ | 30,952,937 | |
Adjustments to reconcile net increase in net assets applicable | | | | |
to common stockholders resulting from operations to net cash | | | | |
used in operating activities | | | | |
Purchases of long-term investments | | | (82,636,822 | ) |
Return of capital on distributions received | | | 15,124,821 | |
Proceeds from sales of long-term investments | | | 11,009,049 | |
Proceeds from sales of short-term investments, net | | | 6,117,508 | |
Deferred income taxes, net | | | 20,503,922 | |
Net unrealized appreciation on investments | | | (56,508,444 | ) |
Realized gain on investments | | | (1,174,399 | ) |
Accretion of discount on long-term investments | | | (6,130 | ) |
Amortization of debt issuance costs | | | 20,321 | |
Dividends to preferred stockholders | | | 1,117,292 | |
Changes in operating assets and liabilities: | | | | |
Decrease in interest receivable | | | 49,818 | |
Increase in prepaid expenses and other assets | | | (105,986 | ) |
Increase in current tax liability | | | 20,925 | |
Increase in payable to Adviser | | | 232,592 | |
Increase in accrued expenses and other liabilities | | | 30,815 | |
| | | | | |
Total adjustments | | | (86,204,718 | ) |
| | | | | |
Net cash used in operating activities | | $ | (55,251,781 | ) |
| | | | | |
Non-Cash Financing Activities | | | | |
Reinvestment of distributions by common stockholders | | | | |
in additional common shares | | $ | 476,372 | |
| | | | | |
See Accompanying Notes to the Financial Statements.
FINANCIAL HIGHLIGHTS
| | | Period from December 1, 2005through May 31, 2006 | | Period from May 31, 2005(1) through November 30, 2005 | |
| | | (Unaudited) | | | |
| | | | | | |
Per Common Share Data(2) | | | | | |
Net Asset Value, beginning of period | | $ | 23.23 | | $ | — | |
Public offering price | | | — | | | 25.00 | |
Underwriting discounts and offering costs | | | | | | | |
on issuance of common shares | | | — | | | (1.18 | ) |
Underwriting discounts and offering costs | | | | | | | |
on issuance of preferred shares | | | (0.05 | ) | | — | |
Income from Investment Operations: | | | | | | | |
Net investment income (loss)(3) | | | (0.19 | ) | | 0.04 | |
Net realized and unrealized gain (loss) on investments(3) | | | 2.20 | | | (0.05 | ) |
Total increase (decrease) from investment | | | | | | | |
operations | | | 2.01 | | | (0.01 | ) |
Less Dividends to Preferred Stockholders: | | | | | | | |
Net investment income | | | — | | | — | |
Return of capital | | | (0.07 | ) | | — | |
Total dividends to preferred stockholders | | | (0.07 | ) | | — | |
Less Dividends to Common Stockholders: | | | | | | | |
Net investment income | | | — | | | (0.03 | ) |
Return of capital | | | (0.74 | ) | | (0.55 | ) |
Total dividends to common stockholders | | | (0.74 | ) | | (0.58 | ) |
Net Asset Value, end of period | | $ | 24.38 | | $ | 23.23 | |
Per common share market value, end of period | | $ | 22.40 | | $ | 22.09 | |
Total Investment Return Based on Market Value(4) | | | 4.55 | % | | (8.33 | )% |
| | | | | | | | |
Supplemental Data and Ratios | | | | | | | |
Net assets applicable to common stockholders, | | | | | | | |
end of period (000’s) | | $ | 389,305 | | $ | 370,455 | |
Ratio of expenses (including current and deferred | | | | | | | |
income tax expense) to average net assets:(5) (6) (7) | | | 14.29 | % | | 1.29 | % |
Ratio of expenses (excluding current and deferred | | | | | | | |
income tax expense) to average net assets:(5) (6) (7) | | | 3.36 | % | | 1.39 | % |
Ratio of net investment income (loss) to average | | | | | | | |
net assets (including current and deferred income | | | | | | | |
tax expense):(5) (6) (7) | | | (13.58 | )% | | 0.60 | % |
Ratio of net investment income (loss) to average | | | | | | | |
net assets (excluding current and deferred income | | | | | | | |
tax expense):(5) (6) (7) (8) | | | (2.65 | )% | | 0.50 | % |
| | | | | | | | |
18 Tortoise Energy Capital Corp.
| | | Period from December 1, 2005 through May 31, 2006 | | Period from May 31, 2005(1) through November 30, 2005 | |
| | | (Unaudited) | | | |
| | | | | | |
Portfolio turnover rate | | 1.99 | % | 0.08 | % |
Tortoise Auction Rate Senior Notes, end of period (000’s) | | $ | 120,000 | | $ | 120,000 | |
Tortoise Preferred Shares, end of period (000’s) | | $ | 70,000 | | | — | |
Per common share amount of auction rate senior notes | | | | | | | |
outstanding at end of period | | $ | 7.51 | | $ | 7.52 | |
Per common share amount of net assets, excluding | | | | | | | |
auction rate senior notes, at end of period | | $ | 31.89 | | $ | 30.75 | |
Asset coverage, per $1,000 of principal amount | | | | | | | |
of auction rate senior notes (9) | | | | | | | |
Series A | | $ | 4,828 | | $ | 4,087 | |
Series B | | $ | 4,828 | | $ | 4,087 | |
Asset coverage, per $25,000 liquidation value | | | | | | | |
per share of preferred shares (10) | | $ | 164,037 | | | — | |
Asset coverage ratio of auction rate senior notes (9) | | | 483 | % | | 409 | % |
Asset coverage ratio of preferred shares (11) | | | 305 | % | | | |
| | | | | | | | |
(1) | Commencement of Operations. |
(2) | Information presented relates to a share of common stock outstanding for the entire period. (3) The per common share data for the period ended November 30, 2005, do not reflect the change in estimate of investment income and return of capital. |
(4) | Not annualized. Total investment return is calculated assuming a purchase of common stock at the beginning of period (or initial public offering price) and a sale at the closing price on the last day of the period reported. The calculation also assumes reinvestment of dividends at actual prices pursuant to the Company’s dividend reinvestment plan. Total investment return does not reflect brokerage commissions. |
(5) | Annualized for periods less than one full year. |
(6) | For the period from December 1, 2005 through May 31, 2006, the Company accrued $20,524,847 in current and deferred income tax expense. For the period from May 31, 2005 through November 30, 2005, the Company accrued $192,462 in net deferred income tax benefit. |
(7) | The expense ratios and net investment loss ratios do not reflect the effect of dividend payments to preferred stockholders. |
(8) | This ratio excludes deferred income tax benefit (expense) on net investment loss (income). |
(9) | Represents value of total assets less all liabilities and indebtedness not represented by auction rate senior notes and preferred shares at the end of the period divided by auction rate senior notes outstanding at the end of the period. |
(10) | Represents value of total assets less all liabilities and indebtedness not represented by preferred shares at the end of the period divided by preferred shares outstanding at the end of the period. |
(11) | Represents value of total assets less all liabilities and indebtedness not represented by auction rate senior notes and preferred shares at the end of the period divided by the sum of auction rate senior notes and preferred shares outstanding at the end of the period. |
See Accompanying Notes to the Financial Statements.
NOTES TO FINANCIAL STATEMENTS (Unaudited)
May 31, 2006
1. O r g a n i z a t i o n
Tortoise Energy Capital Corporation (the "Company") was organized as a Maryland corporation on March 4, 2005, and is a non-diversified, closed-end management investment company under the Investment Company Act of 1940, as amended (the "1940 Act"). The Company’s investment objective is to seek a high level of total return with an emphasis on current cash distributions paid to stockholders. The Company seeks to provide its stockholders with an efficient vehicle to invest in the energy infrastructure sector. The Company received the proceeds of its initial public offering and commenced operations on May 31, 2005. The Company’s shares are listed on the New York Stock Exchange under the symbol “TYY.”
2. Significant Accounting Policies
A. Use of Estimates
The preparation of financial statements in conformity with U.S. generally accepted accounting principles requires management to make estimates and assumptions that affect the reported amount of assets and liabilities, recognition of distribution income, and disclosure of contingent assets and liabilities at the date of the financial statements. Actual results could differ from those estimates.
B. Investment Valuation
The Company owns securities that are listed on a securities exchange. The Company values those securities at their last sale price on that exchange on the valuation date. If the security is listed on more than one exchange, the Company uses the price of that exchange that it generally considers to be the principal exchange on which the stock is traded. Securities listed on the NASDAQ will be valued at the NASDAQ Official Closing Price, which may not necessarily represent the last sale price. If there has been no sale on such exchange or NASDAQ on such day, the security will be valued at the mean between bid and asked price on such day.
The Company may invest up to 50 percent of its total assets in restricted securities. Restricted securities are subject to statutory or contractual restrictions on their public resale, which may make it more difficult to obtain a valuation and may limit the Company’s ability to dispose of them. Investments in restricted securities and other securities for which market quotations are not readily available will be valued in good faith by using fair value procedures approved by the Board of Directors. Such fair value procedures consider factors such as discounts to publicly traded issues, securities with similar yields, quality, type of issue, coupon, duration and rating.
The Company generally values short-term debt securities at prices based on market quotations for such securities, except those securities purchased with 60 days or less to maturity are valued on the basis of amortized cost, which approximates market value.
The Company generally values its interest rate swap contracts using industry-accepted models which discount the estimated future cash flows based on the stated terms of the interest rate swap agreement by using interest rates currently available in the market, or based on dealer quotations, if available.
20 Tortoise Energy Capital Corp.
NOTES TO FINANCIAL STATEMENTS (Unaudited)
(Continued)
If events occur that affect the value of the Company’s portfolio securities before the net asset value has been calculated (a “significant event”), the portfolio securities so affected will generally be priced using a fair value procedure.
C. Security Transactions and Investment Income
Security transactions are accounted for on the date the securities are purchased or sold (trade date). Realized gains and losses are reported on an identified cost basis. Interest income is recognized on the accrual basis, including amortization of premiums and accretion of discounts. Dividend and distribution income is recorded on the ex-dividend date. Distributions received from the Company’s investments in master limited partnerships (“MLPs”) generally are comprised of ordinary income, capital gains and return of capital from the MLP. The Company records investment income and return of capital based on estimates made at the time such distributions are received. Such estimates are based on historical information available from each MLP and other industry sources. These estimates may subsequently be revised based on information received from MLPs after their tax reporting periods are concluded.
For the period from May 31, 2005 (commencement of operations) through November 30, 2005, the Company estimated the allocation of investment income and return of capital for the distributions received from MLPs within the Statement of Operations. For this period, the Company had estimated approximately 21 percent as investment income and approximately 79 percent as return of capital.
Subsequent to November 30, 2005, the Company reclassified the amount of investment income and return of capital it recognized based on the 2005 tax reporting information received from the individual MLPs. This reclassification amounted to a decrease in pre-tax net investment income of approximately $1.3 million or $0.08 per share ($0.8 million or $0.05 per share, net of deferred tax benefit), and a corresponding increase in unrealized appreciation of investments for the period from December 1, 2005 through May 31, 2006. The reclassification is reflected in the accompanying financial statements.
D. Dividends to Stockholders
Dividends to common stockholders are recorded on the ex-dividend date. The character of dividends to common stockholders made during the year may differ from their ultimate characterization for federal income tax purposes. For the year ended November 30, 2005, the Company’s dividends, for book purposes, were comprised of approximately 6 percent investment income and 94 percent return of capital. For the period ended May 31, 2006, the Company’s dividends, for book purposes, were comprised entirely of return of capital as a result of the net investment loss incurred by the Company in the reporting period. For the year ended November 30, 2005, for tax purposes, the Company determined the dividends to common stockholders were comprised of 100 percent return of capital.
Dividends to preferred stockholders are based on variable rates set at auctions, normally held every 28 days. Dividends on preferred shares are accrued on a daily basis for the subsequent 28 day period at a rate as determined on the auction date. Dividends on preferred shares are payable every 28 days, on the first day following the end of the dividend period. The character of dividends to preferred stockholders made during the year may differ from their ultimate characterization for federal income tax purposes.
NOTES TO FINANCIAL STATEMENTS (Unaudited)
(Continued)
E. Federal Income Taxation
The Company, as a corporation, is obligated to pay federal and state income tax on its taxable income. The Company invests its assets primarily in MLPs, which generally are treated as partnerships for federal income tax purposes. As a partner in the MLPs, the Company reports its allocable share of the MLP’s taxable income in computing its own taxable income. The Company’s tax expense or benefit is included in the Statement of Operations based on the component of income or gains (losses) to which such expense or benefit relates. Deferred income taxes reflect the net tax effects of temporary differences between the carrying amounts of assets and liabilities for financial reporting purposes and the amounts used for income tax purposes. A valuation allowance is recognized if, based on the weight of available evidence, it is more likely than not that some portion or all of the deferred income tax asset will not be realized.
F. Organization Expenses, Offering and Debt Issuance Costs
The Company is responsible for paying all organizational expenses, which are expensed as incurred. Offering costs related to the issuance of common and preferred stock are charged to additional paid-in capital when the shares are issued. Offering costs (excluding underwriter commissions) of $907,924 and $237,000 were charged to additional paid-in capital for the initial public offering of common stock in May 2005 and the issuance of preferred stock in January 2006, respectively. Debt issuance costs related to the auction rate senior notes are capitalized and amortized over the period the notes are outstanding. The amounts of such capitalized costs for the Auction Rate Senior Notes Series A and B issued in November of 2005 (excluding underwriter commissions) was $415,650.
G. Derivative Financial Instruments
The Company uses interest rate swap contracts to manage interest rate risk. The Company has established policies and procedures for risk assessment and the approval, reporting and monitoring of derivative financial instrument activities. The Company does not hold or issue derivative financial instruments for speculative purposes. All derivative financial instruments are recorded at fair value with changes in value during the reporting period, and amounts accrued under the agreements, included as unrealized gains or losses in the Statement of Operations.
H. Indemnifications
Under the Company’s organizational documents, its officers and directors are indemnified against certain liabilities arising out of the performance of their duties to the Company. In addition, in the normal course of business, the Company may enter into contracts that provide general indemnifications to other parties. The Company’s maximum exposure under these arrangements is unknown, as this would involve future claims that may be made against the Company that have not yet occurred, and may not occur. However, the Company has not had prior claims or losses pursuant to these contracts and expects the risk of loss to be remote.
22 Tortoise Energy Capital Corp.
NOTES TO FINANCIAL STATEMENTS (Unaudited)
(Continued)
3. Concentration of Risk
The Company’s investment objective is to seek a high level of total return with an emphasis on current distributions paid to its stockholders. Under normal circumstances, and once fully invested in accordance with its investment objective, the Company will have at least 80 percent of its net assets, plus any borrowings for investment purposes, invested in equity securities of entities in the energy sector within the United States and at least 80 percent of its total assets in equity securities of MLPs and their affiliates in the energy infrastructure sector. The Company will not invest more than 15 percent of its total assets in any single issuer as of the time of purchase. The Company may invest up to 20 percent of its total assets in debt securities, including securities rated below investment grade. In determining application of these policies, the term “total assets” includes assets to be obtained through anticipated leverage.
4. Agreements
The Company has entered into an Investment Advisory Agreement with Tortoise Capital Advisors, L.L.C. (the “Adviser”). Under the terms of the agreement, until May 31, 2006, the Company will pay the Adviser a fee equal to an annual rate of 0.90 percent of the Company’s average monthly total assets (including any assets attributable to leverage) minus accrued liabilities (other than deferred income taxes, debt entered into for purposes of leverage and the aggregate liquidation preference of outstanding preferred shares) (“Managed Assets”), in exchange for the investment advisory services provided. Thereafter, the Company will pay the Adviser a fee equal to an annual rate of 0.95 percent of the Company’s Managed Assets.
The Company has engaged U.S. Bancorp Fund Services, LLC to serve as the Company’s administrator. The Company pays the administrator a monthly fee computed at an annual rate of 0.07 percent of the first $300 million of the Company’s Managed Assets, 0.06 percent on the next $500 million of Managed Assets and 0.04 percent on the balance of the Company’s Managed Assets, subject to a minimum annual fee of $45,000.
Computershare Investor Services, LLC serves as the Company’s transfer agent, dividend paying agent, and agent for the automatic dividend reinvestment plan.
U.S. Bank, N.A. serves as the Company’s custodian. The Company pays the custodian a monthly fee computed at an annual rate of 0.015 percent on the first $100 million of the Company’s Managed Assets and 0.01 percent on the balance of the Company’s Managed Assets, subject to a minimum annual fee of $4,800.
NOTES TO FINANCIAL STATEMENTS (Unaudited)
(Continued)
5. Income Taxes
Deferred income taxes reflect the net tax effect of temporary differences between the carrying amount of assets and liabilities for financial reporting and tax purposes. Components of the Company’s deferred tax assets and liabilities as of May 31, 2006 are as follows:
| Deferred tax assets: | | |
| Net operating loss carryforwards | $ | 4,191,015 |
| Organization costs | | 22,400 |
| | | 4,213,415 |
| | | |
| Deferred tax liabilities: | | |
| Net unrealized gains on investment securities and interest rate swap contracts | | 21,502,890 |
| Basis reduction of investment in MLPs | | 3,021,985 |
| | | 24,524,875 |
| | | |
| Total net deferred tax liability | $ | 20,311,460 |
| | | |
For the period from December 1, 2005 to May 31, 2006, the components of income tax expense include current foreign taxes payable of $20,925 and deferred federal and state income taxes (net of federal tax benefit) of $18,400,956 and $2,102,966, respectively. As of November 30, 2005, the Company had a net operating loss for federal income tax purposes of approximately $555,000. This net operating loss may be carried forward for 20 years and, accordingly, would expire after the year ending November 30, 2025.
Total income taxes differ from the amount computed by applying the federal statutory income tax rate of 35 percent to net investment income and realized and unrealized gains on investments before taxes, as follows:
| Application of statutory income tax rate | $ | 18,408,277 |
| State income taxes, net of federal taxes | | 2,103,803 |
| Other, net | | 12,767 |
| | | |
| Total | $ | 20,524,847 |
| | | |
At May 31, 2006, the Company did not record a valuation allowance against its deferred tax asset.
24 Tortoise Energy Capital Corp.
NOTES TO FINANCIAL STATEMENTS (Unaudited)
(Continued)
6. Restricted Securities
Certain of the Company’s investments are restricted and are valued as determined in accordance with procedures established by the Board of Directors and more fully described in Note 2. The table below shows the number of units held or principal amount, the acquisition date, acquisition cost, value per unit and percent of net assets which the securities comprise.
Investment Security | Number of Units Held or Principal Amount | Acquisition Dates | Acquisition Cost | Value Per Unit | Percent of Net Assets |
| | | | | | | |
| Plains All American | | | | | | |
| Pipeline, L.P. | Common Units | 65,971 | 3/22/06-4/9/06 | $ 2,765,013 | $46.56 | 0.8% |
| | | | | | | |
| E.W. Transportation, | | | | | | |
| LLC | Promissory Note | $6,227,571 | 9/08/05 | 6,947,500 | N/A | 1.6 |
| | | | | | | |
| | | | | $ 9,712,513 | | 2.4% |
| | | | | | | |
7. Investment Transactions
For the period ended May 31, 2006, the Company purchased (at cost) and sold securities (at proceeds) in the amount of $82,636,822 and $11,009,049 (excluding short-term debt securities and interest rate swaps), respectively.
8. Auction Rate Senior Notes
The Company has issued two $60,000,000 aggregate principal amounts of auction rate senior notes Series A and Series B, respectively (collectively, the “Notes”). The Notes were issued in denominations of $25,000. The principal amount of the Notes will be due and payable on November 14, 2045. Fair value of the Notes approximates carrying amount because the interest rate fluctuates with changes in interest rates available in the current market.
Holders of the Notes are entitled to receive cash interest payments at an annual rate that may vary for each rate period. Interest rates for Series A and Series B as of May 31, 2006, were 5.23 percent and 5.24 percent, respectively. The weighted average interest rates for Series A and Series B for the period ended May 31, 2006, were 4.78 percent and 4.78 percent, respectively. These rates include the applicable rate based on the latest results of the auction, plus commissions paid to the auction agent in the amount of 0.25 percent. For each subsequent rate period, the interest rate will be determined by an auction conducted in accordance with the procedures described in the Notes’ prospectus. Generally, the rate period will be 28 days for Series A and Series B. The Notes will not be listed on any exchange or automated quotation system.
The Notes are redeemable in certain circumstances at the option of the Company. The Notes are also subject to a mandatory redemption if the Company fails to meet an asset coverage ratio required by law, or fails to cure in a timely manner a deficiency as stated in the rating agency guidelines applicable to the Notes.
NOTES TO FINANCIAL STATEMENTS (Unaudited)
(Continued)
The Notes are unsecured obligations of the Company and, upon liquidation, dissolution or winding up of the Company, will rank: (1) senior to all the Company’s outstanding preferred shares; (2) senior to all of the Company’s outstanding common shares; (3) on a parity with any unsecured creditors of the Company and any unsecured senior securities representing indebtedness of the Company; and (4) junior to any secured creditors of the Company.
9. Preferred Shares
The Company has 7,500 authorized Money Market Preferred (“MMP”) Shares, of which 2,800 shares are currently outstanding. The MMP Shares have rights determined by the Board of Directors. The MMP Shares have a liquidation value of $25,000 per share plus any accumulated, but unpaid dividends, whether or not declared.
Holders of the MMP Shares are entitled to receive cash dividend payments at an annual rate that may vary for each rate period. The dividend rate for the MMP Shares as of May 31, 2006, was 5.33 percent. The weighted average dividend rate for the MMP Shares for the period ended May 31, 2006, was 5.04 percent. This rate includes the applicable rate based on the latest results of the auction, plus commissions paid to the auction agent in the amount of 0.25 percent. Under the Investment Company Act of 1940, the Company may not declare dividends or make other distributions on shares of common stock or purchases of such shares if, at the time of the declaration, distribution or purchase, asset coverage with respect to the outstanding MMP Shares would be less than 200 percent.
The MMP Shares are redeemable in certain circumstances at the option of the Company. The MMP Shares are also subject to a mandatory redemption if the Company fails to meet an asset coverage ratio required by law, or fails to cure a deficiency in a timely manner as stated in the rating agency guidelines.
The holders of MMP Shares have voting rights equal to the holders of common stock (one vote per share) and will vote together with the holders of shares of common stock as a single class except on matters affecting only the holders of preferred stock or the holders of common stock.
10. Interest Rate Swap Contracts
The Company has entered into interest rate swap contracts to protect itself from increasing interest expense on its leverage resulting from increasing short-term interest rates. A decline in interest rates may result in a decline in the value of the swap contracts, which may result in a decline in the net assets of the Company. In addition, if the counterparty to the interest rate swap contracts defaults, the Company would not be able to use the anticipated receipts under the swap contracts to offset the interest payments on the Company’s leverage. At the time the interest rate swap contracts reach their scheduled termination, there is a risk that the Company would not be able to obtain a replacement transaction or that the terms of the replacement would not be as favorable as on the expiring transaction.
26 Tortoise Energy Capital Corp.
NOTES TO FINANCIAL STATEMENTS (Unaudited)
(Continued)
In addition, if the Company is required to terminate any swap contract early due to the Company failing to maintain a required 300 percent asset coverage of the liquidation value of the outstanding auction rate senior notes or if the Company loses its credit rating on its auction rate senior notes, then the Company could be required to make a termination payment, in addition to redeeming all or some of the auction rate senior notes. Details of the interest rate swap contracts outstanding as of May 31, 2006, were as follows:
Counterparty | Maturity Date | Notional Amount | Fixed Rate Paid by the Company | Floating Rate Received by the Company | Unrealized Appreciation |
| | | | | | |
| U.S. Bank, N.A. | 11/25/2015 | $60,000,000 | 5.11% | 1 month U.S. Dollar LIBOR | $1,894,376 |
| U.S. Bank, N.A. | 12/02/2015 | 60,000,000 | 5.11% | 1 month U.S. Dollar LIBOR | 1,899,549 |
| U.S. Bank, N.A. | 2/15/2013 | 20,000,000 | 4.95% | 1 month U.S. Dollar LIBOR | 580,635 |
| U.S. Bank, N.A. | 3/01/2018 | 20,000,000 | 4.99% | 1 month U.S. Dollar LIBOR | 1,007,383 |
| U.S. Bank, N.A. | 2/28/2017 | 15,000,000 | 5.05% | 1 month U.S. Dollar LIBOR | 613,262 |
| U.S. Bank, N.A. | 2/28/2015 | 15,000,000 | 5.01% | 1 month U.S. Dollar LIBOR | 525,473 |
| | | | | | |
| | | $190,000,000 | | | $6,520,678 |
| | | | | | |
The Company is exposed to credit risk on the interest rate swap contracts if the counterparty should fail to perform under the terms of the interest rate swap contracts. The amount of credit risk is limited to the net appreciation of the interest rate swap contract, as no collateral is pledged by the counterparty.
11. Common Stock
The Company has 100,000,000 shares of beneficial interest authorized and 15,971,053 shares outstanding at May 31, 2006. Transactions in common shares for the period May 31, 2005 (commencement of operations) and the period ended May 31, 2006, were as follows:
| Shares at May 31, 2005 | 22,530 |
| Shares sold through initial public offering and exercise of overallotment options | 15,887,000 |
| Shares issued through reinvestment of dividends | 41,131 |
| | |
| Shares at November 30, 2005 | 15,950,661 |
| Shares issued through reinvestment of dividends | 20,392 |
| | |
| Shares at May 31, 2006 | 15,971,053 |
| | |
12. Credit Facility
On December 5, 2005, the Company entered into a $50 million secured credit facility, maturing February 10, 2006, with U.S. Bank, N.A. The credit facility was retired on January 31, 2006, with the proceeds from the issuance of preferred shares described in Note 9. The average interest rate for the period during which the credit facility was outstanding was 5.28 percent.
13. Subsequent Events
On June 1, 2006, the Company paid a dividend in the amount of $0.375 per share, for a total of $5,989,165. Of this total, the dividend reinvestment amounted to $1,423,000.
ADDITIONAL INFORMATION (Unaudited)
Forward-Looking Statements
This report contains “forward-looking statements” within the meaning of the Securities Act of 1933. By their nature, all forward-looking statements involve risks and uncertainties, and actual results could differ materially from those contemplated by the forward-looking statements. Several factors that could materially affect Tortoise Energy Capital Corporation’s (the “Company”) actual results are the performance of the portfolio of investments held by it, the conditions in the U.S. and international financial, petroleum and other markets, the price at which shares of Tortoise Energy Capital Corp. will trade in the public markets and other factors discussed in filings with the SEC.
Proxy Voting Policies
A description of the policies and procedures that the Company uses to determine how to vote proxies relating to portfolio securities owned by the Company and information regarding how the Company voted proxies relating to the portfolio of securities during the period ended June 30, 2005 is available to stockholders (i) without charge, upon request by calling the Company at (913) 981-1020 or toll-free at (800) 727-0254; and (ii) on the SEC’s Web site at www.sec.gov.
Form N-Q
The Company files its complete schedule of portfolio holdings for the first and third quarters of each fiscal year with the SEC on Form N-Q. The Company’s Form N-Q and statement of additional information are available without charge upon request by calling the Company at (800) 727-0254 or by visiting the SEC’s Web site at www.sec.gov. In addition, you may review and copy the Company’s Form N-Q at the SEC’s Public Reference Room in Washington D.C. You may obtain information on the operation of the Public Reference Room by calling (800) SEC-0330.
Privacy Policy
In order to conduct its business, the Company collects and maintains certain nonpublic personal information about our stockholders of record with respect to their transactions in shares of our securities. This information includes the stockholder’s address, tax identification or Social Security number, share balances, and dividend elections. We do not collect or maintain personal information about stockholders whose share balances of our securities are held in “street name” by a financial institution such as a bank or broker.
We do not disclose any nonpublic personal information about you, our other stockholders or our former stockholders to third parties unless necessary to process a transaction, service an account, or as otherwise permitted by law.
To protect your personal information internally, we restrict access to nonpublic personal information about our stockholders to those employees who need to know that information to provide services to our stockholders. We also maintain certain other safeguards to protect you nonpublic personal information.
28 Tortoise Energy Capital Corp.
| | |
Office of the Company and of the Investment Adviser Tortoise Capital Advisors, L.L.C. 10801 Mastin Boulevard, Suite 222 Overland Park, Kan. 66210 (913) 981-1020 (913) 981-1021 (fax) www.tortoiseadvisors.com Managing Directors of Tortoise Capital Advisors, L.L.C. H. Kevin Birzer Zachary A. Hamel Kenneth P. Malvey Terry Matlack David J. Schulte Board of Directors of Tortoise Energy Capital Corp. H. Kevin Birzer, Chairman Tortoise Capital Advisors, L.L.C. Terry Matlack Tortoise Capital Advisors, L.L.C. Conrad S. Ciccotello Independent John R. Graham Independent Charles E. Heath Independent | ADMINISTRATOR U.S. Bancorp Fund Services, L.L.C. 615 East Michigan St. Milwaukee, Wis. 53202 CUSTODIAN U.S. Bank, N.A. 425 Walnut St. Cincinnati, Ohio 45202 TRANSFER, DIVIDEND DISBURSING AND REINVESTMENT AGENT Computershare Investor Services, L.L.C. 2 North LaSalle St. Chicago, Ill. 60602 (800) 727-0254 www.computershare.com LEGAL COUNSEL Blackwell Sanders Peper Martin LLP 4801 Main St. Kansas City, Mo. 64112 INVESTOR RELATIONS (913) 981-1020 info@tortoiseadvisors.com STOCK SYMBOL Listed NYSE Symbol: TYY This report is for stockholder information. This is not a prospectus intended for use in the purchase or sale of fund shares. Past performance is no guarantee of future results and your investment may be worth more or less at the time you sell. |
| | |
Tortoise Capital Advisor’s Family of Funds |
| Name | Ticker/ Inception Date | Targeted Investments | Investor Suitability | Investment Restrictions | Total Assets as of 5/31/06 ($ in millions) |
| Tortoise Capital | TYG May 2005 | U.S. Energy Infrastructure, More Concentrated, More Direct Placements | Retirement Accounts Pension Plans Taxable Accounts | 50% Restricted Securities | $607 |
| Tortoise Energy | TYY Feb. 2005 | U.S. Energy Infrastructure, More Diversified in MLPs | Retirement Accounts Pension Plans Taxable Accounts | 30% Restricted Securities 10% Issuer-Limited | $759 |
| Tortoise North America | TYN | Canadian and U.S Energy Infrastructure, Diversified in Canadian RITs and U.S. MLPs | Taxable Accounts | 50% Restricted Securities Diversified to Meet RIC Requirements | $167 |
Not applicable for semi-annual reports.
Not applicable for semi-annual reports.
Not applicable for semi-annual reports.
Not applicable for semi-annual reports.
Schedule of Investments is included as part of the report to shareholders filed under Item 1.
Not applicable for semi-annual reports.
Not yet applicable.
None.
Pursuant to the requirements of the Securities Exchange Act of 1934 and the Investment Company Act of 1940, the Registrant has duly caused this report to be signed on its behalf by the undersigned, thereunto duly authorized.
David J. Schulte
Pursuant to the requirements of the Securities Exchange Act of 1934 and the Investment Company Act of 1940, this report has been signed below by the following persons on behalf of the Registrant and in the capacities and on the dates indicated.
David J. Schulte
Terry C. Matlack