UNITED STATES
SECURITIES AND EXCHANGE COMMISSION
Washington, DC 20549
FORM N-CSR
CERTIFIED SHAREHOLDER REPORT OF REGISTERED
MANAGEMENT INVESTMENT COMPANIES
Investment Company Act File Number:
811-21732
Mercer Funds
(Exact Name of Registrant as Specified in Charter)
99 High Street
Boston, MA 02110
(Address of Principal Executive Offices) (Zip Code)
Scott M. Zoltowski, Esq.
Mercer Investment Management, Inc.
99 High Street
Boston, MA 02110
(Name and Address of Agent for Service)
Registrant’s Telephone Number, including Area Code:
(617) 747-9500
Date of Fiscal Year End: March 31, 2013
Date of Reporting Period: March 31, 2013
Item 1. Reports to Stockholders.
The Report to Shareholders is attached herewith.

Mercer Funds™
Annual Report
Mercer US Large Cap Growth Equity Fund
Mercer US Large Cap Value Equity Fund
Mercer US Small/Mid Cap Growth Equity Fund
Mercer US Small/Mid Cap Value Equity Fund
Mercer Non-US Core Equity Fund
Mercer Core Opportunistic Fixed Income Fund
Mercer Emerging Markets Equity Fund
Mercer Global Low Volatility Equity Fund
Mercer US Short Maturity Fixed Income Fund
This report has been prepared for Mercer Funds shareholders. It is not authorized for distribution to prospective investors unless accompanied or preceded by a current Mercer Funds prospectus. The prospectus contains more complete information about the Funds’ investment objectives, risks, and expenses. Investors are reminded to read the prospectus carefully before investing.
March 31, 2013
MERCER FUNDS
TABLE OF CONTENTS
| Page | ||
| 1 | ||
| 27 | ||
| 160 | ||
| 164 | ||
| 167 | ||
| 172 | ||
| 181 | ||
| 215 | ||
| 216 | ||
| 222 | ||
| 225 | ||
Mercer US Large Cap Growth Equity Fund
Investment Objective and Benchmark
The investment objective of the Fund is long-term total return, which includes capital appreciation and income. The benchmark for the Fund is the Russell 1000® Growth Index.
Investment Strategy
The Fund invests principally in equity securities issued by large capitalization U.S. companies. The companies will generally have higher earnings and/or revenue growth histories or expectations relative to the Russell 1000® Growth Index.
Performance
For the fiscal year ended March 31, 2013, the Fund’s Y-3 share class performance was 6.03% compared to its benchmark return of 10.09%. Performance for the Fund is reported net of operating expenses while the benchmark returns do not include expenses of any kind as indexes are unmanaged.
The Sub-Advisors
As of March 31, 2013, the Fund employed four sub-advisors, Atlanta Capital Management Company, LLC (Atlanta), Neuberger Berman Management LLC( Neuberger Berman), Sands Capital Management, LLC (Sands) and Winslow Capital Management, LLC (Winslow). Atlanta manages its allocated portion of the Fund using high quality securities as a key part of their selection criteria. The firm seeks companies that have a demonstrated history of consistent growth (typically greater than 8%) and earnings stability. Neuberger Berman uses a fundamental process to identify companies with accelerating earnings while seeking to avoid those companies with decelerating earnings. Sands manages a concentrated portfolio using a fundamental, bottom-up approach to identify leading companies in various industries. Winslow manages a portfolio of securities across a range of market capitalizations, earnings growth, market valuations and industry sectors.
Market Commentary and Fund Performance
For the Fund’s fiscal year, the market, as measured by the S&P 500 Index, rose 14.0% continuing the rise which started in March 2009. The now four-year bull market has brought returns of 114% for the four-year period ending March 2013. For the prior fiscal year, it was split into distinct periods as economic news impacted investor’s views regarding which type of investments were most attractive. The fiscal year began with negative returns in the first fiscal quarter as the market digested a European debt crisis and the resulting global slowdown. Investors favored defensive type of equities and the perceived lower risk of U.S. treasuries. The fiscal year was marked by reassurance from the world’s central banks that they would do whatever was necessary to improve global economic growth, including an unprecedented conditional commitment from the U.S. Federal Reserve to maintain low interest rates until unemployment falls below 6.5% or the inflation rate exceeds 2.5%. These commitments coupled with an improving U.S. economic outlook initiated the latter half of the fiscal year in the equity markets. While economic news was mixed over the fiscal year, there was continued and modest growth in nonfarm payrolls, a falling unemployment rate and an improved housing outlook. Growth expectations notched higher and this helped advance the U.S. equity market. Increased expectations were tempered by concerns over the ability of the two major political parties to settle issues regarding the federal budget — issues that must bridge deep philosophical differences. For the full fiscal year, large cap growth stocks, as measured by the Russell 1000® Growth Index provided the weakest returns among major indices rising 10.1%, while the Russell 1000® Value Index gained 18.8%. In addition defensive type stocks outperformed on the year and this is evident in sector performance as telecom, health care and consumer staples sectors outperformed. The Federal Reserve’s decision to keep interest rates lower for the foreseeable future has made riskier assets more attractive and despite some downturns during the period in reaction to poor economic news, the US equity markets have been trending upward.
Within the Russell 1000® Growth Index, the best performing sectors for the fiscal year were health care, telecommunications services, and energy, posting gains of 26.0%, 21.6%, and 20.2% respectively. Nine of ten sectors generated positive returns, with information technology the only sector posting a negative result for the year.
The Mercer Large Cap Growth Equity Fund underperformed the Russell 1000® Growth Index during this fiscal year. This was a difficult market environment for growth portfolios generally; defensive type stocks outperformed the broad market. On a sector attribution basis, the primary driver of the Fund’s underperformance was stock selection in the consumer
1
Mercer US Large Cap Growth Equity Fund
discretionary sector. Notable detractors in the sector included Netflix, Coach and priceline.com, which all posted declines for the Fund. At March 31, 2013 the Fund no longer held Netflix. The timing of the Fund’s purchase and sale of its Netflix holding was an additional source of underperformance for the Fund. A significant underweight to media companies in the consumer discretionary sector (0.9% vs. 3.7%) hampered relative results for the fiscal year and cost the Fund 55 basis points in return. Good stock selection in the information technology and materials sectors was not enough to offset underperformance in other sectors of the portfolio.
The Winslow portion of the Fund underperformed the Russell 1000® Growth Index for the fiscal year. Stock selection in the consumer discretionary and financials sectors were areas of weakness. Winslow was able to add value over the benchmark in the materials and health care sectors. The Sands portion of the Fund underperformed the Index, hurt by stock selection in the consumer discretionary sector and a zero weight in the consumer staples sector. Good stock selection in the information technology sector was a positive contributor to Sand’s performance. Atlanta underperformed the benchmark and was hurt by information technology holding Acme Packet and a lack of exposure to the holding Visa, a strongly performing and large index weight holding. At March 31, 2013 the Fund no longer held Acme. Good stock selection in the materials and health care sectors was a positive contributor. Neuberger Berman underperformed the benchmark for the fiscal year. Overall, this more defensively positioned sub-advisor added value in sector weighting decisions, but was hurt by stock selection in the consumer sectors.
Risk Considerations
The Fund invests in growth stocks which may be particularly sensitive to market conditions. The Fund may experience high portfolio turnover which may result in higher costs and capital gains. The Fund’s volatility may be amplified by its ability to select sub-advisors to allocate assets.
2
Mercer Funds
March 31, 2013
Comparison of Change in Value of a $10,000 Investment in
Mercer US Large Cap Growth Equity Shares vs. the
Russell 1000® Growth Index
As of March 31, 2013
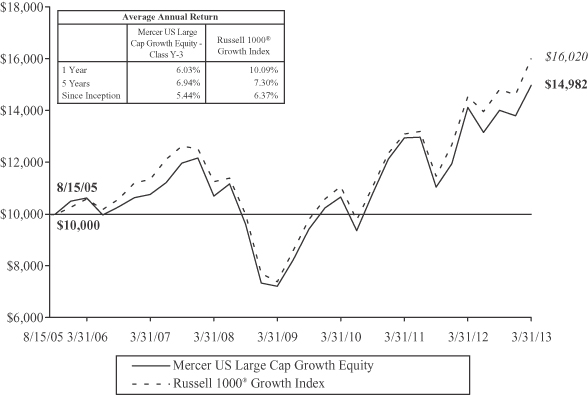
This graph shows the performance of the Mercer US Large Cap Growth Equity Fund1 Class Y-3 shares versus the Russell 1000® Growth Index from August 15, 2005, which is the inception date of the Fund, through March 31, 2013. The performance of other classes, when launched, will vary from the performance of the class shown based on the difference in fees and expenses paid by shareholders investing in different share classes. The Fund may charge a 2% redemption fee on shares owned less than 30 days.
The table and graph assume reinvestment of dividends and capital gains, but do not reflect a deduction of taxes an investor might pay on fund distributions or upon redemption of fund shares. Performance shown reflects a fee waiver and/or expense reimbursement. Without this waiver/reimbursement, returns would have been lower.
The data quoted represents past performance and does not guarantee future results. Current performance of the Fund may be lower or higher than the performance quoted. Please call 1-866-658-9896 for the Fund’s most recent month-end performance. Investment return and principal value will fluctuate so that an investor’s shares, when redeemed, may be worth more or less than when purchased.
3
Mercer US Large Cap Value Equity Fund
Investment Objective and Benchmark
The investment objective of the Fund is to provide long-term total return, which includes capital appreciation and income. The benchmark for the Fund is the Russell 1000® Value Index.
Investment Strategy
The Fund invests principally in equity securities issued by large capitalization U.S. companies that are considered undervalued based on the stocks’ intrinsic values relative to their current market prices.
Performance
For the fiscal year ended March 31, 2013, the Fund’s Y-3 share class performance was 16.71% compared to its benchmark return of 18.77%. Performance for the Fund is reported net of operating expenses while the benchmark returns do not include expenses of any kind as indexes are unmanaged.
The Sub-Advisors
As of March 31, 2013, the Fund employed four sub-advisors, Brandywine Global Investment Management, LLC (Brandywine), The Boston Company Asset Management, LLC (TBCAM), Robeco Investment Management, Inc. (Robeco), and O’Shaughnessy Asset Management, LLC (O’Shaughnessy). Brandywine seeks to build portfolios comprised of companies whose valuations are below the market but whose earnings growth prospects are equal or better than the market. The firm favors industry leaders with strong competitive positions and reasonable growth expectations given the team’s view of industry and overall economic conditions. TBCAM’s investment process is driven by bottom-up, fundamental security selection and uses a combination of traditional valuation measures and the identification of improving business momentum in their stock selection. Robeco’s process begins with a quantitative analysis that provides a statistical ranking of the investment universe based on valuation, momentum, and fundamental factors. The firm then applies fundamental analysis to those securities that includes validation of the quantitative analysis and fundamental research, including an in-depth review of the issuer’s financials. O’Shaughnessy uses quantitative models in seeking to find the most attractive companies on a shareholder yield basis. This is a combination of dividend yield and share buybacks.
Market Commentary and Fund Performance
For the Fund’s fiscal year, the market, as measured by the S&P 500 Index rose 14.0% continuing the rise which started in March 2009. The now four-year bull market has brought returns of 114% for the four-year period ending March 2013. For the prior fiscal year, it was split into distinct periods as economic news impacted investor’s views regarding which type of investments were most attractive. The fiscal year began with negative returns in the first fiscal quarter as the market digested a European debt crisis and the resulting global slowdown. Investors favored defensive type of equities and the perceived lower risk of U.S. treasuries. The fiscal year was marked by reassurance from the world’s central banks that they would do whatever was necessary to improve global economic growth, including an unprecedented conditional commitment from the U.S. Federal Reserve to maintain low interest rates until unemployment falls below 6.5% or the inflation rate exceeds 2.5%. These commitments coupled with an improving U.S. economic outlook initiated in the latter half of the fiscal year in the equity markets. While economic news was mixed over the fiscal year, there was continued and modest growth in nonfarm payrolls, a falling unemployment rate and an improved housing outlook. Growth expectations notched higher and this helped advance the U.S. equity market. Increased expectations were tempered by concerns over the ability of the two major political parties to settle issues regarding the federal budget — issues that must bridge deep philosophical differences. For the full fiscal year, large cap growth stocks, as measured by the Russell 1000® Growth Index provided the weakest returns among major indices rising 10.1%, while the Russell 1000® Value Index gained 18.8%. In addition defensive type stocks outperformed on the year and this is evident in sector performance as telecom, health care and consumer staples sectors outperformed. The Federal Reserve’s decision to keep interest rates lower for the foreseeable future has made riskier assets more attractive and despite some downturns during the period in reaction to poor economic news, the US equity markets have been trending upward.
Within the Russell 1000® Value Index, the best performing sectors for the fiscal year were consumer discretionary, consumer staples and telecommunication services, posting gains of 30.1%, 26.2%, and 24.3%, respectively. All ten sectors generated positive returns, with materials, energy and information technology lagging the other sectors for the year. These latter sectors posted returns of 4.9%, 8.2% and 10.6%, respectively.
4
Mercer US Large Cap Value Equity Fund
The Mercer Large Cap Value Equity Fund underperformed the Russell 1000® Value Index during the fiscal period. The primary driver of underperformance was stock selection in the telecommunication services, information technology and health care sectors. Within the telecommunication services sector, exposure to out-of-benchmark holdings Koninklijke, Vodafone and France Telecom was a significant detractor, costing the portfolio 79 basis points in relative results. Technology holdings Marvel, Qualcomm and Cisco were a drag on relative results over the period. The overweight to health care holdings Humana and Aetna while an underweight to the holding Bristol-Myers was a notable detractor in the health care sector. At March 31, 2013 the Fund no longer held Vodafone and Marvel. An overweight position in the consumer discretionary sector and good stock selection in the financials and energy sectors contributed positively to results.
Robeco’s underperformance relative to the index for the fiscal year and on a sector attribution basis, was due in large part to sector weighting decisions. The underweight positions to the telecommunication services and consumer staples sectors and an overweight position to the tech sector were all large detractors for the period. Good stock selection in the materials sectors was a modest positive contribution to the Fund’s performance for the fiscal year. O’Shaughnessy underperformed the Index for the fiscal year. Despite strong stock selection in the financials sector, which contributed positively to O’Shaughnessy’s performance, their broader investment mandate and stock selection in telecoms detracted from performance. Brandywine also underperformed for the fiscal year, and like Robeco, was primarily hurt by sector weighting decisions. Overall, stock selection added value. TBCAM outperformed the benchmark for the fiscal year. TBCAM’s outperformance was primarily driven by stock selection in the energy and consumer discretionary sectors. Stock selection in the tech sector was a detractor.
Risk Considerations
Value investing involves the risk that an investment made in undervalued securities may not appreciate in value as anticipated or remain undervalued for long periods of time. The Fund may experience high portfolio turnover which may result in higher costs and capital gains. The Fund’s volatility may be amplified by its ability to select sub-advisors to allocate assets.
5
Mercer Funds
March 31, 2013
Comparison of Change in Value of a $10,000 Investment in
Mercer US Large Cap Value Equity Shares vs. the
Russell 1000® Value Index
As of March 31, 2013

This graph shows the performance of the Mercer US Large Cap Value Equity Fund1 Class Y-3 shares versus the Russell 1000® Value Index from August 15, 2005, which is the inception date of the Fund, through March 31, 2013. The performance of other classes, when launched, will vary from the performance of the class shown based on the difference in fees and expenses paid by shareholders investing in different share classes. The Fund may charge a 2% redemption fee on shares owned less than 30 days.
The table and graph assume reinvestment of dividends and capital gains, but do not reflect a deduction of taxes an investor might pay on fund distributions or upon redemption of fund shares. Performance shown reflects a fee waiver and/or expense reimbursement. Without this waiver/reimbursement, returns would have been lower.
The data quoted represents past performance and does not guarantee future results. Current performance of the Fund may be lower or higher than the performance quoted. Please call 1-866-658-9896 for the Fund’s most recent month-end performance. Investment return and principal value will fluctuate so that an investor’s shares, when redeemed, may be worth more or less than when purchased. Due to market conditions, the Fund has experienced unusually high performance which may not be sustainable or repeated in the future.
6
Mercer US Small/Mid Cap Growth Equity Fund
Investment Objective and Benchmark
The investment objective of the Fund is to provide long-term total return, comprised primarily of capital appreciation. The benchmark for the Fund is the Russell 2500® Growth Index.
Investment Strategy
The Fund invests principally in equity securities issued by small-to-medium capitalization U.S. companies. The companies will generally have higher earnings and/or revenue growth histories or expectations relative to the Russell 2500® Growth Index.
Performance
For the fiscal year ended March 31, 2013, the Fund’s Y-3 share class performance was 12.11% compared to its benchmark return of 13.69%. Performance for the Fund is reported net of operating expenses while the benchmark returns do not include expenses of any kind as indexes are unmanaged.
The Sub-Advisors
As of March 31, 2013, the Fund employed four sub-advisors, Delaware Management Company (Delaware), Goldman Sachs Asset Management, L.P. (GSAM), Palisade Capital Management, L.L.C. (Palisade), and Westfield Capital Management Company, L.P. (Westfield). Delaware uses a bottom-up fundamental process in seeking to find companies with attractive business models that generate strong free cash flow. They also believe in a concentrated portfolio and will typically hold approximately 25 to 30 holdings. GSAM bases investment decisions on the identification of high-quality business franchises it believes that are strategically positioned for long-term growth. The firm seeks to invest in companies that meet its criteria for a high-quality growth investment, which include dominant market share, established brand name, pricing power, and recurring revenue streams. Palisade believes companies with strong or improving prospects for growth generate superior returns. Palisade believes that (1) fundamental research is the basis for identifying superior businesses, (2) long term investment success is the result of owning fundamentally strong and dynamic companies trading at a discount to their growth rates, (3) indentifying a dynamic of change before it appears in consensus estimates leads to superior returns, and (4) management plays a significant role in the success of a company. Westfield employs a fundamental, bottom-up approach which seeks to identify reasonably priced stocks with high earnings growth potential.
Market Commentary and Fund Performance
For the Fund’s fiscal year, the market, as measured by the S&P 500 Index, rose 14.0% continuing the rise which started in March 2009. The now four-year bull market has brought returns of 114% for the four-year period ending March 2013. For the prior fiscal year, it was split into distinct periods as economic news impacted investor’s views regarding which type of investments were most attractive. The fiscal year began with negative returns in the first fiscal quarter as the market digested a European debt crisis and the resulting global slowdown. Investors favored defensive type of equities and the perceived lower risk of U.S. treasuries. The fiscal year was marked by reassurance from the world’s central banks that they would do whatever was necessary to improve global economic growth, including an unprecedented conditional commitment from the U.S. Federal Reserve to maintain low interest rates until unemployment falls below 6.5% or the inflation rate exceeds 2.5%. These commitments coupled with an improving U.S. economic outlook initiated the latter half of the fiscal year in the equity markets. While economic news was mixed over the fiscal year, there was continued and modest growth in nonfarm payrolls, a falling unemployment rate and an improved housing outlook. Growth expectations notched higher and this helped advance the U.S. equity market. Increased expectations were tempered by concerns over the ability of the two major political parties to settle issues regarding the federal budget — issues that must bridge deep philosophical differences. For the full fiscal year, large cap growth stocks, as measured by the Russell 1000® Growth Index provided the weakest returns among major indices rising 10.1%, while the Russell 1000® Value Index gained 18.8%. In addition defensive type stocks outperformed on the year and this is evident in sector performance as telecom, health care and consumer staples sectors outperformed. The Federal Reserve’s decision to keep interest rates lower for the foreseeable future has made riskier assets more attractive and despite some downturns during the period in reaction to poor economic news, the US equity markets have been trending upward.
7
Mercer US Small/Mid Cap Growth Equity Fund
Within the Russell 2500® Growth Index, the best performing sectors for the fiscal year were industrials, financials and consumer staples posting gains of 22.1%, 20.9%, and 17.2%, respectively. Lagging sectors for the fiscal year were information technology, energy and consumer discretionary, posting returns of 1.8%, 8.1%, and 11.2%, respectively.
The Mercer US Small/Mid Cap Growth Equity Fund underperformed the Russell 2500® Growth Index for the period. The primary driver of underperformance was stock selection in the industrials sector. Notable detractors in this sector included Expeditors International, Ritchie Brothers, Kennametal and Ryder Systems, costing the portfolio 85 basis points in relative results. A lack of exposure to airline stocks was an additional and significant detractor for the period. Good stock selection in the energy and telecommunications sectors was a positive contributor for the fiscal year.
Delaware underperformed the index for the period. Because Delaware manages a concentrated and high tracking error portfolio with a long term investment horizon, performance can vary significantly from year to year, as was the case from prior fiscal year to the current fiscal year. The primary areas of underperformance were in the industrials, consumer discretionary and tech sectors. Good stock selection in the telecommunication services sector helped to offset some of the underperformance in other sectors. GSAM outperformed the index during the period. Strong stock selection in the tech, telecommunication services and consumer discretionary sectors boosted results for the period. In particular, stock selection among semiconductors, wireless telecommunications services and specialty retail stocks positively contributed to results. An underweight position and poor stock selection in the industrials sector detracted from results. Palisade underperformed for the period. Stock selection in the industrials and tech sectors was a significant detractor. In the tech sector, a significant overweight and stock selection among software industry stocks was a large detractor. A number of acquisitions in the portfolio boosted results. Westfield outperformed for the period. The primary driver of outperformance for the period was stock selection in the energy and consumer discretionary sectors. Stock selection in the health care and industrials sectors detracted from results.
Risk Considerations
The Fund invests in growth stocks which may be particularly sensitive to market conditions. Investments made in small and mid-capitalization companies may be more volatile and less liquid due to limited resources or product lines and more sensitive to economic factors. The Fund may experience high portfolio turnover which may result in higher costs and capital gains. The Fund’s volatility may be amplified by its ability to select sub advisors to allocate assets.
8
Mercer Funds
March 31, 2013
Comparison of Change in Value of a $10,000 Investment in
Mercer US Small/Mid Cap Growth Equity Shares vs. the
Russell 2500® Growth Index
As of March 31, 2013
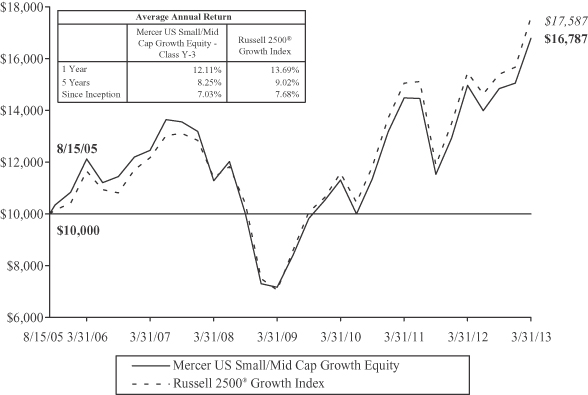
This graph shows the performance of the Mercer US Small/Mid Cap Growth Equity Fund1 Class Y-3 shares versus the Russell 2500® Growth Index from August 15, 2005, which is the inception date of the Fund, through March 31, 2013. The performance of other classes, when launched, will vary from the performance of the class shown based on the difference in fees and expenses paid by shareholders investing in different share classes. The Fund may charge a 2% redemption fee on shares owned less than 30 days.
The table and graph assume reinvestment of dividends and capital gains, but do not reflect a deduction of taxes an investor might pay on fund distributions or upon redemption of fund shares. Performance shown reflects a fee waiver and/or expense reimbursement. Without this waiver/reimbursement, returns would have been lower.
The data quoted represents past performance and does not guarantee future results. Current performance of the Fund may be lower or higher than the performance quoted. Please call 1-866-658-9896 for the Fund’s most recent month-end performance. Investment return and principal value will fluctuate so that an investor’s shares, when redeemed, may be worth more or less than when purchased.
9
Mercer US Small/Mid Cap Value Equity Fund
Investment Objective and Benchmark
The investment objective of the Fund is to provide long-term total return, comprised primarily of capital appreciation. The benchmark for the Fund is the Russell 2500® Value Index.
Investment Strategy
The Fund invests principally in equity securities issued by small-to-medium sized capitalization U.S. companies. Generally, the Fund invests in stocks that appear to be undervalued based on the stocks’ intrinsic values relative to their current market prices.
Performance
For the fiscal year ended March 31, 2013, the Fund’s Y-3 share class performance was 16.51% compared to its benchmark return of 21.17%. Performance for the Fund is reported net of operating expenses while the benchmark returns do not include expenses of any kind as indexes are unmanaged.
The Sub-Advisors
As of March 31, 2013, the Fund employed four sub-advisors, AQR Capital Management, LLC (AQR), NWQ Investment Management Company, LLC (NWQ), Systematic Financial Management, L.P. (Systematic), and River Road Asset Management, LLC (River Road). AQR’s investment philosophy combines concepts of value and momentum into a quantitative process blended with traditional factors as inputs and weightings partially determined through qualitative analysis. NWQ uses bottom-up fundamental analysis to identify undervalued companies where catalysts for improved valuation exist. The firm seeks stocks that are mispriced or neglected by Wall Street with attractive risk/reward characteristics. Systematic’s investment philosophy is predicated on its belief that stock prices are a reflection of consensus earnings estimates, and as revisions to those estimates rise or fall, stock prices will move accordingly. Systematic applies a strategic combination of qualitative and quantitative research seeking to identify high-quality, attractively valued small and medium-sized companies exhibiting a confirmed catalyst for stock price appreciation. River Road believes inefficiencies can be captured in smaller capitalization and out-of-favor companies and in those securities with little analyst coverage. Through bottom-up, fundamental research, the team seeks companies with attractive, sustainable returns that are financially strong and trade at compelling valuations.
Market Commentary and Fund Performance
For the Fund’s fiscal year, the market, as measured by the S&P 500 Index, rose 14.0% continuing the rise which started in March 2009. The now four-year bull market has brought returns of 114% for the four-year period ending March 2013. For the prior fiscal year, it was split into distinct periods as economic news impacted investor’s views regarding which type of investments were most attractive. The fiscal year began with negative returns in the first fiscal quarter as the market digested a European debt crisis and the resulting global slowdown. Investors favored defensive type of equities and the perceived lower risk of U.S. treasuries. The fiscal year was marked by reassurance from the world’s central banks that they would do whatever was necessary to improve global economic growth, including an unprecedented conditional commitment from the U.S. Federal Reserve to maintain low interest rates until unemployment falls below 6.5% or the inflation rate exceeds 2.5%. These commitments coupled with an improving U.S. economic outlook initiated the latter half of the fiscal year in the equity markets. While economic news was mixed over the fiscal year, there was continued and modest growth in nonfarm payrolls, a falling unemployment rate and an improved housing outlook. Growth expectations notched higher and this helped advance the U.S. equity market. Increased expectations were tempered by concerns over the ability of the two major political parties to settle issues regarding the federal budget — issues that must bridge deep philosophical differences. For the full fiscal year, large cap growth stocks, as measured by the Russell 1000® Growth Index provided the weakest returns among major indices rising 10.1%, while the Russell 1000® Value Index gained 18.8%. In addition defensive type stocks outperformed on the year and this is evident in sector performance as telecom, health care and consumer staples sectors outperformed. The Federal Reserve’s decision to keep interest rates lower for the foreseeable future has made riskier assets more attractive and despite some downturns during the period in reaction to poor economic news, the US equity markets have been trending upward.
10
Mercer US Small/Mid Cap Value Equity Fund
Within the Russell 2500® Value Index, the best performing sectors were consumer staples, consumer discretionary and health care with gains of 37.2%, 29.5%, and 26.5%, respectively. Lagging sectors included telecommunication services, and information technology, which posted returns of -3.1%, -3.5%, and -6.3%, respectively.
The Mercer Small/Mid Cap Value Equity Fund underperformed the Russell 2500® Value Index for the fiscal year. Stock selection in the consumer discretionary and health care sectors was the primary driver of underperformance for the period. In the consumer discretionary sector, notable detractors included the holdings Big Lots, Career Education, Ascena Retail and Express. At March 31, 2013 the Fund no longer held Express. In the health care sector, stock selection among health care providers cost the portfolio 84 basis points in relative results and was the leading industry detractor in that sector. Good stock selection in the financials and telecommunications sectors helped to offset underperformance in other sectors.
AQR, a manager with a quantitative strategy combining elements of valuation and momentum, underperformed the index. The strategy underperformed primarily due to implementation of a long/short model portfolio into a long only portfolio. AQR’s sector weighting decisions offset some of the underperformance on the year. NWQ underperformed the benchmark, with the strategy lagging in the tech and consumer discretionary sectors. In the tech sector, underperformance was largely due to significant overweights to underperforming semiconductor and electronic equipment industries. A lack of exposure to homebuilders in the consumer discretionary sector was an additional detractor. Stock selection in the financials sector helped relative results. River Road outperformed for the period, posting strong relative results in the financials and tech sectors. In tech, underweighting those same underperforming semiconductor and electronic equipment industries, was a boost to relative results. Stock selection in the consumer discretionary sector detracted from results. Systematic posted strong absolute returns but lagged the benchmark for the period. Stock selection in the consumer sectors was a significant detractor for the period. In the consumer discretionary sector, the holding Herbalife was a notable detractor, costing the portfolio 94 basis points in relative results. At March 31, 2013 the Fund no longer held Herbalife. Good stock selection in the materials sector was a positive contributor.
Risk Considerations
Value investing involves the risk that an investment made in undervalued securities may not appreciate in value as anticipated or remain undervalued for long periods of time. Investments made in small and mid-capitalization companies may be more volatile and less liquid due to limited resources or product lines and more sensitive to economic factors. The Fund may experience high portfolio turnover which may result in higher costs and capital gains. The Fund’s volatility may be amplified by its ability to select sub advisors to allocate assets.
11
Mercer Funds
March 31, 2013
Comparison of Change in Value of a $10,000 Investment in
Mercer US Small/Mid Cap Value Equity Shares vs. the
Russell 2500® Value Index
As of March 31, 2013
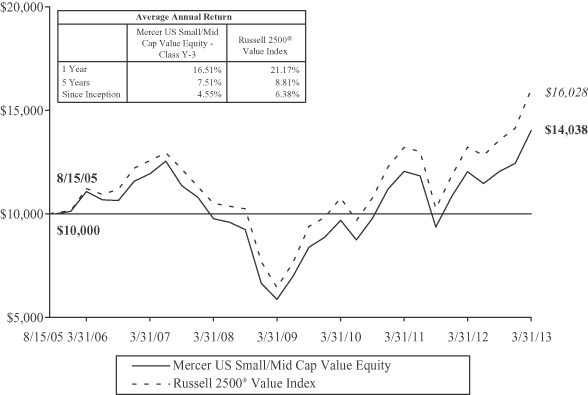
This graph shows the performance of the Mercer US Small/Mid Cap Value Equity Fund1 Class Y-3 shares versus the Russell 2500® Value Index from August 15, 2005, which is the inception date of the Fund, through March 31, 2013. The performance of other classes, when launched, will vary from the performance of the class shown based on the difference in fees and expenses paid by shareholders investing in different share classes. The Fund may charge a 2% redemption fee on shares owned less than 30 days.
The table and graph assume reinvestment of dividends and capital gains, but do not reflect a deduction of taxes an investor might pay on fund distributions or upon redemption of fund shares. Performance shown reflects a fee waiver and/or expense reimbursement. Without this waiver/reimbursement, returns would have been lower.
The data quoted represents past performance and does not guarantee future results. Current performance of the Fund may be lower or higher than the performance quoted. Please call 1-866-658-9896 for the Fund’s most recent month-end performance. Investment return and principal value will fluctuate so that an investor’s shares, when redeemed, may be worth more or less than when purchased.
12
Mercer Non-US Core Equity Fund
Investment Objective and Benchmark
The investment objective of the Fund is to provide long-term total return, which includes capital appreciation and income. The benchmark for the Fund is the MSCI EAFE Index.
Investment Strategy
The Fund invests principally in equity securities issued by non-U.S. companies of any capitalization, located in the world’s developed and emerging capital markets.
Performance
For the fiscal year ended March 31, 2013, the Fund’s Y-3 share class performance was 11.53% compared to its benchmark return of 11.25%. Performance for the Fund is reported net of operating expenses while the benchmark returns do not include expenses of any kind as indexes are unmanaged.
The Sub-Advisors
As of March 31, 2013, the Fund employed four sub-advisors, Arrowstreet Capital, Limited Partnership (Arrowstreet), Echo Point Investment Management, LLC (Echo Point), Lingohr & Partner North America, Inc. (Lingohr) and Massachusetts Financial Services Company (MFS). The Fund was reduced from six managers to four managers in September, 2012 when the dedicated emerging markets managers, Lazard Asset Management (Lazard) and William Blair & Company L.L.C. (William Blair) were removed from the Fund.
Arrowstreet employs a quantitative investment approach, focusing on developing and exploiting proprietary signals. Arrowstreet’s proprietary investment process measures the direct effects on stocks, as well as the indirect effects on countries, global sectors, country/sector interactions, and expanded linkages of inter-related companies. Arrowstreet constructs portfolios with an integrated alpha forecast, while simultaneously estimating risk and transaction costs, to create optimized portfolios. Echo Point manages a growth portfolio, which focuses on attractively valued stocks that are identified as being high quality and exhibiting strong growth characteristics. This strategy invests opportunistically in emerging markets. Lingohr manages a value portfolio, which consists of undervalued stocks identified through the firm’s disciplined, systematic, quantitative investment approach. Stock selection includes a fundamental qualitative overlay through the portfolio management team. This strategy invests opportunistically in emerging markets. MFS manages a value portfolio, which focuses on stocks whose long-term value they believe is not adequately reflected in the stock price. This strategy invests opportunistically in emerging markets.
Market Commentary and Fund Performance
International equity markets were influenced by the on-going sovereign debt crisis in Europe and uncertainty over China growth during the 12 month period ending March 31, 2013. The one year period was defined by two divergent markets. During the second quarter of 2012, concerns over the European crisis and the decelerating US economy resurfaced leading to the selloff of risky assets. News that the Eurozone had officially reentered a recession during the first quarter of 2012 fueled the market selloff. In addition, the French election, although the results were not a surprise, concerned investors due to the potential disruption of established austerity policies and increased tensions with Germany. In addition, the periphery countries remained in focus as Spain’s third largest bank, Bankia, was bailed out. Contributing to the global uncertainty was China’s government warning that their growth expectations for 2012 had fallen to 7.5% from the original 7.9% expectation.
However, over the subsequent 9-month period ending March 31, 2013, the markets stabilized as positive economic and fiscal news buoyed a market rally, posting a 19.8% return, after selling off -7.2% over the previous 3 months. During the third quarter of 2012, the world’s central bankers helped stem investors’ concerns about slowing economic growth and the potential of a Eurozone breakup with accommodative monetary policy. Europe rebounded during the third quarter spurred by the market’s positive reaction to the European Central Bank’s (“ECB”) bond-buying program which reduced the risk of sovereign default. Rounding out 2012, the market continued to rally into the fourth quarter supported by policy measures taken by the ECB and signs of China stabilization.
For 2013, the market forged ahead in January supported again by positive macro news. Positive news out of the U.S. sparked the market rally, particularly the news on the fiscal cliff resolution, an extension of the U.S. debt ceiling and positive earnings
13
Mercer Non-US Core Equity Fund
announcements. In addition, stabilization in Europe and signs that China growth may be recovering supported global equities. Over the rest of the quarter, however, uncertainty resurfaced again regarding stability in Europe particularly the Italian election results and the voter’s failure to endorse the fiscal austerity program. In addition, the banking crisis in Cyprus, fueled an increase in volatility during the second half of the quarter. The market proved resilient and held their gains and returned 5.2% for the first quarter of 2013. The MSCI EAFE Index posted a solid gain of 11.25% for the 12-month period ending March 31, 2013.
In this environment, the Mercer Non-US Core Equity Fund outperformed the MSCI EAFE Index by 0.28% for the 12-month period ending March 31, 2013. The Fund’s bias to quality in terms of investing in companies with sustainable levels of profitability and positive exposures to defensive sectors were the primary drivers of outperformance. In addition, favorable security selection in energy, information technology and materials contributed positively to performance. From a country perspective, positive selection in China, Japan, Germany, and the United Kingdom contributed positively to performance. Somewhat offsetting positive performance was negative country, sector and selection decisions. In particular, an underweight to Australia, an overweight to Italy and an overweight to emerging markets, such as Brazil and China detracted from performance. From a sector perspective, an underweight to the outperforming financials sector and an overweight to the underperforming information technology sector were detractors from performance. In addition, security selection was negative in consumer staples and consumer discretionary.
In aggregate, performance of the Fund’s sub-advisors was positive, with three of the four sub-advisors outperforming. MFS led all sub-advisors, by outperforming the index by 5.29%, as their style of focusing on undervalued, high quality businesses did well over the past year. Performance was driven by both sector and security selection decisions. Security selection was particularly strong in information technology, industrials and materials. Sector allocations were driven by underweighting industrials and materials in favor of overweighting consumer staples. From a regional perspective, selection in the Asia Pacific and Western Europe regions contributed positively to performance. Slightly offsetting the positive performance was the decision to overweight the poor performing telecommunication sector and negative security selection in the information technology sector. Another strong contributor for the year was Arrowstreet. Arrowstreet outperformed from a sector perspective as a result of positive contributors from sector allocations and selection. Sector allocations were positive as a result of overweighting health care and underweighting energy, materials and utilities. Selection was strong in consumer discretionary, energy, health care, industrials, and telecommunication services. From a regional perspective, most of the value-add was driven by positions in Western Europe (France, Germany, Spain, Sweden, and the United Kingdom). In addition, positions in Asia Pacific, led by Australia and Japan also added value. Slightly offsetting the positive performance was the decision to overweight the information technology sector and negative security selection within the sector. Echo Point also added value over the past year driven by positive selection in financials, information technology and telecommunication services. From a regional perspective, the majority of value-add was driven by selection in Europe, particularly in Germany and the United Kingdom. Slightly offsetting the positive performance was negative selection within the industrials sector. The primary detractor for the past year was Lingohr. Lingohr detracted from performance due to sector allocation and selection decisions. Sector allocations were hurt by underweighting consumer staples, financials and health care in favor of overweighting materials and consumer discretionary. Selection was particularly difficult in telecommunication services, consumer staples and industrials. From a regional perspective, most of the underperformance was due to the Emerging Market non-benchmark exposure. Slightly offsetting the negative performance was positive selection in the industrials sector.
Risk Considerations
The Fund invests in foreign and emerging market securities which involves certain risks such as currency volatility, political and social instability and reduced market liquidity. Emerging markets may be more volatile and less liquid than more developed markets and therefore may involve greater risks. Investments made in small and mid-capitalization companies may be more volatile and less liquid due to limited resources or product lines and more sensitive to economic factors. The Fund may experience high portfolio turnover which may result in higher costs and capital gains. The Fund’s volatility may be amplified by its ability to select sub-advisors to allocate assets.
14
Mercer Funds
March 31, 2013
Comparison of Change in Value of a $10,000 Investment in
Mercer Non-US Core Equity Shares vs. the
MSCI EAFE Index
As of March 31, 2013

This graph shows the performance of the Mercer Non-US Core Equity Fund1 Class Y-3 shares versus the MSCI EAFE Index from August 18, 2006, which is the inception date of the Fund, through March 31, 2013. The performance of other classes, when launched, will vary from the performance of the class shown based on the difference in fees and expenses paid by shareholders investing in different share classes. The Fund may charge a 2% redemption fee on shares owned less than 30 days.
The table and graph assume reinvestment of dividends and capital gains, but do not reflect a deduction of taxes an investor might pay on fund distributions or upon redemption of fund shares. Performance shown reflects a fee waiver and/or expense reimbursement. Without this waiver/reimbursement, returns would have been lower.
The data quoted represents past performance and does not guarantee future results. Current performance of the Fund may be lower or higher than the performance quoted. Please call 1-866-658-9896 for the Fund’s most recent month-end performance. Investment return and principal value will fluctuate so that an investor’s shares, when redeemed, may be worth more or less than when purchased.
15
Mercer Core Opportunistic Fixed Income Fund
Investment Objective and Benchmark
The investment objective of the Fund is to provide total return, consisting of both current income and capital appreciation. The benchmark for the Fund is the Barclays U.S. Aggregate BondTM Index.
Investment Strategy
The Fund invests principally in investment grade fixed income securities, including government securities and corporate bonds. The Fund may also invest in non-investment grade bonds, non-U.S. dollar denominated bonds, bonds issued by issuers located in emerging capital markets, and certain derivative instruments.
Performance
For the fiscal year ended March 31, 2013, the Fund’s Y-3 share class performance was 6.15% compared to its benchmark return of 3.77%. Performance for the Fund is reported net of operating expenses while the benchmark returns do not include expenses of any kind as indexes are unmanaged.
The Sub-Advisors
As of March 31, 2013, the Fund employed four sub-advisors, Dodge & Cox, Western Asset Management Company (WAMCO), Pacific Investment Management Company LLC (PIMCO), and MacKay Shields LLC. Dodge & Cox manages its allocated portion of the Fund with an extended investment horizon supported by fundamental research and a strict valuation discipline. Their process emphasizes security-level research and individual security and sector selection to build a high-average-quality portfolio that seeks incremental yield versus the broad market. WAMCO manages its allocated portion of the Fund using a diversified, tightly controlled, value-oriented portfolio. The firm’s management style emphasizes the use of multiple strategies and active sector rotation and issue selection, while constraining overall interest rate risk relative to the benchmark. PIMCO manages its allocated portion of the Fund using a blend of long-range macro-economic forecasts with shorter-term, bottom-up security selection focused on valuation. The firm uses sector rotation and duration targeting as primary drivers of performance within a disciplined, risk-controlled approach. MacKay Shields manages its allocated portion of the Fund using a philosophy which is centered on the belief that the best risk-adjusted returns and, ultimately, the best absolute returns, are generated by a strategy of yield capture and error avoidance. This research process is focused on avoiding securities that have uncompensated risk.
Market Commentary and Fund Performance
Although there was frequent volatility and reversals of investor sentiment during the one-year period ending March 31, 2013, the general trend over the trailing twelve months was favorable for fixed income investors. U.S. Treasury rates fell moderately for the period, with the 10-year Treasury dropping 36 basis points (2.21% at March 31, 2012 versus 1.85% at March 31, 2013) and the 30-year Treasury dropping slightly less at 25 basis points (3.35% at March 31, 2012 versus 3.10% at March 31, 2013), but with sizable moves over short time periods and a wide trading range overall (nearly 100 basis points from high to low for the 10-year Treasury). The calendar pattern in recent years — strong starts followed by mid-year sell-offs and risk aversion, migrating back towards risk seeking in the closing months — continued to hold for 2012. After a big move upwards in risk assets to start the year, the second calendar quarter brought renewed market focus on challenges in the Euro-zone as well as deteriorating U.S. economic data, to the point where 10-year Treasury rates touched below 1.40% (a measure 60 basis points lower than the lowest level seen in the 2008 Global Financial Crisis). Later, despite mixed U.S. economic data and slowing global economic activity, market sentiment improved due largely to efforts by the European Central Bank and Federal Reserve to support economic growth and foster market confidence. Notable “interventions” and actions included extending Operation Twist, announcing Quantitative Easing III, and moving away from rate/date guidance towards inflation and employment targets. This improved sentiment, in addition to strong corporate fundamentals and improving news from Europe, drove a credit sector rally to end the year. Favorable market technicals were also present, with investor appetite for new issuance offering (any) yield relative to near-zero money markets and ultra-low Treasury yields. Not even the tightly contested U.S. presidential election, fiscal cliff/sequester discussions, and headline-making in Italy and Cyprus toward the end of the period could derail non-Treasury bond spreads from moving lower. Although market performance was positive, it was somewhat of a unsettled twelve-month period for investors given a slowly improving U.S. economy that appears to be balancing support for shorter-term risks with the need to prepare for longer-term prosperity.
16
Mercer Core Opportunistic Fixed Income Fund
Given a downward trend in both the U.S. Treasury curve (rates lower) and credit spreads (buyers pushing up prices for riskier assets) over the twelve months ending March 31, 2013, absolute returns in fixed income were relatively strong. Spread sectors (non-Treasury) provided healthy returns for the fiscal period in absolute terms and in relation to similar-duration Treasuries (excess returns), led by a double-digit return in the high yield sector. The Fund’s return was positive in both absolute terms and in relation to the Barclays U.S. Aggregate Bond Index for the period. The Fund benefited from its strategic overweight to spread sectors including an allocation to high yield that was the top performing sub-sector for the trailing twelve months. The Fund underweight to lower yielding US Treasuries in the form of a shorter duration stance or term structure bias (favoring certain maturities over others) relative to the index was detrimental to performance at times.
The risk posture of each sub-advisor correlated with their respective performance results. PIMCO’s relatively defensive top-down positioning was particularly helpful during periods of condensed risk-aversion but not detrimental during spread rallies. WAMCO’s more aggressive spread sector allocation provided returns well ahead of the Fund’s benchmark, while Dodge & Cox’s bias towards corporate credit and avoidance of government exposure most benefited the Fund after the June/July market shift. Although MacKay slightly trailed its sector benchmark, the high yield market itself greatly outperformed broad market fixed income, prompting MacKay to easily surpass the Fund’s benchmark. Strategic and/or tactical underweights to lower yielding US Treasuries in the form of a shorter duration stance or term structure bias (favoring certain maturities over others), relative to benchmarks was detrimental to sub-advisor performance at times.
Risk Considerations
The Fund is subject to the same risks as the underlying bonds in the portfolio such as credit, prepayment, call and interest rate risk. As interest rates rise the value of bond prices will decline. The Fund may invest in more aggressive investments such as foreign securities which may expose the Fund to currency and exchange rate fluctuations, derivatives (futures, options, swaps) and high yield debt (also known as junk bonds) all of which may cause greater volatility and less liquidity. Derivatives may be more sensitive to changes in market conditions and may amplify risks. The Fund may experience high portfolio turnover which may result in higher costs and capital gains. The Fund’s volatility may be amplified by its ability to select sub-advisors to allocate assets.
17
Mercer Funds
March 31, 2013
Comparison of Change in Value of a $10,000 Investment in
Mercer Core Opportunistic Fixed Income Shares vs. the
Barclays U.S. Aggregate Bond™ Index
As of March 31, 2013
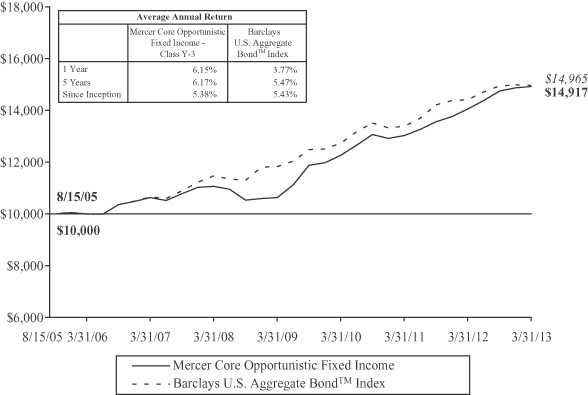
This graph shows the performance of the Mercer Core Opportunistic Fixed Income Fund1 Class Y-3 shares versus the Barclays US Aggregate Bond™ Index from August 15, 2005, which is the inception date of the Fund, through March 31, 2013. The performance of other classes, when launched, will vary from the performance of the class shown based on the difference in fees and expenses paid by shareholders investing in different share classes. The Fund may charge a 2% redemption fee on shares owned less than 30 days.
The table and graph assume reinvestment of dividends and capital gains, but do not reflect a deduction of taxes an investor might pay on fund distributions or upon redemption of fund shares. Performance shown reflects a fee waiver and/or expense reimbursement. Without this waiver/reimbursement, returns would have been lower.
The data quoted represents past performance and does not guarantee future results. Current performance of the Fund may be lower or higher than the performance quoted. Please call 1-866-658-9896 for the Fund’s most recent month-end performance. Investment return and principal value will fluctuate so that an investor’s shares, when redeemed, may be worth more or less than when purchased.
18
Mercer Emerging Markets Equity Fund
Investment Objective and Benchmark
The investment objective of the Fund is to provide long-term total return, which includes capital appreciation and income. The benchmark for the Fund is the MSCI Emerging Markets Index.
Investment Strategy
The Fund invests principally in equity securities of large, medium and small capitalization companies, located in emerging markets, other investments that are tied economically to emerging markets, as well as in American, European and Global Depository receipts.
Performance*
Since inception of May 1, 2012, the Fund’s Y-3 share class performance was 5.64% compared to its benchmark return of 3.19%. Performance for the Fund is reported net of operating expenses while the benchmark returns do not include expenses of any kind as indexes are unmanaged.
The Sub-Advisors
As of March 31, 2013, the Fund employed three sub-advisors, AQR Capital Management, LLC (AQR), Kleinwort Benson Investors International Ltd. (KBI) and Vontobel Asset Management, Inc. (Vontobel). AQR employs a quantitative investment approach focused on sourcing alpha from currency, country and security selection models. AQR’s proprietary investment process uses systematic factors, such as value, momentum, quality factors within the alpha models. AQR constructs portfolios with an integrated alpha forecast, while simultaneously estimating risk and transaction costs, to create optimized portfolios. KBI manages a systematic process focusing on quality firms growing their dividend yield. The portfolio construction process uses sector and region constraints to minimize uncompensated risks to ensure the majority of risk is associated with the alpha model. Vontobel uses a fundamental process to identify high quality, sustainable growth companies in businesses with high barrier to entry. Vontobel’s risk management process focused on capital preservation and manages risk in absolute terms.
Market Commentary and Fund Performance
Emerging equity markets were influenced by the on-going sovereign debt crisis in Europe and uncertainty over China growth during the 11 month period ending March 31, 2013. The period was defined by two divergent markets. During the second quarter of 2012, concerns over the European crisis and the decelerating US economy resurfaced leading to the selloff of risky assets. News that the Eurozone had officially reentered a recession during the first quarter fueled the market sell-off. In addition, the French election, although the results were not a surprise, concerned investors due to the potential disruption of established austerity policies and increased tensions with Germany. In addition, the periphery countries remained in focus as Spain’s third largest bank, Bankia, was bailed out. Contributing to the global uncertainty was China’s government warning that their growth expectations for 2012 had fallen to 7.5% from the original 7.9% expectation.
However, over the subsequent 9-month period ending March 31, 2013, the markets stabilized as positive economic and fiscal news buoyed a market rally, posting a 12.3% return, after selling off -6.6% over the previous 2 months. During the third quarter of 2012, the world’s central bankers helped stem investors’ concerns about slowing economic growth and the potential of a Eurozone breakup with accommodative monetary policy. Europe rebounded during the third quarter spurred by the market’s positive reaction to the European Credit Bank’s (“ECB”) bond-buying program which reduced the risk of sovereign default. Rounding out 2012, the market continued to rally into the fourth quarter supported by policy measures taken by the ECB and signs of China stabilization.
For 2013, the market forged ahead in January supported again by positive macro news. Positive news out of the U.S. sparked the market rally, particularly the news on the fiscal cliff resolution, an extension of the U.S. debt ceiling and positive earnings announcements. In addition, stabilization in Europe and signs that China growth may be recovering supported global equities. Over the rest of the quarter, however, uncertainty resurfaced again regarding stability in Europe particularly the Italian election results and the voter’s failure to endorse the fiscal austerity program. In addition, the banking crisis in Cyprus and
| * | The Fund commenced operations on May 1, 2012. |
19
Mercer Emerging Markets Equity Fund
strict requirements for an EU bailout fueled an increase in volatility during the second half of the quarter. The market struggled to gain a footing and returned -1.62% for the first quarter of 2013. The MSCI Emerging Market Index posted a solid gain of 3.19% for the 11-month period ending March 31, 2013.
In this environment, the Mercer Emerging Markets Equity Fund outperformed the MSCI Emerging Markets Index by +2.45% for the 11-month period ending March 31, 2013. The Fund’s bias to quality in terms of investing in companies with sustainable levels of profitability and positive exposures to defensive sectors were the primary drivers of outperformance. The primary sector allocations adding value included overweighting consumer staples and underweighting energy, financials and materials. In addition, favorable security selection in consumer discretionary, consumer staples and industrials contributed positively to performance. From a country perspective, positive selection in Mexico, Malaysia and South Korea contributed positively to performance. Offsetting some of the positives for the Fund was negative security selection in financials and information technology.
In aggregate, performance of the Fund’s sub-advisors was positive, with all three sub-advisors outperforming. Vontobel was the strongest contributor, as their style of focusing on high quality, sustainable growth businesses did well over the past year. Performance was driven by both sector and selection decisions. Security selection was particularly strong in consumer staples and industrials. Sector allocations were driven by underweighting energy and materials in favor of overweighting consumer staples. From a regional perspective, selection in the Asia Pacific and Latin America regions contributed positively to performance. Slightly offsetting some of the positives for Vontobel was negative security selection in information technology and utilities. KBI added value primarily due to selection in consumer staples, energy, information technology, and telecommunication services. From a regional perspective, regional allocations drove performance, with an overweight to Asia Pacific (China and Taiwan) adding value. Detracting from KBI’s performance was negative security selection in the consumer staples and financial sectors. AQR also contributed positively, with a combination of currency, country and security selection adding value. Positive security selection contribution was driven by consumer staples, energy, financials, and industrials.
Risk Considerations
The Fund invests in emerging market securities which involves certain risks such as currency volatility, political and social instability and reduced market liquidity. Emerging markets may be more volatile and less liquid than more developed markets and therefore may involve greater risks. Investments made in small and mid-capitalization companies may be more volatile and less liquid due to limited resources or product lines and more sensitive to economic factors. The Fund may invest in more aggressive investments such as derivatives (futures, options, swaps) all of which may cause greater volatility and less liquidity. Derivatives are more sensitive to changes in market conditions and may amplify risks. The Fund may experience high portfolio turnover which may result in higher costs and capital gains. The Fund’s volatility may be amplified by its ability to select sub advisors to allocate assets.
20
Mercer Funds
March 31, 2013
Comparison of Change in Value of a $10,000 Investment in
Mercer Emerging Markets Equity Shares vs. the
MSCI Emerging Markets Index
As of March 31, 2013
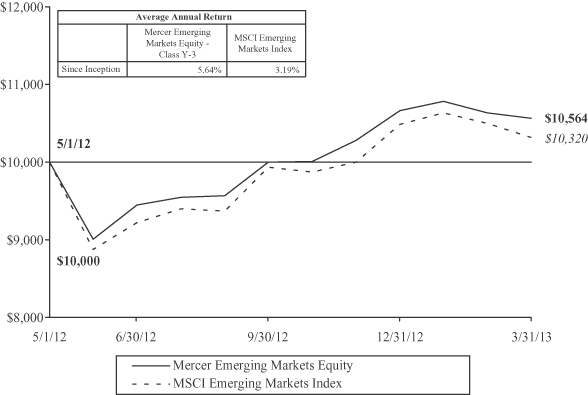
This graph shows the performance of the Mercer Emerging Markets Equity Fund Class Y-3 shares versus the MSCI Emerging Markets Index from May 1, 2012, which is the inception date of the Fund, through March 31, 2013. The performance of other classes, when launched, will vary from the performance of the class shown based on the difference in fees and expenses paid by shareholders investing in different share classes. The Fund may charge a 2% redemption fee on shares owned less than 30 days.
The table and graph assume reinvestment of dividends and capital gains, but do not reflect a deduction of taxes an investor might pay on fund distributions or upon redemption of fund shares. Performance shown reflects a fee waiver and/or expense reimbursement. Without this waiver/reimbursement, returns would have been lower.
The data quoted represents past performance and does not guarantee future results. Current performance of the Fund may be lower or higher than the performance quoted. Please call 1-866-658-9896 for the Fund’s most recent month-end performance. Investment return and principal value will fluctuate so that an investor’s shares, when redeemed, may be worth more or less than when purchased.
21
Mercer Global Low Volatility Equity Fund
Investment Objective and Benchmark
The investment objective of the Fund is to provide long-term total return, which includes capital appreciation and income. The benchmark for the Fund is the MSCI World Index.
Investment Strategy
The Fund invests principally in equity securities of U.S. and foreign issuers, of large, medium and small capitalization companies.
Performance*
Since inception of November 6, 2012, the Fund’s Y-3 share class performance was up 12.13% compared to its benchmark return of 11.00%. Performance for the Fund is reported net of operating expenses while the benchmark returns do not include expenses of any kind as indexes are unmanaged.
The Sub-Advisors
As of March 31, 2013, the Fund employed three sub-advisors, Acadian Asset Management LLC (Acadian), MFG Asset Management (MFG) and First Eagle Investment Management, LLC (First Eagle). Acadian’s process uses both risk analysis and alpha forecasts to create the portfolio. The process uses a risk model to determine the systematic risk and the level of volatility of each stock in the investible universe. Once a stock’s risk is determined, the manager uses their alpha model as an overlay to determine the optimal mix of securities. The alpha model consists of five alpha categories including value, growth, risk, macroeconomic, and technical factors. MFG screens the universe of investible global stocks to identify companies which MFG believes have demonstrable and sustainable competitive advantages, which are then evaluated using MFG’s key quality criteria: economic moat; business risk; agency risk; and re-investment potential. The manager then incorporates “dual-lens” valuation using both long-term intrinsic value and three-year forecast total shareholder returns using MFG’s proprietary forecasts. Portfolio construction is determined by each stock’s ranking based on the qualitative assessment of the key criteria, the quantitative assessment driven by valuation, and detailed macroeconomic research within a robust risk management framework. From time to time, MFG may hold up to 20% in cash if warranted by their assessment of the macro environment. First Eagle can be broadly characterized as value in approach, looking to identify companies selling at a discount to intrinsic value with the goal being to avoid permanent impairment of capital (as opposed to temporary losses in share value relating to shifting investor sentiment or other normal share price volatility). The primary valuation measure is enterprise value to normalized earnings before interest and taxes, although other metrics can be applied depending on the company or industry. If stocks are deemed too expensive, based on their bottom up valuation analysis, cash or bonds will be held instead up to 20%. In addition, a gold exposure is maintained (both through gold backed exchange traded funds and the equities of gold mining companies), with the view that it is a potential portfolio hedge.
Market Commentary and Fund Performance
Global equity markets were influenced by the on-going sovereign debt crisis in Europe and uncertainty over China growth during the 5-month period ending March 31, 2013. The market rallied late in the 4th quarter, led by Europe and Asia, supported by policy measures taken by the ECB and signs of China stabilization.
For 2013, the market forged ahead in January supported again by positive macro news. Positive news out of the U.S. sparked the market rally, particularly the news on the fiscal cliff resolution, an extension of the U.S. Debt ceiling and positive earnings announcements. In addition, stabilization in Europe and signs that China growth may be recovering supported global equities. Over the rest of the quarter, however, uncertainty resurfaced again regarding stability in Europe particularly the Italian election results and the voter’s failure to endorse the fiscal austerity program. In addition, the banking crisis in Cyprus and strict requirements for an EU bailout fueled an increase in volatility during the second half of the quarter. The market proved resilient and held their gains and returned 5.1% for the first quarter of 2013. The MSCI World Index posted a solid gain of 11.00% for the 5-month period ending March 31, 2013.
| * | The Fund commenced operations on November 6, 2012. |
22
Mercer Global Low Volatility Equity Fund
In this environment, the Mercer Global Low Volatility Equity Fund outperformed the MSCI World Index by +1.13% for the 5-month period ending March 31, 2013. The Fund’s bias to lower market volatility with a high quality bias versus the broad index was rewarded over this time period. The majority of positive relative performance was during the first quarter of 2013, as more conservative positioning was rewarded. The defensive sector allocations such as overweight positions in consumer staples and utilities and underweighting the more cyclical areas of the market such as energy, financials, industrials, and materials added value. In addition, favorable security selection in consumer staples, financials and information technology contributed positively to performance. From a country perspective, positive selection in the United States, France and the United Kingdom contributed positively to performance. Offsetting some of the positives was a cash allocation that averaged approximately 9% in the Fund since inception.
In aggregate, performance of the Fund’s sub-advisors was positive, with two of the three sub-advisors outperforming. Acadian was a positive contributor as performance was driven by sector decisions. Sector allocations were driven by underweighting energy, information technology and materials and overweighting consumer staples. From a regional perspective, selection in the Asia Pacific region (ex-Japan), as well as North America and European regions, contributed positively to performance. Detracting from performance included the underweight to the outperforming consumer discretionary sector and negative security selection in the financials sector. MFG contributed positively to performance as performance was driven by both sector and security selection decisions. Security selection was strong in consumer discretionary and financials. Sector allocations were driven by overweighting consumer staples and underweighting materials. From a regional perspective, selection in North America and Western Europe contributed positively. First Eagle lagged since inception, with the majority of underperformance driven by a strategic allocation to gold and a tactical allocation to cash which both underperformed during the equity market rally over this time period. Offsetting some of the negative performance was positive security selection in financials and industrials.
Risk Considerations
The Fund invests in emerging market securities which involves certain risks such as currency volatility, political and social instability and reduced market liquidity. Emerging markets may be more volatile and less liquid than more developed markets and therefore may involve greater risks. Investments made in small and mid-capitalization companies may be more volatile and less liquid due to limited resources or product lines and more sensitive to economic factors. The Fund may invest in more aggressive investments such as derivatives (futures, options, swaps) all of which may cause greater volatility and less liquidity. Derivatives are more sensitive to changes in market conditions and may amplify risks. The Fund may experience high portfolio turnover which may result in higher costs and capital gains. The Fund’s volatility may be amplified by its ability to select sub-advisors to allocate assets.
23
Mercer Funds
March 31, 2013
Comparison of Change in Value of a $10,000 Investment in
Mercer Global Low Volatility Equity Shares vs. the
MSCI World Index
As of March 31, 2013
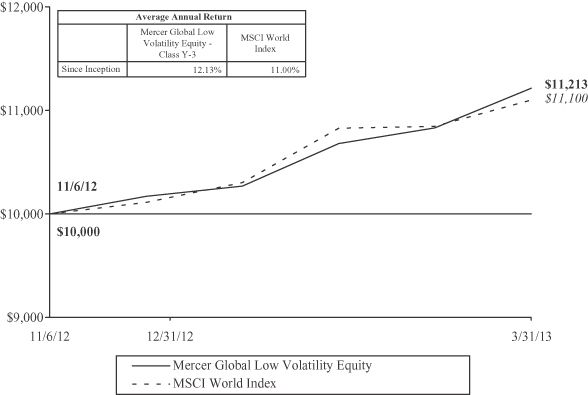
This graph shows the performance of the Mercer Global Low Volatility Equity Fund Class Y-3 shares versus the MSCI World Index from November 6, 2012, which is the inception date of the Fund, through March 31, 2013. The performance of other classes, when launched, will vary from the performance of the class shown based on the difference in fees and expenses paid by shareholders investing in different share classes. The Fund may charge a 2% redemption fee on shares owned less than 30 days.
The table and graph assume reinvestment of dividends and capital gains, but do not reflect a deduction of taxes an investor might pay on fund distributions or upon redemption of fund shares. Performance shown reflects a fee waiver and/or expense reimbursement. Without this waiver/reimbursement, returns would have been lower.
The data quoted represents past performance and does not guarantee future results. Current performance of the Fund may be lower or higher than the performance quoted. Please call 1-866-658-9896 for the Fund’s most recent month-end performance. Investment return and principal value will fluctuate so that an investor’s shares, when redeemed, may be worth more or less than when purchased.
24
Mercer US Short Maturity Fixed Income Fund
Investment Objective and Benchmark
The investment objective of the Fund is to provide safety of principal and a moderate level of income. The benchmark for the Fund is the Barclays Government/Credit 1-3 Year Bond Index.
Investment Strategy
The Fund invests principally in investment grade fixed income securities of U.S. issuers, including government securities and corporate bonds. Generally, the Fund maintains an average dollar-weighted portfolio maturity of one to three years.
Performance
For the fiscal year ended March 31, 2013, the Fund’s Y-3 share class performance was 1.14% compared to its benchmark return of 1.10%. Performance for the Fund is reported net of operating expenses while the benchmark returns do not include expenses of any kind as indexes are unmanaged.
The Sub-Advisors
As of March 31, 2013, the Fund employed one sub-advisor, J.P. Morgan Investment Management Inc. (JP Morgan). JP Morgan manages the Fund using a bottom-up, relative value perspective, seeking to identify bonds that are high quality and offer inexpensive cash flows. The process is driven largely by security selection, seeking bonds that are undervalued.
Market Commentary and Fund Performance
Although there was frequent volatility and reversals of investor sentiment during the one-year period ending March 31, 2013, the general trend over the trailing twelve months was favorable for fixed income investors. U.S. Treasury rates fell moderately for the period, with the 10-year Treasury dropping 36 basis points (2.21% at March 31, 2012 versus 1.85% at March 31, 2013) and the 30-year Treasury dropping slightly less at 25 basis points (3.35% at March 31, 2012 versus 3.10% at March 31, 2013), but with sizable moves over short time periods and a wide trading range overall (nearly 100 basis points from high to low for the 10-year Treasury). The calendar pattern in recent years — strong starts followed by mid-year sell-offs and risk aversion, migrating back towards risk seeking in the closing months — continued to hold for 2012. After a big move upwards in risk assets to start the year, the second calendar quarter brought renewed market focus on challenges in the Euro-zone as well as deteriorating U.S. economic data, to the point where 10-year Treasury rates touched below 1.40% (a measure 60 basis points lower than the lowest level seen in the 2008 Global Financial Crisis). Later, despite mixed U.S. economic data and slowing global economic activity, market sentiment improved due largely to efforts by the European Central Bank and Federal Reserve to support economic growth and foster market confidence. Notable “interventions” and actions included extending Operation Twist, announcing Quantitative Easing III, and moving away from rate/date guidance towards inflation and employment targets. This improved sentiment, in addition to strong corporate fundamentals and improving news from Europe, drove a credit sector rally to end the year. Favorable market technicals were also present, with investor appetite for new issuance offering (any) yield relative to near-zero money markets and ultra-low Treasury yields. Not even the tightly contested U.S. presidential election, fiscal cliff/sequester discussions, and headline-making in Italy and Cyprus toward the end of the period could derail non-Treasury bond spreads from moving lower. Although market performance was positive, it was somewhat of a unsettled twelve-month period for investors given a slowly improving U.S. economy that appears to be balancing support for shorter-term risks with the need to prepare for longer-term prosperity.
Given a downward trend in both the U.S. Treasury curve (rates lower) and credit spreads (buyers pushing up prices for riskier assets) over the twelve months ending March 31, 2013, absolute returns in fixed income were relatively strong. Spread sectors (non-Treasury) provided healthy returns for the fiscal period in absolute terms and in relation to similar-duration Treasuries (excess returns), although agency mortgage-backed securities trailed in excess returns.
Risk Considerations
The Fund is subject to the same risks as the underlying bonds in the portfolio such as credit, prepayment, call and interest rate risk. As interest rates rise the value of bond prices will decline. The Fund may experience high portfolio turnover which may result in higher costs and capital gains. The Fund’s volatility may be amplified by its ability to select sub- advisors to allocate assets.
25
Mercer Funds
March 31, 2013
Comparison of Change in Value of a $10,000 Investment in
Mercer US Short Maturity Fixed Income Shares vs. the
Barclays Government/Credit 1-3 Year Bond Index
As of March 31, 2013
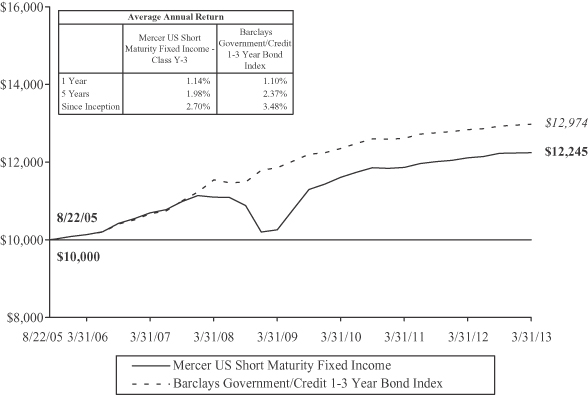
This graph shows the performance of the Mercer US Short Maturity Fixed Income Fund1 Class Y-3 shares versus the Barclays Government/Credit 1-3 Year Bond Index from August 22, 2005, which is the inception date of the Fund, through March 31, 2013. The performance of other classes, when launched, will vary from the performance of the class shown based on the difference in fees and expenses paid by shareholders investing in different share classes. The Fund may charge a 2% redemption fee on shares held less than 30 days.
The table and graph assume reinvestment of dividends and capital gains, but do not reflect a deduction of taxes an investor might pay on fund distributions or upon redemption of fund shares. Performance shown reflects a fee waiver and/or expense reimbursement. Without this waiver/reimbursement, returns would have been lower.
The data quoted represents past performance and does not guarantee future results. Current performance of the Fund may be lower or higher than the performance quoted. Please call 1-866-658-9896 for the Fund’s most recent month-end performance. Investment return and principal value will fluctuate so that an investor’s shares, when redeemed, may be worth more or less than when purchased.
26
Mercer US Large Cap Growth Equity Fund
(showing percentage of net assets)
March 31, 2013
| Shares | Description | Value ($) | ||||||||
COMMON STOCKS — 97.8% | ||||||||||
Aerospace & Defense — 1.0% | ||||||||||
| 25,807 | Boeing Co. (The) | 2,215,532 | ||||||||
| 27,050 | United Technologies Corp. | 2,527,281 | ||||||||
|
| |||||||||
| 4,742,813 | ||||||||||
|
| |||||||||
Agriculture — 3.4% | ||||||||||
| 111,072 | Monsanto Co. | 11,732,535 | ||||||||
| 43,989 | Philip Morris International, Inc. | 4,078,220 | ||||||||
|
| |||||||||
| 15,810,755 | ||||||||||
|
| |||||||||
Airlines — 0.2% | ||||||||||
| 62,000 | Delta Air Lines, Inc.* | 1,023,620 | ||||||||
|
| |||||||||
Apparel — 1.7% | ||||||||||
| 33,214 | Coach, Inc. | 1,660,368 | ||||||||
| 70,369 | NIKE, Inc. Class B | 4,152,474 | ||||||||
| 11,800 | Ralph Lauren Corp. | 1,997,858 | ||||||||
|
| |||||||||
| 7,810,700 | ||||||||||
|
| |||||||||
Auto Parts & Equipment — 0.4% | ||||||||||
| 22,700 | BorgWarner, Inc.* | 1,755,618 | ||||||||
|
| |||||||||
Banks — 0.8% | ||||||||||
| 96,544 | Wells Fargo & Co. | 3,571,163 | ||||||||
|
| |||||||||
Beverages — 2.1% | ||||||||||
| 26,701 | Anheuser-Busch InBev NV, ADR | 2,658,085 | ||||||||
| 175,566 | Coca-Cola Co. (The) | 7,099,889 | ||||||||
|
| |||||||||
| 9,757,974 | ||||||||||
|
| |||||||||
Biotechnology — 4.6% | ||||||||||
| 32,400 | Alexion Pharmaceuticals, Inc.* | 2,985,336 | ||||||||
| 21,900 | Amgen, Inc. | 2,244,969 | ||||||||
| 38,936 | Biogen Idec, Inc.* | 7,511,144 | ||||||||
| 26,900 | Celgene Corp.* | 3,117,979 | ||||||||
| 24,997 | Illumina, Inc.* ‡ | 1,349,838 | ||||||||
| 6,769 | Regeneron Pharmaceuticals, Inc.* | 1,194,051 | ||||||||
| 50,998 | Vertex Pharmaceuticals, Inc.* | 2,803,870 | ||||||||
|
| |||||||||
| 21,207,187 | ||||||||||
|
| |||||||||
Chemicals — 2.1% | ||||||||||
| 23,412 | Agrium, Inc.‡ | 2,282,670 | ||||||||
| 43,824 | Ecolab, Inc. | 3,513,808 | ||||||||
| 24,300 | Praxair, Inc. | 2,710,422 | ||||||||
| 8,667 | Sherwin-Williams Co. (The) | 1,463,770 | ||||||||
|
| |||||||||
| 9,970,670 | ||||||||||
|
| |||||||||
| See accompanying Notes to the Financial Statements. | 27 |
Mercer US Large Cap Growth Equity Fund
Schedule of Investments (Continued)
(showing percentage of net assets)
March 31, 2013
| Shares | Description | Value ($) | ||||||||
Commercial Services — 3.6% | ||||||||||
| 27,430 | ADT Corp. (The) | 1,342,424 | ||||||||
| 3,510 | Mastercard, Inc. Class A | 1,899,366 | ||||||||
| 79,200 | Visa, Inc. Class A | 13,451,328 | ||||||||
|
| |||||||||
| 16,693,118 | ||||||||||
|
| |||||||||
Computers — 7.1% | ||||||||||
| 40,026 | Apple, Inc. | 17,716,708 | ||||||||
| 15,564 | Cognizant Technology Solutions Corp. Class A* | 1,192,358 | ||||||||
| 123,510 | EMC Corp.* | 2,950,654 | ||||||||
| 39,251 | International Business Machines Corp. | 8,372,238 | ||||||||
| 23,435 | SanDisk Corp.* | 1,288,925 | ||||||||
| 28,872 | Teradata Corp.* | 1,689,301 | ||||||||
|
| |||||||||
| 33,210,184 | ||||||||||
|
| |||||||||
Cosmetics & Personal Care — 1.0% | ||||||||||
| 22,000 | Estee Lauder Cos. (The), Inc. Class A | 1,408,660 | ||||||||
| 40,615 | Procter & Gamble Co. (The) | 3,129,792 | ||||||||
|
| |||||||||
| 4,538,452 | ||||||||||
|
| |||||||||
Distribution & Wholesale — 0.4% | ||||||||||
| 9,676 | Fastenal Co. | 496,863 | ||||||||
| 6,700 | W.W. Grainger, Inc. | 1,507,366 | ||||||||
|
| |||||||||
| 2,004,229 | ||||||||||
|
| |||||||||
Diversified Financial Services — 2.4% | ||||||||||
| 20,992 | American Express Co. | 1,416,120 | ||||||||
| 5,700 | BlackRock, Inc. | 1,464,216 | ||||||||
| 23,400 | Citigroup, Inc. | 1,035,216 | ||||||||
| 15,000 | Franklin Resources, Inc. | 2,262,150 | ||||||||
| 13,025 | Goldman Sachs Group, Inc. (The) | 1,916,629 | ||||||||
| 12,528 | IntercontinentalExchange, Inc.* | 2,042,941 | ||||||||
| 16,131 | T. Rowe Price Group, Inc. | 1,207,728 | ||||||||
|
| |||||||||
| 11,345,000 | ||||||||||
|
| |||||||||
Engineering & Construction — 0.4% | ||||||||||
| 28,200 | Fluor Corp. | 1,870,506 | ||||||||
|
| |||||||||
Food — 1.2% | ||||||||||
| 33,347 | Kraft Foods Group, Inc. Class A | 1,718,371 | ||||||||
| 58,508 | Mondelez International, Inc. Class A | 1,790,930 | ||||||||
| 47,941 | Unilever NV | 1,965,581 | ||||||||
|
| |||||||||
| 5,474,882 | ||||||||||
|
| |||||||||
Health Care - Products — 2.8% | ||||||||||
| 24,200 | Covidien Plc | 1,641,728 | ||||||||
| 47,215 | Edwards Lifesciences Corp.* | 3,879,184 | ||||||||
| 6,175 | Intuitive Surgical, Inc.* | 3,033,098 | ||||||||
| 38,620 | Johnson & Johnson | 3,148,689 | ||||||||
| 28 | See accompanying Notes to the Financial Statements. |
Mercer US Large Cap Growth Equity Fund
Schedule of Investments (Continued)
(showing percentage of net assets)
March 31, 2013
| Shares | Description | Value ($) | ||||||||
Health Care - Products — continued | ||||||||||
| 15,584 | Varian Medical Systems, Inc.* | 1,122,048 | ||||||||
|
| |||||||||
| 12,824,747 | ||||||||||
|
| |||||||||
Health Care - Services — 1.0% | ||||||||||
| 6,144 | DaVita HealthCare Partners, Inc.* | 728,617 | ||||||||
| 24,200 | HCA Holdings, Inc. | 983,246 | ||||||||
| 53,127 | UnitedHealth Group, Inc. | 3,039,396 | ||||||||
|
| |||||||||
| 4,751,259 | ||||||||||
|
| |||||||||
Home Builders — 0.3% | ||||||||||
| 31,800 | Lennar Corp. Class A‡ | 1,319,064 | ||||||||
|
| |||||||||
Insurance — 0.7% | ||||||||||
| 59,204 | American International Group, Inc.* | 2,298,299 | ||||||||
| 15,935 | Aon Plc | 980,003 | ||||||||
|
| |||||||||
| 3,278,302 | ||||||||||
|
| |||||||||
Internet — 13.0% | ||||||||||
| 64,744 | Amazon.Com, Inc.* | 17,253,629 | ||||||||
| 13,100 | Baidu, Inc., Sponsored ADR* | 1,148,870 | ||||||||
| 60,925 | eBay, Inc.* | 3,303,353 | ||||||||
| 25,700 | F5 Networks, Inc.* | 2,289,356 | ||||||||
| 226,401 | Facebook, Inc. Class A* | 5,791,338 | ||||||||
| 26,485 | Google, Inc. Class A* | 21,029,885 | ||||||||
| 2,200 | LinkedIn Corp. Class A* | 387,332 | ||||||||
| 13,178 | priceline.com, Inc.* | 9,065,541 | ||||||||
| 12,733 | Splunk, Inc.* | 509,702 | ||||||||
|
| |||||||||
| 60,779,006 | ||||||||||
|
| |||||||||
Iron & Steel — 0.3% | ||||||||||
| 27,067 | Nucor Corp. | 1,249,142 | ||||||||
|
| |||||||||
Lodging — 0.9% | ||||||||||
| 73,800 | Las Vegas Sands Corp. | 4,158,630 | ||||||||
|
| |||||||||
Machinery - Construction & Mining — 0.2% | ||||||||||
| 18,735 | Joy Global, Inc. | 1,115,107 | ||||||||
|
| |||||||||
Media — 2.2% | ||||||||||
| 37,100 | CBS Corp. Class B | 1,732,199 | ||||||||
| 28,179 | Comcast Corp. Class A | 1,183,800 | ||||||||
| 22,057 | Discovery Communications, Inc. Class A* | 1,736,768 | ||||||||
| 51,900 | News Corp. Class A | 1,583,988 | ||||||||
| 494,500 | Sirius XM Radio, Inc. | 1,523,060 | ||||||||
| 46,175 | Walt Disney Co. (The) | 2,622,740 | ||||||||
|
| |||||||||
| 10,382,555 | ||||||||||
|
| |||||||||
Metal Fabricate & Hardware — 1.3% | ||||||||||
| 31,422 | Precision Castparts Corp. | 5,958,240 | ||||||||
|
| |||||||||
| See accompanying Notes to the Financial Statements. | 29 |
Mercer US Large Cap Growth Equity Fund
Schedule of Investments (Continued)
(showing percentage of net assets)
March 31, 2013
| Shares | Description | Value ($) | ||||||||
Miscellaneous - Manufacturing — 3.8% | ||||||||||
| 130,353 | Danaher Corp. | 8,101,439 | ||||||||
| 54,793 | Eaton Corp. Plc | 3,356,071 | ||||||||
| 183,742 | General Electric Co. | 4,248,115 | ||||||||
| 26,976 | Honeywell International, Inc. | 2,032,642 | ||||||||
|
| |||||||||
| 17,738,267 | ||||||||||
|
| |||||||||
Oil & Gas — 2.3% | ||||||||||
| 19,600 | Cabot Oil & Gas Corp. | 1,325,156 | ||||||||
| 11,128 | Occidental Petroleum Corp. | 872,101 | ||||||||
| 54,303 | Range Resources Corp. | 4,400,715 | ||||||||
| 70,200 | Southwestern Energy Co.* | 2,615,652 | ||||||||
| 53,576 | Suncor Energy, Inc. | 1,607,816 | ||||||||
|
| |||||||||
| 10,821,440 | ||||||||||
|
| |||||||||
Oil & Gas Services — 3.8% | ||||||||||
| 63,772 | Cameron International Corp.* | 4,157,934 | ||||||||
| 71,900 | FMC Technologies, Inc.* | 3,910,641 | ||||||||
| 52,256 | National Oilwell Varco, Inc. | 3,697,112 | ||||||||
| 80,178 | Schlumberger, Ltd. | 6,004,531 | ||||||||
|
| |||||||||
| 17,770,218 | ||||||||||
|
| |||||||||
Pharmaceuticals — 6.2% | ||||||||||
| 11,500 | Abbott Laboratories | 406,180 | ||||||||
| 80,494 | Allergan, Inc. | 8,985,545 | ||||||||
| 30,400 | BioMarin Pharmaceutical, Inc.* | 1,892,704 | ||||||||
| 55,288 | Bristol-Myers Squibb Co. | 2,277,313 | ||||||||
| 70,443 | Express Scripts Holding Co.* | 4,061,039 | ||||||||
| 141,935 | Gilead Sciences, Inc.* | 6,944,880 | ||||||||
| 30,000 | GlaxoSmithKline Plc, Sponsored ADR | 1,407,300 | ||||||||
| 12,910 | Perrigo Co. | 1,532,804 | ||||||||
| 52,427 | Pfizer, Inc. | 1,513,043 | ||||||||
|
| |||||||||
| 29,020,808 | ||||||||||
|
| |||||||||
Pipelines — 0.8% | ||||||||||
| 92,773 | Kinder Morgan, Inc. | 3,588,460 | ||||||||
|
| |||||||||
REITS — 0.4% | ||||||||||
| 24,800 | American Tower Corp. REIT | 1,907,616 | ||||||||
|
| |||||||||
Retail — 8.7% | ||||||||||
| 10,842 | Bed Bath & Beyond, Inc.* | 698,442 | ||||||||
| 15,558 | Chipotle Mexican Grill, Inc.* | 5,069,885 | ||||||||
| 32,239 | Costco Wholesale Corp. | 3,420,880 | ||||||||
| 89,514 | CVS Caremark Corp. | 4,922,375 | ||||||||
| 43,500 | Dollar General Corp.* | 2,200,230 | ||||||||
| 34,842 | Family Dollar Stores, Inc. | 2,057,420 | ||||||||
| 30,000 | Home Depot, Inc. (The) | 2,093,400 | ||||||||
| 44,665 | Lowe’s Cos., Inc. | 1,693,697 | ||||||||
| 30 | See accompanying Notes to the Financial Statements. |
Mercer US Large Cap Growth Equity Fund
Schedule of Investments (Continued)
(showing percentage of net assets)
March 31, 2013
| Shares | Description | Value ($) | ||||||||
Retail — continued | ||||||||||
| 20,810 | McDonald’s Corp. | 2,074,549 | ||||||||
| 12,410 | O’Reilly Automotive, Inc.* | 1,272,646 | ||||||||
| 35,428 | Ross Stores, Inc. | 2,147,645 | ||||||||
| 164,954 | Starbucks Corp. | 9,395,780 | ||||||||
| 22,573 | Ulta Salon Cosmetics & Fragrance, Inc.* | 1,832,250 | ||||||||
| 21,300 | Yum! Brands, Inc. | 1,532,322 | ||||||||
|
| |||||||||
| 40,411,521 | ||||||||||
|
| |||||||||
Semiconductors — 3.1% | ||||||||||
| 66,000 | ARM Holdings Plc, Sponsored ADR | 2,796,420 | ||||||||
| 91,246 | ASML Holding NV, ADR‡ | 6,205,640 | ||||||||
| 54,182 | Broadcom Corp. Class A | 1,878,490 | ||||||||
| 54,700 | NXP Semiconductor NV* | 1,655,222 | ||||||||
| 48,666 | Texas Instruments, Inc. | 1,726,670 | ||||||||
|
| |||||||||
| 14,262,442 | ||||||||||
|
| |||||||||
Software — 5.8% | ||||||||||
| 13,000 | athenahealth, Inc.* ‡ | 1,261,520 | ||||||||
| 30,293 | Automatic Data Processing, Inc. | 1,969,651 | ||||||||
| 61,932 | Cerner Corp.* | 5,868,057 | ||||||||
| 16,812 | Informatica Corp.* | 579,510 | ||||||||
| 22,231 | Intuit, Inc. | 1,459,465 | ||||||||
| 205,284 | Microsoft Corp. | 5,873,175 | ||||||||
| 55,900 | Salesforce.com, Inc.* | 9,996,597 | ||||||||
|
| |||||||||
| 27,007,975 | ||||||||||
|
| |||||||||
Telecommunications — 4.7% | ||||||||||
| 45,085 | Crown Castle International Corp.* | 3,139,719 | ||||||||
| 72,652 | Juniper Networks, Inc.* | 1,346,968 | ||||||||
| 167,163 | QUALCOMM, Inc. | 11,191,563 | ||||||||
| 25,300 | SBA Communications Corp. Class A* | 1,822,106 | ||||||||
| 87,388 | Verizon Communications, Inc. | 4,295,120 | ||||||||
|
| |||||||||
| 21,795,476 | ||||||||||
|
| |||||||||
Transportation — 3.1% | ||||||||||
| 17,511 | CH Robinson Worldwide, Inc. | 1,041,204 | ||||||||
| 26,965 | FedEx Corp. | 2,647,963 | ||||||||
| 76,833 | Union Pacific Corp. | 10,941,788 | ||||||||
|
| |||||||||
| 14,630,955 | ||||||||||
|
| |||||||||
TOTAL COMMON STOCKS (COST $361,823,221) | 455,558,101 | |||||||||
|
| |||||||||
| Par Value ($) | Description | Value ($) | ||||||||
SHORT-TERM INVESTMENTS — 2.9% | ||||||||||
Bank Deposit — 1.1% | ||||||||||
| 5,182,872 | State Street Bank & Trust Euro Time Deposit, 0.01%, due 04/01/13 | 5,182,872 | ||||||||
|
| |||||||||
| See accompanying Notes to the Financial Statements. | 31 |
Mercer US Large Cap Growth Equity Fund
Schedule of Investments (Continued)
(showing percentage of net assets)
March 31, 2013
| Par Value ($) | Description | Value ($) | ||||||||
Securities Lending Collateral — 1.8% | ||||||||||
| 8,110,005 | State Street Navigator Securities Lending Prime Portfolio*** | 8,110,005 | ||||||||
|
| |||||||||
TOTAL SHORT-TERM INVESTMENTS (COST $13,292,877) | 13,292,877 | |||||||||
|
| |||||||||
TOTAL INVESTMENTS — 100.7% (Cost $375,116,098) | 468,850,978 | |||||||||
Other Assets and Liabilities (net) — (0.7)% | (3,063,637 | ) | ||||||||
|
| |||||||||
NET ASSETS — 100.0% | $ | 465,787,341 | ||||||||
|
| |||||||||
Notes to Schedule of Investments: | ||||||||||
| ADR — American Depository Receipt | ||||||||||
| REIT — Real Estate Investment Trust | ||||||||||
| * | Non-income producing security | |||||||||
| *** | Represents an investment of securities lending cash collateral. | |||||||||
| ‡ | All or a portion of this security is out on loan. | |||||||||
| 32 | See accompanying Notes to the Financial Statements. |
Mercer US Large Cap Growth Equity Fund
Schedule of Investments (Continued)
March 31, 2013
| Asset Class Summary (Unaudited) | % of Net Assets | ||||
Common Stocks | 97.8 | ||||
Short-Term Investments | 2.9 | ||||
Other Assets and Liabilities (net) | (0.7 | ) | |||
|
| ||||
| 100.0 | % | ||||
|
| ||||
| See accompanying Notes to the Financial Statements. | 33 |
Mercer US Large Cap Value Equity Fund
Schedule of Investments
(showing percentage of net assets)
March 31, 2013
| Shares | Description | Value ($) | ||||||||
COMMON STOCKS — 98.7% | ||||||||||
Advertising — 0.6% | ||||||||||
| 47,679 | Omnicom Group, Inc. | 2,808,293 | ||||||||
|
| |||||||||
Aerospace & Defense — 2.3% | ||||||||||
| 29,619 | BAE Systems Plc, Sponsored ADR‡ | 715,002 | ||||||||
| 41,804 | L-3 Communications Holdings, Inc. | 3,382,780 | ||||||||
| 18,773 | Lockheed Martin Corp. | 1,811,970 | ||||||||
| 39,498 | Northrop Grumman Corp. | 2,770,785 | ||||||||
| 30,286 | Raytheon Co. | 1,780,514 | ||||||||
| 6,498 | Rockwell Collins, Inc. | 410,154 | ||||||||
|
| |||||||||
| 10,871,205 | ||||||||||
|
| |||||||||
Agriculture — 0.0% | ||||||||||
| 4,087 | Reynolds American, Inc. | 181,831 | ||||||||
|
| |||||||||
Airlines — 0.5% | ||||||||||
| 159,000 | Delta Air Lines, Inc.* | 2,625,090 | ||||||||
|
| |||||||||
Auto Manufacturers — 1.0% | ||||||||||
| 87,113 | General Motors Co.* | 2,423,484 | ||||||||
| 23,200 | Toyota Motor Corp., Sponsored ADR‡ | 2,381,248 | ||||||||
|
| |||||||||
| 4,804,732 | ||||||||||
|
| |||||||||
Auto Parts & Equipment — 1.2% | ||||||||||
| 14,610 | Delphi Automotive Plc | 648,684 | ||||||||
| 99,740 | Johnson Controls, Inc. | 3,497,882 | ||||||||
| 26,325 | Lear Corp. | 1,444,453 | ||||||||
|
| |||||||||
| 5,591,019 | ||||||||||
|
| |||||||||
Banks — 7.2% | ||||||||||
| 687,120 | Bank of America Corp. | 8,369,122 | ||||||||
| 45,775 | BB&T Corp. | 1,436,877 | ||||||||
| 46,875 | Capital One Financial Corp. | 2,575,781 | ||||||||
| 38,840 | Comerica, Inc. | 1,396,298 | ||||||||
| 224,255 | Fifth Third Bancorp | 3,657,599 | ||||||||
| 15,720 | PNC Financial Services Group, Inc. | 1,045,380 | ||||||||
| 22,590 | State Street Corp. | 1,334,843 | ||||||||
| 35,040 | SunTrust Banks, Inc. | 1,009,502 | ||||||||
| 40,560 | US Bancorp | 1,376,201 | ||||||||
| 322,212 | Wells Fargo & Co. | 11,918,622 | ||||||||
|
| |||||||||
| 34,120,225 | ||||||||||
|
| |||||||||
Beverages — 0.8% | ||||||||||
| 73,852 | Coca-Cola Enterprises, Inc. | 2,726,616 | ||||||||
| 9,470 | Constellation Brands, Inc. Class A* | 451,151 | ||||||||
| 11,050 | PepsiCo, Inc. | 874,165 | ||||||||
|
| |||||||||
| 4,051,932 | ||||||||||
|
| |||||||||
| 34 | See accompanying Notes to the Financial Statements. |
Mercer US Large Cap Value Equity Fund
Schedule of Investments (Continued)
(showing percentage of net assets)
March 31, 2013
| Shares | Description | Value ($) | ||||||||
Biotechnology — 0.9% | ||||||||||
| 40,303 | Amgen, Inc. | 4,131,460 | ||||||||
|
| |||||||||
Chemicals — 0.4% | ||||||||||
| 8,430 | Eastman Chemical Co. | 589,004 | ||||||||
| 22,820 | LyondellBasell Industries NV Class A | 1,444,278 | ||||||||
|
| |||||||||
| 2,033,282 | ||||||||||
|
| |||||||||
Commercial Services — 2.2% | ||||||||||
| 20,396 | H&R Block, Inc. | 600,050 | ||||||||
| 118,960 | Hertz Global Holdings, Inc.* | 2,648,050 | ||||||||
| 35,215 | McKesson Corp. | 3,801,812 | ||||||||
| 31,520 | Moody’s Corp. | 1,680,646 | ||||||||
| 145,400 | RR Donnelley & Sons Co.‡ | 1,752,070 | ||||||||
|
| |||||||||
| 10,482,628 | ||||||||||
|
| |||||||||
Computers — 2.5% | ||||||||||
| 4,785 | Apple, Inc. | 2,117,985 | ||||||||
| 47,370 | EMC Corp.* | 1,131,669 | ||||||||
| 25,570 | SanDisk Corp.* | 1,406,350 | ||||||||
| 164,213 | Seagate Technology Plc | 6,003,627 | ||||||||
| 23,400 | Western Digital Corp. | 1,176,552 | ||||||||
|
| |||||||||
| 11,836,183 | ||||||||||
|
| |||||||||
Cosmetics & Personal Care — 0.1% | ||||||||||
| 34,640 | Avon Products, Inc. | 718,087 | ||||||||
|
| |||||||||
Diversified Financial Services — 10.0% | ||||||||||
| 80,462 | Ameriprise Financial, Inc. | 5,926,026 | ||||||||
| 1,809 | BlackRock, Inc. | 464,696 | ||||||||
| 50,800 | Blackstone Group (The), LP | 1,004,824 | ||||||||
| 212,535 | Charles Schwab Corp. (The) | 3,759,744 | ||||||||
| 218,998 | Citigroup, Inc. | 9,688,472 | ||||||||
| 42,025 | Discover Financial Services | 1,884,401 | ||||||||
| 5,120 | Franklin Resources, Inc. | 772,147 | ||||||||
| 21,675 | Goldman Sachs Group, Inc. (The) | 3,189,476 | ||||||||
| 20,790 | Invesco, Ltd. | 602,078 | ||||||||
| 289,332 | JPMorgan Chase & Co. | 13,731,697 | ||||||||
| 53,400 | KKR & Co., LP | 1,031,688 | ||||||||
| 37,250 | Morgan Stanley | 818,755 | ||||||||
| 165,551 | SLM Corp. | 3,390,485 | ||||||||
| 59,350 | TD Ameritrade Holding Corp. | 1,223,797 | ||||||||
|
| |||||||||
| 47,488,286 | ||||||||||
|
| |||||||||
Electric — 1.2% | ||||||||||
| 56,115 | AES Corp. | 705,366 | ||||||||
| 22,650 | American Electric Power Co., Inc. | 1,101,470 | ||||||||
| 43,395 | Edison International | 2,183,636 | ||||||||
| 68,080 | NRG Energy, Inc. | 1,803,439 | ||||||||
|
| |||||||||
| 5,793,911 | ||||||||||
|
| |||||||||
| See accompanying Notes to the Financial Statements. | 35 |
Mercer US Large Cap Value Equity Fund
Schedule of Investments (Continued)
(showing percentage of net assets)
March 31, 2013
| Shares | Description | Value ($) | ||||||||
Electronics — 0.2% | ||||||||||
| 20,037 | TE Connectivity, Ltd. | 840,151 | ||||||||
|
| |||||||||
Food — 2.8% | ||||||||||
| 60,600 | ConAgra Foods, Inc. | 2,170,086 | ||||||||
| 40,860 | Dean Foods Co.* | 740,792 | ||||||||
| 36,511 | Koninklijke Ahold NV, Sponsored ADR | 560,444 | ||||||||
| 21,960 | Kraft Foods Group, Inc. Class A | 1,131,599 | ||||||||
| 263,376 | Kroger Co. (The) | 8,728,280 | ||||||||
|
| |||||||||
| 13,331,201 | ||||||||||
|
| |||||||||
Forest Products & Paper — 0.5% | ||||||||||
| 53,145 | International Paper Co. | 2,475,494 | ||||||||
|
| |||||||||
Health Care - Products — 2.7% | ||||||||||
| 20,040 | Baxter International, Inc. | 1,455,706 | ||||||||
| 1,739 | Becton Dickinson and Co. | 166,266 | ||||||||
| 31,695 | CareFusion Corp.* | 1,109,008 | ||||||||
| 23,990 | Covidien Plc | 1,627,482 | ||||||||
| 101,469 | Johnson & Johnson | 8,272,767 | ||||||||
|
| |||||||||
| 12,631,229 | ||||||||||
|
| |||||||||
Health Care - Services — 1.9% | ||||||||||
| 34,754 | Aetna, Inc. | 1,776,624 | ||||||||
| 44,180 | Humana, Inc. | 3,053,280 | ||||||||
| 53,075 | UnitedHealth Group, Inc. | 3,036,421 | ||||||||
| 18,173 | WellPoint, Inc. | 1,203,598 | ||||||||
|
| |||||||||
| 9,069,923 | ||||||||||
|
| |||||||||
Housewares — 0.4% | ||||||||||
| 68,740 | Newell Rubbermaid, Inc. | 1,794,114 | ||||||||
|
| |||||||||
Insurance — 8.5% | ||||||||||
| 30,810 | ACE, Ltd. | 2,741,166 | ||||||||
| 37,140 | American International Group, Inc.* | 1,441,775 | ||||||||
| 18,480 | Aon Plc | 1,136,520 | ||||||||
| 14,140 | Axis Capital Holdings, Ltd. | 588,507 | ||||||||
| 81,684 | Berkshire Hathaway, Inc. Class B* | 8,511,473 | ||||||||
| 23,550 | Chubb Corp. (The) | 2,061,331 | ||||||||
| 43,810 | Cigna Corp. | 2,732,430 | ||||||||
| 177,554 | Lincoln National Corp. | 5,790,036 | ||||||||
| 214,925 | MetLife, Inc. | 8,171,448 | ||||||||
| 15,630 | Prudential Financial, Inc. | 922,014 | ||||||||
| 10,123 | Reinsurance Group of America, Inc. | 604,039 | ||||||||
| 55,408 | Travelers Cos. (The), Inc. | 4,664,799 | ||||||||
| 7,675 | Unum Group | 216,819 | ||||||||
| 26,430 | Validus Holdings, Ltd. | 987,689 | ||||||||
|
| |||||||||
| 40,570,046 | ||||||||||
|
| |||||||||
| 36 | See accompanying Notes to the Financial Statements. |
Mercer US Large Cap Value Equity Fund
Schedule of Investments (Continued)
(showing percentage of net assets)
March 31, 2013
| Shares | Description | Value ($) | ||||||||
Internet — 0.8% | ||||||||||
| 19,323 | eBay, Inc.* | 1,047,693 | ||||||||
| 760 | Google, Inc. Class A* | 603,463 | ||||||||
| 26,720 | IAC/InterActiveCorp | 1,193,849 | ||||||||
| 36,625 | Symantec Corp.* | 903,905 | ||||||||
|
| |||||||||
| 3,748,910 | ||||||||||
|
| |||||||||
Iron & Steel — 0.2% | ||||||||||
| 50,800 | United States Steel Corp.‡ | 990,600 | ||||||||
|
| |||||||||
Leisure Time — 0.4% | ||||||||||
| 50,860 | Carnival Corp. | 1,744,498 | ||||||||
|
| |||||||||
Lodging — 1.2% | ||||||||||
| 6,713 | Marriott International, Inc. Class A | 283,490 | ||||||||
| 28,097 | Wyndham Worldwide Corp. | 1,811,695 | ||||||||
| 27,925 | Wynn Resorts, Ltd. | 3,495,093 | ||||||||
|
| |||||||||
| 5,590,278 | ||||||||||
|
| |||||||||
Machinery - Construction & Mining — 0.5% | ||||||||||
| 15,700 | Caterpillar, Inc. | 1,365,429 | ||||||||
| 15,300 | Joy Global, Inc. | 910,656 | ||||||||
|
| |||||||||
| 2,276,085 | ||||||||||
|
| |||||||||
Machinery - Diversified — 1.0% | ||||||||||
| 13,230 | AGCO Corp. | 689,547 | ||||||||
| 25,500 | Cummins, Inc. | 2,953,155 | ||||||||
| 6,432 | Flowserve Corp. | 1,078,711 | ||||||||
|
| |||||||||
| 4,721,413 | ||||||||||
|
| |||||||||
Media — 6.5% | ||||||||||
| 24,420 | CBS Corp. Class B | 1,140,170 | ||||||||
| 106,056 | Comcast Corp. Class A | 4,455,412 | ||||||||
| 69,433 | DIRECTV, Class A* | 3,930,602 | ||||||||
| 40,510 | Gannett Co., Inc. | 885,954 | ||||||||
| 10,835 | Liberty Global, Inc. Series C* | 743,606 | ||||||||
| 19,635 | Liberty Media Corp. - Capital Series A* | 2,191,855 | ||||||||
| 30,457 | McGraw-Hill Cos. (The), Inc. | 1,586,200 | ||||||||
| 52,360 | News Corp. Class A | 1,598,027 | ||||||||
| 28,311 | Time Warner Cable, Inc. | 2,719,555 | ||||||||
| 73,222 | Time Warner, Inc. | 4,219,052 | ||||||||
| 91,680 | Viacom, Inc. Class B | 5,644,738 | ||||||||
| 32,700 | Walt Disney Co. (The) | 1,857,360 | ||||||||
|
| |||||||||
| 30,972,531 | ||||||||||
|
| |||||||||
Miscellaneous - Manufacturing — 4.7% | ||||||||||
| 16,830 | Dover Corp. | 1,226,570 | ||||||||
| 42,240 | Eaton Corp. Plc | 2,587,200 | ||||||||
| 524,480 | General Electric Co. | 12,125,978 | ||||||||
| See accompanying Notes to the Financial Statements. | 37 |
Mercer US Large Cap Value Equity Fund
Schedule of Investments (Continued)
(showing percentage of net assets)
March 31, 2013
| Shares | Description | Value ($) | ||||||||
Miscellaneous - Manufacturing — continued |
| |||||||||
| 38,325 | Honeywell International, Inc. | 2,887,789 | ||||||||
| 34,202 | Ingersoll-Rand Plc | 1,881,452 | ||||||||
| 10,730 | Parker Hannifin Corp. | 982,653 | ||||||||
| 22,173 | Tyco International, Ltd. | 709,536 | ||||||||
|
| |||||||||
| 22,401,178 | ||||||||||
|
| |||||||||
Office & Business Equipment — 0.4% | ||||||||||
| 20,030 | Pitney Bowes, Inc.‡ | 297,646 | ||||||||
| 177,947 | Xerox Corp. | 1,530,344 | ||||||||
|
| |||||||||
| 1,827,990 | ||||||||||
|
| |||||||||
Oil & Gas — 10.2% | ||||||||||
| 21,410 | Anadarko Petroleum Corp. | 1,872,304 | ||||||||
| 36,400 | Apache Corp. | 2,808,624 | ||||||||
| 126,475 | BP Plc, Sponsored ADR | 5,356,216 | ||||||||
| 40,210 | Chevron Corp. | 4,777,752 | ||||||||
| 63,148 | ConocoPhillips | 3,795,195 | ||||||||
| 49,874 | ENI Spa, Sponsored ADR‡ | 2,238,844 | ||||||||
| 22,894 | EOG Resources, Inc. | 2,932,035 | ||||||||
| 55,330 | Exxon Mobil Corp. | 4,985,786 | ||||||||
| 21,250 | Hess Corp. | 1,521,713 | ||||||||
| 50,500 | Marathon Oil Corp. | 1,702,860 | ||||||||
| 62,912 | Occidental Petroleum Corp. | 4,930,413 | ||||||||
| 39,485 | Phillips 66 | 2,762,765 | ||||||||
| 53,436 | Royal Dutch Shell Plc, ADR | 3,481,890 | ||||||||
| 13,650 | SM Energy Co. | 808,353 | ||||||||
| 30,110 | Transocean, Ltd. | 1,564,516 | ||||||||
| 50,850 | Valero Energy Corp. | 2,313,166 | ||||||||
| 64,355 | Weatherford International, Ltd.* | 781,270 | ||||||||
|
| |||||||||
| 48,633,702 | ||||||||||
|
| |||||||||
Oil & Gas Services — 1.8% | ||||||||||
| 27,515 | Cameron International Corp.* | 1,793,978 | ||||||||
| 121,065 | Halliburton Co. | 4,892,237 | ||||||||
| 22,045 | Schlumberger, Ltd. | 1,650,950 | ||||||||
|
| |||||||||
| 8,337,165 | ||||||||||
|
| |||||||||
Packaging & Containers — 0.4% | ||||||||||
| 14,610 | Packaging Corp. of America | 655,551 | ||||||||
| 12,410 | Rock-Tenn Co. Class A | 1,151,524 | ||||||||
|
| |||||||||
| 1,807,075 | ||||||||||
|
| |||||||||
Pharmaceuticals — 7.4% | ||||||||||
| 9,615 | Abbott Laboratories | 339,602 | ||||||||
| 20,305 | AbbVie, Inc. | 828,038 | ||||||||
| 29,383 | AmerisourceBergen Corp. | 1,511,755 | ||||||||
| 69,425 | AstraZeneca Plc, Sponsored ADR | 3,469,861 | ||||||||
| 17,140 | Eli Lilly & Co. | 973,381 | ||||||||
| 38 | See accompanying Notes to the Financial Statements. |
Mercer US Large Cap Value Equity Fund
Schedule of Investments (Continued)
(showing percentage of net assets)
March 31, 2013
| Shares | Description | Value ($) | ||||||||
Pharmaceuticals — continued |
| |||||||||
| 25,855 | Express Scripts Holding Co.* | 1,490,541 | ||||||||
| 37,200 | GlaxoSmithKline Plc, Sponsored ADR | 1,745,052 | ||||||||
| 127,070 | Merck & Co., Inc. | 5,620,306 | ||||||||
| 37,670 | Mylan, Inc.* | 1,090,170 | ||||||||
| 18,700 | Novartis AG, ADR | 1,332,188 | ||||||||
| 33,370 | Omnicare, Inc. | 1,358,826 | ||||||||
| 474,273 | Pfizer, Inc. | 13,687,519 | ||||||||
| 31,630 | Sanofi, ADR | 1,615,660 | ||||||||
| 1,945 | Zoetis, Inc.* | 64,963 | ||||||||
|
| |||||||||
| 35,127,862 | ||||||||||
|
| |||||||||
REITS — 0.3% | ||||||||||
| 53,400 | Hatteras Financial Corp. REIT | 1,464,762 | ||||||||
|
| |||||||||
Retail — 5.5% | ||||||||||
| 28,950 | American Eagle Outfitters, Inc. | 541,365 | ||||||||
| 16,360 | Bed Bath & Beyond, Inc.* | 1,053,911 | ||||||||
| 62,548 | Best Buy Co., Inc. | 1,385,438 | ||||||||
| 58,845 | CVS Caremark Corp. | 3,235,887 | ||||||||
| 34,100 | Family Dollar Stores, Inc. | 2,013,605 | ||||||||
| 61,475 | Gap, Inc. (The) | 2,176,215 | ||||||||
| 84,936 | Kohl’s Corp. | 3,918,098 | ||||||||
| 11,803 | L Brands, Inc. | 527,122 | ||||||||
| 84,931 | Lowe’s Cos., Inc. | 3,220,583 | ||||||||
| 29,277 | Macy’s, Inc. | 1,224,950 | ||||||||
| 16,532 | O’Reilly Automotive, Inc.* | 1,695,357 | ||||||||
| 7,200 | PVH Corp. | 769,032 | ||||||||
| 33,245 | Staples, Inc. | 446,480 | ||||||||
| 21,760 | Target Corp. | 1,489,472 | ||||||||
| 35,400 | Wal-Mart Stores, Inc. | 2,648,982 | ||||||||
|
| |||||||||
| 26,346,497 | ||||||||||
|
| |||||||||
Semiconductors — 1.5% | ||||||||||
| 94,105 | Applied Materials, Inc. | 1,268,535 | ||||||||
| 71,900 | Intel Corp. | 1,571,015 | ||||||||
| 89,745 | NVIDIA Corp. | 1,150,531 | ||||||||
| 121,100 | ON Semiconductor Corp.* | 1,002,708 | ||||||||
| 67,370 | Texas Instruments, Inc. | 2,390,288 | ||||||||
|
| |||||||||
| 7,383,077 | ||||||||||
|
| |||||||||
Software — 2.8% | ||||||||||
| 90,900 | Activision Blizzard, Inc. | 1,324,413 | ||||||||
| 112,810 | CA, Inc. | 2,839,428 | ||||||||
| 18,640 | Electronic Arts, Inc.* | 329,928 | ||||||||
| 45,000 | Fidelity National Information Services, Inc. | 1,782,900 | ||||||||
| 146,020 | Microsoft Corp. | 4,177,632 | ||||||||
| 88,857 | Oracle Corp. | 2,873,635 | ||||||||
|
| |||||||||
| 13,327,936 | ||||||||||
|
| |||||||||
| See accompanying Notes to the Financial Statements. | 39 |
Mercer US Large Cap Value Equity Fund
Schedule of Investments (Continued)
(showing percentage of net assets)
March 31, 2013
| Shares | Description | Value ($) | ||||||||
Telecommunications — 4.5% | ||||||||||
| 89,960 | AT&T, Inc. | 3,300,632 | ||||||||
| 317,525 | Cisco Systems, Inc. | 6,639,448 | ||||||||
| 41,210 | Corning, Inc. | 549,329 | ||||||||
| 326,770 | France Telecom SA, Sponsored ADR | 3,319,983 | ||||||||
| 55,011 | Motorola Solutions, Inc. | 3,522,354 | ||||||||
| 111,543 | Nippon Telegraph & Telephone Corp., ADR | 2,424,945 | ||||||||
| 23,270 | QUALCOMM, Inc. | 1,557,927 | ||||||||
| 21,373 | Telefonica SA, Sponsored ADR | 288,749 | ||||||||
|
| |||||||||
| 21,603,367 | ||||||||||
|
| |||||||||
Transportation — 0.7% | ||||||||||
| 16,890 | FedEx Corp. | 1,658,598 | ||||||||
| 12,664 | Norfolk Southern Corp. | 976,141 | ||||||||
| 6,855 | United Parcel Service, Inc. Class B | 588,845 | ||||||||
|
| |||||||||
| 3,223,584 | ||||||||||
|
| |||||||||
TOTAL COMMON STOCKS (COST $383,211,336) | 469,778,832 | |||||||||
|
| |||||||||
PREFERRED STOCK — 0.3% | ||||||||||
Auto Manufacturers — 0.3% | ||||||||||
| 31,650 | General Motors Co., 4.75%‡ | 1,359,051 | ||||||||
|
| |||||||||
TOTAL PREFERRED STOCK (COST $1,245,151) | 1,359,051 | |||||||||
|
| |||||||||
| Par Value ($) | Description | Value ($) | ||||||||
SHORT-TERM INVESTMENTS — 2.0% | ||||||||||
Bank Deposit — 0.5% | ||||||||||
| 2,511,925 | State Street Bank & Trust Euro Time Deposit, 0.01%, due 04/01/13 | 2,511,925 | ||||||||
|
| |||||||||
Securities Lending Collateral — 1.5% | ||||||||||
| 7,182,165 | State Street Navigator Securities Lending Prime Portfolio*** | 7,182,165 | ||||||||
|
| |||||||||
TOTAL SHORT-TERM INVESTMENTS (COST $9,694,090) | 9,694,090 | |||||||||
|
| |||||||||
TOTAL INVESTMENTS — 101.0% (Cost $394,150,577) | 480,831,973 | |||||||||
Other Assets and Liabilities (net) — (1.0)% | (4,934,358 | ) | ||||||||
|
| |||||||||
NET ASSETS — 100.0% | $ | 475,897,615 | ||||||||
|
| |||||||||
Notes to Schedule of Investments: | ||||||||||
| ADR — American Depository Receipt | ||||||||||
| REIT — Real Estate Investment Trust | ||||||||||
| * | Non-income producing security | |||||||||
| *** | Represents an investment of securities lending cash collateral. | |||||||||
| ‡ | All or a portion of this security is out on loan. | |||||||||
| 40 | See accompanying Notes to the Financial Statements. |
Mercer US Large Cap Value Equity Fund
Schedule of Investments (Continued)
March 31, 2013
A summary of outstanding financial instruments at March 31, 2013 is as follows:
Forward Foreign Currency Contracts
Settlement | Currency | Counterparty | Units of | Value | Net | |||||||||||||||||
| Sales | ||||||||||||||||||||||
| 06/14/13 | JPY | Barclays Bank Plc | 222,000,000 | $ | 2,362,395 | $ | (11,423 | ) | ||||||||||||||
|
| |||||||||||||||||||||
Currency Abbreviations
| JPY | Japanese Yen |
| See accompanying Notes to the Financial Statements. | 41 |
Mercer US Large Cap Value Equity Fund
Schedule of Investments (Continued)
March 31, 2013
| Asset Class Summary (Unaudited) | % of Net Assets | ||||
Common Stocks | 98.7 | ||||
Preferred Stock | 0.3 | ||||
Forward Foreign Currency Contracts | 0.0 | ||||
Short-Term Investments | 2.0 | ||||
Other Assets and Liabilities (net) | (1.0 | ) | |||
|
| ||||
| 100.0 | % | ||||
|
| ||||
| 42 | See accompanying Notes to the Financial Statements. |
Mercer US Small/Mid Cap Growth Equity Fund
Schedule of Investments
(showing percentage of net assets)
March 31, 2013
| Shares | Description | Value ($) | ||||||||
COMMON STOCKS — 97.2% | ||||||||||
Aerospace & Defense — 1.5% | ||||||||||
| 29,141 | Aerovironment, Inc.* | 528,327 | ||||||||
| 33,010 | BE Aerospace, Inc.* | 1,990,173 | ||||||||
| 15,130 | TransDigm Group, Inc. | 2,313,680 | ||||||||
| 22,660 | Triumph Group, Inc. | 1,778,810 | ||||||||
|
| |||||||||
| 6,610,990 | ||||||||||
|
| |||||||||
Apparel — 1.3% | ||||||||||
| 71,825 | Ascena Retail Group, Inc.* | 1,332,354 | ||||||||
| 28,704 | Carter’s, Inc.* | 1,643,878 | ||||||||
| 33,260 | Deckers Outdoor Corp.* ‡ | 1,852,249 | ||||||||
| 18,725 | Under Armour, Inc. Class A* | 958,720 | ||||||||
|
| |||||||||
| 5,787,201 | ||||||||||
|
| |||||||||
Auto Parts & Equipment — 0.2% | ||||||||||
| 57,396 | Gentherm, Inc.* | 940,146 | ||||||||
|
| |||||||||
Banks �� 1.6% | ||||||||||
| 50,130 | Comerica, Inc. | 1,802,174 | ||||||||
| 77,239 | Eagle Bancorp, Inc.* | 1,690,762 | ||||||||
| 73,623 | First Republic Bank | 2,843,320 | ||||||||
| 24,289 | Popular, Inc.* | 670,619 | ||||||||
|
| |||||||||
| 7,006,875 | ||||||||||
|
| |||||||||
Biotechnology — 0.8% | ||||||||||
| 104,805 | Amarin Corp. Plc, ADR* ‡ | 776,605 | ||||||||
| 92,046 | Ariad Pharmaceuticals, Inc.* | 1,665,112 | ||||||||
| 49,593 | Swedish Orphan Biovitrum AB, ADR* ¤ | 319,587 | ||||||||
| 15,535 | Vertex Pharmaceuticals, Inc.* | 854,115 | ||||||||
|
| |||||||||
| 3,615,419 | ||||||||||
|
| |||||||||
Building Materials — 0.5% | ||||||||||
| 8,895 | Martin Marietta Materials, Inc. | 907,468 | ||||||||
| 31,440 | Owens Corning, Inc.* | 1,239,679 | ||||||||
|
| |||||||||
| 2,147,147 | ||||||||||
|
| |||||||||
Chemicals — 3.3% | ||||||||||
| 15,788 | Airgas, Inc. | 1,565,538 | ||||||||
| 13,630 | Ashland, Inc. | 1,012,709 | ||||||||
| 22,510 | Axiall Corp. | 1,399,221 | ||||||||
| 23,910 | Celanese Corp. Series A | 1,053,235 | ||||||||
| 54,860 | Chemtura Corp.* | 1,185,525 | ||||||||
| 21,020 | Cytec Industries, Inc. | 1,557,161 | ||||||||
| 19,025 | FMC Corp. | 1,084,996 | ||||||||
| 44,820 | Huntsman Corp. | 833,204 | ||||||||
| 18,218 | International Flavors & Fragrances, Inc. | 1,396,774 | ||||||||
| 62,910 | Intrepid Potash, Inc. | 1,180,192 | ||||||||
| See accompanying Notes to the Financial Statements. | 43 |
Mercer US Small/Mid Cap Growth Equity Fund
Schedule of Investments (Continued)
(showing percentage of net assets)
March 31, 2013
| Shares | Description | Value ($) | ||||||||
Chemicals — continued | ||||||||||
| 36,525 | Kraton Performance Polymers, Inc.* | 854,685 | ||||||||
| 20,370 | Rockwood Holdings, Inc. | 1,333,013 | ||||||||
|
| |||||||||
| 14,456,253 | ||||||||||
|
| |||||||||
Coal — 0.3% | ||||||||||
| 33,110 | Consol Energy, Inc. | 1,114,152 | ||||||||
|
| |||||||||
Commercial Services — 9.6% | ||||||||||
| 60,495 | Acacia Research Corp.* ‡ | 1,825,134 | ||||||||
| 20,780 | Alliance Data Systems Corp.* | 3,364,074 | ||||||||
| 59,010 | Coinstar, Inc.* ‡ | 3,447,364 | ||||||||
| 58,976 | ExamWorks Group, Inc.* ‡ | 1,021,464 | ||||||||
| 58,534 | FleetCor Technologies, Inc.* | 4,487,802 | ||||||||
| 119,421 | Genpact, Ltd. | 2,172,268 | ||||||||
| 98,457 | Healthcare Services Group | 2,523,453 | ||||||||
| 129,243 | Heartland Payment Systems, Inc. | 4,261,142 | ||||||||
| 104,140 | Hertz Global Holdings, Inc.* | 2,318,156 | ||||||||
| 65,739 | HMS Holdings Corp.* | 1,784,814 | ||||||||
| 32,845 | Huron Consulting Group, Inc.* | 1,324,310 | ||||||||
| 144,500 | K12, Inc.* ‡ | 3,483,895 | ||||||||
| 32,244 | PAREXEL International Corp.* | 1,273,961 | ||||||||
| 38,393 | Quanta Services, Inc.* | 1,097,272 | ||||||||
| 219,225 | Ritchie Bros Auctioneers, Inc.‡ | 4,757,183 | ||||||||
| 109,380 | Service Corp. International | 1,829,927 | ||||||||
| 27,950 | United Rentals, Inc.* ‡ | 1,536,412 | ||||||||
|
| |||||||||
| 42,508,631 | ||||||||||
|
| |||||||||
Computers — 3.2% | ||||||||||
| 62,650 | Cadence Design Systems, Inc.* | 872,715 | ||||||||
| 138,534 | Fortinet, Inc.* | 3,280,485 | ||||||||
| 17,040 | IHS, Inc. Class A* | 1,784,429 | ||||||||
| 132,190 | j2 Global, Inc.‡ | 5,183,170 | ||||||||
| 31,665 | MICROS Systems, Inc.* | 1,441,074 | ||||||||
| 68,041 | RealD, Inc.* ‡ | 884,533 | ||||||||
| 42,530 | Riverbed Technology, Inc.* | 634,122 | ||||||||
|
| |||||||||
| 14,080,528 | ||||||||||
|
| |||||||||
Distribution & Wholesale — 1.0% | ||||||||||
| 35,930 | Beacon Roofing Supply, Inc.* ‡ | 1,389,054 | ||||||||
| 36,190 | LKQ Corp.* | 787,494 | ||||||||
| 30,990 | WESCO International, Inc.* | 2,250,184 | ||||||||
|
| |||||||||
| 4,426,732 | ||||||||||
|
| |||||||||
Diversified Financial Services — 5.3% | ||||||||||
| 52,830 | Affiliated Managers Group, Inc.* | 8,113,103 | ||||||||
| 40,688 | Evercore Partners, Inc. Class A | 1,692,621 | ||||||||
| 25,710 | Financial Engines, Inc. | 931,216 | ||||||||
| 24,475 | IntercontinentalExchange, Inc.* | 3,991,138 | ||||||||
| 44 | See accompanying Notes to the Financial Statements. |
Mercer US Small/Mid Cap Growth Equity Fund
Schedule of Investments (Continued)
(showing percentage of net assets)
March 31, 2013
| Shares | Description | Value ($) | ||||||||
Diversified Financial Services — continued | ||||||||||
| 128,687 | Lazard, Ltd. Class A | 4,392,087 | ||||||||
| 46,050 | Raymond James Financial, Inc. | 2,122,905 | ||||||||
| 29,420 | SLM Corp. | 602,522 | ||||||||
| 61,020 | WageWorks, Inc.* | 1,527,331 | ||||||||
|
| |||||||||
| 23,372,923 | ||||||||||
|
| |||||||||
Electrical Components & Equipment — 0.7% | ||||||||||
| 30,668 | Hubbell, Inc. Class B | 2,978,169 | ||||||||
|
| |||||||||
Electronics — 1.8% | ||||||||||
| 22,896 | Amphenol Corp. Class A | 1,709,186 | ||||||||
| 27,456 | Coherent, Inc. | 1,557,853 | ||||||||
| 122,650 | Gentex Corp. | 2,454,227 | ||||||||
| 47,730 | Jabil Circuit, Inc. | 882,050 | ||||||||
| 13,565 | Sensata Technologies Holding NV* | 445,882 | ||||||||
| 27,650 | Woodward, Inc. | 1,099,364 | ||||||||
|
| |||||||||
| 8,148,562 | ||||||||||
|
| |||||||||
Engineering & Construction — 0.3% | ||||||||||
| 108,490 | McDermott International, Inc.* | 1,192,305 | ||||||||
|
| |||||||||
Entertainment — 1.1% | ||||||||||
| 26,545 | Bally Technologies, Inc.* | 1,379,544 | ||||||||
| 52,280 | Cinemark Holdings, Inc. | 1,539,123 | ||||||||
| 50,020 | Manchester United Plc Class A* ‡ | 837,835 | ||||||||
| 22,415 | Penn National Gaming, Inc.* | 1,220,048 | ||||||||
|
| |||||||||
| 4,976,550 | ||||||||||
|
| |||||||||
Environmental Control — 1.5% | ||||||||||
| 33,520 | Clean Harbors, Inc.* | 1,947,177 | ||||||||
| 4,764 | Stericycle, Inc.* | 505,841 | ||||||||
| 110,145 | Waste Connections, Inc. | 3,963,017 | ||||||||
|
| |||||||||
| 6,416,035 | ||||||||||
|
| |||||||||
Food — 1.2% | ||||||||||
| 43,030 | Chefs’ Warehouse (The), Inc.* | 794,764 | ||||||||
| 55,243 | Hain Celestial Group (The), Inc.* ‡ | 3,374,243 | ||||||||
| 15,061 | TreeHouse Foods, Inc.* | 981,224 | ||||||||
|
| |||||||||
| 5,150,231 | ||||||||||
|
| |||||||||
Hand & Machine Tools — 0.4% | ||||||||||
| 46,085 | Kennametal, Inc. | 1,799,158 | ||||||||
|
| |||||||||
Health Care - Products — 4.9% | ||||||||||
| 140,591 | ABIOMED, Inc.* ‡ | 2,624,834 | ||||||||
| 14,700 | ArthroCare Corp.* | 510,972 | ||||||||
| 32,797 | CareFusion Corp.* | 1,147,567 | ||||||||
| 45,453 | Cepheid, Inc.* | 1,744,032 | ||||||||
| See accompanying Notes to the Financial Statements. | 45 |
Mercer US Small/Mid Cap Growth Equity Fund
Schedule of Investments (Continued)
(showing percentage of net assets)
March 31, 2013
| Shares | Description | Value ($) | ||||||||
Health Care - Products — continued | ||||||||||
| 38,730 | Conceptus, Inc.* | 935,330 | ||||||||
| 135,116 | DexCom, Inc.* | 2,259,140 | ||||||||
| 102,653 | Endologix, Inc.* | 1,657,846 | ||||||||
| 8,999 | Given Imaging, Ltd.* | 147,134 | ||||||||
| 15,859 | Henry Schein, Inc.* | 1,467,750 | ||||||||
| 14,955 | IDEXX Laboratories, Inc.* | 1,381,692 | ||||||||
| 61,704 | Techne Corp. | 4,186,616 | ||||||||
| 44,075 | Thoratec Corp.* | 1,652,812 | ||||||||
| 36,335 | Tornier BV* | 684,915 | ||||||||
| 52,400 | Volcano Corp.* | 1,166,424 | ||||||||
|
| |||||||||
| 21,567,064 | ||||||||||
|
| |||||||||
Health Care - Services — 3.1% | ||||||||||
| 84,571 | Acadia Healthcare Co., Inc.* | 2,485,542 | ||||||||
| 25,440 | Community Health Systems, Inc. | 1,205,602 | ||||||||
| 16,490 | Covance, Inc.* | 1,225,537 | ||||||||
| 123,150 | Health Management Associates, Inc. Class A* ‡ | 1,584,940 | ||||||||
| 32,465 | Magellan Health Services, Inc.* | 1,544,360 | ||||||||
| 13,501 | MEDNAX, Inc.* ‡ | 1,210,095 | ||||||||
| 14,707 | Mettler-Toledo International, Inc.* | 3,135,826 | ||||||||
| 25,570 | WellCare Health Plans, Inc.* | 1,482,037 | ||||||||
|
| |||||||||
| 13,873,939 | ||||||||||
|
| |||||||||
Home Builders — 0.2% | ||||||||||
| 940 | NVR, Inc.* | 1,015,303 | ||||||||
|
| |||||||||
Home Furnishings — 0.3% | ||||||||||
| 33,630 | Harman International Industries, Inc. | 1,500,907 | ||||||||
|
| |||||||||
Household Products & Wares — 0.7% | ||||||||||
| 19,383 | Church & Dwight Co., Inc. | 1,252,723 | ||||||||
| 41,280 | Jarden Corp.* | 1,768,848 | ||||||||
|
| |||||||||
| 3,021,571 | ||||||||||
|
| |||||||||
Insurance — 0.7% | ||||||||||
| 15,180 | Everest Re Group, Ltd. | 1,971,275 | ||||||||
| 89,910 | Genworth Financial, Inc. Class A* | 899,100 | ||||||||
|
| |||||||||
| 2,870,375 | ||||||||||
|
| |||||||||
Internet — 4.2% | ||||||||||
| 34,120 | BroadSoft, Inc.* ‡ | 903,156 | ||||||||
| 51,350 | CyrusOne, Inc.‡ | 1,172,834 | ||||||||
| 8,373 | Equinix, Inc.* | 1,811,163 | ||||||||
| 95,056 | ExactTarget, Inc.* | 2,211,953 | ||||||||
| 45,023 | Internap Network Services Corp.* | 420,965 | ||||||||
| 119,548 | Pandora Media, Inc.* ‡ | 1,692,800 | ||||||||
| 34,243 | Rackspace Hosting, Inc.* | 1,728,587 | ||||||||
| 40,865 | Sourcefire, Inc.* | 2,420,434 | ||||||||
| 84,340 | TIBCO Software, Inc.* | 1,705,355 | ||||||||
| 46 | See accompanying Notes to the Financial Statements. |
Mercer US Small/Mid Cap Growth Equity Fund
Schedule of Investments (Continued)
(showing percentage of net assets)
March 31, 2013
| Shares | Description | Value ($) | ||||||||
Internet — continued | ||||||||||
| 92,500 | VeriSign, Inc.* | 4,373,400 | ||||||||
|
| |||||||||
| 18,440,647 | ||||||||||
|
| |||||||||
Leisure Time — 0.7% | ||||||||||
| 100,040 | Interval Leisure Group, Inc. | 2,174,870 | ||||||||
| 9,770 | Polaris Industries, Inc. | 903,627 | ||||||||
|
| |||||||||
| 3,078,497 | ||||||||||
|
| |||||||||
Lodging — 0.4% | ||||||||||
| 25,610 | Wyndham Worldwide Corp. | 1,651,333 | ||||||||
|
| |||||||||
Machinery - Diversified — 2.5% | ||||||||||
| 106,496 | Graco, Inc. | 6,179,963 | ||||||||
| 56,465 | IDEX Corp. | 3,016,360 | ||||||||
| 39,775 | Manitowoc Co. (The), Inc. | 817,774 | ||||||||
| 9,386 | Roper Industries, Inc. | 1,194,932 | ||||||||
|
| |||||||||
| 11,209,029 | ||||||||||
|
| |||||||||
Media — 0.0% | ||||||||||
| 38,592 | RLJ Entertainment, Inc.* ‡ | 179,839 | ||||||||
|
| |||||||||
Metal Fabricate & Hardware — 0.3% | ||||||||||
| 25,790 | Timken Co. (The) | 1,459,198 | ||||||||
|
| |||||||||
Miscellaneous - Manufacturing — 0.7% | ||||||||||
| 54,170 | Hexcel Corp.* | 1,571,472 | ||||||||
| 31,285 | Polypore International, Inc.* ‡ | 1,257,031 | ||||||||
| 52,675 | STR Holdings, Inc.* ‡ | 114,305 | ||||||||
|
| |||||||||
| 2,942,808 | ||||||||||
|
| |||||||||
Oil & Gas — 4.7% | ||||||||||
| 42,541 | Approach Resources, Inc.* ‡ | 1,046,934 | ||||||||
| 30,341 | Berry Petroleum Co. Class A | 1,404,485 | ||||||||
| 35,300 | Bill Barrett Corp.* ‡ | 715,531 | ||||||||
| 100,130 | Denbury Resources, Inc.* | 1,867,425 | ||||||||
| 291,015 | Magnum Hunter Resources Corp.* ‡ | 1,166,970 | ||||||||
| 35,210 | Oasis Petroleum, Inc.* ‡ | 1,340,445 | ||||||||
| 75,565 | Rex Energy Corp.* | 1,245,311 | ||||||||
| 46,891 | Rosetta Resources, Inc.* | 2,231,074 | ||||||||
| 102,420 | Rowan Cos. Plc Class A * | 3,621,571 | ||||||||
| 78,890 | Tesoro Corp. | 4,619,009 | ||||||||
| 31,594 | Whiting Petroleum Corp.* | 1,606,239 | ||||||||
|
| |||||||||
| 20,864,994 | ||||||||||
|
| |||||||||
Oil & Gas Services — 2.1% | ||||||||||
| 49,311 | Core Laboratories NV | 6,800,973 | ||||||||
| 24,304 | Dril-Quip, Inc.* | 2,118,580 | ||||||||
| 8,484 | Lufkin Industries, Inc. | 563,253 | ||||||||
|
| |||||||||
| 9,482,806 | ||||||||||
|
| |||||||||
| See accompanying Notes to the Financial Statements. | 47 |
Mercer US Small/Mid Cap Growth Equity Fund
Schedule of Investments (Continued)
(showing percentage of net assets)
March 31, 2013
| Shares | Description | Value ($) | ||||||||
Packaging & Containers — 1.0% | ||||||||||
| 50,170 | Crown Holdings, Inc.* | 2,087,573 | ||||||||
| 32,040 | Packaging Corp. of America | 1,437,635 | ||||||||
| 10,130 | Rock-Tenn Co. Class A | 939,963 | ||||||||
|
| |||||||||
| 4,465,171 | ||||||||||
|
| |||||||||
Pharmaceuticals — 4.3% | ||||||||||
| 71,980 | Achillion Pharmaceuticals, Inc.* | 629,105 | ||||||||
| 74,030 | Alkermes Plc* | 1,755,251 | ||||||||
| 24,059 | BioMarin Pharmaceutical, Inc.* | 1,497,913 | ||||||||
| 23,047 | Catamaran Corp.* | 1,222,182 | ||||||||
| 37,790 | Cubist Pharmaceuticals, Inc.* | 1,769,328 | ||||||||
| 41,390 | DENTSPLY International, Inc. | 1,755,764 | ||||||||
| 38,899 | Durata Therapeutics, Inc.* ‡ | 350,091 | ||||||||
| 40,967 | Medivation, Inc.* | 1,916,027 | ||||||||
| 25,111 | Neurocrine Biosciences, Inc.* | 304,848 | ||||||||
| 26,040 | Onyx Pharmaceuticals, Inc.* | 2,313,914 | ||||||||
| 21,350 | Perrigo Co. | 2,534,886 | ||||||||
| 63,561 | Regulus Therapeutics, Inc.* | 492,598 | ||||||||
| 41,039 | Sagent Pharmaceuticals, Inc.* ‡ | 720,234 | ||||||||
| 17,485 | Sirona Dental Systems, Inc.* | 1,289,169 | ||||||||
| 8,803 | Synageva BioPharma Corp.* | 483,461 | ||||||||
| 22,222 | Synta Pharmaceuticals Corp.* ‡ | 191,109 | ||||||||
|
| |||||||||
| 19,225,880 | ||||||||||
|
| |||||||||
Real Estate — 1.2% | ||||||||||
| 79,259 | CBRE Group, Inc.* | 2,001,290 | ||||||||
| 33,620 | Jones Lang Lasalle, Inc. | 3,342,164 | ||||||||
|
| |||||||||
| 5,343,454 | ||||||||||
|
| |||||||||
Retail — 10.8% | ||||||||||
| 65,970 | Aeropostale, Inc.* | 897,192 | ||||||||
| 38,760 | American Eagle Outfitters, Inc. | 724,812 | ||||||||
| 40,250 | Arcos Dorados Holdings, Inc.‡ | 531,300 | ||||||||
| 24,490 | Asbury Automotive Group, Inc.* | 898,538 | ||||||||
| 68,730 | Best Buy Co., Inc. | 1,522,369 | ||||||||
| 32,900 | Childrens Place Retail Stores (The), Inc.* | 1,474,578 | ||||||||
| 38,416 | Dick’s Sporting Goods, Inc.‡ | 1,817,077 | ||||||||
| 70,675 | DineEquity, Inc. | 4,861,733 | ||||||||
| 25,667 | Dunkin’ Brands Group, Inc. | 946,599 | ||||||||
| 66,992 | Fifth & Pacific Cos., Inc.* | 1,264,809 | ||||||||
| 25,355 | First Cash Financial Services, Inc.* | 1,479,211 | ||||||||
| 104,322 | Foot Locker, Inc. | 3,571,985 | ||||||||
| 18,170 | GNC Holdings, Inc. Class A | 713,718 | ||||||||
| 8,325 | Lululemon Athletica, Inc.* ‡ | 519,064 | ||||||||
| 25,397 | Petsmart, Inc. | 1,577,154 | ||||||||
| 24,135 | PVH Corp. | 2,577,859 | ||||||||
| 41,490 | Red Robin Gourmet Burgers, Inc.* | 1,891,944 | ||||||||
| 51,087 | Restoration Hardware Holdings, Inc.* ‡ | �� | 1,788,045 | |||||||
| 22,904 | Rue21, Inc.* | 673,149 | ||||||||
| 48 | See accompanying Notes to the Financial Statements. |
Mercer US Small/Mid Cap Growth Equity Fund
Schedule of Investments (Continued)
(showing percentage of net assets)
March 31, 2013
| Shares | Description | Value ($) | ||||||||
Retail — continued | ||||||||||
| 157,500 | Sally Beauty Holdings, Inc.* | 4,627,350 | ||||||||
| 26,770 | Signet Jewelers, Ltd. | 1,793,590 | ||||||||
| 45,666 | Texas Roadhouse, Inc. Class A | 921,996 | ||||||||
| 23,892 | Tile Shop Holdings, Inc.* ‡ | 501,971 | ||||||||
| 10,450 | Tractor Supply Co. | 1,088,158 | ||||||||
| 29,577 | Ulta Salon Cosmetics & Fragrance, Inc.* | 2,400,765 | ||||||||
| 109,076 | Urban Outfitters, Inc.* | 4,225,604 | ||||||||
| 43,280 | Williams-Sonoma, Inc. | 2,229,786 | ||||||||
|
| |||||||||
| 47,520,356 | ||||||||||
|
| |||||||||
Semiconductors — 3.5% | ||||||||||
| 170,130 | Atmel Corp.* | 1,184,105 | ||||||||
| 32,210 | Avago Technologies, Ltd. | 1,156,983 | ||||||||
| 34,830 | Cavium, Inc.* | 1,351,752 | ||||||||
| 74,838 | Ceva, Inc.* | 1,167,473 | ||||||||
| 22,919 | Hittite Microwave Corp.* | 1,387,975 | ||||||||
| 53,946 | Intermolecular, Inc.* | 550,249 | ||||||||
| 10,180 | Lam Research Corp.* | 422,063 | ||||||||
| 17,894 | Linear Technology Corp. | 686,593 | ||||||||
| 129,350 | LSI Corp.* | 876,993 | ||||||||
| 52,370 | NXP Semiconductor NV* | 1,584,716 | ||||||||
| 72,490 | Skyworks Solutions, Inc.* | 1,596,955 | ||||||||
| 69,835 | Teradyne, Inc.* | 1,132,724 | ||||||||
| 16,033 | Ultratech, Inc.* | 633,784 | ||||||||
| 45,231 | Xilinx, Inc. | 1,726,467 | ||||||||
|
| |||||||||
| 15,458,832 | ||||||||||
|
| |||||||||
Software — 8.2% | ||||||||||
| 20,400 | athenahealth, Inc.* ‡ | 1,979,616 | ||||||||
| 30,350 | Autodesk, Inc.* | 1,251,634 | ||||||||
| 118,617 | Blackbaud, Inc. | 3,514,622 | ||||||||
| 11,755 | Commvault Systems, Inc.* | 963,675 | ||||||||
| 8,480 | Concur Technologies, Inc.* ‡ | 582,237 | ||||||||
| 34,580 | Imperva, Inc.* | 1,331,330 | ||||||||
| 49,865 | Informatica Corp.* | 1,718,846 | ||||||||
| 64,440 | InterXion Holding NV* | 1,560,737 | ||||||||
| 93,140 | Jive Software, Inc.* ‡ | 1,415,728 | ||||||||
| 37,244 | Medassets, Inc.* | 716,947 | ||||||||
| 211,565 | MSCI, Inc. Class A* | 7,178,400 | ||||||||
| 24,478 | NetSuite, Inc.* | 1,959,709 | ||||||||
| 108,640 | Nuance Communications, Inc.* | 2,192,355 | ||||||||
| 129,845 | QLIK Technologies, Inc.* | 3,353,896 | ||||||||
| 52,970 | SS&C Technologies Holdings, Inc.* | 1,588,041 | ||||||||
| 57,888 | Synchronoss Technologies, Inc.* | 1,796,265 | ||||||||
| 156,975 | VeriFone Systems, Inc.* | 3,246,243 | ||||||||
|
| |||||||||
| 36,350,281 | ||||||||||
|
| |||||||||
Telecommunications — 4.6% | ||||||||||
| 78,817 | Allot Communications, Ltd.* | 941,075 | ||||||||
| 56,730 | Aruba Networks, Inc.* | 1,403,500 | ||||||||
| See accompanying Notes to the Financial Statements. | 49 |
Mercer US Small/Mid Cap Growth Equity Fund
Schedule of Investments (Continued)
(showing percentage of net assets)
March 31, 2013
| Shares | Description | Value ($) | ||||||||
Telecommunications — continued | ||||||||||
| 113,999 | Calix, Inc.* | 929,092 | ||||||||
| 21,642 | IPG Photonics Corp.‡ | 1,437,245 | ||||||||
| 105,800 | NeuStar, Inc. Class A* | 4,922,874 | ||||||||
| 127,618 | SBA Communications Corp. Class A* | 9,191,049 | ||||||||
| 61,726 | tw telecom, Inc. Class A* | 1,554,878 | ||||||||
|
| |||||||||
| 20,379,713 | ||||||||||
|
| |||||||||
Transportation — 2.5% | ||||||||||
| 99,125 | Expeditors International of Washington, Inc. | 3,539,754 | ||||||||
| 15,665 | Genesee & Wyoming, Inc. Class A* | 1,458,568 | ||||||||
| 43,975 | HUB Group, Inc. Class A* | 1,691,278 | ||||||||
| 73,600 | Knight Transportation, Inc. | 1,184,960 | ||||||||
| 31,340 | Landstar System, Inc. | 1,789,201 | ||||||||
| 67,660 | Roadrunner Transportation Systems, Inc.* | 1,556,180 | ||||||||
|
| |||||||||
| 11,219,941 | ||||||||||
|
| |||||||||
TOTAL COMMON STOCKS (COST $358,519,787) | 429,849,945 | |||||||||
|
| |||||||||
INVESTMENT COMPANY — 0.9% | ||||||||||
Unaffiliated Fund — 0.9% | ||||||||||
| 34,850 | iShares Russell 2000 Growth Index Fund‡ | 3,755,087 | ||||||||
|
| |||||||||
TOTAL INVESTMENT COMPANY (COST $3,675,283) | 3,755,087 | |||||||||
|
| |||||||||
| Par Value ($) | Description | Value ($) | ||||||||
SHORT-TERM INVESTMENTS — 11.3% | ||||||||||
Bank Deposit — 2.1% |
| |||||||||
| 9,297,722 | State Street Bank & Trust Euro Time Deposit, 0.01%, due 04/01/13 | 9,297,722 | ||||||||
|
| |||||||||
Securities Lending Collateral — 9.2% |
| |||||||||
| 40,633,413 | State Street Navigator Securities Lending Prime Portfolio*** | 40,633,413 | ||||||||
|
| |||||||||
TOTAL SHORT-TERM INVESTMENTS (COST $49,931,135) | 49,931,135 | |||||||||
|
| |||||||||
TOTAL INVESTMENTS — 109.4% (Cost $412,126,205) | 483,536,167 | |||||||||
Other Assets and Liabilities (net) — (9.4)% | (41,455,873 | ) | ||||||||
|
| |||||||||
NET ASSETS — 100.0% | $ | 442,080,294 | ||||||||
|
| |||||||||
Notes to Schedule of Investments: | ||||||||||
| ADR — American Depository Receipt | ||||||||||
| ¤ | Illiquid security. The total market value of the securities at year end is $319,587 which represents 0.1% of net assets. The aggregate tax cost of these securities held at March 31, 2013 was $281,192. | |||||||||
| * | Non-income producing security | |||||||||
| *** | Represents an investment of securities lending cash collateral. | |||||||||
| ‡ | All or a portion of this security is out on loan. | |||||||||
| 50 | See accompanying Notes to the Financial Statements. |
Mercer US Small/Mid Cap Growth Equity Fund
Schedule of Investments (Continued)
March 31, 2013
| Asset Class Summary (Unaudited) | % of Net Assets | ||||
Common Stocks | 97.2 | ||||
Investment Company | 0.9 | ||||
Short-Term Investments | 11.3 | ||||
Other Assets and Liabilities (net) | (9.4 | ) | |||
|
| ||||
| 100.0 | % | ||||
|
| ||||
| See accompanying Notes to the Financial Statements. | 51 |
Mercer US Small/Mid Cap Value Equity Fund
Schedule of Investments
(showing percentage of net assets)
March 31, 2013
| Shares | Description | Value ($) | ||||||||
COMMON STOCKS — 98.6% | ||||||||||
Aerospace & Defense — 1.5% | ||||||||||
| 10,600 | Alliant Techsystems, Inc. | 767,758 | ||||||||
| 9,975 | Esterline Technologies Corp.* | 755,107 | ||||||||
| 6,500 | Exelis, Inc. | 70,785 | ||||||||
| 151,300 | Orbital Sciences Corp.* | 2,525,197 | ||||||||
| 30,300 | Triumph Group, Inc. | 2,378,550 | ||||||||
|
| |||||||||
| 6,497,397 | ||||||||||
|
| |||||||||
Agriculture — 0.2% | ||||||||||
| 14,200 | Andersons (The), Inc. | 759,984 | ||||||||
| 2,100 | Universal Corp.‡ | 117,684 | ||||||||
|
| |||||||||
| 877,668 | ||||||||||
|
| |||||||||
Airlines — 0.7% | ||||||||||
| 3,800 | Alaska Air Group, Inc.* | 243,048 | ||||||||
| 93,200 | Delta Air Lines, Inc.* | 1,538,732 | ||||||||
| 24,500 | Hawaiian Holdings, Inc.* | 141,120 | ||||||||
| 66,700 | Republic Airways Holdings, Inc.* | 769,718 | ||||||||
| 6,900 | SkyWest, Inc. | 110,745 | ||||||||
|
| |||||||||
| 2,803,363 | ||||||||||
|
| |||||||||
Apparel — 0.8% | ||||||||||
| 76,270 | Ascena Retail Group, Inc.* | 1,414,809 | ||||||||
| 35,100 | Guess?, Inc.‡ | 871,533 | ||||||||
| 4,000 | Maidenform Brands, Inc.* | 70,120 | ||||||||
| 15,600 | Perry Ellis International, Inc. | 283,764 | ||||||||
| 11,000 | Skechers U.S.A., Inc. Class A* | 232,650 | ||||||||
| 25,910 | True Religion Apparel, Inc. | 676,510 | ||||||||
|
| |||||||||
| 3,549,386 | ||||||||||
|
| |||||||||
Auto Manufacturers — 0.1% | ||||||||||
| 5,700 | Oshkosh Corp.* | 242,193 | ||||||||
|
| |||||||||
Auto Parts & Equipment — 1.0% | ||||||||||
| 28,100 | Cooper Tire & Rubber Co. | 721,046 | ||||||||
| 115,600 | Dana Holding Corp. | 2,061,148 | ||||||||
| 10,100 | Lear Corp. | 554,187 | ||||||||
| 88,200 | Meritor, Inc.* | 417,186 | ||||||||
| 44,000 | Modine Manufacturing Co.* | 400,400 | ||||||||
| 7,600 | Standard Motor Products, Inc. | 210,672 | ||||||||
|
| |||||||||
| 4,364,639 | ||||||||||
|
| |||||||||
Banks — 5.8% | ||||||||||
| 48,400 | Associated Banc-Corp. | 735,196 | ||||||||
| 18,900 | Banco Latinoamericano de Comercio Exterior SA | 467,586 | ||||||||
| 11,000 | BOK Financial Corp. | 685,300 | ||||||||
| 12,400 | Chemical Financial Corp. | 327,112 | ||||||||
| 52 | See accompanying Notes to the Financial Statements. |
Mercer US Small/Mid Cap Value Equity Fund
Schedule of Investments (Continued)
(showing percentage of net assets)
March 31, 2013
| Shares | Description | Value ($) | ||||||||
Banks — continued |
| |||||||||
| 3,300 | Citizens Republic Bancorp, Inc.* | 74,415 | ||||||||
| 18,800 | City Holding Co.‡ | 748,052 | ||||||||
| 6,000 | City National Corp. | 353,460 | ||||||||
| 21,500 | Columbia Banking System, Inc. | 472,570 | ||||||||
| 18,611 | Commerce Bancshares, Inc. | 759,887 | ||||||||
| 2,000 | Cullen/Frost Bankers, Inc.‡ | 125,060 | ||||||||
| 6,300 | East-West Bancorp, Inc. | 161,721 | ||||||||
| 2,200 | First Citizens BancShares, Inc. Class A | 401,940 | ||||||||
| 78,300 | First Commonwealth Financial Corp. | 584,118 | ||||||||
| 45,000 | Fulton Financial Corp. | 526,500 | ||||||||
| 34,700 | Huntington Bancshares, Inc. | 256,433 | ||||||||
| 4,700 | Independent Bank Corp.‡ | 153,173 | ||||||||
| 41,300 | International Bancshares Corp. | 859,040 | ||||||||
| 255,675 | KeyCorp | 2,546,523 | ||||||||
| 57,800 | National Penn Bancshares, Inc. | 617,882 | ||||||||
| 23,000 | NBT Bancorp, Inc. | 509,450 | ||||||||
| 44,000 | Northwest Bancshares, Inc. | 558,360 | ||||||||
| 10,300 | Old National Bancorp | 141,625 | ||||||||
| 5,100 | Oriental Financial Group, Inc. | 79,101 | ||||||||
| 9,500 | PacWest Bancorp‡ | 276,545 | ||||||||
| 12,200 | Pinnacle Financial Partners, Inc.* | 284,992 | ||||||||
| 25,010 | Popular, Inc.* | 690,526 | ||||||||
| 35,800 | PrivateBancorp, Inc. | 676,978 | ||||||||
| 42,200 | Prosperity Bancshares, Inc.‡ | 1,999,858 | ||||||||
| 529,100 | Regions Financial Corp. | 4,333,329 | ||||||||
| 1,000 | S&T Bancorp, Inc. | 18,540 | ||||||||
| 36,300 | Texas Capital Bancshares, Inc.* | 1,468,335 | ||||||||
| 1,400 | UMB Financial Corp. | 68,698 | ||||||||
| 29,400 | Umpqua Holdings Corp. | 389,844 | ||||||||
| 12,700 | Webster Financial Corp. | 308,102 | ||||||||
| 115,865 | Western Alliance Bancorp* | 1,603,572 | ||||||||
| 98,000 | Wilshire Bancorp, Inc.* | 664,440 | ||||||||
|
| |||||||||
| 24,928,263 | ||||||||||
|
| |||||||||
Beverages — 0.1% | ||||||||||
| 9,300 | Constellation Brands, Inc. Class A* | 443,052 | ||||||||
|
| |||||||||
Biotechnology — 0.9% | ||||||||||
| 34,700 | Affymetrix, Inc.* ‡ | 163,784 | ||||||||
| 8,400 | AMAG Pharmaceuticals, Inc.* | 200,340 | ||||||||
| 3,900 | Charles River Laboratories International, Inc.* | 172,653 | ||||||||
| 179,900 | Dynavax Technologies Corp.* ‡ | 399,378 | ||||||||
| 16,100 | NPS Pharmaceuticals, Inc.* | 164,059 | ||||||||
| 237,400 | PDL BioPharma, Inc.‡ | 1,735,394 | ||||||||
| 17,900 | Vertex Pharmaceuticals, Inc.* | 984,142 | ||||||||
| 21,900 | Vical, Inc.* | 87,162 | ||||||||
|
| |||||||||
| 3,906,912 | ||||||||||
|
| |||||||||
| See accompanying Notes to the Financial Statements. | 53 |
Mercer US Small/Mid Cap Value Equity Fund
Schedule of Investments (Continued)
(showing percentage of net assets)
March 31, 2013
| Shares | Description | Value ($) | ||||||||
Building Materials — 0.4% | ||||||||||
| 40,000 | Apogee Enterprises, Inc. | 1,158,000 | ||||||||
| 42,400 | Gibraltar Industries, Inc.* | 773,800 | ||||||||
|
| |||||||||
| 1,931,800 | ||||||||||
|
| |||||||||
Chemicals — 2.1% | ||||||||||
| 56,000 | A. Schulman, Inc. | 1,767,360 | ||||||||
| 29,675 | Axiall Corp. | 1,844,598 | ||||||||
| 5,600 | Chemtura Corp.* | 121,016 | ||||||||
| 22,700 | Ferro Corp.* | 153,225 | ||||||||
| 113,100 | Huntsman Corp. | 2,102,529 | ||||||||
| 10,170 | Innophos Holdings, Inc. | 554,875 | ||||||||
| 24,900 | Innospec, Inc. | 1,102,572 | ||||||||
| 26,170 | Intrepid Potash, Inc. | 490,949 | ||||||||
| 32,720 | Kraton Performance Polymers, Inc.* | 765,648 | ||||||||
| 7,600 | Minerals Technologies, Inc. | 315,476 | ||||||||
|
| |||||||||
| 9,218,248 | ||||||||||
|
| |||||||||
Coal — 0.8% | ||||||||||
| 88,500 | Alpha Natural Resources, Inc.* | 726,585 | ||||||||
| 40,030 | Cloud Peak Energy, Inc.* | 751,764 | ||||||||
| 86,675 | Peabody Energy Corp. | 1,833,176 | ||||||||
|
| |||||||||
| 3,311,525 | ||||||||||
|
| |||||||||
Commercial Services — 4.9% | ||||||||||
| 18,400 | AVEO Pharmaceuticals, Inc.* ‡ | 135,240 | ||||||||
| 210,800 | Career Education Corp.* | 499,596 | ||||||||
| 3,900 | Consolidated Graphics, Inc.* | 152,490 | ||||||||
| 100,340 | Convergys Corp. | 1,708,790 | ||||||||
| 73,950 | CoreLogic, Inc.* | 1,912,347 | ||||||||
| 300,500 | Corinthian Colleges, Inc.* ‡ | 631,050 | ||||||||
| 8,200 | Euronet Worldwide, Inc.* | 215,988 | ||||||||
| 44,866 | Geo Group (The), Inc. | 1,687,859 | ||||||||
| 5,700 | H&E Equipment Services, Inc. | 116,280 | ||||||||
| 6,100 | ICF International, Inc.* | 165,920 | ||||||||
| 31,740 | Insperity, Inc. | 900,464 | ||||||||
| 15,507 | Ituran Location and Control, Ltd. | 242,685 | ||||||||
| 36,400 | Kforce, Inc. | 595,868 | ||||||||
| 29,990 | Korn/Ferry International* | 535,621 | ||||||||
| 6,500 | Navigant Consulting, Inc.* | 85,410 | ||||||||
| 47,440 | Rent-A-Center, Inc. | 1,752,434 | ||||||||
| 44,600 | Resources Connection, Inc. | 566,420 | ||||||||
| 56,300 | Service Corp. International | 941,899 | ||||||||
| 35,560 | Standard Parking Corp.* | 736,092 | ||||||||
| 49,500 | Stewart Enterprises, Inc. Class A | 459,855 | ||||||||
| 9,100 | TeleTech Holdings, Inc.* | 193,011 | ||||||||
| 42,950 | Total System Services, Inc. | 1,064,301 | ||||||||
| 28,025 | Towers Watson & Co. Class A | 1,942,693 | ||||||||
| 35,700 | TrueBlue, Inc.* | 754,698 | ||||||||
| 54 | See accompanying Notes to the Financial Statements. |
Mercer US Small/Mid Cap Value Equity Fund
Schedule of Investments (Continued)
(showing percentage of net assets)
March 31, 2013
| Shares | Description | Value ($) | ||||||||
Commercial Services — continued |
| |||||||||
| 44,325 | United Rentals, Inc.* ‡ | 2,436,545 | ||||||||
| 24,900 | Viad Corp. | 688,734 | ||||||||
|
| |||||||||
| 21,122,290 | ||||||||||
|
| |||||||||
Computers — 1.3% | ||||||||||
| 111,100 | Brocade Communications Systems, Inc.* | 641,047 | ||||||||
| 31,510 | DST Systems, Inc. | 2,245,718 | ||||||||
| 9,400 | j2 Global, Inc. | 368,574 | ||||||||
| 12,140 | Lexmark International, Inc. Class A‡ | 320,496 | ||||||||
| 311,000 | Quantum Corp.* | 398,080 | ||||||||
| 101,900 | STEC, Inc.* ‡ | 450,398 | ||||||||
| 35,300 | Sykes Enterprises, Inc.* | 563,388 | ||||||||
| 24,100 | Unisys Corp.* | 548,275 | ||||||||
|
| |||||||||
| 5,535,976 | ||||||||||
|
| |||||||||
Cosmetics & Personal Care — 1.0% | ||||||||||
| 73,580 | Elizabeth Arden, Inc.* | 2,961,595 | ||||||||
| 53,600 | Inter Parfums, Inc. | 1,309,448 | ||||||||
| 9,000 | Skilled Healthcare Group, Inc. Class A* | 59,130 | ||||||||
|
| |||||||||
| 4,330,173 | ||||||||||
|
| |||||||||
Distribution & Wholesale — 0.9% | ||||||||||
| 6,100 | Core-Mark Holding Co., Inc. | 312,991 | ||||||||
| 47,340 | Owens & Minor, Inc.‡ | 1,541,390 | ||||||||
| 5,100 | Tech Data Corp.* ‡ | 232,611 | ||||||||
| 28,000 | United Stationers, Inc. | 1,082,200 | ||||||||
| 8,711 | WESCO International, Inc.* | 632,506 | ||||||||
|
| |||||||||
| 3,801,698 | ||||||||||
|
| |||||||||
Diversified Financial Services — 1.8% | ||||||||||
| 4,100 | DFC Global Corp.* | 68,224 | ||||||||
| 31,500 | Eaton Vance Corp. | 1,317,645 | ||||||||
| 40,200 | Evercore Partners, Inc. Class A | 1,672,320 | ||||||||
| 67,600 | Investment Technology Group, Inc.* | 746,304 | ||||||||
| 8,800 | Nelnet, Inc. Class A | 297,440 | ||||||||
| 8,300 | Ocwen Financial Corp.* | 314,736 | ||||||||
| 15,900 | Piper Jaffray Cos.* | 545,370 | ||||||||
| 58,700 | Raymond James Financial, Inc. | 2,706,070 | ||||||||
|
| |||||||||
| 7,668,109 | ||||||||||
|
| |||||||||
Electric — 2.8% | ||||||||||
| 22,420 | Avista Corp. | 614,308 | ||||||||
| 3,900 | CH Energy Group, Inc. | 255,021 | ||||||||
| 56,675 | Cleco Corp. | 2,665,425 | ||||||||
| 94,075 | CMS Energy Corp. | 2,628,456 | ||||||||
| 3,200 | El Paso Electric Co. | 107,680 | ||||||||
| 7,100 | MGE Energy, Inc. | 393,624 | ||||||||
| 105,125 | NRG Energy, Inc. | 2,784,761 | ||||||||
| See accompanying Notes to the Financial Statements. | 55 |
Mercer US Small/Mid Cap Value Equity Fund
Schedule of Investments (Continued)
(showing percentage of net assets)
March 31, 2013
| Shares | Description | Value ($) | ||||||||
Electric — continued |
| |||||||||
| 900 | OGE Energy Corp. | 62,982 | ||||||||
| 23,000 | Otter Tail Corp. | 716,220 | ||||||||
| 14,700 | Pinnacle West Capital Corp. | 850,983 | ||||||||
| 17,600 | PNM Resources, Inc. | 409,904 | ||||||||
| 21,900 | Portland General Electric Co. | 664,227 | ||||||||
|
| |||||||||
| 12,153,591 | ||||||||||
|
| |||||||||
Electrical Components & Equipment — 0.5% | ||||||||||
| 35,100 | Advanced Energy Industries, Inc.* | 642,330 | ||||||||
| 1,100 | Energizer Holdings, Inc. | 109,703 | ||||||||
| 18,200 | EnerSys* | 829,556 | ||||||||
| 133,900 | Power-One, Inc.* ‡ | 555,685 | ||||||||
|
| |||||||||
| 2,137,274 | ||||||||||
|
| |||||||||
Electronics — 2.6% | ||||||||||
| 2,800 | American Science & Engineering, Inc. | 170,772 | ||||||||
| 31,062 | Arrow Electronics, Inc.* | 1,261,738 | ||||||||
| 98,069 | Avnet, Inc.* | 3,550,098 | ||||||||
| 5,100 | AVX Corp. | 60,690 | ||||||||
| 40,404 | Coherent, Inc. | 2,292,523 | ||||||||
| 12,270 | Cubic Corp. | 524,174 | ||||||||
| 32,820 | Daktronics, Inc. | 344,610 | ||||||||
| 10,550 | FEI Co. | 681,003 | ||||||||
| 14,900 | Sanmina Corp.* | 169,264 | ||||||||
| 161,500 | Vishay Intertechnology, Inc.* | 2,198,015 | ||||||||
|
| |||||||||
| 11,252,887 | ||||||||||
|
| |||||||||
Engineering & Construction — 1.7% | ||||||||||
| 73,725 | AECOM Technology Corp.* | 2,418,180 | ||||||||
| 19,900 | Dycom Industries, Inc.* | 391,831 | ||||||||
| 41,375 | Emcor Group, Inc. | 1,753,886 | ||||||||
| 3,500 | Granite Construction, Inc. | 111,440 | ||||||||
| 9,800 | KBR, Inc. | 314,384 | ||||||||
| 25,440 | Layne Christensen Co.* | 543,907 | ||||||||
| 29,800 | McDermott International, Inc.* | 327,502 | ||||||||
| 45,700 | Mistras Group, Inc.* | 1,106,397 | ||||||||
| 21,200 | MYR Group, Inc.* | 520,672 | ||||||||
|
| |||||||||
| 7,488,199 | ||||||||||
|
| |||||||||
Entertainment — 0.8% | ||||||||||
| 28,400 | Carmike Cinemas, Inc.* | 514,608 | ||||||||
| 37,260 | DreamWorks Animation SKG, Inc. Class A* ‡ | 706,450 | ||||||||
| 27,420 | International Speedway Corp. Class A | 896,085 | ||||||||
| 18,970 | Madison Square Garden, Inc.* | 1,092,672 | ||||||||
| 5,300 | Marriott Vacations Worldwide Corp.* | 227,423 | ||||||||
|
| |||||||||
| 3,437,238 | ||||||||||
|
| |||||||||
Environmental Control — 0.1% | ||||||||||
| 18,300 | Darling International, Inc.* | 328,668 | ||||||||
|
| |||||||||
| 56 | See accompanying Notes to the Financial Statements. |
Mercer US Small/Mid Cap Value Equity Fund
Schedule of Investments (Continued)
(showing percentage of net assets)
March 31, 2013
| Shares | Description | Value ($) | ||||||||
Food — 3.9% | ||||||||||
| 110,600 | Chiquita Brands International, Inc.* | 858,256 | ||||||||
| 14,800 | Dean Foods Co.* | 268,324 | ||||||||
| 46,100 | Fresh Del Monte Produce, Inc. | 1,243,778 | ||||||||
| 69,830 | Harris Teeter Supermarkets, Inc. | 2,982,439 | ||||||||
| 32,800 | Hormel Foods Corp. | 1,355,296 | ||||||||
| 15,254 | Industrias Bachoco, S.A.B., Sponsored ADR‡ | 489,806 | ||||||||
| 27,325 | Ingredion, Inc. | 1,976,144 | ||||||||
| 4,960 | J&J Snack Foods Corp. | 381,374 | ||||||||
| 12,750 | JM Smucker Co. (The) | 1,264,290 | ||||||||
| 33,900 | Nash Finch Co. | 663,762 | ||||||||
| 2,700 | Pilgrim’s Pride Corp.* | 24,813 | ||||||||
| 2,100 | Smithfield Foods, Inc.* | 55,608 | ||||||||
| 27,425 | TreeHouse Foods, Inc.* | 1,786,739 | ||||||||
| 104,550 | Tyson Foods, Inc. Class A | 2,594,931 | ||||||||
| 25,653 | Village Super Market, Inc. Class A | 864,250 | ||||||||
|
| |||||||||
| 16,809,810 | ||||||||||
|
| |||||||||
Forest Products & Paper — 1.6% | ||||||||||
| 44,900 | Boise, Inc. | 388,834 | ||||||||
| 39,940 | Buckeye Technologies, Inc. | 1,196,203 | ||||||||
| 51,300 | Clearwater Paper Corp.* | 2,702,997 | ||||||||
| 21,900 | Deltic Timber Corp. | 1,504,968 | ||||||||
| 7,600 | Domtar Corp. | 589,912 | ||||||||
| 9,400 | Glatfelter | 219,772 | ||||||||
| 12,100 | Wausau Paper Corp. | 130,438 | ||||||||
|
| |||||||||
| 6,733,124 | ||||||||||
|
| |||||||||
Gas — 1.6% | ||||||||||
| 8,200 | Atmos Energy Corp. | 350,058 | ||||||||
| 63,735 | Energen Corp. | 3,314,857 | ||||||||
| 21,700 | Laclede Group (The), Inc. | 926,590 | ||||||||
| 79,850 | NiSource, Inc. | 2,342,799 | ||||||||
|
| |||||||||
| 6,934,304 | ||||||||||
|
| |||||||||
Health Care - Products — 2.4% | ||||||||||
| 28,600 | CareFusion Corp.* | 1,000,714 | ||||||||
| 29,600 | CONMED Corp. | 1,008,176 | ||||||||
| 4,100 | Hanger, Inc.* | 129,273 | ||||||||
| 48,210 | Hill-Rom Holdings, Inc. | 1,697,956 | ||||||||
| 35,680 | ICU Medical, Inc.* | 2,103,336 | ||||||||
| 32,500 | Invacare Corp. | 424,125 | ||||||||
| 97,850 | Nordion, Inc. | 646,789 | ||||||||
| 46,900 | NuVasive, Inc.* | 999,439 | ||||||||
| 12,000 | Orthofix International NV* | 430,440 | ||||||||
| 35,210 | STERIS Corp. | 1,465,088 | ||||||||
| 23,600 | Symmetry Medical, Inc.* | 270,220 | ||||||||
|
| |||||||||
| 10,175,556 | ||||||||||
|
| |||||||||
| See accompanying Notes to the Financial Statements. | 57 |
Mercer US Small/Mid Cap Value Equity Fund
Schedule of Investments (Continued)
(showing percentage of net assets)
March 31, 2013
| Shares | Description | Value ($) | ||||||||
Health Care - Services — 1.4% | ||||||||||
| 31,500 | Amedisys, Inc.* ‡ | 350,280 | ||||||||
| 4,300 | Amsurg Corp.* | 144,652 | ||||||||
| 10,900 | Community Health Systems, Inc. | 516,551 | ||||||||
| 10,400 | Coventry Health Care, Inc. | 489,112 | ||||||||
| 39,920 | Ensign Group (The), Inc. | 1,333,328 | ||||||||
| 111,500 | Gentiva Health Services, Inc.* | 1,206,430 | ||||||||
| 9,600 | Health Net, Inc.* | 274,752 | ||||||||
| 23,800 | ICON Plc* ‡ | 768,502 | ||||||||
| 7,700 | LHC Group, Inc.* | 165,473 | ||||||||
| 3,700 | Magellan Health Services, Inc.* | 176,009 | ||||||||
| 58,100 | Select Medical Holdings Corp. | 522,900 | ||||||||
|
| |||||||||
| 5,947,989 | ||||||||||
|
| |||||||||
Home Builders — 0.9% | ||||||||||
| 27,500 | Beazer Homes USA, Inc.* ‡ | 435,600 | ||||||||
| 13,050 | MDC Holdings, Inc. | 478,282 | ||||||||
| 100 | NVR, Inc.* | 108,011 | ||||||||
| 52,000 | PulteGroup, Inc.* | 1,052,480 | ||||||||
| 46,350 | Ryland Group (The), Inc.‡ | 1,929,087 | ||||||||
|
| |||||||||
| 4,003,460 | ||||||||||
|
| |||||||||
Home Furnishings — 0.8% | ||||||||||
| 37,300 | Harman International Industries, Inc. | 1,664,699 | ||||||||
| 19,800 | La-Z-Boy, Inc. | 373,626 | ||||||||
| 18,800 | VOXX International Corp.* | 201,348 | ||||||||
| 9,675 | Whirlpool Corp. | 1,146,101 | ||||||||
|
| |||||||||
| 3,385,774 | ||||||||||
|
| |||||||||
Household Products & Wares — 0.2% | ||||||||||
| 45,000 | Central Garden and Pet Co. Class A* | 369,900 | ||||||||
| 8,600 | Helen of Troy, Ltd.* | 329,896 | ||||||||
| 600 | Jarden Corp.* | 25,710 | ||||||||
|
| |||||||||
| 725,506 | ||||||||||
|
| |||||||||
Housewares — 0.7% | ||||||||||
| 117,875 | Newell Rubbermaid, Inc. | 3,076,538 | ||||||||
|
| |||||||||
Insurance — 10.4% | ||||||||||
| 4,053 | Alleghany Corp.* | 1,604,664 | ||||||||
| 20,650 | Allied World Assurance Co. Holdings, Ltd. | 1,914,668 | ||||||||
| 14,400 | Alterra Capital Holdings, Ltd. | 453,600 | ||||||||
| 17,200 | American Financial Group, Inc. | 814,936 | ||||||||
| 13,300 | Arch Capital Group, Ltd.* | 699,181 | ||||||||
| 8,300 | Argo Group International Holdings, Ltd. | 343,454 | ||||||||
| 21,100 | Aspen Insurance Holdings, Ltd. | 814,038 | ||||||||
| 8,200 | Assurant, Inc. | 369,082 | ||||||||
| 68,400 | Axis Capital Holdings, Ltd. | 2,846,808 | ||||||||
| 4,100 | Endurance Specialty Holdings, Ltd. | 196,021 | ||||||||
| 58 | See accompanying Notes to the Financial Statements. |
Mercer US Small/Mid Cap Value Equity Fund
Schedule of Investments (Continued)
(showing percentage of net assets)
March 31, 2013
| Shares | Description | Value ($) | ||||||||
Insurance — continued |
| |||||||||
| 17,900 | Everest Re Group, Ltd. | 2,324,494 | ||||||||
| 2,000 | FBL Financial Group, Inc. Class A | 77,720 | ||||||||
| 108,500 | Fidelity National Financial, Inc. Class A | 2,737,455 | ||||||||
| 71,400 | Genworth Financial, Inc. Class A* | 714,000 | ||||||||
| 59,300 | HCC Insurance Holdings, Inc. | 2,492,379 | ||||||||
| 47,600 | Horace Mann Educators Corp. | 992,460 | ||||||||
| 15,600 | Infinity Property & Casualty Corp.¤ | 876,720 | ||||||||
| 139,000 | Lincoln National Corp. | 4,532,790 | ||||||||
| 71,600 | Meadowbrook Insurance Group, Inc. | 504,780 | ||||||||
| 6,600 | Montpelier Re Holdings, Ltd. | 171,930 | ||||||||
| 10,775 | Navigators Group, Inc.* | 633,031 | ||||||||
| 16,930 | PartnerRe, Ltd. | 1,576,352 | ||||||||
| 17,700 | Platinum Underwriters Holdings, Ltd. | 987,837 | ||||||||
| 13,400 | Primerica, Inc. | 439,252 | ||||||||
| 8,000 | ProAssurance Corp. | 378,640 | ||||||||
| 5,900 | Protective Life Corp. | 211,220 | ||||||||
| 52,390 | Reinsurance Group of America, Inc. | 3,126,111 | ||||||||
| 7,800 | RenaissanceRe Holdings, Ltd. | 717,522 | ||||||||
| 5,100 | Safety Insurance Group, Inc. | 250,665 | ||||||||
| 46,600 | Symetra Financial Corp. | 624,906 | ||||||||
| 52,803 | Tower Group International, Ltd. | 974,214 | ||||||||
| 101,450 | Validus Holdings, Ltd. | 3,791,187 | ||||||||
| 4,744 | White Mountains Insurance Group, Ltd. | 2,690,417 | ||||||||
| 43,400 | Willis Group Holdings Plc | 1,713,866 | ||||||||
| 22,340 | WR Berkley Corp. | 991,226 | ||||||||
|
| |||||||||
| 44,587,626 | ||||||||||
|
| |||||||||
Internet — 1.0% | ||||||||||
| 30,200 | AOL, Inc. | 1,162,398 | ||||||||
| 40,500 | Blucora, Inc.* ‡ | 626,940 | ||||||||
| 28,300 | Digital River, Inc.* | 400,162 | ||||||||
| 17,800 | EarthLink, Inc. | 96,476 | ||||||||
| 71,300 | Limelight Networks, Inc.* | 146,878 | ||||||||
| 90,400 | United Online, Inc. | 545,112 | ||||||||
| 46,625 | ValueClick, Inc.* | 1,377,769 | ||||||||
|
| |||||||||
| 4,355,735 | ||||||||||
|
| |||||||||
Investment Companies — 1.3% | ||||||||||
| 105,400 | American Capital, Ltd.* | 1,538,313 | ||||||||
| 11,000 | Apollo Investment Corp. | 91,960 | ||||||||
| 35,300 | Ares Capital Corp. | 638,930 | ||||||||
| 60,800 | BlackRock Kelso Capital Corp.‡ | 608,000 | ||||||||
| 6,020 | Capital Southwest Corp. | 692,300 | ||||||||
| 196,900 | MCG Capital Corp. | 941,182 | ||||||||
| 16,800 | PennantPark Investment Corp. | 189,672 | ||||||||
| 69,000 | Prospect Capital Corp.‡ | 752,790 | ||||||||
| 9,400 | Solar Capital, Ltd. | 220,806 | ||||||||
|
| |||||||||
| 5,673,953 | ||||||||||
|
| |||||||||
| See accompanying Notes to the Financial Statements. | 59 |
Mercer US Small/Mid Cap Value Equity Fund
Schedule of Investments (Continued)
(showing percentage of net assets)
March 31, 2013
| Shares | Description | Value ($) | ||||||||
Iron & Steel — 0.9% | ||||||||||
| 84,000 | AK Steel Holding Corp.‡ | 278,040 | ||||||||
| 5,700 | Reliance Steel & Aluminum Co. | 405,669 | ||||||||
| 18,100 | Schnitzer Steel Industries, Inc. Class A | 482,546 | ||||||||
| 165,150 | Steel Dynamics, Inc. | 2,620,931 | ||||||||
|
| |||||||||
| 3,787,186 | ||||||||||
|
| |||||||||
Lodging — 0.1% | ||||||||||
| 9,100 | Ameristar Casinos, Inc. | 238,693 | ||||||||
| 2,500 | Orient-Express Hotels, Ltd. Class A* | 24,650 | ||||||||
|
| |||||||||
| 263,343 | ||||||||||
|
| |||||||||
Machinery - Construction & Mining — 0.5% | ||||||||||
| 2,100 | Hyster-Yale Materials Handling, Inc. | 119,889 | ||||||||
| 59,325 | Terex Corp.* | 2,041,967 | ||||||||
|
| |||||||||
| 2,161,856 | ||||||||||
|
| |||||||||
Machinery - Diversified — 0.9% | ||||||||||
| 27,875 | AGCO Corp. | 1,452,845 | ||||||||
| 42,800 | Albany International Corp. Class A | 1,236,920 | ||||||||
| 4,000 | Columbus McKinnon Corp.* | 77,000 | ||||||||
| 17,300 | Kadant, Inc.* ¤ | 432,500 | ||||||||
| 2,090 | Middleby Corp.* | 317,993 | ||||||||
| 8,700 | NACCO Industries, Inc. Class A | 464,232 | ||||||||
|
| |||||||||
| 3,981,490 | ||||||||||
|
| |||||||||
Media — 0.9% | ||||||||||
| 4,800 | Belo Corp. Class A | 47,184 | ||||||||
| 7,300 | EW Scripps Co. (The) Class A* | 87,819 | ||||||||
| 121,650 | Gannett Co., Inc. | 2,660,485 | ||||||||
| 21,100 | Scholastic Corp. | 562,315 | ||||||||
| 21,970 | Starz - Liberty Capital* | 486,636 | ||||||||
|
| |||||||||
| 3,844,439 | ||||||||||
|
| |||||||||
Metal Fabricate & Hardware — 0.3% | ||||||||||
| 4,300 | CIRCOR International, Inc. | 182,750 | ||||||||
| 400 | Mueller Industries, Inc. | 21,316 | ||||||||
| 15,700 | Timken Co. (The) | 888,306 | ||||||||
|
| |||||||||
| 1,092,372 | ||||||||||
|
| |||||||||
Mining — 0.5% | ||||||||||
| 181,978 | AuRico Gold, Inc.* ‡ | 1,144,642 | ||||||||
| 6,300 | Coeur d’Alene Mines Corp.* | 118,818 | ||||||||
| 54,750 | Pan American Silver Corp.‡ | 896,805 | ||||||||
|
| |||||||||
| 2,160,265 | ||||||||||
|
| |||||||||
Miscellaneous - Manufacturing — 2.3% | ||||||||||
| 16,460 | Brink’s Co. (The) | 465,160 | ||||||||
| 10,800 | FreightCar America, Inc. | 235,656 | ||||||||
| 60 | See accompanying Notes to the Financial Statements. |
Mercer US Small/Mid Cap Value Equity Fund
Schedule of Investments (Continued)
(showing percentage of net assets)
March 31, 2013
| Shares | Description | Value ($) | ||||||||
Miscellaneous - Manufacturing — continued |
| |||||||||
| 195,369 | Griffon Corp. | 2,328,798 | ||||||||
| 900 | Harsco Corp. | 22,293 | ||||||||
| 26,940 | John Bean Technologies Corp. | 559,005 | ||||||||
| 134,700 | Orkla ASA, Sponsored ADR‡ | 1,092,417 | ||||||||
| 6,100 | Standex International Corp.‡ | 336,842 | ||||||||
| 35,100 | STR Holdings, Inc.* | 76,167 | ||||||||
| 70,140 | Trimas Corp.* | 2,277,446 | ||||||||
| 53,250 | Trinity Industries, Inc. | 2,413,822 | ||||||||
|
| |||||||||
| 9,807,606 | ||||||||||
|
| |||||||||
Office & Business Equipment — 0.4% | ||||||||||
| 36,050 | Avery Dennison Corp. | 1,552,674 | ||||||||
|
| |||||||||
Office Furnishings — 0.1% | ||||||||||
| 40,400 | Steelcase, Inc. Class A | 595,092 | ||||||||
|
| |||||||||
Oil & Gas — 4.2% | ||||||||||
| 74,400 | Callon Petroleum Co.* | 275,280 | ||||||||
| 67,100 | Carrizo Oil & Gas, Inc.* ‡ | 1,729,167 | ||||||||
| 1,400 | Contango Oil & Gas Co. | 56,126 | ||||||||
| 16,200 | Delek US Holdings, Inc. | 639,252 | ||||||||
| 89,214 | Denbury Resources, Inc.* | 1,663,841 | ||||||||
| 1,300 | Energy XXI Bermuda, Ltd. | 35,386 | ||||||||
| 30,200 | EPL Oil & Gas, Inc.* | 809,662 | ||||||||
| 51,300 | HollyFrontier Corp. | 2,639,385 | ||||||||
| 78,880 | Miller Energy Resources, Inc.* ‡ | 292,645 | ||||||||
| 25,200 | Nabors Industries, Ltd. | 408,744 | ||||||||
| 33,840 | Ocean Rig UDW, Inc.* | 545,162 | ||||||||
| 155,900 | Parker Drilling Co.* | 667,252 | ||||||||
| 75,000 | Patterson-UTI Energy, Inc.‡ | 1,788,000 | ||||||||
| 208,700 | Penn Virginia Corp.‡ | 843,148 | ||||||||
| 18,700 | PetroQuest Energy, Inc.* | 83,028 | ||||||||
| 10,500 | Plains Exploration & Production Co.* | 498,435 | ||||||||
| 47,770 | Resolute Energy Corp.* | 549,833 | ||||||||
| 16,000 | Stone Energy Corp.* | 348,000 | ||||||||
| 27,400 | Swift Energy Co.* | 405,794 | ||||||||
| 1,200 | Tesoro Corp. | 70,260 | ||||||||
| 50,790 | Vaalco Energy, Inc.* | 385,496 | ||||||||
| 12,700 | W&T Offshore, Inc.‡ | 180,340 | ||||||||
| 21,600 | Western Refining, Inc.‡ | 764,856 | ||||||||
| 49,000 | Whiting Petroleum Corp.* | 2,491,160 | ||||||||
|
| |||||||||
| 18,170,252 | ||||||||||
|
| |||||||||
Oil & Gas Services — 1.1% | ||||||||||
| 21,800 | Helix Energy Solutions Group, Inc.* | 498,784 | ||||||||
| 20,800 | Mitcham Industries, Inc.* | 351,936 | ||||||||
| 93,450 | RPC, Inc.‡ | 1,417,636 | ||||||||
| 62,600 | Tesco Corp.* | 838,214 | ||||||||
| See accompanying Notes to the Financial Statements. | 61 |
Mercer US Small/Mid Cap Value Equity Fund
Schedule of Investments (Continued)
(showing percentage of net assets)
March 31, 2013
| Shares | Description | Value ($) | ||||||||
Oil & Gas Services — continued |
| |||||||||
| 53,480 | TETRA Technologies, Inc.* | 548,705 | ||||||||
| 91,400 | Willbros Group, Inc.* | 897,548 | ||||||||
|
| |||||||||
| 4,552,823 | ||||||||||
|
| |||||||||
Packaging & Containers — 0.8% | ||||||||||
| 41,025 | Bemis Co., Inc. | 1,655,769 | ||||||||
| 19,200 | Rock-Tenn Co. Class A | 1,781,568 | ||||||||
|
| |||||||||
| 3,437,337 | ||||||||||
|
| |||||||||
Pharmaceuticals — 1.8% | ||||||||||
| 34,900 | Allos Therapeutics, Inc.**** | — | ||||||||
| 29,300 | BioScrip, Inc.* | 372,403 | ||||||||
| 15,800 | Hi-Tech Pharmacal Co., Inc. | 523,138 | ||||||||
| 27,775 | Jazz Pharmaceuticals Plc* | 1,552,900 | ||||||||
| 67,800 | Omnicare, Inc. | 2,760,816 | ||||||||
| 33,100 | PharMerica Corp.* | 463,400 | ||||||||
| 26,500 | Sirona Dental Systems, Inc.* | 1,953,845 | ||||||||
|
| |||||||||
| 7,626,502 | ||||||||||
|
| |||||||||
Pipelines — 0.2% | ||||||||||
| 14,360 | National Fuel Gas Co. | 880,986 | ||||||||
|
| |||||||||
Real Estate — 1.3% | ||||||||||
| 12,340 | FirstService Corp.* | 410,181 | ||||||||
| 136,850 | Forestar Group, Inc.* | 2,991,541 | ||||||||
| 43,930 | Hilltop Holdings, Inc.* | 592,616 | ||||||||
| 15,175 | Jones Lang Lasalle, Inc. | 1,508,547 | ||||||||
|
| |||||||||
| 5,502,885 | ||||||||||
|
| |||||||||
REITS — 6.8% | ||||||||||
| 4,200 | Alexandria Real Estate Equities, Inc. REIT | 298,116 | ||||||||
| 2,300 | American Assets Trust, Inc. REIT | 73,623 | ||||||||
| 10,000 | Ashford Hospitality Trust, Inc. REIT | 123,600 | ||||||||
| 29,500 | Associated Estates Realty Corp. REIT | 549,880 | ||||||||
| 131,700 | BioMed Realty Trust, Inc. REIT | 2,844,720 | ||||||||
| 226,075 | Brandywine Realty Trust REIT | 3,357,214 | ||||||||
| 5,100 | Camden Property Trust REIT | 350,268 | ||||||||
| 19,200 | Campus Crest Communities, Inc. REIT | 266,880 | ||||||||
| 49,300 | CBL & Associates Properties, Inc. REIT | 1,163,480 | ||||||||
| 26,000 | Chesapeake Lodging Trust REIT | 596,440 | ||||||||
| 66,100 | Chimera Investment Corp. REIT | 210,859 | ||||||||
| 25,000 | Coresite Realty Corp. REIT | 874,500 | ||||||||
| 8,000 | Cousins Properties, Inc. REIT | 85,520 | ||||||||
| 6,600 | CubeSmart REIT | 104,280 | ||||||||
| 2,900 | Douglas Emmett, Inc. REIT | 72,297 | ||||||||
| 61,150 | DuPont Fabros Technology, Inc. REIT‡ | 1,484,110 | ||||||||
| 1,000 | EastGroup Properties, Inc. REIT | 58,200 | ||||||||
| 7,900 | EPR Properties REIT | 411,195 | ||||||||
| 2,200 | Federal Realty Investment Trust REIT | 237,688 | ||||||||
| 62 | See accompanying Notes to the Financial Statements. |
Mercer US Small/Mid Cap Value Equity Fund
Schedule of Investments (Continued)
(showing percentage of net assets)
March 31, 2013
| Shares | Description | Value ($) | ||||||||
REITS — continued |
| |||||||||
| 4,500 | First Industrial Realty Trust, Inc. REIT | 77,085 | ||||||||
| 11,100 | Getty Realty Corp. REIT | 224,331 | ||||||||
| 15,700 | Government Properties Income Trust REIT | 403,961 | ||||||||
| 3,600 | Hatteras Financial Corp. REIT | 98,748 | ||||||||
| 14,100 | Hersha Hospitality Trust REIT | 82,344 | ||||||||
| 2,200 | Home Properties, Inc. REIT | 139,524 | ||||||||
| 6,600 | Hospitality Properties Trust REIT | 181,104 | ||||||||
| 88,000 | Inland Real Estate Corp. REIT | 887,920 | ||||||||
| 4,500 | Investors Real Estate Trust REIT | 44,415 | ||||||||
| 58,400 | Kilroy Realty Corp. REIT | 3,060,160 | ||||||||
| 12,500 | Liberty Property Trust REIT | 496,875 | ||||||||
| 17,700 | LTC Properties, Inc. REIT | 720,921 | ||||||||
| 9,000 | Mack-Cali Realty Corp. REIT | 257,490 | ||||||||
| 8,200 | National Retail Properties, Inc. REIT‡ | 296,594 | ||||||||
| 121,000 | NorthStar Realty Finance Corp. REIT | 1,147,080 | ||||||||
| 29,100 | Parkway Properties, Inc. REIT | 539,805 | ||||||||
| 31,500 | Pennsylvania Real Estate Investment Trust REIT | 610,785 | ||||||||
| 23,400 | Piedmont Office Realty Trust, Inc. REIT | 458,406 | ||||||||
| 8,800 | Post Properties, Inc. REIT | 414,480 | ||||||||
| 13,200 | Potlatch Corp. REIT | 605,352 | ||||||||
| 3,200 | PS Business Parks, Inc. REIT | 252,544 | ||||||||
| 74,800 | Ramco-Gershenson Properties Trust REIT | 1,256,640 | ||||||||
| 14,100 | Rayonier, Inc. REIT‡ | 841,347 | ||||||||
| 6,300 | Realty Income Corp. REIT‡ | 285,705 | ||||||||
| 21,600 | Retail Opportunity Investments Corp. REIT‡ | 302,616 | ||||||||
| 13,400 | RLJ Lodging Trust REIT | 304,984 | ||||||||
| 33,000 | Sabra Healthcare, Inc. REIT | 957,330 | ||||||||
| 15,900 | Senior Housing Properties Trust REIT | 426,597 | ||||||||
| 2,100 | Sovran Self Storage, Inc. REIT | 135,429 | ||||||||
| 15,700 | Sunstone Hotel Investors, Inc. REIT* | 193,267 | ||||||||
| 4,800 | Taubman Centers, Inc. REIT | 372,768 | ||||||||
| 3,800 | Washington Real Estate Investment Trust REIT | 105,792 | ||||||||
| 700 | Weingarten Realty Investors REIT | 22,085 | ||||||||
|
| |||||||||
| 29,367,354 | ||||||||||
|
| |||||||||
Retail — 5.8% | ||||||||||
| 53,870 | Abercrombie & Fitch Co. Class A | 2,488,794 | ||||||||
| 59,940 | Big Lots, Inc.* | 2,114,084 | ||||||||
| 660 | Biglari Holdings, Inc.* | 246,305 | ||||||||
| 42,700 | Bloomin’ Brands, Inc.* | 763,049 | ||||||||
| 108,280 | Bob Evans Farms, Inc. | 4,614,894 | ||||||||
| 45,500 | Brown Shoe Co., Inc. | 728,000 | ||||||||
| 11,000 | Chico’s FAS, Inc. | 184,800 | ||||||||
| 7,800 | Childrens Place Retail Stores (The), Inc.* | 349,596 | ||||||||
| 102,100 | Denny’s Corp.* | 589,117 | ||||||||
| 1,700 | Dillard’s, Inc. Class A | 133,535 | ||||||||
| 44,050 | Foot Locker, Inc. | 1,508,272 | ||||||||
| 87,780 | Fred’s, Inc. Class A | 1,200,830 | ||||||||
| 9,500 | GameStop Corp. Class A‡ | 265,715 | ||||||||
| See accompanying Notes to the Financial Statements. | 63 |
Mercer US Small/Mid Cap Value Equity Fund
Schedule of Investments (Continued)
(showing percentage of net assets)
March 31, 2013
| Shares | Description | Value ($) | ||||||||
Retail — continued |
| |||||||||
| 55,175 | GNC Holdings, Inc. Class A | 2,167,274 | ||||||||
| 38,500 | hhgregg, Inc.* ‡ | 425,425 | ||||||||
| 51,900 | Insight Enterprises, Inc.* | 1,070,178 | ||||||||
| 16,310 | JOS A Bank Clothiers, Inc.* | 650,769 | ||||||||
| 19,800 | Kirkland’s, Inc.* | 226,908 | ||||||||
| 18,500 | Movado Group, Inc. | 620,120 | ||||||||
| 23,200 | Office Depot, Inc.* ‡ | 91,176 | ||||||||
| 7,300 | OfficeMax, Inc.‡ | 84,753 | ||||||||
| 58,050 | Pep Boys - Manny, Moe & Jack (The)* | 684,409 | ||||||||
| 6,300 | Red Robin Gourmet Burgers, Inc.* | 287,280 | ||||||||
| 39,140 | Regis Corp.‡ | 711,957 | ||||||||
| 55,500 | Rite Aid Corp.* | 105,450 | ||||||||
| 15,400 | Signet Jewelers, Ltd. | 1,031,800 | ||||||||
| 3,400 | Stage Stores, Inc. | 87,992 | ||||||||
| 27,310 | Texas Roadhouse, Inc. Class A | 551,389 | ||||||||
| 349,700 | Wet Seal (The), Inc. Class A* | 1,056,094 | ||||||||
|
| |||||||||
| 25,039,965 | ||||||||||
|
| |||||||||
Savings & Loans — 1.4% | ||||||||||
| 44,800 | Capitol Federal Financial, Inc. | 540,736 | ||||||||
| 21,500 | Dime Community Bancshares | 308,740 | ||||||||
| 146,000 | EverBank Financial Corp.‡ | 2,248,400 | ||||||||
| 40,800 | Hudson City Bancorp, Inc. | 352,512 | ||||||||
| 34,500 | Oritani Financial Corp. | 534,405 | ||||||||
| 27,300 | Provident Financial Services, Inc. | 416,871 | ||||||||
| 29,900 | ViewPoint Financial Group, Inc. | 601,289 | ||||||||
| 49,300 | Washington Federal, Inc. | 862,750 | ||||||||
|
| |||||||||
| 5,865,703 | ||||||||||
|
| |||||||||
Semiconductors — 3.0% | ||||||||||
| 3,500 | ATMI, Inc.* | 78,505 | ||||||||
| 23,600 | Emulex Corp.* | 154,108 | ||||||||
| 16,100 | Entegris, Inc.* | 158,746 | ||||||||
| 69,600 | Formfactor, Inc.* ‡ | 327,120 | ||||||||
| 23,200 | GT Advanced Technologies, Inc.* ‡ | 76,328 | ||||||||
| 11,700 | Inphi Corp.* | 122,265 | ||||||||
| 288,900 | LSI Corp.* | 1,958,742 | ||||||||
| 34,000 | LTX-Credence Corp.* | 205,360 | ||||||||
| 26,500 | Microsemi Corp.* | 614,005 | ||||||||
| 51,100 | MKS Instruments, Inc. | 1,389,920 | ||||||||
| 82,375 | NXP Semiconductor NV* | 2,492,667 | ||||||||
| 46,400 | Photronics, Inc.* | 309,952 | ||||||||
| 143,200 | PMC-Sierra, Inc.* | 972,328 | ||||||||
| 107,500 | Skyworks Solutions, Inc.* | 2,368,225 | ||||||||
| 103,900 | Teradyne, Inc.* | 1,685,258 | ||||||||
|
| |||||||||
| 12,913,529 | ||||||||||
|
| |||||||||
| 64 | See accompanying Notes to the Financial Statements. |
Mercer US Small/Mid Cap Value Equity Fund
Schedule of Investments (Continued)
(showing percentage of net assets)
March 31, 2013
| Shares | Description | Value ($) | ||||||||
Software — 1.7% | ||||||||||
| 2,200 | Acxiom Corp.* | 44,880 | ||||||||
| 48,700 | Allscripts Healthcare Solutions, Inc.* | 661,833 | ||||||||
| 85,400 | AVG Technologies NV* ‡ | 1,188,768 | ||||||||
| 84,200 | CSG Systems International, Inc.* | 1,784,198 | ||||||||
| 52,500 | Fidelity National Information Services, Inc. | 2,080,050 | ||||||||
| 32,380 | Quality Systems, Inc. | 591,906 | ||||||||
| 87,800 | Schawk, Inc.¤ | 964,922 | ||||||||
|
| |||||||||
| 7,316,557 | ||||||||||
|
| |||||||||
Telecommunications — 1.5% | ||||||||||
| 74,100 | Arris Group, Inc.* | 1,272,297 | ||||||||
| 17,890 | Atlantic Tele-Network, Inc. | 867,844 | ||||||||
| 3,300 | Black Box Corp. | 71,973 | ||||||||
| 42,500 | Calix, Inc.* | 346,375 | ||||||||
| 8,100 | Comtech Telecommunications Corp. | 196,668 | ||||||||
| 71,800 | Harmonic, Inc.* | 415,722 | ||||||||
| 1,100 | IDT Corp. Class B | 13,266 | ||||||||
| 38,320 | NeuStar, Inc. Class A* | 1,783,029 | ||||||||
| 32,700 | Oplink Communications, Inc.* | 536,280 | ||||||||
| 6,200 | Premiere Global Services, Inc.* | 68,138 | ||||||||
| 33,700 | Sycamore Networks, Inc. | 12,469 | ||||||||
| 32,240 | Telephone & Data Systems, Inc. | 679,297 | ||||||||
| 97,700 | Vonage Holdings Corp.* | 282,353 | ||||||||
|
| |||||||||
| 6,545,711 | ||||||||||
|
| |||||||||
Textiles — 0.8% | ||||||||||
| 7,700 | G&K Services, Inc. Class A | 350,427 | ||||||||
| 11,800 | Mohawk Industries, Inc.* | 1,334,816 | ||||||||
| 16,975 | UniFirst Corp. | 1,536,238 | ||||||||
|
| |||||||||
| 3,221,481 | ||||||||||
|
| |||||||||
Toys, Games & Hobbies — 0.0% | ||||||||||
| 10,615 | JAKKS Pacific, Inc.‡ | 111,351 | ||||||||
|
| |||||||||
Transportation — 1.4% | ||||||||||
| 6,700 | Arkansas Best Corp. | 78,256 | ||||||||
| 4,100 | Bristow Group, Inc. | 270,354 | ||||||||
| 55,620 | Heartland Express, Inc. | 741,971 | ||||||||
| 16,200 | Knightsbridge Tankers, Ltd.‡ | 132,840 | ||||||||
| 43,925 | Ryder System, Inc. | 2,624,519 | ||||||||
| 33,300 | Saia, Inc.* | 1,204,461 | ||||||||
| 1,900 | Ship Finance International, Ltd.‡ | 33,516 | ||||||||
| 76,500 | Swift Transportation Co.* | 1,084,770 | ||||||||
|
| |||||||||
| 6,170,687 | ||||||||||
|
| |||||||||
Trucking & Leasing — 0.4% | ||||||||||
| 112,230 | Aircastle, Ltd. | 1,535,306 | ||||||||
| 1,100 | Amerco, Inc. | 190,894 | ||||||||
|
| |||||||||
| 1,726,200 | ||||||||||
|
| |||||||||
| See accompanying Notes to the Financial Statements. | 65 |
Mercer US Small/Mid Cap Value Equity Fund
Schedule of Investments (Continued)
(showing percentage of net assets)
March 31, 2013
| Shares | Description | Value ($) | ||||||||
Water — 0.5% | ||||||||||
| 20,300 | American States Water Co. | 1,168,671 | ||||||||
| 16,700 | California Water Service Group | 332,330 | ||||||||
| 31,730 | PICO Holdings, Inc.* | 704,406 | ||||||||
|
| |||||||||
| 2,205,407 | ||||||||||
|
| |||||||||
TOTAL COMMON STOCKS (COST $359,325,197) | 423,640,977 | |||||||||
|
| |||||||||
| Par Value ($) | Description | Value ($) | ||||||||
SHORT-TERM INVESTMENTS — 6.3% | ||||||||||
Bank Deposit — 0.7% | ||||||||||
| 2,978,549 | State Street Bank & Trust Euro Time Deposit, 0.01%, due 04/01/13 | 2,978,549 | ||||||||
|
| |||||||||
Securities Lending Collateral — 5.6% | ||||||||||
| 23,990,680 | State Street Navigator Securities Lending Prime Portfolio*** | 23,990,680 | ||||||||
|
| |||||||||
TOTAL SHORT-TERM INVESTMENTS (COST $26,969,229) | 26,969,229 | |||||||||
|
| |||||||||
TOTAL INVESTMENTS — 104.9% (Cost $386,294,426) | 450,610,206 | |||||||||
Other Assets and Liabilities (net) — (4.9)% | (21,198,556 | ) | ||||||||
|
| |||||||||
NET ASSETS — 100.0% | $ | 429,411,650 | ||||||||
|
| |||||||||
Notes to Schedule of Investments: | ||||||||||
| ADR — American Depository Receipt | ||||||||||
| REIT — Real Estate Investment Trust | ||||||||||
| ¤ | Illiquid security. The total market value of the securities at year end is $2,274,142 which represents 0.5% of net assets. The aggregate tax cost of these securities held at March 31, 2013 was $2,420,504. | |||||||||
| * | Non-income producing security | |||||||||
| *** | Represents an investment of securities lending cash collateral. | |||||||||
| **** | Securities fair valued by the Valuation Committee as approved by the Board of Trustees. The total market value of the securities at period end is $0 which represents 0.0% of net assets. The aggregate tax cost of these securities held at March 31, 2013 was $0. | |||||||||
| ‡ | All or a portion of this security is out on loan. | |||||||||
| 66 | See accompanying Notes to the Financial Statements. |
Mercer US Small/Mid Cap Value Equity Fund
Schedule of Investments (Continued)
March 31, 2013
| Asset Class Summary (Unaudited) | % of Net Assets | ||||
Common Stocks | 98.6 | ||||
Short-Term Investments | 6.3 | ||||
Other Assets and Liabilities (net) | (4.9 | ) | |||
|
| ||||
| 100.0 | % | ||||
|
| ||||
| See accompanying Notes to the Financial Statements. | 67 |
Mercer Non-US Core Equity Fund
Schedule of Investments
(showing percentage of net assets)
March 31, 2013
| Shares | Description | Value ($) | ||||||||
COMMON STOCKS — 94.7% | ||||||||||
Australia — 3.1% | ||||||||||
| 64,696 | Austria & New Zealand Banking Group, Ltd. | 1,924,314 | ||||||||
| 294,129 | BGP Holdings Plc¤ **** | — | ||||||||
| 318,917 | BHP Billiton, Ltd. | 10,892,267 | ||||||||
| 3,317,643 | Boart Longyear Group | 4,427,273 | ||||||||
| 217,796 | Brambles, Ltd. | 1,923,225 | ||||||||
| 87,873 | Caltex Australia, Ltd. | 1,955,915 | ||||||||
| 325,988 | carsales.com, Ltd. | 3,194,671 | ||||||||
| 112,547 | Coca-Cola Amatil, Ltd. | 1,710,756 | ||||||||
| 260,318 | Computershare, Ltd.‡ | 2,768,223 | ||||||||
| 84,874 | CSL, Ltd. | 5,240,988 | ||||||||
| 346,842 | Downer EDI, Ltd. | 1,793,536 | ||||||||
| 56,559 | Flight Centre, Ltd.‡ | 1,981,243 | ||||||||
| 1,051,599 | Fortescue Metals Group, Ltd.‡ | 4,319,596 | ||||||||
| 98,334 | iiNET, Ltd. | 533,094 | ||||||||
| 49,723 | Macquarie Group, Ltd. | 1,925,808 | ||||||||
| 171,316 | Mineral Resources, Ltd. | 1,891,432 | ||||||||
| 77,614 | Monadelphous Group, Ltd.‡ | 1,836,803 | ||||||||
| 60,956 | National Australia Bank, Ltd. | 1,959,871 | ||||||||
| 147,976 | Origin Energy, Ltd. | 2,048,736 | ||||||||
| 568,367 | Sigma Pharmaceuticals, Ltd. | 438,488 | ||||||||
| 431,844 | Suncorp-Metway, Ltd. | 5,321,586 | ||||||||
| 1,291,573 | Telstra Corp., Ltd. | 6,072,845 | ||||||||
| 71,962 | Woolworths, Ltd. | 2,535,059 | ||||||||
|
| |||||||||
Total Australia | 66,695,729 | |||||||||
|
| |||||||||
Austria — 0.3% | ||||||||||
| 14,610 | Austriamicrosystems AG | 1,652,390 | ||||||||
| 41,098 | Erste Group Bank AG* | 1,146,777 | ||||||||
| 54,930 | OMV AG | 2,340,018 | ||||||||
| 73,931 | Voestalpine AG | 2,274,162 | ||||||||
|
| |||||||||
Total Austria | 7,413,347 | |||||||||
|
| |||||||||
Belgium — 0.5% | ||||||||||
| 29,295 | Ageas | 992,543 | ||||||||
| 92,795 | Belgacom SA | 2,311,069 | ||||||||
| 51,378 | Delhaize Group | 2,807,543 | ||||||||
| 10,563 | Groupe Bruxelles Lambert SA | 809,089 | ||||||||
| 21,455 | ThromboGenics NV* | 1,035,617 | ||||||||
| 28,619 | UCB SA | 1,830,132 | ||||||||
|
| |||||||||
Total Belgium | 9,785,993 | |||||||||
|
| |||||||||
Bermuda — 1.0% | ||||||||||
| 789,683 | Catlin Group, Ltd. | 6,247,283 | ||||||||
| 1,249,000 | Digital China Holdings, Ltd. | 1,686,218 | ||||||||
| 1,573,133 | Esprit Holdings, Ltd. | 1,888,737 | ||||||||
| 604,000 | First Pacific Co., Ltd. | 818,545 | ||||||||
| 401,956 | Hiscox, Ltd. | 3,356,927 | ||||||||
| 68 | See accompanying Notes to the Financial Statements. |
Mercer Non-US Core Equity Fund
Schedule of Investments (Continued)
(showing percentage of net assets)
March 31, 2013
| Shares | Description | Value ($) | ||||||||
Bermuda — continued | ||||||||||
| 257,000 | Hongkong Land Holdings, Ltd. | 1,904,370 | ||||||||
| 29,200 | Jardine Matheson Holdings, Ltd. | 1,900,920 | ||||||||
| 2,025,000 | Noble Group, Ltd. | 1,983,214 | ||||||||
| 550,500 | Yue Yuen Industrial Holdings | 1,797,733 | ||||||||
|
| |||||||||
Total Bermuda | 21,583,947 | |||||||||
|
| |||||||||
Brazil — 0.4% | ||||||||||
| 79,155 | Banco do Brasil SA | 1,077,593 | ||||||||
| 80,200 | Ez Tec Empreendimentos e Participacoes SA | 1,079,091 | ||||||||
| 292,690 | Itau Unibanco Holding SA, ADR | 5,209,882 | ||||||||
| 112,900 | Light SA | 1,119,845 | ||||||||
| 82,700 | Porto Seguro SA | 1,159,486 | ||||||||
|
| |||||||||
Total Brazil | 9,645,897 | |||||||||
|
| |||||||||
Canada — 1.0% | ||||||||||
| 286,371 | Cameco Corp.‡ | 5,941,927 | ||||||||
| 167,748 | Gildan Activewear, Inc. | 6,692,088 | ||||||||
| 164,902 | Potash Corp. of Saskatchewan (Toronto Exchange) | 6,476,293 | ||||||||
| 121,143 | Research In Motion, Ltd. (NYSE)* ‡ | 1,799,348 | ||||||||
|
| |||||||||
Total Canada | 20,909,656 | |||||||||
|
| |||||||||
Cayman Islands — 0.8% | ||||||||||
| 1,671,000 | Dongyue Group | 968,677 | ||||||||
| 1,664,478 | Sands China, Ltd. | 8,630,460 | ||||||||
| 204,950 | Tencent Holdings, Ltd. | 6,516,030 | ||||||||
|
| |||||||||
Total Cayman Islands | 16,115,167 | |||||||||
|
| |||||||||
China — 0.2% | ||||||||||
| 1,155,000 | China Communications Construction Co., Ltd. Class H | 1,075,747 | ||||||||
| 948,000 | China Petroleum & Chemical Corp. Class H | 1,116,207 | ||||||||
| 808,000 | PetroChina Co., Ltd. Class H | 1,061,699 | ||||||||
| 3,218,000 | Zijin Mining Group Co., Ltd. | 1,065,391 | ||||||||
|
| |||||||||
Total China | 4,319,044 | |||||||||
|
| |||||||||
Denmark — 1.9% | ||||||||||
| 275 | AP Moeller - Maersk AS Class B | 2,150,547 | ||||||||
| 45,376 | Carlsberg AS Class B | 4,423,877 | ||||||||
| 253,151 | GN Store Nord AS | 4,513,156 | ||||||||
| 24,733 | Jyske Bank AS* | 843,534 | ||||||||
| 61,490 | NKT Holding AS‡ | 2,283,566 | ||||||||
| 88,010 | Novo Nordisk AS Class B | 14,325,975 | ||||||||
| 92,713 | Pandora AS‡ | 2,555,177 | ||||||||
| 40,304 | Sydbank AS* | 826,838 | ||||||||
| 762,770 | TDC AS | 5,871,706 | ||||||||
| 62,020 | Topdanmark AS* | 1,487,070 | ||||||||
| 166,856 | Vestas Wind Systems AS* ‡ | 1,336,457 | ||||||||
|
| |||||||||
Total Denmark | 40,617,903 | |||||||||
|
| |||||||||
| See accompanying Notes to the Financial Statements. | 69 |
Mercer Non-US Core Equity Fund
Schedule of Investments (Continued)
(showing percentage of net assets)
March 31, 2013
| Shares | Description | Value ($) | ||||||||
Finland — 1.3% | ||||||||||
| 84,957 | Elisa OYJ‡ | 1,580,761 | ||||||||
| 490,475 | Fortum OYJ | 9,900,748 | ||||||||
| 1,998,633 | Nokia OYJ‡ | 6,477,703 | ||||||||
| 1,130,446 | Nokia OYJ, Sponsored ADR | 3,707,863 | ||||||||
| 20,031 | Sampo OYJ Class A | 771,654 | ||||||||
| 267,809 | Stora Enso OYJ | 1,731,503 | ||||||||
| 79,197 | Tieto OYJ‡ | 1,677,997 | ||||||||
| 155,496 | UPM-Kymmene OYJ | 1,738,147 | ||||||||
|
| |||||||||
Total Finland | 27,586,376 | |||||||||
|
| |||||||||
France — 8.2% | ||||||||||
| 1,032,423 | Alcatel-Lucent* | 1,393,346 | ||||||||
| 52,804 | Alstom | 2,152,827 | ||||||||
| 12,325 | AtoS | 849,726 | ||||||||
| 578,922 | AXA SA | 9,968,904 | ||||||||
| 230,659 | BNP Paribas | 11,859,410 | ||||||||
| 80,578 | Bouygues SA | 2,189,428 | ||||||||
| 49,169 | Cap Gemini SA | 2,241,395 | ||||||||
| 73,770 | Casino Guichard Perrachon SA | 7,765,802 | ||||||||
| 6,298 | Christian Dior SA | 1,046,491 | ||||||||
| 251,472 | Cie Generale de Geophysique-Veritas* | 5,673,617 | ||||||||
| 47,075 | Cie Generale des Etablissements Michelin | 3,944,295 | ||||||||
| 209,646 | CNP Assurances | 2,881,853 | ||||||||
| 505,569 | Credit Agricole SA* | 4,171,764 | ||||||||
| 233,499 | Danone SA | 16,275,092 | ||||||||
| 62,354 | Dassault Systemes SA | 7,220,598 | ||||||||
| 18,370 | Eiffage SA | 778,670 | ||||||||
| 16,863 | Essilor International | 1,878,464 | ||||||||
| 15,938 | Euler Hermes SA | 1,470,890 | ||||||||
| 12,717 | Eurazeo | 645,847 | ||||||||
| 49,513 | Faurecia‡ | 788,387 | ||||||||
| 229,206 | France Telecom SA | 2,322,210 | ||||||||
| 40,312 | Iliad SA | 8,590,337 | ||||||||
| 126,889 | Legrand SA | 5,543,153 | ||||||||
| 42,803 | LVMH Moet Hennessy Louis Vuitton SA | 7,359,586 | ||||||||
| 142,798 | Metropole Television SA | 2,223,323 | ||||||||
| 709,248 | Natixis | 2,697,626 | ||||||||
| 63,738 | Neopost SA‡ | 3,825,069 | ||||||||
| 68,859 | Pernod-Ricard SA | 8,595,482 | ||||||||
| 21,567 | Renault SA | 1,353,553 | ||||||||
| 88,356 | Sanofi, ADR | 4,513,224 | ||||||||
| 57,687 | Schneider Electric SA | 4,222,323 | ||||||||
| 322,285 | SCOR SE | 9,270,149 | ||||||||
| 190,799 | Societe Generale* | 6,279,474 | ||||||||
| 17,255 | Teleperformance | 736,614 | ||||||||
| 58,768 | Thales SA | 2,489,933 | ||||||||
| 46,141 | Total SA | 2,213,270 | ||||||||
| 153,331 | UBISOFT Entertainment* | 1,659,801 | ||||||||
| 14,676 | Unibail-Rodamco REIT | 3,424,217 | ||||||||
| 70 | See accompanying Notes to the Financial Statements. |
Mercer Non-US Core Equity Fund
Schedule of Investments (Continued)
(showing percentage of net assets)
March 31, 2013
| Shares | Description | Value ($) | ||||||||
France — continued | ||||||||||
| 41,154 | Valeo SA | 2,230,886 | ||||||||
| 50,230 | Vinci SA | 2,266,863 | ||||||||
| 286,255 | Vivendi SA | 5,923,549 | ||||||||
| 20,431 | Zodiac Aerospace‡ | 2,384,801 | ||||||||
|
| |||||||||
Total France | 175,322,249 | |||||||||
|
| |||||||||
Germany — 8.7% | ||||||||||
| 24,246 | Adidas AG | 2,520,008 | ||||||||
| 17,822 | Allianz AG | 2,424,689 | ||||||||
| 71,479 | Aurubis AG | 4,550,756 | ||||||||
| 25,935 | BASF SE | 2,275,269 | ||||||||
| 251,791 | Bayer AG | 26,017,934 | ||||||||
| 79,578 | Bayerische Motoren Werke AG | 6,878,143 | ||||||||
| 25,581 | Beiersdorf AG | 2,366,409 | ||||||||
| 21,620 | Brenntag AG | 3,381,439 | ||||||||
| 130,806 | Continental AG | 15,666,365 | ||||||||
| 195,646 | DaimlerChrysler AG | 10,663,410 | ||||||||
| 647,265 | Deutsche Post AG | 14,939,966 | ||||||||
| 428,761 | Deutsche Telekom AG | 4,540,014 | ||||||||
| 256,067 | Deutsche Wohnen AG | 4,662,603 | ||||||||
| 121,531 | Deutz AG* | 639,837 | ||||||||
| 21,722 | Duerr AG | 2,371,201 | ||||||||
| 79,854 | Fresenius SE | 9,873,621 | ||||||||
| 267,338 | GEA Group AG | 8,825,948 | ||||||||
| 93,807 | GSW Immobilien AG | 3,717,318 | ||||||||
| 46,078 | Hannover Rueckversicherung AG | 3,620,534 | ||||||||
| 36,379 | HeidelbergCement AG | 2,618,801 | ||||||||
| 15,344 | Henkel AG & Co. KGaA | 1,213,718 | ||||||||
| 22,885 | Kabel Deutschland Holding AG | 2,115,248 | ||||||||
| 79,136 | Kloeckner & Co. SE* | 1,122,884 | ||||||||
| 87,241 | Leoni AG | 3,384,309 | ||||||||
| 59,989 | Linde AG | 11,173,467 | ||||||||
| 12,190 | Merck KGaA | 1,842,378 | ||||||||
| 47,549 | Muenchener Rueckver AG | 8,908,309 | ||||||||
| 353,043 | Premiere AG* | 1,949,825 | ||||||||
| 83,489 | Rheinmetall AG | 3,868,607 | ||||||||
| 67,963 | Siemens AG | 7,333,402 | ||||||||
| 54,432 | Suedzucker AG | 2,303,076 | ||||||||
| 88,570 | Symrise AG | 3,515,477 | ||||||||
| 232,270 | TAG Immobilien AG | 2,663,442 | ||||||||
| 103,145 | TUI AG* | 1,108,726 | ||||||||
| 10,991 | Volkswagen AG | 2,071,161 | ||||||||
|
| |||||||||
Total Germany | 187,128,294 | |||||||||
|
| |||||||||
Gibraltar — 0.0% | ||||||||||
| 65,908 | Bwin.Party Digital Entertainment Plc | 143,712 | ||||||||
|
| |||||||||
Greece — 0.1% | ||||||||||
| 263,541 | Hellenic Telecommunications Organization SA* | 1,597,308 | ||||||||
| See accompanying Notes to the Financial Statements. | 71 |
Mercer Non-US Core Equity Fund
Schedule of Investments (Continued)
(showing percentage of net assets)
March 31, 2013
| Shares | Description | Value ($) | ||||||||
Greece — continued | ||||||||||
| 72,007 | OPAP SA | 569,579 | ||||||||
| 116,330 | Public Power Corp. SA* | 830,549 | ||||||||
|
| |||||||||
Total Greece | 2,997,436 | |||||||||
|
| |||||||||
Hong Kong — 1.9% | ||||||||||
| 424,400 | AIA Group, Ltd. | 1,853,383 | ||||||||
| 2,783,000 | Champion REIT | 1,444,802 | ||||||||
| 2,469,010 | China Overseas Land & Investment, Ltd. | 6,822,446 | ||||||||
| 2,601,300 | China Resources Power Holdings Co., Ltd. | 7,807,938 | ||||||||
| 791,830 | China Unicom Hong Kong, Ltd. | 1,056,773 | ||||||||
| 496,000 | Hutchison Whampoa, Ltd. | 5,172,357 | ||||||||
| 77,000 | Hysan Development Co., Ltd. | 390,324 | ||||||||
| 5,304,061 | Lenovo Group, Ltd. | 5,261,254 | ||||||||
| 164,000 | Link (The) REIT | 895,777 | ||||||||
| 265,500 | MTR Corp., Ltd. | 1,055,139 | ||||||||
| 1,045,000 | New World Development, Ltd. | 1,771,586 | ||||||||
| 3,961,000 | PCCW, Ltd. | 1,826,745 | ||||||||
| 240,500 | Swire Pacific, Ltd. Class A | 3,068,736 | ||||||||
| 49,000 | Television Broadcasts, Ltd. | 370,846 | ||||||||
| 198,000 | Wharf Holdings, Ltd. | 1,768,893 | ||||||||
|
| |||||||||
Total Hong Kong | 40,566,999 | |||||||||
|
| |||||||||
India — 0.5% | ||||||||||
| 3,094,890 | Power Grid Corp. of India, Ltd. | 6,021,796 | ||||||||
| 787,555 | Sun TV Network, Ltd. | 5,649,095 | ||||||||
|
| |||||||||
Total India | 11,670,891 | |||||||||
|
| |||||||||
Indonesia — 0.5% | ||||||||||
| 6,813,250 | Bank Rakyat Indonesia Persero Tbk PT | 6,134,905 | ||||||||
| 254,000 | Indo Tambangraya Megah Tbk PT | 927,914 | ||||||||
| 5,113,500 | Perusahaan Perkebunan London Sumatra Indonesia Tbk PT | 1,015,596 | ||||||||
| 717,000 | Tambang Batubara Bukit Asam Persero Tbk PT | 1,062,495 | ||||||||
| 547,000 | United Tractors Tbk PT | 1,024,482 | ||||||||
| 3,996,000 | Vale Indonesia Tbk PT | 976,640 | ||||||||
|
| |||||||||
Total Indonesia | 11,142,032 | |||||||||
|
| |||||||||
Ireland — 0.3% | ||||||||||
| 14,025,066 | Governor & Co. of the Bank of Ireland (The)* | 2,773,475 | ||||||||
| 32,673 | Paddy Power Plc | 2,946,107 | ||||||||
| 19,886 | Smurfit Kappa Group Plc | 329,409 | ||||||||
|
| |||||||||
Total Ireland | 6,048,991 | |||||||||
|
| |||||||||
Israel — 0.4% | ||||||||||
| 195,828 | Teva Pharmaceutical Industries, Ltd., Sponsored ADR | 7,770,455 | ||||||||
|
| |||||||||
Italy — 2.5% | ||||||||||
| 240,952 | Assicurazioni Generali Spa | 3,756,192 | ||||||||
| 109,963 | Azimut Holding Spa | 1,781,987 | ||||||||
| 72 | See accompanying Notes to the Financial Statements. |
Mercer Non-US Core Equity Fund
Schedule of Investments (Continued)
(showing percentage of net assets)
March 31, 2013
| Shares | Description | Value ($) | ||||||||
Italy — continued | ||||||||||
| 72,734 | Banca Generali Spa | 1,382,286 | ||||||||
| 209,697 | Banca Popolare dell’Emilia Romagna Scarl | 1,483,687 | ||||||||
| 1,422,398 | Banca Popolare di Milano Scarl* | 872,154 | ||||||||
| 675,596 | Beni Stabili Spa REIT | 403,489 | ||||||||
| 152,219 | Buzzi Unicem Spa‡ | 2,343,617 | ||||||||
| 36,421 | Danieli & C. Officine Meccaniche Spa-RSP | 605,648 | ||||||||
| 662,813 | Enel Spa | 2,166,946 | ||||||||
| 402,951 | ENI Spa | 9,070,532 | ||||||||
| 32,677 | Exor Spa | 914,320 | ||||||||
| 313,465 | Fiat Spa (MIL Exchange)* | 1,670,459 | ||||||||
| 658,790 | Gemina Spa* | 1,107,351 | ||||||||
| 2,012,603 | Intesa Sanpaolo Spa | 2,951,364 | ||||||||
| 89,025 | Lottomatica Spa | 2,095,429 | ||||||||
| 577,096 | Mediaset Spa | 1,180,490 | ||||||||
| 274,917 | Mediolanum Spa | 1,513,047 | ||||||||
| 968,187 | Milano Assicurazioni Spa* | 513,461 | ||||||||
| 207,692 | Pirelli & C. Spa | 2,182,916 | ||||||||
| 42,734 | Societa Iniziative Autostradali e Servizi Spa | 400,860 | ||||||||
| 3,209,588 | Telecom Italia Spa | 2,270,908 | ||||||||
| 4,642,815 | Telecom Italia Spa-RNC | 2,861,681 | ||||||||
| 2,093,325 | UniCredit Spa* | 8,951,163 | ||||||||
| 132,349 | Unione di Banche Italiane SCPA | 488,434 | ||||||||
|
| |||||||||
Total Italy | 52,968,421 | |||||||||
|
| |||||||||
Japan — 22.5% | ||||||||||
| 12,700 | 3-D Matrix, Ltd.* | 969,857 | ||||||||
| 97,700 | Advantest Corp. | 1,371,666 | ||||||||
| 328,500 | Aeon Credit Service Co., Ltd. | 9,300,861 | ||||||||
| 38,700 | Aica Kogyo Co., Ltd. | 709,623 | ||||||||
| 189,350 | Aiful Corp.* | 1,260,722 | ||||||||
| 88,500 | Aisin Seiki Co., Ltd. | 3,242,741 | ||||||||
| 16,300 | Alfresa Holdings Corp. | 885,907 | ||||||||
| 92,300 | Alpine Electronics, Inc. | 883,535 | ||||||||
| 116,400 | Alps Electric Co., Ltd. | 762,629 | ||||||||
| 38,000 | Asahi Breweries, Ltd. | 908,977 | ||||||||
| 242,000 | Asahi Glass Co., Ltd. | 1,675,622 | ||||||||
| 130,200 | Astellas Pharma, Inc. | 7,007,147 | ||||||||
| 42,200 | Bridgestone Corp. | 1,413,848 | ||||||||
| 55,100 | Brother Industries, Ltd. | 566,706 | ||||||||
| 279,000 | Calsonic Kansei Corp. | 1,228,526 | ||||||||
| 207,100 | Canon, Inc. | 7,599,394 | ||||||||
| 65,465 | Canon, Inc., Sponsored ADR | 2,401,911 | ||||||||
| 222,000 | Central Glass Co., Ltd. | 769,751 | ||||||||
| 27,700 | Central Japan Railway Co. | 2,922,612 | ||||||||
| 252,294 | Chiba Bank, Ltd. (The) | 1,813,984 | ||||||||
| 98,000 | Chiyoda Corp. | 1,094,448 | ||||||||
| 75,200 | Chugai Pharmaceutical Co., Ltd. | 1,673,244 | ||||||||
| 225,400 | Citizen Holdings Co., Ltd. | 1,148,336 | ||||||||
| 53,700 | Coca-Cola Central Co., Ltd. | 708,232 | ||||||||
| See accompanying Notes to the Financial Statements. | 73 |
Mercer Non-US Core Equity Fund
Schedule of Investments (Continued)
(showing percentage of net assets)
March 31, 2013
| Shares | Description | Value ($) | ||||||||
Japan — continued | ||||||||||
| 33,100 | Coca-Cola West Co., Ltd. | 576,662 | ||||||||
| 100,900 | COMSYS Holdings Corp. | 1,223,421 | ||||||||
| 2,643 | Dai-ichi Life Insurance Co., Ltd. (The) | 3,525,124 | ||||||||
| 73,000 | Daicel Corp. | 569,124 | ||||||||
| 65,500 | Daifuku Co., Ltd. | 532,945 | ||||||||
| 67,000 | Daihatsu Motor Co., Ltd. | 1,388,173 | ||||||||
| 196,300 | Daiichi Sanyko Co., Ltd. | 3,779,015 | ||||||||
| 181,660 | Daikin Industries, Ltd. | 7,119,944 | ||||||||
| 75,000 | Dainippon Sumitomo Pharma Co., Ltd. | 1,325,782 | ||||||||
| 439,130 | Daiwa House Industry Co., Ltd. | 8,570,555 | ||||||||
| 666,246 | Daiwa Securities Group, Inc. | 4,691,075 | ||||||||
| 153,950 | Dena Co., Ltd. | 4,191,789 | ||||||||
| 6,400 | Denso Corp. | 270,581 | ||||||||
| 56,500 | East Japan Railway Co. | 4,645,235 | ||||||||
| 33,500 | Eisai Co., Ltd. | 1,498,272 | ||||||||
| 49,400 | FamilyMart Co., Ltd. | 2,256,679 | ||||||||
| 239,000 | Fuji Electric Holdings Co., Ltd. | 699,053 | ||||||||
| 98,000 | Fuji Heavy Industries, Ltd. | 1,546,820 | ||||||||
| 2,920 | Fuji Media Holdings, Inc. | 5,062,327 | ||||||||
| 292,400 | FUJIFILM Holdings Corp. | 5,765,897 | ||||||||
| 431,000 | Fujikura, Ltd. | 1,361,487 | ||||||||
| 199,000 | Fujitsu General, Ltd. | 1,682,674 | ||||||||
| 577,000 | Fujitsu, Ltd. | 2,399,564 | ||||||||
| 466,000 | Fukuoka Financial Group, Inc. | 2,329,504 | ||||||||
| 74,097 | Glory, Ltd. | 1,774,797 | ||||||||
| 247,294 | Hachijuni Bank, Ltd. (The) | 1,475,558 | ||||||||
| 272,000 | Hankyu Hanshin Holdings, Inc. | 1,640,332 | ||||||||
| 212,000 | Hino Motors, Ltd. | 2,290,917 | ||||||||
| 27,600 | Hirose Electric Co., Ltd. | 3,631,270 | ||||||||
| 16,700 | Hisamitsu Pharmaceutical Co., Inc. | 902,319 | ||||||||
| 61,400 | Hitachi Construction Machinery Co., Ltd. | 1,312,636 | ||||||||
| 34,300 | Hitachi High-Technologies Corp. | 715,769 | ||||||||
| 499,000 | Hitachi, Ltd. | 2,897,830 | ||||||||
| 7,900 | Hogy Medical Co., Ltd. | 426,005 | ||||||||
| 51,600 | Ibiden Co., Ltd. | 804,569 | ||||||||
| 13,100 | Idemitsu Kosan Co., Ltd. | 1,138,343 | ||||||||
| 398,000 | IHI Corp. | 1,206,445 | ||||||||
| 1,584 | Inpex Holdings, Inc. | 8,491,130 | ||||||||
| 409,000 | Isuzu Motors, Ltd. | 2,466,528 | ||||||||
| 86,600 | Ito En, Ltd. | 2,090,853 | ||||||||
| 248,300 | Itochu Corp. | 3,034,426 | ||||||||
| 44,000 | Japan Airlines Co., Ltd. | 2,052,117 | ||||||||
| 63,000 | Japan Aviation Electronics Industry, Ltd. | 479,770 | ||||||||
| 83,000 | Japan Securities Finance Co., Ltd. | 637,375 | ||||||||
| 552,500 | Japan Tobacco, Inc. | 17,658,610 | ||||||||
| 72,000 | JGC Corp. | 1,842,502 | ||||||||
| 355,714 | Joyo Bank, Ltd. (The) | 1,978,711 | ||||||||
| 79,800 | JTEKT Corp. | 751,149 | ||||||||
| 228,200 | JX Holdings, Inc. | 1,279,104 | ||||||||
| 74 | See accompanying Notes to the Financial Statements. |
Mercer Non-US Core Equity Fund
Schedule of Investments (Continued)
(showing percentage of net assets)
March 31, 2013
| Shares | Description | Value ($) | ||||||||
Japan — continued | ||||||||||
| 27,300 | Kagome Co., Ltd. | 518,880 | ||||||||
| 41,000 | Kaken Pharmaceutical Co., Ltd. | 744,384 | ||||||||
| 236,000 | Kaneka Corp. | 1,360,476 | ||||||||
| 415,308 | Kao Corp. | 13,428,380 | ||||||||
| 300,000 | Kawasaki Heavy Industries, Ltd. | 944,480 | ||||||||
| 389,000 | Kawasaki Kisen Kaisha, Ltd.* | 827,483 | ||||||||
| 676,180 | KDDI Corp. | 28,228,106 | ||||||||
| 188,000 | Kirin Holdings Co., Ltd. | 3,021,357 | ||||||||
| 14,900 | Kissei Pharmaceutical Co., Ltd. | 315,528 | ||||||||
| 63,500 | Kobayashi Pharmaceutical Co., Ltd. | 3,086,524 | ||||||||
| 249,750 | Komatsu, Ltd. | 5,931,629 | ||||||||
| 510,000 | Konica Minolta Holdings, Inc. | 3,715,699 | ||||||||
| 69,986 | Kose Corp. | 1,627,945 | ||||||||
| 100 | Kyocera Corp. | 9,136 | ||||||||
| 42,500 | KYORIN Holdings, Inc. | 1,031,536 | ||||||||
| 40,000 | Kyowa Hakko Kirin Co., Ltd. | 452,670 | ||||||||
| 78,373 | Lawson, Inc. | 6,018,433 | ||||||||
| 338 | M3, Inc. | 658,960 | ||||||||
| 517,000 | Marubeni Corp. | 3,937,162 | ||||||||
| 244,000 | Mazda Motor Corp.* | 713,678 | ||||||||
| 76,600 | Medipal Holdings Corp. | 1,072,987 | ||||||||
| 48,800 | Megmilk Snow Brand Co., Ltd. | 773,367 | ||||||||
| 397,000 | Mitsubishi Chemical Holdings Corp. | 1,883,238 | ||||||||
| 109,200 | Mitsubishi Co. | 2,044,161 | ||||||||
| 636,000 | Mitsubishi Heavy Industries, Ltd. | 3,666,369 | ||||||||
| 894,000 | Mitsubishi Materials Corp. | 2,519,783 | ||||||||
| 74,600 | Mitsubishi Tanabe Pharma Corp. | 1,142,565 | ||||||||
| 433,200 | Mitsubishi UFJ Lease & Finance Co., Ltd. | 2,262,297 | ||||||||
| 192,800 | Mitsui & Co., Ltd. | 2,702,727 | ||||||||
| 598,000 | Mitsui Chemicals, Inc. | 1,297,511 | ||||||||
| 558,000 | Mitsui Engineering & Shipbuilding Co., Ltd. | 1,008,934 | ||||||||
| 318,000 | Morinaga Milk Industry Co., Ltd. | 980,855 | ||||||||
| 63,300 | MS&AD Insurance Group Holdings | 1,402,403 | ||||||||
| 63,500 | Namco Bandai Holdings, Inc. | 1,121,144 | ||||||||
| 875,000 | NEC Corp. | 2,326,633 | ||||||||
| 130,430 | Nidec Corp. | 7,796,390 | ||||||||
| 129,900 | Nihon Kohden Corp. | 4,580,073 | ||||||||
| 19,600 | Nintendo Co., Ltd. | 2,115,933 | ||||||||
| 156,000 | Nippon Express Co., Ltd. | 746,650 | ||||||||
| 44,900 | Nippon Konpo Unyu Soko Co., Ltd. | 712,039 | ||||||||
| 72,000 | Nippon Shokubai Co., Ltd. | 633,312 | ||||||||
| 39,100 | Nippon Telegraph & Telephone Corp. | 1,705,063 | ||||||||
| 34,821 | Nippon Telegraph & Telephone Corp., ADR | 757,009 | ||||||||
| 224,200 | Nippon Television Network Corp. | 3,319,362 | ||||||||
| 400,000 | Nishimatsu Construction Co., Ltd. | 676,452 | ||||||||
| 130,700 | Nissan Motor Company, Ltd. | 1,260,848 | ||||||||
| 34,000 | Nisshin Seifun Group, Inc. | 448,415 | ||||||||
| 74,600 | Nisshin Steel Holdings Co., Ltd.* | 587,945 | ||||||||
| 71,000 | Nisshinbo Holdings, Inc. | 493,118 | ||||||||
| See accompanying Notes to the Financial Statements. | 75 |
Mercer Non-US Core Equity Fund
Schedule of Investments (Continued)
(showing percentage of net assets)
March 31, 2013
| Shares | Description | Value ($) | ||||||||
Japan — continued | ||||||||||
| 25,500 | Nitto Denko Corp. | 1,526,962 | ||||||||
| 60,800 | NKSJ Holdings, Inc. | 1,273,295 | ||||||||
| 218,200 | Nomura Holdings, Inc. | 1,346,054 | ||||||||
| 211,941 | Nomura Research Institute, Ltd. | 5,473,226 | ||||||||
| 370,941 | North Pacific Bank, Ltd. | 1,250,673 | ||||||||
| 3,384 | NTT DoCoMo, Inc. | 5,024,531 | ||||||||
| 13,760 | Obic Co., Ltd. | 3,186,080 | ||||||||
| 771,000 | Oki Electric Industry Co., Ltd.* | 885,641 | ||||||||
| 67,800 | Olympus Corp.* | 1,603,778 | ||||||||
| 29,600 | Ono Pharmaceutical Co., Ltd. | 1,829,143 | ||||||||
| 31,100 | Oracle Corp. Japan | 1,400,856 | ||||||||
| 946,200 | Orix Corp.* | 12,036,324 | ||||||||
| 162,000 | Otsuka Holdings Co., Ltd. | 5,625,718 | ||||||||
| 53,000 | Pacific Metals Co., Ltd. | 272,836 | ||||||||
| 13,600 | Paramount Bed Holdings Co., Ltd. | 507,722 | ||||||||
| 6,600 | Pigeon Corp. | 462,604 | ||||||||
| 314,300 | Pioneer Corp.* | 571,637 | ||||||||
| 36,900 | Pola Orbis Holdings, Inc. | 1,177,409 | ||||||||
| 210,000 | Press Kogyo Co., Ltd. | 1,083,280 | ||||||||
| 803,690 | Rakuten, Inc. | 8,214,700 | ||||||||
| 343,000 | Ricoh Company, Ltd. | 3,713,827 | ||||||||
| 98,900 | Round One Corp. | 730,021 | ||||||||
| 28,334 | Sankyo Co., Ltd. | 1,325,990 | ||||||||
| 87,833 | Santen Pharmaceutical Co., Ltd. | 4,068,419 | ||||||||
| 101,400 | SBI Holdings, Inc. | 895,150 | ||||||||
| 120,340 | Shin-Etsu Chemical Co., Ltd. | 7,948,430 | ||||||||
| 137,000 | Shinko Electric Industries Co., Ltd. | 1,135,110 | ||||||||
| 107,200 | Shionogi & Co., Ltd. | 2,167,488 | ||||||||
| 142,700 | Showa Corp. | 1,528,386 | ||||||||
| 249,800 | Showa Shell Sekiyu KK | 1,766,826 | ||||||||
| 1,368 | SKY Perfect JSAT Holdings, Inc. | 646,752 | ||||||||
| 87,500 | Sodick Co., Ltd. | 540,709 | ||||||||
| 56,500 | Sony Corp. | 976,521 | ||||||||
| 25,601 | Sony Corp., Sponsored ADR | 445,457 | ||||||||
| 204,500 | Sony Financial Holdings, Inc. | 3,045,097 | ||||||||
| 916,000 | Sumitomo Chemical Co., Ltd. | 2,864,327 | ||||||||
| 107,700 | Sumitomo Corp. | 1,355,128 | ||||||||
| 221,900 | Sumitomo Electric Industries, Ltd. | 2,711,796 | ||||||||
| 37,600 | Sumitomo Forestry Co., Ltd. | 416,711 | ||||||||
| 60,000 | Sumitomo Metal Mining Co., Ltd. | 847,479 | ||||||||
| 151,541 | Sumitomo Mitsui Financial Group | 6,189,294 | ||||||||
| 56,700 | Suzuki Motor Corp. | 1,265,830 | ||||||||
| 69,900 | T&D Holdings, Inc. | 831,930 | ||||||||
| 73,800 | Tachi-S Co., Ltd. | 1,308,494 | ||||||||
| 39,900 | Taiyo Yuden Co., Ltd. | 505,010 | ||||||||
| 51,300 | Takara Bio, Inc. | 753,513 | ||||||||
| 112,400 | Takeda Pharmaceutical Co., Ltd. | 6,144,820 | ||||||||
| 45,700 | Terumo Corp. | 1,956,419 | ||||||||
| 325,000 | Toagosei Co., Ltd. | 1,420,708 | ||||||||
| 76 | See accompanying Notes to the Financial Statements. |
Mercer Non-US Core Equity Fund
Schedule of Investments (Continued)
(showing percentage of net assets)
March 31, 2013
| Shares | Description | Value ($) | ||||||||
Japan — continued | ||||||||||
| 272,180 | Tokio Marine Holdings, Inc. | 7,827,853 | ||||||||
| 27,100 | Tokyo Electron, Ltd. | 1,150,064 | ||||||||
| 41,300 | Tokyo Ohka Kogyo Co., Ltd. | 877,658 | ||||||||
| 198,000 | Toppan Printing Co., Ltd. | 1,423,612 | ||||||||
| 246,000 | Toyo Ink SC Holdings Co., Ltd. | 1,169,560 | ||||||||
| 26,600 | Toyoda Gosei Co., Ltd. | 636,850 | ||||||||
| 58,100 | Toyota Industries Corp. | 2,128,850 | ||||||||
| 358,320 | Toyota Motor Corp. | 18,388,577 | ||||||||
| 154 | Toyota Motor Corp., Sponsored ADR | 15,807 | ||||||||
| 64,800 | Toyota Tsusho Corp. | 1,652,738 | ||||||||
| 10,600 | Tsumura & Co. | 387,269 | ||||||||
| 28,057 | USS Co., Ltd. | 3,222,884 | ||||||||
| 41,800 | West Japan Railway Co. | 2,009,530 | ||||||||
| 15,100 | Yakult Honsha Co., Ltd. | 608,690 | ||||||||
| 452,962 | Yamato Holdings Co., Ltd. | 8,199,759 | ||||||||
| 735,720 | Yokogawa Electric Corp. | 7,355,635 | ||||||||
|
| |||||||||
Total Japan | 482,234,522 | |||||||||
|
| |||||||||
Luxembourg — 0.4% | ||||||||||
| 378,644 | Tenaris SA‡ | 7,706,531 | ||||||||
|
| |||||||||
Malaysia — 0.2% | ||||||||||
| 929,300 | Genting Malaysia Bhd | 1,101,415 | ||||||||
| 427,900 | RHB Capital Bhd | 1,192,565 | ||||||||
| 365,400 | Sime Darby Bhd | 1,092,719 | ||||||||
|
| |||||||||
Total Malaysia | 3,386,699 | |||||||||
|
| |||||||||
Malta — 0.1% | ||||||||||
| 31,613 | Unibet Group Plc, ADR | 1,106,115 | ||||||||
|
| |||||||||
Mauritius — 0.1% | ||||||||||
| 3,828,000 | Golden Agri-Resources, Ltd.‡ | 1,789,650 | ||||||||
|
| |||||||||
Mexico — 0.4% | ||||||||||
| 443,800 | Alfa SAB de CV Class A | 1,084,040 | ||||||||
| 1,757,700 | Fibra Uno Administracion SA de CV REIT | 5,804,798 | ||||||||
| 271,600 | Grupo Mexico SAB de CV Series B | 1,094,839 | ||||||||
|
| |||||||||
Total Mexico | 7,983,677 | |||||||||
|
| |||||||||
Netherlands — 2.3% | ||||||||||
| 462,925 | Aegon NV | 2,788,526 | ||||||||
| 93,018 | Aegon NV, ADR | 559,038 | ||||||||
| 38,665 | ASM International NV | 1,286,175 | ||||||||
| 50,736 | CSM | 1,074,976 | ||||||||
| 139,980 | Delta Lloyd NV | 2,405,031 | ||||||||
| 6,990 | Heineken Holding NV | 448,703 | ||||||||
| 149,960 | Heineken NV | 11,322,735 | ||||||||
| 1,437,225 | ING Groep NV, ADR* | 10,218,752 | ||||||||
| 266,074 | Koninklijke Ahold NV | 4,084,610 | ||||||||
| See accompanying Notes to the Financial Statements. | 77 |
Mercer Non-US Core Equity Fund
Schedule of Investments (Continued)
(showing percentage of net assets)
March 31, 2013
| Shares | Description | Value ($) | ||||||||
Netherlands — continued | ||||||||||
| 56,347 | Koninklijke Boskalis Westminster NV | 2,242,286 | ||||||||
| 41,480 | Koninklijke DSM NV | 2,418,738 | ||||||||
| 154,632 | Koninklijke KPN NV‡ | 521,029 | ||||||||
| 94,631 | Koninklijke Philips Electronics NV | 2,805,188 | ||||||||
| 65,943 | Koninklijke Philips Electronics NV, ADR | 1,948,616 | ||||||||
| 288,425 | STMicroelectronics NV | 2,222,198 | ||||||||
| 87,398 | Unilever NV | 3,583,318 | ||||||||
|
| |||||||||
Total Netherlands | 49,929,919 | |||||||||
|
| |||||||||
New Zealand — 0.1% | ||||||||||
| 222,913 | Ryman Healthcare, Ltd. | 941,478 | ||||||||
| 182,075 | Sky City Entertainment Group, Ltd. | 672,873 | ||||||||
| 154,950 | Trade Me, Ltd. | 614,182 | ||||||||
|
| |||||||||
Total New Zealand | 2,228,533 | |||||||||
|
| |||||||||
Norway — 1.1% | ||||||||||
| 884,292 | DnB NOR ASA | 12,985,788 | ||||||||
| 40,919 | Fred Olsen Energy ASA | 1,753,922 | ||||||||
| 2,375,444 | Marine Harvest ASA* | 2,205,406 | ||||||||
| 73,768 | Statoil ASA | 1,785,862 | ||||||||
| 352,190 | Storebrand ASA* | 1,368,907 | ||||||||
| 47,897 | TGS Nopec Geophysical Co. ASA | 1,806,659 | ||||||||
| 37,662 | Yara International ASA | 1,708,592 | ||||||||
|
| |||||||||
Total Norway | 23,615,136 | |||||||||
|
| |||||||||
Portugal — 0.1% | ||||||||||
| 1,329,014 | Sonae | 1,194,610 | ||||||||
|
| |||||||||
Russia — 0.3% | ||||||||||
| 37,336 | Magnit OJSC**** | 7,206,702 | ||||||||
|
| |||||||||
Singapore — 0.5% | ||||||||||
| 1,239,000 | First Resources, Ltd. | 1,827,640 | ||||||||
| 344,000 | Frasers Commercial Trust REIT | 390,972 | ||||||||
| 201,000 | Keppel Corp., Ltd. | 1,814,606 | ||||||||
| 230,000 | Oversea-Chinese Banking Corp., Ltd. | 1,974,448 | ||||||||
| 174,000 | Parkway Life Real Estate Investment Trust REIT‡ | 354,844 | ||||||||
| 233,230 | Venture Corp., Ltd. | 1,628,061 | ||||||||
| 2,477,000 | Yangzijiang Shipbuilding Holdings, Ltd.‡ | 1,936,716 | ||||||||
|
| |||||||||
Total Singapore | 9,927,287 | |||||||||
|
| |||||||||
South Africa — 0.3% | ||||||||||
| 17,401 | Kumba Iron Ore, Ltd. | 933,110 | ||||||||
| 131,917 | Sasol, Ltd. | 5,857,034 | ||||||||
|
| |||||||||
Total South Africa | 6,790,144 | |||||||||
|
| |||||||||
South Korea — 0.8% | ||||||||||
| 120,653 | Celltrion, Inc. | 5,769,135 | ||||||||
| 78 | See accompanying Notes to the Financial Statements. |
Mercer Non-US Core Equity Fund
Schedule of Investments (Continued)
(showing percentage of net assets)
March 31, 2013
| Shares | Description | Value ($) | ||||||||
South Korea — continued | ||||||||||
| 28,160 | Hana Financial Group, Inc. | 992,155 | ||||||||
| 5,606 | Hyundai Heavy Industries Co., Ltd. | 1,078,271 | ||||||||
| 3,740 | Hyundai Mobis | 1,045,425 | ||||||||
| 29,209 | Hyundai Motor Co. | 5,867,528 | ||||||||
| 30,100 | KB Financial Group, Inc. | 1,000,989 | ||||||||
| 17,962 | LG Corp. | 1,042,913 | ||||||||
| 763 | Samsung Electronics Co., Ltd. | 1,035,529 | ||||||||
|
| |||||||||
Total South Korea | 17,831,945 | |||||||||
|
| |||||||||
Spain — 2.1% | ||||||||||
| 9,469 | Acciona SA | 517,128 | ||||||||
| 20,496 | Almirall SA | 256,609 | ||||||||
| 253,058 | Amadeus IT Holding SA‡ | 6,848,355 | ||||||||
| 474,403 | Banco Bilbao Vizcaya Argentaria SA | 4,119,888 | ||||||||
| 6,440 | Corp. Financiera Alba SA | 282,324 | ||||||||
| 97,309 | Endesa SA | 2,059,873 | ||||||||
| 44,493 | Fomento de Construcciones y Contratas SA‡ | 425,073 | ||||||||
| 94,349 | Gas Natural SDG SA | 1,673,130 | ||||||||
| 469,932 | Iberdrola SA | 2,192,295 | ||||||||
| 108,175 | Inditex SA | 14,363,029 | ||||||||
| 189,954 | Indra Sistemas SA‡ | 2,268,454 | ||||||||
| 716,857 | Mapfre SA‡ | 2,219,363 | ||||||||
| 419,542 | Repsol VPF SA | 8,538,927 | ||||||||
|
| |||||||||
Total Spain | 45,764,448 | |||||||||
|
| |||||||||
Sweden — 3.6% | ||||||||||
| 25,388 | Betsson AB | 818,023 | ||||||||
| 105,584 | Boliden AB | 1,703,439 | ||||||||
| 112,914 | Castellum AB‡ | 1,611,569 | ||||||||
| 1,551 | Fabege AB‡ | 15,887 | ||||||||
| 58,425 | Holmen AB | 1,741,428 | ||||||||
| 206,057 | Hufvudstaden AB‡ | 2,592,350 | ||||||||
| 38,259 | Industrivarden AB | 697,865 | ||||||||
| 98,758 | Intrum Justitia AB | 1,913,797 | ||||||||
| 67,570 | Investment AB Oresund* | 1,091,180 | ||||||||
| 164,640 | Investor AB Class B | 4,765,495 | ||||||||
| 77,770 | JM AB‡ | 1,847,964 | ||||||||
| 1,463,517 | Nordea Bank AB | 16,611,436 | ||||||||
| 85,445 | Ratos AB | 904,781 | ||||||||
| 82,228 | Saab AB | 1,783,166 | ||||||||
| 485,183 | Skandinaviska Enskilda Banken AB‡ | 4,883,917 | ||||||||
| 6,757 | SkiStar AB | 80,539 | ||||||||
| 321,226 | Svenska Cellulosa AB Class B | 8,299,903 | ||||||||
| 160,309 | Svenska Handelsbanken AB Series A‡ | 6,866,511 | ||||||||
| 110,939 | Tele2 AB | 1,934,864 | ||||||||
| 1,070,086 | Telefonaktiebolaget LM Ericsson | 13,363,732 | ||||||||
| 82,110 | Telefonaktiebolaget LM Ericsson Class B, Sponsored ADR | 1,034,586 | ||||||||
| 259,739 | TeliaSonera AB | 1,858,760 | ||||||||
|
| |||||||||
Total Sweden | 76,421,192 | |||||||||
|
| |||||||||
| See accompanying Notes to the Financial Statements. | 79 |
Mercer Non-US Core Equity Fund
Schedule of Investments (Continued)
(showing percentage of net assets)
March 31, 2013
| Shares | Description | Value ($) | ||||||||
Switzerland — 7.3% | ||||||||||
| 29,896 | Actelion, Ltd. | 1,627,476 | ||||||||
| 196,804 | Aryzta AG | 11,648,835 | ||||||||
| 20,010 | Baloise-Holding AG | 1,878,546 | ||||||||
| 8,303 | Bucher Industries AG | 1,926,362 | ||||||||
| 22,819 | Cie Financiere Richemont SA | 1,795,254 | ||||||||
| 5,736 | Flughafen Zuerich AG | 2,675,831 | ||||||||
| 13,747 | Geberit AG | 3,392,654 | ||||||||
| 4,053 | Georg Fischer AG | 1,720,583 | ||||||||
| 4,567 | Givaudan SA | 5,623,446 | ||||||||
| 4,487 | Helvetia Holding AG | 1,812,427 | ||||||||
| 59,829 | Julius Baer Group, Ltd. | 2,332,001 | ||||||||
| 229 | Lindt & Spruengli AG | 883,401 | ||||||||
| 21 | Lindt & Spruengli AG (Registered Shares) | 950,039 | ||||||||
| 441,788 | Nestle SA | 32,027,822 | ||||||||
| 34,913 | Nestle SA, Sponsored ADR | 2,530,145 | ||||||||
| 98,800 | Novartis AG | 7,037,394 | ||||||||
| 77,490 | OC Oerlikon Corp. AG Class R | 920,600 | ||||||||
| 106,234 | Roche Holding AG | 24,792,982 | ||||||||
| 25,193 | Roche Holding AG, Sponsored ADR | 1,476,310 | ||||||||
| 13,991 | Schindler Holding AG | 2,055,175 | ||||||||
| 4,750 | SGS SA | 11,677,491 | ||||||||
| 6,645 | Swatch Group AG (The) | 3,873,531 | ||||||||
| 16,584 | Swiss Life Holding | 2,464,089 | ||||||||
| 138,675 | Swiss Re, Ltd. | 11,305,465 | ||||||||
| 27,075 | Syngenta AG | 11,322,351 | ||||||||
| 21,860 | Zurich Insurance Group AG | 6,098,962 | ||||||||
|
| |||||||||
Total Switzerland | 155,849,172 | |||||||||
|
| |||||||||
Taiwan — 0.3% | ||||||||||
| 356,087 | Taiwan Semiconductor Manufacturing Co., Ltd., Sponsored ADR | 6,121,136 | ||||||||
|
| |||||||||
Thailand — 0.4% | ||||||||||
| 936,670 | Advanced Info Service PCL (Registered Shares) | 7,548,374 | ||||||||
| 1,218,150 | Krung Thai Bank PCL | 1,031,590 | ||||||||
| 93,902 | PTT PCL | 1,038,902 | ||||||||
|
| |||||||||
Total Thailand | 9,618,866 | |||||||||
|
| |||||||||
United Kingdom — 18.2% | ||||||||||
| 2,311,718 | Aberdeen Asset Management Plc | 15,065,906 | ||||||||
| 711,929 | Alent Plc* | 4,081,966 | ||||||||
| 52,048 | Amec Plc | 834,581 | ||||||||
| 224,154 | Amlin Plc | 1,441,453 | ||||||||
| 21,949 | ARM Holdings Plc, Sponsored ADR | 929,979 | ||||||||
| 422,887 | Ashmore Group Plc | 2,247,466 | ||||||||
| 346,727 | Ashtead Group Plc | 3,087,851 | ||||||||
| 185,831 | AstraZeneca Plc, Sponsored ADR | 9,287,833 | ||||||||
| 50,479 | AstraZeneca Plc | 2,529,063 | ||||||||
| 166,541 | BAE Systems Plc | 997,123 | ||||||||
| 533,004 | Balfour Beatty Plc | 1,900,331 | ||||||||
| 80 | See accompanying Notes to the Financial Statements. |
Mercer Non-US Core Equity Fund
Schedule of Investments (Continued)
(showing percentage of net assets)
March 31, 2013
| Shares | Description | Value ($) | ||||||||
United Kingdom — continued | ||||||||||
| 2,727,753 | Barclays Plc | 12,059,312 | ||||||||
| 1,292,163 | Barratt Developments Plc* | 5,378,077 | ||||||||
| 112,728 | BBA Aviation Plc | 440,768 | ||||||||
| 74,059 | Bellway Plc | 1,458,541 | ||||||||
| 51,705 | Berendsen Plc | 616,315 | ||||||||
| 80,668 | Bodycote Plc | 656,548 | ||||||||
| 1,398,487 | BP Plc | 9,766,131 | ||||||||
| 319,801 | British American Tobacco Plc | 17,127,184 | ||||||||
| 70,914 | British American Tobacco Plc, Sponsored ADR | 7,591,344 | ||||||||
| 537,213 | BT Group Plc | 2,267,733 | ||||||||
| 24,694 | BT Group Plc, Sponsored ADR | 1,037,889 | ||||||||
| 332,169 | Bunzl Plc | 6,531,750 | ||||||||
| 76,514 | Burberry Group Plc | 1,544,069 | ||||||||
| 726,154 | Cairn Energy Plc* | 3,015,690 | ||||||||
| 1,881,562 | Cobham Plc | 6,942,654 | ||||||||
| 756,990 | Compass Group Plc | 9,661,144 | ||||||||
| 32,959 | Diageo Plc, Sponsored ADR | 4,147,561 | ||||||||
| 1,566,148 | DSG International Plc* | 803,566 | ||||||||
| 179,146 | easyJet Plc‡ | 2,937,863 | ||||||||
| 59,244 | Experian Plc | 1,025,534 | ||||||||
| 393,276 | GlaxoSmithKline Plc, Sponsored ADR | 18,448,577 | ||||||||
| 600,818 | GlaxoSmithKline Plc | 14,035,928 | ||||||||
| 416,692 | Halma Plc | 3,277,522 | ||||||||
| 84,222 | Hargreaves Lansdown Plc | 1,110,059 | ||||||||
| 1,045,303 | Hays Plc | 1,530,894 | ||||||||
| 784,101 | Henderson Group Plc, ADR | 1,912,866 | ||||||||
| 228,395 | Home Retail Group | 538,244 | ||||||||
| 171,200 | HSBC Holdings Plc | 1,808,455 | ||||||||
| 1,308 | HSBC Holdings Plc, Sponsored ADR | 69,769 | ||||||||
| 2,367,373 | HSBC Holdings Plc (Ordinary Shares) | 25,253,043 | ||||||||
| 457,561 | ICAP Plc | 2,017,652 | ||||||||
| 133,638 | IG Group Holdings Plc | 1,083,607 | ||||||||
| 62,738 | Imperial Tobacco Group Plc | 2,190,132 | ||||||||
| 116,115 | Inchcape Plc | 885,982 | ||||||||
| 75,948 | Informa Plc | 607,177 | ||||||||
| 46,061 | InterContinental Hotels Group Plc | 1,403,723 | ||||||||
| 391,103 | Intermediate Capital Group Plc | 2,512,667 | ||||||||
| 1,159,814 | ITV Plc | 2,278,890 | ||||||||
| 153,012 | J Sainsbury Plc | 879,411 | ||||||||
| 149,800 | Jardine Lloyd Thompson Group Plc | 1,935,718 | ||||||||
| 425,681 | Kingfisher Plc | 1,860,269 | ||||||||
| 921,174 | Legal & General Group Plc | 2,415,654 | ||||||||
| 5,982,099 | Lloyds TSB Group Plc* | 4,422,767 | ||||||||
| 110,698 | London Stock Exchange Group Plc | 2,195,248 | ||||||||
| 333,351 | Meggitt Plc | 2,485,329 | ||||||||
| 590,531 | Melrose Industries Plc | 2,380,718 | ||||||||
| 213,391 | Mitchells & Butlers Plc* | 1,056,317 | ||||||||
| 179,106 | Mondi Plc | 2,431,355 | ||||||||
| 62,900 | Next Plc | 4,169,991 | ||||||||
| See accompanying Notes to the Financial Statements. | 81 |
Mercer Non-US Core Equity Fund
Schedule of Investments (Continued)
(showing percentage of net assets)
March 31, 2013
| Shares | Description | Value ($) | ||||||||
United Kingdom — continued | ||||||||||
| 1,849,292 | Old Mutual Plc | 5,691,935 | ||||||||
| 263,470 | Pearson Plc | 4,736,784 | ||||||||
| 192,813 | Persimmon Plc | 3,129,787 | ||||||||
| 106,612 | Petrofac, Ltd. | 2,319,813 | ||||||||
| 1,118,207 | Prudential Plc | 18,083,084 | ||||||||
| 1,012,577 | QinetiQ Group Plc | 3,188,875 | ||||||||
| 181,592 | Reckitt Benckiser Group Plc | 13,009,342 | ||||||||
| 185,047 | Reed Elsevier Plc | 2,194,491 | ||||||||
| 564,525 | Resolution, Ltd. | 2,335,879 | ||||||||
| 83,055 | Restaurant Group Plc (The) | 590,092 | ||||||||
| 19,072 | Rightmove Plc | 515,776 | ||||||||
| 223,332 | Rolls-Royce Holdings Plc | 3,832,041 | ||||||||
| 72,816 | Royal Dutch Shell Plc Class A (Amsterdam Exchange) | 2,355,340 | ||||||||
| 340,229 | Royal Dutch Shell Plc Class A (London Exchange) | 10,998,860 | ||||||||
| 1,282,907 | RSA Insurance Group Plc | 2,267,508 | ||||||||
| 175,638 | SABMiller Plc | 9,238,406 | ||||||||
| 144,600 | Shire Plc | 4,400,142 | ||||||||
| 103,729 | Spectris Plc | 3,868,381 | ||||||||
| 368,515 | Stagecoach Group Plc | 1,738,030 | ||||||||
| 407,981 | Standard Chartered Plc | 10,553,166 | ||||||||
| 601,107 | Standard Life Plc | 3,334,281 | ||||||||
| 3,790,137 | Taylor Wimpey Plc | 5,231,419 | ||||||||
| 94,498 | Telecity Group Plc | 1,296,437 | ||||||||
| 80,054 | The Berkeley Group Holdings Unit Plc | 2,481,000 | ||||||||
| 235,686 | Thomas Cook Group Plc* | 402,254 | ||||||||
| 204,322 | TUI Travel Plc | 1,010,183 | ||||||||
| 90,625 | Ultra Electronics Holdings Plc | 2,366,885 | ||||||||
| 128,615 | United Business Media, Ltd. | 1,375,857 | ||||||||
| 711,930 | Vesuvius Plc | 3,811,714 | ||||||||
| 3,074,456 | Vodafone Group Plc | 8,711,253 | ||||||||
| 416,405 | WH Smith Plc‡ | 4,720,048 | ||||||||
| 723,130 | William Hill Plc | 4,061,640 | ||||||||
|
| |||||||||
Total United Kingdom | 388,461,892 | |||||||||
|
| |||||||||
TOTAL COMMON STOCKS (COST $1,794,002,285) | 2,025,600,715 | |||||||||
|
| |||||||||
INVESTMENT COMPANIES — 1.3% | ||||||||||
United States — 1.3% | ||||||||||
| 352,682 | iShares MSCI EAFE Index Fund | 20,801,184 | ||||||||
| 452,666 | iShares MSCI Taiwan Index Fund | 6,038,565 | ||||||||
|
| |||||||||
Total United States | 26,839,749 | |||||||||
|
| |||||||||
TOTAL INVESTMENT COMPANIES (COST $25,701,211) | 26,839,749 | |||||||||
|
| |||||||||
PREFERRED STOCKS — 1.3% | ||||||||||
Brazil — 0.1% | ||||||||||
| 75,500 | Bradespar SA, 7.09% | 985,898 | ||||||||
| 188,000 | Eletropaulo Metropolitana Eletricidade de Sao Paulo SA, 39.62% | 922,121 | ||||||||
|
| |||||||||
Total Brazil | 1,908,019 | |||||||||
|
| |||||||||
| 82 | See accompanying Notes to the Financial Statements. |
Mercer Non-US Core Equity Fund
Schedule of Investments (Continued)
(showing percentage of net assets)
March 31, 2013
| Shares | Description | Value ($) | ||||||||
Germany — 1.2% | ||||||||||
| 137,765 | Henkel AG & Co. KGaA, 1.09% | 13,283,717 | ||||||||
| 28,409 | Porsche Automobil Holding SE, 1.33% | 2,080,088 | ||||||||
| 14,790 | ProSiebenSat.1 Media AG, 4.29% | 528,922 | ||||||||
| 45,941 | Volkswagen AG, 1.96% | 9,143,885 | ||||||||
|
| |||||||||
Total Germany | 25,036,612 | |||||||||
|
| |||||||||
TOTAL PREFERRED STOCKS (COST $23,804,193) | 26,944,631 | |||||||||
|
| |||||||||
RIGHTS — 0.0% | ||||||||||
United Kingdom — 0.0% | ||||||||||
| 160,696 | William Hill Plc, Strike Price $0.00, Expires 04/04/2013* | 302,570 | ||||||||
|
| |||||||||
TOTAL RIGHTS (COST $—) | 302,570 | |||||||||
|
| |||||||||
| Notional | Description | Value ($) | ||||||||
OPTIONS PURCHASED — 0.0% | ||||||||||
Put Options — 0.0% | ||||||||||
| 353,205,535 | OTC Japanese Yen versus U.S. Dollar with Deutsche Bank Securities, Strike Price $85.70, Expires 07/23/13 | 379,844 | ||||||||
| 1,126,158,133 | OTC Japanese Yen versus U.S. Dollar with JP Morgan Securities, Inc., Strike Price $0.01, Expires 01/20/14 | 259,800 | ||||||||
|
| |||||||||
TOTAL PUT OPTIONS PURCHASED (COST $240,898) | 639,644 | |||||||||
|
| |||||||||
| Par Value ($) | Description | Value ($) | ||||||||
SHORT-TERM INVESTMENTS — 5.3% | ||||||||||
Bank Deposit — 2.3% | ||||||||||
| 49,795,728 | State Street Bank & Trust Euro Time Deposit, 0.01%, due 04/01/13 | 49,795,728 | ||||||||
|
| |||||||||
Securities Lending Collateral — 3.0% | ||||||||||
| 65,114,408 | State Street Navigator Securities Lending Prime Portfolio*** | 65,114,408 | ||||||||
|
| |||||||||
TOTAL SHORT-TERM INVESTMENTS (COST $114,910,136) | 114,910,136 | |||||||||
|
| |||||||||
TOTAL INVESTMENTS — 102.6% (Cost $1,958,658,723) | 2,195,237,445 | |||||||||
Other Assets and Liabilities (net) — (2.6)% | (56,307,618 | ) | ||||||||
|
| |||||||||
NET ASSETS — 100.0% | $ | 2,138,929,827 | ||||||||
|
| |||||||||
| See accompanying Notes to the Financial Statements. | 83 |
Mercer Non-US Core Equity Fund
Schedule of Investments (Continued)
(showing percentage of net assets)
March 31, 2013
Notes to Schedule of Investments: | ||||||
| ADR — American Depository Receipt | ||||||
| REIT — Real Estate Investment Trust | ||||||
| ¤ | Illiquid security. The total market value of the securities at year end is $0 which represents 0.0% of net assets. The aggregate tax cost of these securities held at March 31, 2013 was $0. | |||||
| * | Non-income producing security | |||||
| *** | Represents an investment of securities lending cash collateral. | |||||
| **** | Securities fair valued by the Valuation Committee as approved by the Board of Trustees. The total market value of the securities at period end is $7,206,702 which represents 0.3% of net assets. The aggregate tax cost of these securities held at March 31, 2013 was $7,251,839. | |||||
| ‡ | All or a portion of this security is out on loan. | |||||
| 84 | See accompanying Notes to the Financial Statements. |
Mercer Non-US Core Equity Fund
Schedule of Investments (Continued)
March 31, 2013
| Industry Sector Summary (Unaudited) | % of Net Assets | ||||
Banks | 8.4 | ||||
Pharmaceuticals | 7.6 | ||||
Insurance | 7.2 | ||||
Telecommunications | 6.0 | ||||
Chemicals | 4.6 | ||||
Food | 4.5 | ||||
Diversified Financial Services | 3.6 | ||||
Oil & Gas | 3.6 | ||||
Auto Manufacturers | 3.5 | ||||
Retail | 2.5 | ||||
Agriculture | 2.3 | ||||
Auto Parts & Equipment | 2.2 | ||||
Beverages | 2.0 | ||||
Electronics | 1.9 | ||||
Transportation | 1.9 | ||||
Media | 1.8 | ||||
Commercial Services | 1.7 | ||||
Holding Companies — Diversified | 1.6 | ||||
Miscellaneous — Manufacturing | 1.6 | ||||
Electric | 1.5 | ||||
Engineering & Construction | 1.5 | ||||
Internet | 1.5 | ||||
Household Products & Wares | 1.3 | ||||
Real Estate | 1.3 | ||||
Home Builders | 1.2 | ||||
Machinery — Diversified | 1.2 | ||||
Mining | 1.2 | ||||
Software | 1.1 | ||||
Aerospace & Defense | 1.0 | ||||
Health Care — Products | 1.0 | ||||
Unaffiliated Fund | 1.0 | ||||
Computers | 0.9 | ||||
Cosmetics & Personal Care | 0.9 | ||||
Electrical Components & Equipment | 0.9 | ||||
Building Materials | 0.8 | ||||
Distribution & Wholesale | 0.8 | ||||
Forest Products & Paper | 0.8 | ||||
Semiconductors | 0.8 | ||||
Apparel | 0.7 | ||||
Entertainment | 0.7 | ||||
Lodging | 0.6 | ||||
Metal Fabricate & Hardware | 0.6 | ||||
Oil & Gas Services | 0.6 | ||||
Biotechnology | 0.5 | ||||
Food Service | 0.5 | ||||
Machinery — Construction & Mining | 0.5 | ||||
Office & Business Equipment | 0.5 | ||||
REITS | 0.5 | ||||
Investment Companies | 0.4 | ||||
Iron & Steel | 0.4 | ||||
Equity Fund | 0.3 | ||||
| See accompanying Notes to the Financial Statements. | 85 |
Mercer Non-US Core Equity Fund
Schedule of Investments (Continued)
March 31, 2013
| Industry Sector Summary (Unaudited) | % of Net Assets | ||||
Leisure Time | 0.3 | ||||
Airlines | 0.2 | ||||
Shipbuilding | 0.2 | ||||
Coal | 0.1 | ||||
Energy — Alternate Sources | 0.1 | ||||
Gas | 0.1 | ||||
Hand & Machine Tools | 0.1 | ||||
Health Care — Services | 0.1 | ||||
Toys, Games & Hobbies | 0.1 | ||||
Advertising | 0.0 | ||||
Home Furnishings | 0.0 | ||||
Textiles | 0.0 | ||||
Short-Term Investments and Other Assets and Liabilities (net) | 2.7 | ||||
|
| ||||
| 100.0 | % | ||||
|
| ||||
| 86 | See accompanying Notes to the Financial Statements. |
Mercer Core Opportunistic Fixed Income Fund
Schedule of Investments
(showing percentage of net assets)
March 31, 2013
| Par Value** | Description | Value ($) | ||||||||
DEBT OBLIGATIONS — 104.6% | ||||||||||
Asset Backed Securities — 3.4% | ||||||||||
| 38,352 | ACE Securities Corp., Series 2005-SD3, Class A, 0.60%, due 08/25/45† | 37,723 | ||||||||
| 31,657 | American Airlines Pass Through Trust, Series 2001-1, Class A, 6.98%, due 11/23/22††† | 31,737 | ||||||||
| 344,652 | Ameriquest Mortgage Securities, Inc., Series 2004-R2, Class A1A, 0.89%, due 04/25/34† | 329,847 | ||||||||
| 284,355 | Asset Backed Securities Corp. Home Equity, Series 2003-HE7, Class M1, 1.18%, | 268,696 | ||||||||
| 210,000 | Avis Budget Rental Car Funding AESOP LLC, Series 2010-5A, Class A, 3.15%, | 220,909 | ||||||||
| 250,000 | Avis Budget Rental Car Funding AESOP LLC, Series 2012-2A, Class A, 2.80%, | 263,030 | ||||||||
| 200,000 | Avis Budget Rental Car Funding AESOP LLC, Series 2012-3A, Class A, 2.10%, | 204,340 | ||||||||
| 220,000 | Avis Budget Rental Car Funding AESOP LLC, Series 2013-1A, Class A, 1.92%, due 09/20/19 144A | 221,754 | ||||||||
| 29,249 | Bayview Financial Acquisition Trust, Series 2004-A, Class A, 0.88%, due 02/28/44† | 28,732 | ||||||||
| 52,512 | Bayview Financial Acquisition Trust, Series 2004-C, Class A1, 0.83%, due 05/28/44† | 51,806 | ||||||||
| 156,032 | Bear Stearns Asset Backed Securities Trust, Series 2004-SD3, Class A3, 0.77%, | 151,807 | ||||||||
| 271,020 | Bear Stearns Asset Backed Securities, Inc., Series 2005-AQ2, Class A3, 0.56%, | 261,078 | ||||||||
| 40,229 | Bear Stearns Asset Backed Securities, Inc., Series 2005-SD4, Class 2A1, 0.60%, | 39,204 | ||||||||
| 24,661 | Bear Stearns Asset Backed Securities, Inc., Series 2006-HE10, Class 1A1, 0.31%, | 24,618 | ||||||||
| 1,465,976 | BNSF Railway Co. 2007-1 Pass Through Trust, 6.00%, due 04/01/24 | 1,715,192 | ||||||||
| 776,242 | Burlington Northern and Santa Fe Railway Co. 2006-1 Pass Through Trust, 5.72%, | 913,624 | ||||||||
| 2,700,000 | Chase Issuance Trust, Series 2012-A8, Class A8, 0.54%, due 10/16/17 | 2,696,967 | ||||||||
| 293,244 | Citigroup Mortgage Loan Trust, Inc., Series 2006-SHL1, Class A, 0.40%, | 280,668 | ||||||||
| 66,427 | Citigroup Mortgage Loan Trust, Inc., Series 2007-AHL2, Class A3A, 0.27%, due 05/25/37† | 50,032 | ||||||||
| 93,257 | Continental Airlines Pass Through Trust, Series 1998-1, Class A, 6.65%, due 03/15/19 | 99,551 | ||||||||
| 30,208 | Continental Airlines Pass Through Trust, Series 2003-ERJ1, Class A, 7.88%, due 01/02/20 | 32,020 | ||||||||
| 209,825 | Continental Airlines Pass Through Trust, Series 2004-ERJ1, Class A, 9.56%, due 03/01/21 | 230,807 | ||||||||
| 300,615 | Continental Airlines Pass Through Trust, Series 2005-ERJ1, 9.80%, due 10/01/22 | 339,695 | ||||||||
| 41,663 | Countrywide Home Equity Loan Trust, Series 2005-G, Class 2A, 0.43%, due 12/15/35† | 24,664 | ||||||||
| 96,285 | CVS Pass-Through Trust, 5.88%, due 01/10/28 | 111,889 | ||||||||
| 224,982 | CVS Pass-Through Trust, 6.04%, due 12/10/28 | 264,642 | ||||||||
| 52,820 | CVS Pass-Through Trust, 6.94%, due 01/10/30 | 65,854 | ||||||||
| 206,422 | Delta Air Lines Pass Through Trust, Series 2007-1, Class A, 6.82%, due 02/10/24 | 233,773 | ||||||||
| 425,000 | Greenpoint Manufactured Housing, Series 1999-2, Class A2, 2.96%, due 03/18/29† | 374,471 | ||||||||
| 250,000 | Greenpoint Manufactured Housing, Series 1999-3, Class 2A2, 3.60%, due 06/19/29† | 223,575 | ||||||||
| 250,000 | Greenpoint Manufactured Housing, Series 1999-4, Class A2, 3.70%, due 02/20/30† | 220,440 | ||||||||
| See accompanying Notes to the Financial Statements. | 87 |
Mercer Core Opportunistic Fixed Income Fund
Schedule of Investments (Continued)
(showing percentage of net assets)
March 31, 2013
| Par Value** | Description | Value ($) | ||||||||
Asset Backed Securities — continued | ||||||||||
| 375,000 | Greenpoint Manufactured Housing, Series 2001-2, Class IA2, 3.70%, due 02/20/32† | 320,348 | ||||||||
| 500,000 | Greenpoint Manufactured Housing, Series 2001-2, Class IIA2, 3.70%, due 03/13/32† | 420,290 | ||||||||
| 23,351 | Greenpoint Mortgage Funding Trust, Series 2005-HE4, Class 2A1, 0.64%, due 07/25/30† | 23,147 | ||||||||
| 218,472 | GSAA Trust, Series 2006-14, Class A1, 0.25%, due 09/25/36† | 109,622 | ||||||||
| 306,554 | GSAMP Trust, Series 2004-SEA2, Class A2B, 0.75%, due 03/25/34† | 305,356 | ||||||||
| 156,261 | GSAMP Trust, Series 2006-S4, Class A1, 0.29%, due 05/25/36† | 23,611 | ||||||||
| 280,000 | Hertz Vehicle Financing LLC, Series 2009-2A, Class A2, 5.29%, due 03/25/16 144A | 302,417 | ||||||||
| 320,000 | Hertz Vehicle Financing LLC, Series 2013-1A, Class A2, 1.83%, due 08/25/19 144A | 321,547 | ||||||||
| 467,151 | Home Equity Asset Trust, Series 2003-8, Class M1, 1.28%, due 04/25/34† | 433,445 | ||||||||
| 791,430 | Keycorp Student Loan Trust, Series 2003-A, Class 1A2, 0.56%, due 10/25/32† | 788,915 | ||||||||
| 153,283 | Merrill Lynch Mortgage Investors, Inc., Series 2007-MLN1, Class A2A, 0.31%, | 105,804 | ||||||||
| 421,435 | Morgan Stanley ABS Capital I, Series 2003-NC10, Class M1, 1.22%, due 10/25/33† | 391,996 | ||||||||
| 390,504 | Morgan Stanley ABS Capital I, Series 2003-NC6, Class M1, 1.40%, due 06/25/33† | 383,078 | ||||||||
| 295,197 | Morgan Stanley ABS Capital I, Series 2003-NC7, Class M1, 1.25%, due 06/25/33† | 292,879 | ||||||||
| 115,845 | Morgan Stanley ABS Capital I, Series 2007-NC2, Class A2FP, 0.35%, due 02/25/37† | 63,455 | ||||||||
| 1,100,000 | Nelnet Student Loan Trust, Series 2005-4, Class A4R2, 0.58%, due 03/22/32† | 952,051 | ||||||||
| 241,266 | Novastar Home Equity Loan, Series 2003-3, Class A3, 1.10%, due 12/25/33† | 220,999 | ||||||||
| 248,099 | NovaStar Mortgage Funding Trust, Series 2003-3, Class A2C, 1.26%, due 12/25/33† | 233,223 | ||||||||
| 1,666,794 | Origen Manufactured Housing, Series 2006-A, Class A2, 2.81%, due 10/15/37† | 1,129,374 | ||||||||
| 1,467,392 | Origen Manufactured Housing, Series 2007-A, Class A2, 2.59%, due 04/15/37† | 1,187,909 | ||||||||
| 3,600,000 | RASC Trust, Series 2005-EMX4, Class M1, 0.63%, due 11/25/35† | 3,505,286 | ||||||||
| 154,774 | Renaissance Home Equity Loan Trust, Series 2007-2, Class AF1, 5.89%, due 06/25/37†† | 91,883 | ||||||||
| 7,225 | SACO I, Inc., Series 2005-7, Class A, 0.76%, due 09/25/35† | 7,132 | ||||||||
| 314,921 | SACO I, Inc., Series 2006-5, Class 1A, 0.50%, due 04/25/36† | 215,340 | ||||||||
| 119,215 | SACO I, Inc., Series 2006-6, Class A, 0.46%, due 06/25/36† | 66,725 | ||||||||
| 607,660 | Saxon Asset Securities Trust, Series 2005-1, Class M1, 0.89%, due 05/25/35† | 572,980 | ||||||||
| 1,100,000 | SLM Student Loan Trust, Series 2002-5, Class B, 0.71%, due 09/16/24† | 1,013,011 | ||||||||
| 500,000 | SLM Student Loan Trust, Series 2003-11, Class A6, 0.57%, due 12/15/25† 144A | 484,928 | ||||||||
| 530,000 | SLM Student Loan Trust, Series 2008-5, Class A3, 1.60%, due 01/25/18† | 539,174 | ||||||||
| 1,492,646 | SLM Student Loan Trust, Series 2008-9, Class A, 1.80%, due 04/25/23† | 1,554,457 | ||||||||
| 492,460 | SLM Student Loan Trust, Series 2009-CT, Class 1A, 2.35%, due 04/15/39¤ † 144A | 495,179 | ||||||||
| 2,117,971 | SLM Student Loan Trust, Series 2009-D, Class A, 3.50%, due 08/17/43¤ † 144A | 2,032,130 | ||||||||
| 767,378 | SLM Student Loan Trust, Series 2010-1, Class A, 0.60%, due 03/25/25† | 770,123 | ||||||||
| 3,199,294 | SLM Student Loan Trust, Series 2010-A, Class 2A, 3.45%, due 05/16/44† 144A | 3,393,309 | ||||||||
| 2,000,000 | SLM Student Loan Trust, Series 2012-B, Class A2, 3.48%, due 10/15/30 144A | 2,143,409 | ||||||||
| 447,856 | Small Business Administration Participation Certificates, Series 2008-20L, Class 1, 6.22%, due 12/01/28 | 524,240 | ||||||||
| 72,603 | Soundview Home Equity Loan Trust, Series 2006-EQ2, Class A2, 0.31%, due 01/25/37† | 46,589 | ||||||||
| 54,156 | Soundview Home Equity Loan Trust, Series 2007-OPT1, Class 2A1, 0.28%, due 06/25/37† | 51,554 | ||||||||
| 34,879 | Structured Asset Securities Corp., Series 2002-AL1, Class A3, 3.45%, due 02/25/32 | 34,614 | ||||||||
| 618,794 | Structured Asset Securities Corp., Series 2006-ARS1, Class A1, 0.42%, due 02/25/36† 144A | 48,623 | ||||||||
| 38,146 | UAL Pass Through Trust, Series 2009-1, 10.40%, due 05/01/18 | 43,868 | ||||||||
| 89,096 | UAL Pass Through Trust, Series 2009-2A, 9.75%, due 07/15/18 | 103,352 | ||||||||
| 88 | See accompanying Notes to the Financial Statements. |
Mercer Core Opportunistic Fixed Income Fund
Schedule of Investments (Continued)
(showing percentage of net assets)
March 31, 2013
| Par Value** | Description | Value ($) | ||||||||
Asset Backed Securities — continued | ||||||||||
| 1,521,789 | Washington Mutual Alternative Mortgage Pass Through Certificates, Series 2006-AR3, Class A1A, 1.15%, due 05/25/46† | 991,178 | ||||||||
| 46,500 | Washington Mutual, Inc., Series 2005-AR8, Class 2A1A, 0.49%, due 07/25/45† | 43,595 | ||||||||
|
| |||||||||
| 36,795,290 | ||||||||||
|
| |||||||||
Bank Loans — 0.9% | ||||||||||
| 496,250 | Bausch & Lomb, Inc., 7 Year Term Loan, 5.25%, due 05/17/19¤ | 501,610 | ||||||||
| 510,000 | Brickman Group Holdings, Inc., Term Loan B, 5.50%, due 10/14/16¤ | 520,200 | ||||||||
| 447,938 | Capsugel Holdings U.S., Inc., Term Loan, 4.75%, due 08/01/18¤ | 455,964 | ||||||||
| 187,081 | Charter Communications, Term Loan C, 3.46%, due 09/06/16¤ | 188,185 | ||||||||
| 748,125 | Del Monte Foods Company, Term Loan B, 4.00%, due 03/08/18¤ | 755,528 | ||||||||
| 600,000 | Delos Aircraft, Inc., Term Loan B, 4.75%, due 04/12/16 | 604,500 | ||||||||
| 495,960 | Dunkin’ Finance Corp., Term Loan B, 4.00%, due 11/23/17¤ | 502,470 | ||||||||
| 404,955 | Emergency Medical Services Corp., Term Loan, 4.00%, due 05/25/18¤ | 410,523 | ||||||||
| 461,775 | Exopack, LLC, Term Loan, 6.50%, due 05/31/17¤ | 466,970 | ||||||||
| 995,000 | Fotesque Metal Group, Ltd., Term Loan, 5.25%, due 10/18/17¤ | 1,007,971 | ||||||||
| 389,248 | Frac Tech International, LLC, Term Loan B, 8.50%, due 05/06/16¤ | 370,922 | ||||||||
| 471,321 | Gymboree Corp., New Term Loan, 5.00%, due 02/23/18¤ | 458,831 | ||||||||
| 490,787 | Hanger Orthopedic Group, Inc., Term Loan C, 4.00%, due 12/01/16¤ | 495,695 | ||||||||
| 450,000 | Harrahs Operating Company, Inc., Term Loan B, 5.45%, due 01/28/18¤ | 418,050 | ||||||||
| 351,455 | Las Vegas Sands, LLC, Extended Delayed Draw Term Loan, 2.71%, due 11/23/16¤ | 352,836 | ||||||||
| 70,637 | Las Vegas Sands, LLC, Extended Term Loan B, 2.71%, due 11/23/16¤ | 70,915 | ||||||||
| 356,996 | Sunguard Data Systems, Inc., Tranch B Term Loan, 3.86%, due 02/28/16¤ | 357,978 | ||||||||
| 399,727 | Univision Communications, Inc., Extended Term Loan, 4.45%, due 03/31/17¤ | 402,254 | ||||||||
| 350,225 | Walter Energy, Inc., Term Loan B, 5.75%, due 04/02/18¤ | 352,764 | ||||||||
| 537,300 | Wendy’s International, Inc., Term Loan B, 4.75%, due 05/15/19¤ | 543,822 | ||||||||
|
| |||||||||
| 9,237,988 | ||||||||||
|
| |||||||||
Corporate Debt — 34.6% | ||||||||||
| 690,000 | AbbVie, Inc., 1.75%, due 11/06/17 144A | 699,160 | ||||||||
| 420,000 | AbbVie, Inc., 2.90%, due 11/06/22 144A | 421,254 | ||||||||
| 300,000 | Access Midstream Partners LP/ACMP Finance Corp., 4.88%, due 05/15/23 | 296,625 | ||||||||
| 230,000 | Access Midstream Partners LP/ACMP Finance Corp., 5.88%, due 04/15/21 | 244,950 | ||||||||
| 680,000 | AES Corp. (The), Senior Note, 8.00%, due 06/01/20 | 809,200 | ||||||||
| 350,000 | AK Steel Corp., 7.63%, due 05/15/20‡ | 308,000 | ||||||||
| 300,000 | Alcatel-Lucent USA, Inc., 6.45%, due 03/15/29 | 232,500 | ||||||||
| 105,000 | Alere, Inc., 7.25%, due 07/01/18 144A | 112,088 | ||||||||
| 280,000 | Alere, Inc., 8.63%, due 10/01/18 | 298,900 | ||||||||
| 5,000 | Alere, Inc., 9.00%, due 05/15/16 | 5,266 | ||||||||
| 275,000 | Aleris International, Inc., 7.63%, due 02/15/18 | 292,875 | ||||||||
| 200,000 | Aleris International, Inc., 7.88%, due 11/01/20 | 214,000 | ||||||||
| 170,000 | Aleris International, Inc., Senior Note, (PIK), 9.00%, due 12/15/14**** ††† | — | ||||||||
| 425,000 | Alliant Techsystems, Inc., 6.88%, due 09/15/20 | 460,062 | ||||||||
| 3,875,000 | Ally Financial, Inc., 4.50%, due 02/11/14 | 3,967,031 | ||||||||
| 580,000 | Ally Financial, Inc., 7.50%, due 09/15/20 | 709,775 | ||||||||
| 225,000 | Ally Financial, Inc., 8.00%, due 11/01/31 | 285,750 | ||||||||
| 50,000 | Ally Financial, Inc., Senior Note, 8.00%, due 11/01/31‡ | 63,250 | ||||||||
| 265,000 | Alpha Natural Resources, Inc., 6.00%, due 06/01/19 | 245,788 | ||||||||
| 35,000 | Alpha Natural Resources, Inc., 6.25%, due 06/01/21‡ | 31,675 | ||||||||
| See accompanying Notes to the Financial Statements. | 89 |
Mercer Core Opportunistic Fixed Income Fund
Schedule of Investments (Continued)
(showing percentage of net assets)
March 31, 2013
| Par Value** | Description | Value ($) | ||||||||
Corporate Debt — continued | ||||||||||
| 440,000 | Altria Group, Inc., 2.85%, due 08/09/22 | 433,442 | ||||||||
| 390,000 | Altria Group, Inc., 4.75%, due 05/05/21 | 442,161 | ||||||||
| 270,000 | Altria Group, Inc., 8.50%, due 11/10/13 | 282,924 | ||||||||
| 490,000 | Altria Group, Inc., 9.25%, due 08/06/19 | 683,877 | ||||||||
| 620,000 | America Movil SAB de CV, 5.00%, due 03/30/20 | 700,410 | ||||||||
| 150,000 | America Movil SAB de CV, Guaranteed Senior Note, 5.63%, due 11/15/17 | 175,829 | ||||||||
| 276,000 | American Express Co., 2.65%, due 12/02/22 | 271,039 | ||||||||
| 580,000 | American Express Co., Subordinated Note, 6.80%, due 09/01/66† | 627,125 | ||||||||
| 1,900,000 | American Express Credit Corp., 5.88%, due 05/02/13 | 1,908,312 | ||||||||
| 230,000 | American General Finance Corp., (MTN), 5.40%, due 12/01/15 | 237,475 | ||||||||
| 540,000 | American Honda Finance Corp., 1.00%, due 08/11/15 144A | 542,249 | ||||||||
| 110,000 | American International Group, Inc., 3.75%, due 11/30/13 144A | 112,263 | ||||||||
| 525,000 | American International Group, Inc., 4.25%, due 09/15/14 | 550,309 | ||||||||
| 900,000 | American International Group, Inc., 5.85%, due 01/16/18 | 1,055,796 | ||||||||
| 3,750,000 | American International Group, Inc., 8.25%, due 08/15/18 | 4,869,169 | ||||||||
| 460,000 | American International Group, Inc., Junior Subordinated Note, Series A, 6.25%, due 03/15/87 | 511,796 | ||||||||
| 200,000 | AmeriGas Finance LLC/AmeriGas Finance Corp., 7.00%, due 05/20/22 | 218,500 | ||||||||
| 301,000 | AmeriGas Partners LP/AmeriGas Finance Corp., 6.50%, due 05/20/21 | 322,070 | ||||||||
| 310,000 | Amsted Industries, Inc., 8.13%, due 03/15/18 144A | 334,800 | ||||||||
| 430,000 | Anadarko Finance Co., Senior Note, 7.50%, due 05/01/31 | 571,432 | ||||||||
| 180,000 | Anadarko Petroleum Corp., 6.38%, due 09/15/17 | 215,063 | ||||||||
| 740,000 | Anglo American Capital Plc, 4.45%, due 09/27/20 144A | 793,272 | ||||||||
| 290,000 | Anheuser-Busch InBev Worldwide, Inc., 2.50%, due 07/15/22 | 285,635 | ||||||||
| 570,000 | Anheuser-Busch InBev Worldwide, Inc., 5.00%, due 04/15/20 | 676,981 | ||||||||
| 340,000 | Anheuser-Busch InBev Worldwide, Inc., 5.38%, due 01/15/20 | 410,667 | ||||||||
| 250,000 | ANZ National Int’l Ltd/London, 1.85%, due 10/15/15 144A | 255,145 | ||||||||
| 570,000 | Apache Corp., 3.25%, due 04/15/22 | 592,384 | ||||||||
| 590,000 | Apache Corp., 5.25%, due 04/15/13 | 590,925 | ||||||||
| 150,000 | APERAM, 7.38%, due 04/01/16 144A | 151,875 | ||||||||
| 265,000 | ARAMARK Corp., 5.75%, due 03/15/20 144A | 272,287 | ||||||||
| 160,000 | ArcelorMittal, 5.00%, due 02/25/17 | 167,588 | ||||||||
| 300,000 | ArcelorMittal, 6.75%, due 02/25/22‡ | 328,413 | ||||||||
| 125,000 | ArcelorMittal, 7.25%, due 03/01/41 | 124,745 | ||||||||
| 255,000 | ArcelorMittal, 7.50%, due 10/15/39 | 262,776 | ||||||||
| 785,000 | Arch Coal, Inc., 7.00%, due 06/15/19‡ | 712,387 | ||||||||
| 65,000 | Arch Coal, Inc., 7.25%, due 10/01/20‡ | 58,825 | ||||||||
| 60,000 | Arch Coal, Inc., 7.25%, due 06/15/21‡ | 54,150 | ||||||||
| 250,000 | Ardagh Packaging Finance Plc, 9.13%, due 10/15/20 144A | 278,125 | ||||||||
| 135,000 | Ashtead Capital, Inc. Co., 6.50%, due 07/15/22 144A | 147,319 | ||||||||
| 305,000 | Associated Materials LLC, 9.13%, due 11/01/17‡ | 327,112 | ||||||||
| 300,000 | AT&T, Inc., 2.63%, due 12/01/22 | 290,276 | ||||||||
| 120,000 | AT&T, Inc., 3.88%, due 08/15/21 | 129,988 | ||||||||
| 201,000 | AT&T, Inc., 4.35%, due 06/15/45 144A | 187,638 | ||||||||
| 110,000 | AT&T, Inc., 4.45%, due 05/15/21 | 123,995 | ||||||||
| 140,000 | AT&T, Inc., 5.55%, due 08/15/41 | 154,892 | ||||||||
| 660,000 | AT&T, Inc., Global Note, 5.50%, due 02/01/18 | 776,762 | ||||||||
| 780,000 | AT&T, Inc., Global Note, 6.30%, due 01/15/38 | 938,821 | ||||||||
| 1,250,000 | AT&T, Inc., Global Note, 6.55%, due 02/15/39 | 1,549,425 | ||||||||
| 90 | See accompanying Notes to the Financial Statements. |
Mercer Core Opportunistic Fixed Income Fund
Schedule of Investments (Continued)
(showing percentage of net assets)
March 31, 2013
| Par Value** | Description | Value ($) | ||||||||
Corporate Debt — continued | ||||||||||
| 35,000 | Atlas Pipeline Partners, LP/Atlas Pipeline Finance Corp., 5.88%, due 08/01/23 144A | 35,000 | ||||||||
| 250,000 | Atlas Pipeline Partners, LP/Atlas Pipeline Finance Corp., 6.63%, due 10/01/20 144A | 261,875 | ||||||||
| 145,000 | Avis Budget Car Rental LLC/Avis Budget Finance, Inc., 5.50%, due 04/01/23 144A†††† | 145,363 | ||||||||
| 275,000 | Avis Budget Car Rental LLC/Avis Budget Finance, Inc., 8.25%, due 01/15/19 | 306,281 | ||||||||
| 165,000 | Avis Budget Car Rental LLC/Avis Budget Finance, Inc., 9.63%, due 03/15/18 | 187,070 | ||||||||
| 1,125,000 | BAC Capital Trust XI, 6.63%, due 05/23/36 | 1,333,125 | ||||||||
| 410,000 | Baker Hughes, Inc., Senior Note, 7.50%, due 11/15/18 | 538,662 | ||||||||
| 610,000 | Ball Corp., 5.75%, due 05/15/21 | 661,850 | ||||||||
| 270,000 | Ball Corp., 7.38%, due 09/01/19 | 300,375 | ||||||||
| 350,000 | Bank of America Corp., 3.30%, due 01/11/23 | 345,836 | ||||||||
| 140,000 | Bank of America Corp., 3.88%, due 03/22/17 | 150,746 | ||||||||
| 400,000 | Bank of America Corp., 4.50%, due 04/01/15 | 424,053 | ||||||||
| 910,000 | Bank of America Corp., 5.00%, due 05/13/21 | 1,021,751 | ||||||||
| 5,230,000 | Bank of America Corp., 7.63%, due 06/01/19 | 6,652,042 | ||||||||
| 70,000 | Bank of America Corp., 8.00%, due 12/31/49† | 79,027 | ||||||||
| 500,000 | Bank of America Corp., (MTN), Series L, 5.65%, due 05/01/18 | 579,052 | ||||||||
| 410,000 | Bank of America Corp., Senior Note, 5.75%, due 12/01/17 | 474,723 | ||||||||
| 180,000 | Bank of Tokyo-Mitsubishi UFJ, Ltd., 3.85%, due 01/22/15 144A | 189,771 | ||||||||
| 100,000 | Bank One Capital III, 8.75%, due 09/01/30 | 142,881 | ||||||||
| 200,000 | Barclays Bank Plc, 7.70%, due 12/31/49¤ † 144A | 215,402 | ||||||||
| 400,000 | Barclays Bank Plc, 10.18%, due 06/12/21¤ 144A | 537,938 | ||||||||
| 120,000 | Barclays Bank Plc, Subordinated Note, 6.05%, due 12/04/17 144A | 134,304 | ||||||||
| 310,000 | Barrick Gold Corp., 3.85%, due 04/01/22 | 317,491 | ||||||||
| 480,000 | Barrick Gold Corp., 6.95%, due 04/01/19 | 593,404 | ||||||||
| 120,000 | Barrick North America Finance LLC, 4.40%, due 05/30/21 | 128,359 | ||||||||
| 330,000 | Basic Energy Services, Inc., 7.75%, due 10/15/22 | 341,550 | ||||||||
| 530,000 | BBVA US Senior SAU, 3.25%, due 05/16/14 | 533,352 | ||||||||
| 820,000 | BBVA US Senior SAU, 4.66%, due 10/09/15 | 841,385 | ||||||||
| 315,000 | Beazer Homes USA, Inc., 8.13%, due 06/15/16 | 342,562 | ||||||||
| 40,000 | Berkshire Hathaway, Inc., 3.20%, due 02/11/15 | 41,999 | ||||||||
| 370,000 | Berry Petroleum Co., 6.38%, due 09/15/22 | 394,975 | ||||||||
| 30,000 | BHP Billiton Finance USA, Ltd., 3.25%, due 11/21/21 | 31,751 | ||||||||
| 900,000 | BHP Billiton Finance USA, Ltd., 6.50%, due 04/01/19 | 1,139,929 | ||||||||
| 390,000 | BNP Paribas SA, 2.38%, due 09/14/17 | 396,192 | ||||||||
| 210,000 | Boart Longyear Management Pty, Ltd., 7.00%, due 04/01/21 144A | 217,875 | ||||||||
| 260,000 | Boeing Capital Corp., 4.70%, due 10/27/19 | 305,091 | ||||||||
| 160,000 | Boeing Co. (The), 4.88%, due 02/15/20 | 190,119 | ||||||||
| 95,000 | Boise Paper Holdings LLC/Boise Finance Co., 9.00%, due 11/01/17 | 102,838 | ||||||||
| 90,000 | Bombardier, Inc., 7.50%, due 03/15/18 144A | 103,163 | ||||||||
| 315,000 | Bombardier, Inc., 7.75%, due 03/15/20 144A | 363,825 | ||||||||
| 1,950,000 | Boston Properties, LP REIT, 4.13%, due 05/15/21 | 2,120,280 | ||||||||
| 250,000 | Boston Properties, LP REIT, 5.63%, due 11/15/20 | 296,926 | ||||||||
| 250,000 | Boston Properties, LP REIT, 5.88%, due 10/15/19 | 301,234 | ||||||||
| 1,625,000 | Boston Scientific Corp., 6.00%, due 01/15/20 | 1,902,106 | ||||||||
| 425,000 | Boston Scientific Corp., 6.40%, due 06/15/16 | 485,813 | ||||||||
| 30,000 | Boyd Gaming Corp., 9.00%, due 07/01/20‡ 144A | 31,350 | ||||||||
| 270,000 | BP Capital Markets Plc, 3.13%, due 10/01/15 | 285,260 | ||||||||
| 240,000 | BP Capital Markets Plc, 3.25%, due 05/06/22 | 248,438 | ||||||||
| 50,000 | BP Capital Markets Plc, 3.56%, due 11/01/21 | 53,181 | ||||||||
| See accompanying Notes to the Financial Statements. | 91 |
Mercer Core Opportunistic Fixed Income Fund
Schedule of Investments (Continued)
(showing percentage of net assets)
March 31, 2013
| Par Value** | Description | Value ($) | ||||||||
Corporate Debt — continued | ||||||||||
| 390,000 | BP Capital Markets Plc, 5.25%, due 11/07/13 | 400,947 | ||||||||
| 160,000 | BP Capital Markets Plc, Guaranteed Note, 3.88%, due 03/10/15 | 169,716 | ||||||||
| 1,100,000 | Burlington Northern Santa Fe LLC, 3.05%, due 09/01/22 | 1,126,211 | ||||||||
| 90,000 | Caesars Entertainment Operating Co., Inc., 9.00%, due 02/15/20 144A | 91,013 | ||||||||
| 85,000 | Caesars Entertainment Operating Co., Inc., 12.75%, due 04/15/18 | 66,725 | ||||||||
| 120,000 | Caesars Operating Escrow LLC/Caesars Escrow Corp., 9.00%, due 02/15/20 144A | 121,350 | ||||||||
| 650,000 | Caesars Operating Escrow LLC/Caesars Escrow Corp., 9.00%, due 02/15/20 144A | 657,312 | ||||||||
| 195,000 | Calpine Construction Finance Co., LP/CCFC Finance Corp., 8.00%, due 06/01/16 144A | 205,481 | ||||||||
| 216,000 | Calpine Corp., 7.88%, due 07/31/20 144A | 237,600 | ||||||||
| 180,000 | Calpine Corp., 7.88%, due 01/15/23 144A | 200,700 | ||||||||
| 200,000 | GBP | Canada Square Operations, Ltd., 7.50%, due 12/31/49† | 303,671 | |||||||
| 775,000 | Capital One Financial Corp., 4.75%, due 07/15/21 | 875,972 | ||||||||
| 1,500,000 | Capital One Financial Corp., 6.75%, due 09/15/17 | 1,813,996 | ||||||||
| 310,000 | Case New Holland, Inc., 7.88%, due 12/01/17 | 364,250 | ||||||||
| 735,000 | CCO Holdings LLC/CCO Holdings Capital Corp., 7.00%, due 01/15/19 | 795,637 | ||||||||
| 730,000 | Cellco Partnership/Verizon Wireless Capital LLC, 8.50%, due 11/15/18 | 972,624 | ||||||||
| 470,000 | Celulosa Arauco y Constitucion SA, Reg S, 4.75%, due 01/11/22‡‡‡ | 491,161 | ||||||||
| 144,300 | Century Aluminum Co., 8.00%, due 05/15/14 | 145,202 | ||||||||
| 465,000 | CHC Helicopter SA, 9.25%, due 10/15/20 | 496,678 | ||||||||
| 220,000 | Chesapeake Energy Corp., 5.38%, due 06/15/21 | 221,375 | ||||||||
| 40,000 | Chesapeake Energy Corp., 5.75%, due 03/15/23 | 40,650 | ||||||||
| 160,000 | Chesapeake Energy Corp., 6.13%, due 02/15/21‡ | 171,000 | ||||||||
| 95,000 | Chesapeake Energy Corp., 6.50%, due 08/15/17‡ | 105,213 | ||||||||
| 490,000 | Chesapeake Energy Corp., 6.63%, due 08/15/20‡ | 537,775 | ||||||||
| 190,000 | Chesapeake Energy Corp., 6.88%, due 08/15/18 | 204,013 | ||||||||
| 140,000 | Chesapeake Energy Corp., Senior Note, 7.25%, due 12/15/18 | 159,600 | ||||||||
| 425,000 | Chrysler Group LLC/CG Co-Issuer, Inc., 8.25%, due 06/15/21‡ | 476,531 | ||||||||
| 285,000 | CHS/Community Health Systems, Inc., 5.13%, due 08/15/18 | 299,250 | ||||||||
| 4,000,000 | Cie de Financement Foncier SA, 2.13%, due 04/22/13¤ 144A | 4,003,252 | ||||||||
| 630,000 | Cie Generale de Geophysique - Veritas, 6.50%, due 06/01/21 | 664,650 | ||||||||
| 120,000 | Cie Generale de Geophysique - Veritas SA, Senior Note, 7.75%, due 05/15/17 | 124,200 | ||||||||
| 525,000 | Cigna Corp., 4.00%, due 02/15/22 | 568,170 | ||||||||
| 385,000 | Cigna Corp., 5.38%, due 03/15/17 | 440,096 | ||||||||
| 475,000 | Cigna Corp., 5.38%, due 02/15/42 | 539,123 | ||||||||
| 1,100,000 | Cigna Corp., 6.15%, due 11/15/36 | 1,334,044 | ||||||||
| 375,000 | Cigna Corp., 8.50%, due 05/01/19 | 487,247 | ||||||||
| 190,000 | CIT Group, Inc., 4.25%, due 08/15/17 | 199,500 | ||||||||
| 100,000 | EUR | Citigroup, Inc., 0.37%, due 06/28/13† | 128,427 | |||||||
| 4,300,000 | Citigroup, Inc., 1.08%, due 04/01/16† | 4,305,672 | ||||||||
| 560,000 | Citigroup, Inc., 3.95%, due 06/15/16 | 603,866 | ||||||||
| 690,000 | Citigroup, Inc., 4.05%, due 07/30/22 | 714,169 | ||||||||
| 20,000 | Citigroup, Inc., 5.38%, due 08/09/20 | 23,451 | ||||||||
| 160,000 | Citigroup, Inc., 5.90%, due 12/31/49† | 166,778 | ||||||||
| 250,000 | Citigroup, Inc., 5.95%, due 12/31/49† | 259,688 | ||||||||
| 830,000 | Citigroup, Inc., 6.00%, due 12/13/13 | 860,092 | ||||||||
| 1,110,000 | Citigroup, Inc., 6.01%, due 01/15/15 | 1,202,452 | ||||||||
| 3,220,000 | Citigroup, Inc., Global Senior Note, 6.13%, due 11/21/17 | 3,811,153 | ||||||||
| 540,000 | Citigroup, Inc., Global Senior Note, 6.50%, due 08/19/13 | 552,179 | ||||||||
| 92 | See accompanying Notes to the Financial Statements. |
Mercer Core Opportunistic Fixed Income Fund
Schedule of Investments (Continued)
(showing percentage of net assets)
March 31, 2013
| Par Value** | Description | Value ($) | ||||||||
Corporate Debt — continued | ||||||||||
| 340,000 | Citigroup, Inc., Senior Note, 6.88%, due 03/05/38 | 447,587 | ||||||||
| 140,000 | CityCenter Holdings LLC/CityCenter Finance Corp., 7.63%, due 01/15/16 | 151,025 | ||||||||
| 80,000 | Clear Channel Communications, Inc., 5.50%, due 12/15/16 | 53,400 | ||||||||
| 130,000 | Clear Channel Communications, Inc., 6.88%, due 06/15/18 | 86,775 | ||||||||
| 65,000 | Clear Channel Communications, Inc., 7.25%, due 10/15/27 | 35,425 | ||||||||
| 145,000 | Clear Channel Communications, Inc., 9.00%, due 03/01/21 | 136,119 | ||||||||
| 21,000 | Clear Channel Worldwide Holdings, Inc., 7.63%, due 03/15/20 | 21,814 | ||||||||
| 289,000 | Clear Channel Worldwide Holdings, Inc., 7.63%, due 03/15/20 | 303,089 | ||||||||
| 520,000 | Cliffs Natural Resources, Inc., 3.95%, due 01/15/18‡ | 522,660 | ||||||||
| 210,000 | Cliffs Natural Resources, Inc., 4.80%, due 10/01/20‡ | 209,555 | ||||||||
| 70,000 | Cliffs Natural Resources, Inc., 4.88%, due 04/01/21‡ | 69,094 | ||||||||
| 195,000 | Cloud Peak Energy Resources LLC/Cloud Peak Energy Finance Corp., 8.25%, due 12/15/17 | 209,625 | ||||||||
| 65,000 | Cloud Peak Energy Resources LLC/Cloud Peak Energy Finance Corp., 8.50%, due 12/15/19 | 70,850 | ||||||||
| 320,000 | Comcast Corp., 5.65%, due 06/15/35 | 372,046 | ||||||||
| 350,000 | Comcast Corp., 5.70%, due 05/15/18 | 421,368 | ||||||||
| 1,775,000 | Comcast Corp., 5.88%, due 02/15/18 | 2,143,678 | ||||||||
| 100,000 | Comcast Corp., 6.30%, due 11/15/17 | 122,081 | ||||||||
| 640,000 | Comcast Corp., 6.50%, due 01/15/15 | 706,255 | ||||||||
| 130,000 | Comcast Corp., 6.50%, due 01/15/17 | 155,514 | ||||||||
| 225,000 | Commercial Vehicle Group, Inc., 7.88%, due 04/15/19 | 229,500 | ||||||||
| 640,000 | Commonwealth Bank of Australia, 1.25%, due 09/18/15 | 646,734 | ||||||||
| 310,000 | Commonwealth Bank of Australia, 3.75%, due 10/15/14 144A | 325,109 | ||||||||
| 130,000 | Commonwealth Bank of Australia, 5.00%, due 10/15/19 144A | 152,210 | ||||||||
| 365,000 | CommScope, Inc., 8.25%, due 01/15/19 144A | 397,850 | ||||||||
| 105,000 | Concho Resources, Inc., 5.50%, due 10/01/22 | 109,725 | ||||||||
| 553,000 | Concho Resources, Inc., 6.50%, due 01/15/22 | 605,535 | ||||||||
| 490,000 | ConocoPhillips Holding Co., 6.95%, due 04/15/29 | 663,722 | ||||||||
| 90,000 | Consol Energy, Inc., 6.38%, due 03/01/21 | 93,375 | ||||||||
| 220,000 | CONSOL Energy, Inc., 8.25%, due 04/01/20 | 244,750 | ||||||||
| 152,135 | Continental Airlines 2000-2 Class A-1 Pass Through Trust, 7.71%, due 10/02/22 | 171,152 | ||||||||
| 390,000 | Continental Airlines, Inc., 6.75%, due 09/15/15 144A | 410,475 | ||||||||
| 30,000 | Cooperatieve Centrale Raiffeisen-Boerenleenbank BA/Netherlands, 3.88%, due 02/08/22 | 31,705 | ||||||||
| 210,000 | Countrywide Financial Corp., Subordinated Note, 6.25%, due 05/15/16 | 234,072 | ||||||||
| 77,000 | COX Communications, Inc., 5.45%, due 12/15/14 | 83,195 | ||||||||
| 2,150,000 | COX Communications, Inc., 5.88%, due 12/01/16 144A | 2,509,011 | ||||||||
| 875,000 | COX Communications, Inc., 9.38%, due 01/15/19 144A | 1,209,534 | ||||||||
| 760,000 | Credit Agricole SA, 8.38%, due 12/31/49‡ † 144A | 835,050 | ||||||||
| 550,000 | CSX Corp., 7.38%, due 02/01/19 | 702,089 | ||||||||
| 1,160,000 | CVS Caremark Corp., 2.75%, due 12/01/22 | 1,145,984 | ||||||||
| 250,000 | Daimler Finance North America LLC, 1.30%, due 07/31/15 144A | 251,828 | ||||||||
| 550,000 | Daimler Finance North America LLC, 2.63%, due 09/15/16 144A | 573,956 | ||||||||
| 700,000 | Daimler Finance North America LLC, Senior Note, 6.50%, due 11/15/13 | 725,952 | ||||||||
| 430,000 | DaVita, Inc., 5.75%, due 08/15/22 | 448,812 | ||||||||
| 235,000 | Delta Air Lines 2010-1 Class B Pass Through Trust, 6.38%, due 07/02/17 | 244,988 | ||||||||
| 255,000 | Denbury Resources, Inc., 6.38%, due 08/15/21 | 279,225 | ||||||||
| 95,000 | Denbury Resources, Inc., 8.25%, due 02/15/20 | 106,875 | ||||||||
| See accompanying Notes to the Financial Statements. | 93 |
Mercer Core Opportunistic Fixed Income Fund
Schedule of Investments (Continued)
(showing percentage of net assets)
March 31, 2013
| Par Value** | Description | Value ($) | ||||||||
Corporate Debt — continued | ||||||||||
| 500,000 | Deutsche Bank AG/London, 4.88%, due 05/20/13 | 502,848 | ||||||||
| 310,000 | Deutsche Telekom International Finance BV, 5.75%, due 03/23/16 | 350,294 | ||||||||
| 650,000 | Devon Energy Corp., 7.95%, due 04/15/32 | 895,056 | ||||||||
| 730,000 | Diageo Capital Plc, 4.83%, due 07/15/20 | 855,003 | ||||||||
| 200,000 | Diageo Investment Corp., 2.88%, due 05/11/22 | 202,579 | ||||||||
| 190,000 | DISH DBS Corp., 6.75%, due 06/01/21 | 211,850 | ||||||||
| 115,000 | DISH DBS Corp., 7.88%, due 09/01/19 | 136,850 | ||||||||
| 500,000 | Dominion Resources, Inc., 5.20%, due 08/15/19 | 596,178 | ||||||||
| 1,250,000 | Dow Chemical Co. (The), 5.70%, due 05/15/18 | 1,475,181 | ||||||||
| 1,185,000 | Dow Chemical Co. (The), 8.55%, due 05/15/19 | 1,594,841 | ||||||||
| 575,000 | Dow Chemical Co. (The), 9.40%, due 05/15/39 | 917,257 | ||||||||
| 200,000 | Dr Pepper Snapple Group, Inc., 2.90%, due 01/15/16 | 211,031 | ||||||||
| 10,000 | Echostar DBS Corp., Senior Note, 6.63%, due 10/01/14 | 10,663 | ||||||||
| 690,000 | Echostar DBS Corp., Senior Note, 7.13%, due 02/01/16 | 770,212 | ||||||||
| 110,000 | Echostar DBS Corp., Senior Note, 7.75%, due 05/31/15 | 122,650 | ||||||||
| 150,000 | Ecolab, Inc., 4.35%, due 12/08/21 | 165,804 | ||||||||
| 78,000 | El Paso Corp., 7.75%, due 01/15/32 | 87,684 | ||||||||
| 480,000 | El Paso Corp., Senior Note, 7.00%, due 06/15/17 | 551,389 | ||||||||
| 190,000 | El Paso Natural Gas Co. LLC, 8.38%, due 06/15/32 | 271,577 | ||||||||
| 725,000 | Enel Finance International SA, 6.00%, due 10/07/39 144A | 692,205 | ||||||||
| 625,000 | Enel Finance International SA, Guaranteed Note, 6.80%, due 09/15/37 144A | 647,387 | ||||||||
| 1,433,000 | Energy Future Intermediate Holding Co. LLC/EFIH Finance, Inc., 10.00%, due 12/01/20 | 1,631,829 | ||||||||
| 345,000 | Energy Transfer Equity, LP, 7.50%, due 10/15/20 | 399,337 | ||||||||
| 650,000 | Enterprise Products Operating LLC, 3.35%, due 03/15/23 | 663,315 | ||||||||
| 80,000 | Enterprise Products Operating LLC, 4.85%, due 03/15/44 | 81,997 | ||||||||
| 620,000 | Enterprise Products Operating LLC, 5.25%, due 01/31/20 | 727,028 | ||||||||
| 60,000 | Enterprise Products Operating LLC, 5.95%, due 02/01/41 | 69,763 | ||||||||
| 190,000 | Enterprise Products Operating LLC, 6.13%, due 10/15/39 | 224,190 | ||||||||
| 330,000 | EP Energy LLC/EP Energy Finance, Inc., 9.38%, due 05/01/20 | 382,800 | ||||||||
| 2,045,000 | Escrow GCB General Motors, 8.38%, due 07/15/49**** ††† | — | ||||||||
| 2,800,000 | Export-Import Bank of Korea, 1.43%, due 09/21/13¤ † 144A | 2,800,701 | ||||||||
| 1,450,000 | Export-Import Bank of Korea, 4.00%, due 01/11/17 | 1,586,622 | ||||||||
| 1,200,000 | Express Scripts Holding Co., 3.50%, due 11/15/16 | 1,293,890 | ||||||||
| 175,000 | Ferrellgas, LP/Ferrellgas Finance Corp., 6.50%, due 05/01/21 | 181,563 | ||||||||
| 250,000 | Fifth Third Capital Trust IV, 6.50%, due 04/15/67† | 251,563 | ||||||||
| 580,000 | First Data Corp., 7.38%, due 06/15/19 144A | 619,875 | ||||||||
| 200,000 | First Data Corp., 10.63%, due 06/15/21 144A†††† | 203,250 | ||||||||
| 150,000 | FirstEnergy Corp., 2.75%, due 03/15/18 | 151,873 | ||||||||
| 530,000 | FirstEnergy Corp., 4.25%, due 03/15/23 | 537,113 | ||||||||
| 985,000 | FirstEnergy Corp., Series C, 7.38%, due 11/15/31 | 1,157,010 | ||||||||
| 70,000 | FMG Resources August 2006 Pty, Ltd., 6.38%, due 02/01/16‡ 144A | 72,363 | ||||||||
| 400,000 | FMG Resources August 2006 Pty, Ltd., 7.00%, due 11/01/15‡ 144A | 421,000 | ||||||||
| 170,000 | FMG Resources August 2006 Pty, Ltd., 8.25%, due 11/01/19‡ 144A | 184,238 | ||||||||
| 205,000 | Ford Holdings LLC, 9.30%, due 03/01/30 | 288,789 | ||||||||
| 580,000 | Ford Motor Co., 4.75%, due 01/15/43 | 542,708 | ||||||||
| 750,000 | Ford Motor Co., 6.63%, due 10/01/28 | 868,239 | ||||||||
| 110,000 | Ford Motor Co., 7.13%, due 11/15/25 | 130,979 | ||||||||
| 350,000 | Ford Motor Credit Co., 8.00%, due 12/15/16 | 420,486 | ||||||||
| 94 | See accompanying Notes to the Financial Statements. |
Mercer Core Opportunistic Fixed Income Fund
Schedule of Investments (Continued)
(showing percentage of net assets)
March 31, 2013
| Par Value** | Description | Value ($) | ||||||||
Corporate Debt — continued | ||||||||||
| 900,000 | Ford Motor Credit Co. LLC, 1.38%, due 08/28/14† | 900,057 | ||||||||
| 350,000 | Ford Motor Credit Co. LLC, 4.25%, due 09/20/22 | 362,586 | ||||||||
| 1,500,000 | Ford Motor Credit Co. LLC, 5.63%, due 09/15/15 | 1,637,022 | ||||||||
| 2,600,000 | Ford Motor Credit Co. LLC, 5.75%, due 02/01/21 | 2,954,575 | ||||||||
| 580,000 | Ford Motor Credit Co. LLC, 8.13%, due 01/15/20 | 734,491 | ||||||||
| 440,000 | Ford Motor Credit Co. LLC, 12.00%, due 05/15/15 | 534,885 | ||||||||
| 210,000 | Freeport-McMoRan Copper & Gold, Inc., 2.38%, due 03/15/18 144A | 211,123 | ||||||||
| 240,000 | Freeport-McMoRan Copper & Gold, Inc., 3.10%, due 03/15/20 144A | 241,176 | ||||||||
| 560,000 | Freeport-McMoRan Copper & Gold, Inc., 3.55%, due 03/01/22 | 557,700 | ||||||||
| 575,000 | Freescale Semiconductor, Inc., Series 1, 9.25%, due 04/15/18 144A | 633,937 | ||||||||
| 130,000 | Fresenius Medical Care US Finance, Inc., 6.88%, due 07/15/17 | 149,500 | ||||||||
| 90,000 | Frontier Communications Corp., 7.00%, due 11/01/25 | 88,200 | ||||||||
| 3,000,000 | Gazprom Via Gaz Capital SA, 6.51%, due 03/07/22 144A | 3,480,000 | ||||||||
| 2,600,000 | General Electric Capital Corp., 0.58%, due 06/20/14† | 2,603,221 | ||||||||
| 3,800,000 | General Electric Capital Corp., 0.88%, due 12/11/15† | 3,834,189 | ||||||||
| 210,000 | General Electric Capital Corp., 1.63%, due 07/02/15 | 213,704 | ||||||||
| 2,205,000 | General Electric Capital Corp., 4.38%, due 09/16/20 | 2,466,376 | ||||||||
| 1,165,000 | General Electric Capital Corp., 4.63%, due 01/07/21 | 1,313,731 | ||||||||
| 1,275,000 | General Electric Capital Corp., 5.50%, due 01/08/20 | 1,513,013 | ||||||||
| 310,000 | General Electric Capital Corp., 5.88%, due 01/14/38 | 362,712 | ||||||||
| 380,000 | General Electric Capital Corp., 6.00%, due 08/07/19 | 461,969 | ||||||||
| 860,000 | General Electric Capital Corp., 6.38%, due 11/15/67† | 913,750 | ||||||||
| 120,000 | General Electric Capital Corp., 6.88%, due 01/10/39 | 157,768 | ||||||||
| 270,000 | General Electric Co., 0.85%, due 10/09/15 | 271,069 | ||||||||
| 170,000 | GenOn Americas Generation LLC, 9.13%, due 05/01/31 | 190,825 | ||||||||
| 390,000 | GlaxoSmithKline Capital Plc, 2.85%, due 05/08/22 | 398,675 | ||||||||
| 490,000 | GlaxoSmithKline Capital, Inc., Guaranteed Note, 5.65%, due 05/15/18 | 593,013 | ||||||||
| 320,000 | Glitnir Banki HF, Subordinated Note, 6.69%, due 06/15/16††† 144A | 5,600 | ||||||||
| 30,000 | Goldman Sachs Capital II, Guaranteed Note, 4.00%, due 06/01/43† | 25,313 | ||||||||
| 30,000 | Goldman Sachs Group (The), Inc., 4.75%, due 07/15/13 | 30,362 | ||||||||
| 140,000 | Goldman Sachs Group (The), Inc., 5.25%, due 07/27/21 | 158,901 | ||||||||
| 1,380,000 | Goldman Sachs Group (The), Inc., 5.95%, due 01/18/18 | 1,610,653 | ||||||||
| 100,000 | Goldman Sachs Group (The), Inc., 6.00%, due 05/01/14 | 105,434 | ||||||||
| 400,000 | Goldman Sachs Group (The), Inc., 6.15%, due 04/01/18 | 471,863 | ||||||||
| 1,660,000 | Goldman Sachs Group (The), Inc., 6.25%, due 02/01/41 | 1,979,741 | ||||||||
| 480,000 | Goldman Sachs Group (The), Inc., 7.50%, due 02/15/19 | 601,249 | ||||||||
| 130,000 | Goldman Sachs Group (The), Inc., Global Note, 5.25%, due 10/15/13 | 133,204 | ||||||||
| 2,600,000 | Goldman Sachs Group (The), Inc., Senior Note, 6.25%, due 09/01/17 | 3,057,054 | ||||||||
| 50,000 | Goodyear Tire & Rubber Co. (The), 6.50%, due 03/01/21 | 51,813 | ||||||||
| 160,000 | Goodyear Tire & Rubber Co. (The), 7.00%, due 05/15/22‡ | 169,400 | ||||||||
| 230,000 | Goodyear Tire & Rubber Co. (The), 8.25%, due 08/15/20‡ | 255,588 | ||||||||
| 230,000 | Hapag-Lloyd AG, 9.75%, due 10/15/17 144A‡ | 244,375 | ||||||||
| 165,000 | Hartford Financial Services Group, Inc., 6.00%, due 01/15/19 | 197,087 | ||||||||
| 20,000 | HCA, Inc., 5.75%, due 03/15/14 | 20,775 | ||||||||
| 250,000 | HCA, Inc., 5.88%, due 05/01/23 | 260,625 | ||||||||
| 1,475,000 | HCA, Inc., 6.38%, due 01/15/15 | 1,583,781 | ||||||||
| 1,000,000 | HCA, Inc., 6.50%, due 02/15/16 | 1,097,500 | ||||||||
| 3,250,000 | HCA, Inc., 6.75%, due 07/15/13 | 3,304,844 | ||||||||
| 230,000 | HCA, Inc., 7.25%, due 09/15/20 | 255,013 | ||||||||
| See accompanying Notes to the Financial Statements. | 95 |
Mercer Core Opportunistic Fixed Income Fund
Schedule of Investments (Continued)
(showing percentage of net assets)
March 31, 2013
| Par Value** | Description | Value ($) | ||||||||
Corporate Debt — continued | ||||||||||
| 525,000 | HCA, Inc., 7.50%, due 02/15/22 | 605,062 | ||||||||
| 200,000 | HCA, Inc., 8.00%, due 10/01/18‡ | 234,500 | ||||||||
| 600,000 | Health Net, Inc., 6.38%, due 06/01/17 | 645,000 | ||||||||
| 190,000 | Heineken NV, 1.40%, due 10/01/17 144A | 189,341 | ||||||||
| 124,000 | Helix Energy Solutions Group, Inc., Senior Note, 9.50%, due 01/15/16 144A | 127,643 | ||||||||
| 120,000 | Hertz Corp. (The), 5.88%, due 10/15/20 | 127,200 | ||||||||
| 280,000 | Hertz Corp. (The), 6.75%, due 04/15/19 | 306,950 | ||||||||
| 190,000 | Hertz Corp. (The), 7.50%, due 10/15/18 | 210,663 | ||||||||
| 40,000 | Hess Corp., 7.88%, due 10/01/29 | 51,727 | ||||||||
| 570,000 | Hess Corp., 8.13%, due 02/15/19 | 737,066 | ||||||||
| 1,250,000 | Hewlett-Packard Co., 3.30%, due 12/09/16 | 1,302,921 | ||||||||
| 285,000 | Hexion US Finance Corp./Hexion Nova Scotia Finance ULC, 8.88%, due 02/01/18‡ | 296,400 | ||||||||
| 325,000 | Hilcorp Energy I LP/Hilcorp Finance Co., 7.63%, due 04/15/21 144A | 359,125 | ||||||||
| 220,000 | Hornbeck Offshore Services, Inc., 5.00%, due 03/01/21 144A | 218,900 | ||||||||
| 190,000 | Hornbeck Offshore Services, Inc., 5.88%, due 04/01/20 | 197,600 | ||||||||
| 300,000 | HSBC Finance Capital Trust IX, 5.91%, due 11/30/35† | 303,750 | ||||||||
| 1,240,000 | HSBC Finance Corp., 6.68%, due 01/15/21 | 1,469,622 | ||||||||
| 350,000 | HSBC Holdings Plc, 5.10%, due 04/05/21 | 405,091 | ||||||||
| 575,000 | HSBC Holdings Plc, Subordinated Note, 6.50%, due 05/02/36 | 707,243 | ||||||||
| 2,075,000 | HSBC Holdings Plc, Subordinated Note, 6.50%, due 09/15/37 | 2,550,142 | ||||||||
| 365,000 | Hughes Satellite Systems Corp., 7.63%, due 06/15/21 | 419,294 | ||||||||
| 150,000 | Humana, Inc., 3.15%, due 12/01/22 | 148,467 | ||||||||
| 395,000 | Huntsman International LLC, 8.63%, due 03/15/20‡ | 443,387 | ||||||||
| 100,000 | Huntsman International LLC, 8.63%, due 03/15/21‡ | 113,000 | ||||||||
| 150,000 | Hyundai Capital America, 2.13%, due 10/02/17 144A | 151,383 | ||||||||
| 75,000 | Icahn Enterprises, LP/Icahn Enterprises Finance Corp., 7.75%, due 01/15/16 | 78,188 | ||||||||
| 365,000 | Icahn Enterprises, LP/Icahn Enterprises Finance Corp., 8.00%, due 01/15/18 | 391,462 | ||||||||
| 650,000 | Imperial Tobacco Finance Plc, 2.05%, due 02/11/18 144A | 654,835 | ||||||||
| 1,700,000 | Industrial Bank of Korea, 2.38%, due 07/17/17 144A | 1,744,047 | ||||||||
| 90,000 | ING US, Inc., 2.90%, due 02/15/18 144A | 91,390 | ||||||||
| 350,000 | Intelsat Jackson Holdings SA, 7.25%, due 10/15/20 | 385,875 | ||||||||
| 355,000 | Intelsat Luxembourg SA, 7.75%, due 06/01/21 144A†††† | 362,100 | ||||||||
| 240,000 | Intelsat Luxembourg SA, 8.13%, due 06/01/23 144A†††† | 244,800 | ||||||||
| 595,000 | Intelsat Luxembourg SA, 11.50%, due 02/04/17 | 632,187 | ||||||||
| 285,000 | Interface, Inc., 7.63%, due 12/01/18 | 309,937 | ||||||||
| 220,000 | International Lease Finance Corp., 6.50%, due 09/01/14 144A | 235,400 | ||||||||
| 250,000 | Intesa Sanpaolo Spa, 3.13%, due 01/15/16 | 244,547 | ||||||||
| 250,000 | Intesa Sanpaolo Spa, 3.63%, due 08/12/15 144A | 249,963 | ||||||||
| 345,000 | Iron Mountain, Inc., 8.38%, due 08/15/21 | 380,794 | ||||||||
| 425,000 | Isle of Capri Casinos, Inc., 8.88%, due 06/15/20 | 463,250 | ||||||||
| 310,000 | Jarden Corp., 7.50%, due 01/15/20 | 339,062 | ||||||||
| 285,000 | JBS USA LLC/JBS USA Finance, Inc., 8.25%, due 02/01/20 144A | 312,787 | ||||||||
| 320,000 | John Deere Capital Corp., 2.25%, due 04/17/19 | 331,365 | ||||||||
| 3,400,000 | JPMorgan Chase & Co., 0.91%, due 02/26/16† | 3,404,410 | ||||||||
| 990,000 | JPMorgan Chase & Co., 1.10%, due 10/15/15 | 992,024 | ||||||||
| 300,000 | JPMorgan Chase & Co., 3.25%, due 09/23/22 | 300,144 | ||||||||
| 2,100,000 | JPMorgan Chase & Co., 4.25%, due 10/15/20 | 2,307,898 | ||||||||
| 90,000 | JPMorgan Chase & Co., 4.35%, due 08/15/21 | 99,462 | ||||||||
| 860,000 | JPMorgan Chase & Co., 4.40%, due 07/22/20 | 954,837 | ||||||||
| 96 | See accompanying Notes to the Financial Statements. |
Mercer Core Opportunistic Fixed Income Fund
Schedule of Investments (Continued)
(showing percentage of net assets)
March 31, 2013
| Par Value** | Description | Value ($) | ||||||||
Corporate Debt — continued | ||||||||||
| 200,000 | JPMorgan Chase & Co., 4.50%, due 01/24/22 | 219,586 | ||||||||
| 1,325,000 | JPMorgan Chase & Co., 4.95%, due 03/25/20 | 1,521,248 | ||||||||
| 1,030,000 | JPMorgan Chase & Co., Global Subordinated Note, 5.15%, due 10/01/15 | 1,128,326 | ||||||||
| 1,250,000 | JPMorgan Chase & Co., Subordinated Note, 6.13%, due 06/27/17 | 1,468,254 | ||||||||
| 300,000 | JPMorgan Chase Bank NA, 0.61%, due 06/13/16† | 295,454 | ||||||||
| 235,000 | K Hovnanian Enterprises, Inc., 7.25%, due 10/15/20 144A | 261,438 | ||||||||
| 115,000 | K Hovnanian Enterprises, Inc., Guaranteed Senior Note, 6.50%, due 01/15/14 | 119,025 | ||||||||
| 310,000 | Kansas City Southern de Mexico SA de CV, 6.13%, due 06/15/21 | 351,850 | ||||||||
| 100,000 | Kaupthing Bank HF, 7.13%, due 05/19/16††† 144A | 1,750 | ||||||||
| 310,000 | KB Home, 7.50%, due 09/15/22‡ | 349,525 | ||||||||
| 640,000 | Kerr-McGee Corp., 7.88%, due 09/15/31 | 841,055 | ||||||||
| 270,000 | Key Energy Services, Inc., 6.75%, due 03/01/21 | 282,825 | ||||||||
| 60,000 | Kinder Morgan Energy Partners, LP, Senior Note, 5.00%, due 12/15/13 | 61,875 | ||||||||
| 770,000 | Kinder Morgan Energy Partners, LP, Senior Note, 6.00%, due 02/01/17 | 895,911 | ||||||||
| 2,300,000 | Kinder Morgan Finance Co. ULC, Guaranteed Note, 5.70%, due 01/05/16 | 2,512,361 | ||||||||
| 285,000 | Kinetic Concepts, Inc./KCI USA, Inc., 10.50%, due 11/01/18 | 309,937 | ||||||||
| 600,000 | Koninklijke Philips Electronics NV, 5.75%, due 03/11/18 | 716,211 | ||||||||
| 440,000 | Kraft Foods Group, Inc., 3.50%, due 06/06/22 | 460,977 | ||||||||
| 539,000 | Kraft Foods Group, Inc., 5.38%, due 02/10/20 | 644,114 | ||||||||
| 691,000 | Kraft Foods, Inc., 5.38%, due 02/10/20 | 823,340 | ||||||||
| 400,000 | Kroger Co. (The), Senior Note, 6.15%, due 01/15/20 | 487,378 | ||||||||
| 775,000 | Lafarge SA, 6.20%, due 07/09/15 144A | 833,125 | ||||||||
| 2,350,000 | Lafarge SA, 6.50%, due 07/15/16 | 2,629,062 | ||||||||
| 225,000 | Lamar Media Corp., 5.88%, due 02/01/22 | 244,688 | ||||||||
| 600,000 | LBG Capital No.1 Plc, 7.88%, due 11/01/20¤ 144A | 659,400 | ||||||||
| 600,000 | LBG Capital No.1 Plc, 8.00%, due 12/31/49† 144A | 644,387 | ||||||||
| 1,325,000 | Legg Mason, Inc., 5.50%, due 05/21/19 | 1,439,590 | ||||||||
| 470,000 | Lehman Brothers Holdings Capital Trust VII, (MTN), 5.86%, due 12/31/49††† | 165 | ||||||||
| 270,000 | Lehman Brothers Holdings, Inc., (MTN), Series I, 6.75%, due 12/28/17††† | 95 | ||||||||
| 890,000 | Lehman Brothers Holdings, Inc., Subordinated Note, 6.50%, due 07/19/17††† | 312 | ||||||||
| 375,000 | Liberty Mutual Group, Inc., Junior Subordinated Note, Series A, 7.80%, | 438,750 | ||||||||
| 180,000 | Linn Energy LLC/Linn Energy Finance Corp., 6.25%, due 11/01/19 144A | 184,950 | ||||||||
| 410,000 | Linn Energy LLC/Linn Energy Finance Corp., 8.63%, due 04/15/20 | 454,075 | ||||||||
| 300,000 | Lloyds TSB Bank Plc, 6.50%, due 09/14/20 144A | 336,916 | ||||||||
| 10,000 | Lorillard Tobacco Co., 8.13%, due 06/23/19 | 12,739 | ||||||||
| 990,000 | M&T Bank Corp., 6.88%, due 12/31/49 144A | 1,059,331 | ||||||||
| 2,765,000 | Macy’s Retail Holdings, Inc., 6.65%, due 07/15/24 | 3,432,333 | ||||||||
| 600,000 | Macy’s Retail Holdings, Inc., 7.00%, due 02/15/28 | 748,307 | ||||||||
| 150,000 | MarkWest Energy Partners, LP/MarkWest Energy Finance Corp., 5.50%, due 02/15/23 | 157,875 | ||||||||
| 78,000 | MarkWest Energy Partners, LP/MarkWest Energy Finance Corp., 6.25%, due 06/15/22 | 84,435 | ||||||||
| 237,000 | MarkWest Energy Partners, LP/MarkWest Energy Finance Corp., 6.50%, due 08/15/21 | 257,145 | ||||||||
| 230,000 | Mcron Finance Sub LLC/Mcron Finance Corp., 8.38%, due 05/15/19 144A | 255,300 | ||||||||
| 250,000 | Mead Products LLC/ACCO Brands Corp., 6.75%, due 04/30/20‡ 144A | 268,125 | ||||||||
| 70,000 | Medtronic, Inc., 3.13%, due 03/15/22 | 73,380 | ||||||||
| 240,000 | Medtronic, Inc., 4.45%, due 03/15/20 | 276,226 | ||||||||
| 700,000 | EUR | Merrill Lynch & Co., Inc., 0.51%, due 05/30/14† | 896,104 | |||||||
| 7,720,000 | Merrill Lynch & Co., Inc., 6.88%, due 04/25/18 | 9,328,400 | ||||||||
| 840,000 | Merrill Lynch & Co., Inc., Subordinated Note, 5.70%, due 05/02/17 | 938,452 | ||||||||
| See accompanying Notes to the Financial Statements. | 97 |
Mercer Core Opportunistic Fixed Income Fund
Schedule of Investments (Continued)
(showing percentage of net assets)
March 31, 2013
| Par Value** | Description | Value ($) | ||||||||
Corporate Debt — continued | ||||||||||
| 250,000 | MetLife, Inc., 4.75%, due 02/08/21 | 286,511 | ||||||||
| 420,000 | MetLife, Inc., Subordinated Note, 6.40%, due 12/15/66 | 461,475 | ||||||||
| 160,000 | MetroPCS Wireless, Inc., 6.63%, due 11/15/20 | 167,800 | ||||||||
| 135,000 | MetroPCS Wireless, Inc., 7.88%, due 09/01/18‡ | 148,163 | ||||||||
| 459,000 | MGM Resorts International, 6.75%, due 10/01/20‡ 144A | 487,687 | ||||||||
| 325,000 | MGM Resorts International, 8.63%, due 02/01/19 | 380,250 | ||||||||
| 80,000 | MGM Resorts International, 11.38%, due 03/01/18 | 102,200 | ||||||||
| 80,000 | MidAmerican Energy Holdings Co., Senior Note, 6.50%, due 09/15/37 | 104,216 | ||||||||
| 210,000 | Mizuho Capital Investment USD 2, Ltd., 14.95%, due 12/31/49† 144A | 243,600 | ||||||||
| 265,000 | Mohegan Tribal Gaming Authority, 10.50%, due 12/15/16 144A | 262,350 | ||||||||
| 40,000 | Mohegan Tribal Gaming Authority, 11.50%, due 11/01/17 144A | 43,600 | ||||||||
| 50,000 | Molson Coors Brewing Co., 3.50%, due 05/01/22 | 52,119 | ||||||||
| 115,000 | Momentive Performance Materials, Inc., 9.00%, due 01/15/21‡ | 86,825 | ||||||||
| 175,000 | Momentive Performance Materials, Inc., 10.00%, due 10/15/20‡ | 175,875 | ||||||||
| 75,000 | Moog, Inc., 7.25%, due 06/15/18 | 78,656 | ||||||||
| 70,000 | Morgan Stanley, 4.75%, due 03/22/17 | 77,282 | ||||||||
| 5,000,000 | Morgan Stanley, 7.30%, due 05/13/19 | 6,195,275 | ||||||||
| 130,000 | Morgan Stanley, (MTN), Series F, 0.75%, due 10/18/16† | 126,760 | ||||||||
| 1,000,000 | Morgan Stanley, (MTN), Series F, 6.63%, due 04/01/18 | 1,196,701 | ||||||||
| 120,000 | Mueller Water Products, Inc., 8.75%, due 09/01/20 | 137,100 | ||||||||
| 260,000 | Mueller Water Products, Inc., Senior Subordinated Note, 7.38%, due 06/01/17 | 268,775 | ||||||||
| 600,000 | Murray Street Investment Trust I, 4.65%, due 03/09/17†† | 656,693 | ||||||||
| 50,000 | National Semiconductor Corp., Senior Note, 6.60%, due 06/15/17 | 60,728 | ||||||||
| 389,000 | Navistar International Corp., 8.25%, due 11/01/21‡ | 398,239 | ||||||||
| 360,000 | NBCUniversal Enterprise, Inc., 1.97%, due 04/15/19 144A | 361,508 | ||||||||
| 375,000 | NCR Corp., 5.00%, due 07/15/22 144A | 377,812 | ||||||||
| 110,000 | News America, Inc., 4.50%, due 02/15/21 | 124,245 | ||||||||
| 525,000 | News America, Inc., 5.65%, due 08/15/20 | 628,048 | ||||||||
| 475,000 | News America, Inc., 6.20%, due 12/15/34 | 563,646 | ||||||||
| 30,000 | News America, Inc., Senior Note, 6.65%, due 11/15/37 | 37,184 | ||||||||
| 780,000 | Noble Energy, Inc., 4.15%, due 12/15/21 | 859,114 | ||||||||
| 330,000 | Nordea Bank AB, 3.70%, due 11/13/14 144A | 345,717 | ||||||||
| 1,000,000 | Nordstrom, Inc., 6.25%, due 01/15/18 | 1,197,966 | ||||||||
| 250,000 | Norske Skogindustrier ASA, 7.13%, due 10/15/33 144A | 141,250 | ||||||||
| 225,000 | Novelis, Inc., 8.38%, due 12/15/17 | 247,500 | ||||||||
| 175,000 | Novelis, Inc., 8.75%, due 12/15/20 | 198,188 | ||||||||
| 125,000 | NRG Energy, Inc., 7.63%, due 05/15/19 | 135,625 | ||||||||
| 335,000 | NRG Energy, Inc., 8.25%, due 09/01/20 | 379,806 | ||||||||
| 470,000 | Occidental Petroleum Corp., 2.70%, due 02/15/23 | 471,427 | ||||||||
| 370,000 | Occidental Petroleum Corp., 3.13%, due 02/15/22 | 389,766 | ||||||||
| 265,000 | OGX Austria GmbH, Series 1, 8.50%, due 06/01/18 144A | 208,025 | ||||||||
| 580,000 | Oracle Corp., 1.20%, due 10/15/17 | 581,277 | ||||||||
| 340,000 | Owens-Illinois, Inc., 7.80%, due 05/15/18 | 399,500 | ||||||||
| 920,000 | Pacific Gas & Electric Co., 6.05%, due 03/01/34 | 1,154,538 | ||||||||
| 10,000 | Pacific Gas & Electric Co., 8.25%, due 10/15/18 | 13,426 | ||||||||
| 10,000 | Pacific Gas & Electric Co., Senior Note, 5.63%, due 11/30/17 | 11,959 | ||||||||
| 205,000 | Packaging Dynamics Corp., 8.75%, due 02/01/16 144A | 214,994 | ||||||||
| 175,000 | Peabody Energy Corp., 6.00%, due 11/15/18 | 186,594 | ||||||||
| 220,000 | Peabody Energy Corp., 6.50%, due 09/15/20‡ | 235,400 | ||||||||
| 98 | See accompanying Notes to the Financial Statements. |
Mercer Core Opportunistic Fixed Income Fund
Schedule of Investments (Continued)
(showing percentage of net assets)
March 31, 2013
| Par Value** | Description | Value ($) | ||||||||
Corporate Debt — continued | ||||||||||
| 606,000 | Pemex Project Funding Master Trust, 6.63%, due 06/15/35 | 728,715 | ||||||||
| 580,000 | PepsiCo, Inc., 0.70%, due 08/13/15 | 581,208 | ||||||||
| 171,000 | PepsiCo, Inc., Senior Note, 7.90%, due 11/01/18 | 227,940 | ||||||||
| 240,000 | Pernod-Ricard SA, 2.95%, due 01/15/17 144A | 252,297 | ||||||||
| 510,000 | Pernod-Ricard SA, 4.45%, due 01/15/22 144A | 561,163 | ||||||||
| 400,000 | Petrobras International Finance Co., 3.88%, due 01/27/16 | 420,594 | ||||||||
| 3,820,000 | Petrobras International Finance Co., 5.38%, due 01/27/21 | 4,140,853 | ||||||||
| 196,000 | Petrobras International Finance Co., 5.75%, due 01/20/20 | 216,850 | ||||||||
| 160,000 | Petrobras International Finance Co., 6.13%, due 10/06/16 | 179,680 | ||||||||
| 992,000 | Petroleos Mexicanos, 3.50%, due 01/30/23 144A | 992,000 | ||||||||
| 430,000 | Petroleos Mexicanos, 5.50%, due 01/21/21 | 495,575 | ||||||||
| 205,000 | PHI, Inc., 8.63%, due 10/15/18 | 223,963 | ||||||||
| 240,000 | Philip Morris International, Inc., 2.50%, due 08/22/22 | 237,338 | ||||||||
| 480,000 | Philip Morris International, Inc., 2.90%, due 11/15/21 | 496,151 | ||||||||
| 250,000 | Philip Morris International, Inc., 4.50%, due 03/20/42 | 258,022 | ||||||||
| 460,000 | Pinnacle Entertainment, Inc., 7.75%, due 04/01/22‡ | 496,225 | ||||||||
| 465,000 | Plains Exploration & Production Co., 6.13%, due 06/15/19 | 511,500 | ||||||||
| 50,000 | Plains Exploration & Production Co., 6.50%, due 11/15/20 | 55,500 | ||||||||
| 200,000 | Polypore International, Inc., 7.50%, due 11/15/17‡ | 215,500 | ||||||||
| 325,000 | Post Holdings, Inc., 7.38%, due 02/15/22 | 357,094 | ||||||||
| 90,000 | Potash Corp. of Saskatchewan, Inc., 4.88%, due 03/30/20 | 103,422 | ||||||||
| 265,000 | Precision Drilling Corp., 6.50%, due 12/15/21 | 284,212 | ||||||||
| 60,000 | Precision Drilling Corp., 6.63%, due 11/15/20 | 64,350 | ||||||||
| 60,000 | QEP Resources, Inc., 5.25%, due 05/01/23 | 61,800 | ||||||||
| 70,000 | QEP Resources, Inc., 6.88%, due 03/01/21 | 79,975 | ||||||||
| 200,000 | QVC, Inc., 7.38%, due 10/15/20 144A | 221,570 | ||||||||
| 100,000 | Qwest Corp., 6.88%, due 09/15/33 | 99,898 | ||||||||
| 45,000 | Qwest Corp., 7.50%, due 10/01/14 | 49,066 | ||||||||
| 215,000 | Rabobank Nederland NV, 11.00%, due 12/29/49† 144A | 289,353 | ||||||||
| 500,000 | Range Resources Corp., 6.75%, due 08/01/20 | 552,500 | ||||||||
| 487,000 | Range Resources Corp., 8.00%, due 05/15/19 | 535,700 | ||||||||
| 73,098 | RathGibson, Inc., Senior Note, 11.25%, due 02/15/14**** ††† | — | ||||||||
| 220,000 | Raytheon Co., 3.13%, due 10/15/20 | 232,737 | ||||||||
| 1,428,000 | Reed Elsevier Capital, Inc., 3.13%, due 10/15/22 144A | 1,381,064 | ||||||||
| 316,000 | Reed Elsevier Capital, Inc., Guaranteed Note, 8.63%, due 01/15/19 | 411,076 | ||||||||
| 385,000 | Regency Energy Partners, LP/Regency Energy Finance Corp., 5.50%, due 04/15/23 | 413,875 | ||||||||
| 329,000 | Regency Energy Partners, LP/Regency Energy Finance Corp., 6.50%, due 07/15/21 | 363,545 | ||||||||
| 225,000 | Rexel SA, 6.13%, due 12/15/19 144A | 237,938 | ||||||||
| 190,000 | Reynolds American, Inc., 3.25%, due 11/01/22 | 188,236 | ||||||||
| 755,000 | Reynolds American, Inc., Senior Note, 6.75%, due 06/15/17 | 909,577 | ||||||||
| 410,000 | Reynolds Group Issuer, Inc./Reynolds Group Issuer LLC/Reynolds Group Issuer, 7.13%, due 04/15/19 | 442,287 | ||||||||
| 310,000 | Reynolds Group Issuer, Inc./Reynolds Group Issuer LLC/Reynolds Group Issuer, 8.50%, due 05/15/18 | 327,437 | ||||||||
| 325,000 | Reynolds Group Issuer, Inc./Reynolds Group Issuer LLC/Reynolds Group Issuer, 9.00%, due 04/15/19 | 345,312 | ||||||||
| 220,000 | Reynolds Group Issuer, Inc./Reynolds Group Issuer LLC/Reynolds Group Issuer, 9.88%, due 08/15/19 | 241,725 | ||||||||
| 920,000 | Rio Tinto Finance USA, Ltd., 9.00%, due 05/01/19 | 1,268,997 | ||||||||
| See accompanying Notes to the Financial Statements. | 99 |
Mercer Core Opportunistic Fixed Income Fund
Schedule of Investments (Continued)
(showing percentage of net assets)
March 31, 2013
| Par Value** | Description | Value ($) | ||||||||
Corporate Debt — continued | ||||||||||
| 380,000 | Roche Holdings, Inc., Guaranteed Note, 6.00%, due 03/01/19 144A | 473,211 | ||||||||
| 170,000 | Rock-Tenn Co., 3.50%, due 03/01/20 | 174,049 | ||||||||
| 90,000 | Rock-Tenn Co., 4.00%, due 03/01/23 | 91,197 | ||||||||
| 310,000 | Rockwood Specialties Group, Inc., 4.63%, due 10/15/20 | 318,912 | ||||||||
| 40,000 | Rogers Cable, Inc., 6.25%, due 06/15/13 | 40,446 | ||||||||
| 20,000 | Rogers Communications, Inc., Senior Note, 6.80%, due 08/15/18 | 25,187 | ||||||||
| 330,000 | Royal Bank of Scotland Group Plc, 2.55%, due 09/18/15 | 339,373 | ||||||||
| 250,000 | Royal Bank of Scotland Group Plc, 5.00%, due 10/01/14 | 257,593 | ||||||||
| 1,225,000 | Royal Bank of Scotland Group Plc, 6.13%, due 12/15/22 | 1,271,647 | ||||||||
| 200,000 | Royal Bank of Scotland Group Plc, 6.99%, due 12/31/49¤ † 144A | 193,000 | ||||||||
| 70,000 | Royal Bank of Scotland Group Plc, 7.65%, due 12/31/49† | 73,500 | ||||||||
| 775,000 | Royal Bank of Scotland Plc (The), 4.38%, due 03/16/16 | 844,070 | ||||||||
| 600,000 | Royal Bank of Scotland Plc (The), 5.63%, due 08/24/20 | 698,575 | ||||||||
| 325,000 | Royal Bank of Scotland Plc (The), 6.13%, due 01/11/21 | 392,822 | ||||||||
| 70,000 | Safeway, Inc., 3.95%, due 08/15/20 | 71,644 | ||||||||
| 350,000 | Samson Investment Co., 9.75%, due 02/15/20 144A | 373,625 | ||||||||
| 300,000 | Santander US Debt SA Unipersonal, Series 1, 3.72%, due 01/20/15 144A | 303,392 | ||||||||
| 400,000 | Santander US Debt SA Unipersonal, 3.78%, due 10/07/15 144A | 408,255 | ||||||||
| 385,000 | SBA Communications Corp., 5.63%, due 10/01/19 144A | 397,512 | ||||||||
| 75,000 | Sealed Air Corp., 5.25%, due 04/01/23 144A | 75,469 | ||||||||
| 200,000 | Sealed Air Corp., Series 1, 8.13%, due 09/15/19 144A | 227,250 | ||||||||
| 110,000 | Service Corp. International, Senior Note, 7.50%, due 04/01/27 | 122,650 | ||||||||
| 10,000 | Service Corp. International, Senior Note, 7.63%, due 10/01/18 | 11,788 | ||||||||
| 110,000 | SESI LLC, 7.13%, due 12/15/21 | 123,613 | ||||||||
| 335,000 | Shea Homes, LP/Shea Homes Funding Corp., 8.63%, due 05/15/19 | 377,712 | ||||||||
| 580,000 | Shell International Finance BV, 4.38%, due 03/25/20 | 673,229 | ||||||||
| 260,000 | Sinopec Group Overseas Development 2012, Ltd., 2.75%, due 05/17/17 144A | 271,735 | ||||||||
| 1,270,000 | SLM Corp., 3.88%, due 09/10/15 | 1,323,205 | ||||||||
| 10,000 | SLM Corp., 5.00%, due 04/15/15 | 10,600 | ||||||||
| 2,675,000 | SLM Corp., 6.00%, due 01/25/17 | 2,922,437 | ||||||||
| 475,000 | SLM Corp., 6.25%, due 01/25/16 | 521,302 | ||||||||
| 55,000 | SLM Corp., 7.25%, due 01/25/22 | 61,738 | ||||||||
| 950,000 | SLM Corp., 8.00%, due 03/25/20 | 1,105,562 | ||||||||
| 325,000 | Smithfield Foods, Inc., 6.63%, due 08/15/22 | 355,062 | ||||||||
| 880,000 | Southern Copper Corp., 5.25%, due 11/08/42 | 837,647 | ||||||||
| 255,000 | Springleaf Finance Corp., 6.90%, due 12/15/17 | 257,550 | ||||||||
| 660,000 | Sprint Capital Corp., 8.75%, due 03/15/32 | 790,350 | ||||||||
| 1,895,000 | Sprint Capital Corp., Guaranteed Note, 6.90%, due 05/01/19 | 2,089,237 | ||||||||
| 375,000 | Sprint Nextel Corp., 6.00%, due 12/01/16 | 407,812 | ||||||||
| 200,000 | Sprint Nextel Corp., 6.00%, due 11/15/22 | 206,500 | ||||||||
| 740,000 | Sprint Nextel Corp., 7.00%, due 08/15/20 | 817,700 | ||||||||
| 75,000 | Sprint Nextel Corp., 8.38%, due 08/15/17 | 87,656 | ||||||||
| 100,000 | Sprint Nextel Corp., 9.13%, due 03/01/17 | 118,750 | ||||||||
| 225,000 | SPX Corp., 6.88%, due 09/01/17 | 251,438 | ||||||||
| 395,000 | Standard Pacific Corp., 8.38%, due 05/15/18 | 467,087 | ||||||||
| 850,000 | State Street Corp., 4.96%, due 03/15/18 | 966,691 | ||||||||
| 190,000 | Steel Dynamics, Inc., 7.63%, due 03/15/20‡ | 211,850 | ||||||||
| 105,000 | Stora Enso Oyj, 7.25%, due 04/15/36 144A | 99,750 | ||||||||
| 75,000 | Suburban Propane Partners LP/Suburban Energy Finance Corp., 7.38%, due 08/01/21 | 83,063 | ||||||||
| 100 | See accompanying Notes to the Financial Statements. |
Mercer Core Opportunistic Fixed Income Fund
Schedule of Investments (Continued)
(showing percentage of net assets)
March 31, 2013
| Par Value** | Description | Value ($) | ||||||||
Corporate Debt — continued | ||||||||||
| 50,000 | Suburban Propane Partners LP/Suburban Energy Finance Corp., 7.50%, due 10/01/18 | 54,500 | ||||||||
| 330,000 | SunGard Data Systems, Inc., 7.63%, due 11/15/20 | 359,287 | ||||||||
| 99,000 | SunTrust Preferred Capital I, 4.00%, due 12/31/49† | 85,635 | ||||||||
| 100,000 | Swift Energy Co., 7.88%, due 03/01/22 144A | 105,000 | ||||||||
| 325,000 | Swift Energy Co., 8.88%, due 01/15/20 | 354,656 | ||||||||
| 175,000 | Targa Resources Partners, LP/Targa Resources Partners Finance Corp., 5.25%, | 182,875 | ||||||||
| 1,381,000 | Targa Resources Partners, LP/Targa Resources Partners Finance Corp., 6.88%, due 02/01/21 | 1,519,100 | ||||||||
| 95,000 | Targa Resources Partners, LP/Targa Resources Partners Finance Corp., 7.88%, due 10/15/18 | 104,500 | ||||||||
| 380,000 | Teachers Insurance & Annuity Association of America, 6.85%, due 12/16/39 144A | 508,854 | ||||||||
| 35,000 | Teekay Corp., 8.50%, due 01/15/20 | 38,019 | ||||||||
| 550,000 | Telecom Italia Capital SA, 4.95%, due 09/30/14 | 570,329 | ||||||||
| 1,025,000 | Telecom Italia Capital SA, 6.18%, due 06/18/14 | 1,073,605 | ||||||||
| 1,250,000 | Telecom Italia Capital SA, 7.00%, due 06/04/18 | 1,416,907 | ||||||||
| 950,000 | Telecom Italia Capital SA, 7.18%, due 06/18/19 | 1,085,196 | ||||||||
| 280,000 | Telefonica Emisiones SAU, 5.13%, due 04/27/20 | 295,507 | ||||||||
| 10,000 | Telefonica Emisiones SAU, 5.46%, due 02/16/21 | 10,787 | ||||||||
| 30,000 | Telefonica Emisiones SAU, 5.88%, due 07/15/19 | 33,078 | ||||||||
| 50,000 | Telefonica Emisiones SAU, 6.22%, due 07/03/17 | 56,069 | ||||||||
| 360,000 | Temasek Financial I, Ltd., 2.38%, due 01/23/23 144A | 348,483 | ||||||||
| 90,000 | Tenet Healthcare Corp., 4.50%, due 04/01/21 144A | 88,425 | ||||||||
| 355,000 | Terex Corp., 6.00%, due 05/15/21 | 375,412 | ||||||||
| 120,000 | Teva Pharmaceutical Finance Co. BV, 3.65%, due 11/10/21 | 127,941 | ||||||||
| 610,000 | Teva Pharmaceutical Finance IV BV, 3.65%, due 11/10/21 | 650,364 | ||||||||
| 130,000 | Texas Competitive Electric Holdings Co. LLC/TCEH Finance, Inc., Series 1, 11.50%, | 97,825 | ||||||||
| 295,000 | Texas Industries, Inc., 9.25%, due 08/15/20‡ | 323,762 | ||||||||
| 220,000 | Thermo Fisher Scientific, Inc., 3.60%, due 08/15/21 | 227,981 | ||||||||
| 100,000 | Time Warner Cable, Inc., 4.13%, due 02/15/21 | 107,509 | ||||||||
| 740,000 | Time Warner Cable, Inc., 5.85%, due 05/01/17 | 860,163 | ||||||||
| 290,000 | Time Warner Cable, Inc., 5.88%, due 11/15/40 | 310,285 | ||||||||
| 10,000 | Time Warner Cable, Inc., 6.75%, due 07/01/18 | 12,320 | ||||||||
| 160,000 | Time Warner Cable, Inc., 7.30%, due 07/01/38 | 199,674 | ||||||||
| 1,480,000 | Time Warner Cable, Inc., 8.25%, due 04/01/19 | 1,928,931 | ||||||||
| 2,150,000 | Time Warner Cable, Inc., 8.75%, due 02/14/19 | 2,846,828 | ||||||||
| 260,000 | Time Warner, Inc., 4.70%, due 01/15/21 | 293,664 | ||||||||
| 200,000 | Time Warner, Inc., 4.75%, due 03/29/21 | 226,764 | ||||||||
| 50,000 | Time Warner, Inc., 6.25%, due 03/29/41 | 59,319 | ||||||||
| 200,000 | Time Warner, Inc., 7.63%, due 04/15/31 | 271,351 | ||||||||
| 2,700,000 | Time Warner, Inc., 7.70%, due 05/01/32 | 3,689,836 | ||||||||
| 1,100,000 | TNK-BP Finance SA, 7.50%, due 07/18/16 144A | 1,265,880 | ||||||||
| 3,200,000 | TNK-BP Finance SA, Reg S, 7.88%, due 03/13/18‡‡‡ | 3,856,000 | ||||||||
| 54,000 | Tomkins LLC/Tomkins, Inc., 9.00%, due 10/01/18 | 60,413 | ||||||||
| 670,000 | Toyota Motor Credit Corp., 1.25%, due 10/05/17 | 670,000 | ||||||||
| 325,000 | TransDigm, Inc., 7.75%, due 12/15/18 | 358,312 | ||||||||
| 130,000 | Transocean, Inc., 5.05%, due 12/15/16 | 144,566 | ||||||||
| 160,000 | Transocean, Inc., 6.38%, due 12/15/21 | 186,603 | ||||||||
| See accompanying Notes to the Financial Statements. | 101 |
Mercer Core Opportunistic Fixed Income Fund
Schedule of Investments (Continued)
(showing percentage of net assets)
March 31, 2013
| Par Value** | Description | Value ($) | ||||||||
Corporate Debt — continued | ||||||||||
| 1,025,000 | Travelers Cos. (The), Inc., 5.80%, due 05/15/18 | 1,253,735 | ||||||||
| 150,000 | Triumph Group, Inc., 4.88%, due 04/01/21 144A | 151,875 | ||||||||
| 240,000 | Triumph Group, Inc., 8.63%, due 07/15/18 | 267,900 | ||||||||
| 490,000 | Turlock Corp., 1.50%, due 11/02/17 144A | 491,948 | ||||||||
| 1,360,000 | Turlock Corp., 2.75%, due 11/02/22 144A | 1,354,987 | ||||||||
| 250,000 | Turlock Corp., 4.15%, due 11/02/42 144A | 244,776 | ||||||||
| 370,000 | UBS AG/Stamford Branch, 2.25%, due 01/28/14 | 375,009 | ||||||||
| 244,000 | UBS AG/Stamford Branch, 5.75%, due 04/25/18 | 289,381 | ||||||||
| 3,087,000 | Union Pacific Corp., 4.16%, due 07/15/22 | 3,482,753 | ||||||||
| 300,000 | United Business Media, Ltd., 5.75%, due 11/03/20 144A | 318,237 | ||||||||
| 45,000 | United Rentals North America, Inc., 7.38%, due 05/15/20 | 50,175 | ||||||||
| 45,000 | United Rentals North America, Inc., 7.63%, due 04/15/22 | 50,513 | ||||||||
| 500,000 | United Rentals North America, Inc., 8.38%, due 09/15/20‡ | 560,000 | ||||||||
| 150,000 | United States Steel Corp., 7.38%, due 04/01/20‡ | 157,875 | ||||||||
| 50,000 | United States Steel Corp., 7.50%, due 03/15/22‡ | 52,625 | ||||||||
| 95,000 | United States Steel Corp., Senior Note, 7.00%, due 02/01/18‡ | 102,600 | ||||||||
| 30,000 | United Technologies Corp., 3.10%, due 06/01/22 | 31,505 | ||||||||
| 270,000 | United Technologies Corp., 4.50%, due 06/01/42 | 288,981 | ||||||||
| 40,000 | UnitedHealth Group, Inc., 1.63%, due 03/15/19 | 40,170 | ||||||||
| 90,000 | UnitedHealth Group, Inc., 3.38%, due 11/15/21 | 95,187 | ||||||||
| 520,000 | UnitedHealth Group, Inc., Senior Note, 6.00%, due 02/15/18 | 629,416 | ||||||||
| 500,000 | US Airways 2012-1 Class B Pass Through Trust, 8.00%, due 04/01/21 | 551,250 | ||||||||
| 245,000 | USG Corp., 6.30%, due 11/15/16 | 260,925 | ||||||||
| 105,000 | USG Corp., 8.38%, due 10/15/18 144A | 116,550 | ||||||||
| 1,532,000 | Vale Overseas, Ltd., 4.38%, due 01/11/22 | 1,579,562 | ||||||||
| 390,000 | Vale Overseas, Ltd., Guaranteed Note, 6.88%, due 11/21/36 | 444,934 | ||||||||
| 320,000 | Vedanta Resources Plc, 8.25%, due 06/07/21 144A | 368,000 | ||||||||
| 220,000 | Vedanta Resources Plc, Senior Global Note, 8.75%, due 01/15/14 144A | 229,900 | ||||||||
| 40,000 | Verizon Communications, Inc., 2.45%, due 11/01/22 | 37,910 | ||||||||
| 220,000 | Verizon Communications, Inc., 3.50%, due 11/01/21 | 229,040 | ||||||||
| 130,000 | Verizon Communications, Inc., 8.75%, due 11/01/18 | 175,031 | ||||||||
| 190,000 | Vesey Street Investment Trust I, 4.40%, due 09/01/16†† | 206,697 | ||||||||
| 225,000 | ViaSat, Inc., 6.88%, due 06/15/20 | 242,438 | ||||||||
| 225,000 | Vulcan Materials Co., 6.50%, due 12/01/16 | 253,125 | ||||||||
| 1,400,000 | Vulcan Materials Co., 7.50%, due 06/15/21 | 1,655,500 | ||||||||
| 970,000 | Wachovia Capital Trust III, Secured Note, 5.57%, due 12/31/49† | 974,607 | ||||||||
| 570,000 | Wachovia Corp., Senior Note, 5.63%, due 10/15/16 | 651,061 | ||||||||
| 640,000 | Wachovia Corp., Subordinated Note, 5.25%, due 08/01/14 | 677,348 | ||||||||
| 460,000 | Wal-Mart Stores, Inc., 5.63%, due 04/15/41 | 577,591 | ||||||||
| 190,000 | Waste Management, Inc., 7.38%, due 05/15/29 | 246,850 | ||||||||
| 180,000 | Watson Pharmaceuticals, Inc., 1.88%, due 10/01/17 | 182,295 | ||||||||
| 130,000 | WellPoint, Inc., 1.25%, due 09/10/15 | 131,153 | ||||||||
| 30,000 | WellPoint, Inc., 3.70%, due 08/15/21 | 31,738 | ||||||||
| 730,000 | WellPoint, Inc., 5.88%, due 06/15/17 | 860,163 | ||||||||
| 1,750,000 | WellPoint, Inc., 7.00%, due 02/15/19 | 2,191,276 | ||||||||
| 190,000 | Wells Fargo & Co., 1.50%, due 01/16/18 | 189,823 | ||||||||
| 70,000 | Wells Fargo & Co., 2.10%, due 05/08/17 | 72,255 | ||||||||
| 360,000 | Wells Fargo & Co., 3.45%, due 02/13/23 | 363,173 | ||||||||
| 420,000 | Wells Fargo & Co., 3.68%, due 06/15/16†† | 454,497 | ||||||||
| 102 | See accompanying Notes to the Financial Statements. |
Mercer Core Opportunistic Fixed Income Fund
Schedule of Investments (Continued)
(showing percentage of net assets)
March 31, 2013
| Par Value** | Description | Value ($) | ||||||||
Corporate Debt — continued | ||||||||||
| 90,000 | Wells Fargo & Co., 4.60%, due 04/01/21 | 102,959 | ||||||||
| 350,000 | Wells Fargo Capital X, 5.95%, due 12/01/86 | 355,059 | ||||||||
| 270,000 | Williams Cos. (The), Inc., Series A, 7.50%, due 01/15/31 | 332,317 | ||||||||
| 124,000 | Williams Cos. (The), Inc., 7.88%, due 09/01/21 | 158,701 | ||||||||
| 80,000 | Williams Cos. (The), Inc., 8.75%, due 03/15/32 | 107,990 | ||||||||
| 290,000 | Williams Partners, LP/Williams Partners Finance Corp., Senior Note, 7.25%, due 02/01/17 | 349,153 | ||||||||
| 130,000 | Windstream Corp., 7.75%, due 10/15/20 | 141,700 | ||||||||
| 120,000 | WPP Finance UK, 8.00%, due 09/15/14 | 131,784 | ||||||||
| 30,000 | WPX Energy, Inc., 6.00%, due 01/15/22 | 31,575 | ||||||||
| 510,000 | Wyeth LLC, 5.95%, due 04/01/37 | 653,678 | ||||||||
| 110,000 | Wynn Las Vegas LLC/Wynn Las Vegas Capital Corp., 7.88%, due 05/01/20 | 123,475 | ||||||||
| 430,000 | Wynn Las Vegas, LLC, 7.75%, due 08/15/20 | 484,287 | ||||||||
| 1,525,000 | Xerox Corp., 4.50%, due 05/15/21 | 1,633,671 | ||||||||
| 300,000 | Xerox Corp., 5.63%, due 12/15/19 | 343,349 | ||||||||
| 2,500,000 | Xerox Corp., 6.35%, due 05/15/18 | 2,933,262 | ||||||||
| 520,000 | Xstrata Finance Canada, Ltd., 1.80%, due 10/23/15 144A | 526,237 | ||||||||
| 470,000 | Xstrata Finance Canada, Ltd., 2.45%, due 10/25/17 144A | 476,911 | ||||||||
| 100,000 | Xstrata Finance Canada, Ltd., 5.80%, due 11/15/16 144A | 113,947 | ||||||||
| 90,000 | Zoetis, Inc., 3.25%, due 02/01/23 144A | 91,455 | ||||||||
|
| |||||||||
| 378,263,281 | ||||||||||
|
| |||||||||
Mortgage Backed Securities - Private Issuers — 2.0% | ||||||||||
| 400,000 | Americold LLC Trust, Series 2010-ARTA, Class A2FX, 4.95%, due 01/14/29 144A | 461,662 | ||||||||
| 550,000 | Banc of America Commercial Mortgage Trust, Series 2008-1, Class A4, 6.19%, | 661,495 | ||||||||
| 158,441 | Banc of America Funding Corp., Series 2005-E, Class 8A1, 2.50%, due 06/20/35† | 98,639 | ||||||||
| 136,000 | Banc of America Merrill Lynch Commercial Mortgage, Inc., Series 2006-1, Class AM, 5.42%, due 09/10/45† | 150,613 | ||||||||
| 90,000 | Bear Stearns Commercial Mortgage Securities Trust, Series 2007-PW16, Class AM, 5.72%, due 06/11/40† | 103,306 | ||||||||
| 150,000 | Bear Stearns Commercial Mortgage Securities Trust, Series 2007-PW17, Class AM, 5.89%, due 06/11/50† | 174,104 | ||||||||
| 80,000 | CD Commercial Mortgage Trust, Series 2006-CD2, Class AM, 5.35%, due 01/15/46† | 87,425 | ||||||||
| 210,000 | CGRBS Commercial Mortgage Trust, Series 2010-3, Class 4A1, 1.00%, due 03/13/23 | 216,240 | ||||||||
| 419,844 | Citigroup Mortgage Loan Trust, Inc., Series 2010-3, Class 4A1, 2.43%, due 02/25/36† 144A | 418,573 | ||||||||
| 349,000 | Commercial Mortgage Pass-Through Certificates, Series 2007-C2, Class AM, 5.55%, | 390,361 | ||||||||
| 70,251 | Countrywide Alternative Loan Trust, Series 2005-61, Class 1A1, 0.46%, due 12/25/35† | 59,475 | ||||||||
| 69,649 | Countrywide Home Loan Mortgage Pass Through Trust, Series 2005-R3, Class AF, 0.60%, due 09/25/35† 144A | 58,848 | ||||||||
| 301,859 | Credit Suisse First Boston Mortgage Securities Corp., Series 2003-AR30, Class 2A1, 2.83%, due 01/25/34† | 297,544 | ||||||||
| 448,932 | Downey Savings & Loan Association Mortgage Loan Trust, Series 2004-AR1, Class A2A, 1.02%, due 09/19/44† | 400,455 | ||||||||
| 130,000 | Extended Stay America Trust, Series 2013-ESH7, Class A27, 2.96%, due 12/05/31 144A | 132,367 | ||||||||
| See accompanying Notes to the Financial Statements. | 103 |
Mercer Core Opportunistic Fixed Income Fund
Schedule of Investments (Continued)
(showing percentage of net assets)
March 31, 2013
| Par Value** | Description | Value ($) | ||||||||
Mortgage Backed Securities - Private Issuers — continued | ||||||||||
| 250,050 | First Horizon Alternative Mortgage Securities, Series 2006-FA1, Class 1A6, 0.95%, | 248,853 | ||||||||
| 290,000 | Fremont Home Loan Trust, Series 2004-B, Class M1, 1.07%, due 05/25/34† | 257,109 | ||||||||
| 117,986 | Granite Mortgages Plc, Series 2004-3, Class 2A1, 0.56%, due 09/20/44† | 116,995 | ||||||||
| 179,930 | Granite Mortgages Plc, Reg S, Series 2003-2, Class 1A3, 0.80%, due 07/20/43† ‡‡‡ | 178,418 | ||||||||
| 194,000 | Greenwich Capital Commercial Funding Corp., Series 2006-GG7, Class AM, 5.87%, due 07/10/38† | 217,750 | ||||||||
| 256,476 | GSMPS Mortgage Loan Trust, Series 2005-RP2, Class 1AF, 0.55%, | 215,600 | ||||||||
| 158,000 | GSMS 2012-ALOHA, 3.55%, due 04/10/34 144A | 167,247 | ||||||||
| 99,037 | GSR Mortgage Loan Trust, Series 2004-7, Class 4A1, 4.88%, due 06/25/34† | 100,557 | ||||||||
| 73,987 | Harborview Mortgage Loan Trust, Series 2005-9, Class 2A1A, 0.54%, due 06/20/35† | 70,101 | ||||||||
| 1,018,014 | Harborview Mortgage Loan Trust, Series 2007-4, Class 2A1, 0.42%, due 07/19/47† | 818,466 | ||||||||
| 600,000 | JP Morgan Chase Commercial Mortgage Securities Corp., Series 2006-LDP9, Class A3, 5.34%, due 05/15/47 | 678,712 | ||||||||
| 185,000 | JPMorgan Chase Commercial Mortgage Securities Corp., Series 2006-LDP8, Class AM, 5.44%, due 05/15/45 | 207,196 | ||||||||
| 30,000 | JPMorgan Chase Commercial Mortgage Securities Corp., Series 2007-CB20, Class AM, 5.88%, due 02/12/51† | 35,478 | ||||||||
| 470,000 | LB-UBS Commercial Mortgage Trust, Series 2007-C7, Class AM, 6.18%, due 09/15/45† | 554,494 | ||||||||
| 95,742 | Lehman XS Trust, Series 2005-7N, Class 1A1B, 1.00%, due 12/25/35† | 40,613 | ||||||||
| 119,710 | MASTR Adjustable Rate Mortgages Trust, Series 2006-2, Class 3A1, 2.99%, due 01/25/36† | 114,772 | ||||||||
| 75,993 | Merrill Lynch Mortgage Investors, Inc., Series 2005-A3, Class A1, 0.47%, due 04/25/35† | 71,811 | ||||||||
| 80,000 | Merrill Lynch/Countrywide Commercial Mortgage Trust, Series 2006-4, Class AM, 5.20%, due 12/12/49† | 89,525 | ||||||||
| 410,000 | Merrill Lynch/Countrywide Commercial Mortgage Trust, Series 2007-9, Class A4, 5.70%, due 09/12/49 | 477,445 | ||||||||
| 184,636 | MLCC Mortgage Investors, Inc., Series 2007-1, Class 4A3, 5.63%, due 01/25/37† | 189,507 | ||||||||
| 162,000 | Morgan Stanley Bank of America Merrill Lynch Trust, 3.21%, due 02/15/46 | 164,875 | ||||||||
| 150,000 | Morgan Stanley Bank of America Merrill Lynch Trust, Series 2013-C7, Class A4, 2.92%, due 02/15/46 | 152,525 | ||||||||
| 290,000 | Morgan Stanley Capital I, Inc., Series 2007-IQ15, Class A4, 5.89%, due 06/11/49† | 338,783 | ||||||||
| 192,990 | Morgan Stanley Mortgage Loan Trust, Series 2004-5AR, Class 2A, 2.98%, due 07/25/34† | 191,380 | ||||||||
| 330,694 | Morgan Stanley Mortgage Loan Trust, Series 2004-7AR, Class 2A6, 2.65%, due 09/25/34† | 334,990 | ||||||||
| 436,474 | Nomura Asset Acceptance Corp., Series 2004-R3, Class A1, 6.50%, | 460,275 | ||||||||
| 380,125 | Novastar Mortgage-Backed Notes, Series 2006-MTA1, Class 2A1A, 0.39%, due 09/25/46† | 275,318 | ||||||||
| 277,844 | Prime Mortgage Trust, Series 2006-DR1, Class 1A1, 5.50%, due 05/25/35 144A | 277,755 | ||||||||
| 117,761 | Prime Mortgage Trust, Series 2006-DR1, Class 1A2, 6.00%, due 05/25/35 144A | 118,984 | ||||||||
| 1,241,978 | Prime Mortgage Trust, Series 2006-DR1, Class 2A1, 5.50%, due 05/25/35 144A | 1,191,649 | ||||||||
| 1,015,020 | Prime Mortgage Trust, Series 2006-DR1, Class 2A2, 6.00%, due 05/25/35 144A | 1,010,533 | ||||||||
| 419,781 | Provident Funding Mortgage Loan Trust, Series 2005-1, Class 2A1, 2.77%, due 05/25/35† | 429,061 | ||||||||
| 104 | See accompanying Notes to the Financial Statements. |
Mercer Core Opportunistic Fixed Income Fund
Schedule of Investments (Continued)
(showing percentage of net assets)
March 31, 2013
| Par Value** | Description | Value ($) | ||||||||
Mortgage Backed Securities - Private Issuers — continued | ||||||||||
| 208,746 | RBSSP Resecuritization Trust, Series 2010-3, Class 4A1, 3.45%, due 12/26/35† 144A | 211,297 | ||||||||
| 115,553 | Residential Asset Securitization Trust, Series 2003-A8, Class A2, 0.55%, due 10/25/18† | 111,980 | ||||||||
| 149,445 | Structured Asset Securities Corp., Series 2002-9, Class A2, 0.50%, due 10/25/27† | 147,978 | ||||||||
| 210,000 | UBS-Barclays Commercial Mortgage Trust, Series 2012-C4, Class AS, 3.32%, due 12/10/45 144A | 211,717 | ||||||||
| 280,000 | Wachovia Bank Commercial Mortgage Trust, Series 2007-C30, Class A5, 5.34%, due 12/15/43 | 318,469 | ||||||||
| 110,000 | Wachovia Bank Commercial Mortgage Trust, Series 2007-C30, Class AM, 5.38%, due 12/15/43 | 121,281 | ||||||||
| 40,000 | Wachovia Bank Commercial Mortgage Trust, Series 2007-C31, Class A5, 5.50%, due 04/15/47 | 46,007 | ||||||||
| 204,856 | WaMu Mortgage Pass Through Certificates, Series 2002-AR19, Class A6, 2.48%, due 02/25/33† | 206,226 | ||||||||
| 586,537 | WaMu Mortgage Pass Through Certificates, Series 2003-AR10, Class A7, 2.51%, due 10/25/33† | 604,703 | ||||||||
| 812,408 | WaMu Mortgage Pass Through Certificates, Series 2003-AR11, Class A6, 2.47%, due 10/25/33† | 832,648 | ||||||||
| 70,106 | WaMu Mortgage Pass Through Certificates, Series 2003-AR9, Class 1A7, 2.43%, due 09/25/33† | 71,756 | ||||||||
| 304,505 | WaMu Mortgage Pass Through Certificates, Series 2004-AR13, Class A1A, 0.61%, due 11/25/34† | 302,845 | ||||||||
| 749,859 | WaMu Mortgage Pass Through Certificates, Series 2004-AR14, Class A1, 2.44%, due 01/25/35† | 755,042 | ||||||||
| 429,766 | WaMu Mortgage Pass Through Certificates, Series 2004-CB2, Class 4A, 6.50%, due 08/25/34 | 465,095 | ||||||||
| 860,923 | WaMu Mortgage Pass Through Certificates, Series 2005-AR11, Class A1A, 0.52%, due 08/25/45† | 810,753 | ||||||||
| 501,664 | WaMu Mortgage Pass Through Certificates, Series 2005-AR3, Class A2, 2.50%, due 03/25/35† | 500,423 | ||||||||
| 323,857 | WaMu Mortgage Pass Through Certificates, Series 2005-AR6, Class 2A1A, 0.43%, due 04/25/45† | 299,410 | ||||||||
| 68,473 | WaMu Mortgage Pass Through Certificates, Series 2006-AR14, Class 1A1, 2.39%, due 11/25/36† | 58,281 | ||||||||
| 118,350 | Washington Mutual, Inc., Series 2005-AR13, Class A1A1, 0.49%, due 10/25/45† | 110,454 | ||||||||
| 111,839 | Washington Mutual, Inc., Series 2005-AR15, Class A1A1, 0.46%, due 11/25/45† | 102,540 | ||||||||
| 165,621 | Washington Mutual, Inc., Series 2005-AR19, Class A1A1, 0.47%, due 12/25/45† | 154,334 | ||||||||
| 207,026 | Washington Mutual, Inc., Series 2005-AR19, Class A1A2, 0.49%, due 12/25/45† | 192,030 | ||||||||
| 272,587 | Washington Mutual, Inc., Series 2006-AR14, Class 1A4, 2.39%, due 11/25/36† | 232,044 | ||||||||
| 669,486 | Washington Mutual, Inc., Series 2006-AR16, Class 1A1, 2.41%, due 12/25/36† | 569,836 | ||||||||
| 282,437 | Wells Fargo Mortgage Backed Securities Trust, Series 2004-Y, Class 1A2, 2.68%, due 11/25/34† | 286,276 | ||||||||
| 269,321 | Wells Fargo Mortgage Backed Securities Trust, Series 2005-AR8, Class 2A1, 2.74%, due 06/25/35† | 276,928 | ||||||||
| 652,314 | Wells Fargo Mortgage Loan Trust, Series 2010-RR4, Class 2A1, 3.11%, | 658,837 | ||||||||
|
| |||||||||
| 22,167,074 | ||||||||||
|
| |||||||||
| See accompanying Notes to the Financial Statements. | 105 |
Mercer Core Opportunistic Fixed Income Fund
Schedule of Investments (Continued)
(showing percentage of net assets)
March 31, 2013
| Par Value** | Description | Value ($) | ||||||||
Mortgage Backed Securities - U.S. Government Agency Obligations — 25.8% | ||||||||||
| 28,160 | FHLMC, Pool # 1N1589, 2.16%, due 05/01/37† | 29,788 | ||||||||
| 48,243 | FHLMC, Pool # 1Q0136, 2.73%, due 09/01/36† | 51,755 | ||||||||
| 395,257 | FHLMC, Pool # U61703, 3.50%, due 10/01/42 | 419,245 | ||||||||
| 99,428 | FHLMC, Pool # U61745, 3.50%, due 11/01/42 | 105,463 | ||||||||
| 993,714 | FHLMC, Pool # U90503, 3.50%, due 11/01/42 | 1,053,402 | ||||||||
| 99,544 | FHLMC, Pool # U90598, 3.50%, due 12/01/42 | 105,523 | ||||||||
| 498,418 | FHLMC, Pool # U90772, 3.50%, due 01/01/43 | 528,355 | ||||||||
| 99,680 | FHLMC, Pool # U90778, 3.50%, due 01/01/43 | 105,667 | ||||||||
| 99,690 | FHLMC, Pool # U90720, 3.50%, due 01/01/43 | 105,678 | ||||||||
| 99,707 | FHLMC, Pool # U90768, 3.50%, due 01/01/43 | 105,696 | ||||||||
| 99,832 | FHLMC, Pool # U90841, 3.50%, due 02/01/43 | 105,828 | ||||||||
| 199,680 | FHLMC, Pool # U90903, 3.50%, due 02/01/43 | 211,673 | ||||||||
| 99,849 | FHLMC, Pool # U90940, 3.50%, due 02/01/43 | 105,847 | ||||||||
| 99,859 | FHLMC, Pool # U91027, 3.50%, due 02/01/43 | 105,857 | ||||||||
| 600,000 | FHLMC, Pool # U62476, 3.50%, due 04/01/43†††† | 641,293 | ||||||||
| 7,163,148 | FHLMC, Pool # J13193, 4.00%, due 10/01/25 | 7,615,254 | ||||||||
| 1,449,782 | FHLMC, Pool # G14492, 4.00%, due 10/01/25 | 1,540,833 | ||||||||
| 1,509,339 | FHLMC, Pool # G14678, 4.00%, due 12/01/26 | 1,604,601 | ||||||||
| 1,294,660 | FHLMC, Pool # A74793, 5.00%, due 03/01/38 | 1,392,717 | ||||||||
| 1,942,477 | FHLMC, Pool # 1Q0481, 5.11%, due 02/01/38† | 2,092,620 | ||||||||
| 848,892 | FHLMC, Pool # G01749, 5.50%, due 01/01/35 | 925,887 | ||||||||
| 166,972 | FHLMC, Pool # A39306, 5.50%, due 11/01/35 | 181,907 | ||||||||
| 198,690 | FHLMC, Pool # G02427, 5.50%, due 12/01/36 | 215,780 | ||||||||
| 367,725 | FHLMC, Pool # G03695, 5.50%, due 11/01/37 | 399,354 | ||||||||
| 203,175 | FHLMC, Pool # G04222, 5.50%, due 04/01/38 | 220,079 | ||||||||
| 1,379,487 | FHLMC, Pool # G04587, 5.50%, due 08/01/38 | 1,494,158 | ||||||||
| 1,422,581 | FHLMC, Pool # G06172, 5.50%, due 12/01/38 | 1,540,941 | ||||||||
| 856,451 | FHLMC, Pool # G06875, 5.50%, due 12/01/38 | 934,132 | ||||||||
| 600,615 | FHLMC, Pool # G06020, 5.50%, due 12/01/39 | 650,587 | ||||||||
| 431,434 | FHLMC, Pool # G06945, 5.50%, due 02/01/40 | 467,329 | ||||||||
| 2,808,775 | FHLMC, Pool # 782735, 5.77%, due 09/01/36† | 3,041,596 | ||||||||
| 826,885 | FHLMC, Pool # G07117, 6.00%, due 10/01/36 | 923,590 | ||||||||
| 52,489 | FHLMC, Pool # H09061, 6.00%, due 06/01/37 | 57,029 | ||||||||
| 1,780,496 | FHLMC, Pool # G03265, 6.00%, due 08/01/37 | 1,949,221 | ||||||||
| 758,610 | FHLMC, Pool # G03362, 6.00%, due 09/01/37 | 829,550 | ||||||||
| 997,935 | FHLMC, Pool # G08271, 6.00%, due 05/01/38 | 1,090,631 | ||||||||
| 2,232,769 | FHLMC, Pool # G06409, 6.00%, due 11/01/39 | 2,448,465 | ||||||||
| 608,684 | FHLMC, Pool # G06832, 6.00%, due 03/01/40 | 666,365 | ||||||||
| 170,297 | FHLMC, Pool # G06669, 6.50%, due 09/01/39 | 193,534 | ||||||||
| 100,000 | FHLMC, 7.00%, due 04/01/43†††† | 118,063 | ||||||||
| 101,168 | FHLMC, Series 2808, Class FT, 0.55%, due 04/15/33† | 101,278 | ||||||||
| 1,654,957 | FHLMC Multifamily Structured Pass Through Certificates, (IO), Series K006, Class AX1, 1.05%, due 01/25/20† | 96,656 | ||||||||
| 3,191,943 | FHLMC Multifamily Structured Pass Through Certificates, (IO), Series K007, Class X1, 1.23%, due 04/25/20† | 210,576 | ||||||||
| 3,902,781 | FHLMC Multifamily Structured Pass Through Certificates, (IO), Series K008, Class X1, 1.67%, due 06/25/20† | 361,554 | ||||||||
| 1,769,724 | FHLMC Multifamily Structured Pass Through Certificates, (IO), Series K009, Class X1, 1.50%, due 08/25/20† | 143,838 | ||||||||
| 106 | See accompanying Notes to the Financial Statements. |
Mercer Core Opportunistic Fixed Income Fund
Schedule of Investments (Continued)
(showing percentage of net assets)
March 31, 2013
| Par Value** | Description | Value ($) | ||||||||
Mortgage Backed Securities - U.S. Government Agency Obligations — continued | ||||||||||
| 1,731,159 | FHLMC Multifamily Structured Pass Through Certificates, (IO), Series K702, Class X1, 1.55%, due 02/25/18† | 113,928 | ||||||||
| 451,584 | FHLMC Reference REMIC, Series R007, Class ZA, 6.00%, due 05/15/36 | 507,972 | ||||||||
| 388,995 | FHLMC Structured Pass Through Securities, Series T-61, Class 1A1, 1.58%, due 07/25/44† | 398,950 | ||||||||
| 3,300,000 | FHLMC TBA, 2.50%, due 04/01/27 | 3,417,562 | ||||||||
| 10,500,000 | FHLMC TBA, 3.50%, due 12/01/41 | 11,052,481 | ||||||||
| 981,580 | FNMA, Pool # AP9633, 2.50%, due 10/01/42 | 971,785 | ||||||||
| 199,364 | FNMA, Pool # AQ7306, 3.00%, due 01/01/43 | 203,978 | ||||||||
| 99,517 | FNMA, Pool # AR1198, 3.00%, due 01/01/43 | 101,821 | ||||||||
| 199,047 | FNMA, Pool # AR1202, 3.00%, due 01/01/43 | 203,654 | ||||||||
| 387,999 | FNMA, Pool # AE2641, 3.50%, due 10/01/25 | 411,577 | ||||||||
| 1,870,381 | FNMA, Pool # AH2430, 3.50%, due 01/01/26 | 1,984,038 | ||||||||
| 1,533,089 | FNMA, Pool # AE2148, 3.50%, due 02/01/26 | 1,626,729 | ||||||||
| 1,150,547 | FNMA, Pool # AE3507, 3.50%, due 02/01/26 | 1,220,463 | ||||||||
| 201,993 | FNMA, Pool # AL0554, 3.50%, due 08/01/26 | 214,331 | ||||||||
| 596,476 | FNMA, Pool # AQ5369, 3.50%, due 12/01/42 | 633,793 | ||||||||
| 596,734 | FNMA, Pool # AQ7083, 3.50%, due 12/01/42 | 634,067 | ||||||||
| 496,575 | FNMA, Pool # AB7130, 3.50%, due 12/01/42 | 527,642 | ||||||||
| 2,974,496 | FNMA, Pool # MA0587, 4.00%, due 12/01/30 | 3,195,353 | ||||||||
| 82,850 | FNMA, Pool # 776565, 4.00%, due 04/01/34 | 88,898 | ||||||||
| 518,698 | FNMA, Pool # AH1338, 4.00%, due 12/01/40 | 566,288 | ||||||||
| 148,634 | FNMA, Pool # AH6392, 4.00%, due 02/01/41 | 162,132 | ||||||||
| 1,189,384 | FNMA, Pool # AJ5304, 4.00%, due 11/01/41 | 1,269,333 | ||||||||
| 1,931,788 | FNMA, Pool # AJ7689, 4.00%, due 12/01/41 | 2,061,640 | ||||||||
| 396,988 | FNMA, Pool # AP9766, 4.00%, due 10/01/42 | 433,288 | ||||||||
| 32,607 | FNMA, Pool # 254802, 4.50%, due 07/01/18 | 35,173 | ||||||||
| 276,920 | FNMA, Pool # MA0706, 4.50%, due 04/01/31 | 300,046 | ||||||||
| 873,261 | FNMA, Pool # MA0734, 4.50%, due 05/01/31 | 946,187 | ||||||||
| 271,576 | FNMA, Pool # MA0776, 4.50%, due 06/01/31 | 294,256 | ||||||||
| 261,456 | FNMA, Pool # MA0913, 4.50%, due 11/01/31 | 284,598 | ||||||||
| 268,511 | FNMA, Pool # MA0939, 4.50%, due 12/01/31 | 292,277 | ||||||||
| 81,003 | FNMA, Pool # MA0968, 4.50%, due 12/01/31 | 88,123 | ||||||||
| 2,893,538 | FNMA, Pool # AL0215, 4.50%, due 04/01/41 | 3,169,540 | ||||||||
| 1,100,000 | FNMA, Pool # AL3429, 4.50%, due 06/01/41 | 1,184,734 | ||||||||
| 485,624 | FNMA, Pool # AB3517, 4.50%, due 09/01/41 | 531,946 | ||||||||
| 600,000 | FNMA, Pool # AL3414, 4.50%, due 09/01/41 | 646,219 | ||||||||
| 5,658,310 | FNMA, Pool # AL2439, 5.00%, due 06/01/26 | 6,110,701 | ||||||||
| 135,994 | FNMA, Pool # 254793, 5.00%, due 07/01/33 | 148,207 | ||||||||
| 155,083 | FNMA, Pool # 555743, 5.00%, due 09/01/33 | 169,010 | ||||||||
| 476,220 | FNMA, Pool # 889117, 5.00%, due 10/01/35 | 518,986 | ||||||||
| 589,118 | FNMA, Pool # AL0476, 5.00%, due 11/01/40 | 655,645 | ||||||||
| 77,933 | FNMA, Pool # AI0511, 5.00%, due 04/01/41 | 86,733 | ||||||||
| 151,365 | FNMA, Pool # AI1863, 5.00%, due 05/01/41 | 168,458 | ||||||||
| 683,877 | FNMA, Pool # AI1892, 5.00%, due 05/01/41 | 761,105 | ||||||||
| 170,149 | FNMA, Pool # AI2433, 5.00%, due 05/01/41 | 189,363 | ||||||||
| 82,064 | FNMA, Pool # AI2443, 5.00%, due 05/01/41 | 91,332 | ||||||||
| 87,650 | FNMA, Pool # AI2462, 5.00%, due 05/01/41 | 97,548 | ||||||||
| See accompanying Notes to the Financial Statements. | 107 |
Mercer Core Opportunistic Fixed Income Fund
Schedule of Investments (Continued)
(showing percentage of net assets)
March 31, 2013
| Par Value** | Description | Value ($) | ||||||||
Mortgage Backed Securities - U.S. Government Agency Obligations — continued | ||||||||||
| 90,214 | FNMA, Pool # AI4261, 5.00%, due 06/01/41 | 100,401 | ||||||||
| 300,000 | FNMA, Pool # AL3192, 5.00%, due 05/01/42 | 329,566 | ||||||||
| 550,735 | FNMA, Pool # AE0011, 5.50%, due 09/01/23 | 603,136 | ||||||||
| 2,399,682 | FNMA, Pool # 995253, 5.50%, due 12/01/23 | 2,628,004 | ||||||||
| 3,334,107 | FNMA, Pool # AL0278, 5.50%, due 01/01/25 | 3,651,337 | ||||||||
| 20,482 | FNMA, Pool # 254548, 5.50%, due 12/01/32 | 22,581 | ||||||||
| 2,399,977 | FNMA, Pool # 704235, 5.50%, due 05/01/33 | 2,642,875 | ||||||||
| 214,808 | FNMA, Pool # 555591, 5.50%, due 07/01/33 | 236,548 | ||||||||
| 2,688,922 | FNMA, Pool # 725221, 5.50%, due 01/01/34 | 2,961,064 | ||||||||
| 130,383 | FNMA, Pool # 735224, 5.50%, due 02/01/35 | 143,578 | ||||||||
| 298,287 | FNMA, Pool # 990906, 5.50%, due 10/01/35 | 329,129 | ||||||||
| 1,541,799 | FNMA, Pool # 849077, 5.50%, due 01/01/36 | 1,691,579 | ||||||||
| 45,475 | FNMA, Pool # 852523, 5.50%, due 02/01/36 | 49,666 | ||||||||
| 171,392 | FNMA, Pool # 878059, 5.50%, due 03/01/36 | 187,185 | ||||||||
| 46,113 | FNMA, Pool # 256219, 5.50%, due 04/01/36 | 49,707 | ||||||||
| 154,273 | FNMA, Pool # 868658, 5.50%, due 04/01/36 | 168,489 | ||||||||
| 176,178 | FNMA, Pool # 190375, 5.50%, due 11/01/36 | 192,412 | ||||||||
| 410,691 | FNMA, Pool # 995072, 5.50%, due 08/01/38 | 456,107 | ||||||||
| 1,301,589 | FNMA, Pool # 745506, 5.66%, due 02/01/16 | 1,450,671 | ||||||||
| 2,668,051 | FNMA, Pool # AL0144, 5.83%, due 11/01/37† | 2,888,651 | ||||||||
| 22,944 | FNMA, Pool # 840483, 6.00%, due 11/01/21 | 25,072 | ||||||||
| 405,689 | FNMA, Pool # 256517, 6.00%, due 12/01/26 | 447,192 | ||||||||
| 404,768 | FNMA, Pool # 256962, 6.00%, due 11/01/27 | 447,568 | ||||||||
| 156,039 | FNMA, Pool # 985626, 6.00%, due 04/01/33 | 175,635 | ||||||||
| 4,019,059 | FNMA, Pool # 725162, 6.00%, due 02/01/34 | 4,464,514 | ||||||||
| 17,962 | FNMA, Pool # 745000, 6.00%, due 10/01/35 | 19,951 | ||||||||
| 363,280 | FNMA, Pool # 888560, 6.00%, due 11/01/35 | 408,901 | ||||||||
| 90,244 | FNMA, Pool # 882524, 6.00%, due 05/01/36 | 99,096 | ||||||||
| 34,462 | FNMA, Pool # 887324, 6.00%, due 08/01/36 | 37,842 | ||||||||
| 77,489 | FNMA, Pool # 893282, 6.00%, due 08/01/36 | 85,090 | ||||||||
| 9,700 | FNMA, Pool # 900746, 6.00%, due 09/01/36 | 10,640 | ||||||||
| 134,470 | FNMA, Pool # 878210, 6.00%, due 09/01/36 | 147,660 | ||||||||
| 4,405 | FNMA, Pool # 882321, 6.00%, due 09/01/36 | 4,837 | ||||||||
| 112,902 | FNMA, Pool # 898198, 6.00%, due 11/01/36 | 123,976 | ||||||||
| 475,091 | FNMA, Pool # 948690, 6.00%, due 08/01/37 | 530,924 | ||||||||
| 758,760 | FNMA, Pool # 890248, 6.00%, due 08/01/37 | 853,941 | ||||||||
| 36,355 | FNMA, Pool # AD0217, 6.00%, due 08/01/37 | 40,914 | ||||||||
| 148,382 | FNMA, Pool # 888736, 6.00%, due 10/01/37 | 161,104 | ||||||||
| 259,000 | FNMA, Pool # 955166, 6.00%, due 11/01/37 | 281,207 | ||||||||
| 4,054,859 | FNMA, Pool # 967691, 6.00%, due 01/01/38 | 4,447,504 | ||||||||
| 1,612,184 | FNMA, Pool # AL0406, 6.00%, due 06/01/38 | 1,750,411 | ||||||||
| 498,129 | FNMA, Pool # AL0852, 6.00%, due 06/01/38 | 540,838 | ||||||||
| 1,106,389 | FNMA, Pool # AL0901, 6.00%, due 07/01/38 | 1,201,251 | ||||||||
| 429,593 | FNMA, Pool # AE0028, 6.00%, due 10/01/39 | 471,729 | ||||||||
| 2,120,255 | FNMA, Pool # AE0469, 6.00%, due 12/01/39 | 2,325,566 | ||||||||
| 386,246 | FNMA, Pool # AE0616, 6.00%, due 03/01/40 | 423,648 | ||||||||
| 809,400 | FNMA, Pool # AL2688, 6.00%, due 10/01/40 | 887,777 | ||||||||
| 9,825 | FNMA, Pool # 869972, 6.50%, due 04/01/36 | 11,334 | ||||||||
| 108 | See accompanying Notes to the Financial Statements. |
Mercer Core Opportunistic Fixed Income Fund
Schedule of Investments (Continued)
(showing percentage of net assets)
March 31, 2013
| Par Value** | Description | Value ($) | ||||||||
Mortgage Backed Securities - U.S. Government Agency Obligations — continued | ||||||||||
| 1,880,093 | FNMA, Pool # 256421, 6.50%, due 09/01/36 | 2,080,656 | ||||||||
| 87,336 | FNMA, Pool # 955797, 6.50%, due 10/01/37 | 97,671 | ||||||||
| 1,412,612 | FNMA, Pool # AL0778, 6.50%, due 01/01/49 | 1,554,918 | ||||||||
| 3,061,108 | FNMA, Pool # 888369, 7.00%, due 03/01/37 | 3,503,389 | ||||||||
| 50,496 | FNMA, Pool # 924874, 7.00%, due 10/01/37 | 60,019 | ||||||||
| 8,726 | FNMA, Pool # 949563, 7.00%, due 11/01/37 | 10,372 | ||||||||
| 12,793 | FNMA, Pool # 955183, 7.00%, due 11/01/37 | 15,205 | ||||||||
| 23,713 | FNMA, Pool # 928938, 7.00%, due 12/01/37 | 28,185 | ||||||||
| 20,483 | FNMA, Pool # 968252, 7.00%, due 02/01/38 | 24,369 | ||||||||
| 16,077 | FNMA, Pool # 974156, 7.00%, due 02/01/38 | 19,128 | ||||||||
| 49,544 | FNMA, Pool # 985867, 7.00%, due 08/01/38 | 58,944 | ||||||||
| 8,672 | FNMA, Pool # 987891, 7.00%, due 09/01/38 | 10,317 | ||||||||
| 207,673 | FNMA, Pool # 934648, 7.00%, due 11/01/38 | 247,077 | ||||||||
| 13,347 | FNMA, Pool # 934202, 7.00%, due 11/01/38 | 15,880 | ||||||||
| 25,263 | FNMA, Pool # 992249, 7.00%, due 11/01/38 | 30,056 | ||||||||
| 30,965 | FNMA, Pool # 991549, 7.00%, due 11/01/38 | 36,840 | ||||||||
| 1,245,594 | FNMA, Pool # AE0758, 7.00%, due 02/01/39 | 1,480,485 | ||||||||
| 3,400,963 | FNMA, Series 2007-70, Class Z, 5.50%, due 07/25/37 | 3,904,606 | ||||||||
| 1,100,792 | FNMA, Series 2011-59, Class NZ, 5.50%, due 07/25/41 | 1,330,761 | ||||||||
| 1,971,126 | FNMA, Series 2012-134, Class FD, 0.55%, due 12/25/42† | 1,973,905 | ||||||||
| 292,490 | FNMA, Series 2012-28, Class B, 6.50%, due 06/25/39 | 328,801 | ||||||||
| 893,764 | FNMA, Series 2012-46, Class BA, 6.00%, due 05/25/42 | 985,582 | ||||||||
| 900,000 | FNMA, Series 2013-9, Class BC, 6.50%, due 07/25/42 | 1,081,270 | ||||||||
| 1,100,000 | FNMA, Series 2013-9, Class CB, 5.50%, due 04/25/42 | 1,276,422 | ||||||||
| 102,399 | FNMA Grantor Trust, Series 2004-T1, Class 1A2, 6.50%, due 01/25/44 | 122,784 | ||||||||
| 22,833 | FNMA REMIC Trust, Series 2003-W1, Class 1A1, 6.12%, due 12/25/42† | 26,670 | ||||||||
| 1,373,470 | FNMA REMIC Trust 2007-W1, Series 2007-W10, Class 2A, 6.26%, due 08/25/47† | 1,609,173 | ||||||||
| 13,300,000 | FNMA TBA, 2.50%, due 08/01/27 | 13,800,829 | ||||||||
| 400,000 | FNMA TBA, 2.50%, due 11/01/42 | 396,594 | ||||||||
| 2,000,000 | FNMA TBA, 3.00%, due 09/01/42 | 2,063,437 | ||||||||
| 9,500,000 | FNMA TBA, 3.50%, due 01/01/42 | 10,034,375 | ||||||||
| 1,000,000 | FNMA TBA, 4.00%, due 04/01/24 | 1,070,117 | ||||||||
| 24,000,000 | FNMA TBA, 4.00%, due 08/01/40 | 25,593,751 | ||||||||
| 18,000,000 | FNMA TBA, 4.00%, due 08/01/40 | 19,172,813 | ||||||||
| 500,000 | FNMA TBA, 4.50%, due 03/01/21 | 538,027 | ||||||||
| 146,954 | FNMA Trust, Series 2004-W9, Class 2A1, 6.50%, due 02/25/44 | 172,654 | ||||||||
| 710,027 | FNMA, (IO), Series 2011-63, Class SW, 6.48%, due 07/25/41† | 106,996 | ||||||||
| 443,764 | GNMA, Pool # 004617, 4.50%, due 01/20/40 | 491,637 | ||||||||
| 370,690 | GNMA, Pool # 734712, 4.50%, due 03/15/40 | 406,844 | ||||||||
| 598,503 | GNMA, Pool # 004696, 4.50%, due 05/20/40 | 662,231 | ||||||||
| 140,424 | GNMA, Pool # 004854, 4.50%, due 11/20/40 | 155,376 | ||||||||
| 285,589 | GNMA, Pool # 004883, 4.50%, due 12/20/40 | 315,998 | ||||||||
| 69,300 | GNMA, Pool # 004923, 4.50%, due 01/20/41 | 76,679 | ||||||||
| 4,116,933 | GNMA, Pool # 004978, 4.50%, due 03/20/41 | 4,555,298 | ||||||||
| 614,789 | GNMA, Pool # 783368, 4.50%, due 07/20/41 | 677,558 | ||||||||
| 229,228 | GNMA, Pool # 641779, 5.00%, due 09/15/35 | 250,510 | ||||||||
| 139,440 | GNMA, Pool # 733600, 5.00%, due 04/15/40 | 152,589 | ||||||||
| 432,204 | GNMA, Pool # 733627, 5.00%, due 05/15/40 | 472,960 | ||||||||
| See accompanying Notes to the Financial Statements. | 109 |
Mercer Core Opportunistic Fixed Income Fund
Schedule of Investments (Continued)
(showing percentage of net assets)
March 31, 2013
| Par Value** | Description | Value ($) | ||||||||
Mortgage Backed Securities - U.S. Government Agency Obligations — continued | ||||||||||
| 59,123 | GNMA, Pool # 004747, 5.00%, due 07/20/40 | 65,647 | ||||||||
| 59,242 | GNMA, Pool # 783050, 5.00%, due 07/20/40 | 65,188 | ||||||||
| 229,209 | GNMA, Pool # 004802, 5.00%, due 09/20/40 | 252,439 | ||||||||
| 306,152 | GNMA, Pool # 510835, 5.50%, due 02/15/35 | 336,729 | ||||||||
| 365,188 | GNMA, Pool # 783704, 5.50%, due 06/15/36 | 402,003 | ||||||||
| 11,755 | GNMA, Pool # 002657, 6.00%, due 10/20/28 | 13,306 | ||||||||
| 13,279 | GNMA, Pool # 003489, 6.00%, due 12/20/33 | 15,088 | ||||||||
| 71,053 | GNMA, Pool # 003879, 6.00%, due 07/20/36 | 80,198 | ||||||||
| 9,544 | GNMA, Pool # 003920, 6.00%, due 11/20/36 | 10,773 | ||||||||
| 563,186 | GNMA, Pool # 004145, 6.00%, due 05/20/38 | 634,271 | ||||||||
| 239,023 | GNMA, Pool # 004195, 6.00%, due 07/20/38 | 269,192 | ||||||||
| 8,915 | GNMA, Pool # 004245, 6.00%, due 09/20/38 | 10,207 | ||||||||
| 107,426 | GNMA, Pool # 004580, 6.00%, due 11/20/39 | 121,362 | ||||||||
| 149,827 | GNMA, Pool # 004602, 6.00%, due 12/20/39 | 168,738 | ||||||||
| 87,020 | GNMA, Pool # 004620, 6.00%, due 01/20/40 | 98,004 | ||||||||
| 163,874 | GNMA, Pool # 004639, 6.00%, due 02/20/40 | 184,558 | ||||||||
| 290,936 | GNMA, Pool # 004774, 6.00%, due 08/20/40 | 328,385 | ||||||||
| 57,053 | GNMA, Pool # 004804, 6.00%, due 09/20/40 | 64,575 | ||||||||
| 548,367 | GNMA, Pool # 004837, 6.00%, due 10/20/40 | 620,666 | ||||||||
| 344,204 | GNMA, Pool # 004871, 6.00%, due 11/20/40 | 390,661 | ||||||||
| 372,141 | GNMA, Pool # 004928, 6.00%, due 01/20/41 | 421,206 | ||||||||
| 305,500 | GNMA, Pool # 004991, 6.00%, due 03/20/41 | 345,778 | ||||||||
| 805,408 | GNMA, Pool # 005063, 6.00%, due 05/20/41 | 909,079 | ||||||||
| 322,996 | GNMA, Pool # 004040, 6.50%, due 10/20/37 | 372,584 | ||||||||
| 1,000,000 | GNMA TBA, 2.50%, due 10/01/42 | 993,672 | ||||||||
| 39,300,000 | GNMA TBA, 3.00%, due 09/01/42 | 41,093,062 | ||||||||
| 1,300,000 | GNMA TBA, 3.50%, due 11/01/41 | 1,398,719 | ||||||||
| 500,000 | GNMA TBA, 3.50%, due 04/01/42 | 534,766 | ||||||||
| 1,000,000 | GNMA TBA, 4.00%, due 08/01/40 | 1,090,195 | ||||||||
| 293,754 | GNMA, (IO), Series 2010-31, Class GS, 6.30%, due 03/20/39† | 43,193 | ||||||||
| 92,168 | GNMA, (IO), Series 2011-32, Class S, 5.80%, due 03/16/41† | 11,007 | ||||||||
| 608,675 | GNMA, (IO), Series 2011-70, Class BS, 6.50%, due 12/16/36† | 80,626 | ||||||||
|
| |||||||||
| 281,776,528 | ||||||||||
|
| |||||||||
Municipal Obligations — 4.6% | ||||||||||
| 2,250,000 | American Municipal Power-Ohio, Inc., 8.08%, due 02/15/50 | 3,348,518 | ||||||||
| 2,700,000 | California East Bay Municipal Utility District, 5.87%, due 06/01/40 | 3,515,697 | ||||||||
| 600,000 | Chicago Transit Authority, Series A, 6.90%, due 12/01/40 | 736,644 | ||||||||
| 600,000 | Chicago Transit Authority, Series B, 6.90%, due 12/01/40 | 736,644 | ||||||||
| 3,405,000 | Irvine Ranch Water District Joint Powers Agency, 2.39%, due 03/15/14 | 3,412,593 | ||||||||
| 155,000 | Los Angeles Unified School District, 5.75%, due 07/01/34 | 189,805 | ||||||||
| 1,235,000 | Los Angeles Unified School District, 6.76%, due 07/01/34 | 1,670,103 | ||||||||
| 1,250,000 | New Jersey State Turnpike Authority, 7.10%, due 01/01/41 | 1,765,313 | ||||||||
| 1,800,000 | New York City Transitional Finance Authority, 4.73%, due 11/01/23 | 2,113,488 | ||||||||
| 1,300,000 | New York City Transitional Finance Authority, 4.91%, due 11/01/24 | 1,556,178 | ||||||||
| 1,300,000 | New York City Transitional Finance Authority, 5.08%, due 11/01/25 | 1,576,289 | ||||||||
| 3,000,000 | New York State Urban Development Corp., 5.00%, due 03/15/23 | 3,607,140 | ||||||||
| 500,000 | Northstar Education Finance, Inc., 1.71%, due 01/29/46† | 446,321 | ||||||||
| 110 | See accompanying Notes to the Financial Statements. |
Mercer Core Opportunistic Fixed Income Fund
Schedule of Investments (Continued)
(showing percentage of net assets)
March 31, 2013
| Par Value** | Description | Value ($) | ||||||||
Municipal Obligations — continued | ||||||||||
| 3,100,000 | Ohio Tobacco Settlement Financing Authority, 6.50%, due 06/01/47 | 3,024,949 | ||||||||
| 1,100,000 | Port Authority of New York and New Jersey, 4.46%, due 10/01/62 | 1,099,571 | ||||||||
| 900,000 | Southwest Student Services Corp., 0.08%, due 12/01/18† | 828,678 | ||||||||
| 350,000 | Southwest Student Services Corp., 0.51%, due 12/01/36† | 313,091 | ||||||||
| 4,150,000 | State of California General Obligation, 7.30%, due 10/01/39 | 5,760,532 | ||||||||
| 1,360,000 | State of California General Obligation, 7.50%, due 04/01/34 | 1,894,262 | ||||||||
| 1,700,000 | State of California General Obligation, 7.55%, due 04/01/39 | 2,455,939 | ||||||||
| 925,000 | State of Illinois General Obligation, 4.96%, due 03/01/16 | 1,013,624 | ||||||||
| 1,600,000 | State of Illinois General Obligation, 5.37%, due 03/01/17 | 1,790,656 | ||||||||
| 2,025,000 | State of Illinois General Obligation, 5.67%, due 03/01/18 | 2,315,405 | ||||||||
| 1,000,000 | State of Kentucky Property & Building Commission, 4.30%, due 11/01/19 | 1,128,120 | ||||||||
| 1,200,000 | State of Kentucky Property & Building Commission, 4.40%, due 11/01/20 | 1,372,764 | ||||||||
| 2,400,000 | State of Kentucky Property & Building Commission, 5.37%, due 11/01/25 | 2,803,872 | ||||||||
|
| |||||||||
| 50,476,196 | ||||||||||
|
| |||||||||
Sovereign Debt Obligations — 2.1% | ||||||||||
| 3,000,000 | EUR | Bundesschatzanweisungen, 0.75%, due 09/13/13 | 3,865,184 | |||||||
| 4,500,000 | EUR | Bundesschatzanweisungen, 1.75%, due 06/14/13 | 5,798,827 | |||||||
| 2,500,000 | Korea Housing Finance Corp., Reg S, 4.13%, due 12/15/15‡‡‡ | 2,698,830 | ||||||||
| 46,342,000 | MXN | Mexican Bonos, 6.50%, due 06/09/22 | 4,199,558 | |||||||
| 19,860,000 | MXN | Mexican Bonos, 8.00%, due 06/11/20 | 1,927,409 | |||||||
| 140,000 | Mexico Government International Bond, 4.75%, due 03/08/44 | 145,600 | ||||||||
| 2,600,000 | Province of Ontario Canada, 2.70%, due 06/16/15 | 2,725,686 | ||||||||
| 1,500,000 | Spain Government International Bond, 4.00%, due 03/06/18 144A | 1,488,150 | ||||||||
| 304,224 | GBP | United Kingdom Gilt Inflation Linked, 0.13%, due 03/22/24‡‡‡‡ | 536,716 | |||||||
|
| |||||||||
| 23,385,960 | ||||||||||
|
| |||||||||
U.S. Government and Agency Obligations — 31.2% | ||||||||||
| 348,339 | FHLMC, 1.99%, due 02/01/37† | 367,388 | ||||||||
| 280,000 | Financing Corp. FICO STRIPS, (PO), Series B, 0.92%, due 04/06/18‡‡ | 267,605 | ||||||||
| 350,000 | Financing Corp. FICO STRIPS, (PO), Series 1, 0.96%, due 05/11/18‡‡ | 333,576 | ||||||||
| 90,000 | Financing Corp. FICO STRIPS, (PO), Series 11, 0.99%, due 02/08/18‡‡ | 85,873 | ||||||||
| 270,000 | Financing Corp. FICO STRIPS, (PO), Series 7, 1.12%, due 08/03/18‡‡ | 254,680 | ||||||||
| 150,000 | Financing Corp. FICO STRIPS, (PO), Series 7, 1.12%, due 08/03/18‡‡ | 141,489 | ||||||||
| 140,000 | Financing Corp. FICO STRIPS, (PO), Series 8, 1.12%, due 08/03/18‡‡ | 132,057 | ||||||||
| 330,000 | Financing Corp. FICO STRIPS, (PO), Series D, 1.12%, due 08/03/18‡‡ | 311,276 | ||||||||
| 330,000 | Financing Corp. FICO STRIPS, (PO), Series E, 1.17%, due 11/02/18‡‡ | 309,703 | ||||||||
| 150,000 | Financing Corp. FICO STRIPS, (PO), Series 15, 1.35%, due 03/07/19‡‡ | 138,817 | ||||||||
| 50,000 | Financing Corp. FICO STRIPS, (PO), Series 19, 1.40%, due 06/06/19‡‡ | 45,982 | ||||||||
| 20,000 | Financing Corp. FICO STRIPS, (PO), Series D, 1.55%, due 09/26/19‡‡ | 18,160 | ||||||||
| 216,917 | FNMA, Series 2004-38, Class FK, 0.55%, due 05/25/34† | 217,637 | ||||||||
| 269,984 | FNMA, 1.45%, due 08/01/37† | 288,316 | ||||||||
| 830,000 | FNMA, 1.92%, due 10/09/19‡‡ | 736,747 | ||||||||
| 90,035 | FNMA, 2.90%, due 09/01/35† | 96,272 | ||||||||
| 1,235,000 | FNMA, 6.63%, due 11/15/30 | 1,844,233 | ||||||||
| 1,100,331 | GNMA, 0.58%, due 12/20/60† | 1,103,463 | ||||||||
| 1,945,003 | GNMA, 0.65%, due 02/20/61† | 1,957,181 | ||||||||
| 1,888,145 | GNMA, 0.70%, due 01/20/61† | 1,903,839 | ||||||||
| 460,877 | GNMA, 0.70%, due 03/20/61† | 464,872 | ||||||||
| See accompanying Notes to the Financial Statements. | 111 |
Mercer Core Opportunistic Fixed Income Fund
Schedule of Investments (Continued)
(showing percentage of net assets)
March 31, 2013
| Par Value** | Description | Value ($) | ||||||||
U.S. Government and Agency Obligations — continued | ||||||||||
| 1,135,208 | GNMA, (IO), 6.35%, due 11/20/38† | 147,251 | ||||||||
| 764,746 | GNMA, (IO), 6.45%, due 01/20/40† | 121,466 | ||||||||
| 4,000,000 | Overseas Private Investment Corp., (2.54)%, due 11/18/13‡‡ | 4,065,472 | ||||||||
| 190,000 | Tennessee Valley Authority, 5.25%, due 09/15/39 | 243,380 | ||||||||
| 2,664,000 | U.S. Treasury Bond, 2.75%, due 08/15/42 | 2,472,109 | ||||||||
| 7,090,600 | U.S. Treasury Bond, 2.75%, due 11/15/42 | 6,573,206 | ||||||||
| 120,000 | U.S. Treasury Bond, 3.13%, due 02/15/42 | 120,619 | ||||||||
| 1,610,000 | U.S. Treasury Bond, 3.13%, due 02/15/43 | 1,613,270 | ||||||||
| 2,600,000 | U.S. Treasury Bond, 3.88%, due 08/15/40 | 3,007,875 | ||||||||
| 200,000 | U.S. Treasury Bond, 4.25%, due 11/15/40 | 245,938 | ||||||||
| 200,000 | U.S. Treasury Bond, 4.38%, due 02/15/38 | 250,063 | ||||||||
| 4,000,000 | U.S. Treasury Bond, 4.50%, due 02/15/36(a) | 5,081,252 | ||||||||
| 400,000 | U.S. Treasury Bond, 6.25%, due 08/15/23 | 566,188 | ||||||||
| 800,000 | U.S. Treasury Bond, 7.50%, due 11/15/24 | 1,254,625 | ||||||||
| 3,764,121 | U.S. Treasury Inflation Indexed Bond, 0.13%, due 01/15/22 | 4,099,068 | ||||||||
| 2,503,200 | U.S. Treasury Inflation Indexed Bond, 0.13%, due 07/15/22 | 2,730,248 | ||||||||
| 1,097,316 | U.S. Treasury Inflation Indexed Bond, 0.13%, due 01/15/23 | 1,185,016 | ||||||||
| 917,118 | U.S. Treasury Inflation Indexed Bond, 0.75%, due 02/15/42 | 960,036 | ||||||||
| 8,420,800 | U.S. Treasury Inflation Indexed Bond, 1.13%, due 01/15/21(a) | 9,935,230 | ||||||||
| 527,910 | U.S. Treasury Inflation Indexed Bond, 1.25%, due 07/15/20 | 631,059 | ||||||||
| 1,502,101 | U.S. Treasury Inflation Indexed Bond, 2.13%, due 02/15/40 | 2,120,662 | ||||||||
| 2,208,045 | U.S. Treasury Inflation Indexed Bond, 2.13%, due 02/15/41 | 3,131,284 | ||||||||
| 400,000 | U.S. Treasury Note, 0.13%, due 12/31/13 | 400,000 | ||||||||
| 3,200,000 | U.S. Treasury Note, 0.25%, due 11/30/13 | 3,202,627 | ||||||||
| 6,300,000 | U.S. Treasury Note, 0.25%, due 01/31/14 | 6,306,155 | ||||||||
| 13,500,000 | U.S. Treasury Note, 0.25%, due 02/28/14 | 13,513,189 | ||||||||
| 18,200,000 | U.S. Treasury Note, 0.25%, due 03/31/14 | 18,216,362 | ||||||||
| 2,300,000 | U.S. Treasury Note, 0.25%, due 09/15/15 | 2,297,125 | ||||||||
| 2,700,000 | U.S. Treasury Note, 0.25%, due 10/15/15 | 2,695,993 | ||||||||
| 12,500,000 | U.S. Treasury Note, 0.38%, due 02/15/16 | 12,509,762 | ||||||||
| 300,000 | U.S. Treasury Note, 0.50%, due 11/15/13 | 300,727 | ||||||||
| 500,000 | U.S. Treasury Note, 0.75%, due 12/15/13 | 502,187 | ||||||||
| 8,560,000 | U.S. Treasury Note, 0.75%, due 06/30/17 | 8,610,829 | ||||||||
| 60,000 | U.S. Treasury Note, 0.75%, due 02/28/18 | 60,009 | ||||||||
| 28,500,000 | U.S. Treasury Note, 1.00%, due 01/15/14 | 28,695,937 | ||||||||
| 4,500,000 | U.S. Treasury Note, 1.00%, due 05/15/14 | 4,541,661 | ||||||||
| 8,400,000 | U.S. Treasury Note, 1.25%, due 02/15/14 | 8,481,052 | ||||||||
| 9,400,000 | U.S. Treasury Note, 1.25%, due 03/15/14 | 9,498,409 | ||||||||
| 3,600,000 | U.S. Treasury Note, 1.25%, due 04/15/14 | 3,640,500 | ||||||||
| 25,530,000 | U.S. Treasury Note, 1.25%, due 02/29/20 | 25,573,886 | ||||||||
| 14,590,000 | U.S. Treasury Note, 1.38%, due 01/31/20 | 14,758,704 | ||||||||
| 500,000 | U.S. Treasury Note, 1.50%, due 12/31/13 | 505,117 | ||||||||
| 17,500,000 | U.S. Treasury Note, 1.50%, due 07/31/16 | 18,120,707 | ||||||||
| 1,800,000 | U.S. Treasury Note, 1.63%, due 08/15/22 | 1,777,079 | ||||||||
| 3,428,000 | U.S. Treasury Note, 1.63%, due 11/15/22 | 3,367,743 | ||||||||
| 2,700,000 | U.S. Treasury Note, 1.75%, due 01/31/14 | 2,736,283 | ||||||||
| 300,000 | U.S. Treasury Note, 1.75%, due 05/15/22 | 300,914 | ||||||||
| 12,700,000 | U.S. Treasury Note, 1.88%, due 02/28/14 | 12,899,923 | ||||||||
| 100,000 | U.S. Treasury Note, 1.88%, due 08/31/17 | 105,391 | ||||||||
| 32,800,000 | U.S. Treasury Note, 2.00%, due 11/15/21(a) | 33,830,117 | ||||||||
| 112 | See accompanying Notes to the Financial Statements. |
Mercer Core Opportunistic Fixed Income Fund
Schedule of Investments (Continued)
(showing percentage of net assets)
March 31, 2013
| Par Value** | Description | Value ($) | ||||||||
U.S. Government and Agency Obligations — continued | ||||||||||
| 11,700,000 | U.S. Treasury Note, 2.00%, due 02/15/22 | 12,029,975 | ||||||||
| 5,540,000 | U.S. Treasury Note, 2.00%, due 02/15/23 | 5,610,984 | ||||||||
| 5,700,000 | U.S. Treasury Note, 2.13%, due 08/15/21 | 5,957,389 | ||||||||
| 12,000,000 | U.S. Treasury Note, 2.63%, due 11/15/20 | 13,090,320 | ||||||||
| 5,100,000 | U.S. Treasury Note, 2.75%, due 02/15/19 | 5,623,546 | ||||||||
|
| |||||||||
| 341,335,085 | ||||||||||
|
| |||||||||
TOTAL DEBT OBLIGATIONS (COST $1,099,856,291) | 1,143,437,402 | |||||||||
|
| |||||||||
| Shares | Description | Value ($) | ||||||||
COMMON STOCKS — 0.1% | ||||||||||
Auto Manufacturers — 0.1% | ||||||||||
| 8,312 | General Motors Co.* | 231,240 | ||||||||
| 2,087 | Motors Liquidation Co. GUC Trust* | 56,349 | ||||||||
|
| |||||||||
| 287,589 | ||||||||||
|
| |||||||||
Building Materials — 0.0% | ||||||||||
| 10,371 | US Concrete, Inc.* ¤ | 143,223 | ||||||||
|
| |||||||||
Diversified Financial Services — 0.0% | ||||||||||
| 1,754 | CIT Group, Inc.* | 76,264 | ||||||||
|
| |||||||||
TOTAL COMMON STOCKS (COST $478,595) | 507,076 | |||||||||
|
| |||||||||
PREFERRED STOCKS — 0.3% | ||||||||||
Banks — 0.1% | ||||||||||
| 600 | Wells Fargo & Co., 7.50% Class A | 773,250 | ||||||||
|
| |||||||||
Diversified Financial Services — 0.2% | ||||||||||
| 74,625 | Citigroup Capital XIII, 7.88%† | 2,133,529 | ||||||||
| 14,902 | GMAC Capital Trust I, 8.125 %† | 405,334 | ||||||||
|
| |||||||||
| 2,538,863 | ||||||||||
|
| |||||||||
TOTAL PREFERRED STOCKS (COST $2,718,226) | 3,312,113 | |||||||||
|
| |||||||||
WARRANTS — 0.0% | ||||||||||
Auto Manufacturers — 0.0% | ||||||||||
| 7,557 | General Motors Co., Strike Price $10.00, Expires 7/10/16* | 139,880 | ||||||||
| 7,557 | General Motors Co., Strike Price $18.33, Expires 7/10/19* | 89,097 | ||||||||
|
| |||||||||
| 228,977 | ||||||||||
|
| |||||||||
Media — 0.0% | ||||||||||
| 307 | Charter Communications, Inc., Strike Price $46.68, Expires 11/30/14* | 18,037 | ||||||||
|
| |||||||||
Oil & Gas Services — 0.0% | ||||||||||
| 190 | SemGroup Corp., Strike Price $25.00, Expires 11/30/14* ¤ | 5,223 | ||||||||
|
| |||||||||
TOTAL WARRANTS (COST $307,300) | 252,237 | |||||||||
|
| |||||||||
| See accompanying Notes to the Financial Statements. | 113 |
Mercer Core Opportunistic Fixed Income Fund
Schedule of Investments (Continued)
(showing percentage of net assets)
March 31, 2013
| Notional | Description | Value ($) | ||||||||
OPTIONS PURCHASED — 0.0% | ||||||||||
Put Options — 0.0% | ||||||||||
| 115,000 | Euro Dollar Mid-Curve 3-Year Futures Option with Barclays Capital, Inc., Strike Price $98.38, Expires 06/14/13 | 3,450 | ||||||||
| 2,300,000 | OTC 30-Year Interest Rate Swaption with Royal Bank of Scotland Plc, Strike Price $3.45, Expires 09/21/15 | 204,758 | ||||||||
|
| |||||||||
TOTAL OPTIONS PURCHASED (COST $200,729) | 208,208 | |||||||||
|
| |||||||||
| Par Value** | Description | Value ($) | ||||||||
SHORT-TERM INVESTMENTS — 7.3% | ||||||||||
Bank Deposit — 5.2% | ||||||||||
| 57,269,153 | State Street Bank & Trust Euro Time Deposit, 0.01%, due 04/01/13 | 57,269,153 | ||||||||
|
| |||||||||
TOTAL BANK DEPOSITS (COST $57,269,153) | 57,269,153 | |||||||||
|
| |||||||||
Certificates of Deposit — 1.1% | ||||||||||
| 3,600,000 | Banco do Brasil SA, 0.40%, due 06/28/13‡‡ | 3,596,591 | ||||||||
| 3,000,000 | Daimler Finance North America LLC, 0.54%, due 10/11/13‡‡ | 2,991,459 | ||||||||
| 400,000 | Daimler Finance North America LLC, 0.54%, due 10/15/13‡‡ | 398,825 | ||||||||
| 500,000 | Ford Motor Credit Co., 1.06%, due 10/04/13‡‡ | 497,312 | ||||||||
| 600,000 | Ford Motor Credit Co., 1.08%, due 11/01/13‡‡ | 596,222 | ||||||||
| 1,300,000 | Ford Motor Credit Co., 1.08%, due 11/05/13‡‡ | 1,291,639 | ||||||||
| 2,300,000 | Ford Motor Credit Co., 1.10%, due 11/22/13‡‡ | 2,283,807 | ||||||||
|
| |||||||||
TOTAL CERTIFICATES OF DEPOSIT (COST $11,634,158) | 11,655,855 | |||||||||
|
| |||||||||
Securities Lending Collateral — 1.0% | ||||||||||
| 10,976,300 | State Street Navigator Securities Lending Prime Portfolio*** | 10,976,300 | ||||||||
|
| |||||||||
TOTAL SECURITIES LENDING COLLATERAL (COST $10,976,300) | 10,976,300 | |||||||||
|
| |||||||||
U.S. Government and Agency Obligations — 0.0% | ||||||||||
| 91,000 | United States Treasury Bill, 0.13%, due 02/06/14(b) ‡‡ | 90,900 | ||||||||
|
| |||||||||
TOTAL U.S. GOVERNMENT AND AGENCY OBLIGATIONS (COST $90,888) | 90,900 | |||||||||
|
| |||||||||
TOTAL SHORT-TERM INVESTMENTS (COST $79,970,499) | 79,992,208 | |||||||||
|
| |||||||||
TOTAL INVESTMENTS BEFORE TBA COMMITMENTS — 112.3% (Cost $1,183,531,640) | 1,227,709,244 | |||||||||
|
| |||||||||
TBA SALE COMMITMENTS — (0.5)% | ||||||||||
| (5,000,000 | ) | FNMA TBA, 3.50%, due 11/01/25 | (5,301,562 | ) | ||||||
|
| |||||||||
TOTAL TBA SALE COMMITMENTS (PROCEEDS $5,285,156) | (5,301,562 | ) | ||||||||
|
| |||||||||
TOTAL INVESTMENTS NET OF TBA SALE COMMITMENTS — 111.8% (Cost $1,178,246,484) | 1,222,407,682 | |||||||||
Other Assets and Liabilities (net) — (11.8)% | (129,154,860 | ) | ||||||||
|
| |||||||||
NET ASSETS — 100.0% | $ | 1,093,252,822 | ||||||||
|
| |||||||||
| 114 | See accompanying Notes to the Financial Statements. |
Mercer Core Opportunistic Fixed Income Fund
Schedule of Investments (Continued)
(showing percentage of net assets)
March 31, 2013
Notes to Schedule of Investments: | ||||||
| FICO — Financing Corporation | ||||||
| FHLMC — Federal Home Loan Mortgage Corporation | ||||||
| FNMA — Federal National Mortgage Association | ||||||
| GNMA — Government National Mortgage Association | ||||||
| IO — Interest Only | ||||||
| MTN — Medium Term Note | ||||||
| PIK — Payment In Kind | ||||||
| PO — Principal Only | ||||||
| REIT — Real Estate Investment Trust | ||||||
| REMIC — Real Estate Mortgage Investment Conduit | ||||||
| TBA — To Be Announced | ||||||
| (a) | All or a portion of this security is held for open futures collateral. | |||||
| (b) | All or a portion of this security is held for open swaps collateral. | |||||
| ¤ | Illiquid security. The total market value of the securities at year end is $19,718,936 which represents 1.8% of net assets. The aggregate tax cost of these securities held at March 31, 2013 was $19,070,575. | |||||
| * | Non-income producing security | |||||
| ** | Unless otherwise indicated, all par values are denominated in United States dollars ($). | |||||
| *** | Represents an investment of securities lending cash collateral. | |||||
| **** | Securities fair valued by the Valuation Committee as approved by the Board of Trustees. The total market value of the securities at period end is $0 which represents 0.0% of net assets. The aggregate tax cost of these securities held at March 31, 2013 was $220,161. | |||||
| † | Floating rate note. Rate shown is as of March 31, 2013. | |||||
| †† | Debt obligation initially issued in zero coupon form which converts to coupon form at a specific rate and date. The rate shown is the rate at period end. | |||||
| ††† | Security is currently in default. | |||||
| †††† | When-issued security | |||||
| ‡ | All or a portion of this security is out on loan. | |||||
| ‡‡ | Interest rate presented is yield to maturity. | |||||
| ‡‡‡ | Security exempt from registration under Regulation S of the Securities Act of 1933, which exempts from registration securities offered and sold outside the United States. Security may not be offered or sold in the United States except pursuant to an exemption from, or in a transaction not subject to, the registration requirements of the Securities Act of 1933. | |||||
| ‡‡‡‡ | Indexed security in which price and/or coupon is linked to the prices of a specific financial instrument or financial statistic. | |||||
| 144A — Securities exempt from registration under Rule 144A of the Securities Act of 1933. These securities may be resold in transactions exempt from registration, normally to qualified institutional buyers. The total market value of the securities at year end is $73,090,517 which represents 6.7% of net assets. | ||||||
| See accompanying Notes to the Financial Statements. | 115 |
Mercer Core Opportunistic Fixed Income Fund
Schedule of Investments (Continued)
March 31, 2013
A summary of outstanding financial instruments at March 31, 2013 is as follows:
Forward Foreign Currency Contracts
Settlement | Currency | Counterparty | Units of | Value | Net | |||||||||||||||||
| Buys | ||||||||||||||||||||||
| 08/05/13 | CNY | UBS AG | 8,424,725 | $ | 1,346,706 | $ | 12,624 | |||||||||||||||
| 09/13/13 | EUR | HSBC Bank USA | 8,700,000 | 11,186,070 | (381,620 | ) | ||||||||||||||||
| 10/11/13 | EUR | JPMorgan Chase Bank | 216,000 | 277,796 | (3,328 | ) | ||||||||||||||||
| 06/14/13 | �� | EUR | JPMorgan Chase Bank | 400,000 | 513,904 | (29,824 | ) | |||||||||||||||
| 06/14/13 | EUR | UBS AG | 2,500,000 | 3,211,898 | (65,252 | ) | ||||||||||||||||
|
| |||||||||||||||||||||
| $ | (467,400 | ) | ||||||||||||||||||||
|
| |||||||||||||||||||||
| Sales | ||||||||||||||||||||||
| 05/02/13 | AUD | JPMorgan Chase Bank | 194,000 | $ | 201,818 | $ | (2,554 | ) | ||||||||||||||
| 05/02/13 | AUD | UBS AG | 4,213,000 | 4,382,772 | (68,040 | ) | ||||||||||||||||
| 08/05/13 | CNY | UBS AG | 8,003,786 | 1,279,418 | (4,727 | ) | ||||||||||||||||
| 04/02/13 | EUR | Citibank N.A. | 3,808,000 | 4,889,850 | 99,057 | |||||||||||||||||
| 09/13/13 | EUR | HSBC Bank USA | 8,600,000 | 11,057,495 | (262,345 | ) | ||||||||||||||||
| 04/02/13 | EUR | HSBC Bank USA | 24,000 | 30,818 | 609 | |||||||||||||||||
| 09/13/13 | EUR | JPMorgan Chase Bank | 100,000 | 128,576 | (5,351 | ) | ||||||||||||||||
| 10/11/13 | EUR | JPMorgan Chase Bank | 216,000 | 277,796 | (11,349 | ) | ||||||||||||||||
| 06/14/13 | EUR | JPMorgan Chase Bank | 400,000 | 513,904 | 3,177 | |||||||||||||||||
| 05/02/13 | EUR | Morgan Stanley & Co., Inc. | 3,849,000 | 4,943,465 | (5,433 | ) | ||||||||||||||||
| 09/13/13 | EUR | UBS AG | 3,000,000 | 3,857,266 | 32,984 | |||||||||||||||||
| 06/14/13 | EUR | UBS AG | 7,100,000 | 9,121,791 | 410,066 | |||||||||||||||||
| 04/11/13 | GBP | JPMorgan Chase Bank | 212,000 | 321,897 | 1,322 | |||||||||||||||||
| 06/12/13 | GBP | Royal Bank of Scotland Plc | 1,715,000 | 2,603,183 | (10,137 | ) | ||||||||||||||||
|
| |||||||||||||||||||||
| $ | 177,279 | |||||||||||||||||||||
|
| |||||||||||||||||||||
Currency Abbreviations
| AUD | Australian Dollar |
| CNY | Chinese Yuan |
| EUR | Euro |
| GBP | British Pound Sterling |
| MXN | Mexican Peso |
| 116 | See accompanying Notes to the Financial Statements. |
Mercer Core Opportunistic Fixed Income Fund
Schedule of Investments (Continued)
March 31, 2013
Futures Contracts
Number of | Type | Expiration Date | Contract | Net | ||||||||||||||
| Buys | ||||||||||||||||||
| 37 | Euribor | September 2013 | $ | 8,315 | $ | 1,703 | ||||||||||||
| 88 | Euribor | June 2013 | 59,325 | 26,667 | ||||||||||||||
| 105 | Euro Dollar 90 Day | September 2014 | 26,121,375 | 1,996 | ||||||||||||||
| 85 | U.S. Ultra Long | June 2013 | 13,395,469 | (65,448 | ) | |||||||||||||
|
| |||||||||||||||||
| $ | (35,082 | ) | ||||||||||||||||
|
| |||||||||||||||||
| Sales | ||||||||||||||||||
| 37 | Euribor | September 2013 | $ | 2,969 | $ | (672 | ) | |||||||||||
| 88 | Euribor | June 2013 | 16,950 | (7,361 | ) | |||||||||||||
| 105 | Euro Dollar 90 Day | September 2015 | 26,042,625 | (11,941 | ) | |||||||||||||
| 30 | Euro-Bund | June 2013 | 5,604,708 | (94,445 | ) | |||||||||||||
| 11 | Euro-OAT | June 2013 | 1,921,295 | (27,838 | ) | |||||||||||||
| 6 | U.S. Treasury Bond 30 Yr. | June 2013 | 866,813 | (5,457 | ) | |||||||||||||
| 389 | U.S. Treasury Note 10 Yr. | June 2013 | 51,341,922 | (286,882 | ) | |||||||||||||
| 21 | U.S. Treasury Note 2 Yr. | June 2013 | 4,629,516 | (693 | ) | |||||||||||||
| 283 | U.S. Treasury Note 5 Yr. | June 2013 | 35,107,477 | (134,735 | ) | |||||||||||||
|
| |||||||||||||||||
| $ | (570,024 | ) | ||||||||||||||||
|
| |||||||||||||||||
Written Options
Type of Contract | Counterparty | Number of Contracts | Premiums Received | Value at March 31, 2013 | |||||||||||||
CALL — OTC 10-Year Interest Rate Swaption | Morgan Stanley & Co., Inc. | 2,600,000 | $ | 10,724 | $ | (8,935 | ) | ||||||||||
CALL — OTC 10-Year Interest Rate Swaption | Goldman Sachs | 1,500,000 | 6,030 | (5,156 | ) | ||||||||||||
CALL — OTC 10-Year Interest Rate Swaption | Royal Bank of Scotland Plc | 6,800,000 | 20,740 | (23,372 | ) | ||||||||||||
CALL — U.S. Treasury Note 10-Year Futures | Barclays Capital, Inc. | 49 | 14,388 | (19,907 | ) | ||||||||||||
PUT — Euro Dollar Mid-Curve 3-Year Futures | Barclays Capital, Inc. | 46 | 10,201 | (1,150 | ) | ||||||||||||
PUT — OTC 10-Year Interest Rate Swaption | Morgan Stanley & Co., Inc. | 2,600,000 | 20,280 | (8,317 | ) | ||||||||||||
PUT — OTC 10-Year Interest Rate Swaption | Goldman Sachs | 1,500,000 | 11,200 | (4,799 | ) | ||||||||||||
PUT — OTC 10-Year Interest Rate Swaption | Royal Bank of Scotland Plc | 6,800,000 | 20,740 | (21,753 | ) | ||||||||||||
| See accompanying Notes to the Financial Statements. | 117 |
Mercer Core Opportunistic Fixed Income Fund
Schedule of Investments (Continued)
March 31, 2013
Type of Contract | Counterparty | Number of Contracts | Premiums Received | Value at March 31, 2013 | |||||||||||||
PUT — OTC 5-Year Interest Rate Swaption | Bank of America Securities LLC | 3,900,000 | $ | 10,628 | $ | (656 | ) | ||||||||||
PUT — OTC 5-Year Interest Rate Swaption | Royal Bank of Scotland Plc | 9,700,000 | 184,300 | (175,104 | ) | ||||||||||||
TOTAL | $ | 309,231 | $ | (269,149 | ) | ||||||||||||
|
|
|
| ||||||||||||||
Interest Rate Swaps
Description | Notional | Unrealized | Value | ||||||||||||
Agreement with Bank of America N.A. dated 07/06/12 receiving a fixed rate of 8.44% paying the notional amount multiplied by the BRL-CDI rate. Expiring 01/02/15. | $40,800,000 | $119,234 | $153,449 | ||||||||||||
Agreement with Bank of America N.A. dated 1/24/13 receiving a fixed rate of 7.585% paying the notional amount multiplied by the BRL-CDI rate. Expiring 01/02/2015. | 14,700,000 | (66,235 | ) | (96,825 | ) | ||||||||||
Agreement with Goldman Sachs dated 06/05/12 receiving a fixed rate of 4.00% paying the notional amount multiplied by the 6-Month | AUD 200,000 | (702 | ) | (702 | ) | ||||||||||
Agreement with HSBC Bank USA dated 02/13/12 receiving a fixed rate of 10.135% paying the notional amount multiplied by the BRL-CDI rate. Expiring 01/02/2015. | $ 9,800,000 | 251,527 | 268,645 | ||||||||||||
Agreement with HSBC Bank USA dated 10/15/12 receiving a fixed rate of 8.075% paying the notional amount multiplied by the BRL-CDI rate. Expiring 01/02/2015. | 4,200,000 | (13,184 | ) | (5,112 | ) | ||||||||||
Agreement with Morgan Stanley Capital Services LLC dated 02/16/12 receiving a fixed rate of 10.605% paying the notional amount multiplied by the BRL-CDI rate. Expiring 01/02/2015. | 10,300,000 | 297,090 | 360,751 | ||||||||||||
|
| ||||||||||||||
| $680,206 | |||||||||||||||
|
| ||||||||||||||
Centrally Cleared Interest Rate Swaps
Pay/Receive | Floating Rate Index | Fixed Rate | Maturity Date | Counterparty | Notional Amount | Unrealized Appreciation (Depreciation) | ||||||||||
| Receive | 3-Month USD LIBOR | 1.40% | 03/20/18 | Barclays Bank | $1,200,000 | $ | (19,364 | ) | ||||||||
| Receive | 3-Month USD LIBOR | 2.00% | 06/19/23 | Credit Suisse | 5,700,000 | (50,264 | ) | |||||||||
| Receive | 3-Month USD LIBOR | 2.75% | 06/19/43 | Morgan Stanley & Co., Inc. | 2,800,000 | (7,292 | ) | |||||||||
| Pay | 6-Month AUD- BBR-BBSW | 3.75% | 03/15/18 | Deutsche Bank AG | AUD1,400,000 | 6,437 | ||||||||||
| Pay | 6-Month AUD- BBR-BBSW | 3.75% | 12/11/18 | Citigroup Global Markets | 2,900,000 | 8,850 | ||||||||||
| 118 | See accompanying Notes to the Financial Statements. |
Mercer Core Opportunistic Fixed Income Fund
Schedule of Investments (Continued)
March 31, 2013
Pay/Receive | Floating Rate Index | Fixed Rate | Maturity Date | Counterparty | Notional Amount | Unrealized Appreciation (Depreciation) | ||||||||||
| Pay | 6-Month AUD- BBR-BBSW | 3.75% | 03/15/23 | Citigroup Global Markets, Deutsche Bank AG & Credit Suisse | AUD1,100,000 | $ | (20,307 | ) | ||||||||
| Pay | 6-Month AUD- BBR-BBSW | 4.00% | 03/15/23 | Deutsche Bank AG | 700,000 | (6,700 | ) | |||||||||
| Pay | 6-Month AUD- BBR-BBSW | 4.25% | 03/15/23 | Citigroup Global Markets | 2,500,000 | 31,462 | ||||||||||
| Pay | 6-Month AUD- BBR-BBSW | 4.25% | 12/11/23 | Citigroup Global Capital Markets | 9,500,000 | (12,182 | ) | |||||||||
| Receive | 6-Month Euribor | 2.00% | 09/18/23 | Morgan Stanley & Co., Inc. | EUR1,000,000 | (11,735 | ) | |||||||||
|
| |||||||||||||||
| $ | (81,095 | ) | ||||||||||||||
|
| |||||||||||||||
Credit Default Swaps (See Note 2(a))
Notional Amount | Expiration Date | Counterparty | Value | |||||||||
| $ | 1,800,000 | 12/20/17 | JPMorgan Chase Bank | $ | (76,732 | ) | ||||||
| 4,400,000 | 03/20/21 | Goldman Sachs | 157,636 | |||||||||
| 900,000 | 03/20/16 | Deutsche Bank AG | 2,647 | |||||||||
| 1,400,000 | 03/20/16 | Morgan Stanley Capital Services LLC | 4,117 | |||||||||
| 400,000 | 12/20/15 | Deutsche Bank AG | (5,967 | ) | ||||||||
|
| |||||||||||
| $ | 81,701 | |||||||||||
|
| |||||||||||
| See accompanying Notes to the Financial Statements. | 119 |
Mercer Core Opportunistic Fixed Income Fund
Schedule of Investments (Continued)
March 31, 2013
| Asset Class Summary (Unaudited) | % of Net Assets | ||||
Debt Obligations | 104.6 | ||||
Preferred Stocks | 0.3 | ||||
Swaps | 0.1 | ||||
Common Stocks | 0.1 | ||||
Warrants | 0.0 | ||||
Options Purchased | 0.0 | ||||
Written Options | 0.0 | ||||
Forward Foreign Currency Contracts | 0.0 | ||||
Futures Contracts | (0.1 | ) | |||
TBA Sale Commitments | (0.5 | ) | |||
Short-Term Investments | 7.3 | ||||
Other Assets and Liabilities (net) | (11.8 | ) | |||
|
| ||||
| 100.0 | % | ||||
|
| ||||
| 120 | See accompanying Notes to the Financial Statements. |
Mercer Emerging Markets Equity Fund
Schedule of Investments
(showing percentage of net assets)
March 31, 2013
| Shares | Description | Value ($) | ||||||||
COMMON STOCKS — 92.8% | ||||||||||
Bermuda — 0.6% | ||||||||||
| 336,000 | China Gas Holdings, Ltd. | 335,453 | ||||||||
| 536,000 | COSCO Pacific, Ltd. | 776,106 | ||||||||
| 3,000 | Credicorp, Ltd. | 498,150 | ||||||||
| 86,650 | Dairy Farm International Holdings, Ltd.‡ | 1,048,465 | ||||||||
| 4,119,000 | GOME Electrical Appliances Holding, Ltd.* | 451,025 | ||||||||
|
| |||||||||
Total Bermuda | 3,109,199 | |||||||||
|
| |||||||||
Brazil — 8.0% | ||||||||||
| 20,100 | Amil Participacoes SA | 315,204 | ||||||||
| 84,000 | Arteris SA | 946,086 | ||||||||
| 76,560 | Banco Bradesco SA, ADR‡ | 1,303,051 | ||||||||
| 87,500 | Banco do Brasil SA | 1,191,199 | ||||||||
| 798,841 | BM&FBovespa SA | 5,403,919 | ||||||||
| 25,400 | BR Malls Participacoes SA | 316,941 | ||||||||
| 45,800 | BR Properties SA | 508,801 | ||||||||
| 120,400 | CCR SA | 1,226,481 | ||||||||
| 24,300 | Cia Brasileira de Distribuicao Grupo, ADR | 1,294,704 | ||||||||
| 162,438 | Cia de Bebidas das Americas, ADR | 6,876,001 | ||||||||
| 14,800 | Cia de Saneamento Basico do Estado, ADR* | 706,404 | ||||||||
| 254,210 | Cia Siderurgica Nacional SA | 1,151,059 | ||||||||
| 96,566 | Cielo SA | 2,850,980 | ||||||||
| 90,825 | Companhia Energetica de Minas Gerais, Sponsored ADR‡ | 1,076,276 | ||||||||
| 67,500 | Fibria Celulose SA, Sponsored ADR* ‡ | 814,725 | ||||||||
| 73,000 | Itau Unibanco Holding SA, ADR | 1,299,400 | ||||||||
| 125,500 | JBS SA* | 423,240 | ||||||||
| 35,700 | Lojas Renner SA | 1,338,872 | ||||||||
| 127,600 | MRV Engenharia e Participacoes SA | 530,942 | ||||||||
| 8,300 | Multiplan Empreendimentos Imobiliarios SA | 238,748 | ||||||||
| 30,200 | Natura Cosmeticos SA | 739,592 | ||||||||
| 71,000 | Petroleo Brasileiro SA, Sponsored ADR | 1,288,650 | ||||||||
| 136,900 | Porto Seguro SA | 1,919,390 | ||||||||
| 211,987 | Souza Cruz SA | 3,105,659 | ||||||||
| 14,300 | Telefonica Brasil SA, ADR | 381,524 | ||||||||
| 135,300 | Tim Participacoes SA | 598,545 | ||||||||
| 38,400 | Tim Participacoes SA, ADR | 840,192 | ||||||||
| 36,505 | Totvs SA | 750,250 | ||||||||
| 13,500 | Ultrapar Participacoes SA | 342,128 | ||||||||
| 105,200 | Vale SA, ADR | 1,738,956 | ||||||||
|
| |||||||||
Total Brazil | 41,517,919 | |||||||||
|
| |||||||||
Cayman Islands — 3.0% | ||||||||||
| 1,457,000 | Anta Sports Products, Ltd. | 1,244,409 | ||||||||
| 399,000 | China Mengniu Dairy Co., Ltd. | 1,148,789 | ||||||||
| 86,000 | China Resources Land, Ltd. | 240,408 | ||||||||
| 3,465,000 | China Shanshui Cement Group, Ltd. | 1,986,338 | ||||||||
| 255,000 | Country Garden Holdings Co., Ltd.* | 126,142 | ||||||||
| 58,000 | ENN Energy Holdings, Ltd. | 319,788 | ||||||||
| See accompanying Notes to the Financial Statements. | 121 |
Mercer Emerging Markets Equity Fund
Schedule of Investments (Continued)
(showing percentage of net assets)
March 31, 2013
| Shares | Description | Value ($) | ||||||||
Cayman Islands — continued |
| |||||||||
| 416,000 | Evergrande Real Estate Group, Ltd. | 167,201 | ||||||||
| 78,500 | Longfor Properties Co., Ltd. | 129,845 | ||||||||
| 178,000 | MStar Semiconductor, Inc. | 1,437,572 | ||||||||
| 441,500 | Parkson Retail Group, Ltd. | 261,625 | ||||||||
| 834,122 | Sands China, Ltd. | 4,324,993 | ||||||||
| 77,000 | Shimao Property Holdings, Ltd. | 148,194 | ||||||||
| 677,000 | Soho China, Ltd. | 563,393 | ||||||||
| 52,800 | Tencent Holdings, Ltd. | 1,678,684 | ||||||||
| 370,040 | Tingyi Cayman Islands Holding Corp. | 962,920 | ||||||||
| 193,237 | Wynn Macau, Ltd.* | 514,044 | ||||||||
|
| |||||||||
Total Cayman Islands | 15,254,345 | |||||||||
|
| |||||||||
Chile — 1.6% | ||||||||||
| 2,407,623 | Banco de Chile | 379,197 | ||||||||
| 67,349,214 | Banco Santander Chile | 4,782,615 | ||||||||
| 18,229 | Empresas COPEC SA | 264,654 | ||||||||
| 35,300 | Enersis SA, Sponsored ADR‡ | 679,172 | ||||||||
| 47,421 | ENTEL Chile SA | 1,004,209 | ||||||||
| 62,710 | SACI Falabella | 755,046 | ||||||||
| 11,400 | Sociedad Quimica y Minera de Chile SA, Sponsored ADR | 632,130 | ||||||||
|
| |||||||||
Total Chile | 8,497,023 | |||||||||
|
| |||||||||
China — 8.6% | ||||||||||
| 12,620,000 | Bank of China, Ltd. Class H | 5,852,641 | ||||||||
| 659,000 | Bank of Communications Co., Ltd. Class H | 494,930 | ||||||||
| 2,224,000 | China BlueChemical, Ltd. Class H | 1,372,335 | ||||||||
| 682,000 | China Citic Bank Corp., Ltd. Class H | 409,412 | ||||||||
| 240,000 | China Coal Energy Co., Ltd. Class H | 214,875 | ||||||||
| 9,571,000 | China Construction Bank Corp. Class H | 7,816,936 | ||||||||
| 144,000 | China Merchants Bank Co., Ltd. Class H | 304,968 | ||||||||
| 714,000 | China Minsheng Banking Corp., Ltd. Class H | 912,431 | ||||||||
| 332,000 | China Oilfield Services, Ltd. Class H | 694,567 | ||||||||
| 12,100 | China Petroleum & Chemical Corp., ADR | 1,414,732 | ||||||||
| 1,980,000 | China Petroleum & Chemical Corp. Class H | 2,331,317 | ||||||||
| 750,500 | China Railway Construction Corp. Class H | 712,538 | ||||||||
| 2,079,000 | China Railway Group, Ltd. Class H | 1,057,893 | ||||||||
| 641,000 | Chongqing Rural Commercial Bank Class H | 343,512 | ||||||||
| 922,000 | Dongfeng Motor Group Co., Ltd. Class H | 1,294,635 | ||||||||
| 622,400 | Guangzhou R&F Properties Co., Ltd. Class H | 1,042,324 | ||||||||
| 9,219,000 | Industrial & Commercial Bank of China Class H | 6,460,598 | ||||||||
| 1,472,000 | Jiangsu Expressway Co., Ltd. Class H | 1,479,083 | ||||||||
| 925,000 | Jiangxi Copper Co., Ltd. Class H | 2,047,175 | ||||||||
| 8,300 | PetroChina Co., Ltd., ADR‡ | 1,094,106 | ||||||||
| 2,182,000 | PetroChina Co., Ltd. Class H | 2,867,114 | ||||||||
| 84,000 | Sinopharm Group Co., Ltd. Class H | 270,526 | ||||||||
| 296,407 | Tsingtao Brewery Co., Ltd. Class H | 1,880,549 | ||||||||
| 168,000 | Yanzhou Coal Mining Co., Ltd. Class H | 226,376 | ||||||||
| 367,500 | Zhaojin Mining Industry Co., Ltd. Class H | 493,304 | ||||||||
| 1,776,000 | Zhejiang Expressway Co., Ltd. Class H | 1,400,182 | ||||||||
|
| |||||||||
Total China | 44,489,059 | |||||||||
|
| |||||||||
| 122 | See accompanying Notes to the Financial Statements. |
Mercer Emerging Markets Equity Fund
Schedule of Investments (Continued)
(showing percentage of net assets)
March 31, 2013
| Shares | Description | Value ($) | ||||||||
Colombia — 1.1% | ||||||||||
| 2,098,589 | Ecopetrol SA | 5,797,524 | ||||||||
|
| |||||||||
Czech Republic — 0.5% | ||||||||||
| 34,384 | CEZ AS | 1,008,607 | ||||||||
| 8,000 | Komercni Banka AS | 1,530,832 | ||||||||
|
| |||||||||
Total Czech Republic | 2,539,439 | |||||||||
|
| |||||||||
Hong Kong — 4.5% | ||||||||||
| 58,500 | China Mobile, Ltd., Sponsored ADR | 3,108,105 | ||||||||
| 313,500 | China Mobile, Ltd. | 3,317,685 | ||||||||
| 170,000 | China Overseas Land & Investment, Ltd. | 469,749 | ||||||||
| 304,000 | China Resources Power Holdings Co., Ltd. | 912,472 | ||||||||
| 10,100 | CNOOC, Ltd., ADR | 1,934,150 | ||||||||
| 1,006,000 | CNOOC, Ltd. | 1,930,964 | ||||||||
| 814,000 | Guangdong Investment, Ltd. | 715,153 | ||||||||
| 661,656 | Hongkong Electric Holdings | 6,235,002 | ||||||||
| 302,549 | Link (The) REIT | 1,652,538 | ||||||||
| 6,272,000 | Shougang Fushan Resources Group, Ltd. | 2,787,502 | ||||||||
| 184,000 | Sino-Ocean Land Holdings, Ltd. | 111,642 | ||||||||
|
| |||||||||
Total Hong Kong | 23,174,962 | |||||||||
|
| |||||||||
Hungary — 0.1% | ||||||||||
| 3,142 | MOL Hungarian Oil and Gas Plc | 221,268 | ||||||||
| 4,404 | OTP Bank Nyrt | 79,602 | ||||||||
|
| |||||||||
Total Hungary | 300,870 | |||||||||
|
| |||||||||
India — 12.1% | ||||||||||
| 19,800 | Asian Paints, Ltd. | 1,790,379 | ||||||||
| 70,400 | Axis Bank, Ltd. | 1,690,377 | ||||||||
| 89,413 | Bajaj Auto, Ltd. | 2,923,813 | ||||||||
| 80,289 | Bharat Heavy Electricals, Ltd. | 263,100 | ||||||||
| 288,300 | Cipla, Ltd. | 2,020,752 | ||||||||
| 31,164 | Colgate-Palmolive India, Ltd. | 715,023 | ||||||||
| 42,800 | Dr. Reddy’s Laboratories, Ltd., ADR | 1,384,580 | ||||||||
| 47,655 | HDFC Bank, Ltd. | 549,852 | ||||||||
| 230,859 | HDFC Bank, Ltd., ADR | 8,638,744 | ||||||||
| 709,983 | Hindustan Unilever, Ltd. | 6,094,619 | ||||||||
| 573,973 | Housing Development Finance Corp. | 8,685,632 | ||||||||
| 12,012 | ICICI Bank, Ltd. | 232,096 | ||||||||
| 36,500 | ICICI Bank, Ltd., Sponsored ADR | 1,565,850 | ||||||||
| 27,309 | Infosys, Ltd. | 1,449,613 | ||||||||
| 51,900 | Infosys, Ltd., Sponsored ADR‡ | 2,797,929 | ||||||||
| 1,545,400 | ITC, Ltd. | 8,811,766 | ||||||||
| 165,100 | Kotak Mahindra Bank, Ltd. | 1,992,743 | ||||||||
| 27,586 | Nestle India, Ltd. | 2,339,861 | ||||||||
| 125,108 | Power Finance Corp., Ltd. | 420,326 | ||||||||
| 25,147 | Reliance Industries, Ltd., GDR 144A | 716,187 | ||||||||
| 54,365 | Rural Electrification Corp., Ltd. | 211,058 | ||||||||
| See accompanying Notes to the Financial Statements. | 123 |
Mercer Emerging Markets Equity Fund
Schedule of Investments (Continued)
(showing percentage of net assets)
March 31, 2013
| Shares | Description | Value ($) | ||||||||
India — continued |
| |||||||||
| 4,147 | State Bank of India, GDR | 345,652 | ||||||||
| 164,500 | Sun Pharmaceutical Industries, Ltd. | 2,481,877 | ||||||||
| 115,639 | Tata Consultancy Services, Ltd. | 3,344,595 | ||||||||
| 38,300 | Tata Motors, Ltd., Sponsored ADR | 934,903 | ||||||||
| 41,000 | Wipro, Ltd., ADR‡ | 414,100 | ||||||||
|
| |||||||||
Total India | 62,815,427 | |||||||||
|
| |||||||||
Indonesia — 2.8% | ||||||||||
| 1,980,000 | Astra International Tbk PT | 1,609,673 | ||||||||
| 1,414,500 | Bank Central Asia Tbk PT | 1,659,408 | ||||||||
| 371,000 | Bank Rakyat Indonesia Persero Tbk PT | 334,062 | ||||||||
| 5,372,500 | Bumi Resources Tbk PT | 381,479 | ||||||||
| 24,500 | Indo Tambangraya Megah Tbk PT | 89,504 | ||||||||
| 2,002,500 | Indofood Sukses Makmur Tbk PT | 1,535,233 | ||||||||
| 4,364,000 | Kalbe Farma Tbk PT | 556,868 | ||||||||
| 2,782,000 | Perusahaan Gas Negara Persero Tbk PT | 1,703,412 | ||||||||
| 946,501 | Semen Gresik Persero Tbk PT | 1,724,010 | ||||||||
| 158,000 | Tambang Batubara Bukit Asam Persero Tbk PT | 234,134 | ||||||||
| 14,400 | Telekomunikasi Indonesia Persero Tbk PT, Sponsored ADR | 649,152 | ||||||||
| 650,000 | Telekomunikasi Indonesia Tbk PT | 735,786 | ||||||||
| 1,048,896 | Unilever Indonesia Tbk PT | 2,461,006 | ||||||||
| 301,000 | United Tractors Tbk PT | 563,746 | ||||||||
|
| |||||||||
Total Indonesia | 14,237,473 | |||||||||
|
| |||||||||
Malaysia — 4.3% | ||||||||||
| 808,800 | Alliance Financial Group Bhd | 1,149,272 | ||||||||
| 869,600 | AMMB Holdings Bhd | 1,836,649 | ||||||||
| 45,400 | British American Tobacco Malaysia Bhd | 916,064 | ||||||||
| 107,700 | CIMB Group Holdings Bhd | 266,076 | ||||||||
| 411,400 | DiGi.Com Bhd | 616,469 | ||||||||
| 350,600 | Genting Bhd | 1,136,775 | ||||||||
| 1,805,800 | Genting Malaysia Bhd | 2,140,250 | ||||||||
| 1,437,530 | Malayan Banking Bhd | 4,363,889 | ||||||||
| 265,000 | Parkson Holdings Bhd | 402,228 | ||||||||
| 157,700 | Petronas Chemicals Group Bhd | 328,489 | ||||||||
| 93,700 | Petronas Gas Bhd | 574,939 | ||||||||
| 545,200 | Public Bank Bhd | 2,859,373 | ||||||||
| 106,200 | Public Bank Bhd (Foreign Market) | 559,038 | ||||||||
| 9,900 | Sime Darby Bhd | 29,606 | ||||||||
| 563,000 | Tenaga Nasional Bhd | 1,309,091 | ||||||||
| 813,400 | UMW Holdings Bhd | 3,519,961 | ||||||||
|
| |||||||||
Total Malaysia | 22,008,169 | |||||||||
|
| |||||||||
Mexico — 9.7% | ||||||||||
| 725,700 | Alfa SAB de CV Class A | 1,772,618 | ||||||||
| 85,800 | America Movil SA de CV Series L, ADR | 1,798,368 | ||||||||
| 57,600 | Arca Continental SAB de CV | 431,796 | ||||||||
| 19,340 | Coca-Cola Femsa SAB de CV, Sponsored ADR‡ | 3,167,312 | ||||||||
| 124 | See accompanying Notes to the Financial Statements. |
Mercer Emerging Markets Equity Fund
Schedule of Investments (Continued)
(showing percentage of net assets)
March 31, 2013
| Shares | Description | Value ($) | ||||||||
Mexico — continued |
| |||||||||
| 541,355 | Compartamos SAB de CV | 995,477 | ||||||||
| 55,673 | Fomento Economico Mexicano SA de CV, Sponsored ADR | 6,318,886 | ||||||||
| 154,000 | Grupo Bimbo SAB de CV Series A | 491,112 | ||||||||
| 130,134 | Grupo Carso SAB de CV Series A-1 | 725,594 | ||||||||
| 168,900 | Grupo Financiero Banorte SAB de CV Series O | 1,355,263 | ||||||||
| 559,500 | Grupo Financiero Inbursa SAB de CV Series O | 1,625,564 | ||||||||
| 352,568 | Grupo Financiero Santander Mexico SAB de CV Class B, ADR* | 5,440,124 | ||||||||
| 1,053,969 | Grupo Mexico SAB de CV Series B | 4,248,625 | ||||||||
| 184,500 | Grupo Modelo SAB de CV Series C | 1,672,576 | ||||||||
| 133,748 | Grupo Televisa SAB, Sponsored ADR | 3,559,034 | ||||||||
| 144,072 | Industrias Penoles SAB de CV | 6,775,470 | ||||||||
| 573,500 | Kimberly-Clark de Mexico SAB de CV | 2,003,205 | ||||||||
| 2,398,420 | Wal-Mart de Mexico SAB de CV | 7,833,305 | ||||||||
|
| |||||||||
Total Mexico | 50,214,329 | |||||||||
|
| |||||||||
Peru — 0.4% | ||||||||||
| 82,749 | Cia de Minas Buenaventura SA, ADR | 2,148,164 | ||||||||
|
| |||||||||
Philippines — 1.0% | ||||||||||
| 1,498,400 | Aboitiz Equity Ventures, Inc. | 2,024,915 | ||||||||
| 447,970 | Bank of the Philippine Islands | 1,207,466 | ||||||||
| 71,950 | SM Investments Corp. | 1,965,799 | ||||||||
|
| |||||||||
Total Philippines | 5,198,180 | |||||||||
|
| |||||||||
Poland — 1.2% | ||||||||||
| 26,982 | Asseco Poland SA | 348,428 | ||||||||
| 10,848 | Grupa Lotos SA* | 136,415 | ||||||||
| 159,017 | PGE SA | 818,443 | ||||||||
| 164,120 | Powszechna Kasa Oszczednosci Bank Polski SA | 1,743,407 | ||||||||
| 21,878 | Powszechny Zaklad Ubezpieczen SA | 2,717,555 | ||||||||
| 157,683 | Tauron Polska Energia SA | 207,500 | ||||||||
|
| |||||||||
Total Poland | 5,971,748 | |||||||||
|
| |||||||||
Russia — 2.6% | ||||||||||
| 211,466 | Gazprom OAO, Sponsored ADR | 1,808,034 | ||||||||
| 355,599 | Gazprom OAO (OTC Exchange), Sponsored ADR | 3,022,591 | ||||||||
| 45,633 | LUKOIL OAO, Sponsored ADR | 2,943,329 | ||||||||
| 20,439 | Magnit OJSC, GDR | 922,821 | ||||||||
| 94,452 | MMC Norilsk Nickel OJSC, ADR | 1,595,294 | ||||||||
| 111,987 | Rosneft Oil Co., Reg S, GDR‡‡‡ | 854,461 | ||||||||
| 10,603 | Severstal OAO, Reg S, GDR‡‡‡ | 94,208 | ||||||||
| 57,365 | Surgutneftegas OJSC, Sponsored ADR | 516,285 | ||||||||
| 28,513 | Tatneft, Sponsored ADR | 1,128,545 | ||||||||
| 11,393 | TMK OAO, Reg S, GDR‡‡‡ | 136,032 | ||||||||
| 12,110 | Uralkali (Ordinary Shares), GDR | 446,617 | ||||||||
|
| |||||||||
Total Russia | 13,468,217 | |||||||||
|
| |||||||||
| See accompanying Notes to the Financial Statements. | 125 |
Mercer Emerging Markets Equity Fund
Schedule of Investments (Continued)
(showing percentage of net assets)
March 31, 2013
| Shares | Description | Value ($) | ||||||||
Singapore — 0.5% | ||||||||||
| 181,000 | DBS Group Holdings, Ltd. | 2,334,354 | ||||||||
|
| |||||||||
South Africa — 4.7% | ||||||||||
| 72,609 | ABSA Group, Ltd. | 1,226,711 | ||||||||
| 293,844 | African Bank Investments, Ltd. | 970,144 | ||||||||
| 149,302 | Aveng, Ltd. | 525,151 | ||||||||
| 1,348 | Bidvest Group, Ltd. | 35,610 | ||||||||
| 13,489 | Growthpoint Properties, Ltd. | 39,624 | ||||||||
| 12,552 | Imperial Holdings, Ltd. | 287,626 | ||||||||
| 52,542 | Kumba Iron Ore, Ltd. | 2,817,508 | ||||||||
| 49,079 | Liberty Holdings, Ltd. | 641,944 | ||||||||
| 124,627 | MMI Holdings, Ltd. | 315,559 | ||||||||
| 115,323 | MTN Group, Ltd. | 2,029,806 | ||||||||
| 20,513 | Naspers, Ltd. | 1,280,826 | ||||||||
| 12,072 | Nedbank Group, Ltd. | 250,705 | ||||||||
| 41,132 | Netcare, Ltd. | 88,904 | ||||||||
| 820,376 | Redefine Properties, Ltd. | 885,254 | ||||||||
| 140,569 | Remgro, Ltd. | 2,806,186 | ||||||||
| 131,898 | Reunert, Ltd. | 1,103,409 | ||||||||
| 214,547 | RMB Holdings, Ltd. | 972,827 | ||||||||
| 65,383 | Salam, Ltd. | 336,235 | ||||||||
| 58,952 | Sasol, Ltd. | 2,617,433 | ||||||||
| 129,521 | Spar Group, Ltd. (The) | 1,604,745 | ||||||||
| 99,725 | Standard Bank Group, Ltd. | 1,286,883 | ||||||||
| 36,267 | Tiger Brands, Ltd. | 1,162,195 | ||||||||
| 64,985 | Truworths International, Ltd. | 638,697 | ||||||||
| 77,595 | Woolworths Holdings, Ltd. | 597,116 | ||||||||
|
| |||||||||
Total South Africa | 24,521,098 | |||||||||
|
| |||||||||
South Korea — 7.7% | ||||||||||
| 13,254 | Daelim Industrial Co., Ltd. | 1,085,241 | ||||||||
| 14,610 | DGB Financial Group, Inc. | 220,608 | ||||||||
| 45,945 | Dongbu Insurance Co., Ltd. | 1,959,455 | ||||||||
| 7,440 | Hanwha Corp. | 225,019 | ||||||||
| 37,610 | Hanwha Life Insurance Co., Ltd. | 228,175 | ||||||||
| 7,042 | Hyosung Corp. | 347,480 | ||||||||
| 1,226 | Hyundai Heavy Industries Co., Ltd. | 235,812 | ||||||||
| 10,330 | Hyundai Hysco Co., Ltd. | 317,068 | ||||||||
| 77,450 | Hyundai Marine & Fire Insurance Co., Ltd. | 2,217,133 | ||||||||
| 1,687 | Hyundai Mobis | 471,559 | ||||||||
| 7,614 | Hyundai Wia Corp. | 1,129,166 | ||||||||
| 56,170 | Industrial Bank of Korea | 643,688 | ||||||||
| 131,090 | Kangwon Land, Inc. | 3,623,061 | ||||||||
| 1,497 | KCC Corp. | 398,940 | ||||||||
| 10,721 | Kia Motors Corp. | 540,579 | ||||||||
| 9,040 | Korea Exchange Bank | 59,963 | ||||||||
| 5,856 | Korea Gas Corp. | 367,382 | ||||||||
| 3,253 | Korea Zinc Co., Ltd. | 1,036,481 | ||||||||
| 34,060 | KT Corp. | 1,074,515 | ||||||||
| 126 | See accompanying Notes to the Financial Statements. |
Mercer Emerging Markets Equity Fund
Schedule of Investments (Continued)
(showing percentage of net assets)
March 31, 2013
| Shares | Description | Value ($) | ||||||||
South Korea — continued |
| |||||||||
| 59,000 | KT Corp., Sponsored ADR* | 926,890 | ||||||||
| 50,188 | KT&G Corp. | 3,405,711 | ||||||||
| 2,381 | LG Chem, Ltd. | 567,108 | ||||||||
| 6,314 | LG Corp. | 366,605 | ||||||||
| 15,700 | LG Display Co., Ltd., ADR* ‡ | 229,063 | ||||||||
| 4,077 | LG Household & Health Care, Ltd. | 2,238,942 | ||||||||
| 3,080 | Mirae Asset Securities Co., Ltd. | 113,915 | ||||||||
| 1,131 | Orion Corp. Republic of South Korea | 1,105,993 | ||||||||
| 15,361 | S1 Corp. Korea | 857,377 | ||||||||
| 5,869 | Samsung C&T Corp. | 361,340 | ||||||||
| 20,050 | Samsung Card Co., Ltd. | 686,594 | ||||||||
| 8,856 | Samsung Electronics Co., Ltd., GDR 144A | 5,951,232 | ||||||||
| 2,198 | Samsung Engineering Co., Ltd. | 252,871 | ||||||||
| 4,307 | Samsung Fire & Marine Insurance Co., Ltd. | 841,967 | ||||||||
| 51,180 | Samsung Heavy Industries Co., Ltd. | 1,612,313 | ||||||||
| 4,346 | SK Holdings Co., Ltd. | 658,189 | ||||||||
| 2,250 | SK Innovation Co., Ltd. | 328,622 | ||||||||
| 15,600 | SK Telecom Co., Ltd., ADR | 278,772 | ||||||||
| 15,591 | SK Telecom Co., Ltd. | 2,529,369 | ||||||||
| 33,790 | Woori Finance Holdings Co., Ltd. | 379,629 | ||||||||
|
| |||||||||
Total South Korea | 39,873,827 | |||||||||
|
| |||||||||
Taiwan — 7.8% | ||||||||||
| 634,000 | AU Optronics Corp.* | 275,629 | ||||||||
| 491,000 | Catcher Technology Co., Ltd. | 2,200,284 | ||||||||
| 282,000 | Cheng Shin Rubber Industry Co., Ltd. | 801,605 | ||||||||
| 122,000 | Chicony Electronics Co., Ltd. | 323,538 | ||||||||
| 1,688,000 | Chimei Innolux Corp.* | 1,038,682 | ||||||||
| 959,000 | China Motor Corp. | 886,760 | ||||||||
| 225 | China Petrochemical Development Corp. | 122 | ||||||||
| 1,807,000 | Compal Electronics, Inc. | 1,272,046 | ||||||||
| 68,000 | Delta Electronics, Inc. | 284,257 | ||||||||
| 496,000 | Evergreen Marine Corp. Taiwan, Ltd.* | 294,424 | ||||||||
| 44,000 | Far EasTone Telecommunications Co., Ltd. | 99,617 | ||||||||
| 950,000 | Farglory Land Development Co., Ltd. | 1,740,992 | ||||||||
| 63,000 | Feng Hsin Iron & Steel Co. | 109,767 | ||||||||
| 850 | Foxconn Technology Co., Ltd. | 2,342 | ||||||||
| 317,997 | Fubon Financial Holding Co., Ltd. | 454,623 | ||||||||
| 43,000 | Giant Manufacturing Co., Ltd. | 242,304 | ||||||||
| 254,000 | Highwealth Construction Corp. | 529,193 | ||||||||
| 579,700 | Hon Hai Precision Industry Co., Ltd. | 1,603,250 | ||||||||
| 210,000 | Kinsus Interconnect Technology Corp. | 648,207 | ||||||||
| 32,000 | Largan Precision Co., Ltd. | 834,713 | ||||||||
| 945,575 | Lite-On Technology Corp. | 1,533,664 | ||||||||
| 61,374 | MediaTek, Inc. | 697,840 | ||||||||
| 283,000 | Mega Financial Holding Co., Ltd. | 228,558 | ||||||||
| 242,000 | Pou Chen Corp. | 258,166 | ||||||||
| 257,000 | President Chain Store Corp. | 1,409,514 | ||||||||
| 918,000 | Quanta Computer, Inc. | 2,020,045 | ||||||||
| See accompanying Notes to the Financial Statements. | 127 |
Mercer Emerging Markets Equity Fund
Schedule of Investments (Continued)
(showing percentage of net assets)
March 31, 2013
| Shares | Description | Value ($) | ||||||||
Taiwan — continued |
| |||||||||
| 577,000 | Radiant Opto-Electronics Corp. | 2,276,933 | ||||||||
| 222,220 | Realtek Semiconductor Corp. | 507,571 | ||||||||
| 163,000 | Richtek Technology Corp. | 937,581 | ||||||||
| 702,762 | SinoPac Financial Holdings Co., Ltd. | 333,725 | ||||||||
| 212,000 | Standard Foods Corp. | 624,603 | ||||||||
| 440 | Taiwan Business Bank* | 139 | ||||||||
| 353,000 | Taiwan Cement Corp. | 434,425 | ||||||||
| 1,805,000 | Taiwan Semiconductor Manufacturing Co., Ltd. | 6,036,285 | ||||||||
| 151,500 | Taiwan Semiconductor Manufacturing Co., Ltd., Sponsored ADR | 2,604,285 | ||||||||
| 1,358,000 | Teco Electric and Machinery Co., Ltd. | 1,078,589 | ||||||||
| 773,000 | Transcend Information, Inc. | 2,502,346 | ||||||||
| 104,000 | Tripod Technology Corp. | 230,937 | ||||||||
| 398,800 | TSRC Corp. | 773,527 | ||||||||
| 1,151,210 | Uni-President Enterprises Corp. | 2,182,881 | ||||||||
| 445,000 | Walsin Lihwa Corp.* | 127,239 | ||||||||
|
| |||||||||
Total Taiwan | 40,441,208 | |||||||||
|
| |||||||||
Thailand — 2.8% | ||||||||||
| 62,200 | Advanced Info Service PCL, NVDR | 501,253 | ||||||||
| 323,700 | Bangkok Bank PCL | 2,498,078 | ||||||||
| 72,500 | Bangkok Bank PCL, NVDR | 549,599 | ||||||||
| 388,500 | Bank of Ayudhya PCL, NVDR | 457,683 | ||||||||
| 36,900 | Banpu PCL | 475,032 | ||||||||
| 426,000 | CP All PCL, NVDR | 665,511 | ||||||||
| 1,064,000 | CP All PCL Class F | 1,662,216 | ||||||||
| 343,773 | Kasikornbank PCL | 2,453,425 | ||||||||
| 133,500 | Kasikornbank PCL Class N, NVDR | 948,199 | ||||||||
| 1,165,000 | Krung Thai Bank PCL, NVDR | 986,580 | ||||||||
| 65,400 | PTT PCL | 723,565 | ||||||||
| 303,400 | Siam Commercial Bank PCL | 1,838,945 | ||||||||
| 59,600 | Siam Commercial Bank PCL, NVDR | 361,243 | ||||||||
| 135,100 | Thai Oil PCL Class N, NVDR | 295,250 | ||||||||
|
| |||||||||
Total Thailand | 14,416,579 | |||||||||
|
| |||||||||
Turkey — 1.5% | ||||||||||
| 89,117 | Arcelik AS | 630,394 | ||||||||
| 18,976 | BIM Birlesik Magazalar AS | 925,467 | ||||||||
| 65,468 | TAV Havalimanlari Holding AS* | 421,499 | ||||||||
| 32,407 | Tupras Turkiye Petrol Rafinerileri AS | 976,060 | ||||||||
| 357,540 | Turk Hava Yollari AS* | 1,462,170 | ||||||||
| 381,049 | Turk Telekomunikasyon AS | 1,688,871 | ||||||||
| 93,685 | Turkcell Iletisim Hizmetleri AS* | 629,054 | ||||||||
| 90,730 | Turkiye Halk Bankasi AS | 970,227 | ||||||||
|
| |||||||||
Total Turkey | 7,703,742 | |||||||||
|
| |||||||||
United Kingdom — 5.7% | ||||||||||
| 196,870 | British American Tobacco Plc | 10,636,982 | ||||||||
| 751,009 | HSBC Holdings Plc | 7,933,211 | ||||||||
| 128 | See accompanying Notes to the Financial Statements. |
Mercer Emerging Markets Equity Fund
Schedule of Investments (Continued)
(showing percentage of net assets)
March 31, 2013
| Shares | Description | Value ($) | ||||||||
United Kingdom — continued |
| |||||||||
| 172,308 | SABMiller Plc | 9,118,316 | ||||||||
| 64,886 | Standard Chartered Plc | 1,678,394 | ||||||||
| 12,927 | Standard Chartered Plc | 334,721 | ||||||||
|
| |||||||||
Total United Kingdom | 29,701,624 | |||||||||
|
| |||||||||
United States — 0.0% | ||||||||||
| 3,500 | Southern Copper Corp. | 131,495 | ||||||||
|
| |||||||||
TOTAL COMMON STOCKS (COST $455,738,865) | 479,865,974 | |||||||||
|
| |||||||||
PREFERRED STOCKS — 1.9% | ||||||||||
Brazil — 1.9% | ||||||||||
| 21,300 | Aes Tiete SA, 13.61% | 207,047 | ||||||||
| 87,600 | Banco do Estado do Rio Grande do Sul, 4.91% | 761,153 | ||||||||
| 66,000 | Braskem SA, 4.28% | 446,797 | ||||||||
| 20,194 | Cia Brasileira de Distribuicao Grupo Pao de Acucar, 0.69% | 1,069,716 | ||||||||
| 74,200 | Cia de Bebidas das Americas, 2.95% | 3,103,274 | ||||||||
| 97,000 | Cia Energetica de Minas Gerais, 23.13% | 1,136,281 | ||||||||
| 45,500 | Cia Energetica de Sao Paulo, 7.68% | 459,208 | ||||||||
| 88,100 | Cia Paranaense de Energia, 4.00% | 1,351,419 | ||||||||
| 42,800 | Lojas Americanas SA, 0.60% | 369,341 | ||||||||
| 177,900 | Usinas Siderurgicas de Minas Gerais SA, 0.68% Series A | 954,635 | ||||||||
|
| |||||||||
Total Brazil | 9,858,871 | |||||||||
|
| |||||||||
TOTAL PREFERRED STOCKS (COST $9,438,453) | 9,858,871 | |||||||||
|
| |||||||||
| Par Value ($) | Description | Value ($) | ||||||||
SHORT-TERM INVESTMENTS — 6.2% | ||||||||||
Bank Deposit — 4.4% | ||||||||||
| 22,971,172 | State Street Bank & Trust Euro Time Deposit, 0.01%, due 04/01/13 | 22,971,172 | ||||||||
|
| |||||||||
Securities Lending Collateral — 1.8% | ||||||||||
| 9,271,211 | State Street Navigator Securities Lending Prime Portfolio*** | 9,271,211 | ||||||||
|
| |||||||||
TOTAL SHORT-TERM INVESTMENTS (COST $32,242,383) | 32,242,383 | |||||||||
|
| |||||||||
TOTAL INVESTMENTS — 100.9% (Cost $497,419,701) | 521,967,228 | |||||||||
Other Assets and Liabilities (net) — (0.9)% | (4,882,699 | ) | ||||||||
|
| |||||||||
NET ASSETS — 100.0% | $ | 517,084,529 | ||||||||
|
| |||||||||
| See accompanying Notes to the Financial Statements. | 129 |
Mercer Emerging Markets Equity Fund
Schedule of Investments (Continued)
(showing percentage of net assets)
March 31, 2013
Notes to Schedule of Investments: | ||||||
| ADR — American Depository Receipt | ||||||
| GDR — Global Depository Receipt | ||||||
| NVDR — Non-Voting Depository Receipt | ||||||
| REIT — Real Estate Investment Trust | ||||||
| * | Non-income producing security | |||||
| *** | Represents an investment of securities lending cash collateral. | |||||
| ‡ | All or a portion of this security is out on loan. | |||||
| ‡‡‡ | Security exempt from registration under Regulation S of the Securities Act of 1933, which exempts from registration securities offered and sold outside the United States. Security may not be offered or sold in the United States except pursuant to an exemption from, or in a transaction not subject to, the registration requirements of the Securities Act of 1933. | |||||
| 144A — Securities exempt from registration under Rule 144A of the Securities Act of 1933. These securities may be resold in transactions exempt from registration, normally to qualified institutional buyers. The total market value of the securities at year end is $6,667,419 which represents 1.3% of net assets. | ||||||
| 130 | See accompanying Notes to the Financial Statements. |
Mercer Emerging Markets Equity Fund
Schedule of Investments (Continued)
March 31, 2013
A summary of outstanding financial instruments at March 31, 2013 is as follows:
Forward Foreign Currency Contracts
Settlement | Currency | Counterparty | Units of Currency | Value | Net | |||||||||||||||||
| Buys | ||||||||||||||||||||||
| 06/19/13 | BRL | Royal Bank of Scotland Plc | 852,000 | $ | 418,763 | $ | (9,353 | ) | ||||||||||||||
| 06/19/13 | CLP | Royal Bank of Scotland Plc | 774,885,000 | 1,624,550 | 14,388 | |||||||||||||||||
| 06/19/13 | HKD | Royal Bank of Scotland Plc | 31,210,000 | 4,022,028 | (3,290 | ) | ||||||||||||||||
| 06/19/13 | HUF | Royal Bank of Scotland Plc | 2,020,450,000 | 8,448,730 | (257,359 | ) | ||||||||||||||||
| 06/19/13 | IDR | Royal Bank of Scotland Plc | 1,725,165,893 | 175,764 | (814 | ) | ||||||||||||||||
| 06/19/13 | ILS | Royal Bank of Scotland Plc | 13,320,000 | 3,655,083 | 53,551 | |||||||||||||||||
| 06/19/13 | INR | Royal Bank of Scotland Plc | 451,005,000 | 8,167,076 | 106,668 | |||||||||||||||||
| 06/19/13 | KRW | Royal Bank of Scotland Plc | 21,371,841,000 | 19,128,847 | (409,510 | ) | ||||||||||||||||
| 06/19/13 | MXN | Royal Bank of Scotland Plc | 225,823,000 | 18,168,266 | 418,342 | |||||||||||||||||
| 06/19/13 | MYR | Royal Bank of Scotland Plc | 17,857,000 | 5,736,201 | 26,010 | |||||||||||||||||
| 06/19/13 | PEN | Royal Bank of Scotland Plc | 249,000 | 95,945 | (3 | ) | ||||||||||||||||
| 06/19/13 | PLN | Royal Bank of Scotland Plc | 49,898,000 | 15,249,473 | (295,079 | ) | ||||||||||||||||
| 06/19/13 | RUB | Royal Bank of Scotland Plc | 68,301,000 | 2,169,053 | (15,305 | ) | ||||||||||||||||
| 06/19/13 | SGD | Royal Bank of Scotland Plc | 1,180,000 | 951,305 | 5,887 | |||||||||||||||||
| 06/19/13 | THB | Royal Bank of Scotland Plc | 13,721,000 | 466,313 | 3,876 | |||||||||||||||||
| 06/19/13 | TRY | Royal Bank of Scotland Plc | 6,830,000 | 3,735,459 | (14,663 | ) | ||||||||||||||||
| 06/19/13 | TWD | Royal Bank of Scotland Plc | 397,885,000 | 13,327,695 | (115,580 | ) | ||||||||||||||||
| 06/19/13 | ZAR | Royal Bank of Scotland Plc | 5,480,000 | 591,131 | 1,516 | |||||||||||||||||
|
| |||||||||||||||||||||
| $ | (490,718 | ) | ||||||||||||||||||||
|
| |||||||||||||||||||||
| Sales | ||||||||||||||||||||||
| 06/19/13 | BRL | Royal Bank of Scotland Plc | 27,762,000 | $ | 13,645,185 | $ | 219,474 | |||||||||||||||
| 06/19/13 | CLP | Royal Bank of Scotland Plc | 327,512,000 | 686,630 | (1,100 | ) | ||||||||||||||||
| 06/19/13 | COP | Royal Bank of Scotland Plc | 7,943,000,000 | 4,316,178 | 41,106 | |||||||||||||||||
| 06/19/13 | CZK | Royal Bank of Scotland Plc | 34,190,000 | 1,705,120 | 56,252 | |||||||||||||||||
| 06/19/13 | HKD | Royal Bank of Scotland Plc | 34,815,000 | 4,486,604 | 2,731 | |||||||||||||||||
| 06/19/13 | HUF | Royal Bank of Scotland Plc | 670,000,000 | 2,801,677 | 656 | |||||||||||||||||
| 06/19/13 | IDR | Royal Bank of Scotland Plc | 34,650,612,445 | 3,530,286 | 6,573 | |||||||||||||||||
| 06/19/13 | INR | Royal Bank of Scotland Plc | 249,060,000 | 4,510,132 | (30,479 | ) | ||||||||||||||||
| 06/19/13 | KRW | Royal Bank of Scotland Plc | 10,439,260,000 | 9,343,650 | 1,529 | |||||||||||||||||
| 06/19/13 | MXN | Royal Bank of Scotland Plc | 21,280,000 | 1,712,052 | (20,926 | ) | ||||||||||||||||
| 06/19/13 | PEN | Royal Bank of Scotland Plc | 30,000 | 11,560 | (3 | ) | ||||||||||||||||
| 06/19/13 | PHP | Royal Bank of Scotland Plc | 261,100,000 | 6,401,863 | 23,632 | |||||||||||||||||
| 06/19/13 | PLN | Royal Bank of Scotland Plc | 1,057,000 | 323,033 | 5,259 | |||||||||||||||||
| 06/19/13 | RUB | Royal Bank of Scotland Plc | 39,854,000 | 1,265,654 | 8,474 | |||||||||||||||||
| 06/19/13 | SGD | Royal Bank of Scotland Plc | 27,936,000 | 22,521,742 | (97,246 | ) | ||||||||||||||||
| 06/19/13 | THB | Royal Bank of Scotland Plc | 30,700,000 | 1,043,351 | (12,497 | ) | ||||||||||||||||
| 06/19/13 | TRY | Royal Bank of Scotland Plc | 2,640,000 | 1,443,867 | 4,041 | |||||||||||||||||
| 06/19/13 | TWD | Royal Bank of Scotland Plc | 166,812,000 | 5,587,593 | 47,948 | |||||||||||||||||
| 06/19/13 | ZAR | Royal Bank of Scotland Plc | 31,425,000 | 3,389,836 | 3,720 | |||||||||||||||||
|
| |||||||||||||||||||||
| $ | 259,144 | |||||||||||||||||||||
|
| |||||||||||||||||||||
| See accompanying Notes to the Financial Statements. | 131 |
Mercer Emerging Markets Equity Fund
Schedule of Investments (Continued)
March 31, 2013
Currency Abbreviations
| BRL | Brazilian Real |
| CLP | Chilean Peso |
| COP | Colombian Peso |
| CZK | Czech Koruna |
| HKD | Hong Kong Dollar |
| HUF | Hungarian Forint |
| IDR | Indonesian Rupiah |
| ILS | Israeli Shekel |
| INR | Indian Rupee |
| KRW | South Korean Won |
| MXN | Mexican Peso |
| MYR | Malaysian Ringgit |
| PEN | Peruvian Nouveau Sol |
| PHP | Philippines Peso |
| PLN | Polish Zloty |
| RUB | Russian Ruble |
| SGD | Singapore Dollar |
| THB | Thai Baht |
| TRY | New Turkish Lira |
| TWD | Taiwan Dollar |
| ZAR | South African Rand |
Futures Contracts
Number of | Type | Expiration Date | Contract | Net | ||||||||||||||
| Buys | ||||||||||||||||||
| 200 | FTSE/JSE Top 40 Index | June 2013 | $ | 7,741,935 | $ | (115,828 | ) | |||||||||||
| 91 | HSCEI Index | April 2013 | 6,380,134 | (55,273 | ) | |||||||||||||
| 36 | KLSE Composite Index | April 2013 | 965,832 | 13,170 | ||||||||||||||
| 47 | MSCI Singapore Index | April 2013 | 2,824,698 | 34,121 | ||||||||||||||
| 138 | MSCI Taiwan Index | April 2013 | 3,924,720 | 45,220 | ||||||||||||||
| 11 | SET50 Index | June 2013 | 384,258 | 14,860 | ||||||||||||||
| 222 | TurkDEX-ISE 30 Index | April 2013 | 1,292,495 | 53,278 | ||||||||||||||
|
| |||||||||||||||||
| $ | (10,452 | ) | ||||||||||||||||
|
| |||||||||||||||||
| Sales | ||||||||||||||||||
| 45 | KOSPI 200 Index | June 2013 | $ | 5,357,047 | $ | (36,206 | ) | |||||||||||
| 18 | Mexico Bolsa Index | June 2013 | 644,237 | (6,439 | ) | |||||||||||||
| 703 | SGX CNX Nifty Index | April 2013 | 8,042,320 | 27,872 | ||||||||||||||
|
| |||||||||||||||||
| $ | (14,773 | ) | ||||||||||||||||
|
| |||||||||||||||||
Synthetic Futures
Number of | Reference Entity | Expiration Date | Counterparty | Notional Value | Value | |||||||||||
| 15 | Brazil Bovespa Stock Index | 04/17/2013 | Goldman Sachs | $ | 423,872 | $ | 13 | |||||||||
| 3 | Russian Trading System Index | 06/17/2013 | Goldman Sachs | 495,296 | (5,451 | ) | ||||||||||
| 3,970 | Warsaw WIG 20 Index | 06/21/2013 | Goldman Sachs | 3,099,685 | (150,979 | ) | ||||||||||
|
| |||||||||||||||
| $ | (156,417 | ) | ||||||||||||||
|
| |||||||||||||||
| 132 | See accompanying Notes to the Financial Statements. |
Mercer Emerging Markets Equity Fund
Schedule of Investments (Continued)
March 31, 2013
| Industry Sector Summary (Unaudited) | % of Net Assets | ||||
Banks | 19.8 | ||||
Oil & Gas | 7.0 | ||||
Beverages | 6.3 | ||||
Agriculture | 5.2 | ||||
Telecommunications | 4.6 | ||||
Retail | 4.2 | ||||
Semiconductors | 4.1 | ||||
Mining | 3.8 | ||||
Diversified Financial Services | 3.7 | ||||
Food | 3.5 | ||||
Electric | 3.1 | ||||
Computers | 2.3 | ||||
Insurance | 2.2 | ||||
Commercial Services | 1.8 | ||||
Household Products & Wares | 1.7 | ||||
Holding Companies — Diversified | 1.5 | ||||
Lodging | 1.5 | ||||
Auto Manufacturers | 1.4 | ||||
Chemicals | 1.4 | ||||
Pharmaceuticals | 1.4 | ||||
Real Estate | 1.3 | ||||
Electronics | 0.9 | ||||
Iron & Steel | 0.9 | ||||
Media | 0.9 | ||||
Building Materials | 0.8 | ||||
Coal | 0.7 | ||||
Engineering & Construction | 0.7 | ||||
Entertainment | 0.7 | ||||
Cosmetics & Personal Care | 0.6 | ||||
Forest Products & Paper | 0.6 | ||||
Gas | 0.6 | ||||
Leisure Time | 0.6 | ||||
Metal Fabricate & Hardware | 0.6 | ||||
Software | 0.6 | ||||
Auto Parts & Equipment | 0.5 | ||||
Airlines | 0.3 | ||||
Internet | 0.3 | ||||
REITS | 0.3 | ||||
Shipbuilding | 0.3 | ||||
Electrical Components & Equipment | 0.2 | ||||
Home Furnishings | 0.2 | ||||
Machinery — Diversified | 0.2 | ||||
Miscellaneous — Manufacturing | 0.2 | ||||
Office & Business Equipment | 0.2 | ||||
Water | 0.2 | ||||
Apparel | 0.1 | ||||
Distribution & Wholesale | 0.1 | ||||
Health Care — Services | 0.1 | ||||
Home Builders | 0.1 | ||||
Machinery — Construction & Mining | 0.1 | ||||
Oil & Gas Services | 0.1 | ||||
| See accompanying Notes to the Financial Statements. | 133 |
Mercer Emerging Markets Equity Fund
Schedule of Investments (Continued)
March 31, 2013
| Industry Sector Summary (Unaudited) | % of Net Assets | ||||
Pipelines | 0.1 | ||||
Transportation | 0.1 | ||||
Short-Term Investments and Other Assets and Liabilities (net) | 5.3 | ||||
|
| ||||
| 100.0 | % | ||||
|
| ||||
| 134 | See accompanying Notes to the Financial Statements. |
Mercer Global Low Volatility Equity Fund
Schedule of Investments
(showing percentage of net assets)
March 31, 2013
| Shares | Description | Value ($) | ||||||||
COMMON STOCKS — 89.6% | ||||||||||
Australia — 1.2% | ||||||||||
| 11,983 | Brickworks, Ltd. | 162,783 | ||||||||
| 12,632 | CSL, Ltd. | 780,029 | ||||||||
| 4,624 | Energy Developments, Ltd.* | 15,089 | ||||||||
| 45,636 | Newcrest Mining, Ltd. | 953,935 | ||||||||
| 4,839 | Tabcorp Holdings, Ltd. | 16,295 | ||||||||
| 166,403 | Telstra Corp., Ltd. | 782,410 | ||||||||
| 23,615 | Woolworths, Ltd. | 831,903 | ||||||||
|
| |||||||||
Total Australia | 3,542,444 | |||||||||
|
| |||||||||
Austria — 0.2% | ||||||||||
| 182 | Agrana Beteiligungs AG | 24,656 | ||||||||
| 6,786 | EVN AG | 98,467 | ||||||||
| 13,600 | OMV AG | 579,360 | ||||||||
|
| |||||||||
Total Austria | 702,483 | |||||||||
|
| |||||||||
Belgium — 0.6% | ||||||||||
| 13,182 | Belgacom SA | 328,299 | ||||||||
| 2,428 | Elia System Operator SA | 104,134 | ||||||||
| 19,300 | Groupe Bruxelles Lambert SA | 1,478,313 | ||||||||
| 47 | Lotus Bakeries | 40,913 | ||||||||
|
| |||||||||
Total Belgium | 1,951,659 | |||||||||
|
| |||||||||
Bermuda — 0.2% | ||||||||||
| 9,000 | Guoco Group, Ltd. | 110,085 | ||||||||
| 27,000 | GuocoLeisure, Ltd. | 19,152 | ||||||||
| 7,200 | Jardine Matheson Holdings, Ltd. | 468,720 | ||||||||
| 13,600 | Transport International Holdings, Ltd. | 30,484 | ||||||||
| 10,000 | Wing On Co. International, Ltd. | 32,592 | ||||||||
|
| |||||||||
Total Bermuda | 661,033 | |||||||||
|
| |||||||||
Canada — 3.9% | ||||||||||
| 4,700 | Agnico-Eagle Mines, Ltd. | 192,774 | ||||||||
| 11,700 | Bank of Montreal | 736,353 | ||||||||
| 19,316 | BCE, Inc. | 901,864 | ||||||||
| 34,007 | Bell Aliant, Inc. | 901,765 | ||||||||
| 15,000 | Canadian Natural Resources, Ltd. | 480,880 | ||||||||
| 4,700 | Capital Power Corp. | 98,076 | ||||||||
| 14,900 | Cenovus Energy, Inc. | 461,751 | ||||||||
| 29,990 | CML HealthCare, Inc. | 214,309 | ||||||||
| 3,200 | Constellation Software, Inc. | 394,067 | ||||||||
| 24,700 | Fortis, Inc. | 830,262 | ||||||||
| 8,900 | George Weston, Ltd. | 661,663 | ||||||||
| 25,476 | Goldcorp, Inc. | 856,758 | ||||||||
| 10,500 | Jean Coutu Group PJC, Inc. (The) Class A | 163,606 | ||||||||
| 26,000 | Manitoba Telecom Services, Inc. | 844,530 | ||||||||
| 10,500 | Metro, Inc. | 657,833 | ||||||||
| 400 | Morguard Corp. | 46,731 | ||||||||
| See accompanying Notes to the Financial Statements. | 135 |
Mercer Global Low Volatility Equity Fund
Schedule of Investments (Continued)
(showing percentage of net assets)
March 31, 2013
| Shares | Description | Value ($) | ||||||||
Canada — continued | ||||||||||
| 11,219 | Parkland Fuel Corp. | 188,833 | ||||||||
| 47,587 | Penn West Petroleum, Ltd. | 512,036 | ||||||||
| 15,951 | Potash Corp. of Saskatchewan, Inc. | 626,077 | ||||||||
| 17,800 | Rogers Communications, Inc. Class B | 909,141 | ||||||||
| 14,439 | Rogers Sugar, Inc. | 88,969 | ||||||||
| 11,400 | Saputo, Inc. | 578,780 | ||||||||
| 2,800 | Shaw Communications, Inc. Class B | 69,342 | ||||||||
| 3,900 | TELUS Corp. | 269,328 | ||||||||
|
| |||||||||
Total Canada | 11,685,728 | |||||||||
|
| |||||||||
Denmark — 1.1% | ||||||||||
| 15,846 | Coloplast AS Class B | 854,055 | ||||||||
| 32,095 | GN Store Nord AS | 572,187 | ||||||||
| 4,442 | Novo Nordisk AS Class B | 723,054 | ||||||||
| 180 | Ringkjoebing Landbobank AS | 26,850 | ||||||||
| 3,075 | Royal UNIBREW AS | 273,310 | ||||||||
| 1,587 | Schouw & Co. | 54,672 | ||||||||
| 227 | SimCorp AS | 60,997 | ||||||||
| 112,034 | TDC AS | 862,424 | ||||||||
|
| |||||||||
Total Denmark | 3,427,549 | |||||||||
|
| |||||||||
France — 3.4% | ||||||||||
| 436 | Boiron SA | 22,635 | ||||||||
| 1,593 | Bongrain SA | 104,835 | ||||||||
| 28,473 | Bouygues SA | 773,655 | ||||||||
| 26,600 | Carrefour SA | 729,424 | ||||||||
| 67,642 | Danone SA | 4,714,709 | ||||||||
| 3,400 | Legrand SA | 148,529 | ||||||||
| 5,300 | Neopost SA | 318,066 | ||||||||
| 13,100 | Sanofi-Aventis | 1,333,456 | ||||||||
| 8,700 | Sodexo | 812,180 | ||||||||
| 321 | Stef | 16,488 | ||||||||
| 20,665 | Total SA | 991,249 | ||||||||
| 2,600 | Wendel SA | 275,640 | ||||||||
|
| |||||||||
Total France | 10,240,866 | |||||||||
|
| |||||||||
Germany — 1.6% | ||||||||||
| 12,975 | Adidas AG | 1,348,556 | ||||||||
| 11,300 | DaimlerChrysler AG | 615,891 | ||||||||
| 1,050 | Fielmann AG | 97,078 | ||||||||
| 2,100 | Fraport AG Frankfurt Airport Services Worldwide | 117,909 | ||||||||
| 31,199 | Freenet AG | 759,387 | ||||||||
| 18,803 | HeidelbergCement AG | 1,353,564 | ||||||||
| 3,016 | Merck KGaA | 455,834 | ||||||||
|
| |||||||||
Total Germany | 4,748,219 | |||||||||
|
| |||||||||
Hong Kong — 0.5% | ||||||||||
| 6,500 | Aeon Stores Hong Kong Co., Ltd. | 16,244 | ||||||||
| 136 | See accompanying Notes to the Financial Statements. |
Mercer Global Low Volatility Equity Fund
Schedule of Investments (Continued)
(showing percentage of net assets)
March 31, 2013
| Shares | Description | Value ($) | ||||||||
Hong Kong — continued | ||||||||||
| 100,500 | CLP Holdings, Ltd. | 880,370 | ||||||||
| 58,000 | Hongkong Electric Holdings | 546,553 | ||||||||
| 33,000 | Miramar Hotel & Investment Co., Ltd. | 47,868 | ||||||||
|
| |||||||||
Total Hong Kong | 1,491,035 | |||||||||
|
| |||||||||
Ireland — 0.4% | ||||||||||
| 26,522 | CRH Plc | 584,755 | ||||||||
| 14,100 | Willis Group Holdings Plc | 556,809 | ||||||||
|
| |||||||||
Total Ireland | 1,141,564 | |||||||||
|
| |||||||||
Israel — 0.5% | ||||||||||
| 26,300 | Israel Chemicals, Ltd. | 340,125 | ||||||||
| 11,101 | Osem Investments, Ltd. | 212,291 | ||||||||
| 22,055 | Teva Pharmaceutical Industries, Ltd., Sponsored ADR | 875,143 | ||||||||
|
| |||||||||
Total Israel | 1,427,559 | |||||||||
|
| |||||||||
Italy — 0.1% | ||||||||||
| 28,600 | Italcementi Spa | 166,512 | ||||||||
|
| |||||||||
Japan — 9.4% | ||||||||||
| 26,500 | Aeon Co., Ltd. | 342,736 | ||||||||
| 21,700 | Astellas Pharma, Inc. | 1,167,858 | ||||||||
| 11,700 | Coca-Cola Central Co., Ltd. | 154,308 | ||||||||
| 6,600 | Doutor Nichires Holdings Co., Ltd. | 96,803 | ||||||||
| 12,600 | Dydo Drinco, Inc. | 601,723 | ||||||||
| 45,900 | Fancl Corp. | 505,769 | ||||||||
| 7,900 | Fanuc, Ltd. | 1,209,115 | ||||||||
| 14,300 | Fuji Oil Co., Ltd. | 220,842 | ||||||||
| 2,600 | Fukuda Denshi Co., Ltd. | 96,788 | ||||||||
| 4,900 | Hirose Electric Co., Ltd. | 644,682 | ||||||||
| 26,800 | House Foods Corp. | 465,765 | ||||||||
| 41,000 | Hoya Corp. | 770,113 | ||||||||
| 3,900 | Inageya Co., Ltd. | 41,729 | ||||||||
| 27,700 | Ito En, Ltd. | 668,783 | ||||||||
| 3,000 | Kaken Pharmaceutical Co., Ltd. | 54,467 | ||||||||
| 17,800 | Kao Corp. | 575,537 | ||||||||
| 26,600 | KDDI Corp. | 1,110,455 | ||||||||
| 1,000 | Kentucky Fried Chicken, Ltd. | 22,527 | ||||||||
| 32,600 | Kewpie Corp. | 465,318 | ||||||||
| 5,200 | Keyence Corp. | 1,592,853 | ||||||||
| 3,600 | Kissei Pharmaceutical Co., Ltd. | 76,235 | ||||||||
| 26,800 | Kose Corp. | 623,395 | ||||||||
| 9,400 | KYORIN Holdings, Inc. | 228,151 | ||||||||
| 164,000 | Lion Corp. | 914,018 | ||||||||
| 27,900 | Matsumotokiyoshi Holdings Co., Ltd. | 799,135 | ||||||||
| 4,100 | McDonald’s Holdings Co., Ltd. | 110,502 | ||||||||
| 22,500 | Medipal Holdings Corp. | 315,172 | ||||||||
| 15,300 | Megmilk Snow Brand Co., Ltd. | 242,470 | ||||||||
| See accompanying Notes to the Financial Statements. | 137 |
Mercer Global Low Volatility Equity Fund
Schedule of Investments (Continued)
(showing percentage of net assets)
March 31, 2013
| Shares | Description | Value ($) | ||||||||
Japan — continued | ||||||||||
| 15,900 | MISUMI Group, Inc. | 438,679 | ||||||||
| 36,700 | Mitsubishi Estate Co., Ltd. | 1,034,798 | ||||||||
| 15,000 | Morinaga & Co., Ltd. | 33,025 | ||||||||
| 16,000 | Morinaga Milk Industry Co., Ltd. | 49,351 | ||||||||
| 42,800 | MS&AD Insurance Group Holdings | 948,228 | ||||||||
| 39,000 | Nichirei Corp. | 233,121 | ||||||||
| 19,500 | Nippon Telegraph & Telephone Corp. | 850,351 | ||||||||
| 29,000 | Nisshin Oillio Group, Ltd. (The) | 106,414 | ||||||||
| 17,900 | Nissin Foods Holdings Co., Ltd. | 821,511 | ||||||||
| 42,500 | NKSJ Holdings, Inc. | 890,050 | ||||||||
| 5,300 | Noevir Holdings Co., Ltd. | 90,532 | ||||||||
| 19,900 | Nomura Research Institute, Ltd. | 513,903 | ||||||||
| 374 | NTT DoCoMo, Inc. | 555,312 | ||||||||
| 5,600 | Ohsho Food Service Corp. | 173,325 | ||||||||
| 1,100 | Okinawa Cellular Telephone Co. | 26,324 | ||||||||
| 8,600 | Ono Pharmaceutical Co., Ltd. | 531,440 | ||||||||
| 24,700 | Otsuka Holdings Co., Ltd. | 857,748 | ||||||||
| 1,000 | Riken Vitamin Co., Ltd. | 24,676 | ||||||||
| 1,900 | Royal Holdings Co., Ltd. | 27,686 | ||||||||
| 1,300 | San-A Co., Ltd. | 59,317 | ||||||||
| 34,000 | Secom Co., Ltd. | 1,752,074 | ||||||||
| 15,400 | Shimachu Co., Ltd. | 370,177 | ||||||||
| 13,700 | Shimano, Inc. | 1,119,081 | ||||||||
| 3,500 | Shin-Etsu Chemical Co., Ltd. | 231,174 | ||||||||
| 5,000 | Showa Sangyo Co., Ltd. | 17,230 | ||||||||
| 8,000 | SMC Corp. | 1,546,905 | ||||||||
| 10,000 | Takeda Pharmaceutical Co., Ltd. | 546,692 | ||||||||
| 3,300 | Torii Pharmaceutical Co., Ltd. | 82,377 | ||||||||
| 16,000 | Yamazaki Baking Co., Ltd. | 211,019 | ||||||||
| 24 | Yoshinoya Holdings Co., Ltd. | 28,258 | ||||||||
|
| |||||||||
Total Japan | 28,288,027 | |||||||||
|
| |||||||||
Malaysia — 0.1% | ||||||||||
| 241,500 | Genting Malaysia Bhd | 286,228 | ||||||||
|
| |||||||||
Mexico — 0.5% | ||||||||||
| 42,400 | Grupo Televisa SAB, Sponsored ADR | 1,128,264 | ||||||||
| 9,200 | Industrias Penoles SAB de CV | 432,661 | ||||||||
|
| |||||||||
Total Mexico | 1,560,925 | |||||||||
|
| |||||||||
Netherlands — 0.7% | ||||||||||
| 26,803 | TNT Express NV | 196,800 | ||||||||
| 48,834 | Unilever NV, ADR | 2,003,825 | ||||||||
|
| |||||||||
Total Netherlands | 2,200,625 | |||||||||
|
| |||||||||
New Zealand — 0.3% | ||||||||||
| 171,304 | Air New Zealand, Ltd. | 220,353 | ||||||||
| 20,885 | Auckland International Airport, Ltd. | 51,542 | ||||||||
| 32,817 | Chorus, Ltd. | 77,277 | ||||||||
| 138 | See accompanying Notes to the Financial Statements. |
Mercer Global Low Volatility Equity Fund
Schedule of Investments (Continued)
(showing percentage of net assets)
March 31, 2013
| Shares | Description | Value ($) | ||||||||
New Zealand — continued | ||||||||||
| 154,268 | Infratil, Ltd. | 311,557 | ||||||||
| 26,860 | Sky Network Television, Ltd. | 119,296 | ||||||||
| 2,733 | TrustPower, Ltd. | 17,635 | ||||||||
|
| |||||||||
Total New Zealand | 797,660 | |||||||||
|
| |||||||||
Norway — 0.3% | ||||||||||
| 20,308 | Orkla ASA | 162,603 | ||||||||
| 32,559 | Telenor ASA | 712,865 | ||||||||
|
| |||||||||
Total Norway | 875,468 | |||||||||
|
| |||||||||
Portugal — 0.1% | ||||||||||
| 40,119 | Portucel SA | 138,271 | ||||||||
| 32,441 | REN - Redes Energeticas Nacionais SGPS SA | 93,729 | ||||||||
| 87,499 | Sonaecom SGPS SA | 189,098 | ||||||||
|
| |||||||||
Total Portugal | 421,098 | |||||||||
|
| |||||||||
Russia — 0.0% | ||||||||||
| 695 | IBS Group Holding, Ltd., Reg S, GDR‡‡‡ | 15,530 | ||||||||
|
| |||||||||
Singapore — 0.6% | ||||||||||
| 29,000 | Bukit Sembawang Estates, Ltd. | 165,968 | ||||||||
| 5,000 | Great Eastern Holdings, Ltd. | 72,505 | ||||||||
| 15,000 | Hong Leong Finance, Ltd. | 33,613 | ||||||||
| 44,000 | Singapore Press Holdings, Ltd. | 158,891 | ||||||||
| 193,000 | Singapore Telecommunications, Ltd. | 558,496 | ||||||||
| 197,000 | StarHub, Ltd. | 690,754 | ||||||||
|
| |||||||||
Total Singapore | 1,680,227 | |||||||||
|
| |||||||||
South Africa — 0.2% | ||||||||||
| 59,800 | Gold Fields, Ltd., Sponsored ADR | 463,450 | ||||||||
| 20,700 | Harmony Gold Mining Co., Ltd., Sponsored ADR | 132,687 | ||||||||
| 11,875 | Sibanye Gold, Ltd., Sponsored ADR* | 67,094 | ||||||||
|
| |||||||||
Total South Africa | 663,231 | |||||||||
|
| |||||||||
South Korea — 0.3% | ||||||||||
| 9,862 | KT&G Corp. | 669,226 | ||||||||
| 118 | Lotte Confectionery Co., Ltd. | 186,874 | ||||||||
|
| |||||||||
Total South Korea | 856,100 | |||||||||
|
| |||||||||
Spain — 0.2% | ||||||||||
| 10,500 | Red Electrica Corp. SA | 529,209 | ||||||||
|
| |||||||||
Sweden — 0.6% | ||||||||||
| 1,826 | Axfood AB | 74,422 | ||||||||
| 24,600 | Investor AB Class B | 712,046 | ||||||||
| 31,391 | Svenska Cellulosa AB Class B | 811,087 | ||||||||
| 16,679 | TeliaSonera AB | 119,359 | ||||||||
|
| |||||||||
Total Sweden | 1,716,914 | |||||||||
|
| |||||||||
| See accompanying Notes to the Financial Statements. | 139 |
Mercer Global Low Volatility Equity Fund
Schedule of Investments (Continued)
(showing percentage of net assets)
March 31, 2013
| Shares | Description | Value ($) | ||||||||
Switzerland — 5.7% | ||||||||||
| 4,761 | Allreal Holding AG | 693,825 | ||||||||
| 427 | Bank Coop AG | 24,327 | ||||||||
| 396 | Banque Cantonale de Geneve | 99,319 | ||||||||
| 5,753 | Basler Kantonalbank | 573,508 | ||||||||
| 1,633 | Berner Kantonalbank AG | 441,468 | ||||||||
| 227 | Emmi AG | 64,244 | ||||||||
| 208 | Graubuendner Kantonalbank | 252,161 | ||||||||
| 1,384 | Intershop Holdings | 491,075 | ||||||||
| 1,300 | Kuehne + Nagel International AG | 142,088 | ||||||||
| 3,232 | Mobimo Holding AG | 726,982 | ||||||||
| 81,241 | Nestle SA | 5,889,640 | ||||||||
| 83,780 | Novartis AG | 5,967,539 | ||||||||
| 1,488 | PSP Swiss Property AG | 135,923 | ||||||||
| 3,612 | Roche Holding AG | 842,972 | ||||||||
| 1,882 | Swisscom AG | 872,881 | ||||||||
| 43 | Walliser Kantonalbank | 39,052 | ||||||||
|
| |||||||||
Total Switzerland | 17,257,004 | |||||||||
|
| |||||||||
Thailand — 0.1% | ||||||||||
| 58,100 | Bangkok Bank PCL, NVDR | 440,437 | ||||||||
|
| |||||||||
United Kingdom — 6.0% | ||||||||||
| 9,200 | Anglo American Plc | 236,368 | ||||||||
| 31,075 | Associated British Foods Plc | 897,003 | ||||||||
| 19,131 | AstraZeneca Plc | 958,488 | ||||||||
| 16,127 | British American Tobacco Plc | 863,694 | ||||||||
| 23,517 | Cranswick Plc | 352,095 | ||||||||
| 27,786 | Dairy Crest Group Plc | 180,833 | ||||||||
| 15,200 | Fresnillo Plc | 312,971 | ||||||||
| 42,467 | GlaxoSmithKline Plc | 992,087 | ||||||||
| 29,655 | Greggs Plc | 214,701 | ||||||||
| 15,944 | Imperial Tobacco Group Plc | 556,592 | ||||||||
| 159,611 | J Sainsbury Plc | 917,338 | ||||||||
| 4,103 | N Brown Group Plc | 25,419 | ||||||||
| 3,030 | National Grid Plc | 35,197 | ||||||||
| 4,295 | Next Plc | 284,739 | ||||||||
| 12,160 | Reckitt Benckiser Group Plc | 871,149 | ||||||||
| 55,555 | Smith & Nephew Plc | 641,117 | ||||||||
| 16,548 | SSE Plc | 372,889 | ||||||||
| 47,968 | Tate & Lyle Plc | 619,115 | ||||||||
| 1,057,802 | Tesco Plc | 6,128,533 | ||||||||
| 18,372 | The Berkeley Group Holdings Unit Plc | 569,377 | ||||||||
| 203,988 | Vodafone Group Plc | 577,986 | ||||||||
| 2,353 | Vodafone Group Plc, Sponsored ADR | 66,849 | ||||||||
| 346,083 | WM Morrison Supermarkets Plc | 1,451,459 | ||||||||
|
| |||||||||
Total United Kingdom | 18,125,999 | |||||||||
|
| |||||||||
United States — 50.8% | ||||||||||
| 12,300 | 3M Co. | 1,307,613 | ||||||||
| 140 | See accompanying Notes to the Financial Statements. |
Mercer Global Low Volatility Equity Fund
Schedule of Investments (Continued)
(showing percentage of net assets)
March 31, 2013
| Shares | Description | Value ($) | ||||||||
United States — continued | ||||||||||
| 10,825 | Abbott Laboratories | 382,339 | ||||||||
| 474 | Alleghany Corp.* | 187,666 | ||||||||
| 2,789 | Allete, Inc. | 136,717 | ||||||||
| 9,000 | Alliant Techsystems, Inc. | 651,870 | ||||||||
| 21,898 | Altria Group, Inc. | 753,072 | ||||||||
| 12,092 | Amdocs, Ltd. | 438,335 | ||||||||
| 8,676 | Ameren Corp. | 303,833 | ||||||||
| 18,199 | American Electric Power Co., Inc. | 885,017 | ||||||||
| 90,175 | American Express Co. | 6,083,205 | ||||||||
| 5,811 | Amgen, Inc. | 595,686 | ||||||||
| 4,000 | Apache Corp. | 308,640 | ||||||||
| 13,214 | AT&T, Inc. | 484,822 | ||||||||
| 6,900 | Automatic Data Processing, Inc. | 448,638 | ||||||||
| 194,392 | Bank of New York Mellon Corp. (The) | 5,441,032 | ||||||||
| 25,800 | BB&T Corp. | 809,862 | ||||||||
| 8 | Berkshire Hathaway, Inc. Class A* | 1,250,240 | ||||||||
| 1,742 | Cal-Maine Foods, Inc. | 74,140 | ||||||||
| 16,076 | Campbell Soup Co. | 729,207 | ||||||||
| 73,470 | Capitol Federal Financial, Inc. | 886,783 | ||||||||
| 14,565 | CenturyLink, Inc. | 511,668 | ||||||||
| 11,239 | Church & Dwight Co., Inc. | 726,377 | ||||||||
| 16,600 | Cincinnati Financial Corp. | 783,354 | ||||||||
| 26,900 | Cintas Corp. | 1,187,097 | ||||||||
| 81,296 | Cisco Systems, Inc. | 1,699,899 | ||||||||
| 10,253 | Clorox Co. (The) | 907,698 | ||||||||
| 33,412 | Coca-Cola Co. (The) | 1,351,181 | ||||||||
| 25,618 | Colgate-Palmolive Co. | 3,023,693 | ||||||||
| 45,600 | Comcast Corp. Class A | 1,806,672 | ||||||||
| 20,587 | ConAgra Foods, Inc. | 737,220 | ||||||||
| 17,600 | ConocoPhillips | 1,057,760 | ||||||||
| 11,670 | Consolidated Edison, Inc. | 712,220 | ||||||||
| 5,135 | Costco Wholesale Corp. | 544,875 | ||||||||
| 1,478 | CVS Caremark Corp. | 81,275 | ||||||||
| 13,504 | Devon Energy Corp. | 761,896 | ||||||||
| 8,348 | DTE Energy Co. | 570,502 | ||||||||
| 102,098 | eBay, Inc.* | 5,535,754 | ||||||||
| 16,008 | Edison International | 805,523 | ||||||||
| 12,446 | El Paso Electric Co. | 418,808 | ||||||||
| 28,894 | Empire District Electric Co. (The) | 647,226 | ||||||||
| 21,545 | Entergy Corp. | 1,362,506 | ||||||||
| 27,800 | FirstEnergy Corp. | 1,173,160 | ||||||||
| 18,717 | General Mills, Inc. | 922,935 | ||||||||
| 8,839 | Google, Inc. Class A* | 7,018,431 | ||||||||
| 23,067 | Great Plains Energy, Inc. | 534,924 | ||||||||
| 13,993 | H&R Block, Inc. | 411,674 | ||||||||
| 4,441 | Hawaiian Electric Industries, Inc. | 123,060 | ||||||||
| 1,900 | Helmerich & Payne, Inc. | 115,330 | ||||||||
| 20,828 | Hormel Foods Corp. | 860,613 | ||||||||
| 62,132 | Intel Corp. | 1,357,584 | ||||||||
| See accompanying Notes to the Financial Statements. | 141 |
Mercer Global Low Volatility Equity Fund
Schedule of Investments (Continued)
(showing percentage of net assets)
March 31, 2013
| Shares | Description | Value ($) | ||||||||
United States — continued | ||||||||||
| 2,374 | j2 Global, Inc. | 93,085 | ||||||||
| 12,920 | Jack Henry & Associates, Inc. | 597,033 | ||||||||
| 8,435 | JM Smucker Co. (The) | 836,415 | ||||||||
| 58,698 | Johnson & Johnson | 4,785,648 | ||||||||
| 13,450 | Kellogg Co. | 866,583 | ||||||||
| 9,228 | Kimberly-Clark Corp. | 904,159 | ||||||||
| 26,164 | Kroger Co. (The) | 867,075 | ||||||||
| 23,600 | Linear Technology Corp. | 905,532 | ||||||||
| 8,300 | Lockheed Martin Corp. | 801,116 | ||||||||
| 19,613 | Lorillard, Inc. | 791,385 | ||||||||
| 147,525 | Lowe’s Cos., Inc. | 5,594,148 | ||||||||
| 1,615 | Magellan Health Services, Inc.* | 76,826 | ||||||||
| 5,000 | Martin Marietta Materials, Inc. | 510,100 | ||||||||
| 6,439 | Mastercard, Inc. Class A | 3,484,336 | ||||||||
| 47,687 | McDonald’s Corp. | 4,753,917 | ||||||||
| 2,933 | McKesson Corp. | 316,647 | ||||||||
| 264,929 | Microsoft Corp. | 7,579,619 | ||||||||
| 127,059 | Mondelez International, Inc. Class A | 3,889,276 | ||||||||
| 5,471 | NetApp, Inc.* | 186,889 | ||||||||
| 6,800 | Newmont Mining Corp. | 284,852 | ||||||||
| 11,200 | Northrop Grumman Corp. | 785,680 | ||||||||
| 37,653 | NV Energy, Inc. | 754,190 | ||||||||
| 18,000 | Omnicom Group, Inc. | 1,060,200 | ||||||||
| 38,045 | Oracle Corp. | 1,230,375 | ||||||||
| 14,286 | Otter Tail Corp. | 444,866 | ||||||||
| 14,732 | Pepco Holdings, Inc. | 315,265 | ||||||||
| 11,504 | PepsiCo, Inc. | 910,081 | ||||||||
| 7,817 | Philip Morris International, Inc. | 724,714 | ||||||||
| 5,707 | Piedmont Office Realty Trust, Inc. REIT | 111,800 | ||||||||
| 15,183 | Pinnacle West Capital Corp. | 878,944 | ||||||||
| 17,100 | Plum Creek Timber Co., Inc. REIT | 892,620 | ||||||||
| 23,321 | PNM Resources, Inc. | 543,146 | ||||||||
| 28,849 | Portland General Electric Co. | 874,990 | ||||||||
| 25,760 | PPL Corp. | 806,546 | ||||||||
| 11,200 | Procter & Gamble Co. (The) | 863,072 | ||||||||
| 7,500 | Rayonier, Inc. REIT | 447,525 | ||||||||
| 31,225 | Retail Opportunity Investments Corp. REIT | 437,462 | ||||||||
| 1,718 | Reynolds American, Inc. | 76,434 | ||||||||
| 3,414 | San Juan Basin Royalty Trust | 51,654 | ||||||||
| 16,300 | Scotts Miracle-Gro Co. (The) Class A | 704,812 | ||||||||
| 17,837 | Southern Co. (The) | 836,912 | ||||||||
| 58,356 | State Street Corp. | 3,448,256 | ||||||||
| 49,900 | Sysco Corp. | 1,754,983 | ||||||||
| 73,027 | Target Corp. | 4,998,698 | ||||||||
| 10,334 | Texas Instruments, Inc. | 366,650 | ||||||||
| 15,428 | UNS Energy Corp. | 755,046 | ||||||||
| 128,172 | US Bancorp | 4,348,876 | ||||||||
| 30,288 | Vector Group, Ltd. | 488,243 | ||||||||
| 17,142 | Vectren Corp. | 607,170 | ||||||||
| 142 | See accompanying Notes to the Financial Statements. |
Mercer Global Low Volatility Equity Fund
Schedule of Investments (Continued)
(showing percentage of net assets)
March 31, 2013
| Shares | Description | Value ($) | ||||||||
United States — continued | ||||||||||
| 16,268 | Verizon Communications, Inc. | 799,572 | ||||||||
| 23,316 | Visa, Inc. Class A | 3,959,989 | ||||||||
| 10,500 | Vulcan Materials Co. | 542,850 | ||||||||
| 64,256 | Wal-Mart Stores, Inc. | 4,808,276 | ||||||||
| 12,500 | WellPoint, Inc. | 827,875 | ||||||||
| 128,249 | Wells Fargo & Co. | 4,743,930 | ||||||||
| 10,492 | Westar Energy, Inc. | 348,125 | ||||||||
| 28,412 | Weyerhaeuser Co. REIT | 891,569 | ||||||||
| 13,523 | Wisconsin Energy Corp. | 580,001 | ||||||||
| 14,600 | WR Berkley Corp. | 647,802 | ||||||||
| 29,874 | Xcel Energy, Inc. | 887,258 | ||||||||
| 74,537 | Yum! Brands, Inc. | 5,362,192 | ||||||||
|
| |||||||||
Total United States | 152,952,922 | |||||||||
|
| |||||||||
TOTAL COMMON STOCKS (COST $245,491,219) | 269,854,255 | |||||||||
|
| |||||||||
INVESTMENT COMPANY — 1.5% | ||||||||||
United States — 1.5% | ||||||||||
| 30,100 | SPDR Gold Shares* | 4,648,945 | ||||||||
|
| |||||||||
TOTAL INVESTMENT COMPANY (COST $4,976,402) | 4,648,945 | |||||||||
|
| |||||||||
PREFERRED STOCKS — 0.3% | ||||||||||
Germany — 0.2% | ||||||||||
| 6,012 | Henkel AG & Co. KGaA, 1.09% | 579,695 | ||||||||
|
| |||||||||
Japan — 0.1% | ||||||||||
| 103 | Shinkin Central Bank, 3.94% | 182,402 | ||||||||
|
| |||||||||
Sweden — 0.0% | ||||||||||
| 9,114 | Sagax AB, 6.90% | 40,650 | ||||||||
|
| |||||||||
United States — 0.0% | ||||||||||
| 5,297 | Wachovia Preferred Funding Corp. REIT, 7.25% | 145,085 | ||||||||
|
| |||||||||
TOTAL PREFERRED STOCKS (COST $848,633) | 947,832 | |||||||||
|
| |||||||||
WARRANTS — 0.1% | ||||||||||
United States — 0.1% | ||||||||||
| 18,500 | JPMorgan Chase & Co., Strike Price $0.00, Expires 10/28/18* | 263,625 | ||||||||
|
| |||||||||
TOTAL WARRANTS (COST $237,942) | 263,625 | |||||||||
|
| |||||||||
| See accompanying Notes to the Financial Statements. | 143 |
Mercer Global Low Volatility Equity Fund
Schedule of Investments (Continued)
(showing percentage of net assets)
March 31, 2013
| Par Value ($) | Description | Value ($) | ||||||||
SHORT-TERM INVESTMENTS — 8.3% | ||||||||||
Bank Deposit — 8.3% |
| |||||||||
| 25,016,810 | State Street Bank & Trust Euro Time Deposit, 0.01%, due 04/01/13 | 25,016,810 | ||||||||
|
| |||||||||
TOTAL SHORT-TERM INVESTMENTS (COST $25,016,810) | 25,016,810 | |||||||||
|
| |||||||||
TOTAL INVESTMENTS — 99.8% (Cost $276,571,006) | 300,731,467 | |||||||||
Other Assets and Liabilities (net) — 0.2% | 498,671 | |||||||||
|
| |||||||||
NET ASSETS — 100.0% | $ | 301,230,138 | ||||||||
|
| |||||||||
Notes to Schedule of Investments: | ||||||||||
| ADR — American Depository Receipt | ||||||||||
| GDR — Global Depository Receipt | ||||||||||
| NVDR — Non-Voting Depository Receipt | ||||||||||
| REIT — Real Estate Investment Trust | ||||||||||
| * | Non-income producing security | |||||||||
| ‡‡‡ | Security exempt from registration under Regulation S of the Securities Act of 1933, which exempts from registration securities offered and sold outside the United States. Security may not be offered or sold in the United States except pursuant to an exemption from, or in a transaction not subject to, the registration requirements of the Securities Act of 1933. | |||||||||
| 144 | See accompanying Notes to the Financial Statements. |
Mercer Global Low Volatility Equity Fund
Schedule of Investments (Continued)
March 31, 2013
A summary of outstanding financial instruments at March 31, 2013 is as follows:
Forward Foreign Currency Contracts
Settlement | Currency | Counterparty | Units of | Value | Net | |||||||||||||||||
| Buys | ||||||||||||||||||||||
| 07/17/13 | JPY | JPMorgan Chase Bank | 59,920,000 | $ | 637,817 | $ | (21,583 | ) | ||||||||||||||
|
| |||||||||||||||||||||
| Sales | ||||||||||||||||||||||
| 09/18/13 | EUR | Goldman Sachs Capital Markets | 299,000 | $ | 384,458 | $ | 6,530 | |||||||||||||||
| 06/19/13 | EUR | HSBC Bank USA | 433,000 | 556,322 | 5,931 | |||||||||||||||||
| 07/17/13 | EUR | JPMorgan Chase Bank | 341,000 | 438,221 | 7,538 | |||||||||||||||||
| 08/21/13 | EUR | Mellon Bank, N.A. | 528,000 | 678,743 | 26,987 | |||||||||||||||||
| 05/15/13 | EUR | Mellon Bank, N.A. | 365,000 | 468,832 | �� | (1,525 | ) | |||||||||||||||
| 04/17/13 | EUR | UBS AG | 397,000 | 509,836 | 363 | |||||||||||||||||
| 09/18/13 | JPY | Goldman Sachs Capital Markets | 151,969,000 | 1,618,601 | (31,540 | ) | ||||||||||||||||
| 06/19/13 | JPY | HSBC Bank USA | 123,962,000 | 1,319,187 | 169,471 | |||||||||||||||||
| 07/17/13 | JPY | JPMorgan Chase Bank | 66,635,000 | 709,295 | 50,602 | |||||||||||||||||
| 08/21/13 | JPY | Mellon Bank, N.A. | 126,606,000 | 1,348,103 | 8,729 | |||||||||||||||||
| 05/15/13 | JPY | Mellon Bank, N.A. | 103,049,000 | 1,096,353 | 187,560 | |||||||||||||||||
| 04/17/13 | JPY | UBS AG | 90,785,000 | 965,693 | 162,792 | |||||||||||||||||
|
| |||||||||||||||||||||
| $ | 593,438 | |||||||||||||||||||||
|
| |||||||||||||||||||||
Currency Abbreviations
| EUR | Euro |
| JPY | Japanese Yen |
| See accompanying Notes to the Financial Statements. | 145 |
Mercer Global Low Volatility Equity Fund
Schedule of Investments (Continued)
March 31, 2013
| Industry Sector Summary (Unaudited) | % of Net Assets | ||||
Food | 14.0 | ||||
Retail | 9.6 | ||||
Banks | 7.0 | ||||
Electric | 6.5 | ||||
Telecommunications | 6.1 | ||||
Pharmaceuticals | 5.4 | ||||
Internet | 4.1 | ||||
Commercial Services | 3.6 | ||||
Software | 3.3 | ||||
Cosmetics & Personal Care | 2.2 | ||||
Diversified Financial Services | 2.1 | ||||
Health Care — Products | 2.1 | ||||
Oil & Gas | 1.9 | ||||
Insurance | 1.8 | ||||
Agriculture | 1.6 | ||||
Commodity Fund | 1.5 | ||||
Household Products & Wares | 1.5 | ||||
Mining | 1.5 | ||||
Electronics | 1.4 | ||||
Beverages | 1.3 | ||||
Media | 1.2 | ||||
Building Materials | 1.1 | ||||
Real Estate | 1.0 | ||||
Semiconductors | 0.9 | ||||
Aerospace & Defense | 0.8 | ||||
Holding Companies — Diversified | 0.8 | ||||
Forest Products & Paper | 0.6 | ||||
Hand & Machine Tools | 0.5 | ||||
REITS | 0.5 | ||||
Advertising | 0.4 | ||||
Apparel | 0.4 | ||||
Biotechnology | 0.4 | ||||
Chemicals | 0.4 | ||||
Health Care — Services | 0.4 | ||||
Leisure Time | 0.4 | ||||
Miscellaneous — Manufacturing | 0.4 | ||||
Textiles | 0.4 | ||||
Computers | 0.3 | ||||
Engineering & Construction | 0.3 | ||||
Savings & Loans | 0.3 | ||||
Auto Manufacturers | 0.2 | ||||
Gas | 0.2 | ||||
Home Builders | 0.2 | ||||
Investment Companies | 0.2 | ||||
Transportation | 0.2 | ||||
Airlines | 0.1 | ||||
Electrical Components & Equipment | 0.1 | ||||
Lodging | 0.1 | ||||
Metal Fabricate & Hardware | 0.1 | ||||
Office & Business Equipment | 0.1 | ||||
| 146 | See accompanying Notes to the Financial Statements. |
Mercer Global Low Volatility Equity Fund
Schedule of Investments (Continued)
March 31, 2013
| Industry Sector Summary (Unaudited) | % of Net Assets | ||||
Energy — Alternate Sources | 0.0 | ||||
Entertainment | 0.0 | ||||
Short-Term Investments and Other Assets and Liabilities (net) | 8.5 | ||||
|
| ||||
| 100.0 | % | ||||
|
| ||||
| See accompanying Notes to the Financial Statements. | 147 |
Mercer US Short Maturity Fixed Income Fund
Schedule of Investments
(showing percentage of net assets)
March 31, 2013
| Par Value ($) | Description | Value ($) | ||||||||
DEBT OBLIGATIONS — 99.2% | ||||||||||
Asset Backed Securities — 9.8% | ||||||||||
| 200,000 | Ally Auto Receivables Trust, Series 2010-2, Class A4, 2.09%, due 05/15/15 | 201,956 | ||||||||
| 65,000 | Ally Auto Receivables Trust, Series 2010-3, Class A4, 1.55%, due 08/17/15 | 65,571 | ||||||||
| 200,000 | Ally Auto Receivables Trust, Series 2011-1, Class A4, 2.23%, due 03/15/16 | 203,684 | ||||||||
| 16,000 | AmeriCredit Automobile Receivables Trust, Series 2013-1, Class A3, 0.61%, due 10/10/17 | 16,010 | ||||||||
| 88,558 | Bank of America Auto Trust, Series 2010-2, Class A4, 1.94%, due 06/15/17 | 89,141 | ||||||||
| 92,000 | Capital Auto Receivables Asset Trust, Series 2013-1, Class A2, 0.62%, due 07/20/16 | 92,072 | ||||||||
| 100,000 | Capital One Multi-Asset Execution Trust, Series 2007-A7, Class A7, 5.75%, due 07/15/20 | 120,199 | ||||||||
| 200,000 | Capital One Multi-Asset Execution Trust, Series 2008-A3, Class A3, 5.05%, due 02/15/16 | 200,449 | ||||||||
| 150,000 | CarMax Auto Owner Trust, Series 2012-2, Class A4, 1.16%, due 12/15/17 | 151,994 | ||||||||
| 100,000 | CarMax Auto Owner Trust, Series 2012-3, Class A3, 0.52%, due 07/17/17 | 100,042 | ||||||||
| 37,512 | Chase Funding Mortgage Loan Asset-Backed Certificates, Series 2003-2, Class 1A6, 4.36%, due 08/25/14 | 37,512 | ||||||||
| 110,240 | CNH Equipment Trust, Series 2010-A, Class A4, 2.49%, due 01/15/16 | 111,156 | ||||||||
| 51,473 | CNH Equipment Trust, Series 2011-A, Class A3, 1.20%, due 05/16/16 | 51,708 | ||||||||
| 22,000 | CNH Equipment Trust, Series 2012-B, Class A3, 0.86%, due 09/15/17 | 22,110 | ||||||||
| 85,000 | Fifth Third Auto Trust, Series 2013-A, Class A3, 0.61%, due 09/15/17 | 85,030 | ||||||||
| 75,912 | Ford Credit Auto Owner Trust, Series 2009-E, Class A4, 2.42%, due 11/15/14 | 76,468 | ||||||||
| 68,131 | Ford Credit Auto Owner Trust, Series 2011-A, Class A3, 0.97%, due 01/15/15 | 68,245 | ||||||||
| 100,000 | Ford Credit Auto Owner Trust, Series 2012-A, Class A3, 0.84%, due 08/15/16 | 100,418 | ||||||||
| 150,000 | Ford Credit Auto Owner Trust, Series 2012-A, Class A4, 1.15%, due 06/15/17 | 151,938 | ||||||||
| 100,000 | Ford Credit Auto Owner Trust, Series 2012-B, Class A3, 0.72%, due 12/15/16† | 100,321 | ||||||||
| 200,000 | Ford Credit Auto Owner Trust, Series 2012-C, Class A4, 0.79%, due 11/15/17 | 200,741 | ||||||||
| 400,000 | GE Capital Credit Card Master Note Trust, Series 2009-4, Class A, 3.80%, due 11/15/17 | 421,252 | ||||||||
| 119,000 | GE Equipment Transportation LLC, Series 2012-2, Class A3, 0.62%, due 07/25/16 | 119,095 | ||||||||
| 7,786 | Honda Auto Receivables Owner Trust, Series 2010-2, Class A3, 1.34%, due 03/18/14 | 7,795 | ||||||||
| 34,000 | Honda Auto Receivables Owner Trust, Series 2012-2, Class A3, 0.70%, due 02/16/16 | 34,121 | ||||||||
| 100,000 | Huntington Auto Trust, Series 2012-1, Class A3, 0.81%, due 09/15/16 | 100,396 | ||||||||
| 108,000 | Huntington Auto Trust, Series 2012-2, Class A3, 0.51%, due 04/17/17 | 108,023 | ||||||||
| 30,000 | Hyundai Auto Receivables Trust, Series 2010-A, Class A4, 2.45%, due 12/15/16 | 30,599 | ||||||||
| 8,405 | Hyundai Auto Receivables Trust, Series 2010-B, Class A3, 0.97%, due 04/15/15 | 8,425 | ||||||||
| 65,000 | Hyundai Auto Receivables Trust, Series 2010-B, Class A4, 1.63%, due 03/15/17 | 66,083 | ||||||||
| 15,597 | John Deere Owner Trust, Series 2011-A, Class A3, 1.29%, due 01/15/16 | 15,666 | ||||||||
| 83,000 | John Deere Owner Trust, Series 2012-B, Class A3, 0.53%, due 07/15/16 | 83,001 | ||||||||
| 22,138 | Mercedes-Benz Auto Receivables Trust, Series 2010-1, Class A3, 1.42%, due 08/15/14 | 22,184 | ||||||||
| 104,000 | Mercedes-Benz Auto Receivables Trust, Series 2012-1, Class A3, 0.47%, due 10/17/16 | 103,954 | ||||||||
| 100,000 | Nissan Auto Receivables Owner Trust, Series 2012-A, Class A3, 0.73%, due 05/16/16 | 100,419 | ||||||||
| 200,000 | Nissan Auto Receivables Owner Trust, Series 2013-A, Class A3, 0.50%, due 05/15/17 | 199,974 | ||||||||
| 153,781 | Santander Drive Auto Receivables Trust, Series 2010-A, Class A3, 1.83%, | 154,587 | ||||||||
| 7,000 | Santander Drive Auto Receivables Trust, Series 2012-3, Class A3, 1.08%, due 04/15/16 | 7,028 | ||||||||
| 216,000 | Santander Drive Auto Receivables Trust, Series 2012-5, Class A3, 0.83%, due 12/15/16 | 216,643 | ||||||||
| 78,746 | Securitized Asset Backed NIM Trust, Series 2005-FR4, Class NIM, 6.00%, | 1 | ||||||||
| 88,340 | USAA Auto Owner Trust, Series 2009-2, Class A4, 2.53%, due 07/15/15 | 88,429 | ||||||||
| 53,000 | USAA Auto Owner Trust, Series 2012-1, Class A3, 0.43%, due 08/15/16 | 52,897 | ||||||||
| 109,000 | Volkswagen Auto Loan Enhanced Trust, Series 2012-2, Class A3, 0.46%, due 01/20/17 | 108,920 | ||||||||
| 148 | See accompanying Notes to the Financial Statements. |
Mercer US Short Maturity Fixed Income Fund
Schedule of Investments (Continued)
(showing percentage of net assets)
March 31, 2013
| Par Value ($) | Description | Value ($) | ||||||||
Asset Backed Securities — continued |
| |||||||||
| 168,275 | World Omni Auto Receivables Trust, Series 2010-A, Class A4, 2.21%, due 05/15/15 | 169,579 | ||||||||
| 150,000 | World Omni Auto Receivables Trust, Series 2012-A, Class A4, 0.85%, due 08/15/18 | 150,800 | ||||||||
|
| |||||||||
| 4,616,636 | ||||||||||
|
| |||||||||
Corporate Debt — 21.8% | ||||||||||
| 15,000 | AbbVie, Inc., 1.20%, due 11/06/15 144A | 15,126 | ||||||||
| 15,000 | ACE INA Holdings, Inc., 2.60%, due 11/23/15 | 15,735 | ||||||||
| 20,000 | ACE INA Holdings, Inc., 5.88%, due 06/15/14 | 21,259 | ||||||||
| 20,000 | ADT Corp. (The), 2.25%, due 07/15/17 144A | 20,097 | ||||||||
| 15,000 | Aetna, Inc., 6.00%, due 06/15/16 | 17,290 | ||||||||
| 20,000 | Aflac, Inc., 2.65%, due 02/15/17 | 21,046 | ||||||||
| 15,000 | Aflac, Inc., 3.45%, due 08/15/15 | 15,948 | ||||||||
| 45,000 | Alabama Power Co., Series 2, 5.80%, due 11/15/13 | 46,450 | ||||||||
| 80,000 | Allstate Life Global Funding Trusts, 5.38%, due 04/30/13 | 80,323 | ||||||||
| 25,000 | America Movil SAB de CV, Guaranteed Senior Note, 5.63%, due 11/15/17 | 29,305 | ||||||||
| 35,000 | American Express Co., 7.25%, due 05/20/14 | 37,576 | ||||||||
| 25,000 | American Express Credit Corp., 5.13%, due 08/25/14 | 26,568 | ||||||||
| 105,000 | American Express Credit Corp., 7.30%, due 08/20/13 | 107,698 | ||||||||
| 20,000 | American International Group, Inc., 4.25%, due 09/15/14 | 20,964 | ||||||||
| 20,000 | American International Group, Inc., 5.60%, due 10/18/16 | 22,746 | ||||||||
| 60,000 | AON Corp., 3.50%, due 09/30/15 | 63,498 | ||||||||
| 20,000 | Apache Corp., 5.63%, due 01/15/17 | 23,207 | ||||||||
| 20,000 | �� | Arizona Public Service Co., 6.25%, due 08/01/16 | 23,407 | |||||||
| 10,000 | Arrow Electronics, Inc., 3.38%, due 11/01/15 | 10,390 | ||||||||
| 55,000 | Atmos Energy Corp., 4.95%, due 10/15/14 | 58,418 | ||||||||
| 15,000 | BAE Systems Holdings, Inc., 4.95%, due 06/01/14 144A | 15,643 | ||||||||
| 10,000 | BAE Systems Holdings, Inc., 5.20%, due 08/15/15 144A | 10,864 | ||||||||
| 20,000 | Bank of America Corp., 1.25%, due 01/11/16 | 19,930 | ||||||||
| 20,000 | Bank of America Corp., 3.63%, due 03/17/16 | 21,231 | ||||||||
| 20,000 | Bank of America Corp., 4.75%, due 08/01/15 | 21,543 | ||||||||
| 20,000 | Bank of America Corp., 6.50%, due 08/01/16 | 23,051 | ||||||||
| 30,000 | Bank of America Corp., Senior Note, 5.75%, due 12/01/17 | 34,736 | ||||||||
| 35,000 | Bank of New York Mellon Corp. (The), 0.70%, due 10/23/15 | 35,068 | ||||||||
| 25,000 | Bank of New York Mellon Corp. (The), 4.30%, due 05/15/14 | 26,088 | ||||||||
| 80,000 | Bank of New York Mellon Corp. (The), 5.13%, due 08/27/13 | 81,529 | ||||||||
| 25,000 | Bank of Nova Scotia, 0.75%, due 10/09/15 | 25,006 | ||||||||
| 40,000 | Bank of Nova Scotia, 2.55%, due 01/12/17 | 41,941 | ||||||||
| 20,000 | Bank of Nova Scotia, 3.40%, due 01/22/15 | 20,984 | ||||||||
| 25,000 | Barrick Gold Corp., 2.90%, due 05/30/16 | 26,306 | ||||||||
| 40,000 | BB&T Corp., 3.20%, due 03/15/16 | 42,566 | ||||||||
| 100,000 | BB&T Corp., 5.70%, due 04/30/14 | 105,589 | ||||||||
| 15,000 | Beam, Inc., 1.88%, due 05/15/17 | 15,290 | ||||||||
| 5,000 | Beam, Inc., 5.38%, due 01/15/16 | 5,554 | ||||||||
| 170,000 | BellSouth Corp., 5.20%, due 09/15/14 | 181,142 | ||||||||
| 30,000 | BHP Billiton Finance USA, Ltd., 1.63%, due 02/24/17 | 30,564 | ||||||||
| 30,000 | BHP Billiton Finance USA, Ltd., 4.80%, due 04/15/13 | 30,047 | ||||||||
| 35,000 | BlackRock, Inc., 3.50%, due 12/10/14 | 36,772 | ||||||||
| 6,000 | BP Capital Markets Plc, 0.70%, due 11/06/15 | 5,994 | ||||||||
| 15,000 | BP Capital Markets Plc, 1.38%, due 11/06/17 | 15,037 | ||||||||
| See accompanying Notes to the Financial Statements. | 149 |
Mercer US Short Maturity Fixed Income Fund
Schedule of Investments (Continued)
(showing percentage of net assets)
March 31, 2013
| Par Value ($) | Description | Value ($) | ||||||||
Corporate Debt — continued |
| |||||||||
| 21,000 | BP Capital Markets Plc, 1.85%, due 05/05/17 | 21,548 | ||||||||
| 80,000 | BP Capital Markets Plc, 3.63%, due 05/08/14 | 82,668 | ||||||||
| 25,000 | Bunge, Ltd. Finance Corp., 3.20%, due 06/15/17 | 25,885 | ||||||||
| 30,000 | Burlington Northern Santa Fe LLC, 7.00%, due 02/01/14 | 31,577 | ||||||||
| 20,000 | Canadian Imperial Bank of Commerce, 1.55%, due 01/23/18 | 20,157 | ||||||||
| 15,000 | Canadian Imperial Bank of Commerce, 2.35%, due 12/11/15 | 15,641 | ||||||||
| 25,000 | Canadian Natural Resources, Ltd., 4.90%, due 12/01/14 | 26,700 | ||||||||
| 20,000 | Capital One Financial Corp., 2.15%, due 03/23/15 | 20,420 | ||||||||
| 15,000 | Capital One Financial Corp., 3.15%, due 07/15/16 | 15,939 | ||||||||
| 35,000 | Capital One Financial Corp., 7.38%, due 05/23/14 | 37,582 | ||||||||
| 10,000 | Cardinal Health, Inc., 5.80%, due 10/15/16 | 11,538 | ||||||||
| 25,000 | Cargill, Inc., 4.38%, due 06/01/13 144A | 25,157 | ||||||||
| 75,000 | Caterpillar Financial Services Corp., 6.13%, due 02/17/14 | 78,781 | ||||||||
| 25,000 | Caterpillar, Inc., 7.00%, due 12/15/13 | 26,166 | ||||||||
| 15,000 | CBS Corp., 1.95%, due 07/01/17 | 15,264 | ||||||||
| 10,000 | Celgene Corp., 1.90%, due 08/15/17 | 10,164 | ||||||||
| 195,000 | Cellco Partnership/Verizon Wireless Capital LLC, 5.55%, due 02/01/14 | 202,716 | ||||||||
| 25,000 | CenterPoint Energy Resources Corp., 5.95%, due 01/15/14 | 26,028 | ||||||||
| 20,000 | CenterPoint Energy Resources Corp., 6.13%, due 11/01/17 | 23,804 | ||||||||
| 20,000 | Cisco Systems, Inc., 5.50%, due 02/22/16 | 22,745 | ||||||||
| 315,000 | Citigroup, Inc., Global Senior Note, 6.50%, due 08/19/13 | 322,105 | ||||||||
| 100,000 | CME Group, Inc., 5.75%, due 02/15/14 | 104,353 | ||||||||
| 35,000 | CNA Financial Corp., 5.85%, due 12/15/14 | 37,698 | ||||||||
| 20,000 | CNA Financial Corp., 6.50%, due 08/15/16 | 23,036 | ||||||||
| 40,000 | Coca-Cola Co. (The), 1.50%, due 11/15/15 | 41,006 | ||||||||
| 30,000 | Comcast Corp., 5.85%, due 11/15/15 | 33,923 | ||||||||
| 20,000 | Comerica, Inc., 3.00%, due 09/16/15 | 21,061 | ||||||||
| 25,000 | ConAgra Foods, Inc., 1.30%, due 01/25/16 | 25,215 | ||||||||
| 11,000 | ConocoPhillips, 4.75%, due 02/01/14 | 11,398 | ||||||||
| 70,000 | Cooperatieve Centrale Raiffeisen-Boerenleenbank BA/Utrecht, 3.38%, due 01/19/17 | 75,010 | ||||||||
| 16,000 | COX Communications, Inc., 5.45%, due 12/15/14 | 17,287 | ||||||||
| 150,000 | Credit Suisse, 5.50%, due 05/01/14 | 157,848 | ||||||||
| 80,000 | Credit Suisse USA, Inc., 5.13%, due 08/15/15 | 87,855 | ||||||||
| 30,000 | Crown Castle Towers LLC, 3.21%, due 08/15/35 144A | 31,317 | ||||||||
| 30,000 | Daimler Finance North America LLC, Senior Note, 6.50%, due 11/15/13 | 31,112 | ||||||||
| 15,000 | Dell, Inc., 2.30%, due 09/10/15 | 15,035 | ||||||||
| 20,000 | Dell, Inc., 4.70%, due 04/15/13 | 20,024 | ||||||||
| 60,000 | Delmarva Power & Light Co., Series I, 6.40%, due 12/01/13 | 62,220 | ||||||||
| 25,000 | Deutsche Bank AG, 3.88%, due 08/18/14 | 26,042 | ||||||||
| 65,000 | Deutsche Bank Financial LLC, 5.38%, due 03/02/15 | 69,410 | ||||||||
| 75,000 | Deutsche Telekom International Finance BV, 4.88%, due 07/08/14 | 78,883 | ||||||||
| 20,000 | Devon Energy Corp., 1.88%, due 05/15/17 | 20,214 | ||||||||
| 60,000 | Diageo Finance BV, 5.50%, due 04/01/13 | 60,000 | ||||||||
| 30,000 | Dow Chemical Co. (The), 5.90%, due 02/15/15 | 32,805 | ||||||||
| 20,000 | Dr Pepper Snapple Group, Inc., 2.90%, due 01/15/16 | 21,103 | ||||||||
| 20,000 | Duke Energy Carolinas LLC, 5.75%, due 11/15/13 | 20,645 | ||||||||
| 15,000 | Duke Energy Corp., 3.35%, due 04/01/15 | 15,734 | ||||||||
| 35,000 | Duke Energy Corp., 5.65%, due 06/15/13 | 35,361 | ||||||||
| 20,000 | Duke Realty, LP REIT, 5.50%, due 03/01/16 | 22,024 | ||||||||
| 150 | See accompanying Notes to the Financial Statements. |
Mercer US Short Maturity Fixed Income Fund
Schedule of Investments (Continued)
(showing percentage of net assets)
March 31, 2013
| Par Value ($) | Description | Value ($) | ||||||||
Corporate Debt — continued |
| |||||||||
| 15,000 | Eaton Corp., 0.95%, due 11/02/15 144A | 15,080 | ||||||||
| 25,000 | eBay, Inc., 1.63%, due 10/15/15 | 25,649 | ||||||||
| 35,000 | Ecolab, Inc., 1.45%, due 12/08/17 | 34,795 | ||||||||
| 10,000 | EI Du Pont de Nemours & Co., 5.88%, due 01/15/14 | 10,424 | ||||||||
| 35,000 | Emerson Electric Co., 5.00%, due 12/15/14 | 37,587 | ||||||||
| 25,000 | ERAC USA Finance LLC, 2.75%, due 07/01/13 144A | 25,134 | ||||||||
| 15,000 | Fifth Third Bancorp, 3.63%, due 01/25/16 | 16,046 | ||||||||
| 25,000 | France Telecom SA, 2.13%, due 09/16/15 | 25,667 | ||||||||
| 25,000 | Freeport-McMoRan Copper & Gold, Inc., 1.40%, due 02/13/15 | 25,193 | ||||||||
| 12,000 | Freeport-McMoRan Copper & Gold, Inc., 2.15%, due 03/01/17 | 12,153 | ||||||||
| 55,000 | General Electric Capital Corp., 4.75%, due 09/15/14 | 58,223 | ||||||||
| 485,000 | General Electric Capital Corp., 4.88%, due 03/04/15‡ | 523,430 | ||||||||
| 30,000 | General Electric Capital Corp., 5.50%, due 06/04/14 | 31,761 | ||||||||
| 20,000 | General Mills, Inc., 0.88%, due 01/29/16 | 20,081 | ||||||||
| 15,000 | Gilead Sciences, Inc., 2.40%, due 12/01/14 | 15,420 | ||||||||
| 15,000 | GlaxoSmithKline Capital, Inc., 0.70%, due 03/18/16 | 15,014 | ||||||||
| 85,000 | Goldman Sachs Group (The), Inc., 3.63%, due 02/07/16 | 90,331 | ||||||||
| 222,000 | Goldman Sachs Group (The), Inc., 3.70%, due 08/01/15 | 234,747 | ||||||||
| 50,000 | Goldman Sachs Group (The), Inc., 5.15%, due 01/15/14 | 51,761 | ||||||||
| 10,000 | HCP, Inc. REIT, 6.70%, due 01/30/18 | 12,151 | ||||||||
| 120,000 | Hewlett-Packard Co., 6.13%, due 03/01/14 | 125,629 | ||||||||
| 15,000 | HJ Heinz Co., 1.50%, due 03/01/17 | 15,217 | ||||||||
| 45,000 | Honeywell International, Inc., 3.88%, due 02/15/14 | 46,318 | ||||||||
| 20,000 | Hospira, Inc., 6.05%, due 03/30/17 | 22,779 | ||||||||
| 100,000 | HSBC Bank Plc, 1.63%, due 08/12/13 144A | 100,480 | ||||||||
| 20,000 | Intel Corp., 1.95%, due 10/01/16 | 20,736 | ||||||||
| 50,000 | International Business Machines Corp., 7.50%, due 06/15/13 | 50,717 | ||||||||
| 30,000 | Intuit, Inc., 5.75%, due 03/15/17 | 34,387 | ||||||||
| 50,000 | Jackson National Life Global Funding, 5.38%, due 05/08/13 144A | 50,244 | ||||||||
| 61,000 | Jefferies Group, Inc., 3.88%, due 11/09/15 | 64,050 | ||||||||
| 40,000 | John Deere Capital Corp., 1.30%, due 03/12/18 | 40,191 | ||||||||
| 60,000 | John Deere Capital Corp., 4.50%, due 04/03/13 | 60,000 | ||||||||
| 20,000 | John Deere Capital Corp., 4.90%, due 09/09/13 | 20,398 | ||||||||
| 35,000 | Johnson Controls, Inc., 4.88%, due 09/15/13 | 35,692 | ||||||||
| 20,000 | Kellogg Co., 1.88%, due 11/17/16 | 20,564 | ||||||||
| 15,000 | Kellogg Co., 4.45%, due 05/30/16 | 16,517 | ||||||||
| 60,000 | KeyCorp, 6.50%, due 05/14/13 | 60,414 | ||||||||
| 8,000 | Kroger Co. (The), 2.20%, due 01/15/17 | 8,271 | ||||||||
| 10,000 | Kroger Co. (The), 6.40%, due 08/15/17 | 11,956 | ||||||||
| 30,000 | Kroger Co. (The), 7.50%, due 01/15/14 | 31,610 | ||||||||
| 30,000 | Laboratory Corp. of America Holdings, 2.20%, due 08/23/17 | 30,364 | ||||||||
| 5,000 | Liberty Mutual Group, Inc., 6.70%, due 08/15/16 144A | 5,827 | ||||||||
| 20,000 | Lockheed Martin Corp., 2.13%, due 09/15/16 | 20,789 | ||||||||
| 10,000 | Lowe’s Cos., Inc., 5.00%, due 10/15/15 | 11,131 | ||||||||
| 20,000 | Macquarie Group, Ltd., 5.00%, due 02/22/17 144A | 22,091 | ||||||||
| 15,000 | Macquarie Group, Ltd., 7.30%, due 08/01/14 144A | 16,076 | ||||||||
| 45,000 | Merck & Co., Inc., 4.75%, due 03/01/15 | 48,713 | ||||||||
| 160,000 | Merrill Lynch & Co., Inc., 6.15%, due 04/25/13 | 160,564 | ||||||||
| 200,000 | Metropolitan Life Global Funding I, 5.13%, due 04/10/13 144A | 200,189 | ||||||||
| See accompanying Notes to the Financial Statements. | 151 |
Mercer US Short Maturity Fixed Income Fund
Schedule of Investments (Continued)
(showing percentage of net assets)
March 31, 2013
| Par Value ($) | Description | Value ($) | ||||||||
Corporate Debt — continued |
| |||||||||
| 100,000 | Morgan Stanley, 4.10%, due 01/26/15 | 104,448 | ||||||||
| 100,000 | Morgan Stanley, 6.00%, due 05/13/14 | 105,428 | ||||||||
| 50,000 | National City Corp., 4.90%, due 01/15/15 | 53,649 | ||||||||
| 10,000 | National Oilwell Varco, Inc., 1.35%, due 12/01/17 | 10,054 | ||||||||
| 50,000 | National Semiconductor Corp., 3.95%, due 04/15/15 | 53,432 | ||||||||
| 20,000 | NBCUniversal Media LLC, 2.88%, due 04/01/16 | 21,086 | ||||||||
| 20,000 | New York Life Global Funding, 1.65%, due 05/15/17 144A | 20,320 | ||||||||
| 65,000 | New York Life Global Funding, 3.00%, due 05/04/15 144A | 68,353 | ||||||||
| 15,000 | News America, Inc., 7.60%, due 10/11/15 | 17,386 | ||||||||
| 40,000 | NextEra Energy Capital Holdings, Inc., 7.88%, due 12/15/15 | 47,105 | ||||||||
| 15,000 | Nissan Motor Acceptance Corp., 1.00%, due 03/15/16 144A | 14,997 | ||||||||
| 20,000 | Nissan Motor Acceptance Corp., 4.50%, due 01/30/15 144A | 21,303 | ||||||||
| 20,000 | Nomura Holdings, Inc., 4.13%, due 01/19/16 | 21,189 | ||||||||
| 40,000 | Nomura Holdings, Inc., 5.00%, due 03/04/15 | 42,575 | ||||||||
| 10,000 | Norfolk Southern Corp., 7.70%, due 05/15/17 | 12,548 | ||||||||
| 25,000 | Northern Trust Corp., 4.63%, due 05/01/14 | 26,151 | ||||||||
| 60,000 | Northern Trust Corp., 5.50%, due 08/15/13 | 61,087 | ||||||||
| 20,000 | Northrop Grumman Systems Corp., 7.75%, due 03/01/16 | 23,392 | ||||||||
| 10,000 | Novartis Capital Corp., 2.90%, due 04/24/15 | 10,493 | ||||||||
| 20,000 | NSTAR Electric Co., 4.88%, due 04/15/14 | 20,861 | ||||||||
| 10,000 | Nucor Corp., 5.75%, due 12/01/17 | 11,931 | ||||||||
| 60,000 | Ohio Power Co., Series L, 5.75%, due 09/01/13 | 61,214 | ||||||||
| 20,000 | Oncor Electric Delivery Co. LLC, 6.38%, due 01/15/15 | 21,898 | ||||||||
| 45,000 | Oracle Corp., 5.25%, due 01/15/16 | 50,648 | ||||||||
| 20,000 | Pacific Gas & Electric Co., 4.80%, due 03/01/14 | 20,772 | ||||||||
| 35,000 | Pacific Life Global Funding, 5.15%, due 04/15/13 144A | 35,055 | ||||||||
| 160,000 | PacifiCorp, 5.45%, due 09/15/13 | 163,616 | ||||||||
| 35,000 | PC Financial Partnership, 5.00%, due 11/15/14 | 37,332 | ||||||||
| 5,000 | Penske Truck Leasing Co. LP/PTL Finance Corp., 2.50%, due 07/11/14 144A | 5,080 | ||||||||
| 18,000 | Penske Truck Leasing Co. LP/PTL Finance Corp., 3.13%, due 05/11/15 144A | 18,634 | ||||||||
| 80,000 | PepsiCo, Inc., 3.75%, due 03/01/14 | 82,426 | ||||||||
| 25,000 | PG&E Corp., 5.75%, due 04/01/14 | 26,191 | ||||||||
| 15,000 | Pitney Bowes, Inc., 3.88%, due 06/15/13 | 15,080 | ||||||||
| 10,000 | PNC Funding Corp., 4.25%, due 09/21/15 | 10,846 | ||||||||
| 50,000 | Potash Corp. of Saskatchewan, Inc., 3.75%, due 09/30/15 | 53,459 | ||||||||
| 40,000 | PPG Industries, Inc., 6.65%, due 03/15/18 | 49,404 | ||||||||
| 80,000 | Praxair, Inc., 2.13%, due 06/14/13 | 80,284 | ||||||||
| 60,000 | Pricoa Global Funding I, 5.45%, due 06/11/14 144A | 63,500 | ||||||||
| 65,000 | Procter & Gamble Co. (The), 4.95%, due 08/15/14 | 69,155 | ||||||||
| 10,000 | PSEG Power LLC, 5.50%, due 12/01/15 | 11,117 | ||||||||
| 15,000 | Public Service Electric & Gas Co., 2.70%, due 05/01/15 | 15,675 | ||||||||
| 5,000 | Quest Diagnostics, Inc., 5.45%, due 11/01/15 | 5,515 | ||||||||
| 9,000 | Rio Tinto Finance USA Plc, 1.63%, due 08/21/17 | 9,090 | ||||||||
| 10,000 | Rio Tinto Finance USA, Ltd., 1.88%, due 11/02/15 | 10,261 | ||||||||
| 30,000 | Rio Tinto Finance USA, Ltd., 8.95%, due 05/01/14 | 32,645 | ||||||||
| 20,000 | Royal Bank of Canada, 1.45%, due 10/30/14 | 20,307 | ||||||||
| 40,000 | Royal Bank of Canada, 2.30%, due 07/20/16 | 41,776 | ||||||||
| 15,000 | Ryder System, Inc., 2.50%, due 03/01/17 | 15,465 | ||||||||
| 8,000 | Ryder System, Inc., 3.50%, due 06/01/17 | 8,566 | ||||||||
| 152 | See accompanying Notes to the Financial Statements. |
Mercer US Short Maturity Fixed Income Fund
Schedule of Investments (Continued)
(showing percentage of net assets)
March 31, 2013
| Par Value ($) | Description | Value ($) | ||||||||
Corporate Debt — continued |
| |||||||||
| 60,000 | SABMiller Plc, 5.50%, due 08/15/13 144A | 61,094 | ||||||||
| 50,000 | Sempra Energy, 2.00%, due 03/15/14 | 50,612 | ||||||||
| 45,000 | Shell International Finance BV, 4.00%, due 03/21/14 | 46,576 | ||||||||
| 60,000 | Sierra Pacific Power Co., 6.00%, due 05/15/16 | 69,285 | ||||||||
| 30,000 | Southern California Edison Co., 4.15%, due 09/15/14 | 31,580 | ||||||||
| 15,000 | Spectra Energy Capital LLC, 5.67%, due 08/15/14 | 15,967 | ||||||||
| 15,000 | State Street Corp., 2.88%, due 03/07/16 | 15,980 | ||||||||
| 55,000 | State Street Corp., 4.30%, due 05/30/14 | 57,495 | ||||||||
| 60,000 | SunTrust Banks, Inc., 3.60%, due 04/15/16 | 64,297 | ||||||||
| 10,000 | Talisman Energy, Inc., 5.13%, due 05/15/15 | 10,741 | ||||||||
| 35,000 | TCI Communications, Inc., Senior Note, 8.75%, due 08/01/15 | 41,358 | ||||||||
| 10,000 | TD Ameritrade Holding Corp., 4.15%, due 12/01/14 | 10,554 | ||||||||
| 5,000 | Teck Resources, Ltd., 3.15%, due 01/15/17 | 5,212 | ||||||||
| 15,000 | Telecom Italia Capital SA, 6.18%, due 06/18/14 | 15,711 | ||||||||
| 35,000 | Teva Pharmaceutical Finance Co. BV, 2.40%, due 11/10/16 | 36,596 | ||||||||
| 25,000 | Textron, Inc., 6.20%, due 03/15/15 | 27,244 | ||||||||
| 55,000 | Time Warner Cable, Inc., 5.85%, due 05/01/17 | 63,931 | ||||||||
| 50,000 | Time Warner Cable, Inc., 8.25%, due 02/14/14 | 53,199 | ||||||||
| 35,000 | Toronto-Dominion Bank (The), 2.38%, due 10/19/16 | 36,648 | ||||||||
| 5,000 | Total Capital International SA, 0.75%, due 01/25/16 | 5,015 | ||||||||
| 22,000 | Total Capital SA, 3.00%, due 06/24/15 | 23,141 | ||||||||
| 10,000 | Toyota Motor Credit Corp., 1.25%, due 11/17/14 | 10,129 | ||||||||
| 11,000 | Toyota Motor Credit Corp., 1.25%, due 10/05/17 | 11,000 | ||||||||
| 20,000 | Toyota Motor Credit Corp., 2.05%, due 01/12/17 | 20,708 | ||||||||
| 36,000 | Toyota Motor Credit Corp., 3.20%, due 06/17/15 | 38,030 | ||||||||
| 10,000 | TransCanada PipeLines, Ltd., 4.00%, due 06/15/13 | 10,070 | ||||||||
| 10,000 | Transocean, Inc., 4.95%, due 11/15/15 | 10,827 | ||||||||
| 35,000 | Turlock Corp., 1.50%, due 11/02/17 144A | 35,139 | ||||||||
| 20,000 | Tyson Foods, Inc., 6.60%, due 04/01/16 | 23,010 | ||||||||
| 60,000 | United Technologies Corp., 4.88%, due 05/01/15 | 65,457 | ||||||||
| 15,000 | UnitedHealth Group, Inc., 5.00%, due 08/15/14 | 15,924 | ||||||||
| 70,000 | US Bancorp, 1.38%, due 09/13/13 | 70,253 | ||||||||
| 75,000 | US Bancorp, 3.15%, due 03/04/15 | 78,805 | ||||||||
| 10,000 | Valero Energy Corp., 6.13%, due 06/15/17 | 11,907 | ||||||||
| 35,000 | Verizon Communications, Inc., 5.55%, due 02/15/16 | 39,511 | ||||||||
| 15,000 | Virginia Electric and Power Co., 5.95%, due 09/15/17 | 18,093 | ||||||||
| 65,000 | Vodafone Group Plc, 4.15%, due 06/10/14 | 67,682 | ||||||||
| 70,000 | Wachovia Corp., 5.50%, due 05/01/13 | 70,297 | ||||||||
| 60,000 | Wachovia Corp., Senior Note, 5.63%, due 10/15/16 | 68,533 | ||||||||
| 50,000 | Wal-Mart Stores, Inc., 4.55%, due 05/01/13 | 50,167 | ||||||||
| 40,000 | Wal-Mart Stores, Inc., 7.25%, due 06/01/13 | 40,438 | ||||||||
| 15,000 | Waste Management, Inc., 2.60%, due 09/01/16 | 15,736 | ||||||||
| 15,000 | Waste Management, Inc., 6.38%, due 03/11/15 | 16,578 | ||||||||
| 20,000 | Watson Pharmaceuticals, Inc., 5.00%, due 08/15/14 | 21,105 | ||||||||
| 50,000 | WEA Finance LLC/WT Finance Aust Pty Ltd., 7.50%, due 06/02/14 144A | 53,738 | ||||||||
| 30,000 | WellPoint, Inc., 5.00%, due 12/15/14 | 32,159 | ||||||||
| 100,000 | Wells Fargo & Co., 2.10%, due 05/08/17 | 103,222 | ||||||||
| 50,000 | Wells Fargo & Co., 2.63%, due 12/15/16 | 52,591 | ||||||||
| 20,000 | Westpac Banking Corp., 3.00%, due 08/04/15 | 21,016 | ||||||||
| See accompanying Notes to the Financial Statements. | 153 |
Mercer US Short Maturity Fixed Income Fund
Schedule of Investments (Continued)
(showing percentage of net assets)
March 31, 2013
| Par Value ($) | Description | Value ($) | ||||||||
Corporate Debt — continued |
| |||||||||
| 55,000 | Westpac Banking Corp., 4.20%, due 02/27/15 | 58,712 | ||||||||
| 15,000 | Wisconsin Electric Power Co., 6.00%, due 04/01/14 | 15,780 | ||||||||
| 65,000 | Wyeth LLC, 5.50%, due 02/01/14 | 67,764 | ||||||||
| 20,000 | Xerox Corp., 2.95%, due 03/15/17 | 20,618 | ||||||||
| 45,000 | Xerox Corp., 4.25%, due 02/15/15 | 47,422 | ||||||||
|
| |||||||||
| 10,269,747 | ||||||||||
|
| |||||||||
Mortgage Backed Securities - Private Issuers — 3.3% | ||||||||||
| 60,000 | Banc of America Merrill Lynch Commercial Mortgage, Inc., Series 2006-3, Class A4, 5.89%, due 07/10/44† | 67,796 | ||||||||
| 163,652 | Banc of America Mortgage Securities, Inc., Series 2004-3, Class 1A26, 5.50%, due 04/25/34 | 166,576 | ||||||||
| 57,147 | Citigroup Mortgage Loan Trust, Inc., Series 2003-1, Class 3A4, 5.25%, due 09/25/33 | 60,568 | ||||||||
| 48,118 | Commercial Mortgage Acceptance Corp., 5.44%, due 09/15/30 144A | 48,391 | ||||||||
| 250,000 | Commercial Mortgage Asset Trust, Series 1999-C1, Class C, 7.35%, due 01/17/32† | 257,310 | ||||||||
| 768 | Countrywide Alternative Loan Trust, Series 2002-11, Class A4, 6.25%, due 10/25/32 | 789 | ||||||||
| 22,883 | Credit Suisse First Boston Mortgage Securities Corp., Series 2003-17, Class 2A6, 3.50%, due 07/25/18 | 23,015 | ||||||||
| 59,788 | Credit Suisse First Boston Mortgage Securities Corp., Series 2003-27, Class 5A4, 5.25%, due 11/25/33 | 61,648 | ||||||||
| 90,000 | Credit Suisse Mortgage Capital Certificates, Series 2006-C2, Class A3, 5.65%, due 03/15/39† | 100,276 | ||||||||
| 90,000 | GS Mortgage Securities Corp. II, Series 2004-GG2, Class A6, 5.40%, due 08/10/38† | 94,074 | ||||||||
| 55,876 | MASTR Alternative Loans Trust, Series 2004-8, Class 7A1, 5.00%, due 09/25/19 | 57,694 | ||||||||
| 53,917 | MASTR Asset Securitization Trust, Series 2003-8, Class 2A1, 4.50%, due 09/25/18 | 56,032 | ||||||||
| 100,000 | Morgan Stanley Re-REMIC Trust, Series 2010-HQ4B, Class A7A, 4.97%, due 04/16/40 144A | 103,299 | ||||||||
| 95,235 | NCUA Guaranteed Notes, Series 2010-C1, Class A1, 1.60%, due 10/29/20 | 97,007 | ||||||||
| 46,120 | NCUA Guaranteed Notes, Series 2010-R3, Class 3A, 2.40%, due 12/08/20 | 47,674 | ||||||||
| 39,672 | Residential Asset Securitization Trust, Series 2003-A14, Class A1, 4.75%, due 02/25/19 | 40,937 | ||||||||
| 85,745 | Springleaf Mortgage Loan Trust, Series 2012-2A, Class A, 2.22%, due 10/25/57† 144A | 86,886 | ||||||||
| 103,821 | WaMu Mortgage Pass-Through Certificates, Series 2003-S1, Class A5, 5.50%, due 04/25/33 | 107,912 | ||||||||
| 61,732 | Washington Mutual MSC Mortgage Pass-Through Certificates, Series 2003-MS2, Class 3A1, 5.00%, due 03/25/18 | 63,071 | ||||||||
|
| |||||||||
| 1,540,955 | ||||||||||
|
| |||||||||
Mortgage Backed Securities - U.S. Government Agency Obligations — 8.4% |
| |||||||||
| 10,846 | FHLMC, Pool # B14248, 4.00%, due 05/01/14 | 11,509 | ||||||||
| 124,804 | FHLMC, Pool # J14494, 4.00%, due 02/01/26 | 132,837 | ||||||||
| 27,116 | FHLMC, Pool # C91030, 5.50%, due 05/01/27 | 29,469 | ||||||||
| 98,830 | FHLMC, Pool # G11977, 6.00%, due 05/01/21 | 106,676 | ||||||||
| 12,737 | FHLMC, Series 2394, Class KD, 6.00%, due 12/15/16 | 13,471 | ||||||||
| 56,016 | FHLMC, Series 2405, Class PE, 6.00%, due 01/15/17 | 59,797 | ||||||||
| 30,613 | FHLMC, Series 2513, Class DM, 5.50%, due 10/15/17 | 32,871 | ||||||||
| 5,917 | FHLMC, Series 2566, Class LH, 5.00%, due 04/15/32 | 5,941 | ||||||||
| 129,585 | FHLMC, Series 2590, Class AQ, 4.25%, due 03/15/18 | 135,548 | ||||||||
| 25,131 | FHLMC, Series 2594, Class YA, 4.00%, due 04/15/23 | 26,941 | ||||||||
| 667 | FHLMC, Series 2610, Class DJ, 4.00%, due 03/15/33 | 669 | ||||||||
| 154 | See accompanying Notes to the Financial Statements. |
Mercer US Short Maturity Fixed Income Fund
Schedule of Investments (Continued)
(showing percentage of net assets)
March 31, 2013
| Par Value ($) | Description | Value ($) | ||||||||
Mortgage Backed Securities - U.S. Government Agency Obligations — continued | ||||||||||
| 2,246 | FHLMC, Series 2614, Class NA, 3.75%, due 04/15/33 | 2,278 | ||||||||
| 22,046 | FHLMC, Series 2644, Class ED, 4.00%, due 02/15/18 | 22,395 | ||||||||
| 58,712 | FHLMC, Series 2668, Class OG, 5.00%, due 03/15/32 | 60,225 | ||||||||
| 34,061 | FHLMC, Series 2675, Class CK, 4.00%, due 09/15/18 | 36,023 | ||||||||
| 106,826 | FHLMC, Series 2682, Class LC, 4.50%, due 07/15/32 | 110,634 | ||||||||
| 133,257 | FHLMC, Series 2695, Class BG, 4.50%, due 04/15/32 | 137,591 | ||||||||
| 118,977 | FHLMC, Series 2709, Class PE, 5.00%, due 12/15/22 | 124,552 | ||||||||
| 45,039 | FHLMC, Series 2714, Class BQ, 4.50%, due 12/15/18 | 47,827 | ||||||||
| 63,950 | FHLMC, Series 2760, Class LB, 4.50%, due 01/15/33 | 67,288 | ||||||||
| 32,281 | FHLMC, Series 2827, Class QE, 5.50%, due 03/15/33 | 33,067 | ||||||||
| 16,240 | FHLMC, Series 2864, Class NA, 5.50%, due 01/15/31 | 16,414 | ||||||||
| 57,120 | FHLMC, Series 2866, Class W, 4.50%, due 08/15/34 | 61,637 | ||||||||
| 71,327 | FHLMC, Series 2881, Class AE, 5.00%, due 08/15/34 | 77,483 | ||||||||
| 73,122 | FHLMC, Series 2899, Class KB, 4.50%, due 03/15/19 | 74,549 | ||||||||
| 27,805 | FHLMC, Series 2931, Class AM, 4.50%, due 07/15/19 | 28,647 | ||||||||
| 53,804 | FHLMC, Series 2931, Class DC, 4.00%, due 06/15/18 | 54,136 | ||||||||
| 93,078 | FHLMC, Series 2931, Class QC, 4.50%, due 01/15/19 | 94,011 | ||||||||
| 28,203 | FHLMC, Series 2962, Class YE, 4.50%, due 09/15/18 | 28,465 | ||||||||
| 13,136 | FHLMC, Series 3001, Class BN, 4.50%, due 06/15/33 | 13,465 | ||||||||
| 109,223 | FHLMC, Series 3035, Class PA, 5.50%, due 09/15/35 | 122,146 | ||||||||
| 23,655 | FNMA, Pool # 255598, 5.00%, due 12/01/14 | 25,572 | ||||||||
| 57,082 | FNMA, Pool # 254762, 5.00%, due 05/01/23 | 61,092 | ||||||||
| 28,851 | FNMA, Pool # 254831, 5.00%, due 08/01/23 | 31,287 | ||||||||
| 119,865 | FNMA, Pool # AC3237, 5.00%, due 10/01/39 | 133,402 | ||||||||
| 75,612 | FNMA, Pool # AL2193, 5.50%, due 07/01/25 | 82,638 | ||||||||
| 90,933 | FNMA, Pool # 254420, 6.00%, due 07/01/22 | 99,639 | ||||||||
| 123,560 | FNMA, Pool # 254471, 6.00%, due 09/01/22 | 135,390 | ||||||||
| 43,930 | FNMA, Pool # AE0081, 6.00%, due 07/01/24 | 48,456 | ||||||||
| 1,400 | FNMA, Pool # 251812, 6.50%, due 07/01/13 | 1,408 | ||||||||
| 29,249 | FNMA, Series 2001-51, Class GH, 5.50%, due 10/25/31 | 32,825 | ||||||||
| 15,525 | FNMA, Series 2002-19, Class PE, 6.00%, due 04/25/17 | 16,454 | ||||||||
| 51,034 | FNMA, Series 2002-63, Class NB, 5.50%, due 10/25/32 | 57,534 | ||||||||
| 69,174 | FNMA, Series 2003-14, Class AQ, 3.50%, due 03/25/33 | 72,038 | ||||||||
| 80,751 | FNMA, Series 2003-21, Class OA, 4.00%, due 03/25/33 | 86,151 | ||||||||
| 55,837 | FNMA, Series 2003-35, Class UN, 4.25%, due 05/25/33 | 60,882 | ||||||||
| 30,153 | FNMA, Series 2003-39, Class LD, 4.50%, due 10/25/22 | 30,737 | ||||||||
| 13,391 | FNMA, Series 2003-42, Class EP, 4.00%, due 11/25/22 | 13,621 | ||||||||
| 10,599 | FNMA, Series 2003-45, Class AB, 3.75%, due 05/25/33 | 10,829 | ||||||||
| 53,156 | FNMA, Series 2003-64, Class TH, 5.00%, due 07/25/23 | 58,945 | ||||||||
| 30,000 | FNMA, Series 2003-9, Class EB, 5.00%, due 02/25/18 | 32,969 | ||||||||
| 27,521 | FNMA, Series 2004-81, Class KD, 4.50%, due 07/25/18 | 27,763 | ||||||||
| 66,715 | FNMA, Series 2005-62, Class CQ, 4.75%, due 07/25/35 | 71,354 | ||||||||
| 48,371 | FNMA, Series 2007-59, Class AQ, 5.75%, due 07/25/35 | 50,887 | ||||||||
| 58,847 | FNMA REMIC, Series 1998-37, Class VZ, 6.00%, due 06/17/28 | 66,358 | ||||||||
| 98,309 | FNMA REMIC, Series 2004-90, Class GA, 4.35%, due 03/25/34 | 100,973 | ||||||||
| 96,583 | FNMA REMIC, Series 2005-31, Class PA, 5.50%, due 10/25/34 | 107,125 | ||||||||
| 27,814 | FNMA REMIC, Series 2005-58, Class MA, 5.50%, due 07/25/35 | 31,466 | ||||||||
| 52,240 | GNMA, Series 2003-105, Class VH, 4.50%, due 01/16/28 | 52,958 | ||||||||
| 81,915 | GNMA, Series 2003-15, Class PE, 5.50%, due 02/20/33 | 94,200 | ||||||||
| See accompanying Notes to the Financial Statements. | 155 |
Mercer US Short Maturity Fixed Income Fund
Schedule of Investments (Continued)
(showing percentage of net assets)
March 31, 2013
| Par Value ($) | Description | Value ($) | ||||||||
Mortgage Backed Securities - U.S. Government Agency Obligations — continued | ||||||||||
| 51,485 | GNMA, Series 2003-18, Class OA, 5.00%, due 10/20/31 | 58,903 | ||||||||
| 89,346 | GNMA, Series 2005-77, Class BA, 5.00%, due 11/20/32 | 91,903 | ||||||||
| 42,843 | GNMA, Series 2008-49, Class PG, 5.25%, due 11/20/37 | 45,543 | ||||||||
| 79,353 | GNMA, Series 2008-51, Class PG, 5.00%, due 06/20/38 | 88,156 | ||||||||
| 47,838 | GNMA REMIC, Series 2001-52, 6.00%, due 10/20/31 | 55,239 | ||||||||
| 87,683 | GNMA REMIC, Series 2004-047, 5.00%, due 08/16/33 | 91,157 | ||||||||
| 65,607 | GNMA REMIC, Series 2008-050, 5.50%, due 03/16/37 | 70,539 | ||||||||
|
| |||||||||
| 3,964,955 | ||||||||||
|
| |||||||||
U.S. Government and Agency Obligations — 55.9% | ||||||||||
| 150,000 | Federal Farm Credit Bank, 3.70%, due 05/15/13 | 150,689 | ||||||||
| 117,000 | Federal Farm Credit Bank, 5.45%, due 12/11/13 | 121,341 | ||||||||
| 235,000 | Federal Home Loan Bank, 2.38%, due 03/14/14 | 239,982 | ||||||||
| 80,000 | Federal Home Loan Bank, 2.88%, due 09/11/15 | 84,764 | ||||||||
| 125,000 | Federal Home Loan Bank, 3.13%, due 03/11/16 | 134,936 | ||||||||
| 910,000 | Federal Home Loan Bank, 4.25%, due 06/14/13 | 917,854 | ||||||||
| 195,000 | Federal Home Loan Bank, 5.13%, due 05/24/13 | 196,496 | ||||||||
| 300,000 | Federal Home Loan Bank, 6.05%, due 05/12/14 | 319,484 | ||||||||
| 150,000 | FHLMC, 0.50%, due 10/15/13 | 150,304 | ||||||||
| 500,000 | FHLMC, 1.00%, due 08/20/14 | 505,328 | ||||||||
| 100,000 | FHLMC, 1.00%, due 03/08/17 | 101,318 | ||||||||
| 100,000 | FHLMC, 1.25%, due 05/12/17 | 102,293 | ||||||||
| 490,000 | FHLMC, 2.00%, due 08/25/16 | 514,694 | ||||||||
| 235,000 | FHLMC, 2.50%, due 05/27/16 | 249,941 | ||||||||
| 280,000 | FHLMC, 4.00%, due 06/12/13 | 282,210 | ||||||||
| 175,000 | FHLMC, 5.00%, due 01/30/14 | 182,082 | ||||||||
| 250,000 | FHLMC, 5.25%, due 04/18/16 | 286,530 | ||||||||
| 1,000,000 | FNMA, 0.50%, due 08/09/13 | 1,001,426 | ||||||||
| 50,000 | FNMA, 1.13%, due 10/08/13 | 50,263 | ||||||||
| 700,000 | FNMA, 1.25%, due 01/30/17 | 715,951 | ||||||||
| 150,000 | FNMA, 1.38%, due 11/15/16 | 154,616 | ||||||||
| 100,000 | FNMA, 2.25%, due 03/15/16 | 105,343 | ||||||||
| 560,000 | FNMA, 4.63%, due 10/15/13 | 573,736 | ||||||||
| 150,000 | FNMA, 4.88%, due 12/15/16 | 173,694 | ||||||||
| 600,000 | U.S. Treasury Note, 0.13%, due 08/31/13 | 600,094 | ||||||||
| 770,000 | U.S. Treasury Note, 0.25%, due 11/30/13 | 770,632 | ||||||||
| 400,000 | U.S. Treasury Note, 0.25%, due 01/15/15 | 400,141 | ||||||||
| 100,000 | U.S. Treasury Note, 0.38%, due 07/31/13 | 100,106 | ||||||||
| 250,000 | U.S. Treasury Note, 0.50%, due 08/15/14 | 251,045 | ||||||||
| 150,000 | U.S. Treasury Note, 0.50%, due 10/15/14 | 150,656 | ||||||||
| 440,000 | U.S. Treasury Note, 0.50%, due 07/31/17 | 437,559 | ||||||||
| 150,000 | U.S. Treasury Note, 0.63%, due 05/31/17 | 150,211 | ||||||||
| 220,000 | U.S. Treasury Note, 0.63%, due 08/31/17 | 219,811 | ||||||||
| 205,000 | U.S. Treasury Note, 0.63%, due 11/30/17 | 204,343 | ||||||||
| 1,000,000 | U.S. Treasury Note, 0.75%, due 08/15/13 | 1,002,500 | ||||||||
| 300,000 | U.S. Treasury Note, 0.75%, due 06/15/14 | 302,051 | ||||||||
| 370,000 | U.S. Treasury Note, 0.75%, due 12/31/17 | 370,549 | ||||||||
| 650,000 | U.S. Treasury Note, 0.88%, due 11/30/16 | 659,039 | ||||||||
| 350,000 | U.S. Treasury Note, 0.88%, due 12/31/16 | 354,785 | ||||||||
| 156 | See accompanying Notes to the Financial Statements. |
Mercer US Short Maturity Fixed Income Fund
Schedule of Investments (Continued)
(showing percentage of net assets)
March 31, 2013
| Par Value ($) | Description | Value ($) | ||||||||
U.S. Government and Agency Obligations — continued |
| |||||||||
| 755,000 | U.S. Treasury Note, 0.88%, due 01/31/17 | 765,027 | ||||||||
| 420,000 | U.S. Treasury Note, 0.88%, due 04/30/17 | 425,086 | ||||||||
| 1,300,000 | U.S. Treasury Note, 1.00%, due 07/15/13 | 1,303,606 | ||||||||
| 125,000 | U.S. Treasury Note, 1.00%, due 05/15/14 | 126,157 | ||||||||
| 385,000 | U.S. Treasury Note, 1.00%, due 08/31/16 | 392,249 | ||||||||
| 550,000 | U.S. Treasury Note, 1.00%, due 09/30/16 | 560,355 | ||||||||
| 375,000 | U.S. Treasury Note, 1.00%, due 10/31/16 | 382,002 | ||||||||
| 300,000 | U.S. Treasury Note, 1.00%, due 03/31/17 | 305,273 | ||||||||
| 300,000 | U.S. Treasury Note, 1.25%, due 04/15/14 | 303,375 | ||||||||
| 200,000 | U.S. Treasury Note, 1.25%, due 08/31/15 | 204,625 | ||||||||
| 450,000 | U.S. Treasury Note, 1.38%, due 11/30/15 | 462,516 | ||||||||
| 320,000 | U.S. Treasury Note, 1.50%, due 06/30/16 | 331,275 | ||||||||
| 665,000 | U.S. Treasury Note, 1.50%, due 07/31/16 | 688,587 | ||||||||
| 150,000 | U.S. Treasury Note, 1.75%, due 07/31/15 | 155,121 | ||||||||
| 100,000 | U.S. Treasury Note, 1.75%, due 05/31/16 | 104,266 | ||||||||
| 100,000 | U.S. Treasury Note, 1.88%, due 02/28/14 | 101,574 | ||||||||
| 250,000 | U.S. Treasury Note, 1.88%, due 06/30/15 | 258,965 | ||||||||
| 225,000 | U.S. Treasury Note, 1.88%, due 10/31/17 | 237,129 | ||||||||
| 400,000 | U.S. Treasury Note, 2.00%, due 01/31/16 | 418,656 | ||||||||
| 125,000 | U.S. Treasury Note, 2.00%, due 04/30/16 | 131,201 | ||||||||
| 350,000 | U.S. Treasury Note, 2.13%, due 11/30/14 | 361,020 | ||||||||
| 200,000 | U.S. Treasury Note, 2.13%, due 12/31/15 | 209,797 | ||||||||
| 135,000 | U.S. Treasury Note, 2.13%, due 02/29/16 | 141,940 | ||||||||
| 200,000 | U.S. Treasury Note, 2.25%, due 01/31/15 | 207,398 | ||||||||
| 160,000 | U.S. Treasury Note, 2.38%, due 08/31/14 | 164,906 | ||||||||
| 1,500,000 | U.S. Treasury Note, 2.38%, due 02/28/15 | 1,560,996 | ||||||||
| 190,000 | U.S. Treasury Note, 2.38%, due 03/31/16 | 201,370 | ||||||||
| 70,000 | U.S. Treasury Note, 2.50%, due 04/30/15 | 73,248 | ||||||||
| 150,000 | U.S. Treasury Note, 2.50%, due 06/30/17 | 161,930 | ||||||||
| 150,000 | U.S. Treasury Note, 2.63%, due 07/31/14 | 154,869 | ||||||||
| 200,000 | U.S. Treasury Note, 2.63%, due 04/30/16 | 213,703 | ||||||||
| 100,000 | U.S. Treasury Note, 2.75%, due 05/31/17 | 108,899 | ||||||||
| 180,000 | U.S. Treasury Note, 3.13%, due 10/31/16 | 196,959 | ||||||||
| 160,000 | U.S. Treasury Note, 3.25%, due 12/31/16 | 176,313 | ||||||||
| 150,000 | U.S. Treasury Note, 4.00%, due 02/15/15 | 160,523 | ||||||||
| 400,000 | U.S. Treasury Note, 4.25%, due 08/15/13 | 406,266 | ||||||||
| 130,000 | U.S. Treasury Note, 4.25%, due 08/15/14 | 137,226 | ||||||||
| 150,000 | U.S. Treasury Note, 4.25%, due 08/15/15 | 164,051 | ||||||||
| 500,000 | U.S. Treasury Note, 4.50%, due 02/15/16 | 559,414 | ||||||||
|
| |||||||||
| 26,306,670 | ||||||||||
|
| |||||||||
TOTAL DEBT OBLIGATIONS (COST $46,407,232) | 46,698,963 | |||||||||
|
| |||||||||
SHORT-TERM INVESTMENTS — 1.7% | ||||||||||
Bank Deposit — 0.6% | ||||||||||
| 293,643 | State Street Bank & Trust Euro Time Deposit, 0.01%, due 04/01/13 | 293,643 | ||||||||
|
| |||||||||
| See accompanying Notes to the Financial Statements. | 157 |
Mercer US Short Maturity Fixed Income Fund
Schedule of Investments (Continued)
(showing percentage of net assets)
March 31, 2013
| Par Value ($) | Description | Value ($) | ||||||||
Securities Lending Collateral — 1.1% | ||||||||||
| 530,400 | State Street Navigator Securities Lending Prime Portfolio*** | 530,400 | ||||||||
|
| |||||||||
TOTAL SHORT-TERM INVESTMENTS (COST $824,043) | 824,043 | |||||||||
|
| |||||||||
TOTAL INVESTMENTS — 100.9% (Cost $47,231,275) | 47,523,006 | |||||||||
Other Assets and Liabilities (net) — (0.9)% | (423,283 | ) | ||||||||
|
| |||||||||
NET ASSETS — 100.0% | $ | 47,099,723 | ||||||||
|
| |||||||||
Notes to Schedule of Investments: | ||||||||||
| FHLMC — Federal Home Loan Mortgage Corporation | ||||||||||
| FNMA — Federal National Mortgage Association | ||||||||||
| GNMA — Government National Mortgage Association | ||||||||||
| REIT — Real Estate Investment Trust | ||||||||||
| REMIC — Real Estate Mortgage Investment Conduit | ||||||||||
| ¤ | Illiquid security. The total market value of the securities at year end is $1 which represents 0.0% of net assets. The aggregate tax cost of these securities held at March 31, 2013 was $77,673. | |||||||||
| *** | Represents an investment of securities lending cash collateral. | |||||||||
| † | Floating rate note. Rate shown is as of March 31, 2013. | |||||||||
| ‡ | All or a portion of this security is out on loan. | |||||||||
| 144A — Securities exempt from registration under Rule 144A of the Securities Act of 1933. These securities may be resold in transactions exempt from registration, normally to qualified institutional buyers. The total market value of the securities at year end is $1,343,702 which represents 2.9% of net assets. | ||||||||||
| 158 | See accompanying Notes to the Financial Statements. |
Mercer US Short Maturity Fixed Income Fund
Schedule of Investments (Continued)
March 31, 2013
| Asset Class Summary (Unaudited) | % of Net Assets | ||||
Debt Obligations | 99.1 | ||||
Short-Term Investments | 1.8 | ||||
Other Assets and Liabilities (net) | (0.9 | ) | |||
|
| ||||
| 100.0 | % | ||||
|
| ||||
| See accompanying Notes to the Financial Statements. | 159 |
Mercer Funds
Statements of Assets and Liabilities
March 31, 2013
| Mercer US Large Cap Growth Equity Fund | Mercer US Large Cap Value Equity Fund | Mercer US Small/Mid Cap Growth Equity Fund | Mercer US Small/Mid Cap Value Equity Fund | |||||||||||||||||
Assets | ||||||||||||||||||||
Investments, at value(a) | $ | 468,850,978 | $ | 480,831,973 | $ | 483,536,167 | $ | 450,610,206 | ||||||||||||
Cash | 46,658 | 96,922 | 85,515 | 257,495 | ||||||||||||||||
Receivable for investments sold | 8,553,189 | 2,494,101 | 2,856,997 | 5,811,046 | ||||||||||||||||
Dividend and interest receivable | 352,742 | 657,478 | 79,414 | 443,721 | ||||||||||||||||
Receivable for expenses reimbursed by Advisor | 16,638 | 15,192 | 21,901 | 11,165 | ||||||||||||||||
Foreign tax reclaims receivable | — | 20,455 | 28 | — | ||||||||||||||||
Securities lending income receivable | 4,487 | 7,876 | 81,537 | 10,470 | ||||||||||||||||
Prepaid expenses | 2,958 | 2,956 | 2,072 | 2,076 | ||||||||||||||||
|
|
|
|
|
|
|
| |||||||||||||
Total assets | 477,827,650 | 484,126,953 | 486,663,631 | 457,146,179 | ||||||||||||||||
|
|
|
|
|
|
|
| |||||||||||||
Liabilities | ||||||||||||||||||||
Payable for investments purchased | 3,630,980 | 740,434 | 3,515,246 | 3,321,062 | ||||||||||||||||
Unrealized depreciation on open forward foreign currency contracts | — | 11,423 | — | — | ||||||||||||||||
Obligation to return securities lending collateral | 8,110,005 | 7,182,165 | 40,633,413 | 23,990,680 | ||||||||||||||||
Payable to affiliate for: | ||||||||||||||||||||
Advisor fee | 217,927 | 215,662 | 328,747 | 326,606 | ||||||||||||||||
Trustees fees | 6,011 | 6,048 | 4,686 | 4,665 | ||||||||||||||||
Accrued expenses | 75,386 | 73,606 | 101,245 | 91,516 | ||||||||||||||||
|
|
|
|
|
|
|
| |||||||||||||
Total liabilities | 12,040,309 | 8,229,338 | 44,583,337 | 27,734,529 | ||||||||||||||||
|
|
|
|
|
|
|
| |||||||||||||
Net assets | $ | 465,787,341 | $ | 475,897,615 | $ | 442,080,294 | $ | 429,411,650 | ||||||||||||
|
|
|
|
|
|
|
| |||||||||||||
Net assets consist of: | ||||||||||||||||||||
Paid-in capital | 353,399,117 | 479,314,040 | 366,298,177 | 346,499,519 | ||||||||||||||||
Accumulated undistributed | 565,314 | 1,635,764 | (392,627 | ) | 728,939 | |||||||||||||||
Accumulated net realized gain (loss) | 18,088,030 | (91,722,162 | ) | 4,764,782 | 17,867,412 | |||||||||||||||
Net unrealized appreciation on investments and foreign currencies | 93,734,880 | 86,669,973 | 71,409,962 | 64,315,780 | ||||||||||||||||
|
|
|
|
|
|
|
| |||||||||||||
Net assets | $ | 465,787,341 | $ | 475,897,615 | $ | 442,080,294 | $ | 429,411,650 | ||||||||||||
|
|
|
|
|
|
|
| |||||||||||||
Net assets attributable to: | ||||||||||||||||||||
Class Y-3 shares | $ | 465,787,341 | $ | 475,897,615 | $ | 442,080,294 | $ | 429,411,650 | ||||||||||||
|
|
|
|
|
|
|
| |||||||||||||
Shares outstanding: | ||||||||||||||||||||
Class Y-3 | 34,352,844 | 47,848,902 | 37,010,096 | 38,853,909 | ||||||||||||||||
|
|
|
|
|
|
|
| |||||||||||||
Net asset value per share: | ||||||||||||||||||||
Class Y-3 | $ | 13.56 | $ | 9.95 | $ | 11.94 | $ | 11.05 | ||||||||||||
|
|
|
|
|
|
|
| |||||||||||||
(a) Investments, at cost | $ | 375,116,098 | $ | 394,150,577 | $ | 412,126,205 | $ | 386,294,426 | ||||||||||||
|
|
|
|
|
|
|
| |||||||||||||
| 160 | See accompanying Notes to the Financial Statements. |
Mercer Funds
Statements of Assets and Liabilities (Continued)
March 31, 2013
| Mercer Non-US Core Equity Fund | Mercer Core Opportunistic Fixed Income Fund | Mercer Emerging Markets Equity Fund | Mercer Global Low Volatility Equity Fund | |||||||||||||||||
Assets | ||||||||||||||||||||
Investments, at value(a) | $ | 2,195,237,445 | $ | 1,227,709,244 | $ | 521,967,228 | $ | 300,731,467 | ||||||||||||
Foreign currency, at value(b) | 6,586,361 | 232,981 | 556,328 | 450,257 | ||||||||||||||||
Cash | 1,569,629 | 388,736 | 97,692 | 33,036 | ||||||||||||||||
Receivable for investments sold | 31,031,079 | 3,496,261 | 840,002 | 47,461 | ||||||||||||||||
Receivable for TBA securities sold | — | 55,179,145 | — | — | ||||||||||||||||
Dividend and interest receivable | 8,550,893 | 8,296,209 | 1,331,352 | 600,381 | ||||||||||||||||
Cash collateral held at broker on open swap contracts | — | 39,000 | 3,430,000 | — | ||||||||||||||||
Unrealized appreciation on open forward foreign | — | 559,839 | 1,051,633 | 626,503 | ||||||||||||||||
Cash collateral held at broker on open future contracts | — | 850,268 | 2,040,598 | — | ||||||||||||||||
Receivable for variation margin on open futures contracts | — | 20,062 | — | — | ||||||||||||||||
Receivable for expenses reimbursed by Advisor | — | 38,929 | 36,966 | 18,195 | ||||||||||||||||
Swap contracts, at value (up-front net premiums paid of | — | 947,245 | — | — | ||||||||||||||||
Synthetic futures, at value | — | — | 13 | — | ||||||||||||||||
Variation margin receivable on open swap contracts | — | 458,270 | — | — | ||||||||||||||||
Foreign tax reclaims receivable | 1,584,006 | 5,448 | 3,832 | 70,864 | ||||||||||||||||
Securities lending income receivable | 197,816 | 5,685 | 3,204 | — | ||||||||||||||||
Prepaid expenses | 12,067 | 7,100 | 789 | — | ||||||||||||||||
Unrealized gain on unfunded loan commitments | — | 2,725 | — | — | ||||||||||||||||
|
|
|
|
|
|
|
| |||||||||||||
Total assets | 2,244,769,296 | 1,298,237,147 | 531,359,637 | 302,578,164 | ||||||||||||||||
|
|
|
|
|
|
|
| |||||||||||||
Liabilities | ||||||||||||||||||||
Payable for investments purchased | 38,351,127 | 1,784,904 | 2,564,791 | 956,128 | ||||||||||||||||
Payable for TBA and when-issued securities purchased | — | 183,561,031 | — | — | ||||||||||||||||
Payable for Fund shares repurchased | — | 140,000 | — | — | ||||||||||||||||
Swap contracts, at value (up-front net premiums received of $—, $1,589, $— and $—, respectively) | — | 185,338 | — | — | ||||||||||||||||
Synthetic futures, at value | — | — | 156,430 | — | ||||||||||||||||
Payable for variation margin on open swap contracts | — | 275,265 | — | — | ||||||||||||||||
Unrealized depreciation on open forward foreign currency contracts | — | 849,960 | 1,283,207 | 54,648 | ||||||||||||||||
Cash collateral on TBA due to broker | — | 450,000 | — | — | ||||||||||||||||
Cash collateral on open swap contracts due to broker | — | 605,000 | — | — | ||||||||||||||||
Payable for variation margin on open futures contracts | — | 54,237 | 21,817 | — | ||||||||||||||||
Obligation to return securities lending collateral | 65,114,408 | 10,976,300 | 9,271,211 | — | ||||||||||||||||
Payable to affiliate for: | ||||||||||||||||||||
Advisor fee | 1,345,332 | 319,319 | 345,457 | 182,303 | ||||||||||||||||
Trustees fees | 26,075 | 14,825 | 4,036 | 3,300 | ||||||||||||||||
Written options, at value(c) | — | 269,149 | — | — | ||||||||||||||||
TBA Sale Commitments(d) | — | 5,301,562 | — | — | ||||||||||||||||
Accrued expenses | 1,002,527 | 197,435 | 628,159 | 151,647 | ||||||||||||||||
|
|
|
|
|
|
|
| |||||||||||||
Total liabilities | 105,839,469 | 204,984,325 | 14,275,108 | 1,348,026 | ||||||||||||||||
|
|
|
|
|
|
|
| |||||||||||||
Net assets | $ | 2,138,929,827 | $ | 1,093,252,822 | $ | 517,084,529 | $ | 301,230,138 | ||||||||||||
|
|
|
|
|
|
|
| |||||||||||||
| See accompanying Notes to the Financial Statements. | 161 |
Mercer Funds
Statements of Assets and Liabilities (Continued)
March 31, 2013
| Mercer Non-US Core Equity Fund | Mercer Core Opportunistic Fixed Income Fund | Mercer Emerging Markets Equity Fund | Mercer Global Low Volatility Equity Fund | |||||||||||||||||
Net assets consist of: | ||||||||||||||||||||
Paid-in capital | $ | 2,003,547,976 | $ | 1,038,334,348 | $ | 493,384,530 | $ | 273,203,686 | ||||||||||||
Accumulated undistributed (distributions in excess of) net investment income | 8,552,915 | 6,883,601 | (118,819 | ) | 1,418,147 | |||||||||||||||
Accumulated net realized gain (loss) | (109,176,154 | ) | 4,272,430 | 37,455 | 1,889,182 | |||||||||||||||
Net unrealized appreciation on investments, unfunded loan commitments, futures contracts, options written, short sales, swap contracts and foreign currencies | 236,005,090 | 43,762,443 | 23,781,363 | 24,719,123 | ||||||||||||||||
|
|
|
|
|
|
|
| |||||||||||||
Net assets | $ | 2,138,929,827 | $ | 1,093,252,822 | $ | 517,084,529 | $ | 301,230,138 | ||||||||||||
|
|
|
|
|
|
|
| |||||||||||||
Net assets attributable to: | ||||||||||||||||||||
Class Y-3 shares | $ | 2,138,929,827 | $ | 1,093,252,822 | $ | 517,084,529 | $ | 301,230,138 | ||||||||||||
|
|
|
|
|
|
|
| |||||||||||||
Shares outstanding: | ||||||||||||||||||||
Class Y-3 | 202,237,814 | 102,355,962 | 49,300,098 | 26,930,534 | ||||||||||||||||
|
|
|
|
|
|
|
| |||||||||||||
Net asset value per share: | ||||||||||||||||||||
Class Y-3 | $ | 10.58 | $ | 10.68 | $ | 10.49 | $ | 11.19 | ||||||||||||
|
|
|
|
|
|
|
| |||||||||||||
(a) Investments, at cost | $ | 1,958,658,723 | $ | 1,183,531,640 | $ | 497,419,701 | $ | 276,571,006 | ||||||||||||
|
|
|
|
|
|
|
| |||||||||||||
(b) Foreign currency, at cost | $ | 6,614,762 | $ | 242,802 | $ | 552,051 | $ | 449,399 | ||||||||||||
|
|
|
|
|
|
|
| |||||||||||||
(c) Premiums on written options | $ | — | $ | 309,231 | $ | — | $ | — | ||||||||||||
|
|
|
|
|
|
|
| |||||||||||||
(d) Proceeds for TBA Sale Commitments | $ | — | $ | 5,285,156 | $ | — | $ | — | ||||||||||||
|
|
|
|
|
|
|
| |||||||||||||
| 162 | See accompanying Notes to the Financial Statements. |
Mercer Funds
Statements of Assets and Liabilities (Continued)
March 31, 2013
| Mercer US Short Maturity Fixed Income Fund | |||||
Assets | |||||
Investments, at value(a) | $ | 47,523,006 | |||
Interest receivable | 252,327 | ||||
Receivable for expenses reimbursed by Advisor | 8,854 | ||||
Foreign tax reclaims receivable | 3 | ||||
Securities lending income receivable | 78 | ||||
Prepaid expenses | 303 | ||||
|
| ||||
Total assets | 47,784,571 | ||||
|
| ||||
Liabilities | |||||
Payable for investments purchased | 85,687 | ||||
Obligation to return securities lending collateral | 530,400 | ||||
Payable to affiliate for: | |||||
Advisor fee | 9,975 | ||||
Trustees fees | 598 | ||||
Accrued expenses | 58,188 | ||||
|
| ||||
Total liabilities | 684,848 | ||||
|
| ||||
Net assets | $ | 47,099,723 | |||
|
| ||||
Net assets consist of: | |||||
Paid-in capital | 51,164,687 | ||||
Accumulated undistributed net investment income | 89,507 | ||||
Accumulated net realized loss | (4,446,202 | ) | |||
Net unrealized appreciation on investments | 291,731 | ||||
|
| ||||
Net assets | $ | 47,099,723 | |||
|
| ||||
Net assets attributable to: | |||||
Class Y-3 shares | $ | 47,099,723 | |||
|
| ||||
Shares outstanding: | |||||
Class Y-3 | 4,926,880 | ||||
|
| ||||
Net asset value per share: | |||||
Class Y-3 | $ | 9.56 | |||
|
| ||||
(a) Investments, at cost | $ | 47,231,275 | |||
|
| ||||
| See accompanying Notes to the Financial Statements. | 163 |
Mercer Funds
For the Year Ended March 31, 2013
| Mercer US Large Cap Growth Equity Fund | Mercer US Large Cap Value Equity Fund | Mercer US Small/Mid Cap Growth Equity Fund | Mercer US Small/Mid Cap Value Equity Fund | |||||||||||||||||
Investment Income: | ||||||||||||||||||||
Interest | $ | 994 | $ | 619 | $ | 1,085 | $ | 874 | ||||||||||||
Dividends | 5,169,452 | 11,704,349 | 2,671,184 | 7,503,695 | ||||||||||||||||
Securities lending income | 42,932 | 66,060 | 470,815 | 102,301 | ||||||||||||||||
Withholding taxes | (22,731 | ) | (132,235 | ) | (18,388 | ) | (2,267 | ) | ||||||||||||
|
|
|
|
|
|
|
| |||||||||||||
Total investment income | 5,190,647 | 11,638,793 | 3,124,696 | 7,604,603 | ||||||||||||||||
|
|
|
|
|
|
|
| |||||||||||||
Expenses: | ||||||||||||||||||||
Advisory fees | 2,427,773 | 2,353,366 | 3,099,641 | 3,083,088 | ||||||||||||||||
Transfer agent fees | 31,697 | 31,558 | 26,593 | 26,474 | ||||||||||||||||
Custodian and fund accounting fees | 136,137 | 120,780 | 185,211 | 169,032 | ||||||||||||||||
Audit fees | 51,642 | 51,765 | 48,891 | 50,646 | ||||||||||||||||
Legal fees | 30,365 | 30,335 | 22,131 | 34,539 | ||||||||||||||||
Trustees fees | 25,004 | 24,895 | 18,302 | 18,093 | ||||||||||||||||
Registration fees | — | — | 16,610 | 12,455 | ||||||||||||||||
Miscellaneous | 61,786 | 62,173 | 52,452 | 51,547 | ||||||||||||||||
|
|
|
|
|
|
|
| |||||||||||||
Total expenses | 2,764,404 | 2,674,872 | 3,469,831 | 3,445,874 | ||||||||||||||||
Fee reductions | (15,440 | ) | (15,465 | ) | (15,577 | ) | (15,584 | ) | ||||||||||||
Reimbursement of expenses | (232,914 | ) | (217,265 | ) | (162,959 | ) | (156,225 | ) | ||||||||||||
|
|
|
|
|
|
|
| |||||||||||||
Net expenses | 2,516,050 | 2,442,142 | 3,291,295 | 3,274,065 | ||||||||||||||||
|
|
|
|
|
|
|
| |||||||||||||
Net investment income (loss) | 2,674,597 | 9,196,651 | (166,599 | ) | 4,330,538 | |||||||||||||||
|
|
|
|
|
|
|
| |||||||||||||
Realized and Unrealized Gain (Loss): | ||||||||||||||||||||
Net realized gain (loss) on: | ||||||||||||||||||||
Investments | 42,369,111 | 40,763,359 | 17,825,972 | 26,000,805 | ||||||||||||||||
Closed futures contracts | — | — | — | 145,283 | ||||||||||||||||
Forward foreign currency contracts and foreign currency related transactions | 147 | (51 | ) | — | — | |||||||||||||||
|
|
|
|
|
|
|
| |||||||||||||
Net realized gain | 42,369,258 | 40,763,308 | 17,825,972 | 26,146,088 | ||||||||||||||||
|
|
|
|
|
|
|
| |||||||||||||
Change in net unrealized appreciation (depreciation) on: | ||||||||||||||||||||
Investments | (18,880,192 | ) | 20,612,898 | 32,129,046 | 32,469,879 | |||||||||||||||
Open futures contracts | — | — | — | (8,980 | ) | |||||||||||||||
Forward foreign currency contracts and foreign currency related translations | — | (11,340 | ) | — | — | |||||||||||||||
|
|
|
|
|
|
|
| |||||||||||||
Change in net unrealized appreciation (depreciation) | (18,880,192 | ) | 20,601,558 | 32,129,046 | 32,460,899 | |||||||||||||||
|
|
|
|
|
|
|
| |||||||||||||
Net realized and unrealized gain | 23,489,066 | 61,364,866 | 49,955,018 | 58,606,987 | ||||||||||||||||
|
|
|
|
|
|
|
| |||||||||||||
Net increase in net assets resulting from operations | $ | 26,163,663 | $ | 70,561,517 | $ | 49,788,419 | $ | 62,937,525 | ||||||||||||
|
|
|
|
|
|
|
| |||||||||||||
| 164 | See accompanying Notes to the Financial Statements. |
Mercer Funds
Statements of Operations (Continued)
For the Year Ended March 31, 2013
| Mercer Non-US Core Equity Fund | Mercer Core Opportunistic Fixed Income Fund | Mercer Emerging Markets Equity Fund(a) | Mercer Global Low Volatility Equity Fund(b) | |||||||||||||||||
Investment Income: | ||||||||||||||||||||
Interest | $ | 9,102 | $ | 31,004,922 | $ | 1,499 | $ | 1,110 | ||||||||||||
Dividends | 61,953,983 | 208,647 | 6,071,063 | 2,502,594 | ||||||||||||||||
Securities lending income | 711,161 | 67,452 | 15,658 | — | ||||||||||||||||
Withholding taxes | (5,172,752 | ) | — | (584,998 | ) | (115,959 | ) | |||||||||||||
Other income | 7,462 | 45,993 | — | — | ||||||||||||||||
|
|
|
|
|
|
|
| |||||||||||||
Total investment income | 57,508,956 | 31,327,014 | 5,503,222 | 2,387,745 | ||||||||||||||||
|
|
|
|
|
|
|
| |||||||||||||
Expenses: | ||||||||||||||||||||
Advisory fees | 14,126,907 | 3,742,910 | 2,170,886 | 723,561 | ||||||||||||||||
Transfer agent fees | 81,641 | 53,995 | 18,528 | 9,388 | ||||||||||||||||
Custodian and fund accounting fees | 1,655,509 | 518,503 | 705,875 | 96,092 | ||||||||||||||||
Audit fees | 94,011 | 84,954 | 55,130 | 47,500 | ||||||||||||||||
Legal fees | 128,476 | 71,523 | 18,158 | 15,891 | ||||||||||||||||
Trustees fees | 105,165 | 60,358 | 11,480 | 5,645 | ||||||||||||||||
Registration fees | 15,851 | 7,606 | 63,717 | 35,046 | ||||||||||||||||
Interest expense | — | — | 1,057 | — | ||||||||||||||||
Miscellaneous | 190,468 | 121,598 | 71,245 | 27,447 | ||||||||||||||||
|
|
|
|
|
|
|
| |||||||||||||
Total expenses | 16,398,028 | 4,661,447 | 3,116,076 | 960,570 | ||||||||||||||||
Fee reductions | (15,755 | ) | (15,606 | ) | (15,594 | ) | (9,388 | ) | ||||||||||||
Reimbursement of expenses | (417,414 | ) | (612,497 | ) | (521,432 | ) | (131,146 | ) | ||||||||||||
|
|
|
|
|
|
|
| |||||||||||||
Net expenses | 15,964,859 | 4,033,344 | 2,579,050 | 820,036 | ||||||||||||||||
|
|
|
|
|
|
|
| |||||||||||||
Net investment income | 41,544,097 | 27,293,670 | 2,924,172 | 1,567,709 | ||||||||||||||||
|
|
|
|
|
|
|
| |||||||||||||
Realized and Unrealized Gain (Loss): | ||||||||||||||||||||
Net realized gain (loss) on: | ||||||||||||||||||||
Investments | 67,755,403 | 16,436,234 | 209,385 | 1,915,604 | ||||||||||||||||
TBA Sale Commitments | — | 7,930 | — | — | ||||||||||||||||
Swap contracts | — | (160,073 | ) | — | — | |||||||||||||||
Closed futures contracts | — | (748,202 | ) | 1,028,639 | — | |||||||||||||||
Written option contracts | — | 670,365 | — | — | ||||||||||||||||
Forward foreign currency contracts and foreign currency related transactions | (1,962,927 | ) | 864,063 | (1,008,142 | ) | 309,275 | ||||||||||||||
|
|
|
|
|
|
|
| |||||||||||||
Net realized gain | 65,792,476 | 17,070,317 | 229,882 | 2,224,879 | ||||||||||||||||
|
|
|
|
|
|
|
| |||||||||||||
Change in net unrealized appreciation (depreciation) on: | ||||||||||||||||||||
Investments | 124,806,376 | 19,532,181 | 24,547,527 | 24,160,461 | ||||||||||||||||
Unfunded loan commitments | — | 2,725 | — | — | ||||||||||||||||
TBA Sale Commitments | — | 30,312 | — | — | ||||||||||||||||
Swap contracts | — | 397,975 | — | — | ||||||||||||||||
Open futures contracts | — | (415,333 | ) | (181,642 | ) | — | ||||||||||||||
Written option contracts | — | (145,072 | ) | — | — | |||||||||||||||
Forward foreign currency contracts and foreign currency related translations | (154,811 | ) | (342,469 | ) | (584,522 | ) | 558,662 | |||||||||||||
|
|
|
|
|
|
|
| |||||||||||||
Change in net unrealized appreciation (depreciation) | 124,651,565 | 19,060,319 | 23,781,363 | 24,719,123 | ||||||||||||||||
|
|
|
|
|
|
|
| |||||||||||||
Net realized and unrealized gain | 190,444,041 | 36,130,636 | 24,011,245 | 26,944,002 | ||||||||||||||||
|
|
|
|
|
|
|
| |||||||||||||
Net increase in net assets resulting from operations | $ | 231,988,138 | $ | 63,424,306 | $ | 26,935,417 | $ | 28,511,711 | ||||||||||||
|
|
|
|
|
|
|
| |||||||||||||
| (a) | The Fund commenced operations on May 1, 2012. |
| (b) | The Fund commenced operations on November 6, 2012. |
| See accompanying Notes to the Financial Statements. | 165 |
Mercer Funds
Statements of Operations (Continued)
For the Year Ended March 31, 2013
| Mercer US Short Maturity Fixed Income Fund | |||||
Investment Income: | |||||
Interest | $ | 650,655 | |||
Securities lending income | 133 | ||||
Other income | 38 | ||||
|
| ||||
Total investment income | 650,826 | ||||
|
| ||||
Expenses: | |||||
Advisory fees | 111,043 | ||||
Transfer agent fees | 16,749 | ||||
Custodian and fund accounting fees | 57,706 | ||||
Audit fees | 50,701 | ||||
Legal fees | 2,880 | ||||
Trustees fees | 2,502 | ||||
Registration and blue sky fees | 21,414 | ||||
Miscellaneous | 3,431 | ||||
|
| ||||
Total expenses | 266,426 | ||||
Fee reductions | (15,116 | ) | |||
Reimbursement of expenses | (109,174 | ) | |||
|
| ||||
Net expenses | 142,136 | ||||
|
| ||||
Net investment income | 508,690 | ||||
|
| ||||
Realized and Unrealized Gain (Loss): | |||||
Net realized gain (loss) on: | |||||
Investments | 13,089 | ||||
|
| ||||
Net realized gain | 13,089 | ||||
|
| ||||
Change in net unrealized appreciation (depreciation) on: | |||||
Investments | (9,941 | ) | |||
|
| ||||
Change in net unrealized appreciation (depreciation) | (9,941 | ) | |||
|
| ||||
Net realized and unrealized gain | 3,148 | ||||
|
| ||||
Net increase in net assets resulting from operations | $ | 511,838 | |||
|
| ||||
| 166 | See accompanying Notes to the Financial Statements. |
Mercer Funds
Statements of Changes in Net Assets
| Mercer US Large Cap Growth Equity Fund | Mercer US Large Cap Value Equity Fund | |||||||||||||||||||
| Year Ended March 31, 2013 | Year Ended March 31, 2012 | Year Ended March 31, 2013 | Year Ended March 31, 2012 | |||||||||||||||||
Increase (decrease) in net assets: | ||||||||||||||||||||
Operations: | ||||||||||||||||||||
Net investment income (loss) | $ | 2,674,597 | $ | 1,357,824 | $ | 9,196,651 | $ | 8,284,194 | ||||||||||||
Net realized gain (loss) | 42,369,258 | 27,376,893 | 40,763,308 | 26,148,223 | ||||||||||||||||
Change in net unrealized appreciation (depreciation) | (18,880,192 | ) | 13,735,799 | 20,601,558 | 2,063,980 | |||||||||||||||
|
|
|
|
|
|
|
| |||||||||||||
Net increase in net assets from operations | 26,163,663 | 42,470,516 | 70,561,517 | 36,496,397 | ||||||||||||||||
|
|
|
|
|
|
|
| |||||||||||||
Distributions to shareholders from: | ||||||||||||||||||||
Net investment income | ||||||||||||||||||||
Class Y-3 | (2,623,579 | ) | (799,812 | ) | (9,197,559 | ) | (7,996,540 | ) | ||||||||||||
|
|
|
|
|
|
|
| |||||||||||||
Total distributions from net investment income | (2,623,579 | ) | (799,812 | ) | (9,197,559 | ) | (7,996,540 | ) | ||||||||||||
|
|
|
|
|
|
|
| |||||||||||||
Net realized gains | ||||||||||||||||||||
Class Y-3 | (12,798,740 | ) | — | — | — | |||||||||||||||
|
|
|
|
|
|
|
| |||||||||||||
Total distributions from net realized gains | (12,798,740 | ) | — | — | — | |||||||||||||||
|
|
|
|
|
|
|
| |||||||||||||
Net share transactions: | ||||||||||||||||||||
Class Y-3 | (10,594,802 | ) | (3,869,902 | ) | (45,465,052 | ) | 10,980,991 | |||||||||||||
|
|
|
|
|
|
|
| |||||||||||||
Increase (decrease) in net assets resulting from net shares transactions | (10,594,802 | ) | (3,869,902 | ) | (45,465,052 | ) | 10,980,991 | |||||||||||||
|
|
|
|
|
|
|
| |||||||||||||
Net increase in net assets | 146,542 | 37,800,802 | 15,898,906 | 39,480,848 | ||||||||||||||||
|
|
|
|
|
|
|
| |||||||||||||
Net assets: | ||||||||||||||||||||
Beginning of year | 465,640,799 | 427,839,997 | 459,998,709 | 420,517,861 | ||||||||||||||||
|
|
|
|
|
|
|
| |||||||||||||
End of year | $ | 465,787,341 | $ | 465,640,799 | $ | 475,897,615 | $ | 459,998,709 | ||||||||||||
|
|
|
|
|
|
|
| |||||||||||||
Undistributed net investment income included in net assets at end of year | $ | 565,314 | $ | 514,149 | $ | 1,635,764 | $ | 1,819,042 | ||||||||||||
|
|
|
|
|
|
|
| |||||||||||||
| See accompanying Notes to the Financial Statements. | 167 |
Mercer Funds
Statements of Changes in Net Assets (Continued)
| Mercer US Small/Mid Cap Growth Equity Fund | Mercer US Small/Mid Cap Value Equity Fund | |||||||||||||||||||
| Year Ended March 31, 2013 | Year Ended March 31, 2012 | Year Ended March 31, 2013 | Year Ended March 31, 2012 | |||||||||||||||||
Increase (decrease) in net assets: | ||||||||||||||||||||
Operations: | ||||||||||||||||||||
Net investment income (loss) | $ | (166,599 | ) | $ | (978,689 | ) | $ | 4,330,538 | $ | 1,594,458 | ||||||||||
Net realized gain (loss) | 17,825,972 | 41,622,361 | 26,146,088 | 28,195,351 | ||||||||||||||||
Change in net unrealized appreciation (depreciation) | 32,129,046 | (29,177,990 | ) | 32,460,899 | (27,648,458 | ) | ||||||||||||||
|
|
|
|
|
|
|
| |||||||||||||
Net increase in net assets from operations | 49,788,419 | 11,465,682 | 62,937,525 | 2,141,351 | ||||||||||||||||
|
|
|
|
|
|
|
| |||||||||||||
Distributions to shareholders from: | ||||||||||||||||||||
Net investment income | ||||||||||||||||||||
Class Y-3 | (303,053 | ) | — | (3,935,894 | ) | (1,204,230 | ) | |||||||||||||
|
|
|
|
|
|
|
| |||||||||||||
Total distributions from net investment income | (303,053 | ) | — | (3,935,894 | ) | (1,204,230 | ) | |||||||||||||
|
|
|
|
|
|
|
| |||||||||||||
Net realized gains | ||||||||||||||||||||
Class Y-3 | (31,036,701 | ) | (25,512,817 | ) | (13,297,320 | ) | (15,751,437 | ) | ||||||||||||
|
|
|
|
|
|
|
| |||||||||||||
Total distributions from net realized gains | (31,036,701 | ) | (25,512,817 | ) | (13,297,320 | ) | (15,751,437 | ) | ||||||||||||
|
|
|
|
|
|
|
| |||||||||||||
Net share transactions: | ||||||||||||||||||||
Class Y-3 | 123,455,822 | 13,243,135 | 91,316,151 | 11,579,614 | ||||||||||||||||
|
|
|
|
|
|
|
| |||||||||||||
Increase in net assets resulting from net shares transactions | 123,455,822 | 13,243,135 | 91,316,151 | 11,579,614 | ||||||||||||||||
|
|
|
|
|
|
|
| |||||||||||||
Net increase (decrease) in net assets | 141,904,487 | (804,000 | ) | 137,020,462 | (3,234,702 | ) | ||||||||||||||
|
|
|
|
|
|
|
| |||||||||||||
Net assets: | ||||||||||||||||||||
Beginning of year | 300,175,807 | 300,979,807 | 292,391,188 | 295,625,890 | ||||||||||||||||
|
|
|
|
|
|
|
| |||||||||||||
End of year | $ | 442,080,294 | $ | 300,175,807 | $ | 429,411,650 | $ | 292,391,188 | ||||||||||||
|
|
|
|
|
|
|
| |||||||||||||
Undistributed (distributions in excess of) net investment income included in net assets at end of year | $ | (392,627 | ) | $ | (1,202 | ) | $ | 728,939 | $ | 477,151 | ||||||||||
|
|
|
|
|
|
|
| |||||||||||||
| 168 | See accompanying Notes to the Financial Statements. |
Mercer Funds
Statements of Changes in Net Assets (Continued)
| Mercer Non-US Core Equity Fund | Mercer Core Opportunistic Fixed Income Fund | |||||||||||||||||||
| Year Ended March 31, 2013 | Year Ended March 31, 2012 | Year Ended March 31, 2013 | Year Ended March 31, 2012 | |||||||||||||||||
Increase (decrease) in net assets: | ||||||||||||||||||||
Operations: | ||||||||||||||||||||
Net investment income (loss) | $ | 41,544,097 | $ | 41,869,765 | $ | 27,293,670 | $ | 32,747,286 | ||||||||||||
Net realized gain (loss) | 65,792,476 | (57,710,897 | ) | 17,070,317 | 26,872,362 | |||||||||||||||
Change in net unrealized appreciation (depreciation) | 124,651,565 | (34,610,696 | ) | 19,060,319 | 19,571,109 | |||||||||||||||
|
|
|
|
|
|
|
| |||||||||||||
Net increase (decrease) in net assets from operations | 231,988,138 | (50,451,828 | ) | 63,424,306 | 79,190,757 | |||||||||||||||
|
|
|
|
|
|
|
| |||||||||||||
Distributions to shareholders from: | ||||||||||||||||||||
Net investment income | ||||||||||||||||||||
Class Y-3 | (49,488,095 | ) | (32,578,616 | ) | (30,940,168 | ) | (28,936,893 | ) | ||||||||||||
|
|
|
|
|
|
|
| |||||||||||||
Total distributions from net investment income | (49,488,095 | ) | (32,578,616 | ) | (30,940,168 | ) | (28,936,893 | ) | ||||||||||||
|
|
|
|
|
|
|
| |||||||||||||
Net realized gains | ||||||||||||||||||||
Class Y-3 | — | — | (23,150,024 | ) | (12,292,840 | ) | ||||||||||||||
|
|
|
|
|
|
|
| |||||||||||||
Total distributions from net realized gains | — | — | (23,150,024 | ) | (12,292,840 | ) | ||||||||||||||
|
|
|
|
|
|
|
| |||||||||||||
Net share transactions: | ||||||||||||||||||||
Class Y-3 | 63,645,562 | 412,286,027 | 58,295,119 | (55,364,759 | ) | |||||||||||||||
|
|
|
|
|
|
|
| |||||||||||||
Increase (decrease) in net assets resulting from net shares transactions | 63,645,562 | 412,286,027 | 58,295,119 | (55,364,759 | ) | |||||||||||||||
|
|
|
|
|
|
|
| |||||||||||||
Net increase (decrease) in net assets | 246,145,605 | 329,255,583 | 67,629,233 | (17,403,735 | ) | |||||||||||||||
|
|
|
|
|
|
|
| |||||||||||||
Net assets: | ||||||||||||||||||||
Beginning of year | 1,892,784,222 | 1,563,528,639 | 1,025,623,589 | 1,043,027,324 | ||||||||||||||||
|
|
|
|
|
|
|
| |||||||||||||
End of year | $ | 2,138,929,827 | $ | 1,892,784,222 | $ | 1,093,252,822 | $ | 1,025,623,589 | ||||||||||||
|
|
|
|
|
|
|
| |||||||||||||
Undistributed net investment income included in net assets at end of year | $ | 8,552,915 | $ | 16,456,316 | $ | 6,883,601 | $ | 8,180,211 | ||||||||||||
|
|
|
|
|
|
|
| |||||||||||||
| See accompanying Notes to the Financial Statements. | 169 |
Mercer Funds
Statements of Changes in Net Assets (Continued)
| Mercer Emerging Markets Equity Fund | Mercer Global Low Volatility Equity Fund | |||||||||
| Period Ended March 31, 2013(a) | Period Ended March 31, 2013(b) | |||||||||
Increase (decrease) in net assets: | ||||||||||
Operations: | ||||||||||
Net investment income (loss) | $ | 2,924,172 | $ | 1,567,709 | ||||||
Net realized gain (loss) | 229,882 | 2,224,879 | ||||||||
Change in net unrealized appreciation (depreciation) | 23,781,363 | 24,719,123 | ||||||||
|
|
|
| |||||||
Net increase in net assets from operations | 26,935,417 | 28,511,711 | ||||||||
|
|
|
| |||||||
Distributions to shareholders from: | ||||||||||
Net investment income | ||||||||||
Class Y-3 | (2,704,695 | ) | (485,259 | ) | ||||||
|
|
|
| |||||||
Total distributions from net investment income | (2,704,695 | ) | (485,259 | ) | ||||||
|
|
|
| |||||||
Net realized gains | ||||||||||
Class Y-3 | (530,723 | ) | — | |||||||
|
|
|
| |||||||
Total distributions from net realized gains | (530,723 | ) | — | |||||||
|
|
|
| |||||||
Net share transactions: | ||||||||||
Class Y-3 | 493,384,530 | 273,203,686 | ||||||||
|
|
|
| |||||||
Increase in net assets resulting from net shares transactions | 493,384,530 | 273,203,686 | ||||||||
|
|
|
| |||||||
Net increase in net assets | 517,084,529 | 301,230,138 | ||||||||
|
|
|
| |||||||
Net assets: | ||||||||||
Beginning of period | — | — | ||||||||
|
|
|
| |||||||
End of period | $ | 517,084,529 | $ | 301,230,138 | ||||||
|
|
|
| |||||||
Undistributed (distributions in excess of) net investment income included in net assets at end of period | $ | (118,819 | ) | $ | 1,418,147 | |||||
|
|
|
| |||||||
| (a) | The Fund commenced operations on May 1, 2012. |
| (b) | The Fund commenced operations on November 6, 2012. |
| 170 | See accompanying Notes to the Financial Statements. |
Mercer Funds
Statements of Changes in Net Assets (Continued)
| Mercer US Short Maturity Fixed Income Fund | ||||||||||
| Year Ended March 31, 2013 | Year Ended March 31, 2012 | |||||||||
Increase (decrease) in net assets: | ||||||||||
Operations: | ||||||||||
Net investment income (loss) | $ | 508,690 | $ | 731,854 | ||||||
Net realized gain (loss) | 13,089 | 170,629 | ||||||||
Change in net unrealized appreciation (depreciation) | (9,941 | ) | 140,991 | |||||||
|
|
|
| |||||||
Net increase in net assets from operations | 511,838 | 1,043,474 | ||||||||
|
|
|
| |||||||
Distributions to shareholders from: | ||||||||||
Net investment income | ||||||||||
Class Y-3 | (545,067 | ) | (857,686 | ) | ||||||
|
|
|
| |||||||
Total distributions from net investment income | (545,067 | ) | (857,686 | ) | ||||||
|
|
|
| |||||||
Net share transactions: | ||||||||||
Class Y-3 | 2,966,879 | (23,969,220 | ) | |||||||
|
|
|
| |||||||
Increase (decrease) in net assets resulting from net shares transactions | 2,966,879 | (23,969,220 | ) | |||||||
|
|
|
| |||||||
Net increase (decrease) in net assets | 2,933,650 | (23,783,432 | ) | |||||||
|
|
|
| |||||||
Net assets: | ||||||||||
Beginning of year | 44,166,073 | 67,949,505 | ||||||||
|
|
|
| |||||||
End of year | $ | 47,099,723 | $ | 44,166,073 | ||||||
|
|
|
| |||||||
Undistributed net investment income included in net assets at end of year | $ | 89,507 | $ | 125,884 | ||||||
|
|
|
| |||||||
| See accompanying Notes to the Financial Statements. | 171 |
Mercer US Large Cap Growth Equity Fund
| Year Ended 03/31/13 | Year Ended 03/31/12 | Year Ended 03/31/11 | Year Ended 03/31/10 | Year Ended 03/31/09 | |||||||||||||||||||||
For a Class Y-3 Share Outstanding Throughout each Period: | |||||||||||||||||||||||||
Net asset value at beginning of year | $ | 13.27 | $ | 12.19 | $ | 10.08 | $ | 6.85 | $ | 10.20 | |||||||||||||||
Net investment income† | 0.08 | 0.04 | 0.03 | 0.05 | 0.04 | ||||||||||||||||||||
Net realized and unrealized gain (loss) on investments | 0.68 | 1.06 | 2.12 | 3.23 | (3.37 | ) | |||||||||||||||||||
|
|
|
|
|
|
|
|
|
| ||||||||||||||||
Total from investment operations | 0.76 | 1.10 | 2.15 | 3.28 | (3.33 | ) | |||||||||||||||||||
|
|
|
|
|
|
|
|
|
| ||||||||||||||||
Less dividends and distributions: | |||||||||||||||||||||||||
From net investment income | (0.08 | ) | (0.02 | ) | (0.04 | ) | (0.05 | ) | (0.02 | ) | |||||||||||||||
From net realized gain on investments | (0.39 | ) | — | — | — | — | |||||||||||||||||||
|
|
|
|
|
|
|
|
|
| ||||||||||||||||
Total dividends and distributions | (0.47 | ) | (0.02 | ) | (0.04 | ) | (0.05 | ) | (0.02 | ) | |||||||||||||||
|
|
|
|
|
|
|
|
|
| ||||||||||||||||
Net asset value at end of year | $ | 13.56 | $ | 13.27 | $ | 12.19 | $ | 10.08 | $ | 6.85 | |||||||||||||||
|
|
|
|
|
|
|
|
|
| ||||||||||||||||
Total investment return(a) | 6.03 | % | 9.08 | % | 21.38 | % | 47.85 | % | (32.62 | )% | |||||||||||||||
Ratios/Supplemental Data: | |||||||||||||||||||||||||
Net investment income to average net assets | 0.61 | % | 0.33 | % | 0.27 | % | 0.54 | % | 0.43 | % | |||||||||||||||
Net expenses to average daily net assets | 0.57 | % | 0.57 | % | 0.57 | % | 0.57 | % | 0.57 | % | |||||||||||||||
Total expenses (before reductions and reimbursements) to average daily net assets | 0.63 | % | 0.63 | % | 0.64 | % | 0.66 | % | 0.65 | % | |||||||||||||||
Portfolio turnover rate | 65 | % | 64 | % | 106 | %(b) | 102 | % | 93 | % | |||||||||||||||
Net assets at end of year (in 000’s) | $ | 465,787 | $ | 465,641 | $ | 427,840 | $ | 359,792 | $ | 277,740 | |||||||||||||||
| (a) | The total return would have been lower had certain expenses not been reduced or reimbursed during the periods shown. |
| (b) | Portfolio turnover calculation does not include $23,568,413 of in-kind contributions. |
| † | Computed using average shares outstanding throughout the year. |
| 172 | See accompanying Notes to the Financial Statements. |
Mercer US Large Cap Value Equity Fund
Financial Highlights (Continued)
| Year Ended 03/31/13 | Year Ended 03/31/12 | Year Ended 03/31/11 | Year Ended 03/31/10 | Year Ended 03/31/09 | |||||||||||||||||||||
For a Class Y-3 Share Outstanding Throughout each Period: | |||||||||||||||||||||||||
Net asset value at beginning of year | $ | 8.71 | $ | 8.25 | $ | 7.52 | $ | 5.18 | $ | 9.39 | |||||||||||||||
Net investment income† | 0.18 | 0.16 | 0.11 | 0.11 | 0.19 | ||||||||||||||||||||
Net realized and unrealized gain (loss) on investments | 1.26 | 0.45 | 0.72 | 2.37 | (4.23 | ) | |||||||||||||||||||
|
|
|
|
|
|
|
|
|
| ||||||||||||||||
Total from investment operations | 1.44 | 0.61 | 0.83 | 2.48 | (4.04 | ) | |||||||||||||||||||
|
|
|
|
|
|
|
|
|
| ||||||||||||||||
Less dividends and distributions: | |||||||||||||||||||||||||
From net investment income | (0.20 | ) | (0.15 | ) | (0.10 | ) | (0.14 | ) | (0.17 | ) | |||||||||||||||
From net realized gain on investments | — | — | — | — | (0.00 | )(a) | |||||||||||||||||||
|
|
|
|
|
|
|
|
|
| ||||||||||||||||
Total dividends and distributions | (0.20 | ) | (0.15 | ) | (0.10 | ) | (0.14 | ) | (0.17 | ) | |||||||||||||||
|
|
|
|
|
|
|
|
|
| ||||||||||||||||
Net asset value at end of year | $ | 9.95 | $ | 8.71 | $ | 8.25 | $ | 7.52 | $ | 5.18 | |||||||||||||||
|
|
|
|
|
|
|
|
|
| ||||||||||||||||
Total investment return(b) | 16.71 | % | 7.69 | % | 11.07 | % | 47.96 | % | (43.31 | )% | |||||||||||||||
Ratios/Supplemental Data: | |||||||||||||||||||||||||
Net investment income to average net assets | 2.07 | % | 2.03 | % | 1.52 | % | 1.69 | % | 2.57 | % | |||||||||||||||
Net expenses to average daily net assets | 0.55 | % | 0.55 | % | 0.55 | % | 0.55 | % | 0.55 | % | |||||||||||||||
Total expenses (before reductions and reimbursements) to average daily net assets | 0.60 | % | 0.62 | % | 0.63 | % | 0.64 | % | 0.64 | % | |||||||||||||||
Portfolio turnover rate | 59 | % | 109 | % | 117 | %(c) | 128 | % | 238 | % | |||||||||||||||
Net assets at end of year (in 000’s) | $ | 475,898 | $ | 459,999 | $ | 420,518 | $ | 357,787 | $ | 255,400 | |||||||||||||||
| (a) | Amount rounds to less than $0.01 per share. |
| (b) | The total return would have been lower had certain expenses not been reduced or reimbursed during the periods shown. |
| (c) | Portfolio turnover calculation does not include $21,956,759 of in-kind contributions. |
| † | Computed using average shares outstanding throughout the year. |
| See accompanying Notes to the Financial Statements. | 173 |
Mercer US Small/Mid Cap Growth Equity Fund
Financial Highlights (Continued)
| Year Ended 03/31/13 | Year Ended 03/31/12 | Year Ended 03/31/11 | Year Ended 03/31/10 | Year Ended 03/31/09 | |||||||||||||||||||||
For a Class Y-3 Share Outstanding Throughout each Period: | |||||||||||||||||||||||||
Net asset value at beginning of year | $ | 11.62 | $ | 12.49 | $ | 9.75 | $ | 6.19 | $ | 9.84 | |||||||||||||||
Net investment loss† | (0.01 | ) | (0.04 | ) | (0.03 | ) | (0.04 | ) | (0.03 | ) | |||||||||||||||
Net realized and unrealized gain (loss) on investments | 1.31 | 0.27 | 2.77 | 3.60 | (3.55 | ) | |||||||||||||||||||
|
|
|
|
|
|
|
|
|
| ||||||||||||||||
Total from investment operations | 1.30 | 0.23 | 2.74 | 3.56 | (3.58 | ) | |||||||||||||||||||
|
|
|
|
|
|
|
|
|
| ||||||||||||||||
Less dividends and distributions: | |||||||||||||||||||||||||
From net investment income | (0.01 | ) | — | — | — | — | |||||||||||||||||||
From net realized gain on investments | (0.97 | ) | (1.10 | ) | — | — | (0.07 | ) | |||||||||||||||||
|
|
|
|
|
|
|
|
|
| ||||||||||||||||
Total dividends and distributions | (0.98 | ) | (1.10 | ) | — | — | (0.07 | ) | |||||||||||||||||
|
|
|
|
|
|
|
|
|
| ||||||||||||||||
Net asset value at end of year | $ | 11.94 | $ | 11.62 | $ | 12.49 | $ | 9.75 | $ | 6.19 | |||||||||||||||
|
|
|
|
|
|
|
|
|
| ||||||||||||||||
Total investment return(a) | 12.11 | % | 3.36 | % | 28.10 | % | 57.51 | % | (36.43 | )% | |||||||||||||||
Ratios/Supplemental Data: | |||||||||||||||||||||||||
Net investment loss to average net assets | (0.05 | )% | (0.36 | )% | (0.34 | )% | (0.45 | )% | (0.36 | )% | |||||||||||||||
Net expenses to average daily net assets | 0.96 | % | 0.92 | % | 0.92 | % | 0.92 | % | 0.92 | % | |||||||||||||||
Total expenses (before reductions and reimbursements) to average daily net assets | 1.01 | % | 1.01 | % | 1.02 | % | 1.04 | % | 1.07 | % | |||||||||||||||
Portfolio turnover rate | 54 | % | 95 | % | 107 | % | 92 | % | 170 | % | |||||||||||||||
Net assets at end of year (in 000’s) | $ | 442,080 | $ | 300,176 | $ | 300,980 | $ | 220,665 | $ | 133,116 | |||||||||||||||
| (a) | The total return would have been lower had certain expenses not been reduced or reimbursed during the periods shown. |
| † | Computed using average shares outstanding throughout the year. |
| 174 | See accompanying Notes to the Financial Statements. |
Mercer US Small/Mid Cap Value Equity Fund
Financial Highlights (Continued)
| Year Ended 03/31/13 | Year Ended 03/31/12 | Year Ended 03/31/11 | Year Ended 03/31/10 | Year Ended 03/31/09 | |||||||||||||||||||||
For a Class Y-3 Share Outstanding Throughout each Period: | |||||||||||||||||||||||||
Net asset value at beginning of year | $ | 9.94 | $ | 10.64 | $ | 8.64 | $ | 5.26 | $ | 8.85 | |||||||||||||||
Net investment income† | 0.13 | 0.06 | 0.05 | 0.06 | 0.09 | ||||||||||||||||||||
Net realized and unrealized gain (loss) on investments | 1.46 | (0.14 | )(a) | 2.05 | 3.35 | (3.61 | ) | ||||||||||||||||||
|
|
|
|
|
|
|
|
|
| ||||||||||||||||
Total from investment operations | 1.59 | (0.08 | ) | 2.10 | 3.41 | (3.52 | ) | ||||||||||||||||||
|
|
|
|
|
|
|
|
|
| ||||||||||||||||
Less dividends and distributions: | |||||||||||||||||||||||||
From net investment income | (0.11 | ) | (0.04 | ) | (0.10 | ) | (0.03 | ) | (0.06 | ) | |||||||||||||||
From net realized gain on investments | (0.37 | ) | (0.58 | ) | — | — | (0.01 | ) | |||||||||||||||||
|
|
|
|
|
|
|
|
|
| ||||||||||||||||
Total dividends and distributions | (0.48 | ) | (0.62 | ) | (0.10 | ) | (0.03 | ) | (0.07 | ) | |||||||||||||||
|
|
|
|
|
|
|
|
|
| ||||||||||||||||
Net asset value at end of year | $ | 11.05 | $ | 9.94 | $ | 10.64 | $ | 8.64 | $ | 5.26 | |||||||||||||||
|
|
|
|
|
|
|
|
|
| ||||||||||||||||
Total investment return(b) | 16.51 | % | (0.03 | )% | 24.36 | % | 64.86 | % | (39.85 | )% | |||||||||||||||
Ratios/Supplemental Data: | |||||||||||||||||||||||||
Net investment income to average net assets | 1.26 | % | 0.60 | % | 0.65 | % | 0.81 | % | 1.20 | % | |||||||||||||||
Net expenses to average daily net assets | 0.96 | % | 0.92 | % | 0.92 | % | 0.92 | % | 0.92 | % | |||||||||||||||
Total expenses (before reductions and reimbursements) to average daily net assets | 1.01 | % | 1.01 | % | 1.02 | % | 1.07 | % | 1.08 | % | |||||||||||||||
Portfolio turnover rate | 80 | % | 92 | % | 95 | % | 119 | % | 120 | % | |||||||||||||||
Net assets at end of year (in 000’s) | $ | 429,412 | $ | 292,391 | $ | 295,626 | $ | 222,102 | $ | 124,586 | |||||||||||||||
| (a) | The amount shown for a share outstanding does not correspond with the aggregate net realized and unrealized gain for the period due to the timing of sales of the Fund in relation to the fluctuating net asset value per share of the Fund. |
| (b) | The total return would have been lower had certain expenses not been reduced or reimbursed during the periods shown. |
| † | Computed using average shares outstanding throughout the year. |
| See accompanying Notes to the Financial Statements. | 175 |
Mercer Non-US Core Equity Fund
Financial Highlights (Continued)
| Year Ended 03/31/13 | Year Ended 03/31/12 | Year Ended 03/31/11 | Year Ended 03/31/10 | Year Ended 03/31/09 | |||||||||||||||||||||
For a Class Y-3 Share Outstanding Throughout each Period: | |||||||||||||||||||||||||
Net asset value at beginning of year | $ | 9.72 | $ | 10.46 | $ | 9.73 | $ | 6.29 | $ | 12.76 | |||||||||||||||
Net investment income† | 0.21 | 0.25 | 0.17 | 0.17 | 0.25 | ||||||||||||||||||||
Net realized and unrealized gain (loss) on investments | 0.90 | (0.81 | ) | 0.74 | 3.38 | (6.51 | ) | ||||||||||||||||||
|
|
|
|
|
|
|
|
|
| ||||||||||||||||
Total from investment operations | 1.11 | (0.56 | ) | 0.91 | 3.55 | (6.26 | ) | ||||||||||||||||||
|
|
|
|
|
|
|
|
|
| ||||||||||||||||
Less dividends and distributions: | |||||||||||||||||||||||||
From net investment income | (0.25 | ) | (0.18 | ) | (0.18 | ) | (0.11 | ) | (0.12 | ) | |||||||||||||||
From net realized gain on investments | — | — | — | — | (0.09 | ) | |||||||||||||||||||
|
|
|
|
|
|
|
|
|
| ||||||||||||||||
Total dividends and distributions | (0.25 | ) | (0.18 | ) | (0.18 | ) | (0.11 | ) | (0.21 | ) | |||||||||||||||
|
|
|
|
|
|
|
|
|
| ||||||||||||||||
Net asset value at end of year | $ | 10.58 | $ | 9.72 | $ | 10.46 | $ | 9.73 | $ | 6.29 | |||||||||||||||
|
|
|
|
|
|
|
|
|
| ||||||||||||||||
Total investment return(a) | 11.53 | % | (5.15 | )% | 9.45 | % | 56.52 | % | (49.30 | )% | |||||||||||||||
Ratios/Supplemental Data: | |||||||||||||||||||||||||
Net investment income to average net assets | 2.17 | % | 2.57 | % | 1.76 | % | 1.93 | % | 2.68 | % | |||||||||||||||
Net expenses to average daily net assets | 0.83 | % | 0.82 | % | 0.82 | % | 0.82 | % | 0.82 | % | |||||||||||||||
Total expenses (before reductions and reimbursements) to average daily net assets | 0.86 | % | 0.92 | % | 0.92 | % | 0.94 | % | 0.95 | % | |||||||||||||||
Portfolio turnover rate | 90 | % | 105 | %(b) | 87 | % | 51 | % | 64 | % | |||||||||||||||
Net assets at end of year (in 000’s) | $ | 2,138,930 | $ | 1,892,784 | $ | 1,563,529 | $ | 1,042,831 | $ | 485,543 | |||||||||||||||
| (a) | The total return would have been lower had certain expenses not been reduced or reimbursed during the periods shown. |
| (b) | Portfolio turnover calculation does not include $9,536,640 of in-kind transactions. |
| † | Computed using average shares outstanding throughout the year. |
| 176 | See accompanying Notes to the Financial Statements. |
Mercer Core Opportunistic Fixed Income Fund
Financial Highlights (Continued)
| Year Ended 03/31/13 | Year Ended 03/31/12 | Year Ended 03/31/11 | Year Ended 03/31/10 | Year Ended 03/31/09 | |||||||||||||||||||||
For a Class Y-3 Share Outstanding Throughout each Period: | |||||||||||||||||||||||||
Net asset value at beginning of year | $ | 10.58 | $ | 10.23 | $ | 10.11 | $ | 9.00 | $ | 10.24 | |||||||||||||||
Net investment income† | 0.27 | 0.33 | 0.29 | 0.40 | 0.50 | ||||||||||||||||||||
Net realized and unrealized gain (loss) on investments | 0.37 | 0.46 | 0.34 | 0.98 | (0.91 | ) | |||||||||||||||||||
|
|
|
|
|
|
|
|
|
| ||||||||||||||||
Total from investment operations | 0.64 | 0.79 | 0.63 | 1.38 | (0.41 | ) | |||||||||||||||||||
|
|
|
|
|
|
|
|
|
| ||||||||||||||||
Less dividends and distributions: | |||||||||||||||||||||||||
From net investment income | (0.31 | ) | (0.31 | ) | (0.36 | ) | (0.27 | ) | (0.63 | ) | |||||||||||||||
From net realized gain on investments | (0.23 | ) | (0.13 | ) | (0.15 | ) | — | (0.20 | ) | ||||||||||||||||
|
|
|
|
|
|
|
|
|
| ||||||||||||||||
Total dividends and distributions | (0.54 | ) | (0.44 | ) | (0.51 | ) | (0.27 | ) | (0.83 | ) | |||||||||||||||
|
|
|
|
|
|
|
|
|
| ||||||||||||||||
Net asset value at end of year | $ | 10.68 | $ | 10.58 | $ | 10.23 | $ | 10.11 | $ | 9.00 | |||||||||||||||
|
|
|
|
|
|
|
|
|
| ||||||||||||||||
Total investment return(a) | 6.15 | % | 7.88 | % | 6.25 | % | 15.34 | % | (3.90 | )% | |||||||||||||||
Ratios/Supplemental Data: | |||||||||||||||||||||||||
Net investment income to average net assets | 2.51 | % | 3.13 | % | 2.79 | % | 4.12 | % | 5.16 | % | |||||||||||||||
Net expenses to average daily net assets | 0.37 | % | 0.37 | % | 0.37 | % | 0.37 | % | 0.37 | % | |||||||||||||||
Total expenses (before reductions and reimbursements) to average daily net assets | 0.43 | % | 0.44 | % | 0.45 | % | 0.47 | % | 0.47 | % | |||||||||||||||
Portfolio turnover rate | 125 | % | 181 | % | 379 | % | 276 | % | 229 | % | |||||||||||||||
Net assets at end of year (in 000’s) | $ | 1,093,253 | $ | 1,025,624 | $ | 1,043,027 | $ | 758,780 | $ | 394,347 | |||||||||||||||
| (a) | The total return would have been lower had certain expenses not been reduced or reimbursed during the periods shown. |
| † | Computed using average shares outstanding throughout the year. |
| See accompanying Notes to the Financial Statements. | 177 |
Mercer Emerging Markets Equity Fund
Financial Highlights (Continued)
| Period Ended March 31, 2013(a) | |||||
For a Class Y-3 Share Outstanding Throughout the Period: | |||||
Net asset value at beginning of period | $ | 10.00 | |||
Net investment income† | 0.10 | ||||
Net realized and unrealized gain on investments | 0.46 | ||||
|
| ||||
Total from investment operations | 0.56 | ||||
|
| ||||
Less dividends and distributions: | |||||
From net investment income | (0.06 | ) | |||
From net realized gain on investments | (0.01 | ) | |||
|
| ||||
Total dividends and distributions | (0.07 | ) | |||
|
| ||||
Net asset value at end of period | $ | 10.49 | |||
|
| ||||
Total investment return(b) | 5.64 | %** | |||
Ratios/Supplemental Data: | |||||
Net investment income to average net assets | 1.08 | %* | |||
Net expenses to average daily net assets | 0.95 | %* (c) | |||
Total expenses (before reductions and reimbursements) to average daily net assets | 1.15 | %* | |||
Portfolio turnover rate | 52 | %** | |||
Net assets at end of period (in 000’s) | $ | 517,085 | |||
| (a) | The Fund commenced operations on May 1, 2012. |
| (b) | The total return would have been lower had certain expenses not been reduced or reimbursed during the period shown. |
| (c) | Includes interest expense that amounts to less than 0.01%. |
| † | Computed using average shares outstanding throughout the period. |
| * | Annualized |
| ** | Not annualized |
| 178 | See accompanying Notes to the Financial Statements. |
Mercer Global Low Volatility Equity Fund
Financial Highlights (Continued)
| Period Ended March 31, 2013(a) | |||||
For a Class Y-3 Share Outstanding Throughout the Period: | |||||
Net asset value at beginning of period | $ | 10.00 | |||
Net investment income† | 0.07 | ||||
Net realized and unrealized gain on investments | 1.14 | ||||
|
| ||||
Total from investment operations | 1.21 | ||||
|
| ||||
Less dividends and distributions: | |||||
From net investment income | (0.02 | ) | |||
|
| ||||
Total dividends and distributions | (0.02 | ) | |||
|
| ||||
Net asset value at end of period | $ | 11.19 | |||
|
| ||||
Total investment return(b) | 12.13 | %** | |||
Ratios/Supplemental Data: | |||||
Net investment income to average net assets | 1.62 | %* | |||
Net expenses to average daily net assets | 0.85 | %* | |||
Total expenses (before reductions and reimbursements) to average daily net assets | 1.00 | %* | |||
Portfolio turnover rate | 12 | %** | |||
Net assets at end of period (in 000’s) | $ | 301,230 | |||
| (a) | The Fund commenced operations on November 6, 2012. |
| (b) | The total return would have been lower had certain expenses not been reduced or reimbursed during the period shown. |
| † | Computed using average shares outstanding throughout the period. |
| * | Annualized |
| ** | Not annualized |
| See accompanying Notes to the Financial Statements. | 179 |
Mercer US Short Maturity Fixed Income Fund
Financial Highlights (Continued)
| Year Ended 03/31/13 | Year Ended 03/31/12 | Year Ended 03/31/11 | Year Ended 03/31/10 | Year Ended 03/31/09 | |||||||||||||||||||||
For a Class Y-3 Share Outstanding Throughout each Period: | |||||||||||||||||||||||||
Net asset value at beginning of year | $ | 9.57 | $ | 9.56 | $ | 9.51 | $ | 8.57 | $ | 10.01 | |||||||||||||||
Net investment income† | 0.11 | 0.15 | 0.15 | 0.30 | 0.40 | ||||||||||||||||||||
Net realized and unrealized gain (loss) on investments | 0.00 | (a) | 0.05 | 0.06 | 0.83 | (1.16 | ) | ||||||||||||||||||
|
|
|
|
|
|
|
|
|
| ||||||||||||||||
Total from investment operations | 0.11 | 0.20 | 0.21 | 1.13 | (0.76 | ) | |||||||||||||||||||
|
|
|
|
|
|
|
|
|
| ||||||||||||||||
Less dividends and distributions: | |||||||||||||||||||||||||
From net investment income | (0.12 | ) | (0.19 | ) | (0.16 | ) | (0.19 | ) | (0.68 | ) | |||||||||||||||
|
|
|
|
|
|
|
|
|
| ||||||||||||||||
Total dividends and distributions | (0.12 | ) | (0.19 | ) | (0.16 | ) | (0.19 | ) | (0.68 | ) | |||||||||||||||
|
|
|
|
|
|
|
|
|
| ||||||||||||||||
Net asset value at end of year | $ | 9.56 | $ | 9.57 | $ | 9.56 | $ | 9.51 | $ | 8.57 | |||||||||||||||
|
|
|
|
|
|
|
|
|
| ||||||||||||||||
Total investment return(b) | 1.14 | % | 2.07 | % | 2.19 | % | 13.19 | % | (7.52 | )% | |||||||||||||||
Ratios/Supplemental Data: | |||||||||||||||||||||||||
Net investment income to average net assets | 1.15 | % | 1.52 | % | 1.60 | % | 3.24 | % | 4.16 | % | |||||||||||||||
Net expenses to average daily net assets | 0.32 | % | 0.32 | % | 0.32 | % | 0.32 | % | 0.32 | % | |||||||||||||||
Total expenses (before reductions and reimbursements) to average daily net assets | 0.60 | % | 0.53 | % | 0.47 | % | 0.61 | % | 0.49 | % | |||||||||||||||
Portfolio turnover rate | 32 | % | 32 | % | 61 | % | 589 | % | 217 | % | |||||||||||||||
Net assets at end of year (in 000’s) | $ | 47,100 | $ | 44,166 | $ | 67,950 | $ | 47,487 | $ | 18,904 | |||||||||||||||
| (a) | Amount rounds to less than $0.01 per share. |
| (b) | The total return would have been lower had certain expenses not been reduced or reimbursed during the periods shown. |
| † | Computed using average shares outstanding throughout the year. |
| 180 | See accompanying Notes to the Financial Statements. |
Mercer Funds
Notes to the Financial Statements
March 31, 2013
| 1. | Organization |
Mercer Funds (the “Trust”) consists of the following nine series: Mercer US Large Cap Growth Equity Fund (“Large Cap Growth”), Mercer US Large Cap Value Equity Fund (“Large Cap Value”), Mercer US Small/Mid Cap Growth Equity Fund (“Small/Mid Cap Growth”), Mercer US Small/Mid Cap Value Equity Fund (“Small/Mid Cap Value”), Mercer Non-US Core Equity Fund (“Non-US Core Equity”), Mercer Core Opportunistic Fixed Income Fund (“Core Opportunistic”), Mercer Emerging Markets Equity Fund (“Emerging Markets”), which commenced operations on May 1, 2012, Mercer Global Low Volatility Equity Fund (“Global Low Volatility”), which commenced operations on November 6, 2012 and Mercer US Short Maturity Fixed Income Fund (“Short Maturity”), (each a “Fund,” and collectively referred to as the “Funds”). The Trust is a Delaware statutory trust, established on March 11, 2005. The Trust is registered as an investment company under the Investment Company Act of 1940 (the “1940 Act”). The Funds’ investment advisor is Mercer Investment Management, Inc. (the “Advisor”). The Advisor manages each Fund using a “manager of managers” approach by selecting one or more subadvisors (each a “Subadvisor,” and collectively referred to as the “Subadvisors”) to manage each Fund.
Each Fund is classified as “diversified” for purposes of the 1940 Act.
The investment objectives of the Funds are:
Fund | Investment Objective | |
| Large Cap Growth | Long-term total return, which includes capital appreciation and income | |
| Large Cap Value | Long-term total return, which includes capital appreciation and income | |
| Small/Mid Cap Growth | Long-term total return, comprised primarily of capital appreciation | |
| Small/Mid Cap Value | Long-term total return, comprised primarily of capital appreciation | |
| Non-US Core Equity | Long-term total return, which includes capital appreciation and income | |
| Core Opportunistic | Total return, consisting of both current income and capital appreciation | |
| Emerging Markets | Long-term total return, which includes capital appreciation and income | |
| Global Low Volatility | Long-term total return, which includes capital appreciation and income | |
| Short Maturity | Safety of principal and a moderate level of income |
Each Fund is authorized to offer interests in four classes of shares: Class S, Class Y-1, Class Y-2 and Class Y-3. The principal difference between the classes of shares is the level of shareholder service, marketing and administrative fees borne by the classes. As of March 31, 2013, only the Class Y-3 shares of each Fund had commenced operations.
| 2. | Significant Accounting Policies |
The following are significant accounting policies followed by the Funds. These policies are in conformity with accounting principles generally accepted in the United States of America (“GAAP”). The preparation of financial statements in conformity with GAAP requires management to make estimates and assumptions that affect the reported amounts and disclosures in the financial statements. Actual results could differ from these estimates.
(a) Security Valuation
Each Fund’s investments are valued as of the close of regular trading on the New York Stock Exchange (“NYSE”) on each day when the NYSE is open. Portfolio securities listed on an exchange normally are valued at the last sale or
181
Mercer Funds
Notes to the Financial Statements (Continued)
March 31, 2013
official closing price on the day on which the securities are valued or, lacking any sales on such day, at the last available bid price using prices as of the close of trading. In cases where securities are traded on more than one exchange, the securities are generally valued on the exchange considered by the Advisor or the applicable Subadvisor as the primary market for such securities. Securities traded in the over-the-counter market and listed on the NASDAQ Stock Market (“NASDAQ”) normally are valued at the NASDAQ Official Closing Price; other over-the-counter securities are valued at the last bid price available prior to valuation (other than short-term investments, which are valued as described below). The Funds may invest in securities that are traded in foreign markets. Foreign securities will be converted into U.S. dollar equivalents based on the exchange rate in effect at a uniform time on each business day. Investments in open-end investment companies are valued at their net asset value (“NAV”) per share.
The Board of Trustees of the Trust (the “Board”) has delegated its responsibility for valuing portfolio securities to the Advisor, subject to continuing Board oversight. The Advisor has appointed a Valuation Committee that is responsible for overseeing the day-to-day process of valuing portfolio securities. With respect to portfolio securities for which market quotations are not readily available or (in the opinion of the Advisor or the applicable Subadvisor) do not otherwise accurately reflect the fair values of the securities, the Valuation Committee will value such securities at fair value based upon procedures approved by the Board. Certain fixed-income securities may be valued based upon appraisals received from a pricing service using a computerized matrix system or based upon appraisals derived from information concerning the securities or similar securities received from a recognized dealer or dealers in those securities. It should be recognized that judgment often plays a greater role in valuing thinly traded securities, as well as bonds and other securities with few dealer quotations, than is the case with respect to securities for which a broader range of dealer quotations and last-sale information is available. Each Fund generally values short-term investments, which mature in 60 days or less, at amortized cost, which approximates fair value unless the Board determines that this approach does not represent fair value.
Derivative financial instruments, such as futures contracts or options contracts that are traded on a national securities exchange, are stated at the last reported sale or settlement price on the day of valuation. Futures traded on inactive markets are valued using broker quotations. Over the counter derivative financial instruments, such as foreign currency contracts, options contracts, or swaps agreements, derive their value from underlying asset prices, indices, reference rates, and other inputs or a combination of these factors. These contracts are normally valued on the basis of pricing service providers or broker dealer quotations. Depending on the derivative type and the terms of the derivative, the value of the derivative financial instruments is assigned by pricing service providers using a series of techniques, which may include pricing models. The pricing models use inputs that are observed from actively quoted markets such as issuer details, indices, spreads, interest rates, curves, volatilities, dividends and exchange rates.
Senior secured floating rate loans and senior secured floating rate debt securities are valued using an evaluated quote provided by an independent pricing service. Evaluated quotes provided by the pricing service may reflect appropriate factors such as ratings, yield curves, prepayment speeds, tranche type, industry, company performance, spread, individual trading characteristics, institutional size trading in similar groups of securities and other market data.
The application of fair value pricing represents a good faith determination based on specific procedures performed under the supervision of the Board. Due to the subjective nature of fair value pricing, there can be no assurance that a Fund could realize the fair value assigned to the security if the Fund were to sell the security at approximately the time at which the Fund determines its NAV per share. A Fund’s value for a particular security may be different from the last quoted market price.
The Funds follow Financial Accounting Standards Board (“FASB”) “Fair Value Measurements”. Under GAAP for fair value measurements, a three-tier hierarchy to prioritize the assumptions, referred to as inputs, is used in valuation techniques to measure fair value. The three-tier hierarchy of inputs is summarized in the three broad Levels listed below.
| • | Level 1 — quoted prices unadjusted in active markets for identical investments |
| • | Level 2 — other significant observable inputs (including quoted prices for similar investments, interest rates, prepayment speeds, credit risk, etc.) |
182
Mercer Funds
Notes to the Financial Statements (Continued)
March 31, 2013
| • | Level 3 — significant unobservable inputs (including the Fund’s own assumptions in determining the fair value of investments) |
The inputs or methodology used for valuing securities are not necessarily an indication of the risk associated with investing in those securities.
The assets and liabilities shown in the Statements of Assets and Liabilities related to investments purchased for TBA or when-issued securities, approximate fair value and are determined using Level 2 inputs, as of March 31, 2013. The assets and liabilities shown in the Statements of Assets and Liabilities related to cash collateral held at or due to a broker for TBA securities, swap contracts and futures contracts are determined using Level 1 inputs as of March 31, 2013.
At March 31, 2013, Large Cap Growth, Small/Mid Cap Growth and Small/Mid Cap Value each held long-term investments determined using Level 1 inputs, with corresponding major categories as shown in the schedules of investments, and short-term investment positions in a Euro Time Deposit and in State Street Navigator Securities Lending Prime Portfolio, as shown in the schedules of investments, which are determined using Level 2 inputs. Small/Mid Cap Value also held one long-term Level 2 security which had a $0 value.
At March 31, 2013, Short Maturity held all long-term investments and short-term investment positions in a Euro Time Deposit and in State Street Navigator Securities Lending Prime Portfolio, all determined using Level 2 inputs, with corresponding major categories, as shown in the schedule of investments.
The following is a summary of the inputs used as of March 31, 2013 in valuing the assets and liabilities of Large Cap Value, Non-US Core Equity, Core Opportunistic, Emerging Markets and Global Low Volatility for which fair valuation was used:
Large Cap Value
ASSETS VALUATION INPUT
Description | Quoted Prices in Active Markets for Identical Assets (Level 1) | Significant Other Observable Inputs (Level 2) | Significant Unobservable Inputs (Level 3) | Total | ||||||||||||
Common Stocks | ||||||||||||||||
Advertising | $ | 2,808,293 | $ | — | $ | — | $ | 2,808,293 | ||||||||
Aerospace & Defense | 10,871,205 | — | — | 10,871,205 | ||||||||||||
Agriculture | 181,831 | — | — | 181,831 | ||||||||||||
Airlines | 2,625,090 | — | — | 2,625,090 | ||||||||||||
Auto Manufacturers | 4,804,732 | — | — | 4,804,732 | ||||||||||||
Auto Parts & Equipment | 5,591,019 | — | — | 5,591,019 | ||||||||||||
Banks | 34,120,225 | — | — | 34,120,225 | ||||||||||||
Beverages | 4,051,932 | — | — | 4,051,932 | ||||||||||||
Biotechnology | 4,131,460 | — | — | 4,131,460 | ||||||||||||
Chemicals | 2,033,282 | — | — | 2,033,282 | ||||||||||||
Commercial Services | 10,482,628 | — | — | 10,482,628 | ||||||||||||
Computers | 11,836,183 | — | — | 11,836,183 | ||||||||||||
Cosmetics & Personal Care | 718,087 | — | — | 718,087 | ||||||||||||
Diversified Financial Services | 47,488,286 | — | — | 47,488,286 | ||||||||||||
Electric | 5,793,911 | — | — | 5,793,911 | ||||||||||||
Electronics | 840,151 | — | — | 840,151 | ||||||||||||
Food | 13,331,201 | — | — | 13,331,201 | ||||||||||||
Forest Products & Paper | 2,475,494 | — | — | 2,475,494 | ||||||||||||
183
Mercer Funds
Notes to the Financial Statements (Continued)
March 31, 2013
Description | Quoted Prices in Active Markets for Identical Assets (Level 1) | Significant Other Observable Inputs (Level 2) | Significant Unobservable Inputs (Level 3) | Total | ||||||||||||
Health Care - Products | $ | 12,631,229 | $ | — | $ | — | $ | 12,631,229 | ||||||||
Health Care - Services | 9,069,923 | — | — | 9,069,923 | ||||||||||||
Housewares | 1,794,114 | — | — | 1,794,114 | ||||||||||||
Insurance | 40,570,046 | — | — | 40,570,046 | ||||||||||||
Internet | 3,748,910 | — | — | 3,748,910 | ||||||||||||
Iron & Steel | 990,600 | — | — | 990,600 | ||||||||||||
Leisure Time | 1,744,498 | — | — | 1,744,498 | ||||||||||||
Lodging | 5,590,278 | — | — | 5,590,278 | ||||||||||||
Machinery - Construction & Mining | 2,276,085 | — | — | 2,276,085 | ||||||||||||
Machinery - Diversified | 4,721,413 | — | — | 4,721,413 | ||||||||||||
Media | 30,972,531 | — | — | 30,972,531 | ||||||||||||
Miscellaneous - Manufacturing | 22,401,178 | — | — | 22,401,178 | ||||||||||||
Office & Business Equipment | 1,827,990 | — | — | 1,827,990 | ||||||||||||
Oil & Gas | 48,633,702 | — | — | 48,633,702 | ||||||||||||
Oil & Gas Services | 8,337,165 | — | — | 8,337,165 | ||||||||||||
Packaging & Containers | 1,807,075 | — | — | 1,807,075 | ||||||||||||
Pharmaceuticals | 35,127,862 | — | — | 35,127,862 | ||||||||||||
REITS | 1,464,762 | — | — | 1,464,762 | ||||||||||||
Retail | 26,346,497 | — | — | 26,346,497 | ||||||||||||
Semiconductors | 7,383,077 | — | — | 7,383,077 | ||||||||||||
Software | 13,327,936 | — | — | 13,327,936 | ||||||||||||
Telecommunications | 21,603,367 | — | — | 21,603,367 | ||||||||||||
Transportation | 3,223,584 | — | — | 3,223,584 | ||||||||||||
|
|
|
|
|
|
|
| |||||||||
Total Common Stocks | 469,778,832 | — | — | 469,778,832 | ||||||||||||
|
|
|
|
|
|
|
| |||||||||
Preferred Stock | ||||||||||||||||
Auto Manufacturers | 1,359,051 | — | — | 1,359,051 | ||||||||||||
|
|
|
|
|
|
|
| |||||||||
Total Preferred Stock | 1,359,051 | — | — | 1,359,051 | ||||||||||||
|
|
|
|
|
|
|
| |||||||||
Short-Term Investments | ||||||||||||||||
Bank Deposit | — | 2,511,925 | — | 2,511,925 | ||||||||||||
Securities Lending Collateral | — | 7,182,165 | — | 7,182,165 | ||||||||||||
|
|
|
|
|
|
|
| |||||||||
Total Short-Term Investments | — | 9,694,090 | — | 9,694,090 | ||||||||||||
|
|
|
|
|
|
|
| |||||||||
Total | $ | 471,137,883 | $ | 9,694,090 | $ | — | $ | 480,831,973 | ||||||||
|
|
|
|
|
|
|
| |||||||||
LIABILITIES VALUATION INPUT
Description | Quoted Prices in Active Markets for Identical Assets (Level 1) | Significant Other Observable Inputs (Level 2) | Significant Unobservable Inputs (Level 3) | Total | ||||||||||||
Forward Foreign Currency Contracts | ||||||||||||||||
Sales | $ | — | $ | (11,423 | ) | $ | — | $ | (11,423 | ) | ||||||
|
|
|
|
|
|
|
| |||||||||
Total | $ | — | $ | (11,423 | ) | $ | — | $ | (11,423 | ) | ||||||
|
|
|
|
|
|
|
| |||||||||
184
Mercer Funds
Notes to the Financial Statements (Continued)
March 31, 2013
Non-US Core Equity
ASSETS VALUATION INPUT
Description | Quoted Prices in Active Markets for Identical Assets (Level 1) | Significant Other Observable Inputs (Level 2) | Significant Unobservable Inputs (Level 3) | Total | ||||||||||||
Common Stocks | ||||||||||||||||
Australia | $ | 66,695,729 | $ | 0 | * | $ | — | $ | 66,695,729 | |||||||
Austria | 7,413,347 | — | — | 7,413,347 | ||||||||||||
Belgium | 9,785,993 | — | — | 9,785,993 | ||||||||||||
Bermuda | 21,583,947 | — | — | 21,583,947 | ||||||||||||
Brazil | 9,645,897 | — | — | 9,645,897 | ||||||||||||
Canada | 20,909,656 | — | — | 20,909,656 | ||||||||||||
Cayman Islands | 16,115,167 | — | — | 16,115,167 | ||||||||||||
China | 4,319,044 | — | — | 4,319,044 | ||||||||||||
Denmark | 40,617,903 | — | — | 40,617,903 | ||||||||||||
Finland | 27,586,376 | — | — | 27,586,376 | ||||||||||||
France | 175,322,249 | — | — | 175,322,249 | ||||||||||||
Germany | 187,128,294 | — | — | 187,128,294 | ||||||||||||
Gibraltar | 143,712 | — | — | 143,712 | ||||||||||||
Greece | 2,997,436 | — | — | 2,997,436 | ||||||||||||
Hong Kong | 40,566,999 | — | — | 40,566,999 | ||||||||||||
India | 11,670,891 | — | — | 11,670,891 | ||||||||||||
Indonesia | 11,142,032 | — | — | 11,142,032 | ||||||||||||
Ireland | 6,048,991 | — | — | 6,048,991 | ||||||||||||
Israel | 7,770,455 | — | — | 7,770,455 | ||||||||||||
Italy | 52,968,421 | — | — | 52,968,421 | ||||||||||||
Japan | 482,234,522 | — | — | 482,234,522 | ||||||||||||
Luxembourg | 7,706,531 | — | — | 7,706,531 | ||||||||||||
Malaysia | 3,386,699 | — | — | 3,386,699 | ||||||||||||
Malta | 1,106,115 | — | — | 1,106,115 | ||||||||||||
Mauritius | 1,789,650 | — | — | 1,789,650 | ||||||||||||
Mexico | 7,983,677 | — | — | 7,983,677 | ||||||||||||
Netherlands | 49,929,919 | — | — | 49,929,919 | ||||||||||||
New Zealand | 2,228,533 | — | — | 2,228,533 | ||||||||||||
Norway | 23,615,136 | — | — | 23,615,136 | ||||||||||||
Portugal | 1,194,610 | — | — | 1,194,610 | ||||||||||||
Russia | — | 7,206,702 | — | 7,206,702 | ||||||||||||
Singapore | 9,927,287 | — | — | 9,927,287 | ||||||||||||
South Africa | 6,790,144 | — | — | 6,790,144 | ||||||||||||
South Korea | 17,831,945 | — | — | 17,831,945 | ||||||||||||
Spain | 45,764,448 | — | — | 45,764,448 | ||||||||||||
Sweden | 76,421,192 | — | — | 76,421,192 | ||||||||||||
Switzerland | 155,849,172 | — | — | 155,849,172 | ||||||||||||
Taiwan | 6,121,136 | — | — | 6,121,136 | ||||||||||||
Thailand | — | 9,618,866 | — | 9,618,866 | ||||||||||||
United Kingdom | 388,461,892 | — | — | 388,461,892 | ||||||||||||
|
|
|
|
|
|
|
| |||||||||
Total Common Stocks | 2,008,775,147 | 16,825,568 | — | 2,025,600,715 | ||||||||||||
|
|
|
|
|
|
|
| |||||||||
185
Mercer Funds
Notes to the Financial Statements (Continued)
March 31, 2013
Description | Quoted Prices in Active Markets for Identical Assets (Level 1) | Significant Other Observable Inputs (Level 2) | Significant Unobservable Inputs (Level 3) | Total | ||||||||||||
Investment Companies | ||||||||||||||||
United States | $ | 26,839,749 | $ | — | $ | — | $ | 26,839,749 | ||||||||
|
|
|
|
|
|
|
| |||||||||
Total Investment Companies | 26,839,749 | — | — | 26,839,749 | ||||||||||||
|
|
|
|
|
|
|
| |||||||||
Preferred Stocks | ||||||||||||||||
Brazil | 1,908,019 | — | — | 1,908,019 | ||||||||||||
Germany | 25,036,612 | — | — | 25,036,612 | ||||||||||||
|
|
|
|
|
|
|
| |||||||||
Total Preferred Stocks | 26,944,631 | — | — | 26,944,631 | ||||||||||||
|
|
|
|
|
|
|
| |||||||||
Rights | ||||||||||||||||
United Kingdom | 302,570 | — | — | 302,570 | ||||||||||||
|
|
|
|
|
|
|
| |||||||||
Total Rights | 302,570 | — | — | 302,570 | ||||||||||||
|
|
|
|
|
|
|
| |||||||||
Options Purchased | ||||||||||||||||
Put Options | — | 639,644 | — | 639,644 | ||||||||||||
|
|
|
|
|
|
|
| |||||||||
Total Options Purchased | — | 639,644 | — | 639,644 | ||||||||||||
|
|
|
|
|
|
|
| |||||||||
Short-Term Investments | ||||||||||||||||
Bank Deposit | — | 49,795,728 | — | 49,795,728 | ||||||||||||
Securities Lending Collateral | — | 65,114,408 | — | 65,114,408 | ||||||||||||
|
|
|
|
|
|
|
| |||||||||
Total Short-Term Investments | — | 114,910,136 | — | 114,910,136 | ||||||||||||
|
|
|
|
|
|
|
| |||||||||
Total | $ | 2,062,862,097 | $ | 132,375,348 | $ | — | $ | 2,195,237,445 | ||||||||
|
|
|
|
|
|
|
| |||||||||
| * | Represents one security at $0 value as of March 31, 2013. |
Core Opportunistic
ASSETS VALUATION INPUT
Description | Quoted Prices in Active Markets for Identical Assets (Level 1) | Significant Other Observable Inputs (Level 2) | Significant Unobservable Inputs (Level 3) | Total | ||||||||||||
Debt Obligations | ||||||||||||||||
Asset Backed Securities | $ | — | $ | 36,795,290 | $ | — | $ | 36,795,290 | ||||||||
Bank Loans | — | 9,237,988 | — | 9,237,988 | ||||||||||||
Corporate Debt | — | 378,263,281 | 0 | * | 378,263,281 | |||||||||||
Mortgage Backed Securities - Private Issuers | — | 22,167,074 | — | 22,167,074 | ||||||||||||
Mortgage Backed Securities - U.S. Government Agency Obligations | — | 281,776,528 | — | 281,776,528 | ||||||||||||
Municipal Obligations | — | 50,476,196 | — | 50,476,196 | ||||||||||||
Sovereign Debt Obligations | — | 23,385,960 | — | 23,385,960 | ||||||||||||
U.S. Government and Agency Obligations | — | 341,335,085 | — | 341,335,085 | ||||||||||||
|
|
|
|
|
|
|
| |||||||||
Total Debt Obligations | — | 1,143,437,402 | 0 | 1,143,437,402 | ||||||||||||
|
|
|
|
|
|
|
| |||||||||
186
Mercer Funds
Notes to the Financial Statements (Continued)
March 31, 2013
Description | Quoted Prices in Active Markets for Identical Assets (Level 1) | Significant Other Observable Inputs (Level 2) | Significant Unobservable Inputs (Level 3) | Total | ||||||||||||
Common Stocks | ||||||||||||||||
Auto Manufacturers | $ | 287,589 | $ | — | $ | — | $ | 287,589 | ||||||||
Building Materials | 143,223 | — | — | 143,223 | ||||||||||||
Diversified Financial Services | 76,264 | — | — | 76,264 | ||||||||||||
|
|
|
|
|
|
|
| |||||||||
Total Common Stocks | 507,076 | — | — | 507,076 | ||||||||||||
|
|
|
|
|
|
|
| |||||||||
Preferred Stocks | ||||||||||||||||
Banks | 773,250 | — | — | 773,250 | ||||||||||||
Diversified Financial Services | 2,538,863 | — | — | 2,538,863 | ||||||||||||
|
|
|
|
|
|
|
| |||||||||
Total Preferred Stocks | 3,312,113 | — | — | 3,312,113 | ||||||||||||
|
|
|
|
|
|
|
| |||||||||
Warrants | ||||||||||||||||
Auto Manufacturers | 228,977 | — | — | 228,977 | ||||||||||||
Media | 18,037 | — | — | 18,037 | ||||||||||||
Oil & Gas Services | 5,223 | — | — | 5,223 | ||||||||||||
|
|
|
|
|
|
|
| |||||||||
Total Warrants | 252,237 | — | — | 252,237 | ||||||||||||
|
|
|
|
|
|
|
| |||||||||
Options Purchased | ||||||||||||||||
Put Options | 3,450 | 204,758 | — | 208,208 | ||||||||||||
|
|
|
|
|
|
|
| |||||||||
Total Options Purchased | 3,450 | 204,758 | — | 208,208 | ||||||||||||
|
|
|
|
|
|
|
| |||||||||
Short-Term Investments | ||||||||||||||||
Bank Deposit | — | 57,269,153 | — | 57,269,153 | ||||||||||||
Certificates of Deposit | — | 11,655,855 | — | 11,655,855 | ||||||||||||
Securities Lending Collateral | — | 10,976,300 | — | 10,976,300 | ||||||||||||
U.S. Government and Agency Obligations | — | 90,900 | — | 90,900 | ||||||||||||
|
|
|
|
|
|
|
| |||||||||
Total Short-Term Investments | — | 79,992,208 | — | 79,992,208 | ||||||||||||
|
|
|
|
|
|
|
| |||||||||
Forward Foreign Currency Contracts | ||||||||||||||||
Buys | — | 12,624 | — | 12,624 | ||||||||||||
Sales | — | 547,215 | — | 547,215 | ||||||||||||
|
|
|
|
|
|
|
| |||||||||
Total Forward Foreign Currency Contracts | — | 559,839 | — | 559,839 | ||||||||||||
|
|
|
|
|
|
|
| |||||||||
Futures Contracts | ||||||||||||||||
Buys | 1,996 | 28,370 | — | 30,366 | ||||||||||||
|
|
|
|
|
|
|
| |||||||||
Total Futures Contracts | 1,996 | 28,370 | — | 30,366 | ||||||||||||
|
|
|
|
|
|
|
| |||||||||
Swap Contracts | ||||||||||||||||
Interest Rate Swaps | — | 782,845 | — | 782,845 | ||||||||||||
Centrally Cleared Interest Rate Swaps** | — | 46,749 | — | 46,749 | ||||||||||||
Credit Default Swaps | — | 164,400 | — | 164,400 | ||||||||||||
|
|
|
|
|
|
|
| |||||||||
Total Swap Contracts | — | 993,994 | — | 993,994 | ||||||||||||
|
|
|
|
|
|
|
| |||||||||
Total | $ | 4,076,872 | $ | 1,225,216,571 | $ | 0 | $ | 1,229,293,443 | ||||||||
|
|
|
|
|
|
|
| |||||||||
187
Mercer Funds
Notes to the Financial Statements (Continued)
March 31, 2013
LIABILITIES VALUATION INPUT
Description | Quoted Prices in Active Markets for Identical Assets (Level 1) | Significant Other Observable Inputs (Level 2) | Significant Unobservable Inputs (Level 3) | Total | ||||||||||||
TBA Sale Commitments | $ | — | $ | (5,301,562 | ) | $ | — | $ | (5,301,562 | ) | ||||||
|
|
|
|
|
|
|
| |||||||||
Forward Foreign Currency Contracts | ||||||||||||||||
Buys | — | (480,024 | ) | — | (480,024 | ) | ||||||||||
Sales | — | (369,936 | ) | — | (369,936 | ) | ||||||||||
|
|
|
|
|
|
|
| |||||||||
Total Forward Foreign Currency Contracts | — | (849,960 | ) | — | (849,960 | ) | ||||||||||
|
|
|
|
|
|
|
| |||||||||
Futures Contracts | ||||||||||||||||
Buys | (65,448 | ) | — | — | (65,448 | ) | ||||||||||
Sales | (561,991 | ) | (8,033 | ) | — | (570,024 | ) | |||||||||
|
|
|
|
|
|
|
| |||||||||
Total Futures Contracts | (627,439 | ) | (8,033 | ) | — | (635,472 | ) | |||||||||
|
|
|
|
|
|
|
| |||||||||
Written Options | (21,057 | ) | (248,092 | ) | — | (269,149 | ) | |||||||||
|
|
|
|
|
|
|
| |||||||||
Swap Contracts | ||||||||||||||||
Interest Rate Swaps | — | (102,639 | ) | — | (102,639 | ) | ||||||||||
Centrally Cleared Interest Rate Swaps** | — | (127,844 | ) | — | (127,844 | ) | ||||||||||
Credit Default Swaps | — | (82,699 | ) | — | (82,699 | ) | ||||||||||
|
|
|
|
|
|
|
| |||||||||
Total Swap Contracts | — | (313,182 | ) | — | (313,182 | ) | ||||||||||
|
|
|
|
|
|
|
| |||||||||
Total | $ | (648,496 | ) | $ | (6,720,829 | ) | $ | — | $ | (7,369,325 | ) | |||||
|
|
|
|
|
|
|
| |||||||||
| * | Represents three securities at $0 value as of March 31, 2013. |
| ** | Centrally cleared swaps are valued at unrealized appreciation/depreciation. |
Emerging Markets
ASSETS VALUATION INPUT
Description | Quoted Prices in Active Markets for Identical Assets (Level 1) | Significant Other Observable Inputs (Level 2) | Significant Unobservable Inputs (Level 3) | Total | ||||||||||||
Common Stocks | ||||||||||||||||
Bermuda | $ | 3,109,199 | $ | — | $ | — | $ | 3,109,199 | ||||||||
Brazil | 41,517,919 | — | — | 41,517,919 | ||||||||||||
Cayman Islands | 15,254,345 | — | — | 15,254,345 | ||||||||||||
Chile | 8,497,023 | — | — | 8,497,023 | ||||||||||||
China | 44,489,059 | — | — | 44,489,059 | ||||||||||||
Colombia | 5,797,524 | — | — | 5,797,524 | ||||||||||||
Czech Republic | 2,539,439 | — | — | 2,539,439 | ||||||||||||
Hong Kong | 23,174,962 | — | — | 23,174,962 | ||||||||||||
Hungary | 300,870 | — | — | 300,870 | ||||||||||||
India | 62,815,427 | — | — | 62,815,427 | ||||||||||||
Indonesia | 14,237,473 | — | — | 14,237,473 | ||||||||||||
Malaysia | 22,008,169 | — | — | 22,008,169 | ||||||||||||
Mexico | 50,214,329 | — | — | 50,214,329 | ||||||||||||
188
Mercer Funds
Notes to the Financial Statements (Continued)
March 31, 2013
Description | Quoted Prices in Active Markets for Identical Assets (Level 1) | Significant Other Observable Inputs (Level 2) | Significant Unobservable Inputs (Level 3) | Total | ||||||||||||
Peru | $ | 2,148,164 | $ | — | $ | — | $ | 2,148,164 | ||||||||
Philippines | 5,198,180 | — | — | 5,198,180 | ||||||||||||
Poland | 5,971,748 | — | — | 5,971,748 | ||||||||||||
Russia | 13,468,217 | — | — | 13,468,217 | ||||||||||||
Singapore | 2,334,354 | — | — | 2,334,354 | ||||||||||||
South Africa | 24,521,098 | — | — | 24,521,098 | ||||||||||||
South Korea | 39,873,827 | — | — | 39,873,827 | ||||||||||||
Taiwan | 40,441,208 | — | — | 40,441,208 | ||||||||||||
Thailand | 9,716,821 | 4,699,758 | — | 14,416,579 | ||||||||||||
Turkey | 7,703,742 | — | — | 7,703,742 | ||||||||||||
United Kingdom | 29,701,624 | — | — | 29,701,624 | ||||||||||||
United States | 131,495 | — | — | 131,495 | ||||||||||||
|
|
|
|
|
|
|
| |||||||||
Total Common Stocks | 475,166,216 | 4,699,758 | — | 479,865,974 | ||||||||||||
|
|
|
|
|
|
|
| |||||||||
Preferred Stocks | ||||||||||||||||
Brazil | 9,858,871 | — | — | 9,858,871 | ||||||||||||
|
|
|
|
|
|
|
| |||||||||
Total Preferred Stocks | 9,858,871 | — | — | 9,858,871 | ||||||||||||
|
|
|
|
|
|
|
| |||||||||
Short-Term Investments | ||||||||||||||||
Bank Deposit | — | 22,971,172 | — | 22,971,172 | ||||||||||||
Securities Lending Collateral | — | 9,271,211 | — | 9,271,211 | ||||||||||||
|
|
|
|
|
|
|
| |||||||||
Total Short-Term Investments | — | 32,242,383 | — | 32,242,383 | ||||||||||||
|
|
|
|
|
|
|
| |||||||||
Forward Foreign Currency Contracts | ||||||||||||||||
Buys | — | 630,238 | — | 630,238 | ||||||||||||
Sales | — | 421,395 | — | 421,395 | ||||||||||||
|
|
|
|
|
|
|
| |||||||||
Total Forward Foreign Currency Contracts | — | 1,051,633 | — | 1,051,633 | ||||||||||||
|
|
|
|
|
|
|
| |||||||||
Futures Contracts | ||||||||||||||||
Buys | 160,649 | — | — | 160,649 | ||||||||||||
Sales | 27,872 | — | — | 27,872 | ||||||||||||
|
|
|
|
|
|
|
| |||||||||
Total Futures Contracts | 188,521 | — | — | 188,521 | ||||||||||||
|
|
|
|
|
|
|
| |||||||||
Synthetic Futures | — | 13 | — | 13 | ||||||||||||
|
|
|
|
|
|
|
| |||||||||
Total | $ | 485,213,608 | $ | 37,993,787 | $ | — | $ | 523,207,395 | ||||||||
|
|
|
|
|
|
|
| |||||||||
189
Mercer Funds
Notes to the Financial Statements (Continued)
March 31, 2013
LIABILITIES VALUATION INPUT
Description | Quoted Prices in Active Markets for Identical Assets (Level 1) | Significant Other Observable Inputs (Level 2) | Significant Unobservable Inputs (Level 3) | Total | ||||||||||||
Forward Foreign Currency Contracts | ||||||||||||||||
Buys | $ | — | $ | (1,120,956 | ) | $ | — | $ | (1,120,956 | ) | ||||||
Sales | — | (162,251 | ) | — | (162,251 | ) | ||||||||||
|
|
|
|
|
|
|
| |||||||||
Total Forward Foreign Currency Contracts | — | (1,283,207 | ) | — | (1,283,207 | ) | ||||||||||
|
|
|
|
|
|
|
| |||||||||
Futures Contracts | ||||||||||||||||
Buys | (171,101 | ) | — | — | (171,101 | ) | ||||||||||
Sales | (42,645 | ) | — | — | (42,645 | ) | ||||||||||
|
|
|
|
|
|
|
| |||||||||
Total Futures Contracts | (213,746 | ) | — | — | (213,746 | ) | ||||||||||
|
|
|
|
|
|
|
| |||||||||
Synthetic Futures | — | (156,430 | ) | — | (156,430 | ) | ||||||||||
|
|
|
|
|
|
|
| |||||||||
Total | $ | (213,746 | ) | $ | (1,439,637 | ) | $ | — | $ | (1,653,383 | ) | |||||
|
|
|
|
|
|
|
| |||||||||
Global Low Volatility
ASSETS VALUATION INPUT
Description | Quoted Prices in Active Markets for Identical Assets (Level 1) | Significant Other Observable Inputs (Level 2) | Significant Unobservable Inputs (Level 3) | Total | ||||||||||||
Common Stocks | ||||||||||||||||
Australia | $ | 3,542,444 | $ | — | $ | — | $ | 3,542,444 | ||||||||
Austria | 702,483 | — | — | 702,483 | ||||||||||||
Belgium | 1,951,659 | — | — | 1,951,659 | ||||||||||||
Bermuda | 661,033 | — | — | 661,033 | ||||||||||||
Canada | 11,685,728 | — | — | 11,685,728 | ||||||||||||
Denmark | 3,427,549 | — | — | 3,427,549 | ||||||||||||
France | 10,240,866 | — | — | 10,240,866 | ||||||||||||
Germany | 4,748,219 | — | — | 4,748,219 | ||||||||||||
Hong Kong | 1,491,035 | — | — | 1,491,035 | ||||||||||||
Ireland | 1,141,564 | — | — | 1,141,564 | ||||||||||||
Israel | 1,427,559 | — | — | 1,427,559 | ||||||||||||
Italy | 166,512 | — | — | 166,512 | ||||||||||||
Japan | 28,288,027 | — | — | 28,288,027 | ||||||||||||
Malaysia | 286,228 | — | — | 286,228 | ||||||||||||
Mexico | 1,560,925 | — | — | 1,560,925 | ||||||||||||
Netherlands | 2,200,625 | — | — | 2,200,625 | ||||||||||||
New Zealand | 797,660 | — | — | 797,660 | ||||||||||||
Norway | 875,468 | — | — | 875,468 | ||||||||||||
Portugal | 421,098 | — | — | 421,098 | ||||||||||||
Russia | 15,530 | — | — | 15,530 | ||||||||||||
Singapore | 1,680,227 | — | — | 1,680,227 | ||||||||||||
South Africa | 663,231 | — | — | 663,231 | ||||||||||||
190
Mercer Funds
Notes to the Financial Statements (Continued)
March��31, 2013
Description | Quoted Prices in Active Markets for Identical Assets (Level 1) | Significant Other Observable Inputs (Level 2) | Significant Unobservable Inputs (Level 3) | Total | ||||||||||||
South Korea | $ | 856,100 | $ | — | $ | — | $ | 856,100 | ||||||||
Spain | 529,209 | — | — | 529,209 | ||||||||||||
Sweden | 1,716,914 | — | — | 1,716,914 | ||||||||||||
Switzerland | 17,257,004 | — | — | 17,257,004 | ||||||||||||
Thailand | 440,437 | — | — | 440,437 | ||||||||||||
United Kingdom | 18,125,999 | — | — | 18,125,999 | ||||||||||||
United States | 152,952,922 | — | — | 152,952,922 | ||||||||||||
|
|
|
|
|
|
|
| |||||||||
Total Common Stocks | 269,854,255 | — | — | 269,854,255 | ||||||||||||
|
|
|
|
|
|
|
| |||||||||
Investment Company | ||||||||||||||||
United States | 4,648,945 | — | — | 4,648,945 | ||||||||||||
|
|
|
|
|
|
|
| |||||||||
Total Investment Company | 4,648,945 | — | — | 4,648,945 | ||||||||||||
|
|
|
|
|
|
|
| |||||||||
Preferred Stocks | ||||||||||||||||
Germany | 579,695 | — | — | 579,695 | ||||||||||||
Japan | 182,402 | — | — | 182,402 | ||||||||||||
Sweden | 40,650 | — | — | 40,650 | ||||||||||||
United States | 145,085 | — | — | 145,085 | ||||||||||||
|
|
|
|
|
|
|
| |||||||||
Total Preferred Stocks | 947,832 | — | — | 947,832 | ||||||||||||
|
|
|
|
|
|
|
| |||||||||
Warrants | ||||||||||||||||
United States | 263,625 | — | — | 263,625 | ||||||||||||
|
|
|
|
|
|
|
| |||||||||
Total Warrants | 263,625 | — | — | 263,625 | ||||||||||||
|
|
|
|
|
|
|
| |||||||||
Short-Term Investments | ||||||||||||||||
Bank Deposit | — | 25,016,810 | — | 25,016,810 | ||||||||||||
|
|
|
|
|
|
|
| |||||||||
Total Short-Term Investments | — | 25,016,810 | — | 25,016,810 | ||||||||||||
|
|
|
|
|
|
|
| |||||||||
Forward Foreign Currency Contracts | ||||||||||||||||
Sales | — | 626,503 | — | 626,503 | ||||||||||||
|
|
|
|
|
|
|
| |||||||||
Total Forward Foreign Currency Contracts | — | 626,503 | — | 626,503 | ||||||||||||
|
|
|
|
|
|
|
| |||||||||
Total | $ | 275,714,657 | $ | 25,643,313 | $ | — | $ | 301,357,970 | ||||||||
|
|
|
|
|
|
|
| |||||||||
LIABILITIES VALUATION INPUT
Description | Quoted Prices in Active Markets for Identical Assets (Level 1) | Significant Other Observable Inputs (Level 2) | Significant Unobservable Inputs (Level 3) | Total | ||||||||||||
Forward Foreign Currency Contracts | ||||||||||||||||
Buys | $ | — | $ | (21,583 | ) | $ | — | $ | (21,583 | ) | ||||||
Sales | — | (33,065 | ) | — | (33,065 | ) | ||||||||||
|
|
|
|
|
|
|
| |||||||||
Total Forward Foreign Currency Contracts | — | (54,648 | ) | — | (54,648 | ) | ||||||||||
|
|
|
|
|
|
|
| |||||||||
Total | $ | — | $ | (54,648 | ) | $ | — | $ | (54,648 | ) | ||||||
|
|
|
|
|
|
|
| |||||||||
191
Mercer Funds
Notes to the Financial Statements (Continued)
March 31, 2013
There were no significant transfers between Level 1 and Level 2 securities within each of the Funds for the year ended March 31, 2013. For financial statement reporting purposes, the Funds recognize transfers between Levels as of the end of the reporting period.
The following table includes a rollforward of the amounts for the year ended March 31, 2013 for financial instruments classified as Level 3:
Core Opportunistic
Investments | Balance as of March 31, 2012 | Realized Gain (Loss) | Change in Unrealized Appreciation (Depreciation) | Net Transfers In (Out) of Level 3 | Sales | Balance as of March 31, 2013 | Change in Unrealized Appreciation (Depreciation) from Investments Held at March 31, 2013 | ||||||||||||||||||||||||||||
DEBT OBLIGATIONS | |||||||||||||||||||||||||||||||||||
Corporate Debt | $ | 24,949^ | $ | — | $ | (23,104 | ) | $ | (1,750 | )1 | $ | (95 | ) | $ | 0 | ^^ | $ | (23,104 | ) | ||||||||||||||||
|
|
|
|
|
|
|
|
|
|
|
|
|
| ||||||||||||||||||||||
Total | $ | 24,949^ | $ | — | $ | (23,104 | ) | $ | (1,750 | )1 | $ | (95 | ) | $ | 0 | ^^ | $ | (23,104 | ) | ||||||||||||||||
|
|
|
|
|
|
|
|
|
|
|
|
|
| ||||||||||||||||||||||
For financial statement reporting purposes, the Funds recognize transfers between Levels as of the end of the reporting period.
| ^ | Includes three securities at $0 value as of March 31, 2012. |
| ^^ | Three securities at $0 value as of March 31, 2013. |
| 1 | A corporate debt obligation classified as Level 3 at March 31, 2012 is now classified as Level 2. The change in level designation is reflective of the utilization during the current period of valuations, provided by a nationally recognized pricing service, that are based on market observable information (i.e. yield curves). |
Disclosures about Derivative Instruments and Hedging Activities
The Funds follow FASB ASC 815 “Disclosures about Derivative Instruments and Hedging Activities” (“ASC 815”), which requires enhanced disclosures about their use of, and accounting for, derivative instruments and effect on the results of operations and financial position.
Non-US Core Equity and Emerging Markets held rights during the year as a result of corporate actions. Non-US Core Equity, Core Opportunistic and Global Low Volatility held warrants during the year as a result of corporate actions.
At March 31, 2013 and during the period then ended, the Funds had the following derivatives and transactions in derivatives, grouped into appropriate risk categories:
Large Cap Value
LIABILITY DERIVATIVES
| Foreign Exchange Risk | Total | |||||||
Forward Foreign Currency Contracts(5) | $ | (11,423 | ) | $ | (11,423 | ) | ||
|
|
|
| |||||
Total Value | $ | (11,423 | ) | $ | (11,423 | ) | ||
|
|
|
| |||||
192
Mercer Funds
Notes to the Financial Statements (Continued)
March 31, 2013
CHANGE IN NET UNREALIZED APPRECIATION (DEPRECIATION)
| Foreign Exchange Risk | Total | |||||||
Forward Foreign Currency Contracts(13) | $ | (11,423 | ) | $ | (11,423 | ) | ||
|
|
|
| |||||
Total Change in Net Unrealized Appreciation (Depreciation) | $ | (11,423 | ) | $ | (11,423 | ) | ||
|
|
|
| |||||
NUMBER OF CONTRACTS(17)
| Foreign Exchange Risk | Total | |||||||
Forward Foreign Currency Contracts | (2,350,973 | ) | (2,350,973 | ) | ||||
Small/Mid Cap Value
NET REALIZED GAIN (LOSS)
| Equity Risk | Total | |||||||
Futures Contracts(9) | $ | 145,283 | $ | 145,283 | ||||
|
|
|
| |||||
Total Net Realized Gain (Loss) | $ | 145,283 | $ | 145,283 | ||||
|
|
|
| |||||
CHANGE IN NET UNREALIZED APPRECIATION (DEPRECIATION)
| Equity Risk | Total | |||||||
Futures Contracts(14) | $ | (8,980 | ) | $ | (8,980 | ) | ||
|
|
|
| |||||
Total Change in Net Unrealized Appreciation (Depreciation) | $ | (8,980 | ) | $ | (8,980 | ) | ||
|
|
|
| |||||
NUMBER OF CONTRACTS(17)
| Equity Risk | Total | |||||||
Futures Contracts | 23 | 23 | ||||||
Non-US Core Equity
ASSET DERIVATIVES
| Foreign Exchange Risk | Equity Risk | Total | ||||||||||
Rights(1) | $ | — | $ | 302,570 | $ | 302,570 | ||||||
Options Purchased(1) | 639,644 | — | 639,644 | |||||||||
|
|
|
|
|
| |||||||
Total Value | $ | 639,644 | $ | 302,570 | $ | 942,214 | ||||||
|
|
|
|
|
| |||||||
NET REALIZED GAIN (LOSS)
| Foreign Exchange Risk | Equity Risk | Total | ||||||||||
Rights(7) | $ | — | $ | 455,558 | $ | 455,558 | ||||||
Warrants(7) | — | (3,766,540 | ) | (3,766,540 | ) | |||||||
Options Purchased(7) | 79,662 | — | 79,662 | |||||||||
|
|
|
|
|
| |||||||
Total Net Realized Gain (Loss) | $ | 79,662 | $ | (3,310,982 | ) | $ | (3,231,320 | ) | ||||
|
|
|
|
|
| |||||||
193
Mercer Funds
Notes to the Financial Statements (Continued)
March 31, 2013
CHANGE IN NET UNREALIZED APPRECIATION (DEPRECIATION)
| Foreign Exchange Risk | Equity Risk | Total | ||||||||||
Rights(12) | $ | — | $ | 237,679 | $ | 237,679 | ||||||
Warrants(12) | — | 2,381,303 | 2,381,303 | |||||||||
Options Purchased(12) | 338,225 | — | 338,225 | |||||||||
|
|
|
|
|
| |||||||
Total Change in Net Unrealized Appreciation (Depreciation) | $ | 338,225 | $ | 2,618,982 | $ | 2,957,207 | ||||||
|
|
|
|
|
| |||||||
NUMBER OF CONTRACTS, NOTIONAL AMOUNTS OR SHARES/UNITS(17)
| Foreign Exchange Risk | Equity Risk | Total | ||||||||||
Rights | — | 498,700 | 498,700 | |||||||||
Warrants | — | 233,641 | 233,641 | |||||||||
Options Purchased | 1,604,209,893 | — | 1,604,209,893 | |||||||||
Core Opportunistic
ASSET DERIVATIVES
| Interest Rate Risk | Foreign Exchange Risk | Credit Risk | Equity Risk | Total | ||||||||||||||||
Warrants(1) | $ | — | $ | — | $ | — | $ | 252,237 | $ | 252,237 | ||||||||||
Options Purchased(1) | 208,208 | — | — | — | 208,208 | |||||||||||||||
Forward Foreign Currency Contracts(2) | — | 559,839 | — | — | 559,839 | |||||||||||||||
Futures Contracts(3) | 30,366 | — | — | — | 30,366 | |||||||||||||||
Swap Contracts(4) | 829,594 | * | — | 164,400 | — | 993,994 | ||||||||||||||
|
|
|
|
|
|
|
|
|
| |||||||||||
Total Value | $ | 1,068,168 | $ | 559,839 | $ | 164,400 | $ | 252,237 | $ | 2,044,644 | ||||||||||
|
|
|
|
|
|
|
|
|
| |||||||||||
LIABILITY DERIVATIVES
| Interest Rate Risk | Foreign Exchange Risk | Credit Risk | Equity Risk | Total | ||||||||||||||||
Forward Foreign Currency Contracts(5) | $ | — | $ | (849,960 | ) | $ | — | $ | — | $ | (849,960 | ) | ||||||||
Futures Contracts(3) | (635,472 | ) | — | — | — | (635,472 | ) | |||||||||||||
Options Written(6) | (269,149 | ) | — | — | — | (269,149 | ) | |||||||||||||
Swap Contracts(4) | (230,483 | )* | — | (82,699 | ) | — | (313,182 | ) | ||||||||||||
|
|
|
|
|
|
|
|
|
| |||||||||||
Total Value | $ | (1,135,104 | ) | $ | (849,960 | ) | $ | (82,699 | ) | $ | — | $ | (2,067,763 | ) | ||||||
|
|
|
|
|
|
|
|
|
| |||||||||||
194
Mercer Funds
Notes to the Financial Statements (Continued)
March 31, 2013
NET REALIZED GAIN (LOSS)
| Interest Rate Risk | Foreign Exchange Risk | Credit Risk | Equity Risk | Total | ||||||||||||||||
Options Purchased(7) | $ | (359,415 | ) | $ | — | $ | (142,357 | ) | $ | — | $ | (501,772 | ) | |||||||
Forward Foreign Currency Contracts(8) | — | 869,150 | — | — | 869,150 | |||||||||||||||
Futures Contracts(9) | (748,202 | ) | — | — | — | (748,202 | ) | |||||||||||||
Options Written(10) | 419,715 | — | 250,650 | — | 670,365 | |||||||||||||||
Swap Contracts(11) | (29,198 | ) | — | (130,875 | ) | — | (160,073 | ) | ||||||||||||
|
|
|
|
|
|
|
|
|
| |||||||||||
Total Net Realized Gain (Loss) | $ | (717,100 | ) | $ | 869,150 | $ | (22,582 | ) | $ | — | $ | 129,468 | ||||||||
|
|
|
|
|
|
|
|
|
| |||||||||||
CHANGE IN NET UNREALIZED APPRECIATION (DEPRECIATION)
| Interest Rate Risk | Foreign Exchange Risk | Credit Risk | Equity Risk | Total | ||||||||||||||||
Warrants(12) | $ | — | $ | — | $ | — | $ | 34,069 | $ | 34,069 | ||||||||||
Options Purchased(12) | (15,168 | ) | — | 111,894 | — | 96,726 | ||||||||||||||
Forward Foreign Currency Contracts(13) | — | (337,316 | ) | — | — | (337,316 | ) | |||||||||||||
Futures Contracts(14) | (415,333 | ) | — | — | — | (415,333 | ) | |||||||||||||
Options Written(15) | 29,373 | — | (174,445 | ) | — | (145,072 | ) | |||||||||||||
Swap Contracts(16) | 366,300 | — | 31,675 | — | 397,975 | |||||||||||||||
|
|
|
|
|
|
|
|
|
| |||||||||||
Total Change in Net Unrealized Appreciation (Depreciation) | $ | (34,828 | ) | $ | (337,316 | ) | $ | (30,876 | ) | $ | 34,069 | $ | (368,951 | ) | ||||||
|
|
|
|
|
|
|
|
|
| |||||||||||
NUMBER OF CONTRACTS, NOTIONAL AMOUNTS OR SHARES/UNITS(17)
| Interest Rate Risk | Foreign Exchange Risk | Credit Risk | Equity Risk | Total | ||||||||||||||||
Warrants | — | — | — | 15,611 | 15,611 | |||||||||||||||
Options Purchased | 4,840,125 | — | 9,566,280 | — | 14,406,405 | |||||||||||||||
Forward Foreign Currency Contracts | — | (23,464,261 | ) | — | — | (23,464,261 | ) | |||||||||||||
Futures Contracts | 1,011 | — | — | — | 1,011 | |||||||||||||||
Options Written | (18,022,208 | ) | — | (24,140,560 | ) | — | (42,162,768 | ) | ||||||||||||
Swap Contracts | 87,999,667 | — | 8,879,833 | — | 96,879,500 | |||||||||||||||
Emerging Markets
ASSET DERIVATIVES
| Foreign Exchange Risk | Equity Risk | Total | ||||||||||
Forward Foreign Currency Contracts(2) | $ | 1,051,633 | $ | — | $ | 1,051,633 | ||||||
Futures Contracts(3) | — | 188,534 | 188,534 | |||||||||
|
|
|
|
|
| |||||||
Total Value | $ | 1,051,633 | $ | 188,534 | $ | 1,240,167 | ||||||
|
|
|
|
|
| |||||||
195
Mercer Funds
Notes to the Financial Statements (Continued)
March 31, 2013
LIABILITY DERIVATIVES
| Foreign Exchange Risk | Equity Risk | Total | ||||||||||
Forward Foreign Currency Contracts(5) | $ | (1,283,207 | ) | $ | — | $ | (1,283,207 | ) | ||||
Futures Contracts(3) | — | (370,176 | ) | (370,176 | ) | |||||||
|
|
|
|
|
| |||||||
Total Value | $ | (1,283,207 | ) | $ | (370,176 | ) | $ | (1,653,383 | ) | |||
|
|
|
|
|
| |||||||
NET REALIZED GAIN (LOSS)
| Foreign Exchange Risk | Equity Risk | Total | ||||||||||
Rights(7) | $ | — | $ | 9,710 | $ | 9,710 | ||||||
Warrants(7) | — | 287,593 | 287,593 | |||||||||
Forward Foreign Currency Contracts(8) | (559,216 | ) | — | (559,216 | ) | |||||||
Futures Contracts(9) | — | 1,028,639 | 1,028,639 | |||||||||
|
|
|
|
|
| |||||||
Total Net Realized Gain (Loss) | $ | (559,216 | ) | $ | 1,325,942 | $ | 766,726 | |||||
|
|
|
|
|
| |||||||
CHANGE IN NET UNREALIZED APPRECIATION (DEPRECIATION)
| Foreign Exchange Risk | Equity Risk | Total | ||||||||||
Forward Foreign Currency Contracts(13) | $ | (231,574 | ) | $ | — | $ | (231,574 | ) | ||||
Futures Contracts(14) | — | (181,642 | ) | (181,642 | ) | |||||||
|
|
|
|
|
| |||||||
Total Change in Net Unrealized Appreciation (Depreciation) | $ | (231,574 | ) | $ | (181,642 | ) | $ | (413,216 | ) | |||
|
|
|
|
|
| |||||||
NUMBER OF CONTRACTS, NOTIONAL AMOUNTS OR SHARES/UNITS(17)
| Foreign Exchange Risk | Equity Risk | Total | ||||||||||
Rights | — | 97,284 | 97,284 | |||||||||
Warrants | — | 810,650 | 810,650 | |||||||||
Forward Foreign Currency Contracts | 11,619,691 | — | 11,619,691 | |||||||||
Futures Contracts | — | 4,294 | 4,294 | |||||||||
Global Low Volatility
ASSET DERIVATIVES
| Foreign Exchange Risk | Equity Risk | Total | ||||||||||
Warrants(1) | $ | — | $ | 263,625 | $ | 263,625 | ||||||
Forward Foreign Currency Contracts(2) | 626,503 | — | 626,503 | |||||||||
|
|
|
|
|
| |||||||
Total Value | $ | 626,503 | $ | 263,625 | $ | 890,128 | ||||||
|
|
|
|
|
| |||||||
196
Mercer Funds
Notes to the Financial Statements (Continued)
March 31, 2013
LIABILITY DERIVATIVES
| Foreign Exchange Risk | Equity Risk | Total | ||||||||||
Forward Foreign Currency Contracts(5) | $ | (54,648 | ) | $ | — | $ | (54,648 | ) | ||||
|
|
|
|
|
| |||||||
Total Value | $ | (54,648 | ) | $ | — | $ | (54,648 | ) | ||||
|
|
|
|
|
| |||||||
NET REALIZED GAIN (LOSS)
| Foreign Exchange Risk | Equity Risk | Total | ||||||||||
Forward Foreign Currency Contracts(8) | $ | 378,137 | $ | — | $ | 378,137 | ||||||
|
|
|
|
|
| |||||||
Total Net Realized Gain (Loss) | $ | 378,137 | $ | — | $ | 378,137 | ||||||
|
|
|
|
|
| |||||||
CHANGE IN NET UNREALIZED APPRECIATION (DEPRECIATION)
| Foreign Exchange Risk | Equity Risk | Total | ||||||||||
Warrants(12) | $ | — | $ | 25,683 | $ | 25,683 | ||||||
Forward Foreign Currency Contracts(13) | 571,855 | — | 571,855 | |||||||||
|
|
|
|
|
| |||||||
Total Change in Net Unrealized Appreciation (Depreciation) | $ | 571,855 | $ | 25,683 | $ | 597,538 | ||||||
|
|
|
|
|
| |||||||
NUMBER OF CONTRACTS, NOTIONAL AMOUNTS OR SHARES/UNITS(17)
| Foreign Exchange Risk | Equity Risk | Total | ||||||||||
Warrants | — | 12,180 | 12,180 | |||||||||
Forward Foreign Currency Contracts | (8,883,063 | ) | — | (8,883,063 | ) | |||||||
| * | Centrally Cleared Swaps are valued at unrealized appreciation/depreciation in the Schedule of Investments. Only current day’s variation margin, if any, is reported on the Statement of Assets and Liabilities. |
| (1) | Statement of Assets and Liabilities location: Investments, at value. |
| (2) | Statement of Assets and Liabilities location: Unrealized appreciation on open forward foreign currency contracts. |
| (3) | Cumulative appreciation (depreciation) on futures contracts is disclosed within the Schedule of Investments under the open “Futures Contracts” section. Only current day’s variation margin, if any, are reported within the Statement of Assets and Liabilities. Synthetic Futures are presented as Synthetic futures, at value within the Statement of Assets and Liabilities. |
| (4) | Statement of Assets and Liabilities location: Swap contracts, at value and Variation margin receivable and Variation margin payable on swap contracts. |
| (5) | Statement of Assets and Liabilities location: Unrealized depreciation on open forward foreign currency contracts. |
| (6) | Statement of Assets and Liabilities location: Written options, at value. |
| (7) | Statement of Operations location: Amounts are included in Net realized gain (loss) on Investments. |
| (8) | Statement of Operations location: Amounts are included in Net realized gain (loss) on Forward foreign currency contracts and foreign currency related transactions. |
| (9) | Statement of Operations location: Amounts are included in Net realized gain (loss) on Closed futures contracts. |
| (10) | Statement of Operations location: Amounts are included in Net realized gain (loss) on Written option contracts. |
| (11) | Statement of Operations location: Amounts are included in Net realized gain (loss) on Swap contracts. |
| (12) | Statement of Operations location: Amounts are included in Change in net unrealized appreciation (depreciation) on Investments. |
| (13) | Statement of Operations location: Amounts are included in Change in net unrealized appreciation (depreciation) on Forward foreign currency contracts and foreign currency related transactions. |
197
Mercer Funds
Notes to the Financial Statements (Continued)
March 31, 2013
| (14) | Statement of Operations location: Amounts are included in Change in net unrealized appreciation (depreciation) on Open futures contracts. |
| (15) | Statement of Operations location: Amounts are included in Change in net unrealized appreciation (depreciation) on Written option contracts. |
| (16) | Statement of Operations location: Amounts are included in Change in net unrealized appreciation (depreciation) on Swap contracts. |
| (17) | Amounts disclosed represent average number of contracts, notional amounts, or shares outstanding for the months that the Fund held such derivatives during the year ended March 31, 2013. |
The Funds follow FASB ASC 815-10-50 “Disclosures about Credit Derivatives and Certain Guarantees”. This applies to written credit derivatives, hybrid instruments with embedded credit derivatives (for example, credit-linked notes), and certain guarantees. See Note 2 for a description of credit derivative instruments.
The following is a summary of open credit default swap positions held in Core Opportunistic at March 31, 2013:
| Notional Amount | Currency | Expiration Date | Counterparty | Buy/Sell Protection | Maximum Potential Amount of Future Payments Under the Contract | Receive (Pay) Fixed Rate | Deliverable | Unrealized Appreciation (Depreciation) | Value | |||||||||||||||||||||||||
| 1,800,000 | USD | 12/20/2017 | JPMorgan Chase Bank | Buy | N/A | (5.00 | %) | CDX.NA.HY.19 | $ | (68,857 | ) | $ | (76,732 | ) | ||||||||||||||||||||
| 4,400,000 | USD | 03/20/2021 | Goldman Sachs | Sell | $ | 4,400,000 | 1.60 | % | State of Connecticut (Moody’s Rating: Aa3; S&P Rating: AA) | 157,636 | 157,636 | |||||||||||||||||||||||
| 900,000 | USD | 03/20/2016 | Deutsche Bank AG | Buy | N/A | (1.00 | %) | Kinder Morgan, Inc., 6.50%, 09/01/12 | (39,547 | ) | 2,647 | |||||||||||||||||||||||
| 1,400,000 | USD | 03/20/2016 | Morgan Stanley Capital Services LLC | Buy | N/A | (1.00 | %) | Kinder Morgan, Inc., 6.50%, 09/01/12 | (62,977 | ) | 4,117 | |||||||||||||||||||||||
| 400,000 | USD | 12/20/2015 | Deutsche Bank AG | Buy | N/A | (1.00 | %) | Starwood Hotels and Resorts, 6.75%, 05/15/18 | (34,771 | ) | (5,967 | ) | ||||||||||||||||||||||
|
|
|
|
|
| |||||||||||||||||||||||||||||
| $ | 4,400,000 | $ | (48,516 | ) | $ | 81,701 | ||||||||||||||||||||||||||||
|
|
|
|
|
| |||||||||||||||||||||||||||||
(b) Security transactions and related investment income
Security transactions are accounted for on trade date. Dividend income, net of applicable withholding taxes, is recorded on the ex-dividend date or when the Fund is informed of the ex-dividend date, if later. Interest income is recorded on the accrual basis, and is adjusted for amortization of premium and discounts for debt securities. Income is not recognized, nor are premium and discount amortized, on securities for which collection is not expected. Withholding taxes on foreign dividend, interest, and capital gains have been provided for in accordance with the respective country’s tax rules and rates. Non-cash dividends, if any, are recorded at the fair value of the securities received. Interest income on inflation indexed securities is accrued daily based upon an inflation-adjusted principal. Additionally, any increase in the principal or face amount of these securities is recorded as interest income. In determining the net gain or loss on securities sold, the cost of securities is determined on the identified-cost basis.
(c) Cash and short-term investments
A Fund may invest a portion of its assets in short-term debt securities (including repurchase agreements and reverse repurchase agreements) of corporations, the U.S. government and its agencies and instrumentalities and banks and finance companies, which may be denominated in any currency.
198
Mercer Funds
Notes to the Financial Statements (Continued)
March 31, 2013
A Fund may invest a portion of its assets in shares issued by money market mutual funds. A Fund also may invest in collective investment vehicles that are managed by an unaffiliated investment manager, pending investment of the Fund’s assets in portfolio securities. When unusual market conditions warrant, a Fund may make substantial temporary defensive investments in cash equivalents, up to a maximum of 100% of the Fund’s net assets. Cash equivalent holdings may be in any currency. When a Fund invests for temporary defensive purposes, such investments may affect the Fund’s ability to achieve its investment objective.
(d) Securities lending
A Fund may lend its portfolio securities to qualified broker-dealers and financial institutions pursuant to agreements, provided: (1) the loan is secured continuously by collateral marked-to-market daily and maintained in an amount at least equal to the current fair value of the securities loaned; (2) the Fund may call the loan at any time and receive the securities loaned; (3) the Fund will receive any interest or dividends paid on the loaned securities; and (4) the aggregate fair value of securities loaned will not at any time exceed 33 1/3% of the total assets of the Fund. Collateral will consist of U.S. and non-U.S. securities, cash equivalents or irrevocable letters of credit. A liability for cash collateral is reflected in the Statements of Assets and Liabilities, and is categorized as Level 2 within the fair value hierarchy. As with other extensions of credit, there are risks of delay in recovery or even loss of rights in collateral in the event of default or insolvency of a borrower of a Fund’s portfolio securities. A Fund may not retain voting rights on securities while they are on loan.
The Funds participate in a securities lending program under which the Funds’ custodian, State Street Bank and Trust Company (the “Custodian”), is authorized to lend Fund portfolio securities to qualified broker-dealers and financial institutions that post appropriate collateral. Currently, the cash collateral is invested in the State Street Navigator Securities Lending Prime Portfolio. The Custodian receives a portion of the interest earned on any reinvested collateral. The market value of securities on loan to borrowers and the value of collateral held by the Funds with respect to such loans at March 31, 2013 were as follows:
| Market Value of Loaned Securities | Value of Cash Collateral | Value of Non-Cash Collateral | ||||||||||
Large Cap Growth | $ | 8,002,682 | $ | 8,110,005 | $ | — | ||||||
Large Cap Value | 7,091,067 | 7,182,165 | 92,247 | |||||||||
Small/Mid Cap Growth | 39,869,365 | 40,633,413 | 76,081 | |||||||||
Small/Mid Cap Value | 23,325,735 | 23,990,680 | 54,135 | |||||||||
Non-US Core | 67,031,575 | 65,114,408 | 5,254,432 | |||||||||
Core Opportunistic | 10,745,504 | 10,976,300 | — | |||||||||
Emerging Markets | 9,189,047 | 9,271,211 | — | |||||||||
Short Maturity | 519,360 | 530,400 | — | |||||||||
(e) Repurchase agreements
A Fund may enter into a repurchase agreement where the Fund purchases securities from a bank or broker-dealer who simultaneously agrees to repurchase the securities at a mutually agreed upon time and price, thereby determining the yield during the term of the agreement. As a result, a repurchase agreement provides a fixed rate of return insulated from market fluctuations during the term of the agreement. The term of a repurchase agreement generally is short, possibly overnight or for a few days, although it may extend over a number of months (up to one year) from the date of delivery. Repurchase agreements are considered under the 1940 Act to be collateralized loans by a Fund to a seller secured by the securities transferred to the Fund. Repurchase agreements will be fully collateralized and the collateral will be marked-to-market daily. A Fund may not enter into a repurchase agreement having more than seven days remaining to maturity if, as a result, such agreement, together with any other illiquid securities held by the Fund, would exceed 15% of the value of the net assets of the Fund. As of March 31, 2013, none of the Funds held open repurchase agreements.
199
Mercer Funds
Notes to the Financial Statements (Continued)
March 31, 2013
(f) Swaps
A Fund may engage in swaps, including, but not limited to, interest rate, currency, credit default, and index swaps, and the purchase or sale of related caps, floors, collars, and other derivative instruments. A Fund expects to enter into these transactions to preserve a return or spread on a particular investment or portion of the portfolio, to modify the portfolio’s duration, to protect against any increase in the price of securities the Fund anticipates purchasing at a later date, or to gain exposure to certain markets in the most economical way possible.
Interest rate swaps involve the exchange by a Fund with another party of their respective commitments to receive or pay interest (e.g., an exchange of fixed rate payments for floating rate payments) with respect to a notional amount of principal. Currency swaps involve the exchange of cash flows on a notional amount based on changes in the values of referenced currencies.
The purchase of a cap entitles the purchaser to receive payments on a notional principal amount from the party selling the cap to the extent that a specified index exceeds a predetermined interest rate or amount. The purchase of an interest rate floor entitles the purchaser to receive payments on a notional principal amount from the party selling the floor to the extent that a specified index falls below a predetermined interest rate or amount. A collar is a combination of a cap and a floor that preserves a certain return with a predetermined range of interest rates or values.
Swaps do not involve the delivery of securities or other underlying assets or principal, and are subject to counterparty risk. If the other party to a swap defaults and fails to consummate the transaction, a Fund’s risk of loss consists of the net amount of interest payments that the Fund is contractually entitled to receive.
Whether a Fund’s use of swap agreements or swap options will be successful in achieving the Fund’s investment objective will depend on the Subadvisor’s ability to predict correctly whether certain types of investments are likely to produce greater returns than other investments. Moreover, a Fund bears the risk of loss of the amount expected to be received under a swap agreement in the event of the default or bankruptcy of a swap agreement counterparty. The Funds will enter into swap agreements only with counterparties that meet certain standards of creditworthiness.
If there is a default by the counterparty to a swap contract, a Fund will be limited to contractual remedies pursuant to the agreements related to the transaction. There is no assurance that a swap contract counterparty will be able to meet its obligations pursuant to a swap contract or that, in the event of a default, a Fund will succeed in pursuing contractual remedies. A Fund thus assumes the risk that it may be delayed in, or prevented from, obtaining payments owed to it pursuant to a swap contract. However, the amount at risk is only the net unrealized gain, if any, on the swap at the time of default, and not the entire notional amount of the swap contract. The Subadvisor that enters into the swap agreement will closely monitor, subject to the oversight of the Board, the creditworthiness of swap counterparties in order to minimize the risk of counterparty default on swaps.
Because swaps are two party contracts that may be subject to contractual restrictions on transferability and termination, and they may have terms of greater than seven days, swap agreements may be considered to be illiquid and subject to a Fund’s limitation on investments in illiquid securities. However, the Trust has adopted procedures pursuant to which the Advisor may determine that swaps (including swap options) are liquid under certain circumstances. To the extent that a swap is not liquid, it may not be possible to initiate a transaction or liquidate a position at an advantageous time or price, which may result in significant losses.
Certain restrictions imposed on the Funds’ ability to qualify as regulated investment companies under Subchapter M of the Internal Revenue Code of 1986, as amended (the “Code”), may limit the Funds’ ability to use swap agreements. The swaps market is largely unregulated. It is possible that developments in the swaps market, including potential government regulation, could adversely affect a Fund’s ability to terminate existing swap agreements or to realize amounts to be received under such agreements.
The credit default swap agreements may have as reference obligations one or more securities that are not currently held by a Fund. The protection “buyer” in a credit default swap agreement is generally obligated to pay the protection “seller” an upfront or a periodic stream of payments over the term of the contract provided that no credit
200
Mercer Funds
Notes to the Financial Statements (Continued)
March 31, 2013
event, such as a default, on a reference obligation has occurred. If a credit event occurs, the seller generally must pay the buyer the “par value” (full notional value) of the swap in exchange for an equal face amount of deliverable obligations of the reference entity described in the swap, or the seller may be required to deliver the related net cash amount, if the swap is cash settled. A Fund may be either the buyer or seller in the transaction. If a Fund is a buyer and no credit event occurs, the Fund may recover nothing if the swap is held through its termination date. However, if a credit event occurs, the buyer generally may elect to receive the full notional value of the swap in exchange for an equal face amount of deliverable obligations of the reference entity whose value may have significantly decreased. As a seller, a Fund generally receives an upfront payment or a fixed rate of income throughout the term of the swap provided that there is no credit event. As the seller, a Fund would effectively add leverage to its portfolio because, in addition to its total net assets, a Fund would be subject to investment exposure on the notional amount of the swap.
The spread of a credit default swap is the annual amount the protection buyer must pay the protection seller over the length of the contract, expressed as a percentage of the notional amount. When spreads rise, market perceived credit risk rises and when spreads fall, market perceived credit risk falls. Wider credit spreads and decreasing market values, when compared to the notional amount of the swap, represent a deterioration of the referenced entity’s credit worthiness and an increased market perception that there is a greater likelihood of risk of default or other credit event occurring as defined under the terms of the agreement. For credit default swap agreements on asset-backed securities and credit indices, the quoted market prices and resulting values, as well as the annual payment rates, serve as an indication of the current status of the payment/performance risk.
Credit default swap agreements involve greater risks than if a Fund had invested in the reference obligation directly since, in addition to general market risks, credit default swaps are subject to illiquidity risk, counterparty risk and credit risk. A Fund will enter into credit default swap agreements only with counterparties that meet certain standards of creditworthiness. A buyer generally also will lose its investment and recover nothing should no credit event occur and the swap is held to its termination date. If a credit event were to occur, the value of any deliverable obligation received by the seller, coupled with the upfront or periodic payments previously received, may be less than the full notional value it pays to the buyer, resulting in a loss of value to the seller. A Fund’s obligations under a credit default swap agreement will be accrued daily (offset against any amounts owing to the Fund). In connection with credit default swaps in which a Fund is the buyer, the Fund will segregate or “earmark” cash or assets determined to be liquid by the Advisor and/or the Subadvisor in accordance with procedures established by the Board of Trustees, or enter into certain offsetting positions, with a value at least equal to the Fund’s exposure (any accrued but unpaid net amounts owed by the Fund to any counterparty), on a marked-to-market basis. In connection with credit default swaps in which a Fund is the seller, the Fund will segregate or “earmark” cash or assets determined to be liquid by the Advisor and/or Subadvisor in accordance with procedures established by the Board of Trustees, or enter into offsetting positions, with a value at least equal to the full notional amount of the swap (minus any amounts owed to the Fund). Such segregation or “earmarking” will ensure that a Fund has assets available to satisfy its obligations with respect to the transaction and will limit any potential leveraging of the Fund’s portfolio. Such segregation or “earmarking” will not limit the Fund’s exposure to loss.
Certain clearinghouses currently offer clearing for limited types of derivatives transactions, principally credit derivatives. In a cleared derivative transaction, a Fund typically enters into the transaction with a financial institution counterparty, and performance of the transaction is effectively guaranteed by a central clearinghouse, thereby reducing or eliminating the Fund’s exposure to the credit risk of the original counterparty. The Fund typically will be required to post specified levels of margin with the clearinghouse or at the instruction of the clearinghouse; the margin required by a clearinghouse may be greater than the margin the Fund would be required to post in an uncleared derivative transaction. Daily changes in valuation of centrally cleared swaps, if any, are recorded as a receivable or payable for the change in value as appropriate on the Statements of Assets and Liabilities. Only a limited number of derivative transactions are currently eligible for clearing by clearinghouses.
A Fund will accrue for interim payments on swap contracts on a daily basis, with the net amount recorded as interest payable or receivable on swap contracts on the Statements of Assets and Liabilities. Once interim payments are settled in cash, the net amount is recorded as realized gain/loss on swap contracts, in addition to realized gain/loss recorded upon the termination of swap contracts on the Statements of Operations. Fluctuations in the value of
201
Mercer Funds
Notes to the Financial Statements (Continued)
March 31, 2013
swap contracts are recorded for financial statement purposes as unrealized appreciation or depreciation of swap contracts (swap contracts, at value on the Statements of Assets and Liabilities).
Swap agreements are marked to market daily. The change in value, if any, is recorded as unrealized gain or loss in the Statements of Operations. A liquidation payment received or made at the termination of the swap is recorded as realized gain or loss in the Statements of Operations. Net periodic payments are included as part of realized gain (loss) on the Statements of Operations.
The swaps in which the Fund may engage may include instruments under which one party pays a single or periodic fixed amount(s) (or premium), and the other party pays periodic amounts based on the movement of a specified index. The Fund’s maximum risk of loss from counterparty credit risk, as opposed to investment and other types of risk, in respect of swaps is typically the discounted net value of the cash flows to be received from the counterparty over the contract’s remaining life to the extent that such amount is positive, plus the cost of entering into a similar transaction with another counterparty, if possible.
The use of swaps is a highly specialized activity that involves investment techniques and risks different from those associated with ordinary portfolio securities transactions. If the Advisor or Subadvisor is incorrect in its forecasts of market values, interest rates, and currency exchange rates, the investment performance of the Fund would be less favorable than it would have been if this investment technique were not used.
Like most other investments, swap agreements are subject to the risk that the market value of the instrument will change in a way detrimental to a Fund’s interest. A Fund bears the risk that Subadvisor will not accurately forecast future market trends or the values of assets, reference rates, indexes, or other economic factors in establishing swap positions for the Fund. If a Subadvisor attempts to use a swap as a hedge against, or as a substitute for, a portfolio investment, the Fund will be exposed to the risk that the swap will have or will develop imperfect or no correlation with the portfolio investment. This could cause substantial losses for the Fund. While hedging strategies involving swap instruments can reduce the risk of loss, they can also reduce the opportunity for gain or even result in losses by offsetting favorable price movements in other Fund investments.
During the year ended March 31, 2013, Core Opportunistic used swap agreements to adjust interest rate and yield curve exposure or to manage credit exposure. See the Core Opportunistic Schedule of Investments for a listing of open swap agreements as of March 31, 2013.
(g) Futures
A futures contract is a contractual agreement to buy or sell a specific amount of a commodity or financial instrument at a predetermined price on a stipulated future date. A Fund may enter into contracts for the purchase or sale for future delivery of securities, indices and foreign currencies. Futures contracts may be opened to protect against the adverse effects of fluctuations in security prices, interest rates, or foreign exchange rates without actually buying or selling the securities or foreign currency. A Fund also may enter into futures contracts as a low cost method for gaining or reducing exposure to a particular currency or securities market without directly investing in those currencies or securities.
A purchase of a futures contract means the acquisition of a contractual right of a Fund to obtain delivery of the securities or foreign currency underlying the contract at a specified price on a specified future date. When a futures contract is sold, a Fund incurs a contractual obligation to deliver the securities or foreign currency underlying the contract at a specified price on a specified date.
When a Fund enters into a futures contract, it must deliver to the futures commission merchant selected by the Fund an amount referred to as “initial margin.” This amount is maintained by the futures commission merchant in a segregated account at the custodian bank. Futures contracts are marked-to-market daily, depending upon changes in the price of the underlying securities subject to the futures contracts, and the change in value is recorded by the Fund as a variation margin payable or receivable. The Fund recognizes gains and losses on futures contracts in addition to the variation margin, which gains and losses are considered realized at the time the contracts expire or close.
202
Mercer Funds
Notes to the Financial Statements (Continued)
March 31, 2013
A Fund may enter into futures transactions on domestic exchanges and, to the extent such transactions have been approved by the CFTC for sale to customers in the United States, or on foreign exchanges. In addition, a Fund may sell stock index futures in anticipation of, or during a market decline to attempt to offset the decrease in the market value of the Fund’s common stocks that might otherwise result, and a Fund may purchase such contracts in order to offset increases in the cost of common stocks that it intends to purchase. Unlike other futures contracts, a stock index futures contract specifies that no delivery of the actual stocks making up the index will take place. Instead, settlement in cash must occur upon the termination of the contract.
While futures contracts provide for the delivery of securities, deliveries usually do not occur. Contracts are generally terminated by entering into offsetting transactions.
Where the futures market is not as developed or where the regulations prevent or make it disadvantageous to trade futures, the Emerging Markets Fund will utilize synthetic futures as part of the country selection strategy implementation. A synthetic future uses equity index swaps on equity index futures.
During the year ended March 31, 2013, Core Opportunistic used futures to adjust interest rate exposure and replicate government bond positions. Emerging Markets used futures to create passive index exposure to certain domestic emerging market country indices in the Fund. See the Core Opportunistic and Emerging Markets Schedules of Investments for a listing of open futures contracts as of March 31, 2013.
(h) Options
The Funds may purchase and sell (write) put and call options on debt securities and indices to enhance investment performance, manage duration, or protect against changes in market prices. The Funds may also buy and sell combinations of put and call options on the same underlying security, currency or index. Short (sold) options positions will generally be hedged by the Funds with cash, cash equivalents, current portfolio security holdings, or other options or futures positions.
The Funds may enter into swap options (“swaptions”). A swaption is a contract that gives a counterparty the right (but not the obligation), in return for payment of a premium, to enter into a new swap agreement or to shorten, extend, cancel, or otherwise modify an existing swap agreement, at some designated future time on specified terms. Each Fund may write (sell) and purchase put and call swaptions. Depending on the terms of the particular option agreement, a Fund generally will incur a greater degree of risk when the Fund writes a swaption than the Fund will incur when it purchases a swaption. When a Fund purchases a swaption, the Fund’s risk of loss is limited to the amount of the premium it has paid should it decide to let the swaption expire unexercised. However, when a Fund writes a swaption, upon exercise of the option, the Fund will become obligated according to the terms of the underlying agreement.
When the Fund writes a covered call or a put option, an amount equal to the premium received by the Fund is included in the Fund’s Statement of Assets and Liabilities as an asset and as an equivalent liability. The amount of the liability is subsequently marked-to-market to reflect the current market value of the option written. The Fund receives a premium on the sale of a call option but gives up the opportunity to profit from any increase in stock value above the exercise price of the option, and when the Fund writes a put option, it is exposed to a decline in the price of the underlying security.
Whether an option which the Fund has written expires on its stipulated expiration date or the Fund enters into a closing purchase transaction, the Fund realizes a gain (or loss, if the cost of a closing purchase transaction exceeds the premium received when the option was sold) without regard to any unrealized gain or loss on the underlying security, and the liability related to such option is extinguished. If a call option which the Fund has written is exercised, the Fund realizes a capital gain or loss from the sale of the underlying security, and the cost basis of the lots sold are decreased by the premium originally received. When a put option which a Fund has written is exercised, the amount of the premium originally received will reduce the cost of the security which a Fund purchases upon exercise of the option. Realized gains (losses) on purchased options are included in net realized gain (loss) from investments.
203
Mercer Funds
Notes to the Financial Statements (Continued)
March 31, 2013
The Funds’ use of written options involves, to varying degrees, elements of market risk in excess of the amount recognized in the Statements of Assets and Liabilities. The face or contract amounts of these instruments reflect the extent of the Fund’s exposure to market risk. The risks may be caused by an imperfect correlation between movements in the price of the instrument and the price of the underlying securities and interest rates.
During the year ended March 31, 2013, Non-US Core Equity used options to adjust exposure to foreign currency and to efficiently maintain liquidity. Core Opportunistic used options to manage interest rate and volatility exposure.
See the Non-US Core Equity and Core Opportunistic Schedules of Investments for a listing of options contracts as of March 31, 2013.
Transactions in written option contracts for Core Opportunistic for the year ended March 31, 2013, is as follows:
| Number of Contracts | Premiums Received | |||||||
Options outstanding at March 31, 2012 | 20,591,058 | $ | 402,233 | |||||
Options written | 129,561,924 | 904,513 | ||||||
Options terminated in closing purchase transactions | (26,817,384 | ) | (566,971 | ) | ||||
Option exercised | (1,200,000 | ) | (8,280 | ) | ||||
Options expired | (86,735,503 | ) | (422,264 | ) | ||||
|
|
|
| |||||
Options outstanding at March 31, 2013 | 35,400,095 | $ | 309,231 | |||||
(i) Forward foreign currency contracts
The Funds may purchase or sell currencies and/or engage in forward foreign currency transactions in order to expedite settlement of portfolio transactions and to manage currency risk.
Forward foreign currency contracts are traded in the inter-bank market conducted directly between currency traders (usually large commercial banks) and their customers. A forward contract generally has no deposit requirement and no commissions are charged at any stage for trades. The Funds will account for forward contracts by marking-to-market each day at current forward contract values. The change in market value is recorded by the Fund as an unrealized gain or loss. When the contract is closed, the Fund recognizes a realized gain or loss equal to the difference between the value of the contract at the time the contract was opened and the value at the time the contract was closed.
The Funds will only enter into forward contracts to sell, for a fixed amount of U.S. dollars or other appropriate currency, an amount of foreign currency, to the extent that the value of the short forward contract is covered by the underlying value of securities denominated in the currency being sold. Alternatively, when a Fund enters into a forward contract to sell an amount of foreign currency, the Custodian or the Fund’s sub-custodian will segregate assets in a segregated account of the Fund in an amount not less than the value of the Fund’s total assets committed to the consummation of such forward contract. If the additional segregated assets placed in the segregated account decline, additional cash or securities will be placed in the account on a daily basis so that the value of the account will equal the amount of the Fund’s commitments with respect to such contract.
During the year ended March 31, 2013, Large Cap Value used forward foreign currency contracts to hedge Japanese Yen exposure on the currency risk embedded in one ADR position. Core Opportunistic used forward foreign currency contracts to hedge, cross-hedge or to actively manage non-US Dollar exposures in the Fund. Emerging Markets and Global Low Volatility used forward foreign currency contracts to hedge, cross hedge or to actively manage the currency exposures in the Funds. See the Large Cap Value, Core Opportunistic, Emerging Markets and Global Low Volatility Schedules of Investments for a listing of open forward foreign currency contracts as of March 31, 2013.
204
Mercer Funds
Notes to the Financial Statements (Continued)
March 31, 2013
(j) Foreign currency translation
The books and records of each Fund are maintained in US dollars. Foreign currencies, investments and other assets and liabilities denominated in foreign currencies are translated into US dollars at the foreign exchange rates prevailing at the end of the period. Purchases and sales of investment securities, income and expenses are translated at exchange rates prevailing on the respective dates of such transactions. Unrealized gains and losses that result from changes in foreign currency exchange rates have been included in the unrealized gains (losses) on foreign currency translations within each Fund’s Statement of Operations. Net realized foreign currency gains and losses resulting from changes in exchange rates include foreign currency gains and losses between trade date and settlement date on investment securities transactions, foreign currency transactions and the difference between the amounts of interest and dividends recorded on the books of the Fund and the amount actually received. The portion of foreign currency gains and losses related to fluctuations in exchange rates between the purchase settlement date and subsequent sale trade date is included in realized gains and losses on investment transactions.
(k) When-issued/TBA securities
Purchasing securities on a “when-issued” basis is a commitment by a Fund to buy a security before the security is actually issued. A Fund may purchase securities offered on a “when-issued” or “forward delivery” basis such as “to-be-announced” (“TBA”) securities. When so offered, the price, which is generally expressed in yield terms, is fixed at the time the commitment to purchase is made, but delivery and payment for the when-issued or forward delivery securities take place at a later date. During the period between purchase and settlement, no payment is made by the purchaser to the issuer and no interest on the when-issued or forward delivery security accrues to the purchaser. While when-issued or forward delivery securities may be sold prior to the settlement date, it is intended that a Fund will purchase such securities with the purpose of actually acquiring the securities unless a sale appears desirable for investment reasons. At the time a Fund makes the commitment to purchase a security on a when-issued or forward delivery basis, the Fund will record the transaction and reflect the value of the security in determining the Fund’s NAV. The market value of when-issued or forward delivery securities may be more or less than the purchase price. Certain risks may arise upon entering into when-issued or forward delivery securities transactions, including the potential inability of counterparties to meet the terms of their contracts, and the issuer’s failure to issue the securities due to political, economic, or other factors. Additionally, losses may arise due to declines in the value of the securities prior to settlement date. See the Core Opportunistic Schedule of Investments for TBA sale commitments held as of March 31, 2013.
(l) Real estate investment trusts
The Funds may invest in real estate investment trusts (“REITs”), which pool investors’ funds for investment, primarily in income producing real estate or real estate-related loans or interests. A REIT is not taxed on income distributed to its shareholders or unitholders if it complies with regulatory requirements relating to its organization, ownership, assets and income, and with a regulatory requirement to distribute to its shareholders or unitholders at least 90% of its taxable income for each taxable year.
A shareholder in a Fund, by investing in REITs through the Fund, will bear not only the shareholder’s proportionate share of the expenses of the Fund, but also, indirectly, the management expenses of the underlying REITs. REITs depend generally on their ability to generate cash flow to make distributions to shareholders or unitholders, and may be subject to defaults by borrowers and to self-liquidations. In addition, the performance of a REIT may be affected by its failure to qualify for tax-free pass-through of income, or the REIT’s failure to maintain exemption from registration under the 1940 Act. Dividends representing a return of capital are reflected as a reduction of cost and/or as a realized gain when the amount of the return of capital is conclusively determined. See each Fund’s Schedule of Investments for REIT securities held as of March 31, 2013.
(m) Mortgage-related and other asset-backed securities
The Funds may invest in mortgage-backed and asset-backed securities. Mortgage-backed securities represent an interest in a pool of mortgages. Asset-backed securities are structured like mortgage-backed securities, but instead of mortgage loans or interests in mortgage loans, the underlying assets may include such items as motor vehicle
205
Mercer Funds
Notes to the Financial Statements (Continued)
March 31, 2013
installment sales or installment loan contracts, leases of various types of real and personal property, and receivables from credit card agreements. The value of some mortgage or asset-backed securities may be particularly sensitive to changes in prevailing interest rates. Early repayment of principal on some mortgage-related securities may expose the Fund to a lower rate of return upon reinvestment of principal. The value of these securities may fluctuate in response to the market’s perception of the creditworthiness of the issuers. Additionally, although mortgages and mortgage-related securities are generally supported by some form of government or private guarantee and/or insurance, there is no assurance that private guarantors or insurers will meet their obligations.
One type of stripped mortgage-backed security has one class receiving all of the interest from the mortgage assets (the interest-only, or “IO” class), while the other class will receive all of the principal (the principal-only, or “PO” class). Payments received for the IOs are included in interest income on the Statements of Operations. Because principal will not be received at the maturity of an IO, adjustments are made to the cost basis of the security on a daily basis until maturity. These adjustments are included in interest income on the Statements of Operations. Payments received for POs are treated as reductions to the cost and par value of the securities. See the Schedules of Investments for mortgage-backed and asset-backed securities held by Core Opportunistic and Short Maturity as of March 31, 2013.
(n) Bank loans
Core Opportunistic invests in bank loans, which include institutionally-traded floating rate securities generally acquired as an assignment from another holder of, or participation interest in, loans originated by a bank or financial institution (the ‘‘Lender’’) that acts as agent for all holders. The agent administers the terms of the loan, as specified in the loan agreement. The Fund may invest in multiple series or tranches of a loan, which may have varying terms and carry different associated risks. When investing in a loan participation, the Fund has the right to receive payments of principal, interest and any fees to which it is entitled only from the Lender selling the loan agreement and only upon receipt by the Lender of payments from the borrower. The Fund generally has no right to enforce compliance with the terms of the loan agreement with the borrower. As a result, the Fund may be subject to the credit risk of both the borrower and the Lender that is selling the loan agreement. At March 31, 2013, there were four unfunded commitments which amounted to $2,570,000 of par and had cost and value of $2,579,680 and $2,582,405, respectively. See the Core Opportunistic Schedule of Investments for open bank loans held as of March 31, 2013.
(o) Indexed securities
The Funds may invest in indexed securities where the redemption values and/or coupons are linked to the prices of other securities, securities indices, or other financial indicators. The Funds use indexed securities to increase or decrease their exposure to different underlying instruments and to gain exposure to markets in which it may be difficult to invest through conventional securities. Indexed securities may be more volatile than their underlying instruments, but any loss is limited to the amount of the original investment. See the Core Opportunistic Schedule of Investments for indexed securities held as of March 31, 2013.
(p) Taxes and distributions
The Funds intend to qualify each year as regulated investment companies under the Code. The Funds intend to distribute substantially all of their net investment income and net realized short-term and long-term gains, if any, after giving effect to any available capital loss carryovers for U.S. federal income tax purposes. Therefore, no provision for U.S. federal and state income or excise tax is necessary.
The Funds utilize the provisions of the federal income tax laws that provide for the carryforward of capital losses for prior years, offsetting such losses against any future realized capital gains. Under the Regulated Investment Company Modernization Act of 2010 (the “Act”), net capital losses recognized after December 22, 2010 may be carried forward indefinitely, and their character is retained as short-term and/or long-term losses. Previously, net capital losses were carried forward for eight years and treated as short-term losses. As a transition rule, the Act requires that post-enactment net capital losses be used before pre-enactment net capital losses.
206
Mercer Funds
Notes to the Financial Statements (Continued)
March 31, 2013
On March 31, 2013, the following Funds had deferred capital losses available to be offset against future net capital gains through the indicated expiration dates as follows:
| Expiring March 31, | ||||||||||||||||
| 2016 | 2017 | 2018 | 2019 | |||||||||||||
Large Cap Value | $ | — | $ | — | $ | 87,427,716 | $ | — | ||||||||
Non-US Core Equity | — | — | 71,768,661 | — | ||||||||||||
Short Maturity | 65,612 | 1,337,794 | 2,821,093 | 221,547 | ||||||||||||
Net capital loss carry forwards for the Funds shown in the above table are from pre-enactment years and are, therefore, subject to the eight-year carryforward period and possible expiration.
During the year ended March 31, 2013 the following Funds utilized capital loss carryforwards:
Large Cap Growth | $ | 2,026,562 | ||
Large Cap Value | 38,046,452 | |||
Non-US Core Equity | 19,152,848 | |||
Short Maturity | 11,202 |
As of March 31, 2013, the cost for U.S. federal income tax purposes and gross unrealized appreciation and depreciation in value of investments were as follows:
| Federal Income Tax Cost | Tax Basis Unrealized Appreciation | Tax Basis Unrealized Depreciation | Net Unrealized Appreciation (Depreciation) | |||||||||||||
Large Cap Growth | $ | 380,822,045 | $ | 91,266,897 | $ | (3,237,964 | ) | $ | 88,028,933 | |||||||
Large Cap Value | 398,445,023 | 85,272,090 | (2,885,140 | ) | 82,386,950 | |||||||||||
Small/Mid Cap Growth | 415,165,449 | 77,342,997 | (8,972,279 | ) | 68,370,718 | |||||||||||
Small/Mid Cap Value | 388,335,723 | 69,403,553 | (7,129,070 | ) | 62,274,483 | |||||||||||
Non-US Core Equity | 2,004,055,182 | 246,592,448 | (55,410,185 | ) | 191,182,263 | |||||||||||
Core Opportunistic | 1,184,170,108 | 50,363,953 | (6,824,817 | ) | 43,539,136 | |||||||||||
Emerging Markets | 499,723,630 | 33,700,200 | (11,456,602 | ) | 22,243,598 | |||||||||||
Global Low Volatility | 277,221,723 | 25,466,093 | (1,956,349 | ) | 23,509,744 | |||||||||||
Short Maturity | 47,255,448 | 453,267 | (185,709 | ) | 267,558 | |||||||||||
The differences between book-basis and tax-basis unrealized appreciation/(depreciation) are primarily due to wash sale loss deferrals, investments in passive foreign investment companies and other basis adjustments.
As of March 31, 2013, the Funds had no uncertain tax positions that would require recognition, derecognition, or disclosure. Each of the Funds’ federal tax returns filed in the 3-year period ended March 31, 2013 remains subject to examination by the Internal Revenue Service.
The Funds’ policy is to declare and pay distributions from net investment income and net realized short-term and long-term gains at least annually. All distributions are paid in shares of the Funds, at NAV, unless the shareholder elects to receive cash distributions. A Fund may distribute such income dividends and capital gains more frequently, if necessary, in order to reduce or eliminate federal excise taxes on the Funds. The amount of any distribution will vary, and there is no guarantee that a Fund will pay either income dividends or capital gains distributions.
207
Mercer Funds
Notes to the Financial Statements (Continued)
March 31, 2013
During the years ended March 31, 2013 and March 31, 2012 the tax character of distributions (including capital gain dividends, if any, designated pursuant to Section 852 of the Code) paid, were as follows:
| 2013 | 2012 | |||||||||||||||
| Ordinary Income | Long-Term Capital Gains | Ordinary Income | Long-Term Capital Gains | |||||||||||||
Large Cap Growth | $ | 2,623,579 | $ | 12,798,740 | $ | 799,812 | $ | — | ||||||||
Large Cap Value | 9,197,559 | — | 7,996,540 | — | ||||||||||||
Small/Mid Cap Growth | 8,654,824 | 22,684,930 | 4,100,000 | 21,412,817 | ||||||||||||
Small/Mid Cap Value | 6,390,089 | 10,843,125 | 1,204,230 | 15,751,437 | ||||||||||||
Non-US Core Equity | 49,488,095 | — | 32,578,616 | — | ||||||||||||
Core Opportunistic | 49,088,858 | 5,001,334 | 36,149,295 | 5,080,438 | ||||||||||||
Emerging Markets | 3,235,418 | — | — | — | ||||||||||||
Global Low Volatility | 485,259 | — | — | — | ||||||||||||
Short Maturity | 545,067 | — | 857,686 | — | ||||||||||||
As of March 31, 2013, the components of distributable earnings on a tax basis were as follows:
| Undistributed Ordinary Income | Undistributed Long-Term Gains | Capital Losses Other Temporary Differences | Unrealized Appreciation (Depreciation) | Total Distributable Earnings | ||||||||||||||||
Large Cap Growth | $ | 570,983 | $ | 23,793,977 | $ | (5,669 | ) | $ | 88,028,933 | $ | 112,388,224 | |||||||||
Large Cap Value | 1,629,742 | — | (87,433,117 | ) | 82,386,950 | (3,416,425 | ) | |||||||||||||
Small/Mid Cap Growth | 3,470,057 | 4,333,968 | (392,626 | ) | 68,370,718 | 75,782,117 | ||||||||||||||
Small/Mid Cap Value | 10,041,697 | 10,596,821 | (870 | ) | 62,274,483 | 82,912,131 | ||||||||||||||
Non-US Core Equity | 16,554,242 | — | (71,776,390 | ) | 190,603,999 | 135,381,851 | ||||||||||||||
Core Opportunistic | 6,523,261 | 4,298,512 | (12,645 | ) | 44,109,346 | 54,918,474 | ||||||||||||||
Emerging Markets | 1,819,134 | — | 156,418 | 21,724,447 | 23,699,999 | |||||||||||||||
Global Low Volatility | 4,507,646 | 22,698 | — | 23,496,108 | 28,026,452 | |||||||||||||||
Short Maturity | 114,082 | — | (4,446,604 | ) | 267,558 | (4,064,964 | ) | |||||||||||||
All other differences are temporary losses related to mostly organizational costs and other timing adjustments.
(q) Allocation of expenses and income
The majority of expenses of the Trust are directly identifiable to an individual Fund. Expenses which are not readily identifiable to a specific Fund are allocated among the applicable Funds, taking into consideration, among other things, the nature and type of expense and the relative size of each applicable Fund.
(r) Redemption fees
While none of the Funds’ classes have initial or contingent deferred sales charges on purchases of Fund shares, redemptions of Fund shares held less than 30 days may be assessed a 2% short-term trading fee and recorded as paid-in capital.
| 3. | Credit agreement |
The Trust entered into a Credit Agreement on behalf of the Funds (“the Agreement”) with a bank pursuant to a revolving line of credit through June 24, 2013. Borrowings for each Fund under the Agreement are limited to the lesser of $50,000,000 or 33 1/3% of a Fund’s Total Net Assets provided borrowings did not exceed, in the aggregate, $50,000,000. Under the terms of the Agreement the Trust pays an annual commitment fee at the rate 0.15% per year on the difference between the total line of credit and the average daily amount of borrowings outstanding. Interest is charged to the Funds based on its borrowings at a variable rate equal to the Overnight Rate plus 1.25%. The Funds did not borrow under the Agreement during the year ended March 31, 2013.
208
Mercer Funds
Notes to the Financial Statements (Continued)
March 31, 2013
| 4. | Indemnities |
In the normal course of business, the Funds enter into contracts that require them to provide a variety of representations or general indemnification for certain liabilities. The Funds’ maximum exposure under these arrangements is unknown, as this would involve future claims that may be made against the Funds that have not yet occurred. However, the Funds have not had prior claims or losses pursuant to these contracts and expect the risk of loss to be remote.
| 5. | Fees and other transactions with affiliates |
The Advisor provides investment advisory services to each Fund pursuant to an investment management agreement. Pursuant to the investment management agreement, each Fund pays the Advisor a fee for managing the Fund’s investments at an annual rate of:
| Assets up to $750 million | Assets in excess of $750 million | |||||||
Large Cap Growth | 0.55 | % | 0.53 | % | ||||
Large Cap Value | 0.53 | % | 0.51 | % | ||||
Small/Mid Cap Growth | 0.90 | % | 0.90 | % | ||||
Small/Mid Cap Value | 0.90 | % | 0.90 | % | ||||
Non-US Core Equity | 0.75 | % | 0.73 | % | ||||
Core Opportunistic | 0.35 | % | 0.33 | % | ||||
Emerging Markets | 0.80 | % | 0.80 | % | ||||
Global Low Volatility | 0.75 | % | 0.75 | % | ||||
Short Maturity | 0.25 | % | 0.23 | % | ||||
Such fees as referenced above are shown in the Advisory fees line in the Statements of Operations. The Advisor provides certain internal administrative services to the Class S, Class Y-1 and Class Y-2 shares of the Funds, for which the Advisor receives a fee of 0.15%, 0.10% and 0.05% of the average daily net assets of the Class S, Class Y-1 and Class Y-2 shares of the Funds, respectively. These internal administrative services include attending to shareholder correspondence, assisting with the processing of purchases and redemptions of shares, preparing and disseminating information and documents for use by beneficial shareholders and monitoring and overseeing non-advisory relationships with entities providing services to the Class S, Class Y-1 and Class Y-2 shares, including the transfer agent.
The Funds have adopted a plan of marketing and service, or “12b-1 plan” to finance the provision of certain shareholder services to the owners of Class S and Class Y-1 shares of the Funds (collectively referred to as the “plans”). The plan provides for payments at annual rates (based on average net assets) of up to 0.25% of each Fund’s Class S and Class Y-1 shares. However, Class S and Class Y-1 shares have not commenced operations.
The Trust, with respect to each Fund, and the Advisor have entered into a written contractual fee waiver and expense reimbursement agreement pursuant to which the Advisor has agreed to waive a portion of its fees and/or reimburse expenses. Effective August 1, 2012, the contractual fee caps on Small/Mid Cap Growth, Small/Mid Cap Value and Non-US Core Equity were increased by 5 basis points (0.05%) to 0.97%, 0.97% and 0.87%, respectively. For the year ended March 31, 2013, the fees were reimbursed to the extent that each Fund’s class expenses exceeded the net expense rates as set forth below of average daily net assets of the Fund class. These reimbursements are shown in the Reimbursement of expenses line in the Statements of Operations.
Pursuant to the expense reimbursement agreement, the Advisor is entitled to be reimbursed for any fees the Advisor waives and Fund expenses that the Advisor reimburses for a period of three years following such fee waivers and expense reimbursements, to the extent that such reimbursement of the Advisor by a Fund will not cause the Fund to exceed any applicable expense limitation that is in place for the Fund. For the year ended March 31, 2013, the Advisor received no reimbursements.
209
Mercer Funds
Notes to the Financial Statements (Continued)
March 31, 2013
| Class S | Class Y-1 | Class Y-2 | Class Y-3 | |||||||||||||
Large Cap Growth | 1.07% | 1.02% | 0.72% | 0.57% | ||||||||||||
Large Cap Value | 1.05% | 1.00% | 0.70% | 0.55% | ||||||||||||
Small/Mid Cap Growth | 1.47% | 1.42% | 1.12% | 0.97% | ||||||||||||
Small/Mid Cap Value | 1.47% | 1.42% | 1.12% | 0.97% | ||||||||||||
Non-US Core Equity | 1.37% | 1.32% | 1.02% | 0.87% | ||||||||||||
Core Opportunistic | 0.87% | 0.82% | 0.52% | 0.37% | ||||||||||||
Emerging Markets | 1.60% | 1.55% | 1.25% | 0.95% | ||||||||||||
Global Low Volatility | 1.35% | 1.30% | 1.00% | 0.85% | ||||||||||||
Short Maturity | 0.82% | 0.77% | 0.47% | 0.32% | ||||||||||||
As of March 31, 2013 only Class Y-3 had commenced operations.
In June 2012, the Board terminated the Funds’ transfer agency agreement with BNY Mellon Investments Servicing (US) Inc., and approved a transfer agency agreement with State Street Bank and Trust Co. (“SSB”). Pursuant to the transfer agent agreement, SSB has agreed to waive its fees and out of pocket expenses, during the first twelve (12) months of service, up to $33,000 per month for the Funds in the aggregate. For the year ended March 31, 2013, the fees waived, are shown in the Fee reductions line in the Statement of Operations.
| 6. | Purchases and sales of securities |
Cost of purchases and proceeds from sales of securities, excluding short-term investments, for the period ended March 31, 2013, were as follows:
| Long-Term U.S. Government Securities | Other Long-Term Securities | |||||||
Purchases | ||||||||
Large Cap Growth | $ | — | $ | 282,151,334 | ||||
Large Cap Value | — | 256,996,427 | ||||||
Small/Mid Cap Growth | — | 274,847,463 | ||||||
Small/Mid Cap Value | — | 346,848,566 | ||||||
Non-US Core Equity | — | 1,734,803,705 | ||||||
Core Opportunistic | 1,058,888,167 | 180,577,687 | ||||||
Emerging Markets | — | 621,252,009 | ||||||
Global Low Volatility | — | 276,817,483 | ||||||
Short Maturity | 11,355,932 | 6,226,634 | ||||||
Sales | ||||||||
Large Cap Growth | — | 306,076,305 | ||||||
Large Cap Value | — | 302,996,365 | ||||||
Small/Mid Cap Growth | — | 183,958,015 | ||||||
Small/Mid Cap Value | — | 268,566,071 | ||||||
Non-US Core Equity | — | 1,686,090,183 | ||||||
Core Opportunistic | 918,278,130 | 232,530,560 | ||||||
Emerging Markets | — | 156,322,309 | ||||||
Global Low Volatility | — | 27,156,194 | ||||||
Short Maturity | 6,510,054 | 7,310,363 | ||||||
210
Mercer Funds
Notes to the Financial Statements (Continued)
March 31, 2013
| 7. | Share transactions |
Each Fund is authorized to issue an unlimited number of shares of beneficial interest without par value. Transactions in Fund shares were as follows:
Large Cap Growth
| Year Ended March 31, 2013 | Year Ended March 31, 2012 | |||||||||||||||
| Shares | Amount | Shares | Amount | |||||||||||||
Class Y-3: | ||||||||||||||||
Shares sold | 5,065,500 | $ | 64,873,285 | 4,228,266 | $ | 48,170,956 | ||||||||||
Shares issued through in-kind contribution | — | — | — | — | ||||||||||||
Shares issued to shareholders in reinvestment of distributions | 1,221,086 | 15,422,319 | 72,055 | 799,812 | ||||||||||||
Shares repurchased | (7,036,336 | ) | (90,890,406 | ) | (4,299,177 | ) | (52,840,670 | ) | ||||||||
|
|
|
|
|
|
|
| |||||||||
Net increase (decrease) | (749,750 | ) | $ | (10,594,802 | ) | 1,144 | $ | (3,869,902 | ) | |||||||
|
|
|
|
|
|
|
| |||||||||
Large Cap Value
| Year Ended March 31, 2013 | Year Ended March 31, 2012 | |||||||||||||||
| Shares | Amount | Shares | Amount | |||||||||||||
Class Y-3: | ||||||||||||||||
Shares sold | 6,358,367 | $ | 56,988,771 | 5,880,659 | $ | 45,086,185 | ||||||||||
Shares issued through in-kind contribution | — | — | — | — | ||||||||||||
Shares issued to shareholders in reinvestment of distributions | 1,020,817 | 9,197,559 | 1,056,346 | 7,996,540 | ||||||||||||
Shares repurchased | (12,333,094 | ) | (111,651,382 | ) | (5,130,130 | ) | (42,101,734 | ) | ||||||||
|
|
|
|
|
|
|
| |||||||||
Net increase (decrease) | (4,953,910 | ) | $ | (45,465,052 | ) | 1,806,875 | $ | 10,980,991 | ||||||||
|
|
|
|
|
|
|
| |||||||||
Small/Mid Cap Growth
| Year Ended March 31, 2013 | Year Ended March 31, 2012 | |||||||||||||||
| Shares | Amount | Shares | Amount | |||||||||||||
Class Y-3: | ||||||||||||||||
Shares sold | 11,992,815 | $ | 134,366,284 | 5,321,710 | $ | 60,017,995 | ||||||||||
Shares issued to shareholders in reinvestment of distributions | 2,909,912 | 31,339,754 | 2,564,102 | 25,512,817 | ||||||||||||
Shares repurchased | (3,732,632 | ) | (42,250,216 | ) | (6,151,112 | ) | (72,287,677 | ) | ||||||||
|
|
|
|
|
|
|
| |||||||||
Net increase | 11,170,095 | $ | 123,455,822 | 1,734,700 | $ | 13,243,135 | ||||||||||
|
|
|
|
|
|
|
| |||||||||
211
Mercer Funds
Notes to the Financial Statements (Continued)
March 31, 2013
Small/Mid Cap Value
| Year Ended March 31, 2013 | Year Ended March 31, 2012 | |||||||||||||||
| Shares | Amount | Shares | Amount | |||||||||||||
Class Y-3: | ||||||||||||||||
Shares sold | 12,039,409 | $ | 117,965,935 | 6,303,350 | $ | 59,998,309 | ||||||||||
Shares issued to shareholders in reinvestment of distributions | 1,746,020 | 17,233,214 | 1,907,274 | 16,955,667 | ||||||||||||
Shares repurchased | (4,357,440 | ) | (43,882,998 | ) | (6,561,837 | ) | (65,374,362 | ) | ||||||||
|
|
|
|
|
|
|
| |||||||||
Net increase | 9,427,989 | $ | 91,316,151 | 1,648,787 | $ | 11,579,614 | ||||||||||
|
|
|
|
|
|
|
| |||||||||
Non-US Core Equity
| Year Ended March 31, 2013 | Year Ended March 31, 2012 | |||||||||||||||
| Shares | Amount | Shares | Amount | |||||||||||||
Class Y-3: | ||||||||||||||||
Shares sold | 48,377,767 | $ | 464,004,703 | 61,691,368 | $ | 575,035,467 | ||||||||||
Shares issued through in-kind contribution* | — | — | 1,106,339 | 9,536,640 | ||||||||||||
Shares issued to shareholders in reinvestment of distributions | 4,934,007 | 49,488,095 | 3,801,472 | 32,578,616 | ||||||||||||
Shares repurchased | (45,785,469 | ) | (449,847,236 | ) | (21,335,163 | ) | (204,864,696 | ) | ||||||||
|
|
|
|
|
|
|
| |||||||||
Net increase | 7,526,305 | $ | 63,645,562 | 45,264,016 | $ | 412,286,027 | ||||||||||
|
|
|
|
|
|
|
| |||||||||
| * | The Fund received a contribution in-kind on December 15, 2011. |
Core Opportunistic
| Year Ended March 31, 2013 | Year Ended March 31, 2012 | |||||||||||||||
| Shares | Amount | Shares | Amount | |||||||||||||
Class Y-3: | ||||||||||||||||
Shares sold | 18,759,679 | $ | 205,364,923 | 14,400,015 | $ | 151,180,806 | ||||||||||
Shares issued to shareholders in reinvestment of distributions | 5,093,239 | 54,090,192 | 4,002,887 | 41,229,733 | ||||||||||||
Shares repurchased | (18,442,944 | ) | (201,159,996 | ) | (23,409,106 | ) | (247,775,298 | ) | ||||||||
|
|
|
|
|
|
|
| |||||||||
Net increase (decrease) | 5,409,974 | $ | 58,295,119 | (5,006,204 | ) | $ | (55,364,759 | ) | ||||||||
|
|
|
|
|
|
|
| |||||||||
212
Mercer Funds
Notes to the Financial Statements (Continued)
March 31, 2013
Emerging Markets
| Period from May 1, 2012 (commencement of operations) through March 31, 2013 | ||||||||
| Shares | Amount | |||||||
Class Y-3: | ||||||||
Shares sold | 50,549,371 | $ | 506,456,931 | |||||
Shares issued to shareholders in reinvestment of distributions | 307,506 | 3,235,418 | ||||||
Shares repurchased | (1,556,779 | ) | (16,307,819 | ) | ||||
|
|
|
| |||||
Net increase | 49,300,098 | $ | 493,384,530 | |||||
|
|
|
| |||||
Global Low Volatility
| Period from November 6, 2012 (commencement of operations) through March 31, 2013 | ||||||||
| Shares | Amount | |||||||
Class Y-3: | ||||||||
Shares sold | 27,449,755 | $ | 278,760,703 | |||||
Shares issued to shareholders in reinvestment of distributions | 46,930 | 485,259 | ||||||
Shares repurchased | (566,151 | ) | (6,042,276 | ) | ||||
|
|
|
| |||||
Net increase | 26,930,534 | $ | 273,203,686 | |||||
|
|
|
| |||||
Short Maturity
| Year Ended March 31, 2013 | Year Ended March 31, 2012 | |||||||||||||||
| Shares | Amount | Shares | Amount | |||||||||||||
Class Y-3: | ||||||||||||||||
Shares sold | 313,807 | $ | 3,000,000 | 396,246 | $ | 3,800,000 | ||||||||||
Shares issued to shareholders in reinvestment of distributions | 57,135 | 545,067 | 90,188 | 857,686 | ||||||||||||
Shares repurchased | (60,326 | ) | (578,188 | ) | (2,977,496 | ) | (28,626,906 | ) | ||||||||
|
|
|
|
|
|
|
| |||||||||
Net increase (decrease) | 310,616 | $ | 2,966,879 | (2,491,062 | ) | $ | (23,969,220 | ) | ||||||||
|
|
|
|
|
|
|
| |||||||||
| 8. | Recent accounting pronouncement |
In December 2011, FASB issued Accounting Standards Update (“ASU”) No. 2011-11, Disclosures about Offsetting Assets and Liabilities, as clarified with ASU 2013-01 “Clarifying the Scope of Disclosures about Offsetting Assets and Liabilities” issued in January 2013. These common disclosure requirements are intended to help investors and other financial statement users better assess the effect or potential effect of offsetting arrangements on a portfolio’s financial position. They also improve transparency in the reporting of how companies mitigate credit risk, including disclosure of related collateral pledged or received. In addition, ASU 2011-11 facilitates comparison between those entities that prepare their financial statements on the basis of U.S. GAAP and those entities that prepare their financial statements on the basis of International Financial Reporting Standards. ASU 2011-11 requires entities to disclose both gross and net information about both instruments and transactions eligible for offset and disclose instruments and transactions subject to an agreement similar to a master netting agreement. The ASU is effective for interim and annual periods beginning after January 1, 2013. Management is currently evaluating the impact, if any, of applying this provision.
213
Mercer Funds
Notes to the Financial Statements (Continued)
March 31, 2013
| 9. | Subsequent events |
Management has evaluated the impact of subsequent events through May 24, 2013, the date the financial statements were available to be issued. Management has determined that there are no material events that would require adjustment or disclosure in the Funds’ financial statements through this date.
214
Report of Independent Registered Public Accounting Firm
To the Board of Trustees and Shareholders of Mercer Funds:
We have audited the accompanying statements of assets and liabilities, including the schedules of investments, of Mercer Funds (the “Funds”), comprising Mercer US Large Cap Growth Equity Fund, Mercer US Large Cap Value Equity Fund, Mercer US Small/Mid Cap Growth Equity Fund, Mercer US Small/Mid Cap Value Equity Fund, Mercer Non-US Core Equity Fund, Mercer Core Opportunistic Fixed Income Fund, Mercer Emerging Markets Equity Fund, Mercer Global Low Volatility Equity Fund, and Mercer US Short Maturity Fixed Income Fund as of March 31, 2013, and the related statements of operations for the year then ended, and the statements of changes in net assets and the financial highlights for the periods presented. These financial statements and financial highlights are the responsibility of the Funds’ management. Our responsibility is to express an opinion on these financial statements and financial highlights based on our audits.
We conducted our audits in accordance with the standards of the Public Company Accounting Oversight Board (United States). Those standards require that we plan and perform the audit to obtain reasonable assurance about whether the financial statements and financial highlights are free of material misstatement. The Funds are not required to have, nor were we engaged to perform, an audit of their internal control over financial reporting. Our audits included consideration of internal control over financial reporting as a basis for designing audit procedures that are appropriate in the circumstances, but not for the purpose of expressing an opinion on the effectiveness of the Funds’ internal control over financial reporting. Accordingly, we express no such opinion. An audit also includes examining, on a test basis, evidence supporting the amounts and disclosures in the financial statements, assessing the accounting principles used and significant estimates made by management, as well as evaluating the overall financial statement presentation. Our procedures included confirmation of securities owned as of March 31, 2013, by correspondence with the custodian, brokers, and selling or agent banks; where replies were not received from brokers and selling or agent banks, we performed other auditing procedures. We believe that our audits provide a reasonable basis for our opinion.
In our opinion, the financial statements and financial highlights referred to above present fairly, in all material respects, the financial position of each of the Funds constituting the Mercer Funds as of March 31, 2013, the results of their operations for the year then ended, the changes in their net assets and the financial highlights for each of the periods presented, in conformity with accounting principles generally accepted in the United States of America.
/s/ DELOITTE & TOUCHE LLP
May 24, 2013
215
Mercer Funds
Additional Information (Unaudited)
Proxy Voting
A description of the policies and procedures that the Advisor and each Fund’s Subadvisors use to determine how to vote proxies relating to the Fund’s portfolio securities is available, without charge, upon request, by calling 1-866-658-9896, and on the Securities and Exchange Commission’s (“SEC”) website at http://www.sec.gov. Information about Funds’ proxy voting decisions are available without charge, online on the Funds’ website at http://www.mercer.us/mutual-funds-on-offer.
Quarterly Reporting
The Funds file their complete schedule of portfolio holdings with the Securities and Exchange Commission for the first and third quarters of each fiscal year on Form N-Q, which when filed, will be available on the SEC’s website at http://www.sec.gov. When filed, the Funds’ Form N-Q may be reviewed and copied at the Commission’s Public Reference Room in Washington, D.C. Information on the operation of the Public Reference Room may be obtained by calling 1-800-SEC-0330.
Federal Tax Information
The amount of long-term capital gains paid for the fiscal year ended March 31, 2013, the amount of long-term capital gains paid were as follows:
Fund | ||||
Large Cap Growth | $ | 12,798,740 | ||
Small/Mid Cap Growth | 22,684,930 | |||
Small/Mid Cap Value | 10,843,125 | |||
Core Opportunistic | 5,001,334 | |||
Qualified dividend income (“QDI”) received by the Funds through March 31, 2013, that qualified for a reduced tax rate pursuant to the Internal Revenue Code Section 1(h)(11) are as follows:
Fund | QDI | |||
Large Cap Growth | $ | 4,895,901 | ||
Large Cap Value | 10,114,952 | |||
Small/Mid Cap Growth | 2,258,731 | |||
Small/Mid Cap Value | 5,564,747 | |||
Non-US Core Equity | 46,800,757 | |||
Core Opportunistic | 60,135 | |||
Emerging Markets | 3,085,283 | |||
Global Low Volatility | 2,347,590 | |||
For corporate shareholders, a portion of the ordinary dividends paid during the Funds’ year ended March 31, 2013, qualified for the dividends received reduction, as follows:
Fund | ||||
Large Cap Growth | 100.00 | % | ||
Large Cap Value | 95.70 | % | ||
Small/Mid Cap Growth | 17.90 | % | ||
Small/Mid Cap Value | 36.09 | % | ||
Core Opportunistic | 0.14 | % | ||
Emerging Markets | 0.00 | % | ||
Global Low Volatility | 25.03 | % | ||
216
Mercer Funds
Additional Information (Unaudited) (Continued)
Board Approval of Investment Advisory Agreement and Subadvisory Agreements for Mercer Global Low Volatility Equity Fund during the period October 1, 2012 through March 31, 2013
Mercer Global Low Volatility Equity Fund
Approval of the Investment Management Agreement for the Mercer Global Low Volatility Equity Fund
At a July 2012 Meeting, the Board, including the Independent Trustees, considered and approved the Investment Management Agreement between the Mercer Global Low Volatility Equity Fund (the “Global Low Volatility Fund”) and Mercer Investment Management, Inc. (“MIM” or the “Advisor”) (the “Investment Management Agreement”). In considering the approval of the amendment to the Investment Management Agreement with MIM for the Global Low Volatility Fund, the Independent Trustees had considered the information and materials from the Advisor and from counsel that were prepared for the June meeting of the Board of Trustees (the “June Meeting”), as well as certain other materials prepared for this meeting, including: (i) the Investment Management Agreement with respect to the Advisor’s management of the assets of each Fund; (ii) information describing the nature, extent, and quality of the services that the Advisor provided to the Funds and is expected to provide to the Global Low Volatility Fund; the fees that the Advisor proposes to charge to the Global Low Volatility Fund for these services; and a comparison of those fees to the fees paid by a peer group of other investment companies having investment objectives similar to the investment objectives of the Global Low Volatility Fund, and that were identified as competitors, as contained in the Lipper Report; (iii) information regarding the Advisor’s business and operations; financial position; portfolio management team; and compliance program; (iv) information describing the Global Low Volatility Fund’s expected operating expenses compared to the Fund’s peer group of other registered investment companies with investment objectives similar to the investment objectives of the Fund, and that were identified by Lipper in the Lipper Report; (v) information regarding the Advisor’s expected profitability in managing the Global Low Volatility Fund and the Fee Waiver/Expense Limitation Agreement, pursuant to which MIM has agreed to subsidize the Fund’s expenses at specific levels through July 31, 2014; and (vi) information regarding the benefits that MIM may enjoy in the future as a result of its relationship with the Global Low Volatility Fund.
The Independent Trustees also considered presentations made by, and discussions held with, representatives of the Advisor, both at this Meeting, at the June Meeting, and throughout the course of the year at regularly scheduled Board meetings. The Independent Trustees also evaluated MIM’s answers and responses to the questions and information requests contained in the 15(c) Information Request Letter provided at the June Meeting.
In their consideration of the approval of the Investment Management Agreement, the Independent Trustees considered the following factors.
(a) The nature, extent, and quality of the services to be provided by the Advisor. The Independent Trustees reviewed the services that the Advisor expects to provide to the Global Low Volatility Fund and has provided to the Funds. In connection with the investment advisory services that were to be provided to the Global Low Volatility Fund, the Independent Trustees considered the qualifications, experience, and capabilities of the Advisor’s portfolio management team and other investment personnel, and the extent of care and conscientiousness with which MIM personnel performed their duties.
In this regard, the Independent Trustees considered that, while MIM would focus primarily on the selection, evaluation, and oversight of the Global Low Volatility Fund’s Subadvisors, consistent with the Trust’s multi-manager structure, the Advisor also had other extensive responsibilities as the Global Low Volatility Fund’s investment advisor, including: the provision of investment advice; the allocation of the Global Low Volatility Fund’s assets among multiple subadvisors (including overseeing the process of transitioning assets among subadvisor(s) as necessary, and the fee negotiation process whereby the Advisor sought to achieve an appropriate and competitive level of fees and fee structure, and the Advisor’s continual monitoring of the ongoing appropriateness and competitiveness of each subadvisory fee and fee structure (including the Advisor’s initiative to renegotiate and implement reduced subadvisor fee schedules); the monitoring of each Subadvisor’s investment performance and processes; the oversight of each Subadvisor’s compliance with the Global Low Volatility Fund’s investment objective, policies, and limitations; review of portfolio security brokerage and trading practices; oversight of general portfolio compliance with relevant law; and the implementation of Board directives as those directives may relate to the Global Low Volatility Fund.
217
Mercer Funds
Additional Information (Unaudited) (Continued)
The Independent Trustees discussed the Advisor’s ability and willingness to identify instances where there was a need to add a new subadvisor, to replace a current subadvisor, to reallocate Fund assets among current subadvisors, to utilize a new strategy of a current subadvisor, or to implement a combination of these measures, as well as the Advisor’s ability to timely, efficiently, and economically effect such changes. The Independent Trustees reviewed the proprietary tools utilized by the Advisor to review, select, evaluate, and monitor subadvisors for the Funds, as well as the Advisor’s experience, resources, and strengths in advising the Mercer Collective Trust and the Mercer Group Trust, two other pooled investment vehicles overseen by MIM.
The Independent Trustees discussed the Trust’s multi-manager structure, and the services required by the Trust as a consequence of that structure, as measured against an investment company without multiple subadvisors. The Independent Trustees also evaluated the nature, extent, and quality of the non-investment advisory and administrative services that were to be provided to the Global Low Volatility Fund by MIM, such as the supervision of the Fund’s third-party service providers. The Independent Trustees considered the scope and substance of MIM’s regulatory and compliance policies, procedures, and systems. The Independent Trustees evaluated MIM’s capabilities in providing the administrative and compliance services needed to support management of the Global Low Volatility Fund, and the information that regularly had been provided by the CCO to the Trustees at prior Board meetings. The Independent Trustees also considered MIM’s willingness both to add personnel and to replace existing personnel, as the Funds have grown, in order to ensure that appropriate staffing levels were maintained, and to enhance the distribution of the Funds. The Independent Trustees also recalled the Advisor’s identification of the large number of new employees that had been hired over the prior year as MIM grew. Based on their consideration and review of the foregoing information, the Independent Trustees determined that the Funds benefited, and that the Global Low Volatility Fund would benefit, from the nature, extent, and quality of these services, as well as the Advisor’s ability to continue to provide these services based on MIM’s experience, operations, and resources.
(b) The costs of the services to be provided and the profits expected to be realized by the Advisor and its affiliates from the Advisor’s relationship with the Global Low Volatility Fund. The Independent Trustees compared the Global Low Volatility Fund’s contractual management fee and expense ratio to other investment companies considered to be in the Fund’s respective peer group (as identified by Lipper in its Report), and noted the Funds’ favorable rankings.
The Independent Trustees considered the costs of organizing and operating the Global Low Volatility Fund, and the significant economic impact that these activities could have on the profitability of the Advisor. The Independent Trustees also discussed the costs of compensating the proposed Global Low Volatility Fund Subadvisors (as well as MIM’s initiative to negotiate reduced fee schedules for the proposed Global Low Volatility Fund Subadvisors, which may allow the Advisor to reach profitability more quickly). The Independent Trustees noted the Advisor’s commitment to limit the Global Low Volatility Fund’s expenses through the Fee Waiver/Expense Limitation Agreement with the Trust. In addition, the Independent Trustees discussed the entrepreneurial risk undertaken by the Advisor in creating and operating the Global Low Volatility Fund. The Independent Trustees recalled their discussions, both at this Meeting and at prior meetings, regarding MIM’s subsidizing the Funds in their initial stages, and the significant losses that MIM had sustained, as well as MIM reiterating both its and Mercer’s resolution to continue to waive MIM’s fees and to reimburse Fund expenses, until such time as the Funds reach profitable asset levels. After comparing the Global Low Volatility Fund’s fees with the fees of other funds in the Fund’s respective peer group, and in light of the nature, extent, and quality of services that were expected to be provided by the Advisor and the costs that were expected to be incurred by the Advisor in rendering those services, the Independent Trustees concluded that the level of fees that were paid to the Advisor with respect to the Global Low Volatility Fund was fair and reasonable.
The Independent Trustees also considered the other relationships that the Advisor and its affiliates have with the Trust, and any ancillary benefits that could be realized by the Advisor and its affiliates from the Advisor’s relationship with the Global Low Volatility Fund, as well as the comments of MIM personnel at this Meeting and the June Meeting. The Independent Trustees recognized that because of the Trust’s multi-manager structure, the Advisor would not be placing portfolio transactions on behalf of the Global Low Volatility Fund, and, thus, the Advisor would not receive proprietary research from broker-dealers that executed the Fund’s portfolio transactions. In addition, the Independent Trustees noted that MIM, as a policy, would not receive any services paid for by Global Low Volatility Fund soft dollar commissions. As such, the Independent Trustees took note of the fact that
218
Mercer Funds
Additional Information (Unaudited) (Continued)
the Advisor did not derive any benefits from any Global Low Volatility Fund portfolio transactions, which benefits would be enjoyed by the proposed Global Low Volatility Fund Subadvisors, and in the case of other registered investment companies, by their investment managers.
The Independent Trustees noted that the Advisor, by managing the Funds, may benefit (along with its affiliates) to the extent that potential investors view MIM and its affiliates as providing a diverse array of investment products, and managing different asset classes, which were available through multiple investment vehicles. The Independent Trustees also noted that the Advisor serves as the Trust’s internal administrator, and the Advisor will be entitled to receive compensation from the Class S, Class Y-1, and Class Y-2 shares of the Funds for acting in that capacity (although no compensation had been paid to date). The Independent Trustees also considered that, in return for this compensation, the Advisor was responsible for, among other things, attending to shareholder correspondence, assisting with the purchase and redemption of shares, and preparing and distributing documents for shareholder use. As such, the Independent Trustees concluded that the benefits that may accrue to the Advisor and its affiliates by virtue of their relationships to the Global Low Volatility Fund were reasonable and fair in comparison with the costs of providing the relevant services.
(c) The investment performance of the Funds and the Advisor. The Independent Trustees recognized that the Global Low Volatility Fund was a new fund and, therefore, had no performance history to review. Accordingly, the Independent Trustees recalled at the June Meeting, the overall investment performance of the Funds generally, and their evaluation of Fund performance in the context of the Trust’s multi-manager structure, and the unique considerations that this structure required. The Independent Trustees also considered that MIM continued to be proactive in seeking to replace and/or add subadvisors, to reallocate assets among subadvisors, and to implement new investment subadvisor strategies, with a view to improving Fund performance over the long term. On this basis, the Independent Trustees concluded that MIM’s performance in managing the Funds generally suggested that the Advisor’s management of the Global Low Volatility Fund would benefit the Fund and its shareholders.
Conclusion. Following full consideration of the foregoing factors, it was reported that no single factor was determinative to the decisions of the Independent Trustees. Based on these factors, and such other matters as were deemed relevant, the Independent Trustees concluded that the management fee rate of the Global Low Volatility Fund was reasonable in relation to the services to be provided by the Advisor to the Fund, as well as the costs that were expected to be incurred and benefits that were expected to be gained by the Advisor in providing such services. The Independent Trustees also found MIM’s investment management fee to be reasonable in comparison to the fees charged by the investment advisors to the investment companies included in the Funds’ peer groups in the Lipper Report. As a result, the Independent Trustees concluded that the approval of the Investment Management Agreement was in the best interests of the Global Low Volatility Fund and its shareholders, and the Independent Trustees unanimously approved the Investment Management Agreement and recommended the Agreement’s approval to the Board.
Approval of the Subadvisory Agreements for the Global Low Volatility Equity Fund
At a July 2012 Meeting, the Board, including the Independent Trustees, considered and approved the subadvisory agreements (together, the “Subadvisory Agreements”) entered into by the Advisor and the following subadvisors for the Global Low Volatility Fund: Acadian Asset Management LLC; First Eagle Investment Management, LLC; and Magellan Asset Management Limited (each a “Subadvisor,” and together, the “Subadvisors”).
In considering the approval of the Subadvisory Agreements, the Independent Trustees considered the information and materials from the Advisor and counsel that included, as to each Subadvisor and the Global Low Volatility Fund: (i) the Subadvisory Agreement between the Advisor and the Subadvisor; (ii) information regarding the process by which the Advisor had reviewed, selected, and recommended the Subadvisor for the Board’s approval, and MIM’s rationale for recommending that each Subadvisor be appointed as a subadvisor to the Global Low Volatility Fund, complementing the Global Low Volatility Fund’s other proposed subadvisors; (iii) the nature, extent, and quality of the services that the Subadvisor proposed to provide to the Global Low Volatility Fund; (iv) the investment management business, portfolio management personnel, operations, prior investment experience, and reputation of the Subadvisor; (v) the Subadvisor’s brokerage and trading policies and practices; (vi) the level of subadvisory fees to be charged by the Subadvisor for its services to the Global Low Volatility Fund, and a
219
Mercer Funds
Additional Information (Unaudited) (Continued)
comparison of those fees to the fees charged by the Subadvisor to other accounts that the Subadvisor managed; (vii) the compliance program of the Subadvisor; (viii) the historical performance returns of the Subadvisor managing the Subadvisor’s global low volatility strategy, and a comparison of the Subadvisor’s performance to relevant benchmarks; and (ix) the financial condition of the Subadvisor. In addition, the Independent Trustees considered presentations made by, and discussions held with, representatives of the Advisor and representatives of the Subadvisors at the Board meeting. The Independent Trustees also evaluated answers and responses to applicable information requests contained in their 15(c) Information Request Letter. The Independent Trustees considered and analyzed the factors that the Independent Trustees deemed relevant with respect to each Subadvisor, including: the nature, extent, and quality of the services that were provided to the applicable Fund by the Subadvisor; the Subadvisor’s investment management style; the Subadvisor’s historical performance record managing an global low volatility portfolio, as well as pooled investment products similar to the Global Low Volatility Fund; the qualifications and experience of the employees at the Subadvisor who were responsible for the day-to-day management of the allocated portion of the Global Low Volatility Fund; and the Subadvisor’s staffing levels and overall resources. Additionally, the Independent Trustees received assistance and advice regarding legal and industry standards and reviewed materials supplied by counsel.
In particular, and as to each Subadvisor, the Independent Trustees considered the following factors:
(a) The nature, extent, and quality of the advisory services that were provided by the Subadvisors. The Independent Trustees reviewed the nature, extent, and quality of the advisory services to be provided by each Subadvisor to the Global Low Volatility Fund. The Independent Trustees discussed the specific investment management process that each Subadvisor will employ to manage its allocated portion of the Global Low Volatility Fund’s investment portfolio, the qualifications of each Subadvisor’s portfolio managers and investment management personnel with regard to implementing the investment mandate relating to the allocated portion of the Global Low Volatility Fund’s investment portfolio that each Subadvisor would be managing, and the performance record of each Subadvisor’s global low volatility strategy as compared to the relevant benchmark. The Independent Trustees considered each Subadvisor’s infrastructure and resources, and whether each Subadvisor’s organization appeared to support each Subadvisor’s global low volatility strategy adequately. The Independent Trustees also discussed the Advisor’s review, selection, and due diligence process with respect to the Subadvisors, and the Advisor’s favorable assessment as to the nature, extent, and quality of the subadvisory services expected to be provided to the Global Low Volatility Fund by each Subadvisor. The Independent Trustees determined that the Global Low Volatility Fund and its shareholders would benefit from the quality and experience of each Subadvisor’s portfolio managers and the qualifications of its investment professionals. Based on their consideration and review of the foregoing information, the Independent Trustees concluded that the nature, extent, and quality of the subadvisory services anticipated to be provided by each Subadvisor, as well as each Subadvisor’s ability to render such services based on each Subadvisor’s experience, operations, and resources, were appropriate for the Global Low Volatility Fund.
(b) Comparison of the services to be rendered and fees to be paid to the Subadvisors under other advisory and subadvisory contracts, such as those with other clients; economies of scale. The Independent Trustees discussed the services that would be rendered by each Subadvisor and evaluated the compensation to be paid to each Subadvisor by the Advisor for those services. The Independent Trustees noted that the services that each Subadvisor would furnish to the Global Low Volatility Fund appeared to be comparable to the services that such Subadvisor currently provides to its other advisory and subadvisory clients. The Independent Trustees also considered comparisons of the fees that will be paid to each Subadvisor by the Advisor in light of the fees that were charged by each Subadvisor to its other advisory clients, as disclosed in each Subadvisor’s Form ADV, Part 2A (Firm Brochure) and in its 15(c) questionnaire responses, including commingled and separate accounts. In addition, the Independent Trustees considered the review, selection, and due diligence process employed by the Advisor in determining to recommend each Subadvisor to serve as a subadvisor to the Global Low Volatility Fund, and the Advisor’s reasons for concluding that the subadvisory fees to be paid by MIM to each Subadvisor for its services to the Global Low Volatility Fund were reasonable. The Independent Trustees emphasized in their discussions that the subadvisory fees of each Subadvisor would be paid by the Advisor, and were not additional fees to be borne by the Global Low Volatility Fund or its shareholders. Based on their discussion, the Independent Trustees concluded that, in light of the nature, quality, and extent of the services to be provided, the proposed fees to be paid to each Subadvisor with respect to the assets of the Global Low Volatility Fund to be allocated to each Subadvisor appeared to be within a
220
Mercer Funds
Additional Information (Unaudited) (Continued)
reasonable range. The Independent Trustees also considered the potential “fallout” or ancillary benefits that may accrue to each Subadvisor from its relationship with the Global Low Volatility Fund and concluded that they were reasonable. Since the fees to be paid to each Subadvisor were the result of arm’s-length bargaining between unaffiliated parties, and given the Advisor’s economic incentive to negotiate a reasonable fee, the potential profitability of each Subadvisor was not considered relevant to the Independent Trustees’ deliberations. The Independent Trustees took note of the Advisor’s explanation, earlier in the Meeting, that the recommended appointment of each Subadvisor was not affected by the impact that the appointment would have on MIM’s revenues and profitability, and recalled that the Advisor had demonstrated that the appointment of each Subadvisor may allow the Advisor to reach profitability when managing the Global Low Volatility Fund slightly more quickly. On the basis of these considerations, the Independent Trustees concluded that, in light of the nature, extent, and quality of the services expected to be provided by each Subadvisor and the proposed fees to be paid to each Subadvisor by MIM for managing its allocated portion of the Global Low Volatility Fund, the potential benefits accruing to each Subadvisor as a result of serving as a sub advisor to the Global Low Volatility Fund were reasonable.
(c) Investment performance of the Global Low Volatility Fund and the Subadvisors. Because the Global Low Volatility Fund is a new investment portfolio, the Independent Trustees could not consider each Subadvisor’s investment performance in managing the Fund as a factor in evaluating the Subadvisory Agreements. However, the Independent Trustees reviewed each Subadvisor’s historical investment performance record, utilizing the each Subadvisor’s global low volatility strategy in managing commingled and separate accounts. The Independent Trustees also compared the historical investment performance of each Subadvisor’s global low volatility strategy to relevant benchmarks and concluded that each Subadvisor’s historical performance record, viewed together with the other factors considered by the Independent Trustees, supported a decision to approve the Subadvisory Agreements.
(d) Other Considerations. The Independent Trustees considered MIM’s recommendation that the hiring of each Subadvisor as a sub-advisor to the Global Low Volatility Fund would complement the other proposed Subadvisors of the Fund. The Independent Trustees considered the fairness and reasonableness of the terms of the Subadvisory Agreements.
Conclusion. No single factor was determinative to the decisions of the Independent Trustees. Based on these factors, along with the determinations of the Advisor at the conclusion of its review and due diligence process and such other matters as were deemed relevant, the Independent Trustees concluded that the fee rate for each Subadvisor was reasonable in relation to the services that were provided by the Subadvisors to the Global Low Volatility Fund. As a result, the Independent Trustees unanimously approved the Subadvisory Agreements and recommended to the Board the approval of each Subadvisory Agreement concluded that the approval of the Subadvisory Agreements as being in the best interests of the Global Low Volatility Fund and its shareholders.
221
Mercer Funds
Understanding Your Fund’s Expenses (Unaudited)
As a mutual fund shareholder, you incur different costs: transaction costs, including sales charges (loads) on purchases, redemption fees and certain exchange fees and ongoing costs, including management fees, distribution fees (12b-1 fees), and other fund expenses. These costs are described in more detail in the Funds’ prospectus. The examples below are intended to help you understand the ongoing costs of investing in the Funds and help you compare these with the ongoing costs of investing in other mutual funds. The first line in the table for each Fund shows the actual account values and actual fund expenses you would have paid on a $1,000 investment in the Fund from October 1, 2012 through March 31, 2013. It also shows how much a $1,000 investment would be worth at the close of the period, assuming actual fund returns and expenses. To estimate the expenses you paid over the period, simply divide your account value by $1,000 (for example $8,600 account value divided by $1,000 = $8.60) and multiply the result by the number in the Operating Expenses Incurred column as shown below for your Class. The second line in the table for each Fund provides information about hypothetical account values and hypothetical expenses based on the Fund’s actual expense ratios and an assumed rate of return of 5% per year before expenses, which is not the Fund’s actual return. The hypothetical account values and expenses may not be used to estimate the actual ending account balance or expenses you paid on your investment for the period. You may use this information to compare the ongoing costs of investing in the Fund and other funds. To do so, compare this 5% hypothetical example with the 5% hypothetical examples that appear in the shareholder reports of the other funds. Please note that the expenses shown reflect ongoing costs only, and do not include any transaction costs, such as sales charges, redemption fees or exchange fees. Therefore, the second line in the table of each fund is useful in comparing ongoing costs only, and will not help you determine the relative costs of owning different funds. If transaction costs were included, total costs would be higher.
Large Cap Growth — Class Y-3
Hypothetical Return on $1,000
| Expense Ratio | Beginning Amount | Ending Value | Avg Value | Operating Expense Incurred* | |||||||||||||||||||||
Actual | 0.57 | % | 1,000.00 | 1,068.30 | 1,034.15 | 2.94 | |||||||||||||||||||
Hypothetical | 0.57 | % | 1,000.00 | 1,022.09 | 1,011.05 | 2.87 | |||||||||||||||||||
| * | Actual expenses are equal to the Class’ annualized expense ratio of 0.57%, multiplied by the average account value over the period, multiplied by 182/365 |
Large Cap Value — Class Y-3
Hypothetical Return on $1,000
| Expense Ratio | Beginning Amount | Ending Value | Avg Value | Operating Expense Incurred* | |||||||||||||||||||||
Actual | 0.55 | % | 1,000.00 | 1,143.50 | 1,071.75 | 2.94 | |||||||||||||||||||
Hypothetical | 0.55 | % | 1,000.00 | 1,022.19 | 1,011.10 | 2.77 | |||||||||||||||||||
| * | Actual expenses are equal to the Class’ annualized expense ratio of 0.55%, multiplied by the average account value over the period, multiplied by 182/365 |
Small/Mid Cap Growth — Class Y-3
Hypothetical Return on $1,000
| Expense Ratio | Beginning Amount | Ending Value | Avg Value | Operating Expense Incurred* | |||||||||||||||||||||
Actual | 0.97% | 1,000.00 | 1,130.90 | 1,065.45 | 5.15 | ||||||||||||||||||||
Hypothetical | 0.97% | 1,000.00 | 1,020.09 | 1,010.05 | 4.89 | ||||||||||||||||||||
| * | Actual expenses are equal to the Class’ annualized expense ratio of 0.97%, multiplied by the average account value over the period, multiplied by 182/365 |
222
Mercer Funds
Understanding Your Fund’s Expenses (Unaudited) (Continued)
Small/Mid Cap Value — Class Y-3
Hypothetical Return on $1,000
| Expense Ratio | Beginning Amount | Ending Value | Avg Value | Operating Expense Incurred* | |||||||||||||||||||||
Actual | 0.97% | 1,000.00 | 1,164.00 | 1,082.00 | 5.23 | ||||||||||||||||||||
Hypothetical | 0.97% | 1,000.00 | 1,020.09 | 1,010.05 | 4.89 | ||||||||||||||||||||
| * | Actual expenses are equal to the Class’ annualized expense ratio of 0.97%, multiplied by the average account value over the period, multiplied by 182/365 |
Non-US Core Equity — Class Y-3
Hypothetical Return on $1,000
| Expense Ratio | Beginning Amount | Ending Value | Avg Value | Operating Expense Incurred* | |||||||||||||||||||||
Actual | 0.83% | 1,000.00 | 1,117.60 | 1,058.80 | 4.38 | ||||||||||||||||||||
Hypothetical | 0.83% | 1,000.00 | 1,020.79 | 1,010.40 | 4.18 | ||||||||||||||||||||
| * | Actual expenses are equal to the Class’ annualized expense ratio of 0.83%, multiplied by the average account value over the period, multiplied by 182/365 |
Core Opportunistic — Class Y-3
Hypothetical Return on $1,000
| Expense Ratio | Beginning Amount | Ending Value | Avg Value | Operating Expense Incurred* | |||||||||||||||||||||
Actual | 0.37% | 1,000.00 | 1,011.70 | 1,005.85 | 1.86 | ||||||||||||||||||||
Hypothetical | 0.37% | 1,000.00 | 1,023.09 | 1,011.55 | 1.87 | ||||||||||||||||||||
| * | Actual expenses are equal to the Class’ annualized expense ratio of 0.37%, multiplied by the average account value over the period, multiplied by 182/365 |
Emerging Markets — Class Y3
Hypothetical Return on $1,000
| Expense Ratio | Beginning Amount | Ending Value | Avg Value | Operating Expense Incurred* | |||||||||||||||||||||
Actual | 0.95% | 1,000.00 | 1,056.40 | 1,028.20 | 4.87 | ||||||||||||||||||||
Hypothetical | 0.95% | 1,000.00 | 1,020.19 | 1,010.10 | 4.78 | ||||||||||||||||||||
| * | Actual expenses are equal to the Class’ annualized expense ratio of 0.95%, multiplied by the average account value over the period, multiplied by 182/365 |
223
Mercer Funds
Understanding Your Fund’s Expenses (Unaudited) (Continued)
Global Low Volatility — Class Y3
Hypothetical Return on $1,000
| Expense Ratio | Beginning Amount | Ending Value | Avg Value | Operating Expense Incurred* | |||||||||||||||||||||
Actual | 0.85% | 1,000.00 | 1,121.30 | 1,060.65 | 3.58 | ||||||||||||||||||||
Hypothetical | 0.85% | 1,000.00 | 1,016.49 | 1,008.24 | 3.40 | ||||||||||||||||||||
| * | Actual expenses are equal to the Class’ annualized expense ratio of 0.85%, multiplied by the average account value over the period, multiplied by 145/365 |
Short Maturity — Class Y3
Hypothetical Return on $1,000
| Expense Ratio | Beginning Amount | Ending Value | Avg Value | Operating Expense Incurred* | |||||||||||||||||||||
Actual | 0.32% | 1,000.00 | 1,002.00 | 1,001.00 | 1.60 | ||||||||||||||||||||
Hypothetical | 0.32% | 1,000.00 | 1,023.34 | 1,011.67 | 1.61 | ||||||||||||||||||||
| * | Actual expenses are equal to the Class’ annualized expense ratio of 0.32%, multiplied by the average account value over the period, multiplied by 182/365 |
224
Mercer Funds
Trustees and Officers (Unaudited)
The following tables list the Trust’s Trustees and Officers as of the date of this report; their address and age; their position with the Trust; the length of time holding that position with the Trust; their principal occupation(s) during the past five years; the number of portfolios in the fund complex they oversee; and other directorships they hold in companies subject to registration or reporting requirements of the Securities Exchange Act of 1934 (generally called “public companies”) or in registered investment companies. The Trust’s Statement of Additional Information (“SAI”) includes additional information about the Trust’s trustees, including changes subsequent to the date of the report. The SAI is available, without charge, upon request, by calling 1-866-658-9896, or on the SEC website at www.sec.gov.
Independent Trustees
Name, Address | Position(s) | Term of | Principal | Number of Portfolios in Fund Complex* Overseen by Trustee | Other | ||||||||
Harrison M. Bains, Jr. 99 High Street Boston, MA 02110 (70) | Trustee | Since 2005 | Mr. Bains is retired. | 9 | Mr. Bains is a director of BG Medicine, Inc. and Trustee of BofA Fund Series Trust (11 portfolios). | ||||||||
Adela M. Cepeda A.C. Advisory, Inc. 150 North Wacker Drive, Suite 2160 Chicago, IL 60606 (55) | Chairperson and Trustee | Chairperson Since 2011, Trustee Since 2005 | Ms. Cepeda is Founder and President of A.C. Advisory, Inc. (a financial advisory firm) since 1995. | 9 | Ms. Cepeda is a director of The UBS Funds (19 portfolios), UBS Relationship Funds (25 portfolios), Fort Dearborn Income Securities, Inc., SMA Relationship Trust (5 portfolios, Consulting Group Capital Markets Funds (11 portfolios), and the Amalgamated Bank of Chicago. | ||||||||
Gail A. Schneider 99 High Street Boston, MA 02110 (64) | Trustee | Since 2009 | Ms. Schneider is a self-employed consultant since 2007. From 2002 to 2007, Ms. Schneider was retired. | 9 | None | ||||||||
225
Mercer Funds
Trustees and Officers (Unaudited) (Continued)
Interested Trustee:
Name, Address | Position(s) | Term of | Principal | Number of Portfolios in Fund Complex* Overseen by Trustee | Other | ||||||||
Richard Nuzum** (45) | Trustee, President, and Chief Executive Officer | Since 2010 | Mr. Nuzum is President and Global Business Leader of Mercer’s Investment Management Business since 2009. Mr. Nuzum was Americas Business Leader for Mercer Investment Consulting from 2005-2008. | 9 | Mr. Nuzum is a trustee of Mercer Trust Company and a director of Mercer Investment Management, Inc. Mr. Nuzum served as a director of Mercer Investment Consulting, Inc. from 2005 to 2008. | ||||||||
| (1) | Each Trustee holds office for an indefinite term. |
| * | The “Fund Complex” consists of the Trust, which has nine portfolios effective September 30, 2012. The ninth portfolio, Mercer Global Low Volatility Equity Fund, commenced operations on November 6, 2012. |
| ** | Mr. Nuzum is considered to be an “interested person” of the Trust as defined in the 1940 Act, due to his relationship with the Advisor. |
226
Mercer Funds
Trustees and Officers (Unaudited) (Continued)
Officers:
The executive officers of the Trust not named above are:
Name and Age | Position(s) | Term of | Principal Occupation(s) During Past 5 Years | |||
Tom Murphy (42) | Vice President | Since 2011 | Mr. Murphy is President of Mercer Investment Management, Inc. since 2011. He was Chief Investment Officer of Mercer Investment Management, Inc. from 2011-2012. Previously, Mr. Murphy was a Business Leader for Mercer Investment Management in EMEA since 2006. | |||
Richard S. Joseph (48) | Vice President, Treasurer, and Chief Financial Officer | Since 2005 | Mr. Joseph is Chief Operating Officer, Mercer Investment Management, Inc. since 2005. | |||
Stan Mavromates (52) | Vice President and Chief Investment Officer | Since 2012 | Mr. Mavromates is Vice President and Chief Investment Officer of Mercer Investment Management, Inc. since 2012. He served as Chief Investment Officer of the Massachusetts Pension Reserves Investment Management Board since 2005. | |||
Scott M. Zoltowski (44) | Vice President, Chief Legal Officer and Secretary | Since 2008 | Mr. Zoltowski is a partner of Mercer (US) Inc. and serves as Global Chief Counsel - Investments, for Mercer Investment Management, Inc. and Mercer Investment Consulting, Inc. Prior to this, Mr. Zoltowski was Senior Counsel and Vice President prior to this for State Street Global Advisors from 2006-2008. | |||
Colin Dean (36) | Vice President and Assistant Secretary | Since 2010 | Mr. Dean has served as Legal Counsel - Investments for Mercer Investment Management, Inc. since 2010. Prior to that, Mr. Dean was an Associate at Dechert LLP from 2007-2010 and Associate Counsel at Affiliated Managers Group, Inc. from 2005-2007. | |||
Manny Weiss (64) | Vice President | Since 2010 | Mr. Weiss is a Portfolio Manager and Principal of Mercer Investment Management, Inc. since 2009. From 2006 to 2008, Mr. Weiss worked for 21 Capital Group, an affiliate of Old Mutual Asset Management, in Hedge Fund Manager Research and Client Service. | |||
Larry Vasquez (46) | Vice President | Since 2012 | Mr. Vasquez is a Vice President and Portfolio Manager of Mercer Investment Management, Inc. since 2012. Prior to joining Mercer, he was a Portfolio Manager at UBS Global Asset Management, Inc. from 2009 to 2012. Prior to 2009, Mr. Vasquez was a Portfolio Manager at SEI Investments. | |||
Wil Berglund (42) | Vice President | Since 2010 | Mr. Berglund is a Portfolio Manager and Principal of Mercer Investment Management, Inc. since 2009. From 2000 to 2008, Mr. Berglund held several positions with Putnam Investments including fixed income portfolio manager. | |||
Mark Gilbert (41) | Vice President and Chief Compliance Officer | Since 2011 | Mr. Gilbert is the Chief Compliance Officer - Investments of Mercer Investment Management, Inc. and Mercer Investment Consulting, Inc. since 2011. He previously held the position of Americas Compliance Leader - Investments since 2007. | |||
| † | Officers of the Trust are elected by the Trustees and serve at the pleasure of the Board. |
227
Shares of Mercer Funds are distributed by MGI Funds Distributors, LLC.
Item 2. Code of Ethics.
As of March 31, 2011, the Registrant has adopted a code of ethics that applies to its Principal Executive Officer and Treasurer. For the year ended March 31, 2013, there were no amendments to a provision of its code of ethics, nor were there any waivers, including implicit waivers granted from a provision of the code of ethics. A copy of the Registrant’s code of ethics is filed with the Form N-CSR under Item 12(a) (1).
Item 3. Audit Committee Financial Expert.
The Registrant’s Board of Trustees has determined that the Registrant has at least one audit committee financial expert serving on its audit committee. The audit committee financial expert serving on the Registrant’s audit committee is Harrison M. Bains, Jr., who is “independent” as defined in Item 3(a)(2) of this Form.
Item 4. Principal Accountant Fees and Services.
(a) Audit Fees – The aggregate fee billed for the fiscal year for professional services rendered by the principal accountant for the audit of the Registrant’s annual financial statements or services that are normally provided by the accountant in connection with statutory and regulatory filings or engagements was $277,950 and $359,640 for the fiscal years ended March 31, 2012 and March 31, 2013, respectively.
(b) Audit-Related Fees – There were no fees billed for the fiscal years ended March 31, 2012 and March 31, 2013 for assurance and related services by the principal accountant that are reasonably related to the performance of the audit of the Registrant’s financial statements and are not reported under (a) of this Item.
(c) Tax Fees – The aggregate fee billed in the last fiscal year for professional services rendered by the principal accountant for the review of the Registrant’s tax returns and excise tax calculations was $41,650 and $69,480 for the fiscal years ended March 31, 2012 and March 31, 2013, respectively.
(d) All Other Fees – There were no other fees billed for the fiscal years ended March 31, 2012 and March 31, 2013 for products and services provided by the principal accountant, other than the services reported in (a) through (c) of this Item.
(e) (1) The Registrant’s audit committee pre-approves all audit and non-audit services to be performed by the Registrant’s accountant before the accountant is engaged by the Registrant to perform such services.
(2) There were no services described in (b) through (d) above (including services required to be approved by the audit committee pursuant to paragraph (c)(7)(ii) of Rule 2-01 of Regulation S-X) that were approved by the audit committee pursuant to paragraph (c)(7)(i)(C) of Rule 2-01 of Regulation S-X.
| (f) | None of the hours expended on the principal accountant’s engagement to audit the Registrant’s financial statements for the fiscal year ended March 31, 2013 were attributable to work performed by persons other than the principal accountant’s full-time, permanent employees. |
| (g) | There were no aggregate fees billed for the fiscal year ended March 31, 2013 by the Registrant’s principal accountant for non-audit services rendered to the Registrant, its investment adviser and any entity controlling, controlled by or under common control with the investment adviser that provides ongoing services to the Registrant. |
| (h) | Not applicable. |
Item 5. Audit Committee of Listed Registrants.
Not applicable.
Item 6. Schedule of Investments.
The Registrant’s full schedules of investments are included as part of the report to shareholders filed under Item 1 of this Form.
Item 7. Disclosure of Proxy Voting Policies and Procedures for Closed-End Management Investment Companies.
Not applicable.
Item 8. Portfolio Managers of Closed-End Investment Companies.
Not applicable.
Item 9. Purchases of Equity Securities by Closed-End Management Investment Company and Affiliated Purchasers.
Not applicable.
Item 10. Submission of Matters to a Vote of Security Holders.
There have been no material changes to the procedures by which the shareholders may recommend nominees to the Registrant’s Board of Directors, where those changes were implemented after the Registrant last provided disclosure in response to the requirements of Item 22(b)(15) of Schedule 14A (17 CFR 240.14a-101), or this Item.
Item 11. Controls and Procedures.
(a) The Registrant’s Principal Executive Officer and Principal Financial Officer concluded that the Registrant’s disclosure controls and procedures (as defined in Rule 30a-3(c) under the Investment Company Act of 1940 (17 CFR 270.30a-3(c))), are effective based on the evaluation of Registrant’s disclosure controls and procedures as of a date within 90 days prior to the filing date of this report.
(b) There were no changes in the Registrant’s internal control over financial reporting (as defined in Rule 30a-3(d) under the Investment Company Act of 1940 (17 CFR 270.30a-3(d))), that occurred during the Registrant’s second fiscal quarter of the period covered by this report that has materially affected, or is reasonably likely to materially affect, the Registrant’s internal control over financial reporting.
Item 12. Exhibits.
(a)(1) Code of Ethics for the Registrant’s Principal Executive Officer and Treasurer (as referenced in Item 2 above), attached hereto as Exhibit (a)(1).
(a)(2) Certification of the Principal Executive Officer and Principal Financial Officer of the Registrant as required by Rule 30a-2(a) under the Investment Company Act of 1940 (17 CFR 270.30a-2(a)) is attached hereto as Exhibit 99CERT.
(a)(3) Not applicable.
(b) Certification pursuant to Section 906 of the Sarbanes-Oxley Act of 2002 as required by Rule 30a-2(b), under the Investment Company Act of 1940 (17 CFR 270.30a-2(b)), Rule 15d-14(b) under the Securities Exchange Act of 1934 (17 CFR 240.15d-14(b)) and Section 1350 of Chapter 63 of Title 18 of the United States Code (18 U.S.C. 1350) is attached hereto as Exhibit 99.906CERT.
SIGNATURES
Pursuant to the requirements of the Securities Exchange Act of 1934 and the Investment Company Act of 1940, the Registrant has duly caused this report to be signed on its behalf by the undersigned, thereunto duly authorized.
| (Registrant) | Mercer Funds |
| By (Signature and Title) | By: /s/ Richard Nuzum | |
Richard Nuzum President and Chief Executive Officer (Principal Executive Officer) |
| Date | May 23, 2013 | |||
Pursuant to the requirements of the Securities Exchange Act of 1934 and the Investment Company Act of 1940, this report has been signed below by the following person on behalf of the Registrant and in the capacities and on the date indicated.
| By (Signature and Title) | By: /s/ Richard Nuzum | |
Richard Nuzum President and Chief Executive Officer (Principal Executive Officer) |
| Date | May 23, 2013 | |||
| By (Signature and Title) | By: /s/ Richard S. Joseph | |
Richard S. Joseph Vice President, Treasurer and Principal Accounting Officer (Principal Financial Officer) |
| Date | May 23, 2013 | |||