Table of Contents
UNITED STATES
SECURITIES AND EXCHANGE COMMISSION
Washington, DC 20549
FORM N-CSR
CERTIFIED SHAREHOLDER REPORT OF REGISTERED
MANAGEMENT INVESTMENT COMPANIES
Investment Company Act File Number:
811-21732
Mercer Funds
(Exact Name of Registrant as Specified in Charter)
99 High Street
Boston, MA 02110
(Address of Principal Executive Offices)(Zip Code)
Scott M. Zoltowski, Esq.
Mercer Investment Management, Inc.
99 High Street
Boston, MA 02110
(Name and Address of Agent for Service)
Registrant’s Telephone Number, including Area Code:
(617) 747-9500
Date of Fiscal Year End: March 31, 2014
Date of Reporting Period: March 31, 2014
Table of Contents
Item 1. Reports to Stockholders.
The Report to Shareholders is attached herewith.
Table of Contents

Mercer Funds™
Annual Report
Mercer US Large Cap Growth Equity Fund
Mercer US Large Cap Value Equity Fund
Mercer US Small/Mid Cap Growth Equity Fund
Mercer US Small/Mid Cap Value Equity Fund
Mercer Non-US Core Equity Fund
Mercer Core Fixed Income Fund (formerly known as Mercer Core Opportunistic Fixed Income Fund)
Mercer Opportunistic Fixed Income Fund
Mercer Emerging Markets Equity Fund
Mercer Global Low Volatility Equity Fund
This report has been prepared for Mercer Funds shareholders. It is not authorized for distribution to prospective investors unless accompanied or preceded by a current Mercer Funds prospectus. The prospectus contains more complete information about the Funds’ investment objectives, risks, and expenses. Investors are reminded to read the prospectus carefully before investing.
March 31, 2014
Table of Contents
MERCER FUNDS
| Page | ||
| 1 | ||
| 28 | ||
| 143 | ||
| 147 | ||
| 150 | ||
| 155 | ||
| 164 | ||
| 204 | ||
| 205 | ||
| 220 | ||
| 223 | ||
Table of Contents
Mercer US Large Cap Growth Equity Fund
Investment Objective and Benchmark
The investment objective of the Fund is long-term total return, which includes capital appreciation and income. The benchmark for the Fund is the Russell 1000® Growth Index.
Investment Strategy
The Fund invests principally in equity securities issued by large capitalization U.S. companies. The companies will generally have higher earnings and/or revenue growth histories or expectations relative to the Russell 1000® Growth Index.
Performance
For the fiscal year ended March 31, 2014, the Fund’s Y-3 share class performance was 23.99% compared to its benchmark return of 23.22%. Performance for the Fund is reported net of operating expenses while the benchmark returns do not include expenses of any kind as indexes are unmanaged.
The Sub-Advisors
As of March 31, 2014, the Fund employed four sub-advisors, Atlanta Capital Management Company, LLC (Atlanta), Neuberger Berman Management LLC (Neuberger Berman), Sands Capital Management, LLC (Sands) and Winslow Capital Management, LLC (Winslow). Atlanta manages its allocated portion of the Fund using high quality securities as a key part of their selection criteria. The firm seeks companies that have a demonstrated history of consistent growth (typically greater than 8%) and earnings stability. Neuberger Berman uses a fundamental process to identify companies with accelerating earnings while seeking to avoid those companies with decelerating earnings. Sands manages a concentrated portfolio using a fundamental, bottom-up approach to identify leading companies in various industries. Winslow manages a portfolio of securities across a range of market capitalizations, earnings growth, market valuations and industry sectors.
Market Commentary and Fund Performance
For the Fund’s fiscal year, the market, as measured by the Russell 3000 Index, rose 22.61%, which exceeded expectations for the period, given the already strong four-year performance coming into the fiscal year. Overall, the fiscal year rewarded economically sensitive stocks, but began with more defensive sectors such as utilities, staples and telecommunications in favor. It wasn’t until the Federal Reserve (Fed) provided guidance in May 2013 on the winding down of asset purchases through its quantitative easing program that more cyclical (i.e., economically sensitive), or at least, non-defensive stocks returned to favor. Bond markets tended to react negatively to the Fed’s guidance leading to a sell off and likewise, bond proxies (i.e., high dividend yielding stocks) within equities also experienced a sharp decline. While economic growth was weak in the first half of 2013, it did nothing to deter the consensus view, as represented by a Bloomberg poll of economists, that predicted 2.5% growth in the second half of the year. Indeed, by the end of the calendar year, U.S. GDP growth was 2.6%. The markets rose largely on valuation expansion, evidence of an improved growth outlook. However, political and economic risks remain and the withdrawal of the Fed’s support is expected to increase the volatility of equity markets. Despite the risks, we expect stronger global growth for the next fiscal year driven by Europe and emerging markets, which will help the U.S. economy and we expect earnings growth to grow at a similar pace as the economy, which will support the current level of the markets.
Among major U.S. equity indices, smaller cap and growth indices outperformed. The best performing index for the fiscal year among 62 U.S. indices was the Russell Microcap® Growth Index and the worst was the Russell Top 200® Value-Defensive™ Index. In addition, cyclical stocks, outperformed on the fiscal year and this is evident in sector performance as industrials, technology and consumer discretionary sectors outperformed.
Within the Russell 1000® Growth Index, the best performing sectors for the fiscal year were health care, industrials, and consumer discretionary, posting gains of 31.1%, 27.6%, and 26.2% respectively. All ten sectors generated positive returns, with financials, utilities, staples and telecommunications lagging on the year, posting returns of 16.2%, 14.0%, 9.4%, and 4.9%, respectively.
1
Table of Contents
Mercer US Large Cap Growth Equity Fund
The Mercer U.S. Large Cap Growth Equity Fund outperformed the Russell 1000® Growth Index during this fiscal year. The Fund’s bias overall is pro-cyclical, although the Fund does employ more defensive type sub-advisors, and the prior fiscal year was a good market environment for the Fund. On a sector attribution basis, the primary driver of the Fund’s outperformance was stock selection in the technology and consumer discretionary sectors. An underweight position to the consumer staples sector was an additional positive contributor to returns. Notable positive contributors in the technology sector included the holdings Facebook and Google, which advanced 136% and 40%, respectively. An underweight to the holding IBM, a large holding in the Index, was also a source of value for the period. In the consumer discretionary sector, holdings priceline.com and Chipotle Mexican Grill were large positive contributors. Stock selection in the energy and health care sectors were areas of weakness. In the energy sector, Cameron and FMC Technologies were large negative contributors posting returns on the fiscal year of -5.3% and -3.9%, respectively. In the health care sector, the holdings Allergan and Biomarin hampered results.
The Winslow portion of the Fund outperformed the Russell 1000® Growth Index for the fiscal year. Stock selection in the consumer discretionary sector and an underweight position in the consumer staples sector added value. In the consumer discretionary sector, holdings priceline.com, BestBuy and Wynn Resorts were notable positive contributors. Stock selection in the health care sector detracted from results. The Sands portion of the Fund outperformed the Index. The primary driver of outperformance was stock selection in the technology and consumer discretionary sectors. In the technology sector, holdings Facebook, Baidu and Splunk were significant positive contributors to excess return. In the consumer discretionary sector, priceline.com and Chipotle Mexican Grill helped results. In the energy sector, FMC Technologies and National Oilwell Varco hampered returns over the fiscal year. Atlanta Capital underperformed on the year, which was not an unexpected result for this more “core growth” oriented sub-advisor. The primary driver of underperformance was stock selection in the energy and industrials sectors. Good stock selection in the financials sector was able to partially offset some of the underperformance. Neuberger Berman underperformed the benchmark for the fiscal year. Overall, this more defensively positioned sub-advisor was in a poor market environment to outperform. Stock selection in the energy sector and an overweight position to the consumer staples sector were the primary drivers of underperformance for the period. Good stock selection in the technology and financials sectors helped results.
Risk Considerations
The Fund invests in growth stocks which may be particularly sensitive to market conditions. The Fund may experience high portfolio turnover which may result in higher costs and capital gains. The Fund’s volatility may be amplified by its ability to select sub-advisors to allocate assets.
2
Table of Contents
Mercer Funds
March 31, 2014
Comparison of Change in Value of a $10,000 Investment in
Mercer US Large Cap Growth Equity Shares vs. the
Russell 1000® Growth Index
As of March 31, 2014
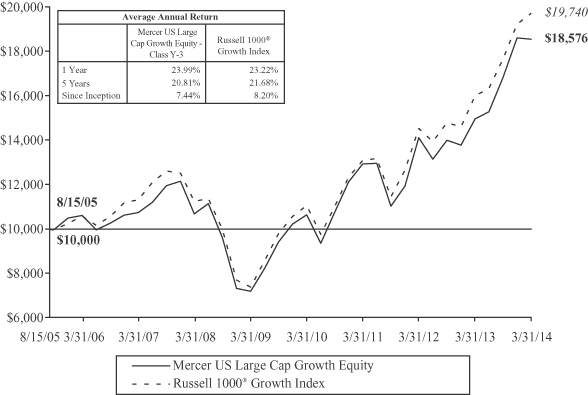
This graph shows the performance of the Mercer US Large Cap Growth Equity Fund Class Y-3 shares versus the Russell 1000® Growth Index from August 15, 2005, which is the inception date of the Fund, through March 31, 2014. The performance of other classes, when launched, will vary from the performance of the class shown based on the difference in fees and expenses paid by shareholders investing in different share classes. The Fund may charge a 2% redemption fee on shares owned less than 30 days.
The table and graph assume reinvestment of dividends and capital gains, but do not reflect a deduction of taxes an investor might pay on fund distributions or upon redemption of fund shares. Performance shown reflects a fee waiver and/or expense reimbursement. Without this waiver/reimbursement, returns would have been lower.
The data quoted represents past performance and does not guarantee future results. Current performance of the Fund may be lower or higher than the performance quoted. Please call 1-866-658-9896 for the Fund’s most recent month-end performance. Investment return and principal value will fluctuate so that an investor’s shares, when redeemed, may be worth more or less than when purchased.
3
Table of Contents
Mercer US Large Cap Value Equity Fund
Investment Objective and Benchmark
The investment objective of the Fund is to provide long-term total return, which includes capital appreciation and income. The benchmark for the Fund is the Russell 1000® Value Index.
Investment Strategy
The Fund invests principally in equity securities issued by large capitalization U.S. companies that are considered undervalued based on the stocks’ intrinsic values relative to their current market prices.
Performance
For the fiscal year ended March 31, 2014, the Fund’s Y-3 share class performance was 29.54% compared to its benchmark return of 21.57%. Performance for the Fund is reported net of operating expenses while the benchmark returns do not include expenses of any kind as indexes are unmanaged.
The Sub-Advisors
As of March 31, 2014, the Fund employed four sub-advisors, Brandywine Global Investment Management, LLC (Brandywine), The Boston Company Asset Management, LLC (TBCAM), Robeco Investment Management, Inc. (Robeco), and O’Shaughnessy Asset Management, LLC (O’Shaughnessy). Brandywine seeks to build portfolios comprised of companies whose valuations are below the market but whose earnings growth prospects are equal or better than the market. The firm favors industry leaders with strong competitive positions and reasonable growth expectations given the team’s view of industry and overall economic conditions. TBCAM’s investment process is driven by bottom-up, fundamental security selection, combining traditional valuation measures with the identification of improving business momentum. Robeco’s process begins with a quantitative analysis that provides a statistical ranking of the investment universe based on valuation, momentum, and fundamental factors. The firm then applies fundamental analysis to those securities that includes validation of the quantitative analysis and fundamental research, including an in-depth review of the issuer’s financials. O’Shaughnessy uses quantitative models in seeking to find the most attractive companies on a shareholder yield basis. This is a combination of dividend yield and share buybacks.
Market Commentary and Fund Performance
For the Fund’s fiscal year, the market, as measured by the Russell 3000 Index, rose 22.61%, which exceeded expectations for the period, given the already strong four-year performance coming into the fiscal year. Overall, the fiscal year rewarded economically sensitive stocks, but began with more defensive sectors such as utilities, staples and telecommunications in favor. It wasn’t until the Federal Reserve (Fed) provided guidance in May 2013 on the winding down of asset purchases through its quantitative easing program that more cyclical (i.e., economically sensitive), or at least, non-defensive stocks returned to favor. Bond markets tended to react negatively to the Fed’s guidance leading to a sell off and likewise, bond proxies (i.e., high dividend yielding stocks) within equities also experienced a sharp decline. While economic growth was weak in the first half of 2013, it did nothing to deter the consensus view, as represented by a Bloomberg poll of economists, that predicted 2.5% growth in the second half of the year. Indeed, by the end of the calendar year, U.S. GDP growth was 2.6%. The markets rose largely on valuation expansion, evidence of an improved growth outlook. However, political and economic risks remain and the withdrawal of the Fed’s support is expected to increase the volatility of equity markets. Despite the risks, we expect stronger global growth for the next fiscal year driven by Europe and emerging markets, which will help the U.S. economy and we expect earnings growth to grow at a similar pace as the economy, which will support the current level of the markets.
Among major U.S. equity indices, smaller cap and growth indices outperformed. The best performing index for the fiscal year among 62 U.S. indices was the Russell Microcap® Growth Index and the worst was the Russell Top 200® Value-Defensive™ Index. In addition, cyclical stocks, outperformed on the fiscal year and this is evident in sector performance as industrials, technology and consumer discretionary sectors outperformed.
4
Table of Contents
Mercer US Large Cap Value Equity Fund
Within the Russell 1000® Value Index, the best performing sectors for the fiscal year were technology, health care and industrials, posting gains of 32.2%, 28.7%, and 27.2%, respectively. All ten sectors generated positive returns, with telecommunications, utilities and energy lagging the other sectors for the year. These latter sectors posted returns of 5.2%, 9.8% and 12.9%, respectively.
The Mercer U.S. Large Cap Value Equity Fund outperformed the Russell 1000® Value Index during the fiscal period. On a sector attribution basis, all sectors posted flat to positive performance indicating a good market environment for the Fund. The Fund employs a combination of yield-seeking, low price-to-earnings and relative value sub-advisors that all enjoyed varying degrees of success over the year. The largest sources of excess return were in the financials, industrials and technology sectors. The only negative contributor to returns on a sector attribution basis was cash, which averaged 0.9% of the portfolio over the period, costing the Fund 0.2% in excess return.
O’Shaughnessy’s outperformance was strong over the period. The primary driver of excess returns was stock selection in the consumer discretionary and industrials sectors. There were no sectors where the strategy did not add value over the benchmark. Brandywine outperformed for the fiscal year. The primary driver of excess returns was stock selection in the industrials and financials sectors. In industrials, an overweight position and good stock selection amongst airlines helped results. The holdings American Airlines and Delta Air Lines were significant positive contributors over the period. In financials, insurance holdings MetLife and Lincoln National were positive contributors. Stock selection in the telecommunications and consumer discretionary sectors hampered results. The holdings China Mobile and Toyota Motor were notable detractors. Robeco outperformed for the fiscal year. Good stock selection in the energy, consumer staples and financials sectors helped results. Stock selection in the materials sector hampered results. The Boston Company outperformed for the fiscal year and like Robeco, the pro-cyclical bias of the portfolio was beneficial. Good sector weighting decisions and stock selection in the financials, consumer discretionary and utilities sectors added value over the period. Stock selection in the health care sector hampered results.
Risk Considerations
Value investing involves the risk that an investment made in undervalued securities may not appreciate in value as anticipated or remain undervalued for long periods of time. The Fund may invest in derivative instruments such as exchange-listed equity futures contracts which involves special risks and may increase volatility due to the use of leverage and management of these sophisticated type instruments. The Fund may experience high portfolio turnover which may result in higher costs and capital gains. The Fund’s volatility may be amplified by its ability to select sub-advisors to allocate assets.
5
Table of Contents
Mercer Funds
March 31, 2014
Comparison of Change in Value of a $10,000 Investment in
Mercer US Large Cap Value Equity Shares vs. the
Russell 1000® Value Index
As of March 31, 2014
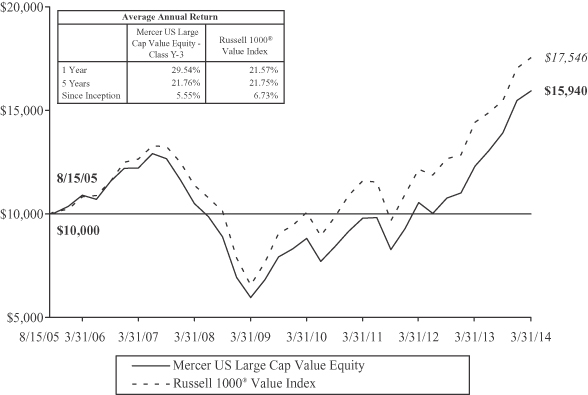
This graph shows the performance of the Mercer US Large Cap Value Equity Fund Class Y-3 shares versus the Russell 1000® Value Index from August 15, 2005, which is the inception date of the Fund, through March 31, 2014. The performance of other classes, when launched, will vary from the performance of the class shown based on the difference in fees and expenses paid by shareholders investing in different share classes. The Fund may charge a 2% redemption fee on shares owned less than 30 days.
The table and graph assume reinvestment of dividends and capital gains, but do not reflect a deduction of taxes an investor might pay on fund distributions or upon redemption of fund shares. Performance shown reflects a fee waiver and/or expense reimbursement. Without this waiver/reimbursement, returns would have been lower.
The data quoted represents past performance and does not guarantee future results. Current performance of the Fund may be lower or higher than the performance quoted. Please call 1-866-658-9896 for the Fund’s most recent month-end performance. Investment return and principal value will fluctuate so that an investor’s shares, when redeemed, may be worth more or less than when purchased. Due to market conditions, the Fund has experienced unusually high performance which may not be sustainable or repeated in the future.
6
Table of Contents
Mercer US Small/Mid Cap Growth Equity Fund
Investment Objective and Benchmark
The investment objective of the Fund is to provide long-term total return, comprised primarily of capital appreciation. The benchmark for the Fund is the Russell 2500® Growth Index.
Investment Strategy
The Fund invests principally in equity securities issued by small-to-medium capitalization U.S. companies. The companies will generally have higher earnings and/or revenue growth histories or expectations relative to the Russell 2500® Growth Index.
Performance
For the fiscal year ended March 31, 2014, the Fund’s Y-3 share class performance was 22.34% compared to its benchmark return of 26.66%. Performance for the Fund is reported net of operating expenses while the benchmark returns do not include expenses of any kind as indexes are unmanaged.
The Sub-Advisors
As of March 31, 2014, the Fund employed three sub-advisors, Delaware Investments Fund Advisers (Delaware), Palisade Capital Management, L.L.C. (Palisade), and Westfield Capital Management Company, L.P. (Westfield). Delaware uses a bottom-up fundamental process in seeking to find companies with attractive business models that generate strong free cash flow. They also believe in a concentrated portfolio and will typically hold approximately 25 to 30 holdings. Palisade believes companies with strong or improving prospects for growth generate superior returns. Palisade believes that fundamental research is the basis for identifying superior businesses, and that long term investment success is the result of owning fundamentally strong and dynamic companies trading at a discount to their growth rates. Palisade also believes that identifying a dynamic of change before it appears in consensus estimates leads to superior returns, and that management plays a significant role in the success of a company. Westfield employs a fundamental, bottom-up approach which seeks to identify reasonably priced stocks with high earnings growth potential.
Market Commentary and Fund Performance
For the Fund’s fiscal year, the market, as measured by the Russell 3000 Index, rose 22.61%, which exceeded expectations for the period, given the already strong four-year performance coming into the fiscal year. Overall, the fiscal year rewarded economically sensitive stocks, but began with more defensive sectors such as utilities, staples and telecommunications in favor. It wasn’t until the Federal Reserve (Fed) provided guidance in May 2013 on the winding down of asset purchases through its quantitative easing program that more cyclical (i.e., economically sensitive), or at least, non-defensive stocks returned to favor. Bond markets tended to react negatively to the Fed’s guidance leading to a sell off and likewise, bond proxies (i.e., high dividend yielding stocks) within equities also experienced a sharp decline. While economic growth was weak in the first half of 2013, it did nothing to deter the consensus view, as represented by a Bloomberg poll of economists, that predicted 2.5% growth in the second half of the year. Indeed, by the end of the calendar year, U.S. GDP growth was 2.6%. The markets rose largely on valuation expansion, evidence of an improved growth outlook. However, political and economic risks remain and the withdrawal of the Fed’s support is expected to increase the volatility of equity markets. Despite the risks, we expect stronger global growth for the next fiscal year driven by Europe and emerging markets, which will help the U.S. economy and we expect earnings growth to grow at a similar pace as the economy, which will support the current level of the markets.
Among major U.S. equity indices, smaller cap and growth indices outperformed. The best performing index for the fiscal year among 62 U.S. indices was the Russell Microcap® Growth Index and the worst was the Russell Top 200® Value-Defensive™ Index. In addition, cyclical stocks, outperformed on the fiscal year and this is evident in sector performance as industrials, technology and consumer discretionary sectors outperformed.
Within the Russell 2500® Growth Index, the best performing sectors for the fiscal year were consumer staples, telecommunications and health care posting gains of 38.9%, 33.6%, and 32.7%, respectively. Lagging sectors for the fiscal year were financials, utilities and materials, posting returns of 13.8%, 14.6%, and 17.3%, respectively.
7
Table of Contents
Mercer US Small/Mid Cap Growth Equity Fund
The Mercer US Small/Mid Cap Growth Equity Fund underperformed the Russell 2500® Growth Index for the period. The primary driver of underperformance was stock selection in the technology, industrials and consumer discretionary sectors. Notable detractors in the technology sector included the holdings Neustar, Jive Software, and Nuance Communications. In industrials, stock selection among industry grouping road and rail stocks was a significant detractor. In the consumer discretionary sector, a lack of exposure to the security Tesla Motors, which advanced over 180% for the fiscal year was a large negative contributor. An underweight to REITs and good stock selection in the financials sectors helped results.
Palisade underperformed for the fiscal year. The primary driver of underperformance was stock selection in the technology sector. In the technology sector, a significant overweight to, and stock selection among, semi-conductor and software industry stocks were large detractors. A number of mergers and/or acquisitions in the portfolio boosted results. Delaware underperformed the index for the period. Delaware manages a quality-focused, concentrated and high tracking error portfolio with a long term investment horizon, which can result in performance varying significantly from year to year. The primary areas of underperformance were in the technology, consumer discretionary, and industrials sectors. Good stock selection in the financials sector helped to offset some of the underperformance in other sectors. Westfield outperformed for the period. The primary driver of outperformance for the period was stock selection in the financials and technology sectors. In financials, an underweight to REITs as well as good stock selection boosted results. Technology holdings Alliance Data Systems and NXP Semiconductors were significant positive contributors. Stock selection in the energy sector detracted from results. Energy holdings Tesoro and Denbury Resources were notable detractors.
Risk Considerations
The Fund invests in growth stocks which may be particularly sensitive to market conditions. Investments made in small and mid-capitalization companies may be more volatile and less liquid due to limited resources or product lines and more sensitive to economic factors. The Fund may invest in derivative instruments such as exchange-listed equity futures contracts which involves special risks and may increase volatility due to the use of leverage and management of these sophisticated type instruments. The Fund may experience high portfolio turnover which may result in higher costs and capital gains. The Fund’s volatility may be amplified by its ability to select sub advisors to allocate assets.
8
Table of Contents
Mercer Funds
March 31, 2014
Comparison of Change in Value of a $10,000 Investment in
Mercer US Small/Mid Cap Growth Equity Shares vs. the
Russell 2500® Growth Index
As of March 31, 2014
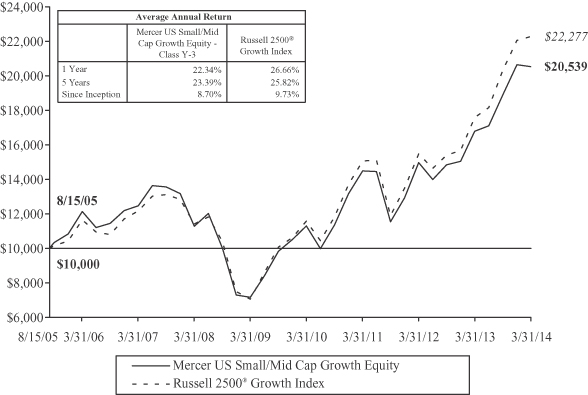
This graph shows the performance of the Mercer US Small/Mid Cap Growth Equity Fund Class Y-3 shares versus the Russell 2500® Growth Index from August 15, 2005, which is the inception date of the Fund, through March 31, 2014. The performance of other classes, when launched, will vary from the performance of the class shown based on the difference in fees and expenses paid by shareholders investing in different share classes. The Fund may charge a 2% redemption fee on shares owned less than 30 days.
The table and graph assume reinvestment of dividends and capital gains, but do not reflect a deduction of taxes an investor might pay on fund distributions or upon redemption of fund shares. Performance shown reflects a fee waiver and/or expense reimbursement. Without this waiver/reimbursement, returns would have been lower.
The data quoted represents past performance and does not guarantee future results. Current performance of the Fund may be lower or higher than the performance quoted. Please call 1-866-658-9896 for the Fund’s most recent month-end performance. Investment return and principal value will fluctuate so that an investor’s shares, when redeemed, may be worth more or less than when purchased.
9
Table of Contents
Mercer US Small/Mid Cap Value Equity Fund
Investment Objective and Benchmark
The investment objective of the Fund is to provide long-term total return, comprised primarily of capital appreciation. The benchmark for the Fund is the Russell 2500® Value Index.
Investment Strategy
The Fund invests principally in equity securities issued by small-to-medium sized capitalization U.S. companies. Generally, the Fund invests in stocks that appear to be undervalued based on the stocks’ intrinsic values relative to their current market prices.
Performance
For the fiscal year ended March 31, 2014, the Fund’s Y-3 share class performance was 21.61% compared to its benchmark return of 21.76%. Performance for the Fund is reported net of operating expenses while the benchmark returns do not include expenses of any kind as indexes are unmanaged.
The Sub-Advisors
As of March 31, 2014, the Fund employed three sub-advisors, NWQ Investment Management Company, LLC (NWQ), Systematic Financial Management, L.P. (Systematic), and River Road Asset Management, LLC (River Road). AQR Capital Management, LLC (AQR) was terminated as a sub-advisor to the Fund on December 10, 2013. NWQ uses bottom-up fundamental analysis to identify undervalued companies where catalysts for improved valuation exist. The firm seeks stocks that are mispriced or neglected by Wall Street with attractive risk/reward characteristics. Systematic’s investment philosophy is predicated on its belief that stock prices are a reflection of consensus earnings estimates, and as revisions to those estimates rise or fall, stock prices will move accordingly. Systematic applies a strategic combination of qualitative and quantitative research seeking to identify high-quality, attractively valued small and medium-sized companies exhibiting a confirmed catalyst for stock price appreciation. River Road believes inefficiencies can be captured in smaller capitalization and out-of-favor companies and in those securities with little analyst coverage. Through bottom-up, fundamental research, the team seeks companies with attractive, sustainable returns that are financially strong and trade at compelling valuations.
Market Commentary and Fund Performance
For the Fund’s fiscal year, the market, as measured by the Russell 3000 Index, rose 22.61%, which exceeded expectations for the period, given the already strong four-year performance coming into the fiscal year. Overall, the fiscal year rewarded economically sensitive stocks, but began with more defensive sectors such as utilities, staples and telecommunications in favor. It wasn’t until the Federal Reserve (Fed) provided guidance in May 2013 on the winding down of asset purchases through its quantitative easing program that more cyclical (i.e., economically sensitive), or at least, non-defensive stocks returned to favor. Bond markets tended to react negatively to the Fed’s guidance leading to a sell off and likewise, bond proxies (i.e., high dividend yielding stocks) within equities also experienced a sharp decline. While economic growth was weak in the first half of 2013, it did nothing to deter the consensus view, as represented by a Bloomberg poll of economists that predicted 2.5% growth in the second half of the year. Indeed, by the end of the calendar year, U.S. GDP growth was 2.6%. The markets rose largely on valuation expansion, evidence of an improved growth outlook. However, political and economic risks remain and the withdrawal of the Fed’s support is expected to increase the volatility of equity markets. Despite the risks, we expect stronger global growth for the next fiscal year driven by Europe and emerging markets, which will help the U.S. economy and we expect earnings growth to grow at a similar pace as the economy, which will support the current level of the markets.
Among major U.S. equity indices, smaller cap and growth indices outperformed. The best performing index for the fiscal year among 62 U.S. indices was the Russell Microcap® Growth Index and the worst was the Russell Top 200® Value-Defensive™ Index. In addition, cyclical stocks, outperformed on the fiscal year and this is evident in sector performance as industrials, technology and consumer discretionary sectors outperformed.
10
Table of Contents
Mercer US Small/Mid Cap Value Equity Fund
Within the Russell 2500® Value Index, the best performing sectors were telecommunications, technology and consumer discretionary with gains of 48.3%, 31.6%, and 27.3%, respectively. Lagging sectors included utilities, financials, and consumer staples, which posted returns of 12.0%, 16.8%, and 17.3%, respectively.
The Mercer U.S. Small/Mid Cap Value Equity Fund underperformed the Russell 2500® Value Index for the fiscal year. The largest detractor for the period was an average cash position of 1.9%, which detracted 0.57% from relative results. Stock selection in the materials, energy and consumer discretionary sectors also hampered results. Good stock selection in the industrials, health care and technology sectors was able to offset most of the underperformance from other sectors.
AQR, for its portion of the fiscal year, outperformed the index. The primary driver of excess returns was stock selection in the financials and technology sectors. Stock selection in the health care and telecommunications sectors hampered results. NWQ outperformed the benchmark, with the strategy posting positive results in the health care, consumer discretionary and financials sectors. In the health care sector, notable positive contributors included Jazz Pharmaceuticals, Vertez Pharmaceuticals and Bruker. The holding Harman International in the consumer discretionary sector gained over 140% for the period and was a significant positive contributor. In the financials sector, a zero weight to the underperforming REITs sector and good stock selection added value. In the consumer staples sector, the holding Elizabeth Arden was a significant negative contributor to results. River Road underperformed for the fiscal year. River Road is expected to be a down market outperformer and the market environment for the fiscal year was a poor one for this sub-advisor as the market gained over 21% for the fiscal year. The primary driver of underperformance was stock selection in the consumer discretionary sector. Specialty retail holdings Rent-A-Center, Ascena Retail and Pep Boys were all significant detractors. Good stock selection in the health care sector as well as some acquisitions across sectors helped results. Systematic posted strong returns and outperformed the benchmark for the period. Stock selection in the industrials sector was a large source of excess returns for the period. Industrials sector holdings Aercap, Generac and Swift Transportation were notable positive contributors. Stock selection in the energy sector was a negative contributor for the period.
Risk Considerations
Value investing involves the risk that an investment made in undervalued securities may not appreciate in value as anticipated or remain undervalued for long periods of time. Investments made in small and mid-capitalization companies may be more volatile and less liquid due to limited resources or product lines and more sensitive to economic factors. The Fund may invest in derivative instruments such as exchange-listed equity futures contracts which involves special risks and may increase volatility due to the use of leverage and management of these sophisticated type instruments. The Fund may experience high portfolio turnover which may result in higher costs and capital gains. The Fund’s volatility may be amplified by its ability to select sub advisors to allocate assets.
11
Table of Contents
Mercer Funds
March 31, 2014
Comparison of Change in Value of a $10,000 Investment in
Mercer US Small/Mid Cap Value Equity Shares vs. the
Russell 2500® Value Index
As of March 31, 2014
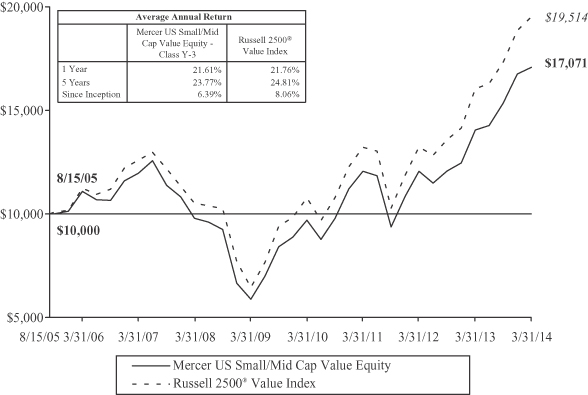
This graph shows the performance of the Mercer US Small/Mid Cap Value Equity Fund Class Y-3 shares versus the Russell 2500® Value Index from August 15, 2005, which is the inception date of the Fund, through March 31, 2014. The performance of other classes, when launched, will vary from the performance of the class shown based on the difference in fees and expenses paid by shareholders investing in different share classes. The Fund may charge a 2% redemption fee on shares owned less than 30 days.
The table and graph assume reinvestment of dividends and capital gains, but do not reflect a deduction of taxes an investor might pay on fund distributions or upon redemption of fund shares. Performance shown reflects a fee waiver and/or expense reimbursement. Without this waiver/reimbursement, returns would have been lower.
The data quoted represents past performance and does not guarantee future results. Current performance of the Fund may be lower or higher than the performance quoted. Please call 1-866-658-9896 for the Fund’s most recent month-end performance. Investment return and principal value will fluctuate so that an investor’s shares, when redeemed, may be worth more or less than when purchased.
12
Table of Contents
Mercer Non-US Core Equity Fund
Investment Objective and Benchmark
The investment objective of the Fund is to provide long-term total return, which includes capital appreciation and income. The benchmark for the Fund is the MSCI EAFE Index.
Investment Strategy
The Fund invests principally in equity securities issued by non-U.S. companies of any capitalization, located in the world’s developed and emerging capital markets.
Performance
For the fiscal year ended March 31, 2014, the Fund’s Y-3 share class performance was 21.48% compared to its benchmark return of 17.56%. Performance for the Fund is reported net of operating expenses while the benchmark returns do not include expenses of any kind as indexes are unmanaged.
The Sub-Advisors
As of March 31, 2014, the Fund employed four sub-advisors, Arrowstreet Capital, Limited Partnership (Arrowstreet), American Century Investment Management (American Century), Lingohr & Partner North America, Inc. (Lingohr) and Massachusetts Financial Services Company (MFS). American Century replaced Echo Point Investment Management, LLC (Echo Point) as sub-advisor to the Fund on November 15, 2013.
Arrowstreet employs a quantitative investment approach, focusing on developing and exploiting proprietary signals. Arrowstreet’s proprietary investment process measures the direct effects on stocks, as well as the indirect effects on countries, global sectors, country/sector interactions, and expanded linkages of inter-related companies. Arrowstreet constructs portfolios with an integrated alpha forecast, while simultaneously estimating risk and transaction costs, to create optimized portfolios. American Century manages a growth portfolio, which focuses on identifying stocks early in the growth cycle where company fundamentals are at an inflection point, when earnings growth accelerates, when market expectations rise, and multiples expand. American Century will invest opportunistically in emerging markets. Lingohr manages a value portfolio, which consists of undervalued stocks identified through the firm’s disciplined, systematic, quantitative investment approach. Stock selection includes a fundamental qualitative overlay through the portfolio management team. This strategy invests opportunistically in emerging markets. MFS manages a value portfolio, which focuses on stocks whose long-term value they believe is not adequately reflected in the stock price. MFS invests opportunistically in emerging markets.
Market Commentary and Fund Performance
Notwithstanding some short-term weakness along the way, global equity markets, as measured by the MSCI World Index, rallied and returned 19.1% during the 12-month period ending March 31, 2014. U.S. equities were the market leaders with the S&P 500 Index up 21.9% for the fiscal year. The MSCI EAFE Index and MSCI Emerging Markets Index returned 17.6% and -1.4%, respectively, over the same time period.
Global equities started the fiscal year well as central banks around the world remained committed to maintaining low interest rate policies. However, the rally stalled on soft economic data, particularly in emerging markets where local currency weakness contributed to losses. Lower-than-expected gross domestic product (GDP) forecasts and signs of stress in China’s financial system also weighed heavily on emerging markets. The European economy remained in recession with weak data reported out of core economies such as Germany. Unemployment in Europe rose to a record high of 12.2% in May; and in June, European Central Bank (ECB) President Mario Draghi confirmed that the ECB would continue to support the European economy with low interest rates. Volatility spiked up in June as firm economic data in the U.S. led the Federal Reserve (Fed) to announce that it would reduce its asset purchases and end the quantitative easing program (QE3) by mid-2014. However, the downward revision of first quarter U.S. GDP from 2.4% to 1.8% suggested that the proposed wind down of QE3 may be premature. May and June 2013 were difficult months for international equities as the MSCI EAFE Index fell -5.9% and the MSCI Emerging Markets Index lost -8.8% over the 2-month period.
Positive economic data and strong earnings from the corporate sector helped equities climb higher over the next 6 months, from July to December 2013. European markets rose sharply, reflecting signals of a stabilizing job market, improving consumer confidence, and increasing regional manufacturing activity. Concerns over a shift in Fed policy that negatively
13
Table of Contents
Mercer Non-US Core Equity Fund
impacted the markets during the previous two months started to dissipate; and the appointment of Janet Yellen as the new Fed Chairman suggested to the market that the Fed’s easy monetary policy would be maintained. Japanese stocks benefited from the government’s reflationary policy and the Bank of Japan’s additional monetary action to stimulate the economy. Developed markets were up strongly led by the U.S., Europe, and stocks that benefit from an improved economic environment. Emerging markets (EM) recovered some of their earlier losses but currency weakness continued to plague some EM countries. Although global equities generally posted gains, emerging markets and Japan underperformed on a relative basis. The divergence between developed and emerging markets continued during the last three months of the fiscal year despite a strong rebound by EM in February and March 2014. Financial and political instability in emerging markets drove up market volatility in January, sparking another sell-off in EM currencies and putting downward pressure on commodity prices. While developed markets were not immune to the negative impact volatility had on equity prices, better-than-expected economic data particularly in Europe and the U.S. and solid earnings reports provided support for developed markets. By contrast, emerging markets were grappling with growth concerns in China, financial turmoil in Argentina, Turkey, South Africa, and Russia, currency fluctuations, the negative effects of Fed tapering and tighter monetary policies, and elevated tensions between Russia and Ukraine. Despite these increased risks, emerging markets rebounded back strongly after some stabilization of the crisis in Ukraine and ended the first quarter of 2014 trailing developed markets by a much smaller margin; the MSCI EAFE Index returned 0.7% for the quarter and the MSCI Emerging Markets Index returned -0.4%.
In this environment, the Mercer Non-US Core Equity Fund outperformed the MSCI EAFE Index by 3.92% for the 12-month period ending March 31, 2014. The Fund benefitted from a bias to stocks with positive fundamental momentum, such as price momentum and company level fundamental improvement, such as earnings growth and margin expansion. Stock selection was strong in 7 of the 10 Global Industry Classification Standard sectors. Stock selection was particularly strong in the consumer discretionary, financial and industrials sectors. From a country perspective, the majority of outperformance was a result of positive selection in Western Europe, in particular, United Kingdom, Germany and Switzerland contributed positively to performance. Conversely, stock selection in Norway, Hong Kong and Spain detracted from performance. An allocation to emerging markets equity detracted from performance, in particular, overweights to Mexico and South Korea.
In aggregate, performance of the Fund’s sub-advisors was positive, with three of the four sub-advisors outperforming. In addition, American Century outperformed since joining the Fund in November 2013. Arrowstreet led all sub-advisors, by outperforming the index by 11.98%, as their style of investing in positively trending securities did well over the past fiscal year. Performance was driven primarily by security selection decisions, particularly in financials, information technology, industrials, and consumer discretionary. From a regional perspective, selection in the Western Europe region contributed positively to performance. Slightly offsetting the positive performance was the decision to overweight Japan and underweight Spain. Another strong contributor for the fiscal year was MFS. MFS outperformed from a sector perspective as a result of positive contributors from strong stock selection. Selection was strong in financials, industrials and telecommunication services. From a regional perspective, most of the value-add was driven by positions in the Asia Pacific region, particularly Japan. In addition, positions in Western Europe, led by strong stock selection in the United Kingdom and Switzerland, also added value. Slightly offsetting the positives was an overweight to health care and an underweight to utilities. Prior to termination in November, Echo Point was underperforming due to poor stock selection in the United Kingdom and an overweight to emerging markets equity. Since joining the Fund, American Century outperformed with positive selection in industrials and financials. Offsetting some of the positives was poor selection in health care and energy. Lingohr outperformed for the period, with positive performance due to sector allocation and selection decisions. Sector allocations were helped by underweighting consumer staples, and overweighting consumer discretionary. Selection was positive in consumer discretionary, financials and industrials. From a regional perspective, most of the outperformance was due to positive selection in the Western European Region, particularly in France, United Kingdom and Switzerland. Slightly offsetting the positive performance was an underweight to Japan in favor of overweights to China and Hong Kong.
Risk Considerations
The Fund invests in foreign and emerging market securities which involves certain risks such as currency volatility, political and social instability and reduced market liquidity. Emerging markets may be more volatile and less liquid than more developed markets and therefore may involve greater risks. Investments made in small and mid-capitalization companies may be more volatile and less liquid due to limited resources or product lines and more sensitive to economic factors. The Fund may invest in derivative instruments such as exchange-listed equity futures contracts which involves special risks and may increase volatility due to the use of leverage and management of these sophisticated type instruments. The Fund may experience high portfolio turnover which may result in higher costs and capital gains. The Fund’s volatility may be amplified by its ability to select sub-advisors to allocate assets.
14
Table of Contents
Mercer Funds
March 31, 2014
Comparison of Change in Value of a $10,000 Investment in
Mercer Non-US Core Equity Shares vs. the
MSCI EAFE Index
As of March 31, 2014
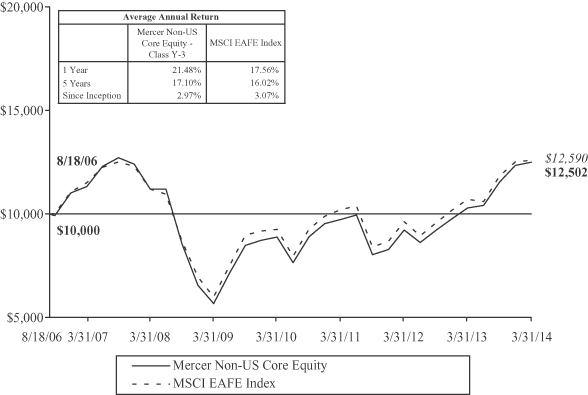
This graph shows the performance of the Mercer Non-US Core Equity Fund Class Y-3 shares versus the MSCI EAFE Index from August 18, 2006, which is the inception date of the Fund, through March 31, 2014. The performance of other classes, when launched, will vary from the performance of the class shown based on the difference in fees and expenses paid by shareholders investing in different share classes. The Fund may charge a 2% redemption fee on shares owned less than 30 days.
The table and graph assume reinvestment of dividends and capital gains, but do not reflect a deduction of taxes an investor might pay on fund distributions or upon redemption of fund shares. Performance shown reflects a fee waiver and/or expense reimbursement. Without this waiver/reimbursement, returns would have been lower.
The data quoted represents past performance and does not guarantee future results. Current performance of the Fund may be lower or higher than the performance quoted. Please call 1-866-658-9896 for the Fund’s most recent month-end performance. Investment return and principal value will fluctuate so that an investor’s shares, when redeemed, may be worth more or less than when purchased.
15
Table of Contents
Mercer Core Fixed Income Fund (formerly Mercer Core Opportunistic Fixed Income Fund)
Investment Objective and Benchmark
The investment objective of the Fund is to provide total return, consisting of both current income and capital appreciation. The benchmark for the Fund is the Barclays U.S. Aggregate Bond™ Index.
Investment Strategy
The Fund invests principally in investment grade fixed income securities, including government securities, corporate bonds and securitized bonds such as mortgage and asset-backed securities. The Fund may also invest in non-investment grade bonds, non-U.S. dollar denominated bonds, bonds issued by issuers located in emerging capital markets, and certain derivative instruments. The Fund may invest in derivative instruments, such as options, futures, and swap agreements. The Fund may engage in transactions in derivatives for a variety of purposes, including changing the investment characteristics of its portfolio, enhancing total returns or as a substitute for taking a position in an underlying asset.
Performance
For the fiscal year ended March 31, 2014, the Fund’s Y-3 share class performance was 0.44% compared to its benchmark return of -0.10%. Performance for the Fund is reported net of operating expenses while the benchmark returns do not include expenses of any kind as indexes are unmanaged.
The Sub-Advisors
As of March 31, 2014, the Fund employed three sub-advisors, Dodge & Cox, Western Asset Management Company (WAMCO) and Pacific Investment Management Company LLC (PIMCO). MacKay Shields was terminated as a sub-advisor to the Fund on August 15, 2013. Dodge & Cox manages its allocated portion of the Fund with an extended investment horizon supported by fundamental research and a strict valuation discipline. Their process emphasizes security-level research and individual security and sector selection to build a high-average-quality portfolio that seeks incremental yield versus the broad market. WAMCO manages its allocated portion of the Fund using a diversified, tightly controlled, value-oriented portfolio. The firm’s management style emphasizes the use of multiple strategies and active sector rotation and issue selection, while constraining overall interest rate risk relative to the benchmark. PIMCO manages its allocated portion of the Fund using a blend of long-range macro-economic forecasts with shorter-term, bottom-up security selection focused on valuation. The firm uses sector rotation and duration targeting as primary drivers of performance within a disciplined, risk-controlled approach.
Market Commentary and Fund Performance
Over the one-year period ending March 31, 2014, fixed income market returns were slightly negative, reflecting price declines associated with rising interest rates. Intermediate long-term U.S. Treasury rates increased between 0.44% and 0.86% year-over-year (with significant interim volatility), while the short end of the yield curve remained anchored by the Federal Reserve’s (Fed) accommodative monetary policy. Interest rate volatility was largely the result of investor anticipation of (and reaction to) the Fed’s policy, particularly the timing and pace of potential tapering of its large asset purchase program, its third quantitative easing program (QE3).
Starting in early May, bond prices fell due in large part to speculation about the potential end of the Fed’s QE3 and the likelihood for such changes coming sooner than projected. Treasury yields climbed into the third quarter of 2013, with the ten-year reaching 3.0% in early September, until the Fed announced it would not taper its asset purchases until it saw further progress in economic conditions. This surprising development sent Treasury rates down substantially (and bond prices up) to a low of 2.50% in October. Later, solid economic news (including higher than expected Gross Domestic Product and better employment numbers) influenced the Fed’s announcement on December 18th to begin tapering asset purchases starting in January. Ten-year Treasury yields had been rising prior to this announcement and continued their climb, ending at a two-year high of 3.03%.
Returns from securities not backed by a U.S. Government guarantee were positive, as they benefitted from the market view of improving economic conditions and earned enough income to overcome the losses from rising rates. Corporate bonds in particular performed well, continuing the strong performance of the past several years. In addition, investment-grade corporate bond issuers were issuing a large amount of new debt to take advantage of very low funding rates. One example of
16
Table of Contents
Mercer Core Fixed Income Fund (formerly Mercer Core Opportunistic Fixed Income Fund)
this was Verizon, which issued an unprecedented $49 billion of debt. As evidence of the market’s demand for corporate debt, the bond orders for this historic deal (the largest-ever bond issuance) were more than double the amount available. By the end of the period, the difference between corporate and Treasury yields was at its lowest level in years.
Given the uptrend in the U.S. Treasury curve (i.e., rates higher) working against the downward move in credit spreads (i.e., buyers pushing up prices for riskier assets) over the twelve months ending March 31, 2014, absolute returns in fixed income were close to zero. Spread sectors (i.e., non-Treasury securities) provided higher returns in relation to similar-duration Treasuries (i.e., excess returns) while registering much smaller gains in absolute terms. The Fund’s return was positive in both absolute terms and in relation to the Barclays U.S. Aggregate Bond Index for the period. The Fund benefited from its strategic overweight to spread sectors including an allocation to high yield that was the top performing sub-sector for the trailing twelve months. The Fund’s underweight to lower yielding U.S. Treasuries in the form of a shorter duration positioning or term structure bias (i.e. favoring certain maturities over others), relative to the index, contributed to performance at times.
The respective performance results of each sub-advisor correlated with their risk posture. Dodge & Cox’s bias towards corporate credit and avoidance of U.S. Treasuries, as well as a relatively shorter duration position, led them to have the strongest returns over the period. WAMCO’s more aggressive spread sector allocation also provided returns well ahead of the Fund’s benchmark. PIMCO’s relatively defensive top-down positioning was particularly helpful during periods of condensed risk-aversion but ended up underperforming the benchmark over the 12 months. MacKay slightly trailed its sector benchmark before their termination in August, but the high yield market itself outperformed broad market fixed income, prompting MacKay to surpass the Fund’s benchmark and benefitting the Fund. Strategic and/or tactical underweights to lower yielding US Treasuries in the form of a shorter duration stance or term structure bias (i.e. favoring certain maturities over others), relative to benchmarks proved beneficial as rates rose over the period.
Risk Considerations
The Fund is subject to the same risks as the underlying bonds in the portfolio such as credit, prepayment, call and interest rate risk. As interest rates rise, the value of bond prices will decline. The Fund may invest in more aggressive investments such as foreign securities which may expose the Fund to currency and exchange rate fluctuations, derivatives (futures, options, swaps), high yield debt (also known as junk bonds) and asset-backed type securities, (mortgage-backed securities and collateralized-loan obligations) all of which may cause greater volatility and less liquidity. Derivatives may be more sensitive to changes in market conditions and may amplify risks. The Fund may experience high portfolio turnover which may result in higher costs and capital gains. The Fund’s volatility may be amplified by its ability to select sub- advisors to allocate assets.
17
Table of Contents
Mercer Funds
March 31, 2014
Comparison of Change in Value of a $10,000 Investment in
Mercer Core Fixed Income1 Shares vs. the
Barclays U.S. Aggregate Bond™ Index
As of March 31, 2014
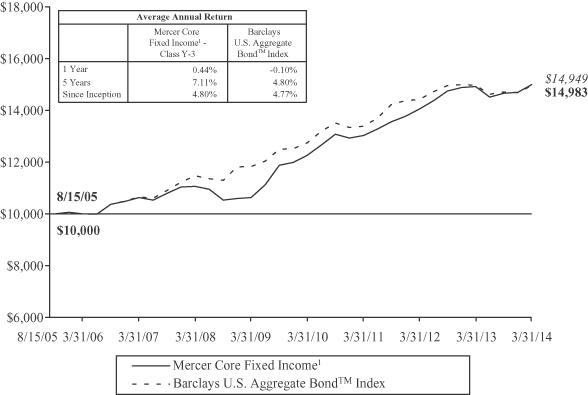
This graph shows the performance of the Mercer Core Fixed Income Fund1 Class Y-3 shares versus the Barclays US Aggregate Bond™ Index from August 15, 2005, which is the inception date of the Fund, through March 31, 2014. The performance of other classes, when launched, will vary from the performance of the class shown based on the difference in fees and expenses paid by shareholders investing in different share classes. The Fund may charge a 2% redemption fee on shares owned less than 30 days.
The table and graph assume reinvestment of dividends and capital gains, but do not reflect a deduction of taxes an investor might pay on fund distributions or upon redemption of fund shares. Performance shown reflects a fee waiver and/or expense reimbursement. Without this waiver/reimbursement, returns would have been lower.
| 1 | Formerly known as Mercer Core Opportunistic Fixed Income Fund. |
The data quoted represents past performance and does not guarantee future results. Current performance of the Fund may be lower or higher than the performance quoted. Please call 1-866-658-9896 for the Fund’s most recent month-end performance. Investment return and principal value will fluctuate so that an investor’s shares, when redeemed, may be worth more or less than when purchased.
18
Table of Contents
Mercer Opportunistic Fixed Income Fund
Investment Objective and Benchmark
The investment objective of the Fund is to provide long-term total return, which includes capital appreciation and income. The Fund’s primary benchmark is the Bank of America Merrill Lynch Global High Yield 2% Constrained Index. The Fund’s secondary benchmark is a blended benchmark consisting of 50% JP Morgan Government Bond Index — Emerging Markets Global Diversified and 50% Bank of America Merrill Lynch Global High Yield 2% Constrained Index.
Investment Strategy
The Fund invests principally in fixed income securities of U.S. and non-U.S. issuers, including those in emerging and frontier markets. The Fund invests in various strategic and tactical global bond market opportunities without limitations in geography, issuer type, quality and currency denomination. The Fund may invest in derivatives such as futures (including among others, interest rate futures, swaps (currency, interest rate, credit default and total return), forwards, options, and credit-linked notes. The Fund may engage in transactions in derivatives for a variety of purposes, including hedging, risk management, efficient portfolio management, enhance total returns, or as a substitute for taking position in the underlying asset.
Performance*
For the fiscal ended March 31, 2014, the Fund’s Y-3 share class performance was 7.00% compared to its primary benchmark return of 8.53% and secondary benchmark return of 6.03%. Performance for the Fund is reported net of operating expenses while the benchmark returns do not include expenses of any kind as indexes are unmanaged.
The Sub-Advisors
As of March 31, 2014, the Fund employed two sub-advisors, Franklin Advisers, Inc. (“Franklin”) and Investec Asset Management US Limited (“Investec”). In managing its allocated portion of the Fund’s portfolio, Franklin will typically invest in non-investment grade securities issued globally. Franklin is a research driven, fundamental investor that relies on a team of analysts to provide in-depth industry expertise, using both qualitative and quantitative analysis to evaluate issuers. Although bottom-up security selection forms the core part of Franklin’s process, it uses industry attractiveness when selecting investments. In managing its allocated portion of the Fund’s portfolio, Investec will invest in public sector, sovereign and corporate bonds issued by emerging market borrowers and those denominated in local emerging market currencies. Investec’s portfolio construction process promotes allocation to countries and currencies identified based on economic fundamentals, valuations and market price behavior.
Market Commentary and Fund Performance
For the seven month period since the Fund’s inception on August 21, 2013 and ending March 31, 2014, fixed income markets experienced a volatile period driven by a few broad underlying factors: the uncertainty and the eventual tapering of the third quantitative easing program (QE3) in the U.S.; an improving global macroeconomic backdrop; pockets of weakness in select emerging market economies; large currency swings in the emerging markets; and geopolitical risk with the Russian annexation of Crimea being the latest example. Riskier fixed income securities showed a mixed response with the global high yield markets rising 8.53% over this time period while local currency emerging markets debt rose by 3.44%.
The global high yield market performed well during this period, outperforming most other interest-rate sensitive fixed income market sectors. The global high yield market benefited from the low yield environment since the 2008 financial crisis, with the overall market in positive territory for all seven months of the period. Although the increase in the U.S. Treasury interest rates was somewhat negative, high yield sectors benefitted from the improving U.S. economic outlook. Global high yield market spreads tightened by over 1.15%, ending the fiscal year period at a near historical low spread of 4.02%. Despite the expensive valuation, credit market outlooks remained relatively stable with low default rates and strong interest coverage ratios. Given the significant refinancing activity that has taken place in the market over the last few years, the maturities of a number of issues have been extended and only a small percentage of outstanding global high yield debt matures over the next few years.
Local emerging markets debt experienced a volatile environment during this period. Much of it was driven by currency swings as a result of the tapering. The QE3 pushed interest rates to historically low levels which lifted emerging markets as
19
Table of Contents
Mercer Opportunistic Fixed Income Fund
investors searched for higher returns while supplying the world with dollar liquidity. With the tapering of QE3 now in process, these flows have started to reverse over this time period, leading to currency swings. This is having a greater effect for the countries that have the highest current account deficits, and therefore leading to the new term: “Fragile Five” denoting the five countries (India, Indonesia, Brazil, South Africa and Turkey) that fit that category. Given this dynamic, as well as political tensions in Turkey, Thailand and Russia, there was a wide dispersion in regional and country returns.
In this environment, the Mercer Opportunistic Fixed Income Fund underperformed its primary benchmark by 1.53% but outperformed its secondary benchmark by 0.97% for the 7-month period ending March 31, 2014. The Fund underperformed its primary benchmark because the global high yield market performed better compared to the local emerging markets debt. Since the Fund invests in both global high yield and local emerging markets debt, the comparison to the secondary benchmark is meaningful.
In aggregate, both sub-advisors outperformed the respective benchmarks during this period. Franklin outperformed the Bank of America Merrill Lynch Global High Yield Index by over 2.2%, driven primarily by strong security selection while industry allocation also contributed positively. Franklin’s underweight quality position has worked well during the period as the supply/demand dynamics was favorable for the high yield market with lower rated names outpacing BB-rated names. Investec outperformed the JP Morgan Government Bond Index — Emerging Markets Global Diversified Index by 0.87% during this period. All of the outperformance came in the first month following the Fund’s launch while Investec has since underperformed slightly over the subsequent two quarters. The underperformance was driven by poor duration positioning that led to negative performance from local rates while currency selection was somewhat positive although it was a period with dramatic currency swings. The outperformance in the first month of the Fund’s inception was driven by both positive currency selection and local rates positioning although country selection was a slight detractor.
Risk Considerations
The Fund invests in non-investment grade and emerging market fixed income securities which involves certain risks such as higher volatility, currency fluctuation, political and social instability and reduced market liquidity. The Fund is subject to the same risks as the underlying bonds in the portfolio such as credit, call and interest rate risk. The Fund may invest in more aggressive investments such as derivatives (futures, options, swaps) all of which may cause greater volatility and less liquidity. Derivatives are more sensitive to changes in market conditions and may amplify risks. The Fund may experience high portfolio turnover which may result in higher costs and capital gains. The Fund’s volatility may be amplified by its ability to select sub-advisors to allocate assets.
| * | The Fund commenced investment operations on August 21, 2013. |
20
Table of Contents
Mercer Funds
March 31, 2014
Comparison of Change in Value of a $10,000 Investment in
Mercer Opportunistic Fixed Income Shares vs. the
Bank of America ML Global High Yield 2% Constrained Index Unhedged and the Fund’s Secondary Index1
As of March 31, 2014
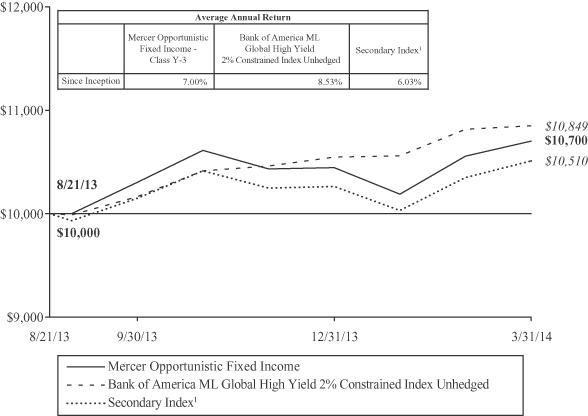
This graph shows the performance of the Mercer Opportunistic Fixed Income Fund Class Y-3 shares versus the Bank of America ML Global High Yield 2% Constrained Index Unhedged and the Fund’s Secondary Index1 from August 21, 2013, which is the inception date of the Fund, through March 31, 2014. The performance of other classes, when launched, will vary from the performance of the class shown based on the difference in fees and expenses paid by shareholders investing in different share classes. The Fund may charge a 2% redemption fee on shares owned less than 30 days.
The table and graph assume reinvestment of dividends and capital gains, but do not reflect a deduction of taxes an investor might pay on fund distributions or upon redemption of fund shares. Performance shown reflects a fee waiver and/or expense reimbursement. Without this waiver/reimbursement, returns would have been lower.
1 The Mercer Opportunistic Fixed Income Fund’s Secondary Index is a blended benchmark consisting of 50% JP Morgan Government Bond Index — Emerging Markets Global Diversified USD Unhedged and 50% Bank of America ML Global High Yield 2% Constrained Index Unhedged.
The data quoted represents past performance and does not guarantee future results. Current performance of the Fund may be lower or higher than the performance quoted. Please call 1-866-658-9896 for the Fund’s most recent month-end performance. Investment return and principal value will fluctuate so that an investor’s shares, when redeemed, may be worth more or less than when purchased.
21
Table of Contents
Mercer Emerging Markets Equity Fund
Investment Objective and Benchmark
The investment objective of the Fund is to provide long-term total return, which includes capital appreciation and income. The benchmark for the Fund is the MSCI Emerging Markets Index.
Investment Strategy
The Fund invests principally in equity securities of large, medium and small capitalization companies, located in emerging markets, other investments that are tied economically to emerging markets, as well as in American, European and Global Depository receipts. Stock index futures and various types of swaps may be used to implement the country selection component of the Fund’s investment strategy. Currency forwards may be used to make stock-selection and country allocation decisions independently of the underlying currency.
Performance
For the fiscal year ended March 31, 2014, the Fund’s Y-3 share class performance was -2.61% compared to its benchmark return of -1.43%. Performance for the Fund is reported net of operating expenses while the benchmark returns do not include expenses of any kind as indexes are unmanaged.
The Sub-Advisors
As of March 31, 2014, the Fund employed four sub-advisors, AQR Capital Management, LLC (AQR), Kleinwort Benson Investors International Ltd. (KBI), Investec Asset Management US Limited (Investec) and Vontobel Asset Management, Inc. (Vontobel). Investec was added to the Fund as a sub-advisor on October 29, 2013.
AQR employs a systematic, research-driven investment approach focused on sourcing alpha (i.e., excess return relative to the benchmark) from currency, country and security selection strategies. AQR’s proprietary investment process uses fundamental factors, such as value, momentum and quality within the alpha models. AQR uses quantitative tools to construct optimized portfolios based on this diversified set of fundamental factors, along with estimates of risk and transactions costs. KBI manages a systematic process focusing on quality firms growing their dividend yield. The portfolio construction process uses sector and region constraints to minimize uncompensated risks to ensure the majority of risk is associated with the alpha model. Investec uses a 4-Factor Model comprised of Strategy, Value, Earnings and Technicals, to build its portfolio. Investec’s strategy looks for high quality, attractively valued companies which have improving operating performance and are receiving increasing investor attention. Vontobel uses a fundamental process to identify high quality, sustainable growth companies in businesses with high barrier to entry. Vontobel’s risk management process focused on capital preservation and manages risk in absolute terms.
Market Commentary and Fund Performance
Notwithstanding some short-term weakness along the way, global equity markets, as measured by the MSCI World Index, rallied and returned 19.1% during the 12-month period ending March 31, 2014. U.S. equities were the market leaders with the S&P 500 Index up 21.9% for the fiscal year. The MSCI EAFE Index and MSCI Emerging Markets Index returned 17.6% and -1.4%, respectively, over the same time period.
In an environment where equity markets across the globe increased by over double-digits, emerging markets was the only laggard, trailing the developed markets by over 20.5%. Much of the increase in the global equity market was fueled by loose monetary policies across much of the developed markets, particularly in the U.S. with quantitative easing (QE3) and most recently in Japan with the Bank of Japan announcing an aggressive $1.4 trillion stimulus that will double its monetary base by 2014. The increase in returns of developed markets was also driven by improving U.S. employment numbers, recovery in the housing market and signs of an overall improving global economy.
Looking into the actual performance of the emerging markets, the -1.4% return of the Emerging Markets Index for the fiscal year understates the volatile period with few sharp swings in the market driven by the risk-on/risk-off mentality. Overall, there are two key factors that contributed to the poor performance of the emerging markets — the actual tapering, as well as the uncertainty over the tapering, of the QE3 in the U.S. and the slowing growth in the major emerging economies of China,
22
Table of Contents
Mercer Emerging Markets Equity Fund
Brazil and India. QE3 pushed interest rates to historically low levels which led to gains in the emerging markets as investors searched for higher returns while supplying the world with dollar liquidity. With the tapering of QE3 now in process, these flows have started to reverse during the year, leading to currency swings. This is having a greater effect for the countries that have the highest current account deficits, and therefore leading to the new term: “Fragile Five” denoting the five countries (India, Indonesia, Brazil, South Africa and Turkey) that fit that category.
Fears of a slow-down in growth in China and potential Chinese credit bubble continue to remain in the market. There is a wide acceptance in the market that the new leadership in China is willing to accept short-term underperformance in order to make structural reforms and lead the transition from an investment led economy to a more consumer driven economy. Given China’s significance in emerging markets and the global economy overall, any slowdown will have spillover effects as it is the second largest economy in the world and the largest exporter to many developing economies. A key risk in the emerging market is geo-political risk, with the Russian annexation of Crimea being the latest example. Unexpected events such as this can have a significant impact on the market and result in sharp asset price adjustments. Although emerging markets as a whole were broadly affected by a few underlying macro drivers, there was dispersion in performance across the various countries, with Emerging Markets Europe & the Middle East declining by 8.3% and Emerging Markets Latin America declining by 13.7%. Emerging Markets Asia rose by 3%.
In this environment, the Mercer Emerging Markets Equity Fund underperformed the MSCI Emerging Markets Index by 1.18% for the 12-month period ending March 31, 2014. Much of the underperformance was driven by the Fund’s defensive positioning that targets sustainable levels of profitability and positive exposures to defensive sectors. Whereas this defensive position helped the Fund outperform last year, it resulted in an underperformance for the year. Stock selection was negative overall, particularly within materials, energy and financials. Country selection and currency effect were major detractors for the Fund, particularly in India, where the Fund had a large overweight position. India is one of the Fragile Five countries and the Indian Rupee declined during the fiscal year before correcting somewhat in the last quarter.
In aggregate, performance of the Fund’s sub-advisors was mixed with two of the four sub-advisors outperforming against the benchmark. AQR and KBI were the two managers that outperformed over this time period. AQR uses three distinct stock selection models that have worked well during this period with only one quarter of underperformance. Currency selection accounted for the majority of the outperformance, much of it coming in the second and third quarters of 2013 when there was a sharp volatility in the market as a result of currency movement. KBI’s dividend focus style of investing that is generally more conservative resulted in slight outperformance over the period. The primary driver of KBI’s outperformance was positive security selection in information technology, materials and consumer staples. KBI’s overweight position in Taiwan also contributed positively to performance while its overweight position in China was a slight detractor. Vontobel, which was the largest contributor to outperformance last year, was the largest detractor this year. As noted earlier, Vontobel’s style of focusing on high quality, sustainable growth businesses did not do well over the year. Performance was driven by both sector and selection decisions. Security selection was particularly weak in materials while poor sector allocations were driven by overweight in consumer staples and underweight in information technology. From a regional perspective, Vontobel’s stock selection in Mexico and underweight position in Taiwan detracted from performance. Investec was added to the Fund in order to lower the defensive bias of the Fund. The strategy worked well initially as Investec outperformed the MSCI Emerging Markets Index in the first two months. However, it has underperformed in the first quarter of 2014 with financials, industrials and services being the major sector detractors in this period. From a regional perspective, underweight to South Africa and overweight to Russia and China were the major drivers of underperformance during the quarter.
Risk Considerations
The Fund invests in emerging market securities which involves certain risks such as currency volatility, political and social instability and reduced market liquidity. Emerging markets may be more volatile and less liquid than more developed markets and therefore may involve greater risks. Investments made in small and mid-capitalization companies may be more volatile and less liquid due to limited resources or product lines and more sensitive to economic factors. The Fund may invest in more aggressive investments such as mortgage- and asset-backed securities and derivatives (futures, forwards, options, swaps) all of which may cause greater volatility and less liquidity. Derivatives are more sensitive to changes in market conditions and may amplify risks. The Fund may experience high portfolio turnover which may result in higher costs and capital gains. The Fund’s volatility may be amplified by its ability to select sub advisors to allocate assets.
23
Table of Contents
Mercer Funds
March 31, 2014
Comparison of Change in Value of a $10,000 Investment in
Mercer Emerging Markets Equity Shares vs. the
MSCI Emerging Markets Index
As of March 31, 2014
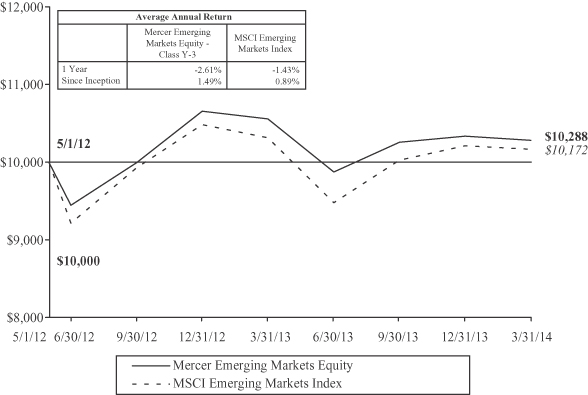
This graph shows the performance of the Mercer Emerging Markets Equity Fund Class Y-3 shares versus the MSCI Emerging Markets Index from May 1, 2012, which is the inception date of the Fund, through March 31, 2014. The performance of other classes, when launched, will vary from the performance of the class shown based on the difference in fees and expenses paid by shareholders investing in different share classes. The Fund may charge a 2% redemption fee on shares owned less than 30 days.
The table and graph assume reinvestment of dividends and capital gains, but do not reflect a deduction of taxes an investor might pay on fund distributions or upon redemption of fund shares. Performance shown reflects a fee waiver and/or expense reimbursement. Without this waiver/reimbursement, returns would have been lower.
The data quoted represents past performance and does not guarantee future results. Current performance of the Fund may be lower or higher than the performance quoted. Please call 1-866-658-9896 for the Fund’s most recent month-end performance. Investment return and principal value will fluctuate so that an investor’s shares, when redeemed, may be worth more or less than when purchased.
24
Table of Contents
Mercer Global Low Volatility Equity Fund
Investment Objective and Benchmark
The investment objective of the Fund is to provide long-term total return, which includes capital appreciation and income. The benchmark for the Fund is the MSCI World Index.
Investment Strategy
The Fund invests principally in equity securities of U.S. and foreign issuers, of large, medium and small capitalization companies. Stock index futures and various types of swaps may be used to implement the equity security selection component of the Fund’s investment strategy. Currency forwards may be used to make stock-selection and country allocation decisions independently of the underlying currency.
Performance
For the fiscal year ended March 31, 2014, the Fund’s Y-3 share class performance was 14.40% compared to its benchmark return of 19.07%. Performance for the Fund is reported net of operating expenses while the benchmark returns do not include expenses of any kind as indexes are unmanaged.
The Sub-Advisors
As of March 31, 2014, the Fund employed three sub-advisors, Acadian Asset Management LLC (Acadian), MFG Asset Management (MFG) and First Eagle Investment Management, LLC (First Eagle). Acadian’s process uses both risk analysis and stock forecasts to create the portfolio. The process uses a risk model to determine the systematic risk and the level of volatility of each stock in the investable universe. Once a stock’s risk is determined, Acadian uses its stock forecast model as an overlay to determine the optimal mix of securities. The security return forecasting model incorporates five categories including value, growth, risk, macroeconomic, and technical factors. MFG screens the universe of investable global stocks to identify high quality companies based on key quality criteria: the sustainability of a company’s competitive advantages; the predictability and reliability of future cash flows and earnings; the extent to which management will act in the best interest of shareholders; and re-investment potential. MFG then evaluates investment opportunities quantitatively incorporating both long-term intrinsic value and three-year forecast total shareholder returns using MFG’s proprietary forecasts. Portfolio construction is determined by each stock’s ranking based on the qualitative assessment of the key criteria, the quantitative assessment driven by valuation, and detailed macroeconomic research within a robust risk management framework. From time to time, MFG may hold up to 20% of its portion of the Fund in cash if warranted by their assessment of the macro environment. First Eagle can be broadly characterized as value in approach, looking to identify companies selling at a discount to intrinsic value with the goal being to avoid permanent impairment of capital (as opposed to temporary losses in share value relating to shifting investor sentiment or other normal share price volatility). First Eagle’s primary valuation measure is the ratio of enterprise value to normalized earnings before interest and taxes, although other metrics can be applied depending on the company or industry. If stocks are deemed too expensive, based on their bottom up valuation analysis, cash or bonds will be held instead, up to 20% of its portion of the Fund. In addition, a gold exposure is maintained (both through gold-backed exchange traded funds and the equities of gold mining companies), with the view that it is a potential portfolio hedge.
Market Commentary and Fund Performance
Notwithstanding some short-term weakness along the way, global equity markets, as measured by the MSCI World Index, rallied and returned 19.1% during the 12-month period ending March 31, 2014. U.S. equities were the market leaders with the S&P 500 Index up 21.9% for the fiscal year. The MSCI EAFE Index and MSCI Emerging Markets Index returned 17.6% and -1.4%, respectively, over the same time period.
Global equities started the fiscal year well as central banks around the world remained committed to maintaining low interest rate policies. However, the rally stalled on soft economic data, particularly in emerging markets where local currency weakness contributed to losses. Lower-than-expected Gross Domestic Product forecasts and signs of stress in China’s financial system also weighed heavily on emerging markets. The European economy remained in recession with weak data reported out of core economies such as Germany. Unemployment in Europe rose to a record high of 12.2% in May; and in June, European Central Bank (ECB) President Mario Draghi confirmed that the ECB would continue to support the European economy with low interest rates. Volatility spiked up in June as firm economic data in the U.S. led the Federal Reserve (Fed)
25
Table of Contents
Mercer Global Low Volatility Equity Fund
to announce that it would reduce its asset purchases and end the quantitative easing program (QE3) by mid-2014. However, the downward revision of first quarter U.S. GDP from 2.4% to 1.8% suggested that the proposed wind down of QE3 may be premature. May and June 2013 were difficult months for international equities as the MSCI EAFE Index fell -5.9% and the MSCI Emerging Markets Index lost -8.8% over the 2-month period. U.S. equities fared much better, with the S&P 500 Index returning 1.0% during the same 2-month span.
Positive economic data and strong earnings from the corporate sector helped equities climb higher over the next 6 months, from July to December 2013. European markets rose sharply, reflecting signals of a stabilizing job market, improving consumer confidence, and increasing regional manufacturing activity. Concerns over a shift in Fed policy that negatively impacted the markets during the previous two months started to dissipate; and the appointment of Janet Yellen as the new Fed Chairman suggested to the market that the Fed’s easy monetary policy would be maintained. Japanese stocks benefited from the government’s reflationary policy and the Bank of Japan’s additional monetary action to stimulate the economy. Developed markets were up strongly, led by the U.S., Europe, and stocks that benefit from an improved economic environment. Although global equities generally posted gains, emerging markets (EM) and Japan underperformed on a relative basis. Financial and political instability in emerging markets drove up market volatility in January, sparking another sell-off in EM currencies and putting downward pressure on commodity prices. While developed markets were not immune to the negative impact volatility had on equity prices, better-than-expected economic data particularly in Europe and the U.S. and solid earnings reports provided support for developed markets. The divergence between international and U.S. equity markets continued during the last three months of the fiscal year with the S&P 500 Index up 1.8% versus the MSCI EAFE Index’s return of 0.7%. Global equities, as measured by the MSCI World Index, rose to an overall gain of 1.3% for the quarter.
In this environment, the Mercer Global Low Volatility Equity Fund returned 14.4%, underperforming the MSCI World Index by 4.7% for the 12-month period ending March 31, 2014. The Fund’s defensive posture — Acadian’s focus on low volatility stocks and First Eagle’s strategic weight to gold and cash — was a drag on relative performance during the fiscal year. The majority of relative underperformance was during the third and fourth calendar quarters of 2013; the Fund returned an 11.6% gain while the MSCI World Index rose 16.8% during the 6-month period. The defensive sector allocations such as overweight positions in consumer staples, a gold-backed exchange traded fund, and utilities detracted from performance. In addition, unfavorable security selection in consumer discretionary, utilities, and materials contributed negatively to performance. From a country perspective, negative selection in the U.S., United Kingdom, and France also hurt relative performance. Offsetting some of the negatives was strong stock selection in technology and industrials and underweight positions in sector laggards, energy and materials.
All three of the Fund’s sub-advisors underperformed the MSCI World Index during the fiscal year ending March 31, 2014. The largest driver of underperformance was Acadian, whose focus on low volatility stocks was a hindrance as higher volatility stocks outperformed on a relative basis. Sector decisions that drove relative underperformance were the large overweight positions in consumer staples and utilities as well as underweight positions in technology, consumer discretionary, and financials. Poor stock selection in utilities, financials, and telecom services also hurt performance. From a regional perspective, Acadian’s positioning in North America was the biggest detractor from performance. MFG underperformed the MSCI World benchmark during the fiscal year but was the best performing sub-advisor on a relative basis. Underperformance was driven by both sector and security selection decisions. Security selection was weak in consumer discretionary and consumer staples. MFG’s overweight to consumer staples and underweight to industrials also detracted from performance. First Eagle lagged the MSCI World benchmark, with the majority of underperformance driven by a strategic allocation to gold and a tactical allocation to cash which both underperformed during the equity market rally of the last fiscal year. Offsetting some of the negative performance was strong security selection in industrials, technology, and consumer discretionary.
Risk Considerations
The Fund invests in emerging market securities which involves certain risks such as currency volatility, political and social instability and reduced market liquidity. Emerging markets may be more volatile and less liquid than more developed markets and therefore may involve greater risks. Investments made in small and mid-capitalization companies may be more volatile and less liquid due to limited resources or product lines and more sensitive to economic factors. The Fund may invest in more aggressive investments such as mortgage- and asset-backed securities and derivatives (futures, options, swaps) all of which may cause greater volatility and less liquidity. Derivatives are more sensitive to changes in market conditions and may amplify risks. The Fund may experience high portfolio turnover which may result in higher costs and capital gains. The Fund’s volatility may be amplified by its ability to select sub-advisors to allocate assets.
26
Table of Contents
Mercer Funds
March 31, 2014
Comparison of Change in Value of a $10,000 Investment in
Mercer Global Low Volatility Equity Shares vs. the
MSCI World Index
As of March 31, 2014
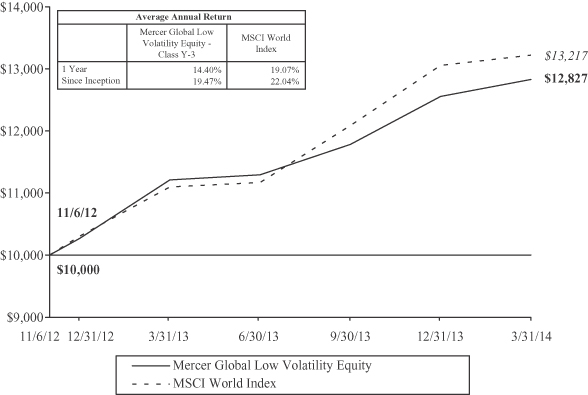
This graph shows the performance of the Mercer Global Low Volatility Equity Fund Class Y-3 shares versus the MSCI World Index from November 6, 2012, which is the inception date of the Fund, through March 31, 2014. The performance of other classes, when launched, will vary from the performance of the class shown based on the difference in fees and expenses paid by shareholders investing in different share classes. The Fund may charge a 2% redemption fee on shares owned less than 30 days.
The table and graph assume reinvestment of dividends and capital gains, but do not reflect a deduction of taxes an investor might pay on fund distributions or upon redemption of fund shares. Performance shown reflects a fee waiver and/or expense reimbursement. Without this waiver/reimbursement, returns would have been lower.
The data quoted represents past performance and does not guarantee future results. Current performance of the Fund may be lower or higher than the performance quoted. Please call 1-866-658-9896 for the Fund’s most recent month-end performance. Investment return and principal value will fluctuate so that an investor’s shares, when redeemed, may be worth more or less than when purchased.
27
Table of Contents
Mercer US Large Cap Growth Equity Fund
(showing percentage of net assets)
March 31, 2014
| Shares | Description | Value ($) | ||||||||
COMMON STOCKS — 98.1% | ||||||||||
Aerospace & Defense — 0.6% | ||||||||||
| 8,452 | Boeing Co. (The) | 1,060,641 | ||||||||
| 9,950 | United Technologies Corp. | 1,162,558 | ||||||||
|
| |||||||||
| 2,223,199 | ||||||||||
|
| |||||||||
Agriculture — 3.8% | ||||||||||
| 96,914 | Monsanto Co. | 11,025,906 | ||||||||
| 29,910 | Philip Morris International, Inc. | 2,448,731 | ||||||||
|
| |||||||||
| 13,474,637 | ||||||||||
|
| |||||||||
Airlines — 0.5% | ||||||||||
| 53,798 | Delta Air Lines, Inc. | 1,864,101 | ||||||||
|
| |||||||||
Apparel — 2.1% | ||||||||||
| 66,901 | NIKE, Inc. Class B | 4,941,308 | ||||||||
| 16,601 | Ralph Lauren Corp. | 2,671,599 | ||||||||
|
| |||||||||
| 7,612,907 | ||||||||||
|
| |||||||||
Auto Manufacturers — 0.5% | ||||||||||
| 48,973 | General Motors Co. | 1,685,651 | ||||||||
|
| |||||||||
Auto Parts & Equipment — 0.3% | ||||||||||
| 19,400 | BorgWarner, Inc. | 1,192,518 | ||||||||
|
| |||||||||
Banks — 1.1% | ||||||||||
| 34,959 | Comerica, Inc. | 1,810,876 | ||||||||
| 45,856 | Wells Fargo & Co. | 2,280,878 | ||||||||
|
| |||||||||
| 4,091,754 | ||||||||||
|
| |||||||||
Beverages — 0.9% | ||||||||||
| 60,475 | Coca-Cola Co. (The) | 2,337,963 | ||||||||
| 9,740 | PepsiCo, Inc. | 813,290 | ||||||||
|
| |||||||||
| 3,151,253 | ||||||||||
|
| |||||||||
Biotechnology — 4.9% | ||||||||||
| 24,000 | Alexion Pharmaceuticals, Inc.* | 3,651,120 | ||||||||
| 12,500 | Amgen, Inc. | 1,541,750 | ||||||||
| 18,145 | Biogen Idec, Inc.* | 5,550,011 | ||||||||
| 23,346 | Celgene Corp.* | 3,259,102 | ||||||||
| 12,900 | Incyte Corp.* | 690,408 | ||||||||
| 9,300 | Regeneron Pharmaceuticals, Inc.* | 2,792,604 | ||||||||
|
| |||||||||
| 17,484,995 | ||||||||||
|
| |||||||||
Chemicals — 1.9% | ||||||||||
| 19,420 | Ecolab, Inc. | 2,097,166 | ||||||||
| 10,192 | LyondellBasell Industries NV Class A | 906,476 | ||||||||
| 7,157 | PPG Industries, Inc. | 1,384,593 | ||||||||
| 28 | See accompanying Notes to the Financial Statements. |
Table of Contents
Mercer US Large Cap Growth Equity Fund
Schedule of Investments (Continued)
(showing percentage of net assets)
March 31, 2014
| Shares | Description | Value ($) | ||||||||
Chemicals — continued | ||||||||||
| 5,268 | Praxair, Inc. | 689,950 | ||||||||
| 8,373 | Sherwin-Williams Co. (The) | 1,650,570 | ||||||||
|
| |||||||||
| 6,728,755 | ||||||||||
|
| |||||||||
Commercial Services — 4.6% | ||||||||||
| 8,460 | Alliance Data Systems Corp.* | 2,304,927 | ||||||||
| 20,250 | Mastercard, Inc. Class A | 1,512,675 | ||||||||
| 4,900 | McKesson Corp. | 865,193 | ||||||||
| 54,149 | Visa, Inc. Class A | 11,688,603 | ||||||||
|
| |||||||||
| 16,371,398 | ||||||||||
|
| |||||||||
Computers — 3.2% | ||||||||||
| 19,385 | Apple, Inc. | 10,404,705 | ||||||||
| 22,800 | Cognizant Technology Solutions Corp. Class A* | 1,153,908 | ||||||||
|
| |||||||||
| 11,558,613 | ||||||||||
|
| |||||||||
Cosmetics & Personal Care — 0.5% | ||||||||||
| 8,100 | Estee Lauder Cos. (The), Inc. Class A | 541,728 | ||||||||
| 15,412 | Procter & Gamble Co. (The) | 1,242,207 | ||||||||
|
| |||||||||
| 1,783,935 | ||||||||||
|
| |||||||||
Distribution & Wholesale — 0.5% | ||||||||||
| 35,365 | Fastenal Co. | 1,744,202 | ||||||||
|
| |||||||||
Diversified Financial Services — 4.1% | ||||||||||
| 27,808 | American Express Co. | 2,503,554 | ||||||||
| 5,520 | BlackRock, Inc. | 1,735,930 | ||||||||
| 120,400 | Charles Schwab Corp. (The) | 3,290,532 | ||||||||
| 25,618 | CIT Group, Inc. | 1,255,794 | ||||||||
| 9,424 | IntercontinentalExchange Group, Inc. | 1,864,350 | ||||||||
| 16,300 | JPMorgan Chase & Co. | 989,573 | ||||||||
| 36,900 | Morgan Stanley | 1,150,173 | ||||||||
| 17,345 | Raymond James Financial, Inc. | 970,106 | ||||||||
| 13,465 | T. Rowe Price Group, Inc. | 1,108,843 | ||||||||
|
| |||||||||
| 14,868,855 | ||||||||||
|
| |||||||||
Electric — 0.9% | ||||||||||
| 26,431 | Dominion Resources, Inc. | 1,876,337 | ||||||||
| 13,573 | NextEra Energy, Inc. | 1,297,850 | ||||||||
|
| |||||||||
| 3,174,187 | ||||||||||
|
| |||||||||
Food — 1.1% | ||||||||||
| 18,269 | Kraft Foods Group, Inc. Class A | 1,024,891 | ||||||||
| 26,585 | Unilever NV | 1,093,175 | ||||||||
| 34,501 | Whole Foods Market, Inc. | 1,749,546 | ||||||||
|
| |||||||||
| 3,867,612 | ||||||||||
|
| |||||||||
| See accompanying Notes to the Financial Statements. | 29 |
Table of Contents
Mercer US Large Cap Growth Equity Fund
Schedule of Investments (Continued)
(showing percentage of net assets)
March 31, 2014
| Shares | Description | Value ($) | ||||||||
Health Care - Products — 1.2% | ||||||||||
| 5,100 | Intuitive Surgical, Inc.* | 2,233,749 | ||||||||
| 21,412 | Johnson & Johnson | 2,103,301 | ||||||||
|
| |||||||||
| 4,337,050 | ||||||||||
|
| |||||||||
Health Care - Services — 0.9% | ||||||||||
| 14,118 | DaVita HealthCare Partners, Inc.* | 972,025 | ||||||||
| 26,873 | UnitedHealth Group, Inc. | 2,203,317 | ||||||||
|
| |||||||||
| 3,175,342 | ||||||||||
|
| |||||||||
Insurance — 0.3% | ||||||||||
| 10,427 | Aon Plc | 878,787 | ||||||||
|
| |||||||||
Internet — 15.5% | ||||||||||
| 31,401 | Amazon.Com, Inc.* | 10,567,065 | ||||||||
| 29,935 | Baidu, Inc., Sponsored ADR* | 4,561,495 | ||||||||
| 17,010 | Check Point Software Technologies, Ltd.* | 1,150,386 | ||||||||
| 41,379 | eBay, Inc.* | 2,285,776 | ||||||||
| 82,500 | Facebook, Inc. Class A* | 4,969,800 | ||||||||
| 15,793 | Google, Inc. Class A* | 17,601,457 | ||||||||
| 18,760 | LinkedIn Corp. Class A* | 3,469,474 | ||||||||
| 740 | Netflix, Inc.* | 260,502 | ||||||||
| 6,928 | priceline.com, Inc.* | 8,257,414 | ||||||||
| 31,600 | Splunk, Inc.* | 2,259,084 | ||||||||
| 3,300 | TripAdvisor, Inc.* | 298,947 | ||||||||
|
| |||||||||
| 55,681,400 | ||||||||||
|
| |||||||||
Lodging — 1.3% | ||||||||||
| 38,800 | Hilton Worldwide Holdings, Inc.* | 862,912 | ||||||||
| 36,000 | Las Vegas Sands Corp. | 2,908,080 | ||||||||
| 3,300 | Wynn Resorts, Ltd. | 733,095 | ||||||||
|
| |||||||||
| 4,504,087 | ||||||||||
|
| |||||||||
Machinery - Diversified — 0.2% | ||||||||||
| 4,314 | Rockwell Automation, Inc. | 537,309 | ||||||||
|
| |||||||||
Media — 4.0% | ||||||||||
| 19,900 | CBS Corp. Class B | 1,229,820 | ||||||||
| 53,137 | Comcast Corp. Class A | 2,657,913 | ||||||||
| 35,800 | Liberty Global Plc Series C* | 1,457,418 | ||||||||
| 50,122 | Nielsen Holdings NV | 2,236,945 | ||||||||
| 106,039 | Twenty-First Century Fox, Inc. | 3,390,067 | ||||||||
| 40,295 | Walt Disney Co. (The) | 3,226,420 | ||||||||
|
| |||||||||
| 14,198,583 | ||||||||||
|
| |||||||||
Metal Fabricate & Hardware — 1.4% | ||||||||||
| 20,321 | Precision Castparts Corp. | 5,136,336 | ||||||||
|
| |||||||||
| 30 | See accompanying Notes to the Financial Statements. |
Table of Contents
Mercer US Large Cap Growth Equity Fund
Schedule of Investments (Continued)
(showing percentage of net assets)
March 31, 2014
| Shares | Description | Value ($) | ||||||||
Miscellaneous - Manufacturing — 3.0% | ||||||||||
| 75,248 | Danaher Corp. | 5,643,600 | ||||||||
| 31,407 | Eaton Corp. Plc | 2,359,294 | ||||||||
| 35,200 | General Electric Co. | 911,328 | ||||||||
| 21,143 | Honeywell International, Inc. | 1,961,224 | ||||||||
|
| |||||||||
| 10,875,446 | ||||||||||
|
| |||||||||
Oil & Gas — 2.9% | ||||||||||
| 29,037 | Noble Energy, Inc. | 2,062,788 | ||||||||
| 17,821 | Occidental Petroleum Corp. | 1,698,163 | ||||||||
| 3,800 | Pioneer Natural Resources Co. | 711,132 | ||||||||
| 36,384 | Range Resources Corp. | 3,018,781 | ||||||||
| 64,400 | Southwestern Energy Co.* | 2,963,044 | ||||||||
|
| |||||||||
| 10,453,908 | ||||||||||
|
| |||||||||
Oil & Gas Services — 3.7% | ||||||||||
| 18,342 | Cameron International Corp.* | 1,132,985 | ||||||||
| 40,600 | FMC Technologies, Inc.* | 2,122,974 | ||||||||
| 31,600 | National Oilwell Varco, Inc. | 2,460,692 | ||||||||
| 78,845 | Schlumberger, Ltd. | 7,687,388 | ||||||||
|
| |||||||||
| 13,404,039 | ||||||||||
|
| |||||||||
Pharmaceuticals — 6.1% | ||||||||||
| 27,562 | Abbott Laboratories | 1,061,413 | ||||||||
| 8,553 | Allergan, Inc. | 1,061,427 | ||||||||
| 53,071 | BioMarin Pharmaceutical, Inc.* | 3,619,973 | ||||||||
| 57,816 | Bristol-Myers Squibb Co. | 3,003,541 | ||||||||
| 37,654 | Express Scripts Holding Co.* | 2,827,439 | ||||||||
| 67,111 | Gilead Sciences, Inc.* | 4,755,486 | ||||||||
| 17,991 | Perrigo Co. Plc | 2,782,488 | ||||||||
| 29,069 | Pfizer, Inc. | 933,696 | ||||||||
| 16,919 | Teva Pharmaceutical Industries, Ltd., Sponsored ADR | 894,000 | ||||||||
| 36,300 | Zoetis, Inc. | 1,050,522 | ||||||||
|
| |||||||||
| 21,989,985 | ||||||||||
|
| |||||||||
Pipelines — 0.3% | ||||||||||
| 38,088 | Kinder Morgan, Inc. | 1,237,479 | ||||||||
|
| |||||||||
REITS — 0.4% | ||||||||||
| 19,400 | American Tower Corp. REIT | 1,588,278 | ||||||||
|
| |||||||||
Retail — 11.1% | ||||||||||
| 7,820 | Chipotle Mexican Grill, Inc.* | 4,442,151 | ||||||||
| 38,139 | Costco Wholesale Corp. | 4,259,363 | ||||||||
| 71,881 | CVS Caremark Corp. | 5,381,012 | ||||||||
| 20,200 | Dollar General Corp.* | 1,120,696 | ||||||||
| 12,981 | Family Dollar Stores, Inc. | 753,028 | ||||||||
| 24,376 | Home Depot, Inc. (The) | 1,928,873 | ||||||||
| 65,714 | Lowe’s Cos., Inc. | 3,213,415 | ||||||||
| See accompanying Notes to the Financial Statements. | 31 |
Table of Contents
Mercer US Large Cap Growth Equity Fund
Schedule of Investments (Continued)
(showing percentage of net assets)
March 31, 2014
| Shares | Description | Value ($) | ||||||||
Retail — continued | ||||||||||
| 17,369 | McDonald’s Corp. | 1,702,683 | ||||||||
| 24,941 | Michael Kors Holdings, Ltd.* | 2,326,247 | ||||||||
| 15,499 | Nordstrom, Inc. | 967,912 | ||||||||
| 6,883 | O’Reilly Automotive, Inc.* | 1,021,368 | ||||||||
| 3,814 | Panera Bread Co. Class A* | 673,057 | ||||||||
| 15,323 | Ross Stores, Inc. | 1,096,361 | ||||||||
| 95,142 | Starbucks Corp. | 6,981,520 | ||||||||
| 26,336 | Ulta Salon Cosmetics & Fragrance, Inc.* | 2,567,233 | ||||||||
| 19,406 | Wal-Mart Stores, Inc. | 1,483,201 | ||||||||
|
| |||||||||
| 39,918,120 | ||||||||||
|
| |||||||||
Semiconductors — 2.8% | ||||||||||
| 48,400 | Applied Materials, Inc. | 988,328 | ||||||||
| 82,100 | ARM Holdings Plc, Sponsored ADR | 4,184,637 | ||||||||
| 37,940 | ASML Holding NV, ADR | 3,542,078 | ||||||||
| 29,226 | Texas Instruments, Inc. | 1,378,006 | ||||||||
|
| |||||||||
| 10,093,049 | ||||||||||
|
| |||||||||
Software — 6.4% | ||||||||||
| 11,900 | athenahealth, Inc.* | 1,906,856 | ||||||||
| 61,500 | Cerner Corp.* | 3,459,375 | ||||||||
| 22,022 | Informatica Corp.* | 831,991 | ||||||||
| 11,748 | Intuit, Inc. | 913,172 | ||||||||
| 51,821 | Microsoft Corp. | 2,124,143 | ||||||||
| 97,443 | Oracle Corp. | 3,986,393 | ||||||||
| 105,800 | Salesforce.com, Inc.* | 6,040,122 | ||||||||
| 8,900 | ServiceNow, Inc.* | 533,288 | ||||||||
| 22,242 | VMware, Inc. Class A* | 2,402,581 | ||||||||
| 6,975 | Workday, Inc. Class A* | 637,724 | ||||||||
|
| |||||||||
| 22,835,645 | ||||||||||
|
| |||||||||
Telecommunications — 2.8% | ||||||||||
| 17,669 | Crown Castle International Corp. | 1,303,619 | ||||||||
| 37,625 | Juniper Networks, Inc.* | 969,220 | ||||||||
| 56,332 | QUALCOMM, Inc. | 4,442,341 | ||||||||
| 14,200 | SBA Communications Corp. Class A* | 1,291,632 | ||||||||
| 39,129 | Verizon Communications, Inc. | 1,861,367 | ||||||||
|
| |||||||||
| 9,868,179 | ||||||||||
|
| |||||||||
Transportation — 2.3% | ||||||||||
| 4,470 | Genesee & Wyoming, Inc. Class A* | 435,020 | ||||||||
| 42,200 | Union Pacific Corp. | 7,919,252 | ||||||||
|
| |||||||||
| 8,354,272 | ||||||||||
|
| |||||||||
TOTAL COMMON STOCKS (COST $264,546,422) | 351,945,866 | |||||||||
|
| |||||||||
| 32 | See accompanying Notes to the Financial Statements. |
Table of Contents
Mercer US Large Cap Growth Equity Fund
Schedule of Investments (Continued)
(showing percentage of net assets)
March 31, 2014
| Par Value ($) | Description | Value ($) | ||||||||
SHORT-TERM INVESTMENTS — 1.3% | ||||||||||
Bank Deposit — 1.3% | ||||||||||
| 4,741,760 | State Street Bank & Trust Euro Time Deposit, 0.01%, due 04/01/14 | 4,741,760 | ||||||||
|
| |||||||||
TOTAL SHORT-TERM INVESTMENTS (COST $4,741,760) | 4,741,760 | |||||||||
|
| |||||||||
TOTAL INVESTMENTS — 99.4% (Cost $269,288,182) | 356,687,626 | |||||||||
Other Assets and Liabilities (net) — 0.6% | 2,174,610 | |||||||||
|
| |||||||||
NET ASSETS — 100.0% | $ | 358,862,236 | ||||||||
|
| |||||||||
Notes to Schedule of Investments: | ||||||||||
| ADR — American Depository Receipt | ||||||||||
| REIT — Real Estate Investment Trust | ||||||||||
| * | Non-income producing security | |||||||||
| See accompanying Notes to the Financial Statements. | 33 |
Table of Contents
Mercer US Large Cap Growth Equity Fund
Schedule of Investments (Continued)
March 31, 2014
| Asset Class Summary (Unaudited) | % of Net Assets | ||||
Common Stocks | 98.1 | ||||
Short-Term Investments | 1.3 | ||||
Other Assets and Liabilities (net) | 0.6 | ||||
|
| ||||
| 100.0 | % | ||||
|
| ||||
| 34 | See accompanying Notes to the Financial Statements. |
Table of Contents
Mercer US Large Cap Value Equity Fund
Schedule of Investments
(showing percentage of net assets)
March 31, 2014
| Shares | Description | Value ($) | ||||||||
COMMON STOCKS — 99.2% | ||||||||||
Advertising — 0.1% | ||||||||||
| 6,694 | Omnicom Group, Inc. | 485,984 | ||||||||
|
| |||||||||
Aerospace & Defense — 2.6% | ||||||||||
| 27,364 | L-3 Communications Holdings, Inc. | 3,233,056 | ||||||||
| 9,965 | Lockheed Martin Corp. | 1,626,687 | ||||||||
| 29,053 | Northrop Grumman Corp. | 3,584,559 | ||||||||
| 13,590 | Raytheon Co. | 1,342,556 | ||||||||
|
| |||||||||
| 9,786,858 | ||||||||||
|
| |||||||||
Agriculture — 0.9% | ||||||||||
| 20,790 | Archer-Daniels-Midland Co. | 902,078 | ||||||||
| 23,084 | Lorillard, Inc. | 1,248,383 | ||||||||
| 8,572 | Philip Morris International, Inc. | 701,790 | ||||||||
| 9,444 | Reynolds American, Inc. | 504,498 | ||||||||
|
| |||||||||
| 3,356,749 | ||||||||||
|
| |||||||||
Airlines — 1.5% | ||||||||||
| 35,400 | American Airlines Group, Inc.* | 1,295,640 | ||||||||
| 123,180 | Delta Air Lines, Inc. | 4,268,187 | ||||||||
|
| |||||||||
| 5,563,827 | ||||||||||
|
| |||||||||
Auto Manufacturers — 2.2% | ||||||||||
| 123,430 | General Motors Co. | 4,248,460 | ||||||||
| 14,270 | PACCAR, Inc. | 962,369 | ||||||||
| 27,100 | Toyota Motor Corp., Sponsored ADR | 3,059,590 | ||||||||
|
| |||||||||
| 8,270,419 | ||||||||||
|
| |||||||||
Auto Parts & Equipment — 0.5% | ||||||||||
| 9,490 | Johnson Controls, Inc. | 449,067 | ||||||||
| 14,710 | Lear Corp. | 1,231,521 | ||||||||
|
| |||||||||
| 1,680,588 | ||||||||||
|
| |||||||||
Banks — 7.5% | ||||||||||
| 398,300 | Bank of America Corp. | 6,850,760 | ||||||||
| 23,580 | BB&T Corp. | 947,208 | ||||||||
| 38,220 | Capital One Financial Corp. | 2,949,055 | ||||||||
| 22,140 | Comerica, Inc. | 1,146,852 | ||||||||
| 118,660 | Fifth Third Bancorp | 2,723,247 | ||||||||
| 52,075 | Grupo Financiero Santander Mexico SAB de CV Class B, ADR‡ | 640,002 | ||||||||
| 13,020 | PNC Financial Services Group, Inc. | 1,132,740 | ||||||||
| 42,660 | Regions Financial Corp. | 473,953 | ||||||||
| 12,870 | State Street Corp. | 895,108 | ||||||||
| 23,700 | SunTrust Banks, Inc. | 943,023 | ||||||||
| 182,297 | Wells Fargo & Co. | 9,067,453 | ||||||||
|
| |||||||||
| 27,769,401 | ||||||||||
|
| |||||||||
| See accompanying Notes to the Financial Statements. | 35 |
Table of Contents
Mercer US Large Cap Value Equity Fund
Schedule of Investments (Continued)
(showing percentage of net assets)
March 31, 2014
| Shares | Description | Value ($) | ||||||||
Beverages — 1.4% | ||||||||||
| 94,080 | Coca-Cola Enterprises, Inc. | 4,493,261 | ||||||||
| 8,280 | PepsiCo, Inc. | 691,380 | ||||||||
|
| |||||||||
| 5,184,641 | ||||||||||
|
| |||||||||
Biotechnology — 0.5% | ||||||||||
| 16,334 | Amgen, Inc. | 2,014,636 | ||||||||
|
| |||||||||
Building Materials — 0.4% | ||||||||||
| 8,740 | Martin Marietta Materials, Inc. | 1,121,779 | ||||||||
| 10,630 | Owens Corning | 458,897 | ||||||||
|
| |||||||||
| 1,580,676 | ||||||||||
|
| |||||||||
Chemicals — 1.4% | ||||||||||
| 5,080 | CF Industries Holdings, Inc. | 1,324,051 | ||||||||
| 50,590 | Dow Chemical Co. (The) | 2,458,168 | ||||||||
| 6,464 | PPG Industries, Inc. | 1,250,526 | ||||||||
|
| |||||||||
| 5,032,745 | ||||||||||
|
| |||||||||
Commercial Services — 2.2% | ||||||||||
| 21,192 | ADT Corp. (The) | 634,700 | ||||||||
| 17,155 | Apollo Group, Inc. Class A* | 587,387 | ||||||||
| 27,791 | H&R Block, Inc. | 839,010 | ||||||||
| 35,160 | Hertz Global Holdings, Inc.* | 936,663 | ||||||||
| 18,735 | McKesson Corp. | 3,308,039 | ||||||||
| 120,871 | Western Union Co. (The) | 1,977,450 | ||||||||
|
| |||||||||
| 8,283,249 | ||||||||||
|
| |||||||||
Computers — 4.6% | ||||||||||
| 5,480 | Apple, Inc. | 2,941,335 | ||||||||
| 127,980 | Brocade Communications Systems, Inc.* | 1,357,868 | ||||||||
| 80,810 | EMC Corp. | 2,215,002 | ||||||||
| 14,650 | NetApp, Inc. | 540,585 | ||||||||
| 108,166 | Seagate Technology Plc | 6,074,603 | ||||||||
| 42,550 | Western Digital Corp. | 3,906,941 | ||||||||
|
| |||||||||
| 17,036,334 | ||||||||||
|
| |||||||||
Cosmetics & Personal Care — 0.1% | ||||||||||
| 23,840 | Avon Products, Inc. | 349,018 | ||||||||
|
| |||||||||
Diversified Financial Services — 11.9% | ||||||||||
| 37,119 | Ameriprise Financial, Inc. | 4,085,688 | ||||||||
| 78,289 | Berkshire Hathaway, Inc. Class B* | 9,783,776 | ||||||||
| 42,800 | Blackstone Group (The), LP | 1,423,100 | ||||||||
| 162,653 | Citigroup, Inc. | 7,742,283 | ||||||||
| 26,235 | Discover Financial Services | 1,526,615 | ||||||||
| 15,185 | Goldman Sachs Group, Inc. (The) | 2,488,062 | ||||||||
| 15,110 | Invesco, Ltd. | 559,070 | ||||||||
| 177,872 | JPMorgan Chase & Co. | 10,798,609 | ||||||||
| 36 | See accompanying Notes to the Financial Statements. |
Table of Contents
Mercer US Large Cap Value Equity Fund
Schedule of Investments (Continued)
(showing percentage of net assets)
March 31, 2014
| Shares | Description | Value ($) | ||||||||
Diversified Financial Services — continued | ||||||||||
| 54,800 | KKR & Co., LP | 1,251,632 | ||||||||
| 35,210 | Morgan Stanley | 1,097,496 | ||||||||
| 22,240 | Santander Consumer USA Holdings, Inc.* | 535,539 | ||||||||
| 75,242 | SLM Corp. | 1,841,924 | ||||||||
| 26,510 | TD Ameritrade Holding Corp. | 900,015 | ||||||||
|
| |||||||||
| 44,033,809 | ||||||||||
|
| |||||||||
Electric — 1.2% | ||||||||||
| 94,900 | AES Corp. | 1,355,172 | ||||||||
| 25,245 | FirstEnergy Corp. | 859,087 | ||||||||
| 7,120 | NextEra Energy, Inc. | 680,815 | ||||||||
| 42,950 | NRG Energy, Inc. | 1,365,810 | ||||||||
|
| |||||||||
| 4,260,884 | ||||||||||
|
| |||||||||
Electronics — 0.6% | ||||||||||
| 10,890 | Agilent Technologies, Inc. | 608,969 | ||||||||
| 22,753 | Koninklijke Philips Electronics NV, ADR | 799,996 | ||||||||
| 12,697 | TE Connectivity, Ltd. | 764,486 | ||||||||
|
| |||||||||
| 2,173,451 | ||||||||||
|
| |||||||||
Entertainment — 0.1% | ||||||||||
| 13,765 | Six Flags Entertainment Corp. | 552,665 | ||||||||
|
| |||||||||
Food — 0.9% | ||||||||||
| 47,162 | Koninklijke Ahold NV, Sponsored ADR | 877,213 | ||||||||
| 11,265 | Kroger Co. (The) | 491,717 | ||||||||
| 44,605 | Tyson Foods, Inc. Class A | 1,963,066 | ||||||||
|
| |||||||||
| 3,331,996 | ||||||||||
|
| |||||||||
Forest Products & Paper — 0.2% | ||||||||||
| 18,695 | International Paper Co. | 857,727 | ||||||||
|
| |||||||||
Hand & Machine Tools — 0.1% | ||||||||||
| 5,955 | Stanley Black & Decker, Inc. | 483,784 | ||||||||
|
| |||||||||
Health Care - Products — 1.8% | ||||||||||
| 15,205 | Covidien Plc | 1,120,000 | ||||||||
| 29,164 | Johnson & Johnson | 2,864,780 | ||||||||
| 15,750 | Medtronic, Inc. | 969,255 | ||||||||
| 14,846 | St. Jude Medical, Inc. | 970,780 | ||||||||
| 8,080 | Zimmer Holdings, Inc. | 764,206 | ||||||||
|
| |||||||||
| 6,689,021 | ||||||||||
|
| |||||||||
Health Care - Services — 1.3% | ||||||||||
| 9,070 | Aetna, Inc. | 679,978 | ||||||||
| 2,915 | Laboratory Corp. of America Holdings* | 286,282 | ||||||||
| 29,858 | Quest Diagnostics, Inc. | 1,729,375 | ||||||||
| 5,790 | UnitedHealth Group, Inc. | 474,722 | ||||||||
| See accompanying Notes to the Financial Statements. | 37 |
Table of Contents
Mercer US Large Cap Value Equity Fund
Schedule of Investments (Continued)
(showing percentage of net assets)
March 31, 2014
| Shares | Description | Value ($) | ||||||||
Health Care - Services — continued | ||||||||||
| 15,000 | WellPoint, Inc. | 1,493,250 | ||||||||
|
| |||||||||
| 4,663,607 | ||||||||||
|
| |||||||||
Insurance — 5.5% | ||||||||||
| 25,900 | ACE, Ltd. | 2,565,654 | ||||||||
| 31,220 | Allstate Corp. (The) | 1,766,427 | ||||||||
| 22,340 | American International Group, Inc. | 1,117,223 | ||||||||
| 23,555 | Cigna Corp. | 1,972,260 | ||||||||
| 1,776 | Everest Re Group, Ltd. | 271,817 | ||||||||
| 28,900 | Hartford Financial Services Group, Inc. (The) | 1,019,303 | ||||||||
| 58,240 | ING US, Inc. | 2,112,365 | ||||||||
| 24,500 | Lincoln National Corp. | 1,241,415 | ||||||||
| 114,540 | MetLife, Inc. | 6,047,712 | ||||||||
| 9,700 | Prudential Financial, Inc. | 821,105 | ||||||||
| 7,930 | Travelers Cos. (The), Inc. | 674,843 | ||||||||
| 15,370 | Validus Holdings, Ltd. | 579,603 | ||||||||
|
| |||||||||
| 20,189,727 | ||||||||||
|
| |||||||||
Internet — 0.9% | ||||||||||
| 15,200 | Check Point Software Technologies, Ltd.* | 1,027,976 | ||||||||
| 570 | Google, Inc. Class A* | 635,271 | ||||||||
| 7,225 | IAC/InterActiveCorp | 515,793 | ||||||||
| 30,313 | Yahoo!, Inc.* | 1,088,236 | ||||||||
|
| |||||||||
| 3,267,276 | ||||||||||
|
| |||||||||
Iron & Steel — 0.4% | ||||||||||
| 20,500 | Reliance Steel & Aluminum Co. | 1,448,530 | ||||||||
|
| |||||||||
Leisure Time — 0.3% | ||||||||||
| 25,960 | Carnival Corp. | 982,846 | ||||||||
|
| |||||||||
Lodging — 0.1% | ||||||||||
| 6,124 | Wyndham Worldwide Corp. | 448,461 | ||||||||
|
| |||||||||
Machinery - Construction & Mining — 0.7% | ||||||||||
| 11,000 | Caterpillar, Inc. | 1,093,070 | ||||||||
| 27,400 | Joy Global, Inc.‡ | 1,589,200 | ||||||||
|
| |||||||||
| 2,682,270 | ||||||||||
|
| |||||||||
Machinery - Diversified — 1.3% | ||||||||||
| 13,690 | Cummins, Inc. | 2,039,673 | ||||||||
| 33,306 | Flowserve Corp. | 2,609,192 | ||||||||
|
| |||||||||
| 4,648,865 | ||||||||||
|
| |||||||||
Media — 5.7% | ||||||||||
| 26,383 | British Sky Broadcasting Group Plc, Sponsored ADR‡ | 1,617,278 | ||||||||
| 9,995 | CBS Corp. Class B | 617,691 | ||||||||
| 43,601 | Comcast Corp. Class A | 2,180,922 | ||||||||
| 38 | See accompanying Notes to the Financial Statements. |
Table of Contents
Mercer US Large Cap Value Equity Fund
Schedule of Investments (Continued)
(showing percentage of net assets)
March 31, 2014
| Shares | Description | Value ($) | ||||||||
Media — continued | ||||||||||
| 46,686 | DIRECTV* | 3,567,744 | ||||||||
| 25,680 | Gannett Co., Inc. | 708,768 | ||||||||
| 34,740 | Liberty Global Plc Series C* | 1,414,265 | ||||||||
| 9,785 | Liberty Media Corp. - Capital Series A* | 1,279,193 | ||||||||
| 53,020 | News Corp. Class A* | 913,004 | ||||||||
| 27,047 | Time Warner, Inc. | 1,766,981 | ||||||||
| 18,000 | Tribune Co.* | 1,433,700 | ||||||||
| 19,970 | Twenty-First Century Fox, Inc. | 638,441 | ||||||||
| 37,728 | Viacom, Inc. Class B | 3,206,503 | ||||||||
| 24,200 | Walt Disney Co. (The) | 1,937,694 | ||||||||
|
| |||||||||
| 21,282,184 | ||||||||||
|
| |||||||||
Mining — 0.2% | ||||||||||
| 11,180 | Vulcan Materials Co. | 742,911 | ||||||||
|
| |||||||||
Miscellaneous - Manufacturing — 2.5% | ||||||||||
| 4,950 | Crane Co. | 352,193 | ||||||||
| 10,655 | Dover Corp. | 871,046 | ||||||||
| 12,150 | Eaton Corp. Plc | 912,708 | ||||||||
| 103,900 | General Electric Co. | 2,689,971 | ||||||||
| 22,565 | Honeywell International, Inc. | 2,093,129 | ||||||||
| 6,800 | Parker Hannifin Corp. | 814,028 | ||||||||
| 6,165 | Siemens AG, Sponsored ADR | 833,200 | ||||||||
| 20,318 | Tyco International, Ltd. | 861,483 | ||||||||
|
| |||||||||
| 9,427,758 | ||||||||||
|
| |||||||||
Office & Business Equipment — 0.4% | ||||||||||
| 134,103 | Xerox Corp. | 1,515,364 | ||||||||
|
| |||||||||
Oil & Gas — 10.4% | ||||||||||
| 4,100 | Anadarko Petroleum Corp. | 347,516 | ||||||||
| 23,700 | Apache Corp. | 1,965,915 | ||||||||
| 80,371 | BP Plc, Sponsored ADR | 3,865,845 | ||||||||
| 24,800 | Canadian Natural Resources, Ltd. | 951,576 | ||||||||
| 13,200 | Chevron Corp. | 1,569,612 | ||||||||
| 2,256 | Ecopetrol SA, Sponsored ADR‡ | 92,022 | ||||||||
| 27,255 | ENI Spa, Sponsored ADR‡ | 1,367,384 | ||||||||
| 4,089 | EOG Resources, Inc. | 802,139 | ||||||||
| 102,840 | Exxon Mobil Corp. | 10,045,411 | ||||||||
| 25,000 | Hess Corp. | 2,072,000 | ||||||||
| 19,510 | Marathon Oil Corp. | 692,995 | ||||||||
| 23,141 | Marathon Petroleum Corp. | 2,014,193 | ||||||||
| 82,797 | Occidental Petroleum Corp. | 7,889,726 | ||||||||
| 39,605 | Phillips 66 | 3,051,961 | ||||||||
| 19,050 | QEP Resources, Inc. | 560,832 | ||||||||
| 23,670 | Valero Energy Corp. | 1,256,877 | ||||||||
|
| |||||||||
| 38,546,004 | ||||||||||
|
| |||||||||
| See accompanying Notes to the Financial Statements. | 39 |
Table of Contents
Mercer US Large Cap Value Equity Fund
Schedule of Investments (Continued)
(showing percentage of net assets)
March 31, 2014
| Shares | Description | Value ($) | ||||||||
Oil & Gas Services — 1.3% | ||||||||||
| 7,460 | Cameron International Corp.* | 460,804 | ||||||||
| 47,137 | Halliburton Co. | 2,775,898 | ||||||||
| 15,510 | Schlumberger, Ltd. | 1,512,225 | ||||||||
|
| |||||||||
| 4,748,927 | ||||||||||
|
| |||||||||
Packaging & Containers — 0.5% | ||||||||||
| 20,855 | Crown Holdings, Inc.* | 933,053 | ||||||||
| 7,860 | Rock-Tenn Co. Class A | 829,780 | ||||||||
|
| |||||||||
| 1,762,833 | ||||||||||
|
| |||||||||
Pharmaceuticals — 7.5% | ||||||||||
| 30,250 | AbbVie, Inc. | 1,554,850 | ||||||||
| 34,491 | AmerisourceBergen Corp. | 2,262,265 | ||||||||
| 15,027 | AstraZeneca Plc, Sponsored ADR | 974,952 | ||||||||
| 19,720 | Cardinal Health, Inc. | 1,380,006 | ||||||||
| 8,650 | Eli Lilly & Co. | 509,139 | ||||||||
| 22,635 | Express Scripts Holding Co.* | 1,699,662 | ||||||||
| 77,110 | Merck & Co., Inc. | 4,377,535 | ||||||||
| 20,574 | Mylan, Inc.* | 1,004,628 | ||||||||
| 12,700 | Novartis AG, ADR | 1,079,754 | ||||||||
| 24,565 | Omnicare, Inc. | 1,465,793 | ||||||||
| 308,144 | Pfizer, Inc. | 9,897,585 | ||||||||
| 31,515 | Sanofi, ADR | 1,647,604 | ||||||||
|
| |||||||||
| 27,853,773 | ||||||||||
|
| |||||||||
REITS — 1.0% | ||||||||||
| 24,165 | American Capital Agency Corp. REIT | 519,306 | ||||||||
| 30,995 | American Homes 4 Rent Class A REIT | 517,927 | ||||||||
| 13,565 | Equity Residential REIT | 786,634 | ||||||||
| 55,700 | Hatteras Financial Corp. REIT | 1,049,945 | ||||||||
| 67,600 | Two Harbors Investment Corp. REIT | 692,900 | ||||||||
|
| |||||||||
| 3,566,712 | ||||||||||
|
| |||||||||
Retail — 5.2% | ||||||||||
| 10,365 | Bed Bath & Beyond, Inc.* | 713,112 | ||||||||
| 53,860 | CVS Caremark Corp. | 4,031,959 | ||||||||
| 11,700 | Dillard’s, Inc. Class A | 1,081,080 | ||||||||
| 2,395 | Gap, Inc. (The) | 95,944 | ||||||||
| 62,374 | Kohl’s Corp. | 3,542,843 | ||||||||
| 44,544 | Lowe’s Cos., Inc. | 2,178,201 | ||||||||
| 38,820 | Macy’s, Inc. | 2,301,638 | ||||||||
| 1,977 | Nordstrom, Inc. | 123,464 | ||||||||
| 14,787 | O’Reilly Automotive, Inc.* | 2,194,243 | ||||||||
| 7,740 | PVH Corp. | 965,720 | ||||||||
| 11,900 | Target Corp. | 720,069 | ||||||||
| 17,300 | Wal-Mart Stores, Inc. | 1,322,239 | ||||||||
|
| |||||||||
| 19,270,512 | ||||||||||
|
| |||||||||
| 40 | See accompanying Notes to the Financial Statements. |
Table of Contents
Mercer US Large Cap Value Equity Fund
Schedule of Investments (Continued)
(showing percentage of net assets)
March 31, 2014
| Shares | Description | Value ($) | ||||||||
Semiconductors — 3.0% | ||||||||||
| 187,545 | Applied Materials, Inc. | 3,829,669 | ||||||||
| 5,080 | Avago Technologies, Ltd. | 327,203 | ||||||||
| 8,112 | Lam Research Corp.* | 446,160 | ||||||||
| 87,560 | LSI Corp. | 969,289 | ||||||||
| 10,200 | Micron Technology, Inc.* | 241,332 | ||||||||
| 95,839 | NVIDIA Corp. | 1,716,477 | ||||||||
| 56,600 | ON Semiconductor Corp.* | 532,040 | ||||||||
| 39,660 | Texas Instruments, Inc. | 1,869,969 | ||||||||
| 19,490 | Xilinx, Inc. | 1,057,722 | ||||||||
|
| |||||||||
| 10,989,861 | ||||||||||
|
| |||||||||
Software — 2.2% | ||||||||||
| 102,300 | Activision Blizzard, Inc. | 2,091,012 | ||||||||
| 3,410 | Fidelity National Information Services, Inc. | 182,264 | ||||||||
| 6,670 | Global Payments, Inc. | 474,304 | ||||||||
| 111,930 | Microsoft Corp. | 4,588,011 | ||||||||
| 21,915 | Oracle Corp. | 896,543 | ||||||||
|
| |||||||||
| 8,232,134 | ||||||||||
|
| |||||||||
Telecommunications — 5.6% | ||||||||||
| 4,018 | America Movil SA de CV Series L, ADR | 79,878 | ||||||||
| 73,295 | AT&T, Inc. | 2,570,456 | ||||||||
| 37,774 | CenturyLink, Inc. | 1,240,498 | ||||||||
| 52,600 | China Mobile, Ltd., Sponsored ADR | 2,398,034 | ||||||||
| 324,410 | Cisco Systems, Inc. | 7,270,028 | ||||||||
| 5,325 | Knowles Corp.* | 168,110 | ||||||||
| 30,495 | Motorola Solutions, Inc. | 1,960,523 | ||||||||
| 38,589 | Nippon Telegraph & Telephone Corp., ADR‡ | 1,051,164 | ||||||||
| 14,145 | QUALCOMM, Inc. | 1,115,475 | ||||||||
| 51,436 | Telefonica Brasil SA, ADR‡ | 1,092,501 | ||||||||
| 8,762 | TELUS Corp. | 314,994 | ||||||||
| 29,500 | Verizon Communications, Inc. | 1,403,315 | ||||||||
|
| |||||||||
| 20,664,976 | ||||||||||
|
| |||||||||
Transportation — 0.5% | ||||||||||
| 5,080 | FedEx Corp. | 673,405 | ||||||||
| 13,030 | Norfolk Southern Corp. | 1,266,125 | ||||||||
|
| |||||||||
| 1,939,530 | ||||||||||
|
| |||||||||
TOTAL COMMON STOCKS (COST $281,543,135) | 367,653,523 | |||||||||
|
| |||||||||
INVESTMENT COMPANY — 0.1% | ||||||||||
Investment Company — 0.1% | ||||||||||
| 3,100 | iShares Russell 1000 Value Index Fund | 299,150 | ||||||||
|
| |||||||||
TOTAL INVESTMENT COMPANY (COST $291,014) | 299,150 | |||||||||
|
| |||||||||
| See accompanying Notes to the Financial Statements. | 41 |
Table of Contents
Mercer US Large Cap Value Equity Fund
Schedule of Investments (Continued)
(showing percentage of net assets)
March 31, 2014
| Par Value ($) | Description | Value ($) | ||||||||
SHORT-TERM INVESTMENTS — 2.1% | ||||||||||
Bank Deposit — 0.5% | ||||||||||
| 1,683,192 | State Street Bank & Trust Euro Time Deposit, 0.01%, due 04/01/14 | 1,683,192 | ||||||||
|
| |||||||||
Securities Lending Collateral — 1.6% | ||||||||||
| 5,975,569 | State Street Navigator Securities Lending Prime Portfolio*** | 5,975,569 | ||||||||
|
| |||||||||
TOTAL SHORT-TERM INVESTMENTS (COST $7,658,761) | 7,658,761 | |||||||||
|
| |||||||||
TOTAL INVESTMENTS — 101.4% (Cost $289,492,910) | 375,611,434 | |||||||||
Other Assets and Liabilities (net) — (1.4)% | (5,133,572 | ) | ||||||||
|
| |||||||||
NET ASSETS — 100.0% | $ | 370,477,862 | ||||||||
|
| |||||||||
Notes to Schedule of Investments: | ||||||||||
| ADR — American Depository Receipt | ||||||||||
| REIT — Real Estate Investment Trust | ||||||||||
| * | Non-income producing security | |||||||||
| ‡ | All or a portion of this security is out on loan. | |||||||||
| *** | Represents an investment of securities lending cash collateral. | |||||||||
| 42 | See accompanying Notes to the Financial Statements. |
Table of Contents
Mercer US Large Cap Value Equity Fund
Schedule of Investments (Continued)
March 31, 2014
A summary of outstanding financial instruments at March 31, 2014 is as follows:
Forward Foreign Currency Contracts
Settlement | Currency | Counterparty | Units of | Value | Unrealized | |||||||||||||||
| Sales | ||||||||||||||||||||
| 04/09/14 | JPY | Barclays Bank Plc | 207,100,000 | $ | 2,011,050 | $ | (23,526 | ) | ||||||||||||
|
| |||||||||||||||||||
Currency Abbreviations
| JPY | Japanese Yen |
| See accompanying Notes to the Financial Statements. | 43 |
Table of Contents
Mercer US Large Cap Value Equity Fund
Schedule of Investments (Continued)
March 31, 2014
| Asset Class Summary (Unaudited) | % of Net Assets | ||||
Common Stocks | 99.2 | ||||
Investment Company | 0.1 | ||||
Forward Foreign Currency Contracts | 0.0 | ||||
Short-Term Investments | 2.1 | ||||
Other Assets and Liabilities (net) | (1.4 | ) | |||
|
| ||||
| 100.0 | % | ||||
|
| ||||
| 44 | See accompanying Notes to the Financial Statements. |
Table of Contents
Mercer US Small/Mid Cap Growth Equity Fund
Schedule of Investments
(showing percentage of net assets)
March 31, 2014
| Shares | Description | Value ($) | ||||||||
COMMON STOCKS — 99.0% | ||||||||||
Aerospace & Defense — 1.7% | ||||||||||
| 30,480 | BE Aerospace, Inc.* | 2,645,360 | ||||||||
| 14,470 | TransDigm Group, Inc. | 2,679,844 | ||||||||
| 20,199 | Triumph Group, Inc. | 1,304,451 | ||||||||
|
| |||||||||
| 6,629,655 | ||||||||||
|
| |||||||||
Apparel — 0.3% | ||||||||||
| 62,355 | Ascena Retail Group, Inc.* | 1,077,494 | ||||||||
|
| |||||||||
Auto Parts & Equipment — 1.2% | ||||||||||
| 18,737 | Dorman Products, Inc.* | 1,106,607 | ||||||||
| 16,397 | Tenneco, Inc.* | 952,174 | ||||||||
| 25,960 | WABCO Holdings, Inc.* | 2,740,338 | ||||||||
|
| |||||||||
| 4,799,119 | ||||||||||
|
| |||||||||
Banks — 1.8% | ||||||||||
| 40,465 | BankUnited, Inc. | 1,406,968 | ||||||||
| 38,580 | Comerica, Inc. | 1,998,444 | ||||||||
| 48,410 | First Republic Bank | 2,613,656 | ||||||||
| 19,723 | Texas Capital Bancshares, Inc.* | 1,280,812 | ||||||||
|
| |||||||||
| 7,299,880 | ||||||||||
|
| |||||||||
Biotechnology — 0.7% | ||||||||||
| 45,340 | Aegerion Pharmaceuticals, Inc.* | 2,091,081 | ||||||||
| 86,240 | Sunesis Pharmaceuticals, Inc.* | 570,046 | ||||||||
|
| |||||||||
| 2,661,127 | ||||||||||
|
| |||||||||
Building Materials — 1.2% | ||||||||||
| 51,893 | Boise Cascade Co.* | 1,486,216 | ||||||||
| 11,150 | Eagle Materials, Inc. | 988,559 | ||||||||
| 16,955 | Martin Marietta Materials, Inc. | 2,176,174 | ||||||||
|
| |||||||||
| 4,650,949 | ||||||||||
|
| |||||||||
Chemicals — 3.8% | ||||||||||
| 58,506 | Axiall Corp. | 2,628,089 | ||||||||
| 22,990 | Cytec Industries, Inc. | 2,244,054 | ||||||||
| 16,501 | FMC Corp. | 1,263,317 | ||||||||
| 30,135 | HB Fuller Co. | 1,454,918 | ||||||||
| 99,520 | Huntsman Corp. | 2,430,278 | ||||||||
| 65,780 | PolyOne Corp. | 2,411,495 | ||||||||
| 33,370 | Rockwood Holdings, Inc. | 2,482,728 | ||||||||
|
| |||||||||
| 14,914,879 | ||||||||||
|
| |||||||||
Coal — 0.8% | ||||||||||
| 82,960 | Consol Energy, Inc. | 3,314,252 | ||||||||
|
| |||||||||
| See accompanying Notes to the Financial Statements. | 45 |
Table of Contents
Mercer US Small/Mid Cap Growth Equity Fund
Schedule of Investments (Continued)
(showing percentage of net assets)
March 31, 2014
| Shares | Description | Value ($) | ||||||||
Commercial Services — 7.5% | ||||||||||
| 55,226 | Acacia Research Corp.‡ | 843,853 | ||||||||
| 31,319 | Bright Horizons Family Solutions, Inc.* | 1,224,886 | ||||||||
| 19,185 | FleetCor Technologies, Inc.* | 2,208,193 | ||||||||
| 138,243 | Heartland Payment Systems, Inc. | 5,730,172 | ||||||||
| 17,448 | Huron Consulting Group, Inc.* | 1,105,854 | ||||||||
| 153,000 | K12, Inc.* ‡ | 3,465,450 | ||||||||
| 20,550 | Nord Anglia Education, Inc.* | 393,944 | ||||||||
| 43,680 | On Assignment, Inc.* | 1,685,611 | ||||||||
| 150,975 | Ritchie Bros Auctioneers, Inc.‡ | 3,643,027 | ||||||||
| 46,400 | Robert Half International, Inc. | 1,946,480 | ||||||||
| 122,300 | Service Corp. International | 2,431,324 | ||||||||
| 65,450 | Total System Services, Inc. | 1,990,335 | ||||||||
| 30,890 | United Rentals, Inc.* | 2,932,697 | ||||||||
|
| |||||||||
| 29,601,826 | ||||||||||
|
| |||||||||
Computers — 4.0% | ||||||||||
| 93,594 | Cadence Design Systems, Inc.* | 1,454,451 | ||||||||
| 65,329 | Fortinet, Inc.* | 1,439,198 | ||||||||
| 19,870 | IHS, Inc. Class A* | 2,414,205 | ||||||||
| 118,290 | j2 Global, Inc.‡ | 5,920,414 | ||||||||
| 252,290 | Logitech International SA | 3,769,998 | ||||||||
| 16,780 | Synaptics, Inc.* ‡ | 1,007,136 | ||||||||
|
| |||||||||
| 16,005,402 | ||||||||||
|
| |||||||||
Distribution & Wholesale — 1.5% | ||||||||||
| 34,999 | Beacon Roofing Supply, Inc.* | 1,353,061 | ||||||||
| 46,630 | Ingram Micro, Inc. Class A* | 1,378,383 | ||||||||
| 9,455 | MWI Veterinary Supply, Inc.* | 1,471,387 | ||||||||
| 19,420 | WESCO International, Inc.* ‡ | 1,616,133 | ||||||||
|
| |||||||||
| 5,818,964 | ||||||||||
|
| |||||||||
Diversified Financial Services — 3.7% | ||||||||||
| 27,550 | Affiliated Managers Group, Inc.* | 5,511,378 | ||||||||
| 18,100 | CBOE Holdings, Inc. | 1,024,460 | ||||||||
| 51,500 | Ellie Mae, Inc.* ‡ | 1,485,260 | ||||||||
| 22,367 | Financial Engines, Inc. | 1,135,796 | ||||||||
| 30,425 | Lazard, Ltd. Class A | 1,432,713 | ||||||||
| 50,410 | Raymond James Financial, Inc. | 2,819,431 | ||||||||
| 23,781 | WageWorks, Inc.* | 1,334,352 | ||||||||
|
| |||||||||
| 14,743,390 | ||||||||||
|
| |||||||||
Electrical Components & Equipment — 1.4% | ||||||||||
| 17,507 | Belden, Inc. | 1,218,487 | ||||||||
| 28,320 | Generac Holdings, Inc. | 1,670,030 | ||||||||
| 23,680 | Hubbell, Inc. Class B | 2,838,522 | ||||||||
|
| |||||||||
| 5,727,039 | ||||||||||
|
| |||||||||
| 46 | See accompanying Notes to the Financial Statements. |
Table of Contents
Mercer US Small/Mid Cap Growth Equity Fund
Schedule of Investments (Continued)
(showing percentage of net assets)
March 31, 2014
| Shares | Description | Value ($) | ||||||||
Electronics — 0.9% | ||||||||||
| 20,604 | Coherent, Inc.* | 1,346,472 | ||||||||
| 35,740 | Gentex Corp. | 1,126,882 | ||||||||
| 25,174 | Woodward, Inc. | 1,045,476 | ||||||||
|
| |||||||||
| 3,518,830 | ||||||||||
|
| |||||||||
Engineering & Construction — 0.2% | ||||||||||
| 119,310 | McDermott International, Inc.* ‡ | 933,004 | ||||||||
|
| |||||||||
Entertainment — 0.6% | ||||||||||
| 42,967 | Cinemark Holdings, Inc. | 1,246,472 | ||||||||
| 38,519 | Multimedia Games Holding Co., Inc.* | 1,118,592 | ||||||||
|
| |||||||||
| 2,365,064 | ||||||||||
|
| |||||||||
Environmental Control — 0.3% | ||||||||||
| 31,263 | Waste Connections, Inc. | 1,371,195 | ||||||||
|
| |||||||||
Food — 0.3% | ||||||||||
| 12,749 | Hain Celestial Group (The), Inc.* | 1,166,151 | ||||||||
|
| |||||||||
Hand & Machine Tools — 0.8% | ||||||||||
| 41,340 | Lincoln Electric Holdings, Inc. | 2,976,893 | ||||||||
|
| |||||||||
Health Care - Products — 5.7% | ||||||||||
| 147,666 | ABIOMED, Inc.* ‡ | 3,845,223 | ||||||||
| 41,620 | ArthroCare Corp.* | 2,005,668 | ||||||||
| 48,025 | DexCom, Inc.* | 1,986,314 | ||||||||
| 93,675 | Endologix, Inc.* | 1,205,597 | ||||||||
| 20,870 | IDEXX Laboratories, Inc.* | 2,533,618 | ||||||||
| 51,540 | Spectranetics Corp.* | 1,562,177 | ||||||||
| 66,179 | Techne Corp. | 5,649,701 | ||||||||
| 36,460 | Thoratec Corp.* | 1,305,633 | ||||||||
| 85,020 | Wright Medical Group, Inc.* | 2,641,571 | ||||||||
|
| |||||||||
| 22,735,502 | ||||||||||
|
| |||||||||
Health Care - Services — 4.2% | ||||||||||
| 59,667 | Acadia Healthcare Co., Inc.* | 2,692,175 | ||||||||
| 47,060 | Brookdale Senior Living, Inc.* | 1,576,981 | ||||||||
| 72,090 | Community Health Systems, Inc.* | 2,823,765 | ||||||||
| 22,630 | Covance, Inc.* | 2,351,257 | ||||||||
| 41,139 | Envision Healthcare Holdings, Inc.* | 1,391,732 | ||||||||
| 29,317 | Magellan Health Services, Inc.* | 1,739,964 | ||||||||
| 11,720 | Mettler-Toledo International, Inc.* | 2,762,170 | ||||||||
| 22,606 | WellCare Health Plans, Inc.* | 1,435,933 | ||||||||
|
| |||||||||
| 16,773,977 | ||||||||||
|
| |||||||||
Home Builders — 0.3% | ||||||||||
| 1,038 | NVR, Inc.* | 1,190,586 | ||||||||
|
| |||||||||
| See accompanying Notes to the Financial Statements. | 47 |
Table of Contents
Mercer US Small/Mid Cap Growth Equity Fund
Schedule of Investments (Continued)
(showing percentage of net assets)
March 31, 2014
| Shares | Description | Value ($) | ||||||||
Home Furnishings — 1.3% | ||||||||||
| 36,354 | Harman International Industries, Inc. | 3,868,065 | ||||||||
| 28,880 | Tempur Sealy International, Inc.* | 1,463,350 | ||||||||
|
| |||||||||
| 5,331,415 | ||||||||||
|
| |||||||||
Household Products & Wares — 1.3% | ||||||||||
| 45,460 | Jarden Corp.* | 2,719,872 | ||||||||
| 41,410 | Scotts Miracle-Gro Co. (The) Class A | 2,537,605 | ||||||||
|
| |||||||||
| 5,257,477 | ||||||||||
|
| |||||||||
Insurance — 0.6% | ||||||||||
| 126,380 | Genworth Financial, Inc. Class A* | 2,240,717 | ||||||||
|
| |||||||||
Internet — 4.1% | ||||||||||
| 47,514 | CyrusOne, Inc. | 989,717 | ||||||||
| 15,542 | FireEye, Inc.* ‡ | 956,921 | ||||||||
| 39,965 | HomeAway, Inc.* | 1,505,482 | ||||||||
| 29,550 | Marketo, Inc.* | 965,398 | ||||||||
| 148,834 | NIC, Inc. | 2,873,984 | ||||||||
| 51,360 | Pandora Media, Inc.* | 1,557,235 | ||||||||
| 30,075 | Shutterstock, Inc.* ‡ | 2,183,746 | ||||||||
| 98,875 | VeriSign, Inc.* ‡ | 5,330,351 | ||||||||
|
| |||||||||
| 16,362,834 | ||||||||||
|
| |||||||||
Leisure Time — 1.2% | ||||||||||
| 105,440 | Interval Leisure Group, Inc. | 2,756,202 | ||||||||
| 13,430 | Polaris Industries, Inc. | 1,876,305 | ||||||||
|
| |||||||||
| 4,632,507 | ||||||||||
|
| |||||||||
Lodging — 0.4% | ||||||||||
| 22,038 | Wyndham Worldwide Corp. | 1,613,843 | ||||||||
|
| |||||||||
Machinery - Construction & Mining — 0.5% | ||||||||||
| 44,132 | Terex Corp. | 1,955,048 | ||||||||
|
| |||||||||
Machinery - Diversified — 2.0% | ||||||||||
| 25,330 | Cognex Corp.* | 857,674 | ||||||||
| 76,475 | Graco, Inc. | 5,715,741 | ||||||||
| 15,533 | Wabtec Corp. | 1,203,808 | ||||||||
|
| |||||||||
| 7,777,223 | ||||||||||
|
| |||||||||
Media — 0.2% | ||||||||||
| 24,650 | Nexstar Broadcasting Group, Inc. Class A‡ | 924,868 | ||||||||
|
| |||||||||
Metal Fabricate & Hardware — 0.7% | ||||||||||
| 48,410 | Timken Co. (The) | 2,845,540 | ||||||||
|
| |||||||||
| 48 | See accompanying Notes to the Financial Statements. |
Table of Contents
Mercer US Small/Mid Cap Growth Equity Fund
Schedule of Investments (Continued)
(showing percentage of net assets)
March 31, 2014
| Shares | Description | Value ($) | ||||||||
Miscellaneous - Manufacturing — 1.0% | ||||||||||
| 11,620 | Carlisle Cos., Inc. | 921,931 | ||||||||
| 43,158 | Hexcel Corp.* | 1,879,099 | ||||||||
| 37,213 | Trimas Corp.* | 1,235,472 | ||||||||
|
| |||||||||
| 4,036,502 | ||||||||||
|
| |||||||||
Oil & Gas — 3.3% | ||||||||||
| 76,898 | Bill Barrett Corp.* ‡ | 1,968,589 | ||||||||
| 91,410 | Denbury Resources, Inc. | 1,499,124 | ||||||||
| 232,689 | Magnum Hunter Resources Corp.* | 1,977,857 | ||||||||
| 32,725 | Oasis Petroleum, Inc.* | 1,365,614 | ||||||||
| 75,750 | Rowan Cos. Plc Class A* | 2,551,260 | ||||||||
| 73,400 | Tesoro Corp. | 3,713,306 | ||||||||
|
| |||||||||
| 13,075,750 | ||||||||||
|
| |||||||||
Oil & Gas Services — 1.6% | ||||||||||
| 32,150 | Core Laboratories NV | 6,379,846 | ||||||||
|
| |||||||||
Packaging & Containers — 1.8% | ||||||||||
| 58,049 | Berry Plastics Group, Inc.* | 1,343,834 | ||||||||
| 60,233 | Crown Holdings, Inc.* | 2,694,825 | ||||||||
| 42,390 | Packaging Corp. of America | 2,982,984 | ||||||||
|
| |||||||||
| 7,021,643 | ||||||||||
|
| |||||||||
Pharmaceuticals — 3.3% | ||||||||||
| 111,848 | ACADIA Pharmaceuticals, Inc.* | 2,721,262 | ||||||||
| 31,820 | Alkermes Plc* | 1,402,944 | ||||||||
| 47,020 | Cubist Pharmaceuticals, Inc.* | 3,439,513 | ||||||||
| 18,250 | Jazz Pharmaceuticals Plc* | 2,530,910 | ||||||||
| 18,308 | Medivation, Inc.* | 1,178,486 | ||||||||
| 16,478 | Sirona Dental Systems, Inc.* ‡ | 1,230,412 | ||||||||
| 8,570 | Synageva BioPharma Corp.* | 711,053 | ||||||||
|
| |||||||||
| 13,214,580 | ||||||||||
|
| |||||||||
Real Estate — 0.7% | ||||||||||
| 23,140 | Jones Lang Lasalle, Inc. | 2,742,090 | ||||||||
|
| |||||||||
REITS — 1.5% | ||||||||||
| 174,725 | CommonWealth REIT | 4,595,268 | ||||||||
| 62,390 | Starwood Property Trust, Inc. REIT | 1,471,780 | ||||||||
|
| |||||||||
| 6,067,048 | ||||||||||
|
| |||||||||
Retail — 10.2% | ||||||||||
| 17,923 | Asbury Automotive Group, Inc.* | 991,321 | ||||||||
| 43,050 | Bloomin’ Brands, Inc.* | 1,037,505 | ||||||||
| 25,920 | Brinker International, Inc. | 1,359,504 | ||||||||
| 25,022 | Childrens Place Retail Stores (The), Inc. | 1,246,346 | ||||||||
| 22,895 | Dick’s Sporting Goods, Inc. | 1,250,296 | ||||||||
| 75,125 | DineEquity, Inc. | 5,865,009 | ||||||||
| See accompanying Notes to the Financial Statements. | 49 |
Table of Contents
Mercer US Small/Mid Cap Growth Equity Fund
Schedule of Investments (Continued)
(showing percentage of net assets)
March 31, 2014
| Shares | Description | Value ($) | ||||||||
Retail — continued | ||||||||||
| 52,100 | Dunkin’ Brands Group, Inc. | 2,614,378 | ||||||||
| 62,728 | Francesca’s Holdings Corp.* ‡ | 1,137,886 | ||||||||
| 19,870 | GNC Holdings, Inc. Class A | 874,677 | ||||||||
| 21,334 | Red Robin Gourmet Burgers, Inc.* | 1,529,221 | ||||||||
| 16,036 | Restoration Hardware Holdings, Inc.* | 1,180,089 | ||||||||
| 179,125 | Sally Beauty Holdings, Inc.* | 4,908,025 | ||||||||
| 24,370 | Signet Jewelers, Ltd. | 2,579,808 | ||||||||
| 22,770 | Tractor Supply Co. | 1,608,245 | ||||||||
| 52,200 | Ulta Salon Cosmetics & Fragrance, Inc.* | 5,088,456 | ||||||||
| 110,248 | Urban Outfitters, Inc.* | 4,020,745 | ||||||||
| 47,459 | Williams-Sonoma, Inc. | 3,162,668 | ||||||||
|
| |||||||||
| 40,454,179 | ||||||||||
|
| |||||||||
Semiconductors — 2.1% | ||||||||||
| 59,001 | Ceva, Inc.* | 1,036,058 | ||||||||
| 35,417 | Mellanox Technologies, Ltd.* ‡ | 1,385,867 | ||||||||
| 29,480 | NXP Semiconductor NV* | 1,733,719 | ||||||||
| 37,608 | Semtech Corp.* | 952,987 | ||||||||
| 35,590 | Skyworks Solutions, Inc.* | 1,335,337 | ||||||||
| 51,082 | Teradyne, Inc.* ‡ | 1,016,021 | ||||||||
| 18,980 | Veeco Instruments, Inc.* | 795,831 | ||||||||
|
| |||||||||
| 8,255,820 | ||||||||||
|
| |||||||||
Software — 11.7% | ||||||||||
| 161,910 | Allscripts Healthcare Solutions, Inc.* | 2,919,237 | ||||||||
| 15,875 | athenahealth, Inc.* ‡ | 2,543,810 | ||||||||
| 110,742 | Blackbaud, Inc. | 3,466,225 | ||||||||
| 26,058 | Commvault Systems, Inc.* | 1,692,467 | ||||||||
| 13,790 | Concur Technologies, Inc.* | 1,366,175 | ||||||||
| 31,432 | EPAM Systems, Inc.* | 1,034,113 | ||||||||
| 37,548 | Imperva, Inc.* | 2,091,424 | ||||||||
| 57,770 | Infoblox, Inc.* | 1,158,866 | ||||||||
| 68,041 | Informatica Corp.* | 2,570,589 | ||||||||
| 151,850 | MSCI, Inc. Class A* | 6,532,587 | ||||||||
| 52,690 | Proofpoint, Inc.* | 1,953,745 | ||||||||
| 131,237 | QLIK Technologies, Inc.* | 3,489,592 | ||||||||
| 18,470 | Rocket Fuel, Inc.* ‡ | 791,994 | ||||||||
| 61,030 | ServiceNow, Inc.* | 3,656,917 | ||||||||
| 32,061 | SS&C Technologies Holdings, Inc.* | 1,283,081 | ||||||||
| 48,446 | Synchronoss Technologies, Inc.* | 1,661,213 | ||||||||
| 246,935 | VeriFone Systems, Inc.* | 8,351,342 | ||||||||
|
| |||||||||
| 46,563,377 | ||||||||||
|
| |||||||||
Telecommunications — 3.7% | ||||||||||
| 77,545 | Allot Communications, Ltd.* ‡ | 1,043,756 | ||||||||
| 79,100 | Aruba Networks, Inc.* | 1,483,125 | ||||||||
| 6,000 | IPG Photonics Corp.* ‡ | 426,480 | ||||||||
| 120,290 | JDS Uniphase Corp.* | 1,684,060 | ||||||||
| 50 | See accompanying Notes to the Financial Statements. |
Table of Contents
Mercer US Small/Mid Cap Growth Equity Fund
Schedule of Investments (Continued)
(showing percentage of net assets)
March 31, 2014
| Shares | Description | Value ($) | ||||||||
Telecommunications — continued | ||||||||||
| 29,080 | MasTec, Inc.* | 1,263,235 | ||||||||
| 78,250 | NeuStar, Inc. Class A* ‡ | 2,543,907 | ||||||||
| 69,525 | SBA Communications Corp. Class A* | 6,323,994 | ||||||||
|
| |||||||||
| 14,768,557 | ||||||||||
|
| |||||||||
Transportation — 2.9% | ||||||||||
| 106,100 | Expeditors International of Washington, Inc. | 4,204,743 | ||||||||
| 52,725 | Genesee & Wyoming, Inc. Class A* | 5,131,197 | ||||||||
| 76,674 | XPO Logistics, Inc.* ‡ | 2,254,982 | ||||||||
|
| |||||||||
| 11,590,922 | ||||||||||
|
| |||||||||
TOTAL COMMON STOCKS (COST $318,205,205) | 393,386,964 | |||||||||
|
| |||||||||
WARRANTS — 0.0% | ||||||||||
Oil & Gas — 0.0% | ||||||||||
| 27,862 | Magnum Hunter Resources Corp., Strike Price $8.50, Expires 4/15/16* ‡ **** | — | ||||||||
|
| |||||||||
TOTAL WARRANTS (COST $—) | — | |||||||||
|
| |||||||||
| Par Value ($) | Description | Value ($) | ||||||||
SHORT-TERM INVESTMENTS — 9.8% | ||||||||||
Bank Deposit — 0.9% | ||||||||||
| 3,776,068 | State Street Bank & Trust Euro Time Deposit, 0.01%, due 04/01/14 | 3,776,068 | ||||||||
|
| |||||||||
Securities Lending Collateral — 8.9% | ||||||||||
| 35,237,041 | State Street Navigator Securities Lending Prime Portfolio*** | 35,237,041 | ||||||||
|
| |||||||||
TOTAL SHORT-TERM INVESTMENTS (COST $39,013,109) | 39,013,109 | |||||||||
|
| |||||||||
TOTAL INVESTMENTS — 108.8% (Cost $357,218,314) | 432,400,073 | |||||||||
Other Assets and Liabilities (net) — (8.8)% | (35,039,953 | ) | ||||||||
|
| |||||||||
NET ASSETS — 100.0% | $ | 397,360,120 | ||||||||
|
| |||||||||
Notes to Schedule of Investments: | ||||||||||
| REIT — Real Estate Investment Trust | ||||||||||
| * | Non-income producing security | |||||||||
| ‡ | All or a portion of this security is out on loan. | |||||||||
| *** | Represents an investment of securities lending cash collateral. | |||||||||
| **** | Securities fair valued by the Valuation Committee as approved by the Board of Trustees. The total market value of the securities at year end is $0 which represents 0.0% of net assets. The aggregate tax cost of these securities held at March 31, 2014 was $0. | |||||||||
| See accompanying Notes to the Financial Statements. | 51 |
Table of Contents
Mercer US Small/Mid Cap Growth Equity Fund
Schedule of Investments (Continued)
March 31, 2014
| Asset Class Summary (Unaudited) | % of Net Assets | ||||
Common Stocks | 99.0 | ||||
Warrants | 0.0 | ||||
Short-Term Investments | 9.8 | ||||
Other Assets and Liabilities (net) | (8.8 | ) | |||
|
| ||||
| 100.0 | % | ||||
|
| ||||
| 52 | See accompanying Notes to the Financial Statements. |
Table of Contents
Mercer US Small/Mid Cap Value Equity Fund
Schedule of Investments
(showing percentage of net assets)
March 31, 2014
| Shares | Description | Value ($) | ||||||||
COMMON STOCKS — 98.1% | ||||||||||
Aerospace & Defense — 1.8% | ||||||||||
| 14,325 | AAR Corp. | 371,734 | ||||||||
| 6,570 | Alliant Techsystems, Inc. | 933,925 | ||||||||
| 28,175 | Astronics Corp.* | 1,786,577 | ||||||||
| 144,081 | Orbital Sciences Corp.* | 4,019,860 | ||||||||
|
| |||||||||
| 7,112,096 | ||||||||||
|
| |||||||||
Airlines — 0.5% | ||||||||||
| 225,100 | JetBlue Airways Corp.* ‡ | 1,956,119 | ||||||||
|
| |||||||||
Apparel — 1.3% | ||||||||||
| 137,810 | Ascena Retail Group, Inc.* | 2,381,357 | ||||||||
| 33,875 | Hanesbrands, Inc. | 2,590,760 | ||||||||
|
| |||||||||
| 4,972,117 | ||||||||||
|
| |||||||||
Auto Parts & Equipment — 0.5% | ||||||||||
| 37,175 | Allison Transmission Holdings, Inc. | 1,113,019 | ||||||||
| 29,850 | Tower International, Inc.* | 812,517 | ||||||||
|
| |||||||||
| 1,925,536 | ||||||||||
|
| |||||||||
Banks — 4.8% | ||||||||||
| 364,775 | Huntington Bancshares, Inc. | 3,636,807 | ||||||||
| 50,900 | MB Financial, Inc. | 1,575,864 | ||||||||
| 47,806 | PrivateBancorp, Inc. | 1,458,561 | ||||||||
| 13,459 | Prosperity Bancshares, Inc. | 890,313 | ||||||||
| 82,650 | Regions Financial Corp. | 918,241 | ||||||||
| 46,976 | Texas Capital Bancshares, Inc.* | 3,050,621 | ||||||||
| 51,675 | United Community Banks, Inc.* | 1,003,012 | ||||||||
| 103,083 | Webster Financial Corp. | 3,201,758 | ||||||||
| 115,505 | Western Alliance Bancorp* | 2,841,423 | ||||||||
|
| |||||||||
| 18,576,600 | ||||||||||
|
| |||||||||
Biotechnology — 1.2% | ||||||||||
| 24,090 | Bio-Rad Laboratories, Inc. Class A* | 3,086,411 | ||||||||
| 40,826 | Myriad Genetics, Inc.* ‡ | 1,395,841 | ||||||||
|
| |||||||||
| 4,482,252 | ||||||||||
|
| |||||||||
Building Materials — 0.9% | ||||||||||
| 20,465 | Drew Industries, Inc. | 1,109,203 | ||||||||
| 138,105 | Louisiana-Pacific Corp.* | 2,329,831 | ||||||||
|
| |||||||||
| 3,439,034 | ||||||||||
|
| |||||||||
Chemicals — 1.8% | ||||||||||
| 69,567 | American Vanguard Corp. | 1,506,126 | ||||||||
| 51,550 | Huntsman Corp. | 1,258,851 | ||||||||
| 30,754 | Innophos Holdings, Inc. | 1,743,752 | ||||||||
| 57,638 | Intrepid Potash, Inc.* ‡ | 891,083 | ||||||||
| See accompanying Notes to the Financial Statements. | 53 |
Table of Contents
Mercer US Small/Mid Cap Value Equity Fund
Schedule of Investments (Continued)
(showing percentage of net assets)
March 31, 2014
| Shares | Description | Value ($) | ||||||||
Chemicals — continued | ||||||||||
| 63,141 | Kraton Performance Polymers, Inc.* | 1,650,506 | ||||||||
|
| |||||||||
| 7,050,318 | ||||||||||
|
| |||||||||
Coal — 0.5% | ||||||||||
| 51,866 | Cloud Peak Energy, Inc.* | 1,096,447 | ||||||||
| 59,100 | Peabody Energy Corp. | 965,694 | ||||||||
|
| |||||||||
| 2,062,141 | ||||||||||
|
| |||||||||
Commercial Services — 5.2% | ||||||||||
| 58,775 | ABM Industries, Inc. | 1,689,193 | ||||||||
| 88,420 | ADT Corp. (The)‡ | 2,648,179 | ||||||||
| 74,850 | AMN Healthcare Services, Inc.* | 1,028,439 | ||||||||
| 112,688 | Convergys Corp. | 2,468,994 | ||||||||
| 38,815 | Euronet Worldwide, Inc.* | 1,614,316 | ||||||||
| 65,249 | Geo Group (The), Inc. | 2,103,628 | ||||||||
| 62,996 | Insperity, Inc. | 1,951,616 | ||||||||
| 49,245 | Korn/Ferry International* | 1,466,024 | ||||||||
| 10,000 | Manpower, Inc. | 788,300 | ||||||||
| 44,786 | Rent-A-Center, Inc. | 1,191,308 | ||||||||
| 61,400 | RR Donnelley & Sons Co. | 1,099,060 | ||||||||
| 19,050 | Sotheby’s | 829,627 | ||||||||
| 53,714 | SP Plus Corp.* | 1,411,067 | ||||||||
|
| |||||||||
| 20,289,751 | ||||||||||
|
| |||||||||
Computers — 1.0% | ||||||||||
| 10,765 | DST Systems, Inc. | 1,020,414 | ||||||||
| 16,888 | j2 Global, Inc.‡ | 845,244 | ||||||||
| 66,750 | Logitech International SA‡ | 993,908 | ||||||||
| 60,810 | Sykes Enterprises, Inc.* | 1,208,295 | ||||||||
|
| |||||||||
| 4,067,861 | ||||||||||
|
| |||||||||
Cosmetics & Personal Care — 1.8% | ||||||||||
| 159,941 | Elizabeth Arden, Inc.* | 4,719,859 | ||||||||
| 61,209 | Inter Parfums, Inc. | 2,216,378 | ||||||||
|
| |||||||||
| 6,936,237 | ||||||||||
|
| |||||||||
Distribution & Wholesale — 1.0% | ||||||||||
| 67,120 | Owens & Minor, Inc.‡ | 2,351,214 | ||||||||
| 20,610 | WESCO International, Inc.* ‡ | 1,715,164 | ||||||||
|
| |||||||||
| 4,066,378 | ||||||||||
|
| |||||||||
Diversified Financial Services — 2.5% | ||||||||||
| 44,784 | Blackhawk Network Holdings, Inc.* ‡ | 1,092,282 | ||||||||
| 52,200 | Eaton Vance Corp. | 1,991,952 | ||||||||
| 28,470 | Outerwall, Inc.* ‡ | 2,064,075 | ||||||||
| 71,850 | Raymond James Financial, Inc. | 4,018,570 | ||||||||
| 9,190 | Waddell & Reed Financial, Inc. Class A | 676,568 | ||||||||
|
| |||||||||
| 9,843,447 | ||||||||||
|
| |||||||||
| 54 | See accompanying Notes to the Financial Statements. |
Table of Contents
Mercer US Small/Mid Cap Value Equity Fund
Schedule of Investments (Continued)
(showing percentage of net assets)
March 31, 2014
| Shares | Description | Value ($) | ||||||||
Electric — 1.7% | ||||||||||
| 72,900 | AES Corp. | 1,041,012 | ||||||||
| 55,807 | Ameren Corp. | 2,299,248 | ||||||||
| 28,575 | Cleco Corp. | 1,445,324 | ||||||||
| 57,125 | CMS Energy Corp. | 1,672,620 | ||||||||
|
| |||||||||
| 6,458,204 | ||||||||||
|
| |||||||||
Electrical Components & Equipment — 1.5% | ||||||||||
| 46,525 | Advanced Energy Industries, Inc.* | 1,139,862 | ||||||||
| 16,350 | EnerSys | 1,132,892 | ||||||||
| 40,700 | Generac Holdings, Inc. | 2,400,079 | ||||||||
| 31,519 | Universal Display Corp.* ‡ | 1,005,771 | ||||||||
|
| |||||||||
| 5,678,604 | ||||||||||
|
| |||||||||
Electronics — 2.6% | ||||||||||
| 59,395 | Coherent, Inc.* | 3,881,464 | ||||||||
| 36,302 | Cubic Corp. | 1,853,943 | ||||||||
| 18,250 | Dolby Laboratories, Inc. Class A* ‡ | 812,125 | ||||||||
| 78,475 | Stoneridge, Inc.* | 881,274 | ||||||||
| 66,885 | Woodward, Inc. | 2,777,734 | ||||||||
|
| |||||||||
| 10,206,540 | ||||||||||
|
| |||||||||
Energy - Alternate Sources — 0.2% | ||||||||||
| 12,295 | First Solar, Inc.* | 858,068 | ||||||||
|
| |||||||||
Engineering & Construction — 0.3% | ||||||||||
| 167,236 | McDermott International, Inc.* ‡ | 1,307,786 | ||||||||
|
| |||||||||
Entertainment — 1.7% | ||||||||||
| 27,125 | Ascent Capital Group, Inc. Class A* | 2,049,294 | ||||||||
| 118,140 | International Game Technology | 1,661,048 | ||||||||
| 56,867 | International Speedway Corp. Class A | 1,932,909 | ||||||||
| 20,520 | Madison Square Garden, Inc.* | 1,165,126 | ||||||||
|
| |||||||||
| 6,808,377 | ||||||||||
|
| |||||||||
Environmental Control — 0.7% | ||||||||||
| 43,923 | Nuverra Environmental Solutions, Inc.* ‡ | 891,198 | ||||||||
| 74,050 | Progressive Waste Solutions, Ltd. | 1,874,205 | ||||||||
|
| |||||||||
| 2,765,403 | ||||||||||
|
| |||||||||
Food — 2.2% | ||||||||||
| 12,555 | Hormel Foods Corp. | 618,585 | ||||||||
| 19,621 | Industrias Bachoco, S.A.B., Sponsored ADR | 856,457 | ||||||||
| 18,263 | Ingles Markets, Inc. | 435,025 | ||||||||
| 15,300 | Pilgrim’s Pride Corp.* | 320,076 | ||||||||
| 53,780 | Pinnacle Foods, Inc. | 1,605,871 | ||||||||
| 249,850 | SUPERVALU, Inc.* ‡ | 1,708,974 | ||||||||
| 30,003 | TreeHouse Foods, Inc.* | 2,159,916 | ||||||||
| See accompanying Notes to the Financial Statements. | 55 |
Table of Contents
Mercer US Small/Mid Cap Value Equity Fund
Schedule of Investments (Continued)
(showing percentage of net assets)
March 31, 2014
| Shares | Description | Value ($) | ||||||||
Food — continued | ||||||||||
| 26,969 | Village Super Market, Inc. Class A | 711,981 | ||||||||
|
| |||||||||
| 8,416,885 | ||||||||||
|
| |||||||||
Forest Products & Paper — 2.6% | ||||||||||
| 68,427 | Clearwater Paper Corp.* | 4,288,320 | ||||||||
| 27,714 | Deltic Timber Corp. | 1,807,784 | ||||||||
| 4,941 | Domtar Corp. | 554,479 | ||||||||
| 122,668 | Glatfelter | 3,339,023 | ||||||||
|
| |||||||||
| 9,989,606 | ||||||||||
|
| |||||||||
Gas — 0.7% | ||||||||||
| 55,808 | Atmos Energy Corp. | 2,630,231 | ||||||||
|
| |||||||||
Hand & Machine Tools — 0.2% | ||||||||||
| 12,050 | Regal-Beloit Corp. | 876,156 | ||||||||
|
| |||||||||
Health Care - Products — 2.6% | ||||||||||
| 131,250 | Bruker Corp.* | 2,991,188 | ||||||||
| 12,325 | ICU Medical, Inc.* | 738,021 | ||||||||
| 286,056 | Nordion, Inc.* | 3,295,365 | ||||||||
| 35,800 | NuVasive, Inc.* | 1,375,078 | ||||||||
| 23,920 | Orthofix International NV* | 721,188 | ||||||||
| 22,432 | STERIS Corp. | 1,071,128 | ||||||||
|
| |||||||||
| 10,191,968 | ||||||||||
|
| |||||||||
Health Care - Services — 1.4% | ||||||||||
| 22,000 | Centene Corp.* | 1,369,500 | ||||||||
| 43,839 | Ensign Group (The), Inc. | 1,913,134 | ||||||||
| 24,425 | Universal Health Services, Inc. Class B | 2,004,560 | ||||||||
|
| |||||||||
| 5,287,194 | ||||||||||
|
| |||||||||
Home Builders — 0.5% | ||||||||||
| 84,650 | D.R. Horton, Inc. | 1,832,672 | ||||||||
|
| |||||||||
Home Furnishings — 1.1% | ||||||||||
| 22,310 | Harman International Industries, Inc. | 2,373,784 | ||||||||
| 130,350 | TiVo, Inc.* | 1,724,530 | ||||||||
|
| |||||||||
| 4,098,314 | ||||||||||
|
| |||||||||
Insurance — 7.3% | ||||||||||
| 4,927 | Alleghany Corp.* | 2,007,161 | ||||||||
| 78,170 | Axis Capital Holdings, Ltd. | 3,584,095 | ||||||||
| 5,250 | Everest Re Group, Ltd. | 803,513 | ||||||||
| 108,925 | Genworth Financial, Inc. Class A* | 1,931,240 | ||||||||
| 53,852 | HCC Insurance Holdings, Inc. | 2,449,727 | ||||||||
| 101,114 | ING US, Inc. | 3,667,405 | ||||||||
| 26,590 | Lincoln National Corp. | 1,347,315 | ||||||||
| 14,742 | Navigators Group, Inc.* | 905,011 | ||||||||
| 56 | See accompanying Notes to the Financial Statements. |
Table of Contents
Mercer US Small/Mid Cap Value Equity Fund
Schedule of Investments (Continued)
(showing percentage of net assets)
March 31, 2014
| Shares | Description | Value ($) | ||||||||
Insurance — continued | ||||||||||
| 16,521 | PartnerRe, Ltd. | 1,709,924 | ||||||||
| 57,811 | Reinsurance Group of America, Inc. | 4,603,490 | ||||||||
| 27,904 | Validus Holdings, Ltd. | 1,052,260 | ||||||||
| 7,348 | White Mountains Insurance Group, Ltd. | 4,408,065 | ||||||||
|
| |||||||||
| 28,469,206 | ||||||||||
|
| |||||||||
Internet — 1.3% | ||||||||||
| 20,925 | F5 Networks, Inc.* | 2,231,232 | ||||||||
| 135,275 | Orbitz Worldwide, Inc.* | 1,060,556 | ||||||||
| 54,525 | Web.com Group, Inc.* | 1,855,486 | ||||||||
|
| |||||||||
| 5,147,274 | ||||||||||
|
| |||||||||
Investment Company — 0.4% | ||||||||||
| 45,215 | Capital Southwest Corp. | 1,569,865 | ||||||||
|
| |||||||||
Iron & Steel — 0.3% | ||||||||||
| 189,875 | Gerdau SA, Sponsored ADR | 1,217,099 | ||||||||
|
| |||||||||
Leisure Time — 0.5% | ||||||||||
| 32,725 | Royal Caribbean Cruises, Ltd. | 1,785,476 | ||||||||
|
| |||||||||
Lodging — 0.3% | ||||||||||
| 51,210 | MGM Resorts International* | 1,324,291 | ||||||||
|
| |||||||||
Machinery - Construction & Mining — 0.2% | ||||||||||
| 13,800 | Terex Corp. | 611,340 | ||||||||
|
| |||||||||
Machinery - Diversified — 0.6% | ||||||||||
| 64,587 | Albany International Corp. Class A | 2,295,422 | ||||||||
|
| |||||||||
Media — 1.1% | ||||||||||
| 84,700 | Cumulus Media, Inc. Class A* | 585,277 | ||||||||
| 82,775 | Entravision Communications Corp. | 554,592 | ||||||||
| 67,300 | Gannett Co., Inc. | 1,857,480 | ||||||||
| 55,500 | Gray Television, Inc.* | 575,535 | ||||||||
| 33,875 | New York Times Co. (The) Class A | 579,940 | ||||||||
|
| |||||||||
| 4,152,824 | ||||||||||
|
| |||||||||
Mining — 0.5% | ||||||||||
| 182,931 | AuRico Gold, Inc.‡ | 795,750 | ||||||||
| 101,900 | Century Aluminum Co.* | 1,346,099 | ||||||||
|
| |||||||||
| 2,141,849 | ||||||||||
|
| |||||||||
Miscellaneous - Manufacturing — 3.0% | ||||||||||
| 1,290 | Brink’s Co. (The) | 36,830 | ||||||||
| 182,148 | Griffon Corp. | 2,174,847 | ||||||||
| 35,650 | ITT Corp. | 1,524,394 | ||||||||
| 543,762 | Orkla ASA, Sponsored ADR‡ | 4,649,165 | ||||||||
| See accompanying Notes to the Financial Statements. | 57 |
Table of Contents
Mercer US Small/Mid Cap Value Equity Fund
Schedule of Investments (Continued)
(showing percentage of net assets)
March 31, 2014
| Shares | Description | Value ($) | ||||||||
Miscellaneous - Manufacturing — continued | ||||||||||
| 18,975 | SPX Corp. | 1,865,432 | ||||||||
| 45,007 | Trimas Corp.* | 1,494,232 | ||||||||
|
| |||||||||
| 11,744,900 | ||||||||||
|
| |||||||||
Office & Business Equipment — 0.9% | ||||||||||
| 46,225 | Avery Dennison Corp. | 2,342,221 | ||||||||
| 50,150 | Pitney Bowes, Inc. | 1,303,398 | ||||||||
|
| |||||||||
| 3,645,619 | ||||||||||
|
| |||||||||
Oil & Gas — 6.3% | ||||||||||
| 48,177 | Carrizo Oil & Gas, Inc.* | 2,575,542 | ||||||||
| 34,500 | Cimarex Energy Co. | 4,109,295 | ||||||||
| 90,200 | Comstock Resources, Inc.‡ | 2,061,070 | ||||||||
| 184,607 | Denbury Resources, Inc. | 3,027,555 | ||||||||
| 210,383 | Miller Energy Resources, Inc.* ‡ | 1,237,052 | ||||||||
| 41,150 | Murphy USA, Inc.* | 1,670,278 | ||||||||
| 101,914 | Ocean Rig UDW, Inc.* | 1,813,050 | ||||||||
| 165,320 | Parker Drilling Co.* | 1,172,119 | ||||||||
| 101,975 | PBF Energy, Inc. Class A | 2,630,955 | ||||||||
| 115,550 | Vaalco Energy, Inc.* | 987,952 | ||||||||
| 24,630 | Whiting Petroleum Corp.* | 1,709,076 | ||||||||
| 91,654 | WPX Energy, Inc.* | 1,652,522 | ||||||||
|
| |||||||||
| 24,646,466 | ||||||||||
|
| |||||||||
Oil & Gas Services — 0.6% | ||||||||||
| 36,361 | MRC Global, Inc.* | 980,293 | ||||||||
| 119,720 | TETRA Technologies, Inc.* | 1,532,416 | ||||||||
|
| |||||||||
| 2,512,709 | ||||||||||
|
| |||||||||
Packaging & Containers — 0.5% | ||||||||||
| 131,335 | Graphic Packaging Holding Co.* | 1,334,364 | ||||||||
| 22,975 | Owens-Illinois, Inc.* | 777,244 | ||||||||
|
| |||||||||
| 2,111,608 | ||||||||||
|
| |||||||||
Pharmaceuticals — 1.5% | ||||||||||
| 23,150 | Anika Therapeutics, Inc.* | 951,465 | ||||||||
| 19,800 | Jazz Pharmaceuticals Plc* | 2,745,864 | ||||||||
| 31,865 | Mallinckrodt Plc* | 2,020,560 | ||||||||
|
| |||||||||
| 5,717,889 | ||||||||||
|
| |||||||||
Pipelines — 0.7% | ||||||||||
| 39,698 | National Fuel Gas Co. | 2,780,448 | ||||||||
|
| |||||||||
Real Estate — 2.2% | ||||||||||
| 57,950 | CBRE Group, Inc.* | 1,589,569 | ||||||||
| 85,030 | Forest City Enterprises, Inc. Class A* | 1,624,073 | ||||||||
| 214,613 | Forestar Group, Inc.* | 3,820,111 | ||||||||
| 58 | See accompanying Notes to the Financial Statements. |
Table of Contents
Mercer US Small/Mid Cap Value Equity Fund
Schedule of Investments (Continued)
(showing percentage of net assets)
March 31, 2014
| Shares | Description | Value ($) | ||||||||
Real Estate — continued | ||||||||||
| 62,490 | Hilltop Holdings, Inc.* | 1,486,637 | ||||||||
|
| |||||||||
| 8,520,390 | ||||||||||
|
| |||||||||
REITS — 3.8% | ||||||||||
| 152,225 | BioMed Realty Trust, Inc. REIT | 3,119,090 | ||||||||
| 150,700 | Brandywine Realty Trust REIT | 2,179,122 | ||||||||
| 162,994 | CBL & Associates Properties, Inc. REIT | 2,893,143 | ||||||||
| 91,709 | DuPont Fabros Technology, Inc. REIT | 2,207,436 | ||||||||
| 83,500 | Liberty Property Trust REIT | 3,086,160 | ||||||||
| 114,900 | Strategic Hotels & Resorts, Inc. REIT* | 1,170,831 | ||||||||
|
| |||||||||
| 14,655,782 | ||||||||||
|
| |||||||||
Retail — 4.0% | ||||||||||
| 54,118 | Abercrombie & Fitch Co. Class A | 2,083,543 | ||||||||
| 50,070 | Big Lots, Inc.* | 1,896,151 | ||||||||
| 77,018 | Bob Evans Farms, Inc. | 3,853,210 | ||||||||
| 18,380 | Childrens Place Retail Stores (The), Inc. | 915,508 | ||||||||
| 6,920 | Dillard’s, Inc. Class A | 639,408 | ||||||||
| 85,630 | Pep Boys - Manny, Moe & Jack (The)* | 1,089,214 | ||||||||
| 265,825 | Rite Aid Corp.* | 1,666,723 | ||||||||
| 42,800 | Stage Stores, Inc.‡ | 1,046,460 | ||||||||
| 21,440 | Texas Roadhouse, Inc. Class A | 559,155 | ||||||||
| 195,313 | Wendy’s Co. (The)‡ | 1,781,254 | ||||||||
|
| |||||||||
| 15,530,626 | ||||||||||
|
| |||||||||
Savings & Loans — 0.3% | ||||||||||
| 59,253 | Dime Community Bancshares | 1,006,116 | ||||||||
|
| |||||||||
Semiconductors — 6.4% | ||||||||||
| 77,675 | GT Advanced Technologies, Inc.* | 1,324,359 | ||||||||
| 178,250 | International Rectifier Corp.* | 4,884,050 | ||||||||
| 36,475 | Lam Research Corp.* | 2,006,125 | ||||||||
| 202,572 | Microsemi Corp.* | 5,070,377 | ||||||||
| 59,504 | MKS Instruments, Inc. | 1,778,575 | ||||||||
| 236,925 | ON Semiconductor Corp.* | 2,227,095 | ||||||||
| 92,544 | Rovi Corp.* | 2,108,152 | ||||||||
| 266,790 | Teradyne, Inc.* ‡ | 5,306,453 | ||||||||
|
| |||||||||
| 24,705,186 | ||||||||||
|
| |||||||||
Shipbuilding — 0.4% | ||||||||||
| 15,800 | Huntington Ingalls Industries, Inc. | 1,615,708 | ||||||||
|
| |||||||||
Software — 1.8% | ||||||||||
| 87,280 | CSG Systems International, Inc. | 2,272,771 | ||||||||
| 32,875 | Electronic Arts, Inc.* | 953,704 | ||||||||
| 27,550 | PTC, Inc.* | 976,096 | ||||||||
| 37,719 | Schawk, Inc. | 754,003 | ||||||||
| See accompanying Notes to the Financial Statements. | 59 |
Table of Contents
Mercer US Small/Mid Cap Value Equity Fund
Schedule of Investments (Continued)
(showing percentage of net assets)
March 31, 2014
| Shares | Description | Value ($) | ||||||||
Software — continued | ||||||||||
| 60,400 | VeriFone Systems, Inc.* | 2,042,728 | ||||||||
|
| |||||||||
| 6,999,302 | ||||||||||
|
| |||||||||
Telecommunications — 2.6% | ||||||||||
| 17,980 | Atlantic Tele-Network, Inc. | 1,185,242 | ||||||||
| 82,525 | Finisar Corp.* | 2,187,738 | ||||||||
| 85,000 | JDS Uniphase Corp.* | 1,190,000 | ||||||||
| 23,725 | Level 3 Communications, Inc.* | 928,596 | ||||||||
| 71,245 | NeuStar, Inc. Class A* | 2,316,175 | ||||||||
| 85,258 | Telephone & Data Systems, Inc. | 2,234,612 | ||||||||
|
| |||||||||
| 10,042,363 | ||||||||||
|
| |||||||||
Textiles — 0.6% | ||||||||||
| 21,266 | UniFirst Corp. | 2,337,984 | ||||||||
|
| |||||||||
Transportation — 4.0% | ||||||||||
| 192,976 | Air Transport Services Group, Inc.* | 1,514,862 | ||||||||
| 67,125 | �� | Arkansas Best Corp. | 2,480,269 | |||||||
| 38,542 | Forward Air Corp. | 1,777,172 | ||||||||
| 42,300 | GasLog, Ltd. | 985,167 | ||||||||
| 37,770 | Heartland Express, Inc.‡ | 857,001 | ||||||||
| 63,588 | Marten Transport, Ltd. | 1,368,414 | ||||||||
| 99,250 | Safe Bulkers, Inc. | 944,860 | ||||||||
| 94,275 | Swift Transportation Co.* ‡ | 2,333,306 | ||||||||
| 76,675 | Tsakos Energy Navigation, Ltd. | 594,998 | ||||||||
| 82,980 | UTi Worldwide, Inc. | 878,758 | ||||||||
| 65,520 | Werner Enterprises, Inc. | 1,671,415 | ||||||||
|
| |||||||||
| 15,406,222 | ||||||||||
|
| |||||||||
Trucking & Leasing — 0.6% | ||||||||||
| 70,872 | Aircastle, Ltd. | 1,373,499 | ||||||||
| 20,750 | Greenbrier Cos. (The), Inc.* | 946,200 | ||||||||
|
| |||||||||
| 2,319,699 | ||||||||||
|
| |||||||||
Water — 0.6% | ||||||||||
| 86,402 | PICO Holdings, Inc.* | 2,245,588 | ||||||||
|
| |||||||||
TOTAL COMMON STOCKS (COST $345,423,452) | 381,445,146 | |||||||||
|
| |||||||||
| Par Value ($) | Description | Value ($) | ||||||||
SHORT-TERM INVESTMENTS — 8.1% | ||||||||||
Bank Deposit — 1.5% | ||||||||||
| 5,717,334 | State Street Bank & Trust Euro Time Deposit, 0.01%, due 04/01/14 | 5,717,334 | ||||||||
|
| |||||||||
| 60 | See accompanying Notes to the Financial Statements. |
Table of Contents
Mercer US Small/Mid Cap Value Equity Fund
Schedule of Investments (Continued)
(showing percentage of net assets)
March 31, 2014
| Par Value ($) | Description | Value ($) | ||||||||
Securities Lending Collateral — 6.6% | ||||||||||
| 25,511,034 | State Street Navigator Securities Lending Prime Portfolio*** | 25,511,034 | ||||||||
|
| |||||||||
TOTAL SHORT-TERM INVESTMENTS (COST $31,228,368) | 31,228,368 | |||||||||
|
| |||||||||
TOTAL INVESTMENTS — 106.2% (Cost $376,651,820) | 412,673,514 | |||||||||
Other Assets and Liabilities (net) — (6.2)% | (23,961,840 | ) | ||||||||
|
| |||||||||
NET ASSETS — 100.0% | $ | 388,711,674 | ||||||||
|
| |||||||||
Notes to Schedule of Investments: | ||||||||||
| ADR — American Depository Receipt | ||||||||||
| REIT — Real Estate Investment Trust | ||||||||||
| * | Non-income producing security | |||||||||
| ‡ | All or a portion of this security is out on loan. | |||||||||
| *** | Represents an investment of securities lending cash collateral. | |||||||||
| See accompanying Notes to the Financial Statements. | 61 |
Table of Contents
Mercer US Small/Mid Cap Value Equity Fund
Schedule of Investments (Continued)
March 31, 2014
| Asset Class Summary (Unaudited) | % of Net Assets | ||||
Common Stocks | 98.1 | ||||
Short-Term Investments | 8.1 | ||||
Other Assets and Liabilities (net) | (6.2 | ) | |||
|
| ||||
| 100.0 | % | ||||
|
| ||||
| 62 | See accompanying Notes to the Financial Statements. |
Table of Contents
Mercer Non-US Core Equity Fund
Schedule of Investments
(showing percentage of net assets)
March 31, 2014
| Shares | Description | Value ($) | ||||||||
COMMON STOCKS — 94.5% | ||||||||||
Australia — 3.5% | ||||||||||
| 54,749 | BC Iron, Ltd. | 240,527 | ||||||||
| 1,486,082 | Beach Energy, Ltd. | 2,348,425 | ||||||||
| 220,868 | Bendigo and Adelaide Bank, Ltd. | 2,329,617 | ||||||||
| 294,129 | BGP Holdings Plc¤ **** | — | ||||||||
| 69,278 | BHP Billiton, Ltd. | 2,341,751 | ||||||||
| 906,058 | Brambles, Ltd. | 7,776,363 | ||||||||
| 220,448 | carsales.com, Ltd. | 2,216,897 | ||||||||
| 308,355 | Computershare, Ltd. | 3,458,167 | ||||||||
| 95,704 | Crown Resorts, Ltd. | 1,475,135 | ||||||||
| 129,314 | CSL, Ltd. | 8,337,093 | ||||||||
| 504,745 | Downer EDI, Ltd. | 2,348,471 | ||||||||
| 515,359 | Fortescue Metals Group, Ltd.‡ | 2,507,718 | ||||||||
| 104,408 | Iress Market Technology, Ltd. | 830,292 | ||||||||
| 43,908 | Macquarie Group, Ltd. | 2,357,527 | ||||||||
| 777,871 | Metcash, Ltd.‡ | 1,888,941 | ||||||||
| 214,634 | Mineral Resources, Ltd. | 2,283,757 | ||||||||
| 146,164 | Monadelphous Group, Ltd.‡ | 2,277,287 | ||||||||
| 71,590 | National Australia Bank, Ltd. | 2,352,885 | ||||||||
| 289,823 | Platinum Asset Management, Ltd.‡ | 2,003,924 | ||||||||
| 95,486 | Premier Investments, Ltd. | 871,737 | ||||||||
| 435,842 | Primary Health Care, Ltd. | 1,902,653 | ||||||||
| 51,792 | Ramsay Health Care, Ltd. | 2,310,405 | ||||||||
| 83,332 | Seven West Media, Ltd.‡ | 152,928 | ||||||||
| 860,565 | Sigma Pharmaceuticals, Ltd. | 530,414 | ||||||||
| 21,529 | Sirtex Medical, Ltd. | 309,689 | ||||||||
| 29,647 | Sonic Healthcare, Ltd. | 474,551 | ||||||||
| 1,777,991 | Southern Cross Media Group, Ltd. | 2,257,666 | ||||||||
| 106,397 | Super Retail Group, Ltd. | 1,088,699 | ||||||||
| 489,997 | Telstra Corp., Ltd. | 2,307,101 | ||||||||
| 362,357 | TPG Telecom, Ltd. | 2,233,407 | ||||||||
| 84,504 | Virtus Health, Ltd. | 570,188 | ||||||||
| 64,419 | Woodside Petroleum, Ltd. | 2,329,758 | ||||||||
|
| |||||||||
Total Australia | 66,713,973 | |||||||||
|
| |||||||||
Austria — 0.4% | ||||||||||
| 12,316 | Austriamicrosystems AG | 1,728,855 | ||||||||
| 37,682 | CA Immobilien Anlagen AG* | 681,130 | ||||||||
| 54,404 | OMV AG | 2,469,542 | ||||||||
| 2,208 | Schoeller-Bleckmann Oilfield Equipment AG | 258,305 | ||||||||
| 56,604 | Voestalpine AG | 2,489,050 | ||||||||
|
| |||||||||
Total Austria | 7,626,882 | |||||||||
|
| |||||||||
Belgium — 0.6% | ||||||||||
| 54,321 | Ageas | 2,421,602 | ||||||||
| 77,422 | Belgacom SA‡ | 2,425,446 | ||||||||
| 48,093 | Delhaize Group | 3,516,375 | ||||||||
| 8,700 | Delhaize Group SA, Sponsored ADR | 632,229 | ||||||||
| See accompanying Notes to the Financial Statements. | 63 |
Table of Contents
Mercer Non-US Core Equity Fund
Schedule of Investments (Continued)
(showing percentage of net assets)
March 31, 2014
| Shares | Description | Value ($) | ||||||||
Belgium — continued | ||||||||||
| 15,576 | Solvay SA | 2,446,235 | ||||||||
|
| |||||||||
Total Belgium | 11,441,887 | |||||||||
|
| |||||||||
Bermuda — 1.3% | ||||||||||
| 245,159 | BW Offshore, Ltd. | 317,349 | ||||||||
| 672,664 | Catlin Group, Ltd. | 6,033,304 | ||||||||
| 1,189,215 | Digital China Holdings, Ltd. | 1,198,866 | ||||||||
| 1,469,933 | Esprit Holdings, Ltd. | 2,448,293 | ||||||||
| 2,326,000 | Haier Electronics Group Co., Ltd. | 6,296,981 | ||||||||
| 258,937 | Hiscox, Ltd. | 2,944,100 | ||||||||
| 353,822 | Hongkong Land Holdings, Ltd. | 2,289,228 | ||||||||
| 673,000 | Luk Fook Holdings International, Ltd. | 2,121,277 | ||||||||
|
| |||||||||
Total Bermuda | 23,649,398 | |||||||||
|
| |||||||||
Brazil — 0.4% | ||||||||||
| 146,555 | Banco do Brasil SA | 1,480,813 | ||||||||
| 253,500 | Banco Santander Brasil SA | 1,412,140 | ||||||||
| 139,700 | Cia de Saneamento Basico do Estado de Sao Paulo | 1,306,302 | ||||||||
| 179,600 | Light SA | 1,492,355 | ||||||||
| 92,200 | Porto Seguro SA | 1,301,383 | ||||||||
|
| |||||||||
Total Brazil | 6,992,993 | |||||||||
|
| |||||||||
Canada — 0.1% | ||||||||||
| 5,410 | Fairfax Financial Holdings, Ltd. | 2,352,707 | ||||||||
|
| |||||||||
Cayman Islands — 0.7% | ||||||||||
| 6,738,000 | Hutchison Telecommunications Hong Kong Holdings, Ltd. | 2,232,377 | ||||||||
| 159,150 | Tencent Holdings, Ltd. | 11,068,824 | ||||||||
|
| |||||||||
Total Cayman Islands | 13,301,201 | |||||||||
|
| |||||||||
China — 0.2% | ||||||||||
| 1,832,327 | China Communications Construction Co., Ltd. Class H | 1,277,920 | ||||||||
| 1,410,048 | China Petroleum & Chemical Corp. Class H | 1,265,163 | ||||||||
| 1,230,272 | PetroChina Co., Ltd. Class H | 1,340,174 | ||||||||
|
| |||||||||
Total China | 3,883,257 | |||||||||
|
| |||||||||
Denmark — 1.5% | ||||||||||
| 13,457 | Genmab AS* | 547,273 | ||||||||
| 321,428 | GN Store Nord AS | 7,980,813 | ||||||||
| 21,086 | Jyske Bank AS* | 1,159,204 | ||||||||
| 16,874 | NKT Holding AS‡ | 978,113 | ||||||||
| 148,147 | Pandora AS‡ | 9,804,449 | ||||||||
| 6,899 | SimCorp AS | 280,188 | ||||||||
| 43,127 | Sydbank AS* | 1,104,249 | ||||||||
| 709,131 | TDC AS | 6,558,513 | ||||||||
|
| |||||||||
Total Denmark | 28,412,802 | |||||||||
|
| |||||||||
| 64 | See accompanying Notes to the Financial Statements. |
Table of Contents
Mercer Non-US Core Equity Fund
Schedule of Investments (Continued)
(showing percentage of net assets)
March 31, 2014
| Shares | Description | Value ($) | ||||||||
Finland — 1.5% | ||||||||||
| 83,408 | Elisa OYJ‡ | 2,401,453 | ||||||||
| 16,596 | Huhtamaki OYJ | 455,181 | ||||||||
| 23,620 | Kemira OYJ‡ | 344,424 | ||||||||
| 77,346 | Neste Oil OYJ‡ | 1,577,711 | ||||||||
| 1,287,601 | Nokia OYJ* | 9,565,285 | ||||||||
| 222,912 | Nokia OYJ, Sponsored ADR* | 1,636,174 | ||||||||
| 70,587 | Orion OYJ Class B | 2,131,547 | ||||||||
| 39,630 | Sampo OYJ Class A | 2,056,444 | ||||||||
| 56,977 | Sponda OYJ | 270,138 | ||||||||
| 218,043 | Stora Enso OYJ | 2,333,520 | ||||||||
| 91,530 | Tieto OYJ‡ | 2,352,720 | ||||||||
| 133,786 | UPM-Kymmene OYJ | 2,288,286 | ||||||||
|
| |||||||||
Total Finland | 27,412,883 | |||||||||
|
| |||||||||
France — 8.4% | ||||||||||
| 252,904 | Accor SA | 12,954,412 | ||||||||
| 130,852 | Airbus Group NV | 9,376,226 | ||||||||
| 602,072 | Alcatel-Lucent* | 2,374,903 | ||||||||
| 466,636 | Alcatel-Lucent, Sponsored ADR | 1,819,880 | ||||||||
| 90,491 | AXA SA | 2,352,827 | ||||||||
| 218,397 | BNP Paribas | 16,853,302 | ||||||||
| 19,960 | Cie Generale des Etablissements Michelin | 2,497,345 | ||||||||
| 160,426 | CNP Assurances | 3,398,416 | ||||||||
| 216,692 | Danone SA | 15,329,995 | ||||||||
| 13,974 | Dassault Systemes SA | 1,637,842 | ||||||||
| 31,485 | Edenred | 988,303 | ||||||||
| 60,057 | Electricite de France | 2,376,842 | ||||||||
| 19,697 | Essilor International SA | 1,987,188 | ||||||||
| 13,588 | Euler Hermes SA | 1,715,453 | ||||||||
| 47,897 | Faurecia* | 2,025,310 | ||||||||
| 166,736 | France Telecom SA | 2,463,497 | ||||||||
| 172,860 | GDF Suez | 4,731,530 | ||||||||
| 85,231 | Havas SA | 638,330 | ||||||||
| 9,996 | Ipsen SA | 409,452 | ||||||||
| 92,195 | Legrand SA | 5,730,119 | ||||||||
| 143,352 | Metropole Television SA | 3,119,707 | ||||||||
| 88,677 | Neopost SA‡ | 7,005,595 | ||||||||
| 23,809 | Nexans SA‡ | 1,248,437 | ||||||||
| 103,621 | Orange SA, Sponsored ADR | 1,522,193 | ||||||||
| 59,483 | Pernod-Ricard SA | 6,927,514 | ||||||||
| 28,976 | Plastic Omnium SA | 1,075,880 | ||||||||
| 82,188 | Publicis Groupe SA | 7,428,612 | ||||||||
| 19,706 | Renault SA | 1,915,851 | ||||||||
| 35,494 | Safran SA | 2,460,166 | ||||||||
| 116,280 | Sanofi, ADR | 6,079,118 | ||||||||
| 34,934 | Sanofi-Aventis | 3,643,823 | ||||||||
| 27,375 | Schneider Electric SA | 2,427,899 | ||||||||
| 31,928 | SCOR SE | 1,117,721 | ||||||||
| 87,760 | Societe Generale | 5,407,301 | ||||||||
| See accompanying Notes to the Financial Statements. | 65 |
Table of Contents
Mercer Non-US Core Equity Fund
Schedule of Investments (Continued)
(showing percentage of net assets)
March 31, 2014
| Shares | Description | Value ($) | ||||||||
France — continued | ||||||||||
| 176,954 | Technicolor* | 1,277,967 | ||||||||
| 16,691 | Teleperformance | 968,139 | ||||||||
| 37,896 | Total SA | 2,486,155 | ||||||||
| 140,099 | UBISOFT Entertainment* | 2,510,188 | ||||||||
| 17,466 | Valeo SA | 2,461,414 | ||||||||
| 87,308 | Vivendi SA | 2,433,117 | ||||||||
| 73,656 | Zodiac Aerospace | 2,603,894 | ||||||||
|
| |||||||||
Total France | 157,781,863 | |||||||||
|
| |||||||||
Germany — 9.5% | ||||||||||
| 25,067 | Aareal Bank AG* | 1,102,963 | ||||||||
| 13,275 | Adidas AG | 1,436,989 | ||||||||
| 77,243 | Allianz AG | 13,062,658 | ||||||||
| 22,103 | BASF SE | 2,457,791 | ||||||||
| 215,530 | Bayer AG | 29,164,774 | ||||||||
| 40,003 | Bayerische Motoren Werke AG | 5,051,388 | ||||||||
| 13,165 | Bechtle AG | 1,134,585 | ||||||||
| 7,522 | Bertrandt AG | 1,152,832 | ||||||||
| 7,317 | Bilfinger SE | 928,696 | ||||||||
| 21,108 | Brenntag AG | 3,917,250 | ||||||||
| 73,780 | Continental AG | 17,683,413 | ||||||||
| 82,442 | DaimlerChrysler AG | 7,793,583 | ||||||||
| 130,474 | Deutsche Annington Immobilien SE* | 3,724,191 | ||||||||
| 90,136 | Deutsche Post AG | 3,350,480 | ||||||||
| 372,613 | Deutsche Telekom AG | 6,023,985 | ||||||||
| 218,309 | Deutsche Wohnen AG | 4,681,759 | ||||||||
| 156,119 | Deutsche Wohnen AG - New* | 3,261,992 | ||||||||
| 30,167 | Deutz AG* | 254,331 | ||||||||
| 79,947 | DIC Asset AG | 739,685 | ||||||||
| 51,389 | Drillisch AG | 1,865,580 | ||||||||
| 13,454 | Duerr AG | 1,038,406 | ||||||||
| 615,929 | E.ON AG | 12,045,946 | ||||||||
| 10,578 | ElringKlinger AG | 417,109 | ||||||||
| 13,614 | Grammer AG | 666,948 | ||||||||
| 25,635 | HeidelbergCement AG | 2,197,968 | ||||||||
| 412,112 | Infineon Technologies AG | 4,919,957 | ||||||||
| 72,307 | Kloeckner & Co. SE* ‡ | 1,066,829 | ||||||||
| 23,399 | KUKA AG‡ | 1,145,508 | ||||||||
| 40,180 | LEG Immobilien AG | 2,636,550 | ||||||||
| 58,382 | Leoni AG | 4,262,229 | ||||||||
| 19,670 | LPKF Laser & Electronics AG | 459,924 | ||||||||
| 9,853 | Merck KGaA | 1,660,142 | ||||||||
| 21,955 | Metro AG* | 896,437 | ||||||||
| 44,009 | Nordex SE* | 710,881 | ||||||||
| 788,368 | Premiere AG* | 6,801,915 | ||||||||
| 33,519 | ProSiebenSat.1 Media AG | 1,534,683 | ||||||||
| 58,736 | QSC AG | 293,049 | ||||||||
| 63,329 | Rheinmetall AG | 4,455,806 | ||||||||
| 34,647 | Rhoen Klinikum AG | 1,110,239 | ||||||||
| 66 | See accompanying Notes to the Financial Statements. |
Table of Contents
Mercer Non-US Core Equity Fund
Schedule of Investments (Continued)
(showing percentage of net assets)
March 31, 2014
| Shares | Description | Value ($) | ||||||||
Germany — continued | ||||||||||
| 118,614 | RWE AG | 4,816,112 | ||||||||
| 61,637 | Software AG | 2,233,366 | ||||||||
| 19,339 | Stada Arzneimittel AG | 828,006 | ||||||||
| 80,477 | Suedzucker AG‡ | 2,293,217 | ||||||||
| 86,577 | Symrise AG | 4,326,714 | ||||||||
| 186,653 | TAG Immobilien AG‡ | 2,315,290 | ||||||||
| 70,048 | Talanx AG* | 2,520,754 | ||||||||
| 123,519 | TUI AG‡ | 2,059,904 | ||||||||
|
| |||||||||
Total Germany | 178,502,814 | |||||||||
|
| |||||||||
Greece — 0.3% | ||||||||||
| 187,407 | Hellenic Telecommunications Organization SA* | 3,099,524 | ||||||||
| 65,793 | OPAP SA | 1,060,946 | ||||||||
| 106,291 | Public Power Corp. SA | 1,757,946 | ||||||||
|
| |||||||||
Total Greece | 5,918,416 | |||||||||
|
| |||||||||
Hong Kong — 0.6% | ||||||||||
| 287,000 | CLP Holdings, Ltd. | 2,162,568 | ||||||||
| 148,000 | Galaxy Entertainment Group, Ltd.* | 1,287,861 | ||||||||
| 1,619,820 | New World Development, Ltd. | 1,628,789 | ||||||||
| 4,653,178 | PCCW, Ltd. | 2,321,475 | ||||||||
| 4,426,000 | Shougang Fushan Resources Group, Ltd. | 1,346,563 | ||||||||
| 186,000 | Sun Hung Kai Properties, Ltd. | 2,277,928 | ||||||||
|
| |||||||||
Total Hong Kong | 11,025,184 | |||||||||
|
| |||||||||
India — 1.0% | ||||||||||
| 288,011 | Tata Consultancy Services, Ltd. | 10,315,301 | ||||||||
| 1,337,817 | Tata Motors, Ltd. | 8,926,620 | ||||||||
|
| |||||||||
Total India | 19,241,921 | |||||||||
|
| |||||||||
Indonesia — 0.3% | ||||||||||
| 1,964,700 | Astra International Tbk PT | 1,275,498 | ||||||||
| 11,869,900 | Bank Tabungan Negara Persero Tbk PT | 1,342,678 | ||||||||
| 6,533,900 | Telekomunikasi Indonesia Persero Tbk PT | 1,273,995 | ||||||||
| 718,496 | United Tractors Tbk PT | 1,312,394 | ||||||||
|
| |||||||||
Total Indonesia | 5,204,565 | |||||||||
|
| |||||||||
Ireland — 0.3% | ||||||||||
| 12,482,174 | Governor & Co. of the Bank of Ireland (The)* | 5,298,694 | ||||||||
|
| |||||||||
Italy — 2.6% | ||||||||||
| 869,489 | A2A Spa | 1,127,669 | ||||||||
| 28,604 | Ansaldo STS Spa | 335,296 | ||||||||
| 53,752 | Azimut Holding Spa | 1,918,767 | ||||||||
| 33,425 | Banca Generali Spa | 1,103,328 | ||||||||
| 150,150 | Banco Popolare SC* ‡ | 3,265,577 | ||||||||
| 617,294 | Beni Stabili Spa REIT‡ | 531,741 | ||||||||
| 7,697 | Danieli & C. Officine Meccaniche Spa | 256,829 | ||||||||
| See accompanying Notes to the Financial Statements. | 67 |
Table of Contents
Mercer Non-US Core Equity Fund
Schedule of Investments (Continued)
(showing percentage of net assets)
March 31, 2014
| Shares | Description | Value ($) | ||||||||
Italy — continued | ||||||||||
| 12,685 | Danieli & C. Officine Meccaniche Spa-RSP | 291,968 | ||||||||
| 459,394 | Enel Spa | 2,601,020 | ||||||||
| 98,588 | ENI Spa | 2,474,354 | ||||||||
| 46,679 | ERG Spa | 755,940 | ||||||||
| 29,857 | Exor Spa | 1,340,680 | ||||||||
| 207,934 | Hera Spa | 607,560 | ||||||||
| 178,272 | Iren Spa | 321,871 | ||||||||
| 185,158 | Mediobanca Spa* | 2,118,110 | ||||||||
| 298,427 | Mediolanum Spa | 2,817,452 | ||||||||
| 141,579 | Pirelli & C. Spa | 2,224,496 | ||||||||
| 10,847 | Societa Cattolica di Assicurazioni SCRL | 278,516 | ||||||||
| 110,026 | Societa Iniziative Autostradali e Servizi Spa | 1,323,846 | ||||||||
| 4,024,536 | Telecom Italia Spa | 4,748,074 | ||||||||
| 2,743,163 | Telecom Italia Spa-RNC | 2,567,138 | ||||||||
| 1,753,930 | UniCredit Spa | 16,027,052 | ||||||||
| 16,019 | Yoox Spa* | 548,201 | ||||||||
|
| |||||||||
Total Italy | 49,585,485 | |||||||||
|
| |||||||||
Japan — 20.6% | ||||||||||
| 50,200 | Aisin Seiki Co., Ltd. | 1,815,750 | ||||||||
| 63,400 | Alpine Electronics, Inc. | 832,939 | ||||||||
| 191,100 | Alps Electric Co., Ltd.* | 2,284,256 | ||||||||
| 103,000 | Amada Co., Ltd. | 726,106 | ||||||||
| 44,900 | Amano Corp. | 464,761 | ||||||||
| 58,200 | Aoyama Trading Co., Ltd. | 1,531,505 | ||||||||
| 275,000 | Asahi Glass Co., Ltd.‡ | 1,596,834 | ||||||||
| 126,000 | Asahi Kasei Corp. | 858,882 | ||||||||
| 307,500 | Astellas Pharma, Inc. | 3,654,707 | ||||||||
| 138,100 | Bridgestone Corp. | 4,907,957 | ||||||||
| 151,800 | Brother Industries, Ltd. | 2,126,984 | ||||||||
| 184,000 | Calsonic Kansei Corp. | 855,814 | ||||||||
| 115,300 | Canon, Inc. | 3,572,581 | ||||||||
| 19,832 | Canon, Inc., Sponsored ADR | 615,982 | ||||||||
| 203,000 | Central Glass Co., Ltd. | 660,339 | ||||||||
| 30,500 | Central Japan Railway Co.‡ | 3,571,685 | ||||||||
| 215,294 | Chiba Bank, Ltd. (The) | 1,329,582 | ||||||||
| 47,600 | Chugai Pharmaceutical Co., Ltd. | 1,217,905 | ||||||||
| 180,600 | Citizen Holdings Co., Ltd. | 1,362,589 | ||||||||
| 40,000 | CKD Corp. | 382,192 | ||||||||
| 90,200 | COMSYS Holdings Corp. | 1,417,135 | ||||||||
| 112,500 | Dai-ichi Life Insurance Co., Ltd. (The) | 1,638,588 | ||||||||
| 67,000 | Daicel Corp. | 550,391 | ||||||||
| 81,900 | Daiei, Inc. (The)* ‡ | 270,389 | ||||||||
| 44,000 | Daifuku Co., Ltd. | 545,167 | ||||||||
| 96,000 | Daiichi Sanyko Co., Ltd.‡ | 1,620,119 | ||||||||
| 233,760 | Daikin Industries, Ltd. | 13,124,244 | ||||||||
| 340,246 | Daiwa Securities Group, Inc. | 2,966,849 | ||||||||
| 389,000 | Denki Kagaku Kogyo KK | 1,337,146 | ||||||||
| 94,400 | Denso Corp. | 4,535,527 | ||||||||
| 68 | See accompanying Notes to the Financial Statements. |
Table of Contents
Mercer Non-US Core Equity Fund
Schedule of Investments (Continued)
(showing percentage of net assets)
March 31, 2014
| Shares | Description | Value ($) | ||||||||
Japan — continued | ||||||||||
| 394,000 | DIC Corp. | 1,036,792 | ||||||||
| 40,600 | Disco Corp.‡ | 2,530,971 | ||||||||
| 96,000 | DMG Mori Seiki Co., Ltd. | 1,216,488 | ||||||||
| 48,400 | East Japan Railway Co. | 3,574,602 | ||||||||
| 142,000 | Ebara Corp.‡ | 892,110 | ||||||||
| 12,000 | Eizo Corp. | 314,376 | ||||||||
| 21,400 | Exedy Corp. | 600,118 | ||||||||
| 17,600 | Fanuc, Ltd. | 3,111,210 | ||||||||
| 218,000 | Fuji Electric Holdings Co., Ltd. | 975,851 | ||||||||
| 109,900 | Fuji Heavy Industries, Ltd. | 2,979,471 | ||||||||
| 188,500 | Fuji Media Holdings, Inc. | 3,468,539 | ||||||||
| 255,700 | FUJIFILM Holdings Corp. | 6,880,077 | ||||||||
| 394,000 | Fujikura, Ltd. | 1,805,778 | ||||||||
| 145,000 | Fujitsu General, Ltd. | 1,402,340 | ||||||||
| 375,000 | Fujitsu, Ltd. | 2,272,176 | ||||||||
| 355,000 | Fukuoka Financial Group, Inc. | 1,461,572 | ||||||||
| 95,797 | Glory, Ltd. | 2,631,545 | ||||||||
| 211,294 | Hachijuni Bank, Ltd. (The) | 1,204,346 | ||||||||
| 249,000 | Hankyu Hanshin Holdings, Inc. | 1,358,819 | ||||||||
| 54,000 | Hanwa Co., Ltd. | 209,739 | ||||||||
| 221,800 | Hino Motors, Ltd. | 3,297,333 | ||||||||
| 32,800 | Hirose Electric Co., Ltd. | 4,516,230 | ||||||||
| 31,300 | Hitachi High-Technologies Corp.‡ | 730,642 | ||||||||
| 59,500 | Hitachi Koki Co., Ltd. | 467,403 | ||||||||
| 834,000 | Hitachi, Ltd. | 6,170,879 | ||||||||
| 40,900 | Honda Motor Co., Ltd. | 1,443,226 | ||||||||
| 126,579 | Ibiden Co., Ltd. | 2,499,992 | ||||||||
| 320,000 | IHI Corp. | 1,348,546 | ||||||||
| 203,200 | Inpex Holdings, Inc. | 2,641,985 | ||||||||
| 180,000 | Isuzu Motors, Ltd. | 1,036,462 | ||||||||
| 84,900 | IT Holdings Corp. | 1,396,520 | ||||||||
| 44,600 | Ito En, Ltd.‡ | 1,000,398 | ||||||||
| 174,900 | Itochu Corp. | 2,048,157 | ||||||||
| 17,800 | Jafco Co., Ltd.* ‡ | 800,252 | ||||||||
| 68,000 | Japan Aviation Electronics Industry, Ltd. | 1,018,168 | ||||||||
| 42,400 | Japan Petroleum Exploration Co. | 1,414,225 | ||||||||
| 279,000 | Japan Tobacco, Inc. | 8,777,589 | ||||||||
| 78,200 | JFE Holdings, Inc. | 1,475,386 | ||||||||
| 303,714 | Joyo Bank, Ltd. (The) | 1,518,791 | ||||||||
| 39,400 | JTEKT Corp. | 586,878 | ||||||||
| 51,000 | Kandenko Co., Ltd. | 258,999 | ||||||||
| 230,600 | Kaneka Corp. | 1,401,715 | ||||||||
| 385,508 | Kao Corp. | 13,689,399 | ||||||||
| 274,000 | Kawasaki Heavy Industries, Ltd. | 1,011,021 | ||||||||
| 420,000 | Kawasaki Kisen Kaisha, Ltd. | 909,453 | ||||||||
| 256,200 | KDDI Corp. | 14,866,740 | ||||||||
| 21,900 | Keyence Corp. | 9,052,610 | ||||||||
| 52,400 | Kobayashi Pharmaceutical Co., Ltd.‡ | 3,027,431 | ||||||||
| 326,500 | Komatsu, Ltd. | 6,778,240 | ||||||||
| See accompanying Notes to the Financial Statements. | 69 |
Table of Contents
Mercer Non-US Core Equity Fund
Schedule of Investments (Continued)
(showing percentage of net assets)
March 31, 2014
| Shares | Description | Value ($) | ||||||||
Japan — continued | ||||||||||
| 71,400 | Komori Corp. | 892,977 | ||||||||
| 454,800 | Konica Minolta Holdings, Inc. | 4,252,779 | ||||||||
| 59,686 | Kose Corp. | 1,964,709 | ||||||||
| 15,900 | Kuroda Electric Co., Ltd. | 257,988 | ||||||||
| 43,800 | Kyocera Corp. | 1,978,943 | ||||||||
| 2,600 | Kyoei Steel, Ltd. | 46,201 | ||||||||
| 66,873 | Lawson, Inc.‡ | 4,740,233 | ||||||||
| 57,000 | Makino Milling Machine Co., Ltd. | 402,379 | ||||||||
| 196,000 | Marubeni Corp.‡ | 1,318,910 | ||||||||
| 82,000 | Maruha Nichiro Holdings, Inc.* **** | 135,360 | ||||||||
| 56,200 | Maruichi Steel Tube, Ltd. | 1,456,501 | ||||||||
| 450,500 | Matsushita Electric Industrial Co., Ltd. | 5,131,199 | ||||||||
| 192,000 | Mazda Motor Corp. | 853,872 | ||||||||
| 49,900 | Medipal Holdings Corp. | 764,599 | ||||||||
| 187,000 | Meidensha Corp. | 829,820 | ||||||||
| 143,000 | Minebea Co., Ltd. | 1,274,690 | ||||||||
| 195,000 | Mitsubishi Chemical Holdings Corp. | 812,303 | ||||||||
| 195,000 | Mitsubishi Electric Corp. | 2,200,223 | ||||||||
| 313,000 | Mitsubishi Heavy Industries, Ltd. | 1,814,449 | ||||||||
| 254,000 | Mitsubishi Materials Corp. | 722,649 | ||||||||
| 100,100 | Mitsubishi Tanabe Pharma Corp. | 1,402,576 | ||||||||
| 99,600 | Mitsui & Co., Ltd. | 1,411,044 | ||||||||
| 327,000 | Mitsui Engineering & Shipbuilding Co., Ltd. | 692,198 | ||||||||
| 323,000 | Mitsui Mining & Smelting Co., Ltd. | 746,458 | ||||||||
| 40,400 | Mitsumi Electric Co., Ltd. | 293,041 | ||||||||
| 754,500 | Mizuho Financial Group, Inc.‡ | 1,494,567 | ||||||||
| 63,100 | MS&AD Insurance Group Holdings | 1,448,448 | ||||||||
| 22,600 | Murata Manufacturing Co., Ltd. | 2,136,340 | ||||||||
| 504,000 | NEC Corp. | 1,551,372 | ||||||||
| 38,000 | NGK Insulators, Ltd. | 793,319 | ||||||||
| 168,200 | Nidec Corp.‡ | 10,255,161 | ||||||||
| 49,300 | Nihon Kohden Corp. | 1,969,894 | ||||||||
| 10,900 | Nintendo Co., Ltd.‡ | 1,297,606 | ||||||||
| 41,000 | Nippon Konpo Unyu Soko Co., Ltd. | 724,173 | ||||||||
| 95,000 | Nippon Soda Co., Ltd. | 517,503 | ||||||||
| 27,000 | Nippon Telegraph & Telephone Corp. | 1,473,156 | ||||||||
| 191,200 | Nippon Television Network Corp. | 3,130,196 | ||||||||
| 53,000 | Nippon Yusen KK | 154,391 | ||||||||
| 77,900 | Nissan Chemical Industries, Ltd. | 1,171,696 | ||||||||
| 92,000 | Nisshinbo Holdings, Inc. | 787,921 | ||||||||
| 23,200 | Nissin Kogyo Co., Ltd. | 433,655 | ||||||||
| 58,500 | NKSJ Holdings, Inc. | 1,506,452 | ||||||||
| 180,641 | Nomura Research Institute, Ltd. | 5,718,208 | ||||||||
| 450,641 | North Pacific Bank, Ltd. | 1,833,457 | ||||||||
| 60,000 | NSK, Ltd. | 618,731 | ||||||||
| 154,000 | NTN Corp.* ‡ | 524,873 | ||||||||
| 204,400 | NTT DoCoMo, Inc. | 3,231,181 | ||||||||
| 115,100 | Obic Co., Ltd. | 3,643,501 | ||||||||
| 256,000 | Oki Electric Industry Co., Ltd.‡ | 549,362 | ||||||||
| 70 | See accompanying Notes to the Financial Statements. |
Table of Contents
Mercer Non-US Core Equity Fund
Schedule of Investments (Continued)
(showing percentage of net assets)
March 31, 2014
| Shares | Description | Value ($) | ||||||||
Japan — continued | ||||||||||
| 20,200 | Omron Corp. | 835,578 | ||||||||
| 542,400 | Orix Corp.* | 7,652,641 | ||||||||
| 25,300 | OSG Corp. | 439,744 | ||||||||
| 132,700 | Otsuka Holdings Co., Ltd. | 3,977,714 | ||||||||
| 686,600 | Pioneer Corp.* ‡ | 1,473,405 | ||||||||
| 12,500 | Plenus Co., Ltd. | 291,183 | ||||||||
| 168,000 | Press Kogyo Co., Ltd. | 610,108 | ||||||||
| 531,390 | Rakuten, Inc.‡ | 7,105,152 | ||||||||
| 226,500 | Ricoh Co., Ltd. | 2,617,226 | ||||||||
| 21,000 | Sanken Electric Co., Ltd.‡ | 148,857 | ||||||||
| 24,134 | Sankyo Co., Ltd. | 1,018,228 | ||||||||
| 79,233 | Santen Pharmaceutical Co., Ltd. | 3,523,689 | ||||||||
| 77,000 | Sanwa Holdings Corp. | 500,199 | ||||||||
| 76,700 | Seiko Epson Corp. | 2,390,707 | ||||||||
| 115,100 | Sekisui House, Ltd. | 1,431,695 | ||||||||
| 80,700 | Shinko Electric Industries Co., Ltd.‡ | 583,789 | ||||||||
| 38,800 | Shionogi & Co., Ltd. | 720,730 | ||||||||
| 130,400 | Showa Corp. | 1,435,875 | ||||||||
| 125,000 | SKY Perfect JSAT Holdings, Inc. | 670,000 | ||||||||
| 7,500 | SMC Corp. | 1,982,692 | ||||||||
| 79,900 | Sodick Co., Ltd. | 301,026 | ||||||||
| 196,600 | Sony Financial Holdings, Inc. | 3,226,237 | ||||||||
| 46,200 | Star Micronics Co., Ltd.‡ | 558,070 | ||||||||
| 75,000 | Sumitomo Bakelite Co., Ltd. | 289,120 | ||||||||
| 406,000 | Sumitomo Chemical Co., Ltd. | 1,502,025 | ||||||||
| 113,300 | Sumitomo Corp. | 1,444,510 | ||||||||
| 202,800 | Sumitomo Electric Industries, Ltd. | 3,024,720 | ||||||||
| 93,300 | Sumitomo Forestry Co., Ltd.‡ | 939,478 | ||||||||
| 135,741 | Sumitomo Mitsui Financial Group | 5,811,352 | ||||||||
| 417,000 | Sumitomo Osaka Cement Co., Ltd. | 1,728,980 | ||||||||
| 13,300 | Sumitomo Real Estate Sales Co., Ltd. | 420,367 | ||||||||
| 50,800 | Suzuki Motor Corp. | 1,328,885 | ||||||||
| 119,100 | T&D Holdings, Inc. | 1,419,000 | ||||||||
| 36,200 | Takeda Pharmaceutical Co., Ltd. | 1,719,575 | ||||||||
| 40,300 | TDK Corp. | 1,686,585 | ||||||||
| 370,000 | Toagosei Co., Ltd. | 1,587,998 | ||||||||
| 45,500 | Tokai Rika Co., Ltd. | 766,102 | ||||||||
| 21,900 | Tokyo Electron, Ltd. | 1,345,026 | ||||||||
| 37,700 | Tokyo Ohka Kogyo Co., Ltd. | 835,012 | ||||||||
| 24,000 | Tokyo Seimitsu Co., Ltd. | 423,440 | ||||||||
| 205,000 | Toppan Printing Co., Ltd. | 1,471,039 | ||||||||
| 139,000 | Tosoh Corp. | 537,185 | ||||||||
| 34,000 | TOTO, Ltd.‡ | 472,438 | ||||||||
| 318,000 | Toyo Ink SC Holdings Co., Ltd. | 1,287,624 | ||||||||
| 67,000 | Toyo Suisan Kaisha, Ltd. | 2,241,249 | ||||||||
| 313,000 | Toyo Tire & Rubber Co., Ltd. | 2,221,712 | ||||||||
| 24,300 | Toyoda Gosei Co., Ltd. | 466,958 | ||||||||
| 55,000 | Toyota Industries Corp. | 2,648,929 | ||||||||
| 99,900 | Toyota Motor Corp. | 5,651,477 | ||||||||
| See accompanying Notes to the Financial Statements. | 71 |
Table of Contents
Mercer Non-US Core Equity Fund
Schedule of Investments (Continued)
(showing percentage of net assets)
March 31, 2014
| Shares | Description | Value ($) | ||||||||
Japan — continued | ||||||||||
| 14,518 | Toyota Motor Corp., Sponsored ADR | 1,639,082 | ||||||||
| 72,100 | TS Tech Co., Ltd. | 2,191,319 | ||||||||
| 92,000 | Tsubakimoto Chain Co. | 659,280 | ||||||||
| 21,900 | TV Asahi Corp. | 397,660 | ||||||||
| 37,000 | Ushio, Inc. | 478,555 | ||||||||
| 239,170 | USS Co., Ltd. | 3,365,124 | ||||||||
| 87,300 | Yamaha Corp. | 1,126,588 | ||||||||
| 405,462 | Yamato Holdings Co., Ltd.‡ | 8,756,105 | ||||||||
| 152,000 | Yokohama Rubber Co., Ltd. (The) | 1,431,665 | ||||||||
|
| |||||||||
Total Japan | 387,658,468 | |||||||||
|
| |||||||||
Luxembourg — 0.4% | ||||||||||
| 911 | Eurofins Scientific SE | 272,776 | ||||||||
| 121,895 | Gagfah SA* | 1,851,379 | ||||||||
| 18,868 | SAF-Holland SA* | 293,724 | ||||||||
| 130,253 | Subsea 7 SA | 2,421,420 | ||||||||
| 71,635 | Tenaris SA | 1,580,682 | ||||||||
| 20,408 | Tenaris SA, ADR | 903,054 | ||||||||
|
| |||||||||
Total Luxembourg | 7,323,035 | |||||||||
|
| |||||||||
Malaysia — 0.2% | ||||||||||
| 976,700 | Genting Malaysia Bhd | 1,256,206 | ||||||||
| 445,400 | Sime Darby Bhd | 1,269,844 | ||||||||
| 342,900 | Tenaga Nasional Bhd | 1,255,882 | ||||||||
|
| |||||||||
Total Malaysia | 3,781,932 | |||||||||
|
| |||||||||
Malta — 0.1% | ||||||||||
| 26,735 | Unibet Group Plc, ADR | 1,340,142 | ||||||||
|
| |||||||||
Mexico — 0.1% | ||||||||||
| 1,266,400 | America Movil SAB de CV Series L | 1,263,610 | ||||||||
|
| |||||||||
Netherlands — 3.5% | ||||||||||
| 380,900 | Aegon NV | 3,497,910 | ||||||||
| 107,528 | Aegon NV, ADR | 989,258 | ||||||||
| 153,359 | Akzo Nobel NV | 12,519,266 | ||||||||
| 63,092 | Arcadis NV | 2,427,391 | ||||||||
| 32,964 | ASM International NV | 1,323,679 | ||||||||
| 80,215 | BinckBank NV | 948,905 | ||||||||
| 140,231 | Delta Lloyd NV | 3,889,625 | ||||||||
| 121,015 | Heineken NV | 8,426,174 | ||||||||
| 1,371,742 | ING Groep NV, ADR* | 19,425,944 | ||||||||
| 48,311 | Koninklijke Boskalis Westminster NV | 2,661,387 | ||||||||
| 93,298 | Reed Elsevier NV | 2,016,902 | ||||||||
| 98,617 | TomTom NV* | 666,818 | ||||||||
| 25,891 | USG People NV | 418,220 | ||||||||
| 10,964 | Vastned Retail NV REIT | 540,147 | ||||||||
| 9,720 | Wereldhave NV | 827,775 | ||||||||
| 72 | See accompanying Notes to the Financial Statements. |
Table of Contents
Mercer Non-US Core Equity Fund
Schedule of Investments (Continued)
(showing percentage of net assets)
March 31, 2014
| Shares | Description | Value ($) | ||||||||
Netherlands — continued | ||||||||||
| 190,850 | Yandex NV Class A* | 5,761,761 | ||||||||
|
| |||||||||
Total Netherlands | 66,341,162 | |||||||||
|
| |||||||||
New Zealand — 0.3% | ||||||||||
| 334,864 | Fisher & Paykel Healthcare Corp., Ltd. | 1,234,957 | ||||||||
| 251,223 | Ryman Healthcare, Ltd. | 1,907,488 | ||||||||
| 605,423 | Sky Network Television, Ltd. | 3,283,473 | ||||||||
|
| |||||||||
Total New Zealand | 6,425,918 | |||||||||
|
| |||||||||
Norway — 1.2% | ||||||||||
| 15,305 | Aker ASA | 494,654 | ||||||||
| 313,021 | DnB NOR ASA | 5,442,661 | ||||||||
| 70,212 | Fred Olsen Energy ASA | 2,345,462 | ||||||||
| 38,847 | Marine Harvest ASA | 439,921 | ||||||||
| 283,505 | Orkla ASA | 2,417,373 | ||||||||
| 1,593,193 | REC Silicon ASA* | 1,038,880 | ||||||||
| 91,036 | SpareBank 1 SMN | 817,295 | ||||||||
| 90,561 | Statoil ASA | 2,556,319 | ||||||||
| 321,797 | Storebrand ASA* | 1,857,022 | ||||||||
| 76,076 | TGS Nopec Geophysical Co. ASA‡ | 2,494,337 | ||||||||
| 55,240 | Yara International ASA | 2,441,353 | ||||||||
|
| |||||||||
Total Norway | 22,345,277 | |||||||||
|
| |||||||||
Singapore — 0.7% | ||||||||||
| 178,000 | DBS Group Holdings, Ltd. | 2,288,784 | ||||||||
| 71,000 | Jardine Cycle & Carriage, Ltd. | 2,559,286 | ||||||||
| 538,000 | SembCorp Industries, Ltd. | 2,348,710 | ||||||||
| 471,000 | UOL Group, Ltd. | 2,344,606 | ||||||||
| 82,230 | Venture Corp., Ltd. | 487,802 | ||||||||
| 2,626,243 | Yangzijiang Shipbuilding Holdings, Ltd.‡ | 2,255,451 | ||||||||
|
| |||||||||
Total Singapore | 12,284,639 | |||||||||
|
| |||||||||
South Africa — 0.1% | ||||||||||
| 36,445 | Kumba Iron Ore, Ltd.‡ | 1,309,787 | ||||||||
| 23,056 | Sasol, Ltd. | 1,292,380 | ||||||||
|
| |||||||||
Total South Africa | 2,602,167 | |||||||||
|
| |||||||||
South Korea — 0.5% | ||||||||||
| 15,332 | Daelim Industrial Co., Ltd. | 1,248,799 | ||||||||
| 44,140 | Hyundai Marine & Fire Insurance Co., Ltd. | 1,273,050 | ||||||||
| 5,713 | Hyundai Motor Co. | 1,347,140 | ||||||||
| 23,239 | Kia Motors Corp. | 1,294,634 | ||||||||
| 1,006 | Samsung Electronics Co., Ltd. | 1,269,254 | ||||||||
| 6,860 | SK Holdings Co., Ltd. | 1,243,816 | ||||||||
| 6,429 | SK Telecom Co., Ltd. | 1,301,564 | ||||||||
|
| |||||||||
Total South Korea | 8,978,257 | |||||||||
|
| |||||||||
| See accompanying Notes to the Financial Statements. | 73 |
Table of Contents
Mercer Non-US Core Equity Fund
Schedule of Investments (Continued)
(showing percentage of net assets)
March 31, 2014
| Shares | Description | Value ($) | ||||||||
Spain — 3.6% | ||||||||||
| 36,127 | Almirall SA | 616,923 | ||||||||
| 379,434 | Amadeus IT Holding SA | 15,767,086 | ||||||||
| 1,345,885 | Banco Popular Espanol SA | 10,165,212 | ||||||||
| 4,673 | Construcciones y Auxiliar de Ferrocarriles SA | 2,398,787 | ||||||||
| 347,049 | Duro Felguera SA‡ | 2,377,251 | ||||||||
| 65,052 | Enagas SA | 1,979,198 | ||||||||
| 73,934 | Endesa SA | 2,662,125 | ||||||||
| 130,790 | Gamesa Corp. Tecnologica SA* | 1,420,459 | ||||||||
| 77,622 | Gas Natural SDG SA | 2,183,513 | ||||||||
| 15,440 | Grifols SA, ADR | 637,672 | ||||||||
| 30,883 | Grifols SA | 1,693,002 | ||||||||
| 750,178 | Iberdrola SA | 5,248,241 | ||||||||
| 141,832 | Indra Sistemas SA‡ | 2,851,074 | ||||||||
| 65,536 | International Consolidated Airlines Group SA (Barcelona Exchange)* | 457,044 | ||||||||
| 1,100,171 | International Consolidated Airlines Group SA (London Exchange)* | 7,652,075 | ||||||||
| 6,877 | Mediaset Espana Comunicacion SA* ‡ | 80,138 | ||||||||
| 611,379 | Prosegur Cia de Seguridad SA | 3,935,095 | ||||||||
| 98,004 | Repsol VPF SA‡ | 2,502,245 | ||||||||
| 154,879 | Telefonica SA | 2,451,610 | ||||||||
|
| |||||||||
Total Spain | 67,078,750 | |||||||||
|
| |||||||||
Sweden — 3.5% | ||||||||||
| 17,343 | Axis Communications AB‡ | 592,763 | ||||||||
| 156,489 | Boliden AB | 2,375,013 | ||||||||
| 90,592 | Hennes & Mauritz AB Class B | 3,856,435 | ||||||||
| 64,156 | Holmen AB‡ | 2,350,109 | ||||||||
| 129,722 | Hufvudstaden AB‡ | 1,826,718 | ||||||||
| 119,528 | Industrivarden AB Class C | 2,311,822 | ||||||||
| 30,754 | Intrum Justitia AB | 837,682 | ||||||||
| 29,445 | Investment AB Oresund* | 896,945 | ||||||||
| 43,190 | Investor AB Class B | 1,560,117 | ||||||||
| 73,361 | JM AB | 2,403,294 | ||||||||
| 9,513 | Lundbergforetagen AB Class B | 449,126 | ||||||||
| 27,785 | Nobia AB | 245,343 | ||||||||
| 119,576 | Nordea Bank AB | 1,693,066 | ||||||||
| 141,571 | Peab AB | 998,752 | ||||||||
| 127,449 | Saab AB | 3,884,280 | ||||||||
| 229,369 | SAS AB* ‡ | 507,661 | ||||||||
| 105,335 | Skandinaviska Enskilda Banken AB‡ | 1,443,502 | ||||||||
| 274,157 | Svenska Cellulosa AB Class B | 8,055,295 | ||||||||
| 41,410 | Swedish Orphan Biovitrum AB* | 452,833 | ||||||||
| 1,796,752 | Telefonaktiebolaget LM Ericsson | 23,888,151 | ||||||||
| 201,520 | Telefonaktiebolaget LM Ericsson Class B, Sponsored ADR | 2,686,262 | ||||||||
| 344,363 | TeliaSonera AB | 2,591,931 | ||||||||
|
| |||||||||
Total Sweden | 65,907,100 | |||||||||
|
| |||||||||
Switzerland — 6.1% | ||||||||||
| 12,238 | Actelion, Ltd.* | 1,159,586 | ||||||||
| 35,672 | Aryzta AG* | 3,153,884 | ||||||||
| 74 | See accompanying Notes to the Financial Statements. |
Table of Contents
Mercer Non-US Core Equity Fund
Schedule of Investments (Continued)
(showing percentage of net assets)
March 31, 2014
| Shares | Description | Value ($) | ||||||||
Switzerland — continued | ||||||||||
| 12,028 | Ascom Holding AG | 247,137 | ||||||||
| 18,268 | Baloise-Holding AG | 2,299,657 | ||||||||
| 10,357 | Basilea Pharmaceutica* | 1,183,021 | ||||||||
| 11,091 | Bucher Industries AG | 3,766,684 | ||||||||
| 114,384 | Clariant AG* | 2,224,619 | ||||||||
| 73,585 | Credit Suisse Group AG* | 2,381,610 | ||||||||
| 5,241 | Flughafen Zuerich AG | 3,372,965 | ||||||||
| 2,648 | Forbo Holding AG* | 2,781,846 | ||||||||
| 2,133 | Galenica AG‡ | 2,065,751 | ||||||||
| 77,704 | GAM Holding AG* | 1,403,044 | ||||||||
| 19,948 | Geberit AG | 6,537,551 | ||||||||
| 1,944 | Georg Fischer AG* | 1,508,589 | ||||||||
| 3,893 | Givaudan SA* | 6,024,487 | ||||||||
| 8,081 | Helvetia Holding AG | 4,141,816 | ||||||||
| 5,000 | Implenia AG* | 374,144 | ||||||||
| 50,039 | Julius Baer Group, Ltd.* | 2,222,256 | ||||||||
| 194,014 | Nestle SA | 14,616,666 | ||||||||
| 78,641 | Nobel Biocare Holding AG* ‡ | 1,130,628 | ||||||||
| 233,152 | Novartis AG | 19,795,551 | ||||||||
| 6,861 | Panalpina Welttransport Holding AG | 1,054,762 | ||||||||
| 4,844 | Rieter Holding AG* | 1,079,186 | ||||||||
| 62,470 | Roche Holding AG | 18,740,646 | ||||||||
| 46,038 | Roche Holding AG, Sponsored ADR | 1,736,553 | ||||||||
| 11,928 | Schindler Holding AG | 1,759,459 | ||||||||
| 1,077 | Swisscom AG | 662,038 | ||||||||
| 9,908 | Temenos Group AG | 348,830 | ||||||||
| 2,607 | U-Blox AG* | 358,284 | ||||||||
| 3,361 | Vontobel Holding AG | 132,979 | ||||||||
| 20,103 | Zurich Insurance Group AG* | 6,176,435 | ||||||||
|
| |||||||||
Total Switzerland | 114,440,664 | |||||||||
|
| |||||||||
Taiwan — 0.8% | ||||||||||
| 771,206 | Taiwan Semiconductor Manufacturing Co., Ltd., Sponsored ADR | 15,439,544 | ||||||||
|
| |||||||||
Thailand — 0.1% | ||||||||||
| 234,700 | PTT Exploration & Production PCL | 1,135,878 | ||||||||
| 24,700 | PTT Exploration & Production PCL (Public Co.) | 119,541 | ||||||||
| 514,600 | PTT Global Chemical PCL | 1,146,111 | ||||||||
| 34,300 | PTT Global Chemical PCL Class C | 76,393 | ||||||||
|
| |||||||||
Total Thailand | 2,477,923 | |||||||||
|
| |||||||||
United Kingdom — 19.5% | ||||||||||
| 58,648 | Abcam Plc | 380,345 | ||||||||
| 384,029 | Aberdeen Asset Management Plc | 2,498,833 | ||||||||
| 505,151 | Amlin Plc | 4,078,593 | ||||||||
| 173,763 | Antofagasta Plc | 2,420,352 | ||||||||
| 1,086,559 | Ashtead Group Plc | 17,226,956 | ||||||||
| 218,477 | Associated British Foods Plc | 10,129,347 | ||||||||
| 143,972 | AstraZeneca Plc, Sponsored ADR | 9,340,903 | ||||||||
| See accompanying Notes to the Financial Statements. | 75 |
Table of Contents
Mercer Non-US Core Equity Fund
Schedule of Investments (Continued)
(showing percentage of net assets)
March 31, 2014
| Shares | Description | Value ($) | ||||||||
United Kingdom — continued | ||||||||||
| 516,504 | Barratt Developments Plc | 3,551,995 | ||||||||
| 103,000 | BBA Aviation Plc | 569,755 | ||||||||
| 158,863 | Bellway Plc | 4,396,485 | ||||||||
| 47,243 | Berendsen Plc | 880,550 | ||||||||
| 57,245 | Berkeley Group Holdings Plc | 2,500,423 | ||||||||
| 288,224 | BG Group Plc | 5,369,729 | ||||||||
| 52,026 | Bodycote Plc | 699,953 | ||||||||
| 303,105 | BP Plc | 2,425,543 | ||||||||
| 32,604 | BP Plc, Sponsored ADR | 1,568,252 | ||||||||
| 146,387 | British American Tobacco Plc | 8,140,258 | ||||||||
| 1,433,706 | BT Group Plc | 9,070,821 | ||||||||
| 32,771 | BT Group Plc, Sponsored ADR | 2,092,428 | ||||||||
| 164,344 | BTG Plc* | 1,486,375 | ||||||||
| 322,893 | Bunzl Plc | 8,591,445 | ||||||||
| 513,234 | Cairn Energy Plc* | 1,428,060 | ||||||||
| 449,560 | Centrica Plc | 2,471,049 | ||||||||
| 1,763,242 | Cobham Plc | 8,789,372 | ||||||||
| 821,014 | Compass Group Plc | 12,524,096 | ||||||||
| 42,211 | Dairy Crest Group Plc | 340,319 | ||||||||
| 40,289 | Dialog Semiconductor Plc* ‡ | 995,622 | ||||||||
| 55,982 | easyJet Plc | 1,600,616 | ||||||||
| 512,225 | GlaxoSmithKline Plc | 13,590,709 | ||||||||
| 267,631 | GlaxoSmithKline Plc, Sponsored ADR | 14,299,524 | ||||||||
| 127,650 | Greene King Plc | 1,921,690 | ||||||||
| 355,249 | Halma Plc | 3,411,380 | ||||||||
| 9,272 | Hargreaves Lansdown Plc | 225,375 | ||||||||
| 955,097 | Hays Plc | 2,308,821 | ||||||||
| 367,761 | Home Retail Group | 1,328,002 | ||||||||
| 688,143 | HSBC Holdings Plc (Ordinary Shares) | 6,969,469 | ||||||||
| 254,737 | IG Group Holdings Plc | 2,664,897 | ||||||||
| 342,672 | Intermediate Capital Group Plc | 2,363,409 | ||||||||
| 795,381 | ITV Plc | 2,539,327 | ||||||||
| 579,420 | J Sainsbury Plc‡ | 3,053,463 | ||||||||
| 155,626 | Jardine Lloyd Thompson Group Plc | 2,760,568 | ||||||||
| 198,255 | John Wood Group Plc | 2,535,095 | ||||||||
| 841,680 | Legal & General Group Plc | 2,872,365 | ||||||||
| 6,069,595 | Lloyds TSB Group Plc* | 7,553,778 | ||||||||
| 74,320 | London Stock Exchange Group Plc | 2,440,881 | ||||||||
| 623,869 | Man Group Plc | 1,052,564 | ||||||||
| 314,923 | Meggitt Plc | 2,519,590 | ||||||||
| 194,976 | Mitchells & Butlers Plc* | 1,481,597 | ||||||||
| 133,399 | Mondi Plc | 2,332,936 | ||||||||
| 447,500 | Ocado Group Plc* | 3,436,305 | ||||||||
| 1,776,905 | Old Mutual Plc | 5,957,321 | ||||||||
| 103,949 | Pearson Plc | 1,842,164 | ||||||||
| 100,725 | Persimmon Plc* | 2,260,253 | ||||||||
| 111,495 | Petrofac, Ltd. | 2,672,939 | ||||||||
| 925,195 | QinetiQ Group Plc | 3,484,370 | ||||||||
| 4,027,572 | Quindell Plc* ‡ | 2,467,603 | ||||||||
| 76 | See accompanying Notes to the Financial Statements. |
Table of Contents
Mercer Non-US Core Equity Fund
Schedule of Investments (Continued)
(showing percentage of net assets)
March 31, 2014
| Shares | Description | Value ($) | ||||||||
United Kingdom — continued | ||||||||||
| 283,531 | Reckitt Benckiser Group Plc | 23,100,299 | ||||||||
| 169,078 | Reed Elsevier Plc | 2,582,006 | ||||||||
| 227,657 | Resolution, Ltd. | 1,134,061 | ||||||||
| 75,888 | Restaurant Group Plc (The) | 902,064 | ||||||||
| 11,953 | Rightmove Plc | 525,686 | ||||||||
| 183,607 | Rio Tinto Plc | 10,216,102 | ||||||||
| 68,010 | Royal Dutch Shell Plc Class A (Amsterdam Exchange) | 2,485,846 | ||||||||
| 232,318 | Royal Dutch Shell Plc Class A (London Exchange) | 8,485,940 | ||||||||
| 201,041 | Shire Plc | 9,870,625 | ||||||||
| 19,179 | Shire Plc, ADR | 2,848,657 | ||||||||
| 464,440 | Smith & Nephew Plc | 7,038,307 | ||||||||
| 133,993 | Spectris Plc | 5,178,098 | ||||||||
| 815,950 | St James’s Place Plc | 11,222,567 | ||||||||
| 239,153 | Stagecoach Group Plc | 1,573,685 | ||||||||
| 549,233 | Standard Life Plc | 3,456,593 | ||||||||
| 167,928 | TalkTalk Telecom Group Plc | 896,716 | ||||||||
| 2,455,692 | Taylor Wimpey Plc | 4,822,741 | ||||||||
| 670,778 | Thomas Cook Group Plc* | 2,016,273 | ||||||||
| 276,770 | Travis Perkins Plc | 8,697,713 | ||||||||
| 79,808 | Ultra Electronics Holdings Plc | 2,381,629 | ||||||||
| 109,650 | United Business Media, Ltd. | 1,246,717 | ||||||||
| 2,433,693 | Vodafone Group Plc | 8,938,300 | ||||||||
| 166,874 | Vodafone Group Plc, Sponsored ADR | 6,142,649 | ||||||||
| 139,652 | WH Smith Plc | 2,800,835 | ||||||||
| 117,808 | Whitbread Plc | 8,174,319 | ||||||||
| 541,332 | William Hill Plc | 3,077,463 | ||||||||
|
| |||||||||
Total United Kingdom | 367,730,761 | |||||||||
|
| |||||||||
TOTAL COMMON STOCKS (COST $1,523,389,488) | 1,777,766,274 | |||||||||
|
| |||||||||
INVESTMENT COMPANY — 0.9% | ||||||||||
United States — 0.9% | ||||||||||
| 265,178 | iShares MSCI EAFE Index Fund | 17,812,006 | ||||||||
|
| |||||||||
TOTAL INVESTMENT COMPANY (COST $16,032,972) | 17,812,006 | |||||||||
|
| |||||||||
PREFERRED STOCKS — 0.8% | ||||||||||
Brazil — 0.1% | ||||||||||
| 94,900 | Itau Unibanco Holding SA, 3.40% | 1,425,708 | ||||||||
|
| |||||||||
Germany — 0.7% | ||||||||||
| 92,536 | Henkel AG & Co. KGaA, 1.21% | 9,963,245 | ||||||||
| 23,083 | Porsche Automobil Holding SE, 2.59% | 2,371,108 | ||||||||
| 9,738 | Volkswagen AG, 1.86% | 2,524,564 | ||||||||
|
| |||||||||
Total Germany | 14,858,917 | |||||||||
|
| |||||||||
TOTAL PREFERRED STOCKS (COST $11,693,643) | 16,284,625 | |||||||||
|
| |||||||||
| See accompanying Notes to the Financial Statements. | 77 |
Table of Contents
Mercer Non-US Core Equity Fund
Schedule of Investments (Continued)
(showing percentage of net assets)
March 31, 2014
| Shares | Description | Value ($) | ||||||||
RIGHTS — 0.1% | ||||||||||
Hong Kong — 0.0% | ||||||||||
| 539,940 | New World Development Co., Ltd., Strike Price $0.80, Expires 04/17/14* **** | 111,370 | ||||||||
|
| |||||||||
Italy — 0.1% | ||||||||||
| 150,150 | Banco Popolare SC, Strike Price $12.45, Expires 04/17/14* | 1,278,914 | ||||||||
|
| |||||||||
TOTAL RIGHTS (COST $713,859) | 1,390,284 | |||||||||
|
| |||||||||
| Notional | Description | Value ($) | ||||||||
OPTIONS PURCHASED — 0.0% | ||||||||||
Call Options — 0.0% | ||||||||||
| 9,336,730 | OTC Euro versus Japanese Yen with UBS AG, Strike Price $0.01, Expires 04/24/15 | 183,374 | ||||||||
|
| |||||||||
Put Options — 0.0% | ||||||||||
| 2,095,817,921 | OTC Japanese Yen versus U.S. Dollar with Deutsche Bank Securities, Strike Price $102.50, Expires 04/02/14 | 154,421 | ||||||||
|
| |||||||||
TOTAL OPTIONS PURCHASED (COST $569,021) | 337,795 | |||||||||
|
| |||||||||
| Par Value ($) | Description | Value ($) | ||||||||
SHORT-TERM INVESTMENTS — 7.0% | ||||||||||
Bank Deposit — 3.1% | ||||||||||
| 57,687,891 | State Street Bank & Trust Euro Time Deposit, 0.01%, due 04/01/14 | 57,687,891 | ||||||||
|
| |||||||||
Securities Lending Collateral — 3.9% | ||||||||||
| 72,792,139 | State Street Navigator Securities Lending Prime Portfolio*** | 72,792,139 | ||||||||
|
| |||||||||
TOTAL SHORT-TERM INVESTMENTS (COST $130,480,030) | 130,480,030 | |||||||||
|
| |||||||||
TOTAL INVESTMENTS — 103.3% (Cost $1,682,879,013) | 1,944,071,014 | |||||||||
Other Assets and Liabilities (net) — (3.3)% | (62,595,380 | ) | ||||||||
|
| |||||||||
NET ASSETS — 100.0% | $ | 1,881,475,634 | ||||||||
|
| |||||||||
Notes to Schedule of Investments: | ||||||||||
| ADR — American Depository Receipt | ||||||||||
| REIT — Real Estate Investment Trust | ||||||||||
| * | Non-income producing security | |||||||||
| ‡ | All or a portion of this security is out on loan. | |||||||||
| ¤ | Illiquid security. The total market value of this security at year end is $0 which represents 0.0% of net assets. The aggregate tax cost of this security held at March 31, 2014 was $0. | |||||||||
| *** | Represents an investment of securities lending cash collateral. | |||||||||
| **** | Securities fair valued by the Valuation Committee as approved by the Board of Trustees. The total market value of the securities at year end is $246,730 which represents 0.0% of net assets. The aggregate tax cost of these securities held at March 31, 2014 was $166,588. | |||||||||
| 78 | See accompanying Notes to the Financial Statements. |
Table of Contents
Mercer Non-US Core Equity Fund
Schedule of Investments (Continued)
March 31, 2014
| Industry Sector Summary (Unaudited) | % of Net Assets | ||||
Telecommunications | 7.7 | ||||
Pharmaceuticals | 7.2 | ||||
Banks | 7.0 | ||||
Insurance | 6.4 | ||||
Chemicals | 4.2 | ||||
Food | 3.4 | ||||
Auto Manufacturers | 2.8 | ||||
Auto Parts & Equipment | 2.8 | ||||
Commercial Services | 2.8 | ||||
Electronics | 2.8 | ||||
Retail | 2.8 | ||||
Oil & Gas | 2.4 | ||||
Electric | 2.1 | ||||
Diversified Financial Services | 2.0 | ||||
Building Materials | 1.9 | ||||
Media | 1.9 | ||||
Household Products & Wares | 1.7 | ||||
Aerospace & Defense | 1.6 | ||||
Computers | 1.6 | ||||
Internet | 1.6 | ||||
Real Estate | 1.6 | ||||
Semiconductors | 1.6 | ||||
Software | 1.6 | ||||
Transportation | 1.6 | ||||
Electrical Components & Equipment | 1.5 | ||||
Machinery — Diversified | 1.3 | ||||
Engineering & Construction | 1.2 | ||||
Beverages | 1.0 | ||||
Home Builders | 1.0 | ||||
Agriculture | 0.9 | ||||
Forest Products & Paper | 0.9 | ||||
Home Furnishings | 0.9 | ||||
Lodging | 0.9 | ||||
Mining | 0.9 | ||||
Unaffiliated Fund | 0.9 | ||||
Cosmetics & Personal Care | 0.8 | ||||
Health Care — Products | 0.8 | ||||
Miscellaneous — Manufacturing | 0.8 | ||||
Distribution & Wholesale | 0.7 | ||||
Food Service | 0.7 | ||||
Biotechnology | 0.6 | ||||
Gas | 0.6 | ||||
Hand & Machine Tools | 0.6 | ||||
Iron & Steel | 0.6 | ||||
Machinery — Construction & Mining | 0.6 | ||||
Office & Business Equipment | 0.6 | ||||
Advertising | 0.5 | ||||
Airlines | 0.5 | ||||
Entertainment | 0.5 | ||||
Health Care — Services | 0.5 | ||||
Oil & Gas Services | 0.5 | ||||
| See accompanying Notes to the Financial Statements. | 79 |
Table of Contents
Mercer Non-US Core Equity Fund
Schedule of Investments (Continued)
March 31, 2014
| Industry Sector Summary (Unaudited) | % of Net Assets | ||||
Holding Companies — Diversified | 0.3 | ||||
Investment Companies | 0.3 | ||||
Leisure Time | 0.3 | ||||
Metal Fabricate & Hardware | 0.3 | ||||
Apparel | 0.2 | ||||
Coal | 0.1 | ||||
Energy — Alternate Sources | 0.1 | ||||
Shipbuilding | 0.1 | ||||
Toys, Games & Hobbies | 0.1 | ||||
Water | 0.1 | ||||
Packaging & Containers | 0.0 | ||||
REITS | 0.0 | ||||
Textiles | 0.0 | ||||
Short-Term Investments and Other Assets and Liabilities (net) | 3.7 | ||||
|
| ||||
| 100.0 | % | ||||
|
| ||||
| 80 | See accompanying Notes to the Financial Statements. |
Table of Contents
Mercer Core Fixed Income Fund
(formerly known as Mercer Core Opportunistic Fixed Income Fund)
Schedule of Investments
(showing percentage of net assets)
March 31, 2014
| Par Value ($) | Description | Value ($) | ||||||||
DEBT OBLIGATIONS — 91.9% | ||||||||||
Asset Backed Securities — 3.6% | ||||||||||
| 8,538 | ACE Securities Corp., Series 2005-SD3, Class A, 0.55%, due 08/25/45† | 8,534 | ||||||||
| 6,700,000 | ACE Securities Corp. Home Equity Loan Trust, Series 2005-SD3, Class M1, 0.85%, due 08/25/45† | 6,462,930 | ||||||||
| 421,374 | Ameriquest Mortgage Securities, Inc., Series 2003-9, Class AV1, 0.91%, due 09/25/33† | 407,037 | ||||||||
| 303,231 | Ameriquest Mortgage Securities, Inc., Series 2004-R2, Class A1A, 0.84%, due 04/25/34† | 289,087 | ||||||||
| 246,731 | Asset Backed Securities Corp. Home Equity, Series 2003-HE7, Class M1, 1.13%, due 12/15/33† | 233,626 | ||||||||
| 18,860 | Bayview Financial Acquisition Trust, Series 2004-A, Class A, 0.83%, due 02/28/44† | 18,707 | ||||||||
| 25,465 | Bayview Financial Acquisition Trust, Series 2004-C, Class A1, 0.78%, due 05/28/44† | 25,418 | ||||||||
| 117,924 | Bear Stearns Asset Backed Securities Trust, Series 2004-SD3, Class A3, 0.72%, due 09/25/34† | 115,260 | ||||||||
| 429,700 | Bear Stearns Asset Backed Securities, Inc., Series 2005-AQ2, Class A3, 0.51%, due 09/25/35† | 415,391 | ||||||||
| 19,615 | Bear Stearns Asset Backed Securities, Inc., Series 2005-SD4, Class 2A1, 0.55%, due 12/25/42† | 19,357 | ||||||||
| 1,361,729 | BNSF Railway Co. 2007-1 Pass Through Trust, 6.00%, due 04/01/24 | 1,533,035 | ||||||||
| 703,983 | Burlington Northern and Santa Fe Railway Co. 2006-1 Pass Through Trust, 5.72%, due 01/15/24 | 801,602 | ||||||||
| 3,230,000 | Chase Issuance Trust, Series 2012-A8, Class A8, 0.54%, due 10/16/17 | 3,230,593 | ||||||||
| 224,397 | Citigroup Mortgage Loan Trust, Inc., Series 2006-SHL1, Class A, 0.35%, due 11/25/45† 144A | 217,206 | ||||||||
| 47,395 | Citigroup Mortgage Loan Trust, Inc., Series 2007-AHL2, Class A3A, 0.22%, due 05/25/37† | 35,372 | ||||||||
| 35,913 | Countrywide Home Equity Loan Trust, Series 2005-G, Class 2A, 0.39%, due 12/15/35† | 29,048 | ||||||||
| 195,181 | Delta Air Lines Pass Through Trust, Series 2007-1, Class A, 6.82%, due 02/10/24 | 229,338 | ||||||||
| 425,000 | Greenpoint Manufactured Housing, Series 1999-2, Class A2, 2.91%, due 03/18/29† | 367,253 | ||||||||
| 250,000 | Greenpoint Manufactured Housing, Series 1999-3, Class 2A2, 3.54%, due 06/19/29† | 217,500 | ||||||||
| 250,000 | Greenpoint Manufactured Housing, Series 1999-4, Class A2, 3.66%, due 02/20/30† | 217,500 | ||||||||
| 375,000 | Greenpoint Manufactured Housing, Series 2001-2, Class IA2, 3.66%, due 02/20/32† | 344,124 | ||||||||
| 500,000 | Greenpoint Manufactured Housing, Series 2001-2, Class IIA2, 3.65%, due 03/13/32† | 451,006 | ||||||||
| 7,286 | Greenpoint Mortgage Funding Trust, Series 2005-HE4, Class 2A1, 0.59%, due 07/25/30† | 7,266 | ||||||||
| 15,735 | GSAMP Trust, Series 2004-SEA2, Class A2B, 0.70%, due 03/25/34† | 15,764 | ||||||||
| 398,615 | Home Equity Asset Trust, Series 2003-8, Class M1, 1.23%, due 04/25/34† | 379,355 | ||||||||
| 7,399,419 | Home Equity Mortgage Loan Asset-Backed Trust Series INDS- 2006-A, Series 2006-A, Class A, 0.41%, due 06/25/36† | 1,872,253 | ||||||||
| 4,000,000 | Merrill Lynch Mortgage Investors Trust, Series 2005-FM1, Class M1, 0.63%, due 05/25/36† | 3,517,956 | ||||||||
| 129,724 | Merrill Lynch Mortgage Investors, Inc., Series 2007-MLN1, Class A2A, 0.26%, due 03/25/37† | 79,542 | ||||||||
| 370,983 | Morgan Stanley ABS Capital I, Series 2003-NC10, Class M1, 1.17%, due 10/25/33† | 350,747 | ||||||||
| 336,444 | Morgan Stanley ABS Capital I, Series 2003-NC6, Class M1, 1.35%, due 06/25/33† | 326,550 | ||||||||
| 263,440 | Morgan Stanley ABS Capital I, Series 2003-NC7, Class M1, 1.20%, due 06/25/33† | 248,925 | ||||||||
| 110,268 | Morgan Stanley ABS Capital I, Series 2007-NC2, Class A2FP, 0.30%, due 02/25/37† | 61,526 | ||||||||
| See accompanying Notes to the Financial Statements. | 81 |
Table of Contents
Mercer Core Fixed Income Fund
(formerly known as Mercer Core Opportunistic Fixed Income Fund)
Schedule of Investments (Continued)
(showing percentage of net assets)
March 31, 2014
| Par Value ($) | Description | Value ($) | ||||||||
Asset Backed Securities — continued | ||||||||||
| 380,698 | New Century Home Equity Loan Trust, Series 2003-A, Class A, 0.87%, due 10/25/33† 144A | 359,654 | ||||||||
| 189,006 | Novastar Home Equity Loan, Series 2003-3, Class A3, 1.05%, due 12/25/33† | 177,865 | ||||||||
| 196,679 | NovaStar Mortgage Funding Trust, Series 2003-3, Class A2C, 1.21%, due 12/25/33† | 185,016 | ||||||||
| 1,700,000 | Ownit Mortgage Loan Trust, Series 2005-2, Class M4, 1.08%, due 03/25/36† | 1,639,474 | ||||||||
| 1,000,000 | People’s Choice Home Loan Securities Trust, Series 2005-3, Class M2, 0.95%, due 08/25/35† | 902,850 | ||||||||
| 154,434 | Renaissance Home Equity Loan Trust, Series 2007-2, Class AF1, 5.89%, due 06/25/37†† | 87,913 | ||||||||
| 253,357 | SACO I, Inc., Series 2006-5, Class 1A, 0.45%, due 04/25/36† | 366,184 | ||||||||
| 100,905 | SACO I, Inc., Series 2006-6, Class A, 0.41%, due 06/25/36† | 151,238 | ||||||||
| 940,928 | Saxon Asset Securities Trust, Series 2005-1, Class M1, 0.84%, due 05/25/35† | 885,261 | ||||||||
| 530,000 | SLM Student Loan Trust, Series 2008-5, Class A3, 1.54%, due 01/25/18† | 534,463 | ||||||||
| 1,332,604 | SLM Student Loan Trust, Series 2008-9, Class A, 1.74%, due 04/25/23† | 1,376,260 | ||||||||
| 43,548 | SLM Student Loan Trust, Series 2009-CT, Class 1A, 2.35%, due 04/15/39† ¤ 144A | 43,558 | ||||||||
| 623,560 | SLM Student Loan Trust, Series 2010-1, Class A, 0.55%, due 03/25/25† | 624,892 | ||||||||
| 2,629,150 | SLM Student Loan Trust, Series 2010-A, Class 2A, 3.41%, due 05/16/44† 144A | 2,801,501 | ||||||||
| 2,000,000 | SLM Student Loan Trust, Series 2012-B, Class A2, 3.48%, due 10/15/30 144A | 2,079,922 | ||||||||
| 381,917 | Small Business Administration Participation Certificates, Series 2008-20L, Class 1, 6.22%, due 12/01/28 | 437,916 | ||||||||
| 66,901 | Soundview Home Equity Loan Trust, Series 2006-EQ2, Class A2, 0.26%, due 01/25/37† | 42,634 | ||||||||
| 1,977,156 | Specialty Underwriting & Residential Finance Trust, Series 2004-BC2, Class M1, 0.98%, due 05/25/35† | 1,847,500 | ||||||||
| 29,014 | Structured Asset Securities Corp., Series 2002-AL1, Class A3, 3.45%, due 02/25/32 | 28,711 | ||||||||
| 613,688 | Structured Asset Securities Corp., Series 2006-ARS1, Class A1, 0.37%, due 02/25/36† 144A | 43,091 | ||||||||
| 72,117 | UAL Pass Through Trust, Series 2009-2A, 9.75%, due 07/15/18 | 82,934 | ||||||||
| 1,419,858 | Washington Mutual Alternative Mortgage Pass Through Certificates, Series 2006-AR3, Class A1A, 1.10%, due 05/25/46† | 1,065,568 | ||||||||
| 950,135 | Washington Mutual, Inc., Series 2005-AR8, Class 2A1A, 0.44%, due 07/25/45† | 888,484 | ||||||||
|
| |||||||||
| 39,181,697 | ||||||||||
|
| |||||||||
Bank Loans — 0.2% | ||||||||||
| 200,000 | Aramark Corp., Term Loan F, 4.00%, due 02/21/21¤ | 198,709 | ||||||||
| 397,000 | Charter Communications Operating, LLC, Term Loan F, 3.00%, due 01/04/21¤ | 394,221 | ||||||||
| 397,000 | CSC Holdings, Inc., New Term Loan B, 2.65%, due 04/17/20¤ | 392,999 | ||||||||
| 358,200 | Fortescue Metal Group, Ltd., New Term Loan B, 4.25%, due 06/30/19¤ | 361,390 | ||||||||
| 396,992 | NRG Energy, Inc., Term Loan B, 2.75%, due 07/02/18¤ | 394,189 | ||||||||
| 122,523 | Phillips-Van Heusen Corp., Term Loan B, 3.25%, due 02/13/20¤ | 122,934 | ||||||||
| 119,095 | Windstream Corp., Term Loan B4, 3.50%, due 01/23/20¤ | 119,120 | ||||||||
|
| |||||||||
| 1,983,562 | ||||||||||
|
| |||||||||
Corporate Debt — 25.2% | ||||||||||
| 20,000 | 21st Century Fox America, Inc., 6.75%, due 01/09/38 | 24,011 | ||||||||
| 290,000 | Access Midstream Partners LP/ACMP Finance Corp., 4.88%, due 05/15/23 | 293,625 | ||||||||
| 170,000 | Access Midstream Partners LP/ACMP Finance Corp., 4.88%, due 03/15/24 | 169,788 | ||||||||
| 180,000 | Activision Blizzard, Inc., 5.63%, due 09/15/21 144A | 193,050 | ||||||||
| 82 | See accompanying Notes to the Financial Statements. |
Table of Contents
Mercer Core Fixed Income Fund
(formerly known as Mercer Core Opportunistic Fixed Income Fund)
Schedule of Investments (Continued)
(showing percentage of net assets)
March 31, 2014
| Par Value ($) | Description | Value ($) | ||||||||
Corporate Debt — continued | ||||||||||
| 680,000 | AES Corp. (The), Senior Note, 8.00%, due 06/01/20 | 805,800 | ||||||||
| 170,000 | Aleris International, Inc., Senior Note, (PIK), 9.00%, due 12/15/14**** ††† ¤ | — | ||||||||
| 390,000 | Altria Group, Inc., 4.75%, due 05/05/21 | 426,263 | ||||||||
| 490,000 | Altria Group, Inc., 9.25%, due 08/06/19 | 647,291 | ||||||||
| 150,000 | Altria Group, Inc., 9.95%, due 11/10/38 | 241,397 | ||||||||
| 620,000 | America Movil SAB de CV, 5.00%, due 03/30/20 | 682,392 | ||||||||
| 150,000 | America Movil SAB de CV, Guaranteed Senior Note, 5.63%, due 11/15/17 | 170,813 | ||||||||
| 300,000 | American International Group, Inc., 5.85%, due 01/16/18 | 343,124 | ||||||||
| 400,000 | American International Group, Inc., 8.25%, due 08/15/18 | 500,944 | ||||||||
| 250,000 | Anadarko Finance Co., Senior Note, 7.50%, due 05/01/31 | 319,151 | ||||||||
| 220,000 | Anadarko Petroleum Corp., 6.38%, due 09/15/17 | 252,057 | ||||||||
| 290,000 | Anheuser-Busch InBev Worldwide, Inc., 2.50%, due 07/15/22 | 274,321 | ||||||||
| 570,000 | Anheuser-Busch InBev Worldwide, Inc., 5.00%, due 04/15/20 | 644,687 | ||||||||
| 340,000 | Anheuser-Busch InBev Worldwide, Inc., 5.38%, due 01/15/20 | 390,807 | ||||||||
| 160,000 | ArcelorMittal, 5.00%, due 02/25/17 | 170,600 | ||||||||
| 150,000 | AT&T, Inc., 2.63%, due 12/01/22‡ | 139,735 | ||||||||
| 120,000 | AT&T, Inc., 3.88%, due 08/15/21 | 125,360 | ||||||||
| 91,000 | AT&T, Inc., 4.35%, due 06/15/45 | 80,637 | ||||||||
| 10,000 | AT&T, Inc., 4.45%, due 05/15/21 | 10,823 | ||||||||
| 610,000 | AT&T, Inc., Global Note, 5.50%, due 02/01/18 | 688,843 | ||||||||
| 2,150,000 | AT&T, Inc., Global Note, 6.55%, due 02/15/39 | 2,545,170 | ||||||||
| 3,125,000 | BAC Capital Trust XI, 6.63%, due 05/23/36 | 3,431,000 | ||||||||
| 610,000 | Ball Corp., 5.75%, due 05/15/21 | 654,225 | ||||||||
| 1,200,000 | Bank of America Corp., 2.00%, due 01/11/18 | 1,198,835 | ||||||||
| 600,000 | Bank of America Corp., 2.60%, due 01/15/19 | 603,041 | ||||||||
| 350,000 | Bank of America Corp., 3.30%, due 01/11/23 | 338,066 | ||||||||
| 140,000 | Bank of America Corp., 3.88%, due 03/22/17 | 149,436 | ||||||||
| 500,000 | Bank of America Corp., 4.13%, due 01/22/24 | 506,648 | ||||||||
| 400,000 | Bank of America Corp., 4.50%, due 04/01/15 | 415,093 | ||||||||
| 910,000 | Bank of America Corp., 5.00%, due 05/13/21 | 1,004,920 | ||||||||
| 880,000 | Bank of America Corp., 5.00%, due 01/21/44 | 901,885 | ||||||||
| 500,000 | Bank of America Corp., 5.63%, due 07/01/20 | 569,733 | ||||||||
| 2,600,000 | Bank of America Corp., 7.63%, due 06/01/19 | 3,203,525 | ||||||||
| 500,000 | Bank of America Corp., (MTN), Series L, 5.65%, due 05/01/18 | 565,738 | ||||||||
| 3,010,000 | Bank of America Corp., Senior Note, 5.75%, due 12/01/17 | 3,410,598 | ||||||||
| 375,000 | Bank One Capital III, 8.75%, due 09/01/30 | 501,615 | ||||||||
| 290,000 | BHP Billiton Finance USA, Ltd., 5.00%, due 09/30/43 | 308,084 | ||||||||
| 415,000 | Boston Properties, LP REIT, 3.13%, due 09/01/23 | 390,190 | ||||||||
| 2,450,000 | Boston Properties, LP REIT, 4.13%, due 05/15/21 | 2,579,681 | ||||||||
| 250,000 | Boston Properties, LP REIT, 5.63%, due 11/15/20 | 285,940 | ||||||||
| 250,000 | Boston Properties, LP REIT, 5.88%, due 10/15/19 | 288,783 | ||||||||
| 2,325,000 | Boston Scientific Corp., 6.00%, due 01/15/20 | 2,671,850 | ||||||||
| 425,000 | Boston Scientific Corp., 6.40%, due 06/15/16 | 471,308 | ||||||||
| 220,000 | BP Capital Markets Plc, 3.25%, due 05/06/22 | 218,534 | ||||||||
| 1,100,000 | Burlington Northern Santa Fe LLC, 3.05%, due 09/01/22 | 1,055,681 | ||||||||
| 2,675,000 | Burlington Northern Santa Fe LLC, 3.75%, due 04/01/24 | 2,688,209 | ||||||||
| 53,000 | Calpine Corp., 7.50%, due 02/15/21 144A | 58,168 | ||||||||
| 311,000 | Calpine Corp., 7.88%, due 01/15/23 144A | 349,875 | ||||||||
| See accompanying Notes to the Financial Statements. | 83 |
Table of Contents
Mercer Core Fixed Income Fund
(formerly known as Mercer Core Opportunistic Fixed Income Fund)
Schedule of Investments (Continued)
(showing percentage of net assets)
March 31, 2014
| Par Value ($) | Description | Value ($) | ||||||||
Corporate Debt — continued | ||||||||||
| 2,025,000 | Capital One Financial Corp., 3.50%, due 06/15/23 | 1,989,026 | ||||||||
| 1,425,000 | Capital One Financial Corp., 4.75%, due 07/15/21 | 1,563,600 | ||||||||
| 500,000 | CCO Holdings LLC/CCO Holdings Capital Corp., 7.00%, due 01/15/19 | 530,000 | ||||||||
| 925,000 | Cemex Finance LLC, 6.00%, due 04/01/24†††† 144A | 929,625 | ||||||||
| 1,425,000 | Cemex SAB de CV, 6.50%, due 12/10/19 144A | 1,519,406 | ||||||||
| 350,000 | Cemex SAB de CV, 7.25%, due 01/15/21‡ 144A | 383,250 | ||||||||
| 430,000 | CGG, 6.50%, due 06/01/21 | 438,600 | ||||||||
| 350,000 | Chrysler Group LLC/CG Co-Issuer, Inc., 8.00%, due 06/15/19 144A | 385,000 | ||||||||
| 120,000 | Cie Generale de Geophysique - Veritas SA, Senior Note, 7.75%, due 05/15/17 | 122,100 | ||||||||
| 525,000 | Cigna Corp., 4.00%, due 02/15/22 | 545,289 | ||||||||
| 525,000 | Cigna Corp., 5.38%, due 02/15/42 | 579,131 | ||||||||
| 250,000 | Cigna Corp., 5.88%, due 03/15/41 | 296,510 | ||||||||
| 1,100,000 | Cigna Corp., 6.15%, due 11/15/36 | 1,320,436 | ||||||||
| 325,000 | Cigna Corp., 7.88%, due 05/15/27 | 415,914 | ||||||||
| 375,000 | Cigna Corp., 8.50%, due 05/01/19 | 477,618 | ||||||||
| 170,000 | CIT Group, Inc., 5.00%, due 08/01/23 | 174,675 | ||||||||
| 4,300,000 | Citigroup, Inc., 1.04%, due 04/01/16† | 4,331,545 | ||||||||
| 825,000 | Citigroup, Inc., 3.50%, due 05/15/23 | 779,842 | ||||||||
| 560,000 | Citigroup, Inc., 3.95%, due 06/15/16 | 593,680 | ||||||||
| 950,000 | Citigroup, Inc., 4.05%, due 07/30/22 | 955,341 | ||||||||
| 3,000,000 | Citigroup, Inc., 4.59%, due 12/15/15 | 3,183,261 | ||||||||
| 20,000 | Citigroup, Inc., 5.38%, due 08/09/20 | 22,534 | ||||||||
| 380,000 | Citigroup, Inc., 5.50%, due 09/13/25 | 405,641 | ||||||||
| 130,000 | Citigroup, Inc., 5.90%, due 12/31/49† | 127,857 | ||||||||
| 230,000 | Citigroup, Inc., 5.95%, due 12/31/49† ‡ | 225,113 | ||||||||
| 748,000 | Citigroup, Inc., 6.01%, due 01/15/15 | 779,779 | ||||||||
| 80,000 | Citigroup, Inc., 6.68%, due 09/13/43 | 94,008 | ||||||||
| 2,725,000 | Citigroup, Inc., Global Senior Note, 6.13%, due 11/21/17 | 3,122,746 | ||||||||
| 320,000 | Comcast Corp., 5.65%, due 06/15/35 | 362,773 | ||||||||
| 350,000 | Comcast Corp., 5.70%, due 05/15/18 | 402,320 | ||||||||
| 1,075,000 | Comcast Corp., 5.88%, due 02/15/18 | 1,231,970 | ||||||||
| 100,000 | Comcast Corp., 6.30%, due 11/15/17 | 116,320 | ||||||||
| 500,000 | Comcast Corp., 6.45%, due 03/15/37 | 617,111 | ||||||||
| 640,000 | Comcast Corp., 6.50%, due 01/15/15 | 669,484 | ||||||||
| 130,000 | Comcast Corp., 6.50%, due 01/15/17 | 148,517 | ||||||||
| 20,000 | Comcast Corp., 6.50%, due 11/15/35 | 24,880 | ||||||||
| 170,000 | Comcast Corp., 6.55%, due 07/01/39 | 212,925 | ||||||||
| 90,000 | Comcast Corp., 6.95%, due 08/15/37 | 117,286 | ||||||||
| 60,000 | Concho Resources, Inc., 5.50%, due 04/01/23 | 62,700 | ||||||||
| 228,000 | Concho Resources, Inc., 6.50%, due 01/15/22 | 249,660 | ||||||||
| 300,000 | ConocoPhillips Holding Co., 6.95%, due 04/15/29 | 400,908 | ||||||||
| 120,000 | Continental Resources, Inc., 4.50%, due 04/15/23 | 124,506 | ||||||||
| 50,000 | Continental Resources, Inc., 5.00%, due 09/15/22 | 52,563 | ||||||||
| 210,000 | Countrywide Financial Corp., Subordinated Note, 6.25%, due 05/15/16 | 230,447 | ||||||||
| 825,000 | COX Communications, Inc., 2.95%, due 06/30/23 144A | 754,425 | ||||||||
| 1,950,000 | COX Communications, Inc., 3.25%, due 12/15/22 144A | 1,835,205 | ||||||||
| 2,150,000 | COX Communications, Inc., 5.88%, due 12/01/16 144A | 2,398,914 | ||||||||
| 875,000 | COX Communications, Inc., 9.38%, due 01/15/19 144A | 1,114,746 | ||||||||
| 84 | See accompanying Notes to the Financial Statements. |
Table of Contents
Mercer Core Fixed Income Fund
(formerly known as Mercer Core Opportunistic Fixed Income Fund)
Schedule of Investments (Continued)
(showing percentage of net assets)
March 31, 2014
| Par Value ($) | Description | Value ($) | ||||||||
Corporate Debt — continued | ||||||||||
| 150,000 | CSC Holdings LLC, 6.75%, due 11/15/21 | 168,375 | ||||||||
| 550,000 | CSX Corp., 7.38%, due 02/01/19 | 669,897 | ||||||||
| 1,160,000 | CVS Caremark Corp., 2.75%, due 12/01/22 | 1,096,333 | ||||||||
| 250,000 | Daimler Finance North America LLC, 1.30%, due 07/31/15 144A | 251,825 | ||||||||
| 550,000 | Daimler Finance North America LLC, 2.63%, due 09/15/16 144A | 570,421 | ||||||||
| 310,000 | Deutsche Telekom International Finance BV, 5.75%, due 03/23/16 | 338,844 | ||||||||
| 520,000 | Devon Energy Corp., 7.95%, due 04/15/32 | 713,757 | ||||||||
| 500,000 | Dominion Resources, Inc., 5.20%, due 08/15/19 | 558,956 | ||||||||
| 359,000 | Dow Chemical Co. (The), 5.70%, due 05/15/18 | 408,389 | ||||||||
| 1,275,000 | Dow Chemical Co. (The), 7.38%, due 11/01/29 | 1,657,922 | ||||||||
| 1,885,000 | Dow Chemical Co. (The), 8.55%, due 05/15/19 | 2,416,242 | ||||||||
| 575,000 | Dow Chemical Co. (The), 9.40%, due 05/15/39 | 911,320 | ||||||||
| 240,000 | Eagle Spinco, Inc., 4.63%, due 02/15/21 144A | 238,200 | ||||||||
| 250,000 | Eaton Corp., 1.50%, due 11/02/17 | 249,013 | ||||||||
| 650,000 | Eaton Corp., 2.75%, due 11/02/22 | 616,473 | ||||||||
| 110,000 | Ecolab, Inc., 4.35%, due 12/08/21 | 118,554 | ||||||||
| 190,000 | El Paso Natural Gas Co. LLC, 8.38%, due 06/15/32 | 254,412 | ||||||||
| 725,000 | Enel Finance International SA, 6.00%, due 10/07/39 144A | 759,959 | ||||||||
| 625,000 | Enel Finance International SA, Guaranteed Note, 6.80%, due 09/15/37 144A | 710,562 | ||||||||
| 400,000 | Enel Spa, 8.75%, due 09/24/73† 144A | 449,840 | ||||||||
| 1,350,000 | ERP Operating, LP, 3.00%, due 04/15/23 | 1,277,049 | ||||||||
| 825,000 | ERP Operating, LP, 4.63%, due 12/15/21 | 893,307 | ||||||||
| 2,045,000 | Escrow GCB General Motors, 8.38%, due 07/15/49**** ¤ | — | ||||||||
| 1,450,000 | Export-Import Bank of Korea, 4.00%, due 01/11/17 | 1,569,664 | ||||||||
| 1,200,000 | Express Scripts Holding Co., 3.50%, due 11/15/16 | 1,271,354 | ||||||||
| 150,000 | FirstEnergy Corp., 2.75%, due 03/15/18 | 149,684 | ||||||||
| 1,475,000 | FirstEnergy Corp., Series C, 7.38%, due 11/15/31 | 1,698,656 | ||||||||
| 540,000 | Ford Motor Co., 4.75%, due 01/15/43 | 524,206 | ||||||||
| 350,000 | Ford Motor Credit Co., 8.00%, due 12/15/16 | 410,168 | ||||||||
| 900,000 | Ford Motor Credit Co. LLC, 1.33%, due 08/28/14† | 903,575 | ||||||||
| 350,000 | Ford Motor Credit Co. LLC, 4.25%, due 09/20/22 | 361,319 | ||||||||
| 800,000 | Ford Motor Credit Co. LLC, 4.38%, due 08/06/23 | 826,980 | ||||||||
| 1,025,000 | Ford Motor Credit Co. LLC, 5.63%, due 09/15/15 | 1,092,990 | ||||||||
| 2,100,000 | Ford Motor Credit Co. LLC, 5.75%, due 02/01/21 | 2,401,610 | ||||||||
| 650,000 | Ford Motor Credit Co. LLC, 5.88%, due 08/02/21 | 749,046 | ||||||||
| 580,000 | Ford Motor Credit Co. LLC, 8.13%, due 01/15/20 | 732,253 | ||||||||
| 440,000 | Ford Motor Credit Co. LLC, 12.00%, due 05/15/15 | 494,133 | ||||||||
| 2,403,000 | General Electric Capital Corp., 1.50%, due 07/12/16 | 2,436,200 | ||||||||
| 210,000 | General Electric Capital Corp., 1.63%, due 07/02/15 | 212,920 | ||||||||
| 2,205,000 | General Electric Capital Corp., 4.38%, due 09/16/20 | 2,398,301 | ||||||||
| 1,165,000 | General Electric Capital Corp., 4.63%, due 01/07/21 | 1,284,567 | ||||||||
| 450,000 | General Electric Capital Corp., 4.65%, due 10/17/21 | 494,997 | ||||||||
| 1,275,000 | General Electric Capital Corp., 5.50%, due 01/08/20 | 1,468,989 | ||||||||
| 310,000 | General Electric Capital Corp., 5.88%, due 01/14/38 | 366,710 | ||||||||
| 380,000 | General Electric Capital Corp., 6.00%, due 08/07/19 | 446,625 | ||||||||
| 720,000 | General Electric Capital Corp., 6.38%, due 11/15/67† | 794,700 | ||||||||
| 150,000 | General Electric Capital Corp., 6.88%, due 01/10/39 | 198,208 | ||||||||
| 270,000 | General Electric Co., 0.85%, due 10/09/15 | 271,324 | ||||||||
| See accompanying Notes to the Financial Statements. | 85 |
Table of Contents
Mercer Core Fixed Income Fund
(formerly known as Mercer Core Opportunistic Fixed Income Fund)
Schedule of Investments (Continued)
(showing percentage of net assets)
March 31, 2014
| Par Value ($) | Description | Value ($) | ||||||||
Corporate Debt — continued | ||||||||||
| 310,000 | General Electric Co., 4.50%, due 03/11/44 | 316,109 | ||||||||
| 490,000 | GlaxoSmithKline Capital, Inc., Guaranteed Note, 5.65%, due 05/15/18 | 562,702 | ||||||||
| 320,000 | Glitnir Banki HF, Subordinated Note, 6.69%, due 06/15/16††† **** 144A | — | ||||||||
| 150,000 | Goldman Sachs Group (The), Inc., 4.00%, due 03/03/24 | 149,638 | ||||||||
| 140,000 | Goldman Sachs Group (The), Inc., 5.25%, due 07/27/21 | 155,216 | ||||||||
| 1,380,000 | Goldman Sachs Group (The), Inc., 5.95%, due 01/18/18 | 1,564,175 | ||||||||
| 100,000 | Goldman Sachs Group (The), Inc., 6.00%, due 05/01/14 | 100,442 | ||||||||
| 400,000 | Goldman Sachs Group (The), Inc., 6.15%, due 04/01/18 | 457,687 | ||||||||
| 1,660,000 | Goldman Sachs Group (The), Inc., 6.25%, due 02/01/41 | 1,978,106 | ||||||||
| 480,000 | Goldman Sachs Group (The), Inc., 7.50%, due 02/15/19 | 581,306 | ||||||||
| 460,000 | HCA, Inc., 5.88%, due 03/15/22 | 496,800 | ||||||||
| 1,475,000 | HCA, Inc., 6.38%, due 01/15/15 | 1,534,000 | ||||||||
| 1,815,000 | HCA, Inc., 6.50%, due 02/15/16 | 1,973,812 | ||||||||
| 875,000 | Health Net, Inc., 6.38%, due 06/01/17 | 955,937 | ||||||||
| 1,250,000 | Hewlett-Packard Co., 3.30%, due 12/09/16 | 1,315,530 | ||||||||
| 220,000 | Hexion US Finance Corp., 6.63%, due 04/15/20 | 228,800 | ||||||||
| 580,000 | Hilton Worldwide Finance LLC/Hilton Worldwide Finance Corp., 5.63%, due 10/15/21 144A | 607,187 | ||||||||
| 740,000 | HSBC Finance Corp., 6.68%, due 01/15/21 | 864,739 | ||||||||
| 350,000 | HSBC Holdings Plc, 5.10%, due 04/05/21 | 391,919 | ||||||||
| 875,000 | HSBC Holdings Plc, Subordinated Note, 6.50%, due 05/02/36 | 1,033,420 | ||||||||
| 2,665,000 | HSBC Holdings Plc, Subordinated Note, 6.50%, due 09/15/37 | 3,163,272 | ||||||||
| 420,000 | Imperial Tobacco Finance Plc, 2.05%, due 02/11/18 144A | 417,020 | ||||||||
| 260,000 | Intelsat Jackson Holdings SA, 5.50%, due 08/01/23 144A | 255,775 | ||||||||
| 120,000 | Intelsat Jackson Holdings SA, 7.25%, due 10/15/20 | 130,650 | ||||||||
| 220,000 | International Lease Finance Corp., 6.50%, due 09/01/14 144A | 225,500 | ||||||||
| 250,000 | Intesa Sanpaolo Spa, 3.13%, due 01/15/16 | 256,063 | ||||||||
| 250,000 | Intesa Sanpaolo Spa, 3.63%, due 08/12/15 144A | 256,583 | ||||||||
| 100,000 | John Deere Capital Corp., 1.70%, due 01/15/20 | 95,891 | ||||||||
| 220,000 | John Deere Capital Corp., 2.25%, due 04/17/19 | 220,453 | ||||||||
| 2,100,000 | JPMorgan Chase & Co., 0.76%, due 02/15/17† | 2,103,293 | ||||||||
| 3,400,000 | JPMorgan Chase & Co., 0.85%, due 02/26/16† | 3,417,915 | ||||||||
| 990,000 | JPMorgan Chase & Co., 1.10%, due 10/15/15 | 994,440 | ||||||||
| 300,000 | JPMorgan Chase & Co., 3.25%, due 09/23/22 | 296,070 | ||||||||
| 1,280,000 | JPMorgan Chase & Co., 3.38%, due 05/01/23 | 1,214,007 | ||||||||
| 90,000 | JPMorgan Chase & Co., 4.35%, due 08/15/21 | 96,623 | ||||||||
| 860,000 | JPMorgan Chase & Co., 4.40%, due 07/22/20 | 928,308 | ||||||||
| 200,000 | JPMorgan Chase & Co., 4.50%, due 01/24/22 | 215,973 | ||||||||
| 250,000 | JPMorgan Chase & Co., 4.95%, due 03/25/20 | 278,282 | ||||||||
| 1,030,000 | JPMorgan Chase & Co., Global Subordinated Note, 5.15%, due 10/01/15 | 1,093,485 | ||||||||
| 1,250,000 | JPMorgan Chase & Co., Subordinated Note, 6.13%, due 06/27/17 | 1,418,025 | ||||||||
| 300,000 | JPMorgan Chase Bank NA, 0.56%, due 06/13/16† | 298,625 | ||||||||
| 100,000 | Kaupthing Bank HF, 7.13%, due 05/19/16††† **** 144A | — | ||||||||
| 430,000 | Key Energy Services, Inc., 6.75%, due 03/01/21 | 454,188 | ||||||||
| 440,000 | Kinder Morgan Finance Co. LLC, 6.00%, due 01/15/18 144A | 478,500 | ||||||||
| 2,300,000 | Kinder Morgan Finance Co. ULC, Guaranteed Note, 5.70%, due 01/05/16 | 2,461,000 | ||||||||
| 600,000 | Koninklijke Philips Electronics NV, 5.75%, due 03/11/18 | 684,028 | ||||||||
| 360,000 | Kraft Foods Group, Inc., 3.50%, due 06/06/22 | 362,811 | ||||||||
| 86 | See accompanying Notes to the Financial Statements. |
Table of Contents
Mercer Core Fixed Income Fund
(formerly known as Mercer Core Opportunistic Fixed Income Fund)
Schedule of Investments (Continued)
(showing percentage of net assets)
March 31, 2014
| Par Value ($) | Description | Value ($) | ||||||||
Corporate Debt — continued | ||||||||||
| 349,000 | Kraft Foods Group, Inc., 5.38%, due 02/10/20 | 398,475 | ||||||||
| 691,000 | Kraft Foods, Inc., 5.38%, due 02/10/20 | 782,168 | ||||||||
| 400,000 | Kroger Co. (The), Senior Note, 6.15%, due 01/15/20 | 466,733 | ||||||||
| 775,000 | Lafarge SA, 6.20%, due 07/09/15 144A | 823,437 | ||||||||
| 2,350,000 | Lafarge SA, 6.50%, due 07/15/16 | 2,596,750 | ||||||||
| 1,325,000 | Legg Mason, Inc., 5.50%, due 05/21/19 | 1,465,084 | ||||||||
| 470,000 | Lehman Brothers Holdings Capital Trust VII, (MTN), 5.86%, due 12/31/49††† | 165 | ||||||||
| 270,000 | Lehman Brothers Holdings, Inc., (MTN), Series I, 6.75%, due 12/28/17††† | 95 | ||||||||
| 890,000 | Lehman Brothers Holdings, Inc., Subordinated Note, 6.50%, due 07/19/17††† | 312 | ||||||||
| 390,000 | Lorillard Tobacco Co., 3.75%, due 05/20/23 | 368,298 | ||||||||
| 525,000 | Macy’s Retail Holdings, Inc., 6.38%, due 03/15/37 | 636,666 | ||||||||
| 3,090,000 | Macy’s Retail Holdings, Inc., 6.65%, due 07/15/24 | 3,699,688 | ||||||||
| 350,000 | Macy’s Retail Holdings, Inc., 6.90%, due 01/15/32 | 426,248 | ||||||||
| 600,000 | Macy’s Retail Holdings, Inc., 7.00%, due 02/15/28 | 729,118 | ||||||||
| 70,000 | Medtronic, Inc., 3.13%, due 03/15/22 | 70,266 | ||||||||
| 240,000 | Medtronic, Inc., 4.45%, due 03/15/20 | 263,820 | ||||||||
| 600,000 | Merrill Lynch & Co., Inc., 6.40%, due 08/28/17 | 689,321 | ||||||||
| 1,720,000 | Merrill Lynch & Co., Inc., 6.88%, due 04/25/18 | 2,030,247 | ||||||||
| 840,000 | Merrill Lynch & Co., Inc., Subordinated Note, 5.70%, due 05/02/17 | 934,953 | ||||||||
| 250,000 | MetLife, Inc., 4.75%, due 02/08/21 | 278,537 | ||||||||
| 420,000 | MetLife, Inc., Subordinated Note, 6.40%, due 12/15/66 | 445,200 | ||||||||
| 80,000 | MidAmerican Energy Holdings Co., Senior Note, 6.50%, due 09/15/37 | 99,262 | ||||||||
| 165,630 | Miran Mid-Atlantic Series C Pass Through Trust, 10.06%, due 12/30/28 | 185,092 | ||||||||
| 70,000 | Morgan Stanley, 4.75%, due 03/22/17 | 76,446 | ||||||||
| 130,000 | Morgan Stanley, (MTN), Series F, 0.69%, due 10/18/16† | 129,757 | ||||||||
| 1,000,000 | Morgan Stanley, (MTN), Series F, 6.63%, due 04/01/18 | 1,166,802 | ||||||||
| 600,000 | Murray Street Investment Trust I, 4.65%, due 03/09/17†† | 648,527 | ||||||||
| 1,050,000 | Myriad International Holdings BV, 6.00%, due 07/18/20 144A | 1,144,500 | ||||||||
| 50,000 | News America, Inc., 4.50%, due 02/15/21 | 54,332 | ||||||||
| 525,000 | News America, Inc., 5.65%, due 08/15/20 | 602,558 | ||||||||
| 475,000 | News America, Inc., 6.20%, due 12/15/34 | 555,325 | ||||||||
| 275,000 | News America, Inc., 6.40%, due 12/15/35 | 329,670 | ||||||||
| 20,000 | News America, Inc., 6.90%, due 08/15/39 | 25,220 | ||||||||
| 30,000 | News America, Inc., Senior Note, 6.65%, due 11/15/37 | 36,761 | ||||||||
| 1,000,000 | NextEra Energy Capital Holdings, Inc., 1.34%, due 09/01/15 | 1,007,616 | ||||||||
| 780,000 | Noble Energy, Inc., 4.15%, due 12/15/21 | 823,129 | ||||||||
| 1,000,000 | Nordstrom, Inc., 6.25%, due 01/15/18 | 1,151,850 | ||||||||
| 920,000 | Pacific Gas & Electric Co., 6.05%, due 03/01/34 | 1,089,886 | ||||||||
| 606,000 | Pemex Project Funding Master Trust, 6.63%, due 06/15/35 | 675,690 | ||||||||
| 1,175,000 | Petrobras Global Finance BV, 4.38%, due 05/20/23‡ | 1,078,087 | ||||||||
| 675,000 | Petrobras Global Finance BV, 6.25%, due 03/17/24 | 697,114 | ||||||||
| 400,000 | Petrobras International Finance Co., 3.88%, due 01/27/16 | 411,776 | ||||||||
| 4,275,000 | Petrobras International Finance Co., 5.38%, due 01/27/21 | 4,344,772 | ||||||||
| 992,000 | Petroleos Mexicanos, 3.50%, due 01/30/23 | 935,952 | ||||||||
| 430,000 | Petroleos Mexicanos, 5.50%, due 01/21/21 | 471,925 | ||||||||
| 2,150,000 | Petroleos Mexicanos, 6.38%, due 01/23/45 144A | 2,324,687 | ||||||||
| 480,000 | Philip Morris International, Inc., 2.90%, due 11/15/21 | 474,505 | ||||||||
| 675,000 | Provident Cos., Inc., 7.25%, due 03/15/28 | 807,361 | ||||||||
| See accompanying Notes to the Financial Statements. | 87 |
Table of Contents
Mercer Core Fixed Income Fund
(formerly known as Mercer Core Opportunistic Fixed Income Fund)
Schedule of Investments (Continued)
(showing percentage of net assets)
March 31, 2014
| Par Value ($) | Description | Value ($) | ||||||||
Corporate Debt — continued | ||||||||||
| 170,000 | QEP Resources, Inc., 6.88%, due 03/01/21 | 187,850 | ||||||||
| 45,000 | Qwest Corp., 7.50%, due 10/01/14 | 46,467 | ||||||||
| 500,000 | Range Resources Corp., 6.75%, due 08/01/20 | 542,500 | ||||||||
| 2,153,000 | Reed Elsevier Capital, Inc., 3.13%, due 10/15/22 | 2,069,302 | ||||||||
| 316,000 | Reed Elsevier Capital, Inc., Guaranteed Note, 8.63%, due 01/15/19 | 399,686 | ||||||||
| 755,000 | Reynolds American, Inc., Senior Note, 6.75%, due 06/15/17 | 871,092 | ||||||||
| 410,000 | Reynolds Group Issuer, Inc./Reynolds Group Issuer LLC/Reynolds Group Issuer, 7.13%, due 04/15/19 | 435,625 | ||||||||
| 920,000 | Rio Tinto Finance USA, Ltd., 9.00%, due 05/01/19 | 1,198,028 | ||||||||
| 262,000 | Roche Holdings, Inc., Guaranteed Note, 6.00%, due 03/01/19 144A | 308,147 | ||||||||
| 170,000 | Rock-Tenn Co., 3.50%, due 03/01/20 | 172,664 | ||||||||
| 90,000 | Rock-Tenn Co., 4.00%, due 03/01/23 | 90,661 | ||||||||
| 3,150,000 | Royal Bank of Scotland Group Plc, 6.13%, due 12/15/22 | 3,310,061 | ||||||||
| 575,000 | Royal Bank of Scotland Plc (The), 5.63%, due 08/24/20 | 650,160 | ||||||||
| 325,000 | Royal Bank of Scotland Plc (The), 6.13%, due 01/11/21 | 379,662 | ||||||||
| 110,000 | Service Corp. International, Senior Note, 7.50%, due 04/01/27 | 117,150 | ||||||||
| 580,000 | Shell International Finance BV, 4.38%, due 03/25/20 | 637,446 | ||||||||
| 1,270,000 | SLM Corp., 3.88%, due 09/10/15 | 1,314,450 | ||||||||
| 400,000 | SLM Corp., 4.63%, due 09/25/17 | 421,500 | ||||||||
| 10,000 | SLM Corp., 5.00%, due 04/15/15 | 10,400 | ||||||||
| 1,750,000 | SLM Corp., 6.00%, due 01/25/17 | 1,914,062 | ||||||||
| 475,000 | SLM Corp., 6.25%, due 01/25/16 | 512,406 | ||||||||
| 320,000 | Softbank Corp., 4.50%, due 04/15/20 144A | 320,000 | ||||||||
| 880,000 | Southern Copper Corp., 5.25%, due 11/08/42 | 757,817 | ||||||||
| 880,000 | Sprint Corp., 7.88%, due 09/15/23 144A | 970,200 | ||||||||
| 375,000 | Sprint Nextel Corp., 6.00%, due 12/01/16 | 412,031 | ||||||||
| 850,000 | State Street Corp., 4.96%, due 03/15/18 | 926,823 | ||||||||
| 3,800,000 | Statoil ASA, 0.70%, due 11/08/18† | 3,826,752 | ||||||||
| 270,000 | Taylor Morrison Communities, Inc./Monarch Communities, Inc., 5.25%, due 04/15/21 144A | 274,050 | ||||||||
| 70,000 | Taylor Morrison Communities, Inc./Monarch Communities, Inc., 7.75%, due 04/15/20 144A | 77,525 | ||||||||
| 380,000 | Teachers Insurance & Annuity Association of America, 6.85%, due 12/16/39 144A | 500,364 | ||||||||
| 666,000 | Telecom Italia Capital SA, 6.18%, due 06/18/14 | 673,492 | ||||||||
| 1,250,000 | Telecom Italia Capital SA, 7.00%, due 06/04/18 | 1,423,437 | ||||||||
| 1,900,000 | Telecom Italia Capital SA, 7.18%, due 06/18/19 | 2,187,375 | ||||||||
| 450,000 | Telecom Italia Capital SA, Guaranteed Senior Note, 7.20%, due 07/18/36 | 460,125 | ||||||||
| 825,000 | Telecom Italia Capital SA, Guaranteed Senior Note, 7.72%, due 06/04/38 | 886,875 | ||||||||
| 90,000 | Tenet Healthcare Corp., 4.50%, due 04/01/21 | 88,313 | ||||||||
| 350,000 | Tenet Healthcare Corp., 6.00%, due 10/01/20 144A | 375,156 | ||||||||
| 220,000 | Thermo Fisher Scientific, Inc., 3.60%, due 08/15/21 | 224,432 | ||||||||
| 520,000 | Time Warner Cable, Inc., 4.13%, due 02/15/21 | 545,191 | ||||||||
| 10,000 | Time Warner Cable, Inc., 5.00%, due 02/01/20 | 10,935 | ||||||||
| 740,000 | Time Warner Cable, Inc., 5.85%, due 05/01/17 | 832,555 | ||||||||
| 2,055,000 | Time Warner Cable, Inc., 8.25%, due 04/01/19 | 2,563,146 | ||||||||
| 2,150,000 | Time Warner Cable, Inc., 8.75%, due 02/14/19 | 2,722,597 | ||||||||
| 180,000 | Time Warner Entertainment Co. LP, Senior Subordinated Note, 8.38%, due 07/15/33 | 248,737 | ||||||||
| 260,000 | Time Warner, Inc., 4.70%, due 01/15/21 | 284,773 | ||||||||
| 88 | See accompanying Notes to the Financial Statements. |
Table of Contents
Mercer Core Fixed Income Fund
(formerly known as Mercer Core Opportunistic Fixed Income Fund)
Schedule of Investments (Continued)
(showing percentage of net assets)
March 31, 2014
| Par Value ($) | Description | Value ($) | ||||||||
Corporate Debt — continued | ||||||||||
| 200,000 | Time Warner, Inc., 4.75%, due 03/29/21 | 219,153 | ||||||||
| 50,000 | Time Warner, Inc., 6.25%, due 03/29/41 | 58,780 | ||||||||
| 1,000,000 | Time Warner, Inc., 7.63%, due 04/15/31 | 1,335,842 | ||||||||
| 3,380,000 | Time Warner, Inc., 7.70%, due 05/01/32 | 4,545,116 | ||||||||
| 130,000 | Transocean, Inc., 5.05%, due 12/15/16 | 141,489 | ||||||||
| 130,000 | tw telecom holdings, Inc., 5.38%, due 10/01/22 | 133,088 | ||||||||
| 3,087,000 | Union Pacific Corp., 4.16%, due 07/15/22 | 3,269,290 | ||||||||
| 260,000 | United Business Media, Ltd., 5.75%, due 11/03/20 144A | 278,995 | ||||||||
| 270,000 | United Technologies Corp., 4.50%, due 06/01/42 | 276,036 | ||||||||
| 90,000 | UnitedHealth Group, Inc., 3.38%, due 11/15/21 | 91,326 | ||||||||
| 520,000 | UnitedHealth Group, Inc., Senior Note, 6.00%, due 02/15/18 | 598,969 | ||||||||
| 170,000 | Univision Communications, Inc., 5.13%, due 05/15/23‡ 144A | 174,675 | ||||||||
| 200,000 | Verizon Communications, Inc., 1.98%, due 09/14/18† | 210,263 | ||||||||
| 40,000 | Verizon Communications, Inc., 2.45%, due 11/01/22 | 36,521 | ||||||||
| 200,000 | Verizon Communications, Inc., 2.50%, due 09/15/16 | 207,217 | ||||||||
| 350,000 | Verizon Communications, Inc., 3.45%, due 03/15/21 | 355,338 | ||||||||
| 500,000 | Verizon Communications, Inc., 3.65%, due 09/14/18 | 532,814 | ||||||||
| 1,140,000 | Verizon Communications, Inc., 4.15%, due 03/15/24 | 1,160,531 | ||||||||
| 110,000 | Verizon Communications, Inc., 5.05%, due 03/15/34 | 113,202 | ||||||||
| 2,660,000 | Verizon Communications, Inc., 5.15%, due 09/15/23 | 2,916,387 | ||||||||
| 50,000 | Verizon Communications, Inc., 6.35%, due 04/01/19 | 59,046 | ||||||||
| 1,230,000 | Verizon Communications, Inc., 6.40%, due 09/15/33 | 1,464,629 | ||||||||
| 5,270,000 | Verizon Communications, Inc., 6.55%, due 09/15/43 | 6,436,441 | ||||||||
| 31,000 | Vulcan Materials Co., 6.50%, due 12/01/16 | 34,739 | ||||||||
| 1,850,000 | Vulcan Materials Co., 7.50%, due 06/15/21 | 2,187,625 | ||||||||
| 250,000 | Wachovia Bank NA, 6.00%, due 11/15/17 | 288,272 | ||||||||
| 130,000 | WellPoint, Inc., 1.25%, due 09/10/15 | 130,917 | ||||||||
| 30,000 | WellPoint, Inc., 3.70%, due 08/15/21 | 30,680 | ||||||||
| 425,000 | WellPoint, Inc., 4.35%, due 08/15/20 | 452,268 | ||||||||
| 730,000 | WellPoint, Inc., 5.88%, due 06/15/17 | 823,686 | ||||||||
| 1,746,000 | WellPoint, Inc., 7.00%, due 02/15/19 | 2,078,573 | ||||||||
| 1,900,000 | Wells Fargo & Co., 1.25%, due 07/20/16 | 1,917,028 | ||||||||
| 190,000 | Wells Fargo & Co., 1.50%, due 01/16/18 | 188,359 | ||||||||
| 250,000 | Wells Fargo & Co., 3.45%, due 02/13/23 | 243,105 | ||||||||
| 420,000 | Wells Fargo & Co., 3.68%, due 06/15/16†† | 445,581 | ||||||||
| 1,308,000 | Wells Fargo & Co., 4.48%, due 01/16/24 | 1,354,043 | ||||||||
| 90,000 | Wells Fargo & Co., 4.60%, due 04/01/21 | 99,207 | ||||||||
| 260,000 | Wells Fargo & Co., 5.38%, due 11/02/43 | 274,919 | ||||||||
| 290,000 | Williams Partners, LP/Williams Partners Finance Corp., Senior Note, 7.25%, due 02/01/17 | 334,035 | ||||||||
| 80,000 | WM Wrigley Jr Co., 2.40%, due 10/21/18 144A | 80,316 | ||||||||
| 320,000 | WM Wrigley Jr Co., 2.90%, due 10/21/19 144A | 323,290 | ||||||||
| 90,000 | WM Wrigley Jr Co., 3.38%, due 10/21/20 144A | 90,995 | ||||||||
| 510,000 | Wyeth LLC, 5.95%, due 04/01/37 | 619,335 | ||||||||
| 2,025,000 | Xerox Corp., 4.50%, due 05/15/21 | 2,137,230 | ||||||||
| 600,000 | Xerox Corp., 5.63%, due 12/15/19 | 680,698 | ||||||||
| 2,500,000 | Xerox Corp., 6.35%, due 05/15/18 | 2,891,555 | ||||||||
| 520,000 | Xstrata Finance Canada, Ltd., 2.05%, due 10/23/15 144A | 526,178 | ||||||||
| See accompanying Notes to the Financial Statements. | 89 |
Table of Contents
Mercer Core Fixed Income Fund
(formerly known as Mercer Core Opportunistic Fixed Income Fund)
Schedule of Investments (Continued)
(showing percentage of net assets)
March 31, 2014
| Par Value ($) | Description | Value ($) | ||||||||
Corporate Debt — continued | ||||||||||
| 470,000 | Xstrata Finance Canada, Ltd., 2.70%, due 10/25/17 144A | 476,089 | ||||||||
| 100,000 | Xstrata Finance Canada, Ltd., 5.80%, due 11/15/16 144A | 110,163 | ||||||||
| 90,000 | Zoetis, Inc., 3.25%, due 02/01/23 | 86,975 | ||||||||
|
| |||||||||
| 271,510,883 | ||||||||||
|
| |||||||||
Mortgage Backed Securities - Private Issuers — 2.0% | ||||||||||
| 2,141,122 | Alternative Loan Trust, Series 2005-36, Class 3A1, 2.62%, due 08/25/35† | 1,875,561 | ||||||||
| 145,530 | Banc of America Funding Corp., Series 2005-E, Class 8A1, 2.21%, due 06/20/35† | 94,895 | ||||||||
| 136,000 | Banc of America Merrill Lynch Commercial Mortgage, Inc., Series 2006-1, Class AM, 5.42%, due 09/10/45† | 145,646 | ||||||||
| 743,288 | Bear Stearns ALT-A Trust, Series 2004-12, Class 1A3, 0.85%, due 01/25/35† | 723,813 | ||||||||
| 711,413 | Bear Stearns ALT-A Trust, Series 2004-7, Class 2A1, 3.05%, due 08/25/34† | 721,307 | ||||||||
| 324,060 | Citigroup Mortgage Loan Trust, Inc., Series 2010-3, Class 4A1, 2.38%, due 02/25/36† 144A | 325,715 | ||||||||
| 80,000 | Commercial Mortgage Pass Through Certificates, Series 2012-CR3, Class A3, 2.82%, due 10/15/45 | 76,784 | ||||||||
| 120,000 | Commercial Mortgage Pass Through Certificates, Series 2013-CR12, Class A4, 4.05%, due 10/10/46 | 124,377 | ||||||||
| 65,558 | Countrywide Alternative Loan Trust, Series 2005-61, Class 1A1, 0.41%, due 12/25/35† | 58,140 | ||||||||
| 55,385 | Countrywide Home Loan Mortgage Pass Through Trust, Series 2005-R3, Class AF, 0.55%, due 09/25/35† 144A | 50,396 | ||||||||
| 175,906 | Credit Suisse First Boston Mortgage Securities Corp., Series 2003-AR30, Class 2A1, 2.51%, due 01/25/34† | 173,589 | ||||||||
| 402,919 | Downey Savings & Loan Association Mortgage Loan Trust, Series 2004-AR1, Class A2A, 0.98%, due 09/19/44† | 395,637 | ||||||||
| 898,906 | DSLA Mortgage Loan Trust, Series 2004-AR2, Class A1A, 0.98%, due 11/19/44† | 803,640 | ||||||||
| 179,521 | First Horizon Alternative Mortgage Securities, Series 2006-FA1, Class 1A6, 0.90%, due 04/25/36† | 179,951 | ||||||||
| 290,000 | Fremont Home Loan Trust, Series 2004-B, Class M1, 1.02%, due 05/25/34† | 269,007 | ||||||||
| 82,847 | Granite Mortgages Plc, Series 2004-3, Class 2A1, 0.51%, due 09/20/44† | 82,446 | ||||||||
| 360,000 | GS Mortgage Securities Corp. II, Series 2013-GC16, Class A4, 4.27%, due 11/10/46 | 381,049 | ||||||||
| 227,584 | GSMPS Mortgage Loan Trust, Series 2005-RP2, Class 1AF, 0.50%, due 03/25/35† 144A | 200,677 | ||||||||
| 69,080 | GSR Mortgage Loan Trust, Series 2004-7, Class 4A1, 4.67%, due 06/25/34† | 68,507 | ||||||||
| 65,086 | Harborview Mortgage Loan Trust, Series 2005-9, Class 2A1A, 0.50%, due 06/20/35† | 61,746 | ||||||||
| 888,245 | Harborview Mortgage Loan Trust, Series 2007-4, Class 2A1, 0.38%, due 07/19/47† | 762,163 | ||||||||
| 290,000 | JPMorgan Chase Commercial Mortgage Securities Corp., Series 2006-LDP9, Class A3, 5.34%, due 05/15/47 | 316,939 | ||||||||
| 450,000 | JPMorgan Chase Commercial Mortgage Securities Corp., Series 2013-INN, Class A, 1.56%, due 10/15/30† 144A | 450,674 | ||||||||
| 77,468 | Lehman XS Trust, Series 2005-7N, Class 1A1B, 0.45%, due 12/25/35† | 43,957 | ||||||||
| 99,086 | MASTR Adjustable Rate Mortgages Trust, Series 2006-2, Class 3A1, 2.63%, due 01/25/36† | 97,261 | ||||||||
| 300,000 | Merrill Lynch/Countrywide Commercial Mortgage Trust, Series 2007-9, Class A4, 5.70%, due 09/12/49 | 335,458 | ||||||||
| 142,998 | MLCC Mortgage Investors, Inc., Series 2007-1, Class 4A3, 5.62%, due 01/25/37† | 144,448 | ||||||||
| 90 | See accompanying Notes to the Financial Statements. |
Table of Contents
Mercer Core Fixed Income Fund
(formerly known as Mercer Core Opportunistic Fixed Income Fund)
Schedule of Investments (Continued)
(showing percentage of net assets)
March 31, 2014
| Par Value ($) | Description | Value ($) | ||||||||
Mortgage Backed Securities - Private Issuers — continued | ||||||||||
| 100,000 | Morgan Stanley Bank of America Merrill Lynch Trust, Series 2013-C7, Class A4, 2.92%, due 02/15/46 | 96,067 | ||||||||
| 285,584 | Morgan Stanley Capital I, Inc., Series 2007-IQ15, Class A4, 5.91%, due 06/11/49† | 318,708 | ||||||||
| 175,603 | Morgan Stanley Mortgage Loan Trust, Series 2004-5AR, Class 2A, 2.68%, due 07/25/34† | 175,397 | ||||||||
| 288,635 | Morgan Stanley Mortgage Loan Trust, Series 2004-7AR, Class 2A6, 2.47%, due 09/25/34† | 288,153 | ||||||||
| 385,610 | Nomura Asset Acceptance Corp., Series 2004-R3, Class A1, 6.50%, due 02/25/35 144A | 400,850 | ||||||||
| 331,024 | Novastar Mortgage-Backed Notes, Series 2006-MTA1, Class 2A1A, 0.34%, due 09/25/46† | 277,416 | ||||||||
| 209,815 | Prime Mortgage Trust, Series 2006-DR1, Class 1A1, 5.50%, due 05/25/35 144A | 218,803 | ||||||||
| 87,254 | Prime Mortgage Trust, Series 2006-DR1, Class 1A2, 6.00%, due 05/25/35 144A | 91,799 | ||||||||
| 1,120,020 | Prime Mortgage Trust, Series 2006-DR1, Class 2A1, 5.50%, due 05/25/35 144A | 1,122,113 | ||||||||
| 930,061 | Prime Mortgage Trust, Series 2006-DR1, Class 2A2, 6.00%, due 05/25/35 144A | 924,411 | ||||||||
| 321,900 | Provident Funding Mortgage Loan Trust, Series 2005-1, Class 2A1, 2.52%, due 05/25/35† | 330,249 | ||||||||
| 146,949 | RBSSP Resecuritization Trust, Series 2010-3, Class 4A1, 3.09%, due 12/26/35† 144A | 147,836 | ||||||||
| 1,603,332 | Residential Accredit Loans, Inc., Series 2004-QS16, Class 1A1, 5.50%, due 12/25/34 | 1,640,082 | ||||||||
| 68,303 | Residential Asset Securitization Trust, Series 2003-A8, Class A2, 0.50%, due 10/25/18† | 66,888 | ||||||||
| 748,000 | Structured Adjustable Rate Mortgage Loan Trust, Series 2004-10, Class 2A, 2.39%, due 08/25/34† | 737,106 | ||||||||
| 180,240 | WaMu Mortgage Pass Through Certificates, Series 2002-AR19, Class A6, 2.46%, due 02/25/33† | 178,129 | ||||||||
| 54,280 | WaMu Mortgage Pass Through Certificates, Series 2003-AR9, Class 1A7, 2.42%, due 09/25/33† | 55,588 | ||||||||
| 359,652 | WaMu Mortgage Pass Through Certificates, Series 2004-CB2, Class 4A, 6.50%, due 08/25/34 | 399,187 | ||||||||
| 754,099 | WaMu Mortgage Pass Through Certificates, Series 2005-AR11, Class A1A, 0.47%, due 08/25/45† | 705,157 | ||||||||
| 424,017 | WaMu Mortgage Pass Through Certificates, Series 2005-AR3, Class A2, 2.41%, due 03/25/35† | 426,174 | ||||||||
| 288,905 | WaMu Mortgage Pass Through Certificates, Series 2005-AR6, Class 2A1A, 0.38%, due 04/25/45† | 271,310 | ||||||||
| 59,245 | WaMu Mortgage Pass Through Certificates, Series 2006-AR14, Class 1A1, 2.06%, due 11/25/36† | 51,931 | ||||||||
| 1,426,204 | WaMu Mortgage Pass-Through Certificates, Series 2006-AR6, Class 2A, 1.09%, due 08/25/46† | 985,537 | ||||||||
| 881,466 | WaMu Mortgage Pass-Through Certificates, Series 2007-OA2, Class 1A, 0.83%, due 03/25/47† | 713,631 | ||||||||
| 104,215 | Washington Mutual, Inc., Series 2005-AR13, Class A1A1, 0.44%, due 10/25/45† | 96,575 | ||||||||
| 100,485 | Washington Mutual, Inc., Series 2005-AR15, Class A1A1, 0.41%, due 11/25/45† | 93,247 | ||||||||
| 147,066 | Washington Mutual, Inc., Series 2005-AR19, Class A1A1, 0.42%, due 12/25/45† | 138,518 | ||||||||
| 183,833 | Washington Mutual, Inc., Series 2005-AR19, Class A1A2, 0.44%, due 12/25/45† | 170,407 | ||||||||
| 235,851 | Washington Mutual, Inc., Series 2006-AR14, Class 1A4, 2.06%, due 11/25/36† | 206,734 | ||||||||
| 584,599 | Washington Mutual, Inc., Series 2006-AR16, Class 1A1, 2.05%, due 12/25/36† | 507,555 | ||||||||
| See accompanying Notes to the Financial Statements. | 91 |
Table of Contents
Mercer Core Fixed Income Fund
(formerly known as Mercer Core Opportunistic Fixed Income Fund)
Schedule of Investments (Continued)
(showing percentage of net assets)
March 31, 2014
| Par Value ($) | Description | Value ($) | ||||||||
Mortgage Backed Securities - Private Issuers — continued | ||||||||||
| 254,010 | Wells Fargo Mortgage Backed Securities Trust, Series 2004-Y, Class 1A2, 2.62%, due 11/25/34† | 253,329 | ||||||||
| 203,311 | Wells Fargo Mortgage Backed Securities Trust, Series 2005-AR8, Class 2A1, 2.63%, due 06/25/35† | 205,775 | ||||||||
| 481,666 | Wells Fargo Mortgage Loan Trust, Series 2010-RR4, Class 2A1, 3.15%, due 08/27/35 144A | 488,373 | ||||||||
|
| |||||||||
| 21,746,818 | ||||||||||
|
| |||||||||
Mortgage Backed Securities - U.S. Government Agency Obligations — 13.7% |
| |||||||||
| 862,708 | FHLMC, Pool # Q17792, 3.50%, due 05/01/43 | 868,323 | ||||||||
| 2,198,898 | FHLMC, Pool # 849096, 3.62%, due 10/01/41† | 2,304,439 | ||||||||
| 4,833,000 | FHLMC, Pool # J13193, 4.00%, due 10/01/25 | 5,127,496 | ||||||||
| 1,335,889 | FHLMC, Pool # G14919, 4.00%, due 06/01/26 | 1,416,007 | ||||||||
| 1,042,001 | FHLMC, Pool # G14678, 4.00%, due 12/01/26 | 1,105,594 | ||||||||
| 139,390 | FHLMC, Pool # G14350, 4.00%, due 12/01/26 | 147,805 | ||||||||
| 3,832,441 | FHLMC, Pool # C91402, 4.00%, due 10/01/31 | 4,042,039 | ||||||||
| 2,304,612 | FHLMC, Pool # Q02552, 4.50%, due 08/01/41 | 2,462,289 | ||||||||
| 1,404,717 | FHLMC, Pool # G07515, 4.50%, due 09/01/41 | 1,500,923 | ||||||||
| 3,038,580 | FHLMC, Pool # G07491, 4.50%, due 03/01/42 | 3,246,175 | ||||||||
| 1,502,859 | FHLMC, Pool # U92272, 4.50%, due 12/01/43 | 1,604,188 | ||||||||
| 4,900,685 | FHLMC, Pool # G08568, 4.50%, due 01/01/44 | 5,241,561 | ||||||||
| 1,187,143 | FHLMC, Pool # 1Q0481, 5.05%, due 02/01/38† | 1,274,387 | ||||||||
| 563,885 | FHLMC, Pool # G01749, 5.50%, due 01/01/35 | 625,621 | ||||||||
| 728,877 | FHLMC, Pool # G04587, 5.50%, due 08/01/38 | 801,466 | ||||||||
| 818,029 | FHLMC, Pool # G05979, 5.50%, due 10/01/38 | 899,497 | ||||||||
| 548,422 | FHLMC, Pool # G06875, 5.50%, due 12/01/38 | 607,259 | ||||||||
| 341,014 | FHLMC, Pool # G06020, 5.50%, due 12/01/39 | 374,976 | ||||||||
| 243,540 | FHLMC, Pool # G06945, 5.50%, due 02/01/40 | 267,795 | ||||||||
| 1,879,233 | FHLMC, Pool # 782735, 5.68%, due 09/01/36† | 2,002,860 | ||||||||
| 28,875 | FHLMC, Pool # H09061, 6.00%, due 06/01/37 | 31,248 | ||||||||
| 1,026,832 | FHLMC, Pool # G03265, 6.00%, due 08/01/37 | 1,148,126 | ||||||||
| 422,800 | FHLMC, Pool # G03362, 6.00%, due 09/01/37 | 469,725 | ||||||||
| 573,060 | FHLMC, Pool # G08271, 6.00%, due 05/01/38 | 636,462 | ||||||||
| 1,177,437 | FHLMC, Pool # G06409, 6.00%, due 11/01/39 | 1,309,115 | ||||||||
| 351,642 | FHLMC, Pool # G06832, 6.00%, due 03/01/40 | 391,198 | ||||||||
| 4,106,702 | FHLMC, Series 311, Class F1, 0.71%, due 08/15/43† | 4,107,349 | ||||||||
| 3,267,230 | FHLMC, Series 317, Class F3, 0.68%, due 11/15/43† | 3,271,925 | ||||||||
| 2,730,483 | FHLMC, Series 3556, Class ZL, 5.50%, due 07/15/38 | 2,967,083 | ||||||||
| 3,416,241 | FHLMC, Series 4240, Class FA, 0.66%, due 08/15/43† | 3,399,148 | ||||||||
| 5,893,887 | FHLMC, Series 4283, Class EW, 6.65%, due 12/15/43† | 6,546,399 | ||||||||
| 1,629,418 | FHLMC Multifamily Structured Pass Through Certificates, (IO), Series K006, Class AX1, 1.04%, due 01/25/20† | 79,311 | ||||||||
| 3,066,614 | FHLMC Multifamily Structured Pass Through Certificates, (IO), Series K007, Class X1, 1.20%, due 04/25/20† | 163,834 | ||||||||
| 1,351,480 | FHLMC Multifamily Structured Pass Through Certificates, (IO), Series K008, Class X1, 1.66%, due 06/25/20† | 105,005 | ||||||||
| 336,684 | FHLMC Reference REMIC, Series R007, Class ZA, 6.00%, due 05/15/36 | 376,055 | ||||||||
| 92 | See accompanying Notes to the Financial Statements. |
Table of Contents
Mercer Core Fixed Income Fund
(formerly known as Mercer Core Opportunistic Fixed Income Fund)
Schedule of Investments (Continued)
(showing percentage of net assets)
March 31, 2014
| Par Value ($) | Description | Value ($) | ||||||||
Mortgage Backed Securities - U.S. Government Agency Obligations — continued |
| |||||||||
| 337,705 | FHLMC Structured Pass Through Securities, Series T-61, Class 1A1, 1.53%, due 07/25/44† | 342,019 | ||||||||
| 2,764,096 | FNMA, Pool # AE4096, 4.00%, due 09/01/30 | 2,915,962 | ||||||||
| 2,231,061 | FNMA, Pool # MA0587, 4.00%, due 12/01/30 | 2,355,588 | ||||||||
| 64,719 | FNMA, Pool # 776565, 4.00%, due 04/01/34 | 67,507 | ||||||||
| 474,382 | FNMA, Pool # AH1338, 4.00%, due 12/01/40 | 494,341 | ||||||||
| 126,990 | FNMA, Pool # AH6392, 4.00%, due 02/01/41 | 132,258 | ||||||||
| 573,178 | FNMA, Pool # AB9383, 4.00%, due 05/01/43 | 597,052 | ||||||||
| 21,151 | FNMA, Pool # 254802, 4.50%, due 07/01/18 | 22,456 | ||||||||
| 434,179 | FNMA, Pool # 725602, 4.50%, due 06/01/19 | 460,477 | ||||||||
| 5,580,371 | FNMA, Pool # AD0244, 4.50%, due 10/01/24 | 5,927,024 | ||||||||
| 1,729,772 | FNMA, Pool # AL4147, 4.50%, due 01/01/25 | 1,837,299 | ||||||||
| 2,527,366 | FNMA, Pool # AL1900, 4.50%, due 08/01/26 | 2,720,796 | ||||||||
| 357,746 | FNMA, Pool # MA0634, 4.50%, due 01/01/31 | 383,846 | ||||||||
| 1,583,938 | FNMA, Pool # AL4549, 4.50%, due 01/01/32 | 1,699,409 | ||||||||
| 3,353,374 | FNMA, Pool # 310098, 4.50%, due 06/01/36 | 3,576,260 | ||||||||
| 2,312,607 | FNMA, Pool # AL0215, 4.50%, due 04/01/41 | 2,470,513 | ||||||||
| 3,660,470 | FNMA, Pool # AL2439, 5.00%, due 06/01/26 | 3,953,256 | ||||||||
| 567,416 | FNMA, Pool # AI1892, 5.00%, due 05/01/41 | 623,549 | ||||||||
| 402,190 | FNMA, Pool # AE0011, 5.50%, due 09/01/23 | 437,585 | ||||||||
| 1,580,143 | FNMA, Pool # 995253, 5.50%, due 12/01/23 | 1,721,457 | ||||||||
| 2,136,768 | FNMA, Pool # AL0278, 5.50%, due 01/01/25 | 2,327,502 | ||||||||
| 13,381 | FNMA, Pool # 254548, 5.50%, due 12/01/32 | 14,911 | ||||||||
| 1,260,875 | FNMA, Pool # 704235, 5.50%, due 05/01/33 | 1,395,728 | ||||||||
| 142,430 | FNMA, Pool # 555591, 5.50%, due 07/01/33 | 158,652 | ||||||||
| 1,824,949 | FNMA, Pool # 725221, 5.50%, due 01/01/34 | 2,032,370 | ||||||||
| 86,830 | FNMA, Pool # 735224, 5.50%, due 02/01/35 | 96,644 | ||||||||
| 185,206 | FNMA, Pool # 990906, 5.50%, due 10/01/35 | 206,183 | ||||||||
| 938,231 | FNMA, Pool # 849077, 5.50%, due 01/01/36 | 1,040,321 | ||||||||
| 1,510,286 | FNMA, Pool # AL0144, 5.63%, due 11/01/37† | 1,620,948 | ||||||||
| 1,266,698 | FNMA, Pool # 745506, 5.66%, due 02/01/16 | 1,354,081 | ||||||||
| 262,370 | FNMA, Pool # 256517, 6.00%, due 12/01/26 | 292,835 | ||||||||
| 255,499 | FNMA, Pool # 256962, 6.00%, due 11/01/27 | 285,881 | ||||||||
| 2,784,431 | FNMA, Pool # 725162, 6.00%, due 02/01/34 | 3,136,052 | ||||||||
| 1,831,762 | FNMA, Pool # AD0218, 6.00%, due 09/01/36 | 2,066,738 | ||||||||
| 1,645,491 | FNMA, Pool # 831834, 6.00%, due 09/01/36 | 1,836,617 | ||||||||
| 80,449 | FNMA, Pool # 888736, 6.00%, due 10/01/37 | 87,247 | ||||||||
| 175,393 | FNMA, Pool # 955166, 6.00%, due 11/01/37 | 189,875 | ||||||||
| 2,273,211 | FNMA, Pool # 967691, 6.00%, due 01/01/38 | 2,532,037 | ||||||||
| 277,051 | FNMA, Pool # AL0852, 6.00%, due 06/01/38 | 300,301 | ||||||||
| 927,533 | FNMA, Pool # AL0406, 6.00%, due 06/01/38 | 1,005,005 | ||||||||
| 646,000 | FNMA, Pool # AL0901, 6.00%, due 07/01/38 | 700,027 | ||||||||
| 632,102 | FNMA, Pool # 190391, 6.00%, due 09/01/38 | 704,072 | ||||||||
| 247,976 | FNMA, Pool # AE0028, 6.00%, due 10/01/39 | 276,724 | ||||||||
| 1,241,183 | FNMA, Pool # AE0469, 6.00%, due 12/01/39 | 1,382,503 | ||||||||
| 231,584 | FNMA, Pool # AE0616, 6.00%, due 03/01/40 | 258,040 | ||||||||
| 1,156,833 | FNMA, Pool # 256421, 6.50%, due 09/01/36 | 1,261,867 | ||||||||
| 748,095 | FNMA, Pool # AL0778, 6.50%, due 01/01/49 | 817,354 | ||||||||
| See accompanying Notes to the Financial Statements. | 93 |
Table of Contents
Mercer Core Fixed Income Fund
(formerly known as Mercer Core Opportunistic Fixed Income Fund)
Schedule of Investments (Continued)
(showing percentage of net assets)
March 31, 2014
| Par Value ($) | Description | Value ($) | ||||||||
Mortgage Backed Securities - U.S. Government Agency Obligations — continued |
| |||||||||
| 1,900,433 | FNMA, Pool # 888369, 7.00%, due 03/01/37 | 2,110,430 | ||||||||
| 2,359,019 | FNMA, Series 2007-50, Class DZ, 5.50%, due 06/25/37 | 2,548,454 | ||||||||
| 1,904,380 | FNMA, Series 2007-63, Class VZ, 5.50%, due 07/25/37 | 2,042,562 | ||||||||
| 3,592,804 | FNMA, Series 2007-70, Class Z, 5.50%, due 07/25/37 | 3,872,973 | ||||||||
| 1,162,886 | FNMA, Series 2011-59, Class NZ, 5.50%, due 07/25/41 | 1,324,340 | ||||||||
| 1,851,651 | FNMA, Series 2012-134, Class FD, 0.50%, due 12/25/42† | 1,840,014 | ||||||||
| 191,789 | FNMA, Series 2012-28, Class B, 6.50%, due 06/25/39 | 213,253 | ||||||||
| 4,365,802 | FNMA, Series 2013-101, Class CF, 0.75%, due 10/25/43† | 4,398,680 | ||||||||
| 88,928 | FNMA Grantor Trust, Series 2004-T1, Class 1A2, 6.50%, due 01/25/44 | 101,091 | ||||||||
| 1,091,716 | FNMA REMIC Trust 2007-W1, Series 2007-W10, Class 2A, 6.29%, due 08/25/47† | 1,231,169 | ||||||||
| 2,520,129 | FNMA Trust, Series 2004-W1, Class 2A2, 7.00%, due 12/25/33 | 2,896,223 | ||||||||
| 127,665 | FNMA Trust, Series 2004-W9, Class 2A1, 6.50%, due 02/25/44 | 145,232 | ||||||||
| 3,208,757 | GNMA, Pool # 004978, 4.50%, due 03/20/41 | 3,469,783 | ||||||||
| 157,072 | GNMA, Pool # 641779, 5.00%, due 09/15/35 | 173,602 | ||||||||
|
| |||||||||
| 147,409,658 | ||||||||||
|
| |||||||||
Municipal Obligations — 4.0% |
| |||||||||
| 2,250,000 | American Municipal Power-Ohio, Inc., 8.08%, due 02/15/50 | 3,227,512 | ||||||||
| 600,000 | Chicago Transit Authority, Series B, 6.90%, due 12/01/40 | 710,118 | ||||||||
| 1,535,000 | Los Angeles Unified School District, 6.76%, due 07/01/34 | 1,987,119 | ||||||||
| 1,850,000 | New Jersey State Turnpike Authority, 7.10%, due 01/01/41 | 2,515,593 | ||||||||
| 300,000 | New Jersey State Turnpike Authority, 7.41%, due 01/01/40 | 421,017 | ||||||||
| 1,800,000 | New York City Transitional Finance Authority, 4.73%, due 11/01/23 | 1,985,580 | ||||||||
| 1,300,000 | New York City Transitional Finance Authority, 4.91%, due 11/01/24 | 1,422,343 | ||||||||
| 1,300,000 | New York City Transitional Finance Authority, 5.08%, due 11/01/25 | 1,461,837 | ||||||||
| 3,000,000 | New York State Urban Development Corp., 5.00%, due 03/15/23 | 3,463,290 | ||||||||
| 3,100,000 | Ohio Tobacco Settlement Financing Authority, 6.50%, due 06/01/47 | 2,702,053 | ||||||||
| 1,100,000 | Port Authority of New York and New Jersey, 4.46%, due 10/01/62 | 1,031,349 | ||||||||
| 4,300,000 | State of California General Obligation, 7.30%, due 10/01/39 | 5,758,861 | ||||||||
| 1,735,000 | State of California General Obligation, 7.50%, due 04/01/34 | 2,341,903 | ||||||||
| 1,700,000 | State of California General Obligation, 7.55%, due 04/01/39 | 2,363,816 | ||||||||
| 350,000 | State of California General Obligation, 7.60%, due 11/01/40 | 492,901 | ||||||||
| 350,000 | State of California General Obligation, 7.63%, due 03/01/40 | 488,905 | ||||||||
| 1,600,000 | State of Illinois General Obligation, 4.96%, due 03/01/16 | 1,712,432 | ||||||||
| 1,600,000 | State of Illinois General Obligation, 5.37%, due 03/01/17 | 1,752,928 | ||||||||
| 2,325,000 | State of Illinois General Obligation, 5.67%, due 03/01/18 | 2,581,006 | ||||||||
| 1,000,000 | State of Kentucky Property & Building Commission, 4.30%, due 11/01/19 | 1,066,050 | ||||||||
| 1,200,000 | State of Kentucky Property & Building Commission, 4.40%, due 11/01/20 | 1,258,512 | ||||||||
| 2,400,000 | State of Kentucky Property & Building Commission, 5.37%, due 11/01/25 | 2,632,056 | ||||||||
|
| |||||||||
| 43,377,181 | ||||||||||
|
| |||||||||
Sovereign Debt Obligations — 0.9% |
| |||||||||
| 680,000 | Colombia Government International Bond, 5.63%, due 02/26/44 | 713,320 | ||||||||
| 912,000 | Hungary Government International Bond, 5.75%, due 11/22/23 | 946,200 | ||||||||
| 720,000 | Indonesia Government International Bond, 5.88%, due 01/15/24 144A | 774,900 | ||||||||
| 140,000 | Mexico Government International Bond, 4.75%, due 03/08/44 | 133,700 | ||||||||
| 1,600,000 | Mexico Government International Bond, 5.55%, due 01/21/45 | 1,704,000 | ||||||||
| 2,600,000 | Province of Ontario Canada, 2.70%, due 06/16/15 | 2,674,428 | ||||||||
| 94 | See accompanying Notes to the Financial Statements. |
Table of Contents
Mercer Core Fixed Income Fund
(formerly known as Mercer Core Opportunistic Fixed Income Fund)
Schedule of Investments (Continued)
(showing percentage of net assets)
March 31, 2014
| Par Value ($) | Description | Value ($) | ||||||||
Sovereign Debt Obligations — continued |
| |||||||||
| 727,050 | Russian Foreign - Eurobond, REG S, 7.50%, due 03/31/30†† ‡‡‡ | 828,473 | ||||||||
| 1,500,000 | Spain Government International Bond, 4.00%, due 03/06/18 144A | 1,588,365 | ||||||||
|
| |||||||||
| 9,363,386 | ||||||||||
|
| |||||||||
U.S. Government and Agency Obligations — 42.3% |
| |||||||||
| 72,954 | FNMA, 2.52%, due 09/01/35† | 77,396 | ||||||||
| 2,300,000 | FNMA, 2.86%, due 10/09/19‡‡ | 1,982,692 | ||||||||
| 1,235,000 | FNMA, 6.63%, due 11/15/30 | 1,701,718 | ||||||||
| 190,000 | Tennessee Valley Authority, 5.25%, due 09/15/39 | 215,946 | ||||||||
| 2,064,000 | U.S. Treasury Bond, 2.75%, due 08/15/42 | 1,762,623 | ||||||||
| 5,450,000 | U.S. Treasury Bond, 3.63%, due 02/15/44 | 5,513,869 | ||||||||
| 13,510,000 | U.S. Treasury Bond, 3.75%, due 11/15/43 | 13,989,186 | ||||||||
| 23,000,000 | U.S. Treasury Bond, 5.25%, due 02/15/29 | 28,784,132 | ||||||||
| 3,823,469 | U.S. Treasury Inflation Indexed Bond, 0.13%, due 01/15/22 | 3,749,389 | ||||||||
| 2,542,675 | U.S. Treasury Inflation Indexed Bond, 0.13%, due 07/15/22 | 2,492,717 | ||||||||
| 1,114,608 | U.S. Treasury Inflation Indexed Bond, 0.13%, due 01/15/23 | 1,079,384 | ||||||||
| 8,542,755 | U.S. Treasury Inflation Indexed Bond, 0.38%, due 07/15/23 | 8,455,995 | ||||||||
| 8,553,520 | U.S. Treasury Inflation Indexed Bond, 1.13%, due 01/15/21 | 9,087,448 | ||||||||
| 536,230 | U.S. Treasury Inflation Indexed Bond, 1.25%, due 07/15/20 | 578,374 | ||||||||
| 111,643 | U.S. Treasury Inflation Indexed Bond, 1.75%, due 01/15/28 | 123,871 | ||||||||
| 1,861,215 | U.S. Treasury Inflation Indexed Bond, 2.00%, due 07/15/14 | 1,892,478 | ||||||||
| 6,800,000 | U.S. Treasury Note, 0.25%, due 01/15/15 | 6,807,970 | ||||||||
| 5,300,000 | U.S. Treasury Note, 0.25%, due 07/31/15 | 5,305,178 | ||||||||
| 5,700,000 | U.S. Treasury Note, 0.25%, due 05/15/16 | 5,670,833 | ||||||||
| 12,500,000 | U.S. Treasury Note, 0.38%, due 04/15/15 | 12,530,275 | ||||||||
| 7,600,000 | U.S. Treasury Note, 0.38%, due 02/15/16 | 7,600,448 | ||||||||
| 4,000,000 | U.S. Treasury Note, 0.38%, due 03/15/16 | 3,997,656 | ||||||||
| 8,800,000 | U.S. Treasury Note, 0.38%, due 03/31/16 | 8,790,716 | ||||||||
| 5,250,000 | U.S. Treasury Note, 0.63%, due 10/15/16 | 5,241,799 | ||||||||
| 500,000 | U.S. Treasury Note, 0.75%, due 03/15/17 | 498,145 | ||||||||
| 1,000,000 | U.S. Treasury Note, 0.75%, due 12/31/17 | 980,625 | ||||||||
| 66,800,000 | U.S. Treasury Note, 1.25%, due 11/30/18 | 65,638,816 | ||||||||
| 6,500,000 | U.S. Treasury Note, 1.25%, due 01/31/19 | 6,368,986 | ||||||||
| 68,780,000 | U.S. Treasury Note, 1.38%, due 06/30/18 | 68,465,675 | ||||||||
| 2,700,000 | U.S. Treasury Note, 1.50%, due 06/30/16 | 2,756,954 | ||||||||
| 14,850,000 | U.S. Treasury Note, 1.50%, due 07/31/16 | 15,166,721 | ||||||||
| 500,000 | U.S. Treasury Note, 1.50%, due 12/31/18 | 496,270 | ||||||||
| 80,000 | U.S. Treasury Note, 1.50%, due 01/31/19 | 79,303 | ||||||||
| 42,250,000 | U.S. Treasury Note, 1.50%, due 02/28/19 | 41,830,795 | ||||||||
| 34,250,000 | U.S. Treasury Note, 1.63%, due 03/31/19 | 34,077,414 | ||||||||
| 100,000 | U.S. Treasury Note, 1.88%, due 08/31/17 | 102,547 | ||||||||
| 6,500,000 | U.S. Treasury Note, 2.00%, due 09/30/20 | 6,423,826 | ||||||||
| 4,950,000 | U.S. Treasury Note, 2.00%, due 11/30/20 | 4,876,329 | ||||||||
| 6,130,000 | U.S. Treasury Note, 2.00%, due 02/28/21 | 6,014,345 | ||||||||
| 4,700,000 | U.S. Treasury Note, 2.13%, due 02/29/16 | 4,855,782 | ||||||||
| 2,000,000 | U.S. Treasury Note, 2.25%, due 03/31/16 | 2,072,266 | ||||||||
| 24,460,000 | U.S. Treasury Note, 2.25%, due 03/31/21 | 24,372,091 | ||||||||
| 31,740,000 | U.S. Treasury Note, 2.75%, due 02/15/24 | 31,811,923 | ||||||||
| See accompanying Notes to the Financial Statements. | 95 |
Table of Contents
Mercer Core Fixed Income Fund
(formerly known as Mercer Core Opportunistic Fixed Income Fund)
Schedule of Investments (Continued)
(showing percentage of net assets)
March 31, 2014
| Par Value ($) | Description | Value ($) | ||||||||
U.S. Government and Agency Obligations — continued |
| |||||||||
| 510,000 | U.S. Treasury Note, 3.63%, due 08/15/19 | 556,936 | ||||||||
| 1,060,000 | U.S. Treasury STRIPS, 6.61%, due 11/15/43‡‡ | 350,665 | ||||||||
|
| |||||||||
| 455,228,507 | ||||||||||
|
| |||||||||
TOTAL DEBT OBLIGATIONS (COST $972,759,594) | 989,801,692 | |||||||||
|
| |||||||||
| Shares | Description | Value ($) | ||||||||
PREFERRED STOCK — 0.3% | ||||||||||
Diversified Financial Services — 0.3% | ||||||||||
| 116,800 | Citigroup Capital XIII, 7.10%† | 3,240,032 | ||||||||
|
| |||||||||
TOTAL PREFERRED STOCK (COST $3,160,968) | 3,240,032 | |||||||||
|
| |||||||||
| Notional | Description | Value ($) | ||||||||
OPTIONS PURCHASED — 0.0% | ||||||||||
Call Options — 0.0% | ||||||||||
| 67,000 | U.S. Treasury Note 5-Year Futures Option with Barclays Capital, Inc., | 523 | ||||||||
|
| |||||||||
TOTAL CALL OPTIONS PURCHASED (COST $7,546) | 523 | |||||||||
|
| |||||||||
Put Options — 0.0% | ||||||||||
| 202,500 | IMM Eurodollar 3 Month Futures Option with Barclays Capital, Inc., | 3,038 | ||||||||
|
| |||||||||
TOTAL PUT OPTIONS PURCHASED (COST $5,326) | 3,038 | |||||||||
|
| |||||||||
TOTAL OPTIONS PURCHASED (COST $12,872) | 3,561 | |||||||||
|
| |||||||||
| Par Value ($) | Description | Value ($) | ||||||||
SHORT-TERM INVESTMENTS — 9.0% | ||||||||||
Bank Deposit — 7.8% | ||||||||||
| 84,220,655 | State Street Bank & Trust Euro Time Deposit, 0.01%, due 04/01/14 | 84,220,655 | ||||||||
|
| |||||||||
TOTAL BANK DEPOSITS (COST $84,220,655) | 84,220,655 | |||||||||
|
| |||||||||
Securities Lending Collateral — 0.3% | ||||||||||
| 2,627,065 | State Street Navigator Securities Lending Prime Portfolio*** | 2,627,065 | ||||||||
|
| |||||||||
TOTAL SECURITIES LENDING COLLATERAL (COST $2,627,065) | 2,627,065 | |||||||||
|
| |||||||||
| 96 | See accompanying Notes to the Financial Statements. |
Table of Contents
Mercer Core Fixed Income Fund
(formerly known as Mercer Core Opportunistic Fixed Income Fund)
Schedule of Investments (Continued)
(showing percentage of net assets)
March 31, 2014
| Par Value ($) | Description | Value ($) | ||||||||
U.S. Government and Agency Obligations — 0.9% | ||||||||||
| 10,000,000 | FHLMC Discount Notes, 0.06%, due 11/17/14‡‡ | 9,996,170 | ||||||||
|
| |||||||||
TOTAL U.S. GOVERNMENT AND AGENCY OBLIGATIONS (COST $9,989,778) | 9,996,170 | |||||||||
|
| |||||||||
TOTAL SHORT-TERM INVESTMENTS (COST $96,837,498) | 96,843,890 | |||||||||
|
| |||||||||
TOTAL INVESTMENTS — 101.2% (Cost $1,072,770,932) | 1,089,889,175 | |||||||||
Other Assets and Liabilities (net) — (1.2)% | (13,449,698 | ) | ||||||||
|
| |||||||||
NET ASSETS — 100.0% | $ | 1,076,439,477 | ||||||||
|
| |||||||||
Notes to Schedule of Investments: | ||||||||||
| FHLMC — Federal Home Loan Mortgage Corporation | ||||||||||
| FNMA — Federal National Mortgage Association | ||||||||||
| GNMA — Government National Mortgage Association | ||||||||||
| IO — Interest Only | ||||||||||
| MTN — Medium Term Note | ||||||||||
| PIK — Payment In Kind | ||||||||||
| REIT — Real Estate Investment Trust | ||||||||||
| REMIC — Real Estate Mortgage Investment Conduit | ||||||||||
| ¤ | Illiquid security. The total market value of the securities at year end is $2,027,120 which represents 0.2% of net assets. The aggregate tax cost of these securities held at March 31, 2014 was $2,175,829. | |||||||||
| *** | Represents an investment of securities lending cash collateral. | |||||||||
| **** | Securities fair valued by the Valuation Committee as approved by the Board of Trustees. The total market value of the securities at year end is $0 which represents 0.0% of net assets. The aggregate tax cost of these securities held at March 31, 2014 was $561,882. | |||||||||
| † | Floating rate note. Rate shown is as of March 31, 2014. | |||||||||
| †† | Debt obligation initially issued in zero coupon form which converts to coupon form at a specific rate and date. The rate shown is the rate at period end. | |||||||||
| ††† | Security is currently in default. | |||||||||
| †††† | When-issued security | |||||||||
| ‡ | All or a portion of this security is out on loan. | |||||||||
| ‡‡ | Interest rate presented is yield to maturity. | |||||||||
| ‡‡‡ | Security exempt from registration under Regulation S of the Securities Act of 1933, which exempts from registration securities offered and sold outside the United States. Security may not be offered or sold in the United States except pursuant to an exemption from, or in a transaction not subject to, the registration requirements of the Securities Act of 1933. | |||||||||
| 144A — Securities exempt from registration under Rule 144A of the Securities Act of 1933. These securities may be resold in transactions exempt from registration, normally to qualified institutional buyers. The total market value of the securities at year end is $36,651,647 which represents 3.4% of net assets. | ||||||||||
| See accompanying Notes to the Financial Statements. | 97 |
Table of Contents
Mercer Core Fixed Income Fund
(formerly known as Mercer Core Opportunistic Fixed Income Fund)
Schedule of Investments (Continued)
March 31, 2014
A summary of outstanding financial instruments at March 31, 2014 is as follows:
Forward Foreign Currency Contracts
Settlement | Currency | Counterparty | Units of | Value | Unrealized | |||||||||||||||
| Buys | ||||||||||||||||||||
| 04/02/14 | BRL | Citibank N.A. | 572,874 | $ | 253,877 | $ | 11,888 | |||||||||||||
| 04/02/14 | BRL | UBS AG | 1,145,748 | 507,754 | 14,940 | |||||||||||||||
| 04/02/14 | EUR | Royal Bank of Scotland Plc | 49,392,000 | 68,074,503 | 71,480 | |||||||||||||||
|
| |||||||||||||||||||
| $ | 98,308 | |||||||||||||||||||
|
| |||||||||||||||||||
| Sales | ||||||||||||||||||||
| 04/02/14 | BRL | Citibank N.A. | 572,874 | $ | 253,877 | $ | (729 | ) | ||||||||||||
| 04/02/14 | BRL | UBS AG | 1,145,748 | 507,754 | (20,392 | ) | ||||||||||||||
| 04/02/14 | EUR | Bank of America N.A. | 5,690,000 | 7,842,240 | (32,715 | ) | ||||||||||||||
| 04/02/14 | EUR | HSBC Bank USA | 10,774,000 | 14,849,261 | 3,522 | |||||||||||||||
| 04/02/14 | EUR | Royal Bank of Scotland Plc | 32,928,000 | 45,383,002 | (23,249 | ) | ||||||||||||||
| 04/01/14 | EUR | UBS AG | 3,300,000 | 4,548,224 | (85,551 | ) | ||||||||||||||
|
| |||||||||||||||||||
| $ | (159,114 | ) | ||||||||||||||||||
|
| |||||||||||||||||||
Currency Abbreviations
| BRL | Brazilian Real |
| EUR | Euro |
Futures Contracts
Number of | Type | Expiration Date | Contract | Unrealized | ||||||||||||||
| Sales | ||||||||||||||||||
| 2 | U.S. Long Bond | June 2014 | $ | 266,438 | $ | (132 | ) | |||||||||||
|
| |||||||||||||||||
Written Options
Type of Contract | Counterparty | Number of Contracts / Notional Amount | Premiums Received | Value at March 31, 2014 | |||||||||||||||||
CALL — U.S. Treasury Note 10-Year Futures | Barclays Capital, Inc. | 21 | $ | 7,260 | $ | (2,297 | ) | ||||||||||||||
PUT — Euro Dollar Futures | Barclays Capital, Inc. | 81 | 1,256 | (1,013 | ) | ||||||||||||||||
PUT — U.S. Treasury Note 10-Year Futures | Barclays Capital, Inc. | 21 | 5,182 | (5,906 | ) | ||||||||||||||||
PUT — U.S. Treasury Note 5-Year Futures | Barclays Capital, Inc. | 52 | 9,581 | (11,781 | ) | ||||||||||||||||
TOTAL | $ | 23,279 | $ | (20,997 | ) | ||||||||||||||||
|
|
|
| ||||||||||||||||||
| 98 | See accompanying Notes to the Financial Statements. |
Table of Contents
Mercer Core Fixed Income Fund
(formerly known as Mercer Core Opportunistic Fixed Income Fund)
Schedule of Investments (Continued)
March 31, 2014
| Asset Class Summary (Unaudited) | % of Net Assets | ||||
Debt Obligations | 91.9 | ||||
Preferred Stocks | 0.3 | ||||
Options Purchased | 0.0 | ||||
Futures Contracts | 0.0 | ||||
Written Options | 0.0 | ||||
Forward Foreign Currency Contracts | 0.0 | ||||
Short-Term Investments | 9.0 | ||||
Other Assets and Liabilities (net) | (1.2 | ) | |||
|
| ||||
| 100.0 | % | ||||
|
| ||||
| See accompanying Notes to the Financial Statements. | 99 |
Table of Contents
Mercer Opportunistic Fixed Income Fund
Schedule of Investments
(showing percentage of net assets)
March 31, 2014
| Par Value** | Description | Value ($) | ||||||||
DEBT OBLIGATIONS — 91.8% | ||||||||||
Corporate Debt — 45.5% | ||||||||||
| 400,000 | Abengoa Finance SAU, 7.75%, due 02/01/20 144A | 434,000 | ||||||||
| 250,000 | Abengoa Finance SAU, 8.88%, due 11/01/17 144A | 281,875 | ||||||||
| 1,100,000 | Alcatel-Lucent USA, Inc., 6.75%, due 11/15/20 144A | 1,168,750 | ||||||||
| 900,000 | Alere, Inc., 6.50%, due 06/15/20 | 949,500 | ||||||||
| 200,000 | Alere, Inc., 7.25%, due 07/01/18 | 221,000 | ||||||||
| 1,200,000 | Ally Financial, Inc., 7.50%, due 09/15/20 | 1,431,000 | ||||||||
| 900,000 | ArcelorMittal, 6.00%, due 03/01/21 | 964,125 | ||||||||
| 600,000 | ArcelorMittal, 6.13%, due 06/01/18 | 660,000 | ||||||||
| 100,000 | EUR | Ardagh Packaging Finance Plc, 7.38%, due 10/15/17 144A | 146,956 | |||||||
| 500,000 | EUR | Ardagh Packaging Finance Plc, 9.25%, due 10/15/20 144A | 771,820 | |||||||
| 600,000 | EUR | Avis Budget Finance Plc, 6.00%, due 03/01/21 144A | 878,700 | |||||||
| 600,000 | Aviv Healthcare Properties LP/Aviv Healthcare Capital Corp., 6.00%, due 10/15/21 | 625,500 | ||||||||
| 300,000 | EUR | Axalta Coating Systems US Holdings, Inc./Axalta Coating Systems Dutch Holding B BV, 5.75%, due 02/01/21 144A | 444,287 | |||||||
| 1,500,000 | Bank of America Corp., Series M, 8.13%, due 12/31/49† | 1,721,959 | ||||||||
| 500,000 | Barminco Finance Pty, Ltd., 9.00%, due 06/01/18 144A | 463,750 | ||||||||
| 242,000 | Big Heart Pet Brands, 7.63%, due 02/15/19 | 252,436 | ||||||||
| 500,000 | Blackboard, Inc., 7.75%, due 11/15/19 144A | 526,250 | ||||||||
| 700,000 | BMC Software Finance, Inc., 8.13%, due 07/15/21 144A | 740,250 | ||||||||
| 1,000,000 | BreitBurn Energy Partners LP/BreitBurn Finance Corp., 7.88%, due 04/15/22 | 1,087,500 | ||||||||
| 400,000 | EUR | Cable Communications Systems NV, 7.50%, due 11/01/20 144A | 585,756 | |||||||
| 500,000 | Caesars Entertainment Operating Co., Inc., 9.00%, due 02/15/20 | 451,250 | ||||||||
| 600,000 | Caesars Entertainment Operating Co., Inc., 11.25%, due 06/01/17 | 579,000 | ||||||||
| 900,000 | Calpine Corp., 6.00%, due 01/15/22 144A | 949,500 | ||||||||
| 267,000 | Calpine Corp., 7.50%, due 02/15/21 144A | 293,033 | ||||||||
| 800,000 | Carrizo Oil & Gas, Inc., 7.50%, due 09/15/20 | 884,000 | ||||||||
| 100,000 | Carrizo Oil & Gas, Inc., 8.63%, due 10/15/18 | 107,750 | ||||||||
| 1,000,000 | CCO Holdings LLC/CCO Holdings Capital Corp., 5.25%, due 09/30/22 | 991,250 | ||||||||
| 200,000 | EUR | Cegedim SA, 6.75%, due 04/01/20 144A | 295,359 | |||||||
| 1,000,000 | Cemex Finance LLC, 9.38%, due 10/12/22 144A | 1,178,750 | ||||||||
| 200,000 | Cemex SAB de CV, 9.00%, due 01/11/18 144A | 218,500 | ||||||||
| 1,600,000 | CenturyLink, Inc., 6.75%, due 12/01/23 | 1,706,000 | ||||||||
| 400,000 | EUR | CeramTec Group GmbH, 8.25%, due 08/15/21 144A | 609,186 | |||||||
| 1,100,000 | CGG, 6.50%, due 06/01/21 | 1,122,000 | ||||||||
| 630,000 | CHC Helicopter SA, 9.25%, due 10/15/20 | 687,487 | ||||||||
| 500,000 | CHC Helicopter SA, 9.38%, due 06/01/21 | 532,500 | ||||||||
| 1,500,000 | Chesapeake Energy Corp., 6.13%, due 02/15/21 | 1,642,500 | ||||||||
| 150,000 | CHS/Community Health Systems, Inc., 5.13%, due 08/15/18 | 157,875 | ||||||||
| 1,000,000 | CHS/Community Health Systems, Inc., 6.88%, due 02/01/22 144A | 1,050,000 | ||||||||
| 200,000 | CHS/Community Health Systems, Inc., 7.13%, due 07/15/20 | 217,250 | ||||||||
| 1,200,000 | CIT Group, Inc., 5.00%, due 08/01/23 | 1,233,000 | ||||||||
| 500,000 | CIT Group, Inc., 5.50%, due 02/15/19 144A | 540,625 | ||||||||
| 900,000 | Clayton Williams Energy, Inc., 7.75%, due 04/01/19 | 960,750 | ||||||||
| 1,200,000 | Clear Channel Communications, Inc., 9.00%, due 03/01/21 | 1,258,500 | ||||||||
| 800,000 | Clear Channel Worldwide Holdings, Inc., 7.63%, due 03/15/20 | 868,000 | ||||||||
| 500,000 | CONSOL Energy, Inc., 6.38%, due 03/01/21 | 531,875 | ||||||||
| 600,000 | CONSOL Energy, Inc., 8.25%, due 04/01/20 | 654,750 | ||||||||
| 900,000 | CSC Holdings LLC, 6.75%, due 11/15/21 | 1,010,250 | ||||||||
| 100 | See accompanying Notes to the Financial Statements. |
Table of Contents
Mercer Opportunistic Fixed Income Fund
Schedule of Investments (Continued)
(showing percentage of net assets)
March 31, 2014
| Par Value** | Description | Value ($) | ||||||||
Corporate Debt — continued | ||||||||||
| 400,000 | EUR | Deutsche Raststaetten Gruppe IV GmbH, 6.75%, due 12/30/20 144A | 605,052 | |||||||
| 300,000 | Digicel Group, Ltd., 7.13%, due 04/01/22†††† 144A | 304,125 | ||||||||
| 200,000 | Digicel Group, Ltd., 8.25%, due 09/30/20 144A | 214,500 | ||||||||
| 500,000 | Digicel, Ltd., 6.00%, due 04/15/21 144A | 512,500 | ||||||||
| 1,200,000 | DISH DBS Corp., 5.13%, due 05/01/20 | 1,254,000 | ||||||||
| 600,000 | Dole Food Co., Inc., 7.25%, due 05/01/19 144A | 603,750 | ||||||||
| 700,000 | E*TRADE Financial Corp., 6.38%, due 11/15/19 | 764,750 | ||||||||
| 300,000 | eAccess, Ltd., 8.25%, due 04/01/18 144A | 327,750 | ||||||||
| 300,000 | Eagle Rock Energy Partners, LP/Eagle Rock Energy Finance Corp., 8.38%, due 06/01/19 | 327,000 | ||||||||
| 700,000 | EUR | Edcon Pty, Ltd., 9.50%, due 03/01/18 144A | 946,857 | |||||||
| 1,000,000 | Eldorado Gold Corp., 6.13%, due 12/15/20 144A | 1,005,000 | ||||||||
| 400,000 | EUR | Empark Funding SA, 6.75%, due 12/15/19 144A | 594,026 | |||||||
| 1,500,000 | Energy Transfer Equity, LP, 7.50%, due 10/15/20 | 1,723,125 | ||||||||
| 300,000 | Energy XXI Gulf Coast, Inc., 7.50%, due 12/15/21 144A | 315,750 | ||||||||
| 250,000 | EPL Oil & Gas, Inc., 8.25%, due 02/15/18 | 271,875 | ||||||||
| 400,000 | Equinix, Inc., 4.88%, due 04/01/20 | 411,000 | ||||||||
| 800,000 | Equinix, Inc., 5.38%, due 04/01/23 | 820,000 | ||||||||
| 400,000 | EUR | Financiere Gaillon 8 SAS, 7.00%, due 09/30/19 144A | 556,124 | |||||||
| 400,000 | EUR | Findus Bondco SA, 9.13%, due 07/01/18 144A | 604,522 | |||||||
| 1,200,000 | First Data Corp., 8.25%, due 01/15/21 144A | 1,308,000 | ||||||||
| 500,000 | First Data Corp., 11.25%, due 01/15/21 | 573,125 | ||||||||
| 500,000 | First Quantum Minerals, Ltd., 6.75%, due 02/15/20 144A | 508,750 | ||||||||
| 700,000 | First Quantum Minerals, Ltd., 7.00%, due 02/15/21 144A | 715,750 | ||||||||
| 900,000 | FMG Resources August 2006 Pty, Ltd., 6.88%, due 04/01/22 144A | 973,125 | ||||||||
| 500,000 | FMG Resources August 2006 Pty, Ltd., 8.25%, due 11/01/19 144A | 551,875 | ||||||||
| 500,000 | Freescale Semiconductor, Inc., 6.00%, due 01/15/22 144A | 531,875 | ||||||||
| 103,000 | Freescale Semiconductor, Inc., 8.05%, due 02/01/20 | 113,686 | ||||||||
| 1,000,000 | Frontier Communications Co., Senior Note, 7.88%, due 01/15/27 | 1,012,500 | ||||||||
| 200,000 | Frontier Communications Corp., 7.63%, due 04/15/24 | 210,000 | ||||||||
| 700,000 | Gannett Co., Inc., 5.13%, due 07/15/20 144A | 722,750 | ||||||||
| 400,000 | Gannett Co., Inc., 6.38%, due 10/15/23 144A | 425,500 | ||||||||
| 700,000 | Goodrich Petroleum Corp., 8.88%, due 03/15/19 | 728,000 | ||||||||
| 1,000,000 | Goodyear Tire & Rubber Co. (The), 6.50%, due 03/01/21 | 1,095,000 | ||||||||
| 200,000 | Grifols Worldwide Operations, Ltd., 5.25%, due 04/01/22 144A | 205,000 | ||||||||
| 900,000 | Halcon Resources Corp., 8.88%, due 05/15/21 | 938,250 | ||||||||
| 600,000 | HCA, Inc., 5.00%, due 03/15/24 | 602,625 | ||||||||
| 900,000 | HCA, Inc., 5.88%, due 05/01/23 | 928,125 | ||||||||
| 500,000 | HCA, Inc., 6.50%, due 02/15/20 | 561,250 | ||||||||
| 600,000 | Hertz Corp. (The), 6.25%, due 10/15/22 | 645,000 | ||||||||
| 700,000 | Hertz Corp. (The), 6.75%, due 04/15/19 | 753,375 | ||||||||
| 100,000 | Ineos Finance Plc, 7.50%, due 05/01/20 144A | 110,125 | ||||||||
| 300,000 | EUR | INEOS Group Holdings SA, 5.75%, due 02/15/19 144A | 424,796 | |||||||
| 400,000 | GBP | Infinis Plc, 7.00%, due 02/15/19 144A | 728,545 | |||||||
| 1,700,000 | Intelsat Jackson Holdings SA, 5.50%, due 08/01/23 144A | 1,672,375 | ||||||||
| 700,000 | InterGen NV, 7.00%, due 06/30/23 144A | 738,500 | ||||||||
| 100,000 | EUR | Jarden Corp., 7.50%, due 01/15/20 | 149,689 | |||||||
| 1,000,000 | JBS USA LLC/JBS USA Finance, Inc., 7.25%, due 06/01/21 144A | 1,067,500 | ||||||||
| 200,000 | JBS USA LLC/JBS USA Finance, Inc., 8.25%, due 02/01/20 144A | 220,000 | ||||||||
| See accompanying Notes to the Financial Statements. | 101 |
Table of Contents
Mercer Opportunistic Fixed Income Fund
Schedule of Investments (Continued)
(showing percentage of net assets)
March 31, 2014
| Par Value** | Description | Value ($) | ||||||||
Corporate Debt — continued | ||||||||||
| 1,000,000 | JPMorgan Chase & Co., 6.00%, due 12/31/49† | 990,000 | ||||||||
| 300,000 | KB Home, 4.75%, due 05/15/19 | 303,000 | ||||||||
| 1,200,000 | KB Home, 7.50%, due 09/15/22 | 1,320,000 | ||||||||
| 300,000 | Kinder Morgan Finance Co. LLC, 6.00%, due 01/15/18 144A | 326,250 | ||||||||
| 100,000 | Kinder Morgan, Inc., 5.00%, due 02/15/21 144A | 100,641 | ||||||||
| 1,200,000 | Kinder Morgan, Inc., 5.63%, due 11/15/23 144A | 1,192,813 | ||||||||
| 400,000 | EUR | KraussMaffei Group GmbH, 8.75%, due 12/15/20 144A | 620,301 | |||||||
| 200,000 | EUR | Labeyrie Fine Foods SAS, 5.63%, due 03/15/21 144A | 282,886 | |||||||
| 750,000 | Landry’s, Inc., 9.38%, due 05/01/20 144A | 829,687 | ||||||||
| 1,200,000 | Linn Energy LLC/Linn Energy Finance Corp., 7.25%, due 11/01/19 144A | 1,257,000 | ||||||||
| 400,000 | EUR | Loxam SAS, 7.38%, due 01/24/20 144A | 606,430 | |||||||
| 100,000 | Martin Midstream Partners, LP/Martin Midstream Finance Corp., 7.25%, due 02/15/21†††† 144A | 105,375 | ||||||||
| 600,000 | Martin Midstream Partners, LP/Martin Midstream Finance Corp., 7.25%, due 02/15/21 | 632,250 | ||||||||
| 1,200,000 | MGM Resorts International, 6.75%, due 10/01/20 | 1,333,500 | ||||||||
| 400,000 | Midstates Petroleum Co., Inc./Midstates Petroleum Co. LLC, 9.25%, due 06/01/21 | 420,000 | ||||||||
| 1,200,000 | Millicom International Cellular SA, 6.63%, due 10/15/21 144A | 1,275,000 | ||||||||
| 500,000 | EUR | Mobile Challenger Intermediate Group SA, 8.75%, due 03/15/19 144A | 717,586 | |||||||
| 500,000 | Murray Energy Corp., 8.63%, due 06/15/21 144A | 528,750 | ||||||||
| 800,000 | Neuberger Berman Group LLC/Neuberger Berman Finance Corp., 5.88%, due 03/15/22 144A | 856,000 | ||||||||
| 450,000 | GBP | New Look Bondco I Plc, 8.75%, due 05/14/18 144A | 808,404 | |||||||
| 100,000 | Nielsen Co. Luxembourg SARL (The), 5.50%, due 10/01/21 144A | 104,875 | ||||||||
| 400,000 | Nielsen Finance LLC/Nielsen Finance Co., 5.00%, due 04/15/22 144A | 401,000 | ||||||||
| 300,000 | EUR | Nokia Siemens Networks Finance BV, 7.13%, due 04/15/20 144A | 475,910 | |||||||
| 300,000 | Novelis, Inc., 8.75%, due 12/15/20 | 336,750 | ||||||||
| 300,000 | Nuveen Investments, Inc., 9.13%, due 10/15/17 144A | 318,750 | ||||||||
| 400,000 | Nuveen Investments, Inc., 9.50%, due 10/15/20 144A | 428,000 | ||||||||
| 700,000 | Ocean Rig UDW, Inc., 7.25%, due 04/01/19 144A | 700,875 | ||||||||
| 800,000 | Offshore Group Investment, Ltd., 7.13%, due 04/01/23 | 818,000 | ||||||||
| 200,000 | Offshore Group Investment, Ltd., 7.50%, due 11/01/19 | 214,000 | ||||||||
| 1,000,000 | Olin Corp., 5.50%, due 08/15/22 | 1,027,500 | ||||||||
| 300,000 | Orion Engineered Carbons Finance & Co. SCA, 9.25%, due 08/01/19 144A | 312,750 | ||||||||
| 300,000 | Paris Las Vegas Holding LLC/Harrahs Las Vegas LLC/Flamingo Las Vegas Holding, 8.00%, due 10/01/20 144A | 317,250 | ||||||||
| 500,000 | Peabody Energy Corp., 6.00%, due 11/15/18 | 526,875 | ||||||||
| 800,000 | Peabody Energy Corp., 6.25%, due 11/15/21 | 806,000 | ||||||||
| 200,000 | Penn Virginia Corp., 8.50%, due 05/01/20 | 223,500 | ||||||||
| 200,000 | Penn Virginia Resource Partners, LP/Penn Virginia Resource Finance Corp. II, 6.50%, due 05/15/21 | 214,500 | ||||||||
| 79,000 | Penn Virginia Resource Partners, LP/Penn Virginia Resource Finance Corp. II, 8.38%, due 06/01/20 | 89,073 | ||||||||
| 6,000,000 | MXN | Petroleos Mexicanos, Reg S, 7.19%, due 09/12/24‡‡‡ | 448,949 | |||||||
| 100,000 | EUR | Play Finance 1 SA, 6.50%, due 08/01/19 144A | 144,716 | |||||||
| 300,000 | EUR | Play Finance 2 SA, 5.25%, due 02/01/19 144A | 422,447 | |||||||
| 600,000 | Post Holdings, Inc., 6.75%, due 12/01/21 144A | 636,750 | ||||||||
| 200,000 | Post Holdings, Inc., 7.38%, due 02/15/22 144A | 216,000 | ||||||||
| 200,000 | GBP | Premier Foods Plc, 6.50%, due 03/15/21 144A | 342,633 | |||||||
| 300,000 | QEP Resources, Inc., 5.38%, due 10/01/22 | 303,000 | ||||||||
| 102 | See accompanying Notes to the Financial Statements. |
Table of Contents
Mercer Opportunistic Fixed Income Fund
Schedule of Investments (Continued)
(showing percentage of net assets)
March 31, 2014
| Par Value** | Description | Value ($) | ||||||||
Corporate Debt — continued | ||||||||||
| 600,000 | QR Energy, LP/QRE Finance Corp., 9.25%, due 08/01/20 | 645,000 | ||||||||
| 800,000 | Quicksilver Resources, Inc., 7.00%, due 06/21/19† 144A | 792,500 | ||||||||
| 200,000 | Radio One, Inc., 9.25%, due 02/15/20 144A | 213,000 | ||||||||
| 700,000 | EUR | Rain CII Carbon LLC/CII Carbon Corp., 8.50%, due 01/15/21 144A | 984,070 | |||||||
| 600,000 | Regency Energy Partners, LP/Regency Energy Finance Corp., 5.88%, due 03/01/22 | 624,000 | ||||||||
| 700,000 | Reynolds Group Issuer, Inc./Reynolds Group Issuer LLC/Reynolds Group Issuer, 5.75%, due 10/15/20 | 736,750 | ||||||||
| 400,000 | Reynolds Group Issuer, Inc./Reynolds Group Issuer LLC/Reynolds Group Issuer, 8.25%, due 02/15/21 | 438,500 | ||||||||
| 400,000 | Reynolds Group Issuer, Inc./Reynolds Group Issuer LLC/Reynolds Group Issuer, 9.00%, due 04/15/19 | 430,000 | ||||||||
| 100,000 | Royal Bank of Scotland Group Plc, 6.13%, due 12/15/22 | 105,081 | ||||||||
| 1,000,000 | EUR | Royal Bank of Scotland Plc (The), 6.93%, due 04/09/18 | 1,576,964 | |||||||
| 400,000 | Sabine Pass Liquefaction LLC, 5.63%, due 02/01/21 | 414,500 | ||||||||
| 600,000 | Sabine Pass Liquefaction LLC, 5.63%, due 04/15/23 | 599,250 | ||||||||
| 200,000 | Samson Investment Co., 10.75%, due 02/15/20 144A | 219,000 | ||||||||
| 800,000 | Sanchez Energy Corp., 7.75%, due 06/15/21 144A | 858,000 | ||||||||
| 1,500,000 | SLM Corp., 5.50%, due 01/15/19 | 1,591,879 | ||||||||
| 200,000 | SLM Corp., 8.45%, due 06/15/18 | 236,250 | ||||||||
| 800,000 | Sprint Communications, Inc., 6.00%, due 11/15/22 | 819,000 | ||||||||
| 800,000 | Sprint Communications, Inc., 7.00%, due 03/01/20 144A | 926,000 | ||||||||
| 900,000 | Sprint Corp., 7.13%, due 06/15/24 144A | 947,250 | ||||||||
| 100,000 | Sprint Corp., 7.88%, due 09/15/23 144A | 110,250 | ||||||||
| 200,000 | SRA International, Inc., 11.00%, due 10/01/19 | 211,500 | ||||||||
| 300,000 | Stena AB, 7.00%, due 02/01/24 144A | 306,000 | ||||||||
| 500,000 | Stena International SA, 5.75%, due 03/01/24 144A | 500,000 | ||||||||
| 1,000,000 | T-Mobile USA, Inc., 6.13%, due 01/15/22 | 1,051,250 | ||||||||
| 100,000 | T-Mobile USA, Inc., 6.50%, due 01/15/24 | 105,000 | ||||||||
| 200,000 | T-Mobile USA, Inc., 6.54%, due 04/28/20 | 216,000 | ||||||||
| 600,000 | Taylor Morrison Communities, Inc./Monarch Communities, Inc., 5.63%, due 03/01/24 144A | 595,500 | ||||||||
| 1,100,000 | EUR | Telecom Italia Spa, 5.38%, due 01/29/19 | 1,658,652 | |||||||
| 1,000,000 | Tenet Healthcare Corp., 8.13%, due 04/01/22 | 1,120,000 | ||||||||
| 1,000,000 | Texas Competitive Electric Holdings Co. LLC/TCEH Finance, Inc., Series 1, 11.50%, due 10/01/20 144A | 772,500 | ||||||||
| 1,000,000 | Toll Brothers Finance Corp., 5.63%, due 01/15/24 | 1,037,500 | ||||||||
| 2,880,000 | ZAR | Transnet SOC, Ltd., Reg S, 9.50%, due 05/13/21‡‡‡ | 267,327 | |||||||
| 400,000 | United Rentals North America, Inc., 5.75%, due 11/15/24 | 403,500 | ||||||||
| 700,000 | EUR | Unitymedia Hessen GmbH & Co. KG/Unitymedia NRW GmbH, 5.75%, due 01/15/23 144A | 1,050,398 | |||||||
| 1,100,000 | Valeant Pharmaceuticals International, 6.38%, due 10/15/20 144A | 1,193,500 | ||||||||
| 200,000 | Valeant Pharmaceuticals International, Inc., 5.63%, due 12/01/21 144A | 210,500 | ||||||||
| 300,000 | Videotron, Ltd., 5.38%, due 06/15/24†††† 144A | 302,250 | ||||||||
| 100,000 | GBP | Virgin Media Secured Finance Plc, 5.50%, due 01/15/25 144A | 168,799 | |||||||
| 500,000 | GBP | Virgin Media Secured Finance Plc, 6.00%, due 04/15/21 144A | 884,632 | |||||||
| 100,000 | Visant Corp., 10.00%, due 10/01/17 | 100,125 | ||||||||
| 400,000 | VTR Finance BV, 6.88%, due 01/15/24 144A | 417,000 | ||||||||
| 250,000 | W&T Offshore, Inc., 8.50%, due 06/15/19 | 271,250 | ||||||||
| 1,200,000 | Wind Acquisition Finance SA, 11.75%, due 07/15/17 144A | 1,266,000 | ||||||||
| See accompanying Notes to the Financial Statements. | 103 |
Table of Contents
Mercer Opportunistic Fixed Income Fund
Schedule of Investments (Continued)
(showing percentage of net assets)
March 31, 2014
| Par Value** | Description | Value ($) | ||||||||
Corporate Debt — continued | ||||||||||
| 300,000 | WMG Acquisition Corp., 5.63%, due 04/15/22†††† 144A | 305,250 | ||||||||
|
| |||||||||
| 118,480,804 | ||||||||||
|
| |||||||||
Sovereign Debt Obligations — 46.3% | ||||||||||
| 260,000,000 | CLP | Bonos de la Tesoreria de la Republica en pesos, 6.00%, due 01/01/18 | 488,899 | |||||||
| 185,000,000 | CLP | Bonos de la Tesoreria de la Republica en pesos, 6.00%, due 01/01/20 | 356,140 | |||||||
| 170,000,000 | CLP | Bonos del Banco Central de Chile en Pesos, 6.00%, due 02/01/16 | 319,762 | |||||||
| 9,800,000 | BRL | Brazil Notas do Tesouro Nacional Serie F, 10.00%, due 01/01/17 | 4,119,477 | |||||||
| 13,400,000 | BRL | Brazil Notas do Tesouro Nacional Serie F, 10.00%, due 01/01/18 | 5,517,355 | |||||||
| 14,041,000 | BRL | Brazil Notas do Tesouro Nacional Serie F, 10.00%, due 01/01/23 | 5,401,542 | |||||||
| 680,200,000 | COP | Colombian TES, 6.00%, due 04/28/28 | 319,764 | |||||||
| 1,546,500,000 | COP | Colombian TES, 7.00%, due 05/04/22 | 819,565 | |||||||
| 609,900,000 | COP | Colombian TES, 7.50%, due 08/26/26 | 319,826 | |||||||
| 2,336,000,000 | COP | Colombian TES, 10.00%, due 07/24/24 | 1,490,737 | |||||||
| 67,800,000 | COP | Colombian TES, 11.25%, due 10/24/18 | 41,993 | |||||||
| 43,610,000 | CZK | Czech Republic Government Bond, 2.50%, due 08/25/28 | 2,121,480 | |||||||
| 12,020,000 | HUF | Hungary Government Bond, 5.50%, due 12/22/16 | 55,949 | |||||||
| 264,980,000 | HUF | Hungary Government Bond, 5.50%, due 12/20/18 | 1,231,945 | |||||||
| 519,170,000 | HUF | Hungary Government Bond, 6.00%, due 11/24/23 | 2,433,417 | |||||||
| 338,000,000 | HUF | Hungary Government Bond, 6.50%, due 06/24/19 | 1,631,349 | |||||||
| 7,290,000 | HUF | Hungary Government Bond, 6.75%, due 10/22/28 | 35,101 | |||||||
| 73,000,000 | HUF | Hungary Government Bond, 7.00%, due 06/24/22 | 363,137 | |||||||
| 117,610,000 | HUF | Hungary Government Bond, 7.75%, due 08/24/15 | 559,122 | |||||||
| 3,000,000,000 | IDR | Indonesia Treasury Bond, 5.25%, due 05/15/18 | 243,133 | |||||||
| 11,500,000,000 | IDR | Indonesia Treasury Bond, 5.63%, due 05/15/23 | 859,783 | |||||||
| 8,900,000,000 | IDR | Indonesia Treasury Bond, 6.13%, due 05/15/28 | 633,234 | |||||||
| 9,178,000,000 | IDR | Indonesia Treasury Bond, 6.63%, due 05/15/33 | 657,628 | |||||||
| 3,300,000,000 | IDR | Indonesia Treasury Bond, 7.00%, due 05/15/27 | 257,094 | |||||||
| 16,228,000,000 | IDR | Indonesia Treasury Bond, 7.88%, due 04/15/19 | 1,444,235 | |||||||
| 45,390,000,000 | IDR | Indonesia Treasury Bond, 8.38%, due 03/15/24 | 4,120,461 | |||||||
| 20,939,000,000 | IDR | Indonesia Treasury Bond, 9.00%, due 03/15/29 | 1,925,144 | |||||||
| 1,161,000 | MYR | Malaysia Government Bond, 3.20%, due 10/15/15 | 356,020 | |||||||
| 12,900,000 | MYR | Malaysia Government Bond, 3.26%, due 03/01/18 | 3,894,500 | |||||||
| 2,078,000 | MYR | Malaysia Government Bond, 3.42%, due 08/15/22 | 608,773 | |||||||
| 120,000 | MYR | Malaysia Government Bond, 3.48%, due 03/15/23 | 35,038 | |||||||
| 418,000 | MYR | Malaysia Government Bond, 3.49%, due 03/31/20 | 125,122 | |||||||
| 1,059,000 | MYR | Malaysia Government Bond, 3.58%, due 09/28/18 | 322,776 | |||||||
| 2,169,000 | MYR | Malaysia Government Bond, 3.84%, due 08/12/15 | 670,501 | |||||||
| 6,302,000 | MYR | Malaysia Government Bond, 3.89%, due 07/31/20 | 1,921,077 | |||||||
| 550,000 | MYR | Malaysia Government Bond, 3.89%, due 03/15/27 | 159,228 | |||||||
| 7,600,000 | MYR | Malaysia Government Bond, 4.01%, due 09/15/17 | 2,360,773 | |||||||
| 174,000 | MYR | Malaysia Government Bond, 4.16%, due 07/15/21 | 53,787 | |||||||
| 9,323,000 | MYR | Malaysia Government Bond, 4.18%, due 07/15/24 | 2,868,175 | |||||||
| 1,221,000 | MYR | Malaysia Government Bond, 4.38%, due 11/29/19 | 383,958 | |||||||
| 9,000,000 | MXN | Mexican Bonos, 7.25%, due 12/15/16 | 743,611 | |||||||
| 7,430,000 | MXN | Mexican Bonos, 7.75%, due 05/29/31 | 622,394 | |||||||
| 11,000,000 | MXN | Mexican Bonos, 8.00%, due 12/17/15 | 899,248 | |||||||
| 31,000,000 | MXN | Mexican Bonos, 8.00%, due 06/11/20 | 2,688,551 | |||||||
| 9,500,000 | MXN | Mexican Bonos, 8.00%, due 12/07/23 | 825,382 | |||||||
| 104 | See accompanying Notes to the Financial Statements. |
Table of Contents
Mercer Opportunistic Fixed Income Fund
Schedule of Investments (Continued)
(showing percentage of net assets)
March 31, 2014
| Par Value** | Description | Value ($) | ||||||||
Sovereign Debt Obligations — continued | ||||||||||
| 19,040,000 | MXN | Mexican Bonos, 8.50%, due 05/31/29 | 1,708,660 | |||||||
| 30,850,000 | MXN | Mexican Bonos, 10.00%, due 12/05/24 | 3,065,554 | |||||||
| 9,000,000 | MXN | Mexican Bonos, 10.00%, due 11/20/36 | 916,107 | |||||||
| 90,340,000 | NGN | Nigeria Government Bond, 14.20%, due 03/14/24 | 545,836 | |||||||
| 18,396,000 | NGN | Nigeria Government Bond, 15.10%, due 04/27/17 | 115,094 | |||||||
| 54,793,000 | NGN | Nigeria Government Bond, 16.00%, due 06/29/19 | 358,391 | |||||||
| 63,905,000 | NGN | Nigeria Government Bond, 16.39%, due 01/27/22 | 433,509 | |||||||
| 530,000 | PEN | Peruvian Government International Bond, Reg S, 6.95%, due 08/12/31‡‡‡ | 190,675 | |||||||
| 2,100,000 | PEN | Peruvian Government International Bond, Reg S, 7.84%, due 08/12/20‡‡‡ | 831,827 | |||||||
| 2,189,000 | PEN | Peruvian Government International Bond, Reg S, 8.20%, due 08/12/26‡‡‡ | 900,814 | |||||||
| 3,272,000 | PLN | Poland Government Bond, 3.75%, due 04/25/18 | 1,093,731 | |||||||
| 2,520,000 | PLN | Poland Government Bond, 4.00%, due 10/25/23 | 819,676 | |||||||
| 4,563,000 | PLN | Poland Government Bond, 5.75%, due 10/25/21 | 1,674,842 | |||||||
| 4,111,000 | PLN | Poland Government Bond, 5.75%, due 09/23/22 | 1,513,191 | |||||||
| 1,830,000 | RON | Romania Government Bond, 4.75%, due 06/24/19 | 568,540 | |||||||
| 1,580,000 | RON | Romania Government Bond, 5.95%, due 06/11/21 | 513,339 | |||||||
| 33,000,000 | RUB | Russian Federal Bond - OFZ, 5.50%, due 08/08/18†† | 845,229 | |||||||
| 25,000,000 | RUB | Russian Federal Bond - OFZ, 6.20%, due 01/31/18 | 672,484 | |||||||
| 19,000,000 | RUB | Russian Federal Bond - OFZ, 6.88%, due 07/15/15 | 538,015 | |||||||
| 7,560,000 | RUB | Russian Federal Bond - OFZ, 6.90%, due 08/03/16 | 211,292 | |||||||
| 15,500,000 | RUB | Russian Federal Bond - OFZ, 7.00%, due 01/25/23 | 397,884 | |||||||
| 15,500,000 | RUB | Russian Federal Bond - OFZ, 7.00%, due 08/16/23 | 395,215 | |||||||
| 69,183,000 | RUB | Russian Federal Bond - OFZ, 7.05%, due 01/19/28 | 1,716,856 | |||||||
| 10,000,000 | RUB | Russian Federal Bond - OFZ, 7.35%, due 01/20/16 | 282,170 | |||||||
| 21,000,000 | RUB | Russian Federal Bond - OFZ, 7.40%, due 04/19/17 | 589,569 | |||||||
| 25,000,000 | RUB | Russian Federal Bond - OFZ, 7.40%, due 06/14/17 | 697,243 | |||||||
| 25,000,000 | RUB | Russian Federal Bond - OFZ, 7.50%, due 03/15/18 | 693,330 | |||||||
| 47,000,000 | RUB | Russian Federal Bond - OFZ, 7.50%, due 02/27/19 | 1,291,021 | |||||||
| 30,000,000 | RUB | Russian Federal Bond - OFZ, 7.60%, due 04/14/21 | 810,652 | |||||||
| 57,000,000 | RUB | Russian Federal Bond - OFZ, 8.15%, due 02/03/27 | 1,549,971 | |||||||
| 70,000,000 | RUB | Russian Foreign Bond-Eurobond, Reg S, 7.85%, due 03/10/18‡‡‡ | 1,966,623 | |||||||
| 4,702,500 | ZAR | South Africa Government Bond, 6.50%, due 02/28/41 | 335,840 | |||||||
| 10,434,700 | ZAR | South Africa Government Bond, 6.75%, due 03/31/21 | 917,404 | |||||||
| 3,965,000 | ZAR | South Africa Government Bond, 7.00%, due 02/28/31 | 319,095 | |||||||
| 26,713,000 | ZAR | South Africa Government Bond, 7.25%, due 01/15/20 | 2,448,718 | |||||||
| 22,100,000 | ZAR | South Africa Government Bond, 7.75%, due 02/28/23 | 2,031,959 | |||||||
| 14,180,000 | ZAR | South Africa Government Bond, 8.00%, due 12/21/18 | 1,358,479 | |||||||
| 7,255,000 | ZAR | South Africa Government Bond, 8.00%, due 01/31/30 | 643,803 | |||||||
| 38,747,586 | ZAR | South Africa Government Bond, 8.50%, due 01/31/37 | 3,533,844 | |||||||
| 6,500,000 | ZAR | South Africa Government Bond, 8.75%, due 12/21/14 | 628,260 | |||||||
| 17,438,500 | ZAR | South Africa Government Bond, 8.75%, due 02/28/48 | 1,605,491 | |||||||
| 12,568,000 | ZAR | South Africa Government Bond, 10.50%, due 12/21/26 | 1,387,030 | |||||||
| 9,000,000 | ZAR | South Africa Government Bond, 13.50%, due 09/15/15 | 933,573 | |||||||
| 10,700,000 | THB | Thailand Government Bond, 3.58%, due 12/17/27 | 317,414 | |||||||
| 82,479,000 | THB | Thailand Government Bond, 3.63%, due 06/16/23 | 2,538,665 | |||||||
| 110,290,000 | THB | Thailand Government Bond, 3.65%, due 12/17/21 | 3,425,511 | |||||||
| 2,000,000 | THB | Thailand Government Bond, 3.78%, due 06/25/32 | 58,680 | |||||||
| 4,856,000 | THB | Thailand Government Bond, 3.88%, due 06/13/19 | 154,868 | |||||||
| 24,680,000 | THB | Thailand Government Bond, 4.88%, due 06/22/29 | 831,160 | |||||||
| See accompanying Notes to the Financial Statements. | 105 |
Table of Contents
Mercer Opportunistic Fixed Income Fund
Schedule of Investments (Continued)
(showing percentage of net assets)
March 31, 2014
| Par Value** | Description | Value ($) | ||||||||
Sovereign Debt Obligations — continued | ||||||||||
| 2,616,728 | TRY | Turkey Government Bond, 6.50%, due 01/07/15 | 1,186,531 | |||||||
| 1,207,834 | TRY | Turkey Government Bond, 7.10%, due 03/08/23 | 467,223 | |||||||
| 3,740,272 | TRY | Turkey Government Bond, 8.30%, due 10/07/15 | 1,702,111 | |||||||
| 3,788,483 | TRY | Turkey Government Bond, 8.50%, due 09/14/22 | 1,620,448 | |||||||
| 1,704,000 | TRY | Turkey Government Bond, 8.80%, due 11/14/18 | 758,723 | |||||||
| 776,683 | TRY | Turkey Government Bond, 8.80%, due 09/27/23 | 335,297 | |||||||
| 6,000,000 | TRY | Turkey Government Bond, 9.00%, due 03/08/17 | 2,731,862 | |||||||
| 2,458,338 | TRY | Turkey Government Bond, 9.50%, due 01/12/22 | 1,111,837 | |||||||
| 250,000 | TRY | Turkey Government Bond, 10.00%, due 06/17/15 | 115,931 | |||||||
| 4,122,969 | TRY | Turkey Government Bond, 10.50%, due 01/15/20 | 1,968,779 | |||||||
|
| |||||||||
| 120,682,062 | ||||||||||
|
| |||||||||
TOTAL DEBT OBLIGATIONS (COST $234,335,669) | 239,162,866 | |||||||||
|
| |||||||||
| Shares | Description | Value ($) | ||||||||
PREFERRED STOCK — 0.1% | ||||||||||
Diversified Financial Services — 0.1% | ||||||||||
| 14,000 | GMAC Capital Trust I, 7.441%† | 382,200 | ||||||||
|
| |||||||||
TOTAL PREFERRED STOCK (COST $377,520) | 382,200 | |||||||||
|
| |||||||||
| Par Value** | Description | Value ($) | ||||||||
SHORT-TERM INVESTMENTS — 7.2% | ||||||||||
Bank Deposit — 7.2% | ||||||||||
| 18,686,992 | State Street Bank & Trust Euro Time Deposit, 0.01%, due 04/01/14 | 18,686,992 | ||||||||
|
| |||||||||
TOTAL BANK DEPOSITS (COST $18,686,992) | 18,686,992 | |||||||||
|
| |||||||||
TOTAL INVESTMENTS — 99.1% (Cost $253,400,181) | 258,232,058 | |||||||||
Other Assets and Liabilities (net) — 0.9% | 2,348,791 | |||||||||
|
| |||||||||
NET ASSETS — 100.0% | $ | 260,580,849 | ||||||||
|
| |||||||||
| 106 | See accompanying Notes to the Financial Statements. |
Table of Contents
Mercer Opportunistic Fixed Income Fund
Schedule of Investments (Continued)
(showing percentage of net assets)
March 31, 2014
Notes to Schedule of Investments: | ||||||
| ** | Unless otherwise indicated, all par values are denominated in United States dollars ($). | |||||
| † | Floating rate note. Rate shown is as of March 31, 2014. | |||||
| †† | Debt obligation initially issued in zero coupon form which converts to coupon form at a specific rate and date. The rate shown is the rate at period end. | |||||
| †††† | When-issued security | |||||
| ‡‡‡ | Security exempt from registration under Regulation S of the Securities Act of 1933, which exempts from registration securities offered and sold outside the United States. Security may not be offered or sold in the United States except pursuant to an exemption from, or in a transaction not subject to, the registration requirements of the Securities Act of 1933. | |||||
| 144A — Securities exempt from registration under Rule 144A of the Securities Act of 1933. These securities may be resold in transactions exempt from registration, normally to qualified institutional buyers. The total market value of the securities at year end is $56,423,247 which represents 21.7% of net assets. | ||||||
| See accompanying Notes to the Financial Statements. | 107 |
Table of Contents
Mercer Opportunistic Fixed Income Fund
Schedule of Investments (Continued)
March 31, 2014
A summary of outstanding financial instruments at March 31, 2014 is as follows:
Cross Currency Foreign Currency Contracts
Settlement | Deliver/Receive | Counterparty | Contract Amount | Contract Amount | Unrealized | |||||||||||||||||
| 06/18/14 | CZK/EUR | Citibank N.A. | 1,552,428 | 42,580,000 | $ | 101 | ||||||||||||||||
| 06/18/14 | EUR/PLN | Goldman Sachs | 8,960,000 | 2,132,572 | 8,883 | |||||||||||||||||
| 06/18/14 | RON/EUR | Citibank N.A. | 712,076 | 3,200,000 | (2,470 | ) | ||||||||||||||||
|
| |||||||||||||||||||||
| $ | 6,514 | |||||||||||||||||||||
|
| |||||||||||||||||||||
Forward Foreign Currency Contracts
Settlement | Currency | Counterparty | Units of | Value | Unrealized | |||||||||||||||||
| Buys | ||||||||||||||||||||||
| 05/02/14 | BRL | Citibank N.A. | 2,676,000 | $ | 1,177,066 | $ | 48,190 | |||||||||||||||
| 05/02/14 | BRL | Goldman Sachs | 1,500,000 | 659,790 | 30,331 | |||||||||||||||||
| 04/16/14 | CLP | Citibank N.A. | 1,131,242,000 | 2,050,990 | 4,693 | |||||||||||||||||
| 07/16/14 | COP | Goldman Sachs | 10,357,400,000 | 5,210,262 | 153,079 | |||||||||||||||||
| 12/04/14 | EUR | Deutsche Bank AG | 200,000 | 275,501 | 491 | |||||||||||||||||
| 02/09/15 | EUR | Deutsche Bank AG | 1,452,000 | 2,000,357 | 1,243 | |||||||||||||||||
| 01/09/15 | EUR | Deutsche Bank AG | 330,350 | 455,074 | (2,249 | ) | ||||||||||||||||
| 12/11/14 | EUR | Deutsche Bank AG | 442,408 | 609,422 | 8,666 | |||||||||||||||||
| 06/18/14 | EUR | Goldman Sachs | 862,000 | 1,187,399 | (7,240 | ) | ||||||||||||||||
| 09/04/14 | EUR | JPMorgan Chase Bank | 100,000 | 137,746 | 4,880 | |||||||||||||||||
| 12/11/14 | GBP | Deutsche Bank AG | 222,000 | 369,388 | 8,572 | |||||||||||||||||
| 06/18/14 | HUF | Citibank N.A. | 80,000,000 | 357,175 | 2,915 | |||||||||||||||||
| 06/18/14 | HUF | Goldman Sachs | 155,787,000 | 695,539 | 10,400 | |||||||||||||||||
| 07/16/14 | IDR | Citibank N.A. | 52,486,830,000 | 4,533,333 | 10,556 | |||||||||||||||||
| 07/16/14 | IDR | Goldman Sachs | 24,500,000,000 | 2,116,086 | 9,464 | |||||||||||||||||
| 06/18/14 | ILS | Citibank N.A. | 401,642 | 115,057 | 380 | |||||||||||||||||
| 04/16/14 | KRW | Citibank N.A. | 573,750,000 | 538,633 | 4,793 | |||||||||||||||||
| 04/16/14 | KRW | Goldman Sachs | 2,764,300,000 | 2,595,108 | 26,825 | |||||||||||||||||
| 06/18/14 | MXN | Citibank N.A. | 25,075,000 | 1,909,041 | 29,147 | |||||||||||||||||
| 06/18/14 | MXN | Goldman Sachs | 38,550,000 | 2,934,937 | 29,027 | |||||||||||||||||
| 04/16/14 | MYR | Citibank N.A. | 12,572,733 | 3,846,323 | 53,045 | |||||||||||||||||
| 04/16/14 | MYR | Goldman Sachs | 2,590,000 | 792,348 | 3,386 | |||||||||||||||||
| 07/16/14 | NGN | Citibank N.A. | 563,971,091 | 3,289,848 | 38,946 | |||||||||||||||||
| 07/16/14 | NGN | Goldman Sachs | 41,138,909 | 239,978 | 572 | |||||||||||||||||
| 04/16/14 | PHP | Goldman Sachs | 17,500,000 | 390,094 | 1,663 | |||||||||||||||||
| 06/18/14 | PLN | Citibank N.A. | 9,525,000 | 3,132,286 | 17,480 | |||||||||||||||||
| 06/18/14 | PLN | Goldman Sachs | 16,384,000 | 5,387,861 | 41,534 | |||||||||||||||||
| 06/18/14 | RON | Citibank N.A. | 4,239,000 | 1,302,632 | 5,906 | |||||||||||||||||
| 06/18/14 | RON | Goldman Sachs | 1,134,000 | 348,475 | 4,911 | |||||||||||||||||
| 07/16/14 | RUB | Citibank N.A. | 151,750,000 | 4,214,199 | 146,416 | |||||||||||||||||
| 07/16/14 | RUB | Goldman Sachs | 63,652,000 | 1,767,659 | 73,207 | |||||||||||||||||
| 05/21/14 | THB | Citibank N.A. | 53,100,000 | 1,633,314 | 41,620 | |||||||||||||||||
| 04/16/14 | THB | Goldman Sachs | 18,070,000 | 556,684 | 16,797 | |||||||||||||||||
| 06/18/14 | TRY | Goldman Sachs | 7,933,000 | 3,620,946 | 160,651 | |||||||||||||||||
| 04/16/14 | TWD | Citibank N.A. | 20,120,000 | 660,980 | (3,358 | ) | ||||||||||||||||
| 108 | See accompanying Notes to the Financial Statements. |
Table of Contents
Mercer Opportunistic Fixed Income Fund
Schedule of Investments (Continued)
March 31, 2014
Forward Foreign Currency Contracts — continued
Settlement | Currency | Counterparty | Units of | Value | Unrealized | |||||||||||||||||
| 04/16/14 | TWD | Goldman Sachs | 92,813,000 | $ | 3,049,081 | $ | (17,469 | ) | ||||||||||||||
| 06/18/14 | ZAR | Goldman Sachs | 11,800,000 | 1,107,299 | 14,854 | |||||||||||||||||
|
| |||||||||||||||||||||
| $ | 974,324 | |||||||||||||||||||||
|
| |||||||||||||||||||||
| Sales | ||||||||||||||||||||||
| 05/02/14 | BRL | Citibank N.A. | 3,847,000 | $ | 1,692,142 | $ | (65,847 | ) | ||||||||||||||
| 07/02/14 | BRL | Goldman Sachs | 700,000 | 302,952 | (7,593 | ) | ||||||||||||||||
| 06/18/14 | CZK | Goldman Sachs | 33,398,000 | 1,677,241 | 17,315 | |||||||||||||||||
| 06/18/14 | EUR | Citibank N.A. | 3,905,326 | 5,379,562 | (7,310 | ) | ||||||||||||||||
| 12/04/14 | EUR | Deutsche Bank AG | 200,000 | 275,501 | (4,481 | ) | ||||||||||||||||
| 12/11/14 | EUR | Deutsche Bank AG | 442,408 | 609,422 | (2,637 | ) | ||||||||||||||||
| 01/09/15 | EUR | Deutsche Bank AG | 1,400,000 | 1,928,574 | (24,909 | ) | ||||||||||||||||
| 02/09/15 | EUR | Deutsche Bank AG | 200,000 | 275,531 | 2,009 | |||||||||||||||||
| 03/09/15 | EUR | Deutsche Bank AG | 400,000 | 551,100 | (1,140 | ) | ||||||||||||||||
| 06/18/14 | ILS | Citibank N.A. | 10,811,000 | 3,096,984 | 23,704 | |||||||||||||||||
| 06/18/14 | MXN | Goldman Sachs | 9,250,000 | 704,233 | (12,379 | ) | ||||||||||||||||
| 04/16/14 | MYR | Citibank N.A. | 3,030,000 | 926,955 | (21,667 | ) | ||||||||||||||||
| 07/16/14 | MYR | Goldman Sachs | 1,767,000 | 537,313 | (2,264 | ) | ||||||||||||||||
| 07/16/14 | NGN | Citibank N.A. | 33,350,000 | 194,543 | (1,153 | ) | ||||||||||||||||
| 04/16/14 | NGN | Citibank N.A. | 111,300,000 | 672,007 | 7,896 | |||||||||||||||||
| 07/16/14 | PEN | Citibank N.A. | 7,942,000 | 2,791,058 | (7,917 | ) | ||||||||||||||||
| 07/16/14 | PEN | Goldman Sachs | 800,000 | 281,144 | (442 | ) | ||||||||||||||||
| 06/18/14 | PLN | Goldman Sachs | 1,580,000 | 519,581 | (4,049 | ) | ||||||||||||||||
| 06/18/14 | RON | Citibank N.A. | 2,970,000 | 912,672 | (3,370 | ) | ||||||||||||||||
| 06/18/14 | RON | Goldman Sachs | 750,000 | 230,473 | (1,402 | ) | ||||||||||||||||
| 07/16/14 | RUB | Citibank N.A. | 47,194,564 | 1,310,625 | (39,599 | ) | ||||||||||||||||
| 07/16/14 | RUB | Goldman Sachs | 142,871,436 | 3,967,635 | (103,443 | ) | ||||||||||||||||
| 06/18/14 | SGD | Citibank N.A. | 850,000 | 675,510 | (4,162 | ) | ||||||||||||||||
| 06/18/14 | SGD | Goldman Sachs | 7,760,000 | 6,167,008 | (36,904 | ) | ||||||||||||||||
| 04/16/14 | THB | Citibank N.A. | 12,300,000 | 378,927 | (3,245 | ) | ||||||||||||||||
| 05/21/14 | THB | Goldman Sachs | 34,530,000 | 1,062,116 | (35,659 | ) | ||||||||||||||||
| 06/18/14 | TRY | Goldman Sachs | 330,000 | 150,626 | (6,180 | ) | ||||||||||||||||
| 04/16/14 | TWD | Citibank N.A. | 112,999,000 | 3,712,229 | 6,067 | |||||||||||||||||
| 06/18/14 | ZAR | Citibank N.A. | 47,735,000 | 4,479,399 | (112,816 | ) | ||||||||||||||||
| 06/18/14 | ZAR | Goldman Sachs | 17,827,000 | 1,672,866 | (30,052 | ) | ||||||||||||||||
|
| |||||||||||||||||||||
| $ | (483,629 | ) | ||||||||||||||||||||
|
| |||||||||||||||||||||
Currency Abbreviations
| BRL | Brazilian Real |
| CLP | Chilean Peso |
| COP | Colombian Peso |
| CZK | Czech Koruna |
| EUR | Euro |
| GBP | British Pound Sterling |
| HUF | Hungarian Forint |
| IDR | Indonesian Rupiah |
| ILS | Israeli Shekel |
| See accompanying Notes to the Financial Statements. | 109 |
Table of Contents
Mercer Opportunistic Fixed Income Fund
Schedule of Investments (Continued)
March 31, 2014
Currency Abbreviations — continued
| KRW | South Korean Won |
| MXN | Mexican Peso |
| MYR | Malaysian Ringgit |
| NGN | Nigeria Naira |
| PEN | Peruvian Nouveau Sol |
| PHP | Philippines Peso |
| PLN | Polish Zloty |
| RON | New Romanian Leu |
| RUB | Russian Ruble |
| SGD | Singapore Dollar |
| THB | Thai Baht |
| TRY | New Turkish Lira |
| TWD | Taiwan Dollar |
| ZAR | South African Rand |
| 110 | See accompanying Notes to the Financial Statements. |
Table of Contents
Mercer Opportunistic Fixed Income Fund
Schedule of Investments (Continued)
March 31, 2014
| Asset Class Summary (Unaudited) | % of Net Assets | ||||
Debt Obligations | 91.8 | ||||
Forward Foreign Currency Contracts | 0.2 | ||||
Preferred Stocks | 0.1 | ||||
Cross Currency Foreign Currency Contracts | 0.0 | ||||
Short-Term Investments | 7.2 | ||||
Other Assets and Liabilities (net) | 0.7 | ||||
|
| ||||
| 100.0 | % | ||||
|
| ||||
| See accompanying Notes to the Financial Statements. | 111 |
Table of Contents
Mercer Emerging Markets Equity Fund
Schedule of Investments
(showing percentage of net assets)
March 31, 2014
| Shares | Description | Value ($) | ||||||||
COMMON STOCKS — 90.7% | ||||||||||
Bermuda — 0.9% | ||||||||||
| 558,000 | China Gas Holdings, Ltd.‡ | 871,847 | ||||||||
| 536,000 | COSCO Pacific, Ltd. | 683,384 | ||||||||
| 4,500 | Credicorp, Ltd. | 620,640 | ||||||||
| 52,977 | Dairy Farm International Holdings, Ltd. | 515,996 | ||||||||
| 18,968,000 | GOME Electrical Appliances Holding, Ltd.‡ | 3,203,290 | ||||||||
| 1,203,000 | Sihuan Pharmaceutical Holdings Group, Ltd. | 1,448,491 | ||||||||
|
| |||||||||
Total Bermuda | 7,343,648 | |||||||||
|
| |||||||||
Brazil — 7.4% | ||||||||||
| 916,863 | AMBEV SA, ADR | 6,793,955 | ||||||||
| 494,200 | AMBEV SA | 3,712,249 | ||||||||
| 159,800 | Arteris SA | 1,290,297 | ||||||||
| 252,559 | Banco Bradesco SA, ADR | 3,452,482 | ||||||||
| 174,100 | Banco do Brasil SA | 1,759,132 | ||||||||
| 81,092 | BB Seguridade Participacoes SA | 902,380 | ||||||||
| 568,974 | BM&FBovespa SA | 2,836,675 | ||||||||
| 181,900 | BR Malls Participacoes SA | 1,578,375 | ||||||||
| 113,500 | BR Properties SA | 937,073 | ||||||||
| 136,500 | CCR SA | 1,053,769 | ||||||||
| 19,000 | Cia Brasileira de Distribuicao Grupo, ADR‡ | 831,440 | ||||||||
| 50,600 | Cia Hering | 613,972 | ||||||||
| 3,000 | Cia Paranaense de Energia, Sponsored ADR‡ | 39,330 | ||||||||
| 142,919 | Cielo SA | 4,579,868 | ||||||||
| 192,092 | Companhia Energetica de Minas Gerais, Sponsored ADR‡ | 1,306,226 | ||||||||
| 26,128 | CPFL Energia SA | 215,369 | ||||||||
| 333,000 | EcoRodovias Infraestrutura e Logistica SA | 2,007,002 | ||||||||
| 288,000 | Even Construtora e Incorporadora SA | 969,998 | ||||||||
| 94,000 | Fibria Celulose SA, Sponsored ADR* ‡ | 1,039,640 | ||||||||
| 208,300 | Gerdau SA, Sponsored ADR | 1,335,203 | ||||||||
| 51,835 | Grupo BTG Pactual | 659,050 | ||||||||
| 457,766 | Itau Unibanco Holding SA, ADR | 6,802,403 | ||||||||
| 3,191 | Itausa - Investimentos Itau SA, ADR* ¤ **** | 13,081 | ||||||||
| 476,700 | JBS SA | 1,639,350 | ||||||||
| 114,100 | Kroton Educacional SA | 2,523,195 | ||||||||
| 63,700 | Lojas Renner SA | 1,812,902 | ||||||||
| 200,800 | MRV Engenharia e Participacoes SA | 719,908 | ||||||||
| 8,900 | Multiplan Empreendimentos Imobiliarios SA | 190,976 | ||||||||
| 32,100 | Petroleo Brasileiro SA, Sponsored ADR‡ | 445,227 | ||||||||
| 346,300 | Porto Seguro SA | 4,887,948 | ||||||||
| 128,200 | Qualicorp SA* | 1,303,873 | ||||||||
| 260,394 | Souza Cruz SA | 2,377,184 | ||||||||
| 14,200 | Telefonica Brasil SA, ADR | 301,608 | ||||||||
| 80,400 | Tim Participacoes SA | 422,220 | ||||||||
| 36,700 | Tim Participacoes SA, ADR | 952,732 | ||||||||
| 25,913 | Totvs SA | 408,820 | ||||||||
| 14,384 | Ultrapar Participacoes SA | 350,022 | ||||||||
| 85,200 | Vale SA, ADR | 1,060,740 | ||||||||
|
| |||||||||
Total Brazil | 64,125,674 | |||||||||
|
| |||||||||
| 112 | See accompanying Notes to the Financial Statements. |
Table of Contents
Mercer Emerging Markets Equity Fund
Schedule of Investments (Continued)
(showing percentage of net assets)
March 31, 2014
| Shares | Description | Value ($) | ||||||||
British Virgin Islands — 0.1% | ||||||||||
| 23,894 | Mail.ru Group, Ltd., Reg S, GDR* ‡‡‡ | 847,042 | ||||||||
|
| |||||||||
Cayman Islands — 4.2% | ||||||||||
| 391,500 | AAC Technologies Holdings, Inc. | 2,033,950 | ||||||||
| 122,000 | Agile Property Holdings, Ltd.‡ | 100,028 | ||||||||
| 213,000 | Anta Sports Products, Ltd.‡ | 355,867 | ||||||||
| 11,053 | Baidu, Inc., Sponsored ADR* | 1,684,256 | ||||||||
| 976,000 | Belle International Holdings, Ltd. | 967,564 | ||||||||
| 7,685 | Bitauto Holdings, Ltd., ADR* | 275,430 | ||||||||
| 272,000 | China Mengniu Dairy Co., Ltd. | 1,360,517 | ||||||||
| 2,100,000 | China Resources Cement Holdings, Ltd. | 1,654,108 | ||||||||
| 228,000 | China Resources Land, Ltd. | 502,026 | ||||||||
| 255,000 | Country Garden Holdings Co., Ltd. | 105,852 | ||||||||
| 2,541,000 | Evergrande Real Estate Group, Ltd.‡ | 1,202,193 | ||||||||
| 1,905,000 | Geely Automobile Holdings, Ltd.‡ | 749,028 | ||||||||
| 60,000 | Kingboard Chemical Holdings, Ltd. | 117,106 | ||||||||
| 78,500 | Longfor Properties Co., Ltd. | 109,092 | ||||||||
| 32,740 | NetEase, Inc., ADR | 2,203,402 | ||||||||
| 42,200 | New Oriental Education & Technology Group, Inc., Sponsored ADR | 1,238,570 | ||||||||
| 506,265 | Sands China, Ltd. | 3,775,589 | ||||||||
| 77,000 | Shimao Property Holdings, Ltd.‡ | 168,750 | ||||||||
| 2,612,000 | Sino Biopharmaceutical, Ltd. | 2,222,391 | ||||||||
| 2,649,500 | Soho China, Ltd. | 2,179,155 | ||||||||
| 8,600 | SouFun Holdings, Ltd., ADR‡ | 588,412 | ||||||||
| 167,340 | Tencent Holdings, Ltd. | 11,638,436 | ||||||||
| 341,000 | Want Want China Holdings, Ltd.‡ | 507,299 | ||||||||
| 22,000 | Zhen Ding Technology Holding, Ltd. | 56,422 | ||||||||
|
| |||||||||
Total Cayman Islands | 35,795,443 | |||||||||
|
| |||||||||
Chile — 1.2% | ||||||||||
| 21,325,102 | Banco de Chile | 2,679,480 | ||||||||
| 3,974 | Banco de Credito e Inversiones | 230,824 | ||||||||
| 28,900 | Banco Santander Chile, ADR | 677,416 | ||||||||
| 75,454,181 | Banco Santander Chile | 4,411,564 | ||||||||
| 14,316 | CAP SA | 231,088 | ||||||||
| 83,277 | Empresas CMPC SA | 190,675 | ||||||||
| 105,900 | Enersis SA, Sponsored ADR | 1,644,627 | ||||||||
| 52,668 | ENTEL Chile SA | 642,356 | ||||||||
|
| |||||||||
Total Chile | 10,708,030 | |||||||||
|
| |||||||||
China — 9.5% | ||||||||||
| 6,071,000 | Agricultural Bank of China, Ltd. Class H | 2,645,333 | ||||||||
| 29,708,000 | Bank of China, Ltd. Class H | 13,174,534 | ||||||||
| 1,388,000 | Bank of Communications Co., Ltd. Class H‡ | 907,195 | ||||||||
| 498,000 | Beijing Capital International Airport Co., Ltd. Class H | 339,616 | ||||||||
| 2,366,000 | China BlueChemical, Ltd. Class H‡ | 1,217,001 | ||||||||
| 1,896,000 | China Citic Bank Corp., Ltd. Class H | 1,092,570 | ||||||||
| 107,000 | China Communications Construction Co., Ltd. Class H‡ | 74,625 | ||||||||
| 1,272,000 | China Communications Services Corp., Ltd. Class H | 588,688 | ||||||||
| See accompanying Notes to the Financial Statements. | 113 |
Table of Contents
Mercer Emerging Markets Equity Fund
Schedule of Investments (Continued)
(showing percentage of net assets)
March 31, 2014
| Shares | Description | Value ($) | ||||||||
China — continued | ||||||||||
| 15,046,000 | China Construction Bank Corp. Class H | 10,532,326 | ||||||||
| 440,500 | China Merchants Bank Co., Ltd. Class H | 799,562 | ||||||||
| 1,024,500 | China Minsheng Banking Corp., Ltd. Class H‡ | 1,027,531 | ||||||||
| 294,000 | China Oilfield Services, Ltd. Class H | 690,556 | ||||||||
| 19,930 | China Petroleum & Chemical Corp., ADR‡ | 1,783,735 | ||||||||
| 5,404,000 | China Petroleum & Chemical Corp. Class H | 4,848,730 | ||||||||
| 2,323,000 | China Railway Construction Corp. Class H‡ | 1,964,520 | ||||||||
| 575,000 | China Railway Group, Ltd. Class H | 267,595 | ||||||||
| 1,380,000 | China Shenhua Energy Co., Ltd. Class H | 3,985,020 | ||||||||
| 2,366,000 | China Telecom Corp., Ltd. Class H | 1,094,996 | ||||||||
| 763,000 | Chongqing Rural Commercial Bank Class H‡ | 335,415 | ||||||||
| 458,000 | Datang International Power Generation Co., Ltd. Class H‡ | 167,092 | ||||||||
| 2,480,000 | Dongfeng Motor Group Co., Ltd. Class H | 3,523,195 | ||||||||
| 207,500 | Great Wall Motor Co., Ltd. Class H‡ | 1,041,907 | ||||||||
| 904,800 | Guangzhou R&F Properties Co., Ltd. Class H‡ | 1,304,061 | ||||||||
| 944,000 | Huaneng Power International, Inc. Class H | 900,549 | ||||||||
| 21,193,000 | Industrial & Commercial Bank of China Class H | 13,032,095 | ||||||||
| 1,592,000 | Jiangsu Expressway Co., Ltd. Class H‡ | 1,816,309 | ||||||||
| 1,604,000 | Jiangxi Copper Co., Ltd. Class H‡ | 2,696,407 | ||||||||
| 154,800 | New China Life Insurance Co., Ltd. Class H* | 467,969 | ||||||||
| 3,400 | PetroChina Co., Ltd., ADR | 368,900 | ||||||||
| 840,000 | PICC Property & Casualty Co., Ltd. Class H | 1,150,025 | ||||||||
| 278,000 | Ping An Insurance Group Co. Class H | 2,304,407 | ||||||||
| 376,000 | Shandong Weigao Group Medical Polymer Co., Ltd. Class H | 428,008 | ||||||||
| 783,500 | Sinopec Engineering Group Co., Ltd. Class H | 846,421 | ||||||||
| 3,408,000 | Sinopec Shanghai Petrochemical Co., Ltd. Class H‡ | 874,291 | ||||||||
| 147,669 | Tsingtao Brewery Co., Ltd. Class H‡ | 1,083,191 | ||||||||
| 2,254,000 | Zhejiang Expressway Co., Ltd. Class H | 2,054,361 | ||||||||
| 95,000 | Zhuzhou CSR Times Electric Co., Ltd. Class H | 318,420 | ||||||||
|
| |||||||||
Total China | 81,747,156 | |||||||||
|
| |||||||||
Colombia — 0.2% | ||||||||||
| 111,522 | Cementos Argos SA | 571,094 | ||||||||
| 750,316 | Ecopetrol SA | 1,536,158 | ||||||||
|
| |||||||||
Total Colombia | 2,107,252 | |||||||||
|
| |||||||||
Czech Republic — 0.6% | ||||||||||
| 72,069 | CEZ AS | 2,067,541 | ||||||||
| 11,532 | Komercni Banka AS | 2,757,916 | ||||||||
|
| |||||||||
Total Czech Republic | 4,825,457 | |||||||||
|
| |||||||||
Denmark — 0.2% | ||||||||||
| 13,972 | Carlsberg A/S Class B | 1,390,236 | ||||||||
|
| |||||||||
Germany — 0.3% | ||||||||||
| 28,098 | HeidelbergCement AG | 2,409,148 | ||||||||
|
| |||||||||
Hong Kong — 4.8% | ||||||||||
| 478,800 | AIA Group, Ltd. | 2,271,461 | ||||||||
| 114 | See accompanying Notes to the Financial Statements. |
Table of Contents
Mercer Emerging Markets Equity Fund
Schedule of Investments (Continued)
(showing percentage of net assets)
March 31, 2014
| Shares | Description | Value ($) | ||||||||
Hong Kong — continued | ||||||||||
| 658,000 | Cathay Pacific Airways, Ltd. | 1,224,888 | ||||||||
| 311,000 | China Agri-Industries Holdings, Ltd. | 121,080 | ||||||||
| 98,900 | China Mobile, Ltd., Sponsored ADR | 4,508,851 | ||||||||
| 460,000 | China Mobile, Ltd. | 4,210,364 | ||||||||
| 972,000 | China Overseas Land & Investment, Ltd.‡ | 2,512,373 | ||||||||
| 1,236,000 | China Resources Power Holdings Co., Ltd. | 3,218,646 | ||||||||
| 4,033,000 | CNOOC, Ltd. | 6,062,199 | ||||||||
| 11,700 | CNOOC, Ltd., ADR | 1,776,177 | ||||||||
| 1,028,000 | Far East Horizon, Ltd. | 758,041 | ||||||||
| 314,000 | Franshion Properties China, Ltd.‡ | 104,841 | ||||||||
| 144,530 | Galaxy Entertainment Group, Ltd.* | 1,257,666 | ||||||||
| 1,372,000 | Guangdong Investment, Ltd.‡ | 1,317,692 | ||||||||
| 456,982 | Hongkong Electric Holdings | 3,961,820 | ||||||||
| 2,180,000 | Lenovo Group, Ltd. | 2,394,415 | ||||||||
| 318,480 | Link (The) REIT | 1,570,424 | ||||||||
| 6,416,000 | Shougang Fushan Resources Group, Ltd.‡ | 1,952,000 | ||||||||
| 184,000 | Sino-Ocean Land Holdings, Ltd.‡ | 100,337 | ||||||||
| 832,000 | SJM Holdings, Ltd. | 2,338,208 | ||||||||
| 442,000 | Yuexiu Property Co., Ltd.‡ | 91,169 | ||||||||
|
| |||||||||
Total Hong Kong | 41,752,652 | |||||||||
|
| |||||||||
Hungary — 0.2% | ||||||||||
| 3,142 | MOL Hungarian Oil and Gas Plc | 176,782 | ||||||||
| 76,514 | OTP Bank Nyrt‡ | 1,465,416 | ||||||||
|
| |||||||||
Total Hungary | 1,642,198 | |||||||||
|
| |||||||||
India — 9.1% | ||||||||||
| 486,926 | Apollo Tyres, Ltd. | 1,297,572 | ||||||||
| 84,819 | Asian Paints, Ltd. | 777,002 | ||||||||
| 355,055 | Aurobindo Pharma, Ltd. | 3,045,664 | ||||||||
| 50,296 | Axis Bank, Ltd. | 1,229,556 | ||||||||
| 44,468 | Bajaj Auto, Ltd. | 1,544,402 | ||||||||
| 211,043 | Cipla, Ltd. | 1,350,060 | ||||||||
| 217,534 | Coal India, Ltd. | 1,050,472 | ||||||||
| 25,964 | Colgate-Palmolive India, Ltd. | 597,534 | ||||||||
| 34,578 | Dr Reddy’s Laboratories, Ltd. | 1,479,983 | ||||||||
| 18,900 | Dr. Reddy’s Laboratories, Ltd., ADR | 829,710 | ||||||||
| 230,784 | Glenmark Pharmaceuticals, Ltd. | 2,197,032 | ||||||||
| 142,823 | HCL Technologies, Ltd. Class T | 3,333,673 | ||||||||
| 134,293 | HDFC Bank, Ltd., ADR | 5,510,042 | ||||||||
| 399,822 | Hindustan Unilever, Ltd. | 4,054,288 | ||||||||
| 360,681 | Housing Development Finance Corp. | 5,314,568 | ||||||||
| 73,974 | ICICI Bank, Ltd. | 1,538,686 | ||||||||
| 48,915 | Infosys, Ltd. | 2,692,178 | ||||||||
| 39,800 | Infosys, Ltd., Sponsored ADR‡ | 2,156,364 | ||||||||
| 959,854 | ITC, Ltd. | 5,672,577 | ||||||||
| 77,083 | Kotak Mahindra Bank, Ltd. | 1,006,735 | ||||||||
| 50,508 | Maruti Suzuki India, Ltd. | 1,663,557 | ||||||||
| 12,897 | Nestle India, Ltd. | 1,092,744 | ||||||||
| See accompanying Notes to the Financial Statements. | 115 |
Table of Contents
Mercer Emerging Markets Equity Fund
Schedule of Investments (Continued)
(showing percentage of net assets)
March 31, 2014
| Shares | Description | Value ($) | ||||||||
India — continued | ||||||||||
| 690,357 | NMDC, Ltd. | 1,609,070 | ||||||||
| 302,942 | Oil & Natural Gas Corp., Ltd. | 1,615,082 | ||||||||
| 200,630 | Oil India, Ltd. | 1,615,857 | ||||||||
| 593,871 | Power Finance Corp., Ltd. | 1,917,670 | ||||||||
| 45,485 | Reliance Industries, Ltd., GDR 144A | 1,410,035 | ||||||||
| 546,898 | Sesa Sterlite, Ltd. | 1,720,202 | ||||||||
| 7,490 | State Bank of India, Ltd., Reg S, GDR‡‡‡ | 476,364 | ||||||||
| 245,608 | Sun Pharmaceutical Industries, Ltd. | 2,365,091 | ||||||||
| 98,114 | Tata Consultancy Services, Ltd. | 3,514,016 | ||||||||
| 306,897 | Tata Motors, Ltd. | 2,047,779 | ||||||||
| 72,700 | Tata Motors, Ltd., Sponsored ADR | 2,574,307 | ||||||||
| 107,244 | Tech Mahindra, Ltd. | 3,220,507 | ||||||||
| 6,903 | United Spirits, Ltd. | 305,155 | ||||||||
| 47,671 | Westlife Development, Ltd.* | 295,337 | ||||||||
| 179,193 | Wipro, Ltd., ADR‡ | 2,401,186 | ||||||||
| 134,003 | Wipro, Ltd. | 1,222,850 | ||||||||
| 114,474 | Zee Entertainment Enterprises, Ltd. | 521,360 | ||||||||
|
| |||||||||
Total India | 78,266,267 | |||||||||
|
| |||||||||
Indonesia — 2.6% | ||||||||||
| 4,426,700 | Adaro Energy Tbk PT | 381,881 | ||||||||
| 1,299,338 | Bank Central Asia Tbk PT | 1,212,410 | ||||||||
| 3,433,200 | Bank Negara Indonesia Persero Tbk PT | 1,499,003 | ||||||||
| 4,552,600 | Bank Rakyat Indonesia Persero Tbk PT | 3,837,249 | ||||||||
| 1,564,400 | Global Mediacom Tbk PT | 323,622 | ||||||||
| 11,700 | Gudang Garam Tbk PT | 50,879 | ||||||||
| 423,300 | Indocement Tunggal Prakarsa Tbk PT | 871,007 | ||||||||
| 3,565,200 | Indofood Sukses Makmur Tbk PT | 2,291,018 | ||||||||
| 7,377,200 | Kalbe Farma Tbk PT | 951,373 | ||||||||
| 1,366,500 | Lippo Karawaci Tbk PT | 130,515 | ||||||||
| 765,700 | Media Nusantara Citra Tbk PT | 177,270 | ||||||||
| 6,965,400 | Perusahaan Gas Negara Persero Tbk PT | 3,142,401 | ||||||||
| 659,769 | Semen Gresik Persero Tbk PT | 917,636 | ||||||||
| 43,100 | Telekomunikasi Indonesia Persero Tbk PT, Sponsored ADR | 1,696,847 | ||||||||
| 15,718,650 | Telekomunikasi Indonesia Persero Tbk PT | 3,064,860 | ||||||||
| 839,096 | Unilever Indonesia Tbk PT | 2,160,524 | ||||||||
| 71,900 | United Tractors Tbk PT | 131,331 | ||||||||
|
| |||||||||
Total Indonesia | 22,839,826 | |||||||||
|
| |||||||||
Luxembourg — 0.3% | ||||||||||
| 6,792 | Kernel Holding SA* | 65,775 | ||||||||
| 93,000 | Ternium SA, Sponsored ADR | 2,750,940 | ||||||||
|
| |||||||||
Total Luxembourg | 2,816,715 | |||||||||
|
| |||||||||
Malaysia — 3.6% | ||||||||||
| 1,855,845 | Alliance Financial Group Bhd | 2,506,286 | ||||||||
| 1,304,800 | AMMB Holdings Bhd | 2,868,922 | ||||||||
| 41,412 | British American Tobacco Malaysia Bhd | 749,740 | ||||||||
| 116 | See accompanying Notes to the Financial Statements. |
Table of Contents
Mercer Emerging Markets Equity Fund
Schedule of Investments (Continued)
(showing percentage of net assets)
March 31, 2014
| Shares | Description | Value ($) | ||||||||
Malaysia — continued | ||||||||||
| 88,500 | DiGi.Com Bhd | 146,077 | ||||||||
| 3,788,600 | Genting Malaysia Bhd | 4,872,797 | ||||||||
| 102,100 | IJM Corp. Bhd | 191,975 | ||||||||
| 583,900 | IOI Corp. Bhd | 858,282 | ||||||||
| 1,254,608 | Malayan Banking Bhd | 3,719,065 | ||||||||
| 101,400 | MISC Bhd* | 214,258 | ||||||||
| 1,228,000 | Petronas Chemicals Group Bhd | 2,598,524 | ||||||||
| 313,000 | Public Bank Bhd | 1,836,497 | ||||||||
| 106,200 | Public Bank Bhd (Foreign Market) | 624,419 | ||||||||
| 26,000 | RHB Capital Bhd | 67,040 | ||||||||
| 1,836,200 | Tenaga Nasional Bhd | 6,725,142 | ||||||||
| 898,800 | UMW Holdings Bhd | 3,022,148 | ||||||||
|
| |||||||||
Total Malaysia | 31,001,172 | |||||||||
|
| |||||||||
Mexico — 4.9% | ||||||||||
| 1,316,200 | Alfa SAB de CV Class A‡ | 3,328,641 | ||||||||
| 187,700 | America Movil SA de CV Series L, ADR | 3,731,476 | ||||||||
| 146,100 | Arca Continental SAB de CV‡ | 872,093 | ||||||||
| 72,500 | Cemex SAB de CV, Sponsored ADR* | 915,675 | ||||||||
| 11,340 | Coca-Cola Femsa SAB de CV, Sponsored ADR‡ | 1,196,597 | ||||||||
| 1,339,455 | Compartamos SAB de CV | 2,451,283 | ||||||||
| 91,600 | Fibra Uno Administracion SA de CV REIT‡ | 296,518 | ||||||||
| 47,092 | Fomento Economico Mexicano SA de CV, Sponsored ADR | 4,390,858 | ||||||||
| 100,700 | Fomento Economico Mexicano SAB de CV‡ | 939,648 | ||||||||
| 56,800 | Genomma Lab Internacional SAB de CV Class B* | 146,214 | ||||||||
| 133,500 | Grupo Carso SAB de CV Series A-1‡ | 700,814 | ||||||||
| 63,423 | Grupo Financiero Banorte SAB de CV Series O‡ | 429,131 | ||||||||
| 315,600 | Grupo Financiero Inbursa SAB de CV Series O‡ | 815,801 | ||||||||
| 125,603 | Grupo Financiero Santander Mexico SAB de CV Class B, ADR | 1,543,661 | ||||||||
| 2,019,200 | Grupo Mexico SAB de CV Series B‡ | 6,375,403 | ||||||||
| 112,589 | Grupo Televisa SAB, Sponsored ADR | 3,748,088 | ||||||||
| 126,739 | Industrias Penoles SAB de CV‡ | 3,303,397 | ||||||||
| 763,600 | Kimberly-Clark de Mexico SAB de CV‡ | 2,039,388 | ||||||||
| 16,422 | Promotora y Operadora de Infraestructura SAB de CV* | 220,705 | ||||||||
| 1,984,299 | Wal-Mart de Mexico SAB de CV‡ | 4,729,319 | ||||||||
|
| |||||||||
Total Mexico | 42,174,710 | |||||||||
|
| |||||||||
Netherlands — 0.2% | ||||||||||
| 56,881 | Yandex NV Class A* | 1,717,237 | ||||||||
|
| |||||||||
Panama — 0.1% | ||||||||||
| 72,600 | Avianca Holdings SA, Sponsored ADR* | 1,237,830 | ||||||||
|
| |||||||||
Peru — 0.0% | ||||||||||
| 12,700 | Cia de Minas Buenaventura SA, ADR | 159,639 | ||||||||
|
| |||||||||
Philippines — 0.6% | ||||||||||
| 844,500 | Aboitiz Equity Ventures, Inc. | 1,054,566 | ||||||||
| 3,032,600 | Alliance Global Group, Inc. | 1,927,285 | ||||||||
| See accompanying Notes to the Financial Statements. | 117 |
Table of Contents
Mercer Emerging Markets Equity Fund
Schedule of Investments (Continued)
(showing percentage of net assets)
March 31, 2014
| Shares | Description | Value ($) | ||||||||
Philippines — continued | ||||||||||
| 673,420 | Metropolitan Bank & Trust Co. | 1,160,784 | ||||||||
| 40,550 | SM Investments Corp. | 637,479 | ||||||||
|
| |||||||||
Total Philippines | 4,780,114 | |||||||||
|
| |||||||||
Poland — 1.4% | ||||||||||
| 8,236 | Bank Pekao SA | 535,910 | ||||||||
| 30,835 | Eurocash SA | 408,119 | ||||||||
| 24,683 | Grupa Lotos SA* | 310,355 | ||||||||
| 186,704 | Orange Polska SA | 639,567 | ||||||||
| 314,479 | PGE SA | 1,967,185 | ||||||||
| 628,771 | Polskie Gornictwo Naftowe i Gazownictwo SA | 923,990 | ||||||||
| 178,461 | Powszechna Kasa Oszczednosci Bank Polski SA | 2,509,109 | ||||||||
| 32,440 | Powszechny Zaklad Ubezpieczen SA | 4,611,432 | ||||||||
| 69,443 | Synthos SA | 112,160 | ||||||||
| 53,249 | Tauron Polska Energia SA | 92,526 | ||||||||
|
| |||||||||
Total Poland | 12,110,353 | |||||||||
|
| |||||||||
Russia — 4.1% | ||||||||||
| 766,920 | Aeroflot - Russian Airlines OJSC* | 1,206,961 | ||||||||
| 1,673,823 | Alrosa AO | 1,717,724 | ||||||||
| 543,221 | Gazprom OAO, Sponsored ADR | 4,182,802 | ||||||||
| 39,150 | LUKOIL OAO (DTC Shares), Sponsored ADR | 2,189,464 | ||||||||
| 54,671 | LUKOIL OAO (Euroclear Shares), Sponsored ADR | 3,037,521 | ||||||||
| 116,564 | MMC Norilsk Nickel OJSC, ADR | 1,938,459 | ||||||||
| 56,166 | MMC Norilsk Nickel OJSC (London Exchange), ADR | 934,041 | ||||||||
| 612,607 | Moscow Exchange MICEX OAO | 1,005,425 | ||||||||
| 436,614 | Rosneft Oil Co., Reg S, GDR‡‡‡ | 2,907,413 | ||||||||
| 1,114,636 | Sberbank of Russia* | 2,651,266 | ||||||||
| 227,808 | Sberbank of Russia, Sponsored ADR | 2,225,684 | ||||||||
| 151,625 | Sistema JSFC, Reg S, GDR‡‡‡ | 3,413,079 | ||||||||
| 268,367 | Surgutneftegas OAO, Sponsored ADR | 1,977,865 | ||||||||
| 43,875 | Tatneft, Sponsored ADR | 1,503,157 | ||||||||
| 74,851 | Tatneft OAO, Sponsored ADR | 2,564,395 | ||||||||
| 16,912 | Uralkali (Ordinary Shares), Reg S, GDR‡‡‡ | 401,322 | ||||||||
| 506,283 | VTB Bank OJSC, Reg S, GDR | 1,113,316 | ||||||||
|
| |||||||||
Total Russia | 34,969,894 | |||||||||
|
| |||||||||
Singapore — 0.1% | ||||||||||
| 94,650 | DBS Group Holdings, Ltd. | 1,217,041 | ||||||||
|
| |||||||||
South Africa — 5.4% | ||||||||||
| 17,335 | African Rainbow Minerals, Ltd. | 343,803 | ||||||||
| 89,310 | Barclays Africa Group, Ltd. | 1,265,195 | ||||||||
| 25,232 | Barloworld, Ltd. | 264,533 | ||||||||
| 26,324 | Bidvest Group, Ltd. | 696,799 | ||||||||
| 456,107 | FirstRand, Ltd. | 1,565,471 | ||||||||
| 78,083 | Foschini Group, Ltd. (The) | 795,462 | ||||||||
| 65,050 | Growthpoint Properties, Ltd. | 150,907 | ||||||||
| 118 | See accompanying Notes to the Financial Statements. |
Table of Contents
Mercer Emerging Markets Equity Fund
Schedule of Investments (Continued)
(showing percentage of net assets)
March 31, 2014
| Shares | Description | Value ($) | ||||||||
South Africa — continued | ||||||||||
| 227,200 | Harmony Gold Mining Co., Ltd., Sponsored ADR* ‡ | 692,960 | ||||||||
| 85,232 | Imperial Holdings, Ltd. | 1,527,513 | ||||||||
| 137,122 | Investec, Ltd. | 1,106,060 | ||||||||
| 44,477 | Kumba Iron Ore, Ltd. | 1,598,447 | ||||||||
| 95,419 | Liberty Holdings, Ltd. | 1,128,110 | ||||||||
| 451,740 | Life Healthcare Group Holdings, Ltd. | 1,653,991 | ||||||||
| 29,491 | Mediclinic International, Ltd. | 209,815 | ||||||||
| 442,394 | MMI Holdings, Ltd. | 1,034,702 | ||||||||
| 542,465 | MTN Group, Ltd. | 11,117,080 | ||||||||
| 116,443 | Nampak, Ltd. | 398,000 | ||||||||
| 32,433 | Naspers, Ltd. | 3,581,108 | ||||||||
| 256,614 | Netcare, Ltd. | 569,445 | ||||||||
| 26,253 | Northam Platinum, Ltd.* | 97,170 | ||||||||
| 158,622 | Redefine Properties, Ltd. | 144,025 | ||||||||
| 105,615 | Remgro, Ltd. | 2,057,895 | ||||||||
| 234,106 | Reunert, Ltd. | 1,435,632 | ||||||||
| 160,206 | RMB Holdings, Ltd. | 730,515 | ||||||||
| 120,062 | Salam, Ltd. | 656,820 | ||||||||
| 104,148 | Sasol, Ltd. | 5,837,908 | ||||||||
| 108,928 | Spar Group, Ltd. (The) | 1,258,515 | ||||||||
| 115,817 | Standard Bank Group, Ltd. | 1,528,385 | ||||||||
| 301,430 | Steinhoff International Holdings, Ltd. | 1,461,597 | ||||||||
| 92,564 | Truworths International, Ltd. | 679,848 | ||||||||
| 158,912 | Woolworths Holdings, Ltd. | 1,108,678 | ||||||||
|
| |||||||||
Total South Africa | 46,696,389 | |||||||||
|
| |||||||||
South Korea — 10.8% | ||||||||||
| 4,840 | BS Financial Group, Inc. | 68,432 | ||||||||
| 21,806 | Daelim Industrial Co., Ltd. | 1,776,110 | ||||||||
| 121,770 | DGB Financial Group, Inc. | 1,761,715 | ||||||||
| 37,716 | Dongbu Insurance Co., Ltd. | 1,955,868 | ||||||||
| 5,494 | E-Mart Co., Ltd. | 1,259,370 | ||||||||
| 42,230 | Grand Korea Leisure Co., Ltd. | 1,735,697 | ||||||||
| 44,320 | Halla Visteon Climate Control Corp. | 2,023,535 | ||||||||
| 21,352 | Hana Financial Group, Inc. | 780,302 | ||||||||
| 115,040 | Hanwha Life Insurance Co., Ltd. | 754,361 | ||||||||
| 48,710 | Hite Jinro Co., Ltd. | 1,075,377 | ||||||||
| 27,030 | Hyosung Corp. | 1,950,213 | ||||||||
| 2,866 | Hyundai Department Store Co., Ltd. | 382,331 | ||||||||
| 6,571 | Hyundai Engineering & Construction Co., Ltd. | 345,696 | ||||||||
| 8 | Hyundai Hysco Co., Ltd. | 413 | ||||||||
| 70,000 | Hyundai Marine & Fire Insurance Co., Ltd. | 2,018,883 | ||||||||
| 18,670 | Hyundai Mobis | 5,524,966 | ||||||||
| 21,401 | Hyundai Motor Co. | 5,046,410 | ||||||||
| 7,646 | Hyundai Wia Corp. | 1,228,302 | ||||||||
| 74,200 | Industrial Bank of Korea | 941,049 | ||||||||
| 100,800 | Kangwon Land, Inc. | 2,935,601 | ||||||||
| 32,550 | KB Financial Group, Inc. | 1,139,074 | ||||||||
| 1,095 | KCC Corp. | 560,642 | ||||||||
| See accompanying Notes to the Financial Statements. | 119 |
Table of Contents
Mercer Emerging Markets Equity Fund
Schedule of Investments (Continued)
(showing percentage of net assets)
March 31, 2014
| Shares | Description | Value ($) | ||||||||
South Korea — continued | ||||||||||
| 36,795 | Kia Motors Corp. | 2,049,832 | ||||||||
| 26,430 | Korea Electric Power Corp. | 905,043 | ||||||||
| 36,550 | Korean Air Lines Co., Ltd.* | 1,323,691 | ||||||||
| 177,384 | Korean Reinsurance Co. | 1,716,431 | ||||||||
| 49,800 | KT Corp., Sponsored ADR* | 691,722 | ||||||||
| 52,482 | KT&G Corp. | 3,944,347 | ||||||||
| 4,316 | LG Chem, Ltd. | 1,029,888 | ||||||||
| 30,610 | LG Corp. | 1,665,009 | ||||||||
| 126,300 | LG Display Co., Ltd., ADR* ‡ | 1,578,750 | ||||||||
| 2,893 | LG Household & Health Care, Ltd. | 1,248,845 | ||||||||
| 2,795 | LS Corp. | 200,346 | ||||||||
| 42,960 | Mirae Asset Securities Co., Ltd. | 1,666,821 | ||||||||
| 2,176 | NAVER Corp. | 1,582,248 | ||||||||
| 2,242 | NHN Entertainment Corp.* | 202,200 | ||||||||
| 1,281 | Orion Corp. Republic of South Korea | 985,616 | ||||||||
| 630 | POSCO | 175,189 | ||||||||
| 21,638 | S1 Corp. Korea | 1,809,180 | ||||||||
| 26,850 | Samsung Card Co., Ltd. | 874,022 | ||||||||
| 3,033 | Samsung Electronics Co., Ltd. | 3,826,689 | ||||||||
| 17,297 | Samsung Electronics Reg S, GDR‡‡‡ | 10,879,813 | ||||||||
| 7,444 | Samsung Fire & Marine Insurance Co., Ltd. | 1,674,891 | ||||||||
| 58,760 | Samsung Heavy Industries Co., Ltd. | 1,758,191 | ||||||||
| 2,469 | Samsung Life Insurance Co., Ltd. | 233,110 | ||||||||
| 26,700 | Shinhan Financial Group Co., Ltd. | 1,178,919 | ||||||||
| 1,262 | Shinsegae Co., Ltd. | 273,278 | ||||||||
| 13,978 | SK C&C Co., Ltd. | 1,963,184 | ||||||||
| 11,922 | SK Holdings Co., Ltd. | 2,161,629 | ||||||||
| 85,310 | SK Hynix, Inc.* | 2,885,208 | ||||||||
| 23,540 | SK Networks Co., Ltd.* | 209,205 | ||||||||
| 29,982 | SK Telecom Co., Ltd. | 6,069,915 | ||||||||
| 114,360 | Woori Finance Holdings Co., Ltd.* | 1,299,973 | ||||||||
|
| |||||||||
Total South Korea | 93,327,532 | |||||||||
|
| |||||||||
Switzerland — 0.2% | ||||||||||
| 197,812 | Cie Financiere Richemont SA, ADR | 1,899,149 | ||||||||
|
| |||||||||
Taiwan — 10.6% | ||||||||||
| 2,194,000 | Advanced Semiconductor Engineering, Inc. | 2,435,176 | ||||||||
| 254,000 | Asustek Computer, Inc. | 2,514,769 | ||||||||
| 2,945,000 | AU Optronics Corp.* | 1,039,611 | ||||||||
| 164,000 | Cathay Financial Holding Co., Ltd. | 239,113 | ||||||||
| 300 | Cheng Shin Rubber Industry Co., Ltd. | 856 | ||||||||
| 135,000 | Cheng Uei Precision Industry Co., Ltd. | 285,937 | ||||||||
| 247,560 | Chicony Electronics Co., Ltd. | 642,221 | ||||||||
| 250,000 | China Airlines, Ltd.* | 82,506 | ||||||||
| 207,000 | China Development Financial Holding Corp. | 59,206 | ||||||||
| 571,000 | China Life Insurance Co., Ltd. | 524,077 | ||||||||
| 1,273,000 | China Motor Corp. | 1,137,036 | ||||||||
| 225 | China Petrochemical Development Corp. | 93 | ||||||||
| 120 | See accompanying Notes to the Financial Statements. |
Table of Contents
Mercer Emerging Markets Equity Fund
Schedule of Investments (Continued)
(showing percentage of net assets)
March 31, 2014
| Shares | Description | Value ($) | ||||||||
Taiwan — continued | ||||||||||
| 330,000 | Compal Electronics, Inc. | 234,069 | ||||||||
| 2,024,000 | CTBC Financial Holding Co., Ltd. | 1,266,142 | ||||||||
| 878,000 | CTCI Corp. | 1,316,171 | ||||||||
| 577,000 | Delta Electronics, Inc. | 3,562,138 | ||||||||
| 3,027,000 | E.Sun Financial Holding Co., Ltd. | 1,824,003 | ||||||||
| 27,000 | Eclat Textile Co., Ltd. | 312,093 | ||||||||
| 458,000 | Eva Airways Corp.* | 230,109 | ||||||||
| 194,000 | Far Eastern Department Stores, Ltd. | 171,050 | ||||||||
| 372,000 | Far EasTone Telecommunications Co., Ltd. | 787,916 | ||||||||
| 1,162,000 | Farglory Land Development Co., Ltd. | 1,980,389 | ||||||||
| 39,000 | Formosa Chemicals & Fibre Corp. | 94,258 | ||||||||
| 892 | Foxconn Technology Co., Ltd. | 2,103 | ||||||||
| 4,420,997 | Fubon Financial Holding Co., Ltd. | 5,995,802 | ||||||||
| 2,418,670 | Hon Hai Precision Industry Co., Ltd. | 6,854,321 | ||||||||
| 2,696,000 | Inventec Corp. | 2,655,940 | ||||||||
| 782,000 | Kinsus Interconnect Technology Corp. | 2,901,765 | ||||||||
| 30,000 | Largan Precision Co., Ltd. | 1,418,603 | ||||||||
| 1,882,165 | Lite-On Technology Corp. | 2,806,019 | ||||||||
| 42,880 | MediaTek, Inc. | 632,939 | ||||||||
| 283,000 | Mega Financial Holding Co., Ltd. | 219,319 | ||||||||
| 395,000 | Pegatron Corp. | 588,236 | ||||||||
| 169,000 | Phison Electronics Corp. | 1,087,727 | ||||||||
| 1,704,000 | Pou Chen Corp. | 2,403,310 | ||||||||
| 450,062 | President Chain Store Corp. | 3,177,517 | ||||||||
| 1,079,000 | Quanta Computer, Inc. | 2,905,443 | ||||||||
| 619,060 | Radiant Opto-Electronics Corp. | 2,500,431 | ||||||||
| 938,212 | Realtek Semiconductor Corp. | 2,828,269 | ||||||||
| 57,000 | Ruentex Development Co., Ltd. | 104,257 | ||||||||
| 105,000 | Ruentex Industries, Ltd. | 251,014 | ||||||||
| 199,000 | Siliconware Precision Industries Co. | 264,658 | ||||||||
| 2,491,731 | SinoPac Financial Holdings Co., Ltd. | 1,198,715 | ||||||||
| 1,124,000 | Taishin Financial Holding Co., Ltd. | 509,357 | ||||||||
| 457 | Taiwan Business Bank* | 135 | ||||||||
| 1,973,000 | Taiwan Cement Corp. | 3,045,103 | ||||||||
| 170,000 | Taiwan Cooperative Financial Holding Co., Ltd. | 90,994 | ||||||||
| 4,195,000 | Taiwan Semiconductor Manufacturing Co., Ltd. | 16,324,029 | ||||||||
| 192,600 | Taiwan Semiconductor Manufacturing Co., Ltd., Sponsored ADR | 3,855,852 | ||||||||
| 1,160,000 | Teco Electric and Machinery Co., Ltd. | 1,293,227 | ||||||||
| 583,000 | Transcend Information, Inc. | 1,895,312 | ||||||||
| 1,220,282 | Uni-President Enterprises Corp. | 2,123,798 | ||||||||
| 882,000 | Walsin Lihwa Corp.* | 280,653 | ||||||||
| 448,000 | Yuanta Financial Holding Co., Ltd. | 225,821 | ||||||||
|
| |||||||||
Total Taiwan | 91,179,608 | |||||||||
|
| |||||||||
Thailand — 3.1% | ||||||||||
| 268,600 | Advanced Info Service PCL (Registered Shares) | 1,871,258 | ||||||||
| 191,700 | Airports of Thailand PCL, NVDR | 1,146,418 | ||||||||
| 239,800 | Bangkok Bank PCL | 1,326,883 | ||||||||
| 708,100 | Bangkok Bank PCL, NVDR | 3,896,296 | ||||||||
| See accompanying Notes to the Financial Statements. | 121 |
Table of Contents
Mercer Emerging Markets Equity Fund
Schedule of Investments (Continued)
(showing percentage of net assets)
March 31, 2014
| Shares | Description | Value ($) | ||||||||
Thailand — continued | ||||||||||
| 54,955 | Bangkok Dusit Medical Services PCL Class F | 225,309 | ||||||||
| 423,000 | BEC World PCL, NVDR | 710,650 | ||||||||
| 1,355,600 | CP All PCL Class F | 1,817,774 | ||||||||
| 265,673 | Kasikornbank PCL | 1,515,090 | ||||||||
| 989,900 | Krung Thai Bank PCL, NVDR | 570,627 | ||||||||
| 3,582,000 | Krung Thai Bank PCL | 2,064,840 | ||||||||
| 332,700 | PTT Exploration & Production PCL Class N, NVDR | 1,610,170 | ||||||||
| 887,300 | PTT Global Chemical PCL Class N, NVDR | 1,976,185 | ||||||||
| 1,602,400 | PTT Global Chemical PCL | 3,568,847 | ||||||||
| 149,600 | PTT PCL | 1,378,866 | ||||||||
| 27,700 | PTT PCL, NVDR | 255,311 | ||||||||
| 285,400 | Siam Commercial Bank PCL | 1,385,650 | ||||||||
| 2,934,900 | Thai Beverage PCL Class C‡ | 1,411,963 | ||||||||
|
| |||||||||
Total Thailand | 26,732,137 | |||||||||
|
| |||||||||
Turkey — 1.4% | ||||||||||
| 99,088 | Arcelik AS | 553,525 | ||||||||
| 13,969 | Coca-Cola Icecek AS | 336,296 | ||||||||
| 1,560,089 | Emlak Konut Gayrimenkul Yatirim Ortakligi AS | 1,837,801 | ||||||||
| 134,750 | Enka Insaat ve Sanayi AS | 402,512 | ||||||||
| 70,103 | KOC Holding AS | 295,591 | ||||||||
| 24,772 | Koza Altin Isletmeleri AS | 214,810 | ||||||||
| 193,298 | TAV Havalimanlari Holding AS | 1,554,191 | ||||||||
| 140,243 | Tofas Turk Otomobil Fabrikasi AS | 796,537 | ||||||||
| 776,734 | Turk Hava Yollari AS | 2,392,800 | ||||||||
| 588,395 | Turk Telekomunikasyon AS | 1,636,570 | ||||||||
| 302,852 | Turkcell Iletisim Hizmetleri AS* | 1,691,792 | ||||||||
| 56,916 | Turkiye Halk Bankasi AS | 352,532 | ||||||||
| 42,762 | Turkiye Is Bankasi | 94,951 | ||||||||
|
| |||||||||
Total Turkey | 12,159,908 | |||||||||
|
| |||||||||
United Kingdom — 2.2% | ||||||||||
| 142,801 | British American Tobacco Plc | 7,978,902 | ||||||||
| 106,764 | Mondi Plc | 1,867,132 | ||||||||
| 498,713 | Old Mutual Plc | 1,678,988 | ||||||||
| 11,944 | Randgold Resources, Ltd., ADR‡ | 895,800 | ||||||||
| 12,027 | Randgold Resources, Ltd. | 902,687 | ||||||||
| 112,852 | SABMiller Plc | 5,643,083 | ||||||||
|
| |||||||||
Total United Kingdom | 18,966,592 | |||||||||
|
| |||||||||
United States — 0.4% | ||||||||||
| 3,500 | Southern Copper Corp. | 101,885 | ||||||||
| 20,454 | Visteon Corp.* | 1,808,952 | ||||||||
| 19,199 | Yum! Brands, Inc. | 1,447,412 | ||||||||
|
| |||||||||
Total United States | 3,358,249 | |||||||||
|
| |||||||||
TOTAL COMMON STOCKS (COST $767,126,130) | 782,304,298 | |||||||||
|
| |||||||||
| 122 | See accompanying Notes to the Financial Statements. |
Table of Contents
Mercer Emerging Markets Equity Fund
Schedule of Investments (Continued)
(showing percentage of net assets)
March 31, 2014
| Shares | Description | Value ($) | ||||||||
PREFERRED STOCKS — 1.7% | ||||||||||
Brazil — 1.3% | ||||||||||
| 425,300 | Bradespar SA, 6.42% | 3,709,242 | ||||||||
| 291,200 | Cia Energetica de Sao Paulo, 5.25% | 3,439,167 | ||||||||
| 87,500 | Cia Paranaense de Energia, 5.68% | 1,155,939 | ||||||||
| 274,178 | Itausa - Investimentos Itau SA, 4.06% | 1,123,929 | ||||||||
| 1,000,500 | Klabin SA, 2.88% | 1,033,089 | ||||||||
| 86,600 | Metalurgica Gerdau SA, 2.27% | 668,161 | ||||||||
| 153,500 | Usinas Siderurgicas de Minas Gerais SA, 0.68% Series A | 695,903 | ||||||||
|
| |||||||||
Total Brazil | 11,825,430 | |||||||||
|
| |||||||||
Chile — 0.1% | ||||||||||
| 14,936 | Sociedad Quimica y Minera de Chile SA, 3.11% Class B | 471,343 | ||||||||
|
| |||||||||
Colombia — 0.3% | ||||||||||
| 64,688 | Banco Davivienda SA, 3.52% | 837,355 | ||||||||
| 137,776 | Bancolombia SA, 2.76% | 1,920,633 | ||||||||
|
| |||||||||
Total Colombia | 2,757,988 | |||||||||
|
| |||||||||
India — 0.0% | ||||||||||
| 2,134,356 | Zee Entertainment Enterprises, Ltd., 0.72%¤ | 25,731 | ||||||||
|
| |||||||||
TOTAL PREFERRED STOCKS (COST $14,616,900) | 15,080,492 | |||||||||
|
| |||||||||
| Par Value ($) | Description | Value ($) | ||||||||
SHORT-TERM INVESTMENTS — 11.2% | ||||||||||
Bank Deposit — 5.8% | ||||||||||
| 49,615,231 | State Street Bank & Trust Euro Time Deposit, 0.01%, due 04/01/14 | 49,615,231 | ||||||||
|
| |||||||||
Investment Fund — 1.2% | ||||||||||
| 10,390,000 | State Street Institutional Treasury Money Market Fund***** | 10,390,000 | ||||||||
|
| |||||||||
Securities Lending Collateral — 4.2% | ||||||||||
| 36,536,471 | State Street Navigator Securities Lending Prime Portfolio*** | 36,536,471 | ||||||||
|
| |||||||||
TOTAL SHORT-TERM INVESTMENTS (COST $96,541,702) | 96,541,702 | |||||||||
|
| |||||||||
TOTAL INVESTMENTS — 103.6% (Cost $878,284,732) | 893,926,492 | |||||||||
Other Assets and Liabilities (net) — (3.6)% | (31,003,651 | ) | ||||||||
|
| |||||||||
NET ASSETS — 100.0% | $ | 862,922,841 | ||||||||
|
| |||||||||
| See accompanying Notes to the Financial Statements. | 123 |
Table of Contents
Mercer Emerging Markets Equity Fund
Schedule of Investments (Continued)
(showing percentage of net assets)
March 31, 2014
Notes to Schedule of Investments: | ||||||
| ADR — American Depository Receipt | ||||||
| GDR — Global Depository Receipt | ||||||
| NVDR — Non-Voting Depository Receipt | ||||||
| REIT — Real Estate Investment Trust | ||||||
| * | Non-income producing security | |||||
| *** | Represents an investment of securities lending cash collateral. | |||||
| ¤ | Illiquid security. The total market value of the securities at year end is $38,812 which represents 0.0% of net assets. The aggregate tax cost of these securities held at March 31, 2014 was $33,780. | |||||
| **** | Securities fair valued by the Valuation Committee as approved by the Board of Trustees. The total market value of the securities at year end is $13,081 which represents 0.0% of net assets. The aggregate tax cost of these securities held at March 31, 2014 was $8,590. | |||||
| ***** | Security has been segregated to cover collateral requirements on open synthetic futures contracts. | |||||
| ‡ | All or a portion of this security is out on loan. | |||||
| ‡‡‡ | Security exempt from registration under Regulation S of the Securities Act of 1933, which exempts from registration securities offered and sold outside the United States. Security may not be offered or sold in the United States except pursuant to an exemption from, or in a transaction not subject to, the registration requirements of the Securities Act of 1933. | |||||
| 144A — Securities exempt from registration under Rule 144A of the Securities Act of 1933. These securities may be resold in transactions exempt from registration, normally to qualified institutional buyers. The total market value of the securities at year end is $1,410,035 which represents 0.2% of net assets. | ||||||
| 124 | See accompanying Notes to the Financial Statements. |
Table of Contents
Mercer Emerging Markets Equity Fund
Schedule of Investments (Continued)
March 31, 2014
A summary of outstanding financial instruments at March 31, 2014 is as follows:
Forward Foreign Currency Contracts
Settlement | Currency | Counterparty | Units of | Value | Unrealized | |||||||||||||||||
| Buys | ||||||||||||||||||||||
| 06/18/14 | BRL | Royal Bank of Scotland Plc | 74,703,000 | $ | 32,433,406 | $ | 1,267,151 | |||||||||||||||
| 06/18/14 | COP | Royal Bank of Scotland Plc | 6,000,000,000 | 3,027,833 | (2,160 | ) | ||||||||||||||||
| 06/18/14 | CZK | Royal Bank of Scotland Plc | 151,310,000 | 7,605,634 | (114,264 | ) | ||||||||||||||||
| 06/18/14 | HKD | Royal Bank of Scotland Plc | 30,300,000 | 3,907,212 | 2,225 | |||||||||||||||||
| 06/18/14 | HUF | Royal Bank of Scotland Plc | 3,339,450,000 | 14,906,679 | 178,497 | |||||||||||||||||
| 06/18/14 | IDR | Royal Bank of Scotland Plc | 111,931,756,836 | 9,717,873 | 150,177 | |||||||||||||||||
| 06/18/14 | ILS | Royal Bank of Scotland Plc | 7,800,000 | 2,233,376 | (15,282 | ) | ||||||||||||||||
| 06/18/14 | INR | Royal Bank of Scotland Plc | 1,750,834,000 | 28,785,368 | 651,746 | |||||||||||||||||
| 06/18/14 | KRW | Royal Bank of Scotland Plc | 3,814,447,000 | 3,569,730 | 8,208 | |||||||||||||||||
| 06/18/14 | MXN | Royal Bank of Scotland Plc | 99,900,000 | 7,610,781 | 126,031 | |||||||||||||||||
| 06/18/14 | MYR | Royal Bank of Scotland Plc | 24,606,000 | 7,495,469 | 6,885 | |||||||||||||||||
| 06/18/14 | PEN | Royal Bank of Scotland Plc | 1,238,000 | 436,067 | 1,844 | |||||||||||||||||
| 06/18/14 | PLN | Royal Bank of Scotland Plc | 60,247,000 | 19,843,153 | 120,522 | |||||||||||||||||
| 06/18/14 | RUB | Royal Bank of Scotland Plc | 555,087,000 | 15,525,490 | 473,769 | |||||||||||||||||
| 06/18/14 | THB | Royal Bank of Scotland Plc | 13,000,000 | 399,381 | (232 | ) | ||||||||||||||||
| 06/18/14 | TRY | Royal Bank of Scotland Plc | 36,477,000 | 16,667,373 | 513,561 | |||||||||||||||||
| 06/18/14 | TWD | Royal Bank of Scotland Plc | 111,930,000 | 3,683,997 | (24,750 | ) | ||||||||||||||||
| 06/18/14 | ZAR | Royal Bank of Scotland Plc | 77,500,000 | 7,280,657 | 177,837 | |||||||||||||||||
|
| |||||||||||||||||||||
| $ | 3,521,765 | |||||||||||||||||||||
|
| |||||||||||||||||||||
| Sales | ||||||||||||||||||||||
| 06/18/14 | CLP | Royal Bank of Scotland Plc | 10,789,108,000 | $ | 19,442,637 | $ | (518,692 | ) | ||||||||||||||
| 06/18/14 | COP | Royal Bank of Scotland Plc | 6,813,000,000 | 3,438,104 | (127,370 | ) | ||||||||||||||||
| 06/18/14 | CZK | Royal Bank of Scotland Plc | 36,000,000 | 1,809,549 | (72 | ) | ||||||||||||||||
| 06/18/14 | HKD | Royal Bank of Scotland Plc | 29,300,000 | 3,778,262 | (2,570 | ) | ||||||||||||||||
| 06/18/14 | ILS | Royal Bank of Scotland Plc | 15,280,000 | 4,375,127 | 20,058 | |||||||||||||||||
| 06/18/14 | KRW | Royal Bank of Scotland Plc | 17,420,000,000 | 16,302,415 | (132,662 | ) | ||||||||||||||||
| 06/18/14 | MXN | Royal Bank of Scotland Plc | 82,679,000 | 6,298,816 | (78,966 | ) | ||||||||||||||||
| 06/18/14 | PEN | Royal Bank of Scotland Plc | 200,000 | 70,447 | (182 | ) | ||||||||||||||||
| 06/18/14 | PHP | Royal Bank of Scotland Plc | 288,100,000 | 6,412,295 | 43,991 | |||||||||||||||||
| 06/18/14 | PLN | Royal Bank of Scotland Plc | 100,000 | 32,936 | (95 | ) | ||||||||||||||||
| 06/18/14 | RUB | Royal Bank of Scotland Plc | 1,419,254,000 | 39,695,785 | (1,512,558 | ) | ||||||||||||||||
| 06/18/14 | SGD | Royal Bank of Scotland Plc | 44,626,000 | 35,487,760 | (258,924 | ) | ||||||||||||||||
| 06/18/14 | THB | Royal Bank of Scotland Plc | 41,221,000 | 1,266,375 | 1,065 | |||||||||||||||||
| 06/18/14 | TRY | Royal Bank of Scotland Plc | 18,900,000 | 8,635,945 | (401,364 | ) | ||||||||||||||||
| 06/18/14 | ZAR | Royal Bank of Scotland Plc | 13,600,000 | 1,277,638 | (41,386 | ) | ||||||||||||||||
|
| |||||||||||||||||||||
| $ | (3,009,727 | ) | ||||||||||||||||||||
|
| |||||||||||||||||||||
Currency Abbreviations
| BRL | Brazilian Real |
| CLP | Chilean Peso |
| COP | Colombian Peso |
| CZK | Czech Koruna |
| HKD | Hong Kong Dollar |
| See accompanying Notes to the Financial Statements. | 125 |
Table of Contents
Mercer Emerging Markets Equity Fund
Schedule of Investments (Continued)
March 31, 2014
Currency Abbreviations — continued
| HUF | Hungarian Forint |
| IDR | Indonesian Rupiah |
| ILS | Israeli Shekel |
| INR | Indian Rupee |
| KRW | South Korean Won |
| MXN | Mexican Peso |
| MYR | Malaysian Ringgit |
| PEN | Peruvian Nouveau Sol |
| PHP | Philippines Peso |
| PLN | Polish Zloty |
| RUB | Russian Ruble |
| SGD | Singapore Dollar |
| THB | Thai Baht |
| TRY | New Turkish Lira |
| TWD | Taiwan Dollar |
| ZAR | South African Rand |
Futures Contracts
Number of | Type | Expiration Date | Contract | Unrealized | ||||||||||||||
| Buys | ||||||||||||||||||
| 165 | FTSE Bursa Malaysia KLCI Index | April 2014 | $ | 4,672,600 | $ | 16,809 | ||||||||||||
| 81 | FTSE/JSE TOP 40 | June 2014 | 3,340,454 | 75,780 | ||||||||||||||
| 145 | H-shares Index | April 2014 | 9,422,042 | 296,277 | ||||||||||||||
| 67 | MSCI Singapore Index | April 2014 | 3,808,326 | 94,605 | ||||||||||||||
| 76 | MSCI Taiwan Index | April 2014 | 2,373,480 | 55,304 | ||||||||||||||
|
| |||||||||||||||||
| $538,775 | ||||||||||||||||||
|
| |||||||||||||||||
| Sales | ||||||||||||||||||
| 136 | BIST 30 Index | April 2014 | $ | 543,409 | $ | (62,477 | ) | |||||||||||
| 42 | KOSPI 200 Index | June 2014 | 5,097,844 | (56,557 | ) | |||||||||||||
| 61 | Mexico Bolsa Index | June 2014 | 1,899,082 | (70,076 | ) | |||||||||||||
| 72 | SET50 Index | June 2014 | 2,056,794 | (62,983 | ) | |||||||||||||
| 407 | SGX CNX Nifty Index | April 2014 | 5,497,756 | (81,083 | ) | |||||||||||||
|
| |||||||||||||||||
| $(333,176) | ||||||||||||||||||
|
| |||||||||||||||||
Synthetic Futures
Number of | Reference Entity | Expiration Date | Counterparty | Notional | Value | |||||||||||||||||
| 772 | Brazil Bovespa Stock Index | 04/16/2014 | Goldman Sachs | $ | 15,500,094 | $ | 719,279 | |||||||||||||||
| 400 | MSCI Taiwan Stock Index | 04/29/2014 | Goldman Sachs | 122,031 | 2,889 | |||||||||||||||||
| 7,200 | Taiwan Stock Exchange Capitalization Weighted Stock Index | 04/16/2014 | Goldman Sachs | 2,061,566 | 16,552 | |||||||||||||||||
| 400 | Tel Aviv 25 Index | 04/25/2014 | Goldman Sachs | 159,688 | 1,317 | |||||||||||||||||
| 1,790 | Warsaw WIG 20 Index | 06/20/2014 | Goldman Sachs | 1,410,009 | 38,876 | |||||||||||||||||
|
| |||||||||||||||||||||
| $ | 778,913 | |||||||||||||||||||||
| �� |
|
| ||||||||||||||||||||
| 126 | See accompanying Notes to the Financial Statements. |
Table of Contents
Mercer Emerging Markets Equity Fund
Schedule of Investments (Continued)
March 31, 2014
| Industry Sector Summary (Unaudited) | % of Net Assets | ||||
Banks | 14.5 | ||||
Oil & Gas | 6.3 | ||||
Telecommunications | 5.7 | ||||
Diversified Financial Services | 5.5 | ||||
Semiconductors | 4.1 | ||||
Beverages | 3.3 | ||||
Electric | 3.3 | ||||
Insurance | 3.3 | ||||
Retail | 3.0 | ||||
Mining | 2.8 | ||||
Auto Manufacturers | 2.7 | ||||
Agriculture | 2.6 | ||||
Computers | 2.6 | ||||
Internet | 2.5 | ||||
Electronics | 2.4 | ||||
Commercial Services | 2.2 | ||||
Pharmaceuticals | 1.9 | ||||
Chemicals | 1.7 | ||||
Electrical Components & Equipment | 1.7 | ||||
Food | 1.7 | ||||
Real Estate | 1.7 | ||||
Lodging | 1.6 | ||||
Holding Companies — Diversified | 1.4 | ||||
Auto Parts & Equipment | 1.3 | ||||
Building Materials | 1.3 | ||||
Engineering & Construction | 1.1 | ||||
Media | 1.0 | ||||
Software | 1.0 | ||||
Iron & Steel | 0.9 | ||||
Airlines | 0.8 | ||||
Coal | 0.8 | ||||
Household Products & Wares | 0.8 | ||||
Forest Products & Paper | 0.6 | ||||
Home Furnishings | 0.5 | ||||
Gas | 0.4 | ||||
Apparel | 0.3 | ||||
Cosmetics & Personal Care | 0.3 | ||||
Entertainment | 0.3 | ||||
Health Care — Services | 0.3 | ||||
Home Builders | 0.2 | ||||
Leisure Time | 0.2 | ||||
Machinery — Diversified | 0.2 | ||||
Metal Fabricate & Hardware | 0.2 | ||||
Miscellaneous — Manufacturing | 0.2 | ||||
Office & Business Equipment | 0.2 | ||||
Oil & Gas Services | 0.2 | ||||
REITS | 0.2 | ||||
Shipbuilding | 0.2 | ||||
Health Care — Products | 0.1 | ||||
Pipelines | 0.1 | ||||
Textiles | 0.1 | ||||
| See accompanying Notes to the Financial Statements. | 127 |
Table of Contents
Mercer Emerging Markets Equity Fund
Schedule of Investments (Continued)
March 31, 2014
| Industry Sector Summary (Unaudited) | % of Net Assets | ||||
Water | 0.1 | ||||
Distribution & Wholesale | 0.0 | ||||
Machinery — Construction & Mining | 0.0 | ||||
Packaging & Containers | 0.0 | ||||
Transportation | 0.0 | ||||
Short-Term Investments and Other Assets and Liabilities (net) | 7.6 | ||||
|
| ||||
| 100.0 | % | ||||
|
| ||||
| 128 | See accompanying Notes to the Financial Statements. |
Table of Contents
Mercer Global Low Volatility Equity Fund
Schedule of Investments
(showing percentage of net assets)
March 31, 2014
| Shares | Description | Value ($) | ||||||||
COMMON STOCKS — 89.1% | ||||||||||
Australia — 0.4% | ||||||||||
| 196,707 | Newcrest Mining, Ltd.* ‡ | 1,803,124 | ||||||||
| 283,615 | Telstra Corp., Ltd.‡ | 1,335,373 | ||||||||
|
| |||||||||
Total Australia | 3,138,497 | |||||||||
|
| |||||||||
Austria — 0.2% | ||||||||||
| 182 | Agrana Beteiligungs AG | 22,024 | ||||||||
| 14,153 | EVN AG‡ | 199,355 | ||||||||
| 1,130 | Flughafen Wien AG | 111,979 | ||||||||
| 1,752 | Oesterreichische Post AG | 88,257 | ||||||||
| 14,592 | OMV AG | 662,370 | ||||||||
| 7,654 | Verbund AG | 157,498 | ||||||||
|
| |||||||||
Total Austria | 1,241,483 | |||||||||
|
| |||||||||
Bahamas — 0.0% | ||||||||||
| 1,372 | United International Enterprises | 277,338 | ||||||||
|
| |||||||||
Belgium — 0.6% | ||||||||||
| 2,428 | Elia System Operator SA | 122,696 | ||||||||
| 46,519 | Groupe Bruxelles Lambert SA | 4,647,040 | ||||||||
| 47 | Lotus Bakeries | 53,441 | ||||||||
|
| |||||||||
Total Belgium | 4,823,177 | |||||||||
|
| |||||||||
Bermuda — 0.6% | ||||||||||
| 28,116 | Bunge, Ltd. | 2,235,503 | ||||||||
| 6,221 | China Yuchai International, Ltd. | 131,761 | ||||||||
| 9,000 | Guoco Group, Ltd. | 107,205 | ||||||||
| 25,000 | Jardine Matheson Holdings, Ltd. | 1,577,000 | ||||||||
| 13,600 | Transport International Holdings, Ltd. | 25,422 | ||||||||
| 5,000 | Wing On Co. International, Ltd. | 13,214 | ||||||||
|
| |||||||||
Total Bermuda | 4,090,105 | |||||||||
|
| |||||||||
Canada — 4.7% | ||||||||||
| 41,799 | Agnico-Eagle Mines, Ltd. | 1,267,508 | ||||||||
| 33,300 | Bank of Montreal‡ | 2,231,364 | ||||||||
| 69,166 | Barrick Gold Corp. | 1,233,230 | ||||||||
| 47,445 | BCE, Inc. | 2,046,777 | ||||||||
| 34,007 | Bell Aliant, Inc.‡ | 833,114 | ||||||||
| 27,200 | Canadian Imperial Bank of Commerce‡ | 2,347,271 | ||||||||
| 79,286 | Canadian Natural Resources, Ltd. | 3,043,577 | ||||||||
| 24,500 | Canadian Tire Corp., Ltd. Class A | 2,313,599 | ||||||||
| 5,900 | Capital Power Corp.‡ | 137,484 | ||||||||
| 91,094 | Cenovus Energy, Inc.‡ | 2,638,082 | ||||||||
| 15,400 | Empire Co., Ltd. | 944,161 | ||||||||
| 2,700 | First Capital Realty, Inc.‡ | 42,931 | ||||||||
| 24,700 | Fortis, Inc.‡ | 705,363 | ||||||||
| 20,100 | George Weston, Ltd. | 1,499,464 | ||||||||
| 94,887 | Goldcorp, Inc. | 2,322,834 | ||||||||
| See accompanying Notes to the Financial Statements. | 129 |
Table of Contents
Mercer Global Low Volatility Equity Fund
Schedule of Investments (Continued)
(showing percentage of net assets)
March 31, 2014
| Shares | Description | Value ($) | ||||||||
Canada — continued | ||||||||||
| 35,700 | Jean Coutu Group PJC, Inc. (The) Class A | 706,722 | ||||||||
| 253,978 | Kinross Gold Corp. | 1,051,469 | ||||||||
| 1,400 | Laurentian Bank of Canada | 59,894 | ||||||||
| 37,800 | Manitoba Telecom Services, Inc. | 1,038,365 | ||||||||
| 31,800 | Metro, Inc.‡ | 1,869,826 | ||||||||
| 10,100 | National Bank of Canada | 405,373 | ||||||||
| 103,158 | Penn West Petroleum, Ltd.‡ | 862,401 | ||||||||
| 52,728 | Potash Corp. of Saskatchewan, Inc. | 1,909,808 | ||||||||
| 14,700 | Saputo, Inc. | 741,692 | ||||||||
| 5,244 | Tim Hortons, Inc. | 290,046 | ||||||||
| 48,400 | Toronto-Dominion Bank | 2,272,772 | ||||||||
|
| |||||||||
Total Canada | 34,815,127 | |||||||||
|
| |||||||||
Cayman Islands — 0.1% | ||||||||||
| 401,800 | Chow Tai Fook Jewellery Group, Ltd. | 632,972 | ||||||||
| 1,566 | Fresh Del Monte Produce, Inc. | 43,175 | ||||||||
| 368,000 | Logan Property Holdings Co., Ltd.* | 112,909 | ||||||||
| 103,000 | Times Property Holdings, Ltd.* | 42,490 | ||||||||
|
| |||||||||
Total Cayman Islands | 831,546 | |||||||||
|
| |||||||||
Denmark — 0.9% | ||||||||||
| 6,051 | Carlsberg A/S Class B | 602,084 | ||||||||
| 6,449 | D/S Norden | 275,008 | ||||||||
| 1,035 | Dfds AS | 84,738 | ||||||||
| 1,887 | Ringkjoebing Landbobank AS | 411,051 | ||||||||
| 10,039 | Royal UNIBREW AS | 1,671,622 | ||||||||
| 3,399 | Schouw & Co. | 166,593 | ||||||||
| 1,139 | SimCorp AS | 46,258 | ||||||||
| 1,562 | Sydbank AS* | 39,994 | ||||||||
| 239,753 | TDC AS | 2,217,394 | ||||||||
| 39,130 | Topdanmark AS* | 1,139,877 | ||||||||
|
| |||||||||
Total Denmark | 6,654,619 | |||||||||
|
| |||||||||
France — 4.9% | ||||||||||
| 1,437 | Bongrain SA | 124,735 | ||||||||
| 61,491 | Bouygues SA | 2,565,804 | ||||||||
| 6,427 | Caisse Regionale de Credit Agricole Mutuel Nord de France | 161,216 | ||||||||
| 57,021 | Carrefour SA | 2,207,963 | ||||||||
| 32,253 | Cie de Saint-Gobain | 1,949,250 | ||||||||
| 103,431 | Danone SA | 7,317,283 | ||||||||
| 2,682 | Korian-Medica | 102,939 | ||||||||
| 9,928 | Legrand SA | 617,047 | ||||||||
| 872 | Manutan International | 62,075 | ||||||||
| 9,196 | Neopost SA‡ | 726,496 | ||||||||
| 126,505 | Sanofi-Aventis | 13,195,221 | ||||||||
| 20,066 | Sodexo | 2,105,448 | ||||||||
| 1,815 | Stef | 149,516 | ||||||||
| 43,799 | Total SA | 2,873,419 | ||||||||
| 858 | Vetoquinol SA | 44,783 | ||||||||
| 130 | See accompanying Notes to the Financial Statements. |
Table of Contents
Mercer Global Low Volatility Equity Fund
Schedule of Investments (Continued)
(showing percentage of net assets)
March 31, 2014
| Shares | Description | Value ($) | ||||||||
France — continued | ||||||||||
| 41,360 | Vivendi SA | 1,152,629 | ||||||||
| 5,979 | Wendel SA | 929,946 | ||||||||
|
| |||||||||
Total France | 36,285,770 | |||||||||
|
| |||||||||
Germany — 2.8% | ||||||||||
| 37,941 | Adidas AG | 4,107,027 | ||||||||
| 16,076 | DaimlerChrysler AG | 1,519,731 | ||||||||
| 19,538 | Fielmann AG | 2,626,311 | ||||||||
| 4,362 | Fraport AG Frankfurt Airport Services Worldwide | 325,967 | ||||||||
| 19,944 | Fresenius Medical Care AG & Co. KGaA | 1,392,258 | ||||||||
| 43,582 | HeidelbergCement AG | 3,736,760 | ||||||||
| 7,041 | Merck KGaA | 1,186,345 | ||||||||
| 32,016 | Rhoen Klinikum AG | 1,025,930 | ||||||||
| 55,673 | SAP AG | 4,508,730 | ||||||||
| 16,323 | Stada Arzneimittel AG | 698,875 | ||||||||
|
| |||||||||
Total Germany | 21,127,934 | |||||||||
|
| |||||||||
Hong Kong — 0.3% | ||||||||||
| 6,500 | Aeon Stores Hong Kong Co., Ltd. | 7,290 | ||||||||
| 276,000 | CLP Holdings, Ltd. | 2,079,683 | ||||||||
| 33,000 | Miramar Hotel & Investment Co., Ltd. | 40,840 | ||||||||
| 233,000 | Regal Real Estate Investment Trust REIT | 69,686 | ||||||||
| 109,000 | Sunlight Real Estate Investment Trust REIT | 40,750 | ||||||||
|
| |||||||||
Total Hong Kong | 2,238,249 | |||||||||
|
| |||||||||
Ireland — 0.6% | ||||||||||
| 61,337 | CRH Plc | 1,712,821 | ||||||||
| 27,368 | Greencore Group Plc | 125,793 | ||||||||
| 16,440 | Kerry Group Plc | 1,255,503 | ||||||||
| 27,870 | Willis Group Holdings Plc | 1,229,903 | ||||||||
|
| |||||||||
Total Ireland | 4,324,020 | |||||||||
|
| |||||||||
Israel — 0.8% | ||||||||||
| 25,758 | Azrieli Group | 900,384 | ||||||||
| 86,725 | Israel Chemicals, Ltd. | 757,631 | ||||||||
| 38,508 | Osem Investments, Ltd. | 904,734 | ||||||||
| 4,793 | Plus500, Ltd. | 47,784 | ||||||||
| 22,401 | Strauss Group, Ltd. | 404,869 | ||||||||
| 56,191 | Teva Pharmaceutical Industries, Ltd., Sponsored ADR | 2,969,133 | ||||||||
|
| |||||||||
Total Israel | 5,984,535 | |||||||||
|
| |||||||||
Italy — 0.0% | ||||||||||
| 28,600 | Italcementi Spa | 353,185 | ||||||||
|
| |||||||||
Japan — 7.3% | ||||||||||
| 179,500 | Astellas Pharma, Inc. | 2,133,398 | ||||||||
| 3,000 | AT-Group Co., Ltd. | 54,183 | ||||||||
| 48,700 | Bic Camera, Inc.‡ | 294,134 | ||||||||
| See accompanying Notes to the Financial Statements. | 131 |
Table of Contents
Mercer Global Low Volatility Equity Fund
Schedule of Investments (Continued)
(showing percentage of net assets)
March 31, 2014
| Shares | Description | Value ($) | ||||||||
Japan — continued | ||||||||||
| 59,800 | Coca-Cola West Co., Ltd.‡ | 1,045,781 | ||||||||
| 21,600 | Dydo Drinco, Inc. | 902,928 | ||||||||
| 6,600 | Earth Chemical Co., Ltd. | 240,647 | ||||||||
| 35,900 | Fancl Corp. | 427,377 | ||||||||
| 18,300 | Fanuc, Ltd. | 3,234,952 | ||||||||
| 2,600 | Fuji Co., Ltd. | 47,918 | ||||||||
| 4,800 | Fukuda Denshi Co., Ltd. | 212,303 | ||||||||
| 5,900 | Hirose Electric Co., Ltd. | 812,371 | ||||||||
| 71,000 | House Foods Group, Inc.‡ | 1,181,667 | ||||||||
| 89,300 | Hoya Corp. | 2,786,045 | ||||||||
| 15,300 | Inageya Co., Ltd. | 152,577 | ||||||||
| 41,300 | Ito En, Ltd.‡ | 926,378 | ||||||||
| 17,000 | Itoham Foods, Inc. | 77,584 | ||||||||
| 56,800 | KDDI Corp. | 3,295,983 | ||||||||
| 1,000 | Kentucky Fried Chicken, Ltd. | 20,479 | ||||||||
| 94,800 | Kewpie Corp. | 1,308,062 | ||||||||
| 8,300 | Keyence Corp. | 3,430,898 | ||||||||
| 26,100 | Kose Corp. | 859,144 | ||||||||
| 306,000 | Lion Corp. | 1,815,468 | ||||||||
| 1,400 | McDonald’s Holdings Co., Ltd.‡ | 37,751 | ||||||||
| 18,000 | Megmilk Snow Brand Co., Ltd. | 235,257 | ||||||||
| 20,300 | MISUMI Group, Inc. | 563,752 | ||||||||
| 69,300 | Mitsubishi Estate Co., Ltd. | 1,645,946 | ||||||||
| 159,000 | Morinaga & Co., Ltd. | 348,925 | ||||||||
| 163,000 | Morinaga Milk Industry Co., Ltd.‡ | 525,475 | ||||||||
| 4,800 | MOS Food Services, Inc.‡ | 96,853 | ||||||||
| 99,000 | MS&AD Insurance Group Holdings | 2,272,525 | ||||||||
| 66,000 | Nippon Flour Mills Co., Ltd. | 362,092 | ||||||||
| 38,100 | Nippon Telegraph & Telephone Corp. | 2,078,787 | ||||||||
| 147,000 | Nisshin Oillio Group, Ltd. (The)‡ | 479,604 | ||||||||
| 26,600 | Nissin Foods Holdings Co., Ltd.‡ | 1,202,340 | ||||||||
| 2,600 | Nitori Holdings Co., Ltd. | 112,978 | ||||||||
| 93,600 | NKSJ Holdings, Inc. | 2,410,324 | ||||||||
| 29,200 | Noevir Holdings Co., Ltd. | 552,329 | ||||||||
| 22,900 | Nomura Research Institute, Ltd. | 724,902 | ||||||||
| 101,200 | NTT DoCoMo, Inc. | 1,599,782 | ||||||||
| 17,900 | Ohsho Food Service Corp.‡ | 603,127 | ||||||||
| 4,500 | Okinawa Cellular Telephone Co. | 114,832 | ||||||||
| 10,100 | Ono Pharmaceutical Co., Ltd. | 876,768 | ||||||||
| 4,900 | Plenus Co., Ltd. | 114,144 | ||||||||
| 1,000 | Riken Vitamin Co., Ltd. | 22,935 | ||||||||
| 39,500 | Royal Holdings Co., Ltd. | 569,573 | ||||||||
| 62,500 | Secom Co., Ltd. | 3,608,535 | ||||||||
| 25,100 | Shimano, Inc. | 2,527,426 | ||||||||
| 6,000 | Shin-Etsu Chemical Co., Ltd. | 343,623 | ||||||||
| 34,000 | Showa Sangyo Co., Ltd. | 111,259 | ||||||||
| 13,100 | SMC Corp. | 3,463,101 | ||||||||
| 22,500 | Starbucks Coffee Japan, Ltd.‡ | 249,284 | ||||||||
| 9,000 | Yamazaki Baking Co., Ltd. | 106,792 | ||||||||
| 132 | See accompanying Notes to the Financial Statements. |
Table of Contents
Mercer Global Low Volatility Equity Fund
Schedule of Investments (Continued)
(showing percentage of net assets)
March 31, 2014
| Shares | Description | Value ($) | ||||||||
Japan — continued | ||||||||||
| 61,400 | Yoshinoya Holdings Co., Ltd.‡ | 784,604 | ||||||||
|
| |||||||||
Total Japan | 54,005,902 | |||||||||
|
| |||||||||
Malaysia — 0.0% | ||||||||||
| 96,900 | Genting Malaysia Bhd | 124,630 | ||||||||
|
| |||||||||
Mexico — 0.5% | ||||||||||
| 84,966 | Grupo Televisa SAB, Sponsored ADR | 2,828,518 | ||||||||
| 20,878 | Industrias Penoles SAB de CV | 544,176 | ||||||||
|
| |||||||||
Total Mexico | 3,372,694 | |||||||||
|
| |||||||||
Netherlands — 0.9% | ||||||||||
| 7,954 | Koninklijke Ahold NV | 159,838 | ||||||||
| 2,451 | Sligro Food Group NV | 100,498 | ||||||||
| 91,530 | TNT Express NV | 899,332 | ||||||||
| 125,788 | Unilever NV, ADR | 5,172,412 | ||||||||
|
| |||||||||
Total Netherlands | 6,332,080 | |||||||||
|
| |||||||||
New Zealand — 0.7% | ||||||||||
| 464,842 | Air New Zealand, Ltd. | 824,885 | ||||||||
| 244,990 | Argosy Property, Ltd. | 193,457 | ||||||||
| 376,248 | Auckland International Airport, Ltd. | 1,243,923 | ||||||||
| 22,392 | Contact Energy, Ltd. | 103,371 | ||||||||
| 68,522 | Fisher & Paykel Healthcare Corp., Ltd. | 252,705 | ||||||||
| 523,521 | Infratil, Ltd. | 1,026,685 | ||||||||
| 48,956 | Meridian Energy, Ltd. | 49,279 | ||||||||
| 7,205 | Nuplex Industries, Ltd. | 21,632 | ||||||||
| 201,290 | Sky Network Television, Ltd. | 1,091,683 | ||||||||
| 2,733 | TrustPower, Ltd. | 15,391 | ||||||||
| 20,235 | Vector, Ltd. | 42,668 | ||||||||
| 8,880 | Warehouse Group, Ltd. (The) | 24,812 | ||||||||
|
| |||||||||
Total New Zealand | 4,890,491 | |||||||||
|
| |||||||||
Norway — 1.2% | ||||||||||
| 5,525 | Cermaq ASA | 61,368 | ||||||||
| 258,291 | Norsk Hydro ASA | 1,287,777 | ||||||||
| 279,662 | Orkla ASA | 2,384,604 | ||||||||
| 96,680 | Statoil ASA | 2,729,044 | ||||||||
| 97,358 | Telenor ASA | 2,157,892 | ||||||||
|
| |||||||||
Total Norway | 8,620,685 | |||||||||
|
| |||||||||
Portugal — 0.4% | ||||||||||
| 15,507 | CTT-Correios de Portugal SA* | 170,339 | ||||||||
| 555,394 | EDP - Energias de Portugal SA | 2,580,405 | ||||||||
| 9,710 | Portucel SA | 44,203 | ||||||||
| 58,031 | REN - Redes Energeticas Nacionais SGPS SA | 228,826 | ||||||||
| 70,665 | Sonaecom SGPS SA | 210,371 | ||||||||
|
| |||||||||
Total Portugal | 3,234,144 | |||||||||
|
| |||||||||
| See accompanying Notes to the Financial Statements. | 133 |
Table of Contents
Mercer Global Low Volatility Equity Fund
Schedule of Investments (Continued)
(showing percentage of net assets)
March 31, 2014
| Shares | Description | Value ($) | ||||||||
Russia — 0.1% | ||||||||||
| 101,800 | Gazprom OAO, Sponsored ADR | 783,860 | ||||||||
| 4,548 | IBS Group Holding, Ltd., Reg S, GDR‡‡‡ | 124,087 | ||||||||
|
| |||||||||
Total Russia | 907,947 | |||||||||
|
| |||||||||
Singapore — 0.6% | ||||||||||
| 7,000 | Bukit Sembawang Estates, Ltd. | 30,170 | ||||||||
| 53,000 | Fraser and Neave, Ltd. | 132,758 | ||||||||
| 106,000 | Frasers Centrepoint, Ltd. | 129,386 | ||||||||
| 20,000 | Great Eastern Holdings, Ltd. | 297,563 | ||||||||
| 15,000 | Hong Leong Finance, Ltd. | 32,683 | ||||||||
| 318,000 | M1, Ltd.‡ | 877,468 | ||||||||
| 123,000 | OSIM International, Ltd.‡ | 253,326 | ||||||||
| 17,000 | Raffles Medical Group, Ltd. | 43,394 | ||||||||
| 1,005,000 | Singapore Post, Ltd.‡ | 1,086,875 | ||||||||
| 44,000 | Singapore Press Holdings, Ltd. | 146,952 | ||||||||
| 101,000 | Singapore Telecommunications, Ltd. | 293,149 | ||||||||
| 321,000 | StarHub, Ltd. | 1,072,085 | ||||||||
| 64,000 | Yanlord Land Group, Ltd. | 54,455 | ||||||||
|
| |||||||||
Total Singapore | 4,450,264 | |||||||||
|
| |||||||||
South Africa — 0.3% | ||||||||||
| 95,213 | AngloGold Ashanti, Ltd., Sponsored ADR* | 1,626,238 | ||||||||
| 99,152 | Gold Fields, Ltd., Sponsored ADR‡ | 365,871 | ||||||||
| 8,772 | Harmony Gold Mining Co., Ltd., Sponsored ADR* | 26,755 | ||||||||
|
| |||||||||
Total South Africa | 2,018,864 | |||||||||
|
| |||||||||
South Korea — 0.3% | ||||||||||
| 23,778 | KT&G Corp. | 1,787,064 | ||||||||
| 323 | Lotte Confectionery Co., Ltd. | 553,177 | ||||||||
|
| |||||||||
Total South Korea | 2,340,241 | |||||||||
|
| |||||||||
Spain — 0.2% | ||||||||||
| 50,751 | Abengoa SA‡ | 236,003 | ||||||||
| 172,177 | Iberdrola SA | 1,204,549 | ||||||||
| 1,825 | Red Electrica Corp. SA | 148,403 | ||||||||
|
| |||||||||
Total Spain | 1,588,955 | |||||||||
|
| |||||||||
Sweden — 0.9% | ||||||||||
| 10,956 | Axfood AB | 604,954 | ||||||||
| 46,420 | Hennes & Mauritz AB Class B | 1,976,066 | ||||||||
| 57,261 | Investor AB Class B | 2,068,392 | ||||||||
| 286,209 | TeliaSonera AB | 2,154,221 | ||||||||
|
| |||||||||
Total Sweden | 6,803,633 | |||||||||
|
| |||||||||
Switzerland — 4.2% | ||||||||||
| 4,460 | Allreal Holding AG* | 643,742 | ||||||||
| 3,541 | Alpiq Holding AG* | 489,050 | ||||||||
| 280 | APG SGA SA | 95,092 | ||||||||
| 134 | See accompanying Notes to the Financial Statements. |
Table of Contents
Mercer Global Low Volatility Equity Fund
Schedule of Investments (Continued)
(showing percentage of net assets)
March 31, 2014
| Shares | Description | Value ($) | ||||||||
Switzerland — continued | ||||||||||
| 3,396 | Aryzta AG* | 300,252 | ||||||||
| 4,010 | Bank Coop AG | 198,605 | ||||||||
| 863 | Banque Cantonale de Geneve | 221,770 | ||||||||
| 9,411 | Basler Kantonalbank | 820,340 | ||||||||
| 18 | Bell AG | 49,394 | ||||||||
| 1,875 | Berner Kantonalbank AG | 456,359 | ||||||||
| 19,673 | Coca-Cola HBC AG | 490,000 | ||||||||
| 2,501 | Galenica AG‡ | 2,422,149 | ||||||||
| 325 | Graubuendner Kantonalbank | 442,973 | ||||||||
| 809 | Intershop Holdings | 315,962 | ||||||||
| 2,500 | Kuehne + Nagel International AG | 350,088 | ||||||||
| 124 | Luzerner Kantonalbank AG | 50,780 | ||||||||
| 206 | Mobimo Holding AG* | 43,726 | ||||||||
| 192,746 | Nestle SA | 14,521,137 | ||||||||
| 76,672 | Novartis AG | 6,509,764 | ||||||||
| 3,971 | Swisscom AG | 2,440,995 | ||||||||
| 43 | Walliser Kantonalbank | 36,022 | ||||||||
|
| |||||||||
Total Switzerland | 30,898,200 | |||||||||
|
| |||||||||
Thailand — 0.1% | ||||||||||
| 173,300 | Bangkok Bank PCL, NVDR | 953,577 | ||||||||
|
| |||||||||
United Kingdom — 6.1% | ||||||||||
| 21,485 | Anglo American Plc | 546,773 | ||||||||
| 32,625 | Associated British Foods Plc | 1,512,607 | ||||||||
| 40,361 | AstraZeneca Plc | 2,608,413 | ||||||||
| 30,984 | Berkeley Group Holdings Plc | 1,353,361 | ||||||||
| 43,764 | BP Plc, Sponsored ADR | 2,105,048 | ||||||||
| 30,527 | British American Tobacco Plc | 1,697,539 | ||||||||
| 23,517 | Cranswick Plc | 479,494 | ||||||||
| 27,786 | Dairy Crest Group Plc | 224,020 | ||||||||
| 82,565 | Diageo Plc | 2,561,634 | ||||||||
| 95,571 | Fresnillo Plc | 1,343,959 | ||||||||
| 115,605 | GlaxoSmithKline Plc | 3,067,312 | ||||||||
| 107,864 | Greggs Plc | 909,018 | ||||||||
| 40,653 | Imperial Tobacco Group Plc | 1,642,180 | ||||||||
| 332,986 | J Sainsbury Plc‡ | 1,754,790 | ||||||||
| 24,706 | Next Plc | 2,718,448 | ||||||||
| 60,713 | Royal Dutch Shell Plc Class A (Amsterdam Exchange) | 2,219,132 | ||||||||
| 126,345 | Smith & Nephew Plc | 1,914,682 | ||||||||
| 83,231 | SSE Plc | 2,038,364 | ||||||||
| 25,341 | Synergy Health Plc | 583,012 | ||||||||
| 115,603 | Tate & Lyle Plc | 1,286,457 | ||||||||
| 2,409,838 | Tesco Plc | 11,867,877 | ||||||||
| 214,776 | WM Morrison Supermarkets Plc | 762,676 | ||||||||
|
| |||||||||
Total United Kingdom | 45,196,796 | |||||||||
|
| |||||||||
United States — 48.4% | ||||||||||
| 27,262 | 3M Co. | 3,698,363 | ||||||||
| See accompanying Notes to the Financial Statements. | 135 |
Table of Contents
Mercer Global Low Volatility Equity Fund
Schedule of Investments (Continued)
(showing percentage of net assets)
March 31, 2014
| Shares | Description | Value ($) | ||||||||
United States — continued | ||||||||||
| 1,637 | Alleghany Corp.* | 666,881 | ||||||||
| 11,658 | Alliant Techsystems, Inc. | 1,657,185 | ||||||||
| 59,640 | Altria Group, Inc. | 2,232,325 | ||||||||
| 53,434 | Amdocs, Ltd. | 2,482,544 | ||||||||
| 81,180 | American Express Co. | 7,308,635 | ||||||||
| 10,548 | Amsurg Corp.* | 496,600 | ||||||||
| 9,028 | Apache Corp. | 748,873 | ||||||||
| 30,099 | Archer-Daniels-Midland Co. | 1,305,996 | ||||||||
| 21,413 | AT&T, Inc. | 750,954 | ||||||||
| 298 | Atrion Corp. | 91,230 | ||||||||
| 11,780 | Automatic Data Processing, Inc. | 910,123 | ||||||||
| 20,928 | Avista Corp. | 641,443 | ||||||||
| 375,582 | Bank of New York Mellon Corp. (The) | 13,254,289 | ||||||||
| 61,315 | BB&T Corp. | 2,463,024 | ||||||||
| 19,509 | Becton Dickinson and Co. | 2,284,114 | ||||||||
| 15 | Berkshire Hathaway, Inc. Class A* | 2,810,251 | ||||||||
| 12,629 | Brookline Bancorp, Inc. | 118,965 | ||||||||
| 88,038 | Cablevision Systems Corp.‡ | 1,485,201 | ||||||||
| 7,136 | CACI International, Inc. Class A* | 526,637 | ||||||||
| 173,538 | Capitol Federal Financial, Inc. | 2,177,902 | ||||||||
| 31,270 | Cardinal Health, Inc. | 2,188,275 | ||||||||
| 5,742 | Charles River Laboratories International, Inc.* | 346,472 | ||||||||
| 702 | Chemed Corp.‡ | 62,794 | ||||||||
| 11,208 | Cigna Corp. | 938,446 | ||||||||
| 35,708 | Cincinnati Financial Corp. | 1,737,551 | ||||||||
| 58,141 | Cintas Corp. | 3,465,785 | ||||||||
| 162,249 | Cisco Systems, Inc. | 3,636,000 | ||||||||
| 23,106 | Clorox Co. (The) | 2,033,559 | ||||||||
| 586 | Coca-Cola Bottling Co. Consolidated | 49,798 | ||||||||
| 70,056 | Coca-Cola Co. (The) | 2,708,365 | ||||||||
| 47,756 | Colgate-Palmolive Co. | 3,097,932 | ||||||||
| 73,082 | Comcast Corp. Class A | 3,563,478 | ||||||||
| 7,302 | CONMED Corp. | 317,272 | ||||||||
| 61,208 | ConocoPhillips | 4,305,983 | ||||||||
| 5,181 | CR Bard, Inc. | 766,684 | ||||||||
| 20,421 | CVS Caremark Corp. | 1,528,716 | ||||||||
| 30,814 | Devon Energy Corp. | 2,062,381 | ||||||||
| 166,042 | DIRECTV* | 12,688,930 | ||||||||
| 1,905 | Dr Pepper Snapple Group, Inc. | 103,746 | ||||||||
| 25,509 | DST Systems, Inc. | 2,417,998 | ||||||||
| 302,787 | eBay, Inc.* | 16,725,954 | ||||||||
| 7,503 | Eli Lilly & Co. | 441,627 | ||||||||
| 93,129 | Empire District Electric Co. (The) | 2,264,897 | ||||||||
| 1,489 | Energizer Holdings, Inc. | 150,002 | ||||||||
| 7,755 | Exxon Mobil Corp. | 757,508 | ||||||||
| 1,442 | First American Financial Corp. | 38,285 | ||||||||
| 20,691 | General Mills, Inc. | 1,072,208 | ||||||||
| 10,549 | Google, Inc. Class A* | 11,756,966 | ||||||||
| 43,931 | Great Plains Energy, Inc. | 1,187,894 | ||||||||
| 136 | See accompanying Notes to the Financial Statements. |
Table of Contents
Mercer Global Low Volatility Equity Fund
Schedule of Investments (Continued)
(showing percentage of net assets)
March 31, 2014
| Shares | Description | Value ($) | ||||||||
United States — continued | ||||||||||
| 16,715 | H&R Block, Inc. | 504,626 | ||||||||
| 4,993 | Harris Corp. | 365,288 | ||||||||
| 3,379 | HealthSouth Corp. | 121,407 | ||||||||
| 19,637 | Henry Schein, Inc.* | 2,344,069 | ||||||||
| 13,445 | Hershey Co. (The) | 1,403,658 | ||||||||
| 48,304 | Hill-Rom Holdings, Inc. | 1,861,636 | ||||||||
| 147,494 | Intel Corp. | 3,806,820 | ||||||||
| 19,702 | Intuit, Inc. | 1,531,436 | ||||||||
| 26,670 | Jack Henry & Associates, Inc. | 1,487,119 | ||||||||
| 54,685 | Johnson & Johnson | 5,371,708 | ||||||||
| 21,450 | Kaiser Aluminum Corp. | 1,531,959 | ||||||||
| 35,961 | Kellogg Co. | 2,255,114 | ||||||||
| 21,346 | Kimberly-Clark Corp. | 2,353,396 | ||||||||
| 6,823 | L-3 Communications Holdings, Inc. | 806,137 | ||||||||
| 23,554 | Laboratory Corp. of America Holdings* | 2,313,238 | ||||||||
| 75,756 | Liberty Media Corp. - Interactive Class A* | 2,187,076 | ||||||||
| 52,701 | Linear Technology Corp. | 2,566,012 | ||||||||
| 11,296 | Lockheed Martin Corp. | 1,843,959 | ||||||||
| 42,630 | Lorillard, Inc. | 2,305,430 | ||||||||
| 238,674 | Lowe’s Cos., Inc. | 11,671,159 | ||||||||
| 12,062 | Martin Marietta Materials, Inc. | 1,548,158 | ||||||||
| 111,638 | Mastercard, Inc. Class A | 8,339,359 | ||||||||
| 50,372 | McDonald’s Corp. | 4,937,967 | ||||||||
| 16,742 | McKesson Corp. | 2,956,135 | ||||||||
| 10,295 | MEDNAX, Inc.* | 638,084 | ||||||||
| 37,223 | Medtronic, Inc. | 2,290,703 | ||||||||
| 32,424 | Merck & Co., Inc. | 1,840,710 | ||||||||
| 527,828 | Microsoft Corp. | 21,635,670 | ||||||||
| 11,876 | Monster Worldwide, Inc.* | 88,832 | ||||||||
| 3,891 | National Healthcare Corp. | 217,001 | ||||||||
| 26,413 | National Oilwell Varco, Inc. | 2,056,780 | ||||||||
| 8,371 | NetApp, Inc. | 308,890 | ||||||||
| 15,317 | Newmont Mining Corp. | 359,030 | ||||||||
| 15,676 | Northrop Grumman Corp. | 1,934,105 | ||||||||
| 21,511 | Northwest Bancshares, Inc. | 314,061 | ||||||||
| 39,552 | Nutri/System, Inc. | 596,049 | ||||||||
| 12,321 | Omnicare, Inc. | 735,194 | ||||||||
| 41,032 | Omnicom Group, Inc. | 2,978,923 | ||||||||
| 517,897 | Oracle Corp. | 21,187,166 | ||||||||
| 62,641 | Owens & Minor, Inc.‡ | 2,194,314 | ||||||||
| 44,619 | Patterson Cos., Inc. | 1,863,289 | ||||||||
| 50,696 | People’s United Financial, Inc. | 753,849 | ||||||||
| 25,275 | PepsiCo, Inc. | 2,110,462 | ||||||||
| 22,638 | Philip Morris International, Inc. | 1,853,373 | ||||||||
| 37,563 | Plum Creek Timber Co., Inc. REIT | 1,579,148 | ||||||||
| 11,200 | Procter & Gamble Co. (The) | 902,720 | ||||||||
| 28,919 | Provident Financial Services, Inc. | 531,242 | ||||||||
| 21,354 | Quest Diagnostics, Inc. | 1,236,824 | ||||||||
| 17,974 | Rayonier, Inc. REIT | 825,186 | ||||||||
| See accompanying Notes to the Financial Statements. | 137 |
Table of Contents
Mercer Global Low Volatility Equity Fund
Schedule of Investments (Continued)
(showing percentage of net assets)
March 31, 2014
| Shares | Description | Value ($) | ||||||||
United States — continued | ||||||||||
| 6,024 | San Juan Basin Royalty Trust | 106,324 | ||||||||
| 22,518 | Scotts Miracle-Gro Co. (The) Class A | 1,379,903 | ||||||||
| 65,298 | State Street Corp. | 4,541,476 | ||||||||
| 79,302 | Steel Dynamics, Inc. | 1,410,783 | ||||||||
| 69,525 | Sysco Corp. | 2,511,938 | ||||||||
| 228,672 | Target Corp. | 13,836,943 | ||||||||
| 33,746 | Teradata Corp.* | 1,659,966 | ||||||||
| 17,795 | Tyson Foods, Inc. Class A | 783,158 | ||||||||
| 17,302 | Universal Corp.‡ | 967,009 | ||||||||
| 213,566 | US Bancorp | 9,153,439 | ||||||||
| 31,802 | Vector Group, Ltd.‡ | 685,015 | ||||||||
| 2,464 | Vectren Corp. | 97,057 | ||||||||
| 33,444 | VeriSign, Inc.* | 1,802,966 | ||||||||
| 61,329 | Visa, Inc. Class A | 13,238,478 | ||||||||
| 19,559 | Vulcan Materials Co. | 1,299,696 | ||||||||
| 133,561 | Wal-Mart Stores, Inc. | 10,208,067 | ||||||||
| 20,574 | WellPoint, Inc. | 2,048,142 | ||||||||
| 209,404 | Wells Fargo & Co. | 10,415,755 | ||||||||
| 63,760 | Weyerhaeuser Co. REIT | 1,871,356 | ||||||||
| 34,964 | WR Berkley Corp. | 1,455,202 | ||||||||
| 594 | WSFS Financial Corp. | 42,429 | ||||||||
| 152,522 | Yum! Brands, Inc. | 11,498,634 | ||||||||
| 6,773 | Zimmer Holdings, Inc. | 640,590 | ||||||||
|
| |||||||||
Total United States | 359,625,838 | |||||||||
|
| |||||||||
TOTAL COMMON STOCKS (COST $584,767,403) | 661,550,526 | |||||||||
|
| |||||||||
INVESTMENT COMPANY — 1.6% | ||||||||||
United States — 1.6% | ||||||||||
| 94,628 | SPDR Gold Shares* ‡ | 11,696,967 | ||||||||
|
| |||||||||
TOTAL INVESTMENT COMPANY (COST $13,148,277) | 11,696,967 | |||||||||
|
| |||||||||
PREFERRED STOCKS — 0.1% | ||||||||||
Germany — 0.0% | ||||||||||
| 938 | Henkel AG & Co. KGaA, 1.21% | 100,993 | ||||||||
|
| |||||||||
Japan — 0.0% | ||||||||||
| 113 | Shinkin Central Bank, 3.44% | 207,160 | ||||||||
|
| |||||||||
Sweden — 0.1% | ||||||||||
| 49,515 | Sagax AB, 5.99% | 255,077 | ||||||||
|
| |||||||||
TOTAL PREFERRED STOCKS (COST $537,179) | 563,230 | |||||||||
|
| |||||||||
WARRANTS — 0.1% | ||||||||||
United States — 0.1% | ||||||||||
| 36,776 | JPMorgan Chase & Co., Strike Price $0.00, Expires 10/28/18* | 742,876 | ||||||||
|
| |||||||||
TOTAL WARRANTS (COST $545,378) | 742,876 | |||||||||
|
| |||||||||
| 138 | See accompanying Notes to the Financial Statements. |
Table of Contents
Mercer Global Low Volatility Equity Fund
Schedule of Investments (Continued)
(showing percentage of net assets)
March 31, 2014
| Par Value ($) | Description | Value ($) | ||||||||
SHORT-TERM INVESTMENTS — 13.5% | ||||||||||
Bank Deposit — 9.0% | ||||||||||
| 67,184,060 | State Street Bank & Trust Euro Time Deposit, 0.01%, due 04/01/14 | 67,184,060 | ||||||||
|
| |||||||||
Securities Lending Collateral — 4.5% | ||||||||||
| 33,949,069 | State Street Navigator Securities Lending Prime Portfolio*** | 33,949,069 | ||||||||
|
| |||||||||
TOTAL SHORT-TERM INVESTMENTS (COST $101,133,129) | 101,133,129 | |||||||||
|
| |||||||||
TOTAL INVESTMENTS — 104.4% (Cost $700,131,366) | 775,686,728 | |||||||||
Other Assets and Liabilities (net) — (4.4)% | (33,045,334 | ) | ||||||||
|
| |||||||||
NET ASSETS — 100.0% | $ | 742,641,394 | ||||||||
|
| |||||||||
Notes to Schedule of Investments: | ||||||||||
| ADR — American Depository Receipt | ||||||||||
| GDR — Global Depository Receipt | ||||||||||
| NVDR — Non-Voting Depository Receipt | ||||||||||
| REIT — Real Estate Investment Trust | ||||||||||
| * | Non-income producing security | |||||||||
| *** | Represents an investment of securities lending cash collateral. | |||||||||
| ‡ | All or a portion of this security is out on loan. | |||||||||
| ‡‡‡ | Security exempt from registration under Regulation S of the Securities Act of 1933, which exempts from registration securities offered and sold outside the United States. Security may not be offered or sold in the United States except pursuant to an exemption from, or in a transaction not subject to, the registration requirements of the Securities Act of 1933. | |||||||||
| See accompanying Notes to the Financial Statements. | 139 |
Table of Contents
Mercer Global Low Volatility Equity Fund
Schedule of Investments (Continued)
March 31, 2014
A summary of outstanding financial instruments at March 31, 2014 is as follows:
Forward Foreign Currency Contracts
Settlement | Currency | Counterparty | Units of | Value | Unrealized | |||||||||||||||
| Buys | ||||||||||||||||||||
| 05/13/14 | JPY | Bank of New York Mellon | 214,963,000 | $ | 2,087,790 | $ | 30,255 | |||||||||||||
|
| |||||||||||||||||||
| Sales | ||||||||||||||||||||
| 05/13/14 | EUR | Bank of New York Mellon | 2,017,000 | $ | 2,779,712 | $ | (87,420 | ) | ||||||||||||
| 08/20/14 | EUR | Bank of New York Mellon | 1,158,000 | 1,595,791 | (22,548 | ) | ||||||||||||||
| 09/17/14 | EUR | Goldman Sachs | 1,956,000 | 2,695,458 | 28,604 | |||||||||||||||
| 06/18/14 | EUR | HSBC Bank USA | 260,000 | 358,304 | (153 | ) | ||||||||||||||
| 07/16/14 | EUR | JPMorgan Chase Bank | 1,214,000 | 1,672,981 | (27,768 | ) | ||||||||||||||
| 04/16/14 | EUR | UBS AG | 955,000 | 1,316,188 | (21,263 | ) | ||||||||||||||
| 05/13/14 | GBP | Bank of New York Mellon | 80,000 | 133,331 | (2,836 | ) | ||||||||||||||
| 08/20/14 | GBP | Bank of New York Mellon | 91,000 | 151,549 | (922 | ) | ||||||||||||||
| 09/17/14 | GBP | Goldman Sachs | 8,000 | 13,320 | 13 | |||||||||||||||
| 06/18/14 | GBP | HSBC Bank USA | 80,000 | 133,295 | (2,818 | ) | ||||||||||||||
| 07/16/14 | GBP | JPMorgan Chase Bank | 54,000 | 89,955 | (1,184 | ) | ||||||||||||||
| 04/16/14 | GBP | UBS AG | 80,000 | 133,358 | (2,875 | ) | ||||||||||||||
| 05/13/14 | JPY | Bank of New York Mellon | 439,972,000 | 4,273,150 | 160,867 | |||||||||||||||
| 09/17/14 | JPY | Goldman Sachs | 256,826,000 | 2,496,185 | 16,372 | |||||||||||||||
| 06/18/14 | JPY | HSBC Bank USA | 198,155,000 | 1,924,901 | 10,528 | |||||||||||||||
| 07/16/14 | JPY | JPMorgan Chase Bank | 190,991,000 | 1,855,597 | (31,981 | ) | ||||||||||||||
| 04/16/14 | JPY | UBS AG | 189,480,000 | 1,840,022 | 46,147 | |||||||||||||||
|
| |||||||||||||||||||
| $ | 60,763 | |||||||||||||||||||
|
| |||||||||||||||||||
Currency Abbreviations
| GBP | British Pound Sterling |
| EUR | Euro |
| JPY | Japanese Yen |
| 140 | See accompanying Notes to the Financial Statements. |
Table of Contents
Mercer Global Low Volatility Equity Fund
Schedule of Investments (Continued)
March 31, 2014
| Industry Sector Summary (Unaudited) | % of Net Assets | ||||
Food | 10.2 | ||||
Retail | 9.1 | ||||
Banks | 6.9 | ||||
Software | 6.8 | ||||
Pharmaceuticals | 5.8 | ||||
Internet | 4.5 | ||||
Commercial Services | 4.2 | ||||
Telecommunications | 4.1 | ||||
Oil & Gas | 3.6 | ||||
Media | 3.2 | ||||
Health Care — Products | 2.4 | ||||
Electric | 2.3 | ||||
Agriculture | 2.2 | ||||
Insurance | 2.1 | ||||
Mining | 2.1 | ||||
Beverages | 1.7 | ||||
Commodity Fund | 1.6 | ||||
Electronics | 1.4 | ||||
Health Care — Services | 1.4 | ||||
Building Materials | 1.2 | ||||
Cosmetics & Personal Care | 1.1 | ||||
Diversified Financial Services | 1.1 | ||||
Holding Companies — Diversified | 0.9 | ||||
Aerospace & Defense | 0.8 | ||||
Computers | 0.8 | ||||
Household Products & Wares | 0.8 | ||||
Semiconductors | 0.8 | ||||
Apparel | 0.5 | ||||
Chemicals | 0.5 | ||||
Engineering & Construction | 0.5 | ||||
Hand & Machine Tools | 0.5 | ||||
Miscellaneous — Manufacturing | 0.5 | ||||
Real Estate | 0.5 | ||||
Textiles | 0.5 | ||||
Advertising | 0.4 | ||||
REITS | 0.4 | ||||
Savings & Loans | 0.4 | ||||
Transportation | 0.4 | ||||
Distribution & Wholesale | 0.3 | ||||
Investment Companies | 0.3 | ||||
Leisure Time | 0.3 | ||||
Metal Fabricate & Hardware | 0.3 | ||||
Oil & Gas Services | 0.3 | ||||
Auto Manufacturers | 0.2 | ||||
Forest Products & Paper | 0.2 | ||||
Home Builders | 0.2 | ||||
Iron & Steel | 0.2 | ||||
Airlines | 0.1 | ||||
Auto Parts & Equipment | 0.1 | ||||
Electrical Components & Equipment | 0.1 | ||||
Office & Business Equipment | 0.1 | ||||
| See accompanying Notes to the Financial Statements. | 141 |
Table of Contents
Mercer Global Low Volatility Equity Fund
Schedule of Investments (Continued)
March 31, 2014
| Industry Sector Summary (Unaudited) | % of Net Assets | ||||
Biotechnology | 0.0 | ||||
Gas | 0.0 | ||||
Lodging | 0.0 | ||||
Short-Term Investments and Other Assets and Liabilities (net) | 9.1 | ||||
|
| ||||
| 100.0 | % | ||||
|
| ||||
| 142 | See accompanying Notes to the Financial Statements. |
Table of Contents
Mercer Funds
Statements of Assets and Liabilities
March 31, 2014
| Mercer US Large Cap Growth Equity Fund | Mercer US Large Cap Value Equity Fund | Mercer US Small/Mid Cap Growth Equity Fund | Mercer US Small/Mid Cap Value Equity Fund | |||||||||||||
Assets | ||||||||||||||||
Investments, at value(a) | $ | 356,687,626 | $ | 375,611,434 | $ | 432,400,073 | $ | 412,673,514 | ||||||||
Cash | — | 61,535 | 150 | 67,273 | ||||||||||||
Receivable for investments sold | 2,214,083 | 5,109,928 | 1,812,983 | 5,120,389 | ||||||||||||
Dividend and interest receivable | 227,080 | 576,947 | 117,382 | 306,522 | ||||||||||||
Receivable for expenses reimbursed by Advisor | 34,872 | 29,559 | 24,605 | 27,838 | ||||||||||||
Foreign tax reclaims receivable | 1,667 | 14,532 | — | — | ||||||||||||
Securities lending income receivable | 663 | 4,292 | 12,327 | 36,859 | ||||||||||||
Prepaid expenses | 2,325 | 2,371 | 2,249 | 2,182 | ||||||||||||
|
|
|
|
|
|
|
| |||||||||
Total assets | 359,168,316 | 381,410,598 | 434,369,769 | 418,234,577 | ||||||||||||
|
|
|
|
|
|
|
| |||||||||
Liabilities | ||||||||||||||||
Payable for investments purchased | 51,460 | 4,084,703 | 1,374,845 | 3,625,717 | ||||||||||||
Payable for Fund shares repurchased | — | 600,595 | — | — | ||||||||||||
Unrealized depreciation on open forward foreign currency contracts | — | 23,526 | — | — | ||||||||||||
Obligation to return securities lending collateral | — | 5,975,569 | 35,237,041 | 25,511,034 | ||||||||||||
Payable to affiliate for: | ||||||||||||||||
Advisor fee | 172,945 | 168,336 | 309,569 | 297,354 | ||||||||||||
Trustees fees | 4,984 | 5,022 | 5,007 | 4,804 | ||||||||||||
Accrued expenses | 76,691 | 74,985 | 83,187 | 83,994 | ||||||||||||
|
|
|
|
|
|
|
| |||||||||
Total liabilities | 306,080 | 10,932,736 | 37,009,649 | 29,522,903 | ||||||||||||
|
|
|
|
|
|
|
| |||||||||
Net assets | $ | 358,862,236 | $ | 370,477,862 | $ | 397,360,120 | $ | 388,711,674 | ||||||||
|
|
|
|
|
|
|
| |||||||||
Net assets consist of: | ||||||||||||||||
Paid-in capital | 243,457,704 | 274,105,907 | 300,098,812 | 300,924,371 | ||||||||||||
Accumulated undistributed (distributions in excess of) net investment income | 313,482 | 1,507,583 | (914 | ) | (39,343 | ) | ||||||||||
Accumulated net realized gain | 27,691,606 | 8,769,372 | 22,080,463 | 51,804,936 | ||||||||||||
Net unrealized appreciation on investments and foreign currencies | 87,399,444 | 86,095,000 | 75,181,759 | 36,021,710 | ||||||||||||
|
|
|
|
|
|
|
| |||||||||
Net assets | $ | 358,862,236 | $ | 370,477,862 | $ | 397,360,120 | $ | 388,711,674 | ||||||||
|
|
|
|
|
|
|
| |||||||||
Net assets attributable to: | ||||||||||||||||
Class Y-3 shares | $ | 358,862,236 | $ | 370,477,862 | $ | 397,360,120 | $ | 388,711,674 | ||||||||
|
|
|
|
|
|
|
| |||||||||
Shares outstanding: | ||||||||||||||||
Class Y-3 | 27,259,950 | 29,274,767 | 31,932,265 | 35,398,053 | ||||||||||||
|
|
|
|
|
|
|
| |||||||||
Net asset value per share: | ||||||||||||||||
Class Y-3 | $ | 13.16 | $ | 12.66 | $ | 12.44 | $ | 10.98 | ||||||||
|
|
|
|
|
|
|
| |||||||||
(a) Investments, at cost | 269,288,182 | 289,492,910 | 357,218,314 | 376,651,820 | ||||||||||||
|
|
|
|
|
|
|
| |||||||||
| See accompanying Notes to the Financial Statements. | 143 |
Table of Contents
Mercer Funds
Statements of Assets and Liabilities (Continued)
March 31, 2014
| Mercer Non-US Core Equity Fund | Mercer Core Fixed Income Fund (formerly known as Mercer Core Opportunistic Fixed Income Fund) | Mercer Opportunistic Fixed Income Fund | Mercer Emerging Markets Equity Fund | |||||||||||||||||
Assets | ||||||||||||||||||||
Investments, at value(a) | $ | 1,944,071,014 | $ | 1,089,889,175 | $ | 258,232,058 | $ | 893,926,492 | ||||||||||||
Foreign currency, at value(b) | 3,062,511 | 728,001 | 601,013 | 2,533,132 | ||||||||||||||||
Cash | — | 5,767,936 | 22,889 | — | ||||||||||||||||
Receivable for investments sold | 14,315,657 | 48,839,650 | 1,159,032 | 2,266,688 | ||||||||||||||||
Receivable for TBA securities sold | — | 119,107,903 | — | — | ||||||||||||||||
Dividend and interest receivable | 5,987,558 | 6,349,919 | 4,359,550 | 1,796,451 | ||||||||||||||||
Unrealized appreciation on open forward foreign currency contracts | — | 101,830 | 1,070,615 | 3,743,567 | ||||||||||||||||
Cash collateral held at broker on open future contracts | — | 645,039 | — | 2,058,001 | ||||||||||||||||
Receivable for variation margin on open futures contracts | — | 11,975 | — | 40,342 | ||||||||||||||||
Receivable for expenses reimbursed by Advisor | — | 88,145 | 65,480 | 156,308 | ||||||||||||||||
Synthetic futures, at value | — | — | — | 778,913 | ||||||||||||||||
Foreign tax reclaims receivable | 1,222,307 | — | 56,235 | 2,477 | ||||||||||||||||
Securities lending income receivable | 71,757 | 2,455 | — | 12,175 | ||||||||||||||||
Prepaid expenses | 10,230 | 5,895 | — | 2,924 | ||||||||||||||||
|
|
|
|
|
|
|
| |||||||||||||
Total assets | 1,968,741,034 | 1,271,537,923 | 265,566,872 | 907,317,470 | ||||||||||||||||
|
|
|
|
|
|
|
| |||||||||||||
Liabilities | ||||||||||||||||||||
Payable for investments purchased | 12,903,119 | 71,599,757 | 2,729,691 | 3,306,297 | ||||||||||||||||
Payable for TBA and when-issued securities purchased | — | 120,111,828 | 1,403,926 | — | ||||||||||||||||
Due to custodian | — | — | — | 57,342 | ||||||||||||||||
Written options, at value(c) | — | 20,997 | — | — | ||||||||||||||||
Unrealized depreciation on open forward foreign currency contracts | — | 162,636 | 573,406 | 3,231,529 | ||||||||||||||||
Cash collateral due to broker on closed swap contracts | — | 70,000 | — | — | ||||||||||||||||
Obligation to return securities lending collateral | 72,792,139 | 2,627,065 | — | 36,536,471 | ||||||||||||||||
Payable to affiliate for: | ||||||||||||||||||||
Advisor fee | 1,178,430 | 319,116 | 157,484 | 561,709 | ||||||||||||||||
Trustees fees | 23,337 | 13,217 | 1,460 | 7,478 | ||||||||||||||||
Accrued expenses | 368,375 | 173,830 | 120,056 | 693,803 | ||||||||||||||||
|
|
|
|
|
|
|
| |||||||||||||
Total liabilities | 87,265,400 | 195,098,446 | 4,986,023 | 44,394,629 | ||||||||||||||||
|
|
|
|
|
|
|
| |||||||||||||
Net assets | $ | 1,881,475,634 | $ | 1,076,439,477 | $ | 260,580,849 | $ | 862,922,841 | ||||||||||||
|
|
|
|
|
|
|
| |||||||||||||
Net assets consist of: | ||||||||||||||||||||
Paid-in capital | 1,497,164,415 | 1,048,708,509 | 252,911,638 | 857,737,699 | ||||||||||||||||
Accumulated undistributed net investment income | 15,302,164 | 6,679,686 | 2,764,086 | 4,792,103 | ||||||||||||||||
Accumulated net realized gain (loss) | 107,815,425 | 3,960,942 | (434,115 | ) | (16,319,065 | ) | ||||||||||||||
Net unrealized appreciation on investments, futures contracts, options written and foreign currencies | 261,193,630 | 17,090,340 | 5,339,240 | 16,712,104 | ||||||||||||||||
|
|
|
|
|
|
|
| |||||||||||||
Net assets | $ | 1,881,475,634 | $ | 1,076,439,477 | $ | 260,580,849 | $ | 862,922,841 | ||||||||||||
|
|
|
|
|
|
|
| |||||||||||||
| 144 | See accompanying Notes to the Financial Statements. |
Table of Contents
Mercer Funds
Statements of Assets and Liabilities (Continued)
March 31, 2014
| Mercer Non- US Core Equity Fund | Mercer Core Fixed Income Fund (formerly known as Mercer Core Opportunistic Fixed Income Fund) | Mercer Opportunistic Fixed Income Fund | Mercer Emerging Markets Equity Fund | |||||||||||||||||
Net assets attributable to: | ||||||||||||||||||||
Class Y-3 shares | $ | 1,881,475,634 | $ | 1,076,439,477 | $ | 260,580,849 | $ | 862,922,841 | ||||||||||||
|
|
|
|
|
|
|
| |||||||||||||
Shares outstanding: | ||||||||||||||||||||
Class Y-3 | 157,869,071 | 103,276,370 | 24,973,336 | 86,340,076 | ||||||||||||||||
|
|
|
|
|
|
|
| |||||||||||||
Net asset value per share: | ||||||||||||||||||||
Class Y-3 | $ | 11.92 | $ | 10.42 | $ | 10.43 | $ | 9.99 | ||||||||||||
|
|
|
|
|
|
|
| |||||||||||||
(a) Investments, at cost | 1,682,879,013 | 1,072,770,932 | 253,400,181 | 878,284,732 | ||||||||||||||||
|
|
|
|
|
|
|
| |||||||||||||
(b) Foreign currency, at cost | 3,086,972 | 708,195 | 597,705 | 2,500,442 | ||||||||||||||||
|
|
|
|
|
|
|
| |||||||||||||
(c) Premiums on written options | — | 23,279 | — | — | ||||||||||||||||
|
|
|
|
|
|
|
| |||||||||||||
| See accompanying Notes to the Financial Statements. | 145 |
Table of Contents
Mercer Funds
Statements of Assets and Liabilities (Continued)
March 31, 2014
| Mercer Global Low Volatility Equity Fund | |||||
Assets | |||||
Investments, at value(a) | $ | 775,686,728 | |||
Foreign currency, at value(b) | 433,693 | ||||
Receivable for investments sold | 164,501 | ||||
Dividend and interest receivable | 1,302,938 | ||||
Unrealized appreciation on open forward foreign currency contracts | 292,786 | ||||
Foreign tax reclaims receivable | 278,929 | ||||
Securities lending income receivable | 18,013 | ||||
Prepaid expenses | 3,294 | ||||
|
| ||||
Total assets | 778,180,882 | ||||
|
| ||||
Liabilities | |||||
Payable for investments purchased | 317,025 | ||||
Payable for Fund shares repurchased | 400,000 | ||||
Unrealized depreciation on open forward foreign currency contracts | 201,768 | ||||
Obligation to return securities lending collateral | 33,949,069 | ||||
Payable to affiliate for: | |||||
Advisor fee | 542,784 | ||||
Trustees fees | 7,692 | ||||
Accrued expenses | 121,150 | ||||
|
| ||||
Total liabilities | 35,539,488 | ||||
|
| ||||
Net assets | $ | 742,641,394 | |||
|
| ||||
Net assets consist of: | |||||
Paid-in capital | 653,027,930 | ||||
Accumulated undistributed net investment income | 1,063,496 | ||||
Accumulated net realized gain | 12,888,672 | ||||
Net unrealized appreciation on investments and foreign currencies | 75,661,296 | ||||
|
| ||||
Net assets | $ | 742,641,394 | |||
|
| ||||
Net assets attributable to: | |||||
Class Y-3 shares | $ | 742,641,394 | |||
|
| ||||
Shares outstanding: | |||||
Class Y-3 | 60,539,379 | ||||
|
| ||||
Net asset value per share: | |||||
Class Y-3 | $ | 12.27 | |||
|
| ||||
(a) Investments, at cost | 700,131,366 | ||||
|
| ||||
(b) Foreign currency, at cost | 430,390 | ||||
|
| ||||
| 146 | See accompanying Notes to the Financial Statements. |
Table of Contents
Mercer Funds
For the Year Ended March 31, 2014
| Mercer US Large Cap Growth Equity Fund | Mercer US Large Cap Value Equity Fund | Mercer US Small/Mid Cap Growth Equity Fund | Mercer US Small/Mid Cap Value Equity Fund | |||||||||||||||||
Investment Income: | ||||||||||||||||||||
Interest | $ | 664 | $ | 380 | $ | 816 | $ | 742 | ||||||||||||
Dividends | 4,276,491 | 8,855,125 | 3,071,257 | 5,146,364 | ||||||||||||||||
Securities lending income | 35,858 | 72,294 | 212,949 | 199,390 | ||||||||||||||||
Withholding taxes | (38,108 | ) | (98,933 | ) | (21,819 | ) | (23,406 | ) | ||||||||||||
|
|
|
|
|
|
|
| |||||||||||||
Total investment income | 4,274,905 | 8,828,866 | 3,263,203 | 5,323,090 | ||||||||||||||||
|
|
|
|
|
|
|
| |||||||||||||
Expenses: | ||||||||||||||||||||
Advisory fees | 2,238,991 | 2,174,473 | 3,690,903 | 3,541,415 | ||||||||||||||||
Transfer agent fees | 22,949 | 22,910 | 23,248 | 23,260 | ||||||||||||||||
Custodian and fund accounting fees | 150,612 | 147,872 | 159,420 | 186,207 | ||||||||||||||||
Audit fees | 48,410 | 48,694 | 52,639 | 54,392 | ||||||||||||||||
Legal fees | 41,454 | 41,183 | 42,918 | 50,414 | ||||||||||||||||
Trustees fees | 18,258 | 18,536 | 18,875 | 18,182 | ||||||||||||||||
Registration fees | 22,620 | 22,620 | 22,406 | 22,428 | ||||||||||||||||
Miscellaneous | 33,954 | 34,735 | 33,074 | 31,940 | ||||||||||||||||
|
|
|
|
|
|
|
| |||||||||||||
Total expenses | 2,577,248 | 2,511,023 | 4,043,483 | 3,928,238 | ||||||||||||||||
Fee reductions | (22,104 | ) | (22,071 | ) | (22,523 | ) | (22,510 | ) | ||||||||||||
Reimbursement of expenses | (234,734 | ) | (232,423 | ) | (42,987 | ) | (88,870 | ) | ||||||||||||
|
|
|
|
|
|
|
| |||||||||||||
Net expenses | 2,320,410 | 2,256,529 | 3,977,973 | 3,816,858 | ||||||||||||||||
|
|
|
|
|
|
|
| |||||||||||||
Net investment income (loss) | 1,954,495 | 6,572,337 | (714,770 | ) | 1,506,232 | |||||||||||||||
|
|
|
|
|
|
|
| |||||||||||||
Realized and Unrealized Gain (Loss): | ||||||||||||||||||||
Net realized gain (loss) on: | ||||||||||||||||||||
Investments | 91,017,590 | 100,402,087 | 79,473,254 | 95,926,702 | ||||||||||||||||
In-kind redemptions | — | — | — | 7,168,911 | ||||||||||||||||
Closed futures contracts | — | — | — | 200,287 | ||||||||||||||||
Forward foreign currency contracts and foreign currency related transactions | — | 224,730 | (6,593 | ) | — | |||||||||||||||
|
|
|
|
|
|
|
| |||||||||||||
Net realized gain | 91,017,590 | 100,626,817 | 79,466,661 | 103,295,900 | ||||||||||||||||
|
|
|
|
|
|
|
| |||||||||||||
Change in net unrealized appreciation (depreciation) on: | ||||||||||||||||||||
Investments | (6,335,436 | ) | (562,872 | ) | 3,771,797 | (28,294,086 | ) | |||||||||||||
Forward foreign currency contracts and foreign currency related translations | — | (12,101 | ) | — | 16 | |||||||||||||||
|
|
|
|
|
|
|
| |||||||||||||
Change in net unrealized appreciation (depreciation) | (6,335,436 | ) | (574,973 | ) | 3,771,797 | (28,294,070 | ) | |||||||||||||
|
|
|
|
|
|
|
| |||||||||||||
Net realized and unrealized gain (loss) | 84,682,154 | 100,051,844 | 83,238,458 | 75,001,830 | ||||||||||||||||
|
|
|
|
|
|
|
| |||||||||||||
Net increase in net assets resulting from operations | $ | 86,636,649 | $ | 106,624,181 | $ | 82,523,688 | $ | 76,508,062 | ||||||||||||
|
|
|
|
|
|
|
| |||||||||||||
| See accompanying Notes to the Financial Statements. | 147 |
Table of Contents
Mercer Funds
Statements of Operations (Continued)
For the Year Ended March 31, 2014
| Mercer Non-US Core Equity Fund | Mercer Core Fixed Income Fund (formerly known as Mercer Core Opportunistic Fixed Income Fund) | Mercer Opportunistic Fixed Income Fund(a) | Mercer Emerging Markets Equity Fund | |||||||||||||||||
Investment Income: | ||||||||||||||||||||
Interest | $ | 5,851 | $ | 28,837,115 | $ | 5,035,600 | $ | 4,794 | ||||||||||||
Dividends | 67,589,785 | 262,202 | 8,125 | 18,687,793 | ||||||||||||||||
Securities lending income | 1,463,686 | 43,755 | — | 66,605 | ||||||||||||||||
Withholding taxes | (4,531,359 | ) | (5,555 | ) | (70,705 | ) | (1,815,558 | ) | ||||||||||||
Other income | 4,784 | 3,415 | 23,620 | — | ||||||||||||||||
|
|
|
|
|
|
|
| |||||||||||||
Total investment income | 64,532,747 | 29,140,932 | 4,996,640 | 16,943,634 | ||||||||||||||||
|
|
|
|
|
|
|
| |||||||||||||
Expenses: | ||||||||||||||||||||
Advisory fees | 14,111,420 | 3,722,510 | 622,666 | 4,987,747 | ||||||||||||||||
Transfer agent fees | 26,013 | 24,320 | 13,583 | 23,276 | ||||||||||||||||
Custodian and fund accounting fees | 1,489,584 | 535,549 | 109,636 | 1,212,249 | ||||||||||||||||
Audit fees | 282,229 | 71,260 | 68,785 | 93,056 | ||||||||||||||||
Legal fees | 191,870 | 116,300 | 49,670 | 62,152 | ||||||||||||||||
Trustees fees | 86,707 | 47,874 | 3,335 | 28,171 | ||||||||||||||||
Registration fees | 25,545 | 23,840 | 31,578 | 25,706 | ||||||||||||||||
Interest expense | — | — | — | 5,132 | ||||||||||||||||
Miscellaneous | 158,571 | 91,824 | 11,892 | 56,286 | ||||||||||||||||
|
|
|
|
|
|
|
| |||||||||||||
Total expenses | 16,371,939 | 4,633,477 | 911,145 | 6,493,775 | ||||||||||||||||
Fee reductions | (22,479 | ) | (22,300 | ) | (13,583 | ) | (22,388 | ) | ||||||||||||
Reimbursement of expenses | — | (602,436 | ) | (193,679 | ) | (533,749 | ) | |||||||||||||
|
|
|
|
|
|
|
| |||||||||||||
Net expenses | 16,349,460 | 4,008,741 | 703,883 | 5,937,638 | ||||||||||||||||
|
|
|
|
|
|
|
| |||||||||||||
Net investment income | 48,183,287 | 25,132,191 | 4,292,757 | 11,005,996 | ||||||||||||||||
|
|
|
|
|
|
|
| |||||||||||||
Realized and Unrealized Gain (Loss): | ||||||||||||||||||||
Net realized gain (loss) on: | ||||||||||||||||||||
Investments | 279,473,579 | 4,692,757 | (51,428 | ) | (12,987,238 | ) | ||||||||||||||
Swap contracts | — | (1,324,502 | ) | (15,540 | ) | — | ||||||||||||||
In-kind redemptions | 30,662,932 | — | — | — | ||||||||||||||||
Closed futures contracts | — | 1,641,692 | — | (1,815,107 | ) | |||||||||||||||
Written option contracts | — | 1,155,019 | — | — | ||||||||||||||||
Forward foreign currency contracts and foreign currency related transactions | (685,925 | ) | (1,109,785 | ) | 409,517 | 6,239,327 | ||||||||||||||
|
|
|
|
|
|
|
| |||||||||||||
Net realized gain | 309,450,586 | 5,055,181 | 342,549 | (8,563,018 | ) | |||||||||||||||
|
|
|
|
|
|
|
| |||||||||||||
Change in net unrealized appreciation (depreciation) on: | ||||||||||||||||||||
Investments | 24,613,279 | (27,059,361 | ) | 4,831,877 | (8,905,767 | ) | ||||||||||||||
Unfunded loan commitments | — | (2,725 | ) | — | — | |||||||||||||||
TBA Sale Commitments | — | 16,406 | — | — | ||||||||||||||||
Swap contracts | — | (458,119 | ) | — | — | |||||||||||||||
Open futures contracts | — | 604,974 | — | 1,166,154 | ||||||||||||||||
Written option contracts | — | (37,800 | ) | — | — | |||||||||||||||
Forward foreign currency contracts and foreign currency related translations | 575,261 | 264,522 | 507,363 | 670,354 | ||||||||||||||||
|
|
|
|
|
|
|
| |||||||||||||
Change in net unrealized appreciation (depreciation) | 25,188,540 | (26,672,103 | ) | 5,339,240 | (7,069,259 | ) | ||||||||||||||
|
|
|
|
|
|
|
| |||||||||||||
Net realized and unrealized gain (loss) | 334,639,126 | (21,616,922 | ) | 5,681,789 | (15,632,277 | ) | ||||||||||||||
|
|
|
|
|
|
|
| |||||||||||||
Net increase (decrease) in net assets resulting from operations | $ | 382,822,413 | $ | 3,515,269 | $ | 9,974,546 | $ | (4,626,281 | ) | |||||||||||
|
|
|
|
|
|
|
| |||||||||||||
| (a) | The Fund commenced operations on August 21, 2013. |
| 148 | See accompanying Notes to the Financial Statements. |
Table of Contents
Mercer Funds
Statements of Operations (Continued)
For the Year Ended March 31, 2014
| Mercer Global Low Volatility Equity Fund | |||||
Investment Income: | |||||
Interest | $ | 5,985 | |||
Dividends | 13,522,389 | ||||
Securities lending income | 108,304 | ||||
Withholding taxes | (651,190 | ) | |||
|
| ||||
Total investment income | 12,985,488 | ||||
|
| ||||
Expenses: | |||||
Advisory fees | 4,744,812 | ||||
Transfer agent fees | 21,964 | ||||
Custodian and fund accounting fees | 315,817 | ||||
Audit fees | 61,361 | ||||
Legal fees | 51,249 | ||||
Trustees fees | 27,014 | ||||
Registration fees | 55,694 | ||||
Miscellaneous | 45,598 | ||||
|
| ||||
Total expenses | 5,323,509 | ||||
Fee reductions | (21,964 | ) | |||
Recapture of expenses | 76,000 | ||||
|
| ||||
Net expenses | 5,377,545 | ||||
|
| ||||
Net investment income | 7,607,943 | ||||
|
| ||||
Realized and Unrealized Gain (Loss): | |||||
Net realized gain (loss) on: | |||||
Investments | 30,801,130 | ||||
Forward foreign currency contracts and foreign currency related transactions | 805,924 | ||||
|
| ||||
Net realized gain | 31,607,054 | ||||
|
| ||||
Change in net unrealized appreciation (depreciation) on: | |||||
Investments | 51,394,901 | ||||
Forward foreign currency contracts and foreign currency related translations | (452,728 | ) | |||
|
| ||||
Change in net unrealized appreciation (depreciation) | 50,942,173 | ||||
|
| ||||
Net realized and unrealized gain (loss) | 82,549,227 | ||||
|
| ||||
Net increase in net assets resulting from operations | $ | 90,157,170 | |||
|
| ||||
| See accompanying Notes to the Financial Statements. | 149 |
Table of Contents
Mercer Funds
Statements of Changes in Net Assets
| Mercer US Large Cap Growth Equity Fund | Mercer US Large Cap Value Equity Fund | |||||||||||||||||||
| Year Ended March 31, 2014 | Year Ended March 31, 2013 | Year Ended March 31, 2014 | Year Ended March 31, 2013 | |||||||||||||||||
Increase (decrease) in net assets: | ||||||||||||||||||||
Operations: | ||||||||||||||||||||
Net investment income (loss) | $ | 1,954,495 | $ | 2,674,597 | $ | 6,572,337 | $ | 9,196,651 | ||||||||||||
Net realized gain (loss) | 91,017,590 | 42,369,258 | 100,626,817 | 40,763,308 | ||||||||||||||||
Change in net unrealized appreciation (depreciation) | (6,335,436 | ) | (18,880,192 | ) | (574,973 | ) | 20,601,558 | |||||||||||||
|
|
|
|
|
|
|
| |||||||||||||
Net increase in net assets resulting from operations | 86,636,649 | 26,163,663 | 106,624,181 | 70,561,517 | ||||||||||||||||
|
|
|
|
|
|
|
| |||||||||||||
Distributions to shareholders from: | ||||||||||||||||||||
Net investment income | ||||||||||||||||||||
Class Y-3 | (2,145,143 | ) | (2,623,579 | ) | (6,835,803 | ) | (9,197,559 | ) | ||||||||||||
|
|
|
|
|
|
|
| |||||||||||||
Total distributions from net investment income | (2,145,143 | ) | (2,623,579 | ) | (6,835,803 | ) | (9,197,559 | ) | ||||||||||||
|
|
|
|
|
|
|
| |||||||||||||
Net realized gains | ||||||||||||||||||||
Class Y-3 | (81,475,198 | ) | (12,798,740 | ) | — | — | ||||||||||||||
|
|
|
|
|
|
|
| |||||||||||||
Total distributions from net realized gains | (81,475,198 | ) | (12,798,740 | ) | — | — | ||||||||||||||
|
|
|
|
|
|
|
| |||||||||||||
Net share transactions (See Note 7): | ||||||||||||||||||||
Class Y-3 | (109,941,413 | ) | (10,594,802 | ) | (205,208,131 | ) | (45,465,052 | ) | ||||||||||||
|
|
|
|
|
|
|
| |||||||||||||
Decrease in net assets resulting from net shares transactions | (109,941,413 | ) | (10,594,802 | ) | (205,208,131 | ) | (45,465,052 | ) | ||||||||||||
|
|
|
|
|
|
|
| |||||||||||||
Net increase (decrease) in net assets | (106,925,105 | ) | 146,542 | (105,419,753 | ) | 15,898,906 | ||||||||||||||
Net assets: | ||||||||||||||||||||
Beginning of year | 465,787,341 | 465,640,799 | 475,897,615 | 459,998,709 | ||||||||||||||||
|
|
|
|
|
|
|
| |||||||||||||
End of year | $ | 358,862,236 | $ | 465,787,341 | $ | 370,477,862 | $ | 475,897,615 | ||||||||||||
|
|
|
|
|
|
|
| |||||||||||||
Undistributed net investment income included in net assets at end of year | $ | 313,482 | $ | 565,314 | $ | 1,507,583 | $ | 1,635,764 | ||||||||||||
|
|
|
|
|
|
|
| |||||||||||||
| 150 | See accompanying Notes to the Financial Statements. |
Table of Contents
Mercer Funds
Statements of Changes in Net Assets (Continued)
| Mercer US Small/Mid Cap Growth Equity Fund | Mercer US Small/Mid Cap Value Equity Fund | |||||||||||||||||||
| Year Ended March 31, 2014 | Year Ended March 31, 2013 | Year Ended March 31, 2014 | Year Ended March 31, 2013 | |||||||||||||||||
Increase (decrease) in net assets: | ||||||||||||||||||||
Operations: | ||||||||||||||||||||
Net investment income (loss) | $ | (714,770 | ) | $ | (166,599 | ) | $ | 1,506,232 | $ | 4,330,538 | ||||||||||
Net realized gain (loss) | 79,466,661 | 17,825,972 | 103,295,900 | 26,146,088 | ||||||||||||||||
Change in net unrealized appreciation (depreciation) | 3,771,797 | 32,129,046 | (28,294,070 | ) | 32,460,899 | |||||||||||||||
|
|
|
|
|
|
|
| |||||||||||||
Net increase in net assets resulting from operations | 82,523,688 | 49,788,419 | 76,508,062 | 62,937,525 | ||||||||||||||||
|
|
|
|
|
|
|
| |||||||||||||
Distributions to shareholders from: | ||||||||||||||||||||
Net investment income | ||||||||||||||||||||
Class Y-3 | — | (303,053 | ) | (3,068,973 | ) | (3,935,894 | ) | |||||||||||||
|
|
|
|
|
|
|
| |||||||||||||
Total distributions from net investment income | — | (303,053 | ) | (3,068,973 | ) | (3,935,894 | ) | |||||||||||||
|
|
|
|
|
|
|
| |||||||||||||
Net realized gains | ||||||||||||||||||||
Class Y-3 | (61,044,497 | ) | (31,036,701 | ) | (68,563,917 | ) | (13,297,320 | ) | ||||||||||||
|
|
|
|
|
|
|
| |||||||||||||
Total distributions from net realized gains | (61,044,497 | ) | (31,036,701 | ) | (68,563,917 | ) | (13,297,320 | ) | ||||||||||||
|
|
|
|
|
|
|
| |||||||||||||
Net share transactions (See Note 7): | ||||||||||||||||||||
Class Y-3 | (66,199,365 | ) | 123,455,822 | (45,575,148 | ) | 91,316,151 | ||||||||||||||
|
|
|
|
|
|
|
| |||||||||||||
Increase (decrease) in net assets resulting from net shares transactions | (66,199,365 | ) | 123,455,822 | (45,575,148 | ) | 91,316,151 | ||||||||||||||
|
|
|
|
|
|
|
| |||||||||||||
Net increase (decrease) in net assets | (44,720,174 | ) | 141,904,487 | (40,699,976 | ) | 137,020,462 | ||||||||||||||
Net assets: | ||||||||||||||||||||
Beginning of year | 442,080,294 | 300,175,807 | 429,411,650 | 292,391,188 | ||||||||||||||||
|
|
|
|
|
|
|
| |||||||||||||
End of year | $ | 397,360,120 | $ | 442,080,294 | $ | 388,711,674 | $ | 429,411,650 | ||||||||||||
|
|
|
|
|
|
|
| |||||||||||||
Undistributed (distributions in excess of) net investment income included in net assets at end of year | $ | (914 | ) | $ | (392,627 | ) | $ | (39,343 | ) | $ | 728,939 | |||||||||
|
|
|
|
|
|
|
| |||||||||||||
| See accompanying Notes to the Financial Statements. | 151 |
Table of Contents
Mercer Funds
Statements of Changes in Net Assets (Continued)
| Mercer Non-US Core Equity Fund | Mercer Core Fixed Income Fund (formerly known as Mercer Core Opportunistic Fixed Income Fund) | |||||||||||||||||||
| Year Ended March 31, 2014 | Year Ended March 31, 2013 | Year Ended March 31, 2014 | Year Ended March 31, 2013 | |||||||||||||||||
Increase (decrease) in net assets: | ||||||||||||||||||||
Operations: | ||||||||||||||||||||
Net investment income (loss) | $ | 48,183,287 | $ | 41,544,097 | $ | 25,132,191 | $ | 27,293,670 | ||||||||||||
Net realized gain (loss) | 309,450,586 | 65,792,476 | 5,055,181 | 17,070,317 | ||||||||||||||||
Change in net unrealized appreciation (depreciation) | 25,188,540 | 124,651,565 | (26,672,103 | ) | 19,060,319 | |||||||||||||||
|
|
|
|
|
|
|
| |||||||||||||
Net increase in net assets resulting from operations | 382,822,413 | 231,988,138 | 3,515,269 | 63,424,306 | ||||||||||||||||
|
|
|
|
|
|
|
| |||||||||||||
Distributions to shareholders from: | ||||||||||||||||||||
Net investment income | ||||||||||||||||||||
Class Y-3 | (51,237,787 | ) | (49,488,095 | ) | (24,984,359 | ) | (30,940,168 | ) | ||||||||||||
|
|
|
|
|
|
|
| |||||||||||||
Total distributions from net investment income | (51,237,787 | ) | (49,488,095 | ) | (24,984,359 | ) | (30,940,168 | ) | ||||||||||||
|
|
|
|
|
|
|
| |||||||||||||
Net realized gains | ||||||||||||||||||||
Class Y-3 | (85,693,489 | ) | — | (5,718,416 | ) | (23,150,024 | ) | |||||||||||||
|
|
|
|
|
|
|
| |||||||||||||
Total distributions from net realized gains | (85,693,489 | ) | — | (5,718,416 | ) | (23,150,024 | ) | |||||||||||||
|
|
|
|
|
|
|
| |||||||||||||
Net share transactions (See Note 7): | ||||||||||||||||||||
Class Y-3 | (503,345,330 | ) | 63,645,562 | 10,374,161 | 58,295,119 | |||||||||||||||
|
|
|
|
|
|
|
| |||||||||||||
Increase (decrease) in net assets resulting from net shares transactions | (503,345,330 | ) | 63,645,562 | 10,374,161 | 58,295,119 | |||||||||||||||
|
|
|
|
|
|
|
| |||||||||||||
Net increase (decrease) in net assets | (257,454,193 | ) | 246,145,605 | (16,813,345 | ) | 67,629,233 | ||||||||||||||
Net assets: | ||||||||||||||||||||
Beginning of year | 2,138,929,827 | 1,892,784,222 | 1,093,252,822 | 1,025,623,589 | ||||||||||||||||
|
|
|
|
|
|
|
| |||||||||||||
End of year | $ | 1,881,475,634 | $ | 2,138,929,827 | $ | 1,076,439,477 | $ | 1,093,252,822 | ||||||||||||
|
|
|
|
|
|
|
| |||||||||||||
Undistributed net investment income included in net assets at end of year | $ | 15,302,164 | $ | 8,552,915 | $ | 6,679,686 | $ | 6,883,601 | ||||||||||||
|
|
|
|
|
|
|
| |||||||||||||
| 152 | See accompanying Notes to the Financial Statements. |
Table of Contents
Mercer Funds
Statements of Changes in Net Assets (Continued)
| Mercer Opportunistic Fixed Income Fund | Mercer Emerging Markets Equity Fund | |||||||||||
| Period Ended March 31, 2014(b) | Year Ended March 31, 2014 | Period Ended March 31, 2013(a) | ||||||||||
Increase (decrease) in net assets: | ||||||||||||
Operations: | ||||||||||||
Net investment income (loss) | $ | 4,292,757 | $ | 11,005,996 | $ | 2,924,172 | ||||||
Net realized gain (loss) | 342,549 | (8,563,018 | ) | 229,882 | ||||||||
Change in net unrealized appreciation (depreciation) | 5,339,240 | (7,069,259 | ) | 23,781,363 | ||||||||
|
|
|
|
|
| |||||||
Net increase (decrease) in net assets resulting from operations | 9,974,546 | (4,626,281 | ) | 26,935,417 | ||||||||
|
|
|
|
|
| |||||||
Distributions to shareholders from: | ||||||||||||
Net investment income | ||||||||||||
Class Y-3 | (1,909,755 | ) | (12,069,442 | ) | (2,704,695 | ) | ||||||
|
|
|
|
|
| |||||||
Total distributions from net investment income | (1,909,755 | ) | (12,069,442 | ) | (2,704,695 | ) | ||||||
|
|
|
|
|
| |||||||
Net realized gains | ||||||||||||
Class Y-3 | (370,327 | ) | (1,819,134 | ) | (530,723 | ) | ||||||
|
|
|
|
|
| |||||||
Total distributions from net realized gains | (370,327 | ) | (1,819,134 | ) | (530,723 | ) | ||||||
|
|
|
|
|
| |||||||
Net share transactions (See Note 7): | ||||||||||||
Class Y-3 | 252,886,385 | 364,353,169 | 493,384,530 | |||||||||
|
|
|
|
|
| |||||||
Increase in net assets resulting from net shares transactions | 252,886,385 | 364,353,169 | 493,384,530 | |||||||||
|
|
|
|
|
| |||||||
Net increase in net assets | 260,580,849 | 345,838,312 | 517,084,529 | |||||||||
Net assets: | ||||||||||||
Beginning of period | — | 517,084,529 | — | |||||||||
|
|
|
|
|
| |||||||
End of period | $ | 260,580,849 | $ | 862,922,841 | $ | 517,084,529 | ||||||
|
|
|
|
|
| |||||||
Undistributed (distributions in excess of) net investment income included in net assets at end of period | $ | 2,764,086 | $ | 4,792,103 | $ | (118,819 | ) | |||||
|
|
|
|
|
| |||||||
| (a) | The Fund commenced operations on May 1, 2012. |
| (b) | The Fund commenced operations on August 21, 2013. |
| See accompanying Notes to the Financial Statements. | 153 |
Table of Contents
Mercer Funds
Statements of Changes in Net Assets (Continued)
| Mercer Global Low Volatility Equity Fund | ||||||||||
| Year Ended March 31, 2014 | Period Ended March 31, 2013(a) | |||||||||
Increase (decrease) in net assets: | ||||||||||
Operations: | ||||||||||
Net investment income (loss) | $ | 7,607,943 | $ | 1,567,709 | ||||||
Net realized gain (loss) | 31,607,054 | 2,224,879 | ||||||||
Change in net unrealized appreciation (depreciation) | 50,942,173 | 24,719,123 | ||||||||
|
|
|
| |||||||
Net increase in net assets resulting from operations | 90,157,170 | 28,511,711 | ||||||||
|
|
|
| |||||||
Distributions to shareholders from: | ||||||||||
Net investment income | ||||||||||
Class Y-3 | (8,930,712 | ) | (485,259 | ) | ||||||
|
|
|
| |||||||
Total distributions from net investment income | (8,930,712 | ) | (485,259 | ) | ||||||
|
|
|
| |||||||
Net realized gains | ||||||||||
Class Y-3 | (19,639,446 | ) | — | |||||||
|
|
|
| |||||||
Total distributions from net realized gains | (19,639,446 | ) | — | |||||||
|
|
|
| |||||||
Net share transactions (See Note 7): | ||||||||||
Class Y-3 | 379,824,244 | 273,203,686 | ||||||||
|
|
|
| |||||||
Increase in net assets resulting from net shares transactions | 379,824,244 | 273,203,686 | ||||||||
|
|
|
| |||||||
Net increase in net assets | 441,411,256 | 301,230,138 | ||||||||
Net assets: | ||||||||||
Beginning of year | 301,230,138 | — | ||||||||
|
|
|
| |||||||
End of year | $ | 742,641,394 | $ | 301,230,138 | ||||||
|
|
|
| |||||||
Undistributed net investment income included in net assets at end of year | $ | 1,063,496 | $ | 1,418,147 | ||||||
|
|
|
| |||||||
| (a) | The Fund commenced operations on November 6, 2012. |
| 154 | See accompanying Notes to the Financial Statements. |
Table of Contents
Mercer US Large Cap Growth Equity Fund
| Year Ended 03/31/14 | Year Ended 03/31/13 | Year Ended 03/31/12 | Year Ended 03/31/11 | Year Ended 03/31/10 | |||||||||||||||||||||
For a Class Y-3 Share Outstanding Throughout Each Period: | |||||||||||||||||||||||||
Net asset value at beginning of year | $ | 13.56 | $ | 13.27 | $ | 12.19 | $ | 10.08 | $ | 6.85 | |||||||||||||||
Net investment income† | 0.07 | 0.08 | 0.04 | 0.03 | 0.05 | ||||||||||||||||||||
Net realized and unrealized gain on investments | 3.11 | 0.68 | 1.06 | 2.12 | 3.23 | ||||||||||||||||||||
|
|
|
|
|
|
|
|
|
| ||||||||||||||||
Total from investment operations | 3.18 | 0.76 | 1.10 | 2.15 | 3.28 | ||||||||||||||||||||
|
|
|
|
|
|
|
|
|
| ||||||||||||||||
Less dividends and distributions: | |||||||||||||||||||||||||
From net investment income | (0.09 | ) | (0.08 | ) | (0.02 | ) | (0.04 | ) | (0.05 | ) | |||||||||||||||
From net realized gain on investments | (3.49 | ) | (0.39 | ) | — | — | — | ||||||||||||||||||
|
|
|
|
|
|
|
|
|
| ||||||||||||||||
Total dividends and distributions | (3.58 | ) | (0.47 | ) | (0.02 | ) | (0.04 | ) | (0.05 | ) | |||||||||||||||
|
|
|
|
|
|
|
|
|
| ||||||||||||||||
Net asset value at end of year | $ | 13.16 | $ | 13.56 | $ | 13.27 | $ | 12.19 | $ | 10.08 | |||||||||||||||
|
|
|
|
|
|
|
|
|
| ||||||||||||||||
Total investment return(a) | 23.99 | % | 6.03 | % | 9.08 | % | 21.38 | % | 47.85 | % | |||||||||||||||
Ratios/Supplemental Data: | |||||||||||||||||||||||||
Net investment income to average net assets | 0.48 | % | 0.61 | % | 0.33 | % | 0.27 | % | 0.54 | % | |||||||||||||||
Net expenses to average daily net assets | 0.57 | % | 0.57 | % | 0.57 | % | 0.57 | % | 0.57 | % | |||||||||||||||
Total expenses (before reductions and reimbursements) to average daily net assets | 0.63 | % | 0.63 | % | 0.63 | % | 0.64 | % | 0.66 | % | |||||||||||||||
Portfolio turnover rate | 50 | % | 65 | % | 64 | % | 106 | %(b) | 102 | % | |||||||||||||||
Net assets at end of year (in 000’s) | $ | 358,862 | $ | 465,787 | $ | 465,641 | $ | 427,840 | $ | 359,792 | |||||||||||||||
| (a) | The total return would have been lower had certain expenses not been reduced or reimbursed during the periods shown. |
| (b) | Portfolio turnover calculation does not include $23,568,413 of securities transferred into the Fund as part of in-kind contributions. |
| † | Computed using average shares outstanding throughout the year. |
| See accompanying Notes to the Financial Statements. | 155 |
Table of Contents
Mercer US Large Cap Value Equity Fund
Financial Highlights (Continued)
| Year Ended 03/31/14 | Year Ended 03/31/13 | Year Ended 03/31/12 | Year Ended 03/31/11 | Year Ended 03/31/10 | |||||||||||||||||||||
For a Class Y-3 Share Outstanding Throughout Each Period: | |||||||||||||||||||||||||
Net asset value at beginning of year | $ | 9.95 | $ | 8.71 | $ | 8.25 | $ | 7.52 | $ | 5.18 | |||||||||||||||
Net investment income† | 0.18 | 0.18 | 0.16 | 0.11 | 0.11 | ||||||||||||||||||||
Net realized and unrealized gain on investments | 2.75 | 1.26 | 0.45 | 0.72 | 2.37 | ||||||||||||||||||||
|
|
|
|
|
|
|
|
|
| ||||||||||||||||
Total from investment operations | 2.93 | 1.44 | 0.61 | 0.83 | 2.48 | ||||||||||||||||||||
|
|
|
|
|
|
|
|
|
| ||||||||||||||||
Less dividends and distributions: | |||||||||||||||||||||||||
From net investment income | (0.22 | ) | (0.20 | ) | (0.15 | ) | (0.10 | ) | (0.14 | ) | |||||||||||||||
|
|
|
|
|
|
|
|
|
| ||||||||||||||||
Total dividends and distributions | (0.22 | ) | (0.20 | ) | (0.15 | ) | (0.10 | ) | (0.14 | ) | |||||||||||||||
|
|
|
|
|
|
|
|
|
| ||||||||||||||||
Net asset value at end of year | $ | 12.66 | $ | 9.95 | $ | 8.71 | $ | 8.25 | $ | 7.52 | |||||||||||||||
|
|
|
|
|
|
|
|
|
| ||||||||||||||||
Total investment return(a) | 29.54 | % | 16.71 | % | 7.69 | % | 11.07 | % | 47.96 | % | |||||||||||||||
Ratios/Supplemental Data: | |||||||||||||||||||||||||
Net investment income to average net assets | 1.60 | % | 2.07 | % | 2.03 | % | 1.52 | % | 1.69 | % | |||||||||||||||
Net expenses to average daily net assets | 0.55 | %(b) | 0.55 | % | 0.55 | % | 0.55 | % | 0.55 | % | |||||||||||||||
Total expenses (before reductions and reimbursements) to average daily net assets | 0.61 | %(b) | 0.60 | % | 0.62 | % | 0.63 | % | 0.64 | % | |||||||||||||||
Portfolio turnover rate | 45 | % | 59 | % | 109 | % | 117 | %(c) | 128 | % | |||||||||||||||
Net assets at end of year (in 000’s) | $ | 370,478 | $ | 475,898 | $ | 459,999 | $ | 420,518 | $ | 357,787 | |||||||||||||||
| (a) | The total return would have been lower had certain expenses not been reduced or reimbursed during the periods shown. |
| (b) | The Fund invests in Underlying Funds and consequently bears its proportionate share of operating expenses of the Underlying Funds. This ratio does not include the expenses of the Underlying Funds. |
| (c) | Portfolio turnover calculation does not include $21,956,759 of securities transferred into the Fund as part of in-kind contributions. |
| † | Computed using average shares outstanding throughout the year. |
| 156 | See accompanying Notes to the Financial Statements. |
Table of Contents
Mercer US Small/Mid Cap Growth Equity Fund
Financial Highlights (Continued)
| Year Ended 03/31/14 | Year Ended 03/31/13 | Year Ended 03/31/12 | Year Ended 03/31/11 | Year Ended 03/31/10 | |||||||||||||||||||||
For a Class Y-3 Share Outstanding Throughout Each Period: | |||||||||||||||||||||||||
Net asset value at beginning of year | $ | 11.94 | $ | 11.62 | $ | 12.49 | $ | 9.75 | $ | 6.19 | |||||||||||||||
Net investment loss† | (0.02 | ) | (0.01 | ) | (0.04 | ) | (0.03 | ) | (0.04 | ) | |||||||||||||||
Net realized and unrealized gain on investments | 2.63 | 1.31 | 0.27 | 2.77 | 3.60 | ||||||||||||||||||||
|
|
|
|
|
|
|
|
|
| ||||||||||||||||
Total from investment operations | 2.61 | 1.30 | 0.23 | 2.74 | 3.56 | ||||||||||||||||||||
|
|
|
|
|
|
|
|
|
| ||||||||||||||||
Less dividends and distributions: | |||||||||||||||||||||||||
From net investment income | — | (0.01 | ) | — | — | — | |||||||||||||||||||
From net realized gain on investments | (2.11 | ) | (0.97 | ) | (1.10 | ) | — | — | |||||||||||||||||
|
|
|
|
|
|
|
|
|
| ||||||||||||||||
Total dividends and distributions | (2.11 | ) | (0.98 | ) | (1.10 | ) | — | — | |||||||||||||||||
|
|
|
|
|
|
|
|
|
| ||||||||||||||||
Net asset value at end of year | $ | 12.44 | $ | 11.94 | $ | 11.62 | $ | 12.49 | $ | 9.75 | |||||||||||||||
|
|
|
|
|
|
|
|
|
| ||||||||||||||||
Total investment return(a) | 22.34 | % | 12.11 | % | 3.36 | % | 28.10 | % | 57.51 | % | |||||||||||||||
Ratios/Supplemental Data: | |||||||||||||||||||||||||
Net investment loss to average net assets | (0.17 | )% | (0.05 | )% | (0.36 | )% | (0.34 | )% | (0.45 | )% | |||||||||||||||
Net expenses to average daily net assets | 0.97 | %(b) | 0.96 | % | 0.92 | % | 0.92 | % | 0.92 | % | |||||||||||||||
Total expenses (before reductions and reimbursements) to average daily net assets | 0.99 | %(b) | 1.01 | % | 1.01 | % | 1.02 | % | 1.04 | % | |||||||||||||||
Portfolio turnover rate | 67 | % | 54 | % | 95 | % | 107 | % | 92 | % | |||||||||||||||
Net assets at end of year (in 000’s) | $ | 397,360 | $ | 442,080 | $ | 300,176 | $ | 300,980 | $ | 220,665 | |||||||||||||||
| (a) | The total return would have been lower had certain expenses not been reduced or reimbursed during the periods shown. |
| (b) | The Fund invests in Underlying Funds and consequently bears its proportionate share of operating expenses of the Underlying Funds. This ratio does not include the expenses of the Underlying Funds. |
| † | Computed using average shares outstanding throughout the year. |
| See accompanying Notes to the Financial Statements. | 157 |
Table of Contents
Mercer US Small/Mid Cap Value Equity Fund
Financial Highlights (Continued)
| Year Ended 03/31/14 | Year Ended 03/31/13 | Year Ended 03/31/12 | Year Ended 03/31/11 | Year Ended 03/31/10 | |||||||||||||||||||||
For a Class Y-3 Share Outstanding Throughout Each Period: | |||||||||||||||||||||||||
Net asset value at beginning of year | $ | 11.05 | $ | 9.94 | $ | 10.64 | $ | 8.64 | $ | 5.26 | |||||||||||||||
Net investment income† | 0.04 | 0.13 | 0.06 | 0.05 | 0.06 | ||||||||||||||||||||
Net realized and unrealized gain (loss) on investments | 2.24 | 1.46 | (0.14 | )(a) | 2.05 | 3.35 | |||||||||||||||||||
|
|
|
|
|
|
|
|
|
| ||||||||||||||||
Total from investment operations | 2.28 | 1.59 | (0.08 | ) | 2.10 | 3.41 | |||||||||||||||||||
|
|
|
|
|
|
|
|
|
| ||||||||||||||||
Less dividends and distributions: | |||||||||||||||||||||||||
From net investment income | (0.10 | ) | (0.11 | ) | (0.04 | ) | (0.10 | ) | (0.03 | ) | |||||||||||||||
From net realized gain on investments | (2.25 | ) | (0.37 | ) | (0.58 | ) | — | — | |||||||||||||||||
|
|
|
|
|
|
|
|
|
| ||||||||||||||||
Total dividends and distributions | (2.35 | ) | (0.48 | ) | (0.62 | ) | (0.10 | ) | (0.03 | ) | |||||||||||||||
|
|
|
|
|
|
|
|
|
| ||||||||||||||||
Net asset value at end of year | $ | 10.98 | $ | 11.05 | $ | 9.94 | $ | 10.64 | $ | 8.64 | |||||||||||||||
|
|
|
|
|
|
|
|
|
| ||||||||||||||||
Total investment return(b) | 21.61 | % | 16.51 | % | (0.03 | )% | 24.36 | % | 64.86 | % | |||||||||||||||
Ratios/Supplemental Data: | |||||||||||||||||||||||||
Net investment income to average net assets | 0.38 | % | 1.26 | % | 0.60 | % | 0.65 | % | 0.81 | % | |||||||||||||||
Net expenses to average daily net assets | 0.97 | %(c) | 0.96 | % | 0.92 | % | 0.92 | % | 0.92 | % | |||||||||||||||
Total expenses (before reductions and reimbursements) to average daily net assets | 1.00 | %(c) | 1.01 | % | 1.01 | % | 1.02 | % | 1.07 | % | |||||||||||||||
Portfolio turnover rate | 122 | %(d) | 80 | % | 92 | % | 95 | % | 119 | % | |||||||||||||||
Net assets at end of year (in 000’s) | $ | 388,712 | $ | 429,412 | $ | 292,391 | $ | 295,626 | $ | 222,102 | |||||||||||||||
| (a) | The amount shown for a share outstanding does not correspond with the aggregate net realized and unrealized gain for the period due to the timing of sales of the Fund in relation to the fluctuating net asset value per share of the Fund. |
| (b) | The total return would have been lower had certain expenses not been reduced or reimbursed during the periods shown. |
| (c) | The Fund invests in Underlying Funds and consequently bears its proportionate share of operating expenses of the Underlying Funds. This ratio does not include the expenses of the Underlying Funds. |
| (d) | Portfolio turnover calculation does not include $38,447,113 of securities transferred out of the Fund as part of an in-kind redemption. |
| † | Computed using average shares outstanding throughout the year. |
| 158 | See accompanying Notes to the Financial Statements. |
Table of Contents
Mercer Non-US Core Equity Fund
Financial Highlights (Continued)
| Year Ended 03/31/14 | Year Ended 03/31/13 | Year Ended 03/31/12 | Year Ended 03/31/11 | Year Ended 03/31/10 | |||||||||||||||||||||
For a Class Y-3 Share Outstanding Throughout Each Period: | |||||||||||||||||||||||||
Net asset value at beginning of year | $ | 10.58 | $ | 9.72 | $ | 10.46 | $ | 9.73 | $ | 6.29 | |||||||||||||||
Net investment income† | 0.29 | 0.21 | 0.25 | 0.17 | 0.17 | ||||||||||||||||||||
Net realized and unrealized gain (loss) on investments | 1.94 | 0.90 | (0.81 | ) | 0.74 | 3.38 | |||||||||||||||||||
|
|
|
|
|
|
|
|
|
| ||||||||||||||||
Total from investment operations | 2.23 | 1.11 | (0.56 | ) | 0.91 | 3.55 | |||||||||||||||||||
|
|
|
|
|
|
|
|
|
| ||||||||||||||||
Less dividends and distributions: | |||||||||||||||||||||||||
From net investment income | (0.33 | ) | (0.25 | ) | (0.18 | ) | (0.18 | ) | (0.11 | ) | |||||||||||||||
From net realized gain on investments | (0.56 | ) | — | — | — | — | |||||||||||||||||||
|
|
|
|
|
|
|
|
|
| ||||||||||||||||
Total dividends and distributions | (0.89 | ) | (0.25 | ) | (0.18 | ) | (0.18 | ) | (0.11 | ) | |||||||||||||||
|
|
|
|
|
|
|
|
|
| ||||||||||||||||
Net asset value at end of year | $ | 11.92 | $ | 10.58 | $ | 9.72 | $ | 10.46 | $ | 9.73 | |||||||||||||||
|
|
|
|
|
|
|
|
|
| ||||||||||||||||
Total investment return(a) | 21.48 | % | 11.53 | % | (5.15 | )% | 9.45 | % | 56.52 | % | |||||||||||||||
Ratios/Supplemental Data: | |||||||||||||||||||||||||
Net investment income to average net assets | 2.52 | % | 2.17 | % | 2.57 | % | 1.76 | % | 1.93 | % | |||||||||||||||
Net expenses to average daily net assets | 0.85 | %(b) | 0.83 | % | 0.82 | % | 0.82 | % | 0.82 | % | |||||||||||||||
Total expenses (before reductions and reimbursements) to average daily net assets | 0.86 | %(b) | 0.86 | % | 0.92 | % | 0.92 | % | 0.94 | % | |||||||||||||||
Portfolio turnover rate | 95 | %(c) | 90 | % | 105 | %(d) | 87 | % | 51 | % | |||||||||||||||
Net assets at end of year (in 000’s) | $ | 1,881,476 | $ | 2,138,930 | $ | 1,892,784 | $ | 1,563,529 | $ | 1,042,831 | |||||||||||||||
| (a) | The total return would have been lower had certain expenses not been reduced or reimbursed during the periods shown. |
| (b) | The Fund invests in Underlying Funds and consequently bears its proportionate share of operating expenses of the Underlying Funds. This ratio does not include the expenses of the Underlying Funds. |
| (c) | Portfolio turnover calculation does not include $177,821,966 of securities transferred out of the Fund as part of an in-kind redemption. |
| (d) | Portfolio turnover calculation does not include $9,536,640 of securities transferred into the Fund as part of an in-kind contribution. |
| † | Computed using average shares outstanding throughout the year. |
| See accompanying Notes to the Financial Statements. | 159 |
Table of Contents
Mercer Core Fixed Income Fund (formerly known as Mercer Core Opportunistic Fixed Income Fund)
Financial Highlights (Continued)
| Year Ended 03/31/14 | Year Ended 03/31/13 | Year Ended 03/31/12 | Year Ended 03/31/11 | Year Ended 03/31/10 | |||||||||||||||||||||
For a Class Y-3 Share Outstanding Throughout Each Period: | |||||||||||||||||||||||||
Net asset value at beginning of year | $ | 10.68 | $ | 10.58 | $ | 10.23 | $ | 10.11 | $ | 9.00 | |||||||||||||||
Net investment income† | 0.24 | 0.27 | 0.33 | 0.29 | 0.40 | ||||||||||||||||||||
Net realized and unrealized gain (loss) on investments | (0.19 | ) | 0.37 | 0.46 | 0.34 | 0.98 | |||||||||||||||||||
|
|
|
|
|
|
|
|
|
| ||||||||||||||||
Total from investment operations | 0.05 | 0.64 | 0.79 | 0.63 | 1.38 | ||||||||||||||||||||
|
|
|
|
|
|
|
|
|
| ||||||||||||||||
Less dividends and distributions: | |||||||||||||||||||||||||
From net investment income | (0.25 | ) | (0.31 | ) | (0.31 | ) | (0.36 | ) | (0.27 | ) | |||||||||||||||
From net realized gain on investments | (0.06 | ) | (0.23 | ) | (0.13 | ) | (0.15 | ) | — | ||||||||||||||||
|
|
|
|
|
|
|
|
|
| ||||||||||||||||
Total dividends and distributions | (0.31 | ) | (0.54 | ) | (0.44 | ) | (0.51 | ) | (0.27 | ) | |||||||||||||||
|
|
|
|
|
|
|
|
|
| ||||||||||||||||
Net asset value at end of year | $ | 10.42 | $ | 10.68 | $ | 10.58 | $ | 10.23 | $ | 10.11 | |||||||||||||||
|
|
|
|
|
|
|
|
|
| ||||||||||||||||
Total investment return(a) | 0.44 | % | 6.15 | % | 7.88 | % | 6.25 | % | 15.34 | % | |||||||||||||||
Ratios/Supplemental Data: | |||||||||||||||||||||||||
Net investment income to average net assets | 2.32 | % | 2.51 | % | 3.13 | % | 2.79 | % | 4.12 | % | |||||||||||||||
Net expenses to average daily net assets | 0.37 | % | 0.37 | % | 0.37 | % | 0.37 | % | 0.37 | % | |||||||||||||||
Total expenses (before reductions and reimbursements) to average daily net assets | 0.43 | % | 0.43 | % | 0.44 | % | 0.45 | % | 0.47 | % | |||||||||||||||
Portfolio turnover rate | 187 | %(b) | 125 | % | 181 | % | 379 | % | 276 | % | |||||||||||||||
Net assets at end of year (in 000’s) | $ | 1,076,439 | $ | 1,093,253 | $ | 1,025,624 | $ | 1,043,027 | $ | 758,780 | |||||||||||||||
| (a) | The total return would have been lower had certain expenses not been reduced or reimbursed during the periods shown. |
| (b) | Excludes treasury dollar roll transactions. The Portfolio turnover rate including treasury dollar roll transactions was 251% for the year ended March 31, 2014. |
| † | Computed using average shares outstanding throughout the year. |
| 160 | See accompanying Notes to the Financial Statements. |
Table of Contents
Mercer Opportunistic Fixed Income Fund
Financial Highlights (Continued)
| Period Ended 03/31/14(a) | |||||
For a Class Y-3 Share Outstanding Throughout the Period: | |||||
Net asset value at beginning of period | $ | 10.00 | |||
Net investment income† | 0.34 | ||||
Net realized and unrealized gain on investments | 0.35 | ||||
|
| ||||
Total from investment operations | 0.69 | ||||
|
| ||||
Less dividends and distributions: | |||||
From net investment income | (0.22 | ) | |||
From net realized gain on investments | (0.04 | ) | |||
|
| ||||
Total dividends and distributions | (0.26 | ) | |||
|
| ||||
Net asset value at end of period | $ | 10.43 | |||
|
| ||||
Total investment return(b) | 7.00 | %** | |||
Ratios/Supplemental Data: | |||||
Net investment income to average net assets | 5.52 | %* | |||
Net expenses to average daily net assets | 0.90 | %* | |||
Total expenses (before reductions and reimbursements) to average daily net assets | 1.17 | %* | |||
Portfolio turnover rate | 28 | %** | |||
Net assets at end of period (in 000’s) | $ | 260,581 | |||
| (a) | The Fund commenced operations on August 21, 2013. |
| (b) | The total return would have been lower had certain expenses not been reduced or reimbursed during the period shown. |
| † | Computed using average shares outstanding throughout the period. |
| ** | Not annualized. |
| * | Annualized. |
| See accompanying Notes to the Financial Statements. | 161 |
Table of Contents
Mercer Emerging Markets Equity Fund
Financial Highlights (Continued)
| Year Ended 03/31/14 | Period Ended 03/31/13(a) | |||||||||
For a Class Y-3 Share Outstanding Throughout Each Period: | ||||||||||
Net asset value at beginning of year | $ | 10.49 | $ | 10.00 | ||||||
Net investment income† | 0.18 | 0.10 | ||||||||
Net realized and unrealized gain (loss) on investments | (0.46 | ) | 0.46 | |||||||
|
|
|
| |||||||
Total from investment operations | (0.28 | ) | 0.56 | |||||||
|
|
|
| |||||||
Less dividends and distributions: | ||||||||||
From net investment income | (0.19 | ) | (0.06 | ) | ||||||
From net realized gain on investments | (0.03 | ) | (0.01 | ) | ||||||
|
|
|
| |||||||
Total dividends and distributions | (0.22 | ) | (0.07 | ) | ||||||
|
|
|
| |||||||
Net asset value at end of year | $ | 9.99 | $ | 10.49 | ||||||
|
|
|
| |||||||
Total investment return(b) | (2.61 | )% | 5.64 | %** | ||||||
Ratios/Supplemental Data: | ||||||||||
Net investment income to average net assets | 1.77 | % | 1.08 | %* | ||||||
Net expenses to average daily net assets | 0.95 | %(c) | 0.95 | %*(c) | ||||||
Total expenses (before reductions and reimbursements) to average daily net assets | 1.04 | %(c) | 1.15 | %*(c) | ||||||
Portfolio turnover rate | 64 | % | 52 | %** | ||||||
Net assets at end of year (in 000’s) | $ | 862,923 | $ | 517,085 | ||||||
| (a) | The Fund commenced operations on May 1, 2012. |
| (b) | The total return would have been lower had certain expenses not been reduced or reimbursed during the period shown. |
| (c) | Includes interest expense that amounts to less than 0.01%. |
| † | Computed using average shares outstanding throughout the year. |
| * | Annualized. |
| ** | Not annualized. |
| 162 | See accompanying Notes to the Financial Statements. |
Table of Contents
Mercer Global Low Volatility Equity Fund
Financial Highlights (Continued)
| Year Ended 03/31/14 | Period Ended 03/31/13(a) | |||||||||
For a Class Y-3 Share Outstanding Throughout Each Period: | ||||||||||
Net asset value at beginning of year | $ | 11.19 | $ | 10.00 | ||||||
Net investment income† | 0.14 | 0.07 | ||||||||
Net realized and unrealized gain on investments | 1.45 | 1.14 | ||||||||
|
|
|
| |||||||
Total from investment operations | 1.59 | 1.21 | ||||||||
|
|
|
| |||||||
Less dividends and distributions: | ||||||||||
From net investment income | (0.16 | ) | (0.02 | ) | ||||||
From net realized gain on investments | (0.35 | ) | — | |||||||
|
|
|
| |||||||
Total dividends and distributions | (0.51 | ) | (0.02 | ) | ||||||
|
|
|
| |||||||
Net asset value at end of year | $ | 12.27 | $ | 11.19 | ||||||
|
|
|
| |||||||
Total investment return(b) | 14.40 | % | 12.13 | %** | ||||||
Ratios/Supplemental Data: | ||||||||||
Net investment income to average net assets | 1.20 | % | 1.62 | %* | ||||||
Net expenses to average daily net assets | 0.85 | %(c) | 0.85 | %* | ||||||
Total expenses (before reductions and reimbursements/recapture) to average daily net assets | 0.84 | %(c) | 1.00 | %* | ||||||
Portfolio turnover rate | 46 | % | 12 | %** | ||||||
Net assets at end of year (in 000’s) | $ | 742,641 | $ | 301,230 | ||||||
| (a) | The Fund commenced operations on November 6, 2012. |
| (b) | The total return would have been lower had certain expenses not been reduced or reimbursed during the period shown. |
| (c) | The Fund invests in Underlying Funds and consequently bears its proportionate share of operating expenses of the Underlying Funds. This ratio does not include the expenses of the Underlying Funds. |
| † | Computed using average shares outstanding throughout the year. |
| * | Annualized. |
| ** | Not annualized. |
| See accompanying Notes to the Financial Statements. | 163 |
Table of Contents
Mercer Funds
Notes to the Financial Statements
March 31, 2014
| 1. | Organization |
Mercer Funds (the “Trust”) consists of the following nine series: Mercer US Large Cap Growth Equity Fund (“Large Cap Growth”), Mercer US Large Cap Value Equity Fund (“Large Cap Value”), Mercer US Small/Mid Cap Growth Equity Fund (“Small/Mid Cap Growth”), Mercer US Small/Mid Cap Value Equity Fund (“Small/Mid Cap Value”), Mercer Non-US Core Equity Fund (“Non-US Core Equity”), Mercer Core Fixed Income Fund (“Core Fixed”) (formerly known as Mercer Core Opportunistic Fixed Income Fund), Mercer Opportunistic Fixed Income Fund (“Opportunistic Fixed”), which commenced operations on August 21, 2013, Mercer Emerging Markets Equity Fund (“Emerging Markets”) and Mercer Global Low Volatility Equity Fund (“Global Low Volatility”) (each a “Fund,” and collectively referred to as the “Funds”). The Trust is a Delaware statutory trust established on March 11, 2005. The Trust is registered as an investment company under the Investment Company Act of 1940 (the “1940 Act”). The Fund’s investment advisor is Mercer Investment Management, Inc. (the “Advisor”). The Advisor manages each Fund using a “manager of managers” approach by selecting one or more subadvisors (each a “Subadvisor,” and collectively referred to as the “Subadvisors”) to manage each Fund’s assets.
Under the 1940 Act, each Fund is classified as “diversified”, with the exception of Opportunistic Fixed. Opportunistic Fixed is classified as “non-diversified” under the 1940 Act, as amended, and may invest a larger percentage of its assets in fewer issuers than diversified funds.
The investment objectives of the Funds are:
Fund | Investment Objective | |
| Large Cap Growth | Long-term total return, which includes capital appreciation and income | |
| Large Cap Value | Long-term total return, which includes capital appreciation and income | |
| Small/Mid Cap Growth | Long-term total return, comprised primarily of capital appreciation | |
| Small/Mid Cap Value | Long-term total return, comprised primarily of capital appreciation | |
| Non-US Core Equity | Long-term total return, which includes capital appreciation and income | |
| Core Fixed | Total return, consisting of both current income and capital appreciation | |
| Opportunistic Fixed | Long-term total return, which includes capital appreciation and income | |
| Emerging Markets | Long-term total return, which includes capital appreciation and income | |
| Global Low Volatility | Long-term total return, which includes capital appreciation and income |
Each Fund has registered and is authorized to offer interests in four classes of shares: Class S, Class Y-1, Class Y-2 and Class Y-3. The principal difference between the classes of shares is the level of shareholder service, marketing and administrative fees borne by the classes. As of March 31, 2014, only the Class Y-3 shares of each Fund had commenced operations.
| 2. | Significant Accounting Policies |
The following are significant accounting policies followed by the Funds. These policies are in conformity with accounting principles generally accepted in the United States of America (“GAAP”). The preparation of financial statements in conformity with GAAP requires management to make estimates and assumptions that affect the reported amounts and disclosures in the financial statements. Actual results could differ from these estimates.
164
Table of Contents
Mercer Funds
Notes to the Financial Statements (Continued)
March 31, 2014
(a) Security Valuation
Each Fund’s investments are valued as of the close of regular trading on the New York Stock Exchange (“NYSE”) on each day when the NYSE is open. Portfolio securities listed on an exchange normally are valued at the last sale or official closing price on the day on which the securities are valued or, lacking any sales on such day, at the last available bid price using prices as of the close of trading. In cases where securities are traded on more than one exchange, the securities are generally valued on the exchange considered by the Advisor or the applicable Subadvisor as the primary market for such securities. Securities traded in the over-the-counter (“OTC”) market and listed on the NASDAQ Stock Market (“NASDAQ”) normally are valued at the NASDAQ Official Closing Price; other OTC securities are valued at the last bid price available prior to valuation (other than short-term investments, which are valued as described below). The Funds may invest in securities that are traded in foreign markets. Foreign securities will be converted into U.S. dollar equivalents based on the exchange rate in effect at a uniform time on each business day. Events occurring after the close of trading on foreign exchanges may result in adjustments to the valuation of foreign securities to more accurately reflect their fair value as of the close of regular trading on the New York Stock Exchange. When valuing foreign equity securities that meet certain criteria, the Board of Trustees of the Trust (the “Board”) has approved the use of a fair value service that values such securities to reflect market trading that occurs after the close of the applicable foreign markets of comparable securities or other instruments that have a strong correlation to the fair-valued securities. Investments in open-end investment companies are valued at their net asset value (“NAV”) per share.
Certain fixed-income securities may be valued based upon appraisals received from a pricing service using a computerized matrix system or based upon appraisals derived from information concerning the securities or similar securities received from a recognized dealer or dealers in those securities. It should be recognized that judgment often plays a greater role in valuing thinly traded securities, as well as bonds and other securities with few dealer quotations, than is the case with respect to securities for which a broader range of dealer quotations and last-sale information is available. Each such determination is based on consideration of relevant factors, and judgment is made by or at the direction of the Board. Each Fund generally values short-term investments, which mature in 60 days or less, at amortized cost, which approximates fair value unless the Board determines that this approach does not represent fair value.
Derivative financial instruments, such as futures contracts or options contracts that are traded on a national securities exchange, are stated at the last reported sale or settlement price on the day of valuation. Futures traded on inactive markets are valued using broker quotations. OTC derivative financial instruments, such as foreign currency contracts, options contracts, or swaps agreements, derive their value from underlying asset prices, indices, reference rates, and other inputs or a combination of these factors. These contracts are normally valued on the basis of pricing service providers or broker dealer quotations. Depending on the derivative type and the terms of the derivative, the value of the derivative financial instruments is assigned by pricing service providers using a series of techniques, which may include pricing models. The pricing models use inputs that are observed from actively quoted markets such as issuer details, indices, spreads, interest rates, curves, volatilities, dividends and exchange rates.
Senior secured floating rate loans and senior secured floating rate debt securities are valued using an evaluated quote provided by an independent pricing service. Evaluated quotes provided by the pricing service may reflect appropriate factors such as ratings, yield curves, prepayment speeds, tranche type, industry, company performance, spread, individual trading characteristics, institutional size trading in similar groups of securities and other market data.
The Board has delegated its responsibility for valuing portfolio securities to the Advisor, subject to continuing Board oversight. The Advisor has appointed a Valuation Committee that is responsible for overseeing the day-to-day process of valuing portfolio securities. With respect to portfolio securities for which market quotations are not readily available or (in the opinion of the Advisor or the applicable Subadvisor) do not otherwise accurately reflect the fair values of the securities, the Valuation Committee will value such securities at fair value based upon procedures approved by the Board.
165
Table of Contents
Mercer Funds
Notes to the Financial Statements (Continued)
March 31, 2014
The application of fair value pricing represents a good faith determination based on specific procedures performed under the supervision of the Board. Due to the subjective nature of fair value pricing, there can be no assurance that a Fund could realize the fair value assigned to the security if the Fund were to sell the security at approximately the time at which the Fund determines its NAV per share. A Fund’s value for a particular security may be different from the last quoted market price.
The Funds follow a three-tier hierarchy to prioritize the assumptions, referred to as inputs, used in valuation techniques to measure fair value. The three-tier hierarchy of inputs is summarized in the three broad Levels listed below.
| • | Level 1 — quoted prices unadjusted in active markets for identical investments |
| • | Level 2 — other significant observable inputs (including quoted prices for similar investments, interest rates, prepayment speeds, credit risk, etc.) |
| • | Level 3 — significant unobservable inputs (including the Fund’s own assumptions in determining the fair value of investments) |
The inputs or methodology used for valuing securities are not necessarily an indication of the risk associated with investing in those securities.
The assets and liabilities shown in the Statements of Assets and Liabilities related to investments purchased for TBA or when-issued securities approximate fair value and are determined using Level 2 inputs, as of March 31, 2014. The assets and liabilities shown in the Statements of Assets and Liabilities related to cash collateral held at or due to broker for futures contracts are determined using Level 1 inputs as of March 31, 2014.
At March 31, 2014, Large Cap Growth held long-term investments whose value was determined using Level 1 inputs, with corresponding major categories as shown in the schedule of investments, and a short-term investment position in a Euro Time Deposit, as shown in the schedule of investments, whose value was determined using a Level 2 input.
At March 31, 2014, Small/Mid Cap Value held long-term investments whose value was determined using Level 1 inputs, with corresponding major categories as shown in the schedule of investments, and short-term investment positions in a Euro Time Deposit and in State Street Navigator Securities Lending Prime Portfolio, as shown in the schedule of investments, whose value was determined using Level 2 inputs.
The following is a summary of the inputs used as of March 31, 2014 in valuing the assets and liabilities of Large Cap Value, Small/Mid Cap Growth, Non-US Core Equity, Core Fixed, Opportunistic Fixed, Emerging Markets and Global Low Volatility for which fair valuation was used:
Large Cap Value
ASSETS VALUATION INPUT
Description | Quoted Prices in Active Markets for Identical Assets (Level 1) | Significant Other Observable Inputs (Level 2) | Significant Unobservable Inputs (Level 3) | Total | ||||||||||||
Common Stocks | ||||||||||||||||
Advertising | $ | 485,984 | $ | — | $ | — | $ | 485,984 | ||||||||
Aerospace & Defense | 9,786,858 | — | — | 9,786,858 | ||||||||||||
Agriculture | 3,356,749 | — | — | 3,356,749 | ||||||||||||
Airlines | 5,563,827 | — | — | 5,563,827 | ||||||||||||
Auto Manufacturers | 8,270,419 | — | — | 8,270,419 | ||||||||||||
Auto Parts & Equipment | 1,680,588 | — | — | 1,680,588 | ||||||||||||
Banks | 27,769,401 | — | — | 27,769,401 | ||||||||||||
166
Table of Contents
Mercer Funds
Notes to the Financial Statements (Continued)
March 31, 2014
Description | Quoted Prices in Active Markets for Identical Assets (Level 1) | Significant Other Observable Inputs (Level 2) | Significant Unobservable Inputs (Level 3) | Total | ||||||||||||
Beverages | $ | 5,184,641 | $ | — | $ | — | $ | 5,184,641 | ||||||||
Biotechnology | 2,014,636 | — | — | 2,014,636 | ||||||||||||
Building Materials | 1,580,676 | — | — | 1,580,676 | ||||||||||||
Chemicals | 5,032,745 | — | — | 5,032,745 | ||||||||||||
Commercial Services | 8,283,249 | — | — | 8,283,249 | ||||||||||||
Computers | 17,036,334 | — | — | 17,036,334 | ||||||||||||
Cosmetics & Personal Care | 349,018 | — | — | 349,018 | ||||||||||||
Diversified Financial Services | 44,033,809 | — | — | 44,033,809 | ||||||||||||
Electric | 4,260,884 | — | — | 4,260,884 | ||||||||||||
Electronics | 2,173,451 | — | — | 2,173,451 | ||||||||||||
Entertainment | 552,665 | — | — | 552,665 | ||||||||||||
Food | 3,331,996 | — | — | 3,331,996 | ||||||||||||
Forest Products & Paper | 857,727 | — | — | 857,727 | ||||||||||||
Hand & Machine Tools | 483,784 | — | — | 483,784 | ||||||||||||
Health Care - Products | 6,689,021 | — | — | 6,689,021 | ||||||||||||
Health Care - Services | 4,663,607 | — | — | 4,663,607 | ||||||||||||
Insurance | 20,189,727 | — | — | 20,189,727 | ||||||||||||
Internet | 3,267,276 | — | — | 3,267,276 | ||||||||||||
Iron & Steel | 1,448,530 | — | — | 1,448,530 | ||||||||||||
Leisure Time | 982,846 | — | — | 982,846 | ||||||||||||
Lodging | 448,461 | — | — | 448,461 | ||||||||||||
Machinery - Construction & Mining | 2,682,270 | — | — | 2,682,270 | ||||||||||||
Machinery - Diversified | 4,648,865 | — | — | 4,648,865 | ||||||||||||
Media | 21,282,184 | — | — | 21,282,184 | ||||||||||||
Mining | 742,911 | — | — | 742,911 | ||||||||||||
Miscellaneous - Manufacturing | 9,427,758 | — | — | 9,427,758 | ||||||||||||
Office & Business Equipment | 1,515,364 | — | — | 1,515,364 | ||||||||||||
Oil & Gas | 38,546,004 | — | — | 38,546,004 | ||||||||||||
Oil & Gas Services | 4,748,927 | — | — | 4,748,927 | ||||||||||||
Packaging & Containers | 1,762,833 | — | — | 1,762,833 | ||||||||||||
Pharmaceuticals | 27,853,773 | — | — | 27,853,773 | ||||||||||||
REITS | 3,566,712 | — | — | 3,566,712 | ||||||||||||
Retail | 19,270,512 | — | — | 19,270,512 | ||||||||||||
Semiconductors | 10,989,861 | — | — | 10,989,861 | ||||||||||||
Software | 8,232,134 | — | — | 8,232,134 | ||||||||||||
Telecommunications | 20,664,976 | — | — | 20,664,976 | ||||||||||||
Transportation | 1,939,530 | — | — | 1,939,530 | ||||||||||||
|
|
|
|
|
|
|
| |||||||||
Total Common Stocks | 367,653,523 | — | — | 367,653,523 | ||||||||||||
|
|
|
|
|
|
|
| |||||||||
Investment Company | ||||||||||||||||
Unaffiliated Fund | 299,150 | — | — | 299,150 | ||||||||||||
|
|
|
|
|
|
|
| |||||||||
Total Investment Company | 299,150 | — | — | 299,150 | ||||||||||||
|
|
|
|
|
|
|
| |||||||||
Short-Term Investments | ||||||||||||||||
Bank Deposit | — | 1,683,192 | — | 1,683,192 | ||||||||||||
Securities Lending Collateral | — | 5,975,569 | — | 5,975,569 | ||||||||||||
|
|
|
|
|
|
|
| |||||||||
Total Short-Term Investments | — | 7,658,761 | — | 7,658,761 | ||||||||||||
|
|
|
|
|
|
|
| |||||||||
Total | $ | 367,952,673 | $ | 7,658,761 | $ | — | $ | 375,611,434 | ||||||||
|
|
|
|
|
|
|
| |||||||||
167
Table of Contents
Mercer Funds
Notes to the Financial Statements (Continued)
March 31, 2014
LIABILITIES VALUATION INPUT
Description | Quoted Prices in Active Markets for Identical Assets (Level 1) | Significant Other Observable Inputs (Level 2) | Significant Unobservable Inputs (Level 3) | Total | ||||||||||||
Forward Foreign Currency Contracts* | ||||||||||||||||
Sales | $ | — | $ | (23,526 | ) | $ | — | $ | (23,526 | ) | ||||||
|
|
|
|
|
|
|
| |||||||||
Total | $ | — | $ | (23,526 | ) | $ | — | $ | (23,526 | ) | ||||||
|
|
|
|
|
|
|
| |||||||||
| * | Forward foreign currency contracts are valued at unrealized appreciation/depreciation. |
Small/Mid Cap Growth
ASSETS VALUATION INPUT
Description | Quoted Prices in Active Markets for Identical Assets (Level 1) | Significant Other Observable Inputs (Level 2) | Significant Unobservable Inputs (Level 3) | Total | ||||||||||||
Common Stocks | ||||||||||||||||
Aerospace & Defense | $ | 6,629,655 | $ | — | $ | — | $ | 6,629,655 | ||||||||
Apparel | 1,077,494 | — | — | 1,077,494 | ||||||||||||
Auto Parts & Equipment | 4,799,119 | — | — | 4,799,119 | ||||||||||||
Banks | 7,299,880 | — | — | 7,299,880 | ||||||||||||
Biotechnology | 2,661,127 | — | — | 2,661,127 | ||||||||||||
Building Materials | 4,650,949 | — | — | 4,650,949 | ||||||||||||
Chemicals | 14,914,879 | — | — | 14,914,879 | ||||||||||||
Coal | 3,314,252 | — | — | 3,314,252 | ||||||||||||
Commercial Services | 29,601,826 | — | — | 29,601,826 | ||||||||||||
Computers | 16,005,402 | — | — | 16,005,402 | ||||||||||||
Distribution & Wholesale | 5,818,964 | — | — | 5,818,964 | ||||||||||||
Diversified Financial Services | 14,743,390 | — | — | 14,743,390 | ||||||||||||
Electrical Components & Equipment | 5,727,039 | — | — | 5,727,039 | ||||||||||||
Electronics | 3,518,830 | — | — | 3,518,830 | ||||||||||||
Engineering & Construction | 933,004 | — | — | 933,004 | ||||||||||||
Entertainment | 2,365,064 | — | — | 2,365,064 | ||||||||||||
Environmental Control | 1,371,195 | — | — | 1,371,195 | ||||||||||||
Food | 1,166,151 | — | — | 1,166,151 | ||||||||||||
Hand & Machine Tools | 2,976,893 | — | — | 2,976,893 | ||||||||||||
Health Care - Products | 22,735,502 | — | — | 22,735,502 | ||||||||||||
Health Care - Services | 16,773,977 | — | — | 16,773,977 | ||||||||||||
Home Builders | 1,190,586 | — | — | 1,190,586 | ||||||||||||
Home Furnishings | 5,331,415 | — | — | 5,331,415 | ||||||||||||
Household Products & Wares | 5,257,477 | — | — | 5,257,477 | ||||||||||||
Insurance | 2,240,717 | — | — | 2,240,717 | ||||||||||||
Internet | 16,362,834 | — | — | 16,362,834 | ||||||||||||
Leisure Time | 4,632,507 | — | — | 4,632,507 | ||||||||||||
Lodging | 1,613,843 | — | — | 1,613,843 | ||||||||||||
Machinery - Construction & Mining | 1,955,048 | — | — | 1,955,048 | ||||||||||||
168
Table of Contents
Mercer Funds
Notes to the Financial Statements (Continued)
March 31, 2014
Description | Quoted Prices in Active Markets for Identical Assets (Level 1) | Significant Other Observable Inputs (Level 2) | Significant Unobservable Inputs (Level 3) | Total | ||||||||||||
Machinery - Diversified | $ | 7,777,223 | $ | — | $ | — | $ | 7,777,223 | ||||||||
Media | 924,868 | — | — | 924,868 | ||||||||||||
Metal Fabricate & Hardware | 2,845,540 | — | — | 2,845,540 | ||||||||||||
Miscellaneous - Manufacturing | 4,036,502 | — | — | 4,036,502 | ||||||||||||
Oil & Gas | 13,075,750 | — | — | 13,075,750 | ||||||||||||
Oil & Gas Services | 6,379,846 | — | — | 6,379,846 | ||||||||||||
Packaging & Containers | 7,021,643 | — | — | 7,021,643 | ||||||||||||
Pharmaceuticals | 13,214,580 | — | — | 13,214,580 | ||||||||||||
Real Estate | 2,742,090 | — | — | 2,742,090 | ||||||||||||
REITS | 6,067,048 | — | — | 6,067,048 | ||||||||||||
Retail | 40,454,179 | — | — | 40,454,179 | ||||||||||||
Semiconductors | 8,255,820 | — | — | 8,255,820 | ||||||||||||
Software | 46,563,377 | — | — | 46,563,377 | ||||||||||||
Telecommunications | 14,768,557 | — | — | 14,768,557 | ||||||||||||
Transportation | 11,590,922 | — | — | 11,590,922 | ||||||||||||
|
|
|
|
|
|
|
| |||||||||
Total Common Stocks | 393,386,964 | — | — | 393,386,964 | ||||||||||||
|
|
|
|
|
|
|
| |||||||||
Warrants | ||||||||||||||||
Oil & Gas | — | 0 | * | — | 0 | |||||||||||
|
|
|
|
|
|
|
| |||||||||
Total Warrants | — | 0 | — | 0 | ||||||||||||
|
|
|
|
|
|
|
| |||||||||
Short-Term Investments | ||||||||||||||||
Bank Deposit | — | 3,776,068 | — | 3,776,068 | ||||||||||||
Securities Lending Collateral | — | 35,237,041 | — | 35,237,041 | ||||||||||||
|
|
|
|
|
|
|
| |||||||||
Total Short-Term Investments | — | 39,013,109 | — | 39,013,109 | ||||||||||||
|
|
|
|
|
|
|
| |||||||||
Total | $ | 393,386,964 | $ | 39,013,109 | $ | — | $ | 432,400,073 | ||||||||
|
|
|
|
|
|
|
| |||||||||
| * | Represents one security at $0 value as of March 31, 2014. |
Non-US Core Equity
ASSETS VALUATION INPUT
Description | Quoted Prices in Active Markets for Identical Assets (Level 1) | Significant Other Observable Inputs (Level 2) | Significant Unobservable Inputs (Level 3) | Total | ||||||||||||
Common Stocks | ||||||||||||||||
Australia | $ | 66,713,973 | $ | 0 | * | $ | — | $ | 66,713,973 | |||||||
Austria | 7,626,882 | — | — | 7,626,882 | ||||||||||||
Belgium | 11,441,887 | — | — | 11,441,887 | ||||||||||||
Bermuda | 23,649,398 | — | — | 23,649,398 | ||||||||||||
Brazil | 6,992,993 | — | — | 6,992,993 | ||||||||||||
Canada | 2,352,707 | — | — | 2,352,707 | ||||||||||||
Cayman Islands | 13,301,201 | — | — | 13,301,201 | ||||||||||||
China | 3,883,257 | — | — | 3,883,257 | ||||||||||||
Denmark | 28,412,802 | — | — | 28,412,802 | ||||||||||||
Finland | 27,412,883 | — | — | 27,412,883 | ||||||||||||
France | 157,781,863 | — | — | 157,781,863 | ||||||||||||
169
Table of Contents
Mercer Funds
Notes to the Financial Statements (Continued)
March 31, 2014
Description | Quoted Prices in Active Markets for Identical Assets (Level 1) | Significant Other Observable Inputs (Level 2) | Significant Unobservable Inputs (Level 3) | Total | ||||||||||||
Germany | $ | 178,502,814 | $ | — | $ | — | $ | 178,502,814 | ||||||||
Greece | 5,918,416 | — | — | 5,918,416 | ||||||||||||
Hong Kong | 11,025,184 | — | — | 11,025,184 | ||||||||||||
India | 19,241,921 | — | — | 19,241,921 | ||||||||||||
Indonesia | 5,204,565 | — | — | 5,204,565 | ||||||||||||
Ireland | 5,298,694 | — | — | 5,298,694 | ||||||||||||
Italy | 49,585,485 | — | — | 49,585,485 | ||||||||||||
Japan | 387,523,108 | 135,360 | — | 387,658,468 | ||||||||||||
Luxembourg | 7,323,035 | — | — | 7,323,035 | ||||||||||||
Malaysia | 3,781,932 | — | — | 3,781,932 | ||||||||||||
Malta | 1,340,142 | — | — | 1,340,142 | ||||||||||||
Mexico | 1,263,610 | — | — | 1,263,610 | ||||||||||||
Netherlands | 66,341,162 | — | — | 66,341,162 | ||||||||||||
New Zealand | 6,425,918 | — | — | 6,425,918 | ||||||||||||
Norway | 22,345,277 | — | — | 22,345,277 | ||||||||||||
Singapore | 12,284,639 | — | — | 12,284,639 | ||||||||||||
South Africa | 2,602,167 | — | — | 2,602,167 | ||||||||||||
South Korea | 8,978,257 | — | — | 8,978,257 | ||||||||||||
Spain | 67,078,750 | — | — | 67,078,750 | ||||||||||||
Sweden | 65,907,100 | — | — | 65,907,100 | ||||||||||||
Switzerland | 114,440,664 | — | — | 114,440,664 | ||||||||||||
Taiwan | 15,439,544 | — | — | 15,439,544 | ||||||||||||
Thailand | 195,934 | 2,281,989 | — | 2,477,923 | ||||||||||||
United Kingdom | 367,730,761 | — | — | 367,730,761 | ||||||||||||
|
|
|
|
|
|
|
| |||||||||
Total Common Stocks | 1,775,348,925 | 2,417,349 | — | 1,777,766,274 | ||||||||||||
|
|
|
|
|
|
|
| |||||||||
Investment Company | ||||||||||||||||
United States | 17,812,006 | — | — | 17,812,006 | ||||||||||||
|
|
|
|
|
|
|
| |||||||||
Total Investment Company | 17,812,006 | — | — | 17,812,006 | ||||||||||||
|
|
|
|
|
|
|
| |||||||||
Preferred Stocks | ||||||||||||||||
Brazil | 1,425,708 | — | — | 1,425,708 | ||||||||||||
Germany | 14,858,917 | — | — | 14,858,917 | ||||||||||||
|
|
|
|
|
|
|
| |||||||||
Total Preferred Stocks | 16,284,625 | — | — | 16,284,625 | ||||||||||||
|
|
|
|
|
|
|
| |||||||||
Rights | ||||||||||||||||
Hong Kong | — | 111,370 | — | 111,370 | ||||||||||||
Italy | 1,278,914 | — | — | 1,278,914 | ||||||||||||
|
|
|
|
|
|
|
| |||||||||
Total Rights | 1,278,914 | 111,370 | — | 1,390,284 | ||||||||||||
|
|
|
|
|
|
|
| |||||||||
Options Purchased | ||||||||||||||||
Call Options | — | 183,374 | — | 183,374 | ||||||||||||
Put Options | — | 154,421 | — | 154,421 | ||||||||||||
|
|
|
|
|
|
|
| |||||||||
Total Options Purchased | — | 337,795 | — | 337,795 | ||||||||||||
|
|
|
|
|
|
|
| |||||||||
Short-Term Investments | ||||||||||||||||
Bank Deposit | — | 57,687,891 | — | 57,687,891 | ||||||||||||
Securities Lending Collateral | — | 72,792,139 | — | 72,792,139 | ||||||||||||
|
|
|
|
|
|
|
| |||||||||
Total Short-Term Investments | — | 130,480,030 | — | 130,480,030 | ||||||||||||
|
|
|
|
|
|
|
| |||||||||
Total | $ | 1,810,724,470 | $ | 133,346,544 | $ | — | $ | 1,944,071,014 | ||||||||
|
|
|
|
|
|
|
| |||||||||
| * | Represents one security at $0 value as of March 31, 2014. |
170
Table of Contents
Mercer Funds
Notes to the Financial Statements (Continued)
March 31, 2014
Core Fixed
ASSETS VALUATION INPUT
Description | Quoted Prices in Active Markets for Identical Assets (Level 1) | Significant Other Observable Inputs (Level 2) | Significant Unobservable Inputs (Level 3) | Total | ||||||||||||
Debt Obligations | ||||||||||||||||
Asset Backed Securities | $ | — | $ | 39,181,697 | $ | — | $ | 39,181,697 | ||||||||
Bank Loans | — | 1,983,562 | — | 1,983,562 | ||||||||||||
Corporate Debt | — | 271,510,883 | 0 | * | 271,510,883 | |||||||||||
Mortgage Backed Securities - Private Issuers | — | 21,746,818 | — | 21,746,818 | ||||||||||||
Mortgage Backed Securities - U.S. Government Agency Obligations | — | 147,409,658 | — | 147,409,658 | ||||||||||||
Municipal Obligations | — | 43,377,181 | — | 43,377,181 | ||||||||||||
Sovereign Debt Obligations | — | 9,363,386 | — | 9,363,386 | ||||||||||||
U.S. Government and Agency Obligations | — | 455,228,507 | — | 455,228,507 | ||||||||||||
|
|
|
|
|
|
|
| |||||||||
Total Debt Obligations | — | 989,801,692 | 0 | 989,801,692 | ||||||||||||
|
|
|
|
|
|
|
| |||||||||
Preferred Stock | ||||||||||||||||
Diversified Financial Services | 3,240,032 | — | — | 3,240,032 | ||||||||||||
|
|
|
|
|
|
|
| |||||||||
Total Preferred Stock | 3,240,032 | — | — | 3,240,032 | ||||||||||||
|
|
|
|
|
|
|
| |||||||||
Options Purchased | ||||||||||||||||
Call Options | 523 | — | — | 523 | ||||||||||||
Put Options | 3,038 | — | — | 3,038 | ||||||||||||
|
|
|
|
|
|
|
| |||||||||
Total Options Purchased | 3,561 | — | — | 3,561 | ||||||||||||
|
|
|
|
|
|
|
| |||||||||
Short-Term Investments | ||||||||||||||||
Bank Deposit | — | 84,220,655 | — | 84,220,655 | ||||||||||||
Securities Lending Collateral | — | 2,627,065 | — | 2,627,065 | ||||||||||||
U.S. Government and Agency Obligations | — | 9,996,170 | — | 9,996,170 | ||||||||||||
|
|
|
|
|
|
|
| |||||||||
Total Short-Term Investments | — | 96,843,890 | — | 96,843,890 | ||||||||||||
|
|
|
|
|
|
|
| |||||||||
Forward Foreign Currency Contracts** | ||||||||||||||||
Buys | — | 98,308 | — | 98,308 | ||||||||||||
Sales | — | 3,522 | — | 3,522 | ||||||||||||
|
|
|
|
|
|
|
| |||||||||
Total Forward Foreign Currency Contracts | — | 101,830 | — | 101,830 | ||||||||||||
|
|
|
|
|
|
|
| |||||||||
Total | $ | 3,243,593 | $ | 1,086,747,412 | $ | 0 | $ | 1,089,991,005 | ||||||||
|
|
|
|
|
|
|
| |||||||||
171
Table of Contents
Mercer Funds
Notes to the Financial Statements (Continued)
March 31, 2014
LIABILITIES VALUATION INPUT
Description | Quoted Prices in Active Markets for Identical Assets (Level 1) | Significant Other Observable Inputs (Level 2) | Significant Unobservable Inputs (Level 3) | Total | ||||||||||||
Forward Foreign Currency Contracts** | ||||||||||||||||
Sales | $ | — | $ | (162,636 | ) | $ | — | $ | (162,636 | ) | ||||||
|
|
|
|
|
|
|
| |||||||||
Total Forward Foreign Currency Contracts | — | (162,636 | ) | — | (162,636 | ) | ||||||||||
|
|
|
|
|
|
|
| |||||||||
Futures Contracts** | ||||||||||||||||
Sales | (132 | ) | — | — | (132 | ) | ||||||||||
|
|
|
|
|
|
|
| |||||||||
Total Futures Contracts | (132 | ) | — | — | (132 | ) | ||||||||||
|
|
|
|
|
|
|
| |||||||||
Written Options | (20,997 | ) | — | — | (20,997 | ) | ||||||||||
|
|
|
|
|
|
|
| |||||||||
Total | $ | (21,129 | ) | $ | (162,636 | ) | $ | — | $ | (183,765 | ) | |||||
|
|
|
|
|
|
|
| |||||||||
| * | Represents four securities at $0 value as of March 31, 2014. |
| ** | Forward foreign currency contracts and Futures contracts are valued at unrealized appreciation/depreciation. Only current day’s variation margin, if any, is reported on the Statements of Assets and Liabilities. |
Opportunistic Fixed
ASSETS VALUATION INPUT
Description | Quoted Prices in Active Markets for Identical Assets (Level 1) | Significant Other Observable Inputs (Level 2) | Significant Unobservable Inputs (Level 3) | Total | ||||||||||||
Debt Obligations | ||||||||||||||||
Corporate Debt | $ | — | $ | 118,480,804 | $ | — | $ | 118,480,804 | ||||||||
Sovereign Debt Obligations | — | 120,682,062 | — | 120,682,062 | ||||||||||||
|
|
|
|
|
|
|
| |||||||||
Total Debt Obligations | — | 239,162,866 | — | 239,162,866 | ||||||||||||
|
|
|
|
|
|
|
| |||||||||
Preferred Stock | ||||||||||||||||
Diversified Financial Services | 382,200 | — | — | 382,200 | ||||||||||||
|
|
|
|
|
|
|
| |||||||||
Total Preferred Stock | 382,200 | — | — | 382,200 | ||||||||||||
|
|
|
|
|
|
|
| |||||||||
Short-Term Investments | ||||||||||||||||
Bank Deposit | — | 18,686,992 | — | 18,686,992 | ||||||||||||
|
|
|
|
|
|
|
| |||||||||
Total Short-Term Investments | — | 18,686,992 | — | 18,686,992 | ||||||||||||
|
|
|
|
|
|
|
| |||||||||
Cross Currency Foreign Currency Contracts* | — | 8,984 | — | 8,984 | ||||||||||||
|
|
|
|
|
|
|
| |||||||||
Forward Foreign Currency Contracts* | ||||||||||||||||
Buys | — | 1,004,640 | — | 1,004,640 | ||||||||||||
Sales | — | 56,991 | — | 56,991 | ||||||||||||
|
|
|
|
|
|
|
| |||||||||
Total Forward Foreign Currency Contracts | — | 1,061,631 | — | 1,061,631 | ||||||||||||
|
|
|
|
|
|
|
| |||||||||
Total | $ | 382,200 | $ | 258,920,473 | $ | — | $ | 259,302,673 | ||||||||
|
|
|
|
|
|
|
| |||||||||
172
Table of Contents
Mercer Funds
Notes to the Financial Statements (Continued)
March 31, 2014
LIABILITIES VALUATION INPUT
Description | Quoted Prices in Active Markets for Identical Assets (Level 1) | Significant Other Observable Inputs (Level 2) | Significant Unobservable Inputs (Level 3) | Total | ||||||||||||
Cross Currency Foreign Currency Contracts* | $ | — | $ | (2,470 | ) | $ | — | $ | (2,470 | ) | ||||||
|
|
|
|
|
|
|
| |||||||||
Forward Foreign Currency Contracts* | ||||||||||||||||
Buys | — | (30,316 | ) | — | (30,316 | ) | ||||||||||
Sales | — | (540,620 | ) | — | (540,620 | ) | ||||||||||
|
|
|
|
|
|
|
| |||||||||
Total Forward Foreign Currency Contracts | — | (570,936 | ) | — | (570,936 | ) | ||||||||||
|
|
|
|
|
|
|
| |||||||||
Total | $ | — | $ | (573,406 | ) | $ | — | $ | (573,406 | ) | ||||||
|
|
|
|
|
|
|
| |||||||||
| * | Cross currency foreign currency contracts and Forward foreign currency contracts are valued at unrealized appreciation/depreciation. |
Emerging Markets
ASSETS VALUATION INPUT
Description | Quoted Prices in Active Markets for Identical Assets (Level 1) | Significant Other Observable Inputs (Level 2) | Significant Unobservable Inputs (Level 3) | Total | ||||||||||||
Common Stocks | ||||||||||||||||
Bermuda | $ | 7,343,648 | $ | — | $ | — | $ | 7,343,648 | ||||||||
Brazil | 64,112,593 | 13,081 | — | 64,125,674 | ||||||||||||
British Virgin Islands | 847,042 | — | — | 847,042 | ||||||||||||
Cayman Islands | 35,795,443 | — | — | 35,795,443 | ||||||||||||
Chile | 10,708,030 | — | — | 10,708,030 | ||||||||||||
China | 81,747,156 | — | — | 81,747,156 | ||||||||||||
Colombia | 2,107,252 | — | — | 2,107,252 | ||||||||||||
Czech Republic | 4,825,457 | — | — | 4,825,457 | ||||||||||||
Denmark | 1,390,236 | — | — | 1,390,236 | ||||||||||||
Germany | 2,409,148 | — | — | 2,409,148 | ||||||||||||
Hong Kong | 41,752,652 | — | — | 41,752,652 | ||||||||||||
Hungary | 1,642,198 | — | — | 1,642,198 | ||||||||||||
India | 78,266,267 | — | — | 78,266,267 | ||||||||||||
Indonesia | 22,839,826 | — | — | 22,839,826 | ||||||||||||
Luxembourg | 2,816,715 | — | — | 2,816,715 | ||||||||||||
Malaysia | 31,001,172 | — | — | 31,001,172 | ||||||||||||
Mexico | 42,174,710 | — | — | 42,174,710 | ||||||||||||
Netherlands | 1,717,237 | — | — | 1,717,237 | ||||||||||||
Panama | 1,237,830 | — | — | 1,237,830 | ||||||||||||
Peru | 159,639 | — | — | 159,639 | ||||||||||||
Philippines | 4,780,114 | — | — | 4,780,114 | ||||||||||||
Poland | 12,110,353 | — | — | 12,110,353 | ||||||||||||
Russia | 28,388,518 | 6,581,376 | — | 34,969,894 | ||||||||||||
Singapore | 1,217,041 | — | — | 1,217,041 | ||||||||||||
173
Table of Contents
Mercer Funds
Notes to the Financial Statements (Continued)
March 31, 2014
Description | Quoted Prices in Active Markets for Identical Assets (Level 1) | Significant Other Observable Inputs (Level 2) | Significant Unobservable Inputs (Level 3) | Total | ||||||||||||
South Africa | $ | 46,696,389 | $ | — | $ | — | $ | 46,696,389 | ||||||||
South Korea | 93,327,532 | — | — | 93,327,532 | ||||||||||||
Switzerland | 1,899,149 | — | — | 1,899,149 | ||||||||||||
Taiwan | 91,179,608 | — | — | 91,179,608 | ||||||||||||
Thailand | 11,577,620 | 15,154,517 | — | 26,732,137 | ||||||||||||
Turkey | 12,159,908 | — | — | 12,159,908 | ||||||||||||
United Kingdom | 18,966,592 | — | — | 18,966,592 | ||||||||||||
United States | 3,358,249 | — | — | 3,358,249 | ||||||||||||
|
|
|
|
|
|
|
| |||||||||
Total Common Stocks | 760,555,324 | 21,748,974 | — | 782,304,298 | ||||||||||||
|
|
|
|
|
|
|
| |||||||||
Preferred Stocks | ||||||||||||||||
Brazil | 11,825,430 | — | — | 11,825,430 | ||||||||||||
Chile | 471,343 | — | — | 471,343 | ||||||||||||
Colombia | 2,757,988 | — | — | 2,757,988 | ||||||||||||
India | 25,731 | — | — | 25,731 | ||||||||||||
|
|
|
|
|
|
|
| |||||||||
Total Preferred Stocks | 15,080,492 | — | — | 15,080,492 | ||||||||||||
|
|
|
|
|
|
|
| |||||||||
Short-Term Investments | ||||||||||||||||
Bank Deposit | — | 49,615,231 | — | 49,615,231 | ||||||||||||
Investment Fund | — | 10,390,000 | — | 10,390,000 | ||||||||||||
Securities Lending Collateral | — | 36,536,471 | — | 36,536,471 | ||||||||||||
|
|
|
|
|
|
|
| |||||||||
Total Short-Term Investments | — | 96,541,702 | — | 96,541,702 | ||||||||||||
|
|
|
|
|
|
|
| |||||||||
Forward Foreign Currency Contracts* | ||||||||||||||||
Buys | — | 3,678,453 | — | 3,678,453 | ||||||||||||
Sales | — | 65,114 | — | 65,114 | ||||||||||||
|
|
|
|
|
|
|
| |||||||||
Total Forward Foreign Currency Contracts | — | 3,743,567 | — | 3,743,567 | ||||||||||||
|
|
|
|
|
|
|
| |||||||||
Futures Contracts* | ||||||||||||||||
Buys | 538,775 | — | — | 538,775 | ||||||||||||
|
|
|
|
|
|
|
| |||||||||
Total Futures Contracts | 538,775 | — | — | 538,775 | ||||||||||||
|
|
|
|
|
|
|
| |||||||||
Synthetic Futures | — | 778,913 | — | 778,913 | ||||||||||||
|
|
|
|
|
|
|
| |||||||||
Total Swaps | — | 778,913 | — | 778,913 | ||||||||||||
|
|
|
|
|
|
|
| |||||||||
Total | $ | 776,174,591 | $ | 122,813,156 | $ | — | $ | 898,987,747 | ||||||||
|
|
|
|
|
|
|
| |||||||||
LIABILITIES VALUATION INPUT
Description | Quoted Prices in Active Markets for Identical Assets (Level 1) | Significant Other Observable Inputs (Level 2) | Significant Unobservable Inputs (Level 3) | Total | ||||||||||||
Forward Foreign Currency Contracts* | ||||||||||||||||
Buys | $ | — | $ | (156,688 | ) | $ | — | $ | (156,688 | ) | ||||||
Sales | — | (3,074,841 | ) | — | (3,074,841 | ) | ||||||||||
|
|
|
|
|
|
|
| |||||||||
Total Forward Foreign Currency Contracts | — | (3,231,529 | ) | — | (3,231,529 | ) | ||||||||||
|
|
|
|
|
|
|
| |||||||||
174
Table of Contents
Mercer Funds
Notes to the Financial Statements (Continued)
March 31, 2014
Description | Quoted Prices in Active Markets for Identical Assets (Level 1) | Significant Other Observable Inputs (Level 2) | Significant Unobservable Inputs (Level 3) | Total | ||||||||||||
Futures Contracts* | ||||||||||||||||
Sales | $ | (333,176 | ) | $ | — | $ | — | $ | (333,176 | ) | ||||||
Total Futures Contracts | (333,176 | ) | — | — | (333,176 | ) | ||||||||||
|
|
|
|
|
|
|
| |||||||||
Total | $ | (333,176 | ) | $ | (3,231,529 | ) | $ | — | $ | (3,564,705 | ) | |||||
|
|
|
|
|
|
|
| |||||||||
| * | Forward foreign currency contracts and Futures contracts are valued at unrealized appreciation/depreciation. Only current day’s variation margin, if any, is reported on the Statements of Assets and Liabilities. |
Global Low Volatility
ASSETS VALUATION INPUT
Description | Quoted Prices in Active Markets for Identical Assets (Level 1) | Significant Other Observable Inputs (Level 2) | Significant Unobservable Inputs (Level 3) | Total | ||||||||||||
Common Stocks | ||||||||||||||||
Australia | $ | 3,138,497 | $ | — | $ | — | $ | 3,138,497 | ||||||||
Austria | 1,241,483 | — | — | 1,241,483 | ||||||||||||
Bahamas | 277,338 | — | — | 277,338 | ||||||||||||
Belgium | 4,823,177 | — | — | 4,823,177 | ||||||||||||
Bermuda | 4,090,105 | — | — | 4,090,105 | ||||||||||||
Canada | 34,815,127 | — | — | 34,815,127 | ||||||||||||
Cayman Islands | 831,546 | — | — | 831,546 | ||||||||||||
Denmark | 6,654,619 | — | — | 6,654,619 | ||||||||||||
France | 36,285,770 | — | — | 36,285,770 | ||||||||||||
Germany | 21,127,934 | — | — | 21,127,934 | ||||||||||||
Hong Kong | 2,238,249 | — | — | 2,238,249 | ||||||||||||
Ireland | 4,324,020 | — | — | 4,324,020 | ||||||||||||
Israel | 5,984,535 | — | — | 5,984,535 | ||||||||||||
Italy | 353,185 | — | — | 353,185 | ||||||||||||
Japan | 54,005,902 | — | — | 54,005,902 | ||||||||||||
Malaysia | 124,630 | — | — | 124,630 | ||||||||||||
Mexico | 3,372,694 | — | — | 3,372,694 | ||||||||||||
Netherlands | 6,332,080 | — | — | 6,332,080 | ||||||||||||
New Zealand | 4,890,491 | — | — | 4,890,491 | ||||||||||||
Norway | 8,620,685 | — | — | 8,620,685 | ||||||||||||
Portugal | 3,234,144 | — | — | 3,234,144 | ||||||||||||
Russia | 907,947 | — | — | 907,947 | ||||||||||||
Singapore | 4,450,264 | — | — | 4,450,264 | ||||||||||||
South Africa | 2,018,864 | — | — | 2,018,864 | ||||||||||||
South Korea | 2,340,241 | — | — | 2,340,241 | ||||||||||||
Spain | 1,588,955 | — | — | 1,588,955 | ||||||||||||
Sweden | 6,803,633 | — | — | 6,803,633 | ||||||||||||
Switzerland | 30,898,200 | — | — | 30,898,200 | ||||||||||||
Thailand | 953,577 | — | — | 953,577 | ||||||||||||
United Kingdom | 45,196,796 | — | — | 45,196,796 | ||||||||||||
United States | 359,625,838 | — | — | 359,625,838 | ||||||||||||
|
|
|
|
|
|
|
| |||||||||
Total Common Stocks | 661,550,526 | — | — | 661,550,526 | ||||||||||||
|
|
|
|
|
|
|
| |||||||||
175
Table of Contents
Mercer Funds
Notes to the Financial Statements (Continued)
March 31, 2014
Description | Quoted Prices in Active Markets for Identical Assets (Level 1) | Significant Other Observable Inputs (Level 2) | Significant Unobservable Inputs (Level 3) | Total | ||||||||||||
Investment Company | ||||||||||||||||
United States | $ | 11,696,967 | $ | — | $ | — | $ | 11,696,967 | ||||||||
|
|
|
|
|
|
|
| |||||||||
Total Investment Company | 11,696,967 | — | — | 11,696,967 | ||||||||||||
|
|
|
|
|
|
|
| |||||||||
Preferred Stocks | ||||||||||||||||
Germany | 100,993 | — | — | 100,993 | ||||||||||||
Japan | 207,160 | — | — | 207,160 | ||||||||||||
Sweden | 255,077 | — | — | 255,077 | ||||||||||||
|
|
|
|
|
|
|
| |||||||||
Total Preferred Stocks | 563,230 | — | — | 563,230 | ||||||||||||
|
|
|
|
|
|
|
| |||||||||
Warrants | ||||||||||||||||
United States | 742,876 | — | — | 742,876 | ||||||||||||
|
|
|
|
|
|
|
| |||||||||
Total Warrants | 742,876 | — | — | 742,876 | ||||||||||||
|
|
|
|
|
|
|
| |||||||||
Short-Term Investments | ||||||||||||||||
Bank Deposit | — | 67,184,060 | — | 67,184,060 | ||||||||||||
Securities Lending Collateral | — | 33,949,069 | — | 33,949,069 | ||||||||||||
|
|
|
|
|
|
|
| |||||||||
Total Short-Term Investments | — | 101,133,129 | — | 101,133,129 | ||||||||||||
|
|
|
|
|
|
|
| |||||||||
Forward Foreign Currency Contracts* | ||||||||||||||||
Buys | — | 30,255 | — | 30,255 | ||||||||||||
Sales | — | 262,531 | — | 262,531 | ||||||||||||
|
|
|
|
|
|
|
| |||||||||
Total Forward Foreign Currency Contracts | — | 292,786 | — | 292,786 | ||||||||||||
|
|
|
|
|
|
|
| |||||||||
Total | $ | 674,553,599 | $ | 101,425,915 | $ | — | $ | 775,979,514 | ||||||||
|
|
|
|
|
|
|
| |||||||||
LIABILITIES VALUATION INPUT
Description | Quoted Prices in Active Markets for Identical Assets (Level 1) | Significant Other Observable Inputs (Level 2) | Significant Unobservable Inputs (Level 3) | Total | ||||||||||||
Forward Foreign Currency Contracts* | ||||||||||||||||
Sales | $ | — | $ | (201,768 | ) | $ | — | $ | (201,768 | ) | ||||||
|
|
|
|
|
|
|
| |||||||||
Total Forward Foreign Currency Contracts | — | (201,768 | ) | — | (201,768 | ) | ||||||||||
|
|
|
|
|
|
|
| |||||||||
Total | $ | — | $ | (201,768 | ) | $ | — | $ | (201,768 | ) | ||||||
|
|
|
|
|
|
|
| |||||||||
| * | Forward foreign currency contracts are valued at unrealized appreciation/depreciation. |
176
Table of Contents
Mercer Funds
Notes to the Financial Statements (Continued)
March 31, 2014
The following table shows transfers between Level 1 and Level 2 of the fair value hierarchy:
Emerging Markets
| Transfers In | Transfers Out | |||||||||||||||
| Level 1 — Quoted Prices | Level 2 — Other Significant Observable Inputs | Level 1 — Quoted Prices | Level 2 — Other Significant Observable Inputs | |||||||||||||
Common Stocks | $ | — | $ | 2,841,973 | * | $ | 2,841,973 | * | $ | — | ||||||
| * | Transfers occurred between Level 1 and Level 2 as a result of foreign securities not receiving an exchange traded price. |
For financial statement reporting purposes, the Funds recognize transfers between Levels as of the end of the reporting period.
The following table includes a rollforward of the amounts for the year ended March 31, 2014 for financial instruments classified as Level 3:
Core Fixed
Investments | Balance as of March 31, 2013 | Realized Gain (Loss) | Change in Unrealized Appreciation (Depreciation) | Net Transfers In (Out) of Level 3 | Sales | Balance as of March 31, 2014 | Change in Unrealized Appreciation (Depreciation) from Investments Held at March 31, 2014 | ||||||||||||||||||||||||||||
DEBT OBLIGATIONS |
| ||||||||||||||||||||||||||||||||||
Corporate Debt | $ | 0^ | $ | (77,175 | ) | $ | 77,242 | $ | — | ^^ | $ | (67 | ) | $ | 0^^^ | $ | — | ||||||||||||||||||
|
|
|
|
|
|
|
|
|
|
|
|
|
| ||||||||||||||||||||||
Total | $ | 0^ | $ | (77,175 | ) | $ | 77,242 | $ | — | ^^ | $ | (67 | ) | $ | 0^^^ | $ | — | ||||||||||||||||||
|
|
|
|
|
|
|
|
|
|
|
|
|
| ||||||||||||||||||||||
For financial statement reporting purposes, the Funds recognize transfers between Levels as of the end of the reporting period.
| ^ | Represents three securities at $0 value as of March 31, 2013. |
| ^^ | Represents two securities at $0 value as of March 31, 2014. |
| ^^^ | Represents four securities at $0 value as of March 31, 2014. |
Investments in Derivative Instruments
Small/Mid Cap Value, Non-US Core Equity and Emerging Markets held rights during the year as a result of corporate actions. Small/Mid Cap Growth, Non-US Core Equity, Core Fixed and Global Low Volatility held warrants during the year as a result of corporate actions.
At March 31, 2014 and during the period then ended, the Funds had the following derivatives and transactions in derivatives, grouped into appropriate risk categories:
Large Cap Value
LIABILITY DERIVATIVES
| Foreign Exchange Risk | Total | |||||||
Forward Foreign Currency Contracts(4) | $ | (23,526 | ) | $ | (23,526 | ) | ||
|
|
|
| |||||
Total Value | $ | (23,526 | ) | $ | (23,526 | ) | ||
|
|
|
| |||||
177
Table of Contents
Mercer Funds
Notes to the Financial Statements (Continued)
March 31, 2014
NET REALIZED GAIN (LOSS)
| Foreign Exchange Risk | Total | |||||||
Forward Foreign Currency Contracts(7) | $ | 224,730 | $ | 224,730 | ||||
|
|
|
| |||||
Total Net Realized Gain (Loss) | $ | 224,730 | $ | 224,730 | ||||
|
|
|
| |||||
CHANGE IN NET UNREALIZED APPRECIATION (DEPRECIATION)
| Foreign Exchange Risk | Total | |||||||
Forward Foreign Currency Contracts(12) | $ | (12,103 | ) | $ | (12,103 | ) | ||
|
|
|
| |||||
Total Change in Net Unrealized Appreciation (Depreciation) | $ | (12,103 | ) | $ | (12,103 | ) | ||
|
|
|
| |||||
NUMBER OF CONTRACTS(16)
| Foreign Exchange Risk | Total | |||||||
Forward Foreign Currency Contracts | (2,286,780 | ) | (2,286,780 | ) | ||||
Small/Mid Cap Growth
ASSET DERIVATIVES
| Equity Risk | Total | |||||||
Warrants(1) | $ | 0 | * | $ | 0 | |||
|
|
|
| |||||
Total Value | $ | 0 | $ | 0 | ||||
|
|
|
| |||||
CHANGE IN NET UNREALIZED APPRECIATION (DEPRECIATION)
| Equity Risk | Total | |||||||
Warrants(11) | $ | 0 | $ | 0 | ||||
|
|
|
| |||||
Total Change in Net Unrealized Appreciation (Depreciation) | $ | 0 | $ | 0 | ||||
|
|
|
| |||||
NUMBER OF CONTRACTS(16)
| Equity Risk | Total | |||||||
Warrants | 27,862 | 27,862 | ||||||
Small/Mid Cap Value
NET REALIZED GAIN (LOSS)
| Equity Risk | Total | |||||||
Rights(6) | $ | 3,906 | $ | 3,906 | ||||
Futures Contracts(8) | 200,287 | 200,287 | ||||||
|
|
|
| |||||
Total Net Realized Gain (Loss) | $ | 204,193 | $ | 204,193 | ||||
|
|
|
| |||||
178
Table of Contents
Mercer Funds
Notes to the Financial Statements (Continued)
March 31, 2014
NUMBER OF CONTRACTS(16)
| Equity Risk | Total | |||||||
Rights | 127 | 127 | ||||||
Futures Contracts | 24 | 24 | ||||||
Non-US Core Equity
ASSET DERIVATIVES
| Foreign Exchange Risk | Equity Risk | Total | ||||||||||
Rights(1) | $ | — | $ | 1,390,284 | $ | 1,390,284 | ||||||
Options Purchased(1) | 337,795 | — | 337,795 | |||||||||
|
|
|
|
|
| |||||||
Total Value | $ | 337,795 | $ | 1,390,284 | $ | 1,728,079 | ||||||
|
|
|
|
|
| |||||||
NET REALIZED GAIN (LOSS)
| Foreign Exchange Risk | Equity Risk | Total | ||||||||||
Rights(6) | $ | — | $ | (18,854 | ) | $ | (18,854 | ) | ||||
Options Purchased(6) | 588,098 | — | 588,098 | |||||||||
|
|
|
|
|
| |||||||
Total Net Realized Gain (Loss) | $ | 588,098 | $ | (18,854 | ) | $ | 569,244 | |||||
|
|
|
|
|
| |||||||
CHANGE IN NET UNREALIZED APPRECIATION (DEPRECIATION)
| Foreign Exchange Risk | Equity Risk | Total | ||||||||||
Rights(11) | $ | — | $ | 373,855 | $ | 373,855 | ||||||
Options Purchased(11) | (629,972 | ) | — | (629,972 | ) | |||||||
|
|
|
|
|
| |||||||
Total Change in Net Unrealized Appreciation (Depreciation) | $ | (629,972 | ) | $ | 373,855 | $ | (256,117 | ) | ||||
|
|
|
|
|
| |||||||
NUMBER OF CONTRACTS, NOTIONAL AMOUNTS OR SHARES/UNITS(16)
| Foreign Exchange Risk | Equity Risk | Total | ||||||||||
Rights | — | 264,077 | 264,077 | |||||||||
Options Purchased | 3,903,353,917 | — | 3,903,353,917 | |||||||||
Core Fixed
ASSET DERIVATIVES
| Interest Rate Risk | Foreign Exchange Risk | Credit Risk | Equity Risk | Total | ||||||||||||||||
Options Purchased(1) | $ | 3,561 | $ | — | $ | — | $ | — | $ | 3,561 | ||||||||||
Forward Foreign Currency Contracts(2) | — | 101,830 | — | — | 101,830 | |||||||||||||||
|
|
|
|
|
|
|
|
|
| |||||||||||
Total Value | $ | 3,561 | $ | 101,830 | $ | — | $ | — | $ | 105,391 | ||||||||||
|
|
|
|
|
|
|
|
|
| |||||||||||
179
Table of Contents
Mercer Funds
Notes to the Financial Statements (Continued)
March 31, 2014
LIABILITY DERIVATIVES
| Interest Rate Risk | Foreign Exchange Risk | Credit Risk | Equity Risk | Total | ||||||||||||||||
Forward Foreign Currency Contracts(4) | $ | — | $ | (162,636 | ) | $ | — | $ | — | $ | (162,636 | ) | ||||||||
Futures Contracts(3) | (132 | ) | — | — | — | (132 | ) | |||||||||||||
Options Written(5) | (20,997 | ) | — | — | — | (20,997 | ) | |||||||||||||
|
|
|
|
|
|
|
|
|
| |||||||||||
Total Value | $ | (21,129 | ) | $ | (162,636 | ) | $ | — | $ | — | $ | (183,765 | ) | |||||||
|
|
|
|
|
|
|
|
|
| |||||||||||
NET REALIZED GAIN (LOSS)
| Interest Rate Risk | Foreign Exchange Risk | Credit Risk | Equity Risk | Total | ||||||||||||||||
Warrants(6) | $ | — | $ | — | $ | — | $ | 45,245 | $ | 45,245 | ||||||||||
Options Purchased(6) | 77,448 | — | — | — | 77,448 | |||||||||||||||
Forward Foreign Currency Contracts(7) | — | (1,150,960 | ) | — | — | (1,150,960 | ) | |||||||||||||
Futures Contracts(8) | 1,641,692 | — | — | — | 1,641,692 | |||||||||||||||
Options Written(9) | 767,028 | 234 | 387,757 | — | 1,155,019 | |||||||||||||||
Swap Contracts(10) | (1,500,883 | ) | — | 176,381 | — | (1,324,502 | ) | |||||||||||||
|
|
|
|
|
|
|
|
|
| |||||||||||
Total Net Realized Gain (Loss) | $ | 985,285 | $ | (1,150,726 | ) | $ | 564,138 | $ | 45,245 | $ | 443,942 | |||||||||
|
|
|
|
|
|
|
|
|
| |||||||||||
CHANGE IN NET UNREALIZED APPRECIATION (DEPRECIATION)
| Interest Rate Risk | Foreign Exchange Risk | Credit Risk | Equity Risk | Total | ||||||||||||||||
Warrants(11) | $ | — | $ | — | $ | — | $ | 55,063 | $ | 55,063 | ||||||||||
Options Purchased(11) | (16,790 | ) | — | — | — | (16,790 | ) | |||||||||||||
Forward Foreign Currency Contracts(12) | — | 229,315 | — | — | 229,315 | |||||||||||||||
Futures Contracts(13) | 604,974 | — | — | — | 604,974 | |||||||||||||||
Options Written(14) | (37,800 | ) | — | — | — | (37,800 | ) | |||||||||||||
Swap Contracts(15) | (506,635 | ) | — | 48,516 | — | (458,119 | ) | |||||||||||||
|
|
|
|
|
|
|
|
|
| |||||||||||
Total Change in Net Unrealized Appreciation (Depreciation) | $ | 43,749 | $ | 229,315 | $ | 48,516 | $ | 55,063 | $ | 376,643 | ||||||||||
|
|
|
|
|
|
|
|
|
| |||||||||||
NUMBER OF CONTRACTS, NOTIONAL AMOUNTS OR SHARES/UNITS(16)
| Interest Rate Risk | Foreign Exchange Risk | Credit Risk | Equity Risk | Total | ||||||||||||||||
Warrants | — | — | — | 12,527 | 12,527 | |||||||||||||||
Options Purchased | 5,209,083 | — | — | — | 5,209,083 | |||||||||||||||
Forward Foreign Currency Contracts | — | (18,413,092 | ) | — | — | (18,413,092 | ) | |||||||||||||
Futures Contracts | 1,285 | — | — | 1,285 | ||||||||||||||||
Options Written | (78,526,667 | ) | (200,000 | ) | (500,000 | ) | — | (79,226,667 | ) | |||||||||||
Swap Contracts | 85,045,455 | — | 27,918,182 | — | 112,963,637 | |||||||||||||||
180
Table of Contents
Mercer Funds
Notes to the Financial Statements (Continued)
March 31, 2014
Opportunistic Fixed
ASSET DERIVATIVES
| Foreign Exchange Risk | Credit Risk | Total | ||||||||||
Forward Foreign Currency Contracts(2) | $ | 1,070,615 | $ | — | $ | 1,070,615 | ||||||
|
|
|
|
|
| |||||||
Total Value | $ | 1,070,615 | $ | — | $ | 1,070,615 | ||||||
|
|
|
|
|
| |||||||
LIABILITY DERIVATIVES
| Foreign Exchange Risk | Credit Risk | Total | ||||||||||
Forward Foreign Currency Contracts(4) | $ | (573,406 | ) | $ | — | $ | (573,406 | ) | ||||
|
|
|
|
|
| |||||||
Total Value | $ | (573,406 | ) | $ | — | $ | (573,406 | ) | ||||
|
|
|
|
|
| |||||||
NET REALIZED GAIN (LOSS)
| Foreign Exchange Risk | Credit Risk | Total | ||||||||||
Forward Foreign Currency Contracts(7) | $ | 149,975 | $ | — | $ | 149,975 | ||||||
Swap Contracts(15) | — | (15,540 | ) | (15,540 | ) | |||||||
|
|
|
|
|
| |||||||
Total Net Realized Gain (Loss) | $ | 149,975 | $ | (15,540 | ) | $ | 134,435 | |||||
|
|
|
|
|
| |||||||
CHANGE IN NET UNREALIZED APPRECIATION (DEPRECIATION)
| Foreign Exchange Risk | Credit Risk | Total | ||||||||||
Forward Foreign Currency Contracts(12) | $ | 497,209 | $ | — | $ | 497,209 | ||||||
|
|
|
|
|
| |||||||
Total Change in Net Unrealized Appreciation (Depreciation) | $ | 497,209 | $ | — | $ | 497,209 | ||||||
|
|
|
|
|
| |||||||
NUMBER OF CONTRACTS, NOTIONAL AMOUNTS OR SHARES/UNITS(16)
| Foreign Exchange Risk | Credit Risk | Total | ||||||||||
Forward Foreign Currency Contracts | 2,597,587 | — | 2,597,587 | |||||||||
Swap Contracts | — | 7,500,000 | 7,500,000 | |||||||||
Emerging Markets
ASSET DERIVATIVES
| Foreign Exchange Risk | Equity Risk | Total | ||||||||||
Forward Foreign Currency Contracts(2) | $ | 3,743,567 | $ | — | $ | 3,743,567 | ||||||
Futures Contracts(3) | — | 1,317,688 | 1,317,688 | |||||||||
|
|
|
|
|
| |||||||
Total Value | $ | 3,743,567 | $ | 1,317,688 | $ | 5,061,255 | ||||||
|
|
|
|
|
| |||||||
181
Table of Contents
Mercer Funds
Notes to the Financial Statements (Continued)
March 31, 2014
LIABILITY DERIVATIVES
| Foreign Exchange Risk | Equity Risk | Total | ||||||||||
Forward Foreign Currency Contracts(4) | $ | (3,231,529 | ) | $ | — | $ | (3,231,529 | ) | ||||
Futures Contracts(3) | — | (333,176 | ) | (333,176 | ) | |||||||
|
|
|
|
|
| |||||||
Total Value | $ | (3,231,529 | ) | $ | (333,176 | ) | $ | (3,564,705 | ) | |||
|
|
|
|
|
| |||||||
NET REALIZED GAIN (LOSS)
| Foreign Exchange Risk | Equity Risk | Total | ||||||||||
Rights(6) | $ | — | $ | 19,891 | $ | 19,891 | ||||||
Forward Foreign Currency Contracts(7) | 6,932,379 | — | 6,932,379 | |||||||||
Futures Contracts(8) | — | (1,815,107 | ) | (1,815,107 | ) | |||||||
|
|
|
|
|
| |||||||
Total Net Realized Gain (Loss) | $ | 6,932,379 | $ | (1,795,216 | ) | $ | 5,137,163 | |||||
|
|
|
|
|
| |||||||
CHANGE IN NET UNREALIZED APPRECIATION (DEPRECIATION)
| Foreign Exchange Risk | Equity Risk | Total | ||||||||||
Forward Foreign Currency Contracts(12) | $ | 743,612 | $ | — | $ | 743,612 | ||||||
Futures Contracts(13) | — | 1,166,154 | 1,166,154 | |||||||||
|
|
|
|
|
| |||||||
Total Change in Net Unrealized Appreciation (Depreciation) | $ | 743,612 | $ | 1,166,154 | $ | 1,909,766 | ||||||
|
|
|
|
|
| |||||||
NUMBER OF CONTRACTS, NOTIONAL AMOUNTS OR SHARES/UNITS(16)
| Foreign Exchange Risk | Equity Risk | Total | ||||||||||
Rights | — | 43,761 | 43,761 | |||||||||
Forward Foreign Currency Contracts | 21,843,094 | — | 21,843,094 | |||||||||
Futures Contracts | — | 17,089 | 17,089 | |||||||||
Global Low Volatility
ASSET DERIVATIVES
| Foreign Exchange Risk | Equity Risk | Total | ||||||||||
Warrants(1) | $ | — | $ | 742,876 | $ | 742,876 | ||||||
Forward Foreign Currency Contracts(2) | 292,786 | — | 292,786 | |||||||||
|
|
|
|
|
| |||||||
Total Value | $ | 292,786 | $ | 742,876 | $ | 1,035,662 | ||||||
|
|
|
|
|
| |||||||
LIABILITY DERIVATIVES
| Foreign Exchange Risk | Equity Risk | Total | ||||||||||
Forward Foreign Currency Contracts(4) | $ | (201,768 | ) | $ | — | $ | (201,768 | ) | ||||
|
|
|
|
|
| |||||||
Total Value | $ | (201,768 | ) | $ | — | $ | (201,768 | ) | ||||
|
|
|
|
|
| |||||||
182
Table of Contents
Mercer Funds
Notes to the Financial Statements (Continued)
March 31, 2014
NET REALIZED GAIN (LOSS)
| Foreign Exchange Risk | Equity Risk | Total | ||||||||||
Rights(6) | $ | — | $ | 2,442 | $ | 2,442 | ||||||
Warrants(6) | — | 45,830 | 45,830 | |||||||||
Forward Foreign Currency Contracts(7) | 963,466 | — | 963,466 | |||||||||
|
|
|
|
|
| |||||||
Total Net Realized Gain (Loss) | $ | 963,466 | $ | 48,272 | $ | 1,011,738 | ||||||
|
|
|
|
|
| |||||||
CHANGE IN NET UNREALIZED APPRECIATION (DEPRECIATION)
| Foreign Exchange Risk | Equity Risk | Total | ||||||||||
Warrants(11) | $ | — | $ | 171,815 | $ | 171,815 | ||||||
Forward Foreign Currency Contracts(12) | (480,837 | ) | — | (480,837 | ) | |||||||
|
|
|
|
|
| |||||||
Total Change in Net Unrealized Appreciation (Depreciation) | $ | (480,837 | ) | $ | 171,815 | $ | (309,022 | ) | ||||
|
|
|
|
|
| |||||||
NUMBER OF CONTRACTS, NOTIONAL AMOUNTS OR SHARES/UNITS(16)
| Foreign Exchange Risk | Equity Risk | Total | ||||||||||
Rights | — | 1,625 | 1,625 | |||||||||
Warrants | — | 36,534 | 36,534 | |||||||||
Forward Foreign Currency Contracts | (19,393,248 | ) | — | (19,393,248 | ) | |||||||
| * | Represents one security at $0 value as of March 31, 2014. |
| (1) | Statements of Assets and Liabilities location: Investments, at value. |
| (2) | Statements of Assets and Liabilities location: Unrealized appreciation on open forward foreign currency contracts. |
| (3) | Cumulative appreciation (depreciation) on futures contracts is disclosed within the Schedule of Investments under the open “Futures Contracts” section. Only current day’s variation margin, if any, are reported within the Statements of Assets and Liabilities. Synthetic Futures are presented as Synthetic futures, at value within the Statements of Assets and Liabilities. |
| (4) | Statements of Assets and Liabilities location: Unrealized depreciation on open forward foreign currency contracts. |
| (5) | Statements of Assets and Liabilities location: Written options, at value. |
| (6) | Statements of Operations location: Amounts are included in Net realized gain (loss) on Investments. |
| (7) | Statements of Operations location: Amounts are included in Net realized gain (loss) on Forward foreign currency contracts and foreign currency related transactions. |
| (8) | Statements of Operations location: Amounts are included in Net realized gain (loss) on Closed futures contracts. |
| (9) | Statements of Operations location: Amounts are included in Net realized gain (loss) on Written option contracts. |
| (10) | Statements of Operations location: Amounts are included in Net realized gain (loss) on Swap contracts. |
| (11) | Statements of Operations location: Amounts are included in Change in net unrealized appreciation (depreciation) on Investments. |
| (12) | Statements of Operations location: Amounts are included in Change in net unrealized appreciation (depreciation) on Forward foreign currency contracts and foreign currency related transactions. |
| (13) | Statements of Operations location: Amounts are included in Change in net unrealized appreciation (depreciation) on Open futures contracts. |
| (14) | Statements of Operations location: Amounts are included in Change in net unrealized appreciation (depreciation) on Written option contracts. |
| (15) | Statements of Operations location: Amounts are included in Change in net unrealized appreciation (depreciation) on Swap contracts. |
| (16) | Amounts disclosed represent average number of contracts, notional amounts, or shares outstanding for the months that the Fund held such derivatives during the year ended March 31, 2014. |
183
Table of Contents
Mercer Funds
Notes to the Financial Statements (Continued)
March 31, 2014
Netting Agreements and Collateral Requirements
In order to better define contractual rights under derivative contracts and to secure rights that will help the Funds mitigate their counterparty risk, a sub-adviser may, on behalf of the Funds, enter into an International Swaps and Derivatives Association, Inc. Master Agreement (“ISDA Master Agreement”) or similar agreement with its derivative contract counterparties. An ISDA Master Agreement is a bilateral agreement between the Funds and a counterparty that governs OTC derivatives and foreign exchange contracts and typically contains, among other things, collateral posting terms and netting provisions in the event of a default and/or termination event. Under an ISDA Master Agreement, the Funds may, under certain circumstances, offset with the counterparty certain derivative financial instrument’s payables and/or receivables with certain collateral held and/or posted and create a net payment. The provisions of the ISDA Master Agreement typically permit a net payment in the event of default including the bankruptcy or insolvency of the counterparty. Absent an event of default by the counterparty or termination of the agreement, the ISDA Master Agreement does not result in an offset of reported amounts of assets and liabilities in the Statement of Assets and Liabilities across the transactions between the Funds and the applicable counterparty. The right to offset and net payments across all transactions traded under the ISDA Master Agreement could result in a reduction of the Funds’ credit risk to such counterparty equal to any amounts payable by the Funds under the applicable transactions, if any. However, bankruptcy or insolvency laws of a particular jurisdiction may impose restrictions on or prohibitions against the right of offset in bankruptcy, insolvency or other events. In addition, certain ISDA Master Agreements allow counterparties to OTC derivatives to terminate derivative contracts prior to maturity in the event a Funds’ net assets decline by a stated percentage or if the Funds fail to meet the terms of its ISDA Master Agreements, which would cause the Funds to accelerate payment of any net liability owed to the counterparty.
For derivatives traded under an ISDA Master Agreement, the collateral requirements are typically calculated by netting the mark to market amount for each transaction under such agreement and comparing that amount to the value of any collateral currently pledged by the Funds and the counterparty.
Cash collateral that has been pledged to cover obligations of the Funds and cash collateral received from the counterparty, if any, is reported separately on the Statement of Assets and Liabilities as cash collateral held at broker or cash collateral due to broker, respectively. Non-cash collateral pledged by the Funds, if any, is noted in the Schedule of Investments. Generally, the amount of collateral due from or to a party has to exceed a minimum transfer amount threshold before a transfer is required, which is determined at the close of business of the Funds and any additional required collateral is delivered to/pledged by the Funds on the next business day. Typically, the Funds and counterparties are not permitted to sell, re-pledge or use the collateral they receive. To the extent amounts due to the Funds from their counterparties are not fully collateralized, contractually or otherwise, the Funds bear the risk of loss from counterparty non-performance. The Funds attempt to mitigate counterparty risk by entering into agreements only with counterparties that it believes have the financial resources to honor their obligations and by monitoring the financial stability of those counterparties.
During the current reporting period, the Funds adopted the new disclosure requirements for offsetting assets and liabilities, pursuant to which an entity is required to disclose both gross and net information for assets and liabilities related to derivatives, repurchase and reverse repurchase agreements, and securities lending and securities borrowings transactions that are eligible for offset or subject to an enforceable master netting or similar agreement. The Funds’ derivative assets and liabilities at fair value by risk are presented in the tables above. For financial reporting purposes the Funds do not offset derivative assets and derivative liabilities that are subject to netting arrangements in the Statements of Assets and Liabilities.
The following tables present the Funds’ derivative assets and liabilities by counterparty, net of amounts available for offset under a Master Netting Agreement (“MNA”) and net of related collateral received by the Funds for assets or pledged by the Funds for liabilities as of March 31, 2014.
184
Table of Contents
Mercer Funds
Notes to the Financial Statements (Continued)
March 31, 2014
Large Cap Value
Offsetting of Financial Liabilities and Derivative Liabilities:
Counterparty | Derivative Liabilities Subject to MNA(a) | Derivative Assets/(Liabilities) available for offset | Collateral Pledged* | Net Amount of Derivative Liabilities(a) | ||||||||||||
Barclays Bank Plc | $ | (23,526 | ) | $ | — | $ | — | $ | (23,526 | ) | ||||||
|
|
|
|
|
|
|
| |||||||||
| $ | (23,526 | ) | $ | — | $ | — | $ | (23,526 | ) | |||||||
|
|
|
|
|
|
|
| |||||||||
| (a) | Represents the net amount payable to the counterparty in the event of default. |
| * | In some instances, the actual collateral received and/or pledged may be more than the derivative asset or liability due to overcollateralization. |
Non-US Core Equity
Offsetting of Financial Assets and Derivative Assets:
Counterparty | Derivative Assets Subject to MNA | Derivative Assets/(Liabilities) available for offset | Collateral Received* | Net Amount of Derivative Assets(a) | ||||||||||||
Deutsche Bank Securities | $ | 154,421 | $ | — | $ | — | $ | 154,421 | ||||||||
UBS AG | 183,374 | — | — | 183,374 | ||||||||||||
|
|
|
|
|
|
|
| |||||||||
| $ | 337,795 | $ | — | $ | — | $ | 337,795 | |||||||||
|
|
|
|
|
|
|
| |||||||||
| (a) | Represents the net amount receivable from the counterparty in the event of default. |
| * | In some instances, the actual collateral received and/or pledged may be more than the derivative asset or liability due to overcollateralization. |
Core Fixed
Offsetting of Financial Assets and Derivative Assets:
Counterparty | Derivative Assets Subject to MNA | Derivative Assets/(Liabilities) available for offset | Collateral Received* | Net Amount of Derivative Assets(a) | ||||||||||||
Citibank N.A. | $ | 11,888 | $ | (729 | ) | $ | — | $ | 11,159 | |||||||
HSBC Bank USA | 3,522 | — | — | 3,522 | ||||||||||||
Royal Bank of Scotland Plc | 71,480 | (23,249 | ) | — | 48,231 | |||||||||||
UBS AG | 14,940 | (14,940 | ) | — | — | |||||||||||
|
|
|
|
|
|
|
| |||||||||
| $ | 101,830 | $ | (38,918 | ) | $ | — | $ | 62,912 | ||||||||
|
|
|
|
|
|
|
| |||||||||
Offsetting of Financial Liabilities and Derivative Liabilities:
Counterparty | Derivative Liabilities Subject to MNA | Derivative Assets/(Liabilities) available for offset | Collateral Pledged* | Net Amount of Derivative Liabilities(b) | ||||||||||||
Bank of America N.A. | $ | (32,715 | ) | $ | — | $ | — | $ | (32,715 | ) | ||||||
Citibank N.A. | (729 | ) | 729 | — | — | |||||||||||
Royal Bank of Scotland Plc | (23,249 | ) | 23,249 | — | — | |||||||||||
UBS AG | (105,943 | ) | 14,940 | — | (91,003 | ) | ||||||||||
|
|
|
|
|
|
|
| |||||||||
| $ | (162,636 | ) | $ | 38,918 | $ | — | $ | (123,718 | ) | |||||||
|
|
|
|
|
|
|
| |||||||||
| (a) | Represents the net amount receivable from the counterparty in the event of default. |
| (b) | Represents the net amount payable to the counterparty in the event of default. |
| * | In some instances, the actual collateral received and/or pledged may be more than the derivative asset or liability due to overcollateralization. |
185
Table of Contents
Mercer Funds
Notes to the Financial Statements (Continued)
March 31, 2014
Opportunistic Fixed
Offsetting of Financial Assets and Derivative Assets:
Counterparty | Derivative Assets Subject to MNA | Derivative Assets/(Liabilities) available for offset | Collateral Received* | Net Amount of Derivative Assets(a) | ||||||||||||
Citibank N.A. | $ | 441,855 | $ | (272,914 | ) | $ | — | $ | 168,941 | |||||||
Deutsche Bank AG | 20,981 | (20,981 | ) | — | — | |||||||||||
Goldman Sachs | 602,899 | (265,076 | ) | — | 337,823 | |||||||||||
JPMorgan Chase Bank | 4,880 | — | — | 4,880 | ||||||||||||
|
|
|
|
|
|
|
| |||||||||
| $ | 1,070,615 | $ | (558,971 | ) | $ | — | $ | 511,644 | ||||||||
|
|
|
|
|
|
|
| |||||||||
Offsetting of Financial Liabilities and Derivative Liabilities:
Counterparty | Derivative Liabilities Subject to MNA | Derivative Assets/(Liabilities) available for offset | Collateral Pledged* | Net Amount of Derivative Liabilities(b) | ||||||||||||
Citibank N.A. | $ | (272,914 | ) | $ | 272,914 | $ | — | $ | — | |||||||
Deutsche Bank AG | (35,416 | ) | 20,981 | — | (14,435 | ) | ||||||||||
Goldman Sachs | (265,076 | ) | 265,076 | — | — | |||||||||||
|
|
|
|
|
|
|
| |||||||||
| $ | (573,406 | ) | $ | 558,971 | $ | — | $ | (14,435 | ) | |||||||
|
|
|
|
|
|
|
| |||||||||
| (a) | Represents the net amount receivable from the counterparty in the event of default. |
| (b) | Represents the net amount payable to the counterparty in the event of default. |
| * | In some instances, the actual collateral received and/or pledged may be more than the derivative asset or liability due to overcollateralization. |
Emerging Markets
Offsetting of Financial Assets and Derivative Assets:
Counterparty | Derivative Assets Subject to MNA | Derivative Assets/(Liabilities) available for offset | Collateral Received* | Net Amount of Derivative Assets(a) | ||||||||||||
Goldman Sachs | $ | 778,913 | $ | — | $ | — | $ | 778,913 | ||||||||
Royal Bank of Scotland Plc | 3,743,567 | (3,231,529 | ) | — | 512,038 | |||||||||||
|
|
|
|
|
|
|
| |||||||||
| $ | 4,522,480 | $ | (3,231,529 | ) | $ | — | $ | 1,290,951 | ||||||||
|
|
|
|
|
|
|
| |||||||||
Offsetting of Financial Liabilities and Derivative Liabilities:
Counterparty | Derivative Liabilities Subject to MNA | Derivative Assets/(Liabilities) available for offset | Collateral Pledged* | Net Amount of Derivative Liabilities(b) | ||||||||||||
Royal Bank of Scotland Plc | $ | (3,231,529 | ) | $ | 3,231,529 | $ | — | $ | — | |||||||
|
|
|
|
|
|
|
| |||||||||
| $ | (3,231,529 | ) | $ | 3,231,529 | $ | — | $ | — | ||||||||
|
|
|
|
|
|
|
| |||||||||
| (a) | Represents the net amount receivable from the counterparty in the event of default. |
| (b) | Represents the net amount payable to the counterparty in the event of default. |
| * | In some instances, the actual collateral received and/or pledged may be more than the derivative asset or liability due to overcollateralization. |
186
Table of Contents
Mercer Funds
Notes to the Financial Statements (Continued)
March 31, 2014
Global Low Volatility
Offsetting of Financial Assets and Derivative Assets:
Counterparty | Derivative Assets Subject to MNA | Derivative Assets/(Liabilities) available for offset | Collateral Received* | Net Amount of Derivative Assets(a) | ||||||||||||
Bank of New York Mellon | $ | 191,122 | $ | (113,726 | ) | $ | — | $ | 77,396 | |||||||
Goldman Sachs | 44,989 | — | — | 44,989 | ||||||||||||
HSBC Bank USA | 10,528 | (2,971 | ) | — | 7,557 | |||||||||||
UBS AG | 46,147 | (24,138 | ) | — | 22,009 | |||||||||||
|
|
|
|
|
|
|
| |||||||||
| $ | 292,786 | $ | (140,835 | ) | $ | — | $ | 151,951 | ||||||||
|
|
|
|
|
|
|
| |||||||||
Offsetting of Financial Liabilities and Derivative Liabilities:
Counterparty | Derivative Liabilities Subject to MNA | Derivative Assets/(Liabilities) available for offset | Collateral Pledged* | Net Amount of Derivative Liabilities(b) | ||||||||||||
Bank of New York Mellon | $ | (113,726 | ) | $ | 113,726 | $ | — | $ | — | |||||||
HSBC Bank USA | (2,971 | ) | 2,971 | — | — | |||||||||||
JPMorgan Chase Bank | (60,933 | ) | — | — | (60,933 | ) | ||||||||||
UBS AG | (24,138 | ) | 24,138 | — | — | |||||||||||
|
|
|
|
|
|
|
| |||||||||
| $ | (201,768 | ) | $ | 140,835 | $ | — | $ | (60,933 | ) | |||||||
|
|
|
|
|
|
|
| |||||||||
| (a) | Represents the net amount receivable from the counterparty in the event of default. |
| (b) | Represents the net amount payable to the counterparty in the event of default. |
| * | In some instances, the actual collateral received and/or pledged may be more than the derivative asset or liability due to overcollateralization. |
(b) Security transactions and related investment income
Security transactions are accounted for on trade date. Dividend income, net of applicable withholding taxes, is recorded on the ex-dividend date or when the Fund is informed of the ex-dividend date, if later. Interest income is recorded on the accrual basis, and is adjusted for amortization of premium and discounts for debt securities. Income is not recognized, nor are premium and discount amortized, on securities for which collection is not expected. Withholding taxes on foreign dividend, interest, and capital gains have been provided for in accordance with the respective country’s tax rules and rates. Non-cash dividends, if any, are recorded at the fair value of the securities received. Interest income on inflation indexed securities is accrued daily based upon an inflation-adjusted principal. Additionally, any increase in the principal or face amount of these securities is recorded as interest income. In determining the net gain or loss on securities sold, the cost of securities is determined on the identified-cost basis.
(c) Cash and short term investments
A Fund may invest a portion of its assets in short-term debt securities (including repurchase agreements and reverse repurchase agreements) of corporations, the U.S. government and its agencies and instrumentalities and banks and finance companies, which may be denominated in any currency.
A Fund may invest a portion of its assets in shares issued by money market mutual funds. A Fund also may invest in collective investment vehicles that are managed by an unaffiliated investment manager, pending investment of the Fund’s assets in portfolio securities. When unusual market conditions warrant, a Fund may make substantial temporary defensive investments in cash equivalents, up to a maximum of 100% of the Fund’s net assets. Cash equivalent holdings may be in any currency. When a Fund invests for temporary defensive purposes, such investments may affect the Fund’s ability to achieve its investment objective.
187
Table of Contents
Mercer Funds
Notes to the Financial Statements (Continued)
March 31, 2014
(d) Securities lending
A Fund may lend its portfolio securities to qualified broker-dealers and financial institutions pursuant to agreements, provided: (1) the loan is secured continuously by collateral marked-to-market daily and maintained in an amount at least equal to the current fair value of the securities loaned; (2) the Fund may call the loan at any time and receive the securities loaned; (3) the Fund will receive any interest or dividends paid on the loaned securities; and (4) the aggregate fair value of securities loaned will not at any time exceed 33 1/3% of the total assets of the Fund. Collateral will consist of U.S. and non-U.S. securities, cash equivalents or irrevocable letters of credit. A liability for cash collateral is reflected in the Statements of Assets and Liabilities, and is categorized as Level 2 within the fair value hierarchy. As with other extensions of credit, there are risks of delay in recovery or even loss of rights in collateral in the event of default or insolvency of a borrower of a Fund’s portfolio securities. A Fund may not retain voting rights on securities while they are on loan.
The Funds participate in a securities lending program under which the Funds’ custodian, State Street Bank and Trust Company (the “Custodian”), is authorized to lend Fund portfolio securities to qualified broker-dealers and financial institutions that post appropriate collateral. The Custodian has agreed to indemnify the Funds in case of default of any security borrower. Securities on Loan are fully collateralized and the collateral exceeded the securities on loan at March 31, 2014. Currently, the cash collateral is invested in the State Street Navigator Securities Lending Prime Portfolio. The Custodian receives a portion of the interest earned on any reinvested collateral. The market value of securities on loan to borrowers and the value of collateral held by the Funds with respect to such loans at March 31, 2014 were as follows:
| Market Value of Loaned Securities | Value of Cash Collateral | Value of Non-Cash Collateral | ||||||||||
Large Cap Value | $ | 5,860,639 | $ | 5,975,569 | $ | — | ||||||
Small/Mid Cap Growth | 34,777,618 | 35,237,041 | — | |||||||||
Small/Mid Cap Value | 25,811,115 | 25,511,034 | 573,651 | |||||||||
Non-US Core Equity | 69,765,454 | 72,792,139 | 789,112 | |||||||||
Core Fixed | 2,577,457 | 2,627,065 | — | |||||||||
Emerging Markets | 35,138,798 | 36,536,471 | 564,770 | |||||||||
Global Low Volatility | 33,543,500 | 33,949,069 | 890,722 | |||||||||
(e) Repurchase agreements
A Fund may enter into a repurchase agreement under the terms of a Master Repurchase Agreement (“MRA”) where the Fund purchases securities from a bank or broker-dealer who simultaneously agrees to repurchase the securities at a mutually agreed upon time and price, thereby determining the yield during the term of the agreement. As a result, a repurchase agreement provides a fixed rate of return insulated from market fluctuations during the term of the agreement. The term of a repurchase agreement generally is short, possibly overnight or for a few days, although it may extend over a number of months (up to one year) from the date of delivery. Repurchase agreements are considered under the 1940 Act to be collateralized loans by a Fund to a seller secured by the securities transferred to the Fund. Repurchase agreements are fully collateralized and the collateral is marked-to-market daily. A Fund may not enter into a repurchase agreement having more than seven days remaining to maturity if, as a result, such agreement, together with any other illiquid securities held by the Fund, would exceed 15% of the value of the net assets of the Fund. As of March 31, 2014, none of the Funds held open repurchase agreements.
(f) Swaps
A Fund may engage in swaps, including, but not limited to, interest rate, currency, credit default, and index swaps, and the purchase or sale of related caps, floors, collars, and other derivative instruments. A Fund expects to enter into these transactions to preserve a return or spread on a particular investment or portion of the portfolio, to modify the portfolio’s duration, to protect against any increase in the price of securities the Fund anticipates purchasing at a later date, or to gain exposure to certain markets in the most economical way possible.
188
Table of Contents
Mercer Funds
Notes to the Financial Statements (Continued)
March 31, 2014
Interest rate swaps involve the exchange by a Fund with another party of their respective commitments to receive or pay interest (e.g., an exchange of fixed rate payments for floating rate payments) with respect to a notional amount of principal. Currency swaps involve the exchange of cash flows on a notional amount based on changes in the values of referenced currencies. Currency swaps usually involve the delivery of the entire principal value of one designated currency in exchange for the other designated currency. Therefore, the entire principal value of a currency swap is subject to the risk that the other party to the swap will default on its contractual delivery obligations. If there is default by the counterparty, the Fund may have contractual remedies pursuant to the agreements related to the transaction.
The credit default swap agreements may have as reference obligations one or more securities that are not currently held by a Fund. The protection “buyer” in a credit default swap agreement is generally obligated to pay the protection “seller” an upfront or a periodic stream of payments over the term of the contract provided that no credit event, such as a default, on a reference obligation has occurred. If a credit event occurs, the seller generally must pay the buyer the “par value” (full notional value) of the swap in exchange for an equal face amount of deliverable obligations of the reference entity described in the swap, or the seller may be required to deliver the related net cash amount, if the swap is cash settled. A Fund may be either the buyer or seller in the transaction. If a Fund is a buyer and no credit event occurs, the Fund may recover nothing if the swap is held through its termination date. However, if a credit event occurs, the buyer generally may elect to receive the full notional value of the swap in exchange for an equal face amount of deliverable obligations of the reference entity whose value may have significantly decreased. As a seller, a Fund generally receives an upfront payment or a fixed rate of income throughout the term of the swap provided that there is no credit event. As the seller, a Fund would effectively add leverage to its portfolio because, in addition to its total net assets, a Fund would be subject to investment exposure on the notional amount of the swap.
The spread of a credit default swap is the annual amount the protection buyer must pay the protection seller over the length of the contract, expressed as a percentage of the notional amount. When spreads rise, market perceived credit risk rises and when spreads fall, market perceived credit risk falls. Wider credit spreads and decreasing market values, when compared to the notional amount of the swap, represent a deterioration of the referenced entity’s credit worthiness and an increased market perception that there is a greater likelihood of risk of default or other credit event occurring as defined under the terms of the agreement. For credit default swap agreements on asset-backed securities and credit indices, the quoted market prices and resulting values, as well as the annual payment rates, serve as an indication of the current status of the payment/performance risk.
Credit default swap agreements involve greater risks than if a Fund had invested in the reference obligation directly since, in addition to general market risks, credit default swaps are subject to illiquidity risk, counterparty risk and credit risk. A Fund will enter into credit default swap agreements only with counterparties that meet certain standards of creditworthiness. A buyer generally also will lose its investment and recover nothing should no credit event occur and the swap is held to its termination date. If a credit event were to occur, the value of any deliverable obligation received by the seller, coupled with the upfront or periodic payments previously received, may be less than the full notional value it pays to the buyer, resulting in a loss of value to the seller. A Fund’s obligations under a credit default swap agreement will be accrued daily (offset against any amounts owing to the Fund). In connection with credit default swaps in which a Fund is the buyer, the Fund will segregate or “earmark” cash or assets determined to be liquid by the Advisor and/or the Subadvisor in accordance with procedures established by the Board of Trustees, or enter into certain offsetting positions, with a value at least equal to the Fund’s exposure (any accrued but unpaid net amounts owed by the Fund to any counterparty), on a marked-to-market basis. In connection with credit default swaps in which a Fund is the seller, the Fund will segregate or “earmark” cash or assets determined to be liquid by the Advisor and/or Subadvisor in accordance with procedures established by the Board of Trustees, or enter into offsetting positions, with a value at least equal to the full notional amount of the swap (minus any amounts owed to the Fund). Such segregation or “earmarking” will ensure that a Fund has assets available to satisfy its obligations with respect to the transaction and will limit any potential leveraging of the Fund’s portfolio. Such segregation or “earmarking” will not limit the Fund’s exposure to loss.
The purchase of a cap entitles the purchaser to receive payments on a notional principal amount from the party selling the cap to the extent that a specified index exceeds a predetermined interest rate or amount. The purchase of
189
Table of Contents
Mercer Funds
Notes to the Financial Statements (Continued)
March 31, 2014
an interest rate floor entitles the purchaser to receive payments on a notional principal amount from the party selling the floor to the extent that a specified index falls below a predetermined interest rate or amount. A collar is a combination of a cap and a floor that preserves a certain return with a predetermined range of interest rates or values.
Swaps do not involve the delivery of securities or other underlying assets or principal, and are subject to counterparty risk. If the other party to a swap defaults and fails to consummate the transaction, a Fund’s risk of loss consists of the net amount of interest payments that the Fund is contractually entitled to receive.
Whether a Fund’s use of swap agreements or swap options will be successful in achieving the Fund’s investment objective will depend on the Subadvisor’s ability to predict correctly whether certain types of investments are likely to produce greater returns than other investments. Moreover, a Fund bears the risk of loss of the amount expected to be received under a swap agreement in the event of the default or bankruptcy of a swap agreement counterparty. The Funds will enter into swap agreements only with counterparties that meet certain standards of creditworthiness.
If there is a default by the counterparty to a swap contract, a Fund will be limited to contractual remedies pursuant to the agreements related to the transaction. There is no assurance that a swap contract counterparty will be able to meet its obligations pursuant to a swap contract or that, in the event of a default, a Fund will succeed in pursuing contractual remedies. A Fund thus assumes the risk that it may be delayed in, or prevented from, obtaining payments owed to it pursuant to a swap contract. However, the amount at risk is only the net unrealized gain, if any, on the swap at the time of default, and not the entire notional amount of the swap contract now that the potential loss can be mitigated by the posting of collateral and offsetting provisions of the ISDA. The Subadvisor that enters into the swap agreement will closely monitor, subject to the oversight of the Board, the creditworthiness of swap counterparties in order to minimize the risk of counterparty default on swaps.
Because swaps are two party contracts that may be subject to contractual restrictions on transferability and termination, and they may have terms of greater than seven days, swap agreements may be considered to be illiquid and subject to a Fund’s limitation on investments in illiquid securities. However, the Trust has adopted procedures pursuant to which the Advisor may determine that swaps (including swap options) are liquid under certain circumstances. To the extent that a swap is not liquid, it may not be possible to initiate a transaction or liquidate a position at an advantageous time or price, which may result in significant losses.
Certain restrictions imposed on the Funds’ ability to qualify as regulated investment companies under Subchapter M of the Internal Revenue Code of 1986, as amended (the “Code”), may limit the Funds’ ability to use swap agreements. The swaps market is largely unregulated. It is possible that developments in the swaps market, including potential government regulation, could adversely affect a Fund’s ability to terminate existing swap agreements or to realize amounts to be received under such agreements.
Certain clearinghouses currently offer clearing for limited types of derivatives transactions, principally credit and interest derivatives. In a cleared derivative transaction, a Fund typically enters into the transaction with a financial institution counterparty, and performance of the transaction is effectively guaranteed by a central clearinghouse, thereby reducing or eliminating the Fund’s exposure to the credit risk of the original counterparty. The Fund typically will be required to post specified levels of margin with the clearinghouse or at the instruction of the clearinghouse; the margin required by a clearinghouse may be greater than the margin the Fund would be required to post in an uncleared derivative transaction. Daily changes in valuation of centrally cleared swaps, if any, are recorded as a receivable or payable for the change in value as appropriate on the Statements of Assets and Liabilities. Only a limited number of derivative transactions are currently eligible for clearing by clearinghouses.
A Fund will accrue for interim payments on swap contracts on a daily basis, with the net amount recorded as interest payable or receivable on swap contracts on the Statements of Assets and Liabilities. Once interim payments are settled in cash, the net amount is recorded as realized gain/loss on swap contracts, in addition to realized gain/loss recorded upon the termination of swap contracts on the Statements of Operations. Fluctuations in the value of swap contracts are recorded for financial statement purposes as unrealized appreciation or depreciation of swap contracts (swap contracts, at value on the Statements of Assets and Liabilities).
190
Table of Contents
Mercer Funds
Notes to the Financial Statements (Continued)
March 31, 2014
Swap agreements are marked to market daily. The change in value, if any, is recorded as unrealized gain or loss in the Statements of Operations. A liquidation payment received or made at the termination of the swap is recorded as realized gain or loss in the Statements of Operations. Net periodic payments are included as part of realized gain (loss) on the Statements of Operations.
The swaps in which the Fund may engage may include instruments under which one party pays a single or periodic fixed amount(s) (or premium), and the other party pays periodic amounts based on the movement of a specified index. The Fund’s maximum risk of loss from counterparty credit risk, as opposed to investment and other types of risk, in respect of swaps is typically the discounted net value of the cash flows to be received from the counterparty over the contract’s remaining life to the extent that such amount is positive, plus the cost of entering into a similar transaction with another counterparty, if possible.
The use of swaps is a highly specialized activity that involves investment techniques and risks different from those associated with ordinary portfolio securities transactions. If the Advisor or Subadvisor is incorrect in its forecasts of market values, interest rates, and currency exchange rates, the investment performance of the Fund would be less favorable than it would have been if this investment technique were not used.
Like most other investments, swap agreements are subject to the risk that the market value of the instrument will change in a way detrimental to a Fund’s interest. A Fund bears the risk that Subadvisor will not accurately forecast future market trends or the values of assets, reference rates, indexes, or other economic factors in establishing swap positions for the Fund. If a Subadvisor attempts to use a swap as a hedge against, or as a substitute for, a portfolio investment, the Fund will be exposed to the risk that the swap will have or will develop imperfect or no correlation with the portfolio investment. This could cause substantial losses for the Fund. While hedging strategies involving swap instruments can reduce the risk of loss, they can also reduce the opportunity for gain or even result in losses by offsetting favorable price movements in other Fund investments.
During the year ended March 31, 2014, Core Fixed used swap agreements to adjust interest rate and yield curve exposure or to manage credit exposure. Opportunistic Fixed used swap agreements to manage country and currency exposure as a substitute for holding securities directly and to facilitate the implementation of its investment strategy. As of March 31, 2014, none of the Funds held open swap agreements.
(g) Futures
A futures contract is a contractual agreement to buy or sell a specific amount of a commodity or financial instrument at a predetermined price on a stipulated future date. A Fund may enter into contracts for the purchase or sale for future delivery of securities, indices and foreign currencies. Futures contracts may be opened to protect against the adverse effects of fluctuations in security prices, interest rates, or foreign exchange rates without actually buying or selling the securities or foreign currency. A Fund also may enter into futures contracts as a low cost method for gaining or reducing exposure to a particular currency or securities market without directly investing in those currencies or securities.
A purchase of a futures contract means the acquisition of a contractual right of a Fund to obtain delivery of the securities or foreign currency underlying the contract at a specified price on a specified future date. When a futures contract is sold, a Fund incurs a contractual obligation to deliver the securities or foreign currency underlying the contract at a specified price on a specified date.
When a Fund enters into a futures contract, it must deliver to the futures commission merchant selected by the Fund an amount referred to as “initial margin.” This amount is maintained by the futures commission merchant in a segregated account at the custodian bank. Futures contracts are marked-to-market daily, depending upon changes in the price of the underlying securities subject to the futures contracts, and the change in value is recorded by the Fund as a variation margin payable or receivable. The Fund recognizes gains and losses on futures contracts in addition to the variation margin, which gains and losses are considered realized at the time the contracts expire or close.
191
Table of Contents
Mercer Funds
Notes to the Financial Statements (Continued)
March 31, 2014
A Fund may enter into futures transactions on domestic exchanges and, to the extent such transactions have been approved by the Commodity Futures Trading Commission (“CFTC”) for sale to customers in the United States, or on foreign exchanges. In addition, a Fund may sell stock index futures in anticipation of, or during a market decline to attempt to offset the decrease in the market value of the Fund’s common stocks that might otherwise result, and a Fund may purchase such contracts in order to offset increases in the cost of common stocks that it intends to purchase. Unlike other futures contracts, a stock index futures contract specifies that no delivery of the actual stocks making up the index will take place. Instead, settlement in cash must occur upon the termination of the contract.
While futures contracts provide for the delivery of securities, deliveries usually do not occur. Contracts are generally terminated by entering into offsetting transactions.
Where the futures market is not as developed or where the regulations prevent or make it disadvantageous to trade futures, the Emerging Markets Fund will utilize synthetic futures as part of the country selection strategy implementation. A synthetic future operates like a swap transaction and uses equity index swaps on equity index futures. These are marked to market daily and the change in value is recorded as unrealized gain or loss in the Statement of Operations.
During the year ended March 31, 2014, Small/Mid Cap Value used futures to equitize cash. Core Fixed used futures to adjust interest rate exposure and replicate government bond positions. Emerging Markets used futures to create passive index exposure to certain domestic emerging market country indices in the Fund. See the Core Fixed and Emerging Markets Schedules of Investments for a listing of open futures contracts as of March 31, 2014.
(h) Options
The Funds may purchase and sell (write) put and call options on debt securities and indices to enhance investment performance, manage duration, or protect against changes in market prices. The Funds may also buy and sell combinations of put and call options on the same underlying security, currency or index. Short (sold) options positions will generally be hedged by the Funds with cash, cash equivalents, current portfolio security holdings, or other options or futures positions.
The Funds may enter into swap options (“swaptions”). A swaption is a contract that gives a counterparty the right (but not the obligation), in return for payment of a premium, to enter into a new swap agreement or to shorten, extend, cancel, or otherwise modify an existing swap agreement, at some designated future time on specified terms. Each Fund may write (sell) and purchase put and call swaptions. Depending on the terms of the particular option agreement, a Fund generally will incur a greater degree of risk when the Fund writes a swaption than the Fund will incur when it purchases a swaption. When a Fund purchases a swaption, the Fund’s risk of loss is limited to the amount of the premium it has paid should it decide to let the swaption expire unexercised. However, when a Fund writes a swaption, upon exercise of the option, the Fund will become obligated according to the terms of the underlying agreement.
When the Fund writes a covered call or a put option, an amount equal to the premium received by the Fund is included in the Fund’s Statement of Assets and Liabilities as an asset and as an equivalent liability. The amount of the liability is subsequently marked-to-market to reflect the current market value of the option written. The Fund receives a premium on the sale of a call option but gives up the opportunity to profit from any increase in stock value above the exercise price of the option, and when the Fund writes a put option, it is exposed to a decline in the price of the underlying security.
Whether an option which the Fund has written expires on its stipulated expiration date or the Fund enters into a closing purchase transaction, the Fund realizes a gain (or loss, if the cost of a closing purchase transaction exceeds the premium received when the option was sold) without regard to any unrealized gain or loss on the underlying security, and the liability related to such option is extinguished. If a call option which the Fund has written is exercised, the Fund realizes a capital gain or loss from the sale of the underlying security, and the cost basis of the lots sold are decreased by the premium originally received. When a put option which a Fund has written is exercised, the amount of the premium originally received will reduce the cost of the security which a Fund purchases upon exercise of the option. Realized gains (losses) on purchased options are included in net realized gain (loss) from investments.
192
Table of Contents
Mercer Funds
Notes to the Financial Statements (Continued)
March 31, 2014
The Funds’ use of written options involves, to varying degrees, elements of market risk in excess of the amount recognized in the Statements of Assets and Liabilities. The face or contract amounts of these instruments reflect the extent of the Fund’s exposure to market risk. The risks may be caused by an imperfect correlation between movements in the price of the instrument and the price of the underlying securities and interest rates.
During the year ended March 31, 2014, Non-US Core Equity used options to adjust exposure to foreign currency and to efficiently maintain liquidity. Core Fixed used options to manage interest rate and volatility exposure.
See the Non-US Core Equity and Core Fixed Schedules of Investments for a listing of options contracts as of March 31, 2014.
Transactions in written option contracts for Core Fixed for the year ended March 31, 2014, is as follows:
| Number of Contracts/ Notional Amount | Premiums Received | |||||||
Options outstanding at March 31, 2013 | 35,400,095 | $ | 309,231 | |||||
Options written | 239,702,387 | 1,871,530 | ||||||
Options terminated in closing purchase transactions | (117,801,593 | ) | (1,253,423 | ) | ||||
Options exercised | (25,000,000 | ) | (82,900 | ) | ||||
Options expired | (132,300,714 | ) | (821,159 | ) | ||||
|
|
|
| |||||
Options outstanding at March 31, 2014 | 175 | $ | 23,279 | |||||
(i) Forward foreign currency contracts
The Funds may purchase or sell currencies and/or engage in forward foreign currency transactions in order to expedite settlement of portfolio transactions and to manage currency risk.
Forward foreign currency contracts are traded in the inter-bank market conducted directly between currency traders (usually large commercial banks) and their customers. A forward contract generally has no deposit requirement and no commissions are charged at any stage for trades. The Funds will account for forward contracts by marking-to-market each day at current forward contract values. The change in market value is recorded by the Fund as an unrealized gain or loss. When the contract is closed, the Fund recognizes a realized gain or loss equal to the difference between the value of the contract at the time the contract was opened and the value at the time the contract was closed.
The Funds will only enter into forward contracts to sell, for a fixed amount of U.S. dollars or other appropriate currency, an amount of foreign currency, to the extent that the value of the short forward contract is covered by the underlying value of securities denominated in the currency being sold. Alternatively, when a Fund enters into a forward contract to sell an amount of foreign currency, the Custodian or the Fund’s sub-custodian will segregate assets in a segregated account of the Fund in an amount not less than the value of the Fund’s total assets committed to the consummation of such forward contract. If the additional segregated assets placed in the segregated account decline, additional cash or securities will be placed in the account on a daily basis so that the value of the account will equal the amount of the Fund’s commitments with respect to such contract.
During the year ended March 31, 2014, Large Cap Value used forward foreign currency contracts to partially hedge Japanese Yen exposure on the currency risk embedded in one ADR position. Core Fixed used forward foreign currency contracts to hedge, cross-hedge or to actively manage non-US Dollar exposures in the Fund. Opportunistic Fixed used forward foreign currency contracts for a variety of purposes, including hedging, risk management, efficient portfolio management, enhancing total returns, or as a substitute for taking a position in the underlying asset. Emerging Markets and Global Low Volatility used forward foreign currency contracts to hedge, cross hedge or to actively manage the currency exposures in the Funds. See the Large Cap Value, Core Fixed, Opportunistic Fixed, Emerging Markets and Global Low Volatility Schedules of Investments for a listing of open forward foreign currency contracts as of March 31, 2014.
193
Table of Contents
Mercer Funds
Notes to the Financial Statements (Continued)
March 31, 2014
(j) Foreign currency translation
The books and records of each Fund are maintained in US dollars. Foreign currencies, investments and other assets and liabilities denominated in foreign currencies are translated into US dollars at the foreign exchange rates prevailing at the end of the period. Purchases and sales of investment securities, income and expenses are translated at exchange rates prevailing on the respective dates of such transactions. Unrealized gains and losses that result from changes in foreign currency exchange rates have been included in the unrealized gains (losses) on foreign currency translations within each Fund’s Statement of Operations. Net realized foreign currency gains and losses resulting from changes in exchange rates include foreign currency gains and losses between trade date and settlement date on investment securities transactions, foreign currency transactions and the difference between the amounts of interest and dividends recorded on the books of the Fund and the amount actually received. The portion of foreign currency gains and losses related to fluctuations in exchange rates between the purchase settlement date and subsequent sale trade date is included in realized gains and losses on investment transactions.
(k) When-issued securities/TBA securities
Purchasing securities on a “when-issued” basis is a commitment by a Fund to buy a security before the security is actually issued. A Fund may purchase securities offered on a “when-issued” or “forward delivery” basis such as “to-be-announced” (“TBA”) securities. When so offered, the price, which is generally expressed in yield terms, is fixed at the time the commitment to purchase is made, but delivery and payment for the when-issued or forward delivery securities take place at a later date. During the period between purchase and settlement, no payment is made by the purchaser to the issuer and no interest on the when-issued or forward delivery security accrues to the purchaser. While when-issued or forward delivery securities may be sold prior to the settlement date, it is intended that a Fund will purchase such securities with the purpose of actually acquiring the securities unless a sale appears desirable for investment reasons. At the time a Fund makes the commitment to purchase a security on a when-issued or forward delivery basis, the Fund will record the transaction and reflect the value of the security in determining the Fund’s NAV. The market value of when-issued or forward delivery securities may be more or less than the purchase price. Certain risks may arise upon entering into when-issued or forward delivery securities transactions, including the potential inability of counterparties to meet the terms of their contracts, and the issuer’s failure to issue the securities due to political, economic, or other factors. Additionally, losses may arise due to declines in the value of the securities prior to settlement date. As of March 31, 2014, none of the Funds held TBA sale commitments.
(l) Real estate investment trusts
The Funds may invest in real estate investment trusts (“REITs”), which pool investors’ funds for investment, primarily in income producing real estate or real estate-related loans or interests. A REIT is not taxed on income distributed to its shareholders or unitholders if it complies with regulatory requirements relating to its organization, ownership, assets and income, and with a regulatory requirement to distribute to its shareholders or unitholders at least 90% of its taxable income for each taxable year.
A shareholder in a Fund, by investing in REITs through the Fund, will bear not only the shareholder’s proportionate share of the expenses of the Fund, but also, indirectly, the management expenses of the underlying REITs. REITs depend generally on their ability to generate cash flow to make distributions to shareholders or unitholders, and may be subject to defaults by borrowers and to self-liquidations. In addition, the performance of a REIT may be affected by its failure to qualify for tax-free pass-through of income, or the REIT’s failure to maintain exemption from registration under the 1940 Act. Dividends representing a return of capital are reflected as a reduction of cost and/or as a realized gain when the amount of the return of capital is conclusively determined. See each Fund’s Schedule of Investments for REIT securities held as of March 31, 2014.
(m) Mortgage-related and other asset-backed securities
The Funds may invest in mortgage-backed and asset-backed securities. Mortgage-backed securities represent an interest in a pool of mortgages. Asset-backed securities are structured like mortgage-backed securities, but instead of mortgage loans or interests in mortgage loans, the underlying assets may include such items as motor vehicle installment sales or installment loan contracts, leases of various types of real and personal property, and receivables
194
Table of Contents
Mercer Funds
Notes to the Financial Statements (Continued)
March 31, 2014
from credit card agreements. The value of some mortgage or asset-backed securities may be particularly sensitive to changes in prevailing interest rates. Early repayment of principal on some mortgage-related securities may expose the Fund to a lower rate of return upon reinvestment of principal. The value of these securities may fluctuate in response to the market’s perception of the creditworthiness of the issuers. Additionally, although mortgages and mortgage-related securities are generally supported by some form of government or private guarantee and/or insurance, there is no assurance that private guarantors or insurers will meet their obligations.
One type of stripped mortgage-backed security has one class receiving all of the interest from the mortgage assets (the interest-only, or “IO” class), while the other class will receive all of the principal (the principal-only, or “PO” class). Payments received for the IOs are included in interest income on the Statements of Operations. Because principal will not be received at the maturity of an IO, adjustments are made to the cost basis of the security on a daily basis until maturity. These adjustments are included in interest income on the Statements of Operations. Payments received for POs are treated as reductions to the cost and par value of the securities. See the Schedules of Investments for mortgage-backed and asset-backed securities held by Core Fixed as of March 31, 2014.
(n) Mortgage dollar roll and treasury roll transactions
The Funds may sell mortgage-backed securities and simultaneously contract to repurchase substantially similar (same type, coupon and maturity) securities on a specific future date at an agreed upon price. During the period between the sale and repurchase, the Fund will not be entitled to receive interest and principal payments on the securities sold. The Fund accounts for mortgage dollar roll transactions as purchases and sales and realizes gains and losses on these transactions. Mortgage dollar rolls involve the risk that the market value of the securities that the Fund is required to purchase may decline below the agreed upon repurchase price of those securities.
The Funds may enter into treasury roll transactions. In a treasury roll transaction the Fund sells a treasury security to a counterparty with a simultaneous agreement to repurchase the same security at an agreed upon price at a future settlement date. The Fund receives cash from the sale of the treasury security to use for other investment purposes. The difference between the sale and repurchase price represents net interest income or net interest expense. Under GAAP, the treasury roll transaction is accounted for as a financing transaction and not as a purchase or sale. During the term of the borrowing the Fund records the related interest income or interest expenses on an accrual basis. Treasury roll transactions involve the risk that the market value of the securities that the Fund is required to repurchase may decline below the agreed upon repurchase price of those securities.
Treasury roll transactions are entered into by the Funds under an MRA. An MRA permits the Fund, under certain circumstances, including an event of default (such as bankruptcy or insolvency), to offset payables and/or receivables under the MRA with collateral held and/or posted to the counterparty and create one single net payment due to or from the Fund. With treasury roll transactions, typically the Fund and the counterparties are permitted to sell, re-pledge, or use the collateral associated with the transaction. However, bankruptcy or insolvency laws of a particular jurisdiction may impose restrictions on or prohibitions against such a right of offset in the event of the MRA counterparty’s bankruptcy or insolvency. Pursuant to the terms of the MRA, the Fund receives or posts securities as collateral with a market value in excess of the repurchase price to be paid or received by the Fund upon the maturity of the transaction. Upon a bankruptcy or insolvency of the MRA counterparty, the Fund would recognize a liability with respect to such excess collateral to reflect the Fund obligation under bankruptcy law to return the excess to the counterparty. The Funds did not hold open treasury rolls as of March 31, 2014.
(o) Bank loans
Core Fixed invests in bank loans, which include institutionally-traded floating rate securities generally acquired as an assignment from another holder of, or participation interest in, loans originated by a bank or financial institution (the ‘‘Lender’’) that acts as agent for all holders. The agent administers the terms of the loan, as specified in the loan agreement. The Fund may invest in multiple series or tranches of a loan, which may have varying terms and carry different associated risks. When investing in a loan participation, the Fund has the right to receive payments of principal, interest and any fees to which it is entitled only from the Lender selling the loan agreement and only upon receipt by the Lender of payments from the borrower. The Fund generally has no right to enforce compliance with
195
Table of Contents
Mercer Funds
Notes to the Financial Statements (Continued)
March 31, 2014
the terms of the loan agreement with the borrower. As a result, the Fund may be subject to the credit risk of both the borrower and the Lender that is selling the loan agreement. At March 31, 2014, the Funds held no unfunded loan commitments.
(p) Indexed securities
The Funds may invest in indexed securities where the redemption values and/or coupons are linked to the prices of other securities, securities indices, or other financial indicators. The Funds use indexed securities to increase or decrease their exposure to different underlying instruments and to gain exposure to markets in which it may be difficult to invest through conventional securities. Indexed securities may be more volatile than their underlying instruments, but any loss is limited to the amount of the original investment.
(q) Taxes and distributions
The Funds intend to qualify each year as regulated investment companies under the Code. The Funds intend to distribute substantially all of their net investment income and net realized short-term and long-term gains, if any, after giving effect to any available capital loss carryovers for U.S. federal income tax purposes. Therefore, no provision for U.S. federal and state income or excise tax is necessary.
The Funds utilize the provisions of the federal income tax laws that provide for the carryforward of capital losses for prior years, offsetting such losses against any future realized capital gains. Under the Regulated Investment Company Modernization Act of 2010 (the “Act”), net capital losses recognized after December 22, 2010 may be carried forward indefinitely, and their character is retained as short-term and/or long-term losses. Previously, net capital losses were carried forward for eight years and treated as short-term losses. As a transition rule, the Act requires that post-enactment net capital losses be used before pre-enactment net capital losses.
On March 31, 2014, the following Funds had deferred capital losses available to be offset against future net capital gains through the indicated expiration dates as follows:
| Expiring March 31, | ||||||||||||||||||||
| 2016 | 2017 | 2018 | 2019 | Unlimited | ||||||||||||||||
Emerging Markets | $ | — | $ | — | $ | — | $ | — | $ | 4,160,307 | ||||||||||
Net capital loss carry forwards for the Funds shown in the above table are from pre-enactment years and are, therefore, subject to the eight-year carryforward period and possible expiration.
During the year ended March 31, 2014 the following Funds utilized capital loss carryforwards:
Large Cap Value | $ | 87,427,715 | ||
Non-US Core Equity | 71,876,353 |
As of March 31, 2014, the cost for U.S. federal income tax purposes and gross unrealized appreciation and depreciation in value of investments were as follows:
| Federal Income Tax Cost | Tax Basis Unrealized Appreciation | Tax Basis Unrealized Depreciation | Net Unrealized Appreciation (Depreciation) | |||||||||||||
Large Cap Growth | $ | 271,346,568 | $ | 87,174,004 | $ | (1,832,946 | ) | $ | 85,341,058 | |||||||
Large Cap Value | 291,142,480 | 85,907,769 | (1,438,815 | ) | 84,468,954 | |||||||||||
Small/Mid Cap Growth | 359,528,504 | 79,332,270 | (6,460,701 | ) | 72,871,569 | |||||||||||
Small/Mid Cap Value | 378,534,988 | 40,263,071 | (6,124,545 | ) | 34,138,526 | |||||||||||
Non-US Core Equity | 1,698,875,573 | 276,962,166 | (31,766,725 | ) | 245,195,441 | |||||||||||
Core Fixed | 1,073,188,307 | 24,085,627 | (7,384,759 | ) | 16,700,868 | |||||||||||
Opportunistic Fixed | 253,902,257 | 5,615,183 | (1,285,382 | ) | 4,329,801 | |||||||||||
Emerging Markets | 884,773,374 | 42,899,553 | (33,746,435 | ) | 9,153,118 | |||||||||||
Global Low Volatility | 702,624,980 | 84,951,643 | (11,889,895 | ) | 73,061,748 | |||||||||||
196
Table of Contents
Mercer Funds
Notes to the Financial Statements (Continued)
March 31, 2014
The differences between book-basis and tax-basis unrealized appreciation/(depreciation) are primarily due to wash sale loss deferrals, investments in passive foreign investment companies and other basis adjustments.
As of March 31, 2014, the Funds had no uncertain tax positions that would require recognition, derecognition, or disclosure. Each of the Funds’ federal tax returns filed in the 3-year period ended March 31, 2014 remains subject to examination by the Internal Revenue Service.
The Funds’ policy is to declare and pay distributions from net investment income and net realized short-term and long-term gains at least annually. All distributions are paid in shares of the Funds, at NAV, unless the shareholder elects to receive cash distributions. A Fund may distribute such income dividends and capital gains more frequently, if necessary, in order to reduce or eliminate federal excise taxes on the Funds. The amount of any distribution will vary, and there is no guarantee that a Fund will pay either income dividends or capital gains distributions.
During the years ended March 31, 2014 and March 31, 2013 the tax character of distributions (including capital gain dividends, if any, designated pursuant to Section 852 of the Code) paid, were as follows:
| 2014 | 2013 | |||||||||||||||
| Ordinary Income | Long-Term Capital Gains | Ordinary Income | Long-Term Capital Gains | |||||||||||||
Large Cap Growth | $ | 10,178,962 | $ | 73,441,379 | $ | 2,623,579 | $ | 12,798,740 | ||||||||
Large Cap Value | 6,835,803 | — | 9,197,559 | — | ||||||||||||
Small/Mid Cap Growth | 16,026,482 | 45,018,015 | 8,654,824 | 22,684,930 | ||||||||||||
Small/Mid Cap Value | 34,388,584 | 37,244,306 | 6,390,089 | 10,843,125 | ||||||||||||
Non-US Core Equity | 51,237,787 | 85,693,489 | 49,488,095 | — | ||||||||||||
Core Fixed | 24,984,359 | 5,718,416 | 49,088,858 | 5,001,334 | ||||||||||||
Opportunistic Fixed | 2,280,082 | — | — | — | ||||||||||||
Emerging Markets | 13,888,576 | — | 3,235,418 | — | ||||||||||||
Global Low Volatility | 28,469,221 | 100,937 | 485,259 | — | ||||||||||||
As of March 31, 2014, the components of distributable earnings on a tax basis were as follows:
| Undistributed Ordinary Income | Undistributed Long-Term Gains | Capital Losses Other Temporary Differences | Unrealized Appreciation (Depreciation) | Total Distributable Earnings | ||||||||||||||||
Large Cap Growth | $ | 5,237,112 | $ | 24,831,262 | $ | (4,900 | ) | $ | 85,341,058 | $ | 115,404,532 | |||||||||
Large Cap Value | 1,466,475 | 10,441,191 | (4,668 | ) | 84,468,957 | 96,371,955 | ||||||||||||||
Small/Mid Cap Growth | 8,283,628 | 16,107,024 | (913 | ) | 72,871,569 | 97,261,308 | ||||||||||||||
Small/Mid Cap Value | 19,725,930 | 33,923,581 | (750 | ) | 34,138,542 | 87,787,303 | ||||||||||||||
Non-US Core Equity | 35,525,443 | 103,601,372 | (6,809 | ) | 245,191,213 | 384,311,219 | ||||||||||||||
Core Fixed | 6,697,829 | 4,272,076 | (10,931 | ) | 16,771,994 | 27,730,968 | ||||||||||||||
Opportunistic Fixed | 3,123,751 | — | (11,614 | ) | 4,557,074 | 7,669,211 | ||||||||||||||
Emerging Markets | 6,698,164 | — | (10,368,588 | ) | 8,855,566 | 5,185,142 | ||||||||||||||
Global Low Volatility | 9,726,069 | 6,810,728 | — | 73,076,667 | 89,613,464 | |||||||||||||||
All other differences are temporary losses related to mostly organizational costs and other timing adjustments.
(r) Allocation of expenses and income
The majority of expenses of the Trust are directly identifiable to an individual Fund. Expenses which are not readily identifiable to a specific Fund are allocated among the applicable Funds, taking into consideration, among other things, the nature and type of expense and the relative size of each applicable Fund.
197
Table of Contents
Mercer Funds
Notes to the Financial Statements (Continued)
March 31, 2014
(s) Redemption fees
While none of the Funds’ classes have initial or contingent deferred sales charges on purchases of Fund shares, redemptions of Fund shares held less than 30 days may be assessed a 2% short-term trading fee and recorded as paid-in capital.
| 3. | Credit agreement |
The Trust entered into a Credit Agreement on behalf of the Funds (“the Agreement”) with a bank pursuant to a revolving line of credit through June 23, 2014. Borrowings for each Fund under the Agreement are limited to the lesser of $50,000,000 or 33 1/3% of a Fund’s Total Net Assets provided borrowings did not exceed, in the aggregate, $50,000,000. Under the terms of the Agreement the Trust pays an annual commitment fee at the rate 0.15% per year on the difference between the total line of credit and the average daily amount of borrowings outstanding. Interest is charged to the Funds based on its borrowings at a variable rate equal to the Overnight Rate plus 1.25%. The Funds did not borrow under the Agreement during the year ended March 31, 2014.
| 4. | Indemnities |
In the normal course of business, the Funds enter into contracts that require them to provide a variety of representations or general indemnification for certain liabilities. The Funds’ maximum exposure under these arrangements is unknown, as this would involve future claims that may be made against the Funds that have not yet occurred. However, the Funds have not had prior claims or losses pursuant to these contracts and expect the risk of loss to be remote.
| 5. | Fees and other transactions with affiliates |
The Advisor provides investment advisory services to each Fund pursuant to an investment management agreement. Pursuant to the investment management agreement, each Fund pays the Advisor a fee for managing the Fund’s investments at an annual rate of:
| Average net assets up to $750 million | Average net assets in excess of $750 million | |||||||
Large Cap Growth | 0.55% | 0.53% | ||||||
Large Cap Value | 0.53% | 0.51% | ||||||
Small/Mid Cap Growth | 0.90% | 0.90% | ||||||
Small/Mid Cap Value | 0.90% | 0.90% | ||||||
Non-US Core Equity | 0.75% | 0.73% | ||||||
Core Fixed | 0.35% | 0.33% | ||||||
Opportunistic Fixed | 0.80% | 0.80% | ||||||
Emerging Markets | 0.80% | 0.80% | ||||||
Global Low Volatility | 0.75% | 0.75% | ||||||
Such fees as referenced above are shown in the Advisory fees line in the Statements of Operations. The Advisor provides certain internal administrative services to the Class S, Class Y-1 and Class Y-2 shares of the Funds, for which the Advisor receives a fee of 0.15%, 0.10% and 0.05% of the average daily net assets of the Class S, Class Y-1 and Class Y-2 shares of the Funds, respectively. These internal administrative services include attending to shareholder correspondence, assisting with the processing of purchases and redemptions of shares, preparing and disseminating information and documents for use by beneficial shareholders and monitoring and overseeing non-advisory relationships with entities providing services to the Class S, Class Y-1 and Class Y-2 shares, including the transfer agent. However, Class S, Class Y-1 and Class Y-2 shares have not commenced operations.
The Funds have adopted a plan of marketing and service, or “12b-1 plan” to finance the provision of certain shareholder services to the owners of Class S and Class Y-1 shares of the Funds (collectively referred to as the “plans”). The plan provides for payments at annual rates (based on average net assets) of up to 0.25% of each Fund’s Class S and Class Y-1 shares. However, Class S and Class Y-1 shares have not commenced operations.
198
Table of Contents
Mercer Funds
Notes to the Financial Statements (Continued)
March 31, 2014
The Trust, with respect to each Fund, and the Advisor have entered into a written contractual fee waiver and expense reimbursement agreement pursuant to which the Advisor has agreed to waive a portion of its fees and/or reimburse expenses. For the year ended March 31, 2014, the fees were reimbursed to the extent that each Fund’s class expenses exceeded the net expense rates as set forth below of average daily net assets of the Fund class. These reimbursements are shown in the Reimbursement of expenses line in the Statements of Operations.
| Class S | Class Y-1 | Class Y-2 | Class Y-3 | |||||||||||||
Large Cap Growth | 1.07% | 1.02% | 0.72% | 0.57% | ||||||||||||
Large Cap Value | 1.05% | 1.00% | 0.70% | 0.55% | ||||||||||||
Small/Mid Cap Growth | 1.47% | 1.42% | 1.12% | 0.97% | ||||||||||||
Small/Mid Cap Value | 1.47% | 1.42% | 1.12% | 0.97% | ||||||||||||
Non-US Core Equity | 1.37% | 1.32% | 1.02% | 0.87% | ||||||||||||
Core Fixed | 0.87% | 0.82% | 0.52% | 0.37% | ||||||||||||
Opportunistic Fixed | 1.40% | 1.35% | 1.05% | 0.90% | ||||||||||||
Emerging Markets | 1.60% | 1.55% | 1.25% | 0.95% | ||||||||||||
Global Low Volatility | 1.35% | 1.30% | 1.00% | 0.85% | ||||||||||||
Pursuant to the expense reimbursement agreement, the Advisor is entitled to be reimbursed for any fees the Advisor waives and Fund expenses that the Advisor reimburses for a period of three years following such fee waivers and expense reimbursements, to the extent that such reimbursement of the Advisor by a Fund will not cause the Fund to exceed any applicable expense limitation that is in place for the Fund. For the year ended March 31, 2014, the Advisor recovered $76,000 in reimbursed expenses from Global Low Volatility.
As of March 31, 2014 only Class Y-3 had commenced operations.
Pursuant to the Funds’ expense reimbursement agreement, the Advisor can recapture certain amounts waived or reimbursed over the past three 12-month periods ended July 31, 2013. The following amounts were available for recapture as of July 31, 2013:
| Expenses Reimbursed in the 12-Months Ended July 31, | ||||||||||||
| 2011 | 2012 | 2013 | ||||||||||
| Subject to Recapture until July 31, | ||||||||||||
| 2014 | 2015 | 2016 | ||||||||||
Large Cap Growth | $ | 268,664 | $ | 243,890 | $ | 206,394 | ||||||
Large Cap Value | 299,759 | 268,658 | 198,065 | |||||||||
Small/Mid Cap Growth | 254,984 | 240,500 | 85,083 | |||||||||
Small/Mid Cap Value | 259,564 | 237,686 | 84,500 | |||||||||
Non-US Core Equity | 1,571,260 | 1,321,132 | — | |||||||||
Core Fixed | 761,910 | 661,339 | 556,235 | |||||||||
Opportunistic Fixed | — | — | — | |||||||||
Emerging Markets | — | 83,093 | 556,088 | |||||||||
Global Low Volatility | — | — | 131,146 | |||||||||
Pursuant to a transfer agency agreement with State Street Bank and Trust Co. (“SSB”), SSB has agreed to waive its fees and out of pocket expenses, up to $33,000 per month for the Funds in the aggregate. For the year ended March 31, 2014, the fees waived are shown in the Fee reductions line in the Statement of Operations.
199
Table of Contents
Mercer Funds
Notes to the Financial Statements (Continued)
March 31, 2014
| 6. | Purchases and sales of securities |
Cost of purchases and proceeds from sales of securities, excluding short-term investments, for the period ended March 31, 2014, were as follows:
| Long-Term U.S. Government Securities | Other Long-Term Securities | |||||||
Purchases | ||||||||
Large Cap Growth | $ | — | $ | 200,132,255 | ||||
Large Cap Value | — | 182,347,592 | ||||||
Small/Mid Cap Growth | — | 267,652,562 | ||||||
Small/Mid Cap Value | — | 472,153,500 | ||||||
Non-US Core Equity | — | 1,763,805,587 | ||||||
Core Fixed | 1,580,530,036 | 249,430,468 | ||||||
Opportunistic Fixed | — | 269,994,259 | ||||||
Emerging Markets | — | 702,079,820 | ||||||
Global Low Volatility | — | 579,019,264 | ||||||
Sales | ||||||||
Large Cap Growth | — | 388,417,978 | ||||||
Large Cap Value | — | 385,350,931 | ||||||
Small/Mid Cap Growth | — | 391,377,320 | ||||||
Small/Mid Cap Value | — | 549,491,242 | ||||||
Non-US Core Equity | — | 2,197,005,276 | ||||||
Core Fixed | 1,441,093,260 | 392,468,696 | ||||||
Opportunistic Fixed | — | 35,070,595 | ||||||
Emerging Markets | — | 372,407,783 | ||||||
Global Low Volatility | — | 262,251,936 | ||||||
| 7. | Share transactions |
Each Fund is authorized to issue an unlimited number of shares of beneficial interest without par value. Transactions in Fund shares were as follows:
Large Cap Growth
| Year Ended March 31, 2014 | Year Ended March 31, 2013 | |||||||||||||||
| Shares | Amount | Shares | Amount | |||||||||||||
Class Y-3: | ||||||||||||||||
Shares sold | 220,686 | $ | 2,949,064 | 5,065,500 | $ | 64,873,285 | ||||||||||
Shares issued to shareholders in reinvestment of distributions | 6,477,176 | 83,620,341 | 1,221,086 | 15,422,319 | ||||||||||||
Shares repurchased | (13,790,756 | ) | (196,510,818 | ) | (7,036,336 | ) | (90,890,406 | ) | ||||||||
|
|
|
|
|
|
|
| |||||||||
Net decrease | (7,092,894 | ) | $ | (109,941,413 | ) | (749,750 | ) | $ | (10,594,802 | ) | ||||||
|
|
|
|
|
|
|
| |||||||||
200
Table of Contents
Mercer Funds
Notes to the Financial Statements (Continued)
March 31, 2014
Large Cap Value
| Year Ended March 31, 2014 | Year Ended March 31, 2013 | |||||||||||||||
| Shares | Amount | Shares | Amount | |||||||||||||
Class Y-3: | ||||||||||||||||
Shares sold | 232,374 | $ | 2,849,063 | 6,358,367 | $ | 56,988,771 | ||||||||||
Shares issued to shareholders in reinvestment of distributions | 570,125 | 6,835,803 | 1,020,817 | 9,197,559 | ||||||||||||
Shares repurchased | (19,376,634 | ) | (214,892,997 | ) | (12,333,094 | ) | (111,651,382 | ) | ||||||||
|
|
|
|
|
|
|
| |||||||||
Net decrease | (18,574,135 | ) | $ | (205,208,131 | ) | (4,953,910 | ) | $ | (45,465,052 | ) | ||||||
|
|
|
|
|
|
|
| |||||||||
Small/Mid Cap Growth
| Year Ended March 31, 2014 | Year Ended March 31, 2013 | |||||||||||||||
| Shares | Amount | Shares | Amount | |||||||||||||
Class Y-3: | ||||||||||||||||
Shares sold | 2,889,213 | $ | 37,028,139 | 11,992,815 | $ | 134,366,284 | ||||||||||
Shares issued to shareholders in reinvestment of distributions | 5,049,172 | 61,044,497 | 2,909,912 | 31,339,754 | ||||||||||||
Shares repurchased | (13,016,216 | ) | (164,272,001 | ) | (3,732,632 | ) | (42,250,216 | ) | ||||||||
|
|
|
|
|
|
|
| |||||||||
Net increase (decrease) | (5,077,831 | ) | $ | (66,199,365 | ) | 11,170,095 | $ | 123,455,822 | ||||||||
|
|
|
|
|
|
|
| |||||||||
Small/Mid Cap Value
| Year Ended March 31, 2014 | Year Ended March 31, 2013 | |||||||||||||||
| Shares | Amount | Shares | Amount | |||||||||||||
Class Y-3: | ||||||||||||||||
Shares sold | 6,584,297 | $ | 74,869,203 | 12,039,409 | $ | 117,965,935 | ||||||||||
Shares issued to shareholders in reinvestment of distributions | 6,815,689 | 71,632,890 | 1,746,020 | 17,233,214 | ||||||||||||
Shares repurchased through in-kind redemption* | (3,518,476 | ) | (39,406,931 | ) | — | — | ||||||||||
Shares repurchased | (13,337,366 | ) | (152,670,310 | ) | (4,357,440 | ) | (43,882,998 | ) | ||||||||
|
|
|
|
|
|
|
| |||||||||
Net increase (decrease) | (3,455,856 | ) | $ | (45,575,148 | ) | 9,427,989 | $ | 91,316,151 | ||||||||
|
|
|
|
|
|
|
| |||||||||
| * | The fund had a redemption in-kind on May 6, 2013. |
201
Table of Contents
Mercer Funds
Notes to the Financial Statements (Continued)
March 31, 2014
Non-US Core Equity
| Year Ended March 31, 2014 | Year Ended March 31, 2013 | |||||||||||||||
| Shares | Amount | Shares | Amount | |||||||||||||
Class Y-3: | ||||||||||||||||
Shares sold | 32,304,150 | $ | 365,809,642 | 48,377,767 | $ | 464,004,703 | ||||||||||
Shares issued to shareholders in reinvestment of distributions | 11,990,479 | 136,931,276 | 4,934,007 | 49,488,095 | ||||||||||||
Shares repurchased through in-kind redemption* | (16,779,118 | ) | (188,093,909 | ) | — | — | ||||||||||
Shares repurchased | (71,884,254 | ) | (817,992,339 | ) | (45,785,469 | ) | (449,847,236 | ) | ||||||||
|
|
|
|
|
|
|
| |||||||||
Net increase (decrease) | (44,368,743 | ) | $ | (503,345,330 | ) | 7,526,305 | $ | 63,645,562 | ||||||||
|
|
|
|
|
|
|
| |||||||||
| * | The fund had a redemption in-kind on May 3, 2013. |
Core Fixed
| Year Ended March 31, 2014 | Year Ended March 31, 2013 | |||||||||||||||
| Shares | Amount | Shares | Amount | |||||||||||||
Class Y-3: | ||||||||||||||||
Shares sold | 18,298,152 | $ | 191,482,003 | 18,759,679 | $ | 205,364,923 | ||||||||||
Shares issued to shareholders in reinvestment of distributions | 2,998,318 | 30,702,775 | 5,093,239 | 54,090,192 | ||||||||||||
Shares repurchased | (20,376,062 | ) | (211,810,617 | ) | (18,442,944 | ) | (201,159,996 | ) | ||||||||
|
|
|
|
|
|
|
| |||||||||
Net increase | 920,408 | $ | 10,374,161 | 5,409,974 | $ | 58,295,119 | ||||||||||
|
|
|
|
|
|
|
| |||||||||
Opportunistic Fixed
| Period from August 21, 2013 (commencement of operations) through March 31, 2014 | ||||||||
| Shares | Amount | |||||||
Class Y-3: | ||||||||
Shares sold | 25,054,617 | $ | 253,754,909 | |||||
Shares issued to shareholders in reinvestment of distributions | 223,977 | 2,280,082 | ||||||
Shares repurchased | (305,258 | ) | (3,148,606 | ) | ||||
|
|
|
| |||||
Net increase | 24,973,336 | $ | 252,886,385 | |||||
|
|
|
| |||||
202
Table of Contents
Mercer Funds
Notes to the Financial Statements (Continued)
March 31, 2014
Emerging Markets
| Year Ended March 31, 2014 | Period from May 1, 2012 (commencement of operations) through March 31, 2013 | |||||||||||||||
| Shares | Amount | Shares | Amount | |||||||||||||
Class Y-3: | ||||||||||||||||
Shares sold | 42,700,320 | $ | 421,595,439 | 50,549,371 | $ | 506,456,931 | ||||||||||
Shares issued to shareholders in reinvestment of distributions | 1,401,471 | 13,888,576 | 307,506 | 3,235,418 | ||||||||||||
Shares repurchased | (7,061,813 | ) | (71,130,846 | ) | (1,556,779 | ) | (16,307,819 | ) | ||||||||
|
|
|
|
|
|
|
| |||||||||
Net increase | 37,039,978 | $ | 364,353,169 | 49,300,098 | $ | 493,384,530 | ||||||||||
|
|
|
|
|
|
|
| |||||||||
Global Low Volatility
| Year Ended March 31, 2014 | Period from November 6, 2012 (commencement of operations) through March 31, 2013 | |||||||||||||||
| Shares | Amount | Shares | Amount | |||||||||||||
Class Y-3: | ||||||||||||||||
Shares sold | 40,641,924 | $ | 462,693,554 | 27,449,755 | $ | 278,760,703 | ||||||||||
Shares issued to shareholders in reinvestment of distributions | 2,435,648 | 28,570,158 | 46,930 | 485,259 | ||||||||||||
Shares repurchased | (9,468,727 | ) | (111,439,468 | ) | (566,151 | ) | (6,042,276 | ) | ||||||||
|
|
|
|
|
|
|
| |||||||||
Net increase | 33,608,845 | $ | 379,824,244 | 26,930,534 | $ | 273,203,686 | ||||||||||
|
|
|
|
|
|
|
| |||||||||
On May 6, 2013, Small/Mid Cap Value transferred securities in-kind valued at $38,447,113 and cash of $959,818 for a redemption. This transfer resulted in a realized gain of $7,168,911 which is shown on the Statements of Operations.
On May 3, 2013, Non-US Core Equity transferred securities in-kind valued at $177,821,966 and cash of $10,271,943 for a redemption. This transfer resulted in a realized gain of $30,662,932 which is shown on the Statements of Operations.
| 8. | Recent accounting pronouncement |
In June 2013, the Financial Accounting Standards Board issued Accounting Standards Update (“ASU”) 2013-08, Financial Services — Investment Companies (Topic 946): Amendments to the Scope, Measurement, and Disclosure Requirements (“ASU 2013-08”). ASU 2013-08 amends the criteria that define an investment company, clarifies the measurement guidance and requires certain additional disclosures. Public companies are required to apply ASU 2013-08 prospectively for interim and annual reporting periods beginning after December 15, 2013. Management is currently evaluating the impact, if any, of applying this provision.
| 9. | Subsequent events |
Management has evaluated the impact of subsequent events through May 28, 2014, the date the financial statements were available to be issued. Management has determined that there are no material events that would require adjustment or disclosure in the Funds’ financial statements through this date.
203
Table of Contents
REPORT OF INDEPENDENT REGISTERED PUBLIC ACCOUNTING FIRM
To the Board of Trustees and Shareholders of Mercer Funds:
We have audited the accompanying statements of assets and liabilities, including the schedules of investments, of Mercer Funds (the “Funds”), comprising Mercer US Large Cap Growth Equity Fund, Mercer US Large Cap Value Equity Fund, Mercer US Small/Mid Cap Growth Equity Fund, Mercer US Small/Mid Cap Value Equity Fund, Mercer Non-US Core Equity Fund, Mercer Core Fixed Income Fund (formerly known as Mercer Core Opportunistic Fixed Income Fund), Mercer Opportunistic Fixed Income Fund, Mercer Emerging Markets Equity Fund, and Mercer Global Low Volatility Equity Fund as of March 31, 2014, the related statements of operations for the period then ended, and the statements of changes in net assets and the financial highlights for the periods presented. These financial statements and financial highlights are the responsibility of the Funds’ management. Our responsibility is to express an opinion on these financial statements and financial highlights based on our audits.
We conducted our audits in accordance with the standards of the Public Company Accounting Oversight Board (United States). Those standards require that we plan and perform the audits to obtain reasonable assurance about whether the financial statements and financial highlights are free of material misstatement. The Funds are not required to have, nor were we engaged to perform, an audit of their internal control over financial reporting. Our audits included consideration of internal control over financial reporting as a basis for designing audit procedures that are appropriate in the circumstances, but not for the purpose of expressing an opinion on the effectiveness of the Funds’ internal control over financial reporting. Accordingly, we express no such opinion. An audit also includes examining, on a test basis, evidence supporting the amounts and disclosures in the financial statements, assessing the accounting principles used and significant estimates made by management, as well as evaluating the overall financial statement presentation. Our procedures included confirmation of securities owned as of March 31, 2014, by correspondence with the custodian, brokers, and agent banks; where replies were not received from brokers and agent banks, we performed other auditing procedures. We believe that our audits provide a reasonable basis for our opinion.
In our opinion, such financial statements and financial highlights referred to above present fairly, in all material respects, the financial position of each of the Funds as of March 31, 2014, the results of their operations for the period then ended, the changes in their net assets and the financial highlights for each of the periods presented, in conformity with accounting principles generally accepted in the United States of America.
Deloitte & Touche LLP
Boston, Massachusetts
May 28, 2014
204
Table of Contents
Mercer Funds
Additional Information (Unaudited)
Proxy Voting
A description of the policies and procedures that the Advisor and each Fund’s Subadvisors use to determine how to vote proxies relating to the Fund’s portfolio securities is available, without charge, upon request, by calling 1-866-658-9896, and on the Securities and Exchange Commission’s (“SEC”) website at http://www.sec.gov. Information about Funds’ proxy voting decisions are available without charge, online on the Funds’ website at http://www.mercer.us/mutual-funds-on-offer.
Quarterly Reporting
The Funds file their complete schedule of portfolio holdings with the Securities and Exchange Commission for the first and third quarters of each fiscal year on Form N-Q, which when filed, will be available on the SEC’s website at http://www.sec.gov. When filed, the Funds’ Form N-Q may be reviewed and copied at the Commission’s Public Reference Room in Washington, D.C. Information on the operation of the Public Reference Room may be obtained by calling 1-800-SEC-0330.
Federal Tax Information
The amount of long-term capital gains paid for the fiscal year ended March 31, 2014, the amount of long-term capital gains paid were as follows:
Fund | ||||
Large Cap Growth | $ | 73,441,379 | ||
Small/Mid Cap Growth | 45,018,015 | |||
Small/Mid Cap Value | 37,244,306 | |||
Non-US Core Equity | 85,693,489 | |||
Core Fixed | 5,718,416 | |||
Global Low Volatility | 100,937 | |||
Qualified dividend income (“QDI”) received by the Funds through March 31, 2014, that qualified for a reduced tax rate pursuant to the Internal Revenue Code Section 1(h)(11) are as follows:
Fund | QDI | |||
Large Cap Growth | $ | 3,909,998 | ||
Large Cap Value | 8,004,334 | |||
Small/Mid Cap Growth | 2,594,475 | |||
Small/Mid Cap Value | 3,615,544 | |||
Non-US Core Equity | 51,237,787 | |||
Core Fixed | 75,270 | |||
Emerging Markets | 11,232,195 | |||
Global Low Volatility | 11,433,002 | |||
For corporate shareholders, a portion of the ordinary dividends paid during the Funds’ year ended March 31, 2014, qualified for the dividends received reduction, as follows:
Fund | ||||
Large Cap Growth | 29.00% | |||
Large Cap Value | 99.19% | |||
Small/Mid Cap Growth | 18.15% | |||
Small/Mid Cap Value | 13.97% | |||
Core Fixed | 0.26% | |||
Opportunistic Fixed | 0.00% | |||
Emerging Markets | 0.00% | |||
Global Low Volatility | 19.57% | |||
205
Table of Contents
Mercer Funds
Additional Information (Unaudited) (Continued)
Board Approval of Subadvisory Agreements for the Funds during the period October 1, 2013 through March 31, 2014
Mercer Non-US Core Equity Fund
At a meeting of the Board of Trustees (the “Board” or the “Trustees”) of Mercer Funds (the “Trust”) held on November 4, 2013 (the “November Meeting”), the Trustees, including the Trustees who are not “interested persons” (as that term is defined in the Investment Company Act of 1940, as amended (the “1940 Act”)) of the Trust or Mercer Investment Management, Inc., the Trust’s investment advisor (the “Advisor”) (together, the “Independent Trustees”), considered and approved the proposed subadvisory agreement (the “Proposed American Century Subadvisory Agreement”) between the Advisor and American Century Investment Management, Inc. (“American Century”) with respect to the Mercer Non-US Core Equity Fund (the “Non-US Core Equity Fund”).
In considering the approval of the Proposed American Century Subadvisory Agreement, the Board considered the information and materials from the Advisor, American Century and counsel that included, as to American Century and the Non-US Core Equity Fund: (i) the Proposed American Century Subadvisory Agreement; (ii) information regarding the process by which the Advisor had reviewed, selected, and recommended American Century for the Board’s approval, and the Advisor’s rationale for recommending that American Century be appointed as a subadvisor to the Non-US Core Equity Fund, and how American Century would supplement the Non-US Core Equity Fund’s other current subadvisors; (iii) the nature, extent, and quality of the services that American Century proposed to provide to the Non-US Core Equity Fund; (iv) the investment management business, portfolio management personnel, operations, prior investment experience, and reputation of American Century; (v) American Century’s brokerage and trading policies and practices; (vi) the level of subadvisory fees to be charged by American Century for its services to the Non-US Core Equity Fund, and a comparison of those fees to other accounts that American Century managed; (vii) American Century’s compliance program; (viii) information regarding American Century’s historical performance returns managing an investment mandate similar to the Non-US Core Equity Fund’s investment mandate, and a comparison of such performance to a relevant index; and (ix) the financial condition of American Century.
In addition, the Board considered presentations made by, and discussions held with, representatives of the Advisor. The Board considered and analyzed factors that the Board deemed relevant with respect to American Century, including: the nature, extent, and quality of the services to be provided to the Non-US Core Equity Fund by American Century; American Century’s management style and investment decision-making process; American Century’s historical performance record managing investment products similar to the Non-US Core Equity Fund; the qualifications and experience of the members of American Century’s portfolio management team; and American Century’s staffing levels and overall resources. The Independent Trustees also took into consideration the nature and extent of the oversight duties performed by the Advisor in connection with each of the subadvisors, which includes extensive management and compliance due diligence with respect to the management and operations of each of the subadvisors. Additionally, the Independent Trustees received assistance and advice regarding legal and industry standards and reviewed materials supplied by their independent legal counsel.
In particular, and as to American Century, the Board, including the Independent Trustees, considered the following factors:
(a) The nature, extent, and quality of the services to be provided by American Century. The Board reviewed the nature, extent, and quality of the services to be provided by American Century to the Non-US Core Equity Fund. The Board discussed the specific investment management process that American Century indicated that it will employ to manage its allocated portion of the Non-US Core Equity Fund’s investment portfolio (which was described in detail in the materials provided by American Century), the qualifications of American Century’s portfolio managers and investment management personnel with regard to implementing the investment mandate relating to the allocated portion of the Non-US Core Equity Fund’s investment portfolio that American Century would be managing, and the performance record of American Century as compared to a relevant benchmark. The Board considered American Century’s infrastructure and resources, and whether American Century’s organization appeared to support American Century’s strategy adequately. The Board also discussed the Advisor’s review, selection, and due diligence process with respect to American Century, and the Advisor’s favorable assessment as to the nature, extent, and quality of the subadvisory services expected to be provided to the Non-US Core Equity Fund
206
Table of Contents
Mercer Funds
Additional Information (Unaudited) (Continued)
by American Century. The Board determined that the Non-US Core Equity Fund and its shareholders would benefit from the quality and experience of American Century’s portfolio managers and the qualifications of its investment professionals. Based on their consideration and review of the foregoing information, the Board concluded that the nature, extent and quality of the subadvisory services anticipated to be provided by American Century, as well as American Century’s ability to render such services based on American Century’s experience, operations and resources, were appropriate for the Non-US Core Equity Fund, in light of the Non-US Core Equity Fund’s investment objective, and the mandate relating to the allocated portion of the Non-US Core Equity Fund’s investment portfolio that American Century would manage.
(b) Comparison of the services to be rendered and fees to be paid to American Century under other advisory and subadvisory contracts, such as those with other clients. The Board discussed the services that would be rendered by American Century and evaluated the compensation to be paid to American Century by the Advisor for those services. The Board noted that the services that American Century would furnish to the Non-US Core Equity Fund appeared to be comparable to the services that American Century currently provides to its other advisory and subadvisory clients having similar investment strategies. The Trustees also considered comparisons of the fees that will be paid to American Century by the Advisor in light of the fees that were charged by American Century to its other advisory clients, as disclosed in American Century’s Form ADV, Part 2A (Firm Brochure) and in its 15(c) Questionnaire responses, including commingled and separate accounts. The Board also considered that the fees agreed to by American Century were the result of an arm’s length bargain negotiated by unaffiliated parties.
The Board considered the review, selection, and due diligence process employed by the Advisor, in determining to recommend American Century to serve as a subadvisor to the Non-US Core Equity Fund, and the Advisor’s reasons for concluding that the subadvisory fees to be paid by the Advisor to American Century for its services to the Non-US Core Equity Fund were reasonable. The Board emphasized in their discussions that the subadvisory fees of American Century would be paid by the Advisor, and were not additional fees to be borne by the Non-US Core Equity Fund or its shareholders. Based on their discussion, the Board concluded that, in light of the nature, quality, and extent of the services to be provided, the proposed fees to be paid to American Century with respect to the assets of the Non-US Core Equity Fund to be allocated to American Century appeared to be within a reasonable range. The Board also considered the potential “fallout” or ancillary benefits that may accrue to American Century from its relationship with the Non-US Core Equity Fund and concluded that they were reasonable.
Since the fees to be paid to American Century were the result of arm’s-length bargaining between unaffiliated parties, and given the Advisor’s economic incentive to negotiate a reasonable fee, the potential profitability of American Century was not considered relevant to the Board’s deliberations. The Board took note of the Advisor’s explanation that the recommended appointment of American Century was not affected by the impact that the appointment would have on the Advisor revenues and profitability, and recalled that the Advisor had demonstrated that the appointment of American Century may allow the Advisor to reach profitability when managing the Non-US Core Equity Fund slightly more quickly. On the basis of these considerations, the Board concluded that, in light of the nature, extent and quality of the services expected to be provided by American Century and the proposed fees to be paid to American Century by the Advisor for managing its allocated portion of the Non-US Core Equity Fund, the potential benefits accruing to American Century as a result of serving as a subadvisor to the Non-US Core Equity Fund were reasonable.
(c) Investment performance of the Non-US Core Equity Fund and American Century. Because American Century was a newly proposed subadvisor to the Non-US Core Equity Fund, the Board, at the Meeting, could not consider American Century’s investment performance in managing the Non-US Core Equity Fund as a factor in evaluating the Proposed American Century Subadvisory Agreement. However, the Board reviewed American Century’s historical investment performance record in subadvising another investment company that was comparable to the Non-US Core Equity Fund. The Board also compared the historical investment performance of American Century to relevant benchmarks and concluded that American Century’s historical performance record, viewed together with the other factors considered by the Board, supported a decision to approve the Proposed American Century Subadvisory Agreement.
Conclusion. Following consideration of the foregoing factors, it was reported that no single factor was determinative to the decisions of the Trustees. Based on these factors, along with the determination of the Advisor at
207
Table of Contents
Mercer Funds
Additional Information (Unaudited) (Continued)
the conclusion of its review, selection, and due diligence process to recommend American Century to serve as a new subadvisor to the Non-US Core Equity Fund, and such other matters as were deemed relevant, the Trustees concluded that the proposed fee rate for American Century was reasonable in relation to the services that would be provided to the Non-US Core Equity Fund. As a result, the Board, including all of the Independent Trustees, concluded that the approval of the Proposed American Century Subadvisory Agreement was in the best interests of the Non-US Core Equity Fund and its shareholders and approved the Proposed American Century Subadvisory Agreement.
Mercer Non-US Core Equity Fund
At a meeting of the Board held on February 27, 2014 (the “February Meeting”), the Trustees, including the Independent Trustees, considered and approved a new subadvisory agreement (the “New Arrowstreet Subadvisory Agreement”) between the Advisor and Arrowstreet Capital, Limited Partnership (“Arrowstreet”) on behalf of the Non-US Core Equity Fund. Due to a change in the ownership and governance structure of Arrowstreet, effective April 1, 2014 (the “Arrowstreet Transaction”), the prior subadvisory agreement between Arrowstreet and the Advisor, on behalf of the Non-US Core Equity Fund (the “Prior Arrowstreet Subadvisory Agreement”), was terminated, and the Board approved the New Arrowstreet Subadvisory Agreement to replace the Prior Arrowstreet Subadvisory Agreement.
In considering the approval of the New Arrowstreet Subadvisory Agreement, the Board considered the information and materials from the Advisor, Arrowstreet and counsel that included, as to Arrowstreet and the Non-US Core Equity Fund (i) a copy of a form of the New Arrowstreet Subadvisory Agreement; (ii) information regarding the process by which the Advisor initially selected and recommended Arrowstreet for Board approval, and the Advisor’s rationale for retaining Arrowstreet following the closing of the Arrowstreet Transaction; (iii) information regarding the nature, extent and quality of the services that Arrowstreet provided to the Non-US Core Equity Fund; (iv) information regarding Arrowstreet’s reputation, investment management business, personnel, and operations, and the effect that the Arrowstreet Transaction may have on Arrowstreet’s business and operations; (v) information regarding Arrowstreet’s brokerage and trading policies and practices; (vi) information regarding the level of subadvisory fees charged by Arrowstreet; (vii) information regarding Arrowstreet’s compliance program; (viii) information regarding Arrowstreet’s historical performance returns managing its allocated portion of the Non-US Core Equity Fund’s portfolio and investment mandates similar to the Non-US Core Equity Fund’s investment mandate, including information comparing that performance to a relevant index; and (ix) information regarding Arrowstreet’s financial condition before and after the Arrowstreet Transaction.
In addition, the Board considered presentations made by, and discussions held with, representatives of the Advisor. The Board considered and analyzed factors that the Board deemed relevant with respect to Arrowstreet, including: the nature, extent, and quality of the services to be provided to the Non-US Core Equity Fund by Arrowstreet following the consummation of the Arrowstreet Transaction; Arrowstreet’s management style and investment decision-making process; Arrowstreet’s historical performance record managing investment products similar to the Non-US Core Equity Fund; the qualifications and experience of the members of Arrowstreet’s portfolio management team; and Arrowstreet’s staffing levels and overall resources. The Independent Trustees also took into consideration the nature and extent of the oversight duties performed by the Advisor in connection with each of the subadvisors, which includes extensive management and compliance due diligence with respect to the management and operations of each of the subadvisors. Additionally, the Independent Trustees received assistance and advice regarding legal and industry standards and reviewed materials supplied by their independent legal counsel.
In particular, the Board, including the Independent Trustees, considered the following factors:
(a) The nature, extent, and quality of the advisory services to be provided by Arrowstreet. In examining the nature, extent and quality of the services that had been furnished by Arrowstreet to the Non-US Core Equity Fund under the Prior Arrowstreet Subadvisory Agreement, and that are proposed to be provided by Arrowstreet to the Non-US Core Equity Fund under the New Arrowstreet Subadvisory Agreement, the Board considered: (i) Arrowstreet’s organization, history, reputation, qualification and background, as well as the qualifications of its personnel; (ii) its expertise in providing portfolio management services to the Non-US Core Equity Fund and other similar investment portfolios and the performance history of the Non-US Core Equity Fund and those other portfolios; (iii) its
208
Table of Contents
Mercer Funds
Additional Information (Unaudited) (Continued)
investment strategy for the Non-US Core Equity Fund; (iv) its performance relative to comparable mutual funds and unmanaged indices; and (v) its compliance program. The Board also considered the review process undertaken by the Advisor and the Advisor’s favorable assessment of the nature and quality of the subadvisory services provided and expected to be provided to the Non-US Core Equity Fund by Arrowstreet after consummation of the Arrowstreet Transaction. The Board also noted that the executive and portfolio management teams of Arrowstreet were expected to stay in place after consummation of the Arrowstreet Transaction. The Board concluded that the Non-US Core Equity Fund and its shareholders would continue to benefit from the quality and experience of Arrowstreet’s investment professionals. Based on their consideration and review of the foregoing information, the Board concluded that the nature, extent and quality of the subadvisory services provided by Arrowstreet under the Prior Arrowstreet Subadvisory Agreement, as well as Arrowstreet’s ability to render such services based on its experience, operations and resources, were adequate and appropriate for the Non-US Core Equity Fund in light of the Non-US Core Equity Fund’s investment objective, and supported a decision to approve the New Arrowstreet Subadvisory Agreement.
(b) Comparison of the services to be rendered and fees to be paid to Arrowstreet under other advisory and subadvisory contracts, such as those with other clients. The Trustees discussed the services that would be rendered by Arrowstreet and evaluated the compensation to be paid to Arrowstreet by the Advisor for those services. The Trustees considered the proposed new fees payable under the proposed New Arrowstreet Subadvisory Agreement, noting that the proposed fee would be paid by the Advisor, and not the Non-US Core Equity Fund, and, thus, would not impact the fees paid by the Non-US Core Equity Fund. The Board concluded that the proposed fee payable to Arrowstreet by the Advisor with respect to the assets allocated to Arrowstreet in its capacity as subadvisor was reasonable and appropriate. The Trustees noted that the services that Arrowstreet would furnish to the Non-US Core Equity Fund appeared to be comparable to the services that Arrowstreet currently provides to its other advisory and subadvisory clients having similar investment strategies. The Trustees also considered that the fees agreed to by Arrowstreet were the result of an arm’s length bargain negotiated by unaffiliated parties.
(c) The investment performance of the Non-US Core Equity Fund and Arrowstreet. The Trustees considered Arrowstreet’s prior investment performance in managing its allocated portion of the Non-US Core Equity Fund’s portfolio as a factor in evaluating the proposed New Arrowstreet Subadvisory Agreement. The Trustees also considered the Advisor’s conclusions, and the reasons supporting the Advisor’s conclusions, that the performance record of Arrowstreet supported the approval of the proposed New Arrowstreet Subadvisory Agreement.
Conclusion. Following full consideration of the foregoing factors, it was reported that no single factor was determinative to the decisions of the Trustees. Based on these factors, along with the determination of the Advisor at the conclusion of its review and due diligence process and such other matters as were deemed relevant, the Trustees concluded that the fee rate for Arrowstreet pursuant to the New Arrowstreet Subadvisory Agreement was reasonable in relation to the services to be provided to the Non-US Core Equity Fund. As a result, the Board, including all of the Independent Trustees, concluded that the approval of the New Arrowstreet Subadvisory Agreement was in the best interests of the Non-US Core Equity Fund and its shareholders and approved the New Arrowstreet Subadvisory Agreement.
Mercer Core Fixed Income Fund
At the February Meeting, the Board, including the Independent Trustees, considered and approved a new subadvisory agreement (the “Proposed IR+M Subadvisory Agreement”) entered into by the Advisor and Income Research & Management (“IR+M”), with respect to the Mercer Core Fixed Income Fund (the “Core Fixed Income Fund”).
In considering the approval of the Proposed IR+M Subadvisory Agreement, the Board considered the information and materials from the Advisor, IR+M and counsel, that included, as to IR+M and the Core Fixed Income Fund: (i) the Proposed IR+M Subadvisory Agreement; (ii) information regarding the process by which the Advisor had reviewed, selected, and recommended IR+M for the Board’s approval, and the Advisor’s rationale for recommending that IR+M be appointed as a subadvisor to the Core Fixed Income Fund, and how IR+M would supplement the Fund’s other current subadvisors; (iii) the nature, extent, and quality of the services that IR+M proposed to provide to the Core Fixed Income Fund; (iv) the investment management business, portfolio
209
Table of Contents
Mercer Funds
Additional Information (Unaudited) (Continued)
management personnel, operations, prior investment experience, and reputation of IR+M; (v) IR+M’s brokerage and trading policies and practices; (vi) the level of subadvisory fees to be charged by IR+M for its services to the Core Fixed Income Fund, and a comparison of those fees to other accounts that IR+M manages; (vii) IR+M’s compliance program; (viii) information regarding IR+M’s historical performance returns managing an investment mandate similar to the Core Fixed Income Fund’s investment mandate, and a comparison of such performance to a relevant index; and (ix) the financial condition of IR+M.
In addition, the Board considered presentations made by, and discussions held with, representatives of the Advisor. The Board considered and analyzed factors that the Board deemed relevant with respect to IR+M, including: the nature, extent, and quality of the services to be provided to the Core Fixed Income Fund by IR+M; IR+M’s management style and investment decision-making process; IR+M’s historical performance record managing investment products similar to the Core Fixed Income Fund; the qualifications and experience of the members of IR+M’s portfolio management team; and IR+M’s staffing levels and overall resources. The Independent Trustees also took into consideration the nature and extent of the oversight duties performed by the Advisor in connection with each of the subadvisors, which includes extensive management and compliance due diligence with respect to the management and operations of each of the subadvisors. Additionally, the Independent Trustees received assistance and advice regarding legal and industry standards and reviewed materials supplied by their independent legal counsel.
In particular, and as to IR+M, the Board, including the Independent Trustees, considered the following factors:
(a) The nature, extent, and quality of the services to be provided by IR+M. The Board reviewed the nature, extent, and quality of the services to be provided by IR+M to the Core Fixed Income Fund. The Board discussed the specific investment management process that IR+M indicated that it will employ to manage its allocated portion of the Core Fixed Income Fund’s investment portfolio (which was described in detail in the materials provided by IR+M), the qualifications of IR+M’s portfolio managers and investment management personnel with regard to implementing the investment mandate relating to the allocated portion of the Core Fixed Income Fund’s investment portfolio that IR+M would be managing, and the performance record of IR+M as compared to the relevant benchmark. The Board considered IR+M’s infrastructure and resources, and whether IR+M’s organization appeared to support IR+M’s strategy adequately. The Board also discussed the Advisor’s review, selection, and due diligence process with respect to IR+M, and the Advisor’s favorable assessment as to the nature, extent, and quality of the subadvisory services expected to be provided to the Core Fixed Income Fund by IR+M. The Board determined that the Core Fixed Income Fund and its shareholders would benefit from the quality and experience of IR+M’s portfolio managers and the qualifications of its investment professionals. Based on their consideration and review of the foregoing information, the Board concluded that the nature, extent and quality of the subadvisory services anticipated to be provided by IR+M, as well as IR+M’s ability to render such services based on IR+M’s experience, operations and resources, were appropriate for the Core Fixed Income Fund, in light of the Core Fixed Income Fund’s investment objective, and the mandate relating to the allocated portion of the Core Fixed Income Fund’s investment portfolio that IR+M would manage.
(b) Comparison of the services to be rendered and fees to be paid to IR+M under other advisory and subadvisory contracts, such as those with other clients. The Board discussed the services that would be rendered by IR+M and evaluated the compensation to be paid to IR+M by the Advisor for those services. The Board noted that the services that IR+M would furnish to the Core Fixed Income Fund appeared to be comparable to the services that IR+M currently provides to its other advisory and subadvisory clients having similar investment strategies. The Trustees also considered comparisons of the fees that will be paid to IR+M by the Advisor in light of the fees that were charged by IR+M to its other advisory clients, as disclosed in IR+M’s Form ADV, Part 2A (Firm Brochure) and in its 15(c) Questionnaire responses, including commingled and separate accounts. The Board also considered that the fees agreed to by IR+M were the result of an arm’s length bargain negotiated by unaffiliated parties.
The Board considered the review, selection, and due diligence process employed by the Advisor, in determining to recommend IR+M to serve as a subadvisor to the Core Fixed Income Fund, and the Advisor’s reasons for concluding that the subadvisory fees to be paid by the Advisor to IR+M for its services to the Core Fixed Income Fund were reasonable. The Board emphasized in their discussions that the subadvisory fees of IR+M would be paid by the Advisor, and were not additional fees to be borne by the Core Fixed Income Fund or its shareholders. Based
210
Table of Contents
Mercer Funds
Additional Information (Unaudited) (Continued)
on their discussion, the Board concluded that, in light of the nature, quality, and extent of the services to be provided, the proposed fees to be paid to IR+M with respect to the assets of the Core Fixed Income Fund to be allocated to IR+M appeared to be within a reasonable range. The Board also considered the potential “fallout” or ancillary benefits that may accrue to IR+M from its relationship with the Core Fixed Income Fund and concluded that they were reasonable.
Since the fees to be paid to IR+M were the result of arm’s-length bargaining between unaffiliated parties, and given the Advisor’s economic incentive to negotiate a reasonable fee, the potential profitability of IR+M was not considered relevant to the Board’s deliberations. The Board took note of the Advisor’s explanation that the recommended appointment of IR+M was not affected by the impact that the appointment would have on the Advisor revenues and profitability, and recalled that the Advisor had demonstrated that the appointment of IR+M may result in a benefit to the Advisor as a result of the level of the subadvisory fee. On the basis of these considerations, the Board concluded that, in light of the nature, extent and quality of the services expected to be provided by IR+M and the proposed fees to be paid to IR+M by the Advisor for managing its allocated portion of the Core Fixed Income Fund, the potential benefits accruing to IR+M as a result of serving as a subadvisor to the Core Fixed Income Fund were reasonable.
(c) Investment performance of the Core Fixed Income Fund and IR+M. Because IR+M was a newly proposed subadvisor to the Core Fixed Income Fund, the Board, at the Meeting, could not consider IR+M’s investment performance in managing the Core Fixed Income Fund as a factor in evaluating the Proposed IR+M Subadvisory Agreement. However, the Board reviewed IR+M’s historical investment performance record in managing or subadvising other investment companies and accounts that were comparable to the Core Fixed Income Fund. The Board also compared the historical investment performance of IR+M to relevant benchmarks and concluded that IR+M’s historical performance record, viewed together with the other factors considered by the Board, supported a decision to approve the Proposed IR+M Subadvisory Agreement.
Conclusion. Following consideration of the foregoing factors, it was reported that no single factor was determinative to the decisions of the Trustees. Based on these factors, along with the determination of the Advisor at the conclusion of its review, selection, and due diligence process to recommend IR+M to serve as a new subadvisor to the Core Fixed Income Fund, and such other matters as were deemed relevant, the Trustees concluded that the proposed fee rate for IR+M was reasonable in relation to the services that would be provided to the Core Fixed Income Fund. As a result, the Board, including all of the Independent Trustees, concluded that the approval of the Proposed IR+M Subadvisory Agreement was in the best interests of the Core Fixed Income Fund and its shareholders and approved the Proposed IR+M Subadvisory Agreement.
Mercer Core Fixed Income Fund
At the February Meeting, the Board, including the Independent Trustees, considered and approved a new subadvisory agreement (the “Proposed Prudential Subadvisory Agreement”) entered into by the Advisor and Prudential Investment Management Inc. (“Prudential”), with respect to the Mercer Core Fixed Income Fund (the “Core Fixed Income Fund”).
In considering the approval of the Proposed Prudential Subadvisory Agreement, the Board considered the information and materials from the Advisor, Prudential and counsel, that included, as to Prudential and the Core Fixed Income Fund: (i) the Proposed Prudential Subadvisory Agreement; (ii) information regarding the process by which the Advisor had reviewed, selected, and recommended Prudential for the Board’s approval, and the Advisor’s rationale for recommending that Prudential be appointed as a subadvisor to the Core Fixed Income Fund, and how Prudential would supplement the Fund’s other current subadvisors; (iii) the nature, extent, and quality of the services that Prudential proposed to provide to the Core Fixed Income Fund; (iv) the investment management business, portfolio management personnel, operations, prior investment experience, and reputation of Prudential; (v) Prudential’s brokerage and trading policies and practices; (vi) the level of subadvisory fees to be charged by Prudential for its services to the Core Fixed Income Fund, and a comparison of those fees to other accounts that Prudential manages; (vii) Prudential’s compliance program; (viii) information regarding Prudential’s historical performance returns managing an investment mandate similar to the Core Fixed Income Fund’s investment mandate, and a comparison of such performance to a relevant index; and (ix) the financial condition of Prudential.
211
Table of Contents
Mercer Funds
Additional Information (Unaudited) (Continued)
In addition, the Board considered presentations made by, and discussions held with, representatives of the Advisor. The Board considered and analyzed factors that the Board deemed relevant with respect to Prudential, including: the nature, extent, and quality of the services to be provided to the Core Fixed Income Fund by Prudential; Prudential’s management style and investment decision-making process; Prudential’s historical performance record managing investment products similar to the Core Fixed Income Fund; the qualifications and experience of the members of Prudential’s portfolio management team; and Prudential’s staffing levels and overall resources. The Independent Trustees also took into consideration the nature and extent of the oversight duties performed by the Advisor in connection with each of the subadvisors, which includes extensive management and compliance due diligence with respect to the management and operations of each of the subadvisors. Additionally, the Independent Trustees received assistance and advice regarding legal and industry standards and reviewed materials supplied by their independent legal counsel.
In particular, and as to Prudential, the Board, including the Independent Trustees, considered the following factors:
(a) The nature, extent, and quality of the services to be provided by Prudential. The Board reviewed the nature, extent, and quality of the services to be provided by Prudential to the Core Fixed Income Fund. The Board discussed the specific investment management process that Prudential indicated that it will employ to manage its allocated portion of the Core Fixed Income Fund’s investment portfolio (which was described in detail in the materials provided by Prudential), the qualifications of Prudential’s portfolio managers and investment management personnel with regard to implementing the investment mandate relating to the allocated portion of the Core Fixed Income Fund’s investment portfolio that Prudential would be managing, and the performance record of Prudential as compared to a relevant benchmark. The Board considered Prudential’s infrastructure and resources, and whether Prudential’s organization appeared to support Prudential’s strategy adequately. The Board also discussed the Advisor’s review, selection, and due diligence process with respect to Prudential, and the Advisor’s favorable assessment as to the nature, extent, and quality of the subadvisory services expected to be provided to the Core Fixed Income Fund by Prudential. The Board determined that the Core Fixed Income Fund and its shareholders would benefit from the quality and experience of Prudential’s portfolio managers and the qualifications of its investment professionals. Based on their consideration and review of the foregoing information, the Board concluded that the nature, extent and quality of the subadvisory services anticipated to be provided by Prudential, as well as Prudential’s ability to render such services based on Prudential’s experience, operations and resources, were appropriate for the Core Fixed Income Fund, in light of the Core Fixed Income Fund’s investment objective, and the mandate relating to the allocated portion of the Core Fixed Income Fund’s investment portfolio that Prudential would manage.
(b) Comparison of the services to be rendered and fees to be paid to Prudential under other advisory and subadvisory contracts, such as those with other clients. The Board discussed the services that would be rendered by Prudential and evaluated the compensation to be paid to Prudential by the Advisor for those services. The Board noted that the services that Prudential would furnish to the Core Fixed Income Fund appeared to be comparable to the services that Prudential currently provides to its other advisory and subadvisory clients having similar investment strategies. The Trustees also considered comparisons of the fees that will be paid to Prudential by the Advisor in light of the fees that were charged by Prudential to its other advisory clients, as disclosed in Prudential’s Form ADV, Part 2A (Firm Brochure) and in its 15(c) Questionnaire responses, including commingled and separate accounts. The Board also considered that the fees agreed to by Prudential were the result of an arm’s length bargain negotiated by unaffiliated parties.
The Board considered the review, selection, and due diligence process employed by the Advisor, in determining to recommend Prudential to serve as a subadvisor to the Core Fixed Income Fund, and the Advisor’s reasons for concluding that the subadvisory fees to be paid by the Advisor to Prudential for its services to the Core Fixed Income Fund were reasonable. The Board emphasized in their discussions that the subadvisory fees of Prudential would be paid by the Advisor, and were not additional fees to be borne by the Core Fixed Income Fund or its shareholders. Based on their discussion, the Board concluded that, in light of the nature, quality, and extent of the services to be provided, the proposed fees to be paid to Prudential with respect to the assets of the Core Fixed Income Fund to be allocated to Prudential appeared to be within a reasonable range. The Board also considered the potential “fallout” or ancillary benefits that may accrue to Prudential from its relationship with the Core Fixed Income Fund and concluded that they were reasonable.
212
Table of Contents
Mercer Funds
Additional Information (Unaudited) (Continued)
Since the fees to be paid to Prudential were the result of arm’s-length bargaining between unaffiliated parties, and given the Advisor’s economic incentive to negotiate a reasonable fee, the potential profitability of Prudential was not considered relevant to the Board’s deliberations. The Board took note of the Advisor’s explanation that the recommended appointment of Prudential was not affected by the impact that the appointment would have on the Advisor revenues and profitability, and recalled that the Advisor had demonstrated that the appointment of Prudential may result in a benefit to the Advisor as a result of the level of the subadvisory fee. On the basis of these considerations, the Board concluded that, in light of the nature, extent and quality of the services expected to be provided by Prudential and the proposed fees to be paid to Prudential by the Advisor for managing its allocated portion of the Core Fixed Income Fund, the potential benefits accruing to Prudential as a result of serving as a subadvisor to the Core Fixed Income Fund were reasonable.
(c) Investment performance of the Core Fixed Income Fund and Prudential. Because Prudential was a newly proposed subadvisor to the Core Fixed Income Fund, the Board, at the Meeting, could not consider Prudential’s investment performance in managing the Core Fixed Income Fund as a factor in evaluating the Proposed Prudential Subadvisory Agreement. However, the Board reviewed Prudential’s historical investment performance record in managing or subadvising other investment companies and accounts that were comparable to the Core Fixed Income Fund. The Board also compared the historical investment performance of Prudential to relevant benchmarks and concluded that Prudential’s historical performance record, viewed together with the other factors considered by the Board, supported a decision to approve the Proposed Prudential Subadvisory Agreement.
Conclusion. Following consideration of the foregoing factors, it was reported that no single factor was determinative to the decisions of the Trustees. Based on these factors, along with the determination of the Advisor at the conclusion of its review, selection, and due diligence process to recommend Prudential to serve as a new subadvisor to the Core Fixed Income Fund, and such other matters as were deemed relevant, the Trustees concluded that the proposed fee rate for Prudential was reasonable in relation to the services that would be provided to the Core Fixed Income Fund. As a result, the Board, including all of the Independent Trustees, concluded that the approval of the Proposed Prudential Subadvisory Agreement was in the best interests of the Core Fixed Income Fund and its shareholders and approved the Proposed Prudential Subadvisory Agreement.
Mercer US Large Cap Growth Equity Fund
Mercer US Large Cap Value Equity Fund
Mercer US Small/Mid Cap Growth Equity Fund
Mercer US Small/Mid Cap Value Equity Fund
Mercer Non-US Core Equity Fund
Mercer Emerging Markets Equity Fund
Mercer Global Low Volatility Equity Fund
At the February Meeting, the Board, including the Independent Trustees, considered and approved a new subadvisory agreement (the “Proposed SSgA Subadvisory Agreement”) entered into by the Advisor and SSgA Funds Management. Inc. (“SSgA”), with respect to the Mercer US Large Cap Growth Equity Fund, Mercer US Large Cap Value Equity Fund, Mercer US Small/Mid Cap Growth Equity Fund, Mercer US Small/Mid Cap Value Equity Fund, Mercer Non-US Core Equity Fund, Mercer Emerging Markets Equity Fund and Mercer Global Low Volatility Equity Fund (the “Cash Equitization Funds”).
In considering the approval of the Proposed SSgA Subadvisory Agreement, the Board considered the information and materials from the Advisor, SSgA and counsel, that included, as to SSgA and the Cash Equitization Funds: (i) the Proposed SSgA Subadvisory Agreement; (ii) information regarding the process by which the Advisor had reviewed, selected, and recommended SSgA for the Board’s approval, and the Advisor’s rationale for recommending that SSgA be appointed as a subadvisor to the Cash Equitization Funds, and how SSgA would supplement the Fund’s other current subadvisors; (iii) the nature, extent, and quality of the services that SSgA proposed to provide to the Cash Equitization Funds; (iv) the investment management business, portfolio management personnel, operations, prior investment experience, and reputation of SSgA; (v) SSgA’s brokerage and trading policies and practices; (vi) the level of subadvisory fees to be charged by SSgA for its services to the Cash Equitization Funds, and a comparison of those fees to other accounts that SSgA manages; (vii) SSgA’s compliance
213
Table of Contents
Mercer Funds
Additional Information (Unaudited) (Continued)
program; (viii) information regarding SSgA’s historical performance returns managing the investment mandate that it intended to use with respect to each of the Cash Equitization Fund’s, and a comparison of such performance to a relevant index; and (ix) the financial condition of SSgA.
In addition, the Board considered presentations made by, and discussions held with, representatives of the Advisor. The Board considered and analyzed factors that the Board deemed relevant with respect to SSgA, including: the nature, extent, and quality of the services to be provided to the Cash Equitization Funds by SSgA; SSgA’s management style and investment decision-making process; SSgA’s historical performance record managing investment products similar to the investment mandate that it intended to use with respect to each of the Cash Equitization Funds; the qualifications and experience of the members of SSgA’s portfolio management team; and SSgA’s staffing levels and overall resources. The Independent Trustees also took into consideration the nature and extent of the oversight duties performed by the Advisor in connection with each of the subadvisors, which includes extensive management and compliance due diligence with respect to the management and operations of each of the subadvisors. Additionally, the Independent Trustees received assistance and advice regarding legal and industry standards and reviewed materials supplied by their independent legal counsel.
In particular, and as to SSgA, the Board, including the Independent Trustees, considered the following factors:
(a) The nature, extent, and quality of the services to be provided by SSgA. The Board reviewed the nature, extent, and quality of the services to be provided by SSgA to the Cash Equitization Funds. The Board discussed the specific investment management process that SSgA indicated that it will employ to manage its allocated portion of each Cash Equitization Fund’s investment portfolio (which was described in detail in the materials provided by SSgA), the qualifications of SSgA’s portfolio managers and investment management personnel with regard to implementing the investment mandate relating to the allocated portion of each Cash Equitization Fund’s investment portfolio that SSgA would be managing, and the performance record of SSgA as compared to a relevant benchmark. The Board considered SSgA’s infrastructure and resources, and whether SSgA’s organization appeared to support SSgA’s strategy adequately. The Board also discussed the Advisor’s review, selection, and due diligence process with respect to SSgA, and the Advisor’s favorable assessment as to the nature, extent, and quality of the subadvisory services expected to be provided to each Cash Equitization Fund by SSgA. The Board determined that each Cash Equitization Fund and its shareholders would benefit from the quality and experience of SSgA’s portfolio managers and the qualifications of its investment professionals. Based on their consideration and review of the foregoing information, the Board concluded that the nature, extent and quality of the subadvisory services anticipated to be provided by SSgA, as well as SSgA’s ability to render such services based on SSgA’s experience, operations and resources, were appropriate for each Cash Equitization Fund, in light of the such Fund’s investment objective, and the mandate relating to the allocated portion of the Fund’s investment portfolio that SSgA would manage.
(b) Comparison of the services to be rendered and fees to be paid to SSgA under other advisory and subadvisory contracts, such as those with other clients. The Board discussed the services that would be rendered by SSgA and evaluated the compensation to be paid to SSgA by the Advisor for those services. The Board noted that the services that SSgA would furnish to each Cash Equitization Fund appeared to be comparable to the services that SSgA currently provides to its other advisory and subadvisory clients having similar investment strategies. The Trustees also considered comparisons of the fees that will be paid to SSgA by the Advisor in light of the fees that were charged by SSgA to its other advisory clients, as disclosed in SSgA’s Form ADV, Part 2A (Firm Brochure) and in its 15(c) Questionnaire responses, including commingled and separate accounts. The Board also considered that the fees agreed to by SSgA were the result of an arm’s length bargain negotiated by unaffiliated parties.
The Board considered the review, selection, and due diligence process employed by the Advisor, in determining to recommend SSgA to serve as a subadvisor to each Cash Equitization Fund, and the Advisor’s reasons for concluding that the subadvisory fees to be paid by the Advisor to SSgA for its services to each Cash Equitization Fund were reasonable. The Board emphasized in their discussions that the subadvisory fees of SSgA would be paid by the Advisor, and were not additional fees to be borne by each Cash Equitization Funds or its shareholders. Based on their discussion, the Board concluded that, in light of the nature, quality, and extent of the services to be provided, the proposed fees to be paid to SSgA with respect to the assets of each Cash Equitization Fund to be allocated to SSgA appeared to be within a reasonable range. The Board also considered the potential “fallout” or ancillary benefits that may accrue to SSgA from its relationship with the Cash Equitization Funds and concluded that they were reasonable.
214
Table of Contents
Mercer Funds
Additional Information (Unaudited) (Continued)
Since the fees to be paid to SSgA were the result of arm’s-length bargaining between unaffiliated parties, and given the Advisor’s economic incentive to negotiate a reasonable fee, the potential profitability of SSgA was not considered relevant to the Board’s deliberations. The Board took note of the Advisor’s explanation that the recommended appointment of SSgA was not affected by the impact that the appointment would have on the Advisor revenues and profitability, and recalled that the Advisor had demonstrated that the appointment of SSgA may result in a benefit to the Advisor as a result of the level of the subadvisory fee. On the basis of these considerations, the Board concluded that, in light of the nature, extent and quality of the services expected to be provided by SSgA and the proposed fees to be paid to SSgA by the Advisor for managing its allocated portion of the Cash Equitization Funds, the potential benefits accruing to SSgA as a result of serving as a subadvisor to each Cash Equitization Fund were reasonable.
(c) Investment performance of the Cash Equitization Funds and SSgA. Because SSgA was a newly proposed subadvisor to the Cash Equitization Funds, the Board, at the Meeting, could not consider SSgA’s investment performance in managing each Cash Equitization Fund as a factor in evaluating the Proposed SSgA Subadvisory Agreement. However, the Board reviewed SSgA’s historical investment performance record in managing or subadvising other investment companies and accounts that were comparable to the investment mandate that it intended to use with respect to each of the Cash Equitization Funds. The Board also compared the historical investment performance of SSgA to relevant benchmarks and concluded that SSgA’s historical performance record, viewed together with the other factors considered by the Board, supported a decision to approve the Proposed SSgA Subadvisory Agreement.
Conclusion. Following consideration of the foregoing factors, it was reported that no single factor was determinative to the decisions of the Trustees. Based on these factors, along with the determination of the Advisor at the conclusion of its review, selection, and due diligence process to recommend SSgA to serve as a new subadvisor to each Cash Equitization Fund, and such other matters as were deemed relevant, the Trustees concluded that the proposed fee rate for SSgA was reasonable in relation to the services that would be provided to the Cash Equitization Funds. As a result, the Board, including all of the Independent Trustees, concluded that the approval of the Proposed SSgA Subadvisory Agreement was in the best interests of each Cash Equitization Fund and its shareholders and approved the Proposed SSgA Subadvisory Agreement.
Mercer US Large Cap Growth Equity Fund
At a meeting of the Board on March 11-12, 2014 (the “March Meeting”), the Trustees, including the Independent Trustees, considered and approved a new subadvisory agreement (the “Proposed Columbia Subadvisory Agreement”) between the Advisor and Columbia Management Investment Advisers, LLC (“Columbia”) on behalf of the Mercer US Large Cap Growth Equity (“Large Cap Growth Fund”).
In considering the approval of the Proposed Columbia Subadvisory Agreement, the Board considered the information and materials from the Advisor, Columbia and counsel, that included, as to Columbia and the Large Cap Growth Fund: (i) the Proposed Columbia Subadvisory Agreement; (ii) information regarding the process by which the Advisor had reviewed, selected, and recommended Columbia for the Board’s approval, and the Advisor’s rationale for recommending that Columbia be appointed as a subadvisor to the Large Cap Growth Fund, and how Columbia would supplement the Fund’s other current subadvisors; (iii) the nature, extent, and quality of the services that Columbia proposed to provide to the Large Cap Growth Fund; (iv) the investment management business, portfolio management personnel, operations, prior investment experience, and reputation of Columbia; (v) Columbia’s brokerage and trading policies and practices; (vi) the level of subadvisory fees to be charged by Columbia for its services to the Large Cap Growth Fund, and a comparison of those fees to other accounts that Columbia manages; (vii) Columbia’s compliance program; (viii) information regarding Columbia’s historical performance returns managing an investment mandate similar to the Large Cap Growth Fund’s investment mandate, and a comparison of such performance to a relevant index; and (ix) the financial condition of Columbia.
In addition, the Board considered presentations made by, and discussions held with, representatives of the Advisor. The Board considered and analyzed factors that the Board deemed relevant with respect to Columbia, including: the nature, extent, and quality of the services to be provided to the Large Cap Growth Fund by Columbia; Columbia’s management style and investment decision-making process; Columbia’s historical performance record managing
215
Table of Contents
Mercer Funds
Additional Information (Unaudited) (Continued)
investment products similar to the Large Cap Growth Fund; the qualifications and experience of the members of Columbia’s portfolio management team; and Columbia’s staffing levels and overall resources. The Independent Trustees also took into consideration the nature and extent of the oversight duties performed by the Advisor in connection with each of the subadvisors, which includes extensive management and compliance due diligence with respect to the management and operations of each of the subadvisors. Additionally, the Independent Trustees received assistance and advice regarding legal and industry standards and reviewed materials supplied by their independent legal counsel.
In particular, and as to Columbia, the Board, including the Independent Trustees, considered the following factors:
(a) The nature, extent, and quality of the services to be provided by Columbia. The Board reviewed the nature, extent, and quality of the services to be provided by Columbia to the Large Cap Growth Fund. The Board discussed the specific investment management process that Columbia indicated that it will employ to manage its allocated portion of the Large Cap Growth Fund’s investment portfolio (which was described in detail in the materials provided by Columbia), the qualifications of Columbia’s portfolio managers and investment management personnel with regard to implementing the investment mandate relating to the allocated portion of the Large Cap Growth Fund’s investment portfolio that Columbia would be managing, and the performance record of Columbia as compared to a relevant benchmark. The Board considered Columbia’s infrastructure and resources, and whether Columbia’s organization appeared to support Columbia’s strategy adequately. The Board also discussed the Advisor’s review, selection, and due diligence process with respect to Columbia, and the Advisor’s favorable assessment as to the nature, extent, and quality of the subadvisory services expected to be provided to the Large Cap Growth Fund by Columbia. The Board determined that the Large Cap Growth Fund and its shareholders would benefit from the quality and experience of Columbia’s portfolio managers and the qualifications of its investment professionals. Based on their consideration and review of the foregoing information, the Board concluded that the nature, extent and quality of the subadvisory services anticipated to be provided by Columbia, as well as Columbia’s ability to render such services based on Columbia’s experience, operations and resources, were appropriate for the Large Cap Growth Fund, in light of the Large Cap Growth Fund’s investment objective, and the mandate relating to the allocated portion of the Large Cap Growth Fund’s investment portfolio that Columbia would manage.
(b) Comparison of the services to be rendered and fees to be paid to Columbia under other advisory and subadvisory contracts, such as those with other clients. The Board discussed the services that would be rendered by Columbia and evaluated the compensation to be paid to Columbia by the Advisor for those services. The Board noted that the services that Columbia would furnish to the Large Cap Growth Fund appeared to be comparable to the services that Columbia currently provides to its other advisory and subadvisory clients having similar investment strategies. The Trustees also considered comparisons of the fees that will be paid to Columbia by the Advisor in light of the fees that were charged by Columbia to its other advisory clients, as disclosed in Columbia’s Form ADV, Part 2A (Firm Brochure) and in its 15(c) Questionnaire responses, including commingled and separate accounts. The Board also considered that the fees agreed to by Columbia were the result of an arm’s length bargain negotiated by unaffiliated parties.
The Board considered the review, selection, and due diligence process employed by the Advisor, in determining to recommend Columbia to serve as a subadvisor to the Large Cap Growth Fund, and the Advisor’s reasons for concluding that the subadvisory fees to be paid by the Advisor to Columbia for its services to the Large Cap Growth Fund were reasonable. The Board emphasized in their discussions that the subadvisory fees of Columbia would be paid by the Advisor, and were not additional fees to be borne by the Large Cap Growth Fund or its shareholders. Based on their discussion, the Board concluded that, in light of the nature, quality, and extent of the services to be provided, the proposed fees to be paid to Columbia with respect to the assets of the Large Cap Growth Fund to be allocated to Columbia appeared to be within a reasonable range. The Board also considered the potential “fallout” or ancillary benefits that may accrue to Columbia from its relationship with the Large Cap Growth Fund and concluded that they were reasonable.
Since the fees to be paid to Columbia were the result of arm’s-length bargaining between unaffiliated parties, and given the Advisor’s economic incentive to negotiate a reasonable fee, the potential profitability of Columbia was not considered relevant to the Board’s deliberations. The Board took note of the Advisor’s explanation that the
216
Table of Contents
Mercer Funds
Additional Information (Unaudited) (Continued)
recommended appointment of Columbia was not affected by the impact that the appointment would have on the Advisor revenues and profitability, and recalled that the Advisor had demonstrated that the appointment of Columbia may result in a benefit to the Advisor as a result of the level of the subadvisory fee. On the basis of these considerations, the Board concluded that, in light of the nature, extent and quality of the services expected to be provided by Columbia and the proposed fees to be paid to Columbia by the Advisor for managing its allocated portion of the Large Cap Growth Fund, the potential benefits accruing to Columbia as a result of serving as a subadvisor to the Large Cap Growth Fund were reasonable.
(c) Investment performance of the Large Cap Growth Fund and Columbia. Because Columbia was a newly proposed subadvisor to the Large Cap Growth Fund, the Board, at the Meeting, could not consider Columbia’s investment performance in managing the Large Cap Growth Fund as a factor in evaluating the Proposed Columbia Subadvisory Agreement. However, the Board reviewed Columbia’s historical investment performance record in managing or subadvising other investment companies and accounts that were comparable to the Large Cap Growth Fund. The Board also compared the historical investment performance of Columbia to relevant benchmarks and concluded that Columbia’s historical performance record, viewed together with the other factors considered by the Board, supported a decision to approve the Proposed Columbia Subadvisory Agreement.
Conclusion. Following consideration of the foregoing factors, it was reported that no single factor was determinative to the decisions of the Trustees. Based on these factors, along with the determination of the Advisor at the conclusion of its review, selection, and due diligence process to recommend Columbia to serve as a new subadvisor to the Large Cap Growth Fund, and such other matters as were deemed relevant, the Trustees concluded that the proposed fee rate for Columbia was reasonable in relation to the services that would be provided to the Large Cap Growth Fund. As a result, the Board, including all of the Independent Trustees, concluded that the approval of the Proposed Columbia Subadvisory Agreement was in the best interests of the Large Cap Growth Fund and its shareholders and approved the Proposed Columbia Subadvisory Agreement.
Mercer US Large Cap Growth Equity Fund
At the March Meeting, the Trustees, including the Independent Trustees, considered and approved a new subadvisory agreement (the “Proposed HSMP Subadvisory Agreement”) between the Advisor and HS Management Partners, LLC (“HSMP”) on behalf of the Large Cap Growth Fund.
In considering the approval of the Proposed HSMP Subadvisory Agreement, the Board considered the information and materials from the Advisor, HSMP and counsel, that included, as to HSMP and the Large Cap Growth Fund: (i) the Proposed HSMP Subadvisory Agreement; (ii) information regarding the process by which the Advisor had reviewed, selected, and recommended HSMP for the Board’s approval, and the Advisor’s rationale for recommending that HSMP be appointed as a subadvisor to the Large Cap Growth Fund, and how HSMP would supplement the Fund’s other current subadvisors; (iii) the nature, extent, and quality of the services that HSMP proposed to provide to the Large Cap Growth Fund; (iv) the investment management business, portfolio management personnel, operations, prior investment experience, and reputation of HSMP; (v) HSMP’s brokerage and trading policies and practices; (vi) the level of subadvisory fees to be charged by HSMP for its services to the Large Cap Growth Fund, and a comparison of those fees to other accounts that HSMP manages; (vii) HSMP’s compliance program; (viii) information regarding HSMP’s historical performance returns managing an investment mandate similar to the Large Cap Growth Fund’s investment mandate, and a comparison of such performance to a relevant index; and (ix) the financial condition of HSMP.
In addition, the Board considered presentations made by, and discussions held with, representatives of the Advisor. The Board considered and analyzed factors that the Board deemed relevant with respect to HSMP, including: the nature, extent, and quality of the services to be provided to the Large Cap Growth Fund by HSMP; HSMP’s management style and investment decision-making process; HSMP’s historical performance record managing investment products similar to the Large Cap Growth Fund; the qualifications and experience of the members of HSMP’s portfolio management team; and HSMP’s staffing levels and overall resources. The Independent Trustees also took into consideration the nature and extent of the oversight duties performed by the Advisor in connection with each of the subadvisors, which includes extensive management and compliance due diligence with respect to the management and operations of each of the subadvisors. Additionally, the Independent Trustees received assistance and advice regarding legal and industry standards and reviewed materials supplied by their independent legal counsel.
217
Table of Contents
Mercer Funds
Additional Information (Unaudited) (Continued)
In particular, and as to HSMP, the Board, including the Independent Trustees, considered the following factors:
(a) The nature, extent, and quality of the services to be provided by HSMP. The Board reviewed the nature, extent, and quality of the services to be provided by HSMP to the Large Cap Growth Fund. The Board discussed the specific investment management process that HSMP indicated that it will employ to manage its allocated portion of the Large Cap Growth Fund’s investment portfolio (which was described in detail in the materials provided by HSMP), the qualifications of HSMP’s portfolio managers and investment management personnel with regard to implementing the investment mandate relating to the allocated portion of the Large Cap Growth Fund’s investment portfolio that HSMP would be managing, and the performance record of HSMP as compared to a relevant benchmark. The Board considered HSMP’s infrastructure and resources, and whether HSMP’s organization appeared to support HSMP’s strategy adequately. The Board also discussed the Advisor’s review, selection, and due diligence process with respect to HSMP, and the Advisor’s favorable assessment as to the nature, extent, and quality of the subadvisory services expected to be provided to the Large Cap Growth Fund by HSMP. The Board determined that the Large Cap Growth Fund and its shareholders would benefit from the quality and experience of HSMP’s portfolio managers and the qualifications of its investment professionals. Based on their consideration and review of the foregoing information, the Board concluded that the nature, extent and quality of the subadvisory services anticipated to be provided by HSMP, as well as HSMP’s ability to render such services based on HSMP’s experience, operations and resources, were appropriate for the Large Cap Growth Fund, in light of the Large Cap Growth Fund’s investment objective, and the mandate relating to the allocated portion of the Large Cap Growth Fund’s investment portfolio that HSMP would manage.
(b) Comparison of the services to be rendered and fees to be paid to HSMP under other advisory and subadvisory contracts, such as those with other clients. The Board discussed the services that would be rendered by HSMP and evaluated the compensation to be paid to HSMP by the Advisor for those services. The Board noted that the services that HSMP would furnish to the Large Cap Growth Fund appeared to be comparable to the services that HSMP currently provides to its other advisory and subadvisory clients having similar investment strategies. The Trustees also considered comparisons of the fees that will be paid to HSMP by the Advisor in light of the fees that were charged by HSMP to its other advisory clients, as disclosed in HSMP’s Form ADV, Part 2A (Firm Brochure) and in its 15(c) Questionnaire responses, including commingled and separate accounts. The Board also considered that the fees agreed to by HSMP were the result of an arm’s length bargain negotiated by unaffiliated parties.
The Board considered the review, selection, and due diligence process employed by the Advisor, in determining to recommend HSMP to serve as a subadvisor to the Large Cap Growth Fund, and the Advisor’s reasons for concluding that the subadvisory fees to be paid by the Advisor to HSMP for its services to the Large Cap Growth Fund were reasonable. The Board emphasized in their discussions that the subadvisory fees of HSMP would be paid by the Advisor, and were not additional fees to be borne by the Large Cap Growth Fund or its shareholders. Based on their discussion, the Board concluded that, in light of the nature, quality, and extent of the services to be provided, the proposed fees to be paid to HSMP with respect to the assets of the Large Cap Growth Fund to be allocated to HSMP appeared to be within a reasonable range. The Board also considered the potential “fallout” or ancillary benefits that may accrue to HSMP from its relationship with the Large Cap Growth Fund and concluded that they were reasonable.
Since the fees to be paid to HSMP were the result of arm’s-length bargaining between unaffiliated parties, and given the Advisor’s economic incentive to negotiate a reasonable fee, the potential profitability of HSMP was not considered relevant to the Board’s deliberations. The Board took note of the Advisor’s explanation that the recommended appointment of HSMP was not affected by the impact that the appointment would have on the Advisor revenues and profitability, and recalled that the Advisor had demonstrated that the appointment of HSMP may result in a benefit to the Advisor as a result of the level of the subadvisory fee. On the basis of these considerations, the Board concluded that, in light of the nature, extent and quality of the services expected to be provided by HSMP and the proposed fees to be paid to HSMP by the Advisor for managing its allocated portion of the Large Cap Growth Fund, the potential benefits accruing to HSMP as a result of serving as a subadvisor to the Large Cap Growth Fund were reasonable.
(c) Investment performance of the Large Cap Growth Fund and HSMP. Because HSMP was a newly proposed subadvisor to the Large Cap Growth Fund, the Board, at the Meeting, could not consider HSMP’s investment
218
Table of Contents
Mercer Funds
Additional Information (Unaudited) (Continued)
performance in managing the Large Cap Growth Fund as a factor in evaluating the Proposed HSMP Subadvisory Agreement. However, the Board reviewed HSMP’s historical investment performance record in managing or subadvising other accounts that were comparable to the Large Cap Growth Fund. The Board also compared the historical investment performance of HSMP to relevant benchmarks and concluded that HSMP’s historical performance record, viewed together with the other factors considered by the Board, supported a decision to approve the Proposed HSMP Subadvisory Agreement.
Conclusion. Following consideration of the foregoing factors, it was reported that no single factor was determinative to the decisions of the Trustees. Based on these factors, along with the determination of the Advisor at the conclusion of its review, selection, and due diligence process to recommend HSMP to serve as a new subadvisor to the Large Cap Growth Fund, and such other matters as were deemed relevant, the Trustees concluded that the proposed fee rate for HSMP was reasonable in relation to the services that would be provided to the Large Cap Growth Fund. As a result, the Board, including all of the Independent Trustees, concluded that the approval of the Proposed HSMP Subadvisory Agreement was in the best interests of the Large Cap Growth Fund and its shareholders and approved the Proposed HSMP Subadvisory Agreement.
219
Table of Contents
Mercer Funds
Understanding Your Fund’s Expenses (Unaudited)
As a mutual fund shareholder, you incur different costs: transaction costs, including sales charges (loads) on purchases, redemption fees and certain exchange fees and ongoing costs, including management fees, distribution fees (12b-1 fees), and other fund expenses. These costs are described in more detail in the Funds’ prospectus. The examples below are intended to help you understand the ongoing costs of investing in the Funds and help you compare these with the ongoing costs of investing in other mutual funds. The first line in the table for each Fund shows the actual account values and actual fund expenses you would have paid on a $1,000 investment in the Fund from October 1, 2014 through March 31, 2014. It also shows how much a $1,000 investment would be worth at the close of the period, assuming actual fund returns and expenses. To estimate the expenses you paid over the period, simply divide your account value by $1,000 (for example $8,600 account value divided by $1,000 = $8.60) and multiply the result by the number in the Operating Expenses Incurred column as shown below for your Class. The second line in the table for each Fund provides information about hypothetical account values and hypothetical expenses based on the Fund’s actual expense ratios and an assumed rate of return of 5% per year before expenses, which is not the Fund’s actual return. The hypothetical account values and expenses may not be used to estimate the actual ending account balance or expenses you paid on your investment for the period. You may use this information to compare the ongoing costs of investing in the Fund and other funds. To do so, compare this 5% hypothetical example with the 5% hypothetical examples that appear in the shareholder reports of the other funds. Please note that the expenses shown reflect ongoing costs only, and do not include any transaction costs, such as sales charges, redemption fees or exchange fees. Therefore, the second line in the table of each fund is useful in comparing ongoing costs only, and will not help you determine the relative costs of owning different funds. If transaction costs were included, total costs would be higher.
Large Cap Growth — Class Y-3
Hypothetical Return on $1,000
| Expense Ratio | Beginning Amount | Ending Value | Avg Value | Operating Expense Incurred* | |||||||||||||||||||||
Actual | 0.57% | 1,000.00 | 1,102.50 | 1,051.25 | 2.99 | ||||||||||||||||||||
Hypothetical | 0.57% | 1,000.00 | 1,022.09 | 1,011.05 | 2.87 | ||||||||||||||||||||
| * | Actual expenses are equal to the Class’ annualized expense ratio of 0.57%, multiplied by the average account value over the period, multiplied by 182/365 |
Large Cap Value — Class Y-3
Hypothetical Return on $1,000
| Expense Ratio | Beginning Amount | Ending Value | Avg Value | Operating Expense Incurred* | |||||||||||||||||||||
Actual | 0.55% | 1,000.00 | 1,145.70 | 1,072.85 | 2.94 | ||||||||||||||||||||
Hypothetical | 0.55% | 1,000.00 | 1,022.19 | 1,011.10 | 2.77 | ||||||||||||||||||||
| * | Actual expenses are equal to the Class’ annualized expense ratio of 0.55%, multiplied by the average account value over the period, multiplied by 182/365 |
Small/Mid Cap Growth — Class Y-3
Hypothetical Return on $1,000
| Expense Ratio | Beginning Amount | Ending Value | Avg Value | Operating Expense Incurred* | |||||||||||||||||||||
Actual | 0.97% | 1,000.00 | 1,086.00 | 1,043.00 | 5.04 | ||||||||||||||||||||
Hypothetical | 0.97% | 1,000.00 | 1,020.09 | 1,010.05 | 4.89 | ||||||||||||||||||||
| * | Actual expenses are equal to the Class’ annualized expense ratio of 0.97%, multiplied by the average account value over the period, multiplied by 182/365 |
220
Table of Contents
Mercer Funds
Understanding Your Fund’s Expenses (Unaudited) (Continued)
Small/Mid Cap Value — Class Y-3
Hypothetical Return on $1,000
| Expense Ratio | Beginning Amount | Ending Value | Avg Value | Operating Expense Incurred* | |||||||||||||||||||||
Actual | 0.97% | 1,000.00 | 1,112.40 | 1,056.20 | 5.11 | ||||||||||||||||||||
Hypothetical | 0.97% | 1,000.00 | 1,020.09 | 1,010.05 | 4.89 | ||||||||||||||||||||
| * | Actual expenses are equal to the Class’ annualized expense ratio of 0.97%, multiplied by the average account value over the period, multiplied by 182/365 |
Non-US Core Equity — Class Y-3
Hypothetical Return on $1,000
| Expense Ratio | Beginning Amount | Ending Value | Avg Value | Operating Expense Incurred* | |||||||||||||||||||||
Actual | 0.86% | 1,000.00 | 1,083.70 | 1,041.85 | 4.47 | ||||||||||||||||||||
Hypothetical | 0.86% | 1,000.00 | 1,020.64 | 1,010.32 | 4.33 | ||||||||||||||||||||
| * | Actual expenses are equal to the Class’ annualized expense ratio of 0.86%, multiplied by the average account value over the period, multiplied by 182/365 |
Core Fixed — Class Y-3
Hypothetical Return on $1,000
| Expense Ratio | Beginning Amount | Ending Value | Avg Value | Operating Expense Incurred* | |||||||||||||||||||||
Actual | 0.37% | 1,000.00 | 1,022.60 | 1,011.30 | 1.87 | ||||||||||||||||||||
Hypothetical | 0.37% | 1,000.00 | 1,023.09 | 1,011.55 | 1.87 | ||||||||||||||||||||
| * | Actual expenses are equal to the Class’ annualized expense ratio of 0.37%, multiplied by the average account value over the period, multiplied by 182/365 |
Opportunistic Fixed — Class Y-3
Hypothetical Return on $1,000
| Expense Ratio | Beginning Amount | Ending Value | Avg Value | Operating Expense Incurred* | |||||||||||||||||||||
Actual | 0.91% | 1,000.00 | 1,038.90 | 1,019.45 | 4.63 | ||||||||||||||||||||
Hypothetical | 0.91% | 1,000.00 | 1,020.39 | 1,010.20 | 4.58 | ||||||||||||||||||||
| * | Actual expenses are equal to the Class’ annualized expense ratio of 0.91%, multiplied by the average account value over the period, multiplied by 182/365 |
221
Table of Contents
Mercer Funds
Understanding Your Fund’s Expenses (Unaudited) (Continued)
Emerging Markets — Class Y3
Hypothetical Return on $1,000
| Expense Ratio | Beginning Amount | Ending Value | Avg Value | Operating Expense Incurred* | |||||||||||||||||||||
Actual | 0.95% | 1,000.00 | 1,002.60 | 1,001.30 | 4.74 | ||||||||||||||||||||
Hypothetical | 0.95% | 1,000.00 | 1,020.19 | 1,010.10 | 4.78 | ||||||||||||||||||||
| * | Actual expenses are equal to the Class’ annualized expense ratio of 0.95%, multiplied by the average account value over the period, multiplied by 182/365 |
Global Low Volatility — Class Y3
Hypothetical Return on $1,000
| Expense Ratio | Beginning Amount | Ending Value | Avg Value | Operating Expense Incurred* | |||||||||||||||||||||
Actual | 0.83% | 1,000.00 | 1,088.60 | 1,044.30 | 4.32 | ||||||||||||||||||||
Hypothetical | 0.83% | 1,000.00 | 1,020.79 | 1,010.40 | 4.18 | ||||||||||||||||||||
| * | Actual expenses are equal to the Class’ annualized expense ratio of 0.83%, multiplied by the average account value over the period, multiplied by 182/365 |
222
Table of Contents
Mercer Funds
Trustees and Officers (Unaudited)
The following tables list the Trust’s Trustees and Officers as of the date of this report; their address and age; their position with the Trust; the length of time holding that position with the Trust; their principal occupation(s) during the past five years; the number of portfolios in the fund complex they oversee; and other directorships they hold in companies subject to registration or reporting requirements of the Securities Exchange Act of 1934 (generally called “public companies”) or in registered investment companies. The Trust’s Statement of Additional Information (“SAI”) includes additional information about the Trust’s trustees, including changes subsequent to the date of the report. The SAI is available, without charge, upon request, by calling 1-866-658-9896, or on the SEC website at www.sec.gov.
Independent Trustees
Name, Address and Age | Position(s) | Term of | Principal | Number of Portfolios in Fund Complex* Overseen by Trustee | Other | ||||||||
Harrison M. Bains, Jr. 99 High Street Boston, MA 02110 (71) | Trustee | Since 2005 | Mr. Bains is retired. | 9 | Mr. Bains is a director of BG Medicine, Inc. and Trustee of BofA Fund Series Trust (11 portfolios). | ||||||||
Adela M. Cepeda A.C. Advisory, Inc. 150 North Wacker Drive, Suite 2160 Chicago, IL 60606 (56) | Trustee | Since 2005 | Ms. Cepeda is Founder and President of A.C. Advisory, Inc. (a financial advisory firm) since 1995. | 9 | Ms. Cepeda is a director of The UBS Funds (19 portfolios), UBS Relationship Funds (25 portfolios), Fort Dearborn Income Securities, Inc., SMA Relationship Trust (5 portfolios, Consulting Group Capital Markets Funds (11 portfolios), and the Amalgamated Bank of Chicago. | ||||||||
Gail A. Schneider 99 High Street Boston, MA 02110 (65) | Chairperson and Trustee | Chairperson Since 2013; Trustee Since 2009 | Ms. Schneider is a self-employed consultant since 2007. From 2002 to 2007, Ms. Schneider was retired. | 9 | None | ||||||||
223
Table of Contents
Mercer Funds
Trustees and Officers (Unaudited) (Continued)
Interested Trustee:
Name, Address and Age | Position(s) | Term of | Principal | Number of Portfolios in Fund Complex* Overseen by Trustee | Other | ||||||||
Richard Nuzum** (46) | Trustee, President, and Chief Executive Officer | Since 2010 | Mr. Nuzum is President and Global Business Leader of Mercer’s Investment Management Business since 2009. Mr. Nuzum was Americas Business Leader for Mercer Investment Consulting from 2005-2008. | 9 | Mr. Nuzum is a trustee of Mercer Trust Company and a director of Mercer Investment Management, Inc. Mr. Nuzum served as a director of Mercer Investment Consulting, Inc. from 2005 to 2008. | ||||||||
| (1) | Each Trustee holds office for an indefinite term. |
| * | The “Fund Complex” consists of the Trust, which has nine portfolios effective March 31, 2014. |
| ** | Mr. Nuzum is considered to be an “interested person” of the Trust as defined in the 1940 Act, due to his relationship with the Advisor. |
224
Table of Contents
Mercer Funds
Trustees and Officers (Unaudited) (Continued)
Officers:
The executive officers of the Trust not named above are:
Name and Age | Position(s) | Term of | Principal Occupation(s) During Past 5 Years | |||
Tom Murphy (43) | Vice President | Since 2011 | Mr. Murphy is President of Mercer Investment Management, Inc. since 2011. He was Chief Investment Officer of Mercer Investment Management, Inc. from 2011-2012. Previously, Mr. Murphy was a Business Leader for Mercer Investment Management in EMEA since 2006. | |||
Richard S. Joseph (49) | Vice President, Treasurer, and Chief Financial Officer | Since 2005 | Mr. Joseph is Chief Operating Officer, Mercer Investment Management, Inc. since 2005. | |||
Stan Mavromates (53) | Vice President and Chief Investment Officer | Since 2012 | Mr. Mavromates is Vice President and Chief Investment Officer of Mercer Investment Management, Inc. since 2012. He served as Chief Investment Officer of the Massachusetts Pension Reserves Investment Management Board since 2005. | |||
Scott M. Zoltowski (45) | Vice President, Chief Legal Officer and Secretary | Since 2008 | Mr. Zoltowski is a partner of Mercer (US) Inc. and serves as Global Chief Counsel — Investments, for Mercer Investment Management, Inc. and Mercer Investment Consulting, Inc. Prior to this, Mr. Zoltowski was Senior Counsel and Vice President prior to this for State Street Global Advisors from 2006-2008. | |||
Colin Dean (37) | Vice President and Assistant Secretary | Since 2010 | Mr. Dean has served as Legal Counsel — Investments for Mercer Investment Management, Inc. since 2010. Prior to that, Mr. Dean was an Associate at Dechert LLP from 2007-2010 and Associate Counsel at Affiliated Managers Group, Inc. from 2005-2007. | |||
Manny Weiss (65) | Vice President | Since 2010 | Mr. Weiss is a Portfolio Manager and Principal of Mercer Investment Management, Inc. since 2009. From 2006 to 2008, Mr. Weiss worked for 21 Capital Group, an affiliate of Old Mutual Asset Management, in Hedge Fund Manager Research and Client Service. | |||
Larry Vasquez (47) | Vice President | Since 2012 | Mr. Vasquez is a Vice President and Portfolio Manager of Mercer Investment Management, Inc. since 2012. Prior to joining Mercer, he was a Portfolio Manager at UBS Global Asset Management, Inc. from 2009 to 2012. Prior to 2009, Mr. Vasquez was a Portfolio Manager at SEI Investments. | |||
Mark Gilbert (42) | Vice President and Chief Compliance Officer | Since 2011 | Mr. Gilbert is the Chief Compliance Officer — Investments of Mercer Investment Management, Inc. and Mercer Investment Consulting, Inc. since 2011. He previously held the position of Americas Compliance Leader — Investments since 2007. | |||
| † | Officers of the Trust are elected by the Trustees and serve at the pleasure of the Board. |
225
Table of Contents
Shares of Mercer Funds are distributed by MGI Funds Distributors, LLC.
Table of Contents
Item 2. Code of Ethics.
As of the end of the period covered by this report, the Registrant has adopted a code of ethics that applies to its President, Chief Financial Officer and Chief Investment Officer. During the period covered by this report, there were no amendments to a provision of its code of ethics, nor were there any waivers, including implicit waivers granted from a provision of the code of ethics. A copy of the Registrant’s code of ethics is filed with the Form N-CSR under Item 12(a)(1).
Item 3. Audit Committee Financial Expert.
The Registrant’s Board of Trustees has determined that the Registrant has at least one audit committee financial expert serving on its audit committee. The audit committee financial expert serving on the Registrant’s audit committee is Harrison M. Bains, Jr., who is “independent” as defined in Item 3(a)(2) of this Form.
Item 4. Principal Accountant Fees and Services.
(a) Audit Fees – The aggregate fee billed for the fiscal year for professional services rendered by the principal accountant for the audit of the Registrant’s annual financial statements or services that are normally provided by the accountant in connection with statutory and regulatory filings or engagements was $379,345 and $373,060 for the fiscal years ended March 31, 2013 and March 31, 2014, respectively.
(b) Audit-Related Fees – There were no fees billed for the fiscal years ended March 31, 2013 and March 31, 2014 for assurance and related services by the principal accountant that are reasonably related to the performance of the audit of the Registrant’s financial statements and are not reported under (a) of this Item.
(c) Tax Fees – The aggregate fee billed in the last fiscal year for professional services rendered by the principal accountant for the review of the Registrant’s tax returns and excise tax calculations was $67,133 and $72,252 for the fiscal years ended March 31, 2013 and March 31, 2014, respectively.
(d) All Other Fees – Fees in the amount of $134,080 were billed in the fiscal year ended March 31, 2014 for tax advisory services related to the reclamation of taxes paid by the Mercer Non-US Core Equity Fund in certain European Union countries.
(e) (1) The Registrant’s audit committee pre-approves all audit and non-audit services to be performed by the Registrant’s accountant before the accountant is engaged by the Registrant to perform such services.
(2) There were no services described in (b) through (d) above (including services required to be approved by the audit committee pursuant to paragraph (c)(7)(ii) of Rule 2-01 of Regulation S-X) that were approved by the audit committee pursuant to paragraph (c)(7)(i)(C) of Rule 2-01 of Regulation S-X.
| (f) | None of the hours expended on the principal accountant’s engagement to audit the Registrant’s financial statements for the fiscal year ended March 31, 2014 were attributable to work performed by persons other than the principal accountant’s full-time, permanent employees. |
| (g) | There were no aggregate fees billed for the fiscal year ended March 31, 2014 by the Registrant’s principal accountant for non-audit services rendered to the Registrant, its investment adviser and any entity controlling, controlled by or under common control with the investment adviser that provides ongoing services to the Registrant. |
| (h) | Not applicable. |
Item 5. Audit Committee of Listed Registrants.
Not applicable.
Table of Contents
Item 6. Schedule of Investments.
The Registrant’s full schedules of investments are included as part of the report to shareholders filed under Item 1 of this Form.
Item 7. Disclosure of Proxy Voting Policies and Procedures for Closed-End Management Investment Companies.
Not applicable.
Item 8. Portfolio Managers of Closed-End Investment Companies.
Not applicable.
Item 9. Purchases of Equity Securities by Closed-End Management Investment Company and Affiliated Purchasers.
Not applicable.
Item 10. Submission of Matters to a Vote of Security Holders.
There have been no material changes to the procedures by which the shareholders may recommend nominees to the Registrant’s Board of Directors, where those changes were implemented after the Registrant last provided disclosure in response to the requirements of Item 22(b)(15) of Schedule 14A (17 CFR 240.14a-101), or this Item.
Item 11. Controls and Procedures.
(a) The Registrant’s Principal Executive Officer and Principal Financial Officer concluded that the Registrant’s disclosure controls and procedures (as defined in Rule 30a-3(c) under the Investment Company Act of 1940 (17 CFR 270.30a-3(c))), are effective based on the evaluation of Registrant’s disclosure controls and procedures as of a date within 90 days prior to the filing date of this report.
(b) There were no changes in the Registrant’s internal control over financial reporting (as defined in Rule 30a-3(d) under the Investment Company Act of 1940 (17 CFR 270.30a-3(d))), that occurred during the Registrant’s second fiscal quarter of the period covered by this report that has materially affected, or is reasonably likely to materially affect, the Registrant’s internal control over financial reporting.
Item 12. Exhibits.
(a)(1) Code of Ethics for the Registrant’s President, Chief Financial Officer and Chief Investment Officer (as referenced in Item 2 above), attached hereto as Exhibit (a)(1).
(a)(2) Certification of the Principal Executive Officer and Principal Financial Officer of the Registrant as required by Rule 30a-2(a) under the Investment Company Act of 1940 (17 CFR 270.30a-2(a)) is attached hereto as Exhibit 99CERT.
(a)(3) Not applicable.
(b) Certification pursuant to Section 906 of the Sarbanes-Oxley Act of 2002 as required by Rule 30a-2(b), under the Investment Company Act of 1940 (17 CFR 270.30a-2(b)), Rule 15d-14(b) under the Securities Exchange Act of 1934 (17 CFR 240.15d-14(b)) and Section 1350 of Chapter 63 of Title 18 of the United States Code (18 U.S.C. 1350) is attached hereto as Exhibit 99.906CERT.
Table of Contents
SIGNATURES
Pursuant to the requirements of the Securities Exchange Act of 1934 and the Investment Company Act of 1940, the Registrant has duly caused this report to be signed on its behalf by the undersigned, thereunto duly authorized.
(Registrant) | Mercer Funds |
| By (Signature and Title) | By: /s/ Richard Nuzum | |
Richard Nuzum President and Chief Executive Officer (Principal Executive Officer) |
Date | May 28, 2014 |
Pursuant to the requirements of the Securities Exchange Act of 1934 and the Investment Company Act of 1940, this report has been signed below by the following person on behalf of the Registrant and in the capacities and on the date indicated.
| By (Signature and Title) | By: /s/ Richard Nuzum | |
Richard Nuzum President and Chief Executive Officer (Principal Executive Officer) |
Date | May 28, 2014 |
| By (Signature and Title) | By: /s/ Richard S. Joseph | |
Richard S. Joseph Vice President, Treasurer and Principal Accounting Officer (Principal Financial Officer) |
Date | May 28, 2014 |