UNITED STATES
SECURITIES AND EXCHANGE COMMISSION
Washington, DC 20549
FORM N-CSR
CERTIFIED SHAREHOLDER REPORT OF REGISTERED
MANAGEMENT INVESTMENT COMPANIES
Investment Company Act File Number: 811-21732
Mercer Funds
(Exact Name of Registrant as Specified in Charter)
99 High Street
Boston, MA 02110
(Address of Principal Executive Offices)(Zip Code)
Scott M. Zoltowski, Esq.
Mercer Investment Management, Inc. 99 High Street
Boston, MA 02110
(Name and Address of Agent for Service)
Registrant’s Telephone Number, including Area Code: (617) 747-9500
Date of Fiscal Year End: March 31, 2017
Date of Reporting Period: March 31, 2017
Item 1. Reports to Stockholders.
The Report to Shareholders is attached herewith.

Mercer Funds™
Annual Report
Mercer US Large Cap Equity Fund (formerly known as Mercer US Large Cap Growth Equity Fund)
Mercer US Small/Mid Cap Equity Fund (formerly known as Mercer US Small/Mid Cap Growth Equity Fund)
Mercer Non-US Core Equity Fund
Mercer Core Fixed Income Fund
Mercer Opportunistic Fixed Income Fund
Mercer Emerging Markets Equity Fund
Mercer Global Low Volatility Equity Fund
This report has been prepared for Mercer Funds shareholders. It is not authorized for distribution to prospective investors unless accompanied or preceded by a current Mercer Funds prospectus. The prospectus contains more complete information about the Funds’ investment objectives, risks, and expenses. Investors are reminded to read the prospectus carefully before investing.
March 31, 2017
MERCER FUNDS
TABLE OF CONTENTS
Mercer US Large Cap Equity Fund
(formerly the Mercer US Large Cap Growth Equity Fund)1
Investment Objective and Benchmark
The investment objective of the Fund is long-term total return, which includes capital appreciation and income. The benchmark for the Fund is the Russell 1000 Index.
Investment Strategy
The Fund invests principally in equity securities issued by large capitalization U.S. companies. The Fund employs a “core equity” investment strategy by investing in both growth and value oriented equity securities.
Performance
For the fiscal year ended March 31, 2017, the Fund’s Y-3 share class performance was 17.74% compared to its benchmark, the Russell 1000 Index, return of 15.43%. Performance for the Fund is reported net of operating expenses while the benchmark returns do not include expenses of any kind as indexes are unmanaged.
The Sub-Advisors
Prior to the Reorganization, the Fund employed four subadvisors, Sands Capital Management, LLC (Sands), HS Management Partners (HS), Columbia Management Investment Advisers, LLC (Columbia) and Parametric Portfolio Associates LLC (Parametric).
Following the Reorganization, the Fund employed six subadvisors, terminating Sands, maintaining HS, Columbia, and Parametric, and adding AJO, LP (AJO), Brandywine Global Investment Management, LLC (Brandywine), and O’Shaughnessy Asset Management, LLC (OSAM).
AJO is a quantitative manager that relies on a combination of value, management, momentum, and sentiment factors to evaluate securities. Columbia is an aggressive growth manager, following a high conviction, concentrated strategy that focuses on financially strong companies that are growing earnings faster than the broader equity market. HS is a growth manager that invests in quality businesses with strong management that trade at attractive valuations. Brandywine, a deep value manager, focuses on cheap stocks that trade at a significant discount to intrinsic value, that have strong free cash flows and quality balance sheets. OSAM is a yield focused quantitative value manager that seeks stocks that are ranked high based on valuation, quality and shareholder yield. Parametric utilizes exchange-traded futures to generate exposure corresponding to the Fund’s benchmark, the Russell 1000 Index.
Market Commentary and Fund Performance
For the 12-month period ending March 31, 2017, the U.S. equity market, as measured by the Russell 3000 Index, increased 18.07%. After a period of uncertainty following the Brexit vote results in June and the lead up to the U.S. presidential election in November, the U.S. equity markets surged following the election with investors anticipating tax reform, increased infrastructure spending and deregulation. The so-called “Trump rally” was further supported by upbeat housing and labor market data, as well as encouraging results of consumer sentiment surveys, all of which helped drive U.S. equity markets higher during the period. Then in December, with the Federal Reserve raising interest rates by 0.25% the anticipation of deregulation and corporate tax reform, there was a sector rotation shift into financials, energy and industrials that drove performance for the rest of 2016.
Starting in 2017, growth stocks led the market rally, outperforming value stocks across market capitalization ranges, which was supported by strong performance from information technology and consumer discretionary stocks. Energy was the weakest performing sector throughout the first quarter of 2017.
1
| 1 | On June 24, 2016, the Mercer US Large Cap Value Equity Fund (“Large Cap Value Fund”) merged into the Mercer US Large Cap Growth Equity Fund (“Large Cap Growth Fund”) and the Large Cap Growth Fund changed its investment strategy to implement a “core” (i.e., both “growth” and value”) investment strategy and changed its name to the Mercer US Large Cap Equity Fund (the “Reorganization”). Prior to the Reorganization the Fund’s benchmark was the Russell 1000 Growth Index, which returned 15.76% for the fiscal year ended March 31, 2017. |
Mercer US Large Cap Equity Fund
(formerly the Mercer US Large Cap Growth Equity Fund)1
Within the Russell 1000 Index, the Fund’s benchmark, the best performing sectors for the fiscal year were financials, information technology and materials with returns of 33.4%, 24.75%, and 20.78% respectively. Telecommunications was the laggard with returns of 3.98%. The best performing industries were wireless telecommunication services, banks and internet & direct marketing retail with returns of 64.82%, 45.46%, and 40.95% respectively.
The Mercer U.S. Large Cap Equity Fund outperformed the Russell 1000 Index for the period. The Fund’s exposure to value, from a factor perspective coupled with strong security selection were the primary contributors to the Fund’s outperformance. Specifically, security selection in the information technology, industrials and financials sectors drove performance despite poor security selection in the healthcare sector.
Brandywine’s overweight to the financial sector combined with an underweight to real estate contributed to its outperformance as did strong security selection within financials, information technology and industrial sectors. OSAM’s positive performance was driven by its underweight to healthcare and real estate, combined with strong security selection in industrials, energy and information technology. Columbia outperformed for the fiscal year due to strong security selection within the information technology and consumer discretionary sectors. HS underperformed for the period due in part to its underweight in financials, overweight in consumer discretionary, and poor security selection within the information technology sector. For the nine months AJO subadvised a portion of the Fund, they outperformed due to strong security selection within the industrials and financials sectors. Parametric utilized exchange–traded futures to generate market exposure corresponding to the Fund’s benchmark. Its performance was in line with the benchmark.
Risk Considerations
The Fund invests in both growth stocks and value stocks. Growth stocks may be particularly sensitive to market conditions. Investing in value stocks involves the risk that an investment made in undervalued securities may not appreciate in value as anticipated or remain undervalued for long periods of time. The Fund may invest in derivative instruments such as exchange-listed equity futures contracts which involves special risks and may increase volatility due to the use of leverage and management of these sophisticated type instruments. The Fund may experience high portfolio turnover which may result in higher costs and capital gains. The Fund’s volatility may be amplified by its ability to select sub-advisors to allocate assets.
2
Mercer Funds
March 31, 2017
Comparison of Change in Value of a $10,000 Investment in
Mercer US Large Cap Equity Shares vs. the
Russell 1000® Index and the Fund’s Prior Index1
As of March 31, 2017
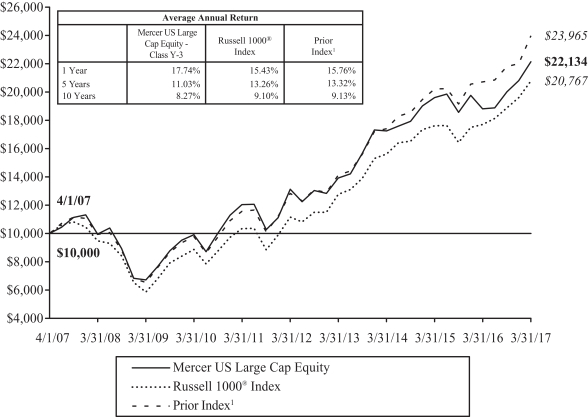
This graph shows the performance of the Mercer US Large Cap Equity Fund Class Y-3 shares versus the Russell 1000® Index and the Fund’s Prior Index1 from April 1, 2007 through March 31, 2017. The performance of other classes, when launched, will vary from the performance of the class shown based on the difference in fees and expenses paid by shareholders investing in different share classes. The Fund may charge a 2% redemption fee on shares owned less than 30 days.
The table and graph assume reinvestment of dividends and capital gains, but do not reflect a deduction of taxes an investor might pay on fund distributions or upon redemption of fund shares. Performance shown reflects a fee waiver and/or expense reimbursement. Without this waiver/reimbursement, returns would have been lower.
1 Effective as of June 27, 2016, the Fund changed its primary benchmark from the Russell 1000® Growth Index to the Russell 1000® Index in connection with a change to the Fund’s principal investment strategies because it was determined that this index is more reflective of the Fund’s current investment style.
The data quoted represents past performance and does not guarantee future results. Current performance of the Fund may be lower or higher than the performance quoted. Please call 1-866-658-9896 for the Fund’s most recent month-end performance. Investment return and principal value will fluctuate so that an investor’s shares, when redeemed, may be worth more or less than when purchased.
3
Mercer US Small/Mid Cap Equity Fund
(formerly the Mercer US Small/Mid Cap Growth Equity Fund)1
Investment Objective and Benchmark
The investment objective of the Fund is to provide long-term total return, comprised primarily of capital appreciation. The benchmark for the Fund is the Russell 2500 Index.
Investment Strategy
The Fund invests principally in equity securities issued by small-to-medium capitalization U.S. companies. The Fund employs a “core equity” investment strategy by investing in both growth and value oriented equity securities.
Performance
For the fiscal year ended March 31, 2017, the Fund’s Y-3 share class performance was 21.24% compared to its benchmark, the Russell 2500 Index, return of 20.44%. Performance for the Fund is reported net of operating expenses while the benchmark returns do not include expenses of any kind as indexes are unmanaged.
The Sub-Advisors
Prior to the Reorganization, the Fund employed four subadvisors, Jackson Square Partners, LLC (Jackson Square), Palisade Capital Management, LLC (Palisade), Westfield Capital Management Company, LP (Westfield) and Parametric Portfolio Associates LLC (Parametric).
Following the Reorganization, the Fund employed six sub-advisors, terminating Jackson Square and Palisade, maintaining Westfield and Parametric and adding GW&K Investment Management, LLC (GW&K), Loomis, Sayles & Company L.P. (Loomis), LSV Asset Management (LSV) and NWQ Investment Management Company, LLC (NWQ).
GW&K uses a bottoms-up fundamental research process in order to identify companies with sustainable long-term earnings growth rates. Westfield, a traditional growth manager, employs a fundamental, bottoms-up approach which seeks to identify reasonably priced stocks with high earnings growth potential. Loomis, a low growth manager, seeks companies with high quality business models that have differentiated and sustainable growth opportunities. LSV, a quantitative value manager, seeks deep value out of favor companies with recent momentum. LSV attempts to avoid introducing any judgmental biases or behavioral weaknesses into their investment process. NWQ, a concentrated value manager, utilizes a fundamental process that focuses on value with a catalyst. NWQ looks to uncover factors that enhance valuations three months to a year in advance in order to capitalize on inflection points and catalysts as they emerge. Parametric utilizes exchange traded futures to generate market exposure corresponding to the Fund’s benchmark.
Market Commentary and Fund Performance
For the 12-month -period ending March 31, 2017, the U.S. equity market, as measured by the Russell 3000 Index, increased 18.07%. After a period of uncertainty following the Brexit vote results in June and the lead up to the U.S. presidential election in November, the U.S. equity markets surged following the election with investors anticipating tax reforms, increased infrastructure spending and deregulation. The so-called “Trump rally” was further supported by upbeat housing and labor market data as well as encouraging results of consumer sentiment surveys, all of which helped drive U.S. equity markets higher during the period. Then in December, with the Federal Reserve raising interest rates by 0.25% and the anticipation of deregulation and corporate tax reform, there was a sector rotation shift into financials, energy and industrials that drove performance for the rest of 2016.
| 1 | On June 24, 2016, the Mercer US Small/Mid Cap Value Equity Fund (“Small/Mid Cap Value Fund”) merged into the Mercer US Small/Mid Cap Growth Equity Fund (“Small/Mid Cap Growth Fund”) and the Small/Mid Cap Growth Fund changed its investment strategy to implement a “core” (i.e., both “growth” and value”) investment strategy and changed its name to the Mercer US Small/Mid Cap Equity Fund (the “Reorganization”). Prior to the Reorganization the Fund’s benchmark was the Russell 2500 Growth Index , which returned 19.77% for the fiscal year ended March 31, 2017. |
4
Mercer US Small/Mid Cap Equity Fund
(formerly the Mercer US Small/Mid Cap Growth Equity Fund)1
Starting in 2017, growth stocks led the market rally outperforming value stocks across market capitalization ranges, which was supported by strong performance from information technology and consumer discretionary stocks. Energy was the weakest performing sector throughout the first quarter of 2017.
Within the Russell 2500 Index, the Fund’s benchmark, the best performing sectors for the fiscal year were financials and materials with positive returns of 34.28% and 31.34% respectively. Underperforming sectors for the fiscal year were telecommunications and consumer staples, with a negative return of 7.00% and a positive return of 6.39%, respectively. The top performing industries for the fiscal year were automobiles and banks with positive returns of 49.72% and 43.6%, respectively. The underperforming industries for the fiscal year were multiline retail and food & staples with negative returns of 23.85% and 16.69%, respectively.
The Mercer U.S. Small/Mid Cap Equity Fund outperformed the Russell 2500 Index for the period. The Fund’s exposure to value coupled with strong security selection were the primary drivers to the Fund’s outperformance. Specifically, strong security selection in the consumer discretionary and financials sectors drove performance for the fiscal year despite poor security selection in the information technology and materials sectors.
NWQ outperformed for the fiscal year due to its strong security selection in the financials, information technology and consumer staples sectors. LSV’s outperformance for the period was driven by its overweight in the financials sector and its strong security selection in the consumer staples, information technology and financial sectors. Westfield outperformed for the fiscal year due to its strong security selection in the health care and consumer discretionary sectors. In addition, their underweight in the consumer staples and real estate sectors from an allocation standpoint helped drive their outperformance. Loomis underperformed for the fiscal year due to its poor security selection in the information technology and industrial sectors. GW&K‘s underperformance was due to its poor security selection in the materials and information technology sectors. Parametric utilized exchange traded futures to generate market exposure corresponding to the Fund’s benchmark. Its performance was in line with the benchmark.
Risk Considerations
The Fund invests in both growth stocks and value stocks. Growth stocks may be particularly sensitive to market conditions. Investing in value stocks involves the risk that an investment made in undervalued securities may not appreciate in value as anticipated or remain undervalued for long periods of time. Investments made in small and mid-capitalization companies may be more volatile and less liquid due to limited resources or product lines and more sensitive to economic factors. The Fund may invest in derivative instruments such as exchange-listed equity futures contracts which involves special risks and may increase volatility due to the use of leverage and management of these sophisticated type instruments. The Fund may experience high portfolio turnover which may result in higher costs and capital gains. The Fund’s volatility may be amplified by its ability to select sub-advisors to allocate assets.
5
Mercer Funds
March 31, 2017
Comparison of Change in Value of a $10,000 Investment in
Mercer US Small/Mid Cap Equity Shares vs. the
Russell 2500™ Index and the Fund’s Prior Index1
As of March 31, 2017
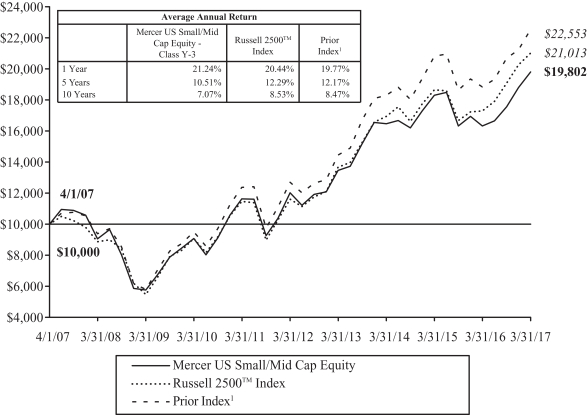
This graph shows the performance of the Mercer US Small/Mid Cap Equity Fund Class Y-3 shares versus the Russell 2500™ Index and the Fund’s Prior Index1 from April 1, 2007 through March 31, 2017. The performance of other classes, when launched, will vary from the performance of the class shown based on the difference in fees and expenses paid by shareholders investing in different share classes. The Fund may charge a 2% redemption fee on shares owned less than 30 days.
The table and graph assume reinvestment of dividends and capital gains, but do not reflect a deduction of taxes an investor might pay on fund distributions or upon redemption of fund shares. Performance shown reflects a fee waiver and/or expense reimbursement. Without this waiver/reimbursement, returns would have been lower.
1 Effective as of June 27, 2016, the Fund changed its primary benchmark from the Russell 2500TM Growth Index to the Russell 2500TM Index in connection with a change to the Fund’s principal investment strategies because it was determined that this index is more reflective of the Fund’s current investment style.
The data quoted represents past performance and does not guarantee future results. Current performance of the Fund may be lower or higher than the performance quoted. Please call 1-866-658-9896 for the Fund’s most recent month-end performance. Investment return and principal value will fluctuate so that an investor’s shares, when redeemed, may be worth more or less than when purchased.
6
Mercer Non-US Core Equity Fund
Investment Objective and Benchmark
The investment objective of the Fund is to provide long-term total return, which includes capital appreciation and income. The benchmark for the Fund is the MSCI EAFE Index.
Investment Strategy
The Fund invests principally in equity securities issued by non-U.S. companies of any capitalization, located in the world’s developed and emerging capital markets.
Performance
For the fiscal year ended March 31, 2017, the Fund’s Y-3 share class performance was 10.62% compared to its benchmark return of 11.67%. Performance for the Fund is reported net of operating expenses while the benchmark returns do not include expenses of any kind as indexes are unmanaged.
The Sub-Advisors
As of March 31, 2017, the Fund employed five sub-advisors, Arrowstreet Capital, Limited Partnership (Arrowstreet), American Century Investment Management, Inc. (American Century), MFS Investment Management (MFS), LSV Asset Management (LSV) and Parametric Portfolio Associates LLC (Parametric).
Arrowstreet’s strategy seeks to outperform international equity benchmarks through a risk-controlled core approach. Arrowstreet combines sound investment intuition and research with rigorous quantitative tools to identify mispriced stocks around the world. Arrowstreet believes that the key to generating return in excess of the benchmark involves evaluating the prospects of a security considering both the characteristics of the stock itself (direct effects) as well as the characteristics of other related stocks (indirect effects). American Century manages its portfolio based on an investment philosophy that companies exhibiting improving or accelerating growth will outperform the market over time. American Century constructs its portfolio through bottom-up stock selection within a risk aware framework. American Century’s thorough research process seeks to identify companies that are exhibiting an improvement or acceleration in growth where it believes that growth is sustainable but that the earnings power of the company is generally underestimated. American Century will invest primarily in equity securities of companies located in Non-U.S. developed markets. MFS manages a value portfolio, which focuses on stocks whose long-term value they believe is not adequately reflected in the stock price. MFS invests opportunistically in emerging markets. LSV utilizes a quantitative approach which seeks deep value stocks that have fallen out of favor with the market, but have recent momentum, either in terms of price or earnings. LSV believes that long-term results are achieved through systematic exploitation of judgmental biases and behavioral weaknesses that influence investor decisions. LSV aims to exploit these biases through the disciplined application of quantitative techniques to drive bottom-up security selection. Parametric utilizes exchange-traded futures to generate market exposure corresponding to the Fund’s benchmark.
Market Commentary and Fund Performance
Global equity markets, as measured by the MSCI World Index, rose 14.8% during the 12-month period ending March 31, 2017. U.S. equities rallied with the S&P 500 Index up 17.2% for the fiscal year. The MSCI EAFE Index and MSCI Emerging Markets Index returned 11.7% and 17.2%, respectively, over the same time period.
Global equity and emerging markets in particular, rallied significantly since the end of the first calendar quarter of 2016. Underpinning the overall rally in global equity markets during this period was an improvement in consumer and business confidence in addition to the pickup in global growth. Growth has remained positive in Europe and Japan during this period as other economic variables, such as employment, have slowly improved.
During the period, the biggest challenge to equity markets came in June, when markets fell sharply after British voters voted in favor of exiting the European Union. This correction in the global equity markets was short-lived, however, with markets making up the majority of losses within a month. Developed international markets continued their rally through the remainder of 2016 and the first quarter of 2017. However, emerging markets suffered a second setback after the US election. In addition to headwinds caused by the rally in the US Dollar, market participants also became concerned with possible disruptions in global trade due to the rhetoric coming from the incoming administration.
7
Mercer Non-US Core Equity Fund
GDP growth in emerging markets has varied. Despite a slowdown in Chinese economic growth over the last few years, the country has remained the biggest contributor to global growth. During this period, China’s GDP growth has stayed steadily just under 7%. Elsewhere in emerging markets, Brazil’s economy may have bottomed at the end of 2016, while India’s GDP growth has been above 7%. Importantly, emerging market earnings have stabilized in recent periods. Higher commodity prices and easing financial conditions lead to an uptick in earnings. Protectionist trade policies and a continuation of US interest rate increases may be potential headwinds to emerging markets if they were to lead to currency weakness and capital outflows.
In this environment, the Mercer Non-US Core Equity Fund underperformed the MSCI EAFE Index by 1.00% for the 12-month period ending March 31, 2017. During this period, the Fund’s underperformance was driven primarily by poor stock selection and unfavorable currency exposures. The Fund held an overweight position to the consumer staples sector — one of the worst performing sectors during the period. Also detracting from performance were underweights in the financial and energy sectors, which performed strongly, particularly in the fourth quarter of 2016.
The sub-advisors that struggled during the period tended to have larger weightings of growth companies and/or quality companies.
American Century provides the growth allocation for the Fund. Value outperformed growth significantly during this period which was a serious headwind for the American Century strategy to overcome. The focus on growth stocks generally, along with some poor individual stock selections, led to underperformance by the American Century portfolio for the period.
MFS, a manager that has outperformed significantly over the last few years, underperformed during the period ended March 31, 2017, as quality, stable companies became less favored in the markets compared to higher risk companies. Given its focus on quality companies, MFS tends to hold less cyclical exposure, which contributed to its underperformance.
Arrowstreet beat the Fund’s benchmark during this period through stock selection and favorable currency exposures. The biggest contributor to Arrowstreet’s outperformance was stock selection in the technology sector.
LSV is the dedicated value manager in the Fund. Value stocks outperformed growth stocks during this period which helped the LSV strategy outpace the Fund’s benchmark. The LSV portfolio’s overweight to the financial sector gave a boost to relative returns. Currency exposures and exposure to small cap stocks also contributed to positive relative returns, but the value exposure was the dominant driver of outperformance for LSV.
Parametric utilized exchange-traded futures to generate market exposure corresponding to the Fund’s benchmark. Its performance was in line with the benchmark.
Risk Considerations
The Fund invests in foreign and emerging market securities which involves certain risks such as currency volatility, political and social instability and reduced market liquidity. Emerging markets may be more volatile and less liquid than more developed markets and therefore may involve greater risks. Investments made in small and mid-capitalization companies may be more volatile and less liquid due to limited resources or product lines and more sensitive to economic factors. The Fund may invest in derivative instruments such as exchange-listed equity futures contracts which involves special risks and may increase volatility due to the use of leverage and management of these sophisticated type instruments. The Fund may experience high portfolio turnover which may result in higher costs and capital gains. The Fund’s volatility may be amplified by its ability to select sub-advisors to allocate assets.
8
Mercer Funds
March 31, 2017
Comparison of Change in Value of a $10,000 Investment in
Mercer Non-US Core Equity Shares vs. the
MSCI EAFE Index
As of March 31, 2017
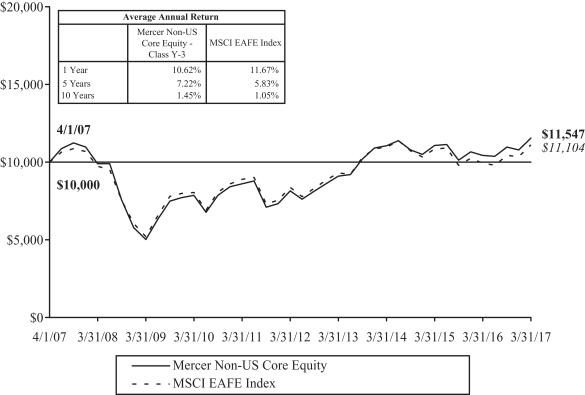
This graph shows the performance of the Mercer Non-US Core Equity Fund Class Y-3 shares versus the MSCI EAFE Index from April 1, 2007 through March 31, 2017. The performance of other classes, when launched, will vary from the performance of the class shown based on the difference in fees and expenses paid by shareholders investing in different share classes. The Fund may charge a 2% redemption fee on shares owned less than 30 days.
The table and graph assume reinvestment of dividends and capital gains, but do not reflect a deduction of taxes an investor might pay on fund distributions or upon redemption of fund shares. Performance shown reflects a fee waiver and/or expense reimbursement. Without this waiver/reimbursement, returns would have been lower.
The data quoted represents past performance and does not guarantee future results. Current performance of the Fund may be lower or higher than the performance quoted. Please call 1-866-658-9896 for the Fund’s most recent month-end performance. Investment return and principal value will fluctuate so that an investor’s shares, when redeemed, may be worth more or less than when purchased.
9
Mercer Core Fixed Income Fund
Investment Objective and Benchmark
The investment objective of the Fund is to provide total return, consisting of both current income and capital appreciation. The benchmark for the Fund is the Barclays U.S. Aggregate Bond™ Index.
Investment Strategy
The Fund invests principally in investment grade fixed income securities, including government securities, corporate bonds and securitized bonds such as mortgage and asset-backed securities. The Fund may also invest in non-investment grade bonds, non-U.S. dollar denominated bonds, bonds issued by issuers located in emerging capital markets, and certain derivative instruments. The Fund may invest in derivative instruments, such as options, futures, and swap agreements. The Fund may engage in transactions in derivatives for a variety of purposes, including changing the investment characteristics of its portfolio, enhancing total returns or as a substitute for taking a position in an underlying asset.
Performance
For the fiscal year ended March 31, 2017, the Fund’s Y-3 share class performance was 1.58% compared to its benchmark return of 0.44%. Performance for the Fund is reported net of operating expenses while the benchmark returns do not include expenses of any kind as indexes are unmanaged.
The Sub-Advisors
As of March 31, 2017, the Fund employed three sub-advisors, Manulife Asset Management (Manulife), Income Research & Management (IR&M) and Prudential Fixed Income, a business unit of PGIM, Inc. (Prudential). Manulife replaced Dodge & Cox on June 1st, 2016.
Manulife manages its allocated portion of the Fund by seeking to produce superior results by anticipating shifts in the business cycle and moderating risk relative to the direction of interest rates. The investment team capitalizes on these shifts by using a research-driven process to identify attractive sectors as well as mispriced securities within those sectors. IR&M manages its allocated portion based on the belief that careful security selection and higher portfolio income provide superior returns over the long term. Portfolios are constructed using a disciplined, bottom-up investment approach to select attractive securities from the U.S fixed income universe. Prudential manages its allocated portion of the Fund by seeking to maximize excess return opportunities from sustainable alpha sources such as sector allocation and bottoms up security selection. This process is coupled with a diligent daily portfolio risk evaluation and monitoring process. Research-based security selection is a major source of added value and incorporates both fundamental analysis as well as proprietary models that identify relative value and detailed technical review of issuers across both benchmark and non-benchmark sectors, with an emphasis on credit-oriented sectors.
Market Commentary and Fund Performance
For the 12 month period ending March 31, 2017, U.S. fixed income market returns as measured by the Barclay U.S. Aggregate index were positive, reflecting price increases of securities not backed by a U.S. Government Guarantee (Corporate Bonds, Asset Backed Securities, and Commercial Mortgage Backed Securities), which more than offset the general drop in prices resulting from rising interest rates. Intermediate U.S. Treasury rates increased 0.71% and longer term interest rates increased 0.40% year-over-year (with some interim volatility). The short end of the yield curve also rose year-over-year by 0.52% as the Federal Reserve raised short term interest rates twice over the period. Despite quarter-to-quarter volatility during the period, interest rates moved higher as the market expected President Trump’s pro-growth agenda would lead the Federal Reserve to raise interest rates. Foreign buying of U.S. Treasuries continued at a strong pace, and this helped to temper the effect of the rise in interest rates.
Returns from securities not backed by a U.S. Government Guarantee (Corporate Bonds, Asset Backed Securities, and Commercial Mortgage Backed Securities) were positive, as they benefitted from strong demand in the market for higher yielding securities. Lower credit quality rated corporate bonds (i.e., high yield or “junk” bonds) tended to provide greater excess returns during the 12-month period than the higher credit quality rated corporate bonds (i.e., investment-grade bonds). Investment-grade corporate bond issuers issued a record amount of new bonds to take advantage of low funding rates, once again exceeding the record breaking issuance of the prior year.
10
Mercer Core Fixed Income Fund
With Treasury rates rising so significantly during the 12-month period, positive total return was driven almost entirely from outperformance of the spread sectors (i.e., non-Treasury securities). Spread sectors provided higher returns in relation to similar-duration Treasuries while registering moderate gains in absolute terms. The Fund’s return was positive in absolute terms and it also outperformed in relation to the Barclays U.S. Aggregate Bond Index for the period. The Fund was helped by its strategic overweight to spread sectors including an allocation to high yield.
The respective performance results of each sub-advisor correlated with their risk posture, as more risk translated into more returns in this “risk-on” period. Manulife has the largest share of the risk allocation within the Fund. Their bias towards corporate credit and their approximate 15% allocation to relatively “higher quality” high yield bonds, led them to have the strongest returns for the period in which they have been a manager in the Fund. Manulife carried an underweight to utilities, which detracted from returns over the year. Prudential had a less aggressive allocation to spread sectors but was nonetheless overweight as spreads tightened, which helped them outperform. Prudential was slightly long in duration, which detracted from returns over the year. IR&M’s positive convexity bias relative to the Index helped them outperform and their spread positioning was biased towards higher quality corporate bonds which also helped them outperform, but to a lesser extent than the other two managers. IR&M had an out of benchmark exposure to Small Business Administration loans (SBA’s) which detracted from returns over the year.
Risk Considerations
The Fund is subject to the same risks as the underlying bonds in the portfolio such as credit, prepayment, call and interest rate risk. As interest rates rise, the value of bond prices will decline. The Fund may invest in more aggressive investments such as foreign securities which may expose the Fund to currency and exchange rate fluctuations, derivatives (futures, options, swaps) and high yield bonds (also known as “junk” bonds) all of which may cause greater volatility and less liquidity. Derivatives may be more sensitive to changes in market conditions and may amplify risks. The Fund may experience high portfolio turnover which may result in higher costs and capital gains. The Fund’s volatility may be amplified by its ability to select sub- advisors to allocate assets.
11
Mercer Funds
March 31, 2017
Comparison of Change in Value of a $10,000 Investment in
Mercer Core Fixed Income Shares vs. the
Barclays U.S. Aggregate Bond™ Index
As of March 31, 2017
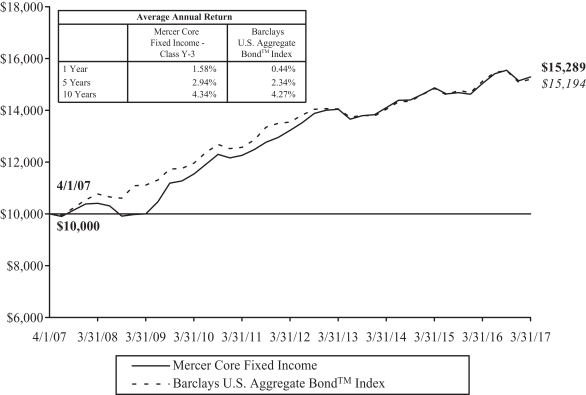
This graph shows the performance of the Mercer Core Fixed Income Fund Class Y-3 shares versus the Barclays US Aggregate Bond™ Index from April 1, 2007 through March 31, 2017. The performance of other classes, when launched, will vary from the performance of the class shown based on the difference in fees and expenses paid by shareholders investing in different share classes. The Fund may charge a 2% redemption fee on shares owned less than 30 days.
The table and graph assume reinvestment of dividends and capital gains, but do not reflect a deduction of taxes an investor might pay on fund distributions or upon redemption of fund shares. Performance shown reflects a fee waiver and/or expense reimbursement. Without this waiver/reimbursement, returns would have been lower.
The data quoted represents past performance and does not guarantee future results. Current performance of the Fund may be lower or higher than the performance quoted. Please call 1-866-658-9896 for the Fund’s most recent month-end performance. Investment return and principal value will fluctuate so that an investor’s shares, when redeemed, may be worth more or less than when purchased.
12
Mercer Opportunistic Fixed Income Fund
Investment Objective and Benchmark
The investment objective of the Fund is to provide long-term total return, which includes capital appreciation and income. The Fund’s primary benchmark is the Bank of America Merrill Lynch Global High Yield 2.0% Constrained Index. The Fund’s secondary benchmark is a blended benchmark consisting of 50% JP Morgan Government Bond Index – Emerging Markets Global Diversified and 50% Bank of America Merrill Lynch Global High Yield 2.0% Constrained Index.
Investment Strategy
The Fund invests principally in fixed income securities of U.S. and non-U.S. issuers, including those in emerging and frontier markets. The Fund invests in various strategic and tactical global bond market opportunities without limitations in geography, issuer type, quality and currency denomination. The Fund may invest in derivatives such as futures (including among others, interest rate futures), swaps (currency, interest rate, credit default and total return), forwards, options, and credit-linked notes. The Fund may engage in transactions in derivatives for a variety of purposes, including hedging, risk management, efficient portfolio management, enhance total returns, or as a substitute for taking position in the underlying asset.
Performance
For the fiscal ended March 31, 2017, the Fund’s Y-3 share class performance was 10.31% compared to its primary benchmark return of 13.81% and secondary benchmark return of 9.72%. Performance for the Fund is reported net of operating expenses while the benchmark returns do not include expenses of any kind as indexes are unmanaged.
The Sub-Advisors
As of March 31, 2017, the Fund employed two sub-advisors, Franklin Advisers, Inc. (Franklin) and Investec Asset Management Limited (Investec).
In managing its allocated portion of the Fund’s portfolio, Franklin will typically invest in non-investment grade securities issued globally. Franklin is a research driven, fundamental investor that relies on a team of analysts to provide in-depth industry expertise, using both qualitative and quantitative analysis to evaluate issuers. Although bottom-up security selection forms the core part of Franklin’s process, it uses industry attractiveness when selecting investments. In managing its allocated portion of the Fund’s portfolio, Investec will invest in public sector, sovereign and corporate bonds issued by emerging market borrowers and those denominated in local emerging market currencies. Investec’s portfolio construction process promotes allocation to countries and currencies identified based on economic fundamentals, valuations and market price behavior.
Market Commentary and Fund Performance
For the 12 month period ending March 31, 2017, U.S. and global fixed income markets experienced a volatile period driven by a few broad underlying factors: a recovery in the physical commodities markets; less economic uncertainty in China; a stable U.S. dollar versus developed and emerging market currencies; and significant oil price recovery, which created mixed effects to energy importer and exporter economies.
The perceived recovery in the U.S. economy created negative total returns for U.S. Treasury securities and positive total returns for lower credit quality rated corporate bonds (i.e., high yield or “junk” bonds) and for non-U.S. dollar-denominated bonds. U.S. Treasury securities prices moved lower, primarily from the market’s perception that President Trump’s pro-growth agenda could lead to growth in the U.S. economy and potentially lead to the Federal Reserve raising interest rates. The Bank of America Merrill Lynch Global High Yield Index experienced a tightening in its risk premium by 3.05% (i.e. the decrease in yield over U.S. Treasuries) ending the fiscal year period with a risk premium of 3.81% and an overall yield of 5.44%. Rising oil prices and a stable U.S. dollar positively influenced bond prices as nearly all sectors of the high yield market had positive total returns. Low corporate default rates, stable business fundamentals and a favorable view on the overall direction of the economy provided positive momentum which allowed high yield to outperform in a rising rate environment.
Local Emerging markets debt experienced a volatile environment during the twelve months ending March 31, 2017. Security valuations fluctuated, and U.S. interest rates moved higher, primarily as a result of the U.S. Presidential election. The stabilization in commodity prices, especially oil, led to a rally during the period for physical commodities.
13
Mercer Opportunistic Fixed Income Fund
In the fiscal year Franklin outperformed the Bank of America Merrill Lynch Global High Yield Index. This outperformance was driven primarily by its allocation to the energy sector within the High Yield Index. Both the overweight allocation to the energy sector in general and the specific security selection within the energy sector added to performance. Additionally Franklin’s investment in lower rated bonds in the portfolio impacted performance positively during the year. Franklin’s exposure to certain healthcare bonds negatively impacted performance for the year. During the period Investec also outperformed the JP Morgan Government Bond Index – Emerging Markets Global Diversified. Investec’s outperformance came from a combination of bonds and currencies. In currencies, the overweight allocation to the Russian ruble added to performance, whereas our underweight allocation to the Philippine peso detracted. In bonds, our positioning in South African bonds was a key contributor over the year but the performance was slightly offset by our position in Turkish bonds.
Risk Considerations
The Fund invests in non-investment grade and emerging market fixed income securities which involves certain risks such as higher volatility, currency fluctuation, political and social instability and reduced market liquidity. The Fund is subject to the same risks as the underlying bonds in the portfolio such as credit, call and interest rate risk. The Fund may invest in more aggressive investments such as derivatives (futures, options, swaps) all of which may cause greater volatility and less liquidity. Derivatives are more sensitive to changes in market conditions and may amplify risks. The Fund may experience high portfolio turnover which may result in higher costs and capital gains. The Fund’s volatility may be amplified by its ability to select sub-advisors to allocate assets.
14
Mercer Funds
March 31, 2017
Comparison of Change in Value of a $10,000 Investment in
Mercer Opportunistic Fixed Income Shares vs. the
Bank of America ML Global High Yield 2% Constrained Index Unhedged and the Fund’s Secondary Index1
As of March 31, 2017
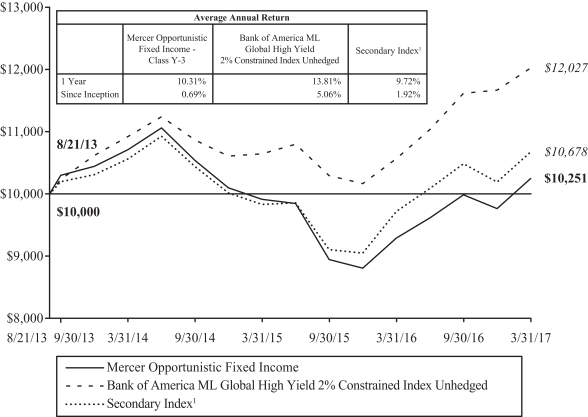
This graph shows the performance of the Mercer Opportunistic Fixed Income Fund Class Y-3 shares versus the Bank of America ML Global High Yield 2% Constrained Index Unhedged and the Fund’s Secondary Index1 from August 21, 2013, which is the inception date of the Fund, through March 31, 2017. The performance of other classes, when launched, will vary from the performance of the class shown based on the difference in fees and expenses paid by shareholders investing in different share classes. The Fund may charge a 2% redemption fee on shares owned less than 30 days.
The table and graph assume reinvestment of dividends and capital gains, but do not reflect a deduction of taxes an investor might pay on fund distributions or upon redemption of fund shares. Performance shown reflects a fee waiver and/or expense reimbursement. Without this waiver/reimbursement, returns would have been lower.
1 The Mercer Opportunistic Fixed Income Fund’s Secondary Index is a blended benchmark consisting of 50% JP Morgan Government Bond Index — Emerging Markets Global Diversified USD Unhedged and 50% Bank of America ML Global High Yield 2% Constrained Index Unhedged.
The data quoted represents past performance and does not guarantee future results. Current performance of the Fund may be lower or higher than the performance quoted. Please call 1-866-658-9896 for the Fund’s most recent month-end performance. Investment return and principal value will fluctuate so that an investor’s shares, when redeemed, may be worth more or less than when purchased.
15
Mercer Emerging Markets Equity Fund
Investment Objective and Benchmark
The investment objective of the Fund is to provide long-term total return, which includes capital appreciation and income. The benchmark for the Fund is the MSCI Emerging Markets Index.
Investment Strategy
The Fund invests principally in equity securities of large, medium and small capitalization companies, located in emerging markets, other investments that are tied economically to emerging markets, as well as in American, European and Global Depository receipts. Stock index futures and various types of swaps may be used to implement the country selection component of the Fund’s investment strategy. Currency forwards may be used to make stock-selection and country allocation decisions independently of the underlying currency.
Performance
For the fiscal year ended March 31, 2017, the Fund’s Y-3 share class performance was 16.14% compared to its benchmark return of 17.21%. Performance for the Fund is reported net of operating expenses while the benchmark returns do not include expenses of any kind as indexes are unmanaged.
The Sub-Advisors
As of March 31, 2017, the Fund employed seven sub-advisors, AQR Capital Management, LLC (AQR), KBI Global Investors (North America) Ltd. (KBI), Investec Asset Management Limited (Investec), Mondrian Investment Partners Limited (Mondrian), Copper Rock Capital Partners LLC (Copper Rock), William Blair Investment Management, LLC (William Blair) and Parametric Portfolio Associates LLC (Parametric). Mondrian, Copper Rock and William Blair were added to the Fund on June 30, 2016. The addition of these three new managers added more quality and small cap exposure to the portfolio.
AQR employs a systematic, research-driven investment approach focused on generating excess return relative to the benchmark from currency, country and security selection strategies. AQR’s proprietary investment process uses fundamental factors, such as value, momentum and quality within its models. AQR uses quantitative tools to construct optimized portfolios based on this diversified set of fundamental factors, along with estimates of risk and transactions costs. KBI manages a systematic process focusing on quality firms growing their dividend yield. KBI’s portfolio construction process uses sector and region constraints to minimize uncompensated risks. Investec uses a 4-Factor Model to evaluate companies based on strategy, value, earnings and technicals to build its portfolio. Investec’s strategy looks for high quality, attractively valued companies which have improving operating performance and are receiving increasing investor attention. Copper Rock specializes in small cap equity investing using a blend of quantitative and fundamental analyses to identify companies with superior growth relative to their peers. Copper Rock’s portfolio typically exhibits factor exposures to growth, momentum and quality. Mondrian is an experienced value manager that uses a Dividend Discount Model to analyze and find attractive companies focused on the domestic oriented growth of emerging markets. Along with emerging market domiciled companies, Mondrian’s management team will also consider any company globally that generates at least 25% of revenues/profits from emerging/frontier markets. William Blair has a quality growth philosophy and process focused on finding those companies that can achieve a higher growth rate for a longer period of time than the market expects. William Blair looks for companies with experienced and motivated management teams, unique business models and attractive financial characteristics. Parametric utilizes exchange-traded futures to generate market exposure corresponding to the Fund’s benchmark.
Market Commentary and Fund Performance
Global equity markets, as measured by the MSCI World Index, rose 14.8% during the 12-month period ending March 31, 2017. U.S. equities rallied with the S&P 500 Index up 17.2% for the fiscal year. The MSCI EAFE Index and MSCI Emerging Markets Index (the Fund’s benchmark) returned 11.7% and 17.2%, respectively, over the same time period.
Global equity markets and emerging markets in particular, have rallied significantly since the end of the first calendar quarter of 2016. Underpinning the overall rally in global equity markets during this period was an improvement in consumer and business confidence in addition to the pickup in global growth. During the period, the biggest challenge to equity markets came in June, when markets fell sharply after British voters voted in favor of exiting the European Union. This correction in
16
Mercer Emerging Markets Equity Fund
the global equity markets was short-lived, however, with markets making up the majority of losses within a month. Developed international markets continued their rally through the remainder of 2016 and the first quarter of 2017. However, emerging markets suffered a second setback after the US election. In addition to headwinds caused by the rally in the US Dollar following the election, markets reflected a concern that potential changes in US policy could result in disruptions to global trade that could adversely impact emerging markets.
GDP growth in emerging markets has varied. Despite a slowdown in Chinese economic growth over the last few years, the country has remained the biggest contributor to global growth. During this period, China’s GDP growth has been consistently just under 7%. Elsewhere in emerging markets, Brazil’s economy may have bottomed at the end of 2016, while India’s GDP growth has been above 7%. Importantly, emerging market earnings have stabilized in recent periods. Higher commodity prices and easing financial conditions have led to an uptick in earnings for emerging markets companies. Protectionist trade policies by emerging markets governments and additional increases in US interest rates by the Federal Reserve may be potential headwinds to emerging markets to the extent they contribute to currency weakness and capital outflows.
In this environment, the Mercer Emerging Markets Equity Fund underperformed the MSCI Emerging Markets Index by 1% for the 12-month period ending March 31, 2017. Underperformance during the period can be attributed to the Fund’s slightly defensive positioning. The Fund held an overweight position to the consumer staples sector (typically a defensive sector), which one of the worst was performing sectors over the 12 month period ended March 31, 2017. The Fund was also hurt by its underweight position in the energy sector; a sector that rallied significantly as the price of oil recovered from prior losses. Despite the Fund’s underperformance, our managers made positive stock picks versus the benchmark, however, those stock picks could not make up the relative losses caused by currency and sector exposures. Currency exposure also detracted at the overall Fund level. The portfolio held an underweight to the Brazilian Real, which rallied over 40% during this time period.
Among the sub-advisors, relative performance by AQR, Investec and Mondrian were all negatively affected by currency exposures as all three managers held underweight positions in Russia and Brazil, both countries whose currencies strongly rebounded during the period.
Investec outperformed the Fund’s benchmark over the period by making up much of the drag caused by currency exposures through positive stock selection especially in the automobiles & components sector. Telco was the largest sector contributor to performance, partly as a result of the underweight position but mainly through positive stock selection. Investec’s largest sector detractors were insurance and banks. In insurance both the stock selection and allocation effect were negative, whereas in banks only the overweight position detracted whilst the stock selection within the sector was positive. In terms of country exposures, our positions in East Asia were the largest contributors to performance.
AQR beat the MSCI EM Index for the period. The AQR strategy relies on three different models to build its portfolio: stock selection, currency selection and country selection. Country and currency selection gains offset marginal losses suffered as a result of negative stock selection by AQR.
The KBI strategy benefitted from a general shift among market participants from favoring growth stocks to favoring value stocks during the second half of 2016 as KBI’s process focuses on value stocks with high dividend yields.
The largest negative detractor during the period, at the sub advisor level, was William Blair, which began managing a portion of the Fund in June 2016. William Blair’s strategy focuses on quality growth companies, and toward the end of the period, quality growth companies became disfavored as markets rallied significantly.
Mondrian, whose strategy also trailed the Fund’s benchmark, began managing a portion of the Fund in June 2016. Mondrian’s strategy focuses on consumer related industries. The rally in commodity related industries was a drag on Mondrian’s relative performance as the portfolio is typically underweight in sectors such as materials and energy.
CopperRock, which began managing a portion of the Fund in June 2016, contributed positively to the Fund’s relative performance as a result of positive stock selection. CopperRock provides small cap company exposure in the Fund. Small cap exposure did not begin to add to positive relative performance until the beginning of 2017.
Parametric utilized exchange-traded futures to generate market exposure corresponding to the Fund’s benchmark. Its performance was in line with the benchmark.
17
Mercer Emerging Markets Equity Fund
Risk Considerations
The Fund invests in emerging market securities which involves certain risks such as currency volatility, political and social instability and reduced market liquidity. Emerging markets may be more volatile and less liquid than more developed markets and therefore may involve greater risks. Investments made in small and mid-capitalization companies may be more volatile and less liquid due to limited resources or product lines and more sensitive to economic factors. The Fund may invest in more aggressive investments such as mortgage- and asset-backed securities and derivatives (futures, forwards, options, swaps) all of which may cause greater volatility and less liquidity. Derivatives are more sensitive to changes in market conditions and may amplify risks. The Fund may experience high portfolio turnover which may result in higher costs and capital gains. The Fund’s volatility may be amplified by its ability to select sub advisors to allocate assets.
18
Mercer Funds
March 31, 2017
Comparison of Change in Value of a $10,000 Investment in
Mercer Emerging Markets Equity Shares vs. the
MSCI Emerging Markets Index
As of March 31, 2017
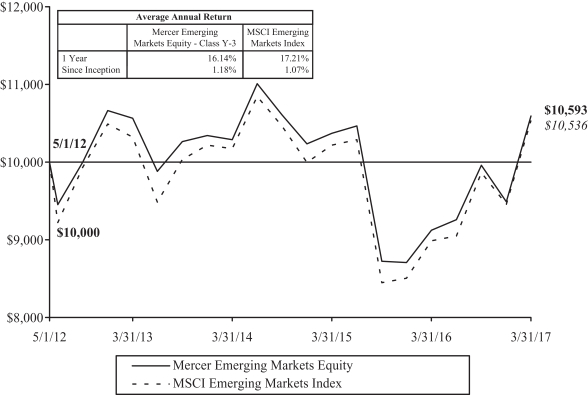
This graph shows the performance of the Mercer Emerging Markets Equity Fund Class Y-3 shares versus the MSCI Emerging Markets Index from May 1, 2012, which is the inception date of the Fund, through March 31, 2017. The performance of other classes, when launched, will vary from the performance of the class shown based on the difference in fees and expenses paid by shareholders investing in different share classes. The Fund may charge a 2% redemption fee on shares owned less than 30 days.
The table and graph assume reinvestment of dividends and capital gains, but do not reflect a deduction of taxes an investor might pay on fund distributions or upon redemption of fund shares. Performance shown reflects a fee waiver and/or expense reimbursement. Without this waiver/reimbursement, returns would have been lower.
The data quoted represents past performance and does not guarantee future results. Current performance of the Fund may be lower or higher than the performance quoted. Please call 1-866-658-9896 for the Fund’s most recent month-end performance. Investment return and principal value will fluctuate so that an investor’s shares, when redeemed, may be worth more or less than when purchased.
19
Mercer Global Low Volatility Equity Fund
Investment Objective and Benchmark
The investment objective of the Fund is to provide long-term total return, which includes capital appreciation and income. The benchmark for the Fund is the MSCI World Index.
Investment Strategy
The Fund invests principally in equity securities of U.S. and foreign issuers, of large, medium and small capitalization companies. Stock index futures and various types of swaps may be used to implement the equity security selection component of the Fund’s investment strategy. Currency forwards may be used to make stock-selection and country allocation decisions independently of the underlying currency.
Performance
For the fiscal year ended March 31, 2017, the Fund’s Y-3 share class performance was 11.02% compared to its benchmark return of 14.77%. Performance for the Fund is reported net of operating expenses while the benchmark returns do not include expenses of any kind as indexes are unmanaged.
The Sub-Advisors
As of March 31, 2017, the Fund employed four sub-advisors, Acadian Asset Management LLC (Acadian), MFG Asset Management (MFG), Martingale Asset Management, L.P. (Martingale) and Parametric Portfolio Associates LLC (Parametric).
First Eagle Investment Management, LLC was removed as a sub-advisor from the Fund in June 2016.
Acadian’s process uses both risk analysis and stock forecasts to create the portfolio. The process uses a risk model to determine the systematic risk and the level of volatility of each stock in the investable universe. Once a stock’s risk is determined, Acadian uses its stock forecast model as an overlay to determine the optimal mix of securities. Acadian’s security return forecasting model incorporates five categories including value, growth, risk, macroeconomic, and technical factors. MFG screens the universe of investable global stocks to identify high quality companies based on key quality criteria: the sustainability of a company’s competitive advantages; the predictability and reliability of future cash flows and earnings; the extent to which management will act in the best interest of shareholders; and re-investment potential. MFG then evaluates investment opportunities quantitatively incorporating both long-term intrinsic value and three-year forecast total shareholder returns using MFG’s proprietary forecasts. MFG determines portfolio construction by each stock’s ranking based on the qualitative assessment of the key criteria, the quantitative assessment driven by valuation, and detailed macroeconomic research within a robust risk management framework. From time to time, MFG may hold up to 20% of its portion of the Fund in cash if warranted by its assessment of the macro environment. Martingale’s approach to low volatility investing is built around a risk-adjusted market index methodology which promotes broad and stable diversification combined with a valuation overlay that favors low risk companies with stronger fundamentals. Martingale’s systematic stock evaluation incorporates measures of relative valuation, growth and quality, along with each security’s risk properties. Parametric utilizes exchange-traded futures to generate market exposure corresponding to the Fund’s benchmark.
Market Commentary and Fund Performance
Global equity markets, as measured by the MSCI World Index (the Fund’s benchmark), rose 14.8% during the 12-month period ending March 31, 2017. U.S. equities rallied with the S&P 500 Index up 17.2% for the fiscal year. The MSCI EAFE Index and MSCI Emerging Markets Index returned 11.7% and 17.2%, respectively, over the same time period.
Global equity and emerging markets in particular have rallied significantly since the end of the first calendar quarter of 2016. Underpinning the overall rally in global equity markets during this period was an improvement in consumer and business confidence in addition to the pickup in global growth. The US economy continued to grow at a level (between 1-2%) consistent with its average since its initial rally following the global financial crisis of 2008-2009. Growth has remained positive in Europe and Japan during this period as other economic variables, such as employment, have slowly improved.
20
Mercer Global Low Volatility Equity Fund
During the period, the biggest challenge to equity markets came in June, when markets fell sharply after British voters voted in favor of exiting the European Union. This correction in the global equity markets was short-lived, however, with markets making up the majority of losses within a month. Developed international markets continued their rally through the remainder of 2016 and the first quarter of 2017. However, emerging markets suffered a second setback after the US election. In addition to headwinds caused by the rally in the US Dollar following the election, markets reflected a concern that potential changes in US policy could result in disruptions to global trade that could adversely impact emerging markets.
In this environment, the Mercer Global Low Volatility Equity Fund returned 11.0%, underperforming the MSCI World Index by 3.8% for the 12-month period ending March 31, 2017. The Fund’s defensive posture — lower risk and volatility — was a negative contributor to performance for the Fund as these factors underperformed. In addition, the Fund’s tactical allocation to cash contributed negatively to performance. Overall, the Fund was hurt the most by its heavier weighting in defensive sectors such as utilities and consumer staples. Underweights to the financial and materials sectors also detracted from performance during this period.
Each of the Fund’s sub-advisors struggled to outperform their respective benchmarks. The market rally was driven by higher risk, lower quality stocks. In this market environment, it would be expected that a strategy that focuses on lower volatility stocks would underperform.
There were three main drivers of the MFG portfolio’s underperformance versus the Fund’s benchmark: an allocation to cash (that averaged around 15% during the 12 month period), an underweight to the financial sector and the strategy’s tendency to hold a large allocation of defensive stocks in order to maintain a more conservative risk profile for the portfolio compared to the Fund’s benchmark. MFG typically holds a large allocation of defensive stocks to maintain a more conservative risk profile for the portfolio compared to the Fund’s benchmark.
The Martingale strategy, which provides U.S. large cap exposure for the Fund, trailed the Russell 1000 Index primarily due to sector allocation. The strategy generally holds overweight allocations to consumer staples, utilities and real estate investment trusts (REITs), as these sectors tend to be lower volatility sectors. These three sectors were among the worst performing sectors during the period. The Martingale strategy was also underweight to technology, the second best performing sector during the period.
The Acadian strategy, which provides international equity exposure for the Fund, underperformed compared to the MSCI EAFE Index, mainly as a result of an overweight allocation to under-performing sectors. While stock selection was positive during the period, Acadian held overweight positions in consumer staples, utilities, telecom and REITs, which trailed the stronger performance of the materials, energy, technology and financial sectors. Holding higher weights in underperforming sectors caused Acadian’s portfolio to trail the benchmark.
Parametric utilized exchange-traded futures to generate market exposure corresponding to the Fund’s benchmark. Its performance was in line with the benchmark.
Risk Considerations
The Fund invests in foreign and emerging market securities which involves certain risks such as currency volatility, political and social instability and reduced market liquidity. Emerging markets may be more volatile and less liquid than more developed markets and therefore may involve greater risks. Investments made in small and mid-capitalization companies may be more volatile and less liquid due to limited resources or product lines and more sensitive to economic factors. The Fund may invest in more aggressive investments such as mortgage- and asset-backed securities and derivatives (futures, options, swaps) all of which may cause greater volatility and less liquidity. Derivatives are more sensitive to changes in market conditions and may amplify risks. The Fund may experience high portfolio turnover which may result in higher costs and capital gains. The Fund’s volatility may be amplified by its ability to select sub-advisors to allocate assets.
21
Mercer Funds
March 31, 2017
Comparison of Change in Value of a $10,000 Investment in
Mercer Global Low Volatility Equity Shares vs. the
MSCI World Index
As of March 31, 2017
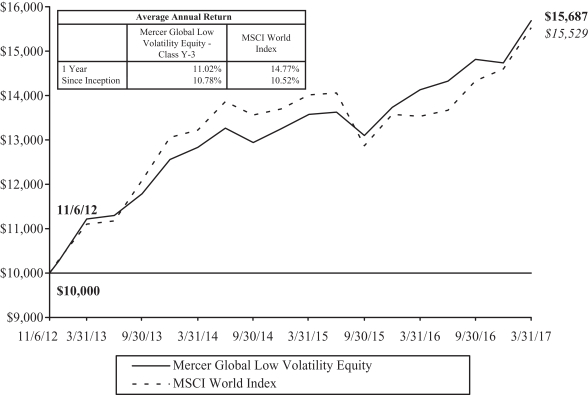
This graph shows the performance of the Mercer Global Low Volatility Equity Fund Class Y-3 shares versus the MSCI World Index from November 6, 2012, which is the inception date of the Fund, through March 31, 2017. The performance of other classes, when launched, will vary from the performance of the class shown based on the difference in fees and expenses paid by shareholders investing in different share classes. The Fund may charge a 2% redemption fee on shares owned less than 30 days.
The table and graph assume reinvestment of dividends and capital gains, but do not reflect a deduction of taxes an investor might pay on fund distributions or upon redemption of fund shares. Performance shown reflects a fee waiver and/or expense reimbursement. Without this waiver/reimbursement, returns would have been lower.
The data quoted represents past performance and does not guarantee future results. Current performance of the Fund may be lower or higher than the performance quoted. Please call 1-866-658-9896 for the Fund’s most recent month-end performance. Investment return and principal value will fluctuate so that an investor’s shares, when redeemed, may be worth more or less than when purchased.
22
Mercer US Large Cap Equity Fund (formerly known as Mercer US Large Cap Growth Equity Fund)
Schedule of Investments
(showing percentage of net assets)
March 31, 2017
| | | | | | | | | | |
| Shares | | | | | Description | | Value ($) | |
| | | |
| | | | | | COMMON STOCKS — 96.5% | | | | |
| | | |
| | | | | | Aerospace & Defense — 1.8% | | | | |
| | | |
| | 30,244 | | | | | Boeing Co. (The) | | | 5,348,954 | |
| | 1,483 | | | | | General Dynamics Corp. | | | 277,618 | |
| | 13,810 | | | | | Northrop Grumman Corp. | | | 3,284,570 | |
| | 6,521 | | | | | Spirit AeroSystems Holdings, Inc. Class A | | | 377,696 | |
| | 15,162 | | | | | United Technologies Corp. | | | 1,701,328 | |
| | | | | | | | | | |
| | | | | | | | | 10,990,166 | |
| | | | | | | | | | |
| | | |
| | | | | | Agriculture — 1.2% | | | | |
| | | |
| | 29,257 | | | | | Altria Group, Inc. | | | 2,089,535 | |
| | 32,197 | | | | | Archer-Daniels-Midland Co. | | | 1,482,350 | |
| | 32,840 | | | | | Philip Morris International, Inc. | | | 3,707,636 | |
| | | | | | | | | | |
| | | | | | | | | 7,279,521 | |
| | | | | | | | | | |
| | | |
| | | | | | Airlines — 3.5% | | | | |
| | | |
| | 16,196 | | | | | Alaska Air Group, Inc. | | | 1,493,595 | |
| | 114,062 | | | | | American Airlines Group, Inc.‡ | | | 4,824,823 | |
| | 104,370 | | | | | Delta Air Lines, Inc. | | | 4,796,845 | |
| | 44,125 | | | | | Southwest Airlines Co. | | | 2,372,160 | |
| | 104,210 | | | | | United Continental Holdings, Inc.* | | | 7,361,394 | |
| | | | | | | | | | |
| | | | | | | | | 20,848,817 | |
| | | | | | | | | | |
| | | |
| | | | | | Apparel — 3.3% | | | | |
| | | |
| | 34,600 | | | | | Hanesbrands, Inc.‡ | | | 718,296 | |
| | 114,025 | | | | | LVMH Moet Hennessy Louis Vuitton SE, ADR‡ | | | 5,012,539 | |
| | 64,866 | | | | | Michael Kors Holdings, Ltd.* | | | 2,472,043 | |
| | 213,680 | | | | | NIKE, Inc. Class B | | | 11,908,387 | |
| | | | | | | | | | |
| | | | | | | | | 20,111,265 | |
| | | | | | | | | | |
| | | |
| | | | | | Auto Manufacturers — 1.9% | | | | |
| | | |
| | 193,130 | | | | | Fiat Chrysler Automobiles NV* | | | 2,110,911 | |
| | 231,555 | | | | | General Motors Co. | | | 8,187,785 | |
| | 12,130 | | | | | Toyota Motor Corp., ADR‡ | | | 1,317,560 | |
| | | | | | | | | | |
| | | | | | | | | 11,616,256 | |
| | | | | | | | | | |
| | | |
| | | | | | Auto Parts & Equipment — 0.9% | | | | |
| | | |
| | 62,216 | | | | | Goodyear Tire & Rubber Co. (The) | | | 2,239,776 | |
| | 77,496 | | | | | Magna International, Inc. Class A | | | 3,344,727 | |
| | | | | | | | | | |
| | | | | | | | | 5,584,503 | |
| | | | | | | | | | |
| | | |
| | | | | | Banks — 5.5% | | | | |
| | | |
| | 373,139 | | | | | Bank of America Corp. | | | 8,802,349 | |
| | 3,143 | | | | | Capital One Financial Corp. | | | 272,372 | |
| | 141,911 | | | | | Citigroup, Inc. | | | 8,489,116 | |
| | 60,643 | | | | | Citizens Financial Group, Inc. | | | 2,095,216 | |
| | 93,794 | | | | | JPMorgan Chase & Co. | | | 8,238,865 | |
| | 45,800 | | | | | Morgan Stanley | | | 1,962,072 | |
| | | | | | |
| | See accompanying Notes to the Financial Statements. | | | 23 | |
Mercer US Large Cap Equity Fund (formerly known as Mercer US Large Cap Growth Equity Fund)
Schedule of Investments (Continued)
(showing percentage of net assets)
March 31, 2017
| | | | | | | | | | |
| Shares | | | | | Description | | Value ($) | |
| | |
| | | | | | Banks — continued | |
| | | |
| | 25,000 | | | | | Popular, Inc. | | | 1,018,250 | |
| | 41,440 | | | | | SunTrust Banks, Inc. | | | 2,291,632 | |
| | | | | | | | | | |
| | | | | | | | | 33,169,872 | |
| | | | | | | | | | |
| | |
| | | | | | Beverages — 3.5% | |
| | | |
| | 56,655 | | | | | Diageo Plc, ADR‡ | | | 6,548,185 | |
| | 10,447 | | | | | Dr Pepper Snapple Group, Inc. | | | 1,022,970 | |
| | 172,700 | | | | | Heineken NV, ADR | | | 7,331,115 | |
| | 53,171 | | | | | Monster Beverage Corp.* | | | 2,454,905 | |
| | 31,000 | | | | | PepsiCo, Inc. | | | 3,467,660 | |
| | | | | | | | | | |
| | | | | | | | | 20,824,835 | |
| | | | | | | | | | |
| | |
| | | | | | Biotechnology — 4.6% | |
| | | |
| | 19,850 | | | | | Alexion Pharmaceuticals, Inc.* | | | 2,406,614 | |
| | 18,756 | | | | | Amgen, Inc. | | | 3,077,297 | |
| | 8,973 | | | | | Biogen, Inc.* | | | 2,453,398 | |
| | 30,837 | | | | | Celgene Corp.* | | | 3,837,048 | |
| | 101,727 | | | | | Gilead Sciences, Inc. | | | 6,909,298 | |
| | 17,477 | | | | | Illumina, Inc.* | | | 2,982,275 | |
| | 18,680 | | | | | Intercept Pharmaceuticals, Inc.* ‡ | | | 2,112,708 | |
| | 33,339 | | | | | Vertex Pharmaceuticals, Inc.* | | | 3,645,619 | |
| | | | | | | | | | |
| | | | | | | | | 27,424,257 | |
| | | | | | | | | | |
| | |
| | | | | | Building Materials — 0.3% | |
| | | |
| | 39,600 | | | | | Louisiana-Pacific Corp.* | | | 982,872 | |
| | 24,751 | | | | | Masco Corp. | | | 841,286 | |
| | | | | | | | | | |
| | | | | | | | | 1,824,158 | |
| | | | | | | | | | |
| | |
| | | | | | Chemicals — 1.7% | |
| | | |
| | 10,920 | | | | | Dow Chemical Co. (The) | | | 693,857 | |
| | 17,000 | | | | | Eastman Chemical Co. | | | 1,373,600 | |
| | 86,942 | | | | | LyondellBasell Industries NV Class A | | | 7,928,241 | |
| | | | | | | | | | |
| | | | | | | | | 9,995,698 | |
| | | | | | | | | | |
| | |
| | | | | | Commercial Services — 1.2% | |
| | | |
| | 100,750 | | | | | PayPal Holdings, Inc.* | | | 4,334,265 | |
| | 59,751 | | | | | Quanta Services, Inc.* | | | 2,217,360 | |
| | 4,798 | | | | | United Rentals, Inc.* | | | 599,990 | |
| | | | | | | | | | |
| | | | | | | | | 7,151,615 | |
| | | | | | | | | | |
| | |
| | | | | | Computers — 2.4% | |
| | | |
| | 49,393 | | | | | Apple, Inc. | | | 7,095,798 | |
| | 5,151 | | | | | Cadence Design Systems, Inc.* | | | 161,741 | |
| | 106,817 | | | | | HP, Inc. | | | 1,909,888 | |
| | 37,442 | | | | | NetApp, Inc. | | | 1,566,948 | |
| | 58,087 | | | | | Seagate Technology Plc | | | 2,667,936 | |
| | 39,130 | | | | | Teradata Corp.* ‡ | | | 1,217,726 | |
| | | | | | | | | | |
| | | | | | | | | 14,620,037 | |
| | | | | | | | | | |
| | | | | | |
| 24 | | See accompanying Notes to the Financial Statements. | | | | |
Mercer US Large Cap Equity Fund (formerly known as Mercer US Large Cap Growth Equity Fund)
Schedule of Investments (Continued)
(showing percentage of net assets)
March 31, 2017
| | | | | | | | | | |
| Shares | | | | | Description | | Value ($) | |
| | |
| | | | | | Cosmetics & Personal Care — 0.5% | |
| | | |
| | 35,800 | | | | | Estee Lauder Cos., Inc. (The) Class A | | | 3,035,482 | |
| | | | | | | | | | |
| | | |
| | | | | | Diversified Financial Services — 4.2% | | | | |
| | | |
| | 49,100 | | | | | AerCap Holdings NV* ‡ | | | 2,257,127 | |
| | 28,057 | | | | | American Express Co. | | | 2,219,589 | |
| | 39,203 | | | | | Ameriprise Financial, Inc. | | | 5,083,845 | |
| | 66,485 | | | | | Charles Schwab Corp. (The) | | | 2,713,253 | |
| | 34,609 | | | | | Discover Financial Services | | | 2,366,910 | |
| | 42,223 | | | | | IntercontinentalExchange Group, Inc. | | | 2,527,891 | |
| | 26,300 | | | | | OneMain Holdings, Inc.* ‡ | | | 653,555 | |
| | 66,900 | | | | | Santander Consumer USA Holdings, Inc.* | | | 891,108 | |
| | 31,500 | | | | | Synchrony Financial | | | 1,080,450 | |
| | 58,745 | | | | | Visa, Inc. Class A‡ | | | 5,220,668 | |
| | | | | | | | | | |
| | | | | | | | | 25,014,396 | |
| | | | | | | | | | |
| | | |
| | | | | | Electric — 1.0% | | | | |
| | | |
| | 185,058 | | | | | AES Corp. | | | 2,068,948 | |
| | 64,500 | | | | | Calpine Corp.* | | | 712,725 | |
| | 17,010 | | | | | Edison International | | | 1,354,166 | |
| | 22,051 | | | | | Entergy Corp. | | | 1,674,994 | |
| | 6,415 | | | | | Exelon Corp. | | | 230,812 | |
| | | | | | | | | | |
| | | | | | | | | 6,041,645 | |
| | | | | | | | | | |
| | | |
| | | | | | Electrical Components & Equipment — 0.3% | | | | |
| | | |
| | 9,109 | | | | | Acuity Brands, Inc. | | | 1,858,236 | |
| | | | | | | | | | |
| | | |
| | | | | | Electronics — 0.9% | | | | |
| | | |
| | 34,759 | | | | | Corning, Inc. | | | 938,493 | |
| | 57,914 | | | | | TE Connectivity, Ltd. | | | 4,317,489 | |
| | | | | | | | | | |
| | | | | | | | | 5,255,982 | |
| | | | | | | | | | |
| | | |
| | | | | | Engineering & Construction — 0.3% | | | | |
| | | |
| | 19,900 | | | | | AECOM* | | | 708,241 | |
| | 20,450 | | | | | Chicago Bridge & Iron Co. NV | | | 628,838 | |
| | 8,200 | | | | | Fluor Corp. | | | 431,484 | |
| | | | | | | | | | |
| | | | | | | | | 1,768,563 | |
| | | | | | | | | | |
| | | |
| | | | | | Environmental Control — 0.0% | | | | |
| | | |
| | 3,246 | | | | | Waste Management, Inc. | | | 236,698 | |
| | | | | | | | | | |
| | | |
| | | | | | Food — 2.4% | | | | |
| | | |
| | 6,534 | | | | | Conagra Brands, Inc. | | | 263,582 | |
| | 11,325 | | | | | Hershey Co. (The) | | | 1,237,256 | |
| | 96,325 | | | | | Nestle SA, ADR | | | 7,407,393 | |
| | 42,132 | | | | | Sysco Corp. | | | 2,187,493 | |
| | 10,458 | | | | | Tyson Foods, Inc. Class A | | | 645,363 | |
| | 83,913 | | | | | Whole Foods Market, Inc.‡ | | | 2,493,894 | |
| | | | | | | | | | |
| | | | | | | | | 14,234,981 | |
| | | | | | | | | | |
| | | | | | |
| | See accompanying Notes to the Financial Statements. | | | 25 | |
Mercer US Large Cap Equity Fund (formerly known as Mercer US Large Cap Growth Equity Fund)
Schedule of Investments (Continued)
(showing percentage of net assets)
March 31, 2017
| | | | | | | | | | |
| Shares | | | | | Description | | Value ($) | |
| | | |
| | | | | | Gas — 0.0% | | | | |
| | | |
| | 4,597 | | | | | CenterPoint Energy, Inc. | | | 126,739 | |
| | | | | | | | | | |
| | | |
| | | | | | Health Care - Products — 0.7% | | | | |
| | | |
| | 29,336 | | | | | Baxter International, Inc. | | | 1,521,365 | |
| | 19,812 | | | | | Edwards Lifesciences Corp.* | | | 1,863,715 | |
| | 11,100 | | | | | Medtronic Plc | | | 894,216 | |
| | | | | | | | | | |
| | | | | | | | | 4,279,296 | |
| | | | | | | | | | |
| | | |
| | | | | | Health Care - Services — 0.7% | | | | |
| | | |
| | 4,196 | | | | | HCA Holdings, Inc.* | | | 373,402 | |
| | 20,052 | | | | | Quest Diagnostics, Inc. | | | 1,968,906 | |
| | 10,480 | | | | | UnitedHealth Group, Inc. | | | 1,718,825 | |
| | | | | | | | | | |
| | | | | | | | | 4,061,133 | |
| | | | | | | | | | |
| | | |
| | | | | | Home Builders — 0.2% | | | | |
| | | |
| | 28,200 | | | | | D.R. Horton, Inc. | | | 939,342 | |
| | | | | | | | | | |
| | | |
| | | | | | Household Products & Wares — 0.2% | | | | |
| | | |
| | 18,725 | | | | | Avery Dennison Corp. | | | 1,509,235 | |
| | | | | | | | | | |
| | | |
| | | | | | Insurance — 4.5% | | | | |
| | | |
| | 241,958 | | | | | Aegon NV, ADR‡ | | | 1,241,245 | |
| | 21,789 | | | | | Aflac, Inc. | | | 1,577,959 | |
| | 68,092 | | | | | Allstate Corp. (The) | | | 5,548,817 | |
| | 13,416 | | | | | Berkshire Hathaway, Inc. Class B* | | | 2,236,179 | |
| | 23,845 | | | | | Hartford Financial Services Group, Inc. (The) | | | 1,146,229 | |
| | 54,985 | | | | | Lincoln National Corp. | | | 3,598,768 | |
| | 28,610 | | | | | MetLife, Inc. | | | 1,511,180 | |
| | 8,000 | | | | | Prudential Financial, Inc. | | | 853,440 | |
| | 35,300 | | | | | Radian Group, Inc. | | | 633,988 | |
| | 49,792 | | | | | Travelers Cos., Inc. (The) | | | 6,001,928 | |
| | 21,300 | | | | | Unum Group | | | 998,757 | |
| | 38,431 | | | | | XL Group, Ltd. | | | 1,531,860 | |
| | | | | | | | | | |
| | | | | | | | | 26,880,350 | |
| | | | | | | | | | |
| | | |
| | | | | | Internet — 6.6% | | | | |
| | | |
| | 31,463 | | | | | Alibaba Group Holding, Ltd., ADR* | | | 3,392,656 | |
| | 1,682 | | | | | Alphabet, Inc. Class A* | | | 1,426,000 | |
| | 7,950 | | | | | Alphabet, Inc. Class C* | | | 6,595,002 | |
| | 4,569 | | | | | Amazon.com, Inc.* | | | 4,050,601 | |
| | 80,332 | | | | | eBay, Inc.* | | | 2,696,745 | |
| | 53,123 | | | | | Facebook, Inc. Class A* | | | 7,546,122 | |
| | 10,231 | | | | | MercadoLibre, Inc.‡ | | | 2,163,550 | |
| | 3,828 | | | | | Priceline Group, Inc. (The)* | | | 6,813,725 | |
| | 41,380 | | | | | Splunk, Inc.* | | | 2,577,560 | |
| | 25,838 | | | | | VeriSign, Inc.* ‡ | | | 2,250,748 | |
| | | | | | | | | | |
| | | | | | | | | 39,512,709 | |
| | | | | | | | | | |
| | | | | | |
| 26 | | See accompanying Notes to the Financial Statements. | | | | |
Mercer US Large Cap Equity Fund (formerly known as Mercer US Large Cap Growth Equity Fund)
Schedule of Investments (Continued)
(showing percentage of net assets)
March 31, 2017
| | | | | | | | | | |
| Shares | | | | | Description | | Value ($) | |
| | | |
| | | | | | Iron & Steel — 0.2% | | | | |
| | | |
| | 14,240 | | | | | Reliance Steel & Aluminum Co. | | | 1,139,485 | |
| | | | | | | | | | |
| | | |
| | | | | | Leisure Time — 1.3% | | | | |
| | | |
| | 112,814 | | | | | Carnival Corp. | | | 6,645,873 | |
| | 17,600 | | | | | Norwegian Cruise Line Holdings, Ltd.* | | | 892,848 | |
| | | | | | | | | | |
| | | | | | | | | 7,538,721 | |
| | | | | | | | | | |
| | | |
| | | | | | Lodging — 1.3% | | | | |
| | | |
| | 57,679 | | | | | Marriott International, Inc. Class A‡ | | | 5,432,208 | |
| | 31,490 | | | | | Wyndham Worldwide Corp. | | | 2,654,292 | |
| | | | | | | | | | |
| | | | | | | | | 8,086,500 | |
| | | | | | | | | | |
| | | |
| | | | | | Machinery - Diversified — 0.3% | | | | |
| | | |
| | 6,947 | | | | | Cognex Corp. | | | 583,200 | |
| | 7,214 | | | | | Cummins, Inc. | | | 1,090,757 | |
| | | | | | | | | | |
| | | | | | | | | 1,673,957 | |
| | | | | | | | | | |
| | | |
| | | | | | Media — 3.9% | | | | |
| | | |
| | 46,924 | | | | | CBS Corp. Class B | | | 3,254,649 | |
| | 141,875 | | | | | Comcast Corp. Class A | | | 5,333,081 | |
| | 41,866 | | | | | Discovery Communications, Inc. Class A* ‡ | | | 1,217,882 | |
| | 5,900 | | | | | Scripps Networks Interactive, Inc. Class A | | | 462,383 | |
| | 168,306 | | | | | Sirius XM Holdings, Inc.‡ | | | 866,776 | |
| | 46,075 | | | | | Time Warner, Inc. | | | 4,501,988 | |
| | 44,193 | | | | | Twenty-First Century Fox, Inc. Class A | | | 1,431,411 | |
| | 57,150 | | | | | Walt Disney Co. (The) | | | 6,480,239 | |
| | | | | | | | | | |
| | | | | | | | | 23,548,409 | |
| | | | | | | | | | |
| | | |
| | | | | | Mining — 0.1% | | | | |
| | | |
| | 18,564 | | | | | Teck Resources, Ltd. Class B‡ | | | 406,552 | |
| | | | | | | | | | |
| | | |
| | | | | | Miscellaneous - Manufacturing — 0.3% | | | | |
| | | |
| | 12,200 | | | | | Eaton Corp. Plc | | | 904,630 | |
| | 31,651 | | | | | General Electric Co. | | | 943,200 | |
| | | | | | | | | | |
| | | | | | | | | 1,847,830 | |
| | | | | | | | | | |
| | | |
| | | | | | Oil & Gas — 4.4% | | | | |
| | | |
| | 24,100 | | | | | Anadarko Petroleum Corp. | | | 1,494,200 | |
| | 21,140 | | | | | Apache Corp.‡ | | | 1,086,385 | |
| | 117,383 | | | | | BP Plc, ADR‡ | | | 4,052,061 | |
| | 93,100 | | | | | Canadian Natural Resources, Ltd. | | | 3,052,749 | |
| | 12,382 | | | | | Chevron Corp. | | | 1,329,455 | |
| | 36,600 | | | | | Devon Energy Corp. | | | 1,526,952 | |
| | 63,228 | | | | | Ensco Plc Class A | | | 565,891 | |
| | 6,021 | | | | | Exxon Mobil Corp. | | | 493,782 | |
| | 20,278 | | | | | Helmerich & Payne, Inc.‡ | | | 1,349,906 | |
| | 37,504 | | | | | Marathon Petroleum Corp. | | | 1,895,452 | |
| | 4,417 | | | | | Murphy Oil Corp.‡ | | | 126,282 | |
| | | | | | |
| | See accompanying Notes to the Financial Statements. | | | 27 | |
Mercer US Large Cap Equity Fund (formerly known as Mercer US Large Cap Growth Equity Fund)
Schedule of Investments (Continued)
(showing percentage of net assets)
March 31, 2017
| | | | | | | | | | |
| Shares | | | | | Description | | Value ($) | |
| | |
| | | | | | Oil & Gas — continued | |
| | | |
| | 67,030 | | | | | Southwestern Energy Co.* | | | 547,635 | |
| | 25,896 | | | | | Tesoro Corp. | | | 2,099,130 | |
| | 103,564 | | | | | Valero Energy Corp. | | | 6,865,258 | |
| | | | | | | | | | |
| | | | | | | | | 26,485,138 | |
| | | | | | | | | | |
| | | |
| | | | | | Oil & Gas Services — 0.3% | | | | |
| | | |
| | 37,683 | | | | | National Oilwell Varco, Inc.‡ | | | 1,510,711 | |
| | 19,500 | | | | | Oceaneering International, Inc.‡ | | | 528,060 | |
| | | | | | | | | | |
| | | | | | | | | 2,038,771 | |
| | | | | | | | | | |
| | | |
| | | | | | Packaging & Containers — 0.2% | | | | |
| | | |
| | 25,100 | | | | | Crown Holdings, Inc.* | | | 1,329,045 | |
| | 8,700 | | | | | Owens-Illinois, Inc.* | | | 177,306 | |
| | | | | | | | | | |
| | | | | | | | | 1,506,351 | |
| | | | | | | | | | |
| | | |
| | | | | | Pharmaceuticals — 4.5% | | | | |
| | | |
| | 17,700 | | | | | AbbVie, Inc. | | | 1,153,332 | |
| | 25,400 | | | | | Akorn, Inc.* ‡ | | | 611,632 | |
| | 64,612 | | | | | Bristol-Myers Squibb Co. | | | 3,513,601 | |
| | 23,021 | | | | | DexCom, Inc.* ‡ | | | 1,950,569 | |
| | 23,434 | | | | | Express Scripts Holding Co.* | | | 1,544,535 | |
| | 61,800 | | | | | Horizon Pharma Plc* | | | 913,404 | |
| | 4,000 | | | | | Jazz Pharmaceuticals Plc* | | | 580,520 | |
| | 40,537 | | | | | Johnson & Johnson | | | 5,048,883 | |
| | 18,300 | | | | | Mallinckrodt Plc* ‡ | | | 815,631 | |
| | 57,236 | | | | | Merck & Co., Inc. | | | 3,636,775 | |
| | 19,300 | | | | | Mylan NV* | | | 752,507 | |
| | 145,581 | | | | | Pfizer, Inc. | | | 4,980,326 | |
| | 9,533 | | | | | Shire Plc, ADR | | | 1,660,935 | |
| | | | | | | | | | |
| | | | | | | | | 27,162,650 | |
| | | | | | | | | | |
| | | |
| | | | | | Private Equity — 1.0% | | | | |
| | | |
| | 75,920 | | | | | Blackstone Group, LP (The) | | | 2,254,824 | |
| | 195,630 | | | | | KKR & Co., LP | | | 3,566,335 | |
| | | | | | | | | | |
| | | | | | | | | 5,821,159 | |
| | | | | | | | | | |
| | | |
| | | | | | Real Estate — 0.2% | | | | |
| | | |
| | 41,034 | | | | | CBRE Group, Inc. Class A* | | | 1,427,573 | |
| | | | | | | | | | |
| | | |
| | | | | | REITS — 0.5% | | | | |
| | | |
| | 123,999 | | | | | Host Hotels & Resorts, Inc. REIT | | | 2,313,821 | |
| | 85,830 | | | | | Two Harbors Investment Corp. REIT | | | 823,110 | |
| | | | | | | | | | |
| | | | | | | | | 3,136,931 | |
| | | | | | | | | | |
| | | |
| | | | | | Retail — 11.5% | | | | |
| | | |
| | 71,315 | | | | | Bed Bath & Beyond, Inc. | | | 2,814,090 | |
| | 147,352 | | | | | Best Buy Co., Inc.‡ | | | 7,242,351 | |
| | 4,767 | | | | | Coach, Inc. | | | 197,020 | |
| | | | | | |
| 28 | | See accompanying Notes to the Financial Statements. | | | | |
Mercer US Large Cap Equity Fund (formerly known as Mercer US Large Cap Growth Equity Fund)
Schedule of Investments (Continued)
(showing percentage of net assets)
March 31, 2017
| | | | | | | | | | |
| Shares | | | | | Description | | Value ($) | |
| | |
| | | | | | Retail — continued | |
| | | |
| | 14,580 | | | | | Costco Wholesale Corp. | | | 2,444,920 | |
| | 11,610 | | | | | Domino’s Pizza, Inc. | | | 2,139,723 | |
| | 3,064 | | | | | Foot Locker, Inc. | | | 229,218 | |
| | 68,592 | | | | | Kohl’s Corp.‡ | | | 2,730,648 | |
| | 74,470 | | | | | Lululemon Athletica, Inc.* ‡ | | | 3,862,759 | |
| | 43,037 | | | | | Macy’s, Inc. | | | 1,275,617 | |
| | 104,030 | | | | | McDonald’s Corp. | | | 13,483,328 | |
| | 233,537 | | | | | Staples, Inc. | | | 2,048,119 | |
| | 136,023 | | | | | Starbucks Corp. | | | 7,942,383 | |
| | 42,011 | | | | | Target Corp. | | | 2,318,587 | |
| | 58,675 | | | | | TJX Cos., Inc. (The) | | | 4,640,019 | |
| | 6,987 | | | | | Ulta Salon Cosmetics & Fragrance, Inc.* | | | 1,992,902 | |
| | 161,543 | | | | | Wal-Mart Stores, Inc. | | | 11,644,019 | |
| | 28,805 | | | | | Yum! Brands, Inc. | | | 1,840,640 | |
| | | | | | | | | | |
| | | | | | | | | 68,846,343 | |
| | | | | | | | | | |
| | |
| | | | | | Semiconductors — 2.9% | |
| | | |
| | 133,178 | | | | | Applied Materials, Inc. | | | 5,180,624 | |
| | 100,266 | | | | | Intel Corp. | | | 3,616,595 | |
| | 18,791 | | | | | Lam Research Corp. | | | 2,412,013 | |
| | 126,534 | | | | | Micron Technology, Inc.* | | | 3,656,832 | |
| | 24,404 | | | | | NVIDIA Corp.‡ | | | 2,658,328 | |
| | | | | | | | | | |
| | | | | | | | | 17,524,392 | |
| | | | | | | | | | |
| | |
| | | | | | Software — 6.0% | |
| | | |
| | 59,146 | | | | | Activision Blizzard, Inc. | | | 2,949,020 | |
| | 21,688 | | | | | Adobe Systems, Inc.* | | | 2,822,259 | |
| | 70,762 | | | | | CA, Inc.‡ | | | 2,244,571 | |
| | 24,900 | | | | | Citrix Systems, Inc.* | | | 2,076,411 | |
| | 54,700 | | | | | First Data Corp. Class A* | | | 847,850 | |
| | 19,928 | | | | | Intuit, Inc. | | | 2,311,449 | |
| | 210,939 | | | | | Microsoft Corp. | | | 13,892,442 | |
| | 7,186 | | | | | MSCI, Inc. Class A | | | 698,407 | |
| | 50,228 | | | | | Oracle Corp. | | | 2,240,671 | |
| | 36,506 | | | | | Salesforce.com, Inc.* | | | 3,011,380 | |
| | 32,092 | | | | | ServiceNow, Inc.* | | | 2,807,087 | |
| | | | | | | | | | |
| | | | | | | | | 35,901,547 | |
| | | | | | | | | | |
| | |
| | | | | | Telecommunications — 2.9% | |
| | | |
| | 59,145 | | | | | AT&T, Inc. | | | 2,457,475 | |
| | 155,757 | | | | | CenturyLink, Inc.‡ | | | 3,671,193 | |
| | 74,360 | | | | | Cisco Systems, Inc. | | | 2,513,368 | |
| | 10,600 | | | | | IPG Photonics Corp.* | | | 1,279,420 | |
| | 52,028 | | | | | Juniper Networks, Inc. | | | 1,447,939 | |
| | 17,752 | | | | | Motorola Solutions, Inc. | | | 1,530,577 | |
| | 17,196 | | | | | QUALCOMM, Inc. | | | 986,019 | |
| | 72,671 | | | | | Verizon Communications, Inc. | | | 3,542,711 | |
| | | | | | | | | | |
| | | | | | | | | 17,428,702 | |
| | | | | | | | | | |
| | | | | | |
| | See accompanying Notes to the Financial Statements. | | | 29 | |
Mercer US Large Cap Equity Fund (formerly known as Mercer US Large Cap Growth Equity Fund)
Schedule of Investments (Continued)
(showing percentage of net assets)
March 31, 2017
| | | | | | | | | | |
| Shares | | | | | Description | | Value ($) | |
| | |
| | | | | | Transportation — 0.4% | |
| | | |
| | 13,066 | | | | | FedEx Corp. | | | 2,549,830 | |
| | | | | | | | | | |
| | | |
| | | | | | TOTAL COMMON STOCKS (COST $504,170,865) | | | 580,266,628 | |
| | | | | | | | | | |
| | | |
| | | | | | INVESTMENT COMPANY — 1.2% | | | | |
| | | |
| | 34,866 | | | | | Vanguard S&P 500 ETF | | | 7,543,259 | |
| | | | | | | | | | |
| | | |
| | | | | | TOTAL INVESTMENT COMPANY (COST $6,860,889) | | | 7,543,259 | |
| | | | | | | | | | |
| | | |
| Par Value ($) | | | | | Description | | Value ($) | |
| | | |
| | | | | | SHORT-TERM INVESTMENTS — 4.2% | | | | |
| | |
| | | | | | Bank Deposit — 2.3% | |
| | | |
| | 13,564,050 | | | | | State Street Bank & Trust Euro Time Deposit, 0.09%, due 04/03/17 | | | 13,564,050 | |
| | | | | | | | | | |
| | |
| | | | | | Mutual Fund - Securities Lending Collateral — 1.8% | |
| | | |
| | 10,620,680 | | | | | State Street Institutional U.S. Government Money Market Fund, Premier Class*** | | | 10,620,680 | |
| | | | | | | | | | |
| | |
| | | | | | U.S. Government and Agency Obligations — 0.1% | |
| | | |
| | 600,000 | | | | | United States Treasury Bill, 0.65%, due 04/27/17** ‡‡ | | | 599,710 | |
| | | | | | | | | | |
| | | |
| | | | | | TOTAL SHORT-TERM INVESTMENTS (COST $24,784,539) | | | 24,784,440 | |
| | | | | | | | | | |
| | | |
| | | | | | TOTAL INVESTMENTS — 101.9% (COST $535,816,293) | | | 612,594,327 | |
| | | |
| | | | | | Other Assets and Liabilities (net) — (1.9)% | | | (11,535,336 | ) |
| | | | | | | | | | |
| | | |
| | | | | | NET ASSETS — 100.0% | | $ | 601,058,991 | |
| | | | | | | | | | |
| | | |
| | | | | | Notes to Schedule of Investments: | | | | |
| | | |
| | | | | | ADR — American Depository Receipt | | | | |
| | | |
| | | | | | REIT — Real Estate Investment Trust | | | | |
| | | |
| | | | * | | Non-income producing security | | | | |
| | | |
| | | | ** | | All or a portion of this security is pledged for open futures collateral. | | | | |
| | | |
| | | | *** | | Represents an investment of securities lending cash collateral. | | | | |
| | | |
| | | | ‡ | | All or a portion of this security is out on loan. | | | | |
| | | |
| | | | ‡‡ | | Interest rate presented is yield to maturity. | | | | |
| | | | | | |
| 30 | | See accompanying Notes to the Financial Statements. | | | | |
Mercer US Large Cap Equity Fund (formerly known as Mercer US Large Cap Growth Equity Fund)
Schedule of Investments (Continued)
March 31, 2017
Futures Contracts
| | | | | | | | | | | | | | | | | | | | |
Number of
Contracts | | | | | Type | | | | Expiration Date | | | Contract
Value | | | Unrealized
Appreciation
(Depreciation) | |
| | Buys | | | | | | | | | | | | | | | | | | | |
| | 45 | | | | | S&P 500 E-mini Index | | | | | June 2017 | | | $ | 5,308,200 | | | $ | (9,043 | ) |
| | 8 | | | | | S&P Mid 400 E-mini Index | | | | | June 2017 | | | | 1,374,560 | | | | 6,399 | |
| | | | | | | | | | | | | | | | | | | | |
| | | | | | | | | | | | | | | | | | $ | (2,644 | ) |
| | | | | | | | | | | | | | | | | | | | |
| | | | | | |
| | See accompanying Notes to the Financial Statements. | | | 31 | |
Mercer US Large Cap Equity Fund (formerly known as Mercer US Large Cap Growth Equity Fund)
Schedule of Investments (Continued)
March 31, 2017
| | | | | |
| Asset Class Summary (Unaudited) | | % of Net Assets |
Common Stocks | | | | 96.5 | |
Investment Company | | | | 1.2 | |
Futures Contracts | | | | (0.0 | ) |
Short-Term Investments | | | | 4.2 | |
Other Assets and Liabilities (net) | | | | (1.9 | ) |
| | | | | |
| | | | 100.0 | % |
| | | | | |
| | | | | | |
| 32 | | See accompanying Notes to the Financial Statements. | | | | |
Mercer US Small/Mid Cap Equity Fund (formerly known as Mercer US Small/Mid Cap Growth Equity Fund)
Schedule of Investments
(showing percentage of net assets)
March 31, 2017
| | | | | | | | | | |
| Shares | | | | | Description | | Value ($) | |
| | | |
| | | | | | COMMON STOCKS — 95.9% | | | | |
| | | |
| | | | | | Aerospace & Defense — 1.7% | | | | |
| | | |
| | 23,788 | | | | | HEICO Corp.‡ | | | 2,074,313 | |
| | 44,990 | | | | | KLX, Inc.* | | | 2,011,053 | |
| | 34,500 | | | | | Moog, Inc. Class A* | | | 2,323,575 | |
| | 31,452 | | | | | Orbital ATK, Inc. | | | 3,082,296 | |
| | 58,500 | | | | | Spirit AeroSystems Holdings, Inc. Class A | | | 3,388,320 | |
| | 15,167 | | | | | TransDigm Group, Inc.‡ | | | 3,339,167 | |
| | | | | | | | | | |
| | | | | | | | | 16,218,724 | |
| | | | | | | | | | |
| | | |
| | | | | | Agriculture — 0.5% | | | | |
| | | |
| | 38,700 | | | | | Bunge, Ltd. | | | 3,067,362 | |
| | 26,900 | | | | | Universal Corp. | | | 1,903,175 | |
| | | | | | | | | | |
| | | | | | | | | 4,970,537 | |
| | | | | | | | | | |
| | | |
| | | | | | Airlines — 0.9% | | | | |
| | | |
| | 30,800 | | | | | Alaska Air Group, Inc. | | | 2,840,376 | |
| | 20,304 | | | | | Allegiant Travel Co.‡ | | | 3,253,716 | |
| | 111,000 | | | | | JetBlue Airways Corp.* | | | 2,287,710 | |
| | | | | | | | | | |
| | | | | | | | | 8,381,802 | |
| | | | | | | | | | |
| | | |
| | | | | | Apparel — 0.3% | | | | |
| | | |
| | 19,948 | | | | | Columbia Sportswear Co.‡ | | | 1,171,945 | |
| | 39,700 | | | | | Michael Kors Holdings, Ltd.* | | | 1,512,967 | |
| | | | | | | | | | |
| | | | | | | | | 2,684,912 | |
| | | | | | | | | | |
| | | |
| | | | | | Auto Manufacturers — 0.2% | | | | |
| | | |
| | 93,900 | | | | | Wabash National Corp.‡ | | | 1,942,791 | |
| | | | | | | | | | |
| | | |
| | | | | | Auto Parts & Equipment — 1.9% | | | | |
| | | |
| | 8,800 | | | | | Cooper-Standard Holdings, Inc.* | | | 976,184 | |
| | 120,220 | | | | | Dana, Inc. | | | 2,321,448 | |
| | 39,801 | | | | | Dorman Products, Inc.* ‡ | | | 3,268,856 | |
| | 81,300 | | | | | Goodyear Tire & Rubber Co. (The) | | | 2,926,800 | |
| | 73,761 | | | | | Horizon Global Corp.* ‡ | | | 1,023,803 | |
| | 17,537 | | | | | LCI Industries‡ | | | 1,750,193 | |
| | 16,500 | | | | | Lear Corp. | | | 2,336,070 | |
| | 27,700 | | | | | Tenneco, Inc.‡ | | | 1,729,034 | |
| | 39,700 | | | | | Tower International, Inc. | | | 1,075,870 | |
| | 12,734 | | | | | WABCO Holdings, Inc.* | | | 1,495,226 | |
| | | | | | | | | | |
| | | | | | | | | 18,903,484 | |
| | | | | | | | | | |
| | | |
| | | | | | Banks — 7.2% | | | | |
| | | |
| | 64,225 | | | | | Ameris Bancorp | | | 2,960,772 | |
| | 47,900 | | | | | Banco Latinoamericano de Comercio Exterior SA‡ | | | 1,328,746 | |
| | 131,025 | | | | | Bank of NT Butterfield & Son, Ltd. (The) | | | 4,181,008 | |
| | 58,848 | | | | | BankUnited, Inc. | | | 2,195,619 | |
| | 33,100 | | | | | Banner Corp. | | | 1,841,684 | |
| | | | | | |
| | See accompanying Notes to the Financial Statements. | | | 33 | |
Mercer US Small/Mid Cap Equity Fund (formerly known as Mercer US Small/Mid Cap Growth Equity Fund)
Schedule of Investments (Continued)
(showing percentage of net assets)
March 31, 2017
| | | | | | | | | | |
| Shares | | | | | Description | | Value ($) | |
| | | |
| | | | | | Banks — continued | | | | |
| | | |
| | 21,400 | | | | | Bryn Mawr Bank Corp.‡ | | | 845,300 | |
| | 66,940 | | | | | Capital Bank Financial Corp. Class A‡ | | | 2,905,196 | |
| | 40,653 | | | | | Columbia Banking System, Inc. | | | 1,585,060 | |
| | 39,200 | | | | | Fidelity Southern Corp. | | | 877,296 | |
| | 27,100 | | | | | First Interstate BancSystem, Inc.‡ | | | 1,074,515 | |
| | 90,807 | | | | | First Republic Bank | | | 8,518,605 | |
| | 35,851 | | | | | Glacier Bancorp, Inc. | | | 1,216,424 | |
| | 48,700 | | | | | Hanmi Financial Corp. | | | 1,497,525 | |
| | 76,125 | | | | | Heritage Financial Corp. | | | 1,884,094 | |
| | 60,100 | | | | | Home BancShares, Inc.‡ | | | 1,626,907 | |
| | 91,700 | | | | | Hope Bancorp, Inc. | | | 1,757,889 | |
| | 29,307 | | | | | IBERIABANK Corp. | | | 2,318,184 | |
| | 30,200 | | | | | International Bancshares Corp. | | | 1,069,080 | |
| | 95,100 | | | | | Old National Bancorp | | | 1,649,985 | |
| | 58,200 | | | | | Opus Bank | | | 1,172,730 | |
| | 68,705 | | | | | PacWest Bancorp | | | 3,659,228 | |
| | 251,000 | | | | | Regions Financial Corp. | | | 3,647,030 | |
| | 12,146 | | | | | Signature Bank* | | | 1,802,345 | |
| | 27,220 | | | | | SVB Financial Group* | | | 5,065,370 | |
| | 162,200 | | | | | TCF Financial Corp. | | | 2,760,644 | |
| | 37,025 | | | | | Texas Capital Bancshares, Inc.* | | | 3,089,736 | |
| | 47,038 | | | | | Webster Financial Corp.‡ | | | 2,353,782 | |
| | 113,511 | | | | | Western Alliance Bancorp* | | | 5,572,255 | |
| | | | | | | | | | |
| | | | | | | | | 70,457,009 | |
| | | | | | | | | | |
| | | |
| | | | | | Biotechnology — 1.1% | | | | |
| | | |
| | 54,590 | | | | | Acceleron Pharma, Inc.* | | | 1,444,997 | |
| | 38,300 | | | | | AMAG Pharmaceuticals, Inc.* | | | 863,665 | |
| | 18,715 | | | | | Bio-Rad Laboratories, Inc. Class A* | | | 3,730,648 | |
| | 23,070 | | | | | Bioverativ, Inc.* | | | 1,256,392 | |
| | 6,000 | | | | | Medicines Co. (The)* ‡ | | | 293,400 | |
| | 20,019 | | | | | Prothena Corp. Plc* | | | 1,116,860 | |
| | 9,480 | | | | | Seattle Genetics, Inc.* ‡ | | | 595,913 | |
| | 10,900 | | | | | United Therapeutics Corp.* ‡ | | | 1,475,642 | |
| | | | | | | | | | |
| | | | | | | | | 10,777,517 | |
| | | | | | | | | | |
| | | |
| | | | | | Building Materials — 1.8% | | | | |
| | | |
| | 21,048 | | | | | Apogee Enterprises, Inc.‡ | | | 1,254,671 | |
| | 89,150 | | | | | Boise Cascade Co.* | | | 2,380,305 | |
| | 237,780 | | | | | Builders FirstSource, Inc.* | | | 3,542,922 | |
| | 21,286 | | | | | Eagle Materials, Inc. | | | 2,067,722 | |
| | 15,420 | | | | | Lennox International, Inc. | | | 2,579,766 | |
| | 26,500 | | | | | Owens Corning | | | 1,626,305 | |
| | 119,415 | | | | | Summit Materials, Inc. Class A* | | | 2,950,745 | |
| | 50,500 | | | | | USG Corp.* | | | 1,605,900 | |
| | | | | | | | | | |
| | | | | | | | | 18,008,336 | |
| | | | | | | | | | |
| | | |
| | | | | | Chemicals — 2.6% | | | | |
| | | |
| | 133,390 | | | | | Axalta Coating Systems, Ltd.* | | | 4,295,158 | |
| | | | | | |
| 34 | | See accompanying Notes to the Financial Statements. | | | | |
Mercer US Small/Mid Cap Equity Fund (formerly known as Mercer US Small/Mid Cap Growth Equity Fund)
Schedule of Investments (Continued)
(showing percentage of net assets)
March 31, 2017
| | | | | | | | | | |
| Shares | | | | | Description | | Value ($) | |
| | | |
| | | | | | Chemicals — continued | | | | |
| | | |
| | 40,100 | | | | | Cabot Corp. | | | 2,402,391 | |
| | 29,900 | | | | | Celanese Corp. Series A | | | 2,686,515 | |
| | 26,400 | | | | | Eastman Chemical Co. | | | 2,133,120 | |
| | 144,900 | | | | | Huntsman Corp. | | | 3,555,846 | |
| | 15,151 | | | | | Quaker Chemical Corp. | | | 1,994,781 | |
| | 90,588 | | | | | RPM International, Inc. | | | 4,985,058 | |
| | 45,630 | | | | | W.R. Grace & Co. | | | 3,180,867 | |
| | | | | | | | | | |
| | | | | | | | | 25,233,736 | |
| | | | | | | | | | |
| | | |
| | | | | | Commercial Services — 8.2% | | | | |
| | | |
| | 34,900 | | | | | Avis Budget Group, Inc.* | | | 1,032,342 | |
| | 137,360 | | | | | Booz Allen Hamilton Holding Corp. | | | 4,861,170 | |
| | 30,497 | | | | | Bright Horizons Family Solutions, Inc.* | | | 2,210,728 | |
| | 44,000 | | | | | Carriage Services, Inc.‡ | | | 1,193,280 | |
| | 20,139 | | | | | CEB, Inc. | | | 1,582,925 | |
| | 37,041 | | | | | CoStar Group, Inc.* | | | 7,675,636 | |
| | 30,700 | | | | | Deluxe Corp. | | | 2,215,619 | |
| | 16,455 | | | | | Euronet Worldwide, Inc.* | | | 1,407,232 | |
| | 67,850 | | | | | Gartner, Inc.* | | | 7,327,121 | |
| | 32,816 | | | | | Grand Canyon Education, Inc.* ‡ | | | 2,349,954 | |
| | 48,153 | | | | | Healthcare Services Group, Inc. | | | 2,074,913 | |
| | 50,810 | | | | | HealthEquity, Inc.* ‡ | | | 2,156,884 | |
| | 69,182 | | | | | IHS Markit, Ltd.* | | | 2,902,185 | |
| | 43,110 | | | | | KAR Auction Services, Inc. | | | 1,882,614 | |
| | 127,538 | | | | | Live Nation Entertainment, Inc.* | | | 3,873,329 | |
| | 9,425 | | | | | LSC Communications, Inc. | | | 237,133 | |
| | 34,700 | | | | | ManpowerGroup, Inc. | | | 3,559,179 | |
| | 42,696 | | | | | MarketAxess Holdings, Inc. | | | 8,005,073 | |
| | 164,826 | | | | | Nord Anglia Education, Inc.* ‡ | | | 4,176,691 | |
| | 16,400 | | | | | PAREXEL International Corp.* | | | 1,035,004 | |
| | 20,103 | | | | | Paylocity Holding Corp.* ‡ | | | 776,579 | |
| | 134,498 | | | | | Ritchie Bros Auctioneers, Inc. | | | 4,424,984 | |
| | 25,133 | | | | | RR Donnelley & Sons Co. | | | 304,361 | |
| | 45,040 | | | | | Sotheby’s* | | | 2,048,419 | |
| | 69,650 | | | | | Total System Services, Inc. | | | 3,723,489 | |
| | 139,914 | | | | | TransUnion* | | | 5,365,702 | |
| | 73,600 | | | | | Western Union Co. (The)‡ | | | 1,497,760 | |
| | | | | | | | | | |
| | | | | | | | | 79,900,306 | |
| | | | | | | | | | |
| | | |
| | | | | | Computers — 1.8% | | | | |
| | | |
| | 20,960 | | | | | Conduent, Inc.* | | | 351,709 | |
| | 77,300 | | | | | Convergys Corp.‡ | | | 1,634,895 | |
| | 74,880 | | | | | Electronics For Imaging, Inc.* ‡ | | | 3,656,390 | |
| | 65,810 | | | | | Fortinet, Inc.* | | | 2,523,813 | |
| | 67,582 | | | | | Lumentum Holdings, Inc.* ‡ | | | 3,605,500 | |
| | 63,100 | | | | | NCR Corp.* | | | 2,882,408 | |
| | 42,200 | | | | | Seagate Technology Plc‡ | | | 1,938,246 | |
| | 47,787 | | | | | VeriFone Systems, Inc.* | | | 895,051 | |
| | | | | | | | | | |
| | | | | | | | | 17,488,012 | |
| | | | | | | | | | |
| | | | | | |
| | See accompanying Notes to the Financial Statements. | | | 35 | |
Mercer US Small/Mid Cap Equity Fund (formerly known as Mercer US Small/Mid Cap Growth Equity Fund)
Schedule of Investments (Continued)
(showing percentage of net assets)
March 31, 2017
| | | | | | | | | | |
| Shares | | | | | Description | | Value ($) | |
| | | |
| | | | | | Cosmetics & Personal Care — 0.1% | | | | |
| | | |
| | 17,794 | | | | | Inter Parfums, Inc. | | | 650,371 | |
| | | | | | | | | | |
| | | |
| | | | | | Distribution & Wholesale — 0.6% | | | | |
| | | |
| | 85,820 | | | | | HD Supply Holdings, Inc.* | | | 3,529,347 | |
| | 57,080 | | | | | LKQ Corp.* | | | 1,670,732 | |
| | 25,400 | | | | | ScanSource, Inc.* | | | 996,950 | |
| | | | | | | | | | |
| | | | | | | | | 6,197,029 | |
| | | | | | | | | | |
| | | |
| | | | | | Diversified Financial Services — 2.2% | | | | |
| | | |
| | 38,265 | | | | | Artisan Partners Asset Management, Inc. Class A | | | 1,056,114 | |
| | 22,336 | | | | | CBOE Holdings, Inc. | | | 1,810,780 | |
| | 105,855 | | | | | CIT Group, Inc. | | | 4,544,355 | |
| | 18,000 | | | | | Federal Agricultural Mortgage Corp. Class C | | | 1,036,260 | |
| | 54,700 | | | | | Legg Mason, Inc. | | | 1,975,217 | |
| | 96,000 | | | | | Navient Corp. | | | 1,416,960 | |
| | 41,120 | | | | | Raymond James Financial, Inc. | | | 3,135,811 | |
| | 32,051 | | | | | SEI Investments Co.‡ | | | 1,616,652 | |
| | 20,674 | | | | | Stifel Financial Corp.* | | | 1,037,628 | |
| | 48,703 | | | | | WageWorks, Inc.* | | | 3,521,227 | |
| | | | | | | | | | |
| | | | | | | | | 21,151,004 | |
| | | | | | | | | | |
| | | |
| | | | | | Electric — 0.9% | | | | |
| | | |
| | 147,600 | | | | | AES Corp. | | | 1,650,168 | |
| | 143,774 | | | | | OGE Energy Corp. | | | 5,029,215 | |
| | 55,184 | | | | | Portland General Electric Co. | | | 2,451,273 | |
| | | | | | | | | | |
| | | | | | | | | 9,130,656 | |
| | | | | | | | | | |
| | | |
| | | | | | Electrical Components & Equipment — 1.0% | | | | |
| | | |
| | 7,206 | | | | | Acuity Brands, Inc. | | | 1,470,024 | |
| | 29,924 | | | | | Advanced Energy Industries, Inc.* | | | 2,051,589 | |
| | 21,100 | | | | | Belden, Inc. | | | 1,459,909 | |
| | 36,390 | | | | | EnerSys | | | 2,872,627 | |
| | 47,135 | | | | | Generac Holdings, Inc.* ‡ | | | 1,757,193 | |
| | | | | | | | | | |
| | | | | | | | | 9,611,342 | |
| | | | | | | | | | |
| | | |
| | | | | | Electronics — 2.8% | | | | |
| | | |
| | 21,700 | | | | | Arrow Electronics, Inc.* | | | 1,592,997 | |
| | 45,300 | | | | | Avnet, Inc. | | | 2,072,928 | |
| | 29,130 | | | | | Coherent, Inc.* | | | 5,990,293 | |
| | 161,700 | | | | | Flex, Ltd.* | | | 2,716,560 | |
| | 8,119 | | | | | Mettler-Toledo International, Inc.* | | | 3,888,270 | |
| | 60,409 | | | | | National Instruments Corp. | | | 1,966,917 | |
| | 43,100 | | | | | Sanmina Corp.* | | | 1,749,860 | |
| | 35,203 | | | | | Sensata Technologies Holding NV* | | | 1,537,315 | |
| | 68,931 | | | | | Trimble, Inc.* | | | 2,206,481 | |
| | 117,800 | | | | | Vishay Intertechnology, Inc.‡ | | | 1,937,810 | |
| | 19,595 | | | | | Woodward, Inc. | | | 1,330,893 | |
| | | | | | | | | | |
| | | | | | | | | 26,990,324 | |
| | | | | | | | | | |
| | | | | | |
| 36 | | See accompanying Notes to the Financial Statements. | | | | |
Mercer US Small/Mid Cap Equity Fund (formerly known as Mercer US Small/Mid Cap Growth Equity Fund)
Schedule of Investments (Continued)
(showing percentage of net assets)
March 31, 2017
| | | | | | | | | | |
| Shares | | | | | Description | | Value ($) | |
| | | |
| | | | | | Energy-Alternate Sources — 0.1% | | | | |
| | | |
| | 142,300 | | | | | Renewable Energy Group, Inc.* ‡ | | | 1,487,035 | |
| | | | | | | | | | |
| | | |
| | | | | | Engineering & Construction — 0.4% | | | | |
| | | |
| | 37,900 | | | | | Chicago Bridge & Iron Co. NV‡ | | | 1,165,425 | |
| | 46,363 | | | | | Exponent, Inc. | | | 2,760,917 | |
| | | | | | | | | | |
| | | | | | | | | 3,926,342 | |
| | | | | | | | | | |
| | | |
| | | | | | Entertainment — 1.3% | | | | |
| | | |
| | 94,849 | | | | | Lions Gate Entertainment Corp. Class B* ‡ | | | 2,312,419 | |
| | 58,986 | | | | | Six Flags Entertainment Corp.‡ | | | 3,509,077 | |
| | 36,917 | | | | | Vail Resorts, Inc. | | | 7,084,372 | |
| | | | | | | | | | |
| | | | | | | | | 12,905,868 | |
| | | | | | | | | | |
| | | |
| | | | | | Food — 2.2% | | | | |
| | | |
| | 44,740 | | | | | Hain Celestial Group, Inc. (The)* ‡ | | | 1,664,328 | |
| | 22,700 | | | | | Ingles Markets, Inc. Class A | | | 979,505 | |
| | 40,072 | | | | | John B Sanfilippo & Son, Inc.‡ | | | 2,932,870 | |
| | 64,700 | | | | | Pilgrim’s Pride Corp.‡ | | | 1,456,073 | |
| | 49,530 | | | | | Pinnacle Foods, Inc. | | | 2,866,301 | |
| | 20,600 | | | | | Sanderson Farms, Inc.‡ | | | 2,139,104 | |
| | 29,600 | | | | | SpartanNash Co. | | | 1,035,704 | |
| | 84,327 | | | | | TreeHouse Foods, Inc.* ‡ | | | 7,139,124 | |
| | 40,200 | | | | | Whole Foods Market, Inc. | | | 1,194,744 | |
| | | | | | | | | | |
| | | | | | | | | 21,407,753 | |
| | | | | | | | | | |
| | | |
| | | | | | Forest Products & Paper — 0.6% | | | | |
| | | |
| | 27,100 | | | | | Clearwater Paper Corp.* | | | 1,517,600 | |
| | 18,224 | | | | | Deltic Timber Corp.‡ | | | 1,423,659 | |
| | 51,438 | | | | | PH Glatfelter Co. | | | 1,118,262 | |
| | 35,400 | | | | | Schweitzer-Mauduit International, Inc. | | | 1,466,268 | |
| | | | | | | | | | |
| | | | | | | | | 5,525,789 | |
| | | | | | | | | | |
| | | |
| | | | | | Gas — 0.3% | | | | |
| | | |
| | 116,800 | | | | | CenterPoint Energy, Inc. | | | 3,220,176 | |
| | | | | | | | | | |
| | | |
| | | | | | Hand & Machine Tools — 0.2% | | | | |
| | | |
| | 27,609 | | | | | Lincoln Electric Holdings, Inc. | | | 2,398,118 | |
| | | | | | | | | | |
| | | |
| | | | | | Health Care - Products — 4.1% | | | | |
| | | |
| | 47,739 | | | | | Align Technology, Inc.* | | | 5,476,141 | |
| | 15,893 | | | | | Cantel Medical Corp. Class B | | | 1,273,029 | |
| | 23,300 | | | | | Hill-Rom Holdings, Inc. | | | 1,644,980 | |
| | 50,950 | | | | | Hologic, Inc.* | | | 2,167,923 | |
| | 16,135 | | | | | ICU Medical, Inc.* | | | 2,463,814 | |
| | 16,483 | | | | | IDEXX Laboratories, Inc.* | | | 2,548,437 | |
| | 69,996 | | | | | Merit Medical Systems, Inc.* | | | 2,022,884 | |
| | 15,193 | | | | | Penumbra, Inc.* | | | 1,267,856 | |
| | 117,179 | | | | | STERIS Plc | | | 8,139,253 | |
| | 68,067 | | | | | VWR Corp.* ‡ | | | 1,919,489 | |
| | | | | | |
| | See accompanying Notes to the Financial Statements. | | | 37 | |
Mercer US Small/Mid Cap Equity Fund (formerly known as Mercer US Small/Mid Cap Growth Equity Fund)
Schedule of Investments (Continued)
(showing percentage of net assets)
March 31, 2017
| | | | | | | | | | |
| Shares | | | | | Description | | Value ($) | |
| | | |
| | | | | | Health Care - Products — continued | | | | |
| | | |
| | 57,639 | | | | | West Pharmaceutical Services, Inc. | | | 4,703,919 | |
| | 193,098 | | | | | Wright Medical Group NV* | | | 6,009,210 | |
| | | | | | | | | | |
| | | | | | | | | 39,636,935 | |
| | | | | | | | | | |
| | | |
| | | | | | Health Care - Services — 1.5% | | | | |
| | | |
| | 37,586 | | | | | Acadia Healthcare Co., Inc.* ‡ | | | 1,638,750 | |
| | 31,700 | | | | | Air Methods Corp.* ‡ | | | 1,363,100 | |
| | 56,600 | | | | | Ensign Group, Inc. (The) | | | 1,064,080 | |
| | 24,772 | | | | | ICON Plc, ADR* | | | 1,974,824 | |
| | 98,400 | | | | | Kindred Healthcare, Inc. | | | 821,640 | |
| | 26,733 | | | | | LifePoint Health, Inc.* | | | 1,751,011 | |
| | 16,085 | | | | | MEDNAX, Inc.* ‡ | | | 1,115,977 | |
| | 31,290 | | | | | Quest Diagnostics, Inc. | | | 3,072,365 | |
| | 15,794 | | | | | WellCare Health Plans, Inc.* | | | 2,214,477 | |
| | | | | | | | | | |
| | | | | | | | | 15,016,224 | |
| | | | | | | | | | |
| | | |
| | | | | | Home Builders — 1.3% | | | | |
| | | |
| | 37,965 | | | | | CalAtlantic Group, Inc.‡ | | | 1,421,789 | |
| | 17,751 | | | | | Cavco Industries, Inc.* | | | 2,066,217 | |
| | 146,910 | | | | | Taylor Morrison Home Corp. Class A* | | | 3,132,121 | |
| | 13,200 | | | | | Thor Industries, Inc. | | | 1,268,916 | |
| | 396,185 | | | | | TRI Pointe Group, Inc.* ‡ | | | 4,968,160 | |
| | | | | | | | | | |
| | | | | | | | | 12,857,203 | |
| | | | | | | | | | |
| | | |
| | | | | | Home Furnishings — 0.7% | | | | |
| | | |
| | 21,508 | | | | | American Woodmark Corp.* | | | 1,974,434 | |
| | 34,300 | | | | | Ethan Allen Interiors, Inc.‡ | | | 1,051,295 | |
| | 74,631 | | | | | La-Z-Boy, Inc. | | | 2,015,037 | |
| | 28,815 | | | | | Universal Electronics, Inc.* ‡ | | | 1,973,828 | |
| | | | | | | | | | |
| | | | | | | | | 7,014,594 | |
| | | | | | | | | | |
| | | |
| | | | | | Household Products & Wares — 0.3% | | | | |
| | | |
| | 31,510 | | | | | Avery Dennison Corp. | | | 2,539,706 | |
| | | | | | | | | | |
| | | |
| | | | | | Housewares — 0.7% | | | | |
| | | |
| | 84,079 | | | | | Toro Co. (The) | | | 5,251,574 | |
| | 22,675 | | | | | Tupperware Brands Corp.‡ | | | 1,422,176 | |
| | | | | | | | | | |
| | | | | | | | | 6,673,750 | |
| | | | | | | | | | |
| | | |
| | | | | | Insurance — 4.9% | | | | |
| | | |
| | 44,245 | | | | | Arthur J. Gallagher & Co. | | | 2,501,612 | |
| | 29,000 | | | | | Aspen Insurance Holdings, Ltd. | | | 1,509,450 | |
| | 23,400 | | | | | Assurant, Inc. | | | 2,238,678 | |
| | 64,200 | | | | | Assured Guaranty, Ltd. | | | 2,382,462 | |
| | 53,770 | | | | | Axis Capital Holdings, Ltd. | | | 3,604,203 | |
| | 158,500 | | | | | CNO Financial Group, Inc. | | | 3,249,250 | |
| | 64,230 | | | | | Essent Group, Ltd.* ‡ | | | 2,323,199 | |
| | 15,800 | | | | | Everest Re Group, Ltd. | | | 3,694,198 | |
| | 30,700 | | | | | Hanover Insurance Group, Inc. (The) | | | 2,764,842 | |
| | | | | | |
| 38 | | See accompanying Notes to the Financial Statements. | | | | |
Mercer US Small/Mid Cap Equity Fund (formerly known as Mercer US Small/Mid Cap Growth Equity Fund)
Schedule of Investments (Continued)
(showing percentage of net assets)
March 31, 2017
| | | | | | | | | | |
| Shares | | | | | Description | | Value ($) | |
| | | |
| | | | | | Insurance — continued | | | | |
| | | |
| | 66,600 | | | | | Heritage Insurance Holdings, Inc.‡ | | | 850,482 | |
| | 47,619 | | | | | James River Group Holdings, Ltd. | | | 2,040,950 | |
| | 48,000 | | | | | Lincoln National Corp. | | | 3,141,600 | |
| | 170,000 | | | | | MGIC Investment Corp.* | | | 1,722,100 | |
| | 54,231 | | | | | ProAssurance Corp. | | | 3,267,418 | |
| | 34,211 | | | | | Reinsurance Group of America, Inc. | | | 4,344,113 | |
| | 87,300 | | | | | Universal Insurance Holdings, Inc. | | | 2,138,850 | |
| | 84,000 | | | | | Unum Group | | | 3,938,760 | |
| | 38,145 | | | | | XL Group, Ltd. | | | 1,520,460 | |
| | | | | | | | | | |
| | | | | | | | | 47,232,627 | |
| | | | | | | | | | |
| | | |
| | | | | | Internet — 0.6% | | | | |
| | | |
| | 52,781 | | | | | Cogent Communications Holdings, Inc.‡ | | | 2,272,222 | |
| | 98,900 | | | | | Rubicon Project, Inc. (The)* | | | 582,521 | |
| | 41,235 | | | | | Splunk, Inc.* ‡ | | | 2,568,528 | |
| | | | | | | | | | |
| | | | | | | | | 5,423,271 | |
| | | | | | | | | | |
| | | |
| | | | | | Investment Companies — 0.2% | | | | |
| | | |
| | 57,300 | | | | | Ares Capital Corp. | | | 995,874 | |
| | 59,200 | | | | | New Mountain Finance Corp. | | | 882,080 | |
| | | | | | | | | | |
| | | | | | | | | 1,877,954 | |
| | | | | | | | | | |
| | | |
| | | | | | Iron & Steel — 0.1% | | | | |
| | | |
| | 17,210 | | | | | Reliance Steel & Aluminum Co. | | | 1,377,144 | |
| | | | | | | | | | |
| | | |
| | | | | | Leisure Time — 1.4% | | | | |
| | | |
| | 45,400 | | | | | American Outdoor Brands Corp.* ‡ | | | 899,374 | |
| | 60,304 | | | | | Brunswick Corp. | | | 3,690,605 | |
| | 46,257 | | | | | Camping World Holdings, Inc. Class A | | | 1,491,325 | |
| | 56,040 | | | | | Harley-Davidson, Inc.‡ | | | 3,390,420 | |
| | 99,289 | | | | | Planet Fitness, Inc. Class A | | | 1,913,299 | |
| | 22,100 | | | | | Polaris Industries, Inc.‡ | | | 1,851,980 | |
| | | | | | | | | | |
| | | | | | | | | 13,237,003 | |
| | | | | | | | | | |
| | | |
| | | | | | Lodging — 0.3% | | | | |
| | | |
| | 35,300 | | | | | Wyndham Worldwide Corp. | | | 2,975,437 | |
| | | | | | | | | | |
| | | |
| | | | | | Machinery - Construction & Mining — 0.3% | | | | |
| | | |
| | 37,200 | | | | | Oshkosh Corp. | | | 2,551,548 | |
| | | | | | | | | | |
| | | |
| | | | | | Machinery - Diversified — 3.4% | | | | |
| | | |
| | 58,777 | | | | | Albany International Corp. Class A | | | 2,706,681 | |
| | 39,444 | | | | | Altra Industrial Motion Corp. | | | 1,536,344 | |
| | 53,600 | | | | | Briggs & Stratton Corp. | | | 1,203,320 | |
| | 44,165 | | | | | Cognex Corp.‡ | | | 3,707,652 | |
| | 51,350 | | | | | Flowserve Corp.‡ | | | 2,486,367 | |
| | 17,467 | | | | | Graco, Inc. | | | 1,644,343 | |
| | 69,735 | | | | | Middleby Corp. (The)* ‡ | | | 9,515,341 | |
| | 21,355 | | | | | Nordson Corp.‡ | | | 2,623,248 | |
| | | | | | |
| | See accompanying Notes to the Financial Statements. | | | 39 | |
Mercer US Small/Mid Cap Equity Fund (formerly known as Mercer US Small/Mid Cap Growth Equity Fund)
Schedule of Investments (Continued)
(showing percentage of net assets)
March 31, 2017
| | | | | | | | | | |
| Shares | | | | | Description | | Value ($) | |
| | | |
| | | | | | Machinery - Diversified — continued | | | | |
| | | |
| | 38,825 | | | | | Wabtec Corp.‡ | | | 3,028,350 | |
| | 50,026 | | | | | Zebra Technologies Corp. Class A* | | | 4,564,872 | |
| | | | | | | | | | |
| | | | | | | | | 33,016,518 | |
| | | | | | | | | | |
| | | |
| | | | | | Media — 0.8% | | | | |
| | | |
| | 47,380 | | | | | Nexstar Media Group, Inc. Class A | | | 3,323,707 | |
| | 37,690 | | | | | Scripps Networks Interactive, Inc. Class A | | | 2,953,765 | |
| | 67,300 | | | | | TEGNA, Inc. | | | 1,724,226 | |
| | | | | | | | | | |
| | | | | | | | | 8,001,698 | |
| | | | | | | | | | |
| | | |
| | | | | | Metal Fabricate & Hardware — 0.6% | | | | |
| | | |
| | 45,900 | | | | | Global Brass & Copper Holdings, Inc. | | | 1,578,960 | |
| | 28,984 | | | | | RBC Bearings, Inc.* | | | 2,814,057 | |
| | 39,386 | | | | | Sun Hydraulics Corp. | | | 1,422,228 | |
| | | | | | | | | | |
| | | | | | | | | 5,815,245 | |
| | | | | | | | | | |
| | | |
| | | | | | Mining — 0.4% | | | | |
| | | |
| | 23,249 | | | | | Compass Minerals International, Inc.‡ | | | 1,577,444 | |
| | 70,265 | | | | | Materion Corp. | | | 2,357,391 | |
| | | | | | | | | | |
| | | | | | | | | 3,934,835 | |
| | | | | | | | | | |
| | | |
| | | | | | Miscellaneous - Manufacturing — 1.6% | | | | |
| | | |
| | 55,740 | | | | | AO Smith Corp.‡ | | | 2,851,658 | |
| | 18,541 | | | | | AptarGroup, Inc. | | | 1,427,472 | |
| | 65,500 | | | | | Crane Co. | | | 4,901,365 | |
| | 37,881 | | | | | Hexcel Corp. | | | 2,066,409 | |
| | 40,100 | | | | | ITT, Inc.‡ | | | 1,644,902 | |
| | 59,400 | | | | | Textron, Inc. | | | 2,826,846 | |
| | | | | | | | | | |
| | | | | | | | | 15,718,652 | |
| | | | | | | | | | |
| | | |
| | | | | | Office & Business Equipment — 0.2% | | | | |
| | | |
| | 93,800 | | | | | Pitney Bowes, Inc.‡ | | | 1,229,718 | |
| | 104,800 | | | | | Xerox Corp. | | | 769,232 | |
| | | | | | | | | | |
| | | | | | | | | 1,998,950 | |
| | | | | | | | | | |
| | | |
| | | | | | Office Furnishings — 0.1% | | | | |
| | | |
| | 58,710 | | | | | Knoll, Inc. | | | 1,397,885 | |
| | | | | | | | | | |
| | | |
| | | | | | Oil & Gas — 3.6% | | | | |
| | | |
| | 174,137 | | | | | Callon Petroleum Co.* ‡ | | | 2,291,643 | |
| | 99,120 | | | | | Carrizo Oil & Gas, Inc.* | | | 2,840,779 | |
| | 94,300 | | | | | Diamond Offshore Drilling, Inc.* ‡ | | | 1,575,753 | |
| | 17,352 | | | | | Diamondback Energy, Inc.* | | | 1,799,663 | |
| | 50,965 | | | | | Energen Corp.* | | | 2,774,535 | |
| | 58,900 | | | | | HollyFrontier Corp. | | | 1,669,226 | |
| | 53,700 | | | | | Murphy Oil Corp.‡ | | | 1,535,283 | |
| | 23,100 | | | | | Murphy USA, Inc.* | | | 1,696,002 | |
| | 131,870 | | | | | Newfield Exploration Co.* | | | 4,867,322 | |
| | | | | | |
| 40 | | See accompanying Notes to the Financial Statements. | | | | |
Mercer US Small/Mid Cap Equity Fund (formerly known as Mercer US Small/Mid Cap Growth Equity Fund)
Schedule of Investments (Continued)
(showing percentage of net assets)
March 31, 2017
| | | | | | | | | | |
| Shares | | | | | Description | | Value ($) | |
| | | |
| | | | | | Oil & Gas — continued | | | | |
| | | |
| | 46,673 | | | | | Parsley Energy, Inc. Class A* | | | 1,517,339 | |
| | 31,800 | | | | | PBF Energy, Inc. Class A | | | 705,006 | |
| | 46,740 | | | | | PDC Energy, Inc.* ‡ | | | 2,914,239 | |
| | 91,254 | | | | | QEP Resources, Inc.* | | | 1,159,838 | |
| | 329,330 | | | | | SRC Energy, Inc.* ‡ | | | 2,779,545 | |
| | 60,190 | | | | | Tesoro Corp. | | | 4,879,001 | |
| | | | | | | | | | |
| | | | | | | | | 35,005,174 | |
| | | | | | | | | | |
| | | |
| | | | | | Oil & Gas Services — 0.6% | | | | |
| | | |
| | 41,817 | | | | | Dril-Quip, Inc.* ‡ | | | 2,281,117 | |
| | 59,700 | | | | | Matrix Service Co.* | | | 985,050 | |
| | 34,854 | | | | | Oil States International, Inc.* ‡ | | | 1,155,410 | |
| | 79,425 | | | | | Superior Energy Services, Inc.* ‡ | | | 1,132,601 | |
| | | | | | | | | | |
| | | | | | | | | 5,554,178 | |
| | | | | | | | | | |
| | | |
| | | | | | Packaging & Containers — 0.7% | | | | |
| | | |
| | 74,600 | | | | | Owens-Illinois, Inc.* | | | 1,520,348 | |
| | 32,200 | | | | | Packaging Corp. of America | | | 2,950,164 | |
| | 63,530 | | | | | Sealed Air Corp. | | | 2,768,637 | |
| | | | | | | | | | |
| | | | | | | | | 7,239,149 | |
| | | | | | | | | | |
| | | |
| | | | | | Pharmaceuticals — 3.5% | | | | |
| | | |
| | 23,600 | | | | | Akorn, Inc.* ‡ | | | 568,288 | |
| | 71,371 | | | | | Alkermes Plc* ‡ | | | 4,175,203 | |
| | 77,509 | | | | | Catalent, Inc.* | | | 2,195,055 | |
| | 53,938 | | | | | DexCom, Inc.* ‡ | | | 4,570,167 | |
| | 120,031 | | | | | Ironwood Pharmaceuticals, Inc.* ‡ | | | 2,047,729 | |
| | 28,607 | | | | | Jazz Pharmaceuticals Plc* | | | 4,151,734 | |
| | 50,275 | | | | | Lannett Co., Inc.* ‡ | | | 1,123,646 | |
| | 23,400 | | | | | Mallinckrodt Plc* ‡ | | | 1,042,938 | |
| | 144,410 | | | | | Nektar Therapeutics* | | | 3,389,303 | |
| | 78,484 | | | | | Neurocrine Biosciences, Inc.* | | | 3,398,357 | |
| | 39,900 | | | | | Omega Protein Corp. | | | 799,995 | |
| | 68,585 | | | | | Pacira Pharmaceuticals, Inc.* | | | 3,127,476 | |
| | 46,413 | | | | | Premier, Inc. Class A* | | | 1,477,326 | |
| | 90,700 | | | | | Sucampo Pharmaceuticals, Inc. Class A* ‡ | | | 997,700 | |
| | 8,165 | | | | | VCA, Inc.* | | | 747,097 | |
| | | | | | | | | | |
| | | | | | | | | 33,812,014 | |
| | | | | | | | | | |
| | | |
| | | | | | Real Estate — 0.5% | | | | |
| | | |
| | 32,160 | | | | | FirstService Corp. | | | 1,939,248 | |
| | 235,101 | | | | | Forestar Group, Inc.* | | | 3,209,129 | |
| | | | | | | | | | |
| | | | | | | | | 5,148,377 | |
| | | | | | | | | | |
| | | |
| | | | | | REITS — 6.3% | | | | |
| | | |
| | 87,520 | | | | | American Campus Communities, Inc. REIT | | | 4,165,077 | |
| | 227,300 | | | | | Annaly Capital Management, Inc. REIT‡ | | | 2,525,303 | |
| | 121,301 | | | | | Brandywine Realty Trust REIT | | | 1,968,715 | |
| | 99,300 | | | | | Chimera Investment Corp. REIT‡ | | | 2,003,874 | |
| | | | | | |
| | See accompanying Notes to the Financial Statements. | | | 41 | |
Mercer US Small/Mid Cap Equity Fund (formerly known as Mercer US Small/Mid Cap Growth Equity Fund)
Schedule of Investments (Continued)
(showing percentage of net assets)
March 31, 2017
| | | | | | | | | | |
| Shares | | | | | Description | | Value ($) | |
| | | |
| | | | | | REITS — continued | | | | |
| | | |
| | 52,000 | | | | | City Office, Inc. REIT | | | 631,800 | |
| | 57,000 | | | | | CoreCivic, Inc. REIT | | | 1,790,940 | |
| | 56,400 | | | | | CyrusOne, Inc. REIT | | | 2,902,908 | |
| | 112,740 | | | | | Easterly Government Properties, Inc. REIT‡ | | | 2,231,125 | |
| | 84,600 | | | | | Franklin Street Properties Corp. REIT | | | 1,027,044 | |
| | 58,700 | | | | | Government Properties Income Trust REIT‡ | | | 1,228,591 | |
| | 91,400 | | | | | Hospitality Properties Trust REIT | | | 2,881,842 | |
| | 113,700 | | | | | Independence Realty Trust, Inc. REIT | | | 1,065,369 | |
| | 227,800 | | | | | Lexington Realty Trust REIT | | | 2,273,444 | |
| | 71,800 | | | | | Mack-Cali Realty Corp. REIT | | | 1,934,292 | |
| | 159,000 | | | | | Medical Properties Trust, Inc. REIT‡ | | | 2,049,510 | |
| | 29,683 | | | | | Mid-America Apartment Communities, Inc. REIT | | | 3,019,948 | |
| | 146,404 | | | | | Physicians Realty Trust REIT‡ | | | 2,909,048 | |
| | 95,600 | | | | | Piedmont Office Realty Trust, Inc. REIT Class A | | | 2,043,928 | |
| | 203,415 | | | | | Ramco-Gershenson Properties Trust REIT | | | 2,851,878 | |
| | 84,500 | | | | | RLJ Lodging Trust REIT | | | 1,986,595 | |
| | 68,800 | | | | | Sabra Healthcare, Inc. REIT | | | 1,921,584 | |
| | 95,800 | | | | | Select Income REIT | | | 2,470,682 | |
| | 211,380 | | | | | Senior Housing Properties Trust REIT | | | 4,280,445 | |
| | 57,980 | | | | | STAG Industrial, Inc. REIT | | | 1,450,660 | |
| | 89,900 | | | | | Starwood Property Trust, Inc. REIT | | | 2,029,942 | |
| | 84,900 | | | | | Summit Hotel Properties, Inc. REIT | | | 1,356,702 | |
| | 55,655 | | | | | Sun Communities, Inc. REIT | | | 4,470,766 | |
| | | | | | | | | | |
| | | | | | | | | 61,472,012 | |
| | | | | | | | | | |
| | | |
| | | | | | Retail — 4.3% | | | | |
| | | |
| | 78,700 | | | | | American Eagle Outfitters, Inc.‡ | | | 1,104,161 | |
| | 38,156 | | | | | BJ’s Restaurants, Inc.* | | | 1,541,503 | |
| | 72,100 | | | | | Bloomin’ Brands, Inc. | | | 1,422,533 | |
| | 49,929 | | | | | BMC Stock Holdings, Inc.* | | | 1,128,396 | |
| | 33,961 | | | | | Burlington Stores, Inc.* | | | 3,304,066 | |
| | 29,700 | | | | | Dick’s Sporting Goods, Inc.‡ | | | 1,445,202 | |
| | 16,800 | | | | | Dillard’s, Inc. Class A‡ | | | 877,632 | |
| | 77,052 | | | | | Dunkin’ Brands Group, Inc. | | | 4,213,203 | |
| | 58,159 | | | | | Five Below, Inc.* ‡ | | | 2,518,866 | |
| | 30,300 | | | | | Foot Locker, Inc. | | | 2,266,743 | |
| | 124,189 | | | | | Fred’s, Inc. Class A‡ | | | 1,626,876 | |
| | 160,615 | | | | | Haverty Furniture Cos., Inc. ¤ | | | 3,910,975 | |
| | 103,830 | | | | | Kate Spade & Co.* | | | 2,411,971 | |
| | 22,113 | | | | | Lithia Motors, Inc. Class A‡ | | | 1,893,979 | |
| | 16,920 | | | | | Lululemon Athletica, Inc.* ‡ | | | 877,640 | |
| | 87,065 | | | | | Michaels Cos., Inc. (The)* | | | 1,949,385 | |
| | 7,798 | | | | | Panera Bread Co. Class A* ‡ | | | 2,042,062 | |
| | 29,243 | | | | | PriceSmart, Inc. | | | 2,696,205 | |
| | 13,800 | | | | | Red Robin Gourmet Burgers, Inc.* ‡ | | | 806,610 | |
| | 60,400 | | | | | Sonic Automotive, Inc. Class A‡ | | | 1,211,020 | |
| | 39,890 | | | | | Urban Outfitters, Inc.* ‡ | | | 947,786 | |
| | 23,900 | | | | | Williams-Sonoma, Inc.‡ | | | 1,281,518 | |
| | | | | | | | | | |
| | | | | | | | | 41,478,332 | |
| | | | | | | | | | |
| | | | | | |
| 42 | | See accompanying Notes to the Financial Statements. | | | | |
Mercer US Small/Mid Cap Equity Fund (formerly known as Mercer US Small/Mid Cap Growth Equity Fund)
Schedule of Investments (Continued)
(showing percentage of net assets)
March 31, 2017
| | | | | | | | | | |
| Shares | | | | | Description | | Value ($) | |
| | | |
| | | | | | Savings & Loans — 0.4% | | | | |
| | | |
| | 71,400 | | | | | Banc of California, Inc.‡ | | | 1,477,980 | |
| | 33,800 | | | | | Berkshire Hills Bancorp, Inc. | | | 1,218,490 | |
| | 44,600 | | | | | United Financial Bancorp, Inc. | | | 758,646 | |
| | | | | | | | | | |
| | | | | | | | | 3,455,116 | |
| | | | | | | | | | |
| | | |
| | | | | | Semiconductors — 3.7% | | | | |
| | | |
| | 244,370 | | | | | Cypress Semiconductor Corp.‡ | | | 3,362,531 | |
| | 60,700 | | | | | Kulicke & Soffa Industries, Inc.* | | | 1,233,424 | |
| | 560,500 | | | | | Lattice Semiconductor Corp.* | | | 3,878,660 | |
| | 36,618 | | | | | MACOM Technology Solutions Holdings, Inc.* ‡ | | | 1,768,649 | |
| | 54,430 | | | | | Mellanox Technologies, Ltd.* ‡ | | | 2,773,209 | |
| | 35,490 | | | | | Microchip Technology, Inc.‡ | | | 2,618,452 | |
| | 67,780 | | | | | Microsemi Corp.* | | | 3,492,703 | |
| | 212,070 | | | | | ON Semiconductor Corp.* | | | 3,284,964 | |
| | 36,416 | | | | | Power Integrations, Inc. | | | 2,394,352 | |
| | 47,985 | | | | | Qorvo, Inc.* ‡ | | | 3,289,852 | |
| | 29,121 | | | | | Silicon Laboratories, Inc.* | | | 2,141,850 | |
| | 171,720 | | | | | Teradyne, Inc. | | | 5,340,492 | |
| | | | | | | | | | |
| | | | | | | | | 35,579,138 | |
| | | | | | | | | | |
| | | |
| | | | | | Shipbuilding — 0.2% | | | | |
| | | |
| | 11,600 | | | | | Huntington Ingalls Industries, Inc. | | | 2,322,784 | |
| | | | | | | | | | |
| | | |
| | | | | | Software — 5.1% | | | | |
| | | |
| | 20,464 | | | | | ANSYS, Inc.* | | | 2,186,988 | |
| | 32,167 | | | | | Black Knight Financial Services, Inc. Class A* ‡ | | | 1,231,996 | |
| | 60,861 | | | | | Blackbaud, Inc.‡ | | | 4,666,213 | |
| | 22,442 | | | | | Broadridge Financial Solutions, Inc. | | | 1,524,934 | |
| | 93,933 | | | | | Callidus Software, Inc.* ‡ | | | 2,005,470 | |
| | 36,731 | | | | | Cotiviti Holdings, Inc.* | | | 1,529,112 | |
| | 38,580 | | | | | CyberArk Software, Ltd.* | | | 1,962,565 | |
| | 9,425 | | | | | Donnelley Financial Solutions, Inc.* | | | 181,808 | |
| | 35,398 | | | | | Guidewire Software, Inc.* | | | 1,993,969 | |
| | 32,936 | | | | | HubSpot, Inc.* | | | 1,994,275 | |
| | 18,972 | | | | | j2 Global, Inc.‡ | | | 1,591,941 | |
| | 774,780 | | | | | Mitel Networks Corp.* | | | 5,369,225 | |
| | 42,742 | | | | | MSCI, Inc. Class A | | | 4,154,095 | |
| | 92,128 | | | | | PTC, Inc.* | | | 4,841,326 | |
| | 57,570 | | | | | RealPage, Inc.* | | | 2,009,193 | |
| | 65,316 | | | | | SS&C Technologies Holdings, Inc. | | | 2,312,186 | |
| | 23,324 | | | | | Tyler Technologies, Inc.* | | | 3,604,957 | |
| | 21,728 | | | | | Ultimate Software Group, Inc. (The)* ‡ | | | 4,241,523 | |
| | 38,796 | | | | | Veeva Systems, Inc. Class A* ‡ | | | 1,989,459 | |
| | | | | | | | | | |
| | | | | | | | | 49,391,235 | |
| | | | | | | | | | |
| | | |
| | | | | | Telecommunications — 1.1% | | | | |
| | | |
| | 38,390 | | | | | ARRIS International Plc* | | | 1,015,415 | |
| | 57,733 | | | | | GTT Communications, Inc.* ‡ | | | 1,405,799 | |
| | | | | | |
| | See accompanying Notes to the Financial Statements. | | | 43 | |
Mercer US Small/Mid Cap Equity Fund (formerly known as Mercer US Small/Mid Cap Growth Equity Fund)
Schedule of Investments (Continued)
(showing percentage of net assets)
March 31, 2017
| | | | | | | | | | |
| Shares | | | | | Description | | Value ($) | |
| | | |
| | | | | | Telecommunications — continued | | | | |
| | | |
| | 6,720 | | | | | IPG Photonics Corp.* | | | 811,104 | |
| | 80,100 | | | | | Juniper Networks, Inc. | | | 2,229,183 | |
| | 37,600 | | | | | Plantronics, Inc. | | | 2,034,536 | |
| | 87,090 | | | | | Zayo Group Holdings, Inc.* | | | 2,865,261 | |
| | | | | | | | | | |
| | | | | | | | | 10,361,298 | |
| | | | | | | | | | |
| | | |
| | | | | | Transportation — 1.5% | | | | |
| | | |
| | 31,300 | | | | | Atlas Air Worldwide Holdings, Inc.* | | | 1,735,585 | |
| | 78,993 | | | | | Heartland Express, Inc.‡ | | | 1,583,810 | |
| | 32,835 | | | | | J.B. Hunt Transport Services, Inc. | | | 3,012,283 | |
| | 65,800 | | | | | Navigator Holdings, Ltd.* ‡ | | | 904,750 | |
| | 33,290 | | | | | Old Dominion Freight Line, Inc.‡ | | | 2,848,625 | |
| | 29,900 | | | | | Ryder System, Inc.‡ | | | 2,255,656 | |
| | 44,935 | | | | | XPO Logistics, Inc.* | | | 2,151,937 | |
| | | | | | | | | | |
| | | | | | | | | 14,492,646 | |
| | | | | | | | | | |
| | | |
| | | | | | TOTAL COMMON STOCKS (COST $791,485,650) | | | 933,177,605 | |
| | | | | | | | | | |
| | | |
| Par Value ($) | | | | | Description | | Value ($) | |
| | | |
| | | | | | SHORT-TERM INVESTMENTS — 8.1% | | | | |
| | | |
| | | | | | Bank Deposit — 4.3% | | | | |
| | | |
| | 41,579,644 | | | | | State Street Bank & Trust Euro Time Deposit, 0.09%, due 04/03/17 | | | 41,579,644 | |
| | | | | | | | | | |
| | | |
| | | | | | Mutual Fund - Securities Lending Collateral — 3.7% | | | | |
| | | |
| | 35,627,563 | | | | | State Street Institutional U.S. Government Money Market Fund, Premier Class*** | | | 35,627,563 | |
| | | | | | | | | | |
| | | |
| | | | | | U.S. Government and Agency Obligations — 0.1% | | | | |
| | | |
| | 600,000 | | | | | United States Treasury Bill, 0.65%, due 04/27/17** ‡‡ | | | 599,711 | |
| | | | | | | | | | |
| | | |
| | | | | | TOTAL SHORT-TERM INVESTMENTS (COST $77,807,017) | | | 77,806,918 | |
| | | | | | | | | | |
| | | |
| | | | | | TOTAL INVESTMENTS — 104.0% (COST $869,292,667) | | | 1,010,984,523 | |
| | | |
| | | | | | Other Assets and Liabilities (net) — (4.0)% | | | (38,528,737 | ) |
| | | | | | | | | | |
| | | |
| | | | | | NET ASSETS — 100.0% | | $ | 972,455,786 | |
| | | | | | | | | | |
| | | |
| | | | | | Notes to Schedule of Investments: | | | | |
| | | |
| | | | | | REIT — Real Estate Investment Trust | | | | |
| | | |
| | | | * | | Non-income producing security | | | | |
| | | |
| | | | ** | | All or a portion of this security is pledged for open futures collateral. | | | | |
| | | |
| | | | *** | | Represents an investment of securities lending cash collateral. | | | | |
| | | |
| | | | ‡ | | All or a portion of this security is out on loan. | | | | |
| | | |
| | | | ‡‡ | | Interest rate presented is yield to maturity. | | | | |
| | | |
| | | | ¤ | | Illiquid security. The total market value of the securities at year end is $3,910,975 which represents 0.4% of net assets. The aggregate tax cost of these securities held at March 31, 2017 was $3,319,807. | | | | |
| | | | | | |
| 44 | | See accompanying Notes to the Financial Statements. | | | | |
Mercer US Small/Mid Cap Equity Fund (formerly known as Mercer US Small/Mid Cap Growth Equity Fund)
Schedule of Investments (Continued)
March 31, 2017
Futures Contracts
| | | | | | | | | | | | | | | | | | | | |
Number of
Contracts | | | | | Type | | | | Expiration Date | | | Contract
Value | | | Unrealized
Appreciation
(Depreciation) | |
| | Buys | | | | | | | | | | | | | | | | | | | |
| | 186 | | | | | Russell 2000 Mini Index | | | | | June 2017 | | | $ | 12,874,920 | | | $ | 149,134 | |
| | 108 | | | | | S&P Mid 400 E-mini Index | | | | | June 2017 | | | | 18,556,560 | | | | 86,388 | |
| | | | | | | | | | | | | | | | | | | | |
| | | | | | | | | | | | | | | | | | $ | 235,522 | |
| | | | | | | | | | | | | | | | | | | | |
| | | | | | |
| | See accompanying Notes to the Financial Statements. | | | 45 | |
Mercer US Small/Mid Cap Equity Fund (formerly known as Mercer US Small/Mid Cap Growth Equity Fund)
Schedule of Investments (Continued)
March 31, 2017
| | | | | |
| Asset Class Summary (Unaudited) | | % of Net Assets |
Common Stocks | | | | 95.9 | |
Futures Contracts | | | | 0.0 | |
Short-Term Investments | | | | 8.1 | |
Other Assets and Liabilities (net) | | | | (4.0 | ) |
| | | | | |
| | | | 100.0 | % |
| | | | | |
| | | | | | |
| 46 | | See accompanying Notes to the Financial Statements. | | | | |
Mercer Non-US Core Equity Fund
Schedule of Investments
(showing percentage of net assets)
March 31, 2017
| | | | | | | | | | |
| Shares | | | | | Description | | Value ($) | |
| | | |
| | | | | | COMMON STOCKS — 92.1% | | | | |
| | | |
| | | | | | Australia — 4.2% | | | | |
| | | |
| | 1,444,167 | | | | | Asaleo Care, Ltd. | | | 1,938,962 | |
| | 259,978 | | | | | Australia & New Zealand Banking Group, Ltd. | | | 6,310,675 | |
| | 294,129 | | | | | BGP Holdings Plc* **** ¤ | | | — | |
| | 366,434 | | | | | BHP Billiton, Ltd. | | | 6,720,000 | |
| | 155,700 | | | | | BlueScope Steel, Ltd. | | | 1,456,190 | |
| | 1,722,133 | | | | | Brambles, Ltd. | | | 12,283,365 | |
| | 27,803 | | | | | Computershare, Ltd. | | | 298,206 | |
| | 95,724 | | | | | Crown Resorts, Ltd. | | | 862,401 | |
| | 105,470 | | | | | CSL, Ltd. | | | 10,083,772 | |
| | 1,079,350 | | | | | CSR, Ltd. | | | 3,713,453 | |
| | 138,622 | | | | | Downer EDI, Ltd. | | | 612,280 | |
| | 1,105,906 | | | | | Evolution Mining, Ltd. | | | 1,771,644 | |
| | 2,074,910 | | | | | Fortescue Metals Group, Ltd. | | | 9,861,123 | |
| | 987,052 | | | | | Genworth Mortgage Insurance Australia, Ltd.‡ | | | 2,364,334 | |
| | 365,400 | | | | | Harvey Norman Holdings, Ltd.‡ | | | 1,262,716 | |
| | 227,700 | | | | | Lend Lease Group | | | 2,706,260 | |
| | 45,800 | | | | | Macquarie Group, Ltd. | | | 3,151,455 | |
| | 73,919 | | | | | Magellan Financial Group, Ltd. | | | 1,332,474 | |
| | 130,170 | | | | | McMillan Shakespeare, Ltd. | | | 1,312,748 | |
| | 788,200 | | | | | Metcash, Ltd.* | | | 1,485,157 | |
| | 1,313,046 | | | | | Myer Holdings, Ltd.‡ | | | 1,217,013 | |
| | 137,589 | | | | | Nufarm, Ltd. | | | 1,018,110 | |
| | 212,433 | | | | | Orica, Ltd. | | | 2,852,159 | |
| | 506,288 | | | | | Orora, Ltd. | | | 1,143,216 | |
| | 237,660 | | | | | OZ Minerals, Ltd. | | | 1,419,570 | |
| | 77,227 | | | | | Premier Investments, Ltd. | | | 843,629 | |
| | 145,800 | | | | | Primary Health Care, Ltd. | | | 397,068 | |
| | 862,388 | | | | | Qantas Airways, Ltd. | | | 2,559,124 | |
| | 249,400 | | | | | Retail Food Group, Ltd.‡ | | | 1,014,058 | |
| | 144,930 | | | | | Seven Group Holdings, Ltd. | | | 1,184,096 | |
| | 1,477,346 | | | | | Sigma Pharmaceuticals, Ltd. | | | 1,453,821 | |
| | 249,709 | | | | | Technology One, Ltd. | | | 977,216 | |
| | 918,310 | | | | | Treasury Wine Estates, Ltd. | | | 8,567,514 | |
| | | | | | | | | | |
| | | | | | Total Australia | | | 94,173,809 | |
| | | | | | | | | | |
| | |
| | | | | | Austria — 1.1% | |
| | | |
| | 21,548 | | | | | ANDRITZ AG | | | 1,080,542 | |
| | 360,299 | | | | | Erste Group Bank AG* | | | 11,763,042 | |
| | 5,986 | | | | | Lenzing AG | | | 1,009,326 | |
| | 10,902 | | | | | Oesterreichische Post AG | | | 435,393 | |
| | 69,200 | | | | | OMV AG | | | 2,729,963 | |
| | 10,862 | | | | | RHI AG | | | 278,877 | |
| | 11,485 | | | | | Schoeller-Bleckmann Oilfield Equipment AG | | | 802,131 | |
| | 45,807 | | | | | UNIQA Insurance Group AG | | | 356,619 | |
| | 62,088 | | | | | Vienna Insurance Group | | | 1,506,093 | |
| | 85,034 | | | | | Voestalpine AG | | | 3,355,984 | |
| | 59,379 | | | | | Wienerberger AG | | | 1,262,555 | |
| | | | | | | | | | |
| | | | | | Total Austria | | | 24,580,525 | |
| | | | | | | | | | |
| | | | | | |
| | See accompanying Notes to the Financial Statements. | | | 47 | |
Mercer Non-US Core Equity Fund
Schedule of Investments (Continued)
(showing percentage of net assets)
March 31, 2017
| | | | | | | | | | |
| Shares | | | | | Description | | Value ($) | |
| | |
| | | | | | Belgium — 0.8% | |
| | | |
| | 55,042 | | | | | Ageas | | | 2,157,002 | |
| | 181,050 | | | | | KBC Group NV* | | | 12,042,593 | |
| | 84,827 | | | | | Orange Belgium SA* ¤ | | | 1,818,163 | |
| | 17,567 | | | | | Telenet Group Holding NV* | | | 1,047,475 | |
| | 16,888 | | | | | Umicore SA | | | 964,540 | |
| | | | | | | | | | |
| | | | | | Total Belgium | | | 18,029,773 | |
| | | | | | | | | | |
| | |
| | | | | | Bermuda — 0.2% | |
| | | |
| | 2,192,633 | | | | | Esprit Holdings, Ltd.* | | | 1,836,716 | |
| | 177,081 | | | | | Hiscox, Ltd. | | | 2,422,455 | |
| | | | | | | | | | |
| | | | | | Total Bermuda | | | 4,259,171 | |
| | | | | | | | | | |
| | |
| | | | | | Brazil — 0.1% | |
| | | |
| | 674,100 | | | | | JBS SA | | | 2,167,770 | |
| | | | | | | | | | |
| | |
| | | | | | Canada — 0.5% | |
| | | |
| | 226,155 | | | | | Entertainment One, Ltd. | | | 691,718 | |
| | 21,312 | | | | | Fairfax Financial Holdings, Ltd.‡ | | | 9,671,220 | |
| | 14,800 | | | | | Home Capital Group, Inc.‡ | | | 288,864 | |
| | 106,000 | | | | | SEMAFO, Inc.* | | | 318,719 | |
| | | | | | | | | | |
| | | | | | Total Canada | | | 10,970,521 | |
| | | | | | | | | | |
| | |
| | | | | | Cayman Islands — 1.9% | |
| | | |
| | 128,350 | | | | | Alibaba Group Holding, Ltd., ADR* | | | 13,839,980 | |
| | 1,969,000 | | | | | China Hongqiao Group, Ltd.**** | | | 1,786,200 | |
| | 3,714,000 | | | | | Jiangnan Group, Ltd. | | | 511,353 | |
| | 2,741,000 | | | | | Lee & Man Paper Manufacturing, Ltd. | | | 2,095,032 | |
| | 593,150 | | | | | Tencent Holdings, Ltd. | | | 17,004,931 | |
| | 3,620,000 | | | | | Truly International Holdings, Ltd. | | | 1,285,620 | |
| | 5,019,500 | | | | | WH Group, Ltd. 144A | | | 4,327,434 | |
| | 2,144,000 | | | | | Xinyi Glass Holdings, Ltd.* | | | 1,887,018 | |
| | | | | | | | | | |
| | | | | | Total Cayman Islands | | | 42,737,568 | |
| | | | | | | | | | |
| | |
| | | | | | China — 0.1% | |
| | | |
| | 905,000 | | | | | China Railway Construction Corp., Ltd. Class H | | | 1,283,291 | |
| | 628,600 | | | | | Shanghai Pharmaceuticals Holding Co., Ltd. Class H | | | 1,646,016 | |
| | | | | | | | | | |
| | | | | | Total China | | | 2,929,307 | |
| | | | | | | | | | |
| | |
| | | | | | Denmark — 1.5% | |
| | | |
| | 6,019 | | | | | AP Moeller - Maersk AS Class B | | | 10,016,156 | |
| | 144,100 | | | | | Danske Bank AS | | | 4,922,333 | |
| | 209,820 | | | | | DSV AS | | | 10,894,253 | |
| | 31,467 | | | | | Jyske Bank AS | | | 1,596,715 | |
| | 41,722 | | | | | Sydbank AS | | | 1,450,391 | |
| | 55,986 | | | | | Vestas Wind Systems AS | | | 4,565,685 | |
| | | | | | | | | | |
| | | | | | Total Denmark | | | 33,445,533 | |
| | | | | | | | | | |
| | | | | | |
| 48 | | See accompanying Notes to the Financial Statements. | | | | |
Mercer Non-US Core Equity Fund
Schedule of Investments (Continued)
(showing percentage of net assets)
March 31, 2017
| | | | | | | | | | |
| Shares | | | | | Description | | Value ($) | |
| | |
| | | | | | Faroe Islands — 0.0% | |
| | | |
| | 17,152 | | | | | Bakkafrost P/F | | | 530,402 | |
| | | | | | | | | | |
| | |
| | | | | | Finland — 0.8% | |
| | | |
| | 27,390 | | | | | Cargotec OYJ Class B | | | 1,359,286 | |
| | 103,787 | | | | | Kemira OYJ | | | 1,277,672 | |
| | 65,833 | | | | | Kone OYJ Class B | | | 2,898,144 | |
| | 87,280 | | | | | Neste OYJ | | | 3,412,887 | |
| | 95,900 | | | | | Outokumpu OYJ* ‡ | | | 937,488 | |
| | 104,456 | | | | | Stora Enso OYJ Class R | | | 1,237,867 | |
| | 182,189 | | | | | UPM-Kymmene OYJ‡ | | | 4,290,821 | |
| | 104,725 | | | | | Valmet OYJ | | | 1,631,965 | |
| | 21,046 | | | | | Wartsila OYJ Abp | | | 1,128,863 | |
| | | | | | | | | | |
| | | | | | Total Finland | | | 18,174,993 | |
| | | | | | | | | | |
| | |
| | | | | | France — 7.4% | |
| | | |
| | 24,200 | | | | | Atos SE | | | 3,001,145 | |
| | 260,311 | | | | | AXA SA | | | 6,752,969 | |
| | 178,427 | | | | | BNP Paribas SA | | | 11,913,924 | |
| | 34,742 | | | | | Cie Generale des Etablissements Michelin | | | 4,230,472 | |
| | 129,388 | | | | | CNP Assurances | | | 2,640,422 | |
| | 359,414 | | | | | Credit Agricole SA | | | 4,882,021 | |
| | 246,500 | | | | | Danone SA | | | 16,809,940 | |
| | 48,207 | | | | | Dassault Systemes SA | | | 4,183,560 | |
| | 57,611 | | | | | Edenred | | | 1,364,835 | |
| | 76,000 | | | | | Electricite de France SA‡ | | | 641,507 | |
| | 112,600 | | | | | Engie SA | | | 1,599,327 | |
| | 14,701 | | | | | Euler Hermes Group | | | 1,354,418 | |
| | 37,759 | | | | | Faurecia | | | 1,800,571 | |
| | 73,878 | | | | | IPSOS | | | 2,299,371 | |
| | 55,010 | | | | | Kering | | | 14,264,770 | |
| | 103,082 | | | | | Legrand SA | | | 6,231,404 | |
| | 12,140 | | | | | LVMH Moet Hennessy Louis Vuitton SE‡ | | | 2,672,825 | |
| | 45,300 | | | | | Metropole Television SA | | | 1,013,586 | |
| | 223,200 | | | | | Natixis SA | | | 1,378,867 | |
| | 109,240 | | | | | Neopost SA | | | 4,204,985 | |
| | 35,220 | | | | | Nexans SA* | | | 1,830,551 | |
| | 177,900 | | | | | Orange SA | | | 2,771,324 | |
| | 95,856 | | | | | Pernod Ricard SA | | | 11,369,773 | |
| | 84,815 | | | | | Renault SA | | | 7,386,829 | |
| | 101,200 | | | | | Sanofi | | | 9,159,135 | |
| | 142,914 | | | | | Schneider Electric SE | | | 10,490,343 | |
| | 178,651 | | | | | Societe Generale SA | | | 9,085,669 | |
| | 293,341 | | | | | Technicolor | | | 1,352,545 | |
| | 338,495 | | | | | Total SA | | | 17,165,994 | |
| | 41,561 | | | | | UBISOFT Entertainment SA* | | | 1,780,062 | |
| | 37,572 | | | | | Valeo SA | | | 2,508,757 | |
| | | | | | | | | | |
| | | | | | Total France | | | 168,141,901 | |
| | | | | | | | | | |
| | | | | | |
| | See accompanying Notes to the Financial Statements. | | | 49 | |
Mercer Non-US Core Equity Fund
Schedule of Investments (Continued)
(showing percentage of net assets)
March 31, 2017
| | | | | | | | | | |
| Shares | | | | | Description | | Value ($) | |
| | |
| | | | | | Germany — 9.1% | |
| | | |
| | 28,177 | | | | | Aareal Bank AG | | | 1,090,948 | |
| | 89,700 | | | | | Adidas AG | | | 17,105,852 | |
| | 18,165 | | | | | Allianz SE | | | 3,373,736 | |
| | 22,267 | | | | | Aurubis AG | | | 1,496,100 | |
| | 67,637 | | | | | BASF SE | | | 6,721,937 | |
| | 92,754 | | | | | Bayer AG | | | 10,719,101 | |
| | 22,808 | | | | | Bayerische Motoren Werke AG | | | 2,085,955 | |
| | 9,731 | | | | | Bechtle AG | | | 1,058,992 | |
| | 32,114 | | | | | Beiersdorf AG | | | 3,047,655 | |
| | 76,793 | | | | | Brenntag AG | | | 4,316,138 | |
| | 9,108 | | | | | Cewe Stiftung & Co. KGaA | | | 800,261 | |
| | 21,117 | | | | | Continental AG | | | 4,641,357 | |
| | 43,243 | | | | | Covestro AG | | | 3,337,438 | |
| | 37,605 | | | | | Daimler AG | | | 2,783,253 | |
| | 70,100 | | | | | Deutsche Bank AG* | | | 1,210,853 | |
| | 129,200 | | | | | Deutsche Lufthansa AG | | | 2,100,424 | |
| | 95,396 | | | | | Deutsche Post AG | | | 3,275,697 | |
| | 252,926 | | | | | Deutsche Wohnen AG | | | 8,349,504 | |
| | 116,064 | | | | | Deutz AG | | | 803,037 | |
| | 52,118 | | | | | DIC Asset AG | | | 518,408 | |
| | 221,298 | | | | | E.ON SE | | | 1,763,571 | |
| | 42,798 | | | | | ElringKlinger AG‡ | | | 834,013 | |
| | 118,809 | | | | | Evonik Industries AG | | | 3,883,959 | |
| | 90,260 | | | | | Fresenius Medical Care AG & Co. KGaA | | | 7,631,293 | |
| | 144,686 | | | | | GEA Group AG | | | 6,165,194 | |
| | 86,230 | | | | | HeidelbergCement AG | | | 8,093,865 | |
| | 1,013,221 | | | | | Infineon Technologies AG | | | 20,747,247 | |
| | 76,774 | | | | | Jenoptik AG | | | 1,908,320 | |
| | 79,600 | | | | | K+S AG‡ | | | 1,855,117 | |
| | 149,661 | | | | | Kloeckner & Co. SE* | | | 1,622,308 | |
| | 13,832 | | | | | Koenig & Bauer AG* | | | 869,740 | |
| | 4,519 | | | | | Lanxess AG | | | 303,966 | |
| | 38,802 | | | | | LEG Immobilien AG* | | | 3,188,911 | |
| | 33,984 | | | | | Leoni AG | | | 1,753,589 | |
| | 21,995 | | | | | Linde AG | | | 3,672,212 | |
| | 119,523 | | | | | METRO AG | | | 3,832,517 | |
| | 46,095 | | | | | Muenchener Rueckversicherungs-Gesellschaft in Muenchen AG | | | 9,041,783 | |
| | 8,742 | | | | | Nemetschek SE | | | 525,751 | |
| | 27,895 | | | | | Rheinmetall AG | | | 2,345,933 | |
| | 196,428 | | | | | RWE AG* | | | 3,263,740 | |
| | 45,186 | | | | | Salzgitter AG | | | 1,640,033 | |
| | 51,543 | | | | | Siemens AG | | | 7,078,409 | |
| | 14,302 | | | | | Sixt SE | | | 738,831 | |
| | 27,995 | | | | | SMA Solar Technology AG‡ | | | 708,878 | |
| | 51,115 | | | | | Software AG | | | 2,026,345 | |
| | 17,600 | | | | | STADA Arzneimittel AG | | | 1,080,314 | |
| | 101,702 | | | | | Symrise AG | | | 6,781,054 | |
| | 136,928 | | | | | TAG Immobilien AG‡ | | | 1,847,483 | |
| | 52,401 | | | | | Talanx AG* | | | 1,852,583 | |
| | | | | | |
| 50 | | See accompanying Notes to the Financial Statements. | | | | |
Mercer Non-US Core Equity Fund
Schedule of Investments (Continued)
(showing percentage of net assets)
March 31, 2017
| | | | | | | | | | |
| Shares | | | | | Description | | Value ($) | |
| | |
| | | | | | Germany — continued | |
| | | |
| | 218,888 | | | | | Uniper SE* | | | 3,694,281 | |
| | 243,362 | | | | | Vonovia SE | | | 8,597,304 | |
| | 10,505 | | | | | Wacker Chemie AG | | | 1,084,799 | |
| | 200,160 | | | | | Zalando SE* | | | 8,119,024 | |
| | | | | | | | | | |
| | | | | | Total Germany | | | 207,389,013 | |
| | | | | | | | | | |
| | |
| | | | | | Gibraltar — 0.0% | |
| | | |
| | 119,955 | | | | | 888 Holdings Plc | | | 400,494 | |
| | | | | | | | | | |
| | |
| | | | | | Hong Kong — 0.8% | |
| | | |
| | 1,742,000 | | | | | AIA Group, Ltd. | | | 10,983,465 | |
| | 3,160,000 | | | | | Champion REIT | | | 1,935,482 | |
| | 147,000 | | | | | Hopewell Holdings, Ltd. | | | 554,217 | |
| | 3,458,000 | | | | | PCCW, Ltd. | | | 2,037,913 | |
| | 380,000 | | | | | Wheelock & Co., Ltd. | | | 3,004,697 | |
| | | | | | | | | | |
| | | | | | Total Hong Kong | | | 18,515,774 | |
| | | | | | | | | | |
| | |
| | | | | | Hungary — 0.1% | |
| | | |
| | 28,700 | | | | | MOL Hungarian Oil & Gas Plc | | | 1,968,080 | |
| | 40,500 | | | | | Richter Gedeon Nyrt | | | 921,544 | |
| | | | | | | | | | |
| | | | | | Total Hungary | | | 2,889,624 | |
| | | | | | | | | | |
| | |
| | | | | | India — 0.6% | |
| | | |
| | 242,660 | | | | | HDFC Bank, Ltd. | | | 5,381,234 | |
| | 423,100 | | | | | KPIT Technologies, Ltd. | | | 846,395 | |
| | 228,780 | | | | | Tata Motors, Ltd., ADR | | | 8,156,007 | |
| | | | | | | | | | |
| | | | | | Total India | | | 14,383,636 | |
| | | | | | | | | | |
| | |
| | | | | | Indonesia — 0.4% | |
| | | |
| | 8,897,800 | | | | | Bank Mandiri Persero Tbk PT | | | 7,812,409 | |
| | 3,540,700 | | | | | Bank Negara Indonesia Persero Tbk PT | | | 1,720,463 | |
| | | | | | | | | | |
| | | | | | Total Indonesia | | | 9,532,872 | |
| | | | | | | | | | |
| | |
| | | | | | Ireland — 1.2% | |
| | | |
| | 5,772,702 | | | | | Bank of Ireland* | | | 1,450,935 | |
| | 313,147 | | | | | C&C Group Plc | | | 1,217,457 | |
| | 241,930 | | | | | CRH Plc (Dublin Exchange) | | | 8,557,065 | |
| | 76,946 | | | | | James Hardie Industries Plc, ADR | | | 1,207,423 | |
| | 66,000 | | | | | Kerry Group Plc Class A | | | 5,202,503 | |
| | 99,160 | | | | | Ryanair Holdings Plc, ADR* | | | 8,228,297 | |
| | 53,015 | | | | | Smurfit Kappa Group Plc | | | 1,406,066 | |
| | | | | | | | | | |
| | | | | | Total Ireland | | | 27,269,746 | |
| | | | | | | | | | |
| | |
| | | | | | Isle of Man — 0.1% | |
| | | |
| | 127,324 | | | | | Playtech Plc | | | 1,482,267 | |
| | | | | | | | | | |
| | |
| | | | | | Israel — 0.3% | |
| | | |
| | 28,631 | | | | | Check Point Software Technologies, Ltd.* | | | 2,939,258 | |
| | | | | | |
| | See accompanying Notes to the Financial Statements. | | | 51 | |
Mercer Non-US Core Equity Fund
Schedule of Investments (Continued)
(showing percentage of net assets)
March 31, 2017
| | | | | | | | | | |
| Shares | | | | | Description | | Value ($) | |
| | |
| | | | | | Israel — continued | |
| | | |
| | 952,345 | | | | | El Al Israel Airlines | | | 699,864 | |
| | 1,900 | | | | | Orbotech, Ltd.* | | | 61,275 | |
| | 76,500 | | | | | Teva Pharmaceutical Industries, Ltd. | | | 2,509,613 | |
| | | | | | | | | | |
| | | | | | Total Israel | | | 6,210,010 | |
| | | | | | | | | | |
| | |
| | | | | | Italy — 1.0% | |
| | | |
| | 1,214,000 | | | | | A2A Spa | | | 1,841,178 | |
| | 183,100 | | | | | Astaldi Spa | | | 1,225,924 | |
| | 212,555 | | | | | Autogrill Spa | | | 2,116,518 | |
| | 924,490 | | | | | Enel Spa | | | 4,364,510 | |
| | 99,858 | | | | | Leonardo Spa* | | | 1,419,413 | |
| | 357,418 | | | | | Mediaset Spa | | | 1,483,232 | |
| | 127,100 | | | | | Mediobanca Spa | | | 1,148,691 | |
| | 62,195 | | | | | Poste Italiane Spa | | | 415,754 | |
| | 570,022 | | | | | Saras Spa | | | 1,091,913 | |
| | 167,166 | | | | | Societa Cattolica di Assicurazioni SCRL | | | 1,342,731 | |
| | 156,407 | | | | | UniCredit Spa | | | 2,417,269 | |
| | 786,027 | | | | | Unipol Gruppo Finanziario Spa | | | 3,258,533 | |
| | | | | | | | | | |
| | | | | | Total Italy | | | 22,125,666 | |
| | | | | | | | | | |
| | |
| | | | | | Japan — 22.3% | |
| | | |
| | 22,000 | | | | | Advantest Corp. | | | 410,661 | |
| | 8,200 | | | | | Aichi Steel Corp. | | | 325,998 | |
| | 79,600 | | | | | Aisin Seiki Co., Ltd. | | | 3,907,493 | |
| | 75,400 | | | | | Alpine Electronics, Inc. | | | 1,083,329 | |
| | 38,200 | | | | | Amano Corp.‡ | | | 762,080 | |
| | 60,000 | | | | | Asahi Kasei Corp. | | | 581,531 | |
| | 407,600 | | | | | Astellas Pharma, Inc. | | | 5,362,484 | |
| | 37,900 | | | | | Azbil Corp.‡ | | | 1,272,063 | |
| | 109,700 | | | | | Brother Industries, Ltd. | | | 2,288,903 | |
| | 295,800 | | | | | Calbee, Inc.‡ | | | 10,074,136 | |
| | 464,000 | | | | | Central Glass Co., Ltd. | | | 1,973,759 | |
| | 23,800 | | | | | Central Japan Railway Co. | | | 3,874,468 | |
| | 253,294 | | | | | Chiba Bank, Ltd. (The)‡ | | | 1,625,282 | |
| | 436,000 | | | | | Citizen Watch Co., Ltd. | | | 2,793,718 | |
| | 53,500 | | | | | CKD Corp. | | | 676,012 | |
| | 118,800 | | | | | COMSYS Holdings Corp. | | | 2,120,553 | |
| | 530,500 | | | | | Concordia Financial Group, Ltd. | | | 2,453,735 | |
| | 37,300 | | | | | Dai-ichi Life Holdings, Inc. | | | 668,307 | |
| | 142,000 | | | | | Daido Steel Co., Ltd. | | | 677,950 | |
| | 12,300 | | | | | Daio Paper Corp. | | | 157,075 | |
| | 333,246 | | | | | Daiwa Securities Group, Inc. | | | 2,027,349 | |
| | 35,400 | | | | | Denso Corp. | | | 1,555,719 | |
| | 91,100 | | | | | DIC Corp. | | | 3,360,145 | |
| | 41,900 | | | | | East Japan Railway Co. | | | 3,645,146 | |
| | 20,900 | | | | | Enplas Corp.‡ | | | 578,628 | |
| | 40,800 | | | | | Exedy Corp. | | | 1,164,354 | |
| | 37,200 | | | | | FCC Co., Ltd. | | | 741,797 | |
| | 87,000 | | | | | Fuji Machine Manufacturing Co., Ltd. | | | 1,138,347 | |
| | | | | | |
| 52 | | See accompanying Notes to the Financial Statements. | | | | |
Mercer Non-US Core Equity Fund
Schedule of Investments (Continued)
(showing percentage of net assets)
March 31, 2017
| | | | | | | | | | |
| Shares | | | | | Description | | Value ($) | |
| | |
| | | | | | Japan — continued | |
| | | |
| | 189,900 | | | | | Fuji Oil Holdings, Inc. | | | 4,442,873 | |
| | 35,700 | | | | | Fuji Seal International, Inc. | | | 771,476 | |
| | 57,900 | | | | | FUJIFILM Holdings Corp. | | | 2,259,259 | |
| | 352,000 | | | | | Fujikura, Ltd. | | | 2,530,306 | |
| | 114,100 | | | | | Fujitec Co., Ltd.‡ | | | 1,251,281 | |
| | 668,000 | | | | | Fujitsu, Ltd. | | | 4,081,856 | |
| | 16,900 | | | | | Fuyo General Lease Co., Ltd. | | | 756,807 | |
| | 38,097 | | | | | Glory, Ltd. | | | 1,247,905 | |
| | 249,294 | | | | | Hachijuni Bank, Ltd. (The)‡ | | | 1,407,215 | |
| | 431,000 | | | | | Hanwa Co., Ltd. | | | 3,059,508 | |
| | 27,600 | | | | | Heiwa Corp. | | | 685,604 | |
| | 40,000 | | | | | Heiwado Co., Ltd. | | | 969,936 | |
| | 41,900 | | | | | Hirose Electric Co., Ltd. | | | 5,790,721 | |
| | 16,200 | | | | | Hitachi High-Technologies Corp. | | | 659,311 | |
| | 1,041,000 | | | | | Hitachi, Ltd. | | | 5,628,668 | |
| | 18,300 | | | | | Hitachi Maxell, Ltd.‡ | | | 333,548 | |
| | 120,800 | | | | | Hokuetsu Kishu Paper Co., Ltd.‡ | | | 841,253 | |
| | 80,700 | | | | | Hokuhoku Financial Group, Inc. | | | 1,265,215 | |
| | 14,400 | | | | | Ibiden Co., Ltd. | | | 224,083 | |
| | 36,700 | | | | | IBJ Leasing Co., Ltd. | | | 782,547 | |
| | 593,500 | | | | | Inpex Corp. | | | 5,829,541 | |
| | 177,100 | | | | | Isuzu Motors, Ltd. | | | 2,340,301 | |
| | 125,200 | | | | | Ito En, Ltd. | | | 4,567,334 | |
| | 210,000 | | | | | Itochu Corp.‡ | | | 2,977,654 | |
| | 70,600 | | | | | Japan Airlines Co., Ltd. | | | 2,234,009 | |
| | 42,000 | | | | | Japan Aviation Electronics Industry, Ltd.‡ | | | 538,616 | |
| | 47,800 | | | | | Japan Petroleum Exploration Co., Ltd.‡ | | | 1,093,442 | |
| | 62,600 | | | | | Japan Steel Works, Ltd. (The) | | | 1,007,847 | |
| | 291,900 | | | | | Japan Tobacco, Inc. | | | 9,477,647 | |
| | 216,600 | | | | | JFE Holdings, Inc. | | | 3,709,783 | |
| | 53,200 | | | | | JTEKT Corp. | | | 825,476 | |
| | 43,500 | | | | | Juki Corp. | | | 511,788 | |
| | 324,000 | | | | | JX Holdings, Inc.‡ | | | 1,589,615 | |
| | 21,100 | | | | | Kaken Pharmaceutical Co., Ltd. | | | 1,191,053 | |
| | 146,000 | | | | | Kaneka Corp. | | | 1,084,878 | |
| | 663,000 | | | | | Kanematsu Corp. | | | 1,189,985 | |
| | 203,900 | | | | | Kansai Electric Power Co., Inc. (The) | | | 2,501,403 | |
| | 215,708 | | | | | Kao Corp. | | | 11,816,222 | |
| | 683,000 | | | | | Kawasaki Heavy Industries, Ltd. | | | 2,071,740 | |
| | 687,600 | | | | | KDDI Corp. | | | 18,030,757 | |
| | 164,300 | | | | | Keihin Corp. | | | 2,692,379 | |
| | 5,100 | | | | | Keyence Corp. | | | 2,040,366 | |
| | 22,900 | | | | | Kiyo Bank, Ltd. (The) | | | 350,600 | |
| | 95,600 | | | | | Kobayashi Pharmaceutical Co., Ltd. | | | 4,624,284 | |
| | 11,900 | | | | | Kohnan Shoji Co., Ltd. | | | 224,800 | |
| | 540,700 | | | | | Komatsu, Ltd. | | | 14,079,162 | |
| | 104,400 | | | | | Komori Corp. | | | 1,338,846 | |
| | 405,400 | | | | | Konica Minolta, Inc. | | | 3,623,606 | |
| | 9,986 | | | | | Kose Corp. | | | 902,441 | |
| | 11,400 | | | | | Kuroda Electric Co., Ltd.‡ | | | 247,991 | |
| | | | | | |
| | See accompanying Notes to the Financial Statements. | | | 53 | |
Mercer Non-US Core Equity Fund
Schedule of Investments (Continued)
(showing percentage of net assets)
March 31, 2017
| | | | | | | | | | |
| Shares | | | | | Description | | Value ($) | |
| | |
| | | | | | Japan — continued | |
| | | |
| | 342,000 | | | | | KYB Corp. | | | 1,780,131 | |
| | 71,000 | | | | | Kyudenko Corp.‡ | | | 1,933,815 | |
| | 13,600 | | | | | Lintec Corp.‡ | | | 289,624 | |
| | 113,000 | | | | | Makino Milling Machine Co., Ltd. | | | 978,596 | |
| | 335,200 | | | | | Marubeni Corp. | | | 2,062,098 | |
| | 19,900 | | | | | Maruwa Co., Ltd. | | | 709,885 | |
| | 38,400 | | | | | Matsumotokiyoshi Holdings Co., Ltd. | | | 1,819,546 | |
| | 644,000 | | | | | Mebuki Financial Group, Inc. | | | 2,571,839 | |
| | 10,600 | | | | | Melco Holdings, Inc. | | | 305,833 | |
| | 101,100 | | | | | MISUMI Group, Inc. | | | 1,825,480 | |
| | 328,000 | | | | | Mitsubishi Chemical Holdings Corp. | | | 2,535,576 | |
| | 187,800 | | | | | Mitsubishi Co. | | | 4,054,141 | |
| | 109,200 | | | | | Mitsubishi Electric Corp. | | | 1,565,040 | |
| | 132,400 | | | | | Mitsubishi Gas Chemical Co., Inc. | | | 2,747,095 | |
| | 52,500 | | | | | Mitsubishi Shokuhin Co., Ltd. | | | 1,625,460 | |
| | 155,400 | | | | | Mitsui & Co., Ltd. | | | 2,248,788 | |
| | 135,000 | | | | | Mitsui Mining & Smelting Co., Ltd. | | | 459,167 | |
| | 1,773,900 | | | | | Mizuho Financial Group, Inc. | | | 3,247,560 | |
| | 259,200 | | | | | MonotaRO Co., Ltd.‡ | | | 8,001,867 | |
| | 167,000 | | | | | Morinaga Milk Industry Co., Ltd. | | | 1,237,925 | |
| | 128,700 | | | | | MS&AD Insurance Group Holdings, Inc. | | | 4,088,648 | |
| | 14,900 | | | | | Musashino Bank, Ltd. (The) | | | 441,264 | |
| | 667,000 | | | | | NEC Corp.‡ | | | 1,604,200 | |
| | 107,100 | | | | | Nichicon Corp. | | | 996,704 | |
| | 170,800 | | | | | Nihon Kohden Corp. | | | 3,815,141 | |
| | 136,700 | | | | | Nihon Unisys, Ltd.‡ | | | 1,864,704 | |
| | 333,000 | | | | | Nippon Electric Glass Co., Ltd. | | | 2,011,209 | |
| | 40,700 | | | | | Nippon Flour Mills Co., Ltd. | | | 600,474 | |
| | 552,100 | | | | | Nippon Light Metal Holdings Co., Ltd. | | | 1,213,897 | |
| | 38,500 | | | | | Nippon Paper Industries Co., Ltd.‡ | | | 691,708 | |
| | 95,400 | | | | | Nippon Sheet Glass Co., Ltd.* ‡ | | | 692,620 | |
| | 326,000 | | | | | Nippon Soda Co., Ltd. | | | 1,799,246 | |
| | 78,800 | | | | | Nippon Steel & Sumitomo Metal Corp. | | | 1,813,892 | |
| | 369,100 | | | | | Nippon Telegraph & Telephone Corp. | | | 15,740,494 | |
| | 66,905 | | | | | Nippon Telegraph & Telephone Corp., ADR | | | 2,866,210 | |
| | 184,500 | | | | | Nipro Corp. | | | 2,599,524 | |
| | 125,200 | | | | | Nishi-Nippon Financial Holdings, Inc.* | | | 1,250,539 | |
| | 770,900 | | | | | Nissan Motor Co., Ltd.‡ | | | 7,426,736 | |
| | 287,500 | | | | | Nisshinbo Holdings, Inc. | | | 2,871,646 | |
| | 57,800 | | | | | Nissin Kogyo Co., Ltd. | | | 1,035,348 | |
| | 48,000 | | | | | NOF Corp. | | | 509,163 | |
| | 259,900 | | | | | Nomura Holdings, Inc. | | | 1,613,792 | |
| | 264,200 | | | | | Nomura Research Institute, Ltd. | | | 9,721,080 | |
| | 371,541 | | | | | North Pacific Bank, Ltd. | | | 1,407,074 | |
| | 176,000 | | | | | NTT DoCoMo, Inc. | | | 4,094,768 | |
| | 75,000 | | | | | Obic Co., Ltd. | | | 3,567,262 | |
| | 67,000 | | | | | Oji Holdings Corp. | | | 313,264 | |
| | 322,700 | | | | | Omron Corp. | | | 14,146,904 | |
| | 819,000 | | | | | Orix Corp. | | | 12,108,970 | |
| | | | | | |
| 54 | | See accompanying Notes to the Financial Statements. | | | | |
Mercer Non-US Core Equity Fund
Schedule of Investments (Continued)
(showing percentage of net assets)
March 31, 2017
| | | | | | | | | | |
| Shares | | | | | Description | | Value ($) | |
| | |
| | | | | | Japan — continued | |
| | | |
| | 87,100 | | | | | Otsuka Holdings Co., Ltd. | | | 3,925,480 | |
| | 767,500 | | | | | Pioneer Corp.* | | | 1,522,189 | |
| | 370,000 | | | | | Prima Meat Packers, Ltd. | | | 1,633,671 | |
| | 431,500 | | | | | Resona Holdings, Inc. | | | 2,315,300 | |
| | 58,500 | | | | | Rohm Co., Ltd. | | | 3,884,950 | |
| | 122,000 | | | | | Rohto Pharmaceutical Co., Ltd.‡ | | | 2,283,873 | |
| | 218,000 | | | | | Sankyu, Inc. | | | 1,320,560 | |
| | 373,300 | | | | | Santen Pharmaceutical Co., Ltd. | | | 5,400,337 | |
| | 25,300 | | | | | Sawai Pharmaceutical Co., Ltd.‡ | | | 1,366,831 | |
| | 52,200 | | | | | SCREEN Holdings Co., Ltd.‡ | | | 3,836,651 | |
| | 89,000 | | | | | Secom Co., Ltd. | | | 6,364,902 | |
| | 200,600 | | | | | Seiko Epson Corp. | | | 4,219,747 | |
| | 37,700 | | | | | Seino Holdings Co., Ltd.‡ | | | 422,911 | |
| | 368,200 | | | | | Senshu Ikeda Holdings, Inc. | | | 1,519,986 | |
| | 59,000 | | | | | Shiga Bank, Ltd. (The) | | | 302,333 | |
| | 164,600 | | | | | Shin-Etsu Chemical Co., Ltd. | | | 14,245,736 | |
| | 212,000 | | | | | Shindengen Electric Manufacturing Co., Ltd.‡ | | | 886,584 | |
| | 686,000 | | | | | Shinsei Bank, Ltd.‡ | | | 1,262,048 | |
| | 56,400 | | | | | Ship Healthcare Holdings, Inc.‡ | | | 1,498,702 | |
| | 2,441,300 | | | | | Sojitz Corp. | | | 6,112,561 | |
| | 71,800 | | | | | Sony Corp. | | | 2,426,625 | |
| | 102,942 | | | | | Sony Corp., ADR | | | 3,472,234 | |
| | 113,000 | | | | | Sumitomo Chemical Co., Ltd. | | | 630,764 | |
| | 89,600 | | | | | Sumitomo Corp. | | | 1,204,128 | |
| | 159,700 | | | | | Sumitomo Electric Industries, Ltd. | | | 2,645,663 | |
| | 370,841 | | | | | Sumitomo Mitsui Financial Group, Inc.‡ | | | 13,461,831 | |
| | 35,800 | | | | | Sumitomo Mitsui Trust Holdings, Inc. | | | 1,240,133 | |
| | 190,500 | | | | | Sumitomo Rubber Industries, Ltd. | | | 3,243,099 | |
| | 84,100 | | | | | T-Gaia Corp. | | | 1,445,315 | |
| | 40,600 | | | | | Taiyo Yuden Co., Ltd. | | | 512,282 | |
| | 31,300 | | | | | TDK Corp. | | | 1,980,302 | |
| | 27,900 | | | | | Teijin, Ltd. | | | 525,551 | |
| | 108,100 | | | | | Terumo Corp.‡ | | | 3,749,497 | |
| | 94,800 | | | | | Toagosei Co., Ltd. | | | 1,080,463 | |
| | 39,700 | | | | | Tokio Marine Holdings, Inc. | | | 1,673,079 | |
| | 455,000 | | | | | Tokuyama Corp.* | | | 2,196,805 | |
| | 47,500 | | | | | Tokyo Century Corp. | | | 1,615,588 | |
| | 25,500 | | | | | Tokyo Electron, Ltd. | | | 2,781,589 | |
| | 49,700 | | | | | Tokyo Ohka Kogyo Co., Ltd. | | | 1,648,044 | |
| | 40,000 | | | | | Tokyo Seimitsu Co., Ltd. | | | 1,258,189 | |
| | 13,900 | | | | | Tokyo TY Financial Group, Inc. | | | 416,015 | |
| | 207,800 | | | | | Tokyu Construction Co., Ltd. | | | 1,631,742 | |
| | 36,000 | | | | | Toppan Printing Co., Ltd. | | | 366,688 | |
| | 34,600 | | | | | Topre Corp.‡ | | | 899,544 | |
| | 240,000 | | | | | Toray Industries, Inc.‡ | | | 2,125,819 | |
| | 175,000 | | | | | Tosoh Corp. | | | 1,535,942 | |
| | 18,000 | | | | | Towa Pharmaceutical Co., Ltd. | | | 909,450 | |
| | 119,100 | | | | | Toyo Suisan Kaisha, Ltd. | | | 4,430,310 | |
| | 87,000 | | | | | Toyoda Gosei Co., Ltd. | | | 2,210,329 | |
| | | | | | |
| | See accompanying Notes to the Financial Statements. | | | 55 | |
Mercer Non-US Core Equity Fund
Schedule of Investments (Continued)
(showing percentage of net assets)
March 31, 2017
| | | | | | | | | | |
| Shares | | | | | Description | | Value ($) | |
| | |
| | | | | | Japan — continued | |
| | | |
| | 20,900 | | | | | Toyota Boshoku Corp. | | | 484,472 | |
| | 47,400 | | | | | Toyota Motor Corp. | | | 2,570,141 | |
| | 71,100 | | | | | TS Tech Co., Ltd. | | | 1,909,102 | |
| | 47,000 | | | | | Tsubakimoto Chain Co. | | | 391,421 | |
| | 694,000 | | | | | Ube Industries, Ltd. | | | 1,563,259 | |
| | 13,100 | | | | | Ulvac, Inc. | | | 610,150 | |
| | 59,500 | | | | | Ushio, Inc. | | | 751,292 | |
| | 88,870 | | | | | USS Co., Ltd. | | | 1,480,236 | |
| | 96,900 | | | | | Valor Holdings Co., Ltd. | | | 2,284,450 | |
| | 44,300 | | | | | West Japan Railway Co. | | | 2,878,725 | |
| | 39,600 | | | | | Yamaha Corp. | | | 1,089,240 | |
| | 148,900 | | | | | Yamaha Motor Co., Ltd. | | | 3,582,526 | |
| | 415,562 | | | | | Yamato Holdings Co., Ltd.‡ | | | 8,698,720 | |
| | 122,500 | | | | | Yokogawa Electric Corp. | | | 1,926,052 | |
| | 73,000 | | | | | Yokohama Rubber Co., Ltd. (The) | | | 1,427,506 | |
| | | | | | | | | | |
| | | | | | Total Japan | | | 505,199,571 | |
| | | | | | | | | | |
| | |
| | | | | | Luxembourg — 0.5% | |
| | | |
| | 1,139,991 | | | | | ArcelorMittal* | | | 9,615,218 | |
| | 106,700 | | | | | SAF-Holland SA | | | 1,784,851 | |
| | | | | | | | | | |
| | | | | | Total Luxembourg | | | 11,400,069 | |
| | | | | | | | | | |
| | |
| | | | | | Malaysia — 0.1% | |
| | | |
| | 748,700 | | | | | Tenaga Nasional Bhd | | | 2,321,131 | |
| | | | | | | | | | |
| | |
| | | | | | Malta — 0.0% | |
| | | |
| | 61,183 | | | | | Kindred Group Plc, SDR | | | 636,616 | |
| | | | | | | | | | |
| | |
| | | | | | Netherlands — 3.6% | |
| | | |
| | 648,761 | | | | | Aegon NV | | | 3,310,511 | |
| | 28,336 | | | | | Akzo Nobel NV | | | 2,355,744 | |
| | 31,255 | | | | | ASM International NV | | | 1,759,022 | |
| | 15,539 | | | | | ASML Holding NV | | | 2,067,495 | |
| | 25,586 | | | | | BE Semiconductor Industries NV | | | 1,046,320 | |
| | 15,056 | | | | | Core Laboratories NV | | | 1,739,269 | |
| | 22,417 | | | | | Euronext NV | | | 980,742 | |
| | 168,486 | | | | | Fiat Chrysler Automobiles NV* | | | 1,847,092 | |
| | 9 | | | | | Fugro NV, ADR* | | | 141 | |
| | 101,580 | | | | | Heineken NV | | | 8,669,859 | |
| | 556,619 | | | | | ING Groep NV | | | 8,435,849 | |
| | 117,575 | | | | | Koninklijke Ahold Delhaize NV | | | 2,522,591 | |
| | 50,651 | | | | | Koninklijke DSM NV | | | 3,435,158 | |
| | 32,778 | | | | | Koninklijke Philips Electronics NV, ADR | | | 1,052,502 | |
| | 337,937 | | | | | Koninklijke Philips NV | | | 10,890,199 | |
| | 181,516 | | | | | NN Group NV | | | 5,918,369 | |
| | 391,811 | | | | | PostNL NV* | | | 1,855,603 | |
| | 370,717 | | | | | RELX NV | | | 6,883,244 | |
| | 177,909 | | | | | STMicroelectronics NV, ADR | | | 2,750,473 | |
| | 42,422 | | | | | TKH Group NV, ADR | | | 1,825,106 | |
| | | | | | |
| 56 | | See accompanying Notes to the Financial Statements. | | | | |
Mercer Non-US Core Equity Fund
Schedule of Investments (Continued)
(showing percentage of net assets)
March 31, 2017
| | | | | | | | | | |
| Shares | | | | | Description | | Value ($) | |
| | |
| | | | | | Netherlands — continued | |
| | | |
| | 116,180 | | | | | Unilever NV, ADR | | | 5,786,801 | |
| | 77,700 | | | | | Unilever NV, ADR | | | 3,860,136 | |
| | 45,254 | | | | | Wolters Kluwer NV | | | 1,885,960 | |
| | | | | | | | | | |
| | | | | | Total Netherlands | | | 80,878,186 | |
| | | | | | | | | | |
| | |
| | | | | | New Zealand — 0.2% | |
| | | |
| | 757,106 | | | | | Air New Zealand, Ltd. | | | 1,301,967 | |
| | 152,951 | | | | | Chorus, Ltd. | | | 461,896 | |
| | 24,000 | | | | | Sky City Entertainment Group, Ltd. REIT | | | 69,625 | |
| | 777,852 | | | | | Sky Network Television, Ltd. | | | 2,131,529 | |
| | 330,102 | | | | | Trade Me Group, Ltd. | | | 1,183,788 | |
| | | | | | | | | | |
| | | | | | Total New Zealand | | | 5,148,805 | |
| | | | | | | | | | |
| | |
| | | | | | Norway — 0.7% | |
| | | |
| | 340,877 | | | | | DNB ASA | | | 5,401,549 | |
| | 11,962 | | | | | Leroy Seafood Group ASA | | | 523,666 | |
| | 157,623 | | | | | Orkla ASA | | | 1,411,264 | |
| | 82,548 | | | | | Salmar ASA | | | 1,779,959 | |
| | 89,259 | | | | | SpareBank 1 SMN | | | 691,092 | |
| | 70,600 | | | | | Statoil ASA | | | 1,205,861 | |
| | 426,276 | | | | | Storebrand ASA* | | | 2,833,932 | |
| | 42,500 | | | | | Yara International ASA | | | 1,635,891 | |
| | | | | | | | | | |
| | | | | | Total Norway | | | 15,483,214 | |
| | | | | | | | | | |
| | |
| | | | | | Philippines — 0.0% | |
| | | |
| | 6,261,800 | | | | | Vista Land & Lifescapes, Inc. | | | 633,980 | |
| | | | | | | | | | |
| | |
| | | | | | Poland — 0.1% | |
| | | |
| | 423,743 | | | | | PGE Polska Grupa Energetyczna SA | | | 1,219,266 | |
| | | | | | | | | | |
| | |
| | | | | | Portugal — 0.5% | |
| | | |
| | 782,528 | | | | | Banco Espirito Santo SA* **** ¤ | | | — | |
| | 615,070 | | | | | Jeronimo Martins SGPS SA | | | 11,032,109 | |
| | 302,546 | | | | | Navigator Co. SA (The) | | | 1,218,632 | |
| | | | | | | | | | |
| | | | | | Total Portugal | | | 12,250,741 | |
| | | | | | | | | | |
| | |
| | | | | | Russia — 0.2% | |
| | | |
| | 346,335 | | | | | Gazprom PJSC, ADR | | | 1,548,118 | |
| | 49,400 | | | | | MMC Norilsk Nickel PJSC, (London Exchange), ADR | | | 776,568 | |
| | 32,432 | | | | | Tatneft PJSC, (London Exchange), ADR | | | 1,195,119 | |
| | | | | | | | | | |
| | | | | | Total Russia | | | 3,519,805 | |
| | | | | | | | | | |
| | |
| | | | | | Singapore — 0.2% | |
| | | |
| | 146,200 | | | | | DBS Group Holdings, Ltd. | | | 2,029,829 | |
| | 1,713,900 | | | | | Yangzijiang Shipbuilding Holdings, Ltd. | | | 1,386,035 | |
| | | | | | | | | | |
| | | | | | Total Singapore | | | 3,415,864 | |
| | | | | | | | | | |
| | | | | | |
| | See accompanying Notes to the Financial Statements. | | | 57 | |
Mercer Non-US Core Equity Fund
Schedule of Investments (Continued)
(showing percentage of net assets)
March 31, 2017
| | | | | | | | | | |
| Shares | | | | | Description | | Value ($) | |
| | |
| | | | | | South Africa — 0.1% | |
| | | |
| | 153,700 | | | | | MTN Group, Ltd. | | | 1,398,445 | |
| | | | | | | | | | |
| | |
| | | | | | South Korea — 0.4% | |
| | | |
| | 35,889 | | | | | Kia Motors Corp. | | | 1,189,026 | |
| | 3,220 | | | | | Samsung Electronics Co., Ltd. | | | 5,931,503 | |
| | 6,440 | | | | | SK Telecom Co., Ltd. | | | 1,451,203 | |
| | | | | | | | | | |
| | | | | | Total South Korea | | | 8,571,732 | |
| | | | | | | | | | |
| | |
| | | | | | Spain — 2.0% | |
| | | |
| | 302,006 | | | | | Amadeus IT Group SA Class A | | | 15,362,375 | |
| | 680,777 | | | | | Banco de Sabadell SA | | | 1,250,918 | |
| | 630,732 | | | | | Banco Santander SA | | | 3,875,572 | |
| | 27,858 | | | | | Bolsas y Mercados Espanoles SHMSF SA | | | 926,640 | |
| | 23,519 | | | | | Construcciones y Auxiliar de Ferrocarriles SA | | | 901,797 | |
| | 334,800 | | | | | Distribuidora Internacional de Alimentacion SA‡ | | | 1,941,180 | |
| | 317,118 | | | | | Ence Energia y Celulosa SA | | | 980,211 | |
| | 48,663 | | | | | Gamesa Corp. Tecnologica SA | | | 1,154,413 | |
| | 162,572 | | | | | Gas Natural SDG SA | | | 3,571,471 | |
| | 715,144 | | | | | Iberdrola SA | | | 5,128,534 | |
| | 167,085 | | | | | International Consolidated Airlines Group SA (London Exchange) | | | 1,105,248 | |
| | 20,191 | | | | | Let’s GOWEX SA* **** ‡ ¤ | | | — | |
| | 260,656 | | | | | Liberbank SA* | | | 336,214 | |
| | 1,027,749 | | | | | Mapfre SA | | | 3,534,020 | |
| | 151,524 | | | | | Repsol SA | | | 2,345,854 | |
| | 210,500 | | | | | Sacyr SA* | | | 524,352 | |
| | 278,896 | | | | | Telefonica SA | | | 3,127,603 | |
| | | | | | | | | | |
| | | | | | Total Spain | | | 46,066,402 | |
| | | | | | | | | | |
| | |
| | | | | | Sweden — 2.1% | |
| | | |
| | 68,167 | | | | | Atlas Copco AB Class A | | | 2,414,930 | |
| | 60,271 | | | | | Atlas Copco AB Class B | | | 1,922,559 | |
| | 92,843 | | | | | BillerudKorsnas AB | | | 1,502,617 | |
| | 91,249 | | | | | Boliden AB | | | 2,728,793 | |
| | 53,960 | | | | | Electrolux AB Class B | | | 1,505,487 | |
| | 53,879 | | | | | Granges AB | | | 494,840 | |
| | 67,645 | | | | | Hexpol AB | | | 696,278 | |
| | 19,433 | | | | | Holmen AB Class B‡ | | | 759,838 | |
| | 30,104 | | | | | Industrivarden AB Class A | | | 698,289 | |
| | 83,312 | | | | | Investor AB Class B | | | 3,519,739 | |
| | 64,010 | | | | | Kinnevik AB Class B | | | 1,713,472 | |
| | 330,370 | | | | | Lundin Petroleum AB* | | | 6,727,066 | |
| | 54,581 | | | | | Mycronic AB‡ | | | 560,891 | |
| | 429,203 | | | | | Nordea Bank AB | | | 4,917,786 | |
| | 37,067 | | | | | Saab AB Class B‡ | | | 1,570,562 | |
| | 156,023 | | | | | Sandvik AB | | | 2,339,917 | |
| | 368,300 | | | | | SAS AB* ‡ | | | 589,887 | |
| | 115,000 | | | | | SKF AB Class B‡ | | | 2,283,693 | |
| | 502,362 | | | | | Svenska Handelsbanken AB Class A‡ | | | 6,915,123 | |
| | 9,316 | | | | | Swedish Match AB | | | 304,158 | |
| | | | | | |
| 58 | | See accompanying Notes to the Financial Statements. | | | | |
Mercer Non-US Core Equity Fund
Schedule of Investments (Continued)
(showing percentage of net assets)
March 31, 2017
| | | | | | | | | | |
| Shares | | | | | Description | | Value ($) | |
| | |
| | | | | | Sweden — continued | |
| | 178,227 | | | | | Telefonaktiebolaget LM Ericsson Class B‡ | | | 1,193,729 | |
| | 182,171 | | | | | Telefonaktiebolaget LM Ericsson Class B, ADR | | | 1,209,615 | |
| | 450,400 | | | | | Telia Co. AB | | | 1,896,278 | |
| | | | | | | | | | |
| | | | | | Total Sweden | | | 48,465,547 | |
| | | | | | | | | | |
| | |
| | | | | | Switzerland — 7.8% | |
| | | |
| | 130,640 | | | | | ABB, Ltd.* | | | 3,057,990 | |
| | 35,600 | | | | | Aryzta AG* | | | 1,143,454 | |
| | 8,468 | | | | | Autoneum Holding AG | | | 2,489,344 | |
| | 9,098 | | | | | Bucher Industries AG | | | 2,663,184 | |
| | 44,656 | | | | | Cembra Money Bank AG* | | | 3,696,238 | |
| | 52,111 | | | | | Cie Financiere Richemont SA | | | 4,123,274 | |
| | 82,184 | | | | | Coca-Cola HBC AG* | | | 2,118,028 | |
| | 197,300 | | | | | Credit Suisse Group AG* | | | 2,936,980 | |
| | 13,736 | | | | | Geberit AG | | | 5,925,576 | |
| | 4,052 | | | | | Georg Fischer AG | | | 3,687,869 | |
| | 5,678 | | | | | Givaudan SA‡ | | | 10,233,390 | |
| | 17,095 | | | | | Implenia AG | | | 1,200,638 | |
| | 265,274 | | | | | Julius Baer Group, Ltd.* | | | 13,251,111 | |
| | 34,748 | | | | | Kudelski SA* | | | 569,326 | |
| | 62,319 | | | | | Logitech International SA | | | 1,982,976 | |
| | 441,168 | | | | | Nestle SA | | | 33,871,583 | |
| | 85,674 | | | | | Novartis AG | | | 6,363,816 | |
| | 10,585 | | | | | Rieter Holding AG* | | | 2,228,143 | |
| | 124,199 | | | | | Roche Holding AG | | | 31,739,951 | |
| | 11,440 | | | | | Schindler Holding AG | | | 2,214,968 | |
| | 4,027 | | | | | SGS SA | | | 8,597,531 | |
| | 2,065 | | | | | Siegfried Holding AG* | | | 544,127 | |
| | 17,200 | | | | | Swiss Life Holding AG* | | | 5,553,764 | |
| | 110,142 | | | | | Swiss Re AG | | | 9,897,870 | |
| | 7,155 | | | | | Syngenta AG* | | | 3,147,785 | |
| | 17,648 | | | | | Temenos Group AG* | | | 1,403,448 | |
| | 580,344 | | | | | UBS Group AG | | | 9,294,085 | |
| | 12,209 | | | | | Zurich Insurance Group AG | | | 3,261,588 | |
| | | | | | | | | | |
| | | | | | Total Switzerland | | | 177,198,037 | |
| | | | | | | | | | |
| | |
| | | | | | Taiwan — 1.0% | |
| | | |
| | 2,407,000 | | | | | Compeq Manufacturing Co., Ltd. | | | 1,741,243 | |
| | 608,000 | | | | | Fubon Financial Holding Co., Ltd. | | | 991,876 | |
| | 1,196,000 | | | | | Taiwan Semiconductor Manufacturing Co., Ltd. | | | 7,449,749 | |
| | 400,054 | | | | | Taiwan Semiconductor Manufacturing Co., Ltd., ADR | | | 13,137,773 | |
| | | | | | | | | | |
| | | | | | Total Taiwan | | | 23,320,641 | |
| | | | | | | | | | |
| | |
| | | | | | Thailand — 0.1% | |
| | | |
| | 16,831,100 | | | | | Quality Houses PCL | | | 1,283,303 | |
| | 23,666,400 | | | | | Sansiri PCL | | | 1,405,004 | |
| | | | | | | | | | |
| | | | | | Total Thailand | | | 2,688,307 | |
| | | | | | | | | | |
| | | | | | |
| | See accompanying Notes to the Financial Statements. | | | 59 | |
Mercer Non-US Core Equity Fund
Schedule of Investments (Continued)
(showing percentage of net assets)
March 31, 2017
| | | | | | | | | | |
| Shares | | | | | Description | | Value ($) | |
| | |
| | | | | | Turkey — 0.0% | |
| | | |
| | 208,146 | | | | | TAV Havalimanlari Holding AS | | | 828,206 | |
| | | | | | | | | | |
| | |
| | | | | | United Kingdom — 15.9% | |
| | | |
| | 252,378 | | | | | 3i Group Plc | | | 2,365,318 | |
| | 159,117 | | | | | Aberdeen Asset Management Plc | | | 526,668 | |
| | 173,829 | | | | | Ashmore Group Plc | | | 768,384 | |
| | 658,687 | | | | | Ashtead Group Plc | | | 13,615,022 | |
| | 17,768 | | | | | ASOS Plc* | | | 1,343,078 | |
| | 132,700 | | | | | AstraZeneca Plc, ADR | | | 4,132,278 | |
| | 25,400 | | | | | AstraZeneca Plc | | | 1,560,280 | |
| | 1,016,981 | | | | | BAE Systems Plc | | | 8,170,570 | |
| | 118,376 | | | | | Barclays Plc, ADR | | | 1,330,546 | |
| | 712,929 | | | | | Barclays Plc | | | 2,006,726 | |
| | 211,562 | | | | | Barratt Developments Plc | | | 1,445,753 | |
| | 256,120 | | | | | BBA Aviation Plc | | | 975,208 | |
| | 61,900 | | | | | Bellway Plc | | | 2,092,199 | |
| | 54,906 | | | | | Berendsen Plc | | | 503,257 | |
| | 61,200 | | | | | Berkeley Group Holdings Plc | | | 2,454,239 | |
| | 759,300 | | | | | BP Plc | | | 4,344,285 | |
| | 109,836 | | | | | British American Tobacco Plc, ADR | | | 7,284,324 | |
| | 236,326 | | | | | British American Tobacco Plc | | | 15,662,236 | |
| | 133,650 | | | | | Britvic Plc | | | 1,082,119 | |
| | 398,700 | | | | | BT Group Plc | | | 1,586,400 | |
| | 313,580 | | | | | Bunzl Plc | | | 9,097,095 | |
| | 758,464 | | | | | Cairn Energy Plc* | | | 1,939,522 | |
| | 349,974 | | | | | Carillion Plc‡ | | | 975,904 | |
| | 570,622 | | | | | Centrica Plc | | | 1,548,370 | |
| | 341,544 | | | | | Cobham Plc‡ | | | 568,021 | |
| | 825,894 | | | | | Compass Group Plc | | | 15,553,054 | |
| | 150,255 | | | | | Crest Nicholson Holdings Plc | | | 1,020,223 | |
| | 34,907 | | | | | Diageo Plc, ADR | | | 4,034,551 | |
| | 43,504 | | | | | Dialog Semiconductor Plc* | | | 2,227,143 | |
| | 419,868 | | | | | Drax Group Plc | | | 1,708,428 | |
| | 126,585 | | | | | easyJet Plc‡ | | | 1,624,037 | |
| | 862,126 | | | | | Evraz Plc* | | | 2,331,813 | |
| | 399,534 | | | | | Experian Plc | | | 8,133,445 | |
| | 701,600 | | | | | Firstgroup Plc* | | | 1,158,057 | |
| | 834,800 | | | | | G4S Plc | | | 3,176,514 | |
| | 53,249 | | | | | Galliford Try Plc | | | 980,134 | |
| | 591,200 | | | | | GKN Plc | | | 2,685,754 | |
| | 108,200 | | | | | GlaxoSmithKline Plc | | | 2,245,282 | |
| | 171,053 | | | | | GlaxoSmithKline Plc, ADR | | | 7,211,595 | |
| | 2,544,910 | | | | | Glencore Plc* | | | 9,965,320 | |
| | 126,176 | | | | | Greene King Plc | | | 1,106,804 | |
| | 47,696 | | | | | Greggs Plc | | | 622,061 | |
| | 432,427 | | | | | Halma Plc | | | 5,537,059 | |
| | 390,441 | | | | | Henderson Group Plc | | | 1,138,057 | |
| | 402,196 | | | | | HSBC Holdings Plc | | | 3,273,546 | |
| | 245,232 | | | | | IG Group Holdings Plc | | | 1,524,972 | |
| | | | | | |
| 60 | | See accompanying Notes to the Financial Statements. | | | | |
Mercer Non-US Core Equity Fund
Schedule of Investments (Continued)
(showing percentage of net assets)
March 31, 2017
| | | | | | | | | | |
| Shares | | | | | Description | | Value ($) | |
| | |
| | | | | | United Kingdom — continued | |
| | | |
| | 376,450 | | | | | IMI Plc | | | 5,615,832 | |
| | 121,168 | | | | | Imperial Brands Plc | | | 5,859,067 | |
| | 10,000 | | | | | Inchcape Plc | | | 105,225 | |
| | 59,200 | | | | | Indivior Plc | | | 238,440 | |
| | 33,293 | | | | | InterContinental Hotels Group Plc | | | 1,626,949 | |
| | 71,726 | | | | | Intermediate Capital Group Plc | | | 635,004 | |
| | 65,531 | | | | | Intertek Group Plc | | | 3,223,647 | |
| | 151,226 | | | | | IWG Plc | | | 603,231 | |
| | 1,838,845 | | | | | J Sainsbury Plc | | | 6,077,272 | |
| | 137,367 | | | | | Jardine Lloyd Thompson Group Plc | | | 1,944,443 | |
| | 239,848 | | | | | John Wood Group Plc | | | 2,280,876 | |
| | 218,943 | | | | | Jupiter Fund Management Plc | | | 1,166,291 | |
| | 676,000 | | | | | Kingfisher Plc | | | 2,756,537 | |
| | 4,197,051 | | | | | Lloyds Banking Group Plc | | | 3,480,608 | |
| | 346,280 | | | | | London Stock Exchange Group Plc | | | 13,730,617 | |
| | 566,237 | | | | | Man Group Plc | | | 1,042,959 | |
| | 489,400 | | | | | Marks & Spencer Group Plc | | | 2,062,340 | |
| | 190,422 | | | | | Marston’s Plc | | | 319,548 | |
| | 309,291 | | | | | Meggitt Plc | | | 1,722,211 | |
| | 400,400 | | | | | Mitchells & Butlers Plc | | | 1,224,163 | |
| | 1,294,785 | | | | | Old Mutual Plc | | | 3,247,843 | |
| | 526,246 | | | | | Paragon Group of Cos. Plc (The) | | | 2,749,310 | |
| | 453,577 | | | | | Paysafe Group Plc* | | | 2,652,112 | |
| | 201,645 | | | | | Pennon Group Plc | | | 2,223,937 | |
| | 19,656 | | | | | Petrofac, Ltd. | | | 225,880 | |
| | 889,732 | | | | | Premier Oil Plc* ‡ | | | 700,916 | |
| | 1,132,996 | | | | | QinetiQ Group Plc | | | 3,952,747 | |
| | 276,956 | | | | | Reckitt Benckiser Group Plc | | | 25,232,852 | |
| | 187,599 | | | | | Redrow Plc | | | 1,196,374 | |
| | 292,245 | | | | | Rentokil Initial Plc | | | 901,535 | |
| | 92,700 | | | | | Restaurant Group Plc (The) | | | 386,582 | |
| | 13,824 | | | | | Rightmove Plc | | | 689,375 | |
| | 46,724 | | | | | Rio Tinto Plc, ADR | | | 1,900,732 | |
| | 79,900 | | | | | Royal Dutch Shell Plc Class B | | | 2,182,555 | |
| | 6 | | | | | Royal Dutch Shell Plc (Turquoise) Class A, ADR | | | 316 | |
| | 211,900 | | | | | Royal Mail Plc | | | 1,126,124 | |
| | 45,266 | | | | | Sage Group Plc (The) | | | 356,881 | |
| | 356,992 | | | | | Shire Plc | | | 20,806,737 | |
| | 25,148 | | | | | Smith & Nephew Plc, ADR | | | 777,828 | |
| | 103,361 | | | | | Spectris Plc | | | 3,228,610 | |
| | 129,759 | | | | | Spirax-Sarco Engineering Plc | | | 7,738,044 | |
| | 56,100 | | | | | SSE Plc | | | 1,035,418 | |
| | 625,774 | | | | | St James’s Place Plc | | | 8,310,142 | |
| | 232,817 | | | | | Stagecoach Group Plc | | | 609,618 | |
| | 216,805 | | | | | Tate & Lyle Plc | | | 2,072,589 | |
| | 1,852,130 | | | | | Tullow Oil Plc* ‡ | | | 5,419,431 | |
| | 69,300 | | | | | Unilever Plc, ADR | | | 3,419,262 | |
| | 73,922 | | | | | Vesuvius Plc | | | 481,128 | |
| | 61,290 | | | | | Vodafone Group Plc, ADR | | | 1,619,895 | |
| | | | | | |
| | See accompanying Notes to the Financial Statements. | | | 61 | |
Mercer Non-US Core Equity Fund
Schedule of Investments (Continued)
(showing percentage of net assets)
March 31, 2017
| | | | | | | | | | |
| Shares | | | | | Description | | Value ($) | |
| | |
| | | | | | United Kingdom — continued | |
| | | |
| | 417,177 | | | | | Weir Group Plc (The) | | | 10,000,204 | |
| | 179,710 | | | | | Wolseley Plc | | | 11,280,864 | |
| | 2,546,550 | | | | | Worldpay Group Plc | | | 9,406,522 | |
| | 236,091 | | | | | WPP Plc | | | 5,172,255 | |
| | | | | | | | | | |
| | | | | | Total United Kingdom | | | 361,455,529 | |
| | | | | | | | | | |
| | |
| | | | | | United States — 2.1% | |
| | | |
| | 68,823 | | | | | Analog Devices, Inc. | | | 5,640,045 | |
| | 46,025 | | | | | ANSYS, Inc.* | | | 4,918,692 | |
| | 276,913 | | | | | Cadence Design Systems, Inc.* | | | 8,695,068 | |
| | 176,673 | | | | | Colgate-Palmolive Co. | | | 12,930,697 | |
| | 39,855 | | | | | Nordson Corp. | | | 4,895,788 | |
| | 46,831 | | | | | NVIDIA Corp. | | | 5,101,301 | |
| | 80,319 | | | | | Texas Instruments, Inc. | | | 6,470,498 | |
| | | | | | | | | | |
| | | | | | Total United States | | | 48,652,089 | |
| | | | | | | | | | |
| | | |
| | | | | | TOTAL COMMON STOCKS (COST $1,918,750,702) | | | 2,091,092,558 | |
| | | | | | | | | | |
| | | |
| | | | | | INVESTMENT COMPANY — 0.9% | | | | |
| | | |
| | | | | | United States — 0.9% | | | | |
| | | |
| | 342,527 | | | | | iShares MSCI EAFE ETF | | | 21,336,007 | |
| | | | | | | | | | |
| | | |
| | | | | | TOTAL INVESTMENT COMPANY (COST $19,269,079) | | | 21,336,007 | |
| | | | | | | | | | |
| | |
| | | | | | PREFERRED STOCKS — 1.1% | |
| | |
| | | | | | Brazil — 0.1% | |
| | 800,360 | | | | | Itausa - Investimentos Itau SA, 6.06% | | | 2,394,815 | |
| | | | | | | | | | |
| | |
| | | | | | Germany — 1.0% | |
| | | |
| | 138,031 | | | | | Henkel AG & Co. KGaA, 1.35% | | | 17,730,483 | |
| | 30,707 | | | | | Porsche Automobil Holding SE, 2.03% | | | 1,679,574 | |
| | 18,920 | | | | | Volkswagen AG, 0.13% | | | 2,764,221 | |
| | | | | | | | | | |
| | | | | | Total Germany | | | 22,174,278 | |
| | | | | | | | | | |
| | | |
| | | | | | TOTAL PREFERRED STOCKS (COST $19,079,452) | | | 24,569,093 | |
| | | | | | | | | | |
| | | |
| | | | | | RIGHTS — 0.0% | | | | |
| | | |
| | | | | | Australia — 0.0% | | | | |
| | | |
| | 55,449 | | | | | Downer EDI, Ltd., Strike Price AUD 5.59, Expires 04/11/2017* | | | 508 | |
| | | | | | | | | | |
| | |
| | | | | | Germany — 0.0% | |
| | | |
| | 70,100 | | | | | Deutsche Bank AG, Strike Price EUR 11.65, Expires 04/06/2017* | | | 167,945 | |
| | | | | | | | | | |
| | | |
| | | | | | TOTAL RIGHTS (COST $0) | | | 168,453 | |
| | | | | | | | | | |
| | | | | | |
| 62 | | See accompanying Notes to the Financial Statements. | | | | |
Mercer Non-US Core Equity Fund
Schedule of Investments (Continued)
(showing percentage of net assets)
March 31, 2017
| | | | | | | | | | |
| Par Value ($) | | | | | Description | | Value ($) | |
| | | |
| | | | | | SHORT-TERM INVESTMENTS — 9.0% | | | | |
| | | |
| | | | | | Bank Deposit — 5.2% | | | | |
| | | |
| | 118,157,051 | | | | | State Street Bank & Trust Euro Time Deposit, 0.09%, due 04/03/17 | | | 118,157,051 | |
| | | | | | | | | | |
| | |
| | | | | | Mutual Fund - Securities Lending Collateral — 3.6% | |
| | | |
| | 81,928,175 | | | | | State Street Institutional U.S. Government Money Market Fund, Premier Class*** | | | 81,928,175 | |
| | | | | | | | | | |
| | |
| | | | | | U.S. Government and Agency Obligations — 0.2% | |
| | | |
| | 2,350,000 | | | | | United States Treasury Bill, 0.65%, due 04/27/17** ‡‡ | | | 2,348,865 | |
| | 2,350,000 | | | | | United States Treasury Bill, 0.73%, due 06/22/17** ‡‡ | | | 2,346,097 | |
| | | | | | | | | | |
| | | |
| | | | | | Total U.S. Government and Agency Obligations | | | 4,694,962 | |
| | | | | | | | | | |
| | | |
| | | | | | TOTAL SHORT-TERM INVESTMENTS (COST $204,781,319) | | | 204,780,188 | |
| | | | | | | | | | |
| | | |
| | | | | | TOTAL INVESTMENTS — 103.1% (COST $2,161,880,552) | | | 2,341,946,299 | |
| | | |
| | | | | | Other Assets and Liabilities (net) — (3.1)% | | | (70,841,924 | ) |
| | | | | | | | | | |
| | | |
| | | | | | NET ASSETS — 100.0% | | $ | 2,271,104,375 | |
| | | | | | | | | | |
| | | |
| | | | | | Notes to Schedule of Investments: | | | | |
| | | |
| | | | | | ADR — American Depository Receipt | | | | |
| | | |
| | | | | | REIT — Real Estate Investment Trust | | | | |
| | | |
| | | | | | SDR — Swedish Depository Receipt | | | | |
| | | |
| | | | * | | Non-income producing security | | | | |
| | | |
| | | | ** | | All or a portion of this security is pledged for open futures collateral. | | | | |
| | | |
| | | | *** | | Represents an investment of securities lending cash collateral. | | | | |
| | | |
| | | | **** | | Securities fair valued by the Valuation Committee as approved by the Board of Trustees. The total market value of the securities at year end is $1,786,200 which represents 0.1% of net assets. The aggregate tax cost of these securities held at March 31, 2017 was $3,170,360. | | | | |
| | | |
| | | | ‡ | | All or a portion of this security is out on loan. | | | | |
| | | |
| | | | ‡‡ | | Interest rate presented is yield to maturity. | | | | |
| | | |
| | | | ¤ | | Illiquid security. The total market value of the securities at year end is $1,818,163 which represents 0.1% of net assets. The aggregate tax cost of these securities held at March 31, 2017 was $3,257,992. | | | | |
| | | |
| | | | | | 144A — Securities exempt from registration under Rule 144A of the Securities Act of 1933. These securities may be resold in transactions exempt from registration, normally to qualified institutional buyers. The total market value of the securities at year end is $4,327,434 which represents 0.2% of net assets. | | | | |
| | | | | | |
| | See accompanying Notes to the Financial Statements. | | | 63 | |
Mercer Non-US Core Equity Fund
Schedule of Investments (Continued)
March 31, 2017
Forward Foreign Currency Contracts
| | | | | | | | | | | | | | | | | | | | |
Settlement
Date | | | | | Currency | | Counterparty | | Units of
Currency | | | Value | | | Unrealized
Appreciation
(Depreciation) | |
| | Buys | | | | | | | | | | | | | | | | | | | |
| | 08/24/17 | | | | | EUR | | Barclays Bank Plc | | | 4,615,000 | | | $ | 4,970,797 | | | $ | (57,033 | ) |
| | | | | | | | | | | | | | | | | | | | |
| | Sales | | | | | | | | | | | | | | | | | | | |
| | 08/24/17 | | | | | JPY | | HSBC Bank USA | | | 2,128,429,000 | | | $ | 19,217,089 | | | $ | 75,440 | |
| | | | | | | | | | | | | | | | | | | | |
Currency Abbreviations
Futures Contracts
| | | | | | | | | | | | | | | | | | | | |
Number of
Contracts | | | | | Type | | | | Expiration Date | | | Contract
Value | | | Unrealized
Appreciation
(Depreciation) | |
| | Buys | | | | | | | | | | | | | | | | | | | |
| | 1,065 | | | | | MSCI EAFE E-mini Index | | | | | June 2017 | | | $ | 94,891,500 | | | $ | 567,382 | |
| | | | | | | | | | | | | | | | | | | | |
| | | | | | |
| 64 | | See accompanying Notes to the Financial Statements. | | | | |
Mercer Non-US Core Equity Fund
Schedule of Investments (Continued)
March 31, 2017
| | | | | |
| Industry Sector Summary (Unaudited) | | % of Net Assets |
Banks | | | | 8.1 | |
Food | | | | 6.1 | |
Pharmaceuticals | | | | 5.0 | |
Insurance | | | | 4.8 | |
Chemicals | | | | 4.2 | |
Diversified Financial Services | | | | 3.6 | |
Semiconductors | | | | 3.4 | |
Commercial Services | | | | 3.2 | |
Telecommunications | | | | 3.1 | |
Electronics | | | | 2.7 | |
Oil & Gas | | | | 2.7 | |
Retail | | | | 2.4 | |
Transportation | | | | 2.4 | |
Auto Parts & Equipment | | | | 2.3 | |
Beverages | | | | 2.0 | |
Internet | | | | 2.0 | |
Software | | | | 2.0 | |
Household Products & Wares | | | | 1.9 | |
Auto Manufacturers | | | | 1.8 | |
Machinery — Diversified | | | | 1.8 | |
Agriculture | | | | 1.7 | |
Distribution & Wholesale | | | | 1.7 | |
Electrical Components & Equipment | | | | 1.7 | |
Iron & Steel | | | | 1.7 | |
Building Materials | | | | 1.6 | |
Mining | | | | 1.3 | |
Real Estate | | | | 1.3 | |
Cosmetics & Personal Care | | | | 1.2 | |
Electric | | | | 1.2 | |
Miscellaneous — Manufacturing | | | | 1.2 | |
Computers | | | | 1.1 | |
Airlines | | | | 0.9 | |
Apparel | | | | 0.9 | |
Unaffiliated Fund | | | | 0.9 | |
Machinery — Construction & Mining | | | | 0.8 | |
Aerospace & Defense | | | | 0.7 | |
Food Service | | | | 0.7 | |
Engineering & Construction | | | | 0.6 | |
Forest Products & Paper | | | | 0.6 | |
Health Care — Products | | | | 0.6 | |
Holding Companies — Diversified | | | | 0.6 | |
Home Furnishings | | | | 0.6 | |
Media | | | | 0.6 | |
Biotechnology | | | | 0.4 | |
Gas | | | | 0.4 | |
Home Builders | | | | 0.4 | |
Metal Fabricate & Hardware | | | | 0.4 | |
Office & Business Equipment | | | | 0.4 | |
Advertising | | | | 0.3 | |
Health Care — Services | | | | 0.3 | |
Energy-Alternate Sources | | | | 0.2 | |
| | | | | | |
| | See accompanying Notes to the Financial Statements. | | | 65 | |
Mercer Non-US Core Equity Fund
Schedule of Investments (Continued)
March 31, 2017
| | | | | |
| Industry Sector Summary (Unaudited) | | % of Net Assets |
Hand & Machine Tools | | | | 0.2 | |
Investment Companies | | | | 0.2 | |
Leisure Time | | | | 0.2 | |
Oil & Gas Services | | | | 0.2 | |
Packaging & Containers | | | | 0.2 | |
Textiles | | | | 0.2 | |
Lodging | | | | 0.1 | |
REITS | | | | 0.1 | |
Shipbuilding | | | | 0.1 | |
Water | | | | 0.1 | |
Entertainment | | | | 0.0 | |
Short-Term Investments and Other Assets and Liabilities (net) | | | | 5.9 | |
| | | | | |
| | | | 100.0 | % |
| | | | | |
| | | | | | |
| 66 | | See accompanying Notes to the Financial Statements. | | | | |
Mercer Core Fixed Income Fund
Schedule of Investments
(showing percentage of net assets)
March 31, 2017
| | | | | | | | | | |
| Par Value ($) | | | | | Description | | Value ($) | |
| | | |
| | | | | | DEBT OBLIGATIONS — 98.0% | | | | |
| | | |
| | | | | | Asset Backed Securities — 14.0% | | | | |
| | | |
| | 750,000 | | | | | A Voce CLO, Ltd., Series 2014-1A, Class A1A, 2.47%, due 07/15/26† 144A | | | 751,034 | |
| | 750,000 | | | | | A Voce CLO, Ltd., Series 2014-1A, Class A1R, 1.00%, due 07/15/26† †††† 144A | | | 753,435 | |
| | 315,000 | | | | | Aegis Asset Backed Securities Trust, Series 2005-4, Class M1, 1.43%, due 10/25/35† | | | 301,426 | |
| | 1,000,000 | | | | | AIMCO CLO, Series 2014-AA, Class B1, 3.03%, due 07/20/26† 144A | | | 1,000,095 | |
| | 1,500,000 | | | | | AIMCO CLO, Series 2014-AA, Class B2, 4.58%, due 07/20/26 144A | | | 1,501,064 | |
| | 750,000 | | | | | AIMCO CLO, Series 2015-AA, Class A1, 2.72%, due 01/15/28† 144A | | | 752,182 | |
| | 621,000 | | | | | Ally Auto Receivables Trust, Series 2014-2, Class A4, 1.84%, due 01/15/20 | | | 623,198 | |
| | 375,000 | | | | | Ally Auto Receivables Trust, Series 2014-3, Class A4, 1.72%, due 03/16/20 | | | 375,678 | |
| | 395,000 | | | | | Ally Auto Receivables Trust, Series 2015-1, Class A4, 1.75%, due 05/15/20 | | | 395,579 | |
| | 250,000 | | | | | ALM CLO VIII, Ltd., Series 2013-8A, Class A1R, 2.51%, due 10/15/28† 144A | | | 251,045 | |
| | 1,000,000 | | | | | American Express Credit Account Master Trust, Series 2013-1, Class B, 1.61%, due 02/16/21† | | | 1,005,746 | |
| | 815,000 | | | | | American Express Credit Account Master Trust, Series 2017-1, Class A, 1.93%, due 09/15/22 | | | 817,006 | |
| | 1,500,000 | | | | | American Express Credit Account Master Trust, Series 2017-2, Class A, 1.36%, due 09/16/24† | | | 1,511,113 | |
| | 654,872 | | | | | Ameriquest Mortgage Securities, Inc., Series 2003-9, Class AV1, 1.74%, due 09/25/33† | | | 634,630 | |
| | 134,206 | | | | | Ameriquest Mortgage Securities, Inc., Series 2004-R2, Class A1A, 1.67%,
due 04/25/34† | | | 133,106 | |
| | 750,000 | | | | | Anchorage Capital CLO 5, Ltd., Series 2014-5A, Class A, 2.62%, due 10/15/26† 144A | | | 750,845 | |
| | 785,000 | | | | | Applebee’s Funding LLC/IHOP Funding LLC, Series 2014-1, Class A2, 4.28%, due 09/05/44 144A | | | 769,987 | |
| | 656,688 | | | | | Arbys Funding LLC, Series 2015-1A, Class A2, 4.97%, due 10/30/45 144A | | | 655,920 | |
| | 304,900 | | | | | Argent Securities, Inc., Series 2004-W6, Class M1, 1.81%, due 05/25/34† | | | 294,939 | |
| | 342,609 | | | | | Asset Backed Securities Corp. Home Equity, Series 2003-HE7, Class M1, 1.89%, due 12/15/33† | | | 326,944 | |
| | 1,000,000 | | | | | Atlas Senior Loan Fund CLO V, Ltd., Series 2014-1A, Class AR, 2.45%,
due 07/16/26† 144A | | | 1,000,707 | |
| | 1,400,000 | | | | | Avis Budget Rental Car Funding AESOP LLC, Series 2015-1A, Class A, 2.50%, due 07/20/21 144A | | | 1,400,143 | |
| | 1,000,000 | | | | | Avis Budget Rental Car Funding AESOP LLC, Series 2015-2A, Class A, 2.63%, due 12/20/21 144A | | | 1,001,899 | |
| | 1,070,000 | | | | | BA Credit Card Trust, Series 2017-A1, Class A1, 1.95%, due 08/15/22 | | | 1,071,979 | |
| | 250,000 | | | | | Battalion CLO VIII, Ltd., Series 2015-8A, Class A1, 2.55%, due 04/18/27† 144A | | | 250,075 | |
| | 500,000 | | | | | Battalion CLO X, Ltd., Series 2016-10A, Class A1, 2.43%, due 01/24/29† 144A | | | 504,836 | |
| | 34,941 | | | | | Bear Stearns Asset Backed Securities Trust, Series 2004-SD3, Class A3, 1.55%, due 09/25/34† | | | 34,729 | |
| | 500,000 | | | | | Benefit Street Partners CLO V, Ltd., Series 2014-VA, Class AR, 2.08%,
due 10/20/26† 144A | | | 500,220 | |
| | 250,000 | | | | | BlueMountain CLO, Ltd., Series 2015-1A, Class A1R, 2.35%, due 04/13/27† 144A | | | 250,307 | |
| | 315,000 | | | | | BMW Vehicle Owner Trust, Series 2016-A, Class A4, 1.37%, due 12/27/22 | | | 310,513 | |
| | 947,500 | | | | | Cabela’s Credit Card Master Note Trust, Series 2016-1, Class A1, 1.78%, due 06/15/22 | | | 945,981 | |
| | 190,000 | | | | | California Republic Auto Receivables Trust, Series 2016-2, Class A4, 1.83%,
due 12/15/21 | | | 189,351 | |
| | 860,000 | | | | | Capital One Multi-Asset Execution Trust, Series 2016-A3, Class A3, 1.34%, due 04/15/22 | | | 852,898 | |
| | 900,000 | | | | | Capital One Multi-Asset Execution Trust, Series 2017-A1, Class A1, 2.00%, due 01/17/23 | | | 903,421 | |
| | | | | | |
| | See accompanying Notes to the Financial Statements. | | | 67 | |
Mercer Core Fixed Income Fund
Schedule of Investments (Continued)
(showing percentage of net assets)
March 31, 2017
| | | | | | | | | | |
| Par Value ($) | | | | | Description | | Value ($) | |
| | | |
| | | | | | Asset Backed Securities — continued | | | | |
| | | |
| | 500,000 | | | | | Carlyle Global Market Strategies CLO, Ltd., Series 2012-4A, Class AR, 2.48%, due 01/20/29† 144A | | | 502,342 | |
| | 250,000 | | | | | Carlyle Global Market Strategies CLO, Ltd., Series 2014-3A, Class A1AR, 2.19%, due 07/27/26† 144A | | | 250,112 | |
| | 500,000 | | | | | Carlyle Global Market Strategies CLO, Ltd., Series 2017-1A, Class A1B, 1.00%, due 04/20/31† †††† 144A | | | 500,458 | |
| | 270,000 | | | | | CarMax Auto Owner Trust, Series 2015-2, Class A4, 1.80%, due 03/15/21 | | | 270,489 | |
| | 160,000 | | | | | CarMax Auto Owner Trust, Series 2015-3, Class A4, 1.98%, due 02/16/21 | | | 160,571 | |
| | 280,000 | | | | | CarMax Auto Owner Trust, Series 2016-2, Class A4, 1.68%, due 09/15/21 | | | 277,367 | |
| | 565,000 | | | | | Chase Issuance Trust, Series 2016-A2, Class A, 1.37%, due 06/15/21 | | | 561,374 | |
| | 1,220,000 | | | | | Chase Issuance Trust, Series 2016-A5, Class A5, 1.27%, due 07/15/21 | | | 1,207,463 | |
| | 255,000 | | | | | Chrysler Capital Auto Receivables Trust, Series 2016-BA, Class A4, 1.87%, due 02/15/22 144A | | | 252,541 | |
| | 1,020,000 | | | | | Citibank Credit Card Issuance Trust, Series 2016-A1, Class A1, 1.75%, due 11/19/21 | | | 1,018,731 | |
| | 600,630 | | | | | CKE Restaurant Holdings, Inc., Series 2013-1A, Class A2, 4.47%, due 03/20/43 144A | | | 596,323 | |
| | 575,000 | | | | | CNH Equipment Trust, Series 2015-C, Class A3, 1.66%, due 11/16/20 | | | 575,572 | |
| | 315,000 | | | | | CNH Equipment Trust, Series 2016-B, Class A3, 1.63%, due 08/15/21 | | | 314,701 | |
| | 1,451,836 | | | | | Colony American Homes, Series 2014-1A, Class A, 2.09%, due 05/17/31† 144A | | | 1,453,787 | |
| | 189,377 | | | | | CSMC Trust, Series 2006-CF2, Class M1, 1.45%, due 05/25/36† 144A | | | 188,290 | |
| | 903,463 | | | | | CSMC Trust, Series 2016-12R, Class 1A1, 3.27%, due 02/28/47† 144A | | | 893,119 | |
| | 705,600 | | | | | DB Master Finance LLC, Series 2015-1A, Class A2II, 3.98%, due 02/20/45 144A | | | 718,289 | |
| | 1,160,000 | | | | | Discover Card Execution Note Trust, Series 2016-A1, Class A1, 1.64%, due 07/15/21 | | | 1,160,050 | |
| | 250,000 | | | | | Eaton Vance CLO, Ltd., Series 2014-1A, Class AR, 2.23%, due 07/15/26† 144A | | | 250,214 | |
| | 500,000 | | | | | Enterprise Fleet Financing LLC, Series 2016-2, Class A2, 1.74%, due 02/22/22 144A | | | 499,068 | |
| | 800,000 | | | | | Enterprise Fleet Financing LLC, Series 2017-1, Class A2, 2.13%, due 07/20/22 144A | | | 801,101 | |
| | 219,435 | | | | | EquiFirst Mortgage Loan Trust, Series 2004-3, Class M3, 1.75%, due 12/25/34† | | | 211,929 | |
| | 250,000 | | | | | Flagship CLO VIII, Ltd., Series 2014-8A, Class AR, 2.09%, due 01/16/26† 144A | | | 250,062 | |
| | 125,000 | | | | | FOCUS Brands Funding LLC, Series 2017-1A, Class A2I, 3.86%,
due 04/30/47¤ †††† 144A | | | 125,939 | |
| | 210,000 | | | | | Ford Credit Auto Owner Trust, Series 2015-B, Class A4, 1.58%, due 08/15/20 | | | 209,755 | |
| | 365,000 | | | | | Ford Credit Auto Owner Trust, Series 2016-B, Class A3, 1.33%, due 10/15/20 | | | 363,365 | |
| | 343,000 | | | | | Ford Credit Auto Owner Trust, Series 2016-C, Class A4, 1.40%, due 02/15/22 | | | 338,066 | |
| | 1,100,000 | | | | | Ford Credit Auto Owner Trust, Series 2017-1, Class A, 2.62%, due 08/15/28 144A | | | 1,107,181 | |
| | 500,000 | | | | | GE Dealer Floorplan Master Note Trust, Series 2015-1, Class A, 1.48%, due 01/20/20† | | | 500,732 | |
| | 330,000 | | | | | GMF Floorplan Owner Revolving Trust, Series 2015-1, Class A1, 1.65%,
due 05/15/20 144A | | | 330,259 | |
| | 500,000 | | | | | Hertz Vehicle Financing LLC, Series 2015-3A, Class A, 2.67%, due 09/25/21 144A | | | 496,110 | |
| | 700,000 | | | | | Hertz Vehicle Financing LLC, Series 2016-1A, Class A, 2.32%, due 03/25/20 144A | | | 697,655 | |
| | 300,000 | | | | | Hertz Vehicle Financing LLC, Series 2016-3A, Class A, 2.27%, due 07/25/20 144A | | | 297,880 | |
| | 250,000 | | | | | Highbridge Loan Management CLO, Ltd., Series 2015-6A, Class A, 2.48%,
due 05/05/27† 144A | | | 250,081 | |
| | 315,000 | | | | | Hilton Grand Vacations Trust, Series 2017-AA, Class A, 2.66%, due 12/26/28 ¤ 144A | | | 314,989 | |
| | 262,654 | | | | | Home Equity Asset Trust, Series 2003-8, Class M1, 2.06%, due 04/25/34† | | | 246,380 | |
| | 512,000 | | | | | Honda Auto Receivables Owner Trust, Series 2015-3, Class A4, 1.56%, due 10/18/21 | | | 511,461 | |
| | 445,000 | | | | | Honda Auto Receivables Owner Trust, Series 2015-4, Class A3, 1.23%, due 09/23/19 | | | 443,764 | |
| | 1,185,000 | | | | | Honda Auto Receivables Owner Trust, Series 2016-3, Class A4, 1.33%, due 11/18/22 | | | 1,171,041 | |
| | 510,000 | | | | | Honda Auto Receivables Owner Trust, Series 2016-4, Class A4, 1.36%, due 01/18/23 | | | 503,116 | |
| | 560,000 | | | | | Honda Auto Receivables Owner Trust, Series 2017-1, Class A3, 1.72%, due 07/21/21 | | | 560,399 | |
| | 880,000 | | | | | Huntington Auto Trust, Series 2016-1, Class A4, 1.93%, due 04/15/22 | | | 875,275 | |
| | | | | | |
| 68 | | See accompanying Notes to the Financial Statements. | | | | |
Mercer Core Fixed Income Fund
Schedule of Investments (Continued)
(showing percentage of net assets)
March 31, 2017
| | | | | | | | | | |
| Par Value ($) | | | | | Description | | Value ($) | |
| | | |
| | | | | | Asset Backed Securities — continued | | | | |
| | | |
| | 365,000 | | | | | Hyundai Auto Receivables Trust, Series 2015-A, Class A4, 1.37%, due 07/15/20 | | | 364,242 | |
| | 450,000 | | | | | Hyundai Auto Receivables Trust, Series 2017-A, Class A3, 1.76%, due 08/16/21 | | | 449,964 | |
| | 250,000 | | | | | ICG US CLO, Ltd., Series 2014-3A, Class A1B, 3.28%, due 01/25/27 ¤ 144A | | | 250,163 | |
| | 1,011,844 | | | | | Invitation Homes Trust, Series 2014-SFR1, Class A, 1.77%, due 06/17/31† 144A | | | 1,012,589 | |
| | 1,160,183 | | | | | Invitation Homes Trust, Series 2015-SFR3, Class A, 2.24%, due 08/17/32† 144A | | | 1,169,084 | |
| | 68,000 | | | | | John Deere Owner Trust, Series 2015-A, Class A4, 1.65%, due 12/15/21 | | | 68,087 | |
| | 500,000 | | | | | KVK CLO, Ltd., Series 2014-1A, Class A1R, 2.34%, due 05/15/26† 144A | | | 500,624 | |
| | 500,000 | | | | | KVK CLO, Ltd., Series 2014-2A, Class A, 2.57%, due 07/15/26† 144A | | | 500,264 | |
| | 750,000 | | | | | Limerock CLO III LLC, Series 2014-3A, Class A1R, 2.23%, due 10/20/26† 144A | | | 750,149 | |
| | 250,000 | | | | | Magnetite XI CLO, Ltd., Series 2014-11A, Class A1, 2.47%, due 01/18/27¤ † 144A | | | 250,076 | |
| | 3,370,000 | | | | | Mercedes-Benz Auto Receivables Trust, Series 2016-1, Class A4, 1.46%, due 12/15/22 | | | 3,322,573 | |
| | 116,445 | | | | | Merrill Lynch Mortgage Investors Trust, Series 2004-OPT1, Class A1A, 1.50%, due 06/25/35† | | | 113,228 | |
| | 1,570,000 | | | | | MMAF Equipment Finance LLC, Series 2014-AA, Class A5, 2.33%, due 12/08/25 144A | | | 1,570,850 | |
| | 252,621 | | | | | Morgan Stanley ABS Capital I, Series 2003-NC6, Class M1, 2.18%, due 06/25/33† | | | 248,397 | |
| | 163,410 | | | | | Morgan Stanley ABS Capital I, Series 2003-NC7, Class M1, 2.03%, due 06/25/33† | | | 159,388 | |
| | 224,057 | | | | | Morgan Stanley ABS Capital I, Series 2003-NC10, Class M1, 2.00%, due 10/25/33† | | | 215,532 | |
| | 250,000 | | | | | Mountain View CLO, Ltd., Series 2014-1A, Class AR, 2.30%, due 10/15/26† 144A | | | 250,070 | |
| | 293,543 | | | | | New Century Home Equity Loan Trust, Series 2003-A, Class A, 1.70%,
due 10/25/33† 144A | | | 280,727 | |
| | 460,000 | | | | | New Century Home Equity Loan Trust, Series 2005-1, Class M1, 1.66%, due 03/25/35† | | | 437,281 | |
| | 340,000 | | | | | New Century Home Equity Loan Trust, Series 2005-2, Class M2, 1.66%, due 06/25/35† | | | 334,804 | |
| | 2,211,000 | | | | | NextGear Floorplan Master Owner Trust, Series 2015-2A, Class A, 2.38%,
due 10/15/20 144A | | | 2,220,870 | |
| | 770,000 | | | | | Nissan Auto Receivables Owner Trust, Series 2015-B, Class A3, 1.34%, due 03/16/20 | | | 769,049 | |
| | 515,000 | | | | | Nissan Auto Receivables Owner Trust, Series 2015-B, Class A4, 1.79%, due 01/17/22 | | | 515,329 | |
| | 280,000 | | | | | Nissan Auto Receivables Owner Trust, Series 2017-A, Class A3, 1.74%, due 08/16/21 | | | 279,970 | |
| | 413,000 | | | | | Nissan Master Owner Trust Receivables, Series 2015-A, Class A2, 1.44%, due 01/15/20 | | | 412,900 | |
| | 198,674 | | | | | OneMain Direct Auto Receivables Trust, Series 2016-1A, Class A, 2.04%,
due 01/15/21 144A | | | 199,062 | |
| | 1,700,000 | | | | | OneMain Direct Auto Receivables Trust, Series 2017-1A, Class A, 2.16%,
due 10/15/20 144A | | | 1,698,840 | |
| | 1,200,000 | | | | | OneMain Financial Issuance Trust, Series 2015-2A, Class A, 2.57%, due 07/18/25 144A | | | 1,203,929 | |
| | 500,000 | | | | | OZLM Funding II CLO, Ltd., Series 2012-2A, Class A1R, 2.48%, due 10/30/27† 144A | | | 502,090 | |
| | 750,000 | | | | | OZLM XV CLO, Ltd., Series 2016-15A, Class A1, 2.41%, due 01/20/29† 144A | | | 752,675 | |
| | 750,000 | | | | | Palmer Square CLO, Ltd., Series 2015-2A, Class A1A, 2.53%, due 07/20/27† 144A | | | 750,534 | |
| | 215,000 | | | | | RAAC Trust, Series 2006-SP4, Class M1, 1.32%, due 11/25/36† | | | 203,915 | |
| | 750,000 | | | | | Regatta IV Funding CLO, Ltd., Series 2014-1A, Class A2, 2.57%, due 07/25/26† 144A | | | 750,261 | |
| | 250,000 | | | | | Regatta IV Funding CLO, Ltd., Series 2014-1A, Class B, 3.05%, due 07/25/26† 144A | | | 250,013 | |
| | 750,000 | | | | | Regatta V Funding CLO, Ltd., Series 2014-1A, Class A1A, 2.60%, due 10/25/26† 144A | | | 750,257 | |
| | 500,000 | | | | | Regatta VII Funding CLO, Ltd., Series 2016-1A, Class A1, 2.67%, due 12/20/28† 144A | | | 501,639 | |
| | 15,000 | | | | | Renaissance Home Equity Loan Trust, Series 2005-2, Class AF4, 4.93%, due 08/25/35†† | | | 15,087 | |
| | 546,284 | | | | | Saxon Asset Securities Trust, Series 2005-1, Class M1, 1.67%, due 05/25/35† | | | 529,661 | |
| | 500,000 | | | | | Shackleton CLO, Ltd., Series 2014-6A, Class A1, 2.50%, due 07/17/26† 144A | | | 500,144 | |
| | 404,827 | | | | | Sierra Timeshare Receivables Funding LLC, Series 2013-3A, Class A, 2.20%, due 10/20/30 144A | | | 404,890 | |
| | 743,406 | | | | | Silvermore CLO, Ltd., Series 2014-1A, Class A1, 2.49%, due 05/15/26† 144A | | | 743,585 | |
| | 1,205,292 | | | | | Small Business Administration Participation Certificates, Series 2011-20F, Class 1, 3.67%, due 06/01/31 | | | 1,258,676 | |
| | | | | | |
| | See accompanying Notes to the Financial Statements. | | | 69 | |
Mercer Core Fixed Income Fund
Schedule of Investments (Continued)
(showing percentage of net assets)
March 31, 2017
| | | | | | | | | | |
| Par Value ($) | | | | | Description | | Value ($) | |
| | | |
| | | | | | Asset Backed Securities — continued | | | | |
| | | |
| | 4,175,945 | | | | | Small Business Administration Participation Certificates, Series 2013-20H, Class 1, 3.16%, due 08/01/33 | | | 4,321,483 | |
| | 3,829,900 | | | | | Small Business Administration Participation Certificates, Series 2014-20C, Class 1, 3.21%, due 03/01/34 | | | 3,954,575 | |
| | 1,619,254 | | | | | Small Business Administration Participation Certificates, Series 2014-20D, Class 1, 3.11%, due 04/01/34 | | | 1,662,373 | |
| | 1,104,797 | | | | | Small Business Administration Participation Certificates, Series 2014-20I, Class 1, 2.92%, due 09/01/34 | | | 1,120,463 | |
| | 608,411 | | | | | SpringCastle America Funding LLC, Series 2016-AA, Class A, 3.05%,
due 04/25/29 144A | | | 612,903 | |
| | 860,000 | | | | | Springleaf Funding Trust, Series 2015-AA, Class A, 3.16%, due 11/15/24 144A | | | 868,479 | |
| | 3,268,375 | | | | | Store Master Funding I LLC, Series 2015-1A, Class A1, 3.75%, due 04/20/45 144A | | | 3,219,199 | |
| | 1,208,632 | | | | | STORE Master Funding LLC, Series 2014-1A, Class A2, 5.00%, due 04/20/44 144A | | | 1,234,724 | |
| | 225,524 | | | | | Structured Asset Investment Loan Trust, Series 2005-2, Class M2, 1.72%,
due 03/25/35† | | | 217,217 | |
| | 2,000,000 | | | | | Synchrony Credit Card Master Note Trust, Series 2015-3, Class A, 1.74%, due 09/15/21 | | | 2,003,347 | |
| | 305,000 | | | | | Synchrony Credit Card Master Note Trust, Series 2016-1, Class A, 2.04%, due 03/15/22 | | | 306,251 | |
| | 388,050 | | | | | Taco Bell Funding LLC, Series 2016-1A, Class A2I, 3.83%, due 05/25/46 144A | | | 393,690 | |
| | 500,000 | | | | | THL Credit Wind River CLO, Ltd., Series 2014-3A, Class A, 2.66%,
due 01/22/27† 144A | | | 500,195 | |
| | 750,000 | | | | | THL Credit Wind River CLO, Ltd., Series 2015-1A, Class A, 2.53%,
due 07/20/27† 144A | | | 754,583 | |
| | 1,000,000 | | | | | TICP CLO VI, Ltd., Series 2016-6A, Class A, 2.43%, due 01/15/29† 144A | | | 1,004,914 | |
| | 174,417 | | | | | Towd Point Mortgage Trust, Series 2017-1, Class A1, 2.75%, due 10/25/56¤ † 144A | | | 174,689 | |
| | 430,000 | | | | | Toyota Auto Receivables Owner Trust, Series 2015-B, Class A4, 1.74%, due 09/15/20 | | | 431,240 | |
| | 675,000 | | | | | Toyota Auto Receivables Owner Trust, Series 2016-A, Class A3, 1.25%, due 03/16/20 | | | 673,369 | |
| | 265,000 | | | | | Toyota Auto Receivables Owner Trust, Series 2016-C, Class A4, 1.32%, due 11/15/21 | | | 261,091 | |
| | 425,000 | | | | | Toyota Auto Receivables Owner Trust, Series 2017-A, Class A3, 1.73%, due 02/16/21 | | | 424,950 | |
| | 750,000 | | | | | Trinitas CLO V, Ltd., Series 2016-5A, Class A, 2.74%, due 10/25/28† 144A | | | 753,411 | |
| | 2,398,000 | | | | | Verizon Owner Trust, Series 2016-1A, Class A, 1.42%, due 01/20/21 144A | | | 2,386,290 | |
| | 700,000 | | | | | Verizon Owner Trust, Series 2016-2A, Class A, 1.68%, due 05/20/21 144A | | | 697,988 | |
| | 3,220,000 | | | | | Verizon Owner Trust, Series 2017-1A, Class A, 2.06%, due 09/20/21 144A | | | 3,232,162 | |
| | 315,000 | | | | | Volkswagen Credit Auto Master Trust, Series 2014-1A, Class A2, 1.40%,
due 07/22/19 144A | | | 314,919 | |
| | 500,000 | | | | | Wellfleet CLO, Ltd., Series 2016-2A, Class A1, 2.51%, due 10/20/28† 144A | | | 502,634 | |
| | 923,422 | | | | | Wells Fargo Home Equity Trust, Series 2005-4, Class M1, 1.44%, due 12/25/35† | | | 918,836 | |
| | 856,950 | | | | | Wendys Funding LLC, Series 2015-1A, Class A2I, 3.37%, due 06/15/45 144A | | | 863,192 | |
| | 275,000 | | | | | Westgate Resorts LLC, Series 2017-1A, Class A, 3.05%, due 12/20/30¤ † †††† 144A | | | 274,667 | |
| | 695,000 | | | | | World Omni Auto Receivables Trust, Series 2016-A, Class A3, 1.77%, due 09/15/21 | | | 696,353 | |
| | | | | | | | | | |
| | | | | | | | | 107,321,087 | |
| | | | | | | | | | |
| | | |
| | | | | | Corporate Debt — 39.2% | | | | |
| | | |
| | 20,000 | | | | | 21st Century Fox America, Inc., 6.75%, due 01/09/38 | | | 24,071 | |
| | 775,000 | | | | | Abbott Laboratories, 2.90%, due 11/30/21 | | | 779,219 | |
| | 812,000 | | | | | AbbVie, Inc., 3.20%, due 11/06/22 | | | 822,152 | |
| | 720,000 | | | | | AbbVie, Inc., 3.60%, due 05/14/25 | | | 721,394 | |
| | 500,000 | | | | | AbbVie, Inc., 4.50%, due 05/14/35 | | | 498,079 | |
| | 244,486 | | | | | Abengoa Transmision Sur SA, 6.88%, due 04/30/43 144A | | | 262,822 | |
| | 30,000 | | | | | ACE INA Holdings, Inc., 4.35%, due 11/03/45 | | | 31,747 | |
| | | | | | |
| 70 | | See accompanying Notes to the Financial Statements. | | | | |
Mercer Core Fixed Income Fund
Schedule of Investments (Continued)
(showing percentage of net assets)
March 31, 2017
| | | | | | | | | | |
| Par Value ($) | | | | | Description | | Value ($) | |
| | | |
| | | | | | Corporate Debt — continued | | | | |
| | | |
| | 385,000 | | | | | Actavis Funding SCS, 3.80%, due 03/15/25‡ | | | 389,156 | |
| | 605,000 | | | | | Actavis Funding SCS, 4.55%, due 03/15/35 | | | 608,462 | |
| | 115,000 | | | | | Actavis Funding SCS, 4.75%, due 03/15/45 | | | 115,935 | |
| | 410,000 | | | | | Activision Blizzard, Inc., 3.40%, due 09/15/26 144A | | | 401,173 | |
| | 380,000 | | | | | Activision Blizzard, Inc., 6.13%, due 09/15/23 144A | | | 411,493 | |
| | 347,000 | | | | | AECOM, 5.13%, due 03/15/27 144A | | | 348,735 | |
| | 340,000 | | | | | AerCap Global Aviation Trust, 6.50%, due 06/15/45† ‡ 144A | | | 356,575 | |
| | 280,000 | | | | | AerCap Ireland Capital DAC/AerCap Global Aviation Trust, 3.75%, due 05/15/19 | | | 287,650 | |
| | 355,000 | | | | | AerCap Ireland Capital DAC/AerCap Global Aviation Trust, 4.63%, due 10/30/20 | | | 375,477 | |
| | 370,000 | | | | | Aetna, Inc., 4.75%, due 03/15/44 | | | 402,041 | |
| | 315,000 | | | | | Agrium, Inc., 4.90%, due 06/01/43 | | | 328,491 | |
| | 150,000 | | | | | Agrium, Inc., 5.25%, due 01/15/45 | | | 163,337 | |
| | 390,000 | | | | | Ahern Rentals, Inc., 7.38%, due 05/15/23 144A | | | 337,350 | |
| | 250,000 | | | | | Air Canada 2013-1 Class C Pass Through Trust, 6.63%, due 05/15/18 144A | | | 260,312 | |
| | 1,992,998 | | | | | Air Canada 2015-1 Class A Pass Through Trust, 3.60%, due 09/15/28 144A | | | 2,005,454 | |
| | 275,000 | | | | | Air Lease Corp., 3.00%, due 09/15/23 | | | 269,123 | |
| | 170,000 | | | | | Air Lease Corp., 3.38%, due 01/15/19‡ | | | 174,013 | |
| | 235,000 | | | | | Air Lease Corp., 3.63%, due 04/01/27 | | | 228,881 | |
| | 195,000 | | | | | Air Lease Corp., 3.88%, due 04/01/21‡ | | | 202,330 | |
| | 155,000 | | | | | Aircastle, Ltd., 5.50%, due 02/15/22 | | | 167,013 | |
| | 150,000 | | | | | Aircastle, Ltd., 7.63%, due 04/15/20 | | | 168,750 | |
| | 225,000 | | | | | Ally Financial, Inc., 3.25%, due 11/05/18 | | | 227,111 | |
| | 465,000 | | | | | Ally Financial, Inc., 5.13%, due 09/30/24‡ | | | 479,531 | |
| | 200,000 | | | | | Altice Financing SA, 6.50%, due 01/15/22‡ 144A | | | 210,098 | |
| | 200,000 | | | | | Altice Financing SA, 6.63%, due 02/15/23 144A | | | 208,700 | |
| | 135,000 | | | | | Altria Group, Inc., 2.85%, due 08/09/22 | | | 135,441 | |
| | 340,000 | | | | | AMC Networks, Inc., 5.00%, due 04/01/24 | | | 340,850 | |
| | 620,000 | | | | | America Movil SAB de CV, 5.00%, due 03/30/20 | | | 665,487 | |
| | 150,000 | | | | | America Movil SAB de CV, Guaranteed Senior Note, 5.63%, due 11/15/17 | | | 153,617 | |
| | 345,735 | | | | | American Airlines 2011-1 Class B Pass Through Trust, 7.00%, due 07/31/19 144A | | | 357,404 | |
| | 3,946,700 | | | | | American Airlines 2013-2 Class A Pass Through Trust, 4.95%, due 07/15/24 | | | 4,202,762 | |
| | 228,936 | | | | | American Airlines 2016-1 Class A Pass Through Trust, 4.10%, due 07/15/29 | | | 231,512 | |
| | 228,000 | | | | | American Airlines 2017-1 Class A Pass Through Trust, 4.00%, due 08/15/30 | | | 231,135 | |
| | 210,000 | | | | | American Airlines 2017-1 Class AA Pass Through Trust, 3.65%, due 02/15/29 | | | 211,113 | |
| | 310,000 | | | | | American Honda Finance Corp., 1.70%, due 02/22/19 | | | 309,748 | |
| | 465,000 | | | | | American Honda Finance Corp., (MTN), 2.00%, due 02/14/20 | | | 466,335 | |
| | 235,000 | | | | | American Tower Corp. REIT, 3.40%, due 02/15/19‡ | | | 240,361 | |
| | 235,000 | | | | | American Tower Corp. REIT, 4.70%, due 03/15/22 | | | 251,953 | |
| | 180,000 | | | | | AmeriGas Partners, LP/AmeriGas Finance Corp., 5.50%, due 05/20/25 | | | 179,550 | |
| | 193,000 | | | | | Amgen, Inc., 4.40%, due 05/01/45 | | | 188,078 | |
| | 813,000 | | | | | Amgen, Inc., 4.66%, due 06/15/51 | | | 816,957 | |
| | 295,000 | | | | | Anadarko Petroleum Corp., 6.20%, due 03/15/40 | | | 334,193 | |
| | 5,000,000 | | | | | Anadarko Petroleum Corp., 7.09%, due 10/10/36‡‡ | | | 2,054,065 | |
| | 465,000 | | | | | Anheuser-Busch InBev Finance, Inc., 4.70%, due 02/01/36 | | | 493,479 | |
| | 2,280,000 | | | | | Anheuser-Busch InBev Finance, Inc., 4.90%, due 02/01/46 | | | 2,473,782 | |
| | 340,000 | | | | | Anheuser-Busch InBev Worldwide, Inc., 5.38%, due 01/15/20 | | | 370,199 | |
| | 230,000 | | | | | Antero Midstream Partners, LP/Antero Midstream Finance Corp., 5.38%,
due 09/15/24 144A | | | 234,600 | |
| | 5,000 | | | | | Anthem, Inc., 4.65%, due 08/15/44 | | | 5,095 | |
| | | | | | |
| | See accompanying Notes to the Financial Statements. | | | 71 | |
Mercer Core Fixed Income Fund
Schedule of Investments (Continued)
(showing percentage of net assets)
March 31, 2017
| | | | | | | | | | |
| Par Value ($) | | | | | Description | | Value ($) | |
| | | |
| | | | | | Corporate Debt — continued | | | | |
| | | |
| | 730,000 | | | | | Anthem, Inc., 5.88%, due 06/15/17 | | | 736,405 | |
| | 475,000 | | | | | Apache Corp., 5.10%, due 09/01/40 | | | 490,428 | |
| | 295,000 | | | | | Aquarius & Investments Plc for Swiss Reinsurance Co., Ltd., Reg S, 6.38%, due 09/01/24† ‡‡‡ | | | 315,282 | |
| | 390,000 | | | | | Arconic, Inc., 5.13%, due 10/01/24‡ | | | 404,820 | |
| | 215,000 | | | | | Ares Capital Corp., 3.88%, due 01/15/20 | | | 219,434 | |
| | 150,000 | | | | | AT&T, Inc., 2.63%, due 12/01/22 | | | 146,759 | |
| | 2,079,000 | | | | | AT&T, Inc., 3.40%, due 05/15/25 | | | 2,011,680 | |
| | 120,000 | | | | | AT&T, Inc., 3.88%, due 08/15/21 | | | 124,975 | |
| | 5,000,000 | | | | | AT&T, Inc., 4.13%, due 11/27/22‡‡ 144A | | | 4,037,090 | |
| | 10,000 | | | | | AT&T, Inc., 4.45%, due 05/15/21 | | | 10,661 | |
| | 110,000 | | | | | AT&T, Inc., 4.50%, due 05/15/35 | | | 104,158 | |
| | 409,000 | | | | | AT&T, Inc., 4.75%, due 05/15/46 | | | 383,087 | |
| | 110,000 | | | | | AT&T, Inc., 5.25%, due 03/01/37‡ | | | 112,482 | |
| | 640,000 | | | | | AT&T, Inc., 5.45%, due 03/01/47 | | | 656,659 | |
| | 90,000 | | | | | AT&T, Inc., 5.70%, due 03/01/57 | | | 93,350 | |
| | 200,000 | | | | | Australia & New Zealand Banking Group Ltd., 6.75%† ††††† ‡ 144A | | | 220,234 | |
| | 190,000 | | | | | AXA SA, 8.60%, due 12/15/30 | | | 264,385 | |
| | 260,000 | | | | | BAC Capital Trust XIV, 4.00%† ††††† | | | 212,485 | |
| | 2,160,000 | | | | | BAE Systems Holdings, Inc., 6.38%, due 06/01/19 144A | | | 2,352,344 | |
| | 600,000 | | | | | Bank of America Corp., 2.60%, due 01/15/19 | | | 606,510 | |
| | 2,301,000 | | | | | Bank of America Corp., 3.50%, due 04/19/26 | | | 2,273,446 | |
| | 500,000 | | | | | Bank of America Corp., 4.13%, due 01/22/24 | | | 523,042 | |
| | 30,000 | | | | | Bank of America Corp., 4.20%, due 08/26/24 | | | 30,598 | |
| | 245,000 | | | | | Bank of America Corp., 4.25%, due 10/22/26 | | | 249,264 | |
| | 1,390,000 | | | | | Bank of America Corp., 4.45%, due 03/03/26 | | | 1,428,122 | |
| | 420,000 | | | | | Bank of America Corp., 5.13%† ††††† ‡ | | | 422,100 | |
| | 270,000 | | | | | Bank of America Corp., 6.30%† ††††† | | | 294,300 | |
| | 395,000 | | | | | Bank of America Corp., 6.88%, due 04/25/18 | | | 415,739 | |
| | 100,000 | | | | | Bank of America Corp., 7.63%, due 06/01/19 | | | 111,535 | |
| | 335,000 | | | | | Bank of America Corp., 8.00%† ††††† | | | 345,469 | |
| | 450,000 | | | | | Bank of America Corp., (MTN), 3.25%, due 10/21/27 | | | 429,270 | |
| | 740,000 | | | | | Bank of America Corp., (MTN), 3.30%, due 01/11/23 | | | 745,565 | |
| | 340,000 | | | | | Bank of America Corp., (MTN), 3.95%, due 04/21/25 | | | 339,105 | |
| | 270,000 | | | | | Bank of America Corp., (MTN), 4.44%, due 01/20/48† | | | 272,868 | |
| | 340,000 | | | | | Bank of America Corp., Subordinated Note, 5.70%, due 05/02/17 | | | 341,125 | |
| | 680,000 | | | | | Barclays Plc, 3.20%, due 08/10/21 | | | 680,979 | |
| | 325,000 | | | | | Barclays Plc, 4.38%, due 01/12/26 | | | 329,973 | |
| | 200,000 | | | | | Barclays Plc, 4.95%, due 01/10/47 | | | 200,558 | |
| | 220,000 | | | | | Bear Stearns Cos. LLC (The), Senior Global Note, 7.25%, due 02/01/18 | | | 229,955 | |
| | 1,432,000 | | | | | Berkshire Hathaway Energy Co., 6.13%, due 04/01/36 | | | 1,793,149 | |
| | 105,000 | | | | | BHP Billiton Finance USA, Ltd., 6.25%, due 10/19/75† ‡ 144A | | | 113,951 | |
| | 1,099,000 | | | | | Blackstone Holdings Finance Co. LLC, 4.75%, due 02/15/23 144A | | | 1,195,243 | |
| | 1,555,000 | | | | | Blackstone Holdings Finance Co. LLC, Series 1, 6.63%, due 08/15/19 144A | | | 1,713,161 | |
| | 340,000 | | | | | BMW US Capital LLC, 2.15%, due 04/06/20†††† 144A | | | 340,290 | |
| | 110,000 | | | | | Boardwalk Pipelines, LP, 4.45%, due 07/15/27 | | | 111,363 | |
| | 70,000 | | | | | Boise Cascade Co., 5.63%, due 09/01/24‡ 144A | | | 71,400 | |
| | 1,835,000 | | | | | Boston Properties, LP REIT, 5.63%, due 11/15/20 | | | 2,024,093 | |
| | 425,000 | | | | | BP Capital Markets Plc, 3.02%, due 01/16/27 | | | 408,437 | |
| | | | | | |
| 72 | | See accompanying Notes to the Financial Statements. | | | | |
Mercer Core Fixed Income Fund
Schedule of Investments (Continued)
(showing percentage of net assets)
March 31, 2017
| | | | | | | | | | |
| Par Value ($) | | | | | Description | | Value ($) | |
| | | |
| | | | | | Corporate Debt — continued | | | | |
| | | |
| | 280,000 | | | | | BPCE SA, 4.50%, due 03/15/25 144A | | | 275,907 | |
| | 415,000 | | | | | BPCE SA, 5.70%, due 10/22/23‡ 144A | | | 441,083 | |
| | 595,000 | | | | | Branch Banking & Trust Co., 2.10%, due 01/15/20‡ | | | 595,995 | |
| | 205,000 | | | | | Braskem Finance, Ltd., 7.00%, due 05/07/20 144A | | | 225,756 | |
| | 425,239 | | | | | British Airways 2013-1 Class A Pass Through Trust, 4.63%, due 12/20/25 144A | | | 452,348 | |
| | 85,418 | | | | | British Airways 2013-1 Class B Pass Through Trust, 5.63%, due 12/20/21 144A | | | 88,941 | |
| | 425,000 | | | | | Broadcom Corp./Broadcom Cayman Finance, Ltd., 2.38%, due 01/15/20 144A | | | 425,232 | |
| | 943,000 | | | | | Broadcom Corp./Broadcom Cayman Finance, Ltd., 3.88%, due 01/15/27 144A | | | 949,849 | |
| | 280,000 | | | | | Building Materials Corp. of America, 5.38%, due 11/15/24¤ 144A | | | 285,074 | |
| | 185,000 | | | | | Bunge, Ltd. Finance Corp., 8.50%, due 06/15/19 | | | 209,959 | |
| | 305,000 | | | | | CA, Inc., 3.60%, due 08/15/22 | | | 309,854 | |
| | 280,000 | | | | | CA, Inc., 4.70%, due 03/15/27 | | | 291,134 | |
| | 859,000 | | | | | Canadian Pacific Railway Co., 6.13%, due 09/15/15# | | | 1,041,893 | |
| | 310,000 | | | | | Capital One Financial Corp., 2.45%, due 04/24/19 | | | 311,934 | |
| | 585,000 | | | | | Capital One Financial Corp., 3.75%, due 07/28/26 | | | 567,602 | |
| | 460,000 | | | | | Capital One Financial Corp., 4.20%, due 10/29/25 | | | 462,653 | |
| | 250,000 | | | | | Capital One Financial Corp., 5.55%† ††††† | | | 260,000 | |
| | 265,000 | | | | | Capital One NA/Mclean VA, 2.35%, due 08/17/18 | | | 266,753 | |
| | 1,706,000 | | | | | Carlyle Holdings II Finance LLC, 5.63%, due 03/30/43 144A | | | 1,761,372 | |
| | 190,000 | | | | | Cascades, Inc., 5.50%, due 07/15/22 144A | | | 190,475 | |
| | 165,000 | | | | | CCM Merger, Inc., 6.00%, due 03/15/22¤ 144A | | | 168,713 | |
| | 210,000 | | | | | CCO Holdings LLC/CCO Holdings Capital Corp., 5.88%, due 05/01/27 144A | | | 221,025 | |
| | 39,000 | | | | | CDW LLC/CDW Finance Corp., 5.00%, due 09/01/25 | | | 39,975 | |
| | 235,000 | | | | | Cemex SAB de CV, 6.13%, due 05/05/25‡ 144A | | | 251,379 | |
| | 380,000 | | | | | Cenovus Energy, Inc., 4.45%, due 09/15/42 | | | 337,731 | |
| | 5,000 | | | | | Charter Communications Operating LLC/Charter Communications Operating Capital, 4.46%, due 07/23/22 | | | 5,279 | |
| | 1,511,000 | | | | | Charter Communications Operating LLC/Charter Communications Operating Capital, 4.91%, due 07/23/25 | | | 1,599,283 | |
| | 195,000 | | | | | Charter Communications Operating LLC/Charter Communications Operating Capital, 6.38%, due 10/23/35 | | | 222,285 | |
| | 815,000 | | | | | Charter Communications Operating LLC/Charter Communications Operating Capital, 6.48%, due 10/23/45 | | | 941,593 | |
| | 386,000 | | | | | Chemours Co. (The), 6.63%, due 05/15/23‡ | | | 411,090 | |
| | 133,000 | | | | | Cheniere Corpus Christi Holdings LLC, 5.88%, due 03/31/25 144A | | | 139,151 | |
| | 240,000 | | | | | CHS/Community Health Systems, Inc., 5.13%, due 08/01/21‡ | | | 238,200 | |
| | 185,000 | | | | | CHS/Community Health Systems, Inc., 8.00%, due 11/15/19‡ | | | 182,225 | |
| | 365,000 | | | | | Cigna Corp., 5.38%, due 02/15/42‡ | | | 424,894 | |
| | 175,000 | | | | | Cimarex Energy Co., 4.38%, due 06/01/24 | | | 182,056 | |
| | 200,000 | | | | | Cincinnati Bell, Inc., 7.00%, due 07/15/24 144A | | | 210,250 | |
| | 789,000 | | | | | Citigroup, Inc., 2.48%, due 09/01/23† | | | 811,943 | |
| | 1,374,000 | | | | | Citigroup, Inc., 2.70%, due 03/30/21 | | | 1,376,931 | |
| | 983,000 | | | | | Citigroup, Inc., 3.40%, due 05/01/26 | | | 959,646 | |
| | 1,110,000 | | | | | Citigroup, Inc., 3.89%, due 01/10/28† | | | 1,117,199 | |
| | 180,000 | | | | | Citigroup, Inc., 4.40%, due 06/10/25 | | | 183,719 | |
| | 470,000 | | | | | Citigroup, Inc., 4.50%, due 01/14/22‡ | | | 503,522 | |
| | 460,000 | | | | | Citigroup, Inc., 4.60%, due 03/09/26 | | | 473,246 | |
| | 115,000 | | | | | Citigroup, Inc., 4.75%, due 05/18/46 | | | 114,050 | |
| | 220,000 | | | | | Citigroup, Inc., 5.88%† ††††† | | | 227,838 | |
| | | | | | |
| | See accompanying Notes to the Financial Statements. | | | 73 | |
Mercer Core Fixed Income Fund
Schedule of Investments (Continued)
(showing percentage of net assets)
March 31, 2017
| | | | | | | | | | |
| Par Value ($) | | | | | Description | | Value ($) | |
| | | |
| | | | | | Corporate Debt — continued | | | | |
| | | |
| | 130,000 | | | | | Citigroup, Inc., 5.90%† ††††† ‡ | | | 136,013 | |
| | 230,000 | | | | | Citigroup, Inc., 5.95%† ††††† | | | 240,350 | |
| | 550,000 | | | | | Citigroup, Inc., 5.95%† ††††† | | | 574,406 | |
| | 120,000 | | | | | Citigroup, Inc., 6.13%† ††††† ‡ | | | 126,750 | |
| | 495,000 | | | | | Citigroup, Inc., 6.25%† ††††† | | | 534,600 | |
| | 250,000 | | | | | Clear Channel Worldwide Holdings, Inc., 6.50%, due 11/15/22 | | | 261,250 | |
| | 1,614,000 | | | | | Cleveland Clinic Foundation (The), 4.86%, due 01/01/14# | | | 1,567,286 | |
| | 300,000 | | | | | CNO Financial Group, Inc., 5.25%, due 05/30/25 | | | 309,189 | |
| | 233,000 | | | | | Colorado Interstate Gas Co. LLC/Colorado Interstate Issuing Corp., 4.15%,
due 08/15/26 144A | | | 228,158 | |
| | 495,000 | | | | | Columbia Pipeline Group, Inc., 4.50%, due 06/01/25 | | | 519,470 | |
| | 1,930,000 | | | | | Comcast Corp., 4.25%, due 01/15/33 | | | 1,990,509 | |
| | 349,000 | | | | | Comcast Corp., 6.40%, due 05/15/38 | | | 445,990 | |
| | 20,000 | | | | | Comcast Corp., 6.50%, due 11/15/35 | | | 25,558 | |
| | 90,000 | | | | | Comcast Corp., 6.95%, due 08/15/37 | | | 120,965 | |
| | 200,000 | | | | | Comcel Trust via Comunicaciones Celulares SA, 6.88%, due 02/06/24 144A | | | 208,400 | |
| | 200,000 | | | | | Comision Federal de Electricidad, 4.75%, due 02/23/27 144A | | | 201,000 | |
| | 350,000 | | | | | Commerzbank AG, 8.13%, due 09/19/23‡ 144A | | | 410,419 | |
| | 190,000 | | | | | ConocoPhillips Co., 4.95%, due 03/15/26‡ | | | 211,262 | |
| | 575,000 | | | | | ConocoPhillips Holding Co., 6.95%, due 04/15/29 | | | 744,594 | |
| | 65,000 | | | | | Consolidated Edison Co. of New York, Inc., 4.30%, due 12/01/56 | | | 65,451 | |
| | 400,000 | | | | | Consumers Energy Co., 3.25%, due 08/15/46‡ | | | 357,399 | |
| | 1,339,147 | | | | | Continental Airlines 2007-1 Class A Pass Through Trust, 5.98%, due 10/19/23 | | | 1,474,735 | |
| | 203,904 | | | | | Continental Airlines 2012-1 Class B Pass Through Trust, 6.25%, due 10/11/21 | | | 214,354 | |
| | 475,000 | | | | | Continental Resources, Inc., 5.00%, due 09/15/22‡ | | | 481,531 | |
| | 896,000 | | | | | Cooperatieve Centrale Raiffeisen-Boerenleenbank BA/Netherlands, 3.95%, due 11/09/22 | | | 920,653 | |
| | 695,000 | | | | | Corp. Andina de Fomento, 2.13%, due 09/27/21 | | | 684,679 | |
| | 1,526,000 | | | | | Cox Communications, Inc., 3.35%, due 09/15/26 144A | | | 1,479,329 | |
| | 205,000 | | | | | Credit Acceptance Corp., 6.13%, due 02/15/21 | | | 205,513 | |
| | 1,067,000 | | | | | Credit Agricole SA, 4.13%, due 01/10/27 144A | | | 1,060,613 | |
| | 300,000 | | | | | Credit Agricole SA, 7.88%† ††††† 144A | | | 305,887 | |
| | 250,000 | | | | | Credit Agricole SA, 8.13%, due 09/19/33† 144A | | | 268,784 | |
| | 500,000 | | | | | Credit Suisse Group Funding Guernsey, Ltd., 2.75%, due 03/26/20 | | | 501,113 | |
| | 300,000 | | | | | Crown Castle Holdings GS V LLC/Crown Castle GS III Corp. REIT, 3.85%, due 04/15/23 | | | 307,693 | |
| | 357,000 | | | | | Crown Castle Towers LLC, 4.88%, due 08/15/40 144A | | | 380,277 | |
| | 335,000 | | | | | Crown Castle Towers LLC, 6.11%, due 01/15/40 144A | | | 362,969 | |
| | 1,160,000 | | | | | CVS Health Corp., 2.75%, due 12/01/22 | | | 1,149,116 | |
| | 275,000 | | | | | CVS Health Corp., 2.88%, due 06/01/26‡ | | | 262,784 | |
| | 600,000 | | | | | CVS Health Corp., 5.13%, due 07/20/45 | | | 664,531 | |
| | 2,945,786 | | | | | CVS Pass-Through Trust, 7.51%, due 01/10/32 144A | | | 3,627,452 | |
| | 265,000 | | | | | DaVita, Inc., 5.00%, due 05/01/25 | | | 266,325 | |
| | 578,000 | | | | | DCP Midstream Operating LP, 5.35%, due 03/15/20 144A | | | 601,120 | |
| | 240,000 | | | | | DCP Midstream Operating LP, 5.85%, due 05/21/43† 144A | | | 220,200 | |
| | 210,000 | | | | | DCP Midstream Operating LP, 9.75%, due 03/15/19‡ 144A | | | 236,775 | |
| | 955,341 | | | | | Delta Air Lines 2007-1 Class A Pass Through Trust, 6.82%, due 02/10/24 | | | 1,104,613 | |
| | 405,000 | | | | | Delta Air Lines, Inc., 3.63%, due 03/15/22 | | | 413,885 | |
| | 375,000 | | | | | Deutsche Bank AG, 3.38%, due 05/12/21‡ | | | 377,635 | |
| | 670,000 | | | | | Devon Energy Corp., 7.95%, due 04/15/32 | | | 871,150 | |
| | | | | | |
| 74 | | See accompanying Notes to the Financial Statements. | | | | |
Mercer Core Fixed Income Fund
Schedule of Investments (Continued)
(showing percentage of net assets)
March 31, 2017
| | | | | | | | | | |
| Par Value ($) | | | | | Description | | Value ($) | |
| | | |
| | | | | | Corporate Debt — continued | | | | |
| | | |
| | 250,000 | | | | | Dexia Credit Local SA, 1.88%, due 09/15/21 144A | | | 241,287 | |
| | 215,000 | | | | | Diamond 1 Finance Corp./Diamond 2 Finance Corp., 3.48%, due 06/01/19 144A | | | 220,427 | |
| | 185,000 | | | | | Diamond 1 Finance Corp./Diamond 2 Finance Corp., 4.42%, due 06/15/21‡ 144A | | | 193,644 | |
| | 640,000 | | | | | Diamond 1 Finance Corp./Diamond 2 Finance Corp., 6.02%, due 06/15/26 144A | | | 698,934 | |
| | 55,000 | | | | | Diamond 1 Finance Corp./Diamond 2 Finance Corp., 7.13%, due 06/15/24‡ 144A | | | 60,832 | |
| | 250,000 | | | | | Diamond 1 Finance Corp./Diamond 2 Finance Corp., 8.35%, due 07/15/46 144A | | | 323,902 | |
| | 235,000 | | | | | Digicel, Ltd., 6.75%, due 03/01/23‡ 144A | | | 210,913 | |
| | 665,000 | | | | | Discover Financial Services, 3.75%, due 03/04/25 | | | 653,481 | |
| | 690,000 | | | | | Discover Financial Services, 3.95%, due 11/06/24‡ | | | 692,147 | |
| | 467,000 | | | | | Discover Financial Services, 5.20%, due 04/27/22 | | | 504,391 | |
| | 115,000 | | | | | Dominion Resources, Inc., 2.85%, due 08/15/26 | | | 107,600 | |
| | 400,000 | | | | | Dominion Resources, Inc., 4.45%, due 03/15/21 | | | 426,875 | |
| | 400,000 | | | | | Dow Chemical Co. (The), 4.38%, due 11/15/42 | | | 394,670 | |
| | 2,589,000 | | | | | Duke Energy Corp., 3.55%, due 09/15/21 | | | 2,686,895 | |
| | 420,000 | | | | | Duke Energy Florida LLC, 3.40%, due 10/01/46 | | | 378,501 | |
| | 195,000 | | | | | Duke Energy Progress LLC, 3.70%, due 10/15/46 | | | 186,887 | |
| | 200,000 | | | | | eBay, Inc., 2.50%, due 03/09/18 | | | 201,566 | |
| | 190,000 | | | | | El Paso Natural Gas Co. LLC, 8.38%, due 06/15/32 | | | 239,833 | |
| | 874,000 | | | | | Electricite de France SA, 3.63%, due 10/13/25‡ 144A | | | 880,320 | |
| | 235,000 | | | | | Electricite de France SA, 5.25%† ††††† 144A | | | 232,356 | |
| | 580,000 | | | | | Electronic Arts, Inc., 4.80%, due 03/01/26 | | | 628,359 | |
| | 465,000 | | | | | Emera US Finance, LP, 3.55%, due 06/15/26 | | | 457,996 | |
| | 200,000 | | | | | Enbridge Energy Partners, LP, 4.38%, due 10/15/20 | | | 211,001 | |
| | 230,000 | | | | | Enbridge Energy Partners, LP, 8.05%, due 10/01/77† | | | 224,825 | |
| | 295,000 | | | | | Enbridge, Inc., 4.25%, due 12/01/26‡ | | | 301,725 | |
| | 110,000 | | | | | Energy Transfer Partners, LP, 4.20%, due 04/15/27 | | | 108,899 | |
| | 295,000 | | | | | Energy Transfer Partners, LP, 5.15%, due 03/15/45 | | | 280,233 | |
| | 203,000 | | | | | Energy Transfer Partners, LP, 9.70%, due 03/15/19 | | | 230,940 | |
| | 265,000 | | | | | EnerSys, 5.00%, due 04/30/23 144A | | | 267,650 | |
| | 79,000 | | | | | Engility Corp., 8.88%, due 09/01/24 144A | | | 83,938 | |
| | 307,000 | | | | | EnLink Midstream Partners, LP, 4.85%, due 07/15/26‡ | | | 317,366 | |
| | 235,000 | | | | | Enova International, Inc., 9.75%, due 06/01/21 | | | 239,700 | |
| | 140,000 | | | | | Enterprise Products Operating LLC, 3.70%, due 02/15/26 | | | 140,301 | |
| | 460,000 | | | | | Enterprise Products Operating LLC, 3.75%, due 02/15/25 | | | 463,385 | |
| | 185,000 | | | | | Enterprise Products Operating LLC, 3.95%, due 02/15/27‡ | | | 189,013 | |
| | 230,000 | | | | | Enterprise Products Operating LLC, 4.74%, due 08/01/66† | | | 229,713 | |
| | 174,000 | | | | | Equinix, Inc. REIT, 5.38%, due 05/15/27 | | | 180,090 | |
| | 1,934,000 | | | | | ERAC USA Finance LLC, 2.80%, due 11/01/18¤ 144A | | | 1,958,289 | |
| | 2,045,000 | | | | | Escrow GCB General Motors, 8.38%, due 07/15/49**** ¤ ††† | | | — | |
| | 1,169,000 | | | | | Exelon Corp., 5.10%, due 06/15/45 | | | 1,268,759 | |
| | 912,000 | | | | | Exelon Generation Co. LLC, 4.25%, due 06/15/22‡ | | | 955,636 | |
| | 645,000 | | | | | Expedia, Inc., 5.00%, due 02/15/26‡ | | | 690,551 | |
| | 1,270,000 | | | | | Express Scripts Holding Co., 3.40%, due 03/01/27‡ | | | 1,198,537 | |
| | 405,000 | | | | | Fidelity National Information Services, Inc., 2.85%, due 10/15/18 | | | 410,745 | |
| | 540,000 | | | | | Fidelity National Information Services, Inc., 3.63%, due 10/15/20‡ | | | 561,605 | |
| | 1,303,000 | | | | | Fifth Third Bancorp, 2.88%, due 07/27/20 | | | 1,326,988 | |
| | 270,000 | | | | | Fifth Third Bancorp, 5.10%† ††††† | | | 267,975 | |
| | 150,000 | | | | | FirstEnergy Corp., 2.75%, due 03/15/18 | | | 150,580 | |
| | 245,000 | | | | | FirstEnergy Corp., Series C, 7.38%, due 11/15/31 | | | 320,094 | |
| | | | | | |
| | See accompanying Notes to the Financial Statements. | | | 75 | |
Mercer Core Fixed Income Fund
Schedule of Investments (Continued)
(showing percentage of net assets)
March 31, 2017
| | | | | | | | | | |
| Par Value ($) | | | | | Description | | Value ($) | |
| | | |
| | | | | | Corporate Debt — continued | | | | |
| | | |
| | 250,000 | | | | | Flagstar Bancorp, Inc., 6.13%, due 07/15/21 | | | 266,751 | |
| | 175,000 | | | | | Florida East Coast Holdings Corp., 6.75%, due 05/01/19 144A | | | 180,688 | |
| | 840,000 | | | | | Ford Motor Co., 4.75%, due 01/15/43‡ | | | 792,010 | |
| | 225,000 | | | | | Ford Motor Credit Co. LLC, 2.26%, due 03/28/19 | | | 225,667 | |
| | 155,000 | | | | | Ford Motor Credit Co. LLC, 2.55%, due 10/05/18 | | | 156,288 | |
| | 595,000 | | | | | Ford Motor Credit Co. LLC, 5.88%, due 08/02/21 | | | 663,479 | |
| | 580,000 | | | | | Ford Motor Credit Co. LLC, 8.13%, due 01/15/20 | | | 666,962 | |
| | 200,000 | | | | | Fresenius US Finance II, Inc., 4.50%, due 01/15/23‡ 144A | | | 207,900 | |
| | 275,000 | | | | | Frontier Communications Corp., 8.88%, due 09/15/20‡ | | | 291,156 | |
| | 285,000 | | | | | FS Investment Corp., 4.25%, due 01/15/20 | | | 287,340 | |
| | 60,000 | | | | | Gartner, Inc., 5.13%, due 04/01/25 144A | | | 61,275 | |
| | 135,000 | | | | | Gateway Casinos & Entertainment, Ltd., 8.25%, due 03/01/24‡ 144A | | | 137,025 | |
| | 221,000 | | | | | GCI, Inc., 6.88%, due 04/15/25‡ | | | 232,603 | |
| | 268,000 | | | | | GE Capital International Funding Co., 4.42%, due 11/15/35 | | | 283,539 | |
| | 80,000 | | | | | General Electric Capital Corp., 4.38%, due 09/16/20 | | | 86,027 | |
| | 645,000 | | | | | General Electric Co., 5.00%† ††††† | | | 681,281 | |
| | 450,000 | | | | | General Motors Co., 4.00%, due 04/01/25 | | | 451,481 | |
| | 460,000 | | | | | General Motors Co., 4.88%, due 10/02/23 | | | 491,464 | |
| | 290,000 | | | | | General Motors Co., 6.25%, due 10/02/43 | | | 320,469 | |
| | 1,045,000 | | | | | General Motors Financial Co., Inc., 3.50%, due 07/10/19 | | | 1,074,193 | |
| | 460,000 | | | | | General Motors Financial Co., Inc., 4.00%, due 01/15/25 | | | 463,053 | |
| | 1,430,000 | | | | | General Motors Financial Co., Inc., 4.20%, due 03/01/21 | | | 1,494,000 | |
| | 403,000 | | | | | General Motors Financial Co., Inc., 4.30%, due 07/13/25 | | | 409,963 | |
| | 475,000 | | | | | Gilead Sciences, Inc., 2.50%, due 09/01/23 | | | 459,969 | |
| | 185,000 | | | | | GLP Capital, LP/GLP Financing II, Inc., 5.38%, due 04/15/26 | | | 191,475 | |
| | 265,000 | | | | | Goldcorp, Inc., 3.63%, due 06/09/21 | | | 272,843 | |
| | 285,000 | | | | | Goldman Sachs Group, Inc. (The), 2.00%, due 04/25/19 | | | 284,616 | |
| | 625,000 | | | | | Goldman Sachs Group, Inc. (The), 2.30%, due 12/13/19 | | | 625,774 | |
| | 919,000 | | | | | Goldman Sachs Group, Inc. (The), 2.63%, due 04/25/21 | | | 917,360 | |
| | 295,000 | | | | | Goldman Sachs Group, Inc. (The), 3.75%, due 05/22/25‡ | | | 299,144 | |
| | 85,000 | | | | | Goldman Sachs Group, Inc. (The), 3.75%, due 02/25/26‡ | | | 85,702 | |
| | 325,000 | | | | | Goldman Sachs Group, Inc. (The), 3.85%, due 01/26/27 | | | 327,191 | |
| | 150,000 | | | | | Goldman Sachs Group, Inc. (The), 4.00%, due 03/03/24 | | | 155,752 | |
| | 220,000 | | | | | Goldman Sachs Group, Inc. (The), 4.75%, due 10/21/45 | | | 232,695 | |
| | 290,000 | | | | | Goldman Sachs Group, Inc. (The), 5.15%, due 05/22/45 | | | 305,867 | |
| | 125,000 | | | | | Goldman Sachs Group, Inc. (The), 5.30%† ††††† ‡ | | | 127,656 | |
| | 565,000 | | | | | Goldman Sachs Group, Inc. (The), 5.38%† ††††† | | | 578,419 | |
| | 130,000 | | | | | Goldman Sachs Group, Inc. (The), 5.75%, due 01/24/22 | | | 146,389 | |
| | 680,000 | | | | | Goldman Sachs Group, Inc. (The), 5.95%, due 01/18/18 | | | 702,353 | |
| | 535,000 | | | | | Goldman Sachs Group, Inc. (The), 6.25%, due 02/01/41 | | | 674,159 | |
| | 1,462,000 | | | | | Goldman Sachs Group, Inc. (The), 7.50%, due 02/15/19 | | | 1,605,191 | |
| | 220,000 | | | | | Great Plains Energy, Inc., 3.90%, due 04/01/27 | | | 222,589 | |
| | 200,000 | | | | | Grupo Televisa SAB, 5.00%, due 05/13/45 | | | 183,293 | |
| | 70,000 | | | | | Gulfport Energy Corp., 6.00%, due 10/15/24 144A | | | 68,250 | |
| | 465,000 | | | | | Hartford Financial Services Group, Inc. (The), 8.13%, due 06/15/68† | | | 496,387 | |
| | 380,000 | | | | | HBOS Plc, 6.75%, due 05/21/18 144A | | | 398,052 | |
| | 390,000 | | | | | HCA, Inc., 5.25%, due 04/15/25 | | | 415,350 | |
| | 262,000 | | | | | HCA, Inc., 5.25%, due 06/15/26 | | | 276,410 | |
| | 460,000 | | | | | HCA, Inc., 5.88%, due 03/15/22 | | | 507,150 | |
| | | | | | |
| 76 | | See accompanying Notes to the Financial Statements. | | | | |
Mercer Core Fixed Income Fund
Schedule of Investments (Continued)
(showing percentage of net assets)
March 31, 2017
| | | | | | | | | | |
| Par Value ($) | | | | | Description | | Value ($) | |
| | | |
| | | | | | Corporate Debt — continued | | | | |
| | | |
| | 195,000 | | | | | HCA, Inc., 7.50%, due 02/15/22 | | | 223,519 | |
| | 124,000 | | | | | Health Care, Inc. REIT, 3.75%, due 03/15/23 | | | 127,171 | |
| | 945,000 | | | | | Hewlett Packard Enterprise Co., 2.45%, due 10/05/17 | | | 947,875 | |
| | 175,000 | | | | | Hewlett Packard Enterprise Co., 2.85%, due 10/05/18 | | | 177,174 | |
| | 105,000 | | | | | Hilton Grand Vacations Borrower LLC/Hilton Grand Vacations Borrower, Inc., 6.13%, due 12/01/24 144A | | | 110,775 | |
| | 145,000 | | | | | Home Depot, Inc. (The), 3.50%, due 09/15/56 | | | 126,966 | |
| | 740,000 | | | | | HSBC Finance Corp., 6.68%, due 01/15/21 | | | 837,209 | |
| | 270,000 | | | | | HSBC Holdings Plc, 6.88%† ††††† ‡ | | | 288,225 | |
| | 45,000 | | | | | Humana, Inc., 4.80%, due 03/15/47 | | | 47,231 | |
| | 185,000 | | | | | Huntington Ingalls Industries, Inc., 5.00%, due 11/15/25‡ 144A | | | 193,788 | |
| | 1,260,000 | | | | | Husky Energy, Inc., 7.25%, due 12/15/19 | | | 1,418,587 | |
| | 90,000 | | | | | IHS Markit, Ltd., 4.75%, due 02/15/25 144A | | | 92,925 | |
| | 110,000 | | | | | IHS Markit, Ltd., 5.00%, due 11/01/22 144A | | | 115,775 | |
| | 420,000 | | | | | Imperial Tobacco Finance Plc, 2.05%, due 02/11/18 144A | | | 420,541 | |
| | 385,000 | | | | | ING Bank NV, 5.80%, due 09/25/23 144A | | | 428,931 | |
| | 310,000 | | | | | Ingram Micro, Inc., 5.45%, due 12/15/24 | | | 305,504 | |
| | 200,000 | | | | | International Game Technology Plc, 6.50%, due 02/15/25 144A | | | 214,000 | |
| | 220,000 | | | | | International Lease Finance Corp., 5.88%, due 04/01/19 | | | 234,582 | |
| | 450,000 | | | | | International Paper Co., 4.40%, due 08/15/47 | | | 426,531 | |
| | 310,000 | | | | | Iron Mountain, Inc. REIT, 5.75%, due 08/15/24 | | | 317,750 | |
| | 350,000 | | | | | Iron Mountain, Inc. REIT, 6.00%, due 08/15/23‡ | | | 370,125 | |
| | 260,000 | | | | | Israel Electric Corp., Ltd., 6.88%, due 06/21/23‡ 144A | | | 302,746 | |
| | 105,000 | | | | | Israel Electric Corp., Ltd., 7.25%, due 01/15/19 144A | | | 113,799 | |
| | 588,000 | | | | | Jabil Circuit, Inc., 4.70%, due 09/15/22 | | | 608,580 | |
| | 418,000 | | | | | Jefferies Group LLC, 4.85%, due 01/15/27 | | | 427,515 | |
| | 500,000 | | | | | Jefferies Group LLC, 5.13%, due 01/20/23 | | | 537,975 | |
| | 485,000 | | | | | Jefferies Group LLC, 6.88%, due 04/15/21 | | | 554,166 | |
| | 175,000 | | | | | Jefferies Group LLC, 8.50%, due 07/15/19 | | | 198,348 | |
| | 1,802,000 | | | | | JPMorgan Chase & Co., 3.20%, due 01/25/23 | | | 1,821,791 | |
| | 380,000 | | | | | JPMorgan Chase & Co., 3.20%, due 06/15/26 | | | 369,400 | |
| | 300,000 | | | | | JPMorgan Chase & Co., 3.25%, due 09/23/22 | | | 305,704 | |
| | 1,430,000 | | | | | JPMorgan Chase & Co., 3.38%, due 05/01/23‡ | | | 1,434,294 | |
| | 820,000 | | | | | JPMorgan Chase & Co., 4.25%, due 10/15/20 | | | 870,030 | |
| | 90,000 | | | | | JPMorgan Chase & Co., 4.35%, due 08/15/21 | | | 96,377 | |
| | 200,000 | | | | | JPMorgan Chase & Co., 4.50%, due 01/24/22 | | | 215,679 | |
| | 475,000 | | | | | JPMorgan Chase & Co., 4.63%, due 05/10/21 | | | 512,025 | |
| | 1,000,000 | | | | | JPMorgan Chase & Co., 5.30%† ††††† | | | 1,038,750 | |
| | 822,000 | | | | | Juniper Networks, Inc., 3.13%, due 02/26/19 | | | 837,827 | |
| | 45,000 | | | | | KCA Deutag UK Finance Plc, 9.88%, due 04/01/22†††† 144A | | | 46,238 | |
| | 950,000 | | | | | Kentucky Power Co., 6.00%, due 09/15/17 144A | | | 967,959 | |
| | 290,000 | | | | | Kerr-McGee Corp., 6.95%, due 07/01/24 | | | 342,867 | |
| | 217,000 | | | | | Keysight Technologies, Inc., 4.60%, due 04/06/27†††† | | | 219,000 | |
| | 2,500,000 | | | | | Kinder Morgan Energy Partners, LP, 4.15%, due 02/01/24 | | | 2,536,445 | |
| | 185,000 | | | | | Kinder Morgan Energy Partners, LP, 7.75%, due 03/15/32 | | | 230,670 | |
| | 210,000 | | | | | Kinder Morgan, Inc., 4.30%, due 06/01/25‡ | | | 214,896 | |
| | 460,000 | | | | | Kinder Morgan, Inc., 5.55%, due 06/01/45 | | | 471,678 | |
| | 1,240,000 | | | | | KKR Group Finance Co. II LLC, 5.50%, due 02/01/43 144A | | | 1,294,223 | |
| | 688,000 | | | | | KKR Group Finance Co. LLC, 6.38%, due 09/29/20 144A | | | 774,874 | |
| | | | | | |
| | See accompanying Notes to the Financial Statements. | | | 77 | |
Mercer Core Fixed Income Fund
Schedule of Investments (Continued)
(showing percentage of net assets)
March 31, 2017
| | | | | | | | | | |
| Par Value ($) | | | | | Description | | Value ($) | |
| | | |
| | | | | | Corporate Debt — continued | | | | |
| | | |
| | 360,000 | | | | | Kraft Foods Group, Inc., 3.50%, due 06/06/22 | | | 368,689 | |
| | 349,000 | | | | | Kraft Foods Group, Inc., 5.38%, due 02/10/20 | | | 379,424 | |
| | 315,000 | | | | | Kraft Heinz Foods Co., 2.00%, due 07/02/18 | | | 315,879 | |
| | 95,000 | | | | | Kraft Heinz Foods Co., 4.38%, due 06/01/46 | | | 89,505 | |
| | 235,000 | | | | | Kraft Heinz Foods Co., 4.88%, due 02/15/25 144A | | | 251,379 | |
| | 170,000 | | | | | Kraft Heinz Foods Co., 5.00%, due 07/15/35 | | | 177,081 | |
| | 370,000 | | | | | Kraft Heinz Foods Co., 5.20%, due 07/15/45 | | | 387,630 | |
| | 400,000 | | | | | Kroger Co. (The), Senior Note, 6.15%, due 01/15/20 | | | 441,400 | |
| | 180,000 | | | | | Kronos Acquisition Holdings, Inc., 9.00%, due 08/15/23‡ 144A | | | 183,600 | |
| | 300,000 | | | | | L Brands, Inc., 5.63%, due 10/15/23‡ | | | 315,000 | |
| | 315,000 | | | | | L Brands, Inc., 6.63%, due 04/01/21 | | | 345,271 | |
| | 185,000 | | | | | L Brands, Inc., 6.88%, due 11/01/35 | | | 179,450 | |
| | 82,000 | | | | | Ladder Capital Finance Holdings LLLP/Ladder Capital Finance Corp., 5.25%, due 03/15/22 144A‡ | | | 82,820 | |
| | 272,000 | | | | | Lear Corp., 5.25%, due 01/15/25 | | | 286,994 | |
| | 470,000 | | | | | Lehman Brothers Holdings Capital Trust VII, (MTN), 5.86%**** ††† ††††† | | | 165 | |
| | 270,000 | | | | | Lehman Brothers Holdings, Inc., (MTN), Series I, 6.75%, due 12/28/17**** ††† | | | 95 | |
| | 890,000 | | | | | Lehman Brothers Holdings, Inc., Subordinated Note, 6.50%, due 07/19/17**** ††† | | | 312 | |
| | 290,000 | | | | | Leucadia National Corp., 5.50%, due 10/18/23 | | | 309,226 | |
| | 1,150,000 | | | | | Liberty Mutual Group, Inc., 4.25%, due 06/15/23‡ 144A | | | 1,209,392 | |
| | 1,237,000 | | | | | Liberty Mutual Group, Inc., 4.95%, due 05/01/22 144A | | | 1,345,508 | |
| | 481,000 | | | | | Liberty Mutual Group, Inc., Junior Subordinated Note, Series A, 7.80%,
due 03/07/87 144A | | | 554,352 | |
| | 235,000 | | | | | LifePoint Health, Inc., 5.38%, due 05/01/24‡ 144A | | | 239,583 | |
| | 105,000 | | | | | Lions Gate Entertainment Corp., 5.88%, due 11/01/24 144A | | | 109,463 | |
| | 300,000 | | | | | Lloyds Banking Group Plc, 7.50%† ††††† ‡ | | | 318,030 | |
| | 645,000 | | | | | Lloyds Banking Group Plc, Subordinated Note, 4.65%, due 03/24/26‡ | | | 658,400 | |
| | 370,000 | | | | | Lockheed Martin Corp., 2.90%, due 03/01/25 | | | 361,764 | |
| | 1,268,000 | | | | | Lockheed Martin Corp., 4.70%, due 05/15/46 | | | 1,379,011 | |
| | 247,000 | | | | | LSC Communications, Inc., 8.75%, due 10/15/23‡ 144A | | | 254,410 | |
| | 492,000 | | | | | LyondellBasell Industries NV, 5.00%, due 04/15/19 | | | 518,404 | |
| | 345,000 | | | | | M&T Bank Corp., 5.13%† ††††† | | | 343,706 | |
| | 500,000 | | | | | Macquarie Bank, Ltd., 4.88%, due 06/10/25‡ 144A | | | 522,942 | |
| | 55,000 | | | | | Magellan Midstream Partners, LP, 4.25%, due 09/15/46 | | | 51,727 | |
| | 400,000 | | | | | Magellan Midstream Partners, LP, 5.15%, due 10/15/43 | | | 421,126 | |
| | 700,000 | | | | | Marriott International, Inc., 3.13%, due 06/15/26 | | | 675,825 | |
| | 230,000 | | | | | Martin Marietta Materials, Inc., 4.25%, due 07/02/24 | | | 237,858 | |
| | 195,000 | | | | | Masco Corp., 4.38%, due 04/01/26 | | | 203,621 | |
| | 225,000 | | | | | Masco Corp., 4.45%, due 04/01/25 | | | 235,967 | |
| | 725,000 | | | | | Massachusetts Institute of Technology, 4.68%, due 07/01/14# | | | 751,300 | |
| | 210,000 | | | | | Match Group, Inc., 6.38%, due 06/01/24 | | | 227,980 | |
| | 205,000 | | | | | MDC Partners, Inc., 6.50%, due 05/01/24‡ 144A | | | 196,544 | |
| | 190,000 | | | | | MEDNAX, Inc., 5.25%, due 12/01/23 144A | | | 194,275 | |
| | 70,000 | | | | | Medtronic, Inc., 3.13%, due 03/15/22 | | | 71,650 | |
| | 190,000 | | | | | Medtronic, Inc., 3.15%, due 03/15/22 | | | 195,681 | |
| | 384,000 | | | | | Medtronic, Inc., 4.38%, due 03/15/35 | | | 403,309 | |
| | 360,000 | | | | | Medtronic, Inc., 4.63%, due 03/15/45 | | | 387,468 | |
| | 1,152,000 | | | | | MetLife, Inc., 3.00%, due 03/01/25 | | | 1,136,457 | |
| | 275,000 | | | | | MetLife, Inc., 6.40%, due 12/15/66 | | | 302,500 | |
| | | | | | |
| 78 | | See accompanying Notes to the Financial Statements. | | | | |
Mercer Core Fixed Income Fund
Schedule of Investments (Continued)
(showing percentage of net assets)
March 31, 2017
| | | | | | | | | | |
| Par Value ($) | | | | | Description | | Value ($) | |
| | | |
| | | | | | Corporate Debt — continued | | | | |
| | | |
| | 250,000 | | | | | MetLife, Inc., 9.25%, due 04/08/38 144A | | | 345,937 | |
| | 83,000 | | | | | MGIC Investment Corp., 5.75%, due 08/15/23 | | | 87,773 | |
| | 220,000 | | | | | Micron Technology, Inc., 5.88%, due 02/15/22 | | | 230,725 | |
| | 225,000 | | | | | Micron Technology, Inc., 7.50%, due 09/15/23 144A | | | 251,719 | |
| | 410,000 | | | | | Microsoft Corp., 3.95%, due 08/08/56 | | | 384,279 | |
| | 1,104,000 | | | | | Microsoft Corp., 4.25%, due 02/06/47 | | | 1,134,520 | |
| | 540,000 | | | | | Microsoft Corp., 4.45%, due 11/03/45 | | | 571,311 | |
| | 215,000 | | | | | Midcontinent Communications & Finance Corp., 6.88%, due 08/15/23 144A | | | 229,781 | |
| | 250,000 | | | | | Millicom International Cellular SA, 4.75%, due 05/22/20 144A | | | 255,780 | |
| | 205,000 | | | | | Millicom International Cellular SA, 6.63%, due 10/15/21 144A | | | 215,496 | |
| | 165,630 | | | | | Miran Mid-Atlantic Series C Pass Through Trust, 10.06%, due 12/30/28¤ | | | 150,102 | |
| | 345,000 | | | | | Molson Coors Brewing Co., 1.45%, due 07/15/19 | | | 340,725 | |
| | 375,000 | | | | | Molson Coors Brewing Co., 3.00%, due 07/15/26 | | | 357,313 | |
| | 380,000 | | | | | Mondelez International Holdings Netherlands BV, 1.63%, due 10/28/19‡ 144A | | | 374,503 | |
| | 255,000 | | | | | Morgan Stanley, 2.45%, due 02/01/19 | | | 257,406 | |
| | 921,000 | | | | | Morgan Stanley, 3.88%, due 04/29/24 | | | 949,295 | |
| | 305,000 | | | | | Morgan Stanley, 3.88%, due 01/27/26‡ | | | 309,631 | |
| | 660,000 | | | | | Morgan Stanley, 4.38%, due 01/22/47 | | | 663,222 | |
| | 325,000 | | | | | Morgan Stanley, 5.45%† ††††† | | | 331,289 | |
| | 435,000 | | | | | Morgan Stanley, 5.50%, due 01/26/20 | | | 472,268 | |
| | 2,147,000 | | | | | Morgan Stanley, 7.30%, due 05/13/19 | | | 2,374,500 | |
| | 1,720,000 | | | | | Morgan Stanley, (MTN), 4.10%, due 05/22/23 | | | 1,778,802 | |
| | 1,000,000 | | | | | Morgan Stanley, (MTN), Series F, 6.63%, due 04/01/18 | | | 1,046,935 | |
| | 25,000 | | | | | MPLX, LP, 5.20%, due 03/01/47‡ | | | 25,251 | |
| | 185,000 | | | | | MPT Operating Partnership, LP/MPT Finance Corp. REIT, 6.38%, due 02/15/22 | | | 191,475 | |
| | 225,000 | | | | | MTN Mauritius Investment, Ltd., 4.76%, due 11/11/24 144A | | | 213,300 | |
| | 334,000 | | | | | Mylan NV, 2.50%, due 06/07/19 | | | 335,704 | |
| | 645,000 | | | | | Mylan NV, 3.95%, due 06/15/26 | | | 632,546 | |
| | 360,000 | | | | | Myriad International Holdings BV, 5.50%, due 07/21/25‡ 144A | | | 374,760 | |
| | 245,000 | | | | | Nationstar Mortgage LLC/Nationstar Capital Corp., 6.50%, due 07/01/21 | | | 249,287 | |
| | 235,000 | | | | | Nationstar Mortgage LLC/Nationstar Capital Corp., 7.88%, due 10/01/20 | | | 243,812 | |
| | 165,000 | | | | | Nationstar Mortgage LLC/Nationstar Capital Corp., 9.63%, due 05/01/19 | | | 169,641 | |
| | 175,000 | | | | | Navient Corp., (MTN), 8.45%, due 06/15/18 | | | 186,813 | |
| | 90,000 | | | | | NCR Corp., 5.88%, due 12/15/21 | | | 94,163 | |
| | 237,000 | | | | | Nemak SAB de CV, 5.50%, due 02/28/23 144A | | | 247,369 | |
| | 42,000 | | | | | Newell Brands, Inc., 2.15%, due 10/15/18 | | | 42,193 | |
| | 170,000 | | | | | Newell Brands, Inc., 4.20%, due 04/01/26 | | | 177,120 | |
| | 70,000 | | | | | Newfield Exploration Co., 5.63%, due 07/01/24‡ | | | 74,113 | |
| | 103,000 | | | | | Newfield Exploration Co., 5.75%, due 01/30/22 | | | 109,824 | |
| | 335,000 | | | | | NewStar Financial, Inc., 7.25%, due 05/01/20 | | | 342,537 | |
| | 220,000 | | | | | NextEra Energy Capital Holdings, Inc., 1.65%, due 09/01/18 | | | 219,423 | |
| | 205,000 | | | | | NextEra Energy Capital Holdings, Inc., 2.30%, due 04/01/19 | | | 206,350 | |
| | 285,000 | | | | | Nippon Life Insurance Co., 5.10%, due 10/16/44† 144A | | | 302,100 | |
| | 780,000 | | | | | Noble Energy, Inc., 4.15%, due 12/15/21 | | | 819,248 | |
| | 200,000 | | | | | Noble Energy, Inc., 5.05%, due 11/15/44 | | | 205,277 | |
| | 1,403,000 | | | | | Noble Energy, Inc., 8.25%, due 03/01/19 | | | 1,561,385 | |
| | 205,000 | | | | | Norbord, Inc., 6.25%, due 04/15/23 144A | | | 216,275 | |
| | 220,000 | | | | | Northern States Power Co., 4.13%, due 05/15/44 | | | 224,749 | |
| | 200,090 | | | | | Northwest Airlines 2007-1 Class A Pass Through Trust, 7.03%, due 05/01/21 | | | 221,350 | |
| | | | | | |
| | See accompanying Notes to the Financial Statements. | | | 79 | |
Mercer Core Fixed Income Fund
Schedule of Investments (Continued)
(showing percentage of net assets)
March 31, 2017
| | | | | | | | | | |
| Par Value ($) | | | | | Description | | Value ($) | |
| | | |
| | | | | | Corporate Debt — continued | | | | |
| | | |
| | 370,000 | | | | | NOVA Chemicals Corp., 5.00%, due 05/01/25 144A | | | 377,400 | |
| | 80,000 | | | | | Novelis Corp., 5.88%, due 09/30/26 144A | | | 81,900 | |
| | 569,000 | | | | | NRG Energy, Inc., 6.25%, due 05/01/24‡ | | | 570,067 | |
| | 270,000 | | | | | NRG Energy, Inc., 6.63%, due 01/15/27‡ 144A | | | 270,675 | |
| | 540,000 | | | | | NRG Yield Operating LLC, 5.38%, due 08/15/24‡ | | | 550,800 | |
| | 225,000 | | | | | NRG Yield, Inc., 3.25%, due 06/01/20 144A | | | 220,500 | |
| | 530,000 | | | | | NXP BV/NXP Funding LLC, 4.63%, due 06/01/23 144A | | | 562,462 | |
| | 325,000 | | | | | NXP BV/NXP Funding LLC, 5.75%, due 03/15/23 144A | | | 343,687 | |
| | 315,000 | | | | | Occidental Petroleum Corp., 3.40%, due 04/15/26 | | | 314,756 | |
| | 210,000 | | | | | Omega Healthcare Investors, Inc. REIT, 4.50%, due 01/15/25 | | | 209,918 | |
| | 300,000 | | | | | Omega Healthcare Investors, Inc. REIT, 4.95%, due 04/01/24 | | | 309,233 | |
| | 195,000 | | | | | Omega Healthcare Investors, Inc. REIT, 5.25%, due 01/15/26 | | | 203,935 | |
| | 300,000 | | | | | Omnicom Group, Inc., 3.60%, due 04/15/26 | | | 300,421 | |
| | 139,000 | | | | | ONEOK Partners, LP, 5.00%, due 09/15/23 | | | 149,209 | |
| | 175,000 | | | | | Open Text Corp., 5.88%, due 06/01/26 144A | | | 183,750 | |
| | 320,000 | | | | | Oracle Corp., 4.30%, due 07/08/34 | | | 332,747 | |
| | 250,000 | | | | | Owens Corning, 4.20%, due 12/15/22 | | | 261,814 | |
| | 460,000 | | | | | Pacific Gas & Electric Co., 6.05%, due 03/01/34 | | | 577,509 | |
| | 85,000 | | | | | Park Aerospace Holdings, Ltd., 5.50%, due 02/15/24‡ 144A | | | 88,613 | |
| | 730,000 | | | | | Penske Truck Leasing Co. LP/PTL Finance Corp., 2.50%, due 06/15/19¤ 144A | | | 734,512 | |
| | 370,000 | | | | | PepsiCo, Inc., 1.50%, due 02/22/19 | | | 370,139 | |
| | 370,000 | | | | | Petrobras Global Finance BV, 5.63%, due 05/20/43 | | | 307,174 | |
| | 215,000 | | | | | Petrobras Global Finance BV, 7.38%, due 01/17/27 | | | 227,836 | |
| | 320,000 | | | | | Petroleos Mexicanos, 4.88%, due 01/24/22‡ | | | 329,984 | |
| | 80,000 | | | | | Petroleos Mexicanos, 5.38%, due 03/13/22 144A | | | 83,900 | |
| | 255,000 | | | | | Petroleos Mexicanos, 6.50%, due 06/02/41‡ | | | 255,255 | |
| | 350,000 | | | | | Petroleos Mexicanos, 6.88%, due 08/04/26 | | | 389,375 | |
| | 1,006,000 | | | | | Phillips 66 Partners, LP, 3.61%, due 02/15/25 | | | 981,314 | |
| | 115,000 | | | | | Plains All American Pipeline, LP/PAA Finance Corp., 4.70%, due 06/15/44 | | | 104,457 | |
| | 250,000 | | | | | Plains All American Pipeline, LP/PAA Finance Corp., 4.90%, due 02/15/45 | | | 235,073 | |
| | 435,000 | | | | | Platform Specialty Products Corp., 6.50%, due 02/01/22‡ 144A | | | 453,487 | |
| | 1,190,000 | | | | | PNC Bank NA, 2.95%, due 01/30/23 | | | 1,195,488 | |
| | 270,000 | | | | | PNC Financial Services Group, Inc. (The), 4.85%† ††††† ‡ | | | 269,241 | |
| | 163,000 | | | | | PNC Financial Services Group, Inc. (The), 6.75%† ††††† | | | 182,458 | |
| | 200,000 | | | | | Popular, Inc., 7.00%, due 07/01/19 | | | 209,750 | |
| | 145,000 | | | | | Post Holdings, Inc., 5.75%, due 03/01/27 144A | | | 145,363 | |
| | 540,000 | | | | | PPL Capital Funding, Inc., 5.00%, due 03/15/44 | | | 573,165 | |
| | 165,000 | | | | | Prime Security Services Borrower LLC/Prime Finance, Inc., 9.25%, due 05/15/23 144A | | | 181,294 | |
| | 95,000 | | | | | Private Export Funding Corp., 1.88%, due 07/15/18‡ | | | 95,662 | |
| | 90,000 | | | | | Providence St. Joseph Health Obligated Group, 2.75%, due 10/01/26 | | | 85,857 | |
| | 240,000 | | | | | Prudential Financial, Inc., 5.20%, due 03/15/44† | | | 246,720 | |
| | 190,000 | | | | | Prudential Financial, Inc., 5.88%, due 09/15/42† | | | 206,720 | |
| | 1,000,000 | | | | | Prudential Financial, Inc., 7.38%, due 06/15/19 | | | 1,115,488 | |
| | 170,000 | | | | | QEP Resources, Inc., 6.88%, due 03/01/21‡ | | | 181,475 | |
| | 370,000 | | | | | Quicken Loans, Inc., 5.75%, due 05/01/25‡ 144A | | | 365,375 | |
| | 175,000 | | | | | Quintiles IMS, Inc., 4.88%, due 05/15/23 144A | | | 178,281 | |
| | 400,000 | | | | | QVC, Inc., 4.38%, due 03/15/23 | | | 401,672 | |
| | 265,000 | | | | | QVC, Inc., 5.13%, due 07/02/22 | | | 278,496 | |
| | 300,000 | | | | | QVC, Inc., 5.45%, due 08/15/34 | | | 277,417 | |
| | | | | | |
| 80 | | See accompanying Notes to the Financial Statements. | | | | |
Mercer Core Fixed Income Fund
Schedule of Investments (Continued)
(showing percentage of net assets)
March 31, 2017
| | | | | | | | | | |
| Par Value ($) | | | | | Description | | Value ($) | |
| | | |
| | | | | | Corporate Debt — continued | | | | |
| | | |
| | 305,000 | | | | | Rabobank Nederland NV, 11.00%† ††††† 144A | | | 357,231 | |
| | 135,000 | | | | | Radian Group, Inc., 5.25%, due 06/15/20‡ | | | 142,256 | |
| | 245,000 | | | | | Radian Group, Inc., 7.00%, due 03/15/21 | | | 271,950 | |
| | 235,000 | | | | | Rain CII Carbon LLC/CII Carbon Corp., 8.25%, due 01/15/21 144A | | | 243,519 | |
| | 1,207,000 | | | | | Realty Income Corp. REIT, 4.65%, due 08/01/23 | | | 1,302,190 | |
| | 465,000 | | | | | Regency Energy Partners, LP/Regency Energy Finance Corp., 5.50%, due 04/15/23 | | | 485,344 | |
| | 175,000 | | | | | Revlon Consumer Products Corp., 5.75%, due 02/15/21 | | | 175,656 | |
| | 185,000 | | | | | Revlon Consumer Products Corp., 6.25%, due 08/01/24‡ | | | 185,000 | |
| | 920,000 | | | | | Rio Tinto Finance USA, Ltd., 9.00%, due 05/01/19 | | | 1,049,852 | |
| | 500,000 | | | | | Royal Bank of Scotland Group Plc, 3.88%, due 09/12/23 | | | 493,475 | |
| | 315,000 | | | | | Royal Bank of Scotland Group Plc, 4.80%, due 04/05/26 | | | 322,933 | |
| | 205,000 | | | | | Royal Bank of Scotland Group Plc, 8.00%† ††††† ‡ | | | 204,465 | |
| | 200,000 | | | | | Royal Bank of Scotland Group Plc, 8.63%† ††††† | | | 209,000 | |
| | 345,000 | | | | | S&P Global, Inc., 4.00%, due 06/15/25 | | | 355,194 | |
| | 67,000 | | | | | S&P Global, Inc., 4.40%, due 02/15/26 | | | 71,236 | |
| | 455,000 | | | | | Sabine Pass Liquefaction LLC, 4.20%, due 03/15/28 144A | | | 450,432 | |
| | 140,000 | | | | | Sabine Pass Liquefaction LLC, 5.75%, due 05/15/24 | | | 152,790 | |
| | 320,000 | | | | | Sally Holdings LLC/Sally Capital, Inc., 5.63%, due 12/01/25‡ | | | 321,200 | |
| | 630,000 | | | | | Santander Holdings USA, Inc., 2.70%, due 05/24/19 | | | 633,296 | |
| | 380,000 | | | | | Santander UK Group Holdings Plc, 4.75%, due 09/15/25 144A | | | 380,295 | |
| | 1,295,000 | | | | | Schlumberger Holdings Corp., 3.00%, due 12/21/20‡ 144A | | | 1,324,851 | |
| | 320,000 | | | | | Select Medical Corp., 6.38%, due 06/01/21‡ | | | 324,800 | |
| | 1,220,000 | | | | | Sempra Energy, 2.40%, due 03/15/20 | | | 1,225,259 | |
| | 645,000 | | | | | Shell International Finance BV, 4.38%, due 05/11/45 | | | 655,686 | |
| | 465,000 | | | | | Shire Acquisitions Investments Ireland DAC, 1.90%, due 09/23/19 | | | 461,925 | |
| | 485,000 | | | | | Shire Acquisitions Investments Ireland DAC, 2.88%, due 09/23/23 | | | 471,294 | |
| | 875,000 | | | | | Shire Acquisitions Investments Ireland DAC, 3.20%, due 09/23/26 | | | 834,875 | |
| | 850,000 | | | | | Simon Property Group, LP REIT, 6.75%, due 02/01/40 | | | 1,109,720 | |
| | 230,000 | | | | | Sinclair Television Group, Inc., 5.63%, due 08/01/24‡ 144A | | | 233,450 | |
| | 500,000 | | | | | Sinopec Group Overseas Development 2015, Ltd., 2.50%, due 04/28/20 144A | | | 498,115 | |
| | 215,000 | | | | | Sirius XM Radio, Inc., 5.25%, due 08/15/22 144A | | | 223,063 | |
| | 205,000 | | | | | Sirius XM Radio, Inc., 5.38%, due 04/15/25 144A | | | 210,330 | |
| | 315,000 | | | | | Sirius XM Radio, Inc., 5.38%, due 07/15/26 144A | | | 322,875 | |
| | 210,000 | | | | | Sixsigma Networks Mexico SA de CV, 8.25%, due 11/07/21‡ 144A | | | 208,950 | |
| | 335,000 | | | | | Societe Generale SA, 7.38%† ††††† ‡ 144A | | | 341,063 | |
| | 325,000 | | | | | Societe Generale SA, 8.00%† ††††† 144A | | | 333,125 | |
| | 200,000 | | | | | Societe Generale SA, Reg S, 8.25%† ††††† ‡‡‡ | | | 209,741 | |
| | 1,318,000 | | | | | Southern Co. (The), 3.25%, due 07/01/26 | | | 1,259,834 | |
| | 1,260,000 | | | | | Southern Co. Gas Capital Corp., 2.45%, due 10/01/23 | | | 1,210,326 | |
| | 630,000 | | | | | Southern Copper Corp., 5.25%, due 11/08/42 | | | 620,999 | |
| | 470,000 | | | | | Southern Power Co., 1.95%, due 12/15/19 | | | 466,846 | |
| | 255,000 | | | | | Sprint Capital Corp., 6.88%, due 11/15/28 | | | 269,981 | |
| | 735,000 | | | | | Sprint Spectrum Co. LLC/Sprint Spectrum Co. II LLC/Sprint Spectrum Co. III LLC, 3.36%, due 03/20/23 144A | | | 735,000 | |
| | 540,000 | | | | | Standard Chartered Plc, 2.10%, due 08/19/19 144A | | | 535,871 | |
| | 377,000 | | | | | State Street Corp., 2.13%, due 06/01/77† | | | 331,289 | |
| | 850,000 | | | | | State Street Corp., 4.96%, due 03/15/18 | | | 874,257 | |
| | 395,000 | | | | | State Street Corp., 5.25%† ††††† | | | 414,750 | |
| | 18,000 | | | | | Stearns Holdings LLC, 9.38%, due 08/15/20 144A | | | 18,270 | |
| | | | | | |
| | See accompanying Notes to the Financial Statements. | | | 81 | |
Mercer Core Fixed Income Fund
Schedule of Investments (Continued)
(showing percentage of net assets)
March 31, 2017
| | | | | | | | | | |
| Par Value ($) | | | | | Description | | Value ($) | |
| | | |
| | | | | | Corporate Debt — continued | | | | |
| | | |
| | 310,000 | | | | | Stifel Financial Corp., 4.25%, due 07/18/24 | | | 314,348 | |
| | 245,000 | | | | | Sumitomo Mitsui Banking Corp., 2.45%, due 01/10/19 | | | 246,911 | |
| | 470,000 | | | | | Sumitomo Mitsui Trust Bank, Ltd., 2.05%, due 03/06/19 144A | | | 469,442 | |
| | 215,000 | | | | | Summit Midstream Holdings LLC/Summit Midstream Finance Corp., 5.75%, due 04/15/25 | | | 215,000 | |
| | 922,000 | | | | | Sunoco Logistics Partners Operations, LP, 3.45%, due 01/15/23 | | | 910,264 | |
| | 460,000 | | | | | Sunoco Logistics Partners Operations, LP, 3.90%, due 07/15/26‡ | | | 445,304 | |
| | 271,000 | | | | | Sunoco Logistics Partners Operations, LP, 4.40%, due 04/01/21 | | | 285,442 | |
| | 250,000 | | | | | Sunoco, LP/Sunoco Finance Corp., 6.25%, due 04/15/21 | | | 255,625 | |
| | 145,000 | | | | | SUPERVALU, Inc., 7.75%, due 11/15/22‡ | | | 143,006 | |
| | 85,000 | | | | | Symantec Corp., 5.00%, due 04/15/25 144A | | | 87,258 | |
| | 440,000 | | | | | Synchrony Financial, 3.70%, due 08/04/26 | | | 427,416 | |
| | 217,000 | | | | | Synovus Financial Corp., 7.88%, due 02/15/19 | | | 236,953 | |
| | 190,000 | | | | | T-Mobile USA, Inc., 6.13%, due 01/15/22 | | | 201,163 | |
| | 165,000 | | | | | T-Mobile USA, Inc., 6.25%, due 04/01/21‡ | | | 170,156 | |
| | 130,000 | | | | | Tallgrass Energy Partners, LP/Tallgrass Energy Finance Corp., 5.50%,
due 09/15/24‡ 144A | | | 131,300 | |
| | 270,000 | | | | | Taylor Morrison Communities, Inc./Monarch Communities, Inc., 5.25%,
due 04/15/21 144A | | | 279,450 | |
| | 615,000 | | | | | Teachers Insurance & Annuity Association of America, 6.85%, due 12/16/39 144A | | | 814,507 | |
| | 461,000 | | | | | Tech Data Corp., 4.95%, due 02/15/27 | | | 466,242 | |
| | 295,000 | | | | | Telecom Italia Capital SA, Guaranteed Senior Note, 7.20%, due 07/18/36 | | | 314,246 | |
| | 1,568,000 | | | | | Telefonaktiebolaget LM Ericsson, 4.13%, due 05/15/22‡ | | | 1,605,576 | |
| | 260,000 | | | | | Telefonos de Mexico SAB de CV, 5.50%, due 11/15/19 | | | 281,819 | |
| | 90,000 | | | | | Tenet Healthcare Corp., 4.38%, due 10/01/21 | | | 90,450 | |
| | 60,000 | | | | | Tervita Escrow Corp., 7.63%, due 12/01/21 144A | | | 62,250 | |
| | 140,000 | | | | | Tesoro Logistics, LP/Tesoro Logistics Finance Corp., 5.25%, due 01/15/25‡ | | | 146,825 | |
| | 385,000 | | | | | Tesoro Logistics, LP/Tesoro Logistics Finance Corp., 6.13%, due 10/15/21 | | | 403,769 | |
| | 270,000 | | | | | Tesoro Logistics, LP/Tesoro Logistics Finance Corp., 6.38%, due 05/01/24 | | | 293,625 | |
| | 1,775,000 | | | | | Teva Pharmaceutical Finance Netherlands III BV, 3.15%, due 10/01/26‡ | | | 1,638,980 | |
| | 40,000 | | | | | Teva Pharmaceutical Finance Netherlands III BV, 4.10%, due 10/01/46‡ | | | 34,594 | |
| | 220,000 | | | | | Thermo Fisher Scientific, Inc., 3.60%, due 08/15/21 | | | 228,556 | |
| | 70,000 | | | | | Time Warner Cable LLC, 4.13%, due 02/15/21 | | | 72,884 | |
| | 740,000 | | | | | Time Warner Cable LLC, 5.85%, due 05/01/17 | | | 742,286 | |
| | 670,000 | | | | | Time Warner Cable LLC, 8.25%, due 04/01/19 | | | 747,306 | |
| | 971,000 | | | | | Time Warner Cos., Inc., 7.57%, due 02/01/24 | | | 1,195,420 | |
| | 590,000 | | | | | Time Warner, Inc., 3.80%, due 02/15/27 | | | 584,757 | |
| | 260,000 | | | | | Time Warner, Inc., 4.70%, due 01/15/21 | | | 278,977 | |
| | 200,000 | | | | | Time Warner, Inc., 4.75%, due 03/29/21 | | | 214,892 | |
| | 550,000 | | | | | Total System Services, Inc., 4.80%, due 04/01/26 | | | 593,099 | |
| | 265,000 | | | | | Tutor Perini Corp., 7.63%, due 11/01/18‡ | | | 265,497 | |
| | 1,812,000 | | | | | UBS Group Funding Jersey, Ltd., 4.13%, due 04/15/26‡ 144A | | | 1,845,462 | |
| | 3,294,773 | | | | | United Airlines 2014-1 Class A Pass Through Trust, 4.00%, due 10/11/27 | | | 3,418,327 | |
| | 446,842 | | | | | United Airlines 2014-2 Class A Pass Through Trust, 3.75%, due 03/03/28 | | | 454,139 | |
| | 190,000 | | | | | United Airlines 2016-1 Class A Pass Through Trust, 3.45%, due 01/07/30 | | | 186,438 | |
| | 220,000 | | | | | United Rentals North America, Inc., 5.50%, due 07/15/25‡ | | | 227,425 | |
| | 145,000 | | | | | United Rentals North America, Inc., 5.75%, due 11/15/24 | | | 151,706 | |
| | 105,000 | | | | | United Rentals North America, Inc., 5.88%, due 09/15/26 | | | 109,856 | |
| | 130,000 | | | | | UnitedHealth Group, Inc., 4.20%, due 01/15/47 | | | 132,342 | |
| | 390,000 | | | | | UnitedHealth Group, Inc., 4.38%, due 03/15/42 | | | 405,208 | |
| | | | | | |
| 82 | | See accompanying Notes to the Financial Statements. | | | | |
Mercer Core Fixed Income Fund
Schedule of Investments (Continued)
(showing percentage of net assets)
March 31, 2017
| | | | | | | | | | |
| Par Value ($) | | | | | Description | | Value ($) | |
| | | |
| | | | | | Corporate Debt — continued | | | | |
| | | |
| | 230,000 | | | | | Universal Health Services, Inc., 4.75%, due 08/01/22‡ 144A | | | 237,475 | |
| | 155,000 | | | | | Universal Health Services, Inc., 5.00%, due 06/01/26 144A | | | 160,038 | |
| | 198,637 | | | | | US Airways 2010-1 Class A Pass Through Trust, 6.25%, due 10/22/24 | | | 216,763 | |
| | 216,659 | | | | | US Airways 2012-1 Class A Pass Through Trust, 5.90%, due 04/01/26 | | | 241,638 | |
| | 350,000 | | | | | US Bank NA/Cincinnati OH, 2.00%, due 01/24/20‡ | | | 351,440 | |
| | 145,000 | | | | | US Concrete, Inc., 6.38%, due 06/01/24 144A | | | 150,800 | |
| | 210,000 | | | | | Vale Overseas, Ltd., 6.25%, due 08/10/26‡ | | | 228,638 | |
| | 490,000 | | | | | Valero Energy Corp., 3.40%, due 09/15/26‡ | | | 469,028 | |
| | 115,000 | | | | | Vector Group, Ltd., 6.13%, due 02/01/25 144A | | | 117,731 | |
| | 200,000 | | | | | Vedanta Resources Plc, 6.38%, due 07/30/22 144A | | | 201,500 | |
| | 430,000 | | | | | Ventas Realty, LP REIT, 3.50%, due 02/01/25 | | | 421,599 | |
| | 87,000 | | | | | Ventas Realty, LP REIT, 3.75%, due 05/01/24 | | | 87,517 | |
| | 2,000,000 | | | | | Ventas Realty, LP/Ventas Capital Corp. REIT, 2.70%, due 04/01/20 | | | 2,017,980 | |
| | 260,000 | | | | | VEREIT Operating Partnership, LP REIT, 4.60%, due 02/06/24 | | | 269,100 | |
| | 170,000 | | | | | VeriSign, Inc., 5.25%, due 04/01/25 | | | 177,013 | |
| | 420,000 | | | | | Verisk Analytics, Inc., 4.00%, due 06/15/25 | | | 427,612 | |
| | 255,000 | | | | | Verizon Communications, Inc., 4.40%, due 11/01/34 | | | 242,027 | |
| | 1,017,000 | | | | | Verizon Communications, Inc., 4.52%, due 09/15/48 | | | 925,053 | |
| | 310,000 | | | | | Verizon Communications, Inc., 4.67%, due 03/15/55 | | | 277,983 | |
| | 1,546,000 | | | | | Verizon Communications, Inc., 4.86%, due 08/21/46 | | | 1,492,015 | |
| | 1,190,000 | | | | | Verizon Communications, Inc., 5.01%, due 08/21/54‡ | | | 1,137,264 | |
| | 110,000 | | | | | Verizon Communications, Inc., 5.05%, due 03/15/34 | | | 112,173 | |
| | 430,000 | | | | | Viacom, Inc., 4.38%, due 03/15/43 | | | 374,073 | |
| | 824,000 | | | | | Virginia Electric & Power Co., 3.15%, due 01/15/26 | | | 820,992 | |
| | 223,000 | | | | | Vista Outdoor, Inc., 5.88%, due 10/01/23‡ | | | 217,983 | |
| | 415,000 | | | | | Voya Financial, Inc., 5.65%, due 05/15/53† | | | 423,300 | |
| | 325,000 | | | | | Walgreens Boots Alliance, Inc., 1.75%, due 05/30/18 | | | 325,488 | |
| | 855,000 | | | | | WEA Finance LLC/Westfield UK & Europe Finance Plc REIT, 2.70%,
due 09/17/19 144A | | | 863,423 | |
| | 200,000 | | | | | WellCare Health Plans, Inc., 5.75%, due 11/15/20 | | | 205,820 | |
| | 1,298,000 | | | | | Wells Fargo & Co., 3.07%, due 01/24/23‡ | | | 1,306,764 | |
| | 90,000 | | | | | Wells Fargo & Co., 4.60%, due 04/01/21 | | | 96,809 | |
| | 265,000 | | | | | Wells Fargo & Co., 4.65%, due 11/04/44 | | | 266,587 | |
| | 735,000 | | | | | Wells Fargo & Co., 5.88%† ††††† | | | 793,206 | |
| | 315,000 | | | | | Wells Fargo & Co., Class A, Series K, 7.98%† ††††† ‡ | | | 329,569 | |
| | 1,100,000 | | | | | Welltower, Inc. REIT, 4.50%, due 01/15/24 | | | 1,159,029 | |
| | 240,000 | | | | | Westlake Chemical Corp., 4.63%, due 02/15/21 144A | | | 249,291 | |
| | 581,000 | | | | | Westpac Banking Corp., 2.15%, due 03/06/20 | | | 581,591 | |
| | 170,000 | | | | | WestRock RKT Co., 3.50%, due 03/01/20 | | | 174,596 | |
| | 1,000,000 | | | | | Weyerhaeuser Co. REIT, 7.38%, due 10/01/19 | | | 1,121,551 | |
| | 575,000 | | | | | Whole Foods Market, Inc., 5.20%, due 12/03/25 | | | 612,131 | |
| | 255,000 | | | | | Williams Partners, LP/ACMP Finance Corp., 4.88%, due 05/15/23 | | | 263,332 | |
| | 430,000 | | | | | Williams Partners, LP/ACMP Finance Corp., 4.88%, due 03/15/24 | | | 442,805 | |
| | 200,000 | | | | | Wind Acquisition Finance SA, 7.38%, due 04/23/21 144A | | | 208,500 | |
| | 80,000 | | | | | WM Wrigley Jr Co., 2.40%, due 10/21/18 144A | | | 80,678 | |
| | 320,000 | | | | | WM Wrigley Jr Co., 2.90%, due 10/21/19 144A | | | 325,898 | |
| | 90,000 | | | | | WM Wrigley Jr Co., 3.38%, due 10/21/20 144A | | | 93,138 | |
| | 145,000 | | | | | WMG Acquisition Corp., 4.88%, due 11/01/24¤ 144A | | | 146,450 | |
| | 310,000 | | | | | WMG Acquisition Corp., 6.75%, due 04/15/22‡ 144A | | | 327,050 | |
| | | | | | |
| | See accompanying Notes to the Financial Statements. | | | 83 | |
Mercer Core Fixed Income Fund
Schedule of Investments (Continued)
(showing percentage of net assets)
March 31, 2017
| | | | | | | | | | |
| Par Value ($) | | | | | Description | | Value ($) | |
| | | |
| | | | | | Corporate Debt — continued | | | | |
| | | |
| | 1,000 | | | | | Xerox Corp., 4.07%, due 03/17/22 144A | | | 1,017 | |
| | 360,000 | | | | | XPO Logistics, Inc., 6.50%, due 06/15/22‡ 144A | | | 379,350 | |
| | 310,000 | | | | | YPF SA, 8.50%, due 07/28/25‡ 144A | | | 337,032 | |
| | 110,000 | | | | | Zebra Technologies Corp., 7.25%, due 10/15/22‡ | | | 119,213 | |
| | 225,000 | | | | | ZF North America Capital, Inc., 4.75%, due 04/29/25 144A | | | 233,719 | |
| | 200,000 | | | | | ZFS Finance USA Trust V, Series V, 6.50%, due 05/09/67† 144A | | | 200,250 | |
| | 425,000 | | | | | Zimmer Biomet Holdings, Inc., 3.55%, due 04/01/25 | | | 420,969 | |
| | | | | | | | | | |
| | | | | | | | | 299,903,257 | |
| | | | | | | | | | |
| | | |
| | | | | | Mortgage Backed Securities - Private Issuers — 9.5% | | | | |
| | | |
| | 796,291 | | | | | Agate Bay Mortgage Trust, Series 2016-3, Class A5, 3.50%, due 08/25/46† 144A | | | 811,214 | |
| | 49,924 | | | | | American Home Mortgage Investment Trust, Series 2005-1, Class 1A1, 1.22%, due 06/25/45† | | | 48,234 | |
| | 450,000 | | | | | Americold LLC, Series 2010-ARTA, Class D, 7.44%, due 01/14/29 144A | | | 504,625 | |
| | 113,000 | | | | | AOA Mortgage Trust, Series 2015-1177, Class C, 3.01%, due 12/13/29† 144A | | | 112,216 | |
| | 264,000 | | | | | Barclays Commercial Mortgage Trust, Series 2015-MSQ, Class D, 3.99%,
due 09/15/32† 144A | | | 263,991 | |
| | 1,350,000 | | | | | Barclays Commercial Mortgage Trust, Series 2016-ETC, Class A, 2.94%,
due 08/14/36 144A | | | 1,321,449 | |
| | 359,655 | | | | | Bear Stearns ALT-A Trust, Series 2004-12, Class 1A3, 1.68%, due 01/25/35† | | | 354,175 | |
| | 142,768 | | | | | Bear Stearns ALT-A Trust, Series 2005-7, Class 11A1, 1.52%, due 08/25/35† | | | 138,535 | |
| | 309,954 | | | | | Bear Stearns ARM Trust, Series 2005-2, Class A1, 3.26%, due 03/25/35† | | | 312,661 | |
| | 240,157 | | | | | Bear Stearns ARM Trust, Series 2005-5, Class A2, 2.82%, due 08/25/35† | | | 239,524 | |
| | 130,000 | | | | | BWAY Mortgage Trust, Series 2015-1740, Class D, 3.79%, due 01/10/35† 144A | | | 127,572 | |
| | 300,000 | | | | | BXHTL Mortgage Trust, Series 2015-JWRZ, Class GL2, 4.60%, due 05/15/29† 144A | | | 302,360 | |
| | 366,000 | | | | | CD Mortgage Trust, Series 2017-CD3, Class C, 4.56%, due 02/10/50† | | | 382,248 | |
| | 368,700 | | | | | CDGJ Commercial Mortgage Trust, Series 2014-BXCH, Class DPA, 3.91%, due 12/15/27† 144A | | | 371,489 | |
| | 700,000 | | | | | CFCRE Commercial Mortgage Trust, Series 2016-C4, Class A3, 3.01%, due 05/10/58 | | | 685,949 | |
| | 480,000 | | | | | CGGS Commercial Mortgage Trust, Series 2016-RNDA, Class DFX, 4.39%, due 02/10/33 144A | | | 488,498 | |
| | 1,110,000 | | | | | CIM Trust, Series 2017-3, 1.00%, due 01/25/57 144A | | | 1,107,919 | |
| | 1,301,869 | | | | | Citigroup Commercial Mortgage Trust, Series 2007-C6, Class A4, 5.78%, due 12/10/49† | | | 1,303,422 | |
| | 1,600,000 | | | | | Citigroup Commercial Mortgage Trust, Series 2014-GC23, Class A3, 3.36%, due 07/10/47 | | | 1,631,954 | |
| | 1,500,000 | | | | | Citigroup Commercial Mortgage Trust, Series 2015-GC27, Class A4, 2.88%, due 02/10/48 | | | 1,475,089 | |
| | 1,772,000 | | | | | Citigroup Commercial Mortgage Trust, Series 2016-P5, Class A2, 2.40%, due 10/10/49 | | | 1,771,523 | |
| | 1,000,000 | | | | | Citigroup Commercial Mortgage Trust, Inc., Series 2013-GC17, Class A2, 2.96%, due 11/10/46 | | | 1,013,732 | |
| | 27,500,000 | | | | | Citigroup Commercial Mortgage Trust, Inc., (IO), Series 2014-GC21, Class XB, 0.33%, due 05/10/47† | | | 781,470 | |
| | 677,567 | | | | | Commercial Mortgage Pass Through Certificates, Series 2007-C9, Class A4, 5.81%, due 12/10/49† | | | 680,077 | |
| | 206,000 | | | | | Commercial Mortgage Pass Through Certificates, Series 2012-LC4, Class B, 4.93%, due 12/10/44† | | | 220,402 | |
| | 130,000 | | | | | Commercial Mortgage Pass Through Certificates, Series 2013-300P, Class D, 4.39%, due 08/10/30† 144A | | | 134,274 | |
| | 460,000 | | | | | Commercial Mortgage Pass Through Certificates, Series 2013-CR11, Class B, 5.16%, due 08/10/50† | | | 502,145 | |
| | | | | | |
| 84 | | See accompanying Notes to the Financial Statements. | | | | |
Mercer Core Fixed Income Fund
Schedule of Investments (Continued)
(showing percentage of net assets)
March 31, 2017
| | | | | | | | | | |
| Par Value ($) | | | | | Description | | Value ($) | |
| | | |
| | | | | | Mortgage Backed Securities - Private Issuers — continued | | | | |
| | | |
| | 225,000 | | | | | Commercial Mortgage Pass Through Certificates, Series 2013-CR13, Class C, 4.75%, due 12/10/23† | | | 232,343 | |
| | 300,000 | | | | | Commercial Mortgage Pass Through Certificates, Series 2013-CR8, Class A2, 2.37%, due 06/10/46 | | | 302,467 | |
| | 100,000 | | | | | Commercial Mortgage Pass Through Certificates, Series 2013-LC6, Class A3, 2.67%, due 01/10/46 | | | 100,522 | |
| | 397,000 | | | | | Commercial Mortgage Pass Through Certificates, Series 2014-CR16, Class C, 4.90%, due 04/10/47† | | | 404,153 | |
| | 1,600,000 | | | | | Commercial Mortgage Pass Through Certificates, Series 2014-CR20, Class A3, 3.33%, due 11/10/47 | | | 1,623,082 | |
| | 425,000 | | | | | Commercial Mortgage Pass Through Certificates, Series 2014-FL4, Class D, 3.33%, due 07/13/31† 144A | | | 416,163 | |
| | 195,000 | | | | | Commercial Mortgage Pass Through Certificates, Series 2014-PAT, Class D, 3.03%, due 08/13/27† 144A | | | 195,154 | |
| | 390,000 | | | | | Commercial Mortgage Pass Through Certificates, Series 2014-TWC, Class D, 3.13%, due 02/13/32† 144A | | | 392,070 | |
| | 2,150,000 | | | | | Commercial Mortgage Pass Through Certificates, Series 2014-UBS2, Class A2, 2.82%, due 03/10/47 | | | 2,170,355 | |
| | 1,200,000 | | | | | Commercial Mortgage Pass Through Certificates, Series 2015-CR25, Class A3, 3.51%, due 08/10/48 | | | 1,226,961 | |
| | 250,000 | | | | | Commercial Mortgage Pass Through Certificates, Series 2015-CR27, Class B, 4.36%, due 10/10/48† | | | 262,340 | |
| | 53,000,000 | | | | | Commercial Mortgage Pass Through Certificates, (IO), Series 2014-CR17, Class XB, 0.21%, due 05/10/47† 144A | | | 770,085 | |
| | 355,000 | | | | | Core Industrial Trust, Series 2015-CALW, Class F, 3.85%, due 02/10/34† 144A | | | 353,512 | |
| | 207,633 | | | | | Credit Suisse Commercial Mortgage Trust, Series 2007-C3, Class A4, 5.72%, due 06/15/39† | | | 207,526 | |
| | 475,000 | | | | | Credit Suisse First Boston Mortgage Securities Corp., Series 2006-OMA, Class B2, 5.54%, due 05/15/23 144A | | | 507,480 | |
| | 115,000 | | | | | DBJPM Mortgage Trust, Series 2016-C3, Class C, 3.49%, due 09/10/49† | | | 109,350 | |
| | 255,731 | | | | | Fremont Home Loan Trust, Series 2004-B, Class M1, 1.85%, due 05/25/34† | | | 239,251 | |
| �� | 339,000 | | | | | GAHR Commercial Mortgage Trust, Series 2015-NRF, Class DFX, 3.38%,
due 12/15/34† 144A | | | 342,664 | |
| | 35,386 | | | | | GMACM Mortgage Loan Trust, Series 2004-AR2, Class 3A, 3.65%, due 08/19/34† | | | 34,288 | |
| | 3,189,794 | | | | | Greenwich Capital Commercial Funding Corp., Series 2007-GG11, Class A4, 5.74%, due 12/10/49 | | | 3,206,683 | |
| | 155,000 | | | | | GS Mortgage Securities Trust, Series 2014-NEW, Class C, 3.79%, due 01/10/31¤ 144A | | | 153,124 | |
| | 260,000 | | | | | GS Mortgage Securities Trust, Series 2015-590M, Class C, 3.81%, due 10/10/35† 144A | | | 259,807 | |
| | 900,000 | | | | | GS Mortgage Securities Trust, Series 2015-GC28, Class A4, 3.14%, due 02/10/48 | | | 900,121 | |
| | 475,000 | | | | | GS Mortgage Securities Trust, Series 2016-ICE2, Class D, 6.66%, due 02/15/33† 144A | | | 492,145 | |
| | 325,000 | | | | | GS Mortgage Securities Trust, Series 2016-RENT, Class D, 4.07%, due 02/10/29† 144A | | | 330,789 | |
| | 200,000 | | | | | GS Mortgage Securities Trust, Series 2017-485L, Class C, 3.98%, due 02/10/37¤ † 144A | | | 205,649 | |
| | 165,000 | | | | | GS Mortgage Securities Trust, Series 2017-GS5, Class C, 4.30%, due 03/10/50† | | | 170,695 | |
| | 82,777 | | | | | HarborView Mortgage Loan Trust, Series 2005-9, Class 2A1C, 1.43%, due 06/20/35† | | | 78,865 | |
| | 310,000 | | | | | Hilton Mortgage Trust, Series 2014-ORL, Class D, 2.77%, due 07/15/29† 144A | | | 305,658 | |
| | 280,000 | | | | | Hilton USA Trust, Series 2016-HHV, Class D, 4.19%, due 11/05/38¤ † 144A | | | 266,953 | |
| | 100,000 | | | | | Hudsons Bay Simon JV Trust, Series 2015-HBFL, Class DFL, 4.48%,
due 08/05/34† 144A | | | 99,493 | |
| | 415,000 | | | | | JPMBB Commercial Mortgage Securities Trust, Series 2014-C19, Class C, 4.67%, due 04/15/47† | | | 425,833 | |
| | | | | | |
| | See accompanying Notes to the Financial Statements. | | | 85 | |
Mercer Core Fixed Income Fund
Schedule of Investments (Continued)
(showing percentage of net assets)
March 31, 2017
| | | | | | | | | | |
| Par Value ($) | | | | | Description | | Value ($) | |
| | | |
| | | | | | Mortgage Backed Securities - Private Issuers — continued | | | | |
| | | |
| | 700,000 | | | | | JPMDB Commercial Mortgage Securities Trust, Series 2016-C2, Class A3A, 2.88%, due 06/15/49 | | | 684,150 | |
| | 1,300,000 | | | | | JPMDB Commercial Mortgage Securities Trust, Series 2017-C5, Class A4, 3.41%, due 03/15/50 | | | 1,321,574 | |
| | 1,643,473 | | | | | JPMorgan Chase Commercial Mortgage Securities Corp., Series 2007-LD11, Class A4, 5.84%, due 06/15/49† | | | 1,644,042 | |
| | 1,725,000 | | | | | JPMorgan Chase Commercial Mortgage Securities Corp., Series 2014-C19, Class A3, 3.67%, due 04/15/47 | | | 1,790,054 | |
| | 1,331,000 | | | | | JPMorgan Chase Commercial Mortgage Securities Trust, Series 2011-C3, Class A4, 4.72%, due 02/15/46 144A | | | 1,435,724 | |
| | 500,000 | | | | | JPMorgan Chase Commercial Mortgage Securities Trust, Series 2013-C13, Class A3, 3.53%, due 01/15/46 | | | 515,409 | |
| | 516,000 | | | | | JPMorgan Chase Commercial Mortgage Securities Trust, Series 2014-FL5, Class C, 2.87%, due 07/15/31† 144A | | | 510,832 | |
| | 400,000 | | | | | JPMorgan Chase Commercial Mortgage Securities Trust, Series 2014-INN, Class F, 4.91%, due 06/15/29† 144A | | | 394,947 | |
| | 18,000 | | | | | JPMorgan Chase Commercial Mortgage Securities Trust, Series 2014-PHH, Class C, 3.01%, due 08/15/27† 144A | | | 18,023 | |
| | 455,000 | | | | | JPMorgan Chase Commercial Mortgage Securities Trust, Series 2015-MAR7, Class C, 4.49%, due 06/05/32 144A | | | 456,221 | |
| | 171,000 | | | | | JPMorgan Chase Commercial Mortgage Securities Trust, Series 2015-SGP, Class B, 3.66%, due 07/15/36† 144A | | | 172,393 | |
| | 177,000 | | | | | JPMorgan Chase Commercial Mortgage Securities Trust, Series 2016-JP3, Class C, 3.48%, due 08/15/49† | | | 166,968 | |
| | 1,349,250 | | | | | JPMorgan Mortgage Trust, Series 2016-1, Class A5, 3.50%, due 05/25/46 144A | | | 1,380,228 | |
| | 830,127 | | | | | JPMorgan Mortgage Trust, Series 2016-4, Class A5, 3.50%, due 10/25/46† 144A | | | 848,019 | |
| | 106,859 | | | | | LSTAR Securities Investment Trust, Series 2015-10, Class A1, 2.78%,
due 11/02/20† 144A | | | 106,959 | |
| | 850,964 | | | | | LSTAR Securities Investment Trust, Series 2015-6, Class A, 2.78%,
due 05/01/20† 144A | | | 847,773 | |
| | 235,963 | | | | | LSTAR Securities Investment Trust, Series 2015-8, Class A1, 2.78%,
due 08/01/20† 144A | | | 237,059 | |
| | 395,696 | | | | | LSTAR Securities Investment Trust, Series 2015-9, Class A1, 2.78%,
due 10/01/20† 144A | | | 394,213 | |
| | 667,315 | | | | | LSTAR Securities Investment Trust, Series 2017-1, Class A, 2.78%,
due 01/01/22† 144A | | | 665,647 | |
| | 404,316 | | | | | LSTAR Securities Investment, Ltd., Series 2016-3, Class A, 2.78%, due 09/01/21† 144A | | | 401,245 | |
| | 250,000 | | | | | MASTR Adjustable Rate Mortgages Trust, Series 2004-11, Class M2, 2.08%, due 11/25/34† | | | 244,061 | |
| | 150,247 | | | | | MASTR Alternative Loan Trust, Series 2005-2, Class 4A3, 1.38%, due 03/25/35† | | | 143,763 | |
| | 81,125 | | | | | Merrill Lynch Mortgage Investors Trust, Series 2005-2, Class 1A, 2.54%, due 10/25/35† | | | 81,012 | |
| | 225,511 | | | | | Merrill Lynch/Countrywide Commercial Mortgage Trust, Series 2007-9, Class A4, 5.70%, due 09/12/49 | | | 227,600 | |
| | 100,000 | | | | | Morgan Stanley Bank of America Merrill Lynch Trust, Series 2013-C7, Class A4, 2.92%, due 02/15/46 | | | 101,143 | |
| | 765,000 | | | | | Morgan Stanley Capital I Trust, Series 2014-150E, Class D, 4.30%, due 09/09/32† 144A | | | 760,073 | |
| | 315,000 | | | | | Morgan Stanley Capital I Trust, Series 2015-XLF1, Class C, 3.09%,
due 08/14/31† 144A | | | 315,538 | |
| | 1,600,000 | | | | | Morgan Stanley Capital I Trust, Series 2016-UB11, Class A3, 2.53%, due 08/15/49 | | | 1,513,417 | |
| | | | | | |
| 86 | | See accompanying Notes to the Financial Statements. | | | | |
Mercer Core Fixed Income Fund
Schedule of Investments (Continued)
(showing percentage of net assets)
March 31, 2017
| | | | | | | | | | |
| Par Value ($) | | | | | Description | | Value ($) | |
| | | |
| | | | | | Mortgage Backed Securities - Private Issuers — continued | | | | |
| | | |
| | 986,000 | | | | | Morgan Stanley Re-REMIC Trust, Series 2009-GG10, Class A4B, 5.95%,
due 08/12/45† 144A | | | 986,368 | |
| | 1,264,000 | | | | | Morgan Stanley Re-REMIC Trust, Series 2010-GG10, Class A4B, 5.95%,
due 08/15/45† 144A | | | 1,263,666 | |
| | 455,000 | | | | | MSCG Trust, Series 2016-SNR, Class D, 6.55%, due 11/15/34 144A | | | 443,185 | |
| | 160,000 | | | | | One Market Plaza Trust, Series 2017-1MKT, Class D, 4.15%, due 02/10/32¤ 144A | | | 162,199 | |
| | 137,034 | | | | | Provident Funding Mortgage Loan Trust, Series 2005-1, Class 2A1, 3.33%,
due 05/25/35† | | | 133,332 | |
| | 2,529,640 | | | | | Small Business Administration Participation Certificates, Series 2013-20L, Class 1, 3.38%, due 12/01/33 | | | 2,626,235 | |
| | 315,000 | | | | | TMSQ Mortgage Trust, Series 2014-1500, Class D, 3.83%, due 10/10/36† 144A | | | 303,641 | |
| | 583,120 | | | | | Towd Point Mortgage Trust, Series 2016-5, Class A1, 2.50%, due 10/25/56† 144A | | | 580,518 | |
| | 215,000 | | | | | UBS Commercial Mortgage Trust, Series 2012-C1, Class B, 4.82%, due 05/10/45 | | | 233,943 | |
| | 1,566,000 | | | | | UBS-Barclays Commercial Mortgage Trust, Series 2012-C3, Class A4, 3.09%, due 08/10/49 | | | 1,602,212 | |
| | 1,867,000 | | | | | UBS-Citigroup Commercial Mortgage Trust, Series 2011-C1, Class A3, 3.60%, due 01/10/45 | | | 1,937,692 | |
| | 490,000 | | | | | VNDO Mortgage Trust, Series 2013-PENN, Class D, 3.95%, due 12/13/29† 144A | | | 502,568 | |
| | 445,000 | | | | | VNDO Trust, Series 2016-350P, Class D, 3.90%, due 01/10/35† 144A | | | 445,686 | |
| | 994,956 | | | | | Wachovia Bank Commercial Mortgage Trust, Series 2007-C34, Class A3, 5.68%, due 05/15/46 | | | 999,010 | |
| | 30,617 | | | | | WaMu Mortgage Pass Through Certificates, Series 2003-AR9, Class 1A7, 2.78%, due 09/25/33† | | | 31,061 | |
| | 35,257 | | | | | WaMu Mortgage Pass Through Certificates, Series 2005-AR2, Class 2A3, 1.33%, due 01/25/45† | | | 33,207 | |
| | 363,000 | | | | | Wells Fargo Commercial Mortgage Trust, Series 2013-120B, Class C, 2.71%, due 03/18/28† 144A | | | 360,631 | |
| | 55,000 | | | | | Wells Fargo Commercial Mortgage Trust, Series 2013-BTC, Class E, 3.55%, due 04/16/35† 144A | | | 49,598 | |
| | 150,000 | | | | | Wells Fargo Commercial Mortgage Trust, Series 2015-LC22, Class B, 4.54%, due 09/15/58† | | | 159,225 | |
| | 1,500,000 | | | | | Wells Fargo Commercial Mortgage Trust, Series 2016-BNK1, Class A2, 2.40%, due 08/15/49 | | | 1,408,700 | |
| | 3,000,000 | | | | | Wells Fargo Commercial Mortgage Trust, Series 2016-NXS6, Class A3, 2.64%, due 11/15/49 | | | 2,856,806 | |
| | 1,400,000 | | | | | Wells Fargo Commercial Mortgage Trust, Series 2017-RB1, Class A4, 3.37%, due 03/15/50 | | | 1,409,835 | |
| | 200,000 | | | | | Wells Fargo Commercial Mortgage Trust, Series 2017-RB1, Class C, 4.31%, due 03/15/50 | | | 205,907 | |
| | 1,380,000 | | | | | WF-RBS Commercial Mortgage Trust, Series 2011-C4, Class A4, 4.90%,
due 06/15/44† 144A | | | 1,507,069 | |
| | 1,462,000 | | | | | WF-RBS Commercial Mortgage Trust, Series 2013-C12, Class A4, 3.20%, due 03/15/48 | | | 1,492,991 | |
| | 195,000 | | | | | WF-RBS Commercial Mortgage Trust, Series 2013-C15, Class B, 4.48%, due 08/15/46† | | | 206,106 | |
| | | | | | | | | | |
| | | | | | | | | 73,191,806 | |
| | | | | | | | | | |
| | |
| | | | | | Mortgage Backed Securities - U.S. Government Agency Obligations — 21.8% | |
| | | |
| | 751,059 | | | | | FHLMC, Pool # J26100, 3.00%, due 10/01/28 | | | 771,646 | |
| | 638,842 | | | | | FHLMC, Pool # V60565, 3.00%, due 06/01/29 | | | 656,355 | |
| | 1,349,723 | | | | | FHLMC, Pool # V60603, 3.00%, due 09/01/29 | | | 1,386,010 | |
| | | | | | |
| | See accompanying Notes to the Financial Statements. | | | 87 | |
Mercer Core Fixed Income Fund
Schedule of Investments (Continued)
(showing percentage of net assets)
March 31, 2017
| | | | | | | | | | |
| Par Value ($) | | | | | Description | | Value ($) | |
| | |
| | | | | | Mortgage Backed Securities - U.S. Government Agency Obligations — continued | |
| | | |
| | 1,462,642 | | | | | FHLMC, Pool # V60599, 3.00%, due 09/01/29 | | | 1,502,661 | |
| | 3,294,177 | | | | | FHLMC, Pool # G60039, 3.00%, due 04/01/43 | | | 3,285,523 | |
| | 1,656,298 | | | | | FHLMC, Pool # Q42618, 3.00%, due 08/01/46 | | | 1,642,695 | |
| | 295,802 | | | | | FHLMC, Pool # J16432, 3.50%, due 08/01/26 | | | 309,772 | |
| | 317,672 | | | | | FHLMC, Pool # J17763, 3.50%, due 01/01/27 | | | 332,720 | |
| | 345,736 | | | | | FHLMC, Pool # Q11218, 3.50%, due 09/01/42 | | | 355,483 | |
| | 646,679 | | | | | FHLMC, Pool # Q12052, 3.50%, due 10/01/42 | | | 664,503 | |
| | 1,293,225 | | | | | FHLMC, Pool # Q12862, 3.50%, due 11/01/42 | | | 1,329,974 | |
| | 613,091 | | | | | FHLMC, Pool # Q17792, 3.50%, due 05/01/43 | | | 630,514 | |
| | 2,404,710 | | | | | FHLMC, Pool # G60059, 3.50%, due 02/01/44 | | | 2,471,005 | |
| | 1,146,360 | | | | | FHLMC, Pool # V82084, 3.50%, due 12/01/45 | | | 1,173,562 | |
| | 2,168,252 | | | | | FHLMC, Pool # V82515, 3.50%, due 06/01/46 | | | 2,222,999 | |
| | 2,821,896 | | | | | FHLMC, Pool # Q41917, 3.50%, due 07/01/46 | | | 2,895,901 | |
| | 2,827,819 | | | | | FHLMC, Pool # Q41918, 3.50%, due 07/01/46 | | | 2,907,547 | |
| | 459,224 | | | | | FHLMC, Pool # G14678, 4.00%, due 12/01/26 | | | 483,894 | |
| | 548,734 | | | | | FHLMC, Pool # G30700, 4.00%, due 04/01/34 | | | 582,085 | |
| | 828,261 | | | | | FHLMC, Pool # G06231, 4.00%, due 12/01/40 | | | 872,762 | |
| | 599,122 | | | | | FHLMC, Pool # A96970, 4.00%, due 02/01/41 | | | 631,313 | |
| | 1,904,475 | | | | | FHLMC, Pool # Q04020, 4.00%, due 10/01/41 | | | 2,007,004 | |
| | 1,921,251 | | | | | FHLMC, Pool # Q36815, 4.00%, due 10/01/45 | | | 2,017,687 | |
| | 1,161,181 | | | | | FHLMC, Pool # G08672, 4.00%, due 10/01/45 | | | 1,219,466 | |
| | 893,566 | | | | | FHLMC, Pool # A89870, 4.50%, due 11/01/39 | | | 960,421 | |
| | 1,026,868 | | | | | FHLMC, Pool # Q02552, 4.50%, due 08/01/41 | | | 1,104,050 | |
| | 152,785 | | | | | FHLMC, Pool # G07515, 4.50%, due 09/01/41 | | | 164,378 | |
| | 2,396,101 | | | | | FHLMC, Pool # G60804, 4.50%, due 05/01/42 | | | 2,571,757 | |
| | 638,158 | | | | | FHLMC, Pool # G08568, 4.50%, due 01/01/44 | | | 684,616 | |
| | 2,016,944 | | | | | FHLMC, Pool # G60700, 4.50%, due 09/01/45 | | | 2,176,700 | |
| | 867,566 | | | | | FHLMC, Pool # G07021, 5.00%, due 09/01/39 | | | 944,477 | |
| | 2,683,861 | | | | | FHLMC, Pool # G60564, 5.00%, due 02/01/42 | | | 2,924,129 | |
| | 256,571 | | | | | FHLMC, Pool # G01749, 5.50%, due 01/01/35 | | | 288,521 | |
| | 240,634 | | | | | FHLMC, Pool # G06875, 5.50%, due 12/01/38 | | | 269,758 | |
| | 453,153 | | | | | FHLMC, Pool # G06409, 6.00%, due 11/01/39 | | | 514,012 | |
| | 943,771 | | | | | FHLMC, Series 4532, Class YA, 3.50%, due 10/15/41 | | | 971,731 | |
| | 1,000,000 | | | | | FHLMC Multifamily Structured Pass Through Certificates, Series K033, Class A2, 3.06%, due 07/25/23† | | | 1,030,285 | |
| | 1,000,000 | | | | | FHLMC Multifamily Structured Pass Through Certificates, Series K053, Class A2, 3.00%, due 12/25/25 | | | 1,013,106 | |
| | 600,000 | | | | | FHLMC Multifamily Structured Pass Through Certificates, Series KS03, Class A4, 3.16%, due 05/25/25† | | | 606,734 | |
| | 34,094,197 | | | | | FHLMC Multifamily Structured Pass Through Certificates, (IO), Series K006, Class AX1, 0.98%, due 01/25/20† | | | 782,366 | |
| | 22,198,970 | | | | | FHLMC Multifamily Structured Pass Through Certificates, (IO), Series K007, Class X1, 1.09%, due 04/25/20† | | | 599,208 | |
| | 27,586,856 | | | | | FHLMC Multifamily Structured Pass Through Certificates, (IO), Series K025, Class X1, 0.88%, due 10/25/22† | | | 1,102,095 | |
| | 147,969 | | | | | FHLMC Reference REMIC, Series R007, Class ZA, 6.00%, due 05/15/36 | | | 166,478 | |
| | 836,201 | | | | | FHLMC Structured Agency Credit Risk Debt Notes, Series 2015-DNA1, Class M1, 1.88%, due 10/25/27† | | | 837,736 | |
| | 250,000 | | | | | FHLMC Structured Agency Credit Risk Debt Notes, Series 2015-DNA1, Class M2, 2.83%, due 10/25/27† | | | 255,679 | |
| | | | | | |
| 88 | | See accompanying Notes to the Financial Statements. | | | | |
Mercer Core Fixed Income Fund
Schedule of Investments (Continued)
(showing percentage of net assets)
March 31, 2017
| | | | | | | | | | |
| Par Value ($) | | | | | Description | | Value ($) | |
| | |
| | | | | | Mortgage Backed Securities - U.S. Government Agency Obligations — continued | |
| | | |
| | 449,906 | | | | | FHLMC Structured Agency Credit Risk Debt Notes, Series 2016-DNA1, Class M1, 2.43%, due 07/25/28† | | | 451,994 | |
| | 655,000 | | | | | FHLMC Structured Agency Credit Risk Debt Notes, Series 2016-DNA3, Class M2, 2.98%, due 12/25/28† | | | 668,766 | |
| | 250,000 | | | | | FHLMC Structured Agency Credit Risk Debt Notes, Series 2016-HQA2, Class M2, 3.23%, due 11/25/28† | | | 257,928 | |
| | 480,000 | | | | | FHLMC Structured Agency Credit Risk Debt Notes, Series 2016-HQA4, Class M2, 2.28%, due 04/25/29† | | | 480,253 | |
| | 663,902 | | | | | FHLMC Structured Agency Credit Risk Debt Notes, Series 2017-DNA1, Class M1, 2.18%, due 07/25/29† | | | 666,629 | |
| | 1,500,000 | | | | | FHLMC TBA, 3.00%, due 09/01/44 | | | 1,486,289 | |
| | 386,222 | | | | | FNMA, Pool # AS7693, 2.00%, due 08/01/31 | | | 376,237 | |
| | 682,113 | | | | | FNMA, Pool # AO7971, 2.50%, due 06/01/27 | | | 690,271 | |
| | 490,761 | | | | | FNMA, Pool # AS8073, 2.50%, due 10/01/46 | | | 468,142 | |
| | 1,072,185 | | | | | FNMA, Pool # AB6212, 3.00%, due 09/01/42 | | | 1,069,198 | |
| | 636,540 | | | | | FNMA, Pool # AQ7923, 3.00%, due 12/01/42 | | | 634,767 | |
| | 1,446,546 | | | | | FNMA, Pool # AB7505, 3.00%, due 01/01/43 | | | 1,442,518 | |
| | 1,135,812 | | | | | FNMA, Pool # AR2001, 3.00%, due 02/01/43 | | | 1,132,649 | |
| | 1,130,865 | | | | | FNMA, Pool # AT0232, 3.00%, due 03/01/43 | | | 1,127,714 | |
| | 2,082,408 | | | | | FNMA, Pool # AB9659, 3.00%, due 06/01/43 | | | 2,076,395 | |
| | 187,152 | | | | | FNMA, Pool # AY7121, 3.00%, due 04/01/45 | | | 186,079 | |
| | 898,376 | | | | | FNMA, Pool # AZ0611, 3.00%, due 04/01/45 | | | 892,530 | |
| | 652,991 | | | | | FNMA, Pool # AX3719, 3.50%, due 07/01/27 | | | 681,761 | |
| | 1,150,176 | | | | | FNMA, Pool # MA2164, 3.50%, due 02/01/35 | | | 1,195,822 | |
| | 1,265,887 | | | | | FNMA, Pool # AJ9278, 3.50%, due 12/01/41 | | | 1,302,300 | |
| | 2,031,122 | | | | | FNMA, Pool # AL1895, 3.50%, due 06/01/42 | | | 2,088,842 | |
| | 2,330,078 | | | | | FNMA, Pool # AB6022, 3.50%, due 08/01/42 | | | 2,395,576 | |
| | 1,115,170 | | | | | FNMA, Pool # AP2422, 3.50%, due 08/01/42 | | | 1,146,520 | |
| | 1,652,543 | | | | | FNMA, Pool # AB6802, 3.50%, due 11/01/42 | | | 1,698,995 | |
| | 1,060,527 | | | | | FNMA, Pool # AL3000, 3.50%, due 12/01/42 | | | 1,090,326 | |
| | 1,424,403 | | | | | FNMA, Pool # AL3316, 3.50%, due 03/01/43 | | | 1,464,439 | |
| | 2,487,785 | | | | | FNMA, Pool # AL3873, 3.50%, due 07/01/43 | | | 2,557,553 | |
| | 1,354,827 | | | | | FNMA, Pool # AY5617, 3.50%, due 06/01/45 | | | 1,387,075 | |
| | 4,905,041 | | | | | FNMA, Pool # AL7594, 3.50%, due 08/01/45 | | | 5,032,067 | |
| | 1,440,052 | | | | | FNMA, Pool # AZ4775, 3.50%, due 10/01/45 | | | 1,474,328 | |
| | 448,189 | | | | | FNMA, Pool # AZ3743, 3.50%, due 11/01/45 | | | 458,857 | |
| | 931,205 | | | | | FNMA, Pool # AS6452, 3.50%, due 01/01/46 | | | 953,370 | |
| | 834,851 | | | | | FNMA, Pool # AL7359, 4.00%, due 05/01/29 | | | 879,291 | |
| | 1,510,253 | | | | | FNMA, Pool # MA1689, 4.00%, due 12/01/33 | | | 1,599,797 | |
| | 1,823,820 | | | | | FNMA, Pool # 725331, 4.00%, due 01/01/34 | | | 1,932,408 | |
| | 669,433 | | | | | FNMA, Pool # MA2019, 4.00%, due 09/01/34 | | | 709,144 | |
| | 1,960,037 | | | | | FNMA, Pool # AL6663, 4.00%, due 03/01/39 | | | 2,066,604 | |
| | 770,462 | | | | | FNMA, Pool # 932807, 4.00%, due 09/01/40 | | | 811,039 | |
| | 422,834 | | | | | FNMA, Pool # AE7685, 4.00%, due 10/01/40 | | | 445,277 | |
| | 1,838,418 | | | | | FNMA, Pool # AH4404, 4.00%, due 01/01/41 | | | 1,935,868 | |
| | 717,717 | | | | | FNMA, Pool # AJ9317, 4.00%, due 01/01/42 | | | 756,017 | |
| | 283,735 | | | | | FNMA, Pool # AO4109, 4.00%, due 06/01/42 | | | 298,570 | |
| | 7,591,157 | | | | | FNMA, Pool # AL2598, 4.00%, due 10/01/42 | | | 7,987,016 | |
| | 374,467 | | | | | FNMA, Pool # AB9383, 4.00%, due 05/01/43 | | | 395,839 | |
| | 1,667,214 | | | | | FNMA, Pool # AL8191, 4.00%, due 12/01/45 | | | 1,762,083 | |
| | | | | | |
| | See accompanying Notes to the Financial Statements. | | | 89 | |
Mercer Core Fixed Income Fund
Schedule of Investments (Continued)
(showing percentage of net assets)
March 31, 2017
| | | | | | | | | | |
| Par Value ($) | | | | | Description | | Value ($) | |
| | |
| | | | | | Mortgage Backed Securities - U.S. Government Agency Obligations — continued | |
| | | |
| | 471,497 | | | | | FNMA, Pool # AS6286, 4.00%, due 12/01/45 | | | 494,939 | |
| | 1,438,579 | | | | | FNMA, Pool # AS6304, 4.00%, due 12/01/45 | | | 1,510,122 | |
| | 1,255,782 | | | | | FNMA, Pool # BC2494, 4.00%, due 03/01/46 | | | 1,329,866 | |
| | 1,169,056 | | | | | FNMA, Pool # AL9737, 4.50%, due 08/01/38 | | | 1,258,262 | |
| | 919,723 | | | | | FNMA, Pool # 995243, 4.50%, due 08/01/38 | | | 988,464 | |
| | 798,027 | | | | | FNMA, Pool # AD9153, 4.50%, due 08/01/40 | | | 856,575 | |
| | 1,259,772 | | | | | FNMA, Pool # AL0215, 4.50%, due 04/01/41* | | | 1,356,715 | |
| | 1,684,987 | | | | | FNMA, Pool # AL6301, 4.50%, due 06/01/42 | | | 1,814,362 | |
| | 2,364,766 | | | | | FNMA, Pool # 254903, 5.00%, due 10/01/33 | | | 2,593,457 | |
| | 955,958 | | | | | FNMA, Pool # 725027, 5.00%, due 11/01/33 | | | 1,048,871 | |
| | 786,334 | | | | | FNMA, Pool # 745148, 5.00%, due 01/01/36 | | | 861,129 | |
| | 598,391 | | | | | FNMA, Pool # 995245, 5.00%, due 01/01/39 | | | 653,507 | |
| | 889,449 | | | | | FNMA, Pool # AI1971, 5.00%, due 05/01/41 | | | 974,065 | |
| | 275,847 | | | | | FNMA, Pool # AI1892, 5.00%, due 05/01/41 | | | 306,339 | |
| | 1,984,367 | | | | | FNMA, Pool # AL0761, 5.00%, due 09/01/41 | | | 2,179,138 | |
| | 682,811 | | | | | FNMA, Pool # AL5955, 5.00%, due 01/01/42 | | | 747,222 | |
| | 887,585 | | | | | FNMA, Pool # AL6839, 5.00%, due 04/01/42 | | | 977,886 | |
| | 558,504 | | | | | FNMA, Pool # AL5788, 5.00%, due 05/01/42 | | | 612,601 | |
| | 6,027 | | | | | FNMA, Pool # 254548, 5.50%, due 12/01/32 | | | 6,752 | |
| | 517,433 | | | | | FNMA, Pool # 704235, 5.50%, due 05/01/33 | | | 579,540 | |
| | 74,334 | | | | | FNMA, Pool # 990906, 5.50%, due 10/01/35 | | | 83,255 | |
| | 395,742 | | | | | FNMA, Pool # 849077, 5.50%, due 01/01/36 | | | 442,291 | |
| | 815,488 | | | | | FNMA, Pool # 983471, 5.50%, due 05/01/38 | | | 908,304 | |
| | 926,067 | | | | | FNMA, Pool # 985184, 5.50%, due 08/01/38 | | | 1,032,451 | |
| | 493,609 | | | | | FNMA, Pool # AE0469, 6.00%, due 12/01/39 | | | 557,971 | |
| | 1,370,982 | | | | | FNMA, Series 2011-59, Class NZ, 5.50%, due 07/25/41 | | | 1,563,821 | |
| | 67,010 | | | | | FNMA, Series 2012-28, Class B, 6.50%, due 06/25/39 | | | 73,804 | |
| | 105,288 | | | | | FNMA Connecticut Avenue Securities, Series 2014-C04, Class 1M1, 2.93%, due 11/25/24† | | | 105,446 | |
| | 253,792 | | | | | FNMA Connecticut Avenue Securities, Series 2016-C02, Class 1M1, 3.13%, due 09/25/28† | | | 257,289 | |
| | 385,715 | | | | | FNMA Connecticut Avenue Securities, Series 2016-C03, Class 2M1, 3.18%, due 10/25/28† | | | 390,525 | |
| | 355,758 | | | | | FNMA Connecticut Avenue Securities, Series 2016-C04, Class 1M1, 2.43%, due 01/25/29† | | | 359,726 | |
| | 160,000 | | | | | FNMA Connecticut Avenue Securities, Series 2017-C01, Class 1M2, 4.53%, due 07/25/29† | | | 162,132 | |
| | 1,000,000 | | | | | FNMA TBA, 2.50%, due 04/01/29 | | | 1,000,547 | |
| | 1,250,000 | | | | | FNMA TBA, 3.00%, due 11/01/28 | | | 1,280,644 | |
| | 1,000,000 | | | | | FNMA TBA, 4.00%, due 03/01/43 | | | 1,048,984 | |
| | 1,200,000 | | | | | FNMA-ACES, Series 2014-M4, Class A2, 3.35%, due 03/25/24† | | | 1,246,282 | |
| | 899,911 | | | | | FNMA-ACES, Series 2014-M4, Class AB2, 3.21%, due 03/25/24 | | | 909,599 | |
| | 1,700,000 | | | | | FNMA-ACES, Series 2015-M10, Class A2, 3.09%, due 04/25/27† | | | 1,711,738 | |
| | 1,300,000 | | | | | FNMA-ACES, Series 2015-M8, Class AB2, 2.83%, due 01/25/25† | | | 1,287,648 | |
| | 500,000 | | | | | FNMA-ACES, Series 2016-M7, Class AB2, 2.38%, due 09/25/26 | | | 463,470 | |
| | 500,000 | | | | | FNMA-ACES, Series 2017-M1, Class A2, 2.42%, due 10/25/26† | | | 478,605 | |
| | 74,191 | | | | | GNMA, Pool # 783637, 3.00%, due 06/20/42 | | | 75,160 | |
| | 108,673 | | | | | GNMA, Pool # MA0624, 3.00%, due 12/20/42 | | | 110,091 | |
| | 281,208 | | | | | GNMA, Pool # MA0698, 3.00%, due 01/20/43 | | | 284,878 | |
| | 964,807 | | | | | GNMA, Pool # MA0851, 3.00%, due 03/20/43 | | | 977,399 | |
| | | | | | |
| 90 | | See accompanying Notes to the Financial Statements. | | | | |
Mercer Core Fixed Income Fund
Schedule of Investments (Continued)
(showing percentage of net assets)
March 31, 2017
| | | | | | | | | | |
| Par Value ($) | | | | | Description | | Value ($) | |
| | |
| | | | | | Mortgage Backed Securities - U.S. Government Agency Obligations — continued | |
| | | |
| | 165,733 | | | | | GNMA, Pool # MA1156, 3.00%, due 07/20/43 | | | 167,896 | |
| | 228,505 | | | | | GNMA, Pool # MA1599, 3.00%, due 01/20/44 | | | 231,488 | |
| | 524,190 | | | | | GNMA, Pool # AL8626, 3.00%, due 08/15/45 | | | 529,406 | |
| | 1,439,597 | | | | | GNMA, Pool # MA3873, 3.00%, due 08/20/46 | | | 1,454,365 | |
| | 499,779 | | | | | GNMA, Pool # MA0625, 3.50%, due 12/20/42 | | | 520,590 | |
| | 1,280,402 | | | | | GNMA, Pool # MA2754, 3.50%, due 04/20/45 | | | 1,329,517 | |
| | 636,001 | | | | | GNMA, Pool # 004833, 4.00%, due 10/20/40 | | | 678,144 | |
| | 537,896 | | | | | GNMA, Pool # 004977, 4.00%, due 03/20/41 | | | 572,803 | |
| | 557,633 | | | | | GNMA, Pool # 004636, 4.50%, due 02/20/40 | | | 602,286 | |
| | 102,654 | | | | | GNMA, Pool # 004678, 4.50%, due 04/20/40 | | | 111,286 | |
| | 1,458,964 | | | | | GNMA, Pool # 004978, 4.50%, due 03/20/41 | | | 1,575,795 | |
| | 2,317,735 | | | | | GNMA, Pool # 005055, 4.50%, due 05/20/41 | | | 2,503,339 | |
| | 323,368 | | | | | GNMA, Pool # 005334, 5.00%, due 03/20/42 | | | 360,032 | |
| | 5,000,000 | | | | | GNMA TBA, 3.50%, due 09/01/44 | | | 5,184,766 | |
| | | | | | | | | | |
| | | | | | | | | 166,720,046 | |
| | | | | | | | | | |
| | | |
| | | | | | Municipal Obligations — 1.2% | | | | |
| | | |
| | 60,000 | | | | | Alabama Economic Settlement Authority, 4.26%, due 09/15/32 | | | 61,418 | |
| | 300,000 | | | | | California Bay Area Toll Authority, 6.26%, due 04/01/49 | | | 409,764 | |
| | 170,000 | | | | | California Educational Facilities Authority, 5.00%, due 06/01/46 | | | 220,431 | |
| | 245,000 | | | | | Central Puget Sound Regional Transit Authority, 5.00%, due 11/01/46 | | | 315,447 | |
| | 90,000 | | | | | District of Columbia Water & Sewer Authority, 4.81%, due 10/01/14# | | | 92,003 | |
| | 490,000 | | | | | District of Columbia Water & Sewer Authority, 5.52%, due 10/01/44 | | | 594,022 | |
| | 900,000 | | | | | Energy Northwest, 2.80%, due 07/01/21 | | | 919,620 | |
| | 1,150,000 | | | | | New Jersey Economic Development Authority, 2.51%, due 02/15/19‡‡ | | | 1,097,686 | |
| | 2,049,000 | | | | | New Jersey Economic Development Authority, 3.23%, due 02/15/20‡‡ | | | 1,872,581 | |
| | 705,000 | | | | | State Board of Administration Finance Corp., 2.64%, due 07/01/21 | | | 711,134 | |
| | 700,000 | | | | | State of California General Obligation, 7.50%, due 04/01/34 | | | 992,446 | |
| | 1,000,000 | | | | | State of California General Obligation, 7.55%, due 04/01/39 | | | 1,467,590 | |
| | 305,000 | | | | | University of Texas System (The), 5.00%, due 08/15/47 | | | 387,429 | |
| | | | | | | | | | |
| | | | | | | | | 9,141,571 | |
| | | | | | | | | | |
| | | |
| | | | | | Sovereign Debt Obligations — 1.0% | | | | |
| | | |
| | 130,000 | | | | | Argentine Republic Government International Bond, 6.88%, due 01/26/27 144A | | | 131,982 | |
| | 425,000 | | | | | Argentine Republic Government International Bond, 7.50%, due 04/22/26 144A | | | 452,837 | |
| | 400,000 | | | | | Belgium Government International Bond, Reg S, 1.13%, due 08/03/19 144A‡‡‡ | | | 394,849 | |
| | 1,005,000 | | | | | Hashemite Kingdom of Jordan Government AID Bond, 2.58%, due 06/30/22 | | | 1,024,751 | |
| | 600,000 | | | | | Hashemite Kingdom of Jordan Government AID Bond, 3.00%, due 06/30/25 | | | 616,793 | |
| | 812,000 | | | | | Hungary Government International Bond, 5.75%, due 11/22/23 | | | 919,181 | |
| | 144,000 | | | | | Hungary Government International Bond, 7.63%, due 03/29/41 | | | 209,512 | |
| | 420,000 | | | | | Indonesia Government International Bond, 5.88%, due 01/15/24 144A | | | 477,335 | |
| | 200,000 | | | | | Iraq Government AID Bond, 2.15%, due 01/18/22 | | | 200,103 | |
| | 200,000 | | | | | Japan Bank for International Corp., 1.50%, due 07/21/21 | | | 192,072 | |
| | 200,000 | | | | | Japan Bank for International Corp., 2.25%, due 02/24/20 | | | 200,368 | |
| | 200,000 | | | | | Japan Finance Organization for Municipalities, 2.13%, due 04/13/21 144A | | | 196,957 | |
| | 400,000 | | | | | Japan Finance Organization for Municipalities, 2.13%, due 10/25/23 144A | | | 383,025 | |
| | 340,000 | | | | | Mexico Government International Bond (MTN), 4.75%, due 03/08/44 | | | 331,500 | |
| | 200,000 | | | | | Panama Government International Bond, 3.75%, due 03/16/25 | | | 204,750 | |
| | 200,000 | | | | | Panama Government International Bond, 4.00%, due 09/22/24 | | | 209,750 | |
| | 200,000 | | | | | Province of Alberta Canada, 1.90%, due 12/06/19 | | | 200,225 | |
| | | | | | |
| | See accompanying Notes to the Financial Statements. | | | 91 | |
Mercer Core Fixed Income Fund
Schedule of Investments (Continued)
(showing percentage of net assets)
March 31, 2017
| | | | | | | | | | |
| Par Value ($) | | | | | Description | | Value ($) | |
| | | |
| | | | | | Sovereign Debt Obligations — continued | | | | |
| | | |
| | 100,000 | | | | | Province of Manitoba Canada, 2.13%, due 06/22/26‡ | | | 93,811 | |
| | 125,000 | | | | | Province of Ontario Canada, 2.40%, due 02/08/22 | | | 125,557 | |
| | 125,000 | | | | | Province of Ontario Canada, 4.40%, due 04/14/20 | | | 133,973 | |
| | 300,000 | | | | | Provincia de Buenos Aires, 7.88%, due 06/15/27 144A | | | 304,560 | |
| | 310,000 | | | | | Saudi Government International Bond, 2.38%, due 10/26/21 144A | | | 304,772 | |
| | 400,000 | | | | | Turkey Government International Bond, 7.00%, due 06/05/20 | | | 437,390 | |
| | 200,000 | | | | | Ukraine Government AID Bonds, 1.47%, due 09/29/21 | | | 195,982 | |
| | | | | | | | | | |
| | | | | | | | | 7,942,035 | |
| | | | | | | | | | |
| | | |
| | | | | | U.S. Government and Agency Obligations — 11.3% | | | | |
| | | |
| | 365,000 | | | | | Federal Home Loan Mortgage Corp., 1.50%, due 01/17/20 | | | 364,567 | |
| | 400,000 | | | | | Resolution Funding Corp. STRIPS, (PO), 3.82%, due 01/15/30‡‡ | | | 267,031 | |
| | 140,000 | | | | | Resolution Funding Corp. STRIPS, (PO), 3.82%, due 04/15/30‡‡ | | | 92,827 | |
| | 275,000 | | | | | Tennessee Valley Authority, 2.88%, due 02/01/27 | | | 276,338 | |
| | 25,000 | | | | | Tennessee Valley Authority, 7.13%, due 05/01/30 | | | 35,880 | |
| | 1,040,000 | | | | | U.S. Treasury Bond, 2.50%, due 02/15/45 | | | 934,741 | |
| | 3,743,000 | | | | | U.S. Treasury Bond, 2.50%, due 05/15/46 | | | 3,352,324 | |
| | 5,260,000 | | | | | U.S. Treasury Bond, 2.75%, due 11/15/42 | | | 5,009,840 | |
| | 9,655,000 | | | | | U.S. Treasury Bond, 2.88%, due 11/15/46 | | | 9,369,878 | |
| | 6,623,000 | | | | | U.S. Treasury Bond, 3.00%, due 05/15/45 | | | 6,586,004 | |
| | 10,150,000 | | | | | U.S. Treasury Bond, 4.50%, due 02/15/36 | | | 12,876,026 | |
| | 15,000 | | | | | U.S. Treasury Bond, 8.13%, due 08/15/21 | | | 18,937 | |
| | 2,661,958 | | | | | U.S. Treasury Inflation Indexed Note, 0.38%, due 07/15/25 | | | 2,670,024 | |
| | 1,186,030 | | | | | U.S. Treasury Inflation Indexed Note, 0.38%, due 01/15/27 | | | 1,181,564 | |
| | 3,273,000 | | | | | U.S. Treasury Note, 0.88%, due 04/15/19 | | | 3,246,855 | |
| | 230,000 | | | | | U.S. Treasury Note, 1.13%, due 02/28/19 | | | 229,506 | |
| | 7,492,000 | | | | | U.S. Treasury Note, 1.13%, due 09/30/21 | | | 7,248,510 | |
| | 1,265,000 | | | | | U.S. Treasury Note, 1.38%, due 01/15/20 | | | 1,262,183 | |
| | 2,215,000 | | | | | U.S. Treasury Note, 1.38%, due 02/15/20 | | | 2,208,251 | |
| | 3,760,000 | | | | | U.S. Treasury Note, 1.38%, due 04/30/21 | | | 3,697,358 | |
| | 220,000 | | | | | U.S. Treasury Note, 1.63%, due 03/15/20 | | | 220,812 | |
| | 3,570,000 | | | | | U.S. Treasury Note, 1.63%, due 04/30/23** | | | 3,469,244 | |
| | 996,000 | | | | | U.S. Treasury Note, 1.63%, due 02/15/26 | | | 936,609 | |
| | 8,816,000 | | | | | U.S. Treasury Note, 1.88%, due 01/31/22 | | | 8,797,918 | |
| | 160,000 | | | | | U.S. Treasury Note, 1.88%, due 02/28/22 | | | 159,675 | |
| | 4,650,000 | | | | | U.S. Treasury Note, 2.13%, due 09/30/21 | | | 4,698,681 | |
| | 7,240,000 | | | | | U.S. Treasury Note, 2.25%, due 02/15/27 | | | 7,148,508 | |
| | | | | | | | | | |
| | | | | | | | | 86,360,091 | |
| | | | | | | | | | |
| | | |
| | | | | | TOTAL DEBT OBLIGATIONS (COST $755,523,005) | | | 750,579,893 | |
| | | | | | | | | | |
| | | |
| Notional | | | | | Description | | Value ($) | |
| | | |
| | | | | | OPTIONS PURCHASED — 0.0% | | | | |
| | | |
| | | | | | Put Options — 0.0% | | | | |
| | | |
| | 100,000 | | | | | U.S. Treasury Note 10-Year Futures Option with JPMorgan Chase Bank N.A., Strike Price $125.00, Expires 05/26/17 | | | 70,300 | |
| | | | | | | | | | |
| | | |
| | | | | | TOTAL PUT OPTIONS PURCHASED (COST $72,372) | �� | | 70,300 | |
| | | | | | | | | | |
| | | | | | |
| 92 | | See accompanying Notes to the Financial Statements. | | | | |
Mercer Core Fixed Income Fund
Schedule of Investments (Continued)
(showing percentage of net assets)
March 31, 2017
| | | | | | | | | | |
| Par Value ($) | | | | | Description | | Value ($) | |
| | | |
| | | | | | SHORT-TERM INVESTMENTS — 5.1% | | | | |
| | | |
| | | | | | Bank Deposit — 3.0% | | | | |
| | | |
| | 23,010,937 | | | | | State Street Bank & Trust Euro Time Deposit, 0.09%, due 04/03/17 | | | 23,010,937 | |
| | | | | | | | | | |
| | | | | | TOTAL BANK DEPOSITS (COST $23,010,937) | | | 23,010,937 | |
| | | | | | | | | | |
| | | |
| | | | | | Mutual Fund - Securities Lending Collateral — 1.4% | | | | |
| | | |
| | 10,554,630 | | | | | State Street Institutional U.S. Government Money Market Fund, Premier Class*** | | | 10,554,630 | |
| | | | | | | | | | |
| | | | | | TOTAL MUTUAL FUND - SECURITIES LENDING COLLATERAL
(COST $10,554,630) | | | 10,554,630 | |
| | | | | | | | | | |
| | | |
| | | | | | U.S. Government and Agency Obligations — 0.7% | | | | |
| | | |
| | 1,795,000 | | | | | United States Treasury Bill, 0.62%, due 04/20/17‡‡ | | | 1,794,388 | |
| | 3,281,000 | | | | | United States Treasury Bill, 0.73%, due 06/22/17‡‡ | | | 3,275,550 | |
| | | | | | | | | | |
| | | | | | TOTAL U.S. GOVERNMENT AND AGENCY OBLIGATIONS (COST $5,070,028) | | | 5,069,938 | |
| | | | | | | | | | |
| | | |
| | | | | | TOTAL SHORT-TERM INVESTMENTS (COST $38,635,595) | | | 38,635,505 | |
| | | | | | | | | | |
| | | |
| | | | | | TOTAL INVESTMENTS BEFORE TBA SALE COMMITMENTS — 103.1% (COST $794,230,972) | | | 789,285,698 | |
| | | | | | | | | | |
| | | |
| | | | | | TBA Sale Commitments — (0.1)% | | | | |
| | | |
| | (500,000 | ) | | | | FNMA TBA, 3.50%, due 02/01/44 | | | (511,484 | ) |
| | | | | | | | | | |
| | | |
| | | | | | TOTAL TBA SALE COMMITMENTS (PROCEEDS $505,625) | | | (511,484 | ) |
| | | | | | | | | | |
| | | |
| | | | | | TOTAL INVESTMENTS NET OF TBA SALE COMMITMENTS — 103.0% (COST $793,725,347) | | | 788,774,214 | |
| | | |
| | | | | | Other Assets and Liabilities (net) — (3.0)% | | | (23,171,239 | ) |
| | | | | | | | | | |
| | | |
| | | | | | NET ASSETS — 100.0% | | $ | 765,602,975 | |
| | | | | | | | | | |
| | | | | | |
| | See accompanying Notes to the Financial Statements. | | | 93 | |
Mercer Core Fixed Income Fund
Schedule of Investments (Continued)
(showing percentage of net assets)
March 31, 2017
| | | | | | | | | | |
| | | | | | Notes to Schedule of Investments: | | | | |
| | | |
| | | | | | ACES — Alternative Credit Enhancement Securities | | | | |
| | | |
| | | | | | CLO — Collateralized Loan Obligation | | | | |
| | | |
| | | | | | FHLMC — Federal Home Loan Mortgage Corporation | | | | |
| | | |
| | | | | | FNMA — Federal National Mortgage Association | | | | |
| | | |
| | | | | | GNMA — Government National Mortgage Association | | | | |
| | | |
| | | | | | IO — Interest Only | | | | |
| | | |
| | | | | | MTN — Medium Term Note | | | | |
| | | |
| | | | | | PO — Principal Only | | | | |
| | | |
| | | | | | REIT — Real Estate Investment Trust | | | | |
| | | |
| | | | | | REMIC — Real Estate Mortgage Investment Conduit | | | | |
| | | |
| | | | | | TBA — To Be Announced | | | | |
| | | |
| | | | # | | Year of maturity is greater than 2100. | | | | |
| | | |
| | | | * | | All or a portion of this security is pledged for open futures collateral. | | | | |
| | | |
| | | | ** | | All or a portion of this security is pledged for open swaps collateral. | | | | |
| | | |
| | | | *** | | Represents an investment of securities lending cash collateral. | | | | |
| | | |
| | | | **** | | Securities fair valued by the Valuation Committee as approved by the Board of Trustees. The total market value of the securities at year end is $572 which represents 0.0% of net assets. The aggregate tax cost of these securities held at March 31, 2017 was $1,565,555. | | | | |
| | | |
| | | | ¤ | | Illiquid security. The total market value of the securities at year end is $5,621,588 which represents 0.7% of net assets. The aggregate tax cost of these securities held at March 31, 2017 was $5,617,717. | | | | |
| | | |
| | | | † | | Floating rate note. Rate shown is as of March 31, 2017. | | | | |
| | | |
| | | | †† | | Debt obligation initially issued in zero coupon form which converts to coupon form at a specific rate and date. The rate shown is the rate at period end. | | | | |
| | | |
| | | | ††† | | Security is currently in default. | | | | |
| | | |
| | | | †††† | | When-issued security. | | | | |
| | | |
| | | | ††††† | | Security is perpetual and has no stated maturity date. | | | | |
| | | |
| | | | ‡ | | All or a portion of this security is out on loan. | | | | |
| | | |
| | | | ‡‡ | | Interest rate presented is yield to maturity. | | | | |
| | | |
| | | | ‡‡‡ | | Security exempt from registration under Regulation S of the Securities Act of 1933, which exempts from registration securities offered and sold outside the United States. Security may not be offered or sold in the United States except pursuant to an exemption from, or in a transaction not subject to, the registration requirements of the Securities Act of 1933. | | | | |
| | | |
| | | | 144A | | Securities exempt from registration under Rule 144A of the Securities Act of 1933. These securities may be resold in transactions exempt from registration, normally to qualified institutional buyers. The total market value of the securities at year end is $156,734,870 which represents 20.5% of net assets. | | | | |
| | | | | | |
| 94 | | See accompanying Notes to the Financial Statements. | | | | |
Mercer Core Fixed Income Fund
Schedule of Investments (Continued)
March 31, 2017
Futures Contracts
| | | | | | | | | | | | | | | | | | | | |
Number of
Contracts | | | | | Type | | | | Expiration Date | | | Contract
Value | | | Unrealized
Appreciation
(Depreciation) | |
| | Buys | | | | | | | | | | | | | | | | | | | |
| | 229 | | | | | U.S. Treasury Note 2-Year | | | | | June 2017 | | | $ | 49,567,766 | | | $ | 39,366 | |
| | 171 | | | | | U.S. Treasury Note 5-Year | | | | | June 2017 | | | | 20,131,242 | | | | 21,868 | |
| | 87 | | | | | U.S. Treasury Note 10-Year | | | | | June 2017 | | | | 10,836,938 | | | | 34,853 | |
| | 106 | | | | | U.S. Ultra Bond | | | | | June 2017 | | | | 17,026,250 | | | | 152,378 | |
| | | | | | | | | | | | | | | | | | | | |
| | | | | | | | | | | | | | | | | | $ | 248,465 | |
| | | | | | | | | | | | | | | | | | | | |
| | Sales | | | | | | | | | | | | | | | | | | | |
| | 53 | | | | | U.S. Long Bond | | | | | June 2017 | | | $ | 7,994,719 | | | $ | (33,109 | ) |
| | | | | | | | | | | | | | | | | | | | |
Written Options
| | | | | | | | | | | | | | | | | | | | |
Type of Contract | | Counterparty | | Number of
Contracts/Notional
Amount | | Premiums
Received | | Value at
March 31, 2017 |
CALL — U.S. Treasury Note 10-Year Futures
Option Strike @ $ 128.00
Expires 05/26/2017 | | JPMorgan Chase Bank N.A. | | $100,000 | | $14,300 | | | $ | (12,500 | ) |
Centrally Cleared Interest Rate Swaps
| | | | | | | | | | | | | | | | | | | | |
Pay/Receive
Floating Rate | | Floating
Rate Index | | | Fixed Rate | | | Maturity Date | | | Notional
Amount | | | Unrealized
Appreciation
(Depreciation) | |
| Receive | | | 3-Month USD LIBOR | | | | 1.20% | | | | 05/31/23 | | | $ | 1,170,000 | | | $ | 64,781 | |
| Receive | |
| Overnight Federal Funds
Effective Rate (12M) |
| | | 0.54% | | | | 09/09/17 | | | | 35,205,000 | | | | 72,209 | |
| Receive | | | 3-Month USD LIBOR | | | | 2.57% | | | | 09/08/24 | | | | 1,600,000 | | | | (35,947 | ) |
| Receive | | | 3-Month USD LIBOR | | | | 2.21% | | | | 01/08/26 | | | | 7,920,000 | | | | 70,753 | |
| Receive | | | 3-Month USD LIBOR | | | | 1.46% | | | | 08/15/23 | | | | 4,480,000 | | | | (30,043 | ) |
| Receive | | | 3-Month USD LIBOR | | | | 2.01% | | | | 08/31/21 | | | | 100,000 | | | | 43 | |
| Receive | |
| Overnight Federal Funds
Effective Rate (12M) |
| | | 0.61% | | | | 10/18/17 | | | | 29,950,000 | | | | 68,767 | |
| Receive | |
| Overnight Federal Funds
Effective Rate (12M) |
| | | 0.63% | | | | 11/09/17 | | | | 16,645,000 | | | | 42,336 | |
| | | | | | | | | | | | | | | | | | $ | 252,899 | |
| | | | | | | | | | | | | | | | | | | | |
Centrally Cleared Credit Default Swaps (See Note 2(a))
| | | | | | | | | | |
Notional Amount | | | Expiration Date | | | Unrealized
Appreciation
(Depreciation) | |
| $ | 17,000,000 | | | | 06/20/20 | | | $ | (26,705 | ) |
| | | | | | | | | | |
| | | | | | |
| | See accompanying Notes to the Financial Statements. | | | 95 | |
Mercer Core Fixed Income Fund
Schedule of Investments (Continued)
March 31, 2017
| | | | | |
| Asset Class Summary (Unaudited) | | % of Net Assets |
Debt Obligations | | | | 98.0 | |
Futures Contracts | | | | 0.0 | |
Swaps | | | | 0.0 | |
Options Purchased | | | | 0.0 | |
Written Options | | | | 0.0 | |
TBA Sale Commitments | | | | (0.1 | ) |
Short-Term Investments | | | | 5.1 | |
Other Assets and Liabilities (net) | | | | (3.0 | ) |
| | | | | |
| | | | 100.0 | % |
| | | | | |
| | | | | | |
| 96 | | See accompanying Notes to the Financial Statements. | | | | |
Mercer Opportunistic Fixed Income Fund
Schedule of Investments
(showing percentage of net assets)
March 31, 2017
| | | | | | | | | | |
| Par Value** | | | | | Description | | Value ($) | |
| | | |
| | | | | | DEBT OBLIGATIONS — 95.4% | | | | |
| | | |
| | | | | | Corporate Debt — 46.1% | | | | |
| | | |
| | 2,500,000 | | | | | 24 Hour Holdings III LLC, 8.00%, due 06/01/22 144A | | | 2,093,750 | |
| | 800,000 | EUR | | | | Adient Global Holdings, Ltd., 3.50%, due 08/15/24 144A | | | 863,169 | |
| | 1,000,000 | | | | | AerCap Ireland Capital DAC/AerCap Global Aviation Trust, 5.00%, due 10/01/21 | | | 1,071,512 | |
| | 1,000,000 | | | | | Aircastle, Ltd., 4.13%, due 05/01/24 | | | 1,003,750 | |
| | 1,200,000 | | | | | Alere, Inc., 6.50%, due 06/15/20 | | | 1,215,000 | |
| | 2,500,000 | | | | | Allison Transmission, Inc., 5.00%, due 10/01/24 144A | | | 2,531,250 | |
| | 3,300,000 | | | | | Altice US Finance I Corp., 5.50%, due 05/15/26 144A | | | 3,399,000 | |
| | 2,000,000 | | | | | AMC Networks, Inc., 5.00%, due 04/01/24 | | | 2,005,000 | |
| | 10,540,000 | MXN | | | | America Movil SAB de CV, 7.13%, due 12/09/24 | | | 534,629 | |
| | 1,500,000 | | | | | ArcelorMittal, 6.25%, due 03/01/21‡ | | | 1,627,500 | |
| | 2,000,000 | | | | | Ardagh Packaging Finance Plc/Ardagh Holdings USA, Inc., 6.00%, due 06/30/21 144A | | | 2,067,500 | |
| | 500,000 | | | | | Ardagh Packaging Finance Plc/Ardagh Holdings USA, Inc., 7.25%, due 05/15/24 144A | | | 536,875 | |
| | 2,000,000 | | | | | Axalta Coating Systems LLC, 4.88%, due 08/15/24 144A | | | 2,055,000 | |
| | 1,700,000 | EUR | | | | Ball Corp., 4.38%, due 12/15/23 | | | 2,017,869 | |
| | 2,500,000 | | | | | Bank of America Corp., Series M, 8.13%† ††††† | | | 2,609,375 | |
| | 1,000,000 | | | | | Barminco Finance Pty, Ltd., 9.00%, due 06/01/18‡ 144A | | | 1,055,000 | |
| | 300,000 | | | | | Beazer Homes USA, Inc., 6.75%, due 03/15/25 144A | | | 302,250 | |
| | 1,800,000 | | | | | Beazer Homes USA, Inc., 8.75%, due 03/15/22 144A | | | 1,975,500 | |
| | 1,558,000 | | | | | Blackboard, Inc., 9.75%, due 10/15/21 144A | | | 1,565,790 | |
| | 600,000 | | | | | Block Communications, Inc., 6.88%, due 02/15/25 144A | | | 637,500 | |
| | 2,000,000 | | | | | BMC Software Finance, Inc., 8.13%, due 07/15/21‡ 144A | | | 2,025,000 | |
| | 900,000 | | | | | BreitBurn Energy Partners LP/BreitBurn Finance Corp., 7.88%, due 04/15/22¤ ††† | | | 544,500 | |
| | 2,400,000 | | | | | BWAY Holding Co., 7.25%, due 04/15/25†††† 144A | | | 2,406,000 | |
| | 15,000 | | | | | California Resources Corp., 5.50%, due 09/15/21 | | | 11,175 | |
| | 36,000 | | | | | California Resources Corp., 6.00%, due 11/15/24 | | | 25,380 | |
| | 1,293,000 | | | | | California Resources Corp., 8.00%, due 12/15/22 144A | | | 1,055,411 | |
| | 2,500,000 | | | | | Calpine Corp., 5.75%, due 01/15/25‡ | | | 2,496,875 | |
| | 500,000 | | | | | Calumet Specialty Products Partners, LP/Calumet Finance Corp., 11.50%, due 01/15/21 144A | | | 580,000 | |
| | 1,000,000 | | | | | CCO Holdings LLC/CCO Holdings Capital Corp., 5.25%, due 09/30/22 | | | 1,040,000 | |
| | 1,400,000 | | | | | CCO Holdings LLC/CCO Holdings Capital Corp., 5.75%, due 02/15/26 144A | | | 1,473,500 | |
| | 1,200,000 | | | | | CDW LLC/CDW Finance Corp., 5.00%, due 09/01/25 | | | 1,230,000 | |
| | 2,200,000 | | | | | Cemex Finance LLC, 6.00%, due 04/01/24‡ 144A | | | 2,318,800 | |
| | 800,000 | | | | | Cemex Finance LLC, 9.38%, due 10/12/22 144A | | | 866,400 | |
| | 1,500,000 | | | | | Centene Corp., 4.75%, due 05/15/22 | | | 1,548,750 | |
| | 2,200,000 | | | | | CenturyLink, Inc., 6.75%, due 12/01/23 | | | 2,301,750 | |
| | 1,200,000 | EUR | | | | CeramTec Group GmbH, 8.25%, due 08/15/21 144A | | | 1,368,668 | |
| | 538,009 | | | | | CHC Group LLC/CHC Finance, Ltd., 0.00%, due 09/15/20‡‡ | | | 992,627 | |
| | 2,200,000 | EUR | | | | Chemours Co. (The), 6.13%, due 05/15/23 | | | 2,525,216 | |
| | 1,600,000 | | | | | Cheniere Corpus Christi Holdings LLC, 5.88%, due 03/31/25 144A | | | 1,674,000 | |
| | 900,000 | | | | | Cheniere Corpus Christi Holdings LLC, 7.00%, due 06/30/24 144A | | | 995,625 | |
| | 400,000 | | | | | CHS/Community Health Systems, Inc., 6.25%, due 03/31/23 | | | 408,500 | |
| | 2,000,000 | | | | | CHS/Community Health Systems, Inc., 6.88%, due 02/01/22‡ | | | 1,727,500 | |
| | 2,500,000 | | | | | CIT Group, Inc., 5.00%, due 08/01/23 | | | 2,612,500 | |
| | 2,000,000 | | | | | Citigroup, Inc., 6.30%† ††††† | | | 2,087,500 | |
| | 200,000 | | | | | Clear Channel Worldwide Holdings, Inc., 6.50%, due 11/15/22 | | | 209,000 | |
| | 800,000 | | | | | Clear Channel Worldwide Holdings, Inc., 7.63%, due 03/15/20 | | | 809,000 | |
| | 2,400,000 | | | | | Cloud Crane LLC, 10.13%, due 08/01/24 144A | | | 2,568,000 | |
| | | | | | |
| | See accompanying Notes to the Financial Statements. | | | 97 | |
Mercer Opportunistic Fixed Income Fund
Schedule of Investments (Continued)
(showing percentage of net assets)
March 31, 2017
| | | | | | | | | | |
| Par Value** | | | | | Description | | Value ($) | |
| | | |
| | | | | | Corporate Debt — continued | | | | |
| | | |
| | 2,000,000 | | | | | CNH Industrial Capital LLC, 3.88%, due 10/15/21 | | | 2,006,020 | |
| | 2,500,000 | | | | | CommScope Technologies LLC, 6.00%, due 06/15/25 144A | | | 2,631,250 | |
| | 2,400,000 | | | | | Concordia Healthcare Corp., 7.00%, due 04/15/23‡ 144A | | | 474,000 | |
| | 300,000 | | | | | Concordia International Corp., 9.00%, due 04/01/22‡ 144A | | | 217,875 | |
| | 1,000,000 | | | | | CONSOL Energy, Inc., 5.88%, due 04/15/22 | | | 993,750 | |
| | 900,000 | | | | | CONSOL Energy, Inc., 8.00%, due 04/01/23 | | | 950,625 | |
| | 1,300,000 | EUR | | | | Cott Corp., 5.50%, due 07/01/24 144A | | | 1,470,294 | |
| | 1,000,000 | | | | | Cott Holdings, Inc., 5.50%, due 04/01/25 144A | | | 1,020,300 | |
| | 800,000 | | | | | Crestwood Midstream Partners, LP/Crestwood Midstream Finance Corp., 5.75%, due 04/01/25 144A | | | 819,000 | |
| | 1,500,000 | | | | | Crestwood Midstream Partners, LP/Crestwood Midstream Finance Corp., 6.25%, due 04/01/23 | | | 1,563,750 | |
| | 500,000 | | | | | CSC Holdings LLC, 6.75%, due 11/15/21 | | | 543,438 | |
| | 2,000,000 | | | | | CSC Holdings LLC, 10.88%, due 10/15/25 144A | | | 2,410,000 | |
| | 300,000 | | | | | CSI Compressco, LP/Compressco Finance, Inc., 7.25%, due 08/15/22 | | | 286,500 | |
| | 2,000,000 | | | | | CVR Partners, LP/CVR Nitrogen Finance Corp., 9.25%, due 06/15/23‡ 144A | | | 2,060,000 | |
| | 2,000,000 | | | | | DaVita, Inc., 5.13%, due 07/15/24 | | | 2,023,750 | |
| | 300,000 | | | | | Diamond 1 Finance Corp./Diamond 2 Finance Corp., 5.88%, due 06/15/21 144A | | | 315,490 | |
| | 300,000 | | | | | Diamond 1 Finance Corp./Diamond 2 Finance Corp., 7.13%, due 06/15/24 144A | | | 331,813 | |
| | 1,000,000 | | | | | Digicel Group, Ltd., 7.13%, due 04/01/22 144A | | | 782,500 | |
| | 1,500,000 | | | | | Digicel, Ltd., 6.00%, due 04/15/21 144A | | | 1,370,625 | |
| | 1,800,000 | | | | | DISH DBS Corp., 5.00%, due 03/15/23 | | | 1,813,500 | |
| | 700,000 | | | | | DISH DBS Corp., 5.88%, due 11/15/24 | | | 737,800 | |
| | 1,000,000 | | | | | Dynegy, Inc., 7.63%, due 11/01/24‡ | | | 960,000 | |
| | 1,900,000 | | | | | Dynegy, Inc., 8.00%, due 01/15/25‡ 144A | | | 1,828,750 | |
| | 800,000 | | | | | Eldorado Gold Corp., 6.13%, due 12/15/20 144A | | | 824,000 | |
| | 500,000 | | | | | Endo, Ltd./Endo Finance LLC/Endo Finco, Inc., 6.00%, due 07/15/23‡ 144A | | | 440,000 | |
| | 1,500,000 | | | | | Endo, Ltd./Endo Finance LLC/Endo Finco, Inc., 6.00%, due 02/01/25 144A | | | 1,286,250 | |
| | 2,000,000 | | | | | Energy Transfer Equity, LP, 7.50%, due 10/15/20 | | | 2,240,000 | |
| | 1,042,280 | | | | | EnQuest Plc, Reg S, 7.00%, due 10/15/23‡‡‡ 144A | | | 814,281 | |
| | 1,500,000 | | | | | Equinix, Inc., 5.38%, due 04/01/23 | | | 1,569,375 | |
| | 100,000 | | | | | Escrow GCB Penn Virginia Corp., 8.50%, due 05/01/20**** ††† | | | — | |
| | 9,280,000,000 | IDR | | | | European Investment Bank, Reg S, 6.95%, due 02/06/20‡‡‡ | | | 702,259 | |
| | 24,240,000,000 | IDR | | | | European Investment Bank, Reg S, 7.20%, due 07/09/19‡‡‡ | | | 1,848,856 | |
| | 8,150,000 | ZAR | | | | European Investment Bank, Reg S, 8.50%, due 09/17/24‡‡‡ | | | 602,755 | |
| | 300,000 | | | | | Ferrellgas Partners, LP/Ferrellgas Partners Finance Corp., 8.63%, due 06/15/20 144A | | | 288,750 | |
| | 1,500,000 | | | | | Ferrellgas, LP/Ferrellgas Finance Corp., 6.75%, due 06/15/23 | | | 1,417,500 | |
| | 2,500,000 | | | | | Fiat Chrysler Automobiles NV, 4.50%, due 04/15/20‡ | | | 2,559,375 | |
| | 649,000,000 | COP | | | | Financiera de Desarrollo Territorial SA Findeter, Reg S, 7.88%, due 08/12/24‡‡‡ | | | 220,118 | |
| | 2,200,000 | | | | | First Data Corp., 5.75%, due 01/15/24 144A | | | 2,277,550 | |
| | 500,000 | | | | | First Data Corp., 7.00%, due 12/01/23 144A | | | 537,500 | |
| | 2,000,000 | | | | | First Quantum Minerals, Ltd., 7.00%, due 02/15/21 144A | | | 2,070,000 | |
| | 400,000 | | | | | First Quantum Minerals, Ltd., 7.25%, due 04/01/23 144A | | | 405,500 | |
| | 400,000 | EUR | | | | Galapagos Holding SA, 7.00%, due 06/15/22 144A | | | 376,437 | |
| | 449,000 | EUR | | | | Galapagos SA/Luxembourg, 5.38%, due 06/15/21 144A | | | 482,174 | |
| | 1,500,000 | | | | | Goodyear Tire & Rubber Co. (The), 5.00%, due 05/31/26 | | | 1,541,250 | |
| | 500,000 | | | | | Goodyear Tire & Rubber Co. (The), 5.13%, due 11/15/23 | | | 521,563 | |
| | 700,000 | | | | | Grinding Media, Inc./MC Grinding Media Canada, Inc., 7.38%, due 12/15/23 144A | | | 736,750 | |
| | 1,500,000 | EUR | | | | Hanesbrands Finance Luxembourg SCA, 3.50%, due 06/15/24 144A | | | 1,645,860 | |
| | 2,000,000 | | | | | Hanesbrands, Inc., 4.88%, due 05/15/26 144A | | | 1,975,000 | |
| | | | | | |
| 98 | | See accompanying Notes to the Financial Statements. | | | | |
Mercer Opportunistic Fixed Income Fund
Schedule of Investments (Continued)
(showing percentage of net assets)
March 31, 2017
| | | | | | | | | | |
| Par Value** | | | | | Description | | Value ($) | |
| | | |
| | | | | | Corporate Debt — continued | | | | |
| | | |
| | 2,500,000 | | | | | HCA, Inc., 5.00%, due 03/15/24 | | | 2,628,125 | |
| | 2,000,000 | | | | | Horizon Pharma Financing, Inc., 6.63%, due 05/01/23‡ | | | 1,970,000 | |
| | 400,000 | | | | | Horizon Pharma, Inc./Horizon Pharma USA, Inc., 8.75%, due 11/01/24 144A | | | 418,500 | |
| | 400,000 | | | | | Hughes Satellite Systems Corp., 6.63%, due 08/01/26 144A | | | 410,000 | |
| | 1,000,000 | | | | | iHeartCommunications, Inc., 9.00%, due 03/01/21 | | | 763,750 | |
| | 500,000 | | | | | iHeartCommunications, Inc., 9.00%, due 09/15/22 | | | 377,500 | |
| | 2,000,000 | EUR | | | | Infor US, Inc., 5.75%, due 05/15/22 | | | 2,209,583 | |
| | 900,000 | | | | | Infor US, Inc., 6.50%, due 05/15/22 | | | 929,340 | |
| | 700,000 | EUR | | | | Inovyn Finance Plc, 6.25%, due 05/15/21 144A | | | 791,044 | |
| | 2,500,000 | | | | | Intelsat Jackson Holdings SA, 5.50%, due 08/01/23 | | | 2,075,000 | |
| | 8,860,000,000 | IDR | | | | Inter-American Development Bank, 7.35%, due 09/12/18 | | | 674,099 | |
| | 2,500,000 | | | | | InterGen NV, 7.00%, due 06/30/23 144A | | | 2,250,000 | |
| | 1,500,000 | | | | | International Game Technology Plc, 6.25%, due 02/15/22 144A | | | 1,608,750 | |
| | 1,300,000 | | | | | Jaguar Holding Co. II/Pharmaceutical Product Development LLC, 6.38%, due 08/01/23 144A | | | 1,358,500 | |
| | 2,000,000 | | | | | JBS USA LUX SA/JBS USA Finance, Inc., 5.88%, due 07/15/24 144A | | | 2,070,000 | |
| | 1,000,000 | | | | | JPMorgan Chase & Co., 5.00%† ††††† | | | 1,012,500 | |
| | 1,500,000 | | | | | JPMorgan Chase & Co., 6.00%† ††††† | | | 1,567,950 | |
| | 545,527 | | | | | K2016470219 South Africa, Ltd., 3.00%, due 12/31/22 144A | | | 70,018 | |
| | 78,795 | | | | | K2016470260 South Africa, Ltd., 25.00%, due 12/31/22 144A | | | 106,767 | |
| | 1,000,000 | | | | | KB Home, 7.50%, due 09/15/22 | | | 1,102,500 | |
| | 1,000,000 | | | | | Lamb Weston Holdings, Inc., 4.63%, due 11/01/24 144A | | | 1,022,500 | |
| | 1,000,000 | | | | | Lamb Weston Holdings, Inc., 4.88%, due 11/01/26 144A | | | 1,022,500 | |
| | 600,000 | EUR | | | | Lincoln Finance, Ltd., 6.88%, due 04/15/21 144A | | | 687,774 | |
| | 900,000 | | | | | Martin Midstream Partners, LP/Martin Midstream Finance Corp., 7.25%, due 02/15/21 | | | 913,500 | |
| | 500,000 | EUR | | | | Matterhorn Telecom Holding SA, 4.88%, due 05/01/23 144A | | | 535,109 | |
| | 1,300,000 | EUR | | | | Matterhorn Telecom SA, 3.88%, due 05/01/22 144A | | | 1,411,293 | |
| | 600,000 | | | | | Microsemi Corp., 9.13%, due 04/15/23 144A | | | 692,250 | |
| | 1,000,000 | | | | | Midstates Petroleum Co., Inc./Midstates Petroleum Co. LLC, 9.25%, due 06/01/21**** ¤ | | | — | |
| | 2,000,000 | | | | | Millicom International Cellular SA, 6.63%, due 10/15/21 144A | | | 2,102,400 | |
| | 400,000 | | | | | MPH Acquisition Holdings LLC, 7.13%, due 06/01/24 144A | | | 431,050 | |
| | 1,000,000 | | | | | MPT Operating Partnership, LP/MPT Finance Corp. REIT, 5.25%, due 08/01/26 | | | 990,000 | |
| | 600,000 | | | | | MSCI, Inc., 4.75%, due 08/01/26 144A | | | 607,500 | |
| | 800,000 | | | | | Murray Energy Corp., 11.25%, due 04/15/21 144A | | | 622,000 | |
| | 800,000 | | | | | Navient Corp., 6.63%, due 07/26/21 | | | 830,000 | |
| | 2,500,000 | | | | | Navient Corp., 7.25%, due 09/25/23 | | | 2,525,000 | |
| | 2,000,000 | | | | | Netflix, Inc., 5.88%, due 02/15/25 | | | 2,155,000 | |
| | 1,700,000 | EUR | | | | NEW Areva Holding SA, Reg S, 3.13%, due 03/20/23‡‡‡ | | | 1,744,141 | |
| | 700,000 | | | | | Nexstar Broadcasting, Inc., 5.63%, due 08/01/24 144A | | | 712,250 | |
| | 1,500,000 | | | | | NOVA Chemicals Corp., 5.00%, due 05/01/25 144A | | | 1,530,000 | |
| | 1,200,000 | | | | | Novelis Corp., 5.88%, due 09/30/26 144A | | | 1,228,500 | |
| | 1,400,000 | | | | | Novelis Corp., 6.25%, due 08/15/24 144A | | | 1,463,000 | |
| | 1,000,000 | | | | | NRG Yield Operating LLC, 5.38%, due 08/15/24 | | | 1,020,000 | |
| | 2,000,000 | | | | | Owens-Brockway Glass Container, Inc., 5.00%, due 01/15/22 144A | | | 2,065,000 | |
| | 1,100,000 | | | | | Park Aerospace Holdings, Ltd., 5.25%, due 08/15/22 144A | | | 1,148,125 | |
| | 1,100,000 | | | | | Park Aerospace Holdings, Ltd., 5.50%, due 02/15/24 144A | | | 1,146,750 | |
| | 1,500,000 | | | | | Petrobras Global Finance BV, 5.38%, due 01/27/21 | | | 1,543,500 | |
| | 61,562,400 | MXN | | | | Petroleos Mexicanos, Reg S, 7.19%, due 09/12/24‡‡‡ | | | 2,899,300 | |
| | 300,000 | | | | | Platform Specialty Products Corp., 10.38%, due 05/01/21 144A | | | 334,500 | |
| | 900,000 | EUR | | | | Play Topco SA, 5.38%, due 09/15/22 144A | | | 962,118 | |
| | | | | | |
| | See accompanying Notes to the Financial Statements. | | | 99 | |
Mercer Opportunistic Fixed Income Fund
Schedule of Investments (Continued)
(showing percentage of net assets)
March 31, 2017
| | | | | | | | | | |
| Par Value** | | | | | Description | | Value ($) | |
| | | |
| | | | | | Corporate Debt — continued | | | | |
| | | |
| | 2,000,000 | | | | | Post Holdings, Inc., 5.00%, due 08/15/26 144A | | | 1,920,000 | |
| | 400,000 | | | | | Post Holdings, Inc., 5.50%, due 03/01/25 144A | | | 404,000 | |
| | 1,000,000 | EUR | | | | PSPC Escrow Corp., 6.00%, due 02/01/23 144A | | | 1,104,177 | |
| | 2,000,000 | | | | | PulteGroup, Inc., 5.00%, due 01/15/27 | | | 2,007,500 | |
| | 1,400,000 | | | | | QEP Resources, Inc., 5.25%, due 05/01/23 | | | 1,379,546 | |
| | 2,000,000 | | | | | Qorvo, Inc., 7.00%, due 12/01/25 | | | 2,220,000 | |
| | 1,000,000 | EUR | | | | Quintiles IMS, Inc., 3.25%, due 03/15/25 144A | | | 1,065,026 | |
| | 1,000,000 | | | | | Radio One, Inc., 9.25%, due 02/15/20‡ 144A | | | 970,000 | |
| | 1,500,000 | EUR | | | | Rain CII Carbon LLC/CII Carbon Corp., 8.50%, due 01/15/21 144A | | | 1,664,487 | |
| | 400,000 | | | | | Reynolds Group Issuer, Inc./Reynolds Group Issuer LLC/Reynolds Group Issuer, 5.13%, due 07/15/23 144A | | | 411,500 | |
| | 700,000 | | | | | Reynolds Group Issuer, Inc./Reynolds Group Issuer LLC/Reynolds Group Issuer, 5.75%, due 10/15/20 | | | 721,007 | |
| | 200,000 | | | | | Reynolds Group Issuer, Inc./Reynolds Group Issuer LLC/Reynolds Group Issuer, 7.00%, due 07/15/24‡ 144A | | | 214,500 | |
| | 2,000,000 | | | | | Sabine Pass Liquefaction LLC, 5.00%, due 03/15/27 144A | | | 2,094,774 | |
| | 500,000 | | | | | Sabine Pass Liquefaction LLC, 5.63%, due 04/15/23 | | | 543,123 | |
| | 1,000,000 | | | | | Sanchez Energy Corp., 6.13%, due 01/15/23‡ | | | 932,500 | |
| | 1,300,000 | EUR | | | | Schoeller Allibert Group, 8.00%, due 10/01/21 144A | | | 1,496,194 | |
| | 800,000 | EUR | | | | Sealed Air Corp., 4.50%, due 09/15/23 144A | | | 951,696 | |
| | 600,000 | EUR | | | | SIG Combibloc Holdings SCA, 7.75%, due 02/15/23 144A | | | 686,571 | |
| | 2,000,000 | | | | | Sprint Communications, Inc., 6.00%, due 11/15/22 | | | 2,050,000 | |
| | 1,500,000 | | | | | Sprint Corp., 7.13%, due 06/15/24 | | | 1,605,000 | |
| | 500,000 | | | | | Sprint Corp., 7.63%, due 02/15/25‡ | | | 547,500 | |
| | 300,000 | | | | | Steel Dynamics, Inc., 5.13%, due 10/01/21 | | | 310,875 | |
| | 1,000,000 | | | | | Steel Dynamics, Inc., 5.50%, due 10/01/24 | | | 1,047,500 | |
| | 800,000 | | | | | Symantec Corp., 5.00%, due 04/15/25 144A | | | 821,250 | |
| | 1,300,000 | | | | | T-Mobile USA, Inc., 6.00%, due 04/15/24 | | | 1,389,375 | |
| | 1,700,000 | | | | | T-Mobile USA, Inc., 6.38%, due 03/01/25 | | | 1,836,000 | |
| | 2,600,000 | | | | | Talen Energy Supply LLC, 6.50%, due 06/01/25‡ | | | 2,216,500 | |
| | 1,800,000 | | | | | Taylor Morrison Communities, Inc./Monarch Communities, Inc., 5.63%, due 03/01/24 144A | | | 1,872,000 | |
| | 500,000 | | | | | Tenet Healthcare Corp., 5.00%, due 03/01/19 | | | 503,265 | |
| | 200,000 | | | | | Tenet Healthcare Corp., 7.50%, due 01/01/22‡ 144A | | | 216,500 | |
| | 1,800,000 | | | | | Tenet Healthcare Corp., 8.13%, due 04/01/22 | | | 1,887,750 | |
| | 700,000 | | | | | Terex Corp., 5.63%, due 02/01/25 144A | | | 711,375 | |
| | 1,200,000 | GBP | | | | Tesco Plc, 6.13%, due 02/24/22 | | | 1,731,517 | |
| | 2,000,000 | | | | | Texas Competitive Electric Holdings Co. LLC/TCEH Finance, Inc., 11.50%, due 10/01/20¤ ††† | | | 25,000 | |
| | 1,000,000 | | | | | TransDigm, Inc., 6.50%, due 07/15/24 | | | 1,016,250 | |
| | 1,800,000 | | | | | TransDigm, Inc., 6.50%, due 05/15/25 | | | 1,820,250 | |
| | 2,880,000 | ZAR | | | | Transnet SOC, Ltd., Reg S, 9.50%, due 05/13/21‡‡‡ | | | 206,676 | |
| | 800,000 | | | | | Triangle USA Petroleum Corp., 6.75%, due 07/15/22††† 144A | | | 236,000 | |
| | 2,500,000 | | | | | United Rentals North America, Inc., 5.88%, due 09/15/26 | | | 2,615,625 | |
| | 800,000 | EUR | | | | Unitymedia Hessen GmbH & Co. KG/Unitymedia NRW GmbH, 4.00%, due 01/15/25 144A | | | 891,470 | |
| | 810,000 | EUR | | | | Unitymedia Hessen GmbH & Co. KG/Unitymedia NRW GmbH, 5.75%, due 01/15/23 144A | | | 915,287 | |
| | 500,000 | | | | | Univar USA, Inc., 6.75%, due 07/15/23 144A | | | 521,250 | |
| | 1,600,000 | EUR | | | | UPCB Finance IV, Ltd., 4.00%, due 01/15/27 144A | | | 1,747,730 | |
| | | | | | |
| 100 | | See accompanying Notes to the Financial Statements. | | | | |
Mercer Opportunistic Fixed Income Fund
Schedule of Investments (Continued)
(showing percentage of net assets)
March 31, 2017
| | | | | | | | | | |
| Par Value** | | | | | Description | | Value ($) | |
| | | |
| | | | | | Corporate Debt — continued | | | | |
| | | |
| | 1,000,000 | | | | | Valeant Pharmaceuticals International, Inc., 5.50%, due 03/01/23 144A | | | 775,000 | |
| | 1,000,000 | | | | | Valeant Pharmaceuticals International, Inc., 5.63%, due 12/01/21 144A | | | 810,000 | |
| | 600,000 | | | | | Valeant Pharmaceuticals International, Inc., 6.13%, due 04/15/25‡ 144A | | | 464,250 | |
| | 200,000 | | | | | Valeant Pharmaceuticals International, Inc., 7.00%, due 03/15/24 144A | | | 205,750 | |
| | 900,000 | | | | | Valvoline, Inc., 5.50%, due 07/15/24 144A | | | 947,250 | |
| | 2,400,000 | | | | | Vertiv Group Corp., 9.25%, due 10/15/24 144A | | | 2,580,000 | |
| | 450,000 | GBP | | | | Virgin Media Secured Finance Plc, 5.50%, due 01/15/25 144A | | | 591,541 | |
| | 900,000 | | | | | Weatherford International, Ltd., 7.75%, due 06/15/21 | | | 973,125 | |
| | 1,100,000 | | | | | Weatherford International, Ltd., 8.25%, due 06/15/23‡ | | | 1,199,000 | |
| | 1,300,000 | | | | | WellCare Health Plans, Inc., 5.25%, due 04/01/25 | | | 1,333,540 | |
| | 2,000,000 | | | | | Western Digital Corp., 10.50%, due 04/01/24 | | | 2,362,500 | |
| | 1,200,000 | EUR | | | | Wind Acquisition Finance SA, 4.00%, due 07/15/20 144A | | | 1,305,978 | |
| | 700,000 | EUR | | | | Wind Acquisition Finance SA, 7.00%, due 04/23/21 144A | | | 777,621 | |
| | 1,349,000 | | | | | WMG Acquisition Corp., 5.63%, due 04/15/22 144A | | | 1,401,274 | |
| | 1,400,000 | | | | | WPX Energy, Inc., 8.25%, due 08/01/23‡ | | | 1,564,500 | |
| | 1,200,000 | | | | | Wynn Las Vegas LLC/Wynn Las Vegas Capital Corp., 5.50%, due 03/01/25‡ 144A | | | 1,222,500 | |
| | 1,300,000 | | | | | Wynn Macau, Ltd., 5.25%, due 10/15/21 144A | | | 1,329,250 | |
| | 1,300,000 | EUR | | | | XPO Logistics, Inc., 5.75%, due 06/15/21 144A | | | 1,459,525 | |
| | 1,200,000 | | | | | XPO Logistics, Inc., 6.13%, due 09/01/23 144A | | | 1,252,500 | |
| | 600,000 | | | | | Zayo Group LLC/Zayo Capital, Inc., 5.75%, due 01/15/27 144A | | | 634,380 | |
| | 1,900,000 | EUR | | | | Ziggo Secured Finance BV, 4.25%, due 01/15/27 144A | | | 2,125,036 | |
| | | | | | | | | | |
| | | | | | | | | 257,645,081 | |
| | | | | | | | | | |
| | | |
| | | | | | Sovereign Debt Obligations — 49.3% | | | | |
| | | |
| | 5,852,400 | ARS | | | | Argentina Bonar Bonds, 22.81%, due 03/01/18† | | | 390,779 | |
| | 15,295,164 | ARS | | | | Argentina Bonar Bonds, 23.31%, due 03/01/20† | | | 1,094,466 | |
| | 1,653,420 | ARS | | | | Argentina Bonar Bonds, 24.26%, due 10/09/17† | | | 109,316 | |
| | 6,962,000 | BRL | | | | Brazil Letras do Tesouro Nacional, 9.39%, due 01/01/18‡‡ | | | 2,045,336 | |
| | 54,580,000 | BRL | | | | Brazil Letras do Tesouro Nacional, 9.39%, due 01/01/19‡‡ | | | 14,687,494 | |
| | 20,000,000 | BRL | | | | Brazil Letras do Tesouro Nacional, 10.04%, due 01/01/20‡‡ | | | 4,890,647 | |
| | 26,000,000 | BRL | | | | Brazil Letras do Tesouro Nacional, 10.38%, due 07/01/20‡‡ | | | 6,053,272 | |
| | 1,758,000 | BRL | | | | Brazil Notas do Tesouro Nacional Series B, 17.89%, due 05/15/35 | | | 1,808,314 | |
| | 462,000 | BRL | | | | Brazil Notas do Tesouro Nacional Series F, 10.00%, due 01/01/19 | | | 146,796 | |
| | 21,186,000 | BRL | | | | Brazil Notas do Tesouro Nacional Series F, 10.00%, due 01/01/21 | | | 6,721,269 | |
| | 9,814,000 | BRL | | | | Brazil Notas do Tesouro Nacional Series F, 10.00%, due 01/01/23 | | | 3,104,116 | |
| | 10,720,000 | BRL | | | | Brazil Notas do Tesouro Nacional Series F, 10.00%, due 01/01/25 | | | 3,379,604 | |
| | 1,505,000 | BRL | | | | Brazil Notas do Tesouro Nacional Series F, 10.00%, due 01/01/27 | | | 473,591 | |
| | 7,264,900,000 | COP | | | | Colombian TES, 6.00%, due 04/28/28 | | | 2,373,550 | |
| | 11,344,500,000 | COP | | | | Colombian TES, 7.00%, due 05/04/22 | | | 4,070,267 | |
| | 845,000,000 | COP | | | | Colombian TES, 7.50%, due 08/26/26 | | | 309,559 | |
| | 2,113,000,000 | COP | | | | Colombian TES, 7.75%, due 09/18/30 | | | 792,754 | |
| | 24,545,800,000 | COP | | | | Colombian TES, 10.00%, due 07/24/24 | | | 10,194,556 | |
| | 8,395,800,000 | COP | | | | Colombian TES, 11.00%, due 07/24/20 | | | 3,337,417 | |
| | 529,410,000 | HUF | | | | Hungary Government Bond, 3.00%, due 06/26/24 | | | 1,855,807 | |
| | 448,500,000 | HUF | | | | Hungary Government Bond, 3.00%, due 10/27/27 | | | 1,516,217 | |
| | 44,848,000,000 | IDR | | | | Indonesia Treasury Bond, 5.63%, due 05/15/23 | | | 3,157,430 | |
| | 8,900,000,000 | IDR | | | | Indonesia Treasury Bond, 6.13%, due 05/15/28 | | | 603,411 | |
| | 15,988,000,000 | IDR | | | | Indonesia Treasury Bond, 6.63%, due 05/15/33 | | | 1,088,631 | |
| | 43,162,000,000 | IDR | | | | Indonesia Treasury Bond, 7.00%, due 05/15/22 | | | 3,266,585 | |
| | | | | | |
| | See accompanying Notes to the Financial Statements. | | | 101 | |
Mercer Opportunistic Fixed Income Fund
Schedule of Investments (Continued)
(showing percentage of net assets)
March 31, 2017
| | | | | | | | | | |
| Par Value** | | | | | Description | | Value ($) | |
| | | |
| | | | | | Sovereign Debt Obligations — continued | | | | |
| | | |
| | 3,300,000,000 | IDR | | | | Indonesia Treasury Bond, 7.00%, due 05/15/27 | | | 247,645 | |
| | 8,113,000,000 | IDR | | | | Indonesia Treasury Bond, 8.25%, due 05/15/36 | | | 646,402 | |
| | 108,663,000,000 | IDR | | | | Indonesia Treasury Bond, 8.38%, due 03/15/24 | | | 8,700,167 | |
| | 86,688,000,000 | IDR | | | | Indonesia Treasury Bond, 8.38%, due 09/15/26 | | | 7,081,152 | |
| | 50,513,000,000 | IDR | | | | Indonesia Treasury Bond, 8.38%, due 03/15/34 | | | 4,025,726 | |
| | 32,136,000,000 | IDR | | | | Indonesia Treasury Bond, 8.75%, due 05/15/31 | | | 2,679,909 | |
| | 33,162,000,000 | IDR | | | | Indonesia Treasury Bond, 9.00%, due 03/15/29 | | | 2,765,328 | |
| | 3,006,000,000 | IDR | | | | Indonesia Treasury Bond, 10.50%, due 08/15/30 | | | 281,980 | |
| | 645,000,000 | IDR | | | | Indonesia Treasury Bond, 12.80%, due 06/15/21 | | | 58,666 | |
| | 120,000 | MYR | | | | Malaysia Government Bond, 3.48%, due 03/15/23 | | | 26,391 | |
| | 1,497,000 | MYR | | | | Malaysia Government Bond, 3.49%, due 03/31/20 | | | 336,130 | |
| | 1,059,000 | MYR | | | | Malaysia Government Bond, 3.58%, due 09/28/18 | | | 239,796 | |
| | 35,132,000 | MYR | | | | Malaysia Government Bond, 3.62%, due 11/30/21 | | | 7,855,691 | |
| | 1,497,000 | MYR | | | | Malaysia Government Bond, 3.66%, due 10/15/20 | | | 337,474 | |
| | 3,763,000 | MYR | | | | Malaysia Government Bond, 3.76%, due 03/15/19 | | | 854,557 | |
| | 9,387,000 | MYR | | | | Malaysia Government Bond, 3.80%, due 08/17/23 | | | 2,093,480 | |
| | 999,000 | MYR | | | | Malaysia Government Bond, 3.89%, due 03/15/27 | | | 216,035 | |
| | 3,108,000 | MYR | | | | Malaysia Government Bond, 3.90%, due 11/30/26 | | | 688,408 | |
| | 8,779,000 | MYR | | | | Malaysia Government Bond, 3.96%, due 09/15/25 | | | 1,950,936 | |
| | 4,915,000 | MYR | | | | Malaysia Government Bond, 4.07%, due 09/30/26 | | | 1,095,005 | |
| | 174,000 | MYR | | | | Malaysia Government Bond, 4.16%, due 07/15/21 | | | 39,818 | |
| | 16,055,000 | MYR | | | | Malaysia Government Bond, 4.18%, due 07/15/24 | | | 3,642,524 | |
| | 2,939,000 | MYR | | | | Malaysia Government Bond, 4.25%, due 05/31/35 | | | 632,840 | |
| | 12,774,000 | MYR | | | | Malaysia Government Bond, 4.38%, due 11/29/19 | | | 2,938,975 | |
| | 1,068,000 | MYR | | | | Malaysia Government Bond, 4.39%, due 04/15/26 | | | 244,077 | |
| | 155,459,700 | MXN | | | | Mexican Bonos, 6.50%, due 06/10/21 | | | 8,158,804 | |
| | 76,803,800 | MXN | | | | Mexican Bonos, 6.50%, due 06/09/22 | | | 4,006,579 | |
| | 18,283,700 | MXN | | | | Mexican Bonos, 7.50%, due 06/03/27 | | | 998,824 | |
| | 79,673,500 | MXN | | | | Mexican Bonos, 7.75%, due 05/29/31 | | | 4,400,748 | |
| | 85,200,700 | MXN | | | | Mexican Bonos, 7.75%, due 11/23/34 | | | 4,686,680 | |
| | 25,260,000 | MXN | | | | Mexican Bonos, 8.00%, due 06/11/20 | | | 1,385,969 | |
| | 26,604,600 | MXN | | | | Mexican Bonos, 8.50%, due 12/13/18 | | | 1,453,650 | |
| | 7,197,300 | MXN | | | | Mexican Bonos, 8.50%, due 05/31/29 | | | 422,499 | |
| | 94,242,800 | MXN | | | | Mexican Bonos, 10.00%, due 12/05/24 | | | 5,891,329 | |
| | 96,293,300 | MXN | | | | Mexican Bonos, 10.00%, due 11/20/36 | | | 6,466,744 | |
| | 6,096,000 | PEN | | | | Peru Government Bond, 6.85%, due 02/12/42 | | | 1,974,457 | |
| | 8,602,000 | PEN | | | | Peru Government Bond, 6.90%, due 08/12/37 | | | 2,834,542 | |
| | 4,050,000 | PEN | | | | Peruvian Government International Bond, Reg S, 5.70%, due 08/12/24‡‡‡ | | | 1,273,995 | |
| | 5,543,000 | PEN | | | | Peruvian Government International Bond, Reg S, 6.35%, due 08/12/28‡‡‡ | | | 1,736,902 | |
| | 6,804,000 | PEN | | | | Peruvian Government International Bond, Reg S, 6.95%, due 08/12/31‡‡‡ | | | 2,250,122 | |
| | 1,937,000 | PEN | | | | Peruvian Government International Bond, Reg S, 7.84%, due 08/12/20‡‡‡ | | | 654,620 | |
| | 4,435,000 | PEN | | | | Peruvian Government International Bond, Reg S, 8.20%, due 08/12/26‡‡‡ | | | 1,610,977 | |
| | 2,030,000 | PLN | | | | Poland Government Bond, 1.50%, due 04/25/20 | | | 500,333 | |
| | 1,488,000 | PLN | | | | Poland Government Bond, 1.75%, due 07/25/21 | | | 361,414 | |
| | 11,821,000 | PLN | | | | Poland Government Bond, 2.50%, due 07/25/26 | | | 2,780,297 | |
| | 1,197,000 | PLN | | | | Poland Government Bond, 2.50%, due 07/25/27 | | | 277,773 | |
| | 8,457,000 | PLN | | | | Poland Government Bond, 3.25%, due 07/25/25 | | | 2,130,606 | |
| | 12,850,000 | PLN | | | | Poland Government Bond, 5.25%, due 10/25/20 | | | 3,549,525 | |
| | 1,339,000 | PLN | | | | Poland Government Bond, 5.50%, due 10/25/19 | | | 365,921 | |
| | 9,965,000 | RON | | | | Romania Government Bond, 3.50%, due 12/19/22 | | | 2,392,792 | |
| | | | | | |
| 102 | | See accompanying Notes to the Financial Statements. | | | | |
Mercer Opportunistic Fixed Income Fund
Schedule of Investments (Continued)
(showing percentage of net assets)
March 31, 2017
| | | | | | | | | | |
| Par Value** | | | | | Description | | Value ($) | |
| | | |
| | | | | | Sovereign Debt Obligations — continued | | | | |
| | | |
| | 12,025,000 | RON | | | | Romania Government Bond, 4.75%, due 02/24/25 | | | 3,052,615 | |
| | 1,650,000 | RON | | | | Romania Government Bond, 5.80%, due 07/26/27 | | | 450,874 | |
| | 9,090,000 | RON | | | | Romania Government Bond, 5.85%, due 04/26/23 | | | 2,450,284 | |
| | 33,000,000 | RUB | | | | Russian Federal Bond - OFZ, 5.00%, due 08/08/18†† | | | 568,256 | |
| | 83,002,000 | RUB | | | | Russian Federal Bond - OFZ, 6.20%, due 01/31/18 | | | 1,441,421 | |
| | 224,750,000 | RUB | | | | Russian Federal Bond - OFZ, 6.70%, due 05/15/19 | | | 3,888,275 | |
| | 142,470,000 | RUB | | | | Russian Federal Bond - OFZ, 7.00%, due 08/16/23 | | | 2,424,892 | |
| | 42,950,000 | RUB | | | | Russian Federal Bond - OFZ, 7.05%, due 01/19/28 | | | 718,852 | |
| | 6,960,000 | RUB | | | | Russian Federal Bond - OFZ, 7.50%, due 03/15/18 | | | 122,445 | |
| | 67,880,000 | RUB | | | | Russian Federal Bond - OFZ, 7.50%, due 02/27/19 | | | 1,194,509 | |
| | 297,842,000 | RUB | | | | Russian Federal Bond - OFZ, 7.75%, due 09/16/26 | | | 5,262,544 | |
| | 288,962,000 | RUB | | | | Russian Federal Bond - OFZ, 8.50%, due 09/17/31 | | | 5,365,167 | |
| | 20,000,000 | RUB | | | | Russian Foreign Bond - Eurobond, Reg S, 7.85%, due 03/10/18‡‡‡ | | | 351,124 | |
| | 76,463,982 | ZAR | | | | South Africa Government Bond, 6.75%, due 03/31/21 | | | 5,487,757 | |
| | 55,828,190 | ZAR | | | | South Africa Government Bond, 8.00%, due 01/31/30 | | | 3,781,811 | |
| | 82,221,611 | ZAR | | | | South Africa Government Bond, 8.25%, due 03/31/32 | | | 5,569,344 | |
| | 22,017,451 | ZAR | | | | South Africa Government Bond, 8.88%, due 02/28/35 | | | 1,547,433 | |
| | 69,891,449 | ZAR | | | | South Africa Government Bond, 10.50%, due 12/21/26 | | | 5,768,537 | |
| | 108,299,000 | THB | | | | Thailand Government Bond, 2.13%, due 12/17/26 | | | 3,004,842 | |
| | 129,224,000 | THB | | | | Thailand Government Bond, 3.63%, due 06/16/23 | | | 4,050,923 | |
| | 22,191,000 | THB | | | | Thailand Government Bond, 3.85%, due 12/12/25 | | | 710,024 | |
| | 119,810,000 | THB | | | | Thailand Government Bond, 3.88%, due 06/13/19 | | | 3,656,714 | |
| | 1,717,000 | THB | | | | Thailand Government Bond, 4.68%, due 06/29/44 | | | 60,878 | |
| | 74,034,000 | THB | | | | Thailand Government Bond, 4.88%, due 06/22/29 | | | 2,588,849 | |
| | 48,654,678 | THB | | | | Thailand Government Bond, Reg S, 1.25%, due 03/12/28‡‡‡ | | | 1,330,377 | |
| | 8,186,000 | TRY | | | | Turkey Government Bond, 7.40%, due 02/05/20 | | | 2,056,812 | |
| | 4,165,394 | TRY | | | | Turkey Government Bond, 8.00%, due 03/12/25 | | | 981,398 | |
| | 11,644,741 | TRY | | | | Turkey Government Bond, 8.30%, due 06/20/18 | | | 3,102,685 | |
| | 3,885,833 | TRY | | | | Turkey Government Bond, 8.50%, due 07/10/19 | | | 1,017,168 | |
| | 1,710,885 | TRY | | | | Turkey Government Bond, 8.50%, due 09/14/22 | | | 425,888 | |
| | 1,831,712 | TRY | | | | Turkey Government Bond, 8.80%, due 11/14/18 | | | 487,045 | |
| | 19,897,174 | TRY | | | | Turkey Government Bond, 9.00%, due 07/24/24 | | | 5,015,750 | |
| | 5,549,857 | TRY | | | | Turkey Government Bond, 9.20%, due 09/22/21 | | | 1,434,460 | |
| | 3,832,000 | TRY | | | | Turkey Government Bond, 9.50%, due 01/12/22 | | | 1,000,709 | |
| | 10,764,871 | TRY | | | | Turkey Government Bond, 10.60%, due 02/11/26 | | | 2,941,262 | |
| | 10,565,453 | TRY | | | | Turkey Government Bond, 10.70%, due 02/17/21 | | | 2,878,072 | |
| | | | | | | | | | |
| | | | | | | | | 275,906,394 | |
| | | | | | | | | | |
| | | |
| | | | | | TOTAL DEBT OBLIGATIONS (COST $543,003,086) | | | 533,551,475 | |
| | | | | | | | | | |
| | | |
| Shares | | | | | Description | | Value ($) | |
| | | |
| | | | | | COMMON STOCKS — 0.7% | | | | |
| | | |
| | | | | | Diversified Financial Services — 0.0% | | | | |
| | | |
| | 7,396,155 | | | | | Edcon Holdings, Ltd. 1* **** ¤ | | | — | |
| | 736,020 | | | | | Edcon Holdings, Ltd. 2* **** ¤ | | | — | |
| | | | | | | | | | |
| | | |
| | | | | | | | | — | |
| | | | | | | | | | |
| | | |
| | | | | | Electric — 0.1% | | | | |
| | | |
| | 34,251 | | | | | Vistra Energy Corp. | | | 558,291 | |
| | | | | | | | | | |
| | | | | | |
| | See accompanying Notes to the Financial Statements. | | | 103 | |
Mercer Opportunistic Fixed Income Fund
Schedule of Investments (Continued)
(showing percentage of net assets)
March 31, 2017
| | | | | | | | | | |
| Shares | | | | | Description | | Value ($) | |
| | | |
| | | | | | Oil & Gas — 0.6% | | | | |
| | | |
| | 19,687 | | | | | Energy XXI Gulf Coast, Inc.* | | | 590,019 | |
| | 43,602 | | | | | Goodrich Petroleum Corp.* | | | 595,603 | |
| | 73,737 | | | | | Halcon Resources Corp.* ¤ ‡ | | | 567,775 | |
| | 49,395 | | | | | Linn Energy, Inc.* | | | 1,432,455 | |
| | 455 | | | | | Midstates Petroleum Co., Inc.* | | | 8,395 | |
| | 552 | | | | | Penn Virginia Corp.* ‡ | | | 24,978 | |
| | 690 | | | | | Penn Virginia Corp. New* **** | | | 31,223 | |
| | | | | | | | | | |
| | | | | | | | | 3,250,448 | |
| | | | | | | | | | |
| | | |
| | | | | | Transportation — 0.0% | | | | |
| | | |
| | 11,563 | | | | | CHC Group LLC* | | | 164,773 | |
| | | | | | | | | | |
| | | |
| | | | | | TOTAL COMMON STOCKS (COST $7,060,531) | | | 3,973,512 | |
| | | | | | | | | | |
| | | |
| | | | | | WARRANTS — 0.0% | | | | |
| | | |
| | | | | | Oil & Gas — 0.0% | | | | |
| | | |
| | 3,095 | | | | | Energy XXI Gulf Coast, Inc. Strike Price $43.66, Expires 12/30/21* | | | 18,570 | |
| | 3,495 | | | | | Halcon Resources Corp. Strike Price $14.04, Expires 09/09/20* | | | 6,256 | |
| | 3,224 | | | | | Midstates Petroleum Co., Inc. Strike Price $46.00, Expires 04/21/20* **** ¤ | | | — | |
| | | | | | | | | | |
| | | | | | | | | 24,826 | |
| | | | | | | | | | |
| | | |
| | | | | | TOTAL WARRANTS (COST $86,597) | | | 24,826 | |
| | | | | | | | | | |
| | | |
| Par Value ($) | | | | | Description | | Value ($) | |
| | | |
| | | | | | SHORT-TERM INVESTMENTS — 7.2% | | | | |
| | | |
| | | | | | Bank Deposit — 3.2% | | | | |
| | | |
| | 17,755,207 | | | | | State Street Bank & Trust Euro Time Deposit, 0.09%, due 04/03/17 | | | 17,755,207 | |
| | | | | | | | | | |
| | | |
| | | | | | Mutual Fund - Securities Lending Collateral — 4.0% | | | | |
| | | |
| | 22,260,085 | | | | | State Street Institutional U.S. Government Money Market Fund, Premier Class*** | | | 22,260,085 | |
| | | | | | | | | | |
| | | |
| | | | | | TOTAL SHORT-TERM INVESTMENTS (COST $40,015,292) | | | 40,015,292 | |
| | | | | | | | | | |
| | | |
| | | | | | TOTAL INVESTMENTS — 103.3% (Cost $590,165,506) | | | 577,565,105 | |
| | | |
| | | | | | Other Assets and Liabilities (net) — (3.3)% | | | (18,706,484 | ) |
| | | | | | | | | | |
| | | |
| | | | | | NET ASSETS — 100.0% | | $ | 558,858,621 | |
| | | | | | | | | | |
| | | | | | |
| 104 | | See accompanying Notes to the Financial Statements. | | | | |
Mercer Opportunistic Fixed Income Fund
Schedule of Investments (Continued)
(showing percentage of net assets)
March 31, 2017
| | | | | | | | | | |
| | | | | | Notes to Schedule of Investments: | | | | |
| | | |
| | | | | | REIT — Real Estate Investment Trust | | | | |
| | | |
| | | | * | | Non-income producing security | | | | |
| | | |
| | | | ** | | Unless otherwise indicated, all par values are denominated in United States dollars ($). | | | | |
| | | |
| | | | *** | | Represents an investment of securities lending cash collateral. | | | | |
| | | |
| | | | **** | | Securities fair valued by the Valuation Committee as approved by the Board of Trustees. The total market value of the securities at year end is $31,223 which represents 0.0% of net assets. The aggregate tax cost of these securities held at March 31, 2017 was $106,289. | | | | |
| | | |
| | | | ¤ | | Illiquid security. The total market value of the securities at year end is $1,137,275 which represents 0.2% of net assets. The aggregate tax cost of these securities held at March 31, 2017 was $1,880,891. | | | | |
| | | |
| | | | † | | Floating rate note. Rate shown is as of March 31, 2017. | | | | |
| | | |
| | | | †† | | Debt obligation initially issued in zero coupon form which converts to coupon form at a specific rate and date. The rate shown is the rate at period end. | | | | |
| | | |
| | | | ††† | | Security is currently in default. | | | | |
| | | |
| | | | †††† | | When-issued security. | | | | |
| | | |
| | | | ††††† | | Security is perpetual and has no stated maturity date. | | | | |
| | | |
| | | | ‡ | | All or a portion of this security is out on loan. | | | | |
| | | |
| | | | ‡‡ | | Interest rate presented is yield to maturity. | | | | |
| | | |
| | | | ‡‡‡ | | Security exempt from registration under Regulation S of the Securities Act of 1933, which exempts from registration securities offered and sold outside the United States. Security may not be offered or sold in the United States except pursuant to an exemption from, or in a transaction not subject to, the registration requirements of the Securities Act of 1933. | | | | |
| | | |
| | | | | | 144A — Securities exempt from registration under Rule 144A of the Securities Act of 1933. These securities may be resold in transactions exempt from registration, normally to qualified institutional buyers. The total market value of the securities at year end is $133,911,777 which represents 24.0% of net assets. | | | | |
| | | | | | |
| | See accompanying Notes to the Financial Statements. | | | 105 | |
Mercer Opportunistic Fixed Income Fund
Schedule of Investments (Continued)
March 31, 2017
Forward Foreign Currency Contracts
| | | | | | | | | | | | | | | | | | | | |
Settlement
Date | | | | | Currency | | Counterparty | | Units of
Currency | | | Value | | | Unrealized
Appreciation
(Depreciation) | |
| | Buys | | | | | | | | | | | | | | | | | | | |
| | 04/19/17 | | | | | ARS | | Citibank N.A. | | | 32,307,999 | | | $ | 2,087,754 | | | $ | 130,278 | |
| | 05/17/17 | | | | | ARS | | Citibank N.A. | | | 43,750,000 | | | | 2,792,405 | | | | 108,045 | |
| | 06/21/17 | | | | | ARS | | Citibank N.A. | | | 39,400,000 | | | | 2,475,393 | | | | 33,679 | |
| | 06/22/17 | | | | | ARS | | Citibank N.A. | | | 15,730,000 | | | | 987,858 | | | | 20,262 | |
| | 04/19/17 | | | | | ARS | | JPMorgan Chase Bank N.A. London | | | 5,452,001 | | | | 352,310 | | | | 22,146 | |
| | 06/02/17 | | | | | BRL | | JPMorgan Chase Bank N.A. London | | | 1,820,000 | | | | 565,448 | | | | (8,322 | ) |
| | 06/21/17 | | | | | CLP | | Citibank N.A. | | | 1,450,910,000 | | | | 2,183,766 | | | | 3,585 | |
| | 06/21/17 | | | | | COP | | Citibank N.A. | | | 10,125,130,000 | | | | 3,461,737 | | | | 101,913 | |
| | 06/21/17 | | | | | COP | | HSBC Bank plc | | | 26,944,993,392 | | | | 9,212,373 | | | | (2,741 | ) |
| | 06/21/17 | | | | | COP | | JPMorgan Chase Bank N.A. London | | | 2,686,010,000 | | | | 918,335 | | | | 33,760 | |
| | 05/18/17 | | | | | EUR | | Citibank N.A. | | | 500,000 | | | | 535,842 | | | | 710 | |
| | 06/21/17 | | | | | EUR | | Citibank N.A. | | | 3,675,600 | | | | 3,945,743 | | | | (22,011 | ) |
| | 05/18/17 | | | | | EUR | | Deutsche Bank AG London | | | 4,000,000 | | | | 4,286,739 | | | | (203,181 | ) |
| | 06/21/17 | | | | | EUR | | HSBC Bank plc | | | 464,400 | | | | 498,532 | | | | 3,908 | |
| | 05/18/17 | | | | | GBP | | Deutsche Bank AG London | | | 1,222,000 | | | | 1,529,613 | | | | (64,549 | ) |
| | 06/21/17 | | | | | HUF | | Barclays Bank Plc | | | 2,860,934,917 | | | | 9,934,836 | | | | 39,690 | |
| | 06/21/17 | | | | | HUF | | JPMorgan Chase Bank N.A. London | | | 383,480,000 | | | | 1,331,666 | | | | 10,919 | |
| | 06/21/17 | | | | | KRW | | Citibank N.A. | | | 12,280,400,000 | | | | 10,991,271 | | | | (47,728 | ) |
| | 06/21/17 | | | | | MXN | | Goldman Sachs International | | | 32,730,000 | | | | 1,717,288 | | | | 61,436 | |
| | 06/21/17 | | | | | PEN | | Citibank N.A. | | | 2,690,000 | | | | 821,159 | | | | 5,390 | |
| | 06/21/17 | | | | | PEN | | Goldman Sachs International | | | 4,811,482 | | | | 1,468,770 | | | | 3,196 | |
| | 06/21/17 | | | | | PHP | | Citibank N.A. | | | 66,800,000 | | | | 1,326,731 | | | | 12,287 | |
| | 06/21/17 | | | | | PHP | | Standard Chartered Bank | | | 530,740,000 | | | | 10,541,152 | | | | 64,642 | |
| | 06/21/17 | | | | | PLN | | Citibank N.A. | | | 4,580,000 | | | | 1,155,233 | | | | 29,389 | |
| | 06/21/17 | | | | | PLN | | Goldman Sachs International | | | 17,100,000 | | | | 4,313,206 | | | | 105,655 | |
| | 06/21/17 | | | | | PLN | | JPMorgan Chase Bank N.A. London | | | 4,710,000 | | | | 1,188,024 | | | | 29,577 | |
| | 06/22/17 | | | | | PLN | | JPMorgan Chase Bank N.A. London | | | 2,570,000 | | | | 648,240 | | | | (1,835 | ) |
| | 06/21/17 | | | | | PLN | | Standard Chartered Bank | | | 74,263,295 | | | | 18,731,750 | | | | 524,607 | |
| | 06/22/17 | | | | | RUB | | Citibank N.A. | | | 36,450,000 | | | | 635,332 | | | | 10,118 | |
| | 06/21/17 | | | | | RUB | | JPMorgan Chase Bank N.A. London | | | 330,380,624 | | | | 5,759,787 | | | | 183,037 | |
| | 06/21/17 | | | | | THB | | Goldman Sachs International | | | 481,183,250 | | | | 13,995,181 | | | | 249,641 | |
| | 06/21/17 | | | | | TRY | | Citibank N.A. | | | 30,704,659 | | | | 8,244,177 | | | | (74,898 | ) |
| | 06/21/17 | | | | | TRY | | Goldman Sachs International | | | 1,860,000 | | | | 499,409 | | | | (4,424 | ) |
| | 06/21/17 | | | | | TRY | | JPMorgan Chase Bank N.A. London | | | 3,210,000 | | | | 861,882 | | | | 27,852 | |
| | 06/21/17 | | | | | ZAR | | Citibank N.A. | | | 49,220,000 | | | | 3,621,726 | | | | (136,584 | ) |
| | 06/21/17 | | | | | ZAR | | Goldman Sachs International | | | 11,560,000 | | | | 850,613 | | | | (21,214 | ) |
| | 06/21/17 | | | | | ZAR | | JPMorgan Chase Bank N.A. London | | | 54,159,959 | | | | 3,985,220 | | | | (123,977 | ) |
| | | | | | | | | | | | | | | | | | | | |
| | | | | | | | | | | | | | | | | | $ | 1,104,258 | |
| | | | | | | | | | | | | | | | | | | | |
| | Sales | | | | | | | | | | | | | | | | | | | |
| | 06/02/17 | | | | | BRL | | Citibank N.A. | | | 35,892,547 | | | $ | 11,151,304 | | | $ | 222,571 | |
| | 06/21/17 | | | | | CLP | | Citibank N.A. | | | 3,881,140,676 | | | | 5,841,508 | | | | 175,112 | |
| | 06/21/17 | | | | | CLP | | JPMorgan Chase Bank N.A. London | | | 460,540,000 | | | | 693,159 | | | | 14,058 | |
| | 12/20/17 | | | | | CNY | | Barclays Bank Plc | | | 103,864,000 | | | | 14,880,353 | | | | (190,586 | ) |
| | 12/20/17 | | | | | CNY | | Citibank N.A. | | | 4,990,000 | | | | 714,906 | | | | (7,205 | ) |
| | 12/21/17 | | | | | CNY | | Citibank N.A. | | | 7,410,000 | | | | 1,061,571 | | | | (11,476 | ) |
| | | | | | |
| 106 | | See accompanying Notes to the Financial Statements. | | | | |
Mercer Opportunistic Fixed Income Fund
Schedule of Investments (Continued)
March 31, 2017
Forward Foreign Currency Contracts — continued
| | | | | | | | | | | | | | | | | | | | |
Settlement
Date | | | | | Currency | | Counterparty | | Units of
Currency | | | Value | | | Unrealized
Appreciation
(Depreciation) | |
| | 12/20/17 | | | | | CNY | | Standard Chartered Bank | | | 4,430,000 | | | $ | 634,676 | | | $ | (5,816 | ) |
| | 12/20/17 | | | | | CNY | | UBS AG London | | | 5,160,000 | | | | 739,261 | | | | (16,461 | ) |
| | 06/21/17 | | | | | EUR | | Citibank N.A. | | | 5,250,000 | | | | 5,635,855 | | | | (15,372 | ) |
| | 06/21/17 | | | | | EUR | | Goldman Sachs International | | | 963,210 | | | | 1,034,002 | | | | (9,176 | ) |
| | 06/21/17 | | | | | IDR | | Citibank N.A. | | | 26,532,229,000 | | | | 1,974,291 | | | | (2,221 | ) |
| | 06/21/17 | | | | | KRW | | Citibank N.A. | | | 12,339,400,001 | | | | 11,044,077 | | | | (127,925 | ) |
| | 06/21/17 | | | | | KRW | | JPMorgan Chase Bank N.A. London | | | 723,120,000 | | | | 647,211 | | | | (17,315 | ) |
| | 06/21/17 | | | | | MXN | | Citibank N.A. | | | 60,430,000 | | | | 3,170,661 | | | | (165,677 | ) |
| | 06/21/17 | | | | | MXN | | Goldman Sachs International | | | 52,110,000 | | | | 2,734,125 | | | | (120,818 | ) |
| | 06/21/17 | | | | | MXN | | JPMorgan Chase Bank N.A. London | | | 93,930,000 | | | | 4,928,350 | | | | (1,152 | ) |
| | 06/22/17 | | | | | RON | | Citibank N.A. | | | 2,420,000 | | | | 569,502 | | | | 4,026 | |
| | 09/20/17 | | | | | RON | | Citibank N.A. | | | 3,610,000 | | | | 850,850 | | | | (3,472 | ) |
| | 06/21/17 | | | | | RUB | | Citibank N.A. | | | 731,550,000 | | | | 12,753,691 | | | | (440,097 | ) |
| | 06/21/17 | | | | | RUB | | Goldman Sachs International | | | 170,030,000 | | | | 2,964,268 | | | | (117,863 | ) |
| | 06/21/17 | | | | | SGD | | Goldman Sachs International | | | 9,844,000 | | | | 7,049,176 | | | | (40,320 | ) |
| | 06/21/17 | | | | | ZAR | | Citibank N.A. | | | 115,320,000 | | | | 8,485,523 | | | | 285,060 | |
| | 06/21/17 | | | | | ZAR | | Goldman Sachs International | | | 40,470,000 | | | | 2,977,880 | | | | 129,994 | |
| | | | | | | | | | | | | | | | | | | | |
| | | | | | | | | | | | | | | | | | $ | (462,131 | ) |
| | | | | | | | | | | | | | | | | | | | |
Cross-Currency Forwards
| | | | | | | | | | | | | | | | | | | | |
Settlement
Date | | | | | Receive/Deliver | | Counterparty | | Contract Amount
Purchased | | | Contract Amount
Sold | | | Unrealized
Appreciation
(Depreciation) | |
| | 12/19/18 | | | | | CZK/EUR | | JPMorgan Chase Bank N.A. London | | | 128,810,000 | | | | 4,863,498 | | | $ | (33,804 | ) |
| | 09/20/17 | | | | | EUR/RON | | Goldman Sachs International | | | 7,969,282 | | | | 36,242,722 | | | | 53,622 | |
| | 09/20/17 | | | | | EUR/RON | | JPMorgan Chase Bank N.A. London | | | 460,040 | | | | 2,083,476 | | | | 5,145 | |
| | | | | | | | | | | | | | | | | | | | |
| | | | | | | | | | | | | | | | | | $ | 24,963 | |
| | | | | | | | | | | | | | | | | | | | |
| | | | | | |
| | See accompanying Notes to the Financial Statements. | | | 107 | |
Mercer Opportunistic Fixed Income Fund
Schedule of Investments (Continued)
March 31, 2017
Currency Abbreviations
| GBP | — British Pound Sterling |
| PEN | — Peruvian Nouveau Sol |
Futures Contracts
| | | | | | | | | | | | | | | | | | | | |
Number of
Contracts | | | | | Type | | | | Expiration Date | | | Contract
Value | | | Unrealized
Appreciation
(Depreciation) | |
| | Buys | | | | | | | | | | | | | | | | | | | |
| | 201 | | | | | South Africa Government Bond, Series R186 | | | | | May 2017 | | | $ | 1,715,856 | | | $ | (13,163 | ) |
| | 39 | | | | | South Africa Government Bond, Series R2035 | | | | | May 2017 | | | | 278,215 | | | | (4,419 | ) |
| | 855 | | | | | South Africa Government Bond, Series R2037 | | | | | May 2017 | | | | 5,871,436 | | | | (106,766 | ) |
| | 105 | | | | | South Africa Government Bond, Series R207 | | | | | May 2017 | | | | 791,336 | | | | 3,358 | |
| | 253 | | | | | South Africa Government Bond, Series R208 | | | | | May 2017 | | | | 1,828,825 | | | | 11,790 | |
| | | | | | | | | | | | | | | | | | | | |
| | | | | | | | | | | | | | | | | | $ | (109,200 | ) |
| | | | | | | | | | | | | | | | | | | | |
| | Sales | | | | | | | | | | | | | | | | | | | |
| | 3 | | | | | U.S. Treasury Note 10-Year | | | | | June 2017 | | | $ | 373,688 | | | $ | (240 | ) |
| | | | | | | | | | | | | | | | | | | | |
| | | | | | |
| 108 | | See accompanying Notes to the Financial Statements. | | | | |
Mercer Opportunistic Fixed Income Fund
Schedule of Investments (Continued)
March 31, 2017
| | | | | |
| Asset Class Summary (Unaudited) | | % of Net Assets |
Sovereign Debt Obligations | | | | 49.3 | |
Corporate Debt | | | | 46.1 | |
Common Stocks | | | | 0.7 | |
Forward Foreign Currency Contracts | | | | 0.1 | |
Warrants | | | | 0.0 | |
Futures Contracts | | | | 0.0 | |
Short-Term Investments | | | | 7.2 | |
Other Assets and Liabilities (net) | | | | (3.4 | ) |
| | | | | |
| | | | 100.0 | % |
| | | | | |
| | | | | | |
| | See accompanying Notes to the Financial Statements. | | | 109 | |
Mercer Emerging Markets Equity Fund
Schedule of Investments
(showing percentage of net assets)
March 31, 2017
| | | | | | | | | | |
| Shares | | | | | Description | | Value ($) | |
| | | |
| | | | | | COMMON STOCKS — 88.5% | | | | |
| | | |
| | | | | | Austria — 0.2% | | | | |
| | | |
| | 50,564 | | | | | Erste Group Bank AG* | | | 1,650,814 | |
| | 75,613 | | | | | Raiffeisen Bank International AG* | | | 1,710,844 | |
| | | | | | | | | | |
| | | | | | Total Austria | | | 3,361,658 | |
| | | | | | | | | | |
| | | |
| | | | | | Bermuda — 1.2% | | | | |
| | | |
| | 346,627 | | | | | Cosan, Ltd. Class A | | | 2,960,194 | |
| | 54,265 | | | | | Credicorp, Ltd. | | | 8,861,474 | |
| | 3,910,000 | | | | | GOME Electrical Appliances Holding, Ltd. | | | 533,308 | |
| | 22,900 | | | | | Jardine Matheson Holdings, Ltd. | | | 1,471,325 | |
| | 2,501,000 | | | | | Nine Dragons Paper Holdings, Ltd. | | | 2,687,171 | |
| | 8,268,000 | | | | | SMI Holdings Group, Ltd. | | | 787,277 | |
| | | | | | | | | | |
| | | | | | Total Bermuda | | | 17,300,749 | |
| | | | | | | | | | |
| | | |
| | | | | | Brazil — 4.5% | | | | |
| | | |
| | 44,900 | | | | | AES Tiete Energia SA | | | 193,745 | |
| | 356,900 | | | | | AMBEV SA | | | 2,050,381 | |
| | 590,441 | | | | | AMBEV SA, ADR | | | 3,400,940 | |
| | 931,159 | | | | | Banco Bradesco SA, ADR | | | 9,535,068 | |
| | 716,467 | | | | | Banco do Brasil SA | | | 7,620,621 | |
| | 115,462 | | | | | Banco Santander Brasil SA, ADR‡ | | | 1,018,375 | |
| | 540,800 | | | | | BM&FBovespa SA - Bolsa de Valores Mercadorias e Futuros | | | 3,285,731 | |
| | 937,714 | | | | | CCR SA | | | 5,331,025 | |
| | 153,500 | | | | | Centrais Eletricas Brasileiras SA* | | | 826,737 | |
| | 84,705 | | | | | Cia de Saneamento Basico do Estado de Sao Paulo, ADR | | | 881,779 | |
| | 235,200 | | | | | Cielo SA | | | 2,097,202 | |
| | 273,200 | | | | | Cosan SA Industria e Comercio | | | 3,343,848 | |
| | 21,100 | | | | | Equatorial Energia SA | | | 390,705 | |
| | 100,500 | | | | | Fleury SA | | | 1,338,966 | |
| | 238,900 | | | | | Hypermarcas SA | | | 2,182,113 | |
| | 128,400 | | | | | Iguatemi Empresa de Shopping Centers SA | | | 1,326,484 | |
| | 264,785 | | | | | Itau Unibanco Holding SA, ADR | | | 3,195,955 | |
| | 1,187,414 | | | | | JBS SA | | | 3,818,484 | |
| | 47,000 | | | | | Klabin SA | | | 224,271 | |
| | 151,300 | | | | | Kroton Educacional SA | | | 632,849 | |
| | 100,000 | | | | | Localiza Rent a Car SA | | | 1,312,462 | |
| | 211,100 | | | | | Lojas Renner SA | | | 1,848,401 | |
| | 12,700 | | | | | M Dias Branco SA | | | 511,208 | |
| | 135,800 | | | | | Porto Seguro SA | | | 1,215,162 | |
| | 178,400 | | | | | Qualicorp SA | | | 1,160,321 | |
| | 129,100 | | | | | Raia Drogasil SA | | | 2,385,643 | |
| | 203,474 | | | | | Sul America SA | | | 1,069,620 | |
| | 6,171 | | | | | Tim Participacoes SA, ADR | | | 98,612 | |
| | 197,000 | | | | | Ultrapar Participacoes SA | | | 4,443,894 | |
| | 116,800 | | | | | WEG SA | | | 640,111 | |
| | | | | | | | | | |
| | | | | | Total Brazil | | | 67,380,713 | |
| | | | | | | | | | |
| | | | | | |
| 110 | | See accompanying Notes to the Financial Statements. | | | | |
Mercer Emerging Markets Equity Fund
Schedule of Investments (Continued)
(showing percentage of net assets)
March 31, 2017
| | | | | | | | | | |
| Shares | | | | | Description | | Value ($) | |
| | | |
| | | | | | British Virgin Islands — 0.1% | | | | |
| | | |
| | 70,599 | | | | | Mail.Ru Group, Ltd. (London Exchange), Reg S, GDR* ‡‡‡ | | | 1,560,238 | |
| | 8,063 | | | | | Mail.Ru Group, Ltd., Reg S, GDR* ‡‡‡ | | | 178,192 | |
| | | | | | | | | | |
| | | | | | Total British Virgin Islands | | | 1,738,430 | |
| | | | | | | | | | |
| | | |
| | | | | | Cayman Islands — 9.1% | | | | |
| | | |
| | 5,561 | | | | | 58.com, Inc., ADR* ‡ | | | 196,804 | |
| | 280,495 | | | | | Alibaba Group Holding, Ltd., ADR* | | | 30,245,776 | |
| | 19,813 | | | | | Baidu, Inc., ADR* | | | 3,418,139 | |
| | 3,974,000 | | | | | Belle International Holdings, Ltd. | | | 2,582,346 | |
| | 248,942 | | | | | Bizlink Holding, Inc. | | | 1,415,259 | |
| | 72,000 | | | | | Casetek Holdings, Ltd. | | | 239,664 | |
| | 1,023,000 | | | | | Chailease Holding Co., Ltd. | | | 2,390,400 | |
| | 1,184,500 | | | | | China Conch Venture Holdings, Ltd. | | | 2,325,866 | |
| | 923,000 | | | | | China Evergrande Group‡ | | | 855,124 | |
| | 21,687 | | | | | China Lodging Group, Ltd., ADR* | | | 1,345,678 | |
| | 1,514,000 | | | | | China Medical System Holdings, Ltd. | | | 2,684,542 | |
| | 488,000 | | | | | China Resources Land, Ltd. | | | 1,318,664 | |
| | 431,000 | | | | | Country Garden Holdings Co., Ltd. | | | 387,659 | |
| | 69,782 | | | | | Ctrip.com International, Ltd., ADR* ‡ | | | 3,429,785 | |
| | 3,835,000 | | | | | Geely Automobile Holdings, Ltd. | | | 5,872,290 | |
| | 136,100 | | | | | Gourmet Master Co., Ltd. | | | 1,287,326 | |
| | 50,741 | | | | | JD.com, Inc., ADR* | | | 1,578,552 | |
| | 3,896,652 | | | | | Lee & Man Paper Manufacturing, Ltd. | | | 2,978,333 | |
| | 35,354 | | | | | NetEase, Inc., ADR | | | 10,040,536 | |
| | 50,886 | | | | | New Oriental Education & Technology Group, Inc., ADR* | | | 3,072,497 | |
| | 1,806,000 | | | | | Shimao Property Holdings, Ltd. | | | 2,867,663 | |
| | 40,520 | | | | | Silicon Motion Technology Corp., ADR‡ | | | 1,894,310 | |
| | 330,000 | | | | | Sunny Optical Technology Group Co., Ltd. | | | 2,411,890 | |
| | 27,961 | | | | | TAL Education Group, ADR* | | | 2,979,804 | |
| | 79,719 | | | | | Tarena International, Inc., ADR | | | 1,489,151 | |
| | 1,142,700 | | | | | Tencent Holdings, Ltd. | | | 32,759,900 | |
| | 1,262,000 | | | | | Tianneng Power International, Ltd. | | | 1,146,461 | |
| | 4,950,000 | | | | | Tongda Group Holdings, Ltd. | | | 1,751,592 | |
| | 28,968 | | | | | Vipshop Holdings, Ltd., ADR* | | | 386,433 | |
| | 8,964,832 | | | | | WH Group, Ltd. 144A | | | 7,728,801 | |
| | 1,276,000 | | | | | Xinyi Glass Holdings, Ltd.* | | | 1,123,057 | |
| | 2,371,500 | | | | | Xtep International Holdings, Ltd. | | | 933,769 | |
| | | | | | | | | | |
| | | | | | Total Cayman Islands | | | 135,138,071 | |
| | | | | | | | | | |
| | | |
| | | | | | Chile — 0.8% | | | | |
| | | |
| | 12,433,431 | | | | | Banco de Chile | | | 1,486,329 | |
| | 60,326 | | | | | Banco Santander Chile, ADR | | | 1,512,976 | |
| | 28,144,386 | | | | | Banco Santander Chile | | | 1,755,982 | |
| | 744,008 | | | | | Cencosud SA | | | 2,272,236 | |
| | 4,625 | | | | | Cia Cervecerias Unidas SA, ADR | | | 116,874 | |
| | 418,292 | | | | | Enel Americas SA, ADR | | | 4,346,054 | |
| | 26,046 | | | | | Enel Chile SA, ADR | | | 143,253 | |
| | 829,642 | | | | | Enel Generacion Chile SA | | | 620,980 | |
| | | | | | | | | | |
| | | | | | Total Chile | | | 12,254,684 | |
| | | | | | | | | | |
| | | | | | |
| | See accompanying Notes to the Financial Statements. | | | 111 | |
Mercer Emerging Markets Equity Fund
Schedule of Investments (Continued)
(showing percentage of net assets)
March 31, 2017
| | | | | | | | | | |
| Shares | | | | | Description | | Value ($) | |
| | | |
| | | | | | China — 10.2% | | | | |
| | | |
| | 11,706,000 | | | | | Agricultural Bank of China, Ltd. Class H | | | 5,392,457 | |
| | 2,384,000 | | | | | Air China, Ltd. Class H | | | 1,929,532 | |
| | 1,931,500 | | | | | Anhui Conch Cement Co., Ltd. Class H‡ | | | 6,561,359 | |
| | 51,907 | | | | | Autohome, Inc. Class H, ADR* | | | 1,649,085 | |
| | 33,777,000 | | | | | Bank of China, Ltd. Class H | | | 16,776,584 | |
| | 2,634,000 | | | | | Bank of Communications Co., Ltd. Class H | | | 2,047,141 | |
| | 1,298,000 | | | | | Beijing Capital International Airport Co., Ltd. Class H | | | 1,553,291 | |
| | 3,595,000 | | | | | China Cinda Asset Management Co., Ltd. Class H | | | 1,397,015 | |
| | 2,141,000 | | | | | China CITIC Bank Corp., Ltd. Class H | | | 1,418,793 | |
| | 4,344,000 | | | | | China Communications Services Corp., Ltd. Class H | | | 2,845,134 | |
| | 35,926,000 | | | | | China Construction Bank Corp. Class H | | | 28,892,427 | |
| | 4,092,000 | | | | | China Everbright Bank Co., Ltd. Class H | | | 2,000,849 | |
| | 246,000 | | | | | China Galaxy Securities Co., Ltd. Class H | | | 226,960 | |
| | 65,500 | | | | | China Merchants Bank Co., Ltd. Class H | | | 173,200 | |
| | 7,812,000 | | | | | China Petroleum & Chemical Corp. Class H | | | 6,332,832 | |
| | 2,093,484 | | | | | China Shenhua Energy Co., Ltd. Class H | | | 4,859,609 | |
| | 138,000 | | | | | China Vanke Co., Ltd. Class H | | | 372,901 | |
| | 1,407,000 | | | | | Chongqing Rural Commercial Bank Co., Ltd. Class H | | | 950,492 | |
| | 2,900,000 | | | | | Dongfeng Motor Group Co., Ltd. Class H | | | 3,257,672 | |
| | 2,722,400 | | | | | Guangzhou R&F Properties Co., Ltd. Class H | | | 4,252,710 | |
| | 34,108,000 | | | | | Industrial & Commercial Bank of China Class H | | | 22,295,392 | |
| | 2,694,000 | | | | | Lonking Holdings, Ltd. Class H | | | 811,164 | |
| | 3,088,000 | | | | | People’s Insurance Co. Group of China, Ltd. (The) Class H | | | 1,279,465 | |
| | 2,286,760 | | | | | PICC Property & Casualty Co., Ltd. Class H | | | 3,525,109 | |
| | 1,829,000 | | | | | Ping An Insurance Group Co. Class H | | | 10,237,599 | |
| | 4,167 | | | | | SINA Corp. Class H* | | | 300,524 | |
| | 2,017,000 | | | | | Sinopec Engineering Group Co., Ltd. Class H | | | 2,071,114 | |
| | 3,248,000 | | | | | Sinopec Shanghai Petrochemical Co., Ltd. Class H* | | | 1,801,310 | |
| | 1,603,200 | | | | | Sinopharm Group Co., Ltd. Class H | | | 7,436,835 | |
| | 2,490,000 | | | | | Sinotrans, Ltd. Class H | | | 1,163,057 | |
| | 1,535,000 | | | | | TravelSky Technology, Ltd. Class H | | | 3,626,404 | |
| | 2,950,000 | | | | | Zhejiang Expressway Co., Ltd. Class H | | | 3,856,656 | |
| | | | | | | | | | |
| | | | | | Total China | | | 151,294,672 | |
| | | | | | | | | | |
| | | |
| | | | | | Colombia — 0.1% | | | | |
| | | |
| | 238,548 | | | | | Cementos Argos SA | | | 972,700 | |
| | | | | | | | | | |
| | | |
| | | | | | Czech Republic — 0.1% | | | | |
| | | |
| | 454,357 | | | | | Moneta Money Bank AS* 144A | | | 1,542,921 | |
| | | | | | | | | | |
| | | |
| | | | | | France — 0.2% | | | | |
| | | |
| | 27,552 | | | | | Sanofi | | | 2,493,602 | |
| | | | | | | | | | |
| | | |
| | | | | | Hong Kong — 4.0% | | | | |
| | | |
| | 425,800 | | | | | AIA Group, Ltd. | | | 2,684,707 | |
| | 395,000 | | | | | Beijing Enterprises Holdings, Ltd. | | | 2,043,235 | |
| | 2,126,000 | | | | | Brilliance China Automotive Holdings, Ltd. | | | 3,556,328 | |
| | 1,119,000 | | | | | BYD Electronic International Co., Ltd. | | | 1,555,067 | |
| | 206,000 | | | | | China Everbright International, Ltd. | | | 277,264 | |
| | | | | | |
| 112 | | See accompanying Notes to the Financial Statements. | | | | |
Mercer Emerging Markets Equity Fund
Schedule of Investments (Continued)
(showing percentage of net assets)
March 31, 2017
| | | | | | | | | | |
| Shares | | | | | Description | | Value ($) | |
| | | |
| | | | | | Hong Kong — continued | | | | |
| | | |
| | 1,766,000 | | | | | China Everbright, Ltd. | | | 3,563,132 | |
| | 100,000 | | | | | China Merchants Port Holdings Co., Ltd. | | | 292,736 | |
| | 1,701,480 | | | | | China Mobile, Ltd. | | | 18,620,713 | |
| | 1,736,658 | | | | | China Overseas Land & Investment, Ltd. | | | 4,960,922 | |
| | 3,870,000 | | | | | China Resources Power Holdings Co., Ltd. | | | 6,981,587 | |
| | 3,097,000 | | | | | CNOOC, Ltd. | | | 3,698,148 | |
| | 2,050,000 | | | | | CSPC Pharmaceutical Group, Ltd. | | | 2,685,325 | |
| | 308,000 | | | | | Haier Electronics Group Co., Ltd. | | | 705,449 | |
| | 1,239,000 | | | | | Shanghai Industrial Holdings, Ltd. | | | 3,642,945 | |
| | 3,002,000 | | | | | Shenzhen Investment, Ltd. | | | 1,344,266 | |
| | 4,138,000 | | | | | Sino-Ocean Land Holdings, Ltd. | | | 1,943,473 | |
| | 1,147,000 | | | | | Sun Art Retail Group, Ltd. | | | 1,074,459 | |
| | | | | | | | | | |
| | | | | | Total Hong Kong | | | 59,629,756 | |
| | | | | | | | | | |
| | | |
| | | | | | Hungary — 0.9% | | | | |
| | | |
| | 421,702 | | | | | Magyar Telekom Telecommunications Plc | | | 701,039 | |
| | 46,354 | | | | | MOL Hungarian Oil & Gas Plc | | | 3,178,689 | |
| | 228,337 | | | | | OTP Bank Nyrt | | | 6,400,023 | |
| | 162,517 | | | | | Richter Gedeon Nyrt | | | 3,697,940 | |
| | | | | | | | | | |
| | | | | | Total Hungary | | | 13,977,691 | |
| | | | | | | | | | |
| | | |
| | | | | | India — 8.5% | | | | |
| | | |
| | 142,409 | | | | | Asian Paints, Ltd. | | | 2,346,618 | |
| | 56,048 | | | | | Bajaj Auto, Ltd. | | | 2,421,971 | |
| | 101,372 | | | | | Bharat Financial Inclusion, Ltd.* | | | 1,261,393 | |
| | 468,940 | | | | | Bharat Petroleum Corp., Ltd. | | | 4,690,122 | |
| | 43,968 | | | | | Cadila Healthcare, Ltd. | | | 299,620 | |
| | 47,765 | | | | | Ceat, Ltd. | | | 976,485 | |
| | 33,116 | | | | | Coal India, Ltd. | | | 149,426 | |
| | 16,185 | | | | | Divi’s Laboratories, Ltd. | | | 155,307 | |
| | 554,123 | | | | | Edelweiss Financial Services, Ltd. | | | 1,341,467 | |
| | 364,773 | | | | | Exide Industries, Ltd. | | | 1,265,625 | |
| | 1,478,382 | | | | | Federal Bank, Ltd. | | | 2,070,668 | |
| | 348,236 | | | | | GAIL India, Ltd. | | | 2,018,841 | |
| | 5,539 | | | | | Godrej Consumer Products, Ltd. | | | 143,305 | |
| | 1,081,331 | | | | | HCL Technologies, Ltd. Class T | | | 14,587,602 | |
| | 75,379 | | | | | HDFC Bank, Ltd., ADR | | | 5,670,008 | |
| | 57,247 | | | | | Hero MotoCorp Ltd. | | | 2,840,089 | |
| | 850,586 | | | | | Hindalco Industries, Ltd. | | | 2,548,418 | |
| | 653,373 | | | | | Hindustan Petroleum Corp., Ltd. | | | 5,292,588 | |
| | 89,772 | | | | | Hindustan Unilever, Ltd. | | | 1,260,555 | |
| | 407,982 | | | | | Housing Development Finance Corp., Ltd. | | | 9,423,451 | |
| | 138,690 | | | | | Indiabulls Housing Finance, Ltd. | | | 2,132,411 | |
| | 100,006 | | | | | Indraprastha Gas, Ltd. | | | 1,566,969 | |
| | 146,885 | | | | | IndusInd Bank, Ltd. | | | 3,225,091 | |
| | 608,605 | | | | | Infosys, Ltd. | | | 9,583,408 | |
| | 125,010 | | | | | Infosys, Ltd., ADR‡ | | | 1,975,158 | |
| | 890,662 | | | | | ITC, Ltd. | | | 3,850,826 | |
| | 488,245 | | | | | JSW Steel, Ltd. | | | 1,412,816 | |
| | | | | | |
| | See accompanying Notes to the Financial Statements. | | | 113 | |
Mercer Emerging Markets Equity Fund
Schedule of Investments (Continued)
(showing percentage of net assets)
March 31, 2017
| | | | | | | | | | |
| Shares | | | | | Description | | Value ($) | |
| | | |
| | | | | | India — continued | | | | |
| | | |
| | 577,906 | | | | | Karnataka Bank, Ltd. (The) | | | 1,249,526 | |
| | 264,211 | | | | | Marico, Ltd. | | | 1,201,532 | |
| | 59,007 | | | | | Maruti Suzuki India, Ltd. | | | 5,484,057 | |
| | 360,739 | | | | | Motherson Sumi Systems, Ltd. | | | 2,066,604 | |
| | 71,751 | | | | | NTPC, Ltd. | | | 183,259 | |
| | 842,274 | | | | | Oil & Natural Gas Corp., Ltd. | | | 2,399,641 | |
| | 3,662 | | | | | Piramal Enterprises, Ltd. | | | 107,376 | |
| | 1,303,848 | | | | | Power Finance Corp., Ltd. | | | 2,931,575 | |
| | 155,529 | | | | | Reliance Capital, Ltd. | | | 1,473,017 | |
| | 16,459 | | | | | Reliance Industries, Ltd. (London Exchange), GDR 144A | | | 663,298 | |
| | 15,669 | | | | | State Bank of India, Ltd., Reg S, GDR‡‡‡ | | | 699,621 | |
| | 283,868 | | | | | Tata Consultancy Services, Ltd. | | | 10,592,755 | |
| | 486,170 | | | | | Tata Motors, Ltd.* | | | 3,499,061 | |
| | 14,384 | | | | | Tata Motors, Ltd., ADR‡ | | | 512,790 | |
| | 355,612 | | | | | Tata Power Co., Ltd. (The) | | | 494,522 | |
| | 98,620 | | | | | Tata Steel, Ltd. | | | 731,658 | |
| | 160,839 | | | | | Tech Mahindra, Ltd. | | | 1,133,192 | |
| | 689,935 | | | | | Vedanta, Ltd. | | | 2,929,315 | |
| | 71,117 | | | | | Videocon d2h, Ltd., ADR* | | | 817,846 | |
| | 13,874 | | | | | Wipro, Ltd., ADR‡ | | | 141,931 | |
| | 269,246 | | | | | Zee Entertainment Enterprises, Ltd. | | | 2,220,393 | |
| | | | | | | | | | |
| | | | | | Total India | | | 126,043,207 | |
| | | | | | | | | | |
| | | |
| | | | | | Indonesia — 2.8% | | | | |
| | | |
| | 6,587,600 | | | | | Adaro Energy Tbk PT | | | 865,131 | |
| | 12,665,500 | | | | | Astra International Tbk PT | | | 8,197,811 | |
| | 778,400 | | | | | Bank Central Asia Tbk PT | | | 966,757 | |
| | 2,052,900 | | | | | Bank Mandiri Persero Tbk PT | | | 1,802,479 | |
| | 6,116,300 | | | | | Bank Negara Indonesia Persero Tbk PT | | | 2,971,974 | |
| | 5,184,000 | | | | | Bank Rakyat Indonesia Persero Tbk PT | | | 5,047,645 | |
| | 5,280,900 | | | | | Bank Tabungan Negara Persero Tbk PT | | | 899,602 | |
| | 195,300 | | | | | Gudang Garam Tbk PT | | | 960,342 | |
| | 547,500 | | | | | Indofood CBP Sukses Makmur Tbk PT | | | 334,856 | |
| | 1,748,800 | | | | | Indofood Sukses Makmur Tbk PT | | | 1,049,897 | |
| | 3,267,900 | | | | | Matahari Department Store Tbk PT | | | 3,230,992 | |
| | 3,610,600 | | | | | Mitra Keluarga Karyasehat Tbk PT | | | 715,319 | |
| | 25,267,100 | | | | | Telekomunikasi Indonesia Persero Tbk PT | | | 7,831,085 | |
| | 607,800 | | | | | Unilever Indonesia Tbk PT | | | 1,976,131 | |
| | 2,090,210 | | | | | United Tractors Tbk PT | | | 4,156,734 | |
| | 3,832,400 | | | | | Waskita Karya Persero Tbk PT | | | 681,610 | |
| | | | | | | | | | |
| | | | | | Total Indonesia | | | 41,688,365 | |
| | | | | | | | | | |
| | | |
| | | | | | Japan — 0.2% | | | | |
| | | |
| | 91,900 | | | | | Honda Motor Co., Ltd. | | | 2,763,680 | |
| | | | | | | | | | |
| | | |
| | | | | | Luxembourg — 0.2% | | | | |
| | | |
| | 109,920 | | | | | Ternium SA, ADR | | | 2,871,110 | |
| | | | | | | | | | |
| | | | | | |
| 114 | | See accompanying Notes to the Financial Statements. | | | | |
Mercer Emerging Markets Equity Fund
Schedule of Investments (Continued)
(showing percentage of net assets)
March 31, 2017
| | | | | | | | | | |
| Shares | | | | | Description | | Value ($) | |
| | | |
| | | | | | Malaysia — 1.3% | | | | |
| | | |
| | 5,355,115 | | | | | AirAsia Bhd | | | 3,799,584 | |
| | 2,038,800 | | | | | CIMB Group Holdings Bhd | | | 2,566,064 | |
| | 228,200 | | | | | Genting Bhd | | | 494,506 | |
| | 3,713,300 | | | | | Genting Malaysia Bhd | | | 4,572,926 | |
| | 43,800 | | | | | Kuala Lumpur Kepong Bhd | | | 244,263 | |
| | 261,400 | | | | | Malayan Banking Bhd | | | 526,876 | |
| | 80,500 | | | | | MISC Bhd | | | 133,151 | |
| | 91,900 | | | | | Petronas Chemicals Group Bhd | | | 159,898 | |
| | 979,900 | | | | | Public Bank Bhd | | | 4,406,284 | |
| | 46,800 | | | | | Sime Darby Bhd | | | 98,137 | |
| | 447,000 | | | | | Tenaga Nasional Bhd | | | 1,385,796 | |
| | 1,250,700 | | | | | Westports Holdings Bhd | | | 1,144,579 | |
| | | | | | | | | | |
| | | | | | Total Malaysia | | | 19,532,064 | |
| | | | | | | | | | |
| | | |
| | | | | | Mexico — 3.3% | | | | |
| | | |
| | 451,900 | | | | | Alfa SAB de CV Class A | | | 656,226 | |
| | 340,400 | | | | | Alsea SAB de CV | | | 1,130,501 | |
| | 118,984 | | | | | America Movil SAB de CV Series L, ADR‡ | | | 1,686,003 | |
| | 75,300 | | | | | Arca Continental SAB de CV | | | 519,747 | |
| | 427,662 | | | | | Cemex SAB de CV, ADR* | | | 3,878,894 | |
| | 2,819,797 | | | | | Fibra Uno Administracion SA de CV REIT | | | 4,792,449 | |
| | 292,000 | | | | | Fomento Economico Mexicano SAB de CV | | | 2,577,344 | |
| | 25,085 | | | | | Fomento Economico Mexicano SAB de CV, ADR | | | 2,220,524 | |
| | 1,240,300 | | | | | Gentera SAB de CV | | | 2,036,199 | |
| | 152,035 | | | | | Gruma SAB de CV Class B | | | 2,135,609 | |
| | 18,100 | | | | | Grupo Aeroportuario del Pacifico SAB de CV Class B | | | 174,733 | |
| | 16,950 | | | | | Grupo Aeroportuario del Sureste SAB de CV, ADR | | | 2,936,418 | |
| | 112,195 | | | | | Grupo Aeroportuario del Sureste SAB de CV | | | 1,932,212 | |
| | 1,302,741 | | | | | Grupo Financiero Banorte SAB de CV Series O | | | 7,452,278 | |
| | 138,700 | | | | | Grupo Financiero Santander Mexico SAB de CV Class B, ADR‡ | | | 1,252,461 | |
| | 1,756,416 | | | | | Grupo Mexico SAB de CV Series B | | | 5,238,245 | |
| | 47,010 | | | | | Industrias Penoles SAB de CV | | | 1,203,096 | |
| | 686,000 | | | | | Kimberly-Clark de Mexico SAB de CV Class A | | | 1,480,603 | |
| | 71,400 | | | | | OHL Mexico SAB de CV* | | | 100,310 | |
| | 74,740 | | | | | Promotora y Operadora de Infraestructura SAB de CV* | | | 802,157 | |
| | 1,793,700 | | | | | Wal-Mart de Mexico SAB de CV | | | 4,114,220 | |
| | | | | | | | | | |
| | | | | | Total Mexico | | | 48,320,229 | |
| | | | | | | | | | |
| | | |
| | | | | | Netherlands — 0.2% | | | | |
| | | |
| | 155,874 | | | | | Steinhoff International Holdings NV | | | 745,963 | |
| | 74,051 | | | | | Yandex NV Class A* | | | 1,623,939 | |
| | | | | | | | | | |
| | | | | | Total Netherlands | | | 2,369,902 | |
| | | | | | | | | | |
| | | |
| | | | | | Philippines — 0.3% | | | | |
| | | |
| | 15,160 | | | | | Ayala Corp. | | | 255,311 | |
| | 101,140 | | | | | Bank of the Philippine Islands | | | 203,993 | |
| | 144,880 | | | | | BDO Unibank, Inc. | | | 339,569 | |
| | 448,200 | | | | | Cebu Air, Inc. | | | 838,784 | |
| | | | | | |
| | See accompanying Notes to the Financial Statements. | | | 115 | |
Mercer Emerging Markets Equity Fund
Schedule of Investments (Continued)
(showing percentage of net assets)
March 31, 2017
| | | | | | | | | | |
| Shares | | | | | Description | | Value ($) | |
| | | |
| | | | | | Philippines — continued | | | | |
| | | |
| | 14,220 | | | | | Globe Telecom, Inc. | | | 575,885 | |
| | 201,390 | | | | | JG Summit Holdings, Inc. | | | 326,519 | |
| | 29,860 | | | | | Jollibee Foods Corp. | | | 117,536 | |
| | 10,877,900 | | | | | Metro Pacific Investments Corp. | | | 1,305,131 | |
| | 24,670 | | | | | Security Bank Corp. | | | 99,319 | |
| | 9,040 | | | | | SM Investments Corp. | | | 125,578 | |
| | | | | | | | | | |
| | | | | | Total Philippines | | | 4,187,625 | |
| | | | | | | | | | |
| | | |
| | | | | | Poland — 0.6% | | | | |
| | | |
| | 57,748 | | | | | Asseco Poland SA | | | 791,458 | |
| | 84,316 | | | | | Eurocash SA | | | 679,091 | |
| | 98,494 | | | | | Jastrzebska Spolka Weglowa SA* | | | 1,561,207 | |
| | 17,702 | | | | | KRUK SA | | | 1,075,001 | |
| | 328,523 | | | | | PGE Polska Grupa Energetyczna SA | | | 945,282 | |
| | 17,267 | | | | | Polski Koncern Naftowy ORLEN SA | | | 435,821 | |
| | 481,207 | | | | | Polskie Gornictwo Naftowe i Gazownictwo SA | | | 719,026 | |
| | 275,366 | | | | | Powszechna Kasa Oszczednosci Bank Polski SA* | | | 2,228,255 | |
| | 520,980 | | | | | Tauron Polska Energia SA* | | | 445,771 | |
| | | | | | | | | | |
| | | | | | Total Poland | | | 8,880,912 | |
| | | | | | | | | | |
| | | |
| | | | | | Qatar — 0.4% | | | | |
| | | |
| | 130,619 | | | | | Qatar National Bank QPSC | | | 5,241,118 | |
| | | | | | | | | | |
| | | |
| | | | | | Romania — 0.0% | | | | |
| | | |
| | 39,231 | | | | | New Europe Property Investments Plc | | | 407,268 | |
| | | | | | | | | | |
| | | |
| | | | | | Russia — 2.5% | | | | |
| | | |
| | 391,156 | | | | | Gazprom PJSC, ADR | | | 1,748,467 | |
| | 1,268,042 | | | | | Gazprom PJSC (OTC Exchange), ADR‡ | | | 5,699,849 | |
| | 46,726 | | | | | LUKOIL PJSC, ADR | | | 2,479,281 | |
| | 118,501 | | | | | LUKOIL PJSC (Euroclear Shares), ADR | | | 6,275,813 | |
| | 62,953 | | | | | Magnit PJSC, Reg S, GDR‡‡‡ | | | 2,404,805 | |
| | 2,026,164 | | | | | Magnitogorsk Iron & Steel OJSC | | | 1,321,601 | |
| | 25 | | | | | Magnitogorsk Iron & Steel OJSC, Reg S, GDR‡‡‡ | | | 213 | |
| | 26,972 | | | | | MMC Norilsk Nickel PJSC, (London Exchange), ADR | | | 424,000 | |
| | 288,729 | | | | | Mobile Telesystems PJSC, ADR | | | 3,184,681 | |
| | 7,128 | | | | | Novatek PJSC, Reg S, GDR‡‡‡ | | | 887,436 | |
| | 274,260 | | | | | Rosneft Oil Co. PJSC, Reg S, GDR‡‡‡ | | | 1,560,539 | |
| | 92,659 | | | | | Rosneft Oil Co. PJSC, Reg S, (London Exchange), GDR‡‡‡ | | | 527,230 | |
| | 1,493,974 | | | | | RusHydro PJSC, ADR | | | 2,435,178 | |
| | 101,862 | | | | | Sberbank of Russia PJSC, ADR‡ | | | 1,174,469 | |
| | 19,314 | | | | | Severstal PAO (London Exchange), GDR‡‡‡ | | | 278,315 | |
| | 179,293 | | | | | Severstal PJSC, Reg S, GDR‡‡‡ | | | 2,583,612 | |
| | 215,334 | | | | | Sistema PJSC FC, GDR‡‡‡ | | | 1,927,239 | |
| | 137,124 | | | | | Surgutneftegas OJSC, ADR | | | 702,075 | |
| | 20,024 | | | | | Tatneft PJSC, (London Exchange), ADR | | | 737,884 | |
| | | | | | | | | | |
| | | | | | Total Russia | | | 36,352,687 | |
| | | | | | | | | | |
| | | | | | |
| 116 | | See accompanying Notes to the Financial Statements. | | | | |
Mercer Emerging Markets Equity Fund
Schedule of Investments (Continued)
(showing percentage of net assets)
March 31, 2017
| | | | | | | | | | |
| Shares | | | | | Description | | Value ($) | |
| | | |
| | | | | | Singapore — 0.6% | | | | |
| | | |
| | 15,165 | | | | | Broadcom, Ltd. | | | 3,320,528 | |
| | 116,305 | | | | | Flex, Ltd.* | | | 1,953,924 | |
| | 28,700 | | | | | SembCorp Industries, Ltd. | | | 65,316 | |
| | 569,700 | | | | | Singapore Telecommunications, Ltd. (London Exchange) | | | 1,594,165 | |
| | 119,338 | | | | | United Overseas Bank, Ltd. | | | 1,888,330 | |
| | | | | | | | | | |
| | | | | | Total Singapore | | | 8,822,263 | |
| | | | | | | | | | |
| | | |
| | | | | | South Africa — 4.8% | | | | |
| | | |
| | 9,552 | | | | | Anglo American Platinum, Ltd.* | | | 218,042 | |
| | 79,656 | | | | | AngloGold Ashanti, Ltd., ADR* | | | 857,895 | |
| | 160,982 | | | | | AVI, Ltd. | | | 1,188,568 | |
| | 395,850 | | | | | Barclays Africa Group, Ltd. | | | 4,118,582 | |
| | 163,327 | | | | | Bid Corp., Ltd.‡ | | | 3,163,309 | |
| | 336,996 | | | | | Bidvest Group, Ltd. (The) | | | 3,867,145 | |
| | 22,007 | | | | | Capitec Bank Holdings, Ltd. | | | 1,249,592 | |
| | 104,505 | | | | | Clicks Group, Ltd. | | | 998,385 | |
| | 179,721 | | | | | Exxaro Resources, Ltd. | | | 1,580,111 | |
| | 1,831,407 | | | | | FirstRand, Ltd.‡ | | | 6,331,987 | |
| | 217,489 | | | | | Foschini Group, Ltd. (The) | | | 2,505,817 | |
| | 390,382 | | | | | Growthpoint Properties, Ltd. REIT | | | 754,052 | |
| | 36,256 | | | | | Hyprop Investments, Ltd. REIT | | | 331,769 | |
| | 64,919 | | | | | Imperial Holdings, Ltd.‡ | | | 798,854 | |
| | 108,613 | | | | | Investec, Ltd. | | | 740,840 | |
| | 268,808 | | | | | Liberty Holdings, Ltd.‡ | | | 2,170,110 | |
| | 395,152 | | | | | MMI Holdings, Ltd.‡ | | | 674,562 | |
| | 51,097 | | | | | Mondi, Ltd. | | | 1,221,412 | |
| | 231,958 | | | | | MTN Group, Ltd.‡ | | | 2,110,478 | |
| | 56,207 | | | | | Naspers, Ltd. Class N | | | 9,704,052 | |
| | 119,907 | | | | | Nedbank Group, Ltd.‡ | | | 2,159,600 | |
| | 728,346 | | | | | Redefine Properties, Ltd. REIT | | | 598,049 | |
| | 39,012 | | | | | Remgro, Ltd. | | | 599,607 | |
| | 29,715 | | | | | Resilient, Ltd. REIT | | | 258,263 | |
| | 556,765 | | | | | RMB Holdings, Ltd.‡ | | | 2,431,974 | |
| | 180,152 | | | | | Sappi, Ltd. | | | 1,224,369 | |
| | 34,585 | | | | | Sasol, Ltd. | | | 1,007,443 | |
| | 46,215 | | | | | Shoprite Holdings, Ltd. | | | 667,268 | |
| | 1,011,013 | | | | | Sibanye Gold, Ltd. | | | 2,163,966 | |
| | 88,213 | | | | | Spar Group, Ltd. (The) | | | 1,146,415 | |
| | 516,817 | | | | | Standard Bank Group, Ltd. | | | 5,540,594 | |
| | 839,063 | | | | | Telkom SA SOC, Ltd. | | | 4,695,061 | |
| | 270,202 | | | | | Truworths International, Ltd. | | | 1,745,293 | |
| | 512,662 | | | | | Tsogo Sun Holdings, Ltd. | | | 1,056,771 | |
| | 171,211 | | | | | Vodacom Group, Ltd. | | | 1,940,828 | |
| | | | | | | | | | |
| | | | | | Total South Africa | | | 71,821,063 | |
| | | | | | | | | | |
| | | |
| | | | | | South Korea — 12.4% | | | | |
| | | |
| | 31,610 | | | | | Able C&C Co., Ltd. | | | 695,347 | |
| | 5,729 | | | | | Amorepacific Corp. | | | 1,436,989 | |
| | 2,447 | | | | | AMOREPACIFIC Group | | | 261,483 | |
| | | | | | |
| | See accompanying Notes to the Financial Statements. | | | 117 | |
Mercer Emerging Markets Equity Fund
Schedule of Investments (Continued)
(showing percentage of net assets)
March 31, 2017
| | | | | | | | | | |
| Shares | | | | | Description | | Value ($) | |
| | | |
| | | | | | South Korea — continued | | | | |
| | | |
| | 14,520 | | | | | BGF retail Co., Ltd. | | | 1,363,319 | |
| | 12,039 | | | | | BNK Financial Group, Inc. | | | 98,827 | |
| | 60,944 | | | | | Coway Co., Ltd. | | | 5,242,612 | |
| | 4,617 | | | | | Daelim Industrial Co., Ltd. | | | 334,003 | |
| | 72,502 | | | | | Dongbu Insurance Co., Ltd. | | | 4,149,269 | |
| | 88,909 | | | | | Hana Financial Group, Inc. | | | 2,937,662 | |
| | 51,975 | | | | | Hankook Tire Co., Ltd. | | | 2,532,985 | |
| | 6,763 | | | | | Hanssem Co., Ltd. | | | 1,330,466 | |
| | 70,676 | | | | | Hanwha Chemical Corp. | | | 1,668,467 | |
| | 36,289 | | | | | Hanwha Corp. | | | 1,164,960 | |
| | 26,032 | | | | | Hanwha Life Insurance Co., Ltd. | | | 140,600 | |
| | 54,246 | | | | | Hyosung Corp. | | | 6,572,774 | |
| | 75,559 | | | | | Hyundai Development Co-Engineering & Construction | | | 2,746,556 | |
| | 44,198 | | | | | Hyundai Engineering & Construction Co., Ltd. | | | 1,956,363 | |
| | 262,899 | | | | | Hyundai Marine & Fire Insurance Co., Ltd. | | | 8,228,083 | |
| | 19,336 | | | | | Hyundai Mobis Co., Ltd. | | | 4,158,373 | |
| | 12,754 | | | | | Industrial Bank of Korea | | | 139,139 | |
| | 13,901 | | | | | Innocean Worldwide, Inc. | | | 765,717 | |
| | 84,271 | | | | | Kangwon Land, Inc. | | | 2,878,612 | |
| | 137,875 | | | | | KB Financial Group, Inc. | | | 6,041,201 | |
| | 36,111 | | | | | KEPCO Plant Service & Engineering Co., Ltd. | | | 2,014,957 | |
| | 97,265 | | | | | Kia Motors Corp. | | | 3,222,452 | |
| | 57,394 | | | | | Korea Electric Power Corp. | | | 2,383,932 | |
| | 6,631 | | | | | Korea Petrochemical Ind Co., Ltd. | | | 1,452,736 | |
| | 25,403 | | | | | KT Corp., ADR* | | | 427,532 | |
| | 50,863 | | | | | KT&G Corp. | | | 4,434,537 | |
| | 15,659 | | | | | LG Chem, Ltd. | | | 4,116,736 | |
| | 51,552 | | | | | LG Corp. | | | 3,236,118 | |
| | 72,623 | | | | | LG Uplus Corp. | | | 928,650 | |
| | 14,545 | | | | | Loen Entertainment, Inc.* | | | 1,170,571 | |
| | 8,487 | | | | | Lotte Chemical Corp. | | | 2,811,798 | |
| | 16,992 | | | | | LS Corp. | | | 975,486 | |
| | 4,805 | | | | | NAVER Corp. | | | 3,673,679 | |
| | 14,520 | | | | | POSCO | | | 3,778,342 | |
| | 60,669 | | | | | Posco Daewoo Corp. | | | 1,293,889 | |
| | 5,569 | | | | | Samsung Card Co., Ltd. | | | 195,211 | |
| | 26,804 | | | | | Samsung Electronics Co., Ltd.‡ | | | 49,375,159 | |
| | 33,523 | | | | | Samsung Life Insurance Co., Ltd. | | | 3,252,477 | |
| | 257,015 | | | | | Shinhan Financial Group Co., Ltd. | | | 10,709,916 | |
| | 42,997 | | | | | Silicon Works Co., Ltd. | | | 1,178,448 | |
| | 16,290 | | | | | SK Holdings Co., Ltd. | | | 3,547,004 | |
| | 135,891 | | | | | SK Hynix, Inc. | | | 6,136,543 | |
| | 24,640 | | | | | SK Innovation Co., Ltd. | | | 3,668,568 | |
| | 91,785 | | | | | SK Networks Co., Ltd. | | | 613,104 | |
| | 42,494 | | | | | SK Telecom Co., Ltd. | | | 9,575,685 | |
| | 30,733 | | | | | Value Added Technologies Co., Ltd. | | | 770,867 | |
| | 15,846 | | | | | Vieworks Co., Ltd. | | | 913,947 | |
| | 80,924 | | | | | Woori Bank | | | 940,724 | |
| | | | | | | | | | |
| | | | | | Total South Korea | | | 183,642,875 | |
| | | | | | | | | | |
| | | | | | |
| 118 | | See accompanying Notes to the Financial Statements. | | | | |
Mercer Emerging Markets Equity Fund
Schedule of Investments (Continued)
(showing percentage of net assets)
March 31, 2017
| | | | | | | | | | |
| Shares | | | | | Description | | Value ($) | |
| | | |
| | | | | | Sweden — 0.1% | | | | |
| | | |
| | 197,704 | | | | | Telefonaktiebolaget LM Ericsson Class B‡ | | | 1,324,183 | |
| | | | | | | | | | |
| | | |
| | | | | | Switzerland — 0.4% | | | | |
| | | |
| | 90,462 | | | | | ABB, Ltd.* | | | 2,117,513 | |
| | 22,905 | | | | | Nestle SA | | | 1,758,579 | |
| | 4,733 | | | | | Syngenta AG | | | 2,090,473 | |
| | | | | | | | | | |
| | | | | | Total Switzerland | | | 5,966,565 | |
| | | | | | | | | | |
| | | |
| | | | | | Taiwan — 11.0% | | | | |
| | | |
| | 3,057,000 | | | | | Advanced Semiconductor Engineering, Inc. | | | 3,904,054 | |
| | 784,000 | | | | | Asia Cement Corp. | | | 790,653 | |
| | 258,000 | | | | | Asustek Computer, Inc. | | | 2,550,878 | |
| | 341,000 | | | | | Basso Industry Corp. | | | 1,036,177 | |
| | 258,000 | | | | | Bioteque Corp. | | | 948,076 | |
| | 683,000 | | | | | Catcher Technology Co., Ltd. | | | 6,752,904 | |
| | 890,000 | | | | | Cathay Financial Holding Co., Ltd. | | | 1,428,459 | |
| | 1,838,660 | | | | | China General Plastics Corp. | | | 1,708,831 | |
| | 2,825,372 | | | | | China Life Insurance Co., Ltd. | | | 2,793,480 | |
| | 4,142,000 | | | | | Compal Electronics, Inc. | | | 2,702,862 | |
| | 3,000,120 | | | | | CTBC Financial Holding Co., Ltd. | | | 1,853,910 | |
| | 827,800 | | | | | E.Sun Financial Holding Co., Ltd. | | | 503,350 | |
| | 78,000 | | | | | Eclat Textile Co., Ltd. | | | 781,478 | |
| | 397,000 | | | | | Elite Material Co., Ltd. | | | 1,543,907 | |
| | 36,720 | | | | | Feng TAY Enterprise Co., Ltd. | | | 146,432 | |
| | 1,222,570 | | | | | First Financial Holding Co., Ltd. | | | 745,408 | |
| | 48,000 | | | | | Formosa Chemicals & Fibre Corp. | | | 149,335 | |
| | 621,230 | | | | | Foxconn Technology Co., Ltd. | | | 1,893,838 | |
| | 4,270,997 | | | | | Fubon Financial Holding Co., Ltd. | | | 6,967,598 | |
| | 149,000 | | | | | Grape King Bio, Ltd. | | | 937,925 | |
| | 5,554,905 | | | | | Hon Hai Precision Industry Co., Ltd. | | | 16,659,681 | |
| | 160,000 | | | | | Hotai Motor Co., Ltd. | | | 1,874,598 | |
| | 238,950 | | | | | Hua Nan Financial Holdings Co., Ltd. | | | 133,483 | |
| | 2,128,000 | | | | | Inventec Corp. | | | 1,595,518 | |
| | 1,365,000 | | | | | King Yuan Electronics Co., Ltd. | | | 1,259,619 | |
| | 34,000 | | | | | Largan Precision Co., Ltd. | | | 5,356,184 | |
| | 1,452,195 | | | | | Lite-On Technology Corp. | | | 2,503,083 | |
| | 458,000 | | | | | MediaTek, Inc. | | | 3,245,283 | |
| | 973,000 | | | | | Mega Financial Holding Co., Ltd. | | | 785,647 | |
| | 1,150,000 | | | | | Micro-Star International Co., Ltd. | | | 2,675,785 | |
| | 41,000 | | | | | Nien Made Enterprise Co., Ltd. | | | 382,401 | |
| | 130,000 | | | | | Novatek Microelectronics Corp. | | | 503,419 | |
| | 1,969,000 | | | | | Pegatron Corp. | | | 5,827,345 | |
| | 641,000 | | | | | Phison Electronics Corp. | | | 5,756,694 | |
| | 1,016,000 | | | | | Pou Chen Corp. | | | 1,406,344 | |
| | 772,000 | | | | | Powertech Technology, Inc. | | | 2,246,605 | |
| | 868,000 | | | | | Primax Electronics, Ltd. | | | 1,423,185 | |
| | 514,000 | | | | | Realtek Semiconductor Corp. | | | 1,837,983 | |
| | 439,164 | | | | | SinoPac Financial Holdings Co., Ltd. | | | 137,065 | |
| | 757,087 | | | | | Taishin Financial Holding Co., Ltd. | | | 315,635 | |
| | | | | | |
| | See accompanying Notes to the Financial Statements. | | | 119 | |
Mercer Emerging Markets Equity Fund
Schedule of Investments (Continued)
(showing percentage of net assets)
March 31, 2017
| | | | | | | | | | |
| Shares | | | | | Description | | Value ($) | |
| | | |
| | | | | | Taiwan — continued | | | | |
| | | |
| | 4,385,000 | | | | | Taiwan Semiconductor Manufacturing Co., Ltd. | | | 27,313,669 | |
| | 675,127 | | | | | Taiwan Semiconductor Manufacturing Co., Ltd., ADR | | | 22,171,171 | |
| | 116,000 | | | | | Teco Electric and Machinery Co., Ltd. | | | 117,940 | |
| | 532,015 | | | | | Uni-President Enterprises Corp. | | | 997,665 | |
| | 1,366,000 | | | | | Vanguard International Semiconductor Corp. | | | 2,602,119 | |
| | 11,716,230 | | | | | Wistron Corp. | | | 10,734,488 | |
| | 2,531,000 | | | | | WPG Holdings, Ltd. | | | 3,178,087 | |
| | | | | | | | | | |
| | | | | | Total Taiwan | | | 163,180,251 | |
| | | | | | | | | | |
| | | |
| | | | | | Thailand — 2.8% | | | | |
| | | |
| | 1,414,000 | | | | | Airports of Thailand PCL | | | 1,615,118 | |
| | 5,749,300 | | | | | Ananda Development PCL Class F | | | 833,220 | |
| | 1,190,800 | | | | | Charoen Pokphand Foods PCL, ADR | | | 961,650 | |
| | 1,337,300 | | | | | CP All PCL Class F | | | 2,296,128 | |
| | 20,697,500 | | | | | IRPC PCL Class F | | | 3,101,990 | |
| | 357,900 | | | | | Kasikornbank PCL, ADR | | | 1,968,515 | |
| | 259,500 | | | | | KCE Electronics PCL Class F | | | 789,167 | |
| | 1,311,100 | | | | | Krung Thai Bank PCL, NVDR | | | 778,361 | |
| | 299,500 | | | | | Krungthai Card PCL Class F | | | 1,185,362 | |
| | 102,500 | | | | | PTT Exploration & Production PCL Class N, ADR | | | 277,410 | |
| | 1,791,600 | | | | | PTT Global Chemical PCL | | | 3,819,126 | |
| | 1,172,300 | | | | | PTT Global Chemical PCL, ADR | | | 2,498,973 | |
| | 219,900 | | | | | PTT PCL | | | 2,476,575 | |
| | 19,200 | | | | | PTT PCL, NVDR | | | 216,236 | |
| | 15,499,700 | | | | | Sansiri PCL | | | 920,171 | |
| | 412,750 | | | | | Siam Cement PCL (The) | | | 6,486,286 | |
| | 32,000 | | | | | Siam Cement PCL (The), ADR | | | 502,874 | |
| | 63,200 | | | | | Siam Commercial Bank PCL (The), NVDR | | | 299,792 | |
| | 3,042,100 | | | | | Thai Oil PCL | | | 6,683,988 | |
| | 965,000 | | | | | Thai Oil PCL, ADR | | | 2,120,262 | |
| | 2,328,400 | | | | | Thai Union Group PCL, ADR | | | 1,450,062 | |
| | | | | | | | | | |
| | | | | | Total Thailand | | | 41,281,266 | |
| | | | | | | | | | |
| | | |
| | | | | | Turkey — 1.2% | | | | |
| | | |
| | 67,490 | | | | | Akbank TAS | | | 158,085 | |
| | 99,728 | | | | | Arcelik AS | | | 620,553 | |
| | 1,609,103 | | | | | Emlak Konut Gayrimenkul Yatirim Ortakligi AS REIT | | | 1,281,397 | |
| | 831,379 | | | | | Eregli Demir ve Celik Fabrikalari TAS | | | 1,346,954 | |
| | 152,373 | | | | | Ford Otomotiv Sanayi AS | | | 1,489,566 | |
| | 452,256 | | | | | KOC Holding AS | | | 1,906,314 | |
| | 340,326 | | | | | TAV Havalimanlari Holding AS | | | 1,354,146 | |
| | 216,068 | | | | | Tupras Turkiye Petrol Rafinerileri AS | | | 5,351,787 | |
| | 310,743 | | | | | Turkiye Garanti Bankasi AS | | | 756,026 | |
| | 79,559 | | | | | Turkiye Halk Bankasi AS | | | 226,553 | |
| | 1,532,806 | | | | | Turkiye Is Bankasi | | | 2,790,632 | |
| | 78,062 | | | | | Turkiye Vakiflar Bankasi TAO Series D | | | 114,896 | |
| | | | | | | | | | |
| | | | | | Total Turkey | | | 17,396,909 | |
| | | | | | | | | | |
| | | | | | |
| 120 | | See accompanying Notes to the Financial Statements. | | | | |
Mercer Emerging Markets Equity Fund
Schedule of Investments (Continued)
(showing percentage of net assets)
March 31, 2017
| | | | | | | | | | |
| Shares | | | | | Description | | Value ($) | |
| | | |
| | | | | | United Arab Emirates — 1.1% | | | | |
| | | |
| | 438,437 | | | | | Abu Dhabi Commercial Bank PJSC | | | 811,699 | |
| | 4,974,485 | | | | | Aldar Properties PJSC | | | 3,060,805 | |
| | 1,784,975 | | | | | Dubai Islamic Bank PJSC | | | 2,721,443 | |
| | 2,481,539 | | | | | Emaar Malls PJSC | | | 1,783,627 | |
| | 2,680,230 | | | | | Emaar Properties PJSC | | | 5,326,893 | |
| | 740,541 | | | | | First Gulf Bank PJSC | | | 2,600,866 | |
| | | | | | | | | | |
| | | | | | Total United Arab Emirates | | | 16,305,333 | |
| | | | | | | | | | |
| | | |
| | | | | | United Kingdom — 1.1% | | | | |
| | | |
| | 61,706 | | | | | Diageo Plc | | | 1,761,955 | |
| | 266,739 | | | | | Evraz Plc* | | | 721,455 | |
| | 118,597 | | | | | GlaxoSmithKline Plc | | | 2,461,033 | |
| | 203,103 | | | | | Mondi Plc | | | 4,894,005 | |
| | 40,259 | | | | | NMC Health Plc | | | 890,548 | |
| | 1,290,512 | | | | | Old Mutual Plc | | | 3,241,499 | |
| | 195,921 | | | | | Polymetal International Plc | | | 2,429,070 | |
| | | | | | | | | | |
| | | | | | Total United Kingdom | | | 16,399,565 | |
| | | | | | | | | | |
| | | |
| | | | | | United States — 1.3% | | | | |
| | | |
| | 10,267 | | | | | China Biologic Products, Inc.* | | | 1,028,035 | |
| | 37,693 | | | | | Citigroup, Inc. | | | 2,254,795 | |
| | 40,792 | | | | | Crown Holdings, Inc.* | | | 2,159,936 | |
| | 13,417 | | | | | MercadoLibre, Inc. | | | 2,837,293 | |
| | 27,474 | | | | | Microsoft Corp. | | | 1,809,438 | |
| | 19,086 | | | | | Monsanto Co. | | | 2,160,535 | |
| | 68,532 | | | | | Pfizer, Inc. | | | 2,344,480 | |
| | 13,900 | | | | | Southern Copper Corp.‡ | | | 498,871 | |
| | 10,687 | | | | | Waters Corp.* | | | 1,670,485 | |
| | 119,586 | | | | | Yum China Holdings, Inc.* | | | 3,252,739 | |
| | | | | | | | | | |
| | | | | | Total United States | | | 20,016,607 | |
| | | | | | | | | | |
| | | |
| | | | | | TOTAL COMMON STOCKS (COST $1,166,615,981) | | | 1,311,900,694 | |
| | | | | | | | | | |
| | | |
| | | | | | PREFERRED STOCKS — 3.1% | | | | |
| | | |
| | | | | | Brazil — 2.9% | | | | |
| | | |
| | 348,240 | | | | | Banco Bradesco SA, 4.15% | | | 3,551,554 | |
| | 341,500 | | | | | Braskem SA, 3.79% | | | 3,415,054 | |
| | 54,300 | | | | | Cia Brasileira de Distribuicao Grupo Pao de Acucar, 0.03% | | | 1,027,868 | |
| | 110,318 | | | | | Cia de Transmissao de Energia Eletrica Paulista, 2.36% | | | 2,262,684 | |
| | 355,000 | | | | | Cia Energetica de Minas Gerais, 6.74% | | | 1,153,908 | |
| | 266,500 | | | | | Cia Paranaense de Energia, 4.12% | | | 2,748,141 | |
| | 527,670 | | | | | Itau Unibanco Holding SA, 4.70% | | | 6,298,900 | |
| | 1,953,196 | | | | | Itausa - Investimentos Itau SA, 6.06% | | | 5,844,300 | |
| | 1,822,400 | | | | | Petroleo Brasileiro SA, 0.00%* | | | 8,317,163 | |
| | 686,400 | | | | | Suzano Papel e Celulose SA, 2.14% | | | 2,866,711 | |
| | 198,600 | | | | | Telefonica Brasil SA, 4.64% | | | 2,924,314 | |
| | 285,200 | | | | | Vale SA, 0.60% | | | 2,534,053 | |
| | | | | | | | | | |
| | | | | | Total Brazil | | | 42,944,650 | |
| | | | | | | | | | |
| | | | | | |
| | See accompanying Notes to the Financial Statements. | | | 121 | |
Mercer Emerging Markets Equity Fund
Schedule of Investments (Continued)
(showing percentage of net assets)
March 31, 2017
| | | | | | | | | | |
| Shares | | | | | Description | | Value ($) | |
| | | |
| | | | | | Colombia — 0.1% | | | | |
| | | |
| | 60,749 | | | | | Bancolombia SA, 3.11% | | | 602,479 | |
| | | | | | | | | | |
| | | |
| | | | | | Germany — 0.1% | | | | |
| | | |
| | 20,005 | | | | | Bayerische Motoren Werke AG, 4.87% | | | 1,579,479 | |
| | | | | | | | | | |
| | | |
| | | | | | TOTAL PREFERRED STOCKS (COST $38,571,967) | | | 45,126,608 | |
| | | | | | | | | | |
| | | |
| Par Value ($) | | | | | Description | | Value ($) | |
| | | |
| | | | | | SHORT-TERM INVESTMENTS — 10.8% | | | | |
| | | |
| | | | | | Bank Deposit — 8.4% | | | | |
| | | |
| | 125,115,810 | | | | | State Street Bank & Trust Euro Time Deposit, 0.09%, due 04/03/17 | | | 125,115,810 | |
| | | | | | | | | | |
| | | |
| | | | | | Investment Fund — 0.6% | | | | |
| | | |
| | 8,252,201 | | | | | State Street Institutional Treasury Plus Money Market Fund, Premier Class***** | | | 8,252,201 | |
| | | | | | | | | | |
| | | |
| | | | | | Mutual Fund - Securities Lending Collateral — 1.6% | | | | |
| | | |
| | 23,309,405 | | | | | State Street Institutional U.S. Government Money Market Fund, Premier Class*** | | | 23,309,405 | |
| | | | | | | | | | |
| | | |
| | | | | | U.S. Government and Agency Obligations — 0.2% | | | | |
| | | |
| | 1,700,000 | | | | | United States Treasury Bill, 0.73%, due 06/22/17** ‡‡ | | | 1,697,176 | |
| | 1,700,000 | | | | | United States Treasury Bill, 0.65%, due 04/27/17** ‡‡ | | | 1,699,179 | |
| | | | | | | | | | |
| | | | | | TOTAL U.S. GOVERNMENT AND AGENCY OBLIGATIONS (COST $3,397,173) | | | 3,396,355 | |
| | | | | | | | | | |
| | | |
| | | | | | TOTAL SHORT-TERM INVESTMENTS (COST $160,074,590) | | | 160,073,771 | |
| | | | | | | | | | |
| | | |
| | | | | | TOTAL INVESTMENTS — 102.4% (Cost $1,365,262,538) | | | 1,517,101,073 | |
| | | |
| | | | | | Other Assets and Liabilities (net) — (2.4)% | | | (35,111,277 | ) |
| | | | | | | | | | |
| | | |
| | | | | | NET ASSETS — 100.0% | | $ | 1,481,989,796 | |
| | | | | | | | | | |
| | | | | | |
| 122 | | See accompanying Notes to the Financial Statements. | | | | |
Mercer Emerging Markets Equity Fund
Schedule of Investments (Continued)
(showing percentage of net assets)
March 31, 2017
| | | | | | | | | | |
| | | | | | Notes to Schedule of Investments: | | | | |
| | | |
| | | | | | ADR — American Depository Receipt | | | | |
| | | |
| | | | | | GDR — Global Depository Receipt | | | | |
| | | |
| | | | | | NVDR — Non-Voting Depository Receipt | | | | |
| | | |
| | | | | | REIT — Real Estate Investment Trust | | | | |
| | | |
| | | | * | | Non-income producing security | | | | |
| | | |
| | | | ** | | All or a portion of this security is pledged for open futures collateral. | | | | |
| | | |
| | | | *** | | Represents an investment of securities lending cash collateral. | | | | |
| | | |
| | | | ***** | | Security has been segregated to cover collateral requirements on open synthetic futures contracts. | | | | |
| | | |
| | | | ‡ | | All or a portion of this security is out on loan. | | | | |
| | | |
| | | | ‡‡ | | Interest rate presented is yield to maturity. | | | | |
| | | |
| | | | ‡‡‡ | | Security exempt from registration under Regulation S of the Securities Act of 1933, which exempts from registration securities offered and sold outside the United States. Security may not be offered or sold in the United States except pursuant to an exemption from, or in a transaction not subject to, the registration requirements of the Securities Act of 1933. | | | | |
| | | |
| | | | | | 144A — Securities exempt from registration under Rule 144A of the Securities Act of 1933. These securities may be resold in transactions exempt from registration, normally to qualified institutional buyers. The total market value of the securities at year end is $9,935,020 which represents 0.7% of net assets. | | | | |
| | | | | | |
| | See accompanying Notes to the Financial Statements. | | | 123 | |
Mercer Emerging Markets Equity Fund
Schedule of Investments (Continued)
March 31, 2017
Forward Foreign Currency Contracts
| | | | | | | | | | | | | | | | | | | | |
Settlement
Date | | | | | Currency | | Counterparty | | Units of
Currency | | | Value | | | Unrealized
Appreciation
(Depreciation) | |
| | Buys | | | | | | | | | | | | | | | | | | | |
| | 06/21/17 | | | | | BRL | | Citibank N.A. London | | | 98,972,000 | | | $ | 30,616,304 | | | $ | (588,866 | ) |
| | 06/21/17 | | | | | CLP | | Citibank N.A. London | | | 41,744,000 | | | | 62,829 | | | | 103 | |
| | 06/21/17 | | | | | COP | | Citibank N.A. London | | | 29,987,000,000 | | | | 10,252,422 | | | | 112,510 | |
| | 06/21/17 | | | | | CZK | | Citibank N.A. London | | | 217,310,000 | | | | 8,690,227 | | | | (17,494 | ) |
| | 06/21/17 | | | | | HKD | | Citibank N.A. London | | | 119,258,000 | | | | 15,370,683 | | | | (12,212 | ) |
| | 06/21/17 | | | | | HUF | | Citibank N.A. London | | | 530,000,000 | | | | 1,840,469 | | | | (1,670 | ) |
| | 06/21/17 | | | | | IDR | | Citibank N.A. London | | | 100,583,317,225 | | | | 7,484,509 | | | | 58,365 | |
| | 06/21/17 | | | | | INR | | Citibank N.A. London | | | 1,530,551,000 | | | | 23,325,822 | | | | 152,645 | |
| | 06/21/17 | | | | | KRW | | Citibank N.A. London | | | 4,692,757,000 | | | | 4,200,137 | | | | 10,561 | |
| | 06/21/17 | | | | | MXN | | Citibank N.A. London | | | 344,334,000 | | | | 18,066,630 | | | | 831,190 | |
| | 06/21/17 | | | | | PEN | | Citibank N.A. London | | | 300,000 | | | | 91,579 | | | | (58 | ) |
| | 06/21/17 | | | | | PHP | | Citibank N.A. London | | | 174,000,000 | | | | 3,455,855 | | | | 12,655 | |
| | 06/21/17 | | | | | PLN | | Citibank N.A. London | | | 36,938,000 | | | | 9,317,030 | | | | 86,763 | |
| | 06/21/17 | | | | | RUB | | Citibank N.A. London | | | 724,919,000 | | | | 12,638,087 | | | | 428,787 | |
| | 06/21/17 | | | | | SGD | | Citibank N.A. London | | | 9,700,000 | | | | 6,946,059 | | | | 60,114 | |
| | 06/21/17 | | | | | THB | | Citibank N.A. London | | | 26,000,000 | | | | 756,208 | | | | 7,416 | |
| | 06/21/17 | | | | | TRY | | Citibank N.A. London | | | 65,444,000 | | | | 17,571,663 | | | | (29,558 | ) |
| | 06/21/17 | | | | | TWD | | Citibank N.A. London | | | 235,513,000 | | | | 7,788,643 | | | | 33,321 | |
| | 06/21/17 | | | | | ZAR | | Citibank N.A. London | | | 169,367,000 | | | | 12,462,431 | | | | (212,960 | ) |
| | | | | | | | | | | | | | | | | | | | |
| | | | | | | | | | | | | | | | | | $ | 931,612 | |
| | | | | | | | | | | | | | | | | | | | |
| | Sales | | | | | | | | | | | | | | | | | | | |
| | 06/21/17 | | | | | BRL | | Citibank N.A. London | | | 61,231,000 | | | $ | 18,941,387 | | | $ | 320,729 | |
| | 06/21/17 | | | | | CLP | | Citibank N.A. London | | | 7,898,775,000 | | | | 11,888,452 | | | | 27,162 | |
| | 06/21/17 | | | | | COP | | Citibank N.A. London | | | 14,200,000,000 | | | | 4,854,917 | | | | (67,289 | ) |
| | 06/21/17 | | | | | HKD | | Citibank N.A. London | | | 55,945,000 | | | | 7,210,525 | | | | 4,467 | |
| | 06/21/17 | | | | | HUF | | Citibank N.A. London | | | 2,999,878,000 | | | | 10,417,327 | | | | (124,424 | ) |
| | 06/21/17 | | | | | IDR | | Citibank N.A. London | | | 35,400,000,000 | | | | 2,634,151 | | | | 2,252 | |
| | 06/21/17 | | | | | ILS | | Citibank N.A. London | | | 22,880,000 | | | | 6,317,778 | | | | (123,805 | ) |
| | 06/21/17 | | | | | INR | | Citibank N.A. London | | | 126,643,000 | | | | 1,930,058 | | | | 7,191 | |
| | 06/21/17 | | | | | KRW | | Citibank N.A. London | | | 21,110,801,000 | | | | 18,894,704 | | | | (353,081 | ) |
| | 06/21/17 | | | | | MXN | | Citibank N.A. London | | | 70,278,000 | | | | 3,687,369 | | | | (40,683 | ) |
| | 06/21/17 | | | | | PEN | | Citibank N.A. London | | | 500,000 | | | | 152,632 | | | | (549 | ) |
| | 06/21/17 | | | | | PHP | | Citibank N.A. London | | | 744,639,000 | | | | 14,789,451 | | | | (165,709 | ) |
| | 06/21/17 | | | | | PLN | | Citibank N.A. London | | | 1,095,000 | | | | 276,197 | | | | 2,499 | |
| | 06/21/17 | | | | | RUB | | Citibank N.A. London | | | 283,094,000 | | | | 4,935,402 | | | | (140,439 | ) |
| | 06/21/17 | | | | | SGD | | Citibank N.A. London | | | 59,436,000 | | | | 42,561,439 | | | | (530,396 | ) |
| | 06/21/17 | | | | | THB | | Citibank N.A. London | | | 56,817,000 | | | | 1,652,519 | | | | (27,694 | ) |
| | 06/21/17 | | | | | TRY | | Citibank N.A. London | | | 10,657,000 | | | | 2,861,396 | | | | 3,932 | |
| | 06/21/17 | | | | | TWD | | Citibank N.A. London | | | 23,167,000 | | | | 766,155 | | | | 3,201 | |
| | 06/21/17 | | | | | ZAR | | Citibank N.A. London | | | 76,377,000 | | | | 5,620,003 | | | | 254,074 | |
| | | | | | | | | | | | | | | | | | | | |
| | | | | | | | | | | | | | | | | | $ | (948,562 | ) |
| | | | | | | | | | | | | | | | | | | | |
| | | | | | |
| 124 | | See accompanying Notes to the Financial Statements. | | | | |
Mercer Emerging Markets Equity Fund
Schedule of Investments (Continued)
March 31, 2017
Currency Abbreviations
| PEN | — Peruvian Nouveau Sol |
Futures Contracts
| | | | | | | | | | | | | | | | | | | | |
Number of
Contracts | | | | | Type | | | | Expiration Date | | | Contract
Value | | | Unrealized
Appreciation (Depreciation) | |
| | Buys | | | | | | | | | | | | | | | | | | | |
| | 106 | | | | | KOSPI 200 Index | | | | | June 2017 | | | $ | 6,675,355 | | | $ | 259,334 | |
| | 1,661 | | | | | MSCI Emerging Markets E-mini Index | | | | | June 2017 | | | | 79,844,270 | | | | 2,525,499 | |
| | 4 | | | | | MSCI Taiwan Index | | | | | April 2017 | | | | 145,080 | | | | (1,568 | ) |
| | 934 | | | | | SET50 Index | | | | | June 2017 | | | | 5,383,972 | | | | (14,395 | ) |
| | | | | | | | | | | | | | | | | | | | |
| | | | | | | | | | | | | | | | | | $ | 2,768,870 | |
| | | | | | | | | | | | | | | | | | | | |
| | Sales | | | | | | | | | | | | | | | | | | | |
| | 493 | | | | | BIST 30 Index | | | | | April 2017 | | | $ | 1,471,223 | | | $ | 21,528 | |
| | 22 | | | | | FTSE Bursa Malaysia KLCI Index | | | | | April 2017 | | | | 434,109 | | | | 4,992 | |
| | 464 | | | | | FTSE/JSE Top 40 Index | | | | | June 2017 | | | | 15,837,682 | | | | (224,962 | ) |
| | 58 | | | | | Mexico Bolsa Index | | | | | June 2017 | | | | 1,496,304 | | | | (1,074 | ) |
| | 174 | | | | | MSCI Singapore Index | | | | | April 2017 | | | | 4,350,311 | | | | (27,993 | ) |
| | 883 | | | | | SGX Nifty 50 Index | | | | | April 2017 | | | | 16,243,668 | | | | (166,179 | ) |
| | | | | | | | | | | | | | | | | | | | |
| | | | | | | | | | | | | | | | | | $ | (393,688 | ) |
| | | | | | | | | | | | | | | | | | | | |
| | | | | | |
| | See accompanying Notes to the Financial Statements. | | | 125 | |
Mercer Emerging Markets Equity Fund
Schedule of Investments (Continued)
March 31, 2017
Synthetic Futures
| | | | | | | | | | | | | | | | | | |
Number of
Contracts Long
(Short) | | | | | Reference Entity | | Expiration Date | | Counterparty | | Notional
Value | | | Value | |
| | (275 | ) | | | | Brazil Bovespa Stock Index | | 04/12/2017 | | Goldman Sachs International | | $ | 5,857,634 | | | $ | 105,953 | |
| | 28,450 | | | | | Hang Seng China Enterprises Index | | 04/27/2017 | | Goldman Sachs International | | | 38,303,202 | | | | (624,308 | ) |
| | 72,750,000 | | | | | KOSPI 200 Index | | 06/8/2017 | | Goldman Sachs International | | | 17,163,756 | | | | 622,777 | |
| | (4,835 | ) | | | | MSCI Brazil Net Return Index | | 06/21/2017 | | Goldman Sachs International | | | 1,201,700 | | | | 60,610 | |
| | 1,698 | | | | | MSCI China Net Return Index | | 06/21/2017 | | Goldman Sachs International | | | 96,146 | | | | 330 | |
| | (6,061 | ) | | | | MSCI Mexico Net Index | | 06/21/2017 | | Goldman Sachs International | | | 299,013 | | | | (8,155 | ) |
| | (1,791 | ) | | | | MSCI Poland Net Return Index | | 06/21/2017 | | Goldman Sachs International | | | 84,948 | | | | 3,548 | |
| | (54,406 | ) | | | | MSCI South Africa Net Return Index | | 06/21/2017 | | Goldman Sachs International | | | 3,701,623 | | | | (7,060 | ) |
| | 7,700 | | | | | MSCI Taiwan Stock Index | | 04/27/2017 | | Goldman Sachs International | | | 2,823,529 | | | | (30,739 | ) |
| | (691 | ) | | | | MSCI Turkey Net Return Index | | 06/21/2017 | | Goldman Sachs International | | | 199,797 | | | | 946 | |
| | (536 | ) | | | | MSCI Turkey Net Return Index | | 06/21/2017 | | Goldman Sachs International | | | 160,553 | | | | 663 | |
| | (162 | ) | | | | SGX Nifty 50 Index | | 04/27/2017 | | Goldman Sachs International | | | 1,479,591 | | | | (10,485 | ) |
| | 28,200 | | | | | Taiwan Stock Exchange Capitalization Weighted Stock Index | | 04/19/2017 | | Goldman Sachs International | | | 8,818,654 | | | | 131,112 | |
| | 6,900 | | | | | Tel Aviv 35 Index | | 04/28/2017 | | Goldman Sachs International | | | 2,671,017 | | | | (7,494 | ) |
| | (2,520 | ) | | | | Warsaw WIG 20 Index | | 06/16/2017 | | Goldman Sachs International | | | 1,367,620 | | | | 12,194 | |
| | | | | | | | | | | | | | | | | | |
| | | | | | | | | | | | | | | | $ | 249,892 | |
| | | | | | | | | | | | | | | | | | |
| | | | | | |
| 126 | | See accompanying Notes to the Financial Statements. | | | | |
Mercer Emerging Markets Equity Fund
Schedule of Investments (Continued)
March 31, 2017
| | | | | |
| Industry Sector Summary (Unaudited) | | % of Net Assets |
Banks | | | | 15.0 | |
Semiconductors | | | | 8.4 | |
Internet | | | | 6.1 | |
Oil & Gas | | | | 5.2 | |
Diversified Financial Services | | | | 4.7 | |
Telecommunications | | | | 4.2 | |
Electronics | | | | 3.2 | |
Computers | | | | 3.0 | |
Insurance | | | | 3.0 | |
Retail | | | | 2.9 | |
Chemicals | | | | 2.5 | |
Real Estate | | | | 2.5 | |
Food | | | | 2.4 | |
Auto Manufacturers | | | | 2.0 | |
Electric | | | | 1.9 | |
Pharmaceuticals | | | | 1.9 | |
Commercial Services | | | | 1.8 | |
Holding Companies — Diversified | | | | 1.6 | |
Software | | | | 1.6 | |
Mining | | | | 1.5 | |
Engineering & Construction | | | | 1.1 | |
Iron & Steel | | | | 1.1 | |
Building Materials | | | | 1.0 | |
Forest Products & Paper | | | | 1.0 | |
Media | | | | 1.0 | |
Beverages | | | | 0.9 | |
Auto Parts & Equipment | | | | 0.8 | |
Metal Fabricate & Hardware | | | | 0.8 | |
Agriculture | | | | 0.7 | |
Coal | | | | 0.6 | |
Airlines | | | | 0.5 | |
Home Furnishings | | | | 0.5 | |
Lodging | | | | 0.5 | |
Miscellaneous — Manufacturing | | | | 0.5 | |
Entertainment | | | | 0.4 | |
Environmental Control | | | | 0.4 | |
Health Care — Products | | | | 0.4 | |
Leisure Time | | | | 0.4 | |
Machinery — Construction & Mining | | | | 0.4 | |
Gas | | | | 0.3 | |
Household Products & Wares | | | | 0.3 | |
Packaging & Containers | | | | 0.3 | |
REITS | | | | 0.3 | |
Apparel | | | | 0.2 | |
Distribution & Wholesale | | | | 0.2 | |
Electrical Components & Equipment | | | | 0.2 | |
Food Service | | | | 0.2 | |
Health Care — Services | | | | 0.2 | |
Home Builders | | | | 0.2 | |
Water | | | | 0.2 | |
Advertising | | | | 0.1 | |
| | | | | | |
| | See accompanying Notes to the Financial Statements. | | | 127 | |
Mercer Emerging Markets Equity Fund
Schedule of Investments (Continued)
March 31, 2017
| | | | | |
| Industry Sector Summary (Unaudited) | | % of Net Assets |
Biotechnology | | | | 0.1 | |
Cosmetics & Personal Care | | | | 0.1 | |
Hand & Machine Tools | | | | 0.1 | |
Oil & Gas Services | | | | 0.1 | |
Transportation | | | | 0.1 | |
Machinery — Diversified | | | | 0.0 | |
Short-Term Investments and Other Assets and Liabilities (net) | | | | 8.4 | |
| | | | | |
| | | | 100.0 | % |
| | | | | |
| | | | | | |
| 128 | | See accompanying Notes to the Financial Statements. | | | | |
Mercer Global Low Volatility Equity Fund
Schedule of Investments
(showing percentage of net assets)
March 31, 2017
| | | | | | | | | | |
| Shares | | | | | Description | | Value ($) | |
| | | |
| | | | | | COMMON STOCKS — 87.9% | | | | |
| | | |
| | | | | | Australia — 1.2% | | | | |
| | | |
| | 228,292 | | | | | AGL Energy, Ltd. | | | 4,592,402 | |
| | 83,971 | | | | | Coca-Cola Amatil, Ltd. | | | 693,099 | |
| | 208,664 | | | | | Computershare, Ltd. | | | 2,238,061 | |
| | 61,232 | | | | | Costa Group Holdings, Ltd. | | | 203,192 | |
| | 74,076 | | | | | Rio Tinto, Ltd.‡ | | | 3,416,526 | |
| | 98,087 | | | | | South32, Ltd. | | | 206,519 | |
| | 47,000 | | | | | Telstra Corp., Ltd. | | | 167,079 | |
| | 102,339 | | | | | Wesfarmers, Ltd. | | | 3,518,583 | |
| | | | | | | | | | |
| | | | | | Total Australia | | | 15,035,461 | |
| | | | | | | | | | |
| | | |
| | | | | | Austria — 1.9% | | | | |
| | | |
| | 203 | | | | | Agrana Beteiligungs AG | | | 21,525 | |
| | 26,151 | | | | | BUWOG AG* | | | 661,486 | |
| | 75,367 | | | | | CA Immobilien Anlagen AG* | | | 1,660,137 | |
| | 119,376 | | | | | Conwert Immobilien Invest SE* | | | 2,021,152 | |
| | 70,461 | | | | | Erste Group Bank AG* | | | 2,300,411 | |
| | 17,851 | | | | | EVN AG | | | 228,156 | |
| | 34,272 | | | | | Flughafen Wien AG | | | 1,084,823 | |
| | 5,268 | | | | | Mayr Melnhof Karton AG | | | 614,993 | |
| | 57,223 | | | | | Oesterreichische Post AG | | | 2,285,314 | |
| | 78,229 | | | | | OMV AG | | | 3,086,160 | |
| | 98,549 | | | | | Raiffeisen Bank International AG* | | | 2,229,801 | |
| | 50,599 | | | | | S IMMO AG* | | | 608,288 | |
| | 175,068 | | | | | Telekom Austria AG | | | 1,196,114 | |
| | 56,640 | | | | | UNIQA Insurance Group AG | | | 440,957 | |
| | 63,472 | | | | | Verbund AG | | | 1,080,413 | |
| | 93,487 | | | | | Voestalpine AG | | | 3,689,593 | |
| | | | | | | | | | |
| | | | | | Total Austria | | | 23,209,323 | |
| | | | | | | | | | |
| | | |
| | | | | | Belgium — 0.3% | | | | |
| | | |
| | 39,322 | | | | | Colruyt SA | | | 1,935,455 | |
| | 32,340 | | | | | Elia System Operator SA | | | 1,710,092 | |
| | | | | | | | | | |
| | | | | | Total Belgium | | | 3,645,547 | |
| | | | | | | | | | |
| | | |
| | | | | | Bermuda — 1.4% | | | | |
| | | |
| | 26,500 | | | | | Arch Capital Group, Ltd.* | | | 2,511,405 | |
| | 24,600 | | | | | Aspen Insurance Holdings, Ltd. | | | 1,280,430 | |
| | 22,400 | | | | | Axis Capital Holdings, Ltd. | | | 1,501,472 | |
| | 27,000 | | | | | Bunge, Ltd. | | | 2,140,020 | |
| | 124,000 | | | | | Cheung Kong Infrastructure Holdings, Ltd. | | | 973,300 | |
| | 34,000 | | | | | Clear Media, Ltd. | | | 39,375 | |
| | 126,000 | | | | | Emperor International Holdings, Ltd. | | | 39,236 | |
| | 10,400 | | | | | Everest Re Group, Ltd. | | | 2,431,624 | |
| | 45,300 | | | | | Genpact, Ltd. | | | 1,121,628 | |
| | 7,000 | | | | | Guoco Group, Ltd. | | | 81,065 | |
| | 12,100 | | | | | RenaissanceRe Holdings, Ltd. | | | 1,750,265 | |
| | 23,227 | | | | | Stolt-Nielsen, Ltd. | | | 394,828 | |
| | | | | | |
| | See accompanying Notes to the Financial Statements. | | | 129 | |
Mercer Global Low Volatility Equity Fund
Schedule of Investments (Continued)
(showing percentage of net assets)
March 31, 2017
| | | | | | | | | | |
| Shares | | | | | Description | | Value ($) | |
| | | |
| | | | | | Bermuda — continued | | | | |
| | | |
| | 28,600 | | | | | Validus Holdings, Ltd. | | | 1,612,754 | |
| | 1,500 | | | | | White Mountains Insurance Group, Ltd. | | | 1,319,820 | |
| | 5,000 | | | | | Wing On Co. International, Ltd. | | | 16,599 | |
| | | | | | | | | | |
| | | | | | Total Bermuda | | | 17,213,821 | |
| | | | | | | | | | |
| | |
| | | | | | Canada — 3.6% | |
| | | |
| | 93,112 | | | | | Atco, Ltd. Class I | | | 3,610,259 | |
| | 51,000 | | | | | Bank of Montreal | | | 3,798,470 | |
| | 14,000 | | | | | Bank of Nova Scotia (The)‡ | | | 816,706 | |
| | 39,447 | | | | | BCE, Inc. | | | 1,746,319 | |
| | 40,200 | | | | | Canadian Imperial Bank of Commerce | | | 3,456,480 | |
| | 700 | | | | | Canadian Real Estate Investment Trust REIT | | | 25,446 | |
| | 54,000 | | | | | Capital Power Corp.‡ | | | 1,055,179 | |
| | 10,200 | | | | | Cogeco, Inc. | | | 455,526 | |
| | 200 | | | | | E-L Financial Corp., Ltd. | | | 122,821 | |
| | 176,343 | | | | | First Capital Realty, Inc. | | | 2,648,484 | |
| | 39,700 | | | | | George Weston, Ltd. | | | 3,453,973 | |
| | 975 | | | | | Granite Real Estate Investment Trust REIT | | | 34,057 | |
| | 1,400 | | | | | Lions Gate Entertainment Corp. Class A‡ | | | 37,184 | |
| | 61,100 | | | | | Loblaw Cos., Ltd. | | | 3,305,947 | |
| | 78,400 | | | | | Maple Leaf Foods, Inc. | | | 1,897,613 | |
| | 200 | | | | | Morguard Corp. | | | 27,443 | |
| | 24,700 | | | | | Precision Drilling Corp.* | | | 116,494 | |
| | 167,300 | | | | | Pure Industrial Real Estate Trust REIT | | | 763,961 | |
| | 83,900 | | | | | Rogers Communications, Inc. Class B | | | 3,699,111 | |
| | 51,700 | | | | | Royal Bank of Canada | | | 3,756,018 | |
| | 126,300 | | | | | Shaw Communications, Inc. Class B‡ | | | 2,610,948 | |
| | 27,100 | | | | | Sun Life Financial, Inc. | | | 986,748 | |
| | 42,200 | | | | | TFI International, Inc.‡ | | | 982,499 | |
| | 49,400 | | | | | Thomson Reuters Corp. (New York Exchange) | | | 2,135,562 | |
| | 73,600 | | | | | Toronto-Dominion Bank | | | 3,675,999 | |
| | 8,613 | | | | | Valener, Inc.‡ | | | 141,177 | |
| | | | | | | | | | |
| | | | | | Total Canada | | | 45,360,424 | |
| | | | | | | | | | |
| | |
| | | | | | Denmark — 0.2% | |
| | | |
| | 7,900 | | | | | Carlsberg AS Class B | | | 731,739 | |
| | 27,802 | | | | | H Lundbeck AS | | | 1,293,182 | |
| | 1,767 | | | | | Matas AS | | | 25,160 | |
| | 963 | | | | | Schouw & Co. | | | 88,575 | |
| | | | | | | | | | |
| | | | | | Total Denmark | | | 2,138,656 | |
| | | | | | | | | | |
| | |
| | | | | | Finland — 0.2% | |
| | | |
| | 40,106 | | | | | Orion OYJ Class B | | | 2,096,296 | |
| | 32,235 | | | | | Raisio OYJ Class V | | | 116,187 | |
| | 12,320 | | | | | Tokmanni Group Corp. | | | 137,171 | |
| | | | | | | | | | |
| | | | | | Total Finland | | | 2,349,654 | |
| | | | | | | | | | |
| | | | | | |
| 130 | | See accompanying Notes to the Financial Statements. | | | | |
Mercer Global Low Volatility Equity Fund
Schedule of Investments (Continued)
(showing percentage of net assets)
March 31, 2017
| | | | | | | | | | |
| Shares | | | | | Description | | Value ($) | |
| | |
| | | | | | France — 1.8% | |
| | | |
| | 10,732 | | | | | Aeroports de Paris | | | 1,329,773 | |
| | 487 | | | | | Bongrain SA | | | 40,649 | |
| | 6,521 | | | | | Caisse Regionale de Credit Agricole Mutuel Nord de France | | | 140,955 | |
| | 15,678 | | | | | Carrefour SA | | | 370,582 | |
| | 223,817 | | | | | Credit Agricole SA | | | 3,040,169 | |
| | 233 | | | | | GFI Informatique SA | | | 1,941 | |
| | 4,758 | | | | | Groupe Guillin | | | 169,868 | |
| | 7,434 | | | | | Ipsen SA | | | 745,489 | |
| | 885 | | | | | Manutan International | | | 65,880 | |
| | 15,353 | | | | | Metropole Television SA | | | 343,523 | |
| | 167,356 | | | | | Sanofi | | | 15,146,603 | |
| | 14,798 | | | | | SPIE SA | | | 357,932 | |
| | 1,748 | | | | | Vetoquinol SA | | | 98,676 | |
| | 5,599 | | | | | Vilmorin & Cie SA | | | 386,671 | |
| | | | | | | | | | |
| | | | | | Total France | | | 22,238,711 | |
| | | | | | | | | | |
| | | |
| | | | | | Germany — 1.3% | | | | |
| | | |
| | 8,103 | | | | | Aurubis AG | | | 544,433 | |
| | 68,779 | | | | | Celesio AG | | | 1,892,029 | |
| | 227 | | | | | Homag Group AG | | | 12,018 | |
| | 6,693 | | | | | Hornbach Baumarkt AG | | | 209,243 | |
| | 5,425 | | | | | Hornbach Holding AG & Co. KGaA | | | 403,260 | |
| | 2,351 | | | | | KWS Saat SE | | | 731,597 | |
| | 31,806 | | | | | Merck KGaA | | | 3,633,133 | |
| | 21,210 | | | | | METRO AG | | | 680,101 | |
| | 78,113 | | | | | Rhoen-Klinikum AG | | | 2,136,264 | |
| | 42,903 | | | | | Salzgitter AG | | | 1,557,171 | |
| | 7,209 | | | | | SAP SE | | | 709,201 | |
| | 9,414 | | | | | STADA Arzneimittel AG | | | 577,845 | |
| | 96,747 | | | | | Suedzucker AG | | | 2,433,749 | |
| | 17,892 | | | | | Wuestenrot & Wuerttembergische AG | | | 355,937 | |
| | | | | | | | | | |
| | | | | | Total Germany | | | 15,875,981 | |
| | | | | | | | | | |
| | | |
| | | | | | Hong Kong — 0.4% | | | | |
| | | |
| | 335,000 | | | | | CLP Holdings, Ltd. | | | 3,502,380 | |
| | 28,900 | | | | | Hong Kong & China Gas Co., Ltd. | | | 57,789 | |
| | 26,000 | | | | | Hong Kong Ferry Holdings Co., Ltd. | | | 29,809 | |
| | 59,500 | | | | | Hongkong & Shanghai Hotels (The) | | | 69,977 | |
| | 51,500 | | | | | Hopewell Holdings, Ltd. | | | 194,165 | |
| | 60,000 | | | | | Liu Chong Hing Investment, Ltd. | | | 85,698 | |
| | 60,000 | | | | | Miramar Hotel & Investment Co., Ltd. | | | 128,933 | |
| | 397,000 | | | | | Regal Real Estate Investment Trust REIT | | | 113,407 | |
| | 784,000 | | | | | Sunlight Real Estate Investment Trust REIT | | | 464,054 | |
| | | | | | | | | | |
| | | | | | Total Hong Kong | | | 4,646,212 | |
| | | | | | | | | | |
| | | |
| | | | | | Ireland — 0.5% | | | | |
| | | |
| | 21,800 | | | | | Accenture Plc Class A | | | 2,613,384 | |
| | 106,989 | | | | | Hibernia Plc REIT | | | 142,465 | |
| | | | | | |
| | See accompanying Notes to the Financial Statements. | | | 131 | |
Mercer Global Low Volatility Equity Fund
Schedule of Investments (Continued)
(showing percentage of net assets)
March 31, 2017
| | | | | | | | | | |
| Shares | | | | | Description | | Value ($) | |
| | | |
| | | | | | Ireland — continued | | | | |
| | | |
| | 134,153 | | | | | Irish Residential Properties Plc REIT | | | 177,919 | |
| | 3,278 | | | | | Kerry Group Plc Class A | | | 258,391 | |
| | 40,200 | | | | | Medtronic Plc | | | 3,238,512 | |
| | 55,591 | | | | | Total Produce Plc | | | 115,942 | |
| | 13,016 | | | | | UDG Healthcare Plc | | | 114,257 | |
| | | | | | | | | | |
| | | | | | Total Ireland | | | 6,660,870 | |
| | | | | | | | | | |
| | | |
| | | | | | Israel — 0.5% | | | | |
| | | |
| | 166,473 | | | | | Amot Investments, Ltd. | | | 802,445 | |
| | 426,581 | | | | | Bank Hapoalim BM | | | 2,594,383 | |
| | 51,123 | | | | | Bank Leumi Le-Israel BM* | | | 225,305 | |
| | 4,566 | | | | | Check Point Software Technologies, Ltd.* ‡ | | | 468,746 | |
| | 1,770 | | | | | FIBI Holdings, Ltd. | | | 36,321 | |
| | 340,722 | | | | | Israel Discount Bank, Ltd. Class A* | | | 798,663 | |
| | 134,362 | | | | | Shufersal, Ltd. | | | 649,512 | |
| | 39,238 | | | | | Teva Pharmaceutical Industries, Ltd., ADR | | | 1,259,147 | |
| | | | | | | | | | |
| | | | | | Total Israel | | | 6,834,522 | |
| | | | | | | | | | |
| | | |
| | | | | | Italy — 0.2% | | | | |
| | | |
| | 62,664 | | | | | Ascopiave Spa | | | 232,567 | |
| | 118,097 | | | | | Hera Spa | | | 329,418 | |
| | 768,501 | | | | | Parmalat Spa‡ | | | 2,520,099 | |
| | | | | | | | | | |
| | | | | | Total Italy | | | 3,082,084 | |
| | | | | | | | | | |
| | | |
| | | | | | Japan — 3.9% | | | | |
| | | |
| | 11,300 | | | | | Aeon Hokkaido Corp. | | | 61,454 | |
| | 37,400 | | | | | Alpen Co., Ltd. | | | 649,457 | |
| | 8,600 | | | | | Asahi Holdings, Inc. | | | 155,437 | |
| | 3,000 | | | | | AT-Group Co., Ltd. | | | 71,264 | |
| | 101,200 | | | | | Canon, Inc. | | | 3,152,340 | |
| | 152,200 | | | | | Daiichi Sanyko Co., Ltd. | | | 3,424,261 | |
| | 27,000 | | | | | DyDo Group Holdings, Inc. | | | 1,262,407 | |
| | 9,900 | | | | | Earth Chemical Co., Ltd. | | | 530,405 | |
| | 150,100 | | | | | EDION Corp.‡ | | | 1,378,016 | |
| | 12,200 | | | | | Heiwa Corp. | | | 303,057 | |
| | 102,500 | | | | | Japan Tobacco, Inc. | | | 3,328,053 | |
| | 6,000 | | | | | Joshin Denki Co., Ltd. | | | 61,168 | |
| | 1,900 | | | | | Kadoya Sesame Mills, Inc. | | | 96,680 | |
| | 19,200 | | | | | Kato Sangyo Co., Ltd. | | | 492,104 | |
| | 1,000 | | | | | KFC Holdings Japan, Ltd. | | | 17,545 | |
| | 49,000 | | | | | KYORIN Holdings, Inc. | | | 1,033,824 | |
| | 39,000 | | | | | McDonald’s Holdings Co., Ltd. | | | 1,137,485 | |
| | 4,200 | | | | | Mitsubishi Shokuhin Co., Ltd. | | | 130,037 | |
| | 167,200 | | | | | Mitsubishi Tanabe Pharma Corp. | | | 3,478,144 | |
| | 3,400 | | | | | Mitsui Sugar Co., Ltd. | | | 82,658 | |
| | 6,700 | | | | | Mochida Pharmaceutical Co., Ltd. | | | 496,653 | |
| | 14,900 | | | | | MOS Food Services, Inc.‡ | | | 433,909 | |
| | 30,500 | | | | | Nippon Flour Mills Co., Ltd. | | | 449,987 | |
| | | | | | |
| 132 | | See accompanying Notes to the Financial Statements. | | | | |
Mercer Global Low Volatility Equity Fund
Schedule of Investments (Continued)
(showing percentage of net assets)
March 31, 2017
| | | | | | | | | | |
| Shares | | | | | Description | | Value ($) | |
| | | |
| | | | | | Japan — continued | | | | |
| | | |
| | 60,700 | | | | | Nippon Telegraph & Telephone Corp. | | | 2,588,588 | |
| | 542,000 | | | | | Nisshin Oillio Group, Ltd. (The) | | | 3,083,801 | |
| | 20,800 | | | | | NTT DoCoMo, Inc. | | | 483,927 | |
| | 6,000 | | | | | Ohsho Food Service Corp. | | | 221,574 | |
| | 16,900 | | | | | Okinawa Cellular Telephone Co. | | | 546,751 | |
| | 42,500 | | | | | Okinawa Electric Power Co., Inc. (The) | | | 1,009,199 | |
| | 32,200 | | | | | Otsuka Holdings Co., Ltd. | | | 1,451,211 | |
| | 12,600 | | | | | Parco Co., Ltd. | | | 134,673 | |
| | 22,500 | | | | | Shimachu Co., Ltd. | | | 547,406 | |
| | 78,000 | | | | | Showa Sangyo Co., Ltd.‡ | | | 411,595 | |
| | 43,100 | | | | | Sumitomo Dainippon Pharma Co., Ltd.‡ | | | 710,920 | |
| | 17,100 | | | | | Suzuken Co., Ltd. | | | 560,127 | |
| | 33,200 | | | | | Taisho Pharmaceutical Holdings Co., Ltd. | | | 2,693,422 | |
| | 45,400 | | | | | Takara Holdings, Inc. | | | 489,324 | |
| | 74,300 | | | | | Takeda Pharmaceutical Co., Ltd. | | | 3,486,626 | |
| | 130,000 | | | | | Toppan Printing Co., Ltd. | | | 1,324,150 | |
| | 78,700 | | | | | Tsumura & Co. | | | 2,464,893 | |
| | 68,900 | | | | | Vital KSK Holdings, Inc. | | | 638,112 | |
| | 284,600 | | | | | Yamada Denki Co., Ltd.‡ | | | 1,417,509 | |
| | 24,100 | | | | | Yodogawa Steel Works, Ltd. | | | 653,163 | |
| | 97,300 | | | | | Yoshinoya Holdings Co., Ltd.‡ | | | 1,413,701 | |
| | 5,900 | | | | | ZERIA Pharmaceutical Co., Ltd. | | | 90,647 | |
| | | | | | | | | | |
| | | | | | Total Japan | | | 48,647,664 | |
| | | | | | | | | | |
| | | |
| | | | | | Luxembourg — 0.3% | | | | |
| | | |
| | 67,092 | | | | | Aperam SA‡ | | | 3,361,873 | |
| | 89,943 | | | | | Atento SA* | | | 822,978 | |
| | | | | | | | | | |
| | | | | | Total Luxembourg | | | 4,184,851 | |
| | | | | | | | | | |
| | | |
| | | | | | Netherlands — 0.6% | | | | |
| | | |
| | 2,996 | | | | | ASR Nederland NV* | | | 85,637 | |
| | 54,264 | | | | | ForFarmers NV* | | | 463,724 | |
| | 40,906 | | | | | Heineken Holding NV | | | 3,262,512 | |
| | 131,227 | | | | | QIAGEN NV* | | | 3,801,646 | |
| | | | | | | | | | |
| | | | | | Total Netherlands | | | 7,613,519 | |
| | | | | | | | | | |
| | | |
| | | | | | New Zealand — 1.7% | | | | |
| | | |
| | 709,120 | | | | | Argosy Property, Ltd. | | | 480,839 | |
| | 420,500 | | | | | Auckland International Airport, Ltd. | | | 1,987,105 | |
| | 380,765 | | | | | Chorus, Ltd. | | | 1,149,871 | |
| | 645,888 | | | | | Contact Energy, Ltd. | | | 2,284,630 | |
| | 85,411 | | | | | Ebos Group, Ltd. | | | 1,089,645 | |
| | 355,045 | | | | | Fisher & Paykel Healthcare Corp., Ltd. | | | 2,407,484 | |
| | 94,773 | | | | | Fonterra Co-operative Group, Ltd. | | | 401,481 | |
| | 137,950 | | | | | Freightways, Ltd. | | | 722,290 | |
| | 662,719 | | | | | Genesis Energy, Ltd. | | | 963,609 | |
| | 445,940 | | | | | Goodman Property Trust REIT‡ | | | 375,640 | |
| | 794,444 | | | | | Infratil, Ltd. | | | 1,616,086 | |
| | | | | | |
| | See accompanying Notes to the Financial Statements. | | | 133 | |
Mercer Global Low Volatility Equity Fund
Schedule of Investments (Continued)
(showing percentage of net assets)
March 31, 2017
| | | | | | | | | | |
| Shares | | | | | Description | | Value ($) | |
| | | |
| | | | | | New Zealand — continued | | | | |
| | | |
| | 1,388,432 | | | | | Kiwi Property Group, Ltd. REIT | | | 1,383,081 | |
| | 68,440 | | | | | Mainfreight, Ltd. | | | 1,080,773 | |
| | 953,517 | | | | | Mercury NZ, Ltd. | | | 2,099,651 | |
| | 166,431 | | | | | Metlifecare, Ltd. | | | 713,186 | |
| | 290,401 | | | | | Precinct Properties New Zealand, Ltd. | | | 247,666 | |
| | 96,270 | | | | | Sky City Entertainment Group, Ltd. REIT | | | 279,285 | |
| | 268,778 | | | | | Summerset Group Holdings, Ltd. | | | 971,387 | |
| | 11,949 | | | | | Trustpower, Ltd. | | | 38,424 | |
| | 135,941 | | | | | Vector, Ltd. | | | 304,095 | |
| | 69,743 | | | | | Warehouse Group, Ltd. (The)‡ | | | 112,621 | |
| | 23,743 | | | | | Z Energy, Ltd. | | | 115,519 | |
| | | | | | | | | | |
| | | | | | Total New Zealand | | | 20,824,368 | |
| | | | | | | | | | |
| | | |
| | | | | | Norway — 1.7% | | | | |
| | | |
| | 19,417 | | | | | Aker ASA Class A | | | 750,555 | |
| | 20,824 | | | | | Atea ASA* | | | 244,877 | |
| | 317,581 | | | | | Austevoll Seafood ASA | | | 2,329,472 | |
| | 60,501 | | | | | Leroy Seafood Group ASA | | | 2,648,579 | |
| | 191,778 | | | | | Marine Harvest ASA* | | | 2,922,812 | |
| | 764,850 | | | | | Norsk Hydro ASA | | | 4,440,082 | |
| | 3,384 | | | | | Olav Thon Eiendomsselskap ASA | | | 63,433 | |
| | 343,961 | | | | | Orkla ASA | | | 3,079,626 | |
| | 29,440 | | | | | SpareBank 1 Nord Norge | | | 189,379 | |
| | 206,541 | | | | | Telenor ASA | | | 3,436,378 | |
| | 1,401 | | | | | Wilh Wilhelmsen Holding ASA Class A | | | 37,028 | |
| | 26,099 | | | | | Yara International ASA | | | 1,004,591 | |
| | | | | | | | | | |
| | | | | | Total Norway | | | 21,146,812 | |
| | | | | | | | | | |
| | | |
| | | | | | Panama — 0.2% | | | | |
| | | |
| | 40,300 | | | | | Carnival Corp. | | | 2,374,073 | |
| | | | | | | | | | |
| | | |
| | | | | | Portugal — 0.0% | | | | |
| | | |
| | 139,574 | | | | | REN - Redes Energeticas Nacionais SGPS SA | | | 421,123 | |
| | | | | | | | | | |
| | | |
| | | | | | Puerto Rico — 0.1% | | | | |
| | | |
| | 47,400 | | | | | Popular, Inc. | | | 1,930,602 | |
| | | | | | | | | | |
| | | |
| | | | | | Singapore — 0.6% | | | | |
| | | |
| | 158,100 | | | | | DBS Group Holdings, Ltd. | | | 2,195,048 | |
| | 210,000 | | | | | Fortune Real Estate Investment Trust REIT | | | 235,090 | |
| | 53,800 | | | | | Fraser and Neave, Ltd. | | | 88,942 | |
| | 15,200 | | | | | Hong Leong Finance, Ltd. | | | 29,371 | |
| | 52,700 | | | | | Metro Holdings, Ltd. | | | 44,504 | |
| | 830,800 | | | | | OUE, Ltd. | | | 1,272,391 | |
| | 310,600 | | | | | Sheng Siong Group, Ltd. | | | 210,060 | |
| | 31,400 | | | | | SIA Engineering Co., Ltd. | | | 82,921 | |
| | 39,200 | | | | | Singapore Airlines, Ltd. | | | 282,505 | |
| | 460,800 | | | | | SPH REIT | | | 323,183 | |
| | 741,900 | | | | | StarHub, Ltd.‡ | | | 1,529,143 | |
| | | | | | |
| 134 | | See accompanying Notes to the Financial Statements. | | | | |
Mercer Global Low Volatility Equity Fund
Schedule of Investments (Continued)
(showing percentage of net assets)
March 31, 2017
| | | | | | | | | | |
| Shares | | | | | Description | | Value ($) | |
| | | |
| | | | | | Singapore — continued | | | | |
| | | |
| | 159,300 | | | | | Venture Corp., Ltd. | | | 1,307,644 | |
| | 126,400 | | | | | Wilmar International, Ltd. | | | 319,325 | |
| | | | | | | | | | |
| | | | | | Total Singapore | | | 7,920,127 | |
| | | | | | | | | | |
| | | |
| | | | | | Spain — 0.4% | | | | |
| | | |
| | 140,725 | | | | | Ebro Foods SA | | | 2,852,209 | |
| | 112,952 | | | | | Endesa SA | | | 2,661,395 | |
| | | | | | | | | | |
| | | | | | Total Spain | | | 5,513,604 | |
| | | | | | | | | | |
| | | |
| | | | | | Sweden — 0.8% | | | | |
| | | |
| | 9,636 | | | | | Axfood AB‡ | | | 145,269 | |
| | 106,652 | | | | | Bonava AB Class B* | | | 1,564,846 | |
| | 102,048 | | | | | Cloetta AB Class B | | | 404,612 | |
| | 22,988 | | | | | Saab AB Class B‡ | | | 974,022 | |
| | 102,697 | | | | | Svenska Cellulosa AB SCA Class B | | | 3,324,197 | |
| | 101,007 | | | | | Swedish Match AB | | | 3,297,777 | |
| | | | | | | | | | |
| | | | | | Total Sweden | | | 9,710,723 | |
| | | | | | | | | | |
| | | |
| | | | | | Switzerland — 4.2% | | | | |
| | | |
| | 14,845 | | | | | Allreal Holding AG* | | | 2,426,337 | |
| | 720 | | | | | Alpiq Holding AG* | | | 63,408 | |
| | 7,839 | | | | | ALSO Holding AG* | | | 964,065 | |
| | 106 | | | | | APG SGA SA | | | 49,481 | |
| | 1,752 | | | | | Banque Cantonale de Geneve | | | 273,928 | |
| | 190 | | | | | Barry Callebaut AG* | | | 248,474 | |
| | 1,090 | | | | | Bell AG | | | 453,010 | |
| | 170 | | | | | Berner Kantonalbank AG | | | 31,318 | |
| | 18,242 | | | | | BKW AG | | | 986,867 | |
| | 1,100 | | | | | Chubb, Ltd. | | | 149,875 | |
| | 4,328 | | | | | Coca-Cola HBC AG* | | | 111,540 | |
| | 60,365 | | | | | Credit Suisse Group AG* | | | 898,585 | |
| | 4,904 | | | | | Flughafen Zuerich AG | | | 1,046,010 | |
| | 845 | | | | | Galenica AG | | | 891,473 | |
| | 2,259 | | | | | Intershop Holding AG | | | 1,123,914 | |
| | 14,530 | | | | | Kuehne + Nagel International AG | | | 2,054,044 | |
| | 244 | | | | | Luzerner Kantonalbank AG | | | 103,358 | |
| | 27 | | | | | Metall Zug AG Class B | | | 107,924 | |
| | 2,486 | | | | | Mobimo Holding AG* | | | 643,884 | |
| | 268,596 | | | | | Nestle SA | | | 20,622,012 | |
| | 189,029 | | | | | Novartis AG | | | 14,040,967 | |
| | 44 | | | | | Romande Energie Holding SA | | | 55,168 | |
| | 1,098 | | | | | St Galler Kantonalbank AG | | | 460,448 | |
| | 4,036 | | | | | Swiss Life Holding AG* | | | 1,303,197 | |
| | 11,996 | | | | | Swiss Prime Site AG* | | | 1,056,444 | |
| | 331 | | | | | Swisscom AG | | | 152,810 | |
| | 3,589 | | | | | Valora Holding AG | | | 1,241,512 | |
| | 2,755 | | | | | Ypsomed Holding AG* | | | 524,329 | |
| | 32 | | | | | Zug Estates Holding AG Class B* | | | 54,796 | |
| | | | | | | | | | |
| | | | | | Total Switzerland | | | 52,139,178 | |
| | | | | | | | | | |
| | | | | | |
| | See accompanying Notes to the Financial Statements. | | | 135 | |
Mercer Global Low Volatility Equity Fund
Schedule of Investments (Continued)
(showing percentage of net assets)
March 31, 2017
| | | | | | | | | | |
| Shares | | | | | Description | | Value ($) | |
| | | |
| | | | | | United Kingdom — 7.0% | | | | |
| | | |
| | 20,200 | | | | | Aon Plc | | | 2,397,538 | |
| | 58,307 | | | | | AstraZeneca Plc | | | 3,581,704 | |
| | 135,219 | | | | | Atrium European Real Estate, Ltd. | | | 548,557 | |
| | 82,943 | | | | | BAE Systems Plc | | | 666,376 | |
| | 372,056 | | | | | BCA Marketplace Plc | | | 846,732 | |
| | 92,348 | | | | | Berendsen Plc | | | 846,443 | |
| | 50,245 | | | | | British American Tobacco Plc | | | 3,329,930 | |
| | 230,829 | | | | | Britvic Plc | | | 1,868,945 | |
| | 67,568 | | | | | BTG Plc* | | | 495,536 | |
| | 1,502 | | | | | Carnival Plc | | | 85,983 | |
| | 448,311 | | | | | Centrica Plc | | | 1,216,481 | |
| | 69,691 | | | | | Compass Group Plc | | | 1,312,406 | |
| | 4,163 | | | | | Cranswick Plc | | | 133,212 | |
| | 7,565 | | | | | Dechra Pharmaceuticals Plc | | | 158,355 | |
| | 123,830 | | | | | Diageo Plc | | | 3,535,845 | |
| | 20,842 | | | | | EI Group Plc* | | | 35,379 | |
| | 29,881 | | | | | EMIS Group Plc | | | 331,612 | |
| | 6,588 | | | | | Gamma Communications Plc | | | 40,448 | |
| | 171,031 | | | | | GlaxoSmithKline Plc | | | 3,549,102 | |
| | 15,264 | | | | | Headlam Group Plc | | | 119,102 | |
| | 24,417 | | | | | Hill & Smith Holdings Plc | | | 388,370 | |
| | 66,623 | | | | | Imperial Brands Plc | | | 3,221,549 | |
| | 152,166 | | | | | International Game Technology Plc | | | 3,606,334 | |
| | 404,739 | | | | | J Sainsbury Plc | | | 1,337,638 | |
| | 237,580 | | | | | JD Sports Fashion Plc | | | 1,144,657 | |
| | 26,331 | | | | | John Menzies Plc | | | 223,236 | |
| | 37,437 | | | | | Kcom Group Plc | | | 42,132 | |
| | 144,494 | | | | | Kennedy Wilson Europe Real Estate Plc | | | 1,706,547 | |
| | 773,315 | | | | | Kingfisher Plc | | | 3,153,360 | |
| | 15,084,581 | | | | | Lloyds Banking Group Plc | | | 12,509,621 | |
| | 252,640 | | | | | Melrose Industries Plc | | | 704,488 | |
| | 3,101 | | | | | National Grid Plc | | | 39,300 | |
| | 18,738 | | | | | QinetiQ Group Plc | | | 65,372 | |
| | 37,130 | | | | | Reckitt Benckiser Group Plc | | | 3,382,833 | |
| | 88,946 | | | | | RELX Plc | | | 1,739,521 | |
| | 1,087,037 | | | | | Rentokil Initial Plc | | | 3,353,358 | |
| | 784,838 | | | | | Royal Bank of Scotland Group Plc* | | | 2,375,971 | |
| | 11,227 | | | | | Secure Income Plc REIT | | | 48,574 | |
| | 171,079 | | | | | Smith & Nephew Plc | | | 2,601,337 | |
| | 156,184 | | | | | SSE Plc | | | 2,882,633 | |
| | 68,745 | | | | | Tate & Lyle Plc | | | 657,181 | |
| | 12,010 | | | | | TBC Bank Group Plc* | | | 224,818 | |
| | 5,237,554 | | | | | Tesco Plc* | | | 12,155,501 | |
| | 658,218 | | | | | Tritax Big Box Plc REIT | | | 1,190,157 | |
| | 12,470 | | | | | Ultra Electronics Holdings Plc | | | 323,089 | |
| | 1,142,674 | | | | | Vodafone Group Plc | | | 2,973,451 | |
| | | | | | | | | | |
| | | | | | Total United Kingdom | | | 87,150,714 | |
| | | | | | | | | | |
| | | | | | |
| 136 | | See accompanying Notes to the Financial Statements. | | | | |
Mercer Global Low Volatility Equity Fund
Schedule of Investments (Continued)
(showing percentage of net assets)
March 31, 2017
| | | | | | | | | | |
| Shares | | | | | Description | | Value ($) | |
| | | |
| | | | | | United States — 52.9% | | | | |
| | | |
| | 19,200 | | | | | 3M Co. | | | 3,673,536 | |
| | 23,200 | | | | | Adobe Systems, Inc.* | | | 3,019,016 | |
| | 4,600 | | | | | Alexandria Real Estate Equities, Inc. REIT‡ | | | 508,392 | |
| | 2,600 | | | | | Alleghany Corp.* | | | 1,598,116 | |
| | 30,200 | | | | | Allstate Corp. (The) | | | 2,460,998 | |
| | 9,413 | | | | | Alphabet, Inc. Class A* | | | 7,980,341 | |
| | 26,977 | | | | | Alphabet, Inc. Class C* | | | 22,379,040 | |
| | 67,900 | | | | | Altria Group, Inc. | | | 4,849,418 | |
| | 2,500 | | | | | Amazon.com, Inc.* | | | 2,216,350 | |
| | 35,400 | | | | | Amdocs, Ltd. | | | 2,159,046 | |
| | 31,700 | | | | | Ameren Corp. | | | 1,730,503 | |
| | 32,200 | | | | | American Campus Communities, Inc. REIT | | | 1,532,398 | |
| | 33,700 | | | | | American Electric Power Co., Inc. | | | 2,262,281 | |
| | 4,900 | | | | | American Express Co. | | | 387,639 | |
| | 21,800 | | | | | American Financial Group, Inc. | | | 2,080,156 | |
| | 190,700 | | | | | Annaly Capital Management, Inc. REIT | | | 2,118,677 | |
| | 15,300 | | | | | ANSYS, Inc.* | | | 1,635,111 | |
| | 54,000 | | | | | Apple Hospitality, Inc. REIT | | | 1,031,400 | |
| | 256,033 | | | | | Apple, Inc. | | | 36,781,701 | |
| | 30,100 | | | | | Applied Materials, Inc. | | | 1,170,890 | |
| | 58,000 | | | | | Aramark | | | 2,138,460 | |
| | 4,500 | | | | | Archer-Daniels-Midland Co. | | | 207,180 | |
| | 37,800 | | | | | Arthur J. Gallagher & Co. | | | 2,137,212 | |
| | 104,000 | | | | | AT&T, Inc. | | | 4,321,200 | |
| | 17,200 | | | | | Atmos Energy Corp. | | | 1,358,628 | |
| | 1,900 | | | | | AutoZone, Inc.* | | | 1,373,795 | |
| | 19,100 | | | | | Bank of Hawaii Corp. | | | 1,573,076 | |
| | 14,600 | | | | | Bank of New York Mellon Corp. (The) | | | 689,558 | |
| | 27,900 | | | | | Baxter International, Inc. | | | 1,446,894 | |
| | 14,000 | | | | | Becton Dickinson and Co. | | | 2,568,160 | |
| | 9,800 | | | | | Berkshire Hathaway, Inc. Class B* | | | 1,633,464 | |
| | 19,100 | | | | | Boeing Co. (The) | | | 3,378,026 | |
| | 26,900 | | | | | Brinker International, Inc.‡ | | | 1,182,524 | |
| | 41,900 | | | | | Brown & Brown, Inc. | | | 1,748,068 | |
| | 58,600 | | | | | CA, Inc. | | | 1,858,792 | |
| | 2,300 | | | | | Cable One, Inc.‡ | | | 1,436,281 | |
| | 14,200 | | | | | Cabot Corp. | | | 850,722 | |
| | 20,600 | | | | | Cadence Design Systems, Inc.* | | | 646,840 | |
| | 26,100 | | | | | Campbell Soup Co. | | | 1,493,964 | |
| | 31,300 | | | | | Cardinal Health, Inc. | | | 2,552,515 | |
| | 18,300 | | | | | Carlisle Cos., Inc. | | | 1,947,303 | |
| | 34,400 | | | | | CDK Global, Inc. | | | 2,236,344 | |
| | 75,600 | | | | | CenterPoint Energy, Inc. | | | 2,084,292 | |
| | 19,400 | | | | | CH Robinson Worldwide, Inc. | | | 1,499,426 | |
| | 66,700 | | | | | Chimera Investment Corp. REIT | | | 1,346,006 | |
| | 35,000 | | | | | Cinemark Holdings, Inc. | | | 1,551,900 | |
| | 200 | | | | | Clean Harbors, Inc.* | | | 11,124 | |
| | 17,100 | | | | | Clorox Co. (The) | | | 2,305,593 | |
| | 12,800 | | | | | CMS Energy Corp. | | | 572,672 | |
| | | | | | |
| | See accompanying Notes to the Financial Statements. | | | 137 | |
Mercer Global Low Volatility Equity Fund
Schedule of Investments (Continued)
(showing percentage of net assets)
March 31, 2017
| | | | | | | | | | |
| Shares | | | | | Description | | Value ($) | |
| | | |
| | | | | | United States — continued | | | | |
| | | |
| | 40,000 | | | | | Columbia Property Trust, Inc. REIT | | | 890,000 | |
| | 110,200 | | | | | Comcast Corp. Class A | | | 4,142,418 | |
| | 31,513 | | | | | Commerce Bancshares, Inc.‡ | | | 1,769,770 | |
| | 56,700 | | | | | Conagra Brands, Inc. | | | 2,287,278 | |
| | 23,800 | | | | | Consolidated Edison, Inc. | | | 1,848,308 | |
| | 6,500 | | | | | Constellation Brands, Inc. Class A | | | 1,053,455 | |
| | 10,700 | | | | | Cooper Cos., Inc. (The) | | | 2,138,823 | |
| | 34,600 | | | | | Copart, Inc.* | | | 2,142,778 | |
| | 32,600 | | | | | Corporate Office Properties Trust REIT | | | 1,079,060 | |
| | 78,682 | | | | | Costco Wholesale Corp. | | | 13,194,184 | |
| | 9,300 | | | | | CR Bard, Inc. | | | 2,311,422 | |
| | 6,800 | | | | | Crane Co. | | | 508,844 | |
| | 212,114 | | | | | CVS Health Corp. | | | 16,650,949 | |
| | 24,200 | | | | | Danaher Corp. | | | 2,069,826 | |
| | 32,000 | | | | | Darden Restaurants, Inc. | | | 2,677,440 | |
| | 700 | | | | | Domino’s Pizza, Inc. | | | 129,010 | |
| | 22,300 | | | | | Dr Pepper Snapple Group, Inc. | | | 2,183,616 | |
| | 21,600 | | | | | DTE Energy Co. | | | 2,205,576 | |
| | 22,400 | | | | | East-West Bancorp, Inc. | | | 1,156,064 | |
| | 584,573 | | | | | eBay, Inc.* | | | 19,624,116 | |
| | 28,100 | | | | | Edison International | | | 2,237,041 | |
| | 15,200 | | | | | Eli Lilly & Co. | | | 1,278,472 | |
| | 4,400 | | | | | Entergy Corp. | | | 334,224 | |
| | 3,600 | | | | | EPR Properties REIT | | | 265,068 | |
| | 17,100 | | | | | Equity LifeStyle Properties, Inc. REIT | | | 1,317,726 | |
| | 4,100 | | | | | Erie Indemnity Co. Class A | | | 503,070 | |
| | 5,400 | | | | | Essex Property Trust, Inc. REIT | | | 1,250,262 | |
| | 48,700 | | | | | Exelon Corp. | | | 1,752,226 | |
| | 1,200 | | | | | Express Scripts Holding Co.* | | | 79,092 | |
| | 4,100 | | | | | F5 Networks, Inc.* | | | 584,537 | |
| | 140,373 | | | | | Facebook, Inc. Class A* | | | 19,939,985 | |
| | 12,400 | | | | | FedEx Corp. | | | 2,419,860 | |
| | 59,800 | | | | | FirstEnergy Corp. | | | 1,902,836 | |
| | 5,800 | | | | | Fiserv, Inc.* | | | 668,798 | |
| | 13,300 | | | | | General Dynamics Corp. | | | 2,489,760 | |
| | 29,300 | | | | | General Mills, Inc. | | | 1,728,993 | |
| | 14,400 | | | | | Hanover Insurance Group, Inc. (The) | | | 1,296,864 | |
| | 13,300 | | | | | Hawaiian Electric Industries, Inc. | | | 443,023 | |
| | 155,817 | | | | | HCA Holdings, Inc.* | | | 13,866,155 | |
| | 14,200 | | | | | Hershey Co. (The) | | | 1,551,350 | |
| | 8,200 | | | | | Highwoods Properties, Inc. REIT | | | 402,866 | |
| | 10,100 | | | | | Hill-Rom Holdings, Inc. | | | 713,060 | |
| | 8,200 | | | | | Hologic, Inc.* | | | 348,910 | |
| | 23,900 | | | | | Home Depot, Inc. (The) | | | 3,509,237 | |
| | 26,300 | | | | | Honeywell International, Inc. | | | 3,284,081 | |
| | 46,100 | | | | | Hospitality Properties Trust REIT | | | 1,453,533 | |
| | 11,900 | | | | | Huntington Ingalls Industries, Inc. | | | 2,382,856 | |
| | 4,100 | | | | | IAC/InterActiveCorp* | | | 302,252 | |
| | 15,900 | | | | | Ingredion, Inc. | | | 1,914,837 | |
| | | | | | |
| 138 | | See accompanying Notes to the Financial Statements. | | | | |
Mercer Global Low Volatility Equity Fund
Schedule of Investments (Continued)
(showing percentage of net assets)
March 31, 2017
| | | | | | | | | | |
| Shares | | | | | Description | | Value ($) | |
| | | |
| | | | | | United States — continued | | | | |
| | | |
| | 97,800 | | | | | Intel Corp. | | | 3,527,646 | |
| | 2,100 | | | | | IntercontinentalExchange Group, Inc. | | | 125,727 | |
| | 26,900 | | | | | International Business Machines Corp. | | | 4,684,366 | |
| | 21,500 | | | | | Intuit, Inc. | | | 2,493,785 | |
| | 6,200 | | | | | J.B. Hunt Transport Services, Inc. | | | 568,788 | |
| | 10,400 | | | | | Jack Henry & Associates, Inc. | | | 968,240 | |
| | 15,300 | | | | | JM Smucker Co. (The) | | | 2,005,524 | |
| | 41,200 | | | | | Johnson & Johnson | | | 5,131,460 | |
| | 22,500 | | | | | Kellogg Co. | | | 1,633,725 | |
| | 2,000 | | | | | Kimberly-Clark Corp. | | | 263,260 | |
| | 5,900 | | | | | Kla-Tencor Corp. | | | 560,913 | |
| | 16,200 | | | | | Landstar System, Inc. | | | 1,387,530 | |
| | 8,700 | | | | | Liberty Property Trust REIT | | | 335,385 | |
| | 11,100 | | | | | Lockheed Martin Corp. | | | 2,970,360 | |
| | 324,722 | | | | | Lowe’s Cos., Inc. | | | 26,695,396 | |
| | 11,200 | | | | | M&T Bank Corp. | | | 1,732,976 | |
| | 22,700 | | | | | Macquarie Infrastructure Corp. | | | 1,829,166 | |
| | 6,600 | | | | | ManpowerGroup, Inc. | | | 676,962 | |
| | 153,634 | | | | | Mastercard, Inc. Class A | | | 17,279,216 | |
| | 42,100 | | | | | Maxim Integrated Products, Inc. | | | 1,892,816 | |
| | 3,300 | | | | | McCormick & Co., Inc. | | | 321,915 | |
| | 156,823 | | | | | McDonald’s Corp. | | | 20,325,829 | |
| | 61,700 | | | | | Merck & Co., Inc. | | | 3,920,418 | |
| | 90,100 | | | | | MFA Financial, Inc. REIT | | | 728,008 | |
| | 405,337 | | | | | Microsoft Corp. | | | 26,695,495 | |
| | 263 | | | | | Mid-America Apartment Communities, Inc. REIT | | | 26,758 | |
| | 7,200 | | | | | Morningstar, Inc. | | | 565,920 | |
| | 27,000 | | | | | Motorola Solutions, Inc. | | | 2,327,940 | |
| | 2,400 | | | | | NewMarket Corp. | | | 1,087,752 | |
| | 6,500 | | | | | Newmont Mining Corp. | | | 214,240 | |
| | 18,200 | | | | | NextEra Energy, Inc. | | | 2,336,334 | |
| | 13,400 | | | | | Northern Trust Corp. | | | 1,160,172 | |
| | 9,600 | | | | | Northrop Grumman Corp. | | | 2,283,264 | |
| | 200 | | | | | NVR, Inc.* | | | 421,376 | |
| | 23,700 | | | | | Omnicom Group, Inc. | | | 2,043,177 | |
| | 478,174 | | | | | Oracle Corp. | | | 21,331,342 | |
| | 34,000 | | | | | PacWest Bancorp | | | 1,810,840 | |
| | 8,400 | | | | | Panera Bread Co. Class A* ‡ | | | 2,199,708 | |
| | 366,378 | | | | | PayPal Holdings, Inc.* | | | 15,761,581 | |
| | 33,000 | | | | | PepsiCo, Inc. | | | 3,691,380 | |
| | 78,400 | | | | | Pfizer, Inc. | | | 2,682,064 | |
| | 36,100 | | | | | PG&E Corp. | | | 2,395,596 | |
| | 47,200 | | | | | Philip Morris International, Inc. | | | 5,328,880 | |
| | 52,000 | | | | | Piedmont Office Realty Trust, Inc. REIT Class A | | | 1,111,760 | |
| | 29,800 | | | | | Pinnacle Foods, Inc. | | | 1,724,526 | |
| | 4,000 | | | | | Pinnacle West Capital Corp. | | | 333,520 | |
| | 14,200 | | | | | Pool Corp. | | | 1,694,486 | |
| | 200 | | | | | Priceline Group, Inc. (The)* | | | 355,994 | |
| | 41,800 | | | | | Procter & Gamble Co. (The) | | | 3,755,730 | |
| | | | | | |
| | See accompanying Notes to the Financial Statements. | | | 139 | |
Mercer Global Low Volatility Equity Fund
Schedule of Investments (Continued)
(showing percentage of net assets)
March 31, 2017
| | | | | | | | | | |
| Shares | | | | | Description | | Value ($) | |
| | | |
| | | | | | United States — continued | | | | |
| | | |
| | 37,300 | | | | | Progressive Corp. (The) | | | 1,461,414 | |
| | 24,500 | | | | | Public Service Enterprise Group, Inc. | | | 1,086,575 | |
| | 117,232 | | | | | QUALCOMM, Inc. | | | 6,722,083 | |
| | 17,600 | | | | | Raytheon Co. | | | 2,684,000 | |
| | 33,000 | | | | | Regal Entertainment Group Class A‡ | | | 745,140 | |
| | 16,300 | | | | | Reinsurance Group of America, Inc. | | | 2,069,774 | |
| | 39,300 | | | | | Republic Services, Inc. | | | 2,468,433 | |
| | 25,900 | | | | | Retail Properties of America, Inc. REIT Class A | | | 373,478 | |
| | 17,400 | | | | | RPM International, Inc. | | | 957,522 | |
| | 68,900 | | | | | Senior Housing Properties Trust REIT | | | 1,395,225 | |
| | 1,600 | | | | | Six Flags Entertainment Corp. | | | 95,184 | |
| | 3,400 | | | | | Spectrum Brands Holdings, Inc. | | | 472,634 | |
| | 1,900 | | | | | Spirit AeroSystems Holdings, Inc. Class A | | | 110,048 | |
| | 341,323 | | | | | Starbucks Corp. | | | 19,929,850 | |
| | 59,200 | | | | | Starwood Property Trust, Inc. REIT ‡ | | | 1,336,736 | |
| | 20,100 | | | | | Stryker Corp.‡ | | | 2,646,165 | |
| | 15,700 | | | | | Sun Communities, Inc. REIT | | | 1,261,181 | |
| | 44,300 | | | | | SunTrust Banks, Inc. | | | 2,449,790 | |
| | 35,500 | | | | | Synopsys, Inc.* | | | 2,560,615 | |
| | 52,000 | | | | | Synovus Financial Corp. | | | 2,133,040 | |
| | 46,800 | | | | | Sysco Corp. | | | 2,429,856 | |
| | 71,700 | | | | | TCF Financial Corp. | | | 1,220,334 | |
| | 6,100 | | | | | Teleflex, Inc. | | | 1,181,753 | |
| | 39,000 | | | | | Texas Instruments, Inc. | | | 3,141,840 | |
| | 18,400 | | | | | TFS Financial Corp. | | | 305,808 | |
| | 14,500 | | | | | Thermo Fisher Scientific, Inc. | | | 2,227,200 | |
| | 6,300 | | | | | Torchmark Corp. | | | 485,352 | |
| | 9,700 | | | | | Travelers Cos., Inc. (The) | | | 1,169,238 | |
| | 8,200 | | | | | Tupperware Brands Corp. | | | 514,304 | |
| | 30,900 | | | | | Tyson Foods, Inc. Class A | | | 1,906,839 | |
| | 32,300 | | | | | UGI Corp. | | | 1,595,620 | |
| | 24,400 | | | | | United Parcel Service, Inc. Class B | | | 2,618,120 | |
| | 21,800 | | | | | UnitedHealth Group, Inc. | | | 3,575,418 | |
| | 50,100 | | | | | US Bancorp | | | 2,580,150 | |
| | 30,500 | | | | | Vectren Corp. | | | 1,787,605 | |
| | 20,000 | | | | | Ventas, Inc. REIT | | | 1,300,800 | |
| | 71,900 | | | | | Verizon Communications, Inc. | | | 3,505,125 | |
| | 274,203 | | | | | Visa, Inc. Class A‡ | | | 24,368,421 | |
| | 48,000 | | | | | Wal-Mart Stores, Inc. | | | 3,459,840 | |
| | 34,000 | | | | | Waste Management, Inc. | | | 2,479,280 | |
| | 373,125 | | | | | Wells Fargo & Co. | | | 20,768,137 | |
| | 23,400 | | | | | WP Carey, Inc. REIT‡ | | | 1,455,948 | |
| | 3,300 | | | | | Xcel Energy, Inc. | | | 146,685 | |
| | 17,500 | | | | | Yum China Holdings, Inc. * | | | 476,000 | |
| | 267,519 | | | | | Yum! Brands, Inc. | | | 17,094,464 | |
| | 7,700 | | | | | Zimmer Biomet Holdings, Inc. | | | 940,247 | |
| | | | | | | | | | |
| | | | | | Total United States | | | 661,101,456 | |
| | | | | | | | | | |
| | | |
| | | | | | TOTAL COMMON STOCKS (COST $977,983,443) | | | 1,098,970,080 | |
| | | | | | | | | | |
| | | | | | |
| 140 | | See accompanying Notes to the Financial Statements. | | | | |
Mercer Global Low Volatility Equity Fund
Schedule of Investments (Continued)
(showing percentage of net assets)
March 31, 2017
| | | | | | | | | | |
| Shares | | | | | Description | | Value ($) | |
| | | |
| | | | | | PREFERRED STOCKS — 0.3% | | | | |
| | | |
| | | | | | Germany — 0.3% | | | | |
| | | |
| | 26,000 | | | | | Henkel AG & Co. KGaA, 1.35% | | | 3,339,776 | |
| | | | | | | | | | |
| | | |
| | | | | | Japan — 0.0% | | | | |
| | | |
| | 128 | | | | | Shinkin Central Bank, 2.81% Class A | | | 269,486 | |
| | | | | | | | | | |
| | | |
| | | | | | Sweden — 0.0% | | | | |
| | | |
| | 3,915 | | | | | Akelius Residential Property AB, 6.42% | | | 135,494 | |
| | | | | | | | | | |
| | | |
| | | | | | TOTAL PREFERRED STOCKS (COST $3,192,475) | | | 3,744,756 | |
| | | | | | | | | | |
| | | |
| Par Value ($) | | | | | Description | | Value ($) | |
| | | |
| | | | | | SHORT-TERM INVESTMENTS — 14.8% | | | | |
| | | |
| | | | | | Bank Deposit — 13.4% | | | | |
| | | |
| | 167,115,205 | | | | | State Street Bank & Trust Euro Time Deposit, 0.09%, due 04/03/17 | | | 167,115,205 | |
| | | | | | | | | | |
| | | |
| | | | | | Mutual Fund - Securities Lending Collateral — 1.3% | | | | |
| | | |
| | 15,618,084 | | | | | State Street Institutional U.S. Government Money Market Fund, Premier Class** | | | 15,618,084 | |
| | | | | | | | | | |
| | | |
| | | | | | U.S. Government and Agency Obligations — 0.1% | | | | |
| | | |
| | 1,600,000 | | | | | United States Treasury Bill, 0.65%, due 04/27/17*** ‡‡ | | | 1,599,227 | |
| | | | | | | | | | |
| | | |
| | | | | | TOTAL SHORT-TERM INVESTMENTS (COST $184,332,781) | | | 184,332,516 | |
| | | | | | | | | | |
| | | |
| | | | | | TOTAL INVESTMENTS — 103.0% (Cost $1,165,508,699) | | | 1,287,047,352 | |
| | | |
| | | | | | Other Assets and Liabilities (net) — (3.0)% | | | (37,187,575 | ) |
| | | | | | | | | | |
| | | |
| | | | | | NET ASSETS — 100.0% | | | $1,249,859,777 | |
| | | | | | | | | | |
| | | |
| | | | | | Notes to Schedule of Investments: | | | | |
| | | |
| | | | | | ADR — American Depository Receipt | | | | |
| | | |
| | | | | | REIT — Real Estate Investment Trust | | | | |
| | | |
| | | | * | | Non-income producing security | | | | |
| | | |
| | | | ** | | Represents an investment of securities lending cash collateral. | | | | |
| | | |
| | | | *** | | All or a portion of this security is held for open futures collateral. | | | | |
| | | |
| | | | ‡ | | All or a portion of this security is out on loan. | | | | |
| | | |
| | | | ‡‡ | | Interest rate presented is yield to maturity. | | | | |
| | | | | | |
| | See accompanying Notes to the Financial Statements. | | | 141 | |
Mercer Global Low Volatility Equity Fund
Schedule of Investments (Continued)
March 31, 2017
Futures Contracts
| | | | | | | | | | | | | | | | | | | | |
Number of
Contracts | | | | | Type | | | | Expiration Date | | | Contract
Value | | | Unrealized
Appreciation
(Depreciation) | |
| | Buys | | | | | | | | | | | | | | | | | | | |
| | 25 | | | | | Canadian Dollar | | | | | June 2017 | | | $ | 1,883,250 | | | $ | 17,934 | |
| | 213 | | | | | MSCI EAFE E-mini Index | | | | | June 2017 | | | | 18,978,300 | | | | 278,792 | |
| | 275 | | | | | S&P 500 E-mini Index | | | | | June 2017 | | | | 32,439,000 | | | | (15,804 | ) |
| | 14 | | | | | S&P/TSX 60 Index | | | | | June 2017 | | | | 1,914,955 | | | | (7,524 | ) |
| | | | | | | | | | | | | | | | | | | | |
| | | | | | | | | | | | | | | | | | $ | 273,398 | |
| | | | | | | | | | | | | | | | | | | | |
| | | | | | |
| 142 | | See accompanying Notes to the Financial Statements. | | | | |
Mercer Global Low Volatility Equity Fund
Schedule of Investments (Continued)
March 31, 2017
| | | | | |
| Industry Sector Summary (Unaudited) | | % of Net Assets |
Retail | | | | 11.9 | |
Food | | | | 7.1 | |
Pharmaceuticals | | | | 7.0 | |
Banks | | | | 6.8 | |
Internet | | | | 5.9 | |
Software | | | | 4.9 | |
Computers | | | | 4.2 | |
Electric | | | | 4.2 | |
Commercial Services | | | | 3.9 | |
Telecommunications | | | | 2.9 | |
Insurance | | | | 2.8 | |
Agriculture | | | | 2.2 | |
Health Care — Products | | | | 2.2 | |
Diversified Financial Services | | | | 2.1 | |
REITS | | | | 2.1 | |
Health Care — Services | | | | 1.8 | |
Beverages | | | | 1.6 | |
Real Estate | | | | 1.6 | |
Aerospace & Defense | | | | 1.3 | |
Transportation | | | | 1.3 | |
Media | | | | 0.9 | |
Semiconductors | | | | 0.9 | |
Household Products & Wares | | | | 0.8 | |
Miscellaneous — Manufacturing | | | | 0.8 | |
Iron & Steel | | | | 0.7 | |
Electronics | | | | 0.6 | |
Gas | | | | 0.6 | |
Chemicals | | | | 0.5 | |
Engineering & Construction | | | | 0.5 | |
Entertainment | | | | 0.5 | |
Environmental Control | | | | 0.4 | |
Metal Fabricate & Hardware | | | | 0.4 | |
Cosmetics & Personal Care | | | | 0.3 | |
Forest Products & Paper | | | | 0.3 | |
Machinery — Diversified | | | | 0.3 | |
Mining | | | | 0.3 | |
Advertising | | | | 0.2 | |
Distribution & Wholesale | | | | 0.2 | |
Investment Companies | | | | 0.2 | |
Leisure Time | | | | 0.2 | |
Oil & Gas | | | | 0.2 | |
Shipbuilding | | | | 0.2 | |
Biotechnology | | | | 0.1 | |
Food Service | | | | 0.1 | |
Holding Companies — Diversified | | | | 0.1 | |
Packaging & Containers | | | | 0.1 | |
Airlines | | | | 0.0 | |
Energy-Alternate Sources | | | | 0.0 | |
Home Builders | | | | 0.0 | |
Housewares | | | | 0.0 | |
Lodging | | | | 0.0 | |
Savings & Loans | | | | 0.0 | |
Short-Term Investments and Other Assets and Liabilities (net) | | | | 11.8 | |
| | | | | |
| | | | 100.0 | % |
| | | | | |
| | | | | | |
| | See accompanying Notes to the Financial Statements. | | | 143 | |
Mercer Funds
Statements of Assets and Liabilities
March 31, 2017
| | | | | | | | | | | | | | | | | | | | |
| | | Mercer US Large
Cap Equity Fund
(formerly known as
Mercer US Large Cap
Growth Equity Fund) | | Mercer US Small/Mid
Cap Equity Fund
(formerly known as
Mercer US Small/Mid Cap
Growth Equity Fund) | | Mercer Non-US
Core Equity Fund | | Mercer Core Fixed
Income Fund |
Assets | | | | | | | | | | | | | | | | | | | | |
Investments, at value(a) | | | $ | 612,594,327 | | | | $ | 1,010,984,523 | | | | $ | 2,341,946,299 | | | | $ | 789,285,698 | |
Foreign currency, at value(b) | | | | — | | | | | — | | | | | 5,403,648 | | | | | — | |
Cash | | | | — | | | | | 41,286 | | | | | 140,608 | | | | | — | |
Receivable for investments sold | | | | 3,614,571 | | | | | 7,553,113 | | | | | 8,101,435 | | | | | 1,026,060 | |
Receivable for TBA securities sold | | | | — | | | | | — | | | | | — | | | | | 5,841,005 | |
Dividend and interest receivable | | | | 702,666 | | | | | 861,452 | | | | | 8,300,191 | | | | | 5,079,035 | |
Cash collateral held at broker on open centrally cleared swap contracts | | | | — | | | | | — | | | | | — | | | | | 860,000 | |
Cash collateral held at broker on open futures contracts | | | | — | | | | | 850,000 | | | | | 150,000 | | | | | — | |
Unrealized appreciation on open forward foreign currency contracts | | | | — | | | | | — | | | | | 75,440 | | | | | — | |
Receivable for variation margin on open futures contracts | | | | — | | | | | 32,465 | | | | | — | | | | | 74,605 | |
Foreign tax reclaims receivable | | | | 162,191 | | | | | 49,197 | | | | | 2,510,011 | | | | | 713 | |
Securities lending income receivable | | | | 12,078 | | | | | 24,150 | | | | | 75,071 | | | | | 7,266 | |
Prepaid expenses | | | | 3,170 | | | | | 5,057 | | | | | 10,937 | | | | | 4,437 | |
| | | | | | | | | | | | | | | | | | | | |
Total assets | | | | 617,089,003 | | | | | 1,020,401,243 | | | | | 2,366,713,640 | | | | | 802,178,819 | |
| | | | | | | | | | | | | | | | | | | | |
| | | | |
Liabilities | | | | | | | | | | | | | | | | | | | | |
Payable for investments purchased | | | | 3,015,208 | | | | | 6,273,430 | | | | | 11,011,577 | | | | | 6,183,215 | |
Payable for TBA and when-issued securities purchased | | | | — | | | | | — | | | | | — | | | | | 17,564,798 | |
Payable for Fund shares repurchased | | | | 1,933,619 | | | | | 5,000,000 | | | | | 351,632 | | | | | — | |
Due to custodian | | | | — | | | | | — | | | | | — | | | | | 718,151 | |
Written options, at value(c) | | | | — | | | | | — | | | | | — | | | | | 12,500 | |
Payable for variation margin on open centrally cleared swap contracts | | | | — | | | | | — | | | | | — | | | | | 96,920 | |
Cash collateral on open centrally cleared swap contracts due to broker | | | | — | | | | | — | | | | | — | | | | | 480,000 | |
Unrealized depreciation on open forward foreign currency contracts | | | | — | | | | | — | | | | | 57,033 | | | | | — | |
Variation margin payable on open futures contracts | | | | 12,649 | | | | | — | | | | | 237,108 | | | | | — | |
Obligation to return securities lending collateral | | | | 10,620,680 | | | | | 35,627,563 | | | | | 81,928,175 | | | | | 10,554,630 | |
Payable to affiliate for: | | | | | | | | | | | | | | | | | | | | |
Advisory fees | | | | 272,522 | | | | | 741,653 | | | | | 1,343,062 | | | | | 227,033 | |
Trustees fees | | | | 546 | | | | | 857 | | | | | 1,784 | | | | | 774 | |
TBA Sale Commitments, at value(d) | | | | — | | | | | — | | | | | — | | | | | 511,484 | |
Interest payable on TBA securities | | | | — | | | | | — | | | | | — | | | | | 535 | |
Payable for foreign capital gains tax | | | | — | | | | | — | | | | | 21,671 | | | | | — | |
Accrued expenses | | | | 174,788 | | | | | 301,954 | | | | | 657,223 | | | | | 225,804 | |
| | | | | | | | | | | | | | | | | | | | |
Total liabilities | | | | 16,030,012 | | | | | 47,945,457 | | | | | 95,609,265 | | | | | 36,575,844 | |
| | | | | | | | | | | | | | | | | | | | |
Net assets | | | $ | 601,058,991 | | | | $ | 972,455,786 | | | | $ | 2,271,104,375 | | | | $ | 765,602,975 | |
| | | | | | | | | | | | | | | | | | | | |
| | | | | | |
| 144 | | See accompanying Notes to the Financial Statements. | | | | |
Mercer Funds
Statements of Assets and Liabilities (Continued)
March 31, 2017
| | | | | | | | | | | | | | | | | | | | |
| | | Mercer US Large
Cap Equity Fund
(formerly known as
Mercer US Large Cap
Growth Equity Fund) | | Mercer US Small/Mid
Cap Equity Fund
(formerly known as
Mercer US Small/Mid Cap
Growth Equity Fund) | | Mercer Non-US
Core Equity Fund | | Mercer Core Fixed
Income Fund |
| | | | |
Net assets consist of: | | | | | | | | | | | | | | | | | | | | |
Paid-in capital | | | $ | 511,422,539 | | | | $ | 791,847,931 | | | | $ | 2,105,510,214 | | | | $ | 773,617,140 | |
Accumulated undistributed (distributions in excess of) net investment income | | | | 1,596,941 | | | | | (884 | ) | | | | (1,107,717 | ) | | | | 3,400,638 | |
Accumulated net realized gain (loss) | | | | 11,263,872 | | | | | 38,682,845 | | | | | (13,771,672 | ) | | | | (6,899,806 | ) |
Net unrealized appreciation (depreciation) on investments, futures contracts, options written, short sales, swap contracts and foreign currencies | | | | 76,775,639 | | | | | 141,925,894 | | | | | 180,473,550 | | | | | (4,514,997 | ) |
| | | | | | | | | | | | | | | | | | | | |
Net assets | | | $ | 601,058,991 | | | | $ | 972,455,786 | | | | $ | 2,271,104,375 | | | | $ | 765,602,975 | |
| | | | | | | | | | | | | | | | | | | | |
| | | | |
Net assets attributable to: | | | | | | | | | | | | | | | | | | | | |
Class Y-3 shares | | | $ | 601,058,991 | | | | $ | 972,455,786 | | | | $ | 2,271,104,375 | | | | $ | 765,602,975 | |
| | | | | | | | | | | | | | | | | | | | |
| | | | |
Shares outstanding: | | | | | | | | | | | | | | | | | | | | |
Class Y-3 | | | | 56,658,077 | | | | | 80,228,021 | | | | | 217,612,129 | | | | | 76,843,506 | |
| | | | | | | | | | | | | | | | | | | | |
| | | | |
Net asset value per share: | | | | | | | | | | | | | | | | | | | | |
Class Y-3 | | | $ | 10.61 | | | | $ | 12.12 | | | | $ | 10.44 | | | | $ | 9.96 | |
| | | | | | | | | | | | | | | | | | | | |
| | | | |
(a) Investments, at cost | | | $ | 535,816,293 | | | | $ | 869,292,667 | | | | $ | 2,161,880,552 | | | | $ | 794,230,972 | |
| | | | | | | | | | | | | | | | | | | | |
(b) Foreign currency, at cost | | | $ | — | | | | $ | — | | | | $ | 5,415,729 | | | | $ | — | |
| | | | | | | | | | | | | | | | | | | | |
(c) Premiums on written options | | | $ | — | | | | $ | — | | | | $ | — | | | | $ | 14,300 | |
| | | | | | | | | | | | | | | | | | | | |
(d) Proceeds for TBA Sale Commitments | | | $ | — | | | | $ | — | | | | $ | — | | | | $ | 505,625 | |
| | | | | | | | | | | | | | | | | | | | |
| | | | | | |
| | See accompanying Notes to the Financial Statements. | | | 145 | |
Mercer Funds
Statements of Assets and Liabilities (Continued)
March 31, 2017
| | | | | | | | | | | | | | | |
| | | Mercer Opportunistic
Fixed Income Fund | | Mercer Emerging
Markets Equity Fund | | Mercer Global Low
Volatility Equity Fund |
Assets | | | | | | | | | | | | | | | |
Investments, at value(a) | | | $ | 577,565,105 | | | | $ | 1,517,101,073 | | | | $ | 1,287,047,352 | |
Foreign currency, at value(b) | | | | 922,209 | | | | | 7,892,846 | | | | | 565,951 | |
Cash | | | | 91,011 | | | | | 1,730,339 | | | | | 34,191 | |
Receivable for investments sold | | | | 92,500 | | | | | 11,438,841 | | | | | 3,285,609 | |
Receivable for Fund shares sold | | | | — | | | | | 11,856 | | | | | — | |
Dividend and interest receivable | | | | 9,511,005 | | | | | 5,081,122 | | | | | 1,879,346 | |
Cash collateral held at broker on open futures contracts | | | | 625,049 | | | | | 2,658,143 | | | | | 850,000 | |
Unrealized appreciation on open forward foreign currency contracts | | | | 2,705,310 | | | | | 2,419,937 | | | | | — | |
Receivable for variation margin on open futures contracts | | | | — | | | | | 101,167 | | | | | — | |
Synthetic futures, at value | | | | — | | | | | 938,133 | | | | | — | |
Foreign tax reclaims receivable | | | | 61,862 | | | | | 16,475 | | | | | 556,631 | |
Securities lending income receivable | | | | 10,093 | | | | | 5,928 | | | | | 20,098 | |
Prepaid expenses | | | | 2,475 | | | | | 6,725 | | | | | 5,724 | |
| | | | | | | | | | | | | | | |
Total assets | | | | 591,586,619 | | | | | 1,549,402,585 | | | | | 1,294,244,902 | |
| | | | | | | | | | | | | | | |
| | | |
Liabilities | | | | | | | | | | | | | | | |
Payable for investments purchased | | | | 1,031 | | | | | 34,908,686 | | | | | 27,649,077 | |
Payable for TBA and when-issued securities purchased | | | | 2,395,000 | | | | | — | | | | | — | |
Payable for Fund shares repurchased | | | | 5,000,000 | | | | | 2,200 | | | | | — | |
Synthetic futures, at value | | | | — | | | | | 688,241 | | | | | — | |
Cash collateral due to broker on open forward foreign currency contracts | | | | — | | | | | 820,000 | | | | | — | |
Unrealized depreciation on open forward foreign currency contracts | | | | 2,038,220 | | | | | 2,436,887 | | | | | — | |
Variation margin payable on open futures contracts | | | | 27,535 | | | | | 598,129 | | | | | 118,198 | |
Obligation to return securities lending collateral | | | | 22,260,085 | | | | | 23,309,405 | | | | | 15,618,084 | |
Payable to affiliate for: | | | | | | | | | | | | | | | |
Advisory fees | | | | 370,372 | | | | | 941,187 | | | | | 742,721 | |
Trustees fees | | | | 524 | | | | | 1,420 | | | | | 1,136 | |
Payable for foreign capital gains tax | | | | 338,601 | | | | | 2,627,712 | | | | | — | |
Accrued expenses | | | | 296,630 | | | | | 1,078,922 | | | | | 255,909 | |
| | | | | | | | | | | | | | | |
Total liabilities | | | | 32,727,998 | | | | | 67,412,789 | | | | | 44,385,125 | |
| | | | | | | | | | | | | | | |
Net assets | | | $ | 558,858,621 | | | | $ | 1,481,989,796 | | | | $ | 1,249,859,777 | |
| | | | | | | | | | | | | | | |
Net assets consist of: | | | | | | | | | | | | | | | |
Paid-in capital | | | | 583,147,766 | | | | | 1,452,366,321 | | | | | 1,115,139,079 | |
Accumulated undistributed net investment income | | | | 4,387,125 | | | | | 10,803,027 | | | | | 3,071,515 | |
Accumulated net realized gain (loss) | | | | (16,373,763 | ) | | | | (133,223,675 | ) | | | | 9,876,171 | |
Net unrealized appreciation (depreciation) on investments, futures contracts and foreign currencies | | | | (12,302,507 | ) | | | | 152,044,123 | | | | | 121,773,012 | |
| | | | | | | | | | | | | | | |
Net assets | | | $ | 558,858,621 | | | | $ | 1,481,989,796 | | | | $ | 1,249,859,777 | |
| | | | | | | | | | | | | | | |
| | | |
Net assets attributable to: | | | | | | | | | | | | | | | |
Class Y-3 shares | | | $ | 558,858,621 | | | | $ | 1,481,989,796 | | | | $ | 1,249,859,777 | |
| | | | | | | | | | | | | | | |
| | | |
Shares outstanding: | | | | | | | | | | | | | | | |
Class Y-3 | | | | 60,052,184 | | | | | 151,625,331 | | | | | 99,043,598 | |
| | | | | | | | | | | | | | | |
| | | |
Net asset value per share: | | | | | | | | | | | | | | | |
Class Y-3 | | | $ | 9.31 | | | | $ | 9.77 | | | | $ | 12.62 | |
| | | | | | | | | | | | | | | |
| | | |
(a) Investments, at cost | | | $ | 590,165,506 | | | | $ | 1,365,262,538 | | | | $ | 1,165,508,699 | |
| | | | | | | | | | | | | | | |
(b) Foreign currency, at cost | | | $ | 922,882 | | | | $ | 7,882,258 | | | | $ | 566,079 | |
| | | | | | | | | | | | | | | |
| | | | | | |
| 146 | | See accompanying Notes to the Financial Statements. | | | | |
Mercer Funds
Statements of Operations
For the Year Ended March 31, 2017
| | | | | | | | | | | | | | | | | | | | |
| | | Mercer US Large
Cap Equity Fund
(formerly known as
Mercer US Large Cap
Growth Equity Fund) | | Mercer US Small/Mid
Cap Equity Fund
(formerly known as
Mercer US Small/Mid Cap
Growth Equity Fund) | | Mercer Non-US
Core Equity Fund | | Mercer Core Fixed
Income Fund |
Investment Income: | | | | | | | | | | | | | | | | | | | | |
Interest | | | $ | 5,633 | | | | $ | 12,171 | | | | $ | 39,323 | | | | $ | 23,482,703 | |
Dividends | | | | 9,202,475 | | | | | 11,251,200 | | | | | 58,298,771 | | | | | 42,439 | |
Securities lending income | | | | 100,700 | | | | | 248,292 | | | | | 901,822 | | | | | 66,223 | |
Withholding taxes | | | | (82,130 | ) | | | | (19,250 | ) | | | | (4,995,277 | ) | | | | (1,341 | ) |
Non-recurring income(a) | | | | 11,009 | | | | | 12,496 | | | | | 405,206 | | | | | 8,739 | |
Other income | | | | — | | | | | — | | | | | 1,530 | | | | | — | |
| | | | | | | | | | | | | | | | | | | | |
Total investment income | | | | 9,237,687 | | | | | 11,504,909 | | | | | 54,651,375 | | | | | 23,598,763 | |
| | | | | | | | | | | | | | | | | | | | |
| | | | |
Expenses: | | | | | | | | | | | | | | | | | | | | |
Advisory fees | | | | 2,804,563 | | | | | 7,551,279 | | | | | 14,861,816 | | | | | 2,873,116 | |
Custodian and fund accounting fees | | | | 138,602 | | | | | 203,204 | | | | | 1,289,412 | | | | | 329,012 | |
Audit fees | | | | 70,951 | | | | | 72,932 | | | | | 157,743 | | | | | 77,391 | |
Transfer agent fees | | | | 22,734 | | | | | 23,394 | | | | | 23,858 | | | | | 23,691 | |
Legal fees | | | | 49,179 | | | | | 86,092 | | | | | 197,114 | | | | | 77,697 | |
Trustees fees | | | | 28,930 | | | | | 46,078 | | | | | 115,423 | | | | | 45,954 | |
Registration fees | | | | 44,771 | | | | | 65,632 | | | | | 33,587 | | | | | 19,237 | |
Interest expense | | | | — | | | | | — | | | | | 71 | | | | | 325 | |
Miscellaneous | | | | 57,219 | | | | | 91,891 | | | | | 169,664 | | | | | 69,227 | |
| | | | | | | | | | | | | | | | | | | | |
Total expenses | | | | 3,216,949 | | | | | 8,140,502 | | | | | 16,848,688 | | | | | 3,515,650 | |
Advisory fee refund(a) | | | | 9,376 | | | | | 11,624 | | | | | 248,772 | | | | | 7,180 | |
| | | | | | | | | | | | | | | | | | | | |
Net expenses | | | | 3,226,325 | | | | | 8,152,126 | | | | | 17,097,460 | | | | | 3,522,830 | |
| | | | | | | | | | | | | | | | | | | | |
Net investment income | | | | 6,011,362 | | | | | 3,352,783 | | | | | 37,553,915 | | | | | 20,075,933 | |
| | | | | | | | | | | | | | | | | | | | |
| | | | |
Realized and Unrealized Gain (Loss): | | | | | | | | | | | | | | | | | | | | |
Net realized gain (loss) on: | | | | | | | | | | | | | | | | | | | | |
Investments | | | | 19,048,035 | | | | | 60,620,819 | | | | | 13,248,544 | | | | | 2,770,252 | |
Swap contracts | | | | — | | | | | — | | | | | — | | | | | (195,650 | ) |
Closed futures contracts | | | | 2,457,762 | | | | | 7,089,122 | | | | | 8,791,397 | | | | | (1,715,956 | ) |
Written option contracts | | | | — | | | | | — | | | | | — | | | | | 26,468 | |
Forward foreign currency contracts and foreign currency related transactions | | | | (564 | ) | | | | (5,252 | ) | | | | 415,617 | | | | | (22,505 | ) |
| | | | | | | | | | | | | | | | | | | | |
Net realized gain | | | | 21,505,233 | | | | | 67,704,689 | | | | | 22,455,558 | | | | | 862,609 | |
| | | | | | | | | | | | | | | | | | | | |
Change in net unrealized appreciation (depreciation) on: | | | | | | | | | | | | | | | | | | | | |
Investments | | | | 75,681,294 | | | | | 112,701,459 | | | | | 154,556,819 | | | | | (10,735,462 | ) |
TBA Sale Commitments | | | | — | | | | | — | | | | | — | | | | | (5,859 | ) |
Swap contracts | | | | — | | | | | — | | | | | — | | | | | 923,338 | |
Open futures contracts | | | | (287,270 | ) | | | | (22,135 | ) | | | | 766,327 | | | | | (165,076 | ) |
Written option contracts | | | | — | | | | | — | | | | | — | | | | | 1,800 | |
Forward foreign currency contracts and foreign currency related translations | | | | 249 | | | | | (4,481 | ) | | | | (169,584 | ) | | | | (7,051 | ) |
| | | | | | | | | | | | | | | | | | | | |
Change in net unrealized appreciation (depreciation) | | | | 75,394,273 | | | | | 112,674,843 | | | | | 155,153,562 | | | | | (9,988,310 | ) |
| | | | | | | | | | | | | | | | | | | | |
Net realized and unrealized gain (loss) | | | | 96,899,506 | | | | | 180,379,532 | | | | | 177,609,120 | | | | | (9,125,701 | ) |
| | | | | | | | | | | | | | | | | | | | |
| | | | |
Net increase in net assets resulting from operations | | | $ | 102,910,868 | | | | $ | 183,732,315 | | | | $ | 215,163,035 | | | | $ | 10,950,232 | |
| | | | | | | | | | | | | | | | | | | | |
| (a) | Non-recurring income represents a refund for overbilling of prior years’ custody fees, a portion of which was paid to the Advisor for prior years’ reimbursement of expenses. |
| | | | | | |
| | See accompanying Notes to the Financial Statements. | | | 147 | |
Mercer Funds
Statements of Operations (Continued)
For the Year Ended March 31, 2017
| | | | | | | | | | | | | | | |
| | | Mercer Opportunistic
Fixed Income Fund | | Mercer Emerging
Markets Equity Fund | | Mercer Global Low
Volatility Equity Fund |
Investment Income: | | | | | | | | | | | | | | | |
Interest | | | $ | 33,091,060 | | | | $ | 43,799 | | | | $ | 43,919 | |
Dividends | | | | 79,462 | | | | | 36,160,243 | | | | | 24,218,669 | |
Securities lending income | | | | 190,358 | | | | | 208,044 | | | | | 215,174 | |
Withholding taxes | | | | (356,452 | ) | | | | (4,073,626 | ) | | | | (1,241,688 | ) |
Non-recurring income(a) | | | | 10,831 | | | | | 139,526 | | | | | 4,444 | |
Other income | | | | 57,649 | | | | | 1,580 | | | | | — | |
| | | | | | | | | | | | | | | |
Total investment income | | | | 33,072,908 | | | | | 32,479,566 | | | | | 23,240,518 | |
| | | | | | | | | | | | | | | |
| | | |
Expenses: | | | | | | | | | | | | | | | |
Advisory fees | | | | 3,954,705 | | | | | 10,079,086 | | | | | 8,023,976 | |
Custodian and fund accounting fees | | | | 451,431 | | | | | 2,166,457 | | | | | 373,236 | |
Audit fees | | | | 65,410 | | | | | 142,483 | | | | | 60,992 | |
Transfer agent fees | | | | 23,560 | | | | | 24,023 | | | | | 23,552 | |
Legal fees | | | | 44,973 | | | | | 117,217 | | | | | 99,532 | |
Trustees fees | | | | 27,468 | | | | | 71,767 | | | | | 60,284 | |
Registration fees | | | | 54,935 | | | | | 34,859 | | | | | 21,404 | |
Interest expense | | | | 6,050 | | | | | 21,287 | | | | | 95 | |
Miscellaneous | | | | 41,800 | | | | | 105,178 | | | | | 86,134 | |
| | | | | | | | | | | | | | | |
Total expenses | | | | 4,670,332 | | | | | 12,762,357 | | | | | 8,749,205 | |
Advisory fee refund(a) | | | | 10,831 | | | | | 102,772 | | | | | — | |
Reimbursement of expenses | | | | (39,153 | ) | | | | — | | | | | — | |
| | | | | | | | | | | | | | | |
Net expenses | | | | 4,642,010 | | | | | 12,865,129 | | | | | 8,749,205 | |
| | | | | | | | | | | | | | | |
Net investment income | | | | 28,430,898 | | | | | 19,614,437 | | | | | 14,491,313 | |
| | | | | | | | | | | | | | | |
| | | |
Realized and Unrealized Gain (Loss): | | | | | | | | | | | | | | | |
Net realized gain (loss) on: | | | | | | | | | | | | | | | |
Investments | | | | (19,400,705 | ) | | | | (27,722,320 | ) | | | | 29,133,214 | |
Closed futures contracts | | | | 655,112 | | | | | 20,080,035 | | | | | 5,805,263 | |
Forward foreign currency contracts and foreign currency related transactions | | | | (5,191,805 | ) | | | | 12,122,678 | | | | | (1,316,648 | ) |
| | | | | | | | | | | | | | | |
Net realized gain (loss) | | | | (23,937,398 | ) | | | | 4,480,393 | | | | | 33,621,829 | |
| | | | | | | | | | | | | | | |
Change in net unrealized appreciation (depreciation) on: | | | | | | | | | | | | | | | |
Investments | | | | 39,070,190 | | | | | 181,547,792 | | | | | 66,945,311 | |
Open futures contracts | | | | (406,517 | ) | | | | (1,172,075 | ) | | | | (385,174 | ) |
Forward foreign currency contracts and foreign currency related translations | | | | 2,993,936 | | | | | (2,753,364 | ) | | | | 9,075 | |
| | | | | | | | | | | | | | | |
Change in net unrealized appreciation (depreciation) | | | | 41,657,609 | | | | | 177,622,353 | | | | | 66,569,212 | |
| | | | | | | | | | | | | | | |
Net realized and unrealized gain (loss) | | | | 17,720,211 | | | | | 182,102,746 | | | | | 100,191,041 | |
| | | | | | | | | | | | | | | |
| | | |
Net increase in net assets resulting from operations | | | $ | 46,151,109 | | | | $ | 201,717,183 | | | | $ | 114,682,354 | |
| | | | | | | | | | | | | | | |
| (a) | Non-recurring income represents a refund for overbilling of prior years’ custody fees, a portion of which was paid to the Advisor for prior years’ reimbursement of expenses. |
| | | | | | |
| 148 | | See accompanying Notes to the Financial Statements. | | | | |
Mercer Funds
Statements of Changes in Net Assets
| | | | | | | | | | | | | | | | | | | | |
| | | Mercer US Large Cap Equity Fund
(formerly known as Mercer US
Large Cap Growth Equity Fund) | | Mercer US Small/Mid Cap Equity Fund
(formerly known as Mercer US Small/
Mid Cap Growth Equity Fund) |
| | | Year Ended
March 31, 2017 | | Year Ended
March 31, 2016 | | Year Ended
March 31, 2017 | | Year Ended
March 31, 2016 |
Increase (decrease) in Net Assets: | | | | | | | | | | | | | | | | | | | | |
Operations: | | | | | | | | | | | | | | | | | | | | |
Net investment income (loss) | | | $ | 6,011,362 | | | | $ | 1,187,529 | | | | $ | 3,352,783 | | | | $ | (804,412 | ) |
Net realized gain (loss) | | | | 21,505,233 | | | | | 24,886,587 | | | | | 67,704,689 | | | | | 7,264,017 | |
Change in net unrealized appreciation (depreciation) | | | | 75,394,273 | | | | | (36,723,410 | ) | | | | 112,674,843 | | | | | (55,146,208 | ) |
| | | | | | | | | | | | | | | | | | | | |
Net increase (decrease) in net assets resulting from operations | | | | 102,910,868 | | | | | (10,649,294 | ) | | | | 183,732,315 | | | | | (48,686,603 | ) |
| | | | | | | | | | | | | | | | | | | | |
Distributions to shareholders from: | | | | | | | | | | | | | | | | | | | | |
Net investment income | | | | | | | | | | | | | | | | | | | | |
Class Y-3 | | | | (4,340,709 | ) | | | | (1,544,807 | ) | | | | (6,503,271 | ) | | | | — | |
| | | | | | | | | | | | | | | | | | | | |
Total distributions from net investment income | | | | (4,340,709 | ) | | | | (1,544,807 | ) | | | | (6,503,271 | ) | | | | — | |
| | | | | | | | | | | | | | | | | | | | |
Net realized gains | | | | | | | | | | | | | | | | | | | | |
Class Y-3 | | | | (16,932,342 | ) | | | | (38,484,951 | ) | | | | (22,642,529 | ) | | | | (24,352,888 | ) |
| | | | | | | | | | | | | | | | | | | | |
Total distributions from net realized gains | | | | (16,932,342 | ) | | | | (38,484,951 | ) | | | | (22,642,529 | ) | | | | (24,352,888 | ) |
| | | | | | | | | | | | | | | | | | | | |
Net share transactions (See Note 7): | | | | | | | | | | | | | | | | | | | | |
Class Y-3 | | | | 218,161,247 | | | | | (10,759,407 | ) | | | | 390,443,708 | | | | | 29,572,449 | |
| | | | | | | | | | | | | | | | | | | | |
Increase (decrease) in net assets resulting from net shares transactions | | | | 218,161,247 | | | | | (10,759,407 | ) | | | | 390,443,708 | | | | | 29,572,449 | |
| | | | | | | | | | | | | | | | | | | | |
Net increase (decrease) in net assets | | | | 299,799,064 | | | | | (61,438,459 | ) | | | | 545,030,223 | | | | | (43,467,042 | ) |
Net assets: | | | | | | | | | | | | | | | | | | | | |
Beginning of year | | | | 301,259,927 | | | | | 362,698,386 | | | | | 427,425,563 | | | | | 470,892,605 | |
| | | | | | | | | | | | | | | | | | | | |
End of year | | | $ | 601,058,991 | | | | $ | 301,259,927 | | | | $ | 972,455,786 | | | | $ | 427,425,563 | |
| | | | | | | | | | | | | | | | | | | | |
Undistributed (distributions in excess of) net investment income included in net assets at end of year | | | $ | 1,596,941 | | | | $ | (3,362 | ) | | | $ | (884 | ) | | | $ | (97,703 | ) |
| | | | | | | | | | | | | | | | | | | | |
| | | | | | |
| | See accompanying Notes to the Financial Statements. | | | 149 | |
Mercer Funds
Statements of Changes in Net Assets (Continued)
| | | | | | | | | | | | | | | | | | | | |
| | | Mercer Non-US Core
Equity Fund | | Mercer Core
Fixed Income Fund |
| | | Year Ended
March 31, 2017 | | Year Ended
March 31, 2016 | | Year Ended
March 31, 2017 | | Year Ended
March 31, 2016 |
Increase (decrease) in Net Assets: | | | | | | | | | | | | | | | | | | | | |
Operations: | | | | | | | | | | | | | | | | | | | | |
Net investment income (loss) | | | $ | 37,553,915 | | | | $ | 32,027,708 | | | | $ | 20,075,933 | | | | $ | 23,898,914 | |
Net realized gain (loss) | | | | 22,455,558 | | | | | (7,197,050 | ) | | | | 862,609 | | | | | 1,032,247 | |
Change in net unrealized appreciation (depreciation) | | | | 155,153,562 | | | | | (132,623,438 | ) | | | | (9,988,310 | ) | | | | (17,182,435 | ) |
| | | | | | | | | | | | | | | | | | | | |
Net increase (decrease) in net assets resulting from operations | | | | 215,163,035 | | | | | (107,792,780 | ) | | | | 10,950,232 | | | | | 7,748,726 | |
| | | | | | | | | | | | | | | | | | | | |
Distributions to shareholders from: | | | | | | | | | | | | | | | | | | | | |
Net investment income | | | | | | | | | | | | | | | | | | | | |
Class Y-3 | | | | (37,187,651 | ) | | | | (32,290,964 | ) | | | | (21,073,131 | ) | | | | (24,184,241 | ) |
| | | | | | | | | | | | | | | | | | | | |
Total distributions from net investment income | | | | (37,187,651 | ) | | | | (32,290,964 | ) | | | | (21,073,131 | ) | | | | (24,184,241 | ) |
| | | | | | | | | | | | | | | | | | | | |
Net realized gains | | | | | | | | | | | | | | | | | | | | |
Class Y-3 | | | | — | | | | | (49,778,409 | ) | | | | (8,462,989 | ) | | | | (8,369,548 | ) |
| | | | | | | | | | | | | | | | | | | | |
Total distributions from net realized gains | | | | — | | | | | (49,778,409 | ) | | | | (8,462,989 | ) | | | | (8,369,548 | ) |
| | | | | | | | | | | | | | | | | | | | |
Net share transactions (See Note 7): | | | | | | | | | | | | | | | | | | | | |
Class Y-3 | | | | 151,494,721 | | | | | 58,515,147 | | | | | 313,880 | | | | | (83,968,766 | ) |
| | | | | | | | | | | | | | | | | | | | |
Increase (decrease) in net assets resulting from net shares transactions | | | | 151,494,721 | | | | | 58,515,147 | | | | | 313,880 | | | | | (83,968,766 | ) |
| | | | | | | | | | | | | | | | | | | | |
Net increase (decrease) in net assets | | | | 329,470,105 | | | | | (131,347,006 | ) | | | | (18,272,008 | ) | | | | (108,773,829 | ) |
Net assets: | | | | | | | | | | | | | | | | | | | | |
Beginning of year | | | | 1,941,634,270 | | | | | 2,072,981,276 | | | | | 783,874,983 | | | | | 892,648,812 | |
| | | | | | | | | | | | | | | | | | | | |
End of year | | | $ | 2,271,104,375 | | | | $ | 1,941,634,270 | | | | $ | 765,602,975 | | | | $ | 783,874,983 | |
| | | | | | | | | | | | | | | | | | | | |
Undistributed (distributions in excess of) net investment income included in net assets at end of year | | | $ | (1,107,717 | ) | | | $ | (3,143,284 | ) | | | $ | 3,400,638 | | | | $ | 4,915,211 | |
| | | | | | | | | | | | | | | | | | | | |
| | | | | | |
| 150 | | See accompanying Notes to the Financial Statements. | | | | |
Mercer Funds
Statements of Changes in Net Assets (Continued)
| | | | | | | | | | | | | | | | | | | | |
| | | Mercer Opportunistic Fixed
Income Fund | | Mercer Emerging
Markets Equity Fund |
| | | Year Ended
March 31, 2017 | | Year Ended
March 31, 2016 | | Year Ended
March 31, 2017 | | Year Ended
March 31, 2016 |
Increase (decrease) in Net Assets: | | | | | | | | | | | | | | | | | | | | |
Operations: | | | | | | | | | | | | | | | | | | | | |
Net investment income (loss) | | | $ | 28,430,898 | | | | $ | 24,954,703 | | | | $ | 19,614,437 | | | | $ | 19,019,703 | |
Net realized gain (loss) | | | | (23,937,398 | ) | | | | (35,118,225 | ) | | | | 4,480,393 | | | | | (100,628,113 | ) |
Change in net unrealized appreciation (depreciation) | | | | 41,657,609 | | | | | (14,480,513 | ) | | | | 177,622,353 | | | | | (43,988,114 | ) |
| | | | | | | | | | | | | | | | | | | | |
Net increase (decrease) in net assets resulting from operations | | | | 46,151,109 | | | | | (24,644,035 | ) | | | | 201,717,183 | | | | | (125,596,524 | ) |
| | | | | | | | | | | | | | | | | | | | |
Distributions to shareholders from: | | | | | | | | | | | | | | | | | | | | |
Net investment income | | | | | | | | | | | | | | | | | | | | |
Class Y-3 | | | | — | | | | | (3,476,394 | ) | | | | (26,250,811 | ) | | | | (11,714,562 | ) |
| | | | | | | | | | | | | | | | | | | | |
Total distributions from net investment income | | | | — | | | | | (3,476,394 | ) | | | | (26,250,811 | ) | | | | (11,714,562 | ) |
| | | | | | | | | | | | | | | | | | | | |
Net realized gains | | | | | | | | | | | | | | | | | | | | |
Class Y-3 | | | | — | | | | | (1,749,711 | ) | | | | — | | | | | — | |
| | | | | | | | | | | | | | | | | | | | |
Total distributions from net realized gains | | | | — | | | | | (1,749,711 | ) | | | | — | | | | | — | |
| | | | | | | | | | | | | | | | | | | | |
Net share transactions (See Note 7): | | | | | | | | | | | | | | | | | | | | |
Class Y-3 | | | | 98,445,823 | | | | | 48,192,685 | | | | | 156,387,071 | | | | | 200,092,196 | |
| | | | | | | | | | | | | | | | | | | | |
Increase in net assets resulting from net shares transactions | | | | 98,445,823 | | | | | 48,192,685 | | | | | 156,387,071 | | | | | 200,092,196 | |
| | | | | | | | | | | | | | | | | | | | |
Net increase in net assets | | | | 144,596,932 | | | | | 18,322,545 | | | | | 331,853,443 | | | | | 62,781,110 | |
Net assets: | | | | | | | | | | | | | | | | | | | | |
Beginning of year | | | | 414,261,689 | | | | | 395,939,144 | | | | | 1,150,136,353 | | | | | 1,087,355,243 | |
| | | | | | | | | | | | | | | | | | | | |
End of year | | | $ | 558,858,621 | | | | $ | 414,261,689 | | | | $ | 1,481,989,796 | | | | $ | 1,150,136,353 | |
| | | | | | | | | | | | | | | | | | | | |
Undistributed (distributions in excess of) net investment income included in net assets at end of year | | | $ | 4,387,125 | | | | $ | (4,384,265 | ) | | | $ | 10,803,027 | | | | $ | 5,375,948 | |
| | | | | | | | | | | | | | | | | | | | |
| | | | | | |
| | See accompanying Notes to the Financial Statements. | | | 151 | |
Mercer Funds
Statements of Changes in Net Assets (Continued)
| | | | | | | | | | |
| | | Mercer Global Low
Volatility Equity Fund |
| | | Year Ended
March 31, 2017 | | Year Ended
March 31, 2016 |
Increase (decrease) in Net Assets: | | | | | | | | | | |
Operations: | | | | | | | | | | |
Net investment income (loss) | | | $ | 14,491,313 | | | | $ | 10,558,566 | |
Net realized gain (loss) | | | | 33,621,829 | | | | | 13,378,459 | |
Change in net unrealized appreciation (depreciation) | | | | 66,569,212 | | | | | 12,025,245 | |
| | | | | | | | | | |
Net increase in net assets resulting from operations | | | | 114,682,354 | | | | | 35,962,270 | |
| | | | | | | | | | |
Distributions to shareholders from: | | | | | | | | | | |
Net investment income | | | | | | | | | | |
Class Y-3 | | | | (12,612,013 | ) | | | | (10,380,943 | ) |
| | | | | | | | | | |
Total distributions from net investment income | | | | (12,612,013 | ) | | | | (10,380,943 | ) |
| | | | | | | | | | |
Net realized gains | | | | | | | | | | |
Class Y-3 | | | | (28,619,153 | ) | | | | (47,787,568 | ) |
| | | | | | | | | | |
Total distributions from net realized gains | | | | (28,619,153 | ) | | | | (47,787,568 | ) |
| | | | | | | | | | |
Net share transactions (See Note 7): | | | | | | | | | | |
Class Y-3 | | | | 224,023,068 | | | | | 155,539,826 | |
| | | | | | | | | | |
Increase in net assets resulting from net shares transactions | | | | 224,023,068 | | | | | 155,539,826 | |
| | | | | | | | | | |
Net increase in net assets | | | | 297,474,256 | | | | | 133,333,585 | |
Net assets: | | | | | | | | | | |
Beginning of year | | | | 952,385,521 | | | | | 819,051,936 | |
| | | | | | | | | | |
End of year | | | $ | 1,249,859,777 | | | | $ | 952,385,521 | |
| | | | | | | | | | |
Undistributed net investment income included in net assets at end of year | | | $ | 3,071,515 | | | | $ | 1,709,899 | |
| | | | | | | | | | |
| | | | | | |
| 152 | | See accompanying Notes to the Financial Statements. | | | | |
Mercer US Large Cap Equity Fund (formerly known as Mercer US Large Cap Growth Equity Fund)
Financial Highlights
| | | | | | | | | | | | | | | | | | | | | | | | | |
| | | Year Ended
03/31/17 | | Year Ended
03/31/16 | | Year Ended
03/31/15 | | Year Ended
03/31/14 | | Year Ended
03/31/13 |
For a Class Y-3 Share Outstanding Throughout Each Period: | | | | | | | | | | | | | | | | | | | | | | | | | |
| | | | | |
Net asset value at beginning of year | | | $ | 9.34 | | | | $ | 11.11 | | | | $ | 13.16 | | | | $ | 13.56 | | | | $ | 13.27 | |
| | | | | | | | | | | | | | | | | | | | | | | | | |
| | | | | |
Net investment income† | | | | 0.11 | (a) | | | | 0.04 | | | | | 0.05 | | | | | 0.07 | | | | | 0.08 | |
Net realized and unrealized gain (loss) on investments | | | | 1.54 | | | | | (0.43 | ) | | | | 1.63 | | | | | 3.11 | | | | | 0.68 | |
| | | | | | | | | | | | | | | | | | | | | | | | | |
| | | | | |
Total from investment operations | | | | 1.65 | | | | | (0.39 | ) | | | | 1.68 | | | | | 3.18 | | | | | 0.76 | |
| | | | | | | | | | | | | | | | | | | | | | | | | |
Less dividends and distributions: | | | | | | | | | | | | | | | | | | | | | | | | | |
From net investment loss | | | | (0.08 | ) | | | | (0.05 | ) | | | | (0.04 | ) | | | | (0.09 | ) | | | | (0.08 | ) |
From net realized gain on investments | | | | (0.30 | ) | | | | (1.33 | ) | | | | (3.69 | ) | | | | (3.49 | ) | | | | (0.39 | ) |
| | | | | | | | | | | | | | | | | | | | | | | | | |
| | | | | |
Total dividends and distributions | | | | (0.38 | ) | | | | (1.38 | ) | | | | (3.73 | ) | | | | (3.58 | ) | | | | (0.47 | ) |
| | | | | | | | | | | | | | | | | | | | | | | | | |
| | | | | |
Net asset value at end of year | | | $ | 10.61 | | | | $ | 9.34 | | | | $ | 11.11 | | | | $ | 13.16 | | | | $ | 13.56 | |
| | | | | | | | | | | | | | | | | | | | | | | | | |
Total investment return | | | | 17.74 | % | | | | (4.09 | )% | | | | 13.63 | %(b) | | | | 23.99 | %(b) | | | | 6.03 | %(b) |
| | | | | |
Ratios/Supplemental Data: | | | | | | | | | | | | | | | | | | | | | | | | | |
Net investment income to average net assets | | | | 1.14 | %(a) | | | | 0.33 | % | | | | 0.37 | % | | | | 0.48 | % | | | | 0.61 | % |
Net expenses to average daily net assets | | | | 0.61 | %(d) | | | | 0.63 | %(c) | | | | 0.60 | %(c) | | | | 0.57 | % | | | | 0.57 | % |
Total expenses (before reductions and reimbursements) to average daily net assets | | | | 0.61 | % | | | | 0.63 | %(c) | | | | 0.63 | %(c) | | | | 0.63 | % | | | | 0.63 | % |
Portfolio turnover rate | | | | 84 | % | | | | 66 | % | | | | 118 | % | | | | 50 | % | | | | 65 | % |
Net assets at end of year (in 000’s) | | | $ | 601,059 | | | | $ | 301,260 | | | | $ | 362,698 | | | | $ | 358,862 | | | | $ | 465,787 | |
| (a) | Includes a non-recurring refund for overbilling of prior years’ custody fees, a portion of which was paid to the Advisor for prior years’ reimbursement of expenses. This amounted to less than $0.01 per share and less than 0.01% of average net assets. |
| (b) | The total return would have been lower had certain expenses not been reduced or reimbursed during the periods shown. |
| (c) | Includes interest expense that amounts to less than 0.01%. |
| (d) | Includes a repayment to the Advisor, referenced above, for prior years’ reimbursement of expenses. The amount is less than 0.01% of average net assets. |
| † | Computed using average shares outstanding throughout the year. |
| | | | | | |
| | See accompanying Notes to the Financial Statements. | | | 153 | |
Mercer US Small/Mid Cap Equity Fund (formerly known as Mercer US Small/Mid Cap Growth Equity Fund)
Financial Highlights (Continued)
| | | | | | | | | | | | | | | | | | | | | | | | | |
| | | Year Ended
03/31/17 | | Year Ended
03/31/16 | | Year Ended
03/31/15 | | Year Ended
03/31/14 | | Year Ended
03/31/13 |
For a Class Y-3 Share Outstanding Throughout Each Period: | | | | | | | | | | | | | | | | | | | | | | | | | |
| | | | | |
Net asset value at beginning of year | | | $ | 10.30 | | | | $ | 12.23 | | | | $ | 12.44 | | | | $ | 11.94 | | | | $ | 11.62 | |
| | | | | | | | | | | | | | | | | | | | | | | | | |
| | | | | |
Net investment income (loss)† | | | | 0.04 | (a) | | | | (0.02 | ) | | | | (0.03 | ) | | | | (0.02 | ) | | | | (0.01 | ) |
Net realized and unrealized gain (loss) on investments | | | | 2.13 | | | | | (1.28 | ) | | | | 1.32 | | | | | 2.63 | | | | | 1.31 | |
| | | | | | | | | | | | | | | | | | | | | | | | | |
| | | | | |
Total from investment operations | | | | 2.17 | | | | | (1.30 | ) | | | | 1.29 | | | | | 2.61 | | | | | 1.30 | |
| | | | | | | | | | | | | | | | | | | | | | | | | |
Less dividends and distributions: | | | | | | | | | | | | | | | | | | | | | | | | | |
From net investment income (loss) | | | | (0.08 | ) | | | | — | | | | | — | | | | | — | | | | | (0.01 | ) |
From net realized gain on investments | | | | (0.27 | ) | | | | (0.63 | ) | | | | (1.50 | ) | | | | (2.11 | ) | | | | (0.97 | ) |
| | | | | | | | | | | | | | | | | | | | | | | | | |
| | | | | |
Total dividends and distributions | | | | (0.35 | ) | | | | (0.63 | ) | | | | (1.50 | ) | | | | (2.11 | ) | | | | (0.98 | ) |
| | | | | | | | | | | | | | | | | | | | | | | | | |
| | | | | |
Net asset value at end of year | | | $ | 12.12 | | | | $ | 10.30 | | | | $ | 12.23 | | | | $ | 12.44 | | | | $ | 11.94 | |
| | | | | | | | | | | | | | | | | | | | | | | | | |
Total investment return | | | | 21.24 | % | | | | (10.78 | )% | | | | 11.11 | %(b) | | | | 22.34 | %(b) | | | | 12.11 | %(b) |
| | | | | |
Ratios/Supplemental Data: | | | | | | | | | | | | | | | | | | | | | | | | | |
Net investment income (loss) to average net assets | | | | 0.40 | %(a) | | | | (0.18 | )% | | | | (0.25 | )% | | | | (0.17 | )% | | | | (0.05 | )% |
Net expenses to average daily net assets | | | | 0.97 | %(d) | | | | 0.98 | %(c) | | | | 0.98 | %(c) | | | | 0.97 | % | | | | 0.96 | % |
Total expenses (before reductions and reimbursements) to average daily net assets | | | | 0.97 | % | | | | 0.98 | %(c) | | | | 0.99 | %(c) | | | | 0.99 | % | | | | 1.01 | % |
Portfolio turnover rate | | | | 106 | % | | | | 68 | % | | | | 75 | % | | | | 67 | % | | | | 54 | % |
Net assets at end of year (in 000’s) | | | $ | 972,456 | | | | $ | 427,426 | | | | $ | 470,893 | | | | $ | 397,360 | | | | $ | 442,080 | |
| (a) | Includes a non-recurring refund for overbilling of prior years’ custody fees, a portion of which was paid to the Advisor for prior years’ reimbursement of expenses. This amounted to less than $0.01 per share and less than 0.01% of average net assets. |
| (b) | The total return would have been lower had certain expenses not been reduced or reimbursed during the periods shown. |
| (c) | Includes interest expense that amounts to less than 0.01%. |
| (d) | Includes a repayment to the Advisor, referenced above, for prior years’ reimbursement of expenses. The amount is less than 0.01% of average net assets. |
| † | Computed using average shares outstanding throughout the year. |
| | | | | | |
| 154 | | See accompanying Notes to the Financial Statements. | | | | |
Mercer Non-US Core Equity Fund
Financial Highlights (Continued)
| | | | | | | | | | | | | | | | | | | | | | | | | |
| | | Year Ended
03/31/17 | | Year Ended
03/31/16 | | Year Ended
03/31/15 | | Year Ended
03/31/14 | | Year Ended
03/31/13 |
For a Class Y-3 Share Outstanding Throughout Each Period: | | | | | | | | | | | | | | | | | | | | | | | | | |
| | | | | |
Net asset value at beginning of year | | | $ | 9.61 | | | | $ | 10.64 | | | | $ | 11.92 | | | | $ | 10.58 | | | | $ | 9.72 | |
| | | | | | | | | | | | | | | | | | | | | | | | | |
| | | | | |
Net investment income† | | | | 0.18 | (a) | | | | 0.16 | | | | | 0.19 | | | | | 0.29 | | | | | 0.21 | |
Net realized and unrealized gain (loss) on investments | | | | 0.83 | | | | | (0.76 | ) | | | | (0.22 | ) | | | | 1.94 | | | | | 0.90 | |
| | | | | | | | | | | | | | | | | | | | | | | | | |
| | | | | |
Total from investment operations | | | | 1.01 | | | | | (0.60 | ) | | | | (0.03 | ) | | | | 2.23 | | | | | 1.11 | |
| | | | | | | | | | | | | | | | | | | | | | | | | |
Less dividends and distributions: | | | | | | | | | | | | | | | | | | | | | | | | | |
From net investment loss | | | | (0.18 | ) | | | | (0.17 | ) | | | | (0.27 | ) | | | | (0.33 | ) | | | | (0.25 | ) |
From net realized gain on investments | | | | — | | | | | (0.26 | ) | | | | (0.98 | ) | | | | (0.56 | ) | | | | — | |
| | | | | | | | | | | | | | | | | | | | | | | | | |
| | | | | |
Total dividends and distributions | | | | (0.18 | ) | | | | (0.43 | ) | | | | (1.25 | ) | | | | (0.89 | ) | | | | (0.25 | ) |
| | | | | | | | | | | | | | | | | | | | | | | | | |
| | | | | |
Net asset value at end of year | | | $ | 10.44 | | | | $ | 9.61 | | | | $ | 10.64 | | | | $ | 11.92 | | | | $ | 10.58 | |
| | | | | | | | | | | | | | | | | | | | | | | | | |
Total investment return | | | | 10.62 | % | | | | (5.64 | )% | | | | 0.19 | %(b) | | | | 21.48 | %(b) | | | | 11.53 | %(b) |
| | | | | |
Ratios/Supplemental Data: | | | | | | | | | | | | | | | | | | | | | | | | | |
Net investment income to average net assets | | | | 1.81 | %(a) | | | | 1.60 | % | | | | 1.72 | % | | | | 2.52 | % | | | | 2.17 | % |
Net expenses to average daily net assets | | | | 0.82 | %(c)(d) | | | | 0.83 | %(c) | | | | 0.84 | %(c) | | | | 0.85 | % | | | | 0.83 | % |
Total expenses (before reductions and reimbursements) to average daily net assets | | | | 0.81 | %(c) | | | | 0.83 | %(c) | | | | 0.84 | %(c) | | | | 0.86 | % | | | | 0.86 | % |
Portfolio turnover rate | | | | 81 | % | | | | 109 | % | | | | 101 | % | | | | 95 | %(e) | | | | 90 | % |
Net assets at end of year (in 000’s) | | | $ | 2,271,104 | | | | $ | 1,941,634 | | | | $ | 2,072,981 | | | | $ | 1,881,476 | | | | $ | 2,138,930 | |
| (a) | Includes a non-recurring refund for overbilling of prior years’ custody fees, a portion of which was paid to the Advisor for prior years’ reimbursement of expenses. This amounted to less than $0.01 per share and is 0.01% of average net assets. |
| (b) | The total return would have been lower had certain expenses not been reduced or reimbursed during the periods shown. |
| (c) | Includes interest expense that amounts to less than 0.01%. |
| (d) | Includes a repayment to the Advisor, referenced above, for prior years’ reimbursement of expenses. The amount is 0.01% of average net assets. |
| (e) | Portfolio turnover calculation does not include $177,821,966 of securities transferred out of the Fund as part of an in-kind redemption. |
| † | Computed using average shares outstanding throughout the year. |
| | | | | | |
| | See accompanying Notes to the Financial Statements. | | | 155 | |
Mercer Core Fixed Income Fund
Financial Highlights (Continued)
| | | | | | | | | | | | | | | | | | | | | | | | | |
| | | Year Ended
03/31/17 | | Year Ended
03/31/16 | | Year Ended
03/31/15 | | Year Ended
03/31/14 | | Year Ended
03/31/13 |
For a Class Y-3 Share Outstanding Throughout Each Period: | | | | | | | | | | | | | | | | | | | | | | | | | |
| | | | | |
Net asset value at beginning of year | | | $ | 10.15 | | | | $ | 10.43 | | | | $ | 10.42 | | | | $ | 10.68 | | | | $ | 10.58 | |
| | | | | | | | | | | | | | | | | | | | | | | | | |
| | | | | |
Net investment income† | | | | 0.25 | (a) | | | | 0.29 | | | | | 0.28 | | | | | 0.24 | | | | | 0.27 | |
Net realized and unrealized gain (loss) on investments | | | | (0.09 | ) | | | | (0.17 | ) | | | | 0.28 | | | | | (0.19 | ) | | | | 0.37 | |
| | | | | | | | | | | | | | | | | | | | | | | | | |
| | | | | |
Total from investment operations | | | | 0.16 | | | | | 0.12 | | | | | 0.56 | | | | | 0.05 | | | | | 0.64 | |
| | | | | | | | | | | | | | | | | | | | | | | | | |
Less dividends and distributions: | | | | | | | | | | | | | | | | | | | | | | | | | |
From net investment loss | | | | (0.25 | ) | | | | (0.30 | ) | | | | (0.33 | ) | | | | (0.25 | ) | | | | (0.31 | ) |
From net realized gain on investments | | | | (0.10 | ) | | | | (0.10 | ) | | | | (0.22 | ) | | | | (0.06 | ) | | | | (0.23 | ) |
| | | | | | | | | | | | | | | | | | | | | | | | | |
| | | | | |
Total dividends and distributions | | | | (0.35 | ) | | | | (0.40 | ) | | | | (0.55 | ) | | | | (0.31 | ) | | | | (0.54 | ) |
| | | | | | | | | | | | | | | | | | | | | | | | | |
| | | | | |
Net asset value at end of year | | | $ | 9.96 | | | | $ | 10.15 | | | | $ | 10.43 | | | | $ | 10.42 | | | | $ | 10.68 | |
| | | | | | | | | | | | | | | | | | | | | | | | | |
Total investment return | | | | 1.58 | % | | | | 1.26 | % | | | | 5.43 | %(b) | | | | 0.44 | %(b) | | | | 6.15 | %(b) |
| | | | | |
Ratios/Supplemental Data: | | | | | | | | | | | | | | | | | | | | | | | | | |
Net investment income to average net assets | | | | 2.43 | %(a) | | | | 2.80 | % | | | | 2.66 | % | | | | 2.32 | % | | | | 2.51 | % |
Net expenses to average daily net assets | | | | 0.43 | %(c)(d) | | | | 0.42 | % | | | | 0.40 | % | | | | 0.37 | % | | | | 0.37 | % |
Total expenses (before reductions and reimbursements) to average daily net assets | | | | 0.43 | %(c) | | | | 0.42 | % | | | | 0.42 | % | | | | 0.43 | % | | | | 0.43 | % |
Portfolio turnover rate | | | | 151 | % | | | | 88 | % | | | | 192 | % | | | | 187 | %(e) | | | | 125 | % |
Net assets at end of year (in 000’s) | | | $ | 765,603 | | | | $ | 783,875 | | | | $ | 892,649 | | | | $ | 1,076,439 | | | | $ | 1,093,253 | |
| (a) | Includes a non-recurring refund for overbilling of prior years’ custody fees, a portion of which was paid to the Advisor for prior years’ reimbursement of expenses. This amounted to less than $0.01 per share and less than 0.01% of average net assets. |
| (b) | The total return would have been lower had certain expenses not been reduced or reimbursed during the periods shown. |
| (c) | Includes interest expense that amounts to less than 0.01%. |
| (d) | Includes a repayment to the Advisor, referenced above, for prior years’ reimbursement of expenses. The amount is less than 0.01% of average net assets. |
| (e) | Excludes treasury dollar roll transactions. The Portfolio turnover rate including treasury dollar roll transactions was 251% for the year ended March 31, 2014. |
| † | Computed using average shares outstanding throughout the year. |
| | | | | | |
| 156 | | See accompanying Notes to the Financial Statements. | | | | |
Mercer Opportunistic Fixed Income Fund
Financial Highlights (Continued)
| | | | | | | | | | | | | | | | | | | | |
| | | Year Ended
03/31/17 | | Year Ended
03/31/16 | | Year Ended
03/31/15 | | Period Ended
03/31/14(a) |
For a Class Y-3 Share Outstanding Throughout Each Period: | | | | | | | | | | | | | | | | | | | | |
| | | | |
Net asset value at beginning of year | | | $ | 8.44 | | | | $ | 9.13 | | | | $ | 10.43 | | | | $ | 10.00 | |
| | | | | | | | | | | | | | | | | | | | |
| | | | |
Net investment income† | | | | 0.51 | (b) | | | | 0.54 | | | | | 0.56 | | | | | 0.34 | |
Net realized and unrealized gain (loss) on investments | | | | 0.36 | | | | | (1.12 | ) | | | | (1.32 | ) | | | | 0.35 | |
| | | | | | | | | | | | | | | | | | | | |
| | | | |
Total from investment operations | | | | 0.87 | | | | | (0.58 | ) | | | | (0.76 | ) | | | | 0.69 | |
| | | | | | | | | | | | | | | | | | | | |
Less dividends and distributions: | | | | | | | | | | | | | | | | | | | | |
From net investment income (loss) | | | | — | | | | | (0.07 | ) | | | | (0.47 | ) | | | | (0.22 | ) |
From net realized gain on investments | | | | — | | | | | (0.04 | ) | | | | (0.07 | ) | | | | (0.04 | ) |
| | | | | | | | | | | | | | | | | | | | |
| | | | |
Total dividends and distributions | | | | — | | | | | (0.11 | ) | | | | (0.54 | ) | | | | (0.26 | ) |
| | | | | | | | | | | | | | | | | | | | |
| | | | |
Net asset value at end of year | | | $ | 9.31 | | | | $ | 8.44 | | | | $ | 9.13 | | | | $ | 10.43 | |
| | | | | | | | | | | | | | | | | | | | |
Total investment return(c) | | | | 10.31 | % | | | | (6.25 | )% | | | | (7.36 | )% | | | | 7.00 | %** |
| | | | |
Ratios/Supplemental Data: | | | | | | | | | | | | | | | | | | | | |
Net investment income to average net assets | | | | 5.75 | %(b) | | | | 6.28 | % | | | | 5.55 | % | | | | 5.52 | %* |
Net expenses to average daily net assets | | | | 0.94 | %(d)(e) | | | | 0.90 | %(d) | | | | 0.90 | %(d) | | | | 0.90 | %* |
Total expenses (before reductions and reimbursements) to average daily net assets | | | | 0.94 | %(d) | | | | 0.95 | %(d) | | | | 0.97 | %(d) | | | | 1.17 | %* |
Portfolio turnover rate | | | | 55 | % | | | | 53 | % | | | | 58 | % | | | | 28 | %** |
Net assets at end of year (in 000’s) | | | $ | 558,859 | | | | $ | 414,262 | | | | $ | 395,939 | | | | $ | 260,581 | |
| (a) | The Fund commenced operations on August 21, 2013. |
| (b) | Includes a non-recurring refund for overbilling of prior years’ custody fees, a portion of which was paid to the Advisor for prior years’ reimbursement of expenses. This amounted to less than $0.01 per share and less than 0.01% of average net assets. |
| (c) | The total return would have been lower had certain expenses not been reduced or reimbursed during the periods shown. |
| (d) | Includes interest expense that amounts to less than 0.01%. |
| (e) | Includes a repayment to the Advisor, referenced above, for prior years’ reimbursement of expenses. The amount is less than 0.01% of average net assets. |
| † | Computed using average shares outstanding throughout the year. |
| | | | | | |
| | See accompanying Notes to the Financial Statements. | | | 157 | |
Mercer Emerging Markets Equity Fund
Financial Highlights (Continued)
| | | | | | | | | | | | | | | | | | | | | | | | | |
| | | Year Ended
03/31/17 | | Year Ended
03/31/16 | | Year Ended
03/31/15 | | Year Ended
03/31/14 | | Period Ended
03/31/13(a) |
For a Class Y-3 Share Outstanding Throughout Each Period: | | | | | | | | | | | | | | | | | | | | | | | | | |
| | | | | |
Net asset value at beginning of year | | | $ | 8.59 | | | | $ | 9.88 | | | | $ | 9.99 | | | | $ | 10.49 | | | | $ | 10.00 | |
| | | | | | | | | | | | | | | | | | | | | | | | | |
| | | | | |
Net investment income† | | | | 0.14 | (b) | | | | 0.16 | | | | | 0.17 | | | | | 0.18 | | | | | 0.10 | |
Net realized and unrealized gain (loss) on investments | | | | 1.22 | | | | | (1.36 | ) | | | | (0.09 | ) | | | | (0.46 | ) | | | | 0.46 | |
| | | | | | | | | | | | | | | | | | | | | | | | | |
| | | | | |
Total from investment operations | | | | 1.36 | | | | | (1.20 | ) | | | | 0.08 | | | | | (0.28 | ) | | | | 0.56 | |
| | | | | | | | | | | | | | | | | | | | | | | | | |
Less dividends and distributions: | | | | | | | | | | | | | | | | | | | | | | | | | |
From net investment loss | | | | (0.18 | ) | | | | (0.09 | ) | | | | (0.19 | ) | | | | (0.19 | ) | | | | (0.06 | ) |
From net realized gain on investments | | | | — | | | | | — | | | | | — | | | | | (0.03 | ) | | | | (0.01 | ) |
| | | | | | | | | | | | | | | | | | | | | | | | | |
| | | | | |
Total dividends and distributions | | | | (0.18 | ) | | | | (0.09 | ) | | | | (0.19 | ) | | | | (0.22 | ) | | | | (0.07 | ) |
| | | | | | | | | | | | | | | | | | | | | | | | | |
| | | | | |
Net asset value at end of year | | | $ | 9.77 | | | | $ | 8.59 | | | | $ | 9.88 | | | | $ | 9.99 | | | | $ | 10.49 | |
| | | | | | | | | | | | | | | | | | | | | | | | | |
Total investment return | | | | 16.14 | % | | | | (12.06 | )% | | | | 0.81 | %(c) | | | | (2.61 | )%(c) | | | | 5.64 | %(c)** |
| | | | | |
Ratios/Supplemental Data: | | | | | | | | | | | | | | | | | | | | | | | | | |
Net investment income to average net assets | | | | 1.52 | %(b) | | | | 1.79 | % | | | | 1.66 | % | | | | 1.77 | % | | | | 1.08 | %* |
Net expenses to average daily net assets | | | | 1.00 | %(d)(e) | | | | 1.00 | %(d) | | | | 0.98 | %(d) | | | | 0.95 | %(d) | | | | 0.95 | %(d)* |
Total expenses (before reductions and reimbursements) to average daily net assets | | | | 0.99 | %(d) | | | | 1.00 | %(d) | | | | 1.00 | %(d) | | | | 1.04 | %(d) | | | | 1.15 | %(d)* |
Portfolio turnover rate | | | | 89 | % | | | | 66 | % | | | | 46 | % | | | | 64 | % | | | | 52 | %** |
Net assets at end of year (in 000’s) | | | $ | 1,481,990 | | | | $ | 1,150,136 | | | | $ | 1,087,355 | | | | $ | 862,923 | | | | $ | 517,085 | |
| (a) | The Fund commenced operations on May 1, 2012. |
| (b) | Includes a non-recurring refund for overbilling of prior years’ custody fees, a portion of which was paid to the Advisor for prior years’ reimbursement of expenses. This amounted to less than $0.01 per share and less than 0.01% of average net assets. |
| (c) | The total return would have been lower had certain expenses not been reduced or reimbursed during the periods shown. |
| (d) | Includes interest expense that amounts to less than 0.01%. |
| (e) | Includes a repayment to the Advisor, referenced above, for prior years’ reimbursement of expenses. The amount is 0.01% of average net assets. |
| † | Computed using average shares outstanding throughout the year. |
| | | | | | |
| 158 | | See accompanying Notes to the Financial Statements. | | | | |
Mercer Global Low Volatility Equity Fund
Financial Highlights (Continued)
| | | | | | | | | | | | | | | | | | | | | | | | | |
| | | Year Ended
03/31/17 | | Year Ended
03/31/16 | | Year Ended
03/31/15 | | Year Ended
03/31/14 | | Period Ended
03/31/13(a) |
For a Class Y-3 Share Outstanding Throughout Each Period: | | | | | | | | | | | | | | | | | | | | | | | | | |
| | | | | |
Net asset value at beginning of year | | | $ | 11.81 | | | | $ | 12.11 | | | | $ | 12.27 | | | | $ | 11.19 | | | | $ | 10.00 | |
| | | | | | | | | | | | | | | | | | | | | | | | | |
| | | | | |
Net investment income† | | | | 0.16 | (b) | | | | 0.15 | | | | | 0.15 | | | | | 0.14 | | | | | 0.07 | |
Net realized and unrealized gain on investments | | | | 1.11 | | | | | 0.33 | | | | | 0.54 | | | | | 1.45 | | | | | 1.14 | |
| | | | | | | | | | | | | | | | | | | | | | | | | |
| | | | | |
Total from investment operations | | | | 1.27 | | | | | 0.48 | | | | | 0.69 | | | | | 1.59 | | | | | 1.21 | |
| | | | | | | | | | | | | | | | | | | | | | | | | |
Less dividends and distributions: | | | | | | | | | | | | | | | | | | | | | | | | | |
From net investment loss | | | | (0.14 | ) | | | | (0.14 | ) | | | | (0.19 | ) | | | | (0.16 | ) | | | | (0.02 | ) |
From net realized gain on investments | | | | (0.32 | ) | | | | (0.64 | ) | | | | (0.66 | ) | | | | (0.35 | ) | | | | — | |
| | | | | | | | | | | | | | | | | | | | | | | | | |
| | | | | |
Total dividends and distributions | | | | (0.46 | ) | | | | (0.78 | ) | | | | (0.85 | ) | | | | (0.51 | ) | | | | (0.02 | ) |
| | | | | | | | | | | | | | | | | | | | | | | | | |
| | | | | |
Net asset value at end of year | | | $ | 12.62 | | | | $ | 11.81 | | | | $ | 12.11 | | | | $ | 12.27 | | | | $ | 11.19 | |
| | | | | | | | | | | | | | | | | | | | | | | | | |
Total investment return | | | | 11.02 | % | | | | 4.13 | % | | | | 5.80 | %(c) | | | | 14.40 | %(c) | | | | 12.13 | %(c)** |
| | | | | |
Ratios/Supplemental Data: | | | | | | | | | | | | | | | | | | | | | | | | | |
Net investment income to average net assets | | | | 1.34 | %(b) | | | | 1.23 | % | | | | 1.25 | % | | | | 1.20 | % | | | | 1.62 | %* |
Net expenses to average daily net assets | | | | 0.81 | %(d) | | | | 0.82 | %(d) | | | | 0.85 | %(d) | | | | 0.85 | % | | | | 0.85 | %* |
Total expenses (before reductions and reimbursements/recapture) to average daily net assets | | | | 0.81 | %(d) | | | | 0.82 | %(d) | | | | 0.84 | %(d) | | | | 0.84 | % | | | | 1.00 | %* |
Portfolio turnover rate | | | | 55 | % | | | | 31 | % | | | | 84 | % | | | | 46 | % | | | | 12 | %** |
Net assets at end of year (in 000’s) | | | $ | 1,249,860 | | | | $ | 952,386 | | | | $ | 819,052 | | | | $ | 742,641 | | | | $ | 301,230 | |
| (a) | The Fund commenced operations on November 6, 2012. |
| (b) | Includes a non-recurring refund for overbilling of prior years’ custody fees, a portion of which was paid to the Advisor for prior years’ reimbursement of expenses. This amounted to less than $0.01 per share and less than 0.01% of average net assets. |
| (c) | The total return would have been lower had certain expenses not been reduced or reimbursed during the periods shown. |
| (d) | Includes interest expense that amounts to less than 0.01%. |
| † | Computed using average shares outstanding throughout the year. |
| | | | | | |
| | See accompanying Notes to the Financial Statements. | | | 159 | |
Mercer Funds
Notes to the Financial Statements
March 31, 2017
Mercer Funds (the “Trust”) consists of the following seven series: Mercer US Large Cap Equity Fund (“Large Cap”) (formerly Mercer US Large Cap Growth Equity Fund), Mercer US Small/Mid Cap Equity Fund (“Small/Mid Cap”) (formerly Mercer US Small/Mid Cap Growth Equity Fund), Mercer Non-US Core Equity Fund (“Non-US Core Equity”), Mercer Core Fixed Income Fund (“Core Fixed”), Mercer Opportunistic Fixed Income Fund (“Opportunistic Fixed”), Mercer Emerging Markets Equity Fund (“Emerging Markets”) and Mercer Global Low Volatility Equity Fund (“Global Low Volatility”) (each a “Fund,” and collectively referred to as the “Funds”). The Trust is a Delaware statutory trust established on March 11, 2005. The Trust is registered as an investment company under the Investment Company Act of 1940 (the “1940 Act”). The Funds’ investment advisor is Mercer Investment Management, Inc. (the “Advisor”). The Advisor manages each Fund using a “manager of managers” approach by selecting one or more subadvisors (each a “Subadvisor,” and collectively referred to as the “Subadvisors”) to manage each Fund’s assets. The Funds are investment companies and accordingly follow the investment company accounting and reporting guidance of the Financial Accounting Standards Board (FASB) Accounting Standard Codification Topic 946: Financial Services – Investment Companies.
Under the 1940 Act, each Fund is classified as “diversified”, with the exception of Opportunistic Fixed. Opportunistic Fixed is classified as “non-diversified” under the 1940 Act, as amended, and may invest a larger percentage of its assets in fewer issuers than diversified funds.
The investment objectives of the Funds are:
| | |
Fund | | Investment Objective |
| Large Cap | | Long-term total return, which includes capital appreciation and income |
| Small/Mid Cap | | Long-term total return, comprised primarily of capital appreciation |
| Non-US Core Equity | | Long-term total return, which includes capital appreciation and income |
| Core Fixed | | Total return, consisting of both current income and capital appreciation |
| Opportunistic Fixed | | Long-term total return, which includes capital appreciation and income |
| Emerging Markets | | Long-term total return, which includes capital appreciation and income |
| Global Low Volatility | | Long-term total return, which includes capital appreciation and income |
Each Fund has registered and is authorized to offer interests in four classes of shares: Class S, Class Y-1, Class Y-2 and Class Y-3. The principal difference between the classes of shares is the level of shareholder service, marketing and administrative fees borne by the classes. As of March 31, 2017, only the Class Y-3 shares of each Fund had commenced operations.
| 2. | Significant Accounting Policies |
The following are significant accounting policies followed by the Funds. These policies are in conformity with accounting principles generally accepted in the United States of America (“GAAP”). The preparation of financial statements in conformity with GAAP requires management to make estimates and assumptions that affect the reported amounts and disclosures in the financial statements. Actual results could differ from these estimates.
(a) Security Valuation
Each Fund’s investments are valued as of the close of regular trading on the New York Stock Exchange (“NYSE”) on each day when the NYSE is open. Portfolio securities listed on an exchange normally are valued at the last sale
160
Mercer Funds
Notes to the Financial Statements (Continued)
March 31, 2017
or official closing price on the day on which the securities are valued or, lacking any sales on such day, at the last available bid price using prices as of the close of trading. In cases where securities are traded on more than one exchange, the securities are generally valued on the exchange considered by the Advisor or the applicable Subadvisor as the primary market for such securities. Securities traded in the over-the-counter (“OTC”) market and listed on the NASDAQ Stock Market (“NASDAQ”) normally are valued at the NASDAQ Official Closing Price; other OTC securities are valued at the last bid price available prior to valuation (other than short-term investments, which are valued as described below). The Funds may invest in securities that are traded in foreign markets. Foreign securities will be converted into U.S. dollar equivalents based on the exchange rate in effect at a uniform time on each business day. Events occurring after the close of trading on foreign exchanges may result in adjustments to the valuation of foreign securities to more accurately reflect their fair value as of the close of regular trading on the New York Stock Exchange. When valuing foreign equity securities that meet certain criteria, the Board of Trustees of the Trust (the “Board”) has approved the use of a fair value service that values such securities to reflect market trading that occurs after the close of the applicable foreign markets of comparable securities or other instruments that have a strong correlation to the fair-valued securities. Investments in open-end investment companies are valued at their net asset value (“NAV”) per share.
Certain fixed-income securities may be valued based upon appraisals received from an independent pricing service using a computerized matrix system or based upon appraisals derived from information concerning the securities or similar securities received from a recognized dealer or dealers in those securities. It should be recognized that judgment often plays a greater role in valuing thinly traded securities, as well as bonds and other securities with few dealer quotations, than is the case with respect to securities for which a broader range of dealer quotations and last-sale information is available. Each such determination is based on consideration of relevant factors, and judgment is made by or at the direction of the Board. Each Fund values its investments for which market quotations are readily available at market value. Each Fund may value short-term investments that will mature within 60 days or less by using pricing service quotations or at amortized cost, provided that such amortized cost approximates market value.
Derivative financial instruments, such as futures contracts or options contracts that are traded on a national securities exchange, are stated at the last reported sale or settlement price on the day of valuation. Futures traded on inactive markets are valued using broker quotations. OTC derivative financial instruments, such as foreign currency contracts, options contracts, synthetic futures, or swaps agreements, derive their value from underlying asset prices, indices, reference rates, and other inputs or a combination of these factors. These contracts are normally valued on the basis of an independent pricing service providers or broker dealer quotations. Depending on the derivative type and the terms of the derivative, the value of the derivative financial instruments is assigned by independent pricing service providers using a series of techniques, which may include pricing models. The pricing models use inputs that are observed from actively quoted markets such as issuer details, indices, spreads, interest rates, curves, volatilities, dividends and exchange rates.
Senior secured floating rate loans and senior secured floating rate debt securities are valued using an evaluated quote provided by an independent pricing service. Evaluated quotes provided by the pricing service may reflect appropriate factors such as ratings, yield curves, prepayment speeds, tranche type, industry, company performance, spread, individual trading characteristics, institutional size trading in similar groups of securities and other market data.
The Board has delegated its responsibility for valuing portfolio securities to the Advisor, subject to continuing Board oversight. The Advisor has appointed a Valuation Committee that is responsible for overseeing the day-to-day process of valuing portfolio securities. With respect to portfolio securities for which market quotations are not readily available or (in the opinion of the Advisor or the applicable Subadvisor) do not otherwise accurately reflect the fair values of the securities, the Valuation Committee will value such securities at fair value based upon procedures approved by the Board.
The application of fair value pricing represents a good faith determination based on specific procedures performed under the supervision of the Board. Due to the subjective nature of fair value pricing, there can be no assurance that a Fund could realize the fair value assigned to the security if the Fund were to sell the security at approximately the
161
Mercer Funds
Notes to the Financial Statements (Continued)
March 31, 2017
time at which the Fund determines its NAV per share. A Fund’s value for a particular security may be different from the last quoted market price.
The Funds follow a three-tier hierarchy to prioritize the assumptions, referred to as inputs, used in valuation techniques to measure fair value. The three-tier hierarchy of inputs is summarized in the three broad Levels listed below.
| | • | | Level 1 — quoted prices unadjusted in active markets for identical investments |
| | • | | Level 2 — other significant observable inputs (including quoted prices for similar investments, interest rates, prepayment speeds, credit risk, etc.) |
| | • | | Level 3 — significant unobservable inputs (including the Fund’s own assumptions in determining the fair value of investments) |
The inputs or methodology used for valuing securities are not necessarily an indication of the risk associated with investing in those securities.
The assets and liabilities shown in the Statements of Assets and Liabilities related to investments purchased for “to-be-announced” (“TBA”), TBA commitments or when-issued securities approximate fair value and are determined using Level 2 inputs, as of March 31, 2017. The assets and liabilities shown in the Statements of Assets and Liabilities related to cash collateral held at broker for futures contracts and swap contracts are determined using Level 1 inputs as of March 31, 2017.
At March 31, 2017, Large Cap and Small/Mid Cap held long-term investments whose value was determined using Level 1 inputs, with corresponding major categories as shown in the schedule of investments, Futures Contracts and State Street Institutional U.S. Government Money Market Fund, Premier Class whose value was determined using Level 1 inputs and short-term investment positions in a Euro Time Deposit and a United States Treasury Bill, as shown in the schedule of investments, whose value was determined using Level 2 inputs.
The following is a summary of the inputs used as of March 31, 2017 in valuing the assets and liabilities of Non-US Core Equity, Core Fixed, Opportunistic Fixed, Emerging Markets and Global Low Volatility for which fair valuation was used:
Non-US Core Equity
ASSETS VALUATION INPUT
| | | | | | | | | | | | | | | | |
Description | | Quoted Prices
in Active
Markets for
Identical Assets
(Level 1) | | | Significant
Other
Observable
Inputs
(Level 2) | | | Significant
Unobservable
Inputs
(Level 3) | | | Total | |
Common Stocks | | | | | | | | | | | | | | | | |
Australia | | $ | 94,173,809 | | | $ | 0 | * | | $ | — | | | $ | 94,173,809 | |
Austria | | | 24,580,525 | | | | — | | | | — | | | | 24,580,525 | |
Belgium | | | 18,029,773 | | | | — | | | | — | | | | 18,029,773 | |
Bermuda | | | 4,259,171 | | | | — | | | | — | | | | 4,259,171 | |
Brazil | | | 2,167,770 | | | | — | | | | — | | | | 2,167,770 | |
Canada | | | 10,970,521 | | | | — | | | | — | | | | 10,970,521 | |
Cayman Islands | | | 40,951,368 | | | | 1,786,200 | | | | — | | | | 42,737,568 | |
China | | | 2,929,307 | | | | — | | | | — | | | | 2,929,307 | |
Denmark | | | 33,445,533 | | | | — | | | | — | | | | 33,445,533 | |
Faroe Islands | | | 530,402 | | | | — | | | | — | | | | 530,402 | |
Finland | | | 18,174,993 | | | | — | | | | — | | | | 18,174,993 | |
France | | | 168,141,901 | | | | — | | | | — | | | | 168,141,901 | |
162
Mercer Funds
Notes to the Financial Statements (Continued)
March 31, 2017
| | | | | | | | | | | | | | | | |
Description | | Quoted Prices
in Active
Markets for
Identical Assets
(Level 1) | | | Significant
Other
Observable
Inputs
(Level 2) | | | Significant
Unobservable
Inputs
(Level 3) | | | Total | |
Germany | | $ | 207,389,013 | | | $ | — | | | $ | — | | | $ | 207,389,013 | |
Gibraltar | | | 400,494 | | | | — | | | | — | | | | 400,494 | |
Hong Kong | | | 18,515,774 | | | | — | | | | — | | | | 18,515,774 | |
Hungary | | | 2,889,624 | | | | — | | | | — | | | | 2,889,624 | |
India | | | 14,383,636 | | | | — | | | | — | | | | 14,383,636 | |
Indonesia | | | 9,532,872 | | | | — | | | | — | | | | 9,532,872 | |
Ireland | | | 27,269,746 | | | | — | | | | — | | | | 27,269,746 | |
Isle Of Man | | | 1,482,267 | | | | — | | | | — | | | | 1,482,267 | |
Israel | | | 6,210,010 | | | | — | | | | — | | | | 6,210,010 | |
Italy | | | 22,125,666 | | | | — | | | | — | | | | 22,125,666 | |
Japan | | | 505,199,571 | | | | — | | | | — | | | | 505,199,571 | |
Luxembourg | | | 11,400,069 | | | | — | | | | — | | | | 11,400,069 | |
Malaysia | | | 2,321,131 | | | | — | | | | — | | | | 2,321,131 | |
Malta | | | 636,616 | | | | — | | | | — | | | | 636,616 | |
Netherlands | | | 80,878,186 | | | | — | | | | — | | | | 80,878,186 | |
New Zealand | | | 5,148,805 | | | | — | | | | — | | | | 5,148,805 | |
Norway | | | 15,483,214 | | | | — | | | | — | | | | 15,483,214 | |
Philippines | | | 633,980 | | | | — | | | | — | | | | 633,980 | |
Poland | | | 1,219,266 | | | | — | | | | — | | | | 1,219,266 | |
Portugal | | | 12,250,741 | | | | — | | | | 0 | ** | | | 12,250,741 | |
Russia | | | 3,519,805 | | | | — | | | | — | | | | 3,519,805 | |
Singapore | | | 3,415,864 | | | | — | | | | — | | | | 3,415,864 | |
South Africa | | | 1,398,445 | | | | — | | | | — | | | | 1,398,445 | |
South Korea | | | 8,571,732 | | | | — | | | | — | | | | 8,571,732 | |
Spain | | | 46,066,402 | | | | — | | | | 0 | ** | | | 46,066,402 | |
Sweden | | | 48,465,547 | | | | — | | | | — | | | | 48,465,547 | |
Switzerland | | | 177,198,037 | | | | — | | | | — | | | | 177,198,037 | |
Taiwan | | | 23,320,641 | | | | — | | | | — | | | | 23,320,641 | |
Thailand | | | 2,688,307 | | | | — | | | | — | | | | 2,688,307 | |
Turkey | | | 828,206 | | | | — | | | | — | | | | 828,206 | |
United Kingdom | | | 361,455,529 | | | | — | | | | — | | | | 361,455,529 | |
United States | | | 48,652,089 | | | | — | | | | — | | | | 48,652,089 | |
| | | | | | | | | | | | | | | | |
Total Common Stocks | | | 2,089,306,358 | | | | 1,786,200 | | | | 0 | | | | 2,091,092,558 | |
| | | | | | | | | | | | | | | | |
Investment Companies | | | | | | | | | | | | | | | | |
United States | | | 21,336,007 | | | | — | | | | — | | | | 21,336,007 | |
| | | | | | | | | | | | | | | | |
Total Investment Companies | | | 21,336,007 | | | | — | | | | — | | | | 21,336,007 | |
| | | | | | | | | | | | | | | | |
Preferred Stocks | | | | | | | | | | | | | | | | |
Brazil | | | 2,394,815 | | | | — | | | | — | | | | 2,394,815 | |
Germany | | | 22,174,278 | | | | — | | | | — | | | | 22,174,278 | |
| | | | | | | | | | | | | | | | |
Total Preferred Stocks | | | 24,569,093 | | | | — | | | | — | | | | 24,569,093 | |
| | | | | | | | | | | | | | | | |
Rights | | | | | | | | | | | | | | | | |
Australia | | | 508 | | | | — | | | | — | | | | 508 | |
Germany | | | 167,945 | | | | — | | | | — | | | | 167,945 | |
| | | | | | | | | | | | | | | | |
Total Rights | | | 168,453 | | | | — | | | | — | | | | 168,453 | |
| | | | | | | | | | | | | | | | |
163
Mercer Funds
Notes to the Financial Statements (Continued)
March 31, 2017
| | | | | | | | | | | | | | | | |
Description | | Quoted Prices
in Active
Markets for
Identical Assets
(Level 1) | | | Significant
Other
Observable
Inputs
(Level 2) | | | Significant
Unobservable
Inputs
(Level 3) | | | Total | |
Short-Term Investments | | | | | | | | | | | | | | | | |
Bank Deposits | | $ | — | | | $ | 118,157,051 | | | $ | — | | | $ | 118,157,051 | |
Mutual Fund - Securities Lending Collateral | | | 81,928,175 | | | | — | | | | — | | | | 81,928,175 | |
U.S. Government and Agency Obligations | | | — | | | | 4,694,962 | | | | — | | | | 4,694,962 | |
| | | | | | | | | | | | | | | | |
Total Short-Term Investments | | | 81,928,175 | | | | 122,852,013 | | | | — | | | | 204,780,188 | |
| | | | | | | | | | | | | | | | |
Forward Foreign Currency Contracts† | | | | | | | | | | | | | | | | |
Sales | | | — | | | | 75,440 | | | | — | | | | 75,440 | |
| | | | | | | | | | | | | | | | |
Total Forward Foreign Currency Contracts | | | — | | | | 75,440 | | | | — | | | | 75,440 | |
| | | | | | | | | | | | | | | | |
Futures Contracts† | | | | | | | | | | | | | | | | |
Buys | | | 567,382 | | | | — | | | | — | | | | 567,382 | |
| | | | | | | | | | | | | | | | |
Total Futures Contracts | | | 567,382 | | | | — | | | | — | | | | 567,382 | |
| | | | | | | | | | | | | | | | |
Total | | $ | 2,217,875,468 | | | $ | 124,713,653 | | | $ | 0 | | | $ | 2,342,589,121 | |
| | | | | | | | | | | | | | | | |
LIABILITIES VALUATION INPUT
| | | | | | | | | | | | | | | | |
Description | | Quoted Prices
in Active
Markets for
Identical Assets
(Level 1) | | | Significant
Other
Observable
Inputs
(Level 2) | | | Significant
Unobservable
Inputs
(Level 3) | | | Total | |
Forward Foreign Currency Contracts† | | | | | | | | | | | | | | | | |
Buys | | $ | — | | | $ | (57,033 | ) | | $ | — | | | $ | (57,033 | ) |
| | | | | | | | | | | | | | | | |
Total Forward Foreign Currency Contracts | | | — | | | | (57,033 | ) | | | — | | | | (57,033 | ) |
| | | | | | | | | | | | | | | | |
Total | | $ | — | | | $ | (57,033 | ) | | $ | — | | | $ | (57,033 | ) |
| | | | | | | | | | | | | | | | |
| | * | Represents one or more Level 2 securities at $0 value as of March 31, 2017. |
| | ** | Represents one or more Level 3 securities at $0 value as of March 31, 2017. |
| | † | Forward foreign currency contracts and Futures contracts are valued at unrealized appreciation/depreciation. Only current day’s variation margin, if any, is reported on the Statements of Assets and Liabilities. |
164
Mercer Funds
Notes to the Financial Statements (Continued)
March 31, 2017
Core Fixed
ASSETS VALUATION INPUT
| | | | | | | | | | | | | | | | |
Description | | Quoted Prices
in Active
Markets for
Identical Assets
(Level 1) | | | Significant
Other
Observable
Inputs
(Level 2) | | | Significant
Unobservable
Inputs
(Level 3) | | | Total | |
Debt Obligations | | | | | | | | | | | | | | | | |
Asset Backed Securities | | $ | — | | | $ | 107,321,087 | | | $ | — | | | $ | 107,321,087 | |
Corporate Debt | | | — | | | | 299,903,257 | | | | 0 | ** | | | 299,903,257 | |
Mortgage Backed Securities - Private Issuers | | | — | | | | 73,191,806 | | | | — | | | | 73,191,806 | |
Mortgage Backed Securities - U.S. Government Agency Obligations | | | — | | | | 166,720,046 | | | | — | | | | 166,720,046 | |
Municipal Obligations | | | — | | | | 9,141,571 | | | | — | | | | 9,141,571 | |
Sovereign Debt Obligations | | | — | | | | 7,942,035 | | | | — | | | | 7,942,035 | |
U.S. Government and Agency Obligations | | | — | | | | 86,360,091 | | | | — | | | | 86,360,091 | |
| | | | | | | | | | | | | | | | |
Total Debt Obligations | | | — | | | | 750,579,893 | | | | 0 | | | | 750,579,893 | |
| | | | | | | | | | | | | | | | |
Options Purchased | | | | | | | | | | | | | | | | |
Put Options | | | 70,300 | | | | — | | | | — | | | | 70,300 | |
| | | | | | | | | | | | | | | | |
Total Options Purchased | | | 70,300 | | | | — | | | | — | | | | 70,300 | |
| | | | | | | | | | | | | | | | |
Short-Term Investments | | | | | | | | | | | | | | | | |
Bank Deposits | | | — | | | | 23,010,937 | | | | — | | | | 23,010,937 | |
Mutual Fund - Securities Lending Collateral | | | 10,554,630 | | | | — | | | | — | | | | 10,554,630 | |
U.S. Government and Agency Obligations | | | — | | | | 5,069,938 | | | | — | | | | 5,069,938 | |
| | | | | | | | | | | | | | | | |
Total Short-Term Investments | | | 10,554,630 | | | | 28,080,875 | | | | — | | | | 38,635,505 | |
| | | | | | | | | | | | | | | | |
Futures Contracts† | | | | | | | | | | | | | | | | |
Buys | | | 248,465 | | | | — | | | | — | | | | 248,465 | |
| | | | | | | | | | | | | | | | |
Total Futures Contracts | | | 248,465 | | | | — | | | | — | | | | 248,465 | |
| | | | | | | | | | | | | | | | |
Swaps | | | | | | | | | | | | | | | | |
Centrally Cleared Interest Rate Swaps† | | | — | | | | 318,889 | | | | — | | | | 318,889 | |
| | | | | | | | | | | | | | | | |
Total Swaps | | | — | | | | 318,889 | | | | — | | | | 318,889 | |
| | | | | | | | | | | | | | | | |
Total | | $ | 10,873,395 | | | $ | 778,979,657 | | | $ | 0 | | | $ | 789,853,052 | |
| | | | | | | | | | | | | | | | |
165
Mercer Funds
Notes to the Financial Statements (Continued)
March 31, 2017
LIABILITIES VALUATION INPUT
| | | | | | | | | | | | | | | | |
Description | | Quoted Prices
in Active
Markets for
Identical Assets
(Level 1) | | | Significant
Other
Observable
Inputs
(Level 2) | | | Significant
Unobservable
Inputs
(Level 3) | | | Total | |
TBA Sale Commitments | | $ | — | | | $ | (511,484 | ) | | $ | — | | | $ | (511,484 | ) |
| | | | | | | | | | | | | | | | |
Futures Contracts† | | | | | | | | | | | | | | | | |
Sales | | | (33,109 | ) | | | — | | | | — | | | | (33,109 | ) |
| | | | | | | | | | | | | | | | |
Total Futures Contracts | | | (33,109 | ) | | | — | | | | — | | | | (33,109 | ) |
| | | | | | | | | | | | | | | | |
Swaps | | | | | | | | | | | | | | | | |
Centrally Cleared Interest Rate Swaps† | | | — | | | | (65,990 | ) | | | — | | | | (65,990 | ) |
Centrally Cleared Credit Default Swaps† | | | — | | | | (26,705 | ) | | | — | | | | (26,705 | ) |
| | | | | | | | | | | | | | | | |
Total Swaps | | | — | | | | (92,695 | ) | | | — | | | | (92,695 | ) |
| | | | | | | | | | | | | | | | |
Written Options | | | (12,500 | ) | | | — | | | | — | | | | (12,500 | ) |
| | | | | | | | | | | | | | | | |
Total | | $ | (45,609 | ) | | $ | (604,179 | ) | | $ | — | | | $ | (649,788 | ) |
| | | | | | | | | | | | | | | | |
| | ** | Represents one or more Level 3 securities at $0 value as of March 31, 2017. |
| | † | Futures contracts and Centrally Cleared Swaps are valued at unrealized appreciation/depreciation. Only current day’s variation margin, if any, is reported on the Statements of Assets and Liabilities. |
Opportunistic Fixed
ASSETS VALUATION INPUT
| | | | | | | | | | | | | | | | |
Description | | Quoted Prices
in Active
Markets for
Identical Assets
(Level 1) | | | Significant
Other
Observable
Inputs
(Level 2) | | | Significant
Unobservable
Inputs
(Level 3) | | | Total | |
Debt Obligations | | | | | | | | | | | | | | | | |
Corporate Debt | | $ | — | | | $ | 257,645,081 | | | $ | 0 | ** | | $ | 257,645,081 | |
Sovereign Debt Obligations | | | — | | | | 275,906,394 | | | | — | | | | 275,906,394 | |
| | | | | | | | | | | | | | | | |
Total Debt Obligations | | | — | | | | 533,551,475 | | | | 0 | | | | 533,551,475 | |
| | | | | | | | | | | | | | | | |
Common Stocks | | | | | | | | | | | | | | | | |
Diversified Financial Services | | | — | | | | — | | | | 0 | ** | | | — | |
Electric | | | 558,291 | | | | — | | | | — | | | | 558,291 | |
Oil & Gas | | | 2,623,622 | | | | 626,826 | | | | — | | | | 3,250,448 | |
Transportation | | | — | | | | 164,773 | | | | — | | | | 164,773 | |
| | | | | | | | | | | | | | | | |
Total Common Stocks | | | 3,181,913 | | | | 791,599 | | | | 0 | | | | 3,973,512 | |
| | | | | | | | | | | | | | | | |
Warrants | | | | | | | | | | | | | | | | |
Oil & Gas | | | — | | | | 24,826 | | | | 0 | ** | | | 24,826 | |
| | | | | | | | | | | | | | | | |
Total Warrants | | | — | | | | 24,826 | | | | 0 | | | | 24,826 | |
| | | | | | | | | | | | | | | | |
166
Mercer Funds
Notes to the Financial Statements (Continued)
March 31, 2017
| | | | | | | | | | | | | | | | |
Description | | Quoted Prices
in Active
Markets for
Identical Assets
(Level 1) | | | Significant
Other
Observable
Inputs
(Level 2) | | | Significant
Unobservable
Inputs
(Level 3) | | | Total | |
Short-Term Investments | | | | | | | | | | | | | | | | |
Bank Deposits | | $ | — | | | $ | 17,755,207 | | | $ | — | | | $ | 17,755,207 | |
Mutual Fund - Securities Lending Collateral | | | 22,260,085 | | | | — | | | | — | | | | 22,260,085 | |
| | | | | | | | | | | | | | | | |
Total Short-Term Investments | | | 22,260,085 | | | | 17,755,207 | | | | — | | | | 40,015,292 | |
| | | | | | | | | | | | | | | | |
Forward Foreign Currency Contracts† | | | | | | | | | | | | | | | | |
Buys | | | — | | | | 1,815,722 | | | | — | | | | 1,815,722 | |
Sales | | | — | | | | 830,821 | | | | — | | | | 830,821 | |
Cross-Currency Forwards | | | — | | | | 58,767 | | | | — | | | | 58,767 | |
| | | | | | | | | | | | | | | | |
Total Forward Foreign Currency Contracts | | | — | | | | 2,705,310 | | | | — | | | | 2,705,310 | |
| | | | | | | | | | | | | | | | |
Futures Contracts† | | | | | | | | | | | | | | | | |
Buys | | | 15,148 | | | | — | | | | — | | | | 15,148 | |
| | | | | | | | | | | | | | | | |
Total Futures Contracts | | | 15,148 | | | | — | | | | — | | | | 15,148 | |
| | | | | | | | | | | | | | | | |
Total | | $ | 25,457,146 | | | $ | 554,828,417 | | | $ | 0 | | | $ | 580,285,563 | |
| | | | | | | | | | | | | | | | |
LIABILITIES VALUATION INPUT
| | | | | | | | | | | | | | | | |
Description | | Quoted Prices
in Active
Markets for
Identical Assets
(Level 1) | | | Significant
Other
Observable
Inputs
(Level 2) | | | Significant
Unobservable
Inputs
(Level 3) | | | Total | |
Forward Foreign Currency Contracts† | | | | | | | | | | | | | | | | |
Buys | | $ | — | | | $ | (711,464 | ) | | $ | — | | | $ | (711,464 | ) |
Sales | | | — | | | | (1,292,952 | ) | | | — | | | | (1,292,952 | ) |
Cross-Currency Forwards | | | — | | | | (33,804 | ) | | | — | | | | (33,804 | ) |
| | | | | | | | | | | | | | | | |
Total Forward Foreign Currency Contracts | | | — | | | | (2,038,220 | ) | | | — | | | | (2,038,220 | ) |
| | | | | | | | | | | | | | | | |
Futures Contracts† | | | | | | | | | | | | | | | | |
Buys | | | (119,929 | ) | | | (4,419 | ) | | | — | | | | (124,348 | ) |
Sales | | | (240 | ) | | | — | | | | — | | | | (240 | ) |
| | | | | | | | | | | | | | | | |
Total Futures Contracts | | | (120,169 | ) | | | (4,419 | ) | | | — | | | | (124,588 | ) |
| | | | | | | | | | | | | | | | |
Total | | $ | (120,169 | ) | | $ | (2,042,639 | ) | | $ | — | | | $ | (2,162,808 | ) |
| | | | | | | | | | | | | | | | |
| | ** | Represents one or more Level 3 securities at $0 value as of March 31, 2017. |
| | † | Forward foreign currency contracts and Futures contracts are valued at unrealized appreciation/depreciation. Only current day’s variation margin, if any, is reported on the Statements of Assets and Liabilities. |
167
Mercer Funds
Notes to the Financial Statements (Continued)
March 31, 2017
Emerging Markets
ASSETS VALUATION INPUT
| | | | | | | | | | | | | | | | |
Description | | Quoted Prices
in Active
Markets for
Identical Assets
(Level 1) | | | Significant
Other
Observable
Inputs
(Level 2) | | | Significant
Unobservable
Inputs
(Level 3) | | | Total | |
Common Stocks | | | | | | | | | | | | |
Austria | | $ | 3,361,658 | | | $ | — | | | $ | — | | | $ | 3,361,658 | |
Bermuda | | | 17,300,749 | | | | — | | | | — | | | | 17,300,749 | |
Brazil | | | 67,380,713 | | | | — | | | | — | | | | 67,380,713 | |
British Virgin Islands | | | 1,738,430 | | | | — | | | | — | | | | 1,738,430 | |
Cayman Islands | | | 135,138,071 | | | | — | | | | — | | | | 135,138,071 | |
Chile | | | 12,254,684 | | | | — | | | | — | | | | 12,254,684 | |
China | | | 151,294,672 | | | | — | | | | — | | | | 151,294,672 | |
Colombia | | | 972,700 | | | | — | | | | — | | | | 972,700 | |
Czech Republic | | | 1,542,921 | | | | — | | | | — | | | | 1,542,921 | |
France | | | 2,493,602 | | | | — | | | | — | | | | 2,493,602 | |
Hong Kong | | | 59,629,756 | | | | — | | | | — | | | | 59,629,756 | |
Hungary | | | 13,977,691 | | | | — | | | | — | | | | 13,977,691 | |
India | | | 126,043,207 | | | | — | | | | — | | | | 126,043,207 | |
Indonesia | | | 41,688,365 | | | | — | | | | — | | | | 41,688,365 | |
Japan | | | 2,763,680 | | | | — | | | | — | | | | 2,763,680 | |
Luxembourg | | | 2,871,110 | | | | — | | | | — | | | | 2,871,110 | |
Malaysia | | | 19,532,064 | | | | — | | | | — | | | | 19,532,064 | |
Mexico | | | 48,320,229 | | | | — | | | | — | | | | 48,320,229 | |
Netherlands | | | 2,369,902 | | | | — | | | | — | | | | 2,369,902 | |
Philippines | | | 4,187,625 | | | | — | | | | — | | | | 4,187,625 | |
Poland | | | 8,880,912 | | | | — | | | | — | | | | 8,880,912 | |
Qatar | | | 5,241,118 | | | | — | | | | — | | | | 5,241,118 | |
Romania | | | 407,268 | | | | — | | | | — | | | | 407,268 | |
Russia | | | 33,917,509 | | | | 2,435,178 | | | | — | | | | 36,352,687 | |
Singapore | | | 8,822,263 | | | | — | | | | — | | | | 8,822,263 | |
South Africa | | | 71,821,063 | | | | — | | | | — | | | | 71,821,063 | |
South Korea | | | 183,642,875 | | | | — | | | | — | | | | 183,642,875 | |
Sweden | | | 1,324,183 | | | | — | | | | — | | | | 1,324,183 | |
Switzerland | | | 5,966,565 | | | | — | | | | — | | | | 5,966,565 | |
Taiwan | | | 163,180,251 | | | | — | | | | — | | | | 163,180,251 | |
Thailand | | | 22,572,285 | | | | 18,708,981 | | | | — | | | | 41,281,266 | |
Turkey | | | 17,396,909 | | | | — | | | | — | | | | 17,396,909 | |
United Arab Emirates | | | 16,305,333 | | | | — | | | | — | | | | 16,305,333 | |
United Kingdom | | | 16,399,565 | | | | — | | | | — | | | | 16,399,565 | |
United States | | | 20,016,607 | | | | — | | | | — | | | | 20,016,607 | |
| | | | | | | | | | | | | | | | |
Total Common Stocks | | | 1,290,756,535 | | | | 21,144,159 | | | | — | | | | 1,311,900,694 | |
| | | | | | | | | | | | | | | | |
Preferred Stocks | | | | | | | | | | | | |
Brazil | | | 42,944,650 | | | | — | | | | — | | | | 42,944,650 | |
Colombia | | | 602,479 | | | | — | | | | — | | | | 602,479 | |
Germany | | | 1,579,479 | | | | — | | | | — | | | | 1,579,479 | |
| | | | | | | | | | | | | | | | |
Total Preferred Stocks | | | 45,126,608 | | | | — | | | | — | | | | 45,126,608 | |
| | | | | | | | | | | | | | | | |
168
Mercer Funds
Notes to the Financial Statements (Continued)
March 31, 2017
| | | | | | | | | | | | | | | | |
Description | | Quoted Prices
in Active
Markets for
Identical Assets
(Level 1) | | | Significant
Other
Observable
Inputs
(Level 2) | | | Significant
Unobservable
Inputs
(Level 3) | | | Total | |
Short-Term Investments | | | | | | | | | | | | |
Bank Deposits | | $ | — | | | $ | 125,115,810 | | | $ | — | | | $ | 125,115,810 | |
Investment Fund | | | 8,252,201 | | | | — | | | | — | | | | 8,252,201 | |
Mutual Fund - Securities Lending Collateral | | | 23,309,405 | | | | — | | | | — | | | | 23,309,405 | |
U.S. Government and Agency Obligations | | | — | | | | 3,396,355 | | | | — | | | | 3,396,355 | |
| | | | | | | | | | | | | | | | |
Total Short-Term Investments | | | 31,561,606 | | | | 128,512,165 | | | | — | | | | 160,073,771 | |
| | | | | | | | | | | | | | | | |
Forward Foreign Currency Contracts† | | | | | | | | | | | | |
Buys | | | — | | | | 1,794,430 | | | | — | | | | 1,794,430 | |
Sales | | | — | | | | 625,507 | | | | — | | | | 625,507 | |
| | | | | | | | | | | | | | | | |
Total Forward Foreign Currency Contracts | | | — | | | | 2,419,937 | | | | — | | | | 2,419,937 | |
| | | | | | | | | | | | | | | | |
Futures Contracts† | | | | | | | | | | | | |
Buys | | | 2,784,833 | | | | — | | | | — | | | | 2,784,833 | |
Sales | | | 26,520 | | | | — | | | | — | | | | 26,520 | |
| | | | | | | | | | | | | | | | |
Total Futures Contracts | | | 2,811,353 | | | | — | | | | — | | | | 2,811,353 | |
| | | | | | | | | | | | | | | | |
Synthetic Futures | | | — | | | | 938,133 | | | | — | | | | 938,133 | |
| | | | | | | | | | | | | | | | |
Total | | $ | 1,370,256,102 | | | $ | 153,014,394 | | | $ | — | | | $ | 1,523,270,496 | |
| | | | | | | | | | | | | | | | |
LIABILITIES VALUATION INPUT
| | | | | | | | | | | | | | | | |
Description | | Quoted Prices
in Active
Markets for
Identical Assets
(Level 1) | | | Significant
Other
Observable
Inputs
(Level 2) | | | Significant
Unobservable
Inputs
(Level 3) | | | Total | |
Forward Foreign Currency Contracts† | | | | | | | | | | | | | | | | |
Buys | | $ | — | | | $ | (862,818 | ) | | $ | — | | | $ | (862,818 | ) |
Sales | | | — | | | | (1,574,069 | ) | | | — | | | | (1,574,069 | ) |
| | | | | | | | | | | | | | | | |
Total Forward Foreign Currency Contracts | | | — | | | | (2,436,887 | ) | | | — | | | | (2,436,887 | ) |
| | | | | | | | | | | | | | | | |
Futures Contracts† | | | | | | | | | | | | | | | | |
Buys | | | (15,963 | ) | | | — | | | | — | | | | (15,963 | ) |
Sales | | | (420,208 | ) | | | — | | | | — | | | | (420,208 | ) |
| | | | | | | | | | | | | | | | |
Total Futures Contracts | | | (436,171 | ) | | | — | | | | — | | | | (436,171 | ) |
| | | | | | | | | | | | | | | | |
Synthetic Futures | | | — | | | | (688,241 | ) | | | — | | | | (688,241 | ) |
| | | | | | | | | | | | | | | | |
Total | | $ | (436,171 | ) | | $ | (3,125,128 | ) | | $ | — | | | $ | (3,561,299 | ) |
| | | | | | | | | | | | | | | | |
| | † | Forward foreign currency contracts and Futures contracts are valued at unrealized appreciation/depreciation. Only current day’s variation margin, if any, is reported on the Statements of Assets and Liabilities. |
169
Mercer Funds
Notes to the Financial Statements (Continued)
March 31, 2017
Global Low Volatility
ASSETS VALUATION INPUT
| | | | | | | | | | | | | | | | |
Description | | Quoted Prices
in Active
Markets for
Identical Assets
(Level 1) | | | Significant
Other
Observable
Inputs
(Level 2) | | | Significant
Unobservable
Inputs
(Level 3) | | | Total | |
Common Stocks | | | | | | | | | | | | | | | | |
Australia | | $ | 15,035,461 | | | $ | — | | | $ | — | | | $ | 15,035,461 | |
Austria | | | 23,209,323 | | | | — | | | | — | | | | 23,209,323 | |
Belgium | | | 3,645,547 | | | | — | | | | — | | | | 3,645,547 | |
Bermuda | | | 17,197,222 | | | | 16,599 | | | | — | | | | 17,213,821 | |
Canada | | | 45,360,424 | | | | — | | | | — | | | | 45,360,424 | |
Denmark | | | 2,138,656 | | | | — | | | | — | | | | 2,138,656 | |
Finland | | | 2,349,654 | | | | — | | | | — | | | | 2,349,654 | |
France | | | 22,238,711 | | | | — | | | | — | | | | 22,238,711 | |
Germany | | | 15,875,981 | | | | — | | | | — | | | | 15,875,981 | |
Hong Kong | | | 4,646,212 | | | | — | | | | — | | | | 4,646,212 | |
Ireland | | | 6,660,870 | | | | — | | | | — | | | | 6,660,870 | |
Israel | | | 6,834,522 | | | | — | | | | — | | | | 6,834,522 | |
Italy | | | 3,082,084 | | | | — | | | | — | | | | 3,082,084 | |
Japan | | | 48,576,400 | | | | 71,264 | | | | — | | | | 48,647,664 | |
Luxembourg | | | 4,184,851 | | | | — | | | | — | | | | 4,184,851 | |
Netherlands | | | 7,613,519 | | | | — | | | | — | | | | 7,613,519 | |
New Zealand | | | 20,824,368 | | | | — | | | | — | | | | 20,824,368 | |
Norway | | | 21,146,812 | | | | — | | | | — | | | | 21,146,812 | |
Panama | | | 2,374,073 | | | | — | | | | — | | | | 2,374,073 | |
Portugal | | | 421,123 | | | | — | | | | — | | | | 421,123 | |
Puerto Rico | | | 1,930,602 | | | | — | | | | — | | | | 1,930,602 | |
Singapore | | | 7,920,127 | | | | — | | | | — | | | | 7,920,127 | |
Spain | | | 5,513,604 | | | | — | | | | — | | | | 5,513,604 | |
Sweden | | | 9,710,723 | | | | — | | | | — | | | | 9,710,723 | |
Switzerland | | | 52,139,178 | | | | — | | | | — | | | | 52,139,178 | |
United Kingdom | | | 87,150,714 | | | | — | | | | — | | | | 87,150,714 | |
United States | | | 661,101,456 | | | | — | | | | — | | | | 661,101,456 | |
| | | | | | | | | | | | | | | | |
Total Common Stocks | | | 1,098,882,217 | | | | 87,863 | | | | — | | | | 1,098,970,080 | |
| | | | | | | | | | | | | | | | |
Preferred Stocks | | | | | | | | | | | | | | | | |
Germany | | | 3,339,776 | | | | — | | | | — | | | | 3,339,776 | |
Japan | | | 269,486 | | | | — | | | | — | | | | 269,486 | |
Sweden | | | 135,494 | | | | — | | | | — | | | | 135,494 | |
| | | | | | | | | | | | | | | | |
Total Preferred Stocks | | | 3,744,756 | | | | — | | | | — | | | | 3,744,756 | |
| | | | | | | | | | | | | | | | |
Short-Term Investments | | | | | | | | | | | | | | | | |
Bank Deposits | | | — | | | | 167,115,205 | | | | — | | | | 167,115,205 | |
Mutual Fund - Securities Lending Collateral | | | 15,618,084 | | | | — | | | | — | | | | 15,618,084 | |
U.S. Government and Agency Obligations | | | — | | | | 1,599,227 | | | | — | | | | 1,599,227 | |
| | | | | | | | | | | | | | | | |
Total Short-Term Investments | | | 15,618,084 | | | | 168,714,432 | | | | — | | | | 184,332,516 | |
| | | | | | | | | | | | | | | | |
170
Mercer Funds
Notes to the Financial Statements (Continued)
March 31, 2017
| | | | | | | | | | | | | | | | |
Description | | Quoted Prices
in Active
Markets for
Identical Assets
(Level 1) | | | Significant
Other
Observable
Inputs
(Level 2) | | | Significant
Unobservable
Inputs
(Level 3) | | | Total | |
Futures Contracts† | | | | | | | | | | | | | | | | |
Buys | | $ | 296,726 | | | $ | — | | | $ | — | | | $ | 296,726 | |
| | | | | | | | | | | | | | | | |
Total Futures Contracts | | | 296,726 | | | | — | | | | — | | | | 296,726 | |
| | | | | | | | | | | | | | | | |
Total | | $ | 1,118,541,783 | | | $ | 168,802,295 | | | $ | — | | | $ | 1,287,344,078 | |
| | | | | | | | | | | | | | | | |
LIABILITIES VALUATION INPUT
| | | | | | | | | | | | | | | | |
Description | | Quoted Prices
in Active
Markets for
Identical Assets
(Level 1) | | | Significant
Other
Observable
Inputs
(Level 2) | | | Significant
Unobservable
Inputs
(Level 3) | | | Total | |
Futures Contracts† | | | | | | | | | | | | | | | | |
Buys | | $ | (23,328 | ) | | $ | — | | | $ | — | | | $ | (23,328 | ) |
| | | | | | | | | | | | | | | | |
Total Futures Contracts | | | (23,328 | ) | | | — | | | | — | | | | (23,328 | ) |
| | | | | | | | | | | | | | | | |
Total | | $ | (23,328 | ) | | $ | — | | | $ | — | | | $ | (23,328 | ) |
| | | | | | | | | | | | | | | | |
| | † | Futures contracts are valued at unrealized appreciation/depreciation. Only current day’s variation margin, if any, is reported on the Statements of Assets and Liabilities. |
The following tables show transfers between Level 1 and Level 2 of the fair value hierarchy:
Non-US Core Equity
| | | | | | | | | | | | | | | | |
| | | Transfers In | | | Transfers Out | |
| | | Level 1 — Quoted
Prices | | | Level 2 — Other
Significant
Observable Inputs | | | Level 1 — Quoted
Prices | | | Level 2 — Other
Significant
Observable Inputs | |
Common Stocks | | $ | — | | | $ | 1,786,200 | * | | $ | 1,786,200 | * | | $ | — | |
| | | | | | | | | | | | | | | | |
Global Low Volatility
| | | | | | | | | | | | | | | | |
| | | Transfers In | | | Transfers Out | |
| | | Level 1 — Quoted
Prices | | | Level 2 — Other
Significant
Observable Inputs | | | Level 1 — Quoted
Prices | | | Level 2 — Other
Significant
Observable Inputs | |
Common Stocks | | $ | — | | | $ | 16,599 | * | | $ | 16,599 | * | | $ | — | |
| | | | | | | | | | | | | | | | |
| | * | Transfers occurred between Level 1 and Level 2 as a result of foreign securities not receiving an exchange traded price. |
For financial statement reporting purposes, the Funds recognize transfers between Levels as of the end of the reporting period.
171
Mercer Funds
Notes to the Financial Statements (Continued)
March 31, 2017
The following tables include a rollforward of the amounts for the year ended March 31, 2017 for financial instruments classified as Level 3:
Non-US Core Equity
| | | | | | | | | | | | | | | | | | | | | | | | | | | | |
Investments
in Securities | | Balance as of
March 31,
2016 | | | Realized
Gain
(Loss) | | | Change in
Unrealized
Appreciation
(Depreciation) | | | Net
Transfers
In (Out) of
Level 3 | | | Purchases | | | Balance as of
March 31,
2017 | | | Change in
Unrealized
Appreciation
(Depreciation)
from
Investments
Held at
March 31,
2017 | |
COMMON STOCKS | | | | | | | | | | | | | | | | | | | | | | | | | |
Portugal | | $ | 0 | ^ | | $ | — | | | $ | — | | | $ | — | | | $ | — | | | $ | 0 | ^^ | | $ | — | |
Spain | | | 0 | ^ | | | — | | | | — | | | | — | | | | — | | | | 0 | ^^ | | | — | |
| | | | | | | | | | | | | | | | | | | | | | | | | | | | |
Total | | $ | 0 | ^ | | $ | — | | | $ | — | | | $ | — | | | $ | — | | | $ | 0 | ^^ | | $ | — | |
| | | | | | | | | | | | | | | | | | | | | | | | | | | | |
| | ^ | Represents one security at $0 value as of March 31, 2016. |
| | ^^ | Represents one security at $0 value as of March 31, 2017. |
Core Fixed
| | | | | | | | | | | | | | | | | | | | | | | | | | | | |
Investments
in Securities | | Balance as of
March 31,
2016 | | | Realized
Gain
(Loss) | | | Change in
Unrealized
Appreciation
(Depreciation) | | | Net
Transfers
In (Out) of
Level 3 | | | Purchases/
Sales | | | Balance as of
March 31,
2017 | | | Change in
Unrealized
Appreciation
(Depreciation)
from
Investments
Held at
March 31,
2017 | |
DEBT OBLIGATIONS | | | | | | | | | | | | | | | | | | | | | | | | | |
Corporate Debt | | $ | 0 | ^ | | $ | — | | | $ | — | | | $ | — | | | $ | — | | | $ | 0 | ^^ | | $ | — | |
| | | | | | | | | | | | | | | | | | | | | | | | | | | | |
Total | | $ | 0 | ^ | | $ | — | | | $ | — | | | $ | — | | | $ | — | | | $ | 0 | ^^ | | $ | — | |
| | | | | | | | | | | | | | | | | | | | | | | | | | | | |
| | ^ | Represents one security at $0 value as of March 31, 2016. |
| | ^^ | Represents one security at $0 value as of March 31, 2017. |
172
Mercer Funds
Notes to the Financial Statements (Continued)
March 31, 2017
Opportunistic Fixed
| | | | | | | | | | | | | | | | | | | | | | | | | | | | |
Investments
in Securities | | Balance as of
March 31,
2016 | | | Realized
Gain
(Loss) | | | Change in
Unrealized
Appreciation
(Depreciation) | | | Net
Transfers
In (Out) of
Level 3 | | | Net
Purchases | | | Balance as of
March 31,
2017 | | | Change in
Unrealized
Appreciation
(Depreciation)
from
Investments
Held at
March 31,
2017 | |
DEBT OBLIGATIONS | | | | | | | | | | | | | | | | | | | | | | | | | |
Corporate Debt | | $ | — | | | $ | — | | | $ | — | | | $ | — | | | $ | 0 | | | | 0^ | | | $ | — | |
COMMON STOCKS | | | | | | | | | | | | | | | | | | | | | | | | | |
Diversified Financial Services | | | — | | | | �� | | | | (101,769 | ) | | | — | | | | 101,769 | | | | 0^ | | | | (101,769 | ) |
WARRANTS | | | | | | | | | | | | | | | | | | | | | | | | | |
Oil & Gas | | | — | | | | — | | | | — | | | | — | | | | 0 | | | | 0^ | | | | — | |
| | | | | | | | | | | | | | | | | | | | | | | | | | | | |
Total | | $ | — | | | $ | — | | | $ | (101,769 | ) | | $ | — | | | $ | 101,769 | | | $ | 0^ | | | $ | (101,769 | ) |
| | | | | | | | | | | | | | | | | | | | | | | | | | | | |
| | ^ | Represents one or more securities at $0 value as of March 31, 2017. |
Investments in Derivative Instruments
Non-US Core Equity, Emerging Markets and Global Low Volatility held rights during the year as a result of corporate actions. Small/Mid Cap, Opportunistic Fixed, Emerging Markets and Global Low Volatility held warrants during the year as a result of corporate actions.
At March 31, 2017 and during the period then ended, the Funds had the following derivatives and transactions in derivatives, grouped into appropriate risk categories:
Large Cap
| | | | | | | | |
| ASSET DERIVATIVES | |
| | | Equity Risk | | | Total | |
Futures Contracts(3) | | $ | 6,399 | | | $ | 6,399 | |
| | | | | | | | |
Total Value | | $ | 6,399 | | | $ | 6,399 | |
| | | | | | | | |
| | |
| | | | | | | | |
| LIABILITY DERIVATIVES | |
| | | Equity Risk | | | Total | |
Futures Contracts(3) | | $ | (9,043 | ) | | $ | (9,043 | ) |
| | | | | | | | |
Total Value | | $ | (9,043 | ) | | $ | (9,043 | ) |
| | | | | | | | |
| | |
| | | | | | | | |
| NET REALIZED GAIN (LOSS) | |
| | | Equity Risk | | | Total | |
Futures Contracts(8) | | $ | 2,457,762 | | | $ | 2,457,762 | |
| | | | | | | | |
Total Realized Gain (Loss) | | $ | 2,457,762 | | | $ | 2,457,762 | |
| | | | | | | | |
173
Mercer Funds
Notes to the Financial Statements (Continued)
March 31, 2017
| | | | | | | | |
| CHANGE IN APPRECIATION (DEPRECIATION) | |
| | | Equity Risk | | | Total | |
Futures Contracts(13) | | $ | (287,270 | ) | | $ | (287,270 | ) |
| | | | | | | | |
Total Change in Appreciation (Depreciation) | | $ | (287,270 | ) | | $ | (287,270 | ) |
| | | | | | | | |
| | |
| | | | | | | | |
| NUMBER OF CONTRACTS, NOTIONAL AMOUNTS OR SHARES/UNITS(16) | |
| | | Equity Risk | | | Total | |
Futures Contracts | | | 102 | | | | 102 | |
Small/Mid Cap
| | | | | | | | |
| ASSET DERIVATIVES | |
| | | Equity Risk | | | Total | |
Futures Contracts(3) | | $ | 235,522 | | | $ | 235,522 | |
| | | | | | | | |
Total Value | | $ | 235,522 | | | $ | 235,522 | |
| | | | | | | | |
| | |
| | | | | | | | |
| NET REALIZED GAIN (LOSS) | |
| | | Equity Risk | | | Total | |
Futures Contracts(8) | | $ | 7,089,122 | | | $ | 7,089,122 | |
| | | | | | | | |
Total Realized Gain (Loss) | | $ | 7,089,122 | | | $ | 7,089,122 | |
| | | | | | | | |
| | |
| | | | | | | | |
| CHANGE IN APPRECIATION (DEPRECIATION) | |
| | | Equity Risk | | | Total | |
Futures Contracts(13) | | $ | (22,135 | ) | | $ | (22,135 | ) |
| | | | | | | | |
Total Change in Appreciation (Depreciation) | | $ | (22,135 | ) | | $ | (22,135 | ) |
| | | | | | | | |
| | |
| | | | | | | | |
| NUMBER OF CONTRACTS, NOTIONAL AMOUNTS OR SHARES/UNITS(16) | |
| | | Equity Risk | | | Total | |
Warrants | | | 27,862 | | | | 27,862 | |
Futures Contracts | | | 218 | | | | 218 | |
Non-US Core Equity
| | | | | | | | | | | | |
| ASSET DERIVATIVES | |
| | | Foreign
Currency Risk | | | Equity Risk | | | Total | |
Rights(1) | | $ | — | | | $ | 168,453 | | | $ | 168,453 | |
Futures Contracts(3) | | | — | | | | 567,382 | | | | 567,382 | |
Forward Foreign Currency Contracts(2) | | | 75,440 | | | | — | | | | 75,440 | |
| | | | | | | | | | | | |
Total Value | | $ | 75,440 | | | $ | 735,835 | | | $ | 811,275 | |
| | | | | | | | | | | | |
| | | |
| | | | | | | | | | | | |
174
Mercer Funds
Notes to the Financial Statements (Continued)
March 31, 2017
| | | | | | | | | | | | |
| LIABILITY DERIVATIVES | |
| | | Foreign
Currency Risk | | | Equity Risk | | | Total | |
Forward Foreign Currency Contracts(4) | | $ | (57,033 | ) | | $ | — | | | $ | (57,033 | ) |
| | | | | | | | | | | | |
Total Value | | $ | (57,033 | ) | | $ | — | | | $ | (57,033 | ) |
| | | | | | | | | | | | |
| | | |
| | | | | | | | | | | | |
| NET REALIZED GAIN (LOSS) | |
| | | Foreign
Currency Risk | | | Equity Risk | | | Total | |
Rights(6) | | $ | — | | | $ | 60,585 | | | $ | 60,585 | |
Futures Contracts(8) | | | — | | | | 8,791,397 | | | | 8,791,397 | |
Forward Foreign Currency Contracts(7) | | | 1,391,519 | | | | — | | | | 1,391,519 | |
| | | | | | | | | | | | |
Total Realized Gain (Loss) | | $ | 1,391,519 | | | $ | 8,851,982 | | | $ | 10,243,501 | |
| | | | | | | | | | | | |
| | | |
| | | | | | | | | | | | |
| CHANGE IN APPRECIATION (DEPRECIATION) | |
| | | Foreign
Currency Risk | | | Equity Risk | | | Total | |
Rights(11) | | $ | — | | | $ | 168,453 | | | $ | 168,453 | |
Futures Contracts(13) | | | — | | | | 766,327 | | | | 766,327 | |
Forward Foreign Currency Contracts(12) | | | 18,407 | | | | — | | | | 18,407 | |
| | | | | | | | | | | | |
Total Change in Appreciation (Depreciation) | | $ | 18,407 | | | $ | 934,780 | | | $ | 953,187 | |
| | | | | | | | | | | | |
| | | |
| | | | | | | | | | | | |
| NUMBER OF CONTRACTS, NOTIONAL AMOUNTS OR SHARES/UNITS(16) | |
| | | Foreign
Currency Risk | | | Equity Risk | | | Total | |
Rights | | | — | | | | 142,681 | | | | 142,681 | |
Futures Contracts | | | — | | | | 1,003 | | | | 1,003 | |
Forward Foreign Currency Contracts | | | (13,104,169 | ) | | | — | | | | (13,104,169 | ) |
Core Fixed
| | | | | | | | | | | | |
| ASSET DERIVATIVES | |
| | | Credit Risk | | | Interest
Rate Risk | | | Total | |
Options Purchased(1) | | $ | — | | | $ | 70,300 | | | $ | 70,300 | |
Futures Contracts(3) | | | — | | | | 248,465 | | | | 248,465 | |
Centrally Cleared Swap Contracts** | | | — | | | | 318,889 | | | | 318,889 | |
| | | | | | | | | | | | |
Total Value | | $ | — | | | $ | 637,654 | | | $ | 637,654 | |
| | | | | | | | | | | | |
| | | |
| | | | | | | | | | | | |
175
Mercer Funds
Notes to the Financial Statements (Continued)
March 31, 2017
| | | | | | | | | | | | |
| LIABILITY DERIVATIVES | |
| | | Credit Risk | | | Interest
Rate Risk | | | Total | |
Options Written(5) | | $ | — | | | $ | (12,500 | ) | | $ | (12,500 | ) |
Futures Contracts(3) | | | — | | | | (33,109 | ) | | | (33,109 | ) |
Centrally Cleared Swap Contracts** | | | (26,705 | ) | | | (65,990 | ) | | | (92,695 | ) |
| | | | | | | | | | | | |
Total Value | | $ | (26,705 | ) | | $ | (111,599 | ) | | $ | (138,304 | ) |
| | | | | | | | | | | | |
| | | |
| | | | | | | | | | | | |
| NET REALIZED GAIN (LOSS) | |
| | | Credit Risk | | | Interest
Rate Risk | | | Total | |
Options Purchased(6) | | $ | — | | | $ | (57,160 | ) | | $ | (57,160 | ) |
Options Written(9) | | | — | | | | 26,468 | | | | 26,468 | |
Swaps Contracts(10) | | | (158,194 | ) | | | (37,456 | ) | | | (195,650 | ) |
Futures Contracts(8) | | | — | | | | (1,715,956 | ) | | | (1,715,956 | ) |
| | | | | | | | | | | | |
Total Realized Gain (Loss) | | $ | (158,194 | ) | | $ | (1,784,104 | ) | | $ | (1,942,298 | ) |
| | | | | | | | | | | | |
| | | |
| | | | | | | | | | | | |
| CHANGE IN APPRECIATION (DEPRECIATION) | |
| | | Credit Risk | | | Interest
Rate Risk | | | Total | |
Options Purchased(11) | | $ | — | | | $ | (2,072 | ) | | $ | (2,072 | ) |
Options Written(14) | | | — | | | | 1,800 | | | | 1,800 | |
Swaps Contracts(15) | | | (249,038 | ) | | | 1,172,376 | | | | 923,338 | |
Futures Contracts(13) | | | — | | | | (165,076 | ) | | | (165,076 | ) |
| | | | | | | | | | | | |
Total Change in Appreciation (Depreciation) | | $ | (249,038 | ) | | $ | 1,007,028 | | | $ | 757,990 | |
| | | | | | | | | | | | |
| | | |
| | | | | | | | | | | | |
| NUMBER OF CONTRACTS, NOTIONAL AMOUNTS OR SHARES/UNITS(16) | |
| | | Credit Risk | | | Interest
Rate Risk | | | Total | |
Options Purchased | | | — | | | | 100,000 | | | | 100,000 | |
Options Written | | | — | | | | (55,000 | ) | | | (55,000 | ) |
Swaps Contracts | | | 17,000,000 | | | | 72,343,057 | | | | 89,343,057 | |
Futures Contracts | | | — | | | | 688 | | | | 688 | |
Opportunistic Fixed
| | | | | | | | | | | | | | | | |
| ASSET DERIVATIVES | |
| | | Foreign
Currency Risk | | | Interest
Rate Risk | | | Equity Risk | | | Total | |
Warrants(1) | | $ | — | | | $ | — | | | $ | 24,826 | | | $ | 24,826 | |
Futures Contracts(3) | | | — | | | | 15,148 | | | | — | | | | 15,148 | |
Forward Foreign Currency Contracts(2)† | | | 2,705,310 | | | | — | | | | — | | | | 2,705,310 | |
| | | | | | | | | | | | | | | | |
Total Value | | $ | 2,705,310 | | | $ | 15,148 | | | $ | 24,826 | | | $ | 2,745,284 | |
| | | | | | | | | | | | | | | | |
| | | | |
| | | | | | | | | | | | | | | | |
176
Mercer Funds
Notes to the Financial Statements (Continued)
March 31, 2017
| | | | | | | | | | | | | | | | |
| LIABILITY DERIVATIVES | |
| | | Foreign
Currency Risk | | | Interest
Rate Risk | | | Equity Risk | | | Total | |
Futures Contracts(3) | | $ | — | | | $ | (124,588 | ) | | $ | — | | | $ | (124,588 | ) |
Forward Foreign Currency Contracts(4)† | | | (2,038,220 | ) | | | — | | | | — | | | | (2,038,220 | ) |
| | | | | | | | | | | | | | | | |
Total Value | | $ | (2,038,220 | ) | | $ | (124,588 | ) | | $ | — | | | $ | (2,162,808 | ) |
| | | | | | | | | | | | | | | | |
| | | | |
| | | | | | | | | | | | | | | | |
| NET REALIZED GAIN (LOSS) | |
| | | Foreign
Currency Risk | | | Interest
Rate Risk | | | Equity Risk | | | Total | |
Warrants(6) | | $ | — | | | $ | — | | | $ | (18 | ) | | $ | (18 | ) |
Futures Contracts(8) | | | — | | | | 655,112 | | | | — | | | | 655,112 | |
Forward Foreign Currency Contracts(7)† | | | (3,499,077 | ) | | | — | | | | — | | | | (3,499,077 | ) |
| | | | | | | | | | | | | | | | |
Total Realized Gain (Loss) | | $ | (3,499,077 | ) | | $ | 655,112 | | | $ | (18 | ) | | $ | (2,843,983 | ) |
| | | | | | | | | | | | | | | | |
| | | | |
| | | | | | | | | | | | | | | | |
| CHANGE IN APPRECIATION (DEPRECIATION) | |
| | | Foreign
Currency Risk | | | Interest
Rate Risk | | | Equity Risk | | | Total | |
Warrants(11) | | $ | — | | | $ | — | | | $ | (61,771 | ) | | $ | (61,771 | ) |
Futures Contracts(13) | | | — | | | | (406,517 | ) | | | — | | | | (406,517 | ) |
Forward Foreign Currency Contracts(12)† | | | 3,419,146 | | | | — | | | | — | | | | 3,419,146 | |
| | | | | | | | | | | | | | | | |
Total Change in Appreciation (Depreciation) | | $ | 3,419,146 | | | $ | (406,517 | ) | | $ | (61,771 | ) | | $ | 2,950,858 | |
| | | | | | | | | | | | | | | | |
| | | | |
| | | | | | | | | | | | | | | | |
| NUMBER OF CONTRACTS, NOTIONAL AMOUNTS OR SHARES/UNITS(16) | |
| | | Foreign
Currency Risk | | | Interest
Rate Risk | | | Equity Risk | | | Total | |
Warrants | | | — | | | | — | | | | 7,124 | | | | 7,124 | |
Futures Contracts | | | — | | | | 1,811 | | | | — | | | | 1,811 | |
Forward Foreign Currency Contracts† | | | (937,181 | ) | | | — | | | | — | | | | (937,181 | ) |
Emerging Markets
| | | | | | | | | | | | |
| ASSET DERIVATIVES | |
| | | Foreign
Currency Risk | | | Equity Risk | | | Total | |
Futures Contracts(3)†† | | $ | — | | | $ | 3,749,486 | | | $ | 3,749,486 | |
Forward Foreign Currency Contracts(2) | | | 2,419,937 | | | | — | | | | 2,419,937 | |
| | | | | | | | | | | | |
Total Value | | $ | 2,419,937 | | | $ | 3,749,486 | | | $ | 6,169,423 | |
| | | | | | | | | | | | |
| | | |
| | | | | | | | | | | | |
177
Mercer Funds
Notes to the Financial Statements (Continued)
March 31, 2017
| | | | | | | | | | | | |
| LIABILITY DERIVATIVES | |
| | | Foreign
Currency Risk | | | Equity Risk | | | Total | |
Futures Contracts(3)†† | | $ | — | | | $ | (1,124,412 | ) | | $ | (1,124,412 | ) |
Forward Foreign Currency Contracts(4) | | | (2,436,887 | ) | | | — | | | | (2,436,887 | ) |
| | | | | | | | | | | | |
Total Value | | $ | (2,436,887 | ) | | $ | (1,124,412 | ) | | $ | (3,561,299 | ) |
| | | | | | | | | | | | |
| | | |
| | | | | | | | | | | | |
| NET REALIZED GAIN (LOSS) | |
| | | Foreign
Currency Risk | | | Equity Risk | | | Total | |
Rights(6) | | $ | — | | | $ | 136,731 | | | $ | 136,731 | |
Warrants(6) | | | — | | | | 188,452 | | | | 188,452 | |
Futures Contracts(8)†† | | | — | | | | 20,080,035 | | | | 20,080,035 | |
Forward Foreign Currency Contracts(7) | | | 13,002,781 | | | | — | | | | 13,002,781 | |
| | | | | | | | | | | | |
Total Realized Gain (Loss) | | $ | 13,002,781 | | | $ | 20,405,218 | | | $ | 33,407,999 | |
| | | | | | | | | | | | |
| | | |
| | | | | | | | | | | | |
| CHANGE IN APPRECIATION (DEPRECIATION) | |
| | | Foreign
Currency Risk | | | Equity Risk | | | Total | |
Futures Contracts(13)†† | | $ | — | | | $ | (1,172,075 | ) | | $ | (1,172,075 | ) |
Forward Foreign Currency Contracts(12) | | | (322,557 | ) | | | — | | | | (322,557 | ) |
| | | | | | | | | | | | |
Total Change in Appreciation (Depreciation) | | $ | (322,557 | ) | | $ | (1,172,075 | ) | | $ | (1,494,632 | ) |
| | | | | | | | | | | | |
| | | |
| | | | | | | | | | | | |
| NUMBER OF CONTRACTS, NOTIONAL AMOUNTS OR SHARES/UNITS(16) | |
| | | Foreign
Currency Risk | | | Equity Risk | | | Total | |
Rights | | | — | | | | 182,849 | | | | 182,849 | |
Warrants | | | — | | | | 834,500 | | | | 834,500 | |
Futures Contracts | | | — | | | | 130,716,801 | | | | 130,716,801 | |
Forward Foreign Currency Contracts | | | 27,838,984 | | | | — | | | | 27,838,984 | |
Global Low Volatility
| | | | | | | | | | | | |
| ASSET DERIVATIVES | |
| | | Foreign
Currency Risk | | | Equity Risk | | | Total | |
Futures Contracts(3) | | $ | 17,934 | | | $ | 278,792 | | | $ | 296,726 | |
| | | | | | | | | | | | |
Total Value | | $ | 17,934 | | | $ | 278,792 | | | $ | 296,726 | |
| | | | | | | | | | | | |
| | | |
| | | | | | | | | | | | |
| LIABILITY DERIVATIVES | |
| | | Foreign
Currency Risk | | | Equity Risk | | | Total | |
Futures Contracts(3) | | $ | — | | | $ | (23,328 | ) | | $ | (23,328 | ) |
| | | | | | | | | | | | |
Total Value | | $ | — | | | $ | (23,328 | ) | | $ | (23,328 | ) |
| | | | | | | | | | | | |
| | | |
| | | | | | | | | | | | |
178
Mercer Funds
Notes to the Financial Statements (Continued)
March 31, 2017
| | | | | | | | | | | | |
| NET REALIZED GAIN (LOSS) | |
| | | Foreign
Currency Risk | | | Equity Risk | | | Total | |
Rights(6) | | $ | — | | | $ | 741,655 | | | $ | 741,655 | |
Warrants(6) | | | — | | | | 33,648 | | | | 33,648 | |
Futures Contracts(8) | | | (19,169 | ) | | | 5,824,432 | | | | 5,805,263 | |
Forward Foreign Currency Contracts(7) | | | (142,345 | ) | | | — | | | | (142,345 | ) |
| | | | | | | | | | | | |
Total Realized Gain (Loss) | | $ | (161,514 | ) | | $ | 6,599,735 | | | $ | 6,438,221 | |
| | | | | | | | | | | | |
| | | |
| | | | | | | | | | | | |
| CHANGE IN APPRECIATION (DEPRECIATION) | |
| | | Foreign
Currency Risk | | | Equity Risk | | | Total | |
Rights(11) | | $ | — | | | $ | (77 | ) | | $ | (77 | ) |
Warrants(11) | | | — | | | | (21,204 | ) | | | (21,204 | ) |
Futures Contracts(13) | | | (25,450 | ) | | | (359,724 | ) | | | (385,174 | ) |
Forward Foreign Currency Contracts(12) | | | 46,188 | | | | — | | | | 46,188 | |
| | | | | | | | | | | | |
Total Change in Appreciation (Depreciation) | | $ | 20,738 | | | $ | (381,005 | ) | | $ | (360,267 | ) |
| | | | | | | | | | | | |
| | | |
| | | | | | | | | | | | |
| NUMBER OF CONTRACTS, NOTIONAL AMOUNTS OR SHARES/UNITS(16) | |
| | | Foreign
Currency Risk | | | Equity Risk | | | Total | |
Rights | | | — | | | | 562,296 | | | | 562,296 | |
Warrants | | | — | | | | 14,369 | | | | 14,369 | |
Futures Contracts | | | 18 | | | | 397 | | | | 415 | |
Forward Foreign Currency Contracts | | | (5,121,240 | ) | | | — | | | | (5,121,240 | ) |
| | ** | Centrally Cleared Swaps are valued at unrealized appreciation/depreciation on the Schedule of Investments. Only current day’s variation margin, if any, is reported on the Statement of Assets and Liabilities. |
| | † | Includes Cross Currency Foreign Currency Contracts. |
| | †† | Includes Synthetic Futures. |
| | (1) | Statements of Assets and Liabilities location: Investments, at value. |
| | (2) | Statements of Assets and Liabilities location: Unrealized appreciation on open forward foreign currency contracts. |
| | (3) | Cumulative appreciation (depreciation) on futures contracts is disclosed within the Schedule of Investments under the open “Futures Contracts” section. Only current day’s variation margin, if any, are reported within the Statements of Assets and Liabilities. Synthetic futures are presented as Synthetic futures, at value within the Statements of Assets and Liabilities. |
| | (4) | Statements of Assets and Liabilities location: Unrealized depreciation on open forward foreign currency contracts. |
| | (5) | Statements of Assets and Liabilities location: Written options, at value. |
| | (6) | Statements of Operations location: Amounts are included in Net realized gain (loss) on Investments. |
| | (7) | Statements of Operations location: Amounts are included in Net realized gain (loss) on Forward foreign currency contracts and foreign currency related transactions. |
| | (8) | Statements of Operations location: Amounts are included in Net realized gain (loss) on Closed futures contracts. |
| | (9) | Statements of Operations location: Amounts are included in Net realized gain (loss) on Written option contracts. |
| | (10) | Statements of Operations location: Amounts are included in Net realized gain (loss) on Swap contracts. |
| | (11) | Statements of Operations location: Amounts are included in Change in net unrealized appreciation (depreciation) on Investments. |
| | (12) | Statements of Operations location: Amounts are included in Change in net unrealized appreciation (depreciation) on Forward foreign currency contracts and foreign currency related transactions. |
179
Mercer Funds
Notes to the Financial Statements (Continued)
March 31, 2017
| | (13) | Statements of Operations location: Amounts are included in Change in net unrealized appreciation (depreciation) on Open futures contracts. |
| | (14) | Statements of Operations location: Amounts are included in Change in net unrealized appreciation (depreciation) on Written option contracts. |
| | (15) | Statements of Operations location: Amounts are included in Change in net unrealized appreciation (depreciation) on Swap contracts. |
| | (16) | Amounts disclosed represent average number of contracts, notional amounts, or shares outstanding for the time period that the Fund held such derivatives during the year ended March 31, 2017. |
The Funds follow FASB ASC 815-10-50 “Disclosures about Credit Derivatives and Certain Guarantees”. This applies to written credit derivatives, hybrid instruments with embedded credit derivatives (for example, credit-linked notes), and certain guarantees.
The following is a summary of open centrally cleared credit default swap positions held by Core Fixed at March 31, 2017:
| | | | | | | | | | | | | | | | | | | | | | | | |
Notional
Amount* | | | Currency | | | Expiration
Date | | | Buy/Sell
Protection | | Receive
(Pay)
Fixed
Rate | | | Deliverable
on Default | | Unrealized
Appreciation
(Depreciation) | | | Value |
| $ | 17,000,000 | | | | USD | | | | 06/20/20 | | | Buy | | | 1.00 | % | | CDX.IG.24 CG24 | | $ | (26,705 | ) | | $(341,635) |
| * | The maximum potential amount of future undiscounted payments that the Fund could be required to make under a credit default swap contract would be the notional amount of the contract. These potential amounts would be partially offset by any recovery values of the referenced debt obligation or net amounts received from the settlement of purchased protection credit default swap contracts entered into by the Fund for the same referenced debt obligation. |
Netting Agreements and Collateral Requirements
In order to better define contractual rights under derivative contracts and to secure rights that will help the Funds mitigate their counterparty risk, a sub-adviser may, on behalf of the Funds, enter into an International Swaps and Derivatives Association, Inc. Master Agreement (“ISDA Master Agreement”) or similar agreement with its derivative contract counterparties. An ISDA Master Agreement is a bilateral agreement between the Funds and a counterparty that governs OTC derivatives and foreign exchange contracts and typically contains, among other things, collateral posting terms and netting provisions in the event of a default and/or termination event. Under an ISDA Master Agreement, the Funds may, under certain circumstances, offset with the counterparty certain derivative financial instrument’s payables and/or receivables with certain collateral held and/or posted and create a net payment. The provisions of the ISDA Master Agreement typically permit a net payment in the event of default including the bankruptcy or insolvency of the counterparty. Absent an event of default by the counterparty or termination of the agreement, the ISDA Master Agreement does not result in an offset of reported amounts of assets and liabilities in the Statement of Assets and Liabilities across the transactions between the Funds and the applicable counterparty. The right to offset and net payments across all transactions traded under the ISDA Master Agreement could result in a reduction of the Funds’ credit risk to such counterparty equal to any amounts payable by the Funds under the applicable transactions, if any. However, bankruptcy or insolvency laws of a particular jurisdiction may impose restrictions on or prohibitions against the right of offset in bankruptcy, insolvency or other events. In addition, certain ISDA Master Agreements allow counterparties to OTC derivatives to terminate derivative contracts prior to maturity in the event a Fund’s net assets decline by a stated percentage or the Funds fail to meet the terms of their ISDA Master Agreements, which would cause the Funds to accelerate payment of any net liability owed to the counterparty.
For derivatives traded under an ISDA Master Agreement, the collateral requirements are typically calculated by netting the mark to market amount for each transaction under such agreement and comparing that amount to the value of any collateral currently pledged by the Funds and the counterparty.
Cash collateral that has been pledged to cover obligations of the Funds and cash collateral received from the counterparty, if any, is reported separately on the Statement of Assets and Liabilities as cash collateral held at
180
Mercer Funds
Notes to the Financial Statements (Continued)
March 31, 2017
broker or cash collateral due to broker, respectively. Non-cash collateral pledged by or received by the Funds, if any, is noted in the Schedule of Investments. Generally, the amount of collateral due from or to a party has to exceed a minimum transfer amount threshold before a transfer is required, which is determined each day at the close of business of the Funds, typically based on changes in market values for each transaction under an ISDA Master Agreement and netted into one amount for such agreement and any additional required collateral is delivered to/pledged by the Funds on the next business day. Typically, the Funds and counterparties are not permitted to sell, re-pledge or use the collateral they receive. To the extent amounts due to the Funds from their counterparties are not fully collateralized, contractually or otherwise, the Funds bear the risk of loss from counterparty non-performance. The Funds attempt to mitigate counterparty risk by entering into agreements only with counterparties that they believe have the financial resources to honor their obligations and by monitoring the financial stability of those counterparties.
The Funds are required to disclose both gross and net information for assets and liabilities related to derivatives, repurchase and reverse repurchase agreements, and securities lending and securities borrowings transactions that are eligible for offset or subject to an enforceable master netting or similar agreement. The Funds’ derivative assets and liabilities at fair value by risk are presented in the tables above. For financial reporting purposes the Funds do not offset derivative assets and derivative liabilities that are subject to netting arrangements in the Statements of Assets and Liabilities.
The following tables present the Funds’ derivative assets and liabilities by counterparty, net of amounts available for offset under a Master Netting Agreement (“MNA”) and net of related collateral received by the Funds for assets or pledged by the Funds for liabilities as of March 31, 2017.
Non-US Core Equity
Offsetting of Financial Assets and Derivative Assets:
| | | | | | | | | | | | | | | | |
Counterparty | | Derivative
Assets Subject
to MNA | | | Derivative
Assets/(Liabilities)
available for offset | | | Collateral
Received* | | | Net Amount
of Derivative
Assets(a) | |
HSBC Bank USA | | $ | 75,440 | | | $ | — | | | $ | — | | | $ | 75,440 | |
| | | | | | | | | | | | | | | | |
| | $ | 75,440 | | | $ | — | | | $ | — | | | $ | 75,440 | |
| | | | | | | | | | | | | | | | |
Offsetting of Financial Liabilities and Derivative Liabilities:
| | | | | | | | | | | | | | | | |
Counterparty | | Derivative
Liabilities Subject
to MNA | | | Derivative
Assets/(Liabilities)
available for offset | | | Collateral
Pledged* | | | Net Amount
of Derivative
Assets(b) | |
Barclays Bank Plc | | $ | (57,033 | ) | | $ | — | | | $ | — | | | $ | (57,033 | ) |
| | | | | | | | | | | | | | | | |
| | $ | (57,033 | ) | | $ | — | | | $ | — | | | $ | (57,033 | ) |
| | | | | | | | | | | | | | | | |
| | (a) | Represents the net amount receivable from the counterparty in the event of default. |
| | (b) | Represents the net amount payable to the counterparty in the event of default. |
| | * | In some instances, the actual collateral received and/or pledged may be more than the derivative asset or liability due to overcollateralization. |
181
Mercer Funds
Notes to the Financial Statements (Continued)
March 31, 2017
Opportunistic Fixed
Offsetting of Financial Assets and Derivative Assets:
| | | | | | | | | | | | | | | | |
Counterparty | | Derivative
Assets Subject
to MNA | | | Derivative
Assets/(Liabilities)
available for offset | | | Collateral
Received* | | | Net Amount
of Derivative
Assets(a) | |
Barclays Bank Plc | | $ | 39,690 | | | $ | (39,690 | ) | | $ | — | | | $ | — | |
Citibank N.A. | | | 1,142,425 | | | | (1,054,666 | ) | | | — | | | | 87,759 | |
Goldman Sachs International | | | 603,544 | | | | (313,815 | ) | | | — | | | | 289,729 | |
HSBC Bank plc | | | 3,908 | | | | (2,741 | ) | | | — | | | | 1,167 | |
JPMorgan Chase Bank N.A. London | | | 326,494 | | | | (186,405 | ) | | | — | | | | 140,089 | |
Standard Chartered Bank | | | 589,249 | | | | (5,816 | ) | | | — | | | | 583,433 | |
| | | | | | | | | | | | | | | | |
| | $ | 2,705,310 | | | $ | (1,603,133 | ) | | $ | — | | | $ | 1,102,177 | |
| | | | | | | | | | | | | | | | |
Offsetting of Financial Liabilities and Derivative Liabilities:
| | | | | | | | | | | | | | | | |
Counterparty | | Derivative
Liabilities Subject
to MNA | | | Derivative
Assets/(Liabilities)
available for offset | | | Collateral
Pledged* | | | Net Amount
of Derivative
Assets(b) | |
Barclays Bank Plc | | $ | (190,586 | ) | | $ | 39,690 | | | $ | — | | | $ | (150,896 | ) |
Citibank N.A. | | | (1,054,666 | ) | | | 1,054,666 | | | | — | | | | — | |
Deutsche Bank AG London | | | (267,730 | ) | | | — | | | | — | | | | (267,730 | ) |
Goldman Sachs International | | | (313,815 | ) | | | 313,815 | | | | — | | | | — | |
HSBC Bank plc | | | (2,741 | ) | | | 2,741 | | | | — | | | | — | |
JPMorgan Chase Bank N.A. London | | | (186,405 | ) | | | 186,405 | | | | — | | | | — | |
Standard Chartered Bank | | | (5,816 | ) | | | 5,816 | | | | — | | | | — | |
UBS AG London | | | (16,461 | ) | | | — | | | | — | | | | (16,461 | ) |
| | | | | | | | | | | | | | | | |
| | $ | (2,038,220 | ) | | $ | 1,603,133 | | | $ | — | | | $ | (435,087 | ) |
| | | | | | | | | | | | | | | | |
| | (a) | Represents the net amount receivable from the counterparty in the event of default. |
| | (b) | Represents the net amount payable to the counterparty in the event of default. |
| | * | In some instances, the actual collateral received and/or pledged may be more than the derivative asset or liability due to overcollateralization. |
Emerging Markets
Offsetting of Financial Assets and Derivative Assets:
| | | | | | | | | | | | | | | | |
Counterparty | | Derivative
Assets Subject
to MNA | | | Derivative
Assets/(Liabilities)
available for offset | | | Collateral
Received* | | | Net Amount
of Derivative
Assets(a) | |
Citibank N.A. London | | $ | 2,419,937 | | | $ | (2,419,937 | ) | | $ | — | | | $ | — | |
Goldman Sachs International | | | 938,133 | | | | (688,241 | ) | | | — | | | | 249,892 | |
| | | | | | | | | | | | | | | | |
| | $ | 3,358,070 | | | $ | (3,108,178 | ) | | $ | — | | | $ | 249,892 | |
| | | | | | | | | | | | | | | | |
182
Mercer Funds
Notes to the Financial Statements (Continued)
March 31, 2017
Offsetting of Financial Liabilities and Derivative Liabilities:
| | | | | | | | | | | | | | | | |
Counterparty | | Derivative
Liabilities Subject
to MNA | | | Derivative
Assets/(Liabilities)
available for offset | | | Collateral
Pledged* | | | Net Amount
of Derivative
Assets(b) | |
Citibank N.A. London | | $ | (2,436,887 | ) | | $ | 2,419,937 | | | $ | — | | | $ | (16,950 | ) |
Goldman Sachs International | | | (688,241 | ) | | | 688,241 | | | | — | | | | — | |
| | | | | | | | | | | | | | | | |
| | $ | (3,125,128 | ) | | $ | 3,108,178 | | | $ | — | | | $ | (16,950 | ) |
| | | | | | | | | | | | | | | | |
| | (a) | Represents the net amount receivable from the counterparty in the event of default. |
| | (b) | Represents the net amount payable to the counterparty in the event of default. |
| | * | In some instances, the actual collateral received and/or pledged may be more than the derivative asset or liability due to overcollateralization. |
(b) Security transactions and related investment income
Security transactions are accounted for on trade date. Dividend income, net of applicable withholding taxes, is recorded on the ex-dividend date or when the Fund is informed of the ex-dividend date, if later. Interest income is recorded on the accrual basis, and is adjusted for amortization of premium and discounts for debt securities. Income is not recognized, nor are premium and discount amortized, on securities for which collection is not expected. Withholding taxes on foreign dividend, interest, and capital gains have been provided for in accordance with the respective country’s tax rules and rates. Non-cash dividends, if any, are recorded at the fair value of the securities received. Interest income on inflation indexed securities is accrued daily based upon an inflation-adjusted principal. Additionally, any increase in the principal or face amount of these securities is recorded as interest income. In determining the net gain or loss on securities sold, the cost of securities is determined on the identified-cost basis.
(c) Cash and short term investments
A Fund may invest a portion of its assets in short-term debt securities (including repurchase agreements and reverse repurchase agreements) of corporations, the U.S. government and its agencies and instrumentalities and banks and finance companies, which may be denominated in any currency.
A Fund may invest a portion of its assets in shares issued by money market mutual funds. A Fund also may invest in collective investment vehicles that are managed by an unaffiliated investment manager, pending investment of the Fund’s assets in portfolio securities. When unusual market conditions warrant, a Fund may make substantial temporary defensive investments in cash equivalents, up to a maximum of 100% of the Fund’s net assets. Cash equivalent holdings may be in any currency. When a Fund invests for temporary defensive purposes, such investments may affect the Fund’s ability to achieve its investment objective.
(d) Securities lending
A Fund may lend its portfolio securities to qualified broker/dealers and financial institutions pursuant to agreements, provided: (1) the loan is secured continuously by collateral marked-to-market daily and maintained in an amount at least equal to the current fair value of the securities loaned; (2) the Fund may call the loan at any time and receive the securities loaned; (3) the Fund will receive any interest or dividends paid on the loaned securities; and (4) the aggregate fair value of securities loaned will not at any time exceed 33 1/3% of the total assets of the Fund. Collateral will consist of U.S. and non-U.S. securities, cash equivalents or irrevocable letters of credit. A liability for cash collateral is reflected in the Statements of Assets and Liabilities, and is categorized as Level 2 within the fair value hierarchy. As with other extensions of credit, there are risks of delay in recovery or even loss of rights in collateral in the event of default or insolvency of a borrower of a Fund’s portfolio securities. A Fund may not retain voting rights on securities while they are on loan.
Certain Funds may from time to time participate in a securities lending program under which the Funds’ custodian, State Street Bank and Trust Company (the “Custodian”) acting as securities lending agent, is authorized to lend
183
Mercer Funds
Notes to the Financial Statements (Continued)
March 31, 2017
Fund portfolio securities to qualified broker/dealers and financial institutions that post appropriate collateral. The Custodian has agreed to indemnify the Funds in case of default of any security borrower.
Securities on loan are fully collateralized and the collateral was equal to or exceeded the securities on loan at March 31, 2017. If the market value of the collateral at the close of trading on a business day is less than 100% of the market value of the loaned securities at the close of trading on that day, the borrower shall be required to deliver, by the close of business on the following business day, an additional amount of collateral, so that the total amount of posted collateral is equal to at least 100% of the market value of all the loaned securities as of such preceding day. Cash collateral is invested in the State Street Institutional U.S. Government Money Market Fund, Premier Class. The Custodian receives a portion of the interest earned on any reinvested collateral. The market value of securities on loan to borrowers and the value of collateral held by the Funds with respect to such loans at March 31, 2017 were as follows:
| | | | | | | | | | | | |
| | | Market Value of
Loaned Securities | | | Value of
Cash Collateral | | | Value of
Non-Cash Collateral | |
Large Cap | | $ | 54,869,101 | | | $ | 10,620,680 | | | $ | 45,627,479 | |
Small/Mid Cap | | | 136,178,643 | | | | 35,627,563 | | | | 103,716,928 | |
Non-US Core Equity | | | 110,147,766 | | | | 81,928,175 | | | | 34,070,937 | |
Core Fixed | | | 33,418,372 | | | | 10,554,630 | | | | 23,522,328 | |
Opportunistic Fixed | | | 23,542,388 | | | | 22,260,085 | | | | 1,770,000 | |
Emerging Markets | | | 31,320,235 | | | | 23,309,405 | | | | 10,264,904 | |
Global Low Volatility | | | 50,536,745 | | | | 15,618,084 | | | | 36,587,049 | |
For Large Cap, Small/Mid Cap, Non-US Core Equity, Emerging Markets and Global Low Volatility, all of the securities on loan collateralized by cash are classified as Common Stocks in each Fund’s Schedule of Investments at March 31, 2017, with a contractual maturity of overnight and continuous.
For Core Fixed, all of the securities on loan collateralized by cash are classified as Corporate Debt in the Fund’s Schedule of Investments at March 31, 2017, with a contractual maturity of overnight and continuous.
For Opportunistic Fixed, the value of the security loan obligation is classified as follows at March 31, 2017:
Opportunistic Fixed
| | | | | | | | | | | | | | | | | | | | |
| | | Remaining Contractual Maturity of the Agreements
As of March 31, 2017 | |
| | | Overnight and
Continuous | | | <30 days | | | Between
30 & 90 days | | | >90 days | | | Total | |
Securities Lending Transactions | | | | | | | | | | | | | | | | | | | | |
Common Stocks | | $ | 617,083 | | | $ | — | | | $ | — | | | $ | — | | | $ | 617,083 | |
Corporate Debt | | | 21,643,002 | | | | — | | | | — | | | | — | | | | 21,643,002 | |
| | | | | | | | | | | | | | | | | | | | |
Total | | $ | 22,260,085 | | | $ | — | | | $ | — | | | $ | — | | | $ | 22,260,085 | |
| | | | | | | | | | | | | | | | | | | | |
Total Borrowings | | $ | 22,260,085 | | | $ | — | | | $ | — | | | $ | — | | | $ | 22,260,085 | |
| | | | | | | | | | | | | | | | | | | | |
Gross amount of recognized liabilities for securities lending transactions | | | $ | 22,260,085 | |
| | | | | | | | | | | | | | | | | | | | |
(e) Repurchase agreements
A Fund may enter into a repurchase agreement under the terms of a Master Repurchase Agreement (“MRA”) where the Fund purchases securities from a bank or broker/dealer who simultaneously agrees to repurchase the securities at a mutually agreed upon time and price, thereby determining the yield during the term of the agreement. As a result, a repurchase agreement provides a fixed rate of return insulated from market fluctuations during the term of the agreement. The term of a repurchase agreement generally is short, possibly overnight or for a few days, although it may extend over a number of months (up to one year) from the date of delivery. Repurchase agreements are
184
Mercer Funds
Notes to the Financial Statements (Continued)
March 31, 2017
considered under the 1940 Act to be collateralized loans by a Fund to a seller secured by the securities transferred to the Fund. Repurchase agreements are fully collateralized and the collateral is marked-to-market daily. A Fund may not enter into a repurchase agreement having more than seven days remaining to maturity if, as a result, such agreement, together with any other illiquid securities held by the Fund, would exceed 15% of the value of the net assets of the Fund.
An MRA permits the Funds, under certain circumstances, including an event of default (such as bankruptcy or insolvency), to offset payables and/or receivables under the MRA with collateral held and/or posted to the counterparty and create one single net payment due to or from the Funds. However, bankruptcy or insolvency laws of a particular jurisdiction may impose restrictions on or prohibitions against such a right of offset in the event of the MRA counterparty’s bankruptcy or insolvency. Pursuant to the terms of the MRA, the Funds receive or post securities as collateral with a market value in excess of the repurchase price to be paid or received by the Funds upon the maturity of the transaction. Upon a bankruptcy or insolvency of the MRA counterparty, the Funds would recognize a liability with respect to such excess collateral to reflect the Funds’ obligation under bankruptcy law to return the excess to the counterparty. As of March 31, 2017, none of the Funds held open repurchase agreements.
(f) Swaps
Swap contracts are derivatives in the form of a contract or similar instrument, which is an agreement to exchange the return generated by one instrument for the return generated by another instrument. A Fund may engage in swaps, including, but not limited to, interest rate, currency, credit default, and index swaps, and the purchase or sale of related caps, floors, collars, and other derivative instruments. A Fund expects to enter into these transactions to preserve a return or spread on a particular investment or portion of the portfolio, to modify the portfolio’s duration, to protect against any increase in the price of securities the Fund anticipates purchasing at a later date, or to gain exposure to certain markets in the most economical way possible.
Interest rate swaps involve the exchange by a Fund with another party of their respective commitments to receive or pay interest (e.g., an exchange of fixed rate payments for floating rate payments) with respect to a notional amount of principal. Currency swaps involve the exchange of cash flows on a notional amount based on changes in the values of referenced currencies.
The credit default swap agreements may have as reference obligations one or more securities that are not currently held by a Fund. The protection “buyer” in a credit default swap agreement is generally obligated to pay the protection “seller” an upfront or a periodic stream of payments over the term of the contract provided that no credit event, such as a default, on a reference obligation has occurred. If a credit event occurs, the seller generally must pay the buyer the “par value” (full notional value) of the swap in exchange for an equal face amount of deliverable obligations of the reference entity described in the swap, or the seller may be required to deliver the related net cash amount, if the swap is cash settled. A Fund may be either the buyer or seller in the transaction. If a Fund is a buyer and no credit event occurs, the Fund may recover nothing if the swap is held through its termination date. However, if a credit event occurs, the buyer generally may elect to receive the full notional value of the swap in exchange for an equal face amount of deliverable obligations of the reference entity whose value may have significantly decreased. As a seller, a Fund generally receives an upfront payment or a fixed rate of income throughout the term of the swap provided that there is no credit event. As the seller, a Fund would effectively add leverage to its portfolio because, in addition to its total net assets, a Fund would be subject to investment exposure on the notional amount of the swap.
The spread of a credit default swap is the annual amount the protection buyer must pay the protection seller over the length of the contract, expressed as a percentage of the notional amount. When spreads rise, market perceived credit risk rises and when spreads fall, market perceived credit risk falls. Wider credit spreads and decreasing market values, when compared to the notional amount of the swap, represent a deterioration of the referenced entity’s credit worthiness and an increased market perception that there is a greater likelihood of risk of default or other credit event occurring as defined under the terms of the agreement. For credit default swap agreements on asset-backed securities and credit indices, the quoted market prices and resulting values, as well as the annual payment rates, serve as an indication of the current status of the payment/performance risk.
185
Mercer Funds
Notes to the Financial Statements (Continued)
March 31, 2017
Swaps do not involve the delivery of securities or other underlying assets or principal, and are subject to counterparty risk. If the other party to a swap defaults and fails to consummate the transaction, a Fund’s risk of loss consists of the net amount of interest payments that the Fund is contractually entitled to receive.
The equity swaps in which the Funds may invest involve agreements with a counterparty. The return to the Funds on any equity swap contract will be the total return on the notional amount of the contract as if it were invested in the stocks comprising the contract index in exchange for an interest component based on the notional amount of the agreement. The Funds will only enter into an equity swap contract on a net basis, i.e., the two parties’ obligations are netted out, with the Funds paying or receiving, as the case may be, only the net amount of the payments. Payments under an equity swap contract may be made at the conclusion of the contract or periodically during its term.
Whether a Fund’s use of swap agreements or swap options will be successful in achieving the Fund’s investment objective will depend on the Subadvisor’s ability to predict correctly whether certain types of investments are likely to produce greater returns than other investments. Moreover, a Fund bears the risk of loss of the amount expected to be received under a swap agreement in the event of the default or bankruptcy of a swap agreement counterparty. The Funds will enter into swap agreements only with counterparties that meet certain standards of creditworthiness.
If there is a default by the counterparty to a swap contract, a Fund will be limited to contractual remedies pursuant to the agreements related to the transaction. There is no assurance that a swap contract counterparty will be able to meet its obligations pursuant to a swap contract or that, in the event of a default, a Fund will succeed in pursuing contractual remedies. A Fund thus assumes the risk that it may be delayed in, or prevented from, obtaining payments owed to it pursuant to a swap contract. However, the amount at risk is only the net unrealized gain, if any, on the swap at the time of default, and not the entire notional amount of the swap contract now that the potential loss can be mitigated by the posting of collateral and offsetting provisions of the ISDA. The Subadvisor that enters into the swap agreement will closely monitor, subject to the oversight of the Board, the creditworthiness of swap counterparties in order to minimize the risk of counterparty default on swaps.
Because swaps are two party contracts that may be subject to contractual restrictions on transferability and termination, and they may have terms of greater than seven days, swap agreements may be considered to be illiquid and subject to a Fund’s limitation on investments in illiquid securities. However, the Trust has adopted procedures pursuant to which the Advisor may determine that swaps (including swap options) are liquid under certain circumstances. To the extent that a swap is not liquid, it may not be possible to initiate a transaction or liquidate a position at an advantageous time or price, which may result in significant losses.
Under the Dodd-Frank Wall Street Reform and Consumer Protection Act (the “Dodd-Frank Act”) enacted in 2010, a regulatory framework for certain OTC derivatives, such as swaps was enacted. The Dodd-Frank Act requires many swap transactions to be executed on registered exchanges or through swap execution facilities, cleared through a regulated clearinghouse, and publicly reported. In addition, many market participants are now regulated as swap dealers or swap participants, and are subject to certain minimum capital and margin requirements and business conduct standards.
The swaps market is largely unregulated. It is possible that developments in the swaps market, including potential government regulation, could adversely affect the Funds’ ability to terminate existing swap agreements or to realize amounts to be received under such agreements.
Certain clearinghouses currently offer clearing for limited types of derivatives transactions, principally credit and interest derivatives. In a cleared derivative transaction, a Fund typically enters into the transaction with a financial institution counterparty, and performance of the transaction is effectively guaranteed by a central clearinghouse, thereby reducing or eliminating the Fund’s exposure to the credit risk of the original counterparty. The Fund typically will be required to post specified levels of margin with the clearinghouse or at the instruction of the clearinghouse; the margin required by a clearinghouse may be greater than the margin the Fund would be required to post in an uncleared derivative transaction. Cash margin is recorded on the Statements of Assets and Liabilities as cash collateral held at broker on open swap contracts. Swap agreements are marked to market daily. Daily changes
186
Mercer Funds
Notes to the Financial Statements (Continued)
March 31, 2017
in valuation of centrally cleared swaps, if any, are recorded as a receivable or payable for the change in value as appropriate on the Statements of Assets and Liabilities. Only a limited number of derivative transactions are currently eligible for clearing by clearinghouses.
A Fund will accrue for interim payments on swap contracts on a daily basis, with the net amount recorded as interest payable or receivable on swap contracts on the Statements of Assets and Liabilities. Once interim payments are settled in cash, the net amount is recorded as realized gain/loss on swap contracts, in addition to realized gain/loss recorded upon the termination of swap contracts on the Statements of Operations. Fluctuations in the value of swap contracts are recorded for financial statement purposes as unrealized appreciation or depreciation of swap contracts (swap contracts, at value on the Statements of Assets and Liabilities).
Swap agreements are marked to market daily. The change in value, if any, is recorded as unrealized gain or loss in the Statements of Operations. A liquidation payment received or made at the termination of the swap is recorded as realized gain or loss in the Statements of Operations. Net periodic payments are included as part of realized gain (loss) on the Statements of Operations.
The swaps in which the Fund may engage may include instruments under which one party pays a single or periodic fixed amount(s) (or premium), and the other party pays periodic amounts based on the movement of a specified index. The Fund’s maximum risk of loss from counterparty credit risk, as opposed to investment and other types of risk, in respect of swaps is typically the discounted net value of the cash flows to be received from the counterparty over the contract’s remaining life to the extent that such amount is positive, plus the cost of entering into a similar transaction with another counterparty, if possible.
The use of swaps is a highly specialized activity that involves investment techniques and risks different from those associated with ordinary portfolio securities transactions. If the Advisor or Subadvisor is incorrect in its forecasts of market values, interest rates, and currency exchange rates, the investment performance of the Fund would be less favorable than it would have been if this investment technique were not used.
Like most other investments, swap agreements are subject to the risk that the market value of the instrument will change in a way detrimental to a Fund’s interest. A Fund bears the risk that Subadvisor will not accurately forecast future market trends or the values of assets, reference rates, indexes, or other economic factors in establishing swap positions for the Fund. If a Subadvisor attempts to use a swap as a hedge against, or as a substitute for, a portfolio investment, the Fund will be exposed to the risk that the swap will have or will develop imperfect or no correlation with the portfolio investment. This could cause substantial losses for the Fund. While hedging strategies involving swap instruments can reduce the risk of loss, they can also reduce the opportunity for gain or even result in losses by offsetting favorable price movements in other Fund investments.
During the year ended March 31, 2017, Core Fixed used swap agreements to adjust interest rate and yield curve exposure or to manage credit exposure. See the Core Fixed Schedule of Investments for a listing of open swap agreements as of March 31, 2017.
(g) Futures
A futures contract is a contractual agreement to buy or sell a specific amount of a commodity or financial instrument at a predetermined price on a stipulated future date. A Fund may enter into contracts for the purchase or sale for future delivery of securities, indices and foreign currencies. Futures contracts may be opened to protect against the adverse effects of fluctuations in security prices, interest rates, or foreign exchange rates without actually buying or selling the securities or foreign currency. A Fund also may enter into futures contracts as a low cost method for gaining or reducing exposure to a particular currency or securities market without directly investing in those currencies or securities.
A purchase of a futures contract means the acquisition of a contractual right of a Fund to obtain delivery of the securities, indices or foreign currency underlying the contract at a specified price on a specified future date. When a futures contract is sold, a Fund incurs a contractual obligation to deliver the securities, indices or foreign currency underlying the contract at a specified price on a specified date.
187
Mercer Funds
Notes to the Financial Statements (Continued)
March 31, 2017
When a Fund enters into a futures contract, it must deliver to the futures commission merchant selected by the Fund an amount referred to as “initial margin.” This amount is maintained by the futures commission merchant in a segregated account at the custodian bank. Futures contracts are marked-to-market daily, depending upon changes in the price of the underlying securities, indices or foreign currencies subject to the futures contracts, and the change in value is recorded by the Fund as a variation margin payable or receivable. The Fund recognizes gains and losses on futures contracts in addition to the variation margin, which gains and losses are considered realized at the time the contracts expire or close.
A Fund may enter into futures transactions on domestic exchanges and, to the extent such transactions have been approved by the Commodity Futures Trading Commission (“CFTC”) for sale to customers in the United States, or on foreign exchanges. In addition, a Fund may sell stock index futures in anticipation of, or during a market decline to attempt to offset the decrease in the market value of the Fund’s common stocks that might otherwise result, and a Fund may purchase such contracts in order to offset increases in the cost of common stocks that it intends to purchase. Unlike other futures contracts, a stock index futures contract specifies that no delivery of the actual stocks making up the index will take place. Instead, settlement in cash must occur upon the termination of the contract.
In entering into futures contracts and options on futures contracts, there is a credit risk that a counterparty will not be able to meet its obligations to the Fund. The counterparty for futures contracts and options on futures contracts traded in the United States and on most foreign futures exchanges is the clearinghouse associated with such exchange. In general, clearinghouses are backed by the corporate members of the clearinghouse who are required to share any financial burden resulting from the non-performance by one of its members and, as such, should significantly reduce this credit risk. In cases where the clearinghouse is not backed by the clearing members (i.e., some foreign exchanges), it is normally backed by a consortium of banks or other financial institutions. There can be no assurance that any counterparty, clearing member or clearinghouse will be able to meet its obligations to the Fund.
While futures contracts provide for the delivery of securities, deliveries usually do not occur. Contracts are generally terminated by entering into offsetting transactions.
Where the futures market is not as developed or where the regulations prevent or make it disadvantageous to trade futures, Emerging Markets will utilize synthetic futures as part of the country selection strategy implementation. A synthetic future operates like a swap transaction and uses equity index swaps on equity index futures. These are marked to market daily and the change in value is recorded as unrealized gain or loss in the Statement of Operations.
During the year ended March 31, 2017, Large Cap, Small/Mid Cap, Non-US Core Equity, Emerging Markets and Global Low Volatility used futures to equitize cash. Core Fixed and Opportunistic Fixed used futures to adjust interest rate exposure and replicate government bond positions. Emerging Markets also used futures to create passive index exposure to certain domestic emerging market country indices in the Fund. See the Large Cap, Small/Mid Cap, Non-US Core Equity, Core Fixed, Opportunistic Fixed, Emerging Markets and Global Low Volatility Schedules of Investments for a listing of open futures contracts as of March 31, 2017.
(h) Options
The Funds may purchase and sell (write) put and call options on debt securities, currencies and indices to enhance investment performance, manage duration, or protect against changes in market prices. The Funds may also buy and sell combinations of put and call options on the same underlying security, currency or index. Short (sold) options positions will generally be hedged by the Funds with cash, cash equivalents, current portfolio security holdings, or other options or futures positions.
The Funds may enter into swap options (“swaptions”). A swaption is a contract that gives a counterparty the right (but not the obligation), in return for payment of a premium, to enter into a new swap agreement or to shorten, extend, cancel, or otherwise modify an existing swap agreement, at some designated future time on specified terms. Each Fund may sell (write) and purchase put and call swaptions. Depending on the terms of the particular option
188
Mercer Funds
Notes to the Financial Statements (Continued)
March 31, 2017
agreement, a Fund generally will incur a greater degree of risk when the Fund writes a swaption than the Fund will incur when it purchases a swaption. When a Fund purchases a swaption, the Fund’s risk of loss is limited to the amount of the premium it has paid should it decide to let the swaption expire unexercised. However, when a Fund writes a swaption, upon exercise of the option, the Fund will become obligated according to the terms of the underlying agreement.
When the Fund writes a covered call or a put option, an amount equal to the premium received by the Fund is included in the Fund’s Statement of Assets and Liabilities as an asset and as an equivalent liability. The amount of the liability is subsequently marked-to-market to reflect the current market value of the option written. The Fund receives a premium on the sale of a call option but gives up the opportunity to profit from any increase in stock value above the exercise price of the option, and when the Fund writes a put option, it is exposed to a decline in the price of the underlying security.
Whether an option which the Fund has written expires on its stipulated expiration date or the Fund enters into a closing purchase transaction, the Fund realizes a gain (or loss, if the cost of a closing purchase transaction exceeds the premium received when the option was sold) without regard to any unrealized gain or loss on the underlying security, and the liability related to such option is extinguished. If a call option which the Fund has written is exercised, the Fund realizes a capital gain or loss from the sale of the underlying security, and the cost basis of the lots sold are decreased by the premium originally received. When a put option which a Fund has written is exercised, the amount of the premium originally received will reduce the cost of the security which a Fund purchases upon exercise of the option. Realized gains (losses) on purchased options are included in net realized gain (loss) from investments.
The Funds’ use of written options involves, to varying degrees, elements of market risk in excess of the amount recognized in the Statements of Assets and Liabilities. The face or contract amounts of these instruments reflect the extent of the Fund’s exposure to market risk. The risks may be caused by an imperfect correlation between movements in the price of the instrument and the price of the underlying securities, currencies and interest rates.
During the year ended March 31, 2017, Core Fixed used options to manage interest rate and volatility exposure.
Transactions in written option contracts for Core Fixed for the year ended March 31, 2017, is as follows:
| | | | | | | | |
| | | Number of Contracts/
Notional Amount | | | Premiums
Received | |
Options outstanding at March 31, 2016 | | $ | — | | | $ | — | |
Options written | | | 568,000 | | | | 64,283 | |
Options terminated in closing purchase transactions | | | (170,000 | ) | | | (34,894 | ) |
Options expired | | | (298,000 | ) | | | (15,089 | ) |
| | | | | | | | |
Options outstanding at March 31, 2017 | | $ | 100,000 | | | $ | 14,300 | |
(i) Forward foreign currency contracts
The Funds may purchase or sell currencies and/or engage in forward foreign currency transactions in order to expedite settlement of portfolio transactions and to manage currency risk.
Forward foreign currency contracts are traded in the inter-bank market conducted directly between currency traders (usually large commercial banks) and their customers. A forward contract generally has no deposit requirement and no commissions are charged at any stage for trades. The Funds will account for forward contracts by marking-to-market each day at current forward contract values. The change in market value is recorded by the Fund as an unrealized gain or loss. When the contract is closed, the Fund recognizes a realized gain or loss equal to the difference between the value of the contract at the time the contract was opened and the value at the time the contract was closed.
The Funds will only enter into forward contracts to sell, for a fixed amount of U.S. dollars or other appropriate currency, an amount of foreign currency, to the extent that the value of the short forward contract is covered by the
189
Mercer Funds
Notes to the Financial Statements (Continued)
March 31, 2017
underlying value of securities denominated in the currency being sold. Alternatively, when a Fund enters into a forward contract to sell an amount of foreign currency, the Custodian or the Fund’s sub-custodian will segregate assets in a segregated account of the Fund in an amount not less than the value of the Fund’s total assets committed to the consummation of such forward contract. If the additional segregated assets placed in the segregated account decline, additional cash or securities will be placed in the account on a daily basis so that the value of the account will equal the amount of the Fund’s commitments with respect to such contract.
During the year ended March 31, 2017, Opportunistic Fixed used forward foreign currency contracts for a variety of purposes, including hedging, risk management, efficient portfolio management, enhancing total returns, or as a substitute for taking a position in the underlying asset. Non-US Core Equity, Emerging Markets and Global Low Volatility used forward foreign currency contracts to hedge, cross hedge or to actively manage the currency exposures in the Funds. See the Non-US Core Equity, Opportunistic Fixed and Emerging Markets Schedules of Investments for a listing of open forward foreign currency contracts as of March 31, 2017.
(j) Foreign currency translation
The books and records of each Fund are maintained in US dollars. Foreign currencies, investments and other assets and liabilities denominated in foreign currencies are translated into US dollars at the foreign exchange rates prevailing at the end of the period. Purchases and sales of investment securities, income and expenses are translated at exchange rates prevailing on the respective dates of such transactions. Unrealized gains and losses that result from changes in foreign currency exchange rates have been included in the unrealized gains (losses) on foreign currency translations within each Fund’s Statement of Operations. Net realized foreign currency gains and losses resulting from changes in exchange rates include foreign currency gains and losses between trade date and settlement date on investment securities transactions, foreign currency transactions and the difference between the amounts of interest and dividends recorded on the books of the Fund and the amount actually received. The portion of foreign currency gains and losses related to fluctuations in exchange rates between the purchase settlement date and subsequent sale trade date is included in realized gains and losses on investment transactions.
(k) When-issued securities/TBA securities
Purchasing securities on a “when-issued” basis is a commitment by a Fund to buy a security before the security is actually issued. A Fund may purchase securities offered on a “when-issued” or “forward delivery” basis such as TBA securities. When so offered, the price, which is generally expressed in yield terms, is fixed at the time the commitment to purchase is made, but delivery and payment for the when-issued or forward delivery securities take place at a later date. During the period between purchase and settlement, no payment is made by the purchaser to the issuer and no interest on the when-issued or forward delivery security accrues to the purchaser. While when-issued or forward delivery securities may be sold prior to the settlement date, it is intended that a Fund will purchase such securities with the purpose of actually acquiring the securities unless a sale appears desirable for investment reasons. At the time a Fund makes the commitment to purchase a security on a when-issued or forward delivery basis, the Fund will record the transaction and reflect the value of the security in determining the Fund’s NAV. The market value of when-issued or forward delivery securities may be more or less than the purchase price. Certain risks may arise upon entering into when-issued or forward delivery securities transactions, including the potential inability of counterparties to meet the terms of their contracts, and the issuer’s failure to issue the securities due to political, economic, or other factors. Additionally, losses may arise due to declines in the value of the securities prior to settlement date.
A Fund may enter into TBA commitments to purchase or sell securities for a fixed price at a future date. TBA commitments are considered securities in themselves, and involve a risk of loss if the value of the security to be purchased or sold declines or increases prior to settlement date, which is in addition to the risk of decline in the value of a Fund’s other assets. TBA forward sale commitments are valued at the current market value of the underlying securities, according to the procedures described under “Security Valuation”.
See the Core Fixed and Opportunistic Fixed Schedules of Investments for TBA and when-issued securities held as of March 31, 2017.
190
Mercer Funds
Notes to the Financial Statements (Continued)
March 31, 2017
(l) Real estate investment trusts
The Funds may invest in real estate investment trusts (“REITs”), which pool investors’ funds for investment, primarily in income producing real estate or real estate-related loans or interests. A REIT is not taxed on income distributed to its shareholders or unitholders if it complies with regulatory requirements relating to its organization, ownership, assets and income, and with a regulatory requirement to distribute to its shareholders or unitholders at least 90% of its taxable income for each taxable year.
A shareholder in a Fund, by investing in REITs through the Fund, will bear not only the shareholder’s proportionate share of the expenses of the Fund, but also, indirectly, the management expenses of the underlying REITs. REITs depend generally on their ability to generate cash flow to make distributions to shareholders or unitholders, and may be subject to defaults by borrowers and to self-liquidations. In addition, the performance of a REIT may be affected by its failure to qualify for tax-free pass-through of income, or the REIT’s failure to maintain exemption from registration under the 1940 Act. Dividends representing a return of capital are reflected as a reduction of cost and/or as a realized gain when the amount of the return of capital is conclusively determined. See each Fund’s Schedule of Investments for REIT securities held as of March 31, 2017.
(m) Mortgage-related and other asset-backed securities
The Funds may invest in mortgage-backed and asset-backed securities. Mortgage-backed securities represent an interest in a pool of mortgages. Asset-backed securities are structured like mortgage-backed securities, but instead of mortgage loans or interests in mortgage loans, the underlying assets may include such items as motor vehicle installment sales or installment loan contracts, leases of various types of real and personal property, and receivables from credit card agreements. The value of some mortgage or asset-backed securities may be particularly sensitive to changes in prevailing interest rates. Early repayment of principal on some mortgage-related securities may expose the Fund to a lower rate of return upon reinvestment of principal. The value of these securities may fluctuate in response to the market’s perception of the creditworthiness of the issuers. Additionally, although mortgages and mortgage-related securities are generally supported by some form of government or private guarantee and/or insurance, there is no assurance that private guarantors or insurers will meet their obligations.
One type of stripped mortgage-backed security has one class receiving all of the interest from the mortgage assets (the interest-only, or “IO” class), while the other class will receive all of the principal (the principal-only, or “PO” class). Payments received for the IOs are included in interest income on the Statements of Operations. Because principal will not be received at the maturity of an IO, adjustments are made to the cost basis of the security on a daily basis until maturity. These adjustments are included in interest income on the Statements of Operations. Payments received for POs are treated as reductions to the cost and par value of the securities. See the Schedule of Investments for mortgage-backed and asset-backed securities held by Core Fixed as of March 31, 2017.
(n) Mortgage dollar roll and treasury roll transactions
The Funds may sell mortgage-backed securities and simultaneously contract to repurchase substantially similar (same type, coupon and maturity) securities on a specific future date at an agreed upon price. During the period between the sale and repurchase, the Fund will not be entitled to receive interest and principal payments on the securities sold. The Fund accounts for mortgage dollar roll transactions as purchases and sales and realizes gains and losses on these transactions. Mortgage dollar rolls involve the risk that the market value of the securities that the Fund is required to purchase may decline below the agreed upon repurchase price of those securities.
The Funds may enter into treasury roll transactions. In a treasury roll transaction the Fund sells a treasury security to a counterparty with a simultaneous agreement to repurchase the same security at an agreed upon price at a future settlement date. The Fund receives cash from the sale of the treasury security to use for other investment purposes. The difference between the sale and repurchase price represents net interest income or net interest expense. Under GAAP, the treasury roll transaction is accounted for as a financing transaction and not as a purchase or sale. During the term of the borrowing the Fund records the related interest income or interest expenses on an accrual basis. Treasury roll transactions involve the risk that the market value of the securities that the Fund is required to repurchase may decline below the agreed upon repurchase price of those securities.
191
Mercer Funds
Notes to the Financial Statements (Continued)
March 31, 2017
Treasury roll transactions are entered into by the Funds under an MRA. An MRA permits the Fund, under certain circumstances, including an event of default (such as bankruptcy or insolvency), to offset payables and/or receivables under the MRA with collateral held and/or posted to the counterparty and create one single net payment due to or from the Fund. With treasury roll transactions, typically the Fund and the counterparties are permitted to sell, re-pledge, or use the collateral associated with the transaction. However, bankruptcy or insolvency laws of a particular jurisdiction may impose restrictions on or prohibitions against such a right of offset in the event of the MRA counterparty’s bankruptcy or insolvency. Pursuant to the terms of the MRA, the Fund receives or posts securities as collateral with a market value in excess of the repurchase price to be paid or received by the Fund upon the maturity of the transaction. Upon a bankruptcy or insolvency of the MRA counterparty, the Fund would recognize a liability with respect to such excess collateral to reflect the Fund obligation under bankruptcy law to return the excess to the counterparty. The Funds did not hold open mortgage dollar rolls or treasury rolls as of March 31, 2017.
(o) Bank loans
Core Fixed may invest in bank loans, which include institutionally-traded floating rate securities generally acquired as an assignment from another holder of, or participation interest in, loans originated by a bank or financial institution (the ‘‘Lender’’) that acts as agent for all holders. The agent administers the terms of the loan, as specified in the loan agreement. The Fund may invest in multiple series or tranches of a loan, which may have varying terms and carry different associated risks. When investing in a loan participation, the Fund has the right to receive payments of principal, interest and any fees to which it is entitled only from the Lender selling the loan agreement and only upon receipt by the Lender of payments from the borrower. The Fund generally has no right to enforce compliance with the terms of the loan agreement with the borrower. As a result, the Fund may be subject to the credit risk of both the borrower and the Lender that is selling the loan agreement. At March 31, 2017, the Funds held no unfunded loan commitments.
(p) Indexed securities
The Funds may invest in indexed securities where the redemption values and/or coupons are linked to the prices of other securities, securities indices, or other financial indicators. The Funds use indexed securities to increase or decrease their exposure to different underlying instruments and to gain exposure to markets in which it may be difficult to invest through conventional securities. Indexed securities may be more volatile than their underlying instruments, but any loss is limited to the amount of the original investment.
(q) Taxes and distributions
The Funds intend to qualify each year as regulated investment companies under Subchapter M of the Internal Revenue Code of 1986, as amended (“the Code”). The Funds intend to distribute substantially all of their net investment income and net realized short-term and long-term gains, if any, after giving effect to any available capital loss carryovers for U.S. federal income tax purposes. Therefore, no provision for U.S. federal and state income or excise tax is necessary.
The Funds utilize the provisions of the federal income tax laws that provide for the carryforward of capital losses for prior years, offsetting such losses against any future realized capital gains. Under the Regulated Investment Company Modernization Act of 2010 (the “Act”), net capital losses recognized after December 22, 2010 may be carried forward indefinitely, and their character is retained as short-term and/or long-term losses. Previously, net capital losses were carried forward for eight years and treated as short-term losses. As a transition rule, the Act requires that post-enactment net capital losses be used before pre-enactment net capital losses.
192
Mercer Funds
Notes to the Financial Statements (Continued)
March 31, 2017
On March 31, 2017, the following Funds had deferred capital losses available to be offset against future net capital gains through the indicated expiration dates as follows:
| | | | | | | | | | | | | | | | | | | | |
| | | Expiring March 31, | |
| | | 2017 | | | 2018 | | | 2019 | | | 2020 | | | Unlimited | |
Non-US Core Equity | | $ | — | | | $ | — | | | $ | — | | | $ | — | | | $ | 470,303 | |
Opportunistic Fixed | | | — | | | | — | | | | — | | | | — | | | | 13,384,849 | |
Emerging Markets | | | — | | | | — | | | | — | | | | — | | | | 114,109,505 | |
During the year ended March 31, 2017, none of the Funds utilized capital loss carryforwards.
Under current tax rules, regulated investment companies can elect to treat certain late-year ordinary losses incurred and post-October capital losses (capital losses realized after October 31) as arising on the first day of the following taxable year. As of March 31, 2017, Core Fixed and Opportunistic Fixed have elected to defer current year post-October losses of $6,154,104 and $1,745,756, respectively.
As of March 31, 2017, the cost for U.S. federal income tax purposes and gross unrealized appreciation and depreciation in value of investments were as follows:
| | | | | | | | | | | | | | | | |
| | | Federal
Income Tax
Cost | | | Tax Basis
Unrealized
Appreciation | | | Tax Basis
Unrealized
Depreciation | | | Net
Unrealized
Appreciation
(Depreciation) | |
Large Cap | | $ | 539,216,442 | | | $ | 83,173,004 | | | $ | (9,795,119 | ) | | $ | 73,377,885 | |
Small/Mid Cap | | | 872,914,094 | | | | 154,178,203 | | | | (16,107,774 | ) | | | 138,070,429 | |
Non-US Core Equity | | | 2,179,001,521 | | | | 234,586,600 | | | | (71,641,822 | ) | | | 162,944,778 | |
Core Fixed | | | 794,792,650 | | | | 7,989,189 | | | | (13,496,141 | ) | | | (5,506,952 | ) |
Opportunistic Fixed | | | 591,408,903 | | | | 17,802,603 | | | | (31,646,401 | ) | | | (13,843,798 | ) |
Emerging Markets | | | 1,384,480,210 | | | | 153,240,143 | | | | (20,619,280 | ) | | | 132,620,863 | |
Global Low Volatility | | | 1,167,898,426 | | | | 143,628,927 | | | | (24,480,001 | ) | | | 119,148,926 | |
The temporary differences between book-basis and tax-basis unrealized appreciation/(depreciation) are primarily due to wash sale loss deferrals, investments in passive foreign investment companies and other basis adjustments.
As of March 31, 2017, the Funds had no uncertain tax positions that would require recognition, derecognition, or disclosure. Each of the Funds’ federal tax returns filed in the 3-year period ended March 31, 2017 remains subject to examination by the Internal Revenue Service.
The Funds’ policy is to declare and pay distributions from net investment income and net realized short-term and long-term gains at least annually. All distributions are paid in shares of the Funds, at NAV, unless the shareholder elects to receive cash distributions. A Fund may distribute such income dividends and capital gains more frequently, if necessary, in order to reduce or eliminate federal excise taxes on the Funds. The amount of any distribution will vary, and there is no guarantee that a Fund will pay either income dividends or capital gains distributions.
193
Mercer Funds
Notes to the Financial Statements (Continued)
March 31, 2017
During the years ended March 31, 2017 and March 31, 2016, the tax character of distributions (including capital gain dividends, if any, designated pursuant to Section 852 of the Code) paid, were as follows:
| | | | | | | | | | | | | | | | | | | | | | | | |
| | | 2017 | | | 2016 | |
| | | Ordinary
Income | | | Long-Term
Capital Gains | | | Return of
Capital | | | Ordinary
Income | | | Long-Term
Capital Gains | | | Return of
Capital | |
Large Cap | | $ | 4,865,519 | | | $ | 16,407,532 | | | $ | — | | | $ | 11,304,258 | | | $ | 28,725,500 | | | $ | — | |
Small/Mid Cap | | | 10,867,942 | | | | 18,277,858 | | | | — | | | | — | | | | 24,352,888 | | | | — | |
Non-US Core Equity | | | 37,187,651 | | | | — | | | | — | | | | 41,554,865 | | | | 40,514,508 | | | | — | |
Core Fixed | | | 24,864,792 | | | | 4,671,328 | | | | — | | | | 29,092,642 | | | | 3,461,147 | | | | — | |
Opportunistic Fixed | | | — | | | | — | | | | — | | | | 5,165,823 | | | | — | | | | 60,282 | |
Emerging Markets | | | 26,250,811 | | | | — | | | | — | | | | 11,714,562 | | | | — | | | | — | |
Global Low Volatility | | | 16,812,054 | | | | 24,419,112 | | | | — | | | | 18,709,142 | | | | 39,459,369 | | | | — | |
As of March 31, 2017, the components of distributable earnings on a tax basis were as follows:
| | | | | | | | | | | | | | | | | | | | |
| | | Undistributed
Ordinary
Income | | | Undistributed
Long-Term
Gains | | | Capital Losses
Other Temporary
Differences | | | Unrealized
Appreciation
(Depreciation) | | | Total
Distributable
Earnings | |
Large Cap | | $ | 8,984,573 | | | $ | 7,278,810 | | | $ | (5,064 | ) | | $ | 73,378,133 | | | $ | 89,636,452 | |
Small/Mid Cap | | | 29,815,741 | | | | 12,724,052 | | | | (883 | ) | | | 138,068,945 | | | | 180,607,855 | |
Non-US Core Equity | | | 3,306,506 | | | | — | | | | (474,341 | ) | | | 162,761,996 | | | | 165,594,161 | |
Core Fixed | | | 3,492,556 | | | | — | | | | (6,159,893 | ) | | | (5,346,828 | ) | | | (8,014,165 | ) |
Opportunistic Fixed | | | 4,264,228 | | | | — | | | | (15,139,898 | ) | | | (13,413,475 | ) | | | (24,289,145 | ) |
Emerging Markets | | | 14,096,235 | | | | — | | | | (114,109,503 | ) | | | 129,636,743 | | | | 29,623,475 | |
Global Low Volatility | | | 4,946,996 | | | | 10,671,339 | | | | — | | | | 119,102,363 | | | | 134,720,698 | |
All other differences are temporary losses related to mostly organizational costs and other timing adjustments.
(r) Allocation of expenses and income
The majority of expenses of the Trust are directly identifiable to an individual Fund. Expenses which are not readily identifiable to a specific Fund are allocated among the applicable Funds, taking into consideration, among other things, the nature and type of expense and the relative size of each applicable Fund.
(s) Redemption fees
While none of the Funds’ classes have initial or contingent deferred sales charges on purchases of Fund shares, redemptions of Fund shares held less than 30 days may be assessed a 2% short-term trading fee and recorded as paid-in capital.
The Trust entered into a Credit Agreement on behalf of the Funds (“the Agreement”) with a bank pursuant to a committed, unsecured revolving line of credit through December 14, 2017. Borrowings for each Fund under the Agreement are limited to the lesser of $50,000,000 or 33 1/3% of a Fund’s Adjusted Net Assets provided borrowings did not exceed, in the aggregate, $50,000,000. Under the terms of the Agreement the Trust pays an annual commitment fee at the rate 0.25% per year on the difference between the total line of credit and the average daily amount of borrowings outstanding. Interest is charged to the Funds based on its borrowings at a variable rate equal to the higher of the Overnight Federal Funds Rate or 30-Day LIBOR plus 1.00%. The Funds did not borrow under the Agreement during the year ended March 31, 2017.
In the normal course of business, the Funds enter into contracts that require them to provide a variety of representations or general indemnification for certain liabilities. The Funds’ maximum exposure under these
194
Mercer Funds
Notes to the Financial Statements (Continued)
March 31, 2017
arrangements is unknown, as this would involve future claims that may be made against the Funds that have not yet occurred. However, the Funds have not had prior claims or losses pursuant to these contracts and expect the risk of loss to be remote.
| 5. | Fees and other transactions with affiliates |
The Advisor provides investment advisory services to each Fund pursuant to an investment management agreement. Effective July 1, 2016, pursuant to the investment management agreement, each Fund pays the Advisor a fee for managing the Fund’s investments at an annual rate of:
| | | | | | | | | | | | |
| | | Investment Advisory Fee* on Net Assets | |
| | | Average net assets
up to
$750 million | | | Average net assets
in excess of
$750 million up to
$1 billion | | | Average net assets
in excess of
$1 billion | |
Large Cap | | | 0.53 | % | | | 0.51 | % | | | 0.46 | % |
Small/Mid Cap | | | 0.90 | % | | | 0.88 | % | | | 0.83 | % |
Non-US Core Equity | | | 0.75 | % | | | 0.73 | % | | | 0.68 | % |
Core Fixed | | | 0.35 | % | | | 0.33 | % | | | 0.28 | % |
Opportunistic Fixed | | | 0.80 | % | | | 0.78 | % | | | 0.73 | % |
Emerging Markets | | | 0.80 | % | | | 0.78 | % | | | 0.73 | % |
Global Low Volatility | | | 0.75 | % | | | 0.73 | % | | | 0.68 | % |
| | * | Consists of the total advisory fee payable by the Funds to the Advisor. The Advisor is responsible for paying the subadvisory fees. |
Prior to July 1, 2016, pursuant to the investment management agreement, each Fund paid the Advisor a fee for managing the Fund’s investments at an annual rate of:
| | | | | | | | |
| | | Investment Advisory Fee* on Net Assets | |
| | | Average net assets
up to
$750 million | | | Average net assets
in excess of
$750 million | |
Large Cap** | | | 0.53% | | | | 0.51 | % |
Small/Mid Cap | | | 0.90% | | | | 0.88 | % |
Non-US Core Equity | | | 0.75% | | | | 0.73 | % |
Core Fixed | | | 0.35% | | | | 0.33 | % |
Opportunistic Fixed | | | 0.80% | | | | 0.78 | % |
Emerging Markets | | | 0.80% | | | | 0.78 | % |
Global Low Volatility | | | 0.75% | | | | 0.73 | % |
| | * | Consists of the total advisory fee payable by the Funds to the Advisor. The Advisor is responsible for paying the subadvisory fees. |
| | ** | Prior to the acquisition (See Note 8), Large Cap paid the Advisor an annual rate of 0.55% on average net assets up to $750 million and 0.53% on average net assets in excess of $750 million for managing the Fund’s investments. |
Such fees as referenced above are shown in the Advisory fees line in the Statements of Operations. The Advisor provides certain internal administrative services to the Class S, Class Y-1 and Class Y-2 shares of the Funds, for which the Advisor receives a fee of 0.15%, 0.10% and 0.05% of the average daily net assets of the Class S, Class Y-1 and Class Y-2 shares of the Funds, respectively. These internal administrative services include attending to shareholder correspondence, assisting with the processing of purchases and redemptions of shares, preparing and disseminating information and documents for use by beneficial shareholders and monitoring and overseeing non-advisory relationships with entities providing services to the Class S, Class Y-1 and Class Y-2 shares, including the transfer agent. However, Class S, Class Y-1 and Class Y-2 shares have not commenced operations.
195
Mercer Funds
Notes to the Financial Statements (Continued)
March 31, 2017
The Funds have adopted a plan of marketing and service, or “12b-1 plan” to finance the provision of certain shareholder services to the owners of Class S and Class Y-1 shares of the Funds (collectively referred to as the “plans”). The plan provides for payments at annual rates (based on average net assets) of up to 0.25% of each Fund’s Class S and Class Y-1 shares. However, Class S and Class Y-1 shares have not commenced operations.
The Trust, with respect to Opportunistic Fixed, and the Advisor entered into a written contractual fee waiver and expense reimbursement agreement pursuant to which the Advisor agreed to waive a portion of its fees and/or reimburse expenses through July 31, 2016 in an amount necessary to limit the Fund’s total annual operating expenses to an annual rate (as a percentage of the Fund’s average daily net assets) as set forth in the table below. This agreement expired on July 31, 2016. For the year ended March 31, 2017, the fees were reimbursed to the extent that the Fund’s class expenses exceeded the net expense rates of average daily net assets of the Fund class. These reimbursements are shown in the Reimbursement of expenses line in the Statements of Operations. However, Class S, Class Y-1 and Class Y-2 shares have not commenced operations.
| | | | | | | | | | | | | | | | |
| | | Class S | | | Class Y-1 | | | Class Y-2 | | | Class Y-3 | |
Opportunistic Fixed | | | 1.40% | | | | 1.35% | | | | 1.05% | | | | 0.90% | |
Pursuant to the expense reimbursement agreement, the Advisor is entitled to be reimbursed for any fees the Advisor waives and Fund expenses that the Advisor reimburses for a period of three years following such fee waiver and expense reimbursement, to the extent that such reimbursement of the Advisor by a Fund will not cause the Fund to exceed any applicable expense limitation that is in place for the Fund. For the year ended March 31, 2017, there were no reimbursed expenses recovered by the Advisor from the Funds.
Pursuant to the Funds’ expense reimbursement agreement, the Advisor can recapture certain amounts waived or reimbursed over the 12-month period ended July 31, 2014 (and over the past three 12-month periods ended July 31, 2016 with respect to Opportunistic Fixed). The following amounts were available for recapture as of July 31, 2016:
| | | | | | | | | | | | |
| | | Expenses Reimbursed in the
12-Months Ended July 31, | |
| | | 2014 | | | 2015 | | | 2016 | |
| | | Subject to Recapture until July 31, | |
| | | 2017 | | | 2018 | | | 2019 | |
Large Cap | | $ | 248,632 | | | $ | — | | | $ | — | |
Small/Mid Cap | | | 54,175 | | | | — | | | | — | |
Non-US Core Equity | | | — | | | | — | | | | — | |
Core Fixed | | | 651,589 | | | | — | | | | — | |
Opportunistic Fixed | | | 253,811 | | | | 208,082 | | | | 176,732 | |
Emerging Markets | | | 556,688 | | | | — | | | | — | |
Global Low Volatility | | | — | | | | — | | | | — | |
196
Mercer Funds
Notes to the Financial Statements (Continued)
March 31, 2017
| 6. | Purchases and sales of securities |
Cost of purchases and proceeds from sales of securities, excluding short-term investments, for the year ended March 31, 2017, were as follows:
| | | | | | | | |
| | | Long-Term
U.S. Government Securities | | | Other Long-Term
Securities | |
Purchases | | | | | | | | |
Large Cap* | | $ | — | | | $ | 426,912,842 | |
Small/Mid Cap** | | | — | | | | 851,412,471 | |
Non-US Core Equity | | | — | | | | 1,746,106,085 | |
Core Fixed | | | 839,705,364 | | | | 348,784,013 | |
Opportunistic Fixed | | | — | | | | 388,717,706 | |
Emerging Markets | | | — | | | | 1,223,703,770 | |
Global Low Volatility | | | — | | | | 703,680,590 | |
Sales | | | | | | | | |
Large Cap | | | — | | | | 494,963,429 | |
Small/Mid Cap | | | — | | | | 950,297,906 | |
Non-US Core Equity | | | — | | | | 1,594,526,922 | |
Core Fixed | | | 837,450,669 | | | | 345,841,786 | |
Opportunistic Fixed | | | — | | | | 257,320,612 | |
Emerging Markets | | | — | | | | 1,052,269,198 | |
Global Low Volatility | | | — | | | | 528,799,681 | |
| * | With respect to Large Cap’s merger with Mercer US Large Cap Value Equity Fund (“Large Cap Value”) (see Note 8) on June 24, 2016, Large Cap acquired long-term securities with a cost of $277,806,252 that are not included in the above other long-term securities purchases value. |
| ** | With respect to Small/Mid Cap’s merger with Mercer US Small/Mid Cap Value Equity Fund (“Small/Mid Cap Value”) (see Note 8) on June 24, 2016, Small/Mid Cap acquired long-term securities with a cost of $450,558,318 that are not included in the above other long-term securities purchases value. |
Each Fund is authorized to issue an unlimited number of shares of beneficial interest without par value. Transactions in Fund shares were as follows:
Large Cap
| | | | | | | | | | | | | | | | |
| | | Year Ended
March 31, 2017 | | | Year Ended
March 31, 2016 | |
| | | Shares | | | Amount | | | Shares | | | Amount | |
Class Y-3: | | | | | | | | | | | | | | | | |
Shares sold | | | 3,013,075 | | | $ | 29,359,225 | | | | 4,985,529 | | | $ | 54,996,490 | |
Shares issued through acquisition (see Note 8) | | | 30,126,230 | | | | 274,762,972 | | | | — | | | | — | |
Shares issued to shareholders in reinvestment of distributions | | | 2,091,745 | | | | 21,273,051 | | | | 4,072,203 | | | | 40,029,758 | |
Shares repurchased | | | (10,819,328 | ) | | | (107,234,001 | ) | | | (9,458,703 | ) | | | (105,785,655 | ) |
| | | | | | | | | | | | | | | | |
Net increase (decrease) | | | 24,411,722 | | | $ | 218,161,247 | | | | (400,971 | ) | | $ | (10,759,407 | ) |
| | | | | | | | | | | | | | | | |
197
Mercer Funds
Notes to the Financial Statements (Continued)
March 31, 2017
Small/Mid Cap
| | | | | | | | | | | | | | | | |
| | | Year Ended
March 31, 2017 | | | Year Ended
March 31, 2016 | |
| | | Shares | | | Amount | | | Shares | | | Amount | |
Class Y-3: | | | | | | | | | | | | | | | | |
Shares sold | | | 4,542,072 | | | $ | 49,111,330 | | | | 4,942,894 | | | $ | 55,377,890 | |
Shares issued through acquisition (see Note 8) | | | 44,707,680 | | | | 461,393,851 | | | | — | | | | — | |
Shares issued to shareholders in reinvestment of distributions | | | 2,514,737 | | | | 29,145,800 | | | | 2,293,116 | | | | 24,352,888 | |
Shares repurchased | | | (13,020,694 | ) | | | (149,207,273 | ) | | | (4,259,716 | ) | | | (50,158,329 | ) |
| | | | | | | | | | | | | | | | |
Net increase | | | 38,743,795 | | | $ | 390,443,708 | | | | 2,976,294 | | | $ | 29,572,449 | |
| | | | | | | | | | | | | | | | |
Non-US Core Equity
| | | | | | | | | | | | | | | | |
| | | Year Ended
March 31, 2017 | | | Year Ended
March 31, 2016 | |
| | | Shares | | | Amount | | | Shares | | | Amount | |
Class Y-3: | | | | | | | | | | | | | | | | |
Shares sold | | | 30,189,177 | | | $ | 298,749,804 | | | | 21,486,792 | | | $ | 213,382,507 | |
Shares issued to shareholders in reinvestment of distributions | | | 3,873,714 | | | | 37,187,651 | | | | 8,452,047 | | | | 82,069,373 | |
Shares repurchased | | | (18,541,674 | ) | | | (184,442,734 | ) | | | (22,605,539 | ) | | | (236,936,733 | ) |
| | | | | | | | | | | | | | | | |
Net increase | | | 15,521,217 | | | $ | 151,494,721 | | | | 7,333,300 | | | $ | 58,515,147 | |
| | | | | | | | | | | | | | | | |
Core Fixed
| | | | | | | | | | | | | | | | |
| | | Year Ended
March 31, 2017 | | | Year Ended
March 31, 2016 | |
| | | Shares | | | Amount | | | Shares | | | Amount | |
Class Y-3: | | | | | | | | | | | | | | | | |
Shares sold | | | 21,634,648 | | | $ | 222,899,384 | | | | 15,717,334 | | | $ | 161,679,985 | |
Shares issued to shareholders in reinvestment of distributions | | | 3,023,144 | | | | 29,536,120 | | | | 3,294,918 | | | | 32,553,789 | |
Shares repurchased | | | (25,081,385 | ) | | | (252,121,624 | ) | | | (27,303,611 | ) | | | (278,202,540 | ) |
| | | | | | | | | | | | | | | | |
Net decrease | | | (423,593 | ) | | $ | 313,880 | | | | (8,291,359 | ) | | $ | (83,968,766 | ) |
| | | | | | | | | | | | | | | | |
Opportunistic Fixed
| | | | | | | | | | | | | | | | |
| | | Year Ended
March 31, 2017 | | | Year Ended
March 31, 2016 | |
| | | Shares | | | Amount | | | Shares | | | Amount | |
Class Y-3: | | | | | | | | | | | | | | | | |
Shares sold | | | 17,780,404 | | | $ | 159,120,616 | | | | 10,534,645 | | | $ | 90,807,455 | |
Shares issued to shareholders in reinvestment of distributions | | | — | | | | — | | | | 655,722 | | | | 5,226,105 | |
Shares repurchased | | | (6,812,473 | ) | | | (60,674,793 | ) | | | (5,465,227 | ) | | | (47,840,875 | ) |
| | | | | | | | | | | | | | | | |
Net increase | | | 10,967,931 | | | $ | 98,445,823 | | | | 5,725,140 | | | $ | 48,192,685 | |
| | | | | | | | | | | | | | | | |
198
Mercer Funds
Notes to the Financial Statements (Continued)
March 31, 2017
Emerging Markets
| | | | | | | | | | | | | | | | |
| | | Year Ended
March 31, 2017 | | | Year Ended
March 31, 2016 | |
| | | Shares | | | Amount | | | Shares | | | Amount | |
Class Y-3: | | | | | | | | | | | | | | | | |
Shares sold | | | 32,571,851 | | | $ | 293,233,025 | | | | 37,663,658 | | | $ | 329,515,356 | |
Shares issued to shareholders in reinvestment of distributions | | | 3,007,053 | | | | 26,250,811 | | | | 1,428,605 | | | | 11,714,562 | |
Shares repurchased | | | (17,835,590 | ) | | | (163,096,765 | ) | | | (15,257,581 | ) | | | (141,137,722 | ) |
| | | | | | | | | | | | | | | | |
Net increase | | | 17,743,314 | | | $ | 156,387,071 | | | | 23,834,682 | | | $ | 200,092,196 | |
| | | | | | | | | | | | | | | | |
Global Low Volatility
| | | | | | | | | | | | | | | | |
| | | Year Ended
March 31, 2017 | | | Year Ended
March 31, 2016 | |
| | | Shares | | | Amount | | | Shares | | | Amount | |
Class Y-3: | | | | | | | | | | | | | | | | |
Shares sold | | | 27,192,594 | | | $ | 332,279,779 | | | | 15,663,054 | | | $ | 191,381,879 | |
Shares issued to shareholders in reinvestment of distributions | | | 3,485,306 | | | | 41,231,166 | | | | 5,098,029 | | | | 58,168,511 | |
Shares repurchased | | | (12,271,880 | ) | | | (149,487,877 | ) | | | (7,747,497 | ) | | | (94,010,564 | ) |
| | | | | | | | | | | | | | | | |
Net increase | | | 18,406,020 | | | $ | 224,023,068 | | | | 13,013,586 | | | $ | 155,539,826 | |
| | | | | | | | | | | | | | | | |
At the close of business on June 24, 2016, Large Cap, formerly Mercer US Large Cap Growth Equity Fund, with Class Y-3 net assets of $267,918,751 acquired all of the assets and liabilities of Large Cap Value, each a series of the Trust, in a tax-free reorganization. The acquisition was accomplished by a tax-free exchange of 30,880,775 Class Y-3 shares of Large Cap Value valued at $274,762,972 for 30,126,230 Class Y-3 shares of Large Cap. Large Cap Value’s net assets on June 24, 2016 were $274,762,972 for Class Y-3, including investments valued at $273,909,251 with a cost basis of $281,311,613. For financial reporting purposes, assets received, liabilities assumed, and shares issued by Large Cap were recorded at fair value; however, the cost basis of the investments received by Large Cap from Large Cap Value were carried forward to align ongoing reporting of Large Cap’s realized and unrealized gains and losses with amounts distributable to shareholders for tax purposes. The aggregate net assets of Large Cap immediately after the acquisition was $542,681,723, which included $7,402,474 of acquired unrealized depreciation on investments and foreign currency transactions from Large Cap Value.
Assuming the acquisition had been completed on April 1, 2016, Large Cap’s pro-forma results of operations for the year ended March 31, 2017 are as follows:
| | | | |
Net investment income | | $ | 7,338,647 | (a) |
Net realized and unrealized gain on investments | | | 90,015,237 | (b) |
| | | | |
Net increase in net assets from operations | | $ | 97,353,884 | |
| | | | |
Because the combined investment portfolios have been managed as a single integrated portfolio since the acquisition was completed, it is not practicable to separate the amounts of revenue and earnings of Large Cap Value that have been included in the Fund’s Statement of Operations since June 24, 2016.
| | (a) | $6,011,362 net investment income as reported at March 31, 2017 plus $1,258,593 from Large Cap Value pre-merger net investment income, plus $13,667 in lower net advisory fees, plus $55,025 of pro-forma eliminated other expenses. |
199
Mercer Funds
Notes to the Financial Statements (Continued)
March 31, 2017
| | (b) | $76,775,639 unrealized appreciation as reported at March 31, 2017 minus $8,099,693 pro-forma March 31, 2016 unrealized appreciation, plus $21,505,233 net realized gain as reported at March 31, 2017 minus $165,942 in net realized loss from Large Cap Value pre-merger. |
At the close of business on June 24, 2016, Small/Mid Cap, formerly Mercer US Small/Mid Cap Growth Equity Fund, with Class Y-3 net assets of $440,701,905 acquired all of the assets and liabilities of Small/Mid Cap Value, each a series of the Trust, in a tax-free reorganization. The acquisition was accomplished by a tax-free exchange of 53,005,209 Class Y-3 shares of Small/Mid Cap Value valued at $461,393,851 for 44,707,680 Class Y-3 shares of Small/Mid Cap. Small/Mid Cap Value’s net assets on June 24, 2016 were $461,393,851 for Class Y-3, including investments valued at $461,246,059 with a cost basis of $459,083,775. For financial reporting purposes, assets received, liabilities assumed, and shares issued by Small/Mid Cap were recorded at fair value; however, the cost basis of the investments received by Small/Mid Cap from Small/Mid Cap Value were carried forward to align ongoing reporting of Small/Mid Cap’s realized and unrealized gains and losses with amounts distributable to shareholders for tax purposes. The aggregate net assets of Small/Mid Cap immediately after the acquisition was $902,095,756, which included $2,162,284 of acquired unrealized appreciation on investments from Small/Mid Cap Value.
Assuming the acquisition had been completed on April 1, 2016, Small/Mid Cap’s pro-forma results of operations for the period ended March 31, 2017 are as follows:
| | | | |
Net investment income | | $ | 3,676,399 | (a) |
Net realized and unrealized gain on investments | | | 177,784,445 | (b) |
| | | | |
Net increase in net assets from operations | | $ | 181,460,844 | |
| | | | |
Because the combined investment portfolios have been managed as a single integrated portfolio since the acquisition was completed, it is not practicable to separate the amounts of revenue and earnings of Small/Mid Cap Value that have been included in the Fund’s Statement of Operations since June 24, 2016.
| | (a) | $3,352,783 net investment income as reported at March 31, 2017 plus $259,669 from Small/Mid Cap Value pre-merger net investment income, plus $7,289 in lower net advisory fees, plus $56,658 of pro-forma eliminated other expenses. |
| | (b) | $141,925,894 unrealized appreciation as reported at March 31, 2017 minus $35,608,850 pro-forma March 31, 2016 unrealized appreciation, plus $67,704,689 net realized gain as reported at March 31, 2017 plus $3,762,712 in net realized gain from Small/Mid Cap Value pre-merger, respectively. |
Management has evaluated the impact of subsequent events through May 25, 2017, the date the financial statements were available to be issued for possible adjustment to and/or disclosure in the Funds’ financial statements. Management has determined that there are no material events that would require adjustment and/or disclosure in the Funds’ financial statements through this date.
200
201
Mercer Funds
Additional Information (Unaudited)
Proxy Voting
A description of the policies and procedures that the Advisor and each Fund’s Subadvisors use to determine how to vote proxies relating to the Fund’s portfolio securities is available, without charge, upon request, by calling 1-866-658-9896, and on the Securities and Exchange Commission’s (“SEC”) website at http://www.sec.gov. Information about Funds’ proxy voting decisions are available without charge, online on the Funds’ website at http://www.mercer.us/mutual-funds-on-offer.
Quarterly Reporting
The Funds file their complete schedule of portfolio holdings with the Securities and Exchange Commission for the first and third quarters of each fiscal year on Form N-Q, which when filed, will be available on the SEC’s website at http://www.sec.gov. When filed, the Funds’ Form N-Q may be reviewed and copied at the Commission’s Public Reference Room in Washington, D.C. Information on the operation of the Public Reference Room may be obtained by calling 1-800-SEC-0330.
Federal Tax Information
The amount of long-term capital gains paid for the fiscal year ended March 31, 2017, the amount of long-term capital gains paid were as follows:
| | | | |
Fund | | | |
Large Cap | | $ | 16,407,532 | |
Small/Mid Cap | | | 18,277,858 | |
Core Fixed | | | 4,671,328 | |
Global Low Volatility | | | 24,419,112 | |
For the year ended March 31, 2017, Non-US Core Equity and Emerging Markets had foreign tax credits in the amount of $3,313,846 and $2,545,967, respectively, and foreign source income of $45,348,124 and $35,984,808, respectively.
Qualified dividend income (“QDI”) received by the Funds through March 31, 2017, that qualified for a reduced tax rate pursuant to the Internal Revenue Code Section 1(h)(11) are as follows:
| | | | |
Fund | | QDI | |
Large Cap | | $ | 8,290,127 | |
Small/Mid Cap | | | 8,202,907 | |
Non-US Core Equity | | | 42,048,402 | |
Opportunistic Fixed Income | | | 79,462 | |
Emerging Markets | | | 21,281,728 | |
Global Low Volatility | | | 18,548,446 | |
For corporate shareholders, a portion of the ordinary dividends paid during the Funds’ year ended March 31, 2017, qualified for the dividends received deduction, as follows:
| | | | |
Fund | | | |
Large Cap | | | 49.98 | % |
Small/Mid Cap | | | 18.62 | % |
Non-US Core Equity | | | 1.65 | % |
Emerging Markets | | | 0.46 | % |
Global Low Volatility | | | 56.30 | % |
202
Mercer Funds
Understanding Your Fund’s Expenses (Unaudited)
As a mutual fund shareholder, you incur different costs: transaction costs, including sales charges (loads) on purchases, redemption fees and certain exchange fees and ongoing costs, including management fees, distribution fees (12b-1 fees), and other fund expenses. These costs are described in more detail in the Funds’ prospectus. The examples below are intended to help you understand the ongoing costs of investing in the Funds and help you compare these with the ongoing costs of investing in other mutual funds. The first line in the table for each Fund shows the actual account values and actual fund expenses you would have paid on a $1,000 investment in the Fund from October 1, 2016 through March 31, 2017. It also shows how much a $1,000 investment would be worth at the close of the period, assuming actual fund returns and expenses. To estimate the expenses you paid over the period, simply divide your account value by $1,000 (for example $8,600 account value divided by $1,000 = $8.60) and multiply the result by the number in the Operating Expenses Incurred column as shown below for your Class. The second line in the table for each Fund provides information about hypothetical account values and hypothetical expenses based on the Fund’s actual expense ratios and an assumed rate of return of 5% per year before expenses, which is not the Fund’s actual return. The hypothetical account values and expenses may not be used to estimate the actual ending account balance or expenses you paid on your investment for the period. You may use this information to compare the ongoing costs of investing in the Fund and other funds. To do so, compare this 5% hypothetical example with the 5% hypothetical examples that appear in the shareholder reports of the other funds. Please note that the expenses shown reflect ongoing costs only, and do not include any transaction costs, such as sales charges, redemption fees or exchange fees. Therefore, the second line in the table of each fund is useful in comparing ongoing costs only, and will not help you determine the relative costs of owning different funds. If transaction costs were included, total costs would be higher.
Large Cap — Class Y-3
Hypothetical Return on $1,000
| | | | | | | | | | | | | | | | | | | | | | | | | |
| | | Expense
Ratio | | Beginning
Amount | | Ending
Value | | Avg
Value | | Operating
Expense
Incurred* |
Actual | | | | 0.62% | | | | | 1,000.00 | | | | | 1,106.30 | | | | | 1,053.15 | | | | | 3.26 | |
Hypothetical | | | | 0.62% | | | | | 1,000.00 | | | | | 1,021.84 | | | | | 1,010.92 | | | | | 3.13 | |
| * | Actual expenses are equal to the Class’ annualized expense ratio of 0.62%, multiplied by the average account value over the period, multiplied by 182/365 |
Small/Mid Cap — Class Y-3
Hypothetical Return on $1,000
| | | | | | | | | | | | | | | | | | | | | | | | | |
| | | Expense
Ratio | | Beginning
Amount | | Ending
Value | | Avg
Value | | Operating
Expense
Incurred* |
Actual | | | | 0.97% | | | | | 1,000.00 | | | | | 1,127.10 | | | | | 1,063.55 | | | | | 5.14 | |
Hypothetical | | | | 0.97% | | | | | 1,000.00 | | | | | 1,020.09 | | | | | 1,010.05 | | | | | 4.89 | |
| * | Actual expenses are equal to the Class’ annualized expense ratio of 0.97%, multiplied by the average account value over the period, multiplied by 182/365 |
203
Mercer Funds
Understanding Your Fund’s Expenses (Unaudited) (Continued)
Non-US Core Equity — Class Y-3
Hypothetical Return on $1,000
| | | | | | | | | | | | | | | | | | | | | | | | | |
| | | Expense
Ratio | | Beginning
Amount | | Ending
Value | | Avg
Value | | Operating
Expense
Incurred* |
Actual | | | | 0.81%** | | | | | 1,000.00 | | | | | 1,052.50 | | | | | 1,026.25 | | | | | 4.14 | |
Hypothetical | | | | 0.81%** | | | | | 1,000.00 | | | | | 1,020.89 | | | | | 1,010.45 | | | | | 4.08 | |
| * | Actual expenses are equal to the Class’ annualized expense ratio of 0.81%, multiplied by the average account value over the period, multiplied by 182/365 |
| ** | Includes interest expense that amounts to less than 0.01%. |
Core Fixed — Class Y-3
Hypothetical Return on $1,000
| | | | | | | | | | | | | | | | | | | | | | | | | |
| | | Expense
Ratio | | Beginning
Amount | | Ending
Value | | Avg
Value | | Operating
Expense
Incurred* |
Actual | | | | 0.43%** | | | | | 1,000.00 | | | | | 983.80 | | | | | 991.90 | | | | | 2.13 | |
Hypothetical | | | | 0.43%** | | | | | 1,000.00 | | | | | 1,022.79 | | | | | 1,011.40 | | | | | 2.17 | |
| * | Actual expenses are equal to the Class’ annualized expense ratio of 0.43%, multiplied by the average account value over the period, multiplied by 182/365 |
| ** | Includes interest expense that amounts to less than 0.01%. |
Opportunistic Fixed — Class Y-3
Hypothetical Return on $1,000
| | | | | | | | | | | | | | | | | | | | | | | | | |
| | | Expense
Ratio | | Beginning
Amount | | Ending
Value | | Avg
Value | | Operating
Expense
Incurred* |
Actual | | | | 0.96%** | | | | | 1,000.00 | | | | | 1,026.50 | | | | | 1,013.25 | | | | | 4.85 | |
Hypothetical | | | | 0.96%** | | | | | 1,000.00 | | | | | 1,020.14 | | | | | 1,010.07 | | | | | 4.84 | |
| * | Actual expenses are equal to the Class’ annualized expense ratio of 0.96%, multiplied by the average account value over the period, multiplied by 182/365 |
| ** | Includes interest expense that amounts to less than 0.01%. |
Emerging Markets — Class Y-3
Hypothetical Return on $1,000
| | | | | | | | | | | | | | | | | | | | | | | | | |
| | | Expense
Ratio | | Beginning
Amount | | Ending
Value | | Avg
Value | | Operating
Expense
Incurred* |
Actual | | | | 1.01%** | | | | | 1,000.00 | | | | | 1,063.60 | | | | | 1,031.80 | | | | | 5.20 | |
Hypothetical | | | | 1.01%** | | | | | 1,000.00 | | | | | 1,019.90 | | | | | 1,009.95 | | | | | 5.09 | |
| * | Actual expenses are equal to the Class’ annualized expense ratio of 1.01%, multiplied by the average account value over the period, multiplied by 182/365 |
| ** | Includes interest expense that amounts to less than 0.01%. |
204
Mercer Funds
Understanding Your Fund’s Expenses (Unaudited) (Continued)
Global Low Volatility — Class Y-3
Hypothetical Return on $1,000
| | | | | | | | | | | | | | | | | | | | | | | | | |
| | | Expense
Ratio | | Beginning
Amount | | Ending
Value | | Avg
Value | | Operating
Expense
Incurred* |
Actual | | | | 0.81%** | | | | | 1,000.00 | | | | | 1,059.10 | | | | | 1,029.55 | | | | | 4.16 | |
Hypothetical | | | | 0.81%** | | | | | 1,000.00 | | | | | 1,020.89 | | | | | 1,010.45 | | | | | 4.08 | |
| * | Actual expenses are equal to the Class’ annualized expense ratio of 0.81%, multiplied by the average account value over the period, multiplied by 182/365 |
| ** | Includes interest expense that amounts to less than 0.01%. |
205
Mercer Funds
Trustees and Officers (Unaudited)
The following tables list the Trust’s Trustees and Officers as of the date of this report; their address and age; their position with the Trust; the length of time holding that position with the Trust; their principal occupation(s) during the past five years; the number of portfolios in the fund complex they oversee; and other directorships they hold in companies subject to registration or reporting requirements of the Securities Exchange Act of 1934 (generally called “public companies”) or in registered investment companies. The Trust’s Statement of Additional Information (“SAI”) includes additional information about the Trust’s trustees, including changes subsequent to the date of the report. The SAI is available, without charge, upon request, by calling 1-866-658-9896, or on the SEC website at www.sec.gov.
Independent Trustees
| | | | | | | | | | | | | |
Name, Address
and Age | | Position(s)
Held with
Trust | | Term of
Office(1) and
Length of
Time
Served | | Principal
Occupation(s) During
Past 5 Years | | Number of
Portfolios
in Fund
Complex*
Overseen
by Trustee | | Other
Directorships
Held by
Trustee |
Harrison M. Bains, Jr. 99 High Street Boston, MA 02110 (73) | | Chairperson and Trustee | | Chairperson since 2016; Trustee since 2005 | | Mr. Bains is retired. | | | | 7 | | | Mr. Bains is a director of Cara Therapeutics, Inc.; Mr. Bains was a director of BG Medicine, Inc.(2007 to 2014) and a trustee of BofA Funds Series Trust (11 portfolios) (2011 to 2016). |
| | | | | |
Adela M. Cepeda A.C. Advisory, Inc. 150 North Wacker Drive, Suite 2160 Chicago, IL 60606 (59) | | Trustee | | Since 2005 | | Ms. Cepeda is Managing Director of PFM Financial Advisors LLC (a financial advisory firm) since September 2016. Ms. Cepeda was previously Founder and President of A.C. Advisory, Inc. (a financial advisory firm) 1995 – 2016. | | | | 7 | | | Ms. Cepeda is a director or trustee of: The UBS Funds (15 portfolios); UBS Relationship Funds (11 portfolios); SMA Relationship Trust (5 portfolios); Consulting Group Capital Markets Funds (9 portfolios); BMO Financial Corp. (U.S. holding company for BMO Harris Bank N.A.); Ms. Cepeda was a director of Fort Dearborn Income Securities, Inc. (2000 to 2016); and Amalgamated Bank of Chicago (2003 to 2012). |
| | | | | |
Gail A. Schneider 99 High Street Boston, MA 02110 (68) | | Trustee | | Trustee Since 2009 | | Ms. Schneider is a self-employed consultant since 2007. | | | | 7 | | | None |
206
Mercer Funds
Trustees and Officers (Unaudited) (Continued)
Interested Trustee:
| | | | | | | | | | | | | |
Name, Address
and Age | | Position(s)
Held with
Trust | | Term of
Office(1) and
Length of
Time
Served | | Principal
Occupation(s) During
Past 5 Years | | Number of
Portfolios
in Fund
Complex*
Overseen
by Trustee | | Other
Directorships
Held by
Trustee |
Richard S. Joseph** (52) | | Trustee, President, and Chief Executive Officer | | Since 2016 | | Mr. Joseph is President and Head of the US Mercer Delegated Solutions of Mercer Investment Management, Inc. since December 2015. Prior to December 2015, he was Chief Operating Officer of Mercer Investment Management, Inc. since 2005. | | | | 7 | | | Mr. Joseph is a trustee of Mercer Trust Company and a director of Mercer Investment Management, Inc. |
| (1) | Each Trustee holds office for an indefinite term. |
| * | The “Fund Complex” consists of the Trust, which has seven portfolios. |
| ** | Mr. Joseph is considered to be an “interested person,” as defined in the 1940 Act, of the Trust due to his relationship with the Advisor. |
207
Mercer Funds
Trustees and Officers (Unaudited) (Continued)
Officers:
The executive officers of the Trust not named above are:
| | | | | | |
Name and Age | | Position(s)
Held with
the Trust | | Term of
Office† and
Length of
Time
Served | | Principal Occupation(s) During Past 5 Years |
Janice Desmond (66) | | Treasurer and Chief Financial Officer | | Since 2015 | | Ms. Desmond is a CPA and has served as Head of Fund Administration for Mercer Investment Management, Inc. since 2010. |
| | | |
Jeremiah France (46) | | Vice President and Assistant Treasurer | | Since 2005 | | Mr. France is a partner and COO of North American Investments at Mercer Investment Management, Inc. since 2005. |
| | | |
Scott M. Zoltowski (48) | | Vice President, Chief Legal Officer, and Secretary | | Since 2008 | | Mr. Zoltowski is a partner of Mercer (US) Inc. and serves as Global Chief Counsel – Investment for Mercer Investment Management, Inc. and Mercer Investment Consulting LLC. |
| | | |
Stan Mavromates (56) | | Vice President and Chief Investment Officer | | Since 2012 | | Mr. Mavromates is Vice President and Chief Investment Officer of Mercer Investment Management, Inc. since 2012. Prior to 2012, he served as Chief Investment Officer of the Massachusetts Pension Reserves Investment Management Board (2005-2012). |
| | | |
Colin Dean (40) | | Vice President and Assistant Secretary | | Since 2010 | | Mr. Dean has served as Senior Legal Counsel – Investments for Mercer Investment Management, Inc. and Mercer Investment Consulting LLC since 2010. |
| | | |
John Johnson (50) | | Vice President | | Since 2015 | | Mr. Johnson is a Portfolio Manager and Principal of Mercer Investment Management, Inc. since 2015. Prior to joining Mercer, he was a Fixed Income Portfolio Manager and Trader for Aberdeen Asset Management. |
| | | |
Larry Vasquez (50) | | Vice President | | Since 2012 | | Mr. Vasquez is a Vice President and Portfolio Manager of Mercer Investment Management, Inc. since 2012. Prior to joining Mercer, he was a Portfolio Manager at UBS Global Asset Management, Inc. from 2009 to 2012. |
| | | |
Robert Phay (49) | | Vice President and Chief Compliance Officer | | Since 2016 | | Mr. Phay is the Chief Risk and Compliance Officer – Investments of Mercer Investment Management, Inc. and Mercer Investment Consulting, Inc. since March 2015. Mr. Phay most recently served in various compliance and legal positions for Commonfund, including Chief Compliance Officer (September 2011 – February 2015), Acting General Counsel (January 2015 – February 2015), and Associate General Counsel (July 2006 – December 2014). |
| † | Officers of the Trust are elected by the Trustees and serve at the pleasure of the Board. |
208
Shares of Mercer Funds are distributed by MGI Funds Distributors, LLC.
Item 2. Code of Ethics.
As of the end of the period covered by this report, the Registrant has adopted a code of ethics that applies to its President, Chief Financial Officer and Chief Investment Officer. During the period covered by this report, there were no amendments to a provision of its code of ethics, nor were there any waivers, including implicit waivers granted from a provision of the code of ethics. A copy of the Registrant’s code of ethics is filed with the Form N-CSR under Item 12(a)(1).
Item 3. Audit Committee Financial Expert.
The Registrant’s Board of Trustees has determined that the Registrant has at least one audit committee financial expert serving on its audit committee. The audit committee financial expert serving on the Registrant’s audit committee is Harrison M. Bains, Jr., who is “independent” as defined in Item 3(a)(2) of this Form.
Item 4. Principal Accountant Fees and Services.
(a) Audit Fees – The aggregate fee billed for the fiscal year for professional services rendered by the principal accountant for the audit of the Registrant’s annual financial statements or services that are normally provided by the principal accountant in connection with statutory and regulatory filings or engagements was $426,509 and $341,194 for the fiscal years ended March 31, 2016 and March 31, 2017, respectively.
(b) Audit-Related Fees – There were no fees billed for the fiscal years ended March 31, 2016 and March 31, 2017 for assurance and related services by the principal accountant that are reasonably related to the performance of the audit of the Registrant’s financial statements and are not reported under (a) of this Item.
(c) Tax Fees – The aggregate fee billed in the last fiscal year for professional services rendered by the principal accountant for the review of the Registrant’s tax returns and excise tax calculations was $80,298 and $84,933 for the fiscal years ended March 31, 2016 and March 31, 2017, respectively. Fees in the amount of $18,458 and $69,367were billed in the fiscal years ended March 31, 2016 and March 31, 2017, respectively for review of non-US capital gains and the preparation and filing of return of income for the Mercer Non-US Core Equity Fund and the Mercer Emerging Markets Equity Fund.
(d) All Other Fees – Fees in the amount of $117,747 and $0 were billed in the fiscal years ended March 31, 2016 and March 31, 2017, respectively for tax advisory services related to the reclamation of taxes paid by the Mercer Non-US Core Equity Fund in certain European Union countries. Fees in the amount of $5,000 were billed in the fiscal year ended March 31, 2017 related to the issuance of consents for inclusion in the N14 filing of Mercer US Large Cap Value Equity Fund into Mercer US Large Cap Growth Equity Fund and Mercer US Small/Mid Value Equity Fund into Mercer US Small/Mid Growth Equity Fund on June 24, 2016.
(e) (1) The Registrant’s audit committee pre-approves all audit and non-audit services to be performed by the Registrant’s accountant before the accountant is engaged by the Registrant to perform such services.
(2) There were no services described in (b) through (d) above (including services required to be approved by the audit committee pursuant to paragraph (c)(7)(ii) of Rule 2-01 of Regulation S-X) that were approved by the audit committee pursuant to paragraph (c)(7)(i)(C) of Rule 2-01 of Regulation S-X.
| (f) | None of the hours expended on the principal accountant’s engagement to audit the Registrant’s financial statements for the fiscal year ended March 31, 2017 were attributable to work performed by persons other than the principal accountant’s full-time, permanent employees. |
| (g) | There were no aggregate fees billed for the fiscal year ended March 31, 2017 by the Registrant’s principal accountant for non-audit services rendered to the Registrant, its investment adviser and any entity controlling, controlled by or under common control with the investment adviser that provides ongoing services to the Registrant. |
(h) Not applicable.
Item 5. Audit Committee of Listed Registrants.
Not applicable.
Item 6. Schedule of Investments.
The Registrant’s full schedules of investments are included as part of the report to shareholders filed under Item 1 of this Form.
Item 7. Disclosure of Proxy Voting Policies and Procedures for Closed-End Management Investment Companies.
Not applicable.
Item 8. Portfolio Managers of Closed-End Investment Companies.
Not applicable.
Item 9. Purchases of Equity Securities by Closed-End Management Investment Company and Affiliated Purchasers.
Not applicable.
Item 10. Submission of Matters to a Vote of Security Holders.
There have been no material changes to the procedures by which the shareholders may recommend nominees to the Registrant’s Board of Directors, where those changes were implemented after the Registrant last provided disclosure in response to the requirements of Item 22(b)(15) of Schedule 14A (17 CFR 240.14a-101), or this Item.
Item 11. Controls and Procedures.
(a) The Registrant’s Principal Executive Officer and Principal Financial Officer concluded that the Registrant’s disclosure controls and procedures (as defined in Rule 30a-3(c) under the Investment Company Act of 1940 (17 CFR 270.30a-3(c))), are effective based on the evaluation of Registrant’s disclosure controls and procedures as of a date within 90 days prior to the filing date of this report.
(b) There were no changes in the Registrant’s internal control over financial reporting (as defined in Rule 30a-3(d) under the Investment Company Act of 1940 (17 CFR 270.30a-3(d))), that occurred during the Registrant’s second fiscal quarter of the period covered by this report that has materially affected, or is reasonably likely to materially affect, the Registrant’s internal control over financial reporting.
Item 12. Exhibits.
(a)(1) Code of Ethics for the Registrant’s President, Chief Financial Officer and Chief Investment Officer (as referenced in Item 2 above), attached hereto as Exhibit (a)(1).
(a)(2) Certification of the Principal Executive Officer and Principal Financial Officer of the Registrant as required by Rule 30a-2(a) under the Investment Company Act of 1940 (17 CFR 270.30a-2(a)) is attached hereto as Exhibit 99CERT.
(a)(3) Not applicable.
(b) Certification pursuant to Section 906 of the Sarbanes-Oxley Act of 2002 as required by Rule 30a-2(b), under the Investment Company Act of 1940 (17 CFR 270.30a-2(b)), Rule 15d-14(b) under the Securities Exchange Act of 1934 (17 CFR 240.15d-14(b)) and Section 1350 of Chapter 63 of Title 18 of the United States Code (18 U.S.C. 1350) is attached hereto as Exhibit 99.906CERT.
SIGNATURES
Pursuant to the requirements of the Securities Exchange Act of 1934 and the Investment Company Act of 1940, the Registrant has duly caused this report to be signed on its behalf by the undersigned, thereunto duly authorized.
| | | | |
| (Registrant) | | Mercer Funds | | |
| | | | |
| By (Signature and Title) | | By: /S/ Richard Joseph | | |
| | Richard Joseph President and Chief Executive Officer (Principal Executive Officer) | | |
Pursuant to the requirements of the Securities Exchange Act of 1934 and the Investment Company Act of 1940, this report has been signed below by the following person on behalf of the Registrant and in the capacities and on the date indicated.
| | | | |
| By (Signature and Title) | | By: /S/ Richard Joseph | | |
| | Richard Joseph President and Chief Executive Officer (Principal Executive Officer) | | |
| | | | |
| By (Signature and Title) | | By: /S/ Janice Desmond | | |
| | Janice Desmond Treasurer and Chief Financial Officer | | |