UNITED STATES
SECURITIES AND EXCHANGE COMMISSION
Washington, DC 20549
FORMN-CSR
CERTIFIED SHAREHOLDER REPORT OF REGISTERED
MANAGEMENT INVESTMENT COMPANIES
Investment Company Act File Number:811-21732
Mercer Funds
(Exact Name of Registrant as Specified in Charter)
99 High Street
Boston, MA 02110
(Address of Principal Executive Offices)(Zip Code)
Colin J. Dean, Esq.
Mercer Investment Management, Inc.
99 High Street
Boston, MA 02110
(Name and Address of Agent for Service)
Registrant’s Telephone Number, including Area Code: (617)747-9500
Date of Fiscal Year End: March 31, 2020
Date of Reporting Period: March 31, 2020
Item 1. Reports to Stockholders.
The Report to Shareholders is attached herewith.

Mercer FundsTM
Annual Report
Mercer US Large Cap Equity Fund
Mercer US Small/Mid Cap Equity Fund
MercerNon-US Core Equity Fund
Mercer Core Fixed Income Fund
Mercer Opportunistic Fixed Income Fund
Mercer Emerging Markets Equity Fund
Mercer Global Low Volatility Equity Fund
This report has been prepared for Mercer Funds shareholders. It is not authorized for distribution to prospective investors unless accompanied or preceded by a current Mercer Funds prospectus. The prospectus contains more complete information about the Funds’ investment objectives, risks, and expenses. Investors are reminded to read the prospectus carefully before investing.
Beginning on January 1, 2021, as permitted by regulations adopted by the Securities and Exchange Commission, paper copies of the Funds’ shareholder reports will no longer be sent by mail, unless you specifically request paper copies of the reports from a Fund or from your financial intermediary, such as a broker-dealer or bank if you hold your shares through such an institution. Instead, the reports will be made available on a website, and you will be notified by mail each time a report is posted and provided with a website link to access the report.
If you already elected to receive shareholder reports electronically, you will not be affected by this change and you need not take any action. You may elect to receive shareholder reports and other communications from a Fund or your financial intermediary electronically by calling1-888-887-0619 if you hold your shares directly with the Mercer Funds, or, if you hold your shares through a financial intermediary, by contacting your financial intermediary.
You may elect to receive all future reports in paper copies free of charge. You can inform the Funds or your financial intermediary that you wish to continue receiving paper copies of your shareholder reports by calling1-888-887-0619 if you hold your shares directly with the Mercer Funds, or, if you hold your shares through a financial intermediary, by contacting your financial intermediary. Your election to receive reports in paper copies will apply to all Funds held with the Mercer Funds or through your financial intermediary, as applicable.
March 31, 2020
MERCER FUNDS
TABLE OF CONTENTS
Mercer US Large Cap Equity Fund
Investment Objective and Benchmark
The investment objective of the Fund is long-term total return, which includes capital appreciation and income. The benchmark for the Fund is the Russell 1000® Index.
Investment Strategy
The Fund invests principally in equity securities (such as common stock) issued by large capitalization U.S. companies. The Fund employs a “core equity” investment strategy by investing in both growth and value oriented equity securities. The Fund may invest in derivative instruments to gain market exposure on cash balances or to reduce market exposure in anticipation of liquidity needs.
Performance
For the fiscal year ended March 31, 2020, the Fund’sY-3 share class performance was-10.95% compared to its benchmark, the Russell 1000® Index, return of-8.03%. Performance for the Fund is reported net of fees and operating expenses while the benchmark returns do not include expenses of any kind as indexes are unmanaged.
TheSub-Advisors
As of March 31, 2020, the Fund employed sixsub-advisors: Brandywine Global Investment Management LLC (Brandywine), O’Shaughnessy Asset Management LLC (OSAM), Polen Capital Management LLC (Polen), Jennison Associates LLC (Jennison), Delaware Investments Fund Advisers, a series of Macquarie Investment Management Business Trust (Macquarie), and Parametric Portfolio Associates LLC (Parametric). Polen, Jennison, and Macquarie were added assub-advisors during the fiscal year. HS Management Partners, LLC, Columbia Management Investment Advisers, and AJO LP were terminated assub-advisors to the Fund during the fiscal year.
Brandywine, a deep value manager, focuses on cheap stocks that trade at a significant discount to intrinsic value, with strong free cash flows and quality balance sheets.
OSAM is a yield focused quantitative value manager that seeks stocks that rank high based on valuation, quality and shareholder yield.
Polen is a concentrated quality growth manager, focused on finding high quality companies, with sustainable, above-average earnings growth.
Jennison is a growth manager who selects stocks with long-term competitive advantages that are growing earnings faster or longer than the broad market.
Macquarie is a quality value manager who invests in strong, high quality businesses with sound balance sheets and free cash flow generation.
Parametric utilizes exchange-traded futures to generate exposure corresponding to the Fund’s benchmark.
Market Commentary and Fund Performance
For the12-month-period ended March 31, 2020, the broad U.S. equity market, as measured by the Russell 3000® Index, declined-9.13% due to a largesell-off in the first quarter of 2020.
In 2019, markets advanced to record levels, with the S&P 500 ending the year up over 31%, boosted by optimism over aphase-one trade deal with China, that reduces some US tariffs on Chinese goods while boosting Chinese purchases of American goods. During the year, markets were resilient despite the US House of Representatives
1
Mercer US Large Cap Equity Fund
approving 2 articles of impeachment against the president, the United Kingdom finally separating from the EU, and escalating tensions between the US and Iran. Geopolitical concerns were eased by accommodative central bank policy, with the US Federal Reserve cutting interest rates by 25 bps in October, and the European Central Bank (ECB) and Bank of Japan (BOJ) continuing to ease their policies. Coming into 2020, market commentators were expecting global trade tensions to ease further, and global growth to stabilize.
In an about-face from the previous year, the worldwide spread ofCOVID-19 sent volatility to historic levels and caused risk assets tosell-off dramatically as the market tried to adjust to large parts of the global economy halting amid social distancing measures. Unemployment surged as companies furloughed and laid off workers prompting strong responses from policy makers to blunt the economic damage. The central banks, notably the US Federal Reserve, took swift andfar-reaching action to provide liquidity and inject stability into the bond market and fiscal measures by Congress provided backstop loans to businesses and cash payouts to individuals. Compounding the economic strain was a collapse in oil prices due to both lower global demand and a price war between Russia and Saudi Arabia. The equity sell off, which began on February 19th bottomed on March 23rd with a decline of 34% as measured by the Russell 1000® Index. Looking forward, there is still a large degree of uncertainty surrounding the spread of the disease, duration of social distancing measures, the impact on the economy and corporate earnings, and just how long and deep the ensuing recession will last.
Within the Russell 1000® Index, the Fund’s benchmark, the best performing sectors for the fiscal year were technology (+8.5%), health care(-1.2%), and consumer staples(-1.5%). The worst performing sectors were energy(-53.7%), industrials(-19.3%), and financials(-18.5%).
The Mercer U.S. Large Cap Equity Fund underperformed the Russell 1000® Index for the period, with Brandywine and OSAM underperforming, Polen and Jennison outperforming since their inception in April 2019, and Macquarie roughly flat since its inception in July 2019. At the total Fund level, exposure to energy and financials, along with an underweight allocation to technology were the largest detractors. From a style perspective, exposure to smaller cap companies, value stocks, and more cyclical exposures all detracted.
Since its inception in the Fund, Jennison outperformed the Russell 1000® Growth Index. Stock selection was strong in consumer discretionary (where online retailers Amazon and Alibaba, and electric vehicle maker Tesla, advanced) and financials. No exposure to two of the benchmark’s underperforming sectors, energy and materials, also benefited the portfolio. Industrials positions, including Boeing, and health care holdings, primarily biotechnology names, detracted from performance.
Polen has also outperformed its benchmark, the Russell 1000® Growth Index, since inception. Outperformance was driven by effective asset allocation, which is a byproduct of Polen’sbottom-up stock selection, which focuses on the analysis of individual stocks andde-emphasizes the significance of macroeconomic and market cycles. A lack of exposure to the industrials and energy sectors, contributed most to the relative outperformance. The portfolio is less exposed to more capital intensive or commoditized sectors like industrials and energy because companies in these sectors often do not meet Polen’s hurdles for high quality and long-term, secular growth. Stock selection within financials helped to lift relative returns as well, driven by the portfolio’s overweight position in MSCI, Inc. Stock selection within health care added relative value, led by an overweight position in Regeneron Pharmaceuticals. Detracting from relative performance were holdings in technology, particularly IT service companies, and lack of exposure to Apple.
Macquarie has performed in line with the Russell 1000® Value Index since their inception in the fund. On the positive side, holdings in health care, particularly health care service providers, industrials, and technology were the top contributors. Offsetting positive areas was exposure and selection in the energy sector, particularly moreoil-sensitive exploration and production companies and an energy services provider.
OSAM underperformed its benchmark for the period, with the majority of its underperformance coming during the marketsell-off in the first quarter of 2020. Shareholder yield, the three ways in which a company can
2
Mercer US Large Cap Equity Fund
distribute cash to shareholders: cash dividends, stock repurchases and debt reduction, are the primary selection criteria for the strategy, which was neutral during the period, but an underweight allocation to mega cap stocks was a large detractor. Incorporating elements of quality, including earnings growth, earnings quality, and financial strength helped offset losses. From a sector standpoint, overweight allocations to financials and industrial were the largest detractors, while selection within health care and an underweight to energy were positive.
Brandywine underperformed its benchmark for the period, with the majority of its underperformance also coming during the marketsell-off in the first quarter of 2020. An overweight allocation to the energy sector and in particular, service providers and exploration & production companies, was the largest detractor. Holdings of mortgage REITS within financials was also a notable detractor for the period. From a style perspective, higher beta, a measure of the risk arising from exposure to general market movements, and Brandywine’s deeper value style were both out of favor. Offsetting losses slightly were holdings in media, telecom, and biotech.
Parametric utilizes exchange-traded futures replicating the Fund’s benchmark, aimingto provide broad, passive, equity market exposure to the Fund’s liquidity sleeve, and seeking to create positive returns on assets that would have otherwise been earning cash or cash equivalent returns. Performance differences versus the benchmark are largely a result of cash flow effects related to daily subscription/redemption activity and through financing costs of futures relative to interest earned on cash.
Risk Considerations
The Fund invests in both growth stocks and value stocks. Growth stocks may be particularly sensitive to market conditions. Investing in value stocks involves the risk that an investment made in undervalued securities may not appreciate in value as anticipated or remain undervalued for long periods of time.
The Fund may invest in derivative instruments such as exchange-listed equity futures contracts, which may cause the Fund to experience greater volatility and less liquidity. Derivatives may be more sensitive to changes in market conditions and may amplify the risk of loss for the Fund. The Fund may experience high portfolio turnover which may result in higher transaction costs and capital gains.
3
Mercer Funds
March 31, 2020
Comparison of Change in Value of a $10,000 Investment in
Mercer US Large Cap Equity Shares vs. the
Russell 1000® Index
As of March 31, 2020
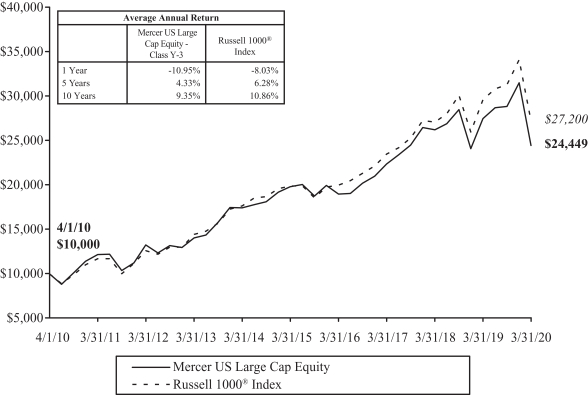
This graph shows the performance of the Mercer US Large Cap Equity Fund ClassY-3 shares versus the Russell 1000® Index from April 1, 2010 through March 31, 2020. The performance of other classes, when launched, will vary from the performance of the class shown based on the difference in fees and expenses paid by shareholders investing in different share classes. The Fund may charge a 2% redemption fee on shares owned less than 30 days.
The table and graph assume reinvestment of dividends and capital gains, but do not reflect a deduction of taxes an investor might pay on fund distributions or upon redemption of fund shares. Performance shown reflects a fee waiver and/or expense reimbursement. Without this waiver/reimbursement, returns would have been lower.
The data quoted represents past performance and does not guarantee future results. Current performance of the Fund may be lower or higher than the performance quoted. Please call 1-866-658-9896 for the Fund’s most recentmonth-end performance. Investment return and principal value will fluctuate so that an investor’s shares, when redeemed, may be worth more or less than when purchased.
4
Mercer US Small/Mid Cap Equity Fund
Investment Objective and Benchmark
The investment objective of the Fund is to provide long-term total return, comprised primarily of capital appreciation. The benchmark for the Fund is the Russell 2500® Index.
Investment Strategy
The Fund invests principally in equity securities issued bysmall-to-medium capitalization U.S. companies. The Fund employs a “core equity” investment strategy by investing in both growth and value oriented equity securities. The Fund may invest in derivative instruments to gain market exposure on cash balances or to reduce market exposure in anticipation of liquidity needs.
Performance
For the fiscal year ended March 31, 2020, the Fund’sY-3 share class performance was-21.65% compared to its benchmark, the Russell 2500® Index, return of-22.47%. Performance for the Fund is reported net of fees and operating expenses while the benchmark returns do not include expenses of any kind as indexes are unmanaged.
TheSub-Advisors
As of March 31, 2020, the Fund employed sixsub-advisors: Westfield Capital Management Company (Westfield), GW&K Investment Management LLC (GW&K), Loomis, Sayles & Company, LP (Loomis), LSV Asset Management (LSV), River Road Asset Management (River Road) and Parametric Portfolio Associates LLC (Parametric). River Road replaced BNY Mellon Asset Management North America Corporation, which was terminated assub-advisor to the Fund in April 2019.
Westfield, a traditional growth manager, employs a fundamental,bottom-up approach, which seeks to identify reasonably priced stocks with high earnings growth potential. Abottom-up approach focuses on the analysis of individual stocks andde-emphasizes the significance of macroeconomic and market cycles with the assumption individual companies can do well even in an industry that is not performing, at least on a relative basis.
GW&K uses abottom-up fundamental research process in order to identify high quality companies with sustainable long-term earnings growth rates.
Loomis looks to provide a lower volatility approach to high growth investing by seeking companies with high quality business models that have differentiated and sustainable growth opportunities.
LSV, a quantitative value manager, using mathematical and statistical methods, seeks deep value,out-of-favor companies with recent momentum. LSV avoids introducing any judgmental biases or behavioral weaknesses into their investment process.
River Road, a fundamental absolute value manager, which seeks to buy stocks at a discount to their fair value and sell them at or in excess of that value, and focuses on purchasing companies that are priced at a modest discount to their absolute value and possess superior fundamental business characteristics.
Parametric utilizes exchange traded futures to generate market exposure corresponding to the Fund’s benchmark.
Market Commentary and Fund Performance
For the12-month-period ended March 31, 2020, the U.S. equity market, as measured by the Russell 3000® Index, declined-9.13% due to a large selloff in the first quarter of 2020.
In 2019 markets advanced to record levels, with the S&P 500 ending the year up over 31%, boosted by optimism over a phase one trade deal with China. During the year, markets were resilient despite the US House of
5
Mercer US Small/Mid Cap Equity Fund
Representatives approving 2 articles of impeachment against the president, the UK finally separating from the EU, and escalating tensions between the US and Iran. Geopolitical concerns were eased by accommodative central bank policy, with the US Federal Reserve cutting interest rates by 25bps in October, and the ECB and BOJ continuing to ease their policies. Coming into 2020, market commentators were expecting global trade tensions to ease further, and global growth to stabilize.
In an about-face from the previous year, the worldwide spread ofCOVID-19 sent volatility to historic levels and caused risk assets to selloff dramatically as the market tried to adjust to large parts of the global economy grind to a halt amid social distancing measures. Unemployment surged as companies furloughed and laid off workers prompting strong responses from policy makers to blunt the economic damage. The central banks, notably the US Federal Reserve, took swift andfar-reaching action to provide liquidity and inject stability into the bond market and fiscal measures by congress provided backstop loans to businesses and cash payouts to individuals. Compounding the economic strain was a collapse in oil prices due to both lower global demand and a price war between Russia and Saudi Arabia. The equity sell off, which began on February 19th bottomed on March 23rd with a decline of 34% as measured by the Russell 1000® Index. Looking forward, there is still a large degree of uncertainty surrounding the spread of the disease, length of social distancing measures, the impact on the economy and corporate earnings, and just how long and deep the ensuing recession will last.
Within the Russell 2500® Index, the Fund’s benchmark, the best performing sectors for the fiscal year were health care and information technology with negative returns of-6.93% and-9.00%, respectively. Underperforming sectors for the fiscal year were energy and consumer discretionary, with negative returns of-73.56% and-35.99%, respectively. The top performing industries for the fiscal year were health care technology and water utilities with positive returns of 32.56% and 9.22%, respectively. The underperforming industries for the fiscal year were energy equipment & services and oil, gas & consumable fuels with negative returns of-78.76% and-71.54%, respectively.
The Mercer U.S. Small/Mid Cap Equity Fund outperformed the Russell 2500® Index for the period. The Fund’s exposure to quality and size from a market capitalization standpoint helped drive performance for the year despite its exposure to value from a style perspective. Security selection, particularly in the health care, consumer staples, energy and industrials sectors contributed towards performance while selection in the information technology, materials and utilities sectors detracted from performance for the fiscal year. From an allocation standpoint, the Fund’s overweight position in the information technology sector coupled with its underweight to the real estate and financials sectors contributed towards performance while the Fund’s underweight to the utilities sector combined with its overweight to the consumer discretionary sector detracted from performance.
Westfield outperformed the Russell 2500® Growth Index for the fiscal year. Their exposure to lower leverage and their larger market capitalization bias provided a tailwind towards performance coupled with their strong security selection in the health care and industrials sectors.
Loomis’ exposure to high quality growth coupled with their size exposure from a market capitalization standpoint helped drive their outperformance versus the Russell 2500® Growth Index. In addition, their outperformance for the fiscal year was led by their security selection in the industrials, financials, consumer staples and communication services sectors.
GW&K‘s outperformance was attributed to its exposure to higher quality consistent growth oriented businesses and size from a market capitalization standpoint. In addition, their strong security selection across multiple sectors; industrials, real estate, health care, consumer discretionary and financials drove their performance for the fiscal year.
LSV’s underperformance versus the Russell 2500® Value Index for the period was driven by its deep value style being out of favor, which is evident with its security selection in multiple sectors to include the financials,
6
Mercer US Small/Mid Cap Equity Fund
industrials, real estate, consumer discretionary, health care, materials and information technology weighing on performance.
River Road’s outperformance versus the Russell 2500® Value Index for the period was driven by their security selection in the financials, consumer staples, consumer discretionary and energy sectors.
Parametric utilizes exchange-traded futures replicating the Fund’s benchmarkto provide broad, passive, equity market exposure to the Fund’s liquidity sleeve, creating positive returns on assets that would have otherwise been earning cash or cash equivalent returns. Performance differences versus the benchmark are largely a result of cash flow effects related to daily subscription/redemption activity and through financing costs of futures relative to interest earned on cash.
Risk Considerations
The Fund invests in both growth stocks and value stocks. Growth stocks may be particularly sensitive to market conditions. Investing in value stocks involves the risk that an investment made in undervalued securities may not appreciate in value as anticipated or remain undervalued for long periods of time. Investments made in small andmid-capitalization companies may be more volatile and less liquid due to limited resources or product lines and more sensitive to economic factors. The Fund may invest in derivative instruments such as exchange-listed equity futures contracts, which may cause the Fund to experience greater volatility and less liquidity. Derivatives may be more sensitive to changes in market conditions and may amplify the risk of loss for the Fund. The Fund may experience high portfolio turnover which may result in higher transaction costs and capital gains.
7
Mercer Funds
March 31, 2020
Comparison of Change in Value of a $10,000 Investment in
Mercer US Small/Mid Cap Equity Shares vs. the
Russell 2500™ Index
As of March 31, 2020
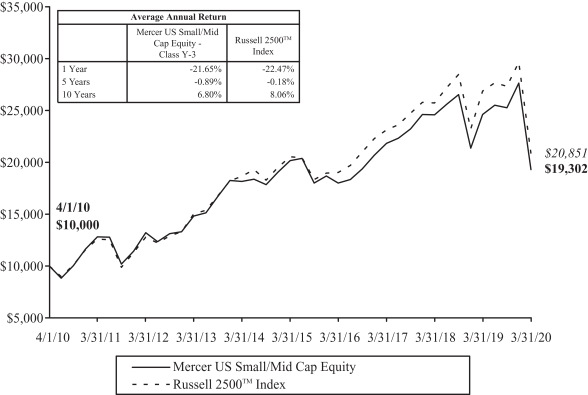
This graph shows the performance of the Mercer US Small/Mid Cap Equity Fund ClassY-3 shares versus the Russell 2500™ Index from April 1, 2010 through March 31, 2020. The performance of other classes, when launched, will vary from the performance of the class shown based on the difference in fees and expenses paid by shareholders investing in different share classes. The Fund may charge a 2% redemption fee on shares owned less than 30 days.
The table and graph assume reinvestment of dividends and capital gains, but do not reflect a deduction of taxes an investor might pay on fund distributions or upon redemption of fund shares. Performance shown reflects a fee waiver and/or expense reimbursement. Without this waiver/reimbursement, returns would have been lower.
The data quoted represents past performance and does not guarantee future results. Current performance of the Fund may be lower or higher than the performance quoted. Please call 1-866-658-9896 for the Fund’s most recentmonth-end performance. Investment return and principal value will fluctuate so that an investor’s shares, when redeemed, may be worth more or less than when purchased.
8
MercerNon-US Core Equity Fund
Investment Objective and Benchmark
The investment objective of the Fund is to provide long-term total return, which includes capital appreciation and income. The benchmark for the Fund is the MSCI EAFE® Index.
Investment Strategy
The Fund invests principally in equity securities issued bynon-US companies of any capitalization, located in the world’s developed and emerging capital markets. The Fund employs a “core equity” investment strategy that seeks to meet the Fund’s investment objective by investing in both growth- and value-oriented equity securities.
Performance
For the fiscal year ended March 31, 2020, the Fund’sY-3 share class performance was-12.55% compared to its benchmark return of-14.38%. Performance for the Fund is reported net of fees and operating expenses while the benchmark returns do not include expenses of any kind as indexes are unmanaged.
TheSub-Advisors
As of March 31, 2020, the Fund employed fivesub-advisors: Arrowstreet Capital, Limited Partnership (Arrowstreet), American Century Investment Management, Inc. (American Century), MFS Investment Management (MFS), LSV Asset Management (LSV) and Parametric Portfolio Associates LLC (Parametric).
Arrowstreet’s strategy seeks to outperform international equity benchmarks through a risk-controlled core approach. Arrowstreet combines sound investment intuition and research with rigorous quantitative tools to identify mispriced stocks around the world. Arrowstreet believes that the key to generating return in excess of the benchmark involves evaluating the prospects of a security considering both the characteristics of the stock itself (direct effects) as well as the characteristics of other related stocks (indirect effects).
American Century manages its portfolio based on an investment philosophy that companies exhibiting improving or accelerating growth will outperform the market over time. American Century constructs its portfolio through abottom-up stock selection, which focuses on individual stock selection rather than macroeconomic and market cycles, within a risk aware framework. American Century’s thorough research process seeks to identify companies that are exhibiting an improvement or acceleration in growth where it believes that growth is sustainable but that the earnings power of the company is generally underestimated. American Century can opportunistically invest in emerging market stocks.
MFS’s investment process is based on a fundamental,bottom-up stock selection of high quality companies whose long-term value MFS believes is not adequately reflected in the stock price.
LSV utilizes a quantitative approach, which uses mathematical and statistical methods and seeks deep value stocks that have fallen out of favor with the market, but have recent momentum, either in terms of price or earnings. LSV believes that long-term results are achieved through systematic exploitation of judgmental biases and behavioral weaknesses that influence investor decisions. LSV aims to exploit these biases through the disciplined application of quantitative techniques to drivebottom-up security selection.
Parametric utilizes exchange-traded futures to generate market exposure corresponding to the Fund’s benchmark.
Market Commentary and Fund Performance
As a group, global developed equity markets fell, as measured by the MSCI World® Index, by 10.39% during the12-month period ended March 31, 2020. US equities, measured using the Russell 1000 Index fell 8.03% for the fiscal year. Compared to the US, international developed markets lagged, with the MSCI EAFE® Index (the
9
MercerNon-US Core Equity Fund
Fund’s benchmark) returning-14.38% over the period. The MSCI Emerging Markets® Index suffered a greater drop, with a fall of-17.69% for the12-month period ended March 31, 2020.
The trailing12-month performance figures shown above were driven primarily by the steep fall in global equity markets during the first quarter of 2020. Throughout the last nine months of 2019, equity markets managed to generate positive gains at the broad asset class level despite economic growth slowing globally. US equity markets led other developed international markets, while emerging markets lagged the most, mainly due to a slowing China.
Several things were already hampering international economic growth prior to the spread of COVID-19 in Q1 of 2020. Manufacturing was in a mild recession across the globe. The growth slowdown was most pronounced in Europe and China. Lackluster growth in the Eurozone, along with the ongoing Brexit saga in the UK increased uncertainty around the future of Europe. China’s economy had been slowing during the period, as continued trade rhetoric escalated tensions between the world’s two largest economies. However in Q4 of 2019, the US and China agreed to a “Phase One” trade deal, which reduced US tariffs on Chinese goods while boosting Chinese purchases of American goods and delayed further confrontations during the period. The resulting reduction in uncertainty was welcomed by markets.
The biggest market moving news during this period was the spread of theCOVID-19 virus. In March 2020, the World Health Organization officially labeledCOVID-19 a global pandemic amid a rapid escalation in the number of affected countries, confirmed cases, and deaths. In an effort to slow the spread ofCOVID-19, global governments enacted social distancing measures that led to the widespread closure of businesses. The resulting slowdown in activity led to a massive spike in unemployment.
In response to the shutdown of economic activity, central banks across the globe implemented unprecedented levels of monetary stimulus. In the US, the Fed cut rates to 0%, announced unlimited bond buying (or QE quantitative easing) andre-instated several programs used during the financial crisis in 2008-2009. In Europe, the ECB restarted its QE program, with 870 billion euros in planned purchases and lowered its policy rate to-0.75%. The European Union also relaxed fiscal rules to allow member countries more flexibility in managing deficits. In addition to monetary stimulus, in the US, Congress passed a $2.3 trillion economic relief plan, which included direct payments to citizens and expanded unemployment benefits.
Throughout this12-month period investors preferred growth stocks over value stocks and large cap stocks over small cap stocks globally. In Q1, as markets fell swiftly, lower beta, a measure of the risk arising from exposure to general market movements, and quality stocks were sought after in an attempt by investors to reduce overall risk.
Arrowstreet underperformed the Fund’s benchmark by 1.15%. Underperformance was largely due to stock selection, while allocation effects helped to partially offset losses for the period. Currency effects were a slight positive contributor to results. Performance for sector allocation was aided by positive quality and momentum bias; specifically, overweights to both Swiss and Japanese Health Care were the primary drivers of positive returns. An underweight to French Industrials and an overweight to Japanese Industrials weighed on performance. For stock selection, value signals and smaller capitalization bias led to negative performance. Selection within both Japanese and French Consumer Discretionary as well as selection within Japanese and Swiss IT were negative. On the other hand, selection within French and Australian Financials were top contributors.
American Century outperformed the Fund’s benchmark by 11.28%. The strong excess returns were in large part due to investments in businesses with structural or secular growth drivers that are less dependent on cyclical recovery. American Century’s disciplined process had been leading it to these types of names through most of 2019 amidst a declining earnings environment. For most of the stocks in the portfolio, the long-term structural growth story has not changed and they outperformed as the outlook for cyclical earnings growth deteriorated
10
MercerNon-US Core Equity Fund
further. The portfolio has no exposure to areas of the market most directly impacted by theCOVID-19 epidemic. Security selection in sectors such as Financial Services, Communication Services, Healthcare, Information Technology and Materials were largest contributors to excess returns. Notable stock contributors to the outperformance included Cellnex, European cell tower company, London Stock Exchange, Lonza Group, contract manufacturer to the pharmaceutical industry, CSL LTD, specialtybio-tech company and ASML holding, semiconductor capital equipment company.
MFS outperformed the Fund’s benchmark by 10.88%. Thesub-advisor’sbottom-up security selection process of investing in profitable, low leverage companies with sustainable earnings led to strong outperformance; the majority of the businesses held in the portfolio had low exposure to potential earnings decline from the looming recession. Biggest contributors to outperformance were security selection in Materials, Industrials and Consumer Staples. In addition, large overweight to Consumer Staples and Information Technology sectors and underweight to Financial Services and Energy added significantly to excess returns. Notable names that contributed to the returns were Givaudan, leading flavor and fragrances manufacturer and distributor, Schneider Electric, company specializing in digital transformation of energy management, and Ansys, software solutions provider.
LSV underperformed the Fund’s benchmark by 5.72%. Over theone-year, value stocks severely lagged both growth and quality stocks; thus, MSCI EAFE® Value Index was down 22.8% while the MSCI EAFE® Growth Index was down only 5.8% and MSCI EAFE® Quality Index was down just 2.26%. In addition, companies with smaller market capitalization lagged larger capitalization companies; for example, MSCI EAFE® Small Cap index returned-17.81% while MSCI EAFE®’s return was-13.92%. The environment was a major headwind to LSV who invests in deep value and smaller capitalization companies. Largest contributors to negative active returns were security selection in Industrials, Consumer Discretionary, Financials and Information Technology. Additionally, given higher valuations, LSV was underweight in Health Care, which was the strongest performing sector during the marketsell-off.
Parametric utilizes exchange-traded futures replicating the Fund’s benchmark, aiming to provide broad, passive, equity market exposure to the Fund’s liquidity sleeve, and seeking to create positive returns on assets that would have otherwise been earning cash or cash equivalent returns. Performance differences versus the benchmark are largely a result of cash flow effects related to daily subscription/redemption activity and through financing costs of futures relative to interest earned on cash.
Risk Considerations
The Fund invests in foreign and emerging market securities which involves certain risks such as currency volatility, political and social instability and reduced market liquidity. Emerging markets may be more volatile and less liquid than more developed markets and therefore may involve greater risks. Investments made in small andmid-capitalization companies may be more volatile and less liquid due to limited resources or product lines and more sensitive to economic factors. The Fund may invest in derivative instruments such as exchange-listed equity futures contracts, which may cause the Fund to experience greater volatility and less liquidity. Derivatives may be more sensitive to changes in market conditions and may amplify the risk of loss for the Fund. The Fund may experience high portfolio turnover which may result in higher transaction costs and capital gains.
11
Mercer Funds
March 31, 2020
Comparison of Change in Value of a $10,000 Investment in
MercerNon-US Core Equity Shares vs. the
MSCI EAFE Index
As of March 31, 2020
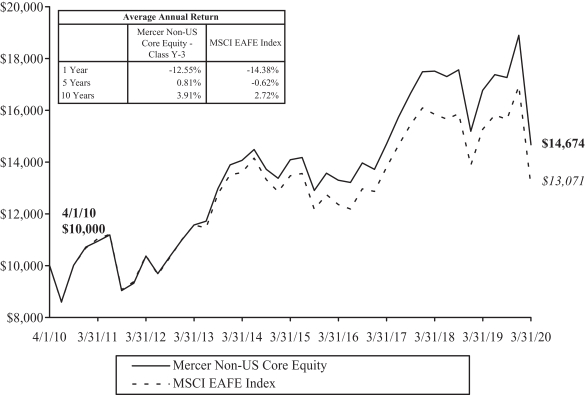
This graph shows the performance of the MercerNon-US Core Equity Fund ClassY-3 shares versus the MSCI EAFE Index from April 1, 2010 through March 31, 2020. The performance of other classes, when launched, will vary from the performance of the class shown based on the difference in fees and expenses paid by shareholders investing in different share classes. The Fund may charge a 2% redemption fee on shares owned less than 30 days.
The table and graph assume reinvestment of dividends and capital gains, but do not reflect a deduction of taxes an investor might pay on fund distributions or upon redemption of fund shares. Performance shown reflects a fee waiver and/or expense reimbursement. Without this waiver/reimbursement, returns would have been lower.
The data quoted represents past performance and does not guarantee future results. Current performance of the Fund may be lower or higher than the performance quoted. Please call 1-866-658-9896 for the Fund’s most recentmonth-end performance. Investment return and principal value will fluctuate so that an investor’s shares, when redeemed, may be worth more or less than when purchased.
12
Mercer Core Fixed Income Fund
Investment Objective and Benchmark
The investment objective of the Fund is to provide total return, consisting of both current income and capital appreciation. The benchmark for the Fund is the Bloomberg Barclays US Aggregate Bond™ Index.
Investment Strategy
The Fund invests principally in investment grade fixed income securities, including government securities, corporate bonds and securitized bonds, such as mortgage and asset-backed securities. The Fund may also invest innon-investment grade bonds (sometimes called high yield or junk bonds),non-U.S. dollar denominated bonds, and bonds issued by issuers located in emerging capital markets. The Fund may also invest in certain derivative instruments, such as options, futures, and swap agreements. The Fund may engage in transactions in derivatives for a variety of purposes, including changing the investment characteristics of its portfolio, enhancing total returns or as a substitute for taking a position in an underlying asset.
Performance
For the fiscal year ended March 31, 2020, the Fund’sY-3 share class performance was 7.81% compared to its benchmark return of 8.93%. Performance for the Fund is reported net of fees and operating expenses while the benchmark returns do not include expenses of any kind as indexes are unmanaged.
TheSub-Advisors
As of March 31, 2020, the Fund employed threesub-advisors: Manulife Asset Management (Manulife), Income Research & Management (IR&M) and PGIM Fixed Income, a business unit of PGIM, Inc. (Prudential).
Manulife manages its allocated portion of the Fund by seeking to produce superior results by anticipating shifts in the business cycle and moderating risk relative to the direction of interest rates. The investment team capitalizes on these shifts by using a research-driven process to identify attractive sectors as well as mispriced securities within those sectors.
IR&M manages its allocated portion of the Fund based on the belief that careful security selection and higher portfolio income provide superior returns over the long term. Portfolios are constructed using a disciplined,bottom-up investment approach to select attractive securities from the US fixed income universe. Abottom-up approach focuses on the analysis of individual stocks andde-emphasizes the significance of macroeconomic and market cycles with the assumption individual companies can do well even in an industry that is not performing, at least on a relative basis.
Prudential manages its allocated portion of the Fund by seeking to maximize excess return opportunities from sustainable alpha sources, such as sector allocation andbottom-up security selection. This process is coupled with a diligent daily portfolio risk evaluation and monitoring process. Research-based security selection is a major source of added value and incorporates both fundamental analysis, by measuring a security’s intrinsic value to determine if undervalued or overvalued, as well as proprietary models, by using software and other means of analysis to gain a competitive edge, which identify relative value and detailed technical review of issuers across both benchmark andnon-benchmark sectors, with an emphasis on credit-oriented sectors.
Market Commentary and Fund Performance
For the12-month period ended March 31, 2020, US fixed income market returns, as measured by the Bloomberg Barclay US Aggregate Bond™ Index, were positive, despite the turbulence across US and global markets experienced during the period. Throughout 2019, the Federal Reserve (“Fed”) began its insurance rate-cutting cycle, attempting to stem the possibility of a recession, and credit spreads (a measure used for valuation of bonds
13
Mercer Core Fixed Income Fund
relative to US Treasuries) generally ground tighter as investors continued to have an appetite forrisk-on sectors. This resulted in corporate spreads as tight as 93 basis points, reflecting the demand for corporate credit. However, in the first three months of 2020, global economies began to address theCOVID-19 pandemic, instituting social measures that effectively put global economic growth on pause. Additionally, disagreement between OPEC and other oil producing nations drove an increase in oil supply against the backdrop of a reduction in oil demand given the ensuing pandemic, leading oil prices to plunge towards $20 per barrel. The Fed announced two emergency rate cuts during the month of March, bringing the Fed Funds Rate target to0.00-0.25%. Despite rate cuts, spreads widened at a historic pace reaching levels last seen during the2008-09 financial crisis, impacting liquidity across the markets prior to the Fed’s initiation of an asset purchase program and other remedial measures. Risky assets traded off in tight correlations driven by investor sentiment and illiquidity. Investment grade corporate spreads topped out in the high 300 basis point range before ending the period at 272.
The Fund’s return was positive in absolute terms for the fiscal year; however, it underperformed in relation to the Bloomberg Barclays US Aggregate Bond™ Index for the fiscal year ended March 31, 2020. The majority of underperformance was due to the Fund’s strategic overweight to spread sectors, particularly during the first quarter of 2020.
The respective performance results of eachSub-advisor correlated with their risk posture, as more risk translated into a larger drag on performance during thesell-off in March 2020. Manulife has the largest share of the risk-allocation within the Fund. Manulife’s bias towards corporate credit and allocation to “higher quality” high yield bonds led the manager to underperform most for the fiscal year.
Prudential had a marginally less aggressive allocation to spread sectors relative to Manulife, but was still overweight relative to the Fund’s benchmark. The majority of underperformance relative to the benchmark was due to price volatility, specifically as it related to thesub-advisors allocation to securitized sectors such as CLOs and CMBS. This forced sellers across the market drove prices lower in an effort to generate liquidity, which disproportionately impacted Prudential’s higher quality holdings.
IR&M also underperformed the Fund’s benchmark over the trailing12-month period; however, their lower risk profile relative to the othersub-advisors led IR&M to underperform by the smallest magnitude. The bias towards higher quality corporate bonds as well as their tactical rotation of spread exposure led them to underperform the least. However, the overweight spread allocation relative to the benchmark still produced a significant drag on performance during March 2020, leading to underperformance for the Fund’s fiscal year.
Risk Considerations
The Fund is subject to the risks that the underlying bonds in its portfolio are subject to, including credit, prepayment, call and interest rate risk. As interest rates rise, the value of bond prices will decline. The Fund may invest in foreign securities, which may expose the Fund to currency and exchange rate fluctuations, derivatives (such as futures, options, or swaps) and high yield bonds (also known as “junk” bonds). These investments may cause the Fund to experience greater volatility and less liquidity. Derivatives may be more sensitive to changes in market conditions and may amplify the risk of loss for the Fund. The Fund may also experience high portfolio turnover, which may result in higher transaction costs and capital gains.
14
Mercer Funds
March 31, 2020
Comparison of Change in Value of a $10,000 Investment in
Mercer Core Fixed Income Shares vs. the
Bloomberg Barclays U.S. Aggregate Bond™ Index
As of March 31, 2020
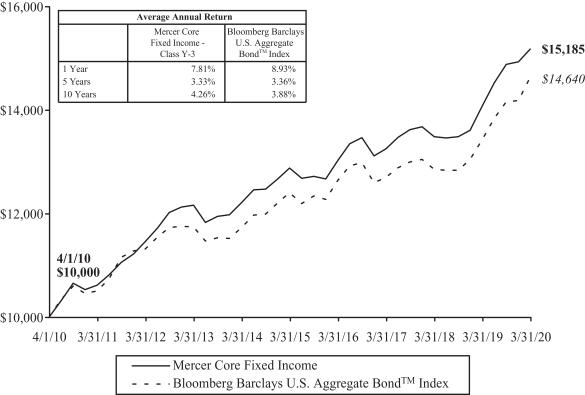
This graph shows the performance of the Mercer Core Fixed Income Fund ClassY-3 shares versus the Bloomberg Barclays U.S. Aggregate Bond™ Index from April 1, 2010 through March 31, 2020. The performance of other classes, when launched, will vary from the performance of the class shown based on the difference in fees and expenses paid by shareholders investing in different share classes. The Fund may charge a 2% redemption fee on shares owned less than 30 days.
The table and graph assume reinvestment of dividends and capital gains, but do not reflect a deduction of taxes an investor might pay on fund distributions or upon redemption of fund shares. Performance shown reflects a fee waiver and/or expense reimbursement. Without this waiver/reimbursement, returns would have been lower.
The data quoted represents past performance and does not guarantee future results. Current performance of the Fund may be lower or higher than the performance quoted. Please call 1-866-658-9896 for the Fund’s most recentmonth-end performance. Investment return and principal value will fluctuate so that an investor’s shares, when redeemed, may be worth more or less than when purchased.
15
Mercer Opportunistic Fixed Income Fund
Investment Objective and Benchmark
The investment objective of the Fund is to provide long-term total return, which includes capital appreciation and income. The Fund’s primary benchmark is the ICE Bank of America Merrill Lynch Global High Yield 2.0% Constrained Index Unhedged. For the fiscal year ended March 31, 2020, the Fund’s secondary benchmark was a blended benchmark consisting of 50% JP Morgan Government Bond Index — Emerging Markets Global Diversified and 50% Bank of America Merrill Lynch Global High Yield 2.0% Constrained Index Unhedged, and its tertiary benchmark was a blended benchmark consisting of 20% Bloomberg Barclays Global Aggregate Corporate Hedged Index, 10% Bloomberg Barclays Global High Yield Index, 6% JP Morgan CEMBI Diversified Index, 4% S&P/LSTA Leveraged Loan Index, 30% US 3 MonthT-Bill Index and 30% JP MorganGBI-EM Diversified Index.1
Investment Strategy
The Fund invests principally in fixed income securities of US andnon-US issuers, including those in emerging and frontier markets. The Fund invests in various strategic and tactical global bond market opportunities without limitations in geography, issuer type, quality and currency denomination. The Fund may invest in derivatives such as futures (including among others, interest rate futures), swaps (currency, interest rate, credit default and total return), forwards, options, and credit-linked notes. The Fund may engage in transactions in derivatives for a variety of purposes, including hedging, risk management, efficient portfolio management, enhance total returns, or as a substitute for taking position in the underlying asset.
Performance
For the fiscal year ended March 31, 2020, the Fund’sY-3 share class performance was-4.72% compared to its primary benchmark return of-8.26%, secondary benchmark of-7.34%, and tertiary benchmark of-1.92%. Performance of the Fund is reported net of fees and operating expenses while the benchmark returns do not include expenses of any kind as indexes are unmanaged.
TheSub-Advisors
As of March 31, 2020, the Fund employed fivesub-advisors and twosub-subadvisors, Western Asset Management Company and Western Asset Management Company Limited (assub-subadvisor) (together referred to as WAMCO), Loomis, Sayles & Company, LP (Loomis), BlackRock International Limited (BlackRock), Colchester Global Investors Limited (Colchester), and T. Rowe Price Associates, Inc. and T. Rowe Price International Limited (assub-subadvisor) (together referred to as T. Rowe). WAMCO, Loomis, BlackRock, and Colchester began managing the Fund in June 2018, and T. Rowe began managing the Fund in September 2019. During the period ended March 31, 2020, T. Rowe was notified of their termination assub-advisor andsub-subadvisor for the Fund. The majority of the transition occurred during March 2020 with T. Rowe’s assets reallocated to the two Multi-Asset Credit managers, Loomis and WAMCO.
In managing its allocated portion of the Fund’s portfolio, Loomis invests in debt of issuers globally. Loomis produces country and credit cycle views as inputs to portfolio construction. Security selection is then carried out by a team of credit analysts who maintain a comprehensive database of internal ratings. The team will also engage in active duration positioning although security and sector selection are identified as main drivers of performance.
| 1 | In April 2020, the Fund’s secondary and tertiary benchmarks were replaced with the following new secondary benchmark:35% Bloomberg Barclays Global Aggregate Corporate Hedged Index, 17.5% Bloomberg Barclays Global High Yield Index, 10.5% JP Morgan CEMBI Diversified Index, 7% S&P/LSTA Leveraged Loan Index, and 30% JP MorganGBI-EM Diversified Index. This new secondary benchmark index is considered to be more reflective of the Fund’s current investment strategy following the termination of an absolute return strategy that was previously employed with respect to the Fund. |
16
Mercer Opportunistic Fixed Income Fund
In managing its allocated portion of the Fund’s portfolio, WAMCO invests in credit securities across sectors and geographies. The strategy focuses on global valuations in credit and volatility conditions. The strategy seeks a blend of income and capital appreciation by dynamically rotating across sectors such as global corporates, emerging markets, and structured credit, and tactically managing overall portfolio duration.
In managing its allocated portion of the Fund’s portfolio, Colchester invests in sovereign debt issued by emerging market borrowers and those denominated in local emerging market currencies. Colchester’s portfolio construction process is based on a quantitative model, using mathematical and statistical methods, that promotes allocation to countries and currencies identified based on attractive real yields and sound financial characteristics.
In managing its allocated portion of the Fund’s portfolio, BlackRock invests in emerging market debt securities denominated in local currency. BlackRock’s portfolio construction process implements a top down philosophy focused on identifying economic or market themes that impact asset prices. The themes inform the team’s market views and portfolios are positioned to benefit from directional moves in the market.
Market Commentary and Fund Performance
For the12-month period ended March 31, 2020, US and global fixed income markets experienced a tumultuous period. Throughout 2019, the Federal Reserve (“Fed”) began its insurance rate-cutting cycle, attempting to stem the possibility of a recession, and credit spreads (a measure used for valuation of bonds relative to US Treasuries) generally ground tighter as investors continued to have an appetite forrisk-on sectors. This resulted in corporate spreads as tight as 93 basis points, reflecting the demand for corporate credit. However, in the first three months of 2020, global economies began to address theCOVID-19 pandemic, instituting social measures that effectively put global economic growth on pause. Additionally, disagreement between OPEC and other oil producing nations drove an increase in oil supply against the backdrop of a reduction in oil demand given the ensuing pandemic, leading oil prices to plunge towards $20 per barrel. The Fed announced two emergency rate cuts during the month of March, bringing the Fed Funds Rate target to0.00-0.25%. Despite rate cuts, spreads widened at a historic pace reaching levels last seen during the2008-09 financial crisis, impacting liquidity across the markets prior to the Fed’s initiation of an asset purchase program and other remedial measures. Risky assets traded off in tight correlations driven by investor sentiment and illiquidity. Investment grade corporate spreads topped out in the high 300 basis point range before ending the period at 272. High Yield Markets produced strong positive returns throughout most of 2019, however, the sharprisk-off environment and dramatic spread widening of March 2020 produced sharply negative returns over the trailing12-months ended March 31, 2020. High yield spreads widened out to over 1000 basis points before ending the period at 880 basis points.
The JP MorganGBI-EM Global Diversified Index of local currency Emerging Market government debt fell-6.5% in US dollar terms over the12-month period ending March 2020. Much of the negative performance over this period was driven by the negative return of-15.2% in the first quarter of 2020. The outbreak of the coronavirus severely disrupted economic activity and consequently the first quarter of this year saw heightened volatility across financial markets. Safe haven assets, such as the US dollar, rallied. In contrast, emerging markets experienced sharp sell-offs in both bond and currency markets. Additionally, the negative performance across emerging markets was further exacerbated by the precipitous drop in the price of oil. Weaker global demand for oil, as a result of theCOVID-19 pandemic, was compounded by a breakdown in relations between Russia and Saudi Arabia which fueled a price war and resulted in oil prices dropping by over 50%. This represented a second negative shock to oil exporting economies such as Colombia and Russia, along with the impact of the wider global downturn. Across the emerging market countries, policymakers reacted swiftly to these shocks with many central banks cutting interest rates and launching new forms of liquidity provisions in support of their economies. In the past three months, interest rates have been lowered in each of South Africa, Mexico, Brazil and Russia, amongst others.
17
Mercer Opportunistic Fixed Income Fund
During the period, WAMCO and Loomis underperformed their component of the Fund’s tertiary benchmark. Tactical rotation across spread sectors benefited for most of the trailing12-month period, however, an overweight spread position coming into the first quarter of 2020 delivered negative absolute and relative performance for both managers.
During the period, each of Blackrock and Colchester underperformed the JP Morgan Global Diversified Emerging Market government bond benchmark for its strategy. The strengthening US dollar delivered negative absolute returns and both managers struggled to forecast the impacts of theCOVID-19 pandemic.
During the period, T. Rowe underperformed its Treasury-Bill +200 benchmark. Performance was generally muted throughout the period with the exception of several idiosyncratic events. Namely, return-seeking positions in Argentina delivered outsized negative performance during the third quarter of 2019. Additionally, T.Rowe’s performance was impacted by preparation for the transition that occurred during March of 2020.
Risk Considerations
The Fund invests innon-investment grade and emerging market fixed income securities which involves certain risks such as higher volatility, currency fluctuation, political and social instability and reduced market liquidity. The Fund is subject to the risks that the underlying bonds in its portfolio are subject to, including credit, prepayment, call and interest rate risk. As interest rates rise, the value of bond prices will decline. The Fund may invest in foreign securities, which may expose the Fund to currency and exchange rate fluctuations, derivatives (such as futures, options, or swaps) and high yield bonds (also known as “junk” bonds). These investments may cause the Fund to experience greater volatility and less liquidity. Derivatives may be more sensitive to changes in market conditions and may amplify the risk of loss for the Fund. The Fund may experience high portfolio turnover which may result in higher transaction costs and capital gains.
18
Mercer Funds
March 31, 2020
Comparison of Change in Value of a $10,000 Investment in
Mercer Opportunistic Fixed Income Shares vs. the
ICE Bank of America Merrill Lynch Global High Yield 2% Constrained Index Unhedged, the Fund’s Secondary Index1 and the Fund’s Tertiary Index2
As of March 31, 2020

This graph shows the performance of the Mercer Opportunistic Fixed Income Fund Class Y-3 shares versus the ICE Bank of America Merrill Lynch Global High Yield 2% Constrained Index Unhedged and the Fund’s Secondary Index1 from August 21, 2013, which is the inception date of the Fund, through March 31, 2020. The performance of other classes, when launched, will vary from the performance of the class shown based on the difference in fees and expenses paid by shareholders investing in different share classes. The Fund may charge a 2% redemption fee on shares owned less than 30 days.
The table and graph assume reinvestment of dividends and capital gains, but do not reflect a deduction of taxes an investor might pay on fund distributions or upon redemption of fund shares. Performance shown reflects a fee waiver and/or expense reimbursement. Without this waiver/reimbursement, returns would have been lower.
| 1 | The Mercer Opportunistic Fixed Income Fund’s Secondary Index is a blended benchmark consisting of 50% JP Morgan Government Bond Index — Emerging Markets Global Diversified USD Unhedged and 50% Bank of America Merrill Lynch Global High Yield 2% Constrained Index Unhedged. |
| 2 | The Mercer Opportunistic Fixed Income Fund’s Tertiary Index is a blended benchmark consisting of 20% Bloomberg Barclays Global Aggregate Corporate Hedged Index, 10% Bloomberg Barclays Global High Yield Index, 6% JP Morgan CEMBI Diversified Index, 4% S&P/LSTA Leveraged Loan Index, 30% US 3 Month T-Bill Index and 30% JP MorganGBI-EM Diversified Index |
The data quoted represents past performance and does not guarantee future results. Current performance of the Fund may be lower or higher than the performance quoted. Please call 1-866-658-9896 for the Fund’s most recentmonth-end performance. Investment return and principal value will fluctuate so that an investor’s shares, when redeemed, may be worth more or less than when purchased.
19
Mercer Emerging Markets Equity Fund
Investment Objective and Benchmark
The investment objective of the Fund is to provide long-term total return, which includes capital appreciation and income. The benchmark for the Fund is the MSCI Emerging Markets® Index.
Investment Strategy
The Fund invests principally in equity securities of large, medium and small capitalization companies, located in emerging markets, other investments that are tied economically to emerging markets, as well as in American, European and Global Depositary receipts. Stock index futures and various types of swaps may be used to implement the country selection component of the Fund’s investment strategy. Currency forwards may be used to make stock-selection and country allocation decisions independently of the underlying currency.
Performance
For the fiscal year ended March 31, 2020, the Fund’sY-3 share class performance was -19.55% compared to its benchmark return of-17.69%. Performance for the Fund is reported net of fees and operating expenses while the benchmark returns do not include expenses of any kind as indexes are unmanaged.
TheSub-Advisors
As of March 31, 2020, the Fund employed sixsub-advisors: Dimensional Fund Advisors LP (DFA), Mondrian Investment Partners Limited (Mondrian), Copper Rock Capital Partners LLC (Copper Rock), William Blair Investment Management LLC (William Blair), Origin Asset Management LLP (Origin) and Parametric Portfolio Associates LLC (Parametric). Janus Capital Management, LLC was terminated as asub-advisor to the Fund in [April?], 2019, and AQR Capital Management LLC was terminated in July 2019 when Origin was added. Origin plays a complementary role within the portfolio. Specifically, Origin’s momentum exposure allows for greater flexibility of exposures across styles, countries and sectors as well as a low correlation of excess returns with the othersub-advisors.
DFA benefits from a robust research platform, which includes close ties to academia, its clear and long-standing focus on exploiting risk premiums, most notably value and size, along with the new addition profitability, and a systematic approach to building and trading its portfolios. DFA’s process is repeatable and results in broad consistent exposures to the risk premiums.
Copper Rock specializes in small cap equity investing, using a blend of quantitative, using mathematical and statistical methods, and fundamental analyses, by measuring a security’s intrinsic value related to economic and financial factors, to identify companies with superior growth relative to their peers. Copper Rock’s portfolio typically exhibits factor exposures to growth, momentum and quality.
Mondrian is an experienced value manager, which seeks to buy stocks at a discount to their fair value and sell them at or in excess of that value, and uses a Dividend Discount Model, a method of valuing stocks based on the net present value of the future dividends, to analyze and find attractive companies focused on the domestic oriented growth of emerging markets. Along with emerging market domiciled companies, Mondrian’s management team will also consider any company globally that generates at least 25% of revenues/profits from emerging/frontier markets.
William Blair has a quality growth philosophy and process focused on finding those companies that can achieve a higher growth rate for a longer period of time than the market expects. William Blair looks for companies with experienced and motivated management teams, unique business models and attractive financial characteristics.
20
Mercer Emerging Markets Equity Fund
Origin’s portfolio is managed using a quantitative process focused on companies with high and improving cash flow return on investment, selling at discounted valuations of expected future growth versus historical growth and that also display fundamental and price momentum. The portfolio is managed to have a higher tracking error and high active share.
Parametric utilizes exchange-traded futures to generate exposure corresponding to the Fund’s benchmark.
Market Commentary and Fund Performance
As a group, global developed equity markets fell, as measured by the MSCI World® Index, by-10.39% during the12-month period ended March 31, 2020. US equities, as measured by the Russell 1000® Index, fell-8.03% for the fiscal year. Compared to the US, international developed markets lagged, with the MSCI EAFE® Index returning-14.38% over the period. The MSCI Emerging Markets® Index (the Fund’s benchmark) suffered a greater drop, with a decline of-17.69% for the12-month period ended March 31, 2020.
The trailing12-month performance figures shown above were driven primarily by the steep fall in global equity markets during the first quarter of 2020. Throughout the last nine months of 2019, equity markets managed to generate positive gains at the broad asset class level despite economic growth slowing globally. US equity markets led other developed international markets, while emerging markets lagged the most, mainly due to slowing growth in China.
Several things were already hampering international economic growth prior to the spread ofCOVID-19 in the first quarter of 2020. Manufacturing was in a mild recession across the globe. The growth slowdown was most pronounced in Europe and China. Lackluster growth in the Eurozone, along with the ongoing Brexit saga in the United Kingdom increased uncertainty around the future of Europe. China’s economy had been slowing during the period, as continued trade rhetoric with the U.S. escalated tensions between the world’s two largest economies. However in the fourth quarter of 2019, the US and China agreed to a “Phase One” trade deal, that reduces some US tariffs on Chinese goods while boosting Chinese purchases of American goods, and delayed further confrontations during the period. The resulting reduction in uncertainty was welcomed by markets.
The biggest market moving news during this period was the spread of theCOVID-19 virus. In March 2020, the World Health Organization officially labeledCOVID-19 a global pandemic amid a rapid escalation in the number of affected countries, confirmed cases, and deaths. In an effort to slow the spread ofCOVID-19, global governments enacted social distancing measures that led to the widespread closure of businesses. The resulting slowdown in activity led to a massive spike in unemployment.
In response to the shutdown of economic activity, central banks across the globe implemented unprecedented levels of monetary stimulus. In the US, the Fed cut rates to 0%, announced unlimited bond buying (known as quantitative easing or QE) andre-instated several programs used during the financial crisis in 2008-2009. In Europe, the ECB restarted its QE program, with 870 billion euros in planned purchases and lowered its policy rate to-0.75%. The European Union also relaxed fiscal rules to allow member countries more flexibility in managing deficits. In addition to monetary stimulus, in the US, Congress passed a $2.3 trillion economic relief plan, which included direct payments to citizens and expanded unemployment benefits.
Throughout this12-month period investors preferred growth stocks over value stocks and large cap stocks over small cap stocks globally. In the first quarter of 2020, as markets fell swiftly, lower beta, a measure of the risk arising from exposure to general market movements, and quality stocks were sought after in an attempt by investors to reduce overall risk.
For the12-month period ending March 31, 2020, the Mercer Emerging Markets Equity Fund trailed the MSCI Emerging Markets Equity® Index by 1.85%. The Fund’s underperformance can mostly be explained by its exposures to value stocks and small cap stocks. Based on the MSCI Style® Indices, emerging market value
21
Mercer Emerging Markets Equity Fund
stocks lagged growth stocks by 15.2%, while emerging market small capitalization stocks trailed large cap stocks by 11.0% over the12-month period. Along with these style headwinds, the Mercer Emerging Markets Equity Fund was also hurt on a relative basis from negative stock selection by certainsub-advisors.
The DFA portfolio in the Mercer Emerging Markets Equity Fund underperformed the MSCI Emerging Markets® Index over the trailing12-month period. With low relative price (value) stocks generally underperforming high relative price (growth) stocks, the sleeve’s focus on value stocks was the primary driver of underperformance relative to the style-neutral index. With small cap stocks generally underperforming large cap stocks, the sleeve’s emphasis on smaller market cap stocks also detracted from relative performance.
The Mondrian sleeve outperformed the benchmark during this period. The most significant contributor of relative returns was stock selection within the Healthcare, Energy and Information Technology sectors. The portfolio is concentrated in companies with strong free cash flow generation and solid balance sheets, many with a net cash position. Mondrian’s defensive value discipline has produced good results over the long-term and protected on the downside during the market selloff in the first quarter of 2020.
The William Blair Emerging Markets strategy outperformed the MSCI Emerging Markets® Index over the trailing12-month period ending March 31st, amid strong relative results in the first half of the year. The outperformance was driven by positive stock selection within Consumer Staples and Communication Services coupled with a natural resources underweighting. From a geographic perspective, strong stock selection within China, Brazil and Taiwan bolstered relative performance. Partially mitigating these positive effects were weak stock selection within Financials, as well as underweighting Information Technology and overweighting India.
Origin’s performance since inception (July 12, 2019) has been relatively strong, with returns outperforming the index by over 7% during the period. Chinese holdings in the Consumer Discretionary and Materials sectors have contributed most to that outperformance as have Technology names in Taiwan. More recently, Origin has continued to outperform during theCOVID-19 crisis thanks to a heavier weighting to China, heavy exposure to internet based business models and crucially, full weighting in the largest three or four names in the benchmark which make up around 25% of the index.
The Copper Rock portfolio trailed the broad MSCI Emerging Markets® Index during the period, but did beat the MSCI Emerging Markets Small Cap® Index by over 2%. Copper Rock benefitted from having exposure to both growth and momentum, which outperformed value within small cap stocks as well.
Risk Considerations
The Fund invests in emerging market securities which involves certain risks such as currency volatility, political and social instability and reduced market liquidity. Emerging markets may be more volatile and less liquid than more developed markets and therefore may involve greater risks. Investments made in small andmid-capitalization companies may be more volatile and less liquid due to limited resources or product lines and more sensitive to economic factors. The Fund may invest in derivatives (such as futures, forwards, options, or swaps), which may cause the Fund to experience greater volatility and less liquidity. Derivatives may be more sensitive to changes in market conditions and may amplify the risk of loss for the Fund. The Fund may experience high portfolio turnover which may result in higher transaction costs and capital gains.
22
Mercer Funds
March 31, 2020
Comparison of Change in Value of a $10,000 Investment in
Mercer Emerging Markets Equity Shares vs. the
MSCI Emerging Markets Index
As of March 31, 2020
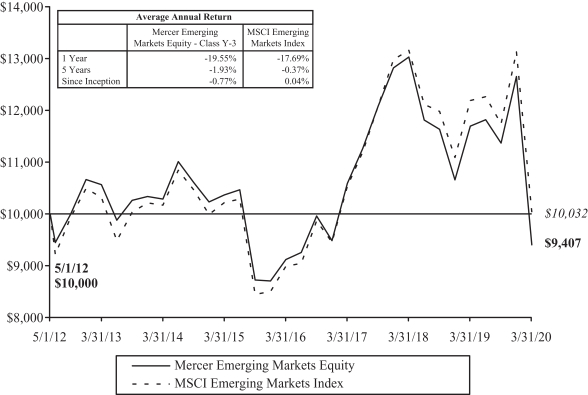
This graph shows the performance of the Mercer Emerging Markets Equity Fund Class Y-3 shares versus the MSCI Emerging Markets Index from May 1, 2012, which is the inception date of the Fund, through March 31, 2020. The performance of other classes, when launched, will vary from the performance of the class shown based on the difference in fees and expenses paid by shareholders investing in different share classes. The Fund may charge a 2% redemption fee on shares owned less than 30 days.
The table and graph assume reinvestment of dividends and capital gains, but do not reflect a deduction of taxes an investor might pay on fund distributions or upon redemption of fund shares. Performance shown reflects a fee waiver and/or expense reimbursement. Without this waiver/reimbursement, returns would have been lower.
The data quoted represents past performance and does not guarantee future results. Current performance of the Fund may be lower or higher than the performance quoted. Please call 1-866-658-9896 for the Fund’s most recentmonth-end performance. Investment return and principal value will fluctuate so that an investor’s shares, when redeemed, may be worth more or less than when purchased.
23
Mercer Global Low Volatility Equity Fund
Investment Objective and Benchmark
The investment objective of the Fund is to provide long-term total return, which includes capital appreciation and income. The benchmark for the Fund is the MSCI World® Index.
Investment Strategy
The Fund invests principally in equity securities of U.S. and foreign issuers, of large, medium and small capitalization companies. Stock index futures and various types of swaps may be used to implement the equity security selection component of the Fund’s investment strategy. Currency forwards may be used to make stock-selection and country allocation decisions independently of the underlying currency.
Performance
For the fiscal year ended March 31, 2020, the Fund’sY-3 share class performance was -8.16% compared to its benchmark return of-10.39%. Performance for the Fund is reported net of fees and operating expenses while the benchmark returns do not include expenses of any kind as indexes are unmanaged.
TheSub-Advisors
As of March 31, 2020, the Fund employed fivesub-advisors, Acadian Asset Management LLC (Acadian), Martingale Asset Management, LP (Martingale), Wellington Management Company LLP (Wellington), Veritas Asset Management LLC (Veritas) and Parametric Portfolio Associates LLC (Parametric).
Acadian is the Fund’s dedicated minimum variance manager for developed economies outside the US. The strategy applies a quantitative investment process, using mathematical and statistical methods, to the EAFE + Canada universe of securities and emphasizeslow-volatility securities, low correlations between securities and a high degree of portfolio diversification with the goal of constructing a portfolio with lower levels of absolute volatility compared to the benchmark. Additionally, the strategy applies Acadian’s stock forecast andtop-down alpha model, which measures the active return on an investment for performance as compared with a suitable market index, in order to enhance the returns. The portfolio does not employ tight constraints vs the benchmark across capitalization and/or sectors, enhancing its ability to more effectively manage portfolio volatility.
Martingale is the Fund’s dedicated minimum variance manager for the US region. The strategy uses a systematic process of investing in stocks with lower stock price volatility and attractive fundamental factors such as value, quality and momentum. The portfolio aims to deliver equity-like market returns with lower volatility and less downside risk than the market index. Martingale’s core process includes reconstituting the Russell 1000 into a proprietary “Stability Index”, which Martingale believes more accurately reflects stock risk properties based on longer-term company fundamentals as well as high frequency short-term risk signals. The strategy is managed against the derived Stability, which measures the degree of change (or stability) of the market, index by applying stock and industry alpha forecasting models and optimizing to minimize the portfolio’s absolute volatility.
Wellington uses abottom-up stock selection process with a focus on individual companies, rather than the macroeconomic cycles and market cycles, which have a high degree of earnings stability and predictability and that are often overlooked by other investors. Wellington believes that stability of cash flows is undervalued in companies that either do not meet the specific criteria of growth, quality or value investors, or are in areas of the market (small capitalization, certain sectors or geographies) not normally associated with stability.
Veritas uses an unconstrained, fundamentally driven, rigorous research process with a long-term horizon. Veritas believes that companies with sustainable competitive advantage and benefitting from long-term drivers of growth, purchased at attractive valuations, will deliver performance in excess of the benchmark over time. The strategy may hold up to 20% cash.
24
Mercer Global Low Volatility Equity Fund
Parametric utilizes exchange-traded futures to generate market exposure corresponding to the Fund’s benchmark with beta, a measure of the risk arising from exposure to general market movements, of 0.8.
Market Commentary and Fund Performance
As a group, global developed equity markets fell, as measured by the MSCI World® Index (the Fund’s benchmark), by 10.39% during the12-month period ended March 31, 2020. U.S. equities, measured using the Russell 1000® Index fell 8.03% for the fiscal year. Compared to the U.S., international developed markets lagged, with the MSCI EAFE® Index returning -14.38% over the period. The MSCI Emerging Markets® Index suffered a greater drop, with a fall of-17.69% for the12-month period ended March 31, 2020.
The trailing12-month performance figures shown above were driven primarily by the steep fall in global equity markets during the first quarter of 2020. Throughout the last nine months of 2019, equity markets managed to generate positive gains at the broad asset class level despite economic growth slowing globally. US equity markets led other developed international markets, while emerging markets lagged the most, mainly due to a slowing China.
Several things were already hampering international economic growth prior to the spread ofCOVID-19 in Q1 of 2020. Manufacturing was in a mild recession across the globe. The growth slowdown was most pronounced in Europe and China. Lackluster growth in the Eurozone, along with the ongoing Brexit saga in the UK increased uncertainty around the future of Europe. China’s economy had been slowing during the period, as continued trade rhetoric escalated tensions between the world’s two largest economies. However in Q4 of 2019, the US and China agreed to a “Phase One” trade deal, which delayed further confrontations during the period. The resulting reduction in uncertainty was welcomed by markets.
The situation in the US was more positive as the weakness in manufacturing and business investment was offset by strong consumption spending. The strong US consumer was underpinned by solid job and wage growth, low levels of debt servicing and supportive monetary policy. The Federal Reserve announced four 25 bps interest rate cuts in the second half of 2019.
However, US investors still had to weigh the consequences of the impeachment inquiry into President Trump during the period. Although unlikely that the Senate would vote to remove the President, the implications of the proceedings on the 2020 election had to be assessed by investors.
The biggest market moving news during this period was the spread of the COVID-19 virus. In March 2020, the World Health Organization officially labeledCOVID-19 a global pandemic amid a rapid escalation in the number of affected countries, confirmed cases, and deaths. In an effort to slow the spread ofCOVID-19, global governments enacted social distancing measures that led to the widespread closure of businesses. The resulting slowdown in activity led to a massive spike in unemployment.
In response to the shutdown of economic activity, central banks across the globe implemented unprecedented levels of monetary stimulus. In the US, the Fed cut rates to 0%, announced unlimited bond buying (or QE quantitative easing) andre-instated several programs used during the financial crisis in 2008-2009. In Europe, the ECB restarted its QE program, with 870 billion euros in planned purchases and lowered its policy rate to-0.75%. The European Union also relaxed fiscal rules to allow member countries more flexibility in managing deficits. In addition to monetary stimulus, in the US, Congress passed a $2.3 trillion economic relief plan, which included direct payments to citizens and expanded unemployment benefits.
Throughout this12-month period investors preferred growth stocks over value stocks and large cap stocks over small cap stocks. In Q1, as markets fell swiftly, lower beta and quality stocks were sought after in an attempt to reduce overall risk.
25
Mercer Global Low Volatility Equity Fund
Acadian outperformed its benchmark, MSCI World ex US®, by 2.31% with benchmark returning-14.89% for the period. As cyclical, higher beta and higher volatility stocks performed poorly during the marketsell-off, being invested in lower beta and lower volatility stocks was the main driver of positive excess returns. Approximately 82% of the portfolio was held in the lowest beta stocks, compared to roughly 36% for the index. In addition, 44% of the portfolio was held in the lowest volatility stocks, compared to roughly 27% for the index. Outperformance predominantly came from being underweight the Energy sector, as well as being overweight and strong security selection within Consumer Staples and Communication Services. Investments in Information Technology and Health Care were major detractors.
Martingale outperformed its benchmark Russell 1000 by 0.53% with benchmark returning-8.03%. The defensive nature of the strategy led to a meaningful level of outperformance during thesell-off in the most recent quarter. While the strategy’s lower beta was helpful in 2020Q1, it also caused significant underperformance in 2019Q4, when the market rallied sharply. From a style perspective, low beta was the main contributor to outperformance while a smaller cap size than the index was the largest detractor. Underweight to Energy and positions in Industrials, Financials and Materials contributed to outperformance. Underweight to Information Technology and security selection within the sector were a major detractor.
Wellington outperformed its benchmark MSCI World® by 2.2% with its benchmark, MSCI World®, returning-10.39%. Relative outperformance came predominately from strong security selection in the Financials, Industrials, Real Estate, and Materials sectors. Not holding Oil, Gas, & Consumable Fuel stocks, one of the worst performingsub-sectors within Energy during the period, also added to positive relative performance. Conversely, security selection in Health Care and an underweight to Information Technology detracted from relative performance. From a market cap perspective, an overweight allocation tomid-cap stocks (market cap between $2B and $10B) detracted from relative performance as large cap stocks were widely favored during the onset of theCOVID-19 pandemic.
Veritas outperformed its benchmark MSCI World® by 7.05% with benchmark returning-10.39%. Given that there had been signs of economic strain even beforeCOVID-19 onset, the portfolio positioning had been focused on the solvency of companies should a recession be forthcoming. This has benefited the performance. Strategy’s concentration on quality companies with high return on capital, high barriers to entry and visibility and predictability of management should lead to any negative operational effect from the global lockdown to be short lived. During the marketsell-off Veritas took the opportunity to add to some existing positions and buy a number of new positions almost fully utilizing its fifteen percent position in cash. The main area of weakness over the12-month period had been, aerospace companies including Airbus and Safran and the Spanish airport operator Aena. However, Veritas believes that these companies suffer from short-term liquidity but not solvency issues. The main positive contributors over the period involved companies benefitting from increased online activity, such as Alphabet (owns YouTube) and Charter Communications, companies in the Healthcare space helping to lower drug pricing (Cigna, CVS Health) and produce critical medical devices and services (Baxter International, ThermoFisher).
Parametric utilizes exchange-traded futures replicating the Fund’s benchmark with beta of 0.8, aiming to provide broad, passive, equity market exposure to the Fund’s liquidity sleeve and seeking to create positive returns on assets that would have otherwise been earning cash or cash equivalent returns. Performance differences versus the benchmark are largely a result of cash flow effects related to daily subscription/redemption activity and through financing costs of futures relative to interest earned on cash.
Risk Considerations
The Fund invests in foreign and emerging market securities which involves certain risks such as currency volatility, political and social instability and reduced market liquidity. Emerging markets may be more volatile and less liquid than more developed markets and therefore may involve greater risks. Investments made in small
26
Mercer Global Low Volatility Equity Fund
andmid-capitalization companies may be more volatile and less liquid due to limited resources or product lines and more sensitive to economic factors. The Fund may invest in derivatives (such as futures, forwards, options, or swaps), which may cause the Fund to experience greater volatility and less liquidity. Derivatives may be more sensitive to changes in market conditions and may amplify the risk of loss for the Fund. The Fund may experience high portfolio turnover which may result in higher transaction costs and capital gains.
27
Mercer Funds
March 31, 2020
Comparison of Change in Value of a $10,000 Investment in
Mercer Global Low Volatility Equity Shares vs. the
MSCI World Index
As of March 31, 2020
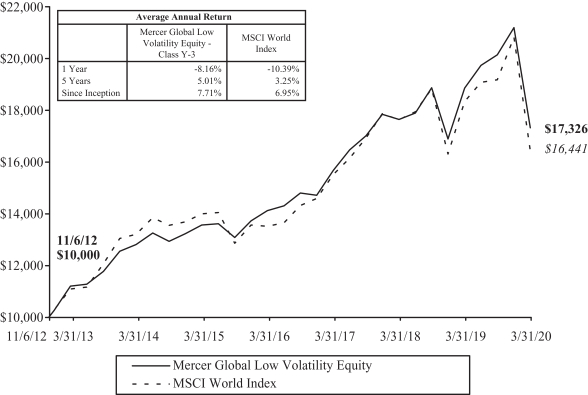
This graph shows the performance of the Mercer Global Low Volatility Equity Fund Class Y-3 shares versus the MSCI World Index from November 6, 2012, which is the inception date of the Fund, through March 31, 2020. The performance of other classes, when launched, will vary from the performance of the class shown based on the difference in fees and expenses paid by shareholders investing in different share classes. The Fund may charge a 2% redemption fee on shares owned less than 30 days.
The table and graph assume reinvestment of dividends and capital gains, but do not reflect a deduction of taxes an investor might pay on fund distributions or upon redemption of fund shares. Performance shown reflects a fee waiver and/or expense reimbursement. Without this waiver/reimbursement, returns would have been lower.
The data quoted represents past performance and does not guarantee future results. Current performance of the Fund may be lower or higher than the performance quoted. Please call 1-866-658-9896 for the Fund’s most recentmonth-end performance. Investment return and principal value will fluctuate so that an investor’s shares, when redeemed, may be worth more or less than when purchased.
28
Mercer US Large Cap Equity Fund
Schedule of Investments
(showing percentage of net assets)
March 31, 2020
| | | | | | | | | | |
| Shares | | | | | Description | | Value ($) | |
| | |
| | | | | | COMMON STOCKS — 95.9% | |
| | |
| | | | | | Basic Materials — 2.5% | |
| | 59,796 | | | | | Celanese Corp. Class A | | | 4,388,429 | |
| | 75,674 | | | | | CF Industries Holdings, Inc. | | | 2,058,333 | |
| | 188,223 | | | | | DuPont de Nemours, Inc. | | | 6,418,404 | |
| | 35,500 | | | | | Eastman Chemical Co. | | | 1,653,590 | |
| | 211,700 | | | | | Freeport-McMoRan, Inc. | | | 1,428,975 | |
| | 99,400 | | | | | Huntsman Corp. | | | 1,434,342 | |
| | 19,700 | | | | | International Paper Co. | | | 613,261 | |
| | 16,975 | | | | | LyondellBasell Industries NV Class A | | | 842,469 | |
| | 71,990 | | | | | Newmont Corp. | | | 3,259,707 | |
| | | | | | | | | | |
| | | | | | | | | 22,097,510 | |
| | | | | | | | | | |
| | |
| | | | | | Communications — 16.0% | |
| | 35,772 | | | | | Alibaba Group Holding, Ltd., ADR* | | | 6,956,939 | |
| | 8,590 | | | | | Alphabet, Inc. Class A* | | | 9,981,150 | |
| | 16,710 | | | | | Alphabet, Inc. Class C* | | | 19,430,555 | |
| | 92,775 | | | | | Altice USA, Inc. Class A* | | | 2,067,955 | |
| | 7,137 | | | | | Amazon.com, Inc.* | | | 13,915,152 | |
| | 11,500 | | | | | Arista Networks, Inc.* | | | 2,329,325 | |
| | 340,120 | | | | | AT&T, Inc. | | | 9,914,498 | |
| | 200 | | | | | Booking Holdings, Inc.* | | | 269,064 | |
| | 213,081 | | | | | Cisco Systems, Inc. | | | 8,376,214 | |
| | 167,494 | | | | | Comcast Corp. Class A | | | 5,758,444 | |
| | 138,849 | | | | | eBay, Inc. | | | 4,173,801 | |
| | 151,864 | | | | | Facebook, Inc. Class A* | | | 25,330,915 | |
| | 25,068 | | | | | Netflix, Inc.* | | | 9,413,034 | |
| | 6,699 | | | | | Shopify, Inc. Class A* | | | 2,793,014 | |
| | 38,034 | | | | | Tencent Holdings, Ltd., ADR | | | 1,867,089 | |
| | 4,148 | | | | | Trade Desk, Inc. (The) Class A* ‡ | | | 800,564 | |
| | 96,197 | | | | | Uber Technologies, Inc.* | | | 2,685,820 | |
| | 191,930 | | | | | Verizon Communications, Inc. | | | 10,312,399 | |
| | 51,410 | | | | | Walt Disney Co. (The) | | | 4,966,206 | |
| | | | | | | | | | |
| | | | | | | | | 141,342,138 | |
| | | | | | | | | | |
| | |
| | | | | | Consumer, Cyclical — 8.8% | |
| | 1,629 | | | | | AutoZone, Inc.* | | | 1,378,134 | |
| | 26,247 | | | | | Best Buy Co., Inc. | | | 1,496,079 | |
| | 2,868 | | | | | Chipotle Mexican Grill, Inc. Class A* | | | 1,876,819 | |
| | 13,672 | | | | | Costco Wholesale Corp. | | | 3,898,297 | |
| | 1,106 | | | | | Cummins, Inc. | | | 149,664 | |
| | 133,176 | | | | | Delta Air Lines, Inc. | | | 3,799,511 | |
| | 43,270 | | | | | Dollar General Corp. | | | 6,534,203 | |
| | 83,700 | | | | | Dollar Tree, Inc.* | | | 6,149,439 | |
| | 19,900 | | | | | DR Horton, Inc. | | | 676,600 | |
| | 8,800 | | | | | Five Below, Inc.* | | | 619,344 | |
| | 123,403 | | | | | General Motors Co. | | | 2,564,314 | |
| | 11,776 | | | | | Home Depot, Inc. (The) | | | 2,198,697 | |
| | 80,311 | | | | | Kering SA, ADR | | | 4,165,732 | |
See accompanying Notes to the Financial Statements.
29
Mercer US Large Cap Equity Fund
Schedule of Investments (Continued)
(showing percentage of net assets)
March 31, 2020
| | | | | | | | | | |
| Shares | | | | | Description | | Value ($) | |
| | |
| | | | | | Consumer, Cyclical — continued | |
| | 67,900 | | | | | Lowe’s Cos., Inc. | | | 5,842,795 | |
| | 17,913 | | | | | Lululemon Athletica, Inc.* | | | 3,395,409 | |
| | 12,481 | | | | | LVMH Moet Hennessy Louis Vuitton SE, ADR | | | 928,711 | |
| | 18,730 | | | | | Magna International, Inc. | | | 597,862 | |
| | 122,464 | | | | | NIKE, Inc. Class B | | | 10,132,671 | |
| | 26,300 | | | | | PulteGroup, Inc. | | | 587,016 | |
| | 129,787 | | | | | Starbucks Corp. | | | 8,532,197 | |
| | 10,511 | | | | | Tesla, Inc.* | | | 5,507,764 | |
| | 6,200 | | | | | Ulta Salon Cosmetics & Fragrance, Inc.* | | | 1,089,340 | |
| | 100,158 | | | | | Walgreens Boots Alliance, Inc. | | | 4,582,229 | |
| | 7,267 | | | | | Whirlpool Corp.‡ | | | 623,509 | |
| | | | | | | | | | |
| | | | | | | | | 77,326,336 | |
| | | | | | | | | | |
| | |
| | | | | | Consumer,Non-cyclical — 25.0% | |
| | 227,849 | | | | | Abbott Laboratories | | | 17,979,565 | |
| | 37,594 | | | | | AbbVie, Inc. | | | 2,864,287 | |
| | 152,834 | | | | | Adyen NV, ADR* | | | 2,618,046 | |
| | 17,800 | | | | | Alexion Pharmaceuticals, Inc.* | | | 1,598,262 | |
| | 23,460 | | | | | Align Technology, Inc.* | | | 4,080,867 | |
| | 29,282 | | | | | Amgen, Inc. | | | 5,936,340 | |
| | 193,100 | | | | | Archer-Daniels-Midland Co. | | | 6,793,258 | |
| | 131,471 | | | | | AstraZeneca Plc, ADR | | | 5,871,495 | |
| | 42,918 | | | | | Automatic Data Processing, Inc. | | | 5,866,032 | |
| | 6,580 | | | | | Biogen, Inc.* | | | 2,081,780 | |
| | 23,906 | | | | | BioMarin Pharmaceutical, Inc.* | | | 2,020,057 | |
| | 59,629 | | | | | Boston Scientific Corp.* | | | 1,945,694 | |
| | 33,400 | | | | | Bristol-Myers Squibb Co. | | | 1,861,716 | |
| | 222,784 | | | | | Cardinal Health, Inc. | | | 10,680,265 | |
| | 36,700 | | | | | Cigna Corp.* | | | 6,502,506 | |
| | 244,564 | | | | | Conagra Brands, Inc. | | | 7,175,508 | |
| | 12,064 | | | | | Constellation Brands, Inc. Class A | | | 1,729,495 | |
| | 178,100 | | | | | CVS Health Corp. | | | 10,566,673 | |
| | 12,036 | | | | | Danaher Corp. | | | 1,665,903 | |
| | 26,194 | | | | | DaVita, Inc.* | | | 1,992,316 | |
| | 9,905 | | | | | DexCom, Inc.* | | | 2,667,119 | |
| | 81,462 | | | | | Eli Lilly & Co. | | | 11,300,409 | |
| | 19,691 | | | | | Estee Lauder Cos., Inc. (The) Class A | | | 3,137,564 | |
| | 6,260 | | | | | FleetCor Technologies, Inc.* | | | 1,167,740 | |
| | 45,990 | | | | | Gartner, Inc.* | | | 4,579,224 | |
| | 15,400 | | | | | Gilead Sciences, Inc. | | | 1,151,304 | |
| | 11,204 | | | | | Guardant Health, Inc.* ‡ | | | 779,798 | |
| | 26,700 | | | | | Horizon Therapeutics Plc* | | | 790,854 | |
| | 5,984 | | | | | Humana, Inc. | | | 1,879,096 | |
| | 3,889 | | | | | Illumina, Inc.* | | | 1,062,164 | |
| | 35,200 | | | | | Ingredion, Inc. | | | 2,657,600 | |
| | 3,061 | | | | | Intuitive Surgical, Inc.* | | | 1,515,838 | |
| | 14,500 | | | | | Jazz Pharmaceuticals Plc* | | | 1,446,230 | |
| | 79,600 | | | | | Johnson & Johnson | | | 10,437,948 | |
| | 54,500 | | | | | Kroger Co. (The) | | | 1,641,540 | |
See accompanying Notes to the Financial Statements.
30
Mercer US Large Cap Equity Fund
Schedule of Investments (Continued)
(showing percentage of net assets)
March 31, 2020
| | | | | | | | | | |
| Shares | | | | | Description | | Value ($) | |
| | |
| | | | | | Consumer,Non-cyclical — continued | |
| | 29,119 | | | | | McKesson Corp. | | | 3,938,636 | |
| | 13,500 | | | | | Medtronic Plc | | | 1,217,430 | |
| | 92,700 | | | | | Merck & Co., Inc. | | | 7,132,338 | |
| | 76,600 | | | | | Molson Coors Brewing Co. Class B | | | 2,988,166 | |
| | 132,500 | | | | | Mondelez International, Inc. Class A | | | 6,635,600 | |
| | 89,280 | | | | | Mylan NV* | | | 1,331,165 | |
| | 91,317 | | | | | PayPal Holdings, Inc.* | | | 8,742,689 | |
| | 382,070 | | | | | Pfizer, Inc. | | | 12,470,765 | |
| | 14,830 | | | | | Regeneron Pharmaceuticals, Inc.* | | | 7,241,341 | |
| | 8,562 | | | | | S&P Global, Inc. | | | 2,098,118 | |
| | 20,249 | | | | | Square, Inc. Class A* | | | 1,060,643 | |
| | 58,720 | | | | | Tyson Foods, Inc. Class A | | | 3,398,126 | |
| | 12,070 | | | | | Vertex Pharmaceuticals, Inc.* | | | 2,872,056 | |
| | 11,900 | | | | | Zimmer Biomet Holdings, Inc. | | | 1,202,852 | |
| | 82,917 | | | | | Zoetis, Inc. | | | 9,758,502 | |
| | | | | | | | | | |
| | | | | | | | | 220,132,920 | |
| | | | | | | | | | |
| | |
| | | | | | Energy — 2.3% | |
| | 149,328 | | | | | BP Plc, ADR | | | 3,642,110 | |
| | 254,500 | | | | | Canadian Natural Resources, Ltd. | | | 3,448,475 | |
| | 23,900 | | | | | Chevron Corp. | | | 1,731,794 | |
| | 159,100 | | | | | ConocoPhillips | | | 4,900,280 | |
| | 27,100 | | | | | Hess Corp. | | | 902,430 | |
| | 345,181 | | | | | Marathon Oil Corp. | | | 1,135,646 | |
| | 231,400 | | | | | Occidental Petroleum Corp. | | | 2,679,612 | |
| | 18,078 | | | | | Phillips 66 | | | 969,885 | |
| | 36,690 | | | | | Royal Dutch Shell Plc Class B, ADR | | | 1,198,295 | |
| | | | | | | | | | |
| | | | | | | | | 20,608,527 | |
| | | | | | | | | | |
| | |
| | | | | | Financial — 16.3% | |
| | 67,100 | | | | | Allstate Corp. (The) | | | 6,155,083 | |
| | 97,518 | | | | | Ally Financial, Inc. | | | 1,407,185 | |
| | 169,700 | | | | | American International Group, Inc. | | | 4,115,225 | |
| | 7,169 | | | | | American Tower Corp. REIT | | | 1,561,050 | |
| | 52,808 | | | | | Ameriprise Financial, Inc. | | | 5,411,764 | |
| | 567,730 | | | | | Annaly Capital Management, Inc. REIT | | | 2,878,391 | |
| | 486,500 | | | | | Banco Santander SA, ADR‡ | | | 1,143,275 | |
| | 264,710 | | | | | Bank of America Corp. | | | 5,619,793 | |
| | 191,072 | | | | | Bank of New York Mellon Corp. (The) | | | 6,435,305 | |
| | 24,766 | | | | | Berkshire Hathaway, Inc. Class B* | | | 4,527,968 | |
| | 3,100 | | | | | BlackRock, Inc. | | | 1,363,907 | |
| | 21,800 | | | | | Charles Schwab Corp. (The) | | | 732,916 | |
| | 253,185 | | | | | Citigroup, Inc. | | | 10,664,152 | |
| | 60,019 | | | | | Comerica, Inc. | | | 1,760,958 | |
| | 11,590 | | | | | Discover Financial Services | | | 413,415 | |
| | 66,773 | | | | | Equitable Holdings, Inc. | | | 964,870 | |
| | 94,900 | | | | | Equity Residential REIT | | | 5,856,279 | |
| | 51,530 | | | | | Essent Group, Ltd. | | | 1,357,300 | |
| | 65,161 | | | | | Fifth Third Bancorp | | | 967,641 | |
See accompanying Notes to the Financial Statements.
31
Mercer US Large Cap Equity Fund
Schedule of Investments (Continued)
(showing percentage of net assets)
March 31, 2020
| | | | | | | | | | |
| Shares | | | | | Description | | Value ($) | |
| | |
| | | | | | Financial — continued | |
| | 76,047 | | | | | Franklin Resources, Inc. | | | 1,269,224 | |
| | 217,732 | | | | | Host Hotels & Resorts, Inc. REIT | | | 2,403,761 | |
| | 23,616 | | | | | JPMorgan Chase & Co. | | | 2,126,149 | |
| | 57,360 | | | | | KKR & Co., Inc. Class A | | | 1,346,239 | |
| | 2,720 | | | | | M&T Bank Corp. | | | 281,330 | |
| | 73,297 | | | | | Mastercard, Inc. Class A | | | 17,705,623 | |
| | 176,749 | | | | | MetLife, Inc. | | | 5,403,217 | |
| | 44,999 | | | | | Morgan Stanley | | | 1,529,966 | |
| | 1,850 | | | | | PNC Financial Services Group, Inc. (The) | | | 177,082 | |
| | 21,700 | | | | | Popular, Inc. | | | 759,500 | |
| | 45,349 | | | | | Regency Centers Corp. REIT | | | 1,742,762 | |
| | 175,394 | | | | | Regions Financial Corp. | | | 1,573,284 | |
| | 4,940 | | | | | Simon Property Group, Inc. REIT | | | 271,008 | |
| | 172,830 | | | | | SLM Corp.‡ | | | 1,242,648 | |
| | 3,045 | | | | | State Street Corp. | | | 162,207 | |
| | 165,481 | | | | | Synchrony Financial | | | 2,662,589 | |
| | 156,300 | | | | | Truist Financial Corp. | | | 4,820,292 | |
| | 380,970 | | | | | Two Harbors Investment Corp. REIT | | | 1,451,496 | |
| | 109,174 | | | | | Visa, Inc. Class A | | | 17,590,115 | |
| | 70,684 | | | | | Vornado Realty Trust REIT | | | 2,559,468 | |
| | 69,728 | | | | | Voya Financial, Inc.‡ | | | 2,827,470 | |
| | 197,197 | | | | | Wells Fargo & Co. | | | 5,659,554 | |
| | 248,830 | | | | | Western Union Co. (The)‡ | | | 4,511,288 | |
| | | | | | | | | | |
| | | | | | | | | 143,412,749 | |
| | | | | | | | | | |
| | |
| | | | | | Industrial — 5.6% | |
| | 9,190 | | | | | Boeing Co. (The) | | | 1,370,597 | |
| | 55,663 | | | | | Caterpillar, Inc. | | | 6,459,134 | |
| | 43,300 | | | | | Chart Industries, Inc.* | | | 1,254,834 | |
| | 78,073 | | | | | CORTEVA, Inc.* | | | 1,834,715 | |
| | 45,000 | | | | | Crown Holdings, Inc.* | | | 2,611,800 | |
| | 62,664 | | | | | CSX Corp. | | | 3,590,647 | |
| | 2,346 | | | | | Dover Corp. | | | 196,923 | |
| | 6,000 | | | | | FedEx Corp. | | | 727,560 | |
| | 182,738 | | | | | Howmet Aerospace, Inc. | | | 2,934,772 | |
| | 6,304 | | | | | Huntington Ingalls Industries, Inc. | | | 1,148,652 | |
| | 95,933 | | | | | Johnson Controls International Plc | | | 2,586,354 | |
| | 22,200 | | | | | Northrop Grumman Corp. | | | 6,716,610 | |
| | 38,200 | | | | | Raytheon Co. | | | 5,009,930 | |
| | 9,665 | | | | | Rockwell Automation, Inc. | | | 1,458,545 | |
| | 9,300 | | | | | Stanley Black & Decker, Inc. | | | 930,000 | |
| | 55,504 | | | | | Textron, Inc. | | | 1,480,292 | |
| | 18,365 | | | | | Union Pacific Corp. | | | 2,590,200 | |
| | 12,090 | | | | | Waste Management, Inc. | | | 1,119,050 | |
| | 30,193 | | | | | Waters Corp.* | | | 5,496,636 | |
| | | | | | | | | | |
| | | | | | | | | 49,517,251 | |
| | | | | | | | | | |
| | |
| | | | | | Technology — 18.7% | |
| | 52,770 | | | | | Accenture Plc Class A | | | 8,615,230 | |
| | 62,296 | | | | | Adobe, Inc.* | | | 19,825,079 | |
See accompanying Notes to the Financial Statements.
32
Mercer US Large Cap Equity Fund
Schedule of Investments (Continued)
(showing percentage of net assets)
March 31, 2020
| | | | | | | | | | |
| Shares | | | | | Description | | Value ($) | |
| | |
| | | | | | Technology — continued | |
| | 36,462 | | | | | Apple, Inc. | | | 9,271,922 | |
| | 7,780 | | | | | Atlassian Corp. Plc Class A* | | | 1,067,883 | |
| | 30,908 | | | | | Autodesk, Inc.* | | | 4,824,739 | |
| | 26,900 | | | | | Broadcom, Inc. | | | 6,377,990 | |
| | 14,901 | | | | | Citrix Systems, Inc. | | | 2,109,237 | |
| | 11,798 | | | | | Coupa Software, Inc.* ‡ | | | 1,648,535 | |
| | 1,700 | | | | | Electronic Arts, Inc.* | | | 170,289 | |
| | 131,000 | | | | | Intel Corp. | | | 7,089,720 | |
| | 8,900 | | | | | IPG Photonics Corp.* | | | 981,492 | |
| | 1,101 | | | | | Lam Research Corp. | | | 264,240 | |
| | 137,700 | | | | | Marvell Technology Group, Ltd. | | | 3,116,151 | |
| | 40,700 | | | | | Micron Technology, Inc.* | | | 1,711,842 | |
| | 222,521 | | | | | Microsoft Corp. | | | 35,093,787 | |
| | 18,712 | | | | | MSCI, Inc. Class A | | | 5,407,019 | |
| | 26,490 | | | | | NVIDIA Corp. | | | 6,982,764 | |
| | 37,309 | | | | | NXP Semiconductors NV | | | 3,094,035 | |
| | 182,639 | | | | | Oracle Corp. | | | 8,826,943 | |
| | 49,617 | | | | | QUALCOMM, Inc. | | | 3,356,590 | |
| | 6,972 | | | | | RingCentral, Inc. Class A* | | | 1,477,436 | |
| | 101,406 | | | | | salesforce.com, Inc.* | | | 14,600,436 | |
| | 31,848 | | | | | Seagate Technology Plc | | | 1,554,182 | |
| | 36,228 | | | | | ServiceNow, Inc.* | | | 10,382,220 | |
| | 21,525 | | | | | Splunk, Inc.* | | | 2,717,101 | |
| | 30,760 | | | | | Teradyne, Inc. | | | 1,666,269 | |
| | 15,387 | | | | | Twilio, Inc. Class A* ‡ | | | 1,376,983 | |
| | 12,367 | | | | | Workday, Inc. Class A* | | | 1,610,431 | |
| | | | | | | | | | |
| | | | | | | | | 165,220,545 | |
| | | | | | | | | | |
| | | |
| | | | | | Utilities — 0.7% | | | |
| | 109,600 | | | | | Edison International | | | 6,004,984 | |
| | | | | | | | | | |
| | | |
| | | | | | TOTAL COMMON STOCKS (COST $1,019,415,501) | | | 845,662,960 | |
| | | | | | | | | | |
| | | |
| Par Value ($) | | | | | Description | | Value ($) | |
| | | |
| | | | | | SHORT-TERM INVESTMENTS — 0.1% | | | |
| | | |
| | | | | | Mutual Fund - Securities Lending Collateral — 0.0% | | | |
| | 267,594 | | | | | State Street Institutional U.S. Government Money Market Fund, Premier Class, 0.32%## ** | | | 267,594 | |
| | | | | | | | | | |
| | | |
| | | | | | U.S. Government and Agency Obligations — 0.1% | | | |
| | 750,000 | | | | | United States Treasury Bill, 0.09%, due 07/02/20*** ‡‡ | | | 749,827 | |
| | | | | | | | | | |
| | | |
| | | | | | TOTAL SHORT-TERM INVESTMENTS (COST $1,016,367) | | | 1,017,421 | |
| | | | | | | | | | |
| | | |
| | | | | | TOTAL INVESTMENTS — 96.0% (Cost $1,020,431,868) | | | 846,680,381 | |
| | | |
| | | | | | Other Assets and Liabilities (net) — 4.0% | | | 35,534,793 | |
| | | | | | | | | | |
| | | |
| | | | | | NET ASSETS — 100.0% | | $882,215,174 | |
| | | | | | | | | | |
See accompanying Notes to the Financial Statements.
33
Mercer US Large Cap Equity Fund
Schedule of Investments (Continued)
March 31, 2020
| | | | | | | | |
| | | | | | Notes to Schedule of Investments:
|
| | | |
| | | | | | ADR — American Depository Receipt | | |
| | | |
| | | | | | REIT — Real Estate Investment Trust | | |
| | | |
| | | | ## | | The rate disclosed is the7-day net yield as of March 31, 2020. | | |
| | | |
| | | | * | | Non-income producing security. | | |
| | | |
| | | | ** | | Represents an investment of securities lending cash collateral. | | |
| | | |
| | | | *** | | All or a portion of this security is pledged for open futures collateral. | | |
| | | |
| | | | ‡ | | All or a portion of this security is out on loan. | | |
| | | |
| | | | ‡‡ | | Interest rate presented is yield to maturity. | | |
See accompanying Notes to the Financial Statements.
34
Mercer US Large Cap Equity Fund
Schedule of Investments (Continued)
March 31, 2020
Futures Contracts
| | | | | | | | | | | | | | | | | | | | |
Number of
Contracts | | | | | Description | | | | Expiration Date | | | Notional
Value | | | Market Value/
Unrealized
Appreciation
(Depreciation) | |
| | Buys | | | | | | | | | | | | | | | | | | | |
| | 204 | | | | | S&P 500 E-mini Index | | | | | Jun 2020 | | | $ | 26,210,940 | | | $ | 1,007,143 | |
| | 17 | | | | | S&P Mid 400 E-mini Index | | | | | Jun 2020 | | | | 2,444,260 | | | | (76,964 | ) |
| | | | | | | | | | | | | | | | | | | | |
| | | | $ | 930,179 | |
| | | | | | | | | | | | | | | | | | | | |
See accompanying Notes to the Financial Statements.
35
Mercer US Large Cap Equity Fund
Schedule of Investments (Continued)
March 31, 2020
| | | | | |
| Asset Class Summary (Unaudited) | | % of Net Assets |
Common Stocks | | | | 95.9 | |
Futures Contracts | | | | 0.1 | |
Short-Term Investments | | | | 0.1 | |
Other Assets and Liabilities (net) | | | | 3.9 | |
| | | | | |
| | | | 100.0 | % |
| | | | | |
See accompanying Notes to the Financial Statements.
36
Mercer US Small/Mid Cap Equity Fund
Schedule of Investments
(showing percentage of net assets)
March 31, 2020
| | | | | | | | | | |
| Shares | | | | | Description | | Value ($) | |
| | |
| | | | | | COMMON STOCKS — 92.4% | |
| | |
| | | | | | Basic Materials — 2.3% | |
| | 142,634 | | | | | Allegheny Technologies, Inc.* | | | 1,212,389 | |
| | 41,000 | | | | | Cabot Corp. | | | 1,070,920 | |
| | 13,100 | | | | | Celanese Corp. Class A | | | 961,409 | |
| | 70,200 | | | | | Chemours Co. (The) | | | 622,674 | |
| | 129,400 | | | | | Cleveland-Cliffs, Inc.‡ | | | 511,130 | |
| | 26,400 | | | | | Eastman Chemical Co. | | | 1,229,712 | |
| | 39,112 | | | | | FMC Corp. | | | 3,195,059 | |
| | 113,700 | | | | | Huntsman Corp. | | | 1,640,691 | |
| | 56,300 | | | | | Koppers Holdings, Inc.* | | | 696,431 | |
| | 113,503 | | | | | Orion Engineered Carbons SA | | | 846,732 | |
| | 30,035 | | | | | Quaker Chemical Corp.‡ | | | 3,792,820 | |
| | 17,400 | | | | | Reliance Steel & Aluminum Co. | | | 1,524,066 | |
| | 92,941 | | | | | RPM International, Inc. | | | 5,529,990 | |
| | 35,900 | | | | | Schweitzer-Mauduit International, Inc. | | | 998,738 | |
| | 41,400 | | | | | Steel Dynamics, Inc. | | | 933,156 | |
| | | | | | | | | | |
| | | | | | | | | 24,765,917 | |
| | | | | | | | | | |
| | |
| | | | | | Communications — 5.2% | |
| | 164,125 | | | | | 8x8, Inc.* ‡ | | | 2,274,773 | |
| | 65,100 | | | | | AMC Networks, Inc. Class A* | | | 1,582,581 | |
| | 75,640 | | | | | Anaplan, Inc.* | | | 2,288,866 | |
| | 80,500 | | | | | Cars.com, Inc.* | | | 346,150 | |
| | 27,190 | | | | | CDW Corp. | | | 2,536,011 | |
| | 120,932 | | | | | Ciena Corp.* | | | 4,814,303 | |
| | 30,194 | | | | | Cogent Communications Holdings, Inc. | | | 2,475,002 | |
| | 215,337 | | | | | Discovery, Inc. Class C* | | | 3,777,011 | |
| | 214,200 | | | | | Entercom Communications Corp. Class A‡ | | | 366,282 | |
| | 64,760 | | | | | Etsy, Inc.* | | | 2,489,375 | |
| | 27,148 | | | | | Expedia Group, Inc. | | | 1,527,618 | |
| | 5,000 | | | | | F5 Networks, Inc.* | | | 533,150 | |
| | 115,668 | | | | | GCI Liberty, Inc. Class A* | | | 6,589,606 | |
| | 37,054 | | | | | Interpublic Group of Cos., Inc. (The) | | | 599,904 | |
| | 151,034 | | | | | Juniper Networks, Inc. | | | 2,890,791 | |
| | 48,464 | | | | | Liberty Broadband Corp. Class C* | | | 5,365,934 | |
| | 115,330 | | | | | Liberty Latin America, Ltd. Class A* | | | 1,213,272 | |
| | 208,386 | | | | | Liberty Latin America, Ltd. Class C* | | | 2,138,040 | |
| | 2,008 | | | | | LogMeIn, Inc. | | | 167,226 | |
| | 274,600 | | | | | Meet Group, Inc. (The)* | | | 1,611,902 | |
| | 18,406 | | | | | MSG Networks, Inc. Class A* ‡ | | | 187,741 | |
| | 28,053 | | | | | Nexstar Media Group, Inc. Class A‡ | | | 1,619,500 | |
| | 9,700 | | | | | Preformed Line Products Co. | | | 483,351 | |
| | 27,986 | | | | | Q2 Holdings, Inc.* ‡ | | | 1,652,853 | |
| | 78,300 | | | | | TEGNA, Inc. | | | 850,338 | |
| | 260,268 | | | | | Vonage Holdings Corp.* | | | 1,881,738 | |
| | 122,169 | | | | | Yelp, Inc. Class A* | | | 2,202,707 | |
| | | | | | | | | | |
| | | | | | | | | 54,466,025 | |
| | | | | | | | | | |
See accompanying Notes to the Financial Statements.
37
Mercer US Small/Mid Cap Equity Fund
Schedule of Investments (Continued)
(showing percentage of net assets)
March 31, 2020
| | | | | | | | | | |
| Shares | | | | | Description | | Value ($) | |
| | |
| | | | | | Consumer, Cyclical — 14.8% | |
| | 34,929 | | | | | Advance Auto Parts, Inc. | | | 3,259,574 | |
| | 22,100 | | | | | Alaska Air Group, Inc. | | | 629,187 | |
| | 6,900 | | | | | Allegiant Travel Co. Class A | | | 564,420 | |
| | 62,800 | | | | | Allison Transmission Holdings, Inc. | | | 2,047,908 | |
| | 83,200 | | | | | American Axle & Manufacturing Holdings, Inc.* | | | 300,352 | |
| | 77,200 | | | | | American Eagle Outfitters, Inc. | | | 613,740 | |
| | 383,281 | | | | | BJ’s Wholesale Club Holdings, Inc.* ‡ | | | 9,762,167 | |
| | 42,700 | | | | | BorgWarner, Inc. | | | 1,040,599 | |
| | 19,400 | | | | | Brinker International, Inc.‡ | | | 232,994 | |
| | 37,000 | | | | | Brunswick Corp. | | | 1,308,690 | |
| | 41,700 | | | | | Buckle, Inc. (The)‡ | | | 571,707 | |
| | 45,838 | | | | | Burlington Stores, Inc.* | | | 7,263,489 | |
| | 260,026 | | | | | Cannae Holdings, Inc.* | | | 8,708,271 | |
| | 22,200 | | | | | Capri Holdings, Ltd.* | | | 239,538 | |
| | 91,050 | | | | | Carter’s, Inc. | | | 5,984,717 | |
| | 16,791 | | | | | Casey’s General Stores, Inc. | | | 2,224,640 | |
| | 20,910 | | | | | Cavco Industries, Inc.* | | | 3,030,695 | |
| | 45,177 | | | | | Cinemark Holdings, Inc.‡ | | | 460,354 | |
| | 27,328 | | | | | Columbia Sportswear Co. | | | 1,906,675 | |
| | 47,030 | | | | | Core-Mark Holding Co., Inc. | | | 1,343,647 | |
| | 4,486 | | | | | Cracker Barrel Old Country Store, Inc.‡ | | | 373,325 | |
| | 52,700 | | | | | Dick’s Sporting Goods, Inc. | | | 1,120,402 | |
| | 19,000 | | | | | Dillard’s, Inc. Class A‡ | | | 702,050 | |
| | 52,683 | | | | | Dorman Products, Inc.* | | | 2,911,789 | |
| | 56,690 | | | | | Eldorado Resorts, Inc.* ‡ | | | 816,336 | |
| | 41,100 | | | | | Ethan Allen Interiors, Inc. | | | 420,042 | |
| | 341,730 | | | | | Extended Stay America, Inc. | | | 2,498,046 | |
| | 87,416 | | | | | Five Below, Inc.* | | | 6,152,338 | |
| | 37,810 | | | | | Floor & Decor Holdings, Inc. Class A* | | | 1,213,323 | |
| | 39,400 | | | | | Foot Locker, Inc. | | | 868,770 | |
| | 59,836 | | | | | Freshpet, Inc.* | | | 3,821,725 | |
| | 31,200 | | | | | Genesco, Inc.* | | | 416,208 | |
| | 47,200 | | | | | GMS, Inc.* | | | 742,456 | |
| | 61,600 | | | | | Goodyear Tire & Rubber Co. (The) | | | 358,512 | |
| | 15,100 | | | | | Group 1 Automotive, Inc. | | | 668,326 | |
| | 45,000 | | | | | Harley-Davidson, Inc.‡ | | | 851,850 | |
| | 41,200 | | | | | Haverty Furniture Cos., Inc. | | | 489,868 | |
| | 59,200 | | | | | Hawaiian Holdings, Inc. | | | 618,048 | |
| | 47,600 | | | | | Herman Miller, Inc. | | | 1,056,720 | |
| | 56,600 | | | | | Hibbett Sports, Inc.* | | | 618,921 | |
| | 143,500 | | | | | JetBlue Airways Corp.* | | | 1,284,325 | |
| | 16,828 | | | | | Johnson Outdoors, Inc. Class A | | | 1,055,116 | |
| | 64,400 | | | | | Knoll, Inc. | | | 664,608 | |
| | 28,200 | | | | | Kohl’s Corp. | | | 411,438 | |
| | 81,600 | | | | | La-Z-Boy, Inc. | | | 1,676,880 | |
| | 10,200 | | | | | Lear Corp. | | | 828,750 | |
| | 27,661 | | | | | Lithia Motors, Inc. Class A | | | 2,262,393 | |
| | 32,446 | | | | | Live Nation Entertainment, Inc.* | | | 1,474,995 | |
| | 193,380 | | | | | LKQ Corp.* | | | 3,966,224 | |
See accompanying Notes to the Financial Statements.
38
Mercer US Small/Mid Cap Equity Fund
Schedule of Investments (Continued)
(showing percentage of net assets)
March 31, 2020
| | | | | | | | | | |
| Shares | | | | | Description | | Value ($) | |
| | |
| | | | | | Consumer, Cyclical — continued | |
| | 14,668 | | | | | Madison Square Garden Co. (The) Class A* | | | 3,100,962 | |
| | 53,136 | | | | | MDC Holdings, Inc. | | | 1,232,755 | |
| | 204,350 | | | | | Meritor, Inc.* | | | 2,707,638 | |
| | 42,600 | | | | | Methode Electronics, Inc. | | | 1,125,918 | |
| | 53,100 | | | | | Miller Industries, Inc. | | | 1,501,668 | |
| | 27,473 | | | | | MSC Industrial Direct Co., Inc. Class A | | | 1,510,191 | |
| | 27,500 | | | | | Navistar International Corp.* | | | 453,475 | |
| | 22,800 | | | | | Norwegian Cruise Line Holdings, Ltd.* | | | 249,888 | |
| | 492,200 | | | | | Office Depot, Inc. | | | 807,208 | |
| | 42,738 | | | | | Polaris, Inc. | | | 2,057,835 | |
| | 32,586 | | | | | Pool Corp. | | | 6,411,947 | |
| | 43,500 | | | | | PulteGroup, Inc. | | | 970,920 | |
| | 25,200 | | | | | PVH Corp. | | | 948,528 | |
| | 152,173 | | | | | Resideo Technologies, Inc.* | | | 736,517 | |
| | 4,700 | | | | | RH* | | | 472,209 | |
| | 84,700 | | | | | Sally Beauty Holdings, Inc.* ‡ | | | 684,376 | |
| | 25,400 | | | | | ScanSource, Inc.* | | | 543,306 | |
| | 49,800 | | | | | Signet Jewelers, Ltd.‡ | | | 321,210 | |
| | 41,091 | | | | | SiteOne Landscape Supply, Inc.* ‡ | | | 3,025,119 | |
| | 50,635 | | | | | Six Flags Entertainment Corp. | | | 634,963 | |
| | 32,100 | | | | | SkyWest, Inc. | | | 840,699 | |
| | 41,300 | | | | | Sonic Automotive, Inc. Class A‡ | | | 548,464 | |
| | 159,822 | | | | | Texas Roadhouse, Inc. Class A | | | 6,600,649 | |
| | 19,900 | | | | | Thor Industries, Inc.‡ | | | 839,382 | |
| | 31,700 | | | | | Toll Brothers, Inc. | | | 610,225 | |
| | 80,370 | | | | | Toro Co. (The) | | | 5,231,283 | |
| | 90,500 | | | | | TRI Pointe Group, Inc.* | | | 793,685 | |
| | 53,100 | | | | | Triton International, Ltd. | | | 1,373,697 | |
| | 27,054 | | | | | UniFirst Corp. | | | 4,087,589 | |
| | 23,400 | | | | | Vail Resorts, Inc. | | | 3,456,414 | |
| | 90,600 | | | | | Wabash National Corp. | | | 654,132 | |
| | 138,132 | | | | | Wendy’s Co. (The) | | | 2,055,404 | |
| | 19,900 | | | | | Whirlpool Corp. | | | 1,707,420 | |
| | 15,500 | | | | | Williams-Sonoma, Inc. | | | 659,060 | |
| | 23,600 | | | | | Winnebago Industries, Inc. | | | 656,316 | |
| | 103,654 | | | | | World Fuel Services Corp. | | | 2,610,008 | |
| | 41,200 | | | | | Wyndham Destinations, Inc. | | | 894,040 | |
| | | | | | | | | | |
| | | | | | | | | 154,952,248 | |
| | | | | | | | | | |
| | |
| | | | | | Consumer,Non-cyclical — 24.9% | |
| | 85,212 | | | | | Acadia Healthcare Co., Inc.* | | | 1,563,640 | |
| | 37,730 | | | | | Acceleron Pharma, Inc.* ‡ | | | 3,390,795 | |
| | 144,100 | | | | | ACCO Brands Corp. | | | 727,705 | |
| | 15,310 | | | | | Alnylam Pharmaceuticals, Inc.* ‡ | | | 1,666,493 | |
| | 12,313 | | | | | Argenx SE, ADR* | | | 1,621,991 | |
| | 37,624 | | | | | Ascendis Pharma AS, ADR* ‡ | | | 4,236,839 | |
| | 46,452 | | | | | Avalara, Inc.* | | | 3,465,319 | |
| | 32,296 | | | | | Bio-Rad Laboratories, Inc. Class A* | | | 11,321,686 | |
| | 7,096 | | | | | Bio-Techne Corp. | | | 1,345,543 | |
See accompanying Notes to the Financial Statements.
39
Mercer US Small/Mid Cap Equity Fund
Schedule of Investments (Continued)
(showing percentage of net assets)
March 31, 2020
| | | | | | | | | | |
| Shares | | | | | Description | | Value ($) | |
| | |
| | | | | | Consumer,Non-cyclical — continued | |
| | 55,358 | | | | | Blueprint Medicines Corp.* | | | 3,237,336 | |
| | 150,909 | | | | | Booz Allen Hamilton Holding Corp. Class A | | | 10,358,394 | |
| | 17,375 | | | | | Bright Horizons Family Solutions, Inc.* | | | 1,772,250 | |
| | 234,534 | | | | | Catalent, Inc.* | | | 12,184,041 | |
| | 77,600 | | | | | Central Garden & Pet Co. Class A* | | | 1,984,232 | |
| | 41,364 | | | | | Charles River Laboratories International, Inc.* | | | 5,220,550 | |
| | 35,093 | | | | | Chegg, Inc.* ‡ | | | 1,255,628 | |
| | 13,708 | | | | | Chemed Corp. | | | 5,938,306 | |
| | 12,577 | | | | | CONMED Corp. | | | 720,285 | |
| | 4,612 | | | | | CoStar Group, Inc.* | | | 2,708,212 | |
| | 25,400 | | | | | DaVita, Inc.* | | | 1,931,924 | |
| | 51,700 | | | | | Deluxe Corp. | | | 1,340,581 | |
| | 22,640 | | | | | DexCom, Inc.* | | | 6,096,273 | |
| | 24,628 | | | | | Encompass Health Corp. | | | 1,576,931 | |
| | 79,943 | | | | | Evo Payments, Inc. Class A* | | | 1,223,128 | |
| | 10,611 | | | | | FTI Consulting, Inc.* | | | 1,270,879 | |
| | 26,789 | | | | | Gartner, Inc.* | | | 2,667,381 | |
| | 50,754 | | | | | Globus Medical, Inc. Class A* | | | 2,158,568 | |
| | 28,619 | | | | | Grand Canyon Education, Inc.* | | | 2,183,200 | |
| | 19,790 | | | | | Haemonetics Corp.* | | | 1,972,271 | |
| | 147,453 | | | | | Harsco Corp.* | | | 1,027,747 | |
| | 13,201 | | | | | Helen of Troy, Ltd.* | | | 1,901,340 | |
| | 69,912 | | | | | Horizon Therapeutics Plc* | | | 2,070,793 | |
| | 532,000 | | | | | Hostess Brands, Inc. Class A* | | | 5,671,120 | |
| | 35,720 | | | | | ICON Plc, ADR* | | | 4,857,920 | |
| | 20,415 | | | | | ICU Medical, Inc.* | | | 4,119,135 | |
| | 93,002 | | | | | Immunomedics, Inc.* ‡ | | | 1,253,667 | |
| | 84,849 | | | | | Ingles Markets, Inc. Class A | | | 3,068,140 | |
| | 34,900 | | | | | Ingredion, Inc. | | | 2,634,950 | |
| | 94,500 | | | | | Innoviva, Inc.* | | | 1,111,320 | |
| | 55,992 | | | | | Insperity, Inc. | | | 2,088,502 | |
| | 42,606 | | | | | Insulet Corp.* | | | 7,058,962 | |
| | 184,040 | | | | | Ironwood Pharmaceuticals, Inc.* ‡ | | | 1,856,964 | |
| | 49,032 | | | | | Jazz Pharmaceuticals Plc* | | | 4,890,452 | |
| | 17,200 | | | | | JM Smucker Co. (The) | | | 1,909,200 | |
| | 21,155 | | | | | Lancaster Colony Corp. | | | 3,059,859 | |
| | 50,275 | | | | | Lannett Co., Inc.* ‡ | | | 349,411 | |
| | 63,100 | | | | | Lantheus Holdings, Inc.* | | | 805,156 | |
| | 149,378 | | | | | Laureate Education, Inc. Class A* | | | 1,569,963 | |
| | 21,818 | | | | | LHC Group, Inc.* | | | 3,058,884 | |
| | 36,800 | | | | | Mallinckrodt Plc* ‡ | | | 72,864 | |
| | 33,100 | | | | | ManpowerGroup, Inc. | | | 1,753,969 | |
| | 28,029 | | | | | MarketAxess Holdings, Inc. | | | 9,321,605 | |
| | 45,600 | | | | | MEDNAX, Inc.* | | | 530,784 | |
| | 33,450 | | | | | Molina Healthcare, Inc.* | | | 4,673,299 | |
| | 54,986 | | | | | Momenta Pharmaceuticals, Inc.* | | | 1,495,619 | |
| | 17,143 | | | | | Morningstar, Inc. | | | 1,992,874 | |
| | 125,571 | | | | | Neurocrine Biosciences, Inc.* | | | 10,868,170 | |
| | 171,038 | | | | | Nielsen Holdings Plc | | | 2,144,816 | |
See accompanying Notes to the Financial Statements.
40
Mercer US Small/Mid Cap Equity Fund
Schedule of Investments (Continued)
(showing percentage of net assets)
March 31, 2020
| | | | | | | | | | |
| Shares | | | | | Description | | Value ($) | |
| | |
| | | | | | Consumer,Non-cyclical — continued | |
| | 124,919 | | | | | Nomad Foods, Ltd.* | | | 2,318,497 | |
| | 53,800 | | | | | Owens & Minor, Inc.‡ | | | 492,270 | |
| | 27,635 | | | | | Paylocity Holding Corp.* | | | 2,440,723 | |
| | 12,424 | | | | | Penumbra, Inc.* ‡ | | | 2,004,364 | |
| | 35,910 | | | | | Performance Food Group Co.* | | | 887,695 | |
| | 38,900 | | | | | Pilgrim’s Pride Corp.* | | | 704,868 | |
| | 26,252 | | | | | PRA Health Sciences, Inc.* | | | 2,179,966 | |
| | 211,930 | | | | | Premier, Inc. Class A* | | | 6,934,350 | |
| | 42,400 | | | | | Prestige Consumer Healthcare, Inc.* | | | 1,555,232 | |
| | 49,480 | | | | | Quest Diagnostics, Inc. | | | 3,973,244 | |
| | 12,450 | | | | | Reata Pharmaceuticals, Inc. Class A* ‡ | | | 1,797,033 | |
| | 21,200 | | | | | Repligen Corp.* | | | 2,046,648 | |
| | 54,850 | | | | | Resources Connection, Inc. | | | 601,704 | |
| | 175,770 | | | | | Ritchie Bros Auctioneers, Inc. | | | 6,007,819 | |
| | 110,464 | | | | | Rocket Pharmaceuticals, Inc.* ‡ | | | 1,540,973 | |
| | 133,930 | | | | | Sabre Corp. | | | 794,205 | |
| | 47,320 | | | | | Sage Therapeutics, Inc.* ‡ | | | 1,359,030 | |
| | 38,305 | | | | | Sarepta Therapeutics, Inc.* ‡ | | | 3,746,995 | |
| | 45,000 | | | | | Select Medical Holdings Corp.* | | | 675,000 | |
| | 62,500 | | | | | SpartanNash Co. | | | 895,000 | |
| | 63,678 | | | | | STERIS Plc | | | 8,913,010 | |
| | 80,357 | | | | | TransUnion | | | 5,318,026 | |
| | 17,066 | | | | | TriNet Group, Inc.* | | | 642,706 | |
| | 58,000 | | | | | TrueBlue, Inc.* | | | 740,080 | |
| | 12,700 | | | | | United Rentals, Inc.* | | | 1,306,830 | |
| | 27,300 | | | | | Universal Corp. | | | 1,206,933 | |
| | 10,220 | | | | | Universal Health Services, Inc. Class B | | | 1,012,598 | |
| | 72,673 | | | | | Viad Corp. | | | 1,542,848 | |
| | 24,600 | | | | | Weis Markets, Inc. | | | 1,024,836 | |
| | 65,625 | | | | | West Pharmaceutical Services, Inc. | | | 9,991,406 | |
| | 16,650 | | | | | WEX, Inc.* | | | 1,740,757 | |
| | | | | | | | | | |
| | | | | | | | | 260,753,512 | |
| | | | | | | | | | |
| | |
| | | | | | Energy — 1.1% | |
| | 8,600 | | | | | Arch Coal, Inc. Class A | | | 248,540 | |
| | 110,075 | | | | | Callon Petroleum Co.* ‡ | | | 60,310 | |
| | 144,100 | | | | | CNX Resources Corp.* | | | 766,612 | |
| | 70,400 | | | | | Delek US Holdings, Inc. ‡ | | | 1,109,504 | |
| | 35,910 | | | | | Dril-Quip, Inc.* ‡ | | | 1,095,255 | |
| | 117,600 | | | | | Gulfport Energy Corp.* ‡ | | | 52,297 | |
| | 131,035 | | | | | HollyFrontier Corp. | | | 3,211,668 | |
| | 37,300 | | | | | Laredo Petroleum, Inc.* | | | 14,166 | |
| | 21,021 | | | | | Murphy USA, Inc.* | | | 1,773,332 | |
| | 216,657 | | | | | Parsley Energy, Inc. Class A | | | 1,241,445 | |
| | 118,718 | | | | | PBF Energy, Inc. Class A | | | 840,523 | |
| | 190,000 | | | | | Southwestern Energy Co.* ‡ | | | 321,100 | |
| | 62,159 | | | | | TPI Composites, Inc.* | | | 918,710 | |
| | | | | | | | | | |
| | | | | | | | | 11,653,462 | |
| | | | | | | | | | |
See accompanying Notes to the Financial Statements.
41
Mercer US Small/Mid Cap Equity Fund
Schedule of Investments (Continued)
(showing percentage of net assets)
March 31, 2020
| | | | | | | | | | |
| Shares | | | | | Description | | Value ($) | |
| | |
| | | | | | Financial — 15.7% | |
| | 95,000 | | | | | Ally Financial, Inc. | | | 1,370,850 | |
| | 110,508 | | | | | American Campus Communities, Inc. REIT | | | 3,066,597 | |
| | 217,300 | | | | | Annaly Capital Management, Inc. REIT | | | 1,101,711 | |
| | 72,360 | | | | | Apollo Global Management, Inc. Class A | | | 2,424,060 | |
| | 95,000 | | | | | Ares Capital Corp.‡ | | | 1,024,100 | |
| | 101,234 | | | | | Ares Management Corp. Class A | | | 3,131,168 | |
| | 57,515 | | | | | Arthur J. Gallagher & Co. | | | 4,688,048 | |
| | 48,281 | | | | | Artisan Partners Asset Management, Inc. Class A | | | 1,037,559 | |
| | 155,400 | | | | | Associated Banc-Corp. | | | 1,987,566 | |
| | 65,500 | | | | | Assured Guaranty, Ltd. | | | 1,689,245 | |
| | 83,663 | | | | | Atlantic Union Bankshares Corp. | | | 1,832,220 | |
| | 60,760 | | | | | Axis Capital Holdings, Ltd. | | | 2,348,374 | |
| | 38,600 | | | | | Bank of NT Butterfield & Son, Ltd. (The) | | | 657,358 | |
| | 69,900 | | | | | BankUnited, Inc. | | | 1,307,130 | |
| | 33,800 | | | | | Berkshire Hills Bancorp, Inc. | | | 502,268 | |
| | 248,300 | | | | | BlackRock Capital Investment Corp.‡ | | | 546,260 | |
| | 129,000 | | | | | Braemar Hotels & Resorts, Inc. REIT | | | 219,300 | |
| | 193,700 | | | | | Brandywine Realty Trust REIT | | | 2,037,724 | |
| | 80,900 | | | | | Brixmor Property Group, Inc. REIT | | | 768,550 | |
| | 6,897 | | | | | C&F Financial Corp. | | | 275,190 | |
| | 140,800 | | | | | Cadence BanCorp Class A | | | 922,240 | |
| | 445,600 | | | | | Cedar Realty Trust, Inc. REIT | | | 415,789 | |
| | 99,300 | | | | | Chimera Investment Corp. REIT | | | 903,630 | |
| | 53,000 | | | | | CIT Group, Inc. | | | 914,780 | |
| | 170,300 | | | | | City Office, Inc. REIT | | | 1,231,269 | |
| | 162,900 | | | | | CNO Financial Group, Inc. | | | 2,018,331 | |
| | 29,100 | | | | | Comerica, Inc. | | | 853,794 | |
| | 65,496 | | | | | CoreCivic, Inc. REIT | | | 731,590 | |
| | 28,798 | | | | | CoreSite Realty Corp. REIT | | | 3,337,688 | |
| | 81,230 | | | | | Cousins Properties, Inc. REIT | | | 2,377,602 | |
| | 118,900 | | | | | DiamondRock Hospitality Co. REIT | | | 604,012 | |
| | 139,600 | | | | | Diversified Healthcare Trust REIT | | | 506,748 | |
| | 210,185 | | | | | Easterly Government Properties, Inc. REIT | | | 5,178,958 | |
| | 47,500 | | | | | Equity LifeStyle Properties, Inc. REIT | | | 2,730,300 | |
| | 42,858 | | | | | Essent Group, Ltd. | | | 1,128,880 | |
| | 10,700 | | | | | Everest Re Group, Ltd. | | | 2,058,894 | |
| | 21,700 | | | | | Federal Agricultural Mortgage Corp. Class C | | | 1,207,171 | |
| | 53,724 | | | | | Fidelity National Financial, Inc. | | | 1,336,653 | |
| | 35,500 | | | | | Financial Institutions, Inc. | | | 643,970 | |
| | 184,900 | | | | | First Horizon National Corp. | | | 1,490,294 | |
| | 19,300 | | | | | First Republic Bank | | | 1,588,004 | |
| | 36,000 | | | | | Flagstar Bancorp, Inc. | | | 713,880 | |
| | 102,600 | | | | | FNB Corp. | | | 756,162 | |
| | 155,600 | | | | | Franklin Street Properties Corp. REIT | | | 891,588 | |
| | 51,200 | | | | | Gaming and Leisure Properties, Inc. REIT | | | 1,418,752 | |
| | 70,640 | | | | | Glacier Bancorp, Inc. | | | 2,402,113 | |
| | 57,400 | | | | | Global Net Lease, Inc. REIT | | | 767,438 | |
| | 38,600 | | | | | Great Western Bancorp, Inc. | | | 790,528 | |
| | 35,900 | | | | | Hancock Whitney Corp. | | | 700,768 | |
See accompanying Notes to the Financial Statements.
42
Mercer US Small/Mid Cap Equity Fund
Schedule of Investments (Continued)
(showing percentage of net assets)
March 31, 2020
| | | | | | | | | | |
| Shares | | | | | Description | | Value ($) | |
| | |
| | | | | | Financial — continued | |
| | 48,700 | | | | | Hanmi Financial Corp. | | | 528,395 | |
| | 32,800 | | | | | Heritage Insurance Holdings, Inc. | | | 351,288 | |
| | 138,200 | | | | | Hope Bancorp, Inc. | | | 1,136,004 | |
| | 86,500 | | | | | Horizon Bancorp, Inc. | | | 852,890 | |
| | 69,000 | | | | | Independent Bank Corp. | | | 888,030 | |
| | 59,200 | | | | | Industrial Logistics Properties Trust REIT | | | 1,038,368 | |
| | 50,600 | | | | | International Bancshares Corp. | | | 1,360,128 | |
| | 101,700 | | | | | Invesco Mortgage Capital, Inc. REIT | | | 346,797 | |
| | 83,088 | | | | | Kemper Corp. | | | 6,179,255 | |
| | 20,084 | | | | | Kinsale Capital Group, Inc. | | | 2,099,381 | |
| | 23,000 | | | | | Lazard, Ltd. Class A | | | 541,880 | |
| | 20,000 | | | | | Legg Mason, Inc. | | | 977,000 | |
| | 154,400 | | | | | Lexington Realty Trust REIT Class B | | | 1,533,192 | |
| | 52,900 | | | | | Lincoln National Corp. | | | 1,392,328 | |
| | 44,240 | | | | | LPL Financial Holdings, Inc. | | | 2,407,983 | |
| | 262,500 | | | | | MFA Financial, Inc. REIT | | | 406,875 | |
| | 141,500 | | | | | MGIC Investment Corp. | | | 898,525 | |
| | 17,678 | | | | | Mid-America Apartment Communities, Inc. REIT | | | 1,821,364 | |
| | 139,500 | | | | | Navient Corp. | | | 1,057,410 | |
| | 59,200 | | | | | New Mountain Finance Corp. | | | 402,560 | |
| | 103,317 | | | | | Newmark Group, Inc. Class A | | | 439,097 | |
| | 788,168 | | | | | Oaktree Specialty Lending Corp. | | | 2,553,664 | |
| | 55,083 | | | | | Office Properties Income Trust REIT | | | 1,501,012 | |
| | 31,800 | | | | | Omega Healthcare Investors, Inc. REIT | | | 843,972 | |
| | 119,200 | | | | | Outfront Media, Inc. REIT | | | 1,606,816 | |
| | 60,200 | | | | | PennyMac Mortgage Investment Trust REIT | | | 639,324 | |
| | 187,956 | | | | | Physicians Realty Trust REIT | | | 2,620,107 | |
| | 124,000 | | | | | Piedmont Office Realty Trust, Inc. REIT Class A | | | 2,189,840 | |
| | 72,554 | | | | | Pinnacle Financial Partners, Inc. | | | 2,723,677 | |
| | 25,500 | | | | | Popular, Inc. | | | 892,500 | |
| | 75,567 | | | | | Preferred Apartment Communities, Inc. REIT Class A‡ | | | 542,571 | |
| | 18,000 | | | | | Preferred Bank | | | 608,760 | |
| | 193,200 | | | | | Prospect Capital Corp.‡ | | | 821,100 | |
| | 76,700 | | | | | Radian Group, Inc. | | | 993,265 | |
| | 154,500 | | | | | Regions Financial Corp. | | | 1,385,865 | |
| | 17,800 | | | | | Reinsurance Group of America, Inc. Class A | | | 1,497,692 | |
| | 83,500 | | | | | Retail Properties of America, Inc. REIT Class A | | | 431,695 | |
| | 6,493 | | | | | Retail Value, Inc. REIT | | | 79,539 | |
| | 16,264 | | | | | RLI Corp. | | | 1,430,094 | |
| | 69,400 | | | | | RLJ Lodging Trust REIT | | | 535,768 | |
| | 52,300 | | | | | Sabra Healthcare, Inc. REIT | | | 571,116 | |
| | 51,600 | | | | | Sandy Spring Bancorp, Inc. | | | 1,168,224 | |
| | 59,600 | | | | | Service Properties Trust REIT | | | 321,840 | |
| | 34,723 | | | | | Signature Bank | | | 2,791,382 | |
| | 81,300 | | | | | SITE Centers Corp. REIT | | | 423,573 | |
| | 394,659 | | | | | Summit Hotel Properties, Inc. REIT‡ | | | 1,665,461 | |
| | 40,688 | | | | | Sun Communities, Inc. REIT | | | 5,079,897 | |
| | 66,700 | | | | | Tanger Factory Outlet Centers REIT‡ | | | 333,500 | |
| | 138,809 | | | | | TCF Financial Corp. | | | 3,145,412 | |
See accompanying Notes to the Financial Statements.
43
Mercer US Small/Mid Cap Equity Fund
Schedule of Investments (Continued)
(showing percentage of net assets)
March 31, 2020
| | | | | | | | | | |
| Shares | | | | | Description | | Value ($) | |
| | |
| | | | | | Financial — continued | |
| | 44,983 | | | | | Terreno Realty Corp. REIT | | | 2,327,870 | |
| | 157,256 | | | | | THL Credit, Inc. | | | 416,728 | |
| | 72,400 | | | | | Universal Insurance Holdings, Inc. | | | 1,297,408 | |
| | 110,400 | | | | | Unum Group | | | 1,657,104 | |
| | 314,000 | | | | | VEREIT, Inc. REIT | | | 1,535,460 | |
| | 99,200 | | | | | Voya Financial, Inc. | | | 4,022,560 | |
| | 14,400 | | | | | Walker & Dunlop, Inc. | | | 579,888 | |
| | 94,522 | | | | | Webster Financial Corp. | | | 2,164,554 | |
| | 111,969 | | | | | Western Alliance Bancorp | | | 3,427,371 | |
| | 73,600 | | | | | Western Union Co. (The) | | | 1,334,368 | |
| | 4,898 | | | | | White Mountains Insurance Group, Ltd. | | | 4,457,180 | |
| | 85,000 | | | | | Xenia Hotels & Resorts, Inc. REIT | | | 875,500 | |
| | 75,000 | | | | | Zions Bancorp NA | | | 2,007,000 | |
| | | | | | | | | | |
| | | | | | | | | 164,796,511 | |
| | | | | | | | | | |
| | |
| | | | | | Government — 0.0% | |
| | 33,800 | | | | | Banco Latinoamericano de Comercio Exterior SA | | | 348,478 | |
| | | | | | | | | | |
| | |
| | | | | | Industrial — 14.6% | |
| | 43,670 | | | | | Advanced Energy Industries, Inc.* | | | 2,117,558 | |
| | 32,057 | | | | | Aerojet Rocketdyne Holdings, Inc.* | | | 1,340,944 | |
| | 14,700 | | | | | AGCO Corp. | | | 694,575 | |
| | 311,162 | | | | | Air Transport Services Group, Inc.* | | | 5,688,041 | |
| | 33,013 | | | | | Albany International Corp. Class A | | | 1,562,505 | |
| | 42,100 | | | | | Apogee Enterprises, Inc. | | | 876,522 | |
| | 30,063 | | | | | AptarGroup, Inc. | | | 2,992,471 | |
| | 18,712 | | | | | Arcosa, Inc. | | | 743,615 | |
| | 95,220 | | | | | Argan, Inc. | | | 3,291,755 | |
| | 24,527 | | | | | Armstrong World Industries, Inc. | | | 1,947,934 | |
| | 15,200 | | | | | Arrow Electronics, Inc.* | | | 788,424 | |
| | 67,155 | | | | | Atkore International Group, Inc.* | | | 1,414,956 | |
| | 31,300 | | | | | Atlas Air Worldwide Holdings, Inc.* | | | 803,471 | |
| | 41,200 | | | | | Benchmark Electronics, Inc. | | | 823,588 | |
| | 53,600 | | | | | Briggs & Stratton Corp.‡ | | | 97,016 | |
| | 61,300 | | | | | Builders FirstSource, Inc.* | | | 749,699 | |
| | 66,867 | | | | | Cognex Corp. | | | 2,823,125 | |
| | 66,783 | | | | | Colfax Corp.* | | | 1,322,303 | |
| | 68,558 | | | | | Comfort Systems USA, Inc. | | | 2,505,795 | |
| | 35,801 | | | | | Eagle Materials, Inc. | | | 2,091,494 | |
| | 30,401 | | | | | ESCO Technologies, Inc. | | | 2,307,740 | |
| | 101,766 | | | | | Exponent, Inc. | | | 7,317,993 | |
| | 102,632 | | | | | Federal Signal Corp. | | | 2,799,801 | |
| | 56,127 | | | | | FLIR Systems, Inc. | | | 1,789,890 | |
| | 75,700 | | | | | Flowserve Corp. | | | 1,808,473 | |
| | 9,217 | | | | | Forward Air Corp. | | | 466,841 | |
| | 31,915 | | | | | Generac Holdings, Inc.* | | | 2,973,520 | |
| | 65,754 | | | | | Gibraltar Industries, Inc.* | | | 2,822,162 | |
| | 68,693 | | | | | Graco, Inc. | | | 3,347,410 | |
| | 426,375 | | | | | GrafTech International, Ltd.‡ | | | 3,462,165 | |
See accompanying Notes to the Financial Statements.
44
Mercer US Small/Mid Cap Equity Fund
Schedule of Investments (Continued)
(showing percentage of net assets)
March 31, 2020
| | | | | | | | | | |
| Shares | | | | | Description | | Value ($) | |
| | |
| | | | | | Industrial — continued | |
| | 58,200 | | | | | Greif, Inc. Class A | | | 1,809,438 | |
| | 26,143 | | | | | HEICO Corp. | | | 1,950,529 | |
| | 35,540 | | | | | HEICO Corp. Class A | | | 2,271,006 | |
| | 44,427 | | | | | Helios Technologies, Inc. | | | 1,684,672 | |
| | 78,320 | | | | | Hexcel Corp. | | | 2,912,721 | |
| | 36,500 | | | | | Howmet Aerospace, Inc. | | | 586,190 | |
| | 10,900 | | | | | Huntington Ingalls Industries, Inc. | | | 1,986,089 | |
| | 15,380 | | | | | IDEX Corp. | | | 2,124,132 | |
| | 249,647 | | | | | Ingersoll Rand, Inc.* ‡ | �� | | 6,191,246 | |
| | 40,295 | | | | | J.B. Hunt Transport Services, Inc. | | | 3,716,408 | |
| | 82,100 | | | | | Jabil, Inc. | | | 2,018,018 | |
| | 24,693 | | | | | Kaman Corp. | | | 949,940 | |
| | 76,959 | | | | | KBR, Inc. | | | 1,591,512 | |
| | 40,380 | | | | | Lincoln Electric Holdings, Inc. | | | 2,786,220 | |
| | 33,000 | | | | | Matthews International Corp. Class A | | | 798,270 | |
| | 3,944 | | | | | Mettler-Toledo International, Inc.* | | | 2,723,371 | |
| | 31,534 | | | | | Nordson Corp. | | | 4,259,297 | |
| | 111,634 | | | | | nVent Electric Plc | | | 1,883,266 | |
| | 104,000 | | | | | O-I Glass, Inc. | | | 739,440 | |
| | 18,665 | | | | | Old Dominion Freight Line, Inc. | | | 2,449,968 | |
| | 36,100 | | | | | Oshkosh Corp. | | | 2,322,313 | |
| | 26,500 | | | | | Owens Corning | | | 1,028,465 | |
| | 36,416 | | | | | RBC Bearings, Inc.* | | | 4,107,361 | |
| | 24,900 | | | | | Regal Beloit Corp. | | | 1,567,455 | |
| | 43,100 | | | | | Sanmina Corp.* | | | 1,175,768 | |
| | 117,315 | | | | | Schneider National, Inc. Class B | | | 2,268,872 | |
| | 38,900 | | | | | Silgan Holdings, Inc. | | | 1,128,878 | |
| | 41,500 | | | | | SMART Global Holdings, Inc.* | | | 1,008,450 | |
| | 7,100 | | | | | Snap-on, Inc. | | | 772,622 | |
| | 26,600 | | | | | Spirit AeroSystems Holdings, Inc. Class A | | | 636,538 | |
| | 13,206 | | | | | SYNNEX Corp. | | | 965,359 | |
| | 18,325 | | | | | Teledyne Technologies, Inc.* | | | 5,447,473 | |
| | 41,800 | | | | | Textron, Inc. | | | 1,114,806 | |
| | 37,300 | | | | | Timken Co. (The) | | | 1,206,282 | |
| | 42,400 | | | | | TopBuild Corp.* | | | 3,037,536 | |
| | 53,170 | | | | | Trex Co., Inc.* ‡ | | | 4,261,044 | |
| | 68,178 | | | | | Trimble, Inc.* | | | 2,170,106 | |
| | 93,600 | | | | | Trinity Industries, Inc.‡ | | | 1,504,152 | |
| | 35,700 | | | | | Trinseo SA | | | 646,527 | |
| | 107,400 | | | | | TTM Technologies, Inc.* | | | 1,110,516 | |
| | 94,000 | | | | | Universal Logistics Holdings, Inc. | | | 1,231,400 | |
| | 33,185 | | | | | US Ecology, Inc. | | | 1,008,824 | |
| | 82,300 | | | | | Vishay Intertechnology, Inc. | | | 1,185,943 | |
| | 60,100 | | | | | Westrock Co. | | | 1,698,426 | |
| | 20,381 | | | | | Woodward, Inc. | | | 1,211,447 | |
| | | | | | | | | | |
| | | | | | | | | 153,020,082 | |
| | | | | | | | | | |
See accompanying Notes to the Financial Statements.
45
Mercer US Small/Mid Cap Equity Fund
Schedule of Investments (Continued)
(showing percentage of net assets)
March 31, 2020
| | | | | | | | | | |
| Shares | | | | | Description | | Value ($) | |
| | |
| | | | | | Technology — 12.7% | |
| | 69,823 | | | | | 1Life Healthcare, Inc.* | | | 1,267,287 | |
| | 58,894 | | | | | ACI Worldwide, Inc.* | | | 1,422,290 | |
| | 18,000 | | | | | Amdocs, Ltd. | | | 989,460 | |
| | 293,300 | | | | | Avaya Holdings Corp.* ‡ | | | 2,372,797 | |
| | 106,630 | | | | | Black Knight, Inc.* | | | 6,190,938 | |
| | 25,216 | | | | | Blackline, Inc.* | | | 1,326,614 | |
| | 24,079 | | | | | Broadridge Financial Solutions, Inc. | | | 2,283,412 | |
| | 26,900 | | | | | Cadence Design Systems, Inc.* | | | 1,776,476 | |
| | 78,080 | | | | | CDK Global, Inc. | | | 2,564,928 | |
| | 42,750 | | | | | Ceridian HCM Holding, Inc.* ‡ | | | 2,140,492 | |
| | 43,800 | | | | | CSG Systems International, Inc. | | | 1,833,030 | |
| | 84,088 | | | | | Cubic Corp. | | | 3,473,675 | |
| | 46,600 | | | | | Diodes, Inc.* | | | 1,893,591 | |
| | 67,975 | | | | | DXC Technology Co. | | | 887,074 | |
| | 70,570 | | | | | Entegris, Inc. | | | 3,159,419 | |
| | 34,023 | | | | | Envestnet, Inc.* | | | 1,829,757 | |
| | 38,311 | | | | | EPAM Systems, Inc.* | | | 7,112,820 | |
| | 11,575 | | | | | Fair Isaac Corp.* | | | 3,561,512 | |
| | 24,144 | | | | | Five9, Inc.* | | | 1,846,050 | |
| | 48,050 | | | | | Fortinet, Inc.* | | | 4,861,218 | |
| | 68,637 | | | | | Guidewire Software, Inc.* | | | 5,443,600 | |
| | 59,045 | | | | | HubSpot, Inc.* ‡ | | | 7,864,204 | |
| | 18,100 | | | | | Insight Enterprises, Inc.* | | | 762,553 | |
| | 37,033 | | | | | j2 Global, Inc.‡ | | | 2,771,920 | |
| | 53,783 | | | | | MKS Instruments, Inc. | | | 4,380,625 | |
| | 16,375 | | | | | Monolithic Power Systems, Inc. | | | 2,742,157 | |
| | 292,384 | | | | | NCR Corp.* ‡ | | | 5,175,197 | |
| | 101,153 | | | | | Nutanix, Inc. Class A* ‡ | | | 1,598,217 | |
| | 11,889 | | | | | NXP Semiconductors NV | | | 985,955 | |
| | 117,300 | | | | | ON Semiconductor Corp.* | | | 1,459,212 | |
| | 24,584 | | | | | Pegasystems, Inc. | | | 1,751,118 | |
| | 127,400 | | | | | Pitney Bowes, Inc.‡ | | | 259,896 | |
| | 25,202 | | | | | Power Integrations, Inc. | | | 2,226,093 | |
| | 77,529 | | | | | Rapid7, Inc.* | | | 3,359,332 | |
| | 78,970 | | | | | RealPage, Inc.* | | | 4,179,882 | |
| | 36,990 | | | | | Science Applications International Corp. | | | 2,760,564 | |
| | 42,200 | | | | | Seagate Technology Plc | | | 2,059,360 | |
| | 44,735 | | | | | Semtech Corp.* | | | 1,677,563 | |
| | 61,264 | | | | | Silicon Laboratories, Inc.* | | | 5,232,558 | |
| | 29,413 | | | | | Smartsheet, Inc. Class A* | | | 1,220,934 | |
| | 31,285 | | | | | Splunk, Inc.* | | | 3,949,106 | |
| | 38,725 | | | | | SS&C Technologies Holdings, Inc. | | | 1,696,930 | |
| | 13,300 | | | | | Teradyne, Inc. | | | 720,461 | |
| | 22,350 | | | | | Twilio, Inc. Class A* ‡ | | | 2,000,101 | |
| | 20,715 | | | | | Tyler Technologies, Inc.* | | | 6,143,240 | |
| | 55,500 | | | | | Xerox Holdings Corp.* | | | 1,051,170 | |
| | 37,001 | | | | | Zebra Technologies Corp. Class A* | | | 6,793,384 | |
| | | | | | | | | | |
| | | | | | | | | 133,058,172 | |
| | | | | | | | | | |
See accompanying Notes to the Financial Statements.
46
Mercer US Small/Mid Cap Equity Fund
Schedule of Investments (Continued)
(showing percentage of net assets)
March 31, 2020
| | | | | | | | | | |
| Shares | | | | | Description | | Value ($) | |
| | |
| | | | | | Utilities — 1.1% | |
| | 37,100 | | | | | AES Corp. | | | 504,560 | |
| | 48,700 | | | | | National Fuel Gas Co. | | | 1,816,023 | |
| | 54,200 | | | | | NRG Energy, Inc. | | | 1,477,492 | |
| | 81,004 | | | | | OGE Energy Corp. | | | 2,489,253 | |
| | 69,261 | | | | | Portland General Electric Co. | | | 3,320,372 | |
| | 98,100 | | | | | Vistra Energy Corp. | | | 1,565,676 | |
| | | | | | | | | | |
| | | | | | | | | 11,173,376 | |
| | | | | | | | | | |
| | | |
| | | | | | TOTAL COMMON STOCKS (COST $1,234,317,197) | | | 968,987,783 | |
| | | | | | | | | | |
| | | |
| Par Value ($) | | | | | Description | | Value ($) | |
| | |
| | | | | | SHORT-TERM INVESTMENTS — 0.4% | |
| | |
| | | | | | Mutual Fund - Securities Lending Collateral — 0.3% | |
| | 3,556,353 | | | | | State Street Institutional U.S. Government Money Market Fund, Premier Class, 0.32%## ** | | | 3,556,353 | |
| | | | | | | | | | |
| | |
| | | | | | U.S. Government and Agency Obligations — 0.1% | |
| | 1,000,000 | | | | | United States Treasury Bill, 0.09%, due 07/02/20*** ‡‡ | | | 999,770 | |
| | | | | | | | | | |
| | | |
| | | | | | TOTAL SHORT-TERM INVESTMENTS (COST $4,554,717) | | | 4,556,123 | |
| | | | | | | | | | |
| | | |
| | | | | | TOTAL INVESTMENTS — 92.8% (Cost $1,238,871,914) | | | 973,543,906 | |
| | | |
| | | | | | Other Assets and Liabilities (net) — 7.2% | | | 75,000,858 | |
| | | | | | | | | | |
| | | |
| | | | | | NET ASSETS — 100.0% | | $1,048,544,764 | |
| | | | | | | | | | |
| | | | | | | | |
| | | | | | Notes to Schedule of Investments:
|
| | | |
| | | | | | ADR — American Depository Receipt | | |
| | | |
| | | | | | REIT — Real Estate Investment Trust | | |
| | | |
| | | | ## | | The rate disclosed is the7-day net yield as of March 31, 2020. | | |
| | | |
| | | | * | | Non-income producing security. | | |
| | | |
| | | | ** | | Represents an investment of securities lending cash collateral. | | |
| | | |
| | | | *** | | All or a portion of this security is pledged for open futures collateral. | | |
| | | |
| | | | ‡ | | All or a portion of this security is out on loan. | | |
| | | |
| | | | ‡‡ | | Interest rate presented is yield to maturity. | | |
See accompanying Notes to the Financial Statements.
47
Mercer US Small/Mid Cap Equity Fund
Schedule of Investments (Continued)
March 31, 2020
Futures Contracts
| | | | | | | | | | | | | | | | | | | | |
Number of
Contracts | | | | | Description | | | | Expiration Date | | | Notional
Value | | | Market Value/
Unrealized
Appreciation
(Depreciation) | |
| | Buys | | | | | | | | | | | | | | | | | | | |
| | 524 | | | | | Russell 2000E-mini Index | | | | | Jun 2020 | | | $ | 30,067,120 | | | $ | 51,766 | |
| | 214 | | | | | S&P Mid 400 E-mini Index | | | | | Jun 2020 | | | | 30,768,920 | | | | (189,710 | ) |
| | | | | | | | | | | | | | | | | | | | |
| | | | $ | (137,944 | ) |
| | | | | | | | | | | | | | | | | | | | |
See accompanying Notes to the Financial Statements.
48
Mercer US Small/Mid Cap Equity Fund
Schedule of Investments (Continued)
March 31, 2020
| | | | | |
| Asset Class Summary (Unaudited) | | % of Net Assets |
Common Stocks | | | | 92.4 | |
Futures Contracts | | | | (0.0 | )* |
Short-Term Investments | | | | 0.4 | |
Other Assets and Liabilities (net) | | | | 7.2 | |
| | | | | |
| | | | 100.0 | % |
| | | | | |
*Amount rounds to zero.
See accompanying Notes to the Financial Statements.
49
MercerNon-US Core Equity Fund
Schedule of Investments
(showing percentage of net assets)
March 31, 2020
| | | | | | | | | | |
| Shares | | | | | Description | | Value ($) | |
| | |
| | | | | | COMMON STOCKS — 92.1% | |
| | |
| | | | | | Australia — 2.9% | |
| | 224,400 | | | | | AGL Energy, Ltd. | | | 2,391,204 | |
| | 49,220 | | | | | Altium, Ltd. | | | 876,507 | |
| | 161,600 | | | | | Ansell, Ltd. | | | 2,740,440 | |
| | 305,986 | | | | | APA Group | | | 1,944,525 | |
| | 92,665 | | | | | Aristocrat Leisure, Ltd. | | | 1,193,050 | |
| | 172,734 | | | | | Aurizon Holdings, Ltd. | | | 445,261 | |
| | 154,500 | | | | | Australia & New Zealand Banking Group, Ltd. | | | 1,657,973 | |
| | 1,987,600 | | | | | Beach Energy, Ltd. | | | 1,448,257 | |
| | 294,129 | | | | | BGP Holdings Plc* **** | | | — | |
| | 142,720 | | | | | BHP Group, Ltd.‡ | | | 2,581,773 | |
| | 67,359 | | | | | BHP Group, Ltd., ADR | | | 2,471,402 | |
| | 364,800 | | | | | BlueScope Steel, Ltd. | | | 1,979,761 | |
| | 296,029 | | | | | Coles Group, Ltd. | | | 2,786,949 | |
| | 87,136 | | | | | Collins Foods, Ltd. | | | 293,372 | |
| | 116,188 | | | | | Computershare, Ltd. | | | 685,505 | |
| | 96,726 | | | | | CSL, Ltd. | | | 17,459,385 | |
| | 129,840 | | | | | Downer EDI, Ltd. | | | 235,138 | |
| | 1,053,310 | | | | | Fortescue Metals Group, Ltd. | | | 6,401,484 | |
| | 1,233,793 | | | | | Genworth Mortgage Insurance Australia, Ltd. | | | 1,673,046 | |
| | 872,100 | | | | | Harvey Norman Holdings, Ltd.‡ | | | 1,565,410 | |
| | 731,800 | | | | | Inghams Group, Ltd.‡ | | | 1,464,835 | |
| | 118,064 | | | | | Integrated Research, Ltd. | | | 187,014 | |
| | 149,500 | | | | | Lendlease Group | | | 935,707 | |
| | 701,700 | | | | | Link Administration Holdings, Ltd. | | | 1,376,165 | |
| | 720,307 | | | | | Mayne Pharma Group, Ltd.* ‡ | | | 140,863 | |
| | 42,269 | | | | | McMillan Shakespeare, Ltd. | | | 186,271 | |
| | 975,300 | | | | | Metcash, Ltd.‡ | | | 1,877,652 | |
| | 1,454,500 | | | | | Mirvac Group REIT | | | 1,915,504 | |
| | 39,547 | | | | | Newcrest Mining, Ltd. | | | 552,909 | |
| | 216,087 | | | | | Pendal Group, Ltd. | | | 583,076 | |
| | 810,700 | | | | | Perenti Global, Ltd. | | | 300,417 | |
| | 898,400 | | | | | Qantas Airways, Ltd. | | | 1,753,439 | |
| | 172,826 | | | | | Rio Tinto, Ltd. | | | 9,102,943 | |
| | 318,433 | | | | | Scentre Group REIT | | | 313,717 | |
| | 911,644 | | | | | Stockland REIT | | | 1,453,276 | |
| | 423,669 | | | | | Super Retail Group, Ltd.‡ | | | 1,188,686 | |
| | 83,137 | | | | | Vocus Communications, Ltd.* | | | 129,790 | |
| | 38,063 | | | | | Wesfarmers, Ltd. | | | 815,586 | |
| | 64,995 | | | | | WiseTech Global, Ltd.‡ | | | 674,389 | |
| | 84,237 | | | | | Woolworths Group, Ltd. | | | 1,831,450 | |
| | | | | | | | | | |
| | | | | | Total Australia | | | 77,614,131 | |
| | | | | | | | | | |
| | |
| | | | | | Austria — 0.2% | |
| | 99,401 | | | | | ams AG* ‡ | | | 978,793 | |
| | 18,000 | | | | | Erste Group Bank AG | | | 331,916 | |
| | 2,909 | | | | | Kapsch TrafficCom AG | | | 55,176 | |
| | 64,200 | | | | | OMV AG | | | 1,765,405 | |
See accompanying Notes to the Financial Statements.
50
Mercer Non-US Core Equity Fund
Schedule of Investments (Continued)
(showing percentage of net assets)
March 31, 2020
| | | | | | | | | | |
| Shares | | | | | Description | | Value ($) | |
| | |
| | | | | | Austria — continued | |
| | 20,843 | | | | | Verbund AG | | | 751,574 | |
| | 112,743 | | | | | Wienerberger AG | | | 1,774,532 | |
| | | | | | | | | | |
| | | | | | Total Austria | | | 5,657,396 | |
| | | | | | | | | | |
| | |
| | | | | | Belgium — 0.5% | |
| | 66,193 | | | | | Ageas | | | 2,740,204 | |
| | 69,704 | | | | | bpost SA | | | 490,199 | |
| | 11,816 | | | | | Galapagos NV* | | | 2,332,551 | |
| | 8,433 | | | | | Melexis NV | | | 444,102 | |
| | 79,015 | | | | | UCB SA | | | 6,826,021 | |
| | | | | | | | | | |
| | | | | | Total Belgium | | | 12,833,077 | |
| | | | | | | | | | |
| | |
| | | | | | Bermuda — 0.2% | |
| | 72,158 | | | | | Avance Gas Holding, Ltd. 144A | | | 146,052 | |
| | 484,100 | | | | | Esprit Holdings, Ltd.* | | | 40,874 | |
| | 141,653 | | | | | Golden Ocean Group, Ltd. | | | 443,863 | |
| | 231,565 | | | | | Hiscox, Ltd. | | | 2,646,866 | |
| | 70,900 | | | | | Hongkong Land Holdings, Ltd. | | | 265,202 | |
| | 1,289,000 | | | | | Shenzhen International Holdings, Ltd. | | | 2,345,370 | |
| | | | | | | | | | |
| | | | | | Total Bermuda | | | 5,888,227 | |
| | | | | | | | | | |
| | |
| | | | | | Brazil — 0.5% | |
| | 26,700 | | | | | BR Malls Participacoes SA | | | 51,376 | |
| | 239,360 | | | | | Cia Energetica de Minas Gerais, ADR | | | 406,912 | |
| | 541,000 | | | | | JBS SA | | | 2,121,609 | |
| | 660,826 | | | | | Localiza Rent a Car SA | | | 3,350,890 | |
| | 785,523 | | | | | Magazine Luiza SA | | | 5,905,129 | |
| | 157,800 | | | | | Trisul SA | | | 220,578 | |
| | | | | | | | | | |
| | | | | | Total Brazil | | | 12,056,494 | |
| | | | | | | | | | |
| | |
| | | | | | Canada — 0.8% | |
| | 53,048 | | | | | Agnico-Eagle Mines, Ltd. | | | 2,093,819 | |
| | 31,900 | | | | | Canadian Tire Corp., Ltd. Class A‡ | | | 1,903,668 | |
| | 40,391 | | | | | Descartes Systems Group Inc. (The)* | | | 1,373,751 | |
| | 35,700 | | | | | Dorel Industries, Inc. Class B‡ | | | 37,623 | |
| | 25,900 | | | | | Exco Technologies, Ltd.‡ | | | 97,897 | |
| | 7,817 | | | | | Fairfax Financial Holdings, Ltd. | | | 2,369,402 | |
| | 69,441 | | | | | Franco-Nevada Corp. | | | 6,859,942 | |
| | 129,100 | | | | | Gran Colombia Gold Corp.* ‡ | | | 367,341 | |
| | 58,800 | | | | | Loblaw Cos., Ltd. | | | 2,997,112 | |
| | 101,700 | | | | | Medical Facilities Corp. | | | 249,365 | |
| | 168,200 | | | | | Seven Generations Energy, Ltd. Class A* | | | 183,166 | |
| | 30,026 | | | | | Thomson Reuters Corp. | | | 2,022,618 | |
| | | | | | | | | | |
| | | | | | Total Canada | | | 20,555,704 | |
| | | | | | | | | | |
| | |
| | | | | | Cayman Islands — 1.9% | |
| | 59,000 | | | | | Alibaba Group Holding, Ltd., ADR* | | | 11,474,320 | |
| | 300,000 | | | | | China Medical System Holdings, Ltd. | | | 323,482 | |
See accompanying Notes to the Financial Statements.
51
Mercer Non-US Core Equity Fund
Schedule of Investments (Continued)
(showing percentage of net assets)
March 31, 2020
| | | | | | | | | | |
| Shares | | | | | Description | | Value ($) | |
| | |
| | | | | | Cayman Islands — continued | |
| | 3,542,000 | | | | | China Resources Cement Holdings, Ltd. | | | 4,208,589 | |
| | 214,500 | | | | | China Yongda Automobiles Services Holdings, Ltd. | | | 173,979 | |
| | 479,500 | | | | | CK Hutchison Holdings, Ltd. | | | 3,216,442 | |
| | 82,940 | | | | | GDS Holdings, Ltd., ADR* | | | 4,808,032 | |
| | 2,917,000 | | | | | IGG, Inc. | | | 1,734,557 | |
| | 3,714,000 | | | | | Jiangnan Group, Ltd.* | | | 143,486 | |
| | 3,247,000 | | | | | Lee & Man Paper Manufacturing, Ltd. | | | 1,958,571 | |
| | 31,515 | | | | | Momo, Inc., ADR | | | 683,560 | |
| | 222,350 | | | | | Tencent Holdings, Ltd. | | | 10,844,723 | |
| | 9,510,000 | | | | | Tongda Group Holdings, Ltd. | | | 542,187 | |
| | 1,834,000 | | | | | United Laboratories International Holdings, Ltd. (The) | | | 1,473,714 | |
| | 5,634,000 | | | | | WH Group, Ltd. 144A | | | 5,233,199 | |
| | 3,048,000 | | | | | Xinyi Glass Holdings, Ltd. | | | 3,473,394 | |
| | | | | | | | | | |
| | | | | | Total Cayman Islands | | | 50,292,235 | |
| | | | | | | | | | |
| | |
| | | | | | China — 0.3% | |
| | 21,118 | | | | | China Life Insurance Co., Ltd., ADR | | | 206,112 | |
| | 2,710,500 | | | | | China Railway Construction Corp., Ltd. Class H | | | 3,024,917 | |
| | 8,758,000 | | | | | China Telecom Corp., Ltd. Class H | | | 2,642,905 | |
| | 88,750 | | | | | Shandong Gold Mining Co., Ltd. Class H 144A | | | 212,253 | |
| | 628,600 | | | | | Shanghai Pharmaceuticals Holding Co., Ltd. Class H | | | 1,064,649 | |
| | 614,000 | | | | | Zijin Mining Group Co., Ltd. Class H | | | 228,901 | |
| | | | | | | | | | |
| | | | | | Total China | | | 7,379,737 | |
| | | | | | | | | | |
| | |
| | | | | | Denmark — 2.0% | |
| | 761 | | | | | AP Moller - Maersk AS Class A | | | 628,460 | |
| | 1,900 | | | | | Ascendis Pharma AS, ADR* | | | 213,959 | |
| | 195,149 | | | | | Danske Bank AS | | | 2,201,624 | |
| | 63,400 | | | | | DFDS AS* | | | 1,441,415 | |
| | 91,570 | | | | | DSV AS | | | 8,298,890 | |
| | 17,549 | | | | | Genmab AS* | | | 3,545,455 | |
| | 8,044 | | | | | GN Store Nord AS | | | 358,401 | |
| | 54,453 | | | | | ISS AS‡ | | | 747,061 | |
| | 39,269 | | | | | Jyske Bank AS* | | | 976,094 | |
| | 389,159 | | | | | Novo Nordisk AS Class B | | | 23,365,212 | |
| | 29,523 | | | | | Novo Nordisk AS, ADR | | | 1,777,285 | |
| | 148,620 | | | | | Novozymes AS Class B | | | 6,745,373 | |
| | 68,746 | | | | | Pandora AS‡ | | | 2,228,242 | |
| | 10,560 | | | | | SimCorp AS | | | 884,629 | |
| | 88,810 | | | | | Sydbank AS | | | 1,252,194 | |
| | | | | | | | | | |
| | | | | | Total Denmark | | | 54,664,294 | |
| | | | | | | | | | |
| | |
| | | | | | Finland — 0.8% | |
| | 32,172 | | | | | Caverion OYJ | | | 149,693 | |
| | 86,134 | | | | | Fortum OYJ | | | 1,259,969 | |
| | 308,878 | | | | | Neste OYJ | | | 10,408,566 | |
| | 916,469 | | | | | Nokia OYJ, ADR | | | 2,841,054 | |
| | 230,914 | | | | | Nordea Bank Abp | | | 1,301,490 | |
See accompanying Notes to the Financial Statements.
52
Mercer Non-US Core Equity Fund
Schedule of Investments (Continued)
(showing percentage of net assets)
March 31, 2020
| | | | | | | | | | |
| Shares | | | | | Description | | Value ($) | |
| | |
| | | | | | Finland — continued | |
| | 289,264 | | | | | Outokumpu OYJ* ‡ | | | 716,707 | |
| | 172,598 | | | | | TietoEVRY OYJ‡ | | | 3,734,403 | |
| | 119,573 | | | | | Wartsila OYJ Abp‡ | | | 874,203 | |
| | | | | | | | | | |
| | | | | | Total Finland | | | 21,286,085 | |
| | | | | | | | | | |
| | |
| | | | | | France — 9.9% | |
| | 67,120 | | | | | Air Liquide SA | | | 8,559,171 | |
| | 39,100 | | | | | Arkema SA | | | 2,690,086 | |
| | 304,281 | | | | | AXA SA | | | 5,242,218 | |
| | 200,379 | | | | | BNP Paribas SA | | | 6,009,529 | |
| | 29,300 | | | | | BNP Paribas SA, ADR | | | 441,258 | |
| | 78,800 | | | | | Bouygues SA | | | 2,300,583 | |
| | 25,391 | | | | | Cap Gemini SA | | | 2,136,940 | |
| | 246,322 | | | | | Cie de Saint-Gobain | | | 5,958,362 | |
| | 44,728 | | | | | Cie Generale des Etablissements Michelin SCA | | | 3,960,640 | |
| | 178,086 | | | | | CNP Assurances | | | 1,734,248 | |
| | 59,201 | | | | | Coface SA | | | 378,066 | |
| | 12,776 | | | | | Covivio REIT | | | 716,827 | |
| | 655,272 | | | | | Credit Agricole SA | | | 4,778,062 | |
| | 180,624 | | | | | Danone SA | | | 11,589,608 | |
| | 120,569 | | | | | Dassault Systemes SE | | | 17,788,410 | |
| | 141,060 | | | | | Edenred | | | 5,873,580 | |
| | 19,626 | | | | | Electricite de France SA | | | 153,983 | |
| | 661,934 | | | | | Engie SA | | | 6,812,065 | |
| | 25,305 | | | | | EssilorLuxottica SA | | | 2,716,170 | |
| | 11,450 | | | | | Ipsen SA | | | 591,301 | |
| | 42,863 | | | | | IPSOS | | | 902,685 | |
| | 74,112 | | | | | L’Oreal SA | | | 19,353,717 | |
| | 3,500 | | | | | L’Oreal SA, ADR | | | 183,750 | |
| | 200,402 | | | | | Legrand SA | | | 12,811,798 | |
| | 25,604 | | | | | LVMH Moet Hennessy Louis Vuitton SE | | | 9,455,405 | |
| | 125,400 | | | | | Metropole Television SA | | | 1,402,953 | |
| | 536,500 | | | | | Natixis SA‡ | | | 1,735,449 | |
| | 115,945 | | | | | Nexans SA | | | 3,424,231 | |
| | 44,967 | | | | | Nexity SA | | | 1,378,257 | |
| | 117,452 | | | | | Pernod Ricard SA | | | 16,620,662 | |
| | 146,686 | | | | | Peugeot SA‡ | | | 1,945,664 | |
| | 35,500 | | | | | Quadient | | | 621,239 | |
| | 64,292 | | | | | Renault SA | | | 1,242,175 | |
| | 251,009 | | | | | Rexel SA | | | 1,860,857 | |
| | 42,069 | | | | | Safran SA | | | 3,678,757 | |
| | 287,254 | | | | | Sanofi | | | 25,160,528 | |
| | 445,781 | | | | | Schneider Electric SE | | | 38,184,498 | |
| | 34,976 | | | | | Schneider Electric SE, ADR | | | 598,090 | |
| | 51,200 | | | | | Societe BIC SA | | | 2,849,089 | |
| | 159,400 | | | | | Societe Generale SA | | | 2,667,751 | |
| | 22,350 | | | | | Sopra Steria Group | | | 2,439,346 | |
| | 64,586 | | | | | SPIE SA | | | 645,563 | |
| | 17,915 | | | | | Suez‡ | | | 181,595 | |
See accompanying Notes to the Financial Statements.
53
Mercer Non-US Core Equity Fund
Schedule of Investments (Continued)
(showing percentage of net assets)
March 31, 2020
| | | | | | | | | | |
| Shares | | | | | Description | | Value ($) | |
| | |
| | | | | | France — continued | |
| | 45,703 | | | | | Teleperformance | | | 9,490,362 | |
| | 219,200 | | | | | Television Francaise 1 | | | 1,192,843 | |
| | 218,500 | | | | | TOTAL SA‡ | | | 8,429,913 | |
| | 14,076 | | | | | Valeo SA | | | 234,189 | |
| | 174,011 | | | | | Veolia Environnement SA | | | 3,703,529 | |
| | 18,925 | | | | | Veolia Environnement SA, ADR | | | 401,589 | |
| | 73,224 | | | | | Vivendi SA | | | 1,563,093 | |
| | 5,800 | | | | | Vivendi SA, ADR | | | 125,512 | |
| | | | | | | | | | |
| | | | | | Total France | | | 264,916,196 | |
| | | | | | | | | | |
| | |
| | | | | | Germany — 6.5% | |
| | 30,541 | | | | | Aareal Bank AG | | | 507,278 | |
| | 7,769 | | | | | adidas AG | | | 1,778,087 | |
| | 2,500 | | | | | adidas AG, ADR | | | 278,675 | |
| | 58,281 | | | | | Allianz SE | | | 9,995,106 | |
| | 47,200 | | | | | Aurubis AG | | | 1,950,942 | |
| | 43,077 | | | | | BASF SE | | | 2,071,399 | |
| | 156,656 | | | | | Bayer AG | | | 9,148,640 | |
| | 78,800 | | | | | BMW AG | | | 4,115,814 | |
| | 6,506 | | | | | Continental AG | | | 473,346 | |
| | 108,519 | | | | | Covestro AG 144A | | | 3,353,728 | |
| | 280,493 | | | | | Daimler AG | | | 8,560,741 | |
| | 4,641 | | | | | Deutsche Boerse AG | | | 634,260 | |
| | 199,311 | | | | | Deutsche Lufthansa AG | | | 1,893,348 | |
| | 233,239 | | | | | Deutsche Pfandbriefbank AG | | | 1,783,302 | |
| | 311,818 | | | | | Deutsche Post AG | | | 8,559,140 | |
| | 151,407 | | | | | Deutsche Telekom AG | | | 1,994,442 | |
| | 252,856 | | | | | Deutsche Wohnen SE | | | 9,611,596 | |
| | 86,787 | | | | | Deutz AG | | | 319,398 | |
| | 94,500 | | | | | Evonik Industries AG | | | 2,007,427 | |
| | 113,657 | | | | | Fresenius SE & Co. KGaA | | | 4,249,205 | |
| | 161,994 | | | | | GEA Group AG | | | 3,318,605 | |
| | 39,223 | | | | | HeidelbergCement AG | | | 1,701,933 | |
| | 24,745 | | | | | HelloFresh SE* | | | 827,788 | |
| | 19,554 | | | | | Henkel AG & Co. KGaA | | | 1,465,978 | |
| | 64,800 | | | | | HUGO BOSS AG | | | 1,658,611 | |
| | 211,937 | | | | | Infineon Technologies AG | | | 3,158,267 | |
| | 88,038 | | | | | K+S AG‡ | | | 519,224 | |
| | 65,653 | | | | | Kloeckner & Co. SE | | | 240,437 | |
| | 29,802 | | | | | Koenig & Bauer AG | | | 574,151 | |
| | 7,586 | | | | | Lanxess AG | | | 302,139 | |
| | 30,754 | | | | | LEG Immobilien AG | | | 3,457,028 | |
| | 18,131 | | | | | Merck KGaA | | | 1,870,419 | |
| | 249,901 | | | | | METRO AG | | | 2,151,704 | |
| | 24,640 | | | | | Muenchener Rueckversicherungs-Gesellschaft AG in Muenchen | | | 4,955,324 | |
| | 173,387 | | | | | Puma SE | | | 10,304,937 | |
| | 44,482 | | | | | Rheinmetall AG | | | 3,158,516 | |
| | 153,321 | | | | | SAP SE | | | 17,519,199 | |
| | 115,004 | | | | | Siemens AG | | | 9,847,504 | |
See accompanying Notes to the Financial Statements.
54
Mercer Non-US Core Equity Fund
Schedule of Investments (Continued)
(showing percentage of net assets)
March 31, 2020
| | | | | | | | | | |
| Shares | | | | | Description | | Value ($) | |
| | |
| | | | | | Germany — continued | |
| | 26,544
| | | | | Siemens Healthineers AG 144A | | | 1,047,828 | |
| | 44,513 | | | | | Siltronic AG | | | 3,318,702 | |
| | 36,192 | | | | | Software AG | | | 1,082,679 | |
| | 197,927 | | | | | Symrise AG Class A | | | 18,648,761 | |
| | 135,371 | | | | | TAG Immobilien AG | | | 2,672,548 | |
| | 42,000 | | | | | Talanx AG* | | | 1,439,553 | |
| | 18,000 | | | | | Volkswagen AG, ADR | | | 235,800 | |
| | 128,039 | | | | | Vonovia SE | | | 6,278,873 | |
| | | | | | | | | | |
| | | | | | Total Germany | | | 175,042,382 | |
| | | | | | | | | | |
| | |
| | | | | | Hong Kong — 0.7% | |
| | 1,884,600 | | | | | AIA Group, Ltd. | | | 16,958,476 | |
| | 120,500 | | | | | China Mobile, Ltd. | | | 910,581 | |
| | 253,000 | | | | | Techtronic Industries Co., Ltd. | | | 1,630,204 | |
| | | | | | | | | | |
| | | | | | Total Hong Kong | | | 19,499,261 | |
| | | | | | | | | | |
| | |
| | | | | | Hungary — 0.2% | |
| | 229,600 | | | | | MOL Hungarian Oil & Gas Plc | | | 1,346,246 | |
| | 177,913 | | | | | Richter Gedeon Nyrt | | | 3,338,901 | |
| | | | | | | | | | |
| | | | | | Total Hungary | | | 4,685,147 | |
| | | | | | | | | | |
| | |
| | | | | | India — 0.3% | |
| | 506,240 | | | | | HDFC Bank, Ltd. | | | 5,669,912 | |
| | 297,611 | | | | | Nippon Life Asset Management, Ltd. 144A | | | 990,695 | |
| | | | | | | | | | |
| | | | | | Total India | | | 6,660,607 | |
| | | | | | | | | | |
| | |
| | | | | | Indonesia — 0.0% | |
| | 3,540,700 | | | | | Bank Negara Indonesia Persero Tbk PT | | | 826,552 | |
| | | | | | | | | | |
| | |
| | | | | | Ireland — 0.5% | |
| | 225,100 | | | | | C&C Group Plc | | | 547,559 | |
| | 73,614 | | | | | CRH Plc, ADR | | | 1,975,800 | |
| | 64,792 | | | | | Kerry Group Plc Class A | | | 7,389,899 | |
| | 61,931 | | | | | Ryanair Holdings Plc, ADR* | | | 3,287,917 | |
| | | | | | | | | | |
| | | | | | Total Ireland | | | 13,201,175 | |
| | | | | | | | | | |
| | |
| | | | | | Israel — 0.3% | |
| | 14,730 | | | | | Check Point Software Technologies, Ltd.* | | | 1,480,954 | |
| | 7,611 | | | | | Hilan, Ltd. | | | 239,952 | |
| | 348,700 | | | | | Teva Pharmaceutical Industries, Ltd.* | | | 3,178,434 | |
| | 24,889 | | | | | Wix.com, Ltd.* | | | 2,509,309 | |
| | | | | | | | | | |
| | | | | | Total Israel | | | 7,408,649 | |
| | | | | | | | | | |
| | |
| | | | | | Italy — 1.9% | |
| | 1,395,800 | | | | | A2A SpA | | | 1,727,642 | |
| | 164,798 | | | | | Anima Holding SpA 144A | | | 440,186 | |
| | 95,967 | | | | | Assicurazioni Generali SpA‡ | | | 1,300,656 | |
See accompanying Notes to the Financial Statements.
55
Mercer Non-US Core Equity Fund
Schedule of Investments (Continued)
(showing percentage of net assets)
March 31, 2020
| | | | | | | | | | |
| Shares | | | | | Description | | Value ($) | |
| | |
| | | | | | Italy — continued | |
| | 84,905 | | | | | Atlantia SpA‡ | | | 1,058,813 | |
| | 69,713 | | | | | Azimut Holding SpA | | | 1,001,024 | |
| | 201,618 | | | | | Banca Mediolanum SpA | | | 1,023,267 | |
| | 353,252 | | | | | Banca Popolare di Sondrio SCPA | | | 531,649 | |
| | 496,716 | | | | | BPER Banca | | | 1,518,957 | |
| | 55,054 | | | | | Datalogic SpA‡ | | | 641,518 | |
| | 2,429,788 | | | | | Enel SpA | | | 16,825,719 | |
| | 369,483 | | | | | Eni SpA | | | 3,716,496 | |
| | 111,114 | | | | | Esprinet SpA | | | 390,963 | |
| | 70,195 | | | | | Eurotech SpA* ‡ | | | 384,343 | |
| | 1,448,059 | | | | | Intesa Sanpaolo SpA | | | 2,351,493 | |
| | 408,279 | | | | | Leonardo SpA | | | 2,702,232 | |
| | 356,854 | | | | | Mediobanca Banca di Credito Finanziario SpA | | | 1,957,276 | |
| | 36,100 | | | | | Prada SpA | | | 105,407 | |
| | 423,451 | | | | | Reno de Medici SpA | | | 253,410 | |
| | 278,436 | | | | | Rizzoli Corriere Della Sera Mediagroup SpA | | | 220,994 | |
| | 553,667 | | | | | Saras SpA | | | 514,044 | |
| | 403,430 | | | | | Societa Cattolica di Assicurazioni SC | | | 1,990,552 | |
| | 3,202,292 | | | | | Telecom Italia SpA* ‡ | | | 1,302,865 | |
| | 400,725 | | | | | UniCredit SpA | | | 3,121,494 | |
| | 840,869 | | | | | Unipol Gruppo SpA | | | 2,876,847 | |
| | 1,078,000 | | | | | UnipolSai Assicurazioni SpA | | | 2,638,769 | |
| | | | | | | | | | |
| | | | | | Total Italy | | | 50,596,616 | |
| | | | | | | | | | |
| | |
| | | | | | Japan — 24.0% | |
| | 31,900 | | | | | 77 Bank, Ltd. (The) | | | 411,067 | |
| | 35,600 | | | | | Adastria Co., Ltd. | | | 398,516 | |
| | 39,100 | | | | | Advantest Corp.‡ | | | 1,561,856 | |
| | 110,400 | | | | | Aeon Co., Ltd. | | | 2,444,016 | |
| | 17,800 | | | | | Aeon Financial Service Co. Ltd. | | | 189,640 | |
| | 2,200 | | | | | AEON REIT Investment Corp. REIT | | | 2,098,666 | |
| | 234,000 | | | | | AGC, Inc. | | | 5,728,232 | |
| | 104,300 | | | | | Ajinomoto Co., Inc. | | | 1,935,642 | |
| | 145,300 | | | | | Alps Alpine Co., Ltd.‡ | | | 1,402,353 | |
| | 24,200 | | | | | Altech Corp. | | | 324,734 | |
| | 44,000 | | | | | Aozora Bank, Ltd. | | | 835,594 | |
| | 136,500 | | | | | Arisawa Manufacturing Co., Ltd.‡ | | | 1,009,458 | |
| | 150,000 | | | | | Asahi Kasei Corp. | | | 1,055,947 | |
| | 5,300 | | | | | Asanuma Corp. | | | 184,355 | |
| | 864,600 | | | | | Astellas Pharma, Inc. | | | 13,330,840 | |
| | 83,000 | | | | | Avex, Inc. | | | 651,558 | |
| | 32,200 | | | | | Brother Industries, Ltd. | | | 490,225 | |
| | 339,500 | | | | | Canon, Inc. | | | 7,385,290 | |
| | 45,400 | | | | | Central Glass Co., Ltd. | | | 787,487 | |
| | 315,294 | | | | | Chiba Bank, Ltd. (The)‡ | | | 1,373,804 | |
| | 214,300 | | | | | Chubu Electric Power Co., Inc. | | | 3,009,084 | |
| | 13,800 | | | | | Chugai Pharmaceutical Co., Ltd. | | | 1,591,006 | |
| | 15,200 | | | | | CMIC Holdings Co., Ltd. | | | 201,447 | |
| | 57,500 | | | | | Coca-Cola West Co., Ltd. | | | 1,176,456 | |
See accompanying Notes to the Financial Statements.
56
Mercer Non-US Core Equity Fund
Schedule of Investments (Continued)
(showing percentage of net assets)
March 31, 2020
| | | | | | | | | | |
| Shares | | | | | Description | | Value ($) | |
| | |
| | | | | | Japan — continued | |
| | 165,800 | | | | | Credit Saison Co., Ltd. | | | 1,917,685 | |
| | 89,100 | | | | | Cybernet Systems Co., Ltd. | | | 458,905 | |
| | 224,400 | | | | | Dai-ichi Life Holdings, Inc. | | | 2,674,792 | |
| | 275,200 | | | | | Daicel Corp. | | | 2,001,327 | |
| | 65,300 | | | | | Daiichi Sanyko Co., Ltd. | | | 4,474,850 | |
| | 37,600 | | | | | Daiichikosho Co., Ltd. | | | 998,350 | |
| | 21,600 | | | | | Daikin Industries, Ltd. | | | 2,623,543 | |
| | 111,200 | | | | | Daiwa House Industry Co., Ltd. | | | 2,743,106 | |
| | 17,200 | | | | | Daiwabo Holdings Co., Ltd. | | | 822,607 | |
| | 45,400 | | | | | DD Holdings Co., Ltd. | | | 333,367 | |
| | 85,100 | | | | | DIC Corp. | | | 1,873,950 | |
| | 32,900 | | | | | Dip Corp. | | | 527,138 | |
| | 9,800 | | | | | Disco Corp. | | | 1,926,302 | |
| | 51,300 | | | | | Dowa Holdings Co., Ltd. | | | 1,337,612 | |
| | 52,800 | | | | | Eagle Industry Co., Ltd. | | | 329,872 | |
| | 275,800 | | | | | EDION Corp. | | | 2,275,693 | |
| | 10,100 | | | | | Eiken Chemical Co., Ltd. | | | 183,391 | |
| | 25,500 | | | | | Eisai Co., Ltd. | | | 1,864,238 | |
| | 16,200 | | | | | Enplas Corp. | | | 316,479 | |
| | 77,700 | | | | | EPS Holdings, Inc. | | | 808,825 | |
| | 9,800 | | | | | ESPEC Corp.‡ | | | 148,230 | |
| | 91,300 | | | | | Ezaki Glico Co., Ltd. | | | 3,815,050 | |
| | 15,600 | | | | | FANUC Corp. | | | 2,107,061 | |
| | 159,900 | | | | | Fuji Corp. | | | 2,433,575 | |
| | 78,900 | | | | | Fuji Media Holdings, Inc. | | | 783,536 | |
| | 14,000 | | | | | Fujimi, Inc.‡ | | | 347,008 | |
| | 41,000 | | | | | Fujitec Co., Ltd. | | | 526,259 | |
| | 36,800 | | | | | Fujitsu, Ltd. | | | 3,307,571 | |
| | 120,900 | | | | | Fukuoka Financial Group, Inc. | | | 1,594,426 | |
| | 46,400 | | | | | Furukawa Co., Ltd. | | | 453,419 | |
| | 124,400 | | | | | Futaba Industrial Co., Ltd. | | | 523,778 | |
| | 36,300 | | | | | Glory, Ltd. | | | 833,167 | |
| | 23,700 | | | | | Godo Steel, Ltd. | | | 459,009 | |
| | 361,294 | | | | | Hachijuni Bank, Ltd. (The) | | | 1,303,741 | |
| | 17,800 | | | | | Hankyu Hanshin Holdings, Inc. | | | 596,982 | |
| | 326,100 | | | | | Hazama Ando Corp. | | | 2,071,351 | |
| | 72,300 | | | | | Hirose Electric Co., Ltd. | | | 7,469,024 | |
| | 92,500 | | | | | Hitachi Capital Corp.‡ | | | 1,736,027 | |
| | 97,100 | | | | | Hitachi Zosen Corp. | | | 311,387 | |
| | 230,400 | | | | | Hitachi, Ltd. | | | 6,680,192 | |
| | 245,500 | | | | | Honda Motor Co., Ltd.‡ | | | 5,499,235 | |
| | 36,000 | | | | | Honda Motor Co., Ltd., ADR | | | 808,560 | |
| | 22,300 | | | | | Honeys Holdings Co., Ltd. | | | 222,949 | |
| | 7,600 | | | | | Hosokawa Micron Corp. | | | 335,319 | |
| | 170,300 | | | | | Hoya Corp. | | | 14,427,834 | |
| | 124,900 | | | | | Hulic Co., Ltd. | | | 1,263,121 | |
| | 69,900 | | | | | Ichinen Holdings Co., Ltd.‡ | | | 737,051 | |
| | 48,700 | | | | | Ines Corp. | | | 607,260 | |
| | 477,000 | | | | | Inpex Corp. | | | 2,670,571 | |
| | 3,277 | | | | | Invesco OfficeJ-Reit, Inc. REIT | | | 427,221 | |
See accompanying Notes to the Financial Statements.
57
Mercer Non-US Core Equity Fund
Schedule of Investments (Continued)
(showing percentage of net assets)
March 31, 2020
| | | | | | | | | | |
| Shares | | | | | Description | | Value ($) | |
| | |
| | | | | | Japan — continued | |
| | 256,000 | | | | | Isuzu Motors, Ltd. | | | 1,687,767 | |
| | 199,500 | | | | | Ito En, Ltd. | | | 10,526,236 | |
| | 317,400 | | | | | ITOCHU Corp.‡ | | | 6,559,211 | |
| | 41,400 | | | | | Jaccs Co., Ltd. | | | 698,851 | |
| | 10,800 | | | | | Jafco Co., Ltd. | | | 280,396 | |
| | 105,600 | | | | | Japan Airlines Co., Ltd.‡ | | | 1,935,546 | |
| | 153,300 | | | | | Japan Aviation Electronics Industry, Ltd. | | | 1,835,120 | |
| | 62,300 | | | | | Japan Exchange Group, Inc. | | | 1,096,432 | |
| | 21,900 | | | | | Japan Petroleum Exploration Co., Ltd.‡ | | | 358,041 | |
| | 59,600 | | | | | JTEKT Corp. | | | 403,095 | |
| | 59,000 | | | | | Juki Corp. | | | 299,199 | |
| | 14,400 | | | | | Kaga Electronics Co., Ltd. | | | 225,622 | |
| | 17,500 | | | | | Kaken Pharmaceutical Co., Ltd. | | | 811,544 | |
| | 238,126 | | | | | Kandenko Co., Ltd. | | | 1,892,188 | |
| | 37,800 | | | | | Kaneka Corp. | | | 901,726 | |
| | 296,500 | | | | | Kanematsu Corp. | | | 3,033,065 | |
| | 250,800 | | | | | Kansai Electric Power Co., Inc. (The) | | | 2,786,442 | |
| | 173,700 | | | | | Kansai Paint Co., Ltd.‡ | | | 3,298,942 | |
| | 119,500 | | | | | Kanto Denka Kogyo Co., Ltd. | | | 852,273 | |
| | 212,508 | | | | | Kao Corp. | | | 17,330,654 | |
| | 57,400 | | | | | Kawasaki Heavy Industries, Ltd.‡ | | | 828,887 | |
| | 784,200 | | | | | KDDI Corp. | | | 23,087,116 | |
| | 3,200 | | | | | Keihin Corp. | | | 74,862 | |
| | 30,500 | | | | | Keyence Corp. | | | 9,803,616 | |
| | 22,200 | | | | | Ki-Star Real Estate Co., Ltd.‡ | | | 230,365 | |
| | 60,600 | | | | | Kintetsu World Express, Inc. | | | 886,723 | |
| | 32,500 | | | | | Kirindo Holdings Co., Ltd. | | | 519,026 | |
| | 37,400 | | | | | Kito Corp. | | | 343,072 | |
| | 120,100 | | | | | Kobayashi Pharmaceutical Co., Ltd. | | | 11,088,972 | |
| | 18,700 | | | | | Koei Tecmo Holdings Co., Ltd. | | | 480,518 | |
| | 106,300 | | | | | Komatsu, Ltd. | | | 1,742,104 | |
| | 46,800 | | | | | Konami Holdings Corp. | | | 1,429,074 | |
| | 13,886 | | | | | Kose Corp.‡ | | | 1,705,151 | |
| | 148,000 | | | | | Kuraray Co., Ltd. | | | 1,489,765 | |
| | 12,000 | | | | | Kurimoto, Ltd. | | | 209,786 | |
| | 20,700 | | | | | Kurita Water Industries, Ltd. | | | 476,434 | |
| | 3,000 | | | | | Lawson, Inc. | | | 164,349 | |
| | 32,400 | | | | | Lion Corp. | | | 692,350 | |
| | 60,500 | | | | | LIXIL Group Corp. | | | 749,323 | |
| | 25,000 | | | | | Macnica Fuji Electronics Holdings, Inc. | | | 309,052 | |
| | 515,400 | | | | | Marubeni Corp. | | | 2,559,353 | |
| | 55,100 | | | | | Matsumotokiyoshi Holdings Co., Ltd. | | | 2,011,394 | |
| | 39,100 | | | | | Max Co., Ltd. | | | 599,950 | |
| | 520,900 | | | | | Mebuki Financial Group, Inc. | | | 1,057,919 | |
| | 25,800 | | | | | Medipal Holdings Corp. | | | 480,258 | |
| | 53,200 | | | | | Megmilk Snow Brand Co., Ltd. | | | 1,205,945 | |
| | 18,200 | | | | | Meidensha Corp. | | | 271,883 | |
| | 457,700 | | | | | Mitsubishi Chemical Holdings Corp. | | | 2,712,358 | |
| | 172,200 | | | | | Mitsubishi Gas Chemical Co., Inc. | | | 1,863,036 | |
See accompanying Notes to the Financial Statements.
58
Mercer Non-US Core Equity Fund
Schedule of Investments (Continued)
(showing percentage of net assets)
March 31, 2020
| | | | | | | | | | |
| Shares | | | | | Description | | Value ($) | |
| | |
| | | | | | Japan — continued | |
| | 49,000 | | | | | Mitsubishi Heavy Industries, Ltd. | | | 1,234,366 | |
| | 33,200 | | | | | Mitsubishi Shokuhin Co., Ltd. | | | 852,575 | |
| | 3,293,900 | | | | | Mitsubishi UFJ Financial Group, Inc. | | | 12,239,417 | |
| | 89,900 | | | | | Mitsui Fudosan Co., Ltd. | | | 1,548,721 | |
| | 31,900 | | | | | Mitsui Mining & Smelting Co., Ltd.‡ | | | 530,281 | |
| | 3,003,500 | | | | | Mizuho Financial Group, Inc. | | | 3,423,730 | |
| | 91,200 | | | | | Mizuho Leasing Co., Ltd. | | | 1,768,968 | |
| | 332,800 | | | | | MonotaRO Co., Ltd.‡ | | | 8,807,749 | |
| | 128,700 | | | | | MS&AD Insurance Group Holdings, Inc. | | | 3,590,434 | |
| | 242,200 | | | | | Murata Manufacturing Co., Ltd. | | | 12,210,104 | |
| | 39,700 | | | | | Nakanishi, Inc. | | | 525,741 | |
| | 67,900 | | | | | NEC Corp. | | | 2,467,558 | |
| | 35,800 | | | | | NH Foods, Ltd. | | | 1,242,642 | |
| | 14,600 | | | | | Nihon Chouzai Co., Ltd. | | | 221,795 | |
| | 146,600 | | | | | Nihon House Holdings Co., Ltd.‡ | | | 395,945 | |
| | 219,200 | | | | | Nihon Kohden Corp. | | | 8,220,706 | |
| | 96,500 | | | | | Nikkiso Co., Ltd. | | | 715,776 | |
| | 14,200 | | | | | Nintendo Co., Ltd. | | | 5,455,037 | |
| | 49,100 | | | | | Nintendo Co., Ltd., ADR | | | 2,370,548 | |
| | 27,900 | | | | | NipponChemi-Con Corp. | | | 305,313 | |
| | 54,300 | | | | | Nippon Electric Glass Co., Ltd. | | | 724,501 | |
| | 3,300 | | | | | Nippon Express Co., Ltd. | | | 160,954 | |
| | 82,000 | | | | | Nippon Soda Co., Ltd. | | | 2,037,938 | |
| | 680,600 | | | | | Nippon Telegraph & Telephone Corp. | | | 16,086,455 | |
| | 49,200 | | | | | Nisshin Oillio Group, Ltd. (The) | | | 1,666,943 | |
| | 30,900 | | | | | Nissin Foods Holdings Co., Ltd. | | | 2,568,726 | |
| | 9,600 | | | | | Nitto Denko Corp. | | | 426,836 | |
| | 1,404,700 | | | | | Nomura Holdings, Inc. | | | 5,926,946 | |
| | 460,600 | | | | | Nomura Research Institute, Ltd. | | | 9,693,386 | |
| | 463,841 | | | | | North Pacific Bank, Ltd. | | | 872,956 | |
| | 120,300 | | | | | NTT Data Corp. | | | 1,152,440 | |
| | 297,900 | | | | | NTT DOCOMO, Inc. | | | 9,327,236 | |
| | 389,700 | | | | | Obayashi Corp. | | | 3,324,970 | |
| | 61,700 | | | | | Obic Co., Ltd. | | | 8,028,168 | |
| | 104,300 | | | | | Oki Electric Industry Co., Ltd. | | | 974,933 | |
| | 18,900 | | | | | Okuwa Co., Ltd. | | | 302,944 | |
| | 493,100 | | | | | Olympus Corp. | | | 7,088,284 | |
| | 149,100 | | | | | Omron Corp. | | | 7,725,801 | |
| | 24,000 | | | | | Optorun Co., Ltd. | | | 568,232 | |
| | 15,500 | | | | | Organo Corp. | | | 782,915 | |
| | 322,500 | | | | | ORIX Corp. | | | 3,862,729 | |
| | 40,100 | | | | | Otsuka Holdings Co., Ltd. | | | 1,563,640 | |
| | 406,400 | | | | | Pan Pacific International Holdings Corp. | | | 7,686,705 | |
| | 561,100 | | | | | Panasonic Corp. | | | 4,266,236 | |
| | 5,700 | | | | | PCA Corp.‡ | | | 160,923 | |
| | 42,500 | | | | | Prima Meat Packers, Ltd. | | | 962,545 | |
| | 113,500 | | | | | PS Mitsubishi Construction Co., Ltd.‡ | | | 536,425 | |
| | 30,300 | | | | | Punch Industry Co., Ltd.‡ | | | 114,281 | |
| | 15,400 | | | | | Quick Co., Ltd. | | | 139,458 | |
See accompanying Notes to the Financial Statements.
59
Mercer Non-US Core Equity Fund
Schedule of Investments (Continued)
(showing percentage of net assets)
March 31, 2020
| | | | | | | | | | |
| Shares | | | | | Description | | Value ($) | |
| | |
| | | | | | Japan — continued | |
| | 408,100 | | | | | Recruit Holdings Co., Ltd. | | | 10,495,904 | |
| | 57,800 | | | | | Relia, Inc. | | | 556,990 | |
| | 45,600 | | | | | Renesas Electronics Corp.* | | | 163,069 | |
| | 714,000 | | | | | Resona Holdings, Inc. | | | 2,139,925 | |
| | 58,600 | | | | | Ricoh Co., Ltd.‡ | | | 428,586 | |
| | 197,700 | | | | | Rohto Pharmaceutical Co., Ltd. | | | 5,397,410 | |
| | 15,400 | | | | | Ryobi, Ltd. | | | 188,289 | |
| | 220,400 | | | | | Sanki Engineering Co., Ltd. | | | 2,464,290 | |
| | 53,700 | | | | | Sankyu, Inc. | | | 1,997,530 | |
| | 541,300 | | | | | Santen Pharmaceutical Co., Ltd. | | | 9,286,230 | |
| | 61,800 | | | | | Sanwa Holdings Corp. | | | 480,323 | |
| | 85,400 | | | | | Sanyo Trading Co., Ltd. | | | 649,919 | |
| | 40,100 | | | | | Sawai Pharmaceutical Co., Ltd. | | | 2,137,325 | |
| | 26,000 | | | | | SBI Holdings, Inc.‡ | | | 377,790 | |
| | 123,600 | | | | | Secom Co., Ltd. | | | 10,235,462 | |
| | 87,300 | | | | | Seibu Holdings, Inc. | | | 957,514 | |
| | 165,600 | | | | | Seiko Epson Corp.‡ | | | 1,784,891 | |
| | 56,200 | | | | | Seven & i Holdings Co., Ltd. | | | 1,848,464 | |
| | 209,700 | | | | | Shimadzu Corp. | | | 5,497,928 | |
| | 76,300 | | | | | Shin-Etsu Chemical Co., Ltd. | | | 7,531,887 | |
| | 35,500 | | | | | Shindengen Electric Manufacturing Co., Ltd. | | | 761,406 | |
| | 56,300 | | | | | Shionogi & Co., Ltd. | | | 2,759,267 | |
| | 80,900 | | | | | Shiseido Co., Ltd. | | | 4,759,876 | |
| | 208,900 | | | | | SKY Perfect JSAT Holdings, Inc. | | | 740,656 | |
| | 16,500 | | | | | SMC Corp. | | | 7,015,334 | |
| | 67,300 | | | | | Sohgo Security Services Co., Ltd. | | | 3,265,763 | |
| | 896,700 | | | | | Sojitz Corp. | | | 2,097,225 | |
| | 57,600 | | | | | Sompo Holdings, Inc. | | | 1,774,614 | |
| | 19,300 | | | | | ST Corp. | | | 285,336 | |
| | 46,900 | | | | | Sugi Holdings Co., Ltd. | | | 2,502,161 | |
| | 89,000 | | | | | SUMCO Corp. | | | 1,139,981 | |
| | 19,600 | | | | | Sumitomo Bakelite Co., Ltd. | | | 414,132 | |
| | 558,300 | | | | | Sumitomo Chemical Co., Ltd. | | | 1,650,156 | |
| | 189,500 | | | | | Sumitomo Corp. | | | 2,164,311 | |
| | 196,600 | | | | | Sumitomo Electric Industries, Ltd. | | | 2,059,760 | |
| | 128,500 | | | | | Sumitomo Heavy Industries, Ltd. | | | 2,308,425 | |
| | 414,700 | | | | | Sumitomo Mitsui Construction Co., Ltd. | | | 1,823,265 | |
| | 385,500 | | | | | Sumitomo Mitsui Financial Group, Inc. | | | 9,329,305 | |
| | 169,500 | | | | | Sumitomo Mitsui Trust Holdings, Inc. | | | 4,877,187 | |
| | 181,900 | | | | | Sumitomo Rubber Industries, Ltd. | | | 1,709,881 | |
| | 7,600 | | | | | Sumitomo Seika Chemicals Co., Ltd. | | | 186,589 | |
| | 41,900 | | | | | Suzuken Co., Ltd. | | | 1,521,082 | |
| | 18,700 | | | | | SWCC Showa Holdings Co., Ltd. | | | 173,779 | |
| | 192,100 | | | | | T&D Holdings, Inc. | | | 1,562,141 | |
| | 88,200 | | | | | Taiyo Nippon Sanso Corp. | | | 1,301,199 | |
| | 94,500 | | | | | Takeda Pharmaceutical Co., Ltd., ADR* | | | 1,434,510 | |
| | 51,500 | | | | | Takeei Corp. | | | 369,979 | |
| | 77,100 | | | | | Tamura Corp. | | | 280,850 | |
| | 15,800 | | | | | TDK Corp. | | | 1,217,755 | |
See accompanying Notes to the Financial Statements.
60
Mercer Non-US Core Equity Fund
Schedule of Investments (Continued)
(showing percentage of net assets)
March 31, 2020
| | | | | | | | | | |
| Shares | | | | | Description | | Value ($) | |
| | |
| | | | | | Japan — continued | |
| | 148,300 | | | | | Teijin, Ltd. | | | 2,502,460 | |
| | 546,200 | | | | | Terumo Corp. | | | 18,708,714 | |
| | 6,900 | | | | | TOA ROAD Corp. | | | 191,209 | |
| | 33,900 | | | | | TOC Co., Ltd. | | | 183,444 | |
| | 116,700 | | | | | Tokuyama Corp. | | | 2,246,989 | |
| | 87,800 | | | | | Tokyo Electric Power Co. Holdings, Inc.* | | | 305,577 | |
| | 9,400 | | | | | Tokyo Electron, Ltd. | | | 1,760,529 | |
| | 3,200 | | | | | Tokyo Electron, Ltd., ADR | | | 148,960 | |
| | 29,600 | | | | | Tokyo Ohka Kogyo Co., Ltd. | | | 1,130,028 | |
| | 67,000 | | | | | Tokyo Seimitsu Co., Ltd. | | | 1,897,851 | |
| | 77,100 | | | | | Tomy Co., Ltd. | | | 541,769 | |
| | 29,700 | | | | | Topcon Corp. | | | 219,179 | |
| | 102,900 | | | | | Toppan Printing Co., Ltd. | | | 1,570,783 | |
| | 11,300 | | | | | Toray Industries, Inc. | | | 48,804 | |
| | 6,700 | | | | | Torikizoku Co., Ltd. | | | 99,846 | |
| | 27,000 | | | | | Toshiba TEC Corp. | | | 847,013 | |
| | 85,200 | | | | | Towa Corp. | | | 584,309 | |
| | 54,000 | | | | | Towa Pharmaceutical Co., Ltd. | | | 1,129,829 | |
| | 137,400 | | | | | Toyo Construction Co., Ltd. | | | 555,158 | |
| | 220,500 | | | | | Toyo Suisan Kaisha, Ltd. | | | 10,633,113 | |
| | 16,400 | | | | | Toyo Tanso Co., Ltd. | | | 211,353 | |
| | 141,400 | | | | | Toyoda Gosei Co., Ltd. | | | 2,414,818 | |
| | 65,800 | | | | | Toyota Motor Corp. | | | 3,945,498 | |
| | 64,400 | | | | | Toyota Tsusho Corp. | | | 1,510,148 | |
| | 26,800 | | | | | Transaction Co., Ltd. | | | 200,872 | |
| | 22,300 | | | | | Transcosmos, Inc.* | | | 393,440 | |
| | 23,000 | | | | | Trend Micro, Inc. | | | 1,131,537 | |
| | 73,500 | | | | | TS Tech Co., Ltd. | | | 1,734,575 | |
| | 16,600 | | | | | Tsubakimoto Chain Co. | | | 376,375 | |
| | 130,200 | | | | | Ube Industries, Ltd. | | | 1,987,313 | |
| | 62,400 | | | | | Ulvac, Inc. | | | 1,486,092 | |
| | 97,100 | | | | | Ushio, Inc. | | | 925,104 | |
| | 25,700 | | | | | Valor Holdings Co., Ltd. | | | 456,358 | |
| | 53,600 | | | | | West Japan Railway Co. | | | 3,656,076 | |
| | 56,400 | | | | | World Co., Ltd. | | | 779,308 | |
| | 249,400 | | | | | Yamaha Motor Co., Ltd. | | | 3,000,555 | |
| | 39,200 | | | | | Yamato Holdings Co., Ltd. | | | 612,769 | |
| | 24,100 | | | | | Yellow Hat, Ltd. | | | 334,177 | |
| | 230,800 | | | | | Yokogawa Electric Corp. | | | 2,768,694 | |
| | 152,400 | | | | | Yokohama Rubber Co., Ltd. (The) | | | 1,883,337 | |
| | 35,400 | | | | | Yuasa Trading Co., Ltd. | | | 933,058 | |
| | 885,600 | | | | | Z Holdings Corp. | | | 2,837,255 | |
| | | | | | | | | | |
| | | | | | Total Japan | | | 642,306,049 | |
| | | | | | | | | | |
| | |
| | | | | | Luxembourg — 0.0% | |
| | 62,274 | | | | | ArcelorMittal SA ADR NYRS | | | 581,016 | |
| | 53,689 | | | | | eDreams ODIGEO SA* ‡ | | | 108,456 | |
| | | | | | | | | | |
| | | | | | Total Luxembourg | | | 689,472 | |
| | | | | | | | | | |
See accompanying Notes to the Financial Statements.
61
Mercer Non-US Core Equity Fund
Schedule of Investments (Continued)
(showing percentage of net assets)
March 31, 2020
| | | | | | | | | | |
| Shares | | | | | Description | | Value ($) | |
| | |
| | | | | | Malaysia — 0.0% | |
| | 565,800 | | | | | Supermax Corp. Bhd | | | 223,541 | |
| | 320,000 | | | | | Tenaga Nasional Bhd | | | 888,453 | |
| | | | | | | | | | |
| | | | | | Total Malaysia | | | 1,111,994 | |
| | | | | | | | | | |
| | |
| | | | | | Marshall Islands — 0.0% | |
| | 54,735 | | | | | Costamare, Inc. | | | 247,402 | |
| | | | | | | | | | |
| | |
| | | | | | Mauritius — 0.0% | |
| | 6,759,900 | | | | | Golden Agri-Resources, Ltd. | | | 663,551 | |
| | | | | | | | | | |
| | |
| | | | | | Netherlands — 4.5% | |
| | 25,500 | | | | | Aalberts NV | | | 602,360 | |
| | 139,872 | | | | | ABN AMRO Bank NV, CVA 144A | | | 1,142,280 | |
| | 13,229 | | | | | Adyen NV* | | | 11,138,718 | |
| | 1,657,408 | | | | | Aegon NV | | | 4,182,786 | |
| | 8,565 | | | | | AerCap Holdings NV* | | | 195,196 | |
| | 72,159 | | | | | Airbus SE | | | 4,657,927 | |
| | 48,291 | | | | | Akzo Nobel NV | | | 3,167,342 | |
| | 2,539 | | | | | ASM International NV | | | 252,741 | |
| | 62,795 | | | | | ASML Holding NV | | | 16,602,948 | |
| | 8,713 | | | | | ASR Nederland NV | | | 218,384 | |
| | 60,318 | | | | | CNH Industrial NV | | | 343,349 | |
| | 43,813 | | | | | Core Laboratories NV | | | 453,026 | |
| | 38,243 | | | | | Euronext NV | | | 2,834,129 | |
| | 6,442 | | | | | EXOR NV | | | 330,126 | |
| | 410,223 | | | | | Fiat Chrysler Automobiles NV | | | 2,941,002 | |
| | 94,716 | | | | | Heineken NV | | | 7,886,939 | |
| | 1,039,005 | | | | | ING Groep NV | | | 5,414,494 | |
| | 61,757 | | | | | Intertrust NV 144A | | | 769,149 | |
| | 344,100 | | | | | Koninklijke Ahold Delhaize NV | | | 8,011,823 | |
| | 1,250,969 | | | | | Koninklijke BAM Groep NV | | | 1,740,862 | |
| | 98,946 | | | | | Koninklijke DSM NV | | | 11,186,053 | |
| | 855,453 | | | | | Koninklijke KPN NV | | | 2,035,700 | |
| | 71,806 | | | | | Koninklijke Philips NV | | | 2,891,441 | |
| | 160,655 | | | | | NN Group NV | | | 4,316,887 | |
| | 38,282 | | | | | NXP Semiconductors NV | | | 3,174,726 | |
| | 207,756 | | | | | Signify NV 144A | | | 4,014,903 | |
| | 15,104 | | | | | STMicroelectronics NV | | | 327,093 | |
| | 264,013 | | | | | STMicroelectronics NV (Euronext Exchange) | | | 5,716,465 | |
| | 5,528 | | | | | TKH Group NV, CVA, ADR | | | 153,288 | |
| | 54,469 | | | | | TomTom NV* | | | 423,804 | |
| | 105,296 | | | | | Unilever NV | | | 5,161,359 | |
| | 54,272 | | | | | Unilever NV ADR NYRS | | | 2,647,931 | |
| | 39,425 | | | | | Wolters Kluwer NV | | | 2,788,751 | |
| | 35,305 | | | | | X5 Retail Group NV, GDR | | | 950,657 | |
| | 18,781 | | | | | X5 Retail Group NV, Reg S, GDR‡‡‡ | | | 504,412 | |
| | | | | | | | | | |
| | | | | | Total Netherlands | | | 119,179,051 | |
| | | | | | | | | | |
See accompanying Notes to the Financial Statements.
62
Mercer Non-US Core Equity Fund
Schedule of Investments (Continued)
(showing percentage of net assets)
March 31, 2020
| | | | | | | | | | |
| Shares | | | | | Description | | Value ($) | |
| | |
| | | | | | New Zealand — 0.0% | |
| | 141,210 | | | | | Pushpay Holdings, Ltd.* | | | 283,798 | |
| | 267,152 | | | | | Sky City Entertainment Group, Ltd. | | | 293,176 | |
| | 256,400 | | | | | SKY Network Television, Ltd.* | | | 42,412 | |
| | | | | | | | | | |
| | | | | | Total New Zealand | | | 619,386 | |
| | | | | | | | | | |
| | |
| | | | | | Norway — 0.3% | |
| | 17,245 | | | | | Atea ASA* | | | 144,558 | |
| | 100,400 | | | | | Austevoll Seafood ASA | | | 705,958 | |
| | 343,106 | | | | | DNB ASA | | | 3,809,697 | |
| | 161,649 | | | | | Elkem ASA 144A | | | 202,860 | |
| | 121,804 | | | | | Equinor ASA | | | 1,519,053 | |
| | 16,059 | | | | | Grieg Seafood ASA | | | 147,726 | |
| | 113,647 | | | | | Nordic Semiconductor ASA* | | | 499,041 | |
| | 85,317 | | | | | Storebrand ASA‡ | | | 338,733 | |
| | | | | | | | | | |
| | | | | | Total Norway | | | 7,367,626 | |
| | | | | | | | | | |
| | |
| | | | | | Philippines — 0.0% | |
| | 6,261,800 | | | | | Vista Land & Lifescapes, Inc. | | | 503,251 | |
| | | | | | | | | | |
| | |
| | | | | | Portugal — 0.0% | |
| | 782,528 | | | | | Banco Espirito Santo SA* **** ^ | | | — | |
| | | | | | | | | | |
| | |
| | | | | | Russia — 0.9% | |
| | 120,640,000 | | | | | Federal Grid Co. Unified Energy System PJSC | | | 247,108 | |
| | 2,069,170 | | | | | Gazprom PJSC | | | 4,798,047 | |
| | 426,500 | | | | | Gazprom PJSC, ADR | | | 1,964,889 | |
| | 21,108 | | | | | LUKOIL PJSC | | | 1,258,377 | |
| | 59,100 | | | | | LUKOIL PJSC, ADR | | | 3,496,356 | |
| | 62,672 | | | | | Magnit PJSC | | | 2,552,805 | |
| | 8,872 | | | | | MMC Norilsk Nickel PJSC | | | 2,209,058 | |
| | 125,400 | | | | | MMC Norilsk Nickel PJSC, ADR | | | 3,105,318 | |
| | 7,847 | | | | | Polyus PJSC | | | 1,074,926 | |
| | 45,975,000 | | | | | ROSSETI PJSC | | | 683,202 | |
| | 36,400 | | | | | Tatneft PJSC, ADR | | | 1,526,898 | |
| | | | | | | | | | |
| | | | | | Total Russia | | | 22,916,984 | |
| | | | | | | | | | |
| | |
| | | | | | Singapore — 0.3% | |
| | 259,300 | | | | | United Overseas Bank, Ltd. | | | 3,544,747 | |
| | 242,600 | | | | | Venture Corp., Ltd. | | | 2,301,745 | |
| | 3,718,700 | | | | | Yangzijiang Shipbuilding Holdings, Ltd. | | | 2,168,727 | |
| | | | | | | | | | |
| | | | | | Total Singapore | | | 8,015,219 | |
| | | | | | | | | | |
| | |
| | | | | | South Africa — 0.0% | |
| | 1,003,000 | | | | | Old Mutual, Ltd.‡ | | | 644,956 | |
| | | | | | | | | | |
| | |
| | | | | | South Korea — 1.1% | |
| | 75,731 | | | | | Daeduck Electronics Co. | | | 447,346 | |
| | 33,666 | | | | | DB HiTek Co., Ltd. | | | 590,801 | |
See accompanying Notes to the Financial Statements.
63
Mercer Non-US Core Equity Fund
Schedule of Investments (Continued)
(showing percentage of net assets)
March 31, 2020
| | | | | | | | | | |
| Shares | | | | | Description | | Value ($) | |
| | |
| | | | | | South Korea — continued | |
| | 5,961 | | | | | Dong-A ST Co., Ltd. | | | 390,284 | |
| | 100,031 | | | | | Hansol Technics Co., Ltd.* | | | 407,629 | |
| | 7,997 | | | | | Hyundai Mobis Co., Ltd. | | | 1,101,266 | |
| | 50,738 | | | | | KAON Media Co., Ltd. | | | 200,099 | |
| | 93,000 | | | | | Kia Motors Corp. | | | 1,967,702 | |
| | 329 | | | | | LG Household & Health Care, Ltd. | | | 300,963 | |
| | 67,205 | | | | | Mcnex Co., Ltd. | | | 1,419,689 | |
| | 79,203 | | | | | Partron Co., Ltd. | | | 487,291 | |
| | 19,389 | | | | | S&T Motiv Co., Ltd. | | | 436,259 | |
| | 508,562 | | | | | Samsung Electronics Co., Ltd. | | | 19,764,810 | |
| | 74,041 | | | | | Samsung Engineering Co., Ltd.* | | | 609,322 | |
| | 19,188 | | | | | Seoul Semiconductor Co., Ltd. | | | 183,944 | |
| | 8,800 | | | | | SK Telecom Co., Ltd. | | | 1,273,735 | |
| | 68,214 | | | | | Top Engineering Co., Ltd. | | | 475,948 | |
| | 24,083 | | | | | Wemade Co., Ltd. | | | 390,936 | |
| | 9,291 | | | | | YAS Co., Ltd. | | | 74,352 | |
| | | | | | | | | | |
| | | | | | Total South Korea | | | 30,522,376 | |
| | | | | | | | | | |
| | |
| | | | | | Spain — 2.1% | |
| | 252,484 | | | | | Amadeus IT Group SA | | | 11,912,828 | |
| | 801,200 | | | | | Banco Santander SA | | | 1,940,091 | |
| | 381,420 | | | | | Cellnex Telecom SA | | | 17,272,034 | |
| | 152,500 | | | | | Enagas SA | | | 3,018,105 | |
| | 200,300 | | | | | Ence Energia y Celulosa SA‡ | | | 546,270 | |
| | 173,182 | | | | | Ercros SA | | | 430,820 | |
| | 1,159,101 | | | | | Iberdrola SA | | | 11,386,338 | |
| | 63,851 | | | | | International Consolidated Airlines Group SA | | | 169,312 | |
| | 20,191 | | | | | Let’s GOWEX SA* **** ‡ ^ | | | — | |
| | 1,567,692 | | | | | Mapfre SA | | | 2,667,778 | |
| | 463,253 | | | | | Mediaset Espana Comunicacion SA‡ | | | 1,709,963 | |
| | 402,108 | | | | | Repsol SA | | | 3,650,536 | |
| | 171,800 | | | | | Telefonica SA, ADR | | | 785,126 | |
| | | | | | | | | | |
| | | | | | Total Spain | | | 55,489,201 | |
| | | | | | | | | | |
| | |
| | | | | | Sweden — 2.2% | |
| | 51,973 | | | | | Bilia AB Class A | | | 320,568 | |
| | 268,778 | | | | | Boliden AB | | | 4,892,535 | |
| | 30,441 | | | | | Coor Service Management Holding AB 144A | | | 148,812 | |
| | 127,154 | | | | | Electrolux AB Class B | | | 1,580,990 | |
| | 127,154 | | | | | Electrolux Professional AB Class B* | | | 365,765 | |
| | 208,576 | | | | | Elekta AB Class B‡ | | | 1,723,137 | |
| | 199,592 | | | | | Epiroc AB Class A | | | 1,975,612 | |
| | 15,140 | | | | | Essity AB Class B | | | 466,163 | |
| | 2,903 | | | | | Getinge AB Class B | | | 55,658 | |
| | 50,015 | | | | | Haldex AB | | | 128,450 | |
| | 177,811 | | | | | Hennes & Mauritz AB Class B‡ | | | 2,284,388 | |
| | 199,942 | | | | | Hexagon AB Class B | | | 8,515,198 | |
| | 23,462 | | | | | ICA Gruppen AB | | | 987,605 | |
| | 14,539 | | | | | Industrivarden AB Class C | | | 283,388 | |
See accompanying Notes to the Financial Statements.
64
Mercer Non-US Core Equity Fund
Schedule of Investments (Continued)
(showing percentage of net assets)
March 31, 2020
| | | | | | | | | | |
| Shares | | | | | Description | | Value ($) | |
| | |
| | | | | | Sweden — continued | |
| | 19,494 | | | | | Investor AB Class A | | | 883,731 | |
| | 28,733 | | | | | Investor AB Class B | | | 1,319,535 | |
| | 70,468 | | | | | Inwido AB | | | 405,342 | |
| | 122,591 | | | | | Lindab International AB | | | 948,591 | |
| | 56,623 | | | | | Nobia AB | | | 201,359 | |
| | 356,587 | | | | | Samhallsbyggnadsbolaget i Norden AB | | | 679,451 | |
| | 189,200 | | | | | Sandvik AB | | | 2,682,775 | |
| | 645,800 | | | | | SAS AB* ‡ | | | 570,164 | |
| | 237,400 | | | | | SKF AB Class B‡ | | | 3,261,128 | |
| | 364,851 | | | | | Svenska Handelsbanken AB Class A* | | | 3,050,672 | |
| | 38,509 | | | | | Swedish Match AB | | | 2,199,423 | |
| | 1,352,652 | | | | | Telefonaktiebolaget LM Ericsson Class B | | | 11,022,620 | |
| | 606,983 | | | | | Volvo AB Class B | | | 7,287,636 | |
| | | | | | | | | | |
| | | | | | Total Sweden | | | 58,240,696 | |
| | | | | | | | | | |
| | |
| | | | | | Switzerland — 11.3% | |
| | 96,199 | | | | | Adecco Group AG | | | 3,775,792 | |
| | 33,604 | | | | | Alcon, Inc.* | | | 1,705,929 | |
| | 11,105 | | | | | Alcon, Inc. (New York Exchange)* | | | 564,356 | |
| | 71,096 | | | | | Arbonia AG* ‡ | | | 555,577 | |
| | 3,959 | | | | | Bobst Group SA‡ | | | 179,092 | |
| | 4,000 | | | | | Bucher Industries AG | | | 1,056,920 | |
| | 95 | | | | | Chocoladefabriken Lindt & Spruengli AG | | | 798,421 | |
| | 65,382 | | | | | Cie Financiere Richemont SA | | | 3,564,533 | |
| | 4,449 | | | | | Comet Holding AG* | | | 456,922 | |
| | 499,600 | | | | | Credit Suisse Group AG* | | | 4,103,859 | |
| | 55,880 | | | | | Dufry AG* | | | 1,723,150 | |
| | 20,200 | | | | | Flughafen Zurich AG | | | 2,261,970 | |
| | 8,065 | | | | | Geberit AG | | | 3,539,196 | |
| | 8,590 | | | | | Givaudan SA | | | 26,493,637 | |
| | 762 | | | | | Inficon Holding AG | | | 493,890 | |
| | 45,245 | | | | | Julius Baer Group, Ltd.* | | | 1,536,647 | |
| | 32,847 | | | | | LafargeHolcim, Ltd.* | | | 1,194,513 | |
| | 32,784 | | | | | Landis & Gyr Group AG* | | | 2,247,844 | |
| | 39,275 | | | | | Lonza Group AG* | | | 16,255,122 | |
| | 460,128 | | | | | Nestle SA | | | 47,177,049 | |
| | 501,268 | | | | | Novartis AG | | | 41,211,089 | |
| | 13,327 | | | | | Partners Group Holding AG | | | 9,169,913 | |
| | 168,795 | | | | | Roche Holding AG | | | 54,591,195 | |
| | 16,377 | | | | | Roche Holding AG, ADR | | | 664,415 | |
| | 919 | | | | | Roche Holding AG (Bearer Shares) | | | 293,577 | |
| | 15,591 | | | | | Schindler Holding AG | | | 3,409,072 | |
| | 4,521 | | | | | SGS SA | | | 10,432,344 | |
| | 23,943 | | | | | Sika AG | | | 3,940,847 | |
| | 8,247 | | | | | Sonova Holding AG | | | 1,481,111 | |
| | 2,952 | | | | | Straumann Holding AG | | | 2,188,551 | |
| | 4,685 | | | | | Sulzer AG | | | 294,666 | |
| | 16,018 | | | | | Swatch Group AG (The) | | | 627,015 | |
| | 11,918 | | | | | Swatch Group AG (The) (Bearer Shares) | | | 2,369,545 | |
See accompanying Notes to the Financial Statements.
65
Mercer Non-US Core Equity Fund
Schedule of Investments (Continued)
(showing percentage of net assets)
March 31, 2020
| | | | | | | | | | |
| Shares | | | | | Description | | Value ($) | |
| | |
| | | | | | Switzerland — continued | |
| | 18,523 | | | | | Swiss Life Holding AG | | | 6,273,601 | |
| | 46,900 | | | | | Swiss Re AG | | | 3,597,294 | |
| | 74,087 | | | | | Temenos AG* | | | 9,663,920 | |
| | 1,008,922 | | | | | UBS Group AG* | | | 9,380,620 | |
| | 152 | | | | | Vetropack Holding AG | | | 401,776 | |
| | 16,356 | | | | | Zehnder Group AG | | | 622,838 | |
| | 59,125 | | | | | Zurich Insurance Group AG | | | 20,877,408 | |
| | | | | | | | | | |
| | | | | | Total Switzerland | | | 301,175,216 | |
| | | | | | | | | | |
| | |
| | | | | | Taiwan — 1.2% | |
| | 92,000 | | | | | Apacer Technology, Inc. | | | 109,707 | |
| | 1,375,000 | | | | | Chipbond Technology Corp. | | | 2,251,105 | |
| | 759,000 | | | | | ChipMOS Technologies, Inc. | | | 658,578 | |
| | 2,208,000 | | | | | Compeq Manufacturing Co., Ltd. | | | 2,236,771 | |
| | 1,943,000 | | | | | Fubon Financial Holding Co., Ltd. | | | 2,413,006 | |
| | 1,600,000 | | | | | Hon Hai Precision Industry Co., Ltd. | | | 3,699,021 | |
| | 93,000 | | | | | Standard Foods Corp. | | | 187,610 | |
| | 803,000 | | | | | Sunonwealth Electric Machine Industry Co., Ltd. | | | 833,913 | |
| | 250,000 | | | | | Taiflex Scientific Co., Ltd. | | | 344,255 | |
| | 175,000 | | | | | Taiwan Hon Chuan Enterprise Co., Ltd. | | | 286,228 | |
| | 384,764 | | | | | Taiwan Semiconductor Manufacturing Co., Ltd., ADR | | | 18,387,872 | |
| | | | | | | | | | |
| | | | | | Total Taiwan | | | 31,408,066 | |
| | | | | | | | | | |
| | |
| | | | | | Thailand — 0.1% | |
| | 16,831,100 | | | | | Quality Houses PCL Class F | | | 959,513 | |
| | 16,156,000 | | | | | Sansiri PCL Class F | | | 290,383 | |
| | 775,900 | | | | | United Paper PCL Class F | | | 163,119 | |
| | | | | | | | | | |
| | | | | | Total Thailand | | | 1,413,015 | |
| | | | | | | | | | |
| | |
| | | | | | Turkey — 0.2% | |
| | 653,396 | | | | | Aksa Enerji Uretim AS Class B* | | | 322,490 | |
| | 75,338 | | | | | Arcelik AS* | | | 152,420 | |
| | 137,634 | | | | | BIM Birlesik Magazalar AS | | | 1,039,155 | |
| | 2,202,937 | | | | | Dogan Sirketler Grubu Holding AS | | | 502,409 | |
| | 675,399 | | | | | EIS Eczacibasi Ilac ve Sinai ve Finansal Yatirimlar Sanayi ve Ticaret AS | | | 484,866 | |
| | 126,063 | | | | | Ford Otomotiv Sanayi AS | | | 941,152 | |
| | 144,288 | | | | | Sok Marketler Ticaret AS* | | | 203,784 | |
| | 589,086 | | | | | Torunlar Gayrimenkul Yatirim Ortakligi AS REIT* | | | 162,007 | |
| | 1,207,148 | | | | | Turkiye Halk Bankasi AS* | | | 903,008 | |
| | 2,211,920 | | | | | Yapi ve Kredi Bankasi AS* | | | 622,683 | |
| | | | | | | | | | |
| | | | | | Total Turkey | | | 5,333,974 | |
| | | | | | | | | | |
| | |
| | | | | | United Kingdom — 11.5% | |
| | 484,537 | | | | | 3i Group Plc | | | 4,733,759 | |
| | 98,576 | | | | | Aggreko Plc | | | 592,810 | |
| | 283,185 | | | | | Anglo American Plc | | | 4,939,889 | |
| | 178,988 | | | | | Ashtead Group Plc | | | 3,968,555 | |
| | 44,067 | | | | | Associated British Foods Plc | | | 987,278 | |
See accompanying Notes to the Financial Statements.
66
Mercer Non-US Core Equity Fund
Schedule of Investments (Continued)
(showing percentage of net assets)
March 31, 2020
| | | | | | | | | | |
| Shares | | | | | Description | | Value ($) | |
| | |
| | | | | | United Kingdom — continued | |
| | 142,866 | | | | | AstraZeneca Plc | | | 12,739,855 | |
| | 103,853 | | | | | AstraZeneca Plc, ADR | | | 4,638,075 | |
| | 28,786 | | | | | Atlantica Yield Plc | | | 641,928 | |
| | 24,341 | | | | | Atlassian Corp. Plc Class A* | | | 3,341,046 | |
| | 319,109 | | | | | Avast Plc 144A | | | 1,550,366 | |
| | 23,751 | | | | | AVEVA Group Plc | | | 1,023,791 | |
| | 842,305 | | | | | Aviva Plc | | | 2,791,528 | |
| | 437,178 | | | | | Babcock International Group Plc | | | 2,068,669 | |
| | 974,600 | | | | | BAE Systems Plc | | | 6,277,868 | |
| | 45,361 | | | | | Bank of Georgia Group Plc | | | 518,737 | |
| | 1,759,000 | | | | | Barclays Plc | | | 2,040,267 | |
| | 280,200 | | | | | Barratt Developments Plc | | | 1,524,471 | |
| | 54,979 | | | | | Bellway Plc | | | 1,464,001 | |
| | 37,100 | | | | | Berkeley Group Holdings Plc | | | 1,655,539 | |
| | 115,148 | | | | | BHP Group Plc | | | 1,777,905 | |
| | 201,050 | | | | | BHP Group Plc, ADR | | | 6,099,857 | |
| | 93,857 | | | | | Bodycote Plc | | | 653,932 | |
| | 38,893 | | | | | Bovis Homes Group Plc | | | 277,046 | |
| | 1,295,400 | | | | | BP Plc | | | 5,501,314 | |
| | 236,200 | | | | | British American Tobacco Plc | | | 8,051,883 | |
| | 48,923 | | | | | British American Tobacco Plc, ADR | | | 1,672,677 | |
| | 25,200 | | | | | Britvic Plc | | | 218,591 | |
| | 1,821,700 | | | | | BT Group Plc | | | 2,652,396 | |
| | 28,987 | | | | | Carnival Plc, ADR | | | 345,815 | |
| | 399,523 | | | | | Centamin Plc | | | 586,793 | |
| | 2,254,467 | | | | | Centrica Plc | | | 1,058,639 | |
| | 164,112 | | | | | Chemring Group Plc | | | 406,437 | |
| | 709,869 | | | | | Compass Group Plc | | | 11,072,229 | |
| | 171,681 | | | | | ConvaTec Group Plc 144A | | | 398,833 | |
| | 208,800 | | | | | Crest Nicholson Holdings Plc | | | 457,332 | |
| | 35,507 | | | | | Croda International Plc | | | 1,874,546 | |
| | 473,602 | | | | | Diageo Plc | | | 15,142,589 | |
| | 70,900 | | | | | Dialog Semiconductor Plc* | | | 1,909,419 | |
| | 1,270,746 | | | | | Dixons Carphone Plc | | | 1,226,783 | |
| | 44,534 | | | | | EMIS Group Plc | | | 577,466 | |
| | 1,308,680 | | | | | EnQuest Plc* | | | 127,528 | |
| | 260,320 | | | | | Experian Plc | | | 7,234,294 | |
| | 701,600 | | | | | Firstgroup Plc* | | | 437,263 | |
| | 67,765 | | | | | Galliford Try Holdings Plc | | | 108,902 | |
| | 961,208 | | | | | GlaxoSmithKline Plc | | | 17,998,508 | |
| | 6,689 | | | | | GlaxoSmithKline Plc, ADR | | | 253,446 | |
| | 1,456,340 | | | | | Glencore Plc* | | | 2,218,907 | |
| | 52,816 | | | | | Greggs Plc | | | 1,054,146 | |
| | 264,055 | | | | | Halma Plc | | | 6,262,723 | |
| | 507,439 | | | | | IMI Plc | | | 4,685,455 | |
| | 186,700 | | | | | Imperial Brands Plc | | | 3,454,670 | |
| | 201,900 | | | | | Inchcape Plc | | | 1,081,579 | |
| | 30,282 | | | | | InterContinental Hotels Group Plc | | | 1,294,299 | |
| | 87,043 | | | | | Intermediate Capital Group Plc | | | 962,565 | |
See accompanying Notes to the Financial Statements.
67
Mercer Non-US Core Equity Fund
Schedule of Investments (Continued)
(showing percentage of net assets)
March 31, 2020
| | | | | | | | | | |
| Shares | | | | | Description | | Value ($) | |
| | |
| | | | | | United Kingdom — continued | |
| | 111,709 | | | | | Intertek Group Plc
| | | 6,517,971 | |
| | 305,507 | | | | | IWG Plc | | | 650,370 | |
| | 1,699,153 | | | | | J Sainsbury Plc | | | 4,417,447 | |
| | 47,700 | | | | | JD Sports Fashion Plc | | | 274,070 | |
| | 172,095 | | | | | Jupiter Fund Management Plc | | | 425,759 | |
| | 2,280,937 | | | | | Kingfisher Plc | | | 4,101,413 | |
| | 674,748 | | | | | Legal & General Group Plc | | | 1,611,441 | |
| | 5,315,800 | | | | | Lloyds Banking Group Plc | | | 2,092,621 | |
| | 156,905 | | | | | London Stock Exchange Group Plc | | | 14,112,925 | |
| | 690,031 | | | | | M&G Plc* | | | 959,189 | |
| | 1,263,445 | | | | | Man Group Plc | | | 1,942,424 | |
| | 676,700 | | | | | Marks & Spencer Group Plc | | | 829,480 | |
| | 379,651 | | | | | Marston’s Plc | | | 195,639 | |
| | 232,017 | | | | | Meggitt Plc | | | 839,059 | |
| | 923,906 | | | | | Melrose Industries Plc | | | 1,041,560 | |
| | 97,627 | | | | | Micro Focus International Plc | | | 482,093 | |
| | 38,327 | | | | | Micro Focus International Plc, ADR | | | 194,318 | |
| | 484,800 | | | | | Mitchells & Butlers Plc* | | | 1,090,929 | |
| | 162,330 | | | | | Mitie Group Plc | | | 130,673 | |
| | 549,930 | | | | | National Grid Plc | | | 6,434,295 | |
| | 377,455 | | | | | Paragon Banking Group Plc | | | 1,552,609 | |
| | 723,954 | | | | | Pets at Home Group Plc | | | 2,331,512 | |
| | 57,182 | | | | | Prudential Plc, ADR | | | 1,416,970 | |
| | 1,132,996 | | | | | QinetiQ Group Plc | | | 4,548,574 | |
| | 115,276 | | | | | Quilter Plc 144A | | | 168,168 | |
| | 212,004 | | | | | Reckitt Benckiser Group Plc | | | 16,242,646 | |
| | 247,100 | | | | | Redrow Plc | | | 1,098,635 | |
| | 125,742 | | | | | RELX Plc | | | 2,692,170 | |
| | 192,666 | | | | | RELX Plc (London Exchange) | | | 4,123,056 | |
| | 239,176 | | | | | Rentokil Initial Plc | | | 1,145,962 | |
| | 226,599 | | | | | Restaurant Group Plc (The) | | | 118,855 | |
| | 79,327 | | | | | Rio Tinto Plc | | | 3,635,025 | |
| | 117,941 | | | | | Rio Tinto Plc, ADR | | | 5,373,392 | |
| | 266,653 | | | | | Rotork Plc | | | 717,120 | |
| | 7,935 | | | | | Royal Dutch Shell Plc Class A, ADR | | | 276,852 | |
| | 280,600 | | | | | Royal Dutch Shell Plc Class B | | | 4,696,653 | |
| | 26,303 | | | | | Royal Dutch Shell Plc (Amsterdam Exchange) Class A | | | 467,612 | |
| | 429,192 | | | | | Royal Mail Plc | | | 663,746 | |
| | 556,464 | | | | | Saga Plc | | | 116,720 | |
| | 324,347 | | | | | Sage Group Plc (The) | | | 2,371,410 | |
| | 376,251 | | | | | Senior Plc | | | 326,258 | |
| | 156,297 | | | | | Smith & Nephew Plc | | | 2,768,781 | |
| | 140,335 | | | | | Spectris Plc | | | 4,256,276 | |
| | 94,414 | | | | | Spirax-Sarco Engineering Plc | | | 9,520,985 | |
| | 968,534 | | | | | Stagecoach Group Plc | | | 838,448 | |
| | 224,139 | | | | | Standard Life Aberdeen Plc | | | 619,005 | |
| | 145,983 | | | | | SThree Plc | | | 416,280 | |
| | 562,500 | | | | | Tate & Lyle Plc | | | 4,560,386 | |
| | 2,195,140 | | | | | Taylor Wimpey Plc | | | 3,184,377 | |
See accompanying Notes to the Financial Statements.
68
Mercer Non-US Core Equity Fund
Schedule of Investments (Continued)
(showing percentage of net assets)
March 31, 2020
| | | | | | | | | | |
| Shares | | | | | Description | | Value ($) | |
| | |
| | | | | | United Kingdom — continued | |
| | 2,138,361 | | | | | Tesco Plc | | | 6,044,849 | |
| | 46,786 | | | | | Unilever Plc | | | 2,357,835 | |
| | 2,531,287 | | | | | Vodafone Group Plc | | | 3,529,855 | |
| | 78,518 | | | | | Vodafone Group Plc, ADR | | | 1,081,193 | |
| | 15,600 | | | | | WPP Plc, ADR | | | 526,812 | |
| | | | | | | | | | |
| | | | | | Total United Kingdom | | | 308,767,902 | |
| | | | | | | | | | |
| | |
| | | | | | United States — 2.0% | |
| | 2,758 | | | | | Alphabet, Inc. Class A* | | | 3,204,658 | |
| | 84,912 | | | | | Analog Devices, Inc. | | | 7,612,361 | |
| | 42,468 | | | | | ANSYS, Inc.* | | | 9,872,536 | |
| | 252,892 | | | | | Cadence Design Systems, Inc.* | | | 16,700,988 | |
| | 156,586 | | | | | Colgate-Palmolive Co. | | | 10,391,047 | |
| | 0 | (1) | | | | International Flavors & Fragrances, Inc. | | | 47 | |
| | 24,614 | | | | | Nordson Corp. | | | 3,324,613 | |
| | 35,522 | | | | | Texas Instruments, Inc. | | | 3,549,713 | |
| | | | | | | | | | |
| | | | | | Total United States | | | 54,655,963 | |
| | | | | | | | | | |
| | | |
| | | | | | TOTAL COMMON STOCKS (COST $2,742,708,636) | | | 2,462,335,315 | |
| | | | | | | | | | |
| | |
| | | | | | INVESTMENT COMPANIES — 0.9% | |
| | |
| | | | | | United States — 0.9% | |
| | 111,089 | | | | | iShares MSCI EAFE ETF | | | 5,938,818 | |
| | 579,696 | | | | | iShares MSCI Eurozone ETF | | | 17,686,525 | |
| | | | | | | | | | |
| | | | | | Total United States | | | 23,625,343 | |
| | | | | | | | | | |
| | | |
| | | | | | TOTAL INVESTMENT COMPANIES (COST $29,436,835) | | | 23,625,343 | |
| | | | | | | | | | |
| | |
| | | | | | PREFERRED STOCKS — 1.1% | |
| | |
| | | | | | Brazil — 0.0% | |
| | 310,600 | | | | | Cia Energetica de Minas Gerais, 7.95% | | | 533,576 | |
| | | | | | | | | | |
| | |
| | | | | | Germany — 1.1% | |
| | 38,168 | | | | | BMW AG, 8.36% | | | 1,661,307 | |
| | 186,973 | | | | | Henkel AG & Co. KGaA, 2.39% | | | 15,169,395 | |
| | 29,593 | | | | | Porsche Automobil Holding SE, 5.00% | | | 1,271,866 | |
| | 257,100 | | | | | Schaeffler AG, 8.93% | | | 1,573,958 | |
| | 75,724 | | | | | Volkswagen AG, 3.98% | | | 8,975,865 | |
| | | | | | | | | | |
| | | | | | Total Germany | | | 28,652,391 | |
| | | | | | | | | | |
| | |
| | | | | | Russia — 0.0% | |
| | 129,110 | | | | | Sberbank of Russia PJSC, 8.57% | | | 290,548 | |
| | | | | | | | | | |
| | | |
| | | | | | TOTAL PREFERRED STOCKS (COST $41,771,758) | | | 29,476,515 | |
| | | | | | | | | | |
See accompanying Notes to the Financial Statements.
69
Mercer Non-US Core Equity Fund
Schedule of Investments (Continued)
(showing percentage of net assets)
March 31, 2020
| | | | | | | | | | |
| Par Value ($) | | | | | Description | | Value ($) | |
| | |
| | | | | | SHORT-TERM INVESTMENTS — 1.1% | |
| | |
| | | | | | Mutual Fund - Securities Lending Collateral — 1.0% | |
| | 27,307,637 | | | | | State Street Institutional U.S. Government Money Market Fund, Premier Class, 0.32%## ** | | | 27,307,637 | |
| | | | | | | | | | |
| | |
| | | | | | U.S. Government and Agency Obligations — 0.1% | |
| | 3,500,000 | | | | | United States Treasury Bill, due 07/02/20*** ‡‡ | | | 3,499,195 | |
| | | | | | | | | | |
| | | |
| | | | | | TOTAL SHORT-TERM INVESTMENTS (COST $30,801,913) | | | 30,806,832 | |
| | | | | | | | | | |
| | | |
| | | | | | TOTAL INVESTMENTS — 95.2% (Cost $2,844,719,142) | | | 2,546,244,005 | |
| | | |
| | | | | | Other Assets and Liabilities (net) — 4.8% | | | 127,593,592 | |
| | | | | | | | | | |
| | | |
| | | | | | NET ASSETS — 100.0% | | $2,673,837,597 | |
| | | | | | | | | | |
| | | | | | Notes to Schedule of Investments: | |
| | | |
| | | | | | ADR — American Depository Receipt | | | | |
| | | |
| | | | | | CVA — Certificaten Van Aandelen | | | | |
| | | |
| | | | | | GDR — Global Depository Receipt | | | | |
| | | |
| | | | | | NYRS — New York Registry Shares | | | | |
| | | |
| | | | | | REIT — Real Estate Investment Trust | | | | |
| | | |
| | | | (1) | | Fractional Shares, amount rounds to zero. | | | | |
| | | |
| | | | ## | | The rate disclosed is the7-day net yield as of March 31, 2020. | | | | |
| | | |
| | | | * | | Non-income producing security. | | | | |
| | | |
| | | | ** | | Represents an investment of securities lending cash collateral. | | | | |
| | | |
| | | | *** | | All or a portion of this security is pledged for open futures collateral. | | | | |
| | | |
| | | | **** | | Securities fair valued by the Valuation Committee as approved by the Board of Trustees. The total market value of the securities at year end is $0 which represents 0.0% of net assets. The aggregate tax cost of these securities held at March 31, 2020 was $1,457,972. | | | | |
| | | |
| | | | ^ | | Level 3 — significant unobservable inputs were used in determining the value of this portfolio security. | | | | |
| | | |
| | | | ‡ | | All or a portion of this security is out on loan. | | | | |
| | | |
| | | | ‡‡ | | Interest rate presented is yield to maturity. | | | | |
| | | |
| | | | ‡‡‡ | | Security exempt from registration under Regulation S of the Securities Act of 1933, which exempts from registration securities offered and sold outside the United States. Security may not be offered or sold in the United States except pursuant to an exemption from, or in a transaction not subject to, the registration requirements of the Securities Act of 1933. | | | | |
| | | |
| | | | 144A | | Securities exempt from registration under Rule 144A of the Securities Act of 1933. These securities may be resold in transactions exempt from registration, normally to qualified institutional buyers. The total market value of the securities at year end is $19,819,312 which represents 0.7% of net assets. | | | | |
See accompanying Notes to the Financial Statements.
70
Mercer Non-US Core Equity Fund
Schedule of Investments (Continued)
March 31, 2020
Forward Foreign Currency Contracts
| | | | | | | | | | | | | | | | | | | | |
Currency Purchased | | | Currency Sold | | | Settlement
Date | | | Counterparty | | Unrealized
Appreciation
(Depreciation) | |
| USD | | | 19,997,764 | | | JPY | | | 2,204,429,000 | | | | 08/21/20 | | | HSBC Bank USA, N.A. | | $ | (531,874 | ) |
| USD | | | 7,403,752 | | | JPY | | | 804,947,000 | | | | 08/21/20 | | | State Street Bank and Trust | | | (92,643 | ) |
| | | | | | | | | | | | | | | | | | | | |
| | $ | (624,517 | ) |
| | | | | | | | | | | | | | | | | | | | |
Currency Abbreviations
Futures Contracts
| | | | | | | | | | | | | | | | | | | | |
Number of
Contracts | | | | | Description | | | | Expiration Date | | | Notional
Value | | | Market Value/
Unrealized
Appreciation
(Depreciation) | |
| | Buys | | | | | | | | | | | | | | | | | | | |
| | 1,394 | | | | | MSCI EAFE Index | | | | | Jun 2020 | | | $ | 108,683,210 | | | $ | 9,483,565 | |
| | | | | | | | | | | | | | | | | | | | |
See accompanying Notes to the Financial Statements.
71
Mercer Non-US Core Equity Fund
Schedule of Investments (Continued)
March 31, 2020
| | | | | |
| Industry Sector Summary (Unaudited) | | % of Net Assets |
Consumer,Non-cyclical | | | | 30.6 | |
Industrial | | | | 13.7 | |
Financial | | | | 13.4 | |
Consumer, Cyclical | | | | 9.3 | |
Technology | | | | 8.9 | |
Basic Materials | | | | 7.2 | |
Communications | | | | 5.2 | |
Energy | | | | 2.6 | |
Utilities | | | | 2.2 | |
Unaffiliated Funds | | | | 0.9 | |
Diversified | | | | 0.1 | |
Short-Term Investments | | | | 1.1 | |
Other Assets and Liabilities (net) | | | | 4.8 | |
| | | | | |
| | | | 100.0 | % |
| | | | | |
See accompanying Notes to the Financial Statements.
72
Mercer Core Fixed Income Fund
Schedule of Investments
(showing percentage of net assets)
March 31, 2020
| | | | | | | | | | |
| Par Value ($) | | | | | Description | | Value ($) | |
| | |
| | | | | | DEBT OBLIGATIONS — 98.5% | |
| | |
| | | | | | Asset Backed Securities — 9.8% | |
| 190,618
|
| | | | AccessLex Institute, Series2007-A, Class A3, 1.98% (3 mo. USD LIBOR plus 0.30%), due 05/25/36† | | | 173,968 | |
| | 400,000 | | | | | AmeriCredit Automobile Receivables Trust, Series2018-1, Class C, 3.50%, due 01/18/24 | | | 393,005 | |
| | 100,000 | | | | | AmeriCredit Automobile Receivables Trust, Series2019-1, Class B, 3.13%, due 02/18/25 | | | 100,587 | |
| | 200,000 | | | | | AmeriCredit Automobile Receivables Trust, Series2019-1, Class C, 3.36%, due 02/18/25 | | | 202,219 | |
| | 400,000 | | | | | AmeriCredit Automobile Receivables Trust, Series2019-2, Class C, 2.74%, due 04/18/25 | | | 389,848 | |
| | 600,000 | | | | | AmeriCredit Automobile Receivables Trust, Series2019-3, Class C, 2.32%, due 07/18/25 | | | 592,878 | |
| | 500,000 | | | | | AmeriCredit Automobile Receivables Trust, Series2020-1, Class B, 1.48%, due 01/21/25 | | | 474,516 | |
| | 500,000 | | | | | Anchorage Capital CLO 11, Ltd., Series2019-11A, Class A, 3.19% (3 mo. USD LIBOR plus 1.39%), due 07/22/32† 144A | | | 473,288 | |
| | 3,500,000 | | | | | Anchorage Capital CLO 7, Ltd., Series2015-7A, Class AR2, 2.11% (3 mo. USD LIBOR plus 1.09%), due 01/28/31† 144A | | | 3,344,159 | |
| | 366,000 | | | | | Applebee’s Funding LLC/IHOP Funding LLC, Series2019-1A, Class A2I, 4.19%, due 06/07/49 144A | | | 333,335 | |
| | 248,950 | | | | | Arbys Funding LLC, Series2015-1A, Class A2, 4.97%, due 10/30/45 144A | | | 243,743 | |
| | 1,550,000 | | | | | ARI Fleet Lease Trust, Series2020-A, Class A3, 1.80%, due 08/15/28 144A | | | 1,469,700 | |
| | 41,443 | | | | | Asset-Backed Pass-Through Certificates, Series2004-R2, Class A1A, 1.64% (1 mo. USD LIBOR plus 0.69%), due 04/25/34† | | | 40,764 | |
| | 1,000,000 | | | | | Atlas Senior Loan Fund CLO V, Ltd., Series2014-1A, Class AR2, 3.10% (3 mo. USD LIBOR plus 1.26%), due 07/16/29† 144A | | | 950,000 | |
| | 297,000 | | | | | Avis Budget Rental Car Funding AESOP LLC, Series2019-3A, Class A, 2.36%, due 03/20/26 144A | | | 262,696 | |
| | 207,000 | | | | | Avis Budget Rental Car Funding AESOP LLC, Series2020-1A, Class A, 2.33%, due 08/20/26 144A | | | 184,167 | |
| | 250,000 | | | | | Benefit Street Partners CLO XII, Ltd., Series2017-12A, Class A1, 3.08% (3 mo. USD LIBOR plus 1.25%), due 10/15/30† 144A | | | 238,772 | |
| | 1,000,000 | | | | | BMW Vehicle Lease Trust, Series2018-1, Class A3, 3.26%, due 07/20/21 | | | 1,001,898 | |
| | 120,067 | | | | | BRE Grand Islander Timeshare Issuer LLC, Series2019-A, Class A, 3.28%, due 09/26/33 144A | | | 119,276 | |
| | 207,000 | | | | | Capital Automotive REIT LP, Series2020-1A, Class B1, 4.17%, due 02/15/50 144A | | | 188,038 | |
| | 1,713,000 | | | | | Capital One Prime Auto Receivables Trust, Series2019-1, Class A3, 2.51%, due 11/15/23 | | | 1,733,723 | |
| | 500,000 | | | | | Carlyle U.S. CLO, Ltd., Series2017-1A, Class A1B, 3.05% (3 mo. USD LIBOR plus 1.23%), due 04/20/31† 144A | | | 478,462 | |
| | 1,200,000 | | | | | Citibank Credit Card Issuance Trust, Series2018-A7, Class A7, 3.96%, due 10/13/30 | | | 1,403,971 | |
| | 223,380 | | | | | CLI Funding LLC, Series2018-1A, Class A, 4.03%, due 04/18/43 144A | | | 213,947 | |
| | 320,925 | | | | | Coinstar Funding LLC, Series2017-1A, Class A2, 5.22%, due 04/25/47 144A | | | 304,355 | |
| | 438,930 | | | | | Commonbond Student Loan Trust, Series2017-BGS, Class A1, 2.68%, due 09/25/42 144A | | | 446,572 | |
| | 318,771 | | | | | Credit Suisse Mortgage Trust, Series 2018-RPL8, Class A1, 4.13%, due 07/25/58◆◆ 144A | | | 297,760 | |
| | 912,008 | | | | | DB Master Finance LLC, Series2017-1A, Class A2I, 3.63%, due 11/20/47 144A | | | 878,546 | |
See accompanying Notes to the Financial Statements.
73
Mercer Core Fixed Income Fund
Schedule of Investments (Continued)
(showing percentage of net assets)
March 31, 2020
| | | | | | | | | | |
| Par Value ($) | | | | | Description | | Value ($) | |
| | |
| | | | | | Asset Backed Securities — continued | |
| | 146,625 | | | | | DB Master Finance LLC, Series2017-1A, Class A2II, 4.03%, due 11/20/47 144A | | | 137,804 | |
| | 745,368 | | | | | DB Master Finance LLC, Series2019-1A, Class A2I, 3.79%, due 05/20/49 144A | | | 732,159 | |
| | 469,200 | | | | | Domino’s Pizza Master Issuer LLC, Series2017-1A, Class A23, 4.12%,
due 07/25/47 144A | | | 459,900 | |
| | 846,515 | | | | | Domino’s Pizza Master Issuer LLC, Series2017-1A, Class A2I, 3.04% (3 mo. USD LIBOR plus 1.25%), due 07/25/47† 144A | | | 803,270 | |
| | 300,000 | | | | | Drive Auto Receivables Trust, Series2019-3, Class B, 2.65%, due 02/15/24 | | | 296,868 | |
| | 330,338 | | | | | Driven Brands Funding LLC, Series2015-1A, Class A2, 5.22%, due 07/20/45 144A | | | 333,516 | |
| | 126,425 | | | | | FOCUS Brands Funding LLC, Series2017-1A, Class A2I, 3.86%, due 04/30/47 144A | | | 120,651 | |
| | 511,000 | | | | | Ford Credit Auto Owner Trust, Series2020-1, Class A, 2.04%, due 08/15/31 144A | | | 477,508 | |
| | 1,900,000 | | | | | Ford Credit Floorplan Master Owner Trust, Series2018-2, Class A, 3.17%, due 03/15/25 | | | 1,880,701 | |
| | 2,564,000 | | | | | Ford Credit Floorplan Master Owner Trust, Series2018-3, Class A1, 3.52%, due 10/15/23 | | | 2,573,039 | |
| | 573,000 | | | | | Ford Credit Floorplan Master Owner Trust, Series2019-2, Class A, 3.06%, due 04/15/26 | | | 556,206 | |
| | 100,000 | | | | | GM Financial Consumer Automobile Receivables Trust, Series2018-4, Class C, 3.62%, due 06/17/24 | | | 102,513 | |
| | 1,245,000 | | | | | GM Financial Consumer Automobile Receivables Trust, Series2019-1, Class A3, 2.97%, due 11/16/23 | | | 1,257,998 | |
| | 495,000 | | | | | GMF Floorplan Owner Revolving Trust, Series2019-2, Class A, 2.90%, due 04/15/26 144A | | | 457,505 | |
| | 320,000 | | | | | Golden Credit Card Trust, Series2018-4A, Class A, 3.44%, due 10/15/25 144A | | | 318,692 | |
| | 185,813 | | | | | Hilton Grand Vacations Trust, Series2017-AA, Class A, 2.66%, due 12/26/28 144A | | | 183,159 | |
| | 81,587 | | | | | Hilton Grand Vacations Trust, Series2018-AA, Class A, 3.54%, due 02/25/32 144A | | | 81,775 | |
| | 164,322 | | | | | Home Equity Asset Trust, Series2003-8, Class M1, 2.03% (1 mo. USD LIBOR plus 1.08%), due 04/25/34† | | | 155,315 | |
| | 1,750,000 | | | | | HPS Loan Management CLO, Ltd., Series10A-2016, Class A1R, 2.96% (3 mo. USD LIBOR plus 1.14%), due 01/20/28† 144A | | | 1,691,848 | |
| | 750,000 | | | | | HPS Loan Management CLO, Ltd., Series15A-2019, Class A1, 3.12% (3 mo. USD LIBOR plus 1.32%), due 07/22/32† 144A | | | 709,464 | |
| | 500,000 | | | | | ICG US CLO, Ltd., Series2017-2A, Class A1, 3.09% (3 mo. USD LIBOR plus 1.28%), due 10/23/29† 144A | | | 470,116 | |
| | 528,946 | | | | | Invitation Homes Trust, Series 2018-SFR1, Class A, 1.50% (1 mo. USD LIBOR plus 0.70%), due 03/17/37 144A | | | 493,088 | |
| | 154,613 | | | | | Jack In The Box Funding LLC, Series2019-1A, Class A21, 3.98%, due 08/25/49 144A | | | 143,010 | |
| | 154,613 | | | | | Jack In The Box Funding LLC, Series2019-1A, Class A23, 4.97%, due 08/25/49 144A | | | 128,263 | |
| | 355,918 | | | | | Laurel Road Prime Student Loan Trust, Series2017-C, Class A2B, 2.81%, due 11/25/42 144A | | | 358,724 | |
| | 272,832 | | | | | Legacy Mortgage Asset Trust, Series2019-GS4, Class A1, 3.44%, due 05/25/59†† 144A | | | 276,881 | |
| | 311,670 | | | | | Limerock CLO III LLC, Series2014-3A, Class A1R, 3.02% (3 mo. USD LIBOR plus 1.20%), due 10/20/26† 144A | | | 309,641 | |
| | 122,000 | | | | | MelTel Land Funding LLC, Series2019-1A, Class A, 3.77%, due 04/15/49 144A | | | 99,715 | |
| | 1,342,731 | | | | | Mercedes-Benz Auto Receivables Trust, Series2016-1, Class A4, 1.46%, due 12/15/22 | | | 1,339,739 | |
| | 750,000 | | | | | MidOcean Credit CLO III, Series2014-3A, Class A1R, 2.94% (3 mo. USD LIBOR plus 1.12%), due 04/21/31† 144A | | | 699,915 | |
| | 139,384 | | | | | Mill City Mortgage Loan Trust, Series2018-3, Class A1, 3.50%, due 08/25/58◆◆ 144A | | | 142,780 | |
See accompanying Notes to the Financial Statements.
74
Mercer Core Fixed Income Fund
Schedule of Investments (Continued)
(showing percentage of net assets)
March 31, 2020
| | | | | | | | | | |
| Par Value ($) | | | | | Description | | Value ($) | |
| | |
| | | | | | Asset Backed Securities — continued | |
| | 116,478 | | | | | Morgan Stanley ABS Capital I, Inc., Series 2003-NC10, Class M1, 1.97% (1 mo. USD LIBOR plus 1.02%), due 10/25/33† | | | 111,732 | |
| | 61,422 | | | | | Morgan Stanley ABS Capital I, Inc., Series2003-NC7, Class M1, 2.00% (1 mo. USD LIBOR plus 1.05%), due 06/25/33† | | | 59,423 | |
| | 183,401 | | | | | MVW Owner Trust, Series2018-1A, Class A, 3.45%, due 01/21/36 144A | | | 177,130 | |
| | 96,414 | | | | | Navient Private Education Loan Trust, Series2016-AA, Class A2A, 3.91%, due 12/15/45 144A | | | 98,949 | |
| | 338,000 | | | | | Navient Private Education Refi Student Loan Trust, Series2019-FA, Class A2, 2.60%, due 08/15/68 144A | | | 341,961 | |
| | 222,301 | | | | | New Century Home Equity Loan Trust, Series2003-A, Class A, 1.67% (1 mo. USD LIBOR plus 0.72%), due 10/25/33† 144A | | | 199,667 | |
| | 187,514 | | | | | New Residential Mortgage LLC, Series 2018-FNT1, Class A, 3.61%, due 05/25/23 144A | | | 184,915 | |
| | 116,716 | | | | | New Residential Mortgage LLC, Series 2018-FNT2, Class A, 3.79%, due 07/25/54 144A | | | 116,581 | |
| | 1,815,000 | | | | | NextGear Floorplan Master Owner Trust, Series2018-2A, Class A2, 3.69%, due 10/15/23 144A | | | 1,727,158 | |
| | 4,051,000 | | | | | NextGear Floorplan Master Owner Trust, Series2020-1A, Class A2, 1.55%, due 02/18/25 144A | | | 3,710,428 | |
| | 600,000 | | | | | North Carolina State Education Assistance Authority, Series2011-2, Class A3, 2.59% (3 mo. USD LIBOR plus 0.80%), due 07/25/36† | | | 590,400 | |
| | 69,309 | | | | | NRZ Excess Spread-Collateralized Notes, Series 2018-PLS1, Class A, 3.19%, due 01/25/23 144A | | | 69,213 | |
| | 182,864 | | | | | NRZ Excess Spread-Collateralized Notes, Series 2018-PLS2, Class A, 3.27%, due 02/25/23 144A | | | 182,341 | |
| | 250,000 | | | | | OCP CLO, Ltd., Series2017-13A, Class A1A, 3.09% (3 mo. USD LIBOR plus 1.26%), due 07/15/30† 144A | | | 236,257 | |
| | 889,175 | | | | | OneMain Direct Auto Receivables Trust, Series2017-2A, Class B, 2.55%, due 11/14/23 144A | | | 886,669 | |
| | 428,491 | | | | | OneMain Financial Issuance Trust, Series2017-1A, Class A2, 1.50% (1 mo. USD LIBOR plus 0.80%), due 09/14/32† 144A | | | 418,638 | |
| | 170,000 | | | | | OneMain Financial Issuance Trust, Series2018-1A, Class A, 3.30%, due 03/14/29 144A | | | 170,038 | |
| | 108,000 | | | | | Oxford Finance Funding LLC, Series2019-1A, Class A2, 4.46%, due 02/15/27 144A | | | 109,433 | |
| | 750,000 | | | | | OZLM Funding IV CLO, Ltd., Series2013-4A, Class A1R, 3.05% (3 mo. USD LIBOR plus 1.25%), due 10/22/30† 144A | | | 718,396 | |
| | 750,000 | | | | | OZLM IX CLO, Ltd., Series2014-9A, Class A1AR, 3.10% (3 mo. USD LIBOR plus 1.28%), due 10/20/31† 144A | | | 708,539 | |
| | 250,000 | | | | | OZLM XI CLO, Ltd., Series2015-11A, Class A1R, 3.02% (3 mo. USD LIBOR plus 1.25%), due 10/30/30† 144A | | | 240,248 | |
| | 500,000 | | | | | OZLM XXIV CLO, Ltd., Series2019-24A, Class A1A, 3.21% (3 mo. USD LIBOR plus 1.39%), due 07/20/32† 144A | | | 473,250 | |
| | 1,000,000 | | | | | Palmer Square CLO, Ltd., Series2015-1A, Class A1R2, 2.92% (3 mo. USD LIBOR plus 1.22%), due 05/21/29† 144A | | | 977,254 | |
| | 750,000 | | | | | Palmer Square CLO, Ltd., Series2018-2A, Class A1A, 2.94% (3 mo. USD LIBOR plus 1.10%), due 07/16/31† 144A | | | 717,518 | |
| | 650,000 | | | | | Progress Residential Trust, Series 2019-SFR1, Class A, 3.42%, due 08/17/35 144A | | | 657,256 | |
| | 1,329,000 | | | | | Progress Residential Trust, Series 2019-SFR4, Class A, 2.69%, due 10/17/36 144A | | | 1,313,243 | |
| | 1,313,000 | | | | | Progress Residential Trust, Series 2020-SFR1, Class A, 1.73%, due 04/17/37 144A | | | 1,256,423 | |
See accompanying Notes to the Financial Statements.
75
Mercer Core Fixed Income Fund
Schedule of Investments (Continued)
(showing percentage of net assets)
March 31, 2020
| | | | | | | | | | |
| Par Value ($) | | | | | Description | | Value ($) | |
| | |
| | | | | | Asset Backed Securities — continued | |
| | 7,888 | | | | | Renaissance Home Equity Loan Trust, Series2005-2, Class AF4, 4.93%, due 08/25/35†† | | | 7,879 | |
| | 250,000 | | | | | Romark CLO II, Ltd., Series2018-2A, Class A1, 2.97% (3 mo. USD LIBOR plus 1.18%), due 07/25/31† 144A | | | 232,410 | |
| | 900,000 | | | | | Santander Drive Auto Receivables Trust, Series2019-3, Class B, 2.28%, due 09/15/23 | | | 880,968 | |
| | 400,000 | | | | | Santander Drive Auto Receivables Trust, Series2019-3, Class C, 2.49%, due 10/15/25 | | | 387,600 | |
| | 331,000 | | | | | Santander Revolving Auto Loan Trust, Series2019-A, Class A, 2.51%, due 01/26/32 144A | | | 317,281 | |
| | 157,039 | | | | | Saxon Asset Securities Trust, Series2005-1, Class M1, 1.64% (1 mo. USD LIBOR plus 0.69%), due 05/25/35† | | | 155,751 | |
| | 258,700 | | | | | Sesac Finance LLC, Series2019-1, Class A2, 5.22%, due 07/25/49 144A | | | 247,474 | |
| | 88,514 | | | | | Sierra Timeshare Receivables Funding LLC, Series2019-1A, Class A, 3.20%, due 01/20/36 144A | | | 88,109 | |
| | 500,000 | | | | | Silver Creek CLO, Ltd., Series2014-1A, Class AR, 3.06% (3 mo. USD LIBOR plus 1.24%), due 07/20/30† 144A | | | 473,404 | |
| | 2,482,553 | | | | | Small Business Administration, Series2013-20H, Class 1, 3.16%, due 08/01/33 | | | 2,591,675 | |
| | 1,643,630 | | | | | Small Business Administration, Series2013-20L, Class 1, 3.38%, due 12/01/33 | | | 1,729,724 | |
| | 2,337,770 | | | | | Small Business Administration, Series2014-20C, Class 1, 3.21%, due 03/01/34 | | | 2,452,983 | |
| | 1,053,474 | | | | | Small Business Administration, Series2014-20D, Class 1, 3.11%, due 04/01/34 | | | 1,102,485 | |
| | 766,473 | | | | | Small Business Administration, Series2014-20I, Class 1, 2.92%, due 09/01/34 | | | 790,795 | |
| | 2,634,610 | | | | | Small Business Administration, Series2019-25F, Class 1, 2.77%, due 06/01/44 | | | 2,735,907 | |
| | 92,040 | | | | | SMB Private Education Loan Trust, Series2015-C, Class A2A, 2.75%, due 07/15/27 144A | | | 92,812 | |
| | 387,000 | | | | | SMB Private Education Loan Trust, Series2019-B, Class A2A, 2.84%, due 06/15/37 144A | | | 366,211 | |
| | 192,839 | | | | | Sonic Capital LLC, Series2020-1A, Class A2I, 3.85%, due 01/20/50 144A | | | 187,661 | |
| | 1,750,000 | | | | | Sound Point CLOVII-R, Ltd., Series2014-3RA, Class A1, 3.06% (3 mo. USD LIBOR plus 1.25%), due 10/23/31† 144A | | | 1,624,964 | |
| | 2,750,000 | | | | | Sound Point CLO XIV, Ltd., Series2016-3A, Class AR, 2.96% (3 mo. USD LIBOR plus 1.15%), due 01/23/29† 144A | | | 2,652,037 | |
| | 500,000 | | | | | Sound Point CLO XVI, Ltd., Series2017-2A, Class A, 3.07% (3 mo. USD LIBOR plus 1.28%), due 07/25/30† 144A | | | 479,980 | |
| | 547,000 | | | | | Stack Infrastructure Issuer LLC, Series2019-2A, Class A2, 3.08%, due 10/25/44 144A | | | 520,287 | |
| | 3,218,875 | | | | | STORE Master Funding I LLC, Series2015-1A, Class A1, 3.75%, due 04/20/45 144A | | | 2,928,948 | |
| | 654,342 | | | | | STORE Master Funding LLC, Series2014-1A, Class A2, 5.00%, due 04/20/44 144A | | | 546,897 | |
| | 249,124 | | | | | Sunbird Engine Finance LLC, Series2020-1A, Class A, 3.67%, due 02/15/45 144A | | | 152,321 | |
| | 347,600 | | | | | Taco Bell Funding LLC, Series2018-1A, Class A2I, 4.32%, due 11/25/48 144A | | | 339,348 | |
| | 552,742 | | | | | Telos CLO, Series2013-3A, Class AR, 3.14% (3 mo. USD LIBOR plus 1.30%), due 07/17/26† 144A | | | 544,866 | |
| | 1,451,000 | | | | | Toyota Auto Loan Extended Note Trust, Series2019-1A, Class A, 2.56%, due 11/25/31 144A | | | 1,481,862 | |
| | 1,537,000 | | | | | Tricon American Homes Trust, Series 2019-SFR1, Class A, 2.75%, due 03/17/38 144A | | | 1,480,815 | |
| | 196,000 | | | | | Triton Container Finance V LLC, Series2018-1A, Class A, 3.95%, due 03/20/43 144A | | | 194,378 | |
| | 827,396 | | | | | Vantage Data Centers Issuer LLC, Series2018-1A, Class A2, 4.07%, due 02/16/43 144A | | | 825,426 | |
| | 500,000 | | | | | Venture XIX CLO, Ltd., Series2014-19A, Class ARR, 3.09% (3 mo. USD LIBOR plus 1.26%), due 01/15/32† 144A | | | 472,706 | |
| | 3,462,000 | | | | | Verizon Owner Trust, Series2019-B, Class A1A, 2.33%, due 12/20/23 | | | 3,495,257 | |
| | 148,119 | | | | | VSE VOI Mortgage LLC, Series2017-A, Class A, 2.33%, due 03/20/35 144A | | | 144,402 | |
See accompanying Notes to the Financial Statements.
76
Mercer Core Fixed Income Fund
Schedule of Investments (Continued)
(showing percentage of net assets)
March 31, 2020
| | | | | | | | | | |
| Par Value ($) | | | | | Description | | Value ($) | |
| | |
| | | | | | Asset Backed Securities — continued | |
| | 500,000 | | | | | Wellfleet CLO, Ltd., Series2018-3A, Class A1A, 3.07% (3 mo. USD LIBOR plus 1.25%), due 01/20/32† 144A | | | 474,700 | |
| | 750,000 | | | | | Wellfleet CLO, Ltd., Series2019-1A, Class A1, 3.16% (3 mo. USD LIBOR plus 1.34%), due 07/20/32† 144A | | | 703,923 | |
| | 571,763 | | | | | Wendy’s Funding LLC, Series2019-1A, Class A2I, 3.78%, due 06/15/49 144A | | | 544,707 | |
| | 96,732 | | | | | Westgate Resorts LLC, Series2017-1A, Class A, 3.05%, due 12/20/30 144A | | | 91,859 | |
| | 153,000 | | | | | Westlake Automobile Receivables Trust, Series2019-1A, Class C, 3.45%, due 03/15/24 144A | | | 141,924 | |
| | 137,000 | | | | | Willis Engine Structured Trust V, Series2020-A, Class A, 3.23%, due 03/15/45 144A | | | 80,956 | |
| | 1,442,000 | | | | | World Omni Auto Receivables Trust, Series2019-B, Class A3, 2.59%, due 07/15/24 | | | 1,454,558 | |
| | 1,100,000 | | | | | World Omni Select Auto Trust, Series2019-A, Class B, 2.17%, due 12/15/25 | | | 1,052,292 | |
| | 200,000 | | | | | World Omni Select Auto Trust, Series2019-A, Class C, 2.38%, due 12/15/25 | | | 190,623 | |
| | 3,500,000 | | | | | YorkCLO-4, Ltd., Series2016-2A, Class A1R, 2.09% (3 mo. USD LIBOR plus 1.09%), due 04/20/32† 144A | | | 3,336,641 | |
| | 750,000 | | | | | YorkCLO-6, Ltd., Series2019-1A, Class A1, 3.15% (3 mo. USD LIBOR plus 1.35%), due 07/22/32† 144A | | | 705,647 | |
| | 250,000 | | | | | Zais CLO 6, Ltd., Series2017-1A, Class A1, 3.20% (3 mo. USD LIBOR plus 1.37%), due 07/15/29† 144A | | | 238,353 | |
| | | | | | | | | | |
| | | | 92,920,822 | |
| | | | | | | | | | |
| | | |
| Par Value(a) | | | | | Description | | Value ($) | |
| | |
| | | | | | Corporate Debt — 33.2% | |
| | 310,000 | | | | | 3M Co., (MTN), 3.25%, due 02/14/24 | | | 328,859 | |
| | 1,693,000 | | | | | AbbVie, Inc., 2.30%, due 11/21/22 144A | | | 1,696,700 | |
| | 731,000 | | | | | AbbVie, Inc., 3.20%, due 11/21/29 144A | | | 738,454 | |
| | 300,000 | | | | | AbbVie, Inc., 3.60%, due 05/14/25 | | | 315,385 | |
| | 619,000 | | | | | AbbVie, Inc., 4.25%, due 11/21/49 144A | | | 666,060 | |
| | 1,400,000 | | | | | AbbVie, Inc., 4.50%, due 05/14/35 | | | 1,593,225 | |
| | 170,000 | | | | | AbbVie, Inc., 4.70%, due 05/14/45 | | | 191,812 | |
| | 132,233 | | | | | ABY Transmision Sur SA, 6.88%, due 04/30/43 144A | | | 171,738 | |
| | 145,000 | | | | | Activision Blizzard, Inc., 3.40%, due 09/15/26 | | | 153,216 | |
| | 580,000 | | | | | AECOM, 5.13%, due 03/15/27 | | | 526,955 | |
| | 400,000 | | | | | AEP Texas, Inc., 3.80%, due 10/01/47 | | | 388,792 | |
| | 260,000 | | | | | AEP Transmission Co. LLC, 3.80%, due 06/15/49 | | | 281,014 | |
| | 321,000 | | | | | AerCap Ireland Capital DAC/AerCap Global Aviation Trust, 2.88%, due 08/14/24 | | | 256,082 | |
| | 1,600,000 | | | | | AerCap Ireland Capital DAC/AerCap Global Aviation Trust, 4.45%, due 04/03/26 | | | 1,310,719 | |
| | 370,000 | | | | | Aetna, Inc., 4.75%, due 03/15/44 | | | 401,234 | |
| | 310,000 | | | | | Ahern Rentals, Inc., 7.38%, due 05/15/23 144A | | | 179,411 | |
| | 126,349 | | | | | Air Canada Pass Through Trust, Series2013-1, Class A, 4.13%, due 11/15/26 144A | | | 129,377 | |
| | 735,185 | | | | | Air Canada Pass Through Trust, Series2015-1, Class A, 3.60%, due 09/15/28 144A | | | 767,019 | |
| | 174,901 | | | | | Air Canada Pass Through Trust, Series2017-1, Class B, 3.70%, due 07/15/27 144A | | | 154,568 | |
| | 131,000 | | | | | Air Lease Corp., 3.63%, due 12/01/27 | | | 109,621 | |
| | 199,000 | | | | | Aircastle, Ltd., 5.50%, due 02/15/22 | | | 181,343 | |
| | 170,000 | | | | | Aker BP ASA, 3.00%, due 01/15/25 144A | | | 135,379 | |
| | 92,000 | | | | | Albertsons Cos., Inc./Safeway, Inc./New Albertsons, LP/Albertsons LLC, 4.88%, due 02/15/30 144A | | | 92,460 | |
| | 200,000 | | | | | Alimentation Couche-Tard, Inc., 2.70%, due 07/26/22 144A | | | 197,976 | |
| | 640,000 | | | | | Allergan Funding SCS, 4.55%, due 03/15/35 | | | 706,567 | |
See accompanying Notes to the Financial Statements.
77
Mercer Core Fixed Income Fund
Schedule of Investments (Continued)
(showing percentage of net assets)
March 31, 2020
| | | | | | | | | | |
| Par Value(a) | | | | | Description | | Value ($) | |
| | |
| | | | | | Corporate Debt — continued | |
| | 92,000 | | | | | Allied Universal Holdco LLC/Allied Universal Finance Corp., 6.63%, due 07/15/26 144A | | | 90,907 | |
| | 545,000 | | | | | Ally Financial, Inc., 5.13%, due 09/30/24 | | | 534,506 | |
| | 655,000 | | | | | Amazon.com, Inc., 3.15%, due 08/22/27 | | | 718,151 | |
| | 284,000 | | | | | Amazon.com, Inc., 4.05%, due 08/22/47 | | | 371,680 | |
| | 48,103 | | | | | American Airlines Pass Through Trust, Series2001-1, 6.98%, due 11/23/22 | | | 49,326 | |
| | 2,484,581 | | | | | American Airlines Pass Through Trust, Series2013-2, Class A, 4.95%, due 07/15/24 | | | 2,534,282 | |
| | 293,899 | | | | | American Airlines Pass Through Trust, Series2015-1, Class A, 3.38%, due 11/01/28 | | | 273,241 | |
| | 113,587 | | | | | American Airlines Pass Through Trust, Series2015-1, Class B, 3.70%, due 11/01/24 | | | 101,894 | |
| | 291,589 | | | | | American Airlines Pass Through Trust, Series2016-1, Class A, 4.10%, due 07/15/29 | | | 287,558 | |
| | 117,645 | | | | | American Airlines Pass Through Trust, Series2017-1, Class A, 4.00%, due 08/15/30 | | | 108,425 | |
| | 214,830 | | | | | American Airlines Pass Through Trust, Series2017-1, Class AA, 3.65%, due 08/15/30 | | | 205,195 | |
| | 137,822 | | | | | American Airlines Pass Through Trust, Series2017-2, Class A, 3.60%, due 04/15/31 | | | 127,092 | |
| | 147,691 | | | | | American Airlines Pass Through Trust, Series2019-1, Class A, 3.50%, due 08/15/33 | | | 124,210 | |
| | 221,536 | | | | | American Airlines Pass Through Trust, Series2019-1, Class AA, 3.15%, due 08/15/33 | | | 202,582 | |
| | 700,000 | | | | | American Express Co., 3.40%, due 02/27/23 | | | 718,121 | |
| | 982,000 | | | | | American Express Co., 3.70%, due 08/03/23 | | | 1,020,292 | |
| | 287,000 | | | | | American Homes 4 Rent, LP REIT, 4.25%, due 02/15/28 | | | 285,065 | |
| | 1,400,000 | | | | | American International Group, Inc., 4.88%, due 06/01/22 | | | 1,438,153 | |
| | 195,000 | | | | | American Tower Corp. REIT, 2.40%, due 03/15/25 | | | 192,110 | |
| | 230,000 | | | | | American Tower Corp. REIT, 2.95%, due 01/15/25 | | | 232,187 | |
| | 573,000 | | | | | American Tower Corp. REIT, 3.55%, due 07/15/27 | | | 571,869 | |
| | 190,000 | | | | | American Tower Corp. REIT, 3.80%, due 08/15/29 | | | 193,446 | |
| | 190,000 | | | | | AmeriGas Partners, LP/AmeriGas Finance Corp., 5.50%, due 05/20/25 | | | 176,219 | |
| | 250,000 | | | | | AmeriGas Partners, LP/AmeriGas Finance Corp., 5.88%, due 08/20/26 | | | 240,837 | |
| | 150,000 | | | | | Anglo American Capital Plc, 4.75%, due 04/10/27 144A | | | 146,777 | |
| | 2,014,000 | | | | | Anheuser-Busch Cos LLC/Anheuser-Busch InBev Worldwide, Inc., 4.90%, due 02/01/46 | | | 2,203,422 | |
| | 275,000 | | | | | Anheuser-Busch InBev Worldwide, Inc., 4.60%, due 04/15/48 | | | 292,328 | |
| | 350,000 | | | | | Anheuser-Busch InBev Worldwide, Inc., 5.55%, due 01/23/49 | | | 412,966 | |
| | 361,000 | | | | | Antero Resources Corp., 5.00%, due 03/01/25 | | | 136,277 | |
| | 150,000 | | | | | Antero Resources Corp., 5.38%, due 11/01/21 | | | 109,944 | |
| | 5,000 | | | | | Anthem, Inc., 5.10%, due 01/15/44 | | | 5,887 | |
| | 230,000 | | | | | APX Group, Inc., 7.63%, due 09/01/23‡ | | | 179,689 | |
| | 225,000 | | | | | Aquarion Co., 4.00%, due 08/15/24 144A | | | 225,740 | |
| | 233,000 | | | | | Archrock Partners, LP/Archrock Partners Finance Corp., 6.00%, due 10/01/22 | | | 233,000 | |
| | 34,000 | | | | | Arconic Corp., 6.13%, due 02/15/28 144A | | | 35,020 | |
| | 265,000 | | | | | Arconic, Inc., 5.13%, due 10/01/24 | | | 262,207 | |
| | 175,000 | | | | | Ardagh Packaging Finance Plc/Ardagh Holdings USA, Inc., 6.00%, due 02/15/25 144A | | | 176,802 | |
| | 242,000 | | | | | Ares Capital Corp., 4.20%, due 06/10/24 | | | 214,921 | |
| | 14,000 | | | | | Asbury Automotive Group, Inc., 4.75%, due 03/01/30 144A | | | 12,005 | |
| | 150,000 | | | | | Ascension Health, 3.11%, due 11/15/39 | | | 152,879 | |
| | 140,000 | | | | | Ashtead Capital, Inc., 4.38%, due 08/15/27 144A | | | 129,850 | |
| | 2,000,000 | | | | | AT&T, Inc., 0.01%, due 11/27/22‡‡ 144A | | | 1,857,325 | |
| | 700,000 | | | | | AT&T, Inc., 1.96% (3 mo. USD LIBOR plus 1.18%), due 06/12/24† | | | 650,513 | |
| | 150,000 | | | | | AT&T, Inc., 2.63%, due 12/01/22 | | | 148,387 | |
| | 576,000 | | | | | AT&T, Inc., 3.40%, due 05/15/25 | | | 600,230 | |
| | 461,000 | | | | | AT&T, Inc., 3.80%, due 02/15/27 | | | 482,185 | |
| | 1,600,000 | | | | | AT&T, Inc., 4.13%, due 02/17/26 | | | 1,698,556 | |
| | 25,000 | | | | | AT&T, Inc., 4.30%, due 02/15/30 | | | 26,900 | |
| | 10,000 | | | | | AT&T, Inc., 4.45%, due 05/15/21 | | | 10,234 | |
See accompanying Notes to the Financial Statements.
78
Mercer Core Fixed Income Fund
Schedule of Investments (Continued)
(showing percentage of net assets)
March 31, 2020
| | | | | | | | | | |
| Par Value(a) | | | | | Description | | Value ($) | |
| | |
| | | | | | Corporate Debt — continued | |
| | 435,000 | | | | | AT&T, Inc., 4.55%, due 03/09/49‡ | | | 469,825 | |
| | 1,055,000 | | | | | AT&T, Inc., 4.85%, due 03/01/39 | | | 1,186,875 | |
| | 125,000 | | | | | AT&T, Inc., 4.90%, due 08/15/37 | | | 139,759 | |
| | 110,000 | | | | | AT&T, Inc., 5.25%, due 03/01/37 | | | 128,776 | |
| | 130,000 | | | | | Australia & New Zealand Banking Group, Ltd., 6.75% (5 year USD ICE swap plus 5.17%)† ††††† ‡ 144A | | | 127,834 | |
| | 128,000 | | | | | Autodesk, Inc., 2.85%, due 01/15/30 | | | 126,018 | |
| | 192,000 | | | | | Avolon Holdings Funding, Ltd., 5.13%, due 10/01/23 144A | | | 166,209 | |
| | 139,000 | | | | | AXA SA, 8.60%, due 12/15/30 | | | 185,163 | |
| | 160,000 | | | | | Azul Investments LLP, 5.88%, due 10/26/24‡ 144A | | | 89,401 | |
| | 942,000 | | | | | BAE Systems Finance, Inc., 7.50%, due 07/01/27 144A | | | 1,232,324 | |
| | 696,000 | | | | | BAE Systems Holdings, Inc., 3.85%, due 12/15/25 144A | | | 709,272 | |
| | 200,000 | | | | | Banco Santander SA, 3.85%, due 04/12/23 | | | 201,278 | |
| | 100,000 | | | | | Banco Santander SA, 4.38%, due 04/12/28‡ | | | 101,145 | |
| | 172,000 | | | | | Banff Merger Sub, Inc., 9.75%, due 09/01/26 144A | | | 152,663 | |
| | 877,000 | | | | | Bank of America Corp., 4.24% (3 mo. USD LIBOR plus 1.81%), due 04/24/38† | | | 1,011,692 | |
| | 160,000 | | | | | Bank of America Corp., 5.13% (3 mo. USD LIBOR plus 3.29%)† ††††† | | | 152,111 | |
| | 621,000 | | | | | Bank of America Corp., 6.30% (3 mo. USD LIBOR plus 4.55%)† ††††† | | | 652,569 | |
| | 610,000 | | | | | Bank of America Corp., (MTN), 2.50% (3 mo. USD LIBOR plus 0.99%), due 02/13/31† | | | 592,129 | |
| | 160,000 | | | | | Bank of America Corp., (MTN), 2.88% (3 mo. USD LIBOR plus 1.19%), due 10/22/30† | | | 160,275 | |
| | 1,270,000 | | | | | Bank of America Corp., (MTN), 3.50%, due 04/19/26 | | | 1,351,877 | |
| | 755,000 | | | | | Bank of America Corp., (MTN), 3.59% (3 mo. USD LIBOR plus 1.37%), due 07/21/28† | | | 773,530 | |
| | 342,000 | | | | | Bank of America Corp., (MTN), 3.95%, due 04/21/25 | | | 360,200 | |
| | 500,000 | | | | | Bank of America Corp., (MTN), 4.13%, due 01/22/24 | | | 529,370 | |
| | 165,000 | | | | | Bank of America Corp., (MTN), 4.20%, due 08/26/24 | | | 175,814 | |
| | 210,000 | | | | | Bank of America Corp., (MTN), 4.27% (3 mo. USD LIBOR plus 1.31%), due 07/23/29† | | | 227,422 | |
| | 213,000 | | | | | Bank of America Corp., (MTN), 4.33% (3 mo. USD LIBOR plus 1.52%), due 03/15/50† | | | 252,264 | |
| | 1,337,000 | | | | | Bank of America Corp., (MTN), 4.45%, due 03/03/26 | | | 1,443,008 | |
| | 575,000 | | | | | Barclays Plc, 3.68%, due 01/10/23 | | | 577,074 | |
| | 190,000 | | | | | Barclays Plc, 4.38%, due 01/12/26 | | | 193,919 | |
| | 400,000 | | | | | Barclays Plc, 4.97% (3 mo. USD LIBOR plus 1.90%), due 05/16/29† | | | 428,654 | |
| | 770,000 | | | | | BAT Capital Corp., 3.22%, due 08/15/24 | | | 742,458 | |
| | 639,000 | | | | | BAT Capital Corp., 4.70%, due 04/02/27 | | | 650,273 | |
| | 100,000 | | | | | Bausch Health Cos., Inc., 5.25%, due 01/30/30 144A | | | 95,306 | |
| | 305,000 | | | | | Bausch Health Cos., Inc., 6.13%, due 04/15/25 144A | | | 302,333 | |
| | 60,000 | | | | | Baxter International, Inc., 3.95%, due 04/01/30 144A | | | 64,463 | |
| | 605,000 | | | | | Berkshire Hathaway Energy Co., 3.70%, due 07/15/30 144A | | | 649,299 | |
| | 705,000 | | | | | Berkshire Hathaway Energy Co., 4.05%, due 04/15/25 144A | | | 764,066 | |
| | 85,000 | | | | | Berkshire Hathaway Energy Co., 5.95%, due 05/15/37 | | | 95,718 | |
| | 1,312,000 | | | | | Berkshire Hathaway Energy Co., 6.13%, due 04/01/36 | | | 1,733,650 | |
| | 105,000 | | | | | BHP Billiton Finance USA, Ltd., 6.25% (5 year USD swap plus 4.97%), due 10/19/75† 144A | | | 103,225 | |
| | 1,099,000 | | | | | Blackstone Holdings Finance Co. LLC, 4.75%, due 02/15/23 144A | | | 1,159,535 | |
| | 110,000 | | | | | BMW US Capital LLC, 2.26% (3 mo. USD LIBOR plus 0.41%), due 04/12/21† 144A | | | 106,639 | |
See accompanying Notes to the Financial Statements.
79
Mercer Core Fixed Income Fund
Schedule of Investments (Continued)
(showing percentage of net assets)
March 31, 2020
| | | | | | | | | | |
| Par Value(a) | | | | | Description | | Value ($) | |
| | |
| | | | | | Corporate Debt — continued | |
| | 310,000 | | | | | BNP Paribas SA, 3.38%, due 01/09/25 144A | | | 307,883 | |
| | 200,000 | | | | | BNP Paribas SA, 4.38%, due 09/28/25 144A | | | 203,177 | |
| | 576,000 | | | | | Boeing Co. (The), 3.20%, due 03/01/29 | | | 531,868 | |
| | 185,000 | | | | | Boeing Co. (The), 3.75%, due 02/01/50‡ | | | 169,564 | |
| | 295,000 | | | | | Boeing Co. (The), 3.95%, due 08/01/59 | | | 266,010 | |
| | 250,000 | | | | | BPCE SA, 4.50%, due 03/15/25 144A | | | 248,495 | |
| | 255,000 | | | | | BPCE SA, 5.70%, due 10/22/23 144A | | | 262,466 | |
| | 593,000 | | | | | Brighthouse Financial, Inc., 3.70%, due 06/22/27 | | | 515,387 | |
| | 715,000 | | | | | Bristol-Myers Squibb Co., 2.25%, due 08/15/21 144A | | | 719,773 | |
| | 733,000 | | | | | Bristol-Myers Squibb Co., 2.90%, due 07/26/24 144A | | | 778,353 | |
| | 218,000 | | | | | Bristol-Myers Squibb Co., 3.25%, due 02/20/23 144A | | | 229,219 | |
| | 55,000 | | | | | Bristol-Myers Squibb Co., 4.13%, due 06/15/39 144A | | | 66,092 | |
| | 230,000 | | | | | Bristol-Myers Squibb Co., 4.25%, due 10/26/49 144A | | | 289,391 | |
| | 135,000 | | | | | Bristol-Myers Squibb Co., 5.00%, due 08/15/45 144A | | | 181,242 | |
| | 92,233 | | | | | British Airways Pass Through Trust, Series2018-1, Class A, 4.13%,
due 03/20/33 144A | | | 99,307 | |
| | 200,000 | | | | | Broadcom Corp./Broadcom Cayman Finance, Ltd., 3.13%, due 01/15/25 | | | 192,085 | |
| | 1,075,000 | | | | | Broadcom Corp./Broadcom Cayman Finance, Ltd., 3.88%, due 01/15/27 | | | 1,029,438 | |
| | 985,000 | | | | | Broadcom, Inc., 3.63%, due 10/15/24 144A | | | 971,099 | |
| | 469,000 | | | | | Broadcom, Inc., 4.75%, due 04/15/29 144A | | | 476,751 | |
| | 32,000 | | | | | Builders FirstSource, Inc., 5.00%, due 03/01/30 144A | | | 28,980 | |
| | 140,000 | | | | | C&W Senior Financing DAC, 6.88%, due 09/15/27 144A | | | 121,725 | |
| | 130,000 | | | | | Cablevision Systems Corp., 5.88%, due 09/15/22 | | | 131,994 | |
| | 509,000 | | | | | Canadian Pacific Railway Co., 6.13%, due 09/15/15# | | | 678,353 | |
| | 451,000 | | | | | Cantor Fitzgerald, LP, 4.88%, due 05/01/24 144A | | | 450,626 | |
| | 1,595,000 | | | | | Capital One Financial Corp., 3.30%, due 10/30/24 | | | 1,562,851 | |
| | 155,000 | | | | | Capital One Financial Corp., 3.90%, due 01/29/24 | | | 155,591 | |
| | 1,000,000 | | | | | Carlyle Holdings Finance LLC, 3.88%, due 02/01/23 144A | | | 1,030,827 | |
| | 406,000 | | | | | Carrier Global Corp., 2.24%, due 02/15/25 144A | | | 395,758 | |
| | 325,000 | | | | | Carrier Global Corp., 2.72%, due 02/15/30 144A | | | 301,383 | |
| | 55,000 | | | | | Catalent Pharma Solutions, Inc., 5.00%, due 07/15/27 144A | | | 53,655 | |
| | 235,000 | | | | | CC Holdings GS V LLC/Crown Castle GS III Corp. REIT, 3.85%, due 04/15/23 | | | 234,558 | |
| | 115,000 | | | | | CCM Merger, Inc., 6.00%, due 03/15/22 144A | | | 95,162 | |
| | 210,000 | | | | | CCO Holdings LLC/CCO Holdings Capital Corp., 5.38%, due 06/01/29 144A | | | 216,961 | |
| | 130,000 | | | | | Cemex SAB de CV, 6.13%, due 05/05/25‡ 144A | | | 116,187 | |
| | 240,000 | | | | | Cenovus Energy, Inc., 5.40%, due 06/15/47‡ | | | 109,287 | |
| | 107,000 | | | | | Centene Corp., 3.38%, due 02/15/30 144A | | | 99,911 | |
| | 75,000 | | | | | Centene Corp., 4.25%, due 12/15/27 144A | | | 73,916 | |
| | 78,000 | | | | | Centene Corp., 4.63%, due 12/15/29 144A | | | 78,823 | |
| | 218,000 | | | | | Centene Corp., 5.38%, due 06/01/26 144A | | | 225,774 | |
| | 335,000 | | | | | CenterPoint Energy, Inc., 3.70%, due 09/01/49 | | | 325,935 | |
| | 354,000 | | | | | CenturyLink, Inc., 4.00%, due 02/15/27 144A | | | 346,035 | |
| | 50,000 | | | | | Charles River Laboratories International, Inc., 4.25%, due 05/01/28 144A | | | 48,473 | |
| | 454,000 | | | | | Charter Communications Operating LLC/Charter Communications Operating Capital, 4.20%, due 03/15/28 | | | 465,339 | |
| | 5,000 | | | | | Charter Communications Operating LLC/Charter Communications Operating Capital, 4.46%, due 07/23/22 | | | 5,193 | |
| | 902,000 | | | | | Charter Communications Operating LLC/Charter Communications Operating Capital, 4.80%, due 03/01/50 | | | 943,104 | |
See accompanying Notes to the Financial Statements.
80
Mercer Core Fixed Income Fund
Schedule of Investments (Continued)
(showing percentage of net assets)
March 31, 2020
| | | | | | | | | | |
| Par Value(a) | | | | | Description | | Value ($) | |
| | |
| | | | | | Corporate Debt — continued | |
| | 270,000 | | | | | Charter Communications Operating LLC/Charter Communications Operating Capital, 5.38%, due 05/01/47 | | | 292,688 | |
| | 644,000 | | | | | Charter Communications Operating LLC/Charter Communications Operating Capital, 5.75%, due 04/01/48 | | | 733,423 | |
| | 1,964,000 | | | | | Charter Communications Operating LLC/Charter Communications Operating Capital, 6.38%, due 10/23/35 | | | 2,338,228 | |
| | 744,000 | | | | | Charter Communications Operating LLC/Charter Communications Operating Capital, 6.48%, due 10/23/45 | | | 901,134 | |
| | 336,000 | | | | | Cheniere Energy Partners, LP, 4.50%, due 10/01/29 144A | | | 294,185 | |
| | 1,790,000 | | | | | Cigna Corp., 3.40%, due 03/01/27 144A | | | 1,815,880 | |
| | 660,000 | | | | | Cigna Corp., 4.38%, due 10/15/28 | | | 710,040 | |
| | 295,000 | | | | | Cigna Corp., 4.80%, due 07/15/46 144A | | | 351,369 | |
| | 245,000 | | | | | Cigna Corp., 4.90%, due 12/15/48 | | | 295,399 | |
| | 185,000 | | | | | Cimarex Energy Co., 4.38%, due 06/01/24 | | | 146,053 | |
| | 317,000 | | | | | Cincinnati Bell, Inc., 7.00%, due 07/15/24 144A | | | 321,349 | |
| | 546,000 | | | | | Citigroup, Inc., 3.20%, due 10/21/26 | | | 566,674 | |
| | 2,487,000 | | | | | Citigroup, Inc., 3.40%, due 05/01/26 | | | 2,596,843 | |
| | 625,000 | | | | | Citigroup, Inc., 3.52% (3 mo. USD LIBOR plus 1.15%), due 10/27/28† | | | 626,487 | |
| | 310,000 | | | | | Citigroup, Inc., 3.67% (3 mo. USD LIBOR plus 1.39%), due 07/24/28† | | | 321,556 | |
| | 1,585,000 | | | | | Citigroup, Inc., 3.89% (3 mo. USD LIBOR plus 1.56%), due 01/10/28† | | | 1,633,603 | |
| | 1,400,000 | | | | | Citigroup, Inc., 4.08% (3 mo. USD LIBOR plus 1.19%), due 04/23/29† | | | 1,465,009 | |
| | 180,000 | | | | | Citigroup, Inc., 4.40%, due 06/10/25 | | | 188,554 | |
| | 440,000 | | | | | Citigroup, Inc., 4.41% (SOFR plus 3.91%), due 03/31/31† | | | 484,405 | |
| | 644,000 | | | | | Citigroup, Inc., 4.60%, due 03/09/26 | | | 684,521 | |
| | 488,000 | | | | | Citigroup, Inc., 4.70% (SOFR plus 3.23%)† ††††† | | | 418,936 | |
| | 150,000 | | | | | Citigroup, Inc., 5.50%, due 09/13/25 | | | 164,528 | |
| | 130,000 | | | | | Citigroup, Inc., 5.90% (3 mo. USD LIBOR plus 4.23%)† ††††† | | | 125,514 | |
| | 230,000 | | | | | Citigroup, Inc., 5.95% (3 mo. USD LIBOR plus 4.07%)† ††††† ‡ | | | 222,987 | |
| | 550,000 | | | | | Citigroup, Inc., 5.95% (3 mo. USD LIBOR plus 4.10%)† ††††† | | | 484,118 | |
| | 120,000 | | | | | Citigroup, Inc., 6.13% (3 mo. USD LIBOR plus 4.48%)† ††††† | | | 111,642 | |
| | 360,000 | | | | | Citigroup, Inc., 6.25% (3 mo. USD LIBOR plus 4.52%)† ††††† | | | 369,301 | |
| | 438,000 | | | | | Citrix Systems, Inc., 3.30%, due 03/01/30 | | | 409,530 | |
| | 45,000 | | | | | Clean Harbors, Inc., 4.88%, due 07/15/27 144A | | | 44,300 | |
| | 524,000 | | | | | Cleveland Clinic Foundation (The), 4.86%, due 01/01/14# | | | 651,316 | |
| | 245,000 | | | | | CNAC HK Finbridge Co., Ltd., Reg S, 3.50%, due 07/19/22‡‡‡ 144A | | | 243,533 | |
| | 122,000 | | | | | CNO Financial Group, Inc., 5.25%, due 05/30/25 | | | 127,367 | |
| | 305,000 | | | | | CNO Financial Group, Inc., 5.25%, due 05/30/29 | | | 297,529 | |
| | 335,000 | | | | | CNOOC Finance 2013, Ltd., 2.88%, due 09/30/29 | | | 344,378 | |
| | 599,000 | | | | | Coca-Cola Co. (The), 4.20%, due 03/25/50 | | | 784,454 | |
| | 153,000 | | | | | Colorado Interstate Gas Co. LLC/Colorado Interstate Issuing Corp., 4.15%, due 08/15/26 144A | | | 148,865 | |
| | 267,000 | | | | | Comcast Corp., 3.10%, due 04/01/25 | | | 283,809 | |
| | 429,000 | | | | | Comcast Corp., 3.30%, due 04/01/27 | | | 460,997 | |
| | 1,007,000 | | | | | Comcast Corp., 3.40%, due 04/01/30 | | | 1,092,853 | |
| | 475,000 | | | | | Comcast Corp., 3.45%, due 02/01/50 | | | 522,881 | |
| | 2,400,000 | | | | | Comcast Corp., 3.95%, due 10/15/25 | | | 2,614,694 | |
| | 5,000 | | | | | Comcast Corp., 3.97%, due 11/01/47 | | | 5,711 | |
| | 443,000 | | | | | Comcast Corp., 4.05%, due 11/01/52 | | | 529,685 | |
| | 936,000 | | | | | Comcast Corp., 4.15%, due 10/15/28 | | | 1,053,191 | |
See accompanying Notes to the Financial Statements.
81
Mercer Core Fixed Income Fund
Schedule of Investments (Continued)
(showing percentage of net assets)
March 31, 2020
| | | | | | | | | | |
| Par Value(a) | | | | | Description | | Value ($) | |
| | |
| | | | | | Corporate Debt — continued | |
| | 20,000 | | | | | Comcast Corp., 6.50%, due 11/15/35 | | | 29,230 | |
| | 54,000 | | | | | Commercial Metals Co., 5.38%, due 07/15/27 | | | 50,141 | |
| | 1,419,000 | | | | | CommonSpirit Health, 2.76%, due 10/01/24 | | | 1,419,996 | |
| | 357,000 | | | | | CommonSpirit Health, 4.19%, due 10/01/49 | | | 339,504 | |
| | 350,000 | | | | | Commonwealth Edison Co., 4.00%, due 03/01/48 | | | 394,457 | |
| | 315,000 | | | | | CommScope, Inc., 8.25%, due 03/01/27‡ 144A | | | 305,377 | |
| | 130,000 | | | | | Comunicaciones Celulares SA Via Comcel Trust, 6.88%, due 02/06/24 144A | | | 126,914 | |
| | 940,000 | | | | | Concho Resources, Inc., 3.75%, due 10/01/27 | | | 798,977 | |
| | 45,000 | | | | | Concho Resources, Inc., 4.88%, due 10/01/47 | | | 34,796 | |
| | 326,000 | | | | | Connect Finco SARL/Connect US Finco LLC, 6.75%, due 10/01/26 144A | | | 270,580 | |
| | 65,000 | | | | | Consolidated Edison Co. of New York, Inc., 4.30%, due 12/01/56 | | | 69,039 | |
| | 350,000 | | | | | Consolidated Edison Co. of New York, Inc., 4.50%, due 12/01/45 | | | 388,820 | |
| | 996,703 | | | | | Continental Airlines Pass Through Trust, Series2007-1, Class A, 5.98%, due 10/19/23 | | | 1,022,757 | |
| | 700,000 | | | | | Continental Resources, Inc., 4.50%, due 04/15/23 | | | 389,476 | |
| | 1,185,000 | | | | | Cooperatieve Rabobank UA, 3.88%, due 09/26/23 144A | | | 1,220,659 | |
| | 1,876,000 | | | | | Cox Communications, Inc., 3.35%, due 09/15/26 144A | | | 1,897,548 | |
| | 1,750,000 | | | | | Cox Communications, Inc., 3.50%, due 08/15/27 144A | | | 1,712,195 | |
| | 536,000 | | | | | Credit Agricole SA, 3.25%, due 01/14/30 144A | | | 507,921 | |
| | 250,000 | | | | | Credit Agricole SA, 3.75%, due 04/24/23 144A | | | 255,797 | |
| | 225,000 | | | | | Credit Agricole SA, 7.88% (5 year USD swap plus 4.90%)† ††††† 144A | | | 218,348 | |
| | 275,000 | | | | | Credit Suisse Group AG, 7.50% (5 year USD swap plus 4.60%)† ††††† 144A | | | 253,631 | |
| | 500,000 | | | | | Credit Suisse Group Funding Guernsey, Ltd., 3.45%, due 04/16/21 | | | 503,315 | |
| | 125,000 | | | | | Credito Real SAB de CV SOFOM ER, 9.13% (5 year CMT plus 7.03%)† ††††† 144A | | | 96,289 | |
| | 95,000 | | | | | Crown Castle International Corp., 3.30%, due 07/01/30†††† | | | 94,220 | |
| | 85,000 | | | | | Crown Castle International Corp., 4.15%, due 07/01/50†††† | | | 84,065 | |
| | 165,000 | | | | | CSC Holdings LLC, 5.75%, due 01/15/30 144A | | | 167,015 | |
| | 125,000 | | | | | CSC Holdings LLC, 7.50%, due 04/01/28 144A | | | 134,048 | |
| | 311,000 | | | | | CSI Compressco, LP/CSI Compressco Finance, Inc., 7.25%, due 08/15/22 | | | 173,674 | |
| | 247,000 | | | | | CSI Compressco, LP/CSI Compressco Finance, Inc., 7.50%, due 04/01/25 144A | | | 167,652 | |
| | 73,000 | | | | | CVS Health Corp., 3.00%, due 08/15/26 | | | 74,031 | |
| | 1,160,000 | | | | | CVS Health Corp., 3.70%, due 03/09/23 | | | 1,206,323 | |
| | 315,000 | | | | | CVS Health Corp., 3.75%, due 04/01/30 | | | 325,002 | |
| | 413,000 | | | | | CVS Health Corp., 4.30%, due 03/25/28 | | | 442,637 | |
| | 50,000 | | | | | CVS Health Corp., 4.78%, due 03/25/38 | | | 55,488 | |
| | 424,000 | | | | | CVS Health Corp., 5.05%, due 03/25/48 | | | 486,330 | |
| | 130,000 | | | | | CVS Health Corp., 5.13%, due 07/20/45 | | | 150,243 | |
| | 708,379 | | | | | CVS Pass-Through Trust, 6.94%, due��01/10/30 | | | 882,898 | |
| | 1,855,172 | | | | | CVS Pass-Through Trust, 7.51%, due 01/10/32 144A | | | 2,411,837 | |
| | 220,000 | | | | | Cydsa SAB de CV, 6.25%, due 10/04/27 144A | | | 164,679 | |
| | 321,000 | | | | | CyrusOne, LP/CyrusOne Finance Corp. REIT, 3.45%, due 11/15/29 | | | 285,131 | |
| | 1,135,000 | | | | | Daimler Finance North America LLC, 2.55%, due 08/15/22 144A | | | 1,090,873 | |
| | 180,000 | | | | | Daimler Finance North America LLC, 2.70%, due 06/14/24 144A | | | 174,151 | |
| | 155,000 | | | | | Daimler Finance North America LLC, 3.50%, due 08/03/25 144A | | | 150,153 | |
| | 187,000 | | | | | Danske Bank AS, 5.00%, due 01/12/22 144A | | | 192,165 | |
| | 480,000 | | | | | DaVita, Inc., 5.00%, due 05/01/25 | | | 482,374 | |
| | 70,000 | | | | | DCP Midstream Operating, LP, 5.13%, due 05/15/29 | | | 44,485 | |
| | 318,000 | | | | | DCP Midstream Operating, LP, 5.85% (3 mo. USD LIBOR plus 3.85%), due 05/21/43† 144A | | | 155,917 | |
| | 371,000 | | | | | DCP Midstream, LP, 7.38% (3 mo. USD LIBOR plus 5.15%)† ††††† | | | 149,047 | |
See accompanying Notes to the Financial Statements.
82
Mercer Core Fixed Income Fund
Schedule of Investments (Continued)
(showing percentage of net assets)
March 31, 2020
| | | | | | | | | | |
| Par Value(a) | | | | | Description | | Value ($) | |
| | |
| | | | | | Corporate Debt — continued | |
| | 77,000 | | | | | Dealer Tire LLC/DT Issuer LLC, 8.00%, due 02/01/28 144A | | | 62,178 | |
| | 392,000 | | | | | Dell International LLC/EMC Corp., 4.90%, due 10/01/26 144A | | | 386,652 | |
| | 524,000 | | | | | Dell International LLC/EMC Corp., 5.30%, due 10/01/29 144A | | | 535,710 | |
| | 559,000 | | | | | Dell International LLC/EMC Corp., 8.35%, due 07/15/46 144A | | | 666,001 | |
| | 753,268 | | | | | Delta Air Lines Pass Through Trust, Series2007-1, Class A, 6.82%, due 02/10/24 | | | 796,570 | |
| | 1,448,000 | | | | | Delta Air Lines Pass Through Trust, Series2020-1, Class AA, 2.00%, due 12/10/29 | | | 1,325,692 | |
| | 570,000 | | | | | Delta Air Lines, Inc., 2.90%, due 10/28/24 | | | 457,556 | |
| | 268,000 | | | | | Delta Air Lines, Inc., 3.80%, due 04/19/23 | | | 252,378 | |
| | 315,000 | | | | | Delta Air Lines, Inc., 4.38%, due 04/19/28 | | | 254,628 | |
| | 300,000 | | | | | Deutsche Bank AG, 5.00%, due 02/14/22 | | | 296,826 | |
| | 375,000 | | | | | Deutsche Bank AG, (MTN), 3.38%, due 05/12/21‡ | | | 362,076 | |
| | 305,000 | EUR | | | | DH Europe Finance II SARL, 1.35%, due 09/18/39 | | | 276,950 | |
| | 240,000 | | | | | Diamond Sports Group LLC/Diamond Sports Finance Co., 6.63%, due 08/15/27‡ 144A | | | 161,832 | |
| | 865,000 | | | | | Diamondback Energy, Inc., 3.25%, due 12/01/26 | | | 612,897 | |
| | 1,522,000 | | | | | Digital Realty Trust, LP REIT, 3.70%, due 08/15/27 | | | 1,514,484 | |
| | 276,000 | | | | | Discover Bank, 2.45%, due 09/12/24 | | | 260,986 | |
| | 362,000 | | | | | Discover Financial Services, 3.95%, due 11/06/24 | | | 368,197 | |
| | 103,000 | | | | | Discover Financial Services, 4.10%, due 02/09/27 | | | 101,173 | |
| | 82,000 | | | | | Dollar Tree, Inc., 2.54% (3 mo. USD LIBOR plus 0.70%), due 04/17/20† | | | 81,983 | |
| | 690,000 | | | | | Dollar Tree, Inc., 4.20%, due 05/15/28 | | | 689,801 | |
| | 854,000 | | | | | Dominion Energy, Inc., 2.72%, due 08/15/21†† | | | 842,200 | |
| | 115,000 | | | | | Dominion Energy, Inc., 2.85%, due 08/15/26 | | | 110,313 | |
| | 256,000 | | | | | Dominion Energy, Inc., 3.38%, due 04/01/30†††† | | | 253,427 | |
| | 850,000 | | | | | DTE Electric Co., 2.25%, due 03/01/30 | | | 824,552 | |
| | 411,000 | | | | | Duke Energy Carolinas LLC, 3.95%, due 03/15/48 | | | 464,645 | |
| | 1,839,000 | | | | | Duke Energy Corp., 3.55%, due 09/15/21 | | | 1,861,794 | |
| | 420,000 | | | | | Duke Energy Florida LLC, 3.40%, due 10/01/46 | | | 432,818 | |
| | 195,000 | | | | | Duke Energy Progress LLC, 3.70%, due 10/15/46 | | | 209,748 | |
| | 190,000 | | | | | El Paso Natural Gas Co. LLC, 8.38%, due 06/15/32 | | | 222,196 | |
| | 95,000 | | | | | Eldorado Resorts, Inc., 6.00%, due 09/15/26 | | | 86,272 | |
| | 80,000 | | | | | Eldorado Resorts, Inc., 7.00%, due 08/01/23 | | | 72,500 | |
| | 42,000 | | | | | Embraer Netherlands Finance BV, 5.05%, due 06/15/25 | | | 37,432 | |
| | 250,000 | | | | | Embraer Overseas, Ltd., 5.70%, due 09/16/23 144A | | | 215,936 | |
| | 351,000 | | | | | Emera US Finance, LP, 3.55%, due 06/15/26 | | | 335,433 | |
| | 266,000 | | | | | Enable Midstream Partners, LP, 3.90%, due 05/15/24 | | | 147,843 | |
| | 214,000 | | | | | Enable Midstream Partners, LP, 4.95%, due 05/15/28 | | | 129,305 | |
| | 285,000 | | | | | Enbridge, Inc., 5.50% (3 mo. USD LIBOR plus 3.42%), due 07/15/77† | | | 205,697 | |
| | 247,000 | | | | | Enbridge, Inc., 6.25% (3 mo. USD LIBOR plus 3.64%), due 03/01/78† ‡ | | | 185,681 | |
| | 42,000 | | | | | Encompass Health Corp., 4.50%, due 02/01/28 | | | 41,393 | |
| | 450,000 | | | | | Enel Finance International NV, 4.63%, due 09/14/25 144A | | | 478,735 | |
| | 70,000 | | | | | Energy Transfer Operating, LP, 4.20%, due 04/15/27 | | | 56,546 | |
| | 358,000 | | | | | Energy Transfer Operating, LP, 4.25%, due 03/15/23 | | | 324,824 | |
| | 240,000 | | | | | Energy Transfer Operating, LP, 5.15%, due 03/15/45 | | | 186,374 | |
| | 900,000 | | | | | Energy Transfer Operating, LP, 5.50%, due 06/01/27 | | | 786,697 | |
| | 244,000 | | | | | Energy Transfer Operating, LP, 5.88%, due 01/15/24 | | | 230,988 | |
| | 340,000 | | | | | Energy Transfer Operating, LP, 6.25%, due 04/15/49 | | | 292,436 | |
| | 227,000 | | | | | Enova International, Inc., 8.50%, due 09/15/25 144A | | | 196,922 | |
| | 612,000 | | | | | Enterprise Products Operating LLC, 5.25% (3 mo. USD LIBOR plus 3.03%), due 08/16/77† | | | 420,288 | |
See accompanying Notes to the Financial Statements.
83
Mercer Core Fixed Income Fund
Schedule of Investments (Continued)
(showing percentage of net assets)
March 31, 2020
| | | | | | | | | | |
| Par Value(a) | | | | | Description | | Value ($) | |
| | |
| | | | | | Corporate Debt — continued | |
| | 339,000 | | | | | Equinix, Inc. REIT, 3.20%, due 11/18/29 | | | 317,118 | |
| | 179,000 | | | | | Equinix, Inc. REIT, 5.38%, due 05/15/27 | | | 178,007 | |
| | 2,045,000 | | | | | Escrow GCB General Motors, 8.38%, due 07/15/49* **** ^ | | | — | |
| | 1,320,000 | | | | | Eversource Energy, 2.90%, due 10/01/24 | | | 1,251,109 | |
| | 285,000 | | | | | Exelon Corp., 4.70%, due 04/15/50 | | | 294,748 | |
| | 1,128,000 | | | | | Exelon Corp., 5.10%, due 06/15/45 | | | 1,220,967 | |
| | 380,000 | | | | | Expedia Group, Inc., 3.25%, due 02/15/30 | | | 320,047 | |
| | 592,000 | | | | | Expedia Group, Inc., 3.80%, due 02/15/28 | | | 512,901 | |
| | 524,000 | | | | | Expedia Group, Inc., 5.00%, due 02/15/26‡ | | | 474,310 | |
| | 995,000 | | | | | FedEx Corp., 4.05%, due 02/15/48 | | | 879,440 | |
| | 715,000 | | | | | Ferguson Finance Plc, 4.50%, due 10/24/28 144A | | | 749,852 | |
| | 219,000 | | | | | Fifth Third Bancorp, 5.10% (3 mo. USD LIBOR plus 3.03%)† ††††† | | | 177,542 | |
| | 135,000 | | | | | First Quantum Minerals, Ltd., 6.88%, due 03/01/26 144A | | | 109,087 | |
| | 200,000 | | | | | First Quantum Minerals, Ltd., 7.50%, due 04/01/25 144A | | | 167,689 | |
| | 194,000 | | | | | FirstEnergy Corp., 2.65%, due 03/01/30 | | | 182,016 | |
| | 245,000 | | | | | FirstEnergy Corp., 7.38%, due 11/15/31 | | | 319,706 | |
| | 200,000 | | | | | FLIR Systems, Inc., 3.13%, due 06/15/21 | | | 200,298 | |
| | 915,000 | | | | | Ford Motor Credit Co. LLC, 3.35%, due 11/01/22 | | | 857,812 | |
| | 999,000 | | | | | Ford Motor Credit Co. LLC, 4.13%, due 08/04/25 | | | 891,108 | |
| | 565,000 | | | | | Ford Motor Credit Co. LLC, 5.11%, due 05/03/29 | | | 492,609 | |
| | 525,000 | | | | | Ford Motor Credit Co. LLC, 5.88%, due 08/02/21 | | | 517,125 | |
| | 202,000 | | | | | Freedom Mortgage Corp., 8.13%, due 11/15/24 144A | | | 164,496 | |
| | 72,000 | | | | | Freedom Mortgage Corp., 8.25%, due 04/15/25 144A | | | 57,058 | |
| | 113,000 | | | | | GCI LLC, 6.63%, due 06/15/24 144A | | | 112,858 | |
| | 146,000 | | | | | GCI LLC, 6.88%, due 04/15/25 | | | 145,817 | |
| | 1,355,000 | | | | | GE Capital International Funding Co. Unlimited Co., 2.34%, due 11/15/20 | | | 1,332,414 | |
| | 1,122,000 | | | | | GE Capital International Funding Co. Unlimited Co., 4.42%, due 11/15/35 | | | 1,202,045 | |
| | 214,000 | | | | | General Dynamics Corp., 4.25%, due 04/01/50 | | | 270,205 | |
| | 80,000 | | | | | General Electric Co., (MTN), 4.38%, due 09/16/20 | | | 80,052 | |
| | 500,000 | | | | | General Electric Co., (MTN), 5.55%, due 01/05/26 | | | 533,605 | |
| | 160,000 | | | | | General Motors Financial Co., Inc., 2.73% (3 mo. USD LIBOR plus 0.85%), due 04/09/21† | | | 144,058 | |
| | 605,000 | | | | | General Motors Financial Co., Inc., 2.90%, due 02/26/25 | | | 524,723 | |
| | 120,000 | | | | | General Motors Financial Co., Inc., 3.55%, due 04/09/21 | | | 115,013 | |
| | 811,000 | | | | | General Motors Financial Co., Inc., 4.00%, due 01/15/25 | | | 722,025 | |
| | 1,199,000 | | | | | General Motors Financial Co., Inc., 4.15%, due 06/19/23 | | | 1,092,044 | |
| | 304,000 | | | | | General Motors Financial Co., Inc., 4.30%, due 07/13/25 | | | 269,717 | |
| | 535,000 | | | | | General Motors Financial Co., Inc., 5.10%, due 01/17/24 | | | 492,203 | |
| | 44,000 | | | | | GEO Group, Inc. (The) REIT, 6.00%, due 04/15/26 | | | 28,906 | |
| | 361,000 | | | | | GlaxoSmithKline Capital Plc, 3.00%, due 06/01/24 | | | 376,959 | |
| | 424,000 | | | | | GLP Capital, LP/GLP Financing II, Inc. REIT, 5.38%, due 04/15/26 | | | 378,187 | |
| | 161,000 | | | | | Gogo Intermediate Holdings LLC/Gogo Finance Co., Inc., 9.88%, due 05/01/24 144A | | | 128,197 | |
| | 1,200,000 | | | | | Goldman Sachs Group, Inc. (The), 3.27% (3 mo. USD LIBOR plus 1.20%), due 09/29/25† | | | 1,221,567 | |
| | 140,000 | | | | | Goldman Sachs Group, Inc. (The), 3.50%, due 01/23/25 | | | 143,398 | |
| | 560,000 | | | | | Goldman Sachs Group, Inc. (The), 3.69% (3 mo. USD LIBOR plus 1.51%), due 06/05/28† | | | 576,071 | |
| | 85,000 | | | | | Goldman Sachs Group, Inc. (The), 3.75%, due 02/25/26 | | | 88,014 | |
| | 1,131,000 | | | | | Goldman Sachs Group, Inc. (The), 3.80%, due 03/15/30 | | | 1,180,982 | |
See accompanying Notes to the Financial Statements.
84
Mercer Core Fixed Income Fund
Schedule of Investments (Continued)
(showing percentage of net assets)
March 31, 2020
| | | | | | | | | | |
| Par Value(a) | | | | | Description | | Value ($) | |
| | |
| | | | | | Corporate Debt — continued | |
| | 320,000 | | | | | Goldman Sachs Group, Inc. (The), 3.81% (3 mo. USD LIBOR plus 1.16%), due 04/23/29† | | | 331,188 | |
| | 1,147,000 | | | | | Goldman Sachs Group, Inc. (The), 3.85%, due 01/26/27 | | | 1,185,108 | |
| | 125,000 | | | | | Goldman Sachs Group, Inc. (The), 5.30% (3 mo. USD LIBOR plus 3.83%)† ††††† ‡ | | | 121,354 | |
| | 465,000 | | | | | Goldman Sachs Group, Inc. (The), 5.38% (3 mo. USD LIBOR plus 3.92%)† ††††† | | | 415,694 | |
| | 1,850,000 | | | | | Goldman Sachs Group, Inc. (The), 5.75%, due 01/24/22 | | | 1,961,527 | |
| | 175,000 | | | | | Greenko Dutch BV, 4.88%, due 07/24/22 144A | | | 155,778 | |
| | 84,000 | | | | | H&E Equipment Services, Inc., 5.63%, due 09/01/25 | | | 78,435 | |
| | 73,000 | | | | | Harsco Corp., 5.75%, due 07/31/27 144A | | | 68,103 | |
| | 128,000 | | | | | HCA, Inc., 4.13%, due 06/15/29 | | | 128,650 | |
| | 239,000 | | | | | HCA, Inc., 5.25%, due 04/15/25 | | | 251,155 | |
| | 227,000 | | | | | HCA, Inc., 5.25%, due 06/15/26 | | | 238,598 | |
| | 50,000 | | | | | HCA, Inc., 5.38%, due 02/01/25 | | | 51,438 | |
| | 150,000 | | | | | HCA, Inc., 5.88%, due 02/01/29 | | | 159,187 | |
| | 925,000 | | | | | Healthpeak Properties, Inc. REIT, 3.25%, due 07/15/26 | | | 899,192 | |
| | 620,000 | | | | | Healthpeak Properties, Inc. REIT, 4.25%, due 11/15/23 | | | 586,999 | |
| | 127,000 | | | | | Hilton Domestic Operating Co., Inc., 4.88%, due 01/15/30 | | | 108,835 | |
| | 777,000 | | | | | Home Depot, Inc. (The), 3.30%, due 04/15/40 | | | 797,652 | |
| | 607,000 | | | | | HSBC Holdings Plc, 3.95% (3 mo. USD LIBOR plus 0.99%), due 05/18/24† | | | 622,899 | |
| | 260,000 | | | | | HSBC Holdings Plc, 6.88% (5 year USD ICE swap plus 5.51%)† ††††† | | | 255,485 | |
| | 85,000 | | | | | Huntington Ingalls Industries, Inc., 3.84%, due 05/01/25 144A | | | 87,604 | |
| | 213,000 | | | | | Huntington Ingalls Industries, Inc., 4.20%, due 05/01/30 144A | | | 221,222 | |
| | 297,000 | | | | | Huntington Ingalls Industries, Inc., 5.00%, due 11/15/25 144A | | | 306,497 | |
| | 224,000 | | | | | Husky Energy, Inc., 3.95%, due 04/15/22 | | | 203,023 | |
| | 724,000 | | | | | Hyundai Capital America, 2.38%, due 02/10/23 144A | | | 683,972 | |
| | 225,000 | | | | | IHS Markit, Ltd., 4.00%, due 03/01/26 144A | | | 222,667 | |
| | 125,000 | | | | | IHS Markit, Ltd., 4.75%, due 02/15/25 144A | | | 129,059 | |
| | 165,000 | | | | | IHS Markit, Ltd., 4.75%, due 08/01/28 | | | 173,832 | |
| | 215,000 | | | | | ING Groep NV, 3.55%, due 04/09/24 | | | 216,440 | |
| | 200,000 | | | | | Instituto Costarricense de Electricidad, 6.38%, due 05/15/43‡ 144A | | | 127,002 | |
| | 1,002,000 | | | | | Intel Corp., 3.75%, due 03/25/27 | | | 1,115,656 | |
| | 170,000 | | | | | International Game Technology Plc, 6.50%, due 02/15/25 144A | | | 151,701 | |
| | 200,000 | | | | | Israel Electric Corp., Ltd., 6.88%, due 06/21/23 144A | | | 220,362 | |
| | 182,000 | | | | | Jacobs Entertainment, Inc., 7.88%, due 02/01/24 144A | | | 154,927 | |
| | 64,000 | | | | | JB Poindexter & Co., Inc., 7.13%, due 04/15/26 144A | | | 59,773 | |
| | 385,000 | | | | | JBS Investments II GmbH, 5.75%, due 01/15/28 144A | | | 375,779 | |
| | 245,000 | | | | | Jefferies Financial Group, Inc., 5.50%, due 10/18/23 | | | 248,277 | |
| | 500,000 | | | | | Jefferies Group LLC, 5.13%, due 01/20/23 | | | 509,723 | |
| | 300,000 | | | | | Jefferies Group LLC/Jefferies Group Capital Finance, Inc., 4.15%, due 01/23/30 | | | 282,101 | |
| | 280,000 | | | | | Jefferies Group LLC/Jefferies Group Capital Finance, Inc., 4.85%, due 01/15/27 | | | 277,811 | |
| | 309,000 | | | | | JetBlue Pass Through Trust, Series2019-1, Class AA, 2.75%, due 11/15/33 | | | 274,636 | |
| | 462,000 | | | | | JPMorgan Chase & Co., 2.95%, due 10/01/26 | | | 477,702 | |
| | 3,605,000 | | | | | JPMorgan Chase & Co., 3.78% (3 mo. USD LIBOR plus 1.34%), due 02/01/28† | | | 3,823,314 | |
| | 475,000 | | | | | JPMorgan Chase & Co., 3.96% (3 mo. USD LIBOR plus 1.25%), due 01/29/27† | | | 511,890 | |
| | 625,000 | | | | | JPMorgan Chase & Co., 3.96% (3 mo. USD LIBOR plus 1.38%), due 11/15/48† | | | 726,334 | |
| | 585,000 | | | | | JPMorgan Chase & Co., 4.00% (SOFR plus 2.75%)† ††††† ‡ | | | 499,956 | |
| | 340,000 | | | | | JPMorgan Chase & Co., 4.01% (3 mo. USD LIBOR plus 1.12%), due 04/23/29† | | | 365,792 | |
| | 2,450,000 | | | | | JPMorgan Chase & Co., 4.20% (3 mo. USD LIBOR plus 1.26%), due 07/23/29 | | | 2,693,506 | |
| | 1,207,000 | | | | | JPMorgan Chase & Co., 4.49% (SOFR plus 3.79%), due 03/24/31† | | | 1,397,108 | |
See accompanying Notes to the Financial Statements.
85
Mercer Core Fixed Income Fund
Schedule of Investments (Continued)
(showing percentage of net assets)
March 31, 2020
| | | | | | | | | | |
| Par Value(a) | | | | | Description | | Value ($) | |
| | |
| | | | | | Corporate Debt — continued | |
| | 314,000 | | | | | JPMorgan Chase & Co., 4.60% (SOFR plus 3.13%)† ††††† | | | 275,205 | |
| | 180,000 | | | | | JPMorgan Chase & Co., 5.00% (SOFR plus 3.38%)† ††††† | | | 169,188 | |
| | 555,000 | | | | | JPMorgan Chase & Co., 5.30% (3 mo. USD LIBOR plus 3.80%)† ††††† ‡ | | | 512,051 | |
| | 538,000 | | | | | JPMorgan Chase & Co., 6.75% (3 mo. USD LIBOR plus 3.78%)† ††††† | | | 562,584 | |
| | 200,000 | | | | | KazMunayGas National Co. JSC, 4.75%, due 04/24/25 144A | | | 200,062 | |
| | 160,000 | | | | | Kinder Morgan Energy Partners, LP, 7.75%, due 03/15/32 | | | 189,698 | |
| | 1,240,000 | | | | | KKR Group Finance Co. II LLC, 5.50%, due 02/01/43 144A | | | 1,370,099 | |
| | 540,000 | | | | | KKR Group Finance Co. VII LLC, 3.63%, due 02/25/50 144A | | | 447,466 | |
| | 226,000 | | | | | KLA Corp., 4.10%, due 03/15/29 | | | 237,915 | |
| | 360,000 | | | | | Kraft Heinz Foods Co., 3.00%, due 06/01/26 | | | 350,645 | |
| | 205,000 | | | | | Kraft Heinz Foods Co., 4.88%, due 02/15/25 144A | | | 205,487 | |
| | 120,000 | | | | | Kraft Heinz Foods Co., 4.88%, due 10/01/49 144A | | | 109,600 | |
| | 115,000 | | | | | Kraft Heinz Foods Co., 5.20%, due 07/15/45 | | | 111,094 | |
| | 129,000 | | | | | Kratos Defense & Security Solutions, Inc., 6.50%, due 11/30/25 144A | | | 119,163 | |
| | 724,000 | | | | | Kroger Co. (The), 4.00%, due 02/01/24 | | | 762,968 | |
| | 150,000 | | | | | L Brands, Inc., 5.63%, due 10/15/23 | | | 125,453 | |
| | 510,000 | | | | | Laboratory Corp. of America Holdings, 2.95%, due 12/01/29 | | | 493,259 | |
| | 47,000 | | | | | Ladder Capital Finance Holdings LLLP/Ladder Capital Finance Corp. REIT, 5.25%, due 03/15/22 144A | | | 42,417 | |
| | 88,000 | | | | | Ladder Capital Finance Holdings LLLP/Ladder Capital Finance Corp. REIT, 5.25%, due 10/01/25 144A | | | 73,176 | |
| | 286,000 | | | | | Lam Research Corp., 3.75%, due 03/15/26 | | | 304,002 | |
| | 232,000 | | | | | Lam Research Corp., 4.88%, due 03/15/49 | | | 300,485 | |
| | 110,000 | | | | | Laureate Education, Inc., 8.25%, due 05/01/25 144A | | | 110,272 | |
| | 201,000 | | | | | Lazard Group LLC, 4.38%, due 03/11/29 | | | 203,611 | |
| | 470,000 | | | | | Lehman Brothers Holdings Capital Trust VII, (MTN), 5.86%**** ††† ††††† | | | 165 | |
| | 890,000 | | | | | Lehman Brothers Holdings, Inc., 6.50%, due 07/19/17**** ††† | | | 312 | |
| | 270,000 | | | | | Lehman Brothers Holdings, Inc., (MTN), 6.75%, due 12/28/17**** ††† | | | 95 | |
| | 279,000 | | | | | Level 3 Financing, Inc., 3.40%, due 03/01/27 144A | | | 267,115 | |
| | 554,000 | | | | | Liberty Mutual Group, Inc., 3.95%, due 10/15/50 144A | | | 515,774 | |
| | 254,000 | | | | | Liberty Mutual Group, Inc., 4.25%, due 06/15/23 144A | | | 258,944 | |
| | 2,883,000 | | | | | Liberty Mutual Group, Inc., 4.57%, due 02/01/29 144A | | | 3,192,585 | |
| | 190,000 | | | | | Lions Gate Capital Holdings LLC, 5.88%, due 11/01/24 144A | | | 164,112 | |
| | 145,000 | | | | | Liquid Telecommunications Financing Plc, 8.50%, due 07/13/22 144A | | | 113,007 | |
| | 1,150,000 | | | | | Lloyds Banking Group Plc, 2.44% (1 year CMT plus 1.00%), due 02/05/26‡ | | | 1,088,119 | |
| | 775,000 | | | | | Lloyds Banking Group Plc, 4.45%, due 05/08/25 | | | 800,850 | |
| | 265,000 | | | | | Lloyds Banking Group Plc, 7.50% (5 year USD swap plus 4.76%)† ††††† | | | 228,967 | |
| | 713,000 | | | | | Lockheed Martin Corp., 4.70%, due 05/15/46 | | | 880,683 | |
| | 212,000 | | | | | Lowe’s Cos., Inc., 5.00%, due 04/15/40 | | | 242,459 | |
| | 304,000 | | | | | Lowe’s Cos., Inc., 5.13%, due 04/15/50 | | | 368,548 | |
| | 284,000 | | | | | LSC Communications, Inc., 8.75%, due 10/15/23 144A | | | 32,660 | |
| | 185,000 | | | | | M&T Bank Corp., 5.13% (3 mo. USD LIBOR plus 3.52%)† ††††† ‡ | | | 177,754 | |
| | 270,000 | | | | | Macquarie Bank, Ltd., 4.88%, due 06/10/25 144A | | | 284,532 | |
| | 1,484,000 | | | | | Macquarie Group, Ltd., 4.15% (3 mo. USD LIBOR plus 1.33%), due 03/27/24 144A | | | 1,554,582 | |
| | 55,000 | | | | | Magellan Midstream Partners, LP, 4.25%, due 09/15/46 | | | 45,968 | |
| | 200,000 | | | | | Magellan Midstream Partners, LP, 5.15%, due 10/15/43 | | | 195,458 | |
| | 115,000 | | | | | Markel Corp., 4.15%, due 09/17/50 | | | 97,149 | |
| | 400,000 | | | | | Martin Marietta Materials, Inc., 2.50%, due 03/15/30 | | | 364,448 | |
| | 230,000 | | | | | Martin Marietta Materials, Inc., 4.25%, due 07/02/24 | | | 238,746 | |
See accompanying Notes to the Financial Statements.
86
Mercer Core Fixed Income Fund
Schedule of Investments (Continued)
(showing percentage of net assets)
March 31, 2020
| | | | | | | | | | |
| Par Value(a) | | | | | Description | | Value ($) | |
| | |
| | | | | | Corporate Debt — continued | |
| | 328,000 | | | | | Marvell Technology Group, Ltd., 4.88%, due 06/22/28 | | | 340,192 | |
| | 460,000 | | | | | Massachusetts Institute of Technology, 4.68%, due 07/01/14# | | | 634,663 | |
| | 480,000 | | | | | Mastercard, Inc., 3.35%, due 03/26/30 | | | 532,681 | |
| | 258,000 | | | | | Mastercard, Inc., 3.85%, due 03/26/50 | | | 317,657 | |
| | 162,000 | | | | | Match Group, Inc., 4.13%, due 08/01/30 144A | | | 145,699 | |
| | 801,000 | | | | | McDonald’s Corp., (MTN), 3.50%, due 07/01/27 | | | 842,786 | |
| | 321,000 | | | | | MDC Partners, Inc., 6.50%, due 05/01/24 144A | | | 243,157 | |
| | 445,000 | | | | | MEDNAX, Inc., 5.25%, due 12/01/23 144A | | | 365,458 | |
| | 154,000 | | | | | MEDNAX, Inc., 6.25%, due 01/15/27 144A | | | 124,752 | |
| | 198,000 | | | | | Methanex Corp., 4.25%, due 12/01/24 | | | 152,547 | |
| | 260,000 | | | | | Methanex Corp., 5.25%, due 12/15/29 | | | 195,712 | |
| | 255,000 | | | | | MetLife, Inc., 6.40%, due 12/15/66 | | | 266,945 | |
| | 200,000 | | | | | Mexico City Airport Trust, 5.50%, due 07/31/47 144A | | | 165,039 | |
| | 103,000 | | | | | MGIC Investment Corp., 5.75%, due 08/15/23 | | | 94,116 | |
| | 836,000 | | | | | Microchip Technology, Inc., 4.33%, due 06/01/23 | | | 834,543 | |
| | 818,000 | | | | | Micron Technology, Inc., 4.19%, due 02/15/27 | | | 828,729 | |
| | 155,000 | | | | | Micron Technology, Inc., 4.98%, due 02/06/26 | | | 162,852 | |
| | 738,000 | | | | | Micron Technology, Inc., 5.33%, due 02/06/29 | | | 808,838 | |
| | 295,000 | | | | | Microsoft Corp., 4.00%, due 02/12/55 | | | 377,271 | |
| | 288,000 | | | | | Microsoft Corp., 4.45%, due 11/03/45 | | | 380,278 | |
| | 945,000 | | | | | Morgan Stanley, 3.59% (3 mo. USD LIBOR plus 1.34%), due 07/22/28† | | | 961,370 | |
| | 921,000 | | | | | Morgan Stanley, 3.88%, due 04/29/24 | | | 969,411 | |
| | 325,000 | | | | | Morgan Stanley, 5.44% (3 mo. USD LIBOR plus 3.61%)† ††††† | | | 274,380 | |
| | 785,000 | | | | | Morgan Stanley, (MTN), 2.70% (SOFR plus 1.14%), due 01/22/31† | | | 770,465 | |
| | 1,301,000 | | | | | Morgan Stanley, (MTN), 3.13%, due 07/27/26 | | | 1,337,187 | |
| | 1,311,000 | | | | | Morgan Stanley, (MTN), 3.62% (SOFR plus 3.12%), due 04/01/31† | | | 1,374,107 | |
| | 620,000 | | | | | Morgan Stanley, (MTN), 3.77% (3 mo. USD LIBOR plus 1.14%), due 01/24/29† | | | 654,487 | |
| | 230,000 | | | | | Morgan Stanley, (MTN), 3.88%, due 01/27/26 | | | 246,245 | |
| | 1,000,000 | | | | | Morgan Stanley, (MTN), 4.35%, due 09/08/26 | | | 1,061,653 | |
| | 550,000 | | | | | Motorola Solutions, Inc., 4.60%, due 02/23/28 | | | 561,764 | |
| | 258,000 | | | | | MPLX, LP, 4.00%, due 03/15/28 | | | 224,270 | |
| | 86,000 | | | | | MPLX, LP, 4.25%, due 12/01/27 144A | | | 69,618 | |
| | 250,000 | | | | | MPLX, LP, 4.50%, due 04/15/38 | | | 195,988 | |
| | 25,000 | | | | | MPLX, LP, 5.20%, due 03/01/47 | | | 20,720 | |
| | 160,000 | | | | | MPLX, LP, 5.25%, due 01/15/25 144A | | | 137,396 | |
| | 801,000 | | | | | MPLX, LP, 6.88% (3 mo. USD LIBOR plus 4.65%)† ††††† | | | 489,002 | |
| | 145,000 | | | | | MTN Mauritius Investment, Ltd., 4.76%, due 11/11/24 144A | | | 130,500 | |
| | 154,000 | | | | | Murphy Oil Corp., 5.75%, due 08/15/25 | | | 83,369 | |
| | 435,000 | | | | | Mylan, Inc., 5.20%, due 04/15/48 | | | 391,662 | |
| | 110,000 | | | | | National CineMedia LLC, 5.88%, due 04/15/28 144A | | | 76,840 | |
| | 62,000 | | | | | Nationstar Mortgage Holdings, Inc., 6.00%, due 01/15/27 144A | | | 53,049 | |
| | 102,000 | | | | | Nationstar Mortgage Holdings, Inc., 8.13%, due 07/15/23 144A | | | 100,374 | |
| | 83,000 | | | | | Nationstar Mortgage Holdings, Inc., 9.13%, due 07/15/26 144A | | | 75,426 | |
| | 220,000 | | | | | Nationwide Building Society, 3.62% (3 mo. USD LIBOR plus 1.18%), due 04/26/23† 144A | | | 218,957 | |
| | 295,000 | | | | | Natura Cosmeticos SA, 5.38%, due 02/01/23 144A | | | 276,945 | |
| | 200,000 | | | | | NBM US Holdings, Inc., 6.63%, due 08/06/29‡ 144A | | | 180,230 | |
| | 340,000 | | | | | Netflix, Inc., 4.88%, due 04/15/28 | | | 352,775 | |
| | 174,000 | | | | | Netflix, Inc., 4.88%, due 06/15/30 144A | | | 177,602 | |
See accompanying Notes to the Financial Statements.
87
Mercer Core Fixed Income Fund
Schedule of Investments (Continued)
(showing percentage of net assets)
March 31, 2020
| | | | | | | | | | |
| Par Value(a) | | | | | Description | | Value ($) | |
| | |
| | | | | | Corporate Debt — continued | |
| | 59,000 | | | | | Netflix, Inc., 5.38%, due 11/15/29 144A | | | 61,549 | |
| | 335,000 | | | | | Netflix, Inc., 5.88%, due 11/15/28 | | | 359,807 | |
| | 445,000 | | | | | New England Power Co., 3.80%, due 12/05/47 144A | | | 458,875 | |
| | 100,000 | | | | | Newfield Exploration Co., 5.38%, due 01/01/26 | | | 52,396 | |
| | 435,000 | | | | | Newmont Corp., 2.25%, due 10/01/30 | | | 406,988 | |
| | 150,000 | | | | | Newmont Corp., 2.80%, due 10/01/29 | | | 140,312 | |
| | 265,000 | | | | | Newmont Corp., 3.63%, due 06/09/21 | | | 266,126 | |
| | 599,000 | | | | | NextEra Energy Capital Holdings, Inc., 3.55%, due 05/01/27 | | | 611,918 | |
| | 207,000 | | | | | NextEra Energy Operating Partners, LP, 3.88%, due 10/15/26 144A | | | 197,814 | |
| | 75,000 | | | | | NextEra Energy Operating Partners, LP, 4.50%, due 09/15/27 144A | | | 73,648 | |
| | 718,000 | | | | | NIKE, Inc., 2.75%, due 03/27/27 | | | 746,762 | |
| | 574,000 | | | | | NIKE, Inc., 3.25%, due 03/27/40 | | | 602,887 | |
| | 220,000 | | | | | Nippon Life Insurance Co., 5.10% (5 year USD ICE swap plus 3.65%), due 10/16/44† 144A | | | 229,865 | |
| | 670,000 | | | | | NiSource, Inc., 3.49%, due 05/15/27 | | | 678,768 | |
| | 195,000 | | | | | Nissan Motor Acceptance Corp., 3.45%, due 03/15/23 144A | | | 190,775 | |
| | 115,000 | | | | | Norbord, Inc., 6.25%, due 04/15/23 144A | | | 111,981 | |
| | 970,000 | | | | | Norfolk Southern Corp., 4.84%, due 10/01/41 | | | 1,139,520 | |
| | 195,000 | | | | | Northern States Power Co., 3.60%, due 09/15/47 | | | 208,795 | |
| | 392,000 | | | | | Northrop Grumman Corp., 5.25%, due 05/01/50 | | | 532,361 | |
| | 300,000 | | | | | NOVA Chemicals Corp., 4.88%, due 06/01/24‡ 144A | | | 265,126 | |
| | 160,000 | | | | | NRG Energy, Inc., 3.75%, due 06/15/24 144A | | | 157,415 | |
| | 315,000 | | | | | Nutrien, Ltd., 4.90%, due 06/01/43 | | | 323,116 | |
| | 334,000 | | | | | NVIDIA Corp., 2.85%, due 04/01/30 | | | 349,013 | |
| | 1,385,000 | | | | | NXP BV/NXP Funding LLC, 4.63%, due 06/01/23 144A | | | 1,427,371 | |
| | 224,000 | | | | | NXP BV/NXP Funding LLC, 4.88%, due 03/01/24 144A | | | 239,546 | |
| | 222,000 | | | | | NXP BV/NXP Funding LLC/NXP USA, Inc., 3.88%, due 06/18/26 144A | | | 216,436 | |
| | 4,576,000 | | | | | Occidental Petroleum Corp., 9.04%, due 10/10/36‡‡ | | | 1,787,493 | |
| | 107,000 | | | | | ONEOK Partners, LP, 4.90%, due 03/15/25 | | | 93,703 | |
| | 655,000 | | | | | ONEOK, Inc., 3.10%, due 03/15/30 | | | 494,589 | |
| | 390,000 | | | | | ONEOK, Inc., 4.45%, due 09/01/49 | | | 303,948 | |
| | 200,000 | | | | | ONEOK, Inc., 4.95%, due 07/13/47 | | | 158,048 | |
| | 200,000 | | | | | Operadora de Servicios Mega SA de CV Sofom ER, 8.25%, due 02/11/25 144A | | | 137,750 | |
| | 1,542,000 | | | | | Oracle Corp., 2.50%, due 04/01/25†††† | | | 1,558,376 | |
| | 902,000 | | | | | Oracle Corp., 2.95%, due 04/01/30 | | | 910,126 | |
| | 352,000 | | | | | Otis Worldwide Corp., 2.06%, due 04/05/25 144A | | | 345,244 | |
| | 265,000 | | | | �� | Ovintiv, Inc., 6.50%, due 08/15/34 | | | 124,649 | |
| | 305,000 | | | | | Owens Corning, 3.95%, due 08/15/29 | | | 289,586 | |
| | 350,000 | | | | | Owens Corning, 4.30%, due 07/15/47 | | | 300,309 | |
| | 155,000 | | | | | Oztel Holdings SPC, Ltd., 6.63%, due 04/24/28 144A | | | 112,827 | |
| | 557,000 | | | | | PayPal Holdings, Inc., 2.85%, due 10/01/29 | | | 554,562 | |
| | 143,000 | | | | | PBF Holding Co. LLC/PBF Finance Corp., 6.00%, due 02/15/28 144A | | | 95,452 | |
| | 205,000 | | | | | PECO Energy Co., 3.70%, due 09/15/47 | | | 218,683 | |
| | 580,000 | | | | | Pennsylvania Electric Co., 3.60%, due 06/01/29 144A | | | 615,393 | |
| | 2,450,000 | | | | | Penske Truck Leasing Co. LP/PTL Finance Corp., 3.90%, due 02/01/24 144A | | | 2,437,336 | |
| | 525,000 | | | | | PepsiCo, Inc., 3.63%, due 03/19/50 | | | 625,089 | |
| | 673,000 | | | | | Petrobras Global Finance BV, 5.09%, due 01/15/30 144A | | | 613,271 | |
| | 185,000 | | | | | Petrobras Global Finance BV, 5.75%, due 02/01/29 | | | 175,482 | |
| | 350,000 | | | | | Petrobras Global Finance BV, 6.90%, due 03/19/49 | | | 341,801 | |
See accompanying Notes to the Financial Statements.
88
Mercer Core Fixed Income Fund
Schedule of Investments (Continued)
(showing percentage of net assets)
March 31, 2020
| | | | | | | | | | |
| Par Value(a) | | | | | Description | | Value ($) | |
| | |
| | | | | | Corporate Debt — continued | |
| | 345,000 | | | | | Petroleos Mexicanos, 5.35%, due 02/12/28 | | | 243,588 | |
| | 25,000 | | | | | Petroleos Mexicanos, 5.50%, due 01/21/21 | | | 24,206 | |
| | 76,000 | | | | | Petroleos Mexicanos, 6.35%, due 02/12/48 | | | 48,283 | |
| | 270,000 | | | | | Petroleos Mexicanos, 6.50%, due 03/13/27 | | | 201,483 | |
| | 255,000 | | | | | Petroleos Mexicanos, 6.50%, due 06/02/41 | | | 164,775 | |
| | 520,000 | | | | | Petroleos Mexicanos, 6.75%, due 09/21/47 | | | 344,087 | |
| | 380,000 | | | | | Petroleos Mexicanos, 6.88%, due 08/04/26 | | | 292,996 | |
| | 115,000 | | | | | Petroleos Mexicanos, 7.69%, due 01/23/50‡ 144A | | | 80,535 | |
| | 1,006,000 | | | | | Phillips 66 Partners, LP, 3.61%, due 02/15/25 | | | 956,993 | |
| | 774,000 | | | | | Phillips 66 Partners, LP, 3.75%, due 03/01/28 | | | 715,806 | |
| | 145,000 | | | | | Piedmont Natural Gas Co., Inc., 3.50%, due 06/01/29 | | | 147,064 | |
| | 855,000 | | | | | Plains All American Pipeline, LP/PAA Finance Corp., 3.55%, due 12/15/29 | | | 586,875 | |
| | 65,000 | | | | | Plains All American Pipeline, LP/PAA Finance Corp., 4.70%, due 06/15/44 | | | 42,949 | |
| | 50,000 | | | | | Plains All American Pipeline, LP/PAA Finance Corp., 5.15%, due 06/01/42 | | | 33,208 | |
| | 541,000 | | | | | PNC Financial Services Group, Inc. (The), 2.20%, due 11/01/24‡ | | | 555,611 | |
| | 63,000 | | | | | PNC Financial Services Group, Inc. (The), 3.15%, due 05/19/27 | | | 66,123 | |
| | 146,000 | | | | | PNC Financial Services Group, Inc. (The), 3.50%, due 01/23/24 | | | 147,109 | |
| | 215,000 | | | | | PNC Financial Services Group, Inc. (The), 4.85% (3 mo. USD LIBOR plus 3.04%)† ††††† | | | 182,855 | |
| | 364,000 | | | | | PNC Financial Services Group, Inc. (The), 6.75% (3 mo. USD LIBOR plus 3.68%)† ††††† | | | 343,867 | |
| | 120,000 | | | | | Post Holdings, Inc., 5.50%, due 12/15/29 144A | | | 125,142 | |
| | 540,000 | | | | | PPL Capital Funding, Inc., 5.00%, due 03/15/44 | | | 578,950 | |
| | 136,000 | | | | | Prime Security Services Borrower LLC/Prime Finance, Inc., 6.25%, due 01/15/28 144A | | | 118,320 | |
| | 612,000 | | | | | Procter & Gamble Co. (The), 3.55%, due 03/25/40 | | | 715,359 | |
| | 265,000 | | | | | Prosus NV, 5.50%, due 07/21/25 144A | | | 263,444 | |
| | 90,000 | | | | | Providence St. Joseph Health Obligated Group, 2.75%, due 10/01/26 | | | 96,292 | |
| | 695,000 | | | | | Prudential Financial, Inc., 5.88% (3 mo. USD LIBOR plus 4.18%), due 09/15/42† | | | 675,331 | |
| | 48,000 | | | | | PTC, Inc., 4.00%, due 02/15/28 144A | | | 46,454 | |
| | 445,000 | | | | | Public Service Electric & Gas Co., (MTN), 3.00%, due 05/15/27 | | | 455,667 | |
| | 315,000 | | | | | Public Service Electric & Gas Co., (MTN), 3.20%, due 05/15/29 | | | 334,376 | |
| | 1,700,000 | | | | | Public Service Enterprise Group, Inc., 2.88%, due 06/15/24 | | | 1,698,000 | |
| | 85,000 | | | | | Qorvo, Inc., 5.50%, due 07/15/26 | | | 89,324 | |
| | 205,000 | | | | | Quicken Loans, Inc., 5.75%, due 05/01/25 144A | | | 205,257 | |
| | 200,000 | | | | | QVC, Inc., 4.38%, due 03/15/23 | | | 189,400 | |
| | 125,000 | | | | | QVC, Inc., 5.13%, due 07/02/22 | | | 105,007 | |
| | 130,000 | | | | | QVC, Inc., 5.45%, due 08/15/34 | | | 95,494 | |
| | 87,000 | | | | | Radian Group, Inc., 4.50%, due 10/01/24 | | | 86,456 | |
| | 160,000 | | | | | Radiate Holdco LLC/Radiate Finance, Inc., 6.63%, due 02/15/25‡ 144A | | | 137,399 | |
| | 128,000 | | | | | Raymond James Financial, Inc., 4.65%, due 04/01/30 | | | 133,413 | |
| | 201,000 | | | | | Rede D’or Finance Sarl, 4.50%, due 01/22/30‡ 144A | | | 175,423 | |
| | 62,000 | | | | | Refinitiv US Holdings, Inc., 8.25%, due 11/15/26 144A | | | 65,565 | |
| | 38,000 | | | | | Refinitiv US Holdings, Inc., 6.25%, due 05/15/26 144A | | | 39,446 | |
| | 200,000 | | | | | Resorts World Las Vegas LLC/RWLV Capital, Inc., 4.63%, due 04/16/29 144A | | | 177,065 | |
| | 855,000 | | | | | Royal Bank of Scotland Group Plc, 3.88%, due 09/12/23 | | | 879,216 | |
| | 210,000 | | | | | Royal Bank of Scotland Group Plc, 4.45% (3 mo. USD LIBOR plus 1.87%), due 05/08/30† | | | 219,239 | |
| | 643,000 | | | | | Royal Bank of Scotland Group Plc, 8.63% (5 year USD swap plus 7.60%)† ††††† | | | 630,349 | |
| | 1,200,000 | | | | | Ryder System, Inc., (MTN), 3.75%, due 06/09/23 | | | 1,206,112 | |
See accompanying Notes to the Financial Statements.
89
Mercer Core Fixed Income Fund
Schedule of Investments (Continued)
(showing percentage of net assets)
March 31, 2020
| | | | | | | | | | |
| Par Value(a) | | | | | Description | | Value ($) | |
| | |
| | | | | | Corporate Debt — continued | |
| | 189,000 | | | | | Sabine Pass Liquefaction LLC, 4.20%, due 03/15/28‡ | | | 162,540 | |
| | 219,000 | | | | | Sabine Pass Liquefaction LLC, 5.00%, due 03/15/27 | | | 186,503 | |
| | 472,000 | | | | | Sabine Pass Liquefaction LLC, 5.88%, due 06/30/26 | | | 427,932 | |
| | 110,000 | | | | | Sabra Health Care LP REIT, 4.80%, due 06/01/24 | | | 111,819 | |
| | 320,000 | | | | | Sally Holdings LLC/Sally Capital, Inc., 5.63%, due 12/01/25‡ | | | 263,202 | |
| | 290,000 | | | | | San Diego Gas & Electric Co., 4.15%, due 05/15/48 | | | 313,232 | |
| | 490,000 | | | | | Santander Holdings USA, Inc., 3.24%, due 10/05/26 | | | 435,270 | |
| | 217,000 | | | | | Santander Holdings USA, Inc., 3.40%, due 01/18/23 | | | 214,663 | |
| | 615,000 | | | | | Santander Holdings USA, Inc., 3.50%, due 06/07/24‡ | | | 601,421 | |
| | 128,000 | | | | | Santander Holdings USA, Inc., 4.40%, due 07/13/27 | | | 124,036 | |
| | 227,000 | | | | | Santander UK Group Holdings Plc, 4.75%, due 09/15/25 144A | | | 226,297 | |
| | 200,000 | | | | | SASOL Financing USA LLC, 5.88%, due 03/27/24 | | | 84,083 | |
| | 200,000 | | | | | SASOL Financing USA LLC, 6.50%, due 09/27/28 | | | 82,118 | |
| | 109,000 | | | | | SBA Communications Corp. REIT, 3.88%, due 02/15/27 144A | | | 110,090 | |
| | 322,000 | | | | | SBA Tower Trust REIT, 2.84%, due 01/15/50 144A | | | 318,339 | |
| | 385,000 | | | | | SBA Tower Trust REIT, 3.72%, due 04/09/48 144A | | | 391,427 | |
| | 320,000 | | | | | Seagate HDD Cayman, 4.75%, due 01/01/25 | | | 318,804 | |
| | 193,000 | | | | | Select Medical Corp., 6.25%, due 08/15/26 144A | | | 194,062 | |
| | 800,000 | | | | | Shire Acquisitions Investments Ireland DAC, 3.20%, due 09/23/26 | | | 811,085 | |
| | 145,000 | | | | | Simmons Foods, Inc., 5.75%, due 11/01/24 144A | | | 132,538 | |
| | 850,000 | | | | | Simon Property Group, LP REIT, 6.75%, due 02/01/40 | | | 1,054,496 | |
| | 270,000 | | | | | Sinopec Group Overseas Development 2018, Ltd., 3.68%, due 08/08/49 144A | | | 294,470 | |
| | 520,000 | | | | | Sirius XM Radio, Inc., 5.00%, due 08/01/27 144A | | | 530,634 | |
| | 225,000 | | | | | Sirius XM Radio, Inc., 5.38%, due 07/15/26 144A | | | 231,182 | |
| | 195,000 | | | | | Societe Generale SA, 7.38% (5 year USD swap plus 6.24%)† ††††† 144A | | | 180,370 | |
| | 204,000 | | | | | SoftBank Group Corp., Reg S, 6.88% (5 year USD ICE swap plus 4.85%)† ††††† ‡‡‡ | | | 157,300 | |
| | 200,000 | | | | | Sotheby’s, 7.38%, due 10/15/27‡ 144A | | | 160,360 | |
| | 335,000 | | | | | Southern California Edison Co., 4.00%, due 04/01/47 | | | 350,653 | |
| | 1,318,000 | | | | | Southern Co. (The), 3.25%, due 07/01/26 | | | 1,315,165 | |
| | 1,260,000 | | | | | Southern Co. Gas Capital Corp., 2.45%, due 10/01/23 | | | 1,277,061 | |
| | 755,000 | | | | | Southwest Airlines Co., 2.63%, due 02/10/30 | | | 636,792 | |
| | 62,000 | | | | | Springleaf Finance Corp., 6.88%, due 03/15/25 | | | 62,905 | |
| | 225,000 | | | | | Sprint Corp., 7.88%, due 09/15/23 | | | 248,363 | |
| | 178,125 | | | | | Sprint Spectrum Co. LLC/Sprint Spectrum Co. II LLC/Sprint Spectrum Co. III LLC, 3.36%, due 03/20/23 144A | | | 177,902 | |
| | 25,000 | | | | | Standard Industries, Inc., 4.75%, due 01/15/28 144A | | | 23,198 | |
| | 583,000 | | | | | Starbucks Corp., 2.00%, due 03/12/27 | | | 552,523 | |
| | 438,000 | | | | | Starbucks Corp., 2.25%, due 03/12/30 | | | 415,658 | |
| | 380,000 | | | | | State Street Corp., 2.90% (SOFR plus 2.60%), due 03/30/26† 144A | | | 389,247 | |
| | 330,000 | | | | | State Street Corp., 3.15% (SOFR plus 2.65%), due 03/30/31 144A | | | 338,731 | |
| | 18,000 | | | | | Stearns Holdings LLC/Escrow, 9.38%, due 08/15/20**** ^ | | | 1,528 | |
| | 473 | | | | | Stearns Holdings LLC/StearnsCo-Issuer, Inc., 5.00%, due 11/05/24 144A | | | 312 | |
| | 186,000 | | | | | Stifel Financial Corp., 4.25%, due 07/18/24 | | | 189,549 | |
| | 922,000 | | | | | Sunoco Logistics Partners Operations, LP, 3.45%, due 01/15/23 | | | 795,339 | |
| | 350,000 | | | | | Sunoco Logistics Partners Operations, LP, 3.90%, due 07/15/26 | | | 293,432 | |
| | 150,000 | | | | | Sunoco Logistics Partners Operations, LP, 5.30%, due 04/01/44 | | | 118,528 | |
| | 367,000 | | | | | Sunoco Logistics Partners Operations, LP, 5.40%, due 10/01/47 | | | 293,621 | |
| | 248,000 | | | | | Syngenta Finance NV, 4.44%, due 04/24/23 144A | | | 233,920 | |
| | 113,000 | | | | | Sysco Corp., 5.95%, due 04/01/30†††† | | | 118,852 | |
See accompanying Notes to the Financial Statements.
90
Mercer Core Fixed Income Fund
Schedule of Investments (Continued)
(showing percentage of net assets)
March 31, 2020
| | | | | | | | | | |
| Par Value(a) | | | | | Description | | Value ($) | |
| | |
| | | | | | Corporate Debt — continued | |
| | 466,000 | | | | | Targa Resources Partners, LP/Targa Resources Partners Finance Corp., 5.88%, due 04/15/26‡ | | | 389,400 | |
| | 207,000 | | | | | Target Corp., 2.25%, due 04/15/25 | | | 211,332 | |
| | 110,000 | | | | | Taylor Morrison Communities, Inc., 5.88%, due 06/15/27 144A | | | 102,931 | |
| | 150,000 | | | | | Taylor Morrison Communities, Inc./Taylor Morrison Holdings II, Inc., 5.63%, due 03/01/24 144A | | | 142,312 | |
| | 672,000 | | | | | Teachers Insurance & Annuity Association of America, 4.27%, due 05/15/47‡‡‡‡ | | | 647,685 | |
| | 34,000 | | | | | Teachers Insurance & Annuity Association of America, 6.85%, due 12/16/39‡‡‡‡ | | | 47,341 | |
| | 40,000 | | | | | Team Health Holdings, Inc., 6.38%, due 02/01/25 144A | | | 15,162 | |
| | 161,000 | | | | | Tech Data Corp., 3.70%, due 02/15/22 | | | 159,529 | |
| | 224,000 | | | | | Teekay Offshore Partners LP/Teekay Offshore Finance Corp., 8.50%, due 07/15/23 144A | | | 199,081 | |
| | 173,000 | | | | | Telecom Argentina SA, 6.50%, due 06/15/21 144A | | | 147,293 | |
| | 158,000 | | | | | Telecom Argentina SA, 8.00%, due 07/18/26 144A | | | 120,141 | |
| | 293,000 | | | | | Telecom Italia Capital SA, 7.20%, due 07/18/36 | | | 305,540 | |
| | 205,000 | | | | | Telecom Italia SpA, 5.30%, due 05/30/24 144A | | | 207,569 | |
| | 891,000 | | | | | Telefonaktiebolaget LM Ericsson, 4.13%, due 05/15/22 | | | 888,790 | |
| | 200,000 | | | | | Telefonica Celular del Paraguay SA, 5.88%, due 04/15/27 144A | | | 182,091 | |
| | 90,000 | | | | | Tempo Acquisition LLC/Tempo Acquisition Finance Corp., 6.75%, due 06/01/25 144A | | | 83,028 | |
| | 169,000 | | | | | Tervita Corp., 7.63%, due 12/01/21 144A | | | 119,441 | |
| | 612,000 | | | | | Teva Pharmaceutical Finance Netherlands III BV, 3.15%, due 10/01/26 | | | 520,154 | |
| | 1,354,000 | | | | | Textron, Inc., 3.00%, due 06/01/30 | | | 1,268,453 | |
| | 70,000 | | | | | Time Warner Cable LLC, 4.13%, due 02/15/21 | | | 70,222 | |
| | 347,000 | | | | | TJX Cos., Inc., 3.50%, due 04/15/25 | | | 355,094 | |
| | 425,000 | | | | | TJX Cos., Inc., 3.88%, due 04/15/30 | | | 439,674 | |
| | 320,000 | | | | | Toronto-Dominion Bank (The), (MTN), 3.25%, due 03/11/24 | | | 337,800 | |
| | 2,018,000 | | | | | Toyota Motor Credit Corp., (MTN), 3.00%, due 04/01/25†††† | | | 2,025,788 | |
| | 171,000 | | | | | TransCanada PipeLines, Ltd., 4.25%, due 05/15/28‡ | | | 173,021 | |
| | 500,000 | | | | | Transcontinental Gas Pipe Line Co. LLC, 4.60%, due 03/15/48 | | | 497,938 | |
| | 591,000 | | | | | TransDigm, Inc., 5.50%, due 11/15/27 144A | | | 533,703 | |
| | 55,000 | | | | | Trident TPI Holdings, Inc., 6.63%, due 11/01/25 144A | | | 44,619 | |
| | 1,040,000 | | | | | Truist Bank, 2.25%, due 03/11/30 | | | 952,179 | |
| | 225,000 | | | | | Twin River Worldwide Holdings, Inc., 6.75%, due 06/01/27 144A | | | 170,672 | |
| | 61,000 | | | | | Twitter, Inc., 3.88%, due 12/15/27 144A | | | 59,132 | |
| | 430,000 | | | | | Tyson Foods, Inc., 5.10%, due 09/28/48 | | | 534,964 | |
| | 398,000 | | | | | Uber Technologies, Inc., 7.50%, due 09/15/27 144A | | | 395,920 | |
| | 1,897,000 | | | | | UBS Group AG, 4.13%, due 04/15/26 144A | | | 1,925,838 | |
| | 185,000 | | | | | UBS Group AG, 7.00% (5 year USD swap plus 4.34%)† ††††† ‡ 144A | | | 174,029 | |
| | 2,666,780 | | | | | United Airlines Pass Through Trust, Series2014-1, Class A, 4.00%, due 10/11/27 | | | 2,642,536 | |
| | 305,040 | | | | | United Airlines Pass Through Trust, Series2014-2, Class A, 3.75%, due 03/03/28 | | | 307,908 | |
| | 106,881 | | | | | United Airlines Pass Through Trust, Series2014-2, Class B, 4.63%, due 03/03/24 | | | 100,118 | |
| | 227,439 | | | | | United Airlines Pass Through Trust, Series2016-1, Class A, 3.45%, due 01/07/30 | | | 211,163 | |
| | 183,972 | | | | | United Airlines Pass Through Trust, Series2016-1, Class B, 3.65%, due 07/07/27 | | | 150,409 | |
| | 89,729 | | | | | United Airlines Pass Through Trust, Series2018-1, Class B, 4.60%, due 09/01/27 | | | 78,447 | |
| | 204,576 | | | | | United Airlines Pass Through Trust, Series2019-1 Class A, 4.55%, due 02/25/33 | | | 208,074 | |
| | 296,000 | | | | | United Parcel Service, Inc., 3.90%, due 04/01/25 | | | 321,726 | |
| | 268,000 | | | | | United Parcel Service, Inc., 5.30%, due 04/01/50 | | | 352,567 | |
| | 142,000 | | | | | United Rentals North America, Inc., 3.88%, due 11/15/27 | | | 134,978 | |
| | 530,000 | | | | | United Rentals North America, Inc., 4.88%, due 01/15/28 | | | 517,041 | |
See accompanying Notes to the Financial Statements.
91
Mercer Core Fixed Income Fund
Schedule of Investments (Continued)
(showing percentage of net assets)
March 31, 2020
| | | | | | | | | | |
| Par Value(a) | | | | | Description | | Value ($) | |
| | |
| | | | | | Corporate Debt — continued | |
| | 35,000 | | | | | United Rentals North America, Inc., 5.25%, due 01/15/30 | | | 35,184 | |
| | 225,000 | | | | | United Rentals North America, Inc., 5.50%, due 05/15/27 | | | 228,786 | |
| | 5,000 | | | | | United Rentals North America, Inc., 5.88%, due 09/15/26 | | | 5,102 | |
| | 200,000 | | | | | Universal Health Services, Inc., 4.75%, due 08/01/22 144A | | | 200,372 | |
| | 210,000 | | | | | Universal Health Services, Inc., 5.00%, due 06/01/26 144A | | | 211,269 | |
| | 120,000 | | | | | University of Chicago (The), 2.76%, due 04/01/45 | | | 113,509 | |
| | 84,834 | | | | | US Airways Pass Through Trust, Series2010-1, Class A, 6.25%, due 10/22/24 | | | 87,419 | |
| | 99,454 | | | | | US Airways Pass Through Trust, Series2012-1, Class A, 5.90%, due 04/01/26 | | | 100,406 | |
| | 1,163,675 | | | | | US Airways Pass Through Trust, Series2012-2, Class A, 4.63%, due 12/03/26 | | | 1,154,369 | |
| | 490,000 | | | | | Valero Energy Corp., 3.40%, due 09/15/26 | | | 440,575 | |
| | 125,000 | | | | | Valvoline, Inc., 4.25%, due 02/15/30 144A | | | 117,878 | |
| | 275,000 | | | | | Vector Group, Ltd., 6.13%, due 02/01/25 144A | | | 252,304 | |
| | 216,000 | | | | | Ventas Realty, LP REIT, 3.50%, due 02/01/25 | | | 212,034 | |
| | 70,000 | | | | | VeriSign, Inc., 4.75%, due 07/15/27 | | | 72,936 | |
| | 134,000 | | | | | VeriSign, Inc., 5.25%, due 04/01/25 | | | 138,858 | |
| | 85,000 | | | | | Verizon Communications, Inc., 3.00%, due 03/22/27‡ | | | 89,632 | |
| | 85,000 | | | | | Verizon Communications, Inc., 4.00%, due 03/22/50 | | | 100,985 | |
| | 235,000 | | | | | Verizon Communications, Inc., 4.40%, due 11/01/34 | | | 275,167 | |
| | 1,684,000 | | | | | Verizon Communications, Inc., 4.86%, due 08/21/46 | | | 2,206,703 | |
| | 1,000,000 | | | | | ViacomCBS, Inc., 3.70%, due 08/15/24 | | | 978,023 | |
| | 500,000 | | | | | ViacomCBS, Inc., 4.38%, due 03/15/43 | | | 445,254 | |
| | 618,000 | | | | | ViacomCBS, Inc., 4.75%, due 05/15/25†††† | | | 621,575 | |
| | 36,000 | | | | | VICI Properties, LP/VICI Note Co., Inc. REIT, 4.63%, due 12/01/29 144A | | | 33,045 | |
| | 1,400,000 | | | | | Virginia Electric & Power Co., 3.15%, due 01/15/26 | | | 1,458,864 | |
| | 173,000 | | | | | VISA, Inc., 2.70%, due 04/15/40†††† | | | 171,727 | |
| | 460,000 | | | | | Vistra Operations Co. LLC, 3.55%, due 07/15/24 144A | | | 433,737 | |
| | 336,000 | | | | | Vistra Operations Co. LLC, 3.70%, due 01/30/27 144A | | | 300,051 | |
| | 340,000 | | | | | Vistra Operations Co. LLC, 4.30%, due 07/15/29 144A | | | 302,688 | |
| | 135,000 | | | | | Vistra Operations Co. LLC, 5.00%, due 07/31/27 144A | | | 137,774 | |
| | 502,000 | | | | | Vodafone Group Plc, 7.00% (5 year USD swap plus 4.87%), due 04/04/79† ‡ | | | 537,327 | |
| | 933,000 | | | | | Volkswagen Group of America Finance LLC, 4.63%, due 11/13/25 144A | | | 964,184 | |
| | 390,000 | | | | | Voya Financial, Inc., 5.65% (3 mo. USD LIBOR plus 3.58%), due 05/15/53† ‡ | | | 353,631 | |
| | 1,178,000 | | | | | Voya Financial, Inc., 3.13%, due 07/15/24 | | | 1,172,843 | |
| | 634,000 | | | | | Walt Disney Co. (The), 3.35%, due 03/24/25 | | | 692,374 | |
| | 598,000 | | | | | Walt Disney Co. (The), 4.70%, due 03/23/50 | | | 788,385 | |
| | 936,000 | | | | | Wells Fargo & Co., 5.88% (3 mo. USD LIBOR plus 3.99%)† ††††† | | | 950,691 | |
| | 765,000 | | | | | Wells Fargo & Co., (MTN), 2.57% (3 mo. USD LIBOR plus 1.00%), due 02/11/31† | | | 734,612 | |
| | 708,000 | | | | | Welltower, Inc. REIT, 4.50%, due 01/15/24 | | | 731,101 | |
| | 288,000 | | | | | Williams Cos., Inc. (The), 3.75%, due 06/15/27 | | | 264,389 | |
| | 468,000 | | | | | Williams Cos., Inc. (The), 4.55%, due 06/24/24 | | | 428,679 | |
| | 95,000 | | | | | Williams Cos., Inc. (The), 5.75%, due 06/24/44 | | | 99,420 | |
| | 85,000 | | | | | WMG Acquisition Corp., 4.88%, due 11/01/24 144A | | | 83,618 | |
| | 117,000 | | | | | WMG Acquisition Corp., 5.50%, due 04/15/26 144A | | | 115,367 | |
| | 159,000 | | | | | WPX Energy, Inc., 4.50%, due 01/15/30 | | | 86,933 | |
| | 50,000 | | | | | WPX Energy, Inc., 5.25%, due 09/15/24 | | | 30,874 | |
| | 216,000 | | | | | WPX Energy, Inc., 5.25%, due 10/15/27 | | | 119,999 | |
| | 135,000 | | | | | Wyndham Destinations, Inc., 4.63%, due 03/01/30 144A | | | 104,709 | |
| | 116,000 | | | | | XPO Logistics, Inc., 6.50%, due 06/15/22 144A | | | 116,909 | |
See accompanying Notes to the Financial Statements.
92
Mercer Core Fixed Income Fund
Schedule of Investments (Continued)
(showing percentage of net assets)
March 31, 2020
| | | | | | | | | | |
| Par Value(a) | | | | | Description | | Value ($) | |
| | |
| | | | | | Corporate Debt — continued | |
| | 153,000 | | | | | Yum! Brands, Inc., 4.75%, due 01/15/30 144A | | | 144,669 | |
| | 581,000 | | | | | Zimmer Biomet Holdings, Inc., 3.05%, due 01/15/26 | | | 571,028 | |
| | | | | | | | | | |
| | | | 315,144,903 | |
| | | | | | | | | | |
| | | |
| Par Value ($) | | | | | Description | | Value ($) | |
| | |
| | | | | | Mortgage Backed Securities - Private Issuers — 10.1% | |
| | 465,990 | | | | | Arroyo Mortgage Trust CMO, Series2018-1, Class A1, 3.76%, due 04/25/48◆◆ 144A | | | 456,744 | |
| | 290,886 | | | | | Arroyo Mortgage Trust CMO, Series2019-2, Class A1, 3.35%, due 04/25/49◆◆ 144A | | | 279,469 | |
| | 189,633 | | | | | Arroyo Mortgage Trust CMO, Series2019-3, Class A1, 2.96%, due 10/25/48◆◆144A | | | 179,799 | |
| | 147,000 | | | | | BAMLL Commercial Mortgage Securities Trust, Series2019-BPR, Class ENM, 3.84%, due 11/05/32◆◆144A | | | 120,419 | |
| | 1,200,000 | | | | | BANK, Series 2019-BNK20, Class A2, 2.76%, due 09/15/62 | | | 1,256,914 | |
| | 850,000 | | | | | BANK, Series 2019-BNK23, Class A2, 2.67%, due 12/15/52 | | | 883,778 | |
| | 1,806,000 | | | | | BANK, Series 2020-BNK26, Class A2, 2.04%, due 03/15/63 | | | 1,795,282 | |
| | 1,800,000 | | | | | BANK, Series 2020-BNK26, Class A3, 2.31%, due 03/15/63 | | | 1,784,170 | |
| | 193,000 | | | | | Barclays Commercial Mortgage Trust, Series2019-C5, Class A2, 3.04%, due 11/15/52 | | | 201,305 | |
| | 3,000,000 | | | | | BBCMS Mortgage Trust, Series 2018-TALL, Class A, 1.43% (1 mo. USD LIBOR plus 0.72%), due 03/15/37† 144A | | | 2,835,718 | |
| | 207,000 | | | | | BBCMS Mortgage Trust, Series 2018-TALL, Class E, 3.14% (1 mo. USD LIBOR plus 2.44%), due 03/15/37† 144A | | | 170,834 | |
| | 130,000 | | | | | BBCMS Mortgage Trust, Series2020-C6, Class A2, 2.69%, due 02/15/53 | | | 135,275 | |
| | 200,000 | | | | | BBCMS Trust, Series 2015-SRCH, Class D, 4.96%, due 08/10/35◆◆144A | | | 177,961 | |
| | 17,745 | | | | | Bellemeade Re, Ltd. CMO, Series2017-1, Class M1, 2.65% (1 mo. USD LIBOR plus 1.70%), due 10/25/27† 144A | | | 17,726 | |
| | 182,938 | | | | | Bellemeade Re, Ltd. CMO, Series2018-1A, Class M1B, 2.55% (1 mo. USD LIBOR plus 1.60%), due 04/25/28† 144A | | | 181,989 | |
| | 168,782 | | | | | Bellemeade Re, Ltd. CMO, Series2019-3A, Class M1A, 2.05% (1 mo. USD LIBOR plus 1.10%), due 07/25/29† ‡‡‡‡ | | | 168,165 | |
| | 150,000 | | | | | Bellemeade Re, Ltd. CMO, Series2019-3A, Class M1B, 2.55% (1 mo. USD LIBOR plus 1.60%), due 07/25/29† 144A | | | 128,521 | |
| | 235,000 | | | | | Benchmark Mortgage Trust, Series2019-B10, Class A2, 3.61%, due 03/15/62 | | | 249,233 | |
| | 235,000 | | | | | Benchmark Mortgage Trust, Series2019-B11, Class A2, 3.41%, due 05/15/52 | | | 248,121 | |
| | 320,000 | | | | | Benchmark Mortgage Trust, Series2019-B12, Class A2, 3.00%, due 08/15/52 | | | 333,137 | |
| | 270,000 | | | | | Benchmark Mortgage Trust, Series2019-B13, Class A2, 2.89%, due 08/15/57 | | | 279,922 | |
| | 324,000 | | | | | Benchmark Mortgage Trust, Series2019-B14, Class A2, 2.91%, due 12/15/62 | | | 336,772 | |
| | 1,350,000 | | | | | Benchmark Mortgage Trust, Series2019-B15, Class A4, 2.67%, due 12/15/72 | | | 1,403,506 | |
| | 657,000 | | | | | Benchmark Mortgage Trust, Series2019-B15, Class A5, 2.93%, due 12/15/72 | | | 696,580 | |
| | 600,000 | | | | | Benchmark Mortgage Trust, Series2020-B17, Class A4, 2.04%, due 03/15/53 | | | 591,430 | |
| | 143,763 | | | | | BRAVO Residential Funding Trust CMO, Series 2019-NQM1, Class A1, 2.67%, due 07/25/59◆◆ 144A | | | 141,894 | |
| | 215,000 | | | | | BX Commercial Mortgage Trust, Series 2018-BIOA, Class D, 2.03% (1 mo. USD LIBOR plus 1.32%), due 03/15/37† 144A | | | 185,936 | |
| | 1,621,315 | | | | | BX Commercial Mortgage Trust, Series2019-XL, Class A, 1.62% (1 mo. USD LIBOR plus 0.92%), due 10/15/36† 144A | | | 1,565,509 | |
| | 1,200,000 | | | | | CD Mortgage Trust, Series2019-CD8, Class A3, 2.66%, due 08/15/57 | | | 1,242,500 | |
| | 700,000 | | | | | CFCRE Commercial Mortgage Trust, Series2016-C4, Class A3, 3.01%, due 05/10/58 | | | 720,660 | |
| | 2,500,000 | | | | | CFCRE Commercial Mortgage Trust, Series2016-C6, Class A2, 2.95%, due 11/10/49 | | | 2,569,281 | |
| | 219,250 | | | | | CGDBB Commercial Mortgage Trust, Series 2017-BIOC, Class E, 2.85% (1 mo. USD LIBOR plus 2.15%), due 07/15/32† 144A | | | 189,157 | |
See accompanying Notes to the Financial Statements.
93
Mercer Core Fixed Income Fund
Schedule of Investments (Continued)
(showing percentage of net assets)
March 31, 2020
| | | | | | | | | | |
| Par Value ($) | | | | | Description | | Value ($) | |
| | |
| | | | | | Mortgage Backed Securities - Private Issuers — continued | |
| | 206,000 | | | | | CHT Mortgage Trust, Series 2017-CSMO, Class D, 2.95% (1 mo. USD LIBOR plus 2.25%), due 11/15/36† 144A | | | 189,385 | |
| | 149,245 | | | | | CIM Trust CMO, Series2017-2, Class A1, 3.58% (1 mo. USD LIBOR plus 2.00%), due 12/25/57† 144A | | | 154,741 | |
| | 569,909 | | | | | CIM Trust CMO, Series2017-3, Class A1, 3.58% (1 mo. USD LIBOR plus 2.00%), due 01/25/57† 144A | | | 566,943 | |
| | 541,471 | | | | | CIM Trust CMO, Series2017-6, Class A1, 3.02%, due 06/25/57◆◆144A | | | 510,737 | |
| | 1,772,000 | | | | | Citigroup Commercial Mortgage Trust, Series2016-P5, Class A2, 2.40%, due 10/10/49 | | | 1,789,617 | |
| | 1,300,000 | | | | | Citigroup Commercial Mortgage Trust, Series2019-C7, Class A3, 2.86%, due 12/15/72 | | | 1,354,007 | |
| | 115,000 | | | | | Citigroup Commercial Mortgage Trust, Series2019-PRM, Class A, 3.34%, due 05/10/36 144A | | | 111,109 | |
| | 110,000 | | | | | Citigroup Commercial Mortgage Trust, Series 2019-SMRT, Class A, 4.15%, due 01/10/36 144A | | | 114,014 | |
| | 27,500,000 | | | | | Citigroup Commercial Mortgage Trust, (IO), Series 2014-GC21, Class XB, 0.44%, due 05/10/47◆◆ | | | 491,120 | |
| | 89,303 | | | | | COLT Mortgage Loan Trust CMO, Series2019-2, Class A1, 3.34%, due 05/25/49◆◆ 144A | | | 87,495 | |
| | 138,801 | | | | | COLT Mortgage Loan Trust CMO, Series2020-1, Class A1, 2.49%, due 02/25/50◆◆ 144A | | | 135,633 | |
| | 221,000 | | | | | Commercial Mortgage Trust, Series2012-LC4, Class B, 4.93%, due 12/10/44◆◆ | | | 224,660 | |
| | 235,000 | | | | | Commercial Mortgage Trust, Series 2013-300P, Class D, 4.39%, due 08/10/30◆◆ 144A | | | 235,682 | |
| | 714,112 | | | | | Commercial Mortgage Trust, Series 2013-LC6, Class A4, 2.94%, due 01/10/46 | | | 731,680 | |
| | 470,000 | | | | | Commercial Mortgage Trust, Series 2014-CR20, Class A3, 3.33%, due 11/10/47 | | | 495,054 | |
| | 4,166 | | | | | Commercial Mortgage Trust, Series 2014-UBS2, Class A2, 2.82%, due 03/10/47 | | | 4,157 | |
| | 1,015,727 | | | | | Commercial Mortgage Trust, Series 2015-CR25, Class A3, 3.51%, due 08/10/48 | | | 1,071,210 | |
| | 2,500,000 | | | | | Commercial Mortgage Trust, Series 2015-CR26, Class A3, 3.36%, due 10/10/48 | | | 2,608,859 | |
| | 125,000 | | | | | Commercial Mortgage Trust, Series 2016-CR28, Class A3, 3.50%, due 02/10/49 | | | 131,768 | |
| | 78,000 | | | | | Commercial Mortgage Trust, Series2020-CBM, Class A2, 2.90%, due 02/10/37 144A | | | 70,893 | |
| | 355,000 | | | | | Credit Suisse Mortgage Capital Certificates, Series 2019-ICE4, Class D, 2.30% (1 mo. USD LIBOR plus 1.60%), due 05/15/36† 144A | | | 324,767 | |
| | 512,740 | | | | | Credit Suisse Mortgage Trust CMO, Series2017-HL1, Class A3, 3.50%, due 06/25/47 144A | | | 508,996 | |
| | 714,531 | | | | | Credit Suisse Mortgage Trust CMO, Series 2018-RPL9, Class A, 3.85%, due 09/25/57◆◆ 144A | | | 724,411 | |
| | 330,381 | | | | | Credit Suisse Mortgage Trust CMO, Series 2019-AFC1, Class A1, 2.57%, due 07/25/49†† 144A | | | 319,129 | |
| | 213,908 | | | | | Credit Suisse Mortgage Trust CMO, Series 2020-AFC1, Class A1, 2.24%, due 02/25/50◆◆ 144A | | | 191,281 | |
| | 1,138,797 | | | | | Credit Suisse Mortgage Trust CMO, Reg S, Series2020-WL1, Class A, 2.35% (1 mo. USD LIBOR plus 1.40%), due 12/26/59† ‡‡‡ 144A | | | 1,138,797 | |
| | 1,100,000 | | | | | CSAIL Commercial Mortgage Trust, Series2017-C8, Class A3, 3.13%, due 06/15/50 | | | 1,140,101 | |
| | 775,000 | | | | | CSAIL Commercial Mortgage Trust, Series 2017-CX10, Class A4, 3.19%, due 11/15/50 | | | 806,310 | |
| | 1,050,000 | | | | | CSAIL Commercial Mortgage Trust, Series2019-C18, Class A3, 2.72%, due 12/15/52 | | | 1,078,332 | |
| | 885,289 | | | | | FHLMC Seasoned Credit Risk Transfer Trust CMO, Series2018-3, Class MA, 3.50%, due 08/25/57 | | | 935,963 | |
| | 2,048,063 | | | | | FHLMC Seasoned Credit Risk Transfer Trust CMO, Series2018-4, Class MA, 3.50%, due 03/25/58 | | | 2,167,465 | |
See accompanying Notes to the Financial Statements.
94
Mercer Core Fixed Income Fund
Schedule of Investments (Continued)
(showing percentage of net assets)
March 31, 2020
| | | | | | | | | | |
| Par Value ($) | | | | | Description | | Value ($) | |
| | |
| | | | | | Mortgage Backed Securities - Private Issuers — continued | |
| | 1,443,587 | | | | | FHLMC Seasoned Credit Risk Transfer Trust CMO, Series2019-2, Class MA, 3.50%, due 08/25/58 | | | 1,531,628 | |
| | 1,723,926 | | | | | FHLMC Seasoned Credit Risk Transfer Trust CMO, Series2020-1, Class MA, 2.50%, due 08/25/59 | | | 1,755,260 | |
| | 206,529 | | | | | FHLMC Structured Agency Credit Risk Debt Notes CMO, Series 2016-HQA4, Class M2, 2.25% (1 mo. USD LIBOR plus 1.30%), due 04/25/29† | | | 210,508 | |
| | 180,079 | | | | | FHLMC Structured Agency Credit Risk Debt Notes CMO, Series 2017-DNA1, Class M1, 2.15% (1 mo. USD LIBOR plus 1.20%), due 07/25/29† | | | 179,371 | |
| | 496,172 | | | | | FHLMC Structured Agency Credit Risk Debt Notes CMO, Series 2017-DNA3, Class M1, 1.70% (1 mo. USD LIBOR plus 0.75%), due 03/25/30† | | | 489,133 | |
| | 100,737 | | | | | FHLMC Structured Agency Credit Risk Debt Notes CMO, Series 2018-DNA3, Class M1, 1.70% (1 mo. USD LIBOR plus 0.75%), due 09/25/48† 144A | | | 99,364 | |
| | 56,454 | | | | | FHLMC Structured Agency Credit Risk Debt Notes CMO, Series 2019-HRP1, Class M1, 1.70% (1 mo. USD LIBOR plus 0.75%), due 02/25/49† 144A | | | 55,420 | |
| | 84,261 | | | | | FNMA Connecticut Avenue Securities CMO, Series2018-C06, Class 1M2, 3.63% (1 mo. USD LIBOR plus 2.00%), due 03/25/31† | | | 75,048 | |
| | 854,082 | | | | | GCAT LLC CMO, Series2019-4, Class A1, 3.23%, due 11/26/49†† 144A | | | 837,614 | |
| | 326,739 | | | | | GCAT LLC CMO, Series 2019-NQM1, Class A1, 2.99%, due 02/25/59†† 144A | | | 322,193 | |
| | 414,222 | | | | | GCAT LLC CMO, Series 2020-NQM1, Class A1, 2.25%, due 01/25/60†† 144A | | | 398,500 | |
| | 1,117,205 | | | | | GS Mortgage Securities Trust, Series 2012-GCJ7, Class A4, 3.38%, due 05/10/45 | | | 1,132,361 | |
| | 900,000 | | | | | GS Mortgage Securities Trust, Series 2015-GC28, Class A4, 3.14%, due 02/10/48 | | | 932,901 | |
| | 260,000 | | | | | GS Mortgage Securities Trust, Series 2015-GC30, Class A3, 3.12%, due 05/10/50 | | | 268,151 | |
| | 125,000 | | | | | GS Mortgage Securities Trust, Series 2015-GC34, Class A4, 3.51%, due 10/10/48 | | | 134,153 | |
| | 285,000 | | | | | GS Mortgage Securities Trust, Series 2019-GC39, Class A2, 3.46%, due 05/10/52 | | | 300,312 | |
| | 300,000 | | | | | GS Mortgage Securities Trust, Series 2019-GC40, Class A2, 2.97%, due 07/10/52 | | | 311,108 | |
| | 196,000 | | | | | GS Mortgage Securities Trust, Series 2020-UPTN, Class A, 2.75%, due 02/10/37 144A | | | 192,342 | |
| | 100,000 | | | | | Hilton Orlando Trust, Series2018-ORL, Class D, 2.40% (1 mo. USD LIBOR plus 1.70%), due 12/15/34† 144A | | | 79,799 | |
| | 100,000 | | | | | Hudsons Bay Simon JV Trust, Series 2015-HBFL, Class DFL, 5.57% (1 mo. USD LIBOR plus 3.90%), due 08/05/34† 144A | | | 89,443 | |
| | 170,000 | | | | | IMT Trust, Series 2017-APTS, Class CFX, 3.50%, due 06/15/34◆◆144A | | | 158,426 | |
| | 215,000 | | | | | Irvine Core Office Trust, Series2013-IRV, Class A2, 3.17%, due 05/15/48◆◆144A | | | 218,229 | |
| | 1,725,000 | | | | | JPMBB Commercial Mortgage Securities Trust, Series2014-C19, Class A3, 3.67%, due 04/15/47 | | | 1,751,161 | |
| | 245,000 | | | | | JPMBB Commercial Mortgage Securities Trust, Series2015-C31, Class A3, 3.80%, due 08/15/48 | | | 265,542 | |
| | 664,488 | | | | | JPMBB Commercial Mortgage Securities Trust, Series2015-C32, Class A2, 2.82%, due 11/15/48 | | | 666,175 | |
| | 95,000 | | | | | JPMBB Commercial Mortgage Securities Trust, Series2016-C1, Class A4, 3.31%, due 03/15/49 | | | 101,010 | |
| | 700,000 | | | | | JPMDB Commercial Mortgage Securities Trust, Series2016-C2, Class A3A, 2.88%, due 06/15/49 | | | 733,920 | |
| | 1,300,000 | | | | | JPMDB Commercial Mortgage Securities Trust, Series2017-C5, Class A4, 3.41%, due 03/15/50 | | | 1,405,737 | |
| | 1,133,835 | | | | | JPMorgan Chase Commercial Mortgage Securities Trust, Series2011-C3, Class A4, 4.72%, due 02/15/46 144A | | | 1,149,468 | |
| | 1,449,919 | | | | | JPMorgan Chase Commercial Mortgage Securities Trust, Series 2013-LC11, Class A4, 2.69%, due 04/15/46 | | | 1,467,312 | |
See accompanying Notes to the Financial Statements.
95
Mercer Core Fixed Income Fund
Schedule of Investments (Continued)
(showing percentage of net assets)
March 31, 2020
| | | | | | | | | | |
| Par Value ($) | | | | | Description | | Value ($) | |
| | |
| | | | | | Mortgage Backed Securities - Private Issuers — continued | |
| | 430,000 | | | | | JPMorgan Chase Commercial Mortgage Securities Trust, Series2015-JP1, Class A4, 3.65%, due 01/15/49 | | | 464,739 | |
| | 760,000 | | | | | JPMorgan Chase Commercial Mortgage Securities Trust, Series2016-JP2, Class A3, 2.56%, due 08/15/49 | | | 749,645 | |
| | 1,600,000 | | | | | JPMorgan Chase Commercial Mortgage Securities Trust, Series2017-JP6, Class A3, 3.11%, due 07/15/50 | | | 1,652,186 | |
| | 938,000 | | | | | JPMorgan Chase Commercial Mortgage Securities Trust, Series 2019-COR5, Class A2, 3.15%, due 06/13/52 | | | 978,467 | |
| | 181,000 | | | | | JPMorgan Chase Commercial Mortgage Securities Trust, Series2020-NNN, Class AFX, 2.81%, due 01/16/37 144A | | | 183,208 | |
| | 647,399 | | | | | JPMorgan Mortgage Trust CMO, Series2016-1, Class A5, 3.50%, due 05/25/46 144A | | | 644,525 | |
| | 420,445 | | | | | JPMorgan Mortgage Trust CMO, Series2016-4, Class A5, 3.50%, due 10/25/46 144A | | | 426,959 | |
| | 958,564 | | | | | JPMorgan Mortgage Trust CMO, Series2017-2, Class A5, 3.50%, due 05/25/47 144A | | | 952,096 | |
| | 705,210 | | | | | JPMorgan Mortgage Trust CMO, Series2018-4, Class A15, 3.50%, due 10/25/48 144A | | | 704,430 | |
| | 130,000 | | | | | KNDL Mortgage Trust, Series 2019-KNSQ, Class D, 2.05% (1 mo. USD LIBOR plus 1.35%), due 05/15/36† 144A | | | 108,632 | |
| | 478,910 | | | | | Legacy Mortgage Asset Trust CMO, Series2019-PRI, Class A1, 3.86%, due 09/25/59†† 144A | | | 474,189 | |
| | 296,679 | | | | | Legacy Mortgage Asset Trust CMO, Series2020-GS1, Class A1, 2.88%, due 10/25/59†† 144A | | | 296,795 | |
| | 77,545 | | | | | MetLife Securization Trust CMO, Series2018-1A, Class A, 3.75%, due 03/25/57◆◆144A | | | 78,672 | |
| | 173,233 | | | | | Mill City Mortgage Loan Trust CMO, Series2019-1, Class A1, 3.25%, due 10/25/69◆◆144A | | | 175,851 | |
| | 100,000 | | | | | Morgan Stanley Bank of America Merrill Lynch Trust, Series2013-C7, Class A4, 2.92%, due 02/15/46 | | | 101,294 | |
| | 1,600,000 | | | | | Morgan Stanley Capital I Trust, Series 2016-UB11, Class A3, 2.53%, due 08/15/49 | | | 1,604,856 | |
| | 212,000 | | | | | Morgan Stanley Capital I Trust, Series2017-CLS, Class D, 2.10% (1 mo. USD LIBOR plus 1.40%), due 11/15/34† 144A | | | 198,822 | |
| | 2,600,000 | | | | | Morgan Stanley Capital I Trust, Series2019-H6, Class A3, 3.16%, due 06/15/52 | | | 2,759,984 | |
| | 200,000 | | | | | Mortgage Insurance-Linked Notes CMO, Series2020-1, Class M1B, 2.40% (1 mo. USD LIBOR plus 1.45%), due 02/25/30† 144A | | | 184,038 | |
| | 95,000 | | | | | Natixis Commercial Mortgage Securities Trust, Series 2018-285M, Class D, 3.79%, due 11/15/32◆◆ 144A | | | 93,319 | |
| | 165,000 | | | | | Natixis Commercial Mortgage Securities Trust, Series 2018-ALXA, Class C, 4.32%, due 01/15/43◆◆ 144A | | | 151,893 | |
| | 332,001 | | | | | New Residential Mortgage Loan Trust CMO, Series2018-1A, Class A1A, 4.00%, due 12/25/57◆◆ 144A | | | 345,586 | |
| | 177,959 | | | | | New Residential Mortgage Loan Trust CMO, Series2018-4A, Class A1S, 1.70% (1 mo. USD LIBOR plus 0.75%), due 01/25/48† 144A | | | 167,225 | |
| | 91,010 | | | | | Oaktown Re III, Ltd. CMO, Series2019-1A, Class M1A, 2.35% (1 mo. USD LIBOR plus 1.40%), due 07/25/29† 144A | | | 90,696 | |
| | 1,310,537 | | | | | Park Avenue Funding Trust CMO, Series2019-4, Class PT, 2.46% (1 mo. USD LIBOR plus 1.50%), due 05/27/21† 144A | | | 1,311,273 | |
| | 4,527 | | | | | Provident Funding Mortgage Loan Trust CMO, Series2005-1, Class 2A1, 3.95%, due 05/25/35◆◆ | | | 4,521 | |
| | 720,811 | | | | | PSMC Trust, Series2019-1, Class A3, 4.00%, due 07/25/49 144A | | | 717,624 | |
| | 79,145 | | | | | Radnor RE, Ltd. CMO, Series2018-1, Class M1, 2.35% (1 mo. USD LIBOR plus 1.40%), due 03/25/28† 144A | | | 79,029 | |
See accompanying Notes to the Financial Statements.
96
Mercer Core Fixed Income Fund
Schedule of Investments (Continued)
(showing percentage of net assets)
March 31, 2020
| | | | | | | | | | |
| Par Value ($) | | | | | Description | | Value ($) | |
| | |
| | | | | | Mortgage Backed Securities - Private Issuers — continued | |
| | 2,210,000 | | | | | Sequoia Mortgage Trust, Series2020-3, Class A4, 3.00%, due 04/25/50 144A | | | 2,220,618 | |
| | 72,873 | | | | | Starwood Mortgage Residential Trust CMO, Series 2018-IMC1, Class A1, 3.79%, due 03/25/48◆◆ 144A | | | 71,482 | |
| | 174,155 | | | | | Starwood Mortgage Residential Trust CMO, Series2020-1, Class A1, 2.28%, due 02/25/50◆◆ 144A | | | 167,287 | |
| | 89,418 | | | | | Towd Point Mortgage Trust, Series2018-5, Class A1A, 3.25%, due 07/25/58◆◆ 144A | | | 91,078 | |
| | 353,009 | | | | | Towd Point Mortgage Trust, Series2018-6, Class A1A, 3.75%, due 03/25/58◆◆ 144A | | | 364,740 | |
| | 115,000 | | | | | Towd Point Mortgage Trust, Series2015-1, Class A5, 3.91%, due 10/25/53◆◆ 144A | | | 108,256 | |
| | 265,000 | | | | | Towd Point Mortgage Trust, Series2015-2, Class 1M2, 3.76%, due 11/25/60◆◆ 144A | | | 251,486 | |
| | 62,945 | | | | | Towd Point Mortgage Trust, Series2017-1, Class A1, 2.75%, due 10/25/56◆◆ 144A | | | 63,366 | |
| | 590,046 | | | | | Towd Point Mortgage Trust, Series2017-4, Class A1, 2.75%, due 06/25/57◆◆ 144A | | | 577,881 | |
| | 668,673 | | | | | Towd Point Mortgage Trust, Series2017-6, Class A1, 2.75%, due 10/25/57◆◆ 144A | | | 669,629 | |
| | 642,498 | | | | | Towd Point Mortgage Trust, Series2018-1, Class A1, 3.00%, due 01/25/58◆◆ 144A | | | 649,462 | |
| | 215,027 | | | | | Towd Point Mortgage Trust, Series2018-3, Class A1, 3.75%, due 05/25/58◆◆ 144A | | | 216,156 | |
| | 331,430 | | | | | Towd Point Mortgage Trust, Series2018-4, Class A1, 3.00%, due 06/25/58◆◆ 144A | | | 327,840 | |
| | 245,003 | | | | | Towd Point Mortgage Trust, Series2018-5, Class A1, 3.25%, due 07/25/58◆◆ 144A | | | 248,779 | |
| | 172,395 | | | | | Towd Point Mortgage Trust, Series2019-1, Class A1, 3.75%, due 03/25/58◆◆ 144A | | | 177,202 | |
| | 211,667 | | | | | Towd Point Mortgage Trust, Series2019-4, Class A1, 2.90%, due 10/25/59◆◆ 144A | | | 207,345 | |
| | 88,685 | | | | | Towd Point Mortgage Trust, Series2019-HY3, Class A1A, 1.95% (1 mo. USD LIBOR plus 1.00%), due 10/25/59† 144A | | | 86,842 | |
| | 675,000 | | | | | UBS Commercial Mortgage Trust, Series2017-C2, Class ASB, 3.26%, due 08/15/50 | | | 712,116 | |
| | 2,259,801 | | | | | UBS-Barclays Commercial Mortgage Trust, Series2012-C3, Class A4, 3.09%, due 08/10/49 | | | 2,284,588 | |
| | 525,722 | | | | | UBS-Barclays Commercial Mortgage Trust, Series2013-C5, Class A3, 2.92%, due 03/10/46 | | | 534,411 | |
| | 1,523,797 | | | | | UBS-Citigroup Commercial Mortgage Trust, Series2011-C1, Class A3, 3.60%, due 01/10/45 | | | 1,546,803 | |
| | 240,000 | | | | | VNDO Mortgage Trust, Series 2013-PENN, Class D, 3.95%, due 12/13/29◆◆ 144A | | | 237,311 | |
| | 14,856 | | | | | WaMu Mortgage Pass Through Certificates CMO, Series2003-AR9, Class 1A7, 4.31%, due 09/25/33◆◆ | | | 13,273 | |
| | 1,500,000 | | | | | Wells Fargo Commercial Mortgage Trust, Series 2016-BNK1, Class A2, 2.40%, due 08/15/49 | | | 1,437,942 | |
| | 3,000,000 | | | | | Wells Fargo Commercial Mortgage Trust, Series 2016-NXS6, Class A3, 2.64%, due 11/15/49 | | | 3,028,702 | |
| | 950,000 | | | | | Wells Fargo Commercial Mortgage Trust, Series2017-C38, Class A4, 3.19%, due 07/15/50 | | | 998,802 | |
| | 1,400,000 | | | | | Wells Fargo Commercial Mortgage Trust, Series2017-RB1, Class A4, 3.37%, due 03/15/50 | | | 1,501,958 | |
| | 110,000 | | | | | Wells Fargo Commercial Mortgage Trust, Series2017-SMP, Class D, 2.35% (1 mo. USD LIBOR plus 1.65%), due 12/15/34† 144A | | | 86,876 | |
| | 1,198,785 | | | | | WFRBS Commercial Mortgage Trust, Series2011-C2, Class A4, 4.87%, due 02/15/44◆◆ 144A | | | 1,215,404 | |
| | 1,360,000 | | | | | WFRBS Commercial Mortgage Trust, Series2011-C4, Class A4, 4.90%, due 06/15/44 144A | | | 1,391,220 | |
| | | | | | | | | | |
| | | | 96,443,021 | |
| | | | | | | | | | |
| | |
| | | | | | Mortgage Backed Securities - U.S. Government Agency Obligations — 28.1% | |
| | 496,763 | | | | | FHLMC Gold, Pool # A89870, 4.50%, due 11/01/39 | | | 544,755 | |
| | 392,568 | | | | | FHLMC Gold, Pool # A96970, 4.00%, due 02/01/41 | | | 424,521 | |
See accompanying Notes to the Financial Statements.
97
Mercer Core Fixed Income Fund
Schedule of Investments (Continued)
(showing percentage of net assets)
March 31, 2020
| | | | | | | | | | |
| Par Value ($) | | | | | Description | | Value ($) | |
| | |
| | | | | | Mortgage Backed Securities - U.S. Government Agency Obligations — continued | |
| | 675,469 | | | | | FHLMC Gold, Pool # C91908, 3.00%, due 01/01/37 | | | 716,103 | |
| | 530,943 | | | | | FHLMC Gold, Pool # G06231, 4.00%, due 12/01/40 | | | 574,256 | |
| | 244,574 | | | | | FHLMC Gold, Pool # G06409, 6.00%, due 11/01/39 | | | 282,412 | |
| | 126,186 | | | | | FHLMC Gold, Pool # G06875, 5.50%, due 12/01/38 | | | 143,316 | |
| | 472,950 | | | | | FHLMC Gold, Pool # G07021, 5.00%, due 09/01/39 | | | 526,737 | |
| | 626,334 | | | | | FHLMC Gold, Pool # G08672, 4.00%, due 10/01/45 | | | 678,127 | |
| | 871,658 | | | | | FHLMC Gold, Pool # G08726, 3.00%, due 10/01/46 | | | 921,306 | |
| | 140,642 | | | | | FHLMC Gold, Pool # G08735, 4.50%, due 10/01/46 | | | 152,834 | |
| | 81,978 | | | | | FHLMC Gold, Pool # G08748, 3.50%, due 02/01/47 | | | 87,225 | |
| | 1,223,338 | | | | | FHLMC Gold, Pool # G08749, 4.00%, due 02/01/47 | | | 1,316,389 | |
| | 780,823 | | | | | FHLMC Gold, Pool # G08771, 4.00%, due 07/01/47 | | | 837,809 | |
| | 622,605 | | | | | FHLMC Gold, Pool # G08786, 4.50%, due 10/01/47 | | | 676,236 | |
| | 654,181 | | | | | FHLMC Gold, Pool # G08805, 4.00%, due 03/01/48 | | | 704,416 | |
| | 4,338,147 | | | | | FHLMC Gold, Pool # G08883, 4.50%, due 06/01/49 | | | 4,674,442 | |
| | 220,131 | | | | | FHLMC Gold, Pool # G16177, 2.00%, due 01/01/32 | | | 227,149 | |
| | 377,086 | | | | | FHLMC Gold, Pool # G16501, 3.00%, due 04/01/33 | | | 399,133 | |
| | 1,403,010 | | | | | FHLMC Gold, Pool # G16634, 3.00%, due 10/01/31 | | | 1,482,130 | |
| | 1,401,115 | | | | | FHLMC Gold, Pool # G60564, 5.00%, due 02/01/42 | | | 1,555,596 | |
| | 1,402,013 | | | | | FHLMC Gold, Pool # G60722, 3.00%, due 10/01/46 | | | 1,482,766 | |
| | 621,749 | | | | | FHLMC Gold, Pool # G60767, 3.50%, due 10/01/46 | | | 667,078 | |
| | 325,414 | | | | | FHLMC Gold, Pool # G60788, 3.50%, due 12/01/46 | | | 348,023 | |
| | 1,306,562 | | | | | FHLMC Gold, Pool # G60804, 4.50%, due 05/01/42 | | | 1,430,573 | |
| | 1,575,062 | | | | | FHLMC Gold, Pool # G60931, 3.00%, due 02/01/47 | | | 1,674,992 | |
| | 1,698,322 | | | | | FHLMC Gold, Pool # G60934, 3.50%, due 06/01/45 | | | 1,825,611 | |
| | 1,859,046 | | | | | FHLMC Gold, Pool # G60985, 3.00%, due 05/01/47 | | | 1,967,234 | |
| | 1,236,828 | | | | | FHLMC Gold, Pool # G61748, 3.50%, due 11/01/48 | | | 1,327,919 | |
| | 1,515,649 | | | | | FHLMC Gold, Pool # G61891, 4.00%, due 05/01/48 | | | 1,628,089 | |
| | 194,077 | | | | | FHLMC Gold, Pool # G61948, 4.00%, due 12/01/48 | | | 207,725 | |
| | 629,513 | | | | | FHLMC Gold, Pool # G61995, 4.00%, due 11/01/44 | | | 682,536 | |
| | 1,092,886 | | | | | FHLMC Gold, Pool # G67703, 3.50%, due 04/01/47 | | | 1,173,500 | |
| | 135,676 | | | | | FHLMC Gold, Pool # J16432, 3.50%, due 08/01/26 | | | 143,182 | |
| | 149,999 | | | | | FHLMC Gold, Pool # J17763, 3.50%, due 01/01/27 | | | 158,825 | |
| | 419,950 | | | | | FHLMC Gold, Pool # J24414, 2.50%, due 06/01/28 | | | 439,030 | |
| | 504,385 | | | | | FHLMC Gold, Pool # J34888, 2.50%, due 07/01/31 | | | 526,063 | |
| | 954,389 | | | | | FHLMC Gold, Pool # Q09224, 4.00%, due 07/01/42 | | | 1,047,141 | |
| | 213,443 | | | | | FHLMC Gold, Pool # Q11218, 3.50%, due 09/01/42 | | | 229,420 | |
| | 418,487 | | | | | FHLMC Gold, Pool # Q12052, 3.50%, due 10/01/42 | | | 449,791 | |
| | 872,668 | | | | | FHLMC Gold, Pool # Q12862, 3.50%, due 11/01/42 | | | 938,221 | |
| | 398,852 | | | | | FHLMC Gold, Pool # Q17792, 3.50%, due 05/01/43 | | | 428,523 | |
| | 1,676,758 | | | | | FHLMC Gold, Pool # Q34842, 3.00%, due 07/01/45 | | | 1,775,792 | |
| | 1,260,013 | | | | | FHLMC Gold, Pool # Q36815, 4.00%, due 10/01/45 | | | 1,364,502 | |
| | 1,531,249 | | | | | FHLMC Gold, Pool # Q41918, 3.50%, due 07/01/46 | | | 1,644,310 | |
| | 1,176,056 | | | | | FHLMC Gold, Pool # Q42618, 3.00%, due 08/01/46 | | | 1,243,271 | |
| | 1,220,348 | | | | | FHLMC Gold, Pool # Q44455, 3.50%, due 11/01/46 | | | 1,305,191 | |
| | 466,634 | | | | | FHLMC Gold, Pool # Q44963, 3.50%, due 12/01/46 | | | 497,779 | |
| | 1,258,663 | | | | | FHLMC Gold, Pool # Q45741, 3.50%, due 01/01/47 | | | 1,351,507 | |
| | 171,438 | | | | | FHLMC Gold, Pool # Q49494, 4.50%, due 07/01/47 | | | 186,455 | |
| | 558,113 | | | | | FHLMC Gold, Pool # Q52312, 4.00%, due 11/01/47 | | | 600,302 | |
| | 698,730 | | | | | FHLMC Gold, Pool # Q54957, 4.00%, due 03/01/48 | | | 753,528 | |
See accompanying Notes to the Financial Statements.
98
Mercer Core Fixed Income Fund
Schedule of Investments (Continued)
(showing percentage of net assets)
March 31, 2020
| | | | | | | | | | |
| Par Value ($) | | | | | Description | | Value ($) | |
| | |
| | | | | | Mortgage Backed Securities - U.S. Government Agency Obligations — continued | |
| | 335,308 | | | | | FHLMC Gold, Pool # V60565, 3.00%, due 06/01/29 | | | 353,590 | |
| | 835,955 | | | | | FHLMC Gold, Pool # V60599, 3.00%, due 09/01/29 | | | 881,458 | |
| | 1,187,502 | | | | | FHLMC Gold, Pool # V82292, 4.00%, due 04/01/46 | | | 1,285,482 | |
| | 1,423,571 | | | | | FHLMC Gold, Pool # V82515, 3.50%, due 06/01/46 | | | 1,518,263 | |
| | 352,375 | | | | | FHLMC Gold, Pool # V82848, 3.00%, due 12/01/46 | | | 373,433 | |
| | 320,000 | | | | | FHLMC Multifamily Structured Pass Through Certificates, Series K040, Class A2, 3.24%, due 09/25/24 | | | 349,211 | |
| | 375,000 | | | | | FHLMC Multifamily Structured Pass Through Certificates, Series K043, Class A2, 3.06%, due 12/25/24 | | | 407,745 | |
| | 550,000 | | | | | FHLMC Multifamily Structured Pass Through Certificates, Series K059, Class AM, 3.17%, due 09/25/26◆◆ | | | 612,056 | |
| | 1,800,000 | | | | | FHLMC Multifamily Structured Pass Through Certificates, Series K069, Class AM, 3.25%, due 09/25/27◆◆ | | | 2,045,649 | |
| | 325,000 | | | | | FHLMC Multifamily Structured Pass Through Certificates, Series K083, Class AM, 4.03%, due 10/25/28◆◆ | | | 394,364 | |
| | 200,000 | | | | | FHLMC Multifamily Structured Pass Through Certificates, Series K086, Class AM, 3.92%, due 12/25/28◆◆ | | | 241,467 | |
| | 900,000 | | | | | FHLMC Multifamily Structured Pass Through Certificates, Series K157, Class A2, 3.99%, due 05/25/33◆◆ | | | 1,085,488 | |
| | 209,000 | | | | | FHLMC Multifamily Structured Pass Through Certificates, Series K728, Class A2, 3.06%, due 08/25/24◆◆ | | | 224,556 | |
| | 344,000 | | | | | FHLMC Multifamily Structured Pass Through Certificates, Series K729, Class A2, 3.14%, due 10/25/24 | | | 371,478 | |
| | 1,100,000 | | | | | FHLMC Multifamily Structured Pass Through Certificates, Series KC07, Class ASB, 2.18%, due 08/25/29 | | | 1,155,158 | |
| | 490,000 | | | | | FHLMC Multifamily Structured Pass Through Certificates, Series KIR3, Class A1, 3.04%, due 08/25/27 | | | 544,945 | |
| | 389,255 | | | | | FHLMC Multifamily Structured Pass Through Certificates, (IO), Series K007, Class X1, 0.73%, due 04/25/20◆◆ | | | 4 | |
| | 25,232,296 | | | | | FHLMC Multifamily Structured Pass Through Certificates, (IO), Series K025, Class X1, 0.82%, due 10/25/22◆◆ | | | 445,514 | |
| | 79,686 | | | | | FHLMC Reference REMIC CMO, Series R007, Class ZA, 6.00%, due 05/15/36 | | | 94,889 | |
| | 3,725,578 | | | | | FNMA, Pool # AC3668, 4.50%, due 10/01/39 | | | 4,085,929 | |
| | 995,079 | | | | | FNMA, Pool # AI4815, 4.50%, due 06/01/41 | | | 1,092,284 | |
| | 2,793,356 | | | | | FNMA, Pool # BN6216, 4.50%, due 03/01/49 | | | 3,075,511 | |
| | 1,559,441 | | | | | FNMA, Pool # BO5387, 3.50%, due 12/01/49 | | | 1,661,726 | |
| | 5,094,228 | | | | | FNMA, Pool # FM2217, 3.00%, due 03/01/47 | | | 5,404,455 | |
| | 3,452,626 | | | | | FNMA, Pool # FM2226, 3.00%, due 09/01/46 | | | 3,663,006 | |
| | 1,425,000 | | | | | FNMA, Pool # FM2570, 4.50%, due 04/01/48 | | | 1,566,134 | |
| | 956,947 | | | | | FNMA REMIC CMO, Series2011-59, Class NZ, 5.50%, due 07/25/41 | | | 1,111,275 | |
| | 19,408 | | | | | FNMA REMIC CMO, Series2012-28, Class B, 6.50%, due 06/25/39 | | | 21,301 | |
| | 1,700,000 | | | | | FNMA-ACES, Series2015-M10, Class A2, 3.09%, due 04/25/27◆◆ | | | 1,860,750 | |
| | 373,982 | | | | | FNMA-ACES, Series2015-M8, Class AB2, 2.83%, due 01/25/25◆◆ | | | 400,096 | |
| | 170,017 | | | | | FNMA-ACES, Series2016-M7, Class AB2, 2.38%, due 09/25/26 | | | 176,813 | |
| | 500,000 | | | | | FNMA-ACES, Series2017-M1, Class A2, 2.42%, due 10/25/26◆◆ | | | 526,172 | |
| | 421,687 | | | | | FNMA-ACES, Series2018-M10, Class A1, 3.38%, due 07/25/28◆◆ | | | 467,204 | |
| | 1,147,052 | | | | | FNMA-ACES, Series2019-M22, Class A1, 2.10%, due 08/25/29 | | | 1,190,096 | |
| | 1,258,158 | | | | | FNMA-ACES, Series2019-M25, Class AV1, 2.05%, due 12/25/26 | | | 1,302,473 | |
| | 573,360 | | | | | GNMA I, Pool # 734152, 4.00%, due 01/15/41 | | | 622,383 | |
See accompanying Notes to the Financial Statements.
99
Mercer Core Fixed Income Fund
Schedule of Investments (Continued)
(showing percentage of net assets)
March 31, 2020
| | | | | | | | | | |
| Par Value ($) | | | | | Description | | Value ($) | |
| | |
| | | | | | Mortgage Backed Securities - U.S. Government Agency Obligations — continued | |
| | 3,314,652 | | | | | GNMA I, Pool # 784369, 4.00%, due 08/15/45 | | | 3,671,295 | |
| | 413,209 | | | | | GNMA I, Pool # 784605, 4.50%, due 01/15/42 | | | 457,713 | |
| | 398,051 | | | | | GNMA I, Pool # 784699, 5.00%, due 04/15/48 | | | 431,623 | |
| | 305,242 | | | | | GNMA I, Pool # AL8626, 3.00%, due 08/15/45 | | | 323,522 | |
| | 302,932 | | | | | GNMA II, Pool # 004636, 4.50%, due 02/20/40 | | | 334,224 | |
| | 55,246 | | | | | GNMA II, Pool # 004678, 4.50%, due 04/20/40 | | | 60,958 | |
| | 365,839 | | | | | GNMA II, Pool # 004833, 4.00%, due 10/20/40 | | | 399,515 | |
| | 320,282 | | | | | GNMA II, Pool # 004977, 4.00%, due 03/20/41 | | | 349,764 | |
| | 805,176 | | | | | GNMA II, Pool # 004978, 4.50%, due 03/20/41 | | | 888,444 | |
| | 1,262,934 | | | | | GNMA II, Pool # 005055, 4.50%, due 05/20/41 | | | 1,393,703 | |
| | 45,202 | | | | | GNMA II, Pool # 783637, 3.00%, due 06/20/42 | | | 48,556 | |
| | 1,206,398 | | | | | GNMA II, Pool # 796468, 4.00%, due 09/20/42 | | | 1,310,565 | |
| | 1,222,095 | | | | | GNMA II, Pool # AV9421, 3.50%, due 11/20/46 | | | 1,327,480 | |
| | 894,291 | | | | | GNMA II, Pool # AY7555, 3.50%, due 04/20/47 | | | 971,543 | |
| | 465,581 | | | | | GNMA II, Pool # MA0462, 3.50%, due 10/20/42 | | | 498,831 | |
| | 66,879 | | | | | GNMA II, Pool # MA0624, 3.00%, due 12/20/42 | | | 71,897 | |
| | 300,666 | | | | | GNMA II, Pool # MA0625, 3.50%, due 12/20/42 | | | 322,139 | |
| | 172,807 | | | | | GNMA II, Pool # MA0698, 3.00%, due 01/20/43 | | | 185,773 | |
| | 593,656 | | | | | GNMA II, Pool # MA0851, 3.00%, due 03/20/43 | | | 638,270 | |
| | 464,525 | | | | | GNMA II, Pool # MA0852, 3.50%, due 03/20/43 | | | 497,702 | |
| | 101,080 | | | | | GNMA II, Pool # MA1156, 3.00%, due 07/20/43 | | | 108,709 | |
| | 371,498 | | | | | GNMA II, Pool # MA1376, 4.00%, due 10/20/43 | | | 405,617 | |
| | 139,198 | | | | | GNMA II, Pool # MA1599, 3.00%, due 01/20/44 | | | 149,730 | |
| | 380,551 | | | | | GNMA II, Pool # MA2371, 3.50%, due 11/20/44 | | | 405,327 | |
| | 272,994 | | | | | GNMA II, Pool # MA2372, 4.00%, due 11/20/44 | | | 298,045 | |
| | 306,974 | | | | | GNMA II, Pool # MA2825, 3.00%, due 05/20/45 | | | 330,059 | |
| | 5,105,029 | | | | | GNMA II, Pool # MA2891, 3.00%, due 06/20/45 | | | 5,488,713 | |
| | 660,538 | | | | | GNMA II, Pool # MA3310, 3.50%, due 12/20/45 | | | 703,608 | |
| | 259,577 | | | | | GNMA II, Pool # MA3377, 4.00%, due 01/20/46 | | | 283,369 | |
| | 378,392 | | | | | GNMA II, Pool # MA3455, 4.00%, due 02/20/46 | | | 411,020 | |
| | 663,126 | | | | | GNMA II, Pool # MA3456, 4.50%, due 02/20/46 | | | 724,954 | |
| | 760,964 | | | | | GNMA II, Pool # MA3596, 3.00%, due 04/20/46 | | | 814,781 | |
| | 1,381,751 | | | | | GNMA II, Pool # MA3803, 3.50%, due 07/20/46 | | | 1,479,313 | |
| | 1,039,988 | | | | | GNMA II, Pool # MA3873, 3.00%, due 08/20/46 | | | 1,115,284 | |
| | 449,191 | | | | | GNMA II, Pool # MA4004, 3.50%, due 10/20/46 | | | 482,037 | |
| | 243,290 | | | | | GNMA II, Pool # MA4071, 4.50%, due 11/20/46 | | | 266,534 | |
| | 204,342 | | | | | GNMA II, Pool # MA4125, 2.50%, due 12/20/46 | | | 214,985 | |
| | 429,815 | | | | | GNMA II, Pool # MA4263, 4.00%, due 02/20/47 | | | 459,924 | |
| | 586,468 | | | | | GNMA II, Pool # MA4510, 3.50%, due 06/20/47 | | | 619,314 | |
| | 675,828 | | | | | GNMA II, Pool # MA4585, 3.00%, due 07/20/47 | | | 723,207 | |
| | 670,898 | | | | | GNMA II, Pool # MA4586, 3.50%, due 07/20/47 | | | 714,988 | |
| | 1,747,447 | | | | | GNMA II, Pool # MA4720, 4.00%, due 09/20/47 | | | 1,886,488 | |
| | 495,974 | | | | | GNMA II, Pool # MA4838, 4.00%, due 11/20/47 | | | 533,277 | |
| | 2,021,999 | | | | | GNMA II, Pool # MA5019, 3.50%, due 02/20/48 | | | 2,149,193 | |
| | 263,960 | | | | | GNMA II, Pool # MA5021, 4.50%, due 02/20/48 | | | 284,517 | |
| | 91,524 | | | | | GNMA II, Pool # MA5079, 4.50%, due 03/20/48 | | | 97,575 | |
| | 589,881 | | | | | GNMA II, Pool # MA5397, 3.50%, due 08/20/48 | | | 627,167 | |
| | 667,168 | | | | | GNMA II, Pool # MA5466, 4.00%, due 09/20/48 | | | 711,574 | |
| | 594,820 | | | | | GNMA II, Pool # MA5467, 4.50%, due 09/20/48 | | | 636,099 | |
See accompanying Notes to the Financial Statements.
100
Mercer Core Fixed Income Fund
Schedule of Investments (Continued)
(showing percentage of net assets)
March 31, 2020
| | | | | | | | | | |
| Par Value ($) | | | | | Description | | Value ($) | |
| | |
| | | | | | Mortgage Backed Securities - U.S. Government Agency Obligations — continued | |
| | 272,060 | | | | | GNMA II, Pool # MA5530, 5.00%, due 10/20/48 | | | 290,382 | |
| | 384,372 | | | | | GNMA II, Pool # MA5762, 3.50%, due 02/20/49 | | | 406,049 | |
| | 437,842 | | | | | GNMA II, Pool # MA5817, 4.00%, due 03/20/49 | | | 467,390 | |
| | 1,148,070 | | | | | GNMA II, Pool # MA5874, 3.00%, due 04/20/49 | | | 1,217,906 | |
| | 388,594 | | | | | GNMA II, Pool # MA5875, 3.50%, due 04/20/49 | | | 410,224 | |
| | 820,484 | | | | | GNMA II, Pool # MA5985, 3.00%, due 06/20/49 | | | 866,902 | |
| | 1,497,839 | | | | | UMBS, Pool # 254903, 5.00%, due 10/01/33 | | | 1,662,076 | |
| | 1,642,042 | | | | | UMBS, Pool # 725027, 5.00%, due 11/01/33 | | | 1,822,262 | |
| | 1,148,055 | | | | | UMBS, Pool # 735676, 5.00%, due 07/01/35 | | | 1,273,846 | |
| | 421,083 | | | | | UMBS, Pool # 745148, 5.00%, due 01/01/36 | | | 469,441 | |
| | 470,978 | | | | | UMBS, Pool # 932807, 4.00%, due 09/01/40 | | | 509,648 | |
| | 429,641 | | | | | UMBS, Pool # 983471, 5.50%, due 05/01/38 | | | 486,067 | |
| | 519,370 | | | | | UMBS, Pool # 985184, 5.50%, due 08/01/38 | | | 588,334 | |
| | 335,218 | | | | | UMBS, Pool # 995245, 5.00%, due 01/01/39 | | | 372,655 | |
| | 789,985 | | | | | UMBS, Pool # AB6212, 3.00%, due 09/01/42 | | | 836,540 | |
| | 993,232 | | | | | UMBS, Pool # AB6802, 3.50%, due 11/01/42 | | | 1,067,244 | |
| | 257,239 | | | | | UMBS, Pool # AB7059, 2.50%, due 11/01/42 | | | 268,266 | |
| | 621,643 | | | | | UMBS, Pool # AB8703, 3.00%, due 03/01/38 | | | 658,248 | |
| | 225,710 | | | | | UMBS, Pool # AB9383, 4.00%, due 05/01/43 | | | 245,840 | |
| | 1,442,241 | | | | | UMBS, Pool # AB9659, 3.00%, due 06/01/43 | | | 1,529,926 | |
| | 437,099 | | | | | UMBS, Pool # AD9153, 4.50%, due 08/01/40 | | | 479,633 | |
| | 256,246 | | | | | UMBS, Pool # AE0469, 6.00%, due 12/01/39 | | | 295,749 | |
| | 1,131,613 | | | | | UMBS, Pool # AH4404, 4.00%, due 01/01/41 | | | 1,225,435 | |
| | 170,199 | | | | | UMBS, Pool # AI1892, 5.00%, due 05/01/41 | | | 188,926 | |
| | 831,473 | | | | | UMBS, Pool # AJ9278, 3.50%, due 12/01/41 | | | 893,225 | |
| | 396,005 | | | | | UMBS, Pool # AJ9317, 4.00%, due 01/01/42 | | | 428,875 | |
| | 784,229 | | | | | UMBS, Pool # AL0215, 4.50%, due 04/01/41*** | | | 860,833 | |
| | 1,317,084 | | | | | UMBS, Pool # AL1895, 3.50%, due 06/01/42 | | | 1,415,623 | |
| | 679,918 | | | | | UMBS, Pool # AL2466, 4.00%, due 09/01/42 | | | 751,334 | |
| | 752,178 | | | | | UMBS, Pool # AL3000, 3.50%, due 12/01/42 | | | 808,495 | |
| | 981,132 | | | | | UMBS, Pool # AL3316, 3.50%, due 03/01/43 | | | 1,054,560 | |
| | 1,146,022 | | | | | UMBS, Pool # AL6663, 4.00%, due 03/01/39 | | | 1,262,877 | |
| | 448,952 | | | | | UMBS, Pool # AL6839, 5.00%, due 04/01/42 | | | 496,640 | |
| | 1,464,941 | | | | | UMBS, Pool # AL7521, 5.00%, due 06/01/39 | | | 1,619,082 | |
| | 1,228,361 | | | | | UMBS, Pool # AL7594, 3.50%, due 08/01/45 | | | 1,317,471 | |
| | 997,333 | | | | | UMBS, Pool # AL8191, 4.00%, due 12/01/45 | | | 1,099,618 | |
| | 169,742 | | | | | UMBS, Pool # AO4109, 4.00%, due 06/01/42 | | | 183,860 | |
| | 426,195 | | | | | UMBS, Pool # AQ7923, 3.00%, due 12/01/42 | | | 451,312 | |
| | 1,008,981 | | | | | UMBS, Pool # AS5133, 3.50%, due 06/01/45 | | | 1,076,612 | |
| | 272,690 | | | | | UMBS, Pool # AS6286, 4.00%, due 12/01/45 | | | 295,084 | |
| | 430,835 | | | | | UMBS, Pool # AS6304, 4.00%, due 12/01/45 | | | 466,099 | |
| | 608,409 | | | | | UMBS, Pool # AS6452, 3.50%, due 01/01/46 | | | 649,099 | |
| | 256,299 | | | | | UMBS, Pool # AS7693, 2.00%, due 08/01/31 | | | 264,438 | |
| | 392,743 | | | | | UMBS, Pool # AS8073, 2.50%, due 10/01/46 | | | 409,579 | |
| | 312,517 | | | | | UMBS, Pool # AX3719, 3.50%, due 07/01/27 | | | 329,608 | |
| | 317,044 | | | | | UMBS, Pool # AZ3743, 3.50%, due 11/01/45 | | | 339,287 | |
| | 459,877 | | | | | UMBS, Pool # BC9468, 3.00%, due 06/01/46 | | | 487,488 | |
| | 1,412,936 | | | | | UMBS, Pool # BD7043, 4.00%, due 03/01/47 | | | 1,522,125 | |
| | 828,664 | | | | | UMBS, Pool # BE7192, 4.00%, due 03/01/47 | | | 898,065 | |
See accompanying Notes to the Financial Statements.
101
Mercer Core Fixed Income Fund
Schedule of Investments (Continued)
(showing percentage of net assets)
March 31, 2020
| | | | | | | | | | |
| Par Value ($) | | | | | Description | | Value ($) | |
| | |
| | | | | | Mortgage Backed Securities - U.S. Government Agency Obligations — continued | |
| | 1,199,630 | | | | | UMBS, Pool # BH1207, 4.00%, due 06/01/47 | | | 1,298,975 | |
| | 1,125,078 | | | | | UMBS, Pool # BK1023, 4.50%, due 02/01/48 | | | 1,227,761 | |
| | 1,011,935 | | | | | UMBS, Pool # BK7611, 4.50%, due 09/01/48 | | | 1,090,034 | |
| | 1,351,675 | | | | | UMBS, Pool # BM1573, 3.50%, due 07/01/47 | | | 1,450,950 | |
| | 1,229,999 | | | | | UMBS, Pool # BM1655, 5.00%, due 11/01/44 | | | 1,364,643 | |
| | 1,432,539 | | | | | UMBS, Pool # BM1972, 3.50%, due 10/01/37 | | | 1,558,773 | |
| | 1,588,823 | | | | | UMBS, Pool # BM2006, 4.00%, due 01/01/48 | | | 1,705,313 | |
| | 857,756 | | | | | UMBS, Pool # BM3033, 3.00%, due 10/01/47 | | | 906,515 | |
| | 959,569 | | | | | UMBS, Pool # BM3116, 3.00%, due 02/01/47 | | | 1,020,237 | |
| | 265,205 | | | | | UMBS, Pool # BM3258, 3.00%, due 02/01/47 | | | 280,990 | |
| | 581,998 | | | | | UMBS, Pool # BM3286, 4.50%, due 11/01/47 | | | 630,642 | |
| | 987,371 | | | | | UMBS, Pool # BM3332, 3.50%, due 01/01/48 | | | 1,052,539 | |
| | 735,762 | | | | | UMBS, Pool # BM3491, 4.50%, due 01/01/38 | | | 801,725 | |
| | 1,513,429 | | | | | UMBS, Pool # BM3641, 4.00%, due 04/01/48 | | | 1,639,938 | |
| | 1,349,779 | | | | | UMBS, Pool # BM4425, 5.00%, due 07/01/47 | | | 1,502,888 | |
| | 1,194,372 | | | | | UMBS, Pool # BM4896, 3.00%, due 02/01/47 | | | 1,264,504 | |
| | 1,272,095 | | | | | UMBS, Pool # BM5213, 3.00%, due 07/01/45 | | | 1,346,889 | |
| | 790,409 | | | | | UMBS, Pool # BM5293, 3.50%, due 02/01/49 | | | 836,691 | |
| | 651,845 | | | | | UMBS, Pool # BM5446, 3.50%, due 02/01/49 | | | 689,926 | |
| | 1,572,203 | | | | | UMBS, Pool # BM5694, 4.00%, due 06/01/48 | | | 1,688,967 | |
| | 1,005,872 | | | | | UMBS, Pool # BM5827, 5.00%, due 04/01/49 | | | 1,087,923 | |
| | 362,322 | | | | | UMBS, Pool # BM5874, 4.00%, due 01/01/48 | | | 391,045 | |
| | 472,813 | | | | | UMBS, Pool # BM5950, 3.00%, due 11/01/48 | | | 500,322 | |
| | 1,160,722 | | | | | UMBS, Pool # BN2763, 4.50%, due 11/01/48 | | | 1,249,691 | |
| | 1,299,665 | | | | | UMBS, Pool # BO0988, 3.50%, due 07/01/49 | | | 1,373,456 | |
| | 2,536,081 | | | | | UMBS, Pool # BO1040, 3.00%, due 09/01/49 | | | 2,663,365 | |
| | 1,201,055 | | | | | UMBS, Pool # BO1042, 3.00%, due 09/01/49 | | | 1,261,335 | |
| | 917,063 | | | | | UMBS, Pool # BO1420, 3.50%, due 09/01/49 | | | 970,668 | |
| | 524,328 | | | | | UMBS, Pool # BO1439, 3.00%, due 10/01/49 | | | 550,437 | |
| | 1,301,753 | | | | | UMBS, Pool # CA0655, 3.50%, due 11/01/47 | | | 1,391,536 | |
| | 1,227,207 | | | | | UMBS, Pool # CA1560, 4.50%, due 04/01/48 | | | 1,333,967 | |
| | 1,434,303 | | | | | UMBS, Pool # CA2057, 4.50%, due 07/01/48 | | | 1,546,933 | |
| | 2,387,373 | | | | | UMBS, Pool # CA3986, 5.00%, due 08/01/49 | | | 2,595,022 | |
| | 475,297 | | | | | UMBS, Pool # CA4149, 3.00%, due 09/01/49 | | | 503,252 | |
| | 1,016,709 | | | | | UMBS, Pool # CA4546, 3.00%, due 11/01/49 | | | 1,070,242 | |
| | 1,985,114 | | | | | UMBS, Pool # FM0030, 3.00%, due 02/01/49 | | | 2,096,249 | |
| | 841,814 | | | | | UMBS, Pool # FM1001, 3.50%, due 11/01/48 | | | 893,130 | |
| | 724,769 | | | | | UMBS, Pool # FM1057, 3.50%, due 06/01/49 | | | 767,086 | |
| | 726,318 | | | | | UMBS, Pool # FM1266, 5.00%, due 07/01/49 | | | 791,632 | |
| | 1,251,564 | | | | | UMBS, Pool # FM1329, 3.00%, due 07/01/49 | | | 1,314,487 | |
| | 293,073 | | | | | UMBS, Pool # FM1347, 3.00%, due 12/01/48 | | | 309,309 | |
| | 1,660,515 | | | | | UMBS, Pool # FM1467, 3.00%, due 12/01/47 | | | 1,765,878 | |
| | 813,538 | | | | | UMBS, Pool # FM1588, 3.00%, due 10/01/49 | | | 858,883 | |
| | 632,744 | | | | | UMBS, Pool # FM1715, 3.00%, due 12/01/45 | | | 668,938 | |
| | 452,288 | | | | | UMBS, Pool # FM1790, 3.00%, due 11/01/49 | | | 478,891 | |
| | 465,479 | | | | | UMBS, Pool # FM1864, 3.00%, due 11/01/49 | | | 489,936 | |
| | 3,613,379 | | | | | UMBS, Pool # FM2109, 3.50%, due 12/01/49 | | | 3,822,244 | |
| | 5,942,975 | | | | | UMBS, Pool # FM2385, 3.00%, due 09/01/48 | | | 6,249,911 | |
| | 1,750,068 | | | | | UMBS, Pool # FM2461, 3.50%, due 03/01/50 | | | 1,853,255 | |
See accompanying Notes to the Financial Statements.
102
Mercer Core Fixed Income Fund
Schedule of Investments (Continued)
(showing percentage of net assets)
March 31, 2020
| | | | | | | | | | |
| Par Value ($) | | | | | Description | | Value ($) | |
| | |
| | | | | | Mortgage Backed Securities - U.S. Government Agency Obligations — continued | |
| | 310,152 | | | | | UMBS, Pool # MA2781, 2.50%, due 10/01/46 | | | 323,423 | |
| | 436,529 | | | | | UMBS, Pool # MA3087, 3.50%, due 08/01/47 | | | 463,241 | |
| | 293,518 | | | | | UMBS, Pool # MA3155, 3.00%, due 10/01/32 | | | 309,771 | |
| | 1,339,966 | | | | | UMBS, Pool # MA3182, 3.50%, due 11/01/47 | | | 1,422,371 | |
| | 604,208 | | | | | UMBS, Pool # MA3211, 4.00%, due 12/01/47 | | | 648,738 | |
| | 430,226 | | | | | UMBS, Pool # MA3238, 3.50%, due 01/01/48 | | | 455,008 | |
| | 392,122 | | | | | UMBS, Pool # MA3364, 3.50%, due 05/01/33 | | | 414,281 | |
| | 286,468 | | | | | UMBS, Pool # MA3385, 4.50%, due 06/01/48 | | | 309,114 | |
| | 1,264,836 | | | | | UMBS, Pool # MA3414, 3.50%, due 07/01/48 | | | 1,338,704 | |
| | 446,921 | | | | | UMBS, Pool # MA3442, 3.50%, due 08/01/48 | | | 473,288 | |
| | 1,750,562 | | | | | UMBS, Pool # MA3466, 3.50%, due 09/01/48 | | | 1,853,570 | |
| | 393,126 | | | | | UMBS, Pool # MA3521, 4.00%, due 11/01/48 | | | 419,504 | |
| | 2,458,405 | | | | | UMBS, Pool # MA3802, 3.00%, due 10/01/49 | | | 2,580,253 | |
| | 484,383 | | | | | UMBS, Pool # MA3864, 2.50%, due 12/01/34 | | | 503,450 | |
| | 4,052,823 | | | | | UMBS, Pool # QA6328, 3.00%, due 01/01/50 | | | 4,272,992 | |
| | 3,251,946 | | | | | UMBS, Pool # RA1776, 3.00%, due 12/01/49 | | | 3,425,182 | |
| | 3,323,262 | | | | | UMBS, Pool # RA1860, 3.00%, due 12/01/49 | | | 3,490,052 | |
| | 3,653,797 | | | | | UMBS, Pool # RA1878, 3.50%, due 12/01/49 | | | 3,867,374 | |
| | 1,711,934 | | | | | UMBS, Pool # SD0100, 3.00%, due 10/01/49 | | | 1,800,491 | |
| | 115,442 | | | | | UMBS, Pool # SD8017, 3.50%, due 10/01/49 | | | 121,702 | |
| | 14,999 | | | | | UMBS, Pool # SD8025, 3.50%, due 11/01/49 | | | 15,849 | |
| | 988,442 | | | | | UMBS, Pool # SD8029, 2.50%, due 12/01/49 | | | 1,025,935 | |
| | 2,260,809 | | | | | UMBS, Pool # SD8030, 3.00%, due 12/01/49 | | | 2,373,394 | |
| | 1,867,203 | | | | | UMBS, Pool # ZA7040, 3.50%, due 06/01/49 | | | 1,982,408 | |
| | 1,854,790 | | | | | UMBS, Pool # ZM1609, 3.50%, due 09/01/46 | | | 1,998,088 | |
| | 1,002,512 | | | | | UMBS, Pool # ZN6183, 3.50%, due 05/01/49 | | | 1,077,402 | |
| | 840,500 | | | | | UMBS, Pool # ZT0657, 6.00%, due 07/01/40 | | | 982,189 | |
| | 614,646 | | | | | UMBS, Pool # ZT1593, 3.50%, due 01/01/49 | | | 649,681 | |
| | 785,842 | | | | | UMBS, Pool # ZT1748, 5.00%, due 01/01/49 | | | 857,297 | |
| | 2,129,564 | | | | | UMBS, Pool # ZT2100, 3.00%, due 04/01/47 | | | 2,249,857 | |
| | | | | | | | | | |
| | | | 267,277,864 | |
| | | | | | | | | | |
| | |
| | | | | | Municipal Obligations — 0.6% | |
| | 60,000 | | | | | Alabama Economic Settlement Authority, 4.26%, due 09/15/32 | | | 68,669 | |
| | 165,000 | | | | | Bay Area Toll Authority, 2.57%, due 04/01/31 | | | 168,010 | |
| | 300,000 | | | | | Bay Area Toll Authority, 6.26%, due 04/01/49 | | | 459,150 | |
| | 90,000 | | | | | District of Columbia Water & Sewer Authority, 4.81%, due 10/01/14# | | | 117,140 | |
| | 650,000 | | | | | Health & Educational Facilities Authority of the State of Missouri, 3.23%, due 05/15/50†††† | | | 673,159 | |
| | 715,000 | | | | | Michigan Finance Authority, 2.37%, due 09/01/49 | | | 677,212 | |
| | 363,000 | | | | | Municipal Electric Authority of Georgia, 6.64%, due 04/01/57 | | | 476,539 | |
| | 247,000 | | | | | New Jersey Transportation Trust Fund Authority, 4.08%, due 06/15/39 | | | 239,973 | |
| | 25,000 | | | | | New Jersey Transportation Trust Fund Authority, 4.13%, due 06/15/42 | | | 24,273 | |
| | 1,000,000 | | | | | State of California, General Obligation, 7.55%, due 04/01/39 | | | 1,626,620 | |
| | 695,000 | | | | | State of Illinois, General Obligation, 5.00%, due 11/01/22 | | | 715,398 | |
| | 105,000 | | | | | University of Virginia, 4.18%, due 09/01/17# | | | 125,499 | |
| | | | | | | | | | |
| | | | 5,371,642 | |
| | | | | | | | | | |
See accompanying Notes to the Financial Statements.
103
Mercer Core Fixed Income Fund
Schedule of Investments (Continued)
(showing percentage of net assets)
March 31, 2020
| | | | | | | | | | |
| Par Value ($) | | | | | Description | | Value ($) | |
| | |
| | | | | | Sovereign Debt Obligations — 0.6% | |
| | 200,000 | | | | | Colombia Government International Bond, 5.00%, due 06/15/45 | | | 207,000 | |
| | 135,000 | | | | | Colombia Government International Bond, 7.38%, due 09/18/37 | | | 169,466 | |
| | 330,000 | | | | | Corp. Andina de Fomento, 2.13%, due 09/27/21 | | | 335,574 | |
| | 55,000 | | | | | Corp. Andina de Fomento, 2.75%, due 01/06/23 | | | 57,274 | |
| | 215,000 | | | | | Export-Import Bank of India, 3.88%, due 02/01/28 144A | | | 198,759 | |
| | 200,000 | | | | | Indonesia Government International Bond, 4.45%, due 02/11/24 | | | 207,500 | |
| | 220,000 | | | | | Indonesia Government International Bond, 5.88%, due 01/15/24 144A | | | 239,868 | |
| | 200,000 | | | | | Japan Bank for International Cooperation, 3.38%, due 10/31/23 | | | 217,597 | |
| | 200,000 | | | | | Japan Finance Organization for Municipalities, 1.75%, due 09/05/24 144A | | | 207,158 | |
| | 200,000 | | | | | Panama Government International Bond, 4.00%, due 09/22/24 | | | 208,200 | |
| | 250,000 | | | | | Province of Alberta Canada, 3.30%, due 03/15/28 | | | 287,504 | |
| | 100,000 | | | | | Province of Manitoba Canada, 2.13%, due 06/22/26 | | | 105,687 | |
| | 70,000 | | | | | Province of Ontario Canada, 3.40%, due 10/17/23 | | | 76,359 | |
| | 220,000 | | | | | Province of Quebec Canada, 2.75%, due 04/12/27 | | | 244,346 | |
| | 301,000 | | | | | Qatar Government International Bond, 3.38%, due 03/14/24 144A | | | 307,238 | |
| | 520,000 | | | | | Qatar Government International Bond, 5.10%, due 04/23/48 144A | | | 633,110 | |
| | 235,000 | | | | | Saudi Government International Bond, 4.00%, due 04/17/25 144A | | | 244,821 | |
| | 445,000 | | | | | Saudi Government International Bond, 4.38%, due 04/16/29 144A | | | 480,122 | |
| | 400,000 | | | | | Tokyo Metropolitan Government, 2.50%, due 06/08/22 144A | | | 415,138 | |
| | 300,000 | | | | | Turkey Government International Bond, 7.00%, due 06/05/20 | | | 300,619 | |
| | 185,000 | | | | | Uruguay Government International Bond, 4.98%, due 04/20/55 | | | 211,883 | |
| | 65,000 | | | | | Uruguay Government International Bond, 5.10%, due 06/18/50 | | | 74,202 | |
| | | | | | | | | | |
| | | | 5,429,425 | |
| | | | | | | | | | |
| | |
| | | | | | U.S. Government and Agency Obligations — 16.1% | |
| | 270,000 | | | | | FNMA, 2.38%, due 01/19/23 | | | 284,630 | |
| | 315,000 | | | | | FNMA, 2.50%, due 02/05/24 | | | 338,961 | |
| | 310,000 | | | | | FNMA, 6.63%, due 11/15/30*** ***** | | | 471,306 | |
| | 25,000 | | | | | Tennessee Valley Authority, 7.13%, due 05/01/30 | | | 37,567 | |
| | 7,694,000 | | | | | U.S. Treasury Bond, 2.25%, due 08/15/49 | | | 9,375,560 | |
| | 5,591,000 | | | | | U.S. Treasury Bond, 2.38%, due 11/15/49 | | | 6,970,186 | |
| | 3,485,000 | | | | | U.S. Treasury Bond, 2.75%, due 11/15/42 | | | 4,509,127 | |
| | 3,040,000 | | | | | U.S. Treasury Bond, 3.00%, due 02/15/47 | | | 4,212,775 | |
| | 7,480,000 | | | | | U.S. Treasury Bond, 3.00%, due 08/15/48 | | | 10,392,525 | |
| | 4,755,000 | | | | | U.S. Treasury Bond, 3.13%, due 11/15/41 | | | 6,497,819 | |
| | 9,075,000 | | | | | U.S. Treasury Bond, 3.13%, due 02/15/43 | | | 12,432,750 | |
| | 6,290,000 | | | | | U.S. Treasury Bond, 3.13%, due 08/15/44 | | | 8,683,640 | |
| | 3,045,000 | | | | | U.S. Treasury Bond, 3.38%, due 05/15/44 | | | 4,356,729 | |
| | 8,390,000 | | | | | U.S. Treasury Bond, 3.50%, due 02/15/39 | | | 11,956,078 | |
| | 5,780,900 | | | | | U.S. Treasury Bond, 3.63%, due 08/15/43 | | | 8,536,312 | |
| | 20,000 | | | | | U.S. Treasury Bond, 3.75%, due 11/15/43 | | | 30,116 | |
| | 1,843,000 | | | | | U.S. Treasury Bond, 4.50%, due 05/15/38 | | | 2,919,499 | |
| | 6,543,823 | | | | | U.S. Treasury Inflation Indexed Bonds, 0.13%, due 10/15/24 | | | 6,624,327 | |
| | 1,129,397 | | | | | U.S. Treasury Inflation Indexed Bonds, 0.25%, due 07/15/29 | | | 1,172,907 | |
| | 310,000 | | | | | U.S. Treasury Note, 0.38%, due 03/31/22 | | | 310,938 | |
| | 16,621,000 | | | | | U.S. Treasury Note, 0.50%, due 03/31/25 | | | 16,725,530 | |
| | 485,000 | | | | | U.S. Treasury Note, 1.13%, due 02/28/21 | | | 489,594 | |
| | 950,000 | | | | | U.S. Treasury Note, 1.13%, due 02/28/22 | | | 966,514 | |
| | 3,340,000 | | | | | U.S. Treasury Note, 1.38%, due 01/31/22 | | | 3,411,432 | |
See accompanying Notes to the Financial Statements.
104
Mercer Core Fixed Income Fund
Schedule of Investments (Continued)
(showing percentage of net assets)
March 31, 2020
| | | | | | | | | | |
| Par Value ($) | | | | | Description | | Value ($) | |
| | |
| | | | | | U.S. Government and Agency Obligations — continued | |
| | 9,949,000 | | | | | U.S. Treasury Note, 1.50%, due 02/15/30 | | | 10,714,412 | |
| | 2,600,000 | | | | | U.S. Treasury Note, 2.88%, due 05/15/28*** | | | 3,066,172 | |
| | 185,000 | | | | | U.S. Treasury STRIPS, 1.28%, due 02/15/37‡‡ | | | 151,891 | |
| | 3,000,000 | | | | | U.S. Treasury STRIPS, 1.30%, due 05/15/37‡‡ ***** | | | 2,449,276 | |
| | 360,000 | | | | | U.S. Treasury STRIPS, 1.37%, due 11/15/38 ‡‡ | | | 286,406 | |
| | 400,000 | | | | | U.S. Treasury STRIPS, 1.40%, due 05/15/39 ‡‡ | | | 314,826 | |
| | 370,000 | | | | | U.S. Treasury STRIPS, 1.43%, due 02/15/39‡‡ | | | 290,831 | |
| | 2,145,000 | | | | | U.S. Treasury STRIPS, 1.47%, due 11/15/40‡‡ | | | 1,642,017 | |
| | 490,000 | | | | | U.S. Treasury STRIPS, 1.48%, due 08/15/39‡‡ | | | 380,453 | |
| | 2,400,000 | | | | | U.S. Treasury STRIPS, 1.50%, due 02/15/41‡‡ | | | 1,824,204 | |
| | 1,590,000 | | | | | U.S. Treasury STRIPS, 1.51%, due 05/15/41‡‡ | | | 1,204,206 | |
| | 3,035,000 | | | | | U.S. Treasury STRIPS, 1.55%, due 11/15/41‡‡ | | | 2,269,146 | |
| | 2,310,000 | | | | | U.S. Treasury STRIPS, 1.60%, due 05/15/42‡‡ | | | 1,702,580 | |
| | 1,530,000 | | | | | U.S. Treasury STRIPS, 1.64%, due 11/15/42‡‡ | | | 1,112,756 | |
| | 4,620,000 | | | | | U.S. Treasury STRIPS, 1.64%, due 02/15/43‡‡ | | | 3,352,447 | |
| | 646,000 | | | | | U.S. Treasury STRIPS, 1.69%, due 11/15/43‡‡ | | | 460,848 | |
| | 430,000 | | | | | U.S. Treasury STRIPS, 1.75%, due 11/15/45‡‡ | | | 296,145 | |
| | 310,000 | | | | | U.S. Treasury STRIPS, 1.76%, due 02/15/46‡‡ | | | 212,577 | |
| | | | | | | | | | |
| | | | 153,438,015 | |
| | | | | | | | | | |
| | | |
| | | | | | TOTAL DEBT OBLIGATIONS (COST $925,946,723) | | | 936,025,692 | |
| | | | | | | | | | |
| | | | | | | | | | | | |
| | | |
Number of
Contracts | | | Notional
Value ($) | | | Description | | Value ($) | |
| | | | | | | | | | | | |
| | |
| | | | | | | | OPTIONS PURCHASED — 0.0% | |
| | |
| | | | | | | Purchased Futures Options — 0.0% | |
| | |
| | | | | | | Put Options — 0.0% | |
| | 22 | | | | 3,051,125 | | | U.S. Treasury Note10-Year Futures Option with JPMorgan Chase Bank N.A., Strike Price $133.00, Expires 05/22/20 | | | 4,812 | |
| | 42 | | | | 5,824,875 | | | U.S. Treasury Note10-Year Futures Option with JPMorgan Chase Bank N.A., Strike Price $132.00, Expires 05/22/20 | | | 7,875 | |
| | 22 | | | | 3,051,125 | | | U.S. Treasury Note10-Year Futures Option with JPMorgan Chase Bank N.A., Strike Price $127.00, Expires 05/22/20 | | | 1,719 | |
| | 42 | | | | 5,824,875 | | | U.S. Treasury Note10-Year Futures Option with JPMorgan Chase Bank N.A., Strike Price $126.00, Expires 05/22/20 | | | 2,625 | |
| | | | | | | | | | | | |
| | | | | | | | TOTAL FUTURES OPTIONS PURCHASED
(PREMIUMS PAID $63,117) | | | 17,031 | |
| | | | | | | | | | | | |
| | | |
| | | | | | | | TOTAL OPTIONS PURCHASED (PREMIUMS PAID $63,117) | | | 17,031 | |
| | | | | | | | | | | | |
See accompanying Notes to the Financial Statements.
105
Mercer Core Fixed Income Fund
Schedule of Investments (Continued)
(showing percentage of net assets)
March 31, 2020
| | | | | | | | | | |
| Par Value ($) | | | | | Description | | Value ($) | |
| | |
| | | | | | SHORT-TERM INVESTMENT — 0.2% | |
| | |
| | | | | | Mutual Fund - Securities Lending Collateral — 0.2% | |
| | 2,009,610 | | | | | State Street Institutional U.S. Government Money Market Fund, Premier Class, 0.32%## ** | | | 2,009,610 | |
| | | | | | | | | | |
| | | |
| | | | | | TOTAL SHORT-TERM INVESTMENT (COST $2,009,610) | | | 2,009,610 | |
| | | | | | | | | | |
| | | |
| | | | | | TOTAL INVESTMENTS — 98.7% (Cost $928,019,450) | | | 938,052,333 | |
| | | |
| | | | | | Other Assets and Liabilities (net) — 1.3% | | | 11,964,476 | |
| | | | | | | | | | |
| | | |
| | | | | | NET ASSETS — 100.0% | | $950,016,809 | |
| | | | | | | | | | |
| | | |
| | | | | | Notes to Schedule of Investments:
| | | |
| | | |
| | | | | | ACES — Alternative Credit Enhancement Securities | | | | |
| | | |
| | | | | | CLO — Collateralized Loan Obligation | | | | |
| | | |
| | | | | | CMO — Collateralized Mortgage Obligation | | | | |
| | | |
| | | | | | CMT — Constant Maturity Treasury Index | | | | |
| | | |
| | | | | | FHLMC — Federal Home Loan Mortgage Corporation | | | | |
| | | |
| | | | | | FNMA — Federal National Mortgage Association | | | | |
| | | |
| | | | | | GNMA — Government National Mortgage Association | | | | |
| | | |
| | | | | | IO — Interest Only | | | | |
| | | |
| | | | | | LIBOR — London Interbank Offered Rate | | | | |
| | | |
| | | | | | MTN — Medium Term Note | | | | |
| | | |
| | | | | | REIT — Real Estate Investment Trust | | | | |
| | | |
| | | | | | REMIC — Real Estate Mortgage Investment Conduit | | | | |
| | | |
| | | | | | SOFR — Secured Overnight Financing Rate | | | | |
| | | |
| | | | | | STRIPS — Separate Trading of Registered Interest and Principal of Securities | | | | |
| | | |
| | | | | | UMBS — Uniform Mortgage-Backed Securities are single-class securities backed by fixed-rate mortgage loans purchased by either FHLMC or FNMA | | | | |
| | | |
| | | | # | | Year of maturity is greater than 2100. | | | | |
| | | |
| | | | ## | | The rate disclosed is the7-day net yield as of March 31, 2020. | | | | |
| | | |
| | | | * | | Non-income producing security. | | | | |
| | | |
| | | | ** | | Represents an investment of securities lending cash collateral. | | | | |
| | | |
| | | | *** | | All or a portion of this security is pledged for open futures collateral. | | | | |
| | | |
| | | | **** | | Securities fair valued by the Valuation Committee as approved by the Board of Trustees. The total market value of the securities at year end is $2,100 which represents 0.0% of net assets. The aggregate tax cost of these securities held at March 31, 2020 was $1,565,555. | | | | |
| | | |
| | | | ***** | | All or a portion of this security is pledged for open centrally cleared swaps collateral. | | | | |
See accompanying Notes to the Financial Statements.
106
Mercer Core Fixed Income Fund
Schedule of Investments (Continued)
March 31, 2020
| | | | | | | | |
| | | |
| | | | | ^ | | Level 3 — significant unobservable inputs were used in determining the value of this portfolio security. | | |
| | | |
| | | | ◆◆ | | Variable or floating rate security, which interest rate adjusts periodically based on changes in current interest rates and prepayments on the underlying pool of assets. Rate shown is the rate in effect as of period end. | | |
| | | |
| | | | † | | Variable or floating rate note. Rate shown is as of March 31, 2020. | | |
| | | |
| | | | †† | | Step bond that pays an initial coupon rate for the first period and then a lower/higher coupon rate for the following periods. Rate shown is current coupon rate. | | |
| | | |
| | | | ††† | | Security is currently in default. | | |
| | | |
| | | | †††† | | When-issued security. | | |
| | | |
| | | | ††††† | | Security is perpetual and has no stated maturity date. | | |
| | | |
| | | | ‡ | | All or a portion of this security is out on loan. | | |
| | | |
| | | | ‡‡ | | Interest rate presented is yield to maturity. | | |
| | | |
| | | | ‡‡‡ | | Security exempt from registration under Regulation S of the Securities Act of 1933, which exempts from registration securities offered and sold outside the United States. Security may not be offered or sold in the United States except pursuant to an exemption from, or in a transaction not subject to, the registration requirements of the Securities Act of 1933. | | |
| | | |
| | | | ‡‡‡‡ | | Restricted securities are not registered under the Securities Act of 1933 and are subject to legal restrictions on resale. These securities generally may be resold in transactions exempt from registration or to the public if the securities are subsequently registered. Disposal of these securities may involve time-consuming negotiations and prompt sale at an acceptable price may be difficult. As of year end, the market value of restricted securities was $863,191, which is 0.1% of net assets. See details shown in the Restricted Securities table that follows. | | |
| | | |
| | | | (a) | | Unless otherwise indicated, all par values are denominated in United States dollars ($). | | |
| | | |
| | | | 144A | | Securities exempt from registration under Rule 144A of the Securities Act of 1933. These securities may be resold in transactions exempt from registration, normally to qualified institutional buyers. The total market value of the securities at year end is $170,611,731 which represents 18.0% of net assets. | | |
See accompanying Notes to the Financial Statements.
107
Mercer Core Fixed Income Fund
Schedule of Investments (Continued)
March 31, 2020
At March 31, 2020, the Fund held the following restricted securities:
| | | | | | | | | | | | | | |
Restricted Securities | | Acquistion Date | | Principal
Amount | | | Cost | | | Value | |
Bellemeade Re, Ltd. CMO, Series2019-3A, Class M1A, 2.05% (1 mo. USD LIBOR plus 1.10%), due 07/25/29 | | 07/17/19 | | USD | 168,782 | | | $ | 168,782 | | | $ | 168,165 | |
Teachers Insurance & Annuity Association of America, 6.85%, due 12/16/39 | | 12/15/09 | | USD | 34,000 | | | | 35,362 | | | | 47,341 | |
Teachers Insurance & Annuity Association of America, 4.27%, due 05/15/47 | | 05/03/17 | | USD | 672,000 | | | | 674,142 | | | | 647,685 | |
| | | | | | | | | | | | | | |
| | | | | | | | | | | | $ | 863,191 | |
| | | | | | | | | | | | | | |
Forward Foreign Currency Contracts
| | | | | | | | | | | | | | | | | | | | | | | | | | | | |
Currency Purchased | | | Currency Sold | | | Settlement
Date | | | | | | Counterparty | | | | | Unrealized
Appreciation
(Depreciation) | |
| EUR | | | 303,357 | | | USD | | | 327,019 | | | | 04/02/20 | | | | | | | Barclays Bank Plc | | | | | | $ | 5,840 | |
| USD | | | 329,095 | | | EUR | | | 303,357 | | | | 04/02/20 | | | | | | | JPMorgan Chase Bank N.A. | | | | | | | (3,763 | ) |
| USD | | | 327,550 | | | EUR | | | 303,357 | | | | 05/05/20 | | | | | | | Barclays Bank Plc | | | | | | | (5,732 | ) |
| | | | | | | | | | | | | | | | | | | | | | | | | | | | |
| | | | | | $ | (3,655 | ) |
| | | | | | | | | | | | | | | | | | | | | | | | | | | | |
Futures Contracts
| | | | | | | | | | | | | | | | | | |
Number of
Contracts | | | | | Description | | | | ExpirationDate | | Notional
Value | | | Market Value/
Unrealized
Appreciation
(Depreciation) | |
| | Buys | | | | | | |
| | 67 | | | | | U.S. Treasury Note 10-Year | | | | Jun 2020 | | USD | 9,292,063 | | | $ | 70,077 | |
| | 310 | | | | | U.S. Treasury Note 5-Year | | | | Jun 2020 | | | 38,861,406 | | | | 1,000,562 | |
| | 2 | | | | | U.S. Ultra Bond | | | | Jun 2020 | | | 443,750 | | | | 38,810 | |
| | | | | | | | | | | | | | | | | | |
| | | | | | | | | | | | | | | | $ | 1,109,449 | |
| | | | | | | | | | | | | | | | | | |
| | Sales | | | | | | | | | | | | | | | | | |
| | 1 | | | | | Euro-Bund | | | | Jun 2020 | | EUR | 172,510 | | | $ | (286 | ) |
| | 184 | | | | | U.S. Long Bond | | | | Jun 2020 | | USD | 32,947,500 | | | | (1,355,963 | ) |
| | 137 | | | | | U.S. Treasury Note2-Year | | | | Jun 2020 | | | 30,192,445 | | | | (213,367 | ) |
| | 17 | | | | | U.S. Ultra10-Year | | | | Jun 2020 | | | 2,652,531 | | | | (189,546 | ) |
| | | | | | | | | | | | | | | | | | |
| | | | | | | | | | | | | | | | $ | (1,759,162 | ) |
| | | | | | | | | | | | | | | | | | |
See accompanying Notes to the Financial Statements.
108
Mercer Core Fixed Income Fund
Schedule of Investments (Continued)
March 31, 2020
Written Options
Written Futures Options
| | | | | | | | | | | | | | | | | | | | | | | | | |
Type of Contract | | Counterparty | | Number of
Contracts | | Notional
Value | | Premiums
Received | | Value at
March 31, 2020 |
PUT — U.S. Treasury Note
10-Year Strike @ $129.00
Expires 05/22/2020 | | | | JPMorgan Chase Bank N.A. | | | | | 85 | | | | $ | (11,788,438 | ) | | | $ | (14,490 | ) | | | $ | (7,969 | ) |
PUT — U.S. Treasury Note | | | | JPMorgan Chase Bank N.A. | | | | | 44 | | | | | (6,102,250 | ) | | | | (8,876 | ) | | | | (5,500 | ) |
| | | | | | | | | | | | | | | | | | | | | | | | | |
10-Year Strike @ $130.00
Expires 05/22/2020 | | | | | | | | | | | | | | | | | | | | | | | | | |
Total Written Futures Options | | | | | | | | | | | | | | | | | | $ | (23,366 | ) | | | $ | (13,469 | ) |
| | | | | | | | | | | | | | | | | | | | | | | | | |
Total Written Options | | | | | | | | | | | | | | | | | | $ | (23,366 | ) | | | $ | (13,469 | ) |
| | | | | | | | | | | | | | | | | | | | | | | | | |
Centrally Cleared Interest Rate Swaps
| | | | | | | | | | | | | | | | | | | | | | | | |
Payments
Received
by Fund | | Payment
Frequency | | Payments
Made
by Fund | | Payment
Frequency | | Maturity
Date | | Upfront
Premiums
Paid
(Received) | | | Notional
Value | | | Market
Value | | | Unrealized
Appreciation
(Depreciation) | |
| 3-Month USD LIBOR | | Quarterly | | 2.66% | | Semi-Annual | | 11/15/43 | | $ | 103 | | | USD | 145,000 | | | $ | (57,164 | ) | | $ | (57,267 | ) |
| 3-Month USD LIBOR | | Quarterly | | 0.86% | | Semi-Annual | | 03/30/50 | | | 111 | | | USD | 608,000 | | | | 6,408 | | | | 6,297 | |
| 1.38% | | Semi-Annual | | 3-Month USD LIBOR | | Quarterly | | 09/15/21 | | | (22,160 | ) | | USD | 11,148,000 | | | | 155,662 | | | | 177,822 | |
| 1.48% | | Semi-Annual | | 3-Month USD LIBOR | | Quarterly | | 09/15/21 | | | 7,323 | | | USD | 7,475,000 | | | | 115,062 | | | | 107,739 | |
| 1.60% | | Semi-Annual | | 3-Month USD LIBOR | | Quarterly | | 09/15/21 | | | 24,397 | | | USD | 32,725,000 | | | | 563,084 | | | | 538,687 | |
| 1.83% | | Semi-Annual | | 3-Month USD LIBOR | | Quarterly | | 06/15/21 | | | 64 | | | USD | 8,642,000 | | | | 143,743 | | | | 143,679 | |
| Overnight Federal Funds Effective Rate (12M) | | Annual | | 2.58% | | Annual | | 08/15/28 | | | (123,603 | ) | | USD | 6,783,600 | | | | (1,238,199 | ) | | | (1,114,596 | ) |
| Overnight Federal Funds Effective Rate (12M) | | Annual | | 2.27% | | Annual | | 01/31/26 | | | (3,617 | ) | | USD | 488,000 | | | | (57,159 | ) | | | (53,542 | ) |
| Overnight Federal Funds Effective Rate (12M) | | Annual | | 2.07% | | Annual | | 02/15/27 | | | (336 | ) | | USD | 920,000 | | | | (110,532 | ) | | | (110,196 | ) |
| Overnight Federal Funds Effective Rate (12M) | | Annual | | 1.90% | | Annual | | 02/15/27 | | | 797 | | | USD | 390,000 | | | | (42,300 | ) | | | (43,097 | ) |
| Overnight Federal Funds Effective Rate (12M) | | Annual | | 1.82% | | Annual | | 02/15/27 | | | 20,041 | | | USD | 1,447,000 | | | | (149,429 | ) | | | (169,470 | ) |
| Overnight Federal Funds Effective Rate (12M) | | Annual | | 1.61% | | Annual | | 08/15/29 | | | 388 | | | USD | 564,000 | | | | (61,751 | ) | | | (62,139 | ) |
| Overnight Federal Funds Effective Rate (12M) | | Annual | | 1.51% | | Annual | | 08/09/49 | | | 110 | | | USD | 580,000 | | | | (138,980 | ) | | | (139,090 | ) |
| Overnight Federal Funds Effective Rate (12M) | | Annual | | 1.25% | | Annual | | 11/15/45 | | | (15,417 | ) | | USD | 2,248,000 | | | | (336,052 | ) | | | (320,635 | ) |
| Overnight Federal Funds Effective Rate (12M) | | Annual | | 1.04% | | Annual | | 11/15/45 | | | 106 | | | USD | 345,000 | | | | (34,275 | ) | | | (34,381 | ) |
| Overnight Federal Funds Effective Rate (12M) | | Annual | | 0.51% | | Annual | | 11/15/45 | | | (1,781 | ) | | USD | 737,000 | | | | 21,216 | | | | 22,997 | |
| 2.17% | | Annual | | Overnight Federal Funds
Effective Rate (12M) | | Annual | | 03/31/21 | | | (255 | ) | | USD | 1,726,000 | | | | 36,744 | | | | 36,999 | |
| | | | | | | | | | | | | | | | | | | | | | | | |
| | | | | | | | | | | | | | | | | | | | | | $ | (1,070,193 | ) |
| | | | | | | | | | | | | | | | | | | | | | | | |
Currency Abbreviations
See accompanying Notes to the Financial Statements.
109
Mercer Core Fixed Income Fund
Schedule of Investments (Continued)
March 31, 2020
| | | | | |
| Asset Class Summary (Unaudited) | | % of Net Assets |
Debt Obligations | | | | 98.5 | |
Options Purchased | | | | 0.0 | * |
Written Options | | | | 0.0 | * |
Forward Foreign Currency Contracts | | | | 0.0 | * |
Futures Contracts | | | | (0.1 | ) |
Swaps | | | | (0.1 | ) |
Short-Term Investment | | | | 0.2 | |
Other Assets and Liabilities (net) | | | | 1.5 | |
| | | | | |
| | | | 100.0 | % |
| | | | | |
* Amount rounds to zero.
See accompanying Notes to the Financial Statements.
110
Mercer Opportunistic Fixed Income Fund
Schedule of Investments
(showing percentage of net assets)
March 31, 2020
| | | | | | | | | | |
| Par Value(a) | | | | | Description | | Value ($) | |
| | | |
| | | | | | DEBT OBLIGATIONS — 87.3% | | | | |
| | | |
| | | | | | Asset Backed Securities — 3.8% | | | |
| | 250,000 | | | | | 522 Funding CLO I, Ltd., Series2019-1A, Class E, 5.95% (3 mo. USD LIBOR plus 7.34%), due 01/15/33† 144A | | | 151,306 | |
| | 1,090,000 | | | | | Aegis Asset Backed Securities Trust, Series2005-5, Class M1, 1.38% (1 mo. USD LIBOR plus 0.43%), due 12/25/35† | | | 927,281 | |
| | 510,000 | | | | | AGL CLO 3, Ltd., Series2020-3A, Class B1, 2.59% (3 mo. USD LIBOR plus 1.70%), due 01/15/33† 144A | | | 436,927 | |
| | 435,000 | | | | | AGL CLO 3, Ltd., Series2020-3A, Class C, 3.04% (3 mo. USD LIBOR plus 2.15%), due 01/15/33† 144A | | | 347,619 | |
| | 250,000 | | | | | AMMC CLO, Ltd., Series2017-20A, Class D, 5.24% (3 mo. USD LIBOR plus 3.40%), due 04/17/29† 144A | | | 207,279 | |
| | 420,000 | | | | | Apidos CLO XXII, Series2015-22A, Class DR, 8.44% (3 mo. USD LIBOR plus 6.75%), due 04/20/31† 144A | | | 282,652 | |
| | 250,000 | | | | | Apidos CLO XXII, Series2015-22A, Class ER, 10.34% (3 mo. USD LIBOR plus 8.65%), due 04/20/31† 144A | | | 147,673 | |
| | 675,000 | | | | | Apidos CLO XXIII, Series2015-23A, Class CR, 3.60% (3 mo. USD LIBOR plus 2.00%), due 04/15/33† 144A | | | 561,481 | |
| | 965,000 | | | | | Applebee’s Funding LLC/IHOP Funding LLC, Series2019-1A, Class A2I, 4.19%, due 06/07/49 144A | | | 878,874 | |
| | 400,000 | | | | | Ares LII CLO, Ltd., Series2019-52A, Class D, 5.75% (3 mo. USD LIBOR plus 3.95%), due 04/22/31† 144A | | | 309,310 | |
| | 300,000 | | | | | Ares XLI CLO, Ltd., Series2016-41A, Class D, 6.03% (3 mo. USD LIBOR plus 4.20%), due 01/15/29† 144A | | | 243,000 | |
| | 500,000 | | | | | Ares XXXIIR CLO, Ltd., Series 2014-32RA, Class C, 4.59% (3 mo. USD LIBOR plus 2.90%), due 05/15/30† 144A | | | 372,016 | |
| | 1,290,000 | | | | | Asset Backed Securities Corp. Home Equity Loan Trust Series OOMC, Series2006-HE5, Class M1, 1.23% (1 mo. USD LIBOR plus 0.28%), due 07/25/36† | | | 791,974 | |
| | 740,643 | | | | | Asset Backed Securities Corp. Home Equity Loan Trust Series RFC, Series2007-HE1, Class A4, 1.09% (1 mo. USD LIBOR plus 0.14%), due 12/25/36† | | | 612,278 | |
| | 410,000 | | | | | Avery Point VI CLO, Ltd., Series2015-6A, Class DR, 4.69% (3 mo. USD LIBOR plus 2.95%), due 08/05/27† 144A | | | 335,026 | |
| | 545,000 | | | | | Avis Budget Rental Car Funding AESOP LLC, Series2017-1A, Class A, 3.07%, due 09/20/23 144A | | | 514,345 | |
| | 500,000 | | | | | Barings CLO, Ltd., 3.32%, due 01/20/28 144A | | | 436,250 | |
| | 250,000 | | | | | Benefit Street Partners CLO IV, Ltd., Series2014-IVA, Class CRR, 5.62% (3 mo. USD LIBOR plus 3.80%), due 01/20/29† 144A | | | 209,383 | |
| | 250,000 | | | | | BlueMountain CLO, Ltd., Series2012-2A, Class AR2, 2.74% (3 mo. USD LIBOR plus 1.05%), due 11/20/28† 144A | | | 245,290 | |
| | 477,972 | | | | | BlueMountain CLO, Ltd., Series2015-1A, Class A1R, 3.18% (3 mo. USD LIBOR plus 1.33%), due 04/13/27† 144A | | | 478,264 | |
| | 790,000 | | | | | BMW Vehicle Lease Trust, Series2018-1, Class A3, 3.26%, due 07/20/21 | | | 791,500 | |
| | 250,000 | | | | | Bristol Park CLO, Ltd., Series2016-1A, Class CR, 3.58% (3 mo. USD LIBOR plus 1.95%), due 04/15/29† 144A | | | 223,127 | |
| | 250,000 | | | | | Bristol Park CLO, Ltd., Series2016-1A, Class ER, 8.63% (3 mo. USD LIBOR plus 7.00%), due 04/15/29† 144A | | | 168,924 | |
| | 385,000 | | | | | California Republic Auto Receivables Trust, Series2018-1, Class C, 3.87%, due 10/16/23 | | | 391,988 | |
| | 250,000 | | | | | California Street CLO IX, LP, Series2012-9A, Class AR2, 3.16% (3 mo. USD LIBOR plus 1.32%), due 07/16/32† 144A | | | 234,353 | |
See accompanying Notes to the Financial Statements.
111
Mercer Opportunistic Fixed Income Fund
Schedule of Investments (Continued)
(showing percentage of net assets)
March 31, 2020
| | | | | | | | | | |
| Par Value(a) | | | | | Description | | Value ($) | |
| | | |
| | | | | | Asset Backed Securities — continued | | | |
| | 660,000 | | | | | Carlyle Global Market Strategies CLO, Ltd., Series2014-2RA, Class A1, 2.74% (3 mo. USD LIBOR plus 1.05%), due 05/15/31† 144A | | | 627,845 | |
| | 600,000 | | | | | Catskill Park CLO, Ltd., Series2017-1A, Class D, 7.82% (3 mo. USD LIBOR plus 6.00%), due 04/20/29† 144A | | | 380,595 | |
| | 200,000 | | | | | CCG Receivables Trust, Series2018-1, Class C, 3.42%, due 06/16/25 144A | | | 200,475 | |
| | 330,000 | | | | | Cent CLO 24, Ltd., Series2015-24A, Class CR, 4.98% (3 mo. USD LIBOR plus 3.15%), due 10/15/26† 144A | | | 280,425 | |
| | 205,000 | | | | | CIFC Funding CLO, Ltd., Series2013-2A, Class A3LR, 3.78% (3 mo. USD LIBOR plus 1.95%), due 10/18/30† 144A | | | 177,392 | |
| | 265,000 | | | | | CIFC Funding CLO, Ltd., Series2014-2RA, Class A3, 3.70%, due 04/24/30◆◆ 144A | | | 234,201 | |
| | 602,950 | | | | | Coinstar Funding LLC, Series2017-1A, Class A2, 5.22%, due 04/25/47 144A | | | 571,819 | |
| | 250,000 | | | | | Cumberland Park CLO, Ltd., Series2015-2A, Class ER, 7.47% (3 mo. USD LIBOR plus 5.65%), due 07/20/28† 144A | | | 161,861 | |
| | 220,007 | | | | | Diamond Resorts Owner Trust, Series2018-1, Class C, 4.53%, due 01/21/31 144A | | | 219,652 | |
| | 400,000 | | | | | Dryden 72 CLO, Ltd., Series2019-72A, Class D, 5.39%, due 05/15/32◆◆ 144A | | | 303,854 | |
| | 650,000 | | | | | DT Auto Owner Trust, Series2018-2A, Class D, 4.15%, due 03/15/24 144A | | | 648,060 | |
| | 597,089 | | | | | Falcon Aerospace, Ltd., Series2017-1, Class A, 4.58%, due 02/15/42 144A | | | 473,878 | |
| | 600,000 | | | | | FBR Securitization Trust, Series2005-2, Class M4, 1.88% (1 mo. USD LIBOR plus 0.93%), due 09/25/35† | | | 266,048 | |
| | 1,462,359 | | | | | First Franklin Mortgage Loan Trust, Series 2005-FF12, Class M1, 1.40% (1 mo. USD LIBOR plus 0.45%), due 11/25/36† | | | 1,425,459 | |
| | 225,000 | | | | | First Investors Auto Owner Trust, Series2016-2A, Class D, 3.35%, due 11/15/22 144A | | | 223,821 | |
| | 260,000 | | | | | Flatiron CLO, Ltd., Series2017-1A, Class A, 2.94% (3 mo. USD LIBOR plus 1.25%), due 05/15/30† 144A | | | 250,147 | |
| | 360,000 | | | | | GoldenTree Loan Management US CLO 3, Ltd., Series2018-3A, Class C, 3.72% (3 mo. USD LIBOR plus 1.90%), due 04/20/30† 144A | | | 313,556 | |
| | 750,000 | | | | | GoldenTree Loan Opportunities CLO IX, Ltd., Series2014-9A, Class ER2, 7.43% (3 mo. USD LIBOR plus 5.66%), due 10/29/29† 144A | | | 467,146 | |
| | 250,000 | | | | | Greenwood Park CLO, Ltd., Series2018-1A, Class E, 6.78% (3 mo. USD LIBOR plus 4.95%), due 04/15/31† 144A | | | 151,247 | |
| | 250,000 | | | | | Greywolf CLO IV, Ltd., Series2019-1A, Class C, 5.79% (3 mo. USD LIBOR plus 3.95%), due 04/17/30† 144A | | | 212,485 | |
| | 380,553 | | | | | GSAA Home Equity Trust, Series2007-7, Class A4, 1.22% (1 mo. USD LIBOR plus 0.27%), due 07/25/37† | | | 349,454 | |
| | 290,000 | | | | | Halsey Point CLO I, Ltd., Series2019-1A, Class F, 10.11% (3 mo. USD LIBOR plus 8.20%), due 01/20/33† 144A | | | 135,062 | |
| | 499,932 | | | | | Invitation Homes Trust, Series 2018-SFR1, Class E, 2.80% (1 mo. USD LIBOR plus 2.00%), due 03/17/37† 144A | | | 401,882 | |
| | 1,187,025 | | | | | Jack In The Box Funding LLC, Series2019-1A, Class A21, 3.98%, due 08/25/49 144A | | | 1,097,951 | |
| | 383,046 | | | | | KeyCorp Student Loan Trust, Series2005-A, Class 2C, 2.57% (3 mo. USD LIBOR plus 1.30%), due 12/27/38† | | | 356,580 | |
| | 400,000 | | | | | KKR CLO 14, Ltd., Series 14, Class BR, 3.63%, due 07/15/31◆◆ 144A | | | 353,662 | |
| | 250,000 | | | | | KKR CLO, Ltd., Series 11, Class AR, 3.01% (3 mo. USD LIBOR plus 1.18%), due 01/15/31† 144A | | | 236,521 | |
| | 250,000 | | | | | LCM CLO XVIII, LP, Series 19A, Class AR, 3.07% (3 mo. USD LIBOR plus 1.24%), due 07/15/27† 144A | | | 245,040 | |
| | 250,000 | | | | | LCM CLO XXII, Ltd., Series 22A, Class DR, 7.32% (3 mo. USD LIBOR plus 5.50%), due 10/20/28† 144A | | | 148,157 | |
See accompanying Notes to the Financial Statements.
112
Mercer Opportunistic Fixed Income Fund
Schedule of Investments (Continued)
(showing percentage of net assets)
March 31, 2020
| | | | | | | | | | |
| Par Value(a) | | | | | Description | | Value ($) | |
| | | |
| | | | | | Asset Backed Securities — continued | | | |
| | 305,606 | | | | | Legacy Mortgage Asset Trust, Series2019-GS1, Class A1, 4.00%, due 01/25/59†† 144A | | | 280,339 | |
| | 360,000 | | | | | Madison Park Funding CLO XXVI, Ltd., Series2007-4A, Class AR, 2.97% (3 mo. USD LIBOR plus 1.20%), due 07/29/30† 144A | | | 347,513 | |
| | 1,000,000 | | | | | Magnolia Financial X DAC, Series2020-1, 1.00%, due 08/13/24 ‡‡‡‡ | | | 1,000,000 | |
| | 213,150 | | | | | MAPS, Ltd., Series2018-1A, Class A, 4.21%, due 05/15/43 144A | | | 161,654 | |
| | 213,150 | | | | | MAPS, Ltd., Series2018-1A, Class B, 5.19%, due 05/15/43 144A | | | 148,742 | |
| | 250,000 | | | | | Marathon CLO 14, Ltd., Series2019-2A, Class BA, 5.20% (3 mo. USD LIBOR plus 3.30%), due 01/20/33† 144A | | | 199,227 | |
| | 1,241,902 | | | | | Mill City Solar Loan, Ltd., Series2019-1A, Class A, 4.34%, due 03/20/43 144A | | | 1,211,419 | |
| | 575,000 | | | | | Navient Private Education Refi Student Loan Trust, Series2018-CA, Class B, 4.22%, due 06/16/42 144A | | | 605,840 | |
| | 200,000 | | | | | Navient Private Education Refi Student Loan Trust, Series2020-A, Class B, 3.16%, due 11/15/68 144A | | | 200,989 | |
| | 430,000 | | | | | Neuberger Berman CLO XIV, Ltd., Series2013-14A, Class BR2, 3.12% (3 mo. USD LIBOR plus 1.50%), due 01/28/30† 144A | | | 401,671 | |
| | 250,000 | | | | | Oaktree CLO, Ltd., Series2015-1A, Class DR, 7.02% (3 mo. USD LIBOR plus 5.20%), due 10/20/27† 144A | | | 180,244 | |
| | 250,000 | | | | | Oaktree CLO, Ltd., Series2019-1A, Class D, 5.60% (3 mo. USD LIBOR plus 3.80%), due 04/22/30† 144A | | | 183,885 | |
| | 250,000 | | | | | Octagon Investment Partners CLO XXIII, Ltd., Series2015-1A, Class ER, 7.58% (3 mo. USD LIBOR plus 5.75%), due 07/15/27† 144A | | | 166,322 | |
| | 250,000 | | | | | OHA Loan Funding CLO, Ltd., Series2015-1A, Class DR2, 5.69% (3 mo. USD LIBOR plus 4.00%), due 11/15/32† 144A | | | 193,264 | |
| | 950,000 | | | | | OHA Loan Funding CLO, Ltd., Series2016-1A, Class CR, 3.68% (3 mo. USD LIBOR plus 1.95%), due 01/20/33† 144A | | | 794,318 | |
| | 280,000 | | | | | Onemain Financial Issuance Trust, Series2018-1A, Class D, 4.08%, due 03/14/29 144A | | | 235,659 | |
| | 250,000 | | | | | Owl Rock CLO, Ltd., Series2020-3A, Class A1L, 2.97% (3 mo. USD LIBOR plus 1.80%), due 04/20/32† 144A | | | 237,500 | |
| | 530,000 | | | | | OZLM VII CLO, Ltd., Series2014-7RA, Class CR, 4.84% (3 mo. USD LIBOR plus 3.00%), due 07/17/29† 144A | | | 414,671 | |
| | 750,000 | | | | | OZLM XII CLO, Ltd., Series2015-12A, Class CR, 4.77% (3 mo. USD LIBOR plus 3.00%), due 04/30/27† 144A | | | 629,210 | |
| | 805,000 | | | | | Parallel CLO, Ltd., Series2017-1A, Class CR, 3.71% (3 mo. USD LIBOR plus 2.00%), due 07/20/29† 144A | | | 685,568 | |
| | 355,000 | | | | | Pikes Peak CLO 1, Series2018-1A, Class C, 3.90%, due 07/24/31◆◆ 144A | | | 295,555 | |
| | 704,275 | | | | | Planet Fitness Master Issuer LLC, Series2018-1A, Class A2II, 4.67%, due 09/05/48 144A | | | 634,098 | |
| | 250,000 | | | | | PPM CLO 3, Ltd., Series2019-3A, Class A, 3.24% (3 mo. USD LIBOR plus 1.40%), due 07/17/30† 144A | | | 237,017 | |
| | 285,356 | | | | | PRPM LLC, Series2019-4A, Class A1, 3.35%, due 11/25/24†† 144A | | | 283,090 | |
| | 185,078 | | | | | Recette CLO, Ltd., Series2015-1A, Class AR, 2.74% (3 mo. USD LIBOR plus 0.92%), due 10/20/27† 144A | | | 181,836 | |
| | 1,840,000 | | | | | Residential Asset Securities, 1.36%, due 03/25/36 | | | 1,446,235 | |
| | 180,000 | | | | | Saranac CLO III, Ltd., Series2014-3A, Class DR, 4.45% (3 mo. USD LIBOR plus 3.25%), due 06/22/30† 144A | | | 136,154 | |
| | 223,000 | | | | | SLM Private Credit Student Loan Trust, Series2003-A, Class A3, 4.28% (28 day ARS), due 06/15/32† | | | 218,797 | |
| | 110,000 | | | | | SLM Private Credit Student Loan Trust, Series2003-B, Class A3, 4.30% (28 day ARS), due 03/15/33† | | | 105,264 | |
See accompanying Notes to the Financial Statements.
113
Mercer Opportunistic Fixed Income Fund
Schedule of Investments (Continued)
(showing percentage of net assets)
March 31, 2020
| | | | | | | | | | |
| Par Value(a) | | | | | Description | | Value ($) | |
| | | |
| | | | | | Asset Backed Securities — continued | | | |
| | 360,000 | | | | | Sound Point CLO XXIII, Series2019-2A, Class A1, 3.23% (3 mo. USD LIBOR plus 1.40%), due 04/15/32† 144A | | | 337,355 | |
| | 250,000 | | | | | Symphony CLO XIX, Ltd., Series2018-19A, Class E, 7.04%, due 04/16/31◆◆ 144A | | | 154,719 | |
| | 750,000 | | | | | THL Credit Wind River CLO, Ltd., Series2016-1A, Class ER, 7.38% (3 mo. USD LIBOR plus 5.55%), due 07/15/28† 144A | | | 479,129 | |
| | 590,000 | | | | | Trestles CLO III, Ltd., Series2020-3A, Class C, 2.95% (3 mo. USD LIBOR plus 2.25%), due 01/20/33† 144A | | | 470,866 | |
| | 340,000 | | | | | Venture CLO 31, Ltd., Series2018-31A, Class A1, 2.85% (3 mo. USD LIBOR plus 1.03%), due 04/20/31† 144A | | | 320,466 | |
| | 195,865 | | | | | VOLT LXXXIII LLC, Series 2019-NPL9, Class A1A, 3.33%, due 11/26/49†† 144A | | | 178,169 | |
| | 343,531 | | | | | VOLT LXXXV LLC, Series 2020-NPL1, Class A1A, 3.23%, due 01/25/50†† 144A | | | 311,228 | |
| | 500,000 | | | | | Voya CLO, Ltd., Series2015-2A, Class ER, 7.21% (3 mo. USD LIBOR plus 5.40%), due 07/23/27† 144A | | | 314,616 | |
| | 525,000 | | | | | Webster Park CLO, Ltd., Series2015-1A, Class CR, 4.72% (3 mo. USD LIBOR plus 2.90%), due 07/20/30† 144A | | | 395,062 | |
| | 212,313 | | | | | Wendy’s Funding LLC, Series2019-1A, Class A2I, 3.78%, due 06/15/49 144A | | | 202,266 | |
| | 260,000 | | | | | Westlake Automobile Receivables Trust, Series2018-3A, Class D, 4.00%, due 10/16/23 144A | | | 260,076 | |
| | 410,000 | | | | | Whitehorse CLO XII, Ltd., Series2018-12A, Class D, 5.48% (3 mo. USD LIBOR plus 3.65%), due 10/15/31† 144A | | | 304,944 | |
| | | | | | | | | | |
| | | | | | | | | 36,757,372 | |
| | | | | | | | | | |
| | | |
| | | | | | Bank Loans — 8.0% | | | |
| | 997,475 | | | | | 8th Avenue Food & Provisions, Inc., 2018 1st Lien Term Loan, TBD, due 10/01/25### | | | 931,392 | |
| | 500,000 | | | | | ACProducts, Inc., 2020 Term Loan B, TBD, due 08/18/25### | | | 456,250 | |
| | 200,000 | | | | | Acrisure, LLC, 2020 Term Loan B, 5.21% (3 mo. USD LIBOR plus 3.50%), due 02/15/27† | | | 170,000 | |
| | 139,768 | | | | | Advanced Drainage Systems, Inc., Term Loan B, 3.81% (1 mo. USD LIBOR plus 2.25%), due 07/31/26† | | | 130,683 | |
| | 917,683 | | | | | Agiliti Health, Inc., Term Loan B, 3.00% (3 mo. USD LIBOR), due 01/04/26† | | | 885,564 | |
| | 501,008 | | | | | Albany Molecular Research, Inc., 2017 1st Lien Term Loan, 4.25% (1 mo. USD LIBOR plus 3.25%), due 08/30/24† | | | 444,661 | |
| | 498,721 | | | | | Albany Molecular Research, Inc., 2017 1st Lien Term Loan, TBD, due 08/30/24### | | | 450,096 | |
| | 1,000,000 | | | | | Aldevron, LLC, 2019 Term Loan B, TBD, due 10/12/2### | | | 945,000 | |
| | 800,000 | | | | | Allen Media, LLC, 2020 Term Loan B, 7.23% (3 mo. USD LIBOR plus 5.50%), due 02/10/27† | | | 700,000 | |
| | 720,049 | | | | | Allied Universal Holdco LLC, 2019 Term Loan B, 5.24% (1 mo. USD LIBOR plus 4.25%), due 07/10/26† | | | 665,734 | |
| | 498,750 | | | | | Allied Universal Holdco LLC, 2019 Term Loan B, TBD, due 07/10/26### | | | 461,655 | |
| | 348,120 | | | | | Almonde, Inc., USD 1st Lien Term Loan, 5.28% (3 mo. USD LIBOR plus 3.50%), due 06/13/24† | | | 302,865 | |
| | 394,950 | | | | | Alterra Mountain Company, Term Loan B1, 3.74% (1 mo. USD LIBOR plus 2.75%), due 07/31/24† | | | 354,138 | |
| | 800,000 | | | | | Amentum Government Services Holdings LLC, Term Loan B, 4.99% (1 mo. USD LIBOR plus 4.00%), due 02/01/27† | | | 756,000 | |
| | 194,750 | | | | | American Axle & Manufacturing, Inc., Term Loan B, 3.20% (1 mo. USD LIBOR plus 2.25%), due 04/06/24† | | | 165,050 | |
| | 10,227 | | | | | AmeriLife Group, LLC, 2020 Delayed Draw Term Loan, TBD, due 03/18/27### | | | 8,540 | |
See accompanying Notes to the Financial Statements.
114
Mercer Opportunistic Fixed Income Fund
Schedule of Investments (Continued)
(showing percentage of net assets)
March 31, 2020
| | | | | | | | | | |
| Par Value(a) | | | | | Description | | Value ($) | |
| | | |
| | | | | | Bank Loans — continued | | | |
| | 79,773 | | | | | AmeriLife Group, LLC, 2020 Term Loan, TBD, due 03/18/27### | | | 66,610 | |
| | 1,192,013 | | | | | APi Group DE, Inc., Term Loan B, 3.49% (1 mo. USD LIBOR plus 2.50%), due 10/01/26† | | | 1,080,856 | |
| | 498,750 | | | | | APi Group DE, Inc., Term Loan B, TBD, due 10/01/26### | | | 474,645 | |
| | 257,393 | | | | | AppLovin Corp., 2018 Term Loan B, 4.49% (1 mo. USD LIBOR plus 3.50%), due 08/15/25† | | | 232,298 | |
| | 1,480,000 | | | | | Asurion LLC, 2017 2nd Lien Term Loan, TBD, due 08/04/25### | | | 1,383,800 | |
| | 9,003 | | | | | Asurion LLC, 2017 Term Loan B4, 3.99% (1 mo. USD LIBOR plus 3.00%), due 08/04/22† | | | 8,373 | |
| | 498,411 | | | | | Asurion LLC, 2017 Term Loan B4, TBD, due 08/04/22### | | | 463,522 | |
| | 1,373,746 | | | | | Asurion LLC, 2018 Term Loan B6, 3.99% (1 mo. USD LIBOR plus 3.00%), due 11/03/23† | | | 1,325,665 | |
| | 474,470 | | | | | Asurion LLC, 2018 Term Loan B7, 3.99% (1 mo. USD LIBOR plus 3.00%), due 11/03/24† | | | 446,792 | |
| | 684,894 | | | | | Athenahealth, Inc., 2019 Term Loan B, 5.28% (3 mo. USD LIBOR plus 4.50%), due 02/11/26† | | | 643,801 | |
| | 355,443 | | | | | Bass Pro Group, LLC, Term Loan B, 6.07% (1 mo. USD LIBOR plus 5.00%), due 09/25/24† | | | 302,127 | |
| | 1,626,632 | | | | | Bausch Health Companies, Inc., 2018 Term Loan B, 3.61% (1 mo. USD LIBOR plus 3.00%), due 06/02/25† | | | 1,558,855 | |
| | 310,000 | | | | | Berry Global, Inc., Term Loan W, 2.86% (3 mo. USD LIBOR plus 2.00%), due 10/01/22† | | | 299,305 | |
| | 1,000,000 | | | | | BJ’s Wholesale Club, Inc., 2017 1st Lien Term Loan, TBD, due 02/03/24### | | | 955,000 | |
| | 332,264 | | | | | Boyd Gaming Corp., Term Loan B3, 2.93% (1 week USD LIBOR plus 2.25%), due 09/15/23† | | | 292,946 | |
| | 113,404 | | | | | BrightView Landscapes, LLC, 2018 1st Lien Term Loan B, 3.13% (1 mo. USD LIBOR plus 2.50%), due 08/15/25† | | | 108,868 | |
| | 92,921 | | | | | BrightView Landscapes, LLC, 2018 1st Lien Term Loan B, 3.50% (1 mo. USD LIBOR plus 2.50%), due 08/15/25† | | | 89,204 | |
| | 364,344 | | | | | Brookfield Property REIT, Inc., 1st Lien Term Loan B, 3.49% (1 mo. USD LIBOR plus 2.50%), due 08/27/25† | | | 261,599 | |
| | 756,372 | | | | | Brookfield WEC Holdings, Inc., 2020 Term Loan, 3.99% (1 mo. USD LIBOR plus 3.00%), due 08/01/25† | | | 721,390 | |
| | 437,303 | | | | | Caesars Entertainment Operating Co., Exit Term Loan, 2.99% (1 mo. USD LIBOR plus 2.00%), due 10/07/24† | | | 362,233 | |
| | 999,755 | | | | | Caesars Resort Collection, LLC, 2017 1st Lien Term Loan B, 3.74% (1 mo. USD LIBOR plus 2.75%), due 12/23/24† | | | 821,227 | |
| | 1,111,757 | | | | | Camelot U.S. Acquisition 1 Co., Term Loan B, 4.24% (1 mo. USD LIBOR plus 3.25%), due 10/31/26† | | | 1,006,140 | |
| | 200,000 | | | | | Castle US Holding Corp., USD Term Loan B, 5.20% (1 mo. USD LIBOR plus 3.75%), due 01/29/27† | | | 174,250 | |
| | 502,150 | | | | | CEC Entertainment, Inc., 2019 Term Loan B, 7.57% (3 mo. USD LIBOR plus 6.50%), due 08/30/26† | | | 288,736 | |
| | 762,643 | | | | | Change Healthcare Holdings LLC, 2017 Term Loan B, 3.50% (1 mo. USD LIBOR plus 2.50%), due 03/01/24† | | | 695,038 | |
| | 320,000 | | | | | Change Healthcare Holdings LLC, 2017 Term Loan B, TBD, due 03/01/24### | | | 304,602 | |
| | 328,350 | | | | | Charter Communications Operating, LLC, 2019 Term Loan B2, 2.74% (1 mo. USD LIBOR plus 1.75%), due 02/01/27† | | | 317,405 | |
See accompanying Notes to the Financial Statements.
115
Mercer Opportunistic Fixed Income Fund
Schedule of Investments (Continued)
(showing percentage of net assets)
March 31, 2020
| | | | | | | | | | |
| Par Value(a) | | | | | Description | | Value ($) | |
| | | |
| | | | | | Bank Loans — continued | | | |
| | 1,392,375 | | | | | Chesapeake Energy Corp., 2019 Last Out Term Loan, 9.00% (1 mo. USD LIBOR plus 8.00%), due 06/24/24† | | | 565,304 | |
| | 1,516,598 | | | | | Clear Channel Outdoor Holdings, Inc., Term Loan B, 4.49% (1 mo. USD LIBOR plus 3.50%), due 08/21/26† | | | 1,374,417 | |
| | 1,203,950 | | | | | CommScope, Inc., 2019 Term Loan B, 4.24% (1 mo. USD LIBOR plus 3.25%), due 04/06/26† | | | 1,143,753 | |
| | 207,375 | | | | | CoreCivic, Inc., 2019 Term Loan, 5.50% (1 mo. USD LIBOR plus 4.50%), due 12/12/24† | | | 186,119 | |
| | 1,191,967 | | | | | Coty, Inc., 2018 USD Term Loan B, 3.26% (1 mo. USD LIBOR plus 2.25%), due 04/07/25† | | | 998,272 | |
| | 510,000 | | | | | DCert Buyer, Inc., 2019 Term Loan B, 4.99% (1 mo. USD LIBOR plus 4.00%), due 10/16/26† | | | 434,409 | |
| | 500,000 | | | | | DCert Buyer, Inc., 2019 Term Loan B, TBD, due 10/16/26### | | | 473,750 | |
| | 160,000 | | | | | Deerfield Dakota Holding, LLC, 2020 USD Term Loan B, TBD, due 03/05/27### | | | 137,600 | |
| | 485,717 | | | | | Dell International LLC, 2019 Term Loan B, 2.99% (1 mo. USD LIBOR plus 2.00%), due 09/19/25† | | | 463,877 | |
| | 500,000 | | | | | Dell International LLC, 2019 Term Loan B, TBD, due 09/19/25### | | | 484,465 | |
| | 477,105 | | | | | Diamond Sports Group, LLC, Term Loan, 4.18% (1 mo. USD LIBOR plus 3.25%), due 08/24/26† | | | 374,528 | |
| | 520,000 | | | | | Duff & Phelps Corp., 2020 2nd Lien Term Loan, TBD, due 03/06/28### | | | 447,200 | |
| | 104,000 | | | | | Dun & Bradstreet Corp. (The), Term Loan, 4.96% (1 mo. USD LIBOR plus 4.00%), due 02/06/26† | | | 95,680 | |
| | 98,997 | | | | | Edelman Financial Center, LLC, 2018 1st Lien Term Loan, 4.18% (1 mo. USD LIBOR plus 3.25%), due 07/21/25† | | | 85,468 | |
| | 840,000 | | | | | Elanco Animal Health, Inc., Term Loan B, TBD, due 02/04/27### | | | 805,875 | |
| | 638,359 | | | | | Endo Luxembourg Finance Co. I SARL, 2017 Term Loan B, 5.25% (1 mo. USD LIBOR plus 4.25%), due 04/29/24† | | | 572,927 | |
| | 817,343 | | | | | Equinox Holdings, Inc., 2017 1st Lien Term Loan, 4.07% (6 mo. USD LIBOR plus 3.00%), due 03/08/24† | | | 610,283 | |
| | 340,000 | | | | | EyeCare Partners, LLC, 2020 2nd Lien Term Loan, 9.14% (3 mo. USD LIBOR plus 8.25%), due 02/04/28† | | | 297,500 | |
| | 32,162 | | | | | EyeCare Partners, LLC, 2020 Delayed Draw Term Loan, 0.50% (1 mo. USD LIBOR), due 02/18/27† | | | 26,587 | |
| | 356,757 | | | | | EyeCare Partners, LLC, 2020 Term Loan, 4.82% (3 mo. USD LIBOR plus 3.75%), due 02/05/27† | | | 294,919 | |
| | 29,700 | | | | | First Eagle Holdings, Inc., 2020 Term Loan B, 3.95% (3 mo. USD LIBOR plus 2.50%), due 02/01/27† | | | 25,208 | |
| | 288,532 | | | | | Focus Financial Partners, LLC, 2020 Term Loan, 2.99% (1 mo. USD LIBOR plus 2.00%), due 07/03/24† | | | 253,293 | |
| | 748,096 | | | | | Focus Financial Partners, LLC, 2020 Term Loan, TBD, due 07/03/24### | | | 700,405 | |
| | 180,000 | | | EUR | | Froneri International, Ltd., 2020 EUR Term Loan, 2.63% (6 mo. USD LIBOR plus 2.63%), due 01/29/27† | | | 185,737 | |
| | 1,304,000 | | | | | Froneri International, Ltd., 2020 USD Term Loan, 3.24% (1 mo. USD LIBOR plus 2.25%), due 01/29/27† | | | 1,251,840 | |
| | 2,834 | | | | | Frontier Communications Corp., 2017 Term Loan B1, 5.21% (3 mo. USD LIBOR plus 3.75%), due 06/15/24† | | | 2,687 | |
| | 847,928 | | | | | Frontier Communications Corp., 2017 Term Loan B1, 5.35% (3 mo. USD LIBOR plus 3.75%), due 06/15/24† | | | 804,118 | |
| | 437,807 | | | | | Gannett Holdings LLC, Fixed Term Loan, 11.50%, due 11/19/24 | | | 406,614 | |
See accompanying Notes to the Financial Statements.
116
Mercer Opportunistic Fixed Income Fund
Schedule of Investments (Continued)
(showing percentage of net assets)
March 31, 2020
| | | | | | | | | | |
| Par Value(a) | | | | | Description | | Value ($) | |
| | | |
| | | | | | Bank Loans — continued | | | |
| | 611,488 | | | | | Garda World Security Corp., 2019 1st Lien Term Loan B, 6.39% (3 mo. USD LIBOR plus 4.75%), due 10/30/26† | | | 588,408 | |
| | 200,000 | | | | | Garda World Security Corp., 2019 1st Lien Term Loan B, TBD, due 10/30/26### | | | 186,563 | |
| | 265,282 | | | | | GBT Group Services, Ltd., 2018 Term Loan B, 4.21% (3 mo. USD LIBOR plus 2.50%), due 08/13/25† | | | 264,619 | |
| | 770,000 | | | | | Genesee & Wyoming, Inc., Term Loan, 3.45% (3 mo. USD LIBOR plus 2.00%), due 12/30/26† | | | 744,750 | |
| | 500,000 | | | | | Genesee & Wyoming, Inc., Term Loan, TBD, due 12/30/26### | | | 485,563 | |
| | 365,390 | | | | | GFL Environmental, Inc., 2018 USD Term Loan B, 4.00% (1 mo. USD LIBOR plus 3.00%), due 05/30/25† | | | 358,984 | |
| | 500,000 | | | | | GFL Environmental, Inc., 2018 USD Term Loan B, TBD, due 05/30/25### | | | 485,313 | |
| | 277,491 | | | | | Global Tel Link Corp., 2018 1st Lien Term Loan, 5.70% (3 mo. USD LIBOR plus 4.25%), due 11/29/25† | | | 239,336 | |
| | 244,562 | | | | | GlobalTranz Enterprises, Inc., 2019 Term Loan, 5.93% (1 mo. USD LIBOR plus 5.00%), due 05/15/26† | | | 189,536 | |
| | 246,257 | | | | | Golden Nugget, Inc., 2017 Incremental Term Loan B, 3.49% (1 mo. USD LIBOR plus 2.50%), due 10/04/23† | | | 192,491 | |
| | 210,204 | | | | | Golden Nugget, Inc., 2017 Incremental Term Loan B, 3.70% (3 mo. USD LIBOR plus 2.50%), due 10/04/23† | | | 167,679 | |
| | 199,442 | | | | | Golden Nugget, Inc., 2017 Incremental Term Loan B, TBD, due 10/04/23### | | | 152,527 | |
| | 259,350 | | | | | Grifols Worldwide Operations USA, Inc., USD 2019 Term Loan B, 2.68% (1 week USD LIBOR plus 2.00%), due 11/15/27† | | | 245,919 | |
| | 498,750 | | | | | Grifols Worldwide Operations USA, Inc., USD 2019 Term Loan B, TBD, due 11/15/27### | | | 480,593 | |
| | 518,700 | | | | | HC Group Holdings II, Inc., Term Loan B, 5.49% (1 mo. USD LIBOR plus 4.50%), due 08/06/26† | | | 440,895 | |
| | 410,000 | | | | | Hilton Worldwide Finance, LLC, 2019 Term Loan B2, 2.70% (1 mo. USD LIBOR plus 1.75%), due 06/22/26† | | | 384,375 | |
| | 210,000 | | | | | Hornblower Sub, LLC, 2018 Term Loan B, 5.95% (3 mo. USD LIBOR plus 4.50%), due 04/27/25† | | | 136,500 | |
| | 213,499 | | | | | IAA, Inc., Term Loan B, 3.25% (1 mo. USD LIBOR plus 2.25%), due 06/28/26† | | | 204,959 | |
| | 1,007,568 | | | | | iHeartCommunications, Inc., 2020 Term Loan, 3.99% (1 mo. USD LIBOR plus 3.00%), due 05/01/26† | | | 862,982 | |
| | 129,335 | | | | | Immucor, Inc., Extended Term Loan B, 6.45% (3 mo. USD LIBOR plus 5.00%), due 06/15/21† | | | 114,462 | |
| | 290,000 | | | | | Innophos, Inc., 2020 Term Loan B, TBD, due 02/04/27### | | | 246,500 | |
| | 500,799 | | | | | Jaguar Holding Co. II, 2018 Term Loan, 3.50% (1 mo. USD LIBOR plus 2.50%), due 08/18/22† | | | 477,950 | |
| | 398,953 | | | | | Jaguar Holding Co. II, 2018 Term Loan, TBD, due 08/18/22### | | | 389,562 | |
| | 635,468 | | | | | Jane Street Group, LLC, 2020 Term Loan, 4.61% (3 mo. USD LIBOR plus 3.00%), due 01/31/25† | | | 546,983 | |
| | 498,750 | | | | | Jane Street Group, LLC, 2020 Term Loan, TBD, due 01/31/25### | | | 473,813 | |
| | 179,100 | | | | | KAR Auction Services, Inc., 2019 Term Loan B6, 3.19% (1 mo. USD LIBOR plus 2.25%), due 09/19/26† | | | 166,563 | |
| | 344,074 | | | | | Level 3 Financing, Inc., 2019 Term Loan B, 2.74% (1 mo. USD LIBOR plus 1.75%), due 03/01/27† | | | 325,150 | |
| | 965,911 | | | | | McAfee, LLC, 2018 USD Term Loan B, 4.69% (1 mo. USD LIBOR plus 3.75%), due 09/30/24† | | | 901,517 | |
See accompanying Notes to the Financial Statements.
117
Mercer Opportunistic Fixed Income Fund
Schedule of Investments (Continued)
(showing percentage of net assets)
March 31, 2020
| | | | | | | | | | |
| Par Value(a) | | | | | Description | | Value ($) | |
| | | |
| | | | | | Bank Loans — continued | | | |
| | 541,628 | | | | | Michaels Stores, Inc., 2018 Term Loan B, 3.50% (1 mo. USD LIBOR plus 2.50%), due 01/30/23† | | | 457,676 | |
| | 326,358 | | | | | Michaels Stores, Inc., 2018 Term Loan B, 3.56% (3 mo. USD LIBOR plus 2.50%), due 01/30/23† | | | 275,773 | |
| | 314,144 | | | | | Michaels Stores, Inc., 2018 Term Loan B, 3.57% (3 mo. USD LIBOR plus 2.50%), due 01/30/23† | | | 270,497 | |
| | 229,346 | | | | | Michaels Stores, Inc., 2018 Term Loan B, TBD, due 01/30/23### | | | 188,752 | |
| | 1,682,363 | | | | | Midas Intermediate Holdco II, LLC, Incremental Term Loan B, 4.02% (3 mo. USD LIBOR plus 2.75%), due 08/18/21† | | | 1,351,497 | |
| | 657,437 | | | | | Mohegan Tribal Gaming Authority, 2016 Term Loan B, 5.38% (1 mo. USD LIBOR plus 4.38%), due 10/13/23† | | | 502,282 | |
| | 1,833,322 | | | | | MPH Acquisition Holdings LLC, 2016 Term Loan B, 4.20% (3 mo. USD LIBOR plus 2.75%), due 06/07/23† | | | 1,668,323 | |
| | 413,453 | | | | | NASCAR Holdings,, Inc., Term Loan B, 3.67% (1 mo. USD LIBOR plus 2.75%), due 10/19/26† | | | 365,562 | |
| | 970,706 | | | | | Nexstar Broadcasting, Inc., 2019 Term Loan B4, 4.33% (1 mo. USD LIBOR plus 2.75%), due 09/18/26† | | | 917,317 | |
| | 447,750 | | | | | Panther BF Aggregator 2, LP, USD Term Loan B, 4.44% (1 mo. USD LIBOR plus 3.50%), due 04/30/26† | | | 411,930 | |
| | 373,116 | | | | | Phoenix Guarantor, Inc., 2020 Term Loan B, 4.11% (1 mo. USD LIBOR plus 3.25%), due 03/05/26† | | | 343,267 | |
| | 797,990 | | | | | Pluto Acquisition I, Inc., Term Loan B, 5.00%, due 06/22/26 | | | 698,241 | |
| | 485,000 | | | | | Presidio, Inc., 2020 Term Loan B, 5.28% (3 mo. USD LIBOR plus 3.50%), due 01/22/27† | | | 455,900 | |
| | 1,182,158 | | | | | Prime Security Services Borrower, LLC, 2019 Term Loan B1, 4.61% (1 mo. USD LIBOR plus 3.25%), due 09/23/26† | | | 1,016,512 | |
| | 1,436,391 | | | | | Prime Security Services Borrower, LLC, 2019 Term Loan B1, TBD, due 09/23/26### | | | 1,366,367 | |
| | 119,399 | | | | | Project Alpha Intermediate Holding, Inc., 2019 Incremental Term Loan B, 6.13% (6 mo. USD LIBOR plus 4.25%), due 04/26/24† | | | 108,354 | |
| | 378,268 | | | | | Quikrete Holdings, Inc., 2016 1st Lien Term Loan, 3.49% (1 mo. USD LIBOR plus 2.50%), due 02/01/27† | | | 329,093 | |
| | 1,000,000 | | | | | Radiology Partners, Inc., 2018 1st Lien Term Loan B, TBD, due 07/09/25### | | | 848,333 | |
| | 488,345 | | | | | RadNet, Inc., Reprice Term Loan, 5.35% (3 mo. USD LIBOR plus 3.50%), due 06/30/23† | | | 413,694 | |
| | 492,537 | | | | | RadNet, Inc., Reprice Term Loan, TBD, due 06/30/23### | | | 459,291 | |
| | 616,907 | | | | | RegionalCare Hospital Partners Holdings, Inc., 2018 Term Loan B, 4.74% (1 mo. USD LIBOR plus 3.75%), due 11/17/25† | | | 579,030 | |
| | 500,000 | | | | | RegionalCare Hospital Partners Holdings, Inc., 2018 Term Loan B, TBD, due 11/17/25### | | | 469,000 | |
| | 127,815 | | | | | Reynolds Consumer Products LLC, Term Loan, 3.50% (3 mo. USD LIBOR plus 1.75%), due 02/04/27† | | | 121,344 | |
| | 450,918 | | | | | Reynolds Group Holdings, Inc., USD 2017 Term Loan, 3.74% (1 mo. USD LIBOR plus 2.75%), due 02/05/23† | | | 430,063 | |
| | 40,000 | | | | | Rockwood Service Corp., 2020 Term Loan, TBD, due 01/23/27### | | | 36,450 | |
| | 220,000 | | | | | Science Applications International Corp., 2020 Incremental Term Loan B, 3.24% (1 mo. USD LIBOR plus 2.25%), due 03/05/27† | | | 209,550 | |
| | 101,861 | | | | | Scientific Games International, Inc., 2018 Term Loan B5, 3.74% (1 mo. USD LIBOR plus 2.75%), due 08/14/24† | | | 82,762 | |
See accompanying Notes to the Financial Statements.
118
Mercer Opportunistic Fixed Income Fund
Schedule of Investments (Continued)
(showing percentage of net assets)
March 31, 2020
| | | | | | | | | | |
| Par Value(a) | | | | | Description | | Value ($) | |
| | | |
| | | | | | Bank Loans — continued | | | |
| | 369,167 | | | | | Scientific Games International, Inc., 2018 Term Loan B5, 4.37% (2 mo. USD LIBOR plus 2.75%), due 08/14/24† | | | 299,948 | |
| | 447,733 | | | | | Sedgwick Claims Management Services, Inc., 2018 Term Loan B, 4.24% (1 mo. USD LIBOR plus 3.25%), due 12/31/25† | | | 395,497 | |
| | 349,553 | | | | | Sophia, L.P., 2017 Term Loan B, 4.70% (3 mo. USD LIBOR plus 3.25%), due 09/30/22† | | | 334,406 | |
| | 480,000 | | | | | Sotera Health Holdings, LLC, 2019 Term Loan, 5.50% (1 mo. USD LIBOR plus 4.50%), due 12/11/26† | | | 428,000 | |
| | 49,744 | | | | | Sprint Communications, Inc., 1st Lien Term Loan B, 3.50% (1 mo. USD LIBOR plus 2.50%), due 02/02/24† | | | 49,557 | |
| | 813,850 | | | | | Staples, Inc., 7 Year Term Loan, 6.52% (1 mo. USD LIBOR plus 5.00%), due 04/16/26† | | | 654,132 | |
| | 320,635 | | | | | Stars Group Holdings BV (The), 2018 USD Incremental Term Loan, 4.95% (3 mo. USD LIBOR plus 3.50%), due 07/10/25† | | | 307,409 | |
| | 794,782 | | | | | Station Casinos LLC, 2020 Term Loan B, 3.24% (1 mo. USD LIBOR plus 2.25%), due 02/08/27† | | | 669,207 | |
| | 246,087 | | | | | STG-Fairway Holdings, LLC, Term Loan B, 4.57% (3 mo. USD LIBOR plus 3.50%), due 01/31/27† | | | 225,169 | |
| | 250,000 | | | | | Surf Holdings, LLC, USD Term Loan, 4.81% (3 mo. USD LIBOR plus 3.50%), due 03/05/27† | | | 224,375 | |
| | 648,800 | | | | | Telenet Financing USD LLC, 2020 USD Term Loan AR, 2.70% (1 mo. USD LIBOR plus 2.00%), due 04/30/28† | | | 602,573 | |
| | 528,675 | | | | | Terrier Media Buyer, Inc., Term Loan B, 5.70% (3 mo. USD LIBOR plus 4.25%), due 12/17/26† | | | 458,295 | |
| | 420,613 | | | | | TKC Holdings, Inc., 2017 1st Lien Term Loan, 4.75% (1 mo. USD LIBOR plus 3.75%), due 02/01/23† | | | 340,697 | |
| | 406,353 | | | | | Trans Union, LLC, 2019 Term Loan B5, 2.74% (1 mo. USD LIBOR plus 1.75%), due 11/16/26† | | | 391,792 | |
| | 629,989 | | | | | TransDigm, Inc., 2020 Term Loan E, 3.24% (1 mo. USD LIBOR plus 2.25%), due 05/30/25† | | | 589,040 | |
| | 119,700 | | | | | TransDigm, Inc., 2020 Term Loan F, 2.25%, due 12/09/25 | | | 116,807 | |
| | 119,700 | | | | | TransDigm, Inc., 2020 Term Loan F, TBD, due 12/09/25### | | | 107,032 | |
| | 457,700 | | | | | U.S. Renal Care, Inc., 2019 Term Loan B, 6.00% (1 mo. USD LIBOR plus 5.00%), due 06/26/26† | | | 404,378 | |
| | 498,747 | | | | | U.S. Renal Care, Inc., 2019 Term Loan B, TBD, due 06/26/26### | | | 455,628 | |
| | 168,818 | | | | | UFC Holdings, LLC, 2019 Term Loan, 4.25% (1 mo. USD LIBOR plus 3.25%), due 04/29/26† | | | 151,092 | |
| | 417,900 | | | | | Ultimate Software Group, Inc. (The), Term Loan B, 4.74% (1 mo. USD LIBOR plus 3.75%), due 05/04/26† | | | 394,916 | |
| | 560,497 | | | | | Univision Communications, Inc., Term Loan C5, 3.75% (1 mo. USD LIBOR plus 2.75%), due 03/15/24† | | | 479,225 | |
| | 398,963 | | | | | US Foods, Inc., 2016 Term Loan B, 1.75%, due 06/27/23 | | | 384,999 | |
| | 598,446 | | | | | US Foods, Inc., 2016 Term Loan B, TBD, due 06/27/23### | | | 555,890 | |
| | 109,445 | | | | | Verscend Holding Corp., 2018 Term Loan B, 5.49% (1 mo. USD LIBOR plus 4.50%), due 08/27/25† | | | 107,099 | |
| | 468,810 | | | | | Verscend Holding Corp., 2018 Term Loan B, TBD, due 08/27/25### | | | 442,243 | |
| | 997,462 | | | | | Vertex Aerospace Services Corp., Term Loan B, TBD, due 06/29/25### | | | 847,843 | |
| | 169,747 | | | | | VFH Parent LLC, 2019 Term Loan B, 4.01% (1 mo. USD LIBOR plus 3.00%), due 03/01/26† | | | 138,778 | |
| | 700,000 | | | | | VFH Parent LLC, 2019 Term Loan B, TBD, due 03/01/26### | | | 667,188 | |
See accompanying Notes to the Financial Statements.
119
Mercer Opportunistic Fixed Income Fund
Schedule of Investments (Continued)
(showing percentage of net assets)
March 31, 2020
| | | | | | | | | | |
| Par Value(a) | | | | | Description | | Value ($) | |
| | | |
| | | | | | Bank Loans — continued | | | |
| | 670,000 | | | | | VICI Properties 1 LLC, Replacement Term Loan B, 2.67% (1 mo. USD LIBOR plus 1.75%), due 12/20/24† | | | 618,324 | |
| | 340,000 | | | | | VICI Properties 1 LLC, Replacement Term Loan B, TBD, due 12/20/24### | | | 315,085 | |
| | 820,000 | | | | | Virgin Media Bristol LLC, USD Term Loan N, 3.20% (1 mo. USD LIBOR plus 2.50%), due 01/31/28† | | | 781,050 | |
| | 421,598 | | | | | William Morris Endeavor Entertainment, LLC, 2018 1st Lien Term Loan, 3.74% (1 mo. USD LIBOR plus 2.75%), due 05/18/25† | | | 340,089 | |
| | 376,285 | | | | | William Morris Endeavor Entertainment, LLC, 2018 1st Lien Term Loan, 4.37% (3 mo. USD LIBOR plus 2.75%), due 05/18/25† | | | 303,536 | |
| | 229,425 | | | | | WP CityMD Bidco LLC, 2019 Term Loan B, 5.57% (6 mo. USD LIBOR plus 4.50%), due 08/13/26† | | | 207,056 | |
| | 229,425 | | | | | WP CityMD Bidco LLC, 2019 Term Loan B, 5.95% (3 mo. USD LIBOR plus 4.50%), due 08/13/26† | | | 193,340 | |
| | 498,750 | | | | | WP CityMD Bidco LLC, 2019 Term Loan B, TBD, , due 08/13/26### | | | 463,838 | |
| | 787,964 | | | | | Xerox Business Services LLC, USD Term Loan B, 3.49% (1 mo. USD LIBOR plus 2.50%), due 12/07/23† | | | 617,238 | |
| | 1,238,299 | | | | | Ziggo Financing Partnership, USD Term Loan I, 3.20% (1 mo. USD LIBOR plus 2.50%), due 04/30/28† | | | 1,156,261 | |
| | | | | | | | | | |
| | | | | | | | | 77,066,134 | |
| | | | | | | | | | |
| | | |
| | | | | | Convertible Debt — 0.2% | | | |
| | 80,000 | | | | | BofA Finance LLC, (MTN), 0.13%, due 09/01/22 | | | 79,280 | |
| | 340,000 | | | | | Cheniere Energy, Inc., 4.25%, due 03/15/45 | | | 168,352 | |
| | 400,000 | | | | | DISH Network Corp., 3.38%, due 08/15/26 | | | 325,741 | |
| | 280,000 | | | | | Live Nation Entertainment, Inc., 2.00%, due 02/15/25 144A | | | 223,804 | |
| | 710,000 | | | | | Teva Pharmaceutical Finance Co. LLC, 0.25%, due 02/01/26 | | | 660,684 | |
| | 290,000 | | | | | Vishay Intertechnology, Inc., 2.25%, due 06/15/25 | | | 258,281 | |
| | 120,000 | | | | | Vonage Holdings Corp., 1.75%, due 06/01/24 144A | | | 97,415 | |
| | | | | | | | | | |
| | | | | | | | | 1,813,557 | |
| | | | | | | | | | |
| | | |
| | | | | | Corporate Debt — 29.9% | | | |
| | 90,000 | | | | | 1011778 BC ULC/New Red Finance, Inc., 3.88%, due 01/15/28 144A | | | 86,000 | |
| | 180,000 | | | | | AbbVie, Inc., 2.95%, due 11/21/26 144A | | | 181,250 | |
| | 1,975,000 | | | | | AbbVie, Inc., 3.20%, due 11/21/29 144A | | | 1,995,139 | |
| | 880,000 | | | | | AbbVie, Inc., 4.05%, due 11/21/39 144A | | | 909,412 | |
| | 490,000 | | | | | ABN AMRO Bank NV, 4.75%, due 07/28/25 144A | | | 494,087 | |
| | 335,000 | | | | | Abu Dhabi Crude Oil Pipeline LLC, 4.60%, due 11/02/47‡‡‡‡ | | | 333,757 | |
| | 2,775,000 | | | | | Acwa Power Management And Investments One, Ltd., 5.95%, due 12/15/39 144A | | | 2,525,250 | |
| | 1,570,000 | | | | | Adani Green Energy UP, Ltd./Prayatna Developers Pvt., Ltd./Parampujya Solar Energy, 6.25%, due 12/10/24 144A | | | 1,405,150 | |
| | 240,000 | | | | | Advanced Micro Devices, Inc., 7.50%, due 08/15/22 | | | 256,425 | |
| | 150,000 | | | | | AerCap Ireland Capital DAC/AerCap Global Aviation Trust, 3.30%, due 01/23/23 | | | 127,796 | |
| | 180,000 | | | | | AerCap Ireland Capital DAC/AerCap Global Aviation Trust, 3.50%, due 05/26/22 | | | 159,477 | |
| | 150,000 | | | | | AerCap Ireland Capital DAC/AerCap Global Aviation Trust, 3.95%, due 02/01/22 | | | 135,954 | |
| | 1,115,000 | | | | | AES Corp., 5.50%, due 04/15/25 | | | 1,101,029 | |
| | 1,010,000 | | | | | Albertsons Cos., Inc./Safeway, Inc./New Albertsons, LP/Albertsons LLC, 4.63%, due 01/15/27 144A | | | 1,010,555 | |
| | 610,000 | | | | | Albertsons Cos., Inc./Safeway, Inc./New Albertsons, LP/Albertsons LLC, 4.88%, due 02/15/30 | | | 613,050 | |
See accompanying Notes to the Financial Statements.
120
Mercer Opportunistic Fixed Income Fund
Schedule of Investments (Continued)
(showing percentage of net assets)
March 31, 2020
| | | | | | | | | | |
| Par Value(a) | | | | | Description | | Value ($) | |
| | | |
| | | | | | Corporate Debt — continued | | | |
| | 240,000 | | | | | Alcoa Nederland Holding BV, 6.13%, due 05/15/28 144A | | | 219,732 | |
| | 200,000 | | | | | Alcoa Nederland Holding BV, 6.75%, due 09/30/24 144A | | | 195,434 | |
| | 450,000 | | | | | Allen Media LLC/Allen MediaCo-Issuer, Inc., 10.50%, due 02/15/28 144A | | | 370,924 | |
| | 350,000 | | | | | Allied Universal Holdco LLC/Allied Universal Finance Corp., 6.63%, due 07/15/26 144A | | | 345,843 | |
| | 760,000 | | | | | Alpek SAB de CV, 4.25%, due 09/18/29 144A | | | 623,785 | |
| | 260,000 | EUR | | | | Altice France Holding SA, 4.00%, due 02/15/28**** ‡‡‡‡ | | | 237,500 | |
| | 1,000,000 | | | | | Altice France Holding SA, 7.38%, due 05/01/26 144A | | | 998,200 | |
| | 300,000 | | | | | Altice France Holding SA, 10.50%, due 05/15/27 144A | | | 318,000 | |
| | 50,000 | | | | | Altria Group, Inc., 4.40%, due 02/14/26 | | | 52,723 | |
| | 180,000 | | | | | Altria Group, Inc., 4.80%, due 02/14/29 | | | 187,733 | |
| | 650,000 | | | | | Altria Group, Inc., 5.95%, due 02/14/49 | | | 754,932 | |
| | 10,540,000 | MXN | | | | America Movil SAB de CV, 7.13%, due 12/09/24 | | | 432,657 | |
| | 150,000 | | | | | American Axle & Manufacturing, Inc., 6.25%, due 03/15/26 | | | 116,781 | |
| | 325,000 | | | | | American Express Co., 4.05%, due 12/03/42 | | | 388,514 | |
| | 1,365,000 | | | | | American International Group, Inc., 4.75%, due 04/01/48 | | | 1,446,197 | |
| | 670,000 | | | | | American Media LLC, 10.50%, due 12/31/26 144A | | | 711,619 | |
| | 1,210,000 | | | | | American Tower Corp. REIT, 2.40%, due 03/15/25 | | | 1,192,068 | |
| | 200,000 | | | | | Anglo American Capital Plc, 4.00%, due 09/11/27 144A | | | 189,273 | |
| | 790,000 | | | | | Anheuser-Busch InBev Worldwide, Inc., 5.55%, due 01/23/49 | | | 932,123 | |
| | 50,000 | | | | | Anheuser-Busch InBev Worldwide, Inc., 5.80%, due 01/23/59 | | | 61,370 | |
| | 640,000 | | | | | Aon Corp., 4.50%, due 12/15/28 | | | 710,082 | |
| | 10,000 | | | | | ArcelorMittal SA, 3.60%, due 07/16/24 | | | 9,132 | |
| | 150,000 | | | | | ArcelorMittal SA, 6.13%, due 06/01/25 | | | 148,746 | |
| | 350,000 | | | | | ArcelorMittal SA, 7.00%, due 10/15/39†† | | | 357,170 | |
| | 425,000 | EUR | | | | ARD Finance SA, 5.00% (5.00% Cash or 5.75% PIK), due 06/30/27 144A | | | 363,630 | |
| | 200,000 | | | | | ARD Finance SA, 6.50% (6.50% Cash or 7.25% PIK), due 06/30/27 144A | | | 172,890 | |
| | 1,700,000 | EUR | | | | ARD Finance SA, Reg S, 5.00% (5.00% Cash or 5.75% PIK), due 06/30/27‡‡‡ | | | 1,454,521 | |
| | 550,000 | | | | | Ardonagh Midco 3 Plc, 8.63%, due 07/15/23‡ 144A | | | 492,940 | |
| | 340,000 | | | | | Ardonagh Midco 3 Plc, Reg S, 8.63%, due 07/15/23‡‡‡ | | | 304,727 | |
| | 1,050,000 | EUR | | | | Arion Banki HF, (MTN), Reg S, 1.00%, due 03/20/23‡‡‡ | | | 1,122,932 | |
| | 51,000 | | | | | Asbury Automotive Group, Inc., 4.50%, due 03/01/28 144A | | | 43,733 | |
| | 56,000 | | | | | Asbury Automotive Group, Inc., 4.75%, due 03/01/30 144A | | | 48,020 | |
| | 400,000 | | | | | Ashtead Capital, Inc., 4.00%, due 05/01/28 144A | | | 345,800 | |
| | 200,000 | | | | | Ashtead Capital, Inc., 4.25%, due 11/01/29 144A | | | 170,826 | |
| | 330,000 | | | | | Ashtead Capital, Inc., 5.25%, due 08/01/26 144A | | | 315,150 | |
| | 200,000 | | | | | ASP AMC Merger Sub, Inc., 8.00%, due 05/15/25 144A | | | 119,309 | |
| | 730,000 | | | | | AT&T, Inc., 4.85%, due 03/01/39 | | | 821,250 | |
| | 2,415,000 | | | | | Athene Holding, Ltd., 6.15%, due 04/03/30†††† | | | 2,410,363 | |
| | 605,000 | | | | | Australia & New Zealand Banking Group, Ltd., 2.95% (5 year CMT plus 1.29%), due 07/22/30† 144A | | | 574,399 | |
| | 295,000 | | | | | Avery Dennison Corp., 2.65%, due 04/30/30 | | | 276,815 | |
| | 260,000 | | | | | Avolon Holdings Funding, Ltd., 5.13%, due 10/01/23 144A | | | 225,075 | |
| | 400,000 | | | | | Banco Bilbao Vizcaya Argentaria SA, 6.50% (5 year CMT plus 5.19%)†††††† | | | 310,278 | |
| | 400,000 | EUR | | | | Banco Bilbao Vizcaya Argentaria SA, Reg S, 5.88% (5 year EUR swap plus 5.66%)†††††† ‡‡‡ | | | 374,032 | |
| | 200,000 | | | | | Banco Mercantil del Norte SA, 7.50% (10 year CMT plus 5.47%)†††††† 144A | | | 152,752 | |
| | 970,000 | | | | | Banco Mercantil del Norte SA, 7.63% (10 year CMT plus 5.35%)†††††† 144A | | | 744,790 | |
See accompanying Notes to the Financial Statements.
121
Mercer Opportunistic Fixed Income Fund
Schedule of Investments (Continued)
(showing percentage of net assets)
March 31, 2020
| | | | | | | | | | |
| Par Value(a) | | | | | Description | | Value ($) | |
| | | |
| | | | | | Corporate Debt — continued | | | |
| | 305,000 | | | | | Banco Mercantil del Norte SA/Grand Cayman, 6.88% (5 year CMT plus 5.04%)†††††† 144A | | | 234,946 | |
| | 200,000 | | | | | Banco Santander SA, 4.38%, due 04/12/28 | | | 202,291 | |
| | 835,000 | | | | | Bank of America Corp., (MTN), 3.56% (3 mo. USD LIBOR plus 1.06%), due 04/23/27† | | | 875,432 | |
| | 700,000 | | | | | Barclays Bank Plc, 7.63%, due 11/21/22 | | | 716,443 | |
| | 305,000 | | | | | Barclays Plc, 4.84%, due 05/09/28 | | | 312,220 | |
| | 390,000 | | | | | Barclays Plc, 5.09% (3 mo. USD LIBOR plus 3.05%), due 06/20/30† | | | 408,300 | |
| | 210,000 | GBP | | | | Barclays Plc, 7.13% (5 year UK Government Bond plus 6.58%)†††††† | | | 223,099 | |
| | 1,370,000 | | | | | Barclays Plc, 8.00% (5 year CMT plus 5.67%)†††††† | | | 1,271,490 | |
| | 380,000 | EUR | | | | Barclays Plc, (MTN), Reg S, 2.00% (5 year EUR swap plus 1.90%), due 02/07/28† ‡‡‡ | | | 382,498 | |
| | 580,000 | | | | | Bausch Health Americas, Inc., 8.50%, due 01/31/27 144A | | | 609,319 | |
| | 270,000 | | | | | Bausch Health Americas, Inc., 9.25%, due 04/01/26 144A | | | 286,835 | |
| | 265,000 | | | | | Bausch Health Cos., Inc., 5.00%, due 01/30/28 144A | | | 252,863 | |
| | 265,000 | | | | | Bausch Health Cos., Inc., 5.25%, due 01/30/30 144A | | | 252,561 | |
| | 740,000 | | | | | Bausch Health Cos., Inc., 5.88%, due 05/15/23 144A | | | 737,687 | |
| | 349,000 | | | | | Becton Dickinson and Co., 2.25% (3 mo. USD LIBOR plus 0.88%), due 12/29/20† | | | 337,278 | |
| | 482,000 | | | | | Berry Petroleum Co. LLC, 7.00%, due 02/15/26 144A | | | 196,917 | |
| | 295,000 | | | | | BlackRock, Inc., 3.25%, due 04/30/29 | | | 309,838 | |
| | 760,000 | | | | | Blue Racer Midstream LLC/Blue Racer Finance Corp., 6.13%, due 11/15/22 144A | | | 574,058 | |
| | 160,000 | | | | | Blue Racer Midstream LLC/Blue Racer Finance Corp., 6.63%, due 07/15/26 144A | | | 94,167 | |
| | 820,000 | | | | | BNP Paribas SA, 2.82% (3 mo. USD LIBOR plus 1.11%), due 11/19/25† 144A | | | 811,366 | |
| | 535,000 | | | | | BNP Paribas SA, 4.50% (5 year CMT plus 2.94%)†††††† 144A | | | 412,284 | |
| | 760,000 | | | | | BNP Paribas SA, 6.75% (5 year USD swap plus 4.92%)†††††† 144A | | | 686,136 | |
| | 890,000 | | | | | Boeing Co. (The), 1.65%, due 10/30/20‡ | | | 868,947 | |
| | 80,000 | | | | | Boeing Co. (The), 2.70%, due 02/01/27 | | | 73,537 | |
| | 190,000 | | | | | Boeing Co. (The), 3.25%, due 02/01/35 | | | 164,968 | |
| | 1,395,000 | | | | | Bombardier, Inc., 8.75%, due 12/01/21 144A | | | 1,169,010 | |
| | 180,000 | | | | | BP Capital Markets America, Inc., 3.94%, due 09/21/28 | | | 192,671 | |
| | 1,405,000 | | | | | Braskem Netherlands Finance BV, 4.50%, due 01/10/28 144A | | | 1,134,963 | |
| | 760,000 | | | | | BRF SA, 4.88%, due 01/24/30‡ 144A | | | 642,542 | |
| | 440,000 | | | | | Bristol-Myers Squibb Co., 4.25%, due 10/26/49 144A | | | 553,618 | |
| | 365,000 | | | | | Bruin E&P Partners LLC, 8.88%, due 08/01/23 144A | | | 31,025 | |
| | 400,000 | EUR | | | | CaixaBank SA, Reg S, 5.25% (5 year EUR swap plus 4.50%)†††††† ‡‡‡ | | | 329,175 | |
| | 120,000 | | | | | Canadian Pacific Railway Co., 2.05%, due 03/05/30 | | | 112,300 | |
| | 2,190,000 | | | | | Carnival Corp., 3.95%, due 10/15/20 | | | 2,097,072 | |
| | 130,000 | | | | | Carriage Services, Inc., 6.63%, due 06/01/26 144A | | | 128,836 | |
| | 200,000 | | | | | Cascades Inc/Cascades USA, Inc., 5.38%, due 01/15/28 144A | | | 192,500 | |
| | 2,435,000 | EUR | | | | Catalent Pharma Solutions, Inc., 2.38%, due 03/01/28 144A | | | 2,483,630 | |
| | 665,000 | | | | | CCO Holdings LLC/CCO Holdings Capital Corp., 4.50%, due 08/15/30 144A | | | 655,441 | |
| | 2,760,000 | | | | | CCO Holdings LLC/CCO Holdings Capital Corp., 4.50%, due 05/01/32 144A | | | 2,707,077 | |
| | 375,000 | | | | | CCO Holdings LLC/CCO Holdings Capital Corp., 4.75%, due 03/01/30 144A | | | 375,206 | |
| | 220,000 | | | | | CCO Holdings LLC/CCO Holdings Capital Corp., 5.00%, due 02/01/28 144A | | | 221,771 | |
| | 200,000 | | | | | CCO Holdings LLC/CCO Holdings Capital Corp., 5.25%, due 09/30/22 | | | 197,568 | |
| | 230,000 | | | | | CDK Global, Inc., 5.25%, due 05/15/29 144A | | | 235,463 | |
| | 900,000 | | | | | Celulosa Arauco y Constitucion SA, 5.15%, due 01/29/50‡ 144A | | | 713,025 | |
| | 80,000 | | | | | Centene Corp., 3.38%, due 02/15/30 144A | | | 74,700 | |
| | 80,000 | | | | | Centene Corp., 4.25%, due 12/15/27 144A | | | 78,844 | |
| | 190,000 | | | | | Centene Corp., 4.63%, due 12/15/29 144A | | | 192,005 | |
| | 230,000 | | | | | Centene Corp., 5.38%, due 06/01/26 144A | | | 238,202 | |
See accompanying Notes to the Financial Statements.
122
Mercer Opportunistic Fixed Income Fund
Schedule of Investments (Continued)
(showing percentage of net assets)
March 31, 2020
| | | | | | | | | | |
| Par Value(a) | | | | | Description | | Value ($) | |
| | | |
| | | | | | Corporate Debt — continued | | | |
| | 355,000 | | | | | CenterPoint Energy, Inc., 2.95%, due 03/01/30 | | | 338,008 | |
| | 220,000 | | | | | Charles River Laboratories International, Inc., 4.25%, due 05/01/28 144A | | | 213,279 | |
| | 480,000 | | | | | Charter Communications Operating LLC/Charter Communications Operating Capital, 4.20%, due 03/15/28 | | | 491,988 | |
| | 200,000 | | | | | Charter Communications Operating LLC/Charter Communications Operating Capital, 5.13%, due 07/01/49 | | | 210,482 | |
| | 250,000 | | | | | Charter Communications Operating LLC/Charter Communications Operating Capital, 5.38%, due 04/01/38 | | | 270,497 | |
| | 220,000 | | | | | Cheniere Energy Partners, LP, 4.50%, due 10/01/29 144A | | | 192,621 | |
| | 1,000,000 | | | | | Cigna Corp., 1.49% (3 mo. USD LIBOR plus 0.65%), due 09/17/21† | | | 960,260 | |
| | 195,000 | | | | | Cigna Corp., 2.40%, due 03/15/30 | | | 185,907 | |
| | 525,000 | | | | | Cigna Corp., 3.20%, due 03/15/40 | | | 491,064 | |
| | 765,000 | | | | | Cigna Corp., 4.38%, due 10/15/28 | | | 823,001 | |
| | 300,000 | | | | | Cigna Corp., 4.80%, due 08/15/38 | | | 338,695 | |
| | 450,000 | | | | | CIT Group, Inc., 5.25%, due 03/07/25 | | | 441,565 | |
| | 170,000 | | | | | Citigroup, Inc., 4.65%, due 07/30/45 | | | 195,225 | |
| | 39,000 | | | | | Citigroup, Inc., 4.75%, due 05/18/46 | | | 43,830 | |
| | 137,000 | | | | | Citigroup, Inc., 5.30%, due 05/06/44 | | | 161,563 | |
| | 400,000 | | | | | Citigroup, Inc., 6.30% (3 mo. USD LIBOR plus 3.42%)†††††† | | | 378,378 | |
| | 690,000 | | | | | Clear Channel Worldwide Holdings, Inc., 5.13%, due 08/15/27 | | | 656,742 | |
| | 640,000 | | | | | Clearway Energy Operating LLC, 4.75%, due 03/15/28 144A | | | 596,000 | |
| | 230,000 | | | | | Cleaver-Brooks, Inc., 7.88%, due 03/01/23 144A | | | 192,911 | |
| | 330,000 | | | | | Cogent Communications Group, Inc., 5.38%, due 03/01/22 144A | | | 334,434 | |
| | 760,000 | | | | | Colfax Corp., 6.00%, due 02/15/24 144A | | | 738,154 | |
| | 420,000 | | | | | Comcast Corp., 1.87% (3 mo. USD LIBOR plus 0.44%), due 10/01/21† | | | 410,834 | |
| | 1,000,000 | | | | | Comcast Corp., 2.65%, due 02/01/30 | | | 1,030,960 | |
| | 580,000 | | | | | Comcast Corp., 4.25%, due 10/15/30 | | | 676,486 | |
| | 340,000 | | | | | Comcast Corp., 4.70%, due 10/15/48 | | | 442,361 | |
| | 80,000 | | | | | CommScope Technologies LLC, 5.00%, due 03/15/27 144A | | | 70,006 | |
| | 400,000 | | | | | CommScope Technologies LLC, 6.00%, due 06/15/25 144A | | | 369,080 | |
| | 1,190,000 | | | | | CommScope, Inc., 6.00%, due 03/01/26 144A | | | 1,194,905 | |
| | 990,000 | | | | | CommScope, Inc., 8.25%, due 03/01/27 144A | | | 959,755 | |
| | 850,000 | | | | | Comstock Resources, Inc., 7.50%, due 05/15/25 144A | | | 565,250 | |
| | 395,000 | | | | | CONSOL Energy, Inc., 11.00%, due 11/15/25 144A | | | 161,454 | |
| | 600,000 | EUR | | | | Cooperatieve Rabobank UA, Reg S, 4.63% (5 year EUR swap plus 4.10%)†††††† ‡‡‡ | | | 578,541 | |
| | 1,010,000 | | | | | CoreCivic, Inc. REIT, 4.63%, due 05/01/23 | | | 926,675 | |
| | 1,000,000 | | | | | Cott Holdings, Inc., 5.50%, due 04/01/25 144A | | | 976,255 | |
| | 800,000 | | | | | Country Garden Holdings Co., Ltd., Reg S, 7.25%, due 04/04/21‡‡‡ | | | 806,000 | |
| | 705,000 | | | | | Credit Agricole SA, 3.25%, due 01/14/30 144A | | | 668,068 | |
| | 300,000 | EUR | | | | Credit Agricole SA, 6.50% (5 year EUR swap plus 5.12%)†††††† ‡‡‡‡ | | | 315,061 | |
| | 575,000 | | | | | Credit Agricole SA, 7.88% (5 year USD swap plus 4.90%)†††††† 144A | | | 558,001 | |
| | 400,000 | | | | | Credit Agricole SA, 8.13% (5 year USD swap plus 6.19%)†††††† 144A | | | 414,509 | |
| | 900,000 | | | | | Credit Suisse Group AG, 2.59% (SOFR plus 1.56%), due 09/11/25† 144A | | | 856,454 | |
| | 1,240,000 | | | | | Credit Suisse Group AG, 4.19% (SOFR plus 3.73%), due 04/01/31††††† 144A | | | 1,272,360 | |
| | 415,000 | | | | | Credit Suisse Group AG, 5.10% (5 year CMT plus 3.29%)†††††† ‡ 144A | | | 321,106 | |
| | 465,000 | | | | | Credit Suisse Group AG, 7.25% (5 year CMT plus 4.33%)†††††† 144A | | | 422,311 | |
| | 365,000 | | | | | Crown Castle International Corp., 3.30%, due 07/01/30†††† | | | 362,003 | |
| | 180,000 | | | | | Crown Castle International Corp., 4.15%, due 07/01/50†††† | | | 178,020 | |
| | 1,760,000 | | | | | CSC Holdings LLC, 6.50%, due 02/01/29 144A | | | 1,908,042 | |
See accompanying Notes to the Financial Statements.
123
Mercer Opportunistic Fixed Income Fund
Schedule of Investments (Continued)
(showing percentage of net assets)
March 31, 2020
| | | | | | | | | | |
| Par Value(a) | | | | | Description | | Value ($) | |
| | | |
| | | | | | Corporate Debt — continued | | | |
| | 800,000 | | | | | CVS Health Corp., 4.78%, due 03/25/38 | | | 887,812 | |
| | 200,000 | EUR | | | | CyrusOne, LP/CyrusOne Finance Corp. REIT, 1.45%, due 01/22/27 | | | 192,626 | |
| | 1,150,000 | | | | | DAE Funding LLC, 5.75%, due 11/15/23 144A | | | 1,079,557 | |
| | 200,000 | | | | | Danske Bank AS, 5.00%, due 01/12/22 144A | | | 205,524 | |
| | 250,000 | EUR | | | | Danske Bank AS, Reg S, 5.75% (6 year EUR swap plus 4.64%)†††††† ‡‡‡ | | | 273,904 | |
| | 265,000 | | | | | DarAl-Arkan Sukuk Co., Ltd., Reg S, 6.88%, due 03/21/23‡‡‡ | | | 207,396 | |
| | 50,000 | | | | | DCP Midstream Operating, LP, 5.13%, due 05/15/29 | | | 31,775 | |
| | 200,000 | | | | | DCP Midstream Operating, LP, 6.75%, due 09/15/37 144A | | | 110,061 | |
| | 730,000 | | | | | Delek & Avner Tamar Bond, Ltd., 5.41%, due 12/30/25 144A | | | 698,972 | |
| | 1,185,000 | | | | | Dell International LLC/EMC Corp., 8.35%, due 07/15/46 144A | | | 1,411,826 | |
| | 1,250,000 | | | | | Delta Air Lines, Inc., 2.60%, due 12/04/20 | | | 1,193,975 | |
| | 1,150,000 | | | | | Delta Air Lines, Inc., 2.90%, due 10/28/24 | | | 923,139 | |
| | 400,000 | | | | | Deutsche Bank AG, 6.00% (5 year CMT plus 4.52%)†††††† | | | 268,800 | |
| | 256,750,000 | KZT | | | | Development Bank of Kazakhstan JSC, Reg S, 9.50%, due 12/14/20‡‡‡ | | | 552,555 | |
| | 475,000 | | | | | Diamond Sports Group LLC/Diamond Sports Finance Co., 5.38%, due 08/15/26 144A | | | 388,617 | |
| | 200,000 | | | | | Diamondback Energy, Inc., 3.50%, due 12/01/29 | | | 136,762 | |
| | 1,500,000 | | | | | DISH DBS Corp., 5.88%, due 11/15/24 | | | 1,468,132 | |
| | 980,000 | | | | | DISH DBS Corp., 7.75%, due 07/01/26 | | | 1,012,389 | |
| | 325,000 | | | | | Dow Chemical Co. (The), 3.63%, due 05/15/26 | | | 318,694 | |
| | 1,620,000 | | | | | DP World Crescent, Ltd., 4.85%, due 09/26/28 144A | | | 1,478,478 | |
| | 2,715,000 | | | | | DP World Plc, 5.63%, due 09/25/48 144A | | | 2,301,549 | |
| | 450,000 | | | | | eBay, Inc., 4.00%, due 07/15/42 | | | 424,308 | |
| | 120,000 | | | | | Endeavor Energy Resources, LP/EER Finance, Inc., 5.50%, due 01/30/26 144A | | | 83,661 | |
| | 250,000 | | | | | Endeavor Energy Resources, LP/EER Finance, Inc., 5.75%, due 01/30/28 144A | | | 171,388 | |
| | 685,000 | | | | | Enel Finance International NV, 3.50%, due 04/06/28 144A | | | 686,862 | |
| | 305,000 | | | | | Energy Transfer Operating, LP, 3.75%, due 05/15/30 | | | 236,439 | |
| | 235,000 | | | | | Energy Transfer Operating, LP, 6.00%, due 06/15/48 | | | 197,847 | |
| | 395,000 | | | | | Energy Transfer Operating, LP, 6.25%, due 04/15/49 | | | 339,742 | |
| | 1,080,000 | | | | | EnLink Midstream Partners, LP, 4.15%, due 06/01/25 | | | 530,231 | |
| | 285,000 | | | | | EnLink Midstream Partners, LP, 5.45%, due 06/01/47 | | | 96,216 | |
| | 305,000 | | | | | Enstar Group, Ltd., 4.95%, due 06/01/29 | | | 288,814 | |
| | 220,000 | | | | | Entergy Louisiana LLC, 2.90%, due 03/15/51‡ | | | 194,467 | |
| | 250,000 | | | | | Enterprise Products Operating LLC, 3.95%, due 01/31/60 | | | 212,984 | |
| | 815,000 | | | | | EPR Properties REIT, 3.75%, due 08/15/29 | | | 610,737 | |
| | 630,000 | | | | | EQT Corp., 6.13%, due 02/01/25†† | | | 489,888 | |
| | 610,000 | | | | | EQT Corp., 7.00%, due 02/01/30†† | | | 459,037 | |
| | 200,000 | | | | | ESH Hospitality, Inc. REIT, 4.63%, due 10/01/27 144A | | | 157,110 | |
| | 240,000 | | | | | Exxon Mobil Corp., 4.33%, due 03/19/50 | | | 294,546 | |
| | 830,000 | | | | | FedEx Corp., 4.05%, due 02/15/48 | | | 733,603 | |
| | 750,000 | | | | | Fidelity & Guaranty Life Holdings, Inc., 5.50%, due 05/01/25 144A | | | 746,452 | |
| | 500,000 | GBP | | | | Fidelity National Information Services, Inc., 2.25%, due 12/03/29 | | | 581,964 | |
| | 600,000 | | | | | First Quantum Minerals, Ltd., 6.88%, due 03/01/26 144A | | | 484,830 | |
| | 370,000 | | | | | First Quantum Minerals, Ltd., 7.25%, due 04/01/23 144A | | | 313,808 | |
| | 800,000 | | | | | First Quantum Minerals, Ltd., 7.50%, due 04/01/25 144A | | | 670,756 | |
| | 610,000 | | | | | Five Point Operating Co., LP/Five Point Capital Corp., 7.88%, due 11/15/25 144A | | | 529,157 | |
| | 200,000 | | | | | Ford Motor Credit Co. LLC, 2.34%, due 11/02/20 | | | 193,000 | |
| | 300,000 | | | | | Ford Motor Credit Co. LLC, 3.10%, due 05/04/23 | | | 276,000 | |
| | 460,000 | | | | | Ford Motor Credit Co. LLC, 3.20%, due 01/15/21 | | | 446,775 | |
| | 200,000 | | | | | Ford Motor Credit Co. LLC, 3.22%, due 01/09/22 | | | 187,500 | |
See accompanying Notes to the Financial Statements.
124
Mercer Opportunistic Fixed Income Fund
Schedule of Investments (Continued)
(showing percentage of net assets)
March 31, 2020
| | | | | | | | | | |
| Par Value(a) | | | | | Description | | Value ($) | |
| | | |
| | | | | | Corporate Debt — continued | | | |
| | 315,000 | | | | | Ford Motor Credit Co. LLC, 3.34%, due 03/28/22 | | | 294,620 | |
| | 210,000 | | | | | Ford Motor Credit Co. LLC, 3.47%, due 04/05/21 | | | 202,587 | |
| | 1,024,000 | | | | | Ford Motor Credit Co. LLC, 4.14%, due 02/15/23 | | | 954,163 | |
| | 615,000 | | | | | Ford Motor Credit Co. LLC, 4.25%, due 09/20/22 | | | 575,025 | |
| | 300,000 | | | | | Ford Motor Credit Co. LLC, 5.60%, due 01/07/22 | | | 291,750 | |
| | 620,000 | | | | | Ford Motor Credit Co. LLC, 5.88%, due 08/02/21 | | | 610,700 | |
| | 130,000 | | | | | Fox Corp., 4.71%, due 01/25/29‡‡‡‡ | | | 142,773 | |
| | 210,000 | | | | | Fox Corp., 5.48%, due 01/25/39‡‡‡‡ | | | 244,089 | |
| | 890,000 | | | | | Freeport-McMoRan, Inc., 5.45%, due 03/15/43 | | | 803,492 | |
| | 740,000 | | | | | Gazprom PJSC Via Gaz Capital SA, 4.95%, due 03/23/27 144A | | | 770,592 | |
| | 1,880,000 | | | | | GEMS MENASA Cayman, Ltd./GEMS Education Delaware LLC, 7.13%, due 07/31/26 144A | | | 1,575,449 | |
| | 140,000 | | | | | General Dynamics Corp., 4.25%, due 04/01/50 | | | 176,770 | |
| | 920,000 | | | | | General Electric Co., (MTN), 6.88%, due 01/10/39 | | | 1,141,364 | |
| | 170,000 | | | | | General Motors Co., 5.20%, due 04/01/45 | | | 135,195 | |
| | 210,000 | | | | | GEO Group, Inc. (The) REIT, 5.88%, due 01/15/22 | | | 190,772 | |
| | 320,000 | | | | | GEO Group, Inc. (The) REIT, 6.00%, due 04/15/26 | | | 210,224 | |
| | 130,000 | | | | | GFL Environmental, Inc., 5.13%, due 12/15/26 144A | | | 127,725 | |
| | 294,000 | | | | | GFL Environmental, Inc., 8.50%, due 05/01/27 144A | | | 297,014 | |
| | 390,000 | | | | | Glencore Funding LLC, 4.00%, due 03/27/27 144A | | | 356,315 | |
| | 650,000 | | | | | Global Aircraft Leasing Co., Ltd., 6.50% (6.50% Cash or 7.25% PIK), due 09/15/24 144A | | | 423,475 | |
| | 1,835,000 | | | | | Gold Fields Orogen Holdings BVI, Ltd., 6.13%, due 05/15/29 144A | | | 1,744,259 | |
| | 830,000 | | | | | Gold Fields Orogen Holdings BVI, Ltd., Reg S, 6.13%, due 05/15/29‡‡‡ | | | 788,956 | |
| | 100,000 | | | | | Goldman Sachs Group, Inc. (The), 5.15%, due 05/22/45 | | | 115,986 | |
| | 405,000 | | | | | Gran Tierra Energy International Holdings, Ltd., 6.25%, due 02/15/25 144A | | | 104,794 | |
| | 570,000 | EUR | | | | Grifols SA, 2.25%, due 11/15/27 144A | | | 603,386 | |
| | 905,000 | | | | | GTH Finance BV, 7.25%, due 04/26/23 144A | | | 939,996 | |
| | 600,000 | | | | | GTP Acquisition Partners I LLC, 3.48%, due 06/16/25 144A | | | 613,770 | |
| | 490,000 | | | | | Gulfport Energy Corp., 6.00%, due 10/15/24 | | | 123,725 | |
| | 190,000 | | | | | Gulfport Energy Corp., 6.38%, due 05/15/25 | | | 47,737 | |
| | 340,000 | | | | | Hanesbrands, Inc., 4.88%, due 05/15/26 ‡ 144A | | | 335,124 | |
| | 410,000 | | | | | Harley-Davidson Financial Services, Inc., Series S, 3.55%, due 05/21/21 144A | | | 417,097 | |
| | 600,000 | | | | | HCA, Inc., 5.50%, due 06/15/47 | | | 656,254 | |
| | 760,000 | | | | | HCA, Inc., 5.63%, due 09/01/28 | | | 799,710 | |
| | 115,000 | | | | | Healthpeak Properties, Inc. REIT, 3.50%, due 07/15/29 | | | 112,635 | |
| | 555,000 | | | | | Hess Corp., 5.80%, due 04/01/47 | | | 370,616 | |
| | 610,000 | | | | | Hess Midstream Operations, LP, 5.63%, due 02/15/26 144A | | | 434,950 | |
| | 65,000 | | | | | Hill-Rom Holdings, Inc., 4.38%, due 09/15/27 144A | | | 64,580 | |
| | 1,000,000 | | | | | Hill-Rom Holdings, Inc., 5.00%, due 02/15/25 144A | | | 1,018,745 | |
| | 200,000 | | | | | Home Depot, Inc. (The), 3.35%, due 04/15/50 | | | 209,555 | |
| | 400,000 | | | | | HSBC Holdings Plc, 4.58% (3 mo. USD LIBOR plus 1.53%), due 06/19/29† | | | 424,732 | |
| | 220,000 | | | | | HSBC Holdings Plc, 4.95%, due 03/31/30 | | | 240,526 | |
| | 400,000 | | | | | HSBC Holdings Plc, 6.50% (5 year USD ICE swap plus 3.61%)†††††† | | | 374,326 | |
| | 250,000 | EUR | | | | HSBC Holdings Plc, Reg S, 5.25% (5 year EUR swap plus 4.38%)†††††† ‡‡‡ | | | 243,865 | |
| | 500,000 | | | | | Hudbay Minerals, Inc., 7.25%, due 01/15/23 144A | | | 439,373 | |
| | 400,000 | | | | | Hudbay Minerals, Inc., 7.63%, due 01/15/25 144A | | | 350,502 | |
| | 960,000 | | | | | ICICI Bank, Ltd./Hong Kong, Reg S, 5.75%, due 11/16/20‡‡‡ | | | 974,865 | |
| | 440,000 | | | | | iHeartCommunications, Inc., 4.75%, due 01/15/28 144A | | | 398,442 | |
See accompanying Notes to the Financial Statements.
125
Mercer Opportunistic Fixed Income Fund
Schedule of Investments (Continued)
(showing percentage of net assets)
March 31, 2020
| | | | | | | | | | |
| Par Value(a) | | | | | Description | | Value ($) | |
| | | |
| | | | | | Corporate Debt — continued | | | |
| | 525,000 | | | | | iHeartCommunications, Inc., 8.38%, due 05/01/27 | | | 459,989 | |
| | 780,000 | | | | | IHS Netherlands Holdco BV, 7.13%, due 03/18/25 144A | | | 690,300 | |
| | 1,880,000 | | | | | IHS Netherlands Holdco BV, 8.00%, due 09/18/27 144A | | | 1,560,400 | |
| | 1,150,000 | | | | | IHS Netherlands Holdco BV, Reg S, 8.00%, due 09/18/27‡‡‡ | | | 954,500 | |
| | 360,000 | | | | | Intelsat Jackson Holdings SA, 5.50%, due 08/01/23 | | | 238,052 | |
| | 700,000 | | | | | InterGen NV, 7.00%, due 06/30/23 144A | | | 619,500 | |
| | 1,575,000 | | | | | Interpublic Group of Cos., Inc. (The), 4.75%, due 03/30/30 | | | 1,563,656 | |
| | 615,000 | | | | | Intesa Sanpaolo SpA, 4.00%, due 09/23/29‡ 144A | | | 561,521 | |
| | 900,000 | | | | | Intesa Sanpaolo SpA, 5.02%, due 06/26/24 144A | | | 883,207 | |
| | 350,000 | | | | | Intesa Sanpaolo SpA, 5.71%, due 01/15/26 144A | | | 341,670 | |
| | 205,000 | | | | | IQVIA, Inc., 5.00%, due 10/15/26 144A | | | 210,528 | |
| | 285,000 | EUR | | | | IQVIA, Inc., Reg S, 2.25%, due 01/15/28‡‡‡ | | | 288,174 | |
| | 438,000 | EUR | | | | Islandsbanki HF, (MTN), Reg S, 1.13% (1 year EUR swap plus 0.75%), due 01/19/24† ‡‡‡ | | | 464,376 | |
| | 1,439,000 | | | | | Itau Unibanco Holding SA/Cayman Island, 4.63% (5 year CMT plus 3.22%)†††††† 144A | | | 1,191,060 | |
| | 975,000 | | | | | Itau Unibanco Holding SA/Cayman Island, 6.13% (5 year CMT plus 3.98%)†††††† 144A | | | 923,325 | |
| | 260,000 | | | | | j2 Cloud Services LLC/j2 GlobalCo-Obligor, Inc., 6.00%, due 07/15/25 144A | | | 259,674 | |
| | 150,000 | | | | | JB Poindexter & Co., Inc., 7.13%, due 04/15/26 144A | | | 140,094 | |
| | 490,000 | | | | | JM Smucker Co. (The), 3.55%, due 03/15/50 | | | 454,678 | |
| | 594,985 | | | | | K2016470219 South Africa, Ltd., 3.00% (3.00% Cash or PIK), due 12/31/22 | | | 5,950 | |
| | 156,683 | | | | | K2016470260 South Africa, Ltd., 25.00% (25.00% Cash or PIK), due 12/31/22 | | | 5,876 | |
| | 750,000 | | | | | KazMunayGas National Co. JSC, 4.75%, due 04/19/27 144A | | | 722,109 | |
| | 640,000 | | | | | KazTransGas JSC, 4.38%, due 09/26/27 144A | | | 574,694 | |
| | 400,000 | | | | | KeyCorp, (MTN), 2.55%, due 10/01/29 | | | 357,966 | |
| | 785,000 | | | | | KKR Group Finance Co. VI LLC, 3.75%, due 07/01/29 144A | | | 784,353 | |
| | 800,000 | | | | | KLX Energy Services Holdings, Inc., 11.50%, due 11/01/25 144A | | | 404,000 | |
| | 1,580,000 | | | | | Kosmos Energy, Ltd., 7.13%, due 04/04/26 144A | | | 862,083 | |
| | 105,000 | | | | | Kraft Heinz Foods Co., 4.38%, due 06/01/46 | | | 95,080 | |
| | 340,000 | | | | | Kraft Heinz Foods Co., 5.00%, due 06/04/42 | | | 323,381 | |
| | 1,305,000 | EUR | | | | Kraft Heinz Foods Co., Reg S, 2.25%, due 05/25/28‡‡‡ | | | 1,234,411 | |
| | 945,000 | | | | | Kuwait Projects Co. SPC, Ltd. (MTN), Reg S, 4.50%, due 02/23/27‡‡‡ | | | 890,131 | |
| | 950,000 | | | | | L Brands, Inc., 5.25%, due 02/01/28 | | | 730,977 | |
| | 30,000 | | | | | L Brands, Inc., 5.63%, due 10/15/23 | | | 25,091 | |
| | 80,000 | | | | | L Brands, Inc., 6.69%, due 01/15/27 | | | 58,443 | |
| | 455,000 | | | | | Lamar Media Corp., 3.75%, due 02/15/28 144A | | | 429,920 | |
| | 170,000 | | | | | Lamar Media Corp., 4.00%, due 02/15/30 144A | | | 159,375 | |
| | 1,000,000 | | | | | Lamb Weston Holdings, Inc., 4.63%, due 11/01/24 144A | | | 991,255 | |
| | 210,000 | EUR | | | | Landsbankinn HF, (MTN), Reg S, 1.00%, due 05/30/23‡‡‡ | | | 223,935 | |
| | 3,390,000 | EUR | | | | Landsbankinn HF, (MTN), Reg S, 1.38%, due 03/14/22‡‡‡ | | | 3,689,895 | |
| | 40,000 | | | | | Las Vegas Sands Corp., 3.20%, due 08/08/24 | | | 36,175 | |
| | 655,000 | | | | | Lazard Group LLC, 4.38%, due 03/11/29 | | | 663,508 | |
| | 655,000 | | | | | Lennar Corp., 4.75%, due 11/29/27 | | | 656,998 | |
| | 870,000 | | | | | Lennar Corp., 4.88%, due 12/15/23 | | | 860,208 | |
| | 260,000 | | | | | LifePoint Health, Inc., 4.38%, due 02/15/27 144A | | | 246,870 | |
| | 430,000 | | | | | Lions Gate Capital Holdings LLC, 5.88%, due 11/01/24 144A | | | 371,410 | |
| | 575,000 | | | | | Liquid Telecommunications Financing Plc, 8.50%, due 07/13/22 144A | | | 448,132 | |
| | 200,000 | | | | | Lloyds Banking Group Plc, 4.65%, due 03/24/26 | | | 204,604 | |
See accompanying Notes to the Financial Statements.
126
Mercer Opportunistic Fixed Income Fund
Schedule of Investments (Continued)
(showing percentage of net assets)
March 31, 2020
| | | | | | | | | | |
| Par Value(a) | | | | | Description | | Value ($) | |
| | | |
| | | | | | Corporate Debt — continued | | | |
| | 450,000 | EUR | | | | Lloyds Banking Group Plc, Reg S, 6.38% (5 year EUR swap plus 5.29%)†††††† ‡‡‡ | | | 456,205 | |
| | 1,300,000 | | | | | Lonestar Resources America, Inc., 11.25%, due 01/01/23 144A | | | 302,250 | |
| | 640,000 | | | | | Lukoil International Finance BV, 4.75%, due 11/02/26 144A | | | 651,048 | |
| | 800,000 | | | | | MAF Global Securities, Ltd., Reg S, 5.50% (5 year USD swap plus 3.48%)†††††† ‡ ‡‡‡ | | | 599,258 | |
| | 935,000 | | | | | MAF Sukuk, Ltd., Reg S, 4.64%, due 05/14/29‡‡‡ | | | 922,377 | |
| | 140,000 | | | | | Mastercard, Inc., 3.85%, due 03/26/50 | | | 172,372 | |
| | 290,000 | | | | | Match Group, Inc., 5.00%, due 12/15/27 144A | | | 279,427 | |
| | 575,000 | | | | | Mattamy Group Corp., 5.25%, due 12/15/27 144A | | | 539,063 | |
| | 715,000 | | | | | McDonald’s Corp., (MTN), 3.63%, due 09/01/49 | | | 731,158 | |
| | 80,000 | | | | | McDonald’s Corp., (MTN), 4.20%, due 04/01/50 | | | 89,878 | |
| | 935,000 | | | | | MDGH - GMTN BV, 3.70%, due 11/07/49 144A | | | 865,931 | |
| | 354,000 | | | | | MEG Energy Corp., 7.00%, due 03/31/24‡ 144A | | | 165,497 | |
| | 340,000 | | | | | MEG Energy Corp., 7.13%, due 02/01/27 144A | | | 170,551 | |
| | 520,000 | | | | | Melco Resorts Finance, Ltd., 5.38%, due 12/04/29‡ 144A | | | 451,970 | |
| | 260,000 | | | | | Michaels Stores, Inc., 8.00%, due 07/15/27‡ 144A | | | 193,843 | |
| | 3,025,000 | | | | | Millicom International Cellular SA, 6.25%, due 03/25/29 144A | | | 2,724,164 | |
| | 675,000 | | | | | Millicom International Cellular SA, 6.63%, due 10/15/26 144A | | | 644,254 | |
| | 525,000 | | | | | Mineral Resources, Ltd., 8.13%, due 05/01/27 144A | | | 495,515 | |
| | 610,000 | | | | | Mohegan Gaming & Entertainment, 7.88%, due 10/15/24 144A | | | 456,734 | |
| | 840,000 | | | | | Montage Resources Corp., 8.88%, due 07/15/23 | | | 573,275 | |
| | 1,000,000 | | | | | Morgan Stanley, (MTN), 2.50%, due 04/21/21 | | | 1,003,176 | |
| | 110,000 | EUR | | | | Motion Bondco DAC, 4.50%, due 11/15/27 144A | | | 89,094 | |
| | 370,000 | | | | | MPLX, LP, 1.90% (3 mo. USD LIBOR plus 0.90%), due 09/09/21† | | | 349,719 | |
| | 260,000 | GBP | | | | MPT Operating Partnership, LP/MPT Finance Corp. REIT, 3.69%, due 06/05/28 | | | 305,750 | |
| | 300,000 | | | | | MPT Operating Partnership, LP/MPT Finance Corp. REIT, 5.00%, due 10/15/27 | | | 293,273 | |
| | 175,000 | | | | | MSCI, Inc., 4.00%, due 11/15/29 144A | | | 174,813 | |
| | 440,000 | | | | | Mylan NV, 5.25%, due 06/15/46 | | | 421,635 | |
| | 445,000 | | | | | Mylan, Inc., 5.40%, due 11/29/43 | | | 445,739 | |
| | 440,000 | | | | | Nationwide Building Society, 3.96% (3 mo. USD LIBOR plus 1.86%), due 07/18/30† 144A | | | 445,277 | |
| | 410,000 | | | | | Navios Maritime Acquisition Corp./Navios Acquisition Finance US, Inc., 8.13%, due 11/15/21 144A | | | 215,968 | |
| | 435,000 | | | | | NBM US Holdings, Inc., 6.63%, due 08/06/29‡ 144A | | | 392,000 | |
| | 1,330,000 | | | | | NBM US Holdings, Inc., 7.00%, due 05/14/26 144A | | | 1,216,441 | |
| | 350,000 | | | | | NCL Corp., Ltd., Class C, 3.63%, due 12/15/24‡ 144A | | | 225,855 | |
| | 275,000 | EUR | | | | Netflix, Inc., 3.88%, due 11/15/29 144A | | | 296,984 | |
| | 300,000 | | | | | Netflix, Inc., 5.88%, due 11/15/28 | | | 322,215 | |
| | 270,000 | | | | | Netflix, Inc., 6.38%, due 05/15/29 | | | 295,718 | |
| | 1,545,000 | EUR | | | | Netflix, Inc., Reg S, 3.63%, due 06/15/30‡‡‡ | | | 1,665,727 | |
| | 210,000 | EUR | | | | Netflix, Inc., Reg S, 3.88%, due 11/15/29‡‡‡ | | | 226,788 | |
| | 284,000 | | | | | Newell Brands, Inc., 4.20%, due 04/01/26 | | | 279,489 | |
| | 625,000 | | | | | Newmont Corp., 2.25%, due 10/01/30 | | | 584,752 | |
| | 620,000 | | | | | NGPL PipeCo LLC, Senior Note, 7.77%, due 12/15/37 144A | | | 621,648 | |
| | 615,000 | | | | | NIKE, Inc., 3.38%, due 03/27/50 | | | 672,832 | |
| | 171,941 | | | | | Northern Oil and Gas, Inc., 8.50% (8.50% Cash or 9.5% PIK), due 05/15/23 | | | 118,209 | |
| | 640,000 | | | | | Northwest Acquisitions ULC/Dominion Finco, Inc., 7.13%, due 11/01/22 144A | | | 317,018 | |
| | 520,000 | | | | | NVIDIA Corp., 3.50%, due 04/01/50 | | | 567,012 | |
| | 625,000 | | | | | NXP BV/NXP Funding LLC/NXP USA, Inc., 3.88%, due 06/18/26 144A | | | 609,334 | |
| | 610,000 | | | | | Oasis Petroleum, Inc., 6.88%, due 03/15/22 | | | 125,050 | |
See accompanying Notes to the Financial Statements.
127
Mercer Opportunistic Fixed Income Fund
Schedule of Investments (Continued)
(showing percentage of net assets)
March 31, 2020
| | | | | | | | | | |
| Par Value(a) | | | | | Description | | Value ($) | |
| | | |
| | | | | | Corporate Debt — continued | | | |
| | 780,000 | | | | | Oasis Petroleum, Inc., 6.88%, due 01/15/23‡ | | | 165,750 | |
| | 760,000 | | | | | Occidental Petroleum Corp., 2.60%, due 08/13/21 | | | 598,020 | |
| | 270,000 | | | | | Occidental Petroleum Corp., 2.68% (3 mo. USD LIBOR plus 0.95%), due 02/08/21† | | | 213,996 | |
| | 160,000 | | | | | Occidental Petroleum Corp., 2.90%, due 08/15/24 | | | 87,734 | |
| | 90,000 | | | | | Occidental Petroleum Corp., 3.20%, due 08/15/26 | | | 43,222 | |
| | 250,000 | | | | | Occidental Petroleum Corp., 4.40%, due 08/15/49‡ | | | 108,346 | |
| | 30,000 | | | | | Occidental Petroleum Corp., 5.55%, due 03/15/26 | | | 15,895 | |
| | 1,320,000 | | | | | OCP SA, 6.88%, due 04/25/44 144A | | | 1,448,700 | |
| | 170,000 | | | | | Omnicom Group, Inc., 4.20%, due 06/01/30†††† | | | 175,461 | |
| | 980,000 | | | | | Open Text Corp., 3.88%, due 02/15/28 144A | | | 925,794 | |
| | 1,135,000 | | | | | Open Text Holdings, Inc., 4.13%, due 02/15/30 144A | | | 1,073,568 | |
| | 2,400,000 | | | | | ORACLE Corp., 2.80%, due 04/01/27 | | | 2,439,247 | |
| | 2,420,000 | | | | | ORACLE Corp., 3.60%, due 04/01/40 | | | 2,428,677 | |
| | 2,580,000 | | | | | ORACLE Corp., 3.60%, due 04/01/50 | | | 2,591,764 | |
| | 2,900,000 | | | | | ORACLE Corp., 3.85%, due 04/01/60 | | | 2,933,616 | |
| | 1,050,000 | | | | | Oversea-Chinese Banking Corp., Ltd., (MTN), Reg S, 4.25%, due 06/19/24‡‡‡ | | | 1,082,175 | |
| | 430,000 | | | | | Owl Rock Capital Corp., 4.00%, due 03/30/25 | | | 332,200 | |
| | 825,000 | | | | | Oztel Holdings SPC, Ltd., 5.63%, due 10/24/23 144A | | | 662,438 | |
| | 190,000 | | | | | Pactiv LLC, 8.38%, due 04/15/27 | | | 199,223 | |
| | 1,000,000 | | | | | Panther BF Aggregator 2, LP/Panther Finance Co., Inc., 6.25%, due 05/15/26 144A | | | 950,622 | |
| | 140,000 | | | | | Park Aerospace Holdings, Ltd., 4.50%, due 03/15/23 144A | | | 121,684 | |
| | 390,000 | | | | | Park-Ohio Industries, Inc., 6.63%, due 04/15/27 | | | 311,593 | |
| | 1,810,000 | | | | | Pertamina Persero PT, 4.18%, due 01/21/50 144A | | | 1,563,498 | |
| | 925,000 | | | | | Perusahaan Listrik Negara PT, 4.13%, due 05/15/27 144A | | | 899,246 | |
| | 2,220,000 | | | | | Petrobras Global Finance BV, 5.30%, due 01/27/25 | | | 2,128,436 | |
| | 385,000 | | | | | Petrobras Global Finance BV, 6.00%, due 01/27/28 | | | 375,009 | |
| | 720,000 | | | | | Petrobras Global Finance BV, 6.85%, due 06/05/15# | | | 687,820 | |
| | 11,184,300 | MXN | | | | Petroleos Mexicanos, Reg S (GDN), 7.19%, due 09/12/24‡‡‡ | | | 381,404 | |
| | 485,000 | | | | | PetSmart, Inc., 5.88%, due 06/01/25 144A | | | 481,363 | |
| | 1,730,000 | | | | | PetSmart, Inc., 7.13%, due 03/15/23 144A | | | 1,624,037 | |
| | 310,000 | | | | | PetSmart, Inc., 8.88%, due 06/01/25‡ 144A | | | 282,875 | |
| | 230,000 | | | | | Polaris Intermediate Corp., 8.50% (8.50% Cash or 9.25% PIK), due 12/01/22 144A | | | 179,971 | |
| | 1,380,000 | EUR | | | | PPF Arena 1 BV, (MTN), Reg S, 3.13%, due 03/27/26‡‡‡ | | | 1,461,208 | |
| | 230,000 | | | | | PPG Industries, Inc., 2.40%, due 08/15/24 | | | 228,705 | |
| | 1,000,000 | | | | | Prestige Brands, Inc., 6.38%, due 03/01/24 144A | | | 1,031,255 | |
| | 160,000 | | | | | Prime Security Services Borrower LLC/Prime Finance, Inc., 5.75%, due 04/15/26‡ 144A | | | 157,700 | |
| | 180,000 | | | | | Prime Security Services Borrower LLC/Prime Finance, Inc., 6.25%, due 01/15/28 144A | | | 156,600 | |
| | 1,385,000 | | | | | Procter & Gamble Co. (The), 3.00%, due 03/25/30 | | | 1,540,349 | |
| | 280,000 | | | | | Prosperous Ray, Ltd., Reg S, 4.63%, due 11/12/23‡‡‡ | | | 298,022 | |
| | 1,375,000 | | | | | Prosus NV, 3.68%, due 01/21/30 144A | | | 1,247,551 | |
| | 1,625,000 | | | | | Prosus NV, 4.85%, due 07/06/27 144A | | | 1,557,067 | |
| | 720,000 | | | | | Prosus NV, 5.50%, due 07/21/25 144A | | | 715,774 | |
| | 720,000 | | | | | Prosus NV, Reg S, 4.85%, due 07/06/27‡‡‡ | | | 689,900 | |
| | 1,795,000 | | | | | Prudential Financial, Inc., (MTN), 4.35%, due 02/25/50 | | | 1,803,344 | |
| | 225,000 | | | | | PTC, Inc., 3.63%, due 02/15/25 144A | | | 212,063 | |
| | 260,000 | | | | | PTC, Inc., 4.00%, due 02/15/28 144A | | | 251,628 | |
| | 1,030,000 | | | | | Quicken Loans, Inc., 5.25%, due 01/15/28 144A | | | 1,014,311 | |
| | 338,000 | | | | | Quicken Loans, Inc., 5.75%, due 05/01/25 144A | | | 338,424 | |
| | 360,000 | | | | | Radiology Partners, Inc., 9.25%, due 02/01/28 144A | | | 314,370 | |
See accompanying Notes to the Financial Statements.
128
Mercer Opportunistic Fixed Income Fund
Schedule of Investments (Continued)
(showing percentage of net assets)
March 31, 2020
| | | | | | | | | | |
| Par Value(a) | | | | | Description | | Value ($) | |
| | | |
| | | | | | Corporate Debt — continued | | | |
| | 300,000 | | | | | Range Resources Corp., 5.00%, due 08/15/22 | | | 227,160 | |
| | 410,000 | | | | | Range Resources Corp., 5.00%, due 03/15/23‡ | | | 302,363 | |
| | 156,000 | | | | | Range Resources Corp., 5.88%, due 07/01/22 | | | 113,636 | |
| | 230,000 | | | | | Range Resources Corp., 9.25%, due 02/01/26 144A | | | 139,294 | |
| | 130,000 | | | | | Raymond James Financial, Inc., 4.65%, due 04/01/30 | | | 135,497 | |
| | 1,000,000 | EUR | | | | RCI Banque SA, (MTN), Reg S, 2.25%, due 03/29/21‡‡‡ | | | 1,099,569 | |
| | 155,000 | | | | | Roper Technologies, Inc., 2.35%, due 09/15/24 | | | 149,309 | |
| | 165,000 | | | | | Roper Technologies, Inc., 2.95%, due 09/15/29 | | | 164,775 | |
| | 445,000 | | | | | Royal Bank of Scotland Group Plc, 4.27% (3 mo. USD LIBOR plus 1.76%), due 03/22/25† | | | 464,201 | |
| | 300,000 | | | | | Royal Bank of Scotland Group Plc, 4.89% (3 mo. USD LIBOR plus 1.75%), due 05/18/29† | | | 318,144 | |
| | 330,000 | | | | | RR Donnelley & Sons Co., 6.50%, due 11/15/23 | | | 332,886 | |
| | 400,000 | | | | | Sands China, Ltd., 5.13%, due 08/08/25 | | | 386,982 | |
| | 1,000,000 | EUR | | | | Santander Consumer Finance SA, Reg S, 0.88%, due 01/24/22‡‡‡ | | | 1,090,319 | |
| | 590,000 | | | | | Santander UK Group Holdings Plc, 4.75%, due 09/15/25 144A | | | 588,173 | |
| | 1,435,000 | | | | | SASOL Financing USA LLC, 6.50%, due 09/27/28 | | | 589,195 | |
| | 425,000 | | | | | SBA Tower Trust REIT, 2.84%, due 01/15/25 144A | | | 420,168 | |
| | 165,000 | | | | | Science Applications International Corp., 4.88%, due 04/01/28 144A | | | 159,328 | |
| | 110,000 | | | | | Sensata Tech, Inc., 4.38%, due 02/15/30 144A | | | 99,833 | |
| | 280,000 | | | | | Shea Homes, LP/Shea Homes Funding Corp., 4.75%, due 02/15/28 144A | | | 240,625 | |
| | 1,090,000 | | | | | Shelf Drilling Holdings, Ltd., 8.25%, due 02/15/25 144A | | | 548,270 | |
| | 200,000 | | | | | Silversea Cruise Finance, Ltd., 7.25%, due 02/01/25 144A | | | 171,749 | |
| | 990,000 | | | | | Societe Generale SA, 3.00%, due 01/22/30 144A | | | 904,127 | |
| | 765,000 | | | | | Societe Generale SA, 4.75%, due 09/14/28 144A | | | 816,007 | |
| | 350,000 | | | | | Societe Generale SA, 6.75% (5 year USD swap plus 3.93%)†††††† 144A | | | 292,098 | |
| | 780,000 | | | | | Societe Generale SA, 7.38% (5 year USD swap plus 4.30%)†††††† 144A | | | 675,242 | |
| | 970,000 | | | | | Southern California Edison Co., 4.88%, due 03/01/49 | | | 1,123,751 | |
| | 190,000 | | | | | Speedway Motorsports LLC/Speedway Funding II, Inc., 4.88%, due 11/01/27 144A | | | 172,425 | |
| | 370,000 | | | | | Springleaf Finance Corp., 5.38%, due 11/15/29 | | | 340,604 | |
| | 850,000 | | | | | Sprint Capital Corp., 6.88%, due 11/15/28 | | | 975,587 | |
| | 60,000 | | | | | Sprint Capital Corp., 8.75%, due 03/15/32 | | | 79,683 | |
| | 610,000 | | | | | Sprint Corp., 7.25%, due 02/01/28 144A | | | 615,338 | |
| | 1,085,000 | | | | | SS&C Technologies, Inc., 5.50%, due 09/30/27 144A | | | 1,136,901 | |
| | 905,000 | | | | | Standard Chartered Plc, 2.10% (3 mo. USD LIBOR plus 1.20%), due 09/10/22† 144A | | | 879,502 | |
| | 775,000 | | | | | Standard Chartered Plc, 4.30%, due 02/19/27 144A | | | 761,152 | |
| | 1,635,000 | | | | | Standard Chartered Plc, 4.64% (5 year CMT plus 3.85%), due 04/01/31† 144A | | | 1,683,625 | |
| | 585,000 | | | | | Standard Chartered Plc, 7.75% (5 year USD swap plus 5.72%)†††††† 144A | | | 575,049 | |
| | 110,000 | | | | | Standard Industries, Inc., 4.75%, due 01/15/28 144A | | | 102,071 | |
| | 220,000 | | | | | Starbucks Corp., 3.35%, due 03/12/50‡ | | | 211,224 | |
| | 960,301 | EUR | | | | Summer BC Holdco A SARL, Reg S, 9.25%, due 10/31/27‡‡‡ | | | 862,193 | |
| | 325,000 | EUR | | | | Summer BC Holdco B SARL, 5.75%, due 10/31/26 144A | | | 299,892 | |
| | 1,305,000 | EUR | | | | Summer BC Holdco B SARL, Reg S, 5.75%, due 10/31/26‡‡‡ | | | 1,204,181 | |
| | 1,160,000 | | | | | Suzano Austria GmbH, 6.00%, due 01/15/29 | | | 1,093,059 | |
| | 260,000 | | | | | Suzano Austria GmbH, Reg S, 5.75%, due 07/14/26‡‡‡ | | | 254,529 | |
| | 570,000 | | | | | Swire Pacific MTN Financing, Ltd., (MTN), Reg S, 4.50%, due 10/09/23‡‡‡ | | | 626,290 | |
| | 625,000 | | | | | Synchrony Financial, 4.38%, due 03/19/24 | | | 615,932 | |
| | 800,000 | | | | | Synchrony Financial, 4.50%, due 07/23/25 | | | 783,805 | |
| | 620,000 | | | | | Sysco Corp., 6.60%, due 04/01/50†††† | | | 652,231 | |
See accompanying Notes to the Financial Statements.
129
Mercer Opportunistic Fixed Income Fund
Schedule of Investments (Continued)
(showing percentage of net assets)
March 31, 2020
| | | | | | | | | | |
| Par Value(a) | | | | | Description | | Value ($) | |
| | | |
| | | | | | Corporate Debt — continued | | | |
| | 200,000 | | | | | T-Mobile USA, Inc., 6.38%, due 03/01/25 | | | 205,507 | |
| | 280,000 | | | | | Talen Energy Supply LLC, 10.50%, due 01/15/26 144A | | | 203,551 | |
| | 610,000 | | | | | Tallgrass Energy Partners, LP/Tallgrass Energy Finance Corp., 4.75%, due 10/01/23 144A | | | 388,857 | |
| | 715,000 | | | | | Tallgrass Energy Partners, LP/Tallgrass Energy Finance Corp., 5.50%, due 09/15/24 144A | | | 398,591 | |
| | 240,000 | | | | | Taylor Morrison Communities, Inc., 5.88%, due 01/31/25 144A | | | 225,900 | |
| | 230,000 | | | | | Teck Resources, Ltd., 5.40%, due 02/01/43 | | | 182,967 | |
| | 90,000 | | | | | Teck Resources, Ltd., 6.00%, due 08/15/40 | | | 77,493 | |
| | 200,000 | | | | | Telefonica Emisiones SA, 5.21%, due 03/08/47 | | | 225,171 | |
| | 350,000 | | | | | Tennessee Gas Pipeline Co. LLC, 2.90%, due 03/01/30 144A | | | 297,514 | |
| | 425,000 | EUR | | | | Teva Pharmaceutical Finance Netherlands II BV, 3.25%, due 04/15/22 | | | 447,977 | |
| | 235,000 | EUR | | | | Teva Pharmaceutical Finance Netherlands II BV, 6.00%, due 01/31/25 144A | | | 253,247 | |
| | 360,000 | EUR | | | | Teva Pharmaceutical Finance Netherlands II BV, Reg S, 1.25%, due 03/31/23‡‡‡ | | | 350,731 | |
| | 370,000 | | | | | Teva Pharmaceutical Finance Netherlands III BV, 7.13%, due 01/31/25‡ 144A | | | 368,614 | |
| | 1,105,000 | | | | | Textron, Inc., 3.00%, due 06/01/30 | | | 1,035,185 | |
| | 225,000 | | | | | Thermo Fisher Scientific, Inc., 4.50%, due 03/25/30 | | | 253,436 | |
| | 1,610,000 | | | | | TJX Cos., Inc., 3.88%, due 04/15/30 | | | 1,665,587 | |
| | 415,000 | | | | | TJX Cos., Inc., 4.50%, due 04/15/50 | | | 445,185 | |
| | 630,000 | | | | | TransDigm, Inc., 5.50%, due 11/15/27 144A | | | 568,922 | |
| | 2,880,000 | ZAR | | | | Transnet SOC, Ltd., (MTN), Reg S, 9.50%, due 05/13/21‡‡‡ | | | 168,058 | |
| | 540,000 | | | | | Transportadora de Gas del Sur SA, 6.75%, due 05/02/25 144A | | | 393,395 | |
| | 1,490,000 | | | | | Twitter, Inc., 3.88%, due 12/15/27 144A | | | 1,444,369 | |
| | 340,000 | | | | | UBS Group AG, 7.00% (5 year USD swap plus 4.34%)†††††† 144A | | | 319,836 | |
| | 955,000 | | | | | UniCredit SpA, 7.30% (5 year USD ICE swap plus 4.91%), due 04/02/34† 144A | | | 907,711 | |
| | 1,200,000 | | | | | Unifin Financiera SAB de CV, 8.38%, due 01/27/28 144A | | | 738,900 | |
| | 1,015,000 | | | | | Unifin Financiera SAB de CV, Reg S, 7.00%, due 01/15/25‡‡‡ | | | 631,837 | |
| | 200,000 | | | | | Union Pacific Corp., 3.84%, due 03/20/60 144A | | | 212,030 | |
| | 195,000 | | | | | United Parcel Service, Inc., 5.30%, due 04/01/50 | | | 256,532 | |
| | 140,000 | | | | | United Rentals North America, Inc., 3.88%, due 11/15/27 | | | 133,077 | |
| | 500,000 | | | | | United Rentals North America, Inc., 4.88%, due 01/15/28 | | | 487,775 | |
| | 1,580,000 | | | | | United Rentals North America, Inc., 5.25%, due 01/15/30 | | | 1,588,295 | |
| | 600,000 | | | | | Univision Communications, Inc., 5.13%, due 05/15/23 144A | | | 535,500 | |
| | 105,000 | | | | | Unum Group, 4.00%, due 06/15/29 | | | 101,301 | |
| | 550,000 | | | | | Vale Overseas, Ltd., 6.88%, due 11/10/39 | | | 612,048 | |
| | 100,000 | | | | | Verizon Communications, Inc., 4.52%, due 09/15/48 | | | 128,584 | |
| | 465,000 | | | | | VF Ukraine PAT via VFU Funding Plc, 6.20%, due 02/11/25 144A | | | 390,600 | |
| | 1,820,000 | | | | | ViacomCBS, Inc., 4.95%, due 01/15/31†††† | | | 1,795,004 | |
| | 885,000 | | | | | ViacomCBS, Inc., 5.85%, due 09/01/43 | | | 910,214 | |
| | 670,000 | | | | | ViacomCBS, Inc., 6.88%, due 04/30/36 | | | 756,970 | |
| | 1,460,000 | | | | | VICI Properties, LP/VICI Note Co., Inc. REIT, 4.63%, due 12/01/29 144A | | | 1,340,178 | |
| | 950,000 | | | | | Videotron, Ltd., 5.13%, due 04/15/27 144A | | | 956,619 | |
| | 300,000 | | | | | Vine Oil & Gas LP/Vine Oil & Gas Finance Corp., 8.75%, due 04/15/23‡‡‡‡ | | | 73,500 | |
| | 585,000 | | | | | Vine Oil & Gas LP/Vine Oil & Gas Finance Corp., 9.75%, due 04/15/23‡‡‡‡ | | | 152,831 | |
| | 100,000 | | | | | Viper Energy Partners, LP, 5.38%, due 11/01/27 144A | | | 84,555 | |
| | 500,000 | | | | | Virgin Media Secured Finance Plc, 5.50%, due 08/15/26 144A | | | 510,984 | |
| | 500,000 | | | | | Virgin Media Secured Finance Plc, 5.50%, due 05/15/29 144A | | | 500,975 | |
| | 220,000 | | | | | VISA, Inc., 2.70%, due 04/15/40†††† | | | 218,381 | |
| | 1,350,000 | | | | | VOC Escrow, Ltd., 5.00%, due 02/15/28 144A | | | 994,545 | |
See accompanying Notes to the Financial Statements.
130
Mercer Opportunistic Fixed Income Fund
Schedule of Investments (Continued)
(showing percentage of net assets)
March 31, 2020
| | | | | | | | | | |
| Par Value(a) | | | | | Description | | Value ($) | |
| | | |
| | | | | | Corporate Debt — continued | | | |
| | 130,000 | | | | | Vodafone Group Plc, 4.38%, due 05/30/28 | | | 137,581 | |
| | 800,000 | | | | | Vodafone Group Plc, 4.88%, due 06/19/49 | | | 893,427 | |
| | 265,000 | | | | | Walt Disney Co. (The), 4.70%, due 03/23/50 | | | 349,368 | |
| | 230,000 | | | | | Waste Management, Inc., 3.45%, due 06/15/29 | | | 236,364 | |
| | 350,000 | | | | | WEA Finance LLC/Westfield UK & Europe Finance Plc REIT, 4.75%, due 09/17/44 144A | | | 322,277 | |
| | 530,000 | | | | | Weight Watchers International, Inc., 8.63%, due 12/01/25 144A | | | 459,110 | |
| | 480,000 | | | | | Wells Fargo & Co., 2.50%, due 03/04/21 | | | 480,236 | |
| | 140,000 | | | | | Wells Fargo & Co., (MTN), 4.48% (3 mo. USD LIBOR plus 3.77%), due 04/04/31† | | | 159,123 | |
| | 410,000 | | | | | Wells Fargo & Co., (MTN), 5.01% (3 mo. USD LIBOR plus 4.24%), due 04/04/51† | | | 528,006 | |
| | 2,500,000 | | | | | Wells Fargo Bank NA, 2.31% (3 mo. USD LIBOR plus 0.50%), due 07/23/21† | | | 2,437,713 | |
| | 727,000 | | | | | Wendy’s International LLC, 7.00%, due 12/15/25 | | | 730,453 | |
| | 730,000 | | | | | Western Midstream Operating, LP, 4.00%, due 07/01/22 | | | 471,266 | |
| | 120,000 | | | | | Western Midstream Operating, LP, 5.25%, due 02/01/50†† | | | 50,030 | |
| | 260,000 | | | | | Western Midstream Operating, LP, 5.30%, due 03/01/48 | | | 104,253 | |
| | 770,000 | | | | | Western Midstream Operating, LP, 5.45%, due 04/01/44 | | | 299,550 | |
| | 490,000 | | | | | Westlake Chemical Corp., 4.38%, due 11/15/47 | | | 398,910 | |
| | 390,000 | | | | | Westpac Banking Corp., 4.11% (5 year CMT plus 2.00%), due 07/24/34† | | | 379,057 | |
| | 1,035,000 | | | | | Whiting Petroleum Corp., 5.75%, due 03/15/21 | | | 76,538 | |
| | 375,000 | GBP | | | | William Hill Plc, Reg S, 4.88%, due 09/07/23‡‡‡ | | | 361,746 | |
| | 100,000 | | | | | Williams Cos., Inc. (The), 8.75%, due 03/15/32 | | | 108,823 | |
| | 390,000 | | | | | WPX Energy, Inc., 5.25%, due 10/15/27 | | | 216,665 | |
| | 250,000 | | | | | WPX Energy, Inc., 8.25%, due 08/01/23 | | | 185,936 | |
| | 370,000 | | | | | Wynn Macau, Ltd., 5.13%, due 12/15/29 144A | | | 313,575 | |
| | 740,000 | | | | | XPO CNW, Inc., 6.70%, due 05/01/34 | | | 636,152 | |
| | 1,000,000 | | | | | XPO Logistics, Inc., 6.50%, due 06/15/22 144A | | | 1,007,840 | |
| | 100,000 | | | | | XPO Logistics, Inc., 6.75%, due 08/15/24 144A | | | 98,406 | |
| | 290,000 | | | | | Yamana Gold, Inc., 4.63%, due 12/15/27 | | | 291,242 | |
| | 150,000 | | | | | YPF SA, 8.50%, due 03/23/21 144A | | | 102,480 | |
| | 800,000 | | | | | YPF SA, Reg S, 8.50%, due 03/23/21‡‡‡ | | | 546,560 | |
| | 125,000 | | | | | Yum! Brands, Inc., 4.75%, due 01/15/30 144A | | | 118,194 | |
| | 180,000 | | | | | Yum! Brands, Inc., 7.75%, due 04/01/25†††† 144A | | | 189,450 | |
| | 504,000 | EUR | | | | Ziggo BV, 4.25%, due 01/15/27 144A | | | 552,461 | |
| | 1,135,000 | EUR | | | | Ziggo BV, Reg S, 2.88%, due 01/15/30‡‡‡ | | | 1,144,192 | |
| | | | | | | | | | |
| | | | | | | | | 289,147,063 | |
| | | | | | | | | | |
| | | |
| | | | | | Mortgage Backed Securities - Private Issuers — 3.6% | | | |
| | 650,000 | | | | | BANK, Series 2018-BNK14, Class A4, 4.23%, due 09/15/60◆◆ | | | 749,400 | |
| | 565,000 | | | | | BANK, Series 2020-BNK25, Class AS, 2.84%, due 01/15/63 | | | 534,669 | |
| | 2,000,000 | | | | | BBCCRE Trust, Series2015-GTP, Class F, 4.56%, due 08/10/33◆◆ 144A | | | 1,637,259 | |
| | 530,000 | | | | | BBCMS Mortgage Trust, Series2020-C6, Class AS, 2.84%, due 02/15/53 | | | 493,432 | |
| | 620,000 | | | | | BBCMS Trust, Series2018-CBM, Class D, 3.10% (1 mo. USD LIBOR plus 2.39%), due 07/15/37† 144A | | | 572,945 | |
| | 450,000 | | | | | BBCMS Trust, Series2019-C5, Class A4, 3.06%, due 11/15/52 | | | 472,648 | |
| | 380,000 | | | | | Benchmark Mortgage Trust, Series2020-B16, Class AM, 2.94%, due 02/15/53 | | | 376,286 | |
| | 1,000,000 | | | | | BHMS, Series2018-MZB, Class MZB, 7.34% (1 mo. USD LIBOR plus 6.64%), due 07/15/20† 144A | | | 786,302 | |
| | 930,000 | | | | | BX Commercial Mortgage Trust, Series2019-IMC, Class E, 2.85% (1 mo. USD LIBOR plus 2.15%), due 04/15/34† 144A | | | 815,161 | |
See accompanying Notes to the Financial Statements.
131
Mercer Opportunistic Fixed Income Fund
Schedule of Investments (Continued)
(showing percentage of net assets)
March 31, 2020
| | | | | | | | | | |
| Par Value(a) | | | | | Description | | Value ($) | |
| | | |
| | | | | | Mortgage Backed Securities - Private Issuers — continued | | | |
| | 570,000 | | | | | BX Commercial Mortgage Trust, Series 2020-BXLP, Class G, 3.20% (1 mo. USD LIBOR plus 2.50%), due 12/15/36† 144A | | | 486,042 | |
| | 1,500,000 | | | | | BX Trust, Series 2018-BILT, Class B, 1.72% (1 mo. USD LIBOR plus 1.02%), due 05/15/30† 144A | | | 1,381,435 | |
| | 640,000 | | | | | CFCRE Commercial Mortgage Trust, Series2011-C2, Class D, 5.74%, due 12/15/47◆◆ 144A | | | 621,099 | |
| | 480,000 | | | | | CGDB Commercial Mortgage Trust, Series2019-MOB, Class A, 1.65% (1 mo. USD LIBOR plus 0.95%), due 11/15/36† 144A | | | 446,794 | |
| | 320,813 | | | | | Citigroup Mortgage Loan Trust CMO, Series2018-A, Class A1, 4.00%, due 01/25/68◆◆ 144A | | | 300,474 | |
| | 1,172,500 | | | | | CSMC, Series 2019 RIO, 8.74%, due 12/15/22‡‡‡‡ | | | 1,113,085 | |
| | 480,000 | | | | | CSMC, Series 2019-UVIL, Class A, 3.16%, due 12/15/41 144A | | | 447,334 | |
| | 665,000 | | | | | FHLMC Seasoned Credit Risk Transfer Trust CMO, Series2018-3, Class M, 4.75%, due 08/25/57◆◆ 144A | | | 485,352 | |
| | 440,000 | | | | | FHLMC Seasoned Credit Risk Transfer Trust CMO, Series2019-1, Class M, 4.75%, due 07/25/58◆◆ 144A | | | 341,205 | |
| | 880,000 | | | | | FHLMC Seasoned Credit Risk Transfer Trust CMO, Series2019-4, Class M, 4.50%, due 02/25/59◆◆ 144A | | | 692,366 | |
| | 580,000 | | | | | FHLMC Seasoned Credit Risk Transfer Trust CMO, Series2020-1, Class M, 4.25%, due 08/25/59◆◆ 144A | | | 612,816 | |
| | 990,000 | | | | | FHLMC Seasoned Credit Risk Transfer Trust CMO, Series 2020-DNA1, Class B1, 3.25% (1 mo. USD LIBOR plus 2.30%), due 01/25/50† 144A | | | 386,826 | |
| | 1,082,597 | | | | | FHLMC Structured Asset Mortgage Investments II Trust CMO, Series2005-AR2, Class 2A2, 1.51% (1 mo. USD LIBOR plus 0.56%), due 05/25/45† | | | 777,715 | |
| | 2,169,660 | | | | | FNMA Connecticut Avenue Securities CMO, Series2014-C04, Class 1M2, 5.85% (1 mo. USD LIBOR plus 4.90%), due 11/25/24† 144A | | | 2,089,891 | |
| | 650,000 | | | | | FNMA Connecticut Avenue Securities CMO, Series2016-C06, Class 1M2, 5.20% (1 mo. USD LIBOR plus 4.25%), due 04/25/29† 144A | | | 632,655 | |
| | 1,500,000 | | | | | FNMA Connecticut Avenue Securities CMO, Series2017-C03, Class 1B1, 5.80% (1 mo. USD LIBOR plus 4.85%), due 10/25/29† 144A | | | 905,867 | |
| | 960,000 | | | | | FNMA Connecticut Avenue Securities CMO, Series2018-C01, Class 1M2, 3.20% (1 mo. USD LIBOR plus 2.25%), due 07/25/30† 144A | | | 841,234 | |
| | 1,920,000 | | | | | FNMA Connecticut Avenue Securities CMO, Series2018-C05, Class 1B1, 5.20% (1 mo. USD LIBOR plus 4.25%), due 01/25/31† 144A | | | 979,300 | |
| | 1,580,000 | | | | | FNMA Connecticut Avenue Securities CMO, Series2018-C05, Class 1M2, 3.30% (1 mo. USD LIBOR plus 2.35%), due 01/25/31† 144A | | | 1,345,921 | |
| | 642,500 | | | | | FNMA Connecticut Avenue Securities CMO, Series2018-C06, Class 1B1, 4.70% (1 mo. USD LIBOR plus 3.75%), due 03/25/31† 144A | | | 324,811 | |
| | 493,771 | | | | | FNMA Connecticut Avenue Securities CMO, Series2018-C06, Class 1M2, 2.95% (1 mo. USD LIBOR plus 2.00%), due 03/25/31† 144A | | | 439,780 | |
| | 975,000 | | | | | FNMA Connecticut Avenue Securities Trust CMO, Series2019-R05, Class 1M2, 2.95% (1 mo. USD LIBOR plus 2.00%), due 07/25/39† 144A | | | 834,594 | |
| | 860,000 | | | | | FNMA Connecticut Avenue Securities Trust CMO, Series2020-R01, Class 1M2, 3.00% (1 mo. USD LIBOR plus 2.05%), due 01/25/40† 144A | | | 523,427 | |
| | 410,000 | | | | | GS Mortgage Securities Trust, Series2011-GC5, Class D, 5.39%, due 08/10/44◆◆ 144A | | | 397,746 | |
| | 500,000 | | | | | GS Mortgage Securities Trust, Series2017-GS7, Class A4, 3.43%, due 08/10/50 | | | 529,077 | |
| | 900,000 | | | | | GS Mortgage Securities Trust, Series 2020-DUNE, Class A, 1.80% (1 mo. USD LIBOR plus 1.10%), due 12/15/36† 144A | | | 752,408 | |
See accompanying Notes to the Financial Statements.
132
Mercer Opportunistic Fixed Income Fund
Schedule of Investments (Continued)
(showing percentage of net assets)
March 31, 2020
| | | | | | | | | | |
| Par Value(a) | | | | | Description | | Value ($) | |
| | | |
| | | | | | Mortgage Backed Securities - Private Issuers — continued | | | |
| | 1,390,000 | | | | | JPMorgan Chase Commercial Mortgage Securities Trust, Series 2018-PHMZ, Class M, 8.91% (1 mo. USD LIBOR plus 8.21%), due 06/15/35† 144A | | | 1,081,801 | |
| | 840,000 | | | | | JPMorgan Chase Commercial Mortgage Securities Trust, Series 2019-BKWD, Class E, 3.30% (1 mo. USD LIBOR plus 2.60%), due 09/15/29† 144A | | | 818,482 | |
| | 1,270,000 | | | | | JPMorgan Chase Commercial Mortgage Securities Trust, Series 2019-BKWD, Class F, 4.10% (1 mo. USD LIBOR plus 3.40%), due 09/15/29† 144A | | | 1,006,385 | |
| | 662,443 | | | | | JPMorgan Chase Commercial Mortgage Securities Trust, Series 2019-BOLT, Class C, 4.50% (1 mo. USD LIBOR plus 3.80%), due 07/15/34† 144A | | | 586,918 | |
| | 1,019,109 | | | | | Motel 6 Trust, Series 2017-MTL6, Class E, 3.95% (1 mo. USD LIBOR plus 3.25%), due 08/15/34† 144A | | | 829,690 | |
| | 500,000 | | | | | Natixis Commercial Mortgage Securities Trust, Series 2019-MILE, Class A, 2.20% (1 mo. USD LIBOR plus 1.50%), due 07/15/36† 144A | | | 478,097 | |
| | 820,000 | | | | | Natixis Commercial Mortgage Securities Trust, Series 2019-TRUE, Class A, 2.62% (1 mo. USD LIBOR plus 2.01%), due 04/18/24† 144A | | | 763,877 | |
| | 800,000 | | | | | Radnor RE, Ltd. Mortgage Insurance-Linked Notes CMO, Series2020-1, Class M1C, 2.70% (1 mo. USD LIBOR plus 1.75%), due 02/25/30† 144A | | | 587,122 | |
| | 230,000 | | | | | Starwood Retail Property Trust, Series 2014-STAR, Class C, 3.45% (1 mo. USD LIBOR plus 2.75%), due 11/15/27† 144A | | | 189,592 | |
| | 900,000 | | | | | Starwood Retail Property Trust, Series 2014-STAR, Class D, 4.20% (1 mo. USD LIBOR plus 3.50%), due 11/15/27† 144A | | | 669,150 | |
| | 792,335 | | | | | WaMu Mortgage Pass-Through Certificates Trust CMO, Series2005-AR1, Class A1B, 1.73% (1 mo. USD LIBOR plus 0.78%), due 01/25/45† | | | 727,146 | |
| | 1,753,469 | | | | | WaMu Mortgage Pass-Through Certificates Trust CMO, Series2005-AR6, Class 2A1A, 1.41% (1 mo. USD LIBOR plus 0.46%), due 04/25/45† | | | 1,625,974 | |
| | | | | | | | | | |
| | | | | | | | | 34,491,590 | |
| | | | | | | | | | |
| | |
| | | | | | Mortgage Backed Securities - U.S. Government Agency Obligations — 0.2% | |
| | 220,000 | | | | | FNMA, Pool # BL5547, 2.68% , due 01/01/35 | | | 239,364 | |
| | 220,000 | | | | | FNMA, Pool # BL5767, 2.68% , due 02/01/35 | | | 239,482 | |
| | 209,836 | | | | | FNMA, Pool # BM6224, 2.79% , due 01/01/35◆◆ | | | 234,024 | |
| | 1,317,843 | | | | | UMBS, Pool # BM5520, 3.50% , due 02/01/47 | | | 1,404,606 | |
| | | | | | | | | | |
| | | | | | | | | 2,117,476 | |
| | | | | | | | | | |
| | |
| | | | | | Sovereign Debt Obligations — 32.7% | |
| | 860,000 | | | | | Abu Dhabi Government International Bond, 2.13%, due 09/30/24 144A | | | 850,755 | |
| | 1,110,000 | | | | | Abu Dhabi Government International Bond, 3.13%, due 09/30/49 144A | | | 1,037,850 | |
| | 2,870,000 | | | | | Abu Dhabi Government International Bond, 4.13%, due 10/11/47 144A | | | 3,124,431 | |
| | 34,403,128 | ARS | | | | Argentina Treasury Bond, 1.00%, due 08/05/21 | | | 332,678 | |
| | 535,000 | | | | | Argentine Republic Government International Bond, 5.88%, due 01/11/28 | | | 149,003 | |
| | 300,000,000 | CLP | | | | Bonos de la Tesoreria de la Republica en pesos, 4.00%, due 03/01/23‡‡‡‡ | | | 376,265 | |
| | 2,070,000,000 | CLP | | | | Bonos de la Tesoreria de la Republica en pesos, 4.50%, due 03/01/26 | | | 2,656,444 | |
| | 880,000,000 | CLP | | | | Bonos de la Tesoreria de la Republica en pesos, 5.00%, due 03/01/35 | | | 1,149,531 | |
| | 755,000,000 | CLP | | | | Bonos de la Tesoreria de la Republica en pesos, 6.00%, due 01/01/43 | | | 1,130,880 | |
| | 3,544,000 | BRL | | | | Brazil Letras do Tesouro Nacional, 4.93%, due 07/01/22‡‡ | | | 613,791 | |
| | 11,483,000 | BRL | | | | Brazil Letras do Tesouro Nacional, 6.08%, due 07/01/23‡‡ | | | 1,840,719 | |
| | 9,393,000 | BRL | | | | Brazil Letras do Tesouro Nacional, 4.15%, due 01/01/22‡‡ | | | 1,686,188 | |
| | 9,948,000 | BRL | | | | Brazil Letras do Tesouro Nacional, 3.63%, due 07/01/21‡‡ | | | 1,833,764 | |
| | 2,111,000 | BRL | | | | Brazil Notas do Tesouro Nacional Series B Notes, 6.00%, due 08/15/20 | | | 1,345,546 | |
| | 400,000 | BRL | | | | Brazil Notas do Tesouro Nacional Series B Notes, 6.00%, due 08/15/22 | | | 274,671 | |
See accompanying Notes to the Financial Statements.
133
Mercer Opportunistic Fixed Income Fund
Schedule of Investments (Continued)
(showing percentage of net assets)
March 31, 2020
| | | | | | | | | | |
| Par Value(a) | | | | | Description | | Value ($) | |
| | |
| | | | | | Sovereign Debt Obligations — continued | |
| | 1,355,000 | BRL | | | | Brazil Notas do Tesouro Nacional Series B Notes, 6.00%, due 05/15/45 | | | 1,048,853 | |
| | 1,408,001 | BRL | | | | Brazil Notas do Tesouro Nacional Series B Notes, 6.00%, due 08/15/50 | | | 1,110,096 | |
| | 35,191,000 | BRL | | | | Brazil Notas do Tesouro Nacional Series F Notes, 10.00%, due 01/01/23 | | | 7,515,910 | |
| | 15,817,000 | BRL | | | | Brazil Notas do Tesouro Nacional Series F Notes, 10.00%, due 01/01/25 | | | 3,430,470 | |
| | 9,267,000 | BRL | | | | Brazil Notas do Tesouro Nacional Series F Notes, 10.00%, due 01/01/27 | | | 2,020,086 | |
| | 12,656,000 | BRL | | | | Brazil Notas do Tesouro Nacional Series F Notes, 10.00%, due 01/01/29 | | | 2,778,240 | |
| | 2,310,000 | | | | | Brazilian Government International Bond, 4.75%, due 01/14/50 | | | 2,133,285 | |
| | 26,422,500,000 | COP | | | | Colombian TES, 6.00%, due 04/28/28 | | | 6,078,159 | |
| | 576,900,000 | COP | | | | Colombian TES, 6.25%, due 11/26/25 | | | 137,816 | |
| | 24,425,500,000 | COP | | | | Colombian TES, 7.00%, due 05/04/22 | | | 6,248,465 | |
| | 4,618,000,000 | COP | | | | Colombian TES, 7.00%, due 06/30/32 | | | 1,114,313 | |
| | 934,900,000 | COP | | | | Colombian TES, 7.25%, due 10/18/34 | | | 231,139 | |
| | 15,599,800,000 | COP | | | | Colombian TES, 7.50%, due 08/26/26 | | | 3,936,357 | |
| | 6,520,700,000 | COP | | | | Colombian TES, 7.75%, due 09/18/30 | | | 1,668,389 | |
| | 9,907,700,000 | COP | | | | Colombian TES, 10.00%, due 07/24/24 | | | 2,790,283 | |
| | 8,107,000,000 | COP | | | | Colombian TES, 11.00%, due 07/24/20 | | | 2,040,011 | |
| | 4,960,000 | CZK | | | | Czech Republic Government Bond, 0.25%, due 02/10/27 | | | 186,330 | |
| | 8,380,000 | CZK | | | | Czech Republic Government Bond, 2.00%, due 10/13/33 | | | 345,083 | |
| | 16,180,000 | CZK | | | | Czech Republic Government Bond, 2.75%, due 07/23/29 | | | 710,420 | |
| | 20,730,000 | CZK | | | | Czech Republic Government Bond, Reg S, 0.95%, due 05/15/30‡‡‡ | | | 798,702 | |
| | 13,880,000 | CZK | | | | Czech Republic Government Bond, Reg S, 1.00%, due 06/26/26‡‡‡ | | | 553,104 | |
| | 1,430,000 | | | | | Dominican Republic International Bond, 5.88%, due 01/30/60‡ 144A | | | 1,219,075 | |
| | 23,250,000 | DOP | | | | Dominican Republic International Bond, Reg S, 9.75%, due 06/05/26‡‡‡ | | | 390,437 | |
| | 14,474,000 | EGP | | | | Egypt Government Bond, 16.10%, due 05/07/29 | | | 1,037,621 | |
| | 240,000 | | | | | Egypt Government International Bond, 7.60%, due 03/01/29 144A | | | 215,693 | |
| | 85,067,000 | MXN | | | | European Investment Bank, (MTN), 5.50%, due 01/23/23 | | | 3,623,223 | |
| | 43,370,000 | BRL | | | | European Investment Bank, (MTN), 11.89%, due 08/27/21‡‡ | | | 7,975,946 | |
| | 58,980,000 | MXN | | | | European Investment Bank, (MTN), Reg S, 4.75%, due 01/19/21‡‡‡ | | | 2,477,541 | |
| | 8,150,000 | ZAR | | | | European Investment Bank, (MTN), Reg S, 8.50%, due 09/17/24‡‡‡ | | | 493,673 | |
| | 1,010,000 | | | | | Fiji Government International Bond, Reg S, 6.63%, due 10/02/20‡‡‡ | | | 1,013,787 | |
| | 1,340,000 | | | | | Ghana Government International Bond, 7.63%, due 05/16/29 144A | | | 969,552 | |
| | 520,000 | | | | | Ghana Government International Bond, 7.88%, due 02/11/35 144A | | | 368,680 | |
| | 200,000 | | | | | Ghana Government International Bond, 8.13%, due 03/26/32 144A | | | 142,741 | |
| | 441,250,000 | HUF | | | | Hungary Government Bond, 3.00%, due 08/21/30 | | | 1,374,546 | |
| | 156,270,000 | HUF | | | | Hungary Government Bond, 2.50%, due 10/24/24 | | | 496,331 | |
| | 88,770,000 | HUF | | | | Hungary Government Bond, 2.75%, due 12/22/26 | | | 284,337 | |
| | 189,800,000 | HUF | | | | Hungary Government Bond, 3.00%, due 10/27/27 | | | 610,216 | |
| | 392,960,000 | HUF | | | | Hungary Government Bond, 5.50%, due 06/24/25 | | | 1,421,681 | |
| | 223,440,000 | HUF | | | | Hungary Government Bond, 6.75%, due 10/22/28 | | | 899,475 | |
| | 430,000 | | | | | Indonesia Government International Bond, 3.50%, due 01/11/28 | | | 426,060 | |
| | 3,770,000 | | | | | Indonesia Government International Bond, (MTN), Reg S, 5.25%, due 01/17/42‡‡‡ | | | 4,328,070 | |
| | 24,782,000,000 | IDR | | | | Indonesia Treasury Bond, 6.13%, due 05/15/28 | | | 1,339,100 | |
| | 15,805,000,000 | IDR | | | | Indonesia Treasury Bond, 6.63%, due 05/15/33 | | | 834,632 | |
| | 60,374,000,000 | IDR | | | | Indonesia Treasury Bond, 7.00%, due 05/15/27 | | | 3,530,165 | |
| | 48,277,000,000 | IDR | | | | Indonesia Treasury Bond, 7.50%, due 08/15/32 | | | 2,738,412 | |
| | 85,807,000,000 | IDR | | | | Indonesia Treasury Bond, 7.50%, due 05/15/38 | | | 4,787,419 | |
| | 24,702,000,000 | IDR | | | | Indonesia Treasury Bond, 8.13%, due 05/15/24 | | | 1,562,314 | |
| | 131,733,000,000 | IDR | | | | Indonesia Treasury Bond, 8.25%, due 05/15/29 | | | 8,217,956 | |
| | 4,212,000,000 | IDR | | | | Indonesia Treasury Bond, 8.25%, due 06/15/32 | | | 253,427 | |
See accompanying Notes to the Financial Statements.
134
Mercer Opportunistic Fixed Income Fund
Schedule of Investments (Continued)
(showing percentage of net assets)
March 31, 2020
| | | | | | | | | | |
| Par Value(a) | | | | | Description | | Value ($) | |
| | |
| | | | | | Sovereign Debt Obligations — continued | |
| | 22,978,000,000 | IDR | | | | Indonesia Treasury Bond, 8.25%, due 05/15/36 | | | 1,372,680 | |
| | 4,252,000,000 | IDR | | | | Indonesia Treasury Bond, 8.38%, due 03/15/24 | | | 271,565 | |
| | 8,419,000,000 | IDR | | | | Indonesia Treasury Bond, 8.38%, due 09/15/26 | | | 532,868 | |
| | 83,323,000,000 | IDR | | | | Indonesia Treasury Bond, 8.38%, due 03/15/34 | | | 5,080,608 | |
| | 41,103,000,000 | IDR | | | | Indonesia Treasury Bond, 8.38%, due 04/15/39 | | | 2,528,224 | |
| | 43,775,000,000 | IDR | | | | Indonesia Treasury Bond, 8.75%, due 05/15/31 | | | 2,742,172 | |
| | 28,849,000,000 | IDR | | | | Indonesia Treasury Bond, 9.00%, due 03/15/29 | | | 1,867,949 | |
| | 9,536,000,000 | IDR | | | | Indonesia Treasury Bond, 9.50%, due 07/15/31 | | | 628,449 | |
| | 8,707,000,000 | IDR | | | | Indonesia Treasury Bond, 10.50%, due 08/15/30 | | | 615,098 | |
| | 35,350,000,000 | IDR | | | | Inter-American Development Bank, (MTN), 7.88%, due 03/14/23‡‡‡ | | | 2,234,788 | |
| | 1,560,000 | | | | | Kazakhstan Government International Bond, (MTN), Reg S, 5.13%, due 07/21/25‡‡‡ | | | 1,685,424 | |
| | 1,180,000 | | | | | Kuwait International Government Bond, 3.50%, due 03/20/27 144A | | | 1,229,922 | |
| | 2,189,000 | MYR | | | | Malaysia Government Bond, 3.42%, due 08/15/22 | | | 511,281 | |
| | 3,738,000 | MYR | | | | Malaysia Government Bond, 3.48%, due 06/14/24 | | | 882,829 | |
| | 2,535,000 | MYR | | | | Malaysia Government Bond, 3.50%, due 05/31/27 | | | 595,607 | |
| | 27,189,000 | MYR | | | | Malaysia Government Bond, 3.62%, due 11/30/21 | | | 6,389,549 | |
| | 5,119,000 | MYR | | | | Malaysia Government Bond, 3.73%, due 06/15/28 | | | 1,206,989 | |
| | 15,977,000 | MYR | | | | Malaysia Government Bond, 3.80%, due 08/17/23 | | | 3,809,421 | |
| | 3,528,000 | MYR | | | | Malaysia Government Bond, 3.84%, due 04/15/33 | | | 832,975 | |
| | 6,242,000 | MYR | | | | Malaysia Government Bond, 3.88%, due 03/14/25 | | | 1,492,331 | |
| | 12,809,000 | MYR | | | | Malaysia Government Bond, 3.89%, due 08/15/29 | | | 3,089,244 | |
| | 1,047,000 | MYR | | | | Malaysia Government Bond, 3.89%, due 03/15/27 | | | 250,402 | |
| | 6,189,000 | MYR | | | | Malaysia Government Bond, 3.90%, due 11/16/27 | | | 1,477,676 | |
| | 2,259,000 | MYR | | | | Malaysia Government Bond, 3.91%, due 07/15/26 | | | 541,354 | |
| | 12,995,000 | MYR | | | | Malaysia Government Bond, 3.96%, due 09/15/25 | | | 3,130,077 | |
| | 2,020,000 | MYR | | | | Malaysia Government Bond, 4.06%, due 09/30/24 | | | 487,457 | |
| | 989,000 | MYR | | | | Malaysia Government Bond, 4.13%, due 04/15/32 | | | 237,191 | |
| | 1,511,000 | MYR | | | | Malaysia Government Bond, 4.18%, due 07/15/24 | | | 365,535 | |
| | 1,910,000 | MYR | | | | Malaysia Government Bond, 4.23%, due 06/30/31 | | | 462,454 | |
| | 1,289,000 | MYR | | | | Malaysia Government Bond, 4.39%, due 04/15/26 | | | 316,724 | |
| | 6,404,000 | MYR | | | | Malaysia Government Bond, 4.50%, due 04/15/30 | | | 1,570,595 | |
| | 807,000 | MYR | | | | Malaysia Government Bond, 4.74%, due 03/15/46 | | | 199,463 | |
| | 1,866,000 | MYR | | | | Malaysia Government Bond, 4.76%, due 04/07/37 | | | 470,019 | |
| | 1,860,000 | MYR | | | | Malaysia Government Bond, 4.89%, due 06/08/38 | | | 480,465 | |
| | 44,232,000 | MXN | | | | Mexican Bonos, 5.75%, due 03/05/26 | | | 1,783,478 | |
| | 64,672,900 | MXN | | | | Mexican Bonos, 6.50%, due 06/10/21 | | | 2,760,651 | |
| | 117,522,900 | MXN | | | | Mexican Bonos, 7.50%, due 06/03/27 | | | 5,096,629 | |
| | 10,143,900 | MXN | | | | Mexican Bonos, 7.75%, due 05/29/31 | | | 443,790 | |
| | 36,556,700 | MXN | | | | Mexican Bonos, 7.75%, due 11/23/34 | | | 1,590,517 | |
| | 64,157,400 | MXN | | | | Mexican Bonos, 7.75%, due 11/13/42 | | | 2,674,842 | |
| | 20,256,800 | MXN | | | | Mexican Bonos, 8.00%, due 12/07/23 | | | 906,309 | |
| | 119,773,000 | MXN | | | | Mexican Bonos, 8.00%, due 11/07/47 | | | 5,103,126 | |
| | 96,927,700 | MXN | | | | Mexican Bonos, 8.50%, due 05/31/29 | | | 4,463,403 | |
| | 78,326,700 | MXN | | | | Mexican Bonos, 8.50%, due 11/18/38 | | | 3,531,625 | |
| | 60,176,800 | MXN | | | | Mexican Bonos, 10.00%, due 12/05/24 | | | 2,901,071 | |
| | 58,811,300 | MXN | | | | Mexican Bonos, 10.00%, due 11/20/36 | | | 3,050,689 | |
| | 18,191,188 | MXN | | | | Mexican Udibonos, 4.50%, due 11/22/35 | | | 849,609 | |
| | 2,030,000 | | | | | Mexico Government International Bond, 3.60%, due 01/30/25 | | | 2,070,478 | |
| | 760,000 | | | | | Oman Government International Bond, 6.00%, due 08/01/29 144A | | | 548,595 | |
See accompanying Notes to the Financial Statements.
135
Mercer Opportunistic Fixed Income Fund
Schedule of Investments (Continued)
(showing percentage of net assets)
March 31, 2020
| | | | | | | | | | |
| Par Value(a) | | | | | Description | | Value ($) | |
| | |
| | | | | | Sovereign Debt Obligations — continued | |
| | 300,000 | | | | | Panama Government International Bond, 4.50%, due 04/01/56†††† | | | 327,750 | |
| | 6,518,000 | PEN | | | | Peruvian Government International Bond, Reg S (GDN), 6.35%, due 08/12/28‡‡‡ | | | 2,109,624 | |
| | 8,576,000 | PEN | | | | Peruvian Government International Bond, Reg S (GDN), 6.95%, due 08/12/31‡‡‡ | | | 2,864,767 | |
| | 4,423,000 | PEN | | | | Peruvian Government International Bond, Reg S (GDN), 8.20%, due 08/12/26‡‡‡ | | | 1,607,481 | |
| | 58,000,000 | PHP | | | | Philippine Government International Bond, 3.90%, due 11/26/22 | | | 1,139,271 | |
| | 9,000,000 | PHP | | | | Philippine Government International Bond, 4.95%, due 01/15/21 | | | 175,637 | |
| | 95,000,000 | PHP | | | | Philippine Government International Bond, 6.25%, due 01/14/36 | | | 2,337,723 | |
| | 1,710,000 | | | | | Provincia de Buenos Aires/Argentina, 6.50%, due 02/15/23 144A | | | 457,425 | |
| | 150,000 | | | | | Provincia de Buenos Aires/Argentina, 7.88%, due 06/15/27 144A | | | 40,125 | |
| | 180,000 | | | | | Provincia de Buenos Aires/Argentina, 9.13%, due 03/16/24 144A | | | 48,600 | |
| | 300,000 | | | | | Provincia de Buenos Aires/Argentina, 9.95%, due 06/09/21 144A | | | 93,000 | |
| | 180,000 | | | | | Provincia de Buenos Aires/Argentina, Reg S, 9.95%, due 06/09/21‡‡‡ | | | 55,800 | |
| | 170,017 | | | | | Provincia de Buenos Aires/Argentina, Reg S, 10.88%, due 01/26/21‡‡‡ | | | 54,405 | |
| | 650,000 | | | | | Provincia de Cordoba, 7.13%, due 06/10/21 144A | | | 428,194 | |
| | 480,000 | | | | | Qatar Government International Bond, 4.00%, due 03/14/29 144A | | | 515,323 | |
| | 1,070,000 | | | | | Qatar Government International Bond, 4.82%, due 03/14/49 144A | | | 1,265,444 | |
| | 1,580,000 | | | | | Qatar Government International Bond, 5.10%, due 04/23/48 144A | | | 1,923,682 | |
| | 8,749,000 | PLN | | | | Republic of Poland Government Bond, 1.75%, due 07/25/21 | | | 2,135,780 | |
| | 3,015,000 | PLN | | | | Republic of Poland Government Bond, 2.00%, due 04/25/21 | | | 735,294 | |
| | 11,176,000 | PLN | | | | Republic of Poland Government Bond, 2.50%, due 07/25/26 | | | 2,858,626 | |
| | 2,313,000 | PLN | | | | Republic of Poland Government Bond, 2.50%, due 07/25/27 | | | 592,563 | |
| | 1,075,965 | PLN | | | | Republic of Poland Government Bond, 2.75%, due 08/25/23 | | | 288,773 | |
| | 9,800,000 | PLN | | | | Republic of Poland Government Bond, 2.75%, due 04/25/28 | | | 2,539,456 | |
| | 18,744,000 | PLN | | | | Republic of Poland Government Bond, 2.75%, due 10/25/29 | | | 4,948,082 | |
| | 1,551,000 | PLN | | | | Republic of Poland Government Bond, 3.25%, due 07/25/25 | | | 411,228 | |
| | 3,245,000 | RON | | | | Romania Government Bond, 3.25%, due 04/29/24 | | | 718,052 | |
| | 1,990,000 | RON | | | | Romania Government Bond, 3.65%, due 09/24/31 | | | 383,745 | |
| | 1,895,000 | RON | | | | Romania Government Bond, 4.25%, due 06/28/23 | | | 435,406 | |
| | 2,705,000 | RON | | | | Romania Government Bond, 5.00%, due 02/12/29 | | | 621,564 | |
| | 2,340,000 | RON | | | | Romania Government Bond, 5.80%, due 07/26/27 | | | 578,741 | |
| | 416,263,000 | RUB | | | | Russian Federal Bond - OFZ, 6.90%, due 05/23/29 | | | 5,434,121 | |
| | 78,879,000 | RUB | | | | Russian Federal Bond - OFZ, 7.00%, due 08/16/23 | | | 1,027,548 | |
| | 646,843,000 | RUB | | | | Russian Federal Bond - OFZ, 7.05%, due 01/19/28 | | | 8,508,769 | |
| | 210,575,000 | RUB | | | | Russian Federal Bond - OFZ, 7.10%, due 10/16/24 | | | 2,757,718 | |
| | 199,591,000 | RUB | | | | Russian Federal Bond - OFZ, 7.25%, due 05/10/34 | | | 2,670,925 | |
| | 90,051,000 | RUB | | | | Russian Federal Bond - OFZ, 7.40%, due 12/07/22 | | | 1,185,077 | |
| | 202,946,000 | RUB | | | | Russian Federal Bond - OFZ, 7.50%, due 08/18/21 | | | 2,650,145 | |
| | 146,387,000 | RUB | | | | Russian Federal Bond - OFZ, 7.70%, due 03/23/33 | | | 2,031,221 | |
| | 177,677,000 | RUB | | | | Russian Federal Bond - OFZ, 7.75%, due 09/16/26 | | | 2,419,138 | |
| | 55,701,000 | RUB | | | | Russian Federal Bond - OFZ, 7.95%, due 10/07/26 | | | 765,889 | |
| | 224,560,000 | RUB | | | | Russian Federal Bond - OFZ, 8.15%, due 02/03/27 | | | 3,133,932 | |
| | 149,130,000 | RUB | | | | Russian Federal Bond - OFZ, 8.50%, due 09/17/31 | | | 2,184,374 | |
| | 2,195,000 | | | | | Saudi Government International Bond, 3.75%, due 01/21/55 144A | | | 2,030,946 | |
| | 56,591,000 | ZAR | | | | South Africa Government Bond, 6.25%, due 03/31/36 | | | 1,930,780 | |
| | 29,921,175 | ZAR | | | | South Africa Government Bond, 6.50%, due 02/28/41 | | | 997,987 | |
| | 50,812,601 | ZAR | | | | South Africa Government Bond, 7.00%, due 02/28/31 | | | 2,105,053 | |
| | 7,832,000 | ZAR | | | | South Africa Government Bond, 7.75%, due 02/28/23 | | | 446,700 | |
| | 37,164,870 | ZAR | | | | South Africa Government Bond, 8.00%, due 01/31/30 | | | 1,708,523 | |
| | 20,343,158 | ZAR | | | | South Africa Government Bond, 8.25%, due 03/31/32 | | | 906,387 | |
See accompanying Notes to the Financial Statements.
136
Mercer Opportunistic Fixed Income Fund
Schedule of Investments (Continued)
(showing percentage of net assets)
March 31, 2020
| | | | | | | | | | |
| Par Value(a) | | | | | Description | | Value ($) | |
| | |
| | | | | | Sovereign Debt Obligations — continued | |
| | 41,708,390 | ZAR | | | | South Africa Government Bond, 8.50%, due 01/31/37 | | | 1,768,615 | |
| | 61,298,918 | ZAR | | | | South Africa Government Bond, 8.75%, due 01/31/44 | | | 2,599,357 | |
| | 89,133,228 | ZAR | | | | South Africa Government Bond, 8.75%, due 02/28/48 | | | 3,748,236 | |
| | 42,202,854 | ZAR | | | | South Africa Government Bond, 8.88%, due 02/28/35 | | | 1,906,347 | |
| | 9,050,463 | ZAR | | | | South Africa Government Bond, 9.00%, due 01/31/40 | | | 398,942 | |
| | 171,280,479 | ZAR | | | | South Africa Government Bond, 10.50%, due 12/21/26 | | | 9,794,155 | |
| | 490,000 | | | | | State Of Israel, 2.75%, due 07/03/30†††† | | | 490,000 | |
| | 1,470,000 | | | | | State Of Israel, 3.88%, due 07/03/50†††† | | | 1,470,000 | |
| | 57,761,000 | THB | | | | Thailand Government Bond, 2.13%, due 12/17/26 | | | 1,859,991 | |
| | 40,155,000 | THB | | | | Thailand Government Bond, 2.88%, due 12/17/28 | | | 1,365,915 | |
| | 915,952 | TRY | | | | Turkey Government Bond, 7.10%, due 03/08/23 | | | 121,891 | |
| | 1,865,560 | TRY | | | | Turkey Government Bond, 8.00%, due 03/12/25 | | | 234,106 | |
| | 1,690,208 | TRY | | | | Turkey Government Bond, 8.80%, due 09/27/23 | | | 229,416 | |
| | 4,554,073 | TRY | | | | Turkey Government Bond, 9.00%, due 07/24/24 | | | 607,417 | |
| | 3,606,972 | TRY | | | | Turkey Government Bond, 10.50%, due 08/11/27 | | | 486,567 | |
| | 1,770,315 | TRY | | | | Turkey Government Bond, 10.60%, due 02/11/26 | | | 243,107 | |
| | 2,792,885 | TRY | | | | Turkey Government Bond, 11.00%, due 02/24/27 | | | 386,497 | |
| | 1,908,000 | TRY | | | | Turkey Government Bond, 12.40%, due 03/08/28 | | | 279,964 | |
| | 826,000 | | | | | Turkey Government International Bond, 7.63%, due 04/26/29 | | | 790,110 | |
| | 3,765,000 | | | | | Ukraine Government International Bond, Reg S, 1.72%, due 05/31/40◆◆‡‡ ‡‡‡ | | | 2,788,359 | |
| | 69,711,000 | UYU | | | | Uruguay Government International Bond, Reg S, 8.50%, due 03/15/28‡‡‡ | | | 1,305,397 | |
| | | | | | | | | | |
| | | | | | | | | 316,135,517 | |
| | | | | | | | | | |
| | | |
| | | | | | U.S. Government and Agency Obligations — 8.9% | | | |
| | 170,000 | | | | | U.S. Treasury Bond, 2.25%, due 08/15/49‡ | | | 207,154 | |
| | 1,100,000 | | | | | U.S. Treasury Bond, 2.38%, due 11/15/49‡ | | | 1,371,348 | |
| | 700,000 | | | | | U.S. Treasury Bond, 3.13%, due 05/15/48*** ****** | | | 991,949 | |
| | 150,000 | | | | | U.S. Treasury Bond, 3.38%, due 11/15/48****** | | | 222,604 | |
| | 2,814,980 | | | | | U.S. Treasury Inflation Indexed Bonds, 0.13%, due 10/15/24 | | | 2,849,611 | |
| | 15,137,378 | | | | | U.S. Treasury Inflation Indexed Bonds, 0.25%, due 01/15/25 | | | 15,275,101 | |
| | 6,486,983 | | | | | U.S. Treasury Inflation Indexed Bonds, 0.38%, due 07/15/25 | | | 6,617,413 | |
| | 1,457,621 | | | | | U.S. Treasury Inflation Indexed Bonds, 1.00%, due 02/15/49****** ‡ | | | 1,812,091 | |
| | 6,800,000 | | | | | U.S. Treasury Note, 1.38%, due 04/30/20 | | | 6,807,067 | |
| | 3,121,300 | | | | | U.S. Treasury Note, 1.38%, due 04/30/21****** | | | 3,163,243 | |
| | 6,500,000 | | | | | U.S. Treasury Note, 1.38%, due 06/30/23 | | | 6,724,961 | |
| | 6,690,000 | | | | | U.S. Treasury Note, 1.50%, due 02/15/30‡ | | | 7,204,686 | |
| | 10,000 | | | | | U.S. Treasury Note, 1.75%, due 11/15/29 | | | 10,988 | |
| | 1,532,200 | | | | | U.S. Treasury Note, 2.25%, due 03/31/21 | | | 1,564,879 | |
| | 14,270,000 | | | | | U.S. Treasury Note, 2.38%, due 03/15/21 | | | 14,583,550 | |
| | 3,102,800 | | | | | U.S. Treasury Note, 2.38%, due 04/15/21****** | | | 3,174,976 | |
| | 13,020,000 | | | | | U.S. Treasury Note, 2.50%, due 05/31/20‡ | | | 13,071,632 | |
| | | | | | | | | | |
| | | | | | | | | 85,653,253 | |
| | | | | | | | | | |
| | | |
| | | | | | TOTAL DEBT OBLIGATIONS (COST $938,330,823) | | | 843,181,962 | |
| | | | | | | | | | |
See accompanying Notes to the Financial Statements.
137
Mercer Opportunistic Fixed Income Fund
Schedule of Investments (Continued)
(showing percentage of net assets)
March 31, 2020
| | | | | | | | | | |
| Shares | | | | | Description | | Value ($) | |
| | | |
| | | | | | COMMON STOCKS — 0.1% | | | | |
| | |
| | | | | | Consumer, Cyclical — 0.0% | |
| | 7,396,155 | | | | | Edcon Holdings, Ltd. 1* **** ^ | | | — | |
| | 736,020 | | | | | Edcon Holdings, Ltd. 2* **** ^ | | | — | |
| | | | | | | | | | |
| | | | | | TOTAL CONSUMER, CYCLICAL | | | — | |
| | | | | | | | | | |
| | |
| | | | | | Energy — 0.0% | |
| | 10 | | | | | Amplify Energy Corp. | | | 6 | |
| | 14,783 | | | | | Nine Point Energy Holdings, LLC* **** | | | — | |
| | | | | | | | | | |
| | | | | | TOTAL ENERGY | | | 6 | |
| | | | | | | | | | |
| | |
| | | | | | Utilities — 0.1% | |
| | 8,511 | | | | | Birch Permian Holdings, Inc.* **** | | | 76,599 | |
| | 66,347 | | | | | Birch Permian Holdings, Inc.* **** | | | 597,123 | |
| | | | | | | | | | |
| | | | | | TOTAL UTILITIES | | | 673,722 | |
| | | | | | | | | | |
| | | |
| | | | | | TOTAL COMMON STOCKS (COST $1,610,355) | | | 673,728 | |
| | | | | | | | | | |
| | | |
| | | | | | CONVERTIBLE PREFERRED STOCKS — 0.3% | | | | |
| | |
| | | | | | Energy — 0.0% | |
| | 322 | | | | | Nine Point Energy Holdings, Inc., 0.00%* **** | | | 37,832 | |
| | | | | | | | | | |
| | |
| | | | | | Industrial — 0.0% | |
| | 4,300 | | | | | GFL Environmental, Inc., 6.00% | | | 196,897 | |
| | | | | | | | | | |
| | |
| | | | | | Technology — 0.2% | |
| | 1,941 | | | | | Broadcom, Inc., 8.00% | | | 1,813,593 | |
| | | | | | | | | | |
| | |
| | | | | | Utilities — 0.1% | |
| | 3,550 | | | | | NextEra Energy, Inc., 5.28% | | | 156,519 | |
| | 14,933 | | | | | Southern Co. (The), 6.75% | | | 663,025 | |
| | | | | | | | | | |
| | | | | | TOTAL UTILITIES | | | 819,544 | |
| | | | | | | | | | |
| | | |
| | | | | | TOTAL CONVERTIBLE PREFERRED STOCKS (COST $3,415,406) | | | 2,867,866 | |
| | | | | | | | | | |
| | | |
| | | | | | PREFERRED STOCKS — 0.0% | | | | |
| | |
| | | | | | Financial — 0.0% | |
| | 6,375 | | | | | B. Riley Financial, Inc., 6.50%‡ | | | 117,045 | |
| | 2,450 | | | | | B. Riley Financial, Inc., 6.88%‡ | | | 49,686 | |
| | | | | | | | | | |
| | | | | | TOTAL FINANCIAL | | | 166,731 | |
| | | | | | | | | | |
| | | |
| | | | | | TOTAL PREFERRED STOCKS (COST $220,625) | | | 166,731 | |
| | | | | | | | | | |
| | | |
| | | | | | WARRANT — 0.0% | | | | |
| | |
| | | | | | Energy — 0.0% | |
| | 77 | | | | | Amplify Energy Corp.* | | | — | |
| | | | | | | | | | |
| | | |
| | | | | | TOTAL WARRANT (COST $—) | | | — | |
| | | | | | | | | | |
See accompanying Notes to the Financial Statements.
138
Mercer Opportunistic Fixed Income Fund
Schedule of Investments (Continued)
(showing percentage of net assets)
March 31, 2020
| | | | | | | | | | |
| Notional Value | | | | | Description | | Value ($) | |
| | | |
| | | | | | OPTIONS PURCHASED — 0.1% | | | | |
| | |
| | | | | | PURCHASED CURRENCY OPTIONS — 0.0% | |
| | |
| | | | | | Call Options — 0.0% | |
| | 3,270,000 | USD | | | | USD/CAD Option with Goldman Sachs & Co., Strike Price CAD 1.38, Expires 06/09/20 | | | 110,931 | |
| | 3,030,000 | USD | | | | USD/EUR Option with Citigroup Global Markets, Inc., Strike Price EUR 1.08, Expires 04/24/20 | | | 16,041 | |
| | 2,400,000 | USD | | | | USD/EUR Option with JPMorgan Chase Bank N.A., Strike Price EUR 1.13, Expires 06/05/20 | | | 69,790 | |
| | 6,490,000 | USD | | | | USD/EUR Option with BNP Paribas S.A., Strike Price EUR 1.12, Expires 04/08/20 | | | 114,685 | |
| | |
| | | | | | Put Options — 0.0% | |
| | 2,930,000 | USD | | | | USD/BRL Option with Morgan Stanley & Co., Strike Price BRL 4.28, Expires 04/01/20 | | | 3 | |
| | 6,660,000 | USD | | | | USD/JPY Option with Goldman Sachs & Co., Strike Price JPY 104.80, Expires 06/03/20 | | | 75,797 | |
| | 2,380,000 | USD | | | | USD/MXN Option with Morgan Stanley & Co., Strike Price MXN 18.95, Expires 05/21/20 | | | 1,261 | |
| | 2,020,000 | USD | | | | USD/RUB Option with Goldman Sachs & Co., Strike Price RUB 62.86, Expires 04/24/20 | | | 162 | |
| | 2,380,000 | USD | | | | USD/RUB Option with Citigroup Global Markets, Inc., Strike Price RUB 63.96, Expires 05/26/20 | | | 859 | |
| | | | | | | | | | |
| | | |
| | | | | | TOTAL CURRENCY OPTIONS PURCHASED
(PREMIUMS PAID $391,553) | | | 389,529 | |
| | | | | | | | | | |
| | | |
Number of
Contracts | | | Notional
Value ($) | | Description | | Value ($) | |
| | | |
| | | | | | PURCHASED FUTURES OPTIONS — 0.1% | | | | |
| | |
| | | | | | Put Options — 0.1% | |
| | 4 | | | 513,950 | | S&P 500E-mini Futures with UBS Securities LLC, Strike Price $2,800.00, Expires 04/17/20 | | | 48,650 | |
| | 72 | | | 9,251,100 | | S&P 500E-mini Futures with UBS Securities LLC, Strike Price $2,000.00, Expires 04/17/20 | | | 43,200 | |
| | 67 | | | 8,608,663 | | S&P 500E-mini Futures with UBS Securities LLC, Strike Price $2,200.00, Expires 05/15/20 | | | 204,350 | |
| | 42 | | | 5,396,475 | | S&P 500E-mini Futures with UBS Securities LLC, Strike Price $2,500.00, Expires 06/19/20 | | | 350,700 | |
| | | | | | | | | | |
| | | |
| | | | | | TOTAL FUTURES OPTIONS PURCHASED (PREMIUMS PAID $1,212,437) | | | 646,900 | |
| | | | | | | | | | |
See accompanying Notes to the Financial Statements.
139
Mercer Opportunistic Fixed Income Fund
Schedule of Investments (Continued)
(showing percentage of net assets)
March 31, 2020
| | | | | | | | | | |
| Notional Value | | | | | Description | | Value ($) | |
| | | |
| | | | | | PURCHASED SWAPTION — 0.0% | | | | |
| | |
| | | | | | Put Swaption — 0.0% | |
| | 3,332,000 | USD | | | | CDX.NA.HY Index Option with Goldman Sachs & Co., Strike Price $90.00, Expires 05/20/20 | | | 87,386 | |
| | | | | | | | | | |
| | | | | | TOTAL PURCHASED SWAPTION (PREMIUMS PAID $111,622) | | | 87,386 | |
| | | | | | | | | | |
| | | |
| | | | | | TOTAL OPTIONS PURCHASED (PREMIUMS PAID $1,715,612) | | | 1,123,815 | |
| | | | | | | | | | |
| | | |
| Par Value ($) | | | | | Description | | Value ($) | |
| | | |
| | | | | | SHORT-TERM INVESTMENTS — 2.8% | | | | |
| | |
| | | | | | Certificate of Deposit — 0.1% | |
| | 1,000,000 | | | | | Syngenta Wilmington, Inc., 0.01%, due 05/27/20 | | | 995,104 | |
| | | | | | | | | | |
| | |
| | | | | | Mutual Fund - Securities Lending Collateral — 1.9% | |
| | 18,037,151 | | | | | State Street Institutional U.S. Government Money Market Fund, Premier Class, 0.32% ## ** | | | 18,037,151 | |
| | | | | | | | | | |
| | |
| | | | | | Sovereign Debt Obligations — 0.8% | |
| | 99,725,000 | EGP | | | | Egypt Treasury Bills, 11.50%, due 07/14/20‡‡ | | | 6,132,918 | |
| | 33,275,000 | EGP | | | | Egypt Treasury Bills, 8.73%, due 06/16/20‡‡ | | | 2,075,805 | |
| | | | | | | | | | |
| | | | | | TOTAL SOVEREIGN DEBT OBLIGATIONS | | | 8,208,723 | |
| | | | | | | | | | |
| | | |
| | | | | | TOTAL SHORT-TERM INVESTMENTS (COST $27,093,146) | | | 27,240,978 | |
| | | | | | | | | | |
| | | |
| | | | | | TOTAL INVESTMENTS — 90.6% (COST $972,385,967) | | | 875,255,080 | |
| | | |
| | | | | | Other Assets and Liabilities (net)(b) — 9.4% | | | 91,042,941 | |
| | | | | | | | | | |
| | | |
| | | | | | NET ASSETS — 100.0% | | $966,298,021 | |
| | | | | | | | | | |
See accompanying Notes to the Financial Statements.
140
Mercer Opportunistic Fixed Income Fund
Schedule of Investments (Continued)
March 31, 2020
| | | | | | | | | | |
| | | |
| | | | | | Notes to Schedule of Investments: | | | | |
| | | |
| | | | | | ARS — Auction Rate Security | | | | |
| | | |
| | | | | | CDI — Brazil Interbank Deposit Rate | | | | |
| | | |
| | | | | | CDX.NA.HY — Markit North America High Yield CDS Index | | | | |
| | | |
| | | | | | CLO — Collateralized Loan Obligation | | | | |
| | | |
| | | | | | CMO — Collateralized Mortgage Obligation | | | | |
| | | |
| | | | | | CMT — Constant Maturity Treasury Index | | | | |
| | | |
| | | | | | CNRR — China Fixing Repo Rates | | | | |
| | | |
| | | | | | FHLMC — Federal Home Loan Mortgage Corporation | | | | |
| | | |
| | | | | | FNMA — Federal National Mortgage Association | | | | |
| | | |
| | | | | | GDN — Global Depository Note | | | | |
| | | |
| | | | | | GMTN — Global Medium Term Note | | | | |
| | | |
| | | | | | ICE — Intercontinental Exchange | | | | |
| | | |
| | | | | | LIBOR — London Interbank Offered Rate | | | | |
| | | |
| | | | | | MTN — Medium Term Note | | | | |
| | | |
| | | | | | OTC —Over-The-Counter | | | | |
| | | |
| | | | | | PIK — Payment In Kind | | | | |
| | | |
| | | | | | REIT — Real Estate Investment Trust | | | | |
| | | |
| | | | | | SOFR — Secured Overnight Financing Rate | | | | |
| | | |
| | | | | | TBD — To Be Determined | | | | |
| | | |
| | | | | | TIIE — Mexican Interbank Equilibrium Interest Rate | | | | |
| | | |
| | | | | | UMBS — Uniform Mortgage-Backed Securities are single-class securities backed by fixed-rate mortgage loans purchased by either FHLMC or FNMA | | | | |
| | | |
| | | | # | | Year of maturity is greater than 2100. | | | | |
| | | |
| | | | ## | | The rate disclosed is the7-day net yield as of March 31, 2020. | | | | |
| | | |
| | | | ### | | This position represents an unsettled loan commitment at period end. Certain details associated with this purchase are not known prior to the settlement date, including coupon rate, which will be adjusted on settlement date. | | | | |
| | | |
| | | | * | | Non-income producing security. | | | | |
| | | |
| | | | ** | | Represents an investment of securities lending cash collateral. | | | | |
| | | |
| | | | *** | | All or a portion of this security is pledged for open futures collateral. | | | | |
| | | |
| | | | **** | | Securities fair valued by the Valuation Committee as approved by the Board of Trustees. The total market value of the securities at year end is $949,054 which represents 0.1% of net assets. The aggregate tax cost of these securities held at March 31, 2020 was $2,198,422. | | | | |
| | | |
| | | | ****** | | All or a portion of this security is pledged for forward foreign currency contracts, OTC swaps, and/or OTC options collateral. | | | | |
| | | |
| | | | ^ | | Level 3 - significant unobservable inputs were used in determining the value of this portfolio security. | | | | |
See accompanying Notes to the Financial Statements.
141
Mercer Opportunistic Fixed Income Fund
Schedule of Investments (Continued)
March 31, 2020
| | | | | | | | |
| | | |
| | | | ◆◆ | | Variable or floating rate security, which interest rate adjusts periodically based on changes in current interest rates and prepayments on the underlying pool of assets. Rate shown is the rate in effect as of period end. | | |
| | | |
| | | | † | | Variable or floating rate note. Rate shown is as of March 31, 2020. | | |
| | | |
| | | | †† | | Step bond that pays an initial coupon rate for the first period and then a lower/higher coupon rate for the following periods. Rate shown is current coupon rate. | | |
| | | |
| | | | †††† | | When-issued security. | | |
| | | |
| | | | ††††† | | Security is perpetual and has no stated maturity date. | | |
| | | |
| | | | ‡ | | All or a portion of this security is out on loan. | | |
| | | |
| | | | ‡‡ | | Interest rate presented is yield to maturity. | | |
| | | |
| | | | ‡‡‡ | | Security exempt from registration under Regulation S of the Securities Act of 1933, which exempts from registration securities offered and sold outside the United States. Security may not be offered or sold in the United States except pursuant to an exemption from, or in a transaction not subject to, the registration requirements of the Securities Act of 1933. | | |
| | | |
| | | | ‡‡‡‡ | | Restricted securities are not registered under the Securities Act of 1933 and are subject to legal restrictions on resale. These securities generally may be resold in transactions exempt from registration or to the public if the securities are subsequently registered. Disposal of these securities may involve time-consuming negotiations and prompt sale at an acceptable price may be difficult. As of year end, the market value of restricted securities was $3,988,861, which is 0.4% of net assets. See details shown in the Restricted Securities table that follows. | | |
| | | |
| | | | (a) | | Unless otherwise indicated, all par values are denominated in United States dollars ($). | | |
| | | |
| | | | (b) | | As of March 31, 2020, the value of unfunded loan commitments was $42,227 for the Fund. See Notes to Schedule of Investments. | | |
| | | |
| | | | 144A | | Securities exempt from registration under Rule 144A of the Securities Act of 1933. These securities may be resold in transactions exempt from registration, normally to qualified institutional buyers. The total market value of the securities at year end is $210,453,792 which represents 21.8% of net assets. | | |
See accompanying Notes to the Financial Statements.
142
Mercer Opportunistic Fixed Income Fund
Schedule of Investments (Continued)
March 31, 2020
At March 31, 2020, the Fund held the following restricted securities:
| | | | | | | | | | | | | | | | | | |
Restricted Securities | | | | Acquistion
Date | | Principal
Amount | | | Cost | | | Value | |
Abu Dhabi Crude Oil Pipeline LLC, 4.60%, due 11/02/47 | | | | 11/20/19 | | USD | | | 335,000 | | | $ | 382,801 | | | $ | 333,757 | |
| Altice France Holding SA, 4.00%, due 02/15/28 | | | | 01/23/20 | | EUR | | | 260,000 | | | | 287,183 | | | | 237,500 | |
Bonos de la Tesoreria de la Republica en pesos, 4.00%, due 03/01/23 | | | | 05/17/19 | | CLP | | | 300,000,000 | | | | 437,174 | | | | 376,265 | |
CSMC, Series 2019 RIO, 8.74%, due 12/15/22 | | | | 12/16/19 | | USD | | | 1,172,500 | | | | 1,172,500 | | | | 1,113,085 | |
Credit Agricole SA, 6.50% (5 year EUR swap plus 5.12%), due 04/29/49 | | | | 01/09/19 | | EUR | | | 300,000 | | | | 359,896 | | | | 315,061 | |
Fox Corp., 4.71%, due 01/25/29 | | | | 01/15/19 | | USD | | | 130,000 | | | | 130,700 | | | | 142,773 | |
Fox Corp., 5.48%, due 01/25/39 | | | | 01/17/19 | | USD | | | 210,000 | | | | 255,865 | | | | 244,089 | |
Magnolia Financial X DAC, Series2020-1, 1.00%, due 08/13/24 | | | | 02/02/20 | | USD | | | 1,000,000 | | | | 1,000,000 | | | | 1,000,000 | |
Vine Oil & Gas LP/Vine Oil & Gas Finance Corp., 8.75%, due 04/15/23 | | | | 01/18/19 | | USD | | | 300,000 | | | | 259,921 | | | | 73,500 | |
Vine Oil & Gas LP/Vine Oil & Gas Finance Corp., 9.75%, due 04/15/23 | | | | 09/28/18 | | USD | | | 585,000 | | | | 574,530 | | | | 152,831 | |
| | | | | | | | | | | | | | | | | | |
| | | | | | | | | | | | | | | | $ | 3,988,861 | |
| | | | | | | | | | | | | | | | | | |
Forward Foreign Currency Contracts
| | | | | | | | | | | | | | | | | | |
Currency Purchased | | | Currency Sold | | | Settlement
Date | | Counterparty | | Unrealized
Appreciation
(Depreciation) | |
| AUD | | | 623,314 | | | USD | | | 428,223 | | | 04/14/20 | | Barclays Bank Plc | | $ | (46,699 | ) |
| AUD | | | 2,370,000 | | | USD | | | 1,483,801 | | | 04/17/20 | | Citibank N.A. | | | (33,119 | ) |
| AUD | | | 1,290,000 | | | USD | | | 834,234 | | | 04/17/20 | | Morgan Stanley Capital Services, Inc. | | | (44,622 | ) |
| BRL | | | 16,248,750 | | | USD | | | 3,904,644 | | | 04/17/20 | | Citibank N.A. | | | (775,246 | ) |
| BRL | | | 17,181,370 | | | USD | | | 3,528,308 | | | 04/22/20 | | Citibank N.A. | | | (220,485 | ) |
| BRL | | | 1,278,000 | | | USD | | | 302,951 | | | 04/17/20 | | Goldman Sachs & Co. | | | (56,817 | ) |
| BRL | | | 1,017,370 | | | USD | | | 199,004 | | | 04/22/20 | | Goldman Sachs International | | | (3,136 | ) |
| BRL | | | 6,409,900 | | | USD | | | 1,372,864 | | | 04/16/20 | | JPMorgan Chase Bank N.A. | | | (138,272 | ) |
| BRL | | | 12,942,800 | | | USD | | | 2,619,180 | | | 04/22/20 | | JPMorgan Chase Bank N.A. | | | (127,382 | ) |
| BRL | | | 3,914,900 | | | USD | | | 802,509 | | | 04/22/20 | | Morgan Stanley and Co. International Plc | | | (48,797 | ) |
| BRL | | | 20,615,000 | | | USD | | | 4,583,148 | | | 04/02/20 | | Morgan Stanley Capital Services, Inc. | | | (608,483 | ) |
| BRL | | | 6,713,802 | | | USD | | | 1,322,604 | | | 04/03/20 | | Morgan Stanley Capital Services, Inc. | | | (28,249 | ) |
| BRL | | | 8,155,000 | | | USD | | | 1,918,430 | | | 05/04/20 | | Morgan Stanley Capital Services, Inc. | | | (349,753 | ) |
| BRL | | | 1,067,050 | | | USD | | | 214,036 | | | 04/22/20 | | Natwest Markets Plc | | | (8,604 | ) |
| CAD | | | 1,370,000 | | | USD | | | 1,030,728 | | | 04/17/20 | | BNP Paribas S.A. | | | (68,072 | ) |
| CAD | | | 2,122,158 | | | USD | | | 1,634,756 | | | 04/17/20 | | Citibank N.A. | | | (143,581 | ) |
| CAD | | | 474,270 | | | USD | | | 361,309 | | | 04/23/20 | | Citibank N.A. | | | (28,034 | ) |
| CAD | | | 662,082 | | | USD | | | 510,000 | | | 04/06/20 | | Goldman Sachs & Co. | | | (44,824 | ) |
| CAD | | | 2,958,260 | | | USD | | | 2,180,000 | | | 06/10/20 | | Goldman Sachs & Co. | | | (100,398 | ) |
| CLP | | | 315,607,490 | | | USD | | | 370,431 | | | 04/22/20 | | Barclays Bank Plc | | | 64 | |
| CLP | | | 291,703,410 | | | USD | | | 346,236 | | | 04/22/20 | | Citibank N.A. | | | (3,802 | ) |
| CLP | | | 305,123,160 | | | USD | | | 360,666 | | | 04/22/20 | | HSBC Bank Plc | | | (2,478 | ) |
| CLP | | | 1,027,529,400 | | | USD | | | 1,266,678 | | | 04/14/20 | | JPMorgan Chase Bank N.A. | | | (60,765 | ) |
| CLP | | | 4,054,057,100 | | | USD | | | 4,837,225 | | | 04/21/20 | | JPMorgan Chase Bank N.A. | | | (78,280 | ) |
| CNH | | | 13,183,190 | | | USD | | | 1,867,261 | | | 04/22/20 | | Bank of America, N.A. | | | (7,372 | ) |
See accompanying Notes to the Financial Statements.
143
Mercer Opportunistic Fixed Income Fund
Schedule of Investments (Continued)
March 31, 2020
Forward Foreign Currency Contracts — continued
| | | | | | | | | | | | | | | | | | |
Currency Purchased | | | Currency Sold | | | Settlement
Date | | Counterparty | | Unrealized
Appreciation
(Depreciation) | |
| CNH | | | 33,080,000 | | | USD | | | 4,715,750 | | | 04/22/20 | | Goldman Sachs International | | $ | (48,813 | ) |
| CNH | | | 4,616,390 | | | USD | | | 648,852 | | | 04/22/20 | | HSBC Bank Plc | | | 2,430 | |
| CNH | | | 996,430 | | | USD | | | 139,994 | | | 04/22/20 | | Natwest Markets Plc | | | 582 | |
| COP | | | 1,227,988,480 | | | USD | | | 308,540 | | | 04/22/20 | | Barclays Bank Plc | | | (6,459 | ) |
| COP | | | 2,567,751,370 | | | USD | | | 621,732 | | | 04/22/20 | | Goldman Sachs International | | | 9,925 | |
| COP | | | 4,185,477,000 | | | USD | | | 1,027,111 | | | 04/14/20 | | JPMorgan Chase Bank N.A. | | | 3,148 | |
| COP | | | 1,820,956,580 | | | USD | | | 448,291 | | | 04/22/20 | | JPMorgan Chase Bank N.A. | | | (342 | ) |
| CZK | | | 8,946,046 | | | USD | | | 355,986 | | | 04/22/20 | | Bank of America, N.A. | | | 2,352 | |
| CZK | | | 122,908,310 | | | USD | | | 5,431,535 | | | 04/22/20 | | Citibank N.A. | | | (508,388 | ) |
| CZK | | | 4,852,860 | | | USD | | | 198,328 | | | 04/22/20 | | Deutsche Bank AG | | | (3,944 | ) |
| CZK | | | 19,135,644 | | | USD | | | 750,858 | | | 04/22/20 | | JPMorgan Chase Bank N.A. | | | 15,629 | |
| CZK | | | 49,907,000 | | | USD | | | 2,233,775 | | | 06/17/20 | | JPMorgan Chase Bank N.A. | | | (232,577 | ) |
| EUR | | | 4,204,540 | | | USD | | | 4,685,613 | | | 04/22/20 | | Bank of America, N.A. | | | (68,806 | ) |
| EUR | | | 1,360,000 | | | USD | | | 1,544,211 | | | 04/14/20 | | BNP Paribas S.A. | | | (51,355 | ) |
| EUR | | | 1,899,083 | | | USD | | | 2,066,063 | | | 04/17/20 | | BNP Paribas S.A. | | | 18,797 | |
| EUR | | | 4,039,932 | | | USD | | | 4,459,369 | | | 04/17/20 | | Citibank N.A. | | | (24,230 | ) |
| EUR | | | 1,433,000 | | | USD | | | 1,589,340 | | | 04/28/20 | | Citibank N.A. | | | (15,438 | ) |
| EUR | | | 2,766,087 | | | USD | | | 3,091,545 | | | 04/22/20 | | Goldman Sachs International | | | (54,235 | ) |
| EUR | | | 545,853 | | | USD | | | 609,980 | | | 04/22/20 | | JPMorgan Chase Bank N.A. | | | (10,604 | ) |
| EUR | | | 577,300 | | | USD | | | 643,187 | | | 05/04/20 | | JPMorgan Chase Bank N.A. | | | (8,965 | ) |
| EUR | | | 1,635,000 | | | USD | | | 1,848,776 | | | 04/22/20 | | State Street Bank London | | | (53,459 | ) |
| EUR | | | 83,640 | | | USD | | | 95,365 | | | 04/22/20 | | Toronto Dominion Bank | | | (3,524 | ) |
| GBP | | | 919,590 | | | USD | | | 1,202,971 | | | 04/17/20 | | Citibank N.A. | | | (62,409 | ) |
| GBP | | | 436,740 | | | USD | | | 577,283 | | | 05/04/20 | | Morgan Stanley Capital Services, Inc. | | | (35,380 | ) |
| HUF | | | 306,297,560 | | | USD | | | 1,001,361 | | | 04/22/20 | | Bank of America, N.A. | | | (69,150 | ) |
| HUF | | | 85,072,330 | | | USD | | | 275,643 | | | 04/22/20 | | Goldman Sachs International | | | (16,727 | ) |
| HUF | | | 243,908,640 | | | USD | | | 754,153 | | | 04/22/20 | | HSBC Bank Plc | | | (11,821 | ) |
| HUF | | | 128,864,190 | | | USD | | | 395,134 | | | 04/22/20 | | JPMorgan Chase Bank N.A. | | | (2,938 | ) |
| HUF | | | 88,096,000 | | | USD | | | 284,861 | | | 06/17/20 | | JPMorgan Chase Bank N.A. | | | (16,373 | ) |
| HUF | | | 988,746,418 | | | USD | | | 3,349,540 | | | 04/22/20 | | Morgan Stanley and Co. International Plc | | | (340,308 | ) |
| IDR | | | 2,109,670,400 | | | USD | | | 128,914 | | | 04/22/20 | | Bank of America, N.A. | | | 201 | |
| IDR | | | 2,100,000,000 | | | USD | | | 139,535 | | | 04/22/20 | | Citibank N.A. | | | (11,012 | ) |
| IDR | | | 64,900,000,000 | | | USD | | | 4,535,290 | | | 04/06/20 | | Deutsche Bank AG | | | (557,530 | ) |
| IDR | | | 16,019,337,650 | | | USD | | | 1,013,026 | | | 04/22/20 | | Deutsche Bank AG | | | (32,621 | ) |
| IDR | | | 1,429,040,000 | | | USD | | | 93,708 | | | 04/22/20 | | Goldman Sachs International | | | (6,248 | ) |
| IDR | | | 53,261,452,182 | | | USD | | | 3,580,212 | | | 04/22/20 | | HSBC Bank Plc | | | (320,538 | ) |
| IDR | | | 5,207,800,000 | | | USD | | | 343,432 | | | 04/16/20 | | JPMorgan Chase Bank N.A. | | | (24,532 | ) |
| IDR | | | 23,420,071,000 | | | USD | | | 1,489,520 | | | 04/23/20 | | JPMorgan Chase Bank N.A. | | | (56,310 | ) |
| IDR | | | 5,856,220,120 | | | USD | | | 393,828 | | | 04/22/20 | | Morgan Stanley and Co. International Plc | | | (35,419 | ) |
| IDR | | | 173,262,280,000 | | | USD | | | 10,675,433 | | | 04/27/20 | | Morgan Stanley Capital Services, Inc. | | | (76,407 | ) |
| IDR | | | 28,000,000,000 | | | USD | | | 2,031,955 | | | 05/04/20 | | Morgan Stanley Capital Services, Inc. | | | (320,202 | ) |
| IDR | | | 9,262,249,286 | | | USD | | | 649,071 | | | 06/05/20 | | Morgan Stanley Capital Services, Inc. | | | (84,390 | ) |
| INR | | | 31,371,880 | | | USD | | | 398,981 | | | 06/19/20 | | HSBC Bank Plc | | | 12,156 | |
| INR | | | 29,872,670 | | | USD | | | 386,151 | | | 06/19/20 | | JPMorgan Chase Bank N.A. | | | 5,338 | |
| INR | | | 116,291,060 | | | USD | | | 1,550,788 | | | 04/22/20 | | Morgan Stanley and Co. International Plc | | | (16,905 | ) |
| JPY | | | 252,430,580 | | | USD | | | 2,366,657 | | | 04/22/20 | | Bank of America, N.A. | | | (26,363 | ) |
| JPY | | | 63,080,000 | | | USD | | | 579,386 | | | 04/17/20 | | Barclays Bank Plc | | | 5,286 | |
| JPY | | | 500,710,000 | | | USD | | | 4,738,726 | | | 04/17/20 | | Citibank N.A. | | | (97,774 | ) |
See accompanying Notes to the Financial Statements.
144
Mercer Opportunistic Fixed Income Fund
Schedule of Investments (Continued)
March 31, 2020
Forward Foreign Currency Contracts — continued
| | | | | | | | | | | | | | | | | | |
Currency Purchased | | | Currency Sold | | | Settlement
Date | | Counterparty | | Unrealized
Appreciation
(Depreciation) | |
| JPY | | | 77,378,947 | | | USD | | | 713,986 | | | 04/22/20 | | Deutsche Bank AG | | $ | 3,397 | |
| JPY | | | 214,080,403 | | | USD | | | 1,962,722 | | | 04/17/20 | | Goldman Sachs & Co. | | | 21,534 | |
| JPY | | | 1,750,242,763 | | | USD | | | 16,262,859 | | | 04/22/20 | | Goldman Sachs International | | | (36,286 | ) |
| JPY | | | 34,490,000 | | | USD | | | 314,936 | | | 04/17/20 | | JPMorgan Chase Bank N.A. | | | 4,743 | |
| JPY | | | 360,967,290 | | | USD | | | 3,299,502 | | | 04/22/20 | | Morgan Stanley and Co. International Plc | | | 47,041 | |
| JPY | | | 283,569,370 | | | USD | | | 2,691,719 | | | 04/22/20 | | UBS AG | | | (62,736 | ) |
| KRW | | | 2,768,808,350 | | | USD | | | 2,336,212 | | | 04/14/20 | | JPMorgan Chase Bank N.A. | | | (60,934 | ) |
| KRW | | | 8,270,068,650 | | | USD | | | 6,918,585 | | | 04/16/20 | | JPMorgan Chase Bank N.A. | | | (122,202 | ) |
| KRW | | | 1,336,710,000 | | | USD | | | 1,125,792 | | | 04/17/20 | | JPMorgan Chase Bank N.A. | | | (27,242 | ) |
| KZT | | | 118,425,370 | | | USD | | | 307,598 | | | 04/16/20 | | Barclays Bank Plc | | | (44,755 | ) |
| KZT | | | 164,803,640 | | | USD | | | 427,617 | | | 05/04/20 | | Citibank N.A. | | | (63,738 | ) |
| KZT | | | 212,967,080 | | | USD | | | 507,064 | | | 04/16/20 | | Goldman Sachs International | | | (34,387 | ) |
| MXN | | | 15,933,614 | | | USD | | | 662,023 | | | 04/22/20 | | Bank of America, N.A. | | | 15,169 | |
| MXN | | | 4,833,980 | | | USD | | | 228,037 | | | 04/22/20 | | Barclays Bank Plc | | | (22,588 | ) |
| MXN | | | 84,446,012 | | | USD | | | 3,888,620 | | | 04/17/20 | | Citibank N.A. | | | (296,990 | ) |
| MXN | | | 29,835,044 | | | USD | | | 1,364,374 | | | 04/22/20 | | Citibank N.A. | | | (96,360 | ) |
| MXN | | | 32,047,740 | | | USD | | | 1,336,353 | | | 04/22/20 | | Deutsche Bank AG | | | 25,704 | |
| MXN | | | 20,060,000 | | | USD | | | 1,050,823 | | | 04/17/20 | | Goldman Sachs & Co. | | | (197,638 | ) |
| MXN | | | 91,060,000 | | | USD | | | 3,680,530 | | | 04/13/20 | | Goldman Sachs International | | | 194,652 | |
| MXN | | | 30,018,676 | | | USD | | | 1,385,598 | | | 04/22/20 | | Goldman Sachs International | | | (109,778 | ) |
| MXN | | | 74,930,000 | | | USD | | | 3,190,615 | | | 04/27/20 | | Goldman Sachs International | | | (8,331 | ) |
| MXN | | | 9,452,450 | | | USD | | | 446,712 | | | 04/22/20 | | HSBC Bank Plc | | | (44,975 | ) |
| MXN | | | 10,803,536 | | | USD | | | 509,661 | | | 04/22/20 | | JPMorgan Chase Bank N.A. | | | (50,502 | ) |
| MXN | | | 105,139,600 | | | USD | | | 4,451,244 | | | 05/11/20 | | JPMorgan Chase Bank N.A. | | | 4,530 | |
| MXN | | | 3,796,541 | | | USD | | | 156,775 | | | 04/22/20 | | Morgan Stanley and Co. International Plc | | | 4,581 | |
| MXN | | | 9,484,166 | | | USD | | | 392,569 | | | 04/22/20 | | State Street Bank London | | | 10,516 | |
| MXN | | | 7,598,501 | | | USD | | | 313,550 | | | 04/22/20 | | Toronto Dominion Bank | | | 9,392 | |
| MXN | | | 7,773,400 | | | USD | | | 342,470 | | | 04/22/20 | | UBS AG | | | (12,094 | ) |
| PEN | | | 2,521,670 | | | USD | | | 709,630 | | | 04/22/20 | | Goldman Sachs International | | | 23,163 | |
| PEN | | | 112,000 | | | USD | | | 32,428 | | | 04/14/20 | | JPMorgan Chase Bank N.A. | | | 128 | |
| PEN | | | 256,000 | | | USD | | | 74,365 | | | 04/16/20 | | JPMorgan Chase Bank N.A. | | | 43 | |
| PEN | | | 256,000 | | | USD | | | 73,494 | | | 04/17/20 | | JPMorgan Chase Bank N.A. | | | 912 | |
| PHP | | | 2,438,380 | | | USD | | | 48,166 | | | 04/22/20 | | HSBC Bank Plc | | | (289 | ) |
| PHP | | | 18,780,000 | | | USD | | | 370,385 | | | 04/14/20 | | JPMorgan Chase Bank N.A. | | | (1,387 | ) |
| PLN | | | 6,849,020 | | | USD | | | 1,624,074 | | | 04/22/20 | | Bank of America, N.A. | | | 24,599 | |
| PLN | | | 9,842,860 | | | USD | | | 2,593,806 | | | 04/22/20 | | Barclays Bank Plc | | | (224,467 | ) |
| PLN | | | 1,784,390 | | | USD | | | 446,862 | | | 04/22/20 | | HSBC Bank Plc | | | (17,330 | ) |
| PLN | | | 730,910 | | | USD | | | 173,895 | | | 04/22/20 | | JPMorgan Chase Bank N.A. | | | 2,047 | |
| PLN | | | 27,909,000 | | | USD | | | 7,347,818 | | | 06/17/20 | | JPMorgan Chase Bank N.A. | | | (630,779 | ) |
| PLN | | | 1,488,550 | | | USD | | | 386,148 | | | 04/22/20 | | Natwest Markets Plc | | | (27,830 | ) |
| RON | | | 610,570 | | | USD | | | 141,033 | | | 04/22/20 | | JPMorgan Chase Bank N.A. | | | (2,633 | ) |
| RON | | | 22,423,000 | | | USD | | | 5,278,485 | | | 06/17/20 | | JPMorgan Chase Bank N.A. | | | (214,350 | ) |
| RUB | | | 25,778,780 | | | USD | | | 355,982 | | | 04/22/20 | | Barclays Bank Plc | | | (27,092 | ) |
| RUB | | | 76,004,064 | | | USD | | | 1,187,476 | | | 04/17/20 | | Citibank N.A. | | | (217,020 | ) |
| RUB | | | 11,830,000 | | | USD | | | 160,712 | | | 04/22/20 | | Citibank N.A. | | | (9,783 | ) |
| RUB | | | 95,790,000 | | | USD | | | 1,506,271 | | | 04/17/20 | | Goldman Sachs & Co. | | | (283,179 | ) |
| RUB | | | 223,530,390 | | | USD | | | 3,064,639 | | | 04/22/20 | | Goldman Sachs International | | | (212,800 | ) |
| RUB | | | 55,405,240 | | | USD | | | 700,889 | | | 04/23/20 | | HSBC Bank Plc | | | 5,867 | |
See accompanying Notes to the Financial Statements.
145
Mercer Opportunistic Fixed Income Fund
Schedule of Investments (Continued)
March 31, 2020
Forward Foreign Currency Contracts — continued
| | | | | | | | | | | | | | | | | | |
Currency Purchased | | | Currency Sold | | | Settlement
Date | | Counterparty | | Unrealized
Appreciation
(Depreciation) | |
| RUB | | | 250,884,000 | | | USD | | | 3,274,344 | | | 04/16/20 | | JPMorgan Chase Bank N.A. | | $ | (70,424 | ) |
| RUB | | | 69,790,000 | | | USD | | | 887,141 | | | 04/17/20 | | JPMorgan Chase Bank N.A. | | | 3,971 | |
| RUB | | | 101,717,680 | | | USD | | | 1,273,062 | | | 04/23/20 | | JPMorgan Chase Bank N.A. | | | 24,460 | |
| RUB | | | 50,433,630 | | | USD | | | 668,704 | | | 04/22/20 | | Morgan Stanley and Co. International Plc | | | (25,263 | ) |
| RUB | | | 308,430,000 | | | USD | | | 3,853,930 | | | 04/13/20 | | Morgan Stanley Capital Services, Inc. | | | 86,791 | |
| RUB | | | 115,665,000 | | | USD | | | 1,818,839 | | | 05/06/20 | | Morgan Stanley Capital Services, Inc. | | | (346,489 | ) |
| THB | | | 59,298,670 | | | USD | | | 1,821,368 | | | 04/22/20 | | Goldman Sachs International | | | (14,389 | ) |
| THB | | | 43,493,460 | | | USD | | | 1,333,234 | | | 04/22/20 | | HSBC Bank Plc | | | (7,880 | ) |
| THB | | | 12,353,000 | | | USD | | | 379,567 | | | 04/22/20 | | JPMorgan Chase Bank N.A. | | | (3,140 | ) |
| THB | | | 204,627,400 | | | USD | | | 6,281,731 | | | 04/24/20 | | JPMorgan Chase Bank N.A. | | | (46,149 | ) |
| THB | | | 410,530,260 | | | USD | | | 13,044,094 | | | 04/22/20 | | Morgan Stanley and Co. International Plc | | | (534,210 | ) |
| TRY | | | 11,822,640 | | | USD | | | 1,833,694 | | | 06/19/20 | | Bank of America, N.A. | | | (79,929 | ) |
| TRY | | | 2,530,360 | | | USD | | | 397,855 | | | 06/19/20 | | Barclays Bank Plc | | | (22,503 | ) |
| TRY | | | 12,365,000 | | | USD | | | 2,026,510 | | | 05/04/20 | | BNP Paribas S.A. | | | (168,910 | ) |
| TRY | | | 18,961,200 | | | USD | | | 2,971,876 | | | 06/19/20 | | Citibank N.A. | | | (159,182 | ) |
| TRY | | | 11,421,380 | | | USD | | | 1,774,475 | | | 06/19/20 | | Goldman Sachs International | | | (80,234 | ) |
| TRY | | | 32,409,530 | | | USD | | | 5,076,634 | | | 06/19/20 | | HSBC Bank Plc | | | (269,022 | ) |
| TRY | | | 26,014,000 | | | USD | | | 4,180,869 | | | 04/17/20 | | JPMorgan Chase Bank N.A. | | | (251,915 | ) |
| TRY | | | 9,556,980 | | | USD | | | 1,494,430 | | | 06/19/20 | | JPMorgan Chase Bank N.A. | | | (76,753 | ) |
| TRY | | | 12,784,178 | | | USD | | | 2,053,686 | | | 06/19/20 | | Morgan Stanley and Co. International Plc | | | (157,288 | ) |
| TRY | | | 4,011,380 | | | USD | | | 659,328 | | | 06/19/20 | | Natwest Markets Plc | | | (64,283 | ) |
| TRY | | | 2,329,132 | | | USD | | | 350,187 | | | 06/19/20 | | UBS AG | | | (4,685 | ) |
| ZAR | | | 6,238,730 | | | USD | | | 355,348 | | | 04/22/20 | | Bank of America, N.A. | | | (7,085 | ) |
| ZAR | | | 14,460,000 | | | USD | | | 970,558 | | | 05/04/20 | | Bank of America, N.A. | | | (164,812 | ) |
| ZAR | | | 20,174,754 | | | USD | | | 1,193,183 | | | 04/22/20 | | Barclays Bank Plc | | | (66,975 | ) |
| ZAR | | | 30,191,100 | | | USD | | | 1,831,961 | | | 04/22/20 | | Citibank N.A. | | | (146,614 | ) |
| ZAR | | | 13,137,350 | | | USD | | | 813,407 | | | 04/22/20 | | Deutsche Bank AG | | | (80,045 | ) |
| ZAR | | | 5,670,840 | | | USD | | | 340,693 | | | 04/22/20 | | HSBC Bank Plc | | | (24,132 | ) |
| ZAR | | | 17,919,736 | | | USD | | | 1,063,729 | | | 04/22/20 | | JPMorgan Chase Bank N.A. | | | (63,402 | ) |
| ZAR | | | 35,574,000 | | | USD | | | 2,004,856 | | | 05/19/20 | | JPMorgan Chase Bank N.A. | | | (26,277 | ) |
| ZAR | | | 2,930,000 | | | USD | | | 169,116 | | | 04/22/20 | | Morgan Stanley and Co. International Plc | | | (5,556 | ) |
| ZAR | | | 15,808,160 | | | USD | | | 912,611 | | | 04/22/20 | | UBS AG | | | (30,157 | ) |
| USD | | | 285,126 | | | AUD | | | 410,000 | | | 04/17/20 | | Citibank N.A. | | | 34,164 | |
| USD | | | 429,152 | | | AUD | | | 623,314 | | | 04/14/20 | | JPMorgan Chase Bank N.A. | | | 47,627 | |
| USD | | | 2,935,575 | | | AUD | | | 4,285,322 | | | 04/17/20 | | JPMorgan Chase Bank N.A. | | | 312,520 | |
| USD | | | 482,414 | | | BRL | | | 2,464,170 | | | 04/22/20 | | Bank of America, N.A. | | | 8,002 | |
| USD | | | 3,134,744 | | | BRL | | | 15,695,140 | | | 04/22/20 | | Citibank N.A. | | | 113,055 | |
| USD | | | 1,195,936 | | | BRL | | | 5,608,580 | | | 04/22/20 | | Deutsche Bank AG | | | 116,150 | |
| USD | | | 528,866 | | | BRL | | | 2,478,000 | | | 04/22/20 | | HSBC Bank Plc | | | 51,792 | |
| USD | | | 2,213,776 | | | BRL | | | 9,992,100 | | | 04/14/20 | | JPMorgan Chase Bank N.A. | | | 288,950 | |
| USD | | | 1,405,160 | | | BRL | | | 6,536,100 | | | 04/16/20 | | JPMorgan Chase Bank N.A. | | | 146,261 | |
| USD | | | 1,622,722 | | | BRL | | | 8,226,400 | | | 04/22/20 | | JPMorgan Chase Bank N.A. | | | 38,944 | |
| USD | | | 4,582,639 | | | BRL | | | 20,615,000 | | | 04/02/20 | | Morgan Stanley Capital Services, Inc. | | | 607,973 | |
| USD | | | 1,570,480 | | | BRL | | | 6,713,802 | | | 04/03/20 | | Morgan Stanley Capital Services, Inc. | | | 276,125 | |
| USD | | | 1,321,511 | | | BRL | | | 6,713,802 | | | 04/17/20 | | Morgan Stanley Capital Services, Inc. | | | 28,478 | |
| USD | | | 1,896,953 | | | BRL | | | 8,155,000 | | | 05/04/20 | | Morgan Stanley Capital Services, Inc. | | | 328,276 | |
| USD | | | 510,000 | | | CAD | | | 661,656 | | | 04/06/20 | | Barclays Bank Plc | | | 45,123 | |
| USD | | | 361,101 | | | CAD | | | 474,270 | | | 04/23/20 | | BNP Paribas S.A. | | | 27,827 | |
See accompanying Notes to the Financial Statements.
146
Mercer Opportunistic Fixed Income Fund
Schedule of Investments (Continued)
March 31, 2020
Forward Foreign Currency Contracts — continued
| | | | | | | | | | | | | | | | | | |
Currency Purchased | | | Currency Sold | | | Settlement
Date | | Counterparty | | Unrealized
Appreciation
(Depreciation) | |
| USD | | | 305 | | | CAD | | | 426 | | | 04/06/20 | | Citibank N.A. | | $ | 5 | |
| USD | | | 2,181,229 | | | CAD | | | 2,958,260 | | | 06/10/20 | | Citibank N.A. | | | 101,627 | |
| USD | | | 469,982 | | | CAD | | | 621,999 | | | 04/17/20 | | JPMorgan Chase Bank N.A. | | | 32,922 | |
| USD | | | 715,564 | | | CLP | | | 596,899,040 | | | 04/22/20 | | Barclays Bank Plc | | | 14,857 | |
| USD | | | 1,187,765 | | | CLP | | | 1,016,749,840 | | | 04/22/20 | | Citibank N.A. | | | (5,809 | ) |
| USD | | | 640,968 | | | CLP | | | 544,927,550 | | | 04/22/20 | | Credit Suisse International | | | 1,272 | |
| USD | | | 781,707 | | | CLP | | | 663,091,090 | | | 04/22/20 | | JPMorgan Chase Bank N.A. | | | 3,297 | |
| USD | | | 498,936 | | | COP | | | 1,917,410,410 | | | 04/22/20 | | Bank of America, N.A. | | | 27,260 | |
| USD | | | 360,132 | | | COP | | | 1,483,745,670 | | | 04/22/20 | | Barclays Bank Plc | | | (4,863 | ) |
| USD | | | 4,912,090 | | | COP | | | 17,966,711,100 | | | 04/14/20 | | JPMorgan Chase Bank N.A. | | | 489,568 | |
| USD | | | 1,766,323 | | | COP | | | 6,810,007,395 | | | 04/22/20 | | JPMorgan Chase Bank N.A. | | | 91,087 | |
| USD | | | 336,598 | | | COP | | | 1,404,286,910 | | | 04/22/20 | | Morgan Stanley and Co. International Plc | | | (8,851 | ) |
| USD | | | 352,757 | | | CZK | | | 8,197,361 | | | 04/22/20 | | Deutsche Bank AG | | | 24,408 | |
| USD | | | 142,215 | | | CZK | | | 3,670,000 | | | 04/22/20 | | Goldman Sachs International | | | (4,789 | ) |
| USD | | | 63,616 | | | CZK | | | 1,477,359 | | | 04/22/20 | | JPMorgan Chase Bank N.A. | | | 4,439 | |
| USD | | | 2,121,844 | | | CZK | | | 48,034,300 | | | 06/17/20 | | JPMorgan Chase Bank N.A. | | | 195,739 | |
| USD | | | 122,683 | | | EUR | | | 110,000 | | | 04/20/20 | | Bank of America, N.A. | | | 1,907 | |
| USD | | | 2,952,865 | | | EUR | | | 2,681,590 | | | 04/22/20 | | Bank of America, N.A. | | | 8,337 | |
| USD | | | 247,360 | | | EUR | | | 230,000 | | | 04/24/20 | | Bank of America, N.A. | | | (5,213 | ) |
| USD | | | 1,141,934 | | | EUR | | | 1,025,000 | | | 04/30/20 | | Bank of America, N.A. | | | 16,056 | |
| USD | | | 2,499,753 | | | EUR | | | 2,265,000 | | | 04/21/20 | | Barclays Bank Plc | | | 12,767 | |
| USD | | | 800,538 | | | EUR | | | 745,000 | | | 04/24/20 | | Barclays Bank Plc | | | (17,579 | ) |
| USD | | | 1,266,511 | | | EUR | | | 1,145,000 | | | 04/06/20 | | BNP Paribas S.A. | | | 10,021 | |
| USD | | | 4,883,252 | | | EUR | | | 4,377,600 | | | 04/17/20 | | BNP Paribas S.A. | | | 77,414 | |
| USD | | | 3,689,265 | | | EUR | | | 3,352,196 | | | 04/17/20 | | Citibank N.A. | | | 9,140 | |
| USD | | | 452,110 | | | EUR | | | 405,000 | | | 04/20/20 | | Deutsche Bank AG | | | 7,435 | |
| USD | | | 1,643,353 | | | EUR | | | 1,495,000 | | | 05/04/20 | | Deutsche Bank AG | | | 946 | |
| USD | | | 1,863,569 | | | EUR | | | 1,650,380 | | | 04/17/20 | | Goldman Sachs & Co. | | | 51,740 | |
| USD | | | 698,703 | | | EUR | | | 615,000 | | | 04/14/20 | | Goldman Sachs International | | | 23,625 | |
| USD | | | 291,638 | | | EUR | | | 265,000 | | | 04/22/20 | | Goldman Sachs International | | | 654 | |
| USD | | | 640,815 | | | EUR | | | 565,000 | | | 04/14/20 | | HSBC Bank USA, N.A. | | | 20,621 | |
| USD | | | 2,734,024 | | | EUR | | | 2,495,000 | | | 04/27/20 | | HSBC Bank USA, N.A. | | | (6,187 | ) |
| USD | | | 1,181,531 | | | EUR | | | 1,090,000 | | | 04/17/20 | | JPMorgan Chase Bank N.A. | | | (15,099 | ) |
| USD | | | 1,481,418 | | | EUR | | | 1,359,840 | | | 04/22/20 | | JPMorgan Chase Bank N.A. | | | (11,758 | ) |
| USD | | | 1,992,689 | | | EUR | | | 1,785,000 | | | 04/14/20 | | Standard Chartered Bank | | | 33,315 | |
| USD | | | 1,673,240 | | | EUR | | | 1,500,000 | | | 04/06/20 | | State Street Bank and Trust | | | 27,184 | |
| USD | | | 811,803 | | | EUR | | | 755,000 | | | 04/24/20 | | State Street Bank and Trust | | | (17,296 | ) |
| USD | | | 1,519,065 | | | GBP | | | 1,150,000 | | | 04/17/20 | | Citibank N.A. | | | 92,728 | |
| USD | | | 325,769 | | | GBP | | | 250,000 | | | 04/17/20 | | Goldman Sachs & Co. | | | 15,696 | |
| USD | | | 584,043 | | | GBP | | | 495,000 | | | 04/27/20 | | HSBC Bank USA, N.A. | | | (30,047 | ) |
| USD | | | 446,505 | | | GBP | | | 365,000 | | | 04/17/20 | | Standard Chartered Bank | | | (6,203 | ) |
| USD | | | 263,569 | | | GBP | | | 215,000 | | | 04/20/20 | | UBS AG | | | (3,113 | ) |
| USD | | | 733,953 | | | HUF | | | 225,360,380 | | | 04/22/20 | | Bank of America, N.A. | | | 48,073 | |
| USD | | | 237,813 | | | HUF | | | 76,400,000 | | | 04/22/20 | | HSBC Bank Plc | | | 5,290 | |
| USD | | | 161,988 | | | HUF | | | 52,950,000 | | | 06/17/20 | | JPMorgan Chase Bank N.A. | | | 614 | |
| USD | | | 1,575,982 | | | IDR | | | 22,174,062,712 | | | 04/17/20 | | Barclays Bank Plc | | | 218,275 | |
| USD | | | 4,533,073 | | | IDR | | | 64,900,000,000 | | | 04/06/20 | | Deutsche Bank AG | | | 555,312 | |
| USD | | | 1,239,730 | | | IDR | | | 18,964,974,280 | | | 04/22/20 | | Deutsche Bank AG | | | 79,047 | |
See accompanying Notes to the Financial Statements.
147
Mercer Opportunistic Fixed Income Fund
Schedule of Investments (Continued)
March 31, 2020
Forward Foreign Currency Contracts — continued
| | | | | | | | | | | | | | | | | | |
Currency Purchased | | | Currency Sold | | | Settlement
Date | | Counterparty | | Unrealized
Appreciation
(Depreciation) | |
| USD | | | 639,791 | | | IDR | | | 10,066,347,930 | | | 04/22/20 | | HSBC Bank Plc | | $ | 23,717 | |
| USD | | | 792,253 | | | IDR | | | 11,282,479,021 | | | 04/14/20 | | JPMorgan Chase Bank N.A. | | | 101,242 | |
| USD | | | 3,417,319 | | | IDR | | | 49,704,899,520 | | | 04/16/20 | | JPMorgan Chase Bank N.A. | | | 373,634 | |
| USD | | | 2,694,866 | | | IDR | | | 41,025,360,000 | | | 04/17/20 | | JPMorgan Chase Bank N.A. | | | 182,904 | |
| USD | | | 353,559 | | | IDR | | | 5,130,854,600 | | | 04/22/20 | | JPMorgan Chase Bank N.A. | | | 39,544 | |
| USD | | | 2,011,277 | | | IDR | | | 29,515,491,555 | | | 04/23/20 | | JPMorgan Chase Bank N.A. | | | 205,054 | |
| USD | | | 5,486,996 | | | IDR | | | 91,169,553,945 | | | 04/24/20 | | JPMorgan Chase Bank N.A. | | | (91,683 | ) |
| USD | | | 311,094 | | | IDR | | | 4,489,079,286 | | | 06/05/20 | | JPMorgan Chase Bank N.A. | | | 37,413 | |
| USD | | | 10,352,670 | | | IDR | | | 173,262,280,000 | | | 04/27/20 | | Morgan Stanley Capital Services, Inc. | | | (246,356 | ) |
| USD | | | 2,006,449 | | | IDR | | | 28,000,000,000 | | | 05/04/20 | | Morgan Stanley Capital Services, Inc. | | | 294,696 | |
| USD | | | 332,857 | | | IDR | | | 4,773,170,000 | | | 06/05/20 | | Morgan Stanley Capital Services, Inc. | | | 41,856 | |
| USD | | | 136,029 | | | INR | | | 10,483,750 | | | 04/22/20 | | JPMorgan Chase Bank N.A. | | | (2,252 | ) |
| USD | | | 4,358,635 | | | JPY | | | 459,784,770 | | | 04/22/20 | | Bank of America, N.A. | | | 95,951 | |
| USD | | | 19,714,814 | | | JPY | | | 2,050,005,470 | | | 04/22/20 | | Barclays Bank Plc | | | 709,129 | |
| USD | | | 1,487,653 | | | JPY | | | 165,026,715 | | | 04/17/20 | | Citibank N.A. | | | (41,937 | ) |
| USD | | | 2,000,756 | | | JPY | | | 213,443,660 | | | 04/22/20 | | Deutsche Bank AG | | | 21,911 | |
| USD | | | 159,840 | | | JPY | | | 16,762,421 | | | 06/05/20 | | Goldman Sachs & Co. | | | 4,140 | |
| USD | | | 1,742,406 | | | JPY | | | 189,432,732 | | | 04/17/20 | | JPMorgan Chase Bank N.A. | | | (13,397 | ) |
| USD | | | 4,691,103 | | | KRW | | | 5,985,800,000 | | | 04/16/20 | | JPMorgan Chase Bank N.A. | | | (228,056 | ) |
| USD | | | 1,130,191 | | | KRW | | | 1,336,710,005 | | | 04/17/20 | | JPMorgan Chase Bank N.A. | | | 31,643 | |
| USD | | | 1,898,895 | | | MXN | | | 45,556,275 | | | 04/22/20 | | Bank of America, N.A. | | | (37,286 | ) |
| USD | | | 2,530,456 | | | MXN | | | 59,100,000 | | | 04/17/20 | | Citibank N.A. | | | 16,835 | |
| USD | | | 722,576 | | | MXN | | | 17,371,090 | | | 04/22/20 | | Citibank N.A. | | | (15,710 | ) |
| USD | | | 449,598 | | | MXN | | | 10,587,770 | | | 04/22/20 | | Credit Suisse International | | | (392 | ) |
| USD | | | 4,464,098 | | | MXN | | | 91,060,000 | | | 04/13/20 | | Goldman Sachs International | | | 588,915 | |
| USD | | | 2,730,898 | | | MXN | | | 65,624,576 | | | 04/22/20 | | Goldman Sachs International | | | (58,203 | ) |
| USD | | | 2,958,620 | | | MXN | | | 74,930,000 | | | 04/27/20 | | Goldman Sachs International | | | (223,664 | ) |
| USD | | | 3,447,348 | | | MXN | | | 73,013,100 | | | 04/17/20 | | JPMorgan Chase Bank N.A. | | | 341,978 | |
| USD | | | 344,727 | | | MXN | | | 8,386,000 | | | 04/22/20 | | JPMorgan Chase Bank N.A. | | | (11,685 | ) |
| USD | | | 3,944,871 | | | MXN | | | 90,698,000 | | | 05/11/20 | | JPMorgan Chase Bank N.A. | | | 101,125 | |
| USD | | | 923,440 | | | MXN | | | 17,753,134 | | | 05/26/20 | | Morgan Stanley Capital Services, Inc. | | | 172,869 | |
| USD | | | 458,116 | | | MYR | | | 1,974,480 | | | 04/22/20 | | Barclays Bank Plc | | | 1,302 | |
| USD | | | 833,467 | | | MYR | | | 3,518,480 | | | 04/22/20 | | Goldman Sachs International | | | 19,433 | |
| USD | | | 1,333,642 | | | MYR | | | 5,709,320 | | | 04/22/20 | | Morgan Stanley and Co. International Plc | | | 12,737 | |
| USD | | | 6,203,943 | | | PEN | | | 21,743,580 | | | 04/22/20 | | Barclays Bank Plc | | | (114,700 | ) |
| USD | | | 394,202 | | | PEN | | | 1,350,970 | | | 04/22/20 | | Deutsche Bank AG | | | 1,613 | |
| USD | | | 361,255 | | | PEN | | | 1,232,890 | | | 04/22/20 | | JPMorgan Chase Bank N.A. | | | 2,979 | |
| USD | | | 222,666 | | | PLN | | | 949,290 | | | 04/22/20 | | JPMorgan Chase Bank N.A. | | | (5,844 | ) |
| USD | | | 1,942,608 | | | PLN | | | 7,399,200 | | | 06/17/20 | | JPMorgan Chase Bank N.A. | | | 161,795 | |
| USD | | | 1,382,223 | | | PLN | | | 5,900,000 | | | 04/22/20 | | Morgan Stanley and Co. International Plc | | | (38,004 | ) |
| USD | | | 419,753 | | | PLN | | | 1,640,740 | | | 04/22/20 | | UBS AG | | | 24,800 | |
| USD | | | 192,358 | | | RON | | | 869,060 | | | 04/22/20 | | Deutsche Bank AG | | | (4,634 | ) |
| USD | | | 239,771 | | | RON | | | 1,080,000 | | | 04/22/20 | | Goldman Sachs International | | | (5,035 | ) |
| USD | | | 1,082,910 | | | RON | | | 4,835,870 | | | 04/22/20 | | JPMorgan Chase Bank N.A. | | | (13,250 | ) |
| USD | | | 88,669 | | | RON | | | 376,590 | | | 04/22/20 | | UBS AG | | | 3,307 | |
| USD | | | 376,730 | | | RUB | | | 27,380,760 | | | 04/22/20 | | Barclays Bank Plc | | | 27,402 | |
| USD | | | 670,750 | | | RUB | | | 52,600,050 | | | 04/23/20 | | Barclays Bank Plc | | | (222 | ) |
| USD | | | 928,200 | | | RUB | | | 60,479,386 | | | 05/27/20 | | Citibank N.A. | | | 160,766 | |
See accompanying Notes to the Financial Statements.
148
Mercer Opportunistic Fixed Income Fund
Schedule of Investments (Continued)
March 31, 2020
Forward Foreign Currency Contracts — continued
| | | | | | | | | | | | | | | | | | |
Currency Purchased | | | Currency Sold | | | Settlement
Date | | Counterparty | | Unrealized
Appreciation
(Depreciation) | |
| USD | | | 473,314 | | | RUB | | | 34,076,230 | | | 04/22/20 | | Credit Suisse International | | $ | 38,563 | |
| USD | | | 1,724,721 | | | RUB | | | 107,718,760 | | | 04/17/20 | | Goldman Sachs & Co. | | | 349,318 | |
| USD | | | 1,151,400 | | | RUB | | | 72,381,610 | | | 04/27/20 | | Goldman Sachs & Co. | | | 228,687 | |
| USD | | | 46,643 | | | RUB | | | 3,737,050 | | | 04/22/20 | | Goldman Sachs International | | | (1,035 | ) |
| USD | | | 521,638 | | | RUB | | | 40,243,840 | | | 04/22/20 | | HSBC Bank Plc | | | 8,200 | |
| USD | | | 532,941 | | | RUB | | | 41,436,190 | | | 04/23/20 | | HSBC Bank Plc | | | 4,377 | |
| USD | | | 3,057,755 | | | RUB | | | 204,245,800 | | | 04/14/20 | | JPMorgan Chase Bank N.A. | | | 448,587 | |
| USD | | | 6,611,600 | | | RUB | | | 454,920,000 | | | 04/16/20 | | JPMorgan Chase Bank N.A. | | | 802,032 | |
| USD | | | 977,481 | | | RUB | | | 62,534,352 | | | 04/17/20 | | JPMorgan Chase Bank N.A. | | | 179,013 | |
| USD | | | 379,973 | | | RUB | | | 27,639,200 | | | 04/22/20 | | JPMorgan Chase Bank N.A. | | | 27,347 | |
| USD | | | 524,731 | | | RUB | | | 41,275,310 | | | 04/23/20 | | JPMorgan Chase Bank N.A. | | | (1,782 | ) |
| USD | | | 4,503,943 | | | RUB | | | 308,430,000 | | | 04/13/20 | | Morgan Stanley Capital Services, Inc. | | | 563,222 | |
| USD | | | 1,790,480 | | | RUB | | | 115,665,000 | | | 05/06/20 | | Morgan Stanley Capital Services, Inc. | | | 318,129 | |
| USD | | | 2,417,144 | | | SAR | | | 9,080,000 | | | 09/24/20 | | Citibank N.A. | | | (621 | ) |
| USD | | | 1,164,274 | | | SAR | | | 4,380,000 | | | 09/24/20 | | JPMorgan Chase Bank N.A. | | | (2,004 | ) |
| USD | | | 987,763 | | | THB | | | 31,621,560 | | | 04/22/20 | | HSBC Bank Plc | | | 24,176 | |
| USD | | | 884,502 | | | THB | | | 28,489,800 | | | 04/22/20 | | JPMorgan Chase Bank N.A. | | | 16,346 | |
| USD | | | 712,872 | | | THB | | | 22,494,670 | | | 04/22/20 | | UBS AG | | | 27,403 | |
| USD | | | 3,694,729 | | | TRY | | | 23,242,212 | | | 06/19/20 | | Bank of America, N.A. | | | 246,993 | |
| USD | | | 666,334 | | | TRY | | | 4,261,560 | | | 06/19/20 | | Barclays Bank Plc | | | 34,177 | |
| USD | | | 2,023,069 | | | TRY | | | 12,365,000 | | | 05/04/20 | | BNP Paribas S.A. | | | 165,469 | |
| USD | | | 1,700,025 | | | TRY | | | 11,235,070 | | | 06/19/20 | | Citibank N.A. | | | 33,421 | |
| USD | | | 477,540 | | | TRY | | | 3,172,240 | | | 06/19/20 | | Goldman Sachs International | | | 6,971 | |
| USD | | | 3,139,058 | | | TRY | | | 19,881,400 | | | 06/19/20 | | HSBC Bank Plc | | | 189,863 | |
| USD | | | 4,076,832 | | | TRY | | | 25,759,147 | | | 06/19/20 | | JPMorgan Chase Bank N.A. | | | 255,735 | |
| USD | | | 1,362,453 | | | TRY | | | 9,010,520 | | | 06/19/20 | | Natwest Markets Plc | | | 25,837 | |
| USD | | | 1,909,271 | | | TRY | | | 11,838,721 | | | 06/19/20 | | Toronto Dominion Bank | | | 153,121 | |
| USD | | | 431,320 | | | ZAR | | | 7,578,270 | | | 04/22/20 | | Bank of America, N.A. | | | 8,281 | |
| USD | | | 954,360 | | | ZAR | | | 14,460,000 | | | 05/04/20 | | Bank of America, N.A. | | | 148,614 | |
| USD | | | 2,337,837 | | | ZAR | | | 38,217,050 | | | 04/22/20 | | Citibank N.A. | | | 204,460 | |
| USD | | | 2,329,046 | | | ZAR | | | 39,027,220 | | | 04/22/20 | | Goldman Sachs International | | | 150,443 | |
| USD | | | 505,087 | | | ZAR | | | 7,785,000 | | | 05/11/20 | | JPMorgan Chase Bank N.A. | | | 71,665 | |
| USD | | | 9,013,399 | | | ZAR | | | 148,879,200 | | | 05/19/20 | | JPMorgan Chase Bank N.A. | | | 732,934 | |
| USD | | | 571,132 | | | ZAR | | | 10,070,000 | | | 04/22/20 | | UBS AG | | | 8,998 | |
| | | | | | | | | | | | | | | | | | |
| | $ | 843,662 | |
| | | | | | | | | | | | | | | | | | |
Futures Contracts
| | | | | | | | | | | | | | | | | | | | |
Number of
Contracts | | | | | Description | | | | Expiration Date | | | Notional
Value | | | Market Value/
Unrealized
Appreciation
(Depreciation) | |
| | Buys | | | | | | | | | | | | | | | | | | | |
| | 10 | | | | | 10-Year Australian Bond Futures | | | | | Jun 2020 | | | AUD | 1,506,108 | | | $ | 1,291 | |
| | 155 | | | | | Euro-90 Day | | | | | Jun 2020 | | | USD | 38,546,562 | | | | (25,950 | ) |
| | 299 | | | | | U.S. Treasury Note2-Year | | | | | Jun 2020 | | | | 65,894,461 | | | | 987,318 | |
| | 170 | | | | | U.S. Ultra10-Year | | | | | Jun 2020 | | | | 26,525,313 | | | | (2,479 | ) |
| | 50 | | | | | U.S. Ultra Bond | | | | | Jun 2020 | | | | 11,093,750 | | | | 1,174,501 | |
| | | | | | | | | | | | | | | | | | | | |
| | | | $ | 2,134,681 | |
| | | | | | | | | | | | | | | | | | | | |
See accompanying Notes to the Financial Statements.
149
Mercer Opportunistic Fixed Income Fund
Schedule of Investments (Continued)
March 31, 2020
Futures Contracts — continued
| | | | | | | | | | | | | | | | | | | | |
Number of
Contracts | | | | | Description | | | | Expiration Date | | | Notional
Value | | | Market Value/
Unrealized
Appreciation
(Depreciation) | |
| | Sales | | | | | | | | | | | | | | | | | | | |
| | 87 | | | | | Euro-90 Day | | | | | Mar 2021 | | | USD | 21,688,012 | | | $ | (22,983 | ) |
| | 17 | | | | | Euro-Bund | | | | | Jun 2020 | | | EUR | 2,932,670 | | | | 34,717 | |
| | 3 | | | | | Long Gilt | | | | | Jun 2020 | | | GBP | 408,570 | | | | (7,841 | ) |
| | 63 | | | | | U.S. Long Bond | | | | | Jun 2020 | | | USD | 11,280,937 | | | | (125,688 | ) |
| | 154 | | | | | U.S. Treasury Note10-Year | | | | | Jun 2020 | | | | 21,357,875 | | | | (431,044 | ) |
| | 42 | | | | | U.S. Treasury Note5-Year | | | | | Jun 2020 | | | | 5,265,094 | | | | (45,795 | ) |
| | | | | | | | | | | | | | | | | | | | |
| | | | | | | | | | | | | | | | | | $ | (598,634 | ) |
| | | | | | | | | | | | | | | | | | | | |
Written Options
Written Currency Options
| | | | | | | | | | | | | | | | | | | | | | | | | |
Type of Contract | | Counterparty | | Notional
Value | | Premiums
Received | | Value at
March 31, 2020 |
CALL — USD/AUD Option | | JPMorgan Chase Bank N.A. | | | | USD | | | | | (2,020,000 | ) | | | $ | (11,251 | ) | | | $ | (180,226 | ) |
Strike @ AUD 0.67 | | | | | | | | | | | | | | | | | | | | | | |
Expires 04/08/2020 | | | | | | | | | | | | | | | | | | | | | | |
CALL — USD/AUD Option | | BNP Paribas S.A. | | | | USD | | | | | (2,170,000 | ) | | | | (11,590 | ) | | | | (161,185 | ) |
Strike @ AUD 0.66 | | | | | | | | | | | | | | | | | | | | | | |
Expires 04/28/2020 | | | | | | | | | | | | | | | | | | | | | | |
CALL — USD/AUD Option | | JPMorgan Chase Bank N.A. | | | | USD | | | | | (2,380,000 | ) | | | | (14,566 | ) | | | | (137,426 | ) |
Strike @ AUD 0.65 | | | | | | | | | | | | | | | | | | | | | | |
Expires 05/22/2020 | | | | | | | | | | | | | | | | | | | | | | |
CALL — USD/AUD Option | | BNP Paribas S.A. | | | | USD | | | | | (2,400,000 | ) | | | | (14,347 | ) | | | | (125,566 | ) |
Strike @ AUD 0.64 | | | | | | | | | | | | | | | | | | | | | | |
Expires 05/22/2020 | | | | | | | | | | | | | | | | | | | | | | |
CALL — USD/CAD Option | | Citigroup Global Markets, Inc. | | | | USD | | | | | (2,200,000 | ) | | | | (5,743 | ) | | | | (98,969 | ) |
Strike @ CAD 1.35 | | | | | | | | | | | | | | | | | | | | | | |
Expires 04/03/2020 | | | | | | | | | | | | | | | | | | | | | | |
CALL — USD/CAD Option | | BNP Paribas S.A. | | | | USD | | | | | (1,570,000 | ) | | | | (4,867 | ) | | | | (100,568 | ) |
Strike @ CAD 1.33 | | | | | | | | | | | | | | | | | | | | | | |
Expires 04/22/2020 | | | | | | | | | | | | | | | | | | | | | | |
CALL — USD/CAD Option | | BNP Paribas S.A. | | | | USD | | | | | (2,400,000 | ) | | | | (8,801 | ) | | | | (104,484 | ) |
Strike @ CAD 1.35 | | | | | | | | | | | | | | | | | | | | | | |
Expires 05/22/2020 | | | | | | | | | | | | | | | | | | | | | | |
CALL — USD/EUR Option | | JPMorgan Chase Bank N.A. | | | | USD | | | | | (4,800,000 | ) | | | | (29,405 | ) | | | | (88,430 | ) |
Strike @ EUR 1.11 7 | | | | | | | | | | | | | | | | | | | | | | |
Expires 06/05/2020 | | | | | | | | | | | | | | | | | | | | | | |
PUT — USD/CAD Option | | Goldman Sachs & Co. | | | | USD | | | | | (2,120,000 | ) | | | | (7,420 | ) | | | | (2 | ) |
Strike @ CAD 1.28 | | | | | | | | | | | | | | | | | | | | | | |
Expires 04/03/2020 | | | | | | | | | | | | | | | | | | | | | | |
PUT — USD/CAD Option | | Goldman Sachs & Co. | | | | USD | | | | | (3,270,000 | ) | | | | (33,799 | ) | | | | (5,193 | ) |
Strike @ CAD 1.33 | | | | | | | | | | | | | | | | | | | | | | |
Expires 06/09/2020 | | | | | | | | | | | | | | | | | | | | | | |
See accompanying Notes to the Financial Statements.
150
Mercer Opportunistic Fixed Income Fund
Schedule of Investments (Continued)
March 31, 2020
Written Currency Options — continued
| | | | | | | | | | | | | | | | | | | | | | | | | |
Type of Contract | | Counterparty | | Notional
Value | | Premiums
Received | | Value at
March 31, 2020 |
PUT — USD/EUR Option | | | | JPMorgan Chase Bank N.A. | | | | | USD | | | | | (3,137,500 | ) | | | $ | (11,056 | ) | | | $ | (7,477 | ) |
Strike @ EUR 1.13 | | | | | | | | | | | | | | | | | | | | | | | | | |
Expires 04/29/2020 | | | | | | | | | | | | | | | | | | | | | | | | | |
PUT — USD/GBP Option | | | | Morgan Stanley & Co. | | | | | USD | | | | | (2,510,000 | ) | | | | (11,732 | ) | | | | (1,795 | ) |
Strike @ GBP 1.35 | | | | | | | | | | | | | | | | | | | | | | | | | |
Expires 04/30/2020 | | | | | | | | | | | | | | | | | | | | | | | | | |
PUT — USD/IDR Option | | | | Morgan Stanley & Co. | | | | | USD | | | | | (2,330,000 | ) | | | | (14,914 | ) | | | | (2,290 | ) |
Strike @ IDR 13,816.00 | | | | | | | | | | | | | | | | | | | | | | | | | |
Expires 06/03/2020 | | | | | | | | | | | | | | | | | | | | | | | | | |
PUT — USD/JPY Option | | | | Citigroup Global Markets, Inc. | | | | | USD | | | | | (2,020,000 | ) | | | | (10,120 | ) | | | | (1,584 | ) |
Strike @ JPY 104.95 | | | | | | | | | | | | | | | | | | | | | | | | | |
Expires 04/03/2020 | | | | | | | | | | | | | | | | | | | | | | | | | |
PUT — USD/JPY Option | | | | Goldman Sachs & Co. | | | | | USD | | | | | (6,660,000 | ) | | | | (64,569 | ) | | | | (38,874 | ) |
Strike @ JPY 100.50 | | | | | | | | | | | | | | | | | | | | | | | | | |
Expires 06/03/2020 | | | | | | | | | | | | | | | | | | | | | | | | | |
PUT — USD/MXN Option | | | | Citigroup Global Markets, Inc. | | | | | USD | | | | | (1,560,000 | ) | | | | (7,605 | ) | | | | (989 | ) |
Strike @ MXN 18.63 | | | | | | | | | | | | | | | | | | | | | | | | | |
Expires 04/13/2020 | | | | | | | | | | | | | | | | | | | | | | | | | |
PUT — USD/RUB Option | | | | JPMorgan Chase Bank N.A. | | | | | USD | | | | | (2,160,000 | ) | | | | (12,668 | ) | | | | (9 | ) |
Strike @ RUB 60.20 | | | | | | | | | | | | | | | | | | | | | | | | | |
Expires 04/08/2020 | | | | | | | | | | | | | | | | | | | | | | | | | |
| | | | | | | | | | | | | | | | | | | | | | | | | |
Total Written Currency Options | | | | $ | (274,453 | ) | | | $ | (1,055,067 | ) |
| | | | | | | | | | | | | | | | | | | | | | | | | |
Written Futures Options
| | | | | | | | | | | | | | | | | | | | | | | | | |
Type of Contract | | Counterparty | | Number of
Contracts | | Notional
Value | | Premiums
Received | | Value at
March 31, 2020 |
PUT — S&P 500E-mini Futures Option | | | | UBS Securities LLC | | | | | 4 | | | | $ | (513,950 | ) | | | $ | (13,992 | ) | | | $ | (24,000 | ) |
Strike @ $2,600.00 | | | | | | | | | | | | | | | | | | | | | | | | | |
Expires 04/17/2020 | | | | | | | | | | | | | | | | | | | | | | | | | |
PUT — S&P 500E-mini Futures Option | | | | UBS Securities LLC | | | | | 42 | | | | | (5,396,475 | ) | | | | (178,470 | ) | | | | (184,800 | ) |
Strike @ $2,200.00 | | | | | | | | | | | | | | | | | | | | | | | | | |
Expires 06/19/2020 | | | | | | | | | | | | | | | | | | | | | | | | | |
PUT — U.S. Treasury Note5-Year Futures Option | | | | UBS Securities LLC | | | | | 58 | | | | | (7,270,844 | ) | | | | (43,587 | ) | | | | (5,891 | ) |
| | | | | | | | | | | | | | | | | | | | | | | | | |
Strike @ $124.00 | | | | | | | | | | | | | | | | | | | | | | | | | |
Expires 04/24/2020 | | | | | | | | | | | | | | | | | | | | | | | | | |
| | |
Total Written Futures Options | | | | $ | (236,049 | ) | | | $ | (214,691 | ) |
| | | | | | | | | | | | | | | | | | | | | | | | | |
Total Written Options | | | | $ | (510,502 | ) | | | $ | (1,269,758 | ) |
| | | | | | | | | | | | | | | | | | | | | | | | | |
See accompanying Notes to the Financial Statements.
151
Mercer Opportunistic Fixed Income Fund
Schedule of Investments (Continued)
March 31, 2020
OTC — Interest Rate Swaps
| | | | | | | | | | | | | | | | | | | | | | | | | | | | |
Payments
Received
by Fund | | Payments
Made
by Fund | | Payment
Frequency | | Maturity
Date | | Counterparty | | Upfront
Premiums
Paid
(Received) | | | Notional
Value | | | Market
Value | | | Unrealized
Appreciation
(Depreciation) | |
| 2.51% | | 7-Day CNRR | | Quarterly | | 03/18/25 | | Citibank N.A. | | $ | — | | | CNY | 10,306,000 | | | $ | 19,421 | | | $ | 19,421 | |
| 2.55% | | 7-Day CNRR | | Quarterly | | 02/10/25 | | Bank of America, N.A. | | | — | | | CNY | 4,620,000 | | | | 9,887 | | | | 9,887 | |
| 2.56% | | 7-Day CNRR | | Quarterly | | 03/18/25 | | Bank of America, N.A. | | | — | | | CNY | 13,792,000 | | | | 30,590 | | | | 30,590 | |
| 6.87% | | BRL-CDI | | At Maturity | | 01/04/27 | | JPMorgan Chase Bank N.A. | | | — | | | BRL | 7,210,000 | | | | (29,935 | ) | | | (29,935 | ) |
| 7.02% | | BRL-CDI | | At Maturity | | 01/04/27 | | Citigroup Global Markets, Inc. | | | — | | | BRL | 1,800,000 | | | | 747 | | | | 747 | |
| 7.02% | | BRL-CDI | | At Maturity | | 01/04/27 | | Citigroup Global Markets, Inc. | | | 1,105 | | | BRL | 2,100,000 | | | | 872 | | | | (233 | ) |
| 7.02% | | BRL-CDI | | At Maturity | | 01/04/27 | | Citigroup Global Markets, Inc. | | | 1,320 | | | BRL | 2,156,000 | | | | 895 | | | | (425 | ) |
| 7.04% | | BRL-CDI | | At Maturity | | 01/04/27 | | JPMorgan Chase Bank N.A. | | | — | | | BRL | 1,400,000 | | | | 835 | | | | 835 | |
| | | | | | | | | | | | | | | | | | | | | | | | | | | | |
| | $ | 2,425 | | | | | | | $ | 33,312 | | | $ | 30,887 | |
| | | | | | | | | | | | | | | | | | | | | | | | | | | | |
| | | | | | | | | | | | | | | | | | | | | | | | | | | | | | | | |
Centrally Cleared Interest Rate Swaps | |
Payments
Received
by Fund | | Payment
Frequency | | Payments
Made
by Fund | | Payment
Frequency | | Maturity
Date | | Upfront
Premiums
Paid
(Received) | | | Notional
Value | | | Market
Value | | | Unrealized
Appreciation
(Depreciation) | |
| 7.20% | | Monthly | | 1-Month TIIE | | Monthly | | 07/17/24 | | $ | — | | | | MXN | | | | 182,404,200 | | | $ | 308,633 | | | $ | 308,633 | |
| 3-Month USD LIBOR | | Quarterly | | 2.88% | | Semi-Annual | | 05/15/44 | | | 10,190 | | | | USD | | | | 1,786,000 | | | | (801,045 | ) | | | (811,235 | ) |
| 3-Month USD LIBOR | | Quarterly | | 1.85% | | Semi-Annual | | 11/15/44 | | | 4,987 | | | | USD | | | | 2,531,000 | | | | (558,296 | ) | | | (563,283 | ) |
| 3-Month USD LIBOR | | Quarterly | | 0.86% | | Semi-Annual | | 09/18/50 | | | (740 | ) | | | USD | | | | 376,000 | | | | 4,691 | | | | 5,431 | |
| 3-Month USD LIBOR | | Quarterly | | 0.84% | | Semi-Annual | | 09/18/50 | | | — | | | | USD | | | | 487,000 | | | | 8,414 | | | | 8,414 | |
| 0.65% | | Semi-Annual | | 3-Month USD LIBOR | | Quarterly | | 09/18/25 | | | — | | | | USD | | | | 2,674,000 | | | | 19,520 | | | | 19,520 | |
| 0.66% | | Semi-Annual | | 3-Month USD LIBOR | | Quarterly | | 09/18/25 | | | — | | | | USD | | | | 2,075,000 | | | | 16,489 | | | | 16,489 | |
| 0.77% | | Semi-Annual | | 3-Month USD LIBOR | | Quarterly | | 03/24/27 | | | 82,071 | | | | USD | | | | 9,830,000 | | | | 116,412 | | | | 34,341 | |
| | | | | | | | | | | | | | | | | | | | | | | | | | | | | | | | |
| | | | | | | | | | $ | (981,690 | ) |
| | | | | | | | | | | | | | | | | | | | | | | | | | | | | | | | |
OTC — Credit Default Swaps
Buy Protection
| | | | | | | | | | | | | | | | | | | | | | | | | | | | |
Notional
Amount* | | | Currency | | Expiration
Date | | Counterparty | | Receive
(Pay)
Fixed
Rate | | | Payment
Frequency | | Deliverable
on Default | | Unrealized
Appreciation
(Depreciation) | | | Upfront
Premiums
Paid/
(Received) | | | Value | |
| | 730,000 | | | EUR | | 12/20/24 | | Morgan Stanley & Co. | | | (1.00% | ) | | Quarterly | | Daimler AG, 1.40%, 01/12/24 | | $ | 44,496 | | | $ | (19,195 | ) | | $ | 25,301 | |
| | | | | | | | | | | | | | | | | | | | | | | | | | | | |
|
| | Sell Protection | |
| | 730,000 | | | EUR | | 12/20/24 | | Morgan Stanley & Co. | | | 1.00% | | | Quarterly | | Volkswagen International Finance N.V., 0.50%, 03/30/21 (Moody’s rating: A3; S&P rating: BBB+) | | $ | (48,642 | ) | | $ | 9,254 | | | $ | (39,388 | ) |
| | | | | | | | | | | | | | | | | | | | | | | | | | | | |
| | Total OTC Credit Default Swaps | | $ | (4,146 | ) | | $ | (9,941 | ) | | $ | (14,087 | ) |
| | | | | | | | | | | | | | | | | | | | | | | | | | | | |
See accompanying Notes to the Financial Statements.
152
Mercer Opportunistic Fixed Income Fund
Schedule of Investments (Continued)
March 31, 2020
Centrally Cleared Credit Default Swaps
Buy Protection
| | | | | | | | | | | | | | | | | | | | | | | | |
Notional
Amount* | | | Currency | | Expiration
Date | | Receive
(Pay)
Fixed
Rate | | Payment
Frequency | | Deliverable on Default | | Unrealized
Appreciation
(Depreciation) | | | Upfront
Premiums
Paid
(Received) | | | Value | |
| | 2,158,000 | | | USD | | 06/20/25 | | (5.00%) | | Quarterly | | CDX.NA.HY.34** | | $ | 10,354 | | | $ | 124,085 | | | $ | 134,439 | |
| | | | | | | | | | | | | | | | | | | | | | | | |
| | | | |
| | |
| * | | The maximum potential amount of future undiscounted payments that the Fund could be required to make under a credit default swap contract would be the notional amount of the contract. These potential amounts would be partially offset by any recovery values of the referenced debt obligation or net amounts received from the settlement of purchased protection credit default swap contracts entered into by the Fund for the same referenced debt obligation. | | |
| | |
| ** | | CDX.NA.HY— Markit North America High Yield CDS Index. Represents an index of single name credit default swaps (CDS). All of the companies underlying the single name CDS within the index are rated BB and B. | | |
U.S. Treasury securities in the amount of $966,770 received at the custodian bank as collateral for forward foreign currency contracts, OTC swaps and/or OTC options.
Currency Abbreviations
| CNH | — Chinese Yuan Renminbi |
| GBP | — British Pound Sterling |
See accompanying Notes to the Financial Statements.
153
Mercer Opportunistic Fixed Income Fund
Schedule of Investments (Continued)
March 31, 2020
Currency Abbreviations — continued
See accompanying Notes to the Financial Statements.
154
Mercer Opportunistic Fixed Income Fund
Schedule of Investments (Continued)
March 31, 2020
| | | | | |
| Asset Class Summary (Unaudited) | | % of Net Assets |
Sovereign Debt Obligations | | | | 32.7 | |
Corporate Debt | | | | 29.9 | |
U.S. Government and Agency Obligations | | | | 8.9 | |
Bank Loans | | | | 8.0 | |
Asset Backed Securities | | | | 3.8 | |
Mortgage Backed Securities — Private Issuers | | | | 3.6 | |
Forward Foreign Currency Contracts | | | | 2.0 | |
Convertible Preferred Stocks | | | | 0.3 | |
Mortgage Backed Securities — U.S. Government Agency Obligations | | | | 0.2 | |
Convertible Debt | | | | 0.2 | |
Futures Contracts | | | | 0.1 | |
Common Stocks | | | | 0.1 | |
Purchased Futures Options | | | | 0.1 | |
Purchased Currency Options | | | | 0.0 | * |
Preferred Stocks | | | | 0.0 | * |
Centrally Cleared Credit Default Swaps | | | | 0.0 | * |
Purchased Swaption | | | | 0.0 | * |
OTC Interest Rate Swaps | | | | 0.0 | * |
Warrant | | | | 0.0 | * |
OTC Credit Default Swaps | | | | 0.0 | * |
Written Futures Options | | | | 0.0 | * |
Centrally Cleared Interest Rate Swaps | | | | (0.1 | ) |
Written Currency Options | | | | (0.1 | ) |
Short-Term Investments | | | | 2.8 | |
Other Assets and Liabilities (net) | | | | 7.5 | |
| | | | | |
| | | | 100.0 | % |
| | | | | |
* Amount rounds to zero.
See accompanying Notes to the Financial Statements.
155
Mercer Emerging Markets Equity Fund
Schedule of Investments
(showing percentage of net assets)
March 31, 2020
| | | | | | | | | | |
| Shares | | | | | Description | | Value ($) | |
| | |
| | | | | | COMMON STOCKS — 92.4% | |
| | |
| | | | | | Bermuda — 1.6% | |
| | 572,000 | | | | | Beijing Enterprises Water Group, Ltd.* | | | 221,598 | |
| | 570,400 | | | | | China Gas Holdings, Ltd. | | | 1,978,606 | |
| | 100,000 | | | | | China Grand Pharmaceutical and Healthcare Holdings, Ltd.‡ | | | 59,174 | |
| | 306,000 | | | | | China Oriental Group Co., Ltd. | | | 78,257 | |
| | 717,900 | | | | | China Resources Gas Group, Ltd. | | | 3,604,895 | |
| | 745,512 | | | | | COSCO SHIPPING Ports, Ltd. | | | 358,996 | |
| | 748,000 | | | | | CP Pokphand Co., Ltd. | | | 58,806 | |
| | 36,065 | | | | | Credicorp, Ltd. | | | 5,159,820 | |
| | 1,746,000 | | | | | Gemdale Properties & Investment Corp., Ltd. | | | 289,123 | |
| | 95,000 | | | | | Haier Electronics Group Co., Ltd. | | | 251,237 | |
| | 298,000 | | | | | Hopson Development Holdings, Ltd. | | | 265,466 | |
| | 1,520,000 | | | | | Joy City Property, Ltd. | | | 119,070 | |
| | 163,000 | | | | | K Wah International Holdings, Ltd. | | | 69,949 | |
| | 1,028,000 | | | | | Kunlun Energy Co., Ltd. | | | 592,311 | |
| | 155,000 | | | | | Luye Pharma Group, Ltd. 144A | | | 75,313 | |
| | 1,500,000 | | | | | Nan Hai Corp., Ltd. | | | 12,999 | |
| | 764,000 | | | | | Nine Dragons Paper Holdings, Ltd. | | | 693,872 | |
| | 233,000 | | | | | Pou Sheng International Holdings, Ltd. | | | 47,197 | |
| | 310,298 | | | | | Shenzhen International Holdings, Ltd. | | | 564,596 | |
| | 341,000 | | | | | Sihuan Pharmaceutical Holdings Group, Ltd. | | | 34,252 | |
| | 284,000 | | | | | United Energy Group, Ltd.‡ | | | 54,442 | |
| | | | | | | | | | |
| | | | | | Total Bermuda | | | 14,589,979 | |
| | | | | | | | | | |
| | |
| | | | | | Brazil — 4.3% | |
| | 855,600 | | | | | B3 SA - Brasil Bolsa Balcao | | | 5,922,192 | |
| | 80,038 | | | | | Banco Bradesco SA* | | | 290,270 | |
| | 9,144 | | | | | Banco BTG Pactual SA* | | | 58,602 | |
| | 325,900 | | | | | Banco do Brasil SA* | | | 1,752,468 | |
| | 74,502 | | | | | Banco Inter SA* | | | 453,769 | |
| | 20,982 | | | | | Banco Santander Brasil SA | | | 107,891 | |
| | 268,300 | | | | | BR Malls Participacoes SA | | | 516,260 | |
| | 12,000 | | | | | Cia Brasileira de Distribuicao* | | | 153,488 | |
| | 309,600 | | | | | Cia de Locacao das Americas* | | | 626,172 | |
| | 76,985 | | | | | Cia Siderurgica Nacional SA | | | 103,605 | |
| | 119,700 | | | | | Cielo SA | | | 102,469 | |
| | 586,775 | | | | | Cogna Educacao | | | 452,532 | |
| | 11,994 | | | | | Cosan SA | | | 124,320 | |
| | 228,000 | | | | | Cyrela Brazil Realty SA Empreendimentos e Participacoes | | | 621,147 | |
| | 52,960 | | | | | Duratex SA* | | | 95,472 | |
| | 181,700 | | | | | Embraer SA* | | | 334,211 | |
| | 201,285 | | | | | Embraer SA, ADR*‡ | | | 1,489,509 | |
| | 180,300 | | | | | Fleury SA | | | 703,596 | |
| | 24,075 | | | | | Grendene SA | | | 34,953 | |
| | 98,300 | | | | | Grupo SBF SA* | | | 456,002 | |
| | 19,580 | | | | | Guararapes Confeccoes SA | | | 41,186 | |
| | 503,332 | | | | | Hypera SA* | | | 2,774,508 | |
| | 709,600 | | | | | IRB Brasil Resseguros SA | | | 1,324,360 | |
| | 17,211 | | | | | Itau Unibanco Holding SA | | | 73,269 | |
See accompanying Notes to the Financial Statements.
156
Mercer Emerging Markets Equity Fund
Schedule of Investments (Continued)
(showing percentage of net assets)
March 31, 2020
| | | | | | | | | | |
| Shares | | | | | Description | | Value ($) | |
| | |
| | | | | | Brazil — continued | |
| | 300,411 | | | | | Itau Unibanco Holding SA, ADR | | | 1,348,845 | |
| | 58,216 | | | | | JBS SA | | | 228,302 | |
| | 260,990 | | | | | Localiza Rent a Car SA | | | 1,323,417 | |
| | 1,612 | | | | | LOG Commercial Properties e Participacoes SA | | | 6,807 | |
| | 46,200 | | | | | MRV Engenharia e Participacoes SA | | | 109,029 | |
| | 155,800 | | | | | Multiplan Empreendimentos Imobiliarios SA* | | | 573,143 | |
| | 839,700 | | | | | Odontoprev SA | | | 2,344,283 | |
| | 501,874 | | | | | Petroleo Brasileiro SA* | | | 1,368,237 | |
| | 86,982 | | | | | Porto Seguro SA | | | 753,332 | |
| | 144,500 | | | | | Raia Drogasil SA* | | | 2,837,567 | |
| | 657,700 | | | | | Rumo SA* | | | 2,491,768 | |
| | 12,100 | | | | | Sao Martinho SA | | | 34,481 | |
| | 34,220 | | | | | Sul America SA | | | 223,005 | |
| | 2,200 | | | | | Suzano SA | | | 15,181 | |
| | 160,000 | | | | | TOTVS SA* | | | 1,440,019 | |
| | 64,900 | | | | | Ultrapar Participacoes SA | | | 156,788 | |
| | 8,072 | | | | | Usinas Siderurgicas de Minas Gerais SA Usiminas | | | 8,793 | |
| | 433,411 | | | | | Vale SA* | | | 3,611,619 | |
| | 294,600 | | | | | WEG SA | | | 1,906,783 | |
| | 246,100 | | | | | YDUQS Part | | | 1,051,949 | |
| | | | | | | | | | |
| | | | | | Total Brazil | | | 40,445,599 | |
| | | | | | | | | | |
| | |
| | | | | | Cayman Islands — 21.6% | |
| | 142,500 | | | | | 3SBio, Inc.* 144A | | | 147,784 | |
| | 7,256 | | | | | 58.com, Inc., ADR* | | | 353,512 | |
| | 45,000 | | | | | AAC Technologies Holdings, Inc.‡ | | | 231,958 | |
| | 468,000 | | | | | Agile Group Holdings, Ltd. | | | 503,878 | |
| | 189,800 | | | | | Alibaba Group Holding, Ltd.* | | | 4,465,719 | |
| | 202,683 | | | | | Alibaba Group Holding, Ltd., ADR* | | | 39,417,790 | |
| | 389,400 | | | | | ANTA Sports Products, Ltd. | | | 2,815,197 | |
| | 219,000 | | | | | Asia Cement China Holdings Corp. | | | 221,676 | |
| | 8,802 | | | | | Baidu, Inc., ADR* | | | 887,154 | |
| | 434,000 | | | | | Bosideng International Holdings, Ltd. | | | 101,357 | |
| | 84,000 | | | | | CAR, Inc.*‡ | | | 46,887 | |
| | 74,000 | | | | | Casetek Holdings, Ltd. | | | 86,564 | |
| | 73,000 | | | | | Central China Real Estate, Ltd. | | | 37,136 | |
| | 1,022,310 | | | | | Chailease Holding Co., Ltd. | | | 3,094,123 | |
| | 1,142,000 | | | | | China Aoyuan Group, Ltd. | | | 1,329,440 | |
| | 464,900 | | | | | China Conch Venture Holdings, Ltd. | | | 2,067,426 | |
| | 75,000 | | | | | China Evergrande Group‡ | | | 123,489 | |
| | 35,000 | | | | | China High Speed Transmission Equipment Group Co., Ltd.‡ | | | 20,302 | |
| | 183,000 | | | | | China Hongqiao Group, Ltd. | | | 77,682 | |
| | 1,254,000 | | | | | China Lesso Group Holdings, Ltd. | | | 1,645,990 | |
| | 3,789,000 | | | | | China Medical System Holdings, Ltd. | | | 4,085,578 | |
| | 67,000 | | | | | China Mengniu Dairy Co., Ltd.* | | | 232,114 | |
| | 1,618,900 | | | | | China Resources Cement Holdings, Ltd. | | | 1,923,570 | |
| | 102,000 | | | | | China Resources Land, Ltd. | | | 418,567 | |
| | 897,000 | | | | | China SCE Group Holdings, Ltd. | | | 397,101 | |
| | 110,000 | | | | | China Shanshui Cement Group, Ltd.* | | | 30,873 | |
See accompanying Notes to the Financial Statements.
157
Mercer Emerging Markets Equity Fund
Schedule of Investments (Continued)
(showing percentage of net assets)
March 31, 2020
| | | | | | | | | | |
| Shares | | | | | Description | | Value ($) | |
| | |
| | | | | | Cayman Islands — continued | |
| | 870,000 | | | | | China State Construction International Holdings, Ltd. | | | 640,401 | |
| | 96,000 | | | | | China Tianrui Group Cement Co., Ltd.* | | | 103,361 | |
| | 3,848,086 | | | | | China Yuhua Education Corp., Ltd. | | | 2,836,421 | |
| | 723,200 | | | | | China Zhongwang Holdings, Ltd. | | | 189,989 | |
| | 274,000 | | | | | Chinasoft International, Ltd.* | | | 142,241 | |
| | 217,147 | | | | | CIFI Holdings Group Co., Ltd. | | | 155,785 | |
| | 314,001 | | | | | Country Garden Holdings Co., Ltd.‡ | | | 377,056 | |
| | 329,460 | | | | | Country Garden Services Holdings Co., Ltd. | | | 1,331,548 | |
| | 26,500 | | | | | Dali Foods Group Co., Ltd. 144A | | | 18,387 | |
| | 448,100 | | | | | ENN Energy Holdings, Ltd. | | | 4,310,406 | |
| | 1,161,000 | | | | | Fu Shou Yuan International Group, Ltd. | | | 1,017,118 | |
| | 106,000 | | | | | Fufeng Group, Ltd.* | | | 36,267 | |
| | 9,000 | | | | | Fulgent Sun International Holding Co., Ltd. | | | 24,526 | |
| | 445,000 | | | | | Fullshare Holdings, Ltd.*‡ | | | 6,878 | |
| | 559,000 | | | | | GCL-Poly Energy Holdings, Ltd.*‡ | | | 17,822 | |
| | 196,000 | | | | | Geely Automobile Holdings, Ltd. | | | 287,323 | |
| | 27,000 | | | | | General Interface Solution Holding, Ltd. | | | 70,909 | |
| | 5,000 | | | | | Ginko International Co., Ltd. | | | 22,657 | |
| | 39,000 | | | | | Golden Eagle Retail Group, Ltd. | | | 38,200 | |
| | 13,000 | | | | | Gourmet Master Co., Ltd. | | | 32,292 | |
| | 277,500 | | | | | Greentown China Holdings, Ltd.‡ | | | 250,788 | |
| | 87,000 | | | | | Haitian International Holdings, Ltd. | | | 161,880 | |
| | 6,000 | | | | | Health & Happiness H&H International Holdings, Ltd. | | | 22,104 | |
| | 405,500 | | | | | Hengan International Group Co., Ltd. | | | 3,041,492 | |
| | 197,800 | | | | | Huazhu Group, Ltd., ADR‡ | | | 5,682,794 | |
| | 131,800 | | | | | JD.com, Inc., ADR* | | | 5,337,900 | |
| | 79,398 | | | | | Jiayuan International Group, Ltd. | | | 32,251 | |
| | 18,184 | | | | | JOYY, Inc., ADR* | | | 968,480 | |
| | 1,051,000 | | | | | Kaisa Group Holdings, Ltd. | | | 386,325 | |
| | 306,500 | | | | | Kingboard Holdings, Ltd. | | | 714,172 | |
| | 375,000 | | | | | Kingboard Laminates Holdings, Ltd. | | | 345,211 | |
| | 113,000 | | | | | Kingdee International Software Group Co., Ltd.‡ | | | 150,051 | |
| | 596,000 | | | | | KWG Group Holdings, Ltd.* | | | 843,046 | |
| | 602,000 | | | | | Lee & Man Paper Manufacturing, Ltd. | | | 363,123 | |
| | 8,029 | | | | | LexinFintech Holdings, Ltd., ADR*‡ | | | 71,217 | |
| | 102,000 | | | | | Logan Property Holdings Co., Ltd. | | | 156,365 | |
| | 555,900 | | | | | Longfor Group Holdings, Ltd. 144A | | | 2,690,776 | |
| | 3,543,000 | | | | | Lonking Holdings, Ltd. | | | 1,050,076 | |
| | 102,000 | | | | | Minth Group, Ltd. | | | 217,302 | |
| | 45,705 | | | | | Momo, Inc., ADR | | | 991,341 | |
| | 677,200 | | | | | NagaCorp, Ltd. | | | 686,522 | |
| | 5,000 | | | | | NetDragon Websoft Holdings, Ltd. | | | 11,984 | |
| | 70,865 | | | | | NetEase, Inc., ADR | | | 22,744,830 | |
| | 27,500 | | | | | New Oriental Education & Technology Group, Inc., ADR* | | | 2,976,600 | |
| | 250,000 | | | | | Nexteer Automotive Group, Ltd. | | | 124,854 | |
| | 7,692 | | | | | Pharmally International Holding Co., Ltd. | | | 36,785 | |
| | 534,000 | | | | | Powerlong Real Estate Holdings, Ltd. | | | 312,185 | |
| | 116,000 | | | | | Redco Properties Group, Ltd. 144A | | | 56,828 | |
| | 237,000 | | | | | Ronshine China Holdings, Ltd.* | | | 230,706 | |
See accompanying Notes to the Financial Statements.
158
Mercer Emerging Markets Equity Fund
Schedule of Investments (Continued)
(showing percentage of net assets)
March 31, 2020
| | | | | | | | | | |
| Shares | | | | | Description | | Value ($) | |
| | |
| | | | | | Cayman Islands — continued | |
| | 580,400 | | | | | Sands China, Ltd. | | | 2,112,792 | |
| | 127,000 | | | | | Sany Heavy Equipment International Holdings Co., Ltd. | | | 67,590 | |
| | 150,000 | | | | | Seazen Group, Ltd.*‡ | | | 134,732 | |
| | 368,000 | | | | | Semiconductor Manufacturing International Corp.*‡ | | | 575,628 | |
| | 439,700 | | | | | Shenzhou International Group Holdings, Ltd. | | | 4,643,371 | |
| | 83,000 | | | | | Shimao Property Holdings, Ltd. | | | 290,574 | |
| | 1,611,000 | | | | | Shui On Land, Ltd. | | | 269,542 | |
| | 28,089 | | | | | SINA Corp.* | | | 894,354 | |
| | 2,616,600 | | | | | Sino Biopharmaceutical, Ltd. | | | 3,430,524 | |
| | 946,000 | | | | | SOHO China, Ltd. | | | 485,377 | |
| | 1,164,000 | | | | | SSY Group, Ltd. | | | 905,939 | |
| | 90,000 | | | | | Sunac China Holdings, Ltd. | | | 414,020 | |
| | 150,000 | | | | | Sunny Optical Technology Group Co., Ltd. | | | 2,001,170 | |
| | 92,079 | | | | | TAL Education Group, ADR* | | | 4,904,128 | |
| | 680,500 | | | | | Tencent Holdings, Ltd. | | | 33,190,170 | |
| | 414,762 | | | | | Tencent Music Entertainment Group, ADR* | | | 4,172,506 | |
| | 1,860,000 | | | | | Tingyi Cayman Islands Holding Corp. | | | 3,030,980 | |
| | 148,000 | | | | | TPK Holding Co., Ltd.* | | | 169,622 | |
| | 18,373 | | | | | Trip.com Group, Ltd., ADR* | | | 430,847 | |
| | 192,000 | | | | | Uni-President China Holdings, Ltd. | | | 185,570 | |
| | 46,000 | | | | | Vinda International Holdings, Ltd. | | | 110,912 | |
| | 412,423 | | | | | Vipshop Holdings, Ltd., ADR* | | | 6,425,550 | |
| | 4,222,500 | | | | | WH Group, Ltd. | | | 3,922,112 | |
| | 177,000 | | | | | Wisdom Marine Lines Co., Ltd.* | | | 127,029 | |
| | 710,000 | | | | | Xinyi Glass Holdings, Ltd. | | | 809,091 | |
| | 221,772 | | | | | Xinyi Solar Holdings, Ltd. | | | 123,804 | |
| | 85,325 | | | | | Xtep International Holdings, Ltd. | | | 27,733 | |
| | 871,456 | | | | | Yuzhou Properties Co., Ltd. | | | 369,210 | |
| | 395,400 | | | | | Zhen Ding Technology Holding, Ltd. | | | 1,194,845 | |
| | 349,000 | | | | | Zhongsheng Group Holdings, Ltd. | | | 1,215,172 | |
| | 69,500 | | | | | Zhou Hei Ya International Holdings Co., Ltd. 144A | | | 39,956 | |
| | 10,629 | | | | | ZTO Express Cayman, Inc., ADR* | | | 281,456 | |
| | | | | | | | | | |
| | | | | | Total Cayman Islands | | | 204,036,748 | |
| | | | | | | | | | |
| | |
| | | | | | Chile — 0.2% | |
| | 1,567 | | | | | Banco de Credito e Inversiones SA | | | 53,317 | |
| | 17,274 | | | | | CAP SA | | | 74,400 | |
| | 189,731 | | | | | Cencosud SA | | | 198,143 | |
| | 49,989 | | | | | Empresa Nacional de Telecomunicaciones SA* | | | 212,315 | |
| | 144,318 | | | | | Empresas CMPC SA | | | 309,693 | |
| | 42,916 | | | | | Empresas COPEC SA | | | 246,730 | |
| | 1,234,654 | | | | | Enel Americas SA | | | 151,521 | |
| | 83,808 | | | | | Inversiones Aguas Metropolitanas SA | | | 64,111 | |
| | 31,088,559 | | | | | Itau CorpBanca | | | 80,939 | |
| | 5,838 | | | | | Latam Airlines Group SA, ADR‡ | | | 15,471 | |
| | 248,048 | | | | | Ripley Corp. SA | | | 57,623 | |
| | 25,280 | | | | | SACI Falabella | | | 55,939 | |
| | 105,226 | | | | | Sigdo Koppers SA | | | 90,921 | |
| | 234,324 | | | | | SMU SA | | | 35,465 | |
See accompanying Notes to the Financial Statements.
159
Mercer Emerging Markets Equity Fund
Schedule of Investments (Continued)
(showing percentage of net assets)
March 31, 2020
| | | | | | | | | | |
| Shares | | | | | Description | | Value ($) | |
| | |
| | | | | | Chile — continued | |
| | 44,005 | | | | | Vina Concha y Toro SA | | | 55,760 | |
| | | | | | | | | | |
| | | | | | Total Chile | | | 1,702,348 | |
| | | | | | | | | | |
| | |
| | | | | | China — 13.9% | |
| | 293,750 | | | | | A-Living Services Co., Ltd. Class H | | | 1,419,480 | |
| | 4,064,000 | | | | | Agricultural Bank of China, Ltd. Class H | | | 1,624,366 | |
| | 230,000 | | | | | Air China, Ltd. Class H‡ | | | 147,511 | |
| | 1,316,000 | | | | | Aluminum Corp. of China, Ltd. Class H* | | | 260,349 | |
| | 657,999 | | | | | Angang Steel Co., Ltd. Class H‡ | | | 172,466 | |
| | 953,600 | | | | | Anhui Conch Cement Co., Ltd. Class H | | | 6,593,796 | |
| | 950,000 | | | | | AviChina Industry & Technology Co., Ltd. Class H | | | 365,263 | |
| | 729,500 | | | | | BAIC Motor Corp., Ltd. Class H 144A | | | 286,814 | |
| | 10,693,000 | | | | | Bank of China, Ltd. Class H | | | 4,081,590 | |
| | 144,500 | | | | | Bank of Chongqing Co., Ltd. Class H | | | 72,382 | |
| | 1,298,000 | | | | | Bank of Communications Co., Ltd. Class H | | | 792,069 | |
| | 192,000 | | | | | Bank of Zhengzhou Co., Ltd. Class H‡ 144A | | | 55,602 | |
| | 908,000 | | | | | BBMG Corp. Class H‡ | | | 226,388 | |
| | 602,000 | | | | | Beijing Capital International Airport Co., Ltd. Class H | | | 382,873 | |
| | 284,000 | | | | | Beijing North Star Co., Ltd. Class H | | | 65,738 | |
| | 24,500 | | | | | BYD Co., Ltd. Class H‡ | | | 127,157 | |
| | 28,000 | | | | | Central China Securities Co., Ltd. Class H | | | 4,571 | |
| | 178,000 | | | | | China BlueChemical, Ltd. Class H | | | 27,397 | |
| | 2,831,000 | | | | | China Cinda Asset Management Co., Ltd. Class H | | | 534,498 | |
| | 1,407,000 | | | | | China CITIC Bank Corp., Ltd. Class H | | | 693,044 | |
| | 624,000 | | | | | China Coal Energy Co., Ltd. Class H | | | 172,476 | |
| | 667,000 | | | | | China Communications Construction Co., Ltd. Class H | | | 462,759 | |
| | 1,040,000 | | | | | China Communications Services Corp., Ltd. Class H | | | 753,174 | |
| | 12,200,000 | | | | | China Construction Bank Corp. Class H | | | 9,946,265 | |
| | 296,000 | | | | | China Eastern Airlines Corp., Ltd. Class H*‡ | | | 102,292 | |
| | 1,760,000 | | | | | China Energy Engineering Corp., Ltd. Class H | | | 188,216 | |
| | 500,000 | | | | | China Everbright Bank Co., Ltd. Class H | | | 190,971 | |
| | 868,000 | | | | | China Galaxy Securities Co., Ltd. Class H | | | 419,017 | |
| | 3,407,000 | | | | | China Huarong Asset Management Co., Ltd. Class H 144A | | | 429,157 | |
| | 104,800 | | | | | China International Capital Corp., Ltd. Class H 144A | | | 168,752 | |
| | 207,980 | | | | | China International Marine Containers Group Co., Ltd. Class H | | | 192,635 | |
| | 456,010 | | | | | China International Travel Service Corp., Ltd. Class A | | | 4,340,771 | |
| | 295,000 | | | | | China Life Insurance Co., Ltd. Class H | | | 578,833 | |
| | 357,000 | | | | | China Machinery Engineering Corp. Class H | | | 96,221 | |
| | 2,587,300 | | | | | China Merchants Bank Co., Ltd. Class H | | | 11,618,160 | |
| | 14,800 | | | | | China Merchants Securities Co., Ltd. Class H 144A | | | 16,381 | |
| | 1,114,000 | | | | | China Minsheng Banking Corp., Ltd. Class H | | | 825,084 | |
| | 306,000 | | | | | China Molybdenum Co., Ltd. Class H‡ | | | 85,150 | |
| | 2,268,400 | | | | | China National Building Material Co., Ltd. Class H | | | 2,462,972 | |
| | 112,000 | | | | | China Oilfield Services, Ltd. Class H | | | 85,635 | |
| | 114,400 | | | | | China Pacific Insurance Group Co., Ltd. Class H | | | 344,002 | |
| | 3,730,000 | | | | | China Petroleum & Chemical Corp. Class H | | | 1,830,026 | |
| | 276,500 | | | | | China Railway Construction Corp., Ltd. Class H | | | 308,574 | |
| | 533,000 | | | | | China Railway Group, Ltd. Class H | | | 283,111 | |
| | 123,000 | | | | | China Railway Signal & Communication Corp., Ltd. Class H 144A | | | 61,658 | |
See accompanying Notes to the Financial Statements.
160
Mercer Emerging Markets Equity Fund
Schedule of Investments (Continued)
(showing percentage of net assets)
March 31, 2020
| | | | | | | | | | |
| Shares | | | | | Description | | Value ($) | |
| | |
| | | | | | China — continued | |
| | 1,639,000 | | | | | China Reinsurance Group Corp. Class H | | | 189,038 | |
| | 504,000 | | | | | China Shenhua Energy Co., Ltd. Class H | | | 956,342 | |
| | 414,000 | | | | | China Southern Airlines Co., Ltd. Class H‡ | | | 179,296 | |
| | 527,900 | | | | | China Vanke Co., Ltd. Class H | | | 1,729,541 | |
| | 838,000 | | | | | Chongqing Rural Commercial Bank Co., Ltd. Class H | | | 342,974 | |
| | 75,000 | | | | | CITIC Securities Co., Ltd. Class H | | | 136,534 | |
| | 416,000 | | | | | COSCO SHIPPING Development Co., Ltd. Class H | | | 43,285 | |
| | 602,000 | | | | | COSCO SHIPPING Energy Transportation Co., Ltd. Class H | | | 322,732 | |
| | 211,000 | | | | | COSCO SHIPPING Holdings Co., Ltd. Class H* | | | 58,035 | |
| | 178,000 | | | | | CRRC Corp., Ltd. Class H | | | 90,017 | |
| | 30,000 | | | | | CSSC Offshore and Marine Engineering Group Co., Ltd. Class H*‡ | | | 17,868 | |
| | 141,600 | | | | | Dongfang Electric Corp., Ltd. Class H | | | 69,847 | |
| | 76,000 | | | | | Everbright Securities Co., Ltd. Class H 144A | | | 48,283 | |
| | 34,400 | | | | | Fuyao Glass Industry Group Co., Ltd. Class H 144A | | | 73,215 | |
| | 214,400 | | | | | GF Securities Co., Ltd. Class H | | | 228,802 | |
| | 768,500 | | | | | Great Wall Motor Co., Ltd. Class H | | | 489,761 | |
| | 600,000 | | | | | Guangshen Railway Co., Ltd. Class H | | | 127,472 | |
| | 86,800 | | | | | Guangzhou Automobile Group Co., Ltd. Class H | | | 86,774 | |
| | 20,000 | | | | | Guangzhou Baiyunshan Pharmaceutical Holdings Co., Ltd. Class H | | | 53,691 | |
| | 340,400 | | | | | Guangzhou R&F Properties Co., Ltd. Class H | | | 442,191 | |
| | 43,800 | | | | | Guotai Junan Securities Co., Ltd. Class H 144A | | | 64,989 | |
| | 297,200 | | | | | Haitong Securities Co., Ltd. Class H | | | 270,645 | |
| | 305,000 | | | | | Harbin Bank Co., Ltd. Class H* 144A | | | 47,429 | |
| | 63,000 | | | | | Hisense Home Appliances Group Co., Ltd. Class H | | | 57,641 | |
| | 49,800 | | | | | Huatai Securities Co., Ltd. Class H 144A | | | 73,734 | |
| | 67,100 | | | | | Huishang Bank Corp., Ltd. Class H | | | 23,863 | |
| | 8,875,000 | | | | | Industrial & Commercial Bank of China, Ltd. Class H | | | 6,056,928 | |
| | 38,100 | | | | | Inner Mongolia Yitai Coal Co., Ltd. Class H | | | 27,722 | |
| | 170,008 | | | | | Jiangsu Hengrui Medicine Co., Ltd. Class A* | | | 2,212,451 | |
| | 206,100 | | | | | Jiangsu Yanghe Brewery Joint-Stock Co., Ltd. Class A | | | 2,445,334 | |
| | 410,000 | | | | | Jiangxi Copper Co., Ltd. Class H | | | 376,835 | |
| | 26,613 | | | | | Kweichow Moutai Co., Ltd. Class A | | | 4,183,317 | |
| | 140,800 | | | | | Legend Holdings Corp. Class H 144A | | | 173,232 | |
| | 9,633 | | | | | Livzon Pharmaceutical Group, Inc. Class H | | | 35,015 | |
| | 1,001,000 | | | | | Metallurgical Corp. of China, Ltd. Class H | | | 174,688 | |
| | 1,256,538 | | | | | Midea Group Co., Ltd. Class A | | | 8,606,932 | |
| | 29,600 | | | | | New China Life Insurance Co., Ltd. Class H | | | 91,791 | |
| | 17,200 | | | | | Orient Securities Co., Ltd. Class H 144A | | | 8,999 | |
| | 327,000 | | | | | People’s Insurance Co. Group of China, Ltd. (The) Class H | | | 107,475 | |
| | 3,022,000 | | | | | PetroChina Co., Ltd. Class H | | | 1,103,333 | |
| | 2,540,400 | | | | | PICC Property & Casualty Co., Ltd. Class H | | | 2,444,056 | |
| | 2,860,900 | | | | | Ping An Insurance Group Co. of China, Ltd. Class H | | | 27,992,454 | |
| | 1,178,000 | | | | | Postal Savings Bank of China Co., Ltd. Class H 144A | | | 715,205 | |
| | 247,000 | | | | | Qingdao Port International Co., Ltd. Class H 144A | | | 134,900 | |
| | 82,500 | | | | | Qinhuangdao Port Co., Ltd. Class H | | | 13,064 | |
| | 131,297 | | | | | Red Star Macalline Group Corp., Ltd. Class H 144A | | | 83,442 | |
| | 114,500 | | | | | Shandong Chenming Paper Holdings, Ltd. Class H | | | 40,955 | |
| | 1,201,400 | | | | | Shandong Weigao Group Medical Polymer Co., Ltd. Class H | | | 1,514,119 | |
| | 750,000 | | | | | Shanghai Electric Group Co., Ltd. Class H | | | 197,777 | |
See accompanying Notes to the Financial Statements.
161
Mercer Emerging Markets Equity Fund
Schedule of Investments (Continued)
(showing percentage of net assets)
March 31, 2020
| | | | | | | | | | |
| Shares | | | | | Description | | Value ($) | |
| | |
| | | | | | China — continued | |
| | 36,000 | | | | | Shanghai Fosun Pharmaceutical Group Co., Ltd. Class H | | | 117,971 | |
| | 80,000 | | | | | Shanghai Jin Jiang Capital Co., Ltd. Class H | | | 13,368 | |
| | 175,900 | | | | | Shanghai Pharmaceuticals Holding Co., Ltd. Class H | | | 297,919 | |
| | 137,000 | | | | | Shengjing Bank Co., Ltd. Class H‡ 144A | | | 124,496 | |
| | 628,500 | | | | | Sinopec Engineering Group Co., Ltd. Class H | | | 263,459 | |
| | 862,000 | | | | | Sinopec Shanghai Petrochemical Co., Ltd. Class H | | | 212,624 | |
| | 73,600 | | | | | Sinopharm Group Co., Ltd. Class H | | | 164,862 | |
| | 866,000 | | | | | Sinotrans, Ltd. Class H | | | 212,520 | |
| | 63,000 | | | | | Tong Ren Tang Technologies Co., Ltd. Class H | | | 50,128 | |
| | 1,861,000 | | | | | TravelSky Technology, Ltd. Class H | | | 3,267,064 | |
| | 22,000 | | | | | Tsingtao Brewery Co., Ltd. Class H | | | 111,729 | |
| | 806,100 | | | | | Weichai Power Co., Ltd. Class H | | | 1,290,435 | |
| | 50,000 | | | | | Xinhua Winshare Publishing and Media Co., Ltd. Class H | | | 32,109 | |
| | 60,849 | | | | | Xinjiang Goldwind Science & Technology Co., Ltd. Class H | | | 52,804 | |
| | 594,000 | | | | | Yanzhou Coal Mining Co., Ltd. Class H | | | 463,991 | |
| | 399,900 | | | | | YiChang HEC ChangJiang Pharmaceutical Co., Ltd. Class H | | | 1,881,352 | |
| | 196,300 | | | | | Zhangzhou Pientzehuang Pharmaceutical Co., Ltd. Class A | | | 3,428,617 | |
| | 90,000 | | | | | Zhaojin Mining Industry Co., Ltd. Class H | | | 89,459 | |
| | 80,000 | | | | | Zhuzhou CRRC Times Electric Co., Ltd. Class H | | | 236,017 | |
| | 412,000 | | | | | Zijin Mining Group Co., Ltd. Class H | | | 153,595 | |
| | 181,200 | | | | | Zoomlion Heavy Industry Science and Technology Co., Ltd. Class H‡ | | | 131,396 | |
| | | | | | | | | | |
| | | | | | Total China | | | 131,455,584 | |
| | | | | | | | | | |
| | |
| | | | | | Colombia — 0.1% | |
| | 3,883 | | | | | Banco de Bogota SA | | | 67,903 | |
| | 36,773 | | | | | Cementos Argos SA | | | 37,044 | |
| | 13,229 | | | | | Corp. Financiera Colombiana SA* | | | 83,999 | |
| | 56,142 | | | | | Grupo Argos SA | | | 170,358 | |
| | 29,499 | | | | | Grupo de Inversiones Suramericana SA | | | 145,457 | |
| | 8,951 | | | | | Grupo Nutresa SA | | | 42,108 | |
| | | | | | | | | | |
| | | | | | Total Colombia | | | 546,869 | |
| | | | | | | | | | |
| | |
| | | | | | Cyprus — 0.1% | |
| | 44,668 | | | | | TCS Group Holding Plc, Reg S, GDR‡‡‡ | | | 513,929 | |
| | | | | | | | | | |
| | |
| | | | | | Czech Republic — 0.0% | |
| | 25,472 | | | | | CEZ AS | | | 415,730 | |
| | | | | | | | | | |
| | |
| | | | | | France — 0.4% | |
| | 41,060 | | | | | Sanofi | | | 3,596,438 | |
| | | | | | | | | | |
| | |
| | | | | | Greece — 0.2% | |
| | 132,595 | | | | | Alpha Bank AE* | | | 103,062 | |
| | 1,272,808 | | | | | Eurobank Ergasias Services and Holdings SA* | | | 557,245 | |
| | 8,853 | | | | | GEK Terna Holding Real Estate Construction SA* | | | 50,142 | |
| | 2,981 | | | | | Hellenic Petroleum SA | | | 17,442 | |
| | 74,630 | | | | | JUMBO SA | | | 1,014,149 | |
| | 5,901 | | | | | LAMDA Development SA* | | | 37,219 | |
| | 17,050 | | | | | Mytilineos SA | | | 114,893 | |
See accompanying Notes to the Financial Statements.
162
Mercer Emerging Markets Equity Fund
Schedule of Investments (Continued)
(showing percentage of net assets)
March 31, 2020
| | | | | | | | | | |
| Shares | | | | | Description | | Value ($) | |
| | |
| | | | | | Greece — continued | |
| | 61,833 | | | | | National Bank of Greece SA* | | | 84,944 | |
| | 106,195 | | | | | Piraeus Bank SA* | | | 159,282 | |
| | | | | | | | | | |
| | | | | | Total Greece | | | 2,138,378 | |
| | | | | | | | | | |
| | |
| | | | | | Hong Kong — 3.0% | |
| | 163,000 | | | | | Beijing Enterprises Holdings, Ltd. | | | 593,296 | |
| | 94,000 | | | | | BYD Electronic International Co., Ltd.‡ | | | 156,030 | |
| | 430,000 | | | | | China Everbright, Ltd. | | | 631,643 | |
| | 416,000 | | | | | China Jinmao Holdings Group, Ltd. | | | 267,729 | |
| | 447,637 | | | | | China Merchants Port Holdings Co., Ltd. | | | 509,480 | |
| | 1,032,500 | | | | | China Mobile, Ltd. | | | 7,802,280 | |
| | 40,775 | | | | | China Mobile, Ltd., ADR | | | 1,535,994 | |
| | 1,922,000 | | | | | China Overseas Grand Oceans Group, Ltd. | | | 1,117,658 | |
| | 604,000 | | | | | China Overseas Land & Investment, Ltd. | | | 1,864,348 | |
| | 397,000 | | | | | China Resources Pharmaceutical Group, Ltd. 144A | | | 237,697 | |
| | 232,000 | | | | | China South City Holdings, Ltd. | | | 22,388 | |
| | 517,200 | | | | | China Taiping Insurance Holdings Co., Ltd. | | | 843,057 | |
| | 998,000 | | | | | China Traditional Chinese Medicine Holdings Co., Ltd. | | | 453,130 | |
| | 944,000 | | | | | China Unicom Hong Kong, Ltd. | | | 541,022 | |
| | 1,977 | | | | | China Unicom Hong Kong, Ltd., ADR‡ | | | 11,625 | |
| | 738,000 | | | | | CITIC, Ltd. | | | 768,558 | |
| | 2,375,000 | | | | | CNOOC, Ltd. | | | 2,476,708 | |
| | 100 | | | | | CNOOC, Ltd., ADR | | | 10,347 | |
| | 2,254,000 | | | | | CSPC Pharmaceutical Group, Ltd. | | | 4,487,174 | |
| | 877,000 | | | | | Far East Horizon, Ltd. | | | 704,175 | |
| | 723,000 | | | | | Fosun International, Ltd. | | | 830,832 | |
| | 164,000 | | | | | Hua Hong Semiconductor, Ltd.‡ 144A | | | 298,127 | |
| | 510,000 | | | | | Lenovo Group, Ltd. | | | 272,482 | |
| | 396,000 | | | | | MMG, Ltd.* | | | 56,362 | |
| | 704,000 | | | | | Poly Property Group Co., Ltd. | | | 237,767 | |
| | 189,000 | | | | | Shanghai Industrial Holdings, Ltd. | | | 284,827 | |
| | 1,337,936 | | | | | Shenzhen Investment, Ltd. | | | 414,204 | |
| | 1,366,000 | | | | | Sino-Ocean Group Holding, Ltd. | | | 345,648 | |
| | 88,500 | | | | | Sinotruk Hong Kong, Ltd. | | | 146,522 | |
| | 147,000 | | | | | Sun Art Retail Group, Ltd. | | | 217,621 | |
| | 2,974,000 | | | | | Yuexiu Property Co., Ltd. | | | 534,645 | |
| | | | | | | | | | |
| | | | | | Total Hong Kong | | | 28,673,376 | |
| | | | | | | | | | |
| | |
| | | | | | Hungary — 0.4% | |
| | 69,547 | | | | | MOL Hungarian Oil & Gas Plc | | | 407,785 | |
| | 30,080 | | | | | OTP Bank Nyrt | | | 868,209 | |
| | 138,351 | | | | | Richter Gedeon Nyrt | | | 2,596,439 | |
| | | | | | | | | | |
| | | | | | Total Hungary | | | 3,872,433 | |
| | | | | | | | | | |
| | |
| | | | | | India — 8.7% | |
| | 44,017 | | | | | ACC, Ltd. | | | 555,583 | |
| | 51,815 | | | | | Adani Enterprises, Ltd. | | | 93,128 | |
| | 35,296 | | | | | Adani Gas, Ltd. | | | 40,113 | |
| | 41,266 | | | | | Adani Green Energy, Ltd.* | | | 83,880 | |
See accompanying Notes to the Financial Statements.
163
Mercer Emerging Markets Equity Fund
Schedule of Investments (Continued)
(showing percentage of net assets)
March 31, 2020
| | | | | | | | | | |
| Shares | | | | | Description | | Value ($) | |
| | |
| | | | | | India — continued | |
| | 20,509 | | | | | Adani Ports & Special Economic Zone, Ltd. | | | 66,806 | |
| | 104,805 | | | | | Adani Power, Ltd.* | | | 37,700 | |
| | 19,503 | | | | | Adani Transmission, Ltd.* | | | 48,974 | |
| | 139,935 | | | | | Aditya Birla Capital, Ltd.* | | | 76,605 | |
| | 700 | | | | | Ajanta Pharma, Ltd. | | | 12,581 | |
| | 1,619 | | | | | Alembic Pharmaceuticals, Ltd. | | | 11,346 | |
| | 1,582 | | | | | Amara Raja Batteries, Ltd. | | | 9,864 | |
| | 149,810 | | | | | Ambuja Cements, Ltd. | | | 305,315 | |
| | 100,932 | | | | | Apollo Tyres, Ltd. | | | 106,450 | |
| | 4,534 | | | | | Arvind Fashions, Ltd.* | | | 8,722 | |
| | 22,672 | | | | | Arvind, Ltd. | | | 5,873 | |
| | 360,718 | | | | | Ashok Leyland, Ltd. | | | 202,684 | |
| | 151,135 | | | | | Asian Paints, Ltd. | | | 3,278,214 | |
| | 1,268 | | | | | Atul, Ltd. | | | 65,884 | |
| | 81,810 | | | | | AU Small Finance Bank, Ltd. | | | 561,522 | |
| | 66,864 | | | | | Aurobindo Pharma, Ltd. | | | 365,831 | |
| | 236,322 | | | | | Axis Bank, Ltd. | | | 1,164,349 | |
| | 47,033 | | | | | Bajaj Auto, Ltd. | | | 1,240,574 | |
| | 50,534 | | | | | Bajaj Finance, Ltd. | | | 1,455,645 | |
| | 724 | | | | | Bajaj Finserv, Ltd. | | | 44,013 | |
| | 8,264 | | | | | Bajaj Holdings & Investment, Ltd. | | | 196,605 | |
| | 7,393 | | | | | Balkrishna Industries, Ltd. | | | 75,767 | |
| | 101,945 | | | | | Bank of Baroda* | | | 75,446 | |
| | 53,256 | | | | | Bata India, Ltd. | | | 858,320 | |
| | 49,320 | | | | | Bharat Electronics, Ltd. | | | 47,439 | |
| | 19,571 | | | | | Bharat Forge, Ltd. | | | 60,073 | |
| | 187,690 | | | | | Bharti Airtel, Ltd.* | | | 1,080,341 | |
| | 14,003 | | | | | Bharti Infratel, Ltd. | | | 29,341 | |
| | 1,542 | | | | | Birla Corp., Ltd. | | | 8,394 | |
| | 50,795 | | | | | Britannia Industries, Ltd. | | | 1,787,461 | |
| | 45,555 | | | | | Cadila Healthcare, Ltd. | | | 160,699 | |
| | 27,266 | | | | | Canara Bank* | | | 32,971 | |
| | 6,409 | | | | | Ceat, Ltd. | | | 68,052 | |
| | 3,469 | | | | | Century Textiles & Industries, Ltd. | | | 13,285 | |
| | 18,755 | | | | | Chambal Fertilizers and Chemicals, Ltd. | | | 26,097 | |
| | 222,709 | | | | | Cholamandalam Investment and Finance Co., Ltd. | | | 438,123 | |
| | 86,800 | | | | | Cipla, Ltd. | | | 481,239 | |
| | 28,829 | | | | | City Union Bank, Ltd. | | | 48,813 | |
| | 5,698 | | | | | Cochin Shipyard, Ltd. 144A | | | 19,748 | |
| | 11,781 | | | | | Container Corp. Of India, Ltd. | | | 50,736 | |
| | 4,759 | | | | | Coromandel International, Ltd. | | | 34,210 | |
| | 5,869 | | | | | Cummins India, Ltd. | | | 25,470 | |
| | 7,339 | | | | | Dalmia Bharat, Ltd.* | | | 47,768 | |
| | 44,321 | | | | | DCB Bank, Ltd. | | | 55,128 | |
| | 8,523 | | | | | DCM Shriram, Ltd. | | | 24,541 | |
| | 4,025 | | | | | Dilip Buildcon, Ltd. 144A | | | 11,102 | |
| | 102,560 | | | | | DLF, Ltd. | | | 183,518 | |
| | 3,946 | | | | | Dr. Reddy’s Laboratories, Ltd. | | | 161,314 | |
| | 1,155 | | | | | eClerx Services, Ltd. | | | 5,546 | |
See accompanying Notes to the Financial Statements.
164
Mercer Emerging Markets Equity Fund
Schedule of Investments (Continued)
(showing percentage of net assets)
March 31, 2020
| | | | | | | | | | |
| Shares | | | | | Description | | Value ($) | |
| | |
| | | | | | India — continued | |
| | 122,423 | | | | | Edelweiss Financial Services, Ltd. | | | 61,931 | |
| | 16,647 | | | | | EIH, Ltd. | | | 14,531 | |
| | 16,885 | | | | | Engineers India, Ltd. | | | 13,389 | |
| | 8,422 | | | | | Escorts, Ltd. | | | 73,346 | |
| | 73,549 | | | | | Exide Industries, Ltd. | | | 125,388 | |
| | 542,651 | | | | | Federal Bank, Ltd. | | | 295,105 | |
| | 2,842 | | | | | Finolex Cables, Ltd. | | | 7,569 | |
| | 4,764 | | | | | Finolex Industries, Ltd. | | | 24,729 | |
| | 21,744 | | | | | Firstsource Solutions, Ltd. | | | 7,783 | |
| | 201,760 | | | | | GAIL India, Ltd. | | | 201,653 | |
| | 17,950 | | | | | General Insurance Corp. of India 144A | | | 24,958 | |
| | 33,410 | | | | | Glenmark Pharmaceuticals, Ltd. | | | 89,571 | |
| | 4,323 | | | | | Godrej Industries, Ltd. | | | 16,141 | |
| | 49,859 | | | | | Grasim Industries, Ltd. | | | 312,051 | |
| | 9,916 | | | | | Great Eastern Shipping Co., Ltd. (The) Class F | | | 26,566 | |
| | 9,733 | | | | | Gujarat Fluorochemicals, Ltd.* | | | 36,821 | |
| | 6,590 | | | | | Gujarat Narmada Valley Fertilizers & Chemicals, Ltd. | | | 9,925 | |
| | 35,445 | | | | | Gujarat Pipavav Port, Ltd. | | | 28,508 | |
| | 29,302 | | | | | Gujarat State Petronet, Ltd. | | | 66,256 | |
| | 540,079 | | | | | HCL Technologies, Ltd. | | | 3,069,894 | |
| | 322,755 | | | | | HDFC Bank, Ltd. | | | 3,614,872 | |
| | 29,984 | | | | | HDFC Bank, Ltd., ADR | | | 1,153,185 | |
| | 291,324 | | | | | HDFC Life Insurance Co., Ltd. | | | 1,668,669 | |
| | 5,777 | | | | | Hero MotoCorp, Ltd. | | | 119,678 | |
| | 5,042 | | | | | Hexaware Technologies, Ltd. | | | 15,020 | |
| | 322,010 | | | | | Hindalco Industries, Ltd. | | | 403,848 | |
| | 322,311 | | | | | Housing Development Finance Corp., Ltd. | | | 6,849,631 | |
| | 150,299 | | | | | ICICI Bank, Ltd. | | | 651,389 | |
| | 13,156 | | | | | ICICI Bank, Ltd., ADR | | | 111,826 | |
| | 422,223 | | | | | IDFC First Bank, Ltd.* | | | 115,915 | |
| | 285,672 | | | | | IDFC, Ltd. | | | 56,255 | |
| | 812,104 | | | | | Indiabulls Housing Finance, Ltd., ADR | | | 1,045,174 | |
| | 35,342 | | | | | Indiabulls Real Estate, Ltd.* | | | 19,551 | |
| | 15,841 | | | | | Indiabulls Ventures, Ltd. | | | 22,932 | |
| | 27,565 | | | | | Indian Hotels Co., Ltd. (The) | | | 26,989 | |
| | 358,012 | | | | | Indraprastha Gas, Ltd. | | | 1,813,446 | |
| | 173,326 | | | | | IndusInd Bank, Ltd. | | | 789,133 | |
| | 492,031 | | | | | Infosys, Ltd. | | | 4,122,267 | |
| | 223,402 | | | | | Infosys, Ltd., ADR‡ | | | 1,834,130 | |
| | 5,075 | | | | | Ipca Laboratories, Ltd. | | | 92,845 | |
| | 173,466 | | | | | Jindal Steel & Power, Ltd.* | | | 188,108 | |
| | 1,025 | | | | | JK Cement, Ltd. | | | 12,667 | |
| | 41,440 | | | | | JM Financial, Ltd. | | | 35,238 | |
| | 134,159 | | | | | JSW Energy, Ltd. | | | 74,507 | |
| | 108,036 | | | | | JSW Steel, Ltd. | | | 205,518 | |
| | 32,103 | | | | | Jubilant Foodworks, Ltd. | | | 624,319 | |
| | 14,600 | | | | | Jubilant Life Sciences, Ltd. | | | 48,672 | |
| | 119,196 | | | | | Kajaria Ceramics, Ltd. | | | 583,684 | |
| | 4,066 | | | | | Kalpataru Power Transmission, Ltd. | | | 9,658 | |
See accompanying Notes to the Financial Statements.
165
Mercer Emerging Markets Equity Fund
Schedule of Investments (Continued)
(showing percentage of net assets)
March 31, 2020
| | | | | | | | | | |
| Shares | | | | | Description | | Value ($) | |
| | |
| | | | | | India — continued | |
| | 31,854 | | | | | Karnataka Bank, Ltd. (The) | | | 17,977 | |
| | 56,526 | | | | | Karur Vysya Bank, Ltd. (The) | | | 15,051 | |
| | 3,700 | | | | | KEC International, Ltd. | | | 9,144 | |
| | 19,360 | | | | | KPIT Engineering, Ltd.* | | | 8,955 | |
| | 19,360 | | | | | KPIT Technologies, Ltd.* | | | 15,670 | |
| | 1,219 | | | | | KPR Mill, Ltd. | | | 5,459 | |
| | 2,301 | | | | | KRBL, Ltd. | | | 4,099 | |
| | 127,540 | | | | | L&T Finance Holdings, Ltd. | | | 86,297 | |
| | 15,604 | | | | | Larsen & Toubro, Ltd. | | | 165,485 | |
| | 1,896 | | | | | Laurus Labs, Ltd. 144A | | | 8,192 | |
| | 98,662 | | | | | LIC Housing Finance, Ltd. | | | 308,049 | |
| | 50,662 | | | | | Lupin, Ltd. | | | 392,238 | |
| | 144,204 | | | | | Mahanagar Gas, Ltd. | | | 1,536,578 | |
| | 109,705 | | | | | Mahindra & Mahindra Financial Services, Ltd. | | | 208,792 | |
| | 81,747 | | | | | Mahindra & Mahindra, Ltd. | | | 304,384 | |
| | 20,010 | | | | | Mahindra CIE Automotive, Ltd.* | | | 18,012 | |
| | 613,611 | | | | | Manappuram Finance, Ltd. | | | 763,206 | |
| | 33,047 | | | | | Maruti Suzuki India, Ltd. | | | 1,852,019 | |
| | 8,863 | | | | | Max Financial Services, Ltd.* | | | 44,375 | |
| | 1,238 | | | | | Mindtree, Ltd. | | | 13,294 | |
| | 1,784,680 | | | | | Motherson Sumi Systems, Ltd. | | | 1,421,420 | |
| | 3,645 | | | | | Motilal Oswal Financial Services, Ltd. | | | 23,555 | |
| | 10,836 | | | | | Mphasis, Ltd. | | | 94,553 | |
| | 1,265 | | | | | MRF, Ltd. | | | 973,067 | |
| | 126,766 | | | | | Muthoot Finance, Ltd. | | | 1,012,632 | |
| | 7,410 | | | | | Natco Pharma, Ltd. | | | 49,816 | |
| | 124,982 | | | | | National Aluminium Co., Ltd. | | | 47,987 | |
| | 96,063 | | | | | NCC, Ltd. | | | 24,057 | |
| | 58,239 | | | | | NIIT Technologies, Ltd. | | | 882,962 | |
| | 274,375 | | | | | Nippon Life Asset Management, Ltd. | | | 913,346 | |
| | 20,426 | | | | | NMDC, Ltd. | | | 21,266 | |
| | 19,035 | | | | | Oberoi Realty, Ltd. | | | 84,410 | |
| | 54,159 | | | | | PC Jeweller, Ltd.* | | | 8,117 | |
| | 8,118 | | | | | Persistent Systems, Ltd. | | | 59,015 | |
| | 33,048 | | | | | Petronet LNG, Ltd. | | | 86,742 | |
| | 1,284 | | | | | Pfizer, Ltd. | | | 68,008 | |
| | 4,676 | | | | | Phoenix Mills, Ltd. (The) | | | 35,156 | |
| | 26,959 | | | | | Piramal Enterprises, Ltd. | | | 332,573 | |
| | 16,221 | | | | | PNB Housing Finance, Ltd. 144A | | | 34,686 | |
| | 174,603 | | | | | Power Finance Corp., Ltd. | | | 209,312 | |
| | 21,563 | | | | | Prestige Estates Projects, Ltd. | | | 48,188 | |
| | 6,287 | | | | | Quess Corp., Ltd.* 144A | | | 17,407 | |
| | 8,780 | | | | | Rain Industries, Ltd. | | | 6,443 | |
| | 22,196 | | | | | Rajesh Exports, Ltd. | | | 163,639 | |
| | 4,988 | | | | | Ramco Cements, Ltd. (The) | | | 33,820 | |
| | 4,818 | | | | | Raymond, Ltd. | | | 14,128 | |
| | 93,936 | | | | | RBL Bank, Ltd. 144A | | | 169,077 | |
| | 190,475 | | | | | REC, Ltd. | | | 224,560 | |
| | 34,104 | | | | | Reliance Capital, Ltd.* | | | 2,004 | |
See accompanying Notes to the Financial Statements.
166
Mercer Emerging Markets Equity Fund
Schedule of Investments (Continued)
(showing percentage of net assets)
March 31, 2020
| | | | | | | | | | |
| Shares | | | | | Description | | Value ($) | |
| | |
| | | | | | India — continued | |
| | 1,053,348 | | | | | Reliance Industries, Ltd. | | | 15,312,755 | |
| | 1,729 | | | | | Reliance Industries, Ltd., GDR 144A | | | 53,008 | |
| | 191,600 | | | | | Reliance Power, Ltd.* | | | 3,164 | |
| | 2,509 | | | | | Sadbhav Engineering, Ltd. | | | 980 | |
| | 3,895 | | | | | Shriram City Union Finance, Ltd. | | | 39,071 | |
| | 41,486 | | | | | Shriram Transport Finance Co., Ltd. | | | 352,739 | |
| | 8,357 | | | | | Sobha, Ltd. | | | 14,357 | |
| | 1,607 | | | | | SRF, Ltd. | | | 58,383 | |
| | 255,206 | | | | | State Bank of India* | | | 661,043 | |
| | 269,432 | | | | | Steel Authority of India, Ltd. | | | 82,074 | |
| | 13,458 | | | | | Strides Pharma Science, Ltd. | | | 57,357 | |
| | 107,390 | | | | | Sun Pharmaceutical Industries, Ltd. | | | 501,389 | |
| | 10,790 | | | | | Sun TV Network, Ltd. | | | 40,415 | |
| | 2,941 | | | | | Sundaram Finance, Ltd. | | | 47,661 | |
| | 8,857 | | | | | Sunteck Realty, Ltd. | | | 23,946 | |
| | 19,260 | | | | | Tata Chemicals, Ltd. | | | 56,489 | |
| | 21,956 | | | | | Tata Consumer Products, Ltd.**** | | | 85,602 | |
| | 68,519 | | | | | Tata Global Beverages, Ltd. | | | 263,981 | |
| | 383,877 | | | | | Tata Motors, Ltd.* | | | 361,513 | |
| | 99,255 | | | | | Tata Steel, Ltd. | | | 354,153 | |
| | 13,961 | | | | | Tech Mahindra, Ltd. | | | 102,839 | |
| | 22,198 | | | | | Thomas Cook India, Ltd. | | | 6,812 | |
| | 68,915 | | | | | TV18 Broadcast, Ltd.* | | | 14,085 | |
| | 3,133 | | | | | UltraTech Cement, Ltd. | | | 132,016 | |
| | 56,007 | | | | | Union Bank of India* | | | 21,353 | |
| | 544,617 | | | | | UPL, Ltd. | | | 2,352,704 | |
| | 1,848 | | | | | Vardhman Textiles, Ltd. | | | 14,914 | |
| | 866,342 | | | | | Vedanta, Ltd. | | | 751,331 | |
| | 1,107,822 | | | | | Vodafone Idea, Ltd.* | | | 45,002 | |
| | 39,909 | | | | | Welspun India, Ltd. | | | 11,445 | |
| | 76,145 | | | | | Wipro, Ltd. | | | 196,394 | |
| | 3,632 | | | | | Wockhardt, Ltd.* | | | 8,304 | |
| | 324,058 | | | | | Yes Bank, Ltd. | | | 95,493 | |
| | 159,350 | | | | | Zee Entertainment Enterprises, Ltd. | | | 259,877 | |
| | 2,971 | | | | | Zensar Technologies, Ltd. | | | 3,449 | |
| | | | | | | | | | |
| | | | | | Total India | | | 81,989,764 | |
| | | | | | | | | | |
| | |
| | | | | | Indonesia — 1.6% | |
| | 4,188,200 | | | | | Adaro Energy Tbk PT | | | 252,791 | |
| | 761,600 | | | | | AKR Corporindo Tbk PT | | | 91,560 | |
| | 3,996,800 | | | | | Aneka Tambang Tbk PT | | | 109,717 | |
| | 160,000 | | | | | Astra Agro Lestari Tbk PT | | | 52,529 | |
| | 841,400 | | | | | Astra International Tbk PT | | | 200,794 | |
| | 104,300 | | | | | Bank Danamon Indonesia Tbk PT | | | 13,274 | |
| | 2,299,000 | | | | | Bank Mandiri Persero Tbk PT | | | 657,490 | |
| | 799,500 | | | | | Bank Maybank Indonesia Tbk PT | | | 6,763 | |
| | 1,157,800 | | | | | Bank Negara Indonesia Persero Tbk PT | | | 270,280 | |
| | 928,000 | | | | | Bank Pan Indonesia Tbk PT* | | | 38,836 | |
| | 1,484,800 | | | | | Bank Pembangunan Daerah Jawa Barat Dan Banten Tbk PT | | | 66,428 | |
See accompanying Notes to the Financial Statements.
167
Mercer Emerging Markets Equity Fund
Schedule of Investments (Continued)
(showing percentage of net assets)
March 31, 2020
| | | | | | | | | | |
| Shares | | | | | Description | | Value ($) | |
| | |
| | | | | | Indonesia — continued | |
| | 956,700 | | | | | Bank Pembangunan Daerah Jawa Timur Tbk PT | | | 25,589 | |
| | 27,174,800 | | | | | Bank Rakyat Indonesia Persero Tbk PT | | | 4,997,120 | |
| | 1,273,000 | | | | | Bank Tabungan Negara Persero Tbk PT | | | 64,858 | |
| | 4,453,700 | | | | | Bank Tabungan Pensiunan Nasional Syariah Tbk PT* | | | 579,861 | |
| | 1,324,100 | | | | | Barito Pacific Tbk PT* | | | 58,187 | |
| | 669,500 | | | | | Bukit Asam Tbk PT | | | 89,174 | |
| | 1,040,000 | | | | | Bumi Serpong Damai Tbk PT* | | | 42,339 | |
| | 4,209,500 | | | | | Ciputra Development Tbk PT | | | 114,268 | |
| | 15,100 | | | | | Gudang Garam Tbk PT | | | 38,015 | |
| | 756,600 | | | | | Indah Kiat Pulp & Paper Corp. Tbk PT | | | 185,218 | |
| | 160,400 | | | | | Indo Tambangraya Megah Tbk PT | | | 79,017 | |
| | 3,700 | | | | | Indocement Tunggal Prakarsa Tbk PT | | | 2,827 | |
| | 683,500 | | | | | Indofood Sukses Makmur Tbk PT | | | 265,501 | |
| | 371,800 | | | | | Japfa Comfeed Indonesia Tbk PT | | | 21,441 | |
| | 544,400 | | | | | Jaya Real Property Tbk PT | | | 12,934 | |
| | 97,200 | | | | | Link Net Tbk PT | | | 15,663 | |
| | 2,110,500 | | | | | Medco Energi Internasional Tbk PT* | | | 49,565 | |
| | 682,000 | | | | | Media Nusantara Citra Tbk PT | | | 37,645 | |
| | 705,900 | | | | | Mitra Adiperkasa Tbk PT | | | 20,376 | |
| | 131,500 | | | | | Pabrik Kertas Tjiwi Kimia Tbk PT | | | 31,953 | |
| | 1,351,600 | | | | | Pakuwon Jati Tbk PT | | | 25,314 | |
| | 228,200 | | | | | PP Persero Tbk PT | | | 7,665 | |
| | 1,205,900 | | | | | Puradelta Lestari Tbk PT | | | 10,514 | |
| | 257,300 | | | | | Semen Indonesia Persero Tbk PT | | | 119,994 | |
| | 78,000 | | | | | Siloam International Hospitals Tbk PT* | | | 28,537 | |
| | 1,350,500 | | | | | Summarecon Agung Tbk PT | | | 32,763 | |
| | 22,231,100 | | | | | Telekomunikasi Indonesia Persero Tbk PT | | | 4,297,465 | |
| | 4,160,000 | | | | | Unilever Indonesia Tbk PT | | | 1,836,947 | |
| | 219,300 | | | | | United Tractors Tbk PT | | | 226,639 | |
| | 367,100 | | | | | Vale Indonesia Tbk PT* | | | 48,419 | |
| | 1,419,900 | | | | | Waskita Karya Persero Tbk PT | | | 42,019 | |
| | 1,604,800 | | | | | Wijaya Karya Persero Tbk PT | | | 81,782 | |
| | 855,500 | | | | | XL Axiata Tbk PT* | | | 104,578 | |
| | | | | | | | | | |
| | | | | | Total Indonesia | | | 15,354,649 | |
| | | | | | | | | | |
| | |
| | | | | | Japan — 0.2% | |
| | 253,700 | | | | | Isuzu Motors, Ltd. | | | 1,672,603 | |
| | | | | | | | | | |
| | |
| | | | | | Luxembourg — 0.2% | |
| | 5,433 | | | | | Globant SA* | | | 477,452 | |
| | 19,412 | | | | | Kernel Holding SA | | | 154,080 | |
| | 147,426 | | | | | PLAY Communications SA | | | 1,038,690 | |
| | | | | | | | | | |
| | | | | | Total Luxembourg | | | 1,670,222 | |
| | | | | | | | | | |
| | |
| | | | | | Malaysia — 0.5% | |
| | 536,700 | | | | | AirAsia Group Bhd | | | 97,223 | |
| | 370,400 | | | | | Alliance Bank Malaysia Bhd | | | 161,365 | |
| | 326,600 | | | | | AMMB Holdings Bhd | | | 224,489 | |
| | 1,600 | | | | | Batu Kawan Bhd | | | 4,481 | |
See accompanying Notes to the Financial Statements.
168
Mercer Emerging Markets Equity Fund
Schedule of Investments (Continued)
(showing percentage of net assets)
March 31, 2020
| | | | | | | | | | |
| Shares | | | | | Description | | Value ($) | |
| | |
| | | | | | Malaysia — continued | |
| | 15,500 | | | | | BIMB Holdings Bhd | | | 11,586 | |
| | 81,500 | | | | | Boustead Holdings Bhd* | | | 7,783 | |
| | 71,300 | | | | | Bumi Armada Bhd* | | | 2,208 | |
| | 28,500 | | | | | Cahya Mata Sarawak Bhd | | | 7,839 | |
| | 599,588 | | | | | CIMB Group Holdings Bhd | | | 494,175 | |
| | 339,700 | | | | | DRB-Hicom Bhd | | | 102,171 | |
| | 4,900 | | | | | Eco World Development Group Bhd* | | | 457 | |
| | 337,000 | | | | | FGV Holdings Bhd* | | | 65,948 | |
| | 388,163 | | | | | Gamuda Bhd | | | 251,963 | |
| | 246,800 | | | | | Genting Bhd | | | 211,731 | |
| | 908,300 | | | | | Genting Malaysia Bhd | | | 418,927 | |
| | 12,100 | | | | | Genting Plantations Bhd | | | 26,930 | |
| | 20,900 | | | | | Hong Leong Bank Bhd | | | 64,439 | |
| | 41,000 | | | | | Hong Leong Financial Group Bhd | | | 128,473 | |
| | 669,400 | | | | | IJM Corp. Bhd | | | 244,471 | |
| | 328,300 | | | | | IOI Properties Group Bhd | | | 72,092 | |
| | 131,000 | | | | | Lotte Chemical Titan Holding Bhd 144A | | | 34,641 | |
| | 72,000 | | | | | Magnum Bhd | | | 31,503 | |
| | 121,240 | | | | | Malayan Banking Bhd | | | 207,955 | |
| | 68,700 | | | | | Malaysia Airports Holdings Bhd | | | 68,192 | |
| | 683,234 | | | | | Malaysia Building Society Bhd | | | 87,598 | |
| | 326,100 | | | | | Malaysian Resources Corp. Bhd | | | 29,122 | |
| | 118,500 | | | | | MISC Bhd | | | 203,605 | |
| | 102,700 | | | | | MMC Corp. Bhd | | | 14,218 | |
| | 80,200 | | | | | Oriental Holdings Bhd | | | 93,842 | |
| | 69,600 | | | | | Petronas Chemicals Group Bhd | | | 80,567 | |
| | 11,700 | | | | | Pos Malaysia Bhd | | | 1,905 | |
| | 5,100 | | | | | PPB Group Bhd | | | 19,350 | |
| | 70,200 | | | | | Public Bank Bhd | | | 256,496 | |
| | 293,600 | | | | | RHB Bank Bhd | | | 316,010 | |
| | 1,152,800 | | | | | Sapura Energy Bhd | | | 20,894 | |
| | 7,800 | | | | | Scientex Bhd | | | 13,544 | |
| | 705,200 | | | | | Sime Darby Bhd | | | 274,236 | |
| | 842,500 | | | | | Sime Darby Property Bhd | | | 105,083 | |
| | 556,153 | | | | | SP Setia Bhd Group | | | 94,229 | |
| | 364,396 | | | | | Sunway Bhd | | | 129,452 | |
| | 523,700 | | | | | UEM Sunrise Bhd* | | | 47,088 | |
| | 241,300 | | | | | UOA Development Bhd | | | 89,759 | |
| | 30,000 | | | | | Yinson Holdings Bhd | | | 32,969 | |
| | 737,900 | | | | | YTL Corp. Bhd | | | 122,443 | |
| | | | | | | | | | |
| | | | | | Total Malaysia | | | 4,973,452 | |
| | | | | | | | | | |
| | |
| | | | | | Mexico — 2.0% | |
| | 42,023 | | | | | ALEATICA SAB de CV‡ | | | 31,348 | |
| | 721,077 | | | | | Alfa SAB de CV Class A | | | 194,875 | |
| | 147,998 | | | | | Alpek SAB de CV‡ | | | 53,813 | |
| | 44,702 | | | | | Arca Continental SAB de CV | | | 182,453 | |
| | 196,588 | | | | | Banco del Bajio SA 144A | | | 171,622 | |
| | 1,601 | | | | | Becle SAB de CV | | | 1,968 | |
See accompanying Notes to the Financial Statements.
169
Mercer Emerging Markets Equity Fund
Schedule of Investments (Continued)
(showing percentage of net assets)
March 31, 2020
| | | | | | | | | | |
| Shares | | | | | Description | | Value ($) | |
| | |
| | | | | | Mexico — continued | |
| | 1,880,950 | | | | | Cemex SAB de CV | | | 398,492 | |
| | 130,050 | | | | | Cemex SAB de CV, ADR | | | 275,706 | |
| | 12,081 | | | | | Coca-Cola Femsa SAB de CV | | | 48,913 | |
| | 560 | | | | | Coca-Cola Femsa SAB de CV, ADR | | | 22,529 | |
| | 52,276 | | | | | Controladora Vuela Cia de Aviacion SAB de CV, ADR* | | | 179,307 | |
| | 22,334 | | | | | El Puerto de Liverpool SAB de CV‡ | | | 48,658 | |
| | 3,271,686 | | | | | Fibra Uno Administracion SA de CV REIT | | | 2,596,792 | |
| | 38,616 | | | | | Fomento Economico Mexicano SAB de CV | | | 237,415 | |
| | 732 | | | | | Fomento Economico Mexicano SAB de CV, ADR | | | 44,293 | |
| | 1,501,303 | | | | | Gentera SAB de CV | | | 586,845 | |
| | 354,500 | | | | | Grupo Aeroportuario del Centro Norte SAB de CV | | | 1,213,136 | |
| | 476,200 | | | | | Grupo Aeroportuario del Pacifico SAB de CV Class B | | | 2,603,554 | |
| | 39,702 | | | | | Grupo Bimbo SAB de CV Series A | | | 58,878 | |
| | 20,999 | | | | | Grupo Carso SAB de CV Series A-1 | | | 41,704 | |
| | 31,565 | | | | | Grupo Cementos de Chihuahua SAB de CV‡ | | | 94,187 | |
| | 37,401 | | | | | Grupo Comercial Chedraui SA de CV | | | 39,985 | |
| | 8,048 | | | | | Grupo Elektra SAB DE CV | | | 469,996 | |
| | 636,595 | | | | | Grupo Financiero Banorte SAB de CV Series O | | | 1,763,853 | |
| | 153,751 | | | | | Grupo Financiero Inbursa SAB de CV Series O | | | 111,417 | |
| | 34,200 | | | | | Grupo Lala SAB de CV‡ | | | 15,730 | |
| | 342,610 | | | | | Grupo Mexico SAB de CV Series B | | | 642,451 | |
| | 76,700 | | | | | Grupo Sanborns SAB de CV | | | 75,199 | |
| | 369,959 | | | | | Grupo Televisa SAB‡ | | | 435,418 | |
| | 19,886 | | | | | Grupo Televisa SAB, ADR | | | 115,339 | |
| | 71,973 | | | | | Industrias Bachoco SAB de CV Series B‡ | | | 205,556 | |
| | 14,508 | | | | | Industrias CH SAB de CV Series B | | | 54,360 | |
| | 29,718 | | | | | Industrias Penoles SAB de CV | | | 201,952 | |
| | 46,199 | | | | | Megacable Holdings SAB de CV | | | 127,278 | |
| | 131,345 | | | | | Orbia Advance Corp. SAB de CV | | | 146,466 | |
| | 14,495 | | | | | Organizacion Soriana SAB de CV Class B | | | 11,048 | |
| | 20,910 | | | | | Promotora y Operadora de Infraestructura SAB de CV* | | | 141,873 | |
| | 1,809 | | | | | Promotora y Operadora de Infraestructura SAB de CV Series L* | | | 9,639 | |
| | 2,046,800 | | | | | Wal-Mart de Mexico SAB de CV | | | 4,876,356 | |
| | | | | | | | | | |
| | | | | | Total Mexico | | | 18,530,404 | |
| | | | | | | | | | |
| | |
| | | | | | Netherlands — 0.8% | |
| | 41,213 | | | | | Unilever NV | | | 2,020,163 | |
| | 25,779 | | | | | X5 Retail Group NV, Reg S, GDR‡‡‡ | | | 692,361 | |
| | 3,300 | | | | | X5 Retail Group NV, Reg S (London Exchange), GDR‡‡‡ | | | 89,100 | |
| | 144,648 | | | | | Yandex NV Class A* | | | 4,925,264 | |
| | | | | | | | | | |
| | | | | | Total Netherlands | | | 7,726,888 | |
| | | | | | | | | | |
| | |
| | | | | | Papua New Guinea — 0.1% | |
| | 498,876 | | | | | Oil Search, Ltd. | | | 755,127 | |
| | | | | | | | | | |
| | |
| | | | | | Philippines — 0.3% | |
| | 102,600 | | | | | 8990 Holdings, Inc.* | | | 24,103 | |
| | 1,055,400 | | | | | Alliance Global Group, Inc.* | | | 144,245 | |
| | 8,223 | | | | | Altus San Nicolas Corp.* **** | | | 628 | |
See accompanying Notes to the Financial Statements.
170
Mercer Emerging Markets Equity Fund
Schedule of Investments (Continued)
(showing percentage of net assets)
March 31, 2020
| | | | | | | | | | |
| Shares | | | | | Description | | Value ($) | |
| | |
| | | | | | Philippines — continued | |
| | 16,800 | | | | | Ayala Corp. | | | 153,805 | |
| | 122,369 | | | | | Bank of the Philippine Islands | | | 147,394 | |
| | 59,710 | | | | | BDO Unibank, Inc. | | | 122,411 | |
| | 6,590 | | | | | Cebu Air, Inc. | | | 5,865 | |
| | 156,200 | | | | | China Banking Corp. | | | 62,001 | |
| | 217,800 | | | | | Cosco Capital, Inc. | | | 20,348 | |
| | 1,063,900 | | | | | DMCI Holdings, Inc. | | | 79,070 | |
| | 33,900 | | | | | Eagle Cement Corp. | | | 4,916 | |
| | 204,200 | | | | | Emperador, Inc. | | | 32,081 | |
| | 160,300 | | | | | Filinvest Development Corp. | | | 26,599 | |
| | 5,355 | | | | | GT Capital Holdings, Inc. | | | 42,506 | |
| | 191,740 | | | | | JG Summit Holdings, Inc. | | | 195,789 | |
| | 416,900 | | | | | LT Group, Inc. | | | 67,877 | |
| | 2,448,300 | | | | | Megaworld Corp. | | | 120,916 | |
| | 193,946 | | | | | Metropolitan Bank & Trust Co. | | | 150,493 | |
| | 693,000 | | | | | Nickel Asia Corp. | | | 21,211 | |
| | 448,700 | | | | | Petron Corp. | | | 22,281 | |
| | 90,389 | | | | | Philippine National Bank* | | | 35,433 | |
| | 72,220 | | | | | Pilipinas Shell Petroleum Corp. | | | 26,730 | |
| | 3,135 | | | | | PLDT, Inc. | | | 69,761 | |
| | 700 | | | | | PLDT, Inc., ADR | | | 14,392 | |
| | 95,700 | | | | | Puregold Price Club, Inc. | | | 68,729 | |
| | 427,100 | | | | | Robinsons Land Corp. | | | 123,910 | |
| | 130,730 | | | | | Robinsons Retail Holdings, Inc. | | | 145,910 | |
| | 44,120 | | | | | San Miguel Corp. | | | 79,259 | |
| | 12,670 | | | | | San Miguel Food and Beverage, Inc. | | | 12,441 | |
| | 80,330 | | | | | Security Bank Corp. | | | 167,764 | |
| | 89,300 | | | | | Semirara Mining & Power Corp. | | | 19,292 | |
| | 4,270 | | | | | Top Frontier Investment Holdings, Inc.* | | | 12,814 | |
| | 28,020 | | | | | Union Bank of the Philippines | | | 29,283 | |
| | 1,677,500 | | | | | Vista Land & Lifescapes, Inc. | | | 134,818 | |
| | | | | | | | | | |
| | | | | | Total Philippines | | | 2,385,075 | |
| | | | | | | | | | |
| | |
| | | | | | Poland — 0.5% | |
| | 24,001 | | | | | Alior Bank SA* | | | 74,231 | |
| | 25,906 | | | | | Asseco Poland SA | | | 361,409 | |
| | 3,841 | | | | | Bank Handlowy w Warszawie SA | | | 38,796 | |
| | 95,985 | | | | | Bank Millennium SA* | | | 74,306 | |
| | 5,174 | | | | | Bank Polska Kasa Opieki SA | | | 69,773 | |
| | 7,436 | | | | | Cyfrowy Polsat SA | | | 42,754 | |
| | 74,743 | | | | | Dino Polska SA* | | | 2,911,530 | |
| | 73,605 | | | | | Enea SA* | | | 83,760 | |
| | 6,244 | | | | | Grupa Lotos SA | | | 77,739 | |
| | 18,657 | | | | | KGHM Polska Miedz SA* | | | 267,821 | |
| | 2,127 | | | | | mBank SA* | | | 113,330 | |
| | 97,901 | | | | | PGE Polska Grupa Energetyczna SA* | | | 89,486 | |
| | 32,600 | | | | | Polski Koncern Naftowy ORLEN SA | | | 436,147 | |
| | 30,403 | | | | | Powszechna Kasa Oszczednosci Bank Polski SA | | | 165,220 | |
| | | | | | | | | | |
| | | | | | Total Poland | | | 4,806,302 | |
| | | | | | | | | | |
See accompanying Notes to the Financial Statements.
171
Mercer Emerging Markets Equity Fund
Schedule of Investments (Continued)
(showing percentage of net assets)
March 31, 2020
| | | | | | | | | | |
| Shares | | | | | Description | | Value ($) | |
| | |
| | | | | | Russia — 2.0% | |
| | 671,806 | | | | | Gazprom PJSC, ADR | | | 3,095,016 | |
| | 475,512 | | | | | Gazprom PJSC (OTC Exchange), ADR‡ | | | 2,168,335 | |
| | 16,700 | | | | | LUKOIL PJSC, ADR | | | 987,972 | |
| | 55,674 | | | | | LUKOIL PJSC (Euroclear Shares), ADR | | | 3,318,116 | |
| | 37,200 | | | | | MMC Norilsk Nickel PJSC, ADR‡ | | | 902,472 | |
| | 144,257 | | | | | MMC Norilsk Nickel PJSC (London Exchange), ADR | | | 3,572,280 | |
| | 67,034 | | | | | Rosneft Oil Co. PJSC, Reg S, GDR‡‡‡ | | | 270,459 | |
| | 72,100 | | | | | Sberbank of Russia PJSC, ADR | | | 677,740 | |
| | 293,606 | | | | | Sberbank of Russia PJSC (London Exchange), ADR | | | 2,781,945 | |
| | 2,400 | | | | | Tatneft PJSC, ADR‡ | | | 90,960 | |
| | 18,888 | | | | | Tatneft PJSC, ADR | | | 792,309 | |
| | 303,080 | | | | | VTB Bank PJSC, Reg S, GDR‡‡‡ | | | 250,041 | |
| | 20,403 | | | | | VTB Bank PJSC, Reg S (London Exchange), GDR‡‡‡ | | | 16,724 | |
| | | | | | | | | | |
| | | | | | Total Russia | | | 18,924,369 | |
| | | | | | | | | | |
| | |
| | | | | | Singapore — 0.2% | |
| | 168,880 | | | | | United Overseas Bank, Ltd. | | | 2,308,665 | |
| | | | | | | | | | |
| | |
| | | | | | South Africa — 2.1% | |
| | 97,313 | | | | | Absa Group, Ltd. | | | 407,807 | |
| | 16,669 | | | | | AECI, Ltd. | | | 68,401 | |
| | 153,165 | | | | | African Rainbow Minerals, Ltd. | | | 860,022 | |
| | 1,461 | | | | | Anglo American Platinum, Ltd. | | | 61,479 | |
| | 29,672 | | | | | AngloGold Ashanti, Ltd. | | | 507,808 | |
| | 61,242 | | | | | Aspen Pharmacare Holdings, Ltd.* | | | 316,634 | |
| | 1,357 | | | | | Assore, Ltd. | | | 22,582 | |
| | 94,040 | | | | | Barloworld, Ltd. | | | 339,656 | |
| | 149,927 | | | | | Bid Corp., Ltd.‡ | | | 1,777,132 | |
| | 318,327 | | | | | Bidvest Group, Ltd. (The) | | | 2,599,966 | |
| | 56,605 | | | | | Capitec Bank Holdings, Ltd. | | | 2,775,270 | |
| | 198,635 | | | | | Clicks Group, Ltd. | | | 2,860,712 | |
| | 65,938 | | | | | Discovery, Ltd.‡ | | | 287,126 | |
| | 8,192 | | | | | Distell Group Holdings, Ltd. | | | 35,714 | |
| | 68,610 | | | | | Exxaro Resources, Ltd. | | | 379,558 | |
| | 114,112 | | | | | FirstRand, Ltd.‡ | | | 256,740 | |
| | 35,294 | | | | | Foschini Group, Ltd. (The) | | | 133,469 | |
| | 41,113 | | | | | Gold Fields, Ltd. | | | 199,740 | |
| | 186,776 | | | | | Gold Fields, Ltd., ADR | | | 887,186 | |
| | 28,470 | | | | | Impala Platinum Holdings, Ltd.‡ | | | 120,421 | |
| | 7,646 | | | | | Imperial Logistics, Ltd.‡ | | | 11,303 | |
| | 38,754 | | | | | Investec, Ltd. | | | 73,570 | |
| | 670,720 | | | | | KAP Industrial Holdings, Ltd. | | | 56,155 | |
| | 2,551 | | | | | Kumba Iron Ore, Ltd. | | | 39,794 | |
| | 46,699 | | | | | Liberty Holdings, Ltd.‡ | | | 172,942 | |
| | 212,016 | | | | | Life Healthcare Group Holdings, Ltd. | | | 218,863 | |
| | 35 | | | | | Massmart Holdings, Ltd.*‡ | | | 54 | |
| | 322,921 | | | | | Momentum Metropolitan Holdings | | | 281,301 | |
| | 55,245 | | | | | Motus Holdings, Ltd. | | | 83,621 | |
| | 165,842 | | | | | MTN Group, Ltd.‡ | | | 448,108 | |
See accompanying Notes to the Financial Statements.
172
Mercer Emerging Markets Equity Fund
Schedule of Investments (Continued)
(showing percentage of net assets)
March 31, 2020
| | | | | | | | | | |
| Shares | | | | | Description | | Value ($) | |
| | |
| | | | | | South Africa — continued | |
| | 50,344 | | | | | Nedbank Group, Ltd. | | | 232,584 | |
| | 30,344 | | | | | Netcare, Ltd. | | | 25,450 | |
| | 19,377 | | | | | Ninety One, Ltd.* | | | 37,268 | |
| | 7,817 | | | | | Northam Platinum, Ltd.* | | | 30,122 | |
| | 597,072 | | | | | Old Mutual, Ltd.‡ | | | 395,410 | |
| | 6,630 | | | | | PSG Group, Ltd. | | | 47,819 | |
| | 55,632 | | | | | Reunert, Ltd. | | | 134,430 | |
| | 69,664 | | | | | Sanlam, Ltd. | | | 198,997 | |
| | 145,744 | | | | | Sappi, Ltd.* | | | 171,117 | |
| | 45,095 | | | | | Sasol, Ltd.* | | | 90,940 | |
| | 8,988 | | | | | Sasol, Ltd., ADR*‡ | | | 18,066 | |
| | 19,754 | | | | | Shoprite Holdings, Ltd. | | | 137,976 | |
| | 209,036 | | | | | Sibanye Stillwater, Ltd.* | | | 264,162 | |
| | 161,774 | | | | | Standard Bank Group, Ltd. | | | 926,374 | |
| | 85,548 | | | | | Telkom SA SOC, Ltd. | | | 98,042 | |
| | 8,993 | | | | | Tiger Brands, Ltd. | | | 93,019 | |
| | 34,879 | | | | | Tongaat Hulett, Ltd.* | | | 4,277 | |
| | 54,516 | | | | | Transaction Capital, Ltd. | | | 37,353 | |
| | 64,145 | | | | | Truworths International, Ltd. | | | 89,597 | |
| | 28,545 | | | | | Tsogo Sun Gaming, Ltd. | | | 4,932 | |
| | 23,147 | | | | | Vodacom Group, Ltd. | | | 152,145 | |
| | | | | | | | | | |
| | | | | | Total South Africa | | | 19,473,214 | |
| | | | | | | | | | |
| | |
| | | | | | South Korea — 9.2% | |
| | 1,671 | | | | | AK Holdings, Inc. | | | 24,326 | |
| | 6,100 | | | | | Asiana Airlines, Inc.* | | | 16,574 | |
| | 4,361 | | | | | BGF Co., Ltd. | | | 13,057 | |
| | 785 | | | | | Binggrae Co., Ltd. | | | 30,853 | |
| | 93,516 | | | | | BNK Financial Group, Inc. | | | 337,729 | |
| | 45,156 | | | | | Cheil Worldwide, Inc. | | | 581,407 | |
| | 492 | | | | | Chongkundang Holdings Corp. | | | 42,399 | |
| | 1,174 | | | | | CJ CheilJedang Corp. | | | 205,653 | |
| | 5,022 | | | | | CJ Corp. | | | 262,733 | |
| | 870 | | | | | CJ ENM Co., Ltd. | | | 73,123 | |
| | 809 | | | | | CJ Logistics Corp.* | | | 90,213 | |
| | 5,530 | | | | | Daeduck Electronics Co. | | | 32,666 | |
| | 2,932 | | | | | Daekyo Co., Ltd. | | | 14,127 | |
| | 9,583 | | | | | Daelim Industrial Co., Ltd. | | | 574,237 | |
| | 4,930 | | | | | Daesang Corp. | | | 67,873 | |
| | 13,546 | | | | | Daewoo Engineering & Construction Co., Ltd.* | | | 32,171 | |
| | 3,025 | | | | | Daewoo Shipbuilding & Marine Engineering Co., Ltd.* | | | 33,056 | |
| | 2,926 | | | | | Daewoong Co., Ltd. | | | 26,630 | |
| | 10,431 | | | | | Daishin Securities Co., Ltd. | | | 72,483 | |
| | 14,584 | | | | | Daou Technology, Inc. | | | 174,889 | |
| | 16,309 | | | | | DB Insurance Co., Ltd. | | | 462,451 | |
| | 62,490 | | | | | DGB Financial Group, Inc. | | | 233,445 | |
| | 383 | | | | | Dong-A ST Co., Ltd. | | | 25,076 | |
| | 26,905 | | | | | Dongkuk Steel Mill Co., Ltd.* | | | 80,551 | |
| | 10,840 | | | | | Dongwon Development Co., Ltd. | | | 29,005 | |
See accompanying Notes to the Financial Statements.
173
Mercer Emerging Markets Equity Fund
Schedule of Investments (Continued)
(showing percentage of net assets)
March 31, 2020
| | | | | | | | | | |
| Shares | | | | | Description | | Value ($) | |
| | |
| | | | | | South Korea — continued | |
| | 442 | | | | | Dongwon Industries Co., Ltd. | | | 62,248 | |
| | 6,241 | | | | | Doosan Bobcat, Inc. | | | 90,384 | |
| | 534 | | | | | Doosan Co., Ltd. | | | 14,454 | |
| | 1,787 | | | | | Doosan Fuel Cell Co., Ltd.* | | | 7,572 | |
| | 64,498 | | | | | Doosan Heavy Industries & Construction Co., Ltd.* | | | 177,598 | |
| | 66,417 | | | | | Doosan Infracore Co., Ltd.* | | | 169,705 | |
| | 985 | | | | | Doosan Solus Co., Ltd.* | | | 14,637 | |
| | 548 | | | | | DoubleUGames Co., Ltd. | | | 19,423 | |
| | 58,413 | | | | | Douzone Bizon Co., Ltd. | | | 3,843,937 | |
| | 7,232 | | | | | E-MART, Inc.‡ | | | 625,378 | |
| | 10,566 | | | | | Eugene Corp. | | | 28,862 | |
| | 27,173 | | | | | F&F Co., Ltd. | | | 2,059,038 | |
| | 21,183 | | | | | Fila Korea, Ltd. | | | 496,494 | |
| | 1,313 | | | | | Green Cross Holdings Corp. | | | 21,362 | |
| | 20,632 | | | | | GS Engineering & Construction Corp. | | | 342,858 | |
| | 9,805 | | | | | GS Holdings Corp. | | | 294,220 | |
| | 540 | | | | | GS Home Shopping, Inc. | | | 46,599 | |
| | 2,876 | | | | | Halla Holdings Corp. | | | 63,608 | |
| | 48,912 | | | | | Hana Financial Group, Inc. | | | 911,977 | |
| | 5,719 | | | | | Handsome Co., Ltd. | | | 90,757 | |
| | 538 | | | | | Hanil Cement Co., Ltd. | | | 26,973 | |
| | 442 | | | | | Hanil Holdings Co., Ltd. | | | 12,317 | |
| | 2,473 | | | | | Hanjin Transportation Co., Ltd. | | | 61,830 | |
| | 21,275 | | | | | Hankook Tire & Technology Co., Ltd. | | | 335,110 | |
| | 776 | | | | | Hansol Paper Co., Ltd. | | | 6,642 | |
| | 2,622 | | | | | Hanwha Aerospace Co., Ltd.* | | | 43,695 | |
| | 14,190 | | | | | Hanwha Corp. | | | 176,254 | |
| | 6,843 | | | | | Hanwha Investment & Securities Co., Ltd.* | | | 7,762 | |
| | 106,293 | | | | | Hanwha Life Insurance Co., Ltd. | | | 120,092 | |
| | 36,127 | | | | | Hanwha Solutions Corp. | | | 390,150 | |
| | 19,079 | | | | | Harim Holdings Co., Ltd. | | | 79,168 | |
| | 18,034 | | | | | HDC Holdings Co., Ltd. | | | 108,739 | |
| | 1,275 | | | | | Huchems Fine Chemical Corp. | | | 15,334 | |
| | 156 | | | | | Hyosung Advanced Materials Corp.* | | | 7,732 | |
| | 111 | | | | | Hyosung Chemical Corp. | | | 7,426 | |
| | 2,448 | | | | | Hyosung Corp. | | | 121,218 | |
| | 62 | | | | | Hyosung TNC Co., Ltd. | | | 5,554 | |
| | 5,318 | | | | | Hyundai Construction Equipment Co., Ltd.* | | | 64,638 | |
| | 4,891 | | | | | Hyundai Department Store Co., Ltd. | | | 234,552 | |
| | 16,209 | | | | | Hyundai Engineering & Construction Co., Ltd. | | | 359,525 | |
| | 470 | | | | | Hyundai Glovis Co., Ltd. | | | 34,650 | |
| | 22,628 | | | | | Hyundai Greenfood Co., Ltd. | | | 121,125 | |
| | 1,587 | | | | | Hyundai Heavy Industries Holdings Co., Ltd. | | | 254,503 | |
| | 2,815 | | | | | Hyundai Home Shopping Network Corp. | | | 132,438 | |
| | 22,088 | | | | | Hyundai Marine & Fire Insurance Co., Ltd. | | | 405,813 | |
| | 8,249 | | | | | Hyundai Mipo Dockyard Co., Ltd. | | | 180,229 | |
| | 20,544 | | | | | Hyundai Mobis Co., Ltd. | | | 2,829,111 | |
| | 19,477 | | | | | Hyundai Motor Co. | | | 1,403,411 | |
| | 27,909 | | | | | Hyundai Steel Co. | | | 405,984 | |
See accompanying Notes to the Financial Statements.
174
Mercer Emerging Markets Equity Fund
Schedule of Investments (Continued)
(showing percentage of net assets)
March 31, 2020
| | | | | | | | | | |
| Shares | | | | | Description | | Value ($) | |
| | |
| | | | | | South Korea — continued | |
| | 6,715 | | | | | Hyundai Wia Corp. | | | 145,683 | |
| | 42,311 | | | | | Industrial Bank of Korea | | | 258,064 | |
| | 2,322 | | | | | IS Dongseo Co., Ltd. | | | 42,407 | |
| | 63,062 | | | | | JB Financial Group Co., Ltd. | | | 228,899 | |
| | 57,989 | | | | | KB Financial Group, Inc. | | | 1,618,012 | |
| | 1,703 | | | | | KCC Corp. | | | 179,212 | |
| | 1,600 | | | | | KCC Glass Corp.* | | | 23,705 | |
| | 39,323 | | | | | Kia Motors Corp. | | | 831,999 | |
| | 2,487 | | | | | KIWOOM Securities Co., Ltd. | | | 141,654 | |
| | 3,198 | | | | | Koh Young Technology, Inc. | | | 203,518 | |
| | 7,191 | | | | | Kolon Industries, Inc. | | | 174,479 | |
| | 6,176 | | | | | Korea Asset In Trust Co., Ltd. | | | 9,874 | |
| | 1,724 | | | | | Korea Electric Terminal Co., Ltd. | | | 34,133 | |
| | 7,407 | | | | | Korea Investment Holdings Co., Ltd. | | | 299,282 | |
| | 5,996 | | | | | Korea Line Corp.* | | | 64,665 | |
| | 1,596 | | | | | Korea Petrochemical Ind Co., Ltd. | | | 113,191 | |
| | 86,346 | | | | | Korea Real Estate Investment & Trust Co., Ltd. | | | 115,476 | |
| | 1,163 | | | | | Korea Shipbuilding & Offshore Engineering Co., Ltd.* | | | 74,167 | |
| | 3,184 | | | | | Korea Zinc Co., Ltd. | | | 922,765 | |
| | 8,253 | | | | | Korean Air Lines Co., Ltd.* | | | 125,370 | |
| | 43,846 | | | | | Korean Reinsurance Co. | | | 260,254 | |
| | 7,563 | | | | | KT Skylife Co., Ltd. | | | 37,542 | |
| | 1,911 | | | | | Kumho Industrial Co., Ltd. | | | 9,712 | |
| | 1,494 | | | | | Kumho Petrochemical Co., Ltd. | | | 78,671 | |
| | 12,423 | | | | | Kumho Tire Co., Inc.* | | | 31,024 | |
| | 9,969 | | | | | LF Corp. | | | 87,370 | |
| | 18,330 | | | | | LG Chem, Ltd. | | | 4,538,110 | |
| | 2,708 | | | | | LG Corp. | | | 129,948 | |
| | 37,842 | | | | | LG Display Co., Ltd.* | | | 339,631 | |
| | 11,453 | | | | | LG Electronics, Inc. | | | 447,143 | |
| | 2,907 | | | | | LG Hausys, Ltd. | | | 83,524 | |
| | 6,323 | | | | | LG HelloVision Co., Ltd. | | | 15,800 | |
| | 5,941 | | | | | LG Household & Health Care, Ltd. | | | 5,434,722 | |
| | 10,573 | | | | | LG Innotek Co., Ltd. | | | 973,050 | |
| | 14,270 | | | | | LG International Corp. | | | 106,053 | |
| | 6,768 | | | | | LG Uplus Corp. | | | 59,665 | |
| | 1,034 | | | | | LIG Nex1 Co., Ltd. | | | 16,242 | |
| | 2,136 | | | | | Lock&Lock Co., Ltd.* | | | 15,679 | |
| | 2,783 | | | | | Lotte Chemical Corp. | | | 436,288 | |
| | 971 | | | | | Lotte Chilsung Beverage Co., Ltd. | | | 66,960 | |
| | 123 | | | | | Lotte Confectionery Co., Ltd. | | | 10,586 | |
| | 3,868 | | | | | Lotte Fine Chemical Co., Ltd. | | | 97,676 | |
| | 40 | | | | | Lotte Food Co., Ltd. | | | 9,771 | |
| | 4,985 | | | | | Lotte Himart Co., Ltd. | | | 63,164 | |
| | 3,942 | | | | | Lotte Shopping Co., Ltd. | | | 240,264 | |
| | 6,096 | | | | | LS Corp. | | | 143,656 | |
| | 1,230 | | | | | LS Industrial Systems Co., Ltd. | | | 34,510 | |
| | 32,450 | | | | | Mando Corp. | | | 545,267 | |
| | 11,225 | | | | | Meritz Financial Group, Inc. | | | 93,987 | |
See accompanying Notes to the Financial Statements.
175
Mercer Emerging Markets Equity Fund
Schedule of Investments (Continued)
(showing percentage of net assets)
March 31, 2020
| | | | | | | | | | |
| Shares | | | | | Description | | Value ($) | |
| | |
| | | | | | South Korea — continued | |
| | 4,269 | | | | | Meritz Fire & Marine Insurance Co., Ltd. | | | 42,278 | |
| | 91,826 | | | | | Meritz Securities Co., Ltd. | | | 210,424 | |
| | 32,691 | | | | | Mirae Asset Daewoo Co., Ltd. | | | 139,516 | |
| | 30,912 | | | | | Mirae Asset Life Insurance Co., Ltd. | | | 77,911 | |
| | 2,471 | | | | | Namhae Chemical Corp. | | | 14,037 | |
| | 17,716 | | | | | NAVER Corp. | | | 2,437,072 | |
| | 4,200 | | | | | NCSoft Corp. | | | 2,223,319 | |
| | 15,440 | | | | | Nexen Tire Corp. | | | 58,637 | |
| | 49,662 | | | | | NH Investment & Securities Co., Ltd. | | | 362,267 | |
| | 1,141 | | | | | NHN Corp.* | | | 63,981 | |
| | 3,163 | | | | | NICE Holdings Co., Ltd. | | | 47,150 | |
| | 74,561 | | | | | NICE Information Service Co., Ltd. | | | 811,428 | |
| | 4,274 | | | | | NongShim Co., Ltd. | | | 1,011,182 | |
| | 5,227 | | | | | OCI Co., Ltd.* | | | 146,949 | |
| | 12,004 | | | | | Orion Corp. | | | 1,128,145 | |
| | 10,361 | | | | | Orion Holdings Corp. | | | 101,702 | |
| | 37,599 | | | | | Pan Ocean Co., Ltd.* | | | 90,532 | |
| | 9,343 | | | | | Poongsan Corp. | | | 132,428 | |
| | 11,637 | | | | | POSCO | | | 1,526,904 | |
| | 4,691 | | | | | Posco International Corp. | | | 43,272 | |
| | 1,276 | | | | | S&T Motiv Co., Ltd. | | | 28,710 | |
| | 1,347 | | | | | S-Oil Corp. | | | 62,324 | |
| | 3,815 | | | | | Samsung C&T Corp. | | | 277,059 | |
| | 8,536 | | | | | Samsung Card Co., Ltd. | | | 207,921 | |
| | 310,447 | | | | | Samsung Electronics Co., Ltd. | | | 12,065,247 | |
| | 5,500 | | | | | Samsung Electronics Co., Ltd., GDR‡‡‡‡ | | | 5,461,500 | |
| | 4,455 | | | | | Samsung Electronics Co., Ltd. (London Exchange) Reg S, GDR‡‡‡ | | | 4,399,325 | |
| | 4,248 | | | | | Samsung Fire & Marine Insurance Co., Ltd. | | | 531,332 | |
| | 11,648 | | | | | Samsung Heavy Industries Co., Ltd.* | | | 36,629 | |
| | 11,402 | | | | | Samsung Life Insurance Co., Ltd. | | | 399,084 | |
| | 16,512 | | | | | Samsung Securities Co., Ltd. | | | 392,269 | |
| | 1,020 | | | | | Samyang Corp. | | | 25,075 | |
| | 1,710 | | | | | Samyang Holdings Corp. | | | 57,325 | |
| | 5,459 | | | | | Sangsangin Co., Ltd. | | | 27,014 | |
| | 5,781 | | | | | Seah Besteel Corp. | | | 35,244 | |
| | 2,785 | | | | | Sebang Global Battery Co., Ltd. | | | 58,963 | |
| | 30,224 | | | | | SFA Engineering Corp. | | | 765,107 | |
| | 183,097 | | | | | Shinhan Financial Group Co., Ltd. | | | 4,261,105 | |
| | 5,882 | | | | | Shinsegae International, Inc. | | | 902,722 | |
| | 2,572 | | | | | Shinsegae, Inc. | | | 457,612 | |
| | 731 | | | | | Shinyoung Securities Co., Ltd. | | | 27,564 | |
| | 26,788 | | | | | Silicon Works Co., Ltd. | | | 598,489 | |
| | 1,007 | | | | | Sindoh Co., Ltd. | | | 18,311 | |
| | 1,323 | | | | | SK Chemicals Co., Ltd. | | | 91,599 | |
| | 4,094 | | | | | SK Discovery Co., Ltd. | | | 70,712 | |
| | 611 | | | | | SK Gas, Ltd. | | | 31,284 | |
| | 1,247 | | | | | SK Holdings Co., Ltd. | | | 168,984 | |
| | 6,887 | | | | | SK Innovation Co., Ltd. | | | 482,845 | |
| | 56,615 | | | | | SK Networks Co., Ltd. | | | 208,920 | |
See accompanying Notes to the Financial Statements.
176
Mercer Emerging Markets Equity Fund
Schedule of Investments (Continued)
(showing percentage of net assets)
March 31, 2020
| | | | | | | | | | |
| Shares | | | | | Description | | Value ($) | |
| | |
| | | | | | South Korea — continued | |
| | 1,642 | | | | | SKC Co., Ltd. | | | 49,242 | |
| | 6,228 | | | | | SL Corp. | | | 66,914 | |
| | 30,543 | | | | | Soulbrain Co., Ltd. | | | 1,571,887 | |
| | 5,187 | | | | | Ssangyong Cement Industrial Co., Ltd. | | | 19,047 | |
| | 617 | | | | | Ssangyong Motor Co.* | | | 712 | |
| | 168 | | | | | Taekwang Industrial Co., Ltd. | | | 85,877 | |
| | 11,802 | | | | | Taeyoung Engineering & Construction Co., Ltd. | | | 109,174 | |
| | 14,048 | | | | | Tongyang Life Insurance Co., Ltd. | | | 26,886 | |
| | 2,147 | | | | | Unid Co., Ltd. | | | 59,717 | |
| | 2,296 | | | | | WiSoL Co., Ltd. | | | 16,981 | |
| | 81,365 | | | | | Woori Financial Group, Inc. | | | 503,804 | |
| | 86 | | | | | Young Poong Corp. | | | 33,328 | |
| | 4,442 | | | | | Youngone Corp. | | | 80,750 | |
| | 2,086 | | | | | Youngone Holdings Co., Ltd. | | | 56,545 | |
| | 46,630 | | | | | Yuanta Securities Korea Co., Ltd.* | | | 75,032 | |
| | 3,887 | | | | | Yuhan Corp. | | | 727,908 | |
| | | | | | | | | | |
| | | | | | Total South Korea | | | 87,185,850 | |
| | | | | | | | | | |
| | |
| | | | | | Spain — 0.0% | |
| | 16,331 | | | | | CEMEX Latam Holdings SA* | | | 5,993 | |
| | | | | | | | | | |
| | |
| | | | | | Switzerland — 0.3% | |
| | 178,699 | | | | | ABB, Ltd. | | | 3,125,585 | |
| | | | | | | | | | |
| | |
| | | | | | Taiwan — 12.8% | |
| | 372,900 | | | | | Accton Technology Corp. | | | 1,978,140 | |
| | 451,000 | | | | | Acer, Inc. | | | 232,686 | |
| | 92,000 | | | | | Aerospace Industrial Development Corp. | | | 81,082 | |
| | 16,991 | | | | | Arcadyan Technology Corp. | | | 37,695 | |
| | 74,000 | | | | | Ardentec Corp. | | | 51,033 | |
| | 123,000 | | | | | ASE Technology Holding Co., Ltd. | | | 235,774 | |
| | 1,326,000 | | | | | Asia Cement Corp. | | | 1,727,882 | |
| | 22,000 | | | | | Asia Optical Co., Inc. | | | 43,522 | |
| | 34,000 | | | | | Asia Vital Components Co., Ltd. | | | 33,355 | |
| | 105,000 | | | | | Asustek Computer, Inc. | | | 710,123 | |
| | 2,760,000 | | | | | AU Optronics Corp. | | | 572,332 | |
| | 304,000 | | | | | Bioteque Corp. | | | 938,512 | |
| | 45,000 | | | | | Brighton-Best International Taiwan, Inc. | | | 40,177 | |
| | 537,140 | | | | | Capital Securities Corp. | | | 166,633 | |
| | 48,000 | | | | | Career Technology MFG. Co., Ltd. | | | 37,234 | |
| | 38,000 | | | | | Catcher Technology Co., Ltd. | | | 241,635 | |
| | 1,067,058 | | | | | Cathay Financial Holding Co., Ltd. | | | 1,245,709 | |
| | 260,000 | | | | | Cathay Real Estate Development Co., Ltd. | | | 148,337 | |
| | 26,519 | | | | | Center Laboratories, Inc. | | | 34,706 | |
| | 356,049 | | | | | Chang Hwa Commercial Bank, Ltd. | | | 224,315 | |
| | 27,000 | | | | | Charoen Pokphand Enterprise | | | 52,774 | |
| | 335,000 | | | | | Cheng Loong Corp. | | | 227,675 | |
| | 69,000 | | | | | Cheng Shin Rubber Industry Co., Ltd. | | | 70,286 | |
| | 163,000 | | | | | Cheng Uei Precision Industry Co., Ltd. | | | 157,704 | |
See accompanying Notes to the Financial Statements.
177
Mercer Emerging Markets Equity Fund
Schedule of Investments (Continued)
(showing percentage of net assets)
March 31, 2020
| | | | | | | | | | |
| Shares | | | | | Description | | Value ($) | |
| | |
| | | | | | Taiwan — continued | |
| | 35,110 | | | | | Chicony Electronics Co., Ltd. | | | 88,012 | |
| | 55,000 | | | | | Chilisin Electronics Corp. | | | 147,001 | |
| | 141,000 | | | | | Chin-Poon Industrial Co., Ltd. | | | 97,006 | |
| | 828,000 | | | | | China Airlines, Ltd. | | | 181,022 | |
| | 266,000 | | | | | China Bills Finance Corp. | | | 123,152 | |
| | 1,889,000 | | | | | China Development Financial Holding Corp. | | | 463,578 | |
| | 20,278 | | | | | China General Plastics Corp. | | | 9,491 | |
| | 854,335 | | | | | China Life Insurance Co., Ltd.* | | | 476,151 | |
| | 430,260 | | | | | China Man-Made Fiber Corp. | | | 74,285 | |
| | 63,000 | | | | | China Metal Products | | | 47,090 | |
| | 70,800 | | | | | China Motor Corp. | | | 58,306 | |
| | 460,950 | | | | | China Petrochemical Development Corp. | | | 111,748 | |
| | 1,590,000 | | | | | China Steel Corp. | | | 996,477 | |
| | 70,000 | | | | | Chipbond Technology Corp. | | | 114,602 | |
| | 162,944 | | | | | ChipMOS Technologies, Inc. | | | 141,385 | |
| | 26,000 | | | | | Chong Hong Construction Co., Ltd. | | | 64,578 | |
| | 385,000 | | | | | Chung Hung Steel Corp. | | | 84,431 | |
| | 1,334,000 | | | | | Compal Electronics, Inc. | | | 763,239 | |
| | 128,000 | | | | | Compeq Manufacturing Co., Ltd. | | | 129,668 | |
| | 178,000 | | | | | Coretronic Corp. | | | 165,428 | |
| | 2,539,000 | | | | | CTBC Financial Holding Co., Ltd. | | | 1,503,132 | |
| | 80,000 | | | | | CTCI Corp. | | | 77,522 | |
| | 51,000 | | | | | Delta Electronics, Inc. | | | 203,253 | |
| | 190,000 | | | | | E Ink Holdings, Inc. | | | 152,456 | |
| | 5,287,459 | | | | | E.Sun Financial Holding Co., Ltd. | | | 4,241,001 | |
| | 565,100 | | | | | Elite Material Co., Ltd. | | | 1,946,657 | |
| | 7,000 | | | | | Ennoconn Corp. | | | 34,733 | |
| | 77,000 | | | | | EnTie Commercial Bank Co., Ltd. | | | 33,039 | |
| | 115,000 | | | | | Epistar Corp.* | | | 96,444 | |
| | 128,740 | | | | | Eternal Materials Co., Ltd. | | | 96,011 | |
| | 572,208 | | | | | Eva Airways Corp. | | | 168,253 | |
| | 182,000 | | | | | Evergreen International Storage & Transport Corp. | | | 69,219 | |
| | 750,060 | | | | | Evergreen Marine Corp. Taiwan, Ltd.* | | | 229,466 | |
| | 180,000 | | | | | Everlight Electronics Co., Ltd. | | | 146,022 | |
| | 435,000 | | | | | Far Eastern Department Stores, Ltd. | | | 311,450 | |
| | 1,026,282 | | | | | Far Eastern International Bank | | | 341,128 | |
| | 476,000 | | | | | Far Eastern New Century Corp. | | | 355,001 | |
| | 135,000 | | | | | Farglory Land Development Co., Ltd. | | | 169,668 | |
| | 55,000 | | | | | Feng Hsin Steel Co., Ltd. | | | 83,941 | |
| | 127,400 | | | | | Feng TAY Enterprise Co., Ltd. | | | 547,802 | |
| | 277,750 | | | | | First Financial Holding Co., Ltd. | | | 180,512 | |
| | 335,000 | | | | | FLEXium Interconnect, Inc. | | | 1,036,382 | |
| | 33,000 | | | | | Formosa Advanced Technologies Co., Ltd. | | | 35,418 | |
| | 144,000 | | | | | Formosa Chemicals & Fibre Corp. | | | 319,101 | |
| | 35,000 | | | | | Formosa Petrochemical Corp. | | | 93,260 | |
| | 182,000 | | | | | Formosa Plastics Corp. | | | 452,063 | |
| | 7,000 | | | | | Formosa Sumco Technology Corp. | | | 29,561 | |
| | 263,000 | | | | | Formosa Taffeta Co., Ltd. | | | 267,889 | |
| | 293,000 | | | | | Foxconn Technology Co., Ltd. | | | 479,694 | |
See accompanying Notes to the Financial Statements.
178
Mercer Emerging Markets Equity Fund
Schedule of Investments (Continued)
(showing percentage of net assets)
March 31, 2020
| | | | | | | | | | |
| Shares | | | | | Description | | Value ($) | |
| | |
| | | | | | Taiwan — continued | |
| | 923,000 | | | | | Fubon Financial Holding Co., Ltd. | | | 1,146,271 | |
| | 48,000 | | | | | Getac Technology Corp. | | | 66,676 | |
| | 62,000 | | | | | Gigabyte Technology Co., Ltd. | | | 103,230 | |
| | 385,000 | | | | | Grand Pacific Petrochemical* | | | 164,271 | |
| | 152,000 | | | | | Grape King Bio, Ltd. | | | 982,568 | |
| | 80,298 | | | | | Great Wall Enterprise Co., Ltd. | | | 98,126 | |
| | 29,000 | | | | | Greatek Electronics, Inc. | | | 40,283 | |
| | 129,476 | | | | | Hannstar Board Corp. | | | 139,025 | |
| | 801,000 | | | | | HannStar Display Corp. | | | 137,241 | |
| | 58,000 | | | | | Highwealth Construction Corp. | | | 77,691 | |
| | 16,000 | | | | | Holy Stone Enterprise Co., Ltd. | | | 46,365 | |
| | 1,669,200 | | | | | Hon Hai Precision Industry Co., Ltd. | | | 3,859,003 | |
| | 445,120 | | | | | Hua Nan Financial Holdings Co., Ltd. | | | 265,728 | |
| | 23,000 | | | | | Huaku Development Co., Ltd. | | | 62,830 | |
| | 158,880 | | | | | Hung Sheng Construction, Ltd.* | | | 78,420 | |
| | 795,766 | | | | | IBF Financial Holdings Co., Ltd. | | | 272,347 | |
| | 2,696,000 | | | | | Innolux Corp. | | | 466,377 | |
| | 309,809 | | | | | International CSRC Investment Holdings Co. | | | 196,993 | |
| | 134,000 | | | | | Inventec Corp. | | | 101,901 | |
| | 417,790 | | | | | Jih Sun Financial Holdings Co., Ltd. | | | 121,870 | |
| | 76,000 | | | | | Kenda Rubber Industrial Co., Ltd. | | | 65,092 | |
| | 19,000 | | | | | Kerry TJ Logistics Co., Ltd. | | | 22,809 | |
| | 51,000 | | | | | Kindom Development Co., Ltd. | | | 38,182 | |
| | 124,000 | | | | | King Yuan Electronics Co., Ltd. | | | 122,318 | |
| | 300,000 | | | | | King’s Town Bank Co., Ltd. | | | 281,301 | |
| | 436,000 | | | | | Kinpo Electronics | | | 141,910 | |
| | 123,000 | | | | | Kinsus Interconnect Technology Corp. | | | 164,581 | |
| | 178,000 | | | | | Lite-On Technology Corp., ADR | | | 240,746 | |
| | 260,076 | | | | | Longchen Paper & Packaging Co., Ltd. | | | 99,355 | |
| | 3,000 | | | | | Lotes Co., Ltd. | | | 26,776 | |
| | 14,000 | | | | | Lung Yen Life Service Corp. | | | 25,017 | |
| | 119,000 | | | | | Macronix International | | | 98,375 | |
| | 8,000 | | | | | Marketech International Corp. | | | 14,555 | |
| | 283,000 | | | | | MediaTek, Inc. | | | 3,014,232 | |
| | 445,000 | | | | | Mega Financial Holding Co., Ltd. | | | 418,701 | |
| | 114,480 | | | | | Mercuries & Associates Holding, Ltd.* | | | 76,317 | |
| | 342,445 | | | | | Mercuries Life Insurance Co., Ltd.* | | | 92,032 | |
| | 21,000 | | | | | Merry Electronics Co., Ltd. | | | 85,316 | |
| | 835,200 | | | | | Micro-Star International Co., Ltd. | | | 2,450,200 | |
| | 15,000 | | | | | Namchow Holdings Co., Ltd. | | | 19,718 | |
| | 47,000 | | | | | Nan Kang Rubber Tire Co., Ltd. | | | 60,236 | |
| | 211,000 | | | | | Nan Ya Plastics Corp. | | | 381,745 | |
| | 103,000 | | | | | Nan Ya Printed Circuit Board Corp.* | | | 187,373 | |
| | 44,000 | | | | | Nantex Industry Co., Ltd. | | | 38,873 | |
| | 42,000 | | | | | Nanya Technology Corp. | | | 74,607 | |
| | 461,000 | | | | | Novatek Microelectronics Corp. | | | 2,622,479 | |
| | 384,000 | | | | | O-Bank Co., Ltd.* | | | 81,685 | |
| | 94,000 | | | | | Oriental Union Chemical Corp. | | | 44,303 | |
| | 291,000 | | | | | Pegatron Corp. | | | 558,241 | |
See accompanying Notes to the Financial Statements.
179
Mercer Emerging Markets Equity Fund
Schedule of Investments (Continued)
(showing percentage of net assets)
March 31, 2020
| | | | | | | | | | |
| Shares | | | | | Description | | Value ($) | |
| | |
| | | | | | Taiwan — continued | |
| | 9,000 | | | | | Phison Electronics Corp. | | | 73,832 | |
| | 582,000 | | | | | Pou Chen Corp. | | | 493,746 | |
| | 441,000 | | | | | Powertech Technology, Inc. | | | 1,235,035 | |
| | 119,000 | | | | | President Securities Corp. | | | 50,728 | |
| | 765,000 | | | | | Primax Electronics, Ltd. | | | 961,272 | |
| | 378,000 | | | | | Prince Housing & Development Corp. | | | 114,141 | |
| | 455,000 | | | | | Qisda Corp., ADR | | | 222,723 | |
| | 5,000 | | | | | Quang Viet Enterprise Co., Ltd. | | | 19,100 | |
| | 96,000 | | | | | Quanta Computer, Inc. | | | 191,139 | |
| | 773,200 | | | | | Radiant Opto-Electronics Corp. | | | 1,990,891 | |
| | 79,560 | | | | | Radium Life Tech Co., Ltd. | | | 23,577 | |
| | 382,000 | | | | | Realtek Semiconductor Corp. | | | 2,760,827 | |
| | 25,000 | | | | | Ruentex Industries, Ltd.* | | | 57,380 | |
| | 136,000 | | | | | Sanyang Motor Co., Ltd. | | | 87,025 | |
| | 20,000 | | | | | Sercomm Corp. | | | 41,540 | |
| | 80,000 | | | | | Shihlin Electric & Engineering Corp. | | | 105,030 | |
| | 1,762,651 | | | | | Shin Kong Financial Holding Co., Ltd.* | | | 444,827 | |
| | 24,000 | | | | | Shin Zu Shing Co., Ltd. | | | 92,484 | |
| | 18,000 | | | | | Shinkong Insurance Co., Ltd. | | | 20,032 | |
| | 508,000 | | | | | Shinkong Synthetic Fibers Corp. | | | 168,016 | |
| | 43,342 | | | | | Sigurd Microelectronics Corp. | | | 43,770 | |
| | 248,000 | | | | | Simplo Technology Co., Ltd. | | | 2,143,235 | |
| | 33,000 | | | | | Sino-American Silicon Products, Inc. | | | 83,781 | |
| | 1,454,480 | | | | | SinoPac Financial Holdings Co., Ltd. | | | 531,564 | |
| | 34,000 | | | | | Sinyi Realty, Inc. | | | 26,482 | |
| | 726,000 | | | | | Sunonwealth Electric Machine Industry Co., Ltd. | | | 753,949 | |
| | 187,000 | | | | | Synnex Technology International Corp. | | | 227,744 | |
| | 5,000 | | | | | Systex Corp. | | | 12,170 | |
| | 119,530 | | | | | TA Chen Stainless Pipe | | | 106,342 | |
| | 771,983 | | | | | Taichung Commercial Bank Co., Ltd. | | | 264,256 | |
| | 1,381,703 | | | | | Taishin Financial Holding Co., Ltd. | | | 534,672 | |
| | 1,388,514 | | | | | Taiwan Business Bank | | | 445,006 | |
| | 1,519,909 | | | | | Taiwan Cement Corp. | | | 1,985,655 | |
| | 1,269,085 | | | | | Taiwan Cooperative Financial Holding Co., Ltd. | | | 770,214 | |
| | 397,000 | | | | | Taiwan Glass Industry Corp. | | | 97,037 | |
| | 45,000 | | | | | Taiwan Hon Chuan Enterprise Co., Ltd. | | | 73,602 | |
| | 33,000 | | | | | Taiwan Paiho, Ltd. | | | 56,868 | |
| | 1,406,000 | | | | | Taiwan Semiconductor Manufacturing Co., Ltd. | | | 12,549,975 | |
| | 572,096 | | | | | Taiwan Semiconductor Manufacturing Co., Ltd., ADR | | | 27,340,468 | |
| | 28,000 | | | | | Taiwan Shin Kong Security Co., Ltd. | | | 31,577 | |
| | 26,000 | | | | | Taiwan Surface Mounting Technology Corp. | | | 58,278 | |
| | 52,000 | | | | | Tatung Co., Ltd.* | | | 33,323 | |
| | 595,000 | | | | | Teco Electric and Machinery Co., Ltd. | | | 474,218 | |
| | 256,000 | | | | | Ton Yi Industrial Corp. | | | 67,735 | |
| | 15,000 | | | | | Tong Hsing Electronic Industries, Ltd. | | | 52,844 | |
| | 74,000 | | | | | Tong Yang Industry Co., Ltd. | | | 78,325 | |
| | 18,000 | | | | | Topco Scientific Co., Ltd. | | | 53,173 | |
| | 20,000 | | | | | Transcend Information, Inc. | | | 43,632 | |
| | 852,000 | | | | | Tripod Technology Corp. | | | 2,629,769 | |
See accompanying Notes to the Financial Statements.
180
Mercer Emerging Markets Equity Fund
Schedule of Investments (Continued)
(showing percentage of net assets)
March 31, 2020
| | | | | | | | | | |
| Shares | | | | | Description | | Value ($) | |
| | |
| | | | | | Taiwan — continued | |
| | 115,000 | | | | | TSRC Corp. | | | 55,343 | |
| | 339,000 | | | | | Tung Ho Steel Enterprise Corp. | | | 242,167 | |
| | 49,000 | | | | | TXC Corp. | | | 70,866 | |
| | 212,000 | | | | | U-Ming Marine Transport Corp. | | | 182,299 | |
| | 2,574,000 | | | | | Uni-President Enterprises Corp. | | | 5,584,231 | |
| | 80,000 | | | | | Unimicron Technology Corp. | | | 82,918 | |
| | 514,577 | | | | | Union Bank Of Taiwan* | | | 168,145 | |
| | 54,700 | | | | | Unitech Printed Circuit Board Corp. | | | 34,563 | |
| | 1,709,000 | | | | | United Microelectronics Corp. | | | 764,527 | |
| | 236,887 | | | | | UPC Technology Corp. | | | 62,444 | |
| | 420,780 | | | | | USI Corp. | | | 139,870 | |
| | 61,000 | | | | | Wafer Works Corp. | | | 52,360 | |
| | 59,000 | | | | | Wah Lee Industrial Corp. | | | 93,274 | |
| | 468,000 | | | | | Walsin Lihwa Corp. | | | 168,352 | |
| | 19,000 | | | | | Walsin Technology Corp. | | | 99,236 | |
| | 180,000 | | | | | Wan Hai Lines, Ltd. | | | 81,859 | |
| | 910,000 | | | | | Winbond Electronics Corp. | | | 341,649 | |
| | 906,447 | | | | | Wistron Corp. | | | 734,572 | |
| | 28,560 | | | | | Wistron NeWeb Corp. | | | 49,406 | |
| | 68,700 | | | | | Wiwynn Corp. | | | 1,569,671 | |
| | 255,720 | | | | | WPG Holdings, Ltd. | | | 300,240 | |
| | 107,000 | | | | | WT Microelectronics Co., Ltd. | | | 120,675 | |
| | 7,000 | | | | | Yageo Corp. | | | 62,311 | |
| | 459,000 | | | | | Yang Ming Marine Transport Corp.* | | | 76,349 | |
| | 388,000 | | | | | YFY, Inc. | | | 146,977 | |
| | 318,331 | | | | | Yieh Phui Enterprise Co., Ltd. | | | 81,797 | |
| | 1,474,000 | | | | | Yuanta Financial Holding Co., Ltd. | | | 758,115 | |
| | 15,100 | | | | | Yulon Finance Corp. | | | 42,318 | |
| | 435,000 | | | | | Yulon Motor Co., Ltd. | | | 211,495 | |
| | | | | | | | | | |
| | | | | | Total Taiwan | | | 120,401,378 | |
| | | | | | | | | | |
| | |
| | | | | | Thailand — 1.5% | |
| | 2,274,100 | | | | | Airports of Thailand PCL Class F | | | 3,558,001 | |
| | 903,400 | | | | | AP Thailand PCL Class F | | | 104,582 | |
| | 385,200 | | | | | Bangchak Corp. PCL Class F | | | 178,459 | |
| | 50,100 | | | | | Bangkok Bank PCL, NVDR | | | 153,385 | |
| | 876,200 | | | | | Bangkok Land PCL Class F | | | 21,893 | |
| | 216,500 | | | | | Bangkok Life Assurance PCL, NVDR | | | 79,077 | |
| | 1,175,700 | | | | | Banpu PCL Class F | | | 191,873 | |
| | 46,300 | | | | | Berli Jucker PCL Class F | | | 57,538 | |
| | 163,200 | | | | | Charoen Pokphand Foods PCL Class F | | | 120,813 | |
| | 1,613,300 | | | | | CP ALL PCL Class F | | | 2,986,455 | |
| | 28,300 | | | | | Delta Electronics Thailand PCL Class F | | | 29,320 | |
| | 128,800 | | | | | Esso Thailand PCL Class F | | | 16,641 | |
| | 52,400 | | | | | GFPT PCL Class F | | | 13,973 | |
| | 216,000 | | | | | Hana Microelectronics PCL Class F | | | 151,383 | |
| | 189,000 | | | | | Indorama Ventures PCL Class F | | | 123,245 | |
| | 2,994,600 | | | | | IRPC PCL Class F | | | 195,214 | |
| | 98,600 | | | | | Kasikornbank PCL, NVDR | | | 274,822 | |
See accompanying Notes to the Financial Statements.
181
Mercer Emerging Markets Equity Fund
Schedule of Investments (Continued)
(showing percentage of net assets)
March 31, 2020
| | | | | | | | | | |
| Shares | | | | | Description | | Value ($) | |
| | |
| | | | | | Thailand — continued | |
| | 147,700 | | | | | Kasikornbank PCL Class F | | | 409,450 | |
| | 57,500 | | | | | Kiatnakin Bank PCL Class F | | | 68,316 | |
| | 575,700 | | | | | Krung Thai Bank PCL Class F | | | 202,060 | |
| | 710,600 | | | | | Krungthai Card PCL Class F | | | 589,854 | |
| | 108,300 | | | | | MBK PCL Class F | | | 43,507 | |
| | 69,700 | | | | | Precious Shipping PCL Class F* | | | 5,430 | |
| | 251,100 | | | | | Pruksa Holding PCL Class F | | | 71,392 | |
| | 124,300 | | | | | PTT Exploration & Production PCL Class F | | | 259,732 | |
| | 289,500 | | | | | PTT Global Chemical PCL Class F | | | 268,966 | |
| | 628,500 | | | | | PTT PCL Class F | | | 588,747 | |
| | 2,281,600 | | | | | Quality Houses PCL Class F | | | 130,070 | |
| | 30,500 | | | | | Siam Cement PCL (The) Class F | | | 298,005 | |
| | 140,300 | | | | | Siam Commercial Bank PCL (The) Class F | | | 298,815 | |
| | 62,100 | | | | | Sri Trang Agro-Industry PCL Class F | | | 21,001 | |
| | 594,200 | | | | | Star Petroleum Refining PCL Class F | | | 80,029 | |
| | 661,900 | | | | | Supalai PCL Class F | | | 302,404 | |
| | 146,800 | | | | | Thai Airways International PCL Class F* | | | 14,580 | |
| | 250,400 | | | | | Thai Oil PCL Class F | | | 234,543 | |
| | 231,000 | | | | | Thai Union Group PCL Class F | | | 97,118 | |
| | 746,400 | | | | | Thanachart Capital PCL Class F | | | 744,173 | |
| | 314,300 | | | | | Tisco Financial Group PCL Class F | | | 657,801 | |
| | 5,275,336 | | | | | TMB Bank PCL Class F | | | 143,290 | |
| | 791,400 | | | | | TPI Polene PCL Class F | | | 26,959 | |
| | 298,400 | | | | | TPI Polene Power PCL Class F | | | 28,052 | |
| | 3,559,100 | | | | | True Corp. PCL Class F | | | 340,429 | |
| | 50,400 | | | | | Vinythai PCL Class F | | | 27,183 | |
| | 345,500 | | | | | WHA Corp. PCL Class F | | | 23,423 | |
| | | | | | | | | | |
| | | | | | Total Thailand | | | 14,232,003 | |
| | | | | | | | | | |
| | |
| | | | | | Turkey — 0.3% | |
| | 382,463 | | | | | Akbank T.A.S.* | | | 319,145 | |
| | 9,640 | | | | | Anadolu Efes Biracilik Ve Malt Sanayii AS | | | 25,162 | |
| | 369,000 | | | | | Aselsan Elektronik Sanayi Ve Ticaret AS | | | 1,296,617 | |
| | 87,117 | | | | | Dogan Sirketler Grubu Holding AS | | | 19,868 | |
| | 79,680 | | | | | Enka Insaat ve Sanayi AS | | | 74,476 | |
| | 67,443 | | | | | Eregli Demir ve Celik Fabrikalari TAS | | | 75,850 | |
| | 23,713 | | | | | KOC Holding AS | | | 48,248 | |
| | 863 | | | | | Pegasus Hava Tasimaciligi AS* | | | 4,373 | |
| | 16,306 | | | | | Selcuk Ecza Deposu Ticaret ve Sanayi AS | | | 18,295 | |
| | 30,173 | | | | | Soda Sanayii AS | | | 23,001 | |
| | 218,592 | | | | | Trakya Cam Sanayii AS | | | 93,462 | |
| | 73,745 | | | | | Turk Hava Yollari AO* | | | 99,101 | |
| | 96,072 | | | | | Turkiye Garanti Bankasi AS* | | | 116,024 | |
| | 20,227 | | | | | Turkiye Halk Bankasi AS* | | | 15,131 | |
| | 190,164 | | | | | Turkiye Is Bankasi AS Class C* | | | 133,643 | |
| | 604,346 | | | | | Turkiye Sinai Kalkinma Bankasi AS* | | | 84,525 | |
| | 113,221 | | | | | Turkiye Sise ve Cam Fabrikalari AS | | | 70,048 | |
| | 170,595 | | | | | Turkiye Vakiflar Bankasi TAO Series D* | | | 117,569 | |
| | 224,757 | | | | | Yapi ve Kredi Bankasi AS* | | | 63,272 | |
| | | | | | | | | | |
| | | | | | Total Turkey | | | 2,697,810 | |
| | | | | | | | | | |
See accompanying Notes to the Financial Statements.
182
Mercer Emerging Markets Equity Fund
Schedule of Investments (Continued)
(showing percentage of net assets)
March 31, 2020
| | | | | | | | | | |
| Shares | | | | | Description | | Value ($) | |
| | |
| | | | | | United Arab Emirates — 0.1% | |
| | 3,143,497 | | | | | Emaar Malls PJSC | | | 897,376 | |
| | | | | | | | | | |
| | |
| | | | | | United Kingdom — 1.2% | |
| | 203,632 | | | | | GlaxoSmithKline Plc | | | 3,812,986 | |
| | 216,255 | | | | | Mondi Plc | | | 3,682,295 | |
| | 112,928 | | | | | Network International Holdings Plc* | | | 553,255 | |
| | 75,500 | | | | | Polymetal International Plc | | | 1,277,778 | |
| | 5,092,000 | | | | | West China Cement, Ltd. | | | 791,020 | |
| | 16,900 | | | | | WNS Holdings, Ltd., ADR* | | | 726,362 | |
| | | | | | | | | | |
| | | | | | Total United Kingdom | | | 10,843,696 | |
| | | | | | | | | | |
| | |
| | | | | | United States — 2.0% | |
| | 10,988 | | | | | Atlas Corp. | | | 84,498 | |
| | 63,617 | | | | | Colgate-Palmolive Co. | | | 4,221,624 | |
| | 33,786 | | | | | Johnson & Johnson | | | 4,430,358 | |
| | 4,612 | | | | | MercadoLibre, Inc.* | | | 2,253,331 | |
| | 21,345 | | | | | Microsoft Corp. | | | 3,366,320 | |
| | 32,994 | | | | | PepsiCo, Inc. | | | 3,962,579 | |
| | 17,700 | | | | | Yum China Holdings, Inc. | | | 754,551 | |
| | | | | | | | | | |
| | | | | | Total United States | | | 19,073,261 | |
| | | | | | | | | | |
| | | |
| | | | | | TOTAL COMMON STOCKS (COST $1,081,331,166) | | | 871,021,097 | |
| | | | | | | | | | |
| | |
| | | | | | PREFERRED STOCKS — 1.1% | |
| | |
| | | | | | Brazil — 0.6% | |
| | 354,154 | | | | | Banco Bradesco SA, 9.28%* | | | 1,418,227 | |
| | 88,000 | | | | | Banco do Estado do Rio Grande do Sul SA, 8.96% Series B | | | 202,414 | |
| | 41,692 | | | | | Banco Pan SA, 4.69%* | | | 38,022 | |
| | 456,744 | | | | | Gerdau SA, 1.96% | | | 885,026 | |
| | 130,856 | | | | | Itau Unibanco Holding SA, 8.56% | | | 582,552 | |
| | 742,473 | | | | | Petroleo Brasileiro SA, 5.60% | | | 2,002,699 | |
| | 419,000 | | | | | Randon SA Implementos e Participacoes, 5.39% | | | 440,279 | |
| | 115,200 | | | | | Usinas Siderurgicas de Minas Gerais SA, 1.85% Series A | | | 109,278 | |
| | | | | | | | | | |
| | | | | | Total Brazil | | | 5,678,497 | |
| | | | | | | | | | |
| | |
| | | | | | Colombia — 0.0% | |
| | 4,190 | | | | | Banco Davivienda SA, 3.11% | | | 31,476 | |
| | 15,537 | | | | | Grupo Argos SA, 4.01% | | | 36,048 | |
| | 10,752 | | | | | Grupo de Inversiones Suramericana SA, 3.15% | | | 44,437 | |
| | | | | | | | | | |
| | | | | | Total Colombia | | | 111,961 | |
| | | | | | | | | | |
| | |
| | | | | | South Korea — 0.5% | |
| | 149,267 | | | | | Samsung Electronics Co., Ltd., 2.52% | | | 4,872,447 | |
| | | | | | | | | | |
| | | |
| | | | | | TOTAL PREFERRED STOCKS (COST $18,020,554) | | | 10,662,905 | |
| | | | | | | | | | |
| | |
| | | | | | RIGHTS — 0.0% | |
| | |
| | | | | | Hong Kong — 0.0% | |
| | 6,315 | | | | | Legend Holdings Corp., Class H* **** ^ | | | — | |
| | | | | | | | | | |
See accompanying Notes to the Financial Statements.
183
Mercer Emerging Markets Equity Fund
Schedule of Investments (Continued)
(showing percentage of net assets)
March 31, 2020
| | | | | | | | | | |
| Shares | | | | | Description | | Value ($) | |
| | |
| | | | | | Rights — continued | |
| | |
| | | | | | India — 0.0% | |
| | 1,543 | | | | | Arvind Fashions, Ltd. Expires 04/17/2020* **** | | | — | |
| | | | | | | | | | |
| | | |
| | | | | | TOTAL RIGHTS (COST $—) | | | — | |
| | | | | | | | | | |
| | | |
| Par Value ($) | | | | | Description | | Value ($) | |
| | |
| | | | | | SHORT-TERM INVESTMENTS — 0.4% | |
| | |
| | | | | | Mutual Fund - Securities Lending Collateral — 0.2% | |
| | 1,742,607 | | | | | State Street Institutional U.S. Government Money Market Fund, Premier Class, 0.32%## ** | | | 1,742,607 | |
| | | | | | | | | | |
| | |
| | | | | | U.S. Government and Agency Obligations — 0.2% | |
| | 2,000,000 | | | | | United States Treasury Bill, 0.09%, due 05/07/20*** ‡‡ | | | 1,999,892 | |
| | | | | | | | | | |
| | | |
| | | | | | TOTAL SHORT-TERM INVESTMENTS (COST $3,739,555) | | | 3,742,499 | |
| | | | | | | | | | |
| | | |
| | | | | | TOTAL INVESTMENTS — 93.9% (Cost $1,103,091,275) | | | 885,426,501 | |
| | | |
| | | | | | Other Assets and Liabilities (net) — 6.1% | | | 57,597,623 | |
| | | | | | | | | | |
| | | |
| | | | | | NET ASSETS — 100.0% | | $943,024,124 | |
| | | | | | | | | | |
| | |
| | | | | | Notes to Schedule of Investments: | |
| | | |
| | | | | | ADR — American Depository Receipt | | | | |
| | | |
| | | | | | GDR — Global Depository Receipt | | | | |
| | | |
| | | | | | MTN — Medium Term Note | | | | |
| | | |
| | | | | | NVDR — Non-Voting Depository Receipt | | | | |
| | | |
| | | | | | OTC — Over-The-Counter | | | | |
| | | |
| | | | | | REIT — Real Estate Investment Trust | | | | |
| | | |
| | | | ## | | The rate disclosed is the 7-day net yield as of March 31, 2020. | | | | |
| | | |
| | | | * | | Non-income producing security. | | | | |
| | | |
| | | | ** | | Represents an investment of securities lending cash collateral. | | | | |
| | | |
| | | | *** | | All or a portion of this security is pledged for open futures collateral. | | | | |
| | | |
| | | | **** | | Securities fair valued by the Valuation Committee as approved by the Board of Trustees. The total market value of the securities at year end is $86,230 which represents 0.0% of net assets. The aggregate tax cost of these securities held at March 31, 2020 was $95,476. | | | | |
| | | |
| | | | ^ | | Level 3 — significant unobservable inputs were used in determining the value of this portfolio security. | | | | |
| | | |
| | | | ‡ | | All or a portion of this security is out on loan. | | | | |
| | | |
| | | | ‡‡ | | Interest rate presented is yield to maturity. | | | | |
See accompanying Notes to the Financial Statements.
184
Mercer Emerging Markets Equity Fund
Schedule of Investments (Continued)
March 31, 2020
| | | | | | | | |
| | | |
| | | | ‡‡‡ | | Security exempt from registration under Regulation S of the Securities Act of 1933, which exempts from registration securities offered and sold outside the United States. Security may not be offered or sold in the United States except pursuant to an exemption from, or in a transaction not subject to, the registration requirements of the Securities Act of 1933. | | |
| | | |
| | | | ‡‡‡‡ | | Restricted securities are not registered under the Securities Act of 1933 and are subject to legal restrictions on resale. These securities generally may be resold in transactions exempt from registration or to the public if the securities are subsequently registered. Disposal of these securities may involve time-consuming negotiations and prompt sale at an acceptable price may be difficult. As of year end, the market value of restricted securities was $5,461,500, which is 0.6% of net assets. See details shown in the Restricted Securities table that follows. | | |
| | | |
| | | | 144A | | Securities exempt from registration under Rule 144A of the Securities Act of 1933. These securities may be resold in transactions exempt from registration, normally to qualified institutional buyers. The total market value of the securities at year end is $6,675,597 which represents 0.7% of net assets. | | |
At March 31, 2020, the Fund held the following restricted security:
| | | | | | | | | | | | | | | | | | | | |
Restricted Security | | Acquistion Date | | Principal
Amount | | Cost | | Value |
Samsung Electronics Co., Ltd. | | | | 10/10/2019 | | | | | USD 5,500 | | | | $ | 5,851,893 | | | | $ | 5,461,500 | |
| | | | | | | | | | | | | | | | | | | | |
Futures Contracts
| | | | | | | | | | | | | | | | | | |
Number of
Contracts | | | | | Description | | | | Expiration Date | | Notional
Value | | | Market Value/
Unrealized
Appreciation
(Depreciation) | |
| | Buys | | | | | | |
| | 917 | | | | | MSCI Emerging Markets E-mini Index | | | | Jun 2020 | | $ | 38,646,965 | | | $ | 504,523 | |
| | | | | | | | | | | | | | | | | | |
See accompanying Notes to the Financial Statements.
185
Mercer Emerging Markets Equity Fund
Schedule of Investments (Continued)
March 31, 2020
| | | | | |
| Industry Sector Summary (Unaudited) | | % of Net Assets |
Financial | | | | 24.5 | |
Technology | | | | 14.7 | |
Communications | | | | 14.1 | |
Consumer, Non-cyclical | | | | 12.3 | |
Consumer, Cyclical | | | | 8.7 | |
Industrial | | | | 8.1 | |
Basic Materials | | | | 5.0 | |
Energy | | | | 4.5 | |
Utilities | | | | 1.6 | |
Diversified | | | | 0.0 | * |
Short-Term Investments | | | | 0.4 | |
Other Assets and Liabilities (net) | | | | 6.1 | |
| | | | | |
| | | | 100.0 | % |
| | | | | |
* Amount rounds to zero.
See accompanying Notes to the Financial Statements.
186
Mercer Global Low Volatility Equity Fund
Schedule of Investments
(showing percentage of net assets)
March 31, 2020
| | | | | | | | | | |
| Shares | | | | | Description | | Value ($) | |
| | |
| | | | | | COMMON STOCKS — 88.5% | |
| | |
| | | | | | Australia — 1.4% | |
| | 46,997 | | | | | Ansell, Ltd. | | | 796,983 | |
| | 37,700 | | | | | Cochlear, Ltd. | | | 4,309,675 | |
| | 22,279 | | | | | Evolution Mining, Ltd. | | | 51,416 | |
| | 124,341 | | | | | Newcrest Mining, Ltd. | | | 1,738,418 | |
| | 8,117 | | | | | Northern Star Resources, Ltd. | | | 51,718 | |
| | 127,455 | | | | | QBE Insurance Group, Ltd. | | | 692,922 | |
| | 301,629 | | | | | Regis Resources, Ltd. | | | 671,036 | |
| | 69,940 | | | | | Saracen Mineral Holdings, Ltd.* | | | 156,753 | |
| | 314,639 | | | | | Sonic Healthcare, Ltd. | | | 4,688,729 | |
| | 44,718 | | | | | Wesfarmers, Ltd. | | | 958,184 | |
| | 142,363 | | | | | Westgold Resources, Ltd.* | | | 163,937 | |
| | 27,601 | | | | | Woolworths Group, Ltd. | | | 600,091 | |
| | | | | | | | | | |
| | | | | | Total Australia | | | 14,879,862 | |
| | | | | | | | | | |
| | |
| | | | | | Austria — 0.4% | |
| | 28,745 | | | | | Erste Group Bank AG* | | | 530,052 | |
| | 26,711 | | | | | EVN AG | | | 390,120 | |
| | 9,298 | | | | | Flughafen Wien AG | | | 239,040 | |
| | 13,674 | | | | | IMMOFINANZ AG | | | 243,219 | |
| | 15,021 | | | | | Oesterreichische Post AG‡ | | | 536,299 | |
| | 34,645 | | | | | Telekom Austria AG Class A* | | | 240,901 | |
| | 89,777 | | | | | UNIQA Insurance Group AG | | | 693,183 | |
| | 52,834 | | | | | Vienna Insurance Group AG Wiener Versicherung Gruppe | | | 990,736 | |
| | | | | | | | | | |
| | | | | | Total Austria | | | 3,863,550 | |
| | | | | | | | | | |
| | |
| | | | | | Belgium — 0.2% | |
| | 14,710 | | | | | Ageas | | | 608,952 | |
| | 28,446 | | | | | Colruyt SA | | | 1,534,559 | |
| | 1,365 | | | | | D’ieteren SA/NV | | | 67,359 | |
| | | | | | | | | | |
| | | | | | Total Belgium | | | 2,210,870 | |
| | | | | | | | | | |
| | |
| | | | | | Bermuda — 1.3% | |
| | 7,946 | | | | | Bunge, Ltd. | | | 326,024 | |
| | 149,500 | | | | | CK Infrastructure Holdings, Ltd. | | | 792,028 | |
| | 342,000 | | | | | Emperor International Holdings, Ltd. | | | 56,294 | |
| | 26,412 | | | | | Enstar Group, Ltd.* | | | 4,200,829 | |
| | 10,614 | | | | | Everest Re Group, Ltd. | | | 2,042,346 | |
| | 81,229 | | | | | Genpact, Ltd. | | | 2,371,887 | |
| | 70,528 | | | | | GL, Ltd. | | | 25,421 | |
| | 2,000 | | | | | Guoco Group, Ltd. | | | 28,480 | |
| | 300,000 | | | | | Regal Hotels International Holdings, Ltd. | | | 119,224 | |
| | 15,373 | | | | | RenaissanceRe Holdings, Ltd. | | | 2,295,496 | |
| | 76,500 | | | | | SmarTone Telecommunications Holdings, Ltd. | | | 44,842 | |
| | 7,500 | | | | | Soundwill Holdings, Ltd. | | | 6,780 | |
| | 58,000 | | | | | Transport International Holdings, Ltd. | | | 121,840 | |
| | 1,100 | | | | | White Mountains Insurance Group, Ltd. | | | 1,001,000 | |
| | 3,000 | | | | | Wing On Co. International, Ltd. | | | 7,303 | |
See accompanying Notes to the Financial Statements.
187
Mercer Global Low Volatility Equity Fund
Schedule of Investments (Continued)
(showing percentage of net assets)
March 31, 2020
| | | | | | | | | | |
| Shares | | | | | Description | | Value ($) | |
| | |
| | | | | | Bermuda — continued | |
| | 32,000 | | | | | Wing Tai Properties, Ltd. | | | 19,498 | |
| | | | | | | | | | |
| | | | | | Total Bermuda | | | 13,459,292 | |
| | | | | | | | | | |
| | |
| | | | | | Canada — 5.2% | |
| | 37,500 | | | | | Alacer Gold Corp.* | | | 119,612 | |
| | 32,812 | | | | | Atco, Ltd. Class I | | | 898,362 | |
| | 70,200 | | | | | B2Gold Corp. | | | 210,104 | |
| | 37,600 | | | | | Bank of Montreal‡ | | | 1,877,160 | |
| | 32,400 | | | | | Bank of Nova Scotia (The) | | | 1,308,201 | |
| | 48,301 | | | | | BCE, Inc. | | | 1,973,579 | |
| | 28,089 | | | | | Canadian Imperial Bank of Commerce‡ | | | 1,618,223 | |
| | 76,922 | | | | | Canadian National Railway Co.‡ | | | 5,946,343 | |
| | 31,900 | | | | | Canadian Pacific Railway, Ltd. | | | 7,004,921 | |
| | 2,719 | | | | | Canadian Utilities, Ltd. Class A‡ | | | 64,262 | |
| | 98,789 | | | | | Centerra Gold, Inc.* | | | 580,928 | |
| | 3,400 | | | | | Cogeco Communications, Inc. | | | 228,052 | |
| | 6,400 | | | | | Cogeco, Inc. | | | 390,650 | |
| | 2,427 | | | | | Constellation Software, Inc. | | | 2,180,898 | |
| | 32,843 | | | | | Emera, Inc. | | | 1,280,631 | |
| | 1,100 | | | | | Empire Co., Ltd. Class A | | | 21,276 | |
| | 16,548 | | | | | First Capital Real Estate Investment Trust REIT | | | 158,464 | |
| | 49,903 | | | | | Fortis, Inc. | | | 1,902,720 | |
| | 29,600 | | | | | George Weston, Ltd. | | | 2,092,703 | |
| | 117,946 | | | | | Intact Financial Corp. | | | 10,078,879 | |
| | 47,200 | | | | | National Bank of Canada | | | 1,803,638 | |
| | 107,867 | | | | | OceanaGold Corp. | | | 102,308 | |
| | 18,400 | | | | | Osisko Gold Royalties, Ltd.‡ | | | 135,736 | |
| | 8,000 | | | | | RioCan Real Estate Investment Trust REIT | | | 90,659 | |
| | 27,800 | | | | | Rogers Communications, Inc. Class B | | | 1,147,274 | |
| | 29,800 | | | | | Royal Bank of Canada | | | 1,825,037 | |
| | 90,900 | | | | | Shaw Communications, Inc. Class B | | | 1,458,002 | |
| | 40,431 | | | | | Timbercreek Financial Corp.‡ | | | 201,395 | |
| | 36,300 | | | | | Toronto-Dominion Bank (The) | | | 1,525,857 | |
| | 77,445 | | | | | Waste Connections, Inc. | | | 6,001,988 | |
| | | | | | | | | | |
| | | | | | Total Canada | | | 54,227,862 | |
| | | | | | | | | | |
| | |
| | | | | | Cayman Islands — 0.5% | |
| | 25,100 | | | | | Alibaba Group Holding, Ltd., ADR* | | | 4,881,448 | |
| | 249,000 | | | | | Langham Hospitality Investments and Langham Hospitality Investments, Ltd. | | | 44,379 | |
| | | | | | | | | | |
| | | | | | Total Cayman Islands | | | 4,925,827 | |
| | | | | | | | | | |
| | |
| | | | | | Denmark — 0.3% | |
| | 17,199 | | | | | Carlsberg AS Class B | | | 1,943,264 | |
| | 2,224 | | | | | Coloplast AS Class B | | | 322,070 | |
| | 1,102 | | | | | Matas AS | | | 6,892 | |
| | 8,381 | | | | | Novo Nordisk AS Class B | | | 503,197 | |
| | 1,749 | | | | | Schouw & Co. AS | | | 115,735 | |
| | 5,230 | | | | | Spar Nord Bank AS | | | 32,064 | |
| | | | | | | | | | |
| | | | | | Total Denmark | | | 2,923,222 | |
| | | | | | | | | | |
See accompanying Notes to the Financial Statements.
188
Mercer Global Low Volatility Equity Fund
Schedule of Investments (Continued)
(showing percentage of net assets)
March 31, 2020
| | | | | | | | | | |
| Shares | | | | | Description | | Value ($) | |
| | |
| | | | | | Finland — 0.4% | |
| | 46,995 | | | | | Aktia Bank OYJ | | | 370,984 | |
| | 13,028 | | | | | Elisa OYJ | | | 805,396 | |
| | 32,361 | | | | | Kesko OYJ Class B | | | 1,827,726 | |
| | 5,005 | | | | | Lassila & Tikanoja OYJ | | | 63,056 | |
| | 18,684 | | | | | Orion OYJ Class B‡ | | | 762,517 | |
| | 50,685 | | | | | Raisio OYJ Class V | | | 164,162 | |
| | | | | | | | | | |
| | | | | | Total Finland | | | 3,993,841 | |
| | | | | | | | | | |
| | |
| | | | | | France — 2.8% | |
| | 16,858 | | | | | BNP Paribas SA | | | 505,585 | |
| | 1,791 | | | | | Boiron SA | | | 55,105 | |
| | 1,637 | | | | | Caisse Regionale de Credit Agricole Mutuel Brie Picardie | | | 48,058 | |
| | 7,622 | | | | | Caisse Regionale de Credit Agricole Mutuel Nord de France | | | 217,227 | |
| | 112,012 | | | | | Credit Agricole SA | | | 816,761 | |
| | 77,543 | | | | | Edenred | | | 3,228,803 | |
| | 114,091 | | | | | Engie SA | | | 1,174,128 | |
| | 5,600 | | | | | IPSOS | | | 117,935 | |
| | 77,112 | | | | | Lagardere SCA | | | 969,221 | |
| | 470 | | | | | LNA Sante SA | | | 19,638 | |
| | 552 | | | | | Manutan International | | | 24,698 | |
| | 36,602 | | | | | Metropole Television SA | | | 409,497 | |
| | 167,672 | | | | | Orange SA | | | 2,068,185 | |
| | 19,444 | | | | | Peugeot SA | | | 257,908 | |
| | 128,192 | | | | | Rubis SCA | | | 5,330,783 | |
| | 47,393 | | | | | Safran SA | | | 4,144,318 | |
| | 4,250 | | | | | Sanofi | | | 372,257 | |
| | 304 | | | | | Savencia SA | | | 16,098 | |
| | 74 | | | | | Societe Fonciere Lyonnaise SA REIT | | | 5,432 | |
| | 66,610 | | | | | Suez | | | 675,191 | |
| | 97,444 | | | | | Veolia Environnement SA | | | 2,073,930 | |
| | 1,091 | | | | | Vetoquinol SA | | | 56,510 | |
| | 10 | | | | | Vilmorin & Cie SA | | | 394 | |
| | 56,454 | | | | | Vinci SA | | | 4,647,364 | |
| | 478 | | | | | Virbac SA* | | | 84,701 | |
| | 61,408 | | | | | Vivendi SA | | | 1,310,860 | |
| | | | | | | | | | |
| | | | | | Total France | | | 28,630,587 | |
| | | | | | | | | | |
| | |
| | | | | | Germany — 1.7% | |
| | 5,425 | | | | | Allianz SE | | | 930,379 | |
| | 106,784 | | | | | Brenntag AG | | | 4,013,590 | |
| | 52,032 | | | | | CTS Eventim AG & Co. KGaA | | | 2,384,166 | |
| | 158,790 | | | | | Deutsche Telekom AG* | | | 2,091,696 | |
| | 9,939 | | | | | Hannover Rueck SE | | | 1,445,711 | |
| | 3,385 | | | | | Hornbach Holding AG & Co. KGaA | | | 141,686 | |
| | 2,128 | | | | | McKesson Europe AG | | | 58,005 | |
| | 26,054 | | | | | Merck KGaA | | | 2,687,766 | |
| | 8,080 | | | | | Muenchener Rueckversicherungs-Gesellschaft AG in Muenchen | | | 1,624,960 | |
| | 46,993 | | | | | Talanx AG | | | 1,610,689 | |
See accompanying Notes to the Financial Statements.
189
Mercer Global Low Volatility Equity Fund
Schedule of Investments (Continued)
(showing percentage of net assets)
March 31, 2020
| | | | | | | | | | |
| Shares | | | | | Description | | Value ($) | |
| | |
| | | | | | Germany — continued | |
| | 18,732 | | | | | Wuestenrot & Wuerttembergische AG | | | 289,042 | |
| | | | | | | | | | |
| | | | | | Total Germany | | | 17,277,690 | |
| | | | | | | | | | |
| | |
| | | | | | Hong Kong — 1.8% | |
| | 829,227 | | | | | AIA Group, Ltd. | | | 7,461,757 | |
| | 99,500 | | | | | CLP Holdings, Ltd. | | | 914,787 | |
| | 2,013,119 | | | | | Guangdong Investment, Ltd. | | | 3,861,880 | |
| | 239,000 | | | | | HK Electric Investments & HK Electric Investments, Ltd. | | | 229,595 | |
| | 1,823,000 | | | | | HKT Trust & HKT, Ltd. | | | 2,475,577 | |
| | 16,000 | | | | | Hong Kong Ferry Holdings Co., Ltd. | | | 12,381 | |
| | 49,000 | | | | | Kowloon Development Co., Ltd. | | | 53,470 | |
| | 38,000 | | | | | Liu Chong Hing Investment, Ltd. | | | 38,082 | |
| | 12,000 | | | | | Miramar Hotel & Investment | | | 19,452 | |
| | 2,232,000 | | | | | PCCW, Ltd. | | | 1,226,796 | |
| | 360,000 | | | | | Power Assets Holdings, Ltd. | | | 2,145,218 | |
| | 361,000 | | | | | Regal Real Estate Investment Trust REIT | | | 62,784 | |
| | 393,000 | | | | | Sunlight Real Estate Investment Trust REIT | | | 191,665 | |
| | | | | | | | | | |
| | | | | | Total Hong Kong | | | 18,693,444 | |
| | | | | | | | | | |
| | |
| | | | | | Ireland — 1.5% | |
| | 23,437 | | | | | Accenture Plc Class A | | | 3,826,325 | |
| | 102,275 | | | | | C&C Group Plc | | | 248,785 | |
| | 69,146 | | | | | Hibernia REIT Plc REIT | | | 80,514 | |
| | 3,040 | | | | | ICON Plc, ADR* | | | 413,440 | |
| | 109,749 | | | | | Irish Residential Properties Plc REIT | | | 146,735 | |
| | 17,300 | | | | | Jazz Pharmaceuticals Plc* | | | 1,725,502 | |
| | 45,806 | | | | | Medtronic Plc | | | 4,130,785 | |
| | 17,040 | | | | | STERIS Plc | | | 2,385,089 | |
| | 23,991 | | | | | Total Produce Plc | | | 22,362 | |
| | 14,100 | | | | | Willis Towers Watson Plc | | | 2,394,885 | |
| | | | | | | | | | |
| | | | | | Total Ireland | | | 15,374,422 | |
| | | | | | | | | | |
| | |
| | | | | | Israel — 0.5% | |
| | 228,765 | | | | | Bank Hapoalim BM | | | 1,376,818 | |
| | 25,476 | | | | | Bank LeumiLe-Israel BM | | | 141,021 | |
| | 153 | | | | | Bayside Land Corp. | | | 89,615 | |
| | 3,121 | | | | | FIBI Holdings, Ltd. | | | 88,593 | |
| | 22,262 | | | | | First International Bank Of Israel, Ltd. | | | 545,447 | |
| | 11,310 | | | | | Isracard, Ltd. | | | 30,367 | |
| | 331,092 | | | | | Israel Discount Bank, Ltd. Class A | | | 981,758 | |
| | 3,054 | | | | | Mizrahi Tefahot Bank, Ltd. | | | 57,118 | |
| | 696 | | | | | Nice, Ltd., ADR* | | | 99,918 | |
| | 140 | | | | | Paz Oil Co., Ltd. | | | 11,799 | |
| | 1,503 | | | | | Rami Levy Chain Stores Hashikma Marketing 2006, Ltd. | | | 83,414 | |
| | 56,884 | | | | | Strauss Group, Ltd. | | | 1,490,998 | |
| | 1,613 | | | | | Taro Pharmaceutical Industries, Ltd.* | | | 98,716 | |
| | | | | | | | | | |
| | | | | | Total Israel | | | 5,095,582 | |
| | | | | | | | | | |
See accompanying Notes to the Financial Statements.
190
Mercer Global Low Volatility Equity Fund
Schedule of Investments (Continued)
(showing percentage of net assets)
March 31, 2020
| | | | | | | | | | |
| Shares | | | | | Description | | Value ($) | |
| | |
| | | | | | Italy — 0.1% | |
| | 159,356 | | | | | A2A SpA | | | 197,242 | |
| | 41,143 | | | | | Ascopiave SpA | | | 151,449 | |
| | 44,118 | | | | | Assicurazioni Generali SpA | | | 597,939 | |
| | 6,018 | | | | | Enel SpA | | | 41,673 | |
| | 60,462 | | | | | Hera SpA | | | 216,054 | |
| | 75,187 | | | | | Iren SpA | | | 185,046 | |
| | | | | | | | | | |
| | | | | | Total Italy | | | 1,389,403 | |
| | | | | | | | | | |
| | |
| | | | | | Japan — 4.6% | |
| | 7,100 | | | | | Aeon Hokkaido Corp.‡ | | | 48,339 | |
| | 23,200 | | | | | Alpen Co., Ltd. | | | 343,499 | |
| | 46,500 | | | | | Astellas Pharma, Inc. | | | 716,961 | |
| | 1,900 | | | | | AT-Group Co., Ltd. | | | 19,844 | |
| | 17,800 | | | | | Chugoku Electric Power Co., Inc. (The) | | | 248,235 | |
| | 146,242 | | | | | DCM Holdings Co., Ltd.‡ | | | 1,348,161 | |
| | 15,400 | | | | | DyDo Group Holdings, Inc. | | | 517,634 | |
| | 489 | | | | | Earth Corp. | | | 25,873 | |
| | 56,231 | | | | | EDION Corp. | | | 463,976 | |
| | 7,300 | | | | | Fujitsu, Ltd. | | | 656,121 | |
| | 4,900 | | | | | J-Oil Mills, Inc. | | | 206,820 | |
| | 38 | | | | | Japan Excellent, Inc. REIT | | | 43,533 | |
| | 143,300 | | | | | Japan Post Bank Co., Ltd.‡ | | | 1,318,748 | |
| | 221,100 | | | | | Japan Post Holdings Co., Ltd. | | | 1,725,327 | |
| | 84 | | | | | Japan Rental Housing Investments, Inc. REIT | | | 70,671 | |
| | 11,400 | | | | | Japan Wool Textile Co., Ltd. (The) | | | 98,670 | |
| | 15,155 | | | | | Kaken Pharmaceutical Co., Ltd. | | | 702,797 | |
| | 17,700 | | | | | Kato Sangyo Co., Ltd. | | | 559,732 | |
| | 80,900 | | | | | KDDI Corp. | | | 2,381,724 | |
| | 600 | | | | | KFC Holdings Japan, Ltd. | | | 12,778 | |
| | 18,287 | | | | | Kohnan Shoji Co., Ltd. | | | 369,125 | |
| | 53,300 | | | | | Komeri Co., Ltd. | | | 952,597 | |
| | 82,500 | | | | | KYORIN Holdings, Inc. | | | 1,667,674 | |
| | 12,000 | | | | | LIXIL VIVA Corp. | | | 203,183 | |
| | 174,000 | | | | | Marui Group Co., Ltd. | | | 2,909,188 | |
| | 71,100 | | | | | Medipal Holdings Corp. | | | 1,323,503 | |
| | 13,600 | | | | | Mitsubishi Shokuhin Co., Ltd. | | | 349,247 | |
| | 1,701,000 | | | | | Mizuho Financial Group, Inc. | | | 1,938,993 | |
| | 7,400 | | | | | Mizuno Corp. | | | 127,556 | |
| | 30,000 | | | | | Mochida Pharmaceutical Co., Ltd. | | | 1,154,507 | |
| | 31,600 | | | | | MS&AD Insurance Group Holdings, Inc. | | | 881,567 | |
| | 64,700 | | | | | Nichi-iko Pharmaceutical Co., Ltd. | | | 851,481 | |
| | 26,000 | | | | | Nippon Flour Mills Co., Ltd. | | | 405,448 | |
| | 9,701 | | | | | Nippon Kanzai Co., Ltd. | | | 158,539 | |
| | 96,000 | | | | | Nippon Telegraph & Telephone Corp. | | | 2,269,027 | |
| | 30,100 | | | | | Nisshin Oillio Group, Ltd. (The) | | | 1,019,816 | |
| | 115,800 | | | | | NTT DOCOMO, Inc. | | | 3,625,693 | |
| | 10,500 | | | | | Ohsho Food Service Corp. | | | 556,929 | |
| | 10,500 | | | | | Okinawa Cellular Telephone Co. | | | 348,493 | |
| | 20,450 | | | | | Okinawa Electric Power Co., Inc. (The) | | | 375,617 | |
See accompanying Notes to the Financial Statements.
191
Mercer Global Low Volatility Equity Fund
Schedule of Investments (Continued)
(showing percentage of net assets)
March 31, 2020
| | | | | | | | | | |
| Shares | | | | | Description | | Value ($) | |
| | |
| | | | | | Japan — continued | |
| | 19,500 | | | | | Resona Holdings, Inc. | | | 58,443 | |
| | 17,300 | | | | | Sankyo Co., Ltd. | | | 502,214 | |
| | 7,700 | | | | | Sawai Pharmaceutical Co., Ltd. | | | 410,409 | |
| | 22,459 | | | | | Showa Sangyo Co., Ltd.‡ | | | 667,060 | |
| | 9,800 | | | | | SKY Perfect JSAT Holdings, Inc. | | | 34,746 | |
| | 170,900 | | | | | Softbank Corp.‡ | | | 2,166,717 | |
| | 291,838 | | | | | Sony Financial Holdings, Inc. | | | 4,913,203 | |
| | 4,600 | | | | | St. Marc Holdings Co., Ltd. | | | 73,543 | |
| | 161 | | | | | Star Asia Investment Corp. REIT‡ | | | 126,722 | |
| | 3,200 | | | | | Sugi Holdings Co., Ltd. | | | 170,723 | |
| | 65,700 | | | | | Sumitomo Mitsui Financial Group, Inc. | | | 1,589,975 | |
| | 24,900 | | | | | Sumitomo Mitsui Trust Holdings, Inc. | | | 716,472 | |
| | 11,700 | | | | | Suzuken Co., Ltd. | | | 424,741 | |
| | 69,600 | | | | | Toho Holdings Co., Ltd. | | | 1,457,149 | |
| | 90,000 | | | | | Tokyo Electric Power Co. Holdings, Inc.* | | | 313,234 | |
| | 43,000 | | | | | Vital KSK Holdings, Inc.‡ | | | 437,477 | |
| | 2,600 | | | | | Wowow, Inc. | | | 57,675 | |
| | 53,158 | | | | | Yamada Denki Co., Ltd. | | | 211,412 | |
| | 18,800 | | | | | ZERIA Pharmaceutical Co., Ltd. | | | 362,391 | |
| | | | | | | | | | |
| | | | | | Total Japan | | | 47,691,932 | |
| | | | | | | | | | |
| | |
| | | | | | Luxembourg — 0.1% | |
| | 201,460 | | | | | B&M European Value Retail SA | | | 686,681 | |
| | 4,300 | | | | | Spotify Technology SA* | | | 522,192 | |
| | | | | | | | | | |
| | | | | | Total Luxembourg | | | 1,208,873 | |
| | | | | | | | | | |
| | |
| | | | | | Netherlands — 1.5% | |
| | 3,620 | | | | | Accell Group NV | | | 49,944 | |
| | 80,808 | | | | | Airbus SE | | | 5,216,228 | |
| | 1,216 | | | | | Amsterdam Commodities NV | | | 21,713 | |
| | 3,407 | | | | | Heineken Holding NV | | | 260,141 | |
| | 51,364 | | | | | Koninklijke Ahold Delhaize NV | | | 1,195,929 | |
| | 225,694 | | | | | Koninklijke KPN NV | | | 537,079 | |
| | 990 | | | | | Sligro Food Group NV‡ | | | 14,691 | |
| | 177,651 | | | | | Unilever NV | | | 8,708,029 | |
| | | | | | | | | | |
| | | | | | Total Netherlands | | | 16,003,754 | |
| | | | | | | | | | |
| | |
| | | | | | New Zealand — 0.4% | |
| | 253,622 | | | | | Argosy Property, Ltd. | | | 135,324 | |
| | 92,863 | | | | | Arvida Group, Ltd. | | | 68,234 | |
| | 40,901 | | | | | Chorus, Ltd. | | | 167,896 | |
| | 225,864 | | | | | Contact Energy, Ltd. | | | 771,284 | |
| | 46,009 | | | | | Ebos Group, Ltd. | | | 604,471 | |
| | 10,490 | | | | | FonterraCo-operative Group, Ltd.*‡ | | | 23,924 | |
| | 69,101 | | | | | Goodman Property Trust REIT | | | 87,873 | |
| | 348,953 | | | | | Infratil, Ltd. | | | 799,682 | |
| | 49,518 | | | | | Kiwi Property Group, Ltd. REIT | | | 27,595 | |
| | 32,213 | | | | | Mainfreight, Ltd. | | | 659,818 | |
See accompanying Notes to the Financial Statements.
192
Mercer Global Low Volatility Equity Fund
Schedule of Investments (Continued)
(showing percentage of net assets)
March 31, 2020
| | | | | | | | | | |
| Shares | | | | | Description | | Value ($) | |
| | |
| | | | | | New Zealand — continued | |
| | 142,620 | | | | | Mercury NZ, Ltd. | | | 354,517 | |
| | 13,542 | | | | | Property for Industry, Ltd. REIT | | | 16,217 | |
| | 157,944 | | | | | Spark New Zealand, Ltd. | | | 382,508 | |
| | 6,801 | | | | | Trustpower, Ltd. | | | 25,608 | |
| | 15,201 | | | | | Vector, Ltd. | | | 28,331 | |
| | 3,702 | | | | | Warehouse Group, Ltd. (The) | | | 4,342 | |
| | 36,597 | | | | | Z Energy, Ltd. | | | 62,226 | |
| | | | | | | | | | |
| | | | | | Total New Zealand | | | 4,219,850 | |
| | | | | | | | | | |
| | |
| | | | | | Norway — 0.5% | |
| | 109,944 | | | | | DNB ASA | | | 1,220,769 | |
| | 29,602 | | | | | Gjensidige Forsikring ASA* | | | 501,493 | |
| | 4,194 | | | | | Olav Thon Eiendomsselskap ASA | | | 45,091 | |
| | 209,680 | | | | | Orkla ASA | | | 1,776,458 | |
| | 45,940 | | | | | SpareBank 1SR-Bank ASA | | | 258,699 | |
| | 61,697 | | | | | Telenor ASA | | | 895,137 | |
| | | | | | | | | | |
| | | | | | Total Norway | | | 4,697,647 | |
| | | | | | | | | | |
| | |
| | | | | | Portugal — 0.0% | |
| | 99,893 | | | | | REN — Redes Energeticas Nacionais SGPS SA | | | 253,802 | |
| | | | | | | | | | |
| | |
| | | | | | Puerto Rico — 0.1% | |
| | 42,100 | | | | | Popular, Inc. | | | 1,473,500 | |
| | | | | | | | | | |
| | |
| | | | | | Singapore — 0.6% | |
| | 95,300 | | | | | AIMS APAC REIT | | | 69,669 | |
| | 24,921 | | | | | Best World International, Ltd.**** | | | 23,803 | |
| | 443,000 | | | | | Frasers Hospitality Trust REIT | | | 121,717 | |
| | 8,000 | | | | | Great Eastern Holdings, Ltd. | | | 99,697 | |
| | 2,000 | | | | | Haw Par Corp., Ltd. | | | 14,393 | |
| | 57,384 | | | | | Hong Leong Finance, Ltd. | | | 85,144 | |
| | 1,503,810 | | | | | Keppel Infrastructure Trust | | | 449,212 | |
| | 3,404,049 | | | | | NetLink NBN Trust | | | 2,142,723 | |
| | 263,100 | | | | | Olam International, Ltd. | | | 262,356 | |
| | 181,200 | | | | | OUE, Ltd. | | | 126,038 | |
| | 114,100 | | | | | Oversea-Chinese Banking Corp., Ltd. | | | 692,873 | |
| | 42,200 | | | | | Sasseur Real Estate Investment Trust REIT | | | 17,502 | |
| | 1,324,901 | | | | | Sheng Siong Group, Ltd. | | | 1,107,930 | |
| | 475,819 | | | | | SPH REIT | | | 257,503 | |
| | 12,200 | | | | | Straits Trading Co., Ltd. | | | 13,287 | |
| | 33,000 | | | | | United Industrial Corp., Ltd. | | | 49,755 | |
| | 12,200 | | | | | United Overseas Bank, Ltd. | | | 166,779 | |
| | 215,500 | | | | | Wilmar International, Ltd. | | | 486,580 | |
| | 53,300 | | | | | Wing Tai Holdings, Ltd. | | | 57,969 | |
| | | | | | | | | | |
| | | | | | Total Singapore | | | 6,244,930 | |
| | | | | | | | | | |
See accompanying Notes to the Financial Statements.
193
Mercer Global Low Volatility Equity Fund
Schedule of Investments (Continued)
(showing percentage of net assets)
March 31, 2020
| | | | | | | | | | |
| Shares | | | | | Description | | Value ($) | |
| | |
| | | | | | Spain — 0.8% | |
| | 30,146 | | | | | Aena SME SA | | | 3,273,044 | |
| | 1,020 | | | | | Cia de Distribucion Integral Logista Holdings SA | | | 16,270 | |
| | 44,297 | | | | | Endesa SA | | | 943,506 | |
| | 21,765 | | | | | Faes Farma SA | | | 84,413 | |
| | 146,160 | | | | | Iberdrola SA | | | 1,435,791 | |
| | 55,942 | | | | | Viscofan SA | | | 3,049,420 | |
| | | | | | | | | | |
| | | | | | Total Spain | | | 8,802,444 | |
| | | | | | | | | | |
| | |
| | | | | | Sweden — 1.6% | |
| | 71,433 | | | | | Akelius Residential Property AB Class D* | | | 102,291 | |
| | 91,216 | | | | | Axfood AB | | | 1,857,912 | |
| | 15,343 | | | | | Bilia AB Class A | | | 94,635 | |
| | 58,525 | | | | | Cloetta AB Class B | | | 138,596 | |
| | 37,657 | | | | | Essity AB Class B | | | 1,159,465 | |
| | 63,665 | | | | | ICA Gruppen AB | | | 2,679,903 | |
| | 42,161 | | | | | Nyfosa AB* | | | 211,915 | |
| | 799,700 | | | | | Svenska Handelsbanken AB Class A* | | | 6,686,627 | |
| | 57,159 | | | | | Swedish Match AB‡ | | | 3,264,608 | |
| | | | | | | | | | |
| | | | | | Total Sweden | | | 16,195,952 | |
| | | | | | | | | | |
| | |
| | | | | | Switzerland — 3.7% | |
| | 4,888 | | | | | AEVIS VICTORIA SA | | | 57,642 | |
| | 11,952 | | | | | Allreal Holding AG* | | | 2,206,382 | |
| | 1,911 | | | | | Baloise Holding AG | | | 249,524 | |
| | 1,348 | | | | | Banque Cantonale de Geneve | | | 250,634 | |
| | 168 | | | | | Basellandschaftliche Kantonalbank | | | 149,596 | |
| | 579 | | | | | Basler Kantonalbank‡ | | | 38,637 | |
| | 1,076 | | | | | Berner Kantonalbank AG | | | 233,348 | |
| | 17,306 | | | | | BKW AG | | | 1,416,865 | |
| | 14,056 | | | | | Coca-Cola HBC AG* | | | 301,583 | |
| | 438 | | | | | Emmi AG | | | 398,345 | |
| | 17 | | | | | Forbo Holding AG | | | 20,506 | |
| | 9 | | | | | Graubuendner Kantonalbank | | | 13,481 | |
| | 9,369 | | | | | Helvetia Holding AG | | | 803,041 | |
| | 588 | | | | | Intershop Holding AG | | | 307,464 | |
| | 180 | | | | | Luzerner Kantonalbank AG | | | 72,621 | |
| | 3,972 | | | | | Mobimo Holding AG* | | | 1,108,368 | |
| | 43,311 | | | | | Nestle SA | | | 4,440,689 | |
| | 147,920 | | | | | Novartis AG | | | 12,161,048 | |
| | 3,664 | | | | | Orior AG | | | 296,805 | |
| | 10,624 | | | | | Roche Holding AG | | | 3,435,984 | |
| | 3,896 | | | | | Sonova Holding AG | | | 699,698 | |
| | 245 | | | | | St. Galler Kantonalbank AG | | | 101,264 | |
| | 5,691 | | | | | Swiss Life Holding AG | | | 1,927,499 | |
| | 22,547 | | | | | Swiss Prime Site AG | | | 2,201,711 | |
| | 5,472 | | | | | Swisscom AG‡ | | | 2,934,600 | |
| | 603 | | | | | Thurgauer Kantonalbank | | | 61,672 | |
| | 3,202 | | | | | TX Group AG | | | 225,517 | |
| | 2,958 | | | | | Valora Holding AG*‡ | | | 517,228 | |
See accompanying Notes to the Financial Statements.
194
Mercer Global Low Volatility Equity Fund
Schedule of Investments (Continued)
(showing percentage of net assets)
March 31, 2020
| | | | | | | | | | |
| Shares | | | | | Description | | Value ($) | |
| | |
| | | | | | Switzerland — continued | |
| | 294 | | | | | Vaudoise Assurances Holding SA | | | 136,220 | |
| | 13 | | | | | Warteck Invest AG* | | | 27,392 | |
| | 3,460 | | | | | Zurich Insurance Group AG | | | 1,221,748 | |
| | | | | | | | | | |
| | | | | | Total Switzerland | | | 38,017,112 | |
| | | | | | | | | | |
| | |
| | | | | | United Kingdom — 3.9% | |
| | 2,356 | | | | | 4imprint Group Plc | | | 56,186 | |
| | 14,403 | | | | | Aon Plc | | | 2,377,071 | |
| | 31,079 | | | | | Atlantica Yield Plc | | | 693,062 | |
| | 4,600 | | | | | Atlassian Corp. Plc Class A* | | | 631,396 | |
| | 1,568,500 | | | | | BAE Systems Plc | | | 10,103,464 | |
| | 221,774 | | | | | Britvic Plc | | | 1,923,725 | |
| | 786,398 | | | | | BT Group Plc | | | 1,144,996 | |
| | 258,927 | | | | | Central Asia Metals Plc | | | 500,676 | |
| | 10,157 | | | | | Cranswick Plc | | | 464,338 | |
| | 25,501 | | | | | Custodian Reit Plc REIT | | | 31,255 | |
| | 26,882 | | | | | Diageo Plc | | | 859,505 | |
| | 20,695 | | | | | EMIS Group Plc | | | 268,349 | |
| | 62,552 | | | | | Empiric Student Property Plc REIT | | | 51,178 | |
| | 51,637 | | | | | Ferguson Plc | | | 3,223,314 | |
| | 384,292 | | | | | GCP Student Living Plc REIT | | | 632,073 | |
| | 184,591 | | | | | Halfords Group Plc | | | 159,413 | |
| | 447,214 | | | | | Legal & General Group Plc | | | 1,068,041 | |
| | 390,198 | | | | | M&G Plc* | | | 542,401 | |
| | 252,075 | | | | | Marston’s Plc | | | 129,897 | |
| | 333,978 | | | | | National Express Group Plc | | | 845,088 | |
| | 100,299 | | | | | National Grid Plc | | | 1,173,519 | |
| | 11,691 | | | | | QinetiQ Group Plc | | | 46,935 | |
| | 84,648 | | | | | Reckitt Benckiser Group Plc | | | 6,485,290 | |
| | 25,890 | | | | | Secure Income REIT Plc REIT | | | 102,848 | |
| | 75,518 | | | | | Smith & Nephew Plc | | | 1,337,792 | |
| | 103,833 | | | | | Spirent Communications Plc | | | 269,623 | |
| | 16,896 | | | | | SSP Group Plc | | | 64,106 | |
| | 823 | | | | | Target Healthcare REIT Plc REIT | | | 1,083 | |
| | 234,086 | | | | | Tate & Lyle Plc | | | 1,897,818 | |
| | 17,976 | | | | | Telecom Plus Plc | | | 276,273 | |
| | 5,897 | | | | | Tritax Big Box REIT Plc REIT | | | 8,184 | |
| | 23,567 | | | | | Unilever Plc | | | 1,187,686 | |
| | 30,937 | | | | | United Utilities Group Plc | | | 344,867 | |
| | 48,764 | | | | | Vectura Group Plc | | | 58,562 | |
| | 45,501 | | | | | Vodafone Group Plc | | | 63,451 | |
| | 814,768 | | | | | Wm Morrison Supermarkets Plc | | | 1,791,818 | |
| | 4,972 | | | | | YouGov Plc | | | 38,436 | |
| | | | | | | | | | |
| | | | | | Total United Kingdom | | | 40,853,719 | |
| | | | | | | | | | |
| | |
| | | | | | United States — 52.6% | |
| | 106,000 | | | | | Abbott Laboratories | | | 8,364,460 | |
| | 15,275 | | | | | Adobe, Inc.* | | | 4,861,116 | |
| | 46,683 | | | | | AGNC Investment Corp. REIT | | | 493,906 | |
See accompanying Notes to the Financial Statements.
195
Mercer Global Low Volatility Equity Fund
Schedule of Investments (Continued)
(showing percentage of net assets)
March 31, 2020
| | | | | | | | | | |
| Shares | | | | | Description | | Value ($) | |
| | |
| | | | | | United States — continued | |
| | 13,000 | | | | | Akamai Technologies, Inc.* | | | 1,189,370 | |
| | 2,485 | | | | | Alleghany Corp. | | | 1,372,590 | |
| | 30,605 | | | | | Allstate Corp. (The) | | | 2,807,397 | |
| | 16,344 | | | | | Alphabet, Inc. Class A* | | | 18,990,911 | |
| | 307,022 | | | | | Altice USA, Inc. Class A* | | | 6,843,520 | |
| | 2,401 | | | | | Amazon.com, Inc.* | | | 4,681,278 | |
| | 49,171 | | | | | Amdocs, Ltd. | | | 2,702,930 | |
| | 30,478 | | | | | Ameren Corp. | | | 2,219,713 | |
| | 8,613 | | | | | American Electric Power Co., Inc. | | | 688,868 | |
| | 23,257 | | | | | American Express Co. | | | 1,991,032 | |
| | 20,802 | | | | | American Financial Group, Inc. | | | 1,457,804 | |
| | 3,900 | | | | | American National Insurance Co. | | | 321,282 | |
| | 54,115 | | | | | American Tower Corp. REIT | | | 11,783,541 | |
| | 9,700 | | | | | AmerisourceBergen Corp. Class A | | | 858,450 | |
| | 44,890 | | | | | AMETEK, Inc. | | | 3,232,978 | |
| | 6,800 | | | | | Amgen, Inc. | | | 1,378,564 | |
| | 8,646 | | | | | ANSYS, Inc.* | | | 2,009,936 | |
| | 4,200 | | | | | Anthem, Inc. | | | 953,568 | |
| | 63,138 | | | | | Arthur J. Gallagher & Co. | | | 5,146,378 | |
| | 11,900 | | | | | Assurant, Inc. | | | 1,238,671 | |
| | 165,788 | | | | | AT&T, Inc. | | | 4,832,720 | |
| | 231 | | | | | Atmos Energy Corp. | | | 22,922 | |
| | 22,700 | | | | | Automatic Data Processing, Inc. | | | 3,102,636 | |
| | 1,600 | | | | | AutoZone, Inc.* | | | 1,353,600 | |
| | 13,000 | | | | | AvalonBay Communities, Inc. REIT | | | 1,913,210 | |
| | 109,804 | | | | | Avangrid, Inc. | | | 4,807,219 | |
| | 81,295 | | | | | Ball Corp. | | | 5,256,535 | |
| | 103,999 | | | | | Baxter International, Inc. | | | 8,443,679 | |
| | 20,380 | | | | | Becton Dickinson and Co. | | | 4,682,713 | |
| | 2,772 | | | | | Berkshire Hathaway, Inc. Class B* | | | 506,805 | |
| | 1,825 | | | | | Booking Holdings, Inc.* | | | 2,455,209 | |
| | 20,000 | | | | | Boston Properties, Inc. REIT | | | 1,844,600 | |
| | 31,255 | | | | | Bristol-Myers Squibb Co. | | | 1,742,154 | |
| | 8,400 | | | | | Broadcom, Inc. | | | 1,991,640 | |
| | 8,680 | | | | | Broadridge Financial Solutions, Inc. | | | 823,124 | |
| | 124,405 | | | | | BWX Technologies, Inc. | | | 6,059,767 | |
| | 1,600 | | | | | Cable One, Inc. | | | 2,630,416 | |
| | 27,935 | | | | | Cadence Design Systems, Inc.* | | | 1,844,827 | |
| | 22,200 | | | | | Camden Property Trust REIT | | | 1,759,128 | |
| | 22,900 | | | | | Capital One Financial Corp. | | | 1,154,618 | |
| | 11,400 | | | | | Casey’s General Stores, Inc. | | | 1,510,386 | |
| | 23,200 | | | | | CBOE Holdings, Inc. | | | 2,070,600 | |
| | 7,300 | | | | | Cerner Corp. | | | 459,827 | |
| | 35,500 | | | | | Charter Communications, Inc. Class A* | | | 15,489,005 | |
| | 5,200 | | | | | Chemed Corp. | | | 2,252,640 | |
| | 600 | | | | | Chevron Corp. | | | 43,476 | |
| | 100 | | | | | Chipotle Mexican Grill, Inc. Class A* | | | 65,440 | |
| | 3,900 | | | | | Church & Dwight Co., Inc. | | | 250,302 | |
| | 49,600 | | | | | Cigna Corp. | | | 8,788,128 | |
See accompanying Notes to the Financial Statements.
196
Mercer Global Low Volatility Equity Fund
Schedule of Investments (Continued)
(showing percentage of net assets)
March 31, 2020
| | | | | | | | | | |
| Shares | | | | | Description | | Value ($) | |
| | |
| | | | | | United States — continued | |
| | 4,005 | | | | | Cintas Corp. | | | 693,746 | |
| | 16,600 | | | | | Citrix Systems, Inc. | | | 2,349,730 | |
| | 71,129 | | | | | Clean Harbors, Inc.* | | | 3,651,763 | |
| | 16,200 | | | | | Clorox Co. (The) | | | 2,806,650 | |
| | 23,083 | | | | | CMS Energy Corp. | | | 1,356,126 | |
| | 10,100 | | | | | CNA Financial Corp. | | | 313,504 | |
| | 45,400 | | | | | Coca-Cola Co. (The) | | | 2,008,950 | |
| | 42,800 | | | | | Colgate-Palmolive Co. | | | 2,840,208 | |
| | 100,900 | | | | | Comcast Corp. Class A | | | 3,468,942 | |
| | 22,949 | | | | | Consolidated Edison, Inc. | | | 1,790,022 | |
| | 18,949 | | | | | Cooper Cos., Inc. (The) | | | 5,223,671 | |
| | 63,749 | | | | | Copart, Inc.* | | | 4,368,081 | |
| | 1,100 | | | | | CoStar Group, Inc.* | | | 645,931 | |
| | 5,000 | | | | | Costco Wholesale Corp. | | | 1,425,650 | |
| | 10,100 | | | | | Curtiss-Wright Corp. | | | 933,341 | |
| | 103,200 | | | | | CVS Health Corp. | | | 6,122,856 | |
| | 34,102 | | | | | Danaher Corp. | | | 4,720,058 | |
| | 26,815 | | | | | Darden Restaurants, Inc. | | | 1,460,345 | |
| | 3,600 | | | | | Dollar General Corp. | | | 543,636 | |
| | 37 | | | | | Domino’s Pizza, Inc. | | | 11,990 | |
| | 20,400 | | | | | Douglas Emmett, Inc. REIT | | | 622,404 | |
| | 22,077 | | | | | DTE Energy Co. | | | 2,096,653 | |
| | 800 | | | | | Duke Energy Corp. | | | 64,704 | |
| | 27,900 | | | | | Dunkin’ Brands Group, Inc. | | | 1,481,490 | |
| | 39,300 | | | | | eBay, Inc. | | | 1,181,358 | |
| | 1,400 | | | | | Ecolab, Inc. | | | 218,162 | |
| | 10,300 | | | | | Electronic Arts, Inc.* | | | 1,031,751 | |
| | 32,367 | | | | | Eli Lilly & Co. | | | 4,489,950 | |
| | 36,100 | | | | | Encompass Health Corp. | | | 2,311,483 | |
| | 200 | | | | | Entergy Corp. | | | 18,794 | |
| | 4,200 | | | | | Equinix, Inc. REIT | | | 2,623,194 | |
| | 31,600 | | | | | Equity Commonwealth REIT | | | 1,002,036 | |
| | 36,532 | | | | | Equity LifeStyle Properties, Inc. REIT | | | 2,099,859 | |
| | 25,300 | | | | | Equity Residential REIT | | | 1,561,263 | |
| | 9,567 | | | | | Essex Property Trust, Inc. REIT | | | 2,107,036 | |
| | 1,400 | | | | | Estee Lauder Cos., Inc. (The) Class A | | | 223,076 | |
| | 1,400 | | | | | Euronet Worldwide, Inc.* | | | 120,008 | |
| | 42,500 | | | | | Evergy, Inc. | | | 2,339,625 | |
| | 71,162 | | | | | Exelon Corp. | | | 2,619,473 | |
| | 82,962 | | | | | Facebook, Inc. Class A* | | | 13,838,061 | |
| | 3,600 | | | | | Fair Isaac Corp.* | | | 1,107,684 | |
| | 59,684 | | | | | Fidelity National Information Services, Inc. | | | 7,259,962 | |
| | 36,483 | | | | | First American Financial Corp. | | | 1,547,244 | |
| | 2,700 | | | | | First Citizens BancShares, Inc. Class A | | | 898,749 | |
| | 60,718 | | | | | FirstEnergy Corp. | | | 2,432,970 | |
| | 65,300 | | | | | Flowers Foods, Inc. | | | 1,339,956 | |
| | 113,235 | | | | | Fortive Corp. | | | 6,249,440 | |
| | 26,500 | | | | | Gaming and Leisure Properties, Inc. REIT | | | 734,315 | |
| | 12,300 | | | | | General Dynamics Corp. | | | 1,627,413 | |
See accompanying Notes to the Financial Statements.
197
Mercer Global Low Volatility Equity Fund
Schedule of Investments (Continued)
(showing percentage of net assets)
March 31, 2020
| | | | | | | | | | |
| Shares | | | | | Description | | Value ($) | |
| | |
| | | | | | United States — continued | |
| | 36,700 | | | | | General Mills, Inc. | | | 1,936,659 | |
| | 61,475 | | | | | Globe Life, Inc. | | | 4,424,356 | |
| | 400 | | | | | Graham Holdings Co. Class B | | | 136,468 | |
| | 76,600 | | | | | H&R Block, Inc.‡ | | | 1,078,528 | |
| | 14,346 | | | | | Hanover Insurance Group, Inc. (The) | | | 1,299,461 | |
| | 43,600 | | | | | Hartford Financial Services Group, Inc. (The) | | | 1,536,464 | |
| | 33,800 | | | | | Hawaiian Electric Industries, Inc. | | | 1,455,090 | |
| | 56,018 | | | | | HCA Healthcare, Inc. | | | 5,033,217 | |
| | 22,026 | | | | | Hershey Co. (The) | | | 2,918,445 | |
| | 11,816 | | | | | Highwoods Properties, Inc. REIT | | | 418,523 | |
| | 21,286 | | | | | Hill-Rom Holdings, Inc. | | | 2,141,372 | |
| | 83,805 | | | | | Hologic, Inc.* | | | 2,941,555 | |
| | 18,564 | | | | | Home Depot, Inc. (The) | | | 3,466,084 | |
| | 18,843 | | | | | Honeywell International, Inc. | | | 2,521,005 | |
| | 34,800 | | | | | Hormel Foods Corp.‡ | | | 1,623,072 | |
| | 2,900 | | | | | Hudson Pacific Properties, Inc. REIT | | | 73,544 | |
| | 5,400 | | | | | Humana, Inc. | | | 1,695,708 | |
| | 10,126 | | | | | Huntington Ingalls Industries, Inc. | | | 1,845,058 | |
| | 13,000 | | | | | IDACORP, Inc. | | | 1,141,270 | |
| | 16,503 | | | | | Ingredion, Inc. | | | 1,245,976 | |
| | 14,376 | | | | | Insperity, Inc. | | | 536,225 | |
| | 43,800 | | | | | Intel Corp. | | | 2,370,456 | |
| | 136,900 | | | | | Intercontinental Exchange, Inc. | | | 11,054,675 | |
| | 27,984 | | | | | International Business Machines Corp. | | | 3,104,265 | |
| | 14,938 | | | | | Intuit, Inc. | | | 3,435,740 | |
| | 20,479 | | | | | JM Smucker Co. (The) | | | 2,273,169 | |
| | 39,990 | | | | | Johnson & Johnson | | | 5,243,889 | |
| | 100 | | | | | JPMorgan Chase & Co. | | | 9,003 | |
| | 27,738 | | | | | Kellogg Co. | | | 1,664,003 | |
| | 400 | | | | | Kimberly-Clark Corp. | | | 51,148 | |
| | 1,300 | | | | | Kroger Co. (The) | | | 39,156 | |
| | 2,400 | | | | | Laboratory Corp. of America Holdings* | | | 303,336 | |
| | 600 | | | | | Lamb Weston Holdings, Inc. | | | 34,260 | |
| | 12,200 | | | | | Leidos Holdings, Inc. | | | 1,118,130 | |
| | 12,500 | | | | | Life Storage, Inc. REIT | | | 1,181,875 | |
| | 10,375 | | | | | Lockheed Martin Corp. | | | 3,516,606 | |
| | 39,700 | | | | | Macquarie Infrastructure Corp. | | | 1,002,425 | |
| | 2,000 | | | | | Markel Corp.* | | | 1,855,780 | |
| | 35,459 | | | | | Mastercard, Inc. Class A | | | 8,565,476 | |
| | 3,459 | | | | | McCormick & Co., Inc. | | | 488,445 | |
| | 23,996 | | | | | McDonald’s Corp. | | | 3,967,739 | |
| | 15,900 | | | | | McKesson Corp. | | | 2,150,634 | |
| | 58,100 | | | | | MDU Resources Group, Inc. | | | 1,249,150 | |
| | 218,430 | | | | | Medical Properties Trust, Inc. REIT | | | 3,776,655 | |
| | 69,034 | | | | | Merck & Co., Inc. | | | 5,311,476 | |
| | 15,540 | | | | | Mercury General Corp. | | | 632,789 | |
| | 34,643 | | | | | Microsoft Corp. | | | 5,463,547 | |
| | 23,325 | | | | | Mid-America Apartment Communities, Inc. REIT | | | 2,403,175 | |
| | 41,700 | | | | | Mondelez International, Inc. Class A | | | 2,088,336 | |
See accompanying Notes to the Financial Statements.
198
Mercer Global Low Volatility Equity Fund
Schedule of Investments (Continued)
(showing percentage of net assets)
March 31, 2020
| | | | | | | | | | |
| Shares | | | | | Description | | Value ($) | |
| | |
| | | | | | United States — continued | |
| | 5,792 | | | | | Morningstar, Inc. | | | 673,320 | |
| | 61,940 | | | | | Motorola Solutions, Inc. | | | 8,233,065 | |
| | 3,000 | | | | | Nasdaq, Inc. | | | 284,850 | |
| | 2,100 | | | | | NewMarket Corp. | | | 804,027 | |
| | 69,251 | | | | | Newmont Corp. | | | 3,135,685 | |
| | 16,070 | | | | | NextEra Energy, Inc. | | | 3,866,763 | |
| | 6,500 | | | | | NiSource, Inc. | | | 162,305 | |
| | 9,390 | | | | | Northrop Grumman Corp. | | | 2,840,944 | |
| | 11,400 | | | | | NRG Energy, Inc. | | | 310,764 | |
| | 100 | | | | | NVR, Inc.* | | | 256,911 | |
| | 13,200 | | | | | Old Republic International Corp. | | | 201,300 | |
| | 30,707 | | | | | Omnicom Group, Inc. | | | 1,685,814 | |
| | 83,114 | | | | | Oracle Corp. | | | 4,016,900 | |
| | 16,700 | | | | | Paychex, Inc. | | | 1,050,764 | |
| | 75,800 | | | | | People’s United Financial, Inc. | | | 837,590 | |
| | 42,648 | | | | | PepsiCo, Inc. | | | 5,122,025 | |
| | 94,325 | | | | | Performance Food Group Co.* | | | 2,331,714 | |
| | 109,334 | | | | | Pfizer, Inc. | | | 3,568,662 | |
| | 83,600 | | | | | Philip Morris International, Inc. | | | 6,099,456 | |
| | 26,900 | | | | | Pinnacle West Capital Corp. | | | 2,038,751 | |
| | 13,100 | | | | | Post Holdings, Inc.* | | | 1,086,907 | |
| | 46,880 | | | | | Procter & Gamble Co. (The) | | | 5,156,800 | |
| | 38,283 | | | | | Progressive Corp. (The) | | | 2,826,817 | |
| | 16,930 | | | | | Prologis, Inc. REIT | | | 1,360,664 | |
| | 10,100 | | | | | Public Service Enterprise Group, Inc. | | | 453,591 | |
| | 10,900 | | | | | Public Storage REIT | | | 2,164,849 | |
| | 55,881 | | | | | Raytheon Co. | | | 7,328,793 | |
| | 10,420 | | | | | Reinsurance Group of America, Inc. Class A | | | 876,739 | |
| | 36,704 | | | | | Republic Services, Inc. Class A | | | 2,755,002 | |
| | 22,599 | | | | | Ross Stores, Inc. | | | 1,965,435 | |
| | 22,900 | | | | | Royal Gold, Inc. | | | 2,008,559 | |
| | 1,200 | | | | | S&P Global, Inc. | | | 294,060 | |
| | 31 | | | | | Seaboard Corp. | | | 87,197 | |
| | 42,763 | | | | | Service Properties Trust REIT | | | 230,920 | |
| | 49,500 | | | | | Southern Co. (The) | | | 2,679,930 | |
| | 24,500 | | | | | Spirit Realty Capital, Inc. REIT | | | 640,675 | |
| | 38,249 | | | | | Starbucks Corp. | | | 2,514,489 | |
| | 16,853 | | | | | Stryker Corp. | | | 2,805,856 | |
| | 16,496 | | | | | Sun Communities, Inc. REIT | | | 2,059,526 | |
| | 21,472 | | | | | Synopsys, Inc.* | | | 2,765,379 | |
| | 38,947 | | | | | Sysco Corp. | | | 1,777,152 | |
| | 7,100 | | | | | Take-Two Interactive Software, Inc.* | | | 842,131 | |
| | 11,800 | | | | | Target Corp. | | | 1,097,046 | |
| | 118,112 | | | | | TD Ameritrade Holding Corp. | | | 4,093,762 | |
| | 1,700 | | | | | Teledyne Technologies, Inc.* | | | 505,359 | |
| | 27,000 | | | | | TFS Financial Corp.‡ | | | 412,290 | |
| | 21,500 | | | | | Thermo Fisher Scientific, Inc. | | | 6,097,400 | |
| | 19,463 | | | | | Travelers Cos., Inc. (The) | | | 1,933,649 | |
| | 57,500 | | | | | Two Harbors Investment Corp. REIT | | | 219,075 | |
See accompanying Notes to the Financial Statements.
199
Mercer Global Low Volatility Equity Fund
Schedule of Investments (Continued)
(showing percentage of net assets)
March 31, 2020
| | | | | | | | | | |
| Shares | | | | | Description | | Value ($) | |
| | |
| | | | | | United States — continued | |
| | 30,779 | | | | | Tyson Foods, Inc. Class A | | | 1,781,181 | |
| | 12,687 | | | | | UGI Corp. | | | 338,362 | |
| | 35,202 | | | | | UnitedHealth Group, Inc. | | | 8,778,675 | |
| | 43,500 | | | | | US Foods Holding Corp.* | | | 770,385 | |
| | 9,800 | | | | | VeriSign, Inc.* | | | 1,764,882 | |
| | 97,112 | | | | | Verizon Communications, Inc. | | | 5,217,828 | |
| | 6,000 | | | | | Visa, Inc. Class A | | | 966,720 | |
| | 42,036 | | | | | Walmart, Inc. | | | 4,776,130 | |
| | 30,685 | | | | | Waste Management, Inc. | | | 2,840,204 | |
| | 2,800 | | | | | WEC Energy Group, Inc. | | | 246,764 | |
| | 6,700 | | | | | Williams-Sonoma, Inc. | | | 284,884 | |
| | 800 | | | | | Woodward, Inc. | | | 47,552 | |
| | 17,759 | | | | | Xcel Energy, Inc. | | | 1,070,868 | |
| | 139,327 | | | | | Yum China Holdings, Inc. | | | 5,939,510 | |
| | 27,571 | | | | | Yum! Brands, Inc. | | | 1,889,441 | |
| | 11,667 | | | | | Zimmer Biomet Holdings, Inc. | | | 1,179,300 | |
| | 23,500 | | | | | Zoetis, Inc. | | | 2,765,715 | |
| | | | | | | | | | |
| | | | | | Total United States | | | 546,772,383 | |
| | | | | | | | | | |
| | | |
| | | | | | TOTAL COMMON STOCKS (COST $969,284,434) | | | 919,381,352 | |
| | | | | | | | | | |
| | | |
| Par Value ($) | | | | | Description | | Value ($) | |
| | | |
| | | | | | SHORT-TERM INVESTMENTS — 0.5% | | | | |
| | | |
| | | | | | Mutual Fund - Securities Lending Collateral — 0.4% | | | |
| | 3,702,660 | | | | | State Street Institutional U.S. Government Money Market Fund, Premier Class, 0.32% ## ** | | | 3,702,660 | |
| | | | | | | | | | |
| | | |
| | | | | | U.S. Government and Agency Obligations — 0.1% | | | |
| | 1,000,000 | | | | | United States Treasury Bill, 0.09%, due 07/02/20*** ‡‡ | | | 999,770 | |
| | | | | | | | | | |
| | | | | | TOTAL SHORT-TERM INVESTMENTS (COST $4,701,025) | | | 4,702,430 | |
| | | | | | | | | | |
| | | |
| | | | | | TOTAL INVESTMENTS — 89.0%
(COST $973,985,459) | | | 924,083,782 | |
| | | |
| | | | | | Other Assets and Liabilities (net) — 11.0% | | | 114,636,002 | |
| | | | | | | | | | |
| | | |
| | | | | | NET ASSETS — 100.0% | | $1,038,719,784 | |
| | | | | | | | | | |
See accompanying Notes to the Financial Statements.
200
Mercer Global Low Volatility Equity Fund
Schedule of Investments (Continued)
March 31, 2020
| | | | | | | | | | |
| | | | | | Notes to Schedule of Investments: | | | | |
| | | |
| | | | | | ADR — American Depository Receipt | | | | |
| | | |
| | | | | | REIT — Real Estate Investment Trust | | | | |
| | | |
| | | | ## | | The rate disclosed is the7-day net yield as of March 31, 2020. | | | | |
| | | |
| | | | * | | Non-income producing security. | | | | |
| | | |
| | | | ** | | Represents an investment of securities lending cash collateral. | | | | |
| | | |
| | | | *** | | All or a portion of this security is pledged for open futures collateral. | | | | |
| | | |
| | | | **** | | Security fair valued by the Valuation Committee as approved by the Board of Trustees. The total market value of the security at year end is $23,803 which represents 0.0% of net assets. The aggregate tax cost of these securities held at March 31, 2020 was $35,225. | | | | |
| | | |
| | | | ‡ | | All or a portion of this security is out on loan. | | | | |
| | | |
| | | | ‡‡ | | Interest rate presented is yield to maturity. | | | | |
See accompanying Notes to the Financial Statements.
201
Mercer Global Low Volatility Equity Fund
Schedule of Investments (Continued)
March 31, 2020
Futures Contracts
| | | | | | | | | | | | | | | | | | | | |
Number of
Contracts | | | | | Description | | | | Expiration Date | | | Notional
Value | | | Market Value/
Unrealized
Appreciation
(Depreciation) | |
| | Buys | | | | | | | | | | | | | | | | | | | |
| | 43 | | | | | Canadian Dollar | | | | | Jun 2020 | | | $ | 3,054,935 | | | $ | 21,646 | |
| | 332 | | | | | MSCI EAFE Index | | | | | Jun 2020 | | | | 25,884,380 | | | | 2,113,828 | |
| | 399 | | | | | S&P 500 E-mini Index | | | | | Jun 2020 | | | | 51,265,515 | | | | 2,731,694 | |
| | 26 | | | | | S&P/TSX 60 Index | | | | | Jun 2020 | | | | 2,974,560 | | | | 132,020 | |
| | | | | | | | | | | | | | | | | | | | |
| | | | $ | 4,999,188 | |
| | | | | | | | | | | | | | | | | | | | |
See accompanying Notes to the Financial Statements.
202
Mercer Global Low Volatility Equity Fund
Schedule of Investments (Continued)
March 31, 2020
| | | | | |
| Industry Sector Summary (Unaudited) | | % of Net Assets |
Consumer,Non-cyclical | | | | 27.3 | |
Financial | | | | 19.5 | |
Communications | | | | 12.8 | |
Industrial | | | | 10.2 | |
Utilities | | | | 6.1 | |
Technology | | | | 6.0 | |
Consumer, Cyclical | | | | 5.2 | |
Basic Materials | | | | 1.4 | |
Diversified | | | | 0.0 | * |
Energy | | | | 0.0 | * |
Short-Term Investments | | | | 0.5 | |
Other Assets and Liabilities (net) | | | | 11.0 | |
| | | | | |
| | | | 100.0 | % |
| | | | | |
* Amount rounds to zero.
See accompanying Notes to the Financial Statements.
203
Mercer Funds
Statements of Assets and Liabilities
March 31, 2020
| | | | | | | | | | | | | | | | | | | | |
| | | Mercer US Large
Cap Equity Fund | | Mercer US
Small/Mid Cap
Equity Fund | | MercerNon-US
Core Equity Fund | | Mercer Core Fixed
Income Fund |
Assets | | | | | | | | | | | | | | | | | | | | |
Investments, at value(a) | | | $ | 846,680,381 | | | | $ | 973,543,906 | | | | $ | 2,546,244,005 | | | | $ | 938,052,333 | |
Foreign currency, at value(b) | | | | — | | | | | — | | | | | 4,221,623 | | | | | — | |
Cash and cash equivalents | | | | 43,517,111 | | | | | 75,272,351 | | | | | 117,633,382 | | | | | 12,845,849 | |
Receivable for investments sold | | | | 3,528,342 | | | | | 3,807,821 | | | | | 38,036,266 | | | | | 5,207,776 | |
Receivable for Fund shares sold | | | | 2,120,000 | | | | | 5,095,000 | | | | | 12,354,979 | | | | | — | |
Dividend and interest receivable | | | | 1,293,386 | | | | | 1,042,862 | | | | | 10,977,602 | | | | | 5,091,404 | |
Cash collateral held at broker on open futures contracts | | | | 1,989,000 | | | | | 5,800,000 | | | | | 9,000,000 | | | | | — | |
Foreign tax reclaims receivable | | | | 109,182 | | | | | — | | | | | 6,132,587 | | | | | — | |
Receivable for TBA and when-issued securities sold | | | | — | | | | | — | | | | | — | | | | | 2,092,603 | |
Receivable for variation margin on open futures contracts | | | | — | | | | | — | | | | | — | | | | | 285,775 | |
Prepaid expenses | | | | 2,501 | | | | | 4,937 | | | | | 14,829 | | | | | 4,899 | |
Unrealized appreciation on open forward foreign currency contracts | | | | — | | | | | — | | | | | — | | | | | 5,840 | |
Cash collateral held at broker on open centrally cleared swap contracts | | | | — | | | | | — | | | | | — | | | | | 2,039 | |
Receivable for variation margin on open centrally cleared swap contracts | | | | — | | | | | — | | | | | — | | | | | 444,545 | |
Securities lending income receivable | | | | 2,649 | | | | | 15,314 | | | | | 27,222 | | | | | 1,768 | |
Receivable for advisory fee waived | | | | 772,749 | | | | | 1,538,578 | | | | | 2,734,752 | | | | | 565,988 | |
| | | | | | | | | | | | | | | | | | | | |
Total assets | | | | 900,015,301 | | | | | 1,066,120,769 | | | | | 2,747,377,247 | | | | | 964,600,819 | |
| | | | | | | | | | | | | | | | | | | | |
| | | | |
Liabilities | | | | | | | | | | | | | | | | | | | | |
Payable for investments purchased | | | | 2,873,587 | | | | | 7,840,969 | | | | | 39,084,377 | | | | | 3,615,165 | |
Obligation to return securities lending collateral | | | | 267,594 | | | | | 3,556,353 | | | | | 27,307,637 | | | | | 2,009,610 | |
Payable for Fund shares repurchased | | | | 12,478,139 | | | | | 2,461,956 | | | | | — | | | | | — | |
Payable for TBA and when-issued securities purchased | | | | — | | | | | — | | | | | — | | | | | 7,588,093 | |
Payable for variation margin on open futures contracts | | | | 449,765 | | | | | 517,934 | | | | | 765,934 | | | | | — | |
Unrealized depreciation on open forward foreign currency contracts | | | | — | | | | | — | | | | | 624,517 | | | | | 9,495 | |
Payable for closed centrally cleared swap contracts | | | | — | | | | | — | | | | | — | | | | | 317,584 | |
Written options, at value(c) | | | | — | | | | | — | | | | | — | | | | | 13,469 | |
Payable to affiliate for: | | | | | | | | | | | | | | | | | | | | |
Advisory fees | | | | 1,443,753 | | | | | 2,899,716 | | | | | 5,160,857 | | | | | 764,751 | |
Trustees fees | | | | 25,409 | | | | | 29,904 | | | | | 66,374 | | | | | 20,051 | |
Accrued expenses | | | | 261,880 | | | | | 269,173 | | | | | 529,954 | | | | | 245,792 | |
| | | | | | | | | | | | | | | | | | | | |
Total liabilities | | | | 17,800,127 | | | | | 17,576,005 | | | | | 73,539,650 | | | | | 14,584,010 | |
| | | | | | | | | | | | | | | | | | | | |
Net assets | | | $ | 882,215,174 | | | | $ | 1,048,544,764 | | | | $ | 2,673,837,597 | | | | $ | 950,016,809 | |
| | | | | | | | | | | | | | | | | | | | |
See accompanying Notes to the Financial Statements.
204
Mercer Funds
Statements of Assets and Liabilities (Continued)
March 31, 2020
| | | | | | | | | | | | | | | | | | | | |
| | | Mercer US Large
Cap Equity Fund | | Mercer US
Small/Mid Cap
Equity Fund | | MercerNon-US
Core Equity Fund | | Mercer Core Fixed
Income Fund |
| | | | |
Net assets consist of: | | | | | | | | | | | | | | | | | | | | |
Paid-in capital | | | $ | 1,069,192,126 | | | | $ | 1,336,166,711 | | | | $ | 3,029,288,613 | | | | $ | 928,140,458 | |
Distributable earnings (Accumulated loss) | | | | (186,976,952 | ) | | | | (287,621,947 | ) | | | | (355,451,016 | ) | | | | 21,876,351 | |
| | | | | | | | | | | | | | | | | | | | |
Net assets | | | $ | 882,215,174 | | | | $ | 1,048,544,764 | | | | $ | 2,673,837,597 | | | | $ | 950,016,809 | |
| | | | | | | | | | | | | | | | | | | | |
| | | | |
Net assets attributable to: | | | | | | | | | | | | | | | | | | | | |
Class Y-3 | | | $ | 882,215,174 | | | | $ | 1,048,544,764 | | | | $ | 2,673,837,597 | | | | $ | 950,016,809 | |
| | | | | | | | | | | | | | | | | | | | |
| | | | |
Shares outstanding: | | | | | | | | | | | | | | | | | | | | |
Class Y-3 | | | | 120,083,508 | | | | | 135,985,210 | | | | | 316,223,869 | | | | | 90,669,992 | |
| | | | | | | | | | | | | | | | | | | | |
| | | | |
Net asset value per unit: | | | | | | | | | | | | | | | | | | | | |
Class Y-3 | | | $ | 7.35 | | | | $ | 7.71 | | | | $ | 8.46 | | | | $ | 10.48 | |
| | | | | | | | | | | | | | | | | | | | |
| | | | |
(a) Investments, at cost | | | $ | 1,020,431,868 | | | | $ | 1,238,871,914 | | | | $ | 2,844,719,142 | | | | $ | 928,019,450 | |
| | | | | | | | | | | | | | | | | | | | |
(b) Foreign currency, at cost | | | $ | — | | | | $ | — | | | | $ | 4,351,794 | | | | $ | — | |
| | | | | | | | | | | | | | | | | | | | |
(c) Premiums on written options | | | $ | — | | | | $ | — | | | | $ | — | | | | $ | 23,366 | |
| | | | | | | | | | | | | | | | | | | | |
See accompanying Notes to the Financial Statements.
205
Mercer Funds
Statements of Assets and Liabilities (Continued)
March 31, 2020
| | | | | | | | | | | | | | | |
| | | Mercer Opportunistic
Fixed Income Fund | | Mercer Emerging
Markets Equity Fund | | Mercer Global Low
Volatility Equity Fund |
Assets | | | | | | | | | | | | | | | |
Investments, at value(a) | | | $ | 875,255,080 | | | | $ | 885,426,501 | | | | $ | 924,083,782 | |
Foreign currency, at value(b) | | | | — | | | | | 2,301,809 | | | | | 602,161 | |
Cash and cash equivalents | | | | 91,284,108 | | | | | 46,025,689 | | | | | 108,241,084 | |
Receivable for investments sold | | | | 66,238,875 | | | | | 8,144,589 | | | | | 737,387 | |
Dividend and interest receivable | | | | 10,365,411 | | | | | 2,431,271 | | | | | 2,108,915 | |
Unrealized appreciation on open forward foreign currency contracts | | | | 14,636,165 | | | | | — | | | | | — | |
Cash collateral held at broker on open futures contracts | | | | 1,092,000 | | | | | 2,400,000 | | | | | 7,000,000 | |
Receivable for Fund shares sold | | | | — | | | | | 7,119,107 | | | | | 1,227,000 | |
Cash collateral held at broker on open centrally cleared swap contracts | | | | 4,015,685 | | | | | — | | | | | — | |
Receivable for cash collateral on open forward foreign currency contracts, open OTC options, and open OTC swaps contracts | | | | 3,040,000 | | | | | — | | | | | — | |
Foreign tax reclaims receivable | | | | 103,547 | | | | | 118,424 | | | | | 1,199,543 | |
Receivable for swap contract premiums | | | | 989,845 | | | | | — | | | | | — | |
Due from broker for closed forward foreign currency contracts | | | | 13,611,363 | | | | | — | | | | | — | |
Cash collateral held at broker on open forward foreign currency contracts, open OTC options, and open OTC swaps contracts | | | | 700,000 | | | | | — | | | | | — | |
Receivable for variation margin on open futures contracts | | | | 112,617 | | | | | 260,596 | | | | | — | |
OTC — Swap contracts, at value(up-front net premiums received of $16,770, $-, and $-, respectively) | | | | 88,548 | | | | | — | | | | | — | |
Prepaid expenses | | | | 5,206 | | | | | 6,466 | | | | | 6,786 | |
Receivable for variation margin on open centrally cleared swap contracts | | | | 4,583 | | | | | — | | | | | — | |
Securities lending income receivable | | | | 3,636 | | | | | 214,167 | | | | | 4,881 | |
Receivable for advisory fee waived | | | | 1,216,782 | | | | | 1,070,978 | | | | | 1,427,213 | |
| | | | | | | | | | | | | | | |
Total assets | | | | 1,082,763,451 | | | | | 955,519,597 | | | | | 1,046,638,752 | |
| | | | | | | | | | | | | | | |
| | | |
Liabilities | | | | | | | | | | | | | | | |
Payable for investments purchased | | | | 62,691,797 | | | | | 8,125,535 | | | | | 984,449 | |
Obligation to return securities lending collateral | | | | 18,037,151 | | | | | 1,742,607 | | | | | 3,702,660 | |
Unrealized depreciation on open forward foreign currency contracts | | | | 13,792,503 | | | | | — | | | | | — | |
Payable for when-issued securities purchased | | | | 9,420,932 | | | | | — | | | | | — | |
Due to custodian, at value(c) | | | | 5,006,246 | | | | | — | | | | | — | |
Cash collateral due to broker on open forward foreign currency contracts, open OTC options, and open OTC swaps contracts | | | | 3,225,065 | | | | | — | | | | | — | |
Written options, at value(d) | | | | 1,269,758 | | | | | — | | | | | — | |
Payable for variation margin on open futures contracts | | | | — | | | | | — | | | | | 921,925 | |
Payable for Fund shares repurchased | | | | 433,976 | | | | | — | | | | | — | |
Payable for foreign capital gains tax | | | | 153,653 | | | | | 1,217 | | | | | — | |
OTC — Swap contracts, at value(up-front net premiums paid of $9,254, $-, and $-, respectively) | | | | 69,323 | | | | | — | | | | | — | |
Unrealized loss on unfunded loan commitments | | | | 8,791 | | | | | — | | | | | — | |
Payable to affiliate for: | | | | | | | | | | | | | | | |
Advisory fees | | | | 1,998,461 | | | | | 2,239,113 | | | | | 2,074,779 | |
Trustees fees | | | | 22,883 | | | | | 25,884 | | | | | 25,465 | |
Accrued expenses | | | | 334,891 | | | | | 361,117 | | | | | 209,690 | |
| | | | | | | | | | | | | | | |
Total liabilities | | | | 116,465,430 | | | | | 12,495,473 | | | | | 7,918,968 | |
| | | | | | | | | | | | | | | |
Net assets | | | $ | 966,298,021 | | | | $ | 943,024,124 | | | | $ | 1,038,719,784 | |
| | | | | | | | | | | | | | | |
See accompanying Notes to the Financial Statements.
206
Mercer Funds
Statements of Assets and Liabilities (Continued)
March 31, 2020
| | | | | | | | | | | | | | | |
| | | Mercer Opportunistic
Fixed Income Fund | | Mercer Emerging
Markets Equity Fund | | Mercer Global Low
Volatility Equity Fund |
| | | |
Net assets consist of: | | | | | | | | | | | | | | | |
Paid-in capital | | | $ | 1,087,461,559 | | | | $ | 1,204,360,228 | | | | $ | 1,034,406,557 | |
Distributable earnings (Accumulated loss) | | | | (121,163,538 | ) | | | | (261,336,104 | ) | | | | 4,313,227 | |
| | | | | | | | | | | | | | | |
Net assets | | | $ | 966,298,021 | | | | $ | 943,024,124 | | | | $ | 1,038,719,784 | |
| | | | | | | | | | | | | | | |
| | | |
Net assets attributable to: | | | | | | | | | | | | | | | |
Class Y-3 | | | $ | 966,298,021 | | | | $ | 943,024,124 | | | | $ | 1,038,719,784 | |
| | | | | | | | | | | | | | | |
| | | |
Shares outstanding: | | | | | | | | | | | | | | | |
Class Y-3 | | | | 114,367,784 | | | | | 131,150,746 | | | | | 92,461,346 | |
| | | | | | | | | | | | | | | |
| | | |
Net asset value per unit: | | | | | | | | | | | | | | | |
Class Y-3 | | | $ | 8.45 | | | | $ | 7.19 | | | | $ | 11.23 | |
| | | | | | | | | | | | | | | |
| | | |
(a) Investments, at cost | | | $ | 972,385,967 | | | | $ | 1,103,091,275 | | | | $ | 973,985,459 | |
| | | | | | | | | | | | | | | |
(b) Foreign currency, at cost | | | $ | — | | | | $ | 2,318,952 | | | | $ | 620,920 | |
| | | | | | | | | | | | | | | |
(c) Due to custodian, at cost | | | $ | (4,801,596 | ) | | | $ | — | | | | $ | — | |
| | | | | | | | | | | | | | | |
(d) Premiums on written options | | | $ | 510,502 | | | | $ | — | | | | $ | — | |
| | | | | | | | | | | | | | | |
See accompanying Notes to the Financial Statements.
207
Mercer Funds
Statements of Operations
Year Ended March 31, 2020
| | | | | | | | | | | | | | | | | | | | |
| | | Mercer US Large
Cap Equity Fund | | Mercer US
Small/Mid Cap
Equity Fund | | MercerNon-US
Core Equity Fund | | Mercer Core Fixed
Income Fund |
Investment Income: | | | | | | | | | | | | | | | | | | | | |
Dividends | | | $ | 11,726,024 | | | | $ | 13,277,404 | | | | $ | 78,727,964 | | | | $ | — | |
Interest | | | | 228,842 | | | | | 470,703 | | | | | 1,620,086 | | | | | 21,878,574 | |
Securities lending income | | | | 17,891 | | | | | 243,772 | | | | | 646,116 | | | | | 24,051 | |
Withholding taxes | | | | (71,175 | ) | | | | (33,885 | ) | | | | (7,148,103 | ) | | | | — | |
Other income | | | | — | | | | | — | | | | | 3,996 | | | | | 2,934 | |
| | | | | | | | | | | | | | | | | | | | |
Total investment income | | | | 11,901,582 | | | | | 13,957,994 | | | | | 73,850,059 | | | | | 21,905,559 | |
| | | | | | | | | | | | | | | | | | | | |
| | | | |
Expenses: | | | | | | | | | | | | | | | | | | | | |
Advisory fees | | | | 3,322,203 | | | | | 8,617,862 | | | | | 18,148,207 | | | | | 2,701,518 | |
Custodian and fund accounting fees | | | | 160,328 | | | | | 213,744 | | | | | 689,718 | | | | | 193,599 | |
Audit fees | | | | 70,178 | | | | | 81,146 | | | | | 168,873 | | | | | 105,073 | |
Transfer agent fees | | | | 23,824 | | | | | 24,314 | | | | | 24,848 | | | | | 24,648 | |
Legal fees | | | | 145,894 | | | | | 230,789 | | | | | 591,209 | | | | | 222,308 | |
Trustees fees | | | | 54,045 | | | | | 85,361 | | | | | 231,664 | | | | | 70,543 | |
Registration fees | | | | 91,419 | | | | | 76,290 | | | | | 103,475 | | | | | 65,060 | |
Stamp duty tax fee | | | | — | | | | | — | | | | | 226,338 | | | | | — | |
Miscellaneous | | | | 53,460 | | | | | 80,974 | | | | | 211,445 | | | | | 72,728 | |
| | | | | | | | | | | | | | | | | | | | |
Total expenses | | | | 3,921,351 | | | | | 9,410,480 | | | | | 20,395,777 | | | | | 3,455,477 | |
Advisory fee waiver | | | | (1,787,996 | ) | | | | (4,625,580 | ) | | | | (9,622,404 | ) | | | | (1,978,197 | ) |
| | | | | | | | | | | | | | | | | | | | |
Net expenses | | | | 2,133,355 | | | | | 4,784,900 | | | | | 10,773,373 | | | | | 1,477,280 | |
| | | | | | | | | | | | | | | | | | | | |
Net investment income | | | | 9,768,227 | | | | | 9,173,094 | | | | | 63,076,686 | | | | | 20,428,279 | |
| | | | | | | | | | | | | | | | | | | | |
| | | | |
Realized and Unrealized Gain (Loss): | | | | | | | | | | | | | | | | | | | | |
Net realized gain (loss) on: | |
Investments | | | | 15,434,532 | | | | | 15,320,591 | | | | | (40,833,095 | ) | | | | 19,074,579 | |
Purchased option contracts | | | | — | | | | | — | | | | | — | | | | | (138,860 | ) |
Swap contracts | | | | — | | | | | — | | | | | — | | | | | (2,500,610 | ) |
Closed futures contracts | | | | (3,598,844 | ) | | | | (3,485,870 | ) | | | | (11,040,524 | ) | | | | 6,390,926 | |
Written option contracts | | | | — | | | | | — | | | | | — | | | | | 60,365 | |
Forward foreign currency contracts | | | | — | | | | | — | | | | | 642,996 | | | | | 10,934 | |
Foreign currency related transactions | | | | 1,361 | | | | | (696 | ) | | | | (1,283,244 | ) | | | | (2,987 | ) |
| | | | | | | | | | | | | | | | | | | | |
Net realized gain (loss) | | | | 11,837,049 | | | | | 11,834,025 | | | | | (52,513,867 | ) | | | | 22,894,347 | |
| | | | | | | | | | | | | | | | | | | | |
Change in net unrealized appreciation (depreciation) on: | | | | | | | | | | | | | | | | | | | | |
Investments | | | | (206,876,642 | ) | | | | (341,201,860 | ) | | | | (424,069,323 | ) | | | | 13,996,321 | |
Purchased option contracts | | | | — | | | | | — | | | | | — | | | | | (47,575 | ) |
Swap contracts | | | | — | | | | | — | | | | | — | | | | | (785,955 | ) |
Open futures contracts | | | | 752,946 | | | | | (493,724 | ) | | | | 8,109,239 | | | | | (1,754,626 | ) |
Written option contracts | | | | — | | | | | — | | | | | — | | | | | 10,030 | |
Forward foreign currency contracts | | | | — | | | | | — | | | | | (666,604 | ) | | | | (3,655 | ) |
Foreign currency related transactions | | | | 985 | | | | | 1,131 | | | | | (230,701 | ) | | | | (862 | ) |
| | | | | | | | | | | | | | | | | | | | |
Change in net unrealized appreciation (depreciation) | | | | (206,122,711 | ) | | | | (341,694,453 | ) | | | | (416,857,389 | ) | | | | 11,413,678 | |
| | | | | | | | | | | | | | | | | | | | |
Net realized and unrealized gain (loss) | | | | (194,285,662 | ) | | | | (329,860,428 | ) | | | | (469,371,256 | ) | | | | 34,308,025 | |
| | | | | | | | | | | | | | | | | | | | |
| | | | |
Net increase (decrease) in net assets resulting from operations | | | $ | (184,517,435 | ) | | | $ | (320,687,334 | ) | | | $ | (406,294,570 | ) | | | $ | 54,736,304 | |
| | | | | | | | | | | | | | | | | | | | |
See accompanying Notes to the Financial Statements.
208
Mercer Funds
Statements of Operations (Continued)
Year Ended March 31, 2020
| | | | | | | | | | | | | | | |
| | | Mercer Opportunistic
Fixed Income Fund | | Mercer Emerging
Markets Equity Fund | | Mercer Global Low
Volatility Equity Fund |
Investment Income: | | | | | | | | | | | | | | | |
Dividends | | | $ | 73,972 | | | | $ | 29,489,582 | | | | $ | 22,796,386 | |
Interest | | | | 46,740,425 | | | | | 626,994 | | | | | 791,915 | |
Securities lending income | | | | 34,830 | | | | | 307,725 | | | | | 141,638 | |
Withholding taxes | | | | (607,957 | ) | | | | (3,103,485 | ) | | | | (1,184,301 | ) |
Other income | | | | 10,892 | | | | | 150 | | | | | — | |
| | | | | | | | | | | | | | | |
Total investment income | | | | 46,252,162 | | | | | 27,320,966 | | | | | 22,545,638 | |
| | | | | | | | | | | | | | | |
| | | |
Expenses: | | | | | | | | | | | | | | | |
Advisory fees | | | | 7,128,865 | | | | | 8,344,788 | | | | | 8,067,215 | |
Custodian and fund accounting fees | | | | 544,067 | | | | | 611,875 | | | | | 275,323 | |
Audit fees | | | | 105,930 | | | | | 157,405 | | | | | 87,122 | |
Transfer agent fees | | | | 24,304 | | | | | 24,626 | | | | | 24,187 | |
Legal fees | | | | 187,061 | | | | | 257,046 | | | | | 254,153 | |
Trustees fees | | | | 81,271 | | | | | 95,830 | | | | | 99,192 | |
Registration fees | | | | 48,856 | | | | | 43,634 | | | | | 42,656 | |
Miscellaneous | | | | 95,219 | | | | | 96,634 | | | | | 93,782 | |
| | | | | | | | | | | | | | | |
Total expenses | | | | 8,215,573 | | | | | 9,631,838 | | | | | 8,943,630 | |
Advisory fee waiver | | | | (4,348,445 | ) | | | | (3,994,496 | ) | | | | (5,548,056 | ) |
| | | | | | | | | | | | | | | |
Net expenses | | | | 3,867,128 | | | | | 5,637,342 | | | | | 3,395,574 | |
| | | | | | | | | | | | | | | |
Net investment income | | | | 42,385,034 | | | | | 21,683,624 | | | | | 19,150,064 | |
| | | | | | | | | | | | | | | |
| | | |
Realized and Unrealized Gain (Loss): | | | | | | | | | | | | | | | |
Net realized gain (loss) on: | | | | | | | | | | | | | | | |
Investments | | | | (9,882,570 | ) | | | | (29,318,181 | ) | | | | 31,251,096 | |
Purchased option contracts | | | | 1,669,689 | | | | | — | | | | | — | |
Swap contracts | | | | (8,693,958 | ) | | | | — | | | | | — | |
Closed futures contracts | | | | 2,719,755 | | | | | (3,134,219 | ) | | | | 881,145 | |
Written option contracts | | | | (657,619 | ) | | | | — | | | | | — | |
Forward foreign currency contracts | | | | 6,009,004 | | | | | 5,029,209 | | | | | — | |
Foreign currency related transactions | | | | (782,932 | ) | | | | (1,374,393 | ) | | | | (139,795 | ) |
| | | | | | | | | | | | | | | |
Net realized gain (loss) | | | | (9,618,631 | ) | | | | (28,797,584 | ) | | | | 31,992,446 | |
| | | | | | | | | | | | | | | |
Change in net unrealized appreciation (depreciation) on: | | | | | | | | | | | | | | | |
Investments | | | | (94,830,630 | ) | | | | (215,770,194 | ) | | | | (137,894,404 | ) |
Purchased option contracts | | | | 173,980 | | | | | — | | | | | — | |
Unfunded loan commitments | | | | (8,791 | ) | | | | — | | | | | — | |
Swap contracts | | | | 1,696,178 | | | | | — | | | | | — | |
Open futures contracts | | | | 1,808,725 | | | | | (85,917 | ) | | | | 4,373,815 | |
Written option contracts | | | | (776,081 | ) | | | | — | | | | | — | |
Forward foreign currency contracts | | | | 1,305,980 | | | | | (1,680,667 | ) | | | | — | |
Foreign currency related transactions | | | | (880,380 | ) | | | | 1,210,856 | | | | | 3,172 | |
| | | | | | | | | | | | | | | |
Change in net unrealized appreciation (depreciation) | | | | (91,511,019 | ) | | | | (216,325,922 | ) | | | | (133,517,417 | ) |
| | | | | | | | | | | | | | | |
Net realized and unrealized gain (loss) | | | | (101,129,650 | ) | | | | (245,123,506 | ) | | | | (101,524,971 | ) |
| | | | | | | | | | | | | | | |
| | | |
Net decrease in net assets resulting from operations | | | $ | (58,744,616 | ) | | | $ | (223,439,882 | ) | | | $ | (82,374,907 | ) |
| | | | | | | | | | | | | | | |
See accompanying Notes to the Financial Statements.
209
Mercer Funds
Statements of Changes in Net Assets
| | | | | | | | | | | | | | | | | | | | |
| | | Mercer US Large Cap
Equity Fund | | Mercer US Small/Mid Cap
Equity Fund |
| | | Year Ended
March 31, 2020 | | Year Ended
March 31, 2019 | | Year Ended
March 31, 2020 | | Year Ended
March 31, 2019 |
Increase (decrease) in Net Assets: | | | | | | | | | | | | | | | | | | | | |
Operations: | | | | | | | | | | | | | | | | | | | | |
Net investment income | | | $ | 9,768,227 | | | | $ | 5,213,284 | | | | $ | 9,173,094 | | | | $ | 3,892,208 | |
Net realized gain | | | | 11,837,049 | | | | | 47,513,142 | | | | | 11,834,025 | | | | | 62,431,825 | |
Change in net unrealized appreciation (depreciation) | | | | (206,122,711 | ) | | | | (30,975,394 | ) | | | | (341,694,453 | ) | | | | (62,063,801 | ) |
| | | | | | | | | | | | | | | | | | | | |
Net increase (decrease) in net assets resulting from operations | | | | (184,517,435 | ) | | | | 21,751,032 | | | | | (320,687,334 | ) | | | | 4,260,232 | |
| | | | | | | | | | | | | | | | | | | | |
Distributions to shareholders (See Note 2): | | | | | | | | | | | | | | | | | | | | |
Class Y-3 | | | | (43,395,087 | ) | | | | (97,267,079 | ) | | | | (40,162,658 | ) | | | | (134,114,544 | ) |
| | | | | | | | | | | | | | | | | | | | |
Total distributions | | | | (43,395,087 | ) | | | | (97,267,079 | ) | | | | (40,162,658 | ) | | | | (134,114,544 | ) |
| | | | | | | | | | | | | | | | | | | | |
Net share transactions (See Note 7): | | | | | | | | | | | | | | | | | | | | |
Class Y-3 | | | | 720,712,798 | | | | | (47,626,675 | ) | | | | 614,991,514 | | | | | 16,313,503 | |
| | | | | | | | | | | | | | | | | | | | |
Increase (decrease) in net assets resulting from net shares transactions | | | | 720,712,798 | | | | | (47,626,675 | ) | | | | 614,991,514 | | | | | 16,313,503 | |
| | | | | | | | | | | | | | | | | | | | |
Net increase (decrease) in net assets | | | | 492,800,276 | | | | | (123,142,722 | ) | | | | 254,141,522 | | | | | (113,540,809 | ) |
| | | | | | | | | | | | | | | | | | | | |
Net assets: | | | | | | | | | | | | | | | | | | | | |
Beginning of year | | | | 389,414,898 | | | | | 512,557,620 | | | | | 794,403,242 | | | | | 907,944,051 | |
| | | | | | | | | | | | | | | | | | | | |
End of year | | | $ | 882,215,174 | | | | $ | 389,414,898 | | | | $ | 1,048,544,764 | | | | $ | 794,403,242 | |
| | | | | | | | | | | | | | | | | | | | |
See accompanying Notes to the Financial Statements.
210
Mercer Funds
Statements of Changes in Net Assets (Continued)
| | | | | | | | | | | | | | | | | | | | |
| | | MercerNon-US
Core Equity Fund | | Mercer Core
Fixed Income Fund |
| | | Year Ended
March 31, 2020 | | Year Ended
March 31, 2019 | | Year Ended
March 31, 2020 | | Year Ended
March 31, 2019 |
Increase (decrease) in Net Assets: | | | | | | | | | | | | | | | | | | | | |
Operations: | | | | | | | | | | | | | | | | | | | | |
Net investment income | | | $ | 63,076,686 | | | | $ | 42,519,505 | | | | $ | 20,428,279 | | | | $ | 23,742,544 | |
Net realized gain (loss) | | | | (52,513,867 | ) | | | | 9,788,714 | | | | | 22,894,347 | | | | | (5,991,553 | ) |
Change in net unrealized appreciation (depreciation) | | | | (416,857,389 | ) | | | | (130,631,774 | ) | | | | 11,413,678 | | | | | 9,744,840 | |
| | | | | | | | | | | | | | | | | | | | |
Net increase (decrease) in net assets resulting from operations | | | | (406,294,570 | ) | | | | (78,323,555 | ) | | | | 54,736,304 | | | | | 27,495,831 | |
| | | | | | | | | | | | | | | | | | | | |
Distributions to shareholders (See Note 2): | | | | | | | | | | | | | | | | | | | | |
Class Y-3 | | | | (60,608,354 | ) | | | | (218,880,784 | ) | | | | (21,127,381 | ) | | | | (24,784,732 | ) |
| | | | | | | | | | | | | | | | | | | | |
Total distributions | | | | (60,608,354 | ) | | | | (218,880,784 | ) | | | | (21,127,381 | ) | | | | (24,784,732 | ) |
| | | | | | | | | | | | | | | | | | | | |
Net share transactions (See Note 7): | | | | | | | | | | | | | | | | | | | | |
Class Y-3 | | | | 985,155,675 | | | | | 293,490,399 | | | | | 367,807,410 | | | | | (312,057,324 | ) |
| | | | | | | | | | | | | | | | | | | | |
Increase (decrease) in net assets resulting from net shares transactions | | | | 985,155,675 | | | | | 293,490,399 | | | | | 367,807,410 | | | | | (312,057,324 | ) |
| | | | | | | | | | | | | | | | | | | | |
Net increase (decrease) in net assets | | | | 518,252,751 | | | | | (3,713,940 | ) | | | | 401,416,333 | | | | | (309,346,225 | ) |
| | | | | | | | | | | | | | | | | | | | |
Net assets: | | | | | | | | | | | | | | | | | | | | |
Beginning of year | | | | 2,155,584,846 | | | | | 2,159,298,786 | | | | | 548,600,476 | | | | | 857,946,701 | |
| | | | | | | | | | | | | | | | | | | | |
End of year | | | $ | 2,673,837,597 | | | | $ | 2,155,584,846 | | | | $ | 950,016,809 | | | | $ | 548,600,476 | |
| | | | | | | | | | | | | | | | | | | | |
See accompanying Notes to the Financial Statements.
211
Mercer Funds
Statements of Changes in Net Assets (Continued)
| | | | | | | | | | | | | | | | | | | | |
| | | Mercer Opportunistic
Fixed Income Fund | | Mercer Emerging Markets
Equity Fund |
| | | Year Ended
March 31, 2020 | | Year Ended
March 31, 2019 | | Year Ended
March 31, 2020 | | Year Ended
March 31, 2019 |
Increase (decrease) in Net Assets: | | | | | | | | | | | | | | | | | | | | |
Operations: | | | | | | | | | | | | | | | | | | | | |
Net investment income | | | $ | 42,385,034 | | | | $ | 32,074,667 | | | | $ | 21,683,624 | | | | $ | 17,267,289 | |
Net realized loss | | | | (9,618,631 | ) | | | | (53,999,195 | ) | | | | (28,797,584 | ) | | | | (30,343,811 | ) |
Change in net unrealized appreciation (depreciation) | | | | (91,511,019 | ) | | | | (7,693,259 | ) | | | | (216,325,922 | ) | | | | (105,526,011 | ) |
| | | | | | | | | | | | | | | | | | | | |
Net decrease in net assets resulting from operations | | | | (58,744,616 | ) | | | | (29,617,787 | ) | | | | (223,439,882 | ) | | | | (118,602,533 | ) |
| | | | | | | | | | | | | | | | | | | | |
Distributions to shareholders (See Note 2): | | | | | | | | | | | | | | | | | | | | |
Class Y-3 | | | | (22,762,588 | ) | | | | (15,919,968 | ) | | | | (15,100,507 | ) | | | | (142,768,325 | ) |
| | | | | | | | | | | | | | | | | | | | |
Total distributions | | | | (22,762,588 | ) | | | | (15,919,968 | ) | | | | (15,100,507 | ) | | | | (142,768,325 | ) |
| | | | | | | | | | | | | | | | | | | | |
Net share transactions (See Note 7): | | | | | | | | | | | | | | | | | | | | |
Class Y-3 | | | | 235,224,761 | | | | | 210,895,795 | | | | | 162,917,342 | | | | | 163,890,739 | |
| | | | | | | | | | | | | | | | | | | | |
Increase in net assets resulting from net shares transactions | | | | 235,224,761 | | | | | 210,895,795 | | | | | 162,917,342 | | | | | 163,890,739 | |
| | | | | | | | | | | | | | | | | | | | |
Net increase (decrease) in net assets | | | | 153,717,557 | | | | | 165,358,040 | | | | | (75,623,047 | ) | | | | (97,480,119 | ) |
| | | | | | | | | | | | | | | | | | | | |
Net assets: | |
Beginning of year | | | | 812,580,464 | | | | | 647,222,424 | | | | | 1,018,647,171 | | | | | 1,116,127,290 | |
| | | | | | | | | | | | | | | | | | | | |
End of year | | | $ | 966,298,021 | | | | $ | 812,580,464 | | | | $ | 943,024,124 | | | | $ | 1,018,647,171 | |
| | | | | | | | | | | | | | | | | | | | |
See accompanying Notes to the Financial Statements.
212
Mercer Funds
Statements of Changes in Net Assets (Continued)
| | | | | | | | | | |
| | | Mercer Global Low Volatility
Equity Fund |
| | | Year Ended
March 31, 2020 | | Year Ended
March 31, 2019 |
Increase (decrease) in Net Assets: | |
Operations: | |
Net investment income | | | $ | 19,150,064 | | | | $ | 13,559,973 | |
Net realized gain | | | | 31,992,446 | | | | | 66,005,792 | |
Change in net unrealized appreciation (depreciation) | | | | (133,517,417 | ) | | | | (15,468,216 | ) |
| | | | | | | | | | |
Net increase (decrease) in net assets resulting from operations | | | | (82,374,907 | ) | | | | 64,097,549 | |
| | | | | | | | | | |
Distributions to shareholders (See Note 2): | | | | | | | | | | |
Class Y-3 | | | | (81,065,529 | ) | | | | — | |
| | | | | | | | | | |
Total distributions | | | | (81,065,529 | ) | | | | — | |
| | | | | | | | | | |
Net share transactions (See Note 7): | | | | | | | | | | |
Class Y-3 | | | | 246,282,465 | | | | | (28,829,907 | ) |
| | | | | | | | | | |
Increase (decrease) in net assets resulting from net shares transactions | | | | 246,282,465 | | | | | (28,829,907 | ) |
| | | | | | | | | | |
Net increase in net assets | | | | 82,842,029 | | | | | 35,267,642 | |
| | | | | | | | | | |
Net assets: | |
Beginning of year | | | | 955,877,755 | | | | | 920,610,113 | |
| | | | | | | | | | |
End of year | | | $ | 1,038,719,784 | | | | $ | 955,877,755 | |
| | | | | | | | | | |
See accompanying Notes to the Financial Statements.
213
Mercer US Large Cap Equity Fund
Financial Highlights
| | | | | | | | | | | | | | | | | | | | | | | | | |
| | | Year Ended
March 31, 2020 | | Year Ended
March 31, 2019 | | Year Ended
March 31, 2018 | | Year Ended
March 31, 2017 | | Year Ended
March 31, 2016 |
For aClass Y-3 Share Outstanding Throughout Each Year: | | | | | | | | | | | | | | | | | | | | | | | | | |
| | | | | |
Net asset value at beginning of year | | | $ | 8.58 | | | | $ | 10.85 | | | | $ | 10.61 | | | | $ | 9.34 | | | | $ | 11.11 | |
| | | | | | | | | | | | | | | | | | | | | | | | | |
| | | | | |
Net investment income† | | | | 0.14 | | | | | 0.12 | | | | | 0.14 | | | | | 0.11 | (a) | | | | 0.04 | |
Net realized and unrealized gain (loss) on investments | | | | (1.00 | ) | | | | 0.18 | | | | | 1.68 | | | | | 1.54 | | | | | (0.43 | ) |
| | | | | | | | | | | | | | | | | | | | | | | | | |
| | | | | |
Total from investment operations | | | | (0.86 | ) | | | | 0.30 | | | | | 1.82 | | | | | 1.65 | | | | | (0.39 | ) |
| | | | | | | | | | | | | | | | | | | | | | | | | |
Less dividends and distributions: | |
From net investment income | | | | (0.05 | ) | | | | (0.14 | ) | | | | (0.16 | ) | | | | (0.08 | ) | | | | (0.05 | ) |
From net realized capital gains on investments | | | | (0.32 | ) | | | | (2.43 | ) | | | | (1.42 | ) | | | | (0.30 | ) | | | | (1.33 | ) |
| | | | | | | | | | | | | | | | | | | | | | | | | |
| | | | | |
Total dividends and distributions | | | | (0.37 | ) | | | | (2.57 | ) | | | | (1.58 | ) | | | | (0.38 | ) | | | | (1.38 | ) |
| | | | | | | | | | | | | | | | | | | | | | | | | |
| | | | | |
Net asset value, end of year | | | $ | 7.35 | | | | $ | 8.58 | | | | $ | 10.85 | | | | $ | 10.61 | | | | $ | 9.34 | |
| | | | | | | | | | | | | | | | | | | | | | | | | |
Total investment return | | | | (10.95 | )%(b) | | | | 4.81 | % | | | | 17.26 | % | | | | 17.74 | % | | | | (4.09 | )% |
|
Ratios/Supplemental Data: | |
Net investment income to average net assets | | | | 1.53 | % | | | | 1.21 | % | | | | 1.28 | % | | | | 1.14 | %(a) | | | | 0.33 | % |
Total expenses (before reductions and reimbursements/waivers) to average daily net assets | | | | 0.62 | % | | | | 0.63 | % | | | | 0.60 | % | | | | 0.61 | % | | | | 0.63 | %(c) |
Net expenses to average daily net assets | | | | 0.33 | %(e) | | | | 0.63 | % | | | | 0.60 | % | | | | 0.61 | %(d) | | | | 0.63 | %(c) |
Portfolio turnover rate | | | | 76 | %(f) | | | | 74 | % | | | | 64 | % | | | | 84 | % | | | | 66 | % |
Net assets at end of year (in 000’s) | | | $ | 882,215 | | | | $ | 389,415 | | | | $ | 512,558 | | | | $ | 601,059 | | | | $ | 301,260 | |
| (a) | Includes anon-recurring refund for overbilling of prior years’ custody fees, a portion of which was paid to the Advisor for prior years’ reimbursement of expenses. This amounted to less than $0.01 per share and less than 0.01% of average net assets. |
| (b) | The total return would have been lower had certain expenses not been reduced or reimbursed/waived during the years shown. |
| (c) | Includes interest expense that amounts to less than 0.01%. |
| (d) | Includes a repayment to the Advisor, referenced above, for prior years’ reimbursement of expenses. The amount is less than 0.01% of average net assets. |
| (e) | Includes the effects of management fee waivers (see Note 5 of the Notes to the Financial Statements). |
| (f) | Portfolio turnover calculation does not include $769,614,365 of securities transferred into the Fund as part ofin-kind contributions. |
| † | Computed using average shares outstanding throughout the year. |
See accompanying Notes to the Financial Statements.
214
Mercer US Small/Mid Cap Equity Fund
Financial Highlights (Continued)
| | | | | | | | | | | | | | | | | | | | | | | | | |
| | | Year Ended
March 31, 2020 | | Year Ended
March 31, 2019 | | Year Ended
March 31, 2018 | | Year Ended
March 31, 2017 | | Year Ended
March 31, 2016 |
For aClass Y-3 Share Outstanding Throughout Each Year: | | | | | | | | | | | | | | | | | | | | | | | | | |
| | | | | |
Net asset value at beginning of year | | | $ | 10.13 | | | | $ | 12.29 | | | | $ | 12.12 | | | | $ | 10.30 | | | | $ | 12.23 | |
| | | | | | | | | | | | | | | | | | | | | | | | | |
| | | | | |
Net investment income (loss)† | | | | 0.10 | | | | | 0.05 | | | | | 0.04 | | | | | 0.04 | (a) | | | | (0.02 | ) |
Net realized and unrealized gain (loss) on investments | | | | (2.20 | ) | | | | (0.23 | ) | | | | 1.46 | | | | | 2.13 | | | | | (1.28 | ) |
| | | | | | | | | | | | | | | | | | | | | | | | | |
| | | | | |
Total from investment operations | | | | (2.10 | ) | | | | (0.18 | ) | | | | 1.50 | | | | | 2.17 | | | | | (1.30 | ) |
| | | | | | | | | | | | | | | | | | | | | | | | | |
Less dividends and distributions: | |
From net investment income | | | | (0.06 | ) | | | | (0.05 | ) | | | | (0.06 | ) | | | | (0.08 | ) | | | | — | |
From net realized capital gains on investments | | | | (0.26 | ) | | | | (1.93 | ) | | | | (1.27 | ) | | | | (0.27 | ) | | | | (0.63 | ) |
| | | | | | | | | | | | | | | | | | | | | | | | | |
| | | | | |
Total dividends and distributions | | | | (0.32 | ) | | | | (1.98 | ) | | | | (1.33 | ) | | | | (0.35 | ) | | | | (0.63 | ) |
| | | | | | | | | | | | | | | | | | | | | | | | | |
| | | | | |
Net asset value, end of year | | | $ | 7.71 | | | | $ | 10.13 | | | | $ | 12.29 | | | | $ | 12.12 | | | | $ | 10.30 | |
| | | | | | | | | | | | | | | | | | | | | | | | | |
Total investment return | | | | (21.65 | )%(b) | | | | 0.19 | % | | | | 12.64 | % | | | | 21.24 | % | | | | (10.78 | )% |
|
Ratios/Supplemental Data: | |
Net investment income to average net assets | | | | 0.95 | % | | | | 0.47 | % | | | | 0.31 | % | | | | 0.40 | %(a) | | | | (0.18 | )% |
Total expenses (before reductions and reimbursements/waivers) to average daily net assets | | | | 0.97 | % | | | | 0.98 | % | | | | 0.95 | % | | | | 0.97 | % | | | | 0.98 | %(c) |
Net expenses to average daily net assets | | | | 0.49 | %(e) | | | | 0.98 | % | | | | 0.95 | % | | | | 0.97 | %(d) | | | | 0.98 | %(c) |
Portfolio turnover rate | | | | 73 | %(f) | | | | 47 | % | | | | 49 | % | | | | 106 | % | | | | 68 | % |
Net assets at end of year (in 000’s) | | | $ | 1,048,545 | | | | $ | 794,403 | | | | $ | 907,944 | | | | $ | 972,456 | | | | $ | 427,426 | |
| (a) | Includes anon-recurring refund for overbilling of prior years’ custody fees, a portion of which was paid to the Advisor for prior years’ reimbursement of expenses. This amounted to less than $0.01 per share and less than 0.01% of average net assets. |
| (b) | The total return would have been lower had certain expenses not been reduced or reimbursed/waived during the years shown. |
| (c) | Includes interest expense that amounts to less than 0.01%. |
| (d) | Includes a repayment to the Advisor, referenced above, for prior years’ reimbursement of expenses. The amount is less than 0.01% of average net assets. |
| (e) | Includes the effects of management fee waivers (see Note 5 of the Notes to the Financial Statements). |
| (f) | Portfolio turnover calculation does not include $550,516,305 of securities transferred into the Fund as part ofin-kind contributions. |
| † | Computed using average shares outstanding throughout the year. |
See accompanying Notes to the Financial Statements.
215
MercerNon-US Core Equity Fund
Financial Highlights (Continued)
| | | | | | | | | | | | | | | | | | | | | | | | | |
| | | Year Ended
March 31, 2020 | | Year Ended
March 31, 2019 | | Year Ended
March 31, 2018 | | Year Ended
March 31, 2017 | | Year Ended
March 31, 2016 |
For aClass Y-3 Share Outstanding Throughout Each Year: | | | | | | | | | | | | | | | | | | | | | | | | | |
| | | | | |
Net asset value at beginning of year | | | $ | 9.87 | | | | $ | 11.51 | | | | $ | 10.44 | | | | $ | 9.61 | | | | $ | 10.64 | |
| | | | | | | | | | | | | | | | | | | | | | | | | |
| | | | | |
Net investment income† | | | | 0.25 | | | | | 0.22 | | | | | 0.19 | | | | | 0.18 | (a) | | | | 0.16 | |
Net realized and unrealized gain (loss) on investments | | | | (1.44 | ) | | | | (0.76 | ) | | | | 1.75 | | | | | 0.83 | | | | | (0.76 | ) |
| | | | | | | | | | | | | | | | | | | | | | | | | |
| | | | | |
Total from investment operations | | | | (1.19 | ) | | | | (0.54 | ) | | | | 1.94 | | | | | 1.01 | | | | | (0.60 | ) |
| | | | | | | | | | | | | | | | | | | | | | | | | |
Less dividends and distributions: | |
From net investment income | | | | (0.22 | ) | | | | (0.20 | ) | | | | (0.23 | ) | | | | (0.18 | ) | | | | (0.17 | ) |
From net realized capital gains on investments | | | | — | | | | | (0.90 | ) | | | | (0.64 | ) | | | | — | | | | | (0.26 | ) |
| | | | | | | | | | | | | | | | | | | | | | | | | |
| | | | | |
Total dividends and distributions | | | | (0.22 | ) | | | | (1.10 | ) | | | | (0.87 | ) | | | | (0.18 | ) | | | | (0.43 | ) |
| | | | | | | | | | | | | | | | | | | | | | | | | |
| | | | | |
Net asset value, end of year | | | $ | 8.46 | | | | $ | 9.87 | | | | $ | 11.51 | | | | $ | 10.44 | | | | $ | 9.61 | |
| | | | | | | | | | | | | | | | | | | | | | | | | |
Total investment return | | | | (12.55 | )%(b) | | | | (4.00 | )% | | | | 18.80 | % | | | | 10.62 | % | | | | (5.64 | )% |
|
Ratios/Supplemental Data: | |
Net investment income to average net assets | | | | 2.45 | % | | | | 2.03 | % | | | | 1.64 | % | | | | 1.81 | %(a) | | | | 1.60 | % |
Total expenses (before reductions and reimbursements/waivers) to average daily net assets | | | | 0.79 | % | | | | 0.79 | % | | | | 0.79 | %(c) | | | | 0.81 | %(c) | | | | 0.83 | %(c) |
Net expenses to average daily net assets | | | | 0.42 | %(e) | | | | 0.79 | % | | | | 0.79 | %(c) | | | | 0.82 | %(c) (d) | | | | 0.83 | %(c) |
Portfolio turnover rate | | | | 74 | %(f) | | | | 81 | % | | | | 81 | % | | | �� | 81 | % | | | | 109 | % |
Net assets at end of year (in 000’s) | | | $ | 2,673,838 | | | | $ | 2,155,585 | | | | $ | 2,159,299 | | | | $ | 2,271,104 | | | | $ | 1,941,634 | |
| (a) | Includes anon-recurring refund for overbilling of prior years’ custody fees, a portion of which was paid to the Advisor for prior years’ reimbursement of expenses. This amounted to less than $0.01 per share and less than 0.01% of average net assets. |
| (b) | The total return would have been lower had certain expenses not been reduced or reimbursed/waived during the years shown. |
| (c) | Includes interest expense that amounts to less than 0.01%. |
| (d) | Includes a repayment to the Advisor, referenced above, for prior years’ reimbursement of expenses. The amount is 0.01% of average net assets. |
| (e) | Includes the effects of management fee waivers (see Note 5 of the Notes to the Financial Statements). |
| (f) | Portfolio turnover calculation does not include $395,102,338 of securities transferred into the Fund as part ofin-kind contributions. |
| † | Computed using average shares outstanding throughout the year. |
See accompanying Notes to the Financial Statements.
216
Mercer Core Fixed Income Fund
Financial Highlights (Continued)
| | | | | | | | | | | | | | | | | | | | | | | | | |
| | | Year Ended
March 31, 2020 | | Year Ended
March 31, 2019 | | Year Ended
March 31, 2018 | | Year Ended
March 31, 2017 | | Year Ended
March 31, 2016 |
For aClass Y-3 Share Outstanding Throughout Each Year: | | | | | | | | | | | | | | | | | | | | | | | | | |
| | | | | |
Net asset value at beginning of year | | | $ | 10.00 | | | | $ | 9.90 | | | | $ | 9.96 | | | | $ | 10.15 | | | | $ | 10.43 | |
| | | | | | | | | | | | | | | | | | | | | | | | | |
| | | | | |
Net investment income† | | | | 0.27 | | | | | 0.31 | | | | | 0.27 | | | | | 0.25 | (a) | | | | 0.29 | |
Net realized and unrealized gain (loss) on investments | | | | 0.51 | | | | | 0.11 | | | | | (0.09 | ) | | | | (0.09 | ) | | | | (0.17 | ) |
| | | | | | | | | | | | | | | | | | | | | | | | | |
| | | | | |
Total from investment operations | | | | 0.78 | | | | | 0.42 | | | | | 0.18 | | | | | 0.16 | | | | | 0.12 | |
| | | | | | | | | | | | | | | | | | | | | | | | | |
Less dividends and distributions: | |
From net investment income | | | | (0.30 | ) | | | | (0.32 | ) | | | | (0.24 | ) | | | | (0.25 | ) | | | | (0.30 | ) |
From net realized capital gains on investments | | | | — | | | | | — | | | | | — | | | | | (0.10 | ) | | | | (0.10 | ) |
| | | | | | | | | | | | | | | | | | | | | | | | | |
| | | | | |
Total dividends and distributions | | | | (0.30 | ) | | | | (0.32 | ) | | | | (0.24 | ) | | | | (0.35 | ) | | | | (0.40 | ) |
| | | | | | | | | | | | | | | | | | | | | | | | | |
| | | | | |
Net asset value, end of year | | | $ | 10.48 | | | | $ | 10.00 | | | | $ | 9.90 | | | | $ | 9.96 | | | | $ | 10.15 | |
| | | | | | | | | | | | | | | | | | | | | | | | | |
Total investment return | | | | 7.81 | %(b) | | | | 4.37 | % | | | | 1.80 | % | | | | 1.58 | % | | | | 1.26 | % |
|
Ratios/Supplemental Data: | |
Net investment income to average net assets | | | | 2.64 | % | | | | 3.17 | % | | | | 2.71 | % | | | | 2.43 | %(a) | | | | 2.80 | % |
Total expenses (before reductions and reimbursements/waivers) to average daily net assets | | | | 0.45 | % | | | | 0.43 | % | | | | 0.43 | % | | | | 0.43 | %(c) | | | | 0.42 | % |
Net expenses to average daily net assets | | | | 0.19 | %(e) | | | | 0.43 | % | | | | 0.43 | % | | | | 0.43 | %(c)(d) | | | | 0.42 | % |
Portfolio turnover rate | | | | 158 | %(f) | | | | 80 | %(f) | | | | 113 | %(f) | | | | 151 | % | | | | 88 | % |
Net assets at end of year (in 000’s) | | | $ | 950,017 | | | | $ | 548,600 | | | | $ | 857,947 | | | | $ | 765,603 | | | | $ | 783,875 | |
| (a) | Includes anon-recurring refund for overbilling of prior years’ custody fees, a portion of which was paid to the Advisor for prior years’ reimbursement of expenses. This amounted to less than $0.01 per share and less than 0.01% of average net assets. |
| (b) | The total return would have been lower had certain expenses not been reduced or reimbursed/waived during the years shown. |
| (c) | Includes interest expense that amounts to less than 0.01%. |
| (d) | Includes a repayment to the Advisor, referenced above, for prior years’ reimbursement of expenses. The amount is less than 0.01% of average net assets. |
| (e) | Includes the effects of management fee waivers (see Note 5 of the Notes to the Financial Statements). |
| (f) | Includes TBA transactions; excluding these transactions the portfolio turnover rate would have been 139%, 74% and 81% for the years ended March 31, 2020, March 31, 2019 and March 31, 2018, respectively. |
| † | Computed using average shares outstanding throughout the year. |
See accompanying Notes to the Financial Statements.
217
Mercer Opportunistic Fixed Income Fund
Financial Highlights (Continued)
| | | | | | | | | | | | | | | | | | | | | | | | | |
| | | Year Ended
March 31, 2020 | | Year Ended
March 31, 2019 | | Year Ended
March 31, 2018 | | Year Ended
March 31, 2017 | | Year Ended
March 31, 2016 |
For aClass Y-3 Share Outstanding Throughout Each Year: | | | | | | | | | | | | | | | | | | | | | | | | | |
| | | | | |
Net asset value at beginning of year | | | $ | 9.08 | | | | $ | 9.80 | | | | $ | 9.31 | | | | $ | 8.44 | | | | $ | 9.13 | |
| | | | | | | | | | | | | | | | | | | | | | | | | |
| | | | | |
Net investment income† | | | | 0.44 | | | | | 0.43 | | | | | 0.53 | | | | | 0.51 | (a) | | | | 0.54 | |
Net realized and unrealized gain (loss) on investments | | | | (0.85 | ) | | | | (0.94 | ) | | | | 0.33 | | | | | 0.36 | | | | | (1.12 | ) |
| | | | | | | | | | | | | | | | | | | | | | | | | |
| | | | | |
Total from investment operations | | | | (0.41 | ) | | | | (0.51 | ) | | | | 0.86 | | | | | 0.87 | | | | | (0.58 | ) |
| | | | | | | | | | | | | | | | | | | | | | | | | |
Less dividends and distributions: | |
From net investment income | | | | (0.22 | ) | | | | (0.21 | ) | | | | (0.37 | ) | | | | — | | | | | (0.07 | ) |
From net realized capital gains on investments | | | | — | | | | | — | | | | | — | | | | | — | | | | | (0.04 | ) |
| | | | | | | | | | | | | | | | | | | | | | | | | |
| | | | | |
Total dividends and distributions | | | | (0.22 | ) | | | | (0.21 | ) | | | | (0.37 | ) | | | | — | | | | | (0.11 | ) |
| | | | | | | | | | | | | | | | | | | | | | | | | |
| | | | | |
Net asset value, end of year | | | $ | 8.45 | | | | $ | 9.08 | | | | $ | 9.80 | | | | $ | 9.31 | | | | $ | 8.44 | |
| | | | | | | | | | | | | | | | | | | | | | | | | |
Total investment return | | | | (4.72 | )%(b) | | | | (5.15 | )% | | | | 9.42 | % | | | | 10.31 | %(b) | | | | (6.25 | )%(b) |
|
Ratios/Supplemental Data: | |
Ratios to average net assets: | |
Net investment income to average net assets | | | | 4.74 | % | | | | 4.74 | % | | | | 5.49 | % | | | | 5.75 | %(a) | | | | 6.28 | % |
Total expenses (before reductions and reimbursements/waivers) to average daily net assets | | | | 0.92 | % | | | | 0.92 | %(c) | | | | 0.92 | %(c) | | | | 0.94 | %(c) | | | | 0.95 | %(c) |
Net expenses to average daily net assets | | | | 0.43 | %(e) | | | | 0.92 | %(c) | | | | 0.92 | %(c) | | | | 0.94 | %(c)(d) | | | | 0.90 | %(c) |
Portfolio turnover rate | | | | 148 | %(f) | | | | 243 | %(f) | | | | 72 | % | | | | 55 | % | | | | 53 | % |
Net assets at end of year (in 000’s) | | | $ | 966,298 | | | | $ | 812,580 | | | | $ | 647,222 | | | | $ | 558,859 | | | | $ | 414,262 | |
| (a) | Includes anon-recurring refund for overbilling of prior years’ custody fees, a portion of which was paid to the Advisor for prior years’ reimbursement of expenses. This amounted to less than $0.01 per share and less than 0.01% of average net assets. |
| (b) | The total return would have been lower had certain expenses not been reduced or reimbursed/waived during the years shown. |
| (c) | Includes interest expense that amounts to less than 0.01%. |
| (d) | Includes a repayment to the Advisor, referenced above, for prior years’ reimbursement of expenses. The amount is less than 0.01% of average net assets. |
| (e) | Includes the effects of management fee waivers (see Note 5 of the Notes to the Financial Statements). |
| (f) | Includes TBA transactions; excluding these transactions the portfolio turnover rate would have remained the same for the year ended March 31, 2020 and 218% for the year ended March 31, 2019, respectively. |
| † | Computed using average shares outstanding throughout the year. |
See accompanying Notes to the Financial Statements.
218
Mercer Emerging Markets Equity Fund
Financial Highlights (Continued)
| | | | | | | | | | | | | | | | | | | | | | | | | |
| | | Year Ended
March 31, 2020 | | Year Ended
March 31, 2019 | | Year Ended
March 31, 2018 | | Year Ended
March 31, 2017 | | Year Ended
March 31, 2016 |
For aClass Y-3 Share Outstanding Throughout Each Year: | | | | | | | | | | | | | | | | | | | | | | | | | |
| | | | | |
Net asset value at beginning of year | | | $ | 9.05 | | | | $ | 11.75 | | | | $ | 9.77 | | | | $ | 8.59 | | | | $ | 9.88 | |
| | | | | | | | | | | | | | | | | | | | | | | | | |
| | | | | |
Net investment income† | | | | 0.19 | | | | | 0.17 | | | | | 0.18 | | | | | 0.14 | (a) | | | | 0.16 | |
Net realized and unrealized gain (loss) on investments | | | | (1.93 | ) | | | | (1.48 | ) | | | | 2.05 | | | | | 1.22 | | | | | (1.36 | ) |
| | | | | | | | | | | | | | | | | | | | | | | | | |
| | | | | |
Total from investment operations | | | | (1.74 | ) | | | | (1.31 | ) | | | | 2.23 | | | | | 1.36 | | | | | (1.20 | ) |
| | | | | | | | | | | | | | | | | | | | | | | | | |
Less dividends and distributions: | |
From net investment income | | | | (0.12 | ) | | | | (0.01 | ) | | | | (0.25 | ) | | | | (0.18 | ) | | | | (0.09 | ) |
From net realized capital gains on investments | | | | — | | | | | (1.38 | ) | | | | — | | | | | — | | | | | — | |
| | | | | | | | | | | | | | | | | | | | | | | | | |
| | | | | |
Total dividends and distributions | | | | (0.12 | ) | | | | (1.39 | ) | | | | (0.25 | ) | | | | (0.18 | ) | | | | (0.09 | ) |
| | | | | | | | | | | | | | | | | | | | | | | | | |
| | | | | |
Net asset value, end of year | | | $ | 7.19 | | | | $ | 9.05 | | | | $ | 11.75 | | | | $ | 9.77 | | | | $ | 8.59 | |
| | | | | | | | | | | | | | | | | | | | | | | | | |
Total investment return | | | | (19.55 | )%(b) | | | | (10.20 | )% | | | | 22.92 | % | | | | 16.14 | % | | | | (12.06 | )% |
|
Ratios/Supplemental Data: | |
Net investment income to average net assets | | | | 2.05 | % | | | | 1.66 | % | | | | 1.62 | % | | | | 1.52 | %(a) | | | | 1.79 | % |
Total expenses (before reductions and reimbursements/waivers) to average daily net assets | | | | 0.91 | % | | | | 0.92 | %(c) | | | | 0.95 | %(c) | | | | 0.99 | %(c) | | | | 1.00 | %(c) |
Net expenses to average daily net assets | | | | 0.53 | %(e) | | | | 0.92 | %(c) | | | | 0.95 | %(c) | | | | 1.00 | %(c)(d) | | | | 1.00 | %(c) |
Portfolio turnover rate | | | | 81 | %(f) | | | | 57 | % | | | | 93 | % | | | | 89 | % | | | | 66 | % |
Net assets at end of year (in 000’s) | | | $ | 943,024 | | | | $ | 1,018,647 | | | | $ | 1,116,127 | | | | $ | 1,481,990 | | | | $ | 1,150,136 | |
| (a) | Includes anon-recurring refund for overbilling of prior years’ custody fees, a portion of which was paid to the Advisor for prior years’ reimbursement of expenses. This amounted to less than $0.01 per share and less than 0.01% of average net assets. |
| (b) | The total return would have been lower had certain expenses not been reduced or reimbursed/waived during the years shown. |
| (c) | Includes interest expense that amounts to less than 0.01%. |
| (d) | Includes a repayment to the Advisor, referenced above, for prior years’ reimbursement of expenses. The amount is 0.01% of average net assets. |
| (e) | Includes the effects of management fee waivers (see Note 5 of the Notes to the Financial Statements). |
| (f) | Portfolio turnover calculation does not include $10,686,440 of securities transferred into the Fund as part ofin-kind contributions. |
| † | Computed using average shares outstanding throughout the year. |
See accompanying Notes to the Financial Statements.
219
Mercer Global Low Volatility Equity Fund
Financial Highlights (Continued)
| | | | | | | | | | | | | | | | | | | | |
| | | Year Ended
March 31, 2020 | | | Year Ended
March 31, 2019 | | | Year Ended
March 31, 2018 | | | Year Ended
March 31, 2017 | | | Year Ended
March 31, 2016 | |
For aClass Y-3 Share Outstanding Throughout Each Year: | | | | | | | | | | | | | | | | | | | | |
| | | | | |
Net asset value at beginning of year | | $ | 13.13 | | | $ | 12.28 | | | $ | 12.62 | | | $ | 11.81 | | | $ | 12.11 | |
| | | | | | | | | | | | | | | | | | | | |
| | | | | |
Net investment income† | | | 0.24 | | | | 0.18 | | | | 0.18 | | | | 0.16 | (a) | | | 0.15 | |
Net realized and unrealized gain (loss) on investments | | | (1.14 | ) | | | 0.67 | | | | 1.39 | | | | 1.11 | | | | 0.33 | |
| | | | | | | | | | | | | | | | | | | | |
| | | | | |
Total from investment operations | | | (0.90 | ) | | | 0.85 | | | | 1.57 | | | | 1.27 | | | | 0.48 | |
| | | | | | | | | | | | | | | | | | | | |
Less dividends and distributions: | |
From net investment income | | | (0.17 | ) | | | — | | | | (0.18 | ) | | | (0.14 | ) | | | (0.14 | ) |
From net realized capital gains on investments | | | (0.83 | ) | | | — | | | | (1.73 | ) | | | (0.32 | ) | | | (0.64 | ) |
| | | | | | | | | | | | | | | | | | | | |
| | | | | |
Total dividends and distributions | | | (1.00 | ) | | | — | | | | (1.91 | ) | | | (0.46 | ) | | | (0.78 | ) |
| | | | | | | | | | | | | | | | | | | | |
| | | | | |
Net asset value, end of year | | $ | 11.23 | | | $ | 13.13 | | | $ | 12.28 | | | $ | 12.62 | | | $ | 11.81 | |
| | | | | | | | | | | | | | | | | | | | |
Total investment return | | | (8.16 | )%(b) | | | 6.92 | % | | | 12.47 | % | | | 11.02 | % | | | 4.13 | % |
|
Ratios/Supplemental Data: | |
Net investment income to average net assets | | | 1.75 | % | | | 1.40 | % | | | 1.35 | % | | | 1.34 | %(a) | | | 1.23 | % |
Total expenses (before reductions and reimbursements/waivers) to average daily net assets | | | 0.82 | % | | | 0.83 | % | | | 0.80 | %(c) | | | 0.81 | %(c) | | | 0.82 | %(c) |
Net expenses to average daily net assets | | | 0.31 | %(d) | | | 0.83 | % | | | 0.80 | %(c) | | | 0.81 | %(c) | | | 0.82 | %(c) |
Portfolio turnover rate | | | 38 | % | | | 80 | % | | | 36 | % | | | 55 | % | | | 31 | % |
Net assets at end of year (in 000’s) | | $ | 1,038,720 | | | $ | 955,878 | | | $ | 920,610 | | | $ | 1,249,860 | | | $ | 952,386 | |
| (a) | Includes anon-recurring refund for overbilling of prior years’ custody fees, a portion of which was paid to the Advisor for prior years’ reimbursement of expenses. This amounted to less than $0.01 per share and less than 0.01% of average net assets. |
| (b) | The total return would have been lower had certain expenses not been reduced or reimbursed/waived during the years shown. |
| (c) | Includes interest expense that amounts to less than 0.01%. |
| (d) | Includes the effects of management fee waivers (see Note 5 of the Notes to the Financial Statements). |
| † | Computed using average shares outstanding throughout the year. |
See accompanying Notes to the Financial Statements.
220
Mercer Funds
Notes to Financial Statements
March 31, 2020
Mercer Funds (the “Trust”) consists of the following seven series: Mercer US Large Cap Equity Fund (“Large Cap”), Mercer US Small/Mid Cap Equity Fund (“Small/Mid Cap”), MercerNon-US Core Equity Fund(“Non-US Core Equity”), Mercer Core Fixed Income Fund (“Core Fixed”), Mercer Opportunistic Fixed Income Fund (“Opportunistic Fixed”), Mercer Emerging Markets Equity Fund (“Emerging Markets”) and Mercer Global Low Volatility Equity Fund (“Global Low Volatility”) (each a “Fund,” and collectively referred to as the “Funds”). The Trust is a Delaware statutory trust established on March 11, 2005. The Trust is registered as an investment company under the Investment Company Act of 1940 (the “1940 Act”). Mercer Investments LLC, successor to Mercer Investment Management, Inc. (the “Advisor”), a Delaware limited liability company, serves as the investment advisor to the Funds. The Advisor manages each Fund using a “manager of managers” approach by selecting one or more subadvisors (each a “Subadvisor,” and collectively referred to as the “Subadvisors”) to manage each Fund’s assets. The Funds areopen-end investment companies and accordingly follow theopen-end investment company accounting and reporting guidance of the Financial Accounting Standards Board (FASB) Accounting Standard Codification Topic 946: Financial Services — Investment Companies.
Under the 1940 Act, each Fund is classified as diversified.
The investment objectives of the Funds are:
| | |
Fund | | Investment Objective |
| Large Cap | | Long-term total return, which includes capital appreciation and income |
| Small/Mid Cap | | Long-term total return, comprised primarily of capital appreciation |
| Non-US Core Equity | | Long-term total return, which includes capital appreciation and income |
| Core Fixed | | Total return, consisting of both current income and capital appreciation |
| Opportunistic Fixed | | Long-term total return, which includes capital appreciation and income |
| Emerging Markets | | Long-term total return, which includes capital appreciation and income |
| Global Low Volatility | | Long-term total return, which includes capital appreciation and income |
Each Fund has registered and is authorized to offer interests in four classes of shares: Adviser Class (formerly Class S), Class I (formerlyClass Y-1),Class Y-2 andClass Y-3. The principal difference between the classes of shares is the level of shareholder service, marketing and administrative fees borne by the classes. As of March 31, 2020, onlyClass Y-3 was active.
| 2. | Significant Accounting Policies |
The Funds have adopted Financial Accounting Standards Board Accounting Standards Update2017-08 “Premium Amortization of Callable Debt Securities”, which amends the amortization period for certain purchased callable debt securities held at a premium. Under the new standard, the Funds have changed the amortization period for the premium on certain purchased callable debt securities with explicitnon-contingent call features to the earliest call date. In accordance with the transition provisions of the
221
Mercer Funds
Notes to Financial Statements (Continued)
March 31, 2020
standard, the Funds applied the amendments on a modified retrospective basis beginning with the fiscal year ended March 31, 2020. The cost basis of securities at March 31, 2019 has been adjusted to $547,021,906 and $781,385,439 for Core Fixed and Opportunistic Fixed, respectively, with no adjustment necessary for the remaining Funds. This change in accounting policy has been made to comply with the newly issued accounting standard and had no impact on total accumulated earnings (loss) or the net asset value of the Funds’ financial statements.
The following are significant accounting policies followed by the Funds. These policies are in conformity with accounting principles generally accepted in the United States of America (“GAAP”). The preparation of financial statements in conformity with GAAP requires management to make estimates and assumptions that affect the reported amounts and disclosures in the financial statements. Actual results could differ from these estimates.
(a) Security Valuation
Each Fund’s investments are valued as of the close of regular trading on the New York Stock Exchange (“NYSE”) on each day when the NYSE is open. Portfolio securities and exchange-traded funds listed on an exchange normally are valued at the last sale or official closing price on the day on which the securities are valued or, lacking any sales on such day, at the last available bid price using prices as of the close of trading. In cases where securities are traded on more than one exchange, the securities are generally valued on the exchange considered by the Advisor or the applicable Subadvisor as the primary market for such securities. Securities traded in theover-the-counter (“OTC”) market and listed on the NASDAQ Stock Market (“NASDAQ”) normally are valued at the NASDAQ official closing price; other OTC securities are valued at the last bid price available prior to valuation (other than short-term investments, which are valued as described below). The Funds may invest in securities that are traded in foreign markets. Foreign securities will be converted into U.S. dollar equivalents based on the exchange rate in effect at a uniform time on each business day. Events occurring after the close of trading on foreign exchanges may result in adjustments to the valuation of foreign securities to more accurately reflect their fair value as of the close of regular trading on the New York Stock Exchange. When valuing foreign equity securities that meet certain criteria, the Board of Trustees of the Trust (the “Board”) has approved the use of a fair value service that values such securities to reflect market trading that occurs after the close of the applicable foreign markets of comparable securities or other instruments that have a strong correlation to the fair-valued securities. Investments inopen-end investment companies are valued at their net asset value (“NAV”) per share.
Certain fixed-income securities may be valued based upon appraisals received from an independent pricing service using a computerized matrix system or based upon appraisals derived from information concerning the securities or similar securities received from a recognized dealer or dealers in those securities. It should be recognized that judgment often plays a greater role in valuing thinly traded securities, as well as bonds and other securities with few dealer quotations, than is the case with respect to securities for which a broader range of dealer quotations and last-sale information is available. Each such determination is based on consideration of relevant factors, and judgment is made by or at the direction of the Board. Each Fund values its investments for which market quotations are readily available at market value. Each Fund may value short-term investments that will mature within 60 days or less by using pricing service quotations or at amortized cost, provided that such amortized cost approximates market value.
Derivative financial instruments, such as futures contracts or options contracts that are traded on a national securities exchange, are stated at the last reported sale or settlement price on the day of valuation. Futures traded on inactive markets are valued using broker quotations. OTC derivative
222
Mercer Funds
Notes to Financial Statements (Continued)
March 31, 2020
financial instruments, such as foreign currency contracts, options contracts, synthetic futures, or swaps agreements, derive their value from underlying asset prices, indices, reference rates, and other inputs or a combination of these factors. These contracts are normally valued on the basis of an independent pricing service providers or broker/dealer quotations. Depending on the derivative type and the terms of the derivative, the value of the derivative financial instruments is assigned by independent pricing service providers using a series of techniques, which may include pricing models. The pricing models use inputs that are observed from actively quoted markets such as issuer details, indices, spreads, interest rates, curves, volatilities, dividends and exchange rates.
Bank loans are valued using an evaluated quote provided by an independent pricing service. Evaluated quotes provided by the pricing service may reflect appropriate factors such as ratings, yield curves, prepayment speeds, tranche type, industry, company performance, spread, individual trading characteristics, institutional size trading in similar groups of securities and other market data.
The Board has delegated its responsibility for valuing portfolio securities to the Advisor, subject to continuing Board oversight. The Advisor has appointed a Valuation Committee that is responsible for overseeing theday-to-day process of valuing portfolio securities. With respect to portfolio securities for which market quotations are not readily available or (in the opinion of the Advisor or the applicable Subadvisor) do not otherwise accurately reflect the fair values of the securities, the Valuation Committee will value such securities at fair value based upon procedures approved by the Board.
The application of fair value pricing represents a good faith determination based on specific procedures performed under the supervision of the Board. Due to the subjective nature of fair value pricing, there can be no assurance that the Fund could realize the fair value assigned to the security if the Fund were to sell the security at approximately the time at which the Fund determines its NAV per share. The Fund’s value for a particular security may be different from the last quoted market price.
The Funds follow a three-tier hierarchy to prioritize the assumptions, referred to as inputs, used in valuation techniques to measure fair value. The three-tier hierarchy of inputs is summarized in the three broad Levels listed below.
| | • | | Level 1 — quoted prices unadjusted in active markets for identical investments |
| | • | | Level 2 — other significant observable inputs (including quoted prices for similar investments, interest rates, prepayment speeds, credit risk, etc.) |
| | • | | Level 3 — significant unobservable inputs (including the Fund’s own assumptions in determining the fair value of investments) |
The inputs or methodology used for valuing securities are not necessarily an indication of the risk associated with investing in those securities.
The assets and liabilities shown in the Statements of Assets and Liabilities related to investments purchased for“to-be-announced” (“TBA”), TBA commitments or when-issued securities approximate fair value and are determined using Level 2 inputs, as of March 31, 2020. The assets and liabilities shown in the Statements of Assets and Liabilities related to cash collateral held at broker for futures contracts and swap contracts are determined using Level 1 inputs as of March 31, 2020.
At March 31, 2020, Large Cap and Small/Mid Cap held long-term investments whose value was determined using Level 1 inputs, with corresponding major categories as shown in the schedule of investments, Futures Contracts and State Street Institutional U.S. Government Money Market Fund, Premier Class whose value was determined using Level 1 inputs and short-term investment positions in a United States Treasury Bill, as shown in the schedule of investments, whose value was determined using Level 2 inputs.
223
Mercer Funds
Notes to Financial Statements (Continued)
March 31, 2020
The following is a summary of the portfolio securities by level based on inputs used as of March 31, 2020 in valuing the assets and liabilities ofNon-US Core Equity, Core Fixed, Opportunistic Fixed, Emerging Markets and Global Low Volatility for which fair valuation was used:
Non-US Core Equity
ASSETS VALUATION INPUT
| | | | | | | | | | | | | | | | |
Description | | Quoted Prices
in Active
Markets for
Identical Assets
(Level 1) | | | Significant
Other
Observable
Inputs
(Level 2) | | | Significant
Unobservable
Inputs
(Level 3) | | | Total | |
Common Stocks | | | | | |
Australia | | $ | 2,471,402 | | | $ | 75,142,729 | | | $ | — | | | $ | 77,614,131 | |
Austria | | | — | | | | 5,657,396 | | | | — | | | | 5,657,396 | |
Belgium | | | — | | | | 12,833,077 | | | | — | | | | 12,833,077 | |
Bermuda | | | — | | | | 5,888,227 | | | | — | | | | 5,888,227 | |
Brazil | | | 12,056,494 | | | | — | | | | — | | | | 12,056,494 | |
Canada | | | 20,555,704 | | | | — | | | | — | | | | 20,555,704 | |
Cayman Islands | | | 16,965,912 | | | | 33,326,323 | | | | — | | | | 50,292,235 | |
China | | | 206,112 | | | | 7,173,625 | | | | — | | | | 7,379,737 | |
Denmark | | | 1,991,244 | | | | 52,673,050 | | | | — | | | | 54,664,294 | |
Finland | | | 2,841,054 | | | | 18,445,031 | | | | — | | | | 21,286,085 | |
France | | | 1,750,199 | | | | 263,165,997 | | | | — | | | | 264,916,196 | |
Germany | | | 514,475 | | | | 174,527,907 | | | | — | | | | 175,042,382 | |
Hong Kong | | | — | | | | 19,499,261 | | | | — | | | | 19,499,261 | |
Hungary | | | — | | | | 4,685,147 | | | | — | | | | 4,685,147 | |
India | | | — | | | | 6,660,607 | | | | — | | | | 6,660,607 | |
Indonesia | | | — | | | | 826,552 | | | | — | | | | 826,552 | |
Ireland | | | 5,263,717 | | | | 7,937,458 | | | | — | | | | 13,201,175 | |
Israel | | | 3,990,263 | | | | 3,418,386 | | | | — | | | | 7,408,649 | |
Italy | | | — | | | | 50,596,616 | | | | — | | | | 50,596,616 | |
Japan | | | 4,762,578 | | | | 637,543,471 | | | | — | | | | 642,306,049 | |
Luxembourg | | | 581,016 | | | | 108,456 | | | | — | | | | 689,472 | |
Malaysia | | | — | | | | 1,111,994 | | | | — | | | | 1,111,994 | |
Marshall Islands | | | 247,402 | | | | — | | | | — | | | | 247,402 | |
Mauritius | | | — | | | | 663,551 | | | | — | | | | 663,551 | |
Netherlands | | | 6,470,879 | | | | 112,708,172 | | | | — | | | | 119,179,051 | |
New Zealand | | | — | | | | 619,386 | | | | — | | | | 619,386 | |
Norway | | | — | | | | 7,367,626 | | | | — | | | | 7,367,626 | |
Philippines | | | — | | | | 503,251 | | | | — | | | | 503,251 | |
Portugal | | | — | | | | — | | | | 0 | ** | | | — | |
Russia | | | 3,496,356 | | | | 19,420,628 | | | | — | | | | 22,916,984 | |
Singapore | | | — | | | | 8,015,219 | | | | — | | | | 8,015,219 | |
South Africa | | | — | | | | 644,956 | | | | — | | | | 644,956 | |
South Korea | | | — | | | | 30,522,376 | | | | — | | | | 30,522,376 | |
Spain | | | 785,126 | | | | 54,704,075 | | | | 0 | ** | | | 55,489,201 | |
Sweden | | | 365,765 | | | | 57,874,931 | | | | — | | | | 58,240,696 | |
Switzerland | | | 1,228,771 | | | | 299,946,445 | | | | — | | | | 301,175,216 | |
Taiwan | | | 18,387,872 | | | | 13,020,194 | | | | — | | | | 31,408,066 | |
Thailand | | | — | | | | 1,413,015 | | | | — | | | | 1,413,015 | |
Turkey | | | — | | | | 5,333,974 | | | | — | | | | 5,333,974 | |
United Kingdom | | | 25,862,381 | | | | 282,905,521 | | | | — | | | | 308,767,902 | |
United States | | | 54,655,916 | | | | 47 | | | | — | | | | 54,655,963 | |
| | | | | | | | | | | | | | | | |
Total Common Stocks | | | 185,450,638 | | | | 2,276,884,677 | | | | 0 | | | | 2,462,335,315 | |
| | | | | | | | | | | | | | | | |
224
Mercer Funds
Notes to Financial Statements (Continued)
March 31, 2020
| | | | | | | | | | | | | | | | |
Description | | Quoted Prices
in Active
Markets for
Identical Assets
(Level 1) | | | Significant
Other
Observable
Inputs
(Level 2) | | | Significant
Unobservable
Inputs
(Level 3) | | | Total | |
Investment Companies | | $ | 23,625,343 | | | $ | — | | | $ | — | | | $ | 23,625,343 | |
| | | | | | | | | | | | | | | | |
Preferred Stocks | | | | | | | | | |
Brazil | | | 533,576 | | | | — | | | | — | | | | 533,576 | |
Germany | | | — | | | | 28,652,391 | | | | — | | | | 28,652,391 | |
Russia | | | — | | | | 290,548 | | | | — | | | | 290,548 | |
| | | | | | | | | | | | | | | | |
Total Preferred Stocks | | | 533,576 | | | | 28,942,939 | | | | — | | | | 29,476,515 | |
| | | | | | | | | | | | | | | | |
Short-Term Investments | | | | | | | | | |
Mutual Fund - Securities Lending Collateral | | | 27,307,637 | | | | — | | | | — | | | | 27,307,637 | |
U.S. Government and Agency Obligations | | | — | | | | 3,499,195 | | | | — | | | | 3,499,195 | |
| | | | | | | | | | | | | | | | |
Total Short-Term Investments | | | 27,307,637 | | | | 3,499,195 | | | | — | | | | 30,806,832 | |
| | | | | | | | | | | | | | | | |
Futures Contracts† | | | | | | | | | |
Buys | | | 9,483,565 | | | | — | | | | — | | | | 9,483,565 | |
| | | | | | | | | | | | | | | | |
Total Futures Contracts | | | 9,483,565 | | | | — | | | | — | | | | 9,483,565 | |
| | | | | | | | | | | | | | | | |
Total | | $ | 246,400,759 | | | $ | 2,309,326,811 | | | $ | 0 | | | $ | 2,555,727,570 | |
| | | | | | | | | | | | | | | | |
LIABILITIES VALUATION INPUT
| | | | | | | | | | | | | | | | |
Description | | Quoted Prices
in Active
Markets for
Identical Assets
(Level 1) | | | Significant
Other
Observable
Inputs
(Level 2) | | | Significant
Unobservable
Inputs
(Level 3) | | | Total | |
Forward Foreign Currency Contracts† | | $ | — | | | $ | (624,517 | ) | | $ | — | | | $ | (624,517 | ) |
| | | | | | | | | | | | | | | | |
Total | | $ | — | | | $ | (624,517 | ) | | $ | — | | | $ | (624,517 | ) |
| | | | | | | | | | | | | | | | |
| | ** | Represents one or more Level 3 securities at $0 value as of March 31, 2020. |
| | † | Forward foreign currency contracts and Futures contracts are valued at unrealized appreciation/depreciation. Only current day’s variation margin for Futures contracts and Centrally Cleared Swaps, if any, is reported on the Statements of Assets and Liabilities. |
225
Mercer Funds
Notes to Financial Statements (Continued)
March 31, 2020
Core Fixed
ASSETS VALUATION INPUT
| | | | | | | | | | | | | | | | |
Description | | Quoted Prices
in Active
Markets for
Identical Assets
(Level 1) | | | Significant
Other
Observable
Inputs
(Level 2) | | | Significant
Unobservable
Inputs
(Level 3) | | | Total | |
Debt Obligations | | | | | | | | | | | | | | | | |
Asset Backed Securities | | $ | — | | | $ | 92,920,822 | | | $ | — | | | $ | 92,920,822 | |
Corporate Debt | | | — | | | | 315,143,375 | | | | 1,528 | | | | 315,144,903 | |
Mortgage Backed Securities - Private Issuers | | | — | | | | 96,443,021 | | | | — | | | | 96,443,021 | |
Mortgage Backed Securities - U.S. Government Agency Obligations | | | — | | | | 267,277,864 | | | | — | | | | 267,277,864 | |
Municipal Obligations | | | — | | | | 5,371,642 | | | | — | | | | 5,371,642 | |
Sovereign Debt Obligations | | | — | | | | 5,429,425 | | | | — | | | | 5,429,425 | |
U.S. Government and Agency Obligations | | | — | | | | 153,438,015 | | | | — | | | | 153,438,015 | |
| | | | | | | | | | | | | | | | |
Total Debt Obligations | | | — | | | | 936,024,164 | | | | 1,528 | | | | 936,025,692 | |
| | | | | | | | | | | | | | | | |
Short-Term Investment | | | | | | | | | |
Mutual Fund - Securities Lending Collateral | | | 2,009,610 | | | | — | | | | — | | | | 2,009,610 | |
| | | | | | | | | | | | | | | | |
Total Short-Term Investment | | | 2,009,610 | | | | — | | | | — | | | | 2,009,610 | |
| | | | | | | | | | | | | | | | |
Options Purchased | | | 17,031 | | | | — | | | | — | | | | 17,031 | |
| | | | | | | | | | | | | | | | |
Futures Contracts† | | | | | | | | | |
Buys | | | 1,109,449 | | | | — | | | | — | | | | 1,109,449 | |
| | | | | | | | | | | | | | | | |
Total Futures Contracts | | | 1,109,449 | | | | — | | | | — | | | | 1,109,449 | |
| | | | | | | | | | | | | | | | |
Swaps | | | | | | | | | |
Centrally Cleared Interest Rate Swaps† | | | — | | | | 1,034,220 | | | | — | | | | 1,034,220 | |
| | | | | | | | | | | | | | | | |
Total Swaps | | | — | | | | 1,034,220 | | | | — | | | | 1,034,220 | |
| | | | | | | | | | | | | | | | |
Forward Foreign Currency Contracts† | | | — | | | | 5,840 | | | | — | | | | 5,840 | |
| | | | | | | | | | | | | | | | |
Total | | $ | 3,136,090 | | | $ | 937,064,224 | | | $ | 1,528 | | | $ | 940,201,842 | |
| | | | | | | | | | | | | | | | |
226
Mercer Funds
Notes to Financial Statements (Continued)
March 31, 2020
LIABILITIES VALUATION INPUT
| | | | | | | | | | | | | | | | |
Description | | Quoted Prices
in Active
Markets for
Identical Assets
(Level 1) | | | Significant
Other
Observable
Inputs
(Level 2) | | | Significant
Unobservable
Inputs
(Level 3) | | | Total | |
Futures Contracts† | | | | | | | | | |
Sales | | $ | (1,759,162 | ) | | $ | — | | | $ | — | | | $ | (1,759,162 | ) |
| | | | | | | | | | | | | | | | |
Total Futures Contracts | | | (1,759,162 | ) | | | — | | | | — | | | | (1,759,162 | ) |
| | | | | | | | | | | | | | | | |
Swaps | | | | | | | | | |
Centrally Cleared Interest Rate Swaps† | | | — | | | | (2,104,413 | ) | | | — | | | | (2,104,413 | ) |
| | | | | | | | | | | | | | | | |
Total Swaps | | | — | | | | (2,104,413 | ) | | | — | | | | (2,104,413 | ) |
| | | | | | | | | | | | | | | | |
Forward Foreign Currency Contracts† | | | — | | | | (9,495 | ) | | | — | | | | (9,495 | ) |
| | | | | | | | | | | | | | | | |
Written Options | | | (13,469 | ) | | | — | | | | — | | | | (13,469 | ) |
| | | | | | | | | | | | | | | | |
Total | | $ | (1,772,631 | ) | | $ | (2,113,908 | ) | | $ | — | | | $ | (3,886,539 | ) |
| | | | | | | | | | | | | | | | |
| | † | Forward foreign currency contracts, Futures contracts and Centrally Cleared Swaps are valued at unrealized appreciation/depreciation. Only current day’s variation margin for Futures contracts and Centrally Cleared Swaps, if any, is reported on the Statements of Assets and Liabilities. |
Opportunistic Fixed
ASSETS VALUATION INPUT
| | | | | | | | | | | | | | | | |
Description | | Quoted Prices
in Active
Markets for
Identical Assets
(Level 1) | | | Significant
Other
Observable
Inputs
(Level 2) | | | Significant
Unobservable
Inputs
(Level 3) | | | Total | |
Debt Obligations | | $ | — | | | $ | 843,181,962 | | | $ | — | | | $ | 843,181,962 | |
| | | | | | | | | | | | | | | | |
Common Stocks | | | | | | | | | |
Consumer, Cyclical | | | — | | | | — | | | | 0 | ** | | | — | |
Energy | | | 6 | | | | 0 | * | | | — | | | | 6 | |
Utilities | | | — | | | | 673,722 | | | | — | | | | 673,722 | |
| | | | | | | | | | | | | | | | |
Total Common Stocks | | | 6 | | | | 673,722 | | | | 0 | | | | 673,728 | |
| | | | | | | | | | | | | | | | |
Convertible Preferred Stocks | | | | | | | | | |
Energy | | | — | | | | 37,832 | | | | — | | | | 37,832 | |
Industrial | | | 196,897 | | | | — | | | | — | | | | 196,897 | |
Technology | | | 1,813,593 | | | | — | | | | — | | | | 1,813,593 | |
Utilities | | | 819,544 | | | | — | | | | — | | | | 819,544 | |
| | | | | | | | | | | | | | | | |
Total Convertible Preferred Stocks | | | 2,830,034 | | | | 37,832 | | | | — | | | | 2,867,866 | |
| | | | | | | | | | | | | | | | |
Preferred Stocks | | | | | | | | | |
Financial | | | 166,731 | | | | — | | | | — | | | | 166,731 | |
| | | | | | | | | | | | | | | | |
Total Preferred Stocks | | | 166,731 | | | | — | | | | — | | | | 166,731 | |
| | | | | | | | | | | | | | | | |
Warrant | | | | | | | | | |
Energy | | | — | | | | 0 | * | | | — | | | | — | |
| | | | | | | | | | | | | | | | |
Total Warrant | | | — | | | | 0 | | | | — | | | | — | |
| | | | | | | | | | | | | | | | |
227
Mercer Funds
Notes to Financial Statements (Continued)
March 31, 2020
| | | | | | | | | | | | | | | | |
Description | | Quoted Prices
in Active
Markets for
Identical Assets
(Level 1) | | | Significant
Other
Observable
Inputs
(Level 2) | | | Significant
Unobservable
Inputs
(Level 3) | | | Total | |
Short-Term Investments | | | | | | | | | |
Certificates of Deposit | | $ | — | | | $ | 995,104 | | | $ | — | | | $ | 995,104 | |
Mutual Fund - Securities Lending Collateral | | | 18,037,151 | | | | — | | | | — | | | | 18,037,151 | |
Sovereign Debt Obligations | | | — | | | | 8,208,723 | | | | — | | | | 8,208,723 | |
| | | | | | | | | | | | | | | | |
Total Short-Term Investments | | | 18,037,151 | | | | 9,203,827 | | | | — | | | | 27,240,978 | |
| | | | | | | | | | | | | | | | |
Options Purchased | | | 646,900 | | | | 476,915 | | | | — | | | | 1,123,815 | |
| | | | | | | | | | | | | | | | |
Futures Contracts† | | | | | | | | | |
Buys | | | 2,163,110 | | | | — | | | | — | | | | 2,163,110 | |
Sales | | | 34,717 | | | | — | | | | — | | | | 34,717 | |
| | | | | | | | | | | | | | | | |
Total Futures Contracts | | | 2,197,827 | | | | — | | | | — | | | | 2,197,827 | |
| | | | | | | | | | | | | | | | |
Swaps | | | | | | | | | |
OTC Interest Rate Swaps | | | — | | | | 63,247 | | | | — | | | | 63,247 | |
Centrally Cleared Interest Rate Swaps† | | | — | | | | 392,828 | | | | — | | | | 392,828 | |
OTC Credit Default Swaps | | | — | | | | 25,301 | | | | — | | | | 25,301 | |
Centrally Cleared Credit Default Swaps† | | | — | | | | 10,354 | | | | — | | | | 10,354 | |
| | | | | | | | | | | | | | | | |
Total Swaps | | | — | | | | 491,730 | | | | — | | | | 491,730 | |
| | | | | | | | | | | | | | | | |
Forward Foreign Currency Contracts† | | | — | | | | 14,636,165 | | | | — | | | | 14,636,165 | |
| | | | | | | | | | | | | | | | |
Total | | $ | 23,878,649 | | | $ | 868,702,153 | | | $ | 0 | | | $ | 892,580,802 | |
| | | | | | | | | | | | | | | | |
LIABILITIES VALUATION INPUT
| | | | | | | | | | | | | | | | |
Description | | Quoted Prices
in Active
Markets for
Identical Assets
(Level 1) | | | Significant
Other
Observable
Inputs
(Level 2) | | | Significant
Unobservable
Inputs
(Level 3) | | | Total | |
Futures Contracts† | | | | | | | | | |
Buys | | $ | (28,429 | ) | | $ | — | | | $ | — | | | $ | (28,429 | ) |
Sales | | | (633,351 | ) | | | — | | | | — | | | | (633,351 | ) |
| | | | | | | | | | | | | | | | |
Total Futures Contracts | | | (661,780 | ) | | | — | | | | — | | | | (661,780 | ) |
| | | | | | | | | | | | | | | | |
Swaps | | | | | | | | | |
OTC Interest Rate Swaps | | | — | | | | (29,935 | ) | | | — | | | | (29,935 | ) |
Centrally Cleared Interest Rate Swaps† | | | — | | | | (1,374,518 | ) | | | — | | | | (1,374,518 | ) |
OTC Credit Default Swaps | | | — | | | | (39,388 | ) | | | — | | | | (39,388 | ) |
| | | | | | | | | | | | | | | | |
Total Swaps | | | — | | | | (1,443,841 | ) | | | — | | | | (1,443,841 | ) |
| | | | | | | | | | | | | | | | |
Forward Foreign Currency Contracts† | | | — | | | | (13,792,503 | ) | | | — | | | | (13,792,503 | ) |
| | | | | | | | | | | | | | | | |
Written Options | | | (214,691 | ) | | | (1,055,067 | ) | | | — | | | | (1,269,758 | ) |
| | | | | | | | | | | | | | | | |
Total | | $ | (876,471 | ) | | $ | (16,291,411 | ) | | $ | — | | | $ | (17,167,882 | ) |
| | | | | | | | | | | | | | | | |
| | * | Represents one or more Level 2 securities at $0 value as of March 31, 2020. |
228
Mercer Funds
Notes to Financial Statements (Continued)
March 31, 2020
| | ** | Represents one or more Level 3 securities at $0 value as of March 31, 2020. |
| | † | Forward foreign currency contracts, Futures contracts and Centrally Cleared Swaps are valued at unrealized appreciation/depreciation. Only current day’s variation margin for Futures contracts and Centrally Cleared Swaps, if any, is reported on the Statements of Assets and Liabilities. |
Emerging Markets
ASSETS VALUATION INPUT
| | | | | | | | | | | | | | | | |
Description | | Quoted Prices
in Active
Markets for
Identical Assets
(Level 1) | | | Significant
Other
Observable
Inputs
(Level 2) | | | Significant
Unobservable
Inputs
(Level 3) | | | Total | |
Common Stocks | | | | | | | | | |
Bermuda | | $ | 5,159,820 | | | $ | 9,430,159 | | | $ | — | | | $ | 14,589,979 | |
Brazil | | | 40,445,599 | | | | — | | | | — | | | | 40,445,599 | |
Cayman Islands | | | 96,540,459 | | | | 107,496,289 | | | | — | | | | 204,036,748 | |
Chile | | | 1,702,348 | | | | — | | | | — | | | | 1,702,348 | |
China | | | — | | | | 131,455,584 | | | | — | | | | 131,455,584 | |
Colombia | | | 546,869 | | | | — | | | | — | | | | 546,869 | |
Cyprus | | | — | | | | 513,929 | | | | — | | | | 513,929 | |
Czech Republic | | | — | | | | 415,730 | | | | — | | | | 415,730 | |
France | | | — | | | | 3,596,438 | | | | — | | | | 3,596,438 | |
Greece | | | — | | | | 2,138,378 | | | | — | | | | 2,138,378 | |
Hong Kong | | | 1,557,966 | | | | 27,115,410 | | | | — | | | | 28,673,376 | |
Hungary | | | — | | | | 3,872,433 | | | | — | | | | 3,872,433 | |
India | | | 3,099,141 | | | | 78,890,623 | | | | — | | | | 81,989,764 | |
Indonesia | | | — | | | | 15,354,649 | | | | — | | | | 15,354,649 | |
Japan | | | — | | | | 1,672,603 | | | | — | | | | 1,672,603 | |
Luxembourg | | | 477,452 | | | | 1,192,770 | | | | — | | | | 1,670,222 | |
Malaysia | | | — | | | | 4,973,452 | | | | — | | | | 4,973,452 | |
Mexico | | | 18,455,205 | | | | 75,199 | | | | — | | | | 18,530,404 | |
Netherlands | | | 5,014,364 | | | | 2,712,524 | | | | — | | | | 7,726,888 | |
Papua New Guinea | | | — | | | | 755,127 | | | | — | | | | 755,127 | |
Philippines | | | 14,392 | | | | 2,370,683 | | | | — | | | | 2,385,075 | |
Poland | | | — | | | | 4,806,302 | | | | — | | | | 4,806,302 | |
Russia | | | 5,077,520 | | | | 13,846,849 | | | | — | | | | 18,924,369 | |
Singapore | | | — | | | | 2,308,665 | | | | — | | | | 2,308,665 | |
South Africa | | | 1,210,959 | | | | 18,262,255 | | | | — | | | | 19,473,214 | |
South Korea | | | 5,461,500 | | | | 81,724,350 | | | | — | | | | 87,185,850 | |
Spain | | | 5,993 | | | | — | | | | — | | | | 5,993 | |
Switzerland | | | — | | | | 3,125,585 | | | | — | | | | 3,125,585 | |
Taiwan | | | 27,340,468 | | | | 93,060,910 | | | | — | | | | 120,401,378 | |
Thailand | | | 2,986,455 | | | | 11,245,548 | | | | — | | | | 14,232,003 | |
Turkey | | | — | | | | 2,697,810 | | | | — | | | | 2,697,810 | |
United Arab Emirates | | | — | | | | 897,376 | | | | — | | | | 897,376 | |
United Kingdom | | | 726,362 | | | | 10,117,334 | | | | — | | | | 10,843,696 | |
United States | | | 19,073,261 | | | | — | | | | — | | | | 19,073,261 | |
| | | | | | | | | | | | | | | | |
Total Common Stocks | | | 234,896,133 | | | | 636,124,964 | | | | — | | | | 871,021,097 | |
| | | | | | | | | | | | | | | | |
229
Mercer Funds
Notes to Financial Statements (Continued)
March 31, 2020
| | | | | | | | | | | | | | | | |
Description | | Quoted Prices
in Active
Markets for
Identical Assets
(Level 1) | | | Significant
Other
Observable
Inputs
(Level 2) | | | Significant
Unobservable
Inputs
(Level 3) | | | Total | |
Preferred Stocks | | | | | | | | | |
Brazil | | $ | 5,678,497 | | | $ | — | | | $ | — | | | $ | 5,678,497 | |
Colombia | | | 111,961 | | | | — | | | | — | | | | 111,961 | |
South Korea | | | — | | | | 4,872,447 | | | | — | | | | 4,872,447 | |
| | | | | | | | | | | | | | | | |
Total Preferred Stocks | | | 5,790,458 | | | | 4,872,447 | | | | — | | | | 10,662,905 | |
| | | | | | | | | | | | | | | | |
Rights | | | | | | | | | |
Hong Kong | | | — | | | | — | | | | 0 | ** | | | — | |
India | | | — | | | | 0 | * | | | — | | | | — | |
| | | | | | | | | | | | | | | | |
Total Rights | | | — | | | | 0 | | | | 0 | | | | — | |
| | | | | | | | | | | | | | | | |
Short-Term Investments | | | | | | | | | |
Mutual Fund - Securities Lending Collateral | | | 1,742,607 | | | | — | | | | — | | | | 1,742,607 | |
U.S. Government and Agency Obligations | | | — | | | | 1,999,892 | | | | — | | | | 1,999,892 | |
| | | | | | | | | | | | | | | | |
Total Short-Term Investments | | | 1,742,607 | | | | 1,999,892 | | | | — | | | | 3,742,499 | |
| | | | | | | | | | | | | | | | |
Futures Contracts† | | | | | | | | | |
Buys | | | 504,523 | | | | — | | | | — | | | | 504,523 | |
| | | | | | | | | | | | | | | | |
Total Futures Contracts | | | 504,523 | | | | — | | | | — | | | | 504,523 | |
| | | | | | | | | | | | | | | | |
Total | | $ | 242,933,721 | | | $ | 642,997,303 | | | $ | 0 | | | $ | 885,931,024 | |
| | | | | | | | | | | | | | | | |
| | * | Represents one or more Level 2 securities at $0 value as of March 31, 2020. |
| | ** | Represents one or more Level 3 securities at $0 value as of March 31, 2020. |
| | † | Futures contracts are valued at unrealized appreciation/depreciation. Only current day’s variation margin for Futures contracts and Centrally Cleared Swaps, if any, is reported on the Statements of Assets and Liabilities. |
Global Low Volatility
ASSETS VALUATION INPUT
| | | | | | | | | | | | | | | | |
Description | | Quoted Prices
in Active
Markets for
Identical Assets
(Level 1) | | | Significant
Other
Observable
Inputs
(Level 2) | | | Significant
Unobservable
Inputs
(Level 3) | | | Total | |
Common Stocks | | | | | | | | | |
Australia | | $ | — | | | $ | 14,879,862 | | | $ | — | | | $ | 14,879,862 | |
Austria | | | — | | | | 3,863,550 | | | | — | | | | 3,863,550 | |
Belgium | | | — | | | | 2,210,870 | | | | — | | | | 2,210,870 | |
Bermuda | | | 12,237,582 | | | | 1,221,710 | | | | — | | | | 13,459,292 | |
Canada | | | 54,227,862 | | | | — | | | | — | | | | 54,227,862 | |
Cayman Islands | | | 4,881,448 | | | | 44,379 | | | | — | | | | 4,925,827 | |
Denmark | | | — | | | | 2,923,222 | | | | — | | | | 2,923,222 | |
Finland | | | — | | | | 3,993,841 | | | | — | | | | 3,993,841 | |
230
Mercer Funds
Notes to Financial Statements (Continued)
March 31, 2020
| | | | | | | | | | | | | | | | |
Description | | Quoted Prices
in Active
Markets for
Identical Assets
(Level 1) | | | Significant
Other
Observable
Inputs
(Level 2) | | | Significant
Unobservable
Inputs
(Level 3) | | | Total | |
France | | $ | — | | | $ | 28,630,587 | | | $ | — | | | $ | 28,630,587 | |
Germany | | | — | | | | 17,277,690 | | | | — | | | | 17,277,690 | |
Hong Kong | | | — | | | | 18,693,444 | | | | — | | | | 18,693,444 | |
Ireland | | | 14,876,026 | | | | 498,396 | | | | — | | | | 15,374,422 | |
Israel | | | 198,634 | | | | 4,896,948 | | | | — | | | | 5,095,582 | |
Italy | | | — | | | | 1,389,403 | | | | — | | | | 1,389,403 | |
Japan | | | — | | | | 47,691,932 | | | | — | | | | 47,691,932 | |
Luxembourg | | | 522,192 | | | | 686,681 | | | | — | | | | 1,208,873 | |
Netherlands | | | — | | | | 16,003,754 | | | | — | | | | 16,003,754 | |
New Zealand | | | — | | | | 4,219,850 | | | | — | | | | 4,219,850 | |
Norway | | | — | | | | 4,697,647 | | | | — | | | | 4,697,647 | |
Portugal | | | — | | | | 253,802 | | | | — | | | | 253,802 | |
Puerto Rico | | | 1,473,500 | | | | — | | | | — | | | | 1,473,500 | |
Singapore | | | — | | | | 6,244,930 | | | | — | | | | 6,244,930 | |
Spain | | | — | | | | 8,802,444 | | | | — | | | | 8,802,444 | |
Sweden | | | — | | | | 16,195,952 | | | | — | | | | 16,195,952 | |
Switzerland | | | — | | | | 38,017,112 | | | | — | | | | 38,017,112 | |
United Kingdom | | | 3,701,529 | | | | 37,152,190 | | | | — | | | | 40,853,719 | |
United States | | | 546,772,383 | | | | — | | | | — | | | | 546,772,383 | |
| | | | | | | | | | | | | | | | |
Total Common Stocks | | | 638,891,156 | | | | 280,490,196 | | | | — | | | | 919,381,352 | |
| | | | | | | | | | | | | | | | |
Short-Term Investments | | | | | | | | | |
Mutual Fund - Securities Lending Collateral | | | 3,702,660 | | | | — | | | | — | | | | 3,702,660 | |
U.S. Government and Agency Obligations | | | — | | | | 999,770 | | | | — | | | | 999,770 | |
| | | | | | | | | | | | | | | | |
Total Short-Term Investments | | | 3,702,660 | | | | 999,770 | | | | — | | | | 4,702,430 | |
| | | | | | | | | | | | | | | | |
Futures Contracts† | | | | | | | | | |
Buys | | | 4,999,188 | | | | — | | | | — | | | | 4,999,188 | |
| | | | | | | | | | | | | | | | |
Total Futures Contracts | | | 4,999,188 | | | | — | | | | — | | | | 4,999,188 | |
| | | | | | | | | | | | | | | | |
Total | | $ | 647,593,004 | | | $ | 281,489,966 | | | $ | — | | | $ | 929,082,970 | |
| | | | | | | | | | | | | | | | |
| | † | Futures contracts are valued at unrealized appreciation/depreciation. Only current day’s variation margin for Futures contracts and Centrally Cleared Swaps, if any, is reported on the Statements of Assets and Liabilities. |
231
Mercer Funds
Notes to Financial Statements (Continued)
March 31, 2020
The following table includes a rollforward of the amounts for the year ended March 31, 2020 for financial instruments classified as Level 3:
Core Fixed
| | | | | | | | | | | | | | | | | | | | | | | | | | | | | | | | | | | |
Investments in Securities | | Balance as of
March 31,
2019 | | Realized
Gain
(Loss) | | Change in
Unrealized
Appreciation
(Depreciation) | | Net
Transfers
In (Out)
of Level 3 | | Purchases/
Sales | | Balance as of
March 31,
2020 | | Change in
Unrealized
Appreciation
(Depreciation)
from
Investments
Held at
March 31,
2020 |
DEBT OBLIGATIONS | | | | | | | | | | | | | | | | | | | | | | | | | | | | | | | |
Corporate Debt | | | $ | —^ | | | | $ | �� | | | | $ | 1,528 | | | | $ | — | | | | $ | — | | | | $ | 1,528 | | | | $ | 1,528 | |
| | | | | | | | | | | | | | | | | | | | | | | | | | | | | | | | | | | |
Total | | | $ | —^ | | | | $ | — | | | | $ | 1,528 | | | | $ | — | | | | $ | — | | | | $ | 1,528 | | | | $ | 1,528 | |
| | | | | | | | | | | | | | | | | | | | | | | | | | | | | | | | | | | |
| | ^ | Represents one security at $0 value as of March 31, 2019. |
Investments in Derivative Instruments
At March 31, 2020 and during the year then ended, the Funds had the following derivatives and transactions in derivatives, grouped into appropriate risk categories:
Large Cap
| | | | | | | | |
| ASSET DERIVATIVES | |
| | | Equity Risk | | | Total | |
Futures Contracts(2) | | $ | 1,007,143 | | | $ | 1,007,143 | |
| | | | | | | | |
Total Value | | $ | 1,007,143 | | | $ | 1,007,143 | |
| | | | | | | | |
|
| LIABILITY DERIVATIVES | |
| | | Equity Risk | | | Total | |
Futures Contracts(2) | | $ | (76,964 | ) | | $ | (76,964 | ) |
| | | | | | | | |
Total Value | | $ | (76,964 | ) | | $ | (76,964 | ) |
| | | | | | | | |
|
| NET REALIZED GAIN (LOSS)(6) | |
| | | Equity Risk | | | Total | |
Futures Contracts | | $ | (3,598,844 | ) | | $ | (3,598,844 | ) |
| | | | | | | | |
Total Realized Gain (Loss) | | $ | (3,598,844 | ) | | $ | (3,598,844 | ) |
| | | | | | | | |
|
| CHANGE IN APPRECIATION (DEPRECIATION)(7) | |
| | | Equity Risk | | | Total | |
Futures Contracts | | $ | 752,946 | | | $ | 752,946 | |
| | | | | | | | |
Total Change in Appreciation (Depreciation) | | $ | 752,946 | | | $ | 752,946 | |
| | | | | | | | |
232
Mercer Funds
Notes to Financial Statements (Continued)
March 31, 2020
| | | | | | | | |
| NUMBER OF CONTRACTS, NOTIONAL AMOUNTS OR SHARES/UNITS(8) | |
| | | Equity Risk | | | Total | |
Long Futures Contracts | | $ | 16,656,270 | | | $ | 16,656,270 | |
Small/Mid Cap
| | | | | | | | |
| ASSET DERIVATIVES | |
| | | Equity Risk | | | Total | |
Futures Contracts(2) | | $ | 51,766 | | | $ | 51,766 | |
| | | | | | | | |
Total Value | | $ | 51,766 | | | $ | 51,766 | |
| | | | | | | | |
|
| LIABILITY DERIVATIVES | |
| | | Equity Risk | | | Total | |
Futures Contracts(2) | | $ | (189,710 | ) | | $ | (189,710 | ) |
| | | | | | | | |
Total Value | | $ | (189,710 | ) | | $ | (189,710 | ) |
| | | | | | | | |
|
| NET REALIZED GAIN (LOSS)(6) | |
| | | Equity Risk | | | Total | |
Futures Contracts | | $ | (3,485,870 | ) | | $ | (3,485,870 | ) |
| | | | | | | | |
Total Realized Gain (Loss) | | $ | (3,485,870 | ) | | $ | (3,485,870 | ) |
| | | | | | | | |
|
| CHANGE IN APPRECIATION (DEPRECIATION)(7) | |
| | | Equity Risk | | | Total | |
Futures Contracts | | $ | (493,724 | ) | | $ | (493,724 | ) |
| | | | | | | | |
Total Change in Appreciation (Depreciation) | | $ | (493,724 | ) | | $ | (493,724 | ) |
| | | | | | | | |
|
| NUMBER OF CONTRACTS, NOTIONAL AMOUNTS OR SHARES/UNITS(8) | |
| | | Equity Risk | | | Total | |
Long Futures Contracts | | $ | 34,496,550 | | | $ | 34,496,550 | |
Non-US Core Equity
| | | | | | | | | | | | |
| ASSET DERIVATIVES | |
| | | Foreign
Currency Risk | | | Equity Risk | | | Total | |
Futures Contracts(2) | | $ | — | | | $ | 9,483,565 | | | $ | 9,483,565 | |
| | | | | | | | | | | | |
Total Value | | $ | — | | | $ | 9,483,565 | | | $ | 9,483,565 | |
| | | | | | | | | | | | |
|
| LIABILITY DERIVATIVES | |
| | | Foreign
Currency Risk | | | Equity Risk | | | Total | |
Forward Foreign Currency Contracts(5) | | $ | (624,517 | ) | | $ | — | | | $ | (624,517 | ) |
| | | | | | | | | | | | |
Total Value | | $ | (624,517 | ) | | $ | — | | | $ | (624,517 | ) |
| | | | | | | | | | | | |
233
Mercer Funds
Notes to Financial Statements (Continued)
March 31, 2020
| | | | | | | | | | | | |
| NET REALIZED GAIN (LOSS)(6) | |
| | | Foreign
Currency Risk | | | Equity Risk | | | Total | |
Futures Contracts | | $ | — | | | $ | (11,040,524 | ) | | $ | (11,040,524 | ) |
Forward Foreign Currency Contracts | | | 642,996 | | | | — | | | | 642,996 | |
| | | | | | | | | | | | |
Total Realized Gain (Loss) | | $ | 642,996 | | | $ | (11,040,524 | ) | | $ | (10,397,528 | ) |
| | | | | | | | | | | | |
|
| CHANGE IN APPRECIATION (DEPRECIATION)(7) | |
| | | Foreign
Currency Risk | | | Equity Risk | | | Total | |
Futures Contracts | | $ | — | | | $ | 8,109,239 | | | $ | 8,109,239 | |
Forward Foreign Currency Contracts | | | (666,604 | ) | | | — | | | | (666,604 | ) |
| | | | | | | | | | | | |
Total Change in Appreciation (Depreciation) | | $ | (666,604 | ) | | $ | 8,109,239 | | | $ | 7,442,635 | |
| | | | | | | | | | | | |
|
| NUMBER OF CONTRACTS, NOTIONAL AMOUNTS OR SHARES/UNITS(8) | |
| | | Foreign
Currency Risk | | | Equity Risk | | | Total | |
Long Futures Contracts | | $ | — | | | $ | 100,919,741 | | | $ | 100,919,741 | |
Forward Foreign Currency Contracts | | | 21,830,184 | | | | — | | | | 21,830,184 | |
Core Fixed
| | | | | | | | | | | | |
| ASSET DERIVATIVES | |
| | | Foreign
Currency Risk | | | Interest Rate
Risk | | | Total | |
Options Purchased(1) | | $ | — | | | $ | 17,031 | | | $ | 17,031 | |
Futures Contracts(2) | | | — | | | | 1,109,449 | | | | 1,109,449 | |
Forward Foreign Currency Contracts(3) | | | 5,840 | | | | — | | | | 5,840 | |
Centrally Cleared Swap Contracts** | | | — | | | | 1,034,220 | | | | 1,034,220 | |
| | | | | | | | | | | | |
Total Value | | $ | 5,840 | | | $ | 2,160,700 | | | $ | 2,166,540 | |
| | | | | | | | | | | | |
|
| LIABILITY DERIVATIVES | |
| | | Foreign
Currency Risk | | | Interest Rate
Risk | | | Total | |
Options Written(4) | | $ | — | | | $ | (13,469 | ) | | $ | (13,469 | ) |
Futures Contracts(2) | | | — | | | | (1,759,162 | ) | | | (1,759,162 | ) |
Forward Foreign Currency Contracts(5) | | | (9,495 | ) | | | — | | | | (9,495 | ) |
Centrally Cleared Swap Contracts** | | | — | | | | (2,104,413 | ) | | | (2,104,413 | ) |
| | | | | | | | | | | | |
Total Value | | $ | (9,495 | ) | | $ | (3,877,044 | ) | | $ | (3,886,539 | ) |
| | | | | | | | | | | | |
234
Mercer Funds
Notes to Financial Statements (Continued)
March 31, 2020
| | | | | | | | | | | | |
| NET REALIZED GAIN (LOSS)(6) | |
| | | Foreign
Currency Risk | | | Interest Rate
Risk | | | Total | |
Options Purchased | | $ | — | | | $ | (138,860 | ) | | $ | (138,860 | ) |
Options Written | | | — | | | | 60,365 | | | | 60,365 | |
Swaps Contracts | | | — | | | | (2,500,610 | ) | | | (2,500,610 | ) |
Futures Contracts | | | — | | | | 6,390,926 | | | | 6,390,926 | |
Forward Foreign Currency Contracts | | | 10,934 | | | | — | | | | 10,934 | |
| | | | | | | | | | | | |
Total Realized Gain (Loss) | | $ | 10,934 | | | $ | 3,811,821 | | | $ | 3,822,755 | |
| | | | | | | | | | | | |
|
| CHANGE IN APPRECIATION (DEPRECIATION)(7) | |
| | | Foreign
Currency Risk | | | Interest Rate
Risk | | | Total | |
Options Purchased | | $ | — | | | $ | (47,575 | ) | | $ | (47,575 | ) |
Options Written | | | — | | | | 10,030 | | | | 10,030 | |
Swaps Contracts | | | — | | | | (785,955 | ) | | | (785,955 | ) |
Futures Contracts | | | — | | | | (1,754,626 | ) | | | (1,754,626 | ) |
Forward Foreign Currency Contracts | | | (3,655 | ) | | | — | | | | (3,655 | ) |
| | | | | | | | | | | | |
Total Change in Appreciation (Depreciation) | | $ | (3,655 | ) | | $ | (2,578,126 | ) | | $ | (2,581,781 | ) |
| | | | | | | | | | | | |
|
| NUMBER OF CONTRACTS, NOTIONAL AMOUNTS OR SHARES/UNITS(8) | |
| | | Foreign
Currency Risk | | | Interest Rate
Risk | | | Total | |
Options Purchased | | $ | — | | | $ | 416,714 | | | $ | 416,714 | |
Options Written | | | — | | | | (357,571 | ) | | | (357,571 | ) |
Swaps Contracts | | | — | | | | 81,898,683 | | | | 81,898,683 | |
Short Futures Contracts | | | — | | | | (42,742,268 | ) | | | (42,742,268 | ) |
Long Futures Contracts | | | — | | | | 66,043,117 | | | | 66,043,117 | |
Forward Foreign Currency Contracts | | | 904,945 | | | | — | | | | 904,945 | |
Opportunistic Fixed
| | | | | | | | | | | | | | | | | | | | |
| ASSET DERIVATIVES | | | | | |
| | | Credit
Risk | | | Foreign
Currency Risk | | | Interest
Rate Risk | | | Equity
Risk | | | Total | |
| |
| | | | | |
Options Purchased(1) | | $ | 87,386 | | | $ | 389,529 | | | $ | — | | | $ | 646,900 | | | $ | 1,123,815 | |
Futures Contracts(2) | | | — | | | | — | | | | 2,197,827 | | | | — | | | | 2,197,827 | |
Forward Foreign Currency Contracts(3) | | | — | | | | 14,636,165 | | | | — | | | | — | | | | 14,636,165 | |
OTC Swaps Contracts | | | 25,301 | | | | — | | | | 63,247 | | | | — | | | | 88,548 | |
Centrally Cleared Swap Contracts** | | | 10,354 | | | | — | | | | 392,828 | | | | — | | | | 403,182 | |
| | | | | | | | | | | | | | | | | | | | |
Total Value | | $ | 123,041 | | | $ | 15,025,694 | | | $ | 2,653,902 | | | $ | 646,900 | | | $ | 18,449,537 | |
| | | | | | | | | | | | | | | | | | | | |
235
Mercer Funds
Notes to Financial Statements (Continued)
March 31, 2020
| | | | | | | | | | | | | | | | | | | | |
| LIABILITY DERIVATIVES | | | | | |
| | | Credit
Risk | | | Foreign
Currency Risk | | | Interest
Rate Risk | | | Equity
Risk | | | Total | |
Options Written(4) | | $ | — | | | $ | (1,055,067 | ) | | $ | (5,891 | ) | | $ | (208,800 | ) | | $ | (1,269,758 | ) |
Futures Contracts(2) | | | — | | | | — | | | | (661,780 | ) | | | — | | | | (661,780 | ) |
Forward Foreign Currency Contracts(5) | | | — | | | | (13,792,503 | ) | | | — | | | | — | | | | (13,792,503 | ) |
OTC Swaps Contracts | | | (39,388 | ) | | | — | | | | (29,935 | ) | | | — | | | | (69,323 | ) |
Centrally Cleared Swap Contracts** | | | — | | | | — | | | | (1,374,518 | ) | | | — | | | | (1,374,518 | ) |
| | | | | | | | | | | | | | | | | | | | |
Total Value | | $ | (39,388 | ) | | $ | (14,847,570 | ) | | $ | (2,072,124 | ) | | $ | (208,800 | ) | | $ | (17,167,882 | ) |
| | | | | | | | | | | | | | | | | | | | |
| |
| NET REALIZED GAIN (LOSS)(6) | | | | | |
| | | Credit
Risk | | | Foreign
Currency Risk | | | Interest
Rate Risk | | | Equity
Risk | | | Total | |
Options Purchased | | $ | 1,435,476 | | | $ | (1,337,112 | ) | | $ | (545,767 | ) | | $ | 2,117,092 | | | $ | 1,669,689 | |
Options Written | | | 94,068 | | | | (29,509 | ) | | | 99,097 | | | | (821,275 | ) | | | (657,619 | ) |
Swaps Contracts | | | (880,894 | ) | | | — | | | | (7,813,064 | ) | | | — | | | | (8,693,958 | ) |
Futures Contracts | | | — | | | | — | | | | 2,719,755 | | | | — | | | | 2,719,755 | |
Forward Foreign Currency Contracts | | | — | | | | 6,009,004 | | | | — | | | | — | | | | 6,009,004 | |
| | | | | | | | | | | | | | | | | | | | |
Total Realized Gain (Loss) | | $ | 648,650 | | | $ | 4,642,383 | | | $ | (5,539,979 | ) | | $ | 1,295,817 | | | $ | 1,046,871 | |
| | | | | | | | | | | | | | | | | | | | |
| |
| CHANGE IN APPRECIATION (DEPRECIATION)(7) | | | | | |
| | | Credit
Risk | | | Foreign
Currency Risk | | | Interest
Rate Risk | | | Equity
Risk | | | Total | |
Options Purchased | | $ | 263,945 | | | $ | 191,732 | | | $ | 166,727 | | | $ | (448,424 | ) | | $ | 173,980 | |
Options Written | | | (12,112 | ) | | | (784,617 | ) | | | 49,530 | | | | (28,882 | ) | | | (776,081 | ) |
Swaps Contracts | | | 574,936 | | | | — | | | | 1,121,242 | | | | — | | | | 1,696,178 | |
Futures Contracts | | | — | | | | — | | | | 1,808,725 | | | | — | | | | 1,808,725 | |
Forward Foreign Currency Contracts | | | — | | | | 1,305,980 | | | | — | | | | — | | | | 1,305,980 | |
| | | | | | | | | | | | | | | | | | | | |
Total Change in Appreciation (Depreciation) | | $ | 826,769 | | | $ | 713,095 | | | $ | 3,146,224 | | | $ | (477,306 | ) | | $ | 4,208,782 | |
| | | | | | | | | | | | | | | | | | | | |
236
Mercer Funds
Notes to Financial Statements (Continued)
March 31, 2020
| | | | | | | | | | | | | | | | | | | | |
| NUMBER OF CONTRACTS, NOTIONAL AMOUNTS OR SHARES/UNITS(8) | |
| | | Credit Risk | | | Foreign
Currency
Risk | | | Interest Rate
Risk | | | Equity
Risk | | | Total | |
Options Purchased | | $ | 52,100,182 | | | $ | 63,082,818 | | | $ | 3,863,947 | | | $ | 139,452 | | | $ | 119,186,399 | |
Options Written | | | (34,693,333 | ) | | | (25,333,375 | ) | | | (7,460,407 | ) | | | (2,850 | ) | | | (67,489,965 | ) |
Swaps Contracts | | | 122,727,355 | | | | — | | | | 146,108,691 | | | | — | | | | 268,836,046 | |
Short Futures Contracts | | | — | | | | — | | | | (121,738,019 | ) | | | — | | | | (121,738,019 | ) |
Long Futures Contracts | | | — | | | | — | | | | 100,090,610 | | | | — | | | | 100,090,610 | |
Forward Foreign Currency Contracts | | | — | | | | 621,526,109 | | | | — | | | | — | | | | 621,526,109 | |
Emerging Markets
| | | | | | | | | | | | |
| ASSET DERIVATIVES | |
| | | Foreign
Currency Risk | | | Equity Risk | | | Total | |
Futures Contracts(2) | | $ | — | | | $ | 504,523 | | | $ | 504,523 | |
| | | | | | | | | | | | |
Total Value | | $ | — | | | $ | 504,523 | | | $ | 504,523 | |
| | | | | | | | | | | | |
|
| NET REALIZED GAIN (LOSS)(6) | |
| | | Foreign
Currency Risk | | | Equity Risk | | | Total | |
Futures Contracts†† | | $ | — | | | $ | (3,134,219 | ) | | $ | (3,134,219 | ) |
Forward Foreign Currency Contracts | | | 5,029,209 | | | | — | | | | 5,029,209 | |
| | | | | | | | | | | | |
Total Realized Gain (Loss) | | $ | 5,029,209 | | | $ | (3,134,219 | ) | | $ | 1,894,990 | |
| | | | | | | | | | | | |
|
| CHANGE IN APPRECIATION (DEPRECIATION)(7) | |
| | | Foreign
Currency Risk | | | Equity Risk | | | Total | |
Futures Contracts†† | | $ | — | | | $ | (85,917 | ) | | $ | (85,917 | ) |
Forward Foreign Currency Contracts | | | (1,680,667 | ) | | | — | | | | (1,680,667 | ) |
| | | | | | | | | | | | |
Total Change in Appreciation (Depreciation) | | $ | (1,680,667 | ) | | $ | (85,917 | ) | | $ | (1,766,584 | ) |
| | | | | | | | | | | | |
|
| NUMBER OF CONTRACTS, NOTIONAL AMOUNTS OR SHARES/UNITS(8) | |
| | | Foreign
Currency Risk | | | Equity Risk | | | Total | |
Short Futures Contracts†† | | $ | — | | | $ | (12,057,207 | ) | | $ | (12,057,207 | ) |
Long Futures Contracts | | | — | | | | 49,997,274 | | | | 49,997,274 | |
Forward Foreign Currency Contracts | | | 693,089,382 | | | | — | | | | 693,089,382 | |
237
Mercer Funds
Notes to Financial Statements (Continued)
March 31, 2020
Global Low Volatility
| | | | | | | | | | | | |
| ASSET DERIVATIVES | |
| | | Foreign
Currency Risk | | | Equity Risk | | | Total | |
Futures Contracts(2) | | $ | 21,646 | | | $ | 4,977,542 | | | $ | 4,999,188 | |
| | | | | | | | | | | | |
Total Value | | $ | 21,646 | | | $ | 4,977,542 | | | $ | 4,999,188 | |
| | | | | | | | | | | | |
|
| NET REALIZED GAIN (LOSS)(6) | |
| | | Foreign
Currency Risk | | | Equity Risk | | | Total | |
Futures Contracts | | $ | (4,678 | ) | | $ | 885,823 | | | $ | 881,145 | |
| | | | | | | | | | | | |
Total Realized Gain (Loss) | | $ | (4,678 | ) | | $ | 885,823 | | | $ | 881,145 | |
| | | | | | | | | | | | |
|
| CHANGE IN APPRECIATION (DEPRECIATION)(7) | |
| | | Foreign
Currency Risk | | | Equity Risk | | �� | Total | |
Futures Contracts | | $ | 23,501 | | | $ | 4,350,314 | | | $ | 4,373,815 | |
| | | | | | | | | | | | |
Total Change in Appreciation (Depreciation) | | $ | 23,501 | | | $ | 4,350,314 | | | $ | 4,373,815 | |
| | | | | | | | | | | | |
|
| NUMBER OF CONTRACTS, NOTIONAL AMOUNTS OR SHARES/UNITS(8) | |
| | | Foreign
Currency Risk | | | Equity Risk | | | Total | |
Long Futures Contracts | | $ | 1,260,638 | | | $ | 34,755,184 | | | $ | 36,015,822 | |
| | ** | Centrally Cleared Swaps are valued at unrealized appreciation/depreciation on the Schedule of Investments. Only current day’s variation margin, if any, is reported on the Statements of Assets and Liabilities. |
| | †† | Includes Synthetic Futures. |
| | (1) | Statements of Assets and Liabilities location: Investments, at value. |
| | (2) | Cumulative appreciation (depreciation) on futures contracts is disclosed within the Schedule of Investments under the open “Futures Contracts” section. Only current day’s variation margin, if any, are reported within the Statements of Assets and Liabilities. |
| | (3) | Statements of Assets and Liabilities location: Unrealized appreciation on open forward foreign currency contracts. |
| | (4) | Statements of Assets and Liabilities location: Written options, at value. |
| | (5) | Statements of Assets and Liabilities location: Unrealized depreciation on open forward foreign currency contracts. |
| | (6) | Statements of Operations location: Amounts are included in Net realized gain (loss) on Forward foreign currency contracts, Closed futures contracts, Purchased option contracts, Written option contracts and Swap contracts. |
| | (7) | Statements of Operations location: Amounts are included in Change in net unrealized appreciation (depreciation) on Forward foreign currency contracts, Open futures contracts, Purchased option contracts, Written option contracts and Swap contracts. |
| | (8) | Amounts disclosed represent average notional value for the months that the Fund held such derivatives during the year ended March 31, 2020. |
238
Mercer Funds
Notes to Financial Statements (Continued)
March 31, 2020
Netting Agreements and Collateral Requirements
In order to better define contractual rights under derivative contracts and to secure rights that will help the Funds mitigate their counterparty risk, a subadvisor may, on behalf of the Funds, enter into an International Swaps and Derivatives Association, Inc. Master Agreement (“ISDA Master Agreement”) or similar agreement with its derivative contract counterparties. An ISDA Master Agreement is a bilateral agreement between the Funds and a counterparty that governs OTC derivatives and foreign exchange contracts and typically contains, among other things, collateral posting terms and netting provisions in the event of a default and/or termination event. Under an ISDA Master Agreement, the Funds may, under certain circumstances, offset with the counterparty certain derivative financial instrument’s payables and/or receivables with certain collateral held and/or posted and create a net payment. The provisions of the ISDA Master Agreement typically permit a net payment in the event of default including the bankruptcy or insolvency of the counterparty. Absent an event of default by the counterparty or termination of the agreement, the ISDA Master Agreement does not result in an offset of reported amounts of assets and liabilities in the Statements of Assets and Liabilities across the transactions between the Funds and the applicable counterparty. The right to offset and net payments across all transactions traded under the ISDA Master Agreement could result in a reduction of the Funds’ credit risk to such counterparty equal to any amounts payable by the Funds under the applicable transactions, if any. However, bankruptcy or insolvency laws of a particular jurisdiction may impose restrictions on or prohibitions against the right of offset in bankruptcy, insolvency or other events. In addition, certain ISDA Master Agreements allow counterparties to OTC derivatives to terminate derivative contracts prior to maturity in the event a Fund’s net assets decline by a stated percentage or the Funds fail to meet the terms of their ISDA Master Agreements, which would cause the Funds to accelerate payment of any net liability owed to the counterparty.
For derivatives traded under an ISDA Master Agreement, the collateral requirements are typically calculated by netting the mark to market amount for each transaction under such agreement and comparing that amount to the value of any collateral currently pledged by the Funds and the counterparty.
Cash collateral that has been pledged to cover obligations of the Funds and cash collateral received from the counterparty, if any, is reported separately on the Statements of Assets and Liabilities as cash collateral held at broker or cash collateral due to broker, respectively.Non-cash collateral pledged by or received by the Funds, if any, is noted in the Schedule of Investments. Generally, the amount of collateral due from or to a party has to exceed a minimum transfer amount threshold before a transfer is required, which is determined each day at the close of business of the Funds, typically based on changes in market values for each transaction under an ISDA Master Agreement and netted into one amount for such agreement and any additional required collateral is delivered to/pledged by the Funds on the next business day. Typically, the Funds and counterparties are not permitted to sell,re-pledge or use the collateral they receive. To the extent amounts due to the Funds from their counterparties are not fully collateralized, contractually or otherwise, the Funds bear the risk of loss from counterpartynon-performance. The Funds attempt to mitigate counterparty risk by entering into agreements only with counterparties that they believe have the financial resources to honor their obligations and by monitoring the financial stability of those counterparties.
The Funds are required to disclose both gross and net information for assets and liabilities related to derivatives, repurchase and reverse repurchase agreements, and securities lending and securities borrowings transactions that are eligible for offset or subject to an enforceable master netting or similar agreement. The Funds’ derivative assets and liabilities at fair value by risk are presented in the tables
239
Mercer Funds
Notes to Financial Statements (Continued)
March 31, 2020
above. For financial reporting purposes the Funds do not offset derivative assets and derivative liabilities that are subject to netting arrangements in the Statements of Assets and Liabilities.
The following tables present the Funds’ derivative assets and liabilities by counterparty, net of amounts available for offset under a Master Netting Agreement (“MNA”) and net of related collateral received by the Funds for assets or pledged by the Funds for liabilities as of March 31, 2020.
Non-US Core Equity
Offsetting of Financial Liabilities and Derivative Liabilities:
| | | | | | | | | | | | | | | | |
Counterparty | | Derivative
Liabilities Subject
to MNA | | | Derivative
Assets/(Liabilities)
available for offset | | | Collateral
Pledged* | | | Net Amount
of Derivative
Liabilities(a) | |
HSBC Bank USA, N.A. | | $ | (531,874 | ) | | $ | — | | | $ | — | | | $ | (531,874 | ) |
State Street Bank and Trust | | | (92,643 | ) | | | — | | | | — | | | | (92,643 | ) |
| | | | | | | | | | | | | | | | |
| | $ | (624,517 | ) | | $ | — | | | $ | — | | | $ | (624,517 | ) |
| | | | | | | | | | | | | | | | |
| | (a) | Represents the net amount payable to the counterparty in the event of default. |
| | * | In some instances, the actual collateral received and/or pledged may be more than the derivative asset or liability due to overcollateralization. |
Core Fixed
Offsetting of Financial Assets and Derivative Assets:
| | | | | | | | | | | | | | | | |
Counterparty | | Derivative
Assets Subject
to MNA | | | Derivative
Assets/(Liabilities)
available for offset | | | Collateral
Received* | | | Net Amount
of Derivative
Assets(a) | |
Barclays Bank Plc | | $ | 5,840 | | | $ | (5,732 | ) | | $ | — | | | $ | 108 | |
| | | | | | | | | | | | | | | | |
Offsetting of Financial Liabilities and Derivative Liabilities:
| | | | | | | | | | | | | | | | |
Counterparty | | Derivative
Liabilities Subject
to MNA | | | Derivative
Assets/(Liabilities)
available for offset | | | Collateral
Pledged* | | | Net Amount
of Derivative
Liabilities(b) | |
Barclays Bank Plc | | $ | (5,732 | ) | | $ | 5,732 | | | $ | — | | | $ | — | |
JPMorgan Chase Bank N.A. | | | (3,763 | ) | | | — | | | | — | | | | (3,763 | ) |
| | | | | | | | | | | | | | | | |
| | $ | (9,495 | ) | | $ | 5,732 | | | $ | — | | | $ | (3,763 | ) |
| | | | | | | | | | | | | | | | |
| | (a) | Represents the net amount receivable from the counterparty in the event of default. |
| | (b) | Represents the net amount payable to the counterparty in the event of default. |
| | * | In some instances, the actual collateral received and/or pledged may be more than the derivative asset or liability due to overcollateralization. |
240
Mercer Funds
Notes to Financial Statements (Continued)
March 31, 2020
Opportunistic Fixed
Offsetting of Financial Assets and Derivative Assets:
| | | | | | | | | | | | | | | | |
Counterparty | | Derivative
Assets Subject
to MNA | | | Derivative
Assets/(Liabilities)
available for offset | | | Collateral
Received* | | | Net Amount
of Derivative
Assets(a) | |
Bank of America, N.A. | | $ | 692,272 | | | $ | (466,016 | ) | | $ | (36,287 | ) | | $ | 189,969 | |
Barclays Bank Plc | | | 1,068,382 | | | | (598,902 | ) | | | — | | | | 469,480 | |
BNP Paribas S.A. | | | 414,213 | | | | (414,213 | ) | | | — | | | | — | |
Citibank N.A. | | | 785,622 | | | | (785,622 | ) | | | — | | | | — | |
Citigroup Global Markets, Inc. | | | 19,414 | | | | (19,414 | ) | | | — | | | | — | |
Credit Suisse International | | | 39,835 | | | | (392 | ) | | | (39,443 | ) | | | — | |
Deutsche Bank AG | | | 835,923 | | | | (678,774 | ) | | | (157,149 | ) | | | — | |
Goldman Sachs & Co. | | | 945,391 | | | | (726,925 | ) | | | (218,466 | ) | | | — | |
Goldman Sachs International | | | 1,017,781 | | | | (918,090 | ) | | | (99,691 | ) | | | — | |
HSBC Bank Plc | | | 327,868 | | | | (327,868 | ) | | | — | | | | — | |
HSBC Bank USA, N.A. | | | 20,621 | | | | (20,621 | ) | | | — | | | | — | |
JPMorgan Chase Bank N.A. | | | 5,900,512 | | | | (3,245,742 | ) | | | (2,601,555 | ) | | | 53,215 | |
Morgan Stanley & Co. | | | 26,565 | | | | (26,565 | ) | | | — | | | | — | |
Morgan Stanley and Co. International Plc | | | 64,359 | | | | (64,359 | ) | | | — | | | | — | |
Morgan Stanley Capital Services, Inc. | | | 2,718,415 | | | | (2,140,331 | ) | | | (578,084 | ) | | | — | |
Natwest Markets Plc | | | 26,419 | | | | (26,419 | ) | | | — | | | | — | |
Standard Chartered Bank | | | 33,315 | | | | (6,203 | ) | | | — | | | | 27,112 | |
State Street Bank and Trust | | | 27,184 | | | | (17,296 | ) | | | — | | | | 9,888 | |
State Street Bank London | | | 10,516 | | | | (10,516 | ) | | | — | | | | — | |
Toronto Dominion Bank | | | 162,513 | | | | (3,524 | ) | | | — | | | | 158,989 | |
UBS AG | | | 64,508 | | | | (64,508 | ) | | | — | | | | — | |
| | | | | | | | | | | | | | | | |
| | $ | 15,201,628 | | | $ | (10,562,300 | ) | | $ | (3,730,675 | ) | | $ | 908,653 | |
| | | | | | | | | | | | | | | | |
Offsetting of Financial Liabilities and Derivative Liabilities:
| | | | | | | | | | | | | | | | |
Counterparty | | Derivative
Liabilities Subject
to MNA | | | Derivative
Assets/(Liabilities)
available for offset | | | Collateral
Pledged* | | | Net Amount
of Derivative
Liabilities(b) | |
Bank of America, N.A. | | $ | (466,016 | ) | | $ | 466,016 | | | $ | — | | | $ | — | |
Barclays Bank Plc | | | (598,902 | ) | | | 598,902 | | | | — | | | | — | |
BNP Paribas S.A. | | | (780,140 | ) | | | 414,213 | | | | 365,927 | | | | — | |
Citibank N.A. | | | (2,977,282 | ) | | | 785,622 | | | | 969,353 | | | | (1,222,307 | ) |
Citigroup Global Markets, Inc. | | | (101,542 | ) | | | 19,414 | | | | — | | | | (82,128 | ) |
Credit Suisse International | | | (392 | ) | | | 392 | | | | — | | | | — | |
Deutsche Bank AG | | | (678,774 | ) | | | 678,774 | | | | — | | | | — | |
Goldman Sachs & Co. | | | (726,925 | ) | | | 726,925 | | | | — | | | | — | |
Goldman Sachs International | | | (918,090 | ) | | | 918,090 | | | | — | | | | — | |
HSBC Bank Plc | | | (698,465 | ) | | | 327,868 | | | | 314,968 | | | | (55,629 | ) |
HSBC Bank USA, N.A. | | | (36,234 | ) | | | 20,621 | | | | — | | | | (15,613 | ) |
JPMorgan Chase Bank N.A. | | | (3,245,742 | ) | | | 3,245,742 | | | | — | | | | — | |
Morgan Stanley & Co. | | | (43,473 | ) | | | 26,565 | | | | — | | | | (16,908 | ) |
Morgan Stanley and Co. International Plc | | | (1,210,601 | ) | | | 64,359 | | | | 117,282 | | | | (1,028,960 | ) |
Morgan Stanley Capital Services, Inc. | | | (2,140,331 | ) | | | 2,140,331 | | | | — | | | | — | |
Natwest Markets Plc | | | (100,717 | ) | | | 26,419 | | | | 9,209 | | | | (65,089 | ) |
Standard Chartered Bank | | | (6,203 | ) | | | 6,203 | | | | — | | | | — | |
State Street Bank and Trust | | | (17,296 | ) | | | 17,296 | | | | — | | | | — | |
State Street Bank London | | | (53,459 | ) | | | 10,516 | | | | — | | | | (42,943 | ) |
Toronto Dominion Bank | | | (3,524 | ) | | | 3,524 | | | | — | | | | — | |
UBS AG | | | (112,785 | ) | | | 64,508 | | | | — | | | | (48,277 | ) |
| | | | | | | | | | | | | | | | |
| | $ | (14,916,893 | ) | | $ | 10,562,300 | | | $ | 1,776,739 | | | $ | (2,577,854 | ) |
| | | | | | | | | | | | | | | | |
241
Mercer Funds
Notes to Financial Statements (Continued)
March 31, 2020
| | (a) | Represents the net amount receivable from the counterparty in the event of default. |
| | (b) | Represents the net amount payable to the counterparty in the event of default. |
| | * | In some instances, the actual collateral received and/or pledged may be more than the derivative asset or liability due to overcollateralization. |
(b) Security transactions and related investment income
Security transactions are accounted for on trade date. Dividend income, net of applicable withholding taxes, is recorded on theex-dividend date or when the Fund is informed of theex-dividend date, if later. Interest income is recorded on the accrual basis, and is adjusted for amortization of premium and discounts for debt securities. Income is not recognized, nor are premium and discount amortized, on securities for which collection is not expected. Withholding taxes on foreign dividends, interest, and capital gains have been provided for in accordance with the respective country’s tax rules and rates.Non-cash dividends, if any, are recorded at the fair value of the securities received. Interest income on inflation indexed securities is accrued daily based upon an inflation-adjusted principal. Additionally, any increase in the principal or face amount of these securities is recorded as interest income. In determining the net gain or loss on securities sold, the cost of securities is determined on the identified-cost basis.
(c) Cash, cash equivalents and short-term investments
A Fund may invest a portion of its assets in cash and cash equivalents. Cash and cash equivalents are defined as cash and bank balances as well as short-term investments with a maturity of less than three months from the acquisition date.
A Fund may invest a portion of its assets in short-term debt securities (including repurchase agreements and reverse repurchase agreements) of corporations, the U.S. government and its agencies and instrumentalities and banks and finance companies, which may be denominated in any currency.
A Fund may invest a portion of its assets in shares issued by money market mutual funds. A Fund also may invest in collective investment vehicles that are managed by an unaffiliated investment manager, pending investment of the Fund’s assets in portfolio securities. When unusual market conditions warrant, a Fund may make substantial temporary defensive investments in cash equivalents, up to a maximum of 100% of the Fund’s net assets. Cash equivalent holdings may be in any currency. When a Fund invests for temporary defensive purposes, such investments may affect the Fund’s ability to achieve its investment objective.
(d) Securities lending
A Fund may lend its portfolio securities to qualified broker/dealers and financial institutions pursuant to agreements, provided: (1) the loan is secured continuously by collateral marked to market daily and maintained in an amount at least equal to the current fair value of the securities loaned; (2) the Fund may call the loan at any time and receive the securities loaned; (3) the Fund will receive any interest or dividends paid on the loaned securities; and (4) the aggregate fair value of securities loaned will not at any time exceed 33 1/3% of the total assets of the Fund. Collateral will consist of U.S. andnon-U.S. securities, cash equivalents or irrevocable letters of credit. A liability for cash collateral is reflected in the Statements of Assets and Liabilities, and is categorized as Level 2 within the fair value hierarchy. As with other extensions of credit, there are risks of delay in recovery or even loss of rights in collateral in the event of default or insolvency of a borrower of a Fund’s portfolio securities. A Fund may not retain voting rights on securities while they are on loan.
242
Mercer Funds
Notes to Financial Statements (Continued)
March 31, 2020
Certain Funds may from time to time participate in a securities lending program under which the Funds’ custodian, State Street Bank and Trust Company (the “Custodian”) acting as securities lending agent, is authorized to lend Fund portfolio securities to qualified broker/dealers and financial institutions that post appropriate collateral. The Custodian has agreed to indemnify the Funds in case of default of any security borrower.
Securities on loan are fully collateralized and the collateral was equal to or exceeded the securities on loan at March 31, 2020. If the market value of the collateral at the close of trading on a business day is less than 100% of the market value of the loaned securities at the close of trading on that day, the borrower shall be required to deliver, by the close of business on the following business day, an additional amount of collateral, so that the total amount of posted collateral is equal to at least 100% of the market value of all the loaned securities as of such preceding day. Cash collateral is invested in the State Street Institutional U.S. Government Money Market Fund, Premier Class. The Custodian receives a portion of the interest earned on any reinvested collateral. The market value of securities on loan to borrowers and the value of collateral held by the Funds with respect to such loans at March 31, 2020 were as follows:
| | | | | | | | | | | | |
| | | Market Value of
Loaned Securities | | | Value of
Cash Collateral | | | Value of
Non-Cash Collateral | |
Large Cap | | $ | 13,602,187 | | | $ | 267,594 | | | $ | 14,382,062 | |
Small/Mid Cap | | | 68,781,826 | | | | 3,556,353 | | | | 69,476,429 | |
Non-US Core Equity | | | 69,504,118 | | | | 27,307,637 | | | | 45,279,659 | |
Core Fixed | | | 7,698,152 | | | | 2,009,610 | | | | 5,770,993 | |
Opportunistic Fixed | | | 20,058,969 | | | | 18,037,151 | | | | 2,537,893 | |
Emerging Markets | | | 11,524,403 | | | | 1,742,607 | | | | 10,245,552 | |
Global Low Volatility | | | 21,651,572 | | | | 3,702,660 | | | | 18,655,026 | |
For Large Cap, Small/Mid Cap,Non-US Core Equity, Emerging Markets and Global Low Volatility, all of the securities on loan collateralized by cash are classified as Common Stocks in each Fund’s Schedule of Investments at March 31, 2020, with a contractual maturity of overnight and continuous. For Core Fixed, all of the securities on loan collateralized by cash are classified as Corporate Debt in the Fund’s Schedule of Investments at March 31, 2020, with a contractual maturity of overnight and continuous.
For Opportunistic Fixed, the values of the security loan obligations are classified as follows at March 31, 2020:
Opportunistic Fixed
| | | | | | | | | | | | | | | | | | | | |
| | | Remaining Contractual Maturity of the Agreements
As of March 31, 2020 | |
| | | Overnight and
Continuous | | | <30 days | | | Between
30 & 90 days | | | >90 days | | | Total | |
Securities Lending Transactions | |
Corporate Debt | | $ | 3,646,977 | | | $ | — | | | $ | — | | | $ | — | | | $ | 3,646,977 | |
Preferred Stocks | | | 50,380 | | | | — | | | | — | | | | — | | | | 50,380 | |
U.S. Government and Agency Obligations | | | 14,339,794 | | | | — | | | | — | | | | — | | | | 14,339,794 | |
| | | | | | | | | | | | | | | | | | | | |
Total | | $ | 18,037,151 | | | $ | — | | | $ | — | | | $ | — | | | $ | 18,037,151 | |
| | | | | | | | | | | | | | | | | | | | |
Total Borrowings | | $ | 18,037,151 | | | $ | — | | | $ | — | | | $ | — | | | $ | 18,037,151 | |
| | | | | | | | | | | | | | | | | | | | |
Gross amount of recognized liabilities for securities lending transactions | | | $ | 18,037,151 | |
| | | | | | | | | | | | | | | | | | | | |
243
Mercer Funds
Notes to Financial Statements (Continued)
March 31, 2020
(e) Swaps
Swap contracts are derivatives in the form of a contract or similar instrument, which is an agreement to exchange the return generated by one instrument for the return generated by another instrument. A Fund may engage in swaps, including, but not limited to, interest rate, currency, credit default, and index swaps, and the purchase or sale of related caps, floors, collars, and other derivative instruments. A Fund expects to enter into these transactions to preserve a return or spread on a particular investment or portion of the portfolio, to modify the portfolio’s duration, to protect against any increase in the price of securities the Fund anticipates purchasing at a later date, or to gain exposure to certain markets in the most economical way possible.
Interest rate swaps involve the exchange by a Fund with another party of their respective commitments to receive or pay interest (e.g., an exchange of fixed rate payments for floating rate payments) with respect to a notional amount of principal.Up-front payments received or made are reflected as“up-front net premiums received” or“up-front net premiums paid”, respectively, on the Statements of Assets and Liabilities. Currency swaps involve the exchange of cash flows on a notional amount based on changes in the values of referenced currencies.
The credit default swap agreements may have as reference obligations one or more securities that are not currently held by a Fund. The protection “buyer” in a credit default swap agreement is generally obligated to pay the protection “seller” an upfront or a periodic stream of payments over the term of the contract provided that no credit event, such as a default, on a reference obligation has occurred. If a credit event occurs, the seller generally must pay the buyer the “par value” (full notional value) of the swap in exchange for an equal face amount of deliverable obligations of the reference entity described in the swap, or the seller may be required to deliver the related net cash amount, if the swap is cash settled. A Fund may be either the buyer or seller in the transaction. If a Fund is a buyer and no credit event occurs, the Fund may recover nothing if the swap is held through its termination date. However, if a credit event occurs, the buyer generally may elect to receive the full notional value of the swap in exchange for an equal face amount of deliverable obligations of the reference entity whose value may have significantly decreased. As a seller, a Fund generally receives an upfront payment or a fixed rate of income throughout the term of the swap provided that there is no credit event. As the seller, a Fund would effectively add leverage to its portfolio because, in addition to its total net assets, a Fund would be subject to investment exposure on the notional amount of the swap.
The spread of a credit default swap is the annual amount the protection buyer must pay the protection seller over the length of the contract, expressed as a percentage of the notional amount. When spreads rise, market perceived credit risk rises and when spreads fall, market perceived credit risk falls. Wider credit spreads and decreasing market values, when compared to the notional amount of the swap, represent a deterioration of the referenced entity’s credit worthiness and an increased market perception that there is a greater likelihood of risk of default or other credit event occurring as defined under the terms of the agreement. For credit default swap agreements on asset-backed securities and credit indices, the quoted market prices and resulting values, as well as the annual payment rates, serve as an indication of the current status of the payment/performance risk.
Swaps do not involve the delivery of securities or other underlying assets or principal, and are subject to counterparty risk. If the other party to a swap defaults and fails to consummate the transaction, a Fund’s risk of loss consists of the net amount of interest payments that the Fund is contractually entitled to receive.
The equity swaps in which the Funds may invest involve agreements with a counterparty. The return to the Funds on any equity swap contract will be the total return on the notional amount of the contract as
244
Mercer Funds
Notes to Financial Statements (Continued)
March 31, 2020
if it were invested in the stocks comprising the contract index in exchange for an interest component based on the notional amount of the agreement. The Funds will only enter into an equity swap contract on a net basis,i.e., the two parties’ obligations are netted out, with the Funds paying or receiving, as the case may be, only the net amount of the payments. Payments under an equity swap contract may be made at the conclusion of the contract or periodically during its term.
Whether a Fund’s use of swap agreements or swap options will be successful in achieving the Fund’s investment objective will depend on the Subadvisor’s ability to predict correctly whether certain types of investments are likely to produce greater returns than other investments. Moreover, a Fund bears the risk of loss of the amount expected to be received under a swap agreement in the event of the default or bankruptcy of a swap agreement counterparty. The Funds will enter into swap agreements only with counterparties that meet certain standards of creditworthiness.
If there is a default by the counterparty to a swap contract, a Fund will be limited to contractual remedies pursuant to the agreements related to the transaction. There is no assurance that a swap contract counterparty will be able to meet its obligations pursuant to a swap contract or that, in the event of a default, a Fund will succeed in pursuing contractual remedies. A Fund thus assumes the risk that it may be delayed in, or prevented from, obtaining payments owed to it pursuant to a swap contract. However, the amount at risk is only the net unrealized gain, if any, on the swap at the time of default, and not the entire notional amount. The Subadvisor that enters into the swap agreementwill closely monitor, subject to the oversight of the Board, the creditworthiness of swap counterparties in order to minimize the counterparty risk of swaps.
Because swaps are two party contracts that may be subject to contractual restrictions on transferability and termination, and they may have terms of greater than seven days, swap agreements may be considered to be illiquid and subject to a Fund’s limitation on investments in illiquid securities. However, the Trust has adopted procedures pursuant to which the Advisor may determine that swaps (including swap options) are liquid under certain circumstances. To the extent that a swap is not liquid, it may not be possible to initiate a transaction or liquidate a position at an advantageous time or price, which may result in significant losses.
Under the Dodd-Frank Wall Street Reform and Consumer Protection Act (the “Dodd-Frank Act”) enacted in 2010, a regulatory framework for certain OTC derivatives, such as swaps was enacted. The Dodd-Frank Act requires certain swap transactions to be executed on registered exchanges or through swap execution facilities, cleared through a regulated clearinghouse, and publicly reported. In addition, many market participants who were not previously required to register are regulated as swap dealers or swap participants, and are subject to certain minimum capital and margin requirements and business conduct standards.
The swaps market is largely unregulated. It is possible that developments in the swaps market, including potential government regulation, could adversely affect the Funds’ ability to terminate existing swap agreements or to realize amounts to be received under such agreements.
Certain clearinghouses currently offer clearing for limited types of derivatives transactions, principally credit and interest derivatives. In a cleared derivative transaction, a Fund typically enters into the transaction with a financial institution counterparty, and performance of the transaction is effectively guaranteed by a central clearinghouse, thereby reducing or eliminating the Fund’s exposure to the credit risk of the original counterparty.
The Fund typically will be required to post specified levels of margin with the clearinghouse or at the instruction of the clearinghouse; the margin required by a clearinghouse may be greater than the margin
245
Mercer Funds
Notes to Financial Statements (Continued)
March 31, 2020
the Fund would be required to post in an uncleared derivative transaction. Cash margin is recorded on the Statements of Assets and Liabilities as cash collateral held at broker on open swap contracts. Swap agreements are marked to market daily. Daily changes in valuation of centrally cleared swaps, if any, are recorded as a variation margin payable or receivable for the change in value as appropriate on the Statements of Assets and Liabilities. Only a limited number of derivative transactions are currently eligible for clearing by clearinghouses.
A Fund will accrue for interim payments on swap contracts on a daily basis, with the net amount recorded as interest payable or receivable on the Statements of Assets and Liabilities. Once interim payments are settled in cash, the net amount is recorded as realized gain/loss on swap contracts, in addition to realized gain/loss recorded upon the termination of swap contracts on the Statements of Operations. Fluctuations in the value of swap contracts are recorded for financial statement purposes as unrealized appreciation or depreciation of swap contracts (swap contracts, at value on the Statements of Assets and Liabilities).
Swap agreements are marked to market daily. The change in value, if any, is recorded as unrealized gain or loss in the Statements of Operations. A liquidation payment received or made at the termination of the swap is recorded as realized gain or loss in the Statements of Operations. Net periodic payments are included as part of realized gain (loss) on the Statements of Operations.
The swaps in which the Fund may engage may include instruments under which one party pays a single or periodic fixed amount(s) (or premium), and the other party pays periodic amounts based on the movement of a specified index. The Fund’s maximum risk of loss from counterparty credit risk, as opposed to investment and other types of risk, in respect of swaps is typically the discounted net value of the cash flows to be received from the counterparty over the contract’s remaining life to the extent that such amount is positive, plus the cost of entering into a similar transaction with another counterparty, if possible.
The use of swaps is a highly specialized activity that involves investment techniques and risks different from those associated with ordinary portfolio securities transactions. If the Advisor or Subadvisor is incorrect in its forecasts of market values, interest rates, and currency exchange rates, the investment performance of the Fund would be less favorable than it would have been if this investment technique were not used.
Like most other investments, swap agreements are subject to the risk that the market value of the instrument will change in a way detrimental to a Fund’s interest. A Fund bears the risk that Subadvisor will not accurately forecast future market trends or the values of assets, reference rates, indexes, or other economic factors in establishing swap positions for the Fund. If a Subadvisor attempts to use a swap as a hedge against, or as a substitute for, a portfolio investment, the Fund will be exposed to the risk that the swap will have or will develop imperfect or no correlation with the portfolio investment. This could cause substantial losses for the Fund. While hedging strategies involving swap instruments can reduce the risk of loss, they can also reduce the opportunity for gain or even result in losses by offsetting favorable price movements in other Fund investments.
During the year ended March 31, 2020, Core Fixed and Opportunistic Fixed used swap agreements to adjust interest rate and yield curve exposure or to manage credit exposure. See the Core Fixed and Opportunistic Fixed Schedules of Investments for a listing of open swap agreements as of March 31, 2020.
246
Mercer Funds
Notes to Financial Statements (Continued)
March 31, 2020
(f) Futures
A futures contract is a contractual agreement to buy or sell a specific amount of a commodity or financial instrument at a predetermined price on a stipulated future date. A Fund may enter into contracts for the purchase or sale for future delivery of securities, indices and foreign currencies. Futures contracts may be opened to protect against the adverse effects of fluctuations in security prices, interest rates, or foreign exchange rates without actually buying or selling the securities or foreign currency. A Fund also may enter into futures contracts as a low cost method for gaining or reducing exposure to a particular currency or securities market without directly investing in those currencies or securities.
A purchase of a futures contract means the acquisition of a contractual right of a Fund to obtain delivery of the securities or foreign currency underlying the contract at a specified price on a specified future date. When a futures contract is sold, a Fund incurs a contractual obligation to deliver the securities or foreign currency underlying the contract at a specified price on a specified date.
When a Fund enters into a futures contract, it must deliver to the futures commission merchant selected by the Fund an amount referred to as “initial margin.” This amount is maintained by the futures commission merchant in a segregated account at the custodian bank. Futures contracts are marked to market daily, depending upon changes in the price of the underlying securities subject to the futures contracts, and the change in value is recorded by the Fund as a variation margin payable or receivable on the Statements of Assets and Liabilities. The Fund recognizes gains and losses on futures contracts in addition to the variation margin, which gains and losses are considered realized at the time the contracts expire or close.
A Fund may enter into futures transactions on domestic exchanges and, to the extent such transactions have been approved by the Commodity Futures Trading Commission for sale to customers in the United States, or on foreign exchanges. In addition, a Fund may sell stock index futures in anticipation of, or during a market decline to attempt to offset the decrease in the market value of the Fund’s common stocks that might otherwise result, and a Fund may purchase such contracts in order to offset increases in the cost of common stocks that it intends to purchase. Unlike other futures contracts, a stock index futures contract specifies that no delivery of the actual stocks making up the index will take place. Instead, settlement in cash must occur upon the termination of the contract.
In entering into futures contracts and options on futures contracts, there is a credit risk that a counterparty will not be able to meet its obligations to the Fund. The counterparty for futures contracts and options on futures contracts traded in the United States and on most foreign futures exchanges is the clearinghouse associated with such exchange. In general, clearinghouses are backed by the corporate members of the clearinghouse who are required to share any financial burden resulting from thenon-performance by one of its members and, as such, should significantly reduce this credit risk. In cases where the clearinghouse is not backed by the clearing members (i.e., some foreign exchanges), it is normally backed by a consortium of banks or other financial institutions. There can be no assurance that any counterparty, clearing member or clearinghouse will be able to meet its obligations to the Fund.
While futures contracts provide for the delivery of securities, deliveries usually do not occur. Contracts are generally terminated by entering into offsetting transactions.
Where the futures market is not as developed or where the regulations prevent or make it disadvantageous to trade futures, Emerging Markets will utilize synthetic futures as part of the country selection strategy implementation. A synthetic future operates like a total return swap transaction in which there’s a commitment to receive positive or negative returns in exchange for equity index futures.
247
Mercer Funds
Notes to Financial Statements (Continued)
March 31, 2020
If the underlying asset declines in value over the term of the total return swap, the Fund may also be required to pay the dollar value of that decline to the counterparty. These are marked to market daily and the change in value is recorded as unrealized gain or loss in the Statements of Operations.
During the year ended March 31, 2020, Large Cap, Small/Mid Cap,Non-US Core Equity, Emerging Markets and Global Low Volatility used futures to equitize cash. Core Fixed and Opportunistic Fixed used futures to adjust interest rate exposure and replicate government bond positions. Emerging Markets also used futures to create passive index exposure to certain domestic emerging market country indices in the Fund. See each Fund’s Schedule of Investments for a listing of open futures contracts as of March 31, 2020.
(g) Options
The Funds may purchase and sell (write) put and call options on debt securities, currencies and indices to enhance investment performance, manage duration, or protect against changes in market prices. The Funds may also buy and sell combinations of put and call options on the same underlying security, currency or index. Short (sold) options positions will generally be hedged by the Funds with cash, cash equivalents, current portfolio security holdings, or other options or futures positions.
The Funds may enter into swap options (“swaptions”). A swaption is a contract that gives a counterparty the right (but not the obligation), in return for payment of a premium, to enter into a new swap agreement or to shorten, extend, cancel, or otherwise modify an existing swap agreement, at some designated future time on specified terms. Each Fund may sell (write) and purchase put and call swaptions. Depending on the terms of the particular option agreement, a Fund generally will incur a greater degree of risk when the Fund writes a swaption than the Fund will incur when it purchases a swaption. When a Fund purchases a swaption, the Fund’s risk of loss is limited to the amount of the premium it has paid should it decide to let the swaption expire unexercised. However, when a Fund writes a swaption, upon exercise of the option, the Fund will become obligated according to the terms of the underlying agreement.
When the Fund writes a covered call or a put option, an amount equal to the premium received by the Fund is included in the Fund’s Statements of Assets and Liabilities as a liability. The amount of the liability is subsequently marked to market to reflect the current market value of the option written. The Fund receives a premium on the sale of a call option but gives up the opportunity to profit from any increase in stock value above the exercise price of the option, and when the Fund writes a put option, it is exposed to a decline in the price of the underlying security.
Whether an option which the Fund has written expires on its stipulated expiration date or the Fund enters into a closing purchase transaction, the Fund realizes a gain (or loss, if the cost of a closing purchase transaction exceeds the premium received when the option was sold) without regard to any unrealized gain or loss on the underlying security, and the liability related to such option is extinguished. If a call option which the Fund has written is exercised, the Fund realizes a capital gain or loss from the sale of the underlying security, and the cost basis of the lots sold are decreased by the premium originally received. When a put option which a Fund has written is exercised, the amount of the premium originally received will reduce the cost of the security which a Fund purchases upon exercise of the option. Realized gains (losses) on purchased options are included in net realized gain (loss) from investments.
The Funds’ use of written options involves, to varying degrees, elements of market risk in excess of the amount recognized in the Statements of Assets and Liabilities. The face or contract amounts of these
248
Mercer Funds
Notes to Financial Statements (Continued)
March 31, 2020
instruments reflect the extent of the Fund’s exposure to market risk. The risks may be caused by an imperfect correlation between movements in the price of the instrument and the price of the underlying securities, currencies and interest rates.
During the year ended March 31, 2020, Core Fixed and Opportunistic Fixed used options to manage interest rate and volatility exposure.
(h) Forward foreign currency contracts
The Funds may purchase or sell currencies and/or engage in forward foreign currency transactions in order to expedite settlement of portfolio transactions and to manage currency risk.
Forward foreign currency contracts are traded in the inter-bank market conducted directly between currency traders (usually large commercial banks) and their customers. A forward contract generally has no deposit requirement and no commissions are charged at any stage for trades. The Funds will account for forward contracts bymarking-to-market each day at current forward contract values. The change in market value is recorded by the Fund as an unrealized gain or loss. When the contract is closed, the Fund recognizes a realized gain or loss equal to the difference between the value of the contract at the time the contract was opened and the value at the time the contract was closed.
The Funds will only enter into forward contracts to sell, for a fixed amount of U.S. dollars or other appropriate currency, an amount of foreign currency, to the extent that the value of the short forward contract is covered by the underlying value of securities denominated in the currency being sold. Alternatively, when a Fund enters into a forward contract to sell an amount of foreign currency, the Custodian or the Fund’ssub-custodian will segregate assets in a segregated account of the Fund in an amount not less than the value of the Fund’s total assets committed to the consummation of such forward contract. If the additional segregated assets placed in the segregated account decline, additional cash or securities will be placed in the account on a daily basis so that the value of the account will equal the amount of the Fund’s commitments with respect to such contract. The primary risks associated with forward foreign currency contracts include failure of the counterparty to meet the terms of the contract and the value of the foreign currency changing unfavorably.
During the year ended March 31, 2020, Core Fixed and Opportunistic Fixed used forward foreign currency contracts for a variety of purposes, including hedging, risk management, efficient portfolio management, enhancing total returns, or as a substitute for taking a position in the underlying asset.Non-US Core Equity and Emerging Markets used forward foreign currency contracts to hedge, cross hedge or to actively manage the currency exposures in the Funds. See theNon-US Core Equity, Core Fixed, Opportunistic Fixed and Emerging Markets Schedules of Investments for a listing of open forward foreign currency contracts as of March 31, 2020.
(i) Foreign currency translation
The books and records of each Fund are maintained in US dollars. Foreign currencies, investments and other assets and liabilities denominated in foreign currencies are translated into US dollars at the foreign exchange rates prevailing at the end of the period. Purchases and sales of investment securities, income and expenses are translated at exchange rates prevailing on the respective dates of such transactions. Unrealized gains and losses that result from changes in foreign currency exchange rates have been included in the unrealized gains (losses) on foreign currency translations within each Fund’s Statement of Operations. Net realized foreign currency gains and losses resulting from changes in exchange rates include foreign currency gains and losses between trade date and settlement date on investment securities transactions, foreign currency transactions and the difference between the amounts of interest
249
Mercer Funds
Notes to Financial Statements (Continued)
March 31, 2020
and dividends recorded on the books of the Fund and the amount actually received. The portion of foreign currency gains and losses related to fluctuations in exchange rates between the purchase settlement date and subsequent sale trade date is included in realized gains and losses on investment transactions.
(j) When-issued securities/TBA securities
Purchasing securities on a “when-issued” basis is a commitment by a Fund to buy a security before the security is actually issued. A Fund may purchase securities offered on a “when-issued” or “forward delivery” basis such as TBA securities. When so offered, the price, which is generally expressed in yield terms, is fixed at the time the commitment to purchase is made, but delivery and payment for the when-issued or forward delivery securities take place at a later date. During the period between purchase and settlement, no payment is made by the purchaser to the issuer and no interest on the when-issued or forward delivery security accrues to the purchaser. While when-issued or forward delivery securities may be sold prior to the settlement date, it is intended that a Fund will purchase such securities with the purpose of actually acquiring the securities unless a sale appears desirable for investment reasons. At the time a Fund makes the commitment to purchase a security on a when-issued or forward delivery basis, the Fund will record the transaction and reflect the value of the security in determining the Fund’s NAV. The market value of when-issued or forward delivery securities may be more or less than the purchase price. Certain risks may arise upon entering into when-issued or forward delivery securities transactions, including the potential inability of counterparties to meet the terms of their contracts, and the issuer’s failure to issue the securities due to political, economic, or other factors. Additionally, losses may arise due to declines in the value of the securities prior to settlement date.
A Fund may enter into TBA commitments to purchase or sell securities for a fixed price at a future date. TBA commitments are considered securities in themselves, and involve a risk of loss if the value of the security to be purchased or sold declines or increases prior to settlement date, which is in addition to the risk of decline in the value of the Portfolio’s other assets. TBA forward sale commitments are valued at the current market value of the underlying securities, according to the procedures described under “Security Valuation”. See the Schedules of Investments for TBA and when-issued securities held as of March 31, 2020.
(k) Real estate investment trusts
The Funds may invest in real estate investment trusts (“REITs”), which pool investors’ funds for investment, primarily in income producing real estate or real estate-related loans or interests. A REIT is not taxed on income distributed to its shareholders or unitholders if it complies with regulatory requirements relating to its organization, ownership, assets and income, and with a regulatory requirement to distribute to its shareholders or unitholders at least 90% of its taxable income for each taxable year.
A shareholder in a Fund, by investing in REITs through the Fund, will bear not only the shareholder’s proportionate share of the expenses of the Fund, but also, indirectly, the management expenses of the underlying REITs. REITs depend generally on their ability to generate cash flow to make distributions to shareholders or unitholders, and may be subject to defaults by borrowers and to self-liquidations. In addition, the performance of a REIT may be affected by its failure to qualify fortax-free pass-through of income, or the REIT’s failure to maintain exemption from registration under the 1940 Act.Dividends representing a return of capital are reflected as a reduction of cost and/or as a realized gain when the amount of the return of capital is conclusively determined. See each Fund’s Schedule of Investments for REIT securities held as of March 31, 2020.
250
Mercer Funds
Notes to Financial Statements (Continued)
March 31, 2020
(l) Mortgage-related and other asset-backed securities
The Funds may invest in mortgage-backed and asset-backed securities. Mortgage-backed securities represent an interest in a pool of mortgages. Asset-backed securities are structured like mortgage-backed securities, but instead of mortgage loans or interests in mortgage loans, the underlying assets may include such items as motor vehicle installment sales or installment loan contracts, leases of various types of real and personal property, and receivables from credit card agreements. The value of some mortgage or asset-backed securities may be particularly sensitive to changes in prevailing interest rates. Early repayment of principal on some mortgage-related securities may expose the Fund to a lower rate of return upon reinvestment of principal. The value of these securities may fluctuate in response to the market’s perception of the creditworthiness of the issuers. Additionally, although mortgages and mortgage-related securities are generally supported by some form of government or private guarantee and/or insurance, there is no assurance that private guarantors or insurers will meet their obligations.
One type of stripped mortgage-backed security has one class receiving all of the interest from the mortgage assets (the interest-only, or “IO” class), while the other class will receive all of the principal (the principal-only, or “PO” class). Payments received for the IOs are included in interest income on the Statements of Operations. Because principal will not be received at the maturity of an IO, adjustments are made to the cost basis of the security on a daily basis until maturity. These adjustments are included in interest income on the Statements of Operations. Payments received for POs are treated as reductions to the cost and par value of the securities. See the Schedules of Investments for mortgage-backed and asset-backed securities held by Core Fixed and Opportunistic Fixed as of March 31, 2020.
(m) Bank loans
Core Fixed and Opportunistic Fixed may invest in bank loans, which include institutionally-traded floating rate securities generally acquired as an assignment from another holder of, or participation interest in, loans originated by a bank or financial institution (the ‘‘Lender’’) that acts as agent for all holders. The agent administers the terms of the loan, as specified in the loan agreement. The Fund may invest in multiple series or tranches of a loan, which may have varying terms and carry different associated risks. When investing in a loan participation, the Fund has the right to receive payments of principal, interest and any fees to which it is entitled only from the Lender selling the loan agreement and only upon receipt by the Lender of payments from the borrower. The Fund generally has no right to enforce compliance with the terms of the loan agreement with the borrower. As a result, the Fund may be subject to the credit risk of both the borrower and the Lender that is selling the loan agreement. At March 31, 2020, Opportunistic Fixed had the following unfunded loan commitments:
| | | | | | | | | | | | | | | | |
Borrower | | Par | | | Cost | | | Value | | | Unrealized
Gain (Loss) | |
EyeCare Partners, LLC | | $ | 51,081 | | | $ | 51,018 | | | $ | 42,227 | | | $ | (8,791 | ) |
(n) Indexed securities
The Funds may invest in indexed securities where the redemption values and/or coupons are linked to the prices of other securities, securities indices, or other financial indicators. The Funds use indexed securities to increase or decrease their exposure to different underlying instruments and to gain exposure to markets in which it may be difficult to invest through conventional securities. Indexed securities may be more volatile than their underlying instruments, but any loss is limited to the amount of the original investment.
251
Mercer Funds
Notes to Financial Statements (Continued)
March 31, 2020
(o) Taxes and distributions
The Funds intend to qualify each year as regulated investment companies under Subchapter M of the Internal Revenue Code of 1986, as amended (“the Code”). The Funds intend to distribute substantially all of their net investment income and net realized short-term and long-term gains, if any, after giving effect to any available capital loss carryovers for U.S. federal income tax purposes. Therefore, no provision for U.S. federal and state income or excise tax is necessary.
The Funds utilize the provisions of the federal income tax laws that provide for the carryforward of capital losses for prior years, offsetting such losses against any future realized capital gains. Under the Regulated Investment Company Modernization Act of 2010 (the “Act”), net capital losses recognized after December 22, 2010 may be carried forward indefinitely, and their character is retained as short-term and/or long-term losses. Previously, net capital losses were carried forward for eight years and treated as short-term losses. As a transition rule, the Act requires that post-enactment net capital losses be used beforepre-enactment net capital losses.
On March 31, 2020, the following Funds had deferred capital losses available to be offset against future net capital gains through the indicated expiration dates as follows:
| | | | |
| | | Unlimited | |
Non-US Core Equity | | $ | 46,007,731 | |
Opportunistic Fixed | | | 20,121,654 | |
Emerging Markets | | | 54,798,809 | |
During the year ended March 31, 2020, Core Fixed and Opportunistic Fixed utilized capital loss carryforwards of $12,448,296 and $4,332,457, respectively.
Under current tax rules, regulated investment companies can elect to treat certain late-year ordinary losses incurred and post-October capital losses (capital losses realized after October 31) as arising on the first day of the following taxable year. As of March 31, 2020, Large Cap and Small/Mid Cap have elected to defer current year post-October losses of $7,119,824 and $11,611,224, respectively.
As of March 31, 2020, the cost for U.S. federal income tax purposes and gross unrealized appreciation and depreciation in value of investments and derivatives were as follows:
| | | | | | | | | | | | | | | | |
| | | Federal
Income Tax
Cost | | | Tax Basis
Unrealized
Appreciation | | | Tax Basis
Unrealized
Depreciation | | | Net
Unrealized
Appreciation
(Depreciation) | |
Large Cap | | $ | 1,026,538,185 | | | $ | 17,139,560 | | | $ | (196,997,364 | ) | | $ | (179,857,804 | ) |
Small/Mid Cap | | | 1,249,554,528 | | | | 40,344,609 | | | | (316,355,231 | ) | | | (276,010,622 | ) |
Non-US Core Equity | | | 2,870,768,278 | | | | 168,581,061 | | | | (493,105,334 | ) | | | (324,524,273 | ) |
Core Fixed | | | 928,099,428 | | | | 36,174,524 | | | | (26,221,619 | ) | | | 9,952,905 | |
Opportunistic Fixed | | | 980,321,749 | | | | 11,489,297 | | | | (116,555,966 | ) | | | (105,066,669 | ) |
Emerging Markets | | | 1,111,896,873 | | | | 40,281,185 | | | | (266,751,557 | ) | | | (226,470,372 | ) |
Global Low Volatility | | | 975,188,189 | | | | 60,537,983 | | | | (111,642,390 | ) | | | (51,104,407 | ) |
The temporary differences between book-basis andtax-basis unrealized appreciation/(depreciation) are primarily due to wash sale loss deferrals, investments in passive foreign investment companies and other basis adjustments. Certain capital accounts in the financial statements are periodically adjusted for permanent differences in order to reflect their tax character. These differences primarily relate to swap income, gains and losses from passive foreign investment companies and other basis adjustments during the period ended March 31, 2020.
252
Mercer Funds
Notes to Financial Statements (Continued)
March 31, 2020
As of March 31, 2020, the Funds had no uncertain tax positions that would require recognition, derecognition, or disclosure. Each of the Funds’ federal tax returns filed in the3-year period ended March 31, 2020 remains subject to examination by the Internal Revenue Service.
The Funds’ policy is to declare and pay distributions from net investment income and net realized short-term and long-term gains at least annually. All distributions are paid in shares of the Funds, at NAV, unless the shareholder elects to receive cash distributions. A Fund may distribute such income dividends and capital gains more frequently, if necessary, in order to reduce or eliminate federal excise taxes on the Funds. The amount of any distribution will vary, and there is no guarantee that a Fund will pay either income dividends or capital gains distributions.
During the years ended March 31, 2020 and March 31, 2019, the tax character of distributions (including capital gain dividends, if any, designated pursuant to Section 852 of the Code) paid, were as follows:
| | | | | | | | | | | | | | | | | | | | | | | | |
| | | 2020 | | | 2019 | |
| | | Ordinary
Income | | | Long-Term
Capital Gains | | | Return of
Capital | | | Ordinary
Income | | | Long-Term
Capital Gains | | | Return of
Capital | |
Large Cap | | $ | 12,207,874 | | | $ | 31,187,213 | | | $ | — | | | $ | 18,203,269 | | | $ | 79,063,810 | | | $ | — | |
Small/Mid Cap | | | 8,939,375 | | | | 31,223,283 | | | | — | | | | 13,103,133 | | | | 121,011,411 | | | | — | |
Non-US Core Equity | | | 60,608,354 | | | | — | | | | — | | | | 71,614,415 | | | | 147,266,369 | | | | — | |
Core Fixed | | | 21,127,381 | | | | — | | | | — | | | | 24,784,732 | | | | — | | | | — | |
Opportunistic Fixed | | | 22,762,588 | | | | — | | | | — | | | | 15,919,968 | | | | — | | | | — | |
Emerging Markets | | | 15,100,507 | | | | — | | | | — | | | | 39,741,557 | | | | 103,026,768 | | | | — | |
Global Low Volatility | | | 13,667,359 | | | | 67,398,170 | | | | — | | | | — | | | | — | | | | — | |
As of March 31, 2020, the components of distributable earnings on a tax basis were as follows:
| | | | | | | | | | | | | | | | | | | | |
| | | Undistributed
Ordinary
Income | | | Undistributed
Long-Term
Gains | | | Capital Losses
Other Temporary
Differences | | | Unrealized
Appreciation
(Depreciation) | | | Total
Distributable
Earnings | |
Large Cap | | $ | — | | | $ | — | | | $ | (7,120,383 | ) | | $ | (179,856,569 | ) | | $ | (186,976,952 | ) |
Small/Mid Cap | | | — | | | | — | | | | (11,611,325 | ) | | | (276,010,622 | ) | | | (287,621,947 | ) |
Non-US Core Equity | | | 15,447,155 | | | | — | | | | (46,009,002 | ) | | | (324,889,169 | ) | | | (355,451,016 | ) |
Core Fixed | | | 12,948,249 | | | | — | | | | (647 | ) | | | 8,928,749 | | | | 21,876,351 | |
Opportunistic Fixed | | | 7,013,558 | | | | — | | | | (20,128,624 | ) | | | (108,048,472 | ) | | | (121,163,538 | ) |
Emerging Markets | | | 20,069,154 | | | | — | | | | (54,798,809 | ) | | | (226,606,449 | ) | | | (261,336,104 | ) |
Global Low Volatility | | | 30,895,036 | | | | 24,411,732 | | | | — | | | | (50,993,541 | ) | | | 4,313,227 | |
All other differences are temporary losses related to mostly organizational costs and other timing adjustments.
(p) Allocation of expenses and income
The majority of expenses of the Trust are directly identifiable to an individual Fund. Expenses which are not readily identifiable to a specific Fund are allocated among the applicable Funds, taking into consideration, among other things, the nature and type of expense and the relative size of each applicable Fund.
(q) Redemption fees
While none of the Funds’ classes have initial or contingent deferred sales charges on purchases of Fund shares, redemptions of Fund shares held less than 30 days may be assessed a 2% short-term trading fee and recorded aspaid-in capital.
253
Mercer Funds
Notes to Financial Statements (Continued)
March 31, 2020
The Trust entered into a Credit Agreement on behalf of the Funds (“the Agreement”) with a bank pursuant to a committed, unsecured revolving line of credit through December 10, 2020. Borrowings for each Fund under the Agreement are limited to the lesser of $50,000,000 or 33 1/3% of a Fund’s Adjusted Net Assets provided borrowings did not exceed, in the aggregate, $50,000,000. Under the terms of the Agreement the Trust pays an annual commitment fee at the rate 0.25% per year on the difference between the total line of credit and the average daily amount of borrowings outstanding. Interest is charged to the Funds based on its borrowings at a variable rate equal to the higher of the Overnight Federal Funds Rate or30-Day LIBOR plus 1.00%. The Funds did not borrow under the Agreement during the year ended March 31, 2020.
In the normal course of business, the Funds enter into contracts that require them to provide a variety of representations or general indemnification for certain liabilities. The Funds’ maximum exposure under these arrangements is unknown, as this would involve future claims that may be made against the Funds that have not yet occurred. However, the Funds have not had prior claims or losses pursuant to these contracts and expect the risk of loss to be remote.
| 5. | Fees and other transactions with affiliates |
As of March 31, 2020, the Advisor provides investment advisory services to each Fund pursuant to an investment management agreement. Pursuant to the investment management agreement, each Fund pays the Advisor a fee for managing the Fund’s investments at an annual rate of:
| | | | | | | | | | | | |
| | | Investment Advisory Fee* on Net Assets | |
| | | Average net assets
up to
$750 million | | | Average net assets
in excess of
$750 million up to
$1 billion | | | Average net assets
in excess of
$1 billion | |
Large Cap | | | 0.53 | % | | | 0.51 | % | | | 0.46 | % |
Small/Mid Cap | | | 0.90 | % | | | 0.88 | % | | | 0.83 | % |
Non-US Core Equity | | | 0.75 | % | | | 0.73 | % | | | 0.68 | % |
Core Fixed | | | 0.35 | % | | | 0.33 | % | | | 0.28 | % |
Opportunistic Fixed | | | 0.80 | % | | | 0.78 | % | | | 0.73 | % |
Emerging Markets | | | 0.80 | % | | | 0.78 | % | | | 0.73 | % |
Global Low Volatility | | | 0.75 | % | | | 0.73 | % | | | 0.68 | % |
| | * | Consists of the total advisory fee payable by the Funds to the Advisor. The Advisor is responsible for paying the subadvisory fees. |
The Advisor has contractually agreed, until at least July 31, 2020, to waive any portion of its management fee that exceeds the aggregate amount of the subadvisory fees that the Advisor is required to pay to the Funds’ Subadvisors. This contractual fee waiver agreement may only be changed or eliminated with the approval of the Funds’ Board of Trustees. The fees waived by the Advisor pursuant to this agreement are not subject to reimbursement by the Funds to the Advisor. The fees waived are shown in the Advisory fee waiver line in the Statements of Operations.
254
Mercer Funds
Notes to Financial Statements (Continued)
March 31, 2020
The Advisor provides certain internal administrative services to the Adviser Class, Class I andClass Y-2 shares of the Funds, for which the Advisor receives a fee of 0.25%, 0.25% and 0.15% of the average daily net assets of the Adviser Class, Class I andClass Y-2 shares of the Funds, respectively. These internal administrative services include attending to shareholder correspondence, assisting with the processing of purchases and redemptions of shares, preparing and disseminating information and documents for use by beneficial shareholders and monitoring and overseeingnon-advisory relationships with entities providing services to the Adviser Class, Class I andClass Y-2 shares, including the transfer agent. As these classes have not been funded, no fees were charged for the year ended March 31, 2020.
The Funds have adopted a plan of marketing and service, or“12b-1 plan” to finance the provision of certain shareholder services to the owners of Adviser Class shares of the Funds. The plan provides for payments at annual rates (based on average net assets) of up to 0.25% of each Fund’s Adviser Class shares. As this class has not been funded, no fees were charged for the year ended March 31, 2020.
| 6. | Purchases and sales of securities |
Cost of purchases and proceeds from sales of securities, excluding short-term investments andin-kind contributions, for the year ended March 31, 2020, were as follows:
| | | | | | | | |
| | | Long-Term
U.S. Government
Securities | | | Other
Long-Term
Securities | |
Purchases | | | | | | | | |
Large Cap | | $ | — | | | $ | 479,264,205 | |
Small/Mid Cap | | | — | | | | 646,171,291 | |
Non-US Core Equity | | | — | | | | 2,313,336,631 | |
Core Fixed | | | 1,240,911,245 | * | | | 331,863,610 | |
Opportunistic Fixed | | | 263,226,043 | ** | | | 1,111,059,059 | |
Emerging Markets | | | — | | | | 967,939,199 | |
Global Low Volatility | | | — | | | | 506,063,168 | |
| | |
Sales | | | | | | | | |
Large Cap | | | — | | | | 581,836,781 | |
Small/Mid Cap | | | — | | | | 657,779,790 | |
Non-US Core Equity | | | — | | | | 1,785,870,345 | |
Core Fixed | | | 1,050,779,818 | * | | | 148,870,713 | |
Opportunistic Fixed | | | 283,059,784 | ** | | | 884,949,134 | |
Emerging Markets | | | — | | | | 786,978,778 | |
Global Low Volatility | | | — | | | | 372,171,807 | |
| | * | Includes purchases of $143,516,009 and sales of $143,625,622 for TBA securities. |
| | ** | Includes purchases of $5,542,031 and sales of $5,542,031 for TBA securities. |
255
Mercer Funds
Notes to Financial Statements (Continued)
March 31, 2020
Each Fund is authorized to issue an unlimited number of shares of beneficial interest without par value. Transactions in Fund shares were as follows:
Large Cap
| | | | | | | | | | | | | | | | |
| | | Year Ended
March 31, 2020 | | | Year Ended
March 31, 2019 | |
| | | Shares | | | Amount | | | Shares | | | Amount | |
Class Y-3: | | | | | | | | | | | | | | | | |
Shares sold | | | 10,138,802 | | | $ | 90,778,255 | | | | 1,111,242 | | | $ | 9,300,085 | |
Shares issued through
in-kind contribution* | | | 81,706,524 | | | | 781,114,365 | | | | — | | | | — | |
Shares issued to shareholders in
reinvestment of distributions | | | 4,676,195 | | | | 43,395,087 | | | | 12,312,288 | | | | 97,267,079 | |
Shares repurchased | | | (21,820,763 | ) | | | (194,574,909 | ) | | | (15,278,614 | ) | | | (154,193,839 | ) |
| | | | | | | | | | | | | | | | |
Net increase (decrease) | | | 74,700,758 | | | $ | 720,712,798 | | | | (1,855,084 | ) | | $ | (47,626,675 | ) |
| | | | | | | | | | | | | | | | |
Small/Mid Cap
| | | | | | | | | | | | | | | | |
| | | Year Ended
March 31, 2020 | | | Year Ended
March 31, 2019 | |
| | | Shares | | | Amount | | | Shares | | | Amount | |
Class Y-3: | | | | | | | | | | | | | | | | |
Shares sold | | | 22,989,280 | | | $ | 221,232,437 | | | | 9,955,444 | | | $ | 115,835,355 | |
Shares issued through
in-kind contribution** | | | 51,416,668 | | | | 567,640,018 | | | | — | | | | — | |
Shares issued to shareholders in
reinvestment of distributions | | | 3,694,817 | | | | 40,162,658 | | | | 14,532,788 | | | | 134,114,544 | |
Shares repurchased | | | (20,554,836 | ) | | | (214,043,599 | ) | | | (19,938,961 | ) | | | (233,636,396 | ) |
| | | | | | | | | | | | | | | | |
Net increase | | | 57,545,929 | | | $ | 614,991,514 | | | | 4,549,271 | | | $ | 16,313,503 | |
| | | | | | | | | | | | | | | | |
Non-US Core Equity
| | | | | | | | | | | | | | | | |
| | | Year Ended
March 31, 2020 | | | Year Ended
March 31, 2019 | |
| | | Shares | | | Amount | | | Shares | | | Amount | |
Class Y-3: | | | | | | | | | | | | | | | | |
Shares sold | | | 80,075,822 | | | $ | 790,637,683 | | | | 36,986,983 | | | $ | 391,777,967 | |
Shares issued through
in-kind contribution*** | | | 38,582,379 | | | | 410,902,338 | | | | — | | | | — | |
Shares issued to shareholders in
reinvestment of distributions | | | 5,696,274 | | | | 60,608,354 | | | | 23,739,781 | | | | 218,880,784 | |
Shares repurchased | | | (26,429,943 | ) | | | (276,992,700 | ) | | | (29,969,109 | ) | | | (317,168,352 | ) |
| | | | | | | | | | | | | | | | |
Net increase | | | 97,924,532 | | | $ | 985,155,675 | | | | 30,757,655 | | | $ | 293,490,399 | |
| | | | | | | | | | | | | | | | |
256
Mercer Funds
Notes to Financial Statements (Continued)
March 31, 2020
Core Fixed
| | | | | | | | | | | | | | | | |
| | | Year Ended
March 31, 2020 | | | Year Ended
March 31, 2019 | |
| | | Shares | | | Amount | | | Shares | | | Amount | |
Class Y-3: | | | | | | | | | | | | | | | | |
Shares sold | | | 59,487,550 | | | $ | 613,861,885 | | | | 11,872,441 | | | $ | 116,813,300 | |
Shares issued to shareholders in
reinvestment of distributions | | | 2,057,194 | | | | 21,127,381 | | | | 2,581,743 | | | | 24,784,732 | |
Shares repurchased | | | (25,733,623 | ) | | | (267,181,856 | ) | | | (46,284,747 | ) | | | (453,655,356 | ) |
| | | | | | | | | | | | | | | | |
Net increase (decrease) | | | 35,811,121 | | | $ | 367,807,410 | | | | (31,830,563 | ) | | $ | (312,057,324 | ) |
| | | | | | | | | | | | | | | | |
Opportunistic Fixed
| | | | | | | | | | | | | | | | |
| | | Year Ended
March 31, 2020 | | | Year Ended
March 31, 2019 | |
| | | Shares | | | Amount | | | Shares | | | Amount | |
Class Y-3: | | | | | | | | | | | | | | | | |
Shares sold | | | 41,331,790 | | | $ | 386,165,258 | | | | 30,437,722 | | | $ | 274,937,746 | |
Shares issued to shareholders in
reinvestment of distributions | | | 2,450,225 | | | | 22,762,588 | | | | 1,807,034 | | | | 15,919,968 | |
Shares repurchased | | | (18,948,016 | ) | | | (173,703,085 | ) | | | (8,780,534 | ) | | | (79,961,919 | ) |
| | | | | | | | | | | | | | | | |
Net increase | | | 24,833,999 | | | $ | 235,224,761 | | | | 23,464,222 | | | $ | 210,895,795 | |
| | | | | | | | | | | | | | | | |
Emerging Markets
| | | | | | | | | | | | | | | | |
| | | Year Ended
March 31, 2020 | | | Year Ended
March 31, 2019 | |
| | | Shares | | | Amount | | | Shares | | | Amount | |
Class Y-3: | | | | | | | | | | | | | | | | |
Shares sold | | | 34,290,769 | | | $ | 300,441,230 | | | | 21,266,136 | | | $ | 218,061,043 | |
Shares issued through
in-kind contribution**** | | | 14,375,147 | | | | 133,545,116 | | | | — | | | | — | |
Shares issued to shareholders in
reinvestment of distributions | | | 1,618,490 | | | | 15,100,507 | | | | 16,996,229 | | | | 142,768,325 | |
Shares repurchased | | | (31,714,029 | ) | | | (286,169,511 | ) | | | (20,683,889 | ) | | | (196,938,629 | ) |
| | | | | | | | | | | | | | | | |
Net increase | | | 18,570,377 | | | $ | 162,917,342 | | | | 17,578,476 | | | $ | 163,890,739 | |
| | | | | | | | | | | | | | | | |
Global Low Volatility
| | | | | | | | | | | | | | | | |
| | | Year Ended
March 31, 2020 | | | Year Ended
March 31, 2019 | |
| | | Shares | | | Amount | | | Shares | | | Amount | |
Class Y-3: | | | | | | | | | | | | | | | | |
Shares sold | | | 29,601,187 | | | $ | 386,424,292 | | | | 16,031,898 | | | $ | 200,221,293 | |
Shares issued to shareholders in
reinvestment of distributions | | | 6,000,409 | | | | 81,065,529 | | | | — | | | | — | |
Shares repurchased | | | (15,928,861 | ) | | | (221,207,356 | ) | | | (18,205,264 | ) | | | (229,051,200 | ) |
| | | | | | | | | | | | | | | | |
Net increase (decrease) | | | 19,672,735 | | | $ | 246,282,465 | | | | (2,173,366 | ) | | $ | (28,829,907 | ) |
| | | | | | | | | | | | | | | | |
257
Mercer Funds
Notes to Financial Statements (Continued)
March 31, 2020
| | * | On November 26, 2019, Large Cap received securitiesin-kind valued at $769,614,365 and cash of $11,500,000 from Mercer Large Cap Stock Fund. This resulted in the issuance of 81,706,524 shares valued at $781,114,365. |
| | ** | On December 2, 2019, Small/Mid Cap received securitiesin-kind valued at $550,516,305 and cash of $17,123,713 from Mercer Small/Mid Cap Stock Fund. This resulted in the issuance of 51,416,668 shares valued at $567,640,018. |
| | *** | On December 3, 2019,Non-US Core Equity received securitiesin-kind valued at $395,102,338 and cash of $15,800,000 from Mercer International Stock Fund. This resulted in the issuance of 38,582,379 shares valued at $410,902,338. |
| | **** | On November 26, 2019, Emerging Markets received securitiesin-kind valued at $10,686,440 and cash of $122,858,676 from Mercer International Stock Fund. This resulted in the issuance of 14,375,147 shares valued at $133,545,116. |
In the normal course of business, the Funds invest in securities or other instruments and may enter into transactions, and such activities subject each Fund to various risks, including fluctuations in the market (market risk) or failure of an issuer to meet all of its obligations (credit risk). Investments in foreign securities involve certain risks, including foreign currency fluctuations and those related to political or economic instability.
Additional risks associated with certain of the Funds’ investments are described above within the respective security type notes. A more complete description of risks is included in the Funds’ prospectus and statement of additional information.
Certain impacts to public health conditions particular to the coronavirus(COVID-19) outbreak that occurred may have a significant negative impact on the operations and profitability of the Funds’ investments. The extent of the impact to the financial performance of the Funds will depend on future developments, including (i) the duration and spread of the outbreak, (ii) the restrictions and advisories, (iii) the effects on the financial markets, and (iv) the effects on the economy overall, all of which are highly uncertain and cannot be predicted.
Management has evaluated the impact of subsequent events through May 26, 2020, the date the financial statements were available to be issued for possible adjustment and/or disclosure in the Funds’ financial statements. Management has determined that there are no material events that would require adjustment and/or disclosure in the Funds’ financial statements through this date.
258
REPORT OF INDEPENDENT REGISTERED PUBLIC ACCOUNTING FIRM
To the shareholders and the Board of Trustees of Mercer Funds
Opinion on the Financial Statements and Financial Highlights
We have audited the accompanying statements of assets and liabilities of Mercer Funds (the “Funds”) comprising Mercer US Large Cap Equity Fund, Mercer US Small/Mid Cap Equity Fund, MercerNon-US Core Equity Fund, Mercer Core Fixed Income Fund, Mercer Opportunistic Fixed Income Fund, Mercer Emerging Markets Equity Fund, and Mercer Global Low Volatility Equity Fund, including the schedules of investments as of March 31, 2020, the related statements of operations for the year then ended, the statements of changes in net assets for each of the two years in the period then ended, the financial highlights for each of the five years in the period then ended, and the related notes. In our opinion, the financial statements and financial highlights present fairly, in all material respects, the financial position of each of the funds constituting the Mercer Funds as of March 31, 2020, and the results of their operations for the year then ended, the changes in their net assets for each of the two years in the period then ended, and the financial highlights for each of the five years in the period then ended in conformity with accounting principles generally accepted in the United States of America.
Basis for Opinion
These financial statements and financial highlights are the responsibility of the Funds’ management. Our responsibility is to express an opinion on the Funds’ financial statements and financial highlights based on our audits. We are a public accounting firm registered with the Public Company Accounting Oversight Board (United States) (PCAOB) and are required to be independent with respect to the Funds in accordance with the U.S. federal securities laws and the applicable rules and regulations of the Securities and Exchange Commission and the PCAOB.
We conducted our audits in accordance with the standards of the PCAOB. Those standards require that we plan and perform the audit to obtain reasonable assurance about whether the financial statements and financial highlights are free of material misstatement, whether due to error or fraud. The Funds are not required to have, nor were we engaged to perform, an audit of their internal control over financial reporting. As part of our audits we are required to obtain an understanding of internal control over financial reporting but not for the purpose of expressing an opinion on the effectiveness of the Funds’ internal control over financial reporting. Accordingly, we express no such opinion.
Our audits included performing procedures to assess the risks of material misstatement of the financial statements and financial highlights, whether due to error or fraud, and performing procedures that respond to those risks. Such procedures included examining, on a test basis, evidence regarding the amounts and disclosures in the financial statements and financial highlights. Our audits also included evaluating the accounting principles used and significant estimates made by management, as well as evaluating the overall presentation of the financial statements and financial highlights. Our procedures included confirmation of securities owned as of March 31, 2020, by correspondence with the custodian, brokers and agent banks; when replies were not received from brokers or agent banks, we performed other auditing procedures. We believe that our audits provide a reasonable basis for our opinion.

Boston, Massachusetts
May 26, 2020
We have served as the auditor of one or more Mercer investment companies since 2006.
259
Mercer Funds
Additional Information (Unaudited)
Proxy Voting
A description of the policies and procedures that the Advisor and each Fund’s Subadvisors use to determine how to vote proxies relating to the Fund’s portfolio securities is available, without charge, upon request, by calling1-866-658-9896, and on the Securities and Exchange Commission’s (“SEC”) website at http://www.sec.gov. Information about Funds’ proxy voting decisions are available without charge, online on the Funds’ website at https://www.delegated-solutions.mercer.com/us-proxy-voting-policies.html.
Quarterly Reporting
The Funds file their complete schedule of portfolio holdings with the Securities and Exchange Commission for the first and third quarters of each fiscal year on FormN-PORT, which when filed, will be available on the SEC’s website at http://www.sec.gov. When filed, the Funds’ FormN-PORT may be reviewed and copied at the Commission’s Public Reference Room in Washington, D.C. Information on the operation of the Public Reference Room may be obtained by calling1-800-SEC-0330.
Federal Tax Information
The amount of long-term capital gains paid for the fiscal year ended March 31, 2020, were as follows:
| | | | |
Fund | | | |
Large Cap | | $ | 31,187,213 | |
Small/Mid Cap | | | 31,223,283 | |
Global Low Volatility | | | 67,398,170 | |
For the year ended March 31, 2020,Non-US Core Equity and Emerging Markets had foreign tax credits in the amount of $5,343,621 and $2,924,798, respectively, and foreign source income of $77,468,481 and $28,097,562, respectively.
Qualified dividend income (“QDI”) received by the Funds through March 31, 2020, that qualified for a reduced tax rate pursuant to the Internal Revenue Code Section 1(h)(11) are as follows:
| | | | |
Fund | | QDI | |
Large Cap | | $ | 10,264,383 | |
Small/Mid Cap | | | 9,223,055 | |
Non-US Core Equity | | | 60,269,720 | |
Emerging Markets | | | 18,252,686 | |
Global Low Volatility | | | 17,211,573 | |
For corporate shareholders, a portion of the ordinary dividends paid during the Funds’ year ended March 31, 2020, qualified for the dividends received deduction, as follows:
| | | | |
Fund | | | |
Large Cap | | | 76.05 | % |
Small/Mid Cap | | | 92.14 | % |
Non-US Core Equity | | | 0.97 | % |
Emerging Markets | | | 1.88 | % |
Global Low Volatility | | | 55.63 | % |
260
Mercer Funds
Understanding Your Fund’s Expenses (Unaudited)
As a mutual fund shareholder, you incur different costs: transaction costs, including sales charges (loads) on purchases, redemption fees and certain exchange fees and ongoing costs, including management fees, distribution fees(12b-1 fees), and other fund expenses. These costs are described in more detail in the Funds’ prospectus. The examples below are intended to help you understand the ongoing costs of investing in the Funds and help you compare these with the ongoing costs of investing in other mutual funds. The first line in the table for each Fund shows the actual account values and actual fund expenses you would have paid on a $1,000 investment in the Fund from October 1, 2019 through March 31, 2020. It also shows how much a $1,000 investment would be worth at the close of the period, assuming actual fund returns and expenses. To estimate the expenses you paid over the period, simply divide your account value by $1,000 (for example $8,600 account value divided by $1,000 = $8.60) and multiply the result by the number in the Operating Expenses Incurred column as shown below for your Class. The second line in the table for each Fund provides information about hypothetical account values and hypothetical expenses based on the Fund’s actual expense ratios and an assumed rate of return of 5% per year before expenses, which is not the Fund’s actual return. The hypothetical account values and expenses may not be used to estimate the actual ending account balance or expenses you paid on your investment for the period. You may use this information to compare the ongoing costs of investing in the Fund and other funds. To do so, compare this 5% hypothetical example with the 5% hypothetical examples that appear in the shareholder reports of the other funds. Please note that the expenses shown reflect ongoing costs only, and do not include any transaction costs, such as sales charges, redemption fees or exchange fees. Therefore, the second line in the table of each fund is useful in comparing ongoing costs only, and will not help you determine the relative costs of owning different funds. If transaction costs were included, total costs would be higher.
Large Cap —Class Y-3
Hypothetical Return on $1,000
| | | | | | | | | | | | | | | | | | | | |
| | | Expense
Ratio | | | Beginning
Amount | | | Ending
Value | | | Avg
Value | | | Operating
Expense
Incurred* | |
Actual | | | 0.33 | % | | | 1,000.00 | | | | 848.00 | | | | 924.00 | | | | 1.67 | |
Hypothetical | | | 0.33 | % | | | 1,000.00 | | | | 1,023.35 | | | | 1,011.68 | | | | 1.67 | |
| * | Actual expenses are equal to the Class’ annualized expense ratio of 0.33%, multiplied by the average account value over the period, multiplied by 183/366. |
Small/Mid Cap —Class Y-3
Hypothetical Return on $1,000
| | | | | | | | | | | | | | | | | | | | |
| | | Expense
Ratio | | | Beginning
Amount | | | Ending
Value | | | Avg
Value | | | Operating
Expense
Incurred* | |
Actual | | | 0.49 | % | | | 1,000.00 | | | | 763.90 | | | | 881.95 | | | | 2.16 | |
Hypothetical | | | 0.49 | % | | | 1,000.00 | | | | 1,022.55 | | | | 1,011.28 | | | | 2.48 | |
| * | Actual expenses are equal to the Class’ annualized expense ratio of 0.49%, multiplied by the average |
account value over the period, multiplied by 183/366.
261
Mercer Funds
Understanding Your Fund’s Expenses (Unaudited) (Continued)
Non-US Core Equity —Class Y-3
Hypothetical Return on $1,000
| | | | | | | | | | | | | | | | | | | | |
| | | Expense
Ratio | | | Beginning
Amount | | | Ending
Value | | | Avg
Value | | | Operating
Expense
Incurred* | |
Actual | | | 0.43 | % | | | 1,000.00 | | | | 849.60 | | | | 924.80 | | | | 1.99 | |
Hypothetical | | | 0.43 | % | | | 1,000.00 | | | | 1,022.85 | | | | 1,011.43 | | | | 2.17 | |
| * | Actual expenses are equal to the Class’ annualized expense ratio of 0.43%, multiplied by the average account value over the period, multiplied by 183/366. |
Core Fixed —Class Y-3
Hypothetical Return on $1,000
| | | | | | | | | | | | | | | | | | | | |
| | | Expense
Ratio | | | Beginning
Amount | | | Ending
Value | | | Avg
Value | | | Operating
Expense
Incurred* | |
Actual | | | 0.19 | % | | | 1,000.00 | | | | 1,020.00 | | | | 1,010.00 | | | | 0.96 | |
Hypothetical | | | 0.19 | % | | | 1,000.00 | | | | 1,024.05 | | | | 1,012.03 | | | | 0.96 | |
| * | Actual expenses are equal to the Class’ annualized expense ratio of 0.19%, multiplied by the average account value over the period, multiplied by 183/366. |
Opportunistic Fixed —Class Y-3
Hypothetical Return on $1,000
| | | | | | | | | | | | | | | | | | | | |
| | | Expense
Ratio | | | Beginning
Amount | | | Ending
Value | | | Avg
Value | | | Operating
Expense
Incurred* | |
Actual | | | 0.44 | % | | | 1,000.00 | | | | 925.30 | | | | 962.65 | | | | 2.12 | |
Hypothetical | | | 0.44 | % | | | 1,000.00 | | | | 1,022.80 | | | | 1,011.40 | | | | 2.23 | |
| * | Actual expenses are equal to the Class’ annualized expense ratio of 0.44%, multiplied by the average account value over the period, multiplied by 183/366. |
Emerging Markets —Class Y-3
Hypothetical Return on $1,000
| | | | | | | | | | | | | | | | | | | | |
| | | Expense
Ratio | | | Beginning
Amount | | | Ending
Value | | | Avg
Value | | | Operating
Expense
Incurred* | |
Actual | | | 0.52 | % | | | 1,000.00 | | | | 827.30 | | | | 913.65 | | | | 2.38 | |
Hypothetical | | | 0.52 | % | | | 1,000.00 | | | | 1,022.40 | | | | 1,011.20 | | | | 2.63 | |
| * | Actual expenses are equal to the Class’ annualized expense ratio of 0.52%, multiplied by the average account value over the period, multiplied by 183/366. |
262
Mercer Funds
Understanding Your Fund’s Expenses (Unaudited) (Continued)
Global Low Volatility —Class Y-3
Hypothetical Return on $1,000
| | | | | | | | | | | | | | | | | | | | | | | | | |
| | | Expense
Ratio | | Beginning
Amount | | Ending
Value | | Avg
Value | | Operating
Expense
Incurred* |
Actual | | | | 0.31 | % | | | | 1,000.00 | | | | | 860.10 | | | | | 930.05 | | | | | 1.44 | |
Hypothetical | | | | 0.31 | % | | | | 1,000.00 | | | | | 1,023.45 | | | | | 1,011.73 | | | | | 1.57 | |
| * | Actual expenses are equal to the Class’ annualized expense ratio of 0.31%, multiplied by the average account value over the period, multiplied by 183/366. |
263
Mercer Funds
Trustees and Officers (Unaudited)
The following tables list the Trust’s Trustees and Officers as of the date of this report; their address and age; their position with the Trust; the length of time holding that position with the Trust; their principal occupation(s) during the past five years; the number of portfolios in the fund complex they oversee; and other directorships they hold in companies subject to registration or reporting requirements of the Securities Exchange Act of 1934 (generally called “public companies”) or in registered investment companies. The Trust’s Statement of Additional Information (“SAI”) includes additional information about the Trust’s trustees, including changes subsequent to the date of the report. The SAI is available, without charge, upon request, by calling1-866-658-9896, or on the SEC website at www.sec.gov.
Independent Trustees
| | | | | | | | | | | | | |
Name, Address and Age | | Position(s)
Held with
Trust | | Term of
Office(1) and
Length of
Time
Served | | Principal
Occupation(s) During
Past 5 Years | | Number of
Portfolios
in Fund
Complex*
Overseen
by Trustee | | Other
Directorships
Held by
Trustee |
Harrison M. Bains, Jr. 99 High Street Boston, MA 02110 (76) | | Trustee | | Trustee since 2005 | | Mr. Bains is retired. | | | | 7 | | | Mr. Bains is a director of Cara Therapeutics, Inc.; Mr. Bains was a director of BG Medicine, Inc.(2007 to 2014) and a trustee of BofA Funds Series Trust (11 portfolios) (2011 to 2016). |
| | | | | |
Adela M. Cepeda 99 High Street Boston, MA 02110 (61) | | Chairperson and Trustee | | Chairperson since 2018; Trustee since 2005 | | Ms. Cepeda was Managing Director of PFM Financial Advisors LLC (a financial advisory firm) from September 2016 to December 2019. Ms. Cepeda was previously Founder and President of A.C. Advisory, Inc. (a financial advisory firm) 1995—2016. | | | | 7 | | | Ms. Cepeda is a director or trustee of: The UBS Funds (15 portfolios); UBS Relationship Funds (11 portfolios); SMA Relationship Trust (5 portfolios); Morgan Stanley Pathway Funds (11 portfolios); BMO Financial Corp. (U.S. holding company for BMO Harris Bank N.A.); Ms. Cepeda was a director of Fort Dearborn Income Securities, Inc. (2000 to 2016). |
264
Mercer Funds
Trustees and Officers (Unaudited) (Continued)
| | | | | | | | | | | | | |
Name, Address and Age | | Position(s)
Held with
Trust | | Term of
Office(1) and
Length of
Time
Served | | Principal
Occupation(s) During
Past 5 Years | | Number of
Portfolios
in Fund
Complex*
Overseen
by Trustee | | Other Directorships
Held by Trustee |
Gail A. Schneider 99 High Street Boston, MA 02110 (70) | | Trustee | | Trustee Since 2009 | | Ms. Schneider is a self-employed consultant since 2007. Ms. Schneider was previously an Executive Vice President at JPMorgan Chase & Co. | | | | 7 | | | None |
| | | | | |
Luis A. Ubiñas 99 High Street Boston, MA 02110 (56) | | Trustee | | Trustee Since October 2019 | | Mr. Ubiñas is retired. Mr. Ubiñas previously served as President of Ford Foundation (anot-for profit organization) from 2008-2013 and prior to that he served as a Senior Partner for McKinsey & Company (a global consulting firm). | | | | 7 | | | Mr. Ubiñas is a Director of: Electronic Arts, Inc., Boston Private Financial Holdings, Inc., and Tanger Factory Outlet Centers, Inc. |
| | | | | |
Joan E. Steel 99 High Street Boston, MA 02110 (66) | | Trustee | | Trustee Since January 2020 | | Ms. Steel is the Founder and Chief Executive Officer of Alpha Wealth Advisors LLC since September 2009. | | | | 7 | | | None |
Interested Trustee:
| | | | | | | | | | | | | |
Name, Address
and Age | | Position(s)
Held with
Trust | | Term of
Office(1) and
Length of
Time
Served | | Principal
Occupation(s) During
Past 5 Years | | Number of
Portfolios
in Fund
Complex*
Overseen
by Trustee | | Other
Directorships
Held by
Trustee |
Richard S. Joseph** (54) | | Trustee, President, and Chief Executive Officer | | Since 2016 | | Mr. Joseph is Vice President and Head of the US Mercer Delegated Solutions of Mercer Investments LLC since December 2015. Prior to December 2015, he was Chief Operating Officer of Mercer Investments LLC since 2005. | | | | 7 | | | Mr. Joseph is a trustee of Mercer Trust Company and was a director of Mercer Investments LLC from January 2017 — March 2019. |
| (1) | Each Trustee holds office for an indefinite term. |
| * | The “Fund Complex” consists of the Trust, which has seven portfolios. |
| ** | Mr. Joseph is considered to be an “interested person,” as defined in the 1940 Act, of the Trust due to his relationship with the Advisor. |
265
Mercer Funds
Trustees and Officers (Unaudited) (Continued)
Officers:
The executive officers of the Trust not named above are:
| | | | | | |
Name and Age | | Position(s)
Held with
the Trust | | Term of
Office+ and
Length of
Time
Served | | Principal Occupation(s) During Past 5 Years |
Stephen Gouthro
(51) | | Vice President, Treasurer and Chief Financial Officer | | Since 2018 | | Mr. Gouthro is a Partner at Mercer and U.S. Chief Operating Officer for Mercer’s U.S. Business Solutions Group. Mr. Gouthro joined Mercer in 2018. Prior to joining Mercer, Mr. Gouthro was at Putnam Investments in various leadership roles in Operations, Technology, and Investments. |
| | | |
Jeff Coleman (50) | | Vice President and Assistant Treasurer | | Since 2019 | | Mr. Coleman is Head of Investment Operations at Mercer Investments LLC since 2019. Prior to joining Mercer, Mr. Coleman was a Vice President at Fidelity Investments from 2016 to 2018 and a Managing Director, Fund Chief Financial Officer at BofA Global Capital Management from 2010 to 2016. |
| | | |
Jennifer Lewis (50) | | Vice President and Assistant Treasurer | | Since 2018 | | Ms. Lewis is a Principal for Mercer Investments LLC. Ms. Lewis joined Mercer in August 2015 with primary responsibilities related to the treasury functions for the Mercer Funds. Before joining Mercer, Ms. Lewis was a Vice President at State Street with over 19 years working in Fund Administration. |
| | | |
Carol Ann McMahon (47) | | Vice President and Assistant Treasurer | | Since 2017 | | Ms. McMahon is a Partner at Mercer and Global COO for Mercer’s Wealth Global Business Solutions since 2016 and US COO in January 2017. Prior to 2016, Ms. McMahon held the position of European COO since 2006. |
| | | |
Stan Mavromates (58) | | Vice President and Chief Investment Officer | | Since 2012 | | Mr. Mavromates is Vice President and Chief Investment Officer of Mercer Investments LLC since 2012. |
| | | |
Colin Dean (43) | | Vice President, Chief Legal Officer, and Secretary | | Since 2017 | | Mr. Dean is Global Chief Counsel, Investments since 2018. He has also served as Senior Legal Counsel — Investments for Mercer Investments LLC |
| | | |
Caroline Hulme (34) | | Vice President and Assistant Secretary | | Since 2017 | | Ms. Hulme is Senior Legal Counsel, Investments since 2018. She has served as Legal Counsel — Investments for Mercer Investments LLC since 2014. Prior to 2014, she was an Associate in the investment management practice group of Bingham McCutchen LLP. |
| | | |
Larry Vasquez (52) | | Vice President | | Since 2012 | | Mr. Vasquez is a Vice President and Portfolio Manager of Mercer Investments LLC since 2012. |
| | | |
Jennifer Mortimer (49) | | Chief Compliance Officer | | Since 2019 | | Ms. Mortimer is the Chief Compliance Officer of Mercer Trust Company LLC since July 2019. Ms. Mortimer served as Chief Compliance Officer of Mercer Investments LLC from July 2019 to April 2020. She served as US Compliance Leader, Investments since January 2017 to April 2020. Ms. Mortimer served as Chief Compliance Officer for Century Capital Management LLC and Century Funds (June 2014 — January 2017). |
| † | Officers of the Trust are elected by the Trustees and serve at the pleasure of the Board. |
266
Shares of Mercer Funds are distributed by MGI Funds Distributors, LLC.
Item 2. Code of Ethics.
As of the end of the period covered by this report, the Registrant has adopted a code of ethics that applies to its President, Chief Financial Officer and Chief Investment Officer. During the period covered by this report, there were no amendments to a provision of its code of ethics, nor were there any waivers, including implicit waivers granted from a provision of the code of ethics. A copy of the Registrant’s code of ethics is filed with the FormN-CSR under Item 12(a)(1).
Item 3. Audit Committee Financial Expert.
The Registrant’s Board of Trustees has determined that the Registrant has at least one audit committee financial expert serving on its audit committee. The audit committee financial experts serving on the Registrant’s audit committee are Harrison M. Bains, Jr. and Adela Cepeda, who are both “independent” as defined in Item 3(a)(2) of this Form.
Item 4. Principal Accountant Fees and Services.
(a) Audit Fees – The aggregate fee billed for the fiscal year for professional services rendered by the principal accountant for the audit of the Registrant’s annual financial statements or services that are normally provided by the principal accountant in connection with statutory and regulatory filings or engagements was $405,930 and $379,500 for the fiscal years ended March 31, 2019 and March 31, 2020, respectively.
(b) Audit-Related Fees– There were no fees billed for the fiscal years ended March 31, 2019 and March 31, 2020 for assurance and related services by the principal accountant that are reasonably related to the performance of the audit of the Registrant’s financial statements and are not reported under (a) of this Item.
(c) Tax Fees – The aggregate fee billed in the last fiscal year for professional services rendered by the principal accountant for the review of the Registrant’s tax returns and excise tax calculations was $67,954 and $69,300 for the fiscal years ended March 31, 2019 and March 31, 2020, respectively. Fees in the amount of $73,105 and $65,163 were billed in the fiscal years ended March 31, 2019 and March 31, 2020, respectively for review ofnon-US capital gains and the preparation and filing of return of income for the MercerNon-US Core Equity Fund and the Mercer Emerging Markets Equity Fund.
(d) All Other Fees – Fees in the amount of $103,333 were billed in the fiscal year ended March 31, 2020 for tax advisory services related to the reclamation of taxes paid by the MercerNon-US Core Equity Fund and the Mercer Global Low Volatility Equity Fund in certain European Union countries.
(e) (1) The Registrant’s audit committeepre-approves all audit andnon-audit services to be performed by the Registrant’s accountant before the accountant is engaged by the Registrant to perform such services.
(2) There were no services described in (b) through (d) above (including services required to be approved by the audit committee pursuant to paragraph (c)(7)(ii) ofRule 2-01 of RegulationS-X) that were approved by the audit committee pursuant to paragraph (c)(7)(i)(C) ofRule 2-01 of RegulationS-X.
| (f) | None of the hours expended on the principal accountant’s engagement to audit the Registrant’s financial statements for the fiscal year ended March 31, 2020 were attributable to work performed by persons other than the principal accountant’s full-time, permanent employees. |
| (g) | There were no aggregate fees billed for the fiscal year ended March 31, 2020 by the Registrant’s principal accountant fornon-audit services rendered to the Registrant, its investment adviser and any entity controlling, controlled by or under common control with the investment adviser that provides ongoing services to the Registrant. |
Item 5. Audit Committee of Listed Registrants.
Not applicable.
Item 6. Schedule of Investments.
The Registrant’s full schedules of investments are included as part of the report to shareholders filed under Item 1 of this Form.
Item 7. Disclosure of Proxy Voting Policies and Procedures forClosed-End Management Investment Companies.
Not applicable.
Item 8. Portfolio Managers ofClosed-End Investment Companies.
Not applicable.
Item 9. Purchases of Equity Securities byClosed-End Management Investment Company and Affiliated Purchasers.
Not applicable.
Item 10. Submission of Matters to a Vote of Security Holders.
There have been no material changes to the procedures by which the shareholders may recommend nominees to the
Registrant’s Board of Directors, where those changes were implemented after the Registrant last provided disclosure
in response to the requirements of Item 22(b)(15) of Schedule 14A (17 CFR240.14a-101), or this Item.
Item 11. Controls and Procedures.
(a) The Registrant’s Principal Executive Officer and Principal Financial Officer concluded that the Registrant’s disclosure controls and procedures (as defined in Rule30a-3(c) under the Investment Company Act of 1940 (17 CFR270.30a-3(c))), are effective based on the evaluation of Registrant’s disclosure controls and procedures as of a date within 90 days prior to the filing date of this report.
(b) There were no changes in the Registrant’s internal control over financial reporting (as defined in Rule30a-3(d) under the Investment Company Act of 1940 (17 CFR270.30a-3(d))), that occurred during the Registrant’s second fiscal quarter of the period covered by this report that has materially affected, or is reasonably likely to materially affect, the Registrant’s internal control over financial reporting.
Item 12. Exhibits.
(a)(1) Code of Ethics for the Registrant’s President, Chief Financial Officer and Chief Investment Officer (as referenced in Item 2 above), attached hereto as Exhibit (a)(1).
(a)(2) Certification of the Principal Executive Officer and Principal Financial Officer of the Registrant as required by Rule30a-2(a) under the Investment Company Act of 1940 (17 CFR270.30a-2(a)) is attached hereto as Exhibit 99CERT.
(a)(3) Not applicable.
(b) Certification pursuant to Section 906 of the Sarbanes-Oxley Act of 2002 as required by Rule30a-2(b), under the Investment Company Act of 1940 (17 CFR270.30a-2(b)), Rule15d-14(b) under the Securities Exchange Act of 1934 (17 CFR240.15d-14(b)) and Section 1350 of Chapter 63 of Title 18 of the United States Code (18 U.S.C. 1350) is attached hereto as Exhibit 99.906CERT.
SIGNATURES
Pursuant to the requirements of the Securities Exchange Act of 1934 and the Investment Company Act of 1940, the Registrant has duly caused this report to be signed on its behalf by the undersigned, thereunto duly authorized.
| | |
| (Registrant) | | Mercer Funds |
| | |
| |
| By (Signature and Title) | | /S/ Richard Joseph |
| | | Richard Joseph President and Chief Executive Officer (Principal Executive Officer) |
Date May 26, 2020
Pursuant to the requirements of the Securities Exchange Act of 1934 and the Investment Company Act of 1940, this report has been signed below by the following person on behalf of the Registrant and in the capacities and on the date indicated.
| | |
| |
| By (Signature and Title) | | /S/ Richard Joseph |
| | | Richard Joseph President and Chief Executive Officer (Principal Executive Officer) |
Date May 26, 2020
| | |
| |
| By (Signature and Title) | | /S/ Stephen Gouthro |
| | | Stephen Gouthro Vice President, Treasurer and Chief Financial Officer (Principal Financial Officer) |
Date May 26, 2020