UNITED STATES
SECURITIES AND EXCHANGE COMMISSION
Washington, DC 20549
FORM N-CSR
CERTIFIED SHAREHOLDER REPORT OF REGISTERED
MANAGEMENT INVESTMENT COMPANIES
Investment Company Act File Number: 811-21732
Mercer Funds
(Exact Name of Registrant as Specified in Charter)
99 High Street
Boston, MA 02110
(Address of Principal Executive Offices)(Zip Code)
Colin J. Dean, Esq.
Mercer Investments LLC
99 High Street
Boston, MA 02110
(Name and Address of Agent for Service)
Registrant’s Telephone Number, including Area Code: (617) 747-9500
Date of Fiscal Year End: March 31, 2022
Date of Reporting Period: March 31, 2022
| Item 1. | Reports to Stockholders. |
(a) The Report to Shareholders is attached herewith.

Mercer FundsTM
Annual Report
Mercer US Large Cap Equity Fund
Mercer US Small/Mid Cap Equity Fund
Mercer Non-US Core Equity Fund
Mercer Core Fixed Income Fund
Mercer Opportunistic Fixed Income Fund
Mercer Emerging Markets Equity Fund
Mercer Global Low Volatility Equity Fund
This report has been prepared for Mercer Funds shareholders. It is not authorized for distribution to prospective investors unless accompanied or preceded by a current Mercer Funds prospectus. The prospectus contains more complete information about the Funds’ investment objectives, risks, and expenses. Investors are reminded to read the prospectus carefully before investing.
March 31, 2022
MERCER FUNDS
TABLE OF CONTENTS
Mercer US Large Cap Equity Fund
Investment Objective and Benchmark
The investment objective of the Fund is long-term total return, which includes capital appreciation and income. The benchmark for the Fund is the Russell 1000® Index1.
Investment Strategy
The Fund invests principally in equity securities (such as common stock) issued by large capitalization U.S. companies. The Fund employs a “core equity” investment strategy by investing in both growth and value oriented equity securities. The Fund may invest in derivative instruments to gain market exposure on cash balances or to reduce market exposure in anticipation of liquidity needs.
Performance
For the fiscal year ended March 31, 2022, the Fund’s Y-3 share class performance was 8.62% compared to its benchmark, the Russell 1000® Index, return of 13.27%. Performance for the Fund is reported net of fees and operating expenses while the benchmark returns do not include expenses of any kind as indexes are unmanaged.
The Sub-Advisors
As of March 31, 2022, the Fund employed six sub-advisors: Brandywine Global Investment Management LLC (Brandywine), O’Shaughnessy Asset Management LLC (OSAM), Polen Capital Management LLC (Polen), Jennison Associates LLC (Jennison), Delaware Investments Fund Advisers, a series of Macquarie Investment Management Business Trust (Macquarie), and Parametric Portfolio Associates LLC (Parametric).
Brandywine, a deep value manager, focuses on cheap stocks that trade at a significant discount to intrinsic value, with strong free cash flows and quality balance sheets.
OSAM is a yield focused quantitative value manager that seeks stocks that rank high based on valuation, quality and shareholder yield.
Polen is a concentrated quality growth manager, focused on finding high quality companies, with sustainable, above-average earnings growth.
Jennison is a growth manager who selects stocks with long-term competitive advantages that are growing earnings faster or longer than the broad market.
Macquarie is a quality value manager who invests in strong, high quality businesses with sound balance sheets and free cash flow generation.
Parametric utilizes exchange-traded futures to generate market exposure corresponding to the Fund’s benchmark.
Market Commentary and Fund Performance
The US equity rally from pandemic lows continued in the first three quarters of the 2021 fiscal year. It was largely driven by strong economic recovery, robust corporate earnings and loose financial conditions. The environment also presented its challenges with virus variants, a slowdown in China, continuing supply chain disruptions and towards the second half of the year rising commodity prices, soaring inflation, and increasingly hawkish Federal Reserve. With inflation prints reaching 40-year highs and the Federal Reserve signaling its resolve to temper rising prices through monetary tightening, last quarter of the fiscal 2021 year saw US equities closing lower. The Russian invasion of Ukraine at the end of February and subsequent sanctions on Russian economy led to more disruptions in supply chains and created more pressure for energy, food and other commodity prices to move higher.
1
Mercer US Large Cap Equity Fund
The environment led to significant divergences in performance across different sectors and styles of investing. Energy and metals & mining industries, for example, had greater than 50% returns for the year. On the other hand, the rising rate environment traditionally put more pressure on valuations of companies with high earnings growth characteristics. With rich valuations from exceptional performance from the prior year, these types of stocks entered a challenging environment and significantly lagged stocks with lower valuations.
Within the Russell 1000® Index, the Fund’s benchmark, the best performing sectors for the fiscal year were Energy (65.2%), Real Estate (22.7%), and Utilities (19.3%). The worst performing sectors were Communication Services (-3.2%), Industrials (3.6%) and Consumer Discretionary (5.9%). Information Technology, the largest sector in Russell 1000® Index returned 17.2%. However, excluding the impact of Apple and Microsoft, which combined constitute above 35% of the sector, IT returns were in single digits.
The Mercer US Large Cap Equity Fund lagged the Russell 1000® Index for the period, with value oriented managers, Brandywine, OSAM, and Macquarie outperforming, and growth and higher quality managers, Jennison and Polen underperforming their benchmarks.
Jennison lagged the Russell 1000® Growth Index by 12.38%. In contrast to 2020 when stocks with higher earnings growth characteristics had an exceptionally strong performance, 2021 was marked by change of investor sentiment and sharp decline in stock prices of higher growth, expensively priced businesses. The environment was a major headwind for Jennison. Majority of underperformance came from security selection in Information Technology and Communication Services sectors. Overweight positions to Shopify, Block, Twilio and Match were among largest negative contributors to performance.
Polen lagged the Russell 1000® Growth Index by 8.99%. Significant underperformance of higher growth, more expensively priced stocks was a headwind. Polen’s underperformance in most part came from security selection within Information Technology Sector. Overweight positions to Autodesk, Meta, Paypal and Netflix were among largest negative contributors to performance.
Macquarie outperformed the Russell 1000® Value Index by 1.83%. Macquarie’s outperformance was driven by security selection in a number of sectors such as Information Technology, Consumer Discretionary, Industrials and Consumer Staples. Being underweight to Energy and weaker security selection in Communication Services detracted. The investment environment was favorable as less expensively priced companies with relatively strong balance sheets and earnings tended to outperform.
OSAM outperformed the Russell 1000® Value Index by 0.95%. Security selection across a number of sectors such as Industrials, Information Technology, Consumer Staples and Health Care led to outperformance. Security selection in Materials and Financials detracted. OSAM’s higher than index exposure to inexpensive businesses was a tailwind as companies with value characteristics tended to outperform during the period.
Brandywine outperformed the Russell 1000® Value Index by 0.98%. Investments in Information Technology, Materials and Industrials both from allocation as well security selection perspectives were main contributors to returns. Security selection in Financials and Consumer Discretionary detracted. Brandywine’s higher than index exposure to inexpensive businesses was a tailwind as companies with value characteristics tended to outperform during the period.
Parametric utilizes exchange-traded futures replicating the Fund’s benchmark, aiming to provide broad, passive, equity market exposure to the Fund’s liquidity sleeve, and seeking to create positive returns on assets that would have otherwise been earning cash or cash equivalent returns. Performance differences versus the benchmark are largely a result of cash flow effects related to daily subscription/redemption activity and through financing costs of futures relative to interest earned on cash.
2
Mercer US Large Cap Equity Fund
Risk Considerations
The Fund invests in both growth stocks and value stocks. Growth stocks may be particularly sensitive to market conditions. Investing in value stocks involves the risk that an investment made in undervalued securities may not appreciate in value as anticipated or remain undervalued for long periods of time. The Fund may invest in derivative instruments such as exchange-listed equity futures contracts, which may cause the Fund to experience greater volatility and less liquidity. Derivatives may be more sensitive to changes in market conditions and may amplify the risk of loss for the Fund. The Fund may experience high portfolio turnover which may result in higher transaction costs and capital gains.
3
Mercer US Large Cap Equity Fund
March 31, 2022
Comparison of Change in Value of a $10,000 Investment in
Mercer US Large Cap Equity Shares vs. the
Russell 1000® Index
As of March 31, 2022
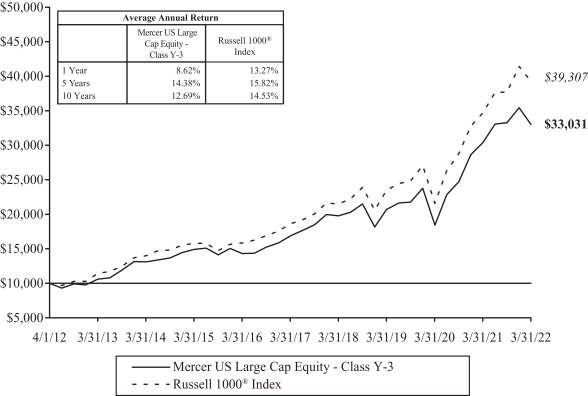
| 1 | Russell 1000® Index measures the performance of the large cap segment of the U.S. equity universe. The index is unmanaged and cannot be invested in directly |
This graph shows the performance of the Mercer US Large Cap Equity Fund Class Y-3 shares versus the Russell 1000® Index from April 1, 2012 through March 31, 2022. The performance of other classes, when launched, will vary from the performance of the class shown based on the difference in fees and expenses paid by shareholders investing in different share classes. The Fund may charge a 2% redemption fee on shares owned less than 30 days.
The table and graph assume reinvestment of dividends and capital gains, but do not reflect a deduction of taxes an investor might pay on fund distributions or upon redemption of fund shares. Performance shown reflects a fee waiver and/or expense reimbursement. Without this waiver/reimbursement, returns would have been lower.
The data quoted represents past performance and does not guarantee future results. Current performance of the Fund may be lower or higher than the performance quoted. Please call 1-888-887-0619 or visit the Trust’s web site at https://www.mercer.us/what-we-do/wealth-and-investments/delegated-solutions-us.html for the Fund’s most recent month-end performance. Investment return and principal value will fluctuate so that an investor’s shares, when redeemed, may be worth more or less than when purchased.
Fund holdings and sector allocations are subject to change and are not a recommendation to buy or sell any security. Please see the Schedule of Investments for a complete list of Fund holdings.
4
Mercer US Small/Mid Cap Equity Fund
Investment Objective and Benchmark
The investment objective of the Fund is to provide long-term total return, comprised primarily of capital appreciation. The benchmark for the Fund is the Russell 2500® Index1.
Investment Strategy
The Fund invests principally in equity securities issued by small-to-medium capitalization U.S. companies. The Fund employs a “core equity” investment strategy by investing in both growth and value oriented equity securities. The Fund may invest in derivative instruments to gain market exposure on cash balances or to reduce market exposure in anticipation of liquidity needs.
Performance
For the fiscal year ended March 31, 2022, the Fund’s Y-3 share class performance was 3.45% compared to its benchmark, the Russell 2500® Index, return of 0.34%. Performance for the Fund is reported net of fees and operating expenses while the benchmark returns do not include expenses of any kind as indexes are unmanaged.
The Sub-Advisors
As of March 31, 2022, the Fund employed six sub-advisors: Westfield Capital Management Company (Westfield), GW&K Investment Management LLC (GW&K), Loomis, Sayles & Company, LP (Loomis), LSV Asset Management (LSV), River Road Asset Management (River Road) and Parametric Portfolio Associates LLC (Parametric).
Westfield, a traditional growth manager, employs a fundamental, bottom-up approach, which seeks to identify reasonably priced stocks with high earnings growth potential. A bottom-up approach focuses on the analysis of individual stocks and de-emphasizes the significance of macroeconomic and market cycles with the assumption individual companies can do well even in an industry that is not performing, at least on a relative basis.
GW&K uses a bottom-up fundamental research process in order to identify high quality companies with sustainable long-term earnings growth rates.
Loomis looks to provide a lower volatility approach to high growth investing by seeking companies with high quality business models that have differentiated and sustainable growth opportunities.
LSV, a quantitative value manager, using mathematical and statistical methods, seeks deep value, out-of-favor companies with recent momentum. LSV avoids introducing any judgmental biases or behavioral weaknesses into their investment process.
River Road, a fundamental absolute value manager, seeks to buy stocks at a discount to their fair value and sell them at or in excess of that value, and focuses on purchasing companies that are priced at a modest discount to their absolute value and possess superior fundamental business characteristics.
Parametric utilizes exchange-traded futures to generate market exposure corresponding to the Fund’s benchmark.
Market Commentary and Fund Performance
The U.S. equity rally from pandemic lows continued in the first three quarters of the 2021 fiscal year. It was largely driven by strong economic recovery, robust corporate earnings and loose financial conditions. The environment also presented its challenges with virus variants, a slowdown in China, continuing supply chain disruptions and towards the second half of the year rising commodity prices, soaring inflation, and increasingly hawkish Federal Reserve. With inflation prints reaching 40-year highs and the Federal Reserve signaling its
5
Mercer US Small/Mid Cap Equity Fund
resolve to temper rising prices through monetary tightening, last quarter of the fiscal 2021 year saw US equities closing lower. The Russian invasion of Ukraine at the end of February and subsequent sanctions on Russian economy led to more disruptions in supply chains and created more pressure for energy, food and other commodity prices to move higher.
The environment led to significant divergences in performance across different sectors and styles of investing. Energy and metals & mining industries, for example, had greater than 50% returns for the year. On the other hand, the rising rate environment traditionally put more pressure on valuations of companies with high earnings growth characteristics. With rich valuations from exceptional performance from the prior year, these types of stocks entered a challenging environment and significantly lagged stocks with lower valuations.
Within the Russell 2500® Index, the Fund’s benchmark, the best performing sectors for the fiscal year were Energy and Materials with returns of 84.05% and 21.21%, respectively. Underperforming sectors for the fiscal year were Health Care and Consumer Discretionary, with returns of -19.74% and -15.98%, respectively. The top performing industries for the fiscal year were Industrial Conglomerates and Metals & Mining with returns of 51.53% and 42.26%, respectively. The underperforming industries for the fiscal year were Biotechnology and Beverages with returns of -37.00% and -33.81%, respectively.
The Mercer US Small/Mid Cap Equity Fund outperformed the Russell 2500® Index for the period. The Fund’s exposure to quality, value, size from a market capitalization standpoint as well as its lower beta profile were tailwinds towards performance for the year. Security selection, particularly in the health care, consumer staples and consumer discretionary sectors contributed towards performance while selection in the materials and energy sectors detracted from performance for the fiscal year. From an allocation standpoint, the Fund’s overweight position in the information technology sector contributed towards performance while the Fund’s underweight positions in the energy and real estate sectors detracted from performance.
Westfield outperformed the Russell 2500® Growth Index for the fiscal year. The relative outperformance was driven by their valuation bias as well as their exposure to size from a weighted average market capitalization standpoint. In addition, their strong security selection in the health care and financials sectors contributed towards performance for the fiscal year. From an allocation standpoint, their underweight positioning in the consumer discretionary and consumer staples sectors coupled with their overweight positioning in the industrials sector contributed towards performance. Westfield’s underweight positioning in the energy sector detracted from performance for the fiscal year.
Loomis’ exposure to high quality growth coupled with their size exposure from a market capitalization standpoint were tailwinds towards performance versus the Russell 2500® Growth Index. In addition, their strong security selection within the biotechnology and life sciences tools & services industries within the health care sector coupled with their selection in the technology hardware, storage & peripherals, IT services and communications equipment industries within the information technology sector as well as the aerospace & defense industry within the industrials sector contributed towards performance for the fiscal year.
GW&K’s outperformance can be attributed to its exposure to higher quality and size from a market capitalization standpoint. In addition, their strong security selection in the biotechnology industry within the health care sector along with strong selection in the IT services and software industries within the information technology sector drove their performance for the fiscal year.
LSV’s underperformance versus the Russell 2500® Value Index for the period was driven by their allocation decisions being underweight to energy and overweight to the consumer discretionary sector despite their deep value style being in favor, which is evident with its security selection in multiple sectors to include financials, consumer staples, health care, real estate, information technology, consumer discretionary and utilities all contributing towards performance.
6
Mercer US Small/Mid Cap Equity Fund
River Road’s underperformance versus the Russell 2500® Value Index for the period was attributed to their underweight exposure to materials, energy and real estate despite their strong security selection within the consumer discretionary and staples sectors for the fiscal year.
Parametric utilizes exchange-traded futures replicating the Fund’s benchmark to provide broad, passive, equity market exposure to the Fund’s liquidity sleeve, creating positive returns on assets that would have otherwise been earning cash or cash equivalent returns. Performance differences versus the benchmark are largely a result of cash flow effects related to daily subscription/redemption activity and through financing costs of futures relative to interest earned on cash.
Risk Considerations
The Fund invests in both growth stocks and value stocks. Growth stocks may be particularly sensitive to market conditions. Investing in value stocks involves the risk that an investment made in undervalued securities may not appreciate in value as anticipated or remain undervalued for long periods of time. Investments made in small and mid-capitalization companies may be more volatile and less liquid due to limited resources or product lines and more sensitive to economic factors. The Fund may invest in derivative instruments such as exchange-listed equity futures contracts, which may cause the Fund to experience greater volatility and less liquidity. Derivatives may be more sensitive to changes in market conditions and may amplify the risk of loss for the Fund. The Fund may experience high portfolio turnover which may result in higher transaction costs and capital gains.
7
Mercer US Small/Mid Cap Equity Fund
March 31, 2022
Comparison of Change in Value of a $10,000 Investment in
Mercer US Small/Mid Cap Equity Shares vs. the
Russell 2500® Index
As of March 31, 2022
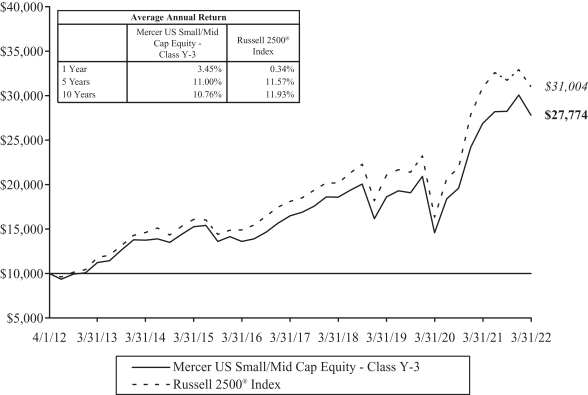
| 1 | Russell 2500® Index measures the performance of the small-to mid-cap segment of the U.S. equity universe. The Russell 2500® Index is a subset of the Russell 3000® Index. It includes approximately 2,500 of the smallest securities based on a combination of their market cap and current index membership. The index is unmanaged and cannot be invested in directly. |
This graph shows the performance of the Mercer US Small/Mid Cap Equity Fund Class Y-3 shares versus the Russell 2500® Index from April 1, 2012 through March 31, 2022. The performance of other classes, when launched, will vary from the performance of the class shown based on the difference in fees and expenses paid by shareholders investing in different share classes. The Fund may charge a 2% redemption fee on shares owned less than 30 days.
The table and graph assume reinvestment of dividends and capital gains, but do not reflect a deduction of taxes an investor might pay on fund distributions or upon redemption of fund shares. Performance shown reflects a fee waiver and/or expense reimbursement. Without this waiver/reimbursement, returns would have been lower.
The data quoted represents past performance and does not guarantee future results. Current performance of the Fund may be lower or higher than the performance quoted. Please call 1-888-887-0619 or visit the Trust’s web site at https://www.mercer.us/what-we-do/wealth-and-investments/delegated-solutions-us.html for the Fund’s most recent month-end performance. Investment return and principal value will fluctuate so that an investor’s shares, when redeemed, may be worth more or less than when purchased.
Fund holdings and sector allocations are subject to change and are not a recommendation to buy or sell any security. Please see the Schedule of Investments for a complete list of Fund holdings.
8
Mercer Non-US Core Equity Fund
Investment Objective and Benchmark
The investment objective of the Fund is to provide long-term total return, which includes capital appreciation and income. The benchmark for the Fund is the MSCI EAFE® Index1.
Investment Strategy
The Fund invests principally in equity securities issued by non-U.S. companies of any capitalization, located in the world’s developed and emerging capital markets. The Fund employs a “core equity” investment strategy that seeks to meet the Fund’s investment objective by investing in both growth- and value-oriented equity securities.
Performance
For the fiscal year ended March 31, 2022, the Fund’s Y-3 share class performance was -1.07% and the I share class performance was -5.97% compared to its benchmark return of 1.16%. Performance for the Fund is reported net of fees and operating expenses while the benchmark returns do not include expenses of any kind as indexes are unmanaged.
The Sub-Advisors
As of March 31, 2022, the Fund employed five sub-advisors: Arrowstreet Capital, Limited Partnership (Arrowstreet), American Century Investment Management, Inc. (American Century), MFS Investment Management (MFS), LSV Asset Management (LSV) and Parametric Portfolio Associates LLC (Parametric).
Arrowstreet’s strategy seeks to outperform international equity benchmarks through a risk-controlled core approach. Arrowstreet combines sound investment intuition and research with rigorous quantitative tools to identify mispriced stocks around the world. Arrowstreet believes that the key to generating return in excess of the benchmark involves evaluating the prospects of a security considering both the characteristics of the stock itself (direct effects) as well as the characteristics of other related stocks (indirect effects).
American Century manages its portfolio based on an investment philosophy that companies exhibiting improving or accelerating growth will outperform the market over time. American Century constructs its portfolio through a bottom-up stock selection, which focuses on individual stock selection rather than macroeconomic and market cycles, within a risk aware framework. American Century’s thorough research process seeks to identify companies that are exhibiting an improvement or acceleration in growth where it believes that growth is sustainable but that the earnings power of the company is generally underestimated. American Century can opportunistically invest in emerging market stocks.
MFS’s investment process is based on a fundamental, bottom-up stock selection of high quality companies whose long-term value MFS believes is not adequately reflected in the stock price.
LSV utilizes a quantitative approach, which uses mathematical and statistical methods and seeks deep value stocks that have fallen out of favor with the market, but have recent momentum, either in terms of price or earnings. LSV believes that long-term results are achieved through systematic exploitation of judgmental biases and behavioral weaknesses that influence investor decisions. LSV aims to exploit these biases through the disciplined application of quantitative techniques to drive bottom-up security selection.
Parametric utilizes exchange-traded futures to generate market exposure corresponding to the Fund’s benchmark.
Market Commentary and Fund Performance
During the first three quarters of fiscal year 2021 equities of developed economies continued to move higher supported by robust economic recovery, strong corporate earnings and relatively loose financials conditions.
9
Mercer Non-US Core Equity Fund
In contrast, emerging market equities appeared under significant pressure starting from the second quarter. Chinese government’s tougher regulations towards a number of industries, including mega-cap technology and education stocks, sent Chinese equities, which constitute more than the third of the MSCI Emerging Markets® Index, sharply lower. In addition, Chinese equities have been under pressure from economic slowdown, which was exasperated by lock-downs as the government continued to pursue Covid-19 zero tolerance policies, as well as government’s attempts to manage soft landing for the overvalued Chinese real estate market.
During the year both developed and emerging markets had to grapple with a number of challenges such as virus variants, continuing supply chain disruptions and rising commodity prices and inflation rates. As it became increasingly clear that inflation pressures were not transitionary in nature, many Central Banks, including Federal Reserve, turned hawkish and began implementing or announcing monetary tightening policies. With multi-decade high inflation prints and hawkish Central banks around the world, equities declined in the last quarter of fiscal year 2021. Russian invasion of Ukraine at the end of February and subsequent sanctions on Russian economy led to more disruptions in supply chains and created more pressure for Energy, food and other commodity prices to move higher.
For the year ended March 31, 2022. U.S. equities — measured using the Russell 1000® Index — increased by 13.27%. Compared to the U.S., international developed markets lagged, with the MSCI EAFE® Index (the Fund’s benchmark) returning 1.16% over the period. The MSCI Emerging Markets® Index declined by 11.37% for the 12-month period ended March 31, 2022. In local currency terms MSCI EAFE® Index and MSCI Emerging Markets® Index posted higher returns, as US dollar significantly appreciated compared to other major currencies.
With rising commodity prices, commodity-producing countries such as Canada, Australia and UK in the developed world and Brazil, Mexico South Africa and Saudi Arabia in the emerging world posted strong returns. US and Switzerland in the developed world and India among emerging countries also registered strong returns for the year. Germany was the worst performing major developed economy, followed by Japan. In Emerging markets, Russia, China and Korea were the worst performers. Russian stocks, which at the end of January 2022 constituted 3.4% of the MSCI Emerging Markets® Index and were predominantly in Energy, Materials and Financial sectors, as a consequence of crises around Ukraine became illiquid and lost most their value. As of end of March, Russian stocks were removed from the MSCI Emerging Markets® Index.
The year witnessed major performance divergences across different sectors, styles of investing and regions. Commodity producing companies posted very strong returns. On the other hand, the rising rate environment traditionally put more pressure on valuations of companies with high earnings growth characteristics. With rich valuations from prior year’s exceptional performance, these types of stocks entered a challenging environment and significantly lagged value stocks. Companies with higher profitability and lower indebtedness levels also tended to lag in performance in part due to richer valuations. In the developed world, smaller market capitalization companies were under more pressure compared to mega and larger market capitalization companies. In contrast, in Emerging markets larger market cap stocks lagged, in large part stemming from significant underperformance of Chinese and Korean mega-cap names such as Tencent, Meituan and Samsung.
For the fiscal year, in EAFE markets Energy (30.8%), Health Care (9.3%) and Materials (8.7%) were the best performing sectors while Communication Services (-9.8%), Consumer Discretionary (-9.5%) and Industrials (-3.5%) were the worst performers.
Arrowstreet lagged the Fund’s benchmark by 0.32%. Largest detractors from performance were weaker security selection within Consumer Discretionary, Energy and Consumer Staples sectors; stronger security selection in Industrials, Financials and Information Technology sectors accounted for largest positive contributions. Arrowstreet’s tilt towards lower market capitalization stocks was a headwind; higher than benchmark exposure to cheaper priced stocks was a tailwind.
10
Mercer Non-US Core Equity Fund
American Century lagged the Fund’s benchmark by 6.61%. While 2020 marked a year with exceptionally strong returns for companies with high and accelerating earnings growth characteristics, 2021 saw a reversal of investor sentiment and a significant sell-off for these types of stocks. This environment was a major headwind for American Century. Majority of underperformance came from security selection within Information Technology, Consumer Discretionary, Materials and Financials.
MFS underperformed the Fund’s benchmark by 2.79%. During 2021 more expensively priced businesses with high quality characteristics such as higher return on equity and lower indebtedness tended to underperform companies with lower valuations. This environment was a headwind for MFS. Largest detractors to performance came from security selection within Information Technology and Consumer Staples as well as being underweight to Health Care and Energy sectors.
LSV outperformed the Fund’s benchmark by 0.26%. Stronger security selection in Communication Services, Financials and Consumer Staples were largest positive contributors to returns. Weaker security selection in Energy, Materials and Information Technology were largest negative detractors. LSV’s tilt towards lower market capitalization stocks was a headwind; higher than benchmark exposure to cheaper priced stocks was a tailwind.
Parametric utilizes exchange-traded futures replicating the Fund’s benchmark, aiming to provide broad, passive, equity market exposure to the Fund’s liquidity sleeve, and seeking to create positive returns on assets that would have otherwise been earning cash or cash equivalent returns. Performance differences versus the benchmark are largely a result of cash flow effects related to daily subscription/redemption activity and through financing costs of futures relative to interest earned on cash.
Risk Considerations
The Fund invests in foreign and emerging market securities which involves certain risks such as currency volatility, political and social instability and reduced market liquidity. Emerging markets may be more volatile and less liquid than more developed markets and therefore may involve greater risks. Investments made in small and mid-capitalization companies may be more volatile and less liquid due to limited resources or product lines and more sensitive to economic factors. The Fund may invest in derivative instruments such as exchange-listed equity futures contracts, which may cause the Fund to experience greater volatility and less liquidity. Derivatives may be more sensitive to changes in market conditions and may amplify the risk of loss for the Fund. The Fund may experience high portfolio turnover which may result in higher transaction costs and capital gains.
11
Mercer Non-US Core Equity Fund
March 31, 2022
Comparison of Change in Value of a $10,000 Investment in
Mercer Non-US Core Equity Shares vs. the
MSCI EAFE Index®
As of March 31, 2022
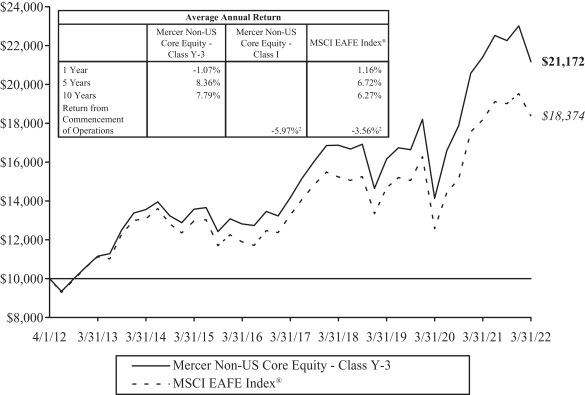
| 1 | MSCI EAFE® Index measures the performance of equity securities in developed markets outside of North America, including Europe, Australasia, and the Far East. The index is unmanaged and cannot be invested in directly. |
| 2 | Class I return is from commencement date July 22, 2021 through March 31, 2022. MSCI EAFE® Index return reflects the same time period. |
This graph shows the performance of the Mercer Non-US Core Equity Fund Class Y-3 shares versus the MSCI EAFE Index® from April 1, 2012 through March 31, 2022. The performance of other classes will vary from the performance of the class shown based on the difference in fees and expenses paid by shareholders investing in different share classes. The Fund may charge a 2% redemption fee on shares owned less than 30 days.
The table and graph assume reinvestment of dividends and capital gains, but do not reflect a deduction of taxes an investor might pay on fund distributions or upon redemption of fund shares. Performance shown reflects a fee waiver and/or expense reimbursement. Without this waiver/reimbursement, returns would have been lower.
The data quoted represents past performance and does not guarantee future results. Current performance of the Fund may be lower or higher than the performance quoted. Please call 1-888-887-0619 or visit the Trust’s web site at https://www.mercer.us/what-we-do/wealth-and-investments/delegated-solutions-us.html for the Fund’s most recent month-end performance. Investment return and principal value will fluctuate so that an investor’s shares, when redeemed, may be worth more or less than when purchased.
Fund holdings and sector allocations are subject to change and are not a recommendation to buy or sell any security. Please see the Schedule of Investments for a complete list of Fund holdings.
12
Mercer Core Fixed Income Fund
Investment Objective and Benchmark
The investment objective of the Fund is to provide total return, consisting of both current income and capital appreciation. The benchmark for the Fund is the Bloomberg U.S. Aggregate Bond™ Index1.
Investment Strategy
The Fund invests principally in investment grade fixed income securities, including government securities, corporate bonds and securitized bonds, such as mortgage and asset-backed securities. The Fund may also invest in non-investment grade bonds (sometimes called high yield or junk bonds), non-U.S. dollar denominated bonds, and bonds issued by issuers located in emerging capital markets. The Fund may also invest in certain derivative instruments, such as options, futures, and swap agreements. The Fund may engage in transactions in derivatives for a variety of purposes, including changing the investment characteristics of its portfolio, enhancing total returns or as a substitute for taking a position in an underlying asset.
Performance
For the fiscal year ended March 31, 2022, the Fund’s Y-3 share class performance was -4.01% compared to its benchmark return of -6.14%. For the fiscal year ended March 31, 2022, the Fund’s I share class performance was -4.29% compared to its benchmark return of -4.15%. Performance for the Fund is reported net of fees and operating expenses while the benchmark returns do not include expenses of any kind as indexes are unmanaged.
The Sub-Advisors
As of March 31, 2022, the Fund employed three sub-advisors: Manulife Asset Management (Manulife), Income Research & Management (IR&M) and PGIM Fixed Income, a business unit of PGIM, Inc. (Prudential).
Manulife manages its allocated portion of the Fund by seeking to produce superior results by anticipating shifts in the business cycle and moderating risk relative to the direction of interest rates. The investment team capitalizes on these shifts by using a research-driven process to identify attractive sectors as well as mispriced securities within those sectors.
IR&M manages its allocated portion of the Fund based on the belief that careful security selection and higher portfolio income provide superior returns over the long term. Portfolios are constructed using a disciplined, bottom-up investment approach to select attractive securities from the U.S. fixed income universe. A bottom-up approach focuses on the analysis of individual stocks and de-emphasizes the significance of macroeconomic and market cycles with the assumption individual companies can do well even in an industry that is not performing, at least on a relative basis.
Prudential manages its allocated portion of the Fund by seeking to maximize excess return opportunities from sustainable alpha sources, such as sector allocation and bottom-up security selection. This process is coupled with a diligent daily portfolio risk evaluation and monitoring process. Research-based security selection is a major source of added value and incorporates both fundamental analysis, by measuring a security’s intrinsic value to determine if undervalued or overvalued, as well as proprietary models, by using software and other means of analysis to gain a competitive edge, which identify relative value and detailed technical review of issuers across both benchmark and non-benchmark sectors, with an emphasis on credit-oriented sectors.
Market Commentary and Fund Performance
For the 12-month period ended March 31, 2022, U.S. fixed income market returns, as measured by the Bloomberg U.S. Aggregate Bond™ Index, were negative, stemming from a move higher in rates in early 2022.
13
Mercer Core Fixed Income Fund
Rising consumer prices as measured by the Consumer Price Index and the Federal Reserve’s (Fed) preferred gauge of the Core Personal Consumption Expenditures Price Index were a recurring theme throughout the period. During the December 2021 Federal Open Market Committee (FOMC) press conference, Chair Powell announced that data collected during fall signals inflation is higher and more persistent, with elevated risk of remaining higher for longer. Subsequently, the FOMC expedited the reduction of monthly asset purchases for U.S. Treasuries and Agency mortgage-backed securities in a move to end the purchasing program in March and put the Fed in position to raise the target federal funds rate if appropriate. Investment grade credit spreads ended the period at 116 basis points (1.16%), widening from their March 2020 level of 91 basis points (0.91%). Rates remained anchored at the front end for the majority of the period, until rising in Q4 in reaction to the Fed’s foreshadowing of rate hikes. Following expectations, the FOMC raised the Fed Funds target range by 25 bps during their March 2022 meeting to a new target range of 25-50 bps, citing strong job gains, a falling unemployment rate and elevated inflation as motivation. The 10-year Treasury ended the period at a rate of 2.32%, 58 basis points higher than its March 2021 level of 1.74%.
The Fund’s return was positive in relative terms as it outperformed in relation to the Bloomberg U.S. Aggregate Bond™ Index for the fiscal year ended March 31, 2022. The majority of outperformance was due to the Fund’s strategic overweight to spread sectors.
The respective performance results of each Sub-advisor was in line with expectations based on risk posture. Manulife has the largest share of the risk-allocation within the Fund. Manulife’s bias towards corporate credit and allocation to “higher quality” high yield bonds led the manager to outperform for the fiscal year. Manulife maintained a significant underweight to treasuries, with an unfavorable risk to reward view of the sector in anticipation of rate hikes.
Prudential had a marginally less aggressive allocation to spread sectors relative to Manulife, but was still overweight relative to the Fund’s benchmark. The majority of outperformance relative to the benchmark was due to their continued overweight allocations to securitized sectors such as CLOs and CMBS. An underweight allocation to Treasuries also contributed positively to the Fund’s returns.
IR&M also outperformed the Fund’s benchmark over the trailing 12-month period. The bias towards higher quality corporate bonds as well as their tactical rotation of spread exposure led them to outperform. Their slightly lower risk posture coming into the fiscal year allowed them to deploy more capital into market dislocations which benefited their overall performance as spreads tightened at a historic pace.
Risk Considerations
The Fund is subject to the risks that the underlying bonds in its portfolio are subject to, including credit, prepayment, call and interest rate risk. As interest rates rise, the value of bond prices will decline. The Fund may invest in foreign securities, which may expose the Fund to currency and exchange rate fluctuations, derivatives (such as futures, options, or swaps) and high yield bonds (also known as “junk” bonds). These investments may cause the Fund to experience greater volatility and less liquidity. Derivatives may be more sensitive to changes in market conditions and may amplify the risk of loss for the Fund. The Fund may also experience high portfolio turnover, which may result in higher transaction costs and capital gains.
14
Mercer Core Fixed Income Fund
March 31, 2022
Comparison of Change in Value of a $10,000 Investment in
Mercer Core Fixed Income Shares vs. the
Bloomberg U.S. Aggregate Bond™ Index
As of March 31, 2022
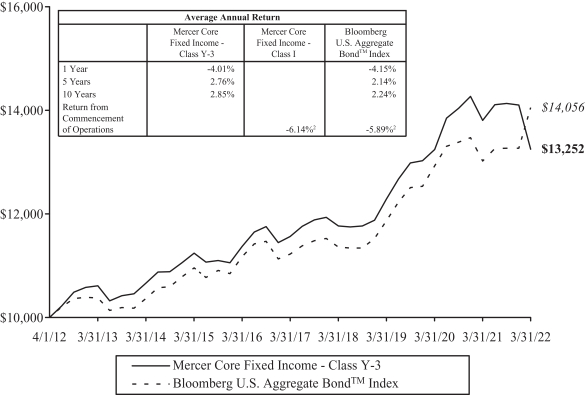
| 1 | Bloomberg U.S. Aggregate Bond Index is an index that measures the performance of securities from the Bloomberg U.S. Government/Corporate Bond Index, Mortgage-Backed Securities Index, Asset-Backed Securities Index, and Commercial Mortgage-Backed Securities Index. The Bloomberg U.S. Aggregate BondTM Index is a broad representation of the investment-grade fixed-income market in the United States and includes U.S. government and corporate debt securities, mortgage- and asset-backed securities, and international U.S. dollar-denominated bonds. All securities contained in the Bloomberg U.S. Aggregate BondTM Index have a minimum term to maturity of one year. The index is unmanaged and cannot be invested in directly. |
| 2 | Class I return is from commencement date December 27, 2021 through March 31, 2022. Bloomberg U.S. Aggregate BondTM Index return reflects the same time period. |
This graph shows the performance of the Mercer Core Fixed Income Fund Class Y-3 shares versus the Bloomberg U.S. Aggregate Bond™ Index from April 1, 2012 through March 31, 2022. The performance of other classes will vary from the performance of the class shown based on the difference in fees and expenses paid by shareholders investing in different share classes. The Fund may charge a 2% redemption fee on shares owned less than 30 days.
The table and graph assume reinvestment of dividends and capital gains, but do not reflect a deduction of taxes an investor might pay on fund distributions or upon redemption of fund shares. Performance shown reflects a fee waiver and/or expense reimbursement. Without this waiver/reimbursement, returns would have been lower.
The data quoted represents past performance and does not guarantee future results. Current performance of the Fund may be lower or higher than the performance quoted. Please call 1-888-887-0619 or visit the Trust’s web site at https://www.mercer.us/what-we-do/wealth-and-investments/delegated-solutions-us.html for the Fund’s most recent month-end performance. Investment return and principal value will fluctuate so that an investor’s shares, when redeemed, may be worth more or less than when purchased.
Fund holdings and sector allocations are subject to change and are not a recommendation to buy or sell any security. Please see the Schedule of Investments for a complete list of Fund holdings.
15
Mercer Opportunistic Fixed Income Fund
Investment Objective and Benchmark
The investment objective of the Fund is to provide long-term total return, which includes capital appreciation and income. The Fund’s primary benchmark is the ICE Bank of America Merrill Lynch Global High Yield 2% Constrained Index Unhedged1. The Fund’s secondary benchmark is a blended benchmark consisting of 35% Bloomberg Global Aggregate Corporate Total Return Index Hedged, 17.5% Bloomberg Global High Yield Index, 10.5% JP Morgan CEMBI Broad Diversified Core Index, 7% S&P/LSTA Leveraged Loan Index, and 30% JP Morgan GBI-EM Diversified Index2.
Investment Strategy
The Fund invests principally in fixed income securities of U.S. and non-U.S. issuers, including those in emerging and frontier markets. The Fund invests in various strategic and tactical global bond market opportunities without limitations in geography, issuer type, quality and currency denomination. The Fund may invest in derivatives such as futures (including among others, interest rate futures), swaps (currency, interest rate, credit default and total return), forwards, options, and credit-linked notes. The Fund may engage in transactions in derivatives for a variety of purposes, including hedging, risk management, efficient portfolio management, enhance total returns, or as a substitute for taking position in the underlying asset.
Performance
For the fiscal year ended March 31, 2022, the Fund’s Y-3 share class performance was -3.44% compared to its primary benchmark return of -4.68% and secondary benchmark return of -5.16%, Performance of the Fund is reported net of fees and operating expenses while the benchmark returns do not include expenses of any kind as indexes are unmanaged.
The Sub-Advisors
As of March 31, 2022, the Fund employed four sub-advisors and a sub-subadvisor, Western Asset Management Company and Western Asset Management Company Limited (as sub-subadvisor) (together referred to as WAMCO), Loomis, Sayles & Company, LP (Loomis), BlackRock International Limited (BlackRock), and Colchester Global Investors Limited (Colchester).
In managing its allocated portion of the Fund’s portfolio, Loomis invests in debt of issuers globally. Loomis produces country and credit cycle views as inputs to portfolio construction. Security selection is then carried out by a team of credit analysts who maintain a comprehensive database of internal ratings. The team will also engage in active duration positioning although security and sector selection are identified as main drivers of performance.
In managing its allocated portion of the Fund’s portfolio, WAMCO invests in credit securities across sectors and geographies. The strategy focuses on global valuations in credit and volatility conditions. The strategy seeks a blend of income and capital appreciation by dynamically rotating across sectors such as global corporates, emerging markets, and structured credit, and tactically managing overall portfolio duration.
In managing its allocated portion of the Fund’s portfolio, Colchester invests in sovereign debt issued by emerging market borrowers and those denominated in local emerging market currencies. Colchester’s portfolio
construction process is based on a quantitative model, using mathematical and statistical methods, that promotes allocation to countries and currencies identified based on attractive real yields and sound financial characteristics.
In managing its allocated portion of the Fund’s portfolio, BlackRock invests in emerging market debt securities denominated in local currency. BlackRock’s portfolio construction process implements a top down philosophy focused on identifying economic or market themes that impact asset prices. The themes inform the team’s market views and portfolios are positioned to benefit from directional moves in the market.
16
Mercer Opportunistic Fixed Income Fund
Market Commentary and Fund Performance
For the 12-month period ended March 31, 2022, U.S. fixed income market returns, as measured by the Bloomberg U.S. Aggregate Bond™ Index, were negative, stemming from a move higher in rates in early 2022. Rising consumer prices as measured by the Consumer Price Index and the Federal Reserve’s (Fed) preferred gauge of the Core Personal Consumption Expenditures Price Index were a recurring theme throughout the period. During the December 2021 Federal Open Market Committee (FOMC) press conference, Chair Powell announced that data collected during fall signals inflation is higher and more persistent, with elevated risk of remaining higher for longer. Subsequently, the FOMC expedited the reduction of monthly asset purchases for U.S. Treasuries and Agency mortgage-backed securities in a move to end the purchasing program in March and put the Fed in position to raise the target federal funds rate if appropriate. Investment grade credit spreads ended the period at 116 basis points (1.16%), widening from their March 2020 level of 91 basis points (0.91%). Rates remained anchored at the front end for the majority of the period, until rising in Q4 in reaction to the Fed’s foreshadowing of rate hikes. Following expectations, the FOMC raised the Fed Funds target range by 25 bps during their March 2022 meeting to a new target range of 25-50 bps, citing strong job gains, a falling unemployment rate and elevated inflation as motivation. The 10-year Treasury ended the period at a rate of 2.32%, 58 basis points higher than its March 2021 level of 1.74%.
JPM GBI-EM Global Diversified Index of local currency Emerging Market government returned -8.53% in U.S. dollar terms over the 12-month period ending March 2022. Rates had a big impact on performance over the year and in March 2022 the index removed Russia as a response to the Russia invasion of Ukraine.
During the period, WAMCO and Loomis outperformed their component of the Fund’s secondary benchmark. The managers continued to tactically capitalize on opportunistic sector exposures. Western took advantage of CLO and bank loan risk exposure along while Loomis gained value in securitized assets and convertible bonds.
During the period, each of Blackrock and Colchester outperformed its component of the Fund’s secondary benchmark, the JPM GBI-EM Global Diversified Index government bond benchmark, for its strategy. BlackRock’s macro regime shifting investment approach helped to take advantage of broad market correlation shifts and idiosyncratic opportunities while increasing their exposure in commodity exporters against the US Dollar in 2022. Colchester benefitted from continuing their fundamental real-yield valuation approach
Risk Considerations
The Fund invests in non-investment grade and emerging market fixed income securities which involves certain risks such as higher volatility, currency fluctuation, political and social instability and reduced market liquidity. The Fund is subject to the risks that the underlying bonds in its portfolio are subject to, including credit, prepayment, call and interest rate risk. As interest rates rise, the value of bond prices will decline. The Fund may invest in foreign securities, which may expose the Fund to currency and exchange rate fluctuations, derivatives (such as futures, options and swaps) and high yield bonds (also known as “junk” bonds). These investments may cause the Fund to experience greater volatility and less liquidity. Derivatives may be more sensitive to changes in market conditions and may amplify the risk of loss for the Fund. The Fund may experience high portfolio turnover which may result in higher transaction costs and capital gains
17
Mercer Opportunistic Fixed Income Fund
March 31, 2022
Comparison of Change in Value of a $10,000 Investment in
Mercer Opportunistic Fixed Income Shares vs. the
ICE Bank of America Merrill Lynch Global High Yield 2% Constrained Index Unhedged, the Fund’s Secondary Index
As of March 31, 2022
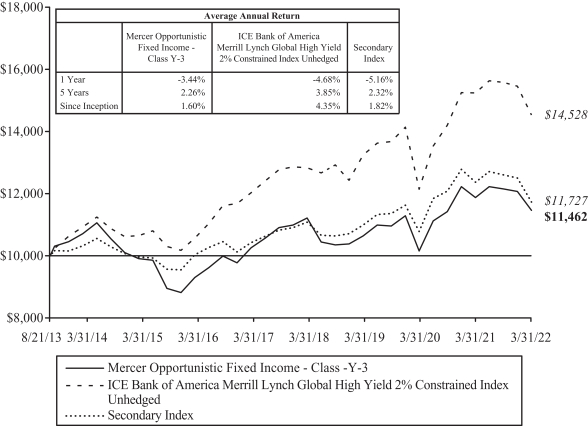
| 1 | ICE Bank of America Merrill Lynch Global High Yield 2.0% Constrained Index Unhedged contains all securities in The Bank of America Merrill Lynch Global High Yield Index but caps issuer exposure at 2%. Index constituents are capitalization-weighted, based on their current amount outstanding, provided the total allocation to an individual issuer does not exceed 2%. Issuers that exceed the limit are reduced to 2% and the face value of each of their bonds is adjusted on a pro-rata basis. |
| 2 | The Fund’s secondary benchmark is a blended benchmark consisting of 35% Bloomberg Global Aggregate Corporate Total Return Index Hedged, 17.5% Bloomberg Global High Yield Index, 10.5% JP Morgan CEMBI Broad Diversified Core Index, 7% S&P/LSTA Leveraged Loan Index, and 30% JP Morgan GBI-EM Diversified Index. |
This graph shows the performance of the Mercer Opportunistic Fixed Income Fund Class Y-3 shares versus the ICE Bank of America Merrill Lynch Global High Yield 2% Constrained Index Unhedged and the Fund’s Secondary Index from August 21, 2013, which is the inception date of the Fund, through March 31, 2022. The performance of other classes, when launched, will vary from the performance of the class shown based on the difference in fees and expenses paid by shareholders investing in different share classes. The Fund may charge a 2% redemption fee on shares owned less than 30 days.
The table and graph assume reinvestment of dividends and capital gains, but do not reflect a deduction of taxes an investor might pay on fund distributions or upon redemption of fund shares. Performance shown reflects a fee waiver and/or expense reimbursement. Without this waiver/reimbursement, returns would have been lower.
The data quoted represents past performance and does not guarantee future results. Current performance of the Fund may be lower or higher than the performance quoted. Please call 1-888-887-0619 or visit the Trust’s web site at https://www.mercer.us/what-we-do/wealth-and-investments/delegated-solutions-us.html for the Fund’s most recent month-end performance. Investment return and principal value will fluctuate so that an investor’s shares, when redeemed, may be worth more or less than when purchased.
Fund holdings and sector allocations are subject to change and are not a recommendation to buy or sell any security. Please see the Schedule of Investments for a complete list of Fund holdings.
18
Mercer Emerging Markets Equity Fund
Investment Objective and Benchmark
The investment objective of the Fund is to provide long-term total return, which includes capital appreciation and income. The benchmark for the Fund is the MSCI Emerging Markets® Index1.
Investment Strategy
The Fund invests principally in equity securities of large, medium and small capitalization companies, located in emerging markets, other investments that are tied economically to emerging markets, as well as in American, European and Global Depositary receipts. Stock index futures and various types of swaps may be used to implement the country selection component of the Fund’s investment strategy. Currency forwards may be used to make stock-selection and country allocation decisions independently of the underlying currency.
Performance
For the fiscal year ended March 31, 2022, the Fund’s Y-3 share class performance was -15.35% compared to its benchmark return of -11.4%. Performance for the Fund is reported net of fees and operating expenses while the benchmark returns do not include expenses of any kind as indexes are unmanaged.
The Sub-Advisors
As of March 31, 2022, the Fund employed six sub-advisors and one sub-subadvisor: William Blair Investment Management LLC (William Blair), Origin Asset Management LLP (Origin), Grantham, Mayo, Van Otterloo & Co. LLC (GMO), Bennbridge (U.S.) LLC, which utilizes certain personnel of Skerryvore Asset Management LLP (together referred to as Bennbridge/Skerryvore), Schroder Investment Management North America Inc. and Schroder Investment Management North America Limited (as sub-subadvisor) (together, referred to as Schroders) and Parametric Portfolio Associates LLC (Parametric).
William Blair has a quality growth philosophy and process focused on finding those companies that can achieve a higher growth rate for a longer period of time than the market expects. William Blair looks for companies with experienced and motivated management teams, unique business models and attractive financial characteristics.
Origin’s portfolio is managed using a quantitative process focused on companies with high and improving cash flow return on investment, selling at discounted valuations of expected future growth versus historical growth and that also display fundamental and price momentum. The portfolio is managed to have a higher tracking error and high active share.
GMO manages a quantitative strategy that combines both top down country and sector models, with bottom up stock selection models. These models combine elements of value, quality, and sentiment to help identify attractively valued countries and assets within those countries to purchase. The process is risk controlled and highly diversified.
Bennbridge/Skerryvore manages a high quality, concentrated equity strategy with an emphasis on preservation of capital, and sustainability of the businesses in which they invest. The strategy is low turnover, and concentrated, roughly 30-60 names.
Schroders manages a dedicated China allocation for the Fund to exploit alpha opportunities within the country. The strategy is a bottom up, fundamental strategy, relying on a team of experienced analysts and PMs to source and evaluate potential investments. The strategy is based on the belief that investing in quality businesses, with sustainable competitive advantages, and focus on shareholder value, trading at reasonable valuations will outperform over time.
19
Mercer Emerging Markets Equity Fund
Parametric utilizes exchange-traded futures to generate market exposure corresponding to the Fund’s benchmark.
Market Commentary and Fund Performance
Over the 12 months ending 3/31/22, emerging market equities significantly lagged global developed equities, returning -11.4% vs 10.1% for the MSCI World Index®. A number of factors, including an uneven response to COVID 19, increasing regulation, tightening monetary policy, and geopolitical events drove this underperformance.
Throughout 2021, emerging market performance was choppy, with Chinese regulation and surging COVID rates in South American and India impacting markets. Within China, increased government regulations on technology and private education caused significant selling pressure in internet and ecommerce stocks. Alongside regulatory concerns, Evergrande, a highly leveraged Chinese property developer, caught headlines as it teetered on the brink of solvency bringing down the entire property sector on risks of contagion. China was also negatively impacted by tightening monetary policy and a surge in COVID 19 towards the end of 2021 and into early 2022. This surge, combined with China’s continued “zero-COVID” approach put significant pressure on future growth prospects for the country.
There were bright spots in EM, with India, Brazil, Saudi Arabia and Taiwan all outperforming. During 2021 an improving COVID situation in India, and flight of capital from China boosted Indian shares dramatically. In Taiwan, a global supply shortage of semiconductors created strong demand and growth for their dominant companies like TSMC.
Going into 2022, the pictured for emerging markets change dramatically, as Russia invaded neighboring Ukraine, shocking the world and markets. In the days following the invasion, strong sanctions from Western governments cut off Russia from the global economy, removing their banks from the SWIFT network and cutting access to Russia’s vast foreign reserves. The impact of this was a severe decline in the Ruble and devaluation of Russian shares. In early March, MSCI removed Russia from its flagship Emerging Markets index. The ripple effects of the invasion were dramatic increases in energy and commodity prices, which benefitted other commodity exporters like Brazil, South Africa, and Middle Eastern countries.
For the fiscal year, financials, utilities and materials were the best performing sectors while consumer discretionary, real estate and health care were the worst performers. From a country perspective, South American and Middle Eastern countries outperformed while Russia, China and Korea were among the laggards.
For the 12-month period ending March 31, 2022, the Mercer Emerging Markets Equity Fund lagged the MSCI Emerging Markets Index by approximately 3.4%. The Fund’s underperformance was driven in large part by an overweight allocation to Russia, which fell dramatically after the Ukraine invasion. Underweight allocations to other commodity exporters (ex Russia) including Brazil and the middle east also detracted. From a sector perspective underweight allocations and selection within financials, materials and energy were the largest detractors.
The William Blair Emerging Markets strategy underperformed the MSCI Emerging Markets® Index over the trailing 12-month period ending March 31st. Underperformance was driven by stock selection within China, particularly a holding in Tal Education whose shares fell after China severely regulated the after school tutoring industry. Other laggards included Ping An, a large Chinese insurer, along with Alibaba Group, an e-commerce company, and Tencent Music, an online music entertainment platform. Outside of China, holdings in Russia along with a relative lack of exposure to the Middle East also detracted. On the positive side, Mexican holdings, including a position in Grupo Aeroport Del Pacific was positive as was the strategy’s overweight to India
Origin underperformed the MSCI Emerging Markets® Index by 2.4%. Style exposure was a tailwind, with momentum, valuation and profitability all contributing. Underperformance was largely the result of South
20
Mercer Emerging Markets Equity Fund
African mining holdings lagging and a lack of exposure to energy companies in the middle east. Exposure to Russia was also a large detractor for the strategy. On the positive side holdings in China and Korea were positive, particularly Chinese energy and financials.
GMO underperformed the MSCI Emerging Markets® Index by 11.1% for the fund’s fiscal year. The majority of the underperformance for the period is attributable to large holdings in Russia. GMO is a value oriented manager, and prior to the invasion felt comfortable holding significant Russian assets due to its low valuations and its strong economic fundamentals from a country standpoint, including their large foreign currency reserves and current account balance. Other detractors included being underweight other commodity exporters like Brazil and the Middle East. Offsetting losses slightly was strong sector selection within China, particularly an underweight in Consumer Discretionary.
Bennbridge outperformed by 9.6% for the year ending 3/31/22. The portfolio’s higher quality positioning was beneficial during a volatile period for emerging markets. Results were driven by strong performance from Indian domiciled business, and a relative lack of holdings in China, which continued to struggle due to increasing regulation and COVID lockdowns. Holding no exposure to Russia was also a strong contributor.
Schroders, the dedicated China manger within the fund outperformed for the year. Among the largest contributors were holdings in gold miners, which performed strongly during a volatile year for China. Our holdings in select Hong Kong banks were also helpful as they rose higher on faster rate hike expectation. The investment in electric vehicle names contributed as overall sentiment for the EV sector remained robust on the back of strong EV sales last year. A general underweight to Chinese internet names and lack of exposure to after school tutoring companies also contributed as these industries came under heavy regulatory pressure.
Parametric utilizes exchange-traded futures to replicate the Fund’s benchmark, aiming to provide broad, passive, equity market exposure to the Fund’s liquidity sleeve and seeking to create positive returns on assets that would have otherwise been earning cash or cash equivalent returns. Performance differences versus the benchmark are largely a result of cash flow effects related to daily subscription/redemption activity and through financing costs of futures relative to interest earned on cash.
Risk Considerations
The Fund invests in emerging market securities which involves certain risks such as currency volatility, political and social instability and reduced market liquidity. Emerging markets may be more volatile and less liquid than more developed markets and therefore may involve greater risks. Investments made in small and mid-capitalization companies may be more volatile and less liquid due to limited resources or product lines and more sensitive to economic factors. The Fund may invest in derivatives (such as futures, forwards, options, or swaps), which may cause the Fund to experience greater volatility and less liquidity. Derivatives may be more sensitive to changes in market conditions and may amplify the risk of loss for the Fund. The Fund may experience high portfolio turnover which may result in higher transaction costs and capital gains.
21
Mercer Emerging Markets Equity Fund
March 31, 2022
Comparison of Change in Value of a $10,000 Investment in
Mercer Emerging Markets Equity Shares vs. the
MSCI Emerging Markets Index®
As of March 31, 2022
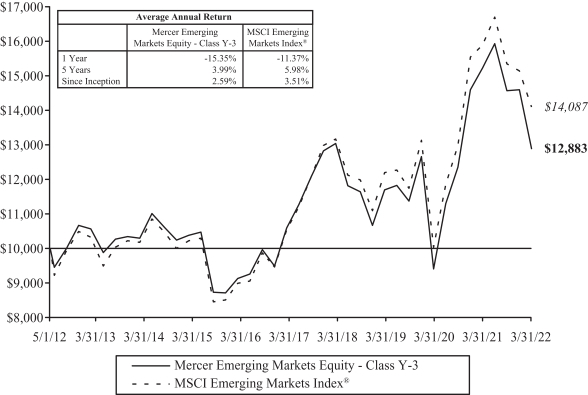
| 1 | MSCI Emerging Markets® Index measures the performance of equity securities in global emerging markets. The index is unmanaged and cannot be invested in directly. |
This graph shows the performance of the Mercer Emerging Markets Equity Fund Class Y-3 shares versus the MSCI Emerging Markets Index® from May 1, 2012, which is the inception date of the Fund, through March 31, 2022. The performance of other classes, when launched, will vary from the performance of the class shown based on the difference in fees and expenses paid by shareholders investing in different share classes. The Fund may charge a 2% redemption fee on shares owned less than 30 days.
The table and graph assume reinvestment of dividends and capital gains, but do not reflect a deduction of taxes an investor might pay on fund distributions or upon redemption of fund shares. Performance shown reflects a fee waiver and/or expense reimbursement. Without this waiver/reimbursement, returns would have been lower.
The data quoted represents past performance and does not guarantee future results. Current performance of the Fund may be lower or higher than the performance quoted. Please call 1-888-887-0619 or visit the Trust’s web site at https://www.mercer.us/what-we-do/wealth-and-investments/delegated-solutions-us.html for the Fund’s most recent month-end performance. Investment return and principal value will fluctuate so that an investor’s shares, when redeemed, may be worth more or less than when purchased.
Fund holdings and sector allocations are subject to change and are not a recommendation to buy or sell any security. Please see the Schedule of Investments for a complete list of Fund holdings.
22
Mercer Global Low Volatility Equity Fund
Investment Objective and Benchmark
The investment objective of the Fund is to provide long-term total return, which includes capital appreciation and income. The benchmark for the Fund is the MSCI World® Index1.
Investment Strategy
The Fund invests principally in equity securities of U.S. and foreign issuers, of large, medium and small capitalization companies. Stock index futures and various types of swaps may be used to implement the equity security selection component of the Fund’s investment strategy. Currency forwards may be used to make stock- selection and country allocation decisions independently of the underlying currency.
Performance
For the fiscal year ended March 31, 2022, the Fund’s Y-3 share class performance was 9.95% compared to its benchmark return of 10.1%. Performance for the Fund is reported net of fees and operating expenses while the benchmark returns do not include expenses of any kind as indexes are unmanaged.
The Sub-Advisors
As of March 31, 2022, the Fund employed five sub-advisors, Acadian Asset Management LLC (Acadian), Martingale Asset Management, LP (Martingale), Ninety One Investment Management (Ninety One), Veritas Asset Management LLC (Veritas) and Parametric Portfolio Associates LLC (Parametric). Ninety One replaced Wellington Management Company in April, 2021.
Acadian is the Fund’s dedicated minimum variance manager for developed economies outside the U.S. The strategy applies a quantitative investment process, using mathematical and statistical methods, to the EAFE + Canada universe of securities and emphasizes low-volatility securities, low correlations between securities and a high degree of portfolio diversification with the goal of constructing a portfolio with lower levels of absolute volatility compared to the benchmark. Additionally, the strategy applies Acadian’s stock forecast and top-down alpha model, which measures the active return on an investment for performance as compared with a suitable market index, in order to enhance the returns. The portfolio does not employ tight constraints vs the benchmark across capitalization and/or sectors, enhancing its ability to more effectively manage portfolio volatility.
Martingale is the Fund’s dedicated minimum variance manager for the U.S. region. The strategy uses a systematic process of investing in stocks with lower stock price volatility and attractive fundamental factors such as value, quality and momentum. The portfolio aims to deliver equity-like market returns with lower volatility and less downside risk than the market index. Martingale’s core process includes reconstituting the Russell 1000 Index® into a proprietary “Stability Index”, which Martingale believes more accurately reflects stock risk properties based on longer-term company fundamentals as well as high frequency short-term risk signals. The strategy is managed against the derived Stability Index, which measures the degree of change (or stability) of the market, by applying stock and industry alpha forecasting models and optimizing to minimize the portfolio’s absolute volatility.
Ninety One manages a cconcentrated portfolio of exceptionally high-quality companies, operating in stable or growing industries with high barriers to entry and low capital intensity. The team uses bottom up fundamental analysis to select businesses that display the best combination of high quality, sustainable growth and compelling valuations. Fundamental analysis focuses on companies with “franchise” characteristics and competitive advantages. Their evidence suggests that dominant intangible assets (low capital intensity) such as high customer loyalty, brands, patents, licenses, copyrights, and distribution networks are difficult to create and more difficult for competitors to duplicate. Enduring franchises consistently generate high returns on capital and compound shareholder wealth. Companies will have high ROIC, high gross margins, low leverage, low capital intensity, above average growth and stable cash flow generation.
23
Mercer Global Low Volatility Equity Fund
Veritas uses an unconstrained, fundamentally driven, rigorous research process with a long-term horizon. Veritas believes that companies with sustainable competitive advantage and benefitting from long-term drivers of growth, purchased at attractive valuations, will deliver performance in excess of the benchmark over time. The strategy may hold up to 20% cash.
Parametric utilizes exchange-traded futures to generate market exposure corresponding to the Fund’s benchmark.
Market Commentary and Fund Performance
During the first three quarters of fiscal year 2021 equities of developed economies continued to move higher supported by robust economic recovery, strong corporate earnings and relatively loose financials conditions. In contrast, emerging market equities appeared under significant pressure starting from the second quarter. Chinese government’s tougher regulations towards a number of industries, including mega-cap technology and education stocks, sent Chinese equities, which constitute more than the third of the MSCI EAFE Emerging Markets® Index, sharply lower. In addition, Chinese equities have been under pressure from economic slowdown, which was exasperated by lock-downs as the government continued to pursue Covid-19 zero tolerance policies, as well as government’s attempts to manage soft landing for the overvalued Chinese real estate market.
During the year both developed and emerging markets had to grapple with a number of challenges such as virus variants, continuing supply chain disruptions and rising commodity prices and inflation rates. As it became increasingly clear that inflation pressures were not transitionary in nature, many Central Banks, including Federal Reserve, turned hawkish and began implementing or announcing monetary tightening policies. With multi-decade high inflation prints and hawkish Central banks around the world, equities declined in the last quarter of fiscal year 2021. Russian invasion of Ukraine at the end of February and subsequent sanctions on Russian economy led to more disruptions in supply chains and created more pressure for Energy, food and other commodity prices to move higher.
For the year ended March 31, 2022. U.S. equities — measured using the Russell 1000® Index — increased by 13.27%. Compared to the U.S., international developed markets lagged, with the MSCI EAFE® Index (the Fund’s benchmark) returning 1.16% over the period. The MSCI Emerging Markets® Index declined by 11.37% for the 12-month period ended March 31, 2022. In local currency terms MSCI EAFE® Index and MSCI EAFE Emerging Markets® Index posted higher returns, as US dollar significantly appreciated compared to other major currencies.
With rising commodity prices, commodity-producing countries such as Canada, Australia and UK in the developed world and Brazil, Mexico South Africa and Saudi Arabia in the emerging world posted strong returns. US and Switzerland in the developed world and India among emerging countries also registered strong returns for the year. Germany was the worst performing major developed economy, followed by Japan. In Emerging markets, Russia, China and Korea were the worst performers. Russian stocks, which at the end of January 2022 constituted 3.4% of the MSCI Emerging Markets’ Index and were predominantly in Energy, Materials and Financial sectors, as a consequence of crises around Ukraine became illiquid and lost most their value. As of end of March, Russian stocks were removed from the MSCI EAFE Emerging Markets® Index.
The year witnessed major performance divergences across different sectors, styles of investing and regions. Commodity producing companies posted very strong returns. On the other hand, the rising rate environment traditionally put more pressure on valuations of companies with high earnings growth characteristics. With rich valuations from prior year’s exceptional performance, these types of stocks entered a challenging environment and significantly lagged value stocks. Companies with higher profitability and lower indebtedness levels also tended to lag in performance in part due to richer valuations. In the developed world, smaller market capitalization companies were under more pressure compared to mega and larger market capitalization
companies. In contrast, in Emerging markets larger market cap stocks lagged, in large part stemming from significant underperformance of Chinese and Korean mega-cap names such as Tencent, Meituan and Samsung.
24
Mercer Global Low Volatility Equity Fund
For the 12-month period ending March 31, 2022, the Mercer Low Volatility Equity Fund outperformed the MSCI World Equity® Index by approximately 0.2%. The Fund’s outperformance was driven in large part by its lower beta and higher profitability profile, which was in favor during a choppy year for equity markets.
Martingale outperformed for the year as lower beta stocks were in favor. Strong performance from, health care, industrials, and real estate helped drive relative results, particularly food and food products. Lack of exposure to energy was the largest detractor along with positioning in technology hardware, primarily underweight Apple.
Acadian outperformed the benchmark for the year. The fund saw positive contributions from overweights to the lowest beta quintiles and from its value exposure. Stock selection in Europe was also beneficial, particularly via holdings in German healthcare and Dutch consumer names. Offsetting gains slightly was a relative lack of exposure to Canadian materials and energy.
Ninety One has underperformed since its inception in April of 2021. Underperformance was largely driven by holdings in US technology, particularly software and IT services. Consumer staples holdings and a lack of exposure to energy were also detractors during the period. Offsetting losses slightly were European health care holdings and a position in Israeli software company Check Point.
Veritas underperformed for the year, with its focus on quality with a strict valuation overlay resulting in holding no unprofitable technology companies (which performed well early in the year) or holding any energy, materials, banks (which performed well in the latter parts of the year). Additionally cash started to build up towards the end of the year and more positions were sold than bought. The portfolio is defensively positioned in companies with enduring competitive advantage and earnings growth and high free cash flow generation. Many of these will lag sharp rising markets but look more attractive in lower return environments.
Parametric utilizes exchange-traded futures to replicate the Fund’s benchmark with beta of 0.8, aiming to provide broad, passive, equity market exposure to the Fund’s liquidity sleeve and seeking to create positive returns on assets that would have otherwise been earning cash or cash equivalent returns. Performance differences versus the benchmark are largely a result of cash flow effects related to daily subscription/redemption activity and through financing costs of futures relative to interest earned on cash.
Risk Considerations
The Fund invests in foreign and emerging market securities which involves certain risks such as currency volatility, political and social instability and reduced market liquidity. Emerging markets may be more volatile and less liquid than more developed markets and therefore may involve greater risks. Investments made in small and mid-capitalization companies may be more volatile and less liquid due to limited resources or product lines and more sensitive to economic factors. The Fund may invest in derivatives (such as futures, forwards, options, or swaps), which may cause the Fund to experience greater volatility and less liquidity. Derivatives may be more sensitive to changes in market conditions and may amplify the risk of loss for the Fund. The Fund may experience high portfolio turnover which may result in higher transaction costs and capital gains.
25
Mercer Global Low Volatility Equity Fund
March 31, 2022
Comparison of Change in Value of a $10,000 Investment in
Mercer Global Low Volatility Equity Shares vs. the
MSCI World Index®
As of March 31, 2022
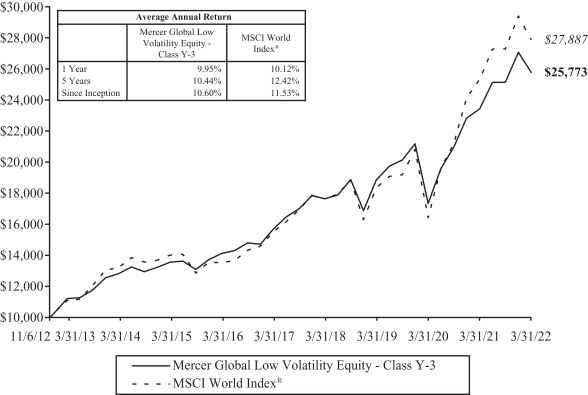
| 1 | MSCI World Index® measures the performance of stocks in 23 developed markets in North America, Europe, and the Asia/Pacific region. The index is unmanaged and cannot be invested in directly. |
This graph shows the performance of the Mercer Global Low Volatility Equity Fund Class Y-3 shares versus the MSCI World Index® from November 6, 2012, which is the inception date of the Fund, through March 31, 2022. The performance of other classes, when launched, will vary from the performance of the class shown based on the difference in fees and expenses paid by shareholders investing in different share classes. The Fund may charge a 2% redemption fee on shares owned less than 30 days.
The table and graph assume reinvestment of dividends and capital gains, but do not reflect a deduction of taxes an investor might pay on fund distributions or upon redemption of fund shares. Performance shown reflects a fee waiver and/or expense reimbursement. Without this waiver/reimbursement, returns would have been lower.
The data quoted represents past performance and does not guarantee future results. Current performance of the Fund may be lower or higher than the performance quoted. Please call 1-888-887-0619 or visit the Trust’s web site at https://www.mercer.us/what-we-do/wealth-and-investments/delegated-solutions-us.html for the Fund’s most recent month-end performance. Investment return and principal value will fluctuate so that an investor’s shares, when redeemed, may be worth more or less than when purchased.
Fund holdings and sector allocations are subject to change and are not a recommendation to buy or sell any security. Please see the Schedule of Investments for a complete list of Fund holdings.
26
Mercer Funds
Financial Terms and Indexes
Russell 1000® Index measures the performance of the large cap segment of the U.S. equity universe. The index is unmanaged and cannot be invested in directly
Russell 1000® Growth Index measures the performance of the large-cap growth segment of the US equity universe.
Russell 1000® Value Index measures the performance of the large-cap value segment of the US equity universe.
Russell 2500™ Growth Index measures the performance of the small to mid-cap growth segment of the US equity universe.
Russell 2500™ Value Index measures the performance of the small to mid-cap value segment of the US equity universe
Russell 2500® Index measures the performance of the small-to mid-cap segment of the U.S. equity universe. The Russell 2500® Index is a subset of the Russell 3000® Index. It includes approximately 2,500 of the smallest securities based on a combination of their market cap and current index membership. The index is unmanaged and cannot be invested in directly.
MSCI EAFE® Index measures the performance of equity securities in developed markets outside of North America, including Europe, Australasia, and the Far East. The index is unmanaged and cannot be invested in directly.
MSCI Emerging Markets® Index measures the performance of equity securities in global emerging markets. The index is unmanaged and cannot be invested in directly
MSCI World Index® measures the performance of stocks in 23 developed markets in North America, Europe, and the Asia/Pacific region. The index is unmanaged and cannot be invested in directly
MSCI World ex USA IndexSM captures large and mid-cap representation across 22 of 23 Developed Markets (DM) countries*— excluding the United States
Bloomberg U.S. Aggregate Bond Index is an index that measures the performance of securities from the Bloomberg U.S. Government/Corporate Bond Index, Mortgage-Backed Securities Index, Asset-Backed Securities Index, and Commercial Mortgage-Backed Securities Index. The Bloomberg U.S. Aggregate Bond Index is a broad representation of the investment-grade fixed-income market in the United States and includes U.S. government and corporate debt securities, mortgage- and asset-backed securities, and international U.S. dollar-denominated bonds. All securities contained in the Bloomberg U.S. Aggregate Bond Index have a minimum term to maturity of one year. The index is unmanaged and cannot be invested in directly.
Bloomberg Global Aggregate Corporate Total Return Index Hedged is a measure of global investment grade, fixed-rate corporate debt. This multi-currency benchmark includes bonds from developed and emerging markets issuers within the industrial, utility and financial sectors.
Bloomberg Global High Yield Index is a multi-currency flagship measure of the global high yield debt market. The index represents the union of the US High Yield, the Pan-European High Yield, and Emerging Markets (EM) Hard Currency High Yield Indices.
J.P. Morgan CEMBI Broad Diversified Core Index (CEMBI CORE) tracks the performance of US dollar-denominated bonds issued by emerging market corporate entities. The CEMBI CORE follows the methodology of the flagship J.P. Morgan CEMBI Broad Diversified (CEMBIB Dividend) closely, while offering a more liquid and higher credit quality subset.
27
Mercer Funds
Financial Terms and Indexes (Continued)
J.P. Morgan Government Bond Index-Emerging Markets (GBI-EM) Indices are comprehensive Emerging Markets debt benchmarks that track local currency bonds issued by Emerging Market governments. The GBI-EM Indices are comprised of only those countries from the GBI universe that meet our criteria for an Emerging Market, resulting in 18 countries from four regions. For the Diversified version of the Index, the methodology uses only a limited portion of a country’s current face amount outstanding for calculating weights. The adjusted face amount used in calculating a country’s weight is based on the respective country’s relative size in the index and the average size of all countries.
S&P (Standard and Poor’s/LSTA (Loan Syndications and Trading Association) Leveraged Loan 100 Index is designed to measure the performance of the U.S. leveraged loan market based upon market weightings, spreads, and interest payments.
ICE Bank of America Merrill Lynch Global High Yield 2.0% Constrained Index Unhedged contains all securities in The Bank of America Merrill Lynch Global High Yield Index but caps issuer exposure at 2%. Index constituents are capitalization-weighted, based on their current amount outstanding, provided the total allocation to an individual issuer does not exceed 2%. Issuers that exceed the limit are reduced to 2% and the face value of each of their bonds is adjusted on a pro-rata basis.
Beta: The Fund’s sensitivity to market changes using its benchmark as an approximation of the market, beta greater than 1 is more volatile, beta less than 1 is less volatile
Alpha: Reflects how a Fund did relative to what would be expected given the Fund’s beta and the performance of its benchmark.
Basis Points: It’s a common unit of measure for interest rates and other percentages in finance. One basis point is equal to 1/100th of 1%, or 0.01%, or 0.0001, and is used to denote the percentage change in a financial instrument.
28
Mercer US Large Cap Equity Fund
Schedule of Investments
(showing percentage of net assets)
March 31, 2022
| | | | | | | | | | |
| Shares | | | | | Description | | Value ($) | |
| | | |
| | | | | | COMMON STOCKS — 96.8% | | | | |
| | | |
| | | | | | Basic Materials — 2.3% | | | |
| | 18,020 | | | | | Alcoa Corp. | | | 1,622,341 | |
| | 56,724 | | | | | Celanese Corp. Class A | | | 8,104,158 | |
| | 176,623 | | | | | DuPont de Nemours, Inc. | | | 12,995,920 | |
| | 16,600 | | | | | Eastman Chemical Co. | | | 1,860,196 | |
| | 60,210 | | | | | Huntsman Corp. | | | 2,258,477 | |
| | 79,300 | | | | | Newmont Corp. | | | 6,300,385 | |
| | | | | | | | | | |
| | | | | | | | | 33,141,477 | |
| | | | | | | | | | |
| | |
| | | | | | Communications — 20.0% | |
| | 121,342 | | | | | Airbnb, Inc. Class A* | | | 20,841,702 | |
| | 4,723 | | | | | Alphabet, Inc. Class A* | | | 13,136,316 | |
| | 14,940 | | | | | Alphabet, Inc. Class C* | | | 41,727,271 | |
| | 18,154 | | | | | Amazon.com, Inc.* | | | 59,181,132 | |
| | 258,700 | | | | | AT&T, Inc. | | | 6,113,081 | |
| | 1,070 | | | | | Booking Holdings, Inc.* | | | 2,512,842 | |
| | 7,270 | | | | | Charter Communications, Inc. Class A* | | | 3,965,930 | |
| | 185,100 | | | | | Cisco Systems, Inc. | | | 10,321,176 | |
| | 190,994 | | | | | Comcast Corp. Class A | | | 8,942,339 | |
| | 22,563 | | | | | Fox Corp. Class A | | | 890,110 | |
| | 98,580 | | | | | Juniper Networks, Inc. | | | 3,663,233 | |
| | 53,576 | | | | | Liberty Global Plc Class C* | | | 1,388,154 | |
| | 475,983 | | | | | Lumen Technologies, Inc.(a) | | | 5,364,328 | |
| | 61,812 | | | | | Match Group, Inc.* | | | 6,721,437 | |
| | 4,209 | | | | | MercadoLibre, Inc.* | | | 5,006,521 | |
| | 125,104 | | | | | Meta Platforms, Inc. Class A* | | | 27,818,125 | |
| | 45,300 | | | | | Motorola Solutions, Inc. | | | 10,971,660 | |
| | 50,524 | | | | | Netflix, Inc.* | | | 18,925,785 | |
| | 5,526 | | | | | Okta, Inc.* | | | 834,205 | |
| | 10,116 | | | | | Shopify, Inc. Class A* | | | 6,838,011 | |
| | 133,140 | | | | | Snap, Inc. Class A* | | | 4,791,709 | |
| | 16,335 | | | | | Spotify Technology SA* | | | 2,466,912 | |
| | 52,590 | | | | | T-Mobile US, Inc.* | | | 6,749,926 | |
| | 39,183 | | | | | Trade Desk, Inc. (The) Class A* | | | 2,713,423 | |
| | 141,145 | | | | | Uber Technologies, Inc.* | | | 5,036,054 | |
| | 186,700 | | | | | Verizon Communications, Inc. | | | 9,510,498 | |
| | 62,741 | | | | | Walt Disney Co. (The)* | | | 8,605,556 | |
| | | | | | | | | | |
| | | | | | | | | 295,037,436 | |
| | | | | | | | | | |
| | |
| | | | | | Consumer, Cyclical — 10.4% | |
| | 3,093 | | | | | Advance Auto Parts, Inc. | | | 640,127 | |
| | 44,700 | | | | | Alaska Air Group, Inc.* | | | 2,593,047 | |
| | 22,508 | | | | | Autoliv, Inc. | | | 1,720,512 | |
| | 1,190 | | | | | AutoZone, Inc.* | | | 2,433,050 | |
| | 2,779 | | | | | Chipotle Mexican Grill, Inc. Class A* | | | 4,396,461 | |
| | 11,243 | | | | | Costco Wholesale Corp. | | | 6,474,282 | |
| | 62,900 | | | | | Delta Air Lines, Inc.* | | | 2,488,953 | |
| | 50,404 | | | | | Dollar General Corp. | | | 11,221,443 | |
See accompanying Notes to the Financial Statements.
29
Mercer US Large Cap Equity Fund
Schedule of Investments (Continued)
(showing percentage of net assets)
March 31, 2022
| | | | | | | | | | |
| Shares | | | | | Description | | Value ($) | |
| | |
| | | | | | Consumer, Cyclical — continued | |
| | 77,700 | | | | | Dollar Tree, Inc.* | | | 12,443,655 | |
| | 10,115 | | | | | Domino’s Pizza, Inc. | | | 4,116,906 | |
| | 25,700 | | | | | DR Horton, Inc. | | | 1,914,907 | |
| | 73,403 | | | | | General Motors Co.* | | | 3,210,647 | |
| | 8,051 | | | | | Home Depot, Inc. (The) | | | 2,409,906 | |
| | 61,853 | | | | | Kering SA, ADR | | | 3,909,728 | |
| | 18,152 | | | | | LKQ Corp. | | | 824,282 | |
| | 9,516 | | | | | Lowe’s Cos., Inc. | | | 1,924,040 | |
| | 14,566 | | | | | Lululemon Athletica, Inc.* | | | 5,319,940 | |
| | 52,001 | | | | | LVMH Moet Hennessy Louis Vuitton SE, ADR | | | 7,414,303 | |
| | 26,340 | | | | | Magna International, Inc. | | | 1,693,925 | |
| | 17,376 | | | | | Marriott International, Inc. Class A* | | | 3,053,832 | |
| | 98,259 | | | | | NIKE, Inc. Class B | | | 13,221,731 | |
| | 3,950 | | | | | O’Reilly Automotive, Inc.* | | | 2,705,592 | |
| | 118,237 | | | | | PulteGroup, Inc. | | | 4,954,130 | |
| | 30,599 | | | | | Tesla, Inc.* | | | 32,973,483 | |
| | 27,200 | | | | | Thor Industries, Inc.(a) | | | 2,140,640 | |
| | 218,571 | | | | | TJX Cos., Inc. (The) | | | 13,241,031 | |
| | 26,060 | | | | | Walgreens Boots Alliance, Inc. | | | 1,166,706 | |
| | 11,446 | | | | | Whirlpool Corp. | | | 1,977,640 | |
| | 4,295 | | | | | Williams-Sonoma, Inc. | | | 622,775 | |
| | | | | | | | | | |
| | | | | | | | | 153,207,674 | |
| | | | | | | | | | |
| | |
| | | | | | Consumer, Non-cyclical — 20.0% | |
| | 142,476 | | | | | Abbott Laboratories | | | 16,863,459 | |
| | 327,752 | | | | | Adyen NV, ADR* | | | 6,479,657 | |
| | 12,656 | | | | | Align Technology, Inc.* | | | 5,518,016 | |
| | 132,288 | | | | | Altria Group, Inc. | | | 6,912,048 | |
| | 18,812 | | | | | Amgen, Inc. | | | 4,549,118 | |
| | 130,600 | | | | | Archer-Daniels-Midland Co. | | | 11,787,956 | |
| | 32,600 | | | | | AstraZeneca Plc, ADR | | | 2,162,684 | |
| | 125,100 | | | | | Baxter International, Inc. | | | 9,700,254 | |
| | 9,160 | | | | | Biogen, Inc.* | | | 1,929,096 | |
| | 84,038 | | | | | Bristol-Myers Squibb Co. | | | 6,137,295 | |
| | 54,762 | | | | | Cardinal Health, Inc. | | | 3,105,005 | |
| | 49,184 | | | | | Cigna Corp. | | | 11,784,978 | |
| | 430,613 | | | | | Conagra Brands, Inc. | | | 14,455,679 | |
| | 140,730 | | | | | CVS Health Corp. | | | 14,243,283 | |
| | 15,622 | | | | | Danaher Corp. | | | 4,582,401 | |
| | 7,589 | | | | | DexCom, Inc.* | | | 3,882,532 | |
| | 20,995 | | | | | Eli Lilly & Co. | | | 6,012,338 | |
| | 22,997 | | | | | Estee Lauder Cos., Inc. (The) Class A | | | 6,262,543 | |
| | 40,424 | | | | | Gartner, Inc.* | | | 12,024,523 | |
| | 76,980 | | | | | GlaxoSmithKline Plc, ADR | | | 3,353,249 | |
| | 22,960 | | | | | Global Payments, Inc. | | | 3,141,846 | |
| | 9,713 | | | | | HCA Healthcare, Inc. | | | 2,434,272 | |
| | 38,926 | | | | | Hologic, Inc.* | | | 2,990,295 | |
| | 17,605 | | | | | Illumina, Inc.* | | | 6,151,187 | |
| | 36,000 | | | | | Ingredion, Inc. | | | 3,137,400 | |
See accompanying Notes to the Financial Statements.
30
Mercer US Large Cap Equity Fund
Schedule of Investments (Continued)
(showing percentage of net assets)
March 31, 2022
| | | | | | | | | | |
| Shares | | | | | Description | | Value ($) | |
| | |
| | | | | | Consumer, Non-cyclical — continued | |
| | 34,294 | | | | | Intra-Cellular Therapies, Inc.* | | | 2,098,450 | |
| | 37,613 | | | | | Intuitive Surgical, Inc.* | | | 11,347,090 | |
| | 18,600 | | | | | Jazz Pharmaceuticals Plc* | | | 2,895,462 | |
| | 35,632 | | | | | JM Smucker Co. (The) | | | 4,824,929 | |
| | 88,700 | | | | | Johnson & Johnson | | | 15,720,301 | |
| | 6,554 | | | | | Kellogg Co. | | | 422,668 | |
| | 3,843 | | | | | Kimberly-Clark Corp. | | | 473,304 | |
| | 163,425 | | | | | Kroger Co. (The) | | | 9,375,692 | |
| | 9,631 | | | | | McKesson Corp. | | | 2,948,338 | |
| | 26,800 | | | | | Medtronic Plc | | | 2,973,460 | |
| | 129,700 | | | | | Merck & Co., Inc. | | | 10,641,885 | |
| | 15,067 | | | | | Novo Nordisk AS, ADR | | | 1,673,190 | |
| | 89,086 | | | | | PayPal Holdings, Inc.* | | | 10,302,796 | |
| | 63,100 | | | | | Pfizer, Inc. | | | 3,266,687 | |
| | 49,259 | | | | | Quest Diagnostics, Inc. | | | 6,741,587 | |
| | 6,812 | | | | | S&P Global, Inc. | | | 2,794,146 | |
| | 25,620 | | | | | Tyson Foods, Inc. Class A | | | 2,296,321 | |
| | 35,218 | | | | | UnitedHealth Group, Inc. | | | 17,960,124 | |
| | 585,878 | | | | | Viatris, Inc. | | | 6,374,353 | |
| | 21,300 | | | | | Zimmer Biomet Holdings, Inc. | | | 2,724,270 | |
| | 40,688 | | | | | Zoetis, Inc. | | | 7,673,350 | |
| | | | | | | | | | |
| | | | | | | | | 295,129,517 | |
| | | | | | | | | | |
| | |
| | | | | | Energy — 2.7% | |
| | 116,728 | | | | | BP Plc, ADR | | | 3,431,803 | |
| | 38,750 | | | | | Canadian Natural Resources, Ltd. | | | 2,401,725 | |
| | 20,330 | | | | | Chevron Corp. | | | 3,310,334 | |
| | 169,442 | | | | | ConocoPhillips | | | 16,944,200 | |
| | 243,446 | | | | | Kinder Morgan, Inc. | | | 4,603,564 | |
| | 34,298 | | | | | Marathon Petroleum Corp. | | | 2,932,479 | |
| | 42,010 | | | | | Shell Plc, ADR | | | 2,307,609 | |
| | 6,527 | | | | | Valero Energy Corp. | | | 662,752 | |
| | 92,243 | | | | | Williams Cos., Inc. (The) | | | 3,081,839 | |
| | | | | | | | | | |
| | | | | | | | | 39,676,305 | |
| | | | | | | | | | |
| | |
| | | | | | Financial — 16.4% | |
| | 64,300 | | | | | AerCap Holdings NV* | | | 3,233,004 | |
| | 39,103 | | | | | Allstate Corp. (The) | | | 5,416,156 | |
| | 27,274 | | | | | Ally Financial, Inc. | | | 1,185,873 | |
| | 184,200 | | | | | American International Group, Inc. | | | 11,562,234 | |
| | 8,645 | | | | | American Tower Corp. REIT | | | 2,171,797 | |
| | 31,281 | | | | | Ameriprise Financial, Inc. | | | 9,395,561 | |
| | 463,321 | | | | | Annaly Capital Management, Inc. REIT | | | 3,261,780 | |
| | 140,126 | | | | | Bank of America Corp. | | | 5,775,994 | |
| | 12,231 | | | | | Bank of New York Mellon Corp. (The) | | | 607,025 | |
| | 16,400 | | | | | Berkshire Hathaway, Inc. Class B* | | | 5,787,724 | |
| | 12,993 | | | | | Boston Properties, Inc. REIT | | | 1,673,498 | |
| | 11,985 | | | | | Capital One Financial Corp. | | | 1,573,511 | |
| | 267,693 | | | | | Citigroup, Inc. | | | 14,294,806 | |
See accompanying Notes to the Financial Statements.
31
Mercer US Large Cap Equity Fund
Schedule of Investments (Continued)
(showing percentage of net assets)
March 31, 2022
| | | | | | | | | | |
| Shares | | | | | Description | | Value ($) | |
| | |
| | | | | | Financial — continued | |
| | 21,525 | | | | | Comerica, Inc. | | | 1,946,506 | |
| | 89,923 | | | | | Discover Financial Services | | | 9,908,615 | |
| | 112,305 | | | | | Equitable Holdings, Inc. | | | 3,471,348 | |
| | 118,000 | | | | | Equity Residential REIT | | | 10,610,560 | |
| | 28,230 | | | | | Essent Group, Ltd. | | | 1,163,358 | |
| | 29,000 | | | | | JPMorgan Chase & Co. | | | 3,953,280 | |
| | 273,308 | | | | | KeyCorp. | | | 6,116,633 | |
| | 29,660 | | | | | KKR & Co., Inc. | | | 1,734,220 | |
| | 55,312 | | | | | Loews Corp. | | | 3,585,324 | |
| | 73,709 | | | | | Mastercard, Inc. Class A | | | 26,342,122 | |
| | 158,888 | | | | | MetLife, Inc. | | | 11,166,649 | |
| | 231,200 | | | | | New York Community Bancorp, Inc. | | | 2,478,464 | |
| | 35,500 | | | | | Popular, Inc. | | | 2,901,770 | |
| | 31,384 | | | | | Progressive Corp. (The) | | | 3,577,462 | |
| | 16,717 | | | | | Prudential Financial, Inc. | | | 1,975,448 | |
| | 20,928 | | | | | Regency Centers Corp. REIT | | | 1,493,003 | |
| | 21,400 | | | | | Reinsurance Group of America, Inc. | | | 2,342,444 | |
| | 39,487 | | | | | Simon Property Group, Inc. REIT | | | 5,194,910 | |
| | 131,530 | | | | | SLM Corp. | | | 2,414,891 | |
| | 111,648 | | | | | Synchrony Financial | | | 3,886,467 | |
| | 15,682 | | | | | T Rowe Price Group, Inc. | | | 2,370,962 | |
| | 170,500 | | | | | Truist Financial Corp. | | | 9,667,350 | |
| | 358,280 | | | | | Two Harbors Investment Corp. REIT(a) | | | 1,981,288 | |
| | 182,500 | | | | | US Bancorp | | | 9,699,875 | |
| | 41,694 | | | | | Ventas, Inc. REIT | | | 2,575,021 | |
| | 120,202 | | | | | Visa, Inc. Class A | | | 26,657,198 | |
| | 112,172 | | | | | Wells Fargo & Co. | | | 5,435,855 | |
| | 112,544 | | | | | Western Union Co. (The) | | | 2,109,075 | |
| | 143,028 | | | | | Weyerhaeuser Co. REIT | | | 5,420,761 | |
| | 15,100 | | | | | Willis Towers Watson Plc | | | 3,566,922 | |
| | | | | | | | | | |
| | | | | | | | | 241,686,744 | |
| | | | | | | | | | |
| | |
| | | | | | Industrial — 5.5% | |
| | 502,906 | | | | | Amcor Plc | | | 5,697,925 | |
| | 20,700 | | | | | Crown Holdings, Inc. | | | 2,589,363 | |
| | 58,697 | | | | | Dover Corp. | | | 9,209,559 | |
| | 5,081 | | | | | Eaton Corp. Plc | | | 771,093 | |
| | 17,800 | | | | | FedEx Corp. | | | 4,118,742 | |
| | 44,999 | | | | | Honeywell International, Inc. | | | 8,755,905 | |
| | 40,640 | | | | | Johnson Controls International Plc | | | 2,664,765 | |
| | 26,444 | | | | | L3Harris Technologies, Inc. | | | 6,570,541 | |
| | 8,810 | | | | | Lockheed Martin Corp. | | | 3,888,734 | |
| | 33,766 | | | | | Northrop Grumman Corp. | | | 15,100,831 | |
| | 116,189 | | | | | Raytheon Technologies Corp. | | | 11,510,844 | |
| | 20,875 | | | | | Union Pacific Corp. | | | 5,703,259 | |
| | 166,780 | | | | | Vontier Corp. | | | 4,234,544 | |
| | | | | | | | | | |
| | | | | | | | | 80,816,105 | |
| | | | | | | | | | |
See accompanying Notes to the Financial Statements.
32
Mercer US Large Cap Equity Fund
Schedule of Investments (Continued)
(showing percentage of net assets)
March 31, 2022
| | | | | | | | | | |
| Shares | | | | | Description | | Value ($) | |
| | |
| | | | | | Technology — 17.7% | |
| | 35,035 | | | | | Accenture Plc Class A | | | 11,814,853 | |
| | 64,657 | | | | | Adobe, Inc.* | | | 29,459,022 | |
| | 123,912 | | | | | Apple, Inc. | | | 21,636,274 | |
| | 20,125 | | | | | Atlassian Corp. Plc Class A* | | | 5,913,329 | |
| | 52,772 | | | | | Autodesk, Inc.* | | | 11,311,678 | |
| | 24,004 | | | | | Broadcom, Inc. | | | 15,114,839 | |
| | 124,255 | | | | | Cognizant Technology Solutions Corp. Class A | | | 11,141,946 | |
| | 21,748 | | | | | Crowdstrike Holdings, Inc. Class A* | | | 4,938,536 | |
| | 35,996 | | | | | DocuSign, Inc. Class A* | | | 3,855,892 | |
| | 2,079 | | | | | Fair Isaac Corp.* | | | 969,770 | |
| | 84,052 | | | | | Fidelity National Information Services, Inc. | | | 8,440,502 | |
| | 118,361 | | | | | HP, Inc. | | | 4,296,504 | |
| | 3,457 | | | | | HubSpot, Inc.* | | | 1,641,868 | |
| | 84,765 | | | | | Intel Corp. | | | 4,200,953 | |
| | 3,566 | | | | | Jack Henry & Associates, Inc. | | | 702,680 | |
| | 37,000 | | | | | Micron Technology, Inc. | | | 2,881,930 | |
| | 121,871 | | | | | Microsoft Corp. | | | 37,574,048 | |
| | 6,729 | | | | | MSCI, Inc. Class A | | | 3,383,880 | |
| | 62,029 | | | | | NVIDIA Corp. | | | 16,925,233 | |
| | 4,933 | | | | | NXP Semiconductors NV | | | 913,000 | |
| | 199,743 | | | | | Oracle Corp. | | | 16,524,738 | |
| | 31,657 | | | | | ROBLOX Corp. Class A* (a) | | | 1,463,820 | |
| | 108,401 | | | | | salesforce.com, Inc.* | | | 23,015,700 | |
| | 9,740 | | | | | Seagate Technology Holdings Plc | | | 875,626 | |
| | 21,050 | | | | | ServiceNow, Inc.* | | | 11,722,534 | |
| | 11,759 | | | | | Snowflake, Inc. Class A* | | | 2,694,340 | |
| | 39,151 | | | | | Teradyne, Inc. | | | 4,628,823 | |
| | 14,278 | | | | | Twilio, Inc. Class A* | | | 2,353,157 | |
| | | | | | | | | | |
| | | | | | 260,395,475 | |
| | | | | | | | | | |
| |
| | | Utilities — 1.8% | |
| | 216,300 | | | | | Edison International | | | 15,162,630 | |
| | 72,400 | | | | | FirstEnergy Corp. | | | 3,320,264 | |
| | 121,300 | | | | | NiSource, Inc. | | | 3,857,340 | |
| | 53,000 | | | | | PPL Corp. | | | 1,513,680 | |
| | 57,400 | | | | | UGI Corp. | | | 2,079,028 | |
| | | | | | | | | | |
| | | | | | 25,932,942 | |
| | | | | | | | | | |
| | | |
| | | | | | TOTAL COMMON STOCKS (COST $1,143,827,881) | | | 1,425,023,675 | |
| | | | | | | | | | |
See accompanying Notes to the Financial Statements.
33
Mercer US Large Cap Equity Fund
Schedule of Investments (Continued)
(showing percentage of net assets)
March 31, 2022
| | | | | | | | | | |
| Par Value ($) | | | | | Description | | Value ($) | |
| | | |
| | | | | | SHORT-TERM INVESTMENT — 0.1% | | | | |
| | | |
| | | | | | Mutual Fund - Securities Lending Collateral — 0.1% | | | |
| | 2,060,110 | | | | | State Street Institutional U.S. Government Money Market Fund, Premier Class, 0.25%(b) (c) | | | 2,060,110 | |
| | | | | | | | | | |
| | | |
| | | | | | TOTAL SHORT-TERM INVESTMENT (COST $2,060,110) | | | 2,060,110 | |
| | | | | | | | | | |
| | | |
| | | | | | TOTAL INVESTMENTS — 96.9% (Cost $1,145,887,991) | | | 1,427,083,785 | |
| | | |
| | | | | | Other Assets and Liabilities (net) — 3.1% | | | 45,694,386 | |
| | | | | | | | | | |
| | | |
| | | | | | NET ASSETS — 100.0% | | $1,472,778,171 | |
| | | | | | | | | | |
| | | |
| | | | | | Notes to Schedule of Investments:
| | | | |
| | | |
| | | | * | | Non-income producing security. | | | | |
| | | |
| | | | (a) | | All or a portion of this security is out on loan. | | | | |
| | | |
| | | | (b) | | The rate disclosed is the 7-day net yield as of March 31, 2022. | | | | |
| | | |
| | | | (c) | | Represents an investment of securities lending cash collateral. | | | | |
Futures Contracts
| | | | | | | | | | | | | | | | | | | | |
Number of
Contracts | | | | | Description | | | | Expiration Date | | | Notional
Value | | | Market Value/
Unrealized
Appreciation
(Depreciation) | |
| | Buys | | | | | | | | | | | | | | | | | | | |
| | 165 | | | | | S&P 500 E-mini Index | | | | | Jun 2022 | | | $ | 37,378,688 | | | $ | 578,926 | |
| | 8 | | | | | S&P Mid 400 E-mini Index | | | | | Jun 2022 | | | | 2,151,360 | | | | 14,102 | |
| | | | | | | | | | | | | | | | | | | | |
| | | | | | | | | | | | | | | | | | $ | 593,028 | |
| | | | | | | | | | | | | | | | | | | | |
Abbreviations
| ADR | — American Depository Receipt |
| REIT | — Real Estate Investment Trust |
See accompanying Notes to the Financial Statements.
34
Mercer US Large Cap Equity Fund
Schedule of Investments (Continued)
March 31, 2022
| | | | | |
| Asset Class Summary (Unaudited) | | % of Net Assets |
Common Stocks | | | | 96.8 | |
Futures Contracts | | | | 0.0 | * |
Short-Term Investment | | | | 0.1 | |
Other Assets and Liabilities (net) | | | | 3.1 | |
| | | | | |
| | | | 100.0 | % |
| | | | | |
* Amount rounds to zero
See accompanying Notes to the Financial Statements.
35
Mercer US Small/Mid Cap Equity Fund
Schedule of Investments
(showing percentage of net assets)
March 31, 2022
| | | | | | | | | | |
| Shares | | | | | Description | | Value ($) | |
| | | |
| | | | | | COMMON STOCKS — 96.7% | | | | |
| | | |
| | | | | | Basic Materials — 2.6% | | | |
| | 176,883 | | | | | Axalta Coating Systems, Ltd.* | | | 4,347,784 | |
| | 19,400 | | | | | Cabot Corp. | | | 1,327,154 | |
| | 70,200 | | | | | Chemours Co. (The) | | | 2,209,896 | |
| | 11,700 | | | | | Eastman Chemical Co. | | | 1,311,102 | |
| | 347,461 | | | | | Element Solutions, Inc. | | | 7,609,396 | |
| | 32,062 | | | | | FMC Corp. | | | 4,218,398 | |
| | 80,900 | | | | | Huntsman Corp. | | | 3,034,559 | |
| | 48,300 | | | | | Koppers Holdings, Inc. | | | 1,329,216 | |
| | 48,900 | | | | | Mosaic Co. (The) | | | 3,251,850 | |
| | 24,109 | | | | | Quaker Chemical Corp. | | | 4,166,276 | |
| | 17,400 | | | | | Reliance Steel & Aluminum Co. | | | 3,190,290 | |
| | 56,436 | | | | | RPM International, Inc. | | | 4,596,148 | |
| | 35,900 | | | | | Schweitzer-Mauduit International, Inc. | | | 987,250 | |
| | 45,400 | | | | | Steel Dynamics, Inc. | | | 3,787,722 | |
| | 18,800 | | | | | Trinseo Plc | | | 900,896 | |
| | 41,500 | | | | | Tronox Holdings Plc Class A | | | 821,285 | |
| | | | | | | | | | |
| | | | | | | | | 47,089,222 | |
| | | | | | | | | | |
| | |
| | | | | | Communications — 2.7% | |
| | 47,900 | | | | | AMC Networks, Inc. Class A* | | | 1,946,177 | |
| | 50,300 | | | | | Cars.com, Inc.* | | | 725,829 | |
| | 88,497 | | | | | Ciena Corp.* | | | 5,365,573 | |
| | 63,885 | | | | | Cogent Communications Holdings, Inc. | | | 4,238,770 | |
| | 108,300 | | | | | Entercom Communications Corp. Class A* | | | 312,987 | |
| | 103,116 | | | | | ePlus, Inc.* | | | 5,780,683 | |
| | 26,280 | | | | | F5 Networks, Inc.* | | | 5,491,206 | |
| | 61,700 | | | | | Gray Television, Inc. | | | 1,361,719 | |
| | 1 | | | | | Liberty Broadband Corp. Class C* | | | 135 | |
| | 163,069 | | | | | Liberty Latin America, Ltd. Class A* | | | 1,581,769 | |
| | 133,907 | | | | | Liberty Latin America, Ltd. Class C* | | | 1,284,168 | |
| | 165,800 | | | | | Lumen Technologies, Inc.(a) | | | 1,868,566 | |
| | 14,200 | | | | | Nexstar Media Group, Inc. Class A | | | 2,676,416 | |
| | 21,610 | | | | | Nice, Ltd., ADR* (a) | | | 4,732,590 | |
| | 9,700 | | | | | Preformed Line Products Co. | | | 615,174 | |
| | 52,584 | | | | | Q2 Holdings, Inc.* | | | 3,241,804 | |
| | 66,966 | | | | | Revolve Group, Inc.* | | | 3,595,404 | |
| | 81,514 | | | | | Yelp, Inc. Class A* | | | 2,780,443 | |
| | | | | | | | | | |
| | | | | | | | | 47,599,413 | |
| | | | | | | | | | |
| | |
| | | | | | Consumer, Cyclical — 14.2% | |
| | 39,494 | | | | | Advance Auto Parts, Inc. | | | 8,173,678 | |
| | 12,700 | | | | | Alaska Air Group, Inc.* | | | 736,727 | |
| | 62,800 | | | | | Allison Transmission Holdings, Inc. | | | 2,465,528 | |
| | 83,200 | | | | | American Axle & Manufacturing Holdings, Inc.* | | | 645,632 | |
| | 333,158 | | | | | BJ’s Wholesale Club Holdings, Inc.* | | | 22,524,812 | |
| | 58,700 | | | | | BorgWarner, Inc. | | | 2,283,430 | |
| | 53,005 | | | | | BRP, Inc. | | | 4,335,279 | |
See accompanying Notes to the Financial Statements.
36
Mercer US Small/Mid Cap Equity Fund
Schedule of Investments (Continued)
(showing percentage of net assets)
March 31, 2022
| | | | | | | | | | |
| Shares | | | | | Description | | Value ($) | |
| | |
| | | | | | Consumer, Cyclical — continued | |
| | 71,683 | | | | | Brunswick Corp. | | | 5,798,438 | |
| | 16,066 | | | | | Burlington Stores, Inc.* | | | 2,926,743 | |
| | 295,273 | | | | | Cannae Holdings, Inc.* | | | 7,062,930 | |
| | 34,184 | | | | | Carter’s, Inc. | | | 3,144,586 | |
| | 15,547 | | | | | Casey’s General Stores, Inc. | | | 3,080,949 | |
| | 22,970 | | | | | Cavco Industries, Inc.* | | | 5,532,325 | |
| | 17,153 | | | | | Churchill Downs, Inc. | | | 3,804,192 | |
| | 34,468 | | | | | Columbia Sportswear Co. | | | 3,120,388 | |
| | 32,000 | | | | | Dick’s Sporting Goods, Inc.(a) | | | 3,200,640 | |
| | 50,277 | | | | | Dorman Products, Inc.* | | | 4,777,823 | |
| | 41,100 | | | | | Ethan Allen Interiors, Inc. | | | 1,071,477 | |
| | 89,420 | | | | | Five Below, Inc.* | | | 14,161,446 | |
| | 48,794 | | | | | Floor & Decor Holdings, Inc. Class A* | | | 3,952,314 | |
| | 49,900 | | | | | Foot Locker, Inc. | | | 1,480,034 | |
| | 27,786 | | | | | Fox Factory Holding Corp.* | | | 2,721,639 | |
| | 23,500 | | | | | Genesco, Inc.* | | | 1,494,835 | |
| | 57,051 | | | | | Gentherm, Inc.* | | | 4,167,005 | |
| | 33,600 | | | | | GMS, Inc.* | | | 1,672,272 | |
| | 79,900 | | | | | Goodyear Tire & Rubber Co. (The)* | | | 1,141,771 | |
| | 11,500 | | | | | Group 1 Automotive, Inc. | | | 1,930,045 | |
| | 45,000 | | | | | Harley-Davidson, Inc. | | | 1,773,000 | |
| | 41,200 | | | | | Haverty Furniture Cos., Inc. | | | 1,129,704 | |
| | 33,000 | | | | | Hibbett, Inc. | | | 1,463,220 | |
| | 57,400 | | | | | JetBlue Airways Corp.* | | | 858,130 | |
| | 16,100 | | | | | Johnson Outdoors, Inc. Class A | | | 1,251,453 | |
| | 38,900 | | | | | Kohl’s Corp. | | | 2,351,894 | |
| | 53,400 | | | | | La-Z-Boy, Inc. | | | 1,408,158 | |
| | 28,524 | | | | | LCI Industries | | | 2,961,077 | |
| | 10,200 | | | | | Lear Corp. | | | 1,454,418 | |
| | 22,674 | | | | | Lithia Motors, Inc. Class A | | | 6,804,921 | |
| | 194,235 | | | | | LKQ Corp. | | | 8,820,211 | |
| | 65,900 | | | | | Macy’s, Inc. | | | 1,605,324 | |
| | 28,200 | | | | | MDC Holdings, Inc. | | | 1,067,088 | |
| | 34,300 | | | | | Methode Electronics, Inc. | | | 1,483,475 | |
| | 34,800 | | | | | Miller Industries, Inc. | | | 979,968 | |
| | 40,271 | | | | | Murphy USA, Inc. | | | 8,052,589 | |
| | 137,101 | | | | | National Vision Holdings, Inc.* | | | 5,973,491 | |
| | 104,720 | | | | | Nordstrom, Inc. | | | 2,838,959 | |
| | 21,000 | | | | | Nu Skin Enterprises, Inc. Class A | | | 1,005,480 | |
| | 39,500 | | | | | ODP Corp. (The)* | | | 1,810,285 | |
| | 49,629 | | | | | Planet Fitness, Inc. Class A* | | | 4,192,658 | |
| | 88,723 | | | | | Polaris, Inc.(a) | | | 9,344,306 | |
| | 10,278 | | | | | Pool Corp. | | | 4,346,052 | |
| | 43,500 | | | | | PulteGroup, Inc. | | | 1,822,650 | |
| | 109,000 | | | | | Qurate Retail, Inc. Series A | | | 518,840 | |
| | 11,370 | | | | | Red Rock Resorts, Inc. Class A | | | 552,127 | |
| | 105,500 | | | | | REV Group, Inc. | | | 1,413,700 | |
| | 91,100 | | | | | Sally Beauty Holdings, Inc.* | | | 1,423,893 | |
| | 25,400 | | | | | ScanSource, Inc.* | | | 883,666 | |
See accompanying Notes to the Financial Statements.
37
Mercer US Small/Mid Cap Equity Fund
Schedule of Investments (Continued)
(showing percentage of net assets)
March 31, 2022
| | | | | | | | | | |
| Shares | | | | | Description | | Value ($) | |
| | |
| | | | | | Consumer, Cyclical — continued | |
| | 25,709 | | | | | SiteOne Landscape Supply, Inc.* | | | 4,156,888 | |
| | 86,570 | | | | | Skechers USA, Inc. Class A* | | | 3,528,593 | |
| | 34,300 | | | | | SkyWest, Inc.* | | | 989,555 | |
| | 29,998 | | | | | Sleep Number Corp.* | | | 1,521,199 | |
| | 30,500 | | | | | Sonic Automotive, Inc. Class A | | | 1,296,555 | |
| | 155,150 | | | | | Tapestry, Inc. | | | 5,763,823 | |
| | 118,830 | | | | | Texas Roadhouse, Inc. Class A | | | 9,949,636 | |
| | 47,400 | | | | | Toll Brothers, Inc. | | | 2,228,748 | |
| | 105,600 | | | | | Tri Pointe Homes, Inc.* | | | 2,120,448 | |
| | 42,509 | | | | | UniFirst Corp. | | | 7,833,559 | |
| | 91,693 | | | | | Univar Solutions, Inc.* | | | 2,947,013 | |
| | 10,940 | | | | | Vail Resorts, Inc. | | | 2,847,354 | |
| | 21,200 | | | | | Whirlpool Corp. | | | 3,662,936 | |
| | 8,700 | | | | | Williams-Sonoma, Inc. | | | 1,261,500 | |
| | 19,442 | | | | | Winnebago Industries, Inc. | | | 1,050,451 | |
| | 127,822 | | | | | World Fuel Services Corp. | | | 3,456,307 | |
| | | | | | | | | | |
| | | | | | | | | 251,612,240 | |
| | | | | | | | | | |
| | |
| | | | | | Consumer, Non-cyclical — 24.0% | |
| | 192,318 | | | | | Acadia Healthcare Co., Inc.* | | | 12,602,599 | |
| | 144,100 | | | | | ACCO Brands Corp. | | | 1,152,800 | |
| | 33,388 | | | | | Adtalem Global Education, Inc.* | | | 991,957 | |
| | 479,830 | | | | | Alight, Inc. Class A* (a) | | | 4,774,308 | |
| | 164,755 | | | | | AngioDynamics, Inc.* | | | 3,548,823 | |
| | 11,563 | | | | | Argenx SE, ADR* | | | 3,645,930 | |
| | 53,578 | | | | | Ascendis Pharma AS, ADR* | | | 6,287,914 | |
| | 167,810 | | | | | Avantor, Inc.* | | | 5,675,334 | |
| | 66,654 | | | | | Axonics, Inc.* | | | 4,172,540 | |
| | 18,898 | | | | | Bio-Rad Laboratories, Inc. Class A* | | | 10,643,921 | |
| | 9,604 | | | | | Bio-Techne Corp. | | | 4,158,916 | |
| | 30,928 | | | | | Biohaven Pharmaceutical Holding Co., Ltd.* | | | 3,667,133 | |
| | 72,018 | | | | | Blueprint Medicines Corp.* | | | 4,600,510 | |
| | 118,236 | | | | | Booz Allen Hamilton Holding Corp. Class A | | | 10,385,850 | |
| | 31,647 | | | | | Bright Horizons Family Solutions, Inc.* | | | 4,199,240 | |
| | 27,900 | | | | | Bunge, Ltd. | | | 3,091,599 | |
| | 147,543 | | | | | Catalent, Inc.* | | | 16,362,519 | |
| | 225,028 | | | | | Catalyst Pharmaceuticals, Inc.* | | | 1,865,482 | |
| | 37,005 | | | | | CONMED Corp. | | | 5,497,093 | |
| | 513,147 | | | | | CoreCivic, Inc.* | | | 5,731,852 | |
| | 5,490 | | | | | CRA International, Inc. | | | 462,587 | |
| | 29,400 | | | | | DaVita, Inc.* | | | 3,325,434 | |
| | 43,400 | | | | | Deluxe Corp. | | | 1,312,416 | |
| | 360,948 | | | | | Dun & Bradstreet Holdings, Inc.* | | | 6,323,809 | |
| | 33,231 | | | | | Elanco Animal Health, Inc.* | | | 866,997 | |
| | 22,100 | | | | | Emergent BioSolutions, Inc.* | | | 907,426 | |
| | 80,415 | | | | | Envista Holdings Corp.* | | | 3,917,015 | |
| | 71,050 | | | | | Fate Therapeutics, Inc.* | | | 2,754,608 | |
| | 15,458 | | | | | FTI Consulting, Inc.* | | | 2,430,307 | |
| | 42,270 | | | | | Gartner, Inc.* | | | 12,573,634 | |
See accompanying Notes to the Financial Statements.
38
Mercer US Small/Mid Cap Equity Fund
Schedule of Investments (Continued)
(showing percentage of net assets)
March 31, 2022
| | | | | | | | | | |
| Shares | | | | | Description | | Value ($) | |
| | |
| | | | | | Consumer, Non-cyclical — continued | |
| | 128,783 | | | | | Globus Medical, Inc. Class A* | | | 9,501,610 | |
| | 27,344 | | | | | Grand Canyon Education, Inc.* | | | 2,655,376 | |
| | 17,030 | | | | | Guardant Health, Inc.* | | | 1,128,067 | |
| | 72,732 | | | | | H&R Block, Inc. | | | 1,893,941 | |
| | 50,364 | | | | | Haemonetics Corp.* | | | 3,184,012 | |
| | 96,656 | | | | | Halozyme Therapeutics, Inc.* | | | 3,854,641 | |
| | 21,907 | | | | | Helen of Troy, Ltd.* | | | 4,290,267 | |
| | 51,280 | | | | | Hologic, Inc.* | | | 3,939,330 | |
| | 128,324 | | | | | Horizon Therapeutics Plc* | | | 13,500,968 | |
| | 121,059 | | | | | Hostess Brands, Inc. Class A* | | | 2,656,034 | |
| | 50,883 | | | | | ICON Plc, ADR* | | | 12,375,763 | |
| | 64,384 | | | | | Ingles Markets, Inc. Class A | | | 5,733,395 | |
| | 39,200 | | | | | Ingredion, Inc. | | | 3,416,280 | |
| | 132,416 | | | | | Innoviva, Inc.* | | | 2,562,250 | |
| | 8,780 | | | | | Inspire Medical Systems, Inc.* | | | 2,253,738 | |
| | 31,902 | | | | | Insulet Corp.* | | | 8,498,374 | |
| | 39,331 | | | | | Integer Holdings Corp.* | | | 3,168,899 | |
| | 683,915 | | | | | Ironwood Pharmaceuticals, Inc. Class A* | | | 8,603,651 | |
| | 63,365 | | | | | Jazz Pharmaceuticals Plc* | | | 9,864,030 | |
| | 19,900 | | | | | JM Smucker Co. (The) | | | 2,694,659 | |
| | 125,576 | | | | | Krispy Kreme, Inc.(a) | | | 1,864,804 | |
| | 29,514 | | | | | Lancaster Colony Corp. | | | 4,402,013 | |
| | 50,275 | | | | | Lannett Co., Inc.* (a) | | | 39,612 | |
| | 5,186 | | | | | LivaNova Plc* | | | 424,370 | |
| | 27,500 | | | | | ManpowerGroup, Inc. | | | 2,582,800 | |
| | 125,301 | | | | | MEDNAX, Inc.* | | | 2,942,067 | |
| | 16,247 | | | | | Molina Healthcare, Inc.* | | | 5,419,837 | |
| | 184,032 | | | | | Molson Coors Beverage Co. Class B | | | 9,823,628 | |
| | 19,273 | | | | | Morningstar, Inc. | | | 5,264,805 | |
| | 122,108 | | | | | Neurocrine Biosciences, Inc.* | | | 11,447,625 | |
| | 63,923 | | | | | Pacira BioSciences, Inc.* | | | 4,878,603 | |
| | 91,152 | | | | | Patterson Cos., Inc. | | | 2,950,590 | |
| | 491,454 | | | | | Paya Holdings, Inc.* | | | 2,879,920 | |
| | 79,410 | | | | | Paylocity Holding Corp.* | | | 16,340,196 | |
| | 67,600 | | | | | Perdoceo Education Corp.* | | | 776,048 | |
| | 108,303 | | | | | Performance Food Group Co.* | | | 5,513,706 | |
| | 2,835 | | | | | Pilgrim’s Pride Corp.* | | | 71,159 | |
| | 245,527 | | | | | Premier, Inc. Class A | | | 8,738,306 | |
| | 31,500 | | | | | Prestige Consumer Healthcare, Inc.* | | | 1,667,610 | |
| | 88,690 | | | | | PTC Therapeutics, Inc.* | | | 3,309,024 | |
| | 27,900 | | | | | Quanex Building Products Corp. | | | 585,621 | |
| | 13,900 | | | | | Quest Diagnostics, Inc. | | | 1,902,354 | |
| | 202,755 | | | | | R1 RCM, Inc.* | | | 5,425,724 | |
| | 29,600 | | | | | Rent-A-Center, Inc. | | | 745,624 | |
| | 15,930 | | | | | Repligen Corp.* | | | 2,996,274 | |
| | 73,810 | | | | | Ritchie Bros Auctioneers, Inc. | | | 4,357,004 | |
| | 80,341 | | | | | Rocket Pharmaceuticals, Inc.* | | | 1,274,208 | |
| | 88,200 | | | | | Select Medical Holdings Corp. | | | 2,115,918 | |
| | 127,204 | | | | | Simply Good Foods Co. (The)* | | | 4,827,392 | |
See accompanying Notes to the Financial Statements.
39
Mercer US Small/Mid Cap Equity Fund
Schedule of Investments (Continued)
(showing percentage of net assets)
March 31, 2022
| | | | | | | | | | |
| Shares | | | | | Description | | Value ($) | |
| | |
| | | | | | Consumer, Non-cyclical — continued | |
| | 77,300 | | | | | SpartanNash Co. | | | 2,550,127 | |
| | 74,000 | | | | | Sprouts Farmers Market, Inc.* | | | 2,366,520 | |
| | 27,173 | | | | | STERIS Plc | | | 6,569,616 | |
| | 126,296 | | | | | Syneos Health, Inc.* | | | 10,223,661 | |
| | 60,900 | | | | | TransUnion | | | 6,293,406 | |
| | 53,100 | | | | | Triton International, Ltd. | | | 3,726,558 | |
| | 21,000 | | | | | United Therapeutics Corp.* | | | 3,767,610 | |
| | 27,300 | | | | | Universal Corp. | | | 1,585,311 | |
| | 19,400 | | | | | Universal Health Services, Inc. Class B | | | 2,812,030 | |
| | 76,600 | | | | | Vanda Pharmaceuticals, Inc.* | | | 866,346 | |
| | 53,831 | | | | | Vericel Corp.* | | | 2,057,421 | |
| | 27,217 | | | | | Viad Corp.* | | | 970,014 | |
| | 31,200 | | | | | Weis Markets, Inc. | | | 2,228,304 | |
| | 196,678 | | | | | WillScot Mobile Mini Holdings Corp.* | | | 7,696,010 | |
| | 93,925 | | | | | Xencor, Inc.* | | | 2,505,919 | |
| | | | | | | | | | |
| | | | | | | | | 425,491,533 | |
| | | | | | | | | | |
| | |
| | | | | | Energy — 3.5% | |
| | 42,200 | | | | | APA Corp. | | | 1,744,126 | |
| | 327,798 | | | | | Centennial Resource Development, Inc. Class A* | | | 2,645,330 | |
| | 162,696 | | | | | ChampionX Corp.* | | | 3,982,798 | |
| | 23,099 | | | | | Chesapeake Energy Corp.(a) | | | 2,009,613 | |
| | 108,000 | | | | | CNX Resources Corp.* | | | 2,237,760 | |
| | 43,200 | | | | | Continental Resources, Inc. | | | 2,649,456 | |
| | 108,193 | | | | | Devon Energy Corp. | | | 6,397,452 | |
| | 133,164 | | | | | Diamondback Energy, Inc. | | | 18,254,121 | |
| | 14,970 | | | | | Enphase Energy, Inc.* | | | 3,020,646 | |
| | 218,499 | | | | | HF Sinclair Corp.* | | | 8,707,185 | |
| | 88,000 | | | | | Marathon Oil Corp. | | | 2,209,680 | |
| | 70,700 | | | | | National Energy Services Reunited Corp.* (a) | | | 593,880 | |
| | 26,326 | | | | | Ovintiv, Inc. | | | 1,423,447 | |
| | 37,600 | | | | | PDC Energy, Inc. | | | 2,732,768 | |
| | 81,265 | | | | | SM Energy Co. | | | 3,165,272 | |
| | | | | | | | | | |
| | | | | | | | | 61,773,534 | |
| | | | | | | | | | |
| | |
| | | | | | Financial — 17.9% | |
| | 61,500 | | | | | Ally Financial, Inc. | | | 2,674,020 | |
| | 80,558 | | | | | American Campus Communities, Inc. REIT | | | 4,508,831 | |
| | 174,964 | | | | | American Equity Investment Life Holding Co. | | | 6,982,813 | |
| | 80,508 | | | | | American Financial Group, Inc. | | | 11,723,575 | |
| | 179,000 | | | | | Annaly Capital Management, Inc. REIT | | | 1,260,160 | |
| | 64,400 | | | | | Ares Capital Corp. | | | 1,349,180 | |
| | 134,597 | | | | | Ares Management Corp. Class A | | | 10,933,314 | |
| | 45,209 | | | | | Artisan Partners Asset Management, Inc. Class A | | | 1,778,974 | |
| | 155,400 | | | | | Associated Banc-Corp. | | | 3,536,904 | |
| | 125,669 | | | | | Atlantic Union Bankshares Corp. | | | 4,610,796 | |
| | 96,335 | | | | | Axis Capital Holdings, Ltd. | | | 5,825,377 | |
| | 90,071 | | | | | Axos Financial, Inc.* | | | 4,178,394 | |
| | 68,600 | | | | | Banco Latinoamericano de Comercio Exterior SA | | | 1,068,788 | |
See accompanying Notes to the Financial Statements.
40
Mercer US Small/Mid Cap Equity Fund
Schedule of Investments (Continued)
(showing percentage of net assets)
March 31, 2022
| | | | | | | | | | |
| Shares | | | | | Description | | Value ($) | |
| | |
| | | | | | Financial — continued | |
| | 35,400 | | | | | Bank of NT Butterfield & Son, Ltd. (The) | | | 1,270,152 | |
| | 60,081 | | | | | BlackRock Capital Investment Corp.(a) | | | 252,941 | |
| | 129,000 | | | | | Braemar Hotels & Resorts, Inc. REIT | | | 797,220 | |
| | 177,700 | | | | | Brandywine Realty Trust REIT | | | 2,512,678 | |
| | 80,900 | | | | | Brixmor Property Group, Inc. REIT | | | 2,088,029 | |
| | 6,897 | | | | | C&F Financial Corp. | | | 345,609 | |
| | 67,515 | | | | | Cedar Realty Trust, Inc. REIT | | | 1,866,115 | |
| | 99,300 | | | | | Chimera Investment Corp. REIT | | | 1,195,572 | |
| | 61,400 | | | | | Citizens Financial Group, Inc. | | | 2,783,262 | |
| | 154,000 | | | | | City Office REIT, Inc. REIT | | | 2,719,640 | |
| | 68,788 | | | | | CNA Financial Corp. | | | 3,344,473 | |
| | 157,800 | | | | | CNO Financial Group, Inc. | | | 3,959,202 | |
| | 38,000 | | | | | Comerica, Inc. | | | 3,436,340 | |
| | 233,094 | | | | | Douglas Emmett, Inc. REIT | | | 7,790,001 | |
| | 214,034 | | | | | Easterly Government Properties, Inc. REIT Class A | | | 4,524,679 | |
| | 49,200 | | | | | Equitable Holdings, Inc. | | | 1,520,772 | |
| | 27,600 | | | | | Essent Group, Ltd. | | | 1,137,396 | |
| | 9,800 | | | | | Federal Agricultural Mortgage Corp. Class C | | | 1,063,104 | |
| | 152,903 | | | | | Fidelity National Financial, Inc. | | | 7,467,782 | |
| | 48,200 | | | | | Fifth Third Bancorp | | | 2,074,528 | |
| | 35,500 | | | | | Financial Institutions, Inc. | | | 1,069,615 | |
| | 33,000 | | | | | First American Financial Corp. | | | 2,139,060 | |
| | 51,900 | | | | | First Busey Corp. | | | 1,315,146 | |
| | 50,800 | | | | | First Horizon Corp. | | | 1,193,292 | |
| | 46,200 | | | | | Flagstar Bancorp, Inc. | | | 1,958,880 | |
| | 105,300 | | | | | FNB Corp. | | | 1,310,985 | |
| | 151,700 | | | | | Franklin Street Properties Corp. REIT | | | 895,030 | |
| | 150,834 | | | | | FS KKR Capital Corp. | | | 3,442,032 | |
| | 43,100 | | | | | Gaming and Leisure Properties, Inc. REIT | | | 2,022,683 | |
| | 912,540 | | | | | Genworth Financial, Inc. Class A* | | | 3,449,401 | |
| | 86,200 | | | | | GEO Group, Inc. (The) REIT* (a) | | | 569,782 | |
| | 131,163 | | | | | Glacier Bancorp, Inc. | | | 6,594,876 | |
| | 85,200 | | | | | Global Net Lease, Inc. REIT | | | 1,340,196 | |
| | 43,879 | | | | | Hamilton Lane, Inc. Class A | | | 3,391,408 | |
| | 47,200 | | | | | Hancock Whitney Corp. | | | 2,461,480 | |
| | 66,600 | | | | | Hanmi Financial Corp. | | | 1,639,026 | |
| | 32,800 | | | | | Heritage Insurance Holdings, Inc. | | | 234,192 | |
| | 138,200 | | | | | Hope Bancorp, Inc. | | | 2,222,256 | |
| | 86,500 | | | | | Horizon Bancorp, Inc. | | | 1,614,955 | |
| | 180,009 | | | | | Hudson Pacific Properties, Inc. REIT | | | 4,995,250 | |
| | 191,213 | | | | | Independence Realty Trust, Inc. REIT | | | 5,055,672 | |
| | 69,000 | | | | | Independent Bank Corp. | | | 1,518,000 | |
| | 64,000 | | | | | Industrial Logistics Properties Trust REIT | | | 1,450,880 | |
| | 63,300 | | | | | Iron Mountain, Inc. REIT | | | 3,507,453 | |
| | 87,500 | | | | | Jefferies Financial Group, Inc. | | | 2,874,375 | |
| | 26,441 | | | | | Kinsale Capital Group, Inc. | | | 6,029,077 | |
| | 52,020 | | | | | Kite Realty Group Trust REIT | | | 1,184,495 | |
| | 37,700 | | | | | Lincoln National Corp. | | | 2,464,072 | |
| | 33,410 | | | | | LPL Financial Holdings, Inc. | | | 6,103,339 | |
See accompanying Notes to the Financial Statements.
41
Mercer US Small/Mid Cap Equity Fund
Schedule of Investments (Continued)
(showing percentage of net assets)
March 31, 2022
| | | | | | | | | | |
| Shares | | | | | Description | | Value ($) | |
| | |
| | | | | | Financial — continued | |
| | 121,600 | | | | | Medical Properties Trust, Inc. REIT | | | 2,570,624 | |
| | 262,500 | | | | | MFA Financial, Inc. REIT | | | 1,057,875 | |
| | 124,700 | | | | | MGIC Investment Corp. | | | 1,689,685 | |
| | 101,714 | | | | | National Health Investors, Inc. REIT | | | 6,002,143 | |
| | 139,500 | | | | | Navient Corp. | | | 2,377,080 | |
| | 113,300 | | | | | New Mountain Finance Corp. | | | 1,569,205 | |
| | 71,298 | | | | | Newmark Group, Inc. Class A | | | 1,135,064 | |
| | 224,825 | | | | | Oaktree Specialty Lending Corp. | | | 1,656,960 | |
| | 55,083 | | | | | Office Properties Income Trust REIT | | | 1,417,286 | |
| | 46,100 | | | | | Omega Healthcare Investors, Inc. REIT | | | 1,436,476 | |
| | 37,400 | | | | | OneMain Holdings, Inc. | | | 1,773,134 | |
| | 81,976 | | | | | Pacific Premier Bancorp, Inc. | | | 2,897,852 | |
| | 80,000 | | | | | PennyMac Mortgage Investment Trust REIT | | | 1,351,200 | |
| | 228,999 | | | | | Physicians Realty Trust REIT | | | 4,016,642 | |
| | 122,100 | | | | | Piedmont Office Realty Trust, Inc. REIT Class A | | | 2,102,562 | |
| | 84,266 | | | | | Pinnacle Financial Partners, Inc. | | | 7,759,213 | |
| | 39,993 | | | | | Piper Sandler Cos. | | | 5,249,081 | |
| | 25,500 | | | | | Popular, Inc. | | | 2,084,370 | |
| | 12,800 | | | | | Preferred Bank | | | 948,352 | |
| | 17,733 | | | | | PS Business Parks, Inc. REIT | | | 2,980,563 | |
| | 52,100 | | | | | Radian Group, Inc. | | | 1,157,141 | |
| | 96,600 | | | | | Redwood Trust, Inc. REIT | | | 1,017,198 | |
| | 125,700 | | | | | Regions Financial Corp. | | | 2,798,082 | |
| | 12,100 | | | | | Reinsurance Group of America, Inc. | | | 1,324,466 | |
| | 6,898 | | | | | Retail Value, Inc. REIT | | | 21,108 | |
| | 117,600 | | | | | Sabra Health Care REIT, Inc. REIT | | | 1,751,064 | |
| | 33,500 | | | | | Sandy Spring Bancorp, Inc. | | | 1,504,820 | |
| | 59,600 | | | | | Service Properties Trust REIT | | | 526,268 | |
| | 49,376 | | | | | Signature Bank | | | 14,491,362 | |
| | 72,725 | | | | | StepStone Group, Inc. Class A | | | 2,404,288 | |
| | 321,779 | | | | | Summit Hotel Properties, Inc. REIT* | | | 3,204,919 | |
| | 40,768 | | | | | Sun Communities, Inc. REIT | | | 7,146,223 | |
| | 128,700 | | | | | Tanger Factory Outlet Centers, Inc. REIT | | | 2,212,353 | |
| | 82,500 | | | | | Umpqua Holdings Corp. | | | 1,555,950 | |
| | 111,740 | | | | | Uniti Group, Inc. REIT(a) | | | 1,537,542 | |
| | 72,400 | | | | | Universal Insurance Holdings, Inc. | | | 976,676 | |
| | 77,500 | | | | | Unum Group | | | 2,442,025 | |
| | 35,200 | | | | | Victory Capital Holdings, Inc. Class A | | | 1,016,224 | |
| | 136,169 | | | | | Voya Financial, Inc. | | | 9,034,813 | |
| | 95,401 | | | | | Western Alliance Bancorp | | | 7,901,111 | |
| | 73,600 | | | | | Western Union Co. (The) | | | 1,379,264 | |
| | 8,279 | | | | | White Mountains Insurance Group, Ltd. | | | 9,406,931 | |
| | 51,600 | | | | | Zions Bancorp NA | | | 3,382,896 | |
| | | | | | | | | | |
| | | | | | | | | 316,895,620 | |
| | | | | | | | | | |
| | |
| | | | | | Industrial — 17.5% | |
| | 16,000 | | | | | Acuity Brands, Inc. | | | 3,028,800 | |
| | 103,619 | | | | | Advanced Drainage Systems, Inc. | | | 12,310,973 | |
| | 38,868 | | | | | Advanced Energy Industries, Inc. | | | 3,345,757 | |
See accompanying Notes to the Financial Statements.
42
Mercer US Small/Mid Cap Equity Fund
Schedule of Investments (Continued)
(showing percentage of net assets)
March 31, 2022
| | | | | | | | | | |
| Shares | | | | | Description | | Value ($) | |
| | |
| | | | | | Industrial — continued | |
| | 25,800 | | | | | AGCO Corp. | | | 3,767,574 | |
| | 411,483 | | | | | Air Transport Services Group, Inc.* | | | 13,764,106 | |
| | 42,100 | | | | | Apogee Enterprises, Inc. | | | 1,998,066 | |
| | 36,971 | | | | | AptarGroup, Inc. | | | 4,344,093 | |
| | 18,100 | | | | | ArcBest Corp. | | | 1,457,050 | |
| | 109,035 | | | | | Argan, Inc. | | | 4,425,731 | |
| | 71,177 | | | | | Armstrong World Industries, Inc. | | | 6,406,642 | |
| | 26,450 | | | | | Arrow Electronics, Inc.* | | | 3,137,764 | |
| | 173,609 | | | | | Atkore, Inc.* | | | 17,090,070 | |
| | 34,700 | | | | | Atlas Air Worldwide Holdings, Inc.* | | | 2,997,039 | |
| | 34,371 | | | | | Axon Enterprise, Inc.* | | | 4,733,918 | |
| | 44,700 | | | | | Berry Global Group, Inc.* | | | 2,590,812 | |
| | 80,568 | | | | | Cognex Corp. | | | 6,215,821 | |
| | 44,237 | | | | | Colfax Corp.* | | | 1,760,190 | |
| | 97,832 | | | | | Columbus McKinnon Corp. | | | 4,148,077 | |
| | 127,834 | | | | | Comfort Systems USA, Inc. | | | 11,378,504 | |
| | 13,400 | | | | | Crane Co. | | | 1,450,952 | |
| | 26,124 | | | | | Curtiss-Wright Corp. | | | 3,922,780 | |
| | 43,467 | | | | | Eagle Materials, Inc. | | | 5,579,424 | |
| | 45,150 | | | | | Encore Wire Corp. | | | 5,150,260 | |
| | 44,800 | | | | | Energizer Holdings, Inc. | | | 1,378,048 | |
| | 35,975 | | | | | ESCO Technologies, Inc. | | | 2,515,372 | |
| | 44,331 | | | | | Exponent, Inc. | | | 4,789,965 | |
| | 121,894 | | | | | Federal Signal Corp. | | | 4,113,923 | |
| | 463,392 | | | | | Gates Industrial Corp. Plc* | | | 6,978,684 | |
| | 70,493 | | | | | Gibraltar Industries, Inc.* | | | 3,027,674 | |
| | 45,806 | | | | | Graco, Inc. | | | 3,193,594 | |
| | 274,122 | | | | | GrafTech International, Ltd. | | | 2,637,054 | |
| | 51,100 | | | | | Greif, Inc. Class A | | | 3,324,566 | |
| | 39,800 | | | | | HEICO Corp. | | | 6,110,892 | |
| | 143,342 | | | | | Hexcel Corp. | | | 8,524,549 | |
| | 31,100 | | | | | Hillenbrand, Inc. | | | 1,373,687 | |
| | 30,847 | | | | | Huntington Ingalls Industries, Inc. | | | 6,152,126 | |
| | 23,590 | | | | | IDEX Corp. | | | 4,522,911 | |
| | 208,642 | | | | | Ingersoll Rand, Inc. | | | 10,505,125 | |
| | 65,700 | | | | | Jabil, Inc. | | | 4,055,661 | |
| | 28,686 | | | | | John Bean Technologies Corp. | | | 3,398,430 | |
| | 27,144 | | | | | Kornit Digital, Ltd.* | | | 2,244,537 | |
| | 27,730 | | | | | Lincoln Electric Holdings, Inc. | | | 3,821,471 | |
| | 31,900 | | | | | Matthews International Corp. Class A | | | 1,032,284 | |
| | 63,900 | | | | | MDU Resources Group, Inc. | | | 1,702,935 | |
| | 17,025 | | | | | Middleby Corp. (The)* | | | 2,791,079 | |
| | 72,305 | | | | | Modine Manufacturing Co.* | | | 651,468 | |
| | 31,900 | | | | | Moog, Inc. Class A | | | 2,800,820 | |
| | 30,069 | | | | | Nordson Corp. | | | 6,828,069 | |
| | 107,400 | | | | | O-I Glass, Inc.* | | | 1,415,532 | |
| | 12,900 | | | | | Oshkosh Corp. | | | 1,298,385 | |
| | 26,500 | | | | | Owens Corning | | | 2,424,750 | |
| | 66,000 | | | | | Primoris Services Corp. | | | 1,572,120 | |
See accompanying Notes to the Financial Statements.
43
Mercer US Small/Mid Cap Equity Fund
Schedule of Investments (Continued)
(showing percentage of net assets)
March 31, 2022
| | | | | | | | | | |
| Shares | | | | | Description | | Value ($) | |
| | |
| | | | | | Industrial — continued | |
| | 118,803 | | | | | Ranpak Holdings Corp. Class A* | | | 2,427,145 | |
| | 52,692 | | | | | RBC Bearings, Inc.* | | | 10,215,925 | |
| | 19,590 | | | | | Saia, Inc.* | | | 4,776,434 | |
| | 38,000 | | | | | Sanmina Corp.* | | | 1,535,960 | |
| | 111,820 | | | | | Schneider National, Inc. Class B | | | 2,851,410 | |
| | 71,490 | | | | | Sensata Technologies Holding Plc* | | | 3,635,267 | |
| | 73,400 | | | | | Silgan Holdings, Inc. | | | 3,393,282 | |
| | 12,200 | | | | | Snap-on, Inc. | | | 2,506,856 | |
| | 10,915 | | | | | TD SYNNEX Corp. | | | 1,126,537 | |
| | 11,845 | | | | | Teledyne Technologies, Inc.* | | | 5,598,302 | |
| | 28,814 | | | | | Tetra Tech, Inc. | | | 4,752,581 | |
| | 14,600 | | | | | Timken Co. (The) | | | 886,220 | |
| | 23,001 | | | | | TopBuild Corp.* | | | 4,172,151 | |
| | 66,396 | | | | | Toro Co. (The) | | | 5,676,194 | |
| | 42,915 | | | | | Trex Co., Inc.* | | | 2,803,637 | |
| | 12,994 | | | | | TriMas Corp. | | | 416,977 | |
| | 56,342 | | | | | Trimble, Inc.* | | | 4,064,512 | |
| | 107,400 | | | | | TTM Technologies, Inc.* | | | 1,591,668 | |
| | 81,767 | | | | | Universal Logistics Holdings, Inc. | | | 1,647,605 | |
| | 82,300 | | | | | Vishay Intertechnology, Inc. | | | 1,613,080 | |
| | 139,126 | | | | | Vontier Corp. | | | 3,532,409 | |
| | 33,310 | | | | | Vulcan Materials Co. | | | 6,119,047 | |
| | 58,900 | | | | | Westrock Co. | | | 2,770,067 | |
| | 20,741 | | | | | Woodward, Inc. | | | 2,590,758 | |
| | | | | | | | | | |
| | | | | | | | | 310,894,138 | |
| | | | | | | | | | |
| | |
| | | | | | Technology — 12.9% | |
| | 198,122 | | | | | ACI Worldwide, Inc.* | | | 6,238,862 | |
| | 32,400 | | | | | Amdocs, Ltd. | | | 2,663,604 | |
| | 136,400 | | | | | Amkor Technology, Inc. | | | 2,962,608 | |
| | 56,420 | | | | | Avalara, Inc.* | | | 5,614,354 | |
| | 363,261 | | | | | Avaya Holdings Corp.* | | | 4,602,517 | |
| | 77,833 | | | | | Avid Technology, Inc.* | | | 2,714,037 | |
| | 38,982 | | | | | Azenta, Inc. | | | 3,230,828 | |
| | 16,750 | | | | | Bill.com Holdings, Inc.* | | | 3,798,733 | |
| | 34,109 | | | | | Blackline, Inc.* | | | 2,497,461 | |
| | 27,111 | | | | | Broadridge Financial Solutions, Inc. | | | 4,221,454 | |
| | 8,657 | | | | | CACI International, Inc. Class A* | | | 2,608,008 | |
| | 101,296 | | | | | CDK Global, Inc. | | | 4,931,089 | |
| | 64,725 | | | | | Cerence, Inc.* (a) | | | 2,336,573 | |
| | 20,591 | | | | | Concentrix Corp. | | | 3,429,637 | |
| | 43,800 | | | | | CSG Systems International, Inc. | | | 2,784,366 | |
| | 120,300 | | | | | DXC Technology Co.* | | | 3,925,389 | |
| | 20,400 | | | | | Ebix, Inc. | | | 676,260 | |
| | 29,938 | | | | | Endava Plc, ADR* | | | 3,982,652 | |
| | 55,720 | | | | | Entegris, Inc. | | | 7,313,807 | |
| | 22,500 | | | | | Globant SA* | | | 5,896,575 | |
| | 18,886 | | | | | HubSpot, Inc.* | | | 8,969,717 | |
| | 100,511 | | | | | KBR, Inc. | | | 5,500,967 | |
See accompanying Notes to the Financial Statements.
44
Mercer US Small/Mid Cap Equity Fund
Schedule of Investments (Continued)
(showing percentage of net assets)
March 31, 2022
| | | | | | | | | | |
| Shares | | | | | Description | | Value ($) | |
| | |
| | | | | | Technology — continued | |
| | 54,010 | | | | | Lumentum Holdings, Inc.* | | | 5,271,376 | |
| | 62,034 | | | | | Manhattan Associates, Inc.* | | | 8,604,736 | |
| | 76,635 | | | | | MaxLinear, Inc.* | | | 4,471,652 | |
| | 66,122 | | | | | MKS Instruments, Inc. | | | 9,918,300 | |
| | 12,560 | | | | | MongoDB, Inc. Class A* | | | 5,571,490 | |
| | 7,083 | | | | | Monolithic Power Systems, Inc. | | | 3,440,071 | |
| | 260,808 | | | | | NCR Corp.* | | | 10,481,874 | |
| | 41,630 | | | | | Nova Measuring Instruments, Ltd.* (a) | | | 4,532,674 | |
| | 42,560 | | | | | Pegasystems, Inc. | | | 3,432,464 | |
| | 63,091 | | | | | Power Integrations, Inc. | | | 5,847,274 | |
| | 205,132 | | | | | Pure Storage, Inc. Class A* | | | 7,243,211 | |
| | 120,037 | | | | | Rapid7, Inc.* | | | 13,352,916 | |
| | 41,400 | | | | | Seagate Technology Holdings Plc | | | 3,721,860 | |
| | 66,076 | | | | | Semtech Corp.* | | | 4,581,710 | |
| | 69,268 | | | | | Silicon Laboratories, Inc.* | | | 10,404,054 | |
| | 61,187 | | | | | Silicon Motion Technology Corp., ADR | | | 4,088,515 | |
| | 83,000 | | | | | SMART Global Holdings, Inc.* | | | 2,143,890 | |
| | 58,462 | | | | | Smartsheet, Inc. Class A* | | | 3,202,548 | |
| | 39,464 | | | | | Synaptics, Inc.* | | | 7,873,068 | |
| | 81,260 | | | | | Tenable Holdings, Inc.* | | | 4,696,015 | |
| | 9,123 | | | | | Tyler Technologies, Inc.* | | | 4,058,731 | |
| | 29,700 | | | | | Ultra Clean Holdings, Inc.* | | | 1,258,983 | |
| | 64,300 | | | | | Xerox Holdings Corp. | | | 1,296,931 | |
| | 17,429 | | | | | Zebra Technologies Corp. Class A* | | | 7,210,377 | |
| | 79,506 | | | | | Zeta Global Holdings Corp.* | | | 1,013,702 | |
| | | | | | | | | | |
| | | | | | 228,617,920 | |
| | | | | | | | | | |
| |
| | | Utilities — 1.4% | |
| | 48,182 | | | | | IDACORP, Inc. | | | 5,558,276 | |
| | 24,700 | | | | | National Fuel Gas Co. | | | 1,696,890 | |
| | 94,200 | | | | | NRG Energy, Inc. | | | 3,613,512 | |
| | 49,898 | | | | | OGE Energy Corp. | | | 2,034,840 | |
| | 81,117 | | | | | Portland General Electric Co. | | | 4,473,603 | |
| | 330,204 | | | | | Vistra Corp. | | | 7,677,243 | |
| | | | | | | | | | |
| | | | | | 25,054,364 | |
| | | | | | | | | | |
| | | |
| | | | | | TOTAL COMMON STOCKS (COST $1,417,619,433) | | | 1,715,027,984 | |
| | | | | | | | | | |
See accompanying Notes to the Financial Statements.
45
Mercer US Small/Mid Cap Equity Fund
Schedule of Investments (Continued)
(showing percentage of net assets)
March 31, 2022
| | | | | | | | | | |
| Par Value ($) | | | | | Description | | Value ($) | |
| | | |
| | | | | | SHORT-TERM INVESTMENT — 0.6% | | | | |
| | | |
| | | | | | Mutual Fund - Securities Lending Collateral — 0.6% | | | |
| | 10,496,590 | | | | | State Street Institutional U.S. Government Money Market Fund, Premier Class, 0.25%(b) (c) | | | 10,496,590 | |
| | | | | | | | | | |
| | | |
| | | | | | TOTAL SHORT-TERM INVESTMENT (COST $10,496,590) | | | 10,496,590 | |
| | | | | | | | | | |
| | | |
| | | | | | TOTAL INVESTMENTS — 97.3% (Cost $1,428,116,023) | | | 1,725,524,574 | |
| | | |
| | | | | | Other Assets and Liabilities (net) — 2.7% | | | 48,774,736 | |
| | | | | | | | | | |
| | | |
| | | | | | NET ASSETS — 100.0% | | $1,774,299,310 | |
| | | | | | | | | | |
| | | |
| | | | | | Notes to Schedule of Investments: | | | | |
| | | |
| | | | * | | Non-income producing security. | | | | |
| | | |
| | | | (a) | | All or a portion of this security is out on loan. | | | | |
| | | |
| | | | (b) | | The rate disclosed is the 7-day net yield as of March 31, 2022. | | | | |
| | | |
| | | | (c) | | Represents an investment of securities lending cash collateral. | | | | |
Futures Contracts
| | | | | | | | | | | | | | | | | | | | |
Number of
Contracts | | | | | Description | | | | Expiration Date | | | Notional
Value | | | Market Value/
Unrealized
Appreciation
(Depreciation) | |
| | Buys | | | | | | | | | | | | | | | | | | | |
| | 125 | | | | | Russell 2000 E-mini Index | | | | | Jun 2022 | | | $ | 12,915,000 | | | $ | 222,567 | |
| | 49 | | | | | S&P Mid 400 E-mini Index | | | | | Jun 2022 | | | | 13,177,080 | | | | 271,769 | |
| | | | | | | | | | | | | | | | | | | | |
| | | | | | | | | | | | | | | | | | $ | 494,336 | |
| | | | | | | | | | | | | | | | | | | | |
Abbreviations
| ADR | — American Depository Receipt |
| REIT | — Real Estate Investment Trust |
See accompanying Notes to the Financial Statements.
46
Mercer US Small/Mid Cap Equity Fund
Schedule of Investments (Continued)
March 31, 2022
| | | | | |
| Asset Class Summary (Unaudited) | | % of Net Assets |
Common Stocks | | | | 96.7 | |
Futures Contracts | | | | 0.0 | * |
Short-Term Investment | | | | 0.6 | |
Other Assets and Liabilities (net) | | | | 2.7 | |
| | | | | |
| | | | 100.0 | % |
| | | | | |
* Amount rounds to zero.
See accompanying Notes to the Financial Statements.
47
Mercer Non-US Core Equity Fund
Schedule of Investments
(showing percentage of net assets)
March 31, 2022
| | | | | | | | | | |
| Shares | | | | | Description | | Value ($) | |
| | |
| | | | | | COMMON STOCKS — 94.1% | |
| | |
| | | | | | Australia — 4.2% | |
| | 1,429,764 | | | | | Aurizon Holdings, Ltd. | | | 3,939,894 | |
| | 163,100 | | | | | Australia & New Zealand Banking Group, Ltd. | | | 3,354,135 | |
| | 1,987,600 | | | | | Beach Energy, Ltd. | | | 2,307,632 | |
| | 294,129 | | | | | BGP Holdings Plc* (a) (b) | | | — | |
| | 308,930 | | | | | BHP Group, Ltd.(c) | | | 12,075,414 | |
| | 300,365 | | | | | BHP Group, Ltd., ADR | | | 23,203,196 | |
| | 115,148 | | | | | BHP Group, Ltd. (London Exchange) | | | 4,424,868 | |
| | 415,742 | | | | | BlueScope Steel, Ltd. | | | 6,447,037 | |
| | 94,803 | | | | | Coles Group, Ltd. | | | 1,268,079 | |
| | 12,978 | | | | | Computershare, Ltd. | | | 238,274 | |
| | 80,520 | | | | | CSL, Ltd. | | | 16,047,648 | |
| | 860,705 | | | | | CSR, Ltd. | | | 3,946,857 | |
| | 561,575 | | | | | Fortescue Metals Group, Ltd. | | | 8,648,351 | |
| | 929,400 | | | | | Genworth Mortgage Insurance Australia, Ltd. | | | 2,001,851 | |
| | 259,762 | | | | | Glencore Plc* | | | 1,691,990 | |
| | 248,638 | | | | | GPT Group (The) REIT | | | 959,789 | |
| | 1,558,600 | | | | | Harvey Norman Holdings, Ltd.(c) | | | 6,225,915 | |
| | 731,800 | | | | | Inghams Group, Ltd.(c) | | | 1,669,843 | |
| | 1,489,800 | | | | | Metcash, Ltd.(c) | | | 5,050,008 | |
| | 1,454,500 | | | | | Mirvac Group REIT | | | 2,702,116 | |
| | 35,640 | | | | | Origin Energy, Ltd. | | | 165,505 | |
| | 1,626,284 | | | | | Orora, Ltd. | | | 4,370,348 | |
| | 810,700 | | | | | Perenti Global, Ltd. | | | 454,282 | |
| | 90,636 | | | | | Rio Tinto Plc | | | 7,206,209 | |
| | 137,883 | | | | | Rio Tinto Plc, ADR | | | 11,085,793 | |
| | 172,547 | | | | | Rio Tinto, Ltd. | | | 15,338,920 | |
| | 95,040 | | | | | Santos, Ltd. | | | 548,434 | |
| | 370,001 | | | | | South32, Ltd. | | | 1,382,693 | |
| | 1,082,420 | | | | | Stockland REIT | | | 3,428,922 | |
| | 345,218 | | | | | Super Retail Group, Ltd. | | | 2,654,540 | |
| | 683,653 | | | | | Telstra Corp., Ltd. | | | 2,023,303 | |
| | 150,231 | | | | | Treasury Wine Estates, Ltd. | | | 1,291,398 | |
| | 21,125 | | | | | Woolworths Group, Ltd. | | | 588,827 | |
| | | | | | | | | | |
| | | | | | | | | 156,742,071 | |
| | | | | | | | | | |
| | |
| | | | | | Austria — 0.6% | |
| | 9,376 | | | | | ANDRITZ AG* | | | 435,322 | |
| | 305,890 | | | | | Erste Group Bank AG | | | 11,158,309 | |
| | 145,742 | | | | | OMV AG | | | 6,989,763 | |
| | 80,800 | | | | | Wienerberger AG | | | 2,443,337 | |
| | | | | | | | | | |
| | | | | | | | | 21,026,731 | |
| | | | | | | | | | |
| | |
| | | | | | Belgium — 0.4% | |
| | 61,000 | | | | | Ageas SA | | | 3,087,620 | |
| | 6,669 | | | | | Anheuser-Busch InBev SA, ADR | | | 400,540 | |
| | 39,710 | | | | | Groupe Bruxelles Lambert SA | | | 4,141,944 | |
| | 21,907 | | | | | Proximus SADP | | | 410,094 | |
See accompanying Notes to the Financial Statements.
48
Mercer Non-US Core Equity Fund
Schedule of Investments (Continued)
(showing percentage of net assets)
March 31, 2022
| | | | | | | | | | |
| Shares | | | | | Description | | Value ($) | |
| | |
| | | | | | Belgium — continued | |
| | 49,498 | | | | | Solvay SA(c) | | | 4,901,499 | |
| | 26,100 | | | | | UCB SA | | | 3,142,572 | |
| | | | | | | | | | |
| | | | | | | | | 16,084,269 | |
| | | | | | | | | | |
| | |
| | | | | | Brazil — 0.9% | |
| | 1,330,300 | | | | | Petroleo Brasileiro SA | | | 9,865,376 | |
| | 249,888 | | | | | Petroleo Brasileiro SA, ADR | | | 3,698,342 | |
| | 369,255 | | | | | Petroleo Brasileiro SA, Preferred ADR | | | 5,162,185 | |
| | 109,431 | | | | | Wheaton Precious Metals Corp. | | | 5,208,497 | |
| | 209,206 | | | | | Yara International ASA | | | 10,503,930 | |
| | | | | | | | | | |
| | | | | | | | | 34,438,330 | |
| | | | | | | | | | |
| | |
| | | | | | Canada — 2.3% | |
| | 109,950 | | | | | Agnico Eagle Mines, Ltd.(c) | | | 6,734,058 | |
| | 212,029 | | | | | Atlas Corp. | | | 3,112,586 | |
| | 767,800 | | | | | B2Gold Corp. | | | 3,528,419 | |
| | 247,570 | | | | | Canadian Pacific Railway, Ltd. | | | 20,450,961 | |
| | 28,200 | | | | | Canadian Tire Corp., Ltd. Class A | | | 4,261,664 | |
| | 145,781 | | | | | Franco-Nevada Corp. | | | 23,218,984 | |
| | 348,848 | | | | | GFL Environmental, Inc. | | | 11,351,514 | |
| | 40,800 | | | | | Loblaw Cos., Ltd. | | | 3,664,340 | |
| | 11,580 | | | | | Shopify, Inc. Class A* | | | 7,838,391 | |
| | | | | | | | | | |
| | | | | | | | | 84,160,917 | |
| | | | | | | | | | |
| | |
| | | | | | China — 0.5% | |
| | 1,310,000 | | | | | Bank of China, Ltd. Class H | | | 526,136 | |
| | 1,310,000 | | | | | China Medical System Holdings, Ltd. | | | 2,050,882 | |
| | 3,542,000 | | | | | China Resources Cement Holdings, Ltd. | | | 2,942,136 | |
| | 574,000 | | | | | Hengan International Group Co., Ltd. | | | 2,650,275 | |
| | 3,714,000 | | | | | Jiangnan Group, Ltd.* | | | 130,088 | |
| | 370,500 | | | | | Kingboard Holdings, Ltd. | | | 1,793,768 | |
| | 1,940,000 | | | | | Lee & Man Paper Manufacturing, Ltd. | | | 1,009,362 | |
| | 628,600 | | | | | Shanghai Pharmaceuticals Holding Co., Ltd. Class H | | | 1,208,049 | |
| | 1,289,000 | | | | | Shenzhen International Holdings, Ltd. | | | 1,357,823 | |
| | 76,000 | | | | | SITC International Holdings Co., Ltd. | | | 268,345 | |
| | 2,782,600 | | | | | Yangzijiang Shipbuilding Holdings, Ltd. | | | 3,134,842 | |
| | | | | | | | | | |
| | | | | | | | | 17,071,706 | |
| | | | | | | | | | |
| | |
| | | | | | Denmark — 2.5% | |
| | 387 | | | | | AP Moller - Maersk AS Class A | | | 1,150,269 | |
| | 4,065 | | | | | AP Moller - Maersk AS Class B | | | 12,323,533 | |
| | 24,716 | | | | | Carlsberg AS Class B | | | 3,035,175 | |
| | 282,200 | | | | | Danske Bank AS | | | 4,690,806 | |
| | 36,700 | | | | | DFDS AS | | | 1,573,291 | |
| | 29,566 | | | | | ISS AS* | | | 526,269 | |
| | 43,071 | | | | | Jyske Bank AS* | | | 2,346,244 | |
| | 70,002 | | | | | Novo Nordisk AS, ADR | | | 7,773,722 | |
| | 352,056 | | | | | Novo Nordisk AS Class B | | | 39,215,022 | |
See accompanying Notes to the Financial Statements.
49
Mercer Non-US Core Equity Fund
Schedule of Investments (Continued)
(showing percentage of net assets)
March 31, 2022
| | | | | | | | | | |
| Shares | | | | | Description | | Value ($) | |
| | |
| | | | | | Denmark — continued | |
| | 211,932 | | | | | Novozymes AS Class B | | | 14,589,038 | |
| | 24,800 | | | | | Pandora AS | | | 2,359,924 | |
| | 21,959 | | | | | Royal Unibrew AS | | | 2,052,935 | |
| | 57,112 | | | | | Sydbank AS | | | 1,961,287 | |
| | | | | | | | | | |
| | | | | | | | | 93,597,515 | |
| | | | | | | | | | |
| | |
| | | | | | Finland — 0.9% | |
| | 120,723 | | | | | Fortum OYJ | | | 2,204,204 | |
| | 2,563,427 | | | | | Nokia OYJ* | | | 14,193,027 | |
| | 232,117 | | | | | Nordea Bank Abp | | | 2,407,189 | |
| | 564,947 | | | | | Nordea Bank Abp (Stockholm Exchange)(c) | | | 5,869,482 | |
| | 172,806 | | | | | TietoEVRY OYJ(c) | | | 4,622,385 | |
| | 81,200 | | | | | Valmet OYJ(c) | | | 2,535,212 | |
| | 53,986 | | | | | Wartsila OYJ Abp(c) | | | 495,927 | |
| | | | | | | | | | |
| | | | | | | | | 32,327,426 | |
| | | | | | | | | | |
| | |
| | | | | | France — 10.5% | |
| | 27,246 | | | | | Airbus SE* | | | 3,312,375 | |
| | 32,000 | | | | | Arkema SA | | | 3,839,773 | |
| | 232,365 | | | | | AXA SA | | | 6,825,229 | |
| | 167,350 | | | | | BNP Paribas SA | | | 9,583,577 | |
| | 158,600 | | | | | Bouygues SA | | | 5,560,911 | |
| | 553,680 | | | | | Bureau Veritas SA | | | 15,906,420 | |
| | 127,074 | | | | | Capgemini SE | | | 28,430,294 | |
| | 365,300 | | | | | Carrefour SA | | | 7,970,567 | |
| | 98,400 | | | | | Cie de Saint-Gobain | | | 5,889,672 | |
| | 62,092 | | | | | Cie Generale des Etablissements Michelin SCA | | | 8,436,719 | |
| | 214,100 | | | | | CNP Assurances | | | 5,191,993 | |
| | 82,642 | | | | | Coface SA | | | 996,119 | |
| | 361,100 | | | | | Credit Agricole SA | | | 4,339,071 | |
| | 558,747 | | | | | Dassault Systemes SE | | | 27,691,537 | |
| | 506,456 | | | | | Engie SA | | | 6,677,243 | |
| | 96,265 | | | | | EssilorLuxottica SA | | | 17,674,370 | |
| | 52,300 | | | | | Ipsen SA | | | 6,571,036 | |
| | 42,863 | | | | | IPSOS | | | 2,137,772 | |
| | 57,437 | | | | | L’Oreal SA | | | 23,123,082 | |
| | 210,643 | | | | | Legrand SA | | | 20,141,054 | |
| | 36,887 | | | | | LVMH Moet Hennessy Louis Vuitton SE | | | 26,418,078 | |
| | 125,400 | | | | | Metropole Television SA | | | 2,484,340 | |
| | 36,500 | | | | | Nexity SA | | | 1,289,617 | |
| | 1,251,215 | | | | | Orange SA | | | 14,880,868 | |
| | 190,940 | | | | | Pernod Ricard SA | | | 42,119,645 | |
| | 62,549 | | | | | Publicis Groupe SA | | | 3,821,615 | |
| | 35,500 | | | | | Quadient SA | | | 670,716 | |
| | 180,000 | | | | | Rexel SA | | | 3,856,722 | |
| | 179,896 | | | | | Sanofi | | | 18,452,708 | |
| | 78,979 | | | | | Sanofi, ADR | | | 4,054,782 | |
| | 50,121 | | | | | Societe BIC SA | | | 2,545,954 | |
| | 220,261 | | | | | Societe Generale SA | | | 5,926,447 | |
See accompanying Notes to the Financial Statements.
50
Mercer Non-US Core Equity Fund
Schedule of Investments (Continued)
(showing percentage of net assets)
March 31, 2022
| | | | | | | | | | |
| Shares | | | | | Description | | Value ($) | |
| | |
| | | | | | France — continued | |
| | 18,000 | | | | | Sopra Steria Group SACA | | | 3,360,205 | |
| | 33,963 | | | | | Teleperformance | | | 13,025,721 | |
| | 219,200 | | | | | Television Francaise 1 | | | 2,138,729 | |
| | 515,754 | | | | | TotalEnergies SE | | | 26,320,112 | |
| | 101,207 | | | | | TotalEnergies SE, ADR | | | 5,115,002 | |
| | | | | | | | | | |
| | | | | | | | | 386,780,075 | |
| | | | | | | | | | |
| | |
| | | | | | Georgia — 0.0% | |
| | 45,361 | | | | | Bank of Georgia Group Plc | | | 708,040 | |
| | | | | | | | | | |
| | |
| | | | | | Germany — 7.5% | |
| | 40,720 | | | | | adidas AG | | | 9,563,799 | |
| | 27,300 | | | | | Allianz SE | | | 6,556,806 | |
| | 58,323 | | | | | Aroundtown SA | | | 336,957 | |
| | 36,600 | | | | | Aurubis AG | | | 4,400,002 | |
| | 160,309 | | | | | BASF SE | | | 9,194,477 | |
| | 312,434 | | | | | Bayer AG | | | 21,499,537 | |
| | 27,649 | | | | | Beiersdorf AG | | | 2,922,202 | |
| | 154,339 | | | | | BMW AG | | | 13,445,308 | |
| | 14,379 | | | | | Brenntag SE | | | 1,169,399 | |
| | 28,905 | | | | | Continental AG* | | | 2,097,013 | |
| | 142,021 | | | | | Covestro AG 144A | | | 7,217,582 | |
| | 48,120 | | | | | Daimler Truck Holding AG* | | | 1,344,558 | |
| | 48,962 | | | | | Deutsche Boerse AG | | | 8,846,360 | |
| | 233,239 | | | | | Deutsche Pfandbriefbank AG | | | 2,853,876 | |
| | 311,200 | | | | | Deutsche Post AG | | | 15,029,825 | |
| | 413,391 | | | | | Deutsche Telekom AG | | | 7,765,630 | |
| | 125,192 | | | | | E.ON SE | | | 1,464,368 | |
| | 228,600 | | | | | Evonik Industries AG | | | 6,392,494 | |
| | 64,869 | | | | | Fresenius Medical Care AG & Co. KGaA | | | 4,375,450 | |
| | 1,321 | | | | | Fresenius Medical Care AG & Co. KGaA, ADR | | | 44,491 | |
| | 62,600 | | | | | Fresenius SE & Co. KGaA | | | 2,316,767 | |
| | 171,866 | | | | | GEA Group AG | | | 7,141,983 | |
| | 13,152 | | | | | Hannover Rueck SE | | | 2,252,944 | |
| | 84,489 | | | | | HUGO BOSS AG | | | 4,946,746 | |
| | 314,360 | | | | | Infineon Technologies AG | | | 10,801,749 | |
| | 54,215 | | | | | Knorr-Bremse AG | | | 4,189,299 | |
| | 39,217 | | | | | LEG Immobilien SE | | | 4,504,573 | |
| | 321,195 | | | | | Mercedes-Benz Group AG | | | 22,690,181 | |
| | 9,776 | | | | | Merck KGaA | | | 2,059,222 | |
| | 50,449 | | | | | Muenchener Rueckversicherungs-Gesellschaft AG in Muenchen | | | 13,591,772 | |
| | 6,415 | | | | | Nemetschek SE | | | 625,894 | |
| | 113,255 | | | | | Puma SE | | | 9,722,805 | |
| | 44,482 | | | | | Rheinmetall AG | | | 9,496,512 | |
| | 131,671 | | | | | RWE AG | | | 5,776,497 | |
| | 74,706 | | | | | SAP SE | | | 8,384,172 | |
| | 86,082 | | | | | SAP SE, ADR | | | 9,551,659 | |
| | 27,377 | | | | | Siltronic AG | | | 2,829,603 | |
| | 99,900 | | | | | Softwareone Holding AG* | | | 1,410,012 | |
See accompanying Notes to the Financial Statements.
51
Mercer Non-US Core Equity Fund
Schedule of Investments (Continued)
(showing percentage of net assets)
March 31, 2022
| | | | | | | | | | |
| Shares | | | | | Description | | Value ($) | |
| | |
| | | | | | Germany — continued | |
| | 85,436 | | | | | Symrise AG Class A | | | 10,316,178 | |
| | 164,234 | | | | | TAG Immobilien AG | | | 3,752,042 | |
| | 42,000 | | | | | Talanx AG* | | | 1,874,681 | |
| | 99,181 | | | | | Telefonica Deutschland Holding AG | | | 272,468 | |
| | 81,200 | | | | | United Internet AG | | | 2,808,848 | |
| | 146,505 | | | | | Vonovia SE | | | 6,889,800 | |
| | 49,384 | | | | | Zalando SE* | | | 2,521,294 | |
| | | | | | | | | | |
| | | | | | | | | 277,247,835 | |
| | | | | | | | | | |
| | |
| | | | | | Hong Kong — 0.2% | |
| | 62,900 | | | | | Hongkong Land Holdings, Ltd. | | | 306,836 | |
| | 213,000 | | | | | Pacific Basin Shipping, Ltd. | | | 115,044 | |
| | 9,510,000 | | | | | Tongda Group Holdings, Ltd.* | | | 199,121 | |
| | 1,834,000 | | | | | United Laboratories International Holdings, Ltd. (The) | | | 959,371 | |
| | 5,812,026 | | | | | WH Group, Ltd. | | | 3,657,228 | |
| | 1,088,000 | | | | | Xinyi Glass Holdings, Ltd. | | | 2,614,324 | |
| | | | | | | | | | |
| | | | | | | | | 7,851,924 | |
| | | | | | | | | | |
| | |
| | | | | | Hungary — 0.1% | |
| | 320,600 | | | | | MOL Hungarian Oil & Gas Plc | | | 2,846,808 | |
| | 95,800 | | | | | Richter Gedeon Nyrt | | | 2,032,981 | |
| | | | | | | | | | |
| | | | | | | | | 4,879,789 | |
| | | | | | | | | | |
| | |
| | | | | | India — 0.3% | |
| | 627,070 | | | | | HDFC Bank, Ltd. | | | 12,100,103 | |
| | | | | | | | | | |
| | |
| | | | | | Indonesia — 0.2% | |
| | 4,356,100 | | | | | Bank Negara Indonesia Persero Tbk PT | | | 2,492,215 | |
| | 7,888,300 | | | | | Golden Agri-Resources, Ltd. | | | 1,766,044 | |
| | 11,902,500 | | | | | Telkom Indonesia Persero Tbk PT | | | 3,795,715 | |
| | | | | | | | | | |
| | | | | | | | | 8,053,974 | |
| | | | | | | | | | |
| | |
| | | | | | Ireland — 1.3% | |
| | 31,918 | | | | | AerCap Holdings NV* | | | 1,604,837 | |
| | 262,680 | | | | | CRH Plc | | | 10,578,451 | |
| | 75,370 | | | | | ICON Plc, ADR* | | | 18,331,492 | |
| | 54,117 | | | | | Kerry Group Plc Class A | | | 6,081,671 | |
| | 137,456 | | | | | Ryanair Holdings Plc, ADR* | | | 11,975,167 | |
| | | | | | | | | | |
| | | | | | | | | 48,571,618 | |
| | | | | | | | | | |
| | |
| | | | | | Israel — 0.5% | |
| | 209,233 | | | | | Bank Hapoalim BM | | | 2,062,822 | |
| | 316,972 | | | | | Bank Leumi Le-Israel BM | | | 3,402,552 | |
| | 26,067 | | | | | Check Point Software Technologies, Ltd.* | | | 3,604,023 | |
| | 42,386 | | | | | ICL Group, Ltd. | | | 503,890 | |
| | 249,942 | | | | | Israel Discount Bank, Ltd. Class A | | | 1,552,928 | |
| | 47,772 | | | | | Mizrahi Tefahot Bank, Ltd. | | | 1,858,232 | |
| | 8,452 | | | | | Nice, Ltd., ADR* | | | 1,850,988 | |
See accompanying Notes to the Financial Statements.
52
Mercer Non-US Core Equity Fund
Schedule of Investments (Continued)
(showing percentage of net assets)
March 31, 2022
| | | | | | | | | | |
| Shares | | | | | Description | | Value ($) | |
| | |
| | | | | | Israel — continued | |
| | 8,767 | | | | | Phoenix Holdings, Ltd. (The) | | | 114,615 | |
| | 210,300 | | | | | Teva Pharmaceutical Industries, Ltd.* | | | 1,980,619 | |
| | 1,805 | | | | | ZIM Integrated Shipping Services, Ltd. | | | 131,242 | |
| | | | | | | | | | |
| | | | | | | | | 17,061,911 | |
| | | | | | | | | | |
| | |
| | | | | | Italy — 2.1% | |
| | 3,024,100 | | | | | A2A SpA | | | 5,211,750 | |
| | 355,511 | | | | | Assicurazioni Generali SpA(c) | | | 8,181,715 | |
| | 57,806 | | | | | Davide Campari-Milano NV | | | 676,284 | |
| | 1,019,004 | | | | | Enel SpA | | | 6,844,326 | |
| | 1,494,573 | | | | | Eni SpA | | | 22,038,840 | |
| | 3,700 | | | | | Eni SpA, ADR | | | 108,225 | |
| | 15,229 | | | | | Ferrari NV | | | 3,321,293 | |
| | 4,068 | | | | | Ferrari NV (Borsa Italiana Exchange) | | | 894,751 | |
| | 2,398,684 | | | | | Intesa Sanpaolo SpA | | | 5,514,412 | |
| | 1,152,531 | | | | | Leonardo SpA* | | | 11,551,607 | |
| | 291,800 | | | | | Mediobanca Banca di Credito Finanziario SpA | | | 2,973,629 | |
| | 54,997 | | | | | MFE-MediaForEurope NV Class B(c) | | | 63,827 | |
| | 19,798 | | | | | Prysmian SpA | | | 678,291 | |
| | 9,677 | | | | | Recordati Industria Chimica e Farmaceutica SpA | | | 489,301 | |
| | 6,924 | | | | | Reply SpA | | | 1,146,409 | |
| | 202,979 | | | | | Rizzoli Corriere Della Sera Mediagroup SpA(c) | | | 174,376 | |
| | 596,700 | | | | | Unipol Gruppo SpA | | | 3,284,564 | |
| | 1,078,000 | | | | | UnipolSai Assicurazioni SpA | | | 3,208,305 | |
| | | | | | | | | | |
| | | | | | | | | 76,361,905 | |
| | | | | | | | | | |
| | |
| | | | | | Japan — 18.3% | |
| | 151,500 | | | | | ADEKA Corp. | | | 3,343,174 | |
| | 3,000 | | | | | Advantest Corp.(c) | | | 236,017 | |
| | 2,200 | | | | | AEON REIT Investment Corp. REIT | | | 2,727,442 | |
| | 134,600 | | | | | AGC, Inc. | | | 5,395,682 | |
| | 10,500 | | | | | Air Water, Inc.(c) | | | 147,820 | |
| | 170,100 | | | | | Alpen Co., Ltd.(c) | | | 2,852,930 | |
| | 21,100 | | | | | Amada Co., Ltd. | | | 186,513 | |
| | 121,700 | | | | | Amano Corp. | | | 2,185,357 | |
| | 67,900 | | | | | Asahi Group Holdings, Ltd. | | | 2,472,426 | |
| | 85,400 | | | | | ASKA Pharmaceutical Holdings Co., Ltd. | | | 881,558 | |
| | 343,400 | | | | | Astellas Pharma, Inc. | | | 5,399,438 | |
| | 32,200 | | | | | Brother Industries, Ltd. | | | 588,133 | |
| | 272,200 | | | | | Canon, Inc.(c) | | | 6,645,995 | |
| | 27,255 | | | | | Canon, Inc., ADR | | | 662,569 | |
| | 45,400 | | | | | Central Glass Co., Ltd. | | | 775,262 | |
| | 5,500 | | | | | Central Japan Railway Co. | | | 719,014 | |
| | 345,694 | | | | | Chiba Bank, Ltd. (The)(c) | | | 2,043,802 | |
| | 130,000 | | | | | Chubu Electric Power Co., Inc.(c) | | | 1,350,932 | |
| | 5,700 | | | | | Chudenko Corp. | | | 96,705 | |
| | 131,700 | | | | | Concordia Financial Group, Ltd. | | | 492,789 | |
| | 4,700 | | | | | Cosmo Energy Holdings Co., Ltd. | | | 101,737 | |
| | 269,600 | | | | | Credit Saison Co., Ltd.(c) | | | 2,864,618 | |
See accompanying Notes to the Financial Statements.
53
Mercer Non-US Core Equity Fund
Schedule of Investments (Continued)
(showing percentage of net assets)
March 31, 2022
| | | | | | | | | | |
| Shares | | | | | Description | | Value ($) | |
| | |
| | | | | | Japan — continued | |
| | 354,500 | | | | | Dai-ichi Life Holdings, Inc. | | | 7,233,637 | |
| | 576,700 | | | | | Daicel Corp. | | | 3,860,799 | |
| | 115,500 | | | | | Daiichi Sanyko Co., Ltd. | | | 2,541,510 | |
| | 154,200 | | | | | Daiwa House Industry Co., Ltd. | | | 4,040,705 | |
| | 847,100 | | | | | Daiwa Securities Group, Inc.(c) | | | 4,810,902 | |
| | 60,000 | | | | | Denka Co., Ltd. | | | 1,672,724 | |
| | 88,000 | | | | | Dexerials Corp. | | | 2,395,946 | |
| | 89,500 | | | | | DIC Corp. | | | 1,833,343 | |
| | 16,300 | | | | | Disco Corp. | | | 4,560,415 | |
| | 17,500 | | | | | Dowa Holdings Co., Ltd. | | | 805,905 | |
| | 52,800 | | | | | Eagle Industry Co., Ltd. | | | 422,001 | |
| | 275,800 | | | | | EDION Corp.(c) | | | 2,571,319 | |
| | 99,200 | | | | | Electric Power Development Co., Ltd. | | | 1,425,275 | |
| | 1,251,100 | | | | | ENEOS Holdings, Inc. | | | 4,716,424 | |
| | 16,200 | | | | | Enplas Corp. | | | 360,857 | |
| | 100,700 | | | | | Ezaki Glico Co., Ltd. | | | 3,083,379 | |
| | 111,900 | | | | | FUJIFILM Holdings Corp. | | | 6,866,270 | |
| | 48,700 | | | | | Fujikura, Ltd.* | | | 247,744 | |
| | 31,000 | | | | | Fujitsu, Ltd. | | | 4,635,447 | |
| | 195,000 | | | | | Fukuoka Financial Group, Inc. | | | 3,784,767 | |
| | 87,100 | | | | | Furukawa Co., Ltd. | | | 920,367 | |
| | 106,200 | | | | | Futaba Industrial Co., Ltd.(c) | | | 316,683 | |
| | 485,894 | | | | | Hachijuni Bank, Ltd. (The)(c) | | | 1,617,308 | |
| | 11,400 | | | | | Hankyu Hanshin Holdings, Inc. | | | 330,740 | |
| | 287,800 | | | | | Haseko Corp. | | | 3,314,789 | |
| | 326,100 | | | | | Hazama Ando Corp. | | | 2,421,749 | |
| | 17,200 | | | | | Hino Motors, Ltd.(c) | | | 100,939 | |
| | 84,100 | | | | | Hirose Electric Co., Ltd. | | | 12,256,928 | |
| | 300 | | | | | Hitachi Metals, Ltd.* | | | 5,035 | |
| | 29,500 | | | | | Hitachi, Ltd. | | | 1,482,645 | |
| | 132,800 | | | | | Hokkaido Electric Power Co., Inc. | | | 529,221 | |
| | 300,500 | | | | | Honda Motor Co., Ltd. | | | 8,564,751 | |
| | 7,800 | | | | | Horiba, Ltd. | | | 427,602 | |
| | 13,500 | | | | | Hoya Corp. | | | 1,545,141 | |
| | 69,900 | | | | | Ichinen Holdings Co., Ltd.(c) | | | 746,035 | |
| | 12,800 | | | | | Idemitsu Kosan Co., Ltd. | | | 354,198 | |
| | 8,300 | | | | | Iida Group Holdings Co., Ltd.(c) | | | 144,104 | |
| | 477,000 | | | | | Inpex Corp. | | | 5,681,170 | |
| | 30,800 | | | | | Inui Global Logistics Co., Ltd.(c) | | | 504,895 | |
| | 256,000 | | | | | Isuzu Motors, Ltd. | | | 3,317,272 | |
| | 166,000 | | | | | Ito En, Ltd. | | | 8,169,411 | |
| | 169,300 | | | | | ITOCHU Corp. | | | 5,760,273 | |
| | 74,400 | | | | | Jaccs Co., Ltd. | | | 1,875,293 | |
| | 105,600 | | | | | Japan Airlines Co., Ltd.* | | | 1,971,357 | |
| | 153,300 | | | | | Japan Aviation Electronics Industry, Ltd. | | | 2,492,250 | |
| | 53,400 | | | | | Japan Exchange Group, Inc. | | | 997,979 | |
| | 108,700 | | | | | Japan Petroleum Exploration Co., Ltd. | | | 2,307,585 | |
| | 648,500 | | | | | Japan Post Bank Co., Ltd.(c) | | | 5,238,713 | |
| | 40,000 | | | | | Japan Post Holdings Co., Ltd. | | | 294,700 | |
See accompanying Notes to the Financial Statements.
54
Mercer Non-US Core Equity Fund
Schedule of Investments (Continued)
(showing percentage of net assets)
March 31, 2022
| | | | | | | | | | |
| Shares | | | | | Description | | Value ($) | |
| | |
| | | | | | Japan — continued | |
| | 171,300 | | | | | Japan Post Insurance Co., Ltd. | | | 3,005,536 | |
| | 219,200 | | | | | Japan Tobacco, Inc. | | | 3,763,583 | |
| | 288,100 | | | | | JFE Holdings, Inc. | | | 4,066,548 | |
| | 9,700 | | | | | JSR Corp.(c) | | | 286,867 | |
| | 3,100 | | | | | JTEKT Corp. | | | 24,360 | |
| | 186,600 | | | | | K’s Holdings Corp.(c) | | | 1,933,077 | |
| | 12,500 | | | | | Kaken Pharmaceutical Co., Ltd. | | | 398,660 | |
| | 106,500 | | | | | Kamigumi Co., Ltd. | | | 1,922,928 | |
| | 278,400 | | | | | Kandenko Co., Ltd. | | | 1,905,238 | |
| | 70,000 | | | | | Kaneka Corp. | | | 2,029,396 | |
| | 282,500 | | | | | Kanematsu Corp. | | | 3,106,313 | |
| | 162,700 | | | | | Kansai Paint Co., Ltd. | | | 2,621,930 | |
| | 226,608 | | | | | Kao Corp. | | | 9,330,628 | |
| | 10,400 | | | | | Kato Sangyo Co., Ltd. | | | 270,386 | |
| | 365,600 | | | | | KDDI Corp. | | | 12,044,718 | |
| | 49,500 | | | | | Keyence Corp. | | | 23,083,141 | |
| | 11,600 | | | | | KH Neochem Co., Ltd. | | | 260,637 | |
| | 94,200 | | | | | Kintetsu World Express, Inc. | | | 2,423,478 | |
| | 15,500 | | | | | Kissei Pharmaceutical Co., Ltd.(c) | | | 324,134 | |
| | 33,100 | | | | | Kito Corp.(c) | | | 481,428 | |
| | 121,000 | | | | | Kobayashi Pharmaceutical Co., Ltd. | | | 9,729,581 | |
| | 419,700 | | | | | Kobe Bussan Co., Ltd. | | | 12,931,245 | |
| | 343,300 | | | | | Kobe Steel, Ltd. | | | 1,662,883 | |
| | 76,200 | | | | | Kohnan Shoji Co., Ltd. | | | 2,181,865 | |
| | 15,386 | | | | | Kose Corp. | | | 1,614,039 | |
| | 147,700 | | | | | Kuraray Co., Ltd. | | | 1,276,595 | |
| | 41,700 | | | | | KYB Corp. | | | 1,011,977 | |
| | 41,100 | | | | | Kyocera Corp. | | | 2,317,125 | |
| | 7,700 | | | | | Kyushu Railway Co. | | | 157,917 | |
| | 199,100 | | | | | Lion Corp. | | | 2,226,120 | |
| | 513,700 | | | | | Marubeni Corp. | | | 6,011,130 | |
| | 63,400 | | | | | Maxell, Ltd. | | | 624,690 | |
| | 35,500 | | | | | Mazda Motor Corp. | | | 263,405 | |
| | 619,000 | | | | | Mebuki Financial Group, Inc. | | | 1,296,497 | |
| | 107,700 | | | | | Medipal Holdings Corp. | | | 1,780,203 | |
| | 744,400 | | | | | Mitsubishi Chemical Holdings Corp. | | | 4,968,019 | |
| | 160,000 | | | | | Mitsubishi Gas Chemical Co., Inc. | | | 2,724,692 | |
| | 453,400 | | | | | Mitsubishi HC Capital, Inc. | | | 2,116,626 | |
| | 27,200 | | | | | Mitsubishi Motors Corp.* (c) | | | 73,307 | |
| | 2,370,300 | | | | | Mitsubishi UFJ Financial Group, Inc. | | | 14,757,110 | |
| | 205,900 | | | | | Mitsui & Co., Ltd. | | | 5,625,523 | |
| | 67,400 | | | | | Mitsui Chemicals, Inc. | | | 1,702,953 | |
| | 613,900 | | | | | Mizuho Financial Group, Inc. | | | 7,881,502 | |
| | 91,200 | | | | | Mizuho Leasing Co., Ltd.(c) | | | 2,225,798 | |
| | 32,800 | | | | | Mochida Pharmaceutical Co., Ltd. | | | 1,005,662 | |
| | 456,900 | | | | | MonotaRO Co., Ltd. | | | 9,820,620 | |
| | 131,000 | | | | | MS&AD Insurance Group Holdings, Inc. | | | 4,269,037 | |
| | 15,100 | | | | | Murata Manufacturing Co., Ltd. | | | 1,001,198 | |
| | 16,100 | | | | | Nachi-Fujikoshi Corp. | | | 551,890 | |
See accompanying Notes to the Financial Statements.
55
Mercer Non-US Core Equity Fund
Schedule of Investments (Continued)
(showing percentage of net assets)
March 31, 2022
| | | | | | | | | | |
| Shares | | | | | Description | | Value ($) | |
| | |
| | | | | | Japan — continued | |
| | 5,800 | | | | | Nagase & Co., Ltd. | | | 86,367 | |
| | 15,000 | | | | | NGK Insulators, Ltd. | | | 214,798 | |
| | 11,800 | | | | | NHK Spring Co., Ltd. | | | 85,379 | |
| | 143,100 | | | | | Nihon Kohden Corp. | | | 3,449,604 | |
| | 164,800 | | | | | Nikon Corp.(c) | | | 1,767,230 | |
| | 3,800 | | | | | Nippon Electric Glass Co., Ltd. | | | 84,433 | |
| | 30,300 | | | | | Nippon Sanso Holdings Corp. | | | 577,476 | |
| | 126,900 | | | | | Nippon Soda Co., Ltd. | | | 3,506,962 | |
| | 324,100 | | | | | Nippon Steel Corp. | | | 5,762,806 | |
| | 432,100 | | | | | Nippon Telegraph & Telephone Corp. | | | 12,593,225 | |
| | 52,000 | | | | | Nippon Yusen KK(c) | | | 4,558,082 | |
| | 134,500 | | | | | Nishio Rent All Co., Ltd. | | | 3,075,975 | |
| | 996,900 | | | | | Nissan Motor Co., Ltd.* | | | 4,451,170 | |
| | 49,200 | | | | | Nisshin Oillio Group, Ltd. (The) | | | 1,153,465 | |
| | 33,900 | | | | | Nissin Foods Holdings Co., Ltd. | | | 2,387,698 | |
| | 29,300 | | | | | Nitto Denko Corp. | | | 2,106,167 | |
| | 2,021,300 | | | | | Nomura Holdings, Inc. | | | 8,495,697 | |
| | 254,300 | | | | | Nomura Research Institute, Ltd. | | | 8,341,955 | |
| | 508,441 | | | | | North Pacific Bank, Ltd.(c) | | | 994,620 | |
| | 4,600 | | | | | NS Solutions Corp. | | | 138,536 | |
| | 166,700 | | | | | NTT Data Corp. | | | 3,279,427 | |
| | 389,700 | | | | | Obayashi Corp. | | | 2,874,102 | |
| | 54,600 | | | | | Obic Co., Ltd. | | | 8,205,779 | |
| | 16,700 | | | | | Okuwa Co., Ltd. | | | 126,426 | |
| | 126,300 | | | | | Olympus Corp. | | | 2,406,712 | |
| | 87,600 | | | | | Omron Corp. | | | 5,858,095 | |
| | 100,200 | | | | | Ono Pharmaceutical Co., Ltd. | | | 2,524,046 | |
| | 30,500 | | | | | Onoken Co., Ltd.(c) | | | 385,683 | |
| | 594,400 | | | | | ORIX Corp. | | | 11,899,298 | |
| | 75,200 | | | | | Osaka Gas Co., Ltd. | | | 1,294,919 | |
| | 18,200 | | | | | OSG Corp. | | | 279,716 | |
| | 72,000 | | | | | Otsuka Holdings Co., Ltd. | | | 2,498,144 | |
| | 10,000 | | | | | Persol Holdings Co., Ltd. | | | 224,830 | |
| | 81,700 | | | | | Pilot Corp. | | | 3,521,360 | |
| | 68,400 | | | | | Plenus Co., Ltd. | | | 1,129,170 | |
| | 66,100 | | | | | Prima Meat Packers, Ltd. | | | 1,194,290 | |
| | 30,300 | | | | | Punch Industry Co., Ltd. | | | 123,589 | |
| | 279,900 | | | | | Recruit Holdings Co., Ltd. | | | 12,290,104 | |
| | 340,500 | | | | | Rengo Co., Ltd. | | | 2,183,506 | |
| | 714,000 | | | | | Resona Holdings, Inc. | | | 3,066,709 | |
| | 160,500 | | | | | Ricoh Co., Ltd. | | | 1,396,658 | |
| | 346,400 | | | | | Rohto Pharmaceutical Co., Ltd. | | | 10,488,276 | |
| | 194,400 | | | | | Sanki Engineering Co., Ltd. | | | 2,233,680 | |
| | 53,700 | | | | | Sankyu, Inc. | | | 1,758,049 | |
| | 402,800 | | | | | Santen Pharmaceutical Co., Ltd. | | | 4,044,352 | |
| | 3,500 | | | | | Sanyo Chemical Industries, Ltd. | | | 144,281 | |
| | 40,100 | | | | | Sawai Group Holdings Co., Ltd. | | | 1,470,656 | |
| | 12,300 | | | | | SBS Holdings, Inc. | | | 337,153 | |
| | 2,100 | | | | | SCREEN Holdings Co., Ltd.(c) | | | 210,294 | |
See accompanying Notes to the Financial Statements.
56
Mercer Non-US Core Equity Fund
Schedule of Investments (Continued)
(showing percentage of net assets)
March 31, 2022
| | | | | | | | | | |
| Shares | | | | | Description | | Value ($) | |
| | |
| | | | | | Japan — continued | |
| | 109,100 | | | | | Secom Co., Ltd. | | | 7,928,795 | |
| | 165,600 | | | | | Seiko Epson Corp.(c) | | | 2,490,265 | |
| | 145,900 | | | | | Seino Holdings Co., Ltd. | | | 1,332,103 | |
| | 35,400 | | | | | Seven & i Holdings Co., Ltd. | | | 1,689,405 | |
| | 387,000 | | | | | Shimadzu Corp. | | | 13,366,324 | |
| | 26,500 | | | | | Shin-Etsu Chemical Co., Ltd. | | | 4,050,354 | |
| | 3,800 | | | | | Shinko Electric Industries Co., Ltd. | | | 179,982 | |
| | 20,900 | | | | | Shizuoka Bank, Ltd. (The) | | | 148,042 | |
| | 378,600 | | | | | SKY Perfect JSAT Holdings, Inc. | | | 1,286,148 | |
| | 22,000 | | | | | SMC Corp. | | | 12,324,242 | |
| | 51,900 | | | | | Sohgo Security Services Co., Ltd. | | | 1,699,944 | |
| | 179,340 | | | | | Sojitz Corp.(c) | | | 2,967,556 | |
| | 141,100 | | | | | Sompo Holdings, Inc. | | | 6,225,255 | |
| | 11,000 | | | | | Studio Alice Co., Ltd. | | | 197,057 | |
| | 145,000 | | | | | Subaru Corp. | | | 2,310,391 | |
| | 19,600 | | | | | Sumitomo Bakelite Co., Ltd. | | | 797,146 | |
| | 93,000 | | | | | Sumitomo Chemical Co., Ltd. | | | 427,601 | |
| | 10,100 | | | | | Sumitomo Dainippon Pharma Co., Ltd. | | | 100,039 | |
| | 196,600 | | | | | Sumitomo Electric Industries, Ltd. | | | 2,345,214 | |
| | 134,400 | | | | | Sumitomo Heavy Industries, Ltd. | | | 3,097,461 | |
| | 330,400 | | | | | Sumitomo Mitsui Financial Group, Inc. | | | 10,576,170 | |
| | 158,100 | | | | | Sumitomo Mitsui Trust Holdings, Inc. | | | 5,180,577 | |
| | 330,400 | | | | | Sumitomo Rubber Industries, Ltd. | | | 3,040,464 | |
| | 11,700 | | | | | Sumitomo Seika Chemicals Co., Ltd. | | | 297,110 | |
| | 206,900 | | | | | Suruga Bank, Ltd.(c) | | | 690,278 | |
| | 37,100 | | | | | T Hasegawa Co., Ltd. | | | 789,909 | |
| | 38,400 | | | | | T&D Holdings, Inc. | | | 522,532 | |
| | 129,300 | | | | | Taiheiyo Cement Corp.(c) | | | 2,139,263 | |
| | 14,000 | | | | | Takara Standard Co., Ltd. | | | 145,655 | |
| | 7,200 | | | | | Takasago Thermal Engineering Co., Ltd. | | | 102,410 | |
| | 14,800 | | | | | Takeuchi Manufacturing Co., Ltd. | | | 319,701 | |
| | 389,600 | | | | | Teijin, Ltd. | | | 4,353,550 | |
| | 56,000 | | | | | Terumo Corp. | | | 1,701,102 | |
| | 28,900 | | | | | TIS, Inc. | | | 677,979 | |
| | 8,600 | | | | | Toagosei Co., Ltd. | | | 75,931 | |
| | 26,600 | | | | | Tobu Railway Co., Ltd. | | | 649,124 | |
| | 119,000 | | | | | Tohoku Electric Power Co., Inc. | | | 698,358 | |
| | 154,500 | | | | | Tokio Marine Holdings, Inc. | | | 9,013,079 | �� |
| | 159,500 | | | | | Tokuyama Corp.(c) | | | 2,243,387 | |
| | 20,900 | | | | | Tokyo Electron, Ltd. | | | 10,763,884 | |
| | 15,700 | | | | | Tokyo Electron, Ltd., ADR | | | 2,017,136 | |
| | 308,400 | | | | | Tokyo Gas Co., Ltd.(c) | | | 5,666,374 | |
| | 85,000 | | | | | Tokyo Seimitsu Co., Ltd. | | | 3,385,335 | |
| | 21,000 | | | | | Tokyo Steel Manufacturing Co., Ltd. | | | 199,895 | |
| | 169,000 | | | | | Tokyu Construction Co., Ltd. | | | 932,126 | |
| | 30,100 | | | | | Tokyu Corp. | | | 392,134 | |
| | 150,100 | | | | | Tomy Co., Ltd. | | | 1,500,130 | |
| | 6,100 | | | | | Topcon Corp. | | | 77,724 | |
| | 34,300 | | | | | TOPPAN, Inc. | | | 607,782 | |
See accompanying Notes to the Financial Statements.
57
Mercer Non-US Core Equity Fund
Schedule of Investments (Continued)
(showing percentage of net assets)
March 31, 2022
| | | | | | | | | | |
| Shares | | | | | Description | | Value ($) | |
| | |
| | | | | | Japan — continued | |
| | 113,400 | | | | | Toray Industries, Inc. | | | 592,826 | |
| | 16,900 | | | | | Tosoh Corp. | | | 250,674 | |
| | 88,600 | | | | | Towa Corp.(c) | | | 1,764,865 | |
| | 84,900 | | | | | Towa Pharmaceutical Co., Ltd. | | | 1,911,255 | |
| | 54,200 | | | | | Toyo Ink SC Holdings Co., Ltd. | | | 845,180 | |
| | 8,100 | | | | | Toyo Seikan Group Holdings, Ltd. | | | 93,110 | |
| | 234,100 | | | | | Toyo Suisan Kaisha, Ltd. | | | 8,396,679 | |
| | 14,700 | | | | | Toyo Tanso Co., Ltd. | | | 378,627 | |
| | 13,000 | | | | | Toyota Tsusho Corp. | | | 536,516 | |
| | 171,200 | | | | | TS Tech Co., Ltd. | | | 1,923,473 | |
| | 16,600 | | | | | Tsubakimoto Chain Co. | | | 414,706 | |
| | 68,500 | | | | | UACJ Corp. | | | 1,305,505 | |
| | 130,200 | | | | | Ube Industries, Ltd. | | | 2,128,695 | |
| | 31,300 | | | | | Ulvac, Inc. | | | 1,603,243 | |
| | 123,700 | | | | | Ushio, Inc. | | | 1,838,278 | |
| | 25,700 | | | | | Valor Holdings Co., Ltd. | | | 445,327 | |
| | 26,900 | | | | | Warabeya Nichiyo Holdings Co., Ltd.(c) | | | 393,630 | |
| | 145,000 | | | | | Yamaha Motor Co., Ltd. | | | 3,259,365 | |
| | 36,200 | | | | | Yamaichi Electronics Co., Ltd. | | | 552,881 | |
| | 206,600 | | | | | Yokogawa Electric Corp. | | | 3,535,189 | |
| | 160,900 | | | | | Yokohama Rubber Co., Ltd. (The) | | | 2,220,304 | |
| | | | | | | | | | |
| | | | | | | | | 674,214,310 | |
| | | | | | | | | | |
| | |
| | | | | | Malaysia — 0.1% | |
| | 1,152,700 | | | | | Tenaga Nasional Bhd | | | 2,466,943 | |
| | | | | | | | | | |
| | |
| | | | | | Mexico — 0.1% | |
| | 3,402,100 | | | | | America Movil SAB de CV Series L | | | 3,594,537 | |
| | | | | | | | | | |
| | |
| | | | | | Netherlands — 5.7% | |
| | 9,369 | | | | | Adyen NV* 144A | | | 18,616,208 | |
| | 10,409 | | | | | Adyen NV, ADR* | | | 205,786 | |
| | 607,600 | | | | | Aegon NV | | | 3,225,146 | |
| | 50,734 | | | | | ASML Holding NV | | | 34,035,334 | |
| | 10,298 | | | | | ASML Holding NV, ADR NYRS | | | 6,878,343 | |
| | 76,928 | | | | | ASR Nederland NV | | | 3,595,150 | |
| | 73,049 | | | | | Euronext NV | | | 6,671,526 | |
| | 3,414 | | | | | Heineken Holding NV | | | 268,749 | |
| | 434,800 | | | | | ING Groep NV | | | 4,570,287 | |
| | 139,851 | | | | | ING Groep NV, ADR | | | 1,458,646 | |
| | 318,100 | | | | | Koninklijke Ahold Delhaize NV | | | 10,284,881 | |
| | 105,593 | | | | | Koninklijke DSM NV(c) | | | 18,980,699 | |
| | 1,114,269 | | | | | Koninklijke KPN NV | | | 3,892,262 | |
| | 65,045 | | | | | Koninklijke Philips NV, ADR NYRS | | | 1,985,824 | |
| | 307,714 | | | | | NN Group NV | | | 15,598,755 | |
| | 5,852 | | | | | OCI NV* | | | 207,229 | |
| | 46,172 | | | | | Randstad NV(c) | | | 2,787,384 | |
| | 716,500 | | | | | Shell Plc | | | 19,708,368 | |
| | 338,916 | | | | | Shell Plc, ADR | | | 18,616,656 | |
See accompanying Notes to the Financial Statements.
58
Mercer Non-US Core Equity Fund
Schedule of Investments (Continued)
(showing percentage of net assets)
March 31, 2022
| | | | | | | | | | |
| Shares | | | | | Description | | Value ($) | |
| | |
| | | | | | Netherlands — continued | |
| | 155,300 | | | | | Signify NV 144A | | | 7,283,285 | |
| | 6,179 | | | | | TKH Group NV CVA, ADR | | | 346,675 | |
| | 578,990 | | | | | Universal Music Group NV | | | 15,459,726 | |
| | 148,272 | | | | | Wolters Kluwer NV | | | 15,874,799 | |
| | | | | | | | | | |
| | | | | | | | | 210,551,718 | |
| | | | | | | | | | |
| | |
| | | | | | Norway — 0.5% | |
| | 100,400 | | | | | Austevoll Seafood ASA | | | 1,565,839 | |
| | 237,976 | | | | | DNB Bank ASA | | | 5,424,754 | |
| | 235,380 | | | | | Equinor ASA | | | 8,892,652 | |
| | 25,929 | | | | | Equinor ASA, ADR | | | 972,597 | |
| | 3,594 | | | | | Kongsberg Gruppen ASA | | | 143,710 | |
| | 8,627 | | | | | Telenor ASA | | | 124,842 | |
| | | | | | | | | | |
| | | | | | | | | 17,124,394 | |
| | | | | | | | | | |
| | |
| | | | | | Philippines — 0.0% | |
| | 6,261,800 | | | | | Vista Land & Lifescapes, Inc. | | | 315,153 | |
| | | | | | | | | | |
| | |
| | | | | | Portugal — 0.0% | |
| | 782,528 | | | | | Banco Espirito Santo SA* (a) (b) | | | — | |
| | 16,514 | | | | | Jeronimo Martins SGPS SA | | | 397,911 | |
| | | | | | | | | | |
| | | | | | | | | 397,911 | |
| | | | | | | | | | |
| | |
| | | | | | Russia — 0.0% | |
| | 3,037,280 | | | | | Gazprom PJSC(a) (b) (d) | | | 85,568 | |
| | 377,400 | | | | | Gazprom PJSC, ADR(a) (b) (d) | | | 22,644 | |
| | 67,678 | | | | | LUKOIL PJSC(a) (b) (d) | | | 40,927 | |
| | 46,100 | | | | | LUKOIL PJSC, ADR(a) (b) (d) | | | 23,050 | |
| | 84,300 | | | | | MMC Norilsk Nickel PJSC, ADR(a) (b) (d) | | | 20,232 | |
| | 11,529 | | | | | Novatek PJSC(a) (b) (d) | | | 1,722 | |
| | 659 | | | | | Novatek PJSC, GDR(a) (b) (d) (e) | | | 824 | |
| | 169,349 | | | | | Rosneft Oil Co. PJSC(a) (b) (d) | | | 6,169 | |
| | 1,092,670 | | | | | Sberbank of Russia PJSC(a) (b) (d) | | | 17,249 | |
| | 27,874 | | | | | Tatneft PJSC(a) (b) (d) | | | 1,246 | |
| | 44,800 | | | | | Tatneft PJSC, ADR(a) (b) (d) | | | 13,440 | |
| | | | | | | | | | |
| | | | | | | | | 233,071 | |
| | | | | | | | | | |
| | |
| | | | | | Singapore — 0.3% | |
| | 2,745,000 | | | | | IGG, Inc. | | | 1,302,698 | |
| | 259,300 | | | | | United Overseas Bank, Ltd. | | | 6,091,141 | |
| | 177,500 | | | | | Venture Corp., Ltd.(c) | | | 2,293,145 | |
| | | | | | | | | | |
| | | | | | | | | 9,686,984 | |
| | | | | | | | | | |
| | |
| | | | | | South Africa — 0.7% | |
| | 17,400 | | | | | Anglo American Platinum, Ltd. | | | 2,389,380 | |
| | 469,307 | | | | | Anglo American Plc | | | 24,260,490 | |
| | 4,103 | | | | | Anglo American Plc, ADR | | | 107,663 | |
| | 1,003,000 | | | | | Old Mutual, Ltd.(c) | | | 930,224 | |
| | | | | | | | | | |
| | | | | | | | | 27,687,757 | |
| | | | | | | | | | |
See accompanying Notes to the Financial Statements.
59
Mercer Non-US Core Equity Fund
Schedule of Investments (Continued)
(showing percentage of net assets)
March 31, 2022
| | | | | | | | | | |
| Shares | | | | | Description | | Value ($) | |
| | |
| | | | | | South Korea — 1.3% | |
| | 17,475 | | | | | HMM Co., Ltd. | | | 417,787 | |
| | 51,200 | | | | | Kia Corp. | | | 3,109,467 | |
| | 687,331 | | | | | Samsung Electronics Co., Ltd. | | | 39,265,600 | |
| | 26,500 | | | | | Samyang Foods Co., Ltd. | | | 2,026,049 | |
| | 27,680 | | | | | SK Square Co., Ltd.* | | | 1,280,083 | |
| | 42,819 | | | | | SK Telecom Co., Ltd. | | | 2,004,046 | |
| | | | | | | | | | |
| | | | | | | | | 48,103,032 | |
| | | | | | | | | | |
| | |
| | | | | | Spain — 1.8% | |
| | 130,943 | | | | | Amadeus IT Group SA* | | | 8,578,451 | |
| | 1,645,300 | | | | | Banco Santander SA | | | 5,614,743 | |
| | 282,397 | | | | | Cellnex Telecom SA | | | 13,614,181 | |
| | 83,100 | | | | | Enagas SA | | | 1,857,266 | |
| | 48,013 | | | | | Grupo Catalana Occidente SA | | | 1,475,113 | |
| | 1,381,814 | | | | | Iberdrola SA | | | 15,127,167 | |
| | 20,191 | | | | | Let’s GOWEX SA* (a) (b) | | | — | |
| | 1,816,288 | | | | | Mapfre SA(c) | | | 3,823,094 | |
| | 481,400 | | | | | Mediaset Espana Comunicacion SA* | | | 2,443,600 | |
| | 789,618 | | | | | Repsol SA | | | 10,442,812 | |
| | 580,402 | | | | | Telefonica SA | | | 2,833,515 | |
| | | | | | | | | | |
| | | | | | | | | 65,809,942 | |
| | | | | | | | | | |
| | |
| | | | | | Sweden — 2.9% | |
| | 76,734 | | | | | Assa Abloy AB Class B | | | 2,087,445 | |
| | 129,900 | | | | | Boliden AB | | | 6,646,003 | |
| | 206,900 | | | | | Electrolux AB Class B(c) | | | 3,158,353 | |
| | 322,866 | | | | | Epiroc AB Class A | | | 6,970,430 | |
| | 24,548 | | | | | EQT AB | | | 969,876 | |
| | 38,584 | | | | | Essity AB Class B | | | 917,192 | |
| | 4,282 | | | | | Getinge AB Class B | | | 171,963 | |
| | 150,949 | | | | | H & M Hennes & Mauritz AB Class B(c) | | | 2,033,835 | |
| | 899,084 | | | | | Hexagon AB Class B | | | 12,726,210 | |
| | 261,600 | | | | | Husqvarna AB Class B | | | 2,750,936 | |
| | 28,824 | | | | | Industrivarden AB Class A | | | 826,510 | |
| | 73,036 | | | | | Industrivarden AB Class C | | | 2,056,290 | |
| | 69,825 | | | | | Intrum AB | | | 1,898,210 | |
| | 195,121 | | | | | Investor AB Class A(c) | | | 4,573,550 | |
| | 351,911 | | | | | Investor AB Class B | | | 7,710,168 | |
| | 14,464 | | | | | Inwido AB | | | 230,520 | |
| | 1,186 | | | | | L E Lundbergforetagen AB Class B | | | 60,783 | |
| | 27,209 | | | | | Lundin Energy AB(c) | | | 1,163,786 | |
| | 333,829 | | | | | Securitas AB Class B | | | 3,794,695 | |
| | 370,500 | | | | | SKF AB Class B(c) | | | 6,076,078 | |
| | 35,848 | | | | | SSAB AB Class B* | | | 241,330 | |
| | 149,311 | | | | | Svenska Cellulosa AB SCA Class B(c) | | | 2,924,950 | |
| | 633,577 | | | | | Svenska Handelsbanken AB Class A(c) | | | 5,882,848 | |
| | 633,537 | | | | | Swedbank AB Class A(c) | | | 9,539,014 | |
| | 627,608 | | | | | Swedish Match AB | | | 4,762,940 | |
| | 127,688 | | | | | Tele2 AB Class B | | | 1,944,844 | |
See accompanying Notes to the Financial Statements.
60
Mercer Non-US Core Equity Fund
Schedule of Investments (Continued)
(showing percentage of net assets)
March 31, 2022
| | | | | | | | | | |
| Shares | | | | | Description | | Value ($) | |
| | |
| | | | | | Sweden — continued | |
| | 202,322 | | | | | Telefonaktiebolaget LM Ericsson, ADR | | | 1,849,223 | |
| | 1,148,522 | | | | | Telia Co. AB(c) | | | 4,640,349 | |
| | 390,400 | | | | | Volvo AB Class B(c) | | | 7,346,399 | |
| | | | | | | | | | |
| | | | | | | | | 105,954,730 | |
| | | | | | | | | | |
| | |
| | | | | | Switzerland — 10.1% | |
| | 401,203 | | | | | ABB, Ltd. | | | 13,033,941 | |
| | 157,875 | | | | | Adecco Group AG | | | 7,175,059 | |
| | 212 | | | | | Chocoladefabriken Lindt & Spruengli AG | | | 2,524,452 | |
| | 81,641 | | | | | Cie Financiere Richemont SA Class A | | | 10,398,802 | |
| | 289 | | | | | Comet Holding AG | | | 83,684 | |
| | 358,000 | | | | | Credit Suisse Group AG | | | 2,836,324 | |
| | 13,198 | | | | | Geberit AG | | | 8,158,353 | |
| | 260 | | | | | Georg Fischer AG | | | 311,514 | |
| | 6,158 | | | | | Givaudan SA | | | 25,453,715 | |
| | 92,600 | | | | | Holcim, Ltd.* | | | 4,539,548 | |
| | 19,317 | | | | | Huber + Suhner AG | | | 1,812,365 | |
| | 132,024 | | | | | Julius Baer Group, Ltd. | | | 7,689,904 | |
| | 26,145 | | | | | Lonza Group AG | | | 19,019,831 | |
| | 330,247 | | | | | Nestle SA | | | 43,049,970 | |
| | 383,673 | | | | | Novartis AG | | | 33,787,629 | |
| | 125,793 | | | | | Novartis AG, ADR | | | 11,038,336 | |
| | 15,415 | | | | | Partners Group Holding AG | | | 19,230,170 | |
| | 140,888 | | | | | Roche Holding AG | | | 55,947,802 | |
| | 65,560 | | | | | Roche Holding AG, ADR | | | 3,239,320 | |
| | 38,953 | | | | | Schindler Holding AG | | | 8,339,188 | |
| | 4,624 | | | | | SGS SA | | | 12,901,370 | |
| | 366,640 | | | | | SIG Combibloc Group AG* | | | 9,297,358 | |
| | 56,812 | | | | | Sika AG(c) | | | 18,794,386 | |
| | 22,320 | | | | | Swatch Group AG (The) | | | 1,216,920 | |
| | 31,920 | | | | | Swiss Life Holding AG | | | 20,458,244 | |
| | 21,344 | | | | | Temenos AG | | | 2,053,554 | |
| | 1,093,537 | | | | | UBS Group AG | | | 21,452,656 | |
| | 10,205 | | | | | Valora Holding AG* (c) | | | 1,913,315 | |
| | 4,695 | | | | | Vontobel Holding AG | | | 396,213 | |
| | 16,685 | | | | | Zurich Insurance Group AG | | | 8,260,151 | |
| | | | | | | | | | |
| | | | | | | | | 374,414,074 | |
| | | | | | | | | | |
| | |
| | | | | | Taiwan — 1.6% | |
| | 937,000 | | | | | ASE Technology Holding Co., Ltd. | | | 3,342,101 | |
| | 1,134,000 | | | | | Chipbond Technology Corp. | | | 2,716,298 | |
| | 798,000 | | | | | ChipMOS Technologies, Inc. | | | 1,418,962 | |
| | 1,616,000 | | | | | Compeq Manufacturing Co., Ltd. | | | 2,705,670 | |
| | 1,153,000 | | | | | Fubon Financial Holding Co., Ltd. | | | 3,066,757 | |
| | 718,000 | | | | | Hon Hai Precision Industry Co., Ltd. | | | 2,645,086 | |
| | 201,000 | | | | | Novatek Microelectronics Corp. | | | 2,966,718 | |
| | 735,000 | | | | | Taiwan Semiconductor Manufacturing Co., Ltd. | | | 15,195,709 | |
| | 232,833 | | | | | Taiwan Semiconductor Manufacturing Co., Ltd., ADR | | | 24,275,168 | |
| | | | | | | | | | |
| | | | | | | | | 58,332,469 | |
| | | | | | | | | | |
See accompanying Notes to the Financial Statements.
61
Mercer Non-US Core Equity Fund
Schedule of Investments (Continued)
(showing percentage of net assets)
March 31, 2022
| | | | | | | | | | |
| Shares | | | | | Description | | Value ($) | |
| | |
| | | | | | Thailand — 0.0% | |
| | 16,831,100 | | | | | Quality Houses PCL Class F | | | 1,161,937 | |
| | | | | | | | | | |
| | |
| | | | | | Turkey — 0.1% | |
| | 280,700 | | | | | Coca-Cola Icecek AS | | | 2,241,393 | |
| | 1,059,183 | | | | | Turk Hava Yollari AO* | | | 2,312,478 | |
| | | | | | | | | | |
| | | | | | | | | 4,553,871 | |
| | | | | | | | | | |
| | |
| | | | | | United Kingdom — 9.3% | |
| | 397,907 | | | | | 3i Group Plc | | | 7,214,152 | |
| | 118,010 | | | | | Ashtead Group Plc | | | 7,456,121 | |
| | 178,930 | | | | | AstraZeneca Plc | | | 23,782,321 | |
| | 26,932 | | | | | AstraZeneca Plc, ADR | | | 1,786,669 | |
| | 245,400 | | | | | Babcock International Group Plc* | | | 1,044,330 | |
| | 1,184,100 | | | | | BAE Systems Plc | | | 11,187,369 | |
| | 1,303,300 | | | | | Barclays Plc | | | 2,537,586 | |
| | 288,541 | | | | | Barclays Plc, ADR | | | 2,279,474 | |
| | 280,200 | | | | | Barratt Developments Plc | | | 1,916,094 | |
| | 54,979 | | | | | Bellway Plc | | | 1,750,939 | |
| | 85,014 | | | | | Bodycote Plc | | | 702,414 | |
| | 1,124,647 | | | | | BP Plc | | | 5,508,742 | |
| | 631,053 | | | | | BP Plc, ADR | | | 18,552,958 | |
| | 235,600 | | | | | British American Tobacco Plc | | | 9,876,808 | |
| | 262,169 | | | | | British American Tobacco Plc, ADR | | | 11,053,045 | |
| | 1,821,700 | | | | | BT Group Plc | | | 4,351,766 | |
| | 1,938,900 | | | | | Centrica Plc* | | | 2,034,183 | |
| | 551,000 | | | | | CK Hutchison Holdings, Ltd. | | | 4,040,725 | |
| | 627,344 | | | | | CNH Industrial NV | | | 9,990,886 | |
| | 208,800 | | | | | Crest Nicholson Holdings Plc | | | 730,435 | |
| | 38,944 | | | | | Croda International Plc | | | 4,011,497 | |
| | 992,500 | | | | | Currys Plc | | | 1,183,331 | |
| | 481,233 | | | | | Diageo Plc | | | 24,378,615 | |
| | 1,079 | | | | | Diageo Plc, ADR | | | 219,188 | |
| | 359,823 | | | | | Experian Plc | | | 13,908,271 | |
| | 274,298 | | | | | Halma Plc | | | 8,974,004 | |
| | 238,930 | | | | | Hiscox, Ltd. | | | 3,087,362 | |
| | 3,663,600 | | | | | HSBC Holdings Plc | | | 25,054,057 | |
| | 556,556 | | | | | IMI Plc | | | 9,941,739 | |
| | 229,500 | | | | | Imperial Brands Plc | | | 4,843,402 | |
| | 45,874 | | | | | Inchcape Plc | | | 401,368 | |
| | 122,521 | | | | | Intertek Group Plc | | | 8,386,118 | |
| | 1,581,400 | | | | | J Sainsbury Plc | | | 5,248,414 | |
| | 1,756,600 | | | | | Kingfisher Plc | | | 5,875,784 | |
| | 7,342,700 | | | | | Lloyds Banking Group Plc | | | 4,505,451 | |
| | 1,637,165 | | | | | Man Group Plc | | | 5,001,602 | |
| | 1,094,200 | | | | | Marks & Spencer Group Plc* | | | 2,219,686 | |
| | 430,100 | | | | | Micro Focus International Plc | | | 2,284,947 | |
| | 681,500 | | | | | Mitchells & Butlers Plc* | | | 2,090,100 | |
| | 100,471 | | | | | Ocado Group Plc* | | | 1,539,279 | |
| | 492,348 | | | | | Paragon Banking Group Plc | | | 3,220,028 | |
See accompanying Notes to the Financial Statements.
62
Mercer Non-US Core Equity Fund
Schedule of Investments (Continued)
(showing percentage of net assets)
March 31, 2022
| | | | | | | | | | |
| Shares | | | | | Description | | Value ($) | |
| | |
| | | | | | United Kingdom — continued | |
| | 414,964 | | | | | QinetiQ Group Plc | | | 1,659,046 | |
| | 226,440 | | | | | Reckitt Benckiser Group Plc | | | 17,347,930 | |
| | 247,100 | | | | | Redrow Plc | | | 1,692,292 | |
| | 192,666 | | | | | RELX Plc | | | 6,014,899 | |
| | 32,494 | | | | | RELX Plc, ADR | | | 1,010,563 | |
| | 890,280 | | | | | Segro Plc REIT | | | 15,719,074 | |
| | 370,380 | | | | | Senior Plc* | | | 617,245 | |
| | 37,819 | | | | | Smith & Nephew Plc | | | 604,197 | |
| | 12,246 | | | | | Spectris Plc | | | 416,857 | |
| | 72,397 | | | | | Spirax-Sarco Engineering Plc | | | 11,890,988 | |
| | 145,983 | | | | | SThree Plc | | | 789,983 | |
| | 346,800 | | | | | Tate & Lyle Plc | | | 3,339,054 | |
| | 1,350,500 | | | | | Taylor Wimpey Plc | | | 2,309,750 | |
| | 1,256,100 | | | | | Tesco Plc | | | 4,551,602 | |
| | 74,000 | | | | | Vistry Group Plc | | | 913,824 | |
| | 645,039 | | | | | Vodafone Group Plc, ADR | | | 10,720,548 | |
| | 11,221 | | | | | WPP Plc | | | 147,176 | |
| | | | | | | | | | |
| | | | | | | | | 343,916,288 | |
| | | | | | | | | | |
| | |
| | | | | | United States — 6.3% | |
| | 25,484 | | | | | Agilent Technologies, Inc. | | | 3,372,298 | |
| | 83,771 | | | | | Analog Devices, Inc. | | | 13,837,294 | |
| | 42,672 | | | | | ANSYS, Inc.* | | | 13,554,761 | |
| | 42,770 | | | | | Atlassian Corp. Plc Class A* | | | 12,567,109 | |
| | 58,503 | | | | | Bruker Corp. | | | 3,761,743 | |
| | 208,216 | | | | | Cadence Design Systems, Inc.* | | | 34,243,203 | |
| | 26,910 | | | | | Ferguson Plc | | | 3,661,106 | |
| | 1,075,781 | | | | | GlaxoSmithKline Plc | | | 23,251,064 | |
| | 677,272 | | | | | GlaxoSmithKline Plc, ADR | | | 29,501,968 | |
| | 101,881 | | | | | James Hardie Industries Plc, CDI | | | 3,076,842 | |
| | 81,612 | | | | | Janus Henderson Group Plc | | | 2,858,052 | |
| | 674,400 | | | | | JBS SA | | | 5,283,707 | |
| | 21,974 | | | | | Nordson Corp. | | | 4,989,856 | |
| | 340,954 | | | | | Schneider Electric SE | | | 57,253,820 | |
| | 177,711 | | | | | Stellantis NV | | | 2,898,521 | |
| | 255,527 | | | | | Stellantis NV (EN Paris Exchange) | | | 4,158,965 | |
| | 100,913 | | | | | Swiss Re AG | | | 9,642,348 | |
| | 19,297 | | | | | Texas Instruments, Inc. | | | 3,540,614 | |
| | | | | | | | | | |
| | | | | | | | | 231,453,271 | |
| | | | | | | | | | |
| | | |
| | | | | | TOTAL COMMON STOCKS (COST $3,232,087,863) | | | 3,475,038,531 | |
| | | | | | | | | | |
| | |
| | | | | | INVESTMENT COMPANIES — 0.9% | |
| | |
| | | | | | United States — 0.9% | |
| | 334,862 | | | | | iShares MSCI EAFE ETF | | | 24,645,843 | |
| | 223,356 | | | | | iShares MSCI Eurozone ETF | | | 9,664,614 | |
| | | | | | | | | | |
| | | | | | | | | 34,310,457 | |
| | | | | | | | | | |
| | | |
| | | | | | TOTAL INVESTMENT COMPANIES (COST $36,472,830) | | | 34,310,457 | |
| | | | | | | | | | |
See accompanying Notes to the Financial Statements.
63
Mercer Non-US Core Equity Fund
Schedule of Investments (Continued)
(showing percentage of net assets)
March 31, 2022
| | | | | | | | | | |
| Shares | | | | | Description | | Value ($) | |
| | |
| | | | | | PREFERRED STOCKS — 1.4% | |
| | |
| | | | | | Brazil — 0.2% | |
| | 1,162,400 | | | | | Petroleo Brasileiro SA, 16.90% | | | 8,182,384 | |
| | | | | | | | | | |
| | |
| | | | | | Germany — 1.1% | |
| | 5,781 | | | | | BMW AG, 2.72% | | | 450,561 | |
| | 221,436 | | | | | Henkel AG & Co. KGaA, 3.04% | | | 14,915,823 | |
| | 66,300 | | | | | Porsche Automobil Holding SE, 2.50% | | | 6,460,285 | |
| | 326,000 | | | | | Schaeffler AG, 4.37% | | | 2,031,920 | |
| | 96,514 | | | | | Volkswagen AG, 3.06% | | | 16,785,404 | |
| | | | | | | | | | |
| | | | | | 40,643,993 | |
| | | | | | | | | | |
| |
| | | South Korea — 0.1% | |
| | 56,818 | | | | | Samsung Electronics Co., Ltd., 1.72% | | | 2,938,844 | |
| | | | | | | | | | |
| | |
| | | TOTAL PREFERRED STOCKS (COST $59,801,167) | | | 51,765,221 | |
| | | | | | | | | | |
| |
| | | WARRANT — 0.0% | |
| |
| | | Switzerland — 0.0% | |
| | 236,912 | | | | | Cie Financiere Richemont SA, Expires 11/22/23* | | | 187,934 | |
| | | | | | | | | | |
| | |
| | | TOTAL WARRANT (COST $—) | | | 187,934 | |
| | | | | | | | | | |
| | | |
| Par Value ($) | | | | | Description | | Value ($) | |
| |
| | | SHORT-TERM INVESTMENT — 2.3% | |
| |
| | | Mutual Fund - Securities Lending Collateral — 2.3% | |
| | 82,677,714 | | | | | State Street Institutional U.S. Government Money Market Fund, Premier Class, 0.25%(f) (g) | | | 82,677,714 | |
| | | | | | | | | | |
| | |
| | | TOTAL SHORT-TERM INVESTMENT (COST $82,677,714) | | | 82,677,714 | |
| | | | | | | | | | |
| | |
| | | TOTAL INVESTMENTS — 98.7% (Cost $3,411,039,574) | | | 3,643,979,857 | |
| | |
| | | Other Assets and Liabilities (net) — 1.3% | | | 48,840,594 | |
| | | | | | | | | | |
| | |
| | | NET ASSETS — 100.0% | | $3,692,820,451 | |
| | | | | | | | | | |
See accompanying Notes to the Financial Statements.
64
Mercer Non-US Core Equity Fund
Schedule of Investments (Continued)
March 31, 2022
| | | | | | | | | | |
| | | | | | Notes to Schedule of Investments:
| | | | |
| | | |
| | | | * | | Non-income producing security. | | | | |
| | | |
| | | | (a) | | Level 3 — significant unobservable inputs were used in determining the value of this security in the fund. | | | | |
| | | |
| | | | (b) | | Securities fair valued by the Valuation Committee as approved by the Board of Trustees. The total market value of the securities at year end is $233,071 which represents 0.0% of net assets. The aggregate cost of these securities held at March 31, 2022 was $30,999,269. | | | | |
| | | |
| | | | (c) | | All or a portion of this security is out on loan. | | | | |
| | | |
| | | | (d) | | Illiquid securities represent Russian securities impacted by the Russian/Ukraine crisis. The total market value of the securities at year end is $233,071 which represents 0.0% of net assets. The aggregate cost of these securities held at March 31, 2022 was $29,541,297. | | | | |
| | | |
| | | | (e) | | Restricted securities are not registered under the Securities Act of 1933 and are subject to legal restrictions on resale. These securities generally may be resold in transactions exempt from registration or to the public if the securities are subsequently registered. Disposal of these securities may involve time-consuming negotiations and prompt sale at an acceptable price may be difficult. As of year end, the market value of restricted securities was $824, which is 0.0% of net assets. See details shown in the Restricted Securities table that follows. | | | | |
| | | |
| | | | (f) | | The rate disclosed is the 7-day net yield as of March 31, 2022. | | | | |
| | | |
| | | | (g) | | Represents an investment of securities lending cash collateral. | | | | |
| | | |
| | | | 144A | | Securities exempt from registration under Rule 144A of the Securities Act of 1933. These securities may be resold in transactions exempt from registration, normally to qualified institutional buyers. The total market value of the securities at year end is $33,117,075 which represents 0.9% of net assets. | | | | |
At March 31, 2022, the Fund held the following restricted security:
| | | | | | | | | | | | | | | | | | | | |
Restricted Security | | Acquisition Date | | Principal
Amount | | Cost | | Value |
Novatek PJSC, GDR | | | | 12/10/21 | | | | | USD 659 | | | | $ | 150,811 | | | | $ | 824 | |
| | | | | | | | | | | | | | | | | | | | |
Futures Contracts
| | | | | | | | | | | | | | | | | | | | |
Number of
Contracts | | | | | Description | | | | Expiration
Date | | | Notional
Value | | | Market Value/
Unrealized
Appreciation
(Depreciation) | |
| | Buys | | | | | | | | | | | | | | | | | | | |
| | 733 | | | | | MSCI EAFE Index | | | | | Jun 2022 | | | $ | 78,592,260 | | | $ | 4,018,218 | |
| | | | | | | | | | | | | | | | | | | | |
Abbreviations
| ADR | — American Depository Receipt |
| CDI | — CREST Depository Interest |
| CVA | — Certificaten Van Aandelen |
| GDR | — Global Depository Receipt |
| NYRS | — New York Registry Shares |
| REIT | — Real Estate Investment Trust |
See accompanying Notes to the Financial Statements.
65
Mercer Non-US Core Equity Fund
Schedule of Investments (Continued)
March 31, 2022
| | | | | |
| Industry Sector Summary (Unaudited) | | % of Net Assets |
Consumer, Non-cyclical | | | | 24.8 | |
Financial | | | | 15.4 | |
Industrial | | | | 15.2 | |
Technology | | | | 10.6 | |
Basic Materials | | | | 9.5 | |
Consumer, Cyclical | | | | 8.9 | |
Energy | | | | 5.2 | |
Communications | | | | 4.3 | |
Utilities | | | | 1.6 | |
Unaffiliated Funds | | | | 0.9 | |
Diversified | | | | 0.1 | |
Short-Term Investment | | | | 2.2 | |
Other Assets and Liabilities (net) | | | | 1.3 | |
| | | | | |
| | | | 100.0 | % |
| | | | | |
See accompanying Notes to the Financial Statements.
66
Mercer Core Fixed Income Fund
Schedule of Investments
(showing percentage of net assets)
March 31, 2022
| | | | | | | | | | |
| Par Value(a) | | | | | Description | | Value ($) | |
| | |
| | | | | | DEBT OBLIGATIONS — 99.0% | |
| | |
| | | | | | Asset Backed Securities — 10.2% | |
| | 2,299,000 | | | | | Aligned Data Centers Issuer LLC, Series 2021-1A, Class A2, 1.94%, due 08/15/46 144A | | | 2,120,411 | |
| | 56,437 | | | | | AmeriCredit Automobile Receivables Trust, Series 2019-1, Class B, 3.13%, due 02/18/25 | | | 56,617 | |
| | 200,000 | | | | | AmeriCredit Automobile Receivables Trust, Series 2019-1, Class C, 3.36%, due 02/18/25 | | | 201,607 | |
| | 400,000 | | | | | AmeriCredit Automobile Receivables Trust, Series 2019-2, Class C, 2.74%, due 04/18/25 | | | 401,671 | |
| | 600,000 | | | | | AmeriCredit Automobile Receivables Trust, Series 2019-3, Class C, 2.32%, due 07/18/25 | | | 601,383 | |
| | 500,000 | | | | | AmeriCredit Automobile Receivables Trust, Series 2020-1, Class B, 1.48%, due 01/21/25 | | | 497,459 | |
| | 1,650,000 | | | | | AmeriCredit Automobile Receivables Trust, Series 2021-1, Class C, 0.89%, due 10/19/26 | | | 1,568,479 | |
| | 400,000 | | | | | AmeriCredit Automobile Receivables Trust, Series 2021-2, Class C, 1.01%, due 01/19/27 | | | 376,077 | |
| | 400,000 | | | | | AmeriCredit Automobile Receivables Trust, Series 2021-3, Class C, 1.41%, due 08/18/27 | | | 374,645 | |
| | 568,000 | | | | | AMSR Trust, Series 2020-SFR4, Class A, 1.36%, due 11/17/37 144A | | | 528,683 | |
| | 1,350,000 | | | | | AMSR Trust, Series 2021-SFR1, Class A, 1.95%, due 06/17/38(b) 144A | | | 1,235,051 | |
| | 1,529,000 | | | | | AMSR Trust, Series 2021-SFR2, Class A, 1.53%, due 08/17/38 144A | | | 1,385,549 | |
| | 227,000 | | | | | AMSR Trust, Series 2021-SFR4, Class A, 2.12%, due 12/17/38 144A | | | 214,176 | |
| | 3,500,000 | | | | | Anchorage Capital CLO 7, Ltd., Series 2015-7A, Class AR2, 1.37% (3 mo. USD LIBOR + 1.09%), due 01/28/31(c) 144A | | | 3,492,713 | |
| | 423,720 | | | | | Applebee’s Funding LLC/IHOP Funding LLC, Series 2019-1A, Class A2I, 4.19%, due 06/05/49 144A | | | 422,069 | |
| | 233,919 | | | | | Aqua Finance Trust, Series 2021-A, Class A, 1.54%, due 07/17/46 144A | | | 223,049 | |
| | 604,790 | | | | | Arbys Funding LLC, Series 2020-1A, Class A2, 3.24%, due 07/30/50 144A | | | 579,806 | |
| | 1,550,000 | | | | | ARI Fleet Lease Trust, Series 2020-A, Class A3, 1.80%, due 08/15/28 144A | | | 1,542,843 | |
| | 506,000 | | | | | Avis Budget Rental Car Funding AESOP LLC, Series 2019-3A, Class A, 2.36%, due 03/20/26 144A | | | 492,662 | |
| | 297,000 | | | | | Avis Budget Rental Car Funding AESOP LLC, Series 2020-1A, Class A, 2.33%, due 08/20/26 144A | | | 288,598 | |
| | 2,500,000 | EUR | | | | Barings Euro CLO, Series 2015-1A, Class ARR, 0.98% (3 mo. EURIBOR + 0.98%), due 07/25/35(c) 144A | | | 2,756,082 | |
| | 198,000 | | | | | BMW Vehicle Lease Trust, Series 2022-1, Class A3, 1.10%, due 03/25/25 | | | 193,165 | |
| | 1,250,000 | EUR | | | | BNPP AM Euro CLO BV, Series 2018-1A, Class AR, 0.60% (3 mo. EURIBOR + 0.60%), due 04/15/31(c) 144A | | | 1,383,105 | |
| | 282,000 | | | | | Bojangles Issuer LLC, Series 2020-1A, Class A2, 3.83%, due 10/20/50 144A | | | 276,814 | |
| | 132,621 | | | | | BRE Grand Islander Timeshare Issuer LLC, Series 2019-A, Class A, 3.28%, due 09/26/33 144A | | | 131,006 | |
| | 366,000 | | | | | Capital Automotive REIT, LP CMO, Series 2020-1A, Class B1, 4.17%, due 02/15/50 144A | | | 361,447 | |
| | 340,900 | | | | | Capital One Prime Auto Receivables Trust, Series 2019-1, Class A3, 2.51%, due 11/15/23 | | | 342,330 | |
| | 1,750,000 | EUR | | | | Carlyle Global Market Strategies Euro CLO, Ltd., Series 2014-2A, Class AR1, 0.75% (3 mo. EURIBOR + 0.75%), due 11/15/31(c) 144A | | | 1,935,103 | |
| | 268,000 | | | | | Carlyle US CLO, Ltd., Series 2019-2A, Class A1R, 1.36% (3 mo. USD LIBOR + 1.12%), due 07/15/32(c) 144A | | | 265,885 | |
See accompanying Notes to the Financial Statements.
67
Mercer Core Fixed Income Fund
Schedule of Investments (Continued)
(showing percentage of net assets)
March 31, 2022
| | | | | | | | | | |
| Par Value(a) | | | | | Description | | Value ($) | |
| | |
| | | | | | Asset Backed Securities — continued | |
| | 400,000 | | | | | CarMax Auto Owner Trust, Series 2020-4, Class C, 1.30%, due 08/17/26 | | | 378,426 | |
| | 300,000 | | | | | CarMax Auto Owner Trust, Series 2021-2, Class C, 1.34%, due 02/16/27 | | | 283,183 | |
| | 310,000 | | | | | CarMax Auto Owner Trust, Series 2021-3, Class C, 1.25%, due 05/17/27 | | | 293,132 | |
| | 300,000 | | | | | CarMax Auto Owner Trust, Series 2021-4, Class C, 1.38%, due 07/15/27 | | | 278,614 | |
| | 281,000 | | | | | CarMax Auto Owner Trust, Series 2022-1, Class A3, 1.47%, due 12/15/26 | | | 272,139 | |
| | 400,000 | | | | | CarMax Auto Owner Trust, Series 2022-1, Class C, 2.20%, due 11/15/27 | | | 382,511 | |
| | 200,000 | | | | | CarMax Auto Owner Trust, Series 2022-1, Class D, 2.47%, due 07/17/28 | | | 191,804 | |
| | 1,629,291 | | | | | CF Hippolyta LLC CMO, Series 2020-1, Class A1, 1.69%, due 07/15/60 144A | | | 1,540,684 | |
| | 499,614 | | | | | CF Hippolyta LLC CMO, Series 2021-1A, Class A1, 1.53%, due 03/15/61 144A | | | 464,590 | |
| | 850,000 | | | | | CIFC Funding CLO, Ltd., Series 2014-2RA, Class A1, 1.31% (3 mo. USD LIBOR + 1.05%), due 04/24/30(c) 144A | | | 846,600 | |
| | 1,500,000 | | | | | CIFC Funding CLO, Ltd., Series 2015-1A, Class ARR, 1.37% (3 mo. USD LIBOR + 1.11%), due 01/22/31(c) 144A | | | 1,491,646 | |
| | 1,200,000 | | | | | Citibank Credit Card Issuance Trust, Series 2018-A7, Class A7, 3.96%, due 10/13/30 | | | 1,280,491 | |
| | 717,787 | | | | | CLI Funding VI LLC, Series 2020-1A, Class A, 2.08%, due 09/18/45 144A | | | 674,071 | |
| | 523,534 | | | | | CLI Funding VIII LLC, Series 2021-1A, Class A, 1.64%, due 02/18/46 144A | | | 476,319 | |
| | 374,411 | | | | | CLI Funding VIII LLC, Series 2022-1A, Class A1, 2.72%, due 01/18/47 144A | | | 354,052 | |
| | 186,578 | | | | | Commonbond Student Loan Trust, Series 2017-BGS, Class A1, 2.68%, due 09/25/42 144A | | | 185,330 | |
| | 2,250,000 | | | | | Crown City CLO I, Series 2020-1A, Class A1AR, 1.44% (3 mo. USD LIBOR + 1.19%), due 07/20/34(c) 144A | | | 2,222,602 | |
| | 1,250,000 | | | | | Crown Point CLO 11, Ltd., Series 2021-11A, Class A, 1.37% (3 mo. USD LIBOR + 1.12%), due 01/17/34(c) 144A | | | 1,241,936 | |
| | 243,000 | | | | | DataBank Issuer, Series 2021-1A, Class A2, 2.06%, due 02/27/51 144A | | | 226,222 | |
| | 194,880 | | | | | DB Master Finance LLC, Series 2017-1A, Class A2II, 4.03%, due 11/20/47 144A | | | 196,226 | |
| | 2,350,110 | | | | | DB Master Finance LLC, Series 2021-1A, Class A23, 2.79%, due 11/20/51 144A | | | 2,113,100 | |
| | 851,865 | | | | | DB Master Finance LLC, Series 2021-1A, Class A2I, 2.05%, due 11/20/51 144A | | | 780,561 | |
| | 112,000 | | | | | Diamond Infrastructure Funding LLC, Series 2021-1A, Class C, 3.48%, due 04/15/49 144A | | | 104,672 | |
| | 595,200 | | | | | Domino’s Pizza Master Issuer LLC, Series 2017-1A, Class A23, 4.12%, due 07/25/47 144A | | | 592,486 | |
| | 3,325,868 | | | | | Domino’s Pizza Master Issuer LLC, Series 2021-1A, Class A2I, 2.66%, due 04/25/51 144A | | | 3,094,443 | |
| | 127,147 | | | | | Drive Auto Receivables Trust, Series 2020-2, Class B, 1.42%, due 03/17/25 | | | 127,106 | |
| | 300,000 | | | | | Drive Auto Receivables Trust, Series 2021-1, Class B, 0.65%, due 07/15/25 | | | 297,417 | |
| | 350,460 | | | | | Driven Brands Funding LLC, Series 2020-2A, Class A2, 3.24%, due 01/20/51 144A | | | 329,727 | |
| | 483,788 | | | | | Driven Brands Funding LLC, Series 2021-1A, Class A2, 2.79%, due 10/20/51 144A | | | 435,717 | |
| | 459,000 | | | | | Elmwood CLO IV, Ltd., Series 2020-1A, Class A, 1.48% (3 mo. USD LIBOR + 1.24%), due 04/15/33(c) 144A | | | 457,315 | |
| | 472,211 | | | | | FirstKey Homes Trust, Series 2020-SFR1, Class A, 1.34%, due 08/17/37 144A | | | 441,717 | |
| | 826,119 | | | | | FirstKey Homes Trust, Series 2020-SFR2, Class A, 1.27%, due 10/19/37 144A | | | 768,035 | |
| | 579,482 | | | | | FirstKey Homes Trust, Series 2021-SFR1, Class A, 1.54%, due 08/17/38 144A | | | 537,460 | |
| | 401,000 | | | | | FirstKey Homes Trust, Series 2021-SFR1, Class D, 2.19%, due 08/17/38 144A | | | 364,810 | |
| | 2,643,000 | | | | | FirstKey Homes Trust, Series 2022-SFRA, Class A, 3.10%, due 03/17/39 144A | | | 2,541,746 | |
| | 220,335 | | | | | Five Guys Funding LLC, Series 2017-1A, Class A2, 4.60%, due 07/25/47 144A | | | 218,599 | |
| | 161,430 | | | | | FOCUS Brands Funding LLC, Series 2017-1A, Class A2IB, 3.86%, due 04/30/47 144A | | | 158,351 | |
| | 719,000 | | | | | Ford Credit Auto Owner Trust, Series 2020-1, Class A, 2.04%, due 08/15/31 144A | | | 695,109 | |
| | 1,745,000 | | | | | Ford Credit Auto Owner Trust, Series 2020-2, Class A, 1.06%, due 04/15/33 144A | | | 1,620,330 | |
See accompanying Notes to the Financial Statements.
68
Mercer Core Fixed Income Fund
Schedule of Investments (Continued)
(showing percentage of net assets)
March 31, 2022
| | | | | | | | | | |
| Par Value(a) | | | | | Description | | Value ($) | |
| | |
| | | | | | Asset Backed Securities — continued | |
| | 300,000 | | | | | Ford Credit Auto Owner Trust, Series 2020-C, Class C, 1.04%, due 05/15/28 | | | 284,706 | |
| | 153,000 | | | | | Ford Credit Auto Owner Trust, Series 2022-A, Class A3, 1.29%, due 06/15/26 | | | 148,427 | |
| | 300,000 | | | | | Ford Credit Auto Owner Trust, Series 2022-A, Class C, 2.14%, due 07/15/29 | | | 288,126 | |
| | 818,000 | | | | | Ford Credit Floorplan Master Owner Trust, Series 2019-2, Class A, 3.06%, due 04/15/26 | | | 821,591 | |
| | 698,000 | | | | | Ford Credit Floorplan Master Owner Trust, Series 2020-2, Class A, 1.06%, due 09/15/27 | | | 652,090 | |
| | 1,000,000 | | | | | Generate CLO-2, Ltd., Series 2015-1A, Class AR, 1.41% (3 mo. USD LIBOR + 1.15%), due 01/22/31(c) 144A | | | 993,861 | |
| | 3,500,000 | | | | | Generate CLO-4, Ltd., Series 2016-2A, Class A1R, 1.34% (3 mo. USD LIBOR + 1.09%), due 04/20/32(c) 144A | | | 3,484,050 | |
| | 139,000 | | | | | GM Financial Automobile Leasing Trust, Series 2021-2, Class A4, 0.41%, due 05/20/25 | | | 134,744 | |
| | 100,000 | | | | | GM Financial Consumer Automobile Receivables Trust, Series 2018-4, Class C, 3.62%, due 06/17/24 | | | 100,865 | |
| | 81,618 | | | | | GM Financial Consumer Automobile Receivables Trust, Series 2019-1, Class A3, 2.97%, due 11/16/23 | | | 81,742 | |
| | 300,000 | | | | | GM Financial Consumer Automobile Receivables Trust, Series 2021-1, Class C, 1.04%, due 05/17/27 | | | 283,791 | |
| | 164,000 | | | | | GM Financial Consumer Automobile Receivables Trust, Series 2021-4, Class A3, 0.68%, due 09/16/26 | | | 158,496 | |
| | 128,000 | | | | | GM Financial Consumer Automobile Receivables Trust, Series 2022-1, Class A3, 1.26%, due 11/16/26 | | | 123,944 | |
| | 575,000 | | | | | GMF Floorplan Owner Revolving Trust, Series 2019-2, Class A, 2.90%, due 04/15/26 144A | | | 574,430 | |
| | 260,000 | | | | | GMF Floorplan Owner Revolving Trust, Series 2020-1, Class A, 0.68%, due 08/15/25 144A | | | 253,346 | |
| | 315,000 | | | | | Golub Capital Partners ABS Funding, Ltd., Series 2020-1A, Class A2, 3.21%, due 01/22/29 144A | | | 309,976 | |
| | 434,000 | | | | | Golub Capital Partners ABS Funding, Ltd., Series 2021-1A, Class A2, 2.77%, due 04/20/29 144A | | | 415,071 | |
| | 364,000 | | | | | HI-FI Music IP Issuer, LP, Series 2022-1A, Class A2, 3.94%, due 02/01/62 144A | | | 364,195 | |
| | 112,758 | | | | | Hilton Grand Vacations Trust, Series 2017-AA, Class A, 2.66%, due 12/26/28 144A | | | 112,712 | |
| | 85,448 | | | | | Hilton Grand Vacations Trust, Series 2018-AA, Class A, 3.54%, due 02/25/32 144A | | | 85,590 | |
| | 109,039 | | | | | Home Equity Asset Trust, Series 2003-8, Class M1, 1.54% (1 mo. USD LIBOR + 1.08%), due 04/25/34(c) | | | 107,892 | |
| | 440,099 | | | | | Home Partners of America Trust, Series 2021-2, Class A, 1.90%, due 12/17/26 144A | | | 413,117 | |
| | 279,000 | | | | | Honda Auto Receivables Owner Trust, Series 2021-2, Class A4, 0.55%, due 08/16/27 | | | 265,775 | |
| | 238,000 | | | | | Hyundai Auto Lease Securitization Trust, Series 2022-A, Class A3, 1.16%, due 01/15/25 144A | | | 232,488 | |
| | 2,000,000 | EUR | | | | Invesco Euro CLO I DAC, Series 1A, Class A1R, 0.65% (3 mo. EURIBOR + 0.65%), due 07/15/31(c) 144A | | | 2,199,208 | |
| | 493,453 | | | | | Invitation Homes Trust, Series 2018-SFR1, Class A, 1.14% (1 mo. USD LIBOR + 0.70%), due 03/17/37(c) 144A | | | 488,875 | |
| | 295,020 | | | | | Jack In The Box Funding LLC, Series 2019-1A, Class A23, 4.97%, due 08/25/49 144A | | | 298,541 | |
| | 494,000 | | | | | Jack In The Box Funding LLC, Series 2022-1A, Class A2I, 3.45%, due 02/26/52 144A | | | 467,118 | |
| | 57,001 | | | | | Laurel Road Prime Student Loan Trust, Series 2017-C, Class A2B, 2.81%, due 11/25/42 144A | | | 57,137 | |
See accompanying Notes to the Financial Statements.
69
Mercer Core Fixed Income Fund
Schedule of Investments (Continued)
(showing percentage of net assets)
March 31, 2022
| | | | | | | | | | |
| Par Value(a) | | | | | Description | | Value ($) | |
| | |
| | | | | | Asset Backed Securities — continued | |
| | 1,000,000 | EUR | | | | Madison Park Euro Funding CLO XIV DAC, Series 14A, Class A1R, 0.80% (3 mo. EURIBOR + 0.80%), due 07/15/32(c) 144A | | | 1,105,938 | |
| | 3,500,000 | | | | | Madison Park Funding CLO XXXIII, Ltd., Series 2019-33A, Class AR, 1.45% (3 mo. TSFR + 1.29%), due 10/15/32(c) 144A | | | 3,489,559 | |
| | 2,000,000 | | | | | Madison Park Funding CLO XXXVIII, Ltd., Series 2021-38A, Class A, 1.36% (3 mo. USD LIBOR + 1.12%), due 07/17/34(c) 144A | | | 1,987,160 | |
| | 338,000 | | | | | Mercedes-Benz Auto Receivables Trust, Series 2021-1, Class A3, 0.46%, due 06/15/26 | | | 324,686 | |
| | 741,126 | | | | | MidOcean Credit CLO III, Series 2014-3A, Class A1R, 1.38% (3 mo. USD LIBOR + 1.12%), due 04/21/31(c) 144A | | | 735,521 | |
| | 72,014 | | | | | Morgan Stanley ABS Capital I, Inc. Trust, Series 2003-NC10, Class M1, 1.48% (1 mo. USD LIBOR + 1.02%), due 10/25/33(c) | | | 71,442 | |
| | 29,955 | | | | | Morgan Stanley ABS Capital I, Inc. Trust, Series 2003-NC7, Class M1, 1.51% (1 mo. USD LIBOR + 1.05%), due 06/25/33(c) | | | 29,810 | |
| | 78,168 | | | | | MVW Owner Trust, Series 2018-1A, Class A, 3.45%, due 01/21/36 144A | | | 78,190 | |
| | 63,019 | | | | | Navient Private Education Loan Trust, Series 2016-AA, Class A2A, 3.91%, due 12/15/45 144A | | | 63,759 | |
| | 174,128 | | | | | Navient Private Education Refi Student Loan Trust, Series 2019-FA, Class A2, 2.60%, due 08/15/68 144A | | | 172,583 | |
| | 486,893 | | | | | Navient Private Education Refi Student Loan Trust, Series 2020-HA, Class A, 1.31%, due 01/15/69 144A | | | 471,726 | |
| | 316,733 | | | | | Navient Student Loan Trust, Series 2020-2A, Class A1A, 1.32%, due 08/26/69 144A | | | 289,312 | |
| | 291,000 | | | | | Neighborly Issuer, Series 2022-1A, Class A2, 3.70%, due 01/30/52 144A | | | 271,672 | |
| | 712,615 | | | | | Neighborly Issuer LLC, Series 2021-1A, Class A2, 3.58%, due 04/30/51 144A | | | 670,653 | |
| | 167,654 | | | | | New Century Home Equity Loan Trust, Series 2003-A, Class A, 1.18% (1 mo. USD LIBOR + 0.72%), due 10/25/33(c) 144A | | | 163,291 | |
| | 785,000 | | | | | New Economy Assets Phase 1 Sponsor LLC, Series 2021-1, Class A1, 1.91%, due 10/20/61 144A | | | 732,800 | |
| | 203,000 | | | | | New Economy Assets Phase 1 Sponsor LLC, Series 2021-1, Class B1, 2.41%, due 10/20/61 144A | | | 191,771 | |
| | 2,643,000 | | | | | NextGear Floorplan Master Owner Trust, Series 2022-1A, Class A2, 2.80%, due 03/15/27 144A | | | 2,602,163 | |
| | 570,063 | | | | | North Carolina State Education Assistance Authority, Series 2011-2, Class A3, 1.06% (3 mo. USD LIBOR + 0.80%), due 07/25/36(c) | | | 568,482 | |
| | 125,059 | | | | | NRZ Excess Spread-Collateralized Notes, Series 2021-FHT1, Class A, 3.10%, due 07/25/26 144A | | | 118,431 | |
| | 1,866,307 | | | | | Oak Street Investment Grade Net Lease Fund, Series 2021-1A, Class A1, 1.48%, due 01/20/51 144A | | | 1,739,137 | |
| | 737,763 | | | | | Oak Street Investment Grade Net Lease Fund, Series 2021-2A, Class A1, 2.38%, due 11/20/51 144A | | | 711,775 | |
| | 1,250,000 | | | | | OCP CLO, Ltd., Series 2015-9A, Class A1R2 (3 mo. TSFR + 1.25%), due 01/15/33(c) 144A | | | 1,247,702 | |
| | 272,000 | | | | | OCP CLO, Ltd., Series 2020-19A, Class AR, 1.40% (3 mo. USD LIBOR + 1.15%), due 10/20/34(c) 144A | | | 269,271 | |
| | 21,275 | | | | | OneMain Financial Issuance Trust, Series 2018-1A, Class A, 3.30%, due 03/14/29 144A | | | 21,281 | |
| | 132,536 | | | | | Oxford Finance Funding LLC, Series 2019-1A, Class A2, 4.46%, due 02/15/27 144A | | | 133,647 | |
| | 2,340,084 | | | | | OZLM Funding IV CLO, Ltd., Series 2013-4A, Class A1R, 1.51% (3 mo. USD LIBOR + 1.25%), due 10/22/30(c) 144A | | | 2,329,379 | |
See accompanying Notes to the Financial Statements.
70
Mercer Core Fixed Income Fund
Schedule of Investments (Continued)
(showing percentage of net assets)
March 31, 2022
| | | | | | | | | | |
| Par Value(a) | | | | | Description | | Value ($) | |
| | |
| | | | | | Asset Backed Securities — continued | |
| | 247,297 | | | | | OZLM XI CLO, Ltd., Series 2015-11A, Class A1R, 1.55% (3 mo. USD LIBOR + 1.25%), due 10/30/30(c) 144A | | | 246,706 | |
| | 2,500,000 | | | | | Palmer Square CLO, Ltd., Series 2015-1A, Class A1A4, 1.61% (3 mo. USD LIBOR + 1.13%), due 05/21/34(c) 144A | | | 2,489,980 | |
| | 750,000 | | | | | Palmer Square CLO, Ltd., Series 2018-2A, Class A1A, 1.34% (3 mo. USD LIBOR + 1.10%), due 07/16/31(c) 144A | | | 746,871 | |
| | 2,000,000 | | | | | Park Avenue Institutional Advisers CLO, Ltd., Series 2018-1A, Class A1AR, 1.25% (3 mo. USD LIBOR + 1.00%), due 10/20/31(c) 144A | | | 1,989,132 | |
| | 137,000 | | | | | PFS Financing Corp., Series 2020-E, Class A, 1.00%, due 10/15/25 144A | | | 133,531 | |
| | 2,492,000 | | | | | PFS Financing Corp., Series 2022-A, Class A, 2.47%, due 02/15/27 144A | | | 2,440,874 | |
| | 1,329,000 | | | | | Progress Residential Trust, Series 2019-SFR4, Class A, 2.69%, due 10/17/36 144A | | | 1,307,875 | |
| | 1,313,000 | | | | | Progress Residential Trust, Series 2020-SFR1, Class A, 1.73%, due 04/17/37 144A | | | 1,248,562 | |
| | 1,364,000 | | | | | Progress Residential Trust, Series 2021-SFR2, Class A, 1.55%, due 04/19/38 144A | | | 1,270,791 | |
| | 246,000 | | | | | Progress Residential Trust, Series 2021-SFR8, Class B, 1.68%, due 10/17/38 144A | | | 223,331 | |
| | 1,570,000 | | | | | Progress Residential Trust, Series 2022-SFR2, Class A, 2.95%, due 04/17/27 | | | 1,499,660 | |
| | 4,543 | | | | | Renaissance Home Equity Loan Trust, Series 2005-2, Class AF4, 4.93%, due 08/25/35(d) | | | 4,545 | |
| | 250,000 | | | | | Romark CLO II, Ltd., Series 2018-2A, Class A1, 1.43% (3 mo. USD LIBOR + 1.18%), due 07/25/31(c) 144A | | | 248,678 | |
| | 739,000 | | | | | Sabey Data Center Issuer LLC, Series 2020-1, Class A2, 3.81%, due 04/20/45 144A | | | 734,788 | |
| | 104,991 | | | | | Santander Drive Auto Receivables Trust, Series 2019-3, Class C, 2.49%, due 10/15/25 | | | 105,211 | |
| | 500,000 | | | | | Santander Drive Auto Receivables Trust, Series 2020-2, Class C, 1.46%, due 09/15/25 | | | 498,477 | |
| | 600,000 | | | | | Santander Drive Auto Receivables Trust, Series 2020-3, Class C, 1.12%, due 01/15/26 | | | 595,585 | |
| | 400,000 | | | | | Santander Drive Auto Receivables Trust, Series 2020-4, Class C, 1.01%, due 01/15/26 | | | 395,570 | |
| | 700,000 | | | | | Santander Drive Auto Receivables Trust, Series 2021-2, Class C, 0.90%, due 06/15/26 | | | 680,668 | |
| | 900,000 | | | | | Santander Drive Auto Receivables Trust, Series 2021-2, Class D, 1.35%, due 07/15/27 | | | 862,220 | |
| | 1,000,000 | | | | | Santander Drive Auto Receivables Trust, Series 2021-3, Class C, 0.95%, due 09/15/27 | | | 970,780 | |
| | 900,000 | | | | | Santander Drive Auto Receivables Trust, Series 2021-4, Class C, 1.26%, due 02/16/27 | | | 859,768 | |
| | 600,000 | | | | | Santander Drive Auto Receivables Trust, Series 2022-1, Class C, 2.56%, due 04/17/28 | | | 587,253 | |
| | 231,000 | | | | | Santander Retail Auto Lease Trust, Series 2022-A, Class A3, 1.34%, due 07/21/25 144A | | | 224,253 | |
| | 653,000 | | | | | Santander Revolving Auto Loan Trust, Series 2019-A, Class A, 2.51%, due 01/26/32 144A | | | 640,843 | |
| | 469,640 | | | | | ServiceMaster Funding LLC, Series 2021-1, Class A2I, 2.87%, due 07/30/51 144A | | | 423,755 | |
| | 487,500 | | | | | Sesac Finance LLC, Series 2019-1, Class A2, 5.22%, due 07/25/49 144A | | | 483,924 | |
| | 45,079 | | | | | Sierra Timeshare Receivables Funding LLC, Series 2019-1A, Class A, 3.20%, due 01/20/36 144A | | | 44,975 | |
| | 459,807 | | | | | Silver Creek CLO, Ltd., Series 2014-1A, Class AR, 1.49% (3 mo. USD LIBOR + 1.24%), due 07/20/30(c) 144A | | | 458,752 | |
| | 1,605,161 | | | | | Small Business Administration, Series 2013-20H, Class 1, 3.16%, due 08/01/33 | | | 1,594,056 | |
See accompanying Notes to the Financial Statements.
71
Mercer Core Fixed Income Fund
Schedule of Investments (Continued)
(showing percentage of net assets)
March 31, 2022
| | | | | | | | | | |
| Par Value(a) | | | | | Description | | Value ($) | |
| | |
| | | | | | Asset Backed Securities — continued | |
| | 1,167,323 | | | | | Small Business Administration, Series 2013-20L, Class 1, 3.38%, due 12/01/33 | | | 1,168,924 | |
| | 1,329,744 | | | | | Small Business Administration, Series 2014-20C, Class 1, 3.21%, due 03/01/34 | | | 1,319,181 | |
| | 643,801 | | | | | Small Business Administration, Series 2014-20D, Class 1, 3.11%, due 04/01/34 | | | 636,370 | |
| | 460,853 | | | | | Small Business Administration, Series 2014-20I, Class 1, 2.92%, due 09/01/34 | | | 454,550 | |
| | 2,316,700 | | | | | Small Business Administration, Series 2019-25F, Class 1, 2.77%, due 06/01/44 | | | 2,331,758 | |
| | 914,111 | | | | | Small Business Administration, Series 2020-25D, Class 1, 1.77%, due 04/01/45 | | | 862,736 | |
| | 2,049,000 | | | | | Small Business Administration, Series 2022-25A, Class 1, 2.04%, due 01/01/47 | | | 1,976,396 | |
| | 396,012 | | | | | SMB Private Education Loan Trust, Series 2019-B, Class A2A, 2.84%, due 06/15/37 144A | | | 391,067 | |
| | 388,081 | | | | | SMB Private Education Loan Trust, Series 2020-PTA, Class A2A, 1.60%, due 09/15/54 144A | | | 371,770 | |
| | 257,393 | | | | | SMB Private Education Loan Trust, Series 2021-A, Class APT2, 1.07%, due 01/15/53 144A | | | 236,895 | |
| | 448,780 | | | | | Sonic Capital LLC, Series 2020-1A, Class A2I, 3.85%, due 01/20/50 144A | | | 439,964 | |
| | 358,200 | | | | | Sonic Capital LLC, Series 2021-1A, Class A2I, 2.19%, due 08/20/51 144A | | | 314,233 | |
| | 547,000 | | | | | Stack Infrastructure Issuer LLC, Series 2019-2A, Class A2, 3.08%, due 10/25/44 144A | | | 538,323 | |
| | 2,178,000 | | | | | Stack Infrastructure Issuer LLC, Series 2021-1A, Class A2, 1.88%, due 03/26/46 144A | | | 2,002,068 | |
| | 655,157 | | | | | Stack Infrastructure Issuer LLC CMO, Series 2019-1A, Class A2, 4.54%, due 02/25/44 144A | | | 658,623 | |
| | 647,602 | | | | | STORE Master Funding LLC, Series 2014-1A, Class A2, 5.00%, due 04/20/44 144A | | | 648,475 | |
| | 190,492 | | | | | Sunbird Engine Finance LLC, Series 2020-1A, Class A, 3.67%, due 02/15/45 144A | | | 173,216 | |
| | 713,213 | | | | | Taco Bell Funding LLC, Series 2021-1A, Class A2I, 1.95%, due 08/25/51 144A | | | 647,599 | |
| | 1,888,268 | | | | | Taco Bell Funding LLC, Series 2021-1A, Class A2II, 2.29%, due 08/25/51 144A | | | 1,689,982 | |
| | 1,000,000 | | | | | TCW CLO, Ltd., Series 2019-2A, Class A1R, 1.52% (3 mo. TSFR + 1.28%), due 10/20/32(c) 144A | | | 998,151 | |
| | 298,343 | | | | | TIF Funding II LLC, Series 2021-1A, Class A, 1.65%, due 02/20/46 144A | | | 268,529 | |
| | 1,204,000 | | | | | Toyota Auto Loan Extended Note Trust, Series 2019-1A, Class A, 2.56%, due 11/25/31 144A | | | 1,196,289 | |
| | 364,000 | | | | | Toyota Auto Loan Extended Note Trust, Series 2020-1A, Class A, 1.35%, due 05/25/33 144A | | | 344,923 | |
| | 2,200,000 | | | | | Toyota Auto Loan Extended Note Trust, Series 2021-1A, Class A, 1.07%, due 02/27/34 144A | | | 2,045,920 | |
| | 417,000 | | | | | Toyota Auto Receivables Owner Trust, Series 2022-A, Class A3, 1.23%, due 06/15/26 | | | 405,237 | |
| | 1,531,638 | | | | | Tricon American Homes Trust, Series 2019-SFR1, Class A, 2.75%, due 03/17/38 144A | | | 1,481,653 | |
| | 1,500,000 | | | | | Trimaran Cavu CLO, Ltd., Series 2021-1A, Class A, 1.47% (3 mo. USD LIBOR + 1.21%), due 04/23/32(c) 144A | | | 1,491,211 | |
| | 682,295 | | | | | Triton Container Finance VIII LLC, Series 2020-1A, Class A, 2.11%, due 09/20/45 144A | | | 630,335 | |
| | 413,580 | | | | | Triton Container Finance VIII LLC, Series 2021-1A, Class A, 1.86%, due 03/20/46 144A | | | 375,104 | |
| | 2,132,000 | | | | | Vantage Data Centers Issuers LLC, Series 2020-1A, Class A2, 1.65%, due 09/15/45 144A | | | 1,986,684 | |
| | 347,000 | | | | | Vantage Data Centers LLC, Series 2020-2A, Class A2, 1.99%, due 09/15/45 144A | | | 318,033 | |
| | 500,000 | | | | | Venture XIX CLO, Ltd., Series 2014-19A, Class ARR, 1.50% (3 mo. USD LIBOR + 1.26%), due 01/15/32(c) 144A | | | 496,452 | |
See accompanying Notes to the Financial Statements.
72
Mercer Core Fixed Income Fund
Schedule of Investments (Continued)
(showing percentage of net assets)
March 31, 2022
| | | | | | | | | | |
| Par Value(a) | | | | | Description | | Value ($) | |
| | |
| | | | | | Asset Backed Securities — continued | |
| | 2,372,000 | | | | | Verizon Master Trust, Series 2021-2, Class A, 0.99%, due 04/20/28 | | | 2,270,263 | |
| | 345,000 | | | | | Verizon Master Trust, Series 2022-2, Class A, 1.53%, due 07/20/28 | | | 332,333 | |
| | 955,151 | | | | | Verizon Owner Trust, Series 2019-B, Class A1A, 2.33%, due 12/20/23 | | | 957,682 | |
| | 460,943 | | | | | VR Funding LLC, Series 2020-1A, Class A, 2.79%, due 11/15/50 144A | | | 434,007 | |
| | 150,093 | | | | | VSE VOI Mortgage LLC, Series 2017-A, Class A, 2.33%, due 03/20/35 144A | | | 147,711 | |
| | 500,000 | | | | | Wellfleet CLO, Ltd., Series 2018-3A, Class A1A, 1.50% (3 mo. USD LIBOR + 1.25%), due 01/20/32(c) 144A | | | 496,383 | |
| | 531,233 | | | | | Wendy’s Funding LLC, Series 2019-1A, Class A2I, 3.78%, due 06/15/49 144A | | | 526,748 | |
| | 1,773,598 | | | | | Wendy’s Funding LLC, Series 2021-1A, Class A2I, 2.37%, due 06/15/51 144A | | | 1,583,794 | |
| | 120,625 | | | | | Willis Engine Structured Trust V, Series 2020-A, Class A, 3.23%, due 03/15/45 144A | | | 109,202 | |
| | 344,219 | | | | | World Omni Auto Receivables Trust, Series 2019-B, Class A3, 2.59%, due 07/15/24 | | | 345,451 | |
| | 1,100,000 | | | | | World Omni Select Auto Trust, Series 2019-A, Class B, 2.17%, due 12/15/25 | | | 1,099,312 | |
| | 200,000 | | | | | World Omni Select Auto Trust, Series 2019-A, Class C, 2.38%, due 12/15/25 | | | 199,204 | |
| | 200,000 | | | | | World Omni Select Auto Trust, Series 2021-A, Class C, 1.09%, due 11/15/27 | | | 185,754 | |
| | 575,110 | | | | | Zaxby’s Funding LLC, Series 2021-1A, Class A2, 3.24%, due 07/30/51 144A | | | 533,108 | |
| | | | | | | | | | |
| | | | | | | | | 150,133,826 | |
| | | | | | | | | | |
| | | |
| | | | | | Corporate Debt — 36.0% | | | |
| | 225,000 | | | | | 1011778 BC ULC/New Red Finance, Inc., 3.88%, due 01/15/28 144A | | | 213,610 | |
| | 615,000 | | | | | 1011778 BC ULC/New Red Finance, Inc., 4.00%, due 10/15/30 144A | | | 555,585 | |
| | 1,920,000 | | | | | AbbVie, Inc., 3.20%, due 11/21/29 | | | 1,899,226 | |
| | 300,000 | | | | | AbbVie, Inc., 3.80%, due 03/15/25 | | | 305,873 | |
| | 450,000 | | | | | AbbVie, Inc., 4.25%, due 11/21/49 | | | 468,683 | |
| | 2,268,000 | | | | | AbbVie, Inc., 4.50%, due 05/14/35(e) | | | 2,439,589 | |
| | 640,000 | | | | | AbbVie, Inc., 4.55%, due 03/15/35 | | | 688,581 | |
| | 170,000 | | | | | AbbVie, Inc., 4.70%, due 05/14/45 | | | 185,290 | |
| | 290,000 | | | | | AbbVie, Inc., 4.75%, due 03/15/45(e) | | | 316,948 | |
| | 200,000 | | | | | Abu Dhabi National Energy Co. PJSC, 2.00%, due 04/29/28 144A | | | 186,884 | |
| | 201,800 | | | | | ABY Transmision Sur SA, 6.88%, due 04/30/43 144A | | | 244,178 | |
| | 323,000 | | | | | Adani Ports & Special Economic Zone, Ltd., 3.10%, due 02/02/31(e) 144A | | | 278,403 | |
| | 203,000 | | | | | AdaptHealth LLC, 5.13%, due 03/01/30(e) 144A | | | 188,931 | |
| | 436,000 | | | | | Advantage Sales & Marketing, Inc., 6.50%, due 11/15/28 144A | | | 413,494 | |
| | 1,340,000 | | | | | Advocate Health & Hospitals Corp., 2.21%, due 06/15/30 | | | 1,240,733 | |
| | 545,000 | | | | | AECOM, 5.13%, due 03/15/27 | | | 558,380 | |
| | 400,000 | | | | | AEP Texas, Inc., 3.80%, due 10/01/47 | | | 376,990 | |
| | 260,000 | | | | | AEP Transmission Co. LLC, 3.80%, due 06/15/49(e) | | | 257,844 | |
| | 646,000 | | | | | AerCap Ireland Capital DAC/AerCap Global Aviation Trust, 1.65%, due 10/29/24 | | | 610,629 | |
| | 482,000 | | | | | AerCap Ireland Capital DAC/AerCap Global Aviation Trust, 1.75%, due 01/30/26 | | | 442,823 | |
| | 690,000 | | | | | AerCap Ireland Capital DAC/AerCap Global Aviation Trust, 2.45%, due 10/29/26 | | | 639,188 | |
| | 432,000 | | | | | AerCap Ireland Capital DAC/AerCap Global Aviation Trust, 2.88%, due 08/14/24 | | | 420,471 | |
| | 150,000 | | | | | AerCap Ireland Capital DAC/AerCap Global Aviation Trust, 3.65%, due 07/21/27 | | | 145,594 | |
| | 1,600,000 | | | | | AerCap Ireland Capital DAC/AerCap Global Aviation Trust, 4.45%, due 04/03/26 | | | 1,618,150 | |
| | 322,000 | | | | | AES Panama Generation Holdings SRL, 4.38%, due 05/31/30 144A | | | 307,354 | |
| | 370,000 | | | | | Aetna, Inc., 4.75%, due 03/15/44 | | | 403,800 | |
| | 137,000 | | | | | Affinity Gaming, 6.88%, due 12/15/27 144A | | | 133,500 | |
| | 645,531 | | | | | Air Canada Pass Through Trust, 3.60%, due 09/15/28 144A | | | 621,166 | |
| | 134,769 | | | | | Air Canada Pass Through Trust, 3.70%, due 07/15/27 144A | | | 128,878 | |
| | 171,309 | | | | | Air Canada Pass Through Trust, 4.13%, due 11/15/26 144A | | | 166,650 | |
| | 298,000 | | | | | Air Lease Corp., 2.10%, due 09/01/28(e) | | | 261,172 | |
See accompanying Notes to the Financial Statements.
73
Mercer Core Fixed Income Fund
Schedule of Investments (Continued)
(showing percentage of net assets)
March 31, 2022
| | | | | | | | | | |
| Par Value(a) | | | | | Description | | Value ($) | |
| | | |
| | | | | | Corporate Debt — continued | | | |
| | 219,000 | | | | | Air Lease Corp., 3.63%, due 12/01/27 | | | 213,491 | |
| | 270,000 | | | | | Air Lease Corp., (MTN), 2.88%, due 01/15/26(e) | | | 260,945 | |
| | 250,000 | | | | | Aker BP ASA, 3.00%, due 01/15/25 144A | | | 246,590 | |
| | 2,065,000 | | | | | Aker BP ASA, 3.75%, due 01/15/30 144A | | | 2,023,527 | |
| | 662,000 | | | | | Aker BP ASA, 4.00%, due 01/15/31 144A | | | 660,566 | |
| | 152,296 | | | | | Alaska Airlines Pass Through Trust, 8.00%, due 02/15/27 144A | | | 161,621 | |
| | 118,000 | | | | | Albertsons Cos., Inc./Safeway, Inc./New Albertsons, LP/Albertsons LLC, 3.25%, due 03/15/26 144A | | | 111,711 | |
| | 621,000 | | | | | Albertsons Cos., Inc./Safeway, Inc./New Albertsons, LP/Albertsons LLC, 3.50%, due 03/15/29 144A | | | 561,198 | |
| | 200,000 | | | | | Albion Financing 1 SARL/Aggreko Holdings, Inc., 6.13%, due 10/15/26 144A | | | 193,334 | |
| | 2,895,000 | | | | | Alexandria Real Estate Equities, Inc. REIT, 2.00%, due 05/18/32 | | | 2,535,048 | |
| | 229,380 | | | | | Alfa Desarrollo SpA, 4.55%, due 09/27/51 144A | | | 199,434 | |
| | 672,000 | | | | | Ally Financial, Inc., 5.13%, due 09/30/24 | | | 701,834 | |
| | 372,000 | | | | | Ally Financial, Inc., 5.80%, due 05/01/25(e) | | | 394,894 | |
| | 63,000 | | | | | Alta Equipment Group, Inc., 5.63%, due 04/15/26 144A | | | 59,981 | |
| | 224,000 | | | | | Altera Infrastructure, LP/Teekay Offshore Finance Corp., 8.50%, due 07/15/23 144A | | | 123,760 | |
| | 210,000 | | | | | Altria Group, Inc., 3.40%, due 05/06/30(e) | | | 202,358 | |
| | 600,000 | | | | | Altria Group, Inc., 3.40%, due 02/04/41 | | | 494,189 | |
| | 916,000 | | | | | Amazon.com, Inc., 3.15%, due 08/22/27 | | | 928,945 | |
| | 500,000 | | | | | Amazon.com, Inc., 4.05%, due 08/22/47 | | | 545,574 | |
| | 539,000 | | | | | AMC Entertainment Holdings, Inc., 10.00% (10.00% Cash or 12.00% PIK), due 06/15/26 144A | | | 484,669 | |
| | 291,000 | | | | | American Airlines Pass Through Trust, 2.88%, due 01/11/36 | | | 263,766 | |
| | 289,761 | | | | | American Airlines Pass Through Trust, 3.15%, due 08/15/33 | | | 273,121 | |
| | 1,040,937 | | | | | American Airlines Pass Through Trust, 3.38%, due 11/01/28 | | | 1,002,801 | |
| | 348,605 | | | | | American Airlines Pass Through Trust, 3.50%, due 08/15/33 | | | 313,147 | |
| | 266,678 | | | | | American Airlines Pass Through Trust, 3.60%, due 04/15/31 | | | 246,603 | |
| | 278,003 | | | | | American Airlines Pass Through Trust, 3.65%, due 08/15/30 | | | 270,003 | |
| | 227,260 | | | | | American Airlines Pass Through Trust, 3.70%, due 11/01/24 | | | 222,674 | |
| | 164,000 | | | | | American Airlines Pass Through Trust, 3.95%, due 01/11/32 | | | 148,860 | |
| | 104,535 | | | | | American Airlines Pass Through Trust, 4.00%, due 08/15/30 | | | 96,538 | |
| | 380,128 | | | | | American Airlines Pass Through Trust, 4.10%, due 07/15/29 | | | 350,367 | |
| | 700,000 | | | | | American Express Co., 3.40%, due 02/27/23 | | | 708,756 | |
| | 232,000 | | | | | American Homes 4 Rent, LP REIT, 4.25%, due 02/15/28 | | | 235,895 | |
| | 1,780,000 | | | | | American Honda Finance Corp., (MTN), 0.88%, due 07/07/23 | | | 1,750,484 | |
| | 835,000 | | | | | American Tower Corp. REIT, 3.55%, due 07/15/27 | | | 829,744 | |
| | 279,000 | | | | | American Tower Corp. REIT, 3.80%, due 08/15/29(e) | | | 278,043 | |
| | 575,000 | | | | | American Water Capital Corp., 2.80%, due 05/01/30 | | | 551,584 | |
| | 365,000 | | | | | AmeriGas Partners, LP/AmeriGas Finance Corp., 5.50%, due 05/20/25 | | | 365,688 | |
| | 250,000 | | | | | AmeriGas Partners, LP/AmeriGas Finance Corp., 5.88%, due 08/20/26 | | | 249,692 | |
| | 461,000 | | | | | AmerisourceBergen Corp., 2.80%, due 05/15/30 | | | 436,480 | |
| | 1,120,000 | | | | | Amgen, Inc., 2.80%, due 08/15/41 | | | 964,688 | |
| | 158,000 | | | | | ANGI Group LLC, 3.88%, due 08/15/28(e) 144A | | | 134,137 | |
| | 290,000 | | | | | Anglo American Capital Plc, 4.75%, due 04/10/27 144A | | | 301,279 | |
| | 2,664,000 | | | | | Anheuser-Busch Cos. LLC/Anheuser-Busch InBev Worldwide, Inc., 4.90%, due 02/01/46 | | | 2,967,012 | |
| | 502,000 | | | | | Anheuser-Busch InBev Worldwide, Inc., 4.60%, due 04/15/48 | | | 543,585 | |
| | 350,000 | | | | | Anheuser-Busch InBev Worldwide, Inc., 5.55%, due 01/23/49 | | | 428,423 | |
See accompanying Notes to the Financial Statements.
74
Mercer Core Fixed Income Fund
Schedule of Investments (Continued)
(showing percentage of net assets)
March 31, 2022
| | | | | | | | | | |
| Par Value(a) | | | | | Description | | Value ($) | |
| | | |
| | | | | | Corporate Debt — continued | | | |
| | 260,000 | | | | | Antero Midstream Partners, LP/Antero Midstream Finance Corp., 5.38%, due 06/15/29 144A | | | 260,190 | |
| | 250,000 | | | | | Antero Midstream Partners, LP/Antero Midstream Finance Corp., 7.88%, due 05/15/26 144A | | | 270,932 | |
| | 94,000 | | | | | Antero Resources Corp., 5.38%, due 03/01/30(e) 144A | | | 96,139 | |
| | 191,000 | | | | | Anthem, Inc., 2.25%, due 05/15/30 | | | 175,463 | |
| | 155,000 | | | | | Anthem, Inc., 3.13%, due 05/15/50 | | | 137,115 | |
| | 300,000 | | | | | Anthem, Inc., 3.60%, due 03/15/51(e) | | | 288,179 | |
| | 5,000 | | | | | Anthem, Inc., 5.10%, due 01/15/44 | | | 5,784 | |
| | 750,000 | | | | | Apple, Inc., 3.85%, due 08/04/46(e) | | | 795,285 | |
| | 980,000 | | | | | AptarGroup, Inc., 3.60%, due 03/15/32 | | | 950,825 | |
| | 1,703,000 | | | | | Aptiv Plc/Aptiv Corp., 3.25%, due 03/01/32(e) | | | 1,616,243 | |
| | 104,000 | | | | | Aptiv Plc/Aptiv Corp., 4.15%, due 05/01/52(e) | | | 97,790 | |
| | 291,000 | | | | | APX Group, Inc., 5.75%, due 07/15/29(e) 144A | | | 266,083 | |
| | 225,000 | | | | | Aquarion Co., 4.00%, due 08/15/24 144A | | | 227,621 | |
| | 97,000 | | | | | Arconic Corp., 6.00%, due 05/15/25 144A | | | 99,474 | |
| | 178,000 | | | | | Arconic Corp., 6.13%, due 02/15/28(e) 144A | | | 178,926 | |
| | 625,000 | | | | | Ares Capital Corp., 2.15%, due 07/15/26 | | | 565,697 | |
| | 389,000 | | | | | Ares Capital Corp., 2.88%, due 06/15/28(e) | | | 345,083 | |
| | 448,000 | | | | | Ares Capital Corp., 3.88%, due 01/15/26 | | | 440,080 | |
| | 350,000 | | | | | Ares Capital Corp., 4.20%, due 06/10/24 | | | 352,795 | |
| | 55,000 | | | | | Asbury Automotive Group, Inc., 4.63%, due 11/15/29 144A | | | 51,286 | |
| | 200,000 | | | | | Asbury Automotive Group, Inc., 4.75%, due 03/01/30 | | | 189,010 | |
| | 710,000 | | | | | Ascension Health, 2.53%, due 11/15/29 | | | 684,233 | |
| | 150,000 | | | | | Ascension Health, 3.11%, due 11/15/39 | | | 140,530 | |
| | 266,000 | | | | | Ascent Resources Utica Holdings LLC/ARU Finance Corp., 5.88%, due 06/30/29 144A | | | 263,345 | |
| | 247,000 | | | | | Ashtead Capital, Inc., 2.45%, due 08/12/31 144A | | | 217,762 | |
| | 200,000 | | | | | Ashtead Capital, Inc., 4.25%, due 11/01/29 144A | | | 199,287 | |
| | 290,000 | | | | | Ashtead Capital, Inc., 4.38%, due 08/15/27 144A | | | 294,195 | |
| | 700,000 | | | | | AT&T, Inc., 1.98% (3 mo. USD LIBOR + 1.18%), due 06/12/24(c) | | | 710,665 | |
| | 2,569,000 | | | | | AT&T, Inc., 2.30%, due 06/01/27 | | | 2,452,054 | |
| | 2,108,000 | | | | | AT&T, Inc., 2.55%, due 12/01/33 | | | 1,877,048 | |
| | 150,000 | | | | | AT&T, Inc., 2.63%, due 12/01/22 | | | 150,755 | |
| | 2,056,000 | | | | | AT&T, Inc., 3.10%, due 02/01/43 | | | 1,780,208 | |
| | 1,487,000 | | | | | AT&T, Inc., 3.50%, due 06/01/41 | | | 1,372,969 | |
| | 1,140,000 | | | | | AT&T, Inc., 3.50%, due 09/15/53 | | | 1,004,642 | |
| | 639,000 | | | | | AT&T, Inc., 3.65%, due 06/01/51 | | | 583,479 | |
| | 410,000 | | | | | AT&T, Inc., 3.65%, due 09/15/59 | | | 360,967 | |
| | 25,000 | | | | | AT&T, Inc., 4.30%, due 02/15/30 | | | 26,443 | |
| | 144,000 | | | | | Atento Luxco 1 SA, 8.00%, due 02/10/26(e) 144A | | | 146,165 | |
| | 276,000 | | | | | Athene Holding, Ltd., 3.50%, due 01/15/31 | | | 264,600 | |
| | 100,000 | | | | | Atkore, Inc., 4.25%, due 06/01/31 144A | | | 93,154 | |
| | 290,000 | | | | | Australia & New Zealand Banking Group, Ltd., 6.75% (5 yr. USD ICE swap + 5.17%)(c) (f) 144A | | | 311,847 | |
| | 168,000 | | | | | Autodesk, Inc., 2.85%, due 01/15/30 | | | 158,437 | |
| | 249,000 | | | | | AutoNation, Inc., 4.75%, due 06/01/30 | | | 260,026 | |
| | 199,000 | | | | | AXA SA, 8.60%, due 12/15/30 | | | 263,599 | |
| | 1,300,000 | | | | | Bacardi, Ltd., 4.70%, due 05/15/28 144A | | | 1,354,169 | |
See accompanying Notes to the Financial Statements.
75
Mercer Core Fixed Income Fund
Schedule of Investments (Continued)
(showing percentage of net assets)
March 31, 2022
| | | | | | | | | | |
| Par Value(a) | | | | | Description | | Value ($) | |
| | | |
| | | | | | Corporate Debt — continued | | | |
| | 942,000 | | | | | BAE Systems Finance, Inc., 7.50%, due 07/01/27 144A | | | 1,099,516 | |
| | 696,000 | | | | | BAE Systems Holdings, Inc., 3.85%, due 12/15/25 144A | | | 699,213 | |
| | 1,309,000 | | | | | BAE Systems Plc, 3.40%, due 04/15/30 144A | | | 1,291,651 | |
| | 175,000 | | | | | Ball Corp., 3.13%, due 09/15/31 | | | 156,783 | |
| | 200,000 | | | | | Banco Santander SA, 1.85%, due 03/25/26(e) | | | 187,209 | |
| | 380,000 | | | | | Banco Santander SA, 4.38%, due 04/12/28 | | | 383,786 | |
| | 265,000 | | | | | Bank of America Corp., 1.66% (SOFR + 0.91%), due 03/11/27(c) | | | 247,278 | |
| | 1,114,000 | | | | | Bank of America Corp., 1.73% (SOFR + 0.96%), due 07/22/27(c) | | | 1,035,561 | |
| | 1,310,000 | | | | | Bank of America Corp., 2.30% (SOFR + 1.22%), due 07/21/32(c) | | | 1,167,696 | |
| | 617,000 | | | | | Bank of America Corp., 2.59% (SOFR + 2.15%), due 04/29/31(c) | | | 570,281 | |
| | 3,151,000 | | | | | Bank of America Corp., 2.69% (SOFR + 1.32%), due 04/22/32(c) | | | 2,902,505 | |
| | 570,000 | | | | | Bank of America Corp., 3.85% (5 yr. CMT + 2.00%), due 03/08/37(c) | | | 546,639 | |
| | 877,000 | | | | | Bank of America Corp., 4.24% (3 mo. USD LIBOR + 1.81%), due 04/24/38(c) (e) | | | 916,625 | |
| | 160,000 | | | | | Bank of America Corp., 5.13% (3 mo. USD LIBOR + 3.29%)(c) (e) (f) | | | 161,300 | |
| | 856,000 | | | | | Bank of America Corp., 6.30% (3 mo. USD LIBOR + 4.55%)(c) (e) (f) | | | 914,593 | |
| | 2,562,000 | | | | | Bank of America Corp., (MTN), 2.09% (SOFR + 1.06%), due 06/14/29(c) (e) | | | 2,342,853 | |
| | 610,000 | | | | | Bank of America Corp., (MTN), 2.50% (3 mo. USD LIBOR + 0.99%), due 02/13/31(c) | | | 561,373 | |
| | 160,000 | | | | | Bank of America Corp., (MTN), 2.88% (3 mo. USD LIBOR + 1.19%), due 10/22/30(c) | | | 151,924 | |
| | 584,000 | | | | | Bank of America Corp., (MTN), 3.25%, due 10/21/27 | | | 582,008 | |
| | 1,970,000 | | | | | Bank of America Corp., (MTN), 3.50%, due 04/19/26(e) | | | 1,996,304 | |
| | 755,000 | | | | | Bank of America Corp., (MTN), 3.59% (3 mo. USD LIBOR + 1.37%), due 07/21/28(c) | | | 757,330 | |
| | 608,000 | | | | | Bank of America Corp., (MTN), 3.95%, due 04/21/25 | | | 620,021 | |
| | 210,000 | | | | | Bank of America Corp., (MTN), 4.27% (3 mo. USD LIBOR + 1.31%), due 07/23/29(c) | | | 216,874 | |
| | 213,000 | | | | | Bank of America Corp., (MTN), 4.33% (3 mo. USD LIBOR + 1.52%), due 03/15/50(c) | | | 229,446 | |
| | 825,000 | | | | | Bank of America Corp., (MTN), 4.45%, due 03/03/26 | | | 854,030 | |
| | 575,000 | | | | | Barclays Plc, 3.93% (3 mo. USD LIBOR + 1.61%), due 05/07/25(c) (e) | | | 579,973 | |
| | 384,000 | | | | | Barclays Plc, 4.38%, due 01/12/26 | | | 392,390 | |
| | 446,000 | | | | | Barclays Plc, 4.38% (5 yr. CMT + 3.41%)(c) (f) | | | 393,929 | |
| | 400,000 | | | | | Barclays Plc, 4.97% (3 mo. USD LIBOR + 1.90%), due 05/16/29(c) | | | 419,017 | |
| | 390,000 | | | | | BAT Capital Corp., 3.56%, due 08/15/27 | | | 380,237 | |
| | 292,000 | | | | | Bausch Health Cos., Inc., 6.13%, due 04/15/25 144A | | | 294,737 | |
| | 270,000 | | | | | Bayer US Finance II LLC, 4.20%, due 07/15/34 144A | | | 279,529 | |
| | 209,000 | | | | | Beacon Roofing Supply, Inc., 4.13%, due 05/15/29 144A | | | 193,462 | |
| | 605,000 | | | | | Berkshire Hathaway Energy Co., 3.70%, due 07/15/30 | | | 622,302 | |
| | 85,000 | | | | | Berkshire Hathaway Energy Co., 5.95%, due 05/15/37(e) | | | 103,817 | |
| | 1,312,000 | | | | | Berkshire Hathaway Energy Co., 6.13%, due 04/01/36 | | | 1,620,413 | |
| | 1,530,000 | | | | | Berry Global, Inc., 1.57%, due 01/15/26 | | | 1,427,299 | |
| | 1,408,000 | | | | | Blackstone Holdings Finance Co. LLC, 1.63%, due 08/05/28 144A | | | 1,259,746 | |
| | 1,015,000 | | | | | Blackstone Holdings Finance Co. LLC, 2.80%, due 09/30/50 144A | | | 821,538 | |
| | 542,000 | | | | | Blackstone Holdings Finance Co. LLC, 3.15%, due 10/02/27(e) 144A | | | 533,539 | |
| | 436,000 | | | | | Blackstone Private Credit Fund, 2.35%, due 11/22/24 144A | | | 416,150 | |
| | 373,000 | | | | | Blackstone Private Credit Fund, 2.70%, due 01/15/25 144A | | | 356,575 | |
| | 88,000 | | | | | Blackstone Private Credit Fund, 3.25%, due 03/15/27 144A | | | 80,788 | |
| | 517,000 | | | | | Blackstone Private Credit Fund, 4.00%, due 01/15/29 144A | | | 479,156 | |
See accompanying Notes to the Financial Statements.
76
Mercer Core Fixed Income Fund
Schedule of Investments (Continued)
(showing percentage of net assets)
March 31, 2022
| | | | | | | | | | |
| Par Value(a) | | | | | Description | | Value ($) | |
| | | |
| | | | | | Corporate Debt — continued | | | |
| | 140,000 | | | | | Block, Inc., 3.50%, due 06/01/31(e) 144A | | | 128,335 | |
| | 304,000 | | | | | BlueLinx Holdings, Inc., 6.00%, due 11/15/29 144A | | | 283,275 | |
| | 1,536,000 | | | | | BMW US Capital LLC, 3.45%, due 04/01/27(g) 144A | | | 1,548,681 | |
| | 700,000 | | | | | BNP Paribas SA, 1.68% (SOFR + 0.91%), due 06/30/27(c) 144A | | | 641,091 | |
| | 260,000 | | | | | BNP Paribas SA, 2.16% (SOFR + 1.22%), due 09/15/29(c) 144A | | | 231,700 | |
| | 455,000 | | | | | BNP Paribas SA, 3.13% (SOFR + 1.56%), due 01/20/33(c) 144A | | | 421,619 | |
| | 310,000 | | | | | BNP Paribas SA, 3.38%, due 01/09/25 144A | | | 308,637 | |
| | 200,000 | | | | | BNP Paribas SA, 4.38%, due 09/28/25 144A | | | 202,095 | |
| | 210,000 | | | | | BOC Aviation USA Corp., 1.63%, due 04/29/24 144A | | | 201,839 | |
| | 2,080,000 | | | | | Boeing Co. (The), 2.20%, due 02/04/26 | | | 1,968,789 | |
| | 459,000 | | | | | Boeing Co. (The), 3.20%, due 03/01/29 | | | 437,940 | |
| | 185,000 | | | | | Boeing Co. (The), 3.75%, due 02/01/50 | | | 165,309 | |
| | 295,000 | | | | | Boeing Co. (The), 3.95%, due 08/01/59 | | | 256,565 | |
| | 785,000 | | | | | Boeing Co. (The), 5.04%, due 05/01/27 | | | 827,987 | |
| | 485,000 | | | | | Boeing Co. (The), 5.15%, due 05/01/30 | | | 517,979 | |
| | 854,000 | | | | | Boeing Co. (The), 5.81%, due 05/01/50 | | | 989,154 | |
| | 44,000 | | | | | Boise Cascade Co., 4.88%, due 07/01/30 144A | | | 42,813 | |
| | 601,000 | | | | | Booking Holdings, Inc., 4.63%, due 04/13/30 | | | 652,741 | |
| | 388,000 | | | | | BPCE SA, 4.50%, due 03/15/25 144A | | | 392,719 | |
| | 222,000 | | | | | Braskem Idesa SAPI, 6.99%, due 02/20/32 144A | | | 217,844 | |
| | 527,000 | | | | | Braskem Netherlands Finance BV, 5.88%, due 01/31/50(e) 144A | | | 523,798 | |
| | 310,000 | | | | | Braskem Netherlands Finance BV, 8.50% (5 yr. CMT + 8.22%), due 01/23/81(c) 144A | | | 340,225 | |
| | 230,000 | | | | | BRF SA, 5.75%, due 09/21/50(e) 144A | | | 202,834 | |
| | 500,000 | | | | | Bristol-Myers Squibb Co., 3.90%, due 03/15/62 | | | 504,343 | |
| | 55,000 | | | | | Bristol-Myers Squibb Co., 4.13%, due 06/15/39 | | | 59,260 | |
| | 124,789 | | | | | British Airways Pass Through Trust, 4.13%, due 03/20/33 144A | | | 119,466 | |
| | 119,768 | | | | | British Airways Pass Through Trust, 4.25%, due 05/15/34 144A | | | 120,043 | |
| | 154,837 | | | | | British Airways Pass Through Trust, 4.63%, due 12/20/25 144A | | | 155,708 | |
| | 78,818 | | | | | British Airways Pass Through Trust, Class B, 8.38%, due 11/15/28 144A | | | 87,183 | |
| | 1,055,000 | | | | | Brixmor Operating Partnership, LP REIT, 2.50%, due 08/16/31 | | | 933,593 | |
| | 249,000 | | | | | Broadcom, Inc., 3.14%, due 11/15/35 144A | | | 219,888 | |
| | 605,000 | | | | | Broadcom, Inc., 3.19%, due 11/15/36 144A | | | 526,462 | |
| | 1,517,000 | | | | | Broadcom, Inc., 3.42%, due 04/15/33 144A | | | 1,418,636 | |
| | 1,966,000 | | | | | Broadcom, Inc., 4.11%, due 09/15/28(e) | | | 1,993,589 | |
| | 1,677,000 | | | | | Broadcom, Inc., 4.75%, due 04/15/29 | | | 1,765,114 | |
| | 706,000 | | | | | Broadcom, Inc., 5.00%, due 04/15/30 | | | 751,906 | |
| | 1,171,000 | | | | | Brookfield Finance, Inc., 2.72%, due 04/15/31(e) | | | 1,082,567 | |
| | 162,000 | | | | | Brookfield Residential Properties, Inc./Brookfield Residential US LLC, 5.00%, due 06/15/29 144A | | | 147,833 | |
| | 323,000 | | | | | Builders FirstSource, Inc., 4.25%, due 02/01/32 144A | | | 301,307 | |
| | 32,000 | | | | | Builders FirstSource, Inc., 5.00%, due 03/01/30 144A | | | 31,536 | |
| | 365,000 | | | | | C&W Senior Financing DAC, 6.88%, due 09/15/27 144A | | | 362,905 | |
| | 99,000 | | | | | Cable One, Inc., 4.00%, due 11/15/30 144A | | | 91,437 | |
| | 137,000 | | | | | Caesars Resort Collection LLC/CRC Finco, Inc., 5.75%, due 07/01/25 144A | | | 139,972 | |
| | 750,000 | | | | | Calpine Corp., 3.75%, due 03/01/31 144A | | | 672,656 | |
| | 636,000 | | | | | Canadian Pacific Railway Co., 3.00%, due 12/02/41(e) | | | 573,473 | |
| | 509,000 | | | | | Canadian Pacific Railway Co., 6.13%, due 09/15/15(h) | | | 653,493 | |
| | 556,000 | | | | | Cantor Fitzgerald, LP, 4.88%, due 05/01/24 144A | | | 573,522 | |
| | 504,000 | | | | | Capital One Financial Corp., 1.34% (SOFR + 0.69%), due 12/06/24(c) | | | 489,038 | |
See accompanying Notes to the Financial Statements.
77
Mercer Core Fixed Income Fund
Schedule of Investments (Continued)
(showing percentage of net assets)
March 31, 2022
| | | | | | | | | | |
| Par Value(a) | | | | | Description | | Value ($) | |
| | | |
| | | | | | Corporate Debt — continued | | | |
| | 1,595,000 | | | | | Capital One Financial Corp., 3.30%, due 10/30/24 | | | 1,604,991 | |
| | 67,000 | | | | | Catalent Pharma Solutions, Inc., 3.13%, due 02/15/29 144A | | | 61,031 | |
| | 55,000 | | | | | Catalent Pharma Solutions, Inc., 5.00%, due 07/15/27 144A | | | 55,711 | |
| | 113,000 | | | | | CCM Merger, Inc., 6.38%, due 05/01/26 144A | | | 114,267 | |
| | 220,000 | | | | | CCO Holdings LLC/CCO Holdings Capital Corp., 4.50%, due 06/01/33 144A | | | 197,773 | |
| | 160,000 | | | | | CCO Holdings LLC/CCO Holdings Capital Corp., 5.38%, due 06/01/29 144A | | | 160,281 | |
| | 134,000 | | | | | CDW LLC/CDW Finance Corp., 3.25%, due 02/15/29 | | | 123,289 | |
| | 598,000 | | | | | CDW LLC/CDW Finance Corp., 3.57%, due 12/01/31 | | | 555,138 | |
| | 450,000 | | | | | CDW LLC/CDW Finance Corp., 5.50%, due 12/01/24 | | | 466,267 | |
| | 204,000 | | | | | Celulosa Arauco y Constitucion SA, 3.88%, due 11/02/27 | | | 206,939 | |
| | 340,000 | | | | | Cemex SAB de CV, 3.88%, due 07/11/31 144A | | | 310,828 | |
| | 279,000 | | | | | Cemex SAB de CV, 5.20%, due 09/17/30 144A | | | 278,032 | |
| | 140,000 | | | | | Cenovus Energy, Inc., 3.75%, due 02/15/52(e) | | | 125,711 | |
| | 240,000 | | | | | Cenovus Energy, Inc., 5.40%, due 06/15/47 | | | 271,233 | |
| | 328,000 | | | | | Centene Corp., 3.00%, due 10/15/30 | | | 301,763 | |
| | 209,000 | | | | | Centene Corp., 3.38%, due 02/15/30 | | | 197,024 | |
| | 103,000 | | | | | Centene Corp., 4.25%, due 12/15/27 | | | 103,492 | |
| | 163,000 | | | | | Centene Corp., 4.63%, due 12/15/29 | | | 164,604 | |
| | 335,000 | | | | | CenterPoint Energy, Inc., 3.70%, due 09/01/49(e) | | | 313,039 | |
| | 391,000 | | | | | Century Communities, Inc., 3.88%, due 08/15/29 144A | | | 351,370 | |
| | 290,000 | | | | | Century Communities, Inc., 6.75%, due 06/01/27(e) | | | 301,358 | |
| | 475,000 | | | | | CGI, Inc., 1.45%, due 09/14/26 144A | | | 437,076 | |
| | 125,000 | | | | | Charter Communications Operating LLC/Charter Communications Operating Capital, 2.30%, due 02/01/32(e) | | | 107,045 | |
| | 750,000 | | | | | Charter Communications Operating LLC/Charter Communications Operating Capital, 2.80%, due 04/01/31 | | | 677,098 | |
| | 857,000 | | | | | Charter Communications Operating LLC/Charter Communications Operating Capital, 3.90%, due 06/01/52 | | | 725,362 | |
| | 767,000 | | | | | Charter Communications Operating LLC/Charter Communications Operating Capital, 4.20%, due 03/15/28 | | | 776,512 | |
| | 5,000 | | | | | Charter Communications Operating LLC/Charter Communications Operating Capital, 4.46%, due 07/23/22 | | | 5,019 | |
| | 1,274,000 | | | | | Charter Communications Operating LLC/Charter Communications Operating Capital, 4.80%, due 03/01/50 | | | 1,214,010 | |
| | 270,000 | | | | | Charter Communications Operating LLC/Charter Communications Operating Capital, 5.38%, due 05/01/47(e) | | | 277,247 | |
| | 936,000 | | | | | Charter Communications Operating LLC/Charter Communications Operating Capital, 5.75%, due 04/01/48(e) | | | 997,957 | |
| | 1,964,000 | | | | | Charter Communications Operating LLC/Charter Communications Operating Capital, 6.38%, due 10/23/35(e) | | | 2,223,273 | |
| | 1,025,000 | | | | | Charter Communications Operating LLC/Charter Communications Operating Capital, 6.48%, due 10/23/45 | | | 1,169,958 | |
| | 519,000 | | | | | Cheniere Energy Partners, LP, 4.00%, due 03/01/31 | | | 503,920 | |
| | 568,000 | | | | | Cheniere Energy Partners, LP, 4.50%, due 10/01/29 | | | 571,513 | |
| | 643,000 | | | | | Chevron Corp., 2.00%, due 05/11/27 | | | 617,849 | |
| | 290,000 | | | | | Choice Hotels International, Inc., 3.70%, due 12/01/29 | | | 284,420 | |
| | 302,000 | | | | | Choice Hotels International, Inc., 3.70%, due 01/15/31 | | | 294,152 | |
| | 2,885,000 | | | | | Cigna Corp., 3.40%, due 03/01/27 | | | 2,916,538 | |
| | 660,000 | | | | | Cigna Corp., 4.38%, due 10/15/28 | | | 695,284 | |
See accompanying Notes to the Financial Statements.
78
Mercer Core Fixed Income Fund
Schedule of Investments (Continued)
(showing percentage of net assets)
March 31, 2022
| | | | | | | | | | |
| Par Value(a) | | | | | Description | | Value ($) | |
| | | |
| | | | | | Corporate Debt — continued | | | |
| | 295,000 | | | | | Cigna Corp., 4.80%, due 07/15/46 | | | 327,675 | |
| | 245,000 | | | | | Cigna Corp., 4.90%, due 12/15/48 | | | 275,722 | |
| | 421,000 | | | | | Cimpress Plc, 7.00%, due 06/15/26 144A | | | 403,865 | |
| | 859,000 | | | | | Citigroup, Inc., 2.56% (SOFR + 1.17%), due 05/01/32(c) | | | 776,326 | |
| | 794,000 | | | | | Citigroup, Inc., 3.20%, due 10/21/26 | | | 788,636 | |
| | 3,626,000 | | | | | Citigroup, Inc., 3.40%, due 05/01/26 | | | 3,657,612 | |
| | 625,000 | | | | | Citigroup, Inc., 3.52% (3 mo. USD LIBOR + 1.15%), due 10/27/28(c) | | | 619,996 | |
| | 310,000 | | | | | Citigroup, Inc., 3.67% (3 mo. USD LIBOR + 1.39%), due 07/24/28(c) | | | 310,440 | |
| | 1,585,000 | | | | | Citigroup, Inc., 3.89% (3 mo. USD LIBOR + 1.56%), due 01/10/28(c) | | | 1,604,737 | |
| | 1,400,000 | | | | | Citigroup, Inc., 4.08% (3 mo. USD LIBOR + 1.19%), due 04/23/29(c) | | | 1,428,337 | |
| | 180,000 | | | | | Citigroup, Inc., 4.40%, due 06/10/25 | | | 185,372 | |
| | 440,000 | | | | | Citigroup, Inc., 4.41% (SOFR + 3.91%), due 03/31/31(c) (e) | | | 457,617 | |
| | 1,006,000 | | | | | Citigroup, Inc., 4.60%, due 03/09/26 | | | 1,044,574 | |
| | 1,228,000 | | | | | Citigroup, Inc., 4.70% (SOFR + 3.23%)(c) (f) | | | 1,178,880 | |
| | 426,000 | | | | | Citigroup, Inc., 6.25% (3 mo. USD LIBOR + 4.52%)(c) (f) | | | 445,894 | |
| | 710,000 | | | | | Citizens Financial Group, Inc., 3.25%, due 04/30/30(e) | | | 694,954 | |
| | 45,000 | | | | | Clean Harbors, Inc., 4.88%, due 07/15/27(e) 144A | | | 44,968 | |
| | 107,000 | | | | | Clear Channel Outdoor Holdings, Inc., 7.75%, due 04/15/28 144A | | | 107,681 | |
| | 524,000 | | | | | Cleveland Clinic Foundation (The), 4.86%, due 01/01/14(e) (h) | | | 597,270 | |
| | 33,000 | | | | | Clydesdale Acquisition Holdings, Inc., 6.63%, due 04/15/29(g) 144A | | | 33,413 | |
| | 194,000 | | | | | CNA Financial Corp., 2.05%, due 08/15/30 | | | 172,560 | |
| | 197,000 | | | | | CNO Financial Group, Inc., 5.25%, due 05/30/25 | | | 204,510 | |
| | 585,000 | | | | | CNO Financial Group, Inc., 5.25%, due 05/30/29 | | | 616,400 | |
| | 18,000 | | | | | Comcast Corp., 2.89%, due 11/01/51 144A | | | 15,250 | |
| | 429,000 | | | | | Comcast Corp., 3.30%, due 04/01/27(e) | | | 434,541 | |
| | 1,007,000 | | | | | Comcast Corp., 3.40%, due 04/01/30 | | | 1,021,473 | |
| | 2,400,000 | | | | | Comcast Corp., 3.95%, due 10/15/25 | | | 2,480,608 | |
| | 5,000 | | | | | Comcast Corp., 3.97%, due 11/01/47 | | | 5,101 | |
| | 912,000 | | | | | Comcast Corp., 4.15%, due 10/15/28 | | | 959,751 | |
| | 5,000 | | | | | Comcast Corp., 6.50%, due 11/15/35 | | | 6,482 | |
| | 600,000 | | | | | Comision Federal de Electricidad, 4.69%, due 05/15/29(e) 144A | | | 589,587 | |
| | 1,419,000 | | | | | CommonSpirit Health, 2.76%, due 10/01/24 | | | 1,409,055 | |
| | 357,000 | | | | | CommonSpirit Health, 4.19%, due 10/01/49 | | | 356,721 | |
| | 350,000 | | | | | Commonwealth Edison Co., 4.00%, due 03/01/48 | | | 373,406 | |
| | 326,000 | | | | | Connect Finco SARL/Connect US Finco LLC, 6.75%, due 10/01/26 144A | | | 332,095 | |
| | 280,000 | | | | | Consensus Cloud Solutions, Inc., 6.50%, due 10/15/28 144A | | | 278,764 | |
| | 65,000 | | | | | Consolidated Edison Co. of New York, Inc., 4.30%, due 12/01/56 | | | 67,465 | |
| | 350,000 | | | | | Consolidated Edison Co. of New York, Inc., 4.50%, due 12/01/45 | | | 368,590 | |
| | 385,000 | | | | | Constellation Brands, Inc., 2.25%, due 08/01/31 | | | 339,648 | |
| | 163,000 | | | | | Constellation Brands, Inc., 3.15%, due 08/01/29 | | | 157,610 | |
| | 231,317 | | | | | Continental Airlines Pass Through Trust, 5.98%, due 10/19/23 | | | 231,652 | |
| | 141,000 | | | | | Continental Resources, Inc., 4.50%, due 04/15/23 | | | 142,919 | |
| | 269,000 | | | | | Continental Resources, Inc., 4.90%, due 06/01/44 | | | 266,709 | |
| | 332,000 | | | | | Coruripe Netherlands BV, 10.00%, due 02/10/27 144A | | | 292,160 | |
| | 571,000 | | | | | CoStar Group, Inc., 2.80%, due 07/15/30 144A | | | 522,707 | |
| | 285,000 | | | | | Coterra Energy, Inc., 4.38%, due 06/01/24 144A | | | 290,930 | |
| | 970,000 | | | | | Cox Communications, Inc., 2.60%, due 06/15/31 144A | | | 878,022 | |
| | 1,876,000 | | | | | Cox Communications, Inc., 3.35%, due 09/15/26 144A | | | 1,867,714 | |
| | 1,750,000 | | | | | Cox Communications, Inc., 3.50%, due 08/15/27 144A | | | 1,743,987 | |
See accompanying Notes to the Financial Statements.
79
Mercer Core Fixed Income Fund
Schedule of Investments (Continued)
(showing percentage of net assets)
March 31, 2022
| | | | | | | | | | |
| Par Value(a) | | | | | Description | | Value ($) | |
| | | |
| | | | | | Corporate Debt — continued | | | |
| | 320,000 | | | | | Credit Agricole SA, 2.81%, due 01/11/41(i) | | | 265,101 | |
| | 656,000 | | | | | Credit Agricole SA, 3.25%, due 01/14/30 144A | | | 622,940 | |
| | 250,000 | | | | | Credit Agricole SA, 3.75%, due 04/24/23 144A | | | 253,462 | |
| | 380,000 | | | | | Credit Agricole SA, 7.88% (5 yr. USD swap + 4.90%)(c) (f) 144A | | | 401,612 | |
| | 2,278,000 | | | | | Credit Suisse Group AG, 1.31% (SOFR + 0.98%), due 02/02/27(c) 144A | | | 2,039,712 | |
| | 510,000 | | | | | Crown Castle International Corp. REIT, 3.30%, due 07/01/30 | | | 488,445 | |
| | 617,000 | | | | | Crown Castle International Corp. REIT, 3.65%, due 09/01/27 | | | 613,573 | |
| | 238,000 | | | | | Crown Castle International Corp. REIT, 3.80%, due 02/15/28 | | | 238,200 | |
| | 270,000 | | | | | CSC Holdings LLC, 3.38%, due 02/15/31 144A | | | 227,822 | |
| | 247,000 | | | | | CSI Compressco, LP/CSI Compressco Finance, Inc., 7.50%, due 04/01/25(e) 144A | | | 244,187 | |
| | 234,364 | | | | | CSI Compressco, LP/CSI Compressco Finance, Inc., 10.00% (10.00% Cash or 7.25% plus 3.50% PIK), due 04/01/26 144A | | | 230,464 | |
| | 72,000 | | | | | CSI Compressco, LP/CSI Compressco Finance, Inc., 7.50%, due 04/01/25 144A | | | 71,180 | |
| | 119,000 | | | | | CVR Partners, LP/CVR Nitrogen Finance Corp., 6.13%, due 06/15/28 144A | | | 119,161 | |
| | 314,000 | | | | | CVS Health Corp., 2.70%, due 08/21/40 | | | 268,529 | |
| | 428,000 | | | | | CVS Health Corp., 3.75%, due 04/01/30 | | | 436,068 | |
| | 203,000 | | | | | CVS Health Corp., 4.30%, due 03/25/28 | | | 212,705 | |
| | 470,000 | | | | | CVS Health Corp., 4.78%, due 03/25/38(e) | | | 514,868 | |
| | 587,000 | | | | | CVS Health Corp., 5.05%, due 03/25/48 | | | 666,517 | |
| | 130,000 | | | | | CVS Health Corp., 5.13%, due 07/20/45 | | | 147,173 | |
| | 1,096,122 | | | | | CVS Pass-Through Trust, 5.77%, due 01/10/33 144A | | | 1,198,440 | |
| | 600,362 | | | | | CVS Pass-Through Trust, 6.94%, due 01/10/30 | | | 672,068 | |
| | 1,638,837 | | | | | CVS Pass-Through Trust, 7.51%, due 01/10/32 144A | | | 1,907,675 | |
| | 231,000 | | | | | CyrusOne, LP/CyrusOne Finance Corp. REIT, 2.15%, due 11/01/30 | | | 230,789 | |
| | 404,000 | | | | | CyrusOne, LP/CyrusOne Finance Corp. REIT, 3.45%, due 11/15/29 | | | 416,372 | |
| | 229,000 | | | | | DAE Funding LLC, 2.63%, due 03/20/25 144A | | | 218,122 | |
| | 240,000 | | | | | Daimler Finance North America LLC, 3.50%, due 08/03/25 144A | | | 240,967 | |
| | 415,000 | | | | | Daimler Trucks Finance North America LLC, 1.63%, due 12/13/24 144A | | | 396,609 | |
| | 375,000 | | | | | Dana, Inc., 4.50%, due 02/15/32 | | | 336,101 | |
| | 36,000 | | | | | Dave & Buster’s, Inc., 7.63%, due 11/01/25 144A | | | 37,925 | |
| | 446,000 | | | | | DaVita, Inc., 3.75%, due 02/15/31(e) 144A | | | 390,796 | |
| | 422,000 | | | | | DaVita, Inc., 4.63%, due 06/01/30 144A | | | 394,654 | |
| | 226,000 | | | | | DCP Midstream Operating, LP, 5.85% (3 mo. USD LIBOR + 3.85%), due 05/21/43(c) 144A | | | 210,744 | |
| | 77,000 | | | | | Dealer Tire LLC/DT Issuer LLC, 8.00%, due 02/01/28(e) 144A | | | 77,284 | |
| | 601,000 | | | | | Dell International LLC/EMC Corp., 3.45%, due 12/15/51(e) 144A | | | 489,670 | |
| | 786,000 | | | | | Dell International LLC/EMC Corp., 4.90%, due 10/01/26 | | | 825,228 | |
| | 386,000 | | | | | Dell International LLC/EMC Corp., 5.30%, due 10/01/29 | | | 421,113 | |
| | 224,000 | | | | | Dell International LLC/EMC Corp., 5.85%, due 07/15/25 | | | 239,281 | |
| | 103,000 | | | | | Dell International LLC/EMC Corp., 8.35%, due 07/15/46 | | | 151,047 | |
| | 1,318,128 | | | | | Delta Air Lines Pass Through Trust, 2.00%, due 12/10/29 | | | 1,203,587 | |
| | 725,000 | | | | | Delta Air Lines, Inc., 2.90%, due 10/28/24(e) | | | 709,844 | |
| | 389,000 | | | | | Delta Air Lines, Inc., 3.80%, due 04/19/23(e) | | | 391,844 | |
| | 445,000 | | | | | Delta Air Lines, Inc., 4.38%, due 04/19/28(e) | | | 427,543 | |
| | 86,000 | | | | | Delta Air Lines, Inc./SkyMiles IP, Ltd., 4.50%, due 10/20/25 144A | | | 86,567 | |
| | 392,525 | | | | | Delta Air Lines, Inc./SkyMiles IP, Ltd., 4.75%, due 10/20/28 144A | | | 396,216 | |
| | 138,000 | | | | | Deluxe Corp., 8.00%, due 06/01/29 144A | | | 140,345 | |
| | 739,000 | | | | | Deutsche Bank AG, 0.96%, due 11/08/23(e) | | | 716,874 | |
| | 427,000 | | | | | Deutsche Bank AG, 2.31% (SOFR + 1.22%), due 11/16/27(c) | | | 391,945 | |
See accompanying Notes to the Financial Statements.
80
Mercer Core Fixed Income Fund
Schedule of Investments (Continued)
(showing percentage of net assets)
March 31, 2022
| | | | | | | | | | |
| Par Value(a) | | | | | Description | | Value ($) | |
| | | |
| | | | | | Corporate Debt — continued | | | |
| | 305,000 | EUR | | | | DH Europe Finance II SARL, 1.35%, due 09/18/39 | | | 305,049 | |
| | 560,000 | | | | | Diageo Capital Plc, 2.13%, due 04/29/32 | | | 505,921 | |
| | 321,000 | | | | | Diamondback Energy, Inc., 3.13%, due 03/24/31(e) | | | 307,113 | |
| | 865,000 | | | | | Diamondback Energy, Inc., 3.25%, due 12/01/26 | | | 865,017 | |
| | 1,050,000 | | | | | Diamondback Energy, Inc., 3.50%, due 12/01/29 | | | 1,041,297 | |
| | 373,000 | | | | | Digital Realty Trust, LP REIT, 3.60%, due 07/01/29(e) | | | 371,731 | |
| | 1,121,000 | | | | | Digital Realty Trust, LP REIT, 3.70%, due 08/15/27(e) | | | 1,129,803 | |
| | 158,000 | | | | | Discover Financial Services, 4.10%, due 02/09/27 | | | 161,357 | |
| | 927,000 | | | | | Dollar Tree, Inc., 4.20%, due 05/15/28(e) | | | 960,187 | |
| | 115,000 | | | | | Dominion Energy, Inc., 2.85%, due 08/15/26 | | | 113,893 | |
| | 311,000 | | | | | Dominion Energy, Inc., 3.38%, due 04/01/30 | | | 307,213 | |
| | 285,000 | | | | | DPL, Inc., 4.13%, due 07/01/25 | | | 283,424 | |
| | 850,000 | | | | | DTE Electric Co., 2.25%, due 03/01/30 | | | 788,685 | |
| | 1,804,000 | | | | | DTE Electric Securitization Funding I LLC, 2.64%, due 12/01/27 | | | 1,789,194 | |
| | 411,000 | | | | | Duke Energy Carolinas LLC, 3.95%, due 03/15/48 | | | 423,538 | |
| | 420,000 | | | | | Duke Energy Florida LLC, 3.40%, due 10/01/46 | | | 397,263 | |
| | 195,000 | | | | | Duke Energy Progress LLC, 3.70%, due 10/15/46 | | | 189,793 | |
| | 652,000 | | | | | eBay, Inc., 2.70%, due 03/11/30(e) | | | 613,484 | |
| | 213,000 | | | | | Ecopetrol SA, 6.88%, due 04/29/30 | | | 223,882 | |
| | 174,000 | | | | | Edgewell Personal Care Co., 4.13%, due 04/01/29 144A | | | 160,317 | |
| | 307,000 | | | | | Edgewell Personal Care Co., 5.50%, due 06/01/28(e) 144A | | | 305,961 | |
| | 546,000 | | | | | EIG Pearl Holdings SARL, 3.55%, due 08/31/36 144A | | | 521,726 | |
| | 190,000 | | | | | El Paso Natural Gas Co. LLC, 8.38%, due 06/15/32 | | | 247,149 | |
| | 42,000 | | | | | Embraer Netherlands Finance BV, 5.05%, due 06/15/25 | | | 42,476 | |
| | 250,000 | | | | | Embraer Overseas, Ltd., 5.70%, due 09/16/23 144A | | | 258,555 | |
| | 461,000 | | | | | Emera US Finance, LP, 3.55%, due 06/15/26 | | | 461,127 | |
| | 87,000 | | | | | Empire Communities Corp., 7.00%, due 12/15/25 144A | | | 86,057 | |
| | 457,000 | | | | | Enbridge, Inc., 5.50% (3 mo. USD LIBOR + 3.42%), due 07/15/77(c) (e) | | | 451,935 | |
| | 470,000 | | | | | Enbridge, Inc., 5.75% (5 yr. CMT + 5.31%), due 07/15/80(c) (e) | | | 487,625 | |
| | 442,000 | | | | | Enbridge, Inc., 6.25% (3 mo. USD LIBOR + 3.64%), due 03/01/78(c) | | | 458,419 | |
| | 148,000 | | | | | Encompass Health Corp., 4.50%, due 02/01/28 | | | 145,314 | |
| | 126,000 | | | | | Encompass Health Corp., 4.63%, due 04/01/31 | | | 118,157 | |
| | 106,000 | | | | | Energean Israel Finance, Ltd., 5.38%, due 03/30/28(j) 144A | | | 102,317 | |
| | 185,000 | | | | | Energean Israel Finance, Ltd., 5.88%, due 03/30/31(j) 144A | | | 177,138 | |
| | 922,000 | | | | | Energy Transfer, LP, 3.45%, due 01/15/23 | | | 927,515 | |
| | 302,000 | | | | | Energy Transfer, LP, 4.20%, due 04/15/27 | | | 307,994 | |
| | 435,000 | | | | | Energy Transfer, LP, 5.15%, due 03/15/45 | | | 440,516 | |
| | 979,000 | | | | | Energy Transfer, LP, 5.25%, due 04/15/29 | | | 1,046,367 | |
| | 150,000 | | | | | Energy Transfer, LP, 5.30%, due 04/01/44 | | | 154,830 | |
| | 450,000 | | | | | Energy Transfer, LP, 5.30%, due 04/15/47 | | | 464,186 | |
| | 501,000 | | | | | Energy Transfer, LP, 5.40%, due 10/01/47 | | | 526,428 | |
| | 1,352,000 | | | | | Energy Transfer, LP, 5.50%, due 06/01/27 | | | 1,454,557 | |
| | 340,000 | | | | | Energy Transfer, LP, 6.25%, due 04/15/49 | | | 391,645 | |
| | 545,000 | | | | | Energy Transfer, LP, 6.50% (5 yr. CMT + 5.69%)(c) (e) (f) | | | 536,989 | |
| | 302,000 | | | | | Enova International, Inc., 8.50%, due 09/15/25 144A | | | 301,305 | |
| | 1,100,000 | | | | | Enterprise Products Operating LLC, 4.90%, due 05/15/46(e) | | | 1,193,027 | |
| | 764,000 | | | | | Enterprise Products Operating LLC, 5.25% (3 mo. USD LIBOR + 3.03%), due 08/16/77(c) (e) | | | 718,950 | |
| | 178,000 | | | | | EQT Corp., 7.50%, due 02/01/30(d) | | | 206,480 | |
See accompanying Notes to the Financial Statements.
81
Mercer Core Fixed Income Fund
Schedule of Investments (Continued)
(showing percentage of net assets)
March 31, 2022
| | | | | | | | | | |
| Par Value(a) | | | | | Description | | Value ($) | |
| | | |
| | | | | | Corporate Debt — continued | | | |
| | 494,000 | | | | | Equinix, Inc. REIT, 1.55%, due 03/15/28 | | | 437,071 | |
| | 268,000 | | | | | Equinix, Inc. REIT, 1.80%, due 07/15/27 | | | 244,116 | |
| | 833,000 | | | | | Equinix, Inc. REIT, 2.50%, due 05/15/31(e) | | | 748,449 | |
| | 258,000 | | | | | Equinix, Inc. REIT, 3.20%, due 11/18/29(e) | | | 247,225 | |
| | 460,000 | | | | | Essential Utilities, Inc., 2.70%, due 04/15/30 | | | 434,525 | |
| | 925,000 | | | | | Essex Portfolio, LP REIT, 1.70%, due 03/01/28 | | | 835,578 | |
| | 1,320,000 | | | | | Eversource Energy, 2.90%, due 10/01/24 | | | 1,314,320 | |
| | 1,250,000 | | | | | Eversource Energy, 2.90%, due 03/01/27 | | | 1,226,965 | |
| | 1,066,000 | | | | | Exelon Corp., 3.35%, due 03/15/32 144A | | | 1,040,119 | |
| | 285,000 | | | | | Exelon Corp., 4.70%, due 04/15/50 | | | 314,478 | |
| | 1,128,000 | | | | | Exelon Corp., 5.10%, due 06/15/45 | | | 1,257,587 | |
| | 375,000 | | | | | Expedia Group, Inc., 2.95%, due 03/15/31 | | | 347,812 | |
| | 555,000 | | | | | Expedia Group, Inc., 3.25%, due 02/15/30(e) | | | 529,033 | |
| | 843,000 | | | | | Expedia Group, Inc., 3.80%, due 02/15/28 | | | 840,149 | |
| | 509,000 | | | | | Expedia Group, Inc., 4.63%, due 08/01/27 | | | 529,691 | |
| | 632,000 | | | | | Expedia Group, Inc., 5.00%, due 02/15/26 | | | 662,387 | |
| | 600,000 | | | | | Falabella SA, 4.38%, due 01/27/25 144A | | | 628,842 | |
| | 995,000 | | | | | FedEx Corp., 4.05%, due 02/15/48(e) | | | 985,943 | |
| | 1,328,000 | | | | | Ferguson Finance Plc, 3.25%, due 06/02/30 144A | | | 1,265,840 | |
| | 2,130,000 | | | | | Ferguson Finance Plc, 4.50%, due 10/24/28 144A | | | 2,199,770 | |
| | 219,000 | | | | | Fifth Third Bancorp, 5.10% (3 mo. USD LIBOR + 3.03%)(c) (e) (f) | | | 217,084 | |
| | 135,000 | | | | | First Quantum Minerals, Ltd., 6.88%, due 03/01/26 144A | | | 138,905 | |
| | 245,000 | | | | | First Quantum Minerals, Ltd., 6.88%, due 10/15/27 144A | | | 256,895 | |
| | 200,000 | | | | | First Quantum Minerals, Ltd., 7.50%, due 04/01/25 144A | | | 203,248 | |
| | 194,000 | | | | | FirstEnergy Corp., 2.65%, due 03/01/30 | | | 176,501 | |
| | 1,252,000 | | | | | Florida Power & Light Co., 2.45%, due 02/03/32 | | | 1,179,230 | |
| | 270,000 | | | | | Flowserve Corp., 3.50%, due 10/01/30 | | | 256,101 | |
| | 196,000 | | | | | Ford Motor Co., 3.25%, due 02/12/32 | | | 175,383 | |
| | 175,000 | | | | | Ford Motor Co., 4.75%, due 01/15/43 | | | 159,260 | |
| | 915,000 | | | | | Ford Motor Credit Co. LLC, 3.35%, due 11/01/22 | | | 918,138 | |
| | 215,000 | | | | | Ford Motor Credit Co. LLC, 4.00%, due 11/13/30 | | | 202,807 | |
| | 476,000 | | | | | Ford Motor Credit Co. LLC, 4.13%, due 08/17/27(e) | | | 465,856 | |
| | 720,000 | | | | | Ford Motor Credit Co. LLC, 5.11%, due 05/03/29 | | | 725,544 | |
| | 202,000 | | | | | Freedom Mortgage Corp., 8.13%, due 11/15/24 144A | | | 201,464 | |
| | 56,000 | | | | | Freedom Mortgage Corp., 8.25%, due 04/15/25 144A | | | 55,915 | |
| | 493,000 | | | | | Freeport-McMoRan, Inc., 4.25%, due 03/01/30 | | | 497,158 | |
| | 350,000 | | | | | Freeport-McMoRan, Inc., 4.63%, due 08/01/30 | | | 358,277 | |
| | 584,000 | | | | | Freeport-McMoRan, Inc., 5.45%, due 03/15/43(e) | | | 655,131 | |
| | 799,000 | | | | | Fresenius Medical Care US Finance III, Inc., 2.38%, due 02/16/31(e) 144A | | | 696,582 | |
| | 389,000 | | | | | FS Luxembourg SARL, 10.00%, due 12/15/25 144A | | | 409,094 | |
| | 163,000 | | | | | Full House Resorts, Inc., 8.25%, due 02/15/28 144A | | | 166,858 | |
| | 100,000 | | | | | Gap, Inc. (The), 3.63%, due 10/01/29(e) 144A | | | 89,298 | |
| | 100,000 | | | | | Gap, Inc. (The), 3.88%, due 10/01/31(e) 144A | | | 87,305 | |
| | 207,000 | | | | | Garda World Security Corp., 6.00%, due 06/01/29 144A | | | 186,346 | |
| | 125,000 | | | | | Gartner, Inc., 3.63%, due 06/15/29 144A | | | 117,361 | |
| | 61,000 | | | | | Gartner, Inc., 3.75%, due 10/01/30 144A | | | 57,360 | |
| | 395,000 | | | | | Gartner, Inc., 4.50%, due 07/01/28 144A | | | 393,973 | |
| | 203,000 | | | | | GCI LLC, 4.75%, due 10/15/28 144A | | | 198,566 | |
| | 826,000 | | | | | GE Capital International Funding Co. Unlimited Co., 4.42%, due 11/15/35 | | | 888,726 | |
See accompanying Notes to the Financial Statements.
82
Mercer Core Fixed Income Fund
Schedule of Investments (Continued)
(showing percentage of net assets)
March 31, 2022
| | | | | | | | | | |
| Par Value(a) | | | | | Description | | Value ($) | |
| | | |
| | | | | | Corporate Debt — continued | | | |
| | 233,000 | | | | | GEMS MENASA Cayman, Ltd./GEMS Education Delaware LLC, 7.13%, due 07/31/26 144A | | | 234,067 | |
| | 820,000 | | | | | General Dynamics Corp., 4.25%, due 04/01/50(e) | | | 925,400 | |
| | 440,000 | | | | | General Motors Co., 5.00%, due 04/01/35 | | | 448,444 | |
| | 205,000 | | | | | General Motors Co., 5.40%, due 04/01/48 | | | 216,338 | |
| | 450,000 | | | | | General Motors Co., 6.25%, due 10/02/43 | | | 511,900 | |
| | 1,045,000 | | | | | General Motors Financial Co., Inc., 2.40%, due 10/15/28(e) | | | 937,354 | |
| | 605,000 | | | | | General Motors Financial Co., Inc., 2.90%, due 02/26/25(e) | | | 591,520 | |
| | 430,000 | | | | | General Motors Financial Co., Inc., 3.10%, due 01/12/32(e) | | | 387,016 | |
| | 1,134,000 | | | | | General Motors Financial Co., Inc., 3.60%, due 06/21/30 | | | 1,086,462 | |
| | 1,199,000 | | | | | General Motors Financial Co., Inc., 4.15%, due 06/19/23 | | | 1,217,162 | |
| | 517,000 | | | | | General Motors Financial Co., Inc., 4.35%, due 01/17/27 | | | 526,554 | |
| | 535,000 | | | | | General Motors Financial Co., Inc., 5.10%, due 01/17/24 | | | 553,358 | |
| | 286,000 | | | | | GFL Environmental, Inc., 3.50%, due 09/01/28 144A | | | 268,897 | |
| | 261,000 | | | | | GFL Environmental, Inc., 4.38%, due 08/15/29(e) 144A | | | 241,580 | |
| | 165,000 | | | | | GFL Environmental, Inc., 4.75%, due 06/15/29 144A | | | 157,159 | |
| | 275,000 | | | | | Global Infrastructure Solutions, Inc., 5.63%, due 06/01/29 144A | | | 265,493 | |
| | 325,000 | | | | | Globo Comunicacao e Participacoes SA, 4.88%, due 01/22/30 144A | | | 287,822 | |
| | 239,000 | | | | | GLP Capital, LP/GLP Financing II, Inc. REIT, 3.25%, due 01/15/32 | | | 217,243 | |
| | 1,000,000 | | | | | GLP Capital, LP/GLP Financing II, Inc. REIT, 4.00%, due 01/15/31 | | | 971,425 | |
| | 618,000 | | | | | GLP Capital, LP/GLP Financing II, Inc. REIT, 5.38%, due 04/15/26(e) | | | 646,449 | |
| | 1,350,000 | | | | | Goldman Sachs Group, Inc. (The), 0.86% (SOFR + 0.61%), due 02/12/26(c) | | | 1,259,012 | |
| | 975,000 | | | | | Goldman Sachs Group, Inc. (The), 1.43% (SOFR + 0.80%), due 03/09/27(c) | | | 899,651 | |
| | 1,100,000 | | | | | Goldman Sachs Group, Inc. (The), 1.54% (SOFR + 0.82%), due 09/10/27(c) | | | 1,006,856 | |
| | 720,000 | | | | | Goldman Sachs Group, Inc. (The), 2.38% (SOFR + 1.25%), due 07/21/32(c) | | | 639,004 | |
| | 1,470,000 | | | | | Goldman Sachs Group, Inc. (The), 2.62% (SOFR + 1.28%), due 04/22/32(c) | | | 1,339,068 | |
| | 566,000 | | | | | Goldman Sachs Group, Inc. (The), 2.65% (SOFR + 1.26%), due 10/21/32(c) | | | 512,941 | |
| | 890,000 | | | | | Goldman Sachs Group, Inc. (The), 3.10% (SOFR + 1.41%), due 02/24/33(c) | | | 839,850 | |
| | 1,200,000 | | | | | Goldman Sachs Group, Inc. (The), 3.27% (3 mo. USD LIBOR + 1.20%), due 09/29/25(c) | | | 1,202,960 | |
| | 140,000 | | | | | Goldman Sachs Group, Inc. (The), 3.50%, due 01/23/25 | | | 141,260 | |
| | 85,000 | | | | | Goldman Sachs Group, Inc. (The), 3.75%, due 02/25/26 | | | 86,422 | |
| | 1,131,000 | | | | | Goldman Sachs Group, Inc. (The), 3.80%, due 03/15/30 | | | 1,139,994 | |
| | 815,000 | | | | | Goldman Sachs Group, Inc. (The), 3.81% (3 mo. USD LIBOR + 1.16%), due 04/23/29(c) (e) | | | 822,075 | |
| | 1,371,000 | | | | | Goldman Sachs Group, Inc. (The), 3.85%, due 01/26/27 | | | 1,384,595 | |
| | 125,000 | | | | | Goldman Sachs Group, Inc. (The), 5.30% (3 mo. USD LIBOR + 3.83%)(c) (e) (f) | | | 127,688 | |
| | 20,000 | | | | | Graham Packaging Co., Inc., 7.13%, due 08/15/28(e) 144A | | | 18,189 | |
| | 220,000 | | | | | Graphic Packaging International LLC, 3.50%, due 03/01/29(e) 144A | | | 202,817 | |
| | 14,000 | | | | | Group 1 Automotive, Inc., 4.00%, due 08/15/28 144A | | | 13,053 | |
| | 762,000 | | | | | H&E Equipment Services, Inc., 3.88%, due 12/15/28 144A | | | 715,324 | |
| | 389,000 | | | | | HCA, Inc., 4.13%, due 06/15/29 | | | 397,051 | |
| | 410,000 | | | | | HCA, Inc., 4.38%, due 03/15/42 144A | | | 405,151 | |
| | 418,000 | | | | | HCA, Inc., 5.25%, due 04/15/25 | | | 440,394 | |
| | 332,000 | | | | | HCA, Inc., 5.25%, due 06/15/26 | | | 350,755 | |
| | 25,000 | | | | | HCA, Inc., 5.38%, due 02/01/25 | | | 26,044 | |
| | 75,000 | | | | | HCA, Inc., 5.88%, due 02/01/29 | | | 82,112 | |
| | 275,000 | | | | | HCA, Inc., (MTN), 7.75%, due 07/15/36 | | | 347,710 | |
| | 646,000 | | | | | Healthpeak Properties, Inc. REIT, 3.25%, due 07/15/26 | | | 645,924 | |
See accompanying Notes to the Financial Statements.
83
Mercer Core Fixed Income Fund
Schedule of Investments (Continued)
(showing percentage of net assets)
March 31, 2022
| | | | | | | | | | |
| Par Value(a) | | | | | Description | | Value ($) | |
| | | |
| | | | | | Corporate Debt — continued | | | |
| | 36,000 | | | | | Hertz Corp. (The), 4.63%, due 12/01/26(e) 144A | | | 33,668 | |
| | 78,000 | | | | | Hertz Corp. (The), 5.00%, due 12/01/29(e) 144A | | | 70,691 | |
| | 89,000 | | | | | Hess Midstream Operations, LP, 4.25%, due 02/15/30 144A | | | 84,132 | |
| | 224,000 | | | | | Hillenbrand, Inc., 3.75%, due 03/01/31 | | | 205,425 | |
| | 274,000 | | | | | Hilton Domestic Operating Co., Inc., 3.63%, due 02/15/32 144A | | | 249,117 | |
| | 184,000 | | | | | Hilton Domestic Operating Co., Inc., 4.00%, due 05/01/31(e) 144A | | | 174,024 | |
| | 396,000 | | | | | Hilton Domestic Operating Co., Inc., 4.88%, due 01/15/30 | | | 395,881 | |
| | 77,000 | | | | | Hilton Domestic Operating Co., Inc., 5.75%, due 05/01/28 144A | | | 79,768 | |
| | 212,000 | | | | | Hilton Grand Vacations Borrower Escrow LLC/Hilton Grand Vacations Borrower Escrow, Inc., 4.88%, due 07/01/31 144A | | | 197,324 | |
| | 265,000 | | | | | Hilton Grand Vacations Borrower Escrow LLC/Hilton Grand Vacations Borrower Escrow, Inc., 5.00%, due 06/01/29 144A | | | 253,218 | |
| | 777,000 | | | | | Home Depot, Inc. (The), 3.30%, due 04/15/40 | | | 751,080 | |
| | 588,000 | | | | | Home Depot, Inc. (The), 3.63%, due 04/15/52 | | | 584,626 | |
| | 597,000 | | | | | Host Hotels & Resorts, LP REIT, 3.38%, due 12/15/29(e) | | | 569,590 | |
| | 412,000 | | | | | Host Hotels & Resorts, LP REIT, 3.50%, due 09/15/30 | | | 393,432 | |
| | 260,000 | | | | | Host Hotels & Resorts, LP REIT, 4.50%, due 02/01/26 | | | 266,298 | |
| | 69,000 | | | | | Hudbay Minerals, Inc., 4.50%, due 04/01/26 144A | | | 67,171 | |
| | 462,000 | | | | | Huntington Ingalls Industries, Inc., 4.20%, due 05/01/30 | | | 481,605 | |
| | 390,000 | | | | | Huntsman International LLC, 2.95%, due 06/15/31 | | | 361,356 | |
| | 870,000 | | | | | Huntsman International LLC, 4.50%, due 05/01/29 | | | 899,246 | |
| | 273,000 | | | | | Hyatt Hotels Corp., 1.80%, due 10/01/24 | | | 262,912 | |
| | 315,000 | | | | | Hyatt Hotels Corp., 5.75%, due 04/23/30(d) (e) | | | 348,660 | |
| | 517,000 | | | | | Hyundai Capital America, 1.00%, due 09/17/24 144A | | | 486,701 | |
| | 220,000 | | | | | Hyundai Capital America, 1.80%, due 10/15/25 144A | | | 205,740 | |
| | 235,000 | | | | | Hyundai Capital America, 2.38%, due 10/15/27 144A | | | 215,556 | |
| | 1,668,000 | | | | | Hyundai Capital America, 5.75%, due 04/06/23 144A | | | 1,714,853 | |
| | 45,000 | | | | | IHS Markit, Ltd., 4.00%, due 03/01/26 144A | | | 44,693 | |
| | 80,000 | | | | | IHS Markit, Ltd., 4.75%, due 08/01/28 | | | 83,029 | |
| | 126,000 | | | | | Infor, Inc., 1.75%, due 07/15/25 144A | | | 118,609 | |
| | 200,000 | | | | | Instituto Costarricense de Electricidad, 6.38%, due 05/15/43(e) 144A | | | 166,585 | |
| | 223,000 | | | | | Intesa Sanpaolo SpA, 4.20% (1 yr. CMT + 2.60%), due 06/01/32(c) 144A | | | 197,488 | |
| | 80,000 | | | | | IPALCO Enterprises, Inc., 4.25%, due 05/01/30 | | | 80,259 | |
| | 257,000 | | | | | Iron Mountain Information Management Services, Inc. REIT, 5.00%, due 07/15/32 144A | | | 241,322 | |
| | 210,000 | | | | | Iron Mountain, Inc. REIT, 4.88%, due 09/15/29 144A | | | 200,253 | |
| | 245,000 | | | | | Iron Mountain, Inc. REIT, 5.25%, due 07/15/30 144A | | | 240,433 | |
| | 200,000 | | | | | Israel Electric Corp., Ltd., 6.88%, due 06/21/23 144A | | | 209,025 | |
| | 125,000 | | | | | Jacobs Entertainment, Inc., 6.75%, due 02/15/29 144A | | | 125,784 | |
| | 107,000 | | | | | JB Poindexter & Co., Inc., 7.13%, due 04/15/26 144A | | | 108,917 | |
| | 347,000 | | | | | JBS Finance Luxembourg SARL, 3.63%, due 01/15/32 144A | | | 318,282 | |
| | 1,050,000 | | | | | JBS USA LUX SA/JBS USA Food Co./JBS USA Finance, Inc., 3.00%, due 02/02/29(e) 144A | | | 973,376 | |
| | 95,000 | | | | | JBS USA LUX SA/JBS USA Food Co./JBS USA Finance, Inc., 3.75%, due 12/01/31 144A | | | 88,379 | |
| | 475,000 | | | | | Jefferies Group LLC/Jefferies Group Capital Finance, Inc., 4.15%, due 01/23/30 | | | 483,213 | |
| | 625,000 | | | | | Jefferies Group LLC/Jefferies Group Capital Finance, Inc., 4.85%, due 01/15/27 | | | 656,324 | |
| | 328,359 | | | | | JetBlue Pass Through Trust, Class A, 2.75%, due 11/15/33 | | | 308,496 | |
| | 965,000 | | | | | Johnson & Johnson, 3.63%, due 03/03/37 | | | 999,898 | |
See accompanying Notes to the Financial Statements.
84
Mercer Core Fixed Income Fund
Schedule of Investments (Continued)
(showing percentage of net assets)
March 31, 2022
| | | | | | | | | | |
| Par Value(a) | | | | | Description | | Value ($) | |
| | | |
| | | | | | Corporate Debt — continued | | | |
| | 2,000,000 | | | | | JPMorgan Chase & Co., 2.07% (SOFR + 1.02%), due 06/01/29(c) (e) | | | 1,844,975 | |
| | 709,000 | | | | | JPMorgan Chase & Co., 2.52% (SOFR + 2.04%), due 04/22/31(c) | | | 658,087 | |
| | 460,000 | | | | | JPMorgan Chase & Co., 2.58% (SOFR + 1.25%), due 04/22/32(c) | | | 422,068 | |
| | 441,000 | | | | | JPMorgan Chase & Co., 2.95%, due 10/01/26 | | | 438,070 | |
| | 655,000 | | | | | JPMorgan Chase & Co., 2.96% (SOFR + 2.52%), due 05/13/31(c) | | | 614,018 | |
| | 536,000 | | | | | JPMorgan Chase & Co., 2.96% (SOFR + 1.26%), due 01/25/33(c) | | | 505,871 | |
| | 3,605,000 | | | | | JPMorgan Chase & Co., 3.78% (3 mo. USD LIBOR + 1.34%), due 02/01/28(c) | | | 3,655,253 | |
| | 608,000 | | | | | JPMorgan Chase & Co., 3.96% (3 mo. USD LIBOR + 1.25%), due 01/29/27(c) | | | 621,225 | |
| | 625,000 | | | | | JPMorgan Chase & Co., 3.96% (3 mo. USD LIBOR + 1.38%), due 11/15/48(c) (e) | | | 641,195 | |
| | 585,000 | | | | | JPMorgan Chase & Co., 4.00% (SOFR + 2.75%)(c) (e) (f) | | | 553,117 | |
| | 340,000 | | | | | JPMorgan Chase & Co., 4.01% (3 mo. USD LIBOR + 1.12%), due 04/23/29(c) | | | 348,005 | |
| | 2,450,000 | | | | | JPMorgan Chase & Co., 4.20% (3 mo. USD LIBOR + 1.26%), due 07/23/29(c) (e) | | | 2,536,633 | |
| | 1,207,000 | | | | | JPMorgan Chase & Co., 4.49% (SOFR + 3.79%), due 03/24/31(c) | | | 1,280,908 | |
| | 551,000 | | | | | JPMorgan Chase & Co., 4.60% (SOFR + 3.13%)(c) (f) | | | 532,404 | |
| | 180,000 | | | | | JPMorgan Chase & Co., 5.00% (SOFR + 3.38%)(c) (f) | | | 179,514 | |
| | 728,000 | | | | | JPMorgan Chase & Co., 6.75% (3 mo. USD LIBOR + 3.78%)(c) (f) | | | 760,167 | |
| | 107,000 | | | | | JW Aluminum Continuous Cast Co., 10.25%, due 06/01/26 144A | | | 112,027 | |
| | 780,000 | | | | | Kaiser Foundation Hospitals, 2.81%, due 06/01/41 | | | 683,713 | |
| | 200,000 | | | | | KazMunayGas National Co. JSC, 4.75%, due 04/24/25 144A | | | 195,068 | |
| | 294,000 | | | | | KB Home, 4.00%, due 06/15/31 | | | 266,645 | |
| | 175,000 | | | | | Ken Garff Automotive LLC, 4.88%, due 09/15/28 144A | | | 164,805 | |
| | 283,000 | | | | | Kinder Morgan Energy Partners, LP, 7.75%, due 03/15/32 | | | 364,438 | |
| | 640,000 | | | | | Kinder Morgan, Inc., 3.60%, due 02/15/51 | | | 570,268 | |
| | 991,000 | | | | | KKR Group Finance Co. II LLC, 5.50%, due 02/01/43 144A | | | 1,133,799 | |
| | 257,000 | | | | | KKR Group Finance Co. VII LLC, 3.63%, due 02/25/50 144A | | | 230,670 | |
| | 283,000 | | | | | KKR Group Finance Co. X LLC, 3.25%, due 12/15/51 144A | | | 236,462 | |
| | 382,000 | | | | | KLA Corp., 4.10%, due 03/15/29 | | | 401,370 | |
| | 333,000 | | | | | Kraft Heinz Foods Co., 3.00%, due 06/01/26 | | | 328,909 | |
| | 364,000 | | | | | Kraft Heinz Foods Co., 4.38%, due 06/01/46(e) | | | 360,866 | |
| | 205,000 | | | | | Kraft Heinz Foods Co., 4.88%, due 10/01/49 | | | 216,250 | |
| | 244,000 | | | | | Kraft Heinz Foods Co., 5.00%, due 06/04/42 | | | 260,921 | |
| | 115,000 | | | | | Kraft Heinz Foods Co., 5.20%, due 07/15/45 | | | 124,631 | |
| | 378,000 | | | | | Kraft Heinz Foods Co., 5.50%, due 06/01/50 | | | 431,120 | |
| | 273,000 | | | | | Kraft Heinz Foods Co., 6.50%, due 02/09/40 | | | 326,917 | |
| | 397,000 | | | | | Lam Research Corp., 2.88%, due 06/15/50(e) | | | 352,889 | |
| | 175,000 | | | | | Lamb Weston Holdings, Inc., 4.13%, due 01/31/30 144A | | | 163,713 | |
| | 325,000 | | | | | Lamb Weston Holdings, Inc., 4.38%, due 01/31/32 144A | | | 304,141 | |
| | 251,000 | | | | | Lazard Group LLC, 4.38%, due 03/11/29(e) | | | 257,026 | |
| | 106,000 | | | | | LCM Investments Holdings II LLC, 4.88%, due 05/01/29 144A | | | 100,246 | |
| | 200,000 | | | | | LCPR Senior Secured Financing DAC, 6.75%, due 10/15/27 144A | | | 205,728 | |
| | 55,000 | | | | | Legends Hospitality Holding Co. LLC/Legends Hospitality Co-Issuer, Inc., 5.00%, due 02/01/26 144A | | | 52,870 | |
| | 470,000 | | | | | Lehman Brothers Holdings Capital Trust VII, (MTN), 5.86% (3 mo. USD LIBOR + 0.84%)(c) (f) (k) (l) (m) | | | — | |
| | 890,000 | | | | | Lehman Brothers Holdings, Inc., 6.50%, due 07/19/17(k) (l) (m) | | | — | |
| | 270,000 | | | | | Lehman Brothers Holdings, Inc., (MTN), 6.75%, due 12/28/17(k) (l) (m) | | | — | |
| | 1,209,000 | | | | | Level 3 Financing, Inc., 3.40%, due 03/01/27 144A | | | 1,141,949 | |
| | 98,000 | | | | | Levi Strauss & Co., 3.50%, due 03/01/31(e) 144A | | | 89,952 | |
| | 511,000 | | | | | Leviathan Bond, Ltd., 6.50%, due 06/30/27(j) 144A | | | 526,245 | |
See accompanying Notes to the Financial Statements.
85
Mercer Core Fixed Income Fund
Schedule of Investments (Continued)
(showing percentage of net assets)
March 31, 2022
| | | | | | | | | | |
| Par Value(a) | | | | | Description | | Value ($) | |
| | | |
| | | | | | Corporate Debt — continued | | | |
| | 69,000 | | | | | Leviathan Bond, Ltd., 6.75%, due 06/30/30(j) 144A | | | 71,243 | |
| | 230,000 | | | | | Liberty Mutual Group, Inc., 3.95%, due 10/15/50 144A | | | 218,224 | |
| | 379,000 | | | | | Liberty Mutual Group, Inc., 4.13% (5 yr. CMT + 3.32%), due 12/15/51(c) 144A | | | 358,123 | |
| | 254,000 | | | | | Liberty Mutual Group, Inc., 4.25%, due 06/15/23 144A | | | 258,051 | |
| | 2,679,000 | | | | | Liberty Mutual Group, Inc., 4.57%, due 02/01/29 144A | | | 2,842,814 | |
| | 116,000 | | | | | Life Time, Inc., 8.00%, due 04/15/26(e) 144A | | | 115,964 | |
| | 115,000 | | | | | Likewize Corp., 9.75%, due 10/15/25 144A | | | 116,565 | |
| | 2,434,000 | | | | | Lincoln National Corp., 3.40%, due 01/15/31(e) | | | 2,387,021 | |
| | 343,000 | | | | | Lions Gate Capital Holdings LLC, 5.50%, due 04/15/29 144A | | | 331,005 | |
| | 129,000 | | | | | Lithia Motors, Inc., 3.88%, due 06/01/29(e) 144A | | | 122,128 | |
| | 129,000 | | | | | Lithia Motors, Inc., 4.38%, due 01/15/31(e) 144A | | | 124,906 | |
| | 64,000 | | | | | Lithia Motors, Inc., 4.63%, due 12/15/27 144A | | | 63,603 | |
| | 365,000 | | | | | Live Nation Entertainment, Inc., 4.75%, due 10/15/27(e) 144A | | | 356,521 | |
| | 1,150,000 | | | | | Lloyds Banking Group Plc, 2.44% (1 yr. CMT + 1.00%), due 02/05/26(c) (e) | | | 1,110,023 | |
| | 1,235,000 | | | | | Lloyds Banking Group Plc, 4.45%, due 05/08/25 | | | 1,266,650 | |
| | 421,000 | | | | | Lloyds Banking Group Plc, 7.50% (5 yr. USD swap + 4.76%)(c) (e) (f) | | | 442,614 | |
| | 712,000 | | | | | Lockheed Martin Corp., 2.80%, due 06/15/50(e) | | | 625,197 | |
| | 713,000 | | | | | Lockheed Martin Corp., 4.70%, due 05/15/46(e) | | | 831,408 | |
| | 386,000 | | | | | Lowe’s Cos., Inc., 3.70%, due 04/15/46 | | | 371,002 | |
| | 212,000 | | | | | Lowe’s Cos., Inc., 5.00%, due 04/15/40 | | | 237,335 | |
| | 1,204,000 | | | | | Lowe’s Cos., Inc., 4.25%, due 04/01/52 | | | 1,247,261 | |
| | 104,000 | | | | | LSB Industries, Inc., 6.25%, due 10/15/28 144A | | | 105,639 | |
| | 284,000 | | | | | LSC Communication, Inc., 8.75%, due 10/15/23(i) (k) | | | 889 | |
| | 720,000 | | | | | Lubrizol Corp. (The), 6.50%, due 10/01/34 | | | 939,014 | |
| | 350,000 | | | | | Lumen Technologies, Inc., 6.75%, due 12/01/23(e) | | | 364,010 | |
| | 327,000 | | | | | Lundin Energy Finance BV, 2.00%, due 07/15/26 144A | | | 304,967 | |
| | 473,000 | | | | | Lundin Energy Finance BV, 3.10%, due 07/15/31 144A | | | 438,782 | |
| | 150,000 | | | | | LYB International Finance BV, 4.88%, due 03/15/44(e) | | | 160,082 | |
| | 380,000 | | | | | LYB International Finance III LLC, 4.20%, due 05/01/50 | | | 376,554 | |
| | 168,000 | | | | | M&T Bank Corp., 5.13% (3 mo. USD LIBOR + 3.52%)(c) (f) | | | 168,630 | |
| | 320,000 | | | | | Macquarie Bank, Ltd., 3.62%, due 06/03/30 144A | | | 302,064 | |
| | 425,000 | | | | | Macquarie Bank, Ltd., 4.88%, due 06/10/25(e) 144A | | | 436,677 | |
| | 943,000 | | | | | Macquarie Group, Ltd., 1.34% (SOFR + 1.07%), due 01/12/27(c) 144A | | | 860,332 | |
| | 1,484,000 | | | | | Macquarie Group, Ltd., 4.15% (3 mo. USD LIBOR + 1.33%), due 03/27/24(c) 144A | | | 1,501,320 | |
| | 74,000 | | | | | Macy’s Retail Holdings LLC, 5.88%, due 04/01/29(e) 144A | | | 73,915 | |
| | 25,000 | | | | | Macy’s Retail Holdings LLC, 5.88%, due 03/15/30(e) 144A | | | 24,692 | |
| | 46,000 | | | | | Macy’s Retail Holdings LLC, 6.13%, due 03/15/32 144A | | | 45,486 | |
| | 790,000 | | | | | Magallanes, Inc., 4.28%, due 03/15/32 144A | | | 794,493 | |
| | 345,000 | | | | | Magallanes, Inc., 5.05%, due 03/15/42 144A | | | 352,626 | |
| | 1,823,000 | | | | | Magallanes, Inc., 5.14%, due 03/15/52 144A | | | 1,869,433 | |
| | 160,000 | | | | | Magallanes, Inc., 5.39%, due 03/15/62 144A | | | 165,773 | |
| | 55,000 | | | | | Magellan Midstream Partners, LP, 4.25%, due 09/15/46(e) | | | 54,375 | |
| | 200,000 | | | | | Magellan Midstream Partners, LP, 5.15%, due 10/15/43 | | | 215,727 | |
| | 2,101,000 | | | | | Manulife Financial Corp., 3.70%, due 03/16/32 | | | 2,122,775 | |
| | 420,000 | | | | | MARB BondCo Plc, 3.95%, due 01/29/31 144A | | | 373,277 | |
| | 520,000 | | | | | Marriott International, Inc., 2.85%, due 04/15/31 | | | 475,381 | |
| | 169,000 | | | | | Marriott International, Inc., 3.13%, due 06/15/26(e) | | | 167,234 | |
| | 250,000 | | | | | Marriott International, Inc., 3.50%, due 10/15/32 | | | 238,426 | |
| | 458,000 | | | | | Marriott International, Inc., 4.63%, due 06/15/30 | | | 475,266 | |
See accompanying Notes to the Financial Statements.
86
Mercer Core Fixed Income Fund
Schedule of Investments (Continued)
(showing percentage of net assets)
March 31, 2022
| | | | | | | | | | |
| Par Value(a) | | | | | Description | | Value ($) | |
| | | |
| | | | | | Corporate Debt — continued | | | |
| | 46,000 | | | | | Marriott Ownership Resorts, Inc., 4.50%, due 06/15/29 144A | | | 43,441 | |
| | 400,000 | | | | | Martin Marietta Materials, Inc., 2.50%, due 03/15/30 | | | 365,742 | |
| | 230,000 | | | | | Martin Marietta Materials, Inc., 4.25%, due 07/02/24(e) | | | 235,518 | |
| | 608,000 | | | | | Marvell Technology, Inc., 2.45%, due 04/15/28 | | | 560,251 | |
| | 300,000 | | | | | Masonite International Corp., 3.50%, due 02/15/30 144A | | | 270,246 | |
| | 460,000 | | | | | Massachusetts Institute of Technology, 4.68%, due 07/01/14(e) (h) | | | 531,009 | |
| | 1,255,000 | | | | | Massachusetts Mutual Life Insurance Co., 3.38%, due 04/15/50(e) 144A | | | 1,132,354 | |
| | 224,000 | | | | | MasTec, Inc., 4.50%, due 08/15/28(e) 144A | | | 222,406 | |
| | 258,000 | | | | | Mastercard, Inc., 3.85%, due 03/26/50 | | | 273,869 | |
| | 157,000 | | | | | Match Group Holdings II LLC, 3.63%, due 10/01/31(e) 144A | | | 140,672 | |
| | 162,000 | | | | | Match Group Holdings II LLC, 4.13%, due 08/01/30(e) 144A | | | 152,138 | |
| | 46,000 | | | | | Mauser Packaging Solutions Holding Co., 8.50%, due 04/15/24 144A | | | 46,933 | |
| | 311,000 | | | | | MC Brazil Downstream Trading SARL, 7.25%, due 06/30/31 144A | | | 286,557 | |
| | 801,000 | | | | | McDonald’s Corp., (MTN), 3.50%, due 07/01/27(e) | | | 815,507 | |
| | 900,000 | | | | | McDonald’s Corp., (MTN), 4.20%, due 04/01/50 | | | 942,619 | |
| | 202,000 | | | | | MDC Holdings, Inc., 2.50%, due 01/15/31 | | | 176,667 | |
| | 475,000 | | | | | MetLife, Inc., 6.40%, due 12/15/66(e) | | | 513,855 | |
| | 115,000 | | | | | MetLife, Inc., 9.25%, due 04/08/68(e) 144A | | | 149,672 | |
| | 3,677,000 | | | | | Metropolitan Life Global Funding I, 3.30%, due 03/21/29 144A | | | 3,651,205 | |
| | 200,000 | | | | | Mexico City Airport Trust, 5.50%, due 07/31/47 144A | | | 176,607 | |
| | 165,000 | | | | | MGM Growth Properties Operating Partnership, LP/MGP Finance Co-Issuer, Inc. REIT, 3.88%, due 02/15/29 144A | | | 162,427 | |
| | 498,000 | | | | | MGM Resorts International, 4.75%, due 10/15/28 | | | 482,520 | |
| | 1,329,000 | | | | | Micron Technology, Inc., 4.19%, due 02/15/27 | | | 1,365,853 | |
| | 250,000 | | | | | Micron Technology, Inc., 4.98%, due 02/06/26(e) | | | 262,150 | |
| | 1,131,000 | | | | | Micron Technology, Inc., 5.33%, due 02/06/29 | | | 1,224,486 | |
| | 825,000 | | | | | Mid-Atlantic Interstate Transmission LLC, 4.10%, due 05/15/28 144A | | | 833,670 | |
| | 100,000 | | | | | MidAmerican Energy Co., 4.25%, due 07/15/49(e) | | | 109,589 | |
| | 483,000 | | | | | Midwest Connector Capital Co. LLC, 3.90%, due 04/01/24 144A | | | 484,751 | |
| | 252,000 | | | | | Midwest Gaming Borrower LLC/Midwest Gaming Finance Corp., 4.88%, due 05/01/29 144A | | | 232,820 | |
| | 234,900 | | | | | Millicom International Cellular SA, 6.25%, due 03/25/29 144A | | | 249,661 | |
| | 59,000 | | | | | MIWD Holdco II LLC/MIWD Finance Corp., 5.50%, due 02/01/30 144A | | | 55,196 | |
| | 333,000 | | | | | Mohegan Gaming & Entertainment, 8.00%, due 02/01/26 144A | | | 331,322 | |
| | 950,000 | | | | | Moody’s Corp., 3.25%, due 05/20/50 | | | 852,738 | |
| | 1,329,000 | | | | | Morgan Stanley, 2.19% (SOFR + 1.99%), due 04/28/26(c) | | | 1,285,109 | |
| | 843,000 | | | | | Morgan Stanley, 2.48% (SOFR + 1.36%), due 09/16/36(c) | | | 724,154 | |
| | 1,478,000 | | | | | Morgan Stanley, 2.94% (SOFR + 1.29%), due 01/21/33(c) | | | 1,387,738 | |
| | 945,000 | | | | | Morgan Stanley, 3.59% (3 mo. USD LIBOR + 1.34%), due 07/22/28(c) | | | 948,727 | |
| | 921,000 | | | | | Morgan Stanley, 3.88%, due 04/29/24(e) | | | 939,931 | |
| | 1,936,000 | | | | | Morgan Stanley, (MTN), 2.24% (SOFR + 1.18%), due 07/21/32(c) | | | 1,718,111 | |
| | 785,000 | | | | | Morgan Stanley, (MTN), 2.70% (SOFR + 1.14%), due 01/22/31(c) | | | 737,545 | |
| | 1,301,000 | | | | | Morgan Stanley, (MTN), 3.13%, due 07/27/26 | | | 1,290,974 | |
| | 1,311,000 | | | | | Morgan Stanley, (MTN), 3.62% (SOFR + 3.12%), due 04/01/31(c) | | | 1,305,868 | |
| | 620,000 | | | | | Morgan Stanley, (MTN), 3.77% (3 mo. USD LIBOR + 1.14%), due 01/24/29(c) | | | 625,387 | |
| | 391,000 | | | | | Morgan Stanley, (MTN), 3.88%, due 01/27/26 | | | 398,799 | |
| | 1,000,000 | | | | | Morgan Stanley, (MTN), 4.35%, due 09/08/26 | | | 1,031,449 | |
| | 644,000 | | | | | Motorola Solutions, Inc., 2.30%, due 11/15/30 | | | 565,494 | |
| | 624,000 | | | | | Motorola Solutions, Inc., 2.75%, due 05/24/31 | | | 565,629 | |
See accompanying Notes to the Financial Statements.
87
Mercer Core Fixed Income Fund
Schedule of Investments (Continued)
(showing percentage of net assets)
March 31, 2022
| | | | | | | | | | |
| Par Value(a) | | | | | Description | | Value ($) | |
| | | |
| | | | | | Corporate Debt — continued | | | |
| | 207,000 | | | | | Motorola Solutions, Inc., 4.60%, due 05/23/29 | | | 215,532 | |
| | 385,000 | | | | | MPLX, LP, 4.00%, due 03/15/28(e) | | | 392,395 | |
| | 87,000 | | | | | MPLX, LP, 4.13%, due 03/01/27 | | | 89,107 | |
| | 297,000 | | | | | MPLX, LP, 4.25%, due 12/01/27 | | | 307,304 | |
| | 250,000 | | | | | MPLX, LP, 4.50%, due 04/15/38 | | | 256,049 | |
| | 25,000 | | | | | MPLX, LP, 5.20%, due 03/01/47(e) | | | 26,883 | |
| | 813,000 | | | | | MPLX, LP, 6.88% (3 mo. USD LIBOR + 4.65%)(c) (f) | | | 800,805 | |
| | 300,000 | | | | | MPT Operating Partnership, LP/MPT Finance Corp. REIT, 3.50%, due 03/15/31 | | | 279,125 | |
| | 325,000 | | | | | MSCI, Inc., 3.25%, due 08/15/33 144A | | | 292,805 | |
| | 336,000 | | | | | MSCI, Inc., 3.63%, due 11/01/31 144A | | | 316,786 | |
| | 145,000 | | | | | MTN Mauritius Investment, Ltd., 4.76%, due 11/11/24 144A | | | 146,082 | |
| | 435,000 | | | | | Mylan, Inc., 5.20%, due 04/15/48(e) | | | 428,002 | |
| | 450,000 | | | | | Mylan, Inc., 5.40%, due 11/29/43 | | | 440,188 | |
| | 141,000 | | | | | Nationstar Mortgage Holdings, Inc., 5.13%, due 12/15/30 144A | | | 130,687 | |
| | 158,000 | | | | | Nationstar Mortgage Holdings, Inc., 5.50%, due 08/15/28 144A | | | 152,043 | |
| | 62,000 | | | | | Nationstar Mortgage Holdings, Inc., 6.00%, due 01/15/27 144A | | | 63,198 | |
| | 265,000 | | | | | NatWest Group Plc, 3.75% (5 yr. CMT + 2.10%), due 11/01/29(c) | | | 263,041 | |
| | 500,000 | | | | | NatWest Group Plc, 3.88%, due 09/12/23 | | | 505,298 | |
| | 210,000 | | | | | NatWest Group Plc, 5.08% (3 mo. USD LIBOR + 1.91%), due 01/27/30(c) | | | 223,967 | |
| | 430,000 | | | | | NatWest Group Plc, 6.00% (5 yr. CMT + 5.63%)(c) (f) | | | 440,169 | |
| | 714,000 | | | | | NatWest Markets Plc, 1.60%, due 09/29/26(e) 144A | | | 654,942 | |
| | 329,000 | | | | | NBM US Holdings, Inc., 6.63%, due 08/06/29 144A | | | 346,606 | |
| | 720,000 | | | | | Netflix, Inc., 4.88%, due 04/15/28 | | | 756,216 | |
| | 229,000 | | | | | Netflix, Inc., 4.88%, due 06/15/30(e) 144A | | | 244,683 | |
| | 59,000 | | | | | Netflix, Inc., 5.38%, due 11/15/29 144A | | | 63,971 | |
| | 574,000 | | | | | Netflix, Inc., 5.88%, due 11/15/28 | | | 634,155 | |
| | 271,000 | | | | | New York Life Insurance Co., 3.75%, due 05/15/50 144A | | | 263,882 | |
| | 435,000 | | | | | Newmont Corp., 2.25%, due 10/01/30(e) | | | 398,100 | |
| | 275,000 | | | | | Newmont Corp., 2.80%, due 10/01/29 | | | 263,398 | |
| | 150,000 | | | | | Newmont Corp., 5.45%, due 06/09/44 | | | 178,964 | |
| | 228,000 | | | | | News Corp., 3.88%, due 05/15/29 144A | | | 215,805 | |
| | 136,000 | | | | | News Corp., 5.13%, due 02/15/32 144A | | | 136,907 | |
| | 435,000 | | | | | NextEra Energy Capital Holdings, Inc., 2.25%, due 06/01/30 | | | 398,753 | |
| | 866,000 | | | | | NextEra Energy Capital Holdings, Inc., 3.55%, due 05/01/27 | | | 877,506 | |
| | 207,000 | | | | | NextEra Energy Operating Partners, LP, 3.88%, due 10/15/26 144A | | | 204,928 | |
| | 75,000 | | | | | NextEra Energy Operating Partners, LP, 4.50%, due 09/15/27(e) 144A | | | 74,799 | |
| | 738,000 | | | | | Nippon Life Insurance Co., 2.75% (5 yr. CMT + 2.65%), due 01/21/51(c) 144A | | | 664,137 | |
| | 385,000 | | | | | Nippon Life Insurance Co., 5.10% (5 yr. USD swap + 3.65%), due 10/16/44(c) 144A | | | 397,002 | |
| | 670,000 | | | | | NiSource, Inc., 3.49%, due 05/15/27 | | | 669,004 | |
| | 311,000 | | | | | NiSource, Inc., 3.60%, due 05/01/30 | | | 308,897 | |
| | 239,000 | | | | | Nissan Motor Acceptance Co. LLC, 1.13%, due 09/16/24(e) 144A | | | 223,726 | |
| | 195,000 | | | | | Nissan Motor Acceptance Co. LLC, 3.45%, due 03/15/23 144A | | | 195,964 | |
| | 200,000 | | | | | Nomura Holdings, Inc., 2.61%, due 07/14/31 | | | 180,095 | |
| | 970,000 | | | | | Norfolk Southern Corp., 4.84%, due 10/01/41 | | | 1,099,010 | |
| | 195,000 | | | | | Northern States Power Co., 3.60%, due 09/15/47 | | | 193,748 | |
| | 942,000 | | | | | Northrop Grumman Corp., 5.25%, due 05/01/50 | | | 1,178,614 | |
| | 300,000 | | | | | NOVA Chemicals Corp., 4.88%, due 06/01/24 144A | | | 303,750 | |
| | 456,000 | | | | | Novelis Corp., 4.75%, due 01/30/30 144A | | | 443,565 | |
| | 396,000 | | | | | NRG Energy, Inc., 2.45%, due 12/02/27 144A | | | 365,943 | |
See accompanying Notes to the Financial Statements.
88
Mercer Core Fixed Income Fund
Schedule of Investments (Continued)
(showing percentage of net assets)
March 31, 2022
| | | | | | | | | | |
| Par Value(a) | | | | | Description | | Value ($) | |
| | | |
| | | | | | Corporate Debt — continued | | | |
| | 50,000 | | | | | NRG Energy, Inc., 3.38%, due 02/15/29 144A | | | 44,535 | |
| | 194,000 | | | | | NRG Energy, Inc., 3.63%, due 02/15/31(e) 144A | | | 170,923 | |
| | 474,000 | | | | | NRG Energy, Inc., 3.88%, due 02/15/32 144A | | | 418,061 | |
| | 303,000 | | | | | NRG Energy, Inc., 4.45%, due 06/15/29 144A | | | 303,596 | |
| | 125,000 | | | | | NRG Energy, Inc., 5.25%, due 06/15/29(e) 144A | | | 122,412 | |
| | 525,000 | | | | | NRG Energy, Inc., 5.75%, due 01/15/28 | | | 534,397 | |
| | 250,000 | | | | | NSTAR Electric Co., 3.10%, due 06/01/51 | | | 226,552 | |
| | 1,320,000 | | | | | Nucor Corp., 3.13%, due 04/01/32 | | | 1,277,472 | |
| | 315,000 | | | | | Nutrien, Ltd., 4.90%, due 06/01/43 | | | 349,558 | |
| | 815,000 | | | | | NXP BV/NXP Funding LLC, 4.63%, due 06/01/23 144A | | | 828,156 | |
| | 2,136,000 | | | | | NXP BV/NXP Funding LLC/NXP USA, Inc., 2.70%, due 05/01/25 144A | | | 2,072,614 | |
| | 188,000 | | | | | NXP BV/NXP Funding LLC/NXP USA, Inc., 3.25%, due 05/11/41 144A | | | 166,295 | |
| | 689,000 | | | | | NXP BV/NXP Funding LLC/NXP USA, Inc., 3.88%, due 06/18/26 144A | | | 692,126 | |
| | 3,517,000 | | | | | Occidental Petroleum Corp., 5.74%, due 10/10/36(n) | | | 1,893,553 | |
| | 325,000 | | | | | OneMain Finance Corp., 6.63%, due 01/15/28 | | | 340,996 | |
| | 62,000 | | | | | OneMain Finance Corp., 6.88%, due 03/15/25 | | | 65,261 | |
| | 200,000 | | | | | OneMain Finance Corp., 8.25%, due 10/01/23 | | | 210,991 | |
| | 120,000 | | | | | OneMain Finance Corp., 8.88%, due 06/01/25 | | | 126,616 | |
| | 655,000 | | | | | ONEOK, Inc., 3.10%, due 03/15/30 | | | 614,886 | |
| | 390,000 | | | | | ONEOK, Inc., 4.45%, due 09/01/49 | | | 375,519 | |
| | 200,000 | | | | | ONEOK, Inc., 4.95%, due 07/13/47 | | | 202,352 | |
| | 200,000 | | | | | Operadora de Servicios Mega SA de CV Sofom ER, 8.25%, due 02/11/25 144A | | | 153,261 | |
| | 1,200,000 | | | | | Oracle Corp., 1.65%, due 03/25/26 | | | 1,120,570 | |
| | 1,542,000 | | | | | Oracle Corp., 2.50%, due 04/01/25 | | | 1,507,502 | |
| | 1,071,000 | | | | | Oracle Corp., 2.95%, due 04/01/30 | | | 989,347 | |
| | 1,106,000 | | | | | Oracle Corp., 3.95%, due 03/25/51(e) | | | 970,423 | |
| | 405,000 | | | | | Orbia Advance Corp. SAB de CV, 5.50%, due 01/15/48 144A | | | 399,200 | |
| | 425,000 | | | | | Organon & Co./Organon Foreign Debt Co-Issuer BV, 4.13%, due 04/30/28 144A | | | 405,450 | |
| | 342,000 | | | | | Organon & Co./Organon Foreign Debt Co-Issuer BV, 5.13%, due 04/30/31(e) 144A | | | 330,492 | |
| | 208,000 | | | | | Oriflame Investment Holding Plc, 5.13%, due 05/04/26(e) 144A | | | 167,960 | |
| | 650,000 | | | | | Ovintiv Exploration, Inc., 5.38%, due 01/01/26 | | | 689,567 | |
| | 265,000 | | | | | Ovintiv, Inc., 6.50%, due 08/15/34 | | | 315,316 | |
| | 63,000 | | | | | Ovintiv, Inc., 7.20%, due 11/01/31 | | | 76,328 | |
| | 391,000 | | | | | Owens Corning, 3.95%, due 08/15/29 | | | 398,462 | |
| | 350,000 | | | | | Owens Corning, 4.30%, due 07/15/47 | | | 344,009 | |
| | 110,000 | | | | | Owens-Brockway Glass Container, Inc., 6.63%, due 05/13/27(e) 144A | | | 109,071 | |
| | 211,000 | | | | | Oztel Holdings SPC, Ltd., 6.63%, due 04/24/28 144A | | | 221,887 | |
| | 265,000 | | | | | PacifiCorp, 2.70%, due 09/15/30(e) | | | 252,915 | |
| | 195,000 | | | | | Pactiv Evergreen Group Issuer LLC/Pactiv Evergreen Group Issuer, Inc., 4.38%, due 10/15/28 144A | | | 179,535 | |
| | 406,000 | | | | | Pactiv Evergreen Group Issuer, Inc./Pactiv Evergreen Group Issuer LLC/Reynolds Gro, 4.00%, due 10/15/27 144A | | | 377,661 | |
| | 51,000 | | | | | Papa John’s International, Inc., 3.88%, due 09/15/29(e) 144A | | | 46,867 | |
| | 500,000 | | | | | Paramount Global, 4.38%, due 03/15/43 | | | 477,189 | |
| | 197,000 | | | | | Parkland Corp., 4.50%, due 10/01/29 144A | | | 182,895 | |
| | 190,000 | | | | | Parkland Corp., 4.63%, due 05/01/30 144A | | | 176,988 | |
| | 722,000 | | | | | PayPal Holdings, Inc., 2.85%, due 10/01/29(e) | | | 707,680 | |
| | 415,000 | | | | | PECO Energy Co., 3.05%, due 03/15/51(e) | | | 376,173 | |
| | 205,000 | | | | | PECO Energy Co., 3.70%, due 09/15/47 | | | 206,815 | |
See accompanying Notes to the Financial Statements.
89
Mercer Core Fixed Income Fund
Schedule of Investments (Continued)
(showing percentage of net assets)
March 31, 2022
| | | | | | | | | | |
| Par Value(a) | | | | | Description | | Value ($) | |
| | | |
| | | | | | Corporate Debt — continued | | | |
| | 580,000 | | | | | Pennsylvania Electric Co., 3.60%, due 06/01/29 144A | | | 576,560 | |
| | 2,450,000 | | | | | Penske Truck Leasing Co., LP/PTL Finance Corp., 3.90%, due 02/01/24 144A | | | 2,481,781 | |
| | 218,000 | | | | | Petrobras Global Finance BV, 5.60%, due 01/03/31 | | | 221,019 | |
| | 185,000 | | | | | Petrobras Global Finance BV, 5.75%, due 02/01/29 | | | 192,541 | |
| | 164,000 | | | | | Petrobras Global Finance BV, 6.90%, due 03/19/49 | | | 163,209 | |
| | 76,000 | | | | | Petroleos Mexicanos, 6.35%, due 02/12/48(e) | | | 59,873 | |
| | 270,000 | | | | | Petroleos Mexicanos, 6.50%, due 03/13/27 | | | 274,652 | |
| | 255,000 | | | | | Petroleos Mexicanos, 6.50%, due 06/02/41 | | | 211,979 | |
| | 403,000 | | | | | Petroleos Mexicanos, 6.75%, due 09/21/47 | | | 328,332 | |
| | 380,000 | | | | | Petroleos Mexicanos, 6.88%, due 08/04/26 | | | 398,006 | |
| | 200,000 | | | | | Petrorio Luxembourg Trading SARL, 6.13%, due 06/09/26(e) 144A | | | 200,422 | |
| | 797,000 | | | | | Phillips 66 Partners, LP, 3.61%, due 02/15/25 | | | 804,446 | |
| | 25,000 | | | | | Picasso Finance Sub, Inc., 6.13%, due 06/15/25 144A | | | 25,450 | |
| | 145,000 | | | | | Piedmont Natural Gas Co., Inc., 3.50%, due 06/01/29(e) | | | 144,050 | |
| | 575,000 | | | | | Pilgrim’s Pride Corp., 5.88%, due 09/30/27 144A | | | 581,293 | |
| | 855,000 | | | | | Plains All American Pipeline, LP/PAA Finance Corp., 3.55%, due 12/15/29 | | | 827,420 | |
| | 65,000 | | | | | Plains All American Pipeline, LP/PAA Finance Corp., 4.70%, due 06/15/44 | | | 61,203 | |
| | 50,000 | | | | | Plains All American Pipeline, LP/PAA Finance Corp., 5.15%, due 06/01/42 | | | 48,607 | |
| | 61,000 | | | | | Playtika Holding Corp., 4.25%, due 03/15/29 144A | | | 56,391 | |
| | 63,000 | | | | | PNC Financial Services Group, Inc. (The), 3.15%, due 05/19/27(e) | | | 63,181 | |
| | 722,000 | | | | | PNC Financial Services Group, Inc. (The), 3.40% (5 yr. CMT + 2.60%)(c) (f) | | | 651,966 | |
| | 524,000 | | | | | PNC Financial Services Group, Inc. (The), 3.99% (3 mo. USD LIBOR + 3.68%)(c) (f) | | | 524,420 | |
| | 212,000 | | | | | PNC Financial Services Group, Inc. (The), 4.85% (3 mo. USD LIBOR + 3.04%)(c) (e) (f) | | | 211,500 | |
| | 292,000 | | | | | Post Holdings, Inc., 5.50%, due 12/15/29 144A | | | 281,409 | |
| | 201,000 | | | | | Premier Entertainment Sub LLC/Premier Entertainment Finance Corp., 5.63%, due 09/01/29 144A | | | 173,157 | |
| | 547,000 | | | | | Premier Entertainment Sub LLC/Premier Entertainment Finance Corp., 5.88%, due 09/01/31 144A | | | 468,000 | |
| | 51,000 | | | | | Prime Security Services Borrower LLC/Prime Finance, Inc., 3.38%, due 08/31/27(e) 144A | | | 46,726 | |
| | 136,000 | | | | | Prime Security Services Borrower LLC/Prime Finance, Inc., 6.25%, due 01/15/28(e) 144A | | | 133,310 | |
| | 90,000 | | | | | Providence St. Joseph Health Obligated Group, 2.75%, due 10/01/26 | | | 89,168 | |
| | 321,000 | | | | | Prudential Financial, Inc., 5.13% (5 yr. CMT + 3.16%), due 03/01/52(c) | | | 324,900 | |
| | 925,000 | | | | | Prudential Financial, Inc., 5.88% (3 mo. USD LIBOR + 4.18%), due 09/15/42(c) | | | 934,250 | |
| | 48,000 | | | | | PTC, Inc., 4.00%, due 02/15/28 144A | | | 46,864 | |
| | 195,000 | | | | | Public Service Electric & Gas Co., (MTN), 2.70%, due 05/01/50 | | | 167,076 | |
| | 445,000 | | | | | Public Service Electric & Gas Co., (MTN), 3.00%, due 05/15/27(e) | | | 441,720 | |
| | 315,000 | | | | | Public Service Electric & Gas Co., (MTN), 3.20%, due 05/15/29 | | | 314,443 | |
| | 1,700,000 | | | | | Public Service Enterprise Group, Inc., 2.88%, due 06/15/24 | | | 1,685,607 | |
| | 515,000 | | | | | Public Storage REIT, 2.25%, due 11/09/31(e) | | | 471,553 | |
| | 379,000 | | | | | Puget Energy, Inc., 2.38%, due 06/15/28 | | | 347,254 | |
| | 900,000 | | | | | Qatar Energy, 1.38%, due 09/12/26 144A | | | 841,324 | |
| | 275,000 | | | | | Qatar Energy, 2.25%, due 07/12/31 144A | | | 253,680 | |
| | 348,000 | | | | | Qorvo, Inc., 1.75%, due 12/15/24 144A | | | 332,357 | |
| | 282,000 | | | | | Qorvo, Inc., 3.38%, due 04/01/31(e) 144A | | | 256,881 | |
| | 237,000 | | | | | Quanta Services, Inc., 0.95%, due 10/01/24 | | | 224,902 | |
| | 130,000 | | | | | QVC, Inc., 5.45%, due 08/15/34 | | | 109,136 | |
| | 130,000 | | | | | Radian Group, Inc., 4.50%, due 10/01/24 | | | 130,814 | |
See accompanying Notes to the Financial Statements.
90
Mercer Core Fixed Income Fund
Schedule of Investments (Continued)
(showing percentage of net assets)
March 31, 2022
| | | | | | | | | | |
| Par Value(a) | | | | | Description | | Value ($) | |
| | | |
| | | | | | Corporate Debt — continued | | | |
| | 191,000 | | | | | Radiate Holdco LLC/Radiate Finance, Inc., 6.50%, due 09/15/28 144A | | | 180,972 | |
| | 1,761,000 | | | | | Raytheon Technologies Corp., 1.90%, due 09/01/31 | | | 1,560,430 | |
| | 790,000 | | | | | Realty Income Corp. REIT, 2.85%, due 12/15/32 | | | 747,627 | |
| | 330,000 | | | | | Realty Income Corp. REIT, 3.25%, due 01/15/31(e) | | | 324,532 | |
| | 224,000 | | | | | Rede D’or Finance SARL, 4.50%, due 01/22/30(e) 144A | | | 205,863 | |
| | 419,000 | | | | | Renesas Electronics Corp., 1.54%, due 11/26/24 144A | | | 399,345 | |
| | 340,000 | | | | | Resorts World Las Vegas LLC/RWLV Capital, Inc., 4.63%, due 04/16/29(e) 144A | | | 307,955 | |
| | 389,000 | | | | | RHP Hotel Properties, LP/RHP Finance Corp. REIT, 4.50%, due 02/15/29 144A | | | 366,121 | |
| | 161,000 | | | | | RLJ Lodging Trust, LP REIT, 3.75%, due 07/01/26 144A | | | 153,166 | |
| | 405,000 | | | | | Roper Technologies, Inc., 1.40%, due 09/15/27 | | | 367,726 | |
| | 217,000 | | | | | Royalty Pharma Plc, 1.75%, due 09/02/27 | | | 197,309 | |
| | 415,000 | | | | | RPM International, Inc., 2.95%, due 01/15/32 | | | 380,920 | |
| | 202,000 | | | | | S&P Global, Inc., 4.75%, due 08/01/28(e) 144A | | | 217,190 | |
| | 232,000 | | | | | Sabine Pass Liquefaction LLC, 4.20%, due 03/15/28 | | | 238,678 | |
| | 542,000 | | | | | Sabine Pass Liquefaction LLC, 4.50%, due 05/15/30 | | | 567,661 | |
| | 231,000 | | | | | Sabine Pass Liquefaction LLC, 5.00%, due 03/15/27 | | | 244,556 | |
| | 288,000 | | | | | Sabine Pass Liquefaction LLC, 5.88%, due 06/30/26 | | | 311,638 | |
| | 247,000 | | | | | Sabre GLBL, Inc., 7.38%, due 09/01/25 144A | | | 258,329 | |
| | 320,000 | | | | | Sally Holdings LLC/Sally Capital, Inc., 5.63%, due 12/01/25 | | | 324,600 | |
| | 290,000 | | | | | San Diego Gas & Electric Co., 4.15%, due 05/15/48(e) | | | 306,120 | |
| | 466,000 | | | | | Santander Holdings USA, Inc., 2.49% (SOFR + 1.25%), due 01/06/28(c) | | | 435,476 | |
| | 1,024,000 | | | | | Santander Holdings USA, Inc., 3.24%, due 10/05/26(e) | | | 999,677 | |
| | 888,000 | | | | | Santander Holdings USA, Inc., 3.45%, due 06/02/25 | | | 882,593 | |
| | 620,000 | | | | | Santander Holdings USA, Inc., 3.50%, due 06/07/24 | | | 622,130 | |
| | 199,000 | | | | | Santander Holdings USA, Inc., 4.40%, due 07/13/27 | | | 202,740 | |
| | 437,000 | | | | | Sasol Financing USA LLC, 5.50%, due 03/18/31 | | | 408,835 | |
| | 200,000 | | | | | Sasol Financing USA LLC, 5.88%, due 03/27/24 | | | 202,897 | |
| | 200,000 | | | | | Sasol Financing USA LLC, 6.50%, due 09/27/28 | | | 203,450 | |
| | 407,000 | | | | | SBA Communications Corp. REIT, 3.88%, due 02/15/27 | | | 397,521 | |
| | 322,000 | | | | | SBA Tower Trust REIT, 2.84%, due 01/15/50 144A | | | 316,941 | |
| | 411,000 | | | | | SBL Holdings, Inc., 5.00%, due 02/18/31 144A | | | 397,181 | |
| | 193,000 | | | | | Select Medical Corp., 6.25%, due 08/15/26 144A | | | 200,019 | |
| | 115,000 | | | | | Sensata Technologies, Inc., 3.75%, due 02/15/31 144A | | | 106,554 | |
| | 122,000 | | | | | Service Corp. International, 3.38%, due 08/15/30 | | | 110,159 | |
| | 254,000 | | | | | Service Corp. International, 4.00%, due 05/15/31 | | | 236,872 | |
| | 950,000 | | | | | Shell International Finance BV, 5.50%, due 03/25/40 | | | 1,172,751 | |
| | 425,000 | | | | | Shire Acquisitions Investments Ireland DAC, 3.20%, due 09/23/26(e) | | | 426,348 | |
| | 44,000 | | | | | Simmons Foods, Inc./Simmons Prepared Foods, Inc./Simmons Pet Food, Inc./Simmons Feed, 4.63%, due 03/01/29 144A | | | 41,307 | |
| | 850,000 | | | | | Simon Property Group, LP REIT, 6.75%, due 02/01/40 | | | 1,114,008 | |
| | 270,000 | | | | | Sinopec Group Overseas Development 2018, Ltd., 3.68%, due 08/08/49 144A | | | 241,302 | |
| | 384,000 | | | | | Sirius XM Radio, Inc., 4.00%, due 07/15/28 144A | | | 365,320 | |
| | 431,000 | | | | | Sirius XM Radio, Inc., 5.00%, due 08/01/27(e) 144A | | | 430,703 | |
| | 220,000 | | | | | SMBC Aviation Capital Finance DAC, 2.30%, due 06/15/28 144A | | | 195,392 | |
| | 810,000 | | | | | Societe Generale SA, 1.18% (SOFR + 1.05%), due 01/21/26(c) 144A | | | 799,895 | |
| | 1,475,000 | | | | | Societe Generale SA, 1.79% (1 yr. CMT + 1.00%), due 06/09/27(c) 144A | | | 1,331,154 | |
| | 410,000 | | | | | Societe Generale SA, 2.80% (1 yr. CMT + 1.30%), due 01/19/28(c) 144A | | | 384,371 | |
| | 385,000 | | | | | Societe Generale SA, 4.75% (5 yr. CMT + 3.93%)(c) (f) 144A | | | 359,975 | |
| | 284,000 | | | | | Societe Generale SA, 5.38% (5 yr. CMT + 4.51%)(c) (e) (f) 144A | | | 265,557 | |
See accompanying Notes to the Financial Statements.
91
Mercer Core Fixed Income Fund
Schedule of Investments (Continued)
(showing percentage of net assets)
March 31, 2022
| | | | | | | | | | |
| Par Value(a) | | | | | Description | | Value ($) | |
| | | |
| | | | | | Corporate Debt — continued | | | |
| | 529,000 | | | | | SoftBank Group Corp., 6.88% (5 yr. USD ICE swap + 4.85%)(c) (f) (j) | | | 525,826 | |
| | 200,000 | | | | | Sotheby’s, 7.38%, due 10/15/27(e) 144A | | | 205,149 | |
| | 570,000 | | | | | Southern California Edison Co., 3.45%, due 02/01/52 | | | 513,486 | |
| | 335,000 | | | | | Southern California Edison Co., 4.00%, due 04/01/47 | | | 323,181 | |
| | 1,318,000 | | | | | Southern Co. (The), 3.25%, due 07/01/26 | | | 1,320,013 | |
| | 1,260,000 | | | | | Southern Co. Gas Capital Corp., 2.45%, due 10/01/23 | | | 1,255,705 | |
| | 755,000 | | | | | Southwest Airlines Co., 2.63%, due 02/10/30(e) | | | 689,635 | |
| | 144,000 | | | | | Southwestern Energy Co., 4.75%, due 02/01/32 | | | 144,021 | |
| | 26,000 | | | | | Specialty Building Products Holdings LLC/SBP Finance Corp., 6.38%, due 09/30/26 144A | | | 26,477 | |
| | 1,701,000 | | | | | Spirit Realty, LP REIT, 2.10%, due 03/15/28 | | | 1,543,364 | |
| | 300,000 | | | | | Sprint Corp., 7.13%, due 06/15/24 | | | 322,140 | |
| | 598,000 | | | | | Stagwell Global LLC, 5.63%, due 08/15/29 144A | | | 564,931 | |
| | 118,000 | | | | | Standard Industries, Inc., 3.38%, due 01/15/31 144A | | | 103,428 | |
| | 493,000 | | | | | Standard Industries, Inc., 4.38%, due 07/15/30 144A | | | 452,180 | |
| | 25,000 | | | | | Standard Industries, Inc., 4.75%, due 01/15/28 144A | | | 23,951 | |
| | 175,000 | | | | | Starwood Property Trust, Inc. REIT, 3.63%, due 07/15/26 144A | | | 167,338 | |
| | 200,000 | | | | | State Grid Overseas Investment BVI, Ltd., 3.50%, due 05/04/27 144A | | | 201,702 | |
| | 330,000 | | | | | State Street Corp., 3.15% (SOFR + 2.65%), due 03/30/31(c) | | | 325,756 | |
| | 920,000 | | | | | Steel Dynamics, Inc., 3.45%, due 04/15/30 | | | 907,626 | |
| | 605,000 | | | | | Stellantis Finance US, Inc., 2.69%, due 09/15/31(e) 144A | | | 532,044 | |
| | 311,000 | | | | | StoneMor, Inc., 8.50%, due 05/15/29 144A | | | 308,504 | |
| | 186,000 | | | | | Suburban Propane Partners, LP/Suburban Energy Finance Corp., 5.00%, due 06/01/31 144A | | | 174,626 | |
| | 77,000 | | | | | Sunoco, LP/Sunoco Finance Corp., 4.50%, due 05/15/29 | | | 72,742 | |
| | 297,000 | | | | | Sunoco, LP/Sunoco Finance Corp., 4.50%, due 04/30/30 144A | | | 274,072 | |
| | 68,000 | | | | | Switch, Ltd., 3.75%, due 09/15/28 144A | | | 66,065 | |
| | 670,000 | | | | | T-Mobile USA, Inc., 2.05%, due 02/15/28 | | | 613,154 | |
| | 254,000 | | | | | T-Mobile USA, Inc., 2.55%, due 02/15/31 | | | 230,729 | |
| | 50,000 | | | | | T-Mobile USA, Inc., 2.88%, due 02/15/31 | | | 45,125 | |
| | 521,000 | | | | | T-Mobile USA, Inc., 3.38%, due 04/15/29 | | | 496,252 | |
| | 2,019,000 | | | | | T-Mobile USA, Inc., 3.50%, due 04/15/25 | | | 2,034,431 | |
| | 388,000 | | | | | T-Mobile USA, Inc., 3.75%, due 04/15/27 | | | 390,918 | |
| | 742,000 | | | | | T-Mobile USA, Inc., 3.88%, due 04/15/30 | | | 745,905 | |
| | 1,479,000 | | | | | T-Mobile USA, Inc., 4.50%, due 04/15/50 | | | 1,501,537 | |
| | 225,000 | | | | | Tallgrass Energy Partners, LP/Tallgrass Energy Finance Corp., 6.00%, due 12/31/30(e) 144A | | | 218,672 | |
| | 560,000 | | | | | Targa Resources Corp., 4.95%, due 04/15/52(g) | | | 571,594 | |
| | 467,000 | | | | | Targa Resources Partners, LP/Targa Resources Partners Finance Corp., 4.00%, due 01/15/32 | | | 449,983 | |
| | 150,000 | | | | | Taylor Morrison Communities, Inc., 5.13%, due 08/01/30(e) 144A | | | 146,845 | |
| | 110,000 | | | | | Taylor Morrison Communities, Inc., 5.88%, due 06/15/27 144A | | | 114,632 | |
| | 175,000 | | | | | Taylor Morrison Communities, Inc., 6.63%, due 07/15/27 144A | | | 180,037 | |
| | 150,000 | | | | | Taylor Morrison Communities, Inc./Taylor Morrison Holdings II, Inc., 5.63%, due 03/01/24 144A | | | 154,536 | |
| | 926,000 | | | | | Teachers Insurance & Annuity Association of America, 4.27%, due 05/15/47(e) 144A | | | 982,338 | |
| | 34,000 | | | | | Teachers Insurance & Annuity Association of America, 6.85%, due 12/16/39 144A | | | 44,710 | |
| | 158,000 | | | | | Telecom Argentina SA, 8.00%, due 07/18/26 144A | | | 150,732 | |
| | 48,000 | | | | | Telecom Italia Capital SA, 7.20%, due 07/18/36 | | | 46,768 | |
See accompanying Notes to the Financial Statements.
92
Mercer Core Fixed Income Fund
Schedule of Investments (Continued)
(showing percentage of net assets)
March 31, 2022
| | | | | | | | | | |
| Par Value(a) | | | | | Description | | Value ($) | |
| | | |
| | | | | | Corporate Debt — continued | | | |
| | 1,125,000 | | | | | Teledyne Technologies, Inc., 2.75%, due 04/01/31 | | | 1,044,369 | |
| | 760,000 | | | | | Telefonaktiebolaget LM Ericsson, 4.13%, due 05/15/22 | | | 760,927 | |
| | 250,000 | | | | | Telefonica Celular del Paraguay SA, 5.88%, due 04/15/27 144A | | | 253,559 | |
| | 838,000 | | | | | Telefonica Emisiones SA, 5.21%, due 03/08/47 | | | 901,476 | |
| | 163,000 | | | | | Telesat Canada/Telesat LLC, 5.63%, due 12/06/26 144A | | | 124,646 | |
| | 50,000 | | | | | Tenet Healthcare Corp., 4.38%, due 01/15/30 144A | | | 48,061 | |
| | 223,000 | | | | | Tenet Healthcare Corp., 4.63%, due 07/15/24(e) | | | 224,281 | |
| | 1,354,000 | | | | | Textron, Inc., 3.00%, due 06/01/30 | | | 1,294,012 | |
| | 83,000 | | | | | Toll Brothers Finance Corp., 3.80%, due 11/01/29(e) | | | 80,361 | |
| | 1,595,000 | | | | | Toll Brothers Finance Corp., 4.35%, due 02/15/28 | | | 1,605,384 | |
| | 1,475,000 | | | | | Toronto-Dominion Bank (The), 1.95%, due 01/12/27(e) | | | 1,398,650 | |
| | 321,000 | | | | | Total Play Telecomunicaciones SA de CV, 6.38%, due 09/20/28 144A | | | 286,666 | |
| | 548,000 | | | | | Total Play Telecomunicaciones SA de CV, 7.50%, due 11/12/25 144A | | | 532,941 | |
| | 88,000 | | | | | Townsquare Media, Inc., 6.88%, due 02/01/26 144A | | | 90,783 | |
| | 2,018,000 | | | | | Toyota Motor Credit Corp., (MTN), 3.00%, due 04/01/25 | | | 2,022,795 | |
| | 251,000 | | | | | TransCanada PipeLines, Ltd., 4.25%, due 05/15/28(e) | | | 261,153 | |
| | 140,000 | | | | | Transcontinental Gas Pipe Line Co. LLC, 3.95%, due 05/15/50 | | | 136,653 | |
| | 500,000 | | | | | Transcontinental Gas Pipe Line Co. LLC, 4.60%, due 03/15/48 | | | 535,322 | |
| | 735,000 | | | | | TransDigm, Inc., 5.50%, due 11/15/27 | | | 730,403 | |
| | 175,000 | | | | | Travel + Leisure Co., 4.63%, due 03/01/30 144A | | | 163,083 | |
| | 166,000 | | | | | Travel + Leisure Co., 6.60%, due 10/01/25(d) (e) | | | 176,536 | |
| | 55,000 | | | | | Trident TPI Holdings, Inc., 6.63%, due 11/01/25 144A | | | 54,325 | |
| | 212,000 | | | | | TriNet Group, Inc., 3.50%, due 03/01/29 144A | | | 195,200 | |
| | 232,000 | | | | | Trinseo Materials Operating SCA/Trinseo Materials Finance, Inc., 5.13%, due 04/01/29 144A | | | 214,516 | |
| | 248,000 | | | | | Tronox, Inc., 4.63%, due 03/15/29 144A | | | 232,489 | |
| | 1,040,000 | | | | | Truist Bank, 2.25%, due 03/11/30 | | | 954,446 | |
| | 342,000 | | | | | Tutor Perini Corp., 6.88%, due 05/01/25(e) 144A | | | 325,683 | |
| | 191,000 | | | | | Twitter, Inc., 3.88%, due 12/15/27(e) 144A | | | 185,896 | |
| | 532,000 | | | | | Uber Technologies, Inc., 4.50%, due 08/15/29 144A | | | 499,747 | |
| | 285,000 | | | | | Uber Technologies, Inc., 7.50%, due 05/15/25 144A | | | 297,712 | |
| | 451,000 | | | | | Uber Technologies, Inc., 7.50%, due 09/15/27 144A | | | 481,445 | |
| | 765,000 | | | | | UBS Group AG, 1.49% (1 yr. CMT + 0.85%), due 08/10/27(c) (e) 144A | | | 695,480 | |
| | 375,000 | | | | | UBS Group AG, 2.10% (1 yr. CMT + 1.00%), due 02/11/32(c) 144A | | | 328,587 | |
| | 1,897,000 | | | | | UBS Group AG, 4.13%, due 04/15/26 144A | | | 1,933,806 | |
| | 305,000 | | | | | UBS Group AG, 7.00% (5 yr. USD swap + 4.34%)(c) (f) 144A | | | 318,422 | |
| | 362,000 | | | | | Unifin Financiera SAB de CV, 9.88%, due 01/28/29 144A | | | 213,508 | |
| | 510,150 | | | | | United Airlines Pass Through Trust, 3.45%, due 01/07/30 | | | 476,508 | |
| | 327,389 | | | | | United Airlines Pass Through Trust, 3.65%, due 07/07/27 | | | 309,466 | |
| | 553,400 | | | | | United Airlines Pass Through Trust, 3.75%, due 03/03/28 | | | 541,046 | |
| | 2,281,556 | | | | | United Airlines Pass Through Trust, 4.00%, due 10/11/27 | | | 2,293,827 | |
| | 255,098 | | | | | United Airlines Pass Through Trust, 4.55%, due 02/25/33 | | | 256,070 | |
| | 80,292 | | | | | United Airlines Pass Through Trust, 4.60%, due 09/01/27 | | | 73,482 | |
| | 113,504 | | | | | United Airlines Pass Through Trust, 4.63%, due 03/03/24 | | | 114,157 | |
| | 220,320 | | | | | United Airlines Pass Through Trust, 4.88%, due 07/15/27 | | | 217,755 | |
| | 941,576 | | | | | United Airlines Pass Through Trust, 5.88%, due 04/15/29 | | | 976,189 | |
| | 307,000 | | | | | United Airlines, Inc., 4.38%, due 04/15/26 144A | | | 302,395 | |
| | 98,000 | | | | | United Airlines, Inc., 4.63%, due 04/15/29 144A | | | 93,318 | |
| | 268,000 | | | | | United Parcel Service, Inc., 5.30%, due 04/01/50 | | | 352,024 | |
See accompanying Notes to the Financial Statements.
93
Mercer Core Fixed Income Fund
Schedule of Investments (Continued)
(showing percentage of net assets)
March 31, 2022
| | | | | | | | | | |
| Par Value(a) | | | | | Description | | Value ($) | |
| | | |
| | | | | | Corporate Debt — continued | | | |
| | 150,000 | | | | | United Rentals North America, Inc., 3.75%, due 01/15/32 | | | 140,138 | |
| | 251,000 | | | | | United Rentals North America, Inc., 3.88%, due 11/15/27 | | | 248,957 | |
| | 137,000 | | | | | United Rentals North America, Inc., 3.88%, due 02/15/31(e) | | | 129,339 | |
| | 245,000 | | | | | United Rentals North America, Inc., 4.88%, due 01/15/28 | | | 249,140 | |
| | 35,000 | | | | | United Rentals North America, Inc., 5.25%, due 01/15/30 | | | 36,158 | |
| | 75,000 | | | | | United Rentals North America, Inc., 5.50%, due 05/15/27 | | | 77,660 | |
| | 390,000 | | | | | UnitedHealth Group, Inc., 3.05%, due 05/15/41(e) | | | 364,134 | |
| | 124,000 | | | | | Uniti Group, LP/Uniti Group Finance, Inc./CSL Capital LLC REIT, 6.50%, due 02/15/29 144A | | | 115,774 | |
| | 433,000 | | | | | Universal Health Services, Inc., 1.65%, due 09/01/26 144A | | | 397,848 | |
| | 430,000 | | | | | Universal Health Services, Inc., 2.65%, due 10/15/30 144A | | | 390,993 | |
| | 120,000 | | | | | University of Chicago (The), 2.76%, due 04/01/45 | | | 107,041 | |
| | 350,000 | | | | | University of Southern California, 2.95%, due 10/01/51(e) | | | 312,297 | |
| | 122,000 | | | | | Univision Communications, Inc., 4.50%, due 05/01/29 144A | | | 116,290 | |
| | 182,000 | | | | | Unum Group, 4.13%, due 06/15/51(e) | | | 159,499 | |
| | 1,124,312 | | | | | US Airways Pass Through Trust, 4.63%, due 12/03/26 | | | 1,085,152 | |
| | 77,430 | | | | | US Airways Pass Through Trust, 5.90%, due 04/01/26 | | | 80,090 | |
| | 83,753 | | | | | US Airways Pass Through Trust, 6.25%, due 10/22/24 | | | 84,429 | |
| | 210,064 | | | | | US Airways Pass Through Trust, 7.13%, due 04/22/25 | | | 214,538 | |
| | 192,000 | | | | | US Foods, Inc., 4.75%, due 02/15/29 144A | | | 183,372 | |
| | 355,000 | | | | | Valvoline, Inc., 3.63%, due 06/15/31 144A | | | 307,320 | |
| | 125,000 | | | | | Valvoline, Inc., 4.25%, due 02/15/30 144A | | | 114,302 | |
| | 165,000 | | | | | Varex Imaging Corp., 7.88%, due 10/15/27 144A | | | 175,110 | |
| | 325,000 | | | | | Vector Group, Ltd., 5.75%, due 02/01/29 144A | | | 296,688 | |
| | 351,000 | | | | | Ventas Realty, LP REIT, 3.50%, due 02/01/25 | | | 352,265 | |
| | 148,000 | | | | | Venture Global Calcasieu Pass LLC, 3.88%, due 08/15/29(e) 144A | | | 144,088 | |
| | 219,000 | | | | | Venture Global Calcasieu Pass LLC, 4.13%, due 08/15/31 144A | | | 215,235 | |
| | 285,000 | | | | | VeriSign, Inc., 2.70%, due 06/15/31 | | | 258,387 | |
| | 207,000 | | | | | VeriSign, Inc., 5.25%, due 04/01/25 | | | 217,590 | |
| | 878,000 | | | | | Verisk Analytics, Inc., 3.63%, due 05/15/50 | | | 829,388 | |
| | 1,300,000 | | | | | Verizon Communications, Inc., 2.55%, due 03/21/31 | | | 1,209,577 | |
| | 578,000 | | | | | Verizon Communications, Inc., 2.88%, due 11/20/50 | | | 484,722 | |
| | 1,224,000 | | | | | Verizon Communications, Inc., 3.55%, due 03/22/51 | | | 1,155,106 | |
| | 1,025,000 | | | | | Verizon Communications, Inc., 4.33%, due 09/21/28 | | | 1,082,881 | |
| | 408,000 | | | | | Verizon Communications, Inc., 4.40%, due 11/01/34 | | | 435,246 | |
| | 338,000 | | | | | Vertiv Group Corp., 4.13%, due 11/15/28 144A | | | 308,864 | |
| | 219,000 | | | | | Viatris, Inc., 2.30%, due 06/22/27 | | | 199,696 | |
| | 584,000 | | | | | Viatris, Inc., 2.70%, due 06/22/30(e) | | | 514,491 | |
| | 325,000 | | | | | Viatris, Inc., 3.85%, due 06/22/40 | | | 281,938 | |
| | 568,000 | | | | | Viatris, Inc., 4.00%, due 06/22/50(e) | | | 479,048 | |
| | 179,000 | | | | | VICI Properties, LP/VICI Note Co., Inc. REIT, 4.13%, due 08/15/30(e) 144A | | | 173,141 | |
| | 270,000 | | | | | VICI Properties, LP/VICI Note Co., Inc. REIT, 4.63%, due 12/01/29 144A | | | 269,830 | |
| | 184,000 | | | | | Videotron, Ltd., 3.63%, due 06/15/29(e) 144A | | | 170,991 | |
| | 1,400,000 | | | | | Virginia Electric & Power Co., 3.15%, due 01/15/26(e) | | | 1,403,137 | |
| | 460,000 | | | | | Vistra Operations Co. LLC, 3.55%, due 07/15/24 144A | | | 455,979 | |
| | 821,000 | | | | | Vistra Operations Co. LLC, 3.70%, due 01/30/27 144A | | | 789,223 | |
| | 626,000 | | | | | Vistra Operations Co. LLC, 4.30%, due 07/15/29 144A | | | 605,003 | |
| | 135,000 | | | | | Vistra Operations Co. LLC, 5.00%, due 07/31/27 144A | | | 133,042 | |
| | 546,000 | | | | | Vodafone Group Plc, 7.00% (5 yr. USD swap + 4.87%), due 04/04/79(c) | | | 604,255 | |
See accompanying Notes to the Financial Statements.
94
Mercer Core Fixed Income Fund
Schedule of Investments (Continued)
(showing percentage of net assets)
March 31, 2022
| | | | | | | | | | |
| Par Value(a) | | | | | Description | | Value ($) | |
| | | |
| | | | | | Corporate Debt — continued | | | |
| | 72,000 | | | | | Volcan Cia Minera SAA, 4.38%, due 02/11/26 144A | | | 69,033 | |
| | 664,000 | | | | | Voya Financial, Inc., 5.65% (3 mo. USD LIBOR + 3.58%), due 05/15/53(c) | | | 668,967 | |
| | 393,000 | | | | | Vulcan Materials Co., 3.50%, due 06/01/30 | | | 390,326 | |
| | 340,000 | | | | | WakeMed, 3.29%, due 10/01/52 | | | 298,967 | |
| | 598,000 | | | | | Walt Disney Co. (The), 4.70%, due 03/23/50(e) | | | 696,634 | |
| | 240,000 | | | | | Waste Connections, Inc., 3.20%, due 06/01/32 | | | 234,435 | |
| | 45,000 | | | | | Watco Cos. LLC/Watco Finance Corp., 6.50%, due 06/15/27 144A | | | 44,330 | |
| | 490,000 | | | | | Wells Fargo & Co., 3.07% (SOFR + 2.53%), due 04/30/41(c) | | | 442,066 | |
| | 1,272,000 | | | | | Wells Fargo & Co., 5.88% (3 mo. USD LIBOR + 3.99%)(c) (f) | | | 1,332,166 | |
| | 1,067,000 | | | | | Wells Fargo & Co., (MTN), 2.39% (SOFR + 2.10%), due 06/02/28(c) | | | 1,010,172 | |
| | 765,000 | | | | | Wells Fargo & Co., (MTN), 2.57% (SOFR + 1.26%), due 02/11/31(c) | | | 711,654 | |
| | 827,000 | | | | | Wells Fargo & Co., (MTN), 2.88% (SOFR + 1.43%), due 10/30/30(c) | | | 786,918 | |
| | 389,000 | | | | | Wells Fargo & Co., (MTN), 3.35% (SOFR + 1.50%), due 03/02/33(c) | | | 378,474 | |
| | 522,000 | | | | | Western Digital Corp., 4.75%, due 02/15/26(e) | | | 530,712 | |
| | 350,000 | | | | | William Carter Co. (The), 5.63%, due 03/15/27 144A | | | 355,607 | |
| | 477,000 | | | | | Williams Cos., Inc. (The), 3.75%, due 06/15/27 | | | 483,033 | |
| | 992,000 | | | | | Williams Cos., Inc. (The), 4.55%, due 06/24/24 | | | 1,019,757 | |
| | 135,000 | | | | | Williams Cos., Inc. (The), 5.75%, due 06/24/44(e) | | | 155,909 | |
| | 60,000 | | | | | Williams Scotsman International, Inc., 4.63%, due 08/15/28 144A | | | 58,568 | |
| | 494,000 | | | | | WMG Acquisition Corp., 3.00%, due 02/15/31(e) 144A | | | 442,856 | |
| | 324,000 | | | | | WMG Acquisition Corp., 3.88%, due 07/15/30 144A | | | 309,266 | |
| | 300,000 | | | | | Wolverine World Wide, Inc., 4.00%, due 08/15/29(e) 144A | | | 266,790 | |
| | 1,289,000 | | | | | Workday, Inc., 3.50%, due 04/01/27(g) | | | 1,289,543 | |
| | 341,000 | | | | | Workday, Inc., 3.80%, due 04/01/32(g) | | | 340,772 | |
| | 665,000 | | | | | WP Carey, Inc. REIT, 2.25%, due 04/01/33 | | | 569,226 | |
| | 124,000 | | | | | WR Grace Holdings LLC, 4.88%, due 06/15/27 144A | | | 121,483 | |
| | 152,000 | | | | | WR Grace Holdings LLC, 5.63%, due 08/15/29 144A | | | 142,515 | |
| | 140,000 | | | | | Wyndham Hotels & Resorts, Inc., 4.38%, due 08/15/28 144A | | | 134,912 | |
| | 1,100,000 | | | | | Xcel Energy, Inc., 3.40%, due 06/01/30 | | | 1,099,538 | |
| | 265,000 | | | | | Xerox Holdings Corp., 5.50%, due 08/15/28(e) 144A | | | 258,714 | |
| | 98,000 | | | | | XHR, LP REIT, 4.88%, due 06/01/29 144A | | | 95,319 | |
| | 610,000 | | | | | Yale University, 2.40%, due 04/15/50 | | | 508,132 | |
| | 1,070,000 | | | | | Yamana Gold, Inc., 2.63%, due 08/15/31 | | | 959,715 | |
| | 1,220,000 | | | | | Yara International ASA, 4.75%, due 06/01/28 144A | | | 1,261,231 | |
| | 201,000 | | | | | Yum! Brands, Inc., 3.63%, due 03/15/31 | | | 183,601 | |
| | 153,000 | | | | | Yum! Brands, Inc., 4.75%, due 01/15/30 144A | | | 150,323 | |
| | 169,000 | | | | | Ziff Davis, Inc., 4.63%, due 10/15/30(e) 144A | | | 161,185 | |
| | | | | | | | | | |
| | | | | | | | | 527,120,133 | |
| | | | | | | | | | |
| | | |
| | | | | | Mortgage Backed Securities - Private Issuers — 9.6% | | | |
| | 188,501 | | | | | Angel Oak Mortgage Trust CMO, Series 2020-R1, Class A1, 0.99%, due 04/25/53(b) 144A | | | 185,667 | |
| | 163,011 | | | | | Angel Oak Mortgage Trust CMO, Series 2021-2, Class A1, 0.99%, due 04/25/66(b) 144A | | | 156,137 | |
| | 393,931 | | | | | Angel Oak Mortgage Trust CMO, Series 2021-4, Class A1, 1.04%, due 01/20/65(b) 144A | | | 374,359 | |
| | 462,707 | | | | | Angel Oak Mortgage Trust CMO, Series 2021-5, Class A1, 0.95%, due 07/25/66(b) 144A | | | 438,720 | |
| | 1,800,000 | | | | | Arbor Multifamily Mortgage Securities Trust, Series 2020-MF1, Class A4, 2.50%, due 05/15/53 144A | | | 1,701,744 | |
See accompanying Notes to the Financial Statements.
95
Mercer Core Fixed Income Fund
Schedule of Investments (Continued)
(showing percentage of net assets)
March 31, 2022
| | | | | | | | | | |
| Par Value(a) | | | | | Description | | Value ($) | |
| | | |
| | | | | | Mortgage Backed Securities - Private Issuers — continued | | | |
| | 2,500,000 | | | | | Arbor Multifamily Mortgage Securities Trust, Series 2021-MF2, Class A4, 2.25%, due 06/15/54 144A | | | 2,283,912 | |
| | 288,571 | | | | | Arroyo Mortgage Trust CMO, Series 2021-1R, Class A1, 1.18%, due 10/25/48(b) 144A | | | 274,593 | |
| | 147,000 | | | | | BAMLL Commercial Mortgage Securities Trust, Series 2019-BPR, Class ENM, 3.72%, due 11/05/32(b) 144A | | | 128,107 | |
| | 1,200,000 | | | | | BANK, Series 2019-BNK20, Class A2, 2.76%, due 09/15/62 | | | 1,149,664 | |
| | 850,000 | | | | | BANK, Series 2019-BNK23, Class A2, 2.67%, due 12/15/52 | | | 817,609 | |
| | 1,806,000 | | | | | BANK, Series 2020-BNK26, Class A2, 2.04%, due 03/15/63 | | | 1,692,282 | |
| | 1,800,000 | | | | | BANK, Series 2020-BNK26, Class A3, 2.16%, due 03/15/63 | | | 1,661,497 | |
| | 869,000 | | | | | BANK, Series 2020-BNK30, Class A4, 1.93%, due 12/15/53 | | | 777,233 | |
| | 3,000,000 | | | | | BANK, Series 2021-BNK32, Class A4, 2.35%, due 04/15/54 | | | 2,797,653 | |
| | 2,300,000 | | | | | BANK, Series 2021-BNK34, Class A4, 2.16%, due 06/15/63 | | | 2,111,505 | |
| | 193,000 | | | | | Barclays Commercial Mortgage Trust, Series 2019-C5, Class A2, 3.04%, due 11/15/52 | | | 191,992 | |
| | 200,000 | | | | | BBCMS Mortgage Trust, Series 2015-SRCH, Class D, 4.96%, due 08/10/35(b) 144A | | | 199,258 | |
| | 3,000,000 | | | | | BBCMS Mortgage Trust, Series 2018-TALL, Class A, 1.12% (1 mo. USD LIBOR + 0.72%), due 03/15/37(c) 144A | | | 2,929,813 | |
| | 186,000 | | | | | BBCMS Mortgage Trust, Series 2020-C6, Class A2, 2.69%, due 02/15/53 | | | 183,054 | |
| | 1,273,000 | | | | | BBCMS Mortgage Trust, Series 2021-C9, Class A5, 2.30%, due 02/15/54 | | | 1,174,156 | |
| | 2,000,000 | | | | | BBCMS Mortgage Trust, Series 2022-C14, Class A4, 2.69%, due 02/15/55 | | | 1,907,746 | |
| | 91,390 | | | | | Bellemeade Re, Ltd. CMO, Series 2019-3A, Class M1B, 2.06% (1 mo. USD LIBOR + 1.60%), due 07/25/29(c) 144A | | | 91,316 | |
| | 309,000 | | | | | Bellemeade Re, Ltd. CMO, Series 2021-2A, Class M1A, 1.30% (SOFR 30-day average + 1.20%), due 06/25/31(c) 144A | | | 306,135 | |
| | 355,000 | | | | | Benchmark Mortgage Trust, Series 2019-B12, Class A2, 3.00%, due 08/15/52 | | | 351,164 | |
| | 270,000 | | | | | Benchmark Mortgage Trust, Series 2019-B13, Class A2, 2.89%, due 08/15/57 | | | 265,151 | |
| | 1,350,000 | | | | | Benchmark Mortgage Trust, Series 2019-B15, Class A4, 2.67%, due 12/15/72 | | | 1,281,367 | |
| | 657,000 | | | | | Benchmark Mortgage Trust, Series 2019-B15, Class A5, 2.93%, due 12/15/72 | | | 637,168 | |
| | 600,000 | | | | | Benchmark Mortgage Trust, Series 2020-B17, Class A4, 2.04%, due 03/15/53 | | | 546,720 | |
| | 1,200,000 | | | | | Benchmark Mortgage Trust, Series 2020-B20, Class A2, 1.75%, due 10/15/53 | | | 1,135,138 | |
| | 1,800,000 | | | | | Benchmark Mortgage Trust, Series 2020-IG3, Class A2, 2.48%, due 09/15/48 144A | | | 1,764,286 | |
| | 2,210,000 | | | | | Benchmark Mortgage Trust, Series 2021-B23, Class A2, 1.62%, due 02/15/54 | | | 2,080,742 | |
| | 1,700,000 | | | | | Benchmark Mortgage Trust, Series 2021-B23, Class A4A1, 1.82%, due 02/15/54 | | | 1,517,659 | |
| | 900,000 | | | | | Benchmark Mortgage Trust, Series 2021-B24, Class A3, 2.01%, due 03/15/54 | | | 838,124 | |
| | 1,750,000 | | | | | Benchmark Mortgage Trust, Series 2021-B24, Class A4, 2.26%, due 03/15/54 | | | 1,612,894 | |
| | 1,250,000 | | | | | Benchmark Mortgage Trust, Series 2021-B28, Class ASB, 1.98%, due 08/15/54 | | | 1,163,794 | |
| | 1,800,000 | | | | | Benchmark Mortgage Trust, Series 2021-B31, Class A4, 2.42%, due 12/15/54 | | | 1,671,653 | |
| | 1,800,000 | | | | | Benchmark Mortgage Trust, Series 2022-B33, Class A5, 3.46%, due 03/15/55 | | | 1,820,752 | |
| | 189,880 | | | | | BRAVO Residential Funding Trust CMO, Series 2021-NQM2, Class A1, 0.94%, due 02/25/49(b) 144A | | | 184,801 | |
| | 363,519 | | | | | BX Commercial Mortgage Trust, Series 2018-BIOA, Class D, 1.72% (1 mo. USD LIBOR + 1.32%), due 03/15/37(c) 144A | | | 358,659 | |
| | 1,415,701 | | | | | BX Commercial Mortgage Trust, Series 2019-XL, Class A, 1.32% (1 mo. USD LIBOR + 0.92%), due 10/15/36(c) 144A | | | 1,410,480 | |
| | 382,429 | | | | | BX Commercial Mortgage Trust, Series 2020-VKNG, Class A, 1.33% (1 mo. USD LIBOR + 0.93%), due 10/15/37(c) 144A | | | 378,617 | |
| | 269,000 | | | | | BX Commercial Mortgage Trust, Series 2021-ACNT, Class A, 1.25% (1 mo. USD LIBOR + 0.85%), due 11/15/38(c) 144A | | | 265,722 | |
See accompanying Notes to the Financial Statements.
96
Mercer Core Fixed Income Fund
Schedule of Investments (Continued)
(showing percentage of net assets)
March 31, 2022
| | | | | | | | | | |
| Par Value(a) | | | | | Description | | Value ($) | |
| | | |
| | | | | | Mortgage Backed Securities - Private Issuers — continued | | | |
| | 1,025,000 | | | | | BX Commercial Mortgage Trust, Series 2021-CIP, Class A, 1.32% (1 mo. USD LIBOR + 0.92%), due 12/15/38(c) 144A | | | 1,009,740 | |
| | 1,516,000 | | | | | BX Commercial Mortgage Trust, Series 2021-VOLT, Class A, 1.10% (1 mo. USD LIBOR + 0.70%), due 09/15/36(c) 144A | | | 1,479,035 | |
| | 342,000 | | | | | BX Commercial Mortgage Trust, Series 2021-VOLT, Class C, 1.50% (1 mo. USD LIBOR + 1.10%), due 09/15/36(c) 144A | | | 328,857 | |
| | 776,000 | | | | | BX Commercial Mortgage Trust, Series 2022-AHP, Class A, 1.29% (1 mo. TSFR + 0.99%), due 01/17/39(c) 144A | | | 766,975 | |
| | 1,200,000 | | | | | CD Mortgage Trust, Series 2019-CD8, Class A3, 2.66%, due 08/15/57 | | | 1,125,775 | |
| | 988,025 | | | | | CF Mortgage Trust, Series 2020-P1, Class A1, 2.84%, due 04/15/25(b) 144A | | | 952,175 | |
| | 653,007 | | | | | CFCRE Commercial Mortgage Trust, Series 2016-C4, Class A3, 3.01%, due 05/10/58 | | | 645,339 | |
| | 2,349,356 | | | | | CFCRE Commercial Mortgage Trust, Series 2016-C6, Class A2, 2.95%, due 11/10/49 | | | 2,293,114 | |
| | 562,070 | | | | | CIM Trust CMO, Series 2020-INV1, Class A2, 2.50%, due 04/25/50(b) 144A | | | 549,201 | |
| | 330,000 | | | | | Citigroup Commercial Mortgage Trust, Series 2019-C7, Class A3, 2.86%, due 12/15/72 | | | 318,112 | |
| | 283,000 | | | | | Citigroup Commercial Mortgage Trust, Series 2019-PRM, Class A, 3.34%, due 05/10/36 144A | | | 281,939 | |
| | 176,000 | | | | | Citigroup Commercial Mortgage Trust, Series 2019-SMRT, Class A, 4.15%, due 01/10/36 144A | | | 178,138 | |
| | 27,500,000 | | | | | Citigroup Commercial Mortgage Trust, (IO), Series 2014-GC21, Class XB, 0.44%, due 05/10/47(b) 144A | | | 244,700 | |
| | 367,544 | | | | | COLT Mortgage Loan Trust CMO, Series 2021-2, Class A1, 0.92%, due 08/25/66(b) 144A | | | 341,554 | |
| | 543,025 | | | | | COLT Mortgage Loan Trust CMO, Series 2021-3, Class A1, 0.96%, due 09/27/66(b) 144A | | | 505,334 | |
| | 414,159 | | | | | COLT Mortgage Loan Trust CMO, Series 2021-HX1, Class A1, 1.11%, due 10/25/66(b) 144A | | | 387,023 | |
| | 587,750 | | | | | COLT Trust CMO, Series 2020-RPL1, Class A1, 1.39%, due 01/25/65(b) 144A | | | 556,152 | |
| | 235,000 | | | | | Commercial Mortgage Trust, Series 2013-300P, Class D, 4.39%, due 08/10/30(b) 144A | | | 231,304 | |
| | 670,493 | | | | | Commercial Mortgage Trust, Series 2013-LC6, Class A4, 2.94%, due 01/10/46 | | | 671,590 | |
| | 917,862 | | | | | Commercial Mortgage Trust, Series 2015-CR25, Class A3, 3.51%, due 08/10/48 | | | 913,366 | |
| | 862,000 | | | | | Commercial Mortgage Trust, Series 2015-CR27, Class A4, 3.61%, due 10/10/48 | | | 869,182 | |
| | 223,000 | | | | | Commercial Mortgage Trust, Series 2020-CBM, Class A2, 2.90%, due 02/10/37 144A | | | 216,419 | |
| | 518,000 | | | | | Connecticut Avenue Securities Trust CMO, Series 2022-R03, Class 1M1, 2.20% (SOFR 30-day average + 2.10%), due 03/25/42(c) 144A | | | 517,718 | |
| | 355,000 | | | | | Credit Suisse Mortgage Capital Certificates, Series 2019-ICE4, Class D, 2.00% (1 mo. USD LIBOR + 1.60%), due 05/15/36(c) 144A | | | 351,378 | |
| | 267,265 | | | | | Credit Suisse Mortgage Trust CMO, Series 2018-RPL9, Class A, 3.85%, due 09/25/57(b) 144A | | | 268,118 | |
| | 292,159 | | | | | Credit Suisse Mortgage Trust CMO, Series 2020-RPL6, Class A1, 2.69%, due 03/25/59(b) 144A | | | 286,552 | |
| | 289,080 | | | | | Credit Suisse Mortgage Trust CMO, Series 2021-NQM2, Class A1, 1.18%, due 02/25/66(b) 144A | | | 279,696 | |
| | 246,768 | | | | | Credit Suisse Mortgage Trust CMO, Series 2021-NQM3, Class A1, 1.02%, due 04/25/66(b) 144A | | | 235,793 | |
| | 251,767 | | | | | Credit Suisse Mortgage Trust CMO, Series 2021-NQM5, Class A1, 0.94%, due 05/25/66(b) 144A | | | 238,707 | |
See accompanying Notes to the Financial Statements.
97
Mercer Core Fixed Income Fund
Schedule of Investments (Continued)
(showing percentage of net assets)
March 31, 2022
| | | | | | | | | | |
| Par Value(a) | | | | | Description | | Value ($) | |
| | | |
| | | | | | Mortgage Backed Securities - Private Issuers — continued | | | |
| | 411,016 | | | | | Credit Suisse Mortgage Trust CMO, Series 2021-NQM6, Class A1, 1.17%, due 07/25/66(b) 144A | | | 387,929 | |
| | 1,065,505 | | | | | CSAIL Commercial Mortgage Trust, Series 2017-C8, Class A3, 3.13%, due 06/15/50 | | | 1,034,837 | |
| | 775,000 | | | | | CSAIL Commercial Mortgage Trust, Series 2017-CX10, Class A4, 3.19%, due 11/15/50 | | | 760,742 | |
| | 1,050,000 | | | | | CSAIL Commercial Mortgage Trust, Series 2019-C18, Class A3, 2.72%, due 12/15/52 | | | 993,142 | |
| | 1,900,000 | | | | | CSAIL Commercial Mortgage Trust, Series 2021-C20, Class A2, 2.49%, due 03/15/54 | | | 1,783,347 | |
| | 119,303 | | | | | Ellington Financial Mortgage Trust CMO, Series 2021-1, Class A1, 0.80%, due 02/25/66(b) 144A | | | 115,000 | |
| | 265,618 | | | | | Ellington Financial Mortgage Trust CMO, Series 2021-2, Class A1, 0.93%, due 06/25/66(b) 144A | | | 249,549 | |
| | 1,364,688 | | | | | FHLMC Seasoned Credit Risk Transfer Trust CMO, Series 2018-2, Class MA, 3.50%, due 11/25/57 | | | 1,371,853 | |
| | 482,158 | | | | | FHLMC Seasoned Credit Risk Transfer Trust CMO, Series 2018-3, Class MA, 3.50%, due 08/25/57(b) | | | 484,809 | |
| | 1,914,108 | | | | | FHLMC Seasoned Credit Risk Transfer Trust CMO, Series 2018-4, Class MA, 3.50%, due 03/25/58 | | | 1,923,741 | |
| | 806,870 | | | | | FHLMC Seasoned Credit Risk Transfer Trust CMO, Series 2019-1, Class MA, 3.50%, due 07/25/58 | | | 811,186 | |
| | 1,451,311 | | | | | FHLMC Seasoned Credit Risk Transfer Trust CMO, Series 2019-2, Class MA, 3.50%, due 08/25/58 | | | 1,457,712 | |
| | 1,007,459 | | | | | FHLMC Seasoned Credit Risk Transfer Trust CMO, Series 2020-1, Class MA, 2.50%, due 08/25/59 | | | 985,948 | |
| | 917,918 | | | | | FHLMC Structured Agency Credit Risk Debt Notes CMO, Series 2019-HQA2, Class M2, 2.51% (1 mo. USD LIBOR + 2.05%), due 04/25/49(c) 144A | | | 918,216 | |
| | 379,429 | | | | | FHLMC Structured Agency Credit Risk Debt Notes CMO, Series 2022-DNA2, Class M1A, 1.40% (SOFR 30-day average + 1.30%), due 02/25/42(c) 144A | | | 377,320 | |
| | 437,000 | | | | | FHLMC Structured Agency Credit Risk Debt Notes CMO, Series 2022-DNA2, Class M1B, 2.50% (SOFR 30-day average + 2.40%), due 02/25/42(c) 144A | | | 425,834 | |
| | 1,155,000 | | | | | FHLMC Structured Agency Credit Risk REMIC Trust CMO, Series 2022-DNA1, Class M1A, 1.10% (SOFR 30-day average + 1.00%), due 01/25/42(c) 144A | | | 1,135,402 | |
| | 48,270 | | | | | FHLMC Structured Agency Credit Risk REMIC Trust CMO, Series 2020-HQA3, Class M2, 4.06% (1 mo. USD LIBOR + 3.60%), due 07/25/50(c) 144A | | | 48,338 | |
| | 311,565 | | | | | Flagstar Mortgage Trust CMO, Series 2020-2, Class A2, 3.00%, due 08/25/50(b) 144A | | | 305,867 | |
| | 510,686 | | | | | Flagstar Mortgage Trust CMO, Series 2021-1, Class A2, 2.50%, due 02/01/51(b) 144A | | | 475,394 | |
| | 1,434,029 | | | | | Flagstar Mortgage Trust CMO, Series 2021-6INV, Class A4, 2.50%, due 08/25/51(b) 144A | | | 1,334,927 | |
| | 206,140 | | | | | GCAT Trust CMO, Series 2021-NQM2, Class A1, 1.04%, due 05/25/66(b) 144A | | | 195,833 | |
| | 236,496 | | | | | GCAT Trust CMO, Series 2021-NQM1, Class A1, 0.87%, due 01/25/66(b) 144A | | | 227,800 | |
| | 340,118 | | | | | GCAT Trust CMO, Series 2021-NQM3, Class A1, 1.09%, due 05/25/66(b) 144A | | | 323,344 | |
| | 445,385 | | | | | GS Mortgage Securities Corp. Trust, Series 2021-RENT, Class A, 1.15% (1 mo. USD LIBOR + 0.70%), due 11/21/35(c) 144A | | | 440,864 | |
| | 872,203 | | | | | GS Mortgage Securities Trust, Series 2015-GC28, Class A4, 3.14%, due 02/10/48 | | | 863,615 | |
| | 2,646,560 | | | | | GS Mortgage Securities Trust, Series 2015-GC30, Class A3, 3.12%, due 05/10/50 | | | 2,610,471 | |
| | 300,000 | | | | | GS Mortgage Securities Trust, Series 2019-GC40, Class A2, 2.97%, due 07/10/52 | | | 297,501 | |
| | 1,600,000 | | | | | GS Mortgage Securities Trust, Series 2020-GC47, Class A4, 2.12%, due 05/12/53 | | | 1,442,495 | |
| | 1,062,000 | | | | | GS Mortgage Securities Trust, Series 2020-GSA2, Class A5, 2.01%, due 12/12/53 | | | 948,686 | |
See accompanying Notes to the Financial Statements.
98
Mercer Core Fixed Income Fund
Schedule of Investments (Continued)
(showing percentage of net assets)
March 31, 2022
| | | | | | | | | | |
| Par Value(a) | | | | | Description | | Value ($) | |
| | | |
| | | | | | Mortgage Backed Securities - Private Issuers — continued | | | |
| | 1,143,000 | | | | | GS Mortgage Securities Trust, Series 2020-GSA2, Class AAB, 1.66%, due 12/12/53 | | | 1,052,264 | |
| | 196,000 | | | | | GS Mortgage Securities Trust, Series 2020-UPTN, Class A, 2.75%, due 02/10/37 144A | | | 189,207 | |
| | 1,900,000 | | | | | GS Mortgage Securities Trust, Series 2021-GSA3, Class A4, 2.37%, due 12/15/54 | | | 1,746,157 | |
| | 68,696 | | | | | GS Mortgage-Backed Securities Trust CMO, Series 2020-NQM1, Class A1, 1.38%, due 09/27/60(b) 144A | | | 67,115 | |
| | 156,189 | | | | | GS Mortgage-Backed Securities Trust CMO, Series 2021-NQM1, Class A1, 1.02%, due 07/25/61(b) 144A | | | 150,370 | |
| | 1,790,321 | | | | | GS Mortgage-Backed Securities Trust CMO, Series 2021-PJ2, Class A2, 2.50%, due 07/25/51(b) 144A | | | 1,656,680 | |
| | 735,000 | | | | | Home RE, Ltd. CMO, Series 2021-2, Class M1A, 1.35% (SOFR 30-day average + 1.25%), due 01/25/34(c) 144A | | | 729,225 | |
| | 200,186 | | | | | Imperial Fund Mortgage Trust CMO, Series 2021-NQM1, Class A1, 1.07%, due 06/25/56(b) 144A | | | 189,182 | |
| | 170,000 | | | | | IMT Trust, Series 2017-APTS, Class CFX, 3.50%, due 06/15/34(b) 144A | | | 166,885 | |
| | 335,000 | | | | | Irvine Core Office Trust, Series 2013-IRV, Class A2, 3.17%, due 05/15/48(b) 144A | | | 335,674 | |
| | 474,370 | | | | | JPMBB Commercial Mortgage Securities Trust, Series 2014-C19, Class A3, 3.67%, due 04/15/47 | | | 473,688 | |
| | 217,944 | | | | | JPMBB Commercial Mortgage Securities Trust, Series 2015-C32, Class A2, 2.82%, due 11/15/48 | | | 218,762 | |
| | 700,000 | | | | | JPMDB Commercial Mortgage Securities Trust, Series 2016-C2, Class A3A, 2.88%, due 06/15/49 | | | 688,177 | |
| | 942,625 | | | | | JPMDB Commercial Mortgage Securities Trust, Series 2017-C5, Class A4, 3.41%, due 03/15/50 | | | 925,465 | |
| | 1,449,919 | | | | | JPMorgan Chase Commercial Mortgage Securities Trust, Series 2013-LC11, Class A4, 2.69%, due 04/15/46 | | | 1,447,929 | |
| | 716,812 | | | | | JPMorgan Chase Commercial Mortgage Securities Trust, Series 2016-JP2, Class A3, 2.56%, due 08/15/49 | | | 693,621 | |
| | 1,600,000 | | | | | JPMorgan Chase Commercial Mortgage Securities Trust, Series 2017-JP6, Class A3, 3.11%, due 07/15/50 | | | 1,592,196 | |
| | 938,000 | | | | | JPMorgan Chase Commercial Mortgage Securities Trust, Series 2019-COR5, Class A2, 3.15%, due 06/13/52 | | | 929,671 | |
| | 267,000 | | | | | JPMorgan Chase Commercial Mortgage Securities Trust, Series 2020-NNN, Class AFX, 2.81%, due 01/16/37 144A | | | 259,355 | |
| | 1,568,968 | | | | | JPMorgan Mortgage Trust CMO, Series 2021-3, Class A3, 2.50%, due 07/25/51(b) 144A | | | 1,458,407 | |
| | 193,000 | | | | | KNDL Mortgage Trust, Series 2019-KNSQ, Class D, 1.75% (1 mo. USD LIBOR + 1.35%), due 05/15/36(c) 144A | | | 190,766 | |
| | 669,029 | | | | | Legacy Mortgage Asset Trust CMO, Series 2019-PRI, Class A1, 3.86%, due 09/25/59(d) 144A | | | 662,670 | |
| | 228,331 | | | | | Legacy Mortgage Asset Trust CMO, Series 2020-GS1, Class A1, 2.88%, due 10/25/59(d) 144A | | | 228,550 | |
| | 86,569 | | | | | Legacy Mortgage Asset Trust CMO, Series 2021-GS1, Class A1, 1.89%, due 10/25/66(d) 144A | | | 84,086 | |
| | 378,444 | | | | | Life Mortgage Trust, Series 2021-BMR, Class A, 1.10% (1 mo. USD LIBOR + 0.70%), due 03/15/38(c) 144A | | | 370,366 | |
| | 331,261 | | | | | Life Mortgage Trust, Series 2021-BMR, Class D, 1.80% (1 mo. USD LIBOR + 1.40%), due 03/15/38(c) 144A | | | 320,738 | |
| | 600,000 | | | | | Mello Warehouse Securitization Trust CMO, Series 2021-1, Class A, 1.16% (1 mo. USD LIBOR + 0.70%), due 02/25/55(c) 144A | | | 595,871 | |
See accompanying Notes to the Financial Statements.
99
Mercer Core Fixed Income Fund
Schedule of Investments (Continued)
(showing percentage of net assets)
March 31, 2022
| | | | | | | | | | |
| Par Value(a) | | | | | Description | | Value ($) | |
| | | |
| | | | | | Mortgage Backed Securities - Private Issuers — continued | | | |
| | 446,150 | | | | | MetLife Securitization Trust CMO, Series 2020-INV1, Class A2A, 2.50%, due 05/25/50(b) 144A | | | 430,179 | |
| | 194,368 | | | | | MFA Trust CMO, Series 2021-NQM1, Class A1, 1.15%, due 04/25/65(b) 144A | | | 191,344 | |
| | 100,000 | | | | | Morgan Stanley Bank of America Merrill Lynch Trust, Series 2013-C7, Class A4, 2.92%, due 02/15/46 | | | 100,003 | |
| | 1,737,000 | | | | | Morgan Stanley Bank of America Merrill Lynch Trust, Series 2015-C22, Class A4, 3.31%, due 04/15/48 | | | 1,726,221 | |
| | 800,000 | | | | | Morgan Stanley Bank of America Merrill Lynch Trust, Series 2015-C24, Class A4, 3.73%, due 05/15/48 | | | 806,624 | |
| | 2,204,000 | | | | | Morgan Stanley Capital I Trust, Series 2015-UBS8, Class A4, 3.81%, due 12/15/48 | | | 2,229,430 | |
| | 1,600,000 | | | | | Morgan Stanley Capital I Trust, Series 2016-UB11, Class A3, 2.53%, due 08/15/49 | | | 1,544,029 | |
| | 212,000 | | | | | Morgan Stanley Capital I Trust, Series 2017-CLS, Class D, 1.80% (1 mo. USD LIBOR + 1.40%), due 11/15/34(c) 144A | | | 210,364 | |
| | 2,600,000 | | | | | Morgan Stanley Capital I Trust, Series 2019-H6, Class A3, 3.16%, due 06/15/52 | | | 2,525,628 | |
| | 980,000 | | | | | Morgan Stanley Capital I Trust, Series 2020-HR8, Class A4, 2.04%, due 07/15/53 | | | 886,729 | |
| | 1,725,000 | | | | | Morgan Stanley Capital I Trust, Series 2021-L5, Class A4, 2.73%, due 05/15/54 | | | 1,645,225 | |
| | 95,000 | | | | | Natixis Commercial Mortgage Securities Trust, Series 2018-285M, Class D, 3.79%, due 11/15/32(b) 144A | | | 94,601 | |
| | 165,000 | | | | | Natixis Commercial Mortgage Securities Trust, Series 2018-ALXA, Class C, 4.32%, due 01/15/43(b) 144A | | | 161,166 | |
| | 92,239 | | | | | New Residential Mortgage Loan Trust CMO, Series 2018-4A, Class A1S, 1.21% (1 mo. USD LIBOR + 0.75%), due 01/25/48(c) 144A | | | 91,755 | |
| | 219,234 | | | | | NYMT Loan Trust CMO, Series 2022-CP1, Class A1, 2.04%, due 07/25/61 144A | | | 212,385 | |
| | 9,074 | | | | | Oaktown Re III, Ltd. CMO, Series 2019-1A, Class M1A, 1.86% (1 mo. USD LIBOR + 1.40%), due 07/25/29(c) 144A | | | 9,074 | |
| | 371,234 | | | | | OBX Trust CMO, Series 2021-NQM2, Class A1, 1.10%, due 05/25/61(b) 144A | | | 351,142 | |
| | 122,110 | | | | | OBX Trust CMO, Series 2020-EXP2, Class A3, 2.50%, due 05/25/60(b) 144A | | | 118,758 | |
| | 455,325 | | | | | OBX Trust CMO, Series 2021-NQM3, Class A1, 1.05%, due 07/25/61(b) 144A | | | 429,069 | |
| | 428,167 | | | | | PMT Credit Risk Transfer Trust CMO, Series 2020-2R, Class A, 4.26% (1 mo. USD LIBOR + 3.82%), due 12/25/22(c) 144A | | | 430,810 | |
| | 373,417 | | | | | Provident Funding Mortgage Trust CMO, Series 2020-F1, Class A2, 2.00%, due 01/25/36(b) 144A | | | 352,445 | |
| | 1,858,329 | | | | | PSMC Trust CMO, Series 2021-2, Class A3, 2.50%, due 05/25/51(b) 144A | | | 1,786,850 | |
| | 12,953 | | | | | Radnor RE, Ltd. CMO, Series 2018-1, Class M1, 1.86% (1 mo. USD LIBOR + 1.40%), due 03/25/28(c) 144A | | | 12,957 | |
| | 200,000 | | | | | Radnor RE, Ltd. CMO, Series 2020-1, Class M1B, 1.91% (1 mo. USD LIBOR + 1.45%), due 01/25/30(c) 144A | | | 195,268 | |
| | 421,130 | | | | | Sequoia Mortgage Trust CMO, Series 2020-3, Class A4, 3.00%, due 04/25/50(b) 144A | | | 420,712 | |
| | 1,803,080 | | | | | Sequoia Mortgage Trust CMO, Series 2021-1, Class A1, 2.50%, due 03/25/51(b) 144A | | | 1,678,473 | |
| | 380,000 | | | | | SLG Office Trust, Series 2021-OVA, Class D, 2.85%, due 07/15/41 144A | | | 331,648 | |
| | 953,000 | | | | | SMRT, Series 2022-MINI, Class A, 1.30% (1 mo. TSFR + 1.00%), due 01/15/24(c) 144A | | | 941,891 | |
| | 469,342 | | | | | Starwood Mortgage Residential Trust CMO, Series 2022-1, Class A1, 2.45%, due 12/25/66(b) 144A | | | 448,852 | |
| | 132,000 | | | | | Towd Point Mortgage Trust CMO, Series 2015-1, Class A5, 3.16%, due 10/25/53(b) 144A | | | 131,765 | |
| | 281,125 | | | | | Towd Point Mortgage Trust CMO, Series 2018-1, Class A1, 3.00%, due 01/25/58(b) 144A | | | 280,381 | |
| | 248,474 | | | | | Towd Point Mortgage Trust CMO, Series 2018-4, Class A1, 3.00%, due 06/25/58(b) 144A | | | 244,122 | |
See accompanying Notes to the Financial Statements.
100
Mercer Core Fixed Income Fund
Schedule of Investments (Continued)
(showing percentage of net assets)
March 31, 2022
| | | | | | | | | | |
| Par Value(a) | | | | | Description | | Value ($) | |
| | | |
| | | | | | Mortgage Backed Securities - Private Issuers — continued | | | |
| | 37,195 | | | | | Towd Point Mortgage Trust CMO, Series 2018-5, Class A1A, 3.25%, due 07/25/58(b) 144A | | | 37,388 | |
| | 125,931 | | | | | Towd Point Mortgage Trust CMO, Series 2018-6, Class A1A, 3.75%, due 03/25/58(b) 144A | | | 126,834 | |
| | 229,984 | | | | | Towd Point Mortgage Trust CMO, Series 2019-1, Class A1, 3.66%, due 03/25/58(b) 144A | | | 229,657 | |
| | 193,581 | | | | | Towd Point Mortgage Trust CMO, Series 2019-4, Class A1, 2.90%, due 10/25/59(b) 144A | | | 190,406 | |
| | 44,190 | | | | | Towd Point Mortgage Trust CMO, Series 2019-HY3, Class A1A, 1.46% (1 mo. USD LIBOR + 1.00%), due 10/25/59(c) 144A | | | 44,165 | |
| | 319,469 | | | | | Towd Point Mortgage Trust CMO, Series 2020-4, Class A1, 1.75%, due 10/25/60 144A | | | 303,039 | |
| | 675,000 | | | | | UBS Commercial Mortgage Trust, Series 2017-C2, Class ASB, 3.26%, due 08/15/50 | | | 676,016 | |
| | 1,642,980 | | | | | UBS-Barclays Commercial Mortgage Trust, Series 2012-C2, Class A4, 3.53%, due 05/10/63 | | | 1,641,207 | |
| | 1,483,232 | | | | | UBS-Barclays Commercial Mortgage Trust, Series 2012-C3, Class A4, 3.09%, due 08/10/49 | | | 1,485,516 | |
| | 236,460 | | | | | UBS-Barclays Commercial Mortgage Trust, Series 2013-C5, Class A3, 2.92%, due 03/10/46 | | | 236,049 | |
| | 91,632 | | | | | Verus Securitization Trust CMO, Series 2020-5, Class A1, 1.22%, due 05/25/65(d) 144A | | | 89,522 | |
| | 356,539 | | | | | Verus Securitization Trust CMO, Series 2021-3, Class A1, 1.05%, due 06/25/66(b) 144A | | | 339,832 | |
| | 196,216 | | | | | Verus Securitization Trust CMO, Series 2021-4, Class A1, 0.94%, due 07/25/66(b) 144A | | | 184,955 | |
| | 464,145 | | | | | Verus Securitization Trust CMO, Series 2021-5, Class A1, 1.01%, due 09/25/66(b) 144A | | | 429,273 | |
| | 213,418 | | | | | Verus Securitization Trust CMO, Series 2021-R1, Class A1, 0.82%, due 10/25/63(b) 144A | | | 208,745 | |
| | 9,059 | | | | | WaMu Mortgage Pass Through Certificates CMO, Series 2003-AR9, Class 1A7, 2.52%, due 09/25/33(b) | | | 8,964 | |
| | 1,490,923 | | | | | Wells Fargo Commercial Mortgage Trust, Series 2016-BNK1, Class A2, 2.40%, due 08/15/49 | | | 1,422,269 | |
| | 3,000,000 | | | | | Wells Fargo Commercial Mortgage Trust, Series 2016-NXS6, Class A3, 2.64%, due 11/15/49 | | | 2,935,082 | |
| | 950,000 | | | | | Wells Fargo Commercial Mortgage Trust, Series 2017-C38, Class A4, 3.19%, due 07/15/50 | | | 946,640 | |
| | 1,179,124 | | | | | Wells Fargo Commercial Mortgage Trust, Series 2017-RB1, Class A4, 3.37%, due 03/15/50 | | | 1,185,389 | |
| | 1,605,000 | | | | | Wells Fargo Commercial Mortgage Trust, Series 2020-C56, Class A3, 1.94%, due 06/15/53 | | | 1,495,232 | |
| | 1,900,000 | | | | | Wells Fargo Commercial Mortgage Trust, Series 2021-C59, Class A3, 1.96%, due 04/15/54 | | | 1,751,967 | |
| | 800,000 | | | | | Wells Fargo Commercial Mortgage Trust, Series 2021-C60, Class ASB, 2.13%, due 08/15/54 | | | 751,998 | |
| | 1,466,000 | | | | | WFRBS Commercial Mortgage Trust, Series 2014-C23, Class A5, 3.92%, due 10/15/57 | | | 1,486,229 | |
| | | | | | | | | | |
| | | | | | | | | 141,243,082 | |
| | | | | | | | | | |
See accompanying Notes to the Financial Statements.
101
Mercer Core Fixed Income Fund
Schedule of Investments (Continued)
(showing percentage of net assets)
March 31, 2022
| | | | | | | | | | |
| Par Value(a) | | | | | Description | | Value ($) | |
| | |
| | | | | | Mortgage Backed Securities - U.S. Government Agency Obligations — 17.8% | |
| | 232,108 | | | | | FHLMC Gold, Pool # A89870, 4.50%, due 11/01/39 | | | 247,368 | |
| | 152,710 | | | | | FHLMC Gold, Pool # A96970, 4.00%, due 02/01/41 | | | 159,955 | |
| | 294,307 | | | | | FHLMC Gold, Pool # C91908, 3.00%, due 01/01/37 | | | 293,968 | |
| | 229,014 | | | | | FHLMC Gold, Pool # G06231, 4.00%, due 12/01/40 | | | 239,796 | |
| | 150,243 | | | | | FHLMC Gold, Pool # G06409, 6.00%, due 11/01/39 | | | 167,965 | |
| | 76,803 | | | | | FHLMC Gold, Pool # G06875, 5.50%, due 12/01/38 | | | 84,197 | |
| | 271,349 | | | | | FHLMC Gold, Pool # G07021, 5.00%, due 09/01/39 | | | 293,912 | |
| | 535,852 | | | | | FHLMC Gold, Pool # G07816, 4.50%, due 09/01/42 | | | 570,955 | |
| | 333,376 | | | | | FHLMC Gold, Pool # G08537, 3.00%, due 07/01/43 | | | 333,087 | |
| | 213,238 | | | | | FHLMC Gold, Pool # G08672, 4.00%, due 10/01/45 | | | 222,310 | |
| | 312,095 | | | | | FHLMC Gold, Pool # G08726, 3.00%, due 10/01/46 | | | 311,026 | |
| | 63,209 | | | | | FHLMC Gold, Pool # G08735, 4.50%, due 10/01/46 | | | 66,753 | |
| | 27,165 | | | | | FHLMC Gold, Pool # G08748, 3.50%, due 02/01/47 | | | 27,615 | |
| | 406,071 | | | | | FHLMC Gold, Pool # G08749, 4.00%, due 02/01/47 | | | 421,048 | |
| | 221,511 | | | | | FHLMC Gold, Pool # G08771, 4.00%, due 07/01/47 | | | 228,960 | |
| | 207,873 | | | | | FHLMC Gold, Pool # G08786, 4.50%, due 10/01/47 | | | 217,966 | |
| | 117,211 | | | | | FHLMC Gold, Pool # G16177, 2.00%, due 01/01/32 | | | 114,414 | |
| | 821,416 | | | | | FHLMC Gold, Pool # G16634, 3.00%, due 10/01/31 | | | 831,531 | |
| | 760,941 | | | | | FHLMC Gold, Pool # G60722, 3.00%, due 10/01/46 | | | 756,923 | |
| | 343,942 | | | | | FHLMC Gold, Pool # G60767, 3.50%, due 10/01/46 | | | 350,736 | |
| | 151,257 | | | | | FHLMC Gold, Pool # G60788, 3.50%, due 12/01/46 | | | 154,211 | |
| | 758,366 | | | | | FHLMC Gold, Pool # G60804, 4.50%, due 05/01/42 | | | 807,509 | |
| | 932,149 | | | | | FHLMC Gold, Pool # G60934, 3.50%, due 06/01/45 | | | 951,661 | |
| | 1,130,930 | | | | | FHLMC Gold, Pool # G60985, 3.00%, due 05/01/47 | | | 1,124,714 | |
| | 635,364 | | | | | FHLMC Gold, Pool # G61748, 3.50%, due 11/01/48 | | | 644,670 | |
| | 326,640 | | | | | FHLMC Gold, Pool # G61995, 4.00%, due 11/01/44 | | | 341,330 | |
| | 247,868 | | | | | FHLMC Gold, Pool # J24414, 2.50%, due 06/01/28 | | | 245,831 | |
| | 295,502 | | | | | FHLMC Gold, Pool # J34888, 2.50%, due 07/01/31 | | | 293,022 | |
| | 624,799 | | | | | FHLMC Gold, Pool # Q09224, 4.00%, due 07/01/42 | | | 654,536 | |
| | 88,369 | | | | | FHLMC Gold, Pool # Q11218, 3.50%, due 09/01/42 | | | 90,083 | |
| | 197,827 | | | | | FHLMC Gold, Pool # Q12052, 3.50%, due 10/01/42 | | | 201,659 | |
| | 535,489 | | | | | FHLMC Gold, Pool # Q12862, 3.50%, due 11/01/42 | | | 546,749 | |
| | 229,753 | | | | | FHLMC Gold, Pool # Q17792, 3.50%, due 05/01/43 | | | 234,606 | |
| | 546,131 | | | | | FHLMC Gold, Pool # Q36815, 4.00%, due 10/01/45 | | | 569,057 | |
| | 479,867 | | | | | FHLMC Gold, Pool # Q41918, 3.50%, due 07/01/46 | | | 488,205 | |
| | 512,902 | | | | | FHLMC Gold, Pool # Q42618, 3.00%, due 08/01/46 | | | 509,284 | |
| | 724,426 | | | | | FHLMC Gold, Pool # Q44455, 3.50%, due 11/01/46 | | | 735,985 | |
| | 207,068 | | | | | FHLMC Gold, Pool # Q44963, 3.50%, due 12/01/46 | | | 210,453 | |
| | 681,370 | | | | | FHLMC Gold, Pool # Q45741, 3.50%, due 01/01/47 | | | 693,385 | |
| | 59,393 | | | | | FHLMC Gold, Pool # Q49494, 4.50%, due 07/01/47 | | | 62,333 | |
| | 181,488 | | | | | FHLMC Gold, Pool # Q52312, 4.00%, due 11/01/47 | | | 186,773 | |
| | 186,655 | | | | | FHLMC Gold, Pool # Q54957, 4.00%, due 03/01/48 | | | 192,583 | |
| | 184,387 | | | | | FHLMC Gold, Pool # V60565, 3.00%, due 06/01/29 | | | 186,496 | |
| | 460,906 | | | | | FHLMC Gold, Pool # V60599, 3.00%, due 09/01/29 | | | 466,180 | |
| | 531,972 | | | | | FHLMC Gold, Pool # V82292, 4.00%, due 04/01/46 | | | 554,659 | |
| | 209,448 | | | | | FHLMC Gold, Pool # V82848, 3.00%, due 12/01/46 | | | 208,167 | |
| | 2,776,000 | | | | | FHLMC Multifamily Structured Pass Through Certificates, Series K140, Class A2, 2.25%, due 01/25/32 | | | 2,632,354 | |
| | 900,000 | | | | | FHLMC Multifamily Structured Pass Through Certificates, Series K157, Class A2, 3.99%, due 05/25/33(b) | | | 971,401 | |
See accompanying Notes to the Financial Statements.
102
Mercer Core Fixed Income Fund
Schedule of Investments (Continued)
(showing percentage of net assets)
March 31, 2022
| | | | | | | | | | |
| Par Value(a) | | | | | Description | | Value ($) | |
| | |
| | | | | | Mortgage Backed Securities - U.S. Government Agency Obligations — continued | |
| | 23,742,477 | | | | | FHLMC Multifamily Structured Pass Through Certificates, (IO), Series K025, Class X1, 0.78%, due 10/25/22(b) 144A | | | 70,418 | |
| | 11,964,434 | | | | | FHLMC Multifamily Structured Pass Through Certificates, (IO), Series K106, Class X1, 1.35%, due 01/25/30(b) 144A | | | 1,054,154 | |
| | 703,063 | | | | | FHLMC Non Gold, Pool # 841085, 2.41% (12 mo. USD LIBOR + 1.63%), due 09/01/47(c) | | | 724,040 | |
| | 47,821 | | | | | FHLMC Reference REMIC CMO, Series R007, Class ZA, 6.00%, due 05/15/36 | | | 52,351 | |
| | 1,117,387 | | | | | FHLMC REMIC CMO, Series 4710, Class KZ, 3.50%, due 08/15/47 | | | 1,118,580 | |
| | 1,300,810 | | | | | FHLMC REMIC CMO, Series 4739, Class Z, 3.50%, due 11/15/47 | | | 1,299,629 | |
| | 723,281 | | | | | FNMA, Pool # BM4377, 2.32% (12 mo. USD LIBOR + 1.89%), due 04/01/38(c) | | | 755,905 | |
| | 902,217 | | | | | FNMA, Pool # BM6482, 2.16% (12 mo. USD LIBOR + 1.58%), due 04/01/47(c) | | | 932,448 | |
| | 1,329,408 | | | | | FNMA REMIC CMO, Series 2012-134, Class ZC, 2.50%, due 12/25/42 | | | 1,267,836 | |
| | 590,254 | | | | | FNMA REMIC CMO, Series 2011-59, Class NZ, 5.50%, due 07/25/41 | | | 638,807 | |
| | 6,791 | | | | | FNMA REMIC CMO, Series 2012-28, Class B, 6.50%, due 06/25/39 | | | 7,185 | |
| | 117,762 | | | | | FNMA-ACES, Series 2018-M10, Class A1, 3.36%, due 07/25/28(b) | | | 119,844 | |
| | 324,517 | | | | | GNMA I, Pool # 734152, 4.00%, due 01/15/41 | | | 339,055 | |
| | 1,976,931 | | | | | GNMA I, Pool # 784369, 4.00%, due 08/15/45 | | | 2,112,750 | |
| | 225,367 | | | | | GNMA I, Pool # 784605, 4.50%, due 01/15/42 | | | 242,972 | |
| | 132,779 | | | | | GNMA I, Pool # AL8626, 3.00%, due 08/15/45 | | | 131,633 | |
| | 149,568 | | | | | GNMA II, Pool # 004636, 4.50%, due 02/20/40 | | | 159,337 | |
| | 26,754 | | | | | GNMA II, Pool # 004678, 4.50%, due 04/20/40 | | | 28,505 | |
| | 168,372 | | | | | GNMA II, Pool # 004833, 4.00%, due 10/20/40 | | | 177,008 | |
| | 155,580 | | | | | GNMA II, Pool # 004977, 4.00%, due 03/20/41 | | | 163,560 | |
| | 392,547 | | | | | GNMA II, Pool # 004978, 4.50%, due 03/20/41 | | | 418,193 | |
| | 611,769 | | | | | GNMA II, Pool # 005055, 4.50%, due 05/20/41 | | | 651,739 | |
| | 22,751 | | | | | GNMA II, Pool # 783637, 3.00%, due 06/20/42 | | | 22,697 | |
| | 3,663,938 | | | | | GNMA II, Pool # 785283, 2.50%, due 01/20/51 | | | 3,580,436 | |
| | 524,945 | | | | | GNMA II, Pool # 796468, 4.00%, due 09/20/42 | | | 546,283 | |
| | 827,787 | | | | | GNMA II, Pool # AV9421, 3.50%, due 11/20/46 | | | 839,084 | |
| | 511,037 | | | | | GNMA II, Pool # AY7555, 3.50%, due 04/20/47 | | | 520,847 | |
| | 227,710 | | | | | GNMA II, Pool # MA0462, 3.50%, due 10/20/42 | | | 232,756 | |
| | 33,702 | | | | | GNMA II, Pool # MA0624, 3.00%, due 12/20/42 | | | 33,623 | |
| | 154,160 | | | | | GNMA II, Pool # MA0625, 3.50%, due 12/20/42 | | | 158,329 | |
| | 85,867 | | | | | GNMA II, Pool # MA0698, 3.00%, due 01/20/43 | | | 85,664 | |
| | 290,965 | | | | | GNMA II, Pool # MA0851, 3.00%, due 03/20/43 | | | 290,280 | |
| | 235,577 | | | | | GNMA II, Pool # MA0852, 3.50%, due 03/20/43 | | | 241,943 | |
| | 49,156 | | | | | GNMA II, Pool # MA1156, 3.00%, due 07/20/43 | | | 49,040 | |
| | 164,569 | | | | | GNMA II, Pool # MA1376, 4.00%, due 10/20/43 | | | 173,015 | |
| | 71,473 | | | | | GNMA II, Pool # MA1599, 3.00%, due 01/20/44 | | | 71,305 | |
| | 152,364 | | | | | GNMA II, Pool # MA2371, 3.50%, due 11/20/44 | | | 156,042 | |
| | 123,512 | | | | | GNMA II, Pool # MA2372, 4.00%, due 11/20/44 | | | 130,069 | |
| | 110,942 | | | | | GNMA II, Pool # MA2825, 3.00%, due 05/20/45 | | | 110,670 | |
| | 257,247 | | | | | GNMA II, Pool # MA3310, 3.50%, due 12/20/45 | | | 262,930 | |
| | 104,956 | | | | | GNMA II, Pool # MA3377, 4.00%, due 01/20/46 | | | 109,898 | |
| | 155,164 | | | | | GNMA II, Pool # MA3455, 4.00%, due 02/20/46 | | | 162,406 | |
| | 297,485 | | | | | GNMA II, Pool # MA3456, 4.50%, due 02/20/46 | | | 317,597 | |
| | 253,597 | | | | | GNMA II, Pool # MA3596, 3.00%, due 04/20/46 | | | 252,707 | |
| | 489,567 | | | | | GNMA II, Pool # MA3803, 3.50%, due 07/20/46 | | | 498,387 | |
| | 356,548 | | | | | GNMA II, Pool # MA3873, 3.00%, due 08/20/46 | | | 355,276 | |
See accompanying Notes to the Financial Statements.
103
Mercer Core Fixed Income Fund
Schedule of Investments (Continued)
(showing percentage of net assets)
March 31, 2022
| | | | | | | | | | |
| Par Value(a) | | | | | Description | | Value ($) | |
| | |
| | | | | | Mortgage Backed Securities - U.S. Government Agency Obligations — continued | |
| | 583,773 | | | | | GNMA II, Pool # MA3936, 3.00%, due 09/20/46 | | | 583,118 | |
| | 167,784 | | | | | GNMA II, Pool # MA4004, 3.50%, due 10/20/46 | | | 170,922 | |
| | 101,221 | | | | | GNMA II, Pool # MA4071, 4.50%, due 11/20/46 | | | 108,630 | |
| | 86,336 | | | | | GNMA II, Pool # MA4125, 2.50%, due 12/20/46 | | | 83,877 | |
| | 141,456 | | | | | GNMA II, Pool # MA4263, 4.00%, due 02/20/47 | | | 146,498 | |
| | 182,122 | | | | | GNMA II, Pool # MA4510, 3.50%, due 06/20/47 | | | 184,804 | |
| | 216,339 | | | | | GNMA II, Pool # MA4585, 3.00%, due 07/20/47 | | | 215,538 | |
| | 208,003 | | | | | GNMA II, Pool # MA4586, 3.50%, due 07/20/47 | | | 211,058 | |
| | 544,980 | | | | | GNMA II, Pool # MA4720, 4.00%, due 09/20/47 | | | 563,249 | |
| | 155,415 | | | | | GNMA II, Pool # MA4838, 4.00%, due 11/20/47 | | | 161,036 | |
| | 612,171 | | | | | GNMA II, Pool # MA5019, 3.50%, due 02/20/48 | | | 621,182 | |
| | 79,805 | | | | | GNMA II, Pool # MA5021, 4.50%, due 02/20/48 | | | 83,757 | |
| | 26,571 | | | | | GNMA II, Pool # MA5079, 4.50%, due 03/20/48 | | | 27,938 | |
| | 306,795 | | | | | GNMA II, Pool # MA5264, 4.00%, due 06/20/48 | | | 315,887 | |
| | 173,546 | | | | | GNMA II, Pool # MA5397, 3.50%, due 08/20/48 | | | 175,998 | |
| | 175,933 | | | | | GNMA II, Pool # MA5466, 4.00%, due 09/20/48 | | | 180,835 | |
| | 148,752 | | | | | GNMA II, Pool # MA5467, 4.50%, due 09/20/48 | | | 155,345 | |
| | 66,894 | | | | | GNMA II, Pool # MA5530, 5.00%, due 10/20/48 | | | 70,304 | |
| | 102,384 | | | | | GNMA II, Pool # MA5762, 3.50%, due 02/20/49 | | | 103,904 | |
| | 100,655 | | | | | GNMA II, Pool # MA5817, 4.00%, due 03/20/49 | | | 103,520 | |
| | 341,693 | | | | | GNMA II, Pool # MA5874, 3.00%, due 04/20/49 | | | 340,324 | |
| | 676,034 | | | | | GNMA II, Pool # MA6038, 3.00%, due 07/20/49 | | | 672,276 | |
| | 627,904 | | | | | GNMA II, Pool # MA6090, 3.50%, due 08/20/49 | | | 633,121 | |
| | 236,172 | | | | | GNMA II, Pool # MA6338, 3.00%, due 12/20/49 | | | 234,472 | |
| | 434,539 | | | | | GNMA II, Pool # MA7254, 2.00%, due 03/20/51 | | | 415,157 | |
| | 444,102 | | | | | GNMA II, Pool # MA7367, 2.50%, due 05/20/51 | | | 431,453 | |
| | 525,455 | | | | | GNMA II, Pool # MA7471, 2.00%, due 07/20/51 | | | 502,006 | |
| | 383,991 | | | | | GNMA II, Pool # MA7534, 2.50%, due 08/20/51 | | | 373,054 | |
| | 691,772 | | | | | GNMA II, Pool # MA7588, 2.00%, due 09/20/51 | | | 660,848 | |
| | 231,899 | | | | | UMBS, Pool # 745148, 5.00%, due 01/01/36 | | | 251,056 | |
| | 215,723 | | | | | UMBS, Pool # 932807, 4.00%, due 09/01/40 | | | 225,753 | |
| | 170,883 | | | | | UMBS, Pool # 983471, 5.50%, due 05/01/38 | | | 185,299 | |
| | 290,385 | | | | | UMBS, Pool # 985184, 5.50%, due 08/01/38 | | | 320,315 | |
| | 188,758 | | | | | UMBS, Pool # 995245, 5.00%, due 01/01/39 | | | 201,448 | |
| | 344,523 | | | | | UMBS, Pool # AB6212, 3.00%, due 09/01/42 | | | 344,309 | |
| | 558,777 | | | | | UMBS, Pool # AB6802, 3.50%, due 11/01/42 | | | 570,116 | |
| | 158,209 | | | | | UMBS, Pool # AB7059, 2.50%, due 11/01/42 | | | 152,764 | |
| | 314,936 | | | | | UMBS, Pool # AB8703, 3.00%, due 03/01/38 | | | 311,635 | |
| | 130,729 | | | | | UMBS, Pool # AB9383, 4.00%, due 05/01/43 | | | 136,705 | |
| | 967,288 | | | | | UMBS, Pool # AB9659, 3.00%, due 06/01/43 | | | 965,883 | |
| | 2,177,328 | | | | | UMBS, Pool # AC3668, 4.50%, due 10/01/39 | | | 2,317,842 | |
| | 205,247 | | | | | UMBS, Pool # AD9153, 4.50%, due 08/01/40 | | | 218,461 | |
| | 161,041 | | | | | UMBS, Pool # AE0469, 6.00%, due 12/01/39 | | | 180,043 | |
| | 430,952 | | | | | UMBS, Pool # AH4404, 4.00%, due 01/01/41 | | | 451,071 | |
| | 93,291 | | | | | UMBS, Pool # AI1892, 5.00%, due 05/01/41 | | | 100,752 | |
| | 435,754 | | | | | UMBS, Pool # AI4815, 4.50%, due 06/01/41 | | | 462,751 | |
| | 351,150 | | | | | UMBS, Pool # AJ9278, 3.50%, due 12/01/41 | | | 357,705 | |
| | 171,506 | | | | | UMBS, Pool # AJ9317, 4.00%, due 01/01/42 | | | 179,082 | |
| | 389,804 | | | | | UMBS, Pool # AL0215, 4.50%, due 04/01/41(o) | | | 415,092 | |
See accompanying Notes to the Financial Statements.
104
Mercer Core Fixed Income Fund
Schedule of Investments (Continued)
(showing percentage of net assets)
March 31, 2022
| | | | | | | | | | |
| Par Value(a) | | | | | Description | | Value ($) | |
| | |
| | | | | | Mortgage Backed Securities - U.S. Government Agency Obligations — continued | |
| | 722,593 | | | | | UMBS, Pool # AL1895, 3.50%, due 06/01/42 | | | 739,120 | |
| | 455,071 | | | | | UMBS, Pool # AL2466, 4.00%, due 09/01/42 | | | 476,433 | |
| | 443,484 | | | | | UMBS, Pool # AL3000, 3.50%, due 12/01/42 | | | 452,507 | |
| | 543,321 | | | | | UMBS, Pool # AL3316, 3.50%, due 03/01/43 | | | 554,389 | |
| | 740,301 | | | | | UMBS, Pool # AL6663, 4.00%, due 03/01/39 | | | 774,619 | |
| | 639,670 | | | | | UMBS, Pool # AL7594, 3.50%, due 08/01/45 | | | 651,884 | |
| | 635,116 | | | | | UMBS, Pool # AL8191, 4.00%, due 12/01/45 | | | 658,723 | |
| | 86,850 | | | | | UMBS, Pool # AO4109, 4.00%, due 06/01/42 | | | 90,713 | |
| | 219,092 | | | | | UMBS, Pool # AQ7923, 3.00%, due 12/01/42 | | | 218,932 | |
| | 366,176 | | | | | UMBS, Pool # AS5133, 3.50%, due 06/01/45 | | | 373,151 | |
| | 90,463 | | | | | UMBS, Pool # AS6286, 4.00%, due 12/01/45 | | | 94,135 | |
| | 128,639 | | | | | UMBS, Pool # AS6304, 4.00%, due 12/01/45 | | | 134,005 | |
| | 191,127 | | | | | UMBS, Pool # AS6452, 3.50%, due 01/01/46 | | | 194,286 | |
| | 144,406 | | | | | UMBS, Pool # AS7693, 2.00%, due 08/01/31 | | | 140,859 | |
| | 206,896 | | | | | UMBS, Pool # AS8073, 2.50%, due 10/01/46 | | | 198,322 | |
| | 145,034 | | | | | UMBS, Pool # AZ3743, 3.50%, due 11/01/45 | | | 147,777 | |
| | 237,899 | | | | | UMBS, Pool # BC9468, 3.00%, due 06/01/46 | | | 236,589 | |
| | 491,751 | | | | | UMBS, Pool # BD7043, 4.00%, due 03/01/47 | | | 509,298 | |
| | 327,771 | | | | | UMBS, Pool # BE7192, 4.00%, due 03/01/47 | | | 340,191 | |
| | 458,286 | | | | | UMBS, Pool # BK1023, 4.50%, due 02/01/48 | | | 478,725 | |
| | 303,259 | | | | | UMBS, Pool # BK7611, 4.50%, due 09/01/48 | | | 315,992 | |
| | 709,416 | | | | | UMBS, Pool # BM1573, 3.50%, due 07/01/47 | | | 721,736 | |
| | 946,767 | | | | | UMBS, Pool # BM1972, 3.50%, due 10/01/37 | | | 981,079 | |
| | 518,365 | | | | | UMBS, Pool # BM3033, 3.00%, due 10/01/47 | | | 515,091 | |
| | 173,355 | | | | | UMBS, Pool # BM3258, 3.00%, due 02/01/47 | | | 172,291 | |
| | 210,658 | | | | | UMBS, Pool # BM3286, 4.50%, due 11/01/47 | | | 223,719 | |
| | 2,860,965 | | | | | UMBS, Pool # BM3325, 3.00%, due 10/01/46 | | | 2,848,177 | |
| | 416,547 | | | | | UMBS, Pool # BM3332, 3.50%, due 01/01/48 | | | 422,393 | |
| | 394,893 | | | | | UMBS, Pool # BM3491, 4.50%, due 01/01/38 | | | 418,466 | |
| | 627,303 | | | | | UMBS, Pool # BM3641, 4.00%, due 04/01/48 | | | 647,190 | |
| | 574,256 | | | | | UMBS, Pool # BM4896, 3.00%, due 02/01/47 | | | 573,432 | |
| | 747,553 | | | | | UMBS, Pool # BM5213, 3.00%, due 07/01/45 | | | 743,036 | |
| | 175,439 | | | | | UMBS, Pool # BM5293, 3.50%, due 02/01/49 | | | 177,070 | |
| | 348,324 | | | | | UMBS, Pool # BM5694, 4.00%, due 06/01/48 | | | 357,846 | |
| | 126,110 | | | | | UMBS, Pool # BM5874, 4.00%, due 01/01/48 | | | 131,226 | |
| | 185,725 | | | | | UMBS, Pool # BM5950, 3.00%, due 11/01/48 | | | 184,754 | |
| | 1,204,709 | | | | | UMBS, Pool # BN6216, 4.50%, due 03/01/49 | | | 1,263,264 | |
| | 201,344 | | | | | UMBS, Pool # BO1420, 3.50%, due 09/01/49 | | | 202,243 | |
| | 479,375 | | | | | UMBS, Pool # BO5387, 3.50%, due 12/01/49 | | | 485,412 | |
| | 392,580 | | | | | UMBS, Pool # BP2898, 4.00%, due 03/01/50 | | | 404,637 | |
| | 598,745 | | | | | UMBS, Pool # BP3048, 3.00%, due 03/01/50 | | | 587,651 | |
| | 441,238 | | | | | UMBS, Pool # BP5462, 2.50%, due 06/01/50 | | | 422,409 | |
| | 341,106 | | | | | UMBS, Pool # BP5568, 3.00%, due 06/01/50 | | | 334,670 | |
| | 1,559,076 | | | | | UMBS, Pool # BP6618, 2.50%, due 08/01/50 | | | 1,491,532 | |
| | 814,228 | | | | | UMBS, Pool # BQ3132, 2.00%, due 10/01/50 | | | 759,348 | |
| | 625,441 | | | | | UMBS, Pool # BQ3138, 2.50%, due 10/01/50 | | | 597,887 | |
| | 1,117,360 | | | | | UMBS, Pool # CA0623, 4.50%, due 10/01/47 | | | 1,171,285 | |
| | 576,987 | | | | | UMBS, Pool # CA0655, 3.50%, due 11/01/47 | | | 584,257 | |
| | 57,919 | | | | | UMBS, Pool # CA3828, 4.00%, due 07/01/49 | | | 59,643 | |
See accompanying Notes to the Financial Statements.
105
Mercer Core Fixed Income Fund
Schedule of Investments (Continued)
(showing percentage of net assets)
March 31, 2022
| | | | | | | | | | |
| Par Value(a) | | | | | Description | | Value ($) | |
| | |
| | | | | | Mortgage Backed Securities - U.S. Government Agency Obligations — continued | |
| | 869,969 | | | | | UMBS, Pool # CA3986, 5.00%, due 08/01/49 | | | 926,159 | |
| | 314,163 | | | | | UMBS, Pool # CA4149, 3.00%, due 09/01/49 | | | 308,942 | |
| | 726,398 | | | | | UMBS, Pool # CA4831, 4.50%, due 12/01/49 | | | 759,004 | |
| | 3,287,840 | | | | | UMBS, Pool # CA5354, 3.50%, due 03/01/50 | | | 3,319,652 | |
| | 495,440 | | | | | UMBS, Pool # CA5571, 4.00%, due 04/01/50 | | | 510,726 | |
| | 6,087,446 | | | | | UMBS, Pool # CA6097, 3.50%, due 06/01/50 | | | 6,106,319 | |
| | 2,969,232 | | | | | UMBS, Pool # CA6738, 3.00%, due 08/01/50 | | | 2,917,804 | |
| | 1,884,690 | | | | | UMBS, Pool # CA6777, 4.50%, due 08/01/50 | | | 1,961,767 | |
| | 417,077 | | | | | UMBS, Pool # CA6799, 2.00%, due 08/01/50 | | | 389,933 | |
| | 717,500 | | | | | UMBS, Pool # CA6871, 2.50%, due 08/01/35 | | | 710,414 | |
| | 1,610,766 | | | | | UMBS, Pool # CA6872, 2.50%, due 08/01/35 | | | 1,602,251 | |
| | 1,466,358 | | | | | UMBS, Pool # CA7030, 2.50%, due 09/01/50 | | | 1,405,864 | |
| | 4,095,612 | | | | | UMBS, Pool # CA8062, 2.50%, due 12/01/50 | | | 3,916,977 | |
| | 840,528 | | | | | UMBS, Pool # FM0030, 3.00%, due 02/01/49 | | | 834,950 | |
| | 236,639 | | | | | UMBS, Pool # FM1001, 3.50%, due 11/01/48 | | | 239,530 | |
| | 257,057 | | | | | UMBS, Pool # FM1266, 5.00%, due 07/01/49 | | | 272,688 | |
| | 117,630 | | | | | UMBS, Pool # FM1347, 3.00%, due 12/01/48 | | | 117,510 | |
| | 658,021 | | | | | UMBS, Pool # FM1467, 3.00%, due 12/01/47 | | | 658,013 | |
| | 470,643 | | | | | UMBS, Pool # FM1588, 3.00%, due 10/01/49 | | | 463,437 | |
| | 233,555 | | | | | UMBS, Pool # FM1715, 3.00%, due 12/01/45 | | | 232,284 | |
| | 301,159 | | | | | UMBS, Pool # FM1790, 3.00%, due 11/01/49 | | | 296,152 | |
| | 234,862 | | | | | UMBS, Pool # FM1864, 3.00%, due 11/01/49 | | | 230,972 | |
| | 3,534,055 | | | | | UMBS, Pool # FM2217, 3.00%, due 03/01/47 | | | 3,530,754 | |
| | 2,292,449 | | | | | UMBS, Pool # FM2226, 3.00%, due 09/01/46 | | | 2,288,895 | |
| | 500,034 | | | | | UMBS, Pool # FM2336, 4.00%, due 01/01/50 | | | 514,834 | |
| | 1,978,165 | | | | | UMBS, Pool # FM2385, 3.00%, due 09/01/48 | | | 1,958,328 | |
| | 541,343 | | | | | UMBS, Pool # FM2461, 3.50%, due 03/01/50 | | | 544,367 | |
| | 703,054 | | | | | UMBS, Pool # FM2570, 4.50%, due 04/01/48 | | | 747,561 | |
| | 473,132 | | | | | UMBS, Pool # FM2674, 4.00%, due 03/01/50 | | | 486,549 | |
| | 1,122,633 | | | | | UMBS, Pool # FM3889, 3.00%, due 07/01/50 | | | 1,101,781 | |
| | 868,721 | | | | | UMBS, Pool # FM4330, 2.50%, due 10/01/50 | | | 833,923 | |
| | 873,737 | | | | | UMBS, Pool # FM4350, 2.00%, due 09/01/50 | | | 814,190 | |
| | 1,776,922 | | | | | UMBS, Pool # FM4532, 3.00%, due 09/01/50 | | | 1,746,655 | |
| | 37,861 | | | | | UMBS, Pool # FM5035, 4.00%, due 07/01/50 | | | 38,694 | |
| | 2,830,733 | | | | | UMBS, Pool # FM5721, 3.00%, due 12/01/40 | | | 2,810,642 | |
| | 779,039 | | | | | UMBS, Pool # FM5875, 4.50%, due 04/01/50 | | | 819,431 | |
| | 1,472,602 | | | | | UMBS, Pool # FM5996, 4.50%, due 03/01/49 | | | 1,537,356 | |
| | 1,494,285 | | | | | UMBS, Pool # FM6133, 3.50%, due 08/01/50 | | | 1,506,322 | |
| | 977,700 | | | | | UMBS, Pool # FM6273, 3.00%, due 12/01/34 | | | 990,407 | |
| | 2,255,727 | | | | | UMBS, Pool # FM6497, 2.00%, due 03/01/51 | | | 2,102,267 | |
| | 1,052,873 | | | | | UMBS, Pool # FM6585, 3.50%, due 11/01/40 | | | 1,064,209 | |
| | 961,601 | | | | | UMBS, Pool # FM7341, 4.00%, due 03/01/48 | | | 996,733 | |
| | 1,444,433 | | | | | UMBS, Pool # FM7785, 4.00%, due 05/01/49 | | | 1,480,448 | |
| | 2,384,065 | | | | | UMBS, Pool # FM7794, 4.00%, due 01/01/50 | | | 2,441,952 | |
| | 793,318 | | | | | UMBS, Pool # FM8451, 2.50%, due 08/01/51 | | | 759,775 | |
| | 1,931,540 | | | | | UMBS, Pool # FM8603, 4.00%, due 09/01/49 | | | 1,984,128 | |
| | 3,127,616 | | | | | UMBS, Pool # FM8968, 3.00%, due 04/01/48 | | | 3,111,270 | |
| | 4,568,392 | | | | | UMBS, Pool # FM9461, 3.50%, due 11/01/51 | | | 4,599,466 | |
| | 1,183,088 | | | | | UMBS, Pool # FM9674, 3.50%, due 06/01/49 | | | 1,196,679 | |
See accompanying Notes to the Financial Statements.
106
Mercer Core Fixed Income Fund
Schedule of Investments (Continued)
(showing percentage of net assets)
March 31, 2022
| | | | | | | | | | |
| Par Value(a) | | | | | Description | | Value ($) | |
| | |
| | | | | | Mortgage Backed Securities - U.S. Government Agency Obligations — continued | |
| | 885,059 | | | | | UMBS, Pool # FM9726, 2.50%, due 11/01/51 | | | 849,793 | |
| | 4,478,661 | | | | | UMBS, Pool # FM9728, 2.50%, due 11/01/51 | | | 4,289,104 | |
| | 1,218,360 | | | | | UMBS, Pool # FS0027, 2.50%, due 11/01/51 | | | 1,170,387 | |
| | 1,528,918 | | | | | UMBS, Pool # FS0065, 4.50%, due 12/01/50 | | | 1,603,446 | |
| | 993,058 | | | | | UMBS, Pool # FS0194, 2.50%, due 01/01/52 | | | 949,256 | |
| | 2,583,262 | | | | | UMBS, Pool # FS0644, 3.00%, due 02/01/52 | | | 2,535,552 | |
| | 2,107,857 | | | | | UMBS, Pool # FS0715, 3.00%, due 01/01/52 | | | 2,068,925 | |
| | 8,723,507 | | | | | UMBS, Pool # FS0731, 2.00%, due 02/01/52 | | | 8,127,287 | |
| | 695,000 | | | | | UMBS, Pool # FS1205, 3.50%, due 04/01/52 | | | 699,728 | |
| | 542,000 | | | | | UMBS, Pool # FS1285, 3.50%, due 02/01/52 | | | 547,293 | |
| | 125,058 | | | | | UMBS, Pool # MA2781, 2.50%, due 10/01/46 | | | 120,330 | |
| | 399,360 | | | | | UMBS, Pool # MA3058, 4.00%, due 07/01/47 | | | 412,267 | |
| | 107,967 | | | | | UMBS, Pool # MA3087, 3.50%, due 08/01/47 | | | 108,753 | |
| | 114,025 | | | | | UMBS, Pool # MA3155, 3.00%, due 10/01/32 | | | 115,248 | |
| | 371,718 | | | | | UMBS, Pool # MA3182, 3.50%, due 11/01/47 | | | 375,959 | |
| | 183,442 | | | | | UMBS, Pool # MA3211, 4.00%, due 12/01/47 | | | 189,200 | |
| | 122,724 | | | | | UMBS, Pool # MA3238, 3.50%, due 01/01/48 | | | 123,928 | |
| | 310,594 | | | | | UMBS, Pool # MA3332, 3.50%, due 04/01/48 | | | 313,051 | |
| | 118,194 | | | | | UMBS, Pool # MA3364, 3.50%, due 05/01/33 | | | 121,342 | |
| | 76,118 | | | | | UMBS, Pool # MA3385, 4.50%, due 06/01/48 | | | 79,129 | |
| | 301,312 | | | | | UMBS, Pool # MA3414, 3.50%, due 07/01/48 | | | 304,081 | |
| | 93,767 | | | | | UMBS, Pool # MA3442, 3.50%, due 08/01/48 | | | 94,483 | |
| | 79,784 | | | | | UMBS, Pool # MA3521, 4.00%, due 11/01/48 | | | 81,617 | |
| | 747,698 | | | | | UMBS, Pool # MA3871, 3.00%, due 12/01/49 | | | 733,387 | |
| | 634,675 | | | | | UMBS, Pool # MA3937, 3.00%, due 02/01/50 | | | 623,456 | |
| | 153,282 | | | | | UMBS, Pool # MA3960, 3.00%, due 03/01/50 | | | 150,358 | |
| | 817,769 | | | | | UMBS, Pool # MA4018, 2.00%, due 05/01/50 | | | 763,375 | |
| | 560,819 | | | | | UMBS, Pool # MA4048, 3.00%, due 06/01/50 | | | 550,437 | |
| | 144,400 | | | | | UMBS, Pool # MA4120, 2.50%, due 09/01/50 | | | 138,198 | |
| | 1,661,820 | | | | | UMBS, Pool # MA4158, 2.00%, due 10/01/50 | | | 1,548,917 | |
| | 456,029 | | | | | UMBS, Pool # MA4181, 1.50%, due 11/01/50 | | | 408,169 | |
| | 380,680 | | | | | UMBS, Pool # MA4204, 2.00%, due 12/01/40 | | | 357,468 | |
| | 844,312 | | | | | UMBS, Pool # MA4208, 2.00%, due 12/01/50 | | | 786,820 | |
| | 3,871,625 | | | | | UMBS, Pool # MA4209, 1.50%, due 12/01/50 | | | 3,464,764 | |
| | 577,874 | | | | | UMBS, Pool # MA4232, 2.00%, due 01/01/41 | | | 542,621 | |
| | 1,298,974 | | | | | UMBS, Pool # MA4237, 2.00%, due 01/01/51 | | | 1,210,464 | |
| | 593,711 | | | | | UMBS, Pool # MA4268, 2.00%, due 02/01/41 | | | 557,463 | |
| | 114,053 | | | | | UMBS, Pool # MA4281, 2.00%, due 03/01/51 | | | 106,227 | |
| | 325,471 | | | | | UMBS, Pool # MA4333, 2.00%, due 05/01/41 | | | 305,595 | |
| | 365,424 | | | | | UMBS, Pool # MA4356, 2.50%, due 06/01/51 | | | 349,275 | |
| | 1,679,025 | | | | | UMBS, Pool # QA6328, 3.00%, due 01/01/50 | | | 1,654,274 | |
| | 1,308,146 | | | | | UMBS, Pool # QA6367, 3.00%, due 01/01/50 | | | 1,285,828 | |
| | 933,230 | | | | | UMBS, Pool # QA7234, 3.00%, due 02/01/50 | | | 916,788 | |
| | 663,944 | | | | | UMBS, Pool # QA8518, 3.00%, due 04/01/50 | | | 652,451 | |
| | 224,051 | | | | | UMBS, Pool # QB0220, 3.00%, due 06/01/50 | | | 219,866 | |
| | 902,061 | | | | | UMBS, Pool # QB4847, 2.50%, due 10/01/50 | | | 863,835 | |
| | 851,284 | | | | | UMBS, Pool # QB6476, 2.50%, due 12/01/50 | | | 817,717 | |
| | 333,847 | | | | | UMBS, Pool # QC0039, 2.50%, due 03/01/51 | | | 320,546 | |
| | 1,640,191 | | | | | UMBS, Pool # QC4339, 2.00%, due 07/01/51 | | | 1,528,496 | |
See accompanying Notes to the Financial Statements.
107
Mercer Core Fixed Income Fund
Schedule of Investments (Continued)
(showing percentage of net assets)
March 31, 2022
| | | | | | | | | | |
| Par Value(a) | | | | | Description | | Value ($) | |
| | |
| | | | | | Mortgage Backed Securities - U.S. Government Agency Obligations — continued | |
| | 927,899 | | | | | UMBS, Pool # QC5189, 2.50%, due 08/01/51 | | | 886,799 | |
| | 493,414 | | | | | UMBS, Pool # QC6357, 2.50%, due 09/01/51 | | | 471,593 | |
| | 325,693 | | | | | UMBS, Pool # QD5507, 2.00%, due 01/01/52 | | | 303,070 | |
| | 1,000,000 | | | | | UMBS, Pool # QE0375, 4.00%, due 04/01/52(g) | | | 1,025,254 | |
| | 970,500 | | | | | UMBS, Pool # RA1741, 3.50%, due 11/01/49 | | | 977,664 | |
| | 1,736,922 | | | | | UMBS, Pool # RA1776, 3.00%, due 12/01/49 | | | 1,707,898 | |
| | 1,118,813 | | | | | UMBS, Pool # RA1860, 3.00%, due 12/01/49 | | | 1,099,111 | |
| | 626,736 | | | | | UMBS, Pool # RA2572, 3.50%, due 05/01/50 | | | 631,816 | |
| | 2,016,295 | | | | | UMBS, Pool # RA2790, 2.50%, due 06/01/50 | | | 1,928,968 | |
| | 2,081,235 | | | | | UMBS, Pool # RA2853, 2.50%, due 06/01/50 | | | 1,991,094 | |
| | 765,324 | | | | | UMBS, Pool # RA3206, 2.00%, due 08/01/50 | | | 713,016 | |
| | 966,922 | | | | | UMBS, Pool # RA3607, 3.00%, due 09/01/50 | | | 949,812 | |
| | 281,321 | | | | | UMBS, Pool # RA6432, 2.50%, due 12/01/51 | | | 268,860 | |
| | 938,254 | | | | | UMBS, Pool # RA6509, 2.00%, due 12/01/51 | | | 872,612 | |
| | 549,155 | | | | | UMBS, Pool # RA6951, 3.50%, due 03/01/52 | | | 554,852 | |
| | 2,080,123 | | | | | UMBS, Pool # RB5111, 2.00%, due 05/01/41 | | | 1,952,863 | |
| | 817,487 | | | | | UMBS, Pool # SD0100, 3.00%, due 10/01/49 | | | 803,901 | |
| | 2,065,100 | | | | | UMBS, Pool # SD0499, 3.00%, due 08/01/50 | | | 2,034,002 | |
| | 1,376,888 | | | | | UMBS, Pool # SD0558, 2.50%, due 03/01/51 | | | 1,322,028 | |
| | 1,564,398 | | | | | UMBS, Pool # SD0619, 4.00%, due 07/01/50 | | | 1,610,472 | |
| | 893,796 | | | | | UMBS, Pool # SD0742, 2.50%, due 11/01/51 | | | 857,074 | |
| | 280,029 | | | | | UMBS, Pool # SD0746, 2.00%, due 11/01/51 | | | 260,611 | |
| | 5,896,613 | | | | | UMBS, Pool # SD7526, 2.50%, due 10/01/50 | | | 5,652,829 | |
| | 3,427 | | | | | UMBS, Pool # SD8025, 3.50%, due 11/01/49 | | | 3,447 | |
| | 1,292,514 | | | | | UMBS, Pool # SD8075, 3.50%, due 07/01/50 | | | 1,299,228 | |
| | 4,792,384 | | | | | UMBS, Pool # SD8090, 2.00%, due 09/01/50 | | | 4,465,543 | |
| | 869,915 | | | | | UMBS, Pool # SD8104, 1.50%, due 11/01/50 | | | 778,058 | |
| | 430,080 | | | | | UMBS, Pool # SD8113, 2.00%, due 12/01/50 | | | 400,728 | |
| | 432,270 | | | | | UMBS, Pool # SD8121, 2.00%, due 01/01/51 | | | 402,758 | |
| | 200,367 | | | | | UMBS, Pool # SD8134, 2.00%, due 03/01/51 | | | 186,588 | |
| | 3,916,797 | | | | | UMBS, Pool # SD8141, 2.50%, due 04/01/51 | | | 3,744,940 | |
| | 948,505 | | | | | UMBS, Pool # ZM1609, 3.50%, due 09/01/46 | | | 961,256 | |
| | 302,519 | | | | | UMBS, Pool # ZS4727, 4.00%, due 07/01/47 | | | 312,466 | |
| | 188,835 | | | | | UMBS, Pool # ZS4760, 4.00%, due 03/01/48 | | | 193,491 | |
| | 1,580,981 | | | | | UMBS, Pool # ZS4763, 3.50%, due 04/01/48 | | | 1,598,946 | |
| | 511,976 | | | | | UMBS, Pool # ZT0657, 6.00%, due 07/01/40 | | | 571,999 | |
| | 247,848 | | | | | UMBS, Pool # ZT1748, 5.00%, due 01/01/49 | | | 263,471 | |
| | 1,770,000 | | | | | UMBS TBA, 2.50%, due 04/13/52 | | | 1,688,829 | |
| | 8,000,000 | | | | | UMBS TBA, 3.00%, due 04/13/52 | | | 7,826,250 | |
| | 5,000,000 | | | | | UMBS TBA, 3.00%, due 05/12/52 | | | 4,880,749 | |
| | 2,000,000 | | | | | UMBS TBA, 4.00%, due 05/12/52 | | | 2,034,595 | |
| | | | | | | | | | |
| | | | | | | | | 261,521,660 | |
| | | | | | | | | | |
| | |
| | | | | | Municipal Obligations — 1.0% | |
| | 60,000 | | | | | Alabama Economic Settlement Authority, 4.26%, due 09/15/32 | | | 64,541 | |
| | 165,000 | | | | | Bay Area Toll Authority, 2.57%, due 04/01/31 | | | 156,353 | |
| | 300,000 | | | | | Bay Area Toll Authority, 6.26%, due 04/01/49 | | | 426,883 | |
| | 1,525,000 | | | | | California Health Facilities Financing Authority, 4.19%, due 06/01/37 | | | 1,557,567 | |
| | 1,300,000 | | | | | Dallas Fort Worth International Airport, 1.93%, due 11/01/28 | | | 1,207,412 | |
See accompanying Notes to the Financial Statements.
108
Mercer Core Fixed Income Fund
Schedule of Investments (Continued)
(showing percentage of net assets)
March 31, 2022
| | | | | | | | | | |
| Par Value(a) | | | | | Description | | Value ($) | |
| | |
| | | | | | Municipal Obligations — continued | |
| | 90,000 | | | | | District of Columbia Water & Sewer Authority, 4.81%, due 10/01/14(h) | | | 101,350 | |
| | 601,000 | | | | | Florida State Board of Administration Finance Corp., 1.71%, due 07/01/27 | | | 560,472 | |
| | 257,000 | | | | | Golden State Tobacco Securitization Corp., 4.21%, due 06/01/50 | | | 229,351 | |
| | 715,000 | | | | | Michigan Finance Authority, 2.37%, due 09/01/49(b) | | | 719,653 | |
| | 550,000 | | | | | Michigan State University, 4.17%, due 08/15/22(h) | | | 537,521 | |
| | 355,000 | | | | | Municipal Electric Authority of Georgia, 6.64%, due 04/01/57 | | | 474,404 | |
| | 327,000 | | | | | New Jersey Transportation Trust Fund Authority, 4.08%, due 06/15/39 | | | 328,653 | |
| | 25,000 | | | | | New Jersey Transportation Trust Fund Authority, 4.13%, due 06/15/42 | | | 24,826 | |
| | 1,350,000 | | | | | New York State Urban Development Corp., 5.77%, due 03/15/39 | | | 1,541,407 | |
| | 2,195,000 | | | | | Port Authority of New York & New Jersey, 1.09%, due 07/01/23 | | | 2,169,147 | |
| | 885,000 | | | | | State of California, 7.50%, due 04/01/34 | | | 1,220,754 | |
| | 555,000 | | | | | State of California, General Obligation, 7.55%, due 04/01/39 | | | 823,884 | |
| | 695,000 | | | | | State of Illinois, General Obligation, 5.00%, due 11/01/22 | | | 707,938 | |
| | 750,000 | | | | | University of Michigan, 4.45%, due 04/01/22(h) | | | 801,562 | |
| | 595,000 | | | | | University of Virginia, 2.58%, due 11/01/51 | | | 506,435 | |
| | 105,000 | | | | | University of Virginia, 4.18%, due 09/01/17(h) | | | 105,393 | |
| | | | | | | | | | |
| | | | | | | | | 14,265,506 | |
| | | | | | | | | | |
| | |
| | | | | | Sovereign Debt Obligations — 0.3% | |
| | 1,407,000 | | | | | Argentine Republic Government International Bond, 2.50%, due 07/09/41(d) | | | 498,655 | |
| | 200,000 | | | | | Bermuda Government International Bond, 2.38%, due 08/20/30 144A | | | 184,000 | |
| | 55,000 | | | | | Corp. Andina de Fomento, 2.75%, due 01/06/23(e) | | | 55,083 | |
| | 215,000 | | | | | Export-Import Bank of India, 3.88%, due 02/01/28 144A | | | 213,205 | |
| | 450,000 | | | | | Indonesia Government International Bond, 3.50%, due 01/11/28 | | | 462,256 | |
| | 200,000 | | | | | Japan Bank for International Cooperation, 3.38%, due 10/31/23 | | | 203,218 | |
| | 200,000 | | | | | Japan Finance Organization for Municipalities, 1.75%, due 09/05/24 144A | | | 196,283 | |
| | 290,000 | | | | | Mexico Government International Bond, 3.50%, due 02/12/34 | | | 270,277 | |
| | 45,000 | | | | | Peruvian Government International Bond, 2.78%, due 01/23/31 | | | 42,480 | |
| | 135,000 | | | | | Province of Alberta Canada, 1.30%, due 07/22/30(e) | | | 121,108 | |
| | 85,000 | | | | | Province of Alberta Canada, 3.30%, due 03/15/28 | | | 87,575 | |
| | 100,000 | | | | | Province of Manitoba Canada, 2.13%, due 06/22/26 | | | 97,834 | |
| | 220,000 | | | | | Province of Quebec Canada, 2.75%, due 04/12/27(e) | | | 220,922 | |
| | 568,000 | | | | | Qatar Government International Bond, 5.10%, due 04/23/48 144A | | | 696,129 | |
| | 789,000 | | | | | Saudi Government International Bond, 4.38%, due 04/16/29 144A | | | 855,053 | |
| | 400,000 | | | | | Tokyo Metropolitan Government, 2.50%, due 06/08/22 144A | | | 401,138 | |
| | 185,000 | | | | | Uruguay Government International Bond, 4.98%, due 04/20/55 | | | 216,361 | |
| | 65,000 | | | | | Uruguay Government International Bond, 5.10%, due 06/18/50 | | | 76,820 | |
| | | | | | | | | | |
| | | | | | | | | 4,898,397 | |
| | | | | | | | | | |
| | |
| | | | | | U.S. Government and Agency Obligations — 24.1% | |
| | 495,000 | | | | | FNMA, 0.88%, due 08/05/30 | | | 432,569 | |
| | 170,000 | | | | | FNMA, 2.38%, due 01/19/23 | | | 171,122 | |
| | 315,000 | | | | | FNMA, 2.50%, due 02/05/24 | | | 316,433 | |
| | 310,000 | | | | | FNMA, 6.63%, due 11/15/30 | | | 406,565 | |
| | 210,000 | | | | | Tennessee Valley Authority, 1.50%, due 09/15/31 | | | 188,853 | |
| | 25,000 | | | | | Tennessee Valley Authority, 7.13%, due 05/01/30 | | | 33,016 | |
| | 1,094,000 | | | | | U.S. Treasury Bond, 1.13%, due 05/15/40 | | | 862,957 | |
| | 14,962,000 | | | | | U.S. Treasury Bond, 1.13%, due 08/15/40 | | | 11,741,079 | |
| | 525,000 | | | | | U.S. Treasury Bond, 1.38%, due 11/15/40 | | | 429,598 | |
See accompanying Notes to the Financial Statements.
109
Mercer Core Fixed Income Fund
Schedule of Investments (Continued)
(showing percentage of net assets)
March 31, 2022
| | | | | | | | | | |
| Par Value(a) | | | | | Description | | Value ($) | |
| | |
| | | | | | U.S. Government and Agency Obligations — continued | |
| | 4,066,000 | | | | | U.S. Treasury Bond, 1.38%, due 08/15/50 | | | 3,133,997 | |
| | 15,401,000 | | | | | U.S. Treasury Bond, 1.75%, due 08/15/41 | | | 13,357,961 | |
| | 8,105,000 | | | | | U.S. Treasury Bond, 1.88%, due 02/15/41 | | | 7,223,106 | |
| | 6,057,000 | | | | | U.S. Treasury Bond, 1.88%, due 02/15/51 | | | 5,300,112 | |
| | 23,922,600 | | | | | U.S. Treasury Bond, 1.88%, due 11/15/51 | | | 20,992,081 | |
| | 13,330,000 | | | | | U.S. Treasury Bond, 2.00%, due 11/15/41 | | | 12,065,733 | |
| | 9,338,000 | | | | | U.S. Treasury Bond, 2.00%, due 08/15/51 | | | 8,427,545 | |
| | 10,720,000 | | | | | U.S. Treasury Bond, 2.25%, due 05/15/41 | | | 10,128,725 | |
| | 12,164,000 | | | | | U.S. Treasury Bond, 2.25%, due 02/15/52 | | | 11,669,837 | |
| | 11,982,000 | | | | | U.S. Treasury Bond, 2.38%, due 02/15/42 | | | 11,560,758 | |
| | 5,140,000 | | | | | U.S. Treasury Bond, 2.38%, due 05/15/51 | | | 5,042,922 | |
| | 13,120,000 | | | | | U.S. Treasury Bond, 2.50%, due 02/15/46 | | | 12,858,369 | |
| | 3,650,000 | | | | | U.S. Treasury Bond, 2.50%, due 05/15/46 | | | 3,579,923 | |
| | 1,441,000 | | | | | U.S. Treasury Bond, 3.00%, due 02/15/47 | | | 1,551,833 | |
| | 170,000 | | | | | U.S. Treasury Bond, 3.00%, due 05/15/47 | | | 183,729 | |
| | 2,835,900 | | | | | U.S. Treasury Bond, 3.63%, due 08/15/43 | | | 3,293,189 | |
| | 2,250,468 | | | | | U.S. Treasury Inflation Indexed Bonds, 0.13%, due 01/15/30 | | | 2,377,235 | |
| | 501,524 | | | | | U.S. Treasury Inflation Indexed Bonds, 1.00%, due 02/15/49 | | | 627,994 | |
| | 3,802,000 | | | | | U.S. Treasury Note, 0.38%, due 01/31/26 | | | 3,503,706 | |
| | 9,644,000 | | | | | U.S. Treasury Note, 0.50%, due 03/31/25 | | | 9,087,210 | |
| | 33,626,000 | | | | | U.S. Treasury Note, 0.63%, due 07/31/26 | | | 31,033,777 | |
| | 4,355,000 | | | | | U.S. Treasury Note, 0.75%, due 05/31/26 | | | 4,051,256 | |
| | 19,300,000 | | | | | U.S. Treasury Note, 1.25%, due 11/30/26 | | | 18,263,002 | |
| | 10,214,000 | | | | | U.S. Treasury Note, 1.25%, due 08/15/31 | | | 9,287,558 | |
| | 7,144,000 | | | | | U.S. Treasury Note, 1.50%, due 02/29/24 | | | 7,040,468 | |
| | 24,055,000 | | | | | U.S. Treasury Note, 1.50%, due 02/15/25 | | | 23,384,091 | |
| | 13,881,000 | | | | | U.S. Treasury Note, 1.50%, due 01/31/27 | | | 13,267,200 | |
| | 11,506,000 | | | | | U.S. Treasury Note, 1.88%, due 02/28/27 | | | 11,199,473 | |
| | 14,701,000 | | | | | U.S. Treasury Note, 1.88%, due 02/15/32 | | | 14,119,851 | |
| | 22,390,000 | | | | | U.S. Treasury Note, 2.25%, due 03/31/24 | | | 22,360,701 | |
| | 978,000 | | | | | U.S. Treasury Note, 2.50%, due 03/31/27 | | | 980,216 | |
| | 18,610,000 | | | | | U.S. Treasury Note, 2.88%, due 05/15/28(o) | | | 19,047,626 | |
| | 5,955,000 | | | | | U.S. Treasury STRIPS, 2.66%, due 08/15/30(n) | | | 4,857,073 | |
| | 955,000 | | | | | U.S. Treasury STRIPS, 3.06%, due 05/15/37(n) | | | 649,815 | |
| | 90,000 | | | | | U.S. Treasury STRIPS, 3.16%, due 11/15/38(n) | | | 58,662 | |
| | 370,000 | | | | | U.S. Treasury STRIPS, 3.17%, due 02/15/39(n) | | | 239,679 | |
| | 155,000 | | | | | U.S. Treasury STRIPS, 3.19%, due 05/15/39(n) | | | 99,716 | |
| | 255,000 | | | | | U.S. Treasury STRIPS, 3.21%, due 08/15/39(n) | | | 162,804 | |
| | 2,310,000 | | | | | U.S. Treasury STRIPS, 3.26%, due 02/15/40(n) | | | 1,449,873 | |
| | 3,325,000 | | | | | U.S. Treasury STRIPS, 3.45%, due 11/15/40(n) | | | 2,009,759 | |
| | 195,000 | | | | | U.S. Treasury STRIPS, 3.52%, due 05/15/41(n) | | | 115,712 | |
| | 55,000 | | | | | U.S. Treasury STRIPS, 3.55%, due 08/15/41(n) | | | 32,340 | |
| | 5,195,000 | | | | | U.S. Treasury STRIPS, 3.58%, due 11/15/41(n) | | | 3,029,406 | |
| | 1,105,000 | | | | | U.S. Treasury STRIPS, 3.62%, due 05/15/42(n) | | | 634,418 | |
| | 85,000 | | | | | U.S. Treasury STRIPS, 3.64%, due 08/15/42(n) | | | 48,402 | |
| | 1,750,000 | | | | | U.S. Treasury STRIPS, 3.67%, due 11/15/42(n) | | | 987,708 | |
| | 4,620,000 | | | | | U.S. Treasury STRIPS, 3.67%, due 02/15/43(n) | | | 2,593,499 | |
| | 646,000 | | | | | U.S. Treasury STRIPS, 3.70%, due 11/15/43(n) | | | 355,786 | |
| | 2,095,000 | | | | | U.S. Treasury STRIPS, 3.72%, due 08/15/44(n) | | | 1,133,925 | |
See accompanying Notes to the Financial Statements.
110
Mercer Core Fixed Income Fund
Schedule of Investments (Continued)
(showing percentage of net assets)
March 31, 2022
| | | | | | | | | | |
| Par Value(a) | | | | | Description | | Value ($) | |
| | |
| | | | | | U.S. Government and Agency Obligations — continued | |
| | 310,000 | | | | | U.S. Treasury STRIPS, 3.72%, due 02/15/46(n) | | | 162,671 | |
| | 280,000 | | | | | U.S. Treasury STRIPS, 3.72%, due 05/15/44(n) | | | 152,242 | |
| | 430,000 | | | | | U.S. Treasury STRIPS, 3.73%, due 11/15/45(n) | | | 226,609 | |
| | 670,000 | | | | | U.S. Treasury STRIPS, 3.76%, due 02/15/45(n) | | | 356,818 | |
| | | | | | | | | | |
| | | | 353,940,293 | |
| | | | | | | | | | |
| | | |
| | | | | | TOTAL DEBT OBLIGATIONS (COST $1,527,689,874) | | | 1,453,122,897 | |
| | | | | | | | | | |
| | | |
| | | | | | SHORT-TERM INVESTMENT — 2.7% | | | | |
| | | |
| | | | | | Mutual Fund - Securities Lending Collateral — 2.7% | | | |
| | 39,160,195 | | | | | State Street Institutional U.S. Government Money Market Fund, Premier Class, 0.25%(p) (q) | | | 39,160,195 | |
| | | | | | | | | | |
| | | |
| | | | | | TOTAL SHORT-TERM INVESTMENT (COST $39,160,195) | | | 39,160,195 | |
| | | | | | | | | | |
| | | |
| | | | | | TOTAL INVESTMENTS — 101.7% (Cost $1,566,850,069) | | | 1,492,283,092 | |
| | | |
| | | | | | Other Assets and Liabilities (net) — (1.7)% | | | (25,625,647 | ) |
| | | | | | | | | | |
| | | |
| | | | | | NET ASSETS — 100.0% | | $1,466,657,445 | |
| | | | | | | | | | |
| | | |
| | | | | | Notes to Schedule of Investments: | | | |
| | | |
| | | | (a) | | Unless otherwise indicated, all par values are denominated in United States dollars ($). | | | | |
| | | |
| | | | (b) | | Variable or floating rate security, which interest rate adjusts periodically based on changes in current interest rates and prepayments on the underlying pool of assets. Rate shown is the rate in effect as of period end. | | | | |
| | | |
| | | | (c) | | Variable or floating rate note. Rate shown is as of March 31, 2022. | | | | |
| | | |
| | | | (d) | | Step coupon security that pays an initial coupon rate for the first period and then a lower/higher coupon rate for the following periods. Rate shown is current coupon rate. | | | | |
| | | |
| | | | (e) | | All or a portion of this security is out on loan. | | | | |
| | | |
| | | | (f) | | Security is perpetual and has no stated maturity date. | | | | |
| | | |
| | | | (g) | | When-issued security. | | | | |
| | | |
| | | | (h) | | Year of maturity is greater than 2100. | | | | |
| | | |
| | | | (i) | | Restricted securities are not registered under the Securities Act of 1933 and are subject to legal restrictions on resale. These securities generally may be resold in transactions exempt from registration or to the public if the securities are subsequently registered. Disposal of these securities may involve time-consuming negotiations and prompt sale at an acceptable price may be difficult. As of year end, the market value of restricted securities was $265,990, which is 0.0% of net assets. See details shown in the Restricted Securities table that follows. | | | | |
See accompanying Notes to the Financial Statements.
111
Mercer Core Fixed Income Fund
Schedule of Investments (Continued)
March 31, 2022
| | | | | | | | |
| | | | (j) | | Security exempt from registration under Regulation S of the Securities Act of 1933, which exempts from registration securities offered and sold outside the United States. Security may not be offered or sold in the United States except pursuant to an exemption from, or in a transaction not subject to, the registration requirements of the Securities Act of 1933. | | |
| | | |
| | | | (k) | | Security is currently in default. | | |
| | | |
| | | | (l) | | Level 3 - significant unobservable inputs were used in determining the value of this security in the fund. | | |
| | | |
| | | | (m) | | Securities fair valued by the Valuation Committee as approved by the Board of Trustees. The total market value of the securities at year end is $0 which represents 0.0% of net assets. The aggregate cost of these securities held at March 31, 2022 was $1,565,555. | | |
| | | |
| | | | (n) | | Interest rate presented is yield to maturity. | | |
| | | |
| | | | (o) | | All or a portion of this security is pledged for open futures collateral. | | |
| | | |
| | | | (p) | | The rate disclosed is the 7-day net yield as of March 31, 2022. | | |
| | | |
| | | | (q) | | Represents an investment of securities lending cash collateral. | | |
| | | |
| | | | 144A | | Securities exempt from registration under Rule 144A of the Securities Act of 1933. These securities may be resold in transactions exempt from registration, normally to qualified institutional buyers. The total market value of the securities at year end is $314,855,591 which represents 21.5% of net assets. | | |
See accompanying Notes to the Financial Statements.
112
Mercer Core Fixed Income Fund
Schedule of Investments (Continued)
March 31, 2022
At March 31, 2022, the Fund held the following restricted securities:
| | | | | | | | | | | | | | |
Restricted Securities | | Acquisition Date | | Principal
Amount | | | Cost | | | Value | |
Credit Agricole SA, 2.81%, due 01/11/41 | | 01/28/21 | | USD | 320,000 | | | $ | 308,104 | | | $ | 265,101 | |
LSC Communication, Inc., 8.75%, due 10/15/23 | | 08/27/21 | | USD | 284,000 | | | | — | | | | 889 | |
| | | | | | | | | | | | | | |
| | | | | | | | | | | | $ | 265,990 | |
| | | | | | | | | | | | | | |
Forward Foreign Currency Contracts
| | | | | | | | | | | | | | | | | | | | | | | | | | | | |
Currency Purchased | | | Currency Sold | | | Settlement
Date | | | | | | Counterparty | | | | | Unrealized
Appreciation
(Depreciation) | |
| EUR | | | 8,768,748 | | | USD | | | 9,651,103 | | | | 04/04/22 | | | | | | | JPMorgan Chase Bank N.A. | | | | | | $ | 105,447 | |
| USD | | | 9,954,796 | | | EUR | | | 8,768,748 | | | | 04/04/22 | | | | | | | JPMorgan Chase Bank N.A. | | | | | | | 198,246 | |
| USD | | | 9,660,968 | | | EUR | | | 8,768,748 | | | | 05/06/22 | | | | | | | JPMorgan Chase Bank N.A. | | | | | | | (105,047 | ) |
| | | | | | | | | | | | | | | | | | | | | | | | | | | | |
| | | | | | $ | 198,646 | |
| | | | | | | | | | | | | | | | | | | | | | | | | | | | |
Futures Contracts
| | | | | | | | | | | | | | | | | | |
Number of
Contracts | | | | | Description | | | | Expiration Date | | Notional
Value | | | Market Value/
Unrealized
Appreciation
(Depreciation) | |
| | Buys | | | | | | |
| | 251 | | | | | U.S. Treasury Note 10-Year | | | | Jun 2022 | | $ | 30,841,625 | | | $ | (909,694 | ) |
| | 142 | | | | | U.S. Treasury Note 2-Year | | | | Jun 2022 | | | 30,092,906 | | | | (385,773 | ) |
| | 215 | | | | | U.S. Treasury Note 5-Year | | | | Jun 2022 | | | 24,657,813 | | | | (634,654 | ) |
| | 48 | | | | | U.S. Ultra Bond | | | | Jun 2022 | | | 8,502,000 | | | | (271,358 | ) |
| | | | | | | | | | | | | | | | | | |
| | | | | | | | | | | | | | | | $ | (2,201,479 | ) |
| | | | | | | | | | | | | | | | | | |
| | Sales | | | | | | | | | | | | | | | | | |
| | 1 | | | | | Euro-Bobl | | | | Jun 2022 | | $ | 143,376 | | | $ | 4,590 | |
| | 3 | | | | | Euro-Bund | | | | Jun 2022 | | | 529,599 | | | | 28,074 | |
| | 194 | | | | | U.S. Long Bond | | | | Jun 2022 | | | 29,112,125 | | | | 839,617 | |
| | 229 | | | | | U.S. Ultra 10-Year | | | | Jun 2022 | | | 31,022,344 | | | | 954,163 | |
| | | | | | | | | | | | | | | | | | |
| | | | | | | | | | | | | | | | $ | 1,826,444 | |
| | | | | | | | | | | | | | | | | | |
Currency Abbreviations
Other Abbreviations
| ACES | — Alternative Credit Enhancement Securities |
| CLO | — Collateralized Loan Obligation |
| CMO | — Collateralized Mortgage Obligation |
| CMT | — Constant Maturity Treasury Index |
| FHLMC | — Federal Home Loan Mortgage Corporation |
| FNMA | — Federal National Mortgage Association |
See accompanying Notes to the Financial Statements.
113
Mercer Core Fixed Income Fund
Schedule of Investments (Continued)
March 31, 2022
Other Abbreviations — continued
| | | | |
| | |
| GNMA | | — | | Government National Mortgage Association |
| | |
| ICE | | — | | Intercontinental Exchange |
| | |
| IO | | — | | Interest Only |
| | |
| LIBOR | | — | | London Interbank Offered Rate |
| | |
| MTN | | — | | Medium Term Note |
| | |
| PIK | | — | | Payment In Kind |
| | |
| REIT | | — | | Real Estate Investment Trust |
| | |
| REMIC | | — | | Real Estate Mortgage Investment Conduit |
| | |
| SOFR | | — | | Secured Overnight Financing Rate |
| | |
| STRIPS | | — | | Separate Trading of Registered Interest and Principal of Securities |
| | |
| TBA | | — | | To Be Announced |
| | |
| TSFR | | — | | Term Secured Overnight Financing Rate |
| | |
| UMBS | | — | | Uniform Mortgage-Backed Securities are single-class securities backed by fixed-rate mortgage loans purchased by either FHLMC or FNMA |
See accompanying Notes to the Financial Statements.
114
Mercer Core Fixed Income Fund
Schedule of Investments (Continued)
March 31, 2022
| | | | | |
| Asset Class Summary (Unaudited) | | % of Net Assets |
Debt Obligations | | | | 99.8 | |
Futures Contracts | | | | 0.0 | * |
Forward Foreign Currency Contracts | | | | (0.7 | ) |
Short-Term Investment | | | | 2.7 | |
Other Assets and Liabilities (net) | | | | (1.8 | ) |
| | | | | |
| | | | 100.0 | % |
| | | | | |
* Amount rounds to zero.
See accompanying Notes to the Financial Statements.
115
Mercer Opportunistic Fixed Income Fund
Schedule of Investments
(showing percentage of net assets)
March 31, 2022
| | | | | | | | | | |
| Par Value(a) | | | | | Description | | Value ($) | |
| | | |
| | | | | | DEBT OBLIGATIONS — 92.8% | | | | |
| | | |
| | | | | | Asset Backed Securities — 5.3% | | | |
| | 690,000 | | | | | Aegis Asset Backed Securities Trust, Series 2005-5, Class M1, 1.10% (1 mo. USD LIBOR + 0.65%), due 12/25/35(b) | | | 671,197 | |
| | 250,000 | | | | | Allegro CLO XI, Ltd., Series 2019-2A, Class A1A, 1.64% (3 mo. USD LIBOR + 1.39%), due 01/19/33(b) 144A | | | 249,501 | |
| | 300,000 | | | | | Anchorage Capital CLO, Ltd., Series 2014-3RA, Class E, 5.78% (3 mo. USD LIBOR + 5.50%), due 01/28/31(b) 144A | | | 281,344 | |
| | 1,000,000 | | | | | Apex Credit CLO, Ltd., Series 2019-1A, Class BR, 2.64% (3 mo. USD LIBOR + 2.40%), due 04/18/32(b) 144A | | | 970,099 | |
| | 420,000 | | | | | Apidos CLO XXII, Series 2015-22A, Class DR, 7.00% (3 mo. USD LIBOR + 6.75%), due 04/20/31(b) 144A | | | 407,603 | |
| | 598,950 | | | | | Applebee’s Funding LLC/IHOP Funding LLC, Series 2019-1A, Class A2I, 4.19%, due 06/05/49 144A | | | 596,616 | |
| | 250,000 | | | | | Ares XXXIIR CLO, Ltd., Series 2014-32RA, Class C, 3.41% (3 mo. USD LIBOR + 2.90%), due 05/15/30(b) 144A | | | 239,476 | |
| | 810,000 | | | | | Asset Backed Securities Corp. Home Equity Loan Trust, Series 2006-HE5, Class M1, 0.74% (1 mo. USD LIBOR + 0.28%), due 07/25/36(b) | | | 715,276 | |
| | 242,182 | | | | | Asset Backed Securities Corp. Home Equity Loan Trust, Series 2007-HE1, Class A4, 0.60% (1 mo. USD LIBOR + 0.14%), due 12/25/36(b) | | | 237,199 | |
| | 410,000 | | | | | Avery Point VI CLO, Ltd., Series 2015-6A, Class DR, 3.27% (3 mo. USD LIBOR + 2.95%), due 08/05/27(b) 144A | | | 406,868 | |
| | 410,000 | | | | | Avis Budget Rental Car Funding AESOP LLC, Series 2020-2A, Class C, 4.25%, due 02/20/27 144A | | | 409,247 | |
| | 835,000 | | | | | Bain Capital Credit CLO, Ltd., Series 2022-1A, Class C, 3.10% (3 mo. TSFR + 2.20%), due 04/18/35(b) 144A | | | 830,118 | |
| | 550,000 | | | | | Bain Capital Credit CLO, Ltd., Series 2022-2A, Class D1, 1.00% (3 mo. TSFR + 3.65%), due 04/22/35(b) (c) 144A | | | 548,434 | |
| | 250,000 | | | | | Ballyrock CLO, Ltd., Series 2016-1A, Class ER, 7.19% (3 mo. USD LIBOR + 6.95%), due 10/15/28(b) 144A | | | 248,523 | |
| | 275,000 | | | | | Ballyrock CLO, Ltd., Series 2018-1A, Class C, 3.40% (3 mo. USD LIBOR + 3.15%), due 04/20/31(b) 144A | | | 269,315 | |
| | 1,560,000 | | | | | Ballyrock CLO, Ltd., Series 2022-19A, Class D, 8.28% (3 mo. TSFR + 7.11%), due 04/20/35(b) (c) 144A | | | 1,518,995 | |
| | 250,000 | | | | | Barings CLO, Ltd., Series 2013-IA, Class CR, 1.75% (3 mo. USD LIBOR + 1.50%), due 01/20/28(b) 144A | | | 249,128 | |
| | 250,000 | | | | | Barings CLO, Ltd., Series 2016-2A, Class ER2, 6.75% (3 mo. USD LIBOR + 6.50%), due 01/20/32(b) 144A | | | 241,169 | |
| | 250,000 | | | | | Benefit Street Partners CLO XII, Ltd., Series 2017-12A, Class C, 3.29% (3 mo. USD LIBOR + 3.05%), due 10/15/30(b) 144A | | | 243,616 | |
| | 450,000 | | | | | BlueMountain CLO XXII, Ltd., Series 2018-22A, Class A1, 1.32% (3 mo. USD LIBOR + 1.08%), due 07/15/31(b) 144A | | | 447,385 | |
| | 850,000 | | | | | BlueMountain CLO XXIX, Ltd., Series 2020-29A, Class ER, 7.12% (3 mo. USD LIBOR + 6.86%), due 07/25/34(b) 144A | | | 815,861 | |
| | 250,000 | | | | | Bristol Park CLO, Ltd., Series 2016-1A, Class ER, 7.24% (3 mo. USD LIBOR + 7.00%), due 04/15/29(b) 144A | | | 247,949 | |
| | 91,597 | | | | | California Republic Auto Receivables Trust, Series 2018-1, Class C, 3.87%, due 10/16/23 | | | 91,902 | |
| | 280,000 | | | | | Canyon Capital CLO, Ltd., Series 2021-1A, Class E, 6.65% (3 mo. USD LIBOR + 6.41%), due 04/15/34(b) 144A | | | 272,795 | |
See accompanying Notes to the Financial Statements.
116
Mercer Opportunistic Fixed Income Fund
Schedule of Investments (Continued)
(showing percentage of net assets)
March 31, 2022
| | | | | | | | | | |
| Par Value(a) | | | | | Description | | Value ($) | |
| | | |
| | | | | | Asset Backed Securities — continued | | | |
| | 404,111 | | | | | Carlyle Global Market Strategies CLO, Ltd., Series 2014-2RA, Class A1, 1.56% (3 mo. USD LIBOR + 1.05%), due 05/15/31(b) 144A | | | 401,994 | |
| | 1,300,000 | | | | | Carlyle US CLO, Ltd., Series 2019-2A, Class DR, 6.74% (3 mo. USD LIBOR + 6.50%), due 07/15/32(b) 144A | | | 1,272,777 | |
| | 1,475,000 | | | | | Carlyle US CLO, Ltd., Series 2019-4A, Class A2R, 1.98% (3 mo. TSFR + 1.75%), due 04/15/35(b) 144A | | | 1,465,032 | |
| | 750,000 | | | | | Catskill Park CLO, Ltd., Series 2017-1A, Class D, 6.25% (3 mo. USD LIBOR + 6.00%), due 04/20/29(b) 144A | | | 729,781 | |
| | 1,020,000 | | | | | CBAM CLO, Ltd., Series 2018-6A, Class B2R, 2.34% (3 mo. USD LIBOR + 2.10%), due 01/15/31(b) 144A | | | 1,005,405 | |
| | 250,000 | | | | | CIFC Funding CLO, Ltd., Series 2017-1A, Class D, 3.76% (3 mo. USD LIBOR + 3.50%), due 04/23/29(b) 144A | | | 248,852 | |
| | 700,000 | | | | | CIFC Funding CLO, Ltd., Series 2017-3A, Class C, 3.90% (3 mo. USD LIBOR + 3.65%), due 07/20/30(b) 144A | | | 694,265 | |
| | 63,155 | | | | | Diamond Resorts Owner Trust, Series 2018-1, Class C, 4.53%, due 01/21/31 144A | | | 63,315 | |
| | 900,000 | | | | | Dryden 70 CLO, Ltd., Series 2018-70A, Class E, 6.29% (3 mo. USD LIBOR + 6.05%), due 01/16/32(b) 144A | | | 869,917 | |
| | 92,016 | | | | | DT Auto Owner Trust, Series 2018-2A, Class D, 4.15%, due 03/15/24 144A | | | 92,342 | |
| | 630,000 | | | | | Eaton Vance CLO, Ltd., Series 2020-2A, Class ER, 6.74% (3 mo. USD LIBOR + 6.50%), due 01/15/35(b) 144A | | | 617,500 | |
| | 368,035 | | | | | Falcon Aerospace, Ltd., Series 2017-1, Class A, 4.58%, due 02/15/42 144A | | | 356,515 | |
| | 118,280 | | | | | First Franklin Mortgage Loan Trust, Series 2005-FF12, Class M1, 1.13% (1 mo. USD LIBOR + 0.68%), due 11/25/36(b) | | | 118,263 | |
| | 250,000 | | | | | Fortress Credit BSL CLO XII, Ltd., Series 2021-4A, Class E, 7.27% (3 mo. USD LIBOR + 7.13%), due 10/15/34(b) 144A | | | 234,838 | |
| | 1,520,000 | | | | | Franklin Park Place CLO I LLC, Series 2022-1A, Class B, 2.77% (3 mo. TSFR + 2.00%), due 04/14/35(b) 144A | | | 1,513,390 | |
| | 380,000 | | | | | Golub Capital Partners CLO, Ltd., Series 2021-53A, Class E, 6.95% (3 mo. USD LIBOR + 6.70%), due 07/20/34(b) 144A | | | 364,072 | |
| | 250,000 | | | | | Greenwood Park CLO, Ltd., Series 2018-1A, Class E, 5.19% (3 mo. USD LIBOR + 4.95%), due 04/15/31(b) 144A | | | 236,650 | |
| | 250,000 | | | | | Greywolf CLO IV, Ltd., Series 2019-1A, Class CR, 3.89% (3 mo. USD LIBOR + 3.65%), due 04/17/34(b) 144A | | | 250,429 | |
| | 450,000 | | | | | Greywolf CLO V, Ltd., Series 2015-1A, Class A1R, 1.42% (3 mo. USD LIBOR + 1.16%), due 01/27/31(b) 144A | | | 448,150 | |
| | 750,000 | | | | | Greywolf CLO VI, Ltd., Series 2018-1A, Class D, 6.02% (3 mo. USD LIBOR + 5.75%), due 04/26/31(b) 144A | | | 709,351 | |
| | 92,909 | | | | | GSAA Home Equity Trust, Series 2007-7, Class A4, 1.00% (1 mo. USD LIBOR + 0.54%), due 07/25/37(b) | | | 92,191 | |
| | 290,000 | | | | | Halsey Point CLO I, Ltd., Series 2019-1A, Class F, 8.45% (3 mo. USD LIBOR + 8.20%), due 01/20/33(b) 144A | | | 275,260 | |
| | 645,000 | | | | | Harbor Park CLO, Ltd., Series 2018-1A, Class C, 2.35% (3 mo. USD LIBOR + 2.10%), due 01/20/31(b) 144A | | | 640,381 | |
| | 265,000 | | | | | Invesco CLO, Ltd., Series 2021-1A, Class D, 3.29% (3 mo. USD LIBOR + 3.05%), due 04/15/34(b) 144A | | | 258,918 | |
| | 1,500,000 | | | | | Invesco CLO, Ltd., Series 2022-1A, Class B, 2.08% (3 mo. TSFR + 1.80%), due 04/20/35(b) 144A | | | 1,487,295 | |
| | 240,849 | | | | | KeyCorp Student Loan Trust, Series 2005-A, Class 2C, 2.27% (3 mo. USD LIBOR + 1.30%), due 12/27/38(b) | | | 233,699 | |
See accompanying Notes to the Financial Statements.
117
Mercer Opportunistic Fixed Income Fund
Schedule of Investments (Continued)
(showing percentage of net assets)
March 31, 2022
| | | | | | | | | | |
| Par Value(a) | | | | | Description | | Value ($) | |
| | | |
| | | | | | Asset Backed Securities — continued | | | |
| | 400,000 | | | | | KKR CLO 14, Ltd., Series 14, Class BR, 2.04% (3 mo. USD LIBOR + 1.80%), due 07/15/31(b) 144A | | | 396,972 | |
| | 190,697 | | | | | LCM CLO XVIII, LP, Series 19A, Class AR, 1.48% (3 mo. USD LIBOR + 1.24%), due 07/15/27(b) 144A | | | 190,679 | |
| | 216,492 | | | | | Long Beach Mortgage Loan Trust, Series 2005-1, Class M4, 1.73% (1 mo. USD LIBOR + 1.28%), due 02/25/35(b) | | | 215,344 | |
| | 1,355,000 | | | | | Madison Park Funding CLO XXVI, Ltd., Series 2007-4A, Class BR, 1.90% (3 mo. USD LIBOR + 1.60%), due 07/29/30(b) 144A | | | 1,346,285 | |
| | 2,605,000 | | | | | Madison Park Funding CLO XXXIX, Ltd., Series 2021-39A, Class D, 3.18% (3 mo. USD LIBOR + 3.05%), due 10/22/34(b) 144A | | | 2,559,905 | |
| | 400,000 | | | | | Magnetite CLO XII, Ltd., Series 2015-12A, Class ER, 5.92% (3 mo. USD LIBOR + 5.68%), due 10/15/31(b) 144A | | | 381,589 | |
| | 1,030,000 | | | | | Magnetite CLO XVII, Ltd., Series 2016-17A, Class CR, 2.15% (3 mo. USD LIBOR + 1.90%), due 07/20/31(b) 144A | | | 1,024,935 | |
| | 1,435,000 | | | | | Magnetite CLO XXIV, Ltd., Series 2019-24A, Class BR, 1.97% (3 mo. TSFR + 1.75%), due 04/15/35(b) (d) | | | 1,428,759 | |
| | 604,674 | | | | | Magnolia Financial X DAC, Series 2020-1, 1.97%, due 08/13/24 144A | | | 591,299 | |
| | 250,000 | | | | | Marathon CLO 14, Ltd., Series 2019-2A, Class BA, 3.55% (3 mo. USD LIBOR + 3.30%), due 01/20/33(b) 144A | | | 238,520 | |
| | 400,000 | | | | | Mercury Financial Credit Card Master Trust, Series 2022-1A, Class B, 3.20%, due 09/21/26 144A | | | 383,311 | |
| | 509,660 | | | | | Mill City Solar Loan, Ltd., Series 2019-1A, Class A, 4.34%, due 03/20/43 144A | | | 516,355 | |
| | 600,000 | | | | | MKS CLO, Ltd., Series 2017-2A, Class D, 2.90% (3 mo. USD LIBOR + 2.65%), due 01/20/31(b) 144A | | | 551,772 | |
| | 1,625,000 | | | | | Morgan Stanley Eaton Vance CLO, Ltd., Series 2021-1A, Class D, 3.23% (3 mo. USD LIBOR + 3.10%), due 10/20/34(b) 144A | | | 1,589,287 | |
| | 803,333 | | | | | Mosaic Solar Loan Trust, Series 2021-1A, Class D, 3.71%, due 12/20/46 144A | | | 769,293 | |
| | 1,290,000 | | | | | Myers Park CLO, Ltd., Series 2018-1A, Class C, 2.30% (3 mo. USD LIBOR + 2.05%), due 10/20/30(b) 144A | | | 1,274,285 | |
| | 1,236,085 | | | | | National Collegiate Student Loan Trust, Series 2007-2, Class A4, 0.75% (1 mo. USD LIBOR + 0.29%), due 01/25/33(b) | | | 1,175,663 | |
| | 370,000 | | | | | Navient Private Education Refi Student Loan Trust, Series 2018-CA, Class B, 4.22%, due 06/16/42 144A | | | 373,559 | |
| | 100,000 | | | | | Navient Private Education Refi Student Loan Trust, Series 2020-A, Class B, 3.16%, due 11/15/68 144A | | | 94,423 | |
| | 760,000 | | | | | Navient Private Education Refi Student Loan Trust, Series 2020-GA, Class B, 2.50%, due 09/16/69 144A | | | 714,069 | |
| | 250,000 | | | | | Neuberger Berman CLO XVIII, Ltd., Series 2014-18A, Class DR2, 6.18% (3 mo. USD LIBOR + 5.92%), due 10/21/30(b) 144A | | | 236,838 | |
| | 480,000 | | | | | Neuberger Berman Loan Advisers CLO 44, Ltd., Series 2021-44A, Class E, 6.24% (3 mo. USD LIBOR + 6.00%), due 10/16/34(b) 144A | | | 470,754 | |
| | 250,000 | | | | | Oaktree CLO, Ltd., Series 2015-1A, Class DR, 5.45% (3 mo. USD LIBOR + 5.20%), due 10/20/27(b) 144A | | | 246,723 | |
| | 650,000 | | | | | Ocean Trails CLO X, Series 2020-10A, Class ER, 7.81% (3 mo. USD LIBOR + 7.57%), due 10/15/34(b) 144A | | | 611,061 | |
| | 1,160,000 | | | | | OCP CLO, Ltd., Series 2015-9A, Class BR2, 2.02% (3 mo. TSFR + 1.75%), due 01/15/33(b) 144A | | | 1,154,968 | |
| | 325,000 | | | | | Octagon Investment Partners CLO 35, Ltd., Series 2018-1A, Class C, 2.85% (3 mo. USD LIBOR + 2.60%), due 01/20/31(b) 144A | | | 310,794 | |
See accompanying Notes to the Financial Statements.
118
Mercer Opportunistic Fixed Income Fund
Schedule of Investments (Continued)
(showing percentage of net assets)
March 31, 2022
| | | | | | | | | | |
| Par Value(a) | | | | | Description | | Value ($) | |
| | | |
| | | | | | Asset Backed Securities — continued | | | |
| | 180,000 | | | | | OneMain Financial Issuance Trust, Series 2018-1A, Class D, 4.08%, due 03/14/29 144A | | | 179,934 | |
| | 850,000 | | | | | Option One Mortgage Loan Trust, Series 2005-3, Class M4, 1.39% (1 mo. USD LIBOR + 0.93%), due 08/25/35(b) | | | 799,778 | |
| | 250,000 | | | | | Owl Rock CLO III, Ltd., Series 2020-3A, Class A1L, 2.05% (3 mo. USD LIBOR + 1.80%), due 04/20/32(b) 144A | | | 250,049 | |
| | 605,000 | | | | | OZLM CLO XXIII, Ltd., Series 2019-23A, Class B1R, 2.09% (3 mo. USD LIBOR + 1.85%), due 04/15/34(b) 144A | | | 598,586 | |
| | 250,000 | | | | | Parallel CLO, Ltd., Series 2017-1A, Class CR, 2.25% (3 mo. USD LIBOR + 2.00%), due 07/20/29(b) 144A | | | 242,387 | |
| | 390,000 | | | | | Peace Park CLO, Ltd., Series 2021-1A, Class E, 6.25% (3 mo. USD LIBOR + 6.00%), due 10/20/34(b) 144A | | | 374,451 | |
| | 443,900 | | | | | Planet Fitness Master Issuer LLC, Series 2018-1A, Class A2II, 4.67%, due 09/05/48 144A | | | 443,486 | |
| | 950,000 | | | | | Post CLO, Ltd., Series 2022-1A, Class B, 2.61% (3 mo. TSFR + 1.90%), due 04/20/35(b) 144A | | | 945,840 | |
| | 1,005,000 | | | | | PPM CLO, Ltd., Series 2018-1A, Class B2, 2.09% (3 mo. USD LIBOR + 1.85%), due 07/15/31(b) 144A | | | 984,055 | |
| | 340,000 | | | | | Recette CLO, Ltd., Series 2015-1A, Class ARR, 1.33% (3 mo. USD LIBOR + 1.08%), due 04/20/34(b) 144A | | | 335,580 | |
| | 1,160,000 | | | | | Residential Asset Securities Trust, Series 2006-KS2, Class M3, 1.07% (1 mo. USD LIBOR + 0.62%), due 03/25/36(b) | | | 1,114,208 | |
| | 720,000 | | | | | RR CLO 18, Ltd., Series 2021-18A, Class D, 6.49% (3 mo. USD LIBOR + 6.25%), due 10/15/34(b) 144A | | | 706,777 | |
| | 180,000 | | | | | Saranac CLO III, Ltd., Series 2014-3A, Class DR, 4.18% (3 mo. USD LIBOR + 3.25%), due 06/22/30(b) 144A | | | 168,690 | |
| | 430,000 | | | | | Sculptor CLO XXVI, Ltd., Series 26A, Class E, 7.50% (3 mo. USD LIBOR + 7.25%), due 07/20/34(b) 144A | | | 417,531 | |
| | 515,000 | | | | | Sixth Street CLO XVIII, Ltd., Series 2021-18A, Class D, 3.15% (3 mo. USD LIBOR + 2.90%), due 04/20/34(b) 144A | | | 502,309 | |
| | 87,000 | | | | | SLM Private Credit Student Loan Trust, Series 2003-A, Class A3, 4.28%, due 06/15/32(e) | | | 84,998 | |
| | 50,000 | | | | | SLM Private Credit Student Loan Trust, Series 2003-B, Class A3, 4.30%, due 03/15/33(e) | | | 48,992 | |
| | 680,000 | | | | | SMB Private Education Loan Trust, Series 2021-A, Class D1, 3.86%, due 01/15/53 144A | | | 650,682 | |
| | 940,000 | | | | | Southwick Park CLO LLC, Series 2019-4A, Class DR, 3.20% (3 mo. USD LIBOR + 2.95%), due 07/20/32(b) 144A | | | 924,811 | |
| | 280,000 | | | | | TCI-Symphony CLO, Ltd., Series 2016-1A, Class DR2, 3.34% (3 mo. USD LIBOR + 3.10%), due 10/13/32(b) 144A | | | 274,523 | |
| | 800,000 | | | | | TCI-Symphony CLO, Ltd., Series 2016-1A, Class ER2, 6.99% (3 mo. USD LIBOR + 6.75%), due 10/13/32(b) 144A | | | 785,022 | |
| | 340,000 | | | | | Venture CLO 31, Ltd., Series 2018-31A, Class A1, 1.28% (3 mo. USD LIBOR + 1.03%), due 04/20/31(b) 144A | | | 337,673 | |
| | 250,000 | | | | | Voya CLO, Ltd., Series 2016-3A, Class A1R, 1.43% (3 mo. USD LIBOR + 1.19%), due 10/18/31(b) 144A | | | 248,896 | |
| | 260,000 | | | | | Voya CLO, Ltd., Series 2017-3A, Class DR, 7.20% (3 mo. USD LIBOR + 6.95%), due 04/20/34(b) 144A | | | 249,109 | |
See accompanying Notes to the Financial Statements.
119
Mercer Opportunistic Fixed Income Fund
Schedule of Investments (Continued)
(showing percentage of net assets)
March 31, 2022
| | | | | | | | | | |
| Par Value(a) | | | | | Description | | Value ($) | |
| | | |
| | | | | | Asset Backed Securities — continued | | | |
| | 275,000 | | | | | Webster Park CLO, Ltd., Series 2015-1A, Class CR, 3.15% (3 mo. USD LIBOR + 2.90%), due 07/20/30(b) 144A | | | 269,684 | |
| | 350,000 | | | | | Wellfleet CLO, Ltd., Series 2017-2A, Class C, 3.65% (3 mo. USD LIBOR + 3.40%), due 10/20/29(b) 144A | | | 346,557 | |
| | 42,745 | | | | | Westlake Automobile Receivables Trust, Series 2018-3A, Class D, 4.00%, due 10/16/23 144A | | | 42,912 | |
| | 260,000 | | | | | Whitebox CLO II, Ltd., Series 2020-2A, Class A1R, 1.48% (3 mo. USD LIBOR + 1.22%), due 10/24/34(b) 144A | | | 257,550 | |
| | 410,000 | | | | | Whitehorse CLO XII, Ltd., Series 2018-12A, Class D, 3.89% (3 mo. USD LIBOR + 3.65%), due 10/15/31(b) 144A | | | 392,012 | |
| | 420,000 | | | | | Z Capital Credit Partners CLO, Ltd., Series 2021-1A, Class D, 4.44% (3 mo. USD LIBOR + 4.20%), due 07/15/33(b) 144A | | | 411,336 | |
| | | | | | | | | | |
| | | | | | | | | 58,126,058 | |
| | | | | | | | | | |
| | | |
| | | | | | Bank Loans — 19.4% | | | |
| | 3,281,000 | | | | | 19th Holdings Golf, LLC, 2022 Term Loan B, 3.75% (3 mo. SOFR + 3.25%), due 02/07/29(b) | | | 3,252,291 | |
| | 616,622 | | | | | 8th Avenue Food & Provisions, Inc., 2018 1st Lien Term Loan, 4.21% (1 mo. USD LIBOR + 3.75%), due 10/01/25(b) | | | 540,058 | |
| | 1,710,563 | | | | | AAdvantage Loyalty IP, Ltd., 2021 Term Loan, 5.50% (3 mo. USD LIBOR + 4.75%), due 04/20/28(b) | | | 1,735,610 | |
| | 591,788 | | | | | Academy, Ltd., 2021 Term Loan, 4.50% (1 mo. USD LIBOR + 3.75%), due 11/05/27(b) | | | 588,336 | |
| | 1,217,880 | | | | | ACProducts, Inc., 2021 Term Loan B, 4.75% (6 mo. USD LIBOR + 4.25%), due 05/17/28(b) | | | 1,107,932 | |
| | 123,669 | | | | | Acrisure, LLC, 2020 Term Loan B, 3.96% (1 mo. USD LIBOR + 3.50%), due 02/15/27(b) | | | 121,999 | |
| | 806,000 | EUR | | | | Adevinta ASA, EUR Term Loan B, 3.00% (3 mo. EURIBOR + 3.00%), due 06/26/28(b) | | | 888,949 | |
| | 956,007 | | | | | Adtalem Global Education Inc., 2021 Term Loan B, 5.25% (1 mo. USD LIBOR + 4.50%), due 08/12/28(b) | | | 954,016 | |
| | 1,538,412 | | | | | AEA International Holdings Lux SARL, Term Loan B, 4.25% (3 mo. USD LIBOR + 3.75%), due 09/07/28(b) | | | 1,536,489 | |
| | 580,000 | | | | | Air Canada, 2021 Term Loan B, 4.25% (3 mo. USD LIBOR + 3.50%), due 08/11/28(b) | | | 574,635 | |
| | 2,200,000 | EUR | | | | Albion Financing 3 SARL, EUR Term Loan, 5.25% (3 mo. Euribor + 5.25%), due 07/31/26(b) | | | 2,447,525 | |
| | 787,949 | | | | | Allen Media, LLC, 2021 Term Loan B, 6.30% (3 mo. USD LIBOR + 5.50%), due 02/10/27(b) | | | 783,025 | |
| | 573,053 | | | | | Allied Universal Holdco LLC, 2021 USD Incremental Term Loan B, 4.25% (1 mo. USD LIBOR + 3.75%), due 05/12/28(b) | | | 565,651 | |
| | 1,220,000 | | | | | AllSpring Buyer LLC, Term Loan B, TBD , due 11/01/28(f) | | | 1,214,205 | |
| | 904,000 | | | | | Altar Bidco, Inc., 2021 Term Loan, TBD , due 02/01/29(f) | | | 893,830 | |
| | 336,531 | | | | | AMC Entertainment Holdings, Inc., 2019 Term Loan B, 3.35% (1 mo. USD LIBOR + 3.00%), due 04/22/26(b) | | | 300,538 | |
| | 611,562 | | | | | Amentum Government Services Holdings LLC, 2022 Term Loan, 4.50% (3 mo. SOFR + 4.00%), due 02/15/29(b) | | | 608,249 | |
| | 400,000 | | | | | Amentum Government Services Holdings LLC, 2020 2nd Lien Term Loan, 10.00% (3 mo. USD LIBOR + 8.75%), due 01/31/28(b) | | | 398,000 | |
See accompanying Notes to the Financial Statements.
120
Mercer Opportunistic Fixed Income Fund
Schedule of Investments (Continued)
(showing percentage of net assets)
March 31, 2022
| | | | | | | | | | |
| Par Value(a) | | | | | Description | | Value ($) | |
| | | |
| | | | | | Bank Loans — continued | | | |
| | 688,438 | | | | | Amentum Government Services Holdings LLC, 2022 Term Loan, 4.78% (3 mo. SOFR + 4.00%), due 02/15/29(b) | | | 684,709 | |
| | 495,936 | | | | | Amentum Government Services Holdings LLC, Term Loan B, 3.96% (1 mo. USD LIBOR + 3.50%), due 01/29/27(b) | | | 492,424 | |
| | 55,802 | | | | | Amerilife Holdings, LLC, 2020 Term Loan, 4.46% (3 mo. USD LIBOR + 4.00%), due 03/18/27(b) | | | 54,965 | |
| | 1,301,577 | | | | | AMG Advanced Metallurgical Group NV, 2018 Term Loan B, 4.00% (1 mo. USD LIBOR + 3.50%), due 11/30/28(b) | | | 1,272,292 | |
| | 1,271,420 | | | | | AmWINS Group, Inc., 2021 Term Loan B, 3.00% (1 mo. USD LIBOR + 2.25%), due 02/19/28(b) | | | 1,252,745 | |
| | 348,128 | | | | | Anticimex International AB, 2021 USD Term Loan B1, 4.01% (3 mo. USD LIBOR + 3.50%), due 11/16/28(b) | | | 344,429 | |
| | 503,033 | | | | | APi Group DE, Inc., 2021 Incremental Term Loan B, 3.20% (1 mo. USD LIBOR + 2.75%), due 01/03/29(b) | | | 499,260 | |
| | 188,575 | | | | | Apollo Commercial Real Estate Finance, Inc., 2021 Incremental Term Loan B1, 4.00% (1 mo. USD LIBOR + 3.50%), due 03/11/28(b) | | | 187,396 | |
| | 538,650 | | | | | AppLovin Corp., 2021 Term Loan B, 3.50% (1 mo. USD LIBOR + 3.00%), due 10/25/28(b) | | | 535,578 | |
| | 1,258,858 | | | | | Arctic Canadian Diamond Co., Ltd., 2nd Lien PIK Term Loan, 5.00% (3 mo. USD LIBOR + 5.00%; 12.5% PIK), due 12/31/27(b) (p) | | | 1,189,117 | |
| | 1,325,980 | EUR | | | | Aruba Investments, Inc., 2020 EUR Term Loan, 4.00% (6 mo. EURIBOR + 4.00%), due 11/24/27(b) | | | 1,460,598 | |
| | 946,461 | | | | | Aruba Investments, Inc., 2020 USD Term Loan, 4.50% (6 mo. USD LIBOR + 3.75%), due 11/24/27(b) | | | 935,813 | |
| | 171,729 | | | | | Asurion LLC, 2018 Term Loan B6, 3.58% (1 mo. USD LIBOR + 3.13%), due 11/03/23(b) | | | 170,934 | |
| | 900,000 | | | | | Asurion LLC, 2021 Second Lien Term Loan B4, 5.71% (1 mo. USD LIBOR + 5.25%), due 01/20/29(b) | | | 882,000 | |
| | 500,544 | | | | | Asurion LLC, 2021 Term Loan B9, 3.71% (1 mo. USD LIBOR + 3.25%), due 07/31/27(b) | | | 491,055 | |
| | 839,895 | | | | | At Home Group Inc., Term Loan B, 4.75% (3 mo. USD LIBOR + 4.25%), due 07/24/28(b) | | | 808,399 | |
| | 102,609 | | | | | Athenahealth, Inc., 2022 Term Loan B, 4.00% (3 mo. SOFR + 3.50%), due 02/15/29(b) | | | 101,743 | |
| | 965,150 | | | | | Atotech BV, 2021 USD Term Loan B, 3.00% (1 mo. USD LIBOR + 2.50%), due 03/18/28(b) | | | 956,102 | |
| | 1,499,333 | | | | | Autokiniton US Holdings, Inc., 2021 Term Loan B, 5.00% (3 mo. USD LIBOR + 4.50%), due 04/06/28(b) | | | 1,482,465 | |
| | 2,872,565 | | | | | Avantor Funding, Inc., 2021 Term Loan B5, 2.75% (1 mo. USD LIBOR + 2.25%), due 11/08/27(b) | | | 2,855,209 | |
| | 428,275 | | | | | Bausch Health Companies, Inc., 2018 Term Loan B, 3.46% (1 mo. USD LIBOR + 3.00%), due 06/02/25(b) | | | 425,464 | |
| | 2,236,000 | EUR | | | | Belron Luxembourg SARL, 2021 EUR Term Loan B, 2.75% (3 mo. EURIBOR + 2.75%), due 04/13/28(b) | | | 2,454,454 | |
| | 127,534 | | | | | BrightView Landscapes, LLC, 2018 1st Lien Term Loan B, 3.00% (1 mo. USD LIBOR + 2.50%), due 08/15/25(b) | | | 126,099 | |
| | 1,003,732 | | | | | Brown Group Holding, LLC, Term Loan B, 3.51% (3 mo. USD LIBOR + 2.50%), due 06/07/28(b) | | | 988,153 | |
| | 778,215 | | | | | Caesars Resort Collection, LLC, 2017 1st Lien Term Loan B, 3.21% (1 mo. USD LIBOR + 2.75%), due 12/23/24(b) | | | 775,297 | |
See accompanying Notes to the Financial Statements.
121
Mercer Opportunistic Fixed Income Fund
Schedule of Investments (Continued)
(showing percentage of net assets)
March 31, 2022
| | | | | | | | | | |
| Par Value(a) | | | | | Description | | Value ($) | |
| | | |
| | | | | | Bank Loans — continued | | | |
| | 281,405 | | | | | Caesars Resort Collection, LLC, 2020 Term Loan B1, 3.96% (1 mo. USD LIBOR + 3.50%), due 07/21/25(b) | | | 280,232 | |
| | 496,713 | | | | | Camelot U.S. Acquisition 1 Co., 2020 Incremental Term Loan B, 4.00% (1 mo. USD LIBOR + 3.00%), due 10/30/26(b) | | | 492,863 | |
| | 791,280 | | | | | Camelot U.S. Acquisition 1 Co., Term Loan B, 3.46% (1 mo. USD LIBOR + 3.00%), due 10/30/26(b) | | | 781,784 | |
| | 1,795,477 | | | | | Cano Health LLC, 2022 Term Loan, 4.51% (6 mo. SOFR + 4.00%), due 11/23/27(b) | | | 1,773,034 | |
| | 567,834 | | | | | Cardinal Parent, Inc., 2020 Term Loan B, 5.25% (3 mo. USD LIBOR + 4.50%), due 11/12/27(b) | | | 567,224 | |
| | 2,023,035 | EUR | | | | Carnival Corp., EUR Term Loan B, 3.75% (3 mo. EURIBOR + 3.75%), due 06/30/25(b) | | | 2,224,669 | |
| | 778,050 | | | | | Carnival Corp., 2021 Incremental Term Loan B, 4.00% (3 mo. USD LIBOR + 3.25%), due 10/18/28(b) | | | 761,841 | |
| | 873,225 | | | | | Carnival Corp., USD Term Loan B, 3.75% (3 mo. USD LIBOR + 3.00%), due 06/30/25(b) | | | 852,704 | |
| | 1,383,050 | | | | | Carriage Purchaser, Inc., 2021 Term Loan B, 5.00% (1 mo. USD LIBOR + 4.25%), due 09/30/28(b) | | | 1,379,161 | |
| | 124,089 | | | | | Castle US Holding Corp., USD Term Loan B, 4.76% (1 mo. USD LIBOR + 3.75%), due 01/29/27(b) | | | 120,263 | |
| | 889,770 | | | | | Chamberlain Group, Inc., Term Loan B, 4.51% (3 mo. USD LIBOR + 3.50%), due 11/03/28(b) | | | 879,760 | |
| | 142,517 | | | | | Cinemark USA, Inc., 2018 Term Loan B, 2.21% (1 mo. USD LIBOR + 1.75%), due 03/31/25(b) | | | 138,827 | |
| | 1,475,799 | | | | | Citadel Securities, LP, 2021 Term Loan B, 2.96% (1 mo. USD LIBOR + 2.50%), due 02/02/28(b) | | | 1,469,607 | |
| | 1,393,995 | | | | | City Brewing Company, LLC, Closing Date Term Loan, 4.25% (3 mo. USD LIBOR + 3.50%), due 04/05/28(b) | | | 1,282,475 | |
| | 2,638,117 | | | | | Clear Channel Outdoor Holdings, Inc., Term Loan B, 3.80% (3 mo. USD LIBOR + 3.50%), due 08/21/26(b) | | | 2,598,052 | |
| | 380,000 | | | | | Cloudera, Inc., 2021 Second Lien Term Loan, 6.50% (1 mo. USD LIBOR + 6.00%), due 10/08/29(b) | | | 375,250 | |
| | 840,203 | | | | | ClubCorp Holdings, Inc., 2017 Term Loan B, 3.76% (3 mo. USD LIBOR + 2.75%), due 09/18/24(b) | | | 800,162 | |
| | 730,000 | | | | | Clydesdale Acquisition Holdings, Inc., Term Loan, TBD, due 03/30/29(f) | | | 718,529 | |
| | 670,067 | | | | | CNT Holdings I Corp., 2020 Term Loan, 4.25% (3 mo. USD LIBOR + 3.50%), due 11/08/27(b) | | | 667,302 | |
| | 1,119,899 | | | | | CommScope, Inc., 2019 Term Loan B, 3.71% (1 mo. USD LIBOR + 3.25%), due 04/06/26(b) | | | 1,095,226 | |
| | 1,338,645 | | | | | Conduent Business Services, LLC, 2021 Term Loan B, 4.75% (1 mo. USD LIBOR + 4.25%), due 10/16/28(b) | | | 1,324,003 | |
| | 1,699,740 | | | | | CoreLogic, Inc., Term Loan, 4.00% (1 mo. USD LIBOR + 3.50%), due 06/02/28(b) | | | 1,676,794 | |
| | 720,000 | | | | | CTC Holdings, LP, Term Loan B, 5.53% (3 mo. SOFR + 5.00%), due 02/15/29(b) | | | 707,400 | |
| | 579,730 | | | | | CWGS Group, LLC, 2021 Term Loan B, 3.25% (1 mo. USD LIBOR + 2.50%), due 06/03/28(b) | | | 559,150 | |
| | 1,741,209 | | | | | DCert Buyer, Inc., 2019 Term Loan B, 4.46% (1 mo. USD LIBOR + 4.00%), due 10/16/26(b) | | | 1,731,727 | |
| | 915,200 | | | | | DCert Buyer, Inc., 2021 2nd Lien Term Loan, 7.46% (1 mo. USD LIBOR + 7.00%), due 02/19/29(b) | | | 907,954 | |
| | 99,187 | | | | | Deerfield Dakota Holding, LLC, 2020 USD Term Loan B, 4.75% (1 mo. USD LIBOR + 3.75%), due 04/09/27(b) | | | 98,902 | |
See accompanying Notes to the Financial Statements.
122
Mercer Opportunistic Fixed Income Fund
Schedule of Investments (Continued)
(showing percentage of net assets)
March 31, 2022
| | | | | | | | | | |
| Par Value(a) | | | | | Description | | Value ($) | |
| | | |
| | | | | | Bank Loans — continued | | | |
| | 288,100 | | | | | Deerfield Dakota Holding, LLC, 2021 USD 2nd Lien Term Loan, 7.50% (1 mo. USD LIBOR + 6.75%), due 04/07/28(b) | | | 288,820 | |
| | 1,050,000 | | | | | Del Monte Foods, Inc., 2022 Term Loan, TBD, due 02/15/29(f) | | | 1,037,531 | |
| | 4,329,970 | | | | | DirecTV Financing, LLC, Term Loan, 5.75% (1 mo. USD LIBOR + 5.00%), due 08/02/27(b) | | | 4,330,420 | |
| | 281,655 | | | | | Dun & Bradstreet Corp. (The), Term Loan, 3.70% (1 mo. USD LIBOR + 3.25%), due 02/06/26(b) | | | 279,578 | |
| | 355,000 | | | | | Electron BidCo Inc., 2021 Term Loan, 3.75% (3 mo. USD LIBOR + 3.25%), due 11/01/28(b) | | | 351,716 | |
| | 265,174 | | | | | Embecta Corp., Term Loan B, TBD, due 03/30/29(f) | | | 262,323 | |
| | 636,800 | | | | | Empire Today, LLC, 2021 Term Loan B, 5.75% (6 mo. USD LIBOR + 5.00%), due 04/03/28(b) | | | 607,614 | |
| | 1,127,283 | | | | | Endure Digital Inc., Term Loan, 4.25% (3 mo. USD LIBOR + 3.50%), due 02/10/28(b) | | | 1,094,170 | |
| | 342,000 | | | | | EP Purchaser, LLC, 2021 Term Loan B, 4.51% (3 mo. USD LIBOR + 3.50%), due 11/06/28(b) | | | 340,219 | |
| | 179,777 | | | | | Equinox Holdings, Inc., 2020 Term Loan B2, 10.01% (3 mo. USD LIBOR + 9.00%), due 03/08/24(b) | | | 182,473 | |
| | 480,000 | | | | | EyeCare Partners, LLC, 2021 Incremental Term Loan, 4.76% (3 mo. USD LIBOR + 3.75%), due 11/15/28(b) | | | 475,601 | |
| | 272,486 | | | | | EyeCare Partners, LLC, 2020 Term Loan, 4.76% (3 mo. USD LIBOR + 3.75%), due 02/18/27(b) | | | 269,534 | |
| | 436,629 | | | | | EyeCare Partners, LLC, 2021 2nd Lien Term Loan, 7.76% (3 mo. USD LIBOR + 6.75%), due 11/15/29(b) | | | 436,083 | |
| | 827,925 | | | | | Fanatics Commerce Intermediate Holdco, LLC, Term Loan B, 3.70% (1 mo. USD LIBOR + 3.25%), due 11/24/28(b) | | | 821,974 | |
| | 190,000 | | | | | First Brands Group, LLC, 2021 2nd Lien Term Loan, 9.50% (3 mo. USD LIBOR + 8.50%), due 03/30/28(b) | | | 190,000 | |
| | 306,902 | | | | | First Brands Group, LLC, 2021 Term Loan, 6.00% (3 mo. USD LIBOR + 5.00%), due 03/30/27(b) | | | 305,598 | |
| | 781,956 | | | | | First Student Bidco, Inc., Term Loan C, 3.98% (3 mo. USD LIBOR + 3.00%), due 07/21/28(b) | | | 776,763 | |
| | 1,291,254 | | | | | Focus Financial Partners, LLC, 2020 Term Loan, 2.45% (1 mo. USD LIBOR + 2.00%), due 07/03/24(b) | | | 1,274,205 | |
| | 486,554 | | | | | Focus Financial Partners, LLC, 2021 Term Loan B4, 3.00% (1 mo. USD LIBOR + 2.50%), due 06/30/28(b) | | | 480,826 | |
| | 1,023,000 | | | | | Freeport LNG Investments, LLLP, Term Loan B, TBD, due 12/21/28(f) | | | 1,016,734 | |
| | 113,573 | EUR | | | | Froneri International, Ltd., 2020 EUR Term Loan B1, 2.38% (6 mo. EURIBOR+ 2.38%), due 01/29/27(b) | | | 122,170 | |
| | 434,140 | | | | | Froneri International, Ltd., 2020 USD Term Loan, 2.71% (1 mo. USD LIBOR + 2.25%), due 01/29/27(b) | | | 427,302 | |
| | 2,170,347 | | | | | Gainwell Acquisition Corp., Term Loan B, 5.01% (3 mo. USD LIBOR + 4.00%), due 10/01/27(b) | | | 2,162,208 | |
| | 2,323,926 | | | | | Garda World Security Corp., 2021 Term Loan B, 4.71% (1 mo. USD LIBOR + 4.25%), due 10/30/26(b) | | | 2,306,497 | |
| | 730,000 | | | | | Garda World Security Corp., 2022 Term Loan B, 4.57% (6 mo. SOFR + 4.25%), due 02/01/29(b) | | | 723,613 | |
See accompanying Notes to the Financial Statements.
123
Mercer Opportunistic Fixed Income Fund
Schedule of Investments (Continued)
(showing percentage of net assets)
March 31, 2022
| | | | | | | | | | |
| Par Value(a) | | | | | Description | | Value ($) | |
| | | |
| | | | | | Bank Loans — continued | | | |
| | 329,611 | | | | | Global Medical Response, Inc., 2020 Term Loan B, 5.25% (3 mo. USD LIBOR + 4.25%), due 10/02/25(b) | | | 327,963 | |
| | 171,619 | | | | | Global Tel*Link Corp., 2018 1st Lien Term Loan, 4.71% (1 mo. USD LIBOR + 4.25%), due 11/29/25(b) | | | 163,664 | |
| | 759,338 | | | | | GoTo Group, Inc., Term Loan B, 5.22% (1 mo. USD LIBOR + 4.75%), due 08/31/27(b) | | | 747,790 | |
| | 802,705 | | | | | Graham Packaging Co. Inc., 2021 Term Loan, 3.75% (1 mo. USD LIBOR + 3.00%), due 08/04/27(b) | | | 790,092 | |
| | 1,506,035 | | | | | Great Outdoors Group, LLC, 2021 Term Loan B1, 4.50% (1 mo. USD LIBOR + 3.75%), due 03/06/28(b) | | | 1,502,505 | |
| | 535,015 | | | | | Greystone Select Financial LLC, Term Loan B, 5.75% (6 mo. USD LIBOR + 5.00%), due 06/16/28(b) | | | 533,678 | |
| | 349,000 | | | | | Griffon Corp., Term Loan B, 3.27% (3 mo. SOFR + 2.75%), due 01/24/29(b) | | | 346,092 | |
| | 642,888 | | | | | Grifols Worldwide Operations USA, Inc., USD 2019 Term Loan B, 2.46% (1 mo. USD LIBOR + 2.00%), due 11/15/27(b) | | | 631,860 | |
| | 960,000 | | | | | Hexion Holdings Corp., 2022 USD Term Loan, 5.00% (3 mo. SOFR + 4.50%), due 03/15/29(b) | | | 941,400 | |
| | 669,835 | | | | | Hornblower Sub, LLC, 2020 Repriced Term Loan B, 5.50% (3 mo. USD LIBOR + 4.50%), due 04/27/25(b) | | | 691,604 | |
| | 1,001,022 | | | | | Hudson River Trading LLC, 2021 Term Loan, 3.14% (1 mo. SOFR + 3.00%), due 03/20/28(b) | | | 987,570 | |
| | 30,983 | | | | | Hyland Software, Inc., 2018 1st Lien Term Loan, 4.25% (1 mo. USD LIBOR + 3.50%), due 07/01/24(b) | | | 30,872 | |
| | 1,325,000 | | | | | II-VI, Inc., 2021 Bridge Term Loan B, TBD , due 12/01/28(f) | | | 1,310,646 | |
| | 508,009 | | | | | Illuminate Buyer, LLC, 2021 Term Loan, 3.96% (1 mo. USD LIBOR + 3.50%), due 06/30/27(b) | | | 491,286 | |
| | 1,169,000 | EUR | | | | INEOS Finance Plc, 2021 EUR Term Loan B, TBD , due 11/04/28(f) | | | 1,288,494 | |
| | 843,625 | | | | | Ingram Micro Inc., 2021 Term Loan B, 4.51% (3 mo. USD LIBOR + 3.50%), due 06/30/28(b) | | | 837,087 | |
| | 706,289 | | | | | IRB Holding Corp., 2020 Term Loan B, 3.76% (6 mo. USD LIBOR + 2.75%), due 02/05/25(b) | | | 700,992 | |
| | 445,500 | | | | | IRB Holding Corp., 2022 Term Loan B, 3.75% (1 week SOFR + 3.00%), due 12/15/27(b) | | | 441,323 | |
| | 928,421 | | | | | Jane Street Group, LLC, 2021 Term Loan, 3.21% (1 mo. USD LIBOR + 2.75%), due 01/26/28(b) | | | 918,441 | |
| | 1,304,190 | | | | | Jazz Financing Lux SARL, USD Term Loan, 4.00% (1 mo. USD LIBOR + 3.50%), due 05/05/28(b) | | | 1,301,382 | |
| | 1,961,048 | | | | | Jump Financial, LLC, Term Loan B, 5.00% (1 mo. USD LIBOR + 4.50%), due 08/02/28(b) | | | 1,946,340 | |
| | 758,100 | | | | | Knight Health Holdings LLC, Term Loan B, TBD, due 12/23/28(f) | | | 693,662 | |
| | 1,850,000 | | | | | Lakeshore Intermediate LLC, Term Loan, 4.00% (3 mo. USD LIBOR + 3.50%), due 09/29/28(b) | | | 1,824,562 | |
| | 705,000 | | | | | LBM Acquisition LLC, Term Loan B, 4.50% (1 mo. USD LIBOR + 3.75%), due 12/17/27(b) | | | 689,799 | |
| | 318,573 | | | | | Les Schwab Tire Centers, Term Loan B, 4.00% (3 mo. USD LIBOR + 3.25%), due 11/02/27(b) | | | 315,255 | |
| | 305,464 | | | | | Leslie’s Poolmart, Inc., 2021 Term Loan B, 3.02% (3 mo. USD LIBOR + 2.50%), due 03/09/28(b) | | | 301,973 | |
| | 1,320,000 | | | | | LIDS Holdings, Inc., Term Loan, 6.50% (1 mo. SOFR + 5.50%), due 12/14/26(b) | | | 1,300,200 | |
See accompanying Notes to the Financial Statements.
124
Mercer Opportunistic Fixed Income Fund
Schedule of Investments (Continued)
(showing percentage of net assets)
March 31, 2022
| | | | | | | | | | |
| Par Value(a) | | | | | Description | | Value ($) | |
| | | |
| | | | | | Bank Loans — continued | | | |
| | 1,176,000 | EUR | | | | Lonza Group AG, EUR Term Loan B, 4.00% (3 mo. EURIBOR + 4.00%), due 07/03/28(b) | | | 1,290,213 | |
| | 383,110 | | | | | Lonza Group AG, USD Term Loan B, 4.75% (6 mo. USD LIBOR + 4.00%), due 07/03/28(b) | | | 375,088 | |
| | 698,250 | | | | | LRS Holdings, LLC, Term Loan B, 4.75% (1 mo. USD LIBOR + 4.25%), due 08/13/28(b) | | | 688,867 | |
| | 9,427 | EUR | | | | MA FinanceCo., LLC, 2020 EUR Term Loan B, 4.50% (3 mo. EURIBOR + 4.50%), due 06/05/25(b) | | | 10,493 | |
| | 1,399,808 | EUR | | | | MA FinanceCo., LLC, 2020 EUR Term Loan B, 4.50% (2 mo. EURIBOR + 4.50%), due 06/05/25(b) | | | 1,557,982 | |
| | 248,750 | | | | | Madison IAQ LLC, Term Loan, 4.52% (6 mo. USD LIBOR + 3.25%), due 06/21/28(b) | | | 245,563 | |
| | 748,125 | | | | | Magenta Buyer LLC, 2021 USD 1st Lien Term Loan, 5.75% (3 mo. USD LIBOR + 5.00%), due 07/27/28(b) | | | 742,747 | |
| | 930,000 | | | | | Magenta Buyer LLC, 2021 USD 2nd Lien Term Loan, 9.00% (3 mo. USD LIBOR + 8.25%), due 07/27/29(b) | | | 923,025 | |
| | 1,492,481 | | | | | MajorDrive Holdings IV LLC, Term Loan B, 4.56% (3 mo. USD LIBOR + 4.00%), due 06/01/28(b) | | | 1,472,892 | |
| | 125,856 | | | | | Maravai Intermediate Holdings, LLC, 2022 Term Loan B, 3.50% (3 mo. SOFR + 3.00%), due 10/19/27(b) | | | 125,541 | |
| | 1,004,950 | | | | | Mavis Tire Express Services Corp., 2021 Term Loan B, 4.75% (1 mo. USD LIBOR + 4.00%), due 05/04/28(b) | | | 999,925 | |
| | 404,366 | | | | | Mayfield Agency Borrower, Inc., 2018 1st Lien Term Loan, 4.96% (1 mo. USD LIBOR + 4.50%), due 02/28/25(b) | | | 401,165 | |
| | 2,670 | | | | | McGraw-Hill Global Education Holdings, LLC, 2021 Term Loan, 5.26% (3 mo. USD LIBOR + 4.75%), due 07/28/28(b) | | | 2,649 | |
| | 1,059,990 | | | | | McGraw-Hill Global Education Holdings, LLC, 2021 Term Loan, 5.55% (6 mo. USD LIBOR + 4.75%), due 07/28/28(b) | | | 1,051,709 | |
| | 3,975,000 | | | | | Medline Borrower, LP, USD Term Loan B, 3.75% (1 mo. USD LIBOR + 3.25%), due 10/23/28(b) | | | 3,937,722 | |
| | 290,000 | | | | | Meridian Adhesives Group, Inc., Term Loan B, 4.75% (3 mo. USD LIBOR + 4.00%), due 07/24/28(b) | | | 287,100 | |
| | 2,002,673 | | | | | MH Sub I, LLC, 2020 Incremental Term Loan, 4.75% (1 mo. USD LIBOR + 3.75%), due 09/13/24(b) | | | 1,986,818 | |
| | 1,021,283 | | | | | Michaels Companies, Inc., 2021 Term Loan B, 5.26% (3 mo. USD LIBOR + 4.25%), due 04/15/28(b) | | | 957,452 | |
| | 599,414 | | | | | Mileage Plus Holdings LLC, 2020 Term Loan B, 6.25% (3 mo. USD LIBOR + 5.25%), due 06/21/27(b) | | | 624,514 | |
| | 242,040 | | | | | Mister Car Wash Holdings, Inc., 2019 Term Loan B, 3.46% (1 mo. USD LIBOR + 3.00%), due 05/14/26(b) | | | 239,529 | |
| | 514,721 | | | | | Monitronics International Inc., Takeback Term Loan, 8.75% (1 mo. USD LIBOR + 7.50%), due 03/29/24(b) | | | 425,931 | |
| | 1,293,448 | | | | | Naked Juice LLC, Term Loan, 3.75% (2 mo. SOFR + 3.25%), due 01/24/29(b) | | | 1,274,450 | |
| | 2,957,588 | | | | | Olympus Water US Holding Corp., 2021 USD Term Loan B, 4.75% (3 mo. USD LIBOR + 3.75%), due 11/09/28(b) | | | 2,888,401 | |
| | 923,025 | | | | | One Call Corp., 2021 Term Loan, 6.25% (3 mo. USD LIBOR + 5.50%), due 04/22/27(b) | | | 867,644 | |
| | 678,300 | | | | | Option Care Health, Inc., 2021 Term Loan B, 3.25% (1 mo. USD LIBOR + 2.75%), due 10/27/28(b) | | | 673,496 | |
| | 328,350 | | | | | Orbcomm Inc., Term Loan B, 5.00% (1 mo. USD LIBOR + 4.25%), due 09/01/28(b) | | | 326,161 | |
See accompanying Notes to the Financial Statements.
125
Mercer Opportunistic Fixed Income Fund
Schedule of Investments (Continued)
(showing percentage of net assets)
March 31, 2022
| | | | | | | | | | |
| Par Value(a) | | | | | Description | | Value ($) | |
| | | |
| | | | | | Bank Loans — continued | | | |
| | 1,191,000 | EUR | | | | Organon & Co., EUR Term Loan B, 3.00% (6 mo. EURIBOR + 3.00%), due 06/02/28(b) | | | 1,309,015 | |
| | 1,073,118 | | | | | Organon & Co., USD Term Loan, 3.56% (3 mo. USD LIBOR + 3.00%), due 06/02/28(b) | | | 1,068,590 | |
| | 414,631 | | | | | Pacific Bells, LLC, Term Loan B, 5.00% (1 mo. USD LIBOR + 4.50%), due 10/13/28(b) | | | 403,747 | |
| | 2,777,000 | | | | | Parexel International Corp., 2021 1st Lien Term Loan, 4.00% (1 mo. USD LIBOR + 3.50%), due 11/15/28(b) | | | 2,759,427 | |
| | 570,000 | | | | | Parexel International Corp., 2021 1st Lien Term Loan, TBD , due 11/15/28(f) | | | 566,393 | |
| | 267,963 | | | | | Particle Investments SARL, Term Loan, 5.75% (3 mo. USD LIBOR + 5.25%), due 02/18/27(b) | | | 265,284 | |
| | 1,315,000 | EUR | | | | Paysafe Holdings (US) Corp., EUR Term Loan B2, 3.00% (1 mo. EURIBOR + 3.00%), due 06/28/28(b) | | | 1,410,828 | |
| | 1,488,157 | | | | | PECF USS Intermediate Holding III Corp., Term Loan B, 4.76% (3 mo. USD LIBOR + 4.25%), due 12/15/28(b) | | | 1,476,465 | |
| | 3,730 | | | | | PECF USS Intermediate Holding III Corp., Term Loan B, 4.75% (1 mo. USD LIBOR + 4.25%), due 12/15/28(b) | | | 3,700 | |
| | 563,069 | | | | | Peraton Corp., 2nd Lien Term Loan B1, 8.50% (1 mo. USD LIBOR + 7.75%), due 02/01/29(b) | | | 560,957 | |
| | 1,513,646 | | | | | Peraton Corp., Term Loan B, 4.50% (1 mo. USD LIBOR + 3.75%), due 02/01/28(b) | | | 1,503,375 | |
| | 997,481 | | | | | Petco Health & Wellness Company, Inc., 2021 Term Loan B, TBD , due 03/03/28(f) | | | 989,127 | |
| | 643,168 | | | | | PetSmart, Inc., 2021 Term Loan B, 4.50% (3 mo. USD LIBOR + 3.75%), due 02/11/28(b) | | | 641,239 | |
| | 139,413 | | | | | Planview Parent, Inc., Term Loan, 5.01% (3 mo. USD LIBOR + 4.00%), due 12/17/27(b) | | | 138,019 | |
| | 723,446 | | | | | Playa Resorts Holding BV, 2017 Term Loan B, 3.75% (1 mo. USD LIBOR + 2.75%), due 04/29/24(b) | | | 708,751 | |
| | 16,864 | | | | | Presidio, Inc., 2020 Term Loan B, 3.96% (1 mo. USD LIBOR + 3.50%), due 01/22/27(b) | | | 16,780 | |
| | 329,198 | | | | | Presidio, Inc., 2020 Term Loan B, 3.80% (3 mo. USD LIBOR + 3.50%), due 01/22/27(b) | | | 327,552 | |
| | 1,123,336 | | | | | Prime Security Services Borrower, LLC, 2021 Term Loan, 3.50% (1 yr. USD LIBOR + 2.75%), due 09/23/26(b) | | | 1,116,237 | |
| | 639,551 | | | | | Prime Security Services Borrower, LLC, 2021 Term Loan, 3.50% (3 mo. USD LIBOR + 2.75%), due 09/23/26(b) | | | 635,510 | |
| | 750,000 | | | | | Proofpoint, Inc., 1st Lien Term Loan, 3.76% (3 mo. USD LIBOR + 3.25%), due 08/31/28(b) | | | 742,676 | |
| | 610,000 | | | | | Quikrete Holdings, Inc., 2021 Term Loan B1, TBD , due 06/11/28(f) | | | 600,045 | |
| | 966,563 | | | | | Rackspace Technology Global, Inc., 2021 Term Loan, 3.50% (3 mo. USD LIBOR + 2.75%), due 02/15/28(b) | | | 949,044 | |
| | 1,417,448 | | | | | Radiate Holdco, LLC, 2021 Term Loan B, 4.00% (1 mo. USD LIBOR + 3.25%), due 09/25/26(b) | | | 1,407,323 | |
| | 291,260 | | | | | Radiology Partners, Inc., 2018 1st Lien Term Loan B, 4.72% (1 mo. USD LIBOR + 4.25%), due 07/09/25(b) | | | 287,983 | |
| | 339,702 | | | | | Radiology Partners, Inc., 2018 1st Lien Term Loan B, 4.70% (1 mo. USD LIBOR + 4.25%), due 07/09/25(b) | | | 335,880 | |
| | 870,000 | | | | | Redstone Holdco 2 LP, 2021 2nd Lien Term Loan, 8.50% (3 mo. USD LIBOR + 7.75%), due 04/27/29(b) | | | 802,575 | |
See accompanying Notes to the Financial Statements.
126
Mercer Opportunistic Fixed Income Fund
Schedule of Investments (Continued)
(showing percentage of net assets)
March 31, 2022
| | | | | | | | | | |
| Par Value(a) | | | | | Description | | Value ($) | |
| | | |
| | | | | | Bank Loans — continued | | | |
| | 786,050 | | | | | Redstone Holdco 2 LP, 2021 Term Loan, 5.50% (3 mo. USD LIBOR + 4.75%), due 04/27/28(b) | | | 774,259 | |
| | 290,508 | | | | | Resolute Investment Managers, Inc., 2020 Term Loan C, 5.26% (3 mo. USD LIBOR + 4.25%), due 04/30/24(b) | | | 288,874 | |
| | 731,325 | | | | | Restoration Hardware, Inc., Term Loan B, 3.00% (1 mo. USD LIBOR + 2.50%), due 10/20/28(b) | | | 719,898 | |
| | 3,046,479 | | | | | RVR Dealership Holdings, LLC, Term Loan B, 4.50% (3 mo. SOFR + 3.75%), due 02/08/28(b) | | | 2,914,475 | |
| | 1,355,000 | | | | | RVR Dealership Holdings, LLC, Term Loan B, TBD , due 02/08/28(f) | | | 1,296,288 | |
| | 217,259 | | | | | Ryan Specialty Group, LLC, Term Loan, 3.75% (1 mo. USD LIBOR + 3.00%), due 09/01/27(b) | | | 216,173 | |
| | 254,712 | | | | | Scientific Games International, Inc., 2018 Term Loan B5, 3.21% (1 mo. USD LIBOR + 2.75%), due 08/14/24(b) | | | 251,697 | |
| | 276,782 | | | | | Sedgwick Claims Management Services, Inc., 2018 Term Loan B, 3.71% (1 mo. USD LIBOR + 3.25%), due 12/31/25(b) | | | 274,409 | |
| | 2,296,703 | | | | | SkyMiles IP, Ltd., 2020 Skymiles Term Loan B, 4.75% (3 mo. USD LIBOR + 3.75%), due 10/20/27(b) | | | 2,377,805 | |
| | 2,572,901 | | | | | Solis IV BV, USD Term Loan B1, 4.00% (3 mo. SOFR + 3.50%), due 02/26/29(b) | | | 2,526,803 | |
| | 1,258,695 | | | | | Sotera Health Holdings, LLC, 2021 Term Loan, 3.25% (3 mo. USD LIBOR + 2.75%), due 12/11/26(b) | | | 1,246,895 | |
| | 1,132,163 | | | | | Southwestern Energy Co., 2021 Term Loan, 3.30% (3 mo. SOFR + 2.50%), due 06/22/27(b) | | | 1,125,086 | |
| | 198,952 | | | | | Sovos Brands Intermediate, Inc., 2021 Term Loan, 4.50% (3 mo. USD LIBOR + 3.75%), due 06/08/28(b) | | | 197,310 | |
| | 604,535 | | | | | Spencer Spirit IH LLC, Term Loan B, 6.21% (1 Week USD LIBOR + 6.00%), due 06/19/26(b) | | | 604,157 | |
| | 1,170,000 | | | | | SPX Flow, Inc., 2022 Term Loan, TBD , due 03/16/29(f) | | | 1,140,933 | |
| | 494,607 | | | | | Station Casinos LLC, 2020 Term Loan B, 2.71% (1 mo. USD LIBOR + 2.25%), due 02/08/27(b) | | | 488,734 | |
| | 2,787,990 | | | | | Summer BC Holdco B SARL, 2021 USD Term Loan B2, 5.51% (3 mo. USD LIBOR + 4.50%), due 12/04/26(b) | | | 2,776,665 | |
| | 155,376 | | | | | Surf Holdings, LLC, USD Term Loan, 4.11% (3 mo. USD LIBOR + 3.50%), due 03/05/27(b) | | | 154,089 | |
| | 437,257 | | | | | Symplr Software, Inc., 2020 Term Loan, 5.25% (3 mo. USD LIBOR + 4.50%), due 12/22/27(b) | | | 431,792 | |
| | 470,800 | | | | | Telenet Financing USD LLC, 2020 USD Term Loan AR, 2.40% (3 mo. USD LIBOR + 2.00%), due 04/30/28(b) | | | 460,796 | |
| | 1,149,072 | | | | | Terrier Media Buyer, Inc., 2021 Term Loan, 3.96% (1 mo. USD LIBOR + 3.50%), due 12/17/26(b) | | | 1,133,374 | |
| | 304,011 | | | | | Thermostat Purchaser III, Inc., Term Loan, 5.25% (3 mo. USD LIBOR + 4.50%), due 08/31/28(b) | | | 301,731 | |
| | 726 | | | | | Thermostat Purchaser III, Inc., Term Loan, 8.00% (1 mo. USD LIBOR + 7.25%), due 08/31/28(b) | | | 721 | |
| | 701,543 | | | | | TKC Holdings, Inc., 2021 Term Loan, 6.51% (3 mo. USD LIBOR + 5.50%), due 05/15/28(b) | | | 692,774 | |
| | 548,872 | | | | | Trans Union, LLC, 2021 Term Loan B6, 2.75% (1 mo. USD LIBOR + 2.25%), due 12/01/28(b) | | | 545,098 | |
| | 395,349 | | | | | TransDigm, Inc., 2020 Term Loan F, 2.71% (1 mo. USD LIBOR + 2.25%), due 12/09/25(b) | | | 388,739 | |
See accompanying Notes to the Financial Statements.
127
Mercer Opportunistic Fixed Income Fund
Schedule of Investments (Continued)
(showing percentage of net assets)
March 31, 2022
| | | | | | | | | | |
| Par Value(a) | | | | | Description | | Value ($) | |
| | | |
| | | | | | Bank Loans — continued | | | |
| | 754,300 | | | | | Triton Water Holdings, Inc., Term Loan, 4.51% (3 mo. USD LIBOR + 3.50%), due 03/31/28(b) | | | 737,564 | |
| | 182,979 | | | | | TruGreen Limited Partnership, 2020 2nd Lien Term Loan, 9.51% (3 mo. USD LIBOR + 8.50%), due 11/02/28(b) | | | 184,351 | |
| | 373,845 | | | | | Tutor Perini Corp., Term Loan B, 5.76% (3 mo. USD LIBOR + 4.75%), due 08/18/27(b) | | | 368,705 | |
| | 2,365,073 | | | | | Twin River Worldwide Holdings, Inc., 2021 Term Loan B, 3.75% (6 mo. USD LIBOR + 3.25%), due 10/02/28(b) | | | 2,353,985 | |
| | 1,911,390 | | | | | U.S. Renal Care, Inc., 2019 Term Loan B, 5.25% (1 mo. USD LIBOR + 5.00%), due 06/26/26(b) | | | 1,764,930 | |
| | 1,272,984 | | | | | Uber Technologies, Inc., 2021 1st Lien Term Loan B, 3.96% (1 mo. USD LIBOR + 3.50%), due 04/04/25(b) | | | 1,270,484 | |
| | 588,395 | | | | | UFC Holdings, LLC, 2021 Term Loan B, 3.50% (6 mo. USD LIBOR + 2.75%), due 04/29/26(b) | | | 583,001 | |
| | 703,061 | | | | | Ultimate Software Group, Inc. (The), 2021 Term Loan, 3.75% (3 mo. USD LIBOR + 3.25%), due 05/04/26(b) | | | 698,227 | |
| | 4,192,864 | | | | | United Airlines, Inc., 2021 Term Loan B, 4.50% (3 mo. USD LIBOR + 3.75%), due 04/21/28(b) | | | 4,150,935 | |
| | 869,682 | | | | | US Foods, Inc., 2019 Term Loan B, 2.51% (3 mo. USD LIBOR + 2.00%), due 09/13/26(b) | | | 854,342 | |
| | 1,436,400 | | | | | UST Holdings, Ltd., Term Loan, 4.25% (1 mo. USD LIBOR + 3.75%), due 11/20/28(b) | | | 1,422,036 | |
| | 1,735,403 | | | | | Verscend Holding Corp., 2021 Term Loan B, 4.46% (1 mo. USD LIBOR + 4.00%), due 08/27/25(b) | | | 1,733,234 | |
| | 1,260,000 | | | | | Vertex Aerospace Services Corp., 2021 First Lien Term Loan, 4.75% (1 mo. USD LIBOR + 4.00%), due 12/06/28(b) | | | 1,257,637 | |
| | 2,470,000 | | | | | VFH Parent LLC, 2022 Term Loan B, 3.50% (1 mo. SOFR + 3.00%), due 01/13/29(b) | | | 2,450,445 | |
| | 1,893,000 | | | | | ViaSat, Inc., Term Loan, 5.00% (3 mo. SOFR + 4.50%), due 03/02/29(b) | | | 1,864,605 | |
| | 537,600 | | | | | Virgin Media Bristol LLC, 2020 USD Term Loan Q, 3.65% (1 mo. USD LIBOR + 3.25%), due 01/31/29(b) | | | 534,156 | |
| | 2,319,297 | | | | | Virgin Media Bristol LLC, USD Term Loan N, 2.90% (3 mo. USD LIBOR + 2.50%), due 01/31/28(b) | | | 2,292,843 | |
| | 330,000 | | | | | Virgin Pulse, Inc., 2021 2nd Lien Term Loan, 8.75% (6 mo. USD LIBOR + 7.25%), due 04/06/29(b) | | | 325,050 | |
| | 1,374,297 | | | | | Virgin Pulse, Inc., 2021 Term Loan, 4.75% (1 mo. USD LIBOR + 4.00%), due 04/06/28(b) | | | 1,360,554 | |
| | 631,000 | | | | | VM Consolidated, Inc., 2021 Term Loan B, 4.26% (3 mo. USD LIBOR + 3.25%), due 03/19/28(b) | | | 628,108 | |
| | 241,154 | | | | | VS Buyer, LLC, Term Loan B, 3.46% (1 mo. USD LIBOR + 3.00%), due 02/28/27(b) | | | 239,647 | |
| | 320,000 | | | | | VT Topco, Inc., 2021 2nd Lien Term Loan, 7.76% (3 mo. USD LIBOR + 6.75%), due 07/31/26(b) | | | 316,800 | |
| | 359,100 | | | | | VT Topco, Inc., 2021 Incremental Term Loan, 4.50% (1 mo. USD LIBOR + 3.75%), due 08/01/25(b) | | | 356,182 | |
| | 16,500 | | | | | Western Dental Services, Inc., 2021 Delayed Draw Term Loan, 5.30% (3 mo. USD LIBOR + 4.50%), due 08/18/28(b) | | | 16,448 | |
| | 46,200 | | | | | Western Dental Services, Inc ., 2021 Delayed Draw Term Loan, 5.25% (3 mo. USD LIBOR + 4.50%), due 08/18/28(b) | | | 46,056 | |
| | 1,080,000 | | | | | Western Dental Services, Inc., 2021 Term Loan B, 5.28% (3 mo. USD LIBOR + 4.50%), due 08/18/28(b) | | | 1,076,625 | |
See accompanying Notes to the Financial Statements.
128
Mercer Opportunistic Fixed Income Fund
Schedule of Investments (Continued)
(showing percentage of net assets)
March 31, 2022
| | | | | | | | | | |
| Par Value(a) | | | | | Description | | Value ($) | |
| | | |
| | | | | | Bank Loans — continued | | | |
| | 129,675 | | | | | Whatabrands LLC, 2021 Term Loan B, 3.75% (1 mo. USD LIBOR + 3.25%), due 08/03/28(b) | | | 128,281 | |
| | 2,435,760 | | | | | Wheel Pros, LLC, 2021 Term Loan, 5.25% (1 mo. USD LIBOR + 4.50%), due 05/11/28(b) | | | 2,330,211 | |
| | 494,082 | | | | | William Morris Endeavor Entertainment, LLC, 2018 1st Lien Term Loan, 2.96% (1 mo. USD LIBOR + 2.75%), due 05/18/25(b) | | | 486,260 | |
| | 1,076,588 | | | | | Windstream Services, LLC, 2020 Exit Term Loan B, 7.25% (1 mo. USD LIBOR + 6.25%), due 09/21/27(b) | | | 1,071,654 | |
| | 738,150 | | | | | Worldwide Express Operations, LLC, 2021 1st Lien Term Loan, 5.75% (3 mo. USD LIBOR + 4.25%), due 07/26/28(b) | | | 731,691 | |
| | 1,793,769 | | | | | WP CityMD Bidco LLC, 2021 1st Lien Term Loan B, 3.75% (6 mo. USD LIBOR + 3.25%), due 12/22/28(b) | | | 1,785,735 | |
| | 1,750,564 | | | | | WP CPP Holdings, LLC, 2018 Term Loan, 4.75% (3 mo. USD LIBOR + 3.75%), due 04/30/25(b) | | | 1,666,537 | |
| | 380,000 | | | | | WP CPP Holdings, LLC, 2019 2nd Lien Incremental Term Loan, 8.75% (3 mo. USD LIBOR + 7.75%), due 04/30/26(b) | | | 372,400 | |
| | | | | | | | | | |
| | | | | | | | | 215,016,330 | |
| | | | | | | | | | |
| | | |
| | | | | | Convertible Debt — 1.4% | | | |
| | 800,000 | | | | | Aerie Pharmaceuticals, Inc., 1.50%, due 10/01/24(g) | | | 729,703 | |
| | 85,000 | | | | | Airbnb, Inc., 0.73%, due 03/15/26(h) | | | 82,594 | |
| | 455,000 | | | | | American Airlines Group, Inc., 6.50%, due 07/01/25(g) | | | 624,715 | |
| | 385,000 | | | | | Atlas Air Worldwide Holdings, Inc., 1.88%, due 06/01/24 | | | 579,184 | |
| | 60,000 | | | | | Bill.com Holdings, Inc., 0.00%, due 12/01/25(h) | | | 95,670 | |
| | 290,000 | | | | | Chegg, Inc., 4.79%, due 09/01/26(h) | | | 238,380 | |
| | 85,000 | | | | | Cloudflare, Inc., 0.00%, due 08/15/26(h) 144A | | | 85,000 | |
| | 50,000 | | | | | Datadog, Inc., 0.13%, due 06/15/25 | | | 88,750 | |
| | 20,000 | | | | | Dick’s Sporting Goods, Inc., 3.25%, due 04/15/25 | | | 62,438 | |
| | 990,000 | | | | | DISH Network Corp., 3.38%, due 08/15/26 | | | 892,980 | |
| | 85,000 | | | | | DocuSign, Inc., 3.51%, due 01/15/24(h) | | | 79,900 | |
| | 1,360,000 | | | | | DraftKings, Inc., 6.23%, due 03/15/28(h) | | | 983,960 | |
| | 85,000 | | | | | Enphase Energy, Inc., 0.00%, due 03/01/28(h) | | | 88,740 | |
| | 45,000 | | | | | EQT Corp., 1.75%, due 05/01/26 | | | 106,875 | |
| | 70,000 | | | | | Expedia Group, Inc., 0.00%, due 02/15/26(g) (h) | | | 85,491 | |
| | 80,000 | | | | | Ford Motor Co., 0.00%, due 03/15/26(h) | | | 94,960 | |
| | 76,000 | | | | | Gannett Co., Inc., 6.00%, due 12/01/27 | | | 93,286 | |
| | 390,000 | | | | | Granite Point Mortgage Trust, Inc. REIT, 5.63%, due 12/01/22 144A | | | 390,244 | |
| | 460,000 | | | | | Halozyme Therapeutics, Inc., 0.25%, due 03/01/27 | | | 403,075 | |
| | 45,000 | | | | | HubSpot, Inc., 0.38%, due 06/01/25 | | | 80,370 | |
| | 70,000 | | | | | Illumina, Inc., 0.00%, due 08/15/23(h) | | | 76,860 | |
| | 140,000 | | | | | Liberty Latin America, Ltd., 2.00%, due 07/15/24(g) | | | 127,663 | |
| | 45,000 | | | | | Liberty Media Corp-Liberty Formula One, 1.00%, due 01/30/23 | | | 85,404 | |
| | 90,000 | | | | | Liberty TripAdvisor Holdings, Inc., 0.50%, due 06/30/51 144A | | | 74,215 | |
| | 30,000 | | | | | MercadoLibre, Inc., 2.00%, due 08/15/28 | | | 83,025 | |
| | 50,000 | | | | | Middleby Corp. (The), 1.00%, due 09/01/25 | | | 69,094 | |
| | 40,000 | | | | | MongoDB, Inc., 0.25%, due 01/15/26 | | | 86,770 | |
| | 65,000 | | | | | MP Materials Corp., 0.25%, due 04/01/26 144A | | | 94,803 | |
| | 120,000 | | | | | NCL Corp, Ltd., 2.50%, due 02/15/27 144A | | | 114,840 | |
See accompanying Notes to the Financial Statements.
129
Mercer Opportunistic Fixed Income Fund
Schedule of Investments (Continued)
(showing percentage of net assets)
March 31, 2022
| | | | | | | | | | |
| Par Value(a) | | | | | Description | | Value ($) | |
| | | |
| | | | | | Convertible Debt — continued | | | |
| | 85,000 | | | | | Nutanix, Inc., 0.24%, due 01/15/23(h) | | | 84,839 | |
| | 60,000 | | | | | ON Semiconductor Corp., 0.00%, due 05/01/27(h) 144A | | | 81,480 | |
| | 510,000 | | | | | Palo Alto Networks, Inc., 0.38%, due 06/01/25 | | | 1,076,610 | |
| | 80,000 | | | | | Pegasystems, Inc., 0.75%, due 03/01/25 | | | 75,560 | |
| | 40,000 | | | | | Pioneer Natural Resources Co., 0.25%, due 05/15/25 | | | 95,180 | |
| | 380,000 | | | | | Rapid7, Inc., 0.25%, due 03/15/27 | | | 474,430 | |
| | 445,000 | | | | | Snap, Inc., 0.13%, due 03/01/28 144A | | | 444,332 | |
| | 90,000 | | | | | Snap, Inc., 3.23%, due 05/01/27(h) 144A | | | 77,130 | |
| | 865,000 | | | | | Southwest Airlines Co., 1.25%, due 05/01/25 | | | 1,177,049 | |
| | 590,000 | | | | | Spirit Airlines, Inc., 1.00%, due 05/15/26(g) | | | 532,180 | |
| | 610,000 | | | | | Splunk, Inc., 1.13%, due 09/15/25 | | | 732,000 | |
| | 1,365,000 | | | | | Stem, Inc., 0.50%, due 12/01/28 144A | | | 1,019,245 | |
| | 590,000 | | | | | Sunrun, Inc., 6.31%, due 02/01/26(g) (h) | | | 472,295 | |
| | 270,000 | | | | | Twitter, Inc., 4.56%, due 03/15/26(h) | | | 228,015 | |
| | 295,000 | | | | | United States Steel Corp., 5.00%, due 11/01/26 | | | 863,317 | |
| | 470,000 | | | | | Unity Software, Inc., 4.51%, due 11/15/26(h) 144A | | | 387,397 | |
| | 45,000 | | | | | Upstart Holdings, Inc., 0.25%, due 08/15/26 144A | | | 38,390 | |
| | 80,000 | | | | | Vishay Intertechnology, Inc., 2.25%, due 06/15/25 | | | 79,904 | |
| | 700,000 | | | | | Zscaler, Inc., 0.13%, due 07/01/25 | | | 1,194,550 | |
| | | | | | | | | | |
| | | | | | | | | 15,832,892 | |
| | | | | | | | | | |
| | | |
| | | | | | Corporate Debt — 33.1% | | | |
| | 150,000 | | | | | AbbVie, Inc., 4.05%, due 11/21/39 | | | 154,566 | |
| | 290,000 | | | | | ABN AMRO Bank NV, 4.75%, due 07/28/25 144A | | | 296,850 | |
| | 427,350 | | | | | Accelerate360 Holdings LLC, 8.00%, due 03/01/28 144A | | | 446,008 | |
| | 290,000 | | | | | Acuris Finance US, Inc./Acuris Finance SARL, 5.00%, due 05/01/28 144A | | | 267,058 | |
| | 370,000 | | | | | AdaptHealth LLC, 4.63%, due 08/01/29 144A | | | 338,334 | |
| | 190,000 | | | | | AdaptHealth LLC, 5.13%, due 03/01/30(g) 144A | | | 176,832 | |
| | 270,000 | | | | | AdaptHealth LLC, 6.13%, due 08/01/28 144A | | | 268,514 | |
| | 245,000 | EUR | | | | Adevinta ASA, 3.00%, due 11/15/27 144A | | | 264,691 | |
| | 1,040,000 | EUR | | | | Adient Global Holdings, Ltd., 3.50%, due 08/15/24(i) | | | 1,138,804 | |
| | 680,000 | | | | | Adtalem Global Education, Inc., 5.50%, due 03/01/28 144A | | | 659,284 | |
| | 1,840,000 | | | | | AerCap Ireland Capital DAC/AerCap Global Aviation Trust, 3.30%, due 01/30/32 | | | 1,661,645 | |
| | 250,000 | | | | | AES Corp. (The), 2.45%, due 01/15/31 | | | 223,973 | |
| | 400,000 | | | | | AFC Gamma, Inc. REIT, 5.75%, due 05/01/27 144A | | | 392,346 | |
| | 645,000 | | | | | Agile Group Holdings, Ltd., 5.75%, due 01/02/25(g) (i) | | | 225,911 | |
| | 2,985,000 | | | | | Agrosuper SA, 4.60%, due 01/20/32 144A | | | 2,884,376 | |
| | 240,000 | | | | | Air Canada, 3.88%, due 08/15/26 144A | | | 226,799 | |
| | 1,015,000 | | | | | Akbank TAS, 6.80%, due 02/06/26 144A | | | 991,386 | |
| | 570,000 | | | | | Akumin Escrow, Inc., 7.50%, due 08/01/28 144A | | | 454,310 | |
| | 410,000 | | | | | Allen Media LLC/Allen Media Co-Issuer, Inc., 10.50%, due 02/15/28 144A | | | 404,750 | |
| | 500,000 | | | | | Allied Universal Holdco LLC/Allied Universal Finance Corp., 6.00%, due 06/01/2 144A 9 | | | 441,750 | |
| | 440,000 | | | | | Allied Universal Holdco LLC/Allied Universal Finance Corp., 6.63%, due 07/15/26 144A | | | 445,808 | |
| | 1,080,000 | | | | | Altice France Holding SA, 10.50%, due 05/15/27 144A | | | 1,131,516 | |
| | 370,000 | | | | | Altice France SA, 5.13%, due 07/15/29 144A | | | 332,112 | |
| | 200,000 | | | | | Altice France SA, 5.50%, due 10/15/29 144A | | | 179,728 | |
| | 480,000 | | | | | Altria Group, Inc., 5.95%, due 02/14/49 | | | 521,659 | |
See accompanying Notes to the Financial Statements.
130
Mercer Opportunistic Fixed Income Fund
Schedule of Investments (Continued)
(showing percentage of net assets)
March 31, 2022
| | | | | | | | | | |
| Par Value(a) | | | | | Description | | Value ($) | |
| | | |
| | | | | | Corporate Debt — continued | | | |
| | 480,000 | | | | | AMC Entertainment Holdings, Inc., 10.00%, due 06/15/26 144A | | | 431,616 | |
| | 6,650,000 | MXN | | | | America Movil SAB de CV, 7.13%, due 12/09/24 | | | 315,477 | |
| | 370,095 | | | | | American Airlines Pass Through Trust, 4.95%, due 08/15/26 | | | 355,347 | |
| | 540,000 | | | | | American Airlines, Inc., 11.75%, due 07/15/25 144A | | | 631,122 | |
| | 350,000 | | | | | American Airlines, Inc./AAdvantage Loyalty IP, Ltd., 5.50%, due 04/20/26 144A | | | 353,117 | |
| | 1,020,000 | | | | | American Airlines, Inc./AAdvantage Loyalty IP, Ltd., 5.75%, due 04/20/29 144A | | | 1,017,577 | |
| | 190,000 | | | | | American Axle & Manufacturing, Inc., 5.00%, due 10/01/29(g) | | | 178,480 | |
| | 220,000 | | | | | American Express Co., 4.05%, due 12/03/42 | | | 232,768 | |
| | 411,085 | | | | | American News Co. LLC, 8.50% (8.50% Cash or 10.00% PIK), due 09/01/26 144A | | | 460,890 | |
| | 445,000 | | | | | Anglo American Capital Plc, 2.88%, due 03/17/31 144A | | | 410,796 | |
| | 365,000 | | | | | Anglo American Capital Plc, 3.88%, due 03/16/29 144A | | | 365,539 | |
| | 295,000 | | | | | Anglo American Capital Plc, 3.95%, due 09/10/50 144A | | | 277,201 | |
| | 685,000 | | | | | AngloGold Ashanti Holdings Plc, 3.75%, due 10/01/30 | | | 641,807 | |
| | 380,000 | | | | | Antares Holdings, LP, 3.95%, due 07/15/26 144A | | | 354,823 | |
| | 1,080,000 | | | | | Antero Resources Corp., 5.38%, due 03/01/30 144A | | | 1,104,581 | |
| | 470,000 | | | | | Apollo Commercial Real Estate Finance, Inc. REIT, 4.63%, due 06/15/29 144A | | | 427,439 | |
| | 712,174 | EUR | | | | ARD Finance SA, 5.00% (5.00% Cash or 5.75% PIK), due 06/30/27(i) | | | 722,404 | |
| | 180,000 | EUR | | | | ARD Finance SA, 5.00% (5.00% Cash or 5.75% PIK), due 06/30/27 144A | | | 182,586 | |
| | 750,000 | | | | | ARD Finance SA, 6.50% (6.50% Cash or 7.25% PIK), due 06/30/27 144A | | | 687,142 | |
| | 2,285,000 | | | | | Ardagh Metal Packaging Finance USA LLC/Ardagh Metal Packaging Finance Plc, 4.00%, due 09/01/29 144A | | | 2,061,755 | |
| | 650,000 | | | | | Ardagh Packaging Finance Plc/Ardagh Holdings USA, Inc., 5.25%, due 04/30/25 144A | | | 650,247 | |
| | 761,340 | | | | | Ardonagh Midco 2 Plc, 11.50% (11.50% Cash or 12.75% PIK), due 01/15/27 144A | | | 810,827 | |
| | 1,370,000 | | | | | Ares Capital Corp., 2.88%, due 06/15/28 | | | 1,215,330 | |
| | 2,990,000 | | | | | Ashland LLC, 3.38%, due 09/01/31 144A | | | 2,644,924 | |
| | 900,000 | | | | | Ashtead Capital, Inc., 2.45%, due 08/12/31 144A | | | 793,465 | |
| | 365,000 | | | | | At Home Group, Inc., 4.88%, due 07/15/28 144A | | | 325,585 | |
| | 557,000 | | | | | AT&T, Inc., 3.50%, due 09/15/53 | | | 490,864 | |
| | 540,000 | | | | | AT&T, Inc., 3.50%, due 02/01/61 | | | 460,896 | |
| | 1,110,000 | | | | | AT&T, Inc., 3.55%, due 09/15/55 | | | 982,781 | |
| | 450,000 | | | | | AT&T, Inc., 3.65%, due 09/15/59 | | | 396,184 | |
| | 275,000 | | | | | AT&T, Inc., 3.80%, due 12/01/57 | | | 251,988 | |
| | 295,000 | | | | | AT&T, Inc., 3.85%, due 06/01/60 | | | 265,103 | |
| | 390,000 | | | | | Australia & New Zealand Banking Group, Ltd., 2.95% (5 yr. CMT + 1.29%), due 07/22/30(b) 144A | | | 375,745 | |
| | 60,000 | | | | | AutoNation, Inc., 4.75%, due 06/01/30 | | | 62,657 | |
| | 160,000 | | | | | Aviation Capital Group LLC, 5.50%, due 12/15/24 144A | | | 164,834 | |
| | 250,000 | | | | | Avolon Holdings Funding, Ltd., 4.25%, due 04/15/26 144A | | | 246,890 | |
| | 160,000 | | | | | Avolon Holdings Funding, Ltd., 5.13%, due 10/01/23 144A | | | 162,905 | |
| | 800,000 | | | | | B3 SA - Brasil Bolsa Balcao, 4.13%, due 09/20/31 144A | | | 721,680 | |
| | 330,000 | | | | | Ball Corp., 3.13%, due 09/15/31 | | | 295,647 | |
| | 200,000 | EUR | | | | Banco Bilbao Vizcaya Argentaria SA, 5.88% (5 yr. EUR swap annual + 5.66%)(b) (i) (j) | | | 230,458 | |
| | 1,090,000 | | | | | Banco Mercantil del Norte SA, 7.50% (10 yr. CMT + 5.47%)(b) (j) 144A | | | 1,070,838 | |
| | 610,000 | | | | | Banco Mercantil del Norte SA, 7.63% (10 yr. CMT + 5.35%)(b) (j) 144A | | | 614,029 | |
| | 800,000 | | | | | Banco Santander SA, 2.75%, due 12/03/30 | | | 705,257 | |
| | 600,000 | | | | | Banco Santander SA, 2.96%, due 03/25/31 | | | 555,444 | |
| | 2,000,000 | | | | | Banco Santander SA, 3.23% (1 yr. CMT + 1.60%), due 11/22/32(b) | | | 1,797,416 | |
| | 800,000 | | | | | Banco Santander SA, 4.18% (1 yr. CMT + 2.00%), due 03/24/28(b) | | | 804,595 | |
See accompanying Notes to the Financial Statements.
131
Mercer Opportunistic Fixed Income Fund
Schedule of Investments (Continued)
(showing percentage of net assets)
March 31, 2022
| | | | | | | | | | |
| Par Value(a) | | | | | Description | | Value ($) | |
| | | |
| | | | | | Corporate Debt — continued | | | |
| | 1,200,000 | | | | | Banco Santander SA, 7.50% (5 yr. USD ICE swap + 4.99%)(b) (i) (j) | | | 1,249,200 | |
| | 220,000 | | | | | Bank of America Corp., 2.48% (5 yr. CMT + 1.20%), due 09/21/36(b) | | | 189,495 | |
| | 1,920,000 | | | | | Barclays Plc, 2.89% (1 yr. CMT + 1.30%), due 11/24/32(b) | | | 1,743,635 | |
| | 720,000 | | | | | Barclays Plc, 4.38% (5 yr. CMT + 3.41%)(b) (j) | | | 635,940 | |
| | 200,000 | | | | | Barclays Plc, 5.09% (3 mo. USD LIBOR + 3.05%), due 06/20/30(b) | | | 207,808 | |
| | 535,000 | GBP | | | | Barclays Plc, 6.38% (5 yr. UK Government Bond + 6.02%)(b) (i) (j) | | | 729,154 | |
| | 350,000 | | | | | Barclays Plc, 8.00% (5 yr. CMT + 5.67%)(b) (j) | | | 370,650 | |
| | 240,000 | EUR | | | | Barclays Plc, (MTN), 2.00% (5 yr. EUR swap annual + 1.90%), due 02/07/28(b) (i) | | | 268,646 | |
| | 700,000 | | | | | Bath & Body Works, Inc., 5.25%, due 02/01/28 | | | 705,561 | |
| | 290,000 | | | | | Bath & Body Works, Inc., 6.63%, due 10/01/30 144A | | | 304,841 | |
| | 250,000 | | | | | Bausch Health Americas, Inc., 8.50%, due 01/31/27(g) 144A | | | 249,575 | |
| | 340,000 | | | | | Bausch Health Cos., Inc., 6.13%, due 02/01/27 144A | | | 342,565 | |
| | 150,000 | | | | | Bausch Health Cos., Inc., 7.00%, due 01/15/28 144A | | | 134,531 | |
| | 30,000 | | | | | Bausch Health Cos., Inc., 9.00%, due 12/15/25 144A | | | 31,113 | |
| | 1,090,000 | | | | | Bed Bath & Beyond, Inc., 5.17%, due 08/01/44(g) | | | 776,096 | |
| | 2,062,000 | | | | | Berry Petroleum Co. LLC, 7.00%, due 02/15/26 144A | | | 2,038,349 | |
| | 850,000 | | | | | Bimbo Bakeries USA, Inc., 4.00%, due 05/17/51(g) 144A | | | 794,914 | |
| | 840,000 | | | | | BlackRock TCP Capital Corp., 2.85%, due 02/09/26 | | | 786,803 | |
| | 1,465,000 | | | | | BlackRock, Inc., 2.10%, due 02/25/32 | | | 1,329,132 | |
| | 1,585,000 | | | | | Blackstone Holdings Finance Co. LLC, 2.00%, due 01/30/32 144A | | | 1,383,319 | |
| | 885,000 | | | | | Blackstone Secured Lending Fund, 2.85%, due 09/30/28 144A | | | 768,829 | |
| | 740,000 | | | | | Blue Racer Midstream LLC/Blue Racer Finance Corp., 7.63%, due 12/15/25 144A | | | 775,154 | |
| | 850,000 | | | | | BNP Paribas SA, 2.16% (SOFR + 1.22%), due 09/15/29(b) 144A | | | 757,479 | |
| | 1,285,000 | | | | | BNP Paribas SA, 4.50% (5 yr. CMT + 2.94%)(b) (g) (j) 144A | | | 1,153,448 | |
| | 1,515,000 | | | | | BNP Paribas SA, 4.63% (5 yr. CMT + 3.20%)(b) (j) 144A | | | 1,427,887 | |
| | 230,000 | | | | | Boeing Co. (The), 2.20%, due 02/04/26 | | | 217,703 | |
| | 50,000 | | | | | Boeing Co. (The), 2.70%, due 02/01/27 | | | 48,035 | |
| | 410,000 | | | | | Boeing Co. (The), 3.25%, due 02/01/35 | | | 366,856 | |
| | 230,000 | | | | | Boeing Co. (The), 3.75%, due 02/01/50 | | | 205,519 | |
| | 430,000 | | | | | Boeing Co. (The), 5.15%, due 05/01/30 | | | 459,239 | |
| | 780,000 | | | | | Boeing Co. (The), 5.93%, due 05/01/60 | | | 903,516 | |
| | 1,620,000 | | | | | Boyne USA, Inc., 4.75%, due 05/15/29 144A | | | 1,557,298 | |
| | 440,000 | | | | | Braskem Netherlands Finance BV, 4.50%, due 01/10/28 144A | | | 434,870 | |
| | 2,195,000 | | | | | Broadcom, Inc., 4.15%, due 04/15/32(c) | | | 2,190,193 | |
| | 1,620,000 | | | | | Brunswick Corp., 2.40%, due 08/18/31 | | | 1,374,675 | |
| | 420,000 | | | | | Builders FirstSource, Inc., 4.25%, due 02/01/32 144A | | | 391,793 | |
| | 2,755,000 | | | | | Caesars Entertainment, Inc., 4.63%, due 10/15/29 144A | | | 2,579,369 | |
| | 685,000 | | | | | Caesars Entertainment, Inc., 8.13%, due 07/01/27 144A | | | 734,882 | |
| | 270,000 | | | | | Callon Petroleum Co., 6.13%, due 10/01/24 | | | 269,027 | |
| | 125,000 | | | | | Callon Petroleum Co., 6.38%, due 07/01/26 | | | 124,449 | |
| | 205,000 | | | | | Callon Petroleum Co., 8.00%, due 08/01/28(g) 144A | | | 216,456 | |
| | 140,000 | | | | | Cano Health LLC, 6.25%, due 10/01/28(g) 144A | | | 134,667 | |
| | 1,120,000 | | | | | Carnival Corp., 9.88%, due 08/01/27 144A | | | 1,239,806 | |
| | 790,000 | | | | | Carnival Plc, 7.88%, due 06/01/27 | | | 881,604 | |
| | 250,000 | | | | | Carriage Purchaser, Inc., 7.88%, due 10/15/29 144A | | | 231,241 | |
| | 490,000 | | | | | Carrols Restaurant Group, Inc., 5.88%, due 07/01/29(g) 144A | | | 400,303 | |
| | 545,000 | EUR | | | | Catalent Pharma Solutions, Inc., 2.38%, due 03/01/28(i) | | | 568,981 | |
| | 765,000 | EUR | | | | Catalent Pharma Solutions, Inc., 2.38%, due 03/01/28 144A | | | 798,662 | |
| | 865,000 | | | | | CCO Holdings LLC/CCO Holdings Capital Corp., 4.25%, due 02/01/31 144A | | | 786,108 | |
See accompanying Notes to the Financial Statements.
132
Mercer Opportunistic Fixed Income Fund
Schedule of Investments (Continued)
(showing percentage of net assets)
March 31, 2022
| | | | | | | | | | |
| Par Value(a) | | | | | Description | | Value ($) | |
| | | |
| | | | | | Corporate Debt — continued | | | |
| | 1,500,000 | | | | | CCO Holdings LLC/CCO Holdings Capital Corp., 4.50%, due 05/01/32 | | | 1,374,150 | |
| | 245,000 | | | | | CCO Holdings LLC/CCO Holdings Capital Corp., 4.75%, due 03/01/30 144A | | | 235,689 | |
| | 1,500,000 | | | | | CCO Holdings LLC/CCO Holdings Capital Corp., 4.75%, due 02/01/32 144A | | | 1,399,080 | |
| | 970,000 | | | | | Celulosa Arauco y Constitucion SA, 5.15%, due 01/29/50 144A | | | 960,882 | |
| | 480,000 | | | | | Cemex SAB de CV, 3.88%, due 07/11/31 144A | | | 438,816 | |
| | 1,390,000 | | | | | Cemex SAB de CV, 5.13% (5 yr. CMT + 4.53%)(b) (j) 144A | | | 1,366,224 | |
| | 1,255,000 | | | | | Cemex SAB de CV, 5.20%, due 09/17/30 144A | | | 1,250,645 | |
| | 83,000 | | | | | Cenovus Energy, Inc., 5.38%, due 07/15/25 | | | 87,593 | |
| | 350,000 | | | | | Centene Corp., 4.25%, due 12/15/27 | | | 351,673 | |
| | 200,000 | | | | | Century Communities, Inc., 3.88%, due 08/15/29 144A | | | 179,729 | |
| | 150,000 | | | | | Charter Communications Operating LLC/Charter Communications Operating Capital, 3.50%, due 03/01/42 | | | 124,437 | |
| | 1,495,000 | | | | | Charter Communications Operating LLC/Charter Communications Operating Capital, 3.90%, due 06/01/52 | | | 1,265,364 | |
| | 2,235,000 | | | | | Charter Communications Operating LLC/Charter Communications Operating Capital, 4.40%, due 04/01/33 | | | 2,231,482 | |
| | 600,000 | | | | | Charter Communications Operating LLC/Charter Communications Operating Capital, 5.13%, due 07/01/49 | | | 597,056 | |
| | 100,000 | | | | | Charter Communications Operating LLC/Charter Communications Operating Capital, 5.38%, due 04/01/38 | | | 102,948 | |
| | 185,000 | | | | | Chevron Corp., 3.08%, due 05/11/50 | | | 175,186 | |
| | 620,000 | | | | | CHS/Community Health Systems, Inc., 6.13%, due 04/01/30(g) 144A | | | 578,131 | |
| | 880,000 | | | | | CHS/Community Health Systems, Inc., 6.88%, due 04/15/29(g) 144A | | | 865,814 | |
| | 160,000 | | | | | Cigna Corp., 4.80%, due 08/15/38 | | | 175,696 | |
| | 530,000 | EUR | | | | Cirsa Finance International SARL, 4.50%, due 03/15/27 144A | | | 556,658 | |
| | 1,520,000 | | | | | Citigroup, Inc., 1.81% (SOFR + 1.53%), due 03/17/26(b) | | | 1,539,039 | |
| | 110,000 | | | | | Citigroup, Inc., 4.65%, due 07/30/45 | | | 121,245 | |
| | 170,000 | | | | | Citigroup, Inc., 6.30% (3 mo. USD LIBOR + 3.42%)(b) (j) | | | 171,318 | |
| | 850,000 | | | | | Clarios Global, LP/Clarios US Finance Co., 8.50%, due 05/15/27 144A | | | 883,022 | |
| | 745,000 | | | | | Clarivate Science Holdings Corp., 4.88%, due 07/01/29(g) 144A | | | 702,464 | |
| | 930,000 | | | | | Clear Channel Outdoor Holdings, Inc., 7.50%, due 06/01/29 144A | | | 929,098 | |
| | 595,000 | | | | | Clydesdale Acquisition Holdings, Inc., 6.63%, due 04/15/29(c) 144A | | | 602,437 | |
| | 980,000 | | | | | Clydesdale Acquisition Holdings, Inc., 8.75%, due 04/15/30(c) 144A | | | 923,650 | |
| | 3,820,000 | | | | | Coca-Cola Icecek AS, 4.50%, due 01/20/29 144A | | | 3,604,707 | |
| | 530,000 | | | | | Coinbase Global, Inc., 3.63%, due 10/01/31 144A | | | 452,856 | |
| | 1,790,000 | | | | | Colgate Energy Partners III LLC, 5.88%, due 07/01/29 144A | | | 1,848,569 | |
| | 635,000 | | | | | Colombia Telecomunicaciones SA ESP, 4.95%, due 07/17/30 144A | | | 583,927 | |
| | 380,000 | | | | | Comcast Corp., 4.25%, due 10/15/30 | | | 405,940 | |
| | 530,000 | | | | | Commercial Metals Co., 3.88%, due 02/15/31 | | | 482,546 | |
| | 1,600,000 | EUR | | | | Commerzbank AG, 6.13% (5 yr. EUR swap annual + 6.36%)(b) (i) (j) | | | 1,830,664 | |
| | 226,000 | | | | | CommScope Technologies LLC, 6.00%, due 06/15/25 144A | | | 214,314 | |
| | 1,665,000 | | | | | CommScope, Inc., 7.13%, due 07/01/28(g) 144A | | | 1,505,992 | |
| | 710,000 | | | | | CommScope, Inc., 8.25%, due 03/01/27(g) 144A | | | 691,295 | |
| | 1,380,000 | | | | | Continental Resources, Inc., 2.27%, due 11/15/26 144A | | | 1,290,300 | |
| | 660,000 | | | | | Continental Resources, Inc., 5.75%, due 01/15/31 144A | | | 722,911 | |
| | 400,000 | EUR | | | | Cooperatieve Rabobank UA, 4.63% (5 yr. EUR swap annual + 4.10%)(b) (g) (i) (j) | | | 455,763 | |
| | 1,750,000 | | | | | Corebridge Financial, Inc., 4.40%, due 04/05/52(c) | | | 1,749,702 | |
| | 1,030,000 | | | | | CoreCivic, Inc., 8.25%, due 04/15/26 | | | 1,062,702 | |
| | 450,000 | | | | | Country Garden Holdings Co., Ltd., 8.00%, due 01/27/24(g) (i) | | | 387,540 | |
See accompanying Notes to the Financial Statements.
133
Mercer Opportunistic Fixed Income Fund
Schedule of Investments (Continued)
(showing percentage of net assets)
March 31, 2022
| | | | | | | | | | |
| Par Value(a) | | | | | Description | | Value ($) | |
| | | |
| | | | | | Corporate Debt — continued | | | |
| | 1,765,000 | | | | | Covanta Holding Corp., 4.88%, due 12/01/29 144A | | | 1,687,252 | |
| | 2,025,000 | | | | | Credit Agricole SA, 4.75% (5 yr. CMT + 3.24%)(b) (j) 144A | | | 1,842,608 | |
| | 375,000 | | | | | Credit Agricole SA, 7.88% (5 yr. USD swap + 4.90%)(b) (j) 144A | | | 396,328 | |
| | 380,000 | | | | | Credit Agricole SA, 8.13% (5 yr. USD swap + 6.19%)(b) (j) 144A | | | 423,757 | |
| | 200,000 | | | | | Credit Suisse Group AG, 7.50% (5 yr. USD swap + 4.60%)(b) (j) 144A | | | 203,550 | |
| | 240,000 | | | | | Crown Castle International Corp. REIT, 3.30%, due 07/01/30 | | | 229,856 | |
| | 600,000 | | | | | CSC Holdings LLC, 4.50%, due 11/15/31 144A | | | 537,750 | |
| | 210,000 | | | | | CSC Holdings LLC, 5.75%, due 01/15/30 144A | | | 187,262 | |
| | 960,000 | | | | | CSC Holdings LLC, 6.50%, due 02/01/29 144A | | | 969,475 | |
| | 1,805,000 | | | | | CT Trust, 5.13%, due 02/03/32 144A | | | 1,805,794 | |
| | 90,000 | | | | | CVS Health Corp., 4.78%, due 03/25/38 | | | 98,592 | |
| | 90,000 | | | | | CVS Health Corp., 5.05%, due 03/25/48 | | | 102,192 | |
| | 30,000 | | | | | DCP Midstream Operating, LP, 5.63%, due 07/15/27 | | | 31,512 | |
| | 130,000 | | | | | DCP Midstream Operating, LP, 6.75%, due 09/15/37 144A | | | 153,083 | |
| | 300,000 | | | | | DCP Midstream, LP, 7.38% (3 mo. USD LIBOR + 5.15%)(b) (j) | | | 288,750 | |
| | 440,000 | | | | | Dell International LLC/EMC Corp., 6.20%, due 07/15/30 | | | 502,389 | |
| | 334,000 | | | | | Dell International LLC/EMC Corp., 8.35%, due 07/15/46 | | | 489,803 | |
| | 640,000 | | | | | Delta Air Lines, Inc., 7.00%, due 05/01/25 144A | | | 686,038 | |
| | 110,000 | | | | | Delta Air Lines, Inc./SkyMiles IP, Ltd., 4.75%, due 10/20/28 144A | | | 111,034 | |
| | 660,000 | | | | | Deutsche Bank AG, 3.73% (SOFR + 2.76%), due 01/14/32(b) | | | 589,643 | |
| | 830,000 | | | | | Deutsche Bank AG, 3.74% (SOFR + 2.26%), due 01/07/33(b) | | | 734,616 | |
| | 1,200,000 | | | | | Deutsche Bank AG, 4.79% (5 yr. USD swap + 4.36%)(b) (i) (j) | | | 1,121,339 | |
| | 400,000 | | | | | Deutsche Bank AG, 7.50% (5 yr. USD swap + 5.00%)(b) (g) (j) | | | 412,120 | |
| | 840,000 | | | | | Devon Energy Corp., 5.00%, due 06/15/45 | | | 917,963 | |
| | 100,000 | | | | | Diamondback Energy, Inc., 3.13%, due 03/24/31 | | | 95,674 | |
| | 300,000 | | | | | Diamondback Energy, Inc., 3.50%, due 12/01/29 | | | 297,513 | |
| | 1,120,000 | | | | | DIRECTV Holdings LLC/DIRECTV Financing Co., Inc., 5.88%, due 08/15/27 144A | | | 1,103,284 | |
| | 2,940,000 | | | | | DISH DBS Corp., 5.13%, due 06/01/29 | | | 2,507,526 | |
| | 580,000 | | | | | DISH DBS Corp., 5.75%, due 12/01/28 144A | | | 549,912 | |
| | 240,000 | | | | | DISH DBS Corp., 7.75%, due 07/01/26 | | | 238,739 | |
| | 240,000 | | | | | Diversified Healthcare Trust REIT, 4.75%, due 02/15/28 | | | 218,989 | |
| | 490,000 | | | | | Diversified Healthcare Trust REIT, 9.75%, due 06/15/25 | | | 516,318 | |
| | 740,000 | | | | | DP World Plc, 5.63%, due 09/25/48 144A | | | 803,124 | |
| | 255,000 | | | | | Dun & Bradstreet Corp. (The), 5.00%, due 12/15/29 144A | | | 239,979 | |
| | 295,000 | | | | | eBay, Inc., 4.00%, due 07/15/42 | | | 291,053 | |
| | 410,000 | | | | | Endeavor Energy Resources, LP/EER Finance, Inc., 5.75%, due 01/30/28 144A | | | 424,299 | |
| | 240,000 | | | | | Endeavor Energy Resources, LP/EER Finance, Inc., 6.63%, due 07/15/25 144A | | | 249,395 | |
| | 1,690,000 | | | | | Endeavour Mining Plc, 5.00%, due 10/14/26 144A | | | 1,558,653 | |
| | 520,000 | | | | | Endo Dac/Endo Finance LLC/Endo Finco, Inc., 9.50%, due 07/31/27(g) 144A | | | 456,820 | |
| | 490,000 | | | | | Endo Luxembourg Finance Co. I SARL/Endo US, Inc., 6.13%, due 04/01/29 144A | | | 447,715 | |
| | 755,000 | | | | | Enel Finance International NV, 2.88%, due 07/12/41 144A | | | 625,377 | |
| | 980,000 | | | | | Energean Israel Finance, Ltd., 5.88%, due 03/30/31(i) 144A | | | 938,350 | |
| | 1,065,000 | EUR | | | | Energizer Gamma Acquisition BV, 3.50%, due 06/30/29 144A | | | 1,047,270 | |
| | 280,000 | | | | | Energy Transfer, LP, 5.35%, due 05/15/45 | | | 289,183 | |
| | 210,000 | | | | | Energy Transfer, LP, 6.25%, due 04/15/49 | | | 241,898 | |
| | 230,000 | | | | | Energy Transfer, LP, 6.25% (3 mo. USD LIBOR + 4.03%)(b) (j) | | | 197,513 | |
| | 270,000 | | | | | Energy Transfer, LP, 7.13% (5 yr. CMT + 5.31%)(b) (j) | | | 263,925 | |
| | 395,000 | | | | | Enstar Group, Ltd., 3.10%, due 09/01/31 | | | 353,936 | |
| | 205,000 | | | | | Enstar Group, Ltd., 4.95%, due 06/01/29 | | | 213,098 | |
See accompanying Notes to the Financial Statements.
134
Mercer Opportunistic Fixed Income Fund
Schedule of Investments (Continued)
(showing percentage of net assets)
March 31, 2022
| | | | | | | | | | |
| Par Value(a) | | | | | Description | | Value ($) | |
| | | |
| | | | | | Corporate Debt — continued | | | |
| | 820,000 | | | | | Enterprise Products Operating LLC, 3.70%, due 01/31/51 | | | 752,819 | |
| | 160,000 | | | | | Enterprise Products Operating LLC, 3.95%, due 01/31/60 | | | 149,305 | |
| | 265,000 | | | | | EPR Properties REIT, 3.75%, due 08/15/29 | | | 248,372 | |
| | 150,000 | | | | | EQM Midstream Partners, LP, 6.00%, due 07/01/25 144A | | | 153,255 | |
| | 140,000 | | | | | EQM Midstream Partners, LP, 6.50%, due 07/01/27 144A | | | 146,453 | |
| | 810,000 | | | | | EQT Corp., 3.90%, due 10/01/27 | | | 808,850 | |
| | 330,000 | | | | | EQT Corp., 7.50%, due 02/01/30(k) | | | 382,968 | |
| | 230,000 | | | | | FAGE International SA/FAGE USA Dairy Industry, Inc., 5.63%, due 08/15/26 144A | | | 227,551 | |
| | 160,000 | | | | | Fertitta Entertainment LLC/Fertitta Entertainment Finance Co., Inc., 4.63%, due 01/15/29 144A | | | 151,923 | |
| | 200,000 | | | | | Fertitta Entertainment LLC/Fertitta Entertainment Finance Co., Inc., 6.75%, due 01/15/30 144A | | | 184,247 | |
| | 300,000 | | | | | First Quantum Minerals, Ltd., 6.88%, due 03/01/26 144A | | | 308,678 | |
| | 1,550,000 | | | | | First Quantum Minerals, Ltd., 6.88%, due 10/15/27 144A | | | 1,625,252 | |
| | 420,000 | | | | | FirstCash, Inc., 5.63%, due 01/01/30 144A | | | 404,036 | |
| | 130,000 | | | | | FirstEnergy Corp., 7.38%, due 11/15/31 | | | 160,576 | |
| | 1,040,000 | | | | | Five Point Operating Co., LP/Five Point Capital Corp., 7.88%, due 11/15/25 144A | | | 1,065,761 | |
| | 2,330,000 | | | | | Foot Locker, Inc., 4.00%, due 10/01/29 144A | | | 2,043,317 | |
| | 1,530,000 | | | | | Ford Motor Co., 3.25%, due 02/12/32 | | | 1,369,059 | |
| | 390,000 | | | | | Ford Motor Credit Co. LLC, 2.90%, due 02/16/28 | | | 353,299 | |
| | 820,000 | | | | | Ford Motor Credit Co. LLC, 3.63%, due 06/17/31 | | | 742,108 | |
| | 380,000 | | | | | Ford Motor Credit Co. LLC, 4.00%, due 11/13/30 | | | 358,450 | |
| | 480,000 | | | | | Ford Motor Credit Co. LLC, 4.95%, due 05/28/27 | | | 488,664 | |
| | 1,000,000 | | | | | Freeport Minerals Corp., 7.13%, due 11/01/27 | | | 1,184,700 | |
| | 180,000 | | | | | Freeport-McMoRan, Inc., 4.55%, due 11/14/24 | | | 185,689 | |
| | 455,000 | | | | | Freeport-McMoRan, Inc., 4.63%, due 08/01/30 | | | 465,761 | |
| | 500,000 | | | | | Gannett Holdings LLC, 6.00%, due 11/01/26 144A | | | 484,375 | |
| | 280,000 | | | | | Gartner, Inc., 3.63%, due 06/15/29 144A | | | 262,889 | |
| | 590,000 | | | | | Gazprom PJSC Via Gaz Capital SA, 4.95%, due 03/23/27(d) | | | 256,650 | |
| | 155,000 | | | | | General Motors Co., 5.20%, due 04/01/45 | | | 157,472 | |
| | 50,000 | | | | | GEO Group, Inc. (The) REIT, 5.13%, due 04/01/23 | | | 47,812 | |
| | 890,000 | | | | | GEO Group, Inc. (The) REIT, 5.88%, due 10/15/24 | | | 769,053 | |
| | 150,000 | | | | | GEO Group, Inc. (The) REIT, 6.00%, due 04/15/26 | | | 117,182 | |
| | 200,000 | | | | | GFL Environmental, Inc., 5.13%, due 12/15/26 144A | | | 201,968 | |
| | 1,066,194 | | | | | Global Aircraft Leasing Co., Ltd., 6.50% (6.50% Cash or 7.25% PIK), due 09/15/24 144A | | | 970,023 | |
| | 280,000 | | | | | Global Atlantic Fin Co., 4.40%, due 10/15/29 144A | | | 280,065 | |
| | 1,125,000 | | | | | Gold Fields Orogen Holdings BVI, Ltd., 6.13%, due 05/15/29 144A | | | 1,220,676 | |
| | 2,100,000 | | | | | Goldman Sachs Group, Inc. (The), 3.44% (SOFR + 1.63%), due 02/24/43(b) | | | 1,949,960 | |
| | 190,000 | | | | | Goldman Sachs Group, Inc. (The), 5.15%, due 05/22/45 | | | 213,121 | |
| | 810,000 | | | | | Granite US Holdings Corp., 11.00%, due 10/01/27(g) 144A | | | 855,518 | |
| | 1,880,000 | | | | | Gray Escrow II, Inc., 5.38%, due 11/15/31 144A | | | 1,800,100 | |
| | 1,460,000 | | | | | Guitar Center, Inc., 8.50%, due 01/15/26 144A | | | 1,492,047 | |
| | 850,000 | | | | | H&E Equipment Services, Inc., 3.88%, due 12/15/28 144A | | | 797,933 | |
| | 420,000 | | | | | Hawaiian Brand Intellectual Property, Ltd./HawaiianMiles Loyalty, Ltd., 5.75%, due 01/20/26 144A | | | 420,794 | |
| | 1,555,000 | | | | | HCA, Inc., 5.88%, due 02/01/29 | | | 1,702,445 | |
| | 80,000 | | | | | Healthpeak Properties, Inc. REIT, 3.50%, due 07/15/29 | | | 79,978 | |
| | 255,000 | | | | | Helmerich & Payne, Inc., 2.90%, due 09/29/31 144A | | | 233,616 | |
See accompanying Notes to the Financial Statements.
135
Mercer Opportunistic Fixed Income Fund
Schedule of Investments (Continued)
(showing percentage of net assets)
March 31, 2022
| | | | | | | | | | |
| Par Value(a) | | | | | Description | | Value ($) | |
| | | |
| | | | | | Corporate Debt — continued | | | |
| | 780,000 | | | | | Hertz Corp. (The), 5.00%, due 12/01/29 144A | | | 706,910 | |
| | 125,000 | | | | | Hess Midstream Operations, LP, 5.13%, due 06/15/28 144A | | | 125,163 | |
| | 570,000 | | | | | Howard Midstream Energy Partners LLC, 6.75%, due 01/15/27 144A | | | 559,224 | |
| | 955,000 | | | | | HSBC Holdings Plc, 4.60% (5 yr. CMT + 3.65%)(b) (g) (j) | | | 854,725 | |
| | 250,000 | EUR | | | | HSBC Holdings Plc, 5.25% (5 yr. EUR swap annual + 4.38%)(b) (i) (j) | | | 282,000 | |
| | 190,000 | EUR | | | | HSE Finance SARL, 5.63%, due 10/15/26 144A | | | 200,965 | |
| | 870,000 | | | | | HTA Group, Ltd., 7.00%, due 12/18/25 144A | | | 862,535 | |
| | 260,000 | | | | | Hudbay Minerals, Inc., 4.50%, due 04/01/26 144A | | | 253,109 | |
| | 610,000 | | | | | Hudbay Minerals, Inc., 6.13%, due 04/01/29 144A | | | 629,227 | |
| | 280,000 | | | | | iHeartCommunications, Inc., 4.75%, due 01/15/28 144A | | | 267,975 | |
| | 320,000 | | | | | iHeartCommunications, Inc., 5.25%, due 08/15/27 144A | | | 316,966 | |
| | 145,000 | | | | | iHeartCommunications, Inc., 6.38%, due 05/01/26 | | | 149,223 | |
| | 740,000 | | | | | IHS Netherlands Holdco BV, 8.00%, due 09/18/27(i) | | | 740,474 | |
| | 2,335,000 | | | | | IHS Netherlands Holdco BV, 8.00%, due 09/18/27 144A | | | 2,336,494 | |
| | 2,945,000 | | | | | II-VI, Inc., 5.00%, due 12/15/29 144A | | | 2,882,934 | |
| | 900,000 | | | | | Iliad Holding SASU, 6.50%, due 10/15/26 144A | | | 903,609 | |
| | 810,000 | | | | | Illuminate Buyer LLC/Illuminate Holdings IV, Inc., 9.00%, due 07/01/28 144A | | | 821,137 | |
| | 265,000 | EUR | | | | IMA Industria Macchine Automatiche SpA, 3.75%, due 01/15/28 144A | | | 277,128 | |
| | 1,995,000 | | | | | Independence Energy Finance LLC, 7.25%, due 05/01/26 144A | | | 2,007,529 | |
| | 1,580,000 | | | | | ING Groep NV, 4.25% (SOFR + 2.07%), due 03/28/33(b) | | | 1,628,219 | |
| | 200,000 | | | | | Intesa Sanpaolo SpA, 4.00%, due 09/23/29 144A | | | 194,553 | |
| | 1,450,000 | | | | | Intesa Sanpaolo SpA, 4.95% (1 yr. CMT + 2.75%), due 06/01/42(b) 144A | | | 1,244,063 | |
| | 350,000 | | | | | Intesa Sanpaolo SpA, 5.71%, due 01/15/26 144A | | | 357,991 | |
| | 570,000 | | | | | Itau Unibanco Holding SA, 3.88% (5 yr. CMT + 3.45%), due 04/15/31(b) 144A | | | 541,004 | |
| | 1,059,000 | | | | | Itau Unibanco Holding SA, 4.63% (5 yr. CMT + 3.22%)(b) (j) 144A | | | 968,985 | |
| | 1,195,000 | | | | | Jackson Financial, Inc., 3.13%, due 11/23/31 144A | | | 1,089,425 | |
| | 690,000 | | | | | Jane Street Group/JSG Finance, Inc., 4.50%, due 11/15/29 144A | | | 654,675 | |
| | 225,000 | | | | | Jazz Securities DAC, 4.38%, due 01/15/29 144A | | | 218,271 | |
| | 631,495 | | | | | K2016470219 South Africa, Ltd., 3.00% (3.00% Cash or PIK), due 12/31/22(d) | | | 1,803 | |
| | 223,090 | | | | | K2016470260 South Africa, Ltd., 25.00% (25.00% Cash or PIK), due 12/31/22(d) | | | 580 | |
| | 660,000 | | | | | KazMunayGas National Co. JSC, 4.75%, due 04/19/27 144A | | | 641,890 | |
| | 790,000 | | | | | KazTransGas JSC, 4.38%, due 09/26/27(g) 144A | | | 715,424 | |
| | 1,770,000 | | | | | Kenbourne Invest SA, 4.70%, due 01/22/28 144A | | | 1,558,538 | |
| | 1,005,000 | | | | | Kosmos Energy, Ltd., 7.13%, due 04/04/26(g) 144A | | | 983,905 | |
| | 30,000 | | | | | Las Vegas Sands Corp., 3.20%, due 08/08/24 | | | 28,663 | |
| | 425,000 | | | | | Lazard Group LLC, 4.38%, due 03/11/29 | | | 435,203 | |
| | 650,000 | | | | | Legends Hospitality Holding Co. LLC/Legends Hospitality Co-Issuer, Inc., 5.00%, due 02/01/26 144A | | | 624,832 | |
| | 35,000 | | | | | Lennar Corp., 4.50%, due 04/30/24 | | | 35,904 | |
| | 120,000 | | | | | Lennar Corp., 4.75%, due 11/15/22(k) | | | 121,232 | |
| | 560,000 | | | | | Lennar Corp., 4.88%, due 12/15/23 | | | 575,499 | |
| | 460,000 | | | | | Leviathan Bond, Ltd., 6.50%, due 06/30/27(i) 144A | | | 473,724 | |
| | 250,000 | | | | | Liberty Interactive LLC, 8.25%, due 02/01/30(g) | | | 228,826 | |
| | 320,000 | | | | | Liberty Interactive LLC, 8.50%, due 07/15/29 | | | 299,880 | |
| | 1,590,000 | | | | | Liberty Mutual Group, Inc., 4.30%, due 02/01/61 144A | | | 1,267,548 | |
| | 960,000 | | | | | Liquid Telecommunications Financing Plc, 5.50%, due 09/04/26 144A | | | 925,594 | |
| | 250,000 | EUR | | | | Lloyds Banking Group Plc, 4.95% (5 yr. EURIBOR + 5.29%)(b) (g) (i) (j) | | | 287,863 | |
| | 540,000 | | | | | LogMeIn, Inc., 5.50%, due 09/01/27 144A | | | 505,024 | |
| | 2,470,000 | EUR | | | | Lorca Telecom Bondco SA, 4.00%, due 09/18/27 144A | | | 2,656,567 | |
See accompanying Notes to the Financial Statements.
136
Mercer Opportunistic Fixed Income Fund
Schedule of Investments (Continued)
(showing percentage of net assets)
March 31, 2022
| | | | | | | | | | |
| Par Value(a) | | | | | Description | | Value ($) | |
| | | |
| | | | | | Corporate Debt — continued | | | |
| | 400,000 | | | | | Lukoil International Finance BV, 4.75%, due 11/02/26 144A | | | 230,000 | |
| | 2,145,000 | | | | | Macquarie Group, Ltd., 4.44% (SOFR + 2.41%), due 06/21/33(b) 144A | | | 2,167,910 | |
| | 1,280,000 | | | | | Macy’s Retail Holdings LLC, 5.88%, due 03/15/30(g) 144A | | | 1,264,218 | |
| | 220,000 | | | | | Macy’s Retail Holdings LLC, 6.13%, due 03/15/32 144A | | | 217,543 | |
| | 630,000 | | | | | Madison IAQ LLC, 5.88%, due 06/30/29 144A | | | 566,298 | |
| | 2,155,000 | | | | | Magallanes, Inc., 5.14%, due 03/15/52 144A | | | 2,209,889 | |
| | 2,570,000 | | | | | Mclaren Finance Plc, 7.50%, due 08/01/26(g) 144A | | | 2,535,279 | |
| | 130,000 | | | | | MDC Holdings, Inc., 6.00%, due 01/15/43 | | | 133,767 | |
| | 440,000 | | | | | MEG Energy Corp., 5.88%, due 02/01/29 144A | | | 446,888 | |
| | 210,000 | | | | | MEG Energy Corp., 7.13%, due 02/01/27 144A | | | 220,150 | |
| | 1,520,000 | | | | | MEGlobal Canada ULC, 5.88%, due 05/18/30 144A | | | 1,689,336 | |
| | 320,000 | | | | | Melco Resorts Finance, Ltd., 5.38%, due 12/04/29 144A | | | 272,800 | |
| | 800,000 | | | | | MercadoLibre, Inc., 3.13%, due 01/14/31 | | | 698,968 | |
| | 3,050,000 | | | | | Merck & Co., Inc., 2.90%, due 12/10/61 | | | 2,605,328 | |
| | 145,000 | | | | | MetLife, Inc., 4.60%, due 05/13/46 | | | 162,574 | |
| | 985,000 | | | | | Michaels Cos, Inc. (The), 5.25%, due 05/01/28 144A | | | 905,589 | |
| | 560,000 | | | | | Michaels Cos, Inc. (The), 7.88%, due 05/01/29 144A | | | 480,197 | |
| | 560,000 | | | | | Micron Technology, Inc., 3.37%, due 11/01/41 | | | 501,382 | |
| | 210,000 | | | | | Midcap Financial Issuer Trust, 5.63%, due 01/15/30 144A | | | 185,971 | |
| | 710,000 | | | | | Midcap Financial Issuer Trust, 6.50%, due 05/01/28 144A | | | 668,756 | |
| | 747,000 | | | | | Millicom International Cellular SA, 4.50%, due 04/27/31 144A | | | 696,637 | |
| | 2,295,000 | | | | | Millicom International Cellular SA, 6.25%, due 03/25/29 144A | | | 2,439,218 | |
| | 170,000 | | | | | Minerals Technologies, Inc., 5.00%, due 07/01/28 144A | | | 162,137 | |
| | 1,350,000 | | | | | Minerva Merger Sub, Inc., 6.50%, due 02/15/30 144A | | | 1,311,363 | |
| | 655,000 | | | | | Mitsubishi UFJ Financial Group, Inc., 2.49% (1 yr. CMT + 0.97%), due 10/13/32(b) | | | 590,408 | |
| | 890,000 | | | | | MIWD Holdco II LLC/MIWD Finance Corp., 5.50%, due 02/01/30 144A | | | 832,617 | |
| | 1,040,000 | | | | | Moody’s Corp., 2.00%, due 08/19/31 | | | 924,143 | |
| | 440,000 | | | | | Mountain Province Diamonds, Inc., 8.00%, due 12/15/22(g) 144A | | | 440,898 | |
| | 2,110,000 | | | | | Mozart Debt Merger SUB, Inc., 3.88%, due 04/01/29 144A | | | 1,954,440 | |
| | 1,370,000 | | | | | Mozart Debt Merger SUB, Inc., 5.25%, due 10/01/29(g) 144A | | | 1,275,401 | |
| | 500,000 | | | | | MPT Operating Partnership, LP/MPT Finance Corp. REIT, 3.50%, due 03/15/31 | | | 465,209 | |
| | 160,000 | GBP | | | | MPT Operating Partnership, LP/MPT Finance Corp. REIT, 3.69%, due 06/05/28 | | | 204,959 | |
| | 120,000 | | | | | MSCI, Inc., 3.25%, due 08/15/33 144A | | | 108,113 | |
| | 295,000 | | | | | Mylan, Inc., 5.40%, due 11/29/43 | | | 288,568 | |
| | 245,000 | | | | | NatWest Group Plc, 4.27% (3 mo. USD LIBOR + 1.76%), due 03/22/25(b) | | | 247,960 | |
| | 1,120,000 | GBP | | | | NatWest Group Plc, 4.50% (5 yr. UK Government Bond + 3.99%)(b) (j) | | | 1,372,483 | |
| | 170,000 | | | | | Navient Corp., (MTN), 5.63%, due 08/01/33 | | | 143,486 | |
| | 235,000 | | | | | NBM US Holdings, Inc., 7.00%, due 05/14/26 144A | | | 244,174 | |
| | 810,000 | | | | | NCL Corp., Ltd., 5.88%, due 02/15/27 144A | | | 798,883 | |
| | 450,000 | | | | | NCL Corp., Ltd., 7.75%, due 02/15/29(g) 144A | | | 453,739 | |
| | 660,000 | | | | | NCR Corp., 5.13%, due 04/15/29 144A | | | 635,280 | |
| | 450,000 | | | | | Neptune Energy Bondco Plc, 6.63%, due 05/15/25 144A | | | 453,195 | |
| | 280,000 | | | | | Netflix, Inc., 6.38%, due 05/15/29 | | | 317,097 | |
| | 1,085,000 | | | | | New Metro Global, Ltd., 4.50%, due 05/02/26(i) | | | 661,850 | |
| | 1,635,000 | | | | | Nexstar Media, Inc., 5.63%, due 07/15/27 144A | | | 1,656,991 | |
| | 420,000 | | | | | NMI Holdings, Inc., 7.38%, due 06/01/25 144A | | | 441,535 | |
| | 915,000 | | | | | Nomura Holdings, Inc., 2.61%, due 07/14/31 | | | 823,933 | |
| | 700,000 | | | | | Northern Oil and Gas, Inc., 8.13%, due 03/01/28 144A | | | 730,387 | |
| | 400,000 | | | | | Northwest Acquisitions ULC/Dominion Finco, Inc., 7.13%, due 11/01/22(d) (l) | | | 24 | |
See accompanying Notes to the Financial Statements.
137
Mercer Opportunistic Fixed Income Fund
Schedule of Investments (Continued)
(showing percentage of net assets)
March 31, 2022
| | | | | | | | | | |
| Par Value(a) | | | | | Description | | Value ($) | |
| | | |
| | | | | | Corporate Debt — continued | | | |
| | 160,000 | EUR | | | | Novelis Sheet Ingot GmbH, 3.38%, due 04/15/29 144A | | | 170,287 | |
| | 60,000 | | | | | NRG Energy, Inc., 3.63%, due 02/15/31 144A | | | 52,863 | |
| | 1,090,000 | | | | | Oasis Petroleum, Inc., 6.38%, due 06/01/26 144A | | | 1,118,651 | |
| | 280,000 | | | | | Occidental Petroleum Corp., 4.50%, due 07/15/44 | | | 268,156 | |
| | 30,000 | | | | | Occidental Petroleum Corp., 6.45%, due 09/15/36 | | | 35,298 | |
| | 180,000 | | | | | Occidental Petroleum Corp., 7.20%, due 03/15/29 | | | 200,712 | |
| | 870,000 | | | | | OCP SA, 5.13%, due 06/23/51 144A | | | 726,450 | |
| | 1,490,000 | | | | | Olympus Water US Holding Corp., 4.25%, due 10/01/28 144A | | | 1,356,198 | |
| | 225,000 | | | | | Olympus Water US Holding Corp., 6.25%, due 10/01/29(g) 144A | | | 199,557 | |
| | 2,155,000 | | | | | OneMain Finance Corp., 5.38%, due 11/15/29 | | | 2,097,375 | |
| | 1,130,000 | | | | | Option Care Health, Inc., 4.38%, due 10/31/29 144A | | | 1,061,449 | |
| | 565,000 | | | | | Oracle Corp., 3.95%, due 03/25/51 | | | 495,741 | |
| | 1,240,000 | | | | | Organon & Co./Organon Foreign Debt Co-Issuer BV, 5.13%, due 04/30/31 144A | | | 1,198,274 | |
| | 950,000 | | | | | Outfront Media Capital LLC/Outfront Media Capital Corp., 4.63%, due 03/15/3 144A | | | 895,973 | |
| | 590,000 | | | | | Oversea-Chinese Banking Corp., Ltd., (MTN), 4.25%, due 06/19/24(i) | | | 602,002 | |
| | 240,000 | | | | | Pactiv LLC, 8.38%, due 04/15/27 | | | 246,336 | |
| | 1,315,000 | | | | | Papa John’s International, Inc., 3.88%, due 09/15/29(g) 144A | | | 1,208,432 | |
| | 580,000 | EUR | | | | Paprec Holding SA, 3.50%, due 07/01/28 144A | | | 621,682 | |
| | 1,340,000 | | | | | Park-Ohio Industries, Inc., 6.63%, due 04/15/27(g) | | | 1,123,824 | |
| | 250,000 | | | | | Parsley Energy LLC/Parsley Finance Corp., 5.63%, due 10/15/27 144A | | | 258,450 | |
| | 260,000 | | | | | Pattern Energy Operations, LP/Pattern Energy Operations, Inc., 4.50%, due 08/15/28 144A | | | 256,090 | |
| | 525,000 | | | | | Paysafe Finance Plc/Paysafe Holdings US Corp., 4.00%, due 06/15/29 144A | | | 447,242 | |
| | 910,000 | | | | | Penn Virginia Escrow LLC, 9.25%, due 08/15/26 144A | | | 961,005 | |
| | 1,260,000 | | | | | PerkinElmer, Inc., 2.25%, due 09/15/31 | | | 1,115,793 | |
| | 580,000 | | | | | Petrobras Global Finance BV, 5.30%, due 01/27/25 | | | 606,648 | |
| | 1,550,000 | | | | | Petrobras Global Finance BV, 6.85%, due 06/05/15(g) (m) | | | 1,456,488 | |
| | 7,056,900 | MXN | | | | Petroleos Mexicanos, 7.19%, due 09/12/24(i) | | | 333,005 | |
| | 300,000 | | | | | PetSmart, Inc./PetSmart Finance Corp., 4.75%, due 02/15/28 144A | | | 290,319 | |
| | 290,000 | | | | | PetSmart, Inc./PetSmart Finance Corp., 7.75%, due 02/15/29 144A | | | 299,779 | |
| | 935,000 | | | | | Phillips 66, 3.30%, due 03/15/52 | | | 825,130 | |
| | 690,000 | | | | | Photo Holdings Merger Sub, Inc., 8.50%, due 10/01/26 144A | | | 658,550 | |
| | 240,000 | | | | | Plains All American Pipeline, LP, 6.13% (3 mo. USD LIBOR + 4.11%)(b) (j) | | | 205,920 | |
| | 280,000 | | | | | Playtika Holding Corp., 4.25%, due 03/15/29 144A | | | 258,842 | |
| | 105,000 | EUR | | | | PLT VII Finance SARL, 4.63%, due 01/05/26 144A | | | 115,758 | |
| | 880,000 | | | | | PM General Purchaser LLC, 9.50%, due 10/01/28 144A | | | 866,422 | |
| | 600,000 | | | | | Precision Drilling Corp., 6.88%, due 01/15/29 144A | | | 609,729 | |
| | 15,000 | | | | | Precision Drilling Corp., 7.13%, due 01/15/26 144A | | | 15,317 | |
| | 110,000 | | | | | Prime Security Services Borrower LLC/Prime Finance, Inc., 6.25%, due 01/15/28 144A | | | 107,824 | |
| | 280,000 | | | | | Prosperous Ray, Ltd., 4.63%, due 11/12/23(i) | | | 287,314 | |
| | 680,000 | | | | | Prosus NV, 3.06%, due 07/13/31 144A | | | 565,851 | |
| | 1,815,000 | | | | | Prosus NV, 4.03%, due 08/03/50 144A | | | 1,373,928 | |
| | 4,195,000 | | | | | Prosus NV, 4.19%, due 01/19/32 144A | | | 3,696,064 | |
| | 45,000 | | | | | Prudential Financial, Inc., 5.63% (3 mo. USD LIBOR + 3.92%), due 06/15/43(b) | | | 45,394 | |
| | 920,000 | | | | | Public Storage REIT, 2.25%, due 11/09/31 | | | 842,385 | |
| | 400,000 | | | | | QVC, Inc., 5.45%, due 08/15/34 | | | 335,804 | |
| | 520,000 | | | | | Rackspace Technology Global, Inc., 3.50%, due 02/15/28 144A | | | 466,284 | |
| | 575,000 | | | | | Radian Group, Inc., 6.63%, due 03/15/25 | | | 605,823 | |
See accompanying Notes to the Financial Statements.
138
Mercer Opportunistic Fixed Income Fund
Schedule of Investments (Continued)
(showing percentage of net assets)
March 31, 2022
| | | | | | | | | | |
| Par Value(a) | | | | | Description | | Value ($) | |
| | | |
| | | | | | Corporate Debt — continued | | | |
| | 750,000 | | | | | Radiology Partners, Inc., 9.25%, due 02/01/28 144A | | | 751,489 | |
| | 410,000 | | | | | Range Resources Corp., 4.75%, due 02/15/30(g) 144A | | | 407,827 | |
| | 130,000 | | | | | Range Resources Corp., 5.00%, due 03/15/23 | | | 131,105 | |
| | 870,000 | | | | | Range Resources Corp., 8.25%, due 01/15/29 | | | 954,668 | |
| | 1,625,000 | | | | | Raytheon Technologies Corp., 1.90%, due 09/01/31 | | | 1,439,920 | |
| | 410,000 | | | | | Raytheon Technologies Corp., 3.13%, due 07/01/50 | | | 369,750 | |
| | 400,000 | | | | | Realogy Group LLC/Realogy Co-Issuer Corp., 5.75%, due 01/15/29 144A | | | 377,776 | |
| | 620,000 | | | | | Rent-A-Center, Inc, 6.38%, due 02/15/29(g) 144A | | | 568,115 | |
| | 400,000 | | | | | Ritchie Bros Holdings, Inc., 4.75%, due 12/15/31 144A | | | 390,648 | |
| | 1,165,000 | | | | | ROBLOX Corp., 3.88%, due 05/01/30 144A | | | 1,091,162 | |
| | 500,000 | | | | | Rocket Mortgage LLC/Rocket Mortgage Co-Issuer, Inc., 4.00%, due 10/15/33 144A | | | 438,925 | |
| | 500,000 | | | | | Rocket Software, Inc., 6.50%, due 02/15/29(g) 144A | | | 454,727 | |
| | 210,000 | | | | | Rockies Express Pipeline LLC, 7.50%, due 07/15/38 144A | | | 213,938 | |
| | 210,000 | | | | | Roller Bearing Co. of America, Inc., 4.38%, due 10/15/29 144A | | | 196,088 | |
| | 2,480,000 | | | | | Rumo Luxembourg SARL, 4.20%, due 01/18/32(g) 144A | | | 2,151,983 | |
| | 590,000 | GBP | | | | Saga Plc, 5.50%, due 07/15/26(i) | | | 736,041 | |
| | 470,000 | | | | | Sands China, Ltd., 2.55%, due 03/08/27(k) 144A | | | 410,545 | |
| | 200,000 | | | | | Sands China, Ltd., 3.10%, due 03/08/29(k) 144A | | | 171,000 | |
| | 200,000 | | | | | Sands China, Ltd., 5.13%, due 08/08/25(k) | | | 199,250 | |
| | 890,000 | | | | | Santander Holdings USA, Inc., 2.49% (SOFR + 1.25%), due 01/06/28(b) | | | 831,703 | |
| | 420,000 | | | | | Sasol Financing USA LLC, 4.38%, due 09/18/26 | | | 401,841 | |
| | 420,000 | | | | | Sasol Financing USA LLC, 5.50%, due 03/18/31 | | | 392,931 | |
| | 1,225,000 | | | | | Scientific Games International, Inc., 7.00%, due 05/15/28 144A | | | 1,271,856 | |
| | 1,050,000 | | | | | Scientific Games International, Inc., 8.63%, due 07/01/25 144A | | | 1,105,650 | |
| | 310,000 | EUR | | | | SCIL IV LLC/SCIL USA Holdings LLC, 4.38%, due 11/01/26 144A | | | 332,461 | |
| | 340,000 | | | | | Seagate HDD Cayman, 4.09%, due 06/01/29 | | | 330,526 | |
| | 321,000 | | | | | Seagate HDD Cayman, 4.88%, due 06/01/27 | | | 328,879 | |
| | 545,000 | | | | | Sempra Energy, 3.70%, due 04/01/29 | | | 548,100 | |
| | 4,080,000 | | | | | Service Properties Trust REIT, 5.00%, due 08/15/22 | | | 4,065,128 | |
| | 290,000 | | | | | Service Properties Trust REIT, 5.50%, due 12/15/27 | | | 280,068 | |
| | 400,000 | | | | | Service Properties Trust REIT, 7.50%, due 09/15/25 | | | 420,120 | |
| | 400,000 | | | | | Shift4 Payments LLC/Shift4 Payments Finance Sub, Inc., 4.63%, due 11/01/26 144A | | | 389,460 | |
| | 900,000 | | | | | Shimao Group Holdings, Ltd., 4.75%, due 07/03/22(i) | | | 333,000 | |
| | 1,615,000 | | | | | Shriram Transport Finance Co., Ltd., 4.15%, due 07/18/25 144A | | | 1,540,306 | |
| | 620,000 | | | | | Simmons Foods, Inc./Simmons Prepared Foods, Inc./Simmons Pet Food, Inc./Simmons Feed, 4.63%, due 03/01/29 144A | | | 582,056 | |
| | 1,480,000 | | | | | Societe Generale SA, 2.89% (1 yr. CMT + 1.30%), due 06/09/32(b) 144A | | | 1,328,511 | |
| | 1,095,000 | | | | | Societe Generale SA, 3.63%, due 03/01/41(d) | | | 917,328 | |
| | 805,000 | | | | | Societe Generale SA, 4.03% (1 yr. CMT + 1.90%), due 01/21/43(b) 144A | | | 701,479 | |
| | 1,565,000 | | | | | Societe Generale SA, 7.38% (5 yr. USD swap + 4.30%)(b) (g) (j) 144A | | | 1,596,996 | |
| | 750,000 | | | | | Southwestern Energy Co., 4.75%, due 02/01/32 | | | 750,109 | |
| | 2,780,000 | | | | | Southwestern Energy Co., 7.75%, due 10/01/27(g) | | | 2,946,425 | |
| | 260,000 | | | | | Southwestern Energy Co., 8.38%, due 09/15/28 | | | 285,669 | |
| | 556,000 | | | | | Spirit Loyalty Cayman, Ltd./Spirit IP Cayman, Ltd., 8.00%, due 09/20/25 144A | | | 593,107 | |
| | 1,170,000 | | | | | SRM Escrow Issuer LLC, 6.00%, due 11/01/28 144A | | | 1,155,340 | |
| | 2,135,000 | | | | | Standard Chartered Plc, 4.30% (5 yr. CMT + 3.14%)(b) (j) 144A | | | 1,878,875 | |
| | 1,500,000 | | | | | Starwood Property Trust, Inc. REIT, 3.63%, due 07/15/26 144A | | | 1,434,322 | |
| | 1,550,000 | | | | | Starwood Property Trust, Inc. REIT, 4.38%, due 01/15/27 144A | | | 1,505,585 | |
| | 930,000 | | | | | StoneMor, Inc., 8.50%, due 05/15/29 144A | | | 922,537 | |
See accompanying Notes to the Financial Statements.
139
Mercer Opportunistic Fixed Income Fund
Schedule of Investments (Continued)
(showing percentage of net assets)
March 31, 2022
| | | | | | | | | | |
| Par Value(a) | | | | | Description | | Value ($) | |
| | | |
| | | | | | Corporate Debt — continued | | | |
| | 240,000 | | | | | StoneX Group, Inc., 8.63%, due 06/15/25 144A | | | 250,318 | |
| | 720,000 | | | | | Strathcona Resources, Ltd., 6.88%, due 08/01/26 144A | | | 726,415 | |
| | 240,000 | | | | | Suburban Propane Partners, LP/Suburban Energy Finance Corp., 5.00%, due 06/01/31 144A | | | 225,324 | |
| | 220,000 | EUR | | | | Summer BC Holdco B SARL, 5.75%, due 10/31/26 144A | | | 249,108 | |
| | 735,000 | EUR | | | | Summer BC Holdco B SARL, 5.75%, due 10/31/26(i) | | | 832,247 | |
| | 100,000 | | | | | Summit Materials LLC/Summit Materials Finance Corp., 5.25%, due 01/15/29 144A | | | 98,857 | |
| | 400,000 | | | | | Summit Midstream Holdings LLC/Summit Midstream Finance Corp., 8.50%, due 10/15/26 144A | | | 382,122 | |
| | 500,000 | | | | | Sunac China Holdings, Ltd., 7.50%, due 02/01/24(i) | | | 130,000 | |
| | 683,000 | | | | | Sunnova Energy Corp., 5.88%, due 09/01/26(g) 144A | | | 654,375 | |
| | 940,000 | | | | | Suzano Austria GmbH, 3.13%, due 01/15/32 | | | 834,335 | |
| | 260,000 | | | | | Suzano Austria GmbH, 5.75%, due 07/14/26(g) (i) | | | 279,273 | |
| | 830,000 | | | | | Suzano Austria GmbH, 6.00%, due 01/15/29 | | | 897,504 | |
| | 1,190,000 | | | | | Suzano Austria GmbH, 7.00%, due 03/16/47(i) | | | 1,336,775 | |
| | 360,000 | | | | | Swire Pacific MTN Financing, Ltd., (MTN), 4.50%, due 10/09/23(i) | | | 369,028 | |
| | 400,000 | | | | | Switch, Ltd., 3.75%, due 09/15/28 144A | | | 388,616 | |
| | 280,000 | | | | | Switch, Ltd., 4.13%, due 06/15/29 144A | | | 275,779 | |
| | 410,000 | | | | | T-Mobile USA, Inc., 3.50%, due 04/15/31 | | | 386,441 | |
| | 415,000 | | | | | T-Mobile USA, Inc., 4.38%, due 04/15/40 | | | 418,001 | |
| | 350,000 | | | | | Talen Energy Supply LLC, 6.63%, due 01/15/28(g) 144A | | | 326,146 | |
| | 330,000 | | | | | Tallgrass Energy Partners, LP/Tallgrass Energy Finance Corp., 6.00%, due 12/31/30 144A | | | 320,719 | |
| | 835,000 | | | | | Tap Rock Resources LLC, 7.00%, due 10/01/26 144A | | | 865,319 | |
| | 320,000 | | | | | Teck Resources, Ltd., 5.40%, due 02/01/43 | | | 346,645 | |
| | 60,000 | | | | | Teck Resources, Ltd., 6.00%, due 08/15/40 | | | 69,072 | |
| | 640,000 | | | | | Teine Energy, Ltd., 6.88%, due 04/15/29 144A | | | 650,371 | |
| | 200,000 | | | | | Telefonica Emisiones SA, 5.21%, due 03/08/47 | | | 215,149 | |
| | 1,540,000 | | | | | Teva Pharmaceutical Finance Co. LLC, 6.15%, due 02/01/36(g) | | | 1,558,580 | |
| | 635,000 | EUR | | | | Teva Pharmaceutical Finance Netherlands II BV, 6.00%, due 01/31/25 | | | 740,976 | |
| | 780,000 | | | | | Teva Pharmaceutical Finance Netherlands III BV, 4.75%, due 05/09/27 | | | 749,736 | |
| | 300,000 | | | | | Time Warner Cable LLC, 6.75%, due 06/15/39 | | | 348,640 | |
| | 360,000 | | | | | TKC Holdings, Inc., 10.50%, due 05/15/29 144A | | | 367,796 | |
| | 440,000 | | | | | TopBuild Corp., 3.63%, due 03/15/29 144A | | | 400,745 | |
| | 1,150,000 | | | | | TransAlta Corp., 6.50%, due 03/15/40 | | | 1,186,955 | |
| | 160,000 | | | | | Transcontinental Gas Pipe Line Co. LLC, 3.25%, due 05/15/30 | | | 156,266 | |
| | 240,000 | | | | | TransDigm, Inc., 5.50%, due 11/15/27 | | | 238,499 | |
| | 250,000 | | | | | TransDigm, Inc., 7.50%, due 03/15/27 | | | 257,941 | |
| | 240,000 | | | | | TransDigm, Inc., 8.00%, due 12/15/25 144A | | | 251,258 | |
| | 340,000 | | | | | Transportadora de Gas del Sur SA, 6.75%, due 05/02/25 144A | | | 309,772 | |
| | 600,000 | | | | | Triumph Group, Inc., 7.75%, due 08/15/25(g) | | | 605,082 | |
| | 690,000 | | | | | Turk Telekomunikasyon AS, 6.88%, due 02/28/25 144A | | | 681,623 | |
| | 460,000 | | | | | Twitter, Inc., 3.88%, due 12/15/27 144A | | | 447,709 | |
| | 540,000 | | | | | UBS Group AG, 7.00% (5 yr. USD swap + 4.34%)(b) (j) 144A | | | 563,763 | |
| | 1,055,000 | | | | | Ulker Biskuvi Sanayi AS, 6.95%, due 10/30/25 144A | | | 925,805 | |
| | 990,000 | | | | | UniCredit SpA, 5.46% (5 yr. CMT + 4.75%), due 06/30/35(b) 144A | | | 947,835 | |
| | 555,000 | | | | | UniCredit SpA, 7.30% (5 yr. USD ICE swap + 4.91%), due 04/02/34(b) 144A | | | 588,748 | |
| | 1,640,000 | | | | | Unifin Financiera SAB de CV, 9.88%, due 01/28/29 144A | | | 967,272 | |
| | 170,000 | | | | | Uniquify, Inc., 6.00%, due 06/15/24 144A | | | 171,413 | |
See accompanying Notes to the Financial Statements.
140
Mercer Opportunistic Fixed Income Fund
Schedule of Investments (Continued)
(showing percentage of net assets)
March 31, 2022
| | | | | | | | | | |
| Par Value(a) | | | | | Description | | Value ($) | |
| | | |
| | | | | | Corporate Debt — continued | | | |
| | 69,120 | | | | | United Airlines Pass Through Trust, 4.88%, due 07/15/27 | | | 68,315 | |
| | 100,000 | | | | | United Airlines, Inc., 4.38%, due 04/15/26 144A | | | 98,500 | |
| | 190,000 | | | | | United Airlines, Inc., 4.63%, due 04/15/29 144A | | | 180,923 | |
| | 2,010,000 | | | | | United Rentals North America, Inc., 3.88%, due 02/15/31(g) | | | 1,897,601 | |
| | 370,000 | | | | | United Rentals North America, Inc., 4.00%, due 07/15/30 | | | 354,521 | |
| | 680,000 | | | | | United Rentals North America, Inc., 5.25%, due 01/15/30 | | | 702,494 | |
| | 410,000 | | | | | Univision Communications, Inc., 9.50%, due 05/01/25 144A | | | 431,064 | |
| | 490,000 | | | | | US Renal Care, Inc., 10.63%, due 07/15/27 144A | | | 467,509 | |
| | 290,000 | | | | | Utah Acquisition Sub, Inc., 5.25%, due 06/15/46 | | | 287,674 | |
| | 740,000 | | | | | Vale Overseas, Ltd., 6.88%, due 11/10/39 | | | 904,735 | |
| | 350,000 | | | | | Vector Group, Ltd., 10.50%, due 11/01/26 144A | | | 358,572 | |
| | 500,000 | | | | | Venture Global Calcasieu Pass LLC, 3.88%, due 11/01/33 144A | | | 478,952 | |
| | 450,000 | | | | | Venture Global Calcasieu Pass LLC, 4.13%, due 08/15/31 144A | | | 442,264 | |
| | 420,000 | | | | | Vericast Corp., 11.00%, due 09/15/26 144A | | | 411,600 | |
| | 490,000 | | | | | Verizon Communications, Inc., 2.85%, due 09/03/41 | | | 432,752 | |
| | 580,000 | | | | | Verizon Communications, Inc., 3.40%, due 03/22/41 | | | 545,255 | |
| | 130,000 | | | | | Verizon Communications, Inc., 3.55%, due 03/22/51 | | | 122,683 | |
| | 300,000 | | | | | Verizon Communications, Inc., 3.70%, due 03/22/61 | | | 279,504 | |
| | 800,000 | | | | | Vertiv Group Corp., 4.13%, due 11/15/28 144A | | | 731,040 | |
| | 220,000 | | | | | Viavi Solutions, Inc., 3.75%, due 10/01/29 144A | | | 206,737 | |
| | 130,000 | | | | | Viking Cruises, Ltd., 7.00%, due 02/15/29 144A | | | 119,852 | |
| | 830,000 | | | | | Viper Energy Partners, LP, 5.38%, due 11/01/27 144A | | | 846,542 | |
| | 300,000 | | | | | Virgin Media Secured Finance Plc, 5.50%, due 05/15/29 144A | | | 298,232 | |
| | 190,000 | | | | | VistaJet Malta Finance Plc/XO Management Holding, Inc., 6.38%, due 02/01/30 144A | | | 179,018 | |
| | 450,000 | | | | | Vmed O2 UK Financing I Plc, 4.75%, due 07/15/31 144A | | | 424,798 | |
| | 710,000 | | | | | VOC Escrow, Ltd., 5.00%, due 02/15/28 144A | | | 661,819 | |
| | 730,000 | | | | | VTR Comunicaciones SpA, 5.13%, due 01/15/28 144A | | | 696,774 | |
| | 1,080,000 | | | | | VTR Finance NV, 6.38%, due 07/15/28 144A | | | 1,048,415 | |
| | 350,000 | | | | | WEA Finance LLC/Westfield UK & Europe Finance Plc REIT, 4.75%,
due 09/17/44 144A | | | 330,983 | |
| | 560,000 | | | | | Wells Fargo & Co., (MTN), 5.01% (SOFR + 4.50%), due 04/04/51(b) | | | 667,561 | |
| | 457,000 | | | | | Wendy’s International LLC, 7.00%, due 12/15/25 | | | 498,715 | |
| | 620,000 | | | | | Western Midstream Operating, LP, 3.60%, due 02/01/25(k) | | | 616,776 | |
| | 470,000 | | | | | Western Midstream Operating, LP, 5.30%, due 03/01/48 | | | 466,186 | |
| | 702,000 | | | | | Western Midstream Operating, LP, 5.45%, due 04/01/44 | | | 713,148 | |
| | 60,000 | | | | | Williams Cos., Inc. (The), 8.75%, due 03/15/32 | | | 81,672 | |
| | 750,000 | | | | | WW International, Inc., 4.50%, due 04/15/29(g) 144A | | | 608,749 | |
| | 220,000 | | | | | Wynn Macau, Ltd., 4.88%, due 10/01/24 144A | | | 206,440 | |
| | 620,000 | | | | | Wynn Macau, Ltd., 5.13%, due 12/15/29 144A | | | 526,662 | |
| | 200,000 | | | | | Wynn Macau, Ltd., 5.50%, due 01/15/26 144A | | | 182,213 | |
| | 370,000 | | | | | Wynn Macau, Ltd., 5.63%, due 08/26/28 144A | | | 322,133 | |
| | 500,000 | | | | | Wynn Resorts Finance LLC/Wynn Resorts Capital Corp., 7.75%, due 04/15/25 144A | | | 519,722 | |
| | 1,230,000 | | | | | XPO CNW, Inc., 6.70%, due 05/01/34 | | | 1,260,842 | |
| | 180,000 | | | | | Yamana Gold, Inc., 4.63%, due 12/15/27 | | | 183,069 | |
| | 414,050 | | | | | YPF SA, 4.00%, due 02/12/26(k) 144A | | | 371,246 | |
| | 460,000 | | | | | YPF SA, 6.95%, due 07/21/27 144A | | | 345,120 | |
| | 860,000 | | | | | YPF SA, 8.50%, due 07/28/25 144A | | | 736,775 | |
| | 85,000 | | | | | Yum! Brands, Inc., 4.75%, due 01/15/30 144A | | | 83,513 | |
See accompanying Notes to the Financial Statements.
141
Mercer Opportunistic Fixed Income Fund
Schedule of Investments (Continued)
(showing percentage of net assets)
March 31, 2022
| | | | | | | | | | |
| Par Value(a) | | | | | Description | | Value ($) | |
| | | |
| | | | | | Corporate Debt — continued | | | |
| | 275,000 | | | | | Yuzhou Group Holdings Co., Ltd., 6.35%, due 01/13/27(i) | | | 31,625 | |
| | 765,000 | | | | | Yuzhou Group Holdings Co., Ltd., 7.38%, due 01/13/26(i) | | | 107,483 | |
| | 270,000 | | | | | Ziff Davis, Inc., 4.63%, due 10/15/30 144A | | | 257,515 | |
| | 240,000 | | | | | ZipRecruiter, Inc., 5.00%, due 01/15/30 144A | | | 234,638 | |
| | 400,000 | | | | | ZoomInfo Technologies LLC/ZoomInfo Finance Corp., 3.88%, due 02/01/29 144A | | | 366,120 | |
| | | | | | | | | | |
| | | | | | | | | 366,437,845 | |
| | | | | | | | | | |
| | | |
| | | | | | Mortgage Backed Securities - Private Issuers — 4.8% | | | |
| | 355,000 | | | | | BANK, Series 2020-BNK25, Class AS, 2.84%, due 01/15/63 | | | 333,441 | |
| | 280,000 | | | | | Barclays Commercial Mortgage Trust, Series 2019-C5, Class A4, 3.06%, due 11/15/52 | | | 274,638 | |
| | 922,000 | | | | | BBCCRE Trust, Series 2015-GTP, Class F, 4.56%, due 08/10/33(e) 144A | | | 818,430 | |
| | 345,000 | | | | | BBCMS Mortgage Trust, Series 2020-C6, Class AS, 2.84%, due 02/15/53 | | | 330,369 | |
| | 390,000 | | | | | BBCMS Trust, Series 2018-CBM, Class D, 2.79% (1 mo. USD LIBOR + 2.39%), due 07/15/37(b) 144A | | | 381,173 | |
| | 250,000 | | | | | Benchmark Mortgage Trust, Series 2020-B16, Class AM, 2.94%, due 02/15/53(e) | | | 238,921 | |
| | 1,000,000 | | | | | BHMS, Series 2018-MZB, Class MZB, 7.03% (1 mo. USD LIBOR + 6.64%), due 07/15/25(b) 144A | | | 962,530 | |
| | 860,000 | | | | | BIG Commercial Mortgage Trust, Series 2022-BIG, Class F, 5.74% (1 mo. TSFR + 5.44%), due 02/15/39(b) 144A | | | 859,598 | |
| | 418,047 | | | | | BX Commercial Mortgage Trust, Series 2018-BIOA, Class E, 2.35% (1 mo. USD LIBOR + 1.95%), due 03/15/37(b) 144A | | | 412,175 | |
| | 590,000 | | | | | BX Commercial Mortgage Trust, Series 2019-IMC, Class E, 2.55% (1 mo. USD LIBOR + 2.15%), due 04/15/34(b) 144A | | | 576,156 | |
| | 690,000 | | | | | BX Commercial Mortgage Trust, Series 2021-VOLT, Class G, 3.25% (1 mo. USD LIBOR + 2.85%), due 09/15/36(b) 144A | | | 665,350 | |
| | 497,742 | | | | | BX Commercial Mortgage Trust, Series 2021-XL2, Class J, 4.29% (1 mo. USD LIBOR + 3.89%), due 10/15/38(b) 144A | | | 480,108 | |
| | 950,000 | | | | | BX Trust, Series 2018-BILT, Class B, 1.42% (1 mo. USD LIBOR + 1.02%), due 05/15/30(b) 144A | | | 937,085 | |
| | 880,000 | | | | | BX Trust, Series 2021-SDM, Class F, 2.49% (1 mo. USD LIBOR + 1.94%), due 09/15/34(b) 144A | | | 847,104 | |
| | 830,000 | | | | | BX Trust, Series 2022-LBA6, Class D, 2.30% (1 mo. TSFR + 2.00%), due 01/15/39(b) 144A | | | 817,077 | |
| | 960,000 | | | | | BX Trust, Series 2022-LP2, Class G, 4.41% (1 mo. TSFR + 4.11%), due 02/15/39(b) 144A | | | 939,627 | |
| | 227,717 | | | | | CFCRE Commercial Mortgage Trust, Series 2011-C2, Class D, 5.12%, due 12/15/47(e) 144A | | | 227,194 | |
| | 425,000 | | | | | CFK Trust, Series 2020-MF2, Class F, 3.46%, due 03/15/39(e) 144A | | | 370,542 | |
| | 300,000 | | | | | CGDB Commercial Mortgage Trust, Series 2019-MOB, Class A, 1.35% (1 mo. USD LIBOR + 0.95%), due 11/15/36(b) 144A | | | 296,880 | |
| | 190,000 | | | | | CHT Mortgage Trust, Series 2017-CSMO, Class E, 3.40% (1 mo. USD LIBOR + 3.00%), due 11/15/36(b) 144A | | | 188,840 | |
| | 305,000 | | | | | Commercial Mortgage Trust, Series 2012-CR3, Class B, 3.92%, due 10/15/45 144A | | | 298,062 | |
| | 192,000 | | | | | Credit Suisse Commercial Mortgage, Series 2018-TOP, Class F, 3.15% (1 mo. USD LIBOR + 2.75%), due 08/15/35(b) 144A | | | 190,677 | |
| | 1,060,000 | | | | | Credit Suisse Mortgage Capital Certificates, Series 2019-ICE4, Class F, 3.05% (1 mo. USD LIBOR + 2.65%), due 05/15/36(b) 144A | | | 1,037,900 | |
See accompanying Notes to the Financial Statements.
142
Mercer Opportunistic Fixed Income Fund
Schedule of Investments (Continued)
(showing percentage of net assets)
March 31, 2022
| | | | | | | | | | |
| Par Value(a) | | | | | Description | | Value ($) | |
| | | |
| | | | | | Mortgage Backed Securities - Private Issuers — continued | | | |
| | 742,500 | | | | | Credit Suisse Mortgage Trust, Series 2019 RIO, Class B, 8.00% (1 mo. USD LIBOR + 7.00%), due 12/15/22(b) 144A | | | 724,593 | |
| | 300,000 | | | | | Credit Suisse Mortgage Trust, Series 2019-UVIL, Class A, 3.16%, due 12/15/41 144A | | | 290,933 | |
| | 1,050,000 | | | | | Credit Suisse Mortgage Trust, Series 2020-TMIC, Class A, 3.40% (1 mo. USD LIBOR + 3.00%), due 12/15/35(b) 144A | | | 1,047,088 | |
| | 450,000 | | | | | Credit Suisse Mortgage Trust LLC, Series 2014-USA, Class F, 4.37%, due 09/15/37 144A | | | 336,846 | |
| | 770,000 | | | | | ELP Commercial Mortgage Trust, Series 2021-ELP, Class D, 1.92% (1 mo. USD LIBOR + 1.52%), due 11/15/38(b) 144A | | | 754,696 | |
| | 487,003 | | | | | Extended Stay America Trust, Series 2021-ESH, Class F, 4.10% (1 mo. USD LIBOR + 3.70%), due 07/15/38(b) 144A | | | 477,805 | |
| | 790,000 | | | | | FHLMC Seasoned Credit Risk Transfer Trust CMO, Series 2019-3, Class M, 4.75%, due 10/25/58(e) 144A | | | 763,836 | |
| | 212,865 | | | | | FHLMC Seasoned Credit Risk Transfer Trust CMO, Series 2017-1, Class M1, 4.00%, due 01/25/56(e) 144A | | | 212,426 | |
| | 415,000 | | | | | FHLMC Seasoned Credit Risk Transfer Trust CMO, Series 2018-3, Class M, 4.75%, due 08/25/57(e) 144A | | | 399,369 | |
| | 280,000 | | | | | FHLMC Seasoned Credit Risk Transfer Trust CMO, Series 2019-1, Class M, 4.75%, due 07/25/58(e) 144A | | | 270,514 | |
| | 560,000 | | | | | FHLMC Seasoned Credit Risk Transfer Trust CMO, Series 2019-4, Class M, 4.50%, due 02/25/59(e) 144A | | | 535,703 | |
| | 370,000 | | | | | FHLMC Seasoned Credit Risk Transfer Trust CMO, Series 2020-1, Class M, 4.25%, due 08/25/59(e) 144A | | | 352,322 | |
| | 640,000 | | | | | FHLMC Seasoned Credit Risk Transfer Trust CMO, Series 2020-2, Class M, 4.25%, due 11/25/59(e) 144A | | | 609,168 | |
| | 590,000 | | | | | FHLMC Seasoned Credit Risk Transfer Trust CMO, Series 2020-3, Class M, 4.25%, due 05/25/60(e) 144A | | | 584,948 | |
| | 400,000 | | | | | FHLMC Structured Agency Credit Risk CMO, Series 2021-DNA6, Class M2, 1.60% (SOFR 30-day average + 1.50%), due 10/25/41(b) 144A | | | 380,894 | |
| | 1,580,000 | | | | | FHLMC Structured Agency Credit Risk CMO, Series 2020-DNA1, Class B1, 2.76% (1 mo. USD LIBOR + 2.30%), due 01/25/50(b) 144A | | | 1,512,331 | |
| | 1,390,630 | | | | | FHLMC Structured Agency Credit Risk CMO, Series 2020-DNA3, Class B1, 5.56% (1 mo. USD LIBOR + 5.10%), due 06/25/50(b) 144A | | | 1,441,645 | |
| | 900,000 | | | | | FHLMC Structured Agency Credit Risk CMO, Series 2020-DNA6, Class B1, 3.10% (SOFR 30-day average + 3.00%), due 12/25/50(b) 144A | | | 844,253 | |
| | 206,211 | | | | | FHLMC Structured Agency Credit Risk Debt Notes CMO, Series 2015-HQ1, Class B, 10.75% (1 mo. USD LIBOR + 10.75%), due 03/25/25(b) | | | 209,443 | |
| | 605,000 | | | | | FHLMC Structured Agency Credit Risk Debt Notes CMO, Series 2017-HRP1, Class B1, 5.06% (1 mo. USD LIBOR + 4.60%), due 12/25/42(b) | | | 606,779 | |
| | 211,088 | | | | | FHLMC Structured Agency Credit Risk Debt Notes CMO, Series 2017-SPI1, Class B, 4.04%, due 09/25/47(e) 144A | | | 196,127 | |
| | 180,346 | | | | | FHLMC Structured Agency Credit Risk REMIC Trust CMO, Series 2020-DNA2, Class M2, 2.31% (1 mo. USD LIBOR + 1.85%), due 02/25/50(b) 144A | | | 180,035 | |
| | 380,000 | | | | | FHLMC Structured Agency Credit Risk REMIC Trust CMO, Series 2021-DNA3, Class B1, 3.60% (SOFR 30-day average + 3.50%), due 10/25/33(b) 144A | | | 357,077 | |
| | 360,000 | | | | | FHLMC Structured Agency Credit Risk REMIC Trust CMO, Series 2021-DNA5, Class B1, 3.15% (SOFR 30-day average + 3.05%), due 01/25/34(b) 144A | | | 336,701 | |
| | 400,515 | | | | | FHLMC Structured Asset Mortgage Investments II Trust CMO, Series 2005-AR2, Class 2A2, 1.02% (1 mo. USD LIBOR + 0.56%), due 05/25/45(b) | | | 290,338 | |
See accompanying Notes to the Financial Statements.
143
Mercer Opportunistic Fixed Income Fund
Schedule of Investments (Continued)
(showing percentage of net assets)
March 31, 2022
| | | | | | | | | | |
| Par Value(a) | | | | | Description | | Value ($) | |
| | | |
| | | | | | Mortgage Backed Securities - Private Issuers — continued | | | |
| | 556,181 | | | | | FNMA Connecticut Avenue Securities CMO, Series 2014-C04, Class 1M2, 5.36% (1 mo. USD LIBOR + 4.90%), due 11/25/24(b) 144A | | | 573,167 | |
| | 234,983 | | | | | FNMA Connecticut Avenue Securities CMO, Series 2016-C06, Class 1M2, 4.71% (1 mo. USD LIBOR + 4.25%), due 04/25/29(b) 144A | | | 245,488 | |
| | 440,000 | | | | | FNMA Connecticut Avenue Securities CMO, Series 2017-C07, Class 1B1, 4.46% (1 mo. USD LIBOR + 4.00%), due 05/25/30(b) 144A | | | 448,815 | |
| | 930,462 | | | | | FNMA Connecticut Avenue Securities CMO, Series 2017-C07, Class 1M2, 2.86% (1 mo. USD LIBOR + 2.40%), due 05/25/30(b) 144A | | | 942,173 | |
| | 610,000 | | | | | FNMA Connecticut Avenue Securities CMO, Series 2018-C01, Class 1B1, 4.01% (1 mo. USD LIBOR + 3.55%), due 07/25/30(b) 144A | | | 605,484 | |
| | 620,402 | | | | | FNMA Connecticut Avenue Securities CMO, Series 2018-C01, Class 1M2, 2.71% (1 mo. USD LIBOR + 2.25%), due 07/25/30(b) 144A | | | 625,659 | |
| | 434,193 | | | | | FNMA Connecticut Avenue Securities CMO, Series 2018-C03, Class 1M2, 2.61% (1 mo. USD LIBOR + 2.15%), due 10/25/30(b) 144A | | | 436,237 | |
| | 1,210,000 | | | | | FNMA Connecticut Avenue Securities CMO, Series 2018-C05, Class 1B1, 4.71% (1 mo. USD LIBOR + 4.25%), due 01/25/31(b) 144A | | | 1,216,400 | |
| | 492,500 | | | | | FNMA Connecticut Avenue Securities CMO, Series 2018-C06, Class 1B1, 4.21% (1 mo. USD LIBOR + 3.75%), due 03/25/31(b) 144A | | | 487,244 | |
| | 501,527 | | | | | FNMA Connecticut Avenue Securities CMO, Series 2018-C06, Class 1M2, 2.46% (1 mo. USD LIBOR + 2.00%), due 03/25/31(b) 144A | | | 501,516 | |
| | 780,000 | | | | | FNMA Connecticut Avenue Securities Trust CMO, Series 2021-R01, Class 1B1, 3.20% (SOFR 30-day average + 3.10%), due 10/25/41(b) 144A | | | 720,172 | |
| | 610,000 | | | | | FNMA Connecticut Avenue Securities Trust CMO, Series 2018-R07, Class 1B1, 4.81% (1 mo. USD LIBOR + 4.35%), due 04/25/31(b) 144A | | | 617,575 | |
| | 4,935 | | | | | FNMA Connecticut Avenue Securities Trust CMO, Series 2019-R05, Class 1M2, 2.46% (1 mo. USD LIBOR + 2.00%), due 07/25/39(b) 144A | | | 4,935 | |
| | 680,000 | | | | | FNMA Connecticut Avenue Securities Trust CMO, Series 2019-R07, Class 1B1, 3.86% (1 mo. USD LIBOR + 3.40%), due 10/25/39(b) 144A | | | 658,844 | |
| | 217,868 | | | | | FNMA Connecticut Avenue Securities Trust CMO, Series 2020-R01, Class 1M2, 2.51% (1 mo. USD LIBOR + 2.05%), due 01/25/40(b) 144A | | | 217,783 | |
| | 800,000 | | | | | FNMA Connecticut Avenue Securities Trust CMO, Series 2021-R03, Class 1B1, 2.85% (SOFR 30-day average + 2.75%), due 12/25/41(b) 144A | | | 726,947 | |
| | 510,000 | | | | | GS Mortgage Securities Corp. Trust, Series 2018-LUAU, Class G, 4.85% (1 mo. USD LIBOR + 4.45%), due 11/15/32(b) 144A | | | 497,950 | |
| | 570,000 | | | | | GS Mortgage Securities Corp. Trust, Series 2020-DUNE, Class A, 1.50% (1 mo. USD LIBOR + 1.10%), due 12/15/36(b) 144A | | | 566,566 | |
| | 265,000 | | | | | GS Mortgage Securities Trust, Series 2011-GC5, Class D, 5.16%, due 08/10/44(e) 144A | | | 126,755 | |
| | 280,000 | | | | | GS Mortgage Securities Trust, Series 2014-GC22, Class D, 4.69%, due 06/10/47(e) 144A | | | 254,706 | |
| | 174,880 | | | | | HarborView Mortgage Loan Trust CMO, Series 2005-9, Class 2A1C, 1.35% (1 mo. USD LIBOR + 0.90%), due 06/20/35(b) | | | 171,084 | |
| | 1,390,000 | | | | | JPMorgan Chase Commercial Mortgage Securities Trust, Series 2018-PHMZ, Class M, 8.75% (1 mo. USD LIBOR + 8.36%), due 06/15/35(b) 144A | | | 27,835 | |
| | 1,210,000 | | | | | JPMorgan Chase Commercial Mortgage Securities Trust, Series 2018-WPT, Class FFL, 3.44% (1 mo. USD LIBOR + 3.15%), due 07/05/33(b) 144A | | | 1,195,128 | |
| | 530,000 | | | | | JPMorgan Chase Commercial Mortgage Securities Trust, Series 2019-BKWD, Class E, 3.00% (1 mo. USD LIBOR + 2.60%), due 09/15/29(b) 144A | | | 511,014 | |
See accompanying Notes to the Financial Statements.
144
Mercer Opportunistic Fixed Income Fund
Schedule of Investments (Continued)
(showing percentage of net assets)
March 31, 2022
| | | | | | | | | | |
| Par Value(a) | | | | | Description | | Value ($) | |
| | | |
| | | | | | Mortgage Backed Securities - Private Issuers — continued | | | |
| | 800,000 | | | | | JPMorgan Chase Commercial Mortgage Securities Trust, Series 2019-BKWD, Class F, 3.80% (1 mo. USD LIBOR + 3.40%), due 09/15/29(b) 144A | | | 774,726 | |
| | 800,000 | | | | | JPMorgan Chase Commercial Mortgage Securities Trust, Series 2020-MKST, Class F, 3.25% (1 mo. USD LIBOR + 2.85%), due 12/15/36(b) 144A | | | 723,709 | |
| | 760,000 | | | | | JPMorgan Chase Commercial Mortgage Securities Trust, Series 2020-NNN, Class GFX, 4.69%, due 01/16/37(e) 144A | | | 699,040 | |
| | 810,000 | | | | | JPMorgan Chase Commercial Mortgage Securities Trust, Series 2021-HTL5, Class F, 4.66% (1 mo. USD LIBOR + 4.27%), due 11/15/38(b) 144A | | | 783,072 | |
| | 630,000 | | | | | KIND Trust, Series 2021-KIND, Class D, 2.70% (1 mo. USD LIBOR + 2.30%), due 08/15/38(b) 144A | | | 616,734 | |
| | 195,958 | | | | | Legacy Mortgage Asset Trust CMO, Series 2020-GS5, Class A1, 3.25%, due 06/25/60(k) 144A | | | 194,443 | |
| | 535,000 | | | | | Med Trust, Series 2021-MDLN, Class C, 2.20% (1 mo. USD LIBOR + 1.80%), due 11/15/38(b) 144A | | | 525,646 | |
| | 580,000 | | | | | Med Trust, Series 2021-MDLN, Class E, 3.55% (1 mo. USD LIBOR + 3.15%), due 11/15/38(b) 144A | | | 567,517 | |
| | 590,000 | | | | | MHC Trust, Series 2021-MHC2, Class E, 2.35% (1 mo. USD LIBOR + 1.95%), due 05/15/23(b) 144A | | | 570,588 | |
| | 320,000 | | | | | Morgan Stanley Capital I Trust, Series 2018-MP, Class A, 4.28%, due 07/11/40(e) 144A | | | 327,370 | |
| | 546,651 | | | | | Motel Trust, Series 2021-MTL6, Class E, 3.10% (1 mo. USD LIBOR + 2.70%), due 09/15/38(b) 144A | | | 535,097 | |
| | 365,000 | | | | | MSBAM Commercial Mortgage Securities Trust, Series 2012-CKSV, Class A2, 3.28%, due 10/15/30 144A | | | 361,388 | |
| | 490,000 | | | | | Multifamily Connecticut Avenue Securities Trust, Series 2019-01, Class M10, 3.71% (1 mo. USD LIBOR + 3.25%), due 10/15/49(b) 144A | | | 465,149 | |
| | 460,000 | | | | | Multifamily Connecticut Avenue Securities Trust, Series 2020-01, Class M10, 4.21% (1 mo. USD LIBOR + 3.75%), due 03/25/50(b) 144A | | | 444,272 | |
| | 320,000 | | | | | Natixis Commercial Mortgage Securities Trust, Series 2019-MILE, Class A, 1.90% (1 mo. USD LIBOR + 1.50%), due 07/15/36(b) 144A | | | 318,668 | |
| | 426,357 | | | | | New Residential Mortgage Loan Trust CMO, Series 2017-5A, Class B4, 2.59%, due 06/25/57(e) 144A | | | 421,180 | |
| | 1,000,000 | | | | | OPG Trust, Series 2021-PORT, Class D, 1.53% (1 mo. USD LIBOR + 1.13%), due 10/15/36(b) 144A | | | 951,484 | |
| | 99,225 | | | | | PMT Credit Risk Transfer Trust CMO, Series 2019-3R, Class A, 3.15% (1 mo. USD LIBOR + 2.70%), due 10/27/22(b) 144A | | | 99,077 | |
| | 500,000 | | | | | Radnor RE, Ltd., Series 2020-1, Class M1C, 2.21% (1 mo. USD LIBOR + 1.75%), due 01/25/30(b) 144A | | | 477,692 | |
| | 230,000 | | | | | Starwood Retail Property Trust, Series 2014-STAR, Class C, 3.15% (1 mo. USD LIBOR + 2.75%), due 11/15/27(b) (d) | | | 111,271 | |
| | 900,000 | | | | | Starwood Retail Property Trust, Series 2014-STAR, Class D, 3.90% (1 mo. USD LIBOR + 3.50%), due 11/15/27(b) (d) | | | 241,629 | |
| | 766,336 | | | | | Tharaldson Hotel Portfolio Trust, Series 2018-THL, Class E, 3.77% (1 mo. USD LIBOR + 3.48%), due 11/11/34(b) 144A | | | 737,746 | |
| | 761,476 | | | | | Tharaldson Hotel Portfolio Trust, Series 2018-THL, Class F, 4.54% (1 mo. USD LIBOR + 4.25%), due 11/11/34(b) 144A | | | 737,518 | |
| | 590,000 | | | | | Towd Point Mortgage Trust CMO, Series 2019-4, Class B1B, 3.50%, due 10/25/59(e) 144A | | | 533,563 | |
See accompanying Notes to the Financial Statements.
145
Mercer Opportunistic Fixed Income Fund
Schedule of Investments (Continued)
(showing percentage of net assets)
March 31, 2022
| | | | | | | | | | |
| Par Value(a) | | | | | Description | | Value ($) | |
| | | |
| | | | | | Mortgage Backed Securities - Private Issuers — continued | | | |
| | 288,063 | | | | | WaMu Mortgage Pass-Through Certificates Trust CMO, Series 2005-AR1, Class A1B, 1.24% (1 mo. USD LIBOR + 0.78%), due 01/25/45(b) | | | 281,098 | |
| | 585,747 | | | | | WaMu Mortgage Pass-Through Certificates Trust CMO, Series 2005-AR6, Class 2A1A, 0.92% (1 mo. USD LIBOR + 0.46%), due 04/25/45(b) | | | 576,979 | |
| | 413,103 | | | | | WaMu Mortgage Pass-Through Certificates Trust CMO, Series 2006-AR16, Class 2A2, 2.39%, due 12/25/36(e) | | | 393,017 | |
| | 283,240 | | | | | Wells Fargo Mortgage Backed Securities Trust CMO, Series 2006-AR5, Class 2A1, 2.72%, due 04/25/36(e) | | | 279,226 | |
| | 460,000 | | | | | ZH Trust CMO, Series 2021-1, Class A, 2.25%, due 02/18/27 144A | | | 453,371 | |
| | | | | | | | | | |
| | | | | | | | | 52,781,494 | |
| | | | | | | | | | |
| | |
| | | | | | Mortgage Backed Securities - U.S. Government Agency Obligations — 0.1% | |
| | 60,000 | | | | | FNMA, Pool # BL5547, 2.68%, due 01/01/35 | | | 57,414 | |
| | 128,673 | | | | | FNMA, Pool # BM6224, 2.79%, due 01/01/35(e) | | | 124,913 | |
| | 280,690 | | | | | UMBS, Pool # BM5520, 3.50%, due 02/01/47 | | | 284,899 | |
| | | | | | | | | | |
| | | | | | | | | 467,226 | |
| | | | | | | | | | |
| | | |
| | | | �� | | Sovereign Debt Obligations — 24.9% | | | |
| | 1,070,000 | | | | | Abu Dhabi Government International Bond, 4.13%, due 10/11/47 144A | | | 1,157,248 | |
| | 900,000 | | | | | Angolan Government International Bond, 9.13%, due 11/26/49 144A | | | 878,715 | |
| | 5,505 | | | | | Argentine Republic Government International Bond, 1.00%, due 07/09/29 | | | 1,894 | |
| | 327,438 | | | | | Argentine Republic Government International Bond, 1.13%, due 07/09/46(k) | | | 103,130 | |
| | 5,930,000 | | | | | Argentine Republic Government International Bond, 2.50%, due 07/09/41(k) | | | 2,101,651 | |
| | 475,000,000 | CLP | | | | Bonos de la Tesoreria de la Republica en pesos, 2.30%, due 10/01/28(i) | | | 484,311 | |
| | 270,000,000 | CLP | | | | Bonos de la Tesoreria de la Republica en pesos, 2.80%, due 10/01/33(i) 144A | | | 256,216 | |
| | 1,185,000,000 | CLP | | | | Bonos de la Tesoreria de la Republica en pesos, 4.50%, due 03/01/26 | | | 1,404,947 | |
| | 685,000,000 | CLP | | | | Bonos de la Tesoreria de la Republica en pesos, 4.70%, due 09/01/30(i) | | | 790,382 | |
| | 1,365,000,000 | CLP | | | | Bonos de la Tesoreria de la Republica en pesos, 5.00%, due 10/01/28(i) 144A | | | 1,641,438 | |
| | 255,000,000 | CLP | | | | Bonos de la Tesoreria de la Republica en pesos, 5.00%, due 03/01/35 | | | 293,728 | |
| | 250,000,000 | CLP | | | | Bonos de la Tesoreria de la Republica en pesos, 6.00%, due 01/01/43 | | | 317,238 | |
| | 10,603,000 | BRL | | | | Brazil Letras do Tesouro Nacional, 0.00%, due 07/01/22(h) | | | 2,168,705 | |
| | 11,821,000 | BRL | | | | Brazil Letras do Tesouro Nacional, 0.00%, due 07/01/23(h) | | | 2,141,845 | |
| | 13,812,000 | BRL | | | | Brazil Letras do Tesouro Nacional, 0.00%, due 01/01/24(h) | | | 2,379,915 | |
| | 6,227,000 | BRL | | | | Brazil Letras do Tesouro Nacional, 0.00%, due 07/01/24(h) | | | 1,022,468 | |
| | 376,000 | BRL | | | | Brazil Notas do Tesouro Nacional Series B Notes, 6.00%, due 05/15/45 | | | 323,095 | |
| | 24,411,000 | BRL | | | | Brazil Notas do Tesouro Nacional Series F Notes, 10.00%, due 01/01/23 | | | 5,051,300 | |
| | 10,647,000 | BRL | | | | Brazil Notas do Tesouro Nacional Series F Notes, 10.00%, due 01/01/25 | | | 2,171,831 | |
| | 43,918,000 | BRL | | | | Brazil Notas do Tesouro Nacional Series F Notes, 10.00%, due 01/01/27 | | | 8,825,887 | |
| | 32,148,000 | BRL | | | | Brazil Notas do Tesouro Nacional Series F Notes, 10.00%, due 01/01/29 | | | 6,337,086 | |
| | 25,518,000 | BRL | | | | Brazil Notas do Tesouro Nacional Series F Notes, 10.00%, due 01/01/31 | | | 4,934,689 | |
| | 2,560,000 | | | | | Brazilian Government International Bond, 4.75%, due 01/14/50 | | | 2,151,654 | |
| | 90,000 | EUR | | | | Bundesrepublik Deutschland Bundesanleihe, 0.00%, due 08/15/26(i) | | | 98,900 | |
| | 8,350,000 | CNY | | | | China Government Bond, 1.99%, due 04/09/25 | | | 1,296,375 | |
| | 18,350,000 | CNY | | | | China Government Bond, 2.68%, due 05/21/30 | | | 2,848,819 | |
| | 5,270,000 | CNY | | | | China Government Bond, 3.02%, due 10/22/25 | | | 844,828 | |
| | 22,460,000 | CNY | | | | China Government Bond, 3.02%, due 05/27/31 | | | 3,583,062 | |
| | 9,130,000 | CNY | | | | China Government Bond, 3.13%, due 11/21/29 | | | 1,467,609 | |
| | 5,150,000 | CNY | | | | China Government Bond, 3.25%, due 11/22/28 | | | 834,324 | |
See accompanying Notes to the Financial Statements.
146
Mercer Opportunistic Fixed Income Fund
Schedule of Investments (Continued)
(showing percentage of net assets)
March 31, 2022
| | | | | | | | | | |
| Par Value(a) | | | | | Description | | Value ($) | |
| | | |
| | | | | | Sovereign Debt Obligations — continued | | | |
| | 5,550,000 | CNY | | | | China Government Bond, 3.27%, due 11/19/30 | | | 902,217 | |
| | 4,920,000 | CNY | | | | China Government Bond, 3.29%, due 05/23/29 | | | 799,323 | |
| | 1,240,000 | CNY | | | | China Government Bond, 3.72%, due 04/12/51 | | | 206,599 | |
| | 3,220,000 | CNY | | | | China Government Bond, 3.81%, due 09/14/50 | | | 542,965 | |
| | 470,000 | | | | | Ciudad Autonoma De Buenos Aires/Government Bonds, 7.50%, due 06/01/27(i) | | | 423,334 | |
| | 1,575,000 | | | | | Colombia Government International Bond, 4.13%, due 05/15/51(g) | | | 1,192,149 | |
| | 11,966,600,000 | COP | | | | Colombian TES, 5.75%, due 11/03/27 | | | 2,695,735 | |
| | 17,662,300,000 | COP | | | | Colombian TES, 6.00%, due 04/28/28 | | | 3,976,112 | |
| | 4,529,000,000 | COP | | | | Colombian TES, 6.25%, due 11/26/25 | | | 1,099,146 | |
| | 1,079,600,000 | COP | | | | Colombian TES, 6.25%, due 07/09/36 | | | 209,332 | |
| | 1,465,100,000 | COP | | | | Colombian TES, 7.00%, due 05/04/22 | | | 390,821 | |
| | 1,517,200,000 | COP | | | | Colombian TES, 7.00%, due 03/26/31 | | | 340,576 | |
| | 6,747,700,000 | COP | | | | Colombian TES, 7.00%, due 06/30/32 | | | 1,485,935 | |
| | 11,536,200,000 | COP | | | | Colombian TES, 7.25%, due 10/18/34 | | | 2,521,648 | |
| | 1,053,100,000 | COP | | | | Colombian TES, 7.25%, due 10/26/50 | | | 208,777 | |
| | 10,320,600,000 | COP | | | | Colombian TES, 7.50%, due 08/26/26 | | | 2,574,739 | |
| | 8,688,900,000 | COP | | | | Colombian TES, 7.75%, due 09/18/30 | | | 2,068,729 | |
| | 13,853,500,000 | COP | | | | Colombian TES, 10.00%, due 07/24/24 | | | 3,789,481 | |
| | 9,720,000 | CZK | | | | Czech Republic Government Bond, 0.25%, due 02/10/27 | | | 368,676 | |
| | 13,010,000 | CZK | | | | Czech Republic Government Bond, 0.95%, due 05/15/30(i) | | | 480,589 | |
| | 15,220,000 | CZK | | | | Czech Republic Government Bond, 1.00%, due 06/26/26(i) | | | 608,245 | |
| | 5,570,000 | CZK | | | | Czech Republic Government Bond, 1.20%, due 03/13/31 | | | 206,127 | |
| | 9,560,000 | CZK | | | | Czech Republic Government Bond, 1.25%, due 02/14/25 | | | 398,837 | |
| | 22,420,000 | CZK | | | | Czech Republic Government Bond, 2.00%, due 10/13/33 | | | 863,404 | |
| | 4,270,000 | CZK | | | | Czech Republic Government Bond, 2.40%, due 09/17/25(i) | | | 182,169 | |
| | 10,550,000 | CZK | | | | Czech Republic Government Bond, 2.75%, due 07/23/29 | | | 449,605 | |
| | 3,220,000 | CZK | | | | Czech Republic Government Bond, 4.20%, due 12/04/36(i) | | | 154,271 | |
| | 550,000 | | | | | Dominican Republic International Bond, 5.50%, due 02/22/29 144A | | | 544,500 | |
| | 2,620,000 | | | | | Dominican Republic International Bond, 6.00%, due 02/22/33(g) 144A | | | 2,566,971 | |
| | 3,090,000 | | | | | Ecuador Government International Bond, 1.00%, due 07/31/35(i) (k) | | | 2,028,616 | |
| | 2,756,000 | EGP | | | | Egypt Government Bond, 14.56%, due 07/06/26 | | | 143,871 | |
| | 12,910,000 | EGP | | | | Egypt Government Bond, 14.61%, due 09/08/25 | | | 688,063 | |
| | 9,054,000 | EGP | | | | Egypt Government Bond, 14.66%, due 10/06/30 | | | 481,965 | |
| | 8,428,000 | EGP | | | | Egypt Government Bond, 14.82%, due 07/06/31 | | | 447,535 | |
| | 24,580,000 | EGP | | | | Egypt Government Bond, 16.50%, due 04/02/26 | | | 1,367,036 | |
| | 325,000 | | | | | Egypt Government International Bond, 5.75%, due 05/29/24 144A | | | 323,698 | |
| | 1,050,000 | | | | | Egypt Government International Bond, 7.60%, due 03/01/29 144A | | | 1,000,398 | |
| | 81,498,000 | MXN | | | | European Investment Bank, (MTN), 5.50%, due 01/23/23 | | | 3,972,731 | |
| | 5,140,000 | ZAR | | | | European Investment Bank, (MTN), 8.50%, due 09/17/24(i) | | | 366,654 | |
| | 490,000 | | | | | Gabon Government International Bond, 7.00%, due 11/24/31 144A | | | 472,037 | |
| | 1,160,000 | | | | | Ghana Government International Bond, 7.63%, due 05/16/29 144A | | | 847,670 | |
| | 2,585,000 | | | | | Ghana Government International Bond, 7.75%, due 04/07/29 144A | | | 1,903,982 | |
| | 200,000 | | | | | Ghana Government International Bond, 8.13%, due 03/26/32 144A | | | 144,975 | |
| | 27,330,000 | HUF | | | | Hungary Government Bond, 3.00%, due 08/21/30 | | | 66,913 | |
| | 103,180,000 | HUF | | | | Hungary Government Bond, 2.50%, due 10/24/24 | | | 284,528 | |
| | 56,010,000 | HUF | | | | Hungary Government Bond, 2.75%, due 12/22/26 | | | 144,776 | |
| | 171,210,000 | HUF | | | | Hungary Government Bond, 3.00%, due 10/27/27 | | | 438,349 | |
| | 66,470,000 | HUF | | | | Hungary Government Bond, 3.25%, due 10/22/31 | | | 162,198 | |
| | 152,850,000 | HUF | | | | Hungary Government Bond, 4.00%, due 04/28/51 | | | 330,977 | |
See accompanying Notes to the Financial Statements.
147
Mercer Opportunistic Fixed Income Fund
Schedule of Investments (Continued)
(showing percentage of net assets)
March 31, 2022
| | | | | | | | | | |
| Par Value(a) | | | | | Description | | Value ($) | |
| | | |
| | | | | | Sovereign Debt Obligations — continued | | | |
| | 163,750,000 | HUF | | | | Hungary Government Bond, 5.50%, due 06/24/25 | | | 483,150 | |
| | 174,190,000 | HUF | | | | Hungary Government Bond, 6.75%, due 10/22/28 | | | 540,959 | |
| | 1,730,000 | | | | | Indonesia Government International Bond, 3.50%, due 01/11/28 | | | 1,777,118 | |
| | 1,800,000 | | | | | Indonesia Government International Bond, 3.55%, due 03/31/32 | | | 1,859,589 | |
| | 2,390,000 | | | | | Indonesia Government International Bond, (MTN), 5.25%, due 01/17/42(i) | | | 2,676,800 | |
| | 5,936,000,000 | IDR | | | | Indonesia Treasury Bond, 5.50%, due 04/15/26 | | | 414,881 | |
| | 7,852,000,000 | IDR | | | | Indonesia Treasury Bond, 6.13%, due 05/15/28 | | | 540,086 | |
| | 9,019,000,000 | IDR | | | | Indonesia Treasury Bond, 6.25%, due 06/15/36 | | | 608,337 | |
| | 27,751,000,000 | IDR | | | | Indonesia Treasury Bond, 6.50%, due 02/15/31 | | | 1,901,907 | |
| | 10,023,000,000 | IDR | | | | Indonesia Treasury Bond, 6.63%, due 05/15/33 | | | 682,255 | |
| | 29,001,000,000 | IDR | | | | Indonesia Treasury Bond, 7.00%, due 05/15/27 | | | 2,118,905 | |
| | 8,794,000,000 | IDR | | | | Indonesia Treasury Bond, 7.00%, due 09/15/30 | | | 623,867 | |
| | 8,193,000,000 | IDR | | | | Indonesia Treasury Bond, 7.38%, due 05/15/48 | | | 576,063 | |
| | 15,855,000,000 | IDR | | | | Indonesia Treasury Bond, 7.50%, due 08/15/32 | | | 1,149,950 | |
| | 72,006,000,000 | IDR | | | | Indonesia Treasury Bond, 7.50%, due 05/15/38 | | | 5,136,503 | |
| | 34,735,000,000 | IDR | | | | Indonesia Treasury Bond, 7.50%, due 04/15/40 | | | 2,467,957 | |
| | 19,048,000,000 | IDR | | | | Indonesia Treasury Bond, 8.25%, due 05/15/29 | | | 1,446,229 | |
| | 2,658,000,000 | IDR | | | | Indonesia Treasury Bond, 8.25%, due 06/15/32 | | | 203,345 | |
| | 17,059,000,000 | IDR | | | | Indonesia Treasury Bond, 8.25%, due 05/15/36 | | | 1,292,256 | |
| | 2,683,000,000 | IDR | | | | Indonesia Treasury Bond, 8.38%, due 03/15/24 | | | 200,861 | |
| | 14,937,000,000 | IDR | | | | Indonesia Treasury Bond, 8.38%, due 09/15/26 | | | 1,153,558 | |
| | 57,221,000,000 | IDR | | | | Indonesia Treasury Bond, 8.38%, due 03/15/34 | | | 4,374,374 | |
| | 50,810,000,000 | IDR | | | | Indonesia Treasury Bond, 8.38%, due 04/15/39 | | | 3,912,644 | |
| | 28,215,000,000 | IDR | | | | Indonesia Treasury Bond, 8.75%, due 05/15/31 | | | 2,226,790 | |
| | 8,328,000,000 | IDR | | | | Indonesia Treasury Bond, 9.00%, due 03/15/29 | | | 654,301 | |
| | 6,017,000,000 | IDR | | | | Indonesia Treasury Bond, 9.50%, due 07/15/31 | | | 493,966 | |
| | 5,494,000,000 | IDR | | | | Indonesia Treasury Bond, 10.50%, due 08/15/30 | | | 472,391 | |
| | 22,300,000,000 | IDR | | | | Inter-American Development Bank, (MTN), 7.88%, due 03/14/23 | | | 1,607,618 | |
| | 200,000 | | | | | Israel Government International Bond, 2.75%, due 07/03/30 | | | 198,310 | |
| | 170,000 | EUR | | | | Ivory Coast Government International Bond, 4.88%, due 01/30/32 144A | | | 167,105 | |
| | 466,431 | | | | | Ivory Coast Government International Bond, 5.75%, due 12/31/32(i) (k) | | | 459,113 | |
| | 740,000 | | | | | Ivory Coast Government International Bond, 6.13%, due 06/15/33(i) | | | 718,852 | |
| | 5,360,000 | | | | | Ivory Coast Government International Bond, 6.38%, due 03/03/28(i) | | | 5,487,782 | |
| | 1,010,000 | | | | | Kazakhstan Government International Bond, (MTN), 5.13%, due 07/21/25(i) | | | 1,050,738 | |
| | 7,896,000 | MYR | | | | Malaysia Government Bond, 2.63%, due 04/15/31 | | | 1,683,431 | |
| | 1,381,000 | MYR | | | | Malaysia Government Bond, 3.42%, due 08/15/22 | | | 330,431 | |
| | 3,415,000 | MYR | | | | Malaysia Government Bond, 3.48%, due 06/14/24 | | | 822,291 | |
| | 1,123,000 | MYR | | | | Malaysia Government Bond, 3.48%, due 03/15/23 | | | 270,434 | |
| | 5,682,000 | MYR | | | | Malaysia Government Bond, 3.50%, due 05/31/27 | | | 1,341,959 | |
| | 10,842,000 | MYR | | | | Malaysia Government Bond, 3.73%, due 06/15/28 | | | 2,571,053 | |
| | 1,022,000 | MYR | | | | Malaysia Government Bond, 3.76%, due 05/22/40 | | | 221,383 | |
| | 8,092,000 | MYR | | | | Malaysia Government Bond, 3.80%, due 08/17/23 | | | 1,964,569 | |
| | 2,196,000 | MYR | | | | Malaysia Government Bond, 3.83%, due 07/05/34 | | | 501,357 | |
| | 2,226,000 | MYR | | | | Malaysia Government Bond, 3.84%, due 04/15/33 | | | 514,717 | |
| | 6,160,000 | MYR | | | | Malaysia Government Bond, 3.88%, due 03/14/25 | | | 1,494,077 | |
| | 11,843,000 | MYR | | | | Malaysia Government Bond, 3.89%, due 08/15/29 | | | 2,803,087 | |
| | 661,000 | MYR | | | | Malaysia Government Bond, 3.89%, due 03/15/27 | | | 159,198 | |
| | 6,454,000 | MYR | | | | Malaysia Government Bond, 3.90%, due 11/16/27 | | | 1,561,160 | |
| | 2,911,000 | MYR | | | | Malaysia Government Bond, 3.90%, due 11/30/26 | | | 706,652 | |
See accompanying Notes to the Financial Statements.
148
Mercer Opportunistic Fixed Income Fund
Schedule of Investments (Continued)
(showing percentage of net assets)
March 31, 2022
| | | | | | | | | | |
| Par Value(a) | | | | | Description | | Value ($) | |
| | | |
| | | | | | Sovereign Debt Obligations — continued | | | |
| | 13,930,000 | MYR | | | | Malaysia Government Bond, 3.96%, due 09/15/25 | | | 3,390,598 | |
| | 1,275,000 | MYR | | | | Malaysia Government Bond, 4.06%, due 09/30/24 | | | 311,461 | |
| | 624,000 | MYR | | | | Malaysia Government Bond, 4.13%, due 04/15/32 | | | 148,424 | |
| | 953,000 | MYR | | | | Malaysia Government Bond, 4.18%, due 07/15/24 | | | 232,905 | |
| | 1,205,000 | MYR | | | | Malaysia Government Bond, 4.23%, due 06/30/31 | | | 290,908 | |
| | 6,905,000 | MYR | | | | Malaysia Government Bond, 4.39%, due 04/15/26 | | | 1,703,674 | |
| | 4,041,000 | MYR | | | | Malaysia Government Bond, 4.50%, due 04/15/30 | | | 997,655 | |
| | 1,597,000 | MYR | | | | Malaysia Government Bond, 4.74%, due 03/15/46 | | | 388,073 | |
| | 1,798,000 | MYR | | | | Malaysia Government Bond, 4.76%, due 04/07/37 | | | 450,024 | |
| | 647,000 | MYR | | | | Malaysia Government Bond, 4.89%, due 06/08/38 | | | 161,667 | |
| | 38,538,500 | MXN | | | | Mexican Bonos, 5.75%, due 03/05/26 | | | 1,759,110 | |
| | 19,558,300 | MXN | | | | Mexican Bonos, 6.50%, due 06/09/22 | | | 978,743 | |
| | 17,598,700 | MXN | | | | Mexican Bonos, 6.75%, due 03/09/23 | | | 871,013 | |
| | 125,262,700 | MXN | | | | Mexican Bonos, 7.50%, due 06/03/27 | | | 6,033,504 | |
| | 24,598,200 | MXN | | | | Mexican Bonos, 7.75%, due 05/29/31 | | | 1,189,378 | |
| | 6,274,100 | MXN | | | | Mexican Bonos, 7.75%, due 11/23/34 | | | 301,045 | |
| | 50,721,500 | MXN | | | | Mexican Bonos, 7.75%, due 11/13/42 | | | 2,372,684 | |
| | 22,141,200 | MXN | | | | Mexican Bonos, 8.00%, due 12/07/23 | | | 1,103,504 | |
| | 9,850,600 | MXN | | | | Mexican Bonos, 8.00%, due 09/05/24 | | | 489,191 | |
| | 39,703,600 | MXN | | | | Mexican Bonos, 8.00%, due 11/07/47 | | | 1,899,848 | |
| | 44,994,000 | MXN | | | | Mexican Bonos, 8.50%, due 05/31/29 | | | 2,342,434 | |
| | 53,918,500 | MXN | | | | Mexican Bonos, 8.50%, due 11/18/38 | | | 2,747,979 | |
| | 76,012,600 | MXN | | | | Mexican Bonos, 10.00%, due 12/05/24 | | | 3,949,922 | |
| | 14,989,000 | MXN | | | | Mexican Bonos, 10.00%, due 11/20/36 | | | 859,613 | |
| | 12,283,536 | MXN | | | | Mexican Udibonos, 4.50%, due 11/22/35 | | | 659,379 | |
| | 1,220,000 | | | | | Mexico Government International Bond, 2.66%, due 05/24/31(g) | | | 1,114,104 | |
| | 895,000 | | | | | Mexico Government International Bond, 3.50%, due 02/12/34 | | | 834,131 | |
| | 902,000 | | | | | Mexico Government International Bond, 3.60%, due 01/30/25 | | | 927,346 | |
| | 945,000 | | | | | Nigeria Government International Bond, 7.38%, due 09/28/33 144A | | | 861,368 | |
| | 2,635,000 | | | | | Nigeria Government International Bond, 8.38%, due 03/24/29(g) 144A | | | 2,666,304 | |
| | 845,000 | | | | | Oman Government International Bond, 5.63%, due 01/17/28(i) | | | 874,127 | |
| | 755,000 | | | | | Oman Sovereign Sukuk Co., 4.88%, due 06/15/30 144A | | | 789,106 | |
| | 1,330,000 | | | | | Panama Government International Bond, 4.50%, due 04/01/56 | | | 1,304,836 | |
| | 895,000 | | | | | Paraguay Government International Bond, 4.95%, due 04/28/31 144A | | | 938,640 | |
| | 1,710,000 | PEN | | | | Peru Government Bond, 6.15%, due 08/12/32 | | | 444,051 | |
| | 2,400,000 | PEN | | | | Peru Government Bond, 5.40%, due 08/12/34 | | | 567,003 | |
| | 1,654,000 | PEN | | | | Peru Government Bond, 5.94%, due 02/12/29 | | | 431,920 | |
| | 1,838,000 | PEN | | | | Peru Government Bond, 6.35%, due 08/12/28 | | | 493,807 | |
| | 2,098,000 | PEN | | | | Peru Government Bond, 6.95%, due 08/12/31 | | | 579,694 | |
| | 1,140,000 | | | | | Peruvian Government International Bond, 2.78%, due 01/23/31 | | | 1,076,160 | |
| | 4,428,000 | PEN | | | | Peruvian Government International Bond (GDN), 6.35%, due 08/12/28(i) | | | 1,189,651 | |
| | 2,977,000 | PEN | | | | Peruvian Government International Bond (GDN), 6.95%, due 08/12/31(i) | | | 815,197 | |
| | 2,849,000 | PEN | | | | Peruvian Government International Bond (GDN), 8.20%, due 08/12/26(i) | | | 828,499 | |
| | 1,980,031 | | | | | Provincia de Buenos Aires/Government Bonds, 3.90%, due 09/01/37(k) 144A | | | 856,363 | |
| | 421,629 | | | | | Provincia de Cordoba, 5.00%, due 12/10/25 144A(k) (l) | | | 330,684 | |
| | 1,000,000 | | | | | Qatar Government International Bond, 4.82%, due 03/14/49 144A | | | 1,188,214 | |
| | 1,250,000 | | | | | Qatar Government International Bond, 5.10%, due 04/23/48 144A | | | 1,531,974 | |
| | 700,000 | GHS | | | | Republic of Ghana Government Bonds, 20.75%, due 03/06/23 | | | 96,001 | |
| | 265,000 | | | | | Republic of Kenya Government International Bond, 8.00%, due 05/22/32(i) | | | 257,732 | |
See accompanying Notes to the Financial Statements.
149
Mercer Opportunistic Fixed Income Fund
Schedule of Investments (Continued)
(showing percentage of net assets)
March 31, 2022
| | | | | | | | | | |
| Par Value(a) | | | | | Description | | Value ($) | |
| | | |
| | | | | | Sovereign Debt Obligations — continued | | | |
| | 2,100,000 | PLN | | | | Republic of Poland Government Bond, 0.25%, due 10/25/26 | | | 399,137 | |
| | 9,714,000 | PLN | | | | Republic of Poland Government Bond, 1.25%, due 10/25/30 | | | 1,726,014 | |
| | 10,168,000 | PLN | | | | Republic of Poland Government Bond, 2.25%, due 04/25/22 | | | 2,437,636 | |
| | 1,119,000 | PLN | | | | Republic of Poland Government Bond, 2.50%, due 07/25/26 | | | 237,293 | |
| | 4,509,000 | PLN | | | | Republic of Poland Government Bond, 2.75%, due 04/25/28 | | | 936,965 | |
| | 8,406,000 | PLN | | | | Republic of Poland Government Bond, 2.75%, due 10/25/29 | | | 1,720,635 | |
| | 986,000 | PLN | | | | Republic of Poland Government Bond, 5.75%, due 09/23/22 | | | 237,896 | |
| | 45,206,040 | ZAR | | | | Republic of South Africa Government Bond, 6.25%, due 03/31/36 | | | 2,178,862 | |
| | 22,848,293 | ZAR | | | | Republic of South Africa Government Bond, 6.50%, due 02/28/41 | | | 1,047,855 | |
| | 48,474,164 | ZAR | | | | Republic of South Africa Government Bond, 7.00%, due 02/28/31 | | | 2,767,962 | |
| | 29,731,955 | ZAR | | | | Republic of South Africa Government Bond, 8.00%, due 01/31/30 | | | 1,859,099 | |
| | 84,801,395 | ZAR | | | | Republic of South Africa Government Bond, 8.25%, due 03/31/32 | | | 5,184,129 | |
| | 44,022,682 | ZAR | | | | Republic of South Africa Government Bond, 8.50%, due 01/31/37 | | | 2,571,166 | |
| | 66,856,058 | ZAR | | | | Republic of South Africa Government Bond, 8.75%, due 01/31/44 | | | 3,857,406 | |
| | 110,044,107 | ZAR | | | | Republic of South Africa Government Bond, 8.75%, due 02/28/48 | | | 6,334,549 | |
| | 36,593,136 | ZAR | | | | Republic of South Africa Government Bond, 8.88%, due 02/28/35 | | | 2,251,182 | |
| | 7,422,320 | ZAR | | | | Republic of South Africa Government Bond, 9.00%, due 01/31/40 | | | 444,196 | |
| | 32,402,486 | ZAR | | | | Republic of South Africa Government Bond, 10.50%, due 12/21/26 | | | 2,418,794 | |
| | 1,345,000 | RON | | | | Romania Government Bond, 3.25%, due 04/29/24 | | | 289,480 | |
| | 860,000 | RON | | | | Romania Government Bond, 4.00%, due 10/25/23 | | | 190,579 | |
| | 1,195,000 | RON | | | | Romania Government Bond, 4.25%, due 06/28/23 | | | 266,892 | |
| | 312,000 | EUR | | | | Romanian Government International Bond, 2.75%, due 02/26/26 144A | | | 353,780 | |
| | 134,000 | EUR | | | | Romanian Government International Bond, 3.62%, due 05/26/30 144A | | | 146,094 | |
| | 42,983,000 | RUB | | | | Russian Federal Bond - OFZ, 5.70%, due 05/17/28(n) (o) (p) | | | 78,293 | |
| | 52,609,000 | RUB | | | | Russian Federal Bond - OFZ, 6.10%, due 07/18/35(n) (o) (p) | | | 95,827 | |
| | 173,153,000 | RUB | | | | Russian Federal Bond - OFZ, 6.90%, due 05/23/29(n) (o) (p) | | | 315,397 | |
| | 99,840,000 | RUB | | | | Russian Federal Bond - OFZ, 6.90%, due 07/23/31(n) (o) (p) | | | 181,858 | |
| | 40,222,000 | RUB | | | | Russian Federal Bond - OFZ, 7.00%, due 08/16/23(n) (o) (p) | | | 73,264 | |
| | 574,040,000 | RUB | | | | Russian Federal Bond - OFZ, 7.05%, due 01/19/28(n) (o) (p) | | | 1,045,610 | |
| | 209,212,000 | RUB | | | | Russian Federal Bond - OFZ, 7.10%, due 10/16/24(n) (o) (p) | | | 381,078 | |
| | 125,568,000 | RUB | | | | Russian Federal Bond - OFZ, 7.25%, due 05/10/34(n) (o) (p) | | | 228,721 | |
| | 56,819,000 | RUB | | | | Russian Federal Bond - OFZ, 7.40%, due 12/07/22(n) (o) (p) | | | 103,495 | |
| | 47,168,000 | RUB | | | | Russian Federal Bond - OFZ, 7.65%, due 04/10/30(n) (o) (p) | | | 85,916 | |
| | 85,421,000 | RUB | | | | Russian Federal Bond - OFZ, 7.70%, due 03/23/33(n) (o) (p) | | | 155,594 | |
| | 46,842,000 | RUB | | | | Russian Federal Bond - OFZ, 7.70%, due 03/16/39(n) (o) (p) | | | 85,322 | |
| | 135,970,000 | RUB | | | | Russian Federal Bond - OFZ, 7.75%, due 09/16/26(n) (o) (p) | | | 247,668 | |
| | 47,137,000 | RUB | | | | Russian Federal Bond - OFZ, 7.95%, due 10/07/26(n) (o) (p) | | | 85,860 | |
| | 197,608,000 | RUB | | | | Russian Federal Bond - OFZ, 8.15%, due 02/03/27(n) (o) (p) | | | 359,942 | |
| | 83,475,000 | RUB | | | | Russian Federal Bond - OFZ, 8.50%, due 09/17/31(n) (o) (p) | | | 152,049 | |
| | 635,000 | | | | | Saudi Government International Bond, 4.63%, due 10/04/47 144A | | | 683,148 | |
| | 572,000 | EUR | | | | Serbia International Bond, 1.00%, due 09/23/28 144A | | | 538,282 | |
| | 330,000 | | | | | State of Israel, 3.38%, due 01/15/50 | | | 313,500 | |
| | 34,376,000 | THB | | | | Thailand Government Bond, 2.13%, due 12/17/26 | | | 1,057,225 | |
| | 3,718,000 | THB | | | | Thailand Government Bond, 3.63%, due 06/16/23 | | | 115,833 | |
| | 2,484,670 | TRY | | | | Turkey Government Bond, 11.70%, due 11/13/30 | | | 94,778 | |
| | 7,884,000 | UYU | | | | Uruguay Government International Bond, 8.50%, due 03/15/28(i) | | | 188,505 | |
| | | | | | | | | | |
| | | | | | | | | 275,560,047 | |
| | | | | | | | | | |
See accompanying Notes to the Financial Statements.
150
Mercer Opportunistic Fixed Income Fund
Schedule of Investments (Continued)
(showing percentage of net assets)
March 31, 2022
| | | | | | | | | | |
| Par Value(a) | | | | | Description | | Value ($) | |
| | | |
| | | | | | U.S. Government and Agency Obligations — 3.8% | | | |
| | 8,125,000 | | | | | U.S. Treasury Bond, 2.25%, due 02/15/52 | | | 7,794,922 | |
| | 9,000,000 | | | | | U.S. Treasury Note, 0.13%, due 12/31/22 | | | 8,913,144 | |
| | 500,000 | | | | | U.S. Treasury Note, 0.38%, due 10/31/23 | | | 486,152 | |
| | 4,050,000 | | | | | U.S. Treasury Note, 0.50%, due 11/30/23 | | | 3,937,122 | |
| | 5,500,000 | | | | | U.S. Treasury Note, 0.75%, due 12/31/23 | | | 5,358,418 | |
| | 12,260,000 | | | | | U.S. Treasury Note, 1.50%, due 02/29/24(g) | | | 12,082,326 | |
| | 3,780,000 | | | | | U.S. Treasury Note, 1.50%, due 11/30/28 | | | 3,561,099 | |
| | | | | | | | | | |
| | | | | | | | | 42,133,183 | |
| | | | | | | | | | |
| | | |
| | | | | | TOTAL DEBT OBLIGATIONS (COST $1,087,158,133) | | | 1,026,355,075 | |
| | | | | | | | | | |
| | | |
| Shares | | | | | Description | | Value ($) | |
| | | |
| | | | | | COMMON STOCKS — 0.1% | | | | |
| | |
| | | | | | Energy — 0.0% | |
| | 10 | | | | | Amplify Energy Corp.* | | | 55 | |
| | | | | | | | | | |
| | | |
| | | | | | Industrial — 0.0% | | | |
| | 1,282 | | | | | Arctic Canadian Diamond Co., Ltd.* (o) | | | — | |
| | | | | | | | | | |
| | | |
| | | | | | Utilities — 0.1% | | | |
| | 8,511 | | | | | Birch Permian Holdings, Inc.* | | | 161,709 | |
| | 66,347 | | | | | Birch Permian Holdings, Inc.* | | | 1,260,593 | |
| | | | | | | | | | |
| | | | | | | | | 1,422,302 | |
| | | | | | | | | | |
| | | |
| | | | | | TOTAL COMMON STOCKS (COST $738,066) | | | 1,422,357 | |
| | | | | | | | | | |
| | | |
| | | | | | CONVERTIBLE PREFERRED STOCKS — 0.7% | | | |
| | | |
| | | | | | Basic Materials — 0.0% | | | |
| | 979 | | | | | ArcelorMittal SA, 5.50%(g) | | | 73,259 | |
| | | | | | | | | | |
| | | |
| | | | | | Consumer, Non-cyclical — 0.0% | | | |
| | 53 | | | | | Danaher Corp., 5.00%(g) | | | 83,700 | |
| | 979 | | | | | Elanco Animal Health, Inc., 5.00% | | | 39,884 | |
| | | | | | | | | | |
| | | | | | | | | 123,584 | |
| | | | | | | | | | |
| | | |
| | | | | | Energy — 0.6% | | | |
| | 103,220 | | | | | MPLX, LP, 8.46%(j) (k) (p) | | | 3,816,856 | |
| | 2,430 | | | | | Targa Resources Corp., 9.50%(j) | | | 2,623,255 | |
| | | | | | | | | | |
| | | | | | | | | 6,440,111 | |
| | | | | | | | | | |
| | | |
| | | | | | Financial — 0.1% | | | |
| | 65 | | | | | Bank of America Corp., 7.25%(j) | | | 85,312 | |
| | 955 | | | | | KKR & Co., Inc., 6.00%(g) | | | 70,966 | |
| | 56 | | | | | Wells Fargo & Co.Class A, 7.50%(j) | | | 74,200 | |
| | | | | | | | | | |
| | | | | | | | | 230,478 | |
| | | | | | | | | | |
See accompanying Notes to the Financial Statements.
151
Mercer Opportunistic Fixed Income Fund
Schedule of Investments (Continued)
(showing percentage of net assets)
March 31, 2022
| | | | | | | | | | |
| | | |
| Shares | | | | | Description | | Value ($) | |
| | | |
| | | | | | Technology — 0.0% | | | |
| | 45 | | | | | Broadcom, Inc., 8.00% | | | 88,342 | |
| | | | | | | | | | |
| | |
| | | | | | Utilities — 0.0% | |
| | 1,590 | | | | | American Electric Power Co., Inc., 6.13%(g) | | | 88,833 | |
| | 755 | | | | | NiSource, Inc., 7.75% | | | 89,830 | |
| | | | | | | | | | |
| | | | | | | | | 178,663 | |
| | | | | | | | | | |
| | | |
| | | | | | TOTAL CONVERTIBLE PREFERRED STOCK
(COST $6,591,076) | | | 7,134,437 | |
| | | | | | | | | | |
| | | |
| | | | | | PREFERRED STOCKS — 0.0% | | | | |
| | |
| | | | | | Financial — 0.0% | |
| | 8,000 | | | | | B Riley Financial, Inc., 5.50% | | | 200,000 | |
| | 7,150 | | | | | B Riley Financial, Inc., 5.25% | | | 171,457 | |
| | | | | | | | | | |
| | | | | | | | | 371,457 | |
| | | | | | | | | | |
| | | |
| | | | | | TOTAL PREFERRED STOCKS (COST $378,750) | | | 371,457 | |
| | | | | | | | | | |
| | | |
| Notional Value | | | | | Description | | Value ($) | |
| | | |
| | | | | | PURCHASED OPTIONS — 0.1% | | | | |
| | |
| | | | | | PURCHASED CURRENCY OPTIONS — 0.0% | |
| | |
| | | | | | Call Options — 0.0% | |
| | 10,600,000 | EUR | | | | EUR/USD Option with HSBC Bank Plc, Strike Price $1.14, Expires 04/07/22 | | | 684 | |
| | 9,440,000 | USD | | | | USD/EUR Option with Goldman Sachs & Co., Strike Price EUR 1.12, Expires 04/01/22 | | | 99,356 | |
| | |
| | | | | | Put Options — 0.0% | |
| | 2,690,000 | | | | | USD/JPY Option with Goldman Sachs & Co., Strike Price JPY 120.65, Expires 04/05/22 | | | 7,190 | |
| | 13,700,000 | | | | | USD/JPY Option with HSBC Bank Plc, Strike Price JPY 119.00, Expires 04/26/22 | | | 45,196 | |
| | 2,709,671 | | | | | USD/JPY Option with Morgan Stanley & Co., Strike Price JPY 113.00, Expires 09/21/22 | | | 15,841 | |
| | 2,709,671 | | | | | USD/JPY Option with Morgan Stanley & Co., Strike Price JPY 116.00, Expires 06/23/22 | | | 11,820 | |
| | | | | | | | | | |
| | | |
| | | | | | TOTAL PURCHASED CURRENCY OPTIONS
(PREMIUMS PAID $279,805) | | | 180,087 | |
| | | | | | | | | | |
See accompanying Notes to the Financial Statements.
152
Mercer Opportunistic Fixed Income Fund
Schedule of Investments (Continued)
(showing percentage of net assets)
March 31, 2022
| | | | | | | | | | |
Number of
Contracts | | | Notional
Value ($) | | Description | | Value ($) | |
| | | | | | | | | | |
| | | |
| | | | | | PURCHASED FUTURES OPTIONS — 0.0% | | | | |
| | |
| | | | | | Put Options — 0.0% | |
| | 1,200 | | | 5,436,900 | | S&P 500 E-mini Futures with JPMorgan Securities LLC,
Strike Price $4,000.00, Expires 04/14/22 | | | 3,840 | |
| | 4,550 | | | 20,614,913 | | S&P 500 E-mini Futures with JPMorgan Securities LLC,
Strike Price $4,000.00, Expires 05/20/22 | | | 114,887 | |
| | 1,250 | | | 5,663,438 | | S&P 500 E-mini Futures with JPMorgan Securities LLC,
Strike Price $4,300.00, Expires 05/20/22 | | | 62,865 | |
| | 1,850 | | | 8,381,888 | | S&P 500 E-mini Futures with JPMorgan Securities LLC,
Strike Price $4,200.00, Expires 05/20/22 | | | 86,488 | |
| | 7,750 | | | 35,113,313 | | S&P 500 E-mini Futures with JPMorgan Securities LLC,
Strike Price $3,800.00, Expires 04/14/22 | | | 16,275 | |
| | | | | | | | | | |
| | | |
| | | | | | TOTAL PURCHASED FUTURES OPTIONS
(PREMIUMS PAID $904,829) | | | 284,355 | |
| | | | | | | | | | |
| | | |
| Notional Value | | | | | Description | | Value ($) | |
| | | |
| | | | | | PURCHASED SWAPTION — 0.1% | | | | |
| | |
| | | | | | Put Swaption — 0.1% | |
| | 36,650,000 | | | | | Interest Rate Swaption pay annually a fixed rate of 2.13% and receive semi-annually a floating rate of 6-Month EUR LIBOR with Morgan Stanley & Co., Strike Price 2.13, Expires 08/17/22 | | | 1,449,160 | |
| | | | | | | | | | |
| | | |
| | | | | | TOTAL PURCHASED SWAPTION (PREMIUMS PAID $838,372) | | | 1,449,160 | |
| | | | | | | | | | |
| | | |
| | | | | | TOTAL PURCHASED OPTIONS
(PREMIUMS PAID $2,023,006) | | | 1,913,602 | |
| | | | | | | | | | |
| | | |
| Par Value(a) | | | | | Description | | Value ($) | |
| | | |
| | | | | | SHORT-TERM INVESTMENTS — 4.6% | | | | |
| | |
| | | | | | Mutual Fund - Securities Lending Collateral — 4.3% | |
| | 46,932,355 | | | | | State Street Institutional U.S. Government Money Market Fund, Premier Class, 0.25%(q) (r) | | | 46,932,355 | |
| | | | | | | | | | |
| | |
| | | | | | Sovereign Debt Obligation — 0.3% | |
| | 67,550,000 | EGP | | | | Egypt Treasury Bills, 0.00%, due 01/03/23(h) | | | 3,369,655 | |
| | | | | | | | | | |
| | | |
| | | | | | TOTAL SHORT-TERM INVESTMENTS (COST $50,850,032) | | | 50,302,010 | |
| | | | | | | | | | |
| | | |
| | | | | | TOTAL INVESTMENTS — 98.3% (Cost $1,147,739,063) | | | 1,087,498,938 | |
| | | |
| | | | | | Other Assets and Liabilities (net)(s) — 1.7% | | | 18,836,307 | |
| | | | | | | | | | |
| | | |
| | | | | | NET ASSETS — 100.0% | | $1,106,335,245 | |
| | | | | | | | | | |
See accompanying Notes to the Financial Statements.
153
Mercer Opportunistic Fixed Income Fund
Schedule of Investments (Continued)
March 31, 2022
| | | | | | | | | | |
| | | | | | Notes to Schedule of Investments: | | | | |
| | | |
| | | | * | | Non-income producing security. | | | | |
| | | |
| | | | (a) | | Unless otherwise indicated, all par values are denominated in United States dollars ($). | | | | |
| | | |
| | | | (b) | | Variable or floating rate note. Rate shown is as of March 31, 2022. | | | | |
| | | |
| | | | (c) | | When-issued security. | | | | |
| | | |
| | | | (d) | | Restricted securities are not registered under the Securities Act of 1933 and are subject to legal restrictions on resale. These securities generally may be resold in transactions exempt from registration or to the public if the securities are subsequently registered. Disposal of these securities may involve time-consuming negotiations and prompt sale at an acceptable price may be difficult. As of year end, the market value of restricted securities was $2,958,044, which is 0.3% of net assets. See details shown in the Restricted Securities table that follows. | | | | |
| | | |
| | | | (e) | | Variable or floating rate security, which interest rate adjusts periodically based on changes in current interest rates and prepayments on the underlying pool of assets. Rate shown is the rate in effect as of period end. | | | | |
| | | |
| | | | (f) | | This position represents an unsettled loan commitment at period end. Certain details associated with this purchase are not known prior to the settlement date, including coupon rate, which will be adjusted on settlement date. | | | | |
| | | |
| | | | (g) | | All or a portion of this security is out on loan. | | | | |
| | | |
| | | | (h) | | Interest rate presented is yield to maturity. | | | | |
| | | |
| | | | (i) | | Security exempt from registration under Regulation S of the Securities Act of 1933, which exempts from registration securities offered and sold outside the United States. Security may not be offered or sold in the United States except pursuant to an exemption from, or in a transaction not subject to, the registration requirements of the Securities Act of 1933. | | | | |
| | | |
| | | | (j) | | Security is perpetual and has no stated maturity date. | | | | |
| | | |
| | | | (k) | | Step coupon security that pays an initial coupon rate for the first period and then a lower/higher coupon rate for the following periods. Rate shown is current coupon rate. | | | | |
| | | |
| | | | (l) | | Security is currently in default. | | | | |
| | | |
| | | | (m) | | Year of maturity is greater than 2100. | | | | |
| | | |
| | | | (n) | | Illiquid securities represent Russian securities impacted by the Russian/Ukraine crisis. The total market value of the securities at year end is $3,675,894 which represents 0.33% of net assets. The aggregate cost of these securities held at March 31, 2022 was $28,840,149. | | | | |
| | | |
| | | | (o) | | Level 3 - significant unobservable inputs were used in determining the value of this security in the Fund. | | | | |
| | | |
| | | | (p) | | Securities fair valued by the Valuation Committee as approved by the Board of Trustees. The total market value of the securities at year end is $8,681,867 which represents 0.8% of net assets. The aggregate cost of these securities held at March 31, 2022 was $33,453,657. | | | | |
| | | |
| | | | (q) | | Represents an investment of securities lending cash collateral. | | | | |
| | | |
| | | | (r) | | The rate disclosed is the 7-day net yield as of March 31, 2022. | | | | |
| | | |
| | | | (s) | | As of March 31, 2022, the value of unfunded loan commitments was $145,875 for the Fund. See Notes to the Financial Statements. | | | | |
| | | |
| | | | 144A | | Securities exempt from registration under Rule 144A of the Securities Act of 1933. These securities may be resold in transactions exempt from registration, normally to qualified institutional buyers. The total market value of the securities at year end is $354,822,128 which represents 32.1% of net assets. | | | | |
See accompanying Notes to the Financial Statements.
154
Mercer Opportunistic Fixed Income Fund
Schedule of Investments (Continued)
March 31, 2022
At March 31, 2022, the Fund held the following restricted securities:
| | | | | | | | | | | | | | | | | | | | |
Restricted Securities | | Acquisition
Date | | Principal
Amount | | Cost | | Value |
Gazprom PJSC Via Gaz Capital SA, 4.95%, due 03/23/27 | | | | 02/24/20 | | | | USD | 590,000 | | | | $ | 622,138 | | | | $ | 256,650 | |
K2016470219 South Africa, Ltd., 3.00% (3.00% Cash or PIK), due 12/31/22 | | | | 08/23/13 | | | | USD | 631,495 | | | | | 683,993 | | | | | 1,803 | |
K2016470260 South Africa, Ltd., 25.00% (25.00% Cash or PIK), due 12/31/22 | | | | 01/30/16 | | | | USD | 223,090 | | | | | 240,733 | | | | | 580 | |
Magnetite CLO XXIV, Ltd., Series 2019-24A, Class BR, 1.97% (3 mo. TSFR + 1.75%), due 04/15/35 | | | | 02/04/22 | | | | USD | 1,435,000 | | | | | 1,435,000 | | | | | 1,428,759 | |
Northwest Acquisitions ULC/Dominion Finco, Inc., 7.13%, due 11/01/22 | | | | 01/25/19 | | | | USD | 400,000 | | | | | 367,985 | | | | | 24 | |
Societe Generale SA, 3.63%, due 03/01/41 | | | | 02/22/21 | | | | USD | 1,095,000 | | | | | 1,094,399 | | | | | 917,328 | |
Starwood Retail Property Trust, Series 2014-STAR, Class C, 3.15% (1 mo. USD LIBOR + 2.75%), due 11/15/27 | | | | 07/25/18 | | | | USD | 230,000 | | | | | 226,550 | | | | | 111,271 | |
Starwood Retail Property Trust, Series 2014-STAR, Class D, 3.90% (1 mo. USD LIBOR + 3.50%), due 11/15/27 | | | | 12/21/18 | | | | USD | 900,000 | | | | | 732,750 | | | | | 241,629 | |
| | | | | | | | | | | | | | | | | | | | |
| | | | | | | | | | | | | | | | | | $ | 2,958,044 | |
| | | | | | | | | | | | | | | | | | | | |
Forward Foreign Currency Contracts
| | | | | | | | | | | | | | | | | | | | |
Currency Purchased | | | Currency Sold | | | Settlement
Date | | | Counterparty | | Unrealized
Appreciation
(Depreciation) | |
| AUD | | | 4,640,000 | | | USD | | | 3,379,883 | | | | 04/19/22 | | | BNP Paribas S.A. | | $ | 105,127 | |
| AUD | | | 12,236,151 | | | USD | | | 8,682,760 | | | | 04/19/22 | | | JPMorgan Chase Bank N.A. | | | 507,567 | |
| AUD | | | 931,700 | | | USD | | | 697,978 | | | | 04/28/22 | | | State Street Bank London | | | 1,880 | |
| BRL | | | 2,780,000 | | | USD | | | 578,624 | | | | 04/19/22 | | | Citibank N.A. | | | 3,888 | |
| BRL | | | 1,805,700 | | | USD | | | 362,210 | | | | 04/28/22 | | | Citibank N.A. | | | 15,236 | |
| BRL | | | 1,470,000 | | | USD | | | 302,914 | | | | 04/28/22 | | | HSBC Bank Plc | | | 4,361 | |
| BRL | | | 9,738,300 | | | USD | | | 1,942,272 | | | | 05/23/22 | | | JPMorgan Chase Bank N.A. | | | 78,569 | |
| BRL | | | 16,593,000 | | | USD | | | 3,213,829 | | | | 04/18/22 | | | Morgan Stanley Capital Services, Inc. | | | 263,953 | |
| BRL | | | 3,770,000 | | | USD | | | 739,433 | | | | 04/19/22 | | | Morgan Stanley Capital Services, Inc. | | | 50,521 | |
| CAD | | | 1,259,024 | | | USD | | | 989,161 | | | | 04/19/22 | | | Citibank N.A. | | | 18,749 | |
| CAD | | | 1,360,000 | | | USD | | | 1,071,216 | | | | 04/19/22 | | | Goldman Sachs & Co. | | | 17,530 | |
| CAD | | | 405,000 | | | USD | | | 322,125 | | | | 04/28/22 | | | HSBC Bank Plc | | | 2,080 | |
| CAD | | | 15,174,237 | | | USD | | | 11,923,845 | | | | 04/19/22 | | | Morgan Stanley Capital Services, Inc. | | | 223,868 | |
| CHF | | | 300,000 | | | USD | | | 321,747 | | | | 04/28/22 | | | JPMorgan Chase Bank N.A. | | | 4,515 | |
| CHF | | | 299,200 | | | USD | | | 320,313 | | | | 04/28/22 | | | Morgan Stanley and Co. International Plc | | | 5,079 | |
| CLP | | | 430,217,400 | | | USD | | | 538,782 | | | | 04/28/22 | | | Citibank N.A. | | | 5,571 | |
| CLP | | | 256,676,900 | | | USD | | | 324,961 | | | | 04/28/22 | | | Goldman Sachs International | | | (188 | ) |
| CLP | | | 185,197,700 | | | USD | | | 231,943 | | | | 04/28/22 | | | HSBC Bank Plc | | | 2,387 | |
| CLP | | | 43,335,800 | | | USD | | | 55,262 | | | | 04/20/22 | | | JPMorgan Chase Bank N.A. | | | (347 | ) |
| CNH | | | 79,057,800 | | | USD | | | 12,443,972 | | | | 06/06/22 | | | JPMorgan Chase Bank N.A. | | | (35,839 | ) |
| CNH | | | 7,070,020 | | | USD | | | 1,107,891 | | | | 04/28/22 | | | Morgan Stanley and Co. International Plc | | | 4,238 | |
| CNY | | | 5,963,300 | | | USD | | | 932,415 | | | | 04/28/22 | | | State Street Bank London | | | 6,402 | |
| COP | | | 1,615,660,000 | | | USD | | | 427,151 | | | | 04/28/22 | | | Citibank N.A. | | | 1,809 | |
| COP | | | 4,110,900,682 | | | USD | | | 1,080,694 | | | | 04/28/22 | | | JPMorgan Chase Bank N.A. | | | 10,758 | |
| COP | | | 97,942,818 | | | USD | | | 25,755 | | | | 04/28/22 | | | Morgan Stanley and Co. International Plc | | | 249 | |
See accompanying Notes to the Financial Statements.
155
Mercer Opportunistic Fixed Income Fund
Schedule of Investments (Continued)
March 31, 2022
Forward Foreign Currency Contracts — continued
| | | | | | | | | | | | | | | | | | | | |
Currency Purchased | | | Currency Sold | | | Settlement
Date | | | Counterparty | | Unrealized
Appreciation
(Depreciation) | |
| CZK | | | 49,356,112 | | | USD | | | 2,200,551 | | | | 04/28/22 | | | HSBC Bank Plc | | $ | 41,315 | |
| CZK | | | 4,560,000 | | | USD | | | 205,209 | | | | 04/28/22 | | | State Street Bank London | | | 1,917 | |
| EUR | | | 730,000 | | | USD | | | 826,292 | | | | 04/19/22 | | | BNP Paribas S.A. | | | (13,705 | ) |
| EUR | | | 1,940,000 | | | USD | | | 2,195,443 | | | | 04/19/22 | | | Citibank N.A. | | | (35,964 | ) |
| EUR | | | 1,699,200 | | | USD | | | 1,923,494 | | | | 04/05/22 | | | Goldman Sachs & Co. | | | (32,827 | ) |
| EUR | | | 680,100 | | | USD | | | 748,034 | | | | 04/28/22 | | | HSBC Bank Plc | | | 9,214 | |
| EUR | | | 1,267,600 | | | USD | | | 1,398,116 | | | | 04/28/22 | | | Morgan Stanley and Co. International Plc | | | 13,277 | |
| EUR | | | 1,330,000 | | | USD | | | 1,514,483 | | | | 04/19/22 | | | Morgan Stanley Capital Services, Inc. | | | (34,016 | ) |
| EUR | | | 722,000 | | | USD | | | 800,235 | | | | 04/07/22 | | | Standard Chartered Bank | | | 3,164 | |
| EUR | | | 330,000 | | | USD | | | 363,989 | | | | 04/28/22 | | | The BNY Mellon | | | 3,445 | |
| GBP | | | 542,400 | | | USD | | | 716,410 | | | | 04/28/22 | | | Morgan Stanley and Co. International Plc | | | (2,369 | ) |
| HUF | | | 180,430,000 | | | USD | | | 526,502 | | | | 04/28/22 | | | Barclays Bank Plc | | | 18,329 | |
| HUF | | | 243,324,293 | | | USD | | | 714,577 | | | | 04/28/22 | | | Goldman Sachs International | | | 20,171 | |
| HUF | | | 277,656,400 | | | USD | | | 797,932 | | | | 04/19/22 | | | JPMorgan Chase Bank N.A. | | | 41,559 | |
| HUF | | | 154,310,700 | | | USD | | | 454,889 | | | | 04/28/22 | | | JPMorgan Chase Bank N.A. | | | 11,072 | |
| HUF | | | 1,636,592,200 | | | USD | | | 4,956,931 | | | | 05/16/22 | | | JPMorgan Chase Bank N.A. | | | (27,320 | ) |
| IDR | | | 8,231,363,300 | | | USD | | | 572,988 | | | | 04/28/22 | | | Barclays Bank Plc | | | 214 | |
| IDR | | | 20,105,924,800 | | | USD | | | 1,399,646 | | | | 04/28/22 | | | HSBC Bank Plc | | | 456 | |
| IDR | | | 15,531,826,000 | | | USD | | | 1,086,360 | | | | 04/13/22 | | | JPMorgan Chase Bank N.A. | | | (5,337 | ) |
| IDR | | | 8,100,706,200 | | | USD | | | 565,021 | | | | 04/28/22 | | | JPMorgan Chase Bank N.A. | | | (918 | ) |
| IDR | | | 5,662,720,000 | | | USD | | | 394,450 | | | | 04/28/22 | | | Morgan Stanley and Co. International Plc | | | (119 | ) |
| INR | | | 21,032,800 | | | USD | | | 274,572 | | | | 04/28/22 | | | Bank of America, N.A. | | | 1,989 | |
| INR | | | 40,946,600 | | | USD | | | 533,124 | | | | 04/28/22 | | | JPMorgan Chase Bank N.A. | | | 5,285 | |
| INR | | | 20,240,000 | | | USD | | | 263,823 | | | | 04/28/22 | | | Morgan Stanley and Co. International Plc | | | 2,314 | |
| JPY | | | 262,220,000 | | | USD | | | 2,270,903 | | | | 04/19/22 | | | Bank of America, N.A. | | | (109,925 | ) |
| JPY | | | 496,320,000 | | | USD | | | 4,305,627 | | | | 04/19/22 | | | Citibank N.A. | | | (215,412 | ) |
| JPY | | | 298,625,485 | | | USD | | | 2,507,177 | | | | 04/28/22 | | | Morgan Stanley and Co. International Plc | | | (45,763 | ) |
| JPY | | | 280,101,000 | | | USD | | | 2,388,982 | | | | 04/19/22 | | | Morgan Stanley Capital Services, Inc. | | | (80,646 | ) |
| KRW | | | 8,714,312,500 | | | USD | | | 7,272,411 | | | | 05/23/22 | | | JPMorgan Chase Bank N.A. | | | (87,824 | ) |
| KZT | | | 100,381,000 | | | USD | | | 225,575 | | | | 04/29/22 | | | JPMorgan Chase Bank N.A. | | | (15,562 | ) |
| MXN | | | 172,735,882 | | | USD | | | 8,229,086 | | | | 04/19/22 | | | Citibank N.A. | | | 410,385 | |
| MXN | | | 6,175,000 | | | USD | | | 307,272 | | | | 04/28/22 | | | Goldman Sachs International | | | 1,086 | |
| MXN | | | 24,745,600 | | | USD | | | 1,173,333 | | | | 05/17/22 | | | JPMorgan Chase Bank N.A. | | | 58,222 | |
| MXN | | | 38,563,700 | | | USD | | | 1,866,290 | | | | 06/14/22 | | | JPMorgan Chase Bank N.A. | | | 43,374 | |
| MXN | | | 51,741,760 | | | USD | | | 2,469,695 | | | | 04/19/22 | | | Morgan Stanley Capital Services, Inc. | | | 118,195 | |
| MXN | | | 69,001,000 | | | USD | | | 3,309,591 | | | | 04/18/22 | | | UBS AG | | | 142,135 | |
| MYR | | | 7,700,760 | | | USD | | | 1,824,464 | | | | 04/28/22 | | | Morgan Stanley and Co. International Plc | | | 2,468 | |
| NOK | | | 94,554,285 | | | USD | | | 10,739,545 | | | | 04/19/22 | | | BNP Paribas S.A. | | | 72,004 | |
| NOK | | | 4,327,785 | | | USD | | | 495,000 | | | | 04/19/22 | | | Goldman Sachs & Co. | | | (151 | ) |
| NZD | | | 1,965,232 | | | USD | | | 1,317,787 | | | | 04/19/22 | | | Goldman Sachs & Co. | | | 48,849 | |
| NZD | | | 500,000 | | | USD | | | 347,461 | | | | 04/28/22 | | | JPMorgan Chase Bank N.A. | | | 189 | |
| NZD | | | 462,900 | | | USD | | | 321,706 | | | | 04/28/22 | | | Morgan Stanley and Co. International Plc | | | 149 | |
| NZD | | | 3,152,709 | | | USD | | | 2,148,130 | | | | 04/19/22 | | | Morgan Stanley Capital Services, Inc. | | | 44,284 | |
| PEN | | | 2,079,700 | | | USD | | | 548,444 | | | | 04/28/22 | | | Bank of America, N.A. | | | 10,175 | |
| PEN | | | 44,100 | | | USD | | | 11,823 | | | | 04/19/22 | | | JPMorgan Chase Bank N.A. | | | 32 | |
| PEN | | | 1,300,000 | | | USD | | | 345,377 | | | | 04/28/22 | | | JPMorgan Chase Bank N.A. | | | 3,810 | |
| PHP | | | 7,487,800 | | | USD | | | 142,421 | | | | 04/28/22 | | | Bank of America, N.A. | | | 1,895 | |
See accompanying Notes to the Financial Statements.
156
Mercer Opportunistic Fixed Income Fund
Schedule of Investments (Continued)
March 31, 2022
Forward Foreign Currency Contracts — continued
| | | | | | | | | | | | | | | | | | | | |
Currency Purchased | | | Currency Sold | | | Settlement
Date | | | Counterparty | | Unrealized
Appreciation
(Depreciation) | |
| PHP | | | 18,580,000 | | | USD | | | 354,154 | | | | 04/28/22 | | | Barclays Bank Plc | | $ | 3,949 | |
| PHP | | | 27,872,000 | | | USD | | | 532,366 | | | | 04/11/22 | | | JPMorgan Chase Bank N.A. | | | 6,099 | |
| PHP | | | 56,219,200 | | | USD | | | 1,073,295 | | | | 04/13/22 | | | JPMorgan Chase Bank N.A. | | | 12,688 | |
| PHP | | | 28,309,500 | | | USD | | | 538,511 | | | | 04/18/22 | | | JPMorgan Chase Bank N.A. | | | 8,184 | |
| PHP | | | 64,253,800 | | | USD | | | 1,222,717 | | | | 04/21/22 | | | JPMorgan Chase Bank N.A. | | | 17,895 | |
| PHP | | | 70,258,200 | | | USD | | | 1,334,946 | | | | 04/28/22 | | | Morgan Stanley and Co. International Plc | | | 19,182 | |
| PLN | | | 1,504,400 | | | USD | | | 349,562 | | | | 04/28/22 | | | Goldman Sachs International | | | 10,621 | |
| PLN | | | 1,070,000 | | | USD | | | 255,015 | | | | 04/28/22 | | | HSBC Bank Plc | | | 1,164 | |
| PLN | | | 2,592,900 | | | USD | | | 609,030 | | | | 04/28/22 | | | JPMorgan Chase Bank N.A. | | | 11,762 | |
| PLN | | | 38,653,450 | | | USD | | | 9,414,276 | | | | 05/16/22 | | | JPMorgan Chase Bank N.A. | | | (176,576 | ) |
| PLN | | | 7,280,165 | | | USD | | | 1,709,685 | | | | 04/28/22 | | | Morgan Stanley and Co. International Plc | | | 33,331 | |
| PLN | | | 2,839,700 | | | USD | | | 660,415 | | | | 04/28/22 | | | State Street Bank London | | | 19,466 | |
| RON | | | 839,900 | | | USD | | | 185,731 | | | | 04/28/22 | | | Barclays Bank Plc | | | 2,772 | |
| RON | | | 15,612,600 | | | USD | | | 3,586,795 | | | | 05/16/22 | | | JPMorgan Chase Bank N.A. | | | (91,346 | ) |
| RUB | | | 44,819,243 | | | USD | | | 568,808 | | | | 04/19/22 | | | Bank of America, N.A. | | | (33,506 | ) |
| RUB | | | 550,728,880 | | | USD | | | 7,083,824 | | | | 04/19/22 | | | Goldman Sachs & Co. | | | (506,149 | ) |
| RUB | | | 76,709,000 | | | USD | | | 829,370 | | | | 04/01/22 | | | JPMorgan Chase Bank N.A. | | | 102,130 | |
| RUB | | | 94,012,688 | | | USD | | | 1,205,600 | | | | 04/15/22 | | | JPMorgan Chase Bank N.A. | | | (76,878 | ) |
| RUB | | | 200,490,000 | | | USD | | | 2,555,386 | | | | 04/19/22 | | | Morgan Stanley Capital Services, Inc. | | | (160,817 | ) |
| THB | | | 6,790,800 | | | USD | | | 202,894 | | | | 04/28/22 | | | HSBC Bank Plc | | | 1,358 | |
| THB | | | 32,700,300 | | | USD | | | 981,844 | | | | 06/21/22 | | | JPMorgan Chase Bank N.A. | | | 2,750 | |
| THB | | | 373,984,550 | | | USD | | | 11,148,742 | | | | 04/28/22 | | | Morgan Stanley and Co. International Plc | | | 99,847 | |
| TRY | | | 17,825,190 | | | USD | | | 1,199,632 | | | | 04/13/22 | | | JPMorgan Chase Bank N.A. | | | 6,634 | |
| UAH | | | 12,933,200 | | | USD | | | 436,196 | | | | 04/19/22 | | | Goldman Sachs International | | | (9,567 | ) |
| UAH | | | 27,905,330 | | | USD | | | 919,451 | | | | 05/31/22 | | | Goldman Sachs International | | | (58,501 | ) |
| UAH | | | 6,500,000 | | | USD | | | 224,680 | | | | 05/17/22 | | | HSBC Bank Plc | | | (20,632 | ) |
| UAH | | | 3,913,000 | | | USD | | | 128,717 | | | | 04/26/22 | | | Morgan Stanley and Co. International Plc | | | (1,640 | ) |
| UAH | | | 12,182,600 | | | USD | | | 390,718 | | | | 07/01/22 | | | Morgan Stanley and Co. International Plc | | | (29,680 | ) |
| ZAR | | | 4,860,000 | | | USD | | | 328,520 | | | | 04/28/22 | | | JPMorgan Chase Bank N.A. | | | 3,056 | |
| ZAR | | | 22,796,300 | | | USD | | | 1,471,674 | | | | 05/23/22 | | | JPMorgan Chase Bank N.A. | | | 78,753 | |
| ZAR | | | 13,128,000 | | | USD | | | 879,222 | | | | 06/13/22 | | | JPMorgan Chase Bank N.A. | | | 11,315 | |
| ZAR | | | 8,653,400 | | | USD | | | 591,647 | | | | 04/28/22 | | | Morgan Stanley and Co. International Plc | | | (1,264 | ) |
| ZAR | | | 52,135,000 | | | USD | | | 3,458,650 | | | | 04/19/22 | | | UBS AG | | | 102,401 | |
| ZAR | | | 3,470,000 | | | USD | | | 237,055 | | | | 04/28/22 | | | UBS AG | | | (312 | ) |
| USD | | | 1,577,384 | | | AUD | | | 2,140,000 | | | | 04/19/22 | | | BNP Paribas S.A. | | | (29,926 | ) |
| USD | | | 3,295,982 | | | AUD | | | 4,510,000 | | | | 04/19/22 | | | Goldman Sachs & Co. | | | (91,388 | ) |
| USD | | | 6,766,906 | | | AUD | | | 9,340,000 | | | | 04/19/22 | | | JPMorgan Chase Bank N.A. | | | (248,180 | ) |
| USD | | | 329,121 | | | AUD | | | 438,300 | | | | 04/28/22 | | | JPMorgan Chase Bank N.A. | | | (113 | ) |
| USD | | | 1,615,911 | | | AUD | | | 2,189,610 | | | | 04/28/22 | | | Morgan Stanley and Co. International Plc | | | (28,841 | ) |
| USD | | | 1,417,245 | | | BRL | | | 7,894,242 | | | | 04/19/22 | | | Citibank N.A. | | | (236,890 | ) |
| USD | | | 6,082,816 | | | BRL | | | 30,550,336 | | | | 04/28/22 | | | Goldman Sachs International | | | (303,135 | ) |
| USD | | | 259,100 | | | BRL | | | 1,246,800 | | | | 04/28/22 | | | HSBC Bank Plc | | | (1,519 | ) |
| USD | | | 3,823,983 | | | BRL | | | 20,441,100 | | | | 05/23/22 | | | JPMorgan Chase Bank N.A. | | | (417,848 | ) |
| USD | | | 880,478 | | | BRL | | | 4,389,800 | | | | 04/28/22 | | | Morgan Stanley and Co. International Plc | | | (37,124 | ) |
| USD | | | 3,241,453 | | | BRL | | | 16,593,000 | | | | 04/18/22 | | | Morgan Stanley Capital Services, Inc. | | | (236,329 | ) |
See accompanying Notes to the Financial Statements.
157
Mercer Opportunistic Fixed Income Fund
Schedule of Investments (Continued)
March 31, 2022
Forward Foreign Currency Contracts — continued
| | | | | | | | | | | | | | | | | | | | |
Currency Purchased | | | Currency Sold | | | Settlement
Date | | | Counterparty | | Unrealized
Appreciation
(Depreciation) | |
| USD | | | 3,350,673 | | | BRL | | | 16,683,000 | | | | 04/25/22 | | | Morgan Stanley Capital Services, Inc. | | $ | (139,395 | ) |
| USD | | | 2,854,114 | | | CAD | | | 3,588,489 | | | | 04/19/22 | | | Citibank N.A. | | | (18,645 | ) |
| USD | | | 320,462 | | | CAD | | | 401,000 | | | | 04/28/22 | | | JPMorgan Chase Bank N.A. | | | (541 | ) |
| USD | | | 7,208,437 | | | CAD | | | 9,070,000 | | | | 04/19/22 | | | Morgan Stanley Capital Services, Inc. | | | (52,538 | ) |
| USD | | | 1,606,697 | | | CAD | | | 2,025,800 | | | | 04/28/22 | | | State Street Bank London | | | (14,968 | ) |
| USD | | | 1,891,201 | | | CHF | | | 1,756,400 | | | | 04/28/22 | | | Morgan Stanley and Co. International Plc | | | (18,956 | ) |
| USD | | | 255,365 | | | CLP | | | 205,900,616 | | | | 04/28/22 | | | Bank of America, N.A. | | | (5,161 | ) |
| USD | | | 2,279,176 | | | CLP | | | 1,824,209,500 | | | | 04/18/22 | | | JPMorgan Chase Bank N.A. | | | (33,318 | ) |
| USD | | | 74,302 | | | CLP | | | 59,251,900 | | | | 04/20/22 | | | JPMorgan Chase Bank N.A. | | | (782 | ) |
| USD | | | 838,187 | | | CNH | | | 5,358,000 | | | | 04/19/22 | | | JPMorgan Chase Bank N.A. | | | (5,146 | ) |
| USD | | | 1,913,291 | | | CNH | | | 12,204,000 | | | | 06/06/22 | | | JPMorgan Chase Bank N.A. | | | (2,129 | ) |
| USD | | | 4,634,962 | | | CNH | | | 29,610,100 | | | | 06/14/22 | | | JPMorgan Chase Bank N.A. | | | (10,518 | ) |
| USD | | | 322,494 | | | CNY | | | 2,070,000 | | | | 04/19/22 | | | Citibank N.A. | | | (3,593 | ) |
| USD | | | 138,618 | | | CNY | | | 890,000 | | | | 04/19/22 | | | JPMorgan Chase Bank N.A. | | | (1,583 | ) |
| USD | | | 3,495,179 | | | COP | | | 13,228,512,900 | | | | 04/13/22 | | | JPMorgan Chase Bank N.A. | | | (24,640 | ) |
| USD | | | 5,298,524 | | | COP | | | 20,268,178,970 | | | | 04/28/22 | | | Morgan Stanley and Co. International Plc | | | (82,711 | ) |
| USD | | | 2,730,550 | | | EUR | | | 2,500,000 | | | | 04/11/22 | | | Bank of America, N.A. | | | (51,611 | ) |
| USD | | | 1,428,864 | | | EUR | | | 1,295,000 | | | | 04/22/22 | | | Bank of America, N.A. | | | (12,774 | ) |
| USD | | | 293,278 | | | EUR | | | 266,000 | | | | 04/29/22 | | | Bank of America, N.A. | | | (2,905 | ) |
| USD | | | 9,425,362 | | | EUR | | | 8,444,000 | | | | 05/02/22 | | | Bank of America, N.A. | | | 22,369 | |
| USD | | | 1,765,442 | | | EUR | | | 1,595,000 | | | | 04/14/22 | | | Barclays Bank Plc | | | (9,738 | ) |
| USD | | | 342,387 | | | EUR | | | 310,000 | | | | 04/22/22 | | | Barclays Bank Plc | | | (2,715 | ) |
| USD | | | 293,984 | | | EUR | | | 266,000 | | | | 04/25/22 | | | Barclays Bank Plc | | | (2,163 | ) |
| USD | | | 1,521,558 | | | EUR | | | 1,366,000 | | | | 04/29/22 | | | Barclays Bank Plc | | | 558 | |
| USD | | | 1,915,294 | | | EUR | | | 1,730,000 | | | | 04/19/22 | | | BNP Paribas S.A. | | | (10,426 | ) |
| USD | | | 2,434,652 | | | EUR | | | 2,207,000 | | | | 04/22/22 | | | BNP Paribas S.A. | | | (22,256 | ) |
| USD | | | 1,327,585 | | | EUR | | | 1,201,000 | | | | 04/25/22 | | | BNP Paribas S.A. | | | (9,530 | ) |
| USD | | | 8,538,548 | | | EUR | | | 7,558,341 | | | | 04/19/22 | | | Citibank N.A. | | | 125,107 | |
| USD | | | 595,313 | | | EUR | | | 540,000 | | | | 04/29/22 | | | Citibank N.A. | | | (5,961 | ) |
| USD | | | 1,184,166 | | | EUR | | | 1,063,000 | | | | 05/02/22 | | | Citibank N.A. | | | 440 | |
| USD | | | 1,278,460 | | | EUR | | | 1,170,000 | | | | 04/11/22 | | | Commonwealth Bank of Australia | | | (23,591 | ) |
| USD | | | 890,070 | | | EUR | | | 799,000 | | | | 04/29/22 | | | Commonwealth Bank of Australia | | | 408 | |
| USD | | | 2,455,911 | | | EUR | | | 2,221,000 | | | | 04/14/22 | | | Deutsche Bank AG | | | (15,985 | ) |
| USD | | | 199,418 | | | EUR | | | 179,000 | | | | 04/29/22 | | | Goldman Sachs & Co. | | | 107 | |
| USD | | | 1,135,024 | | | EUR | | | 1,025,000 | | | | 04/14/22 | | | HSBC Bank USA, N.A. | | | (5,766 | ) |
| USD | | | 1,485,554 | | | EUR | | | 1,350,000 | | | | 04/19/22 | | | HSBC Bank USA, N.A. | | | (17,177 | ) |
| USD | | | 1,293,972 | | | EUR | | | 1,169,000 | | | | 04/14/22 | | | Morgan Stanley Capital Services, Inc. | | | (7,084 | ) |
| USD | | | 2,652,292 | | | EUR | | | 2,405,000 | | | | 04/19/22 | | | Morgan Stanley Capital Services, Inc. | | | (24,794 | ) |
| USD | | | 1,047,593 | | | EUR | | | 950,000 | | | | 04/22/22 | | | Morgan Stanley Capital Services, Inc. | | | (9,980 | ) |
| USD | | | 90,435 | | | EUR | | | 82,000 | | | | 04/29/22 | | | Morgan Stanley Capital Services, Inc. | | | (869 | ) |
| USD | | | 126,741 | | | EUR | | | 114,000 | | | | 05/02/22 | | | Morgan Stanley Capital Services, Inc. | | | (206 | ) |
| USD | | | 799,498 | | | EUR | | | 722,000 | | | | 04/07/22 | | | Standard Chartered Bank | | | (3,902 | ) |
| USD | | | 2,242,353 | | | EUR | | | 2,025,000 | | | | 04/14/22 | | | Standard Chartered Bank | | | (11,401 | ) |
| USD | | | 1,002,131 | | | EUR | | | 900,000 | | | | 05/02/22 | | | Standard Chartered Bank | | | (83 | ) |
| USD | | | 815,174 | | | EUR | | | 732,000 | | | | 04/29/22 | | | State Street Bank and Trust | | | 114 | |
| USD | | | 2,169,572 | | | EUR | | | 1,963,504 | | | | 04/28/22 | | | The BNY Mellon | | | (16,665 | ) |
| USD | | | 1,971,092 | | | EUR | | | 1,784,000 | | | | 04/14/22 | | | UBS AG | | | (14,438 | ) |
See accompanying Notes to the Financial Statements.
158
Mercer Opportunistic Fixed Income Fund
Schedule of Investments (Continued)
March 31, 2022
Forward Foreign Currency Contracts — continued
| | | | | | | | | | | | | | | | | | | | |
Currency Purchased | | | Currency Sold | | | Settlement
Date | | | Counterparty | | Unrealized
Appreciation
(Depreciation) | |
| USD | | | 2,096,424 | | | GBP | | | 1,545,341 | | | | 04/19/22 | | | Goldman Sachs & Co. | | $ | 61,965 | |
| USD | | | 621,388 | | | GBP | | | 470,900 | | | | 04/28/22 | | | HSBC Bank Plc | | | 1,473 | |
| USD | | | 1,343,510 | | | GBP | | | 1,019,200 | | | | 04/28/22 | | | Morgan Stanley and Co. International Plc | | | 1,787 | |
| USD | | | 590,692 | | | GBP | | | 430,000 | | | | 04/19/22 | | | Morgan Stanley Capital Services, Inc. | | | 24,592 | |
| USD | | | 775,017 | | | GBP | | | 591,000 | | | | 04/22/22 | | | Standard Chartered Bank | | | (3,028 | ) |
| USD | | | 5,274,350 | | | IDR | | | 76,514,472,712 | | | | 04/19/22 | | | Citibank N.A. | | | (49,824 | ) |
| USD | | | 3,218,704 | | | IDR | | | 46,201,272,498 | | | | 04/28/22 | | | Deutsche Bank AG | | | 1,418 | |
| USD | | | 975,017 | | | IDR | | | 14,070,474,500 | | | | 04/13/22 | | | JPMorgan Chase Bank N.A. | | | (4,296 | ) |
| USD | | | 6,533,156 | | | IDR | | | 93,600,531,241 | | | | 04/20/22 | | | JPMorgan Chase Bank N.A. | | | 20,327 | |
| USD | | | 1,269,443 | | | IDR | | | 18,233,062,800 | | | | 04/25/22 | | | JPMorgan Chase Bank N.A. | | | 1,020 | |
| USD | | | 215,810 | | | IDR | | | 3,100,763,900 | | | | 04/28/22 | | | Morgan Stanley and Co. International Plc | | | (115 | ) |
| USD | | | 293,558 | | | INR | | | 22,475,700 | | | | 04/28/22 | | | Deutsche Bank AG | | | (1,976 | ) |
| USD | | | 1,317,196 | | | INR | | | 100,923,530 | | | | 04/28/22 | | | HSBC Bank Plc | | | (9,854 | ) |
| USD | | | 375,905 | | | INR | | | 28,814,900 | | | | 04/28/22 | | | JPMorgan Chase Bank N.A. | | | (2,984 | ) |
| USD | | | 7,115,943 | | | JPY | | | 817,871,479 | | | | 04/19/22 | | | Morgan Stanley Capital Services, Inc. | | | 375,795 | |
| USD | | | 390,199 | | | JPY | | | 46,980,000 | | | | 06/27/22 | | | Morgan Stanley Capital Services, Inc. | | | 2,238 | |
| USD | | | 314,324 | | | JPY | | | 37,679,000 | | | | 09/26/22 | | | Morgan Stanley Capital Services, Inc. | | | 1,721 | |
| USD | | | 5,492,944 | | | MXN | | | 113,706,844 | | | | 04/19/22 | | | Citibank N.A. | | | (194,160 | ) |
| USD | | | 1,035,201 | | | MXN | | | 21,081,700 | | | | 04/28/22 | | | Citibank N.A. | | | (17,546 | ) |
| USD | | | 1,188,975 | | | MXN | | | 25,080,000 | | | | 05/17/22 | | | Citibank N.A. | | | (59,223 | ) |
| USD | | | 2,182,370 | | | MXN | | | 44,360,000 | | | | 04/19/22 | | | Goldman Sachs & Co. | | | (36,318 | ) |
| USD | | | 3,361,916 | | | MXN | | | 68,642,000 | | | | 04/25/22 | | | Goldman Sachs & Co. | | | (67,632 | ) |
| USD | | | 846,045 | | | MXN | | | 17,224,000 | | | | 06/14/22 | | | JPMorgan Chase Bank N.A. | | | (6,883 | ) |
| USD | | | 2,703,368 | | | MXN | | | 55,370,375 | | | | 04/28/22 | | | Morgan Stanley and Co. International Plc | | | (61,637 | ) |
| USD | | | 1,048,348 | | | MXN | | | 21,510,000 | | | | 04/19/22 | | | Morgan Stanley Capital Services, Inc. | | | (27,485 | ) |
| USD | | | 346,870 | | | MXN | | | 7,070,000 | | | | 04/28/22 | | | The BNY Mellon | | | (6,181 | ) |
| USD | | | 3,269,105 | | | MXN | | | 69,001,000 | | | | 04/18/22 | | | UBS AG | | | (182,621 | ) |
| USD | | | 1,945,336 | | | NOK | | | 16,820,000 | | | | 04/19/22 | | | BNP Paribas S.A. | | | 22,099 | |
| USD | | | 2,045,279 | | | NOK | | | 17,817,768 | | | | 04/19/22 | | | Morgan Stanley Capital Services, Inc. | | | 7,955 | |
| USD | | | 1,684,022 | | | NZD | | | 2,490,000 | | | | 04/19/22 | | | Goldman Sachs & Co. | | | (47,540 | ) |
| USD | | | 1,342,897 | | | NZD | | | 1,950,650 | | | | 04/28/22 | | | HSBC Bank Plc | | | (13,392 | ) |
| USD | | | 559,355 | | | NZD | | | 805,100 | | | | 04/28/22 | | | JPMorgan Chase Bank N.A. | | | (432 | ) |
| USD | | | 1,799,291 | | | NZD | | | 2,630,000 | | | | 04/19/22 | | | Morgan Stanley Capital Services, Inc. | | | (29,628 | ) |
| USD | | | 895,128 | | | PEN | | | 3,402,380 | | | | 04/28/22 | | | Bank of America, N.A. | | | (18,771 | ) |
| USD | | | 2,426,106 | | | PEN | | | 9,079,700 | | | | 04/13/22 | | | JPMorgan Chase Bank N.A. | | | (16,070 | ) |
| USD | | | 1,334,438 | | | PHP | | | 70,258,160 | | | | 04/28/22 | | | JPMorgan Chase Bank N.A. | | | (19,689 | ) |
| USD | | | 626,413 | | | PLN | | | 2,898,100 | | | | 05/16/22 | | | JPMorgan Chase Bank N.A. | | | (66,197 | ) |
| USD | | | 256,651 | | | PLN | | | 1,100,000 | | | | 04/28/22 | | | Morgan Stanley and Co. International Plc | | | (6,711 | ) |
| USD | | | 398,032 | | | RON | | | 1,800,000 | | | | 04/28/22 | | | HSBC Bank Plc | | | (5,951 | ) |
| USD | | | 1,626,080 | | | RON | | | 7,305,000 | | | | 04/28/22 | | | JPMorgan Chase Bank N.A. | | | (13,417 | ) |
| USD | | | 3,403,660 | | | RON | | | 15,612,600 | | | | 05/16/22 | | | JPMorgan Chase Bank N.A. | | | (91,789 | ) |
| USD | | | 261,853 | | | RUB | | | 20,600,850 | | | | 04/19/22 | | | BNP Paribas S.A. | | | 15,806 | |
| USD | | | 5,607,168 | | | RUB | | | 428,822,712 | | | | 04/19/22 | | | Citibank N.A. | | | 485,488 | |
| USD | | | 3,668,116 | | | RUB | | | 294,038,824 | | | | 04/19/22 | | | Goldman Sachs & Co. | | | 156,240 | |
| USD | | | 904,752 | | | RUB | | | 76,709,000 | | | | 04/01/22 | | | JPMorgan Chase Bank N.A. | | | (26,748 | ) |
| USD | | | 27,027 | | | RUB | | | 2,788,207 | | | | 04/19/22 | | | JPMorgan Chase Bank N.A. | | | (6,274 | ) |
| USD | | | 500,326 | | | RUB | | | 38,280,000 | | | | 04/19/22 | | | Morgan Stanley Capital Services, Inc. | | | 43,125 | |
See accompanying Notes to the Financial Statements.
159
Mercer Opportunistic Fixed Income Fund
Schedule of Investments (Continued)
March 31, 2022
Forward Foreign Currency Contracts — continued
| | | | | | | | | | | | | | | | | | | | |
Currency Purchased | | | Currency Sold | | | Settlement
Date | | | Counterparty | | Unrealized
Appreciation
(Depreciation) | |
| USD | | | 1,078,597 | | | THB | | | 35,820,200 | | | | 06/21/22 | | | JPMorgan Chase Bank N.A. | | $ | 64 | |
| USD | | | 3,579,095 | | | ZAR | | | 53,418,000 | | | | 04/25/22 | | | Bank of America, N.A. | | | (66,780 | ) |
| USD | | | 529,805 | | | ZAR | | | 7,916,400 | | | | 04/28/22 | | | Goldman Sachs International | | | (10,296 | ) |
| USD | | | 10,848,028 | | | ZAR | | | 166,612,467 | | | | 05/23/22 | | | JPMorgan Chase Bank N.A. | | | (483,657 | ) |
| USD | | | 1,120,621 | | | ZAR | | | 17,425,700 | | | | 06/13/22 | | | JPMorgan Chase Bank N.A. | | | (61,450 | ) |
| USD | | | 3,325,419 | | | ZAR | | | 49,809,792 | | | | 04/28/22 | | | Morgan Stanley and Co. International Plc | | | (72,881 | ) |
| USD | | | 541,226 | | | ZAR | | | 7,940,000 | | | | 04/28/22 | | | State Street Bank London | | | (485 | ) |
| USD | | | 3,444,551 | | | ZAR | | | 52,135,000 | | | | 04/19/22 | | | UBS AG | | | (116,501 | ) |
| | | | | | | | | | | | | | | | | | | | |
| | | | | | | | | | | | | | | | | | $ | (1,752,576 | ) |
| | | | | | | | | | | | | | | | | | | | |
Futures Contracts
| | | | | | | | | | | | | | | | | | |
Number of
Contracts | | | | | Description | | | | Expiration Date | | Notional
Value | | | Market Value/
Unrealized
Appreciation
(Depreciation) | |
| | Buys | | | | | | | | | | | | | | | | | |
| | 10 | | | | | 10-Year Australian Bond Futures | | | | Jun 2022 | | $ | 951,776 | | | $ | (37,650 | ) |
| | 121 | | | | | Euro 90-Day | | | | Dec 2022 | | | 29,445,350 | | | | (359,704 | ) |
| | 763 | | | | | Euro 90-Day | | | | Dec 2023 | | | 184,970,275 | | | | (2,562,543 | ) |
| | 266 | | | | | U.S. Treasury Note 2-Year | | | | Jun 2022 | | | 56,371,219 | | | | (753,070 | ) |
| | 11 | | | | | U.S. Ultra 10-Year | | | | Jun 2022 | | | 1,490,156 | | | | (50,005 | ) |
| | 142 | | | | | U.S. Ultra Bond | | | | Jun 2022 | | | 25,151,750 | | | | (851,335 | ) |
| | 159 | | | | | U.S. Ultra Bond | | | | Jun 2022 | | | 28,162,875 | | | | 78,490 | |
| | | | | | | | | | | | | | | | | | |
| | | | | | | | | | | | | | | | $ | (4,535,817 | ) |
| | | | | | | | | | | | | | | | | | |
| | Sales | | | | | | | | | | | | | | | | | |
| | 49 | | | | | Euro-Bund | | | | Jun 2022 | | $ | 8,650,122 | | | $ | 255,648 | |
| | 63 | | | | | U.S. Long Bond | | | | Jun 2022 | | | 9,453,938 | | | | 313,935 | |
| | 259 | | | | | U.S. Treasury Note 10-Year | | | | Jun 2022 | | | 31,824,625 | | | | 1,038,254 | |
| | 177 | | | | | U.S. Treasury Note 5-Year | | | | Jun 2022 | | | 20,299,687 | | | | 388,810 | |
| | | | | | | | | | | | | | | | | | |
| | | | | | | | | | | | | | | | $ | 1,996,647 | |
| | | | | | | | | | | | | | | | | | |
See accompanying Notes to the Financial Statements.
160
Mercer Opportunistic Fixed Income Fund
Schedule of Investments (Continued)
March 31, 2022
Written Options
Written Currency Options
| | | | | | | | | | | | | | | | | | | | | | | | | |
Type of Contract | | Counterparty | | Notional Value | | Premiums
Received | | Value at
March 31,
2022 |
Call — USD/EUR Option | | | | | | | | | | | | | | | | | | | | | | | | | |
Strike @ EUR 1.11 | | | | | | | | | | | | | | | | | | | | | | | | | |
Expires 04/01/2022 | | | | Goldman Sachs & Co. | | | | | USD | | | | | (9,440,000 | ) | | | $ | (32,002 | ) | | | $ | (1,255 | ) |
Call — USD/EUR Option | | | | | | | | | | | | | | | | | | | | | | | | | |
Strike @ EUR 1.12 | | | | | | | | | | | | | | | | | | | | | | | | | |
Expires 04/07/2022 | | | | JPMorgan Securities LLC | | | | | USD | | | | | (2,239,027 | ) | | | | (9,264 | ) | | | | (25,964 | ) |
Call — USD/EUR Option | | | | | | | | | | | | | | | | | | | | | | | | | |
Strike @ EUR 1.11 | | | | | | | | | | | | | | | | | | | | | | | | | |
Expires 04/13/2022 | | | | Goldman Sachs & Co. | | | | | USD | | | | | (3,880,000 | ) | | | | (17,289 | ) | | | | (23,524 | ) |
Call — USD/EUR Option | | | | | | | | | | | | | | | | | | | | | | | | | |
Strike @ EUR 1.11 | | | | | | | | | | | | | | | | | | | | | | | | | |
Expires 04/26/2022 | | | | BNP Paribas S.A. | | | | | USD | | | | | (3,760,000 | ) | | | | (18,274 | ) | | | | (21,037 | ) |
Call — USD/JPY Option | | | | | | | | | | | | | | | | | | | | | | | | | |
Strike @ JPY 117.65 | | | | | | | | | | | | | | | | | | | | | | | | | |
Expires 04/26/2022 | | | | BNP Paribas S.A. | | | | | USD | | | | | (5,010,000 | ) | | | | (21,593 | ) | | | | (161,492 | ) |
PUT — USD/CAD Option | | | | | | | | | | | | | | | | | | | | | | | | | |
Strike @ CAD 1.24 | | | | | | | | | | | | | | | | | | | | | | | | | |
Expires 04/20/2022 | | | | Morgan Stanley & Co. | | | | | USD | | | | | (4,200,000 | ) | | | | (12,881 | ) | | | | (22,428 | ) |
PUT — USD/EUR Option | | | | | | | | | | | | | | | | | | | | | | | | | |
Strike @ EUR 1.17 | | | | | | | | | | | | | | | | | | | | | | | | | |
Expires 04/07/2022 | | | | JPMorgan Securities LLC | | | | | USD | | | | | (2,239,027 | ) | | | | (9,264 | ) | | | | (13 | ) |
PUT — USD/EUR Option | | | | | | | | | | | | | | | | | | | | | | | | | |
Strike @ EUR 1.16 | | | | | | | | | | | | | | | | | | | | | | | | | |
Expires 04/13/2022 | | | | Goldman Sachs & Co. | | | | | USD | | | | | (3,880,000 | ) | | | | (16,420 | ) | | | | (264 | ) |
PUT — USD/MXN Option | | | | | | | | | | | | | | | | | | | | | | | | | |
Strike @ MXN 20.42 | | | | | | | | | | | | | | | | | | | | | | | | | |
Expires 05/13/2022 | | | | JPMorgan Securities LLC | | | | | USD | | | | | (4,400,000 | ) | | | | (30,404 | ) | | | | (107,919 | ) |
PUT — USD/NOK Option | | | | | | | | | | | | | | | | | | | | | | | | | |
Strike @ NOK 8.48 | | | | | | | | | | | | | | | | | | | | | | | | | |
Expires 04/12/2022 | | | | Goldman Sachs & Co. | | | | | USD | | | | | (1,980,000 | ) | | | | (13,108 | ) | | | | (2,208 | ) |
PUT — USD/NOK Option | | | | | | | | | | | | | | | | | | | | | | | | | |
Strike @ NOK 8.54 | | | | | | | | | | | | | | | | | | | | | | | | | |
Expires 04/20/2022 | | | | Citibank N.A. | | | | | USD | | | | | (4,200,000 | ) | | | | (20,118 | ) | | | | (14,276 | ) |
PUT — USD/RUB Option | | | | | | | | | | | | | | | | | | | | | | | | | |
Strike @ RUB 73.85 | | | | | | | | | | | | | | | | | | | | | | | | | |
Expires 04/14/2022 | | | | JPMorgan Securities LLC | | | | | USD | | | | | (4,110,000 | ) | | | | (48,991 | ) | | | | (52,740 | ) |
| | | | | | | | | | | | | | | | | | | | | | | | | |
| | | | | | | | | | | | | | | | | | $ | (249,608 | ) | | | $ | (433,120 | ) |
| | | | | | | | | | | | | | | | | | | | | | | | | |
See accompanying Notes to the Financial Statements.
161
Mercer Opportunistic Fixed Income Fund
Schedule of Investments (Continued)
March 31, 2022
Written Futures Options
| | | | | | | | | | | | | | | | | | | | | | | | | |
Type of Contract | | Counterparty | | Number of
Contracts | | Notional
Value | | Premiums
Received | | Value at
March 31, 2022 |
CALL — U.S. Treasury Note 10-Year Futures Option | | | | | | | | | | | | | | | | | | | | | | | | | |
Strike @ $122.50 | | | | | | | | | | | | | | | | | | | | | | | | | |
Expires 04/22/2022 | | | | Citibank N.A. | | | | | 25 | | | | $ | (3,071,875 | ) | | | $ | (19,879 | ) | | | $ | (26,563 | ) |
CALL — U.S. Treasury Note 10-Year Futures Option | | | | | | | | | | | | | | | | | | | | | | | | | |
Strike @ $124.00 | | | | | | | | | | | | | | | | | | | | | | | | | |
Expires 04/22/2022 | | | | Morgan Stanley & Co. | | | | | 51 | | | | | (6,266,625 | ) | | | | (31,787 | ) | | | | (19,922 | ) |
PUT — S&P 500 E-mini Futures Option | | | | | | | | | | | | | | | | | | | | | | | | | |
Strike @ $3,800.00 | | | | | | | | | | | | | | | | | | | | | | | | | |
Expires 05/20/2022 | | | | JPMorgan Securities LLC | | | | | 1,850 | | | | | (8,381,888 | ) | | | | (19,347 | ) | | | | (25,437 | ) |
PUT — S&P 500 E-mini Futures Option | | | | | | | | | | | | | | | | | | | | | | | | | |
Strike @ $3,900.00 | | | | | | | | | | | | | | | | | | | | | | | | | |
Expires 05/20/2022 | | | | JPMorgan Securities LLC | | | | | 1,250 | | | | | (5,663,438 | ) | | | | (18,385 | ) | | | | (18,385 | ) |
| | | | | | | | | | | | | | | | | | | | | | | | | |
| | | | | | | | | | | | | | | | | | $ | (89,398 | ) | | | $ | (90,307 | ) |
| | | | | | | | | | | | | | | | | | | | | | | | | |
Written Swaption
| | | | | | | | | | | | | | | | | | | | | | | | | |
Type of Contract | | Counterparty | | Notional
Value | | Premiums
Received | | Value at
March 31, 2022 |
Interest Rate Swaption pay annually a fixed rate of 2.88% and receive semi-annually a floating rate of 6-Month EUR LIBOR | | | | | | | | | | | | | | | | | | | | | | | | | |
Strike @ EUR 2.88 | | | | | | | | | | | | | | | | | | | | | | | | | |
Expires 08/17/2022 | | | | Morgan Stanley & Co. | | | | | USD | | | | | (36,650,000 | ) | | | $ | (178,671 | ) | | | $ | (356,497 | ) |
| | | | | | | | | | | | | | | | | | | | | | | | | |
Total Written Options | | | | | | | | | | | | | | | | | | $ | (517,677 | ) | | | $ | (879,924 | ) |
| | | | | | | | | | | | | | | | | | | | | | | | | |
OTC — Interest Rate Swaps
| | | | | | | | | | | | | | | | | | | | | | | | | | |
Payments
Received
by Fund | | Payment
Frequency | | Payments
Made
by Fund | | Payment
Frequency | | Maturity Date | | Counterparty | | Upfront
Premiums
Paid
(Received) | | | Notional | | | Market
Value | | | Unrealized
Appreciation
(Depreciation) | |
| 1.87% | | Quarterly | | 7-Day CNRR | | Quarterly | | 09/16/25 | | HSBC Bank Plc | | $ | — | | | CNY | 2,702,414 | | | $ | (6,916 | ) | | $ | (6,916 | ) |
| 1.90% | | Quarterly | | 7-Day CNRR | | Quarterly | | 09/16/25 | | HSBC Bank Plc | | | — | | | CNY | 9,266,521 | | | | (22,290 | ) | | | (22,290 | ) |
| 2.51% | | Quarterly | | 7-Day CNRR | | Quarterly | | 09/16/25 | | HSBC Bank Plc | | | — | | | CNY | 5,489,373 | | | | 4,158 | | | | 4,158 | |
| 2.69% | | Quarterly | | 7-Day CNRR | | Quarterly | | 12/16/25 | | HSBC Bank Plc | | | — | | | CNY | 3,081,518 | | | | 5,102 | | | | 5,102 | |
| BRL-CDI | | At Maturity | | 10.67% | | At Maturity | | 01/02/29 | | JPMorgan Chase Bank N.A. | | | — | | | BRL | 958,821 | | | | 2,998 | | | | 2,998 | |
| BRL-CDI | | At Maturity | | 10.47% | | At Maturity | | 01/04/27 | | JPMorgan Chase Bank N.A. | | | — | | | BRL | 1,526,090 | | | | 4,174 | | | | 4,174 | |
| BRL-CDI | | At Maturity | | 7.49% | | At Maturity | | 01/04/27 | | Bank of America, N.A. | | | — | | | BRL | 591,999 | | | | 12,147 | | | | 12,147 | |
| 1.84% | | Semi-Annual | | Thai Baht Interest
Rate Fixing | | Semi-Annual | | 09/21/27 | | JPMorgan Chase Bank N.A. | | | — | | | THB | 37,363,293 | | | | (3,045 | ) | | | (3,045 | ) |
| 2.28% | | Semi-Annual | | Thai Baht Interest
Rate Fixing | | Semi-Annual | | 09/21/32 | | Citibank N.A. | | | — | | | THB | 60,887,765 | | | | 9,909 | | | | 9,909 | |
| | | | | | | | | | | | | | | | | | | | | | | | | | |
| | | | | | | | | | | | $ | — | | | | | | | $ | 6,237 | | | $ | 6,237 | |
| | | | | | | | | | | | | | | | | | | | | | | | | | |
See accompanying Notes to the Financial Statements.
162
Mercer Opportunistic Fixed Income Fund
Schedule of Investments (Continued)
March 31, 2022
Centrally Cleared Interest Rate Swaps
| | | | | | | | | | | | | | | | | | | | | | | | |
Payments
Received
by Fund | | Payment
Frequency | | Payments
Made
by Fund | | Payment
Frequency | | Maturity Date | | Upfront
Premiums
Paid
(Received) | | | Notional
Value | | | Market
Value | | | Unrealized
Appreciation
(Depreciation) | |
| 1-Month TIIE | | Monthly | | 7.80% | | Monthly | | 11/13/31 | | $ | 5 | | | MXN | 6,846,042 | | | $ | 7,670 | | | $ | 7,665 | |
| 1-Month TIIE | | Monthly | | 7.50% | | Monthly | | 09/17/31 | | | 4 | | | MXN | 4,768,972 | | | | 10,240 | | | | 10,236 | |
| 1-Month TIIE | | Monthly | | 7.42% | | Monthly | | 11/18/26 | | | 6 | | | MXN | 13,163,755 | | | | 23,432 | | | | 23,426 | |
| 7.20% | | Monthly | | 1-Month TIIE | | Monthly | | 07/17/24 | | | — | | | MXN | 116,734,200 | | | | (166,765 | ) | | | (166,765 | ) |
| 3-Month JIBAR | | Quarterly | | 8.31% | | Quarterly | | 09/21/32 | | | 16 | | | ZAR | 14,977,671 | | | | (7,173 | ) | | | (7,189 | ) |
| 3-Month JIBAR | | Quarterly | | 7.44% | | Quarterly | | 09/21/27 | | | 11 | | | ZAR | 17,304,092 | | | | (2,732 | ) | | | (2,743 | ) |
| 6-Month BUBOR | | Semi-Annual | | 5.76% | | Annual | | 09/21/32 | | | 5 | | | HUF | 112,174,310 | | | | 910 | | | | 905 | |
| 6-Month BUBOR | | Semi-Annual | | 5.67% | | Annual | | 09/21/32 | | | 5 | | | HUF | 98,313,723 | | | | 5 | | | | — | |
| CPI-U | | Annual | | 3.97% | | Annual | | 11/18/23 | | | (17,982 | ) | | USD | 4,870,000 | | | | 133,332 | | | | 151,314 | |
| 3.37% | | Annual | | CPI-U | | Annual | | 11/18/26 | | | 51,775 | | | USD | 4,870,000 | | | | (131,820 | ) | | | (183,595 | ) |
| SOFR | | Annual | | 1.52% | | Annual | | 11/20/26 | | | (9,498 | ) | | USD | 5,530,000 | | | | 119,543 | | | | 129,041 | |
| | | | | | | | | | | | | | | | | | | | | | | | |
| | | | | | | | | | | | | | | | | | | | | | $ | (37,705 | ) |
| | | | | | | | | | | | | | | | | | | | | | | | |
OTC — Credit Default Swaps
Buy Protection
| | | | | | | | | | | | | | | | | | | | | | | | | | | | | | | | |
| | | | | | | | | |
Notional
Amount* | | | Currency | | | Expiration
Date | | | Counterparty | | Receive
(Pay)
Fixed
Rate | | | Payment Frequency | | Deliverable on Default | | Unrealized
Appreciation
(Depreciation) | | | Upfront
Premiums
Paid/
(Received) | | | Value | |
| | 730,000 | | | | EUR | | | | 12/20/24 | | | Morgan Stanley & Co. | | | (1.00% | ) | | Quarterly | | Daimler AG, 1.40%, 01/12/24 | | $ | 5,492 | | | $ | (19,195 | ) | | $ | (13,703 | ) |
| | | | | | | | | | | | | | | | | | | | | | | | | | | | | | | | |
|
Sell Protection | |
| | | | | | | | | |
Notional
Amount* | | | Currency | | | Expiration
Date | | | Counterparty | | Receive
(Pay)
Fixed
Rate | | | Payment Frequency | | Deliverable on Default | | Unrealized
Appreciation
(Depreciation) | | | Upfront
Premiums
Paid/
(Received) | | | Value | |
| | | | | | | | | |
| | 820,000 | | | | USD | | | | 06/20/26 | | | Morgan Stanley & Co. | | | 5.00% | | | Quarterly | | Netflix, Inc., 4.88%, 06/30/30 (Moody’s rating: Ba1; S&P rating: BB+) | | $ | (50,663 | ) | | $ | 180,545 | | | $ | 129,882 | |
| | 410,000 | | | | USD | | | | 06/20/26 | | | Morgan Stanley & Co. | | | 5.00% | | | Quarterly | | Netflix, Inc., 4.88%, 06/30/30 (Moody’s rating: Ba1; S&P rating: BB+) | | | (25,722 | ) | | | 90,662 | | | | 64,940 | |
| | 730,000 | | | | EUR | | | | 12/20/24 | | | Morgan Stanley & Co. | | | 1.00% | | | Quarterly | | Volkswagen International Finance N.V., 0.50%, 03/30/21 (Moody’s rating: A3; S&P rating: BBB+) | | | (38 | ) | | | 9,255 | | | | 9,217 | |
| | | | | | | | | | | | | | | | | | | | | | | | | | | | | | | | |
| | | | | | | | | | | | | | | | | | Total Sell Protection | | $ | (76,423 | ) | | $ | 280,462 | | | $ | 204,039 | |
| | | | | | | | | | | | | | | | | | | | | | | | | | | | | | | | |
| | Total OTC Credit Default Swaps | | $ | (70,931 | ) | | $ | 261,267 | | | $ | 190,336 | |
| | | | | | | | | | | | | | | | | | | | | | | | | | | | | | | | |
See accompanying Notes to the Financial Statements.
163
Mercer Opportunistic Fixed Income Fund
Schedule of Investments (Continued)
March 31, 2022
Centrally Cleared Credit Default Swaps
Buy Protection
| | | | | | | | | | | | | | | | | | | | | | | | |
Notional
Amount* | | | Currency | | Expiration
Date | | Receive
(Pay)
Fixed
Rate | | Payment Frequency | | Deliverable
on Default | | Unrealized
Appreciation
(Depreciation) | | | Upfront
Premiums
Paid
(Received) | | | Value | |
| | 20,500,000 | | | USD | | 12/20/26 | | (5.00%) | | Quarterly | | CDX.NA.HY.37** | | $ | (132,693 | ) | | $ | (1,166,450 | ) | | $ | (1,299,143 | ) |
| | 3,243,000 | | | USD | | 06/20/27 | | (5.00%) | | Quarterly | | CDX.NA.HY.38** | | | (27,035 | ) | | | (152,475 | ) | | | (179,510 | ) |
| | 1,380,000 | | | USD | | 06/20/26 | | (5.00%) | | Quarterly | | General Motors Co. | | | 78,608 | | | | (264,657 | ) | | | (186,049 | ) |
| | 615,000 | | | USD | | 06/20/26 | | (1.00%) | | Quarterly | | ViacomCBS, Inc. | | | 8,055 | | | | (9,500 | ) | | | (1,445 | ) |
| | 615,000 | | | USD | | 06/20/26 | | (1.00%) | | Quarterly | | Walt Disney Co. (The) | | | 2,074 | | | | (18,723 | ) | | | (16,649 | ) |
| | | | | | | | | | | | | | | | | | | | | | | | |
| | | | | | | | | | | | | | $ | (70,991 | ) | | $ | (1,611,805 | ) | | $ | (1,682,796 | ) |
| | | | | | | | | | | | | | | | | | | | | | | | |
|
Sell Protection | |
Notional
Amount* | | | Currency | | Expiration
Date | | Receive
(Pay)
Fixed
Rate | | Payment Frequency | | Deliverable
on Default | | Unrealized
Appreciation
(Depreciation) | | | Upfront
Premiums
Paid
(Received) | | | Value | |
| | | | | | | | |
| | 1,380,000 | | | USD | | 06/20/26 | | 5.00% | | Quarterly | | Ford Motor Co. | | $ | (45,800 | ) | | $ | 196,911 | | | $ | 151,111 | |
| | | | | | | | | | | | | | | | | | | | | | | | |
| | Total Centrally Cleared Credit Default Swaps | | $ | (116,791 | ) | | $ | (1,414,894 | ) | | $ | (1,531,685 | ) |
| | | | | | | | | | | | | |
| * | | The maximum potential amount of future undiscounted payments that the Fund could be required to make under a credit default swap contract would be the notional amount of the contract. These potential amounts would be partially offset by any recovery values of the referenced debt obligation or net amounts received from the settlement of purchased protection credit default swap contracts entered into by the Fund for the same referenced debt obligation. |
| ** | | CDX.NA.HY — Markit North America High Yield CDS Index. Represents an index of single name credit default swaps (CDS). All of the companies underlying the single name CDS within the index are rated BB and B. |
U.S. Treasury securities in the amount of $65,473 received at the custodian bank as collateral for forward foreign currency contracts, OTC swaps and/or OTC options.
Currency Abbreviations
| CNH | — Chinese Yuan Renminbi |
| GBP | — British Pound Sterling |
See accompanying Notes to the Financial Statements.
164
Mercer Opportunistic Fixed Income Fund
Schedule of Investments (Continued)
March 31, 2022
Currency Abbreviations — continued
Other Abbreviations
| | | | |
| | |
| BIBOR | | — | | Bangkok Interbank Offered Rate |
| | |
| BUBOR | | — | | Budapest Interbank Offered Rate |
| | |
| CDI | | — | | Brazil Interbank Deposit Rate |
| | |
| CLO | | — | | Collateralized Loan Obligation |
| | |
| CMO | | — | | Collateralized Mortgage Obligation |
| | |
| CMT | | — | | Constant Maturity Treasury Index |
| | |
| CNRR | | — | | China Fixing Repo Rates |
| | |
| FHLMC | | — | | Federal Home Loan Mortgage Corporation |
| | |
| FNMA | | — | | Federal National Mortgage Association |
| | |
| GDN | | — | | Global Depository Note |
| | |
| ICE | | — | | Intercontinental Exchange |
| | |
| JIBAR | | — | | Johannesburg Interbank Average Rate |
| | |
| LIBOR | | — | | London Interbank Offered Rate |
| | |
| MTN | | — | | Medium Term Note |
| | |
| OTC | | — | | Over-The-Counter |
| | |
| PIK | | — | | Payment In Kind |
| | |
| PRIBOR | | — | | Prague Interbank Offered Rate |
| | |
| REIT | | — | | Real Estate Investment Trust |
| | |
| REMIC | | — | | Real Estate Mortgage Investment Conduit |
| | |
| SOFR | | — | | Secured Overnight Financing Rate |
| | |
| TBD | | — | | To Be Determined |
| | |
| TIIE | | — | | Mexican Interbank Equilibrium Interest Rate |
| | |
| UMBS | | — | | Uniform Mortgage-Backed Securities are single-class securities backed by fixed-rate mortgage loans purchased by either FHLMC or FNMA |
| | |
| WIBOR | | — | | Warsaw Interbank Offer Rate |
See accompanying Notes to the Financial Statements.
165
Mercer Opportunistic Fixed Income Fund
Schedule of Investments (Continued)
March 31, 2022
| | | | | |
| Asset Class Summary (Unaudited) | | % of Net Assets |
Corporate Debt | | | | 33.1 | |
Sovereign Debt Obligations | | | | 24.9 | |
Bank Loans | | | | 19.4 | |
Asset Backed Securities | | | | 5.3 | |
Mortgage Backed Securities — Private Issuers | | | | 4.8 | |
U.S. Government and Agency Obligations | | | | 3.8 | |
Convertible Debt | | | | 1.4 | |
Convertible Preferred Stocks | | | | 0.7 | |
Purchased Swaption | | | | 0.1 | |
Common Stocks | | | | 0.1 | |
Mortgage Backed Securities — U.S. Government Agency Obligations | | | | 0.1 | |
Preferred Stocks | | | | 0.0 | * |
Purchased Futures Options | | | | 0.0 | * |
OTC Credit Default Swaps | | | | 0.0 | * |
Purchased Currency Options | | | | 0.0 | * |
OTC Interest Rate Swaps | | | | 0.0 | * |
Centrally Cleared Interest Rate Swaps | | | | 0.0 | * |
Written Futures Options | | | | 0.0 | * |
Written Swaption | | | | 0.0 | * |
Written Currency Options | | | | 0.0 | * |
Centrally Cleared Credit Default Swaps | | | | (0.1 | ) |
Futures Contracts | | | | (0.2 | ) |
Forward Foreign Currency Contracts | | | | (4.1 | ) |
Short-Term Investments | | | | 4.6 | |
Other Assets and Liabilities (net) | | | | 6.1 | |
| | | | | |
| | | | 100.0 | % |
| | | | | |
* Amount rounds to zero.
See accompanying Notes to the Financial Statements.
166
Mercer Emerging Markets Equity Fund
Schedule of Investments
(showing percentage of net assets)
March 31, 2022
| | | | | | | | | | |
| Shares | | | | | Description | | Value ($) | |
| | | |
| | | | | | COMMON STOCKS — 92.0% | | | | |
| | | |
| | | | | | Argentina — 0.0% | | | |
| | 32,870 | | | | | Banco BBVA Argentina SA, ADR* | | | 116,689 | |
| | 18,200 | | | | | Grupo Financiero Galicia SA, ADR(a) | | | 196,560 | |
| | 8,100 | | | | | Telecom Argentina SA, ADR(a) | | | 48,681 | |
| | | | | | | | | | |
| | | | | | | | | 361,930 | |
| | | | | | | | | | |
| | |
| | | | | | Australia — 0.5% | |
| | 371,906 | | | | | Newcrest Mining, Ltd. | | | 7,409,075 | |
| | | | | | | | | | |
| | |
| | | | | | Brazil — 5.5% | |
| | 576,200 | | | | | Ambev SA | | | 1,867,334 | |
| | 3,234,700 | | | | | B3 SA — Brasil Bolsa Balcao | | | 10,693,954 | |
| | 910,709 | | | | | Banco Bradesco SA* | | | 3,501,437 | |
| | 991,000 | | | | | Banco do Brasil SA | | | 7,236,545 | |
| | 183,400 | | | | | Blau Farmaceutica SA* 144A | | | 1,107,281 | |
| | 102,300 | | | | | Cia Energetica de Minas Gerais, ADR(a) | | | 329,406 | |
| | 111,300 | | | | | Cia Siderurgica Nacional SA | | | 609,674 | |
| | 1,426,700 | | | | | Dexco SA | | | 4,407,445 | |
| | 1,286,700 | | | | | Locaweb Servicos de Internet SA* | | | 2,734,808 | |
| | 339,700 | | | | | Marfrig Global Foods SA | | | 1,529,810 | |
| | 13,929 | | | | | MercadoLibre, Inc.* | | | 16,568,267 | |
| | 75,300 | | | | | Petroleo Brasileiro SA | | | 558,417 | |
| | 1,666,933 | | | | | Raia Drogasil SA | | | 8,397,895 | |
| | 2,703,300 | | | | | Rumo SA* | | | 10,552,766 | |
| | 1,077,400 | | | | | TOTVS SA | | | 8,248,364 | |
| | 203,200 | | | | | Vale SA | | | 4,087,989 | |
| | 710,952 | | | | | Vamos Locacao de Caminhoes Maquinas e Equipamentos SA | | | 1,913,546 | |
| | 759,500 | | | | | WEG SA | | | 5,573,242 | |
| | | | | | | | | | |
| | | | | | | | | 89,918,180 | |
| | | | | | | | | | |
| | |
| | | | | | Canada — 0.1% | |
| | 41,933 | | | | | Canadian Solar, Inc.* (a) | | | 1,482,751 | |
| | | | | | | | | | |
| | |
| | | | | | Chile — 0.3% | |
| | 1,189,705 | | | | | Banco de Chile | | | 127,357 | |
| | 2,436,192 | | | | | Banco Santander Chile | | | 137,176 | |
| | 10,800 | | | | | Banco Santander Chile, ADR | | | 243,972 | |
| | 5,053 | | | | | CAP SA | | | 78,339 | |
| | 32,356 | | | | | Cencosud SA | | | 63,731 | |
| | 62,626 | | | | | Cencosud Shopping SA | | | 73,376 | |
| | 252,555 | | | | | Cia Cervecerias Unidas SA, ADR | | | 3,778,223 | |
| | 1,999,467 | | | | | Colbun SA | | | 163,962 | |
| | 6,046 | | | | | Empresas COPEC SA | | | 49,940 | |
| | 693,079 | | | | | Enel Americas SA | | | 83,671 | |
| | 4,978 | | | | | Inversiones La Construccion SA | | | 21,445 | |
| | | | | | | | | | |
| | | �� | | | | | | 4,821,192 | |
| | | | | | | | | | |
See accompanying Notes to the Financial Statements.
167
Mercer Emerging Markets Equity Fund
Schedule of Investments (Continued)
(showing percentage of net assets)
March 31, 2022
| | | | | | | | | | |
| Shares | | | | | Description | | Value ($) | |
| | |
| | | | | | China — 26.9% | |
| | 1,511,000 | | | | | 361 Degrees International, Ltd.* (a) | | | 768,104 | |
| | 347,250 | | | | | A-Living Smart City Services Co., Ltd.(a) | | | 483,108 | |
| | 2,478,300 | | | | | Agricultural Bank of China, Ltd. Class A | | | 1,202,348 | |
| | 12,873,000 | | | | | Agricultural Bank of China, Ltd. Class H | | | 4,938,512 | |
| | 122,000 | | | | | Airtac International Group | | | 3,933,751 | |
| | 1,768,091 | | | | | Alibaba Group Holding, Ltd.* | | | 24,206,232 | |
| | 49,100 | | | | | Alibaba Group Holding, Ltd., ADR* | | | 5,342,080 | |
| | 100,000 | | | | | Amlogic Shanghai Co., Ltd. Class A* | | | 1,771,770 | |
| | 72,000 | | | | | Angang Steel Co., Ltd. Class H | | | 33,037 | |
| | 35,169 | | | | | Anhui Conch Cement Co., Ltd. Class A | | | 217,827 | |
| | 122,500 | | | | | Anhui Conch Cement Co., Ltd. Class H | | | 627,963 | |
| | 425,498 | | | | | Anhui Guangxin Agrochemical Co., Ltd. Class A | | | 2,132,726 | |
| | 141,200 | | | | | ANTA Sports Products, Ltd. | | | 1,762,606 | |
| | 42,800 | | | | | Autohome, Inc. Class A(a) | | | 329,895 | |
| | 31,800 | | | | | Autohome, Inc., ADR | | | 967,038 | |
| | 12,000 | | | | | Baidu, Inc., ADR* | | | 1,587,600 | |
| | 1,670,683 | | | | | Bank of Chengdu Co., Ltd. Class A | | | 3,950,082 | |
| | 2,776,200 | | | | | Bank of China, Ltd. Class A | | | 1,427,844 | |
| | 20,087,700 | | | | | Bank of China, Ltd. Class H | | | 8,067,838 | |
| | 80,950 | | | | | Beijing Easpring Material Technology Co., Ltd. Class A | | | 953,429 | |
| | 39,000 | | | | | Beijing Wantai Biological Pharmacy Enterprise Co., Ltd. Class A | | | 1,707,881 | |
| | 119,300 | | | | | Budweiser Brewing Co. APAC, Ltd.(a) | | | 316,691 | |
| | 406,515 | | | | | BYD Electronic International Co., Ltd.(a) | | | 811,173 | |
| | 31,694 | | | | | Changchun High & New Technology Industry Group, Inc. Class A | | | 835,957 | |
| | 154,000 | | | | | China BlueChemical, Ltd. Class H | | | 52,600 | |
| | 1,450,000 | | | | | China Communications Services Corp., Ltd. Class H | | | 654,866 | |
| | 960,600 | | | | | China Construction Bank Corp. Class A | | | 950,011 | |
| | 19,884,000 | | | | | China Construction Bank Corp. Class H | | | 14,940,409 | |
| | 943,000 | | | | | China Datang Corp. Renewable Power Co., Ltd. Class H(a) | | | 389,374 | |
| | 768,000 | | | | | China Dongxiang Group Co., Ltd. | | | 48,837 | |
| | 3,832,000 | | | | | China Feihe, Ltd.(a) | | | 3,774,877 | |
| | 1,085,200 | | | | | China Hongqiao Group, Ltd.(a) | | | 1,439,904 | |
| | 545,959 | | | | | China Jushi Co., Ltd. Class A | | | 1,307,245 | |
| | 163,263 | | | | | China Lesso Group Holdings, Ltd. | | | 196,777 | |
| | 1,107,000 | | | | | China Longyuan Power Group Corp., Ltd. Class H | | | 2,509,959 | |
| | 609,000 | | | | | China Medical System Holdings, Ltd. | | | 953,425 | |
| | 528,000 | | | | | China Mengniu Dairy Co., Ltd.* | | | 2,835,935 | |
| | 241,599 | | | | | China Merchants Bank Co., Ltd. Class A | | | 1,776,687 | |
| | 2,395,400 | | | | | China Merchants Bank Co., Ltd. Class H | | | 18,730,266 | |
| | 386,300 | | | | | China Molybdenum Co., Ltd. Class A | | | 315,574 | |
| | 342,000 | | | | | China Molybdenum Co., Ltd. Class H | | | 177,231 | |
| | 456,000 | | | | | China Oriental Group Co., Ltd. | | | 129,103 | |
| | 126,000 | | | | | China Overseas Land & Investment, Ltd. | | | 375,422 | |
| | 172,992 | | | | | China Pacific Insurance Group Co., Ltd. Class A | | | 623,369 | |
| | 1,624,600 | | | | | China Pacific Insurance Group Co., Ltd. Class H | | | 3,946,328 | |
| | 1,582,400 | | | | | China Petroleum & Chemical Corp. Class A | | | 1,076,334 | |
| | 64,000 | | | | | China Petroleum & Chemical Corp. Class H | | | 32,009 | |
| | 1,781,000 | | | | | China Reinsurance Group Corp. Class H | | | 163,175 | |
| | 446,000 | | | | | China Resources Beer Holdings Co., Ltd. | | | 2,722,357 | |
See accompanying Notes to the Financial Statements.
168
Mercer Emerging Markets Equity Fund
Schedule of Investments (Continued)
(showing percentage of net assets)
March 31, 2022
| | | | | | | | | | |
| Shares | | | | | Description | | Value ($) | |
| | |
| | | | | | China — continued | |
| | 198,000 | | | | | China Resources Gas Group, Ltd. | | | 837,633 | |
| | 626,000 | | | | | China Resources Land, Ltd. | | | 2,902,378 | |
| | 54,000 | | | | | China Risun Group, Ltd.(a) | | | 28,583 | |
| | 340,100 | | | | | China Shenhua Energy Co., Ltd. Class A | | | 1,593,268 | |
| | 2,781,100 | | | | | China Shenhua Energy Co., Ltd. Class H | | | 8,873,042 | |
| | 265,496 | | | | | China Tourism Group Duty Free Corp., Ltd. Class A | | | 6,816,342 | |
| | 23,898 | | | | | China Vanke Co., Ltd. Class A | | | 71,332 | |
| | 28,000 | | | | | CIFI Ever Sunshine Services Group, Ltd.(a) | | | 37,589 | |
| | 279,700 | | | | | Citic Pacific Special Steel Group Co., Ltd. Class A | | | 875,725 | |
| | 2,228,000 | | | | | COFCO Joycome Foods, Ltd.* (a) | | | 986,265 | |
| | 63,600 | | | | | Contemporary Amperex Technology Co., Ltd. Class A | | | 5,095,885 | |
| | 1,164,000 | | | | | COSCO SHIPPING Holdings Co., Ltd. Class H* | | | 2,016,129 | |
| | 1,499,100 | | | | | CSPC Pharmaceutical Group, Ltd. | | | 1,719,469 | |
| | 105,000 | | | | | Dongyue Group, Ltd. | | | 142,599 | |
| | 115,893 | | | | | Ecovacs Robotics Co., Ltd. Class A | | | 1,968,199 | |
| | 460,400 | | | | | ENN Energy Holdings, Ltd. | | | 6,862,977 | |
| | 713,000 | | | | | ENN Natural Gas Co., Ltd. Class A | | | 1,983,973 | |
| | 1,464,296 | | | | | Fangda Special Steel Technology Co., Ltd. Class A | | | 1,972,454 | |
| | 113,200 | | | | | Fangda Special Steel Technology Co., Ltd. Class A (Shanghai Exchange) | | | 152,484 | |
| | 635,197 | | | | | Foshan Haitian Flavouring & Food Co., Ltd. Class A | | | 8,734,317 | |
| | 522,000 | | | | | Fuyao Glass Industry Group Co., Ltd. Class H | | | 2,132,047 | |
| | 144,994 | | | | | GoerTek, Inc. Class A | | | 781,598 | |
| | 103,900 | | | | | Gongniu Group Co., Ltd. Class A | | | 2,097,350 | |
| | 849,500 | | | | | Great Wall Motor Co., Ltd. Class H | | | 1,354,450 | |
| | 261,000 | | | | | Greenland Hong Kong Holdings, Ltd. | | | 58,636 | |
| | 502,000 | | | | | Guangdong Investment, Ltd. | | | 685,495 | |
| | 44,200 | | | | | Guangdong Tapai Group Co., Ltd. Class A | | | 76,336 | |
| | 220,300 | | | | | Hangzhou Tigermed Consulting Co., Ltd. Class H | | | 2,655,076 | |
| | 1,209,302 | | | | | Hisense Home Appliances Group Co., Ltd. Class A | | | 2,111,600 | |
| | 40,410 | | | | | Hisense Home Appliances Group Co., Ltd. Class H(a) | | | 38,152 | |
| | 20,653 | | | | | Hollysys Automation Technologies, Ltd.* | | | 329,828 | |
| | 1,348,875 | | | | | Huafon Chemical Co., Ltd. Class A | | | 1,927,997 | |
| | 295,000 | | | | | Industrial & Commercial Bank of China, Ltd. Class A | | | 221,605 | |
| | 13,554,535 | | | | | Industrial & Commercial Bank of China, Ltd. Class H | | | 8,310,745 | |
| | 147,200 | | | | | Jafron Biomedical Co., Ltd. Class A | | | 1,049,508 | |
| | 36,285 | | | | | JD.com, Inc. Class A* | | | 1,062,967 | |
| | 410,624 | | | | | Jiangsu Hengrui Medicine Co., Ltd. Class A | | | 2,377,086 | |
| | 857,000 | | | | | Jiangxi Copper Co., Ltd. Class H | | | 1,430,021 | |
| | 83,567 | | | | | JinkoSolar Holding Co., Ltd., ADR* (a) | | | 4,035,450 | |
| | 652,141 | | | | | Joyoung Co., Ltd. Class A | | | 1,670,148 | |
| | 67,557 | | | | | KE Holdings, Inc., ADR* | | | 835,680 | |
| | 393,000 | | | | | Kingdee International Software Group Co., Ltd.* | | | 867,453 | |
| | 649,800 | | | | | Kingsoft Corp., Ltd. | | | 2,097,759 | |
| | 738,000 | | | | | Kunlun Energy Co., Ltd. | | | 638,984 | |
| | 44,413 | | | | | Kweichow Moutai Co., Ltd. Class A | | | 11,981,058 | |
| | 632,200 | | | | | Li Ning Co., Ltd. | | | 5,419,886 | |
| | 244,597 | | | | | Lier Chemical Co., Ltd. Class A | | | 1,099,395 | |
| | 189,000 | | | | | Logan Group Co., Ltd.(a) | | | 53,378 | |
| | 383,740 | | | | | LONGi Green Energy Technology Co., Ltd. Class A | | | 4,331,352 | |
See accompanying Notes to the Financial Statements.
169
Mercer Emerging Markets Equity Fund
Schedule of Investments (Continued)
(showing percentage of net assets)
March 31, 2022
| | | | | | | | | | |
| Shares | | | | | Description | | Value ($) | |
| | |
| | | | | | China — continued | |
| | 342,472 | | | | | Longshine Technology Group Co., Ltd. Class A | | | 1,495,015 | |
| | 195,000 | | | | | Lonking Holdings, Ltd. | | | 53,127 | |
| | 67,400 | | | | | Lufax Holding, Ltd., ADR* | | | 375,418 | |
| | 64,100 | | | | | Luoyang Xinqianglian Slewing Bearing Co., Ltd. Class A | | | 1,138,137 | |
| | 669,000 | | | | | Luxi Chemical Group Co., Ltd. Class A | | | 1,879,616 | |
| | 97,600 | | | | | Meituan Class B* | | | 1,923,735 | |
| | 774,400 | | | | | Midea Group Co., Ltd. Class A | | | 6,926,816 | |
| | 119,267 | | | | | MINISO Group Holding, Ltd., ADR | | | 930,283 | |
| | 252,000 | | | | | MMG, Ltd.* | | | 101,133 | |
| | 333,894 | | | | | NARI Technology Co., Ltd. Class A | | | 1,643,265 | |
| | 2,446,000 | | | | | Netjoy Holdings, Ltd.* (a) | | | 654,283 | |
| | 28,000 | | | | | Nexteer Automotive Group, Ltd. | | | 17,691 | |
| | 809,770 | | | | | Ningxia Baofeng Energy Group Co., Ltd. Class A | | | 1,886,913 | |
| | 86,449 | | | | | NIO, Inc., ADR* | | | 1,819,751 | |
| | 838,075 | | | | | PetroChina Co., Ltd. Class A | | | 726,453 | |
| | 4,688,600 | | | | | PetroChina Co., Ltd. Class H | | | 2,401,615 | |
| | 4,294,000 | | | | | PICC Property & Casualty Co., Ltd. Class H | | | 4,382,534 | |
| | 358,700 | | | | | Ping An Insurance Group Co. of China, Ltd. Class A | | | 2,713,829 | |
| | 408,300 | | | | | Ping An Insurance Group Co. of China, Ltd. Class H | | | 2,881,492 | |
| | 2,468,100 | | | | | Postal Savings Bank of China Co., Ltd. Class A | | | 2,091,437 | |
| | 748,400 | | | | | Sany Heavy Industry Co., Ltd. Class A | | | 2,055,001 | |
| | 516,493 | | | | | Satellite Chemical Co., Ltd. Class A | | | 3,199,428 | |
| | 1,192,995 | | | | | Shaanxi Coal Industry Co., Ltd. Class A | | | 3,087,995 | |
| | 2,552,500 | | | | | Shandong Gold Mining Co., Ltd. Class H(a) | | | 5,086,315 | |
| | 396,500 | | | | | Shandong Hualu Hengsheng Chemical Co., Ltd. Class A | | | 2,025,349 | |
| | 331,400 | | | | | Shandong Sinocera Functional Material Co., Ltd. Class A | | | 1,796,502 | |
| | 116,010 | | | | | Shanghai Baolong Automotive Corp. Class A | | | 744,494 | |
| | 373,300 | | | | | Shanghai Fosun Pharmaceutical Group Co., Ltd. Class H | | | 1,818,977 | |
| | 156,480 | | | | | Shenzhen Kangtai Biological Products Co., Ltd. Class A | | | 2,290,983 | |
| | 284,400 | | | | | Shenzhou International Group Holdings, Ltd. | | | 3,794,221 | |
| | 241,300 | | | | | Sieyuan Electric Co., Ltd. Class A | | | 1,242,543 | |
| | 32,300 | | | | | Silergy Corp. | | | 3,804,523 | |
| | 479,995 | | | | | Sinoma Science & Technology Co., Ltd. Class A | | | 1,823,064 | |
| | 442,378 | | | | | Sinopec Engineering Group Co., Ltd. Class H | | | 225,449 | |
| | 449,287 | | | | | Sinoseal Holding Co., Ltd. Class A | | | 2,609,055 | |
| | 301,463 | | | | | Sinotruk Hong Kong, Ltd. | | | 458,602 | |
| | 585,500 | | | | | SITC International Holdings Co., Ltd. | | | 2,067,314 | |
| | 396,000 | | | | | Sunac China Holdings, Ltd.(a) | | | 229,291 | |
| | 70,000 | | | | | Sunac Services Holdings, Ltd.(a) | | | 42,896 | |
| | 6,200 | | | | | Sungrow Power Supply Co., Ltd. Class A | | | 103,696 | |
| | 377,300 | | | | | Sunny Optical Technology Group Co., Ltd. | | | 6,044,632 | |
| | 1,002,000 | | | | | Tencent Holdings, Ltd. | | | 47,281,207 | |
| | 16,119 | | | | | Tencent Holdings, Ltd., ADR(a) | | | 748,244 | |
| | 152,700 | | | | | Tencent Music Entertainment Group, ADR* | | | 743,649 | |
| | 136,675 | | | | | Thunder Software Technology Co., Ltd. Class A | | | 2,123,951 | |
| | 166,000 | | | | | Tianli Education International Holdings, Ltd.(a) | | | 16,321 | |
| | 1,040,800 | | | | | Tongcheng Travel Holdings, Ltd.* | | | 1,846,271 | |
| | 1,017,091 | | | | | Tongkun Group Co., Ltd. Class A | | | 2,791,253 | |
| | 278,300 | | | | | Tongwei Co., Ltd. Class A | | | 1,855,836 | |
See accompanying Notes to the Financial Statements.
170
Mercer Emerging Markets Equity Fund
Schedule of Investments (Continued)
(showing percentage of net assets)
March 31, 2022
| | | | | | | | | | |
| Shares | | | | | Description | | Value ($) | |
| | |
| | | | | | China — continued | |
| | 2,492,000 | | | | | TravelSky Technology, Ltd. Class H(a) | | | 3,574,249 | |
| | 258,100 | | | | | Vipshop Holdings, Ltd., ADR* | | | 2,322,900 | |
| | 119,397 | | | | | Wanhua Chemical Group Co., Ltd. Class A | | | 1,515,666 | |
| | 1,418,000 | | | | | Weichai Power Co., Ltd. Class H | | | 2,229,485 | |
| | 43,757 | | | | | Weifu High-Technology Group Co., Ltd. Class A | | | 136,335 | |
| | 97,995 | | | | | Will Semiconductor Co., Ltd. Class A | | | 2,950,377 | |
| | 53,400 | | | | | WuXi AppTec Co., Ltd. Class H | | | 835,417 | |
| | 437,500 | | | | | Wuxi Biologics Cayman, Inc.* | | | 3,549,958 | |
| | 594,769 | | | | | Wuxi Lead Intelligent Equipment Co., Ltd. Class A | | | 5,450,643 | |
| | 1,528,000 | | | | | Xinyi Solar Holdings, Ltd. | | | 2,685,651 | |
| | 302,000 | | | | | Xtep International Holdings, Ltd.(a) | | | 453,225 | |
| | 3,278,000 | | | | | Yangzijiang Shipbuilding Holdings, Ltd. | | | 3,692,953 | |
| | 58,000 | | | | | YongXing Special Materials Technology Co., Ltd. Class A | | | 1,077,619 | |
| | 134,600 | | | | | Yunnan Baiyao Group Co., Ltd. Class A | | | 1,733,086 | |
| | 91,731 | | | | | Zhangzhou Pientzehuang Pharmaceutical Co., Ltd. Class A | | | 4,558,677 | |
| | 294,200 | | | | | Zhejiang Jiecang Linear Motion Technology Co., Ltd. Class A | | | 1,363,514 | |
| | 212,000 | | | | | Zhejiang Jingsheng Mechanical & Electrical Co., Ltd. Class A | | | 1,988,869 | |
| | 1,023,828 | | | | | Zhejiang Sanhua Intelligent Controls Co., Ltd. Class A | | | 2,666,121 | |
| | 40,600 | | | | | Zhejiang Weixing New Building Materials Co., Ltd. Class A | | | 130,156 | |
| | 967,435 | | | | | Zhengzhou Coal Mining Machinery Group Co., Ltd. Class A | | | 2,086,639 | |
| | 264,000 | | | | | Zhenro Properties Group, Ltd.(a) | | | 20,400 | |
| | 549,000 | | | | | Zhongsheng Group Holdings, Ltd. | | | 3,866,511 | |
| | 154,965 | | | | | Zhuzhou Hongda Electronics Corp., Ltd. Class A | | | 1,630,043 | |
| | 40,600 | | | | | Zhuzhou Kibing Group Co., Ltd. Class A | | | 83,894 | |
| | 497,600 | | | | | Zijin Mining Group Co., Ltd. Class A | | | 879,804 | |
| | 3,278,000 | | | | | Zijin Mining Group Co., Ltd. Class H | | | 5,020,495 | |
| | 1,805,600 | | | | | Zoomlion Heavy Industry Science and Technology Co., Ltd. Class H(a) | | | 1,143,569 | |
| | 322,000 | | | | | Zylox-Tonbridge Medical Technology Co., Ltd.* (a) | | | 518,005 | |
| | | | | | | | | | |
| | | | | | | | | 440,063,115 | |
| | | | | | | | | | |
| | |
| | | | | | Czech Republic — 0.1% | |
| | 3,676 | | | | | CEZ AS | | | 154,942 | |
| | 157,760 | | | | | Moneta Money Bank AS | | | 642,793 | |
| | 91 | | | | | Philip Morris CR AS | | | 72,073 | |
| | | | | | | | | | |
| | | | | | | | | 869,808 | |
| | | | | | | | | | |
| | |
| | | | | | Egypt — 0.0% | |
| | 29,643 | | | | | Commercial International Bank Egypt SAE* | | | 74,902 | |
| | | | | | | | | | |
| | |
| | | | | | Hong Kong — 1.2% | |
| | 328,400 | | | | | AIA Group, Ltd. | | | 3,438,996 | |
| | 6,580,000 | | | | | Digital Domain Holdings, Ltd.* (a) | | | 459,154 | |
| | 32,800 | | | | | Hong Kong Exchanges & Clearing, Ltd. | | | 1,546,140 | |
| | 108,500 | | | | | Kingboard Laminates Holdings, Ltd. | | | 177,942 | |
| | 37,000 | | | | | PAX Global Technology, Ltd. | | | 30,350 | |
| | 1,169,000 | | | | | Sino Biopharmaceutical, Ltd. | | | 725,337 | |
| | 104,300 | | | | | Techtronic Industries Co., Ltd. | | | 1,680,658 | |
| | 2,156,000 | | | | | Vinda International Holdings, Ltd.(a) | | | 4,863,599 | |
| | 1,106,000 | | | | | Vitasoy International Holdings, Ltd.(a) | | | 2,096,241 | |
See accompanying Notes to the Financial Statements.
171
Mercer Emerging Markets Equity Fund
Schedule of Investments (Continued)
(showing percentage of net assets)
March 31, 2022
| | | | | | | | | | |
| Shares | | | | | Description | | Value ($) | |
| | |
| | | | | | Hong Kong — continued | |
| | 2,125,300 | | | | | Xinyi Glass Holdings, Ltd. | | | 5,106,822 | |
| | | | | | | | | | |
| | | | | | | | | 20,125,239 | |
| | | | | | | | | | |
| | |
| | | | | | Hungary — 0.1% | |
| | 12,118 | | | | | MOL Hungarian Oil & Gas Plc | | | 107,603 | |
| | 32,034 | | | | | OTP Bank Nyrt* | | | 1,169,256 | |
| | | | | | | | | | |
| | | | | | | | | 1,276,859 | |
| | | | | | | | | | |
| | |
| | | | | | India — 13.6% | |
| | 163,063 | | | | | Asian Paints, Ltd. | | | 6,587,594 | |
| | 103,412 | | | | | Axis Bank, Ltd.* | | | 1,028,908 | |
| | 114,680 | | | | | Bajaj Auto, Ltd. | | | 5,536,568 | |
| | 15,735 | | | | | Bajaj Consumer Care, Ltd. | | | 33,272 | |
| | 72,211 | | | | | Bajaj Finance, Ltd. | | | 6,863,934 | |
| | 1,182,600 | | | | | Bharat Electronics, Ltd. | | | 3,267,200 | |
| | 110,795 | | | | | Britannia Industries, Ltd. | | | 4,677,279 | |
| | 1,178,896 | | | | | Cipla, Ltd. | | | 15,814,986 | |
| | 6,640 | | | | | Clean Science & Technology, Ltd.* 144A | | | 173,804 | |
| | 281,097 | | | | | Colgate-Palmolive India, Ltd. | | | 5,711,747 | |
| | 129,900 | | | | | Coromandel International, Ltd. | | | 1,365,782 | |
| | 4,433 | | | | | Cummins India, Ltd. | | | 65,325 | |
| | 15,841 | | | | | Gujarat Narmada Valley Fertilizers & Chemicals, Ltd. | | | 175,084 | |
| | 23,218 | | | | | Gujarat State Fertilizers & Chemicals, Ltd. | | | 49,278 | |
| | 269,591 | | | | | Havells India, Ltd. | | | 4,074,462 | |
| | 698,593 | | | | | HCL Technologies, Ltd. | | | 10,660,199 | |
| | 605,563 | | | | | HDFC Bank, Ltd. | | | 11,685,098 | |
| | 15,590 | | | | | Hindustan Aeronautics, Ltd. | | | 305,361 | |
| | 59,056 | | | | | Hindustan Petroleum Corp., Ltd. | | | 209,352 | |
| | 33,608 | | | | | Hindustan Unilever, Ltd. | | | 903,937 | |
| | 35,979 | | | | | Hindustan Zinc, Ltd. | | | 146,228 | |
| | 692,292 | | | | | Housing Development Finance Corp., Ltd. | | | 21,628,446 | |
| | 764,046 | | | | | ICICI Bank, Ltd. | | | 7,327,514 | |
| | 211,303 | | | | | Indiabulls Real Estate, Ltd.* | | | 278,061 | |
| | 896,141 | | | | | Infosys, Ltd. | | | 22,426,048 | |
| | 532,556 | | | | | Infosys, Ltd., ADR | | | 13,255,319 | |
| | 258,084 | | | | | InterGlobe Aviation, Ltd.* | | | 6,780,178 | |
| | 211,550 | | | | | Jai Balaji Industries, Ltd.* | | | 122,281 | |
| | 5,341 | | | | | Jindal Stainless Hisar, Ltd.* | | | 27,305 | |
| | 13,847 | | | | | Jindal Stainless, Ltd.* | | | 36,689 | |
| | 39,881 | | | | | Karnataka Bank, Ltd. (The) | | | 29,006 | |
| | 262,103 | | | | | Kotak Mahindra Bank, Ltd. | | | 6,024,230 | |
| | 910 | | | | | L&T Technology Services, Ltd. | | | 60,820 | |
| | 13,396 | | | | | Mahanagar Gas, Ltd. | | | 136,868 | |
| | 36,896 | | | | | Manappuram Finance, Ltd. | | | 54,950 | |
| | 29,214 | | | | | Mindtree, Ltd. | | | 1,649,124 | |
| | 2,650,073 | | | | | Motherson Sumi Wiring India, Ltd.* | | | 2,259,251 | |
| | 154,053 | | | | | Muthoot Finance, Ltd. | | | 2,706,733 | |
| | 75,146 | | | | | NBCC India, Ltd. | | | 35,749 | |
| | 168,425 | | | | | NCC, Ltd. | | | 128,771 | |
See accompanying Notes to the Financial Statements.
172
Mercer Emerging Markets Equity Fund
Schedule of Investments (Continued)
(showing percentage of net assets)
March 31, 2022
| | | | | | | | | | |
| Shares | | | | | Description | | Value ($) | |
| | |
| | | | | | India — continued | |
| | 1,136,200 | | | | | NMDC, Ltd. | | | 2,417,253 | |
| | 8,988 | | | | | Oberoi Realty, Ltd.* | | | 110,890 | |
| | 40,357 | | | | | Petronet LNG, Ltd. | | | 102,798 | |
| | 27,837 | | | | | Prestige Estates Projects, Ltd. | | | 179,073 | |
| | 67,515 | | | | | Redington India, Ltd. | | | 128,433 | |
| | 587,514 | | | | | Reliance Industries, Ltd. | | | 20,344,728 | |
| | 7,046 | | | | | Sobha, Ltd. | | | 65,053 | |
| | 592,000 | | | | | State Bank of India | | | 3,825,257 | |
| | 9,971 | | | | | Sun TV Network, Ltd. | | | 63,935 | |
| | 394,285 | | | | | Tata Consultancy Services, Ltd. | | | 19,405,869 | |
| | 40,209 | | | | | Titan Co., Ltd. | | | 1,340,093 | |
| | 90,208 | | | | | TV18 Broadcast, Ltd.* | | | 88,484 | |
| | 975,467 | | | | | UPL, Ltd. | | | 9,814,662 | |
| | 57,711 | | | | | Welspun Corp., Ltd. | | | 126,147 | |
| | 243,044 | | | | | Yes Bank, Ltd.* | | | 39,038 | |
| | | | | | | | | | |
| | | | | | | | | 222,354,454 | |
| | | | | | | | | | |
| | |
| | | | | | Indonesia — 1.6% | |
| | 1,610,400 | | | | | Adaro Energy Indonesia Tbk PT | | | 301,615 | |
| | 35,237,900 | | | | | Bank Central Asia Tbk PT | | | 19,523,186 | |
| | 2,025,900 | | | | | Bank Mandiri Persero Tbk PT | | | 1,111,622 | |
| | 1,551,841 | | | | | Bank Negara Indonesia Persero Tbk PT | | | 887,840 | |
| | 1,710,400 | | | | | Bank Pembangunan Daerah Jawa Timur Tbk PT | | | 94,109 | |
| | 8,642,225 | | | | | Bank Rakyat Indonesia Persero Tbk PT | | | 2,782,661 | |
| | 458,200 | | | | | Bukit Asam Tbk PT | | | 104,980 | |
| | 449,200 | | | | | Indo Tambangraya Megah Tbk PT | | | 894,451 | |
| | 27,750,400 | | | | | Panin Financial Tbk PT* | | | 332,289 | |
| | 55,100 | | | | | United Tractors Tbk PT | | | 97,849 | |
| | | | | | | | | | |
| | | | | | | | | 26,130,602 | |
| | | | | | | | | | |
| | |
| | | | | | Italy — 0.5% | |
| | 283,939 | | | | | Coca-Cola HBC AG* | | | 5,934,804 | |
| | 435,900 | | | | | Prada SpA | | | 2,756,020 | |
| | | | | | | | | | |
| | | | | | | | | 8,690,824 | |
| | | | | | | | | | |
| | |
| | | | | | Japan — 0.2% | |
| | 125,700 | | | | | Nexon Co., Ltd. | | | 3,016,959 | |
| | | | | | | | | | |
| | |
| | | | | | Malaysia — 0.0% | |
| | 195,000 | | | | | Kossan Rubber Industries Bhd | | | 90,847 | |
| | | | | | | | | | |
| | |
| | | | | | Mexico — 5.2% | |
| | 73,700 | | | | | America Movil SAB de CV Class L, ADR | | | 1,558,755 | |
| | 1,443,900 | | | | | America Movil SAB de CV Series L | | | 1,525,573 | |
| | 37,400 | | | | | Arca Continental SAB de CV | | | 253,166 | |
| | 149,856 | | | | | Banco del Bajio SA | | | 408,418 | |
| | 2,700 | | | | | Coca-Cola Femsa SAB de CV, ADR | | | 148,365 | |
| | 309,671 | | | | | Credito Real SAB de CV SOFOM ER* (a) | | | 26,864 | |
See accompanying Notes to the Financial Statements.
173
Mercer Emerging Markets Equity Fund
Schedule of Investments (Continued)
(showing percentage of net assets)
March 31, 2022
| | | | | | | | | | |
| Shares | | | | | Description | | Value ($) | |
| | |
| | | | | | Mexico — continued | |
| | 14,382 | | | | | El Puerto de Liverpool SAB de CV(a) | | | 73,331 | |
| | 101,580 | | | | | Fibra Uno Administracion SA de CV REIT | | | 118,685 | |
| | 66,400 | | | | | Fomento Economico Mexicano SAB de CV | | | 549,859 | |
| | 231,539 | | | | | Fomento Economico Mexicano SAB de CV, ADR | | | 19,183,006 | |
| | 4,505 | | | | | Gruma SAB de CV Class B | | | 56,338 | |
| | 13,300 | | | | | Grupo Aeroportuario del Centro Norte SAB de CV Class B | | | 98,740 | |
| | 866,200 | | | | | Grupo Aeroportuario del Pacifico SAB de CV Class B* | | | 13,926,873 | |
| | 200 | | | | | Grupo Aeroportuario del Sureste SAB de CV, ADR | | | 44,320 | |
| | 8,860 | | | | | Grupo Aeroportuario del Sureste SAB de CV Class B | | | 196,282 | |
| | 16,900 | | | | | Grupo Bimbo SAB de CV Series A | | | 50,847 | |
| | 2,707,896 | | | | | Grupo Financiero Banorte SAB de CV Series O | | | 20,343,846 | |
| | 29,700 | | | | | Grupo Financiero Inbursa SAB de CV Series O* (a) | | | 61,956 | |
| | 713,408 | | | | | Grupo Mexico SAB de CV Series B | | | 4,248,180 | |
| | 48,200 | | | | | Kimberly-Clark de Mexico SAB de CV Class A | | | 67,797 | |
| | 21,900 | | | | | Orbia Advance Corp. SAB de CV | | | 57,776 | |
| | 38,590 | | | | | Qualitas Controladora SAB de CV(a) | | | 219,519 | |
| | 68,818 | | | | | Regional SAB de CV | | | 479,573 | |
| | 84,300 | | | | | Ternium SA, ADR | | | 3,848,295 | |
| | 167,706 | | | | | Unifin Financiera SAB de CV* (a) | | | 200,066 | |
| | 4,213,815 | | | | | Wal-Mart de Mexico SAB de CV | | | 17,223,351 | |
| | | | | | | | | | |
| | | | | | | | | 84,969,781 | |
| | | | | | | | | | |
| | |
| | | | | | Netherlands — 0.8% | |
| | 177,099 | | | | | Heineken Holding NV | | | 13,941,159 | |
| | | | | | | | | | |
| | |
| | | | | | Panama — 0.0% | |
| | 498,551 | | | | | Bac Holding International Co.* (b) | | | 14,344 | |
| | | | | | | | | | |
| | |
| | | | | | Peru — 0.4% | |
| | 39,325 | | | | | Credicorp, Ltd. | | | 6,758,788 | |
| | | | | | | | | | |
| | |
| | | | | | Philippines — 0.3% | |
| | 24,260 | | | | | GT Capital Holdings, Inc.* | | | 258,084 | |
| | 61,020 | | | | | Manila Electric Co. | | | 440,180 | |
| | 9,529,300 | | | | | Megaworld Corp. | | | 553,429 | |
| | 149,700 | | | | | Puregold Price Club, Inc. | | | 103,325 | |
| | 518,600 | | | | | Semirara Mining & Power Corp. Class A | | | 306,271 | |
| | 1,269,150 | | | | | Universal Robina Corp. | | | 2,960,841 | |
| | | | | | | | | | |
| | | | | | | | | 4,622,130 | |
| | | | | | | | | | |
| | |
| | | | | | Poland — 0.3% | |
| | 8,059 | | | | | Bank Polska Kasa Opieki SA | | | 216,633 | |
| | 7,718 | | | | | Budimex SA | | | 412,536 | |
| | 49,521 | | | | | Dino Polska SA* | | | 3,989,290 | |
| | 21,500 | | | | | Polski Koncern Naftowy ORLEN SA | | | 389,952 | |
| | 61,444 | | | | | Polskie Gornictwo Naftowe i Gazownictwo SA | | | 91,268 | |
| | 2,987 | | | | | Powszechna Kasa Oszczednosci Bank Polski SA* | | | 28,317 | |
| | 76,771 | | | | | Powszechny Zaklad Ubezpieczen SA | | | 619,587 | |
| | | | | | | | | | |
| | | | | | | | | 5,747,583 | |
| | | | | | | | | | |
See accompanying Notes to the Financial Statements.
174
Mercer Emerging Markets Equity Fund
Schedule of Investments (Continued)
(showing percentage of net assets)
March 31, 2022
| | | | | | | | | | |
| Shares | | | | | Description | | Value ($) | |
| | |
| | | | | | Portugal — 0.3% | |
| | 221,232 | | | | | Jeronimo Martins SGPS SA | | | 5,330,673 | |
| | | | | | | | | | |
| | |
| | | | | | Qatar — 0.2% | |
| | 195,119 | | | | | Doha Bank QPSC | | | 138,308 | |
| | 34,998 | | | | | Qatar Electricity & Water Co. QSC | | | 175,725 | |
| | 339,529 | | | | | Qatar National Bank QPSC | | | 2,148,681 | |
| | 211,693 | | | | | Qatar National Cement Co. QSC | | | 301,291 | |
| | | | | | | | | | |
| | | | | | | | | 2,764,005 | |
| | | | | | | | | | |
| | |
| | | | | | Russia — 0.1% | |
| | 214,920 | | | | | Evraz Plc(b) (c) (d) | | | 5,660 | |
| | 1,522 | | | | | Gazprom Neft PJSC, ADR(b) (c) (d) | | | 365 | |
| | 229,600 | | | | | Gazprom PJSC, ADR(b) (c) (d) | | | 11,480 | |
| | 292,041 | | | | | Gazprom PJSC (OTC US Exchange), ADR(b) (c) (d) | | | 17,523 | |
| | 99,121 | | | | | Globaltrans Investment Plc, GDR(b) (c) (d) (e) | | | 3,965 | |
| | 67,845 | | | | | HeadHunter Group Plc, ADR(b) (c) (d) | | | 10,177 | |
| | 221,290 | | | | | LSR Group PJSC, GDR(b) (c) (d) (e) | | | 2,213 | |
| | 59,700 | | | | | LUKOIL PJSC, ADR(b) (c) (d) | | | 29,850 | |
| | 77,055 | | | | | LUKOIL PJSC (London Exchange), ADR(b) (c) (d) | | | 39,298 | |
| | 42,719 | | | | | Magnit PJSC, GDR(b) (c) (d) (e) | | | 3,418 | |
| | 75,743 | | | | | Magnitogorsk Iron & Steel Works PJSC, GDR(b) (c) (d) (e) | | | 6,059 | |
| | 152,499 | | | | | MMC Norilsk Nickel PJSC, ADR(b) (c) (d) | | | 36,600 | |
| | 12,100 | | | | | MMC Norilsk Nickel PJSC (OTC US Exchange), ADR(b) (c) (d) | | | 2,783 | |
| | 126,700 | | | | | Mobile Telesystems PJSC, ADR(b) (c) (d) | | | 7,602 | |
| | 10,900 | | | | | Novatek PJSC, GDR(b) (c) (d) (e) | | | 13,625 | |
| | 4,525 | | | | | Novatek PJSC (London Exchange), GDR(b) (c) (d) (e) | | | 5,656 | |
| | 171,550 | | | | | Novolipetsk Steel PJSC, GDR(b) (c) (d) | | | 44,603 | |
| | 16,074 | | | | | PhosAgro PJSC, GDR(b) (c) (d) (e) | | | 2,893 | |
| | 443,510 | | | | | Polymetal International Plc | | | 1,776,863 | |
| | 50,125 | | | | | Polyus PJSC, GDR(b) (c) (d) (e) | | | 39,098 | |
| | 83,852 | | | | | QIWI Plc, ADR(a) (b) (c) (d) | | | 5,031 | |
| | 1,341 | | | | | QIWI Plc (Moscow Exchange), ADR(b) (c) (d) | | | 61 | |
| | 91,459 | | | | | Raspadskaya OJSC(b) (c) (d) | | | 3,665 | |
| | 4,954 | | | | | Ros Agro Plc, GDR(b) (c) (d) (e) | | | 495 | |
| | 56,100 | | | | | Sberbank of Russia PJSC, ADR(b) (c) (d) | | | 2,244 | |
| | 1,317,945 | | | | | Sberbank of Russia PJSC (London Exchange), ADR(b) (c) (d) | | | 52,718 | |
| | 105,511 | | | | | Severstal PAO, GDR(b) (c) (d) (e) | | | 16,882 | |
| | 2,562,509 | | | | | Surgutneftegas PJSC, ADR(b) (c) (d) | | | 102,500 | |
| | 99,784 | | | | | Tatneft PJSC, ADR(b) (c) (d) | | | 29,935 | |
| | 16,391 | | | | | TCS Group Holding Plc, GDR* (b) (c) (d) (e) | | | 6,616 | |
| | 8,773 | | | | | TCS Group Holding Plc (London Exchange), GDR* (b) (c) (d) (e) | | | 3,158 | |
| | 109,700 | | | | | VEON, Ltd., ADR* | | | 74,903 | |
| | 47,122 | | | | | X5 Retail Group NV, GDR(b) (c) (d) (e) | | | 5,655 | |
| | | | | | | | | | |
| | | | | | | | | 2,363,594 | |
| | | | | | | | | | |
| | |
| | | | | | South Africa — 3.5% | |
| | 215,600 | | | | | Absa Group, Ltd. | | | 2,799,463 | |
| | 281 | | | | | Anglo American Platinum, Ltd. | | | 38,587 | |
| | 8,882 | | | | | AVI, Ltd. | | | 43,856 | |
See accompanying Notes to the Financial Statements.
175
Mercer Emerging Markets Equity Fund
Schedule of Investments (Continued)
(showing percentage of net assets)
March 31, 2022
| | | | | | | | | | |
| Shares | | | | | Description | | Value ($) | |
| | |
| | | | | | South Africa — continued | |
| | 97,114 | | | | | Capitec Bank Holdings, Ltd. | | | 15,515,630 | |
| | 585,307 | | | | | Clicks Group, Ltd. | | | 12,401,226 | |
| | 1,098,600 | | | | | FirstRand, Ltd.(a) | | | 5,801,033 | |
| | 95,021 | | | | | Investec, Ltd. | | | 632,867 | |
| | 15,034 | | | | | Kumba Iron Ore, Ltd.(a) | | | 665,877 | |
| | 159,125 | | | | | Lewis Group, Ltd. | | | 513,004 | |
| | 19,764 | | | | | Mr Price Group, Ltd. | | | 291,733 | |
| | 526,500 | | | | | MTN Group, Ltd.(a) | | | 6,822,034 | |
| | 138,000 | | | | | Nedbank Group, Ltd. | | | 2,192,810 | |
| | 67,000 | | | | | Northam Platinum Holdings, Ltd.* | | | 1,000,760 | |
| | 1,125,793 | | | | | RMB Holdings, Ltd. | | | 124,553 | |
| | 124,000 | | | | | Sasol, Ltd.* | | | 3,005,082 | |
| | 492,218 | | | | | SPAR Group, Ltd. (The) | | | 5,704,795 | |
| | 78,022 | | | | | Truworths International, Ltd. | | | 311,301 | |
| | | | | | | | | | |
| | | | | | | | | 57,864,611 | |
| | | | | | | | | | |
| | |
| | | | | | South Korea — 8.7% | |
| | 37,692 | | | | | BNK Financial Group, Inc. | | | 246,473 | |
| | 1,975 | | | | | Cheil Worldwide, Inc. | | | 38,263 | |
| | 154,653 | | | | | Coupang, Inc.* (a) | | | 2,734,265 | |
| | 3,903 | | | | | Coway Co., Ltd. | | | 220,027 | |
| | 151,055 | | | | | Daewoo Engineering & Construction Co., Ltd.* | | | 867,846 | |
| | 3,228 | | | | | Daou Data Corp. | | | 38,540 | |
| | 2,076 | | | | | DB Insurance Co., Ltd. | | | 119,370 | |
| | 1,563 | | | | | DL Holdings Co., Ltd. | | | 78,603 | |
| | 80,646 | | | | | Dongwon Development Co., Ltd. | | | 357,544 | |
| | 1,017 | | | | | Doosan Bobcat, Inc. | | | 32,304 | |
| | 26,004 | | | | | Douzone Bizon Co., Ltd. | | | 991,385 | |
| | 2,800 | | | | | Ecopro BM Co., Ltd. | | | 900,842 | |
| | 1,810 | | | | | Fila Holdings Corp. | | | 46,681 | |
| | 49,528 | | | | | GS Engineering & Construction Corp. | | | 1,885,192 | |
| | 2,015 | | | | | GS Holdings Corp. | | | 72,755 | |
| | 5,823 | | | | | GS Retail Co., Ltd. | | | 135,709 | |
| | 223,489 | | | | | Hana Financial Group, Inc. | | | 8,922,005 | |
| | 1,084 | | | | | Hana Materials, Inc. | | | 49,449 | |
| | 3,357 | | | | | Hankook Tire & Technology Co., Ltd. | | | 92,769 | |
| | 4,429 | | | | | Hanwha Aerospace Co., Ltd. | | | 190,041 | |
| | 88,686 | | | | | Hanwha Investment & Securities Co., Ltd. | | | 368,909 | |
| | 61,578 | | | | | HDC Hyundai Development Co-Engineering & Construction | | | 761,261 | |
| | 71,152 | | | | | Hyundai Engineering & Construction Co., Ltd. | | | 2,795,917 | |
| | 7,616 | | | | | Hyundai Marine & Fire Insurance Co., Ltd. | | | 200,791 | |
| | 575 | | | | | Hyundai Mobis Co., Ltd. | | | 101,553 | |
| | 10,615 | | | | | Industrial Bank of Korea | | | 94,381 | |
| | 64,372 | | | | | Kakao Corp. | | | 5,590,656 | |
| | 153,008 | | | | | KB Financial Group, Inc. | | | 7,692,083 | |
| | 1,877 | | | | | KC Tech Co., Ltd. | | | 33,354 | |
| | 554 | | | | | KCC Corp. | | | 154,401 | |
| | 1,920 | | | | | KCC Glass Corp. | | | 99,524 | |
| | 72,113 | | | | | Kia Corp. | | | 4,379,550 | |
See accompanying Notes to the Financial Statements.
176
Mercer Emerging Markets Equity Fund
Schedule of Investments (Continued)
(showing percentage of net assets)
March 31, 2022
| | | | | | | | | | |
| Shares | | | | | Description | | Value ($) | |
| | |
| | | | | | South Korea — continued | |
| | 1,992 | | | | | KIWOOM Securities Co., Ltd. | | | 161,515 | |
| | 2,101 | | | | | Korea Petrochemical Ind Co., Ltd. | | | 288,206 | |
| | 23,947 | | | | | Korea Real Estate Investment & Trust Co., Ltd. | | | 46,336 | |
| | 1,863 | | | | | Korea Zinc Co., Ltd. | | | 897,015 | |
| | 87,394 | | | | | KT&G Corp. | | | 5,816,308 | |
| | 35,296 | | | | | Kumho Petrochemical Co., Ltd.(a) | | | 4,482,976 | |
| | 40,226 | | | | | LG Corp. | | | 2,525,391 | |
| | 4,396 | | | | | LG Electronics, Inc. | | | 433,814 | |
| | 21,324 | | | | | LG Household & Health Care, Ltd. | | | 14,978,893 | |
| | 12,650 | | | | | LG Innotek Co., Ltd. | | | 4,002,985 | |
| | 7,550 | | | | | Lotte Chemical Corp. | | | 1,296,855 | |
| | 18,809 | | | | | Lotte Fine Chemical Co., Ltd. | | | 1,223,286 | |
| | 17,575 | | | | | LX Semicon Co., Ltd. | | | 2,090,776 | |
| | 16,670 | | | | | Namsun Aluminum Co., Ltd.* | | | 59,209 | |
| | 29,042 | | | | | NAVER Corp. | | | 8,120,818 | |
| | 3,573 | | | | | NH Investment & Securities Co., Ltd. | | | 33,489 | |
| | 208 | | | | | NHN KCP Corp.* | | | 4,571 | |
| | 22,482 | | | | | POSCO Holdings, Inc. | | | 5,399,531 | |
| | 3,700 | | | | | POSCO Holdings, Inc., ADR | | | 219,299 | |
| | 935 | | | | | Samsung Card Co., Ltd. | | | 24,867 | |
| | 18,600 | | | | | Samsung Electro-Mechanics Co., Ltd. | | | 2,510,835 | |
| | 428,064 | | | | | Samsung Electronics Co., Ltd. | | | 24,454,287 | |
| | 3,105 | | | | | Samsung Electronics Co., Ltd., GDR(f) | | | 4,386,252 | |
| | 569 | | | | | Samsung Electronics Co., Ltd. (London Exchange), GDR(a) (f) | | | 730,747 | |
| | 20,345 | | | | | Samsung Engineering Co., Ltd.* | | | 438,089 | |
| | 22,922 | | | | | Samsung Fire & Marine Insurance Co., Ltd. | | | 4,123,908 | |
| | 1,312 | | | | | Samsung Life Insurance Co., Ltd. | | | 71,083 | |
| | 1,413 | | | | | Samsung SDS Co., Ltd. | | | 160,587 | |
| | 3,108 | | | | | Samsung Securities Co., Ltd. | | | 106,953 | |
| | 23,048 | | | | | SD Biosensor, Inc. | | | 1,062,769 | |
| | 764 | | | | | Sebang Global Battery Co., Ltd. | | | 42,910 | |
| | 168,728 | | | | | Shinhan Financial Group Co., Ltd. | | | 5,754,830 | |
| | 6,611 | | | | | SL Corp. | | | 133,545 | |
| | 1,580 | | | | | TY Holdings Co., Ltd.* | | | 34,634 | |
| | 575 | | | | | Unid Co., Ltd. | | | 49,677 | |
| | 2,561 | | | | | Webzen, Inc.* | | | 51,610 | |
| | 413,007 | | | | | Woori Financial Group, Inc. | | | 5,181,180 | |
| | 23,305 | | | | | Woori Technology Investment Co., Ltd.* | | | 177,416 | |
| | | | | | | | | | |
| | | | | | | | | 141,869,895 | |
| | | | | | | | | | |
| | |
| | | | | | Taiwan — 17.7% | |
| | 15,227 | | | | | Acter Group Corp., Ltd. | | | 108,003 | |
| | 850,003 | | | | | Advantech Co., Ltd. | | | 10,896,106 | |
| | 75,194 | | | | | AmTRAN Technology Co., Ltd. | | | 43,771 | |
| | 37,000 | | | | | Arcadyan Technology Corp. | | | 155,467 | |
| | 869,998 | | | | | Asustek Computer, Inc. | | | 11,316,076 | |
| | 28,531 | | | | | Aten International Co., Ltd. | | | 81,603 | |
| | 1,408,000 | | | | | Catcher Technology Co., Ltd. | | | 7,076,504 | |
| | 4,538,995 | | | | | Cathay Financial Holding Co., Ltd. | | | 10,179,091 | |
See accompanying Notes to the Financial Statements.
177
Mercer Emerging Markets Equity Fund
Schedule of Investments (Continued)
(showing percentage of net assets)
March 31, 2022
| | | | | | | | | | |
| Shares | | | | | Description | | Value ($) | |
| | |
| | | | | | Taiwan — continued | |
| | 765,992 | | | | | Chailease Holding Co., Ltd. | | | 6,740,504 | |
| | 26,000 | | | | | Channel Well Technology Co., Ltd. | | | 34,248 | |
| | 177,110 | | | | | Chicony Electronics Co., Ltd. | | | 553,506 | |
| | 206,000 | | | | | China Steel Corp. | | | 278,597 | |
| | 176,013 | | | | | Chong Hong Construction Co., Ltd. | | | 449,396 | |
| | 222,000 | | | | | Chunghwa Telecom Co., Ltd. | | | 984,228 | |
| | 6,000 | | | | | Cleanaway Co., Ltd. | | | 41,553 | |
| | 272,416 | | | | | Coretronic Corp. | | | 664,174 | |
| | 106,818 | | | | | Delta Electronics, Inc. | | | 993,644 | |
| | 637,500 | | | | | E Ink Holdings, Inc. | | | 4,044,925 | |
| | 6,513,670 | | | | | E.Sun Financial Holding Co., Ltd. | | | 7,503,037 | |
| | 22,665 | | | | | Elan Microelectronics Corp. | | | 135,064 | |
| | 439,817 | | | | | Elite Material Co., Ltd. | | | 3,922,785 | |
| | 74,000 | | | | | eMemory Technology, Inc. | | | 4,710,012 | |
| | 177,092 | | | | | Farglory Land Development Co., Ltd. | | | 421,164 | |
| | 113,000 | | | | | First Financial Holding Co., Ltd. | | | 112,003 | |
| | 550,348 | | | | | FLEXium Interconnect, Inc.* | | | 1,941,521 | |
| | 17,000 | | | | | Formosa Chemicals & Fibre Corp. | | | 46,719 | |
| | 25,000 | | | | | Formosa Petrochemical Corp. | | | 82,162 | |
| | 1,022,000 | | | | | Formosa Plastics Corp. | | | 3,788,704 | |
| | 364,518 | | | | | Foxconn Technology Co., Ltd. | | | 796,130 | |
| | 5,489,791 | | | | | Fubon Financial Holding Co., Ltd. | | | 14,601,785 | |
| | 32,000 | | | | | Gamania Digital Entertainment Co., Ltd. | | | 76,222 | |
| | 602,000 | | | | | Giant Manufacturing Co., Ltd. | | | 5,442,110 | |
| | 114,000 | | | | | Gigabyte Technology Co., Ltd. | | | 511,492 | |
| | 727,777 | | | | | Grand Pacific Petrochemical | | | 691,466 | |
| | 20,000 | | | | | Greatek Electronics, Inc. | | | 51,649 | |
| | 385,000 | | | | | HannStar Display Corp. | | | 206,224 | |
| | 46,000 | | | | | Highwealth Construction Corp. | | | 72,784 | |
| | 53,000 | | | | | Holtek Semiconductor, Inc. | | | 218,964 | |
| | 2,539,277 | | | | | Hon Hai Precision Industry Co., Ltd. | | | 9,354,605 | |
| | 200,759 | | | | | Huaku Development Co., Ltd. | | | 630,677 | |
| | 118,000 | | | | | IEI Integration Corp. | | | 191,355 | |
| | 47,687 | | | | | International Games System Co., Ltd. | | | 1,270,633 | |
| | 58,000 | | | | | King’s Town Bank Co., Ltd. | | | 81,495 | |
| | 39,000 | | | | | Kung Long Batteries Industrial Co., Ltd. | | | 187,066 | |
| | 35,000 | | | | | Largan Precision Co., Ltd. | | | 2,290,276 | |
| | 286,443 | | | | | Lite-On Technology Corp. ADR | | | 678,640 | |
| | 100,442 | | | | | Lotes Co., Ltd. | | | 2,442,130 | |
| | 129,900 | | | | | Makalot Industrial Co., Ltd. | | | 928,469 | |
| | 563,810 | | | | | MediaTek, Inc. | | | 17,578,968 | |
| | 331,680 | | | | | Mercuries Life Insurance Co., Ltd.* | | | 96,892 | |
| | 275,000 | | | | | Merida Industry Co., Ltd. | | | 2,417,171 | |
| | 393,899 | | | | | Micro-Star International Co., Ltd. | | | 1,773,826 | |
| | 91,000 | | | | | Mitac Holdings Corp. | | | 93,485 | |
| | 520,000 | | | | | Nan Ya Plastics Corp. | | | 1,685,246 | |
| | 112,000 | | | | | Nan Ya Printed Circuit Board Corp. | | | 2,023,733 | |
| | 254,000 | | | | | Nantex Industry Co., Ltd. | | | 578,350 | |
| | 240,712 | | | | | Novatek Microelectronics Corp. | | | 3,552,858 | |
See accompanying Notes to the Financial Statements.
178
Mercer Emerging Markets Equity Fund
Schedule of Investments (Continued)
(showing percentage of net assets)
March 31, 2022
| | | | | | | | | | |
| Shares | | | | | Description | | Value ($) | |
| | |
| | | | | | Taiwan — continued | |
| | 55,000 | | | | | Pegatron Corp. | | | 138,676 | |
| | 7,692 | | | | | Pharmally International Holding Co., Ltd.* (b) (c) | | | — | |
| | 226,000 | | | | | Phison Electronics Corp. | | | 3,716,686 | |
| | 81,000 | | | | | Powertech Technology, Inc. | | | 267,341 | |
| | 773,998 | | | | | President Chain Store Corp. | | | 7,093,721 | |
| | 172,437 | | | | | Quanta Computer, Inc. | | | 528,162 | |
| | 103,525 | | | | | Radiant Opto-Electronics Corp. | | | 372,677 | |
| | 326,900 | | | | | Realtek Semiconductor Corp. | | | 4,871,710 | |
| | 21,206 | | | | | Sea, Ltd., ADR* | | | 2,540,267 | |
| | 33,000 | | | | | Shanghai Commercial & Savings Bank, Ltd. (The) | | | 57,489 | |
| | 115,000 | | | | | Shin Kong Financial Holding Co., Ltd. | | | 43,105 | |
| | 13,000 | | | | | Shin Zu Shing Co., Ltd. | | | 37,580 | |
| | 92,190 | | | | | Shinkong Insurance Co., Ltd. | | | 176,209 | |
| | 56,985 | | | | | Simplo Technology Co., Ltd. | | | 615,830 | |
| | 151,000 | | | | | SinoPac Financial Holdings Co., Ltd. | | | 96,627 | |
| | 5,000 | | | | | Sitronix Technology Corp. | | | 50,256 | |
| | 12,000 | | | | | Soft-World International Corp. | | | 38,086 | |
| | 124,000 | | | | | Syncmold Enterprise Corp. | | | 310,929 | |
| | 10,066 | | | | | Tah Hsin Industrial Corp. | | | 29,218 | |
| | 804,644 | | | | | Taiwan Cement Corp. | | | 1,399,431 | |
| | 2,202,859 | | | | | Taiwan Semiconductor Manufacturing Co., Ltd. | | | 45,542,863 | |
| | 543,298 | | | | | Taiwan Semiconductor Manufacturing Co., Ltd., ADR | | | 56,644,249 | |
| | 247,583 | | | | | Transcend Information, Inc. | | | 641,827 | |
| | 128,822 | | | | | Tripod Technology Corp. | | | 601,970 | |
| | 25,000 | | | | | Tung Ho Steel Enterprise Corp. | | | 61,179 | |
| | 3,134,351 | | | | | Uni-President Enterprises Corp. | | | 7,156,602 | |
| | 114,356 | | | | | United Integrated Services Co., Ltd. | | | 776,352 | |
| | 999,000 | | | | | United Microelectronics Corp. | | | 1,844,900 | |
| | 158,772 | | | | | Universal, Inc. | | | 250,992 | |
| | 727,100 | | | | | Vanguard International Semiconductor Corp. | | | 3,132,331 | |
| | 96,000 | | | | | Walsin Technology Corp.* | | | 474,061 | |
| | 109,000 | | | | | Youngtek Electronics Corp. | | | 307,040 | |
| | 1,443,400 | | | | | Yuanta Financial Holding Co., Ltd. | | | 1,326,943 | |
| | 5,506 | | | | | Yulon Nissan Motor Co., Ltd. | | | 48,268 | |
| | | | | | | | | | |
| | | | | | | | | 289,022,845 | |
| | | | | | | | | | |
| | |
| | | | | | Thailand — 0.5% | |
| | 266,800 | | | | | Advanced Info Service PCL, NVDR | | | 1,862,589 | |
| | 291,700 | | | | | Com7 PCL Class F | | | 377,236 | |
| | 63,200 | | | | | CP ALL PCL Class F | | | 123,074 | |
| | 85,700 | | | | | CP ALL PCL, NVDR | | | 166,843 | |
| | 21,500 | | | | | Delta Electronics Thailand PCL, NVDR | | | 249,380 | |
| | 33,700 | | | | | Kasikornbank PCL Class F | | | 163,367 | |
| | 44,700 | | | | | Kasikornbank PCL, NVDR | | | 215,846 | |
| | 874,800 | | | | | Pruksa Holding PCL Class F | | | 359,114 | |
| | 565,800 | | | | | PTT Exploration & Production PCL Class F | | | 2,447,027 | |
| | 36,100 | | | | | PTT Exploration & Production PCL, NVDR | | | 156,129 | |
| | 552,000 | | | | | Siam Commercial Bank PCL (The) Class F | | | 1,875,970 | |
| | 325,300 | | | | | Supalai PCL Class F | | | 211,942 | |
See accompanying Notes to the Financial Statements.
179
Mercer Emerging Markets Equity Fund
Schedule of Investments (Continued)
(showing percentage of net assets)
March 31, 2022
| | | | | | | | | | |
| Shares | | | | | Description | | Value ($) | |
| | |
| | | | | | Thailand — continued | |
| | 28,100 | | | | | Supalai PCL NVDR | | | 18,308 | |
| | | | | | | | | | |
| | | | | | | | | 8,226,825 | |
| | | | | | | | | | |
| | |
| | | | | | Turkey — 0.6% | |
| | 3,660,710 | | | | | Akbank TAS | | | 1,810,897 | |
| | 86,153 | | | | | Enerjisa Enerji AS | | | 94,961 | |
| | 23,212 | | | | | Eregli Demir ve Celik Fabrikalari TAS | | | 51,117 | |
| | 157,937 | | | | | Ford Otomotiv Sanayi AS | | | 3,213,344 | |
| | 994,022 | | | | | KOC Holding AS | | | 2,670,719 | |
| | 933,983 | | | | | Turkiye Garanti Bankasi AS | | | 776,569 | |
| | 1,892,339 | | | | | Yapi ve Kredi Bankasi AS | | | 526,015 | |
| | | | | | | | | | |
| | | | | | | | | 9,143,622 | |
| | | | | | | | | | |
| | |
| | | | | | United Arab Emirates — 0.2% | |
| | 41,498 | | | | | Dubai Islamic Bank PJSC | | | 69,552 | |
| | 1,045,867 | | | | | Network International Holdings Plc* | | | 3,838,723 | |
| | | | | | | | | | |
| | | | | | | | | 3,908,275 | |
| | | | | | | | | | |
| | |
| | | | | | United Kingdom — 1.0% | |
| | 931,600 | | | | | HSBC Holdings Plc(a) | | | 6,370,881 | |
| | 230,159 | | | | | Unilever Plc | | | 10,443,036 | |
| | | | | | | | | | |
| | | | | | | | | 16,813,917 | |
| | | | | | | | | | |
| | |
| | | | | | United States — 1.5% | |
| | 40,527 | | | | | Globant SA* | | | 10,620,911 | |
| | 1,096,800 | | | | | JBS SA | | | 8,593,075 | |
| | 46,000 | | | | | JS Global Lifestyle Co., Ltd. | | | 53,622 | |
| | 73,000 | | | | | Parade Technologies, Ltd. | | | 4,562,973 | |
| | | | | | | | | | |
| | | | | | | | | 23,830,581 | |
| | | | | | | | | | |
| | |
| | | | | | Uruguay — 0.1% | |
| | 78,351 | | | | | Dlocal, Ltd. Class A* | | | 2,449,252 | |
| | | | | | | | | | |
| | | |
| | | | | | TOTAL COMMON STOCKS (COST $1,582,544,529) | | | 1,506,328,617 | |
| | | | | | | | | | |
| | |
| | | | | | INVESTMENT COMPANY — 0.5% | |
| | |
| | | | | | United States — 0.5% | |
| | 157,138 | | | | | iShares Core MSCI Emerging Markets ETF | | | 8,729,016 | |
| | | | | | | | | | |
| | | |
| | | | | | TOTAL INVESTMENT COMPANY (COST $8,849,904) | | | 8,729,016 | |
| | | | | | | | | | |
| | |
| | | | | | PREFERRED STOCKS — 1.3% | |
| | |
| | | | | | Brazil — 0.9% | |
| | 699,706 | | | | | Banco Bradesco SA, 4.51% | | | 3,271,808 | |
| | 160,000 | | | | | Cia Energetica de Minas Gerais, 8.27% | | | 512,127 | |
| | 882,700 | | | | | Cia Paranaense de Energia, 9.67% | | | 1,404,310 | |
| | 87,800 | | | | | Gerdau SA, 10.19% | | | 569,265 | |
See accompanying Notes to the Financial Statements.
180
Mercer Emerging Markets Equity Fund
Schedule of Investments (Continued)
(showing percentage of net assets)
March 31, 2022
| | | | | | | | | | |
| Shares | | | | | Description | | Value ($) | |
| | |
| | | | | | Brazil — continued | |
| | 1,168,900 | | | | | Petroleo Brasileiro SA, 16.90% | | | 8,228,139 | |
| | | | | | | | | | |
| | | | | | | | | 13,985,649 | |
| | | | | | | | | | |
| | |
| | | | | | Chile — 0.0% | |
| | 127,321 | | | | | Embotelladora Andina SA, 6.93% Series B | | | 282,657 | |
| | | | | | | | | | |
| | |
| | | | | | Colombia — 0.0% | |
| | 498,551 | | | | | Grupo Aval Acciones y Valores SA, 6.34% | | | 113,106 | |
| | | | | | | | | | |
| | |
| | | | | | South Korea — 0.4% | |
| | 120,305 | | | | | Samsung Electronics Co., Ltd., 1.72% | | | 6,222,635 | |
| | | | | | | | | | |
| | |
| | | | | | Taiwan — 0.0% | |
| | 41,879 | | | | | Chailease Holding Co., Ltd., 1.18% | | | 148,378 | |
| | | | | | | | | | |
| | | |
| | | | | | TOTAL PREFERRED STOCKS (COST $17,688,164) | | | 20,752,425 | |
| | | | | | | | | | |
| | |
| | | | | | WARRANTS — 0.3% | |
| | |
| | | | | | China — 0.3% | |
| | 84,572 | | | | | Advanced Micro-Fabrication Equipment, Inc., Expires 08/29/22* | | | 1,552,657 | |
| | 210,374 | | | | | Arcsoft Corp., Ltd., Expires 12/15/22* | | | 958,885 | |
| | 29,284 | | | | | iRay Technology Co., Ltd., Expires 09/27/22* | | | 1,701,547 | |
| | | | | | | | | | |
| | | |
| | | | | | TOTAL WARRANT (COST $5,740,493) | | | 4,213,089 | |
| | | | | | | | | | |
| | | |
| Par Value ($) | | | | | Description | | Value ($) | |
| | | |
| | | | | | SHORT-TERM INVESTMENT — 0.4% | | | | |
| | | |
| | | | | | Mutual Fund - Securities Lending Collateral — 0.4% | | | |
| | 6,004,273 | | | | | State Street Institutional U.S. Government Money Market Fund, Premier Class, 0.25%(g) (h) | | | 6,004,273 | |
| | | | | | | | | | |
| | | |
| | | | | | TOTAL SHORT-TERM INVESTMENT (COST $6,004,273) | | | 6,004,273 | |
| | | | | | | | | | |
| | | |
| | | | | | TOTAL INVESTMENTS — 94.5% (Cost $1,620,827,363) | | | 1,546,027,420 | |
| | | |
| | | | | | Other Assets and Liabilities (net) — 5.5% | | | 90,566,831 | |
| | | | | | | | | | |
| | | |
| | | | | | NET ASSETS — 100.0% | | $1,636,594,251 | |
| | | | | | | | | | |
See accompanying Notes to the Financial Statements.
181
Mercer Emerging Markets Equity Fund
Schedule of Investments (Continued)
March 31, 2022
| | | | | | | | | | |
| | | | | | Notes to Schedule of Investments: | | | | |
| | | |
| | | | * | | Non-income producing security. | | | | |
| | | |
| | | | (a) | | All or a portion of this security is out on loan. | | | | |
| | | |
| | | | (b) | | Securities fair valued by the Valuation Committee as approved by the Board of Trustees. The total market value of the securities at year end is $526,172 which represents 0.0% of net assets. The aggregate cost of these securities held at March 31, 2022 was $88,967,268. | | | | |
| | | |
| | | | (c) | | Level 3 - significant unobservable inputs were used in determining the value of this security in the fund. | | | | |
| | | |
| | | | (d) | | Illiquid securities represent Russian securities impacted by the Russian/Ukraine crisis. The total market value of the securities at year end is $511,828 which represents 0.0% of net assets. The aggregate cost of these securities held at March 31, 2022 was $88,912,104. | | | | |
| | | |
| | | | (e) | | Restricted securities are not registered under the Securities Act of 1933 and are subject to legal restrictions on resale. These securities generally may be resold in transactions exempt from registration or to the public if the securities are subsequently registered. Disposal of these securities may involve time-consuming negotiations and prompt sale at an acceptable price may be difficult. As of year end, the market value of restricted securities was $109,733, which is 0.0% of net assets. See details shown in the Restricted Securities table that follows. | | | | |
| | | |
| | | | (f) | | Security exempt from registration under Regulation S of the Securities Act of 1933, which exempts from registration securities offered and sold outside the United States. Security may not be offered or sold in the United States except pursuant to an exemption from, or in a transaction not subject to, the registration requirements of the Securities Act of 1933. | | | | |
| | | |
| | | | (g) | | The rate disclosed is the 7-day net yield as of March 31, 2022. | | | | |
| | | |
| | | | (h) | | Represents an investment of securities lending cash collateral. | | | | |
| | | |
| | | | 144A | | Securities exempt from registration under Rule 144A of the Securities Act of 1933. These securities may be resold in transactions exempt from registration, normally to qualified institutional buyers. The total market value of the securities at year end is $1,281,085 which represents 0.1% of net assets. | | | | |
See accompanying Notes to the Financial Statements.
182
Mercer Emerging Markets Equity Fund
Schedule of Investments (Continued)
March 31, 2022
At March 31, 2022, the Fund held the following restricted securities:
| | | | | | | | | | | | | | |
Restricted Securities | | Acquisition Date | | Principal
Amount | | | Cost | | | Value | |
Globaltrans Investment Plc | | 03/05/21 | | USD | 99,121 | | | $ | 680,748 | | | $ | 3,965 | |
LSR Group PJSC | | 03/04/21 | | USD | 221,290 | | | | 503,078 | | | | 2,213 | |
Magnit PJSC | | 03/04/21 | | USD | 42,719 | | | | 637,479 | | | | 3,418 | |
Magnitogorsk Iron & Steel Works PJSC | | 03/05/21 | | USD | 75,743 | | | | 738,338 | | | | 6,059 | |
Novatek PJSC | | 03/23/21 | | USD | 10,900 | | | | 2,238,193 | | | | 13,625 | |
Novatek PJSC (London Exchange) | | 08/31/21 | | USD | 4,525 | | | | 1,111,647 | | | | 5,656 | |
PhosAgro PJSC | | 03/04/21 | | USD | 16,074 | | | | 319,376 | | | | 2,893 | |
Polyus PJSC | | 03/04/21 | | USD | 50,125 | | | | 4,868,401 | | | | 39,098 | |
Ros Agro Plc | | 02/09/22 | | USD | 4,954 | | | | 71,692 | | | | 495 | |
Severstal PAO | | 03/04/21 | | USD | 105,511 | | | | 2,093,359 | | | | 16,882 | |
TCS Group Holding Plc | | 10/20/21 | | RUB | 16,391 | | | | 1,550,503 | | | | 6,616 | |
TCS Group Holding Plc (London Exchange) | | 03/04/21 | | USD | 8,773 | | | | 527,567 | | | | 3,158 | |
X5 Retail Group NV | | 03/05/21 | | USD | 47,122 | | | | 1,547,335 | | | | 5,655 | |
| | | | | | | | | | | | | | |
| | | | | | | | | | | | $ | 109,733 | |
| | | | | | | | | | | | | | |
Futures Contracts
| | | | | | | | | | | | | | | | | | | | |
Number of
Contracts | | | | | Description | | | | Expiration Date | | | Notional
Value | | | Market Value/
Unrealized
Appreciation
(Depreciation) | |
| | Buys | | | | | | | | | | | | | | | | | | | |
| | 1,414 | | | | | MSCI Emerging Markets E-mini Index | | | | | Jun 2022 | | | $ | 79,572,850 | | | $ | 3,421,250 | |
| | | | | | | | | | | | | | | | | | | | |
| | Sales | | | | | | | | | | | | | | | | | | | |
| | 41 | | | | | SGX Nifty 50 Index | | | | | Apr 2022 | | | $ | 1,437,993 | | | $ | (12,051 | ) |
| | | | | | | | | | | | | | | | | | | | |
Abbreviations
| ADR | — American Depository Receipt |
| GDR | — Global Depository Receipt |
| NVDR | — Non-Voting Depository Receipt |
| REIT | — Real Estate Investment Trust |
See accompanying Notes to the Financial Statements.
183
Mercer Emerging Markets Equity Fund
Schedule of Investments (Continued)
March 31, 2022
| | | | | |
| Industry Sector Summary (Unaudited) | | % of Net Assets |
Financial | | | | 21.9 | |
Technology | | | | 19.6 | |
Consumer, Non-cyclical | | | | 13.2 | |
Industrial | | | | 9.7 | |
Consumer, Cyclical | | | | 8.8 | |
Communications | | | | 8.6 | |
Basic Materials | | | | 6.6 | |
Energy | | | | 4.0 | |
Utilities | | | | 1.0 | |
Unaffiliated Funds | | | | 0.5 | |
Diversified | | | | 0.2 | |
Short-Term Investment | | | | 0.4 | |
Other Assets and Liabilities (net) | | | | 5.5 | |
| | | | | |
| | | | 100.0 | % |
| | | | | |
See accompanying Notes to the Financial Statements.
184
Mercer Global Low Volatility Equity Fund
Schedule of Investments
(showing percentage of net assets)
March 31, 2022
| | | | | | | | | | |
| Shares | | | | | Description | | Value ($) | |
| | |
| | | | | | COMMON STOCKS — 94.9% | |
| | |
| | | | | | Australia — 1.6% | |
| | 807 | | | | | Aristocrat Leisure, Ltd. | | | 21,956 | |
| | 19,614 | | | | | BHP Group, Ltd. | | | 753,720 | |
| | 119,024 | | | | | Charter Hall Long WALE REIT REIT | | | 473,194 | |
| | 10,155 | | | | | Cochlear, Ltd. | | | 1,697,802 | |
| | 24,452 | | | | | EBOS Group, Ltd. | | | 703,006 | |
| | 164,510 | | | | | Gold Road Resources, Ltd. | | | 198,981 | |
| | 150,416 | | | | | Newcrest Mining, Ltd. | | | 2,996,573 | |
| | 668,212 | | | | | Perseus Mining, Ltd. | | | 972,580 | |
| | 27,146 | | | | | Rio Tinto Plc | | | 2,158,301 | |
| | 5,957 | | | | | Rio Tinto Plc, ADR(a) | | | 478,943 | |
| | 294,228 | | | | | Sonic Healthcare, Ltd. | | | 7,775,079 | |
| | 315,130 | | | | | South32, Ltd. | | | 1,177,640 | |
| | 885,479 | | | | | Telstra Corp., Ltd. | | | 2,620,616 | |
| | 6,390 | | | | | Vulcan Steel, Ltd. | | | 42,466 | |
| | | | | | | | | | |
| | | | | | | | | 22,070,857 | |
| | | | | | | | | | |
| | |
| | | | | | Austria — 0.0% | |
| | 22,588 | | | | | Telekom Austria AG Class A* | | | 175,413 | |
| | | | | | | | | | |
| | |
| | | | | | Bermuda — 0.0% | |
| | 3,573 | | | | | RenaissanceRe Holdings, Ltd. | | | 566,356 | |
| | | | | | | | | | |
| | |
| | | | | | Brazil — 0.0% | |
| | 10,091 | | | | | Yara International ASA | | | 506,655 | |
| | | | | | | | | | |
| | |
| | | | | | Burkina Faso — 0.0% | |
| | 25,166 | | | | | Endeavour Mining Plc | | | 628,163 | |
| | | | | | | | | | |
| | |
| | | | | | Canada — 3.9% | |
| | 38,000 | | | | | Atco, Ltd. Class I | | | 1,306,065 | |
| | 51,090 | | | | | BCE, Inc.(a) | | | 2,833,451 | |
| | 10,200 | | | | | Canadian Natural Resources, Ltd. | | | 632,146 | |
| | 181,700 | | | | | Canadian Pacific Railway, Ltd. | | | 14,997,518 | |
| | 69,400 | | | | | Canadian Utilities, Ltd. Class A | | | 2,129,145 | |
| | 6,200 | | | | | Canadian Western Bank | | | 180,383 | |
| | 6,400 | | | | | Cogeco, Inc. | | | 394,950 | |
| | 1,100 | | | | | DREAM Unlimited Corp. Class A(a) | | | 43,857 | |
| | 60,600 | | | | | Dundee Precious Metals, Inc. | | | 361,936 | |
| | 341 | | | | | E-L Financial Corp., Ltd. | | | 241,066 | |
| | 86,000 | | | | | Empire Co., Ltd. Class A | | | 3,052,912 | |
| | 3,600 | | | | | Equitable Group, Inc. | | | 206,768 | |
| | 7,000 | | | | | Evertz Technologies, Ltd. | | | 85,409 | |
| | 6,700 | | | | | First Capital Real Estate Investment Trust REIT | | | 96,285 | |
| | 30,900 | | | | | George Weston, Ltd. | | | 3,808,539 | |
| | 82,900 | | | | | Great-West Lifeco, Inc. | | | 2,445,087 | |
| | 1,000 | | | | | Guardian Capital Group, Ltd. Class A | | | 32,024 | |
| | 3,900 | | | | | Home Capital Group, Inc. Class B | | | 118,650 | |
| | 2,200 | | | | | IGM Financial, Inc. | | | 77,798 | |
See accompanying Notes to the Financial Statements.
185
Mercer Global Low Volatility Equity Fund
Schedule of Investments (Continued)
(showing percentage of net assets)
March 31, 2022
| | | | | | | | | | |
| Shares | | | | | Description | | Value ($) | |
| | |
| | | | | | Canada — continued | |
| | 10,148 | | | | | International Petroleum Corp.* | | | 96,533 | |
| | 18,100 | | | | | Laurentian Bank of Canada | | | 602,247 | |
| | 42,100 | | | | | Loblaw Cos., Ltd. | | | 3,781,096 | |
| | 35,500 | | | | | Metro, Inc. | | | 2,045,218 | |
| | 15,200 | | | | | National Bank of Canada | | | 1,166,179 | |
| | 58,100 | | | | | North West Co., Inc. (The) | | | 1,781,538 | |
| | 25,200 | | | | | Power Corp. of Canada(a) | | | 780,785 | |
| | 1,500 | | | | | Premium Brands Holdings Corp. Class A(a) | | | 131,344 | |
| | 3,700 | | | | | Quebecor, Inc. Class B | | | 88,275 | |
| | 1,600 | | | | | Richelieu Hardware, Ltd. | | | 58,336 | |
| | 25,400 | | | | | Royal Bank of Canada | | | 2,798,972 | |
| | 67,100 | | | | | SmartCentres Real Estate Investment Trust REIT | | | 1,763,655 | |
| | 4,900 | | | | | Stantec, Inc. | | | 246,010 | |
| | 83,300 | | | | | Stella-Jones, Inc. | | | 2,505,569 | |
| | 20,700 | | | | | TMX Group, Ltd. | | | 2,130,904 | |
| | 5,400 | | | | | Torex Gold Resources, Inc.* | | | 67,876 | |
| | 800 | | | | | Toromont Industries, Ltd. | | | 75,904 | |
| | 10,800 | | | | | Tourmaline Oil Corp. | | | 498,043 | |
| | 104,600 | | | | | Western Forest Products, Inc. | | | 168,325 | |
| | 14,900 | | | | | Winpak, Ltd.(a) | | | 458,076 | |
| | | | | | | | | | |
| | | | | | | | | 54,288,874 | |
| | | | | | | | | | |
| | |
| | | | | | China — 0.6% | |
| | 2,331,162 | | | | | CITIC Telecom International Holdings, Ltd. | | | 856,555 | |
| | 151,000 | | | | | Kerry Logistics Network, Ltd. | | | 344,721 | |
| | 87,958 | | | | | NetEase, Inc., ADR | | | 7,888,953 | |
| | | | | | | | | | |
| | | | | | | | | 9,090,229 | |
| | | | | | | | | | |
| | |
| | | | | | Denmark — 0.5% | |
| | 918 | | | | | AP Moller — Maersk AS Class B | | | 2,783,027 | |
| | 7,600 | | | | | DSV AS | | | 1,461,670 | |
| | 463 | | | | | Genmab AS* | | | 168,699 | |
| | 22,523 | | | | | Novo Nordisk AS Class B | | | 2,508,805 | |
| | | | | | | | | | |
| | | | | | | | | 6,922,201 | |
| | | | | | | | | | |
| | |
| | | | | | Finland — 0.2% | |
| | 64,399 | | | | | Fortum OYJ | | | 1,175,820 | |
| | 10,091 | | | | | Kesko OYJ Class B | | | 280,133 | |
| | 2,136 | | | | | Nordea Bank Abp(a) | | | 22,192 | |
| | 33,343 | | | | | Orion OYJ Class B | | | 1,521,755 | |
| | | | | | | | | | |
| | | | | | | | | 2,999,900 | |
| | | | | | | | | | |
| | |
| | | | | | France — 2.7% | |
| | 3,842 | | | | | Air Liquide SA | | | 676,005 | |
| | 5,995 | | | | | Arkema SA | | | 719,357 | |
| | 1,035 | | | | | Boiron SA | | | 44,460 | |
| | 7,951 | | | | | Bureau Veritas SA | | | 228,421 | |
| | 2,875 | | | | | Cie Generale des Etablissements Michelin SCA | | | 390,639 | |
See accompanying Notes to the Financial Statements.
186
Mercer Global Low Volatility Equity Fund
Schedule of Investments (Continued)
(showing percentage of net assets)
March 31, 2022
| | | | | | | | | | |
| Shares | | | | | Description | | Value ($) | |
| | |
| | | | | | France — continued | |
| | 40,495 | | | | | Dassault Systemes SE | | | 2,006,935 | |
| | 8,779 | | | | | Derichebourg SA | | | 91,960 | |
| | 690 | | | | | Esker SA | | | 129,815 | |
| | 4,394 | | | | | IPSOS | | | 219,149 | |
| | 3,709 | | | | | L’Oreal SA | | | 1,493,175 | |
| | 21,611 | | | | | Legrand SA | | | 2,066,379 | |
| | 552 | | | | | Manutan International | | | 41,349 | |
| | 2,173 | | | | | Orange SA | | | 25,844 | |
| | 11,900 | | | | | Publicis Groupe SA | | | 727,066 | |
| | 97,593 | | | | | Safran SA | | | 11,536,487 | |
| | 24,786 | | | | | Sanofi | | | 2,542,407 | |
| | 304 | | | | | Savencia SA | | | 20,522 | |
| | 4,673 | | | | | Societe BIC SA | | | 237,370 | |
| | 16,945 | | | | | Societe Generale SA | | | 455,930 | |
| | 214 | | | | | Societe LDC SA | | | 20,232 | |
| | 1,227 | | | | | Somfy SA | | | 198,621 | |
| | 554 | | | | | Stef SA | | | 61,525 | |
| | 45,608 | | | | | Technip Energies NV* | | | 558,774 | |
| | 397 | | | | | Trigano SA | | | 57,845 | |
| | 1,091 | | | | | Vetoquinol SA | | | 161,106 | |
| | 107,500 | | | | | Vinci SA | | | 11,054,133 | |
| | 18,729 | | | | | Wendel SE | | | 1,916,650 | |
| | | | | | | | | | |
| | | | | | | | | 37,682,156 | |
| | | | | | | | | | |
| | |
| | | | | | Georgia — 0.0% | |
| | 11,481 | | | | | Bank of Georgia Group Plc | | | 179,207 | |
| | | | | | | | | | |
| | |
| | | | | | Germany — 1.4% | |
| | 4,474 | | | | | Aurubis AG | | | 537,858 | |
| | 5,905 | | | | | Bayer AG | | | 406,341 | |
| | 83,782 | | | | | Beiersdorf AG | | | 8,854,858 | |
| | 556 | | | | | Dermapharm Holding SE | | | 35,746 | |
| | 47,225 | | | | | Deutsche Post AG | | | 2,280,795 | |
| | 111,872 | | | | | Deutsche Telekom AG | | | 2,101,537 | |
| | 14,012 | | | | | Freenet AG | | | 377,779 | |
| | 7,861 | | | | | GEA Group AG | | | 326,668 | |
| | 2,128 | | | | | McKesson Europe AG | | | 54,052 | |
| | 14,778 | | | | | Merck KGaA | | | 3,112,846 | |
| | 2,752 | | | | | ProCredit Holding AG & Co. KGaA | | | 10,990 | |
| | 2,403 | | | | | Siltronic AG | | | 248,367 | |
| | 8,485 | | | | | Symrise AG Class A | | | 1,024,542 | |
| | 1,109 | | | | | Wuestenrot & Wuerttembergische AG | | | 22,511 | |
| | | | | | | | | | |
| | | | | | | | | 19,394,890 | |
| | | | | | | | | | |
| | |
| | | | | | Hong Kong — 0.9% | |
| | 77,200 | | | | | Bank of East Asia, Ltd. (The) | | | 120,884 | |
| | 177,500 | | | | | CLP Holdings, Ltd. | | | 1,730,136 | |
| | 352,136 | | | | | Dah Sing Banking Group, Ltd. | | | 310,896 | |
| | 25,900 | | | | | Dairy Farm International Holdings, Ltd. | | | 72,657 | |
See accompanying Notes to the Financial Statements.
187
Mercer Global Low Volatility Equity Fund
Schedule of Investments (Continued)
(showing percentage of net assets)
March 31, 2022
| | | | | | | | | | |
| Shares | | | | | Description | | Value ($) | |
| | |
| | | | | | Hong Kong — continued | |
| | 342,000 | | | | | Emperor International Holdings, Ltd. | | | 35,245 | |
| | 329,000 | | | | | HK Electric Investments & HK Electric Investments, Ltd. | | | 321,242 | |
| | 1,823,000 | | | | | HKT Trust & HKT, Ltd. | | | 2,502,483 | |
| | 16,000 | | | | | Hong Kong Ferry Holdings Co., Ltd.(a) | | | 14,211 | |
| | 49,000 | | | | | Kowloon Development Co., Ltd. | | | 65,599 | |
| | 249,000 | | | | | Langham Hospitality Investments and Langham Hospitality Investments, Ltd.* | | | 28,879 | |
| | 38,000 | | | | | Liu Chong Hing Investment, Ltd. | | | 35,797 | |
| | 12,000 | | | | | Miramar Hotel & Investment(a) | | | 19,137 | |
| | 4,095,000 | | | | | PCCW, Ltd. | | | 2,306,737 | |
| | 373,000 | | | | | Power Assets Holdings, Ltd. | | | 2,430,214 | |
| | 300,000 | | | | | Regal Hotels International Holdings, Ltd.* | | | 122,829 | |
| | 219,000 | | | | | Regal Real Estate Investment Trust REIT | | | 41,277 | |
| | 120,500 | | | | | SmarTone Telecommunications Holdings, Ltd. | | | 64,228 | |
| | 58,000 | | | | | Transport International Holdings, Ltd. | | | 94,414 | |
| | 230,163 | | | | | VTech Holdings, Ltd. | | | 1,671,434 | |
| | 3,000 | | | | | Wing On Co. International, Ltd. | | | 6,803 | |
| | | | | | | | | | |
| | | | | | | | | 11,995,102 | |
| | | | | | | | | | |
| | |
| | | | | | Indonesia — 0.0% | |
| | 229,900 | | | | | Bumitama Agri, Ltd. | | | 129,094 | |
| | | | | | | | | | |
| | |
| | | | | | Ireland — 0.6% | |
| | 32,750 | | | | | ICON Plc, ADR* | | | 7,965,455 | |
| | | | | | | | | | |
| | |
| | | | | | Israel — 1.0% | |
| | 108,531 | | | | | Bank Hapoalim BM | | | 1,070,004 | |
| | 48,659 | | | | | Bank Leumi Le-Israel BM | | | 522,332 | |
| | 44,983 | | | | | Bezeq Israeli Telecommunication Corp., Ltd.* | | | 77,040 | |
| | 51,479 | | | | | Check Point Software Technologies, Ltd.* | | | 7,117,487 | |
| | 17,432 | | | | | First International Bank Of Israel, Ltd. (The) | | | 748,108 | |
| | 15,037 | | | | | ICL Group, Ltd. | | | 178,762 | |
| | 3 | | | | | Isracard, Ltd. | | | 14 | |
| | 59,961 | | | | | Israel Discount Bank, Ltd. Class A | | | 372,547 | |
| | 30,510 | | | | | Mizrahi Tefahot Bank, Ltd. | | | 1,186,776 | |
| | 39,509 | | | | | Radware, Ltd.* | | | 1,263,103 | |
| | 56,884 | | | | | Strauss Group, Ltd. | | | 1,694,253 | |
| | 1,968 | | | | | ZIM Integrated Shipping Services, Ltd. | | | 143,093 | |
| | | | | | | | | | |
| | | | | | | | | 14,373,519 | |
| | | | | | | | | | |
| | |
| | | | | | Italy — 0.2% | |
| | 6,083 | | | | | Coca-Cola HBC AG* | | | 127,145 | |
| | 190,687 | | | | | Eni SpA | | | 2,811,854 | |
| | 2,516 | | | | | Recordati Industria Chimica e Farmaceutica SpA | | | 127,217 | |
| | | | | | | | | | |
| | | | | | | | | 3,066,216 | |
| | | | | | | | | | |
| | |
| | | | | | Japan — 3.8% | |
| | 8,300 | | | | | Amano Corp. | | | 149,042 | |
| | 21,400 | | | | | Aozora Bank, Ltd.(a) | | | 452,931 | |
See accompanying Notes to the Financial Statements.
188
Mercer Global Low Volatility Equity Fund
Schedule of Investments (Continued)
(showing percentage of net assets)
March 31, 2022
| | | | | | | | | | |
| Shares | | | | | Description | | Value ($) | |
| | |
| | | | | | Japan — continued | |
| | 46,800 | | | | | Arcs Co., Ltd. | | | 814,324 | |
| | 14,500 | | | | | ARTERIA Networks Corp. | | | 155,832 | |
| | 8,000 | | | | | Autobacs Seven Co., Ltd. | | | 88,344 | |
| | 7,200 | | | | | Axial Retailing, Inc. | | | 188,969 | |
| | 2,100 | | | | | Belc Co., Ltd. | | | 93,625 | |
| | 2,500 | | | | | Benesse Holdings, Inc. | | | 46,032 | |
| | 7,600 | | | | | Calbee, Inc.(a) | | | 146,946 | |
| | 2,000 | | | | | Canon Electronics, Inc. | | | 26,286 | |
| | 12,100 | | | | | Canon Marketing Japan, Inc. | | | 249,618 | |
| | 9,600 | | | | | Cawachi, Ltd. | | | 177,385 | |
| | 11,900 | | | | | Doshisha Co., Ltd. | | | 146,010 | |
| | 32,289 | | | | | Earth Corp. | | | 1,476,465 | |
| | 22,000 | | | | | Ezaki Glico Co., Ltd. | | | 673,628 | |
| | 4,800 | | | | | Fujicco Co., Ltd.(a) | | | 76,188 | |
| | 18,900 | | | | | Heiwado Co., Ltd. | | | 294,288 | |
| | 15,000 | | | | | Hokuhoku Financial Group, Inc. | | | 109,667 | |
| | 35,700 | | | | | Hokuriku Electric Power Co. | | | 156,106 | |
| | 18,500 | | | | | Hokuto Corp.(a) | | | 289,745 | |
| | 65,700 | | | | | Hyakugo Bank, Ltd. (The) | | | 180,004 | |
| | 3,700 | | | | | Inaba Denki Sangyo Co., Ltd. | | | 75,290 | |
| | 7,300 | | | | | J-Oil Mills, Inc. | | | 96,330 | |
| | 6,600 | | | | | Japan Post Bank Co., Ltd.(a) | | | 53,316 | |
| | 9,700 | | | | | Japan Post Insurance Co., Ltd. | | | 170,191 | |
| | 148,901 | | | | | Japan Tobacco, Inc. | | | 2,556,575 | |
| | 3,800 | | | | | Juroku Financial Group, Inc. | | | 67,709 | |
| | 43,855 | | | | | Kaken Pharmaceutical Co., Ltd. | | | 1,398,659 | |
| | 13,700 | | | | | Kato Sangyo Co., Ltd. | | | 356,181 | |
| | 77,200 | | | | | KDDI Corp. | | | 2,543,360 | |
| | 49,900 | | | | | Keiyo Bank, Ltd. (The) | | | 201,258 | |
| | 1,900 | | | | | Komeri Co., Ltd. | | | 40,976 | |
| | 2,600 | | | | | Kyocera Corp. | | | 146,582 | |
| | 82,500 | | | | | KYORIN Holdings, Inc. | | | 1,202,557 | |
| | 15,500 | | | | | Lawson, Inc. | | | 594,176 | |
| | 14,400 | | | | | Lintec Corp. | | | 287,172 | |
| | 10,100 | | | | | Lion Corp.(a) | | | 112,927 | |
| | 11,800 | | | | | Maruichi Steel Tube, Ltd. | | | 267,121 | |
| | 10,400 | | | | | MEIJI Holdings Co., Ltd. | | | 565,722 | |
| | 5,600 | | | | | Miroku Jyoho Service Co., Ltd. | | | 65,195 | |
| | 80,300 | | | | | Mitsubishi Electric Corp. | | | 927,015 | |
| | 22,800 | | | | | Mitsubishi Shokuhin Co., Ltd. | | | 564,384 | |
| | 196,100 | | | | | Mizuho Financial Group, Inc. | | | 2,517,613 | |
| | 28,800 | | | | | Mochida Pharmaceutical Co., Ltd. | | | 883,020 | |
| | 69,200 | | | | | MS&AD Insurance Group Holdings, Inc. | | | 2,255,094 | |
| | 11,500 | | | | | Nakanishi, Inc. | | | 212,716 | |
| | 10,400 | | | | | Nanto Bank, Ltd. (The) | | | 167,977 | |
| | 2,900 | | | | | Nihon Chouzai Co., Ltd. | | | 31,614 | |
| | 52,300 | | | | | Nippn Corp. | | | 714,820 | |
| | 6,400 | | | | | Nippon Kanzai Co., Ltd. | | | 148,186 | |
| | 8,600 | | | | | Nippon Kayaku Co., Ltd. | | | 81,691 | |
See accompanying Notes to the Financial Statements.
189
Mercer Global Low Volatility Equity Fund
Schedule of Investments (Continued)
(showing percentage of net assets)
March 31, 2022
| | | | | | | | | | |
| Shares | | | | | Description | | Value ($) | |
| | |
| | | | | | Japan — continued | |
| | 96,000 | | | | | Nippon Telegraph & Telephone Corp. | | | 2,797,847 | |
| | 19,100 | | | | | Nisshin Oillio Group, Ltd. (The) | | | 447,788 | |
| | 17,000 | | | | | Oki Electric Industry Co., Ltd. | | | 117,693 | |
| | 28,800 | | | | | Okinawa Cellular Telephone Co. | | | 1,168,966 | |
| | 30,100 | | | | | Okinawa Electric Power Co., Inc. (The) | | | 341,736 | |
| | 2,300 | | | | | Osaka Soda Co., Ltd. | | | 58,746 | |
| | 41,800 | | | | | Otsuka Holdings Co., Ltd. | | | 1,450,311 | |
| | 52,600 | | | | | Resona Holdings, Inc. | | | 225,923 | |
| | 1,400 | | | | | Rohm Co., Ltd. | | | 109,138 | |
| | 800 | | | | | S&B Foods, Inc. | | | 24,254 | |
| | 15,300 | | | | | San-A Co., Ltd. | | | 519,292 | |
| | 96,200 | | | | | Sankyo Co., Ltd. | | | 2,676,909 | |
| | 9,200 | | | | | Santen Pharmaceutical Co., Ltd. | | | 92,373 | |
| | 28,900 | | | | | Sawai Group Holdings Co., Ltd. | | | 1,059,899 | |
| | 30,600 | | | | | Secom Co., Ltd. | | | 2,223,842 | |
| | 533,000 | | | | | Seven Bank, Ltd.(a) | | | 1,045,891 | |
| | 43,800 | | | | | Shinmaywa Industries, Ltd. | | | 325,264 | |
| | 35,500 | | | | | Shizuoka Bank, Ltd. (The) | | | 251,459 | |
| | 25,859 | | | | | Showa Sangyo Co., Ltd.(a) | | | 557,047 | |
| | 9,800 | | | | | SKY Perfect JSAT Holdings, Inc. | | | 33,292 | |
| | 205,700 | | | | | Softbank Corp. | | | 2,411,409 | |
| | 32,900 | | | | | Sompo Holdings, Inc. | | | 1,451,530 | |
| | 20 | | | | | SOSiLA Logistics REIT, Inc. REIT | | | 26,461 | |
| | 11,400 | | | | | Sumitomo Mitsui Financial Group, Inc. | | | 364,916 | |
| | 75,800 | | | | | Teijin, Ltd. | | | 847,020 | |
| | 34,100 | | | | | Toho Holdings Co., Ltd. | | | 517,395 | |
| | 103,300 | | | | | Tohoku Electric Power Co., Inc. | | | 606,222 | |
| | 25,100 | | | | | Tokio Marine Holdings, Inc. | | | 1,464,261 | |
| | 49,300 | | | | | Trend Micro, Inc. | | | 2,886,498 | |
| | 1,500 | | | | | Tv Tokyo Holdings Corp. | | | 24,478 | |
| | 35,200 | | | | | United Super Markets Holdings, Inc. | | | 305,340 | |
| | 4,600 | | | | | Valor Holdings Co., Ltd. | | | 79,708 | |
| | 50,400 | | | | | Vital KSK Holdings, Inc. | | | 303,795 | |
| | 4,300 | | | | | Wowow, Inc. | | | 56,725 | |
| | 5,400 | | | | | Yaoko Co., Ltd. | | | 294,983 | |
| | 18,400 | | | | | ZERIA Pharmaceutical Co., Ltd.(a) | | | 287,303 | |
| | | | | | | | | | |
| | | | | | | | | 52,752,576 | |
| | | | | | | | | | |
| | |
| | | | | | Jordan — 0.1% | |
| | 39,155 | | | | | Hikma Pharmaceuticals Plc | | | 1,055,844 | |
| | | | | | | | | | |
| | |
| | | | | | Luxembourg — 0.2% | |
| | 7,279 | | | | | APERAM SA | | | 323,136 | |
| | 19,882 | | | | | Eurofins Scientific SE | | | 1,982,362 | |
| | | | | | | | | | |
| | | | | | | | | 2,305,498 | |
| | | | | | | | | | |
| | |
| | | | | | Netherlands — 1.8% | |
| | 26,656 | | | | | ASML Holding NV | | | 17,882,404 | |
| | 591 | | | | | HAL Trust | | | 91,946 | |
See accompanying Notes to the Financial Statements.
190
Mercer Global Low Volatility Equity Fund
Schedule of Investments (Continued)
(showing percentage of net assets)
March 31, 2022
| | | | | | | | | | |
| Shares | | | | | Description | | Value ($) | |
| | |
| | | | | | Netherlands — continued | |
| | 49,755 | | | | | Koninklijke Ahold Delhaize NV | | | 1,608,690 | |
| | 25,756 | | | | | NN Group NV | | | 1,305,633 | |
| | 97,143 | | | | | Shell Plc | | | 2,691,287 | |
| | 9,840 | | | | | Wolters Kluwer NV | | | 1,053,523 | |
| | | | | | | | | | |
| | | | | | | | | 24,633,483 | |
| | | | | | | | | | |
| | |
| | | | | | New Zealand — 0.3% | |
| | 84,638 | | | | | Arvida Group, Ltd. | | | 101,042 | |
| | 4,996 | | | | | Fletcher Building, Ltd. | | | 22,066 | |
| | 8,467 | | | | | Fonterra Co-operative Group, Ltd. | | | 20,043 | |
| | 84,023 | | | | | Freightways, Ltd. | | | 720,281 | |
| | 65,420 | | | | | Heartland Group Holdings, Ltd.(a) | | | 102,078 | |
| | 18,064 | | | | | Mainfreight, Ltd.(a) | | | 1,048,141 | |
| | 631,323 | | | | | Spark New Zealand, Ltd. | | | 2,007,438 | |
| | 3,702 | | | | | Warehouse Group, Ltd. (The) | | | 8,536 | |
| | | | | | | | | | |
| | | | | | | | | 4,029,625 | |
| | | | | | | | | | |
| | |
| | | | | | Norway — 0.6% | |
| | 45,221 | | | | | DNB Bank ASA | | | 1,030,830 | |
| | 63,340 | | | | | Equinor ASA | | | 2,392,984 | |
| | 31,642 | | | | | Kongsberg Gruppen ASA | | | 1,265,241 | |
| | 244,319 | | | | | Norsk Hydro ASA | | | 2,396,987 | |
| | 12,853 | | | | | SpareBank 1 SMN | | | 207,045 | |
| | 12,453 | | | | | Sparebanken Vest | | | 146,299 | |
| | 11,686 | | | | | Telenor ASA | | | 169,109 | |
| | 16,762 | | | | | Veidekke ASA | | | 234,050 | |
| | | | | | | | | | |
| | | | | | | | | 7,842,545 | |
| | | | | | | | | | |
| | |
| | | | | | Portugal — 0.2% | |
| | 122,517 | | | | | Jeronimo Martins SGPS SA | | | 2,952,096 | |
| | | | | | | | | | |
| | |
| | | | | | Puerto Rico — 0.2% | |
| | 28,200 | | | | | Popular, Inc. | | | 2,305,068 | |
| | | | | | | | | | |
| | |
| | | | | | Singapore — 0.5% | |
| | 13,075 | | | | | Best World International, Ltd.* (a) (b) (c) | | | — | |
| | 13,600 | | | | | Frasers Centrepoint, Ltd. | | | 11,340 | |
| | 12,000 | | | | | Great Eastern Holdings, Ltd. | | | 188,941 | |
| | 44,804 | | | | | Hong Leong Finance, Ltd.(a) | | | 85,383 | |
| | 22,000 | | | | | Hour Glass, Ltd. (The) | | | 37,802 | |
| | 39,200 | | | | | Jardine Cycle & Carriage, Ltd. | | | 722,917 | |
| | 3,404,049 | | | | | NetLink NBN Trust | | | 2,451,177 | |
| | 11,900 | | | | | SBS Transit, Ltd. | | | 26,214 | |
| | 1,888,801 | | | | | Sheng Siong Group, Ltd. | | | 2,119,633 | |
| | 33,000 | | | | | Singapore Land Group, Ltd. | | | 62,181 | |
| | 556,300 | | | | | Singapore Technologies Engineering, Ltd. | | | 1,688,780 | |
| | | | | | | | | | |
| | | | | | | | | 7,394,368 | |
| | | | | | | | | | |
See accompanying Notes to the Financial Statements.
191
Mercer Global Low Volatility Equity Fund
Schedule of Investments (Continued)
(showing percentage of net assets)
March 31, 2022
| | | | | | | | | | |
| Shares | | | | | Description | | Value ($) | |
| | |
| | | | | | South Africa — 0.1% | |
| | 16,792 | | | | | Anglo American Plc | | | 868,051 | |
| | | | | | | | | | |
| | |
| | | | | | South Korea — 0.4% | |
| | 3,729 | | | | | Samsung Electronics Co., Ltd., GDR(d) | | | 5,267,740 | |
| | | | | | | | | | |
| | |
| | | | | | Spain — 0.6% | |
| | 53,846 | | | | | Aena SME SA* | | | 8,971,537 | |
| | 92 | | | | | Cia de Distribucion Integral Logista Holdings SA | | | 1,691 | |
| | | | | | | | | | |
| | | | | | | | | 8,973,228 | |
| | | | | | | | | | |
| | |
| | | | | | Sweden — 0.4% | |
| | 130,424 | | | | | Akelius Residential Property AB Class D(a) | | | 267,482 | |
| | 50,581 | | | | | Axfood AB | | | 1,659,888 | |
| | 215,131 | | | | | Telefonaktiebolaget LM Ericsson Class B | | | 1,985,976 | |
| | 511,760 | | | | | Telia Co. AB(a) | | | 2,067,653 | |
| | | | | | | | | | |
| | | | | | | | | 5,980,999 | |
| | | | | | | | | | |
| | |
| | | | | | Switzerland — 3.9% | |
| | 4,888 | | | | | AEVIS VICTORIA SA* | | | 96,669 | |
| | 1,236 | | | | | Allreal Holding AG | | | 265,800 | |
| | 1,348 | | | | | Banque Cantonale de Geneve | | | 239,499 | |
| | 876 | | | | | Barry Callebaut AG | | | 2,059,748 | |
| | 168 | | | | | Basellandschaftliche Kantonalbank | | | 162,765 | |
| | 1,370 | | | | | Berner Kantonalbank AG | | | 333,148 | |
| | 12,362 | | | | | BKW AG | | | 1,553,808 | |
| | 131 | | | | | Chocoladefabriken Lindt & Spruengli AG | | | 1,559,921 | |
| | 2,119 | | | | | Emmi AG | | | 2,320,636 | |
| | 402 | | | | | Huber + Suhner AG | | | 37,717 | |
| | 5,304 | | | | | Kuehne + Nagel International AG | | | 1,509,073 | |
| | 275 | | | | | Luzerner Kantonalbank AG | | | 129,447 | |
| | 284 | | | | | Mobimo Holding AG* | | | 90,876 | |
| | 125,386 | | | | | Nestle SA | | | 16,344,928 | |
| | 33,537 | | | | | Novartis AG | | | 2,953,389 | |
| | 37,084 | | | | | Roche Holding AG | | | 14,726,366 | |
| | 257 | | | | | SGS SA | | | 717,053 | |
| | 6,322 | | | | | Sonova Holding AG | | | 2,647,800 | |
| | 717 | | | | | St. Galler Kantonalbank AG | | | 359,066 | |
| | 476 | | | | | Straumann Holding AG | | | 764,813 | |
| | 3,835 | | | | | Swiss Life Holding AG | | | 2,457,937 | |
| | 4,310 | | | | | Swisscom AG | | | 2,598,358 | |
| | 603 | | | | | Thurgauer Kantonalbank | | | 73,694 | |
| | 1,508 | | | | | TX Group AG* | | | 251,326 | |
| | 1,211 | | | | | Valiant Holding AG | | | 125,654 | |
| | 10 | | | | | Warteck Invest AG | | | 25,732 | |
| | 1,668 | | | | | Zurich Insurance Group AG | | | 825,768 | |
| | | | | | | | | | |
| | | | | | | | | 55,230,991 | |
| | | | | | | | | | |
See accompanying Notes to the Financial Statements.
192
Mercer Global Low Volatility Equity Fund
Schedule of Investments (Continued)
(showing percentage of net assets)
March 31, 2022
| | | | | | | | | | |
| Shares | | | | | Description | | Value ($) | |
| | |
| | | | | | United Kingdom — 3.2% | |
| | 561,417 | | | | | Alliance Pharma Plc | | | 850,928 | |
| | 49,155 | | | | | Aviva Plc | | | 290,821 | |
| | 1,564,956 | | | | | BAE Systems Plc | | | 14,785,693 | |
| | 13,138 | | | | | BP Plc, ADR | | | 386,257 | |
| | 27,484 | | | | | Bunzl Plc | | | 1,071,026 | |
| | 7,827 | | | | | Croda International Plc | | | 806,234 | |
| | 34,328 | | | | | Dechra Pharmaceuticals Plc | | | 1,821,747 | |
| | 12,246 | | | | | EMIS Group Plc | | | 214,487 | |
| | 11,280 | | | | | Gamma Communications Plc | | | 200,937 | |
| | 18,158 | | | | | Genus Plc | | | 671,572 | |
| | 1,997 | | | | | Hill & Smith Holdings Plc | | | 38,474 | |
| | 207,468 | | | | | Howden Joinery Group Plc | | | 2,085,647 | |
| | 19,136 | | | | | Oxford Biomedica Plc* | | | 169,643 | |
| | 175,040 | | | | | Pan African Resources Plc | | | 51,325 | |
| | 65,119 | | | | | PZ Cussons Plc | | | 167,641 | |
| | 5,333 | | | | | Reckitt Benckiser Group Plc | | | 408,570 | |
| | 48,436 | | | | | RELX Plc | | | 1,512,139 | |
| | 214,288 | | | | | Sage Group Plc (The) | | | 1,969,581 | |
| | 103,833 | | | | | Spirent Communications Plc | | | 324,530 | |
| | 324,691 | | | | | St. James’s Place Plc | | | 6,135,879 | |
| | 78,738 | | | | | Tate & Lyle Plc | | | 758,104 | |
| | 205,408 | | | | | Tesco Plc | | | 744,316 | |
| | 211,651 | | | | | Unilever Plc | | | 9,635,688 | |
| | 4,972 | | | | | YouGov Plc | | | 89,215 | |
| | | | | | | | | | |
| | | | | | | | | 45,190,454 | |
| | | | | | | | | | |
| | |
| | | | | | United States — 65.0% | |
| | 21,200 | | | | | 3M Co. | | | 3,156,256 | |
| | 47,600 | | | | | Abbott Laboratories | | | 5,633,936 | |
| | 28,500 | | | | | AbbVie, Inc. | | | 4,620,135 | |
| | 20,137 | | | | | Accenture Plc Class A | | | 6,790,801 | |
| | 13,275 | | | | | Adobe, Inc.* | | | 6,048,356 | |
| | 27,800 | | | | | Akamai Technologies, Inc.* | | | 3,319,042 | |
| | 76,600 | | | | | Albertsons Cos., Inc. Class A | | | 2,546,950 | |
| | 4,550 | | | | | Alleghany Corp.* | | | 3,853,850 | |
| | 9,876 | | | | | Alphabet, Inc. Class A* | | | 27,468,613 | |
| | 85,700 | | | | | Altria Group, Inc. | | | 4,477,825 | |
| | 5,340 | | | | | Amazon.com, Inc.* | | | 17,408,133 | |
| | 53,571 | | | | | Amdocs, Ltd. | | | 4,404,072 | |
| | 2,550 | | | | | Amerco | | | 1,522,197 | |
| | 6,178 | | | | | Ameren Corp. | | | 579,249 | |
| | 5,213 | | | | | American Electric Power Co., Inc. | | | 520,101 | |
| | 23,700 | | | | | American Water Works Co., Inc. | | | 3,923,061 | |
| | 21,200 | | | | | AmerisourceBergen Corp. Class A | | | 3,279,852 | |
| | 16,800 | | | | | Amgen, Inc. | | | 4,062,576 | |
| | 10,546 | | | | | ANSYS, Inc.* | | | 3,349,937 | |
| | 9,800 | | | | | Anthem, Inc. | | | 4,813,956 | |
| | 43,300 | | | | | Apple, Inc. | | | 7,560,613 | |
| | 18,300 | | | | | Arch Capital Group, Ltd.* | | | 886,086 | |
See accompanying Notes to the Financial Statements.
193
Mercer Global Low Volatility Equity Fund
Schedule of Investments (Continued)
(showing percentage of net assets)
March 31, 2022
| | | | | | | | | | |
| Shares | | | | | Description | | Value ($) | |
| | |
| | | | | | United States — continued | |
| | 44,100 | | | | | Archer-Daniels-Midland Co. | | | 3,980,466 | |
| | 8,800 | | | | | Arrow Electronics, Inc.* | | | 1,043,944 | |
| | 19,684 | | | | | Arthur J. Gallagher & Co. | | | 3,436,826 | |
| | 3,800 | | | | | Atlassian Corp. Plc Class A* | | | 1,116,554 | |
| | 33,934 | | | | | Autodesk, Inc.* | | | 7,273,753 | |
| | 55,559 | | | | | Automatic Data Processing, Inc. | | | 12,641,895 | |
| | 600 | | | | | AutoNation, Inc.* | | | 59,748 | |
| | 1,100 | | | | | AutoZone, Inc.* | | | 2,249,038 | |
| | 14,200 | | | | | AvalonBay Communities, Inc. REIT | | | 3,526,854 | |
| | 6,500 | | | | | Avery Dennison Corp. | | | 1,130,805 | |
| | 9,400 | | | | | Axis Capital Holdings, Ltd. | | | 568,418 | |
| | 145,600 | | | | | Baxter International, Inc. | | | 11,289,824 | |
| | 70,749 | | | | | Becton Dickinson and Co. | | | 18,819,234 | |
| | 20,472 | | | | | Berkshire Hathaway, Inc. Class B* | | | 7,224,774 | |
| | 7,800 | | | | | BioMarin Pharmaceutical, Inc.* | | | 601,380 | |
| | 1,400 | | | | | BlackRock, Inc. | | | 1,069,838 | |
| | 12,300 | | | | | BOK Financial Corp. | | | 1,155,585 | |
| | 7,213 | | | | | Booking Holdings, Inc.* | | | 16,939,370 | |
| | 81,355 | | | | | Bristol-Myers Squibb Co. | | | 5,941,356 | |
| | 12,150 | | | | | Broadcom, Inc. | | | 7,650,612 | |
| | 6,600 | | | | | CACI International, Inc. Class A* | | | 1,988,316 | |
| | 26,835 | | | | | Cadence Design Systems, Inc.* | | | 4,413,284 | |
| | 21,200 | | | | | Camden Property Trust REIT | | | 3,523,440 | |
| | 13,600 | | | | | Casey’s General Stores, Inc. | | | 2,695,112 | |
| | 95,400 | | | | | Catalent, Inc.* | | | 10,579,860 | |
| | 12,900 | | | | | Cboe Global Markets, Inc. | | | 1,476,018 | |
| | 6,500 | | | | | CDW Corp. | | | 1,162,785 | |
| | 32,000 | | | | | CH Robinson Worldwide, Inc. | | | 3,446,720 | |
| | 6,000 | | | | | Charles River Laboratories International, Inc.* | | | 1,703,820 | |
| | 76,573 | | | | | Charles Schwab Corp. (The) | | | 6,455,870 | |
| | 37,700 | | | | | Charter Communications, Inc. Class A* | | | 20,566,104 | |
| | 5,800 | | | | | Chemed Corp. | | | 2,937,990 | |
| | 600 | | | | | Chevron Corp. | | | 97,698 | |
| | 19,900 | | | | | Chubb, Ltd. | | | 4,256,610 | |
| | 3,000 | | | | | Church & Dwight Co., Inc. | | | 298,140 | |
| | 13,300 | | | | | Cirrus Logic, Inc.* | | | 1,127,707 | |
| | 44,700 | | | | | Cisco Systems, Inc. | | | 2,492,472 | |
| | 18,300 | | | | | Clean Harbors, Inc.* | | | 2,043,012 | |
| | 200 | | | | | Clorox Co. (The) | | | 27,806 | |
| | 51,983 | | | | | CMS Energy Corp. | | | 3,635,691 | |
| | 90,300 | | | | | Coca-Cola Co. (The) | | | 5,598,600 | |
| | 44,800 | | | | | Colgate-Palmolive Co. | | | 3,397,184 | |
| | 20,649 | | | | | Consolidated Edison, Inc. | | | 1,955,047 | |
| | 15,665 | | | | | Cooper Cos., Inc. (The) | | | 6,541,547 | |
| | 25,500 | | | | | Copart, Inc.* | | | 3,199,485 | |
| | 58,100 | | | | | CoStar Group, Inc.* | | | 3,870,041 | |
| | 13,400 | | | | | Costco Wholesale Corp. | | | 7,716,390 | |
| | 18,600 | | | | | CubeSmart REIT | | | 967,758 | |
| | 156,100 | | | | | CVS Health Corp. | | | 15,798,881 | |
See accompanying Notes to the Financial Statements.
194
Mercer Global Low Volatility Equity Fund
Schedule of Investments (Continued)
(showing percentage of net assets)
March 31, 2022
| | | | | | | | | | |
| Shares | | | | | Description | | Value ($) | |
| | |
| | | | | | United States — continued | |
| | 4,622 | | | | | Danaher Corp. | | | 1,355,771 | |
| | 28,100 | | | | | Dell Technologies, Inc. Class C* | | | 1,410,339 | |
| | 2,100 | | | | | Dollar General Corp. | | | 467,523 | |
| | 29,477 | | | | | DTE Energy Co. | | | 3,897,154 | |
| | 34,400 | | | | | Duke Energy Corp. | | | 3,841,104 | |
| | 3,800 | | | | | Ecolab, Inc. | | | 670,928 | |
| | 88,208 | | | | | Electronic Arts, Inc. | | | 11,159,194 | |
| | 25,067 | | | | | Eli Lilly & Co. | | | 7,178,437 | |
| | 9,000 | | | | | Essex Property Trust, Inc. REIT | | | 3,109,320 | |
| | 38,120 | | | | | Estee Lauder Cos., Inc. (The) Class A | | | 10,380,838 | |
| | 8,700 | | | | | Evercore, Inc. Class A | | | 968,484 | |
| | 11,514 | | | | | Everest Re Group, Ltd. | | | 3,470,089 | |
| | 51,900 | | | | | Evergy, Inc. | | | 3,546,846 | |
| | 68,500 | | | | | Exelon Corp. | | | 3,262,655 | |
| | 36,000 | | | | | Expeditors International of Washington, Inc. | | | 3,713,760 | |
| | 17,100 | | | | | Extra Space Storage, Inc. REIT | | | 3,515,760 | |
| | 18,229 | | | | | Factset Research Systems, Inc. | | | 7,914,120 | |
| | 500 | | | | | Fair Isaac Corp.* | | | 233,230 | |
| | 12,300 | | | | | FedEx Corp. | | | 2,846,097 | |
| | 1,550 | | | | | First Citizens BancShares, Inc. Class A | | | 1,031,680 | |
| | 1,300 | | | | | First Republic Bank | | | 210,730 | |
| | 107,900 | | | | | Fiserv, Inc.* | | | 10,941,060 | |
| | 18,500 | | | | | Flowers Foods, Inc. | | | 475,635 | |
| | 7,000 | | | | | Fortinet, Inc.* | | | 2,392,180 | |
| | 143,747 | | | | | Fox Corp. Class A | | | 5,670,819 | |
| | 11,900 | | | | | FTI Consulting, Inc.* | | | 1,870,918 | |
| | 64,029 | | | | | Genpact, Ltd. | | | 2,785,902 | |
| | 46,900 | | | | | Gilead Sciences, Inc. | | | 2,788,205 | |
| | 123,921 | | | | | GlaxoSmithKline Plc | | | 2,678,329 | |
| | 966 | | | | | GlaxoSmithKline Plc, ADR | | | 42,079 | |
| | 10,646 | | | | | Hanover Insurance Group, Inc. (The) | | | 1,591,790 | |
| | 51,400 | | | | | Hawaiian Electric Industries, Inc. | | | 2,174,734 | |
| | 26,300 | | | | | Henry Schein, Inc.* | | | 2,293,097 | |
| | 21,426 | | | | | Hershey Co. (The) | | | 4,641,514 | |
| | 8,064 | | | | | Home Depot, Inc. (The) | | | 2,413,797 | |
| | 2,000 | | | | | ICU Medical, Inc.* | | | 445,280 | |
| | 23,200 | | | | | IDACORP, Inc. | | | 2,676,352 | |
| | 4,400 | | | | | IDEXX Laboratories, Inc.* | | | 2,407,064 | |
| | 8,020 | | | | | Illumina, Inc.* | | | 2,802,188 | |
| | 24,600 | | | | | Ingredion, Inc. | | | 2,143,890 | |
| | 29,876 | | | | | Intercontinental Exchange, Inc. | | | 3,947,217 | |
| | 37,375 | | | | | Intuit, Inc. | | | 17,971,395 | |
| | 9,200 | | | | | IQVIA Holdings, Inc.* | | | 2,127,132 | |
| | 4,000 | | | | | Jack Henry & Associates, Inc. | | | 788,200 | |
| | 23,500 | | | | | JB Hunt Transport Services, Inc. | | | 4,718,565 | |
| | 106,916 | | | | | Johnson & Johnson | | | 18,948,723 | |
| | 31,500 | | | | | JPMorgan Chase & Co. | | | 4,294,080 | |
| | 15,500 | | | | | Keysight Technologies, Inc.* | | | 2,448,535 | |
| | 5,200 | | | | | KLA Corp. | | | 1,903,512 | |
See accompanying Notes to the Financial Statements.
195
Mercer Global Low Volatility Equity Fund
Schedule of Investments (Continued)
(showing percentage of net assets)
March 31, 2022
| | | | | | | | | | |
| Shares | | | | | Description | | Value ($) | |
| | |
| | | | | | United States — continued | |
| | 93,000 | | | | | Kroger Co. (The) | | | 5,335,410 | |
| | 12,600 | | | | | Laboratory Corp. of America Holdings* | | | 3,322,116 | |
| | 1,200 | | | | | Lam Research Corp. | | | 645,132 | |
| | 17,800 | | | | | Landstar System, Inc. | | | 2,684,774 | |
| | 16,500 | | | | | Life Storage, Inc. REIT | | | 2,317,095 | |
| | 9,100 | | | | | Lockheed Martin Corp. | | | 4,016,740 | |
| | 3,200 | | | | | Lowe’s Cos., Inc. | | | 647,008 | |
| | 18,000 | | | | | LyondellBasell Industries NV Class A | | | 1,850,760 | |
| | 9,900 | | | | | Manhattan Associates, Inc.* | | | 1,373,229 | |
| | 2,520 | | | | | Markel Corp.* | | | 3,717,605 | |
| | 26,859 | | | | | Mastercard, Inc. Class A | | | 9,598,869 | |
| | 17,300 | | | | | McKesson Corp. | | | 5,296,049 | |
| | 18,306 | | | | | Medtronic Plc | | | 2,031,051 | |
| | 70,634 | | | | | Merck & Co., Inc. | | | 5,795,520 | |
| | 16,140 | | | | | Mercury General Corp. | | | 887,700 | |
| | 51,300 | | | | | Meta Platforms, Inc. Class A* | | | 11,407,068 | |
| | 600 | | | | | Mettler-Toledo International, Inc.* | | | 823,914 | |
| | 112,985 | | | | | Microsoft Corp. | | | 34,834,405 | |
| | 17,625 | | | | | Mid-America Apartment Communities, Inc. REIT | | | 3,691,556 | |
| | 56,522 | | | | | Moody’s Corp. | | | 19,071,088 | |
| | 3,300 | | | | | NewMarket Corp. | | | 1,070,454 | |
| | 66,351 | | | | | Newmont Corp. | | | 5,271,587 | |
| | 50,080 | | | | | NextEra Energy, Inc. | | | 4,242,277 | |
| | 26,400 | | | | | Northern Trust Corp. | | | 3,074,280 | |
| | 2,800 | | | | | O’Reilly Automotive, Inc.* | | | 1,917,888 | |
| | 14,100 | | | | | Old Dominion Freight Line, Inc. | | | 4,211,388 | |
| | 44,714 | | | | | Oracle Corp. | | | 3,699,189 | |
| | 8,000 | | | | | Paychex, Inc. | | | 1,091,760 | |
| | 36,948 | | | | | PepsiCo, Inc. | | | 6,184,356 | |
| | 117,234 | | | | | Pfizer, Inc. | | | 6,069,204 | |
| | 176,589 | | | | | Philip Morris International, Inc. | | | 16,588,771 | |
| | 50,380 | | | | | Procter & Gamble Co. (The) | | | 7,698,064 | |
| | 18,530 | | | | | Prologis, Inc. REIT | | | 2,992,224 | |
| | 7,500 | | | | | Public Service Enterprise Group, Inc. | | | 525,000 | |
| | 13,600 | | | | | Public Storage REIT | | | 5,307,808 | |
| | 41,100 | | | | | QIAGEN NV* | | | 2,013,900 | |
| | 7,392 | | | | | QIAGEN NV (London Exchange)* | | | 364,941 | |
| | 2,900 | | | | | QUALCOMM, Inc. | | | 443,178 | |
| | 33,750 | | | | | Raymond James Financial, Inc. | | | 3,709,463 | |
| | 4,250 | | | | | Regeneron Pharmaceuticals, Inc.* | | | 2,968,285 | |
| | 35,404 | | | | | Republic Services, Inc. Class A | | | 4,691,030 | |
| | 14,800 | | | | | ResMed, Inc. | | | 3,589,148 | |
| | 7,100 | | | | | Roper Technologies, Inc. | | | 3,352,833 | |
| | 27,400 | | | | | Royal Gold, Inc. | | | 3,871,072 | |
| | 23,314 | | | | | S&P Global, Inc. | | | 9,562,937 | |
| | 3,300 | | | | | salesforce.com, Inc.* | | | 700,656 | |
| | 59,800 | | | | | Schneider National, Inc. Class B | | | 1,524,900 | |
| | 100 | | | | | Seaboard Corp. | | | 420,549 | |
| | 4,300 | | | | | Seagen, Inc.* | | | 619,415 | |
See accompanying Notes to the Financial Statements.
196
Mercer Global Low Volatility Equity Fund
Schedule of Investments (Continued)
(showing percentage of net assets)
March 31, 2022
| | | | | | | | | | |
| Shares | | | | | Description | | Value ($) | |
| | |
| | | | | | United States — continued | |
| | 6,100 | | | | | Sempra Energy | | | 1,025,532 | |
| | 27,000 | | | | | Service Corp. International | | | 1,777,140 | |
| | 5,650 | | | | | ServiceNow, Inc.* | | | 3,146,429 | |
| | 23,800 | | | | | Southern Co. (The) | | | 1,725,738 | |
| | 14,972 | | | | | Synopsys, Inc.* | | | 4,989,718 | |
| | 17,700 | | | | | T-Mobile US, Inc.* | | | 2,271,795 | |
| | 12,700 | | | | | Take-Two Interactive Software, Inc.* | | | 1,952,498 | |
| | 23,600 | | | | | Target Corp. | | | 5,008,392 | |
| | 760 | | | | | Taro Pharmaceutical Industries, Ltd.* | | | 32,878 | |
| | 33,000 | | | | | Texas Instruments, Inc. | | | 6,054,840 | |
| | 25,700 | | | | | TFS Financial Corp. | | | 426,620 | |
| | 13,600 | | | | | Thermo Fisher Scientific, Inc. | | | 8,032,840 | |
| | 17,900 | | | | | Travelers Cos., Inc. (The) | | | 3,270,867 | |
| | 5,900 | | | | | Tyler Technologies, Inc.* | | | 2,624,851 | |
| | 17,800 | | | | | Tyson Foods, Inc. Class A | | | 1,595,414 | |
| | 24,500 | | | | | United Parcel Service, Inc. Class B | | | 5,254,270 | |
| | 4,000 | | | | | United Therapeutics Corp.* | | | 717,640 | |
| | 29,002 | | | | | UnitedHealth Group, Inc. | | | 14,790,150 | |
| | 71,801 | | | | | VeriSign, Inc.* | | | 15,972,850 | |
| | 127,112 | | | | | Verizon Communications, Inc. | | | 6,475,085 | |
| | 9,300 | | | | | Vertex Pharmaceuticals, Inc.* | | | 2,427,021 | |
| | 121,852 | | | | | Visa, Inc. Class A | | | 27,023,118 | |
| | 22,681 | | | | | VMware, Inc. Class A | | | 2,582,685 | |
| | 41,036 | | | | | Walmart, Inc. | | | 6,111,081 | |
| | 31,485 | | | | | Waste Management, Inc. | | | 4,990,373 | |
| | 37,600 | | | | | WEC Energy Group, Inc. | | | 3,752,856 | |
| | 5,600 | | | | | West Pharmaceutical Services, Inc. | | | 2,299,976 | |
| | 1,000 | | | | | White Mountains Insurance Group, Ltd. | | | 1,136,240 | |
| | 35,959 | | | | | Xcel Energy, Inc. | | | 2,595,161 | |
| | 26,300 | | | | | Zoetis, Inc. | | | 4,959,917 | |
| | | | | | | | | | |
| | | | | | | | | 908,633,131 | |
| | | | | | | | | | |
| | | |
| | | | | | TOTAL COMMON STOCKS (COST $1,133,280,357) | | | 1,327,449,984 | |
| | | | | | | | | | |
| | |
| | | | | | PREFERRED STOCKS — 0.1% | |
| | |
| | | | | | Germany — 0.1% | |
| | 5,742 | | | | | Henkel AG & Co. KGaA, 3.04% | | | 386,778 | |
| | 341 | | | | | STO SE & Co. KGaA, 4.10% | | | 78,333 | |
| | | | | | | | | | |
| | | | | | | | | 465,111 | |
| | | | | | | | | | |
| | | |
| | | | | | TOTAL PREFERRED STOCKS (COST $622,736) | | | 465,111 | |
| | | | | | | | | | |
See accompanying Notes to the Financial Statements.
197
Mercer Global Low Volatility Equity Fund
Schedule of Investments (Continued)
(showing percentage of net assets)
March 31, 2022
| | | | | | | | | | |
| Par Value ($) | | | | | Description | | Value ($) | |
| | |
| | | | | | SHORT-TERM INVESTMENT — 0.4% | |
| | |
| | | | | | Mutual Fund - Securities Lending Collateral — 0.4% | |
| | 5,542,973 | | | | | State Street Institutional U.S. Government Money Market Fund, Premier Class, 0.25%(e) (f) | | | 5,542,973 | |
| | | | | | | | | | |
| | | |
| | | | | | TOTAL SHORT-TERM INVESTMENT (COST $5,542,973) | | | 5,542,973 | |
| | | | | | | | | | |
| | | |
| | | | | | TOTAL INVESTMENTS — 95.4% (Cost $1,139,446,066) | | | 1,333,458,068 | |
| | | |
| | | | | | Other Assets and Liabilities (net) — 4.6% | | | 64,885,210 | |
| | | | | | | | | | |
| | | |
| | | | | | NET ASSETS — 100.0% | | $1,398,343,278 | |
| | | | | | | | | | |
| | | |
| | | | | | Notes to Schedule of Investments:
| | | | |
| | | |
| | | | * | | Non-income producing security. | | | | |
| | | |
| | | | (a) | | All or a portion of this security is out on loan. | | | | |
| | | |
| | | | (b) | | Securities fair valued by the Valuation Committee as approved by the Board of Trustees. The total market value of the securities at year end is $0 which represents 0.0% of net assets. The aggregate cost of these securities held at March 31, 2022 was $18,481. | | | | |
| | | |
| | | | (c) | | Level 3 - significant unobservable inputs were used in determining the value of this security of the fund. | | | | |
| | | |
| | | | (d) | | Security exempt from registration under Regulation S of the Securities Act of 1933, which exempts from registration securities offered and sold outside the United States. Security may not be offered or sold in the United States except pursuant to an exemption from, or in a transaction not subject to, the registration requirements of the Securities Act of 1933. | | | | |
| | | |
| | | | (e) | | The rate disclosed is the 7-day net yield as of March 31, 2022. | | | | |
| | | |
| | | | (f) | | Represents an investment of securities lending cash collateral. | | | | |
See accompanying Notes to the Financial Statements.
198
Mercer Global Low Volatility Equity Fund
Schedule of Investments (Continued)
March 31, 2022
Futures Contracts
| | | | | | | | | | | | | | | | | | | | |
Number of
Contracts | | | | | Description | | | | Expiration Date | | | Notional
Value | | | Market Value/
Unrealized
Appreciation
(Depreciation) | |
| | Buys | | | | | | | | | | | | | | | | | | | |
| | 3 | | | | | MSCI EAFE Index | | | | | Jun 2022 | | | $ | 321,660 | | | $ | 17,322 | |
| | 3 | | | | | S&P 500 E-mini Index | | | | | Jun 2022 | | | | 679,613 | | | | 44,346 | |
| | | | | | | | | | | | | | | | | | | | |
| | | | | | | | | | | | | | | | | | $ | 61,668 | |
| | | | | | | | | | | | | | | | | | | | |
Abbreviations
| ADR | — American Depository Receipt |
| GDR | — Global Depository Receipt |
| REIT | — Real Estate Investment Trust |
See accompanying Notes to the Financial Statements.
199
Mercer Global Low Volatility Equity Fund
Schedule of Investments (Continued)
March 31, 2022
| | | | | |
| Industry Sector Summary (Unaudited) | | % of Net Assets |
Consumer, Non-cyclical | | | | 34.4 | |
Technology | | | | 15.5 | |
Financial | | | | 12.7 | |
Communications | | | | 12.6 | |
Industrial | | | | 9.6 | |
Utilities | | | | 4.0 | |
Consumer, Cyclical | | | | 3.3 | |
Basic Materials | | | | 2.2 | |
Energy | | | | 0.7 | |
Short-Term Investment | | | | 0.4 | |
Other Assets and Liabilities (net) | | | | 4.6 | |
| | | | | |
| | | | 100.0 | % |
| | | | | |
See accompanying Notes to the Financial Statements.
200
Mercer Funds
Statements of Assets and Liabilities
March 31, 2022
| | | | | | | | | | | | | | | | | | | | |
| | | Mercer US Large
Cap Equity Fund | | Mercer US
Small/Mid Cap
Equity Fund | | Mercer Non-US
Core Equity Fund | | Mercer Core Fixed
Income Fund |
Assets | | | | | | | | | | | | | | | | | | | | |
Investments, at value(a) (b) | | | $ | 1,427,083,785 | | | | $ | 1,725,524,574 | | | | $ | 3,643,979,857 | | | | $ | 1,492,283,092 | |
Foreign currency, at value(c) | | | | — | | | | | — | | | | | 7,237,623 | | | | | 3,712 | |
Cash and cash equivalents | | | | 52,893,018 | | | | | 54,826,711 | | | | | 110,213,021 | | | | | 34,421,472 | |
Receivable for investments sold | | | | 1,633,678 | | | | | 16,375,950 | | | | | 12,201,281 | | | | | 2,741,465 | |
Dividend and interest receivable | | | | 1,253,001 | | | | | 1,259,751 | | | | | 16,648,181 | | | | | 8,120,080 | |
Receivable for TBA sold | | | | — | | | | | — | | | | | — | | | | | 17,507,868 | |
Foreign tax reclaims receivable | | | | 83,002 | | | | | — | | | | | 8,932,358 | | | | | — | |
Cash collateral held at broker on open futures contracts | | | | 2,281,000 | | | | | 747,000 | | | | | 4,663,000 | | | | | — | |
Unrealized appreciation on open forward foreign currency contracts | | | | — | | | | | — | | | | | — | | | | | 303,693 | |
Receivable for fund shares sold | | | | 555 | | | | | 549 | | | | | 101,367 | | | | | 70,231 | |
Prepaid expenses | | | | 7,469 | | | | | 8,639 | | | | | 17,376 | | | | | 6,380 | |
Cash collateral held at broker on open centrally cleared swap contracts | | | | — | | | | | — | | | | | — | | | | | 2,039 | |
Securities lending income receivable | | | | 1,284 | | | | | 5,088 | | | | | 22,814 | | | | | 7,281 | |
Receivable for advisory fee waived | | | | 972,757 | | | | | 2,054,746 | | | | | 3,461,574 | | | | | 838,836 | |
| | | | | | | | | | | | | | | | | | | | |
Total assets | | | | 1,486,209,549 | | | | | 1,800,803,008 | | | | | 3,807,478,452 | | | | | 1,556,306,149 | |
| | | | | | | | | | | | | | | | | | | | |
| | | | |
Liabilities | | | | | | | | | | | | | | | | | | | | |
Obligation to return securities lending collateral | | | | 2,060,110 | | | | | 10,496,590 | | | | | 82,677,714 | | | | | 39,160,195 | |
Payable for TBA and when-issued securities purchased | | | | — | | | | | — | | | | | — | | | | | 39,224,632 | |
Payable for investments purchased | | | | 3,593,273 | | | | | 4,763,900 | | | | | 16,067,548 | | | | | 9,633,367 | |
Payable for fund shares repurchased | | | | 5,158,906 | | | | | 6,900,878 | | | | | 7,441,447 | | | | | 57,677 | |
Payable for variation margin on open futures contracts | | | | 575,500 | | | | | 284,699 | | | | | 1,343,772 | | | | | 48,591 | |
Payable for foreign capital gains tax | | | | — | | | | | — | | | | | 207,728 | | | | | — | |
Unrealized depreciation on open forward foreign currency contracts | | | | — | | | | | — | | | | | — | | | | | 105,047 | |
Payable to affiliates for: | | | | | | | | | | | | | | | | | | | | |
Advisory fees | | | | 1,859,102 | | | | | 3,827,210 | | | | | 6,396,064 | | | | | 1,160,258 | |
Trustees fees | | | | 570 | | | | | 718 | | | | | 1,446 | | | | | 621 | |
Administrative service fees — Class I | | | | — | | | | | — | | | | | 1,123 | * | | | | 35,805 | ** |
Accrued expenses | | | | 183,917 | | | | | 229,703 | | | | | 521,159 | | | | | 222,511 | |
| | | | | | | | | | | | | | | | | | | | |
Total liabilities | | | | 13,431,378 | | | | | 26,503,698 | | | | | 114,658,001 | | | | | 89,648,704 | |
| | | | | | | | | | | | | | | | | | | | |
Net assets | | | $ | 1,472,778,171 | | | | $ | 1,774,299,310 | | | | $ | 3,692,820,451 | | | | $ | 1,466,657,445 | |
| | | | | | | | | | | | | | | | | | | | |
See accompanying Notes to the Financial Statements.
201
Mercer Funds
Statements of Assets and Liabilities (Continued)
March 31, 2022
| | | | | | | | | | | | | | | | | | | | |
| | | Mercer US Large
Cap Equity Fund | | Mercer US
Small/Mid Cap
Equity Fund | | Mercer Non-US
Core Equity Fund | | Mercer Core Fixed
Income Fund |
| | | | |
Net assets consist of: | | | | | | | | | | | | | | | | | | | | |
Paid-in capital | | | $ | 1,113,062,983 | | | | $ | 1,410,679,265 | | | | $ | 3,408,057,180 | | | | $ | 1,549,354,170 | |
Distributable earnings (Accumulated loss) | | | | 359,715,188 | | | | | 363,620,045 | | | | | 284,763,271 | | | | | (82,696,725 | ) |
| | | | | | | | | | | | | | | | | | | | |
Net assets | | | $ | 1,472,778,171 | | | | $ | 1,774,299,310 | | | | $ | 3,692,820,451 | | | | $ | 1,466,657,445 | |
| | | | | | | | | | | | | | | | | | | | |
| | | | |
Net assets attributable to: | | | | | | | | | | | | | | | | | | | | |
Class Y-3 | | | $ | 1,472,778,171 | | | | $ | 1,774,299,310 | | | | $ | 3,689,849,219 | | | | $ | 1,371,901,048 | |
| | | | | | | | | | | | | | | | | | | | |
Class I | | | $ | — | | | | $ | — | | | | $ | 2,971,232 | * | | | $ | 94,756,397 | ** |
| | | | | | | | | | | | | | | | | | | | |
| | | | |
Shares outstanding: | | | | | | | | | | | | | | | | | | | | |
Class Y-3 | | | | 125,038,831 | | | | | 150,412,469 | | | | | 357,722,307 | | | | | 139,996,696 | |
| | | | | | | | | | | | | | | | | | | | |
Class I | | | | — | | | | | — | | | | | 288,202 | * | | | | 9,681,437 | ** |
| | | | | | | | | | | | | | | | | | | | |
| | | | |
Net asset value per unit: | | | | | | | | | | | | | | | | | | | | |
Class Y-3 | | | $ | 11.78 | | | | $ | 11.80 | | | | $ | 10.31 | | | | $ | 9.80 | |
| | | | | | | | | | | | | | | | | | | | |
Class I | | | $ | — | | | | $ | — | | | | $ | 10.31 | * | | | $ | 9.79 | ** |
| | | | | | | | | | | | | | | | | | | | |
| | | | |
(a) Investments, at cost | | | $ | 1,145,887,991 | | | | $ | 1,428,116,023 | | | | $ | 3,411,039,574 | | | | $ | 1,566,850,069 | |
| | | | | | | | | | | | | | | | | | | | |
| | | | |
(b) Securities loaned, at value | | | $ | 10,950,076 | | | | $ | 27,921,957 | | | | $ | 117,387,579 | | | | $ | 46,314,991 | |
| | | | | | | | | | | | | | | | | | | | |
| | | | |
(c) Foreign currency, at cost | | | $ | — | | | | $ | — | | | | $ | 7,157,180 | | | | $ | 3,712 | |
| | | | | | | | | | | | | | | | | | | | |
| * | The Class commenced operations on July 22, 2021. |
| ** | The Class commenced operations on December 27, 2021. |
See accompanying Notes to the Financial Statements.
202
Mercer Funds
Statements of Assets and Liabilities (Continued)
March 31, 2022
| | | | | | | | | | | | | | | |
| | | Mercer Opportunistic
Fixed Income Fund | | Mercer Emerging
Markets Equity Fund | | Mercer Global Low
Volatility Equity Fund |
Assets | |
Investments, at value(a) (b) | | | $ | 1,087,498,938 | | | | $ | 1,546,027,420 | | | | $ | 1,333,458,068 | |
Foreign currency, at value(c) | | | | 9,221,742 | | | | | 777,787 | | | | | 375,642 | |
Cash and cash equivalents | | | | 47,126,887 | | | | | 83,969,407 | | | | | 53,071,080 | |
Receivable for investments sold | | | | 10,727,372 | | | | | 5,550,048 | | | | | 13,103,729 | |
Dividend and interest receivable | | | | 11,816,345 | | | | | 4,143,527 | | | | | 2,437,023 | |
Receivable for fund shares sold | | | | 356,418 | | | | | 8,663,236 | | | | | 1,259,569 | |
Cash collateral held at broker on open centrally cleared swap contracts | | | | 9,513,000 | | | | | — | | | | | — | |
Cash collateral held at broker on open futures contracts | | | | 4,613,677 | | | | | 4,682,000 | | | | | 89,000 | |
Cash collateral held at broker on open forward foreign currency contracts, open OTC options, and open OTC swaps contracts | | | | 1,620,000 | | | | | — | | | | | — | |
Unrealized appreciation on open forward foreign currency contracts | | | | 4,392,883 | | | | | — | | | | | — | |
Foreign tax reclaims receivable | | | | 211,296 | | | | | 89,487 | | | | | 1,161,637 | |
Receivable for variation margin on open futures contracts | | | | 331,535 | | | | | 22,394 | | | | | — | |
OTC — Swap contracts, at value (up-front net premiums received of $280,462, $-, and $-, respectively) | | | | 242,527 | | | | | — | | | | | — | |
Prepaid expenses | | | | 4,026 | | | | | 6,900 | | | | | 5,920 | |
Receivable for variation margin on open centrally cleared swap contracts | | | | 29,799 | | | | | — | | | | | — | |
Securities lending income receivable | | | | 7,736 | | | | | 22,629 | | | | | 6,869 | |
Receivable for advisory fee waived | | | | 1,178,022 | | | | | 1,610,381 | | | | | 1,657,160 | |
| | | | | | | | | | | | | | | |
Total assets | | | | 1,188,892,203 | | | | | 1,655,565,216 | | | | | 1,406,625,697 | |
| | | | | | | | | | | | | | | |
|
Liabilities | |
Obligation to return securities lending collateral | | | | 46,932,355 | | | | | 6,004,273 | | | | | 5,542,973 | |
Payable for investments purchased | | | | 17,140,863 | | | | | 3,952,235 | | | | | — | |
Payable for when-issued securities purchased | | | | 7,533,621 | | | | | — | | | | | — | |
Unrealized depreciation on open forward foreign currency contracts | | | | 6,145,459 | | | | | — | | | | | — | |
Payable for foreign capital gains tax | | | | 101,256 | | | | | 4,412,244 | | | | | — | |
Cash collateral due to broker on open forward foreign currency contracts, open OTC options, and open OTC swaps contracts | | | | 1,364,781 | | | | | — | | | | | — | |
Payable for fund shares repurchased | | | | 397 | | | | | 1,032,315 | | | | | 10,574 | |
Written options, at value(d) | | | | 879,924 | | | | | — | | | | | — | |
OTC — Swap contracts, at value (up-front net premiums paid of $19,195, $-, and $-, respectively) | | | | 45,954 | | | | | — | | | | | — | |
Payable for closed centrally cleared swap contracts | | | | 34,673 | | | | | — | | | | | — | |
Payable for variation margin on open futures contracts | | | | — | | | | | — | | | | | 18,754 | |
Unrealized loss on unfunded loan commitments | | | | 1,096 | | | | | — | | | | | — | |
Payable to affiliates for: | | | | | | | | | | | | | | | |
Advisory fees | | | | 2,115,423 | | | | | 3,159,273 | | | | | 2,473,643 | |
Trustees fees | | | | 449 | | | | | 639 | | | | | 558 | |
Accrued expenses | | | | 260,707 | | | | | 409,986 | | | | | 235,917 | |
| | | | | | | | | | | | | | | |
Total liabilities | | | | 82,556,958 | | | | | 18,970,965 | | | | | 8,282,419 | |
| | | | | | | | | | | | | | | |
Net assets | | | $ | 1,106,335,245 | | | | $ | 1,636,594,251 | | | | $ | 1,398,343,278 | |
| | | | | | | | | | | | | | | |
See accompanying Notes to the Financial Statements.
203
Mercer Funds
Statements of Assets and Liabilities (Continued)
March 31, 2022
| | | | | | | | | | | | | | | |
| | | Mercer Opportunistic
Fixed Income Fund | | Mercer Emerging
Markets Equity Fund | | Mercer Global Low
Volatility Equity Fund |
| | | |
Net assets consist of: | | | | | | | | | | | | | | | |
Paid-in capital | | | $ | 1,181,852,565 | | | | $ | 1,765,790,098 | | | | $ | 1,127,187,977 | |
Distributable earnings (Accumulated loss) | | | | (75,517,320 | ) | | | | (129,195,847 | ) | | | | 271,155,301 | |
| | | | | | | | | | | | | | | |
Net assets | | | $ | 1,106,335,245 | | | | $ | 1,636,594,251 | | | | $ | 1,398,343,278 | |
| | | | | | | | | | | | | | | |
| | | |
Net assets attributable to: | | | | | | | | | | | | | | | |
Class Y-3 | | | $ | 1,106,335,245 | | | | $ | 1,636,594,251 | | | | $ | 1,398,343,278 | |
| | | | | | | | | | | | | | | |
| | | |
Shares outstanding: | | | | | | | | | | | | | | | |
Class Y-3 | | | | 123,886,708 | | | | | 190,930,049 | | | | | 98,633,331 | |
| | | | | | | | | | | | | | | |
| | | |
Net asset value per unit: | | | | | | | | | | | | | | | |
Class Y-3 | | | $ | 8.93 | | | | $ | 8.57 | | | | $ | 14.18 | |
| | | | | | | | | | | | | | | |
(a) Investments, at cost | | | $ | 1,147,739,063 | | | | $ | 1,620,827,363 | | | | $ | 1,139,446,066 | |
| | | | | | | | | | | | | | | |
(b) Securities loaned, at value | | | $ | 47,741,718 | | | | $ | 46,383,288 | | | | $ | 7,150,161 | |
| | | | | | | | | | | | | | | |
(c) Foreign currency, at cost | | | $ | 9,434,023 | | | | $ | 773,145 | | | | $ | 374,373 | |
| | | | | | | | | | | | | | | |
(d) Premiums on written options | | | $ | 517,677 | | | | $ | — | | | | $ | — | |
| | | | | | | | | | | | | | | |
See accompanying Notes to the Financial Statements.
204
Mercer Funds
Statements of Operations
Year Ended March 31, 2022
| | | | | | | | | | | | | | | | | | | | |
| | | Mercer US Large
Cap Equity Fund | | Mercer US
Small/Mid Cap
Equity Fund | | Mercer Non-US
Core Equity Fund | | Mercer Core Fixed
Income Fund |
Investment Income: | |
Dividends | | | $ | 20,074,327 | | | | $ | 21,097,046 | | | | $ | 116,592,093 | | | | $ | 543 | |
Interest | | | | 18 | | | | | 28 | | | | | 70 | | | | | 30,602,032 | |
Withholding taxes | | | | (62,404 | ) | | | | (21,774 | ) | | | | (10,530,371 | ) | | | | — | |
Securities lending income | | | | 21,722 | | | | | 72,504 | | | | | 417,906 | | | | | 44,303 | |
Other income | | | | — | | | | | — | | | | | 12,300 | | | | | 7,647 | |
| | | | | | | | | | | | | | | | | | | | |
Total investment income | | | | 20,033,663 | | | | | 21,147,804 | | | | | 106,491,998 | | | | | 30,654,525 | |
| | | | | | | | | | | | | | | | | | | | |
|
Expenses: | |
Advisory fees | | | | 7,962,379 | | | | | 16,258,170 | | | | | 26,461,511 | | | | | 4,503,076 | |
Custodian and fund accounting fees | | | | 309,230 | | | | | 364,358 | | | | | 933,407 | | | | | 306,710 | |
Audit and tax fees | | | | 73,345 | | | | | 79,536 | | | | | 159,555 | | | | | 76,742 | |
Transfer agent fees | | | | 24,635 | | | | | 25,890 | | | | | 25,730 | | | | | 27,271 | |
Legal fees | | | | 233,877 | | | | | 283,694 | | | | | 575,547 | | | | | 207,298 | |
Trustees fees | | | | 129,196 | | | | | 152,976 | | | | | 310,007 | | | | | 111,837 | |
Registration fees | | | | 45,166 | | | | | 57,172 | | | | | 85,823 | | | | | 62,524 | |
Administrative service fees: | | | | | | | | | | | | | | | | | | | | |
Class I | | | | — | | | | | — | | | | | 3,257 | * | | | | 36,247 | ** |
Tax expense | | | | — | | | | | — | | | | | 100,612 | | | | | — | |
Shareholder service fees: | | | | | | | | | | | | | | | | | | | | |
Class I | | | | — | | | | | — | | | | | 2,094 | * | | | | 24,565 | ** |
Miscellaneous | | | | 143,749 | | | | | 160,076 | | | | | 264,446 | | | | | 133,034 | |
| | | | | | | | | | | | | | | | | | | | |
Total expenses | | | | 8,921,577 | | | | | 17,381,872 | | | | | 28,921,989 | | | | | 5,489,304 | |
Advisory fee waiver | | | | (4,110,237 | ) | | | | (8,667,072 | ) | | | | (14,276,750 | ) | | | | (3,269,956 | ) |
| | | | | | | | | | | | | | | | | | | | |
Net expenses | | | | 4,811,340 | | | | | 8,714,800 | | | | | 14,645,239 | | | | | 2,219,348 | |
| | | | | | | | | | | | | | | | | | | | |
Net investment income | | | | 15,222,323 | | | | | 12,433,004 | | | | | 91,846,759 | | | | | 28,435,177 | |
| | | | | | | | | | | | | | | | | | | | |
|
Realized and Unrealized Gain (Loss): | |
Net realized gain (loss) on: | |
Investments | | | | 167,691,382 | | | | | 214,449,010 | | | | | 233,032,368 | | | | | (10,458,685 | ) |
TBA Sale Commitments | | | | — | | | | | — | | | | | — | | | | | 2,578 | |
Purchased option contracts | | | | — | | | | | — | | | | | — | | | | | 82,401 | |
Swap contracts | | | | — | | | | | — | | | | | — | | | | | (878,834 | ) |
Closed futures contracts | | | | 3,657,265 | | | | | 256,639 | | | | | 1,358,256 | | | | | (1,423,083 | ) |
Written option contracts | | | | — | | | | | — | | | | | — | | | | | (29,736 | ) |
Forward foreign currency contracts | | | | — | | | | | — | | | | | 1,014,229 | | | | | 596,712 | |
Foreign currency related transactions | | | | (529 | ) | | | | 175 | | | | | (1,826,889 | ) | | | | (12,669 | ) |
| | | | | | | | | | | | | | | | | | | | |
Net realized gain (loss) | | | | 171,348,118 | | | | | 214,705,824 | | | | | 233,577,964 | | | | | (12,121,316 | ) |
| | | | | | | | | | | | | | | | | | | | |
Change in net unrealized appreciation (depreciation) on: | |
Investments | | | | (53,895,122 | ) | | | | (156,670,969 | ) | | | | (356,153,700 | ) | | | | (78,518,760 | ) |
Purchased option contracts | | | | — | | | | | — | | | | | — | | | | | (112,288 | ) |
Swap contracts | | | | — | | | | | — | | | | | — | | | | | (4,053 | ) |
Open futures contracts | | | | 266,591 | | | | | 941,979 | | | | | 3,456,419 | | | | | (808,002 | ) |
Written option contracts | | | | — | | | | | — | | | | | — | | | | | 60,634 | |
Forward foreign currency contracts | | | | — | | | | | — | | | | | (1,203,827 | ) | | | | 33,333 | |
Foreign currency related transactions | | | | 595 | | | | | — | | | | | 218,432 | | | | | 348 | |
| | | | | | | | | | | | | | | | | | | | |
Change in net unrealized appreciation (depreciation) | | | | (53,627,936 | ) | | | | (155,728,990 | ) | | | | (353,682,676 | ) | | | | (79,348,788 | ) |
| | | | | | | | | | | | | | | | | | | | |
Net realized and unrealized gain (loss) | | | | 117,720,182 | | | | | 58,976,834 | | | | | (120,104,712 | ) | | | | (91,470,104 | ) |
| | | | | | | | | | | | | | | | | | | | |
| | | | |
Net increase (decrease) in net assets resulting from operations | | | $ | 132,942,505 | | | | $ | 71,409,838 | | | | $ | (28,257,953 | ) | | | $ | (63,034,927 | ) |
| | | | | | | | | | | | | | | | | | | | |
| * | The Class commenced operations on July 22, 2021. |
| ** | The Class commenced operations on December 27, 2021. |
See accompanying Notes to the Financial Statements.
205
Mercer Funds
Statements of Operations (Continued)
Year Ended March 31, 2022
| | | | | | | | | | | | | | | |
| | | Mercer Opportunistic
Fixed Income Fund | | Mercer Emerging
Markets Equity Fund | | Mercer Global Low
Volatility Equity Fund |
Investment Income: | |
Dividends | | | $ | 659,993 | | | | $ | 40,054,959 | | | | $ | 20,698,800 | |
Interest | | | | 45,797,392 | | | | | 57,036 | | | | | — | |
Withholding taxes | | | | (518,399 | ) | | | | (5,103,826 | ) | | | | (980,964 | ) |
Securities lending income | | | | 56,749 | | | | | 442,947 | | | | | 52,461 | |
Other income | | | | 115,742 | | | | | — | | | | | — | |
| | | | | | | | | | | | | | | |
Total investment income | | | | 46,111,477 | | | | | 35,451,116 | | | | | 19,770,297 | |
| | | | | | | | | | | | | | | |
|
Expenses: | |
Advisory fees | | | | 7,628,047 | | | | | 12,344,743 | | | | | 9,647,657 | |
Custodian and fund accounting fees | | | | 462,756 | | | | | 769,423 | | | | | 308,994 | |
Audit and tax fees | | | | 81,350 | | | | | 220,064 | | | | | 98,926 | |
Transfer agent fees | | | | 23,755 | | | | | 24,330 | | | | | 24,762 | |
Legal fees | | | | 157,875 | | | | | 239,992 | | | | | 200,878 | |
Trustees fees | | | | 77,680 | | | | | 130,117 | | | | | 107,108 | |
Registration fees | | | | 63,972 | | | | | 69,741 | | | | | 62,438 | |
Tax expense | | | | 201 | | | | | — | | | | | — | |
Miscellaneous | | | | 118,124 | | | | | 148,826 | | | | | 133,561 | |
| | | | | | | | | | | | | | | |
Total expenses | | | | 8,613,760 | | | | | 13,947,236 | | | | | 10,584,324 | |
Advisory fee waiver | | | | (4,250,002 | ) | | | | (6,464,143 | ) | | | | (6,427,089 | ) |
| | | | | | | | | | | | | | | |
Net expenses | | | | 4,363,758 | | | | | 7,483,093 | | | | | 4,157,235 | |
| | | | | | | | | | | | | | | |
Net investment income | | | | 41,747,719 | | | | | 27,968,023 | | | | | 15,613,062 | |
| | | | | | | | | | | | | | | |
|
Realized and Unrealized Gain (Loss): | |
Net realized gain (loss) on: | |
Investments | | | | (10,422,429 | ) | | | | 595,674 | | | | | 142,476,785 | |
Purchased option contracts | | | | (2,456,825 | ) | | | | — | | | | | — | |
Swap contracts | | | | 604,736 | | | | | — | | | | | — | |
Closed futures contracts | | | | (1,726,820 | ) | | | | (14,386,464 | ) | | | | 4,363,423 | |
Written option contracts | | | | 1,343,264 | | | | | — | | | | | — | |
Forward foreign currency contracts | | | | 908,044 | | | | | (149 | ) | | | | — | |
Foreign currency related transactions | | | | (605,506 | ) | | | | (1,164,418 | ) | | | | (160,468 | ) |
| | | | | | | | | | | | | | | |
Net realized gain (loss) | | | | (12,355,536 | ) | | | | (14,955,357 | ) | | | | 146,679,740 | |
| | | | | | | | | | | | | | | |
Change in net unrealized appreciation (depreciation) on: | |
Investments | | | | (67,306,048 | ) | | | | (285,636,429 | ) | | | | (40,942,272 | ) |
Purchased option contracts | | | | 248,923 | | | | | — | | | | | — | |
Unfunded loan commitments | | | | (2,464 | ) | | | | — | | | | | — | |
Swap contracts | | | | (1,447,858 | ) | | | | — | | | | | — | |
Open futures contracts | | | | (1,092,039 | ) | | | | 2,647,960 | | | | | (159,532 | ) |
Written option contracts | | | | (502,842 | ) | | | | — | | | | | — | |
Forward foreign currency contracts | | | | (2,458,000 | ) | | | | — | | | | | — | |
Foreign currency related transactions | | | | 222,002 | | | | | (1,279,989 | ) | | | | (544 | ) |
| | | | | | | | | | | | | | | |
Change in net unrealized appreciation (depreciation) | | | | (72,338,326 | ) | | | | (284,268,458 | ) | | | | (41,102,348 | ) |
| | | | | | | | | | | | | | | |
Net realized and unrealized gain (loss) | | | | (84,693,862 | ) | | | | (299,223,815 | ) | | | | 105,577,392 | |
| | | | | | | | | | | | | | | |
| | | |
Net increase (decrease) in net assets resulting from operations | | | $ | (42,946,143 | ) | | | $ | (271,255,792 | ) | | | $ | 121,190,454 | |
| | | | | | | | | | | | | | | |
See accompanying Notes to the Financial Statements.
206
Mercer Funds
Statements of Changes in Net Assets
| | | | | | | | | | | | | | | | | | | | |
| | | Mercer US Large Cap
Equity Fund | | Mercer US Small/Mid Cap
Equity Fund |
| | | Year Ended
March 31, 2022 | | Year Ended
March 31, 2021 | | Year Ended
March 31, 2022 | | Year Ended
March 31, 2021 |
Increase (decrease) in Net Assets: | |
Operations: | |
Net investment income | | | $ | 15,222,323 | | | | $ | 15,257,721 | | | | $ | 12,433,004 | | | | $ | 10,957,637 | |
Net realized gain | | | | 171,348,118 | | | | | 59,078,523 | | | | | 214,705,824 | | | | | 225,148,279 | |
Change in net unrealized appreciation (depreciation) | | | | (53,627,936 | ) | | | | 508,237,064 | | | | | (155,728,990 | ) | | | | 719,097,829 | |
| | | | | | | | | | | | | | | | | | | | |
Net increase in net assets resulting from operations | | | | 132,942,505 | | | | | 582,573,308 | | | | | 71,409,838 | | | | | 955,203,745 | |
| | | | | | | | | | | | | | | | | | | | |
Distributions to shareholders (See Note 2): | |
Class Y-3 | | | | (153,164,374 | ) | | | | (15,659,299 | ) | | | | (327,497,452 | ) | | | | (47,874,139 | ) |
| | | | | | | | | | | | | | | | | | | | |
Total distributions | | | | (153,164,374 | ) | | | | (15,659,299 | ) | | | | (327,497,452 | ) | | | | (47,874,139 | ) |
| | | | | | | | | | | | | | | | | | | | |
Net share transactions (See Note 7): | |
Class Y-3 | | | | (11,793,535 | ) | | | | 55,664,392 | | | | | 163,218,893 | | | | | (88,706,339 | ) |
| | | | | | | | | | | | | | | | | | | | |
Increase (decrease) in net assets resulting from net shares transactions | | | | (11,793,535 | ) | | | | 55,664,392 | | | | | 163,218,893 | | | | | (88,706,339 | ) |
| | | | | | | | | | | | | | | | | | | | |
Net increase (decrease) in net assets | | | | (32,015,404 | ) | | | | 622,578,401 | | | | | (92,868,721 | ) | | | | 818,623,267 | |
| | | | | | | | | | | | | | | | | | | | |
Net assets: | |
Beginning of year | | | | 1,504,793,575 | | | | | 882,215,174 | | | | | 1,867,168,031 | | | | | 1,048,544,764 | |
| | | | | | | | | | | | | | | | | | | | |
End of year | | | $ | 1,472,778,171 | | | | $ | 1,504,793,575 | | | | $ | 1,774,299,310 | | | | $ | 1,867,168,031 | |
| | | | | | | | | | | | | | | | | | | | |
See accompanying Notes to the Financial Statements.
207
Mercer Funds
Statements of Changes in Net Assets (Continued)
| | | | | | | | | | | | | | | | | | | | |
| | | Mercer Non-US
Core Equity Fund | | Mercer Core
Fixed Income Fund |
| | | Year Ended
March 31, 2022 | | Year Ended
March 31, 2021 | | Year Ended
March 31, 2022 | | Year Ended
March 31, 2021 |
Increase (decrease) in Net Assets: | |
Operations: | |
Net investment income | | | $ | 91,846,759 | | | | $ | 62,158,964 | | | | $ | 28,435,177 | | | | $ | 24,507,164 | |
Net realized gain (loss) | | | | 233,577,964 | | | | | 465,851,569 | | | | | (12,121,316 | ) | | | | 13,901,000 | |
Change in net unrealized appreciation (depreciation) | | | | (353,682,676 | ) | | | | 880,550,961 | | | | | (79,348,788 | ) | | | | (3,713,587 | ) |
| | | | | | | | | | | | | | | | | | | | |
Net increase (decrease) in net assets resulting from operations | | | | (28,257,953 | ) | | | | 1,408,561,494 | | | | | (63,034,927 | ) | | | | 34,694,577 | |
| | | | | | | | | | | | | | | | | | | | |
Distributions to shareholders (See Note 2): | |
Class Y-3 | | | | (600,419,082 | ) | | | | (139,174,497 | ) | | | | (32,157,234 | ) | | | | (44,160,867 | ) |
Class I | | | | (495,675 | )* | | | | — | | | | | — | | | | | — | |
| | | | | | | | | | | | | | | | | | | | |
Total distributions | | | | (600,914,757 | ) | | | | (139,174,497 | ) | | | | (32,157,234 | ) | | | | (44,160,867 | ) |
| | | | | | | | | | | | | | | | | | | | |
Net share transactions (See Note 7): | |
Class Y-3 | | | | 489,527,726 | | | | | (114,414,819 | ) | | | | 205,333,836 | | | | | 315,401,172 | |
Class I | | | | 3,655,660 | * | | | | — | | | | | 100,564,079 | ** | | | | — | |
| | | | | | | | | | | | | | | | | | | | |
Increase (decrease) in net assets resulting from net shares transactions | | | | 493,183,386 | | | | | (114,414,819 | ) | | | | 305,897,915 | | | | | 315,401,172 | |
| | | | | | | | | | | | | | | | | | | | |
Net increase (decrease) in net assets | | | | (135,989,324 | ) | | | | 1,154,972,178 | | | | | 210,705,754 | | | | | 305,934,882 | |
| | | | | | | | | | | | | | | | | | | | |
Net assets: | |
Beginning of year | | | | 3,828,809,775 | | | | | 2,673,837,597 | | | | | 1,255,951,691 | | | | | 950,016,809 | |
| | | | | | | | | | | | | | | | | | | | |
End of year | | | $ | 3,692,820,451 | | | | $ | 3,828,809,775 | | | | $ | 1,466,657,445 | | | | $ | 1,255,951,691 | |
| | | | | | | | | | | | | | | | | | | | |
| * | The Class commenced operations on July 22, 2021. |
| ** | The Class commenced operations on December 27, 2021. |
See accompanying Notes to the Financial Statements.
208
Mercer Funds
Statements of Changes in Net Assets (Continued)
| | | | | | | | | | | | | | | | | | | | |
| | | Mercer Opportunistic Fixed
Income Fund | | Mercer Emerging Markets
Equity Fund |
| | | Year Ended
March 31, 2022 | | Year Ended
March 31, 2021 | | Year Ended
March 31, 2022 | | Year Ended
March 31, 2021 |
Increase (decrease) in Net Assets: | |
Operations: | |
Net investment income | | | $ | 41,747,719 | | | | $ | 57,432,632 | | | | $ | 27,968,023 | | | | $ | 19,860,570 | |
Net realized gain (loss) | | | | (12,355,536 | ) | | | | 25,300,335 | | | | | (14,955,357 | ) | | | | 175,573,598 | |
Change in net unrealized appreciation (depreciation) | | | | (72,338,326 | ) | | | | 104,631,986 | | | | | (284,268,458 | ) | | | | 425,718,944 | |
| | | | | | | | | | | | | | | | | | | | |
Net increase (decrease) in net assets resulting from operations | | | | (42,946,143 | ) | | | | 187,364,953 | | | | | (271,255,792 | ) | | | | 621,153,112 | |
| | | | | | | | | | | | | | | | | | | | |
Distributions to shareholders (See Note 2): | |
Class Y-3 | | | | (35,988,286 | ) | | | | (44,901,279 | ) | | | | (198,529,530 | ) | | | | (21,622,556 | ) |
| | | | | | | | | | | | | | | | | | | | |
Total distributions | | | | (35,988,286 | ) | | | | (44,901,279 | ) | | | | (198,529,530 | ) | | | | (21,622,556 | ) |
| | | | | | | | | | | | | | | | | | | | |
Net share transactions (See Note 7): | |
Class Y-3 | | | | 331,110,996 | | | | | (254,603,017 | ) | | | | 587,725,437 | | | | | (23,900,544 | ) |
| | | | | | | | | | | | | | | | | | | | |
Increase (decrease) in net assets resulting from net shares transactions | | | | 331,110,996 | | | | | (254,603,017 | ) | | | | 587,725,437 | | | | | (23,900,544 | ) |
| | | | | | | | | | | | | | | | | | | | |
Net increase (decrease) in net assets | | | | 252,176,567 | | | | | (112,139,343 | ) | | | | 117,940,115 | | | | | 575,630,012 | |
| | | | | | | | | | | | | | | | | | | | |
Net assets: | |
Beginning of year | | | | 854,158,678 | | | | | 966,298,021 | | | | | 1,518,654,136 | | | | | 943,024,124 | |
| | | | | | | | | | | | | | | | | | | | |
End of year | | | $ | 1,106,335,245 | | | | $ | 854,158,678 | | | | $ | 1,636,594,251 | | | | $ | 1,518,654,136 | |
| | | | | | | | | | | | | | | | | | | | |
See accompanying Notes to the Financial Statements.
209
Mercer Funds
Statements of Changes in Net Assets (Continued)
| | | | | | | | | | |
| | | Mercer Global Low Volatility
Equity Fund |
| | | Year Ended
March 31, 2022 | | Year Ended
March 31, 2021 |
Increase (decrease) in Net Assets: | |
Operations: | |
Net investment income | | | $ | 15,613,062 | | | | $ | 17,036,830 | |
Net realized gain | | | | 146,679,740 | | | | | 60,582,649 | |
Change in net unrealized appreciation (depreciation) | | | | (41,102,348 | ) | | | | 280,124,947 | |
| | | | | | | | | | |
Net increase in net assets resulting from operations | | | | 121,190,454 | | | | | 357,744,426 | |
| | | | | | | | | | |
Distributions to shareholders (See Note 2): | |
Class Y-3 | | | | (156,786,038 | ) | | | | (55,306,768 | ) |
| | | | | | | | | | |
Total distributions | | | | (156,786,038 | ) | | | | (55,306,768 | ) |
| | | | | | | | | | |
Net share transactions (See Note 7): | |
Class Y-3 | | | | 234,481,562 | | | | | (141,700,142 | ) |
| | | | | | | | | | |
Increase (decrease) in net assets resulting from net shares transactions | | | | 234,481,562 | | | | | (141,700,142 | ) |
| | | | | | | | | | |
Net increase in net assets | | | | 198,885,978 | | | | | 160,737,516 | |
| | | | | | | | | | |
Net assets: | |
Beginning of year | | | | 1,199,457,300 | | | | | 1,038,719,784 | |
| | | | | | | | | | |
End of year | | | $ | 1,398,343,278 | | | | $ | 1,199,457,300 | |
| | | | | | | | | | |
See accompanying Notes to the Financial Statements.
210
Mercer US Large Cap Equity Fund
Financial Highlights
| | | | | | | | | | | | | | | | | | | | | | | | | |
| | | Year Ended
March 31, 2022 | | Year Ended
March 31, 2021 | | Year Ended
March 31, 2020 | | Year Ended
March 31, 2019 | | Year Ended
March 31, 2018 |
For a Class Y-3 Share Outstanding Throughout Each Year: | | | | | | | | | | | | | | | | | | | | | | | | | |
| | | | | |
Net asset value, beginning of year | | | $ | 11.97 | | | | $ | 7.35 | | | | $ | 8.58 | | | | $ | 10.85 | | | | $ | 10.61 | |
| | | | | | | | | | | | | | | | | | | | | | | | | |
| | | | | |
Net investment income† | | | | 0.12 | | | | | 0.12 | | | | | 0.14 | | | | | 0.12 | | | | | 0.14 | |
Net realized and unrealized gain (loss) on investments | | | | 0.98 | | | | | 4.63 | | | | | (1.00 | ) | | | | 0.18 | | | | | 1.68 | |
| | | | | | | | | | | | | | | | | | | | | | | | | |
| | | | | |
Total from investment operations | | | | 1.10 | | | | | 4.75 | | | | | (0.86 | ) | | | | 0.30 | | | | | 1.82 | |
| | | | | | | | | | | | | | | | | | | | | | | | | |
Less dividends and distributions: | | | | | | | | | | | | | | | | | | | | | | | | | |
From net investment income | | | | (0.10 | ) | | | | (0.13 | ) | | | | (0.05 | ) | | | | (0.14 | ) | | | | (0.16 | ) |
From net realized capital gains on investments | | | | (1.19 | ) | | | | — | | | | | (0.32 | ) | | | | (2.43 | ) | | | | (1.42 | ) |
| | | | | | | | | | | | | | | | | | | | | | | | | |
| | | | | |
Total dividends and distributions | | | | (1.29 | ) | | | | (0.13 | ) | | | | (0.37 | ) | | | | (2.57 | ) | | | | (1.58 | ) |
| | | | | | | | | | | | | | | | | | | | | | | | | |
| | | | | |
Net asset value, end of year | | | $ | 11.78 | | | | $ | 11.97 | | | | $ | 7.35 | | | | $ | 8.58 | | | | $ | 10.85 | |
| | | | | | | | | | | | | | | | | | | | | | | | | |
Total investment return | | | | 8.62 | %(a) | | | | 64.71 | %(a) | | | | (10.95 | )%(a) | | | | 4.81 | % | | | | 17.26 | % |
| | | | | |
Ratios/Supplemental Data: | | | | | | | | | | | | | | | | | | | | | | | | | |
Net investment income to average net assets | | | | 0.96 | % | | | | 1.22 | % | | | | 1.53 | % | | | | 1.21 | % | | | | 1.28 | % |
Total expenses (before reductions and reimbursements/waivers) to average daily net assets | | | | 0.56 | % | | | | 0.57 | % | | | | 0.62 | % | | | | 0.63 | % | | | | 0.60 | % |
Net expenses to average daily net assets | | | | 0.30 | %(b) | | | | 0.30 | %(b) | | | | 0.33 | %(b) | | | | 0.63 | % | | | | 0.60 | % |
Portfolio turnover rate | | | | 30 | % | | | | 43 | % | | | | 76 | %(c) | | | | 74 | % | | | | 64 | % |
Net assets at end of year (in 000’s) | | | $ | 1,472,778 | | | | $ | 1,504,794 | | | | $ | 882,215 | | | | $ | 389,415 | | | | $ | 512,558 | |
| (a) | The total return would have been lower had certain expenses not been reduced or reimbursed/waived during the years shown. |
| (b) | Includes the effects of management fee waivers (see Note 5 of the Notes to the Financial Statements). |
| (c) | Portfolio turnover calculation does not include $769,614,365 of securities transferred into the Fund as part of in-kind contributions. |
| † | Computed using average shares outstanding throughout the year. |
See accompanying Notes to the Financial Statements.
211
Mercer US Small/Mid Cap Equity Fund
Financial Highlights (Continued)
| | | | | | | | | | | | | | | | | | | | | | | | | |
| | | Year Ended
March 31, 2022 | | Year Ended
March 31, 2021 | | Year Ended
March 31, 2020 | | Year Ended
March 31, 2019 | | Year Ended
March 31, 2018 |
For a Class Y-3 Share Outstanding Throughout Each Year: | | | | | | | | | | | | | | | | | | | | | | | | | |
| | | | | |
Net asset value, beginning of year | | | $ | 13.83 | | | | $ | 7.71 | | | | $ | 10.13 | | | | $ | 12.29 | | | | $ | 12.12 | |
| | | | | | | | | | | | | | | | | | | | | | | | | |
| | | | | |
Net investment income† | | | | 0.09 | | | | | 0.07 | | | | | 0.10 | | | | | 0.05 | | | | | 0.04 | |
Net realized and unrealized gain (loss) on investments | | | | 0.49 | | | | | 6.38 | | | | | (2.20 | ) | | | | (0.23 | ) | | | | 1.46 | |
| | | | | | | | | | | | | | | | | | | | | | | | | |
| | | | | |
Total from investment operations | | | | 0.58 | | | | | 6.45 | | | | | (2.10 | ) | | | | (0.18 | ) | | | | 1.50 | |
| | | | | | | | | | | | | | | | | | | | | | | | | |
Less dividends and distributions: | | | | | | | | | | | | | | | | | | | | | | | | | |
From net investment income | | | | (0.09 | ) | | | | (0.07 | ) | | | | (0.06 | ) | | | | (0.05 | ) | | | | (0.06 | ) |
From net realized capital gains on investments | | | | (2.52 | ) | | | | (0.26 | ) | | | | (0.26 | ) | | | | (1.93 | ) | | | | (1.27 | ) |
| | | | | | | | | | | | | | | | | | | | | | | | | |
| | | | | |
Total dividends and distributions | | | | (2.61 | ) | | | | (0.33 | ) | | | | (0.32 | ) | | | | (1.98 | ) | | | | (1.33 | ) |
| | | | | | | | | | | | | | | | | | | | | | | | | |
| | | | | |
Net asset value, end of year | | | $ | 11.80 | | | | $ | 13.83 | | | | $ | 7.71 | | | | $ | 10.13 | | | | $ | 12.29 | |
| | | | | | | | | | | | | | | | | | | | | | | | | |
Total investment return | | | | 3.45 | %(a) | | | | 84.20 | %(a) | | | | (21.65 | )%(a) | | | | 0.19 | % | | | | 12.64 | % |
| | | | | |
Ratios/Supplemental Data: | | | | | | | | | | | | | | | | | | | | | | | | | |
Net investment income to average net assets | | | | 0.66 | % | | | | 0.68 | % | | | | 0.95 | % | | | | 0.47 | % | | | | 0.31 | % |
Total expenses (before reductions and reimbursements/waivers) to average daily net assets | | | | 0.92 | % | | | | 0.93 | % | | | | 0.97 | % | | | | 0.98 | % | | | | 0.95 | % |
Net expenses to average daily net assets | | | | 0.46 | %(b) | | | | 0.46 | %(b) | | | | 0.49 | %(b) | | | | 0.98 | % | | | | 0.95 | % |
Portfolio turnover rate | | | | 36 | % | | | | 59 | % | | | | 73 | %(c) | | | | 47 | % | | | | 49 | % |
Net assets at end of year (in 000’s) | | | $ | 1,774,299 | | | | $ | 1,867,168 | | | | $ | 1,048,545 | | | | $ | 794,403 | | | | $ | 907,944 | |
| (a) | The total return would have been lower had certain expenses not been reduced or reimbursed/waived during the years shown. |
| (b) | Includes the effects of management fee waivers (see Note 5 of the Notes to the Financial Statements). |
| (c) | Portfolio turnover calculation does not include $550,516,305 of securities transferred into the Fund as part of in-kind contributions. |
| † | Computed using average shares outstanding throughout the year. |
See accompanying Notes to the Financial Statements.
212
Mercer Non-US Core Equity Fund
Financial Highlights (Continued)
| | | | | | | | | | | | | | | | | | | | | | | | | |
| | | Year Ended
March 31, 2022 | | Year Ended
March 31, 2021 | | Year Ended
March 31, 2020 | | Year Ended
March 31, 2019 | | Year Ended
March 31, 2018 |
For a Class Y-3 Share Outstanding Throughout Each Year: | | | | | | | | | | | | | | | | | | | | | | | | | |
| | | | | |
Net asset value, beginning of year | | | $ | 12.36 | | | | $ | 8.46 | | | | $ | 9.87 | | | | $ | 11.51 | | | | $ | 10.44 | |
| | | | | | | | | | | | | | | | | | | | | | | | | |
| | | | | |
Net investment income† | | | | 0.30 | | | | | 0.19 | | | | | 0.25 | | | | | 0.22 | | | | | 0.19 | |
Net realized and unrealized gain (loss) on investments | | | | (0.30 | ) | | | | 4.14 | | | | | (1.44 | ) | | | | (0.76 | ) | | | | 1.75 | |
| | | | | | | | | | | | | | | | | | | | | | | | | |
| | | | | |
Total from investment operations | | | | — | | | | | 4.33 | | | | | (1.19 | ) | | | | (0.54 | ) | | | | 1.94 | |
| | | | | | | | | | | | | | | | | | | | | | | | | |
Less dividends and distributions: | | | | | | | | | | | | | | | | | | | | | | | | | |
From net investment income | | | | (0.35 | ) | | | | (0.18 | ) | | | | (0.22 | ) | | | | (0.20 | ) | | | | (0.23 | ) |
From net realized capital gains on investments | | | | (1.70 | ) | | | | (0.25 | ) | | | | — | | | | | (0.90 | ) | | | | (0.64 | ) |
| | | | | | | | | | | | | | | | | | | | | | | | | |
| | | | | |
Total dividends and distributions | | | | (2.05 | ) | | | | (0.43 | ) | | | | (0.22 | ) | | | | (1.10 | ) | | | | (0.87 | ) |
| | | | | | | | | | | | | | | | | | | | | | | | | |
| | | | | |
Net asset value, end of year | | | $ | 10.31 | | | | $ | 12.36 | | | | $ | 8.46 | | | | $ | 9.87 | | | | $ | 11.51 | |
| | | | | | | | | | | | | | | | | | | | | | | | | |
Total investment return | | | | (1.07 | )%(a) | | | | 51.42 | %(a) | | | | (12.55 | )%(a) | | | | (4.00 | )% | | | | 18.80 | % |
| | | | | |
Ratios/Supplemental Data: | | | | | | | | | | | | | | | | | | | | | | | | | |
Net investment income to average net assets | | | | 2.42 | % | | | | 1.78 | % | | | | 2.45 | % | | | | 2.03 | % | | | | 1.64 | % |
Total expenses (before reductions and reimbursements/waivers) to average daily net assets | | | | 0.76 | % | | | | 0.76 | % | | | | 0.79 | % | | | | 0.79 | % | | | | 0.79 | %(b) |
Net expenses to average daily net assets | | | | 0.39 | %(c) | | | | 0.39 | %(c) | | | | 0.42 | %(c) | | | | 0.79 | % | | | | 0.79 | %(b) |
Portfolio turnover rate | | | | 57 | % | | | | 81 | % | | | | 74 | %(d) | | | | 81 | % | | | | 81 | % |
Net assets at end of year (in 000’s) | | | $ | 3,689,849 | | | | $ | 3,828,810 | | | | $ | 2,673,838 | | | | $ | 2,155,585 | | | | $ | 2,159,299 | |
| (a) | The total return would have been lower had certain expenses not been reduced or reimbursed/waived during the years shown. |
| (b) | Includes interest expense that amounts to less than 0.01%. |
| (c) | Includes the effects of management fee waivers (see Note 5 of the Notes to the Financial Statements). |
| (d) | Portfolio turnover calculation does not include $395,102,338 of securities transferred into the Fund as part of in-kind contributions. |
| † | Computed using average shares outstanding throughout the year. |
See accompanying Notes to the Financial Statements.
213
Mercer Non-US Core Equity Fund
Financial Highlights (Continued)
| | | | | |
| | | Period Ended
March 31, 2022 |
For a Class I Share Outstanding Throughout the Period: | | | | | |
| |
Net asset value, beginning of period | | | $ | 12.99 | (a) |
| | | | | |
| |
Net investment income† | | | | 0.17 | |
Net realized and unrealized loss on investments | | | | (0.82 | ) |
| | | | | |
| |
Total from investment operations | | | | (0.65 | ) |
| | | | | |
Less dividends and distributions: | | | | | |
From net investment income | | | | (0.33 | ) |
From net realized capital gains on investments | | | | (1.70 | ) |
| | | | | |
| |
Total dividends and distributions | | | | (2.03 | ) |
| | | | | |
| |
Net asset value, end of period | | | $ | 10.31 | |
| | | | | |
Total investment return | | | | (5.97 | )%** (b) |
| |
Ratios/Supplemental Data: | | | | | |
Net investment income to average net assets | | | | 2.00 | %* |
Total expenses (before reductions and reimbursements/waivers) to average daily net assets | | | | 1.01 | %* |
Net expenses to average daily net assets | | | | 0.63 | %* (c) |
Portfolio turnover rate | | | | 57 | % |
Net assets at end of period (in 000’s) | | | $ | 2,971 | |
| (a) | The Class commenced operations on July 22, 2021. |
| (b) | The total return would have been lower had certain expenses not been reduced or reimbursed/waived during the period shown. |
| (c) | Includes the effects of management fee waivers (see Note 5 of the Notes to the Financial Statements). |
| † | Computed using average shares outstanding throughout the period. |
See accompanying Notes to the Financial Statements.
214
Mercer Core Fixed Income Fund
Financial Highlights (Continued)
| | | | | | | | | | | | | | | | | | | | | | | | | |
| | | Year Ended
March 31, 2022 | | Year Ended
March 31, 2021 | | Year Ended
March 31, 2020 | | Year Ended
March 31, 2019 | | Year Ended
March 31, 2018 |
For a Class Y-3 Share Outstanding Throughout Each Year: | | | | | | | | | | | | | | | | | | | | | | | | | |
| | | | | |
Net asset value, beginning of year | | | $ | 10.46 | | | | $ | 10.48 | | | | $ | 10.00 | | | | $ | 9.90 | | | | $ | 9.96 | |
| | | | | | | | | | | | | | | | | | | | | | | | | |
| | | | | |
Net investment income† | | | | 0.22 | | | | | 0.25 | | | | | 0.27 | | | | | 0.31 | | | | | 0.27 | |
Net realized and unrealized gain (loss) on investments | | | | (0.62 | ) | | | | 0.20 | | | | | 0.51 | | | | | 0.11 | | | | | (0.09 | ) |
| | | | | | | | | | | | | | | | | | | | | | | | | |
| | | | | |
Total from investment operations | | | | (0.40 | ) | | | | 0.45 | | | | | 0.78 | | | | | 0.42 | | | | | 0.18 | |
| | | | | | | | | | | | | | | | | | | | | | | | | |
Less dividends and distributions: | | | | | | | | | | | | | | | | | | | | | | | | | |
From net investment income | | | | (0.22 | ) | | | | (0.25 | ) | | | | (0.30 | ) | | | | (0.32 | ) | | | | (0.24 | ) |
From net realized capital gains on investments | | | | (0.04 | ) | | | | (0.22 | ) | | | | — | | | | | — | | | | | — | |
| | | | | | | | | | | | | | | | | | | | | | | | | |
| | | | | |
Total dividends and distributions | | | | (0.26 | ) | | | | (0.47 | ) | | | | (0.30 | ) | | | | (0.32 | ) | | | | (0.24 | ) |
| | | | | | | | | | | | | | | | | | | | | | | | | |
| | | | | |
Net asset value, end of year | | | $ | 9.80 | | | | $ | 10.46 | | | | $ | 10.48 | | | | $ | 10.00 | | | | $ | 9.90 | |
| | | | | | | | | | | | | | | | | | | | | | | | | |
Total investment return | | | | (4.01 | )%(a) | | | | 4.23 | %(a) | | | | 7.81 | %(a) | | | | 4.37 | % | | | | 1.80 | % |
| | | | | |
Ratios/Supplemental Data: | | | | | | | | | | | | | | | | | | | | | | | | | |
Net investment income to average net assets | | | | 2.09 | % | | | | 2.33 | % | | | | 2.64 | % | | | | 3.17 | % | | | | 2.71 | % |
Total expenses (before reductions and reimbursements/waivers) to average daily net assets | | | | 0.39 | % | | | | 0.40 | % | | | | 0.45 | % | | | | 0.43 | % | | | | 0.43 | % |
Net expenses to average daily net assets | | | | 0.16 | %(b) | | | | 0.15 | %(b) | | | | 0.19 | %(b) | | | | 0.43 | % | | | | 0.43 | % |
Portfolio turnover rate | | | | 131 | %(c) | | | | 127 | %(c) | | | | 158 | %(c) | | | | 80 | %(c) | | | | 113 | %(c) |
Net assets at end of year (in 000’s) | | | $ | 1,371,901 | | | | $ | 1,255,952 | | | | $ | 950,017 | | | | $ | 548,600 | | | | $ | 857,947 | |
| (a) | The total return would have been lower had certain expenses not been reduced or reimbursed/waived during the years shown. |
| (b) | Includes the effects of management fee waivers (see Note 5 of the Notes to the Financial Statements). |
| (c) | Includes TBA transactions; excluding these transactions the portfolio turnover rate would have been 96%, 100%, 139%, 74% and 81% for the year ended March 31, 2022, March 31, 2021, March 31, 2020, March 31, 2019 and March 31, 2018, respectively. |
| † | Computed using average shares outstanding throughout the year. |
See accompanying Notes to the Financial Statements.
215
Mercer Core Fixed Income Fund
Financial Highlights (Continued)
| | | | | |
| | | Period Ended
March 31, 2022 |
For a Class I Share Outstanding Throughout the Period: | | | | | |
| |
Net asset value, beginning of period | | | $ | 10.43 | (a) |
| | | | | |
| |
Net investment income† | | | | 0.03 | |
Net realized and unrealized loss on investments | | | | (0.67 | ) |
| | | | | |
| |
Total from investment operations | | | | (0.64 | ) |
| | | | | |
| |
Net asset value, end of period | | | $ | 9.79 | |
| | | | | |
Total investment return | | | | (6.14 | )%** (b) |
| |
Ratios/Supplemental Data: | | | | | |
Net investment income to average net assets | | | | 0.98 | %* |
Total expenses (before reductions and reimbursements/waivers) to average daily net assets | | | | 0.66 | %* |
Net expenses to average daily net assets | | | | 0.42 | %* (c) |
Portfolio turnover rate | | | | 131 | %(d) |
Net assets at end of period (in 000’s) | | | $ | 94,756 | |
| (a) | The Class commenced operations on December 27, 2021. |
| (b) | The total return would have been lower had certain expenses not been reduced or reimbursed/waived during the period shown. |
| (c) | Includes the effects of management fee waivers (see Note 5 of the Notes to the Financial Statements). |
| (d) | Includes TBA transactions; excluding these transactions the portfolio turnover rate would have been 96% for the period ended March 31, 2022. |
| † | Computed using average shares outstanding throughout the period. |
See accompanying Notes to the Financial Statements.
216
Mercer Opportunistic Fixed Income Fund
Financial Highlights (Continued)
| | | | | | | | | | | | | | | | | | | | | | | | | |
| | | Year Ended
March 31, 2022 | | Year Ended
March 31, 2021 | | Year Ended
March 31, 2020 | | Year Ended
March 31, 2019 | | Year Ended
March 31, 2018 |
For a Class Y-3 Share Outstanding Throughout Each Year: | | | | | | | | | | | | | | | | | | | | | | | | | |
| | | | | |
Net asset value, beginning of year | | | $ | 9.58 | | | | $ | 8.45 | | | | $ | 9.08 | | | | $ | 9.80 | | | | $ | 9.31 | |
| | | | | | | | | | | | | | | | | | | | | | | | | |
| | | | | |
Net investment income† | | | | 0.42 | | | | | 0.46 | | | | | 0.44 | | | | | 0.43 | | | | | 0.53 | |
Net realized and unrealized gain (loss) on investments | | | | (0.74 | ) | | | | 1.00 | | | | | (0.85 | ) | | | | (0.94 | ) | | | | 0.33 | |
| | | | | | | | | | | | | | | | | | | | | | | | | |
| | | | | |
Total from investment operations | | | | (0.32 | ) | | | | 1.46 | | | | | (0.41 | ) | | | | (0.51 | ) | | | | 0.86 | |
| | | | | | | | | | | | | | | | | | | | | | | | | |
Less dividends and distributions: | | | | | | | | | | | | | | | | | | | | | | | | | |
From net investment income | | | | (0.30 | ) | | | | (0.33 | ) | | | | (0.22 | ) | | | | (0.21 | ) | | | | (0.37 | ) |
From net realized capital gains on investments | | | | (0.03 | ) | | | | — | | | | | — | | | | | — | | | | | — | |
| | | | | | | | | | | | | | | | | | | | | | | | | |
| | | | | |
Total dividends and distributions | | | | (0.33 | ) | | | | (0.33 | ) | | | | (0.22 | ) | | | | (0.21 | ) | | | | (0.37 | ) |
| | | | | | | | | | | | | | | | | | | | | | | | | |
| | | | | |
Net asset value, end of year | | | $ | 8.93 | | | | $ | 9.58 | | | | $ | 8.45 | | | | $ | 9.08 | | | | $ | 9.80 | |
| | | | | | | | | | | | | | | | | | | | | | | | | |
Total investment return | | | | (3.44 | )%(a) | | | | 17.12 | % | | | | (4.72 | )%(a) | | | | (5.15 | )% | | | | 9.42 | % |
| | | | | |
Ratios/Supplemental Data: | | | | | | | | | | | | | | | | | | | | | | | | | |
Ratios to average net assets: | | | | | | | | | | | | | | | | | | | | | | | | | |
Net investment income to average net assets | | | | 4.35 | % | | | | 4.83 | % | | | | 4.74 | % | | | | 4.74 | % | | | | 5.49 | % |
Total expenses (before reductions and reimbursements/waivers) to average daily net assets | | | | 0.90 | % | | | | 0.87 | % | | | | 0.92 | % | | | | 0.92 | %(b) | | | | 0.92 | %(b) |
Net expenses to average daily net assets | | | | 0.45 | %(c) | | | | 0.45 | % | | | | 0.43 | %(c) | | | | 0.92 | %(b) | | | | 0.92 | %(b) |
Portfolio turnover rate | | | | 77 | % | | | | 117 | %(e) | | | | 148 | %(d) | | | | 243 | %(d) | | | | 72 | % |
Net assets at end of year (in 000’s) | | | $ | 1,106,335 | | | | $ | 854,159 | | | | $ | 966,298 | | | | $ | 812,580 | | | | $ | 647,222 | |
| (a) | The total return would have been lower had certain expenses not been reduced or reimbursed/waived during the years shown. |
| (b) | Includes interest expense that amounts to less than 0.01%. |
| (c) | Includes the effects of management fee waivers (see Note 5 of the Notes to the Financial Statements). |
| (d) | Includes TBA transactions; excluding these transactions the portfolio turnover rate would have remained the same for the year ended March 31, 2020 and 218% for the year ended March 31, 2019, respectively. |
| (e) | Portfolio turnover calculation does not include $400,305,493 of securities transferred out of the Fund as part of in-kind redemptions. |
| † | Computed using average shares outstanding throughout the year. |
See accompanying Notes to the Financial Statements.
217
Mercer Emerging Markets Equity Fund
Financial Highlights (Continued)
| | | | | | | | | | | | | | | | | | | | | | | | | |
| | | Year Ended
March 31, 2022 | | Year Ended
March 31, 2021 | | Year Ended
March 31, 2020 | | Year Ended
March 31, 2019 | | Year Ended
March 31, 2018 |
For a Class Y-3 Share Outstanding Throughout Each Year: | | | | | | | | | | | | | | | | | | | | | | | | | |
| | | | | |
Net asset value, beginning of year | | | $ | 11.47 | | | | $ | 7.19 | | | | $ | 9.05 | | | | $ | 11.75 | | | | $ | 9.77 | |
| | | | | | | | | | | | | | | | | | | | | | | | | |
| | | | | |
Net investment income† | | | | 0.19 | | | | | 0.14 | | | | | 0.19 | | | | | 0.17 | | | | | 0.18 | |
Net realized and unrealized gain (loss) on investments | | | | (1.82 | ) | | | | 4.29 | | | | | (1.93 | ) | | | | (1.48 | ) | | | | 2.05 | |
| | | | | | | | | | | | | | | | | | | | | | | | | |
| | | | | |
Total from investment operations | | | | (1.63 | ) | | | | 4.43 | | | | | (1.74 | ) | | | | (1.31 | ) | | | | 2.23 | |
| | | | | | | | | | | | | | | | | | | | | | | | | |
Less dividends and distributions: | | | | | | | | | | | | | | | | | | | | | | | | | |
From net investment income | | | | (0.32 | ) | | | | (0.15 | ) | | | | (0.12 | ) | | | | (0.01 | ) | | | | (0.25 | ) |
From net realized capital gains on investments | | | | (0.95 | ) | | | | — | | | | | — | | | | | (1.38 | ) | | | | — | |
| | | | | | | | | | | | | | | | | | | | | | | | | |
| | | | | |
Total dividends and distributions | | | | (1.27 | ) | | | | (0.15 | ) | | | | (0.12 | ) | | | | (1.39 | ) | | | | (0.25 | ) |
| | | | | | | | | | | | | | | | | | | | | | | | | |
| | | | | |
Net asset value, end of year | | | $ | 8.57 | | | | $ | 11.47 | | | | $ | 7.19 | | | | $ | 9.05 | | | | $ | 11.75 | |
| | | | | | | | | | | | | | | | | | | | | | | | | |
Total investment return | | | | (15.35 | )%(a) | | | | 61.78 | %(a) | | | | (19.55 | )%(a) | | | | (10.20 | )% | | | | 22.92 | % |
| | | | | |
Ratios/Supplemental Data: | | | | | | | | | | | | | | | | | | | | | | | | | |
Net investment income to average net assets | | | | 1.75 | % | | | | 1.47 | % | | | | 2.05 | % | | | | 1.66 | % | | | | 1.62 | % |
Total expenses (before reductions and reimbursements/waivers) to average daily net assets | | | | 0.87 | % | | | | 0.87 | % | | | | 0.91 | % | | | | 0.92 | %(b) | | | | 0.95 | %(b) |
Net expenses to average daily net assets | | | | 0.47 | %(c) | | | | 0.48 | %(c) | | | | 0.53 | %(c) | | | | 0.92 | %(b) | | | | 0.95 | %(b) |
Portfolio turnover rate | | | | 51 | % | | | | 106 | % | | | | 81 | %(d) | | | | 57 | % | | | | 93 | % |
Net assets at end of year (in 000’s) | | | $ | 1,636,594 | | | | $ | 1,518,654 | | | | $ | 943,024 | | | | $ | 1,018,647 | | | | $ | 1,116,127 | |
| (a) | The total return would have been lower had certain expenses not been reduced or reimbursed/waived during the years shown. |
| (b) | Includes interest expense that amounts to less than 0.01%. |
| (c) | Includes the effects of management fee waivers (see Note 5 of the Notes to the Financial Statements). |
| (d) | Portfolio turnover calculation does not include $10,686,440 of securities transferred into the Fund as part of in-kind contributions. |
| † | Computed using average shares outstanding throughout the year. |
See accompanying Notes to the Financial Statements.
218
Mercer Global Low Volatility Equity Fund
Financial Highlights (Continued)
| | | | | | | | | | | | | | | | | | | | | | | | | |
| | | Year Ended
March 31, 2022 | | Year Ended
March 31, 2021 | | Year Ended
March 31, 2020 | | Year Ended
March 31, 2019 | | Year Ended
March 31, 2018 |
For a Class Y-3 Share Outstanding Throughout Each Year: | | | | | | | | | | | | | | | | | | | | | | | | | |
| | | | | |
Net asset value, beginning of year | | | $ | 14.55 | | | | $ | 11.23 | | | | $ | 13.13 | | | | $ | 12.28 | | | | $ | 12.62 | |
| | | | | | | | | | | | | | | | | | | | | | | | | |
| | | | | |
Net investment income† | | | | 0.18 | | | | | 0.19 | | | | | 0.24 | | | | | 0.18 | | | | | 0.18 | |
Net realized and unrealized gain (loss) on investments | | | | 1.32 | | | | | 3.75 | | | | | (1.14 | ) | | | | 0.67 | | | | | 1.39 | |
| | | | | | | | | | | | | | | | | | | | | | | | | |
| | | | | |
Total from investment operations | | | | 1.50 | | | | | 3.94 | | | | | (0.90 | ) | | | | 0.85 | | | | | 1.57 | |
| | | | | | | | | | | | | | | | | | | | | | | | | |
Less dividends and distributions: | | | | | | | | | | | | | | | | | | | | | | | | | |
From net investment income | | | | (0.21 | ) | | | | (0.21 | ) | | | | (0.17 | ) | | | | — | | | | | (0.18 | ) |
From net realized capital gains on investments | | | | (1.66 | ) | | | | (0.41 | ) | | | | (0.83 | ) | | | | — | | | | | (1.73 | ) |
| | | | | | | | | | | | | | | | | | | | | | | | | |
| | | | | |
Total dividends and distributions | | | | (1.87 | ) | | | | (0.62 | ) | | | | (1.00 | ) | | | | — | | | | | (1.91 | ) |
| | | | | | | | | | | | | | | | | | | | | | | | | |
| | | | | |
Net asset value, end of year | | | $ | 14.18 | | | | $ | 14.55 | | | | $ | 11.23 | | | | $ | 13.13 | | | | $ | 12.28 | |
| | | | | | | | | | | | | | | | | | | | | | | | | |
Total investment return | | | | 9.95 | %(a) | | | | 35.29 | %(a) | | | | (8.16 | )%(a) | | | | 6.92 | % | | | | 12.47 | % |
| | | | | |
Ratios/Supplemental Data: | | | | | | | | | | | | | | | | | | | | | | | | | |
Net investment income to average net assets | | | | 1.18 | % | | | | 1.42 | % | | | | 1.75 | % | | | | 1.40 | % | | | | 1.35 | % |
Total expenses (before reductions and reimbursements/waivers) to average daily net assets | | | | 0.80 | % | | | | 0.80 | % | | | | 0.82 | % | | | | 0.83 | % | | | | 0.80 | %(b) |
Net expenses to average daily net assets | | | | 0.31 | %(c) | | | | 0.30 | %(c) | | | | 0.31 | %(c) | | | | 0.83 | % | | | | 0.80 | %(b) |
Portfolio turnover rate | | | | 59 | % | | | | 54 | % | | | | 38 | % | | | | 80 | % | | | | 36 | % |
Net assets at end of year (in 000’s) | | | $ | 1,398,343 | | | | $ | 1,199,457 | | | | $ | 1,038,720 | | | | $ | 955,878 | | | | $ | 920,610 | |
| (a) | The total return would have been lower had certain expenses not been reduced or reimbursed/waived during the years shown. |
| (b) | Includes interest expense that amounts to less than 0.01%. |
| (c) | Includes the effects of management fee waivers (see Note 5 of the Notes to the Financial Statements). |
| † | Computed using average shares outstanding throughout the year. |
See accompanying Notes to the Financial Statements.
219
Mercer Funds
Notes to the Financial Statements
March 31, 2022
Mercer Funds (the “Trust”) consists of the following seven series: Mercer US Large Cap Equity Fund (“Large Cap”), Mercer US Small/Mid Cap Equity Fund (“Small/Mid Cap”), Mercer Non-US Core Equity Fund (“Non-US Core Equity”), Mercer Core Fixed Income Fund (“Core Fixed”), Mercer Opportunistic Fixed Income Fund (“Opportunistic Fixed”), Mercer Emerging Markets Equity Fund (“Emerging Markets”) and Mercer Global Low Volatility Equity Fund (“Global Low Volatility”) (each a “Fund,” and collectively referred to as the “Funds”). The Trust is a Delaware statutory trust established on March 11, 2005. The Trust is registered as an investment company under the Investment Company Act of 1940 (the “1940 Act”). Mercer Investments LLC (the “Advisor”), a Delaware limited liability company, serves as the investment advisor to the Funds. The Advisor manages each Fund using a “manager of managers” approach by selecting one or more Sub-advisers (each a “Sub-adviser,” and collectively referred to as the “Sub-advisers”) to manage each Fund’s assets. The Funds are open-end investment companies and accordingly follow the open-end investment company accounting and reporting guidance of the Financial Accounting Standards Board (FASB) Accounting Standard Codification Topic 946: Financial Services — Investment Companies.
Under the 1940 Act, each Fund is classified as diversified.
The investment objectives of the Funds are:
| | |
Fund | | Investment Objective |
| Large Cap | | Long-term total return, which includes capital appreciation and income |
| Small/Mid Cap | | Long-term total return, comprised primarily of capital appreciation |
| Non-US Core Equity | | Long-term total return, which includes capital appreciation and income |
| Core Fixed | | Total return, consisting of both current income and capital appreciation |
| Opportunistic Fixed | | Long-term total return, which includes capital appreciation and income |
| Emerging Markets | | Long-term total return, which includes capital appreciation and income |
| Global Low Volatility | | Long-term total return, which includes capital appreciation and income |
Each Fund has registered and is authorized to offer interests in four classes of shares: Adviser Class, Class I, Class Y-2 and Class Y-3. The principal difference between the classes of shares is the level of shareholder service, marketing and administrative fees borne by the classes. As of March 31, 2022, each Fund had Class Y-3 shares outstanding. In addition, Non-US Core Equity and Core Fixed had Class I shares outstanding. No other classes of shares are outstanding as of March 31, 2022.
| 2. | Significant Accounting Policies |
The following are significant accounting policies followed by the Funds. These policies are in conformity with accounting principles generally accepted in the United States of America (“GAAP”). The preparation of financial statements in conformity with GAAP requires management to make estimates and assumptions that affect the reported amounts and disclosures in the financial statements. Actual results could differ from these estimates.
220
Mercer Funds
Notes to the Financial Statements (Continued)
March 31, 2022
(a) Security Valuation
Each Fund’s investments are valued as of the close of regular trading on the New York Stock Exchange (“NYSE”) on each day when the NYSE is open. Portfolio securities and exchange-traded funds listed on an exchange normally are valued at the last sale or official closing price on the day on which the securities are valued or, lacking any sales on such day, at the last available bid price using prices as of the close of trading. In cases where securities are traded on more than one exchange, the securities are generally valued on the exchange considered by the Advisor or the applicable Sub-adviser as the primary market for such securities. Securities traded in the over-the-counter (“OTC”) market and listed on the NASDAQ Stock Market (“NASDAQ”) normally are valued at the NASDAQ official closing price; other OTC securities are valued at the last bid price available prior to valuation (other than short-term investments, which are valued as described below). The Funds may invest in securities that are traded in foreign markets. Foreign securities will be converted into U.S. dollar equivalents based on the exchange rate in effect at a uniform time on each business day. Events occurring after the close of trading on foreign exchanges may result in adjustments to the valuation of foreign securities to more accurately reflect their fair value as of the close of regular trading on the New York Stock Exchange. When valuing foreign equity securities that meet certain criteria, the Board of Trustees of the Trust (the “Board”) has approved the use of a fair value service that values such securities to reflect market trading that occurs after the close of the applicable foreign markets of comparable securities or other instruments that have a strong correlation to the fair-valued securities. Investments in open-end investment companies are valued at their net asset value (“NAV”) per share.
Certain fixed-income securities may be valued based upon appraisals received from an independent pricing service using a computerized matrix system or based upon appraisals derived from information concerning the securities or similar securities received from a recognized dealer or dealers in those securities. It should be recognized that judgment often plays a greater role in valuing thinly traded securities, as well as bonds and other securities with few dealer quotations, than is the case with respect to securities for which a broader range of dealer quotations and last-sale information is available. Each such determination is based on consideration of relevant factors, and judgment is made by or at the direction of the Board. Each Fund values its investments for which market quotations are readily available at market value. Each Fund may value short-term investments that will mature within 60 days or less by using pricing service quotations or at amortized cost, provided that such amortized cost approximates market value.
Derivative financial instruments, such as futures contracts or options contracts that are traded on a national securities exchange, are stated at the last reported sale or settlement price on the day of valuation. Futures traded on inactive markets are valued using broker quotations. OTC derivative financial instruments, such as foreign currency contracts, options contracts, synthetic futures, or swaps agreements, derive their value from underlying asset prices, indices, reference rates, and other inputs or a combination of these factors. These contracts are normally valued on the basis of an independent pricing service providers or broker/dealer quotations. Depending on the derivative type and the terms of the derivative, the value of the derivative financial instruments is assigned by independent pricing service providers using a series of techniques, which may include pricing models. The pricing models use inputs that are observed from actively quoted markets such as issuer details, indices, spreads, interest rates, curves, volatilities, dividends and exchange rates.
Bank loans are valued using an evaluated quote provided by an independent pricing service. Evaluated quotes provided by the pricing service may reflect appropriate factors such as ratings, yield curves, prepayment speeds, tranche type, industry, company performance, spread, individual trading characteristics, institutional size trading in similar groups of securities and other market data.
221
Mercer Funds
Notes to the Financial Statements (Continued)
March 31, 2022
The Board has delegated its responsibility for valuing portfolio securities to the Advisor, subject to continuing Board oversight. The Advisor has appointed a Valuation Committee that is responsible for overseeing the day-to-day process of valuing portfolio securities. With respect to portfolio securities for which market quotations are not readily available or (in the opinion of the Advisor or the applicable Sub-adviser) do not otherwise accurately reflect the fair values of the securities, the Valuation Committee will value such securities at fair value based upon procedures approved by the Board. In that regard, at March 31, 2022, substantially all foreign equity securities held by Non-US Core Equity, Emerging Markets and Global Low Volatility were fair valued using valuations provided by an independent valuation service consistent with the valuation procedures approved by the Board.
The application of fair value pricing represents a good faith determination based on specific procedures performed under the supervision of the Board. Due to the subjective nature of fair value pricing, there can be no assurance that the Fund could realize the fair value assigned to the security if the Fund were to sell the security at approximately the time at which the Fund determines its NAV per share. The Fund’s value for a particular security may be different from the last quoted market price.
The Funds follow a three-tier hierarchy to prioritize the assumptions, referred to as inputs, used in valuation techniques to measure fair value. The three-tier hierarchy of inputs is summarized in the three broad Levels listed below.
| | • | | Level 1 — quoted prices unadjusted in active markets for identical investments |
| | • | | Level 2 — other significant observable inputs (including quoted prices for similar investments, interest rates, prepayment speeds, credit risk, etc.) |
| | • | | Level 3 — significant unobservable inputs (including the Fund’s own assumptions in determining the fair value of investments) |
The inputs or methodology used for valuing securities are not necessarily an indication of the risk associated with investing in those securities.
The assets and liabilities shown in the Statements of Assets and Liabilities related to investments purchased for “to-be-announced” (“TBA”) commitments or when-issued securities approximate fair value and are determined using Level 2 inputs, as of March 31, 2022. The assets and liabilities shown in the Statements of Assets and Liabilities related to cash collateral held at broker for futures contracts and swap contracts are determined using Level 1 inputs as of March 31, 2022.
At March 31, 2022, Large Cap and Small/Mid Cap held long-term investments whose value was determined using Level 1 inputs, with corresponding major categories as shown in the Schedule of Investments, as well as the “Mutual Fund — Securities Lending Collateral” and the “Futures Contracts” sections whose values were determined using Level 1 inputs.
222
Mercer Funds
Notes to the Financial Statements (Continued)
March 31, 2022
The following is a summary of the portfolio securities by level based on inputs used as of March 31, 2022 in valuing the assets and liabilities of Non-US Core Equity, Core Fixed, Opportunistic Fixed, Emerging Markets and Global Low Volatility for which fair valuation was used:
Non-US Core Equity
ASSETS VALUATION INPUT
| | | | | | | | | | | | | | | | |
Description | | Quoted Prices
in Active
Markets for
Identical Assets
(Level 1) | | | Significant
Other
Observable
Inputs
(Level 2) | | | Significant
Unobservable
Inputs
(Level 3) | | | Total | |
Common Stocks | | | | | |
Australia | | $ | 34,288,989 | | | $ | 122,453,082 | | | $ | 0 | * | | $ | 156,742,071 | |
Austria | | | — | | | | 21,026,731 | | | | — | | | | 21,026,731 | |
Belgium | | | 400,540 | | | | 15,683,729 | | | | — | | | | 16,084,269 | |
Brazil | | | 23,934,400 | | | | 10,503,930 | | | | — | | | | 34,438,330 | |
Canada | | | 84,160,917 | | | | — | | | | — | | | | 84,160,917 | |
China | | | — | | | | 17,071,706 | | | | — | | | | 17,071,706 | |
Denmark | | | 7,773,722 | | | | 85,823,793 | | | | — | | | | 93,597,515 | |
Finland | | | — | | | | 32,327,426 | | | | — | | | | 32,327,426 | |
France | | | 9,169,784 | | | | 377,610,291 | | | | — | | | | 386,780,075 | |
Georgia | | | — | | | | 708,040 | | | | — | | | | 708,040 | |
Germany | | | 13,971,600 | | | | 263,276,235 | | | | — | | | | 277,247,835 | |
Hong Kong | | | — | | | | 7,851,924 | | | | — | | | | 7,851,924 | |
Hungary | | | — | | | | 4,879,789 | | | | — | | | | 4,879,789 | |
India | | | — | | | | 12,100,103 | | | | — | | | | 12,100,103 | |
Indonesia | | | — | | | | 8,053,974 | | | | — | | | | 8,053,974 | |
Ireland | | | 31,911,496 | | | | 16,660,122 | | | | — | | | | 48,571,618 | |
Israel | | | 5,586,253 | | | | 11,475,658 | | | | — | | | | 17,061,911 | |
Italy | | | 3,429,518 | | | | 72,932,387 | | | | — | | | | 76,361,905 | |
Japan | | | 2,679,705 | | | | 671,534,605 | | | | — | | | | 674,214,310 | |
Malaysia | | | — | | | | 2,466,943 | | | | — | | | | 2,466,943 | |
Mexico | | | 3,594,537 | | | | — | | | | — | | | | 3,594,537 | |
Netherlands | | | 29,145,255 | | | | 181,406,463 | | | | — | | | | 210,551,718 | |
Norway | | | 972,597 | | | | 16,151,797 | | | | — | | | | 17,124,394 | |
Philippines | | | — | | | | 315,153 | | | | — | | | | 315,153 | |
Portugal | | | — | | | | 397,911 | | | | 0 | * | | | 397,911 | |
Russia | | | — | | | | — | | | | 233,071 | | | | 233,071 | |
Singapore | | | — | | | | 9,686,984 | | | | — | | | | 9,686,984 | |
South Africa | | | 107,663 | | | | 27,580,094 | | | | — | | | | 27,687,757 | |
South Korea | | | — | | | | 48,103,032 | | | | — | | | | 48,103,032 | |
Spain | | | — | | | | 65,809,942 | | | | 0 | * | | | 65,809,942 | |
Sweden | | | 1,849,223 | | | | 104,105,507 | | | | — | | | | 105,954,730 | |
Switzerland | | | 14,277,656 | | | | 360,136,418 | | | | — | | | | 374,414,074 | |
Taiwan | | | 24,275,168 | | | | 34,057,301 | | | | — | | | | 58,332,469 | |
Thailand | | | — | | | | 1,161,937 | | | | — | | | | 1,161,937 | |
Turkey | | | — | | | | 4,553,871 | | | | — | | | | 4,553,871 | |
United Kingdom | | | 45,622,445 | | | | 298,293,843 | | | | — | | | | 343,916,288 | |
United States | | | 127,510,605 | | | | 103,942,666 | | | | — | | | | 231,453,271 | |
| | | | | | | | | | | | | | | | |
Total Common Stocks | | | 464,662,073 | | | | 3,010,143,387 | | | | 233,071 | | | | 3,475,038,531 | |
| | | | | | | | | | | | | | | | |
223
Mercer Funds
Notes to the Financial Statements (Continued)
March 31, 2022
| | | | | | | | | | | | | | | | |
Description | | Quoted Prices
in Active
Markets for
Identical Assets
(Level 1) | | | Significant
Other
Observable
Inputs
(Level 2) | | | Significant
Unobservable
Inputs
(Level 3) | | | Total | |
Investment Companies | | $ | 34,310,457 | | | $ | — | | | $ | — | | | $ | 34,310,457 | |
| | | | | | | | | | | | | | | | |
Preferred Stocks | | | | | | | | | | | | | | | | |
Brazil | | | 8,182,384 | | | | — | | | | — | | | | 8,182,384 | |
Germany | | | — | | | | 40,643,993 | | | | — | | | | 40,643,993 | |
South Korea | | | — | | | | 2,938,844 | | | | — | | | | 2,938,844 | |
| | | | | | | | | | | | | | | | |
Total Preferred Stocks | | | 8,182,384 | | | | 43,582,837 | | | | — | | | | 51,765,221 | |
| | | | | | | | | | | | | | | | |
Warrant | | | | | | | | | | | | | | | | |
Switzerland | | | 187,934 | | | | — | | | | — | | | | 187,934 | |
| | | | | | | | | | | | | | | | |
Short-Term Investment | | | | | | | | | | | | | | | | |
Mutual Fund - Securities Lending Collateral | | | 82,677,714 | | | | — | | | | — | | | | 82,677,714 | |
| | | | | | | | | | | | | | | | |
Futures Contracts† | | | | | | | | | | | | | | | | |
Buys | | | 4,018,218 | | | | — | | | | — | | | | 4,018,218 | |
| | | | | | | | | | | | | | | | |
Total | | $ | 594,038,780 | | | $ | 3,053,726,224 | | | $ | 233,071 | | | $ | 3,647,998,075 | |
| | | | | | | | | | | | | | | | |
| | * | Represents one or more Level 3 securities at $0 value as of March 31, 2022. |
| | † | Futures contracts are valued at unrealized appreciation/depreciation. Only current day’s variation margin, if any, is reported on the Statements of Assets and Liabilities. |
Core Fixed
ASSETS VALUATION INPUT
| | | | | | | | | | | | | | | | |
Description | | Quoted Prices
in Active
Markets for
Identical Assets
(Level 1) | | | Significant
Other
Observable
Inputs
(Level 2) | | | Significant
Unobservable
Inputs
(Level 3) | | | Total | |
Debt Obligations | | | | | | | | | | | | | | | | |
Asset Backed Securities | | $ | — | | | $ | 150,133,826 | | | $ | — | | | $ | 150,133,826 | |
Corporate Debt | | | — | | | | 527,120,133 | | | | 0 | * | | | 527,120,133 | |
Mortgage Backed Securities - Private Issuers | | | — | | | | 141,243,082 | | | | — | | | | 141,243,082 | |
Mortgage Backed Securities - U.S. Government Agency Obligations | | | — | | | | 261,521,660 | | | | — | | | | 261,521,660 | |
Municipal Obligations | | | — | | | | 14,265,506 | | | | — | | | | 14,265,506 | |
Sovereign Debt Obligations | | | — | | | | 4,898,397 | | | | — | | | | 4,898,397 | |
U.S. Government and Agency Obligations | | | — | | | | 353,940,293 | | | | — | | | | 353,940,293 | |
| | | | | | | | | | | | | | | | |
Total Debt Obligations | | | — | | | | 1,453,122,897 | | | | 0 | | | | 1,453,122,897 | |
| | | | | | | | | | | | | | | | |
224
Mercer Funds
Notes to the Financial Statements (Continued)
March 31, 2022
| | | | | | | | | | | | | | | | |
Description | | Quoted Prices
in Active
Markets for
Identical Assets
(Level 1) | | | Significant
Other
Observable
Inputs
(Level 2) | | | Significant
Unobservable
Inputs
(Level 3) | | | Total | |
Short-Term Investment | | | | | | | | | | | | | | | | |
Mutual Fund - Securities Lending Collateral | | $ | 39,160,195 | | | $ | — | | | $ | — | | | $ | 39,160,195 | |
| | | | | | | | | | | | | | | | |
Futures Contracts† | | | | | | | | | | | | | | | | |
Sales | | | 1,826,444 | | | | — | | | | — | | | | 1,826,444 | |
| | | | | | | | | | | | | | | | |
Forward Foreign Currency Contracts† | | | — | | | | 303,693 | | | | — | | | | 303,693 | |
| | | | | | | | | | | | | | | | |
Total | | $ | 40,986,639 | | | $ | 1,453,426,590 | | | $ | 0 | | | $ | 1,494,413,229 | |
| | | | | | | | | | | | | | | | |
LIABILITIES VALUATION INPUT
| | | | | | | | | | | | | | | | |
Description | | Quoted Prices
in Active
Markets for
Identical Assets
(Level 1) | | | Significant
Other
Observable
Inputs
(Level 2) | | | Significant
Unobservable
Inputs
(Level 3) | | | Total | |
Futures Contracts† | | | | | | | | | | | | | | | | |
Buys | | $ | (2,201,479 | ) | | $ | — | | | $ | — | | | $ | (2,201,479 | ) |
| | | | | | | | | | | | | | | | |
Forward Foreign Currency Contract† | | | — | | | | (105,047 | ) | | | — | | | | (105,047 | ) |
| | | | | | | | | | | | | | | | |
Total | | $ | (2,201,479 | ) | | $ | (105,047 | ) | | $ | — | | | $ | (2,306,526 | ) |
| | | | | | | | | | | | | | | | |
| | * | Represents one or more Level 3 securities at $0 value as of March 31, 2022. |
| | † | Forward foreign currency contracts and Futures contracts are valued at unrealized appreciation/depreciation. Only current day’s variation margin, if any, is reported on the Statements of Assets and Liabilities. |
Opportunistic Fixed
ASSETS VALUATION INPUT
| | | | | | | | | | | | | | | | |
Description | | Quoted Prices
in Active
Markets for
Identical Assets
(Level 1) | | | Significant
Other
Observable
Inputs
(Level 2) | | | Significant
Unobservable
Inputs
(Level 3) | | | Total | |
Debt Obligations | | | | | | | | | | | | | | | | |
Asset Backed Securities | | $ | — | | | $ | 58,126,058 | | | $ | — | | | $ | 58,126,058 | |
Bank Loans | | | — | | | | 215,016,330 | | | | — | | | | 215,016,330 | |
Convertible Debt | | | — | | | | 15,832,892 | | | | — | | | | 15,832,892 | |
Corporate Debt | | | — | | | | 366,437,845 | | | | — | | | | 366,437,845 | |
Mortgage Backed Securities - Private Issuers | | | — | | | | 52,781,494 | | | | — | | | | 52,781,494 | |
Mortgage Backed Securities - U.S. Government Agency Obligations | | | — | | | | 467,226 | | | | — | | | | 467,226 | |
225
Mercer Funds
Notes to the Financial Statements (Continued)
March 31, 2022
| | | | | | | | | | | | | | | | |
Description | | Quoted Prices
in Active
Markets for
Identical Assets
(Level 1) | | | Significant
Other
Observable
Inputs
(Level 2) | | | Significant
Unobservable
Inputs
(Level 3) | | | Total | |
Sovereign Debt Obligations | | $ | — | | | $ | 271,884,153 | | | $ | 3,675,894 | | | $ | 275,560,047 | |
U.S. Government and Agency Obligations | | | — | | | | 42,133,183 | | | | — | | | | 42,133,183 | |
| | | | | | | | | | | | | | | | |
Total Debt Obligations | | | — | | | | 1,022,679,181 | | | | 3,675,894 | | | | 1,026,355,075 | |
| | | | | | | | | | | | | | | | |
Common Stocks | | | | | | | | | | | | | | | | |
Energy | | | 55 | | | | — | | | | — | | | | 55 | |
Industrial | | | — | | | | — | | | | 0 | * | | | — | |
Utilities | | | — | | | | 1,422,302 | | | | — | | | | 1,422,302 | |
| | | | | | | | | | | | | | | | |
Total Common Stocks | | | 55 | | | | 1,422,302 | | | | 0 | | | | 1,422,357 | |
| | | | | | | | | | | | | | | | |
Convertible Preferred Stocks | | | | | | | | | | | | | | | | |
Basic Materials | | | 73,259 | | | | — | | | | — | | | | 73,259 | |
Consumer, Non-cyclical | | | 123,584 | | | | — | | | | — | | | | 123,584 | |
Energy | | | 2,623,255 | | | | 3,816,856 | | | | — | | | | 6,440,111 | |
Financial | | | 230,478 | | | | — | | | | — | | | | 230,478 | |
Technology | | | 88,342 | | | | — | | | | — | | | | 88,342 | |
Utilities | | | 178,663 | | | | — | | | | — | | | | 178,663 | |
| | | | | | | | | | | | | | | | |
Total Convertible Preferred Stocks | | | 3,317,581 | | | | 3,816,856 | | | | — | | | | 7,134,437 | |
| | | | | | | | | | | | | | | | |
Preferred Stocks | | | 371,457 | | | | — | | | | — | | | | 371,457 | |
| | | | | | | | | | | | | | | | |
Short-Term Investments | | | | | | | | | | | | | | | | |
Mutual Fund - Securities Lending Collateral | | | 46,932,355 | | | | — | | | | — | | | | 46,932,355 | |
Sovereign Debt Obligation | | | — | | | | 3,369,655 | | | | — | | | | 3,369,655 | |
| | | | | | | | | | | | | | | | |
Total Short-Term Investments | | | 46,932,355 | | | | 3,369,655 | | | | — | | | | 50,302,010 | |
| | | | | | | | | | | | | | | | |
Purchased Options | | | | | | | | | | | | | | | | |
Purchased Currency Options | | | — | | | | 180,087 | | | | — | | | | 180,087 | |
Purchased Futures Options | | | 284,355 | | | | — | | | | — | | | | 284,355 | |
Purchased Swaption | | | — | | | | 1,449,160 | | | | — | | | | 1,449,160 | |
| | | | | | | | | | | | | | | | |
Total Purchased Options | | | 284,355 | | | | 1,629,247 | | | | — | | | | 1,913,602 | |
| | | | | | | | | | | | | | | | |
Futures Contracts† | | | | | | | | | | | | | | | | |
Buys | | | 78,490 | | | | — | | | | — | | | | 78,490 | |
Sales | | | 1,996,647 | | | | — | | | | — | | | | 1,996,647 | |
| | | | | | | | | | | | | | | | |
Total Futures Contracts | | | 2,075,137 | | | | — | | | | — | | | | 2,075,137 | |
| | | | | | | | | | | | | | | | |
Swaps | | | | | | | | | | | | | | | | |
OTC Interest Rate Swaps | | | — | | | | 38,488 | | | | — | | | | 38,488 | |
Centrally Cleared Interest Rate Swaps† | | | — | | | | 322,587 | | | | — | | | | 322,587 | |
OTC Credit Default Swaps | | | — | | | | 204,039 | | | | — | | | | 204,039 | |
Centrally Cleared Credit Default Swaps† | | | — | | | | 88,737 | | | | — | | | | 88,737 | |
| | | | | | | | | | | | | | | | |
Total Swaps | | | — | | | | 653,851 | | | | — | | | | 653,851 | |
| | | | | | | | | | | | | | | | |
Forward Foreign Currency Contracts† | | | — | | | | 4,392,883 | | | | — | | | | 4,392,883 | |
| | | | | | | | | | | | | | | | |
Total | | $ | 52,980,940 | | | $ | 1,037,963,975 | | | $ | 3,675,894 | | | $ | 1,094,620,809 | |
| | | | | | | | | | | | | | | | |
226
Mercer Funds
Notes to the Financial Statements (Continued)
March 31, 2022
LIABILITIES VALUATION INPUT
| | | | | | | | | | | | | | | | |
Description | | Quoted Prices
in Active
Markets for
Identical Assets
(Level 1) | | | Significant
Other
Observable
Inputs
(Level 2) | | | Significant
Unobservable
Inputs
(Level 3) | | | Total | |
Futures Contracts† | | | | | | | | | | | | | | | | |
Buys | | $ | (4,614,307 | ) | | $ | — | | | $ | — | | | $ | (4,614,307 | ) |
| | | | | | | | | | | | | | | | |
Swaps | | | | | | | | | | | | | | | | |
OTC Interest Rate Swaps | | | — | | | | (32,251 | ) | | | — | | | | (32,251 | ) |
Centrally Cleared Interest Rate Swaps† | | | — | | | | (360,292 | ) | | | — | | | | (360,292 | ) |
OTC Credit Default Swaps | | | — | | | | (13,703 | ) | | | — | | | | (13,703 | ) |
Centrally Cleared Credit Default Swaps† | �� | | — | | | | (205,528 | ) | | | — | | | | (205,528 | ) |
| | | | | | | | | | | | | | | | |
Total Swaps | | | — | | | | (611,774 | ) | | | — | | | | (611,774 | ) |
| | | | | | | | | | | | | | | | |
Forward Foreign Currency Contracts† | | | — | | | | (6,145,459 | ) | | | — | | | | (6,145,459 | ) |
| | | | | | | | | | | | | | | | |
Written Options | | | (90,307 | ) | | | (789,617 | ) | | | — | | | | (879,924 | ) |
| | | | | | | | | | | | | | | | |
Total | | $ | (4,704,614 | ) | | $ | (7,546,850 | ) | | $ | — | | | $ | (12,251,464 | ) |
| | | | | | | | | | | | | | | | |
| | * | Represents one or more Level 3 securities at $0 value as of March 31, 2022. |
| | † | Forward foreign currency contracts, Futures contracts and Centrally Cleared Swaps are valued at unrealized appreciation/depreciation. Only current day’s variation margin, if any, is reported on the Statements of Assets and Liabilities. |
Emerging Markets
ASSETS VALUATION INPUT
| | | | | | | | | | | | | | | | |
Description | | Quoted Prices
in Active
Markets for
Identical Assets
(Level 1) | | | Significant
Other
Observable
Inputs
(Level 2) | | | Significant
Unobservable
Inputs
(Level 3) | | | Total | |
Common Stocks | | | | | | | | | | | | | | | | |
Argentina | | $ | 361,930 | | | $ | — | | | $ | — | | | $ | 361,930 | |
Australia | | | — | | | | 7,409,075 | | | | — | | | | 7,409,075 | |
Brazil | | | 89,918,180 | | | | — | | | | — | | | | 89,918,180 | |
Canada | | | 1,482,751 | | | | — | | | | — | | | | 1,482,751 | |
Chile | | | 4,821,192 | | | | — | | | | — | | | | 4,821,192 | |
China | | | 38,109,275 | | | | 401,953,840 | | | | — | | | | 440,063,115 | |
Czech Republic | | | — | | | | 869,808 | | | | — | | | | 869,808 | |
Egypt | | | — | | | | 74,902 | | | | — | | | | 74,902 | |
Hong Kong | | | — | | | | 20,125,239 | | | | — | | | | 20,125,239 | |
Hungary | | | — | | | | 1,276,859 | | | | — | | | | 1,276,859 | |
India | | | 19,339,827 | | | | 203,014,627 | | | | — | | | | 222,354,454 | |
Indonesia | | | — | | | | 26,130,602 | | | | — | | | | 26,130,602 | |
Italy | | | — | | | | 8,690,824 | | | | — | | | | 8,690,824 | |
Japan | | | — | | | | 3,016,959 | | | | — | | | | 3,016,959 | |
227
Mercer Funds
Notes to the Financial Statements (Continued)
March 31, 2022
| | | | | | | | | | | | | | | | |
Description | | Quoted Prices
in Active
Markets for
Identical Assets
(Level 1) | | | Significant
Other
Observable
Inputs
(Level 2) | | | Significant
Unobservable
Inputs
(Level 3) | | | Total | |
Malaysia | | $ | — | | | $ | 90,847 | | | $ | — | | | $ | 90,847 | |
Mexico | | | 84,969,781 | | | | — | | | | — | | | | 84,969,781 | |
Netherlands | | | — | | | | 13,941,159 | | | | — | | | | 13,941,159 | |
Panama | | | 14,344 | | | | — | | | | — | | | | 14,344 | |
Peru | | | 6,758,788 | | | | — | | | | — | | | | 6,758,788 | |
Philippines | | | — | | | | 4,622,130 | | | | — | | | | 4,622,130 | |
Poland | | | — | | | | 5,747,583 | | | | — | | | | 5,747,583 | |
Portugal | | | — | | | | 5,330,673 | | | | — | | | | 5,330,673 | |
Qatar | | | — | | | | 2,764,005 | | | | — | | | | 2,764,005 | |
Russia | | | 74,903 | | | | 1,776,863 | | | | 511,828 | | | | 2,363,594 | |
South Africa | | | — | | | | 57,864,611 | | | | — | | | | 57,864,611 | |
South Korea | | | 2,953,564 | | | | 138,916,331 | | | | — | | | | 141,869,895 | |
Taiwan | | | 59,184,516 | | | | 229,838,329 | | | | 0 | * | | | 289,022,845 | |
Thailand | | | 500,310 | | | | 7,726,515 | | | | — | | | | 8,226,825 | |
Turkey | | | — | | | | 9,143,622 | | | | — | | | | 9,143,622 | |
United Arab Emirates | | | — | | | | 3,908,275 | | | | — | | | | 3,908,275 | |
United Kingdom | | | — | | | | 16,813,917 | | | | — | | | | 16,813,917 | |
United States | | | 19,213,986 | | | | 4,616,595 | | | | — | | | | 23,830,581 | |
Uruguay | | | 2,449,252 | | | | — | | | | — | | | | 2,449,252 | |
| | | | | | | | | | | | | | | | |
Total Common Stocks | | | 330,152,599 | | | | 1,175,664,190 | | | | 511,828 | | | | 1,506,328,617 | |
| | | | | | | | | | | | | | | | |
Investment Company | | | 8,729,016 | | | | — | | | | — | | | | 8,729,016 | |
| | | | | | | | | | | | | | | | |
Preferred Stocks | | | | | | | | | | | | | | | | |
Brazil | | | 13,985,649 | | | | — | | | | — | | | | 13,985,649 | |
Chile | | | 282,657 | | | | — | | | | — | | | | 282,657 | |
Colombia | | | 113,106 | | | | — | | | | — | | | | 113,106 | |
South Korea | | | — | | | | 6,222,635 | | | | — | | | | 6,222,635 | |
Taiwan | | | 148,378 | | | | — | | | | — | | | | 148,378 | |
| | | | | | | | | | | | | | | | |
Total Preferred Stocks | | | 14,529,790 | | | | 6,222,635 | | | | — | | | | 20,752,425 | |
| | | | | | | | | | | | | | | | |
Warrants | | | | | | | | | | | | | | | | |
China | | | 4,213,089 | | | | — | | | | — | | | | 4,213,089 | |
| | | | | | | | | | | | | | | | |
Short-Term Investment | | | | | | | | | | | | | | | | |
Mutual Fund - Securities Lending Collateral | | | 6,004,273 | | | | — | | | | — | | | | 6,004,273 | |
| | | | | | | | | | | | | | | | |
Futures Contracts† | | | | | | | | | | | | | | | | |
Buys | | | 3,421,250 | | | | — | | | | — | | | | 3,421,250 | |
| | | | | | | | | | | | | | | | |
Total | | $ | 367,050,017 | | | $ | 1,181,886,825 | | | $ | 511,828 | | | $ | 1,549,448,670 | |
| | | | | | | | | | | | | | | | |
228
Mercer Funds
Notes to the Financial Statements (Continued)
March 31, 2022
LIABILITIES VALUATION INPUT
| | | | | | | | | | | | | | | | |
Description | | Quoted Prices
in Active
Markets for
Identical Assets
(Level 1) | | | Significant
Other
Observable
Inputs
(Level 2) | | | Significant
Unobservable
Inputs
(Level 3) | | | Total | |
Futures Contracts† | | | | | | | | | |
Sales | | $ | (12,051 | ) | | $ | — | | | $ | — | | | $ | (12,051 | ) |
| | | | | | | | | | | | | | | | |
Total | | $ | (12,051 | ) | | $ | — | | | $ | — | | | $ | (12,051 | ) |
| | | | | | | | | | | | | | | | |
| | * | Represents one or more Level 3 securities at $0 value as of March 31, 2022. |
| | † | Futures contracts are valued at unrealized appreciation/depreciation. Only current day’s variation margin, if any, is reported on the Statements of Assets and Liabilities. |
Global Low Volatility
ASSETS VALUATION INPUT
| | | | | | | | | | | | | | | | |
Description | | Quoted Prices
in Active
Markets for
Identical Assets
(Level 1) | | | Significant
Other
Observable
Inputs
(Level 2) | | | Significant
Unobservable
Inputs
(Level 3) | | | Total | |
Common Stocks | | | | | | | | | | | | | | | | |
Australia | | $ | 952,137 | | | $ | 21,118,720 | | | $ | — | | | $ | 22,070,857 | |
Austria | | | — | | | | 175,413 | | | | — | | | | 175,413 | |
Bermuda | | | 566,356 | | | | — | | | | — | | | | 566,356 | |
Brazil | | | — | | | | 506,655 | | | | — | | | | 506,655 | |
Burkina Faso | | | — | | | | 628,163 | | | | — | | | | 628,163 | |
Canada | | | 54,192,341 | | | | 96,533 | | | | — | | | | 54,288,874 | |
China | | | 7,888,953 | | | | 1,201,276 | | | | — | | | | 9,090,229 | |
Denmark | | | — | | | | 6,922,201 | | | | — | | | | 6,922,201 | |
Finland | | | — | | | | 2,999,900 | | | | — | | | | 2,999,900 | |
France | | | — | | | | 37,682,156 | | | | — | | | | 37,682,156 | |
Georgia | | | — | | | | 179,207 | | | | — | | | | 179,207 | |
Germany | | | — | | | | 19,394,890 | | | | — | | | | 19,394,890 | |
Hong Kong | | | 6,803 | | | | 11,988,299 | | | | — | | | | 11,995,102 | |
Indonesia | | | — | | | | 129,094 | | | | — | | | | 129,094 | |
Ireland | | | 7,965,455 | | | | — | | | | — | | | | 7,965,455 | |
Israel | | | 8,523,683 | | | | 5,849,836 | | | | — | | | | 14,373,519 | |
Italy | | | — | | | | 3,066,216 | | | | — | | | | 3,066,216 | |
Japan | | | — | | | | 52,752,576 | | | | — | | | | 52,752,576 | |
Jordan | | | — | | | | 1,055,844 | | | | — | | | | 1,055,844 | |
Luxembourg | | | — | | | | 2,305,498 | | | | — | | | | 2,305,498 | |
Netherlands | | | — | | | | 24,633,483 | | | | — | | | | 24,633,483 | |
New Zealand | | | — | | | | 4,029,625 | | | | — | | | | 4,029,625 | |
Norway | | | — | | | | 7,842,545 | | | | — | | | | 7,842,545 | |
Portugal | | | — | | | | 2,952,096 | | | | — | | | | 2,952,096 | |
Puerto Rico | | | 2,305,068 | | | | — | | | | — | | | | 2,305,068 | |
Singapore | | | — | | | | 7,394,368 | | | | 0 | * | | | 7,394,368 | |
South Africa | | | — | | | | 868,051 | | | | — | | | | 868,051 | |
229
Mercer Funds
Notes to the Financial Statements (Continued)
March 31, 2022
| | | | | | | | | | | | | | | | |
Description | | Quoted Prices
in Active
Markets for
Identical Assets
(Level 1) | | | Significant
Other
Observable
Inputs
(Level 2) | | | Significant
Unobservable
Inputs
(Level 3) | | | Total | |
South Korea | | $ | — | | | $ | 5,267,740 | | | $ | — | | | $ | 5,267,740 | |
Spain | | | — | | | | 8,973,228 | | | | — | | | | 8,973,228 | |
Sweden | | | — | | | | 5,980,999 | | | | — | | | | 5,980,999 | |
Switzerland | | | — | | | | 55,230,991 | | | | — | | | | 55,230,991 | |
United Kingdom | | | 386,257 | | | | 44,804,197 | | | | — | | | | 45,190,454 | |
United States | | | 905,589,861 | | | | 3,043,270 | | | | — | | | | 908,633,131 | |
| | | | | | | | | | | | | | | | |
Total Common Stocks | | | 988,376,914 | | | | 339,073,070 | | | | 0 | | | | 1,327,449,984 | |
| | | | | | | | | | | | | | | | |
Preferred Stocks | | | | | | | | | | | | | | | | |
Germany | | | — | | | | 465,111 | | | | — | | | | 465,111 | |
| | | | | | | | | | | | | | | | |
Short-Term Investment | | | | | | | | | | | | | | | | |
Mutual Fund - Securities Lending Collateral | | | 5,542,973 | | | | — | | | | — | | | | 5,542,973 | |
| | | | | | | | | | | | | | | | |
Futures Contracts† | | | | | | | | | | | | | | | | |
Buys | | | 61,668 | | | | — | | | | — | | | | 61,668 | |
| | | | | | | | | | | | | | | | |
Total | | $ | 993,981,555 | | | $ | 339,538,181 | | | $ | 0 | | | $ | 1,333,519,736 | |
| | | | | | | | | | | | | | | | |
| | * | Represents one or more Level 3 securities at $0 value as of March 31, 2022. |
| | † | Futures contracts are valued at unrealized appreciation/depreciation. Only current day’s variation margin, if any, is reported on the Statements of Assets and Liabilities. |
Investments in Derivative Instruments
At March 31, 2022 and during the period then ended, the Funds had the following derivatives and transactions in derivatives, grouped into appropriate risk categories:
Large Cap
| | | | | | | | |
| ASSET DERIVATIVES | |
| | | Equity Risk | | | Total | |
Futures Contracts(2) | | $ | 593,028 | | | $ | 593,028 | |
|
| |
| NET REALIZED GAIN (LOSS)(6) | |
| | | Equity Risk | | | Total | |
Futures Contracts | | $ | 3,657,265 | | | $ | 3,657,265 | |
|
| |
| CHANGE IN APPRECIATION (DEPRECIATION)(7) | | | | | | | | |
| | | Equity Risk | | | Total | |
Futures Contracts | | $ | 266,591 | | | $ | 266,591 | |
|
| |
| NUMBER OF CONTRACTS, NOTIONAL AMOUNTS OR SHARES/UNITS(8) | |
| | | Equity Risk | | | Total | |
Long Futures Contracts | | $ | 32,798,664 | | | $ | 32,798,664 | |
230
Mercer Funds
Notes to the Financial Statements (Continued)
March 31, 2022
Small/Mid Cap
| | | | | | | | |
| ASSET DERIVATIVES | |
| | | Equity Risk | | | Total | |
Futures Contracts(2) | | $ | 494,336 | | | $ | 494,336 | |
|
| |
| NET REALIZED GAIN (LOSS)(6) | |
| | | Equity Risk | | | Total | |
Futures Contracts | | $ | 256,639 | | | $ | 256,639 | |
|
| |
| CHANGE IN APPRECIATION (DEPRECIATION)(7) | |
| | | Equity Risk | | | Total | |
Futures Contracts | | $ | 941,979 | | | $ | 941,979 | |
|
| |
| NUMBER OF CONTRACTS, NOTIONAL AMOUNTS OR SHARES/UNITS(8) | |
| | | Equity Risk | | | Total | |
Long Futures Contracts | | $ | 39,727,956 | | | $ | 39,727,956 | |
Non-US Core Equity
| | | | | | | | | | | | |
| ASSET DERIVATIVES | |
| | | Foreign
Currency Risk | | | Equity Risk | | | Total | |
Futures Contracts(2) | | $ | — | | | $ | 4,018,218 | | | $ | 4,018,218 | |
|
| |
| NET REALIZED GAIN (LOSS)(6) | | | | | |
| | | Foreign
Currency Risk | | | Equity Risk | | | Total | |
Futures Contracts | | $ | — | | | $ | 1,358,256 | | | $ | 1,358,256 | |
Forward Foreign Currency Contracts | | | 1,014,229 | | | | — | | | | 1,014,229 | |
| | | | | | | | | | | | |
Total Realized Gain (Loss) | | $ | 1,014,229 | | | $ | 1,358,256 | | | $ | 2,372,485 | |
| | | | | | | | | | | | |
|
| |
| CHANGE IN APPRECIATION (DEPRECIATION)(7) | |
| | | Foreign
Currency Risk | | | Equity Risk | | | Total | |
Futures Contracts | | $ | — | | | $ | 3,456,419 | | | $ | 3,456,419 | |
Forward Foreign Currency Contracts | | | (1,203,827 | ) | | | — | | | | (1,203,827 | ) |
| | | | | | | | | | | | |
Total Change in Appreciation (Depreciation) | | $ | (1,203,827 | ) | | $ | 3,456,419 | | | $ | 2,252,592 | |
| | | | | | | | | | | | |
|
| |
| NUMBER OF CONTRACTS, NOTIONAL AMOUNTS OR SHARES/UNITS(8) | |
| | | Foreign
Currency Risk | | | Equity Risk | | | Total | |
Long Futures Contracts | | $ | — | | | $ | 96,255,817 | | | $ | 96,255,817 | |
Forward Foreign Currency Contracts | | | 28,279,583 | | | | — | | | | 28,279,583 | |
231
Mercer Funds
Notes to the Financial Statements (Continued)
March 31, 2022
Core Fixed
| | | | | | | | | | | | |
| ASSET DERIVATIVES | |
| | | Foreign
Currency Risk | | | Interest Rate
Risk | | | Total | |
Futures Contracts(2) | | $ | — | | | $ | 1,826,444 | | | $ | 1,826,444 | |
Forward Foreign Currency Contracts(3) | | | 303,693 | | | | — | | | | 303,693 | |
| | | | | | | | | | | | |
Total Value | | $ | 303,693 | | | $ | 1,826,444 | | | $ | 2,130,137 | |
| | | | | | | | | | | | |
|
| |
| LIABILITY DERIVATIVES | |
| | | Foreign
Currency Risk | | | Interest Rate
Risk | | | Total | |
Futures Contracts(2) | | $ | — | | | $ | (2,201,479 | ) | | $ | (2,201,479 | ) |
Forward Foreign Currency Contracts(5) | | | (105,047 | ) | | | — | | | | (105,047 | ) |
| | | | | | | | | | | | |
Total Value | | $ | (105,047 | ) | | $ | (2,201,479 | ) | | $ | (2,306,526 | ) |
| | | | | | | | | | | | |
|
| |
| NET REALIZED GAIN (LOSS)(6) | |
| | | Foreign
Currency Risk | | | Interest Rate
Risk | | | Total | |
Options Purchased | | $ | — | | | $ | 82,401 | | | $ | 82,401 | |
Options Written | | | — | | | | (29,736 | ) | | | (29,736 | ) |
Swaps Contracts | | | — | | | | (878,834 | ) | | | (878,834 | ) |
Futures Contracts | | | — | | | | (1,423,083 | ) | | | (1,423,083 | ) |
Forward Foreign Currency Contracts | | | 596,712 | | | | — | | | | 596,712 | |
| | | | | | | | | | | | |
Total Realized Gain (Loss) | | $ | 596,712 | | | $ | (2,249,252 | ) | | $ | (1,652,540 | ) |
| | | | | | | | | | | | |
|
| |
| CHANGE IN APPRECIATION (DEPRECIATION)(7) | |
| | | Foreign
Currency Risk | | | Interest Rate
Risk | | | Total | |
Options Purchased | | $ | — | | | $ | (112,288 | ) | | $ | (112,288 | ) |
Options Written | | | — | | | | 60,634 | | | | 60,634 | |
Swaps Contracts | | | — | | | | (4,053 | ) | | | (4,053 | ) |
Futures Contracts | | | — | | | | (808,002 | ) | | | (808,002 | ) |
Forward Foreign Currency Contracts | | | 33,333 | | | | — | | | | 33,333 | |
| | | | | | | | | | | | |
Total Change in Appreciation (Depreciation) | | $ | 33,333 | | | $ | (863,709 | ) | | $ | (830,376 | ) |
| | | | | | | | | | | | |
|
| |
| NUMBER OF CONTRACTS, NOTIONAL AMOUNTS OR SHARES/UNITS(8) | |
| | | Foreign
Currency Risk | | | Interest
Rate Risk | | | Total | |
Options Purchased | | $ | — | | | $ | 79,714 | | | $ | 79,714 | |
Options Written | | | — | | | | 102,857 | | | | 102,857 | |
Swaps Contracts | | | — | | | | 12,751,500 | | | | 12,751,500 | |
Long Futures Contracts | | | — | | | | 99,055,549 | | | | 99,055,549 | |
Short Futures Contracts | | | — | | | | (53,484,975 | ) | | | (53,484,975 | ) |
Forward Foreign Currency Contracts | | | 27,488,552 | | | | — | | | | 27,488,552 | |
232
Mercer Funds
Notes to the Financial Statements (Continued)
March 31, 2022
Opportunistic Fixed
| | | | | | | | | | | | | | | | | | | | |
| ASSET DERIVATIVES | | | | | | | | | | | | | |
| | | Credit Risk | | | Foreign
Currency Risk | | | Interest
Rate Risk | | | Equity Risk | | | Total | |
Options Purchased(1) | | $ | — | | | $ | 180,087 | | | $ | 1,449,160 | | | $ | 284,355 | | | $ | 1,913,602 | |
Futures Contracts(2) | | | — | | | | — | | | | 2,075,137 | | | | — | | | | 2,075,137 | |
Forward Foreign Currency Contracts(3) | | | — | | | | 4,392,883 | | | | — | | | | — | | | | 4,392,883 | |
OTC Swaps Contracts | | | 204,039 | | | | — | | | | 38,488 | | | | — | | | | 242,527 | |
Centrally Cleared Swap Contracts** | | | 88,737 | | | | — | | | | 322,587 | | | | — | | | | 411,324 | |
| | | | | | | | | | | | | | | | | | | | |
Total Value | | $ | 292,776 | | | $ | 4,572,970 | | | $ | 3,885,372 | | | $ | 284,355 | | | $ | 9,035,473 | |
| | | | | | | | | | | | | | | | | | | | |
| |
| | | | | |
| LIABILITY DERIVATIVES | | | | | | | | | | | | | |
| | | Credit Risk | | | Foreign
Currency Risk | | | Interest
Rate Risk | | | Equity Risk | | | Total | |
Options Written(4) | | $ | — | | | $ | (433,120 | ) | | $ | (402,982 | ) | | $ | (43,822 | ) | | $ | (879,924 | ) |
Futures Contracts(2) | | | — | | | | — | | | | (4,614,307 | ) | | | — | | | | (4,614,307 | ) |
Forward Foreign Currency Contracts(5) | | | — | | | | (6,145,459 | ) | | | — | | | | — | | | | (6,145,459 | ) |
OTC Swaps Contracts | | | (13,703 | ) | | | — | | | | (32,251 | ) | | | — | | | | (45,954 | ) |
Centrally Cleared Swap Contracts** | | | (205,528 | ) | | | — | | | | (360,292 | ) | | | — | | | | (565,820 | ) |
| | | | | | | | | | | | | | | | | | | | |
Total Value | | $ | (219,231 | ) | | $ | (6,578,579 | ) | | $ | (5,409,832 | ) | | $ | (43,822 | ) | | $ | (12,251,464 | ) |
| | | | | | | | | | | | | | | | | | | | |
| |
| | | | | |
| NET REALIZED GAIN (LOSS)(6) | | | | | | | | | | | | | |
| | | Credit Risk | | | Foreign
Currency Risk | | | Interest
Rate Risk | | | Equity Risk | | | Total | |
Options Purchased | | $ | — | | | $ | (941,268 | ) | | $ | 306,060 | | | $ | (1,821,617 | ) | | $ | (2,456,825 | ) |
Options Written | | | — | | | | 300,941 | | | | 171,639 | | | | 870,684 | | | | 1,343,264 | |
Swaps Contracts | | | (150,147 | ) | | | — | | | | 809,706 | | | | (54,823 | ) | | | 604,736 | |
Futures Contracts | | | — | | | | — | | | | (1,726,820 | ) | | | — | | | | (1,726,820 | ) |
Forward Foreign Currency Contracts | | | — | | | | 908,044 | | | | — | | | | — | | | | 908,044 | |
| | | | | | | | | | | | | | | | | | | | |
Total Realized Gain (Loss) | | $ | (150,147 | ) | | $ | 267,717 | | | $ | (439,415 | ) | | $ | (1,005,756 | ) | | $ | (1,327,601 | ) |
| | | | | | | | | | | | | | | | | | | | |
| |
| | | | | |
| CHANGE IN APPRECIATION (DEPRECIATION)(7) | | | | | |
| | | Credit Risk | | | Foreign
Currency Risk | | | Interest
Rate Risk | | | Equity Risk | | | Total | |
Options Purchased | | $ | — | | | $ | (22,993 | ) | | $ | 610,788 | | | $ | (338,872 | ) | | $ | 248,923 | |
Options Written | | | — | | | | (197,806 | ) | | | (172,645 | ) | | | (132,391 | ) | | | (502,842 | ) |
Swaps Contracts | | | (173,931 | ) | | | — | | | | (1,273,927 | ) | | | — | | | | (1,447,858 | ) |
Futures Contracts | | | — | | | | — | | | | (1,092,039 | ) | | | — | | | | (1,092,039 | ) |
Forward Foreign Currency Contracts | | | — | | | | (2,458,000 | ) | | | — | | | | — | | | | (2,458,000 | ) |
| | | | | | | | | | | | | | | | | | | | |
Total Change in Appreciation (Depreciation) | | $ | (173,931 | ) | | $ | (2,678,799 | ) | | $ | (1,927,823 | ) | | $ | (471,263 | ) | | $ | (5,251,816 | ) |
| | | | | | | | | | | | | | | | | | | | |
233
Mercer Funds
Notes to the Financial Statements (Continued)
March 31, 2022
| | | | | | | | | | | | | | | | | | | | |
| NUMBER OF CONTRACTS, NOTIONAL AMOUNTS OR SHARES/UNITS(8) | | | | | |
| | | Credit Risk | | | Foreign
Currency Risk | | | Interest
Rate Risk | | | Equity Risk | | | Total | |
Options Purchased | | $ | — | | | $ | 31,169,870 | | | $ | 21,196,542 | | | $ | 10,208 | | | $ | 52,376,620 | |
Options Written | | | — | | | | (16,197,313 | ) | | | (22,499,667 | ) | | | (7,333 | ) | | | (38,704,313 | ) |
Swaps Contracts | | | 40,252,381 | | | | — | | | | 38,254,076 | | | | 42,196 | | | | 78,548,653 | |
Long Futures Contracts | | | — | | | | — | | | | 284,933,352 | | | | — | | | | 284,933,352 | |
Short Futures Contracts | | | — | | | | — | | | | (126,663,445 | ) | | | — | | | | (126,663,445 | ) |
Forward Foreign Currency Contracts | | | — | | | | 399,214,934 | | | | — | | | | — | | | | 399,214,934 | |
Emerging Markets
| | | | | | | | | | | | |
| ASSET DERIVATIVES | |
| | | Foreign
Currency Risk | | | Equity Risk | | | Total | |
Futures Contracts(2) | | $ | — | | | $ | 3,421,250 | | | $ | 3,421,250 | |
|
| |
| LIABILITY DERIVATIVES | |
| | | Foreign
Currency Risk | | | Equity Risk | | | Total | |
Futures Contracts(2) | | $ | — | | | $ | (12,051 | ) | | $ | (12,051 | ) |
|
| |
| NET REALIZED GAIN (LOSS)(6) | |
| | | Foreign
Currency Risk | | | Equity Risk | | | Total | |
Futures Contracts | | $ | — | | | $ | (14,386,464 | ) | | $ | (14,386,464 | ) |
Forward Foreign Currency Contracts | | | (149 | ) | | | — | | | | (149 | ) |
| | | | | | | | | | | | |
Total Realized Gain (Loss) | | $ | (149 | ) | | $ | (14,386,464 | ) | | $ | (14,386,613 | ) |
| | | | | | | | | | | | |
|
| |
| CHANGE IN APPRECIATION (DEPRECIATION)(7) | |
| | | Foreign
Currency Risk | | | Equity Risk | | | Total | |
Futures Contracts | | $ | — | | | $ | 2,647,960 | | | $ | 2,647,960 | |
|
| |
| NUMBER OF CONTRACTS, NOTIONAL AMOUNTS OR SHARES/UNITS(8) |
| | | Foreign
Currency Risk | | | Equity Risk | | | Total | |
Long Futures Contracts | | $ | — | | | $ | 95,997,741 | | | $ | 95,997,741 | |
Short Futures Contracts | | | — | | | | (2,498,485 | ) | | | (2,498,485 | ) |
Forward Foreign Currency Contracts | | | 806,041 | | | | — | | | | 806,041 | |
234
Mercer Funds
Notes to the Financial Statements (Continued)
March 31, 2022
Global Low Volatility
| | | | | | | | | | | | |
| ASSET DERIVATIVES | | | | | |
| | | Foreign
Currency Risk | | | Equity Risk | | | Total | |
Futures Contracts(2) | | $ | — | | | $ | 61,668 | | | $ | 61,668 | |
|
| |
| NET REALIZED GAIN (LOSS)(6) | | | | | |
| | | Foreign
Currency Risk | | | Equity Risk | | | Total | |
Futures Contracts | | $ | 7,002 | | | $ | 4,356,421 | | | $ | 4,363,423 | |
|
| |
| CHANGE IN APPRECIATION (DEPRECIATION)(7) | | | | | |
| | | Foreign
Currency Risk | | | Equity Risk | | | Total | |
Futures Contracts | | $ | 1,204 | | | $ | (160,736 | ) | | $ | (159,532 | ) |
|
| |
| NUMBER OF CONTRACTS, NOTIONAL AMOUNTS OR SHARES/UNITS(8) |
| | | Foreign
Currency Risk | | | Equity Risk | | | Total | |
Long Futures Contracts | | $ | 695,730 | | | $ | 19,554,821 | | | $ | 20,250,551 | |
| | **Centrally | Cleared Swaps are valued at unrealized appreciation (depreciation) on the Schedule of Investments. Only current day’s variation margin, if any, is reported on the Statements of Assets and Liabilities. |
| | (1) | Statements of Assets and Liabilities location: Investments, at value. |
| | (2) | Cumulative appreciation (depreciation) on futures contracts is disclosed within the Schedule of Investments under the open “Futures Contracts” section. Only current day’s variation margin, if any, are reported within the Statements of Assets and Liabilities. |
| | (3) | Statements of Assets and Liabilities location: Unrealized appreciation on open forward foreign currency contracts. |
| | (4) | Statements of Assets and Liabilities location: Written options, at value. |
| | (5) | Statements of Assets and Liabilities location: Unrealized depreciation on open forward foreign currency contracts. |
| | (6) | Statements of Operations location: Amounts are included in Net realized gain (loss) on Forward foreign currency contracts, Closed futures contracts, Purchased option contracts, Written option contracts and Swap contracts. |
| | (7) | Statements of Operations location: Amounts are included in Change in net unrealized appreciation (depreciation) on Forward foreign currency contracts, Open futures contracts, Purchased option contracts, Written option contracts and Swap contracts. |
| | (8) | Amounts disclosed represent average notional value for the months that the Fund held such derivatives during the year ended March 31, 2022. |
Netting Agreements and Collateral Requirements
In order to better define contractual rights under derivative contracts and to secure rights that will help the Funds mitigate their counterparty risk, a Sub-adviser may, on behalf of the Funds, enter into an International Swaps and Derivatives Association, Inc. Master Agreement (“ISDA Master Agreement”) or similar agreement with its derivative contract counterparties. An ISDA Master Agreement is a
235
Mercer Funds
Notes to the Financial Statements (Continued)
March 31, 2022
bilateral agreement between the Funds and a counterparty that governs OTC derivatives and foreign exchange contracts and typically contains, among other things, collateral posting terms and netting provisions in the event of a default and/or termination event. Under an ISDA Master Agreement, the Funds may, under certain circumstances, offset with the counterparty certain derivative financial instrument’s payables and/or receivables with certain collateral held and/or posted and create a net payment. The provisions of the ISDA Master Agreement typically permit a net payment in the event of default including the bankruptcy or insolvency of the counterparty. Absent an event of default by the counterparty or termination of the agreement, the ISDA Master Agreement does not result in an offset of reported amounts of assets and liabilities in the Statements of Assets and Liabilities across the transactions between the Funds and the applicable counterparty. The right to offset and net payments across all transactions traded under the ISDA Master Agreement could result in a reduction of the Funds’ credit risk to such counterparty equal to any amounts payable by the Funds under the applicable transactions, if any. However, bankruptcy or insolvency laws of a particular jurisdiction may impose restrictions on or prohibitions against the right of offset in bankruptcy, insolvency or other events. In addition, certain ISDA Master Agreements allow counterparties to OTC derivatives to terminate derivative contracts prior to maturity in the event a Fund’s net assets decline by a stated percentage or the Funds fail to meet the terms of their ISDA Master Agreements, which would cause the Funds to accelerate payment of any net liability owed to the counterparty.
For derivatives traded under an ISDA Master Agreement, the collateral requirements are typically calculated by netting the mark to market amount for each transaction under such agreement and comparing that amount to the value of any collateral currently pledged by the Funds and the counterparty.
Cash collateral that has been pledged to cover obligations of the Funds and cash collateral received from the counterparty, if any, is reported separately on the Statements of Assets and Liabilities as cash collateral held at broker or cash collateral due to broker, respectively. Non-cash collateral pledged by or received by the Funds, if any, is noted in the Schedule of Investments. Generally, the amount of collateral due from or to a party has to exceed a minimum transfer amount threshold before a transfer is required, which is determined each day at the close of business of the Funds, typically based on changes in market values for each transaction under an ISDA Master Agreement and netted into one amount for such agreement and any additional required collateral is delivered to/pledged by the Funds on the next business day. Typically, the Funds and counterparties are not permitted to sell, re-pledge or use the collateral they receive. To the extent amounts due to the Funds from their counterparties are not fully collateralized, contractually or otherwise, the Funds bear the risk of loss from counterparty non-performance. The Funds attempt to mitigate counterparty risk by entering into agreements only with counterparties that they believe have the financial resources to honor their obligations and by monitoring the financial stability of those counterparties.
The Funds are required to disclose both gross and net information for assets and liabilities related to derivatives, repurchase and reverse repurchase agreements, and securities lending and securities borrowings transactions that are eligible for offset or subject to an enforceable master netting or similar agreement. The Funds’ derivative assets and liabilities at fair value by risk are presented in the tables above. For financial reporting purposes the Funds do not offset derivative assets and derivative liabilities that are subject to netting arrangements in the Statements of Assets and Liabilities. Only forward foreign currency contracts, OTC swaps and OTC options assets and liabilities are subject to master netting agreements. An exception to this, Opportunistic Fixed is not a party to an ISDA master agreement with Commonwealth Bank of Australia.
236
Mercer Funds
Notes to the Financial Statements (Continued)
March 31, 2022
The following tables present the Funds’ derivative assets and liabilities by counterparty, net of amounts available for offset under a Master Netting Agreement (“MNA”) and net of related collateral received by the Funds for assets or pledged by the Funds for liabilities as of March 31, 2022.
Core Fixed
Offsetting of Financial Assets and Derivative Assets:
| | | | | | | | | | | | | | | | |
| |
Counterparty | | Derivative
Assets Subject
to MNA | | | Derivative
Assets/(Liabilities)
available for offset | | | Collateral
Received* | | | Net Amount
of Derivative
Assets(a) | |
JPMorgan Chase Bank N.A. | | $ | 303,693 | | | $ | (105,047 | ) | | $ | — | | | $ | 198,646 | |
| | | | | | | | | | | | | | | | |
|
| |
| Offsetting of Financial Liabilities and Derivative Liabilities: | |
Counterparty | | Derivative
Liabilities Subject
to MNA | | | Derivative
Assets/(Liabilities)
available for offset | | | Collateral
Pledged* | | | Net Amount
of Derivative
Liabilities(b) | |
JPMorgan Chase Bank N.A. | | $ | (105,047 | ) | | $ | 105,047 | | | $ | — | | | $ | — | |
| | | | | | | | | | | | | | | | |
| | (a) | Represents the net amount receivable from the counterparty in the event of default. |
| | (b) | Represents the net amount payable to the counterparty in the event of default. |
| | * | In some instances, the actual collateral received and/or pledged may be more than the derivative asset or liability due to overcollateralization. |
Opportunistic Fixed
Offsetting of Financial Assets and Derivative Assets:
| | | | | | | | | | | | | | | | |
Counterparty | | Derivative
Assets Subject
to MNA | | | Derivative
Assets/(Liabilities)
available for offset | | | Collateral
Received* | | | Net Amount
of Derivative
Assets(a) | |
Bank of America, N.A. | | $ | 48,575 | | | $ | (48,575 | ) | | $ | — | | | $ | — | |
Barclays Bank Plc | | | 25,822 | | | | (14,616 | ) | | | — | | | | 11,206 | |
BNP Paribas S.A. | | | 215,036 | | | | (215,036 | ) | | | — | | | | — | |
Citibank N.A. | | | 1,076,582 | | | | (851,494 | ) | | | — | | | | 225,088 | |
Deutsche Bank AG | | | 1,418 | | | | (1,418 | ) | | | — | | | | — | |
Goldman Sachs & Co. | | | 391,237 | | | | (391,237 | ) | | | — | | | | — | |
Goldman Sachs International | | | 31,878 | | | | (31,878 | ) | | | — | | | | — | |
HSBC Bank Plc | | | 118,948 | | | | (80,554 | ) | | | (10,000 | ) | | | 28,394 | |
JPMorgan Chase Bank N.A. | | | 1,054,801 | | | | (1,054,801 | ) | | | — | | | | — | |
Morgan Stanley & Co. | | | 1,680,860 | | | | (392,628 | ) | | | (1,130,254 | ) | | | 157,978 | |
Morgan Stanley and Co. International Plc | | | 181,921 | | | | (181,921 | ) | | | — | | | | — | |
Morgan Stanley Capital Services, Inc. | | | 1,156,247 | | | | (803,787 | ) | | | — | | | | 352,460 | |
Standard Chartered Bank | | | 3,164 | | | | (3,164 | ) | | | — | | | | — | |
State Street Bank and Trust | | | 114 | | | | — | | | | — | | | | 114 | |
State Street Bank London | | | 29,665 | | | | (15,453 | ) | | | — | | | | 14,212 | |
The BNY Mellon | | | 3,445 | | | | (3,445 | ) | | | — | | | | — | |
UBS AG | | | 244,536 | | | | (244,536 | ) | | | — | | | | — | |
| | | | | | | | | | | | | | | | |
| | $ | 6,264,249 | | | $ | (4,334,543 | ) | | $ | (1,140,254 | ) | | $ | 789,452 | |
| | | | | | | | | | | | | | | | |
237
Mercer Funds
Notes to the Financial Statements (Continued)
March 31, 2022
Offsetting of Financial Liabilities and Derivative Liabilities:
| | | | | | | | | | | | | | | | |
Counterparty | | Derivative
Liabilities Subject
to MNA | | | Derivative
Assets/(Liabilities)
available for offset | | | Collateral
Pledged* | | | Net Amount
of Derivative
Liabilities(b) | |
Bank of America, N.A. | | $ | (301,433 | ) | | $ | 48,575 | | | $ | 70,000 | | | $ | (182,858 | ) |
Barclays Bank Plc | | | (14,616 | ) | | | 14,616 | | | | — | | | | — | |
BNP Paribas S.A. | | | (268,372 | ) | | | 215,036 | | | | 53,336 | | | | — | |
Citibank N.A. | | | (851,494 | ) | | | 851,494 | | | | — | | | | — | |
Deutsche Bank AG | | | (17,961 | ) | | | 1,418 | | | | 10,000 | | | | (6,543 | ) |
Goldman Sachs & Co. | | | (809,256 | ) | | | 391,237 | | | | 418,019 | | | | — | |
Goldman Sachs International | | | (381,687 | ) | | | 31,878 | | | | — | | | | (349,809 | ) |
HSBC Bank Plc | | | (80,554 | ) | | | 80,554 | | | | — | | | | — | |
HSBC Bank USA, N.A. | | | (22,943 | ) | | | — | | | | — | | | | (22,943 | ) |
JPMorgan Chase Bank N.A. | | | (2,065,676 | ) | | | 1,054,801 | | | | 450,000 | | | | (560,875 | ) |
JPMorgan Securities LLC | | | (186,636 | ) | | | — | | | | — | | | | (186,636 | ) |
Morgan Stanley & Co. | | | (392,628 | ) | | | 392,628 | | | | — | | | | — | |
Morgan Stanley and Co. International Plc | | | (389,811 | ) | | | 181,921 | | | | — | | | | (207,890 | ) |
Morgan Stanley Capital Services, Inc. | | | (803,787 | ) | | | 803,787 | | | | — | | | | — | |
Standard Chartered Bank | | | (18,414 | ) | | | 3,164 | | | | — | | | | (15,250 | ) |
State Street Bank London | | | (15,453 | ) | | | 15,453 | | | | — | | | | — | |
The BNY Mellon | | | (22,846 | ) | | | 3,445 | | | | — | | | | (19,401 | ) |
UBS AG | | | (313,872 | ) | | | 244,536 | | | | — | | | | (69,336 | ) |
| | | | | | | | | | | | | | | | |
| | $ | (6,957,439 | ) | | $ | 4,334,543 | | | $ | 1,001,355 | | | $ | (1,621,541 | ) |
| | | | | | | | | | | | | | | | |
| | (a) | Represents the net amount receivable from the counterparty in the event of default. |
| | (b) | Represents the net amount payable to the counterparty in the event of default. |
| | * | In some instances, the actual collateral received and/or pledged may be more than the derivative asset or liability due to overcollateralization. |
(b) Security transactions and related investment income
Security transactions are accounted for on trade date. Dividend income, net of applicable withholding taxes, is recorded on the ex-dividend date or when the Fund is informed of the ex-dividend date, if later. Interest income is recorded on the accrual basis, and is adjusted for amortization of premium and discounts for debt securities. Income is not recognized, nor are premium and discount amortized on securities for which collection is not expected. Withholding taxes on foreign dividends, interest, and capital gains have been provided for in accordance with the respective country’s tax rules and rates. Non-cash dividends, if any, are recorded at the fair value of the securities received. Distributions received on securities that represent a return of capital or capital gains are recorded as a reduction of cost of investments and/or as a realized gain. The Funds determine the classification of distributions received as return of capital distributions or capital gain distributions. Interest income on inflation indexed securities is accrued daily based upon an inflation-adjusted principal. Additionally, any increase in the principal or face amount of these securities is recorded as interest income. In determining the net gain or loss on securities sold, the cost of securities is determined on the identified-cost basis.
238
Mercer Funds
Notes to the Financial Statements (Continued)
March 31, 2022
(c) Cash, cash equivalents and short-term investments
A Fund may invest a portion of its assets in cash and cash equivalents. Cash and cash equivalents are defined as cash and bank balances as well as short-term investments with a maturity of less than three months from the acquisition date.
A Fund may invest a portion of its assets in short-term debt securities (including repurchase agreements and reverse repurchase agreements) of corporations, the U.S. government and its agencies and instrumentalities and banks and finance companies, which may be denominated in any currency.
A Fund may invest a portion of its assets in shares issued by money market mutual funds. A Fund also may invest in collective investment vehicles that are managed by an unaffiliated investment manager, pending investment of the Fund’s assets in portfolio securities. When unusual market conditions warrant, a Fund may make substantial temporary defensive investments in cash equivalents, up to a maximum of 100% of the Fund’s net assets. Cash equivalent holdings may be in any currency. When a Fund invests for temporary defensive purposes, such investments may affect the Fund’s ability to achieve its investment objective.
(d) Securities lending
A Fund may lend its portfolio securities to qualified broker/dealers and financial institutions pursuant to agreements, provided: (1) the loan is secured continuously by collateral marked to market daily and maintained in an amount at least equal to the current fair value of the securities loaned; (2) the Fund may call the loan at any time and receive the securities loaned; (3) the Fund will receive any interest or dividends paid on the loaned securities; and (4) the aggregate fair value of securities loaned will not at any time exceed 33 1/3% of the total assets of the Fund. Collateral will consist of U.S. and non-U.S. securities, cash equivalents or irrevocable letters of credit. A liability for cash collateral is reflected in the Statements of Assets and Liabilities, and is categorized as Level 2 within the fair value hierarchy. As with other extensions of credit, there are risks of delay in recovery or even loss of rights in collateral in the event of default or insolvency of a borrower of a Fund’s portfolio securities. A Fund may not retain voting rights on securities while they are on loan.
Certain Funds may from time to time participate in a securities lending program under which the Funds’ custodian, State Street Bank and Trust Company (the “Custodian”) acting as securities lending agent, is authorized to lend Fund portfolio securities to qualified broker/dealers and financial institutions that post appropriate collateral. The Custodian has agreed to indemnify the Funds in case of default of any security borrower.
Securities on loan are fully collateralized and the collateral was equal to or exceeded the securities on loan at March 31, 2022. If the market value of the collateral at the close of trading on a business day is less than 100% of the market value of the loaned securities at the close of trading on that day, the borrower shall be required to deliver, by the close of business on the following business day, an additional amount of collateral, so that the total amount of posted collateral is equal to at least 100% of the market value of all the loaned securities as of such preceding day. Cash collateral is invested in the State Street Institutional U.S. Government Money Market Fund, Premier Class. The Custodian receives a portion of the interest earned on any reinvested collateral. The market value of securities on loan to
239
Mercer Funds
Notes to the Financial Statements (Continued)
March 31, 2022
borrowers and the value of collateral held by the Funds with respect to such loans at March 31, 2022 were as follows:
| | | | | | | | | | | | |
| | | Market Value of
Loaned Securities | | | Value of
Cash Collateral | | | Value of
Non-Cash Collateral | |
Large Cap | | $ | 10,950,076 | | | $ | 2,060,110 | | | $ | 9,477,508 | |
Small/Mid Cap | | | 27,921,957 | | | | 10,496,590 | | | | 18,899,763 | |
Non-US Core Equity | | | 117,387,579 | | | | 82,677,714 | | | | 44,622,499 | |
Core Fixed | | | 46,314,991 | | | | 39,160,195 | | | | 8,053,840 | |
Opportunistic Fixed | | | 47,741,718 | | | | 46,932,355 | | | | 1,656,056 | |
Emerging Markets | | | 46,383,288 | | | | 6,004,273 | | | | 43,232,036 | |
Global Low Volatility | | | 7,150,161 | | | | 5,542,973 | | | | 2,128,886 | |
For Large Cap, Small/Mid Cap, Non-US Core Equity, Emerging Markets and Global Low Volatility, all of the securities on loan collateralized by cash are classified as Common Stocks in each Fund’s Schedule of Investments at March 31, 2022, with a contractual maturity of overnight and continuous.
For Core Fixed the values of the security loan obligations are classified as follows at March 31, 2022:
| | | | | | | | | | | | | | | | | | | | |
| | | Remaining Contractual Maturity of the Agreements
As of March 31, 2022 | |
| | | Overnight and
Continuous | | | <30 days | | | Between
30 & 90 days | | | >90 days | | | Total | |
Securities Lending Transactions | | | | | | | | | | | | | | | | | | | | |
Corporate Debt | | $ | 38,905,361 | | | $ | — | | | $ | — | | | $ | — | | | $ | 38,905,361 | |
Sovereign Debt Obligations | | | 254,834 | | | | — | | | | — | | | | — | | | | 254,834 | |
| | | | | | | | | | | | | | | | | | | | |
Total Borrowings | | $ | 39,160,195 | | | $ | — | | | $ | — | | | $ | — | | | $ | 39,160,195 | |
| | | | | | | | | | | | | | | | | | | | |
Gross amount of recognized liabilities for securities lending transactions | | | $ | 39,160,195 | |
| | | | | | | | | | | | | | | | | | | | |
For Opportunistic Fixed the values of the security loan obligations are classified as follows at March 31, 2022:
| | | | | | | | | | | | | | | | | | | | |
| | | Remaining Contractual Maturity of the Agreements
As of March 31, 2022 | |
| | | Overnight and
Continuous | | | <30 days | | | Between
30 & 90 days | | | >90 days | | | Total | |
Securities Lending Transactions | |
Convertible Debt | | $ | 1,171,272 | | | $ | — | | | $ | — | | | $ | — | | | $ | 1,171,272 | |
Convertible Preferred Stocks | | | 252,202 | | | | — | | | | — | | | | — | | | | 252,202 | |
Corporate Debt | | | 29,307,765 | | | | — | | | | — | | | | — | | | | 29,307,765 | |
Sovereign Debt Obligations | | | 3,803,804 | | | | — | | | | — | | | | — | | | | 3,803,804 | |
U.S. Government and Agency Obligations | | | 12,397,312 | | | | — | | | | — | | | | — | | | | 12,397,312 | |
| | | | | | | | | | | | | | | | | | | | |
Total Borrowings | | $ | 46,932,355 | | | $ | — | | | $ | — | | | $ | — | | | $ | 46,932,355 | |
| | | | | | | | | | | | | | | | | | | | |
Gross amount of recognized liabilities for securities lending transactions | | | $ | 46,932,355 | |
| | | | | | | | | | | | | | | | | | | | |
(e) Swaps
Swap contracts are derivatives in the form of a contract or similar instrument, which is an agreement to exchange the return generated by one instrument for the return generated by another instrument. A Fund
240
Mercer Funds
Notes to the Financial Statements (Continued)
March 31, 2022
may engage in swaps, including, but not limited to, interest rate, currency, credit default, index, and total return swaps, and the purchase or sale of related caps, floors, collars, and other derivative instruments. A Fund expects to enter into these transactions to preserve a return or spread on a particular investment or portion of the portfolio, to modify the portfolio’s duration, to protect against any increase in the price of securities the Fund anticipates purchasing at a later date, or to gain exposure to certain markets in the most economical way possible.
Interest rate swaps involve the exchange by a Fund with another party of their respective commitments to receive or pay interest (e.g., an exchange of fixed rate payments for floating rate payments) with respect to a notional amount of principal. Up-front payments received or made are reflected as “up-front net premiums received” or “up-front net premiums paid”, respectively, on the Statements of Assets and Liabilities. Currency swaps involve the exchange of cash flows on a notional amount based on changes in the values of referenced currencies.
The credit default swaps may have as reference obligations one or more securities that are not currently held by a Fund. The protection “buyer” in a credit default swap agreement is generally obligated to pay the protection “seller” an upfront or a periodic stream of payments over the term of the contract provided that no credit event, such as a default, on a reference obligation has occurred. If a credit event occurs, the seller generally must pay the buyer the “par value” (full notional value) of the swap in exchange for an equal face amount of deliverable obligations of the reference entity described in the swap, or the seller may be required to deliver the related net cash amount, if the swap is cash settled. A Fund may be either the buyer or seller in the transaction. If a Fund is a buyer and no credit event occurs, the Fund may recover nothing if the swap is held through its termination date. However, if a credit event occurs, the buyer generally may elect to receive the full notional value of the swap in exchange for an equal face amount of deliverable obligations of the reference entity whose value may have significantly decreased. As a seller, a Fund generally receives an upfront payment or a fixed rate of income throughout the term of the swap provided that there is no credit event. As the seller, a Fund would effectively add leverage to its portfolio because, in addition to its total net assets, a Fund would be subject to investment exposure on the notional amount of the swap.
The spread of a credit default swap is the annual amount the protection buyer must pay the protection seller over the length of the contract, expressed as a percentage of the notional amount. When spreads rise, market perceived credit risk rises and when spreads fall, market perceived credit risk falls. Wider credit spreads and decreasing market values, when compared to the notional amount of the swap, represent a deterioration of the referenced entity’s credit soundness and an increased market perception that there is a greater likelihood of risk of default or other credit event occurring as defined under the terms of the agreement. For credit default swaps on asset-backed securities and credit indices, the quoted market prices and resulting values, as well as the annual payment rates, serve as an indication of the current status of the payment/performance risk.
In a total return swap, the buyer receives a periodic return equal to the total return of a specified security, securities or index for a specified period of time. In return, the buyer pays the counterparty a fixed or variable stream of payments, typically based upon short-term interest rates, possibly plus or minus an agreed upon spread. During the term of the outstanding swap agreement, changes in the underlying value of the swap are recorded as unrealized gains and losses. Periodic payments received or made are recorded as realized gains or losses. The Fund is exposed to credit loss in the event of nonperformance by the swap counterparty. Risk may also arise from the unanticipated movements in value of exchange rates, interest rates, securities, or the index.
241
Mercer Funds
Notes to the Financial Statements (Continued)
March 31, 2022
Swaps do not involve the delivery of securities or other underlying assets or principal, and are subject to counterparty risk. If the other party to a swap defaults and fails to consummate the transaction, a Fund’s risk of loss consists of the net amount of interest payments that the Fund is contractually entitled to receive.
The equity swaps in which the Funds may invest involve agreements with a counterparty. The return to the Funds on any equity swap contract will be the total return on the notional amount of the contract as if it were invested in the stocks comprising the contract index in exchange for an interest component based on the notional amount of the agreement. The Funds will only enter into an equity swap contract on a net basis, i.e., the two parties’ obligations are netted out, with the Funds paying or receiving, as the case may be, only the net amount of the payments. Payments under an equity swap contract may be made at the conclusion of the contract or periodically during its term.
Whether a Fund’s use of swaps or swap options will be successful in achieving the Fund’s investment objective will depend on the Sub-adviser’s ability to predict correctly whether certain types of investments are likely to produce greater returns than other investments. Moreover, a Fund bears the risk of loss of the amount expected to be received under a swap contract in the event of the default or bankruptcy of a swap counterparty. The Funds will enter into swap agreements only with counterparties that meet certain standards of creditworthiness.
If there is a default by the counterparty to an uncleared swap, a Fund will be limited to contractual remedies pursuant to the agreements related to the transaction. There is no assurance that a swap counterparty will be able to meet its obligations pursuant to a swap or that, in the event of a default, a Fund will succeed in pursuing contractual remedies. A Fund thus assumes the risk that it may be delayed in, or prevented from, obtaining payments owed to it pursuant to a swap. However, the amount at risk is, subject to some exceptions, generally only the net unrealized gain, if any, on the swap not the entire notional amount. The Sub-adviser that enters into the swap will closely monitor, subject to the oversight of the Board, the creditworthiness of swap counterparties in order to minimize the counterparty risk of swaps.
Because swaps are two party contracts that may be subject to contractual restrictions on transferability and termination, and they may have terms of greater than seven days, swap agreements may be considered to be illiquid and subject to a Fund’s limitation on investments in illiquid securities. However, the Trust has adopted procedures pursuant to which the Advisor may determine that swaps (including swap options) are liquid under certain circumstances. To the extent that a swap is not liquid, it may not be possible to initiate a transaction or liquidate a position at an advantageous time or price, which may result in significant losses.
The Dodd-Frank Wall Street Reform and Consumer Protection Act (the “Dodd-Frank Act”) was enacted in July 2010. Among other things, the Dodd-Frank Act sets forth a regulatory framework for certain OTC derivatives, such as swaps. The Dodd-Frank Act requires certain swap transactions to be executed on registered exchanges or through swap execution facilities, cleared through a regulated clearinghouse, and publicly reported. In addition, many market participants who were not previously required to register are regulated as swap dealers or major swap participants, and are, or will be, subject to certain minimum capital and margin requirements and business conduct standards.
Certain standardized swaps, including certain U.S. dollar and non-U.S. dollar denominated interest rate and credit default index swaps, are subject to mandatory clearing, which interposes a central clearing house as the counterparty to each participant’s swap, and exchange-trading. Additional swap asset classes are expected to be subject to mandatory clearing and exchange-trading in the future. The
242
Mercer Funds
Notes to the Financial Statements (Continued)
March 31, 2022
counterparty risk for cleared derivatives is generally considered to be lower than for uncleared derivatives, but cleared contracts are not risk-free. It is possible that developments in the swaps market, including potential government regulation, could adversely affect the Funds’ ability to terminate existing swap agreements or to realize amounts to be received under such agreements.
Central clearing and exchange trading is only required for trading certain instruments, although central clearing and exchange trading for additional instruments is expected to be implemented by the Commodity Futures Trading Commission (“CFTC”) until the majority of the swaps market is ultimately subject to both. In addition, uncleared swaps that are subject to regulatory collateral requirements could adversely affect a Fund’s ability to enter into swaps in the OTC market. The establishment of a centralized exchange or market for cleared swap transactions may not result in swaps being easier to value or trade. However, swap dealers, major swap participants, and swap counterparties may experience other new and/or additional regulations, requirements, compliance burdens, and associated costs. The legislation and rules promulgated may exert a negative effect on a Fund’s ability to meet its investment objective, either through limits or requirements imposed on the Fund or its counterparties. Specifically, position limits imposed on a Fund or its counterparties may affect that Fund’s ability to invest in futures, options, and swaps in a manner consistent with the Fund’s investment objective and strategies. The new requirements prescribed by the Dodd-Frank Act may increase the cost of a Fund’s investments and cost of doing business, which could adversely affect the ability of the Funds to buy or sell derivatives.
In a cleared swap transaction, the Fund typically will be required to post specified levels of margin with the clearinghouse or at the instruction of the clearinghouse; the margin required by a clearinghouse may be greater than the margin the Fund would be required to post in an uncleared derivative transaction. Cash margin is recorded on the Statements of Assets and Liabilities as cash collateral held at broker on open swap contracts. Swap agreements are marked to market daily. Daily changes in valuation of centrally cleared swaps, if any, are recorded as a variation margin payable or receivable for the change in value as appropriate on the Statements of Assets and Liabilities. Only certain derivative transactions are currently eligible for clearing by clearinghouses.
A Fund will accrue for interim payments on swap contracts on a daily basis, with the net amount recorded as interest payable or receivable on the Statements of Assets and Liabilities. Once interim payments are settled in cash, the net amount is recorded as realized gain/loss on swap contracts, in addition to realized gain/loss recorded upon the termination of swap contracts on the Statements of Operations. Fluctuations in the value of swap contracts are recorded for financial statement purposes as unrealized appreciation or depreciation of swap contracts (swap contracts, at value on the Statements of Assets and Liabilities).
Swap agreements are marked to market daily. The change in value, if any, is recorded as unrealized gain or loss in the Statements of Operations. A liquidation payment received or made at the termination of the swap is recorded as realized gain or loss in the Statements of Operations. Net periodic payments are included as part of realized gain (loss) on the Statements of Operations.
The swaps in which the Fund may engage may include instruments under which one party pays a single or periodic fixed amount(s) (or premium), and the other party pays periodic amounts based on the movement of a specified index. The Fund’s maximum risk of loss from counterparty credit risk, as opposed to investment and other types of risk, in respect of swaps is typically the discounted net value of the cash flows to be received from the counterparty over the contract’s remaining life to the extent that such amount is positive, plus the cost of entering into a similar transaction with another counterparty, if possible.
243
Mercer Funds
Notes to the Financial Statements (Continued)
March 31, 2022
The use of swaps is a highly specialized activity that involves investment techniques and risks different from those associated with ordinary portfolio securities transactions. Like most other investments, swaps are subject to the risk that the market value of the instrument will change in a way detrimental to a Fund’s interest. A Fund bears the risk that Sub-adviser will not accurately forecast future market trends or the values of assets, reference rates, indices, or other economic factors in establishing swap positions for the Fund. If a Sub-adviser attempts to use a swap as a hedge against, or as a substitute for, a portfolio investment, the Fund will be exposed to the risk that the swap will have or will develop imperfect or no correlation with the portfolio investment. This could cause substantial losses for the Fund. While hedging strategies involving swap instruments can reduce the risk of loss, they can also reduce the opportunity for gain or even result in losses by offsetting favorable price movements in other Fund investments. If the Sub-adviser is incorrect in its forecasts of market values, interest rates, and currency exchange rates, the investment performance of the Fund would be less favorable than it would have been if this investment technique were not used.
During the year ended March 31, 2022, Core Fixed and Opportunistic Fixed used swaps to adjust interest rate and yield curve exposure or to manage credit exposure. See the Core Fixed and Opportunistic Fixed Schedules of Investments for a listing of open swaps as of March 31, 2022.
(f) Futures
A futures contract is a contractual agreement to buy or sell a specific amount of a commodity or financial instrument at a predetermined price on a stipulated future date. A Fund may enter into contracts for the purchase or sale for future delivery of securities, indices and foreign currencies. Futures contracts may be opened to protect against the adverse effects of fluctuations in security prices, interest rates, or foreign exchange rates without actually buying or selling the securities or foreign currency. A Fund also may enter into futures contracts as a low cost method for gaining or reducing exposure to a particular currency or securities market without directly investing in those currencies or securities.
A purchase of a futures contract means the acquisition of a contractual right of a Fund to obtain delivery of the securities or foreign currency underlying the contract at a specified price on a specified future date. When a futures contract is sold, a Fund incurs a contractual obligation to deliver the securities or foreign currency underlying the contract at a specified price on a specified date.
When a Fund enters into a futures contract, it must deliver to the futures commission merchant selected by the Fund an amount referred to as “initial margin.” This amount is maintained by the futures commission merchant in a segregated account at the futures commission merchant. Thereafter, a “variation margin” may be paid by a Fund to or drawn by a Fund from such account in accordance with controls set for such accounts, depending upon changes in the price of the underlying securities, or currencies, subject to the futures contracts, and the change in value is recorded by the Fund as a variation margin payable or receivable on the Statements of Assets and Liabilities. The Fund recognizes gains and losses on futures contracts in addition to the variation margin, which gains and losses are considered realized at the time the contracts expire or close.
A Fund may enter into futures transactions on domestic exchanges and, to the extent such transactions have been approved by the CFTC for sale to customers in the United States, on foreign exchanges. In addition, a Fund may sell stock index futures in anticipation of, or during a market decline to attempt to offset the decrease in the market value of the Fund’s common stocks that might otherwise result, and a Fund may purchase such contracts in order to offset increases in the cost of common stocks that it intends to purchase. Unlike other futures contracts, a stock index futures contract specifies that no delivery of the actual stocks making up the index will take place. Instead, settlement in cash must occur upon the termination of the contract.
244
Mercer Funds
Notes to the Financial Statements (Continued)
March 31, 2022
In entering into futures contracts and options on futures contracts, there is a credit risk that a counterparty will not be able to meet its obligations to the Fund. The counterparty for futures contracts and options on futures contracts traded in the United States and on most foreign futures exchanges is the clearinghouse associated with such exchange. In general, clearinghouses are backed by the corporate members of the clearinghouse who are required to share any financial burden resulting from the non-performance by one of its members and, as such, should significantly reduce this credit risk. In cases where the clearinghouse is not backed by the clearing members (i.e., some foreign exchanges), it is normally backed by a consortium of banks or other financial institutions. There can be no assurance that any counterparty, clearing member or clearinghouse will be able to meet its obligations to the Fund.
While certain futures contracts provide for the delivery of securities, deliveries usually do not occur. Contracts are generally terminated by entering into offsetting transactions.
Where the futures market is not as developed or where the regulations prevent or make it disadvantageous to trade futures, Emerging Markets will utilize synthetic futures as part of the country selection strategy implementation. A synthetic future generally is an uncleared agreement resembling a total return swap transaction in which a Fund will commit to receive positive or negative returns on one or more specified equity index futures contracts in exchange for an agreed upon payment by the Fund to the counterparty. If the underlying asset declines in value over the term of the total return swap, the Fund may also be required to pay the dollar value of that decline to the counterparty. These are marked to market daily and the change in value is recorded as unrealized gain or loss in the Statements of Operations.
During the year ended March 31, 2022, Large Cap, Small/Mid Cap, Non-US Core Equity, Emerging Markets and Global Low Volatility used futures to equitize cash. Core Fixed and Opportunistic Fixed used futures to adjust interest rate exposure and replicate government bond positions. Emerging Markets also used futures to create passive index exposure to certain domestic emerging market country indices in the Fund. See each Fund’s Schedule of Investments for a listing of open futures contracts as of March 31, 2022.
(g) Options
The Funds may purchase and sell (write) put and call options on debt securities, currencies and indices to enhance investment performance, manage duration, or protect against changes in market prices. The Funds may also buy and sell combinations of put and call options on the same underlying security, currency or index. Short (sold) options positions will generally be hedged by the Funds with cash, cash equivalents, current portfolio security holdings, or other options or futures positions.
The Funds may enter into swap options (“swaptions”). A swaption is a contract that gives a counterparty the right (but not the obligation), in return for payment of a premium, to enter into a new swap agreement or to shorten, extend, cancel, or otherwise modify an existing swap agreement, at some designated future time on specified terms. Each Fund may sell (write) and purchase put and call swaptions. Depending on the terms of the particular option agreement, a Fund generally will incur a greater degree of risk when the Fund writes a swaption than the Fund will incur when it purchases a swaption. When a Fund purchases a swaption, the Fund’s risk of loss is limited to the amount of the premium it has paid should it decide to let the swaption expire unexercised. However, when a Fund writes a swaption, upon exercise of the option, the Fund will become obligated according to the terms of the underlying agreement.
When the Fund writes a covered call or a put option, an amount equal to the premium received by the Fund is included in the Fund’s Statements of Assets and Liabilities as a liability. The amount of the liability is subsequently marked to market to reflect the current market value of the option written. The
245
Mercer Funds
Notes to the Financial Statements (Continued)
March 31, 2022
Fund receives a premium on the sale of a call option but gives up the opportunity to profit from any increase in stock value above the exercise price of the option, and when the Fund writes a put option, it is exposed to a decline in the price of the underlying security.
Whether an option which the Fund has written expires on its stipulated expiration date or the Fund enters into a closing purchase transaction, the Fund realizes a gain (or loss, if the cost of a closing purchase transaction exceeds the premium received when the option was sold) without regard to any unrealized gain or loss on the underlying security, and the liability related to such option is extinguished. If a call option which the Fund has written is exercised, the Fund realizes a capital gain or loss from the sale of the underlying security, and the cost basis of the lots sold are decreased by the premium originally received. When a put option which a Fund has written is exercised, the amount of the premium originally received will reduce the cost of the security which a Fund purchases upon exercise of the option. Realized gains (losses) on purchased options are included in net realized gain (loss) from investments.
The Funds’ use of written options involves, to varying degrees, elements of market risk in excess of the amount recognized in the Statements of Assets and Liabilities. The face or contract amounts of these instruments reflect the extent of the Fund’s exposure to market risk. The risks may be caused by an imperfect correlation between movements in the price of the instrument and the price of the underlying securities, currencies and interest rates.
During the year ended March 31, 2022, Core Fixed and Opportunistic Fixed used options for tail risk hedging and to manage currency, interest rate, duration and volatility exposure. See each Fund’s Schedule of Investments for a listing of options as of March 31, 2022.
(h) Forward foreign currency contracts
The Funds may purchase or sell currencies and/or engage in forward foreign currency transactions in order to expedite settlement of portfolio transactions and to manage currency risk.
Forward foreign currency contracts are traded in the inter-bank market conducted directly between currency traders (usually large commercial banks) and their customers. A forward contract generally has no deposit requirement and no commissions are charged at any stage for trades. The Funds will account for forward contracts by marking-to-market each day at current forward contract values. The change in market value is recorded by the Fund as an unrealized gain or loss. When the contract is closed, the Fund recognizes a realized gain or loss equal to the difference between the value of the contract at the time the contract was opened and the value at the time the contract was closed.
The Funds will only enter into forward contracts to sell, for a fixed amount of U.S. dollars or other appropriate currency, an amount of foreign currency, to the extent that the value of the short forward contract is covered by the underlying value of securities denominated in the currency being sold. Alternatively, when a Fund enters into a non-cash settled forward contract to sell an amount of foreign currency, the Fund will maintain segregated assets in an amount equal to the contract’s full, notional value. When a Fund enters into a cash-settled forward contract to sell an amount of foreign currency, the Fund will maintain segregated assets in an amount equal to the net amount owed by the Fund. However, currency contracts with respect to identical currencies, with the same counterparty and same settlement date may be netted against each other and, in such cases, a Fund will maintain segregated assets in an amount equal to the net amount owed by the Fund, in accordance with the Trust’s Segregation and Offsetting Position Procedures. If the additional segregated assets placed in the segregated account decline, additional cash or securities will be placed in the account on a daily basis so that the value of
246
Mercer Funds
Notes to the Financial Statements (Continued)
March 31, 2022
the account will equal the amount of the Fund’s commitments with respect to such contract. The primary risks associated with forward foreign currency contracts include failure of the counterparty to meet the terms of the contract and the value of the foreign currency changing unfavorably.
During the year ended March 31, 2022, Core Fixed and Opportunistic Fixed used forward foreign currency contracts for a variety of purposes, including hedging, risk management, efficient portfolio management, enhancing total returns, or as a substitute for taking a position in the underlying asset. Non-US Core Equity and Emerging Markets used forward foreign currency contracts to hedge, cross hedge or to actively manage the currency exposures in the Funds. See the Core Fixed and Opportunistic Fixed Schedules of Investments for a listing of open forward foreign currency contracts as of March 31, 2022.
(i) Foreign currency translation
The books and records of each Fund are maintained in US dollars. Foreign currencies, investments and other assets and liabilities denominated in foreign currencies are translated into US dollars at the foreign exchange rates prevailing at the end of the period. Purchases and sales of investment securities, income and expenses are translated at exchange rates prevailing on the respective dates of such transactions. Unrealized gains and losses that result from changes in foreign currency exchange rates have been included in the unrealized gains (losses) on foreign currency translations within each Fund’s Statement of Operations. Net realized foreign currency gains and losses resulting from changes in exchange rates include foreign currency gains and losses between trade date and settlement date on investment securities transactions, foreign currency transactions and the difference between the amounts of interest and dividends recorded on the books of the Fund and the amount actually received. The portion of foreign currency gains and losses related to fluctuations in exchange rates between the purchase settlement date and subsequent sale trade date is included in realized gains and losses on investment transactions.
(j) When-issued securities/TBA securities
Purchasing securities on a “when-issued” basis is a commitment by a Fund to buy a security before the security is actually issued. A Fund may purchase securities offered on a “when-issued” or “forward delivery” basis such as TBA securities. When so offered, the price, which is generally expressed in yield terms, is fixed at the time the commitment to purchase is made, but delivery and payment for the when-issued or forward delivery securities take place at a later date. During the period between purchase and settlement, no payment is made by the purchaser to the issuer and no interest on the when-issued or forward delivery security accrues to the purchaser. While when-issued or forward delivery securities may be sold prior to the settlement date, it is intended that a Fund will purchase such securities with the purpose of actually acquiring the securities unless a sale appears desirable for investment reasons. At the time a Fund makes the commitment to purchase a security on a when-issued or forward delivery basis, the Fund will record the transaction and reflect the value of the security in determining the Fund’s NAV. The market value of when-issued or forward delivery securities may be more or less than the purchase price. Certain risks may arise upon entering into when-issued or forward delivery securities transactions, including the potential inability of counterparties to meet the terms of their contracts, and the issuer’s failure to issue the securities due to political, economic, or other factors. Additionally, losses may arise due to declines in the value of the securities prior to settlement date.
A Fund may enter into TBA commitments to purchase or sell securities for a fixed price at a future date. TBA commitments are considered securities in themselves, and involve a risk of loss if the value of the security to be purchased or sold declines or increases prior to settlement date, which is in addition to the
247
Mercer Funds
Notes to the Financial Statements (Continued)
March 31, 2022
risk of decline in the value of the Portfolio’s other assets. TBA forward sale commitments are valued at the current market value of the underlying securities, according to the procedures described under “Security Valuation”. See the Schedules of Investments for TBA and when-issued securities held as of March 31, 2022.
(k) Real estate investment trusts
The Funds may invest in real estate investment trusts (“REITs”), which pool investors’ funds for investment, primarily in income producing real estate or real estate related loans or interests. A REIT is not taxed on income distributed to its shareholders or unitholders if it complies with regulatory requirements relating to its organization, ownership, assets and income, and with a regulatory requirement to distribute to its shareholders or unitholders at least 90% of its taxable income for each taxable year.
A shareholder in a Fund, by investing in REITs through the Fund, will bear not only the shareholder’s proportionate share of the expenses of the Fund, but also, indirectly, the management expenses of the underlying REITs. REITs depend generally on their ability to generate cash flow to make distributions to shareholders or unitholders, and may be subject to defaults by borrowers and to self-liquidations. In addition, the performance of a REIT may be affected by its failure to qualify for tax-free pass-through of income, or the REIT’s failure to maintain exemption from registration under the 1940 Act. Dividends representing a return of capital are reflected as a reduction of cost and/or as a realized gain when the amount of the return of capital is conclusively determined. See each Fund’s Schedule of Investments for REIT securities held as of March 31, 2022.
(l) Mortgage-related and other asset-backed securities
The Funds may invest in mortgage-backed and asset-backed securities. Mortgage-backed securities represent an interest in a pool of mortgages. Asset-backed securities are structured like mortgage-backed securities, but instead of mortgage loans or interests in mortgage loans, the underlying assets may include such items as motor vehicle installment sales or installment loan contracts, leases of various types of real and personal property, and receivables from credit card agreements. The value of some mortgage or asset-backed securities may be particularly sensitive to changes in prevailing interest rates. Early repayment of principal on some mortgage-related securities may expose the Fund to a lower rate of return upon reinvestment of principal. The value of these securities may fluctuate in response to the market’s perception of the creditworthiness of the issuers. Additionally, although mortgages and mortgage-related securities are generally supported by some form of government or private guarantee and/or insurance, there is no assurance that private guarantors or insurers will meet their obligations.
One type of stripped mortgage-backed security has one class receiving all of the interest from the mortgage assets (the interest-only, or “IO” class), while the other class will receive all of the principal (the principal-only, or “PO” class). Payments received for the IOs are included in interest income on the Statements of Operations. Because principal will not be received at the maturity of an IO, adjustments are made to the cost basis of the security on a daily basis until maturity. These adjustments are included in interest income on the Statements of Operations. Payments received for POs are treated as reductions to the cost and par value of the securities. See the Schedules of Investments for mortgage-backed and asset-backed securities held by Core Fixed and Opportunistic Fixed as of March 31, 2022.
(m) Bank loans
Core Fixed and Opportunistic Fixed may invest in bank loans, which include institutionally-traded floating rate securities generally acquired as an assignment from another holder of, or participation interest in, loans originated by a bank or financial institution (the ‘‘Lender’’) that acts as agent for all holders. The agent administers the terms of the loan, as specified in the loan agreement. The Fund may
248
Mercer Funds
Notes to the Financial Statements (Continued)
March 31, 2022
invest in multiple series or tranches of a loan, which may have varying terms and carry different associated risks. When investing in a loan participation, the Fund has the right to receive payments of principal, interest and any fees to which it is entitled only from the Lender selling the loan agreement and only upon receipt by the Lender of payments from the borrower. The Fund generally has no right to enforce compliance with the terms of the loan agreement with the borrower. As a result, the Fund may be subject to the credit risk of both the borrower and the Lender that is selling the loan agreement. At March 31, 2022, Opportunistic Fixed had the following unfunded loan commitments:
| | | | | | | | | | | | | | | | |
Borrower | | Par | | | Cost | | | Value | | | Unrealized
Gain (Loss) | |
Athenahealth, Inc. | | $ | 17,391 | | | $ | 17,391 | | | $ | 17,244 | | | $ | (147 | ) |
Pacific Bells, LLC | | | 4,330 | | | | 4,288 | | | | 4,216 | | | | (72 | ) |
Thermostat Purchaser III, Inc. | | | 55,263 | | | | 55,394 | | | | 54,849 | | | | (545 | ) |
VT Topco, Inc. | | | 22,597 | | | | 22,598 | | | | 22,414 | | | | (184 | ) |
Western Dental Services, Inc. | | | 47,300 | | | | 47,300 | | | | 47,152 | | | | (148 | ) |
| | | | | | | | | | | | | | | | |
| | $ | 146,881 | | | $ | 146,971 | | | $ | 145,875 | | | $ | (1,096 | ) |
| | | | | | | | | | | | | | | | |
(n) Indexed securities
The Funds may invest in indexed securities where the redemption values and/or coupons are linked to the prices of other securities, securities indices, or other financial indicators. The Funds use indexed securities to increase or decrease their exposure to different underlying instruments and to gain exposure to markets in which it may be difficult to invest through conventional securities. Indexed securities may be more volatile than their underlying instruments, but any loss is limited to the amount of the original investment.
(o) Taxes and distributions
The Funds intend to qualify each year as regulated investment companies under Subchapter M of the Internal Revenue Code of 1986, as amended (“the Code”). The Funds intend to distribute substantially all of their net investment income and net realized short-term and long-term gains, if any, after giving effect to any available capital loss carryovers for U.S. federal income tax purposes. Therefore, no provision for U.S. federal and state income or excise tax is necessary.
The Funds utilize the provisions of the federal income tax laws that provide for the carryforward of capital losses for prior years, offsetting such losses against any future realized capital gains. Under the Regulated Investment Company Modernization Act of 2010 (the “Act”), net capital losses recognized after December 22, 2010 may be carried forward indefinitely, and their character is retained as short-term and/or long-term losses. Previously, net capital losses were carried forward for eight years and treated as short-term losses. As a transition rule, the Act requires that post-enactment net capital losses be used before pre-enactment net capital losses.
On March 31, 2022, the following Funds had deferred capital losses available to be offset against future net capital gains through the indicated expiration dates as follows:
| | | | |
| | | Unlimited | |
Opportunistic Fixed | | $ | 11,784,008 | |
Under current tax rules, regulated investment companies can elect to treat certain late-year ordinary losses incurred and post-October capital losses (capital losses realized after October 31) as arising on the first day of the following taxable year. As of March 31, 2022, Large Cap, Small/Mid Cap, Non-US Core
249
Mercer Funds
Notes to the Financial Statements (Continued)
March 31, 2022
Equity, Core Fixed and Emerging Markets have elected to defer current year post-October losses of $5,090,416, $8,996,368, $3,861,621, $11,647,069 and $31,270,762, respectively.
As of March 31, 2022, the cost for U.S. federal income tax purposes and gross unrealized appreciation and depreciation in value of investments and derivatives were as follows:
| | | | | | | | | | | | | | | | |
| | | Federal
Income Tax
Cost | | | Tax Basis
Unrealized
Appreciation | | | Tax Basis
Unrealized
Depreciation | | | Net
Unrealized
Appreciation
(Depreciation) | |
Large Cap | | $ | 1,150,337,801 | | | $ | 326,825,759 | | | $ | (50,079,775 | ) | | $ | 276,745,984 | |
Small/Mid Cap | | | 1,433,226,161 | | | | 354,807,598 | | | | (62,509,185 | ) | | | 292,298,413 | |
Non-US Core Equity | | | 3,438,748,364 | | | | 460,111,869 | | | | (254,880,376 | ) | | | 205,231,493 | |
Core Fixed | | | 1,571,228,289 | | | | 4,021,004 | | | | (82,966,201 | ) | | | (78,945,197 | ) |
Opportunistic Fixed | | | 1,153,347,993 | | | | 15,165,210 | | | | (81,014,265 | ) | | | (65,849,055 | ) |
Emerging Markets | | | 1,643,748,172 | | | | 192,944,325 | | | | (290,665,077 | ) | | | (97,720,752 | ) |
Global Low Volatility | | | 1,140,864,875 | | | | 225,187,972 | | | | (32,594,779 | ) | | | 192,593,193 | |
The temporary differences between book-basis and tax-basis unrealized appreciation/(depreciation) are primarily due to wash sale loss deferrals, investments in passive foreign investment companies and other basis adjustments. Certain capital accounts in the financial statements are periodically adjusted for permanent differences in order to reflect their tax character. These differences primarily relate to swap income, gains and losses from passive foreign investment companies and other basis adjustments during the period ended March 31, 2022.
As of March 31, 2022, the Funds had no uncertain tax positions that would require recognition, derecognition, or disclosure. Each of the Funds’ federal tax returns filed in the 3-year period ended March 31, 2022 remains subject to examination by the Internal Revenue Service.
The Funds’ policy is to declare and pay distributions from net investment income and net realized short-term and long-term gains at least annually. All distributions are paid in shares of the Funds, at NAV, unless the shareholder elects to receive cash distributions. A Fund may distribute such income dividends and capital gains more frequently, if necessary, in order to reduce or eliminate federal excise taxes on the Funds. The amount of any distribution will vary, and there is no guarantee that a Fund will pay either income dividends or capital gains distributions.
During the years ended March 31, 2022 and March 31, 2021, the tax character of distributions (including capital gain dividends, if any, designated pursuant to Section 852 of the Code) paid, were as follows:
| | | | | | | | | | | | | | | | | | | | | | | | |
| | | 2022 | | | 2021 | |
| | | Ordinary
Income | | | Long-Term
Capital Gains | | | Return of
Capital | | | Ordinary
Income | | | Long-Term
Capital Gains | | | Return of
Capital | |
Large Cap | | $ | 20,757,558 | | | $ | 132,406,816 | | | $ | — | | | $ | 15,195,896 | | | $ | 463,403 | | | $ | — | |
Small/Mid Cap | | | 104,275,807 | | | | 223,221,645 | | | | — | | | | 9,952,139 | | | | 37,922,000 | | | | — | |
Non-US Core Equity | | | 265,504,360 | | | | 335,410,397 | | | | — | | | | 58,417,561 | | | | 80,756,936 | | | | — | |
Core Fixed | | | 27,671,089 | | | | 4,486,145 | | | | — | | | | 41,151,194 | | | | 3,009,673 | | | | — | |
Opportunistic Fixed | | | 35,988,286 | | | | — | | | | — | | | | 44,901,279 | | | | — | | | | — | |
Emerging Markets | | | 93,881,557 | | | | 104,647,973 | | | | — | | | | 21,622,556 | | | | — | | | | — | |
Global Low Volatility | | | 22,655,390 | | | | 134,130,648 | | | | — | | | | 30,895,036 | | | | 24,411,732 | | | | — | |
250
Mercer Funds
Notes to the Financial Statements (Continued)
March 31, 2022
As of March 31, 2022, the components of distributable earnings on a tax basis were as follows:
| | | | | | | | | | | | | | | | | | | | |
| | | Undistributed
Ordinary
Income | | | Undistributed
Long-Term
Gains | | | Capital Losses and
Other Temporary
Differences | | | Unrealized
Appreciation
(Depreciation) | | | Total
Distributable
Earnings | |
Large Cap | | $ | — | | | $ | 88,059,388 | | | $ | (5,090,416 | ) | | $ | 276,746,216 | | | $ | 359,715,188 | |
Small/Mid Cap | | | — | | | | 80,318,000 | | | | (8,996,368 | ) | | | 292,298,413 | | | | 363,620,045 | |
Non-US Core Equity | | | — | | | | 83,464,600 | | | | (3,861,621 | ) | | | 205,160,292 | | | | 284,763,271 | |
Core Fixed | | | 7,895,380 | | | | — | | | | (11,647,069 | ) | | | (78,945,036 | ) | | | (82,696,725 | ) |
Opportunistic Fixed | | | 2,452,570 | | | | — | | | | (11,789,430 | ) | | | (66,180,460 | ) | | | (75,517,320 | ) |
Emerging Markets | | | 4,262,815 | | | | — | | | | (31,270,762 | ) | | | (102,187,900 | ) | | | (129,195,847 | ) |
Global Low Volatility | | | 31,766,487 | | | | 46,770,334 | | | | — | | | | 192,618,480 | | | | 271,155,301 | |
All other differences are temporary losses related to mostly organizational costs and other timing adjustments.
(p) Allocation of expenses and income
The majority of expenses of the Trust are directly identifiable to an individual Fund. Expenses which are not readily identifiable to a specific Fund are allocated among the applicable Funds, taking into consideration, among other things, the nature and type of expense and the relative size of each applicable Fund.
(q) Redemption fees
While none of the Funds’ classes have initial or contingent deferred sales charges on purchases of Fund shares, redemptions of Fund shares held less than 30 days may be assessed a 2% short-term trading fee and recorded as paid-in capital.
The Trust entered into a Credit Agreement on behalf of the Funds (“the Agreement”) with a bank pursuant to a committed, unsecured revolving line of credit through December 8, 2022. Borrowings for each Fund under the Agreement are limited to the lesser of $50,000,000 or 33 1/3% of a Fund’s Adjusted Net Assets provided borrowings did not exceed, in the aggregate, $50,000,000. Under the terms of the Agreement the Trust pays an annual commitment fee at the rate 0.25% per year on the difference between the total line of credit and the average daily amount of borrowings outstanding. Interest is charged to the Funds based on its borrowings at a variable rate equal to 1% plus the higher of (i) the Federal Funds Rate or (ii) the Federal Reserve Bank of New York Overnight Bank Funding Rate. The Funds did not borrow under the Agreement during the year ended March 31, 2022.
In the normal course of business, the Funds enter into contracts that require them to provide a variety of representations or general indemnification for certain liabilities. The Funds’ maximum exposure under these arrangements is unknown, as this would involve future claims that may be made against the Funds that have not yet occurred. However, the Funds have not had prior claims or losses pursuant to these contracts and expect the risk of loss to be remote.
251
Mercer Funds
Notes to the Financial Statements (Continued)
March 31, 2022
| 5. | Fees and other transactions with affiliates |
As of March 31, 2022, the Advisor provides investment advisory services to each Fund pursuant to an investment management agreement. Pursuant to the investment management agreement, each Fund pays the Advisor a fee for managing the Fund’s investments at an annual rate of:
| | | | | | | | | | | | |
| | | Investment Advisory Fee* on Net Assets | |
| | | Average net assets
up to
$750 million | | | Average net assets
in excess of
$750 million up to
$1 billion | | | Average net assets
in excess of
$1 billion | |
Large Cap | | | 0.53 | % | | | 0.51 | % | | | 0.46 | % |
Small/Mid Cap | | | 0.90 | % | | | 0.88 | % | | | 0.83 | % |
Non-US Core Equity | | | 0.75 | % | | | 0.73 | % | | | 0.68 | % |
Core Fixed | | | 0.35 | % | | | 0.33 | % | | | 0.28 | % |
Opportunistic Fixed | | | 0.80 | % | | | 0.78 | % | | | 0.73 | % |
Emerging Markets | | | 0.80 | % | | | 0.78 | % | | | 0.73 | % |
Global Low Volatility | | | 0.75 | % | | | 0.73 | % | | | 0.68 | % |
| | * | Consists of the total advisory fee payable by the Funds to the Advisor. The Advisor is responsible for paying the subadvisory fees. |
The Advisor has contractually agreed, until at least July 31, 2022, to waive any portion of its management fee that exceeds the aggregate amount of the subadvisory fees that the Advisor is required to pay to the Funds’ Sub-advisers. This contractual fee waiver agreement may only be changed or eliminated with the approval of the Funds’ Board of Trustees. The fees waived by the Advisor pursuant to this agreement are not subject to reimbursement by the Funds to the Advisor. The fees waived are shown in the Advisory fee waiver line in the Statements of Operations.
The Advisor provides certain internal administrative services to the Adviser Class, Class I and Class Y-2 shares of the Funds, for which the Advisor receives a fee of 0.15%, 0.15% and 0.15% of the average daily net assets of the Adviser Class, Class I and Class Y-2 shares of the Funds, respectively. These internal administrative services include attending to shareholder correspondence, assisting with the processing of purchases and redemptions of shares, preparing and disseminating information and documents for use by beneficial shareholders and monitoring and overseeing non-advisory relationships with entities providing services to the Adviser Class, Class I and Class Y-2 shares, including the transfer agent. As of March 31, 2022, only Non-US Core Equity and Core Fixed had Class I shares outstanding (since July 22, 2021 and December 27, 2021, respectively). As of March 31, 2022, there were no Advisor Class, Class I (except Non-US Core Equity and Core Fixed) or Class Y-2 shares of any of the Funds outstanding, and as such the Advisor did not receive any administrative services fees from those classes of those Funds.
The Funds have adopted a plan of marketing and service, or “12b-1 plan,” to finance the provision of certain shareholder services to the owners of Adviser Class shares of the Funds. The plan provides for payments at annual rates (based on average net assets) of up to 0.25% of each Fund’s Adviser Class shares. There were no Advisor Class shares of any of the Funds outstanding as of March 31, 2022, and as a result, no 12b-1 fees were paid by any of the Funds for the year ended March 31, 2022.
252
Mercer Funds
Notes to the Financial Statements (Continued)
March 31, 2022
| 6. | Purchases and sales of securities |
Cost of purchases and proceeds from sales of securities, excluding short-term investments for the year ended March 31, 2022, were as follows:
| | | | | | | | |
| | | Long-Term
U.S. Government
Securities | | | Other
Long-Term
Securities | |
Purchases | | | | | | | | |
Large Cap | | $ | — | | | $ | 451,155,046 | |
Small/Mid Cap | | | — | | | | 641,964,035 | |
Non-US Core Equity | | | — | | | | 2,107,431,775 | |
Core Fixed | | | 1,745,867,590 | * | | | 338,553,794 | |
Opportunistic Fixed | | | 96,683,744 | | | | 916,063,360 | |
Emerging Markets | | | — | | | | 1,159,056,315 | |
Global Low Volatility | | | — | | | | 815,320,695 | |
Sales | | | | | | | | |
Large Cap | | | — | | | | 575,368,489 | |
Small/Mid Cap | | | — | | | | 805,222,310 | |
Non-US Core Equity | | | — | | | | 2,060,919,553 | |
Core Fixed | | | 1,582,443,072 | * | | | 189,066,442 | |
Opportunistic Fixed | | | 54,143,470 | | | | 641,941,717 | |
Emerging Markets | | | — | | | | 766,507,829 | |
Global Low Volatility | | | — | | | | 744,305,310 | |
| | * | Includes purchases of $484,636,241 and sales of $500,606,647 for TBA securities. |
Each Fund is authorized to issue an unlimited number of shares of beneficial interest without par value. Transactions in Fund shares were as follows:
Large Cap
| | | | | | | | | | | | | | | | |
| | | Year Ended
March 31, 2022 | | | Year Ended
March 31, 2021 | |
| | | Shares | | | Amount | | | Shares | | | Amount | |
Class Y-3: | | | | | | | | | | | | | | | | |
Shares sold | | | 3,292,166 | | | $ | 41,900,630 | | | | 30,962,052 | | | $ | 287,076,980 | |
Shares issued to shareholders in reinvestment of distributions | | | 12,381,922 | | | | 153,164,374 | | | | 1,395,659 | | | | 15,659,299 | |
Shares repurchased | | | (16,361,027 | ) | | | (206,858,539 | ) | | | (26,715,449 | ) | | | (247,071,887 | ) |
| | | | | | | | | | | | | | | | |
Net increase (decrease) | | | (686,939 | ) | | $ | (11,793,535 | ) | | | 5,642,262 | | | $ | 55,664,392 | |
| | | | | | | | | | | | | | | | |
253
Mercer Funds
Notes to the Financial Statements (Continued)
March 31, 2022
Small/Mid Cap
| | | | | | | | | | | | | | | | |
| | | Year Ended
March 31, 2022 | | | Year Ended
March 31, 2021 | |
| | | Shares | | | Amount | | | Shares | | | Amount | |
Class Y-3: | | | | | | | | | | | | | | | | |
Shares sold | | | 17,437,012 | | | $ | 231,465,353 | | | | 37,439,316 | | | $ | 370,106,733 | |
Shares issued to shareholders in
reinvestment of distributions | | | 26,672,924 | | | | 327,010,046 | | | | 3,876,449 | | | | 47,874,139 | |
Shares repurchased | | | (28,752,187 | ) | | | (395,256,506 | ) | | | (42,246,255 | ) | | | (506,687,211 | ) |
| | | | | | | | | | | | | | | | |
Net increase (decrease) | | | 15,357,749 | | | $ | 163,218,893 | | | | (930,490 | ) | | $ | (88,706,339 | ) |
| | | | | | | | | | | | | | | | |
Non-US Core Equity
| | | | | | | | | | | | | | | | |
| | | Year Ended
March 31, 2022 | | | Year Ended
March 31, 2021 | |
| | | Shares | | | Amount | | | Shares | | | Amount | |
Class Y-3: | | | | | | | | | | | | | | | | |
Shares sold | | | 81,023,506 | | | $ | 991,262,362 | | | | 65,896,176 | | | $ | 677,092,129 | |
Shares issued to shareholders in
reinvestment of distributions | | | 54,329,508 | | | | 599,254,468 | | | | 11,804,453 | | | | 139,174,496 | |
Shares repurchased | | | (87,361,191 | ) | | | (1,100,989,104 | ) | | | (84,194,014 | ) | | | (930,681,444 | ) |
| | | | | | | | | | | | | | | | |
Net increase (decrease) | | | 47,991,823 | | | $ | 489,527,726 | | | | (6,493,385 | ) | | $ | (114,414,819 | ) |
| | | | | | | | | | | | | | | | |
| | | | |
| | | Shares | | | Amount | | | Shares | | | Amount | |
Class I:(a) | | | | | | | | | | | | | | | | |
Shares sold | | | 243,263 | | | $ | 3,159,985 | | | | — | | | $ | — | |
Shares issued to shareholders in
reinvestment of distributions | | | 44,939 | | | | 495,675 | | | | — | | | | — | |
| | | | | | | | | | | | | | | | |
Net increase | | | 288,202 | | | $ | 3,655,660 | | | | — | | | $ | — | |
| | | | | | | | | | | | | | | | |
| | (a) | The Class commenced operations on July 22, 2021. |
Core Fixed
| | | | | | | | | | | | | | | | |
| | | Year Ended
March 31, 2022 | | | Year Ended
March 31, 2021 | |
| | | Shares | | | Amount | | | Shares | | | Amount | |
Class Y-3: | | | | | | | | | | | | | | | | |
Shares sold | | | 45,916,697 | | | $ | 480,297,012 | | | | 51,857,972 | | | $ | 561,129,888 | |
Shares issued to shareholders in
reinvestment of distributions | | | 3,063,726 | | | | 31,985,302 | | | | 4,100,359 | | | | 44,160,867 | |
Shares repurchased | | | (29,088,916 | ) | | | (306,948,478 | ) | | | (26,523,134 | ) | | | (289,889,583 | ) |
| | | | | | | | | | | | | | | | |
Net increase | | | 19,891,507 | | | $ | 205,333,836 | | | | 29,435,197 | | | $ | 315,401,172 | |
| | | | | | | | | | | | | | | | |
254
Mercer Funds
Notes to the Financial Statements (Continued)
March 31, 2022
| | | | | | | | | | | | | | | | |
| | | Year Ended
March 31, 2022 | | | Year Ended
March 31, 2021 | |
| | | Shares | | | Amount | | | Shares | | | Amount | |
Class I:(a) | | | | | | | | | | | | | | | | |
Shares sold | | | 10,280,356 | | | $ | 106,539,496 | | | | — | | | $ | — | |
Shares repurchased | | | (598,919 | ) | | | (5,975,417 | ) | | | — | | | | — | |
| | | | | | | | | | | | | | | | |
Net increase | | | 9,681,437 | | | $ | 100,564,079 | | | | — | | | $ | — | |
| | | | | | | | | | | | | | | | |
| | (a) | The Class commenced operations on December 27, 2021. |
Opportunistic Fixed
| | | | | | | | | | | | | | | | |
| | | Year Ended
March 31, 2022 | | | Year Ended
March 31, 2021 | |
| | | Shares | | | Amount | | | Shares | | | Amount | |
Class Y-3: | | | | | | | | | | | | | | | | |
Shares sold | | | 47,045,253 | | | $ | 450,031,319 | | | | 35,793,896 | | | $ | 341,758,285 | |
Shares issued to shareholders in
reinvestment of distributions | | | 3,837,019 | | | | 35,914,494 | | | | 4,538,747 | | | | 44,890,690 | |
Shares redeemed through
in-kind redemption* | | | — | | | | — | | | | (53,122,684 | ) | | | (522,195,987 | ) |
Shares repurchased | | | (16,191,116 | ) | | | (154,834,817 | ) | | | (12,382,191 | ) | | | (119,056,005 | ) |
| | | | | | | | | | | | | | | | |
Net increase (decrease) | | | 34,691,156 | | | $ | 331,110,996 | | | | (25,172,232 | ) | | $ | (254,603,017 | ) |
| | | | | | | | | | | | | | | | |
| | * | On February 19, 2021, Opportunistic Fixed transferred securities in-kind valued at $400,305,493 and cash of $121,890,494 for a redemption. This resulted in 53,122,684 shares redeemed valued at $522,195,987. This transfer also resulted in a realized gain of $19,839,043 which is shown on the Statements of Operations. |
Emerging Markets
| | | | | | | | | | | | | | | | |
| | | Year Ended
March 31, 2022 | | | Year Ended
March 31, 2021 | |
| | | Shares | | | Amount | | | Shares | | | Amount | |
Class Y-3: | | | | | | | | | | | | | | | | |
Shares sold | | | 70,433,580 | | | $ | 743,231,851 | | | | 35,219,281 | | | $ | 328,271,034 | |
Shares issued to shareholders in
reinvestment of distributions | | | 20,700,953 | | | | 198,108,117 | | | | 1,996,543 | | | | 21,622,556 | |
Shares repurchased | | | (32,569,435 | ) | | | (353,614,531 | ) | | | (36,001,619 | ) | | | (373,794,134 | ) |
| | | | | | | | | | | | | | | | |
Net increase | | | 58,565,098 | | | $ | 587,725,437 | | | | 1,214,205 | | | $ | (23,900,544 | ) |
| | | | | | | | | | | | | | | | |
255
Mercer Funds
Notes to the Financial Statements (Continued)
March 31, 2022
Global Low Volatility
| | | | | | | | | | | | | | | | |
| | | Year Ended
March 31, 2022 | | | Year Ended
March 31, 2021 | |
| | | Shares | | | Amount | | | Shares | | | Amount | |
Class Y-3: | | | | | | | | | | | | | | | | |
Shares sold | | | 33,074,478 | | | $ | 499,899,757 | | | | 21,096,201 | | | $ | 276,904,152 | |
Shares issued to shareholders in
reinvestment of distributions | | | 10,738,770 | | | | 156,786,038 | | | | 3,916,910 | | | | 55,306,768 | |
Shares repurchased | | | (27,607,264 | ) | | | (422,204,233 | ) | | | (35,047,110 | ) | | | (473,911,062 | ) |
| | | | | | | | | | | | | | | | |
Net increase (decrease) | | | 16,205,984 | | | $ | 234,481,562 | | | | (10,033,999 | ) | | $ | (141,700,142 | ) |
| | | | | | | | | | | | | | | | |
| 8. | Recent accounting pronouncements |
In October 2020, Accounting Standards Update 2017-08, Receivables — Nonrefundable Fees and Other Costs (Subtopic 310-20): Premium Amortization on Purchased Callable Debt Securities (“ASU 2017-08”) was amended by Accounting Standards Update 2020-08, Codification Improvements to Subtopic 310-20, Receivables — Nonrefundable Fees and Other Costs (“ASU 2020-08”). ASU 2020-08 requires entities to reevaluate whether callable debt securities fall within the scope of ASU 2017-08 at each reporting period. ASU 2020-08 also amends the relevant guidance to require premiums to be amortized to the “next call date” rather than the “earliest call date,” and further clarifies the definition of “next call date.” ASU 2020-08 is effective for fiscal years, and interim periods within those fiscal years, beginning after December 15, 2020. As of March 31, 2022, Management has fully implemented the new rule and there was no material impact.
In January 2021, FASB issued Accounting Standards Update 2021-01 — Reference Rate Reform (Topic 848) — Scope (“ASU 2021-01”) as an update to Accounting Standards Update 2020-04 — Reference Rate Reform (Topic 848) — Facilitation of the Effects of Reference Rate Reform on Financial Reporting (“ASU 2020-04”) in order to make certain clarifications. ASU 2020-04 and ASU 2021-01 provide optional temporary financial reporting relief from the effect of certain types of contract modifications due to the planned discontinuation of the London Interbank Offered Rate (“LIBOR”) and other interbank-offered based reference rates. The temporary relief provided by ASU 2020-04 and ASU 2021-01 is effective for certain reference rate-related contract modifications that occur during the period March 12, 2020 through December 31, 2022. Management does not believe the impact of adopting ASU 2020-04 and ASU 2021-01 will have a material impact on the financial statements.
In the normal course of business, the Funds invest in securities or other instruments and may enter into transactions, and such activities subject each Fund to various risks, including fluctuations in the market (market risk) or failure of an issuer to meet all of its obligations (credit risk). Investments in foreign securities involve certain risks, including foreign currency fluctuations and those related to political or economic instability.
Additional risks associated with certain of the Funds’ investments are described above within the respective security type notes. A more complete description of risks is included in the Funds’ prospectus and statement of additional information.
The worldwide outbreak of COVID-19, a novel coronavirus disease, began in early 2020 and continues to mutate with new variants, including Delta and Omicron, during both 2020 and 2021. This
256
Mercer Funds
Notes to the Financial Statements (Continued)
March 31, 2022
continuation of the coronavirus, has negatively affected economies, markets and individual companies throughout the world and has increased market volatility. In addition, macro-economic risks have increased in the form of supply chain disruptions, increased inflationary pressures, and the Russian invasion of Ukraine. Annual inflation rates for the United States, the United Kingdom, and the Eurozone, were between 6% and 8%, based on February reports. Both COVID-19 and the geopolitical crisis in Ukraine and Russia (with its affect on commodity prices, in particular) have contributed to these inflationary pressures. These developments that disrupt global economies and financial markets may magnify factors that affect the Funds’ performance. The effects of the pandemic and macro-economic and geopolitical events may materially impact the value and performance of the Funds, their ability to buy and sell investments and their ability to achieve the investment objectives. The ultimate impact of any of these events on the financial performance of the Funds’ investments cannot be reasonably estimated at this time.
LIBOR Transition Risk: The market is in the process of transitioning away from a commonly used interest rate, the London Interbank Offered Rate (“LIBOR”). The terms of many investments, financings or other transactions to which a Fund may be a party have been historically tied to LIBOR, which may be a significant factor in determining a Fund’s payment obligations under a derivative investment, the cost of financing to a Fund or an investment’s value or return to a Fund. Although many LIBOR rates will be phased out at the end of 2021 as originally intended, a selection of widely used USD LIBOR rates will continue to be published until June 2023 in order to assist with the transition. The process of transitioning to a new rate might lead to increased volatility and illiquidity in markets for instruments whose terms currently include LIBOR. It could also lead to a reduction in the value of some LIBOR-based investments and reduce the effectiveness of new hedges placed against existing LIBOR-based investments.
Management has evaluated the impact of subsequent events through May 24, 2022, the date the financial statements were issued, for possible adjustment and/or disclosure in the Funds’ financial statements. Management has determined that there are no material events that would require adjustment and/or disclosure in the Funds’ financial statements through this date.
257
REPORT OF INDEPENDENT REGISTERED PUBLIC ACCOUNTING FIRM
To the shareholders and the Board of Trustees of Mercer Funds
Opinion on the Financial Statements and Financial Highlights
We have audited the accompanying statements of assets and liabilities of Mercer Funds (the “Funds”) comprising Mercer US Large Cap Equity Fund, Mercer US Small/Mid Cap Equity Fund, Mercer Non-US Core Equity Fund, Mercer Core Fixed Income Fund, Mercer Opportunistic Fixed Income Fund, Mercer Emerging Markets Equity Fund, and Mercer Global Low Volatility Equity Fund, including the schedules of investments as of March 31, 2022, the related statements of operations for the year then ended, the statements of changes in net assets for each of the two years in the period then ended, the financial highlights for each of the five years in the period then ended, and the related notes. In our opinion, the financial statements and financial highlights present fairly, in all material respects, the financial position of each of the funds constituting the Mercer Funds as of March 31, 2022, and the results of their operations for the year then ended, the changes in their net assets for each of the two years in the period then ended, and the financial highlights for each of the five years in the period then ended in conformity with accounting principles generally accepted in the United States of America.
Basis for Opinion
These financial statements and financial highlights are the responsibility of the Funds’ management. Our responsibility is to express an opinion on the Funds’ financial statements and financial highlights based on our audits. We are a public accounting firm registered with the Public Company Accounting Oversight Board (United States) (PCAOB) and are required to be independent with respect to the Funds in accordance with the U.S. federal securities laws and the applicable rules and regulations of the Securities and Exchange Commission and the PCAOB.
We conducted our audits in accordance with the standards of the PCAOB. Those standards require that we plan and perform the audit to obtain reasonable assurance about whether the financial statements and financial highlights are free of material misstatement, whether due to error or fraud. The Funds are not required to have, nor were we engaged to perform, an audit of their internal control over financial reporting. As part of our audits we are required to obtain an understanding of internal control over financial reporting but not for the purpose of expressing an opinion on the effectiveness of the Funds’ internal control over financial reporting. Accordingly, we express no such opinion.
Our audits included performing procedures to assess the risks of material misstatement of the financial statements and financial highlights, whether due to error or fraud, and performing procedures that respond to those risks. Such procedures included examining, on a test basis, evidence regarding the amounts and disclosures in the financial statements and financial highlights. Our audits also included evaluating the accounting principles used and significant estimates made by management, as well as evaluating the overall presentation of the financial statements and financial highlights. Our procedures included confirmation of securities owned as of March 31, 2022, by correspondence with the custodian, brokers and agent banks; when replies were not received from brokers or agent banks, we performed other auditing procedures. We believe that our audits provide a reasonable basis for our opinion.
Boston, Massachusetts
May 24, 2022
We have served as the auditor of one or more Mercer investment companies since 2006.
258
Mercer Funds
Additional Information (Unaudited)
Proxy Voting
A description of the policies and procedures that the Advisor and each Fund’s Sub-advisers use to determine how to vote proxies relating to the Fund’s portfolio securities can be found in the Funds SAI (Appendix B), and is available, (i) without charge, upon request, by calling 1-888-887-0619, (ii) on the Securities and Exchange Commission’s (“SEC”) website at http://www.sec.gov, and (iii) online on the Funds’ website at http://www.mercer.us/mutual-funds-on-offer. Information about the Funds’ proxy voting decisions are available online at https://viewpoint.glasslewis.com/WD/?siteId=MercerFundsProxy and http://www.sec.gov.
Quarterly Reporting
The Funds file their complete schedule of portfolio holdings with the Securities and Exchange Commission for the first and third quarters of each fiscal year on Form N-PORT, which when filed, will be available on the SEC’s website at http://www.sec.gov. When filed, the Funds’ Form N-PORT may be reviewed and copied at the Commission’s Public Reference Room in Washington, D.C. Information on the operation of the Public Reference Room may be obtained by calling 1-800-SEC-0330.
Federal Tax Information
The amount of long-term capital gains paid for the fiscal year ended March 31, 2022, were as follows:
| | | | |
Fund | | | |
Large Cap | | $ | 132,406,816 | |
Small/Mid Cap | | | 223,221,645 | |
Non-US Core Equity | | | 335,410,397 | |
Core Fixed | | | 4,486,145 | |
Emerging Markets | | | 104,647,973 | |
Global Low Volatility | | | 134,130,648 | |
For the year ended March 31, 2022, Non-US Core Equity and Emerging Markets had foreign tax credits in the amount of $10,407,065 and $6,789,242, respectively, and foreign source income of $113,643,230 and $39,926,571, respectively.
Qualified dividend income (“QDI”) received by the Funds through March 31, 2022, that qualified for a reduced tax rate pursuant to the Internal Revenue Code Section 1(h)(11) are as follows:
| | | | |
Fund | | | |
Large Cap | | $ | 19,381,319 | |
Small/Mid Cap | | | 17,627,185 | |
Non-US Core Equity | | | 106,657,930 | |
Opportunistic Fixed | | | 228,540 | |
Emerging Markets | | | 22,650,789 | |
Global Low Volatility | | | 17,796,952 | |
For corporate shareholders, a portion of the ordinary dividends paid during the Funds’ year ended March 31, 2022, qualified for the dividends received deduction, as follows:
| | | | |
Fund | | | |
Large Cap | | | 85.95 | % |
Small/Mid Cap | | | 26.78 | % |
Non-US Core Equity | | | 0.37 | % |
Opportunistic Fixed | | | 0.56 | % |
Emerging Markets | | | 0.48 | % |
Global Low Volatility | | | 40.98 | % |
259
Mercer Funds
Additional Information (Unaudited) (Continued)
Board Approval of a New Subadvisory Agreement for One of the Funds During the Period October 1, 2021 through March 31, 2022
Mercer US Large Cap Equity Fund
At a meeting of the Board of Trustees held on December 16, 2021 (the “Meeting”), the Advisor recommended, and the Board of Trustees, including the Independent Trustees, considered and approved, with respect to Mercer US Large Cap Equity Fund (the “Fund”), a proposed new subadvisory agreement to be entered into by the Advisor and O’Shaughnessy Asset Management, LLC (“OSAM” and the “New OSAM Subadvisory Agreement”) to replace the previous subadvisory agreement that had been entered into between the Advisor and OSAM (the “Prior OSAM Subadvisory Agreement”) that was deemed to be terminated effective upon the closing of a transaction involving the acquisition of OSAM by Franklin Resources, Inc. (“Franklin” and the “Franklin Transaction”). The Franklin Transaction was successfully completed and closed effective as of December 31, 2021, and as of that date OSAM became a separate operating subsidiary of Franklin.
Approval of a New Subadvisory Agreement for the Fund with O’Shaughnessy Asset Management, LLC
At the Meeting, the Board, including a majority of the Independent Trustees, considered and approved the New OSAM Subadvisory Agreement, effective upon the closing of the Franklin Transaction. In considering the approval of the New OSAM Subadvisory Agreement, the Independent Trustees considered the information and materials from the Advisor and OSAM that included, as to OSAM and the Fund: (i) the New OSAM Subadvisory Agreement; (ii) information regarding the review and due diligence process by which the Advisor continued to evaluate OSAM, and recommend OSAM for Board approval, and the Advisor’s rationale for recommending the continued retention of OSAM following the closing of the Franklin Transaction; (iii) information describing the nature, extent, and quality of the services that OSAM has provided to the Fund, and the fees that OSAM charged for these services; (iv) the Fee Waiver Agreement, which requires the Advisor to waive any portion of the management fee it is entitled to under the Management Agreement with respect to the Fund that exceeds the aggregate amount of the subadvisory fees that the Advisor is required to pay to the Fund’s subadvisors for the management of their allocated portions of the Fund; (v) information regarding OSAM’s business and operations, financial condition, portfolio management team, and compliance program, and Franklin’s representations and the Advisor’s views of the effect that the Franklin Transaction may have on OSAM’s business and operations; (vi) information regarding OSAM’s compliance policies and procedures as well as the retention incentives intended to ensure the continuity of OSAM’s Chief Compliance Officer; (vii) information regarding OSAM’s historical performance in managing its allocated portion of the Fund’s investment portfolio as well as OSAM’s historical performance in managing other of its client accounts using the investment strategy that it employs for the Fund and a comparison of such performance to a relevant index; and (viii) the Advisor’s detailed monitoring and reporting of OSAM’s performance on qualitative and quantitative factors.
In addition, the Independent Trustees considered their discussions with representatives of the Advisor regarding OSAM and the Franklin Transaction. The Independent Trustees considered the factors that the Independent Trustees deemed relevant with respect to OSAM, including: the nature, extent, and quality of the services to be provided to the Fund by OSAM following the consummation of the Franklin Transaction; OSAM’s investment management style and investment decision-making process; OSAM’s historical performance record managing its allocated portion of the Fund’s portfolio, as well as managing a registered investment company similar to the Fund; the qualifications and experience of the employees at OSAM who were responsible for the day-to-day management of the allocated portion of the Fund; and OSAM’s staffing levels and overall resources. The Independent Trustees also took into
260
Mercer Funds
Additional Information (Unaudited) (Continued)
consideration the nature and extent of the oversight duties performed by the Advisor in connection with each of the other Subadvisors to the Fund, which includes extensive management and compliance due diligence with respect to the management and operations of each of the Subadvisors. Additionally, the Independent Trustees received assistance and advice from their independent legal counsel regarding legal standards in connection with their duties and responsibilities when approving investment advisory agreements.
In particular, and as to the Fund and to OSAM, the Independent Trustees considered the following factors:
(a) The nature, extent, and quality of the advisory services to be provided by OSAM. The Independent Trustees reviewed the nature, extent, and quality of the advisory services that OSAM had provided to the Fund under the Prior OSAM Subadvisory Agreement and that are proposed to be provided by OSAM under the New OSAM Subadvisory Agreement. The Independent Trustees considered, as to OSAM: (i) its reputation and the qualifications of its personnel; (ii) its expertise in providing portfolio management services to the Fund and another similar investment portfolio and the performance history of the Fund and such other portfolio; (iii) its investment strategy for the Fund; (iv) its performance relative to comparable mutual funds and unmanaged indices; and (v) its compliance program. The Independent Trustees also considered the review process undertaken by the Advisor and the Advisor’s favorable assessment of the nature and quality of the subadvisory services provided and expected to be provided by OSAM to the Fund after consummation of the Franklin Transaction. The Independent Trustees also noted that the executive and portfolio management teams of OSAM were expected to stay in place after consummation of the Franklin Transaction. The Independent Trustees concluded that the Fund and its shareholders would likely continue to benefit from the quality and experience of OSAM’s investment professionals after the consummation of the Franklin Transaction.
(b) Comparison of the services to be rendered and fees to be paid to OSAM under other advisory and subadvisory contracts, such as those with other clients. The Independent Trustees considered the services that would be rendered by OSAM and evaluated the compensation to be paid to OSAM by the Advisor for those services. The Independent Trustees considered the fees payable under the New OSAM Subadvisory Agreement. The Independent Trustees took account of the Advisor’s reasons for concluding that the compensation payable to OSAM for its proposed services to the Fund was reasonable in light of the nature and quality of the services furnished to the Fund, and the Advisor’s recommendation that OSAM continue following the Franklin Transaction, particularly in light of the fact that OSAM’s fees would indirectly be borne by the Fund and its shareholders as a result of the Fee Waiver Agreement. The Independent Trustees also took note of the Advisor’s explanation that the Advisor was not realizing a direct profit from the investment advisory services it provides to the Fund as a result of the subadvisory fee arrangements and the Fee Waiver Agreement. The Independent Trustees concluded that the proposed fees to be paid to OSAM by the Advisor with respect to the assets allocated to OSAM were appropriate in light of the services that were expected to be provided by OSAM. The Independent Trustees noted that the services that OSAM would furnish to the Fund appeared to be comparable to the services that OSAM currently provides to its other advisory and subadvisory clients having similar investment strategies. The Independent Trustees also considered that the fees agreed to by OSAM were the result of an arm’s length bargain negotiated by unaffiliated parties.
The Independent Trustees considered the review, selection, and due diligence process employed by the Advisor in determining to recommend that OSAM continue to serve as a subadvisor to the Fund, and the Advisor’s reasons for concluding that the subadvisory fees to be paid by the Advisor to OSAM for its services to the Fund were reasonable.
261
Mercer Funds
Additional Information (Unaudited) (Continued)
The Independent Trustees also considered the potential “fallout” or ancillary benefits that may accrue to OSAM from its relationship with the Fund. Since the fees to be paid to OSAM were the result of arm’s length bargaining between unaffiliated parties, the relevance of OSAM’s potential profitability was considered by the Independent Trustees in that context.
(c) Investment performance of the Fund and OSAM. The Independent Trustees considered whether OSAM operated within the Fund’s investment objective and style, and considered OSAM’s record of compliance with the Fund’s relevant investment restrictions. The Independent Trustees also considered the Advisor’s conclusions, and the reasons supporting the Advisor’s conclusions, that the performance record of OSAM supported the approval of the New OSAM Subadvisory Agreement.
Conclusion. Following full consideration of the foregoing factors, it was reported that no single factor was determinative to the decision of the Independent Trustees. Based on these factors and others addressed at the Meeting, along with the determination of the Advisor at the conclusion of its review and due diligence process and such other matters as were deemed relevant, the Independent Trustees determined to approve the New OSAM Subadvisory Agreement.
262
Mercer Funds
Additional Information (Unaudited) (Continued)
Discussion of the Operation and Effectiveness of the Funds’
Liquidity Risk Management Program
In compliance with Rule 22e-4 under the Investment Company Act of 1940, as amended (the “Liquidity Rule”), the Funds have adopted and implemented a liquidity risk management program (the “Program”) which Mercer Investments LLC, the investment advisor to the Funds (the “Advisor”), believes is reasonably designed to assess and manage each Fund’s liquidity risk. The Board has designated the Advisor to serve as the administrator of the Program pursuant to the Liquidity Rule. The Advisor has established a Liquidity Risk Committee which is appointed to carry out day-to-day responsibilities under the Program. The Liquidity Risk Committee is comprised of representatives from various departments at the Advisor.
At a meeting of the Board held on March 8, 2022, the Advisor provided the Board with a written report addressing the Program’s operation, adequacy and effectiveness of implementation for the period from January 1, 2021 through December 31, 2021 (the “Review Period”). The report noted that the Advisor has concluded that the Program is reasonably designed and adequate to assess and manage each Fund’s liquidity risk, as such term is defined in the Liquidity Rule. In light of its experiences administering the Program during the Review Period, the Advisor has concluded that the Program has been implemented and operated effectively to assess and manage each Fund’s liquidity risk and further believes that the Program has been and continues to be adequately and effectively implemented to monitor and, as applicable, respond to the Funds’ liquidity developments. Additionally, the report noted that no material changes to the Program have occurred during the Review Period or are contemplated. The report also noted that the Liquidity Risk Committee believes that each Fund’s liquidity risk remains within appropriate parameters and that each Fund’s investment strategy is appropriate for an open-end mutual fund. The report further reflected that there were no liquidity events that impacted the Funds’ ability to timely meet redemptions without significant dilution to existing shareholders.
The Liquidity Rule and the Program also require the Funds to classify each portfolio investment into one of four liquidity categories. The Advisor has engaged an independent third-party vendor, which includes the use of that vendor’s proprietary liquidity analytical tool, to assist the Funds in classifying portfolio investments, based on inputs and assumptions adopted by the Liquidity Risk Committee in its reasonable judgment. In classifying portfolio investments, the Liquidity Risk Committee takes into account relevant market, trading and investment-specific considerations as well as the reasonably anticipated trade size of each portfolio investment.
The Liquidity Rule requires funds that do not primarily hold assets that are highly liquid investments to adopt a minimum amount of net assets that must be invested in highly liquid investments that are assets (an “HLIM”). The Liquidity Rule also prohibits the acquisition of illiquid investments if doing so would result in a fund holding more than 15% of its net assets in illiquid investments that are assets. The Program includes provisions reasonably designed to determine, periodically review and comply with the HLIM requirement, as applicable, and to comply with the 15% limit on illiquid investments.
263
Mercer Funds
Understanding Your Fund’s Expenses (Unaudited)
As a mutual fund shareholder, you incur different costs: transaction costs, including sales charges (loads) on purchases, redemption fees and certain exchange fees and ongoing costs, including management fees, distribution fees (12b-1 fees), and other fund expenses. These costs are described in more detail in the Funds’ prospectus. The examples below are intended to help you understand the ongoing costs of investing in the Funds and help you compare these with the ongoing costs of investing in other mutual funds. The first line in the table for each Fund shows the actual account values and actual fund expenses you would have paid on a $1,000 investment in the Fund from October 1, 2021 through March 31, 2022. It also shows how much a $1,000 investment would be worth at the close of the period, assuming actual fund returns and expenses. To estimate the expenses you paid over the period, simply divide your account value by $1,000 (for example $8,600 account value divided by $1,000 = $8.60) and multiply the result by the number in the Operating Expenses Incurred column as shown below for your Class. The second line in the table for each Fund provides information about hypothetical account values and hypothetical expenses based on the Fund’s actual expense ratios and an assumed rate of return of 5% per year before expenses, which is not the Fund’s actual return. The hypothetical account values and expenses may not be used to estimate the actual ending account balance or expenses you paid on your investment for the period. You may use this information to compare the ongoing costs of investing in the Fund and other funds. To do so, compare this 5% hypothetical example with the 5% hypothetical examples that appear in the shareholder reports of the other funds. Please note that the expenses shown reflect ongoing costs only, and do not include any transaction costs, such as sales charges, redemption fees or exchange fees. Therefore, the second line in the table of each fund is useful in comparing ongoing costs only, and will not help you determine the relative costs of owning different funds. If transaction costs were included, total costs would be higher.
Large Cap — Class Y-3
Hypothetical Return on $1,000
| | | | | | | | | | | | | | | | | | | | |
| | | Expense
Ratio | | | Beginning
Amount | | | Ending
Value | | | Avg
Value | | | Operating
Expense
Incurred* | |
Actual | | | 0.31 | % | | | 1,000.00 | | | | 993.30 | | | | 996.65 | | | | 1.54 | |
Hypothetical | | | 0.31 | % | | | 1,000.00 | | | | 1,023.39 | | | | 1,011.70 | | | | 1.56 | |
| * | Actual expenses are equal to the Class’ annualized expense ratio of 0.31%, multiplied by the average account value over the period, multiplied by 182/365. |
Small/Mid Cap — Class Y-3
Hypothetical Return on $1,000
| | | | | | | | | | | | | | | | | | | | |
| | | Expense
Ratio | | | Beginning
Amount | | | Ending
Value | | | Avg
Value | | | Operating
Expense
Incurred* | |
Actual | | | 0.46 | % | | | 1,000.00 | | | | 984.70 | | | | 992.35 | | | | 2.28 | |
Hypothetical | | | 0.46 | % | | | 1,000.00 | | | | 1,022.64 | | | | 1,011.32 | | | | 2.32 | |
| * | Actual expenses are equal to the Class’ annualized expense ratio of 0.46%, multiplied by the average account value over the period, multiplied by 182/365. |
264
Mercer Funds
Understanding Your Fund’s Expenses (Unaudited) (Continued)
Non-US Core Equity — Class Y-3
Hypothetical Return on $1,000
| | | | | | | | | | | | | | | | | | | | |
| | | Expense
Ratio | | | Beginning
Amount | | | Ending
Value | | | Avg
Value | | | Operating
Expense
Incurred* | |
Actual | | | 0.39 | % | | | 1,000.00 | | | | 951.60 | | | | 975.80 | | | | 1.90 | |
Hypothetical | | | 0.39 | % | | | 1,000.00 | | | | 1,022.99 | | | | 1,011.50 | | | | 1.97 | |
| * | Actual expenses are equal to the Class’ annualized expense ratio of 0.39%, multiplied by the average account value over the period, multiplied by 182/365. |
Non-US Core Equity — Class I
Hypothetical Return on $1,000
| | | | | | | | | | | | | | | | | | | | |
| | | Expense
Ratio | | | Beginning
Amount | | | Ending
Value | | | Avg
Value | | | Operating
Expense
Incurred* | |
Actual | | | 0.64 | % | | | 1,000.00 | | | | 950.60 | | | | 975.30 | | | | 3.11 | |
Hypothetical | | | 0.64 | % | | | 1,000.00 | | | | 1,021.74 | | | | 1,010.87 | | | | 3.23 | |
| * | Actual expenses are equal to the Class’ annualized expense ratio of 0.64%, multiplied by the average account value over the period, multiplied by 182/365. |
Core Fixed — Class Y-3
Hypothetical Return on $1,000
| | | | | | | | | | | | | | | | | | | | |
| | | Expense
Ratio | | | Beginning
Amount | | | Ending
Value | | | Avg
Value | | | Operating
Expense
Incurred* | |
Actual | | | 0.17 | % | | | 1,000.00 | | | | 937.50 | | | | 968.75 | | | | 0.82 | |
Hypothetical | | | 0.17 | % | | | 1,000.00 | | | | 1,024.08 | | | | 1,012.04 | | | | 0.86 | |
| * | Actual expenses are equal to the Class’ annualized expense ratio of 0.17%, multiplied by the average account value over the period, multiplied by 182/365. |
Core Fixed — Class I*
Hypothetical Return on $1,000
| | | | | | | | | | | | | | | | | | | | |
| | | Expense
Ratio | | | Beginning
Amount | | | Ending
Value | | | Avg
Value | | | Operating
Expense
Incurred** | |
Actual | | | 0.42 | % | | | 1,000.00 | | | | 938.60 | | | | 969.30 | | | | 1.05 | |
Hypothetical | | | 0.42 | % | | | 1,000.00 | | | | 1,011.80 | | | | 1,005.90 | | | | 1.09 | |
| * | The Class commenced operations on December 27, 2021. |
| ** | Actual expenses are equal to the Class’ annualized expense ratio of 0.42%, multiplied by the average account value over the period, multiplied by 94/365. |
265
Mercer Funds
Understanding Your Fund’s Expenses (Unaudited) (Continued)
Opportunistic Fixed — Class Y-3
Hypothetical Return on $1,000
| | | | | | | | | | | | | | | | | | | | |
| | | Expense
Ratio | | | Beginning
Amount | | | Ending
Value | | | Avg
Value | | | Operating
Expense
Incurred* | |
Actual | | | 0.45 | % | | | 1,000.00 | | | | 943.90 | | | | 971.95 | | | | 2.18 | |
Hypothetical | | | 0.45 | % | | | 1,000.00 | | | | 1,022.69 | | | | 1,011.35 | | | | 2.27 | |
| * | Actual expenses are equal to the Class’ annualized expense ratio of 0.45%, multiplied by the average account value over the period, multiplied by 182/365. |
Emerging Markets — Class Y-3
Hypothetical Return on $1,000
| | | | | | | | | | | | | | | | | | | | |
| | | Expense
Ratio | | | Beginning
Amount | | | Ending
Value | | | Avg
Value | | | Operating
Expense
Incurred* | |
Actual | | | 0.47 | % | | | 1,000.00 | | | | 884.30 | | | | 942.15 | | | | 2.21 | |
Hypothetical | | | 0.47 | % | | | 1,000.00 | | | | 1,022.59 | | | | 1,011.30 | | | | 2.37 | |
| * | Actual expenses are equal to the Class’ annualized expense ratio of 0.47%, multiplied by the average account value over the period, multiplied by 182/365. |
Global Low Volatility — Class Y-3
Hypothetical Return on $1,000
| | | | | | | | | | | | | | | | | | | | |
| | | Expense
Ratio | | | Beginning
Amount | | | Ending
Value | | | Avg
Value | | | Operating
Expense
Incurred* | |
Actual | | | 0.32 | % | | | 1,000.00 | | | | 1,024.80 | | | | 1,012.40 | | | | 1.62 | |
Hypothetical | | | 0.32 | % | | | 1,000.00 | | | | 1,023.34 | | | | 1,011.67 | | | | 1.61 | |
| * | Actual expenses are equal to the Class’ annualized expense ratio of 0.32%, multiplied by the average account value over the period, multiplied by 182/365. |
266
Mercer Funds
Trustees and Officers (Unaudited)
The following tables list the Trust’s Trustees and Officers as of the date of this report; their address and age; their position with the Trust; the length of time holding that position with the Trust; their principal occupation(s) during the past five years; the number of portfolios in the fund complex they oversee; and other directorships they hold in companies subject to registration or reporting requirements of the Securities Exchange Act of 1934 (generally called “public companies”) or in registered investment companies. The Trust’s Statement of Additional Information (“SAI”) includes additional information about the Trust’s trustees, including changes subsequent to the date of the report. The SAI is available, without charge, upon request, by calling 1-888-887-0619, or on the SEC website at www.sec.gov.
Independent Trustees
| | | | | | | | | | | | | |
Name, Address and Age | | Position(s)
Held with
Trust | | Term of
Office(1) and
Length of
Time
Served | | Principal
Occupation(s) During
Past 5 Years | | Number of
Portfolios
in Fund
Complex*
Overseen
by Trustee | | Other
Directorships
Held by
Trustee |
Harrison M. Bains, Jr. 99 High Street Boston, MA 02110 (78) | | Trustee | | Trustee since 2005 | | Mr. Bains is retired. | | | | 7 | | | Mr. Bains is a director of Cara Therapeutics, Inc.; Mr. Bains was a director of BG Medicine, Inc.(2007 to 2014) and a trustee of BofA Funds Series Trust (11 portfolios) (2011 to 2016). |
| | | | | |
Adela M. Cepeda 99 High Street Boston, MA 02110 (64) | | Trustee | | Trustee since 2005 | | Ms. Cepeda was Managing Director of PFM Financial Advisors LLC (a financial advisory firm) from September 2016 to December 2019. Ms. Cepeda was previously Founder and President of A.C. Advisory, Inc. (a financial advisory firm) 1995 — 2016. | | | | 7 | | | Ms. Cepeda is a director or trustee of: The UBS Funds (12 portfolios); UBS Relationship Funds; SMA Relationship Trust (1 portfolio); Morgan Stanley Pathway Funds (11 portfolios); BMO Financial Corp. (U.S. holding company for BMO Harris Bank N.A.); Ms. Cepeda was a director of Fort Dearborn Income Securities, Inc. (2000 to 2016). |
| | | | | |
Gail A. Schneider 99 High Street Boston, MA 02110 (73) | | Chairperson and Trustee | | Chairperson since 2022; Trustee since 2009 | | Ms. Schneider is a self-employed consultant since 2007. Ms. Schneider was previously an Executive Vice President at JPMorgan Chase & Co. | | | | 7 | | | None |
267
Mercer Funds
Trustees and Officers (Unaudited) (Continued)
| | | | | | | | | | | | | |
Name, Address and Age | | Position(s)
Held with
Trust | | Term of
Office(1) and
Length of
Time
Served | | Principal
Occupation(s) During
Past 5 Years | | Number of
Portfolios
in Fund
Complex*
Overseen
by Trustee | | Other
Directorships
Held by
Trustee |
Luis A. Ubiñas 99 High Street Boston, MA 02110 (59) | | Trustee | | Trustee since 2019 | | Mr. Ubiñas is retired. Mr. Ubiñas previously served as President of the Ford Foundation (a not-for profit organization) from 2008 to 2013 and prior to that he served as a Senior Partner for McKinsey & Company (a global consulting firm). | | | | 7 | | | Mr. Ubiñas is a Director of: ATT, Electronic Arts, Inc., and Tanger Factory Outlet Centers, Inc. |
| | | | | |
Joan E. Steel 99 High Street Boston, MA 02110 (68) | | Trustee | | Trustee since 2020 | | Ms. Steel is the Founder and Chief Executive Officer of Alpha Wealth Advisors LLC since September 2009. Prior to founding her own firm, Ms. Steel was a Senior Vice President, Private Wealth Advisor for the Capital Group, a large global asset manager. | | | | 7 | | | Ms. Steel was an independent director of The Hershey Trust Company from 2012 to 2016. |
Interested Trustee:
| | | | | | | | | | | | | |
Name, Address and Age | | Position(s)
Held with
Trust | | Term of
Office(1) and
Length of
Time
Served | | Principal
Occupation(s) During
Past 5 Years | | Number of
Portfolios
in Fund
Complex*
Overseen
by Trustee | | Other
Directorships
Held by
Trustee |
Richard S. Joseph** (57) | | Trustee, President, and Chief Executive Officer | | Since 2016 | | Mr. Joseph is Vice President and Head of the US Mercer Delegated Solutions of Mercer Investments LLC since December 2015. Prior to December 2015, he was Chief Operating Officer of Mercer Investments LLC. | | | | 7 | | | Mr. Joseph is a trustee of Mercer Trust Company LLC and was a director of Mercer Investments LLC from January 2017 to March 2019. |
| (1) | Each Trustee holds office for an indefinite term. |
| * | The “Fund Complex” consists of the Trust, which has seven portfolios. |
| ** | Mr. Joseph is considered to be an “interested person,” as defined in the 1940 Act, of the Trust due to his relationship with the Advisor. |
268
Mercer Funds
Trustees and Officers (Unaudited) (Continued)
Officers:
The executive officers of the Trust not named above are:
| | | | | | |
Name and Age | | Position(s)
Held with
the Trust | | Term of
Office+
and Length of
Time Served | | Principal Occupation(s) During Past 5 Years |
Samantha Davidson (46) | | Vice President | | Since 2021 | | Ms. Davidson is a Senior Partner at Mercer for Mercer’s OCIO Business. Prior to joining Mercer in 2020, Ms. Davidson spent 17 years in various positions, most recently as Managing Director and head of client solutions for Goldman Sachs Personal Financial Management. |
| | | |
Stephen Gouthro (54) | | Vice President, Treasurer and Chief Financial Officer | | Since 2018 | | Mr. Gouthro is a partner at Mercer and U.S. Chief Operating Officer for Mercer’s U.S. Business Solutions Group. Mr. Gouthro joined Mercer in 2018. Prior to joining Mercer, Mr. Gouthro was at Putnam Investments in various leadership roles in Operations, Technology, and Investments. |
| | | |
Barry Vallan (52) | | Vice President and Assistant Treasurer | | Since 2021 | | Mr. Vallan is a Principal and the Head of Fund Administration at Mercer Investments LLC. Prior to joining Mercer in 2020, Mr. Vallan was Vice President of Fund Administration at J.P. Morgan (from 2017 to 2020) and a Director of Fund Accounting & Administration at the Bank of America (from 2002 to 2017). |
| | | |
Jeff Coleman (52) | | Vice President and Assistant Treasurer | | Since 2019 | | Mr. Coleman is Head of Investment Operations at Mercer Investments LLC since 2019. Prior to joining Mercer, Mr. Coleman was a Vice President at Fidelity Investments from 2016 to 2018 and a Managing Director, Fund Chief Financial Officer at BofA Global Capital Management from 2010 to 2016. |
| | | |
Stan Mavromates (61) | | Vice President and Chief Investment Officer | | Since 2012 | | Mr. Mavromates is Vice President and Chief Investment Officer of Mercer Investments LLC since 2012. |
| | | |
Colin Dean (45) | | Vice President and Assistant Secretary | | Since 2021++ | | Mr. Dean is Global Chief Counsel, Investments since 2018. He has served as Senior Legal Counsel — Investments for Mercer Investments LLC since 2010. |
| | | |
Caroline Hulme (36) | | Vice President, Chief Legal Officer and Secretary | | Since 2021++ | | Ms. Hulme is Senior Legal Counsel, Investments since 2018. She served as Legal Counsel — Investments for Mercer Investments LLC since 2014. |
| | | |
Larry Vasquez (54) | | Vice President | | Since 2012 | | Mr. Vasquez is a Vice President and Portfolio Manager of Mercer Investments LLC since 2012. |
| | | |
Erin Lefkowitz (40) | | Vice President | | Since 2021 | | Ms. Lefkowitz is a Vice President and Senior Portfolio Manager of Mercer Investments LLC. Prior to joining Mercer in 2021, Ms. Lefkowitz held various roles in risk management, portfolio construction, trading and global fixed income portfolio management at Putnam Investments. |
269
Mercer Funds
Trustees and Officers (Unaudited) (Continued)
| | | | | | |
Name and Age | | Position(s)
Held with
the Trust | | Term of
Office+
and Length of
Time Served | | Principal Occupation(s) During Past 5 Years |
Tammy Choe (41) | | Vice President and Chief Compliance Officer | | Since 2022 | | Ms. Choe serves as Chief Compliance Officer of Mercer Investments LLC since March 2022 and Mercer Trust Company LLC since May 2022. Prior to joining Mercer, Ms. Choe was Chief Compliance Officer at Cadre (CCV, LLC) from June to December 2021. Ms. Choe also served in various compliance positions for Prudential Financial including Chief Compliance Officer from 2020-2021 of QMA LLC (a PGIM subsidiary), and Deputy Chief Compliance Officer from 2015-2020. |
| | | |
Kevin McKiernan (57) | | Vice President and Deputy Chief Compliance Officer | | Since 2021 | | Mr. McKiernan is a Senior Compliance Officer at Mercer Investments LLC. Prior to joining Mercer in 2019, he served as a compliance consultant for Mission Critical Services Corp. From 2004 to 2018, Mr. McKiernan held various positions with Prudential Financial, most recently as Director, PGIM Investments. |
| + | Officers of the Trust are elected by the Trustees and serve at the pleasure of the Board. |
| ++ | Prior to 2021, Mr. Dean and Ms. Hulme each held different positions with the Trust, since 2010 and 2017, respectively. |
270
Shares of Mercer Funds are distributed by MGI Funds Distributors, LLC.
(b) Not applicable.
As of the end of the period covered by this report, the Registrant has adopted a code of ethics that applies to its President, Chief Financial Officer and Chief Investment Officer. During the period covered by this report, there were no amendments to a provision of its code of ethics, nor were there any waivers, including implicit waivers granted from a provision of the code of ethics. A copy of the Registrant’s code of ethics is filed with the Form N-CSR under Item 13(a)(1).
| Item 3. | Audit Committee Financial Expert. |
The Registrant’s Board of Trustees has determined that the Registrant has at least one audit committee financial expert serving on its audit committee. The audit committee financial expert serving on the Registrant’s audit committee is Harrison M. Bains, Jr. and Adela Cepeda who are both “independent” as defined in Item 3(a)(2) of this Form.
| Item 4. | Principal Accountant Fees and Services. |
(a) Audit Fees – The aggregate fee billed for the fiscal year for professional services rendered by the principal accountant for the audit of the Registrant’s annual financial statements or services that are normally provided by the principal accountant in connection with statutory and regulatory filings or engagements was $365,500 and $380,500 for the fiscal years ended March 31, 2021 and March 31, 2022, respectively.
(b) Audit-Related Fees – There were no fees billed for the fiscal years ended March 31, 2021 and March 31, 2022 for assurance and related services by the principal accountant that are reasonably related to the performance of the audit of the Registrant’s financial statements and are not reported under (a) of this Item.
(c) Tax Fees – The aggregate fee billed in the last fiscal year for professional services rendered by the principal accountant for the review of the Registrant’s tax returns and excise tax calculations was $69,300 and $71,400 for the fiscal years ended March 31, 2021 and March 31, 2022, respectively. Fees in the amount of $123,144 and $31,942 were billed in the fiscal years ended March 31, 2021 and March 31, 2022, respectively for review of non-US capital gains and the preparation and filing of return of income for the Mercer Non-US Core Equity Fund and the Mercer Emerging Markets Equity Fund.
(d) All Other Fees – Fees in the amount of $54,833 and $4,500 were billed in the fiscal year ended March 31, 2021 and March 31, 2022, respectively for tax advisory services related to the reclamation of taxes paid by the Mercer Non-US Core Equity Fund and the Mercer Global Low Volatility Equity Fund in certain European Union countries.
(e) (1) The Registrant’s audit committee pre-approves all audit and non-audit services to be performed by the Registrant’s accountant before the accountant is engaged by the Registrant to perform such services.
(2) There were no services described in (b) through (d) above (including services required to be approved by the audit committee pursuant to paragraph (c)(7)(ii) of Rule 2-01 of Regulation S-X) that were approved by the audit committee pursuant to paragraph (c)(7)(i)(C) of Rule 2-01 of Regulation S-X.
| (f) | None of the hours expended on the principal accountant’s engagement to audit the Registrant’s financial statements for the fiscal year ended March 31, 2022 were attributable to work performed by persons other than the principal accountant’s full-time, permanent employees. |
| (g) | There were no aggregate fees billed for the fiscal year ended March 31, 2022 by the Registrant’s principal accountant for non-audit services rendered to the Registrant, its investment adviser and any entity controlling, controlled by or under common control with the investment adviser that provides ongoing services to the Registrant. |
| Item 5. | Audit Committee of Listed Registrants. |
Not applicable.
| Item 6. | Schedule of Investments. |
The Registrant’s full schedules of investments are included as part of the report to shareholders filed under Item 1 of this Form.
| Item 7. | Disclosure of Proxy Voting Policies and Procedures for Closed-End Management Investment Companies. |
Not applicable.
| Item 8. | Portfolio Managers of Closed-End Investment Companies. |
Not applicable.
| Item 9. | Purchases of Equity Securities by Closed-End Management Investment Company and Affiliated Purchasers. |
Not applicable.
| Item 10. | Submission of Matters to a Vote of Security Holders. |
There have been no material changes to the procedures by which the shareholders may recommend nominees to the Registrant’s Board of Directors, where those changes were implemented after the Registrant last provided disclosure in response to the requirements of Item 22(b)(15) of Schedule 14A (17 CFR 240.14a-101), or this Item.
| Item 11. | Controls and Procedures. |
(a) The Registrant’s Principal Executive Officer and Principal Financial Officer concluded that the Registrant’s disclosure controls and procedures (as defined in Rule 30a-3(c) under the Investment Company Act of 1940 (17 CFR 270.30a-3(c))), are effective based on the evaluation of Registrant’s disclosure controls and procedures as of a date within 90 days prior to the filing date of this report.
(b) There were no changes in the Registrant’s internal control over financial reporting (as defined in Rule 30a-3(d) under the Investment Company Act of 1940 (17 CFR 270.30a-3(d))), that occurred during the Registrant’s second fiscal quarter of the period covered by this report that has materially affected, or is reasonably likely to materially affect, the Registrant’s internal control over financial reporting.
| Item 12. | Disclosure of Securities Lending Activities for Closed-End Management Investment Companies. |
Not applicable.
(a)(1) Code of Ethics for the Registrant’s President, Chief Financial Officer and Chief Investment Officer (as referenced in Item 2 above), attached hereto as Exhibit (a)(1).
(a)(2) Certification of the Principal Executive Officer and Principal Financial Officer of the Registrant as required by Rule 30a-2(a) under the Investment Company Act of 1940 (17 CFR 270.30a-2(a)) is attached hereto as Exhibit 99CERT.
(a)(3) Not applicable.
(b) Certification pursuant to Section 906 of the Sarbanes-Oxley Act of 2002 as required by Rule 30a-2(b), under the Investment Company Act of 1940 (17 CFR 270.30a-2(b)), Rule 15d-14(b) under the Securities Exchange Act of 1934 (17 CFR 240.15d-14(b)) and Section 1350 of Chapter 63 of Title 18 of the United States Code (18 U.S.C. 1350) is attached hereto as Exhibit 99.906CERT.
SIGNATURES
Pursuant to the requirements of the Securities Exchange Act of 1934 and the Investment Company Act of 1940, the Registrant has duly caused this report to be signed on its behalf by the undersigned, thereunto duly authorized.
| | |
| (Registrant) | | Mercer Funds |
| | | | |
| By (Signature and Title) | | /s/ Richard Joseph | | |
| | Richard Joseph President and Chief Executive Officer (Principal Executive Officer) | | |
| Date 5/24/22 | | | | |
Pursuant to the requirements of the Securities Exchange Act of 1934 and the Investment Company Act of 1940, this report has been signed below by the following person on behalf of the Registrant and in the capacities and on the date indicated.
| | | | |
| By (Signature and Title) | | /s/ Richard Joseph | | |
| | Richard Joseph President and Chief Executive Officer (Principal Executive Officer) | | |
| Date 5/24/22 | | |
| | |
| By (Signature and Title) | | /s/ Stephen Gouthro | | |
| | Stephen Gouthro Vice President, Treasurer and Chief Financial Officer (Principal Financial Officer) | | |
| Date 5/24/22 | | |