UNITED STATES
SECURITIES AND EXCHANGE COMMISSION
Washington, DC 20549
FORM N-CSR
CERTIFIED SHAREHOLDER REPORT OF REGISTERED
MANAGEMENT INVESTMENT COMPANIES
Investment Company Act File Number: 811-21732
Mercer Funds
(Exact Name of Registrant as Specified in Charter)
99 High Street
Boston, MA 02110
(Address of Principal Executive Offices)(Zip Code)
Caroline Hulme, Esq.
Mercer Investments LLC
99 High Street
Boston, MA 02110
(Name and Address of Agent for Service)
Registrant’s Telephone Number, including Area Code: (617) 747-9500
Date of Fiscal Year End: March 31, 2023
Date of Reporting Period: March 31, 2023
| Item 1. | Reports to Stockholders. |
(a) The Report to Shareholders is attached herewith.
Mercer FundsTM
Annual Report
March 31, 2023
Mercer US Large Cap Equity Fund |
Mercer US Small/Mid Cap Equity Fund |
Mercer Non-US Core Equity Fund |
Mercer Core Fixed Income Fund |
Mercer Opportunistic Fixed Income Fund |
Mercer Emerging Markets Equity Fund |
Mercer Global Low Volatility Equity Fund |
This report has been prepared for Mercer Funds shareholders. It is not authorized for distribution to prospective investors unless accompanied or preceded by a current Mercer Funds prospectus. The prospectus contains more complete information about the Funds’ investment objectives, risks, and expenses. Investors are reminded to read the prospectus carefully before investing.
MERCER FUNDS
TABLE OF CONTENTS
Management's Discussion of Fund Performance (Unaudited)
Mercer US Large Cap Equity Fund
Investment Objective and Benchmark
The investment objective of the Fund is long-term total return, which includes capital appreciation and income. The benchmark for the Fund is the Russell 1000® Index1.
Investment Strategy
The Fund invests principally in equity securities (such as common stock) issued by large capitalization U.S. companies. The Fund employs a “core equity” investment strategy by investing in both growth and value oriented equity securities. The Fund may invest in derivative instruments to gain market exposure on cash balances or to reduce market exposure in anticipation of liquidity needs.
Performance
For the fiscal year ended March 31, 2023, the Fund’s Y-3 share class performance was -10.94% compared to its benchmark, the Russell 1000® Index, return of -8.39%. Performance for the Fund is reported net of fees and operating expenses while the benchmark returns do not include expenses of any kind as indexes are unmanaged and cannot be invested in directly.
The Sub-Advisers
As of March 31, 2023, the Fund employed six sub-advisers: Brandywine Global Investment Management LLC (Brandywine), O’Shaughnessy Asset Management LLC (OSAM), Polen Capital Management LLC (Polen), Jennison Associates LLC (Jennison), Delaware Investments Fund Advisers, a series of Macquarie Investment Management Business Trust (Macquarie), and Parametric Portfolio Associates LLC (Parametric).
Brandywine, a deep value manager, focuses on cheap stocks that trade at a significant discount to intrinsic value, with strong free cash flows and quality balance sheets.
OSAM is a yield focused quantitative value manager that seeks stocks that rank high based on valuation, quality and shareholder yield.
Polen is a concentrated quality growth manager, focused on finding high quality companies, with sustainable, above-average earnings growth.
Jennison is a growth manager who selects stocks with long-term competitive advantages that are growing earnings faster or longer than the broad market.
Macquarie is a quality value manager who invests in strong, high quality businesses with sound balance sheets and free cash flow generation.
Parametric utilizes exchange-traded futures to generate market exposure corresponding to the Fund’s benchmark.
Market Commentary and Fund Performance
Amidst a backdrop of rising inflation, liquidity tightening from the Federal Reserve and the war in Ukraine and its implications on the energy supply and prices, the U.S. market saw a sharp sell-off that started in the first quarter of 2022 and continued throughout much of the fiscal year. Volatility was persistent throughout the U.S. markets as a result of multi-decade high inflation prints and the Federal Reserve’s determination to fight it via tighter financial conditions. In the summer months, there was the perception that the Federal Reserve would pivot from its hawkish stance after inflation reached its peak sending the U.S. market on a strong rally. With the Fed reaffirming its hawkish stance in Jackson Hole in August, the rally ended and was followed by a sharp sell-off through the end of the summer and into the fall. In early October after the market reached oversold levels, another strong rally ensued through the end of November culminating with another sell-off in December through the end of 2022.
Management's Discussion of Fund Performance (Unaudited) (Continued)
Mercer US Large Cap Equity Fund
After 2022 ended with widespread pessimism and investors had renewed optimism for 2023, the U.S. markets experienced a sharp rally in which companies that experienced severe volatility in 2022 saw a sharp reversal in momentum as their share prices soared in January. This beta2 rally quickly waned as inflation crept higher, the jobs report came in stronger than expected and hopes for a dovish Fed policy waned. In addition, Silicon Valley Bank, the bank of choice for many tech companies and entrepreneurs collapsed, which initiated a contagion effect on others such as Signature Bank. The banking failures and the sharp reversals in interest rate expectations became the main storyline of the first quarter in 2023.
Within the Russell 1000® Index, the Fund’s benchmark, the best performing sectors for the fiscal year were Energy 12.5%, Consumer Staples 1.0% and Industrials -0.2%. The worst performing sectors were Real Estate -19.5%, Consumer Discretionary -18.8% and Communication Services -18.1%. Information Technology, the largest sector in Russell 1000® Index returned -6.7%. Health Care, Utilities, Materials and Financials returned -3.9%, -6.0%, -8.1% and -14.1%, respectively.
The Mercer US Large Cap Equity Fund lagged the Russell 1000® Index for the period, with value oriented managers, Brandywine and OSAM, outperforming, and growth and higher quality managers, Jennison and Polen, underperforming their respective benchmarks. Macquarie, a quality value manager, moderately lagged its benchmark.
Jennison lagged the Russell 1000® Growth Index3 by 5.3%. Significant underperformance of higher growth, higher valuation stocks was a major headwind. The majority of underperformance came from security selection in Communication Services and Information Technology as well from being overweight in the Consumer Discretionary and Communication Services sectors. Overweight positions to Snap, Tesla, Atlassian and Crowdstrike were among the largest detractors from performance. On the positive side, the portfolio’s healthcare, semiconductor and luxury consumer exposure added to relative performance.
Polen lagged the Russell 1000® Growth Index by 6.0%. Significant underperformance resulted from weaker security selection and sector allocation. Specifically, stock selection within Information Technology, Consumer Discretionary and Health Care detracted as did an overweight position in Communication Services. The portfolio’s lack of exposure to Consumer Staples and Industrials detracted from relative results. The largest detractors included Meta, DocuSign, and PayPal.
Macquarie underperformed the Russell 1000® Value Index4 by 0.4%. Macquarie’s underperformance was driven by security selection in a number of sectors such as Financials, Communication Services, Health Care, and Real Estate. Stronger security selection in Information Technology and Utilities were the largest positive contributors.
OSAM outperformed the Russell 1000® Value Index by 0.8%. Security selection in Information Technology, Health Care, Consumer Discretionary, and Energy led to outperformance. Security selection in Communication Services and Financials detracted. OSAM’s higher than index exposure to equities lower value multiples, such as price to earnings and price to cash flow, was a tailwind as companies with value characteristics tended to outperform during the period.
Brandywine outperformed the Russell 1000® Value Index by 1.4%. Security selection in Communication Services, Financials and Consumer Discretionary as well as being underweight to Real Estate were the largest positive contributors. Security selection in Materials and being underweight to Industrials detracted. Brandywine’s higher than index exposure to inexpensively priced equities was a tailwind as companies with value characteristics tended to outperform during the period.
Parametric utilizes exchange-traded futures to replicate the Fund’s benchmark, aiming to provide broad, passive, equity market exposure to the Fund’s liquidity sleeve, and seeking to create positive returns on assets that would have otherwise been earning cash or cash equivalent returns. Performance differences versus the benchmark are largely a result of cash flow effects related to daily subscription/redemption activity and through financing costs of futures relative to interest earned on cash.
Management's Discussion of Fund Performance (Unaudited) (Continued)
Mercer US Large Cap Equity Fund
Risk Considerations
The Fund invests in both growth stocks and value stocks. Growth stocks may be particularly sensitive to market conditions. Investing in value stocks involves the risk that an investment made in undervalued securities may not appreciate in value as anticipated or remain undervalued for long periods of time. The Fund may invest in derivative instruments such as exchange-listed equity futures contracts, which may cause the Fund to experience greater volatility and less liquidity. Derivatives may be more sensitive to changes in market conditions and may amplify the risk of loss for the Fund.
Management's Discussion of Fund Performance (Unaudited) (Continued)
Mercer US Large Cap Equity Fund
March 31, 2023
Comparison of Change in Value of a hypothetical $10,000 Investment in Mercer US Large Cap Equity Class Y-3 Shares vs. the Russell 1000® Index for the period 4/1/13 through 3/31/23
AVERAGE ANNUAL TOTAL RETURNS | | | | |
| | | | |
Mercer US Large Cap Equity Fund – Class Y-3 – 8/15/2005 | | | | |
| | | | |
1 Russell 1000® Index measures the performance of the large cap segment of the U.S. equity universe.
2 Beta is a measure of how an individual asset moves (on average) when the overall stock market increases or decreases.
3 Russell 1000® Growth Index measures the performance of the large-cap growth segment of the US equity universe.
4 Russell 1000® Value Index measures the performance of the large-cap value segment of the US equity universe.
The Fund's total annual gross operating expense for Class Y-3 is 0.58%. Please see the Fund's most recent Prospectus.
The performance of other classes, when launched, will vary from the performance of the class shown based on the difference in fees and expenses paid by shareholders investing in different share classes. The Fund may charge a 2% redemption fee on shares owned less than 30 days.
Management's Discussion of Fund Performance (Unaudited) (Continued)
Mercer US Large Cap Equity Fund
March 31, 2023
The table and graph assume reinvestment of dividends and capital gains, but do not reflect a deduction of taxes an investor might pay on fund distributions or upon redemption of fund shares. Performance shown reflects a fee waiver and/or expense reimbursement. Without this waiver/reimbursement, returns would have been lower.
The data quoted represents past performance and does not guarantee future results. Current performance of the Fund may be lower or higher than the performance quoted. Please call 1-888-887-0619 or visit the Trust’ s website at https://www.mercer.us/what-we-do/wealth-and-investments/delegated-solutions-us.html for the Fund’s most recent month-end performance. Investment return and principal value will fluctuate so that an investor’s shares, when redeemed, may be worth more or less than when purchased.
Fund holdings and sector allocations are subject to change and are not a recommendation to buy or sell any security. Please see the Schedule of Investments for a complete list of Fund holdings.
Management's Discussion of Fund Performance (Unaudited) (Continued)
Mercer US Small/Mid Cap Equity Fund
Investment Objective and Benchmark
The investment objective of the Fund is to provide long-term total return, comprised primarily of capital appreciation. The benchmark for the Fund is the Russell 2500® Index1.
Investment Strategy
The Fund invests principally in equity securities issued by small-to-medium capitalization U.S. companies. The Fund employs a “core equity” investment strategy by investing in both growth and value oriented equity securities. The Fund may invest in derivative instruments to gain market exposure on cash balances or to reduce market exposure in anticipation of liquidity needs.
Performance
For the fiscal year ended March 31, 2023, the Fund’s Y-3 share class performance was -6.69% compared to its benchmark, the Russell 2500® Index, return of -10.39%. Performance for the Fund is reported net of fees and operating expenses while the benchmark returns do not include expenses of any kind as indexes are unmanaged.
The Sub-Advisers
As of March 31, 2023, the Fund employed six sub-advisers: Westfield Capital Management Company, L.P. (Westfield), GW&K Investment Management LLC (GW&K), Loomis, Sayles & Company, L.P. (Loomis), LSV Asset Management (LSV), River Road Asset Management, LLC (River Road) and Parametric Portfolio Associates LLC (Parametric).
Westfield, a traditional growth manager, employs a fundamental, bottom-up approach, which seeks to identify reasonably priced stocks with high earnings growth potential. A bottom-up approach focuses on the analysis of individual stocks and de-emphasizes the significance of macroeconomic and market cycles with the assumption individual companies can do well even in an industry that is not performing, at least on a relative basis.
GW&K uses a bottom-up fundamental research process in order to identify high quality companies with sustainable long-term earnings growth rates.
Loomis looks to provide a lower volatility approach to high growth investing by seeking companies with high quality business models that have differentiated and sustainable growth opportunities.
LSV, a quantitative value manager, using mathematical and statistical methods, seeks deep value, out-of-favor companies with recent momentum. LSV avoids introducing any judgmental biases or behavioral weaknesses into their investment process.
River Road, a fundamental absolute value manager, seeks to buy stocks at a discount to their fair value and sell them at or in excess of that value, and focuses on purchasing companies that are priced at a modest discount to their absolute value and possess superior fundamental business characteristics.
Parametric utilizes exchange-traded futures to generate market exposure corresponding to the Fund’s benchmark.
Market Commentary and Fund Performance
Amidst a backdrop of rising inflation, liquidity tightening from the Federal Reserve and the war in Ukraine and its implications on the energy supply and prices, the U.S. market saw a sharp sell-off that started in the first quarter of 2022 and continued throughout much of the fiscal year. Volatility was persistent throughout the U.S. markets as a result of multi-decade high inflation prints and the Federal Reserve’s determination to fight it via tighter financial conditions. In the summer months, there was the perception that the Federal Reserve would pivot from its hawkish stance after inflation reached its peak sending the U.S. market on a strong rally. With the Fed reaffirming its hawkish stance in Jackson Hole in August, the rally ended and was followed by a sharp sell-off through the end of the summer and into the fall. In early October after the market reached oversold levels, another strong rally ensued through the end of November culminating with another sell-off in December through the end of 2022.
Management's Discussion of Fund Performance (Unaudited) (Continued)
Mercer US Small/Mid Cap Equity Fund
After 2022 ended with widespread pessimism and investors had renewed optimism for 2023, the U.S. markets experienced a sharp rally in which companies that experienced severe volatility in 2022 saw a sharp reversal in momentum as their share prices soared in January. This beta2 rally quickly waned as inflation crept higher, the jobs report came in stronger than expected and hopes for a dovish Fed policy waned. In addition, Silicon Valley Bank, the bank of choice for many tech companies and entrepreneurs collapsed, which initiated a contagion effect on others such as Signature Bank. The banking failures and the sharp reversals in interest rate expectations became the main storyline of the first quarter in 2023.
Within the Russell 2500® Index, the Fund’s benchmark, the best performing sectors for the fiscal year were consumer staples and industrials with returns of 1.5% and -1.4%, respectively. Underperforming sectors for the fiscal year were communication services and real estate, with returns of -24.1% and -21.5%, respectively. The top performing industries for the fiscal year were construction & engineering and beverages with returns of 18.6% and 15.05%, respectively. The underperforming industries for the fiscal year were office REITs and interactive media & services with returns of -52.0% and -41.2%, respectively.
The Mercer US Small/Mid Cap Equity Fund outperformed the Russell 2500® Index by 3.7% for the period. The Fund’s exposure to value, quality and lower beta profile were tailwinds towards performance for the year. Security selection, particularly in the industrials, consumer discretionary and consumer staples sectors contributed towards performance while selection in the information technology and real estate sectors detracted from performance for the fiscal year. From an allocation standpoint, the Fund’s underweight positions in the real estate and communication services sectors contributed towards performance while the Fund’s underweight positions in the energy and utilities sectors detracted from performance.
Westfield outperformed the Russell 2500® Growth Index3 by 4.7% for the fiscal year. In addition, their strong security selection in the industrials and information technology sectors contributed towards performance for the fiscal year. From an allocation standpoint, their underweight positioning in the consumer discretionary and communication services sectors coupled with their overweight positioning in the financials and industrials sectors also contributed towards performance. Westfield’s lack of exposure to the consumer staples sector detracted from performance for the fiscal year.
GW&K’s outperformed the Russell 2500® Index by 4.2% and it can be attributed to its exposure to higher quality and lower beta stocks. In addition, their strong security selection in the industrials, consumer staples and consumer discretionary sectors contributed towards their performance despite their selection in the information technology sector. From an allocation standpoint, their lack of exposure to the communication services sector combined with an underweight to financials contributed towards performance while their underweight positioning in the energy sector weighed on performance for the fiscal year.
LSV’s outperformance versus the Russell 2500® Value Index4 by 5.2% for the period was driven by their deeper value style being in favor, which is evident with their security selection across multiple sectors contributing towards performance. From an allocation standpoint, their underweight to the real estate sector combined with an overweight to the consumer staples and consumer discretionary sectors contributed towards performance despite their underweight to the industrials and energy sectors.
River Road’s outperformance versus the Russell 2500® Value Index by 7.9% for the period was attributed to their lack of exposure to REITs and banks within the financials sector. In addition, their overweight in the industrials sector combined with their strong security selection in the financials sector contributed towards performance for the fiscal year.
Loomis’ exposure to quality growth coupled with their lower beta approach to high growth investing were tailwinds towards performance for the fiscal year despite their underperformance versus the Russell 2500® Growth Index by -0.57%. Despite their strong security selection in the industrials and consumer discretionary sectors, their security selection in the information technology and health care sectors detracted from performance versus the Russell 2500® Growth Index. From an allocation standpoint, their lack of exposure to the real estate sector coupled with an overweight to the consumer staples and industrials sectors contributed towards performance, while their underweight to the energy sector weighed on performance for the full fiscal year.
Management's Discussion of Fund Performance (Unaudited) (Continued)
Mercer US Small/Mid Cap Equity Fund
Parametric utilizes exchange-traded futures replicating the Fund’s benchmark to provide broad, passive, equity market exposure to the Fund’s liquidity sleeve, creating positive returns on assets that would have otherwise been earning cash or cash equivalent returns. Performance differences versus the benchmark are largely a result of cash flow effects related to daily subscription/redemption activity and through financing costs of futures relative to interest earned on cash.
Risk Considerations
The Fund invests in both growth stocks and value stocks. Growth stocks may be particularly sensitive to market conditions. Investing in value stocks involves the risk that an investment made in undervalued securities may not appreciate in value as anticipated or remain undervalued for long periods of time. Investments made in small and mid-capitalization companies may be more volatile and less liquid due to limited resources or product lines and more sensitive to economic factors. The Fund may invest in derivative instruments such as exchange-listed equity futures contracts, which may cause the Fund to experience greater volatility and less liquidity. Derivatives may be more sensitive to changes in market conditions and may amplify the risk of loss for the Fund.
Management's Discussion of Fund Performance (Unaudited) (Continued)
Mercer US Small/Mid Cap Equity Fund
March 31, 2023
Comparison of Change in Value of a hypothetical $10,000 Investment in Mercer US Small/Mid Cap Equity Class Y-3 Shares vs. the Russell 2500® Index for the period 4/1/13 through 3/31/23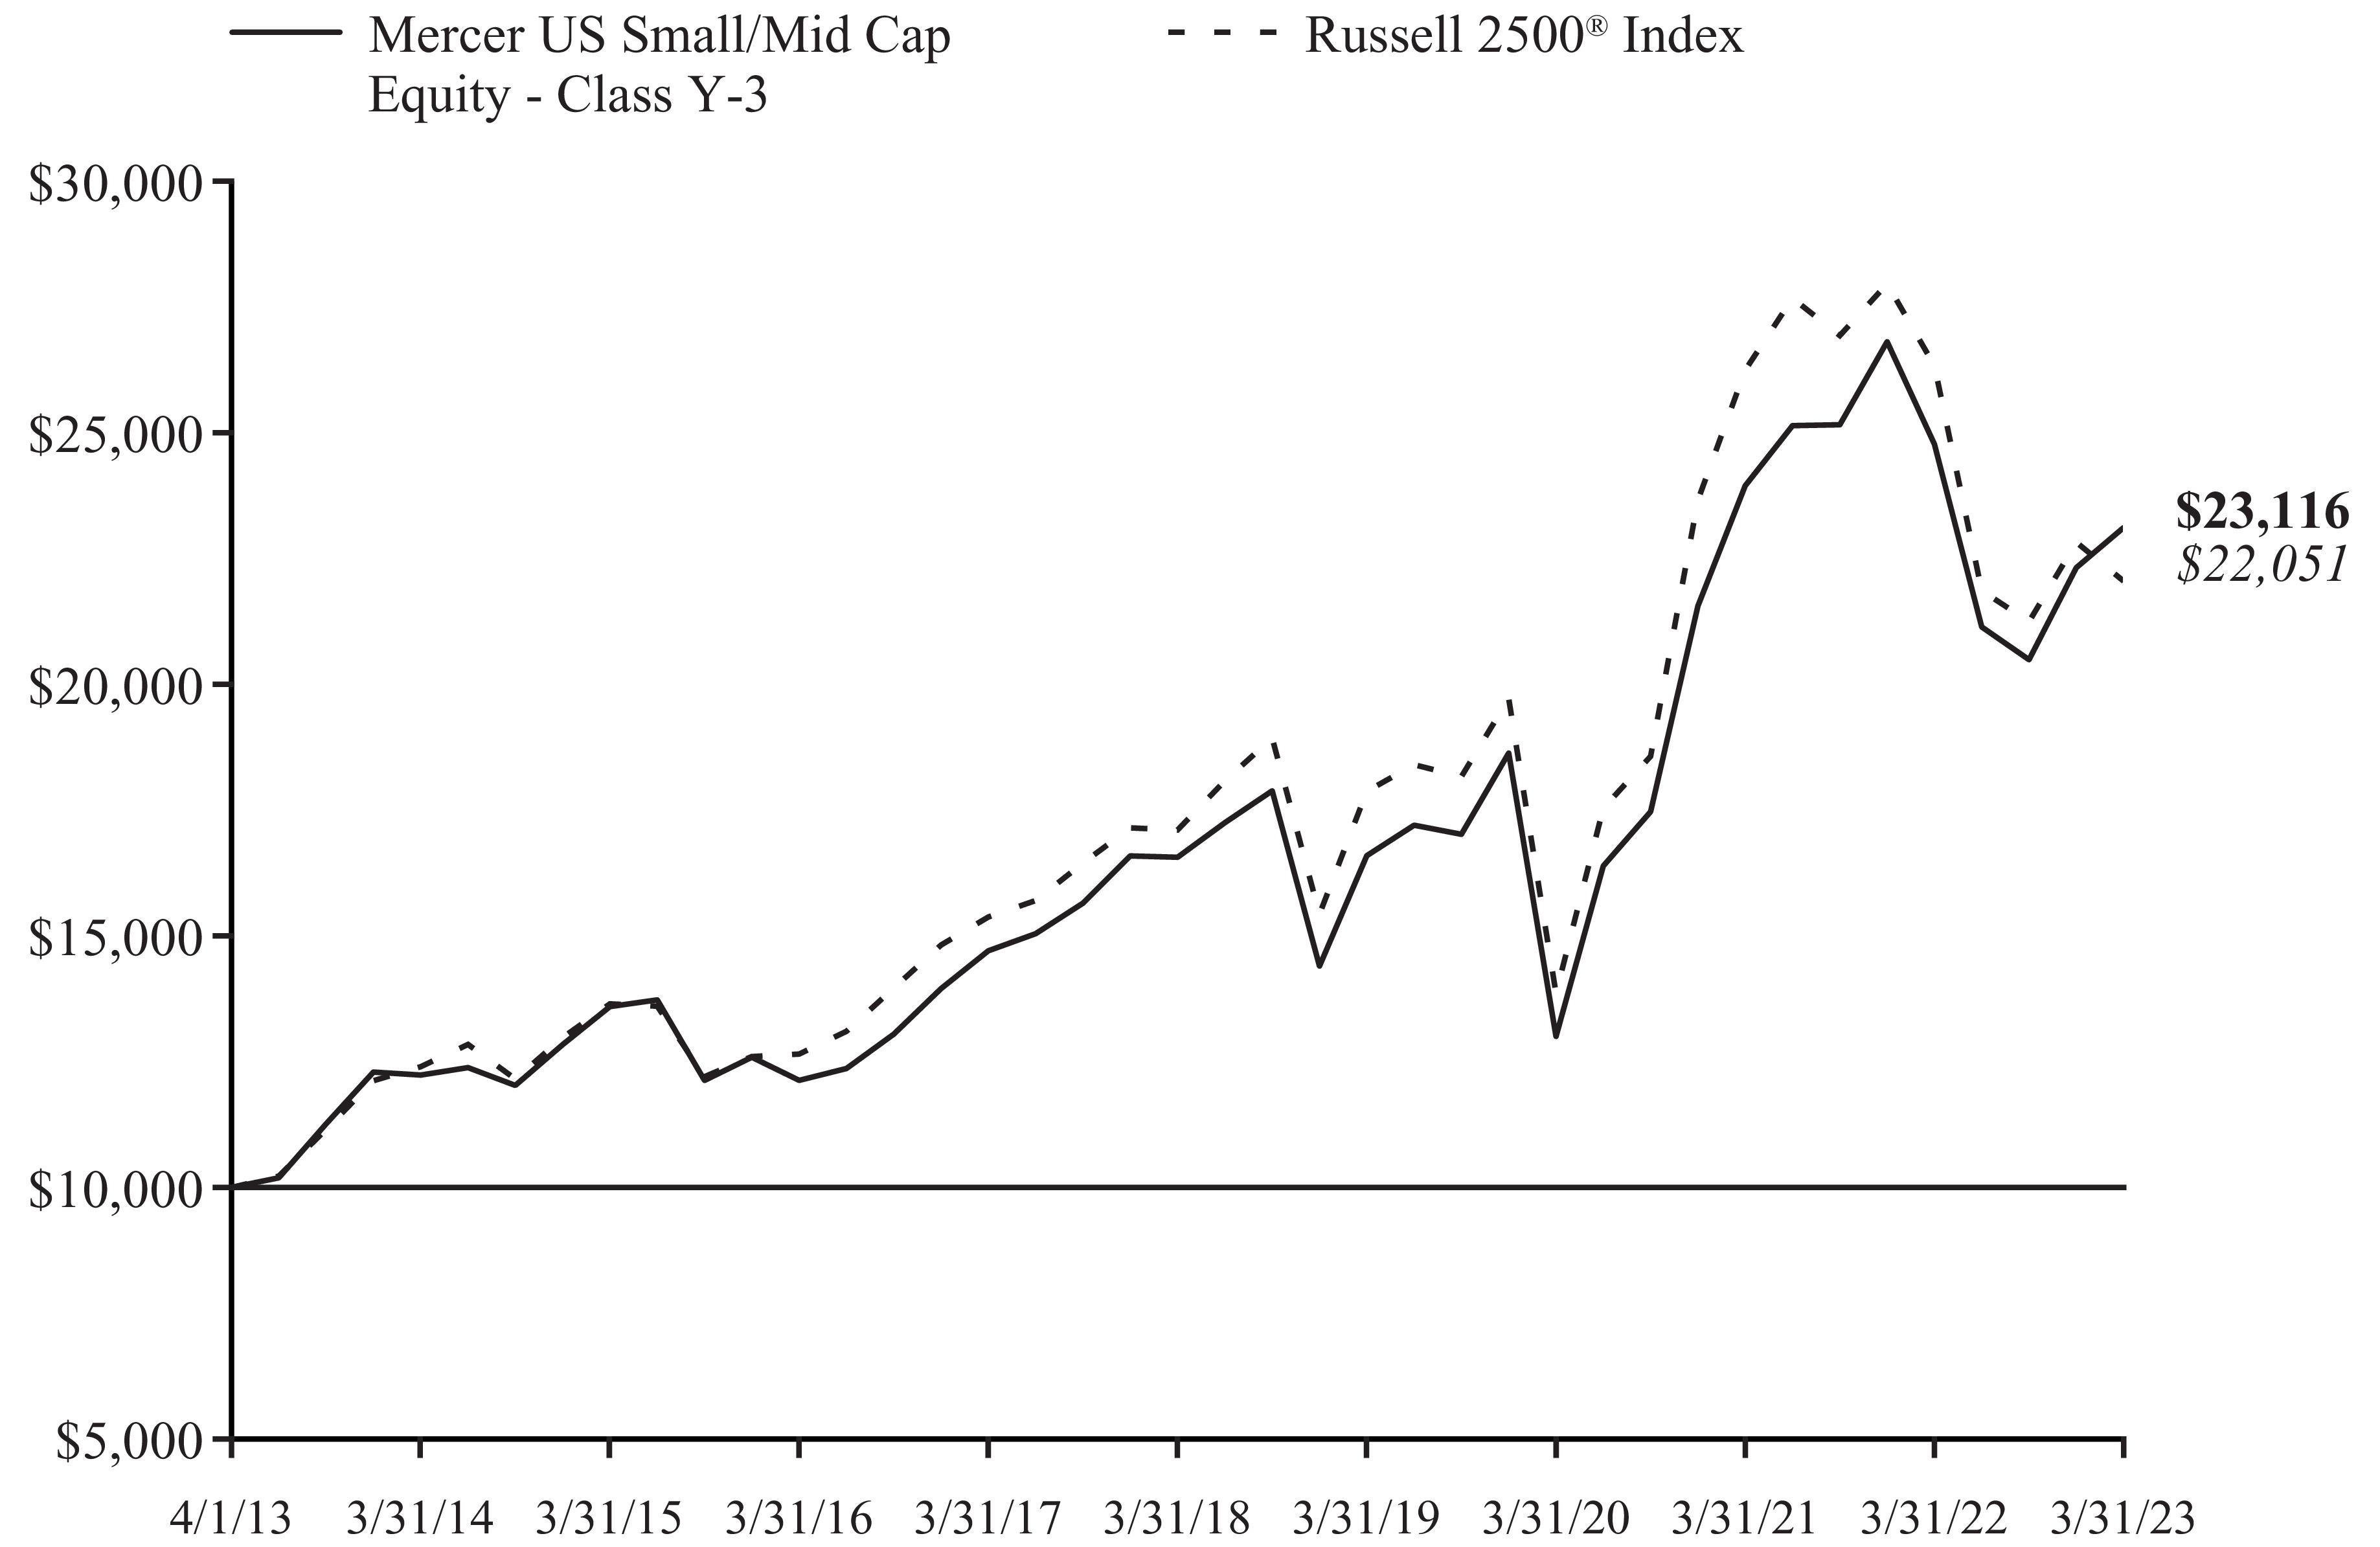
AVERAGE ANNUAL TOTAL RETURNS | | | | |
| | | | |
Mercer US Small/Mid Cap Equity Fund – Class Y-3 – 8/15/2005 | | | | |
| | | | |
1 Russell 2500® Index measures the performance of the small-to mid-cap segment of the U.S. equity universe. The Russell 2500® Index is a subset of the Russell 3000® Index. It includes approximately 2,500 of the smallest securities based on a combination of their market cap and current index membership.
2 Beta is a measure of how an individual asset moves (on average) when the overall stock market increases or decreases.
3 Russell 2500® Growth Index measures the performance of the small to mid-cap growth segment of the US equity universe.
4 Russell 2500® Value Index measures the performance of the small to mid-cap value segment of the US equity universe.
The Fund's total annual gross operating expense for Class Y-3 is 0.94%. Please see the Fund's most recent Prospectus.
The performance of other classes, when launched, will vary from the performance of the class shown based on the difference in fees and expenses paid by shareholders investing in different share classes. The Fund may charge a 2% redemption fee on shares owned less than 30 days.
Management's Discussion of Fund Performance (Unaudited) (Continued)
Mercer US Small/Mid Cap Equity Fund
March 31, 2023
The table and graph assume reinvestment of dividends and capital gains, but do not reflect a deduction of taxes an investor might pay on fund distributions or upon redemption of fund shares. Performance shown reflects a fee waiver and/or expense reimbursement. Without this waiver/reimbursement, returns would have been lower.
The data quoted represents past performance and does not guarantee future results. Current performance of the Fund may be lower or higher than the performance quoted. Please call 1-888-887-0619 or visit the Trust’ s website at https://www.mercer.us/what-we-do/wealth-and-investments/delegated-solutions-us.html for the Fund’s most recent month-end performance. Investment return and principal value will fluctuate so that an investor’s shares, when redeemed, may be worth more or less than when purchased.
Fund holdings and sector allocations are subject to change and are not a recommendation to buy or sell any security. Please see the Schedule of Investments for a complete list of Fund holdings.
Management's Discussion of Fund Performance (Unaudited) (Continued)
Mercer Non-US Core Equity Fund
Investment Objective and Benchmark
The investment objective of the Fund is to provide long-term total return, which includes capital appreciation and income. The benchmark for the Fund is the MSCI EAFE® Index1.
Investment Strategy
The Fund invests principally in equity securities issued by non-U.S. companies of any capitalization, located in the world’s developed and emerging capital markets. The Fund employs a “core equity” investment strategy that seeks to meet the Fund’s investment objective by investing in both growth- and value-oriented equity securities.
Performance
For the fiscal year ended March 31, 2023, the Fund’s Y-3 share class performance was -2.17% and the I share class performance was -2.47% compared to its benchmark return of -1.38%. Performance for the Fund is reported net of fees and operating expenses while the benchmark returns do not include expenses of any kind as indexes are unmanaged.
The Sub-Advisers
As of March 31, 2023, the Fund employed five sub-advisers: Arrowstreet Capital, Limited Partnership (Arrowstreet), American Century Investment Management, Inc. (American Century), Massachusetts Financial Services Company (MFS), LSV Asset Management (LSV) and Parametric Portfolio Associates LLC (Parametric).
Arrowstreet’s strategy seeks to outperform international equity benchmarks through a risk-controlled core approach. Arrowstreet combines sound investment intuition and research with rigorous quantitative tools to identify mispriced stocks around the world. Arrowstreet believes that the key to generating returns in excess of the benchmark involves evaluating the prospects of a security considering the characteristics of the stock itself (direct effects), characteristics of other related stocks (indirect effects) as well as attractiveness of the country and sector basket to which the stock belongs to.
American Century manages its portfolio based on an investment philosophy that companies exhibiting improving or accelerating growth will outperform the market over time. American Century constructs its portfolio through a bottom-up stock selection, which focuses on individual stock selection rather than macroeconomic and market cycles, within a risk aware framework. American Century’s thorough research process seeks to identify companies that are exhibiting an improvement or acceleration in growth where it believes that growth is sustainable but that the earnings power of the company is generally underestimated. American Century can opportunistically invest in emerging market stocks.
MFS’s investment process is based on a fundamental, bottom-up stock selection of high quality companies whose long-term value MFS believes is not adequately reflected in the stock price.
LSV utilizes a quantitative approach, which uses mathematical and statistical methods and seeks deep value stocks that have fallen out of favor with the market, but have recent momentum, either in terms of price or earnings. LSV believes that long-term results are achieved through systematic exploitation of judgmental biases and behavioral weaknesses that influence investor decisions. LSV aims to exploit these biases through the disciplined application of quantitative techniques to drive bottom-up security selection.
Parametric utilizes exchange-traded futures to generate market exposure corresponding to the Fund’s benchmark.
Management's Discussion of Fund Performance (Unaudited) (Continued)
Mercer Non-US Core Equity Fund
Market Commentary and Fund Performance
2023 fiscal year was a turbulent period for capital markets. Multi-decade high inflation rates, fueled by very accommodative fiscal and monetary policy of the prior two years, supply chain disruptions and commodity price spikes, further escalated by Russia’s invasion of Ukraine, were front and center for policy makers and investors. In response to the stubbornly high inflation prints, global central banks initiated one of the most aggressive hiking cycles in decades. With rates rising sharply, the precipitous decline in equity markets which began in January of 2022 continued until October when the global markets bottomed and investor sentiment reached its trough. In contrast to the first half of the fiscal year, the second half experienced strong rallies as investors began to bet on moderating inflation, slowing interest rate hikes by central banks and a possibility of soft landing.
For the year ended March 31, 2023, U.S. equities, measured using the Russell 1000® Index2, declined by 8.39%. Compared to the U.S., international developed markets performed better, with the MSCI EAFE® Index (the Fund’s benchmark) decreasing by 1.38% over the period. The MSCI Emerging Markets® Index3 declined by 10.70% for the 12-month period ended March 31, 2023. In local currency terms MSCI EAFE® Index and MSCI Emerging Markets® Index posted higher returns, as the US dollar appreciated compared to other major currencies.
Fears of looming recession and weak Chinese demand from the prolonged zero COVID policy put pressure on the commodity prices in the second half of the year, resulting in poor returns from commodity producing countries such as Saudi Arabia, South Africa, Canada, Australia and Brazil. These countries were among the best performers in the prior fiscal year. India and Taiwan which performed well during prior fiscal year also had weak returns. On the other hand, European equities with attractive valuations from prior year’s sharp underperformance showed best returns. Chinese equities, which were the worst performing major market in the 2022 fiscal year, rallied sharply in May-June and again between October and January, as the country officially emerged from COVID lockdown. However, on both occasions, these rallies were followed by sharp reversals, leaving Chinese equities with a 6.3% decline for the year.
Triggered by rising interest rates and expensive valuations, the sharp underperformance of companies with high earnings growth and higher profitability characteristics continued in the first three quarters of the fiscal year. In the fourth quarter, this trend reversed, making the underperformance of the growth versus value equities less pronounced. The persistent outperformance of energy stocks also reversed in the fourth quarter of the fiscal year. Smaller market capitalization companies were under significantly more pressure compared to mega and larger market capitalization companies. Momentum was the worst performing equity style across all major markets. For the year, value was the best performing investment style followed by lower volatility.
For the fiscal year, in Europe, Australasia and Far East (EAFE) markets, energy 10.4%, consumer discretionary 5.6% and consumer staples 1.7% were the best performing sectors while real estate -20.0%, materials -6.2% and communication services -6.1% were the worst performers.
Arrowstreet outperformed the Fund’s benchmark by 1.6%. Arrowstreet’s tilt towards value stocks was a tailwind. Among largest positive contributors were being underweight to real estate and overweight to energy. Germany was the most significant country-level positive contributor in large part due to positive security selection in German consumer discretionary and financials sectors. Weaker security selection in health care, primarily due to negative selection in United Kingdom and Swiss health care names was a detractor. Additionally, being underweight to French consumer discretionary names also contributed negatively. Russia was the most significant country-level detractor due to strategy’s exposure to Russian energy stocks.
American Century lagged the Fund’s benchmark by 5.1%. Companies with high and accelerating earnings growth characteristics continued to experience sharp-selloff during the 2023 fiscal year; this environment was a major headwind for American Century. The majority of underperformance came from security selection in information technology, consumer discretionary, materials, industrials, and financials.
Management's Discussion of Fund Performance (Unaudited) (Continued)
Mercer Non-US Core Equity Fund
MFS underperformed the Fund’s benchmark by 2%. Weak security selection within both materials and industrials detracted from relative results. Being underweight to the energy sector further weakened relative performance. Conversely, an overweight exposure to consumer staples and strong security selection within the information technology sector strengthened relative results. The strategy’s relative currency exposure, resulting primarily from differences between the strategy’s and its benchmark’s exposures to holdings of securities denominated in foreign currencies also contributed to relative performance.
LSV outperformed the Fund’s benchmark by 1.2%. LSV’s tilt towards lower market capitalization stocks was a headwind; higher than benchmark exposure to value stocks was a tailwind. Stronger security selection in industrials and financials were largest positive contributors. Security selection in health care and consumer discretionary were main detractors.
Parametric utilizes exchange-traded futures replicating the Fund’s benchmark, aiming to provide broad, passive, equity market exposure to the Fund’s liquidity sleeve, and seeking to create positive returns on assets that would have otherwise been earning cash or cash equivalent returns. Performance differences versus the benchmark are largely a result of cash flow effects related to daily subscription/redemption activity and through financing costs of futures relative to interest earned on cash.
Risk Considerations
The Fund invests in foreign and emerging market securities which involves certain risks such as currency volatility, political and social instability and reduced market liquidity. Emerging markets may be more volatile and less liquid than more developed markets and therefore may involve greater risks. Investments made in small and mid-capitalization companies may be more volatile and less liquid due to limited resources or product lines and more sensitive to economic factors. The Fund may invest in derivative instruments such as exchange-listed equity futures contracts, which may cause the Fund to experience greater volatility and less liquidity. Derivatives may be more sensitive to changes in market conditions and may amplify the risk of loss for the Fund.
Management's Discussion of Fund Performance (Unaudited) (Continued)
Mercer Non-US Core Equity Fund
March 31, 2023
Comparison of Change in Value of a hypothetical $10,000 Investment in Mercer Non-US Core Equity Class Y-3 Shares vs. the MSCI EAFE Index® for the period 4/1/13 through 3/31/23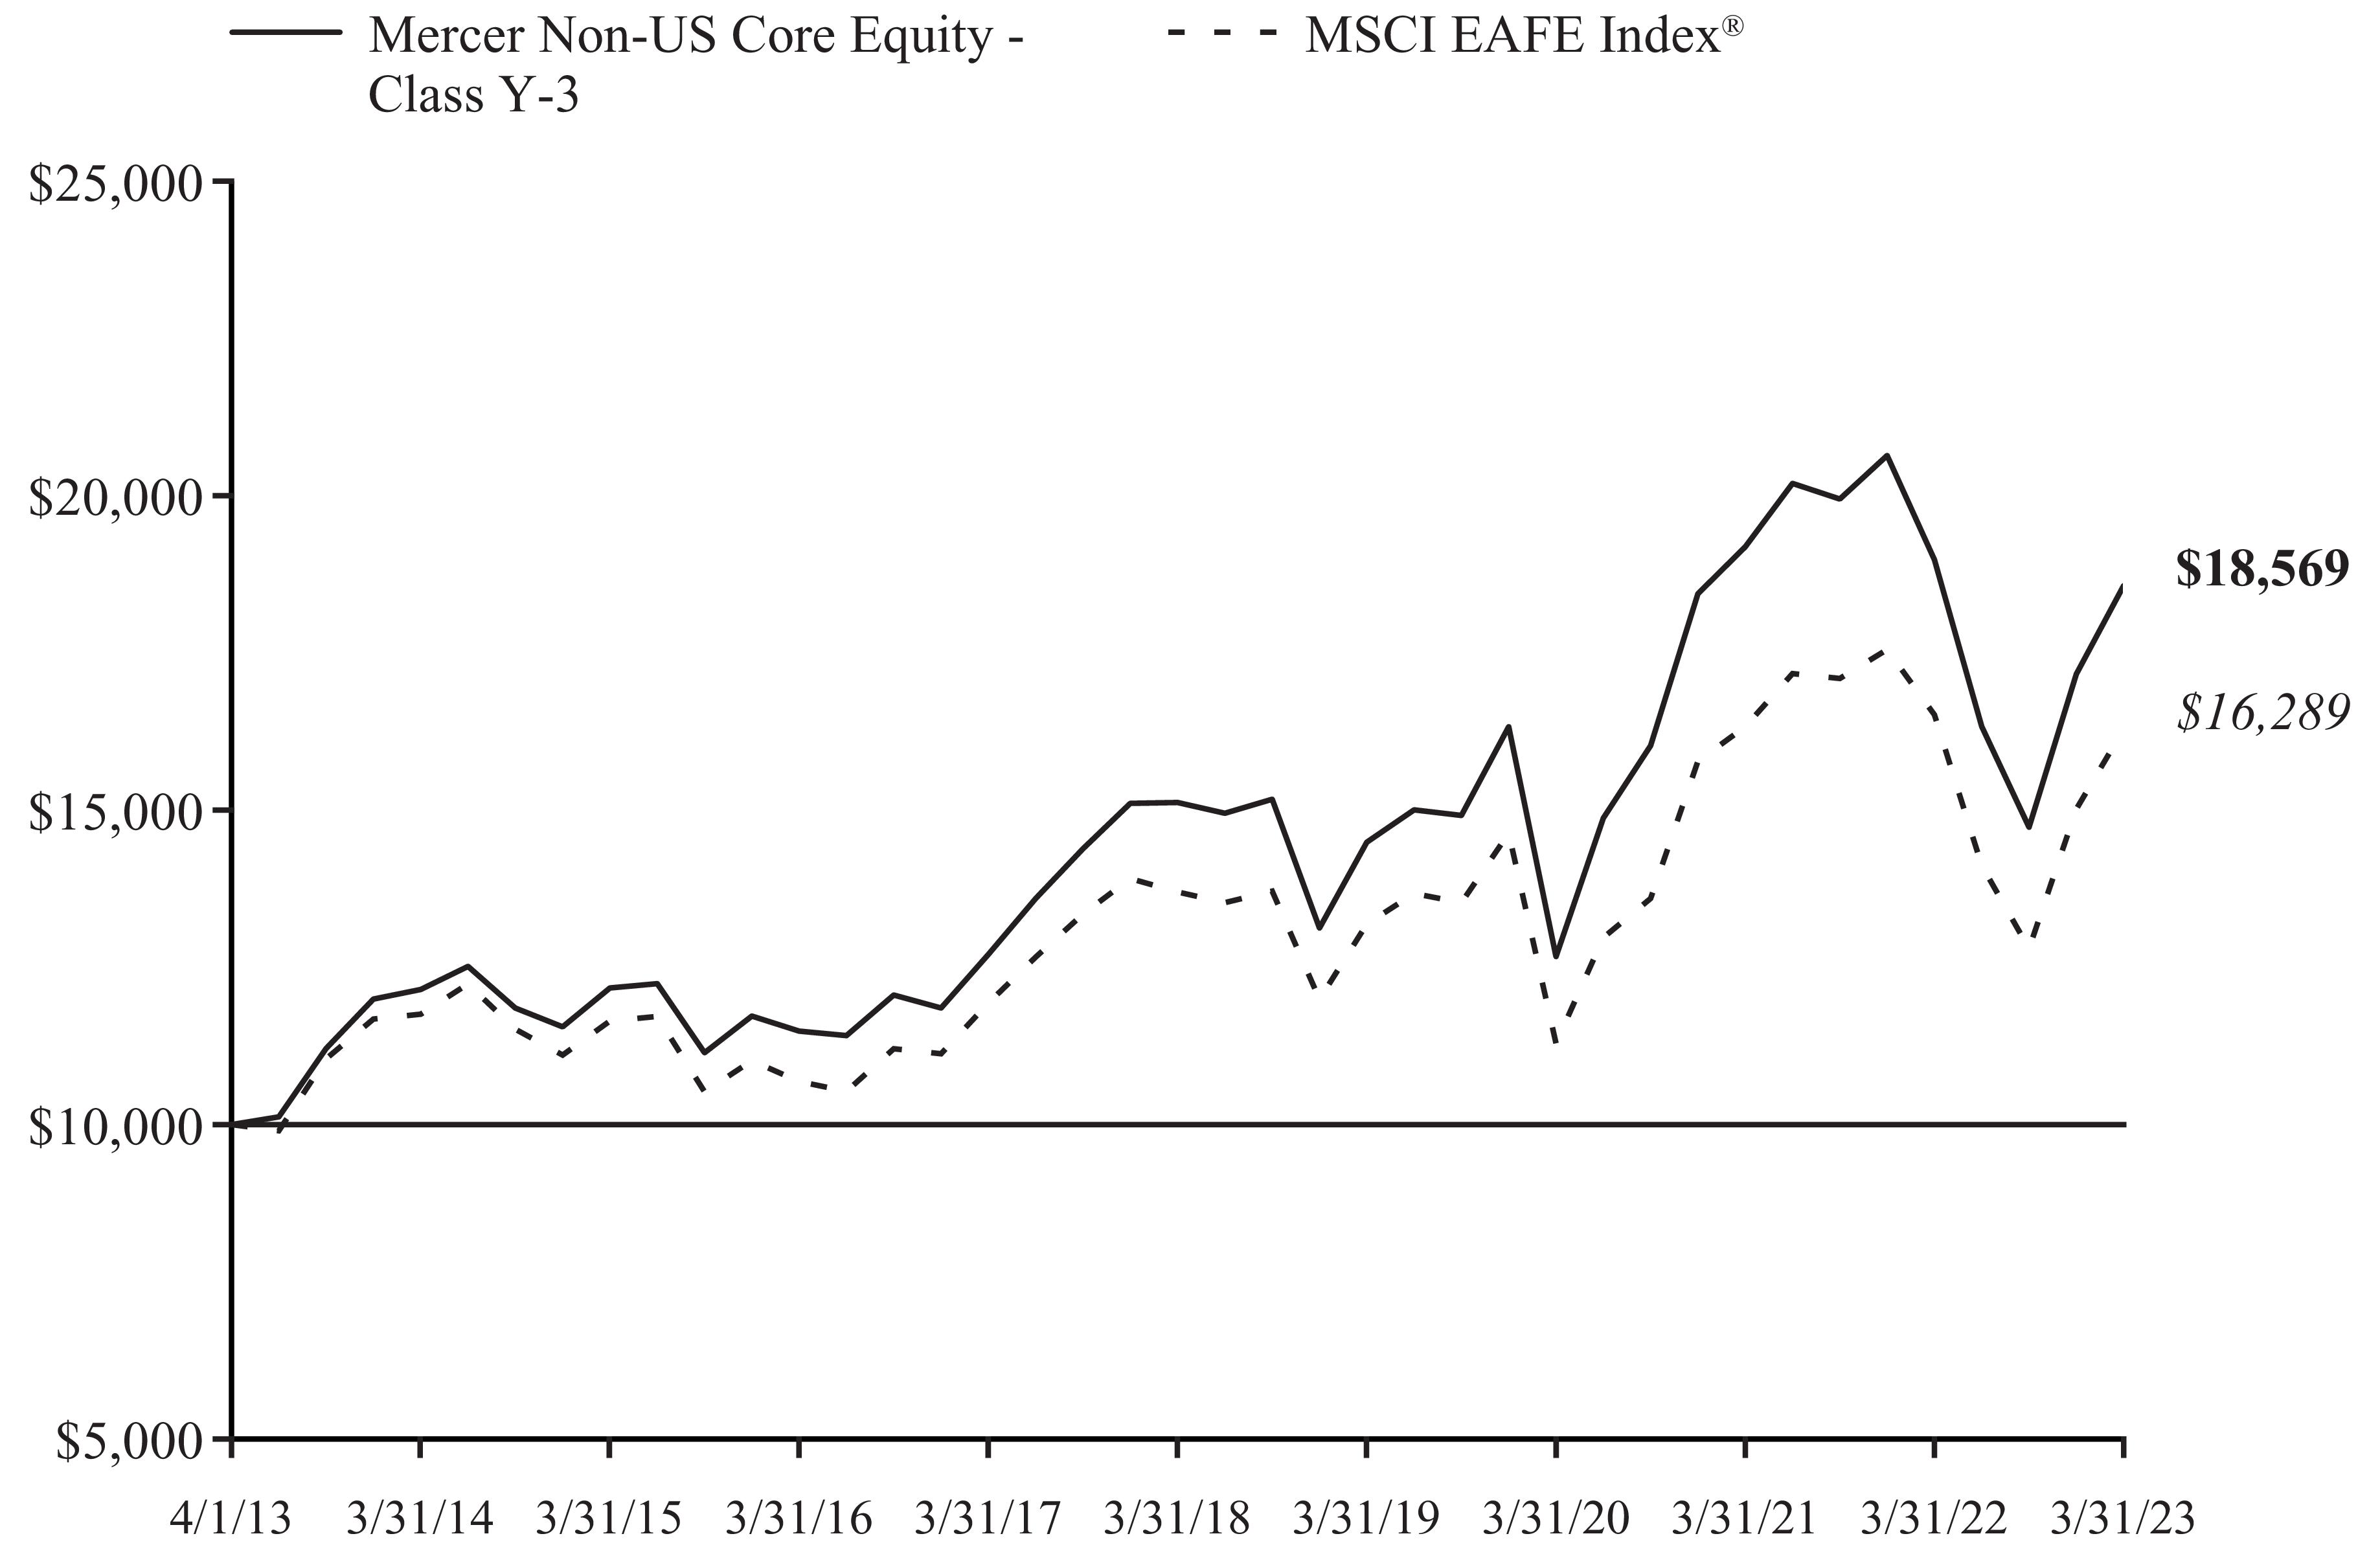
AVERAGE ANNUAL TOTAL RETURNS | | | | |
| | | | |
Mercer Non-US Core Equity Fund – Class Y-3 – 8/18/2006 | | | | |
Mercer Non-US Core Equity Fund – Class I – 7/22/2021 | | | | |
| | | | |
1 MSCI EAFE® Index measures the performance of equity securities in developed markets outside of North America, including Europe, Australasia, and the Far East.
2 Russell 1000® Index measures the performance of the large cap segment of the U.S. equity universe.
3 MSCI Emerging Markets® Index measures the performance of equity securities in global emerging markets.
The Fund's total annual gross operating expense for Class Y-3 is 0.76% and for Class I is 1.01% Please see the Fund's most recent Prospectus.
The performance of other classes, when launched, will vary from the performance of the class shown based on the difference in fees and expenses paid by shareholders investing in different share classes. The Fund may charge a 2% redemption fee on shares owned less than 30 days.
The table and graph assume reinvestment of dividends and capital gains, but do not reflect a deduction of taxes an investor might pay on fund distributions or upon redemption of fund shares. Performance shown reflects a fee waiver and/or expense reimbursement. Without this waiver/reimbursement, returns would have been lower.
Management's Discussion of Fund Performance (Unaudited) (Continued)
Mercer Non-US Core Equity Fund
March 31, 2023
The data quoted represents past performance and does not guarantee future results. Current performance of the Fund may be lower or higher than the performance quoted. Please call 1-888-887-0619 or visit the Trust’ s website at https://www.mercer.us/what-we-do/wealth-and-investments/delegated-solutions-us.html for the Fund’s most recent month-end performance. Investment return and principal value will fluctuate so that an investor’s shares, when redeemed, may be worth more or less than when purchased.
Fund holdings and sector allocations are subject to change and are not a recommendation to buy or sell any security. Please see the Schedule of Investments for a complete list of Fund holdings.
Management's Discussion of Fund Performance (Unaudited) (Continued)
Mercer Core Fixed Income Fund
Investment Objective and Benchmark
The investment objective of the Fund is to provide total return, consisting of both current income and capital appreciation. The benchmark for the Fund is the Bloomberg U.S. Aggregate Bond™ Index1.
Investment Strategy
The Fund invests principally in investment grade fixed income securities, including government securities, corporate bonds and securitized bonds, such as mortgage and asset-backed securities. The Fund may also invest in non-investment grade bonds (sometimes called high yield or junk bonds), non-U.S. dollar denominated bonds, and bonds issued by issuers located in emerging capital markets. The Fund may also invest in certain derivative instruments, such as options, futures, and swap agreements. The Fund may engage in transactions in derivatives for a variety of purposes, including changing the investment characteristics of its portfolio, enhancing total returns or as a substitute for taking a position in an underlying asset.
Performance
For the fiscal year ended March 31, 2023, the Fund’s Y-3 share class performance was -5.20% compared to its benchmark return of -4.78%. For the fiscal year ended March 31, 2023, the Fund’s I share class performance was -5.42% compared to its benchmark return of -4.78%. Performance for the Fund is reported net of fees and operating expenses while the benchmark returns do not include expenses of any kind as indexes are unmanaged.
The Sub-Advisers
As of March 31, 2023, the Fund employed three sub-advisers: Manulife Investment Management (US) LLC (Manulife), Income Research & Management (IR&M) and PGIM Fixed Income, a business unit of PGIM, Inc. (Prudential).
Manulife manages its allocated portion of the Fund by seeking to produce superior results through bottom-up active management of sector allocation and issue selection, combined with yield curve positioning. Duration is also managed in line with the benchmark. The investment team capitalizes on their disciplined investment process and adds value by following a relative value approach to sector allocation and issue selection while engaging in intensive fundamental credit research and identifying points on the yield curve with the greatest return potential.
IR&M manages its allocated portion of the Fund based on the belief that careful security selection and higher portfolio income provide superior returns over the long term. Portfolios are constructed using a disciplined, bottom-up investment approach to select attractive securities from the U.S. fixed income universe. A bottom-up approach focuses on the analysis of individual issuers and de-emphasizes the significance of macroeconomic and market cycles with the assumption individual companies can do well even in an industry that is not performing, at least on a relative basis.
Prudential manages its allocated portion of the Fund by seeking to maximize excess return opportunities from sustainable alpha2 sources, such as sector allocation and bottom-up security selection. This process is coupled with a diligent daily portfolio risk evaluation and monitoring process. Research-based security selection is a major source of added value and incorporates both fundamental analysis, by measuring a security’s intrinsic value to determine if undervalued or overvalued, as well as proprietary models, by using software and other means of analysis to gain a competitive edge, which identify relative value and detailed technical review of issuers across both benchmark and non-benchmark sectors, with an emphasis on credit-oriented sectors.
Market Commentary and Fund Performance
For the 12-month period ended March 31, 2023, U.S. fixed income market returns, as measured by the Bloomberg U.S. Aggregate Bond™ Index, were -4.78%, mainly driven by a move structurally higher in U.S. interest rates.
Management's Discussion of Fund Performance (Unaudited) (Continued)
Mercer Core Fixed Income Fund
Rising consumer prices as measured by the Consumer Price Index (CPI)3 fed in to U.S. monetary policy action, creating the need for one of the most aggressive hiking cycles on record. U.S. inflation as measured by CPI hit a four-decade high of 9.1% in June 2022, with large increases in the cost of gasoline, shelter and food. During the fiscal year, the Fed hiked +50 basis points (bps)4 in May 2022, +75bps in June, July, September, and November 2022, +50bps in December 2022, +25bps in February 2023, and +25bps in March 2023 with the federal funds rate ending the period at 4.75-5%. As indication that Fed action is gaining traction, U.S. inflation eased in March 2023 with CPI rising 5.0% from a year earlier, marking the ninth straight monthly deceleration since the peak in June 2022.
Investment grade credit spreads ended the period at 138bps (1.38%), widening from their March 2022 level of 116bps (1.16%). Front end rates steadily climbed higher for the period, while the 10 and 30-year Treasuries peaked around November 2022 and have since come down. The 3-month T-Bill ended the period at a rate of 4.85%, 433bps higher than its March 2022 level of 0.52%. The 10-year Treasury ended the period at a rate of 3.48%, 116bps higher than its March 2022 level of 2.32%. Perhaps the biggest market signal thus far of tighter conditions and worrying growth outlook is the shape of the curve. The spread between 10-year yields and 3-month yields was +180bps in March 2022, and now sits at an extreme inversion...-137bps.
The Fund’s return was negative in relative terms as it underperformed the Bloomberg U.S. Aggregate Bond™ Index for the fiscal year ended March 31, 2023. The majority of underperformance was due to the Fund’s strategic overweight to spread sectors during a period when credit-sensitive sectors generally lagged, with the majority of underperformance occurring during the early stages of the period.
The respective performance results of each Sub-adviser was in line with expectations based on risk posture. Manulife has the largest share of the risk-allocation within the Fund. Manulife’s bias towards corporate credit and allocation to “higher quality” high yield bonds led the manager to underperform for the fiscal year.
Prudential had a marginally less aggressive allocation to spread sectors relative to Manulife, but was still overweight relative to the Fund’s benchmark. The majority of underperformance relative to the benchmark was due to the portfolio’s long spread risk position in the first quarter of the fiscal year as volatility in risk markets increased and spreads widened in response to the Russia-Ukraine conflict and growing concerns over stickier inflation.
IR&M outperformed the Fund’s benchmark over the trailing 12-month period. The bias towards higher quality corporate bonds as well as their tactical rotation of spread exposure led them to outperform.
Risk Considerations
The Fund is subject to the risks that the underlying bonds in its portfolio are subject to, including credit, prepayment, call and interest rate risk. As interest rates rise, the value of bond prices will decline. The Fund may invest in foreign securities, which may expose the Fund to currency and exchange rate fluctuations, derivatives (such as futures, options, or swaps) and high yield bonds (also known as “junk” bonds). These investments may cause the Fund to experience greater volatility and less liquidity. Derivatives may be more sensitive to changes in market conditions and may amplify the risk of loss for the Fund. The Fund may also experience high portfolio turnover, which may result in higher transaction costs and capital gains.
Management's Discussion of Fund Performance (Unaudited) (Continued)
Mercer Core Fixed Income Fund
March 31, 2023
Comparison of Change in Value of a hypothetical $10,000 Investment in Mercer Core Fixed Income Class Y-3 Shares vs. the Bloomberg U.S. Aggregate Bond™ Index for the period 4/1/13 through 3/31/23
AVERAGE ANNUAL TOTAL RETURNS | | | | |
| | | | |
Mercer Core Fixed Income Fund – Class Y-3 – 8/15/2005 | | | | |
Mercer Core Fixed Income Fund – Class I – 12/27/2021 | | | | |
Bloomberg U.S. Aggregate Bond™ Index | | | | |
1 Bloomberg U.S. Aggregate Bond(TM) Index is an index that measures the performance of securities from the Bloomberg U.S. Government/ Corporate Bond Index, Mortgage-Backed Securities Index, Asset-Backed Securities Index, and Commercial Mortgage-Backed Securities Index. The Bloomberg U.S. Aggregate BondTM Index is a broad representation of the investment-grade fixed-income market in the United States and includes U.S. government and corporate debt securities, mortgage- and asset-backed securities, and international U.S. dollar-denominated bonds. All securities contained in the Bloomberg U.S. Aggregate BondTM Index have a minimum term to maturity of one year.
2 Alpha measures the amount that the investment has returned in comparison to the market index or other broad benchmark that it is compared against.
3 Consumer price Index (CPI) is a measure of the average change over time in the prices paid by urban consumers for a market basket of consumer goods and services. Indexes are available for the U.S. and various geographic areas. Average price data for select utility, automotive fuel, and food items are also available.
4 Basis Points: A common unit of measure for interest rates and other percentages in finance. One basis point is equal to 1/100th of 1%, or 0.01%, or 0.0001, and is used to denote the percentage change in a financial instrument.
Management's Discussion of Fund Performance (Unaudited) (Continued)
Mercer Core Fixed Income Fund
March 31, 2023
The Fund's total annual gross operating expense for Class Y-3 is 0.39% and for Class I is 0.64% Please see the Fund's most recent Prospectus.
The performance of other classes, when launched, will vary from the performance of the class shown based on the difference in fees and expenses paid by shareholders investing in different share classes. The Fund may charge a 2% redemption fee on shares owned less than 30 days.
The table and graph assume reinvestment of dividends and capital gains, but do not reflect a deduction of taxes an investor might pay on fund distributions or upon redemption of fund shares. Performance shown reflects a fee waiver and/or expense reimbursement. Without this waiver/reimbursement, returns would have been lower.
The data quoted represents past performance and does not guarantee future results. Current performance of the Fund may be lower or higher than the performance quoted. Please call 1-888-887-0619 or visit the Trust’ s website at https://www.mercer.us/what-we-do/wealth-and-investments/delegated-solutions-us.html for the Fund’s most recent month-end performance. Investment return and principal value will fluctuate so that an investor’s shares, when redeemed, may be worth more or less than when purchased.
Fund holdings and sector allocations are subject to change and are not a recommendation to buy or sell any security. Please see the Schedule of Investments for a complete list of Fund holdings.
Management's Discussion of Fund Performance (Unaudited) (Continued)
Mercer Opportunistic Fixed Income Fund
Investment Objective and Benchmark
The investment objective of the Fund is to provide long-term total return, which includes capital appreciation and income. The Fund’s primary benchmark is the ICE Bank of America Merrill Lynch Global High Yield 2% Constrained Index Unhedged1. The Fund’s secondary benchmark2 is a blended benchmark consisting of 35% Bloomberg Global Aggregate Corporate Total Return Index Hedged3, 17.5% Bloomberg Global High Yield Index4, 10.5% JP Morgan CEMBI Diversified Index5, 7% S&P/LSTA Leveraged Loan Index6, and 30% JP Morgan GBI-EM Diversified Index7.
Investment Strategy
The Fund invests principally in fixed income securities of U.S. and non-U.S. issuers, including those in emerging and frontier markets. The Fund invests in various strategic and tactical global bond market opportunities without limitations in geography, issuer type, quality and currency denomination. The Fund may invest in derivatives such as futures (including among others, interest rate futures), swaps (currency, interest rate, credit default and total return), forwards, options, and credit-linked notes. The Fund may engage in transactions in derivatives for a variety of purposes, including hedging, risk management, efficient portfolio management, enhance total returns, or as a substitute for taking position in the underlying asset.
Performance
For the fiscal year ended March 31, 2023, the Fund’s Y-3 share class performance was -2.96% compared to its primary benchmark return of -2.47% and secondary benchmark return of -2.54%, Performance of the Fund is reported net of fees and operating expenses while the benchmark returns do not include expenses of any kind as indexes are unmanaged.
The Sub-Advisers
As of March 31, 2023, the Fund employed four sub-advisers, Western Asset Management Company, LLC and Western Asset Management Company Limited (as sub-subadviser) (together referred to as WAMCO), Loomis, Sayles & Company, L.P. (Loomis), BlackRock International Limited (BlackRock), and Colchester Global Investors Limited (Colchester).
In managing its allocated portion of the Fund’s portfolio, Loomis invests in debt of issuers globally. Loomis produces country specific credit cycle views and forward looking financial market regimes as inputs to portfolio construction. Security selection is then carried out by the investment team with input from a team of credit analysts who maintain a comprehensive database of internal ratings. The investment team will also engage in active duration positioning although security and sector selections are identified as main drivers of performance.
In managing its allocated portion of the Fund’s portfolio, WAMCO employs an active, team-managed investment approach around a long-term, value-oriented investment philosophy. The portfolio seeks to harvest income opportunities by constructing a diversified portfolio that includes investment-grade and high yield corporate credit, non-dollar debt, bank loans, Credit Loan Obligations (CLO), emerging markets sovereign and corporate debt, and a variety of structured credit (Residential Mortgage Backed Security (RMBS), Commercial Mortgage Backed Securities (CMBS), Asset Backed Securities (ABS)). Western seeks to add value through sector rotation, issue selection, duration management, yield curve positioning, and tail risk hedging.
In managing its allocated portion of the Fund’s portfolio, Colchester invests in sovereign debt issued by emerging market borrowers denominated in each issuer’s local currency. Colchester’s portfolio construction process is based on a quantitative model, using mathematical and statistical methods, that promotes allocation to countries and currencies identified based on attractive real yields for bonds and attractive valuations for currencies, complemented by sound financial characteristics and Environmental, Social and Governance (ESG) considerations.
In managing its allocated portion of the Fund’s portfolio, BlackRock invests in emerging market debt securities denominated in local currency. BlackRock’s portfolio construction process implements a top down philosophy focused on identifying economic or market themes that impact asset prices. The themes inform the team’s market views and portfolios are positioned to benefit from directional moves in the market.
Management's Discussion of Fund Performance (Unaudited) (Continued)
Mercer Opportunistic Fixed Income Fund
Market Commentary and Fund Performance
For the 12-month period ended March 31, 2023, U.S. fixed income market returns, as measured by the Bloomberg U.S. Aggregate Bond™ Index8, were -4.78%, driven mainly by a structural move higher in US interest rates. Rising consumer prices as measured by the Consumer Price Index (CPI) fed in to US monetary policy action, creating the need for one of the most aggressive hiking cycles on record. U.S. inflation as measured by CPI hit a four-decade high of 9.1% in June 2022, with large increases in the cost of gasoline, shelter and food. During the fiscal year, the Fed hiked +50 basis points (bps) in May 2022, +75bps in June, July, September, and November 2022, +50bps in December 2022, +25bps in February 2023, and +25bps in March 2023 with the federal funds rate ending the period at 4.75-5%. As indication that Fed action is gaining traction, U.S. inflation eased to 5.0% as of March 2023, marking the ninth straight monthly deceleration since the peak in June 2022.
Investment grade credit spreads ended the period at 138bps (1.38%), widening from their March 2022 level of 116bps (1.16%). Front end rates steadily climbed higher for the period, while the 10 and 30-year Treasuries peaked around November 2022 and have since come down. The 3-month T-Bill ended the period at a rate of 4.85%, 433bps higher than its March 2022 level of 0.52%. The 10-year Treasury ended the period at a rate of 3.48%, 116bps higher than its March 2022 level of 2.32%. Perhaps the biggest market signal thus far of tighter conditions and worrying growth outlook is the shape of the curve. The spread between 10 year yields and 2 year yields was +180bps in March 2022, and now sits at an extreme inversion…-137bps.
JPM GBI-EM Global Diversified Index of local currency Emerging Market government returned -0.72% in U.S. dollar terms over the 12-month period ending March 31, 2023. The asset class was challenged by heightened inflation and recession concerns, global central banks’ policy tightening and geopolitical uncertainty over the ongoing Russia-Ukraine war.
During the period, WAMCO and Loomis underperformed their component of the Fund’s secondary benchmark with both managers struggling to meaningfully capitalize on opportunistic sector exposures. WAMCO had mixed performance with duration and yield curve positioning detracting while sector allocation in investment grade corporates, high yield corporates, and emerging market debt offset some of the underperformance. Loomis’ underperformance was driven by sector allocation in investment grade corporates and emerging market debt.
During the period, Blackrock and Colchester outperformed their component of the Fund’s secondary benchmark, the JPM GBI-EM Diversified Index government bond benchmark. BlackRock’s macro regime shifting investment approach helped to take advantage of broad market correlation shifts and idiosyncratic opportunities. Colchester benefited from continuing their fundamental real-yield valuation approach. The repricing higher of out-of-benchmark positions in Russian government bonds in the first half of the fiscal year added to performance while both managers sought too tactically trim exposure.
Risk Considerations
The Fund invests in non-investment grade and emerging market fixed income securities that involve certain risks such as higher volatility, currency fluctuation, political and social instability and reduced market liquidity. The Fund is subject to the risks that the underlying bonds in its portfolio are subject to, including credit, prepayment, call and interest rate risk. As interest rates rise, the value of bond prices will decline. The Fund may invest in foreign securities, which may expose the Fund to currency and exchange rate fluctuations, derivatives (such as futures, options and swaps) and high yield bonds (also known as “junk” bonds). These investments may cause the Fund to experience greater volatility and less liquidity. Derivatives may be more sensitive to changes in market conditions and may amplify the risk of loss for the Fund.
Management's Discussion of Fund Performance (Unaudited) (Continued)
Mercer Opportunistic Fixed Income Fund
March 31, 2023
Comparison of Change in Value of a hypothetical $10,000 Investment in Mercer Opportunistic Fixed Income Class Y-3 Shares vs. the ICE Bank of America Merrill Lynch Global High Yield 2% Constrained Index Unhedged, the Fund’s Secondary Index for the period 8/21/13 through 3/31/23
AVERAGE ANNUAL TOTAL RETURNS | | | | |
| | | | |
Mercer Opportunistic Fixed Income Fund – Class Y-3 – 8/21/2013 | | | | |
ICE Bank of America Merrill Lynch Global High Yield 2% Constrained Index Unhedged | | | | |
| | | | |
1 ICE Bank of America Merrill Lynch Global High Yield 2.0% Constrained Index Unhedged contains all securities in The Bank of America Merrill Lynch Global High Yield Index but caps issuer exposure at 2%. Index constituents are capitalization-weighted, based on their current amount outstanding, provided the total allocation to an individual issuer does not exceed 2%. Issuers that exceed the limit are reduced to 2% and the face value of each of their bonds is adjusted on a pro-rata basis.
2 The Fund’s secondary benchmark is a blended benchmark consisting of 35% Bloomberg Global Aggregate Corporate Total Return Index Hedged, 17.5% Bloomberg Global High Yield Index, 10.5% JP Morgan CEMBI Diversified Index, 7% S&P/LSTA Leveraged Loan Index, and 30% JP Morgan GBI-EM Diversified Index.
3 Bloomberg Global Aggregate Corporate Total Return Index Hedged is a measure of global investment grade, fixed-rate corporate debt. This multi-currency benchmark includes bonds from developed and emerging markets issuers within the industrial, utility and financial sectors.
Management's Discussion of Fund Performance (Unaudited) (Continued)
Mercer Opportunistic Fixed Income Fund
March 31, 2023
4 Bloomberg Global High Yield Index is a multi-currency flagship measure of the global high yield debt market. The index represents the union of the US High Yield, the Pan-European High Yield, and Emerging Markets (EM) Hard Currency High Yield Indices.
5 J.P. Morgan CEMBI Broad Diversified Core Index (CEMBI CORE) tracks the performance of US dollar denominated bonds issued by emerging market corporate entities. The CEMBI CORE follows the methodology of the flagship J.P. Morgan CEMBI Broad Diversified (CEMBIB Dividend) closely, while offering a more liquid and higher credit quality subset.
6 S&P (Standard and Poor’s/LSTA (Loan Syndications and Trading Association) Leveraged Loan 100 Index is designed to measure the performance of the U.S. leveraged loan market based upon market weightings, spreads, and interest payments.
7 J.P. Morgan Government Bond Index-Emerging Markets (GBI-EM) Indices are comprehensive Emerging Markets debt benchmarks that track local currency bonds issued by Emerging Market governments. The GBI-EM Indices are comprised of only those countries from the GBI universe that meet our criteria for an Emerging Market, resulting in 18 countries from four regions. For the Diversified version of the Index, the methodology uses only a limited portion of a country’s current face amount outstanding for calculating weights. The adjusted face amount used in calculating a country’s weight is based on the respective country’s relative size in the index and the average size of all countries.
8 Bloomberg U.S. Aggregate Bond(TM) Index is an index that measures the performance of securities from the Bloomberg U.S. Government/Corporate Bond Index, Mortgage-Backed Securities Index, Asset-Backed Securities Index, and Commercial Mortgage-Backed Securities Index. The Bloomberg U.S. Aggregate Bond Index is a broad representation of the investment-grade fixed-income market in the United States and includes U.S. government and corporate debt securities, mortgage- and asset-backed securities, and international U.S. dollar-denominated bonds. All securities contained in the Bloomberg U.S. Aggregate Bond Index have a minimum term to maturity of one year.
The Fund's total annual gross operating expense for Class Y-3 is 0.90%. Please see the Fund's most recent Prospectus.
The performance of other classes, when launched, will vary from the performance of the class shown based on the difference in fees and expenses paid by shareholders investing in different share classes. The Fund may charge a 2% redemption fee on shares owned less than 30 days.
The table and graph assume reinvestment of dividends and capital gains, but do not reflect a deduction of taxes an investor might pay on fund distributions or upon redemption of fund shares. Performance shown reflects a fee waiver and/or expense reimbursement. Without this waiver/reimbursement, returns would have been lower.
The data quoted represents past performance and does not guarantee future results. Current performance of the Fund may be lower or higher than the performance quoted. Please call 1-888-887-0619 or visit the Trust’ s website at https://www.mercer.us/what-we-do/wealth-and-investments/delegated-solutions-us.html for the Fund’s most recent month-end performance. Investment return and principal value will fluctuate so that an investor’s shares, when redeemed, may be worth more or less than when purchased.
Fund holdings and sector allocations are subject to change and are not a recommendation to buy or sell any security. Please see the Schedule of Investments for a complete list of Fund holdings.
Management's Discussion of Fund Performance (Unaudited) (Continued)
Mercer Emerging Markets Equity Fund
Investment Objective and Benchmark
The investment objective of the Fund is to provide long-term total return, which includes capital appreciation and income. The benchmark for the Fund is the MSCI Emerging Markets® Index1.
Investment Strategy
The Fund invests principally in equity securities of large, medium and small capitalization companies, located in emerging markets, other investments that are tied economically to emerging markets, as well as in American, European and Global Depositary receipts. Stock index futures and various types of swaps may be used to implement the country selection component of the Fund’s investment strategy. Currency forwards may be used to make stock-selection and country allocation decisions independently of the underlying currency.
Performance
For the fiscal year ended March 31, 2023, the Fund’s Y-3 share class performance was -9.51% compared to its benchmark return of -10.70%. Performance for the Fund is reported net of fees and operating expenses while the benchmark returns do not include expenses of any kind as indexes are unmanaged.
The Sub-Advisers
As of March 31, 2023, the Fund employed six sub-advisers and one sub-subadviser: Barrow, Hanley, Mewhinney &Strauss, LLC (Barrow Hanley), William Blair Investment Management LLC (William Blair), Origin Asset Management LLP (Origin), Bennbridge U.S. LLC which utilizes certain personnel of Skerryvore Asset Management LLP (together referred to as Bennbridge/Skerryvore), Schroder Investment Management North America Inc. and Schroder Investment Management North America Limited (as sub-subadviser) (together, referred to as Schroders) and Parametric Portfolio Associates LLC (Parametric). Barrow Hanley replaced Grantham, Mayo, Van Otterloo & Co. LLC as sub-adviser to the Fund on December 22, 2022.
Barrow Hanley manages a fundamentally driven, value oriented strategy. Their process focuses on identifying companies trading in the bottom 1/3rd of the Emerging Markets universe from a valuation standpoint, and conducts in-depth fundamental analysis to identify strong companies positioned well for a business turnaround.
William Blair has a quality growth philosophy and process focused on finding those companies that can achieve a higher growth rate for a longer period of time than the market expects. William Blair looks for companies with experienced and motivated management teams, unique business models and attractive financial characteristics.
Origin’s portfolio is managed using a quantitative process focused on companies with high and improving cash flow return on investment, selling at discounted valuations of expected future growth versus historical growth and that also display fundamental and price momentum. The portfolio is managed to have a higher tracking error and high active share.
Bennbridge/Skerryvore manages a high quality, concentrated equity strategy with an emphasis on preservation of capital, and sustainability of the businesses in which they invest. The strategy is low turnover, and concentrated, roughly 30-60 names.
Schroders manages a dedicated China allocation for the Fund to exploit alpha opportunities within the country. The strategy is a bottom up, fundamental strategy, relying on a team of experienced analysts and PMs to source and evaluate potential investments. The strategy is based on the belief that investing in quality businesses, with sustainable competitive advantages, and focus on shareholder value, trading at reasonable valuations will outperform over time.
Parametric utilizes exchange-traded futures to generate market exposure corresponding to the Fund’s benchmark.
Management's Discussion of Fund Performance (Unaudited) (Continued)
Mercer Emerging Markets Equity Fund
Market Commentary and Fund Performance
2023 fiscal year was a turbulent period for capital markets. Multi-decade high inflation rates, fueled by very accommodative fiscal and monetary policy of the prior two years, supply chain disruptions and commodity price spikes, further escalated by Russia’s invasion of Ukraine, were front and center for policy makers and investors. In response to the stubbornly high inflation prints, global central banks initiated one of the most aggressive hiking cycles in decades. With rates rising sharply, the precipitous decline in equity markets which began in January of 2022 continued until October when the global markets bottomed and investor sentiment reached its trough. In contrast to the first half of the fiscal year, the second half experienced strong rallies as investors began to bet on moderating inflation, slowing interest rate hikes by central banks and a possibility of soft landing.
For the year ended March 31, 2023, U.S. equities, measured using the Russell 1000® Index2, declined by 8.39%. Compared to the U.S., international developed markets performed better, with the MSCI EAFE® Index3 decreasing by 1.39% over the period. The MSCI Emerging Markets® Index (the Fund’s benchmark) declined by 10.70% for the 12-month period ended March 31, 2023. In local currency terms MSCI EAFE® Index and MSCI Emerging Markets® Index posted higher returns, as the US dollar appreciated compared to other major currencies.
Fears of looming recession and weak Chinese demand from the prolonged zero COVID policy put pressure on the commodity prices in the second half of the year, resulting in poor returns from commodity producing countries such as Saudi Arabia, South Africa, Canada, Australia and Brazil. These countries were among the best performers in the prior fiscal year. India and Taiwan which performed well during prior fiscal year also had weak returns. On the other hand, European equities with attractive valuations from prior year’s sharp underperformance showed best returns. Chinese equities, which were the worst performing major market in the 2022 fiscal year, rallied sharply in May-June and again between October and January, as the country officially emerged from COVID lockdown. However, on both occasions, these rallies were followed by sharp reversals, leaving Chinese equities with 6.3% decline for the year.
Triggered by rising interest rates and expensive valuations, the sharp underperformance of companies with high earnings growth and higher profitability characteristics continued in the first three quarters of the fiscal year. In the fourth quarter, this trend reversed, making the underperformance of the growth versus value equities less pronounced. The persistent outperformance of energy stocks also reversed in the fourth quarter of the fiscal year. Smaller market capitalization companies were under significantly more pressure compared to mega and larger market capitalization companies. Momentum was the worst performing equity style across all major markets. For the year value was the best performing investment style followed by lower volatility.
For the 12-month period ending March 31, 2023, the Mercer Emerging Markets Equity Fund outperformed the MSCI Emerging Markets® Index by approximately 1.2%. The Fund’s outperformance was driven in large part by strong performance from two sub-advisers, Schroders and Bennbridge/Skerryvore
Barrow Hanley, the newly appointed manager in the fund outperformed by 0.4% since their inception in December of 2022. Contributing to performance was a general underweight to India, which pulled back during the period on concerns around Adani Enterprises, a large influential Indian industrial conglomerate. Strong stock selection in Brazil and Taiwan along with a general underweight to commodity producers in the Middle East were also additive to performance.
The William Blair Emerging Markets strategy underperformed the MSCI Emerging Markets® Index by 4.0% over the trailing 12-month period ending March 31st. Blair’s focus on high growth, high quality and long-duration assets was significantly out of style as markets favored low-valuation stocks. Nearly all of the trailing 12-month relative underperformance can be traced to the fourth quarter where markets saw a sharp country and industry rotation in the wake of China’s decisive U-turn on its zero-COVID policy and rapid relaxation of travel restrictions. Against this backdrop, stock selection was generally challenged in China, India, and South Korea, particularly within technology, consumer, and financial names. On the positive side Mexico and Indonesia were bright spots on a relative basis.
Management's Discussion of Fund Performance (Unaudited) (Continued)
Mercer Emerging Markets Equity Fund
Bennbridge/Skerryvore outperformed by 10.2% for the year ending 3/31/23. The portfolio’s focus on higher quality businesses with strong alignment with minority shareholders was beneficial during a choppy period for emerging markets. The team added value across sectors and countries, with notable winners in Brazil (WEG SA), India (Cipla) and consumer names (China Resource Beer, Heineken, Unilever, and Fomento Economico).
Origin underperformed by 3.8% during the period as momentum shifted throughout the year, creating headwinds to a core tenant of their investment philosophy. Chinese and Taiwanese holdings in particular were a large detractor, especially within financials and industrials. On the positive side, holdings in Brazil and a general underweight to the Middle East contributed.
The portion of the Fund allocated to Schroders, which pursues investment opportunities in China, outperformed for the year. Strong security selection across a number of industries added value, with holdings in industrials and in companies tied to the electric vehicle (EV) supply chain and renewable energy (solar) space being notable outperformers. Strong relative performance in real estate (selection and underweight), along with an allocation to gold miners, also added value.
Parametric utilizes exchange-traded futures to replicate the Fund’s benchmark, aiming to provide broad, passive, equity market exposure to the Fund’s liquidity sleeve and seeking to create positive returns on assets that would have otherwise been earning cash or cash equivalent returns. Performance differences versus the benchmark are largely a result of cash flow effects related to daily subscription/redemption activity and through financing costs
of futures relative to interest earned on cash.
Risk Considerations
The Fund invests in emerging market securities which involves certain risks such as currency volatility, political and social instability and reduced market liquidity. Emerging markets may be more volatile and less liquid than more developed markets and therefore may involve greater risks. Investments made in small and mid-capitalization companies may be more volatile and less liquid due to limited resources or product lines and more sensitive to economic factors. The Fund may invest in derivatives (such as futures, forwards, options, or swaps), which may cause the Fund to experience greater volatility and less liquidity. Derivatives may be more sensitive to changes in market conditions and may amplify the risk of loss for the Fund.
Management's Discussion of Fund Performance (Unaudited) (Continued)
Mercer Emerging Markets Equity Fund
March 31, 2023
Comparison of Change in Value of a hypothetical $10,000 Investment in Mercer Emerging Markets Equity Class Y-3 Shares vs. the MSCI Emerging Markets Index® for the period 4/1/13 through 3/31/23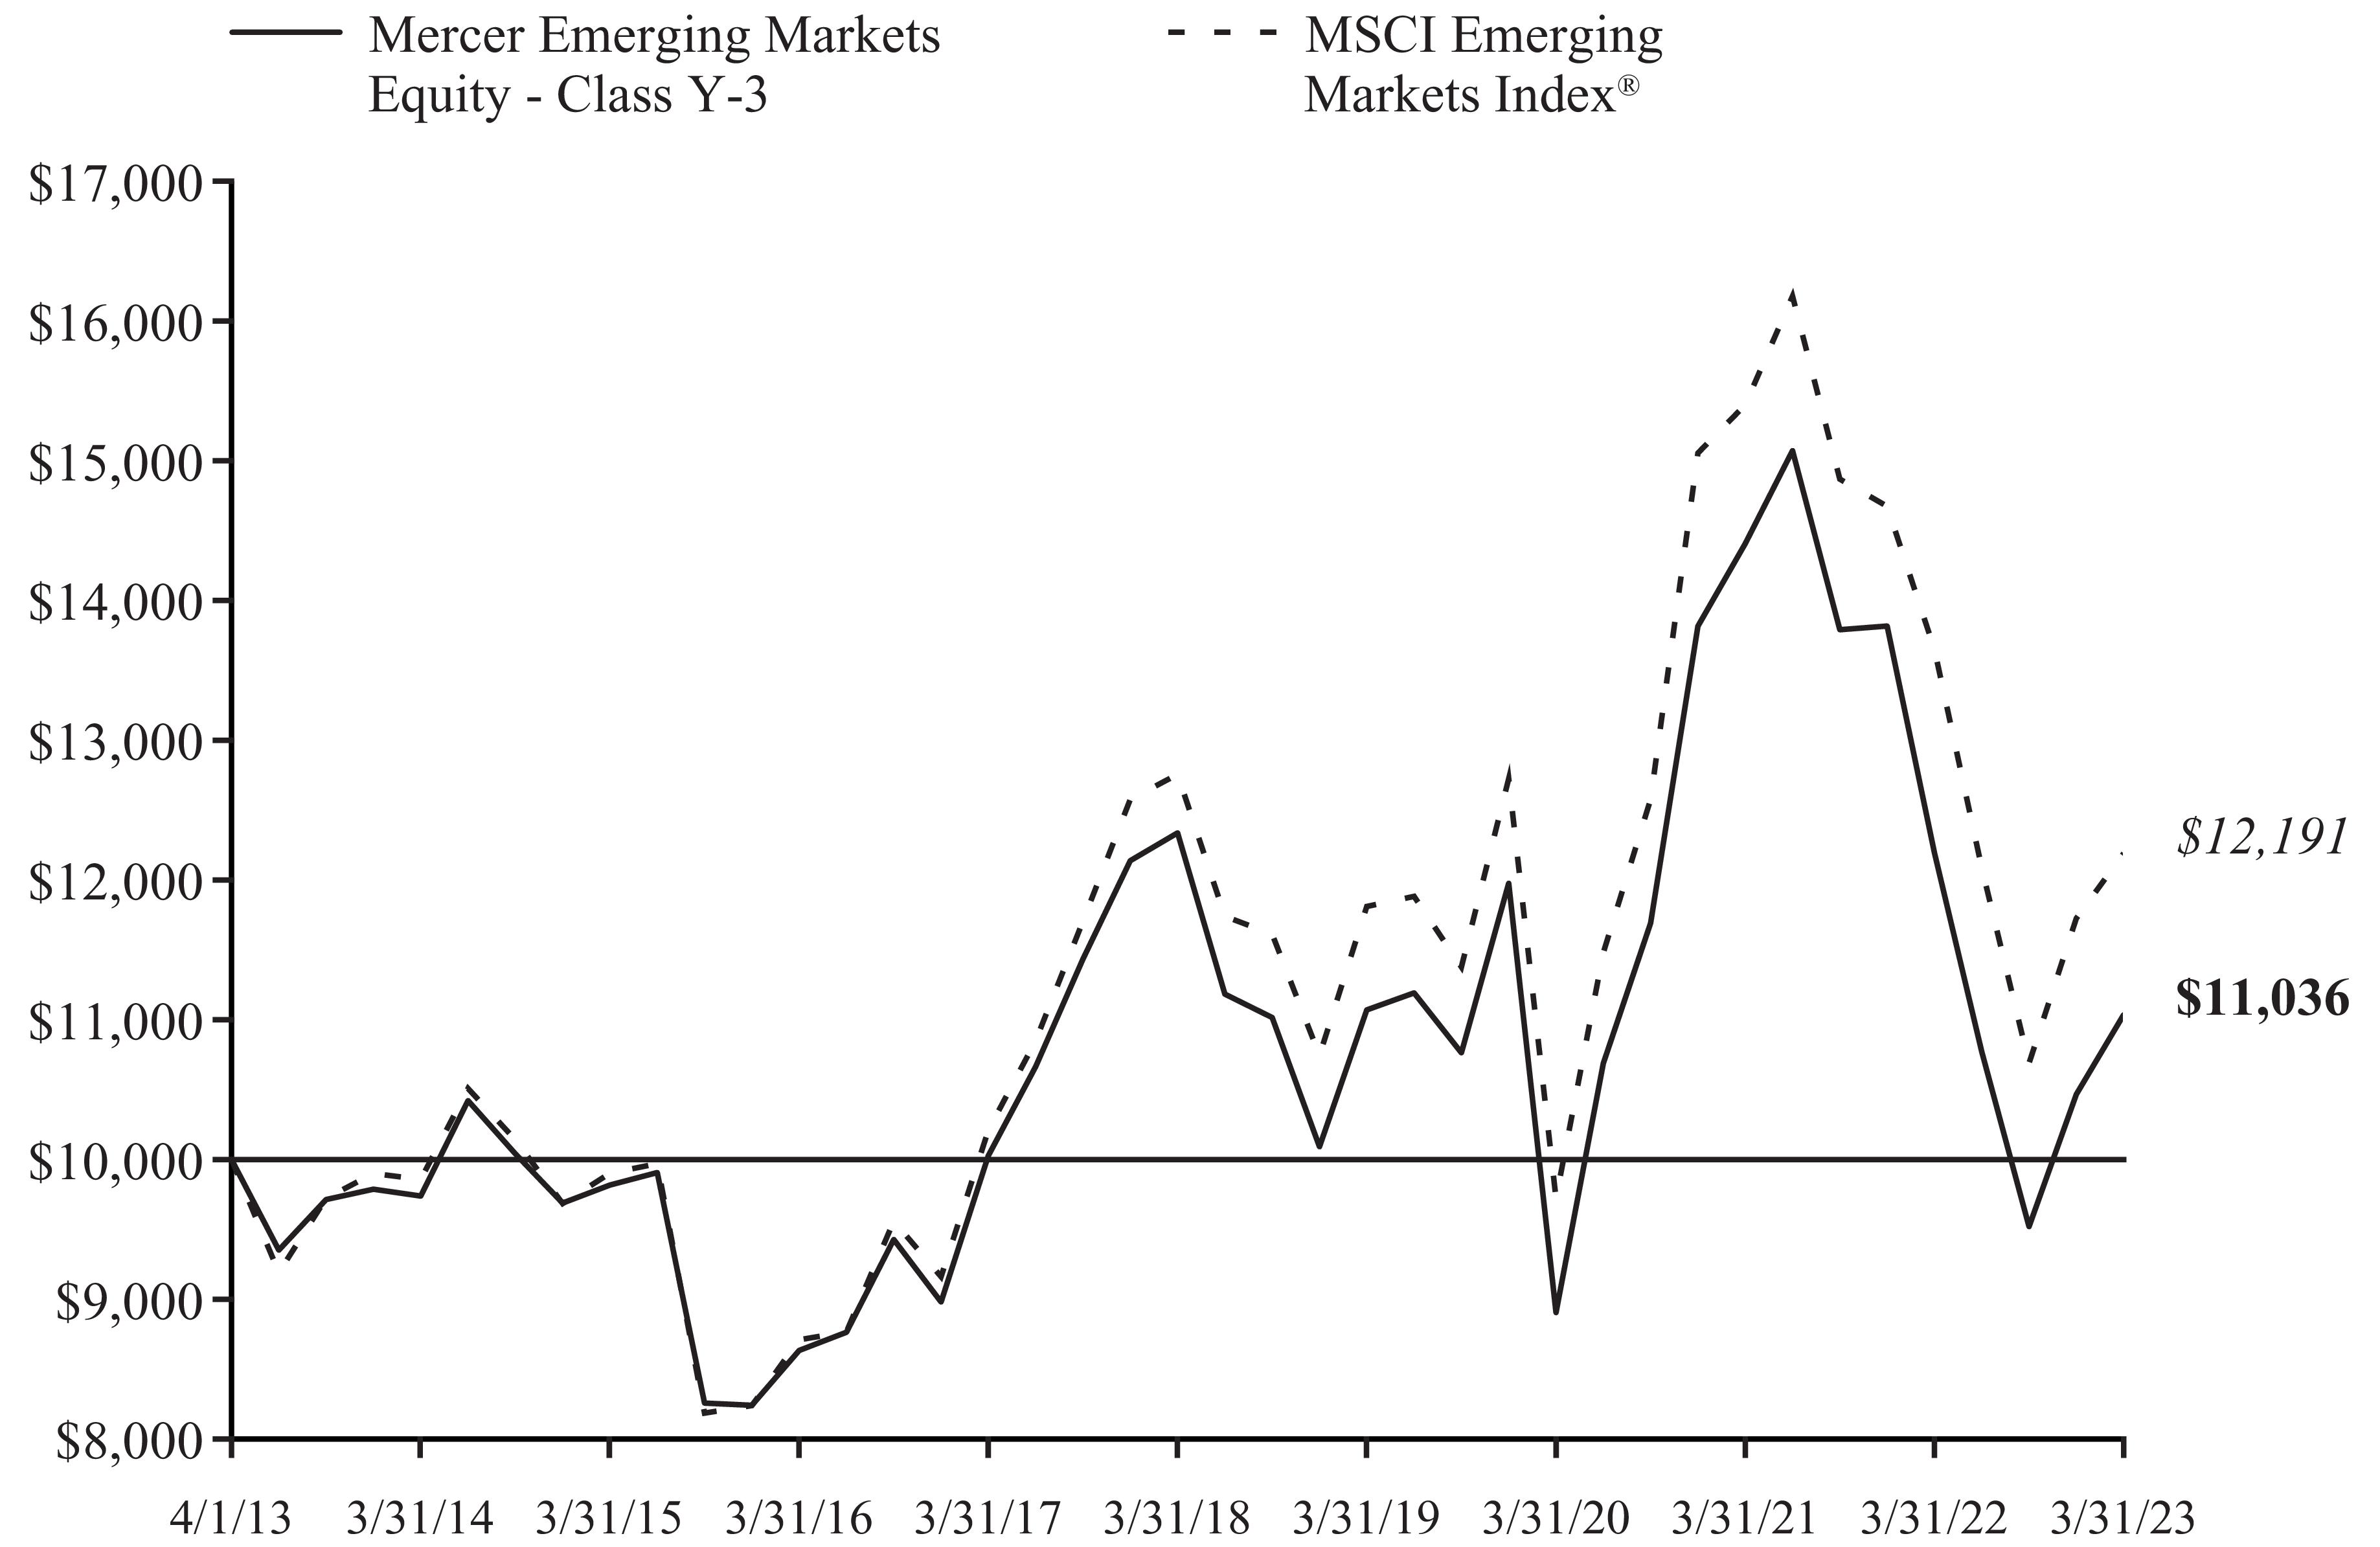
AVERAGE ANNUAL TOTAL RETURNS | | | | |
| | | | |
Mercer Emerging Markets Equity Fund – Class Y-3 – 5/1/2012 | | | | |
MSCI Emerging Markets Index® | | | | |
1 MSCI Emerging Markets® Index measures the performance of equity securities in global emerging markets.
2 Russell 1000® Index measures the performance of the large cap segment of the U.S. equity universe.
3 MSCI EAFE® Index measures the performance of equity securities in developed markets outside of North America, including Europe, Australasia, and the Far East.
The Fund's total annual gross operating expense for Class Y-3 is 0.87%. Please see the Fund's most recent Prospectus.
The performance of other classes, when launched, will vary from the performance of the class shown based on the difference in fees and expenses paid by shareholders investing in different share classes. The Fund may charge a 2% redemption fee on shares owned less than 30 days.
The table and graph assume reinvestment of dividends and capital gains, but do not reflect a deduction of taxes an investor might pay on fund distributions or upon redemption of fund shares. Performance shown reflects a fee waiver and/or expense reimbursement. Without this waiver/reimbursement, returns would have been lower.
Management's Discussion of Fund Performance (Unaudited) (Continued)
Mercer Emerging Markets Equity Fund
March 31, 2023
The data quoted represents past performance and does not guarantee future results. Current performance of the Fund may be lower or higher than the performance quoted. Please call 1-888-887-0619 or visit the Trust’ s website at https://www.mercer.us/what-we-do/wealth-and-investments/delegated-solutions-us.html for the Fund’s most recent month-end performance. Investment return and principal value will fluctuate so that an investor’s shares, when redeemed, may be worth more or less than when purchased.
Fund holdings and sector allocations are subject to change and are not a recommendation to buy or sell any security. Please see the Schedule of Investments for a complete list of Fund holdings.
Management's Discussion of Fund Performance (Unaudited) (Continued)
Mercer Global Low Volatility Equity Fund
Investment Objective and Benchmark
The investment objective of the Fund is to provide long-term total return, which includes capital appreciation and income. The benchmark for the Fund is the MSCI World® Index1.
Investment Strategy
The Fund invests principally in equity securities of U.S. and foreign issuers, of large, medium and small capitalization companies. Stock index futures and various types of swaps may be used to implement the equity security selection component of the Fund’s investment strategy. Currency forwards may be used to make stock- selection and country allocation decisions independently of the underlying currency.
Performance
For the fiscal year ended March 31, 2023, the Fund’s Y-3 share class performance was -4.53% compared to its benchmark return of -7.02%. Performance for the Fund is reported net of fees and operating expenses while the benchmark returns do not include expenses of any kind as indexes are unmanaged.
The Sub-Advisers
As of March 31, 2023, the Fund employed five sub-advisers, Acadian Asset Management LLC (Acadian), Martingale Asset Management, L.P. (Martingale), Ninety One North America, Inc (Ninety One), Veritas Asset Management LLP (Veritas) and Parametric Portfolio Associates LLC (Parametric).
Acadian is the Fund’s dedicated minimum variance manager for developed economies outside the U.S. The strategy applies a quantitative investment process, using mathematical and statistical methods, to the EAFE + Canada universe of securities and emphasizes low-volatility securities, low correlations between securities and a high degree of portfolio diversification with the goal of constructing a portfolio with lower levels of absolute volatility compared to the benchmark. Additionally, the strategy applies Acadian’s stock forecast and top-down alpha model, which measures the active return on an investment for performance as compared with a suitable market index, in order to enhance the returns. The portfolio does not employ tight constraints vs the benchmark across capitalization and/or sectors, enhancing its ability to more effectively manage portfolio volatility.
Martingale is the Fund’s dedicated minimum variance manager for the U.S. region. The strategy uses a systematic process of investing in stocks with lower stock price volatility and attractive fundamental factors such as value, quality and momentum. The portfolio aims to deliver equity-like market returns with lower volatility and less downside risk than the market index. Martingale’s core process includes reconstituting the Russell 1000 Index®2 into a proprietary “Stability Index”, which Martingale believes more accurately reflects stock risk properties based on longer-term company fundamentals as well as high frequency short-term risk signals. The strategy is managed against the derived Stability Index, which measures the degree of change (or stability) of the market, by applying stock and industry alpha forecasting models and optimizing to minimize the portfolio’s absolute volatility.
Ninety One manages a concentrated portfolio of exceptionally high-quality companies, operating in stable or growing industries with high barriers to entry and low capital intensity. The team uses bottom up fundamental analysis to select businesses that display the best combination of high quality, sustainable growth and compelling valuations. Fundamental analysis focuses on companies with “franchise” characteristics and competitive advantages. Their evidence suggests that dominant intangible assets (low capital intensity) such as high customer loyalty, brands, patents, licenses, copyrights, and distribution networks are difficult to create and more difficult for competitors to duplicate. Enduring franchises consistently generate high returns on capital and compound shareholder wealth. Companies will have high return on capital investment, high gross margins, low leverage, low capital intensity, above average growth and stable cash flow generation.
Veritas uses an unconstrained, fundamentally driven, rigorous research process with a long-term horizon. Veritas believes that companies with sustainable competitive advantage and benefiting from long-term drivers of growth, purchased at attractive valuations, will deliver performance in excess of the benchmark over time. The strategy may hold up to 20% cash.
Management's Discussion of Fund Performance (Unaudited) (Continued)
Mercer Global Low Volatility Equity Fund
Parametric utilizes exchange-traded futures to generate market exposure corresponding to the Fund’s benchmark.
Market Commentary and Fund Performance
2023 fiscal year was a turbulent period for capital markets. Multi-decade high inflation rates, fueled by very accommodative fiscal and monetary policy of the prior two years, supply chain disruptions and commodity price spikes, further escalated by Russia’s invasion of Ukraine, were front and center for policy makers and investors. In response to the stubbornly high inflation prints, global central banks initiated one of the most aggressive hiking cycles in decades. With rates rising sharply, the precipitous decline in equity markets which began in January of 2022 continued until October when the global markets bottomed and investor sentiment reached its trough. In contrast to the first half of the fiscal year, the second half experienced strong rallies as investors began to bet on moderating inflation, slowing interest rate hikes by central banks and a possibility of soft landing.
For the year ended March 31, 2023, U.S. equities, measured using the Russell 1000® Index2, declined by 8.39%. Compared to the U.S., international developed markets performed better, with the MSCI EAFE® Index3 decreasing by 1.39% over the period. The MSCI Emerging Markets® Index4 declined by 10.70% for the 12-month period ended March 31, 2023. In local currency terms MSCI EAFE® Index and MSCI Emerging Markets® Index posted higher returns, as the US dollar appreciated compared to other major currencies.
Fears of looming recession and weak Chinese demand from the prolonged zero COVID policy put pressure on the commodity prices in the second half of the year, resulting in poor returns from commodity producing countries such as Saudi Arabia, South Africa, Canada, Australia and Brazil. These countries were among the best performers in the prior fiscal year. India and Taiwan which performed well during prior fiscal year also had weak returns. On the other hand, European equities with attractive valuations from prior year’s sharp underperformance showed best returns. Chinese equities, which were the worst performing major market in the 2022 fiscal year, rallied sharply in May-June and again between October and January, as the country officially emerged from COVID lockdown. However, on both occasions, these rallies were followed by sharp reversals, leaving Chinese equities with 6.3% decline for the year.
Triggered by rising interest rates and expensive valuations, the sharp underperformance of companies with high earnings growth and higher profitability characteristics continued in the first three quarters of the fiscal year. In the fourth quarter, this trend reversed, making the underperformance of the growth versus value equities less pronounced. The persistent outperformance of energy stocks also reversed in the fourth quarter of the fiscal year. Smaller market capitalization companies were under significantly more pressure compared to mega and larger market capitalization companies. Momentum was the worst performing equity style across all major markets. For the year, value was the best performing investment style followed by lower volatility.
For the fiscal year, in developed equity markets, energy 9.1%, consumer staples 1.3% and industrials -0.4% were the best performing sectors while real estate -19.2%, communication services -16.6% and consumer discretionary -12.8% were the worst performers.
The Fund’s outperformance for the fiscal year was largely driven by its lower beta5 profile.
Martingale outperformed its benchmark, Russell 1000® Index, by 4.2%. In the US, lower volatility style of investing was in favor, which was a major tailwind for Martingale. Additionally, the strategy benefited from moderate tilt to value. Both asset allocation and security selection contributed positively. Underweight to consumer discretionary, overweight to defensive sectors such as consumer staples and health care as well as security selection in financials, industrials, information technology and consumer discretionary were the largest positive contributors.
Acadian lagged its benchmark, MSCI World ex USA IndexSM 6 by 0.4%. Outside of the US, low risk equities did not perform strongly. Acadian’s underperformance was driven by its lower risk positioning which was reflected in being overweight to defensive consumer staples companies and underweight to riskier consumer discretionary stocks. While security selection in health care and industrials detracted, security selection in telecommunications and materials contributed positively.
Management's Discussion of Fund Performance (Unaudited) (Continued)
Mercer Global Low Volatility Equity Fund
Ninety One outperformed its benchmark, MSCI World Index®, by 2.8%. Underweight to consumer discretionary and overweight to consumer staples as well as security selection in information technology and communication services were main positive contributors. Security selection in health care (positions in Roche), and underweight to energy were the largest detractors.
Veritas outperformed its benchmark, MSCI World Index®, by 1.9%. Security selection in industrials (largely from travel related and aerospace stocks such as Safran, Airbus, Aena) and information technology (payment systems companies such as Mastercard and Fiserv), as well as positions in cash were main positive contributors. Positions in health care, especially those that had benefited from COVID revenues, and communication services, including Alphabet with concerns that digital advertising revenues may fall, were main detractors.
Parametric utilizes exchange-traded futures to replicate the Fund’s benchmark with beta of 0.8, aiming to provide broad, passive, equity market exposure to the Fund’s liquidity sleeve and seeking to create positive returns on assets that would have otherwise been earning cash or cash equivalent returns. Performance differences versus the benchmark are largely a result of cash flow effects related to daily subscription/redemption activity and through financing costs of futures relative to interest earned on cash.
Risk Considerations
The Fund invests in foreign and emerging market securities which involves certain risks such as currency volatility, political and social instability and reduced market liquidity. Emerging markets may be more volatile and less liquid than more developed markets and therefore may involve greater risks. Investments made in small and mid-capitalization companies may be more volatile and less liquid due to limited resources or product lines and more sensitive to economic factors. The Fund may invest in derivatives (such as futures, forwards, options, or swaps), which may cause the Fund to experience greater volatility and less liquidity. Derivatives may be more sensitive to changes in market conditions and may amplify the risk of loss for the Fund.
Management's Discussion of Fund Performance (Unaudited) (Continued)
Mercer Global Low Volatility Equity Fund
March 31, 2023
Comparison of Change in Value of a hypothetical $10,000 Investment in Mercer Global Low Volatility Equity Class Y-3 Shares vs. the MSCI World Index® for the period 4/1/13 through 3/31/23
AVERAGE ANNUAL TOTAL RETURNS | | | | |
| | | | |
Mercer Global Low Volatility Equity Fund – Class Y-3 – 11/6/2012 | | | | |
| | | | |
1 MSCI World Index® measures the performance of stocks in 23 developed markets in North America, Europe, and the Asia/Pacific region.
2 Russell 1000® Index measures the performance of the large cap segment of the U.S. equity universe.
3 MSCI EAFE® Index measures the performance of equity securities in developed markets outside of North America, including Europe, Australasia, and the Far East.
4 MSCI Emerging Markets® Index measures the performance of equity securities in global emerging markets.
5 Beta is a measure of how an individual asset moves (on average) when the overall stock market increases or decreases.
6 MSCI World ex USA IndexSM captures large and mid-cap representation across 22 of 23 Developed Markets (DM) countries excluding the United States.
The Fund's total annual gross operating expense for Class Y-3 is 0.80%. Please see the Fund's most recent Prospectus.
Management's Discussion of Fund Performance (Unaudited) (Continued)
Mercer Global Low Volatility Equity Fund
March 31, 2023
The performance of other classes, when launched, will vary from the performance of the class shown based on the difference in fees and expenses paid by shareholders investing in different share classes. The Fund may charge a 2% redemption fee on shares owned less than 30 days.
The table and graph assume reinvestment of dividends and capital gains, but do not reflect a deduction of taxes an investor might pay on fund distributions or upon redemption of fund shares. Performance shown reflects a fee waiver and/or expense reimbursement. Without this waiver/reimbursement, returns would have been lower.
The data quoted represents past performance and does not guarantee future results. Current performance of the Fund may be lower or higher than the performance quoted. Please call 1-888-887-0619 or visit the Trust’ s website at https://www.mercer.us/what-we-do/wealth-and-investments/delegated-solutions-us.html for the Fund’s most recent month-end performance. Investment return and principal value will fluctuate so that an investor’s shares, when redeemed, may be worth more or less than when purchased.
Fund holdings and sector allocations are subject to change and are not a recommendation to buy or sell any security. Please see the Schedule of Investments for a complete list of Fund holdings.
Mercer US Large Cap Equity Fund
Schedule of Investments
(showing percentage of net assets)
March 31, 2023
| | | |
| | |
| | |
| | CF Industries Holdings, Inc. | |
| | | |
| | | |
| | | |
| | | |
| | | |
| | | |
| | | |
| | | |
| | | |
| | |
| | | |
| | | |
| | | |
| | | |
| | | |
| | Charter Communications, Inc. Class A* | |
| | | |
| | | |
| | Liberty Global Plc Class C* | |
| | | |
| | Meta Platforms, Inc. Class A* | |
| | | |
| | | |
| | | |
| | Trade Desk, Inc. (The) Class A* | |
| | | |
| | Verizon Communications, Inc. | |
| | | |
| | | |
| | Consumer, Cyclical — 10.7% |
| | | |
| | | |
| | | |
| | | |
| | | |
| | Chipotle Mexican Grill, Inc. Class A* | |
| | | |
| | | |
| | | |
| | | |
| | | |
| | | |
| | Dr. Ing. h.c. F. Porsche AG, ADR* | |
| | | |
| | | |
34
See accompanying Notes to the Financial Statements.
Mercer US Large Cap Equity Fund
Schedule of Investments (Continued)
(showing percentage of net assets)
March 31, 2023
| | | |
| | Consumer, Cyclical — continued |
| | | |
| | Lithia Motors, Inc. Class A | |
| | | |
| | | |
| | Lululemon Athletica, Inc.* | |
| | LVMH Moet Hennessy Louis Vuitton SE, ADR | |
| | Magna International, Inc.(a) | |
| | Marriott International, Inc. Class A | |
| | MGM Resorts International | |
| | | |
| | | |
| | | |
| | | |
| | | |
| | | |
| | | |
| | | |
| | | |
| | Consumer, Non-cyclical — 21.8% |
| | | |
| | | |
| | | |
| | | |
| | | |
| | Archer-Daniels-Midland Co. | |
| | | |
| | Baxter International, Inc. | |
| | | |
| | | |
| | | |
| | | |
| | | |
| | | |
| | | |
| | | |
| | | |
| | Estee Lauder Cos., Inc. (The) Class A | |
| | | |
| | | |
| | | |
| | | |
| | | |
| | | |
| | | |
| | Horizon Therapeutics Plc* | |
| | | |
| | | |
| | Intuitive Surgical, Inc.* | |
See accompanying Notes to the Financial Statements.
35
Mercer US Large Cap Equity Fund
Schedule of Investments (Continued)
(showing percentage of net assets)
March 31, 2023
| | | |
| | Consumer, Non-cyclical — continued |
| | Jazz Pharmaceuticals Plc* | |
| | | |
| | | |
| | | |
| | | |
| | | |
| | | |
| | | |
| | | |
| | | |
| | | |
| | | |
| | | |
| | | |
| | | |
| | Thermo Fisher Scientific, Inc. | |
| | Tyson Foods, Inc. Class A | |
| | | |
| | Vertex Pharmaceuticals, Inc.* | |
| | | |
| | | |
| | | |
| | |
| | | |
| | | |
| | Canadian Natural Resources, Ltd. | |
| | | |
| | | |
| | | |
| | | |
| | | |
| | | |
| | | |
| | | |
| | | |
| | |
| | | |
| | | |
| | American International Group, Inc. | |
| | American Tower Corp. REIT | |
| | | |
| | Bank of New York Mellon Corp. (The) | |
| | Berkshire Hathaway, Inc. Class B* | |
| | Boston Properties, Inc. REIT | |
| | Capital One Financial Corp. | |
| | Charles Schwab Corp. (The) | |
| | | |
36
See accompanying Notes to the Financial Statements.
Mercer US Large Cap Equity Fund
Schedule of Investments (Continued)
(showing percentage of net assets)
March 31, 2023
| | | |
| | |
| | Discover Financial Services | |
| | | |
| | | |
| | Hartford Financial Services Group, Inc. (The) | |
| | Host Hotels & Resorts, Inc. REIT | |
| | Howard Hughes Corp. (The)* | |
| | | |
| | | |
| | | |
| | | |
| | | |
| | New York Community Bancorp, Inc. | |
| | Principal Financial Group, Inc. | |
| | Prudential Financial, Inc. | |
| | Regency Centers Corp. REIT | |
| | Reinsurance Group of America, Inc. | |
| | Simon Property Group, Inc. REIT | |
| | | |
| | | |
| | | |
| | | |
| | | |
| | | |
| | | |
| | | |
| | |
| | | |
| | Builders FirstSource, Inc.* | |
| | CH Robinson Worldwide, Inc. | |
| | | |
| | | |
| | | |
| | Honeywell International, Inc. | |
| | L3Harris Technologies, Inc. | |
| | | |
| | | |
| | | |
| | Raytheon Technologies Corp. | |
| | Stanley Black & Decker, Inc. | |
| | | |
| | | |
| | |
| | | |
| | | |
| | Advanced Micro Devices, Inc.* | |
| | | |
| | ASML Holding NV, ADR NYRS | |
See accompanying Notes to the Financial Statements.
37
Mercer US Large Cap Equity Fund
Schedule of Investments (Continued)
(showing percentage of net assets)
March 31, 2023
| | | |
| | |
| | Atlassian Corp., Ltd. Class A* | |
| | | |
| | | |
| | Cadence Design Systems, Inc.* | |
| | Cognizant Technology Solutions Corp. Class A | |
| | Crowdstrike Holdings, Inc. Class A* | |
| | Dell Technologies, Inc. Class C | |
| | | |
| | | |
| | Fidelity National Information Services, Inc. | |
| | | |
| | | |
| | | |
| | | |
| | | |
| | | |
| | | |
| | Seagate Technology Holdings Plc(a) | |
| | | |
| | | |
| | | |
| | Zebra Technologies Corp. Class A* | |
| | | |
| | |
| | | |
| | | |
| | | |
| | | |
| | | |
| | TOTAL COMMON STOCKS (COST $978,835,420) | |
| | | |
| | Short-Term Investment — 0.4% |
| | Mutual Fund - Securities Lending Collateral — 0.4% |
| | State Street Institutional U.S. Government Money Market Fund, Premier Class, | |
| | TOTAL SHORT-TERM INVESTMENT (COST $4,247,905) | |
| | TOTAL INVESTMENTS — 97.1%
(Cost $983,083,325) | |
| | Other Assets and Liabilities (net) — 2.9% | |
| | | |
38
See accompanying Notes to the Financial Statements.
Mercer US Large Cap Equity Fund
Schedule of Investments (Continued)
March 31, 2023
| Notes to Schedule of Investments: |
| Non-income producing security. |
| All or a portion of this security is out on loan. |
| The rate disclosed is the 7-day net yield as of March 31, 2023. |
| Represents an investment of securities lending cash collateral. |
Futures Contracts
| | | | Market Value/
Unrealized
Appreciation
(Depreciation) |
| | | | |
| | | | |
| | | | |
| | | | |
|
| | American Depository Receipt |
| | |
| | Real Estate Investment Trust |
See accompanying Notes to the Financial Statements.
39
Mercer US Large Cap Equity Fund
Schedule of Investments (Continued)
March 31, 2023
Asset Class Summary (Unaudited) | |
| |
| |
| |
Other Assets and Liabilities (net) | |
| |
40
See accompanying Notes to the Financial Statements.
Mercer US Small/Mid Cap Equity Fund
Schedule of Investments
(showing percentage of net assets)
March 31, 2023
| | | |
| | |
| | |
| | | |
| | Axalta Coating Systems, Ltd.* | |
| | | |
| | | |
| | | |
| | | |
| | | |
| | | |
| | | |
| | | |
| | | |
| | | |
| | Reliance Steel & Aluminum Co. | |
| | | |
| | | |
| | | |
| | | |
| | | |
| | |
| | AMC Networks, Inc. Class A* | |
| | | |
| | | |
| | | |
| | | |
| | | |
| | Liberty Latin America, Ltd. Class A* | |
| | Liberty Latin America, Ltd. Class C* | |
| | Lumen Technologies, Inc.* | |
| | Nexstar Media Group, Inc. Class A | |
| | | |
| | | |
| | Preformed Line Products Co. | |
| | | |
| | | |
| | | |
| | Consumer, Cyclical — 17.1% |
| | | |
| | | |
| | Allison Transmission Holdings, Inc. | |
| | American Axle & Manufacturing Holdings, Inc.* | |
| | BJ's Wholesale Club Holdings, Inc.* | |
| | | |
| | | |
| | | |
| | | |
| | | |
See accompanying Notes to the Financial Statements.
41
Mercer US Small/Mid Cap Equity Fund
Schedule of Investments (Continued)
(showing percentage of net assets)
March 31, 2023
| | | |
| | Consumer, Cyclical — continued |
| | | |
| | Casey's General Stores, Inc. | |
| | | |
| | Cheesecake Factory, Inc. (The)(a) | |
| | | |
| | | |
| | Core & Main, Inc. Class A* | |
| | | |
| | | |
| | Dick's Sporting Goods, Inc. | |
| | | |
| | | |
| | | |
| | | |
| | | |
| | | |
| | | |
| | Goodyear Tire & Rubber Co. (The)* | |
| | | |
| | | |
| | Haverty Furniture Cos., Inc. | |
| | | |
| | Johnson Outdoors, Inc. Class A | |
| | | |
| | | |
| | | |
| | | |
| | Lithia Motors, Inc. Class A | |
| | | |
| | | |
| | | |
| | MSC Industrial Direct Co., Inc. Class A | |
| | | |
| | National Vision Holdings, Inc.* | |
| | Nu Skin Enterprises, Inc. Class A | |
| | | |
| | Planet Fitness, Inc. Class A* | |
| | | |
| | | |
| | | |
| | | |
| | Qurate Retail, Inc. Series A* | |
| | Red Rock Resorts, Inc. Class A | |
| | | |
| | Sally Beauty Holdings, Inc.* | |
| | | |
| | SiteOne Landscape Supply, Inc.* | |
| | Skechers USA, Inc. Class A* | |
| | | |
42
See accompanying Notes to the Financial Statements.
Mercer US Small/Mid Cap Equity Fund
Schedule of Investments (Continued)
(showing percentage of net assets)
March 31, 2023
| | | |
| | Consumer, Cyclical — continued |
| | Sonic Automotive, Inc. Class A | |
| | | |
| | Texas Roadhouse, Inc. Class A | |
| | | |
| | | |
| | Topgolf Callaway Brands Corp.* | |
| | | |
| | | |
| | United Airlines Holdings, Inc.* | |
| | | |
| | | |
| | | |
| | | |
| | WESCO International, Inc. | |
| | | |
| | | |
| | Winnebago Industries, Inc. | |
| | World Fuel Services Corp. | |
| | | |
| | Consumer, Non-cyclical — 22.5% |
| | Acadia Healthcare Co., Inc.* | |
| | | |
| | Albertsons Cos., Inc. Class A | |
| | | |
| | Apellis Pharmaceuticals, Inc.*(a) | |
| | | |
| | | |
| | | |
| | | |
| | | |
| | | |
| | Bio-Rad Laboratories, Inc. Class A* | |
| | Booz Allen Hamilton Holding Corp. Class A | |
| | Bright Horizons Family Solutions, Inc.* | |
| | | |
| | | |
| | | |
| | | |
| | | |
| | | |
| | | |
| | | |
| | Driven Brands Holdings, Inc.* | |
| | Dun & Bradstreet Holdings, Inc. | |
| | Emergent BioSolutions, Inc.* | |
| | | |
| | | |
| | | |
See accompanying Notes to the Financial Statements.
43
Mercer US Small/Mid Cap Equity Fund
Schedule of Investments (Continued)
(showing percentage of net assets)
March 31, 2023
| | | |
| | Consumer, Non-cyclical — continued |
| | FleetCor Technologies, Inc.* | |
| | | |
| | Globus Medical, Inc. Class A* | |
| | Grand Canyon Education, Inc.* | |
| | | |
| | Halozyme Therapeutics, Inc.* | |
| | Herbalife Nutrition, Ltd.* | |
| | | |
| | | |
| | | |
| | | |
| | Ingles Markets, Inc. Class A | |
| | | |
| | | |
| | Inspire Medical Systems, Inc.* | |
| | | |
| | | |
| | Intra-Cellular Therapies, Inc.* | |
| | Ironwood Pharmaceuticals, Inc. Class A* | |
| | Jazz Pharmaceuticals Plc* | |
| | | |
| | | |
| | | |
| | | |
| | | |
| | MarketAxess Holdings, Inc. | |
| | | |
| | Molson Coors Beverage Co. Class B | |
| | | |
| | | |
| | Neurocrine Biosciences, Inc.* | |
| | | |
| | | |
| | | |
| | Pediatrix Medical Group, Inc.* | |
| | Perdoceo Education Corp.* | |
| | Performance Food Group Co.* | |
| | | |
| | Prestige Consumer Healthcare, Inc.* | |
| | | |
| | Prometheus Biosciences, Inc.* | |
| | | |
| | Quanex Building Products Corp. | |
| | | |
| | | |
| | Ritchie Bros Auctioneers, Inc. | |
| | Rocket Pharmaceuticals, Inc.* | |
| | Sarepta Therapeutics, Inc.* | |
| | Select Medical Holdings Corp. | |
44
See accompanying Notes to the Financial Statements.
Mercer US Small/Mid Cap Equity Fund
Schedule of Investments (Continued)
(showing percentage of net assets)
March 31, 2023
| | | |
| | Consumer, Non-cyclical — continued |
| | Simply Good Foods Co. (The)* | |
| | | |
| | Sprouts Farmers Market, Inc.* | |
| | | |
| | Triton International, Ltd. | |
| | United Therapeutics Corp.* | |
| | Universal Health Services, Inc. Class B | |
| | | |
| | | |
| | | |
| | | |
| | | |
| | WillScot Mobile Mini Holdings Corp.* | |
| | | |
| | | |
| | |
| | | |
| | California Resources Corp. | |
| | | |
| | | |
| | | |
| | | |
| | | |
| | Magnolia Oil & Gas Corp. Class A | |
| | | |
| | | |
| | | |
| | | |
| | | |
| | Permian Resources Corp. Class A | |
| | | |
| | | |
| | | |
| | | |
| | |
| | | |
| | | |
| | American Assets Trust, Inc. REIT | |
| | American Equity Investment Life Holding Co. | |
| | American Financial Group, Inc. | |
| | Annaly Capital Management, Inc. REIT | |
| | Apple Hospitality REIT, Inc. REIT | |
| | | |
| | Ares Management Corp. Class A | |
| | | |
| | Atlantic Union Bankshares Corp. | |
| | Axis Capital Holdings, Ltd. | |
See accompanying Notes to the Financial Statements.
45
Mercer US Small/Mid Cap Equity Fund
Schedule of Investments (Continued)
(showing percentage of net assets)
March 31, 2023
| | | |
| | |
| | | |
| | Bank of NT Butterfield & Son, Ltd. (The) | |
| | Braemar Hotels & Resorts, Inc. REIT(a) | |
| | Brandywine Realty Trust REIT | |
| | Brixmor Property Group, Inc. REIT | |
| | | |
| | | |
| | | |
| | Chimera Investment Corp. REIT(a) | |
| | Citizens Financial Group, Inc. | |
| | City Office REIT, Inc. REIT | |
| | | |
| | CNO Financial Group, Inc. | |
| | | |
| | Cullen/Frost Bankers, Inc. | |
| | Easterly Government Properties, Inc. REIT Class A | |
| | EastGroup Properties, Inc. REIT | |
| | | |
| | | |
| | | |
| | | |
| | F&G Annuities & Life, Inc. | |
| | Fidelity National Financial, Inc. | |
| | | |
| | Financial Institutions, Inc. | |
| | First American Financial Corp. | |
| | | |
| | First Citizens BancShares, Inc. Class A | |
| | | |
| | Franklin Street Properties Corp. REIT(a) | |
| | | |
| | Genworth Financial, Inc. Class A* | |
| | | |
| | Global Net Lease, Inc. REIT | |
| | Hamilton Lane, Inc. Class A | |
| | | |
| | | |
| | Heritage Insurance Holdings, Inc. | |
| | | |
| | | |
| | Host Hotels & Resorts, Inc. REIT | |
| | | |
| | Industrial Logistics Properties Trust REIT | |
| | Jefferies Financial Group, Inc. | |
| | | |
| | Kinsale Capital Group, Inc. | |
| | Kite Realty Group Trust REIT | |
| | | |
| | LPL Financial Holdings, Inc. | |
46
See accompanying Notes to the Financial Statements.
Mercer US Small/Mid Cap Equity Fund
Schedule of Investments (Continued)
(showing percentage of net assets)
March 31, 2023
| | | |
| | |
| | Medical Properties Trust, Inc. REIT(a) | |
| | | |
| | National Storage Affiliates Trust REIT | |
| | | |
| | Necessity Retail REIT, Inc. (The) REIT | |
| | New Mountain Finance Corp. | |
| | New York Community Bancorp, Inc. | |
| | Newmark Group, Inc. Class A | |
| | NMI Holdings, Inc. Class A* | |
| | Oaktree Specialty Lending Corp. | |
| | Office Properties Income Trust REIT | |
| | | |
| | Omega Healthcare Investors, Inc. REIT | |
| | | |
| | Physicians Realty Trust REIT | |
| | Piedmont Office Realty Trust, Inc. REIT Class A | |
| | Pinnacle Financial Partners, Inc. | |
| | | |
| | | |
| | | |
| | Redwood Trust, Inc. REIT(a) | |
| | | |
| | Reinsurance Group of America, Inc. | |
| | Sabra Health Care REIT, Inc. REIT | |
| | Sandy Spring Bancorp, Inc. | |
| | Service Properties Trust REIT | |
| | StepStone Group, Inc. Class A | |
| | | |
| | Summit Hotel Properties, Inc. REIT | |
| | Sun Communities, Inc. REIT | |
| | Tanger Factory Outlet Centers, Inc. REIT | |
| | | |
| | Universal Insurance Holdings, Inc. | |
| | | |
| | Victory Capital Holdings, Inc. Class A | |
| | | |
| | | |
| | White Mountains Insurance Group, Ltd. | |
| | | |
| | | |
| | | |
| | |
| | Banco Latinoamericano de Comercio Exterior SA | |
| | |
| | | |
| | Advanced Energy Industries, Inc. | |
| | | |
See accompanying Notes to the Financial Statements.
47
Mercer US Small/Mid Cap Equity Fund
Schedule of Investments (Continued)
(showing percentage of net assets)
March 31, 2023
| | | |
| | |
| | Air Transport Services Group, Inc.* | |
| | | |
| | | |
| | | |
| | | |
| | Armstrong World Industries, Inc. | |
| | | |
| | | |
| | | |
| | | |
| | | |
| | Builders FirstSource, Inc.* | |
| | | |
| | | |
| | | |
| | Comfort Systems USA, Inc. | |
| | | |
| | | |
| | | |
| | | |
| | | |
| | | |
| | | |
| | Gates Industrial Corp. Plc* | |
| | Gibraltar Industries, Inc.* | |
| | | |
| | | |
| | | |
| | | |
| | Huntington Ingalls Industries, Inc. | |
| | | |
| | | |
| | | |
| | | |
| | Lincoln Electric Holdings, Inc. | |
| | | |
| | | |
| | MDU Resources Group, Inc. | |
| | | |
| | Modine Manufacturing Co.* | |
| | | |
| | | |
| | Napco Security Technologies, Inc.* | |
| | | |
| | | |
| | | |
| | | |
| | Ranpak Holdings Corp. Class A* | |
| | | |
48
See accompanying Notes to the Financial Statements.
Mercer US Small/Mid Cap Equity Fund
Schedule of Investments (Continued)
(showing percentage of net assets)
March 31, 2023
| | | |
| | |
| | | |
| | | |
| | | |
| | Schneider National, Inc. Class B | |
| | | |
| | | |
| | | |
| | Teledyne Technologies, Inc.* | |
| | | |
| | | |
| | | |
| | | |
| | | |
| | | |
| | | |
| | Universal Logistics Holdings, Inc. | |
| | | |
| | Vishay Intertechnology, Inc. | |
| | | |
| | | |
| | | |
| | |
| | | |
| | Allegro MicroSystems, Inc.* | |
| | Alpha & Omega Semiconductor, Ltd.* | |
| | | |
| | | |
| | | |
| | | |
| | CSG Systems International, Inc. | |
| | | |
| | | |
| | Donnelley Financial Solutions, Inc.* | |
| | | |
| | | |
| | | |
| | | |
| | Evolent Health, Inc. Class A* | |
| | ExlService Holdings, Inc.* | |
| | | |
| | | |
| | | |
| | | |
| | | |
| | Manhattan Associates, Inc.* | |
| | | |
| | Monolithic Power Systems, Inc. | |
| | | |
See accompanying Notes to the Financial Statements.
49
Mercer US Small/Mid Cap Equity Fund
Schedule of Investments (Continued)
(showing percentage of net assets)
March 31, 2023
| | | |
| | |
| | | |
| | | |
| | | |
| | | |
| | | |
| | Procore Technologies, Inc.* | |
| | Pure Storage, Inc. Class A* | |
| | | |
| | | |
| | Seagate Technology Holdings Plc(a) | |
| | Silicon Laboratories, Inc.* | |
| | | |
| | SMART Global Holdings, Inc.* | |
| | | |
| | | |
| | Tyler Technologies, Inc.* | |
| | Ultra Clean Holdings, Inc.* | |
| | Verra Mobility Corp. Class A* | |
| | | |
| | Zebra Technologies Corp. Class A* | |
| | | |
| | |
| | | |
| | | |
| | | |
| | | |
| | Portland General Electric Co. | |
| | Southwest Gas Holdings, Inc.* | |
| | | |
| | | |
| | TOTAL COMMON STOCKS (COST $1,422,287,153) | |
| | | |
| | Short-Term Investment — 0.6% |
| | Mutual Fund - Securities Lending Collateral — 0.6% |
| | State Street Institutional U.S. Government Money Market Fund, Premier Class, | |
| | TOTAL SHORT-TERM INVESTMENT (COST $9,382,530) | |
| | TOTAL INVESTMENTS — 94.6%
(Cost $1,431,669,683) | |
| | Other Assets and Liabilities (net) — 5.4% | |
| | | |
50
See accompanying Notes to the Financial Statements.
Mercer US Small/Mid Cap Equity Fund
Schedule of Investments (Continued)
March 31, 2023
| Notes to Schedule of Investments: |
| Non-income producing security. |
| All or a portion of this security is out on loan. |
| The rate disclosed is the 7-day net yield as of March 31, 2023. |
| Represents an investment of securities lending cash collateral. |
Futures Contracts
| | | | Market Value/
Unrealized
Appreciation
(Depreciation) |
| | | | |
| Russell 2000 E-mini Index | | | |
| | | | |
| | | | |
|
| | American Depository Receipt |
| | Real Estate Investment Trust |
See accompanying Notes to the Financial Statements.
51
Mercer US Small/Mid Cap Equity Fund
Schedule of Investments (Continued)
March 31, 2023
Asset Class Summary (Unaudited) | |
| |
| |
| |
Other Assets and Liabilities (net) | |
| |
52
See accompanying Notes to the Financial Statements.
Mercer Non-US Core Equity Fund
Schedule of Investments
(showing percentage of net assets)
March 31, 2023
| | | |
| | |
| | |
| | | |
| | | |
| | | |
| | | |
| | | |
| | | |
| | Bank of Queensland, Ltd.(a) | |
| | | |
| | | |
| | | |
| | | |
| | | |
| | | |
| | Fortescue Metals Group, Ltd. | |
| | | |
| | Harvey Norman Holdings, Ltd.(a) | |
| | | |
| | | |
| | | |
| | | |
| | | |
| | | |
| | | |
| | | |
| | | |
| | | |
| | | |
| | | |
| | | |
| | | |
| | | |
| | Treasury Wine Estates, Ltd. | |
| | Viva Energy Group, Ltd. 144A | |
| | | |
| | Woodside Energy Group, Ltd.(a) | |
| | | |
| | Yancoal Australia, Ltd.(a) | |
| | | |
| | |
| | | |
| | | |
| | | |
| | | |
| | Raiffeisen Bank International AG* | |
| | | |
| | | |
See accompanying Notes to the Financial Statements.
53
Mercer Non-US Core Equity Fund
Schedule of Investments (Continued)
(showing percentage of net assets)
March 31, 2023
| | | |
| | |
| | | |
| | | |
| | Anheuser-Busch InBev SA, ADR | |
| | | |
| | | |
| | | |
| | |
| | | |
| | Petroleo Brasileiro SA, ADR | |
| | Petroleo Brasileiro SA, Preferred ADR | |
| | | |
| | Wheaton Precious Metals Corp. | |
| | | |
| | | |
| | |
| | | |
| | Canadian Pacific Railway, Ltd.(a) | |
| | Canadian Tire Corp., Ltd. Class A | |
| | Crescent Point Energy Corp. | |
| | | |
| | | |
| | | |
| | | |
| | | |
| | |
| | | |
| | Bank of China, Ltd. Class H | |
| | China Construction Bank Corp. Class H | |
| | China Medical System Holdings, Ltd. | |
| | China Resources Cement Holdings, Ltd. | |
| | Hengan International Group Co., Ltd. | |
| | Industrial & Commercial Bank of China, Ltd. Class H | |
| | | |
| | Lee & Man Paper Manufacturing, Ltd. | |
| | | |
| | Shanghai Pharmaceuticals Holding Co., Ltd. Class H | |
| | SITC International Holdings Co., Ltd. | |
| | Xinyi Glass Holdings, Ltd. | |
| | Yangzijiang Shipbuilding Holdings, Ltd. | |
| | | |
| | |
| | AP Moller - Maersk AS Class A | |
| | AP Moller - Maersk AS Class B | |
| | | |
| | | |
| | | |
54
See accompanying Notes to the Financial Statements.
Mercer Non-US Core Equity Fund
Schedule of Investments (Continued)
(showing percentage of net assets)
March 31, 2023
| | | |
| | |
| | | |
| | | |
| | | |
| | | |
| | | |
| | | |
| | |
| | | |
| | | |
| | | |
| | Nordea Bank Abp (Stockholm Exchange)(a) | |
| | | |
| | | |
| | | |
| | |
| | | |
| | | |
| | | |
| | | |
| | | |
| | | |
| | | |
| | | |
| | | |
| | | |
| | Cie Generale des Etablissements Michelin SCA | |
| | | |
| | | |
| | | |
| | | |
| | | |
| | | |
| | | |
| | | |
| | LVMH Moet Hennessy Louis Vuitton SE | |
| | Metropole Television SA(a) | |
| | | |
| | | |
| | | |
| | | |
| | | |
| | | |
| | | |
| | | |
| | | |
| | | |
| | | |
See accompanying Notes to the Financial Statements.
55
Mercer Non-US Core Equity Fund
Schedule of Investments (Continued)
(showing percentage of net assets)
March 31, 2023
| | | |
| | |
| | Bank of Georgia Group Plc | |
| | |
| | | |
| | | |
| | | |
| | | |
| | | |
| | | |
| | | |
| | | |
| | | |
| | Daimler Truck Holding AG* | |
| | | |
| | | |
| | Deutsche Pfandbriefbank AG | |
| | | |
| | | |
| | | |
| | | |
| | | |
| | Fresenius Medical Care AG & Co. KGaA | |
| | | |
| | | |
| | | |
| | | |
| | | |
| | | |
| | | |
| | | |
| | | |
| | | |
| | Muenchener Rueckversicherungs-Gesellschaft AG in Muenchen | |
| | | |
| | | |
| | | |
| | | |
| | | |
| | | |
| | | |
| | | |
| | | |
| | | |
| | | |
| | | |
| | |
| | | |
| | | |
56
See accompanying Notes to the Financial Statements.
Mercer Non-US Core Equity Fund
Schedule of Investments (Continued)
(showing percentage of net assets)
March 31, 2023
| | | |
| | |
| | Pacific Basin Shipping, Ltd. | |
| | Tongda Group Holdings, Ltd.* | |
| | United Laboratories International Holdings, Ltd. (The) | |
| | | |
| | | |
| | |
| | MOL Hungarian Oil & Gas Plc | |
| | | |
| | | |
| | |
| | | |
| | | |
| | | |
| | |
| | Golden Agri-Resources, Ltd. | |
| | |
| | | |
| | Bank of Ireland Group Plc | |
| | | |
| | Ryanair Holdings Plc, ADR* | |
| | | |
| | |
| | | |
| | | |
| | Bezeq The Israeli Telecommunication Corp., Ltd. | |
| | Check Point Software Technologies, Ltd.* | |
| | | |
| | | |
| | Israel Discount Bank, Ltd. Class A | |
| | Mizrahi Tefahot Bank, Ltd. | |
| | | |
| | Teva Pharmaceutical Industries, Ltd.* | |
| | ZIM Integrated Shipping Services, Ltd. | |
| | | |
| | |
| | | |
| | Assicurazioni Generali SpA | |
| | | |
| | | |
| | Banca Popolare di Sondrio SpA | |
| | | |
| | | |
| | | |
| | | |
See accompanying Notes to the Financial Statements.
57
Mercer Non-US Core Equity Fund
Schedule of Investments (Continued)
(showing percentage of net assets)
March 31, 2023
| | | |
| | |
| | | |
| | | |
| | | |
| | Mediobanca Banca di Credito Finanziario SpA | |
| | | |
| | | |
| | | |
| | UnipolSai Assicurazioni SpA(a) | |
| | | |
| | |
| | | |
| | | |
| | | |
| | AEON REIT Investment Corp. REIT | |
| | | |
| | | |
| | | |
| | | |
| | | |
| | | |
| | | |
| | | |
| | Asahi Group Holdings, Ltd. | |
| | ASKA Pharmaceutical Holdings Co., Ltd.(a) | |
| | | |
| | BayCurrent Consulting, Inc. | |
| | | |
| | | |
| | | |
| | Chiba Bank, Ltd. (The)(a) | |
| | Chubu Electric Power Co., Inc. | |
| | | |
| | Cosmo Energy Holdings Co., Ltd. | |
| | Credit Saison Co., Ltd.(a) | |
| | | |
| | Dai-ichi Life Holdings, Inc.(a) | |
| | Daiwa House Industry Co., Ltd. | |
| | | |
| | | |
| | | |
| | | |
| | Electric Power Development Co., Ltd. | |
| | | |
| | | |
| | | |
| | | |
| | | |
| | | |
58
See accompanying Notes to the Financial Statements.
Mercer Non-US Core Equity Fund
Schedule of Investments (Continued)
(showing percentage of net assets)
March 31, 2023
| | | |
| | |
| | | |
| | Fukuoka Financial Group, Inc. | |
| | | |
| | Futaba Industrial Co., Ltd.(a) | |
| | Hachijuni Bank, Ltd. (The) | |
| | | |
| | Hirose Electric Co., Ltd. | |
| | | |
| | Hokkaido Electric Power Co., Inc.* | |
| | | |
| | Honda Motor Co., Ltd., ADR | |
| | | |
| | | |
| | Ichinen Holdings Co., Ltd.(a) | |
| | Idemitsu Kosan Co., Ltd.(a) | |
| | | |
| | | |
| | | |
| | | |
| | | |
| | | |
| | Japan Aviation Electronics Industry, Ltd.(a) | |
| | Japan Petroleum Exploration Co., Ltd.(a) | |
| | Japan Post Holdings Co., Ltd. | |
| | Japan Post Insurance Co., Ltd. | |
| | | |
| | | |
| | Kaken Pharmaceutical Co., Ltd. | |
| | | |
| | | |
| | | |
| | | |
| | Kansai Electric Power Co., Inc. (The) | |
| | | |
| | | |
| | | |
| | Kawasaki Heavy Industries, Ltd.(a) | |
| | Kawasaki Kisen Kaisha, Ltd.(a) | |
| | | |
| | | |
| | | |
| | Kissei Pharmaceutical Co., Ltd.(a) | |
| | Kobayashi Pharmaceutical Co., Ltd. | |
| | | |
| | Kohnan Shoji Co., Ltd.(a) | |
| | | |
| | | |
| | | |
| | | |
See accompanying Notes to the Financial Statements.
59
Mercer Non-US Core Equity Fund
Schedule of Investments (Continued)
(showing percentage of net assets)
March 31, 2023
| | | |
| | |
| | | |
| | | |
| | | |
| | | |
| | | |
| | | |
| | | |
| | Mebuki Financial Group, Inc. | |
| | MEIJI Holdings Co., Ltd.(a) | |
| | Mitsubishi Chemical Group Corp. | |
| | | |
| | Mitsubishi Electric Corp. | |
| | Mitsubishi Gas Chemical Co., Inc. | |
| | Mitsubishi HC Capital, Inc. | |
| | Mitsubishi Heavy Industries, Ltd. | |
| | Mitsubishi Materials Corp.(a) | |
| | Mitsubishi Motors Corp.*(a) | |
| | Mitsubishi UFJ Financial Group, Inc. | |
| | | |
| | Mitsui Chemicals, Inc.(a) | |
| | Mitsui OSK Lines, Ltd.(a) | |
| | | |
| | Mizuho Financial Group, Inc. | |
| | Mizuho Leasing Co., Ltd.(a) | |
| | Mochida Pharmaceutical Co., Ltd.(a) | |
| | | |
| | MS&AD Insurance Group Holdings, Inc. | |
| | Murata Manufacturing Co., Ltd. | |
| | | |
| | | |
| | | |
| | | |
| | NGK Spark Plug Co., Ltd.(a) | |
| | | |
| | | |
| | Nippon Electric Glass Co., Ltd. | |
| | NIPPON EXPRESS HOLDINGS, Inc. | |
| | | |
| | Nippon Sanso Holdings Corp.(a) | |
| | | |
| | | |
| | Nippon Telegraph & Telephone Corp. | |
| | | |
| | Nishio Rent All Co., Ltd.(a) | |
| | Nissan Motor Co., Ltd.(a) | |
| | Nissin Foods Holdings Co., Ltd. | |
| | | |
| | | |
| | Nomura Research Institute, Ltd. | |
60
See accompanying Notes to the Financial Statements.
Mercer Non-US Core Equity Fund
Schedule of Investments (Continued)
(showing percentage of net assets)
March 31, 2023
| | | |
| | |
| | | |
| | | |
| | | |
| | | |
| | | |
| | | |
| | Ono Pharmaceutical Co., Ltd. | |
| | | |
| | | |
| | Otsuka Holdings Co., Ltd. | |
| | Prima Meat Packers, Ltd.(a) | |
| | Renesas Electronics Corp.* | |
| | | |
| | | |
| | | |
| | | |
| | Rohto Pharmaceutical Co., Ltd. | |
| | Sanken Electric Co., Ltd. | |
| | Sanki Engineering Co., Ltd.(a) | |
| | | |
| | | |
| | Santen Pharmaceutical Co., Ltd.(a) | |
| | Sanyo Chemical Industries, Ltd. | |
| | Sawai Group Holdings Co., Ltd. | |
| | SCREEN Holdings Co., Ltd.(a) | |
| | | |
| | | |
| | Sekisui Chemical Co., Ltd. | |
| | | |
| | Seven & i Holdings Co., Ltd. | |
| | | |
| | Shin-Etsu Chemical Co., Ltd. | |
| | SKY Perfect JSAT Holdings, Inc. | |
| | | |
| | | |
| | | |
| | | |
| | | |
| | Sumitomo Bakelite Co., Ltd. | |
| | Sumitomo Chemical Co., Ltd.(a) | |
| | | |
| | Sumitomo Electric Industries, Ltd. | |
| | Sumitomo Forestry Co., Ltd. | |
| | Sumitomo Heavy Industries, Ltd. | |
| | Sumitomo Mitsui Financial Group, Inc.(a) | |
| | Sumitomo Mitsui Trust Holdings, Inc. | |
| | Sumitomo Rubber Industries, Ltd. | |
| | Sumitomo Seika Chemicals Co., Ltd. | |
| | Suntory Beverage & Food, Ltd. | |
See accompanying Notes to the Financial Statements.
61
Mercer Non-US Core Equity Fund
Schedule of Investments (Continued)
(showing percentage of net assets)
March 31, 2023
| | | |
| | |
| | | |
| | | |
| | Takara Standard Co., Ltd. | |
| | Takeda Pharmaceutical Co., Ltd. | |
| | Takeda Pharmaceutical Co., Ltd., ADR | |
| | | |
| | | |
| | | |
| | Tokio Marine Holdings, Inc. | |
| | | |
| | Tokyo Electric Power Co. Holdings, Inc.* | |
| | | |
| | | |
| | Tokyo Ohka Kogyo Co., Ltd. | |
| | | |
| | | |
| | | |
| | | |
| | Towa Pharmaceutical Co., Ltd.(a) | |
| | Toyo Ink SC Holdings Co., Ltd. | |
| | Toyo Seikan Group Holdings, Ltd.(a) | |
| | | |
| | | |
| | | |
| | | |
| | | |
| | | |
| | | |
| | | |
| | | |
| | | |
| | Warabeya Nichiyo Holdings Co., Ltd. | |
| | | |
| | | |
| | Yamaichi Electronics Co., Ltd.(a) | |
| | | |
| | Yokohama Rubber Co., Ltd. (The) | |
| | | |
| | |
| | | |
| | |
| | | |
| | |
| | | |
62
See accompanying Notes to the Financial Statements.
Mercer Non-US Core Equity Fund
Schedule of Investments (Continued)
(showing percentage of net assets)
March 31, 2023
| | | |
| | |
| | ABN AMRO Bank NV CVA, GDR | |
| | | |
| | | |
| | | |
| | | |
| | ASML Holding NV, ADR NYRS | |
| | | |
| | | |
| | | |
| | | |
| | | |
| | Koninklijke Ahold Delhaize NV | |
| | | |
| | | |
| | | |
| | | |
| | | |
| | Shell Plc (Amsterdam Exchange) | |
| | Universal Music Group NV(a) | |
| | | |
| | | |
| | |
| | | |
| | | |
| | | |
| | | |
| | | |
| | | |
| | | |
| | |
| | Vista Land & Lifescapes, Inc. | |
| | |
| | Banco Comercial Portugues SA Class R | |
| | | |
| | | |
| | | |
| | | |
| | |
| | | |
| | | |
| | MMC Norilsk Nickel PJSC(b)(c)(d) | |
| | | |
| | Rosneft Oil Co. PJSC(b)(c)(d) | |
| | Sberbank of Russia PJSC*(b)(c)(d) | |
See accompanying Notes to the Financial Statements.
63
Mercer Non-US Core Equity Fund
Schedule of Investments (Continued)
(showing percentage of net assets)
March 31, 2023
| | | |
| | |
| | | |
| | | |
| | |
| | | |
| | | |
| | STMicroelectronics NV (New York Stock Exchange) | |
| | United Overseas Bank, Ltd. | |
| | | |
| | | |
| | |
| | Anglo American Platinum, Ltd.(a) | |
| | | |
| | | |
| | | |
| | | |
| | |
| | | |
| | | |
| | | |
| | | |
| | Samsung Electronics Co., Ltd. | |
| | | |
| | | |
| | |
| | | |
| | Banco Bilbao Vizcaya Argentaria SA(a) | |
| | Banco Bilbao Vizcaya Argentaria SA, ADR | |
| | | |
| | | |
| | | |
| | | |
| | | |
| | | |
| | | |
| | | |
| | Mediaset Espana Comunicacion SA*(a) | |
| | | |
| | | |
| | | |
| | |
| | | |
| | | |
| | Electrolux AB Class B (a) | |
| | | |
| | | |
64
See accompanying Notes to the Financial Statements.
Mercer Non-US Core Equity Fund
Schedule of Investments (Continued)
(showing percentage of net assets)
March 31, 2023
| | | |
| | |
| | H & M Hennes & Mauritz AB Class B (a) | |
| | | |
| | | |
| | | |
| | | |
| | Svenska Cellulosa AB SCA Class B (a) | |
| | | |
| | | |
| | | |
| | | |
| | |
| | | |
| | | |
| | | |
| | | |
| | | |
| | | |
| | Chocoladefabriken Lindt & Spruengli AG | |
| | Cie Financiere Richemont SA Class A | |
| | Credit Suisse Group AG(a) | |
| | | |
| | | |
| | | |
| | | |
| | | |
| | | |
| | | |
| | | |
| | | |
| | | |
| | Swatch Group AG (The) (SIX Swiss Exchange) | |
| | | |
| | | |
| | | |
| | |
| | ASE Technology Holding Co., Ltd. | |
| | Chipbond Technology Corp. | |
| | Compeq Manufacturing Co., Ltd. | |
| | Fubon Financial Holding Co., Ltd. | |
| | | |
| | Hon Hai Precision Industry Co., Ltd. | |
| | | |
| | Novatek Microelectronics Corp. | |
| | Taiwan Semiconductor Manufacturing Co., Ltd., ADR | |
| | United Microelectronics Corp.* | |
| | | |
See accompanying Notes to the Financial Statements.
65
Mercer Non-US Core Equity Fund
Schedule of Investments (Continued)
(showing percentage of net assets)
March 31, 2023
| | | |
| | |
| | Quality Houses PCL Class F | |
| | |
| | Aselsan Elektronik Sanayi Ve Ticaret AS | |
| | BIM Birlesik Magazalar AS | |
| | | |
| | Dogan Sirketler Grubu Holding AS | |
| | Dogus Otomotiv Servis ve Ticaret AS | |
| | | |
| | | |
| | Haci Omer Sabanci Holding AS | |
| | | |
| | Tofas Turk Otomobil Fabrikasi AS | |
| | | |
| | | |
| | Turkiye Garanti Bankasi AS | |
| | Turkiye Is Bankasi AS Class C | |
| | Turkiye Sise ve Cam Fabrikalari AS | |
| | | |
| | |
| | | |
| | Associated British Foods Plc | |
| | | |
| | | |
| | B&M European Value Retail SA | |
| | | |
| | | |
| | | |
| | | |
| | | |
| | | |
| | | |
| | | |
| | British American Tobacco Plc | |
| | British American Tobacco Plc, ADR | |
| | | |
| | | |
| | CK Hutchison Holdings, Ltd. | |
| | | |
| | | |
| | Crest Nicholson Holdings Plc | |
| | | |
| | | |
| | | |
| | | |
| | | |
| | | |
| | | |
66
See accompanying Notes to the Financial Statements.
Mercer Non-US Core Equity Fund
Schedule of Investments (Continued)
(showing percentage of net assets)
March 31, 2023
| | | |
| | United Kingdom — continued |
| | | |
| | | |
| | | |
| | | |
| | Lloyds Banking Group Plc, ADR | |
| | London Stock Exchange Group Plc | |
| | | |
| | Marks & Spencer Group Plc | |
| | | |
| | | |
| | | |
| | Paragon Banking Group Plc | |
| | | |
| | Reckitt Benckiser Group Plc | |
| | | |
| | | |
| | | |
| | RELX Plc (London Exchange) | |
| | | |
| | | |
| | | |
| | Spirax-Sarco Engineering Plc | |
| | | |
| | | |
| | | |
| | | |
| | | |
| | |
| | Agilent Technologies, Inc. | |
| | | |
| | | |
| | | |
| | Cadence Design Systems, Inc.* | |
| | | |
| | | |
| | | |
| | | |
| | | |
| | | |
| | | |
| | | |
| | Janus Henderson Group Plc | |
| | | |
| | | |
| | | |
| | | |
| | | |
| | | |
See accompanying Notes to the Financial Statements.
67
Mercer Non-US Core Equity Fund
Schedule of Investments (Continued)
(showing percentage of net assets)
March 31, 2023
| | | |
| | United States — continued |
| | | |
| | | |
| | | |
| | | |
| | Stellantis NV (EN Paris Exchange) | |
| | | |
| | | |
| | | |
| | | |
| | TOTAL COMMON STOCKS (COST $3,369,569,496) | |
| | | |
| | INVESTMENT COMPANIES — 0.4% |
| | |
| | | |
| | iShares MSCI Eurozone ETF | |
| | TOTAL INVESTMENT COMPANIES (COST $11,182,802) | |
| | | |
| | |
| | |
| | Petroleo Brasileiro SA, 44.88% | |
| | |
| | | |
| | Henkel AG & Co. KGaA, 2.58% | |
| | Porsche Automobil Holding SE, 4.84% | |
| | | |
| | | |
| | | |
| | |
| | Samsung Electronics Co., Ltd., 2.01% | |
| | TOTAL PREFERRED STOCKS (COST $42,206,242) | |
|
| | |
| | |
| | Cie Financiere Richemont SA Expires 11/22/23* | |
| | | |
68
See accompanying Notes to the Financial Statements.
Mercer Non-US Core Equity Fund
Schedule of Investments (Continued)
(showing percentage of net assets)
March 31, 2023
| | | |
| | SHORT-TERM INVESTMENT — 3.9% |
| | Mutual Fund - Securities Lending Collateral — 3.9% |
| | State Street Institutional U.S. Government Money Market Fund, Premier Class, | |
| | TOTAL SHORT-TERM INVESTMENT (COST $146,394,653) | |
| | TOTAL INVESTMENTS — 99.5%
(Cost $3,569,353,193) | |
| | Other Assets and Liabilities (net) — 0.5% | |
| | | |
| Notes to Schedule of Investments: |
| Non-income producing security. |
| All or a portion of this security is out on loan. |
| Level 3 - significant unobservable inputs were used in determining the value of this security in the Fund. |
| Securities are fair valued by the Valuation Committee as approved by the Board of Trustees. The total market value of the securities at year end is $249,587 which represents 0.0% of net assets. The aggregate tax cost of these securities held at March 31, 2023 was $30,137,646. |
| Illiquid securities represent Russian securities impacted by the Russian/Ukraine crisis. The total market value of the securities at year end is $249,587 which represents 0.0% of net assets. The aggregate cost of these securities held at March 31, 2023 was $29,569,045. |
| The rate disclosed is the 7-day net yield as of March 31, 2023. |
| Represents an investment of securities lending cash collateral. |
| Securities exempt from registration under Rule 144A of the Securities Act of 1933. These securities may be resold in transactions exempt from registration, normally to qualified institutional buyers. The total market value of the securities at year end is $9,855,101 which represents 0.3% of net assets. |
Futures Contracts
| | | | Market Value/
Unrealized
Appreciation
(Depreciation) |
| | | | |
| | | | |
|
| | American Depository Receipt |
| | Certificaten Van Aandelen |
| | Global Depository Receipt |
| | |
| | Real Estate Investment Trust |
| | Swedish Depository Receipt |
See accompanying Notes to the Financial Statements.
69
Mercer Non-US Core Equity Fund
Schedule of Investments (Continued)
March 31, 2023
Industry Sector Summary (Unaudited) | |
| |
| |
| |
| |
| |
| |
| |
| |
| |
| |
| |
| |
Other Assets and Liabilities (net) | |
| |
70
See accompanying Notes to the Financial Statements.
Mercer Core Fixed Income Fund
Schedule of Investments
(showing percentage of net assets)
March 31, 2023
| | | |
| | |
| | Asset Backed Securities — 11.0% |
| | ABPCI Direct Lending Fund ABS I, Ltd., Series 2020-1A, Class A, 3.20%, due 12/20/30 144A | |
| | Aligned Data Centers Issuer LLC, Series 2021-1A, Class A2, 1.94%, due 08/15/46 144A | |
| | American Express Credit Account Master Trust, Series 2022-3, Class A, 3.75%, due 08/15/27 | |
| | AmeriCredit Automobile Receivables Trust, Series 2019-1, Class C, 3.36%, due 02/18/25 | |
| | AmeriCredit Automobile Receivables Trust, Series 2019-2, Class C, 2.74%, due 04/18/25 | |
| | AmeriCredit Automobile Receivables Trust, Series 2019-3, Class C, 2.32%, due 07/18/25 | |
| | AmeriCredit Automobile Receivables Trust, Series 2020-1, Class B, 1.48%, due 01/21/25 | |
| | AmeriCredit Automobile Receivables Trust, Series 2021-2, Class C, 1.01%, due 01/19/27 | |
| | AmeriCredit Automobile Receivables Trust, Series 2021-3, Class C, 1.41%, due 08/18/27 | |
| | AmeriCredit Automobile Receivables Trust, Series 2023-1, Class C, 5.80%, due 12/18/28 | |
| | AMSR Trust, Series 2020-SFR4, Class A, 1.36%, due 11/17/37 144A | |
| | AMSR Trust, Series 2021-SFR1, Class A, 1.95%, due 06/17/38(b) 144A | |
| | AMSR Trust, Series 2021-SFR2, Class A, 1.53%, due 08/17/38 144A | |
| | AMSR Trust, Series 2022-SFR3, Class A, 4.00%, due 10/17/39 144A | |
| | Applebee’s Funding LLC/IHOP Funding LLC, Series 2019-1A, Class A2I, 4.19%, due 06/05/49 144A | |
| | Applebee's Funding LLC/IHOP Funding LLC, Series 2023-1A, Class A2, 7.82%, due 03/05/53(c) 144A | |
| | Aqua Finance Trust, Series 2021-A, Class A, 1.54%, due 07/17/46 144A | |
| | Arbys Funding LLC, Series 2020-1A, Class A2, 3.24%, due 07/30/50 144A | |
| | ARI Fleet Lease Trust, Series 2020-A, Class A3, 1.80%, due 08/15/28 144A | |
| | Atlas Static Senior Loan Fund CLO I, Ltd., Series 2022-1A, Class A, 7.26% (3 mo. TSFR + 2.60%), due 07/15/30(d) 144A | |
| | Avis Budget Rental Car Funding AESOP LLC, Series 2019-3A, Class A, 2.36%, due 03/20/26 144A | |
| | Avis Budget Rental Car Funding AESOP LLC, Series 2020-1A, Class A, 2.33%, due 08/20/26 144A | |
| | BA Credit Card Trust, Series 2022-A2, Class A2, 5.00%, due 04/15/28 | |
| | Barings Euro CLO DAC, Series 2015-1A, Class ARR, 3.43% (3 mo. EURIBOR + 0.98%), due 07/25/35(d) 144A | |
| | BNPP AM Euro CLO DAC, Series 2018-1A, Class AR, 2.89% (3 mo. EURIBOR + 0.60%), due 04/15/31(d) 144A | |
| | BRE Grand Islander Timeshare Issuer LLC, Series 2019-A, Class A, 3.28%, due 09/26/33 144A | |
| | Capital Automotive REIT, LP, Series 2020-1A, Class B1, 4.17%, due 02/15/50 144A | |
| | Carlyle Global Market Strategies Euro CLO, Ltd., Series 2014-2A, Class AR1, 3.40% (3 mo. EURIBOR + 0.75%), due 11/15/31(d) 144A | |
| | Carlyle US CLO, Ltd., Series 2019-2A, Class A1R, 5.91% (3 mo. USD LIBOR + 1.12%), due 07/15/32(d) 144A | |
| | CarMax Auto Owner Trust, Series 2020-4, Class C, 1.30%, due 08/17/26 | |
| | CarMax Auto Owner Trust, Series 2021-2, Class C, 1.34%, due 02/16/27 | |
| | CarMax Auto Owner Trust, Series 2021-3, Class C, 1.25%, due 05/17/27 | |
| | CarMax Auto Owner Trust, Series 2021-4, Class C, 1.38%, due 07/15/27 | |
| | CarMax Auto Owner Trust, Series 2022-1, Class C, 2.20%, due 11/15/27 | |
| | CarMax Auto Owner Trust, Series 2022-1, Class D, 2.47%, due 07/17/28 | |
| | CF Hippolyta LLC, Series 2020-1, Class A1, 1.69%, due 07/15/60 144A | |
| | CF Hippolyta LLC, Series 2021-1A, Class A1, 1.53%, due 03/15/61 144A | |
See accompanying Notes to the Financial Statements.
71
Mercer Core Fixed Income Fund
Schedule of Investments (Continued)
(showing percentage of net assets)
March 31, 2023
| | | |
| | Asset Backed Securities — continued |
| | CIFC Funding CLO, Ltd., Series 2014-2RA, Class A1, 5.87% (3 mo. USD LIBOR + 1.05%), due 04/24/30(d) 144A | |
| | CIFC Funding CLO, Ltd., Series 2015-1A, Class ARR, 5.93% (3 mo. USD LIBOR + 1.11%), due 01/22/31(d) 144A | |
| | Citibank Credit Card Issuance Trust, Series 2018-A7, Class A7, 3.96%, due 10/13/30 | |
| | CLI Funding VI LLC, Series 2020-1A, Class A, 2.08%, due 09/18/45 144A | |
| | CLI Funding VIII LLC, Series 2021-1A, Class A, 1.64%, due 02/18/46 144A | |
| | CLI Funding VIII LLC, Series 2022-1A, Class A1, 2.72%, due 01/18/47 144A | |
| | Commonbond Student Loan Trust, Series 2017-BGS, Class A1, 2.68%, due 09/25/42 144A | |
| | Crown City CLO I, Series 2020-1A, Class A1AR, 6.00% (3 mo. USD LIBOR + 1.19%), due 07/20/34(d) 144A | |
| | Crown Point CLO 11, Ltd., Series 2021-11A, Class A, 5.91% (3 mo. USD LIBOR + 1.12%), due 01/17/34(d) 144A | |
| | DataBank Issuer, Series 2021-1A, Class A2, 2.06%, due 02/27/51 144A | |
| | DB Master Finance LLC, Series 2021-1A, Class A23, 2.79%, due 11/20/51 144A | |
| | DB Master Finance LLC, Series 2021-1A, Class A2I, 2.05%, due 11/20/51 144A | |
| | Diamond Infrastructure Funding LLC, Series 2021-1A, Class C, 3.48%, due 04/15/49 144A | |
| | Domino's Pizza Master Issuer LLC, Series 2017-1A, Class A23, 4.12%, due 07/25/47 144A | |
| | Domino's Pizza Master Issuer LLC, Series 2021-1A, Class A2I, 2.66%, due 04/25/51 144A | |
| | Driven Brands Funding LLC, Series 2020-2A, Class A2, 3.24%, due 01/20/51 144A | |
| | Driven Brands Funding LLC, Series 2021-1A, Class A2, 2.79%, due 10/20/51 144A | |
| | Elmwood CLO IV, Ltd., Series 2020-1A, Class A, 6.03% (3 mo. USD LIBOR + 1.24%), due 04/15/33(d) 144A | |
| | FirstKey Homes Trust, Series 2020-SFR2, Class A, 1.27%, due 10/19/37 | |
| | FirstKey Homes Trust, Series 2021-SFR1, Class A, 1.54%, due 08/17/38 144A | |
| | FirstKey Homes Trust, Series 2021-SFR1, Class D, 2.19%, due 08/17/38 144A | |
| | Five Guys Funding LLC, Series 2017-1A, Class A2, 4.60%, due 07/25/47 144A | |
| | Ford Credit Auto Owner Trust, Series 2020-C, Class C, 1.04%, due 05/15/28 | |
| | Ford Credit Auto Owner Trust, Series 2022-A, Class C, 2.14%, due 07/15/29 | |
| | Ford Credit Auto Owner Trust, Series 2022-B, Class A4, 3.93%, due 08/15/27 | |
| | Ford Credit Floorplan Master Owner Trust, Series 2020-2, Class A, 1.06%, due 09/15/27 | |
| | Generate CLO-2, Ltd., Series 2A, Class AR, 5.97% (3 mo. USD LIBOR + 1.15%), due 01/22/31(d) 144A | |
| | Generate CLO-4, Ltd., Series 4A, Class A1R, 5.90% (3 mo. USD LIBOR + 1.09%), due 04/20/32(d) 144A | |
| | GM Financial Consumer Automobile Receivables Trust, Series 2021-1, Class C, 1.04%, due 05/17/27 | |
| | GM Financial Consumer Automobile Receivables Trust, Series 2021-4, Class A3, 0.68%, due 09/16/26 | |
| | Golub Capital Partners ABS Funding, Ltd., Series 2020-1A, Class A2, 3.21%, due 01/22/29 144A | |
| | Golub Capital Partners ABS Funding, Ltd., Series 2021-1A, Class A2, 2.77%, due 04/20/29 144A | |
| | Grosvenor Place CLO DAC, Series 2022-1A, Class A, 4.34% (3 mo. EURIBOR + 2.00%), due 11/24/35(d) 144A | |
| | HI-FI Music IP Issuer, LP, Series 2022-1A, Class A2, 3.94%, due 02/01/62 144A | |
| | Hilton Grand Vacations Trust, Series 2017-AA, Class A, 2.66%, due 12/26/28 144A | |
| | Hilton Grand Vacations Trust, Series 2018-AA, Class A, 3.54%, due 02/25/32 144A | |
72
See accompanying Notes to the Financial Statements.
Mercer Core Fixed Income Fund
Schedule of Investments (Continued)
(showing percentage of net assets)
March 31, 2023
| | | |
| | Asset Backed Securities — continued |
| | Home Equity Asset Trust, Series 2003-8, Class M1, 5.93% (1 mo. USD LIBOR + | |
| | Invesco Euro CLO I DAC, Series 1A, Class A1R, 2.94% (3 mo. EURIBOR + 0.65%), due 07/15/31(d) 144A | |
| | Jack In The Box Funding LLC, Series 2019-1A, Class A23, 4.97%, due 08/25/49 144A | |
| | Jack In The Box Funding LLC, Series 2022-1A, Class A2I, 3.45%, due 02/26/52 144A | |
| | JPMorgan Chase Bank NA, Series 2021-3, Class B, 0.76%, due 02/26/29 144A | |
| | Laurel Road Prime Student Loan Trust, Series 2017-C, Class A2B, 2.81%, due 11/25/42 144A | |
| | Madison Park Euro Funding CLO XIV DAC, Series 14A, Class A1R, 3.09% (3 mo. EURIBOR + 0.80%), due 07/15/32(d) 144A | |
| | Madison Park Funding CLO XXXIII, Ltd., Series 2019-33A, Class AR, 5.95% (3 mo. TSFR + 1.29%), due 10/15/32(d) 144A | |
| | Madison Park Funding CLO XXXVIII, Ltd., Series 2021-38A, Class A, 5.91% (3 mo. USD LIBOR + 1.12%), due 07/17/34(d) 144A | |
| | MetroNet Infrastructure Issuer LLC, Series 2023-1A, Class A2, 6.56%, due 04/20/53(c) 144A | |
| | MidOcean Credit CLO III, Series 2014-3A, Class A1R, 5.94% (3 mo. USD LIBOR + 1.12%), due 04/21/31(d) 144A | |
| | Morgan Stanley ABS Capital I, Inc. Trust, Series 2003-NC10, Class M1, 5.87% (1 mo. USD LIBOR + 1.02%), due 10/25/33(d) | |
| | Morgan Stanley ABS Capital I, Inc. Trust, Series 2003-NC7, Class M1, 5.90% (1 mo. USD LIBOR + 1.05%), due 06/25/33(d) | |
| | Navient Private Education Loan Trust, Series 2016-AA, Class A2A, 3.91%, due 12/15/45 144A | |
| | Navient Private Education Refi Student Loan Trust, Series 2019-FA, Class A2, 2.60%, due 08/15/68 144A | |
| | Navient Private Education Refi Student Loan Trust, Series 2020-HA, Class A, 1.31%, due 01/15/69 144A | |
| | Neighborly Issuer LLC, Series 2021-1A, Class A2, 3.58%, due 04/30/51 144A | |
| | Neighborly Issuer LLC, Series 2022-1A, Class A2, 3.70%, due 01/30/52 144A | |
| | New Century Home Equity Loan Trust, Series 2003-A, Class A, 3.88% (1 mo. USD LIBOR + 0.72%), due 10/25/33(d) 144A | |
| | New Economy Assets Phase 1 Sponsor LLC, Series 2021-1, Class A1, 1.91%, due 10/20/61 144A | |
| | New Economy Assets Phase 1 Sponsor LLC, Series 2021-1, Class B1, 2.41%, due 10/20/61 144A | |
| | NextGear Floorplan Master Owner Trust, Series 2022-1A, Class A2, 2.80%, due 03/15/27 144A | |
| | Northwoods Capital CLO 22, Ltd., Series 2020-22A, Class AR, 6.36% (3 mo. TSFR + 1.45%), due 09/01/31(d) 144A | |
| | NRZ Excess Spread-Collateralized Notes, Series 2021-FHT1, Class A, 3.10%, due 07/25/26 144A | |
| | Oak Street Investment Grade Net Lease Fund, Series 2021-1A, Class A1, 1.48%, due 01/20/51 144A | |
| | Oak Street Investment Grade Net Lease Fund, Series 2021-2A, Class A1, 2.38%, due 11/20/51 144A | |
| | OCP CLO, Ltd., Series 2015-9A, Class A1R2, 5.88% (3 mo. TSFR + 1.25%), due 01/15/33(d) 144A | |
| | OCP CLO, Ltd., Series 2020-19A, Class AR, 5.96% (3 mo. USD LIBOR + 1.15%), due 10/20/34(d) 144A | |
| | OFSI BSL XI CLO, Ltd., Series 2022-11A, Class A1, 6.73% (3 mo. TSFR + 2.10%), due 07/18/31(d) 144A | |
See accompanying Notes to the Financial Statements.
73
Mercer Core Fixed Income Fund
Schedule of Investments (Continued)
(showing percentage of net assets)
March 31, 2023
| | | |
| | Asset Backed Securities — continued |
| | Oxford Finance Funding LLC, Series 2019-1A, Class A2, 4.46%, due 02/15/27 144A | |
| | OZLM Funding IV CLO, Ltd., Series 2013-4A, Class A1R, 6.07% (3 mo. USD LIBOR + 1.25%), due 10/22/30(d) 144A | |
| | OZLM XI CLO, Ltd., Series 2015-11A, Class A1R, 6.05% (3 mo. USD LIBOR + 1.25%), due 10/30/30(d) 144A | |
| | Park Avenue Institutional Advisers CLO, Ltd., Series 2018-1A, Class A1AR, 5.81% (3 mo. USD LIBOR + 1.00%), due 10/20/31(d) 144A | |
| | PFS Financing Corp., Series 2022-A, Class A, 2.47%, due 02/15/27 144A | |
| | Progress Residential Trust, Series 2019-SFR4, Class A, 2.69%, due 10/17/36 144A | |
| | Progress Residential Trust, Series 2020-SFR1, Class A, 1.73%, due 04/17/37 144A | |
| | Progress Residential Trust, Series 2021-SFR2, Class A, 1.55%, due 04/19/38 144A | |
| | Progress Residential Trust, Series 2021-SFR8, Class B, 1.68%, due 10/17/38 144A | |
| | Progress Residential Trust, Series 2022-SFR2, Class A, 2.95%, due 04/17/27 144A | |
| | Renaissance Home Equity Loan Trust, Series 2005-2, Class AF4, 5.43%, due 08/25/35(e) | |
| | Romark CLO II, Ltd., Series 2018-2A, Class A1, 5.99% (3 mo. USD LIBOR + 1.18%), due 07/25/31(d) 144A | |
| | Santander Drive Auto Receivables Trust, Series 2020-2, Class C, 1.46%, due 09/15/25 | |
| | Santander Drive Auto Receivables Trust, Series 2020-3, Class C, 1.12%, due 01/15/26 | |
| | Santander Drive Auto Receivables Trust, Series 2020-4, Class C, 1.01%, due 01/15/26 | |
| | Santander Drive Auto Receivables Trust, Series 2021-2, Class D, 1.35%, due 07/15/27 | |
| | Santander Drive Auto Receivables Trust, Series 2021-3, Class C, 0.95%, due 09/15/27 | |
| | Santander Drive Auto Receivables Trust, Series 2021-4, Class C, 1.26%, due 02/16/27 | |
| | Santander Drive Auto Receivables Trust, Series 2022-1, Class C, 2.56%, due 04/17/28 | |
| | Santander Drive Auto Receivables Trust, Series 2023-1, Class C, 5.09%, due 05/15/30 | |
| | Sesac Finance LLC, Series 2019-1, Class A2, 5.22%, due 07/25/49 144A | |
| | Sierra Timeshare Receivables Funding LLC, Series 2019-1A, Class A, 3.20%, due 01/20/36 144A | |
| | Silver Creek CLO, Ltd., Series 2014-1A, Class AR, 6.05% (3 mo. USD LIBOR + 1.24%), due 07/20/30(d) 144A | |
| | SMB Private Education Loan Trust, Series 2019-B, Class A2A, 2.84%, due 06/15/37 144A | |
| | SMB Private Education Loan Trust, Series 2021-D, Class A1A, 1.34%, due 03/17/53 144A | |
| | Sonic Capital LLC, Series 2020-1A, Class A2I, 3.85%, due 01/20/50 144A | |
| | Sonic Capital LLC, Series 2021-1A, Class A2I, 2.19%, due 08/20/51 144A | |
| | Stack Infrastructure Issuer LLC, Series 2019-1A, Class A2, 4.54%, due 02/25/44 144A | |
| | Stack Infrastructure Issuer LLC, Series 2019-2A, Class A2, 3.08%, due 10/25/44 144A | |
| | Stack Infrastructure Issuer LLC, Series 2021-1A, Class A2, 1.88%, due 03/26/46 144A | |
| | Sunbird Engine Finance LLC, Series 2020-1A, Class A, 3.67%, due 02/15/45 144A | |
| | Taco Bell Funding LLC, Series 2021-1A, Class A2I, 1.95%, due 08/25/51 144A | |
| | Taco Bell Funding LLC, Series 2021-1A, Class A2II, 2.29%, due 08/25/51 144A | |
| | TCW CLO, Ltd., Series 2019-2A, Class A1R, 5.92% (3 mo. TSFR + 1.28%), due 10/20/32(d) 144A | |
| | TIF Funding II LLC, Series 2021-1A, Class A, 1.65%, due 02/20/46 144A | |
| | Tricon American Homes Trust, Series 2019-SFR1, Class A, 2.75%, due 03/17/38 144A | |
| | Tricon Residential Trust, Series 2022-SFR2, Class A, 4.85%, due 07/17/40 144A | |
| | Trimaran Cavu CLO, Ltd., Series 2021-1A, Class A, 6.03% (3 mo. USD LIBOR + 1.21%), due 04/23/32(d) 144A | |
| | Triton Container Finance VIII LLC, Series 2020-1A, Class A, 2.11%, due 09/20/45 144A | |
74
See accompanying Notes to the Financial Statements.
Mercer Core Fixed Income Fund
Schedule of Investments (Continued)
(showing percentage of net assets)
March 31, 2023
| | | |
| | Asset Backed Securities — continued |
| | Triton Container Finance VIII LLC, Series 2021-1A, Class A, 1.86%, due 03/20/46 144A | |
| | U.S. Small Business Administration, Series 2013-20H, Class 1, 3.16%, due 08/01/33 | |
| | U.S. Small Business Administration, Series 2013-20L, Class 1, 3.38%, due 12/01/33 | |
| | U.S. Small Business Administration, Series 2014-20C, Class 1, 3.21%, due 03/01/34 | |
| | U.S. Small Business Administration, Series 2014-20D, Class 1, 3.11%, due 04/01/34 | |
| | U.S. Small Business Administration, Series 2014-20I, Class 1, 2.92%, due 09/01/34 | |
| | U.S. Small Business Administration, Series 2019-25F, Class 1, 2.77%, due 06/01/44 | |
| | U.S. Small Business Administration, Series 2020-25D, Class 1, 1.77%, due 04/01/45 | |
| | U.S. Small Business Administration, Series 2022-25A, Class 1, 2.04%, due 01/01/47 | |
| | U.S. Small Business Administration, Series 2022-25D, Class 1, 3.50%, due 04/01/47 | |
| | U.S. Small Business Administration, Series 2022-25E, Class 1, 3.94%, due 05/01/47 | |
| | U.S. Small Business Administration, Series 2022-25G, Class 1, 3.93%, due 07/01/47 | |
| | U.S. Small Business Administration, Series 2022-25J, Class 1, 5.04%, due 10/01/47 | |
| | Vantage Data Centers Issuers LLC, Series 2020-1A, Class A2, 1.65%, due 09/15/45 144A | |
| | Vantage Data Centers LLC, Series 2020-2A, Class A2, 1.99%, due 09/15/45 144A | |
| | VCP RRL ABS I, Ltd., Series 2021-1A, Class A, 2.15%, due 10/20/31 144A | |
| | Venture XIX CLO, Ltd., Series 2014-19A, Class ARR, 6.05% (3 mo. USD LIBOR + 1.26%), due 01/15/32(d) 144A | |
| | Verizon Master Trust, Series 2021-2, Class A, 0.99%, due 04/20/28 | |
| | VR Funding LLC, Series 2020-1A, Class A, 2.79%, due 11/15/50 144A | |
| | VSE VOI Mortgage LLC, Series 2017-A, Class A, 2.33%, due 03/20/35 144A | |
| | Wellfleet CLO, Ltd., Series 2018-3A, Class A1A, 6.06% (3 mo. USD LIBOR + 1.25%), due 01/20/32(d) 144A | |
| | Wendy's Funding LLC, Series 2019-1A, Class A2I, 3.78%, due 06/15/49 144A | |
| | Wendy's Funding LLC, Series 2021-1A, Class A2I, 2.37%, due 06/15/51 144A | |
| | Willis Engine Structured Trust V, Series 2020-A, Class A, 3.23%, due 03/15/45 144A | |
| | World Omni Select Auto Trust, Series 2019-A, Class B, 2.17%, due 12/15/25 | |
| | World Omni Select Auto Trust, Series 2019-A, Class C, 2.38%, due 12/15/25 | |
| | World Omni Select Auto Trust, Series 2021-A, Class C, 1.09%, due 11/15/27 | |
| | Zaxby's Funding LLC, Series 2021-1A, Class A2, 3.24%, due 07/30/51 144A | |
| | | |
| | |
| | 1011778 BC ULC/New Red Finance, Inc., 3.88%, due 01/15/28 144A | |
| | 1011778 BC ULC/New Red Finance, Inc., 4.00%, due 10/15/30 144A | |
| | AbbVie, Inc., 3.20%, due 11/21/29 | |
| | AbbVie, Inc., 3.80%, due 03/15/25 | |
| | AbbVie, Inc., 4.25%, due 11/21/49 | |
| | AbbVie, Inc., 4.50%, due 05/14/35 | |
| | AbbVie, Inc., 4.55%, due 03/15/35 | |
| | AbbVie, Inc., 4.70%, due 05/14/45 | |
| | AbbVie, Inc., 4.75%, due 03/15/45 | |
| | Abu Dhabi National Energy Co. PJSC, 2.00%, due 04/29/28 144A | |
| | AdaptHealth LLC, 5.13%, due 03/01/30(f) 144A | |
| | Advocate Health & Hospitals Corp., 2.21%, due 06/15/30(f) | |
| | AECOM, 5.13%, due 03/15/27 | |
| | AEP Texas, Inc., 3.80%, due 10/01/47 | |
| | AEP Transmission Co. LLC, 3.80%, due 06/15/49 | |
See accompanying Notes to the Financial Statements.
75
Mercer Core Fixed Income Fund
Schedule of Investments (Continued)
(showing percentage of net assets)
March 31, 2023
| | | |
| | Corporate Debt — continued |
| | AerCap Ireland Capital DAC/AerCap Global Aviation Trust, 1.75%, due 01/30/26 | |
| | AerCap Ireland Capital DAC/AerCap Global Aviation Trust, 2.45%, due 10/29/26 | |
| | AerCap Ireland Capital DAC/AerCap Global Aviation Trust, 3.00%, due 10/29/28 | |
| | AerCap Ireland Capital DAC/AerCap Global Aviation Trust, 4.45%, due 04/03/26 | |
| | AES Panama Generation Holdings SRL, 4.38%, due 05/31/30 144A | |
| | Aetna, Inc., 4.75%, due 03/15/44 | |
| | Affinity Gaming, 6.88%, due 12/15/27 144A | |
| | Air Canada Pass Through Trust, 3.70%, due 07/15/27 144A | |
| | Air Canada Pass Through Trust, 10.50%, due 07/15/26 144A | |
| | Air Canada Pass Through Trust, 3.60%, due 09/15/28 144A | |
| | Air Canada Pass Through Trust, 4.13%, due 11/15/26 144A | |
| | Air Lease Corp., 2.10%, due 09/01/28 | |
| | Air Lease Corp., 3.63%, due 12/01/27 | |
| | Air Lease Corp., (MTN), 2.88%, due 01/15/26 | |
| | Aker BP ASA, 2.00%, due 07/15/26 144A | |
| | Aker BP ASA, 3.00%, due 01/15/25 144A | |
| | Aker BP ASA, 3.10%, due 07/15/31 144A | |
| | Aker BP ASA, 3.75%, due 01/15/30 144A | |
| | Aker BP ASA, 4.00%, due 01/15/31 144A | |
| | Alaska Airlines Pass Through Trust, 8.00%, due 02/15/27 144A | |
| | Albertsons Cos., Inc./Safeway, Inc./New Albertsons, LP/Albertsons LLC, 3.50%, due 03/15/29 144A | |
| | Albion Financing 1 SARL/Aggreko Holdings, Inc., 6.13%, due 10/15/26 144A | |
| | Alexandria Real Estate Equities, Inc. REIT, 2.00%, due 05/18/32(f) | |
| | Alfa Desarrollo SpA, 4.55%, due 09/27/51 144A | |
| | Ally Financial, Inc., 5.13%, due 09/30/24 | |
| | Ally Financial, Inc., 7.10%, due 11/15/27(f) | |
| | Altera Infrastructure, LP/Teekay Offshore Finance Corp., 8.50%, due 07/15/23(g) | |
| | Altria Group, Inc., 3.40%, due 05/06/30 | |
| | Amazon.com, Inc., 4.10%, due 04/13/62 | |
| | American Airlines Pass Through Trust, 2.88%, due 01/11/36 | |
| | American Airlines Pass Through Trust, 3.15%, due 08/15/33 | |
| | American Airlines Pass Through Trust, 3.25%, due 04/15/30 | |
| | American Airlines Pass Through Trust, 3.38%, due 11/01/28 | |
| | American Airlines Pass Through Trust, 3.50%, due 08/15/33 | |
| | American Airlines Pass Through Trust, 3.60%, due 04/15/31 | |
| | American Airlines Pass Through Trust, 3.65%, due 08/15/30 | |
| | American Airlines Pass Through Trust, 3.70%, due 11/01/24 | |
| | American Airlines Pass Through Trust, 3.85%, due 08/15/29 | |
| | American Airlines Pass Through Trust, 3.95%, due 01/11/32 | |
| | American Airlines Pass Through Trust, 4.00%, due 08/15/30 | |
| | American Airlines Pass Through Trust, 4.10%, due 07/15/29 | |
| | American Homes 4 Rent, LP REIT, 4.25%, due 02/15/28 | |
| | American Tower Corp. REIT, 1.60%, due 04/15/26 | |
| | American Tower Corp. REIT, 3.55%, due 07/15/27 | |
| | American Tower Corp. REIT, 3.80%, due 08/15/29 | |
| | American Tower Trust #1 REIT, 5.49%, due 03/15/53 144A | |
| | AmeriGas Partners, LP/AmeriGas Finance Corp., 5.50%, due 05/20/25 | |
| | AmeriGas Partners, LP/AmeriGas Finance Corp., 5.88%, due 08/20/26 | |
76
See accompanying Notes to the Financial Statements.
Mercer Core Fixed Income Fund
Schedule of Investments (Continued)
(showing percentage of net assets)
March 31, 2023
| | | |
| | Corporate Debt — continued |
| | AmerisourceBergen Corp., 2.80%, due 05/15/30 | |
| | Amgen, Inc., 2.80%, due 08/15/41 | |
| | Amgen, Inc., 5.25%, due 03/02/30 | |
| | Anheuser-Busch Cos. LLC/Anheuser-Busch InBev Worldwide, Inc., 4.90%, due 02/01/46 | |
| | Anheuser-Busch InBev Worldwide, Inc., 4.60%, due 04/15/48 | |
| | Antero Midstream Partners, LP/Antero Midstream Finance Corp., 5.38%, due 06/15/29 144A | |
| | Antero Midstream Partners, LP/Antero Midstream Finance Corp., 7.88%, due 05/15/26 144A | |
| | Antero Resources Corp., 5.38%, due 03/01/30(f) 144A | |
| | Apple, Inc., 3.85%, due 08/04/46 | |
| | Apple, Inc., 4.10%, due 08/08/62 | |
| | AptarGroup, Inc., 3.60%, due 03/15/32 | |
| | Aptiv Plc/Aptiv Corp., 3.25%, due 03/01/32(f) | |
| | APX Group, Inc., 5.75%, due 07/15/29 144A | |
| | Aquarion Co., 4.00%, due 08/15/24 144A | |
| | Ares Capital Corp., 2.15%, due 07/15/26 | |
| | Ares Capital Corp., 2.88%, due 06/15/28 | |
| | Ares Capital Corp., 3.25%, due 07/15/25 | |
| | Ares Capital Corp., 3.88%, due 01/15/26 | |
| | Ares Capital Corp., 4.20%, due 06/10/24 | |
| | Asbury Automotive Group, Inc., 4.63%, due 11/15/29(f) 144A | |
| | Asbury Automotive Group, Inc., 4.75%, due 03/01/30 | |
| | Ascension Health, 2.53%, due 11/15/29 | |
| | Ascension Health, 3.11%, due 11/15/39 | |
| | Ascent Resources Utica Holdings LLC/ARU Finance Corp., 5.88%, due 06/30/29(f) 144A | |
| | Ashtead Capital, Inc., 2.45%, due 08/12/31 144A | |
| | Ashtead Capital, Inc., 4.38%, due 08/15/27 144A | |
| | AT&T, Inc., 2.30%, due 06/01/27 | |
| | AT&T, Inc., 2.55%, due 12/01/33 | |
| | AT&T, Inc., 3.50%, due 06/01/41 | |
| | AT&T, Inc., 3.50%, due 09/15/53 | |
| | AT&T, Inc., 3.65%, due 06/01/51 | |
| | AT&T, Inc., 3.65%, due 09/15/59 | |
| | AT&T, Inc., 4.30%, due 02/15/30 | |
| | AT&T, Inc., 4.50%, due 05/15/35 | |
| | AT&T, Inc., 6.33% (3 mo. USD LIBOR + 1.18%), due 06/12/24(d) | |
| | Athene Holding, Ltd., 3.50%, due 01/15/31 | |
| | Atlantica Transmision Sur SA, 6.88%, due 04/30/43 144A | |
| | Autodesk, Inc., 2.85%, due 01/15/30 | |
| | AutoNation, Inc., 4.75%, due 06/01/30 | |
| | Bacardi, Ltd., 4.70%, due 05/15/28 144A | |
| | BAE Systems Holdings, Inc., 3.85%, due 12/15/25 144A | |
| | BAE Systems Plc, 3.40%, due 04/15/30 144A | |
| | Ball Corp., 3.13%, due 09/15/31(f) | |
| | Banco Santander SA, 1.85%, due 03/25/26 | |
| | Banco Santander SA, 4.38%, due 04/12/28 | |
| | Bank of America Corp., 1.66% (SOFR + 0.91%), due 03/11/27(d) | |
| | Bank of America Corp., 2.30% (SOFR + 1.22%), due 07/21/32(d) | |
See accompanying Notes to the Financial Statements.
77
Mercer Core Fixed Income Fund
Schedule of Investments (Continued)
(showing percentage of net assets)
March 31, 2023
| | | |
| | Corporate Debt — continued |
| | Bank of America Corp., 2.59% (SOFR + 2.15%), due 04/29/31(d) | |
| | Bank of America Corp., 2.69% (SOFR + 1.32%), due 04/22/32(d) | |
| | Bank of America Corp., 3.85% (5 yr. CMT + 2.00%), due 03/08/37(d) | |
| | Bank of America Corp., 4.24% (3 mo. USD LIBOR + 1.81%), due 04/24/38(d) | |
| | Bank of America Corp., 5.13% (3 mo. USD LIBOR + 3.29%)(d)(h) | |
| | Bank of America Corp., 6.30% (3 mo. USD LIBOR + 4.55%)(d)(h) | |
| | Bank of America Corp., (MTN), 2.09% (SOFR + 1.06%), due 06/14/29(d) | |
| | Bank of America Corp., (MTN), 2.50% (3 mo. USD LIBOR + 0.99%), due 02/13/31(d) | |
| | Bank of America Corp., (MTN), 2.88% (3 mo. USD LIBOR + 1.19%), due 10/22/30(d) | |
| | Bank of America Corp., (MTN), 3.25%, due 10/21/27 | |
| | Bank of America Corp., (MTN), 3.59% (3 mo. USD LIBOR + 1.37%), due 07/21/28(d) | |
| | Bank of America Corp., (MTN), 3.95%, due 04/21/25 | |
| | Bank of America Corp., (MTN), 4.27% (3 mo. USD LIBOR + 1.31%), due 07/23/29(d) | |
| | Bank of America Corp., (MTN), 4.33% (3 mo. USD LIBOR + 1.52%), due 03/15/50(d) | |
| | Bank of America Corp., (MTN), 4.95% (SOFR + 2.04%), due 07/22/28(d) | |
| | Barclays Plc, 3.93% (3 mo. USD LIBOR + 1.61%), due 05/07/25(d) | |
| | Barclays Plc, 4.38% (5 yr. CMT + 3.41%)(d)(h) | |
| | Barclays Plc, 4.97% (3 mo. USD LIBOR + 1.90%), due 05/16/29(d) | |
| | Barclays Plc, 5.30% (1 yr. CMT + 2.30%), due 08/09/26(d) | |
| | Barclays Plc, 8.00% (5 yr. CMT + 5.43%)(d)(h) | |
| | BAT Capital Corp., 3.56%, due 08/15/27 | |
| | Bayer US Finance II LLC, 4.20%, due 07/15/34 144A | |
| | Beacon Roofing Supply, Inc., 4.13%, due 05/15/29(f) 144A | |
| | Berkshire Hathaway Energy Co., 3.70%, due 07/15/30(f) | |
| | Berkshire Hathaway Energy Co., 5.95%, due 05/15/37 | |
| | Berkshire Hathaway Energy Co., 6.13%, due 04/01/36 | |
| | Blackstone Holdings Finance Co. LLC, 1.63%, due 08/05/28 144A | |
| | Blackstone Holdings Finance Co. LLC, 2.80%, due 09/30/50 144A | |
| | Blackstone Holdings Finance Co. LLC, 3.15%, due 10/02/27 144A | |
| | Blackstone Private Credit Fund, 2.35%, due 11/22/24 | |
| | Blackstone Private Credit Fund, 2.70%, due 01/15/25 | |
| | Blackstone Private Credit Fund, 3.25%, due 03/15/27 | |
| | Blackstone Private Credit Fund, 4.00%, due 01/15/29 | |
| | Block, Inc., 3.50%, due 06/01/31 | |
| | BlueLinx Holdings, Inc., 6.00%, due 11/15/29 144A | |
| | BNP Paribas SA, 1.68% (SOFR + 0.91%), due 06/30/27(d) 144A | |
| | BNP Paribas SA, 2.16% (SOFR + 1.22%), due 09/15/29(d) 144A | |
| | BNP Paribas SA, 2.22% (SOFR + 2.07%), due 06/09/26(d) 144A | |
| | BNP Paribas SA, 3.13% (SOFR + 1.56%), due 01/20/33(d) 144A | |
| | BNP Paribas SA, 9.25% (5 yr. CMT + 4.97%)(d)(h) 144A | |
| | BOC Aviation USA Corp., 1.63%, due 04/29/24 144A | |
| | Boeing Co. (The), 2.20%, due 02/04/26 | |
| | Boeing Co. (The), 3.20%, due 03/01/29 | |
| | Boeing Co. (The), 3.90%, due 05/01/49 | |
| | Boeing Co. (The), 3.95%, due 08/01/59 | |
| | Boeing Co. (The), 5.04%, due 05/01/27 | |
| | Boeing Co. (The), 5.15%, due 05/01/30 | |
| | Boeing Co. (The), 5.81%, due 05/01/50 | |
| | Booking Holdings, Inc., 4.63%, due 04/13/30 | |
78
See accompanying Notes to the Financial Statements.
Mercer Core Fixed Income Fund
Schedule of Investments (Continued)
(showing percentage of net assets)
March 31, 2023
| | | |
| | Corporate Debt — continued |
| | BPCE SA, 4.50%, due 03/15/25 144A | |
| | Braskem Idesa SAPI, 6.99%, due 02/20/32(f) 144A | |
| | Braskem Netherlands Finance BV, 5.88%, due 01/31/50 144A | |
| | Bristol-Myers Squibb Co., 4.13%, due 06/15/39 | |
| | British Airways Pass Through Trust, 4.13%, due 03/20/33 144A | |
| | British Airways Pass Through Trust, 4.25%, due 05/15/34 144A | |
| | British Airways Pass Through Trust, 4.63%, due 12/20/25 144A | |
| | British Airways Pass Through Trust, 8.38%, due 11/15/28 144A | |
| | Brixmor Operating Partnership, LP REIT, 2.50%, due 08/16/31 | |
| | Broadcom, Inc., 3.14%, due 11/15/35 144A | |
| | Broadcom, Inc., 3.19%, due 11/15/36 144A | |
| | Broadcom, Inc., 3.42%, due 04/15/33 144A | |
| | Broadcom, Inc., 4.11%, due 09/15/28 | |
| | Broadcom, Inc., 4.93%, due 05/15/37 144A | |
| | Brookfield Finance, Inc., 2.72%, due 04/15/31 | |
| | Brookfield Residential Properties, Inc./Brookfield Residential US LLC, 5.00%, due 06/15/29 144A | |
| | Builders FirstSource, Inc., 4.25%, due 02/01/32 144A | |
| | Builders FirstSource, Inc., 5.00%, due 03/01/30 144A | |
| | Builders FirstSource, Inc., 6.38%, due 06/15/32 144A | |
| | C&W Senior Financing DAC, 6.88%, due 09/15/27 144A | |
| | Caesars Entertainment, Inc., 7.00%, due 02/15/30 144A | |
| | Calpine Corp., 3.75%, due 03/01/31 144A | |
| | Canadian Pacific Railway Co., 3.00%, due 12/02/41 | |
| | Canadian Pacific Railway Co., 6.13%, due 09/15/15(i) | |
| | Cantor Fitzgerald, LP, 4.88%, due 05/01/24 144A | |
| | Capital One Financial Corp., 3.30%, due 10/30/24 | |
| | Capital One Financial Corp., 4.93% (SOFR + 2.06%), due 05/10/28(d) | |
| | CCM Merger, Inc., 6.38%, due 05/01/26 144A | |
| | CCO Holdings LLC/CCO Holdings Capital Corp., 4.50%, due 06/01/33 144A | |
| | CCO Holdings LLC/CCO Holdings Capital Corp., 5.38%, due 06/01/29 144A | |
| | CDW LLC/CDW Finance Corp., 3.25%, due 02/15/29 | |
| | CDW LLC/CDW Finance Corp., 5.50%, due 12/01/24 | |
| | Celulosa Arauco y Constitucion SA, 3.88%, due 11/02/27 | |
| | Cemex SAB de CV, 3.88%, due 07/11/31 144A | |
| | Cemex SAB de CV, 5.20%, due 09/17/30 144A | |
| | Cenovus Energy, Inc., 3.75%, due 02/15/52(f) | |
| | Cenovus Energy, Inc., 5.40%, due 06/15/47 | |
| | Centene Corp., 2.45%, due 07/15/28 | |
| | Centene Corp., 3.00%, due 10/15/30 | |
| | Centene Corp., 3.38%, due 02/15/30 | |
| | CenterPoint Energy, Inc., 3.70%, due 09/01/49 | |
| | Century Communities, Inc., 3.88%, due 08/15/29 144A | |
| | CGI, Inc., 1.45%, due 09/14/26 | |
| | Charter Communications Operating LLC/Charter Communications Operating Capital, 2.30%, due 02/01/32 | |
| | Charter Communications Operating LLC/Charter Communications Operating Capital, 2.80%, due 04/01/31 | |
| | Charter Communications Operating LLC/Charter Communications Operating Capital, 3.90%, due 06/01/52 | |
See accompanying Notes to the Financial Statements.
79
Mercer Core Fixed Income Fund
Schedule of Investments (Continued)
(showing percentage of net assets)
March 31, 2023
| | | |
| | Corporate Debt — continued |
| | Charter Communications Operating LLC/Charter Communications Operating Capital, 4.20%, due 03/15/28 | |
| | Charter Communications Operating LLC/Charter Communications Operating Capital, 4.80%, due 03/01/50 | |
| | Charter Communications Operating LLC/Charter Communications Operating Capital, 5.38%, due 05/01/47 | |
| | Charter Communications Operating LLC/Charter Communications Operating Capital, 5.75%, due 04/01/48 | |
| | Charter Communications Operating LLC/Charter Communications Operating Capital, 6.38%, due 10/23/35 | |
| | Charter Communications Operating LLC/Charter Communications Operating Capital, 6.48%, due 10/23/45 | |
| | Cheniere Energy Partners, LP, 4.00%, due 03/01/31 | |
| | Cheniere Energy Partners, LP, 4.50%, due 10/01/29 | |
| | Chevron Corp., 2.00%, due 05/11/27 | |
| | Choice Hotels International, Inc., 3.70%, due 12/01/29 | |
| | Choice Hotels International, Inc., 3.70%, due 01/15/31 | |
| | Cigna Group (The), 3.40%, due 03/01/27 | |
| | Citigroup, Inc., 2.56% (SOFR + 1.17%), due 05/01/32(d) | |
| | Citigroup, Inc., 3.20%, due 10/21/26 | |
| | Citigroup, Inc., 3.40%, due 05/01/26 | |
| | Citigroup, Inc., 3.52% (3 mo. TSFR + 1.41%), due 10/27/28(d)(f) | |
| | Citigroup, Inc., 3.67% (3 mo. TSFR + 1.65%), due 07/24/28(d) | |
| | Citigroup, Inc., 3.89% (3 mo. TSFR + 1.82%), due 01/10/28(d) | |
| | Citigroup, Inc., 4.08% (3 mo. TSFR + 1.45%), due 04/23/29(d) | |
| | Citigroup, Inc., 4.40%, due 06/10/25 | |
| | Citigroup, Inc., 4.41% (SOFR + 3.91%), due 03/31/31(d) | |
| | Citigroup, Inc., 4.60%, due 03/09/26 | |
| | Citigroup, Inc., 4.70% (SOFR + 3.23%)(d)(h) | |
| | Citigroup, Inc., 6.25% (3 mo. TSFR + 4.78%)(d)(h) | |
| | Citizens Financial Group, Inc., 3.25%, due 04/30/30(f) | |
| | Cleveland Clinic Foundation (The), 4.86%, due 01/01/14(i) | |
| | CNA Financial Corp., 2.05%, due 08/15/30 | |
| | CNO Financial Group, Inc., 5.25%, due 05/30/25 | |
| | CNO Financial Group, Inc., 5.25%, due 05/30/29 | |
| | CNX Resources Corp., 7.38%, due 01/15/31(f) 144A | |
| | Comcast Corp., 2.89%, due 11/01/51 | |
| | Comcast Corp., 3.30%, due 04/01/27 | |
| | Comcast Corp., 3.40%, due 04/01/30 | |
| | Comcast Corp., 3.97%, due 11/01/47 | |
| | Comcast Corp., 6.50%, due 11/15/35 | |
| | Comision Federal de Electricidad, 4.69%, due 05/15/29 144A | |
| | CommonSpirit Health, 2.76%, due 10/01/24 | |
| | CommonSpirit Health, 4.19%, due 10/01/49 | |
| | Commonwealth Edison Co., 4.00%, due 03/01/48 | |
| | Consensus Cloud Solutions, Inc., 6.50%, due 10/15/28 144A | |
| | Consolidated Edison Co. of New York, Inc., 4.30%, due 12/01/56 | |
| | Consolidated Edison Co. of New York, Inc., 4.50%, due 12/01/45 | |
| | Constellation Brands, Inc., 2.25%, due 08/01/31 | |
| | Continental Resources, Inc., 4.50%, due 04/15/23 | |
80
See accompanying Notes to the Financial Statements.
Mercer Core Fixed Income Fund
Schedule of Investments (Continued)
(showing percentage of net assets)
March 31, 2023
| | | |
| | Corporate Debt — continued |
| | Continental Resources, Inc., 4.90%, due 06/01/44 | |
| | Coruripe Netherlands BV, 10.00%, due 02/10/27 144A | |
| | CoStar Group, Inc., 2.80%, due 07/15/30 144A | |
| | Cox Communications, Inc., 2.60%, due 06/15/31 144A | |
| | Cox Communications, Inc., 3.35%, due 09/15/26 144A | |
| | Credit Agricole SA, 2.81%, due 01/11/41 144A | |
| | Credit Agricole SA, 3.25%, due 01/14/30 144A | |
| | Credit Agricole SA, 3.75%, due 04/24/23 144A | |
| | Credit Agricole SA, 7.88% (5 yr. USD swap + 4.90%)(d)(f)(h) 144A | |
| | Credit Suisse AG, 7.95%, due 01/09/25 | |
| | Crown Castle, Inc. REIT, 3.80%, due 02/15/28 | |
| | CSC Holdings LLC, 3.38%, due 02/15/31(f) 144A | |
| | CSI Compressco, LP/CSI Compressco Finance, Inc., 7.50%, due 04/01/25(f) 144A | |
| | CSI Compressco, LP/CSI Compressco Finance, Inc., 7.50%, due 04/01/25 144A | |
| | CSI Compressco, LP/CSI Compressco Finance, Inc., 10.00% (10.00% Cash or 7.25% plus 3.50% PIK), due 04/01/26 144A | |
| | CVS Health Corp., 3.75%, due 04/01/30 | |
| | CVS Health Corp., 3.88%, due 07/20/25 | |
| | CVS Health Corp., 4.78%, due 03/25/38 | |
| | CVS Health Corp., 5.05%, due 03/25/48 | |
| | CVS Health Corp., 5.13%, due 07/20/45 | |
| | CVS Pass-Through Trust, 5.77%, due 01/10/33 144A | |
| | CVS Pass-Through Trust, 6.94%, due 01/10/30 | |
| | CVS Pass-Through Trust, 7.51%, due 01/10/32 144A | |
| | DAE Funding LLC, 2.63%, due 03/20/25 144A | |
| | Dana, Inc., 4.50%, due 02/15/32 | |
| | Danske Bank AS, 6.47% (1 yr. CMT + 2.10%), due 01/09/26(d) 144A | |
| | DaVita, Inc., 3.75%, due 02/15/31 144A | |
| | DaVita, Inc., 4.63%, due 06/01/30 144A | |
| | DCP Midstream Operating, LP, 5.85% (3 mo. USD LIBOR + 3.85%), due 05/21/43(d) 144A | |
| | Dealer Tire LLC/DT Issuer LLC, 8.00%, due 02/01/28 144A | |
| | Dell International LLC/EMC Corp., 5.30%, due 10/01/29 | |
| | Dell International LLC/EMC Corp., 5.85%, due 07/15/25 | |
| | Delta Air Lines Pass Through Trust, 2.00%, due 12/10/29 | |
| | Delta Air Lines, Inc., 2.90%, due 10/28/24 | |
| | Delta Air Lines, Inc., 3.80%, due 04/19/23 | |
| | Delta Air Lines, Inc., 4.38%, due 04/19/28(f) | |
| | Delta Air Lines, Inc./SkyMiles IP, Ltd., 4.50%, due 10/20/25 144A | |
| | Delta Air Lines, Inc./SkyMiles IP, Ltd., 4.75%, due 10/20/28 144A | |
| | Deutsche Bank AG, 2.31% (SOFR + 1.22%), due 11/16/27(d) | |
| | Deutsche Bank AG, 3.74% (SOFR + 2.26%), due 01/07/33(d) | |
| | Diamondback Energy, Inc., 3.13%, due 03/24/31(f) | |
| | Diamondback Energy, Inc., 3.25%, due 12/01/26 | |
| | Digital Realty Trust, LP REIT, 3.60%, due 07/01/29(f) | |
| | Digital Realty Trust, LP REIT, 3.70%, due 08/15/27 | |
| | Discover Financial Services, 4.10%, due 02/09/27 | |
| | Dollar Tree, Inc., 4.20%, due 05/15/28 | |
| | Dominion Energy, Inc., 2.85%, due 08/15/26 | |
See accompanying Notes to the Financial Statements.
81
Mercer Core Fixed Income Fund
Schedule of Investments (Continued)
(showing percentage of net assets)
March 31, 2023
| | | |
| | Corporate Debt — continued |
| | Dominion Energy, Inc., 3.38%, due 04/01/30 | |
| | DPL, Inc., 4.13%, due 07/01/25 | |
| | DTE Electric Co., 2.25%, due 03/01/30 | |
| | DTE Electric Securitization Funding I LLC, 2.64%, due 12/01/27 | |
| | DTE Energy Co., 1.05%, due 06/01/25 | |
| | Duke Energy Carolinas LLC, 3.95%, due 03/15/48 | |
| | Duke Energy Florida LLC, 3.40%, due 10/01/46 | |
| | Duke Energy Ohio, Inc., 5.25%, due 04/01/33 | |
| | Duke Energy Progress LLC, 3.70%, due 10/15/46(f) | |
| | eBay, Inc., 2.70%, due 03/11/30(f) | |
| | Ecopetrol SA, 6.88%, due 04/29/30 | |
| | Edgewell Personal Care Co., 4.13%, due 04/01/29 144A | |
| | Edgewell Personal Care Co., 5.50%, due 06/01/28 144A | |
| | EIG Pearl Holdings SARL, 3.55%, due 08/31/36 144A | |
| | El Paso Natural Gas Co. LLC, 8.38%, due 06/15/32(f) | |
| | Elevance Health, Inc., 3.60%, due 03/15/51 | |
| | Elevance Health, Inc., 5.10%, due 01/15/44 | |
| | Embraer Netherlands Finance BV, 5.05%, due 06/15/25 | |
| | Embraer Overseas, Ltd., 5.70%, due 09/16/23 144A | |
| | Emera US Finance, LP, 3.55%, due 06/15/26 | |
| | Enbridge, Inc., 5.50% (3 mo. USD LIBOR + 3.42%), due 07/15/77(d) | |
| | Enbridge, Inc., 5.75% (5 yr. CMT + 5.31%), due 07/15/80(d) | |
| | Enbridge, Inc., 6.25% (3 mo. USD LIBOR + 3.64%), due 03/01/78(d) | |
| | Encompass Health Corp., 4.50%, due 02/01/28 | |
| | Encompass Health Corp., 4.63%, due 04/01/31 | |
| | Endeavor Energy Resources, LP/EER Finance, Inc., 5.75%, due 01/30/28 144A | |
| | Energean Israel Finance, Ltd., 4.50%, due 03/30/24(j) 144A | |
| | Energean Israel Finance, Ltd., 4.88%, due 03/30/26(j) 144A | |
| | Energean Israel Finance, Ltd., 5.38%, due 03/30/28(j) 144A | |
| | Energean Israel Finance, Ltd., 5.88%, due 03/30/31(j) 144A | |
| | Energy Transfer, LP, 4.20%, due 04/15/27 | |
| | Energy Transfer, LP, 5.15%, due 03/15/45 | |
| | Energy Transfer, LP, 5.25%, due 04/15/29 | |
| | Energy Transfer, LP, 5.30%, due 04/01/44 | |
| | Energy Transfer, LP, 5.30%, due 04/15/47 | |
| | Energy Transfer, LP, 5.40%, due 10/01/47 | |
| | Energy Transfer, LP, 5.50%, due 06/01/27 | |
| | Energy Transfer, LP, 6.25%, due 04/15/49 | |
| | Energy Transfer, LP, 6.50% (5 yr. CMT + 5.69%)(d)(h) | |
| | Enova International, Inc., 8.50%, due 09/15/25(f) 144A | |
| | Enterprise Products Operating LLC, 4.90%, due 05/15/46 | |
| | Enterprise Products Operating LLC, 5.25% (3 mo. USD LIBOR + 3.03%), due | |
| | EQM Midstream Partners, LP, 7.50%, due 06/01/27 144A | |
| | EQM Midstream Partners, LP, 7.50%, due 06/01/30 144A | |
| | EQT Corp., 5.68%, due 10/01/25 | |
| | Equifax, Inc., 5.10%, due 12/15/27 | |
| | Essential Utilities, Inc., 2.70%, due 04/15/30 | |
| | Essex Portfolio, LP REIT, 1.70%, due 03/01/28(f) | |
82
See accompanying Notes to the Financial Statements.
Mercer Core Fixed Income Fund
Schedule of Investments (Continued)
(showing percentage of net assets)
March 31, 2023
| | | |
| | Corporate Debt — continued |
| | Eversource Energy, 2.90%, due 10/01/24 | |
| | Eversource Energy, 2.90%, due 03/01/27 | |
| | Exelon Corp., 3.35%, due 03/15/32 | |
| | Exelon Corp., 4.70%, due 04/15/50 | |
| | Exelon Corp., 5.10%, due 06/15/45 | |
| | Expedia Group, Inc., 2.95%, due 03/15/31 | |
| | Expedia Group, Inc., 4.63%, due 08/01/27 | |
| | Expedia Group, Inc., 5.00%, due 02/15/26 | |
| | Extra Space Storage, LP REIT, 5.70%, due 04/01/28 | |
| | Fairfax Financial Holdings, Ltd., 5.63%, due 08/16/32 144A | |
| | Falabella SA, 4.38%, due 01/27/25 144A | |
| | Ferguson Finance Plc, 3.25%, due 06/02/30 144A | |
| | Ferguson Finance Plc, 4.50%, due 10/24/28 144A | |
| | Fifth Third Bancorp, 5.10% (3 mo. USD LIBOR + 3.03%)(d)(h) | |
| | First Quantum Minerals, Ltd., 6.88%, due 03/01/26(f) 144A | |
| | First Quantum Minerals, Ltd., 6.88%, due 10/15/27 144A | |
| | First Quantum Minerals, Ltd., 7.50%, due 04/01/25(f) 144A | |
| | FirstEnergy Corp., 2.65%, due 03/01/30 | |
| | FirstEnergy Corp., 3.40%, due 03/01/50 | |
| | Florida Power & Light Co., 2.45%, due 02/03/32 | |
| | Flowserve Corp., 3.50%, due 10/01/30(f) | |
| | Ford Motor Co., 3.25%, due 02/12/32 | |
| | Ford Motor Co., 4.75%, due 01/15/43 | |
| | Ford Motor Credit Co. LLC, 4.00%, due 11/13/30 | |
| | Ford Motor Credit Co. LLC, 4.13%, due 08/04/25 | |
| | Ford Motor Credit Co. LLC, 4.13%, due 08/17/27 | |
| | Ford Motor Credit Co. LLC, 5.11%, due 05/03/29 | |
| | Freedom Mortgage Corp., 8.13%, due 11/15/24 144A | |
| | Freeport-McMoRan, Inc., 4.25%, due 03/01/30 | |
| | Freeport-McMoRan, Inc., 4.63%, due 08/01/30 | |
| | Freeport-McMoRan, Inc., 5.45%, due 03/15/43 | |
| | Fresenius Medical Care US Finance III, Inc., 2.38%, due 02/16/31 144A | |
| | Full House Resorts, Inc., 8.25%, due 02/15/28(f) 144A | |
| | GA Global Funding Trust, 3.85%, due 04/11/25 144A | |
| | Gap, Inc. (The), 3.63%, due 10/01/29(f) 144A | |
| | Gap, Inc. (The), 3.88%, due 10/01/31(f) 144A | |
| | Gartner, Inc., 4.50%, due 07/01/28 144A | |
| | GCI LLC, 4.75%, due 10/15/28 144A | |
| | GEMS MENASA Cayman, Ltd./GEMS Education Delaware LLC, 7.13%, due 07/31/26 144A | |
| | General Motors Co., 5.00%, due 04/01/35 | |
| | General Motors Co., 5.40%, due 10/15/29 | |
| | General Motors Co., 5.40%, due 04/01/48 | |
| | General Motors Co., 6.25%, due 10/02/43 | |
| | General Motors Financial Co., Inc., 2.40%, due 10/15/28 | |
| | General Motors Financial Co., Inc., 2.70%, due 06/10/31 | |
| | General Motors Financial Co., Inc., 2.90%, due 02/26/25 | |
| | General Motors Financial Co., Inc., 3.10%, due 01/12/32 | |
| | General Motors Financial Co., Inc., 3.60%, due 06/21/30 | |
See accompanying Notes to the Financial Statements.
83
Mercer Core Fixed Income Fund
Schedule of Investments (Continued)
(showing percentage of net assets)
March 31, 2023
| | | |
| | Corporate Debt — continued |
| | General Motors Financial Co., Inc., 6.00%, due 01/09/28 | |
| | Global Infrastructure Solutions, Inc., 5.63%, due 06/01/29 144A | |
| | Globo Comunicacao e Participacoes SA, 4.88%, due 01/22/30 144A | |
| | GLP Capital, LP/GLP Financing II, Inc. REIT, 3.25%, due 01/15/32 | |
| | GLP Capital, LP/GLP Financing II, Inc. REIT, 4.00%, due 01/15/30 | |
| | GLP Capital, LP/GLP Financing II, Inc. REIT, 4.00%, due 01/15/31 | |
| | GLP Capital, LP/GLP Financing II, Inc. REIT, 5.38%, due 04/15/26 | |
| | Goldman Sachs Group, Inc. (The), 0.86% (SOFR + 0.61%), due 02/12/26(d) | |
| | Goldman Sachs Group, Inc. (The), 1.43% (SOFR + 0.80%), due 03/09/27(d) | |
| | Goldman Sachs Group, Inc. (The), 1.54% (SOFR + 0.82%), due 09/10/27(d) | |
| | Goldman Sachs Group, Inc. (The), 2.38% (SOFR + 1.25%), due 07/21/32(d) | |
| | Goldman Sachs Group, Inc. (The), 2.62% (SOFR + 1.28%), due 04/22/32(d) | |
| | Goldman Sachs Group, Inc. (The), 2.65% (SOFR + 1.26%), due 10/21/32(d) | |
| | Goldman Sachs Group, Inc. (The), 3.10% (SOFR + 1.41%), due 02/24/33(d) | |
| | Goldman Sachs Group, Inc. (The), 3.27% (3 mo. USD LIBOR + 1.20%), due 09/29/25(d) | |
| | Goldman Sachs Group, Inc. (The), 3.50%, due 01/23/25 | |
| | Goldman Sachs Group, Inc. (The), 3.75%, due 02/25/26 | |
| | Goldman Sachs Group, Inc. (The), 3.80%, due 03/15/30 | |
| | Goldman Sachs Group, Inc. (The), 3.81% (3 mo. USD LIBOR + 1.16%), due 04/23/29(d) | |
| | Goldman Sachs Group, Inc. (The), 3.85%, due 01/26/27 | |
| | Graphic Packaging International LLC, 3.50%, due 03/01/29 144A | |
| | Graphic Packaging International LLC, 4.13%, due 08/15/24 | |
| | Greensaif Pipelines Bidco Sarl, 6.13%, due 02/23/38 144A | |
| | Greensaif Pipelines Bidco Sarl, 6.51%, due 02/23/42 144A | |
| | Group 1 Automotive, Inc., 4.00%, due 08/15/28 144A | |
| | H&E Equipment Services, Inc., 3.88%, due 12/15/28 144A | |
| | HCA, Inc., 4.38%, due 03/15/42 144A | |
| | HCA, Inc., 5.25%, due 04/15/25 | |
| | HCA, Inc., 5.25%, due 06/15/26 | |
| | HCA, Inc., 5.38%, due 02/01/25 | |
| | HCA, Inc., (MTN), 7.75%, due 07/15/36 | |
| | Healthpeak Properties, Inc. REIT, 3.25%, due 07/15/26 | |
| | Hess Midstream Operations, LP, 4.25%, due 02/15/30 144A | |
| | Hess Midstream Operations, LP, 5.50%, due 10/15/30 144A | |
| | Hilcorp Energy I, LP/Hilcorp Finance Co., 6.00%, due 04/15/30 144A | |
| | Hilcorp Energy I, LP/Hilcorp Finance Co., 6.25%, due 04/15/32 144A | |
| | Hillenbrand, Inc., 3.75%, due 03/01/31 | |
| | Hilton Grand Vacations Borrower Escrow LLC/Hilton Grand Vacations Borrower Escrow, Inc., 4.88%, due 07/01/31 144A | |
| | Hilton Grand Vacations Borrower Escrow LLC/Hilton Grand Vacations Borrower Escrow, Inc., 5.00%, due 06/01/29 144A | |
| | Home Depot, Inc. (The), 3.30%, due 04/15/40 | |
| | Home Depot, Inc. (The), 3.63%, due 04/15/52 | |
| | Host Hotels & Resorts, LP REIT, 3.38%, due 12/15/29 | |
| | Host Hotels & Resorts, LP REIT, 3.50%, due 09/15/30 | |
| | Host Hotels & Resorts, LP REIT, 4.50%, due 02/01/26 | |
| | HSBC Holdings Plc, 7.39% (SOFR + 3.35%), due 11/03/28(d) | |
| | Hudbay Minerals, Inc., 4.50%, due 04/01/26 144A | |
| | Huntington Ingalls Industries, Inc., 4.20%, due 05/01/30 | |
84
See accompanying Notes to the Financial Statements.
Mercer Core Fixed Income Fund
Schedule of Investments (Continued)
(showing percentage of net assets)
March 31, 2023
| | | |
| | Corporate Debt — continued |
| | Huntsman International LLC, 2.95%, due 06/15/31 | |
| | Huntsman International LLC, 4.50%, due 05/01/29 | |
| | Hyatt Hotels Corp., 6.00%, due 04/23/30(e) | |
| | Hyundai Capital America, 1.80%, due 10/15/25 144A | |
| | Hyundai Capital America, 2.38%, due 10/15/27 144A | |
| | IHS Markit, Ltd., 4.75%, due 08/01/28 | |
| | Infor, Inc., 1.75%, due 07/15/25 144A | |
| | Instituto Costarricense de Electricidad, 6.38%, due 05/15/43(f) 144A | |
| | Intel Corp., 5.63%, due 02/10/43 | |
| | Intesa Sanpaolo SpA, 4.20% (1 yr. CMT + 2.60%), due 06/01/32(d) 144A | |
| | IPALCO Enterprises, Inc., 4.25%, due 05/01/30 | |
| | Iron Mountain Information Management Services, Inc. REIT, 5.00%, due 07/15/32 144A | |
| | Iron Mountain, Inc. REIT, 4.88%, due 09/15/29 144A | |
| | Iron Mountain, Inc. REIT, 5.25%, due 07/15/30 144A | |
| | Jacobs Entertainment, Inc., 6.75%, due 02/15/29 144A | |
| | JB Poindexter & Co., Inc., 7.13%, due 04/15/26 144A | |
| | JBS USA LUX SA/JBS USA Food Co./JBS USA Finance, Inc., 3.00%, due 02/02/29 144A | |
| | JBS USA LUX SA/JBS USA Food Co./JBS USA Finance, Inc., 3.63%, due 01/15/32(f) 144A | |
| | JBS USA LUX SA/JBS USA Food Co./JBS USA Finance, Inc., 3.75%, due 12/01/31 144A | |
| | JBS USA LUX SA/JBS USA Food Co./JBS USA Finance, Inc., 5.13%, due 02/01/28 144A | |
| | JBS USA LUX SA/JBS USA Food Co./JBS USA Finance, Inc., 5.75%, due 04/01/33 144A | |
| | JetBlue Pass Through Trust, 2.75%, due 11/15/33 | |
| | JPMorgan Chase & Co., 2.07% (SOFR + 1.02%), due 06/01/29(d) | |
| | JPMorgan Chase & Co., 2.52% (SOFR + 2.04%), due 04/22/31(d) | |
| | JPMorgan Chase & Co., 2.58% (SOFR + 1.25%), due 04/22/32(d) | |
| | JPMorgan Chase & Co., 2.96% (SOFR + 1.26%), due 01/25/33(d) | |
| | JPMorgan Chase & Co., 2.96% (SOFR + 2.52%), due 05/13/31(d) | |
| | JPMorgan Chase & Co., 3.78% (3 mo. USD LIBOR + 1.34%), due 02/01/28(d) | |
| | JPMorgan Chase & Co., 3.96% (3 mo. USD LIBOR + 1.38%), due 11/15/48(d) | |
| | JPMorgan Chase & Co., 4.00% (3 mo. TSFR + 2.75%)(d)(f)(h) | |
| | JPMorgan Chase & Co., 4.01% (3 mo. USD LIBOR + 1.12%), due 04/23/29(d) | |
| | JPMorgan Chase & Co., 4.20% (3 mo. USD LIBOR + 1.26%), due 07/23/29(d) | |
| | JPMorgan Chase & Co., 4.49% (3 mo. TSFR + 3.79%), due 03/24/31(d) | |
| | JPMorgan Chase & Co., 4.60% (3 mo. TSFR + 3.13%)(d)(h) | |
| | JPMorgan Chase & Co., 5.00% (3 mo. TSFR + 3.38%)(d)(h) | |
| | JPMorgan Chase & Co., 6.75% (3 mo. USD LIBOR + 3.78%)(d)(f)(h) | |
| | JW Aluminum Continuous Cast Co., 10.25%, due 06/01/26 144A | |
| | Kaiser Foundation Hospitals, 2.81%, due 06/01/41 | |
| | KazMunayGas National Co. JSC, 4.75%, due 04/24/25 144A | |
| | KB Home, 7.25%, due 07/15/30 | |
| | Kinder Morgan Energy Partners, LP, 7.75%, due 03/15/32 | |
| | Kinder Morgan, Inc., 3.60%, due 02/15/51 | |
| | KKR Group Finance Co. II LLC, 5.50%, due 02/01/43(f) 144A | |
| | KKR Group Finance Co. VII LLC, 3.63%, due 02/25/50 144A | |
| | KKR Group Finance Co. X LLC, 3.25%, due 12/15/51 144A | |
See accompanying Notes to the Financial Statements.
85
Mercer Core Fixed Income Fund
Schedule of Investments (Continued)
(showing percentage of net assets)
March 31, 2023
| | | |
| | Corporate Debt — continued |
| | KLA Corp., 4.10%, due 03/15/29 | |
| | Kraft Heinz Foods Co., 4.38%, due 06/01/46 | |
| | Kraft Heinz Foods Co., 4.88%, due 10/01/49 | |
| | Kraft Heinz Foods Co., 5.00%, due 06/04/42 | |
| | Kraft Heinz Foods Co., 5.20%, due 07/15/45 | |
| | Lam Research Corp., 2.88%, due 06/15/50 | |
| | Lamb Weston Holdings, Inc., 4.13%, due 01/31/30 144A | |
| | Lamb Weston Holdings, Inc., 4.38%, due 01/31/32 144A | |
| | Lazard Group LLC, 4.38%, due 03/11/29 | |
| | Lehman Brothers Holdings Capital Trust VII, (MTN), 5.86% (3 mo. USD LIBOR + | |
| | Lehman Brothers Holdings, Inc., 6.50%, due 07/19/17(g)(k)(l) | |
| | Lehman Brothers Holdings, Inc., (MTN), 6.75%, due 12/28/17(g)(k)(l) | |
| | Level 3 Financing, Inc., 3.40%, due 03/01/27 144A | |
| | Leviathan Bond, Ltd., 6.50%, due 06/30/27(j) 144A | |
| | Leviathan Bond, Ltd., 6.75%, due 06/30/30(j) 144A | |
| | Liberty Mutual Group, Inc., 3.95%, due 10/15/50 144A | |
| | Liberty Mutual Group, Inc., 4.13% (5 yr. CMT + 3.32%), due 12/15/51(d) 144A | |
| | Liberty Mutual Group, Inc., 4.25%, due 06/15/23 144A | |
| | Liberty Mutual Group, Inc., 4.57%, due 02/01/29(f) 144A | |
| | Lincoln National Corp., 3.40%, due 01/15/31(f) | |
| | Lithia Motors, Inc., 3.88%, due 06/01/29(f) 144A | |
| | Lithia Motors, Inc., 4.38%, due 01/15/31 144A | |
| | Lithia Motors, Inc., 4.63%, due 12/15/27 144A | |
| | Lloyds Banking Group Plc, 2.44% (1 yr. CMT + 1.00%), due 02/05/26(d) | |
| | Lloyds Banking Group Plc, 4.45%, due 05/08/25 | |
| | Lloyds Banking Group Plc, 7.50% (5 yr. USD swap + 4.76%)(d)(h) | |
| | Lockheed Martin Corp., 2.80%, due 06/15/50(f) | |
| | Lowe's Cos., Inc., 3.70%, due 04/15/46 | |
| | Lowe's Cos., Inc., 5.63%, due 04/15/53(f) | |
| | LSC Communication Escrow, Inc., 8.75%, due 10/15/23(g)(k)(l) | |
| | Lubrizol Corp. (The), 6.50%, due 10/01/34 | |
| | LYB International Finance BV, 4.88%, due 03/15/44 | |
| | LYB International Finance III LLC, 4.20%, due 05/01/50 | |
| | M&T Bank Corp., 5.13% (3 mo. USD LIBOR + 3.52%)(d)(h) | |
| | Macquarie Bank, Ltd., 3.62%, due 06/03/30 144A | |
| | Macquarie Bank, Ltd., 4.88%, due 06/10/25 144A | |
| | Macquarie Group, Ltd., 1.34% (SOFR + 1.07%), due 01/12/27(d) 144A | |
| | Macy's Retail Holdings LLC, 5.88%, due 04/01/29(f) 144A | |
| | Macy's Retail Holdings LLC, 5.88%, due 03/15/30 144A | |
| | Macy's Retail Holdings LLC, 6.13%, due 03/15/32(f) 144A | |
| | Magellan Midstream Partners, LP, 4.25%, due 09/15/46 | |
| | Magellan Midstream Partners, LP, 5.15%, due 10/15/43 | |
| | Manulife Financial Corp., 3.70%, due 03/16/32(f) | |
| | MARB BondCo Plc, 3.95%, due 01/29/31 144A | |
| | Marriott International, Inc., 4.63%, due 06/15/30 | |
| | Marriott International, Inc., 5.00%, due 10/15/27 | |
| | Martin Marietta Materials, Inc., 2.50%, due 03/15/30 | |
| | Marvell Technology, Inc., 2.45%, due 04/15/28 | |
86
See accompanying Notes to the Financial Statements.
Mercer Core Fixed Income Fund
Schedule of Investments (Continued)
(showing percentage of net assets)
March 31, 2023
| | | |
| | Corporate Debt — continued |
| | Masonite International Corp., 3.50%, due 02/15/30 144A | |
| | Massachusetts Institute of Technology, 4.68%, due 07/01/14(i) | |
| | Massachusetts Mutual Life Insurance Co., 3.38%, due 04/15/50 144A | |
| | Massachusetts Mutual Life Insurance Co., 5.67%, due 12/01/52 144A | |
| | MasTec, Inc., 4.50%, due 08/15/28(f) 144A | |
| | Match Group Holdings II LLC, 3.63%, due 10/01/31(f) 144A | |
| | Match Group Holdings II LLC, 4.13%, due 08/01/30 144A | |
| | Mauser Packaging Solutions Holding Co., 7.88%, due 08/15/26 144A | |
| | MC Brazil Downstream Trading SARL, 7.25%, due 06/30/31 144A | |
| | McDonald's Corp., (MTN), 4.20%, due 04/01/50 | |
| | MDC Holdings, Inc., 2.50%, due 01/15/31 | |
| | MetLife, Inc., 6.40%, due 12/15/36 | |
| | Metropolitan Life Global Funding I, 3.30%, due 03/21/29 144A | |
| | Mexico City Airport Trust, 5.50%, due 07/31/47(f) 144A | |
| | MGM Resorts International, 4.75%, due 10/15/28 | |
| | Michaels Cos, Inc. (The), 5.25%, due 05/01/28 144A | |
| | Michaels Cos, Inc. (The), 7.88%, due 05/01/29(f) 144A | |
| | Micron Technology, Inc., 4.19%, due 02/15/27 | |
| | Micron Technology, Inc., 5.33%, due 02/06/29 | |
| | MidAmerican Energy Co., 4.25%, due 07/15/49 | |
| | Mid-Atlantic Interstate Transmission LLC, 4.10%, due 05/15/28 144A | |
| | Midwest Connector Capital Co. LLC, 3.90%, due 04/01/24 144A | |
| | Midwest Gaming Borrower LLC/Midwest Gaming Finance Corp., 4.88%, due 05/01/29 144A | |
| | Millicom International Cellular SA, 6.25%, due 03/25/29 144A | |
| | Mohegan Gaming & Entertainment, 8.00%, due 02/01/26 144A | |
| | Moody's Corp., 3.25%, due 05/20/50 | |
| | Morgan Stanley, 2.19% (SOFR + 1.99%), due 04/28/26(d) | |
| | Morgan Stanley, 2.48% (SOFR + 1.36%), due 09/16/36(d) | |
| | Morgan Stanley, 2.94% (SOFR + 1.29%), due 01/21/33(d)(f) | |
| | Morgan Stanley, 3.59% (3 mo. USD LIBOR + 1.34%), due 07/22/28(d) | |
| | Morgan Stanley, 4.21% (SOFR + 1.61%), due 04/20/28(d) | |
| | Morgan Stanley, 6.34% (SOFR + 2.56%), due 10/18/33(d) | |
| | Morgan Stanley, (MTN), 2.24% (SOFR + 1.18%), due 07/21/32(d) | |
| | Morgan Stanley, (MTN), 2.70% (SOFR + 1.14%), due 01/22/31(d) | |
| | Morgan Stanley, (MTN), 3.13%, due 07/27/26 | |
| | Morgan Stanley, (MTN), 3.62% (SOFR + 3.12%), due 04/01/31(d) | |
| | Morgan Stanley, (MTN), 3.77% (3 mo. USD LIBOR + 1.14%), due 01/24/29(d) | |
| | Morgan Stanley, (MTN), 3.88%, due 01/27/26 | |
| | Motorola Solutions, Inc., 2.30%, due 11/15/30 | |
| | Motorola Solutions, Inc., 2.75%, due 05/24/31 | |
| | Motorola Solutions, Inc., 4.60%, due 05/23/29 | |
| | MPLX, LP, 4.00%, due 03/15/28 | |
| | MPLX, LP, 4.13%, due 03/01/27 | |
| | MPLX, LP, 4.25%, due 12/01/27 | |
| | MPLX, LP, 4.50%, due 04/15/38 | |
| | MPLX, LP, 4.70%, due 04/15/48 | |
| | MPLX, LP, 4.95%, due 09/01/32 | |
| | MPLX, LP, 5.00%, due 03/01/33 | |
See accompanying Notes to the Financial Statements.
87
Mercer Core Fixed Income Fund
Schedule of Investments (Continued)
(showing percentage of net assets)
March 31, 2023
| | | |
| | Corporate Debt — continued |
| | MPLX, LP, 5.20%, due 03/01/47 | |
| | MPT Operating Partnership, LP/MPT Finance Corp. REIT, 3.50%, due 03/15/31 | |
| | MPT Operating Partnership, LP/MPT Finance Corp. REIT, 5.00%, due 10/15/27(f) | |
| | MSCI, Inc., 3.63%, due 11/01/31 144A | |
| | MTN Mauritius Investment, Ltd., 4.76%, due 11/11/24 144A | |
| | Mylan, Inc., 5.40%, due 11/29/43(f) | |
| | Nationstar Mortgage Holdings, Inc., 5.13%, due 12/15/30 144A | |
| | Nationstar Mortgage Holdings, Inc., 5.50%, due 08/15/28 144A | |
| | Nationstar Mortgage Holdings, Inc., 6.00%, due 01/15/27 144A | |
| | NatWest Group Plc, 3.75% (5 yr. CMT + 2.10%), due 11/01/29(d) | |
| | NatWest Group Plc, 5.08% (3 mo. USD LIBOR + 1.91%), due 01/27/30(d)(f) | |
| | NatWest Group Plc, 6.00% (5 yr. CMT + 5.63%)(d)(h) | |
| | NatWest Markets Plc, 1.60%, due 09/29/26 144A | |
| | NBM US Holdings, Inc., 6.63%, due 08/06/29 144A | |
| | Netflix, Inc., 4.88%, due 04/15/28 | |
| | Netflix, Inc., 4.88%, due 06/15/30 144A | |
| | Netflix, Inc., 5.38%, due 11/15/29 144A | |
| | Netflix, Inc., 5.88%, due 11/15/28 | |
| | Newmont Corp., 2.25%, due 10/01/30 | |
| | Newmont Corp., 2.80%, due 10/01/29 | |
| | Newmont Corp., 5.45%, due 06/09/44 | |
| | News Corp., 3.88%, due 05/15/29 144A | |
| | News Corp., 5.13%, due 02/15/32(f) 144A | |
| | NextEra Energy Capital Holdings, Inc., 2.25%, due 06/01/30 | |
| | NextEra Energy Capital Holdings, Inc., 6.05%, due 03/01/25 | |
| | NextEra Energy Operating Partners, LP, 3.88%, due 10/15/26 144A | |
| | NextEra Energy Operating Partners, LP, 4.50%, due 09/15/27 144A | |
| | Nippon Life Insurance Co., 2.75% (5 yr. CMT + 2.65%), due 01/21/51(d) 144A | |
| | NiSource, Inc., 3.60%, due 05/01/30 | |
| | NiSource, Inc., 5.25%, due 03/30/28 | |
| | Nissan Motor Acceptance Co. LLC, 1.13%, due 09/16/24 144A | |
| | Nissan Motor Acceptance Co. LLC, 1.85%, due 09/16/26 144A | |
| | Nissan Motor Acceptance Co. LLC, 2.00%, due 03/09/26 144A | |
| | Nomura Holdings, Inc., 2.61%, due 07/14/31 | |
| | Norfolk Southern Corp., 4.84%, due 10/01/41 | |
| | Northern States Power Co., 3.60%, due 09/15/47 | |
| | Northrop Grumman Corp., 5.25%, due 05/01/50 | |
| | NOVA Chemicals Corp., 4.88%, due 06/01/24 144A | |
| | Novelis Corp., 4.75%, due 01/30/30 144A | |
| | NRG Energy, Inc., 2.45%, due 12/02/27 144A | |
| | NRG Energy, Inc., 3.38%, due 02/15/29 144A | |
| | NRG Energy, Inc., 3.63%, due 02/15/31 144A | |
| | NRG Energy, Inc., 3.88%, due 02/15/32 144A | |
| | NRG Energy, Inc., 4.45%, due 06/15/29 144A | |
| | NRG Energy, Inc., 5.25%, due 06/15/29(f) 144A | |
| | NRG Energy, Inc., 5.75%, due 01/15/28(f) | |
| | NRG Energy, Inc., 7.00%, due 03/15/33 144A | |
| | NRG Energy, Inc., 10.25% (5 yr. CMT + 5.92%)(d)(h) 144A | |
| | NSTAR Electric Co., 3.10%, due 06/01/51 | |
88
See accompanying Notes to the Financial Statements.
Mercer Core Fixed Income Fund
Schedule of Investments (Continued)
(showing percentage of net assets)
March 31, 2023
| | | |
| | Corporate Debt — continued |
| | Nutrien, Ltd., 4.90%, due 06/01/43 | |
| | NXP BV/NXP Funding LLC/NXP USA, Inc., 2.70%, due 05/01/25 | |
| | NXP BV/NXP Funding LLC/NXP USA, Inc., 3.88%, due 06/18/26 | |
| | Occidental Petroleum Corp., 6.45%, due 09/15/36 | |
| | Occidental Petroleum Corp., 6.60%, due 03/15/46 | |
| | Occidental Petroleum Corp., 6.85%, due 10/10/36(m) | |
| | OCI NV, 6.70%, due 03/16/33 144A | |
| | OneMain Finance Corp., 6.63%, due 01/15/28 | |
| | OneMain Finance Corp., 6.88%, due 03/15/25 | |
| | OneMain Finance Corp., 8.25%, due 10/01/23 | |
| | ONEOK, Inc., 3.10%, due 03/15/30 | |
| | ONEOK, Inc., 4.45%, due 09/01/49 | |
| | ONEOK, Inc., 4.95%, due 07/13/47 | |
| | Oracle Corp., 1.65%, due 03/25/26 | |
| | Oracle Corp., 2.95%, due 04/01/30 | |
| | Oracle Corp., 3.95%, due 03/25/51 | |
| | Oracle Corp., 4.90%, due 02/06/33 | |
| | Organon & Co./Organon Foreign Debt Co-Issuer BV, 4.13%, due 04/30/28 144A | |
| | Organon & Co./Organon Foreign Debt Co-Issuer BV, 5.13%, due 04/30/31 144A | |
| | Oriflame Investment Holding Plc, 5.13%, due 05/04/26 144A | |
| | Ovintiv, Inc., 7.20%, due 11/01/31 | |
| | Owens Corning, 3.88%, due 06/01/30 | |
| | Owens Corning, 3.95%, due 08/15/29 | |
| | Owens Corning, 4.30%, due 07/15/47 | |
| | Owens-Brockway Glass Container, Inc., 6.63%, due 05/13/27(f) 144A | |
| | Pacific Gas & Electric Co., 6.70%, due 04/01/53 | |
| | PacifiCorp, 2.70%, due 09/15/30(f) | |
| | Pactiv Evergreen Group Issuer LLC/Pactiv Evergreen Group Issuer, Inc., 4.38%, due 10/15/28 144A | |
| | Pactiv Evergreen Group Issuer, Inc./Pactiv Evergreen Group Issuer LLC, 4.00%, due 10/15/27 144A | |
| | Parkland Corp., 4.50%, due 10/01/29 144A | |
| | Parkland Corp., 4.63%, due 05/01/30 144A | |
| | PECO Energy Co., 3.05%, due 03/15/51(f) | |
| | PECO Energy Co., 3.70%, due 09/15/47 | |
| | Pennsylvania Electric Co., 3.60%, due 06/01/29 144A | |
| | Petroleos Mexicanos, 6.35%, due 02/12/48 | |
| | Petroleos Mexicanos, 6.50%, due 03/13/27 | |
| | Petroleos Mexicanos, 6.50%, due 06/02/41 | |
| | Petroleos Mexicanos, 6.75%, due 09/21/47 | |
| | Petroleos Mexicanos, 6.88%, due 08/04/26 | |
| | Petroleos Mexicanos, 8.75%, due 06/02/29 | |
| | PG&E Wildfire Recovery Funding LLC, 3.59%, due 06/01/32 | |
| | PG&E Wildfire Recovery Funding LLC, 4.26%, due 06/01/38 | |
| | PG&E Wildfire Recovery Funding LLC, 4.72%, due 06/01/39 | |
| | Phillips 66 Co., 3.61%, due 02/15/25 144A | |
| | Piedmont Natural Gas Co., Inc., 3.50%, due 06/01/29 | |
| | Pilgrim's Pride Corp., 5.88%, due 09/30/27 144A | |
| | Plains All American Pipeline, LP/PAA Finance Corp., 3.55%, due 12/15/29 | |
See accompanying Notes to the Financial Statements.
89
Mercer Core Fixed Income Fund
Schedule of Investments (Continued)
(showing percentage of net assets)
March 31, 2023
| | | |
| | Corporate Debt — continued |
| | PNC Financial Services Group, Inc. (The), 3.15%, due 05/19/27 | |
| | PNC Financial Services Group, Inc. (The), 3.40% (5 yr. CMT + 2.60%)(d)(h) | |
| | PNC Financial Services Group, Inc. (The), 4.85% (3 mo. USD LIBOR + 3.04%)(d)(h) | |
| | PNC Financial Services Group, Inc. (The), 5.35% (SOFR + 1.62%), due 12/02/28(d)(f) | |
| | PNC Financial Services Group, Inc. (The), 6.25% (7 yr. CMT + 2.81%)(d)(h) | |
| | PNC Financial Services Group, Inc. (The), 8.49% (3 mo. USD LIBOR + 3.68%)(d)(f)(h) | |
| | Popular, Inc., 7.25%, due 03/13/28 | |
| | Prime Security Services Borrower LLC/Prime Finance, Inc., 3.38%, due 08/31/27 144A | |
| | Prime Security Services Borrower LLC/Prime Finance, Inc., 6.25%, due 01/15/28 144A | |
| | Providence St. Joseph Health Obligated Group, 2.75%, due 10/01/26 | |
| | Prudential Financial, Inc., 5.13% (5 yr. CMT + 3.16%), due 03/01/52(d) | |
| | Public Service Electric & Gas Co., (MTN), 2.70%, due 05/01/50 | |
| | Public Service Electric & Gas Co., (MTN), 3.00%, due 05/15/27 | |
| | Public Service Electric & Gas Co., (MTN), 3.20%, due 05/15/29 | |
| | Public Service Enterprise Group, Inc., 2.88%, due 06/15/24 | |
| | Public Storage REIT, 2.25%, due 11/09/31 | |
| | Puget Energy, Inc., 2.38%, due 06/15/28 | |
| | QatarEnergy, 1.38%, due 09/12/26 144A | |
| | QatarEnergy, 2.25%, due 07/12/31 144A | |
| | Qorvo, Inc., 3.38%, due 04/01/31 144A | |
| | Radian Group, Inc., 4.50%, due 10/01/24 | |
| | Raytheon Technologies Corp., 1.90%, due 09/01/31 | |
| | Realty Income Corp. REIT, 2.85%, due 12/15/32 | |
| | Realty Income Corp. REIT, 3.25%, due 01/15/31 | |
| | Regal Rexnord Corp., 6.05%, due 02/15/26 144A | |
| | Regal Rexnord Corp., 6.40%, due 04/15/33 144A | |
| | Renesas Electronics Corp., 1.54%, due 11/26/24 144A | |
| | Resorts World Las Vegas LLC/RWLV Capital, Inc., 4.63%, due 04/16/29(f) 144A | |
| | RHP Hotel Properties, LP/RHP Finance Corp. REIT, 4.50%, due 02/15/29(f) 144A | |
| | Roper Technologies, Inc., 1.40%, due 09/15/27 | |
| | Royalty Pharma Plc, 1.75%, due 09/02/27 | |
| | RPM International, Inc., 2.95%, due 01/15/32 | |
| | Sabine Pass Liquefaction LLC, 4.20%, due 03/15/28 | |
| | Sabine Pass Liquefaction LLC, 4.50%, due 05/15/30 | |
| | Sabine Pass Liquefaction LLC, 5.00%, due 03/15/27 | |
| | Sabine Pass Liquefaction LLC, 5.88%, due 06/30/26 | |
| | Sabre GLBL, Inc., 7.38%, due 09/01/25 144A | |
| | Sally Holdings LLC/Sally Capital, Inc., 5.63%, due 12/01/25 | |
| | San Diego Gas & Electric Co., 4.15%, due 05/15/48 | |
| | Santander Holdings USA, Inc., 2.49% (SOFR + 1.25%), due 01/06/28(d) | |
| | Santander Holdings USA, Inc., 3.24%, due 10/05/26 | |
| | Santander Holdings USA, Inc., 3.45%, due 06/02/25 | |
| | Santander Holdings USA, Inc., 3.50%, due 06/07/24 | |
| | Santander Holdings USA, Inc., 4.40%, due 07/13/27 | |
| | Sasol Financing USA LLC, 5.50%, due 03/18/31 | |
| | Sasol Financing USA LLC, 5.88%, due 03/27/24 | |
| | Sasol Financing USA LLC, 6.50%, due 09/27/28 | |
| | SBA Tower Trust REIT, 6.60%, due 01/15/28 144A | |
| | SBL Holdings, Inc., 5.00%, due 02/18/31 144A | |
90
See accompanying Notes to the Financial Statements.
Mercer Core Fixed Income Fund
Schedule of Investments (Continued)
(showing percentage of net assets)
March 31, 2023
| | | |
| | Corporate Debt — continued |
| | Schlumberger Holdings Corp., 3.90%, due 05/17/28 144A | |
| | Sensata Technologies, Inc., 3.75%, due 02/15/31(f) 144A | |
| | Service Corp. International, 4.00%, due 05/15/31 | |
| | Simon Property Group, LP REIT, 6.75%, due 02/01/40 | |
| | Sirius XM Radio, Inc., 4.00%, due 07/15/28 144A | |
| | Sirius XM Radio, Inc., 5.00%, due 08/01/27 144A | |
| | SMBC Aviation Capital Finance DAC, 2.30%, due 06/15/28 144A | |
| | Societe Generale SA, 1.79% (1 yr. CMT + 1.00%), due 06/09/27(d) 144A | |
| | Societe Generale SA, 2.80% (1 yr. CMT + 1.30%), due 01/19/28(d) 144A | |
| | Societe Generale SA, 5.38% (5 yr. CMT + 4.51%)(d)(f)(h) 144A | |
| | Societe Generale SA, 5.60% (SOFR + 1.05%), due 01/21/26(d) 144A | |
| | Societe Generale SA, 6.22% (1 yr. CMT + 3.20%), due 06/15/33(d) 144A | |
| | Societe Generale SA, 6.45% (1 yr. CMT + 2.55%), due 01/10/29(d)(f) 144A | |
| | Sotheby's, 7.38%, due 10/15/27(f) 144A | |
| | Southern California Edison Co., 3.45%, due 02/01/52 | |
| | Southern California Edison Co., 4.00%, due 04/01/47 | |
| | Southern Co. (The), 3.25%, due 07/01/26 | |
| | Southern Co. Gas Capital Corp., 2.45%, due 10/01/23 | |
| | Southwest Airlines Co., 2.63%, due 02/10/30 | |
| | Southwestern Energy Co., 4.75%, due 02/01/32 | |
| | Spirit Realty, LP REIT, 2.10%, due 03/15/28 | |
| | Sprint LLC, 7.13%, due 06/15/24 | |
| | Stagwell Global LLC, 5.63%, due 08/15/29 144A | |
| | Standard Industries, Inc., 3.38%, due 01/15/31 144A | |
| | Standard Industries, Inc., 4.38%, due 07/15/30 144A | |
| | Standard Industries, Inc., 4.75%, due 01/15/28(f) 144A | |
| | Starwood Property Trust, Inc. REIT, 3.63%, due 07/15/26 144A | |
| | State Grid Overseas Investment BVI, Ltd., 3.50%, due 05/04/27 144A | |
| | State Street Corp., 3.15% (SOFR + 2.65%), due 03/30/31(d) | |
| | Steel Dynamics, Inc., 3.45%, due 04/15/30 | |
| | Stellantis Finance US, Inc., 1.71%, due 01/29/27 144A | |
| | Stellantis Finance US, Inc., 2.69%, due 09/15/31 144A | |
| | Sunoco, LP/Sunoco Finance Corp., 4.50%, due 05/15/29 | |
| | Sunoco, LP/Sunoco Finance Corp., 4.50%, due 04/30/30 | |
| | Take-Two Interactive Software, Inc., 3.55%, due 04/14/25 | |
| | Tallgrass Energy Partners, LP/Tallgrass Energy Finance Corp., 6.00%, due 12/31/30 144A | |
| | Targa Resources Corp., 4.95%, due 04/15/52 | |
| | Targa Resources Partners, LP/Targa Resources Partners Finance Corp., 4.00%, due 01/15/32 | |
| | Taylor Morrison Communities, Inc., 5.13%, due 08/01/30 144A | |
| | Taylor Morrison Communities, Inc., 5.88%, due 06/15/27 144A | |
| | Taylor Morrison Communities, Inc./Taylor Morrison Holdings II, Inc., 5.63%, due 03/01/24 144A | |
| | Teachers Insurance & Annuity Association of America, 4.27%, due 05/15/47 144A | |
| | Teachers Insurance & Annuity Association of America, 6.85%, due 12/16/39 144A | |
| | Teledyne Technologies, Inc., 2.75%, due 04/01/31(f) | |
| | Telesat Canada/Telesat LLC, 5.63%, due 12/06/26 144A | |
| | Tenet Healthcare Corp., 4.38%, due 01/15/30 | |
| | Tenet Healthcare Corp., 4.63%, due 07/15/24 | |
See accompanying Notes to the Financial Statements.
91
Mercer Core Fixed Income Fund
Schedule of Investments (Continued)
(showing percentage of net assets)
March 31, 2023
| | | |
| | Corporate Debt — continued |
| | T-Mobile USA, Inc., 2.88%, due 02/15/31 | |
| | T-Mobile USA, Inc., 3.38%, due 04/15/29 | |
| | T-Mobile USA, Inc., 3.50%, due 04/15/25 | |
| | T-Mobile USA, Inc., 3.88%, due 04/15/30 | |
| | T-Mobile USA, Inc., 4.50%, due 04/15/50 | |
| | Toll Brothers Finance Corp., 4.35%, due 02/15/28 | |
| | Toronto-Dominion Bank (The), 1.95%, due 01/12/27(f) | |
| | Total Play Telecomunicaciones SA de CV, 6.38%, due 09/20/28(f) 144A | |
| | Total Play Telecomunicaciones SA de CV, 7.50%, due 11/12/25 144A | |
| | Toyota Motor Credit Corp., (MTN), 3.00%, due 04/01/25 | |
| | Transcontinental Gas Pipe Line Co. LLC, 3.95%, due 05/15/50 | |
| | Transcontinental Gas Pipe Line Co. LLC, 4.60%, due 03/15/48 | |
| | TransDigm, Inc., 5.50%, due 11/15/27 | |
| | Travel + Leisure Co., 4.63%, due 03/01/30 144A | |
| | Travel + Leisure Co., 6.60%, due 10/01/25(e) | |
| | TriNet Group, Inc., 3.50%, due 03/01/29 144A | |
| | Trinseo Materials Operating SCA/Trinseo Materials Finance, Inc., 5.13%, due 04/01/29 144A | |
| | Tutor Perini Corp., 6.88%, due 05/01/25(f) 144A | |
| | Uber Technologies, Inc., 4.50%, due 08/15/29 144A | |
| | Uber Technologies, Inc., 7.50%, due 05/15/25 144A | |
| | Uber Technologies, Inc., 7.50%, due 09/15/27 144A | |
| | UBS Group AG, 1.49% (1 yr. CMT + 0.85%), due 08/10/27(d) 144A | |
| | UBS Group AG, 2.10% (1 yr. CMT + 1.00%), due 02/11/32(d) 144A | |
| | UBS Group AG, 4.13%, due 04/15/26 144A | |
| | United Airlines Pass Through Trust, 3.45%, due 01/07/30 | |
| | United Airlines Pass Through Trust, 3.65%, due 07/07/27 | |
| | United Airlines Pass Through Trust, 3.75%, due 03/03/28 | |
| | United Airlines Pass Through Trust, 4.00%, due 10/11/27 | |
| | United Airlines Pass Through Trust, 4.55%, due 02/25/33 | |
| | United Airlines Pass Through Trust, 4.60%, due 09/01/27 | |
| | United Airlines Pass Through Trust, 4.88%, due 07/15/27 | |
| | United Airlines Pass Through Trust, 5.88%, due 04/15/29 | |
| | United Airlines, Inc., 4.38%, due 04/15/26 144A | |
| | United Airlines, Inc., 4.63%, due 04/15/29 144A | |
| | United Rentals North America, Inc., 3.75%, due 01/15/32 | |
| | United Rentals North America, Inc., 3.88%, due 11/15/27 | |
| | United Rentals North America, Inc., 3.88%, due 02/15/31 | |
| | United Rentals North America, Inc., 4.88%, due 01/15/28 | |
| | United Rentals North America, Inc., 5.25%, due 01/15/30 | |
| | UnitedHealth Group, Inc., 3.05%, due 05/15/41 | |
| | UnitedHealth Group, Inc., 3.25%, due 05/15/51 | |
| | UnitedHealth Group, Inc., 5.05%, due 04/15/53 | |
| | Universal Health Services, Inc., 1.65%, due 09/01/26 | |
| | Universal Health Services, Inc., 2.65%, due 10/15/30(f) | |
| | University of Chicago (The), 2.76%, due 04/01/45 | |
| | University of Southern California, 2.95%, due 10/01/51 | |
| | Univision Communications, Inc., 4.50%, due 05/01/29 144A | |
| | US Airways Pass Through Trust, 4.63%, due 12/03/26 | |
92
See accompanying Notes to the Financial Statements.
Mercer Core Fixed Income Fund
Schedule of Investments (Continued)
(showing percentage of net assets)
March 31, 2023
| | | |
| | Corporate Debt — continued |
| | US Airways Pass Through Trust, 5.90%, due 04/01/26 | |
| | US Airways Pass Through Trust, 6.25%, due 10/22/24 | |
| | US Airways Pass Through Trust, 7.13%, due 04/22/25 | |
| | US Bancorp, 5.73% (SOFR + 1.43%), due 10/21/26(d) | |
| | Valvoline, Inc., 3.63%, due 06/15/31 144A | |
| | Var Energi ASA, 8.00%, due 11/15/32 144A | |
| | Varex Imaging Corp., 7.88%, due 10/15/27 144A | |
| | Vector Group, Ltd., 5.75%, due 02/01/29 144A | |
| | Ventas Realty, LP REIT, 3.50%, due 02/01/25 | |
| | Venture Global Calcasieu Pass LLC, 3.88%, due 08/15/29 144A | |
| | Venture Global Calcasieu Pass LLC, 4.13%, due 08/15/31 144A | |
| | VeriSign, Inc., 2.70%, due 06/15/31 | |
| | Verisk Analytics, Inc., 3.63%, due 05/15/50 | |
| | Verizon Communications, Inc., 2.55%, due 03/21/31 | |
| | Verizon Communications, Inc., 2.88%, due 11/20/50 | |
| | Verizon Communications, Inc., 3.55%, due 03/22/51(f) | |
| | Viatris, Inc., 2.30%, due 06/22/27 | |
| | Viatris, Inc., 2.70%, due 06/22/30 | |
| | Viatris, Inc., 3.85%, due 06/22/40 | |
| | Viatris, Inc., 4.00%, due 06/22/50 | |
| | VICI Properties, LP REIT, 5.13%, due 05/15/32 | |
| | VICI Properties, LP/VICI Note Co., Inc. REIT, 3.88%, due 02/15/29 144A | |
| | VICI Properties, LP/VICI Note Co., Inc. REIT, 4.13%, due 08/15/30 144A | |
| | VICI Properties, LP/VICI Note Co., Inc. REIT, 4.63%, due 12/01/29 144A | |
| | Virginia Electric & Power Co., 3.15%, due 01/15/26 | |
| | Vistra Operations Co. LLC, 3.55%, due 07/15/24 144A | |
| | Vistra Operations Co. LLC, 3.70%, due 01/30/27 144A | |
| | Vistra Operations Co. LLC, 4.30%, due 07/15/29 144A | |
| | Vistra Operations Co. LLC, 5.00%, due 07/31/27 144A | |
| | Vodafone Group Plc, 5.63%, due 02/10/53 | |
| | Vodafone Group Plc, 7.00% (5 yr. USD swap + 4.87%), due 04/04/79(d) | |
| | Volcan Cia Minera SAA, 4.38%, due 02/11/26 144A | |
| | WakeMed, 3.29%, due 10/01/52 | |
| | Warnermedia Holdings, Inc., 5.05%, due 03/15/42 144A | |
| | Warnermedia Holdings, Inc., 5.14%, due 03/15/52 144A | |
| | Waste Management, Inc., 4.15%, due 04/15/32 | |
| | Wells Fargo & Co., 5.88% (3 mo. USD LIBOR + 3.99%)(d)(f)(h) | |
| | Wells Fargo & Co., (MTN), 2.39% (SOFR + 2.10%), due 06/02/28(d) | |
| | Wells Fargo & Co., (MTN), 2.57% (SOFR + 1.26%), due 02/11/31(d) | |
| | Wells Fargo & Co., (MTN), 2.88% (3 mo. TSFR + 1.43%), due 10/30/30(d) | |
| | Wells Fargo & Co., (MTN), 3.35% (SOFR + 1.50%), due 03/02/33(d) | |
| | Wells Fargo & Co., (MTN), 4.81% (SOFR + 1.98%), due 07/25/28(d) | |
| | Western Digital Corp., 4.75%, due 02/15/26 | |
| | Western Midstream Operating, LP, 4.30%, due 02/01/30(e) | |
| | Western Midstream Operating, LP, 6.15%, due 04/01/33(c) | |
| | William Carter Co. (The), 5.63%, due 03/15/27 144A | |
| | Williams Cos., Inc. (The), 3.75%, due 06/15/27 | |
| | Williams Cos., Inc. (The), 4.65%, due 08/15/32 | |
| | Williams Cos., Inc. (The), 5.40%, due 03/02/26 | |
See accompanying Notes to the Financial Statements.
93
Mercer Core Fixed Income Fund
Schedule of Investments (Continued)
(showing percentage of net assets)
March 31, 2023
| | | |
| | Corporate Debt — continued |
| | WMG Acquisition Corp., 3.88%, due 07/15/30 144A | |
| | Wolverine World Wide, Inc., 4.00%, due 08/15/29(f) 144A | |
| | Workday, Inc., 3.50%, due 04/01/27 | |
| | WP Carey, Inc. REIT, 2.25%, due 04/01/33(f) | |
| | Wyndham Hotels & Resorts, Inc., 4.38%, due 08/15/28 144A | |
| | XHR, LP REIT, 4.88%, due 06/01/29 144A | |
| | Yale University, 2.40%, due 04/15/50(f) | |
| | Yamana Gold, Inc., 2.63%, due 08/15/31 | |
| | Yara International ASA, 4.75%, due 06/01/28 144A | |
| | Yum! Brands, Inc., 3.63%, due 03/15/31 | |
| | Yum! Brands, Inc., 4.75%, due 01/15/30 144A | |
| | | |
| | Mortgage Backed Securities - Private Issuers — 9.4% |
| | Angel Oak Mortgage Trust CMO, Series 2020-R1, Class A1, 0.99%, due 04/25/53(b) 144A | |
| | Angel Oak Mortgage Trust CMO, Series 2021-2, Class A1, 0.99%, due 04/25/66(b) 144A | |
| | Angel Oak Mortgage Trust CMO, Series 2021-4, Class A1, 1.04%, due 01/20/65(b) 144A | |
| | Angel Oak Mortgage Trust CMO, Series 2021-5, Class A1, 0.95%, due 07/25/66(b) 144A | |
| | Arbor Multifamily Mortgage Securities Trust, Series 2020-MF1, Class A4, 2.50%, due 05/15/53 144A | |
| | Arbor Multifamily Mortgage Securities Trust, Series 2021-MF2, Class A4, 2.25%, due 06/15/54 144A | |
| | Arroyo Mortgage Trust CMO, Series 2021-1R, Class A1, 1.18%, due 10/25/48(b) 144A | |
| | BAMLL Commercial Mortgage Securities Trust, Series 2019-BPR, Class ENM, 3.72%, due 11/05/32(b) 144A | |
| | BANK, Series 2019-BN20, Class A2, 2.76%, due 09/15/62 | |
| | BANK, Series 2019-BN23, Class A2, 2.67%, due 12/15/52 | |
| | BANK, Series 2020-BN26, Class A2, 2.04%, due 03/15/63 | |
| | BANK, Series 2020-BN26, Class A3, 2.16%, due 03/15/63 | |
| | BANK, Series 2020-BN30, Class A4, 1.93%, due 12/15/53 | |
| | BANK, Series 2021-BN32, Class A4, 2.35%, due 04/15/54 | |
| | BANK, Series 2021-BN34, Class A4, 2.16%, due 06/15/63 | |
| | BBCMS Mortgage Trust, Series 2015-SRCH, Class D, 4.96%, due 08/10/35(b) 144A | |
| | BBCMS Mortgage Trust, Series 2018-TALL, Class A, 5.56% (1 mo. USD LIBOR + 0.72%), due 03/15/37(d) 144A | |
| | BBCMS Mortgage Trust, Series 2022-C14, Class A4, 2.69%, due 02/15/55 | |
| | Bellemeade Re, Ltd. CMO, Series 2021-2A, Class M1A, 5.76% (SOFR 30-day average + 1.20%), due 06/25/31(d) 144A | |
| | Benchmark Mortgage Trust, Series 2019-B15, Class A4, 2.67%, due 12/15/72 | |
| | Benchmark Mortgage Trust, Series 2020-B17, Class A4, 2.04%, due 03/15/53 | |
| | Benchmark Mortgage Trust, Series 2020-B20, Class A2, 1.75%, due 10/15/53 | |
| | Benchmark Mortgage Trust, Series 2020-IG3, Class A2, 2.48%, due 09/15/48 144A | |
| | Benchmark Mortgage Trust, Series 2021-B23, Class A2, 1.62%, due 02/15/54 | |
| | Benchmark Mortgage Trust, Series 2021-B23, Class A4A1, 1.82%, due 02/15/54 | |
| | Benchmark Mortgage Trust, Series 2021-B24, Class A3, 2.01%, due 03/15/54 | |
| | Benchmark Mortgage Trust, Series 2021-B24, Class A4, 2.26%, due 03/15/54 | |
| | Benchmark Mortgage Trust, Series 2021-B28, Class ASB, 1.98%, due 08/15/54 | |
| | Benchmark Mortgage Trust, Series 2021-B31, Class A4, 2.42%, due 12/15/54 | |
| | Benchmark Mortgage Trust, Series 2022-B33, Class A5, 3.46%, due 03/15/55 | |
94
See accompanying Notes to the Financial Statements.
Mercer Core Fixed Income Fund
Schedule of Investments (Continued)
(showing percentage of net assets)
March 31, 2023
| | | |
| | Mortgage Backed Securities - Private Issuers — continued |
| | BOCA Commercial Mortgage Trust, Series 2022-BOCA, Class A, 6.60% (1 mo. TSFR + 1.77%), due 05/15/39(d) 144A | |
| | BOCA Commercial Mortgage Trust, Series 2022-BOCA, Class B, 7.15% (1 mo. TSFR + 2.32%), due 05/15/39(d) 144A | |
| | BPR Trust, Series 2022-OANA, Class A, 6.73% (1 mo. TSFR + 1.90%), due 04/15/37(d) 144A | |
| | BRAVO Residential Funding Trust CMO, Series 2021-NQM1, Class A1, 0.94%, due 02/25/49(b) 144A | |
| | BX Commercial Mortgage Trust, Series 2019-XL, Class A, 5.86% (1 mo. TSFR + 1.03%), due 10/15/36(d) 144A | |
| | BX Commercial Mortgage Trust, Series 2020-VKNG, Class A, 5.87% (1 mo. TSFR + 1.04%), due 10/15/37(d) 144A | |
| | BX Commercial Mortgage Trust, Series 2021-ACNT, Class A, 5.54% (1 mo. USD LIBOR + 0.85%), due 11/15/38(d) 144A | |
| | BX Commercial Mortgage Trust, Series 2021-CIP, Class A, 5.61% (1 mo. USD LIBOR + 0.92%), due 12/15/38(d) 144A | |
| | BX Commercial Mortgage Trust, Series 2021-VOLT, Class A, 5.38% (1 mo. USD LIBOR + 0.70%), due 09/15/36(d) 144A | |
| | BX Commercial Mortgage Trust, Series 2021-VOLT, Class C, 5.78% (1 mo. USD LIBOR + 1.10%), due 09/15/36(d) 144A | |
| | BX Commercial Mortgage Trust, Series 2022-AHP, Class A, 5.82% (1 mo. TSFR + 0.99%), due 01/17/39(d) 144A | |
| | BX Trust, Series 2022-CLS, Class A, 5.76%, due 10/13/27 144A | |
| | CD Mortgage Trust, Series 2019-CD8, Class A3, 2.66%, due 08/15/57 | |
| | CF Mortgage Trust, Series 2020-P1, Class A1, 2.84%, due 04/15/25(b) 144A | |
| | CFCRE Commercial Mortgage Trust, Series 2016-C4, Class A3, 3.01%, due 05/10/58 | |
| | CFCRE Commercial Mortgage Trust, Series 2016-C6, Class A2, 2.95%, due 11/10/49 | |
| | CFK Trust CMO, Series 2020-MF2, Class A, 2.39%, due 03/15/39 144A | |
| | Citigroup Commercial Mortgage Trust, Series 2019-C7, Class A3, 2.86%, due 12/15/72 | |
| | Citigroup Commercial Mortgage Trust, Series 2019-SMRT, Class A, 4.15%, due 01/10/36 144A | |
| | Citigroup Commercial Mortgage Trust, (IO), Series 2014-GC21, Class XB, 0.44%, due 05/10/47(b) 144A | |
| | COLT Mortgage Loan Trust CMO, Series 2021-2, Class A1, 0.92%, due 08/25/66(b) 144A | |
| | COLT Mortgage Loan Trust CMO, Series 2021-3, Class A1, 0.96%, due 09/27/66(b) 144A | |
| | COLT Mortgage Loan Trust CMO, Series 2021-HX1, Class A1, 1.11%, due 10/25/66(b) 144A | |
| | COLT Trust CMO, Series 2020-RPL1, Class A1, 1.39%, due 01/25/65(b) 144A | |
| | Commercial Mortgage Trust, Series 2013-300P, Class D, 4.39%, due 08/10/30(b) 144A | |
| | Commercial Mortgage Trust, Series 2015-CR25, Class A3, 3.51%, due 08/10/48 | |
| | Commercial Mortgage Trust, Series 2015-CR27, Class A4, 3.61%, due 10/10/48 | |
| | Commercial Mortgage Trust, Series 2017-PANW, Class A, 3.24%, due 10/10/29 144A | |
| | Commercial Mortgage Trust, Series 2020-CBM, Class A2, 2.90%, due 02/10/37 144A | |
| | Connecticut Avenue Securities Trust CMO, Series 2022-R03, Class 1M1, 6.66% (SOFR 30-day average + 2.10%), due 03/25/42(d) 144A | |
| | Connecticut Avenue Securities Trust CMO, Series 2022-R04, Class 1M1, 6.56% (SOFR 30-day average + 2.00%), due 03/25/42(d) 144A | |
| | Credit Suisse Mortgage Capital Certificates, Series 2019-ICE4, Class D, 6.28% (1 mo. USD LIBOR + 1.60%), due 05/15/36(d) 144A | |
| | Credit Suisse Mortgage Trust, Series 2020-NET, Class A, 2.26%, due 08/15/37 144A | |
See accompanying Notes to the Financial Statements.
95
Mercer Core Fixed Income Fund
Schedule of Investments (Continued)
(showing percentage of net assets)
March 31, 2023
| | | |
| | Mortgage Backed Securities - Private Issuers — continued |
| | Credit Suisse Mortgage Trust CMO, Series 2018-RPL9, Class A, 3.85%, due 09/25/57(b) 144A | |
| | Credit Suisse Mortgage Trust CMO, Series 2020-RPL6, Class A1, 2.69%, due 03/25/59(b) 144A | |
| | Credit Suisse Mortgage Trust CMO, Series 2021-NQM2, Class A1, 1.18%, due 02/25/66(b) 144A | |
| | Credit Suisse Mortgage Trust CMO, Series 2021-NQM3, Class A1, 1.02%, due 04/25/66(b) 144A | |
| | Credit Suisse Mortgage Trust CMO, Series 2021-NQM5, Class A1, 0.94%, due 05/25/66(b) 144A | |
| | Credit Suisse Mortgage Trust CMO, Series 2021-NQM6, Class A1, 1.17%, due 07/25/66(b) 144A | |
| | CSAIL Commercial Mortgage Trust, Series 2017-C8, Class A3, 3.13%, due 06/15/50 | |
| | CSAIL Commercial Mortgage Trust, Series 2017-CX10, Class A4, 3.19%, due 11/15/50 | |
| | CSAIL Commercial Mortgage Trust, Series 2019-C18, Class A3, 2.72%, due 12/15/52 | |
| | CSAIL Commercial Mortgage Trust, Series 2021-C20, Class A2, 2.49%, due 03/15/54 | |
| | Ellington Financial Mortgage Trust CMO, Series 2021-1, Class A1, 0.80%, due 02/25/66(b) 144A | |
| | Ellington Financial Mortgage Trust CMO, Series 2021-2, Class A1, 0.93%, due 06/25/66(b) 144A | |
| | FHLMC Seasoned Credit Risk Transfer Trust CMO, Series 2018-2, Class MA, 3.50%, due 11/25/57 | |
| | FHLMC Seasoned Credit Risk Transfer Trust CMO, Series 2018-3, Class MA, 3.50%, | |
| | FHLMC Seasoned Credit Risk Transfer Trust CMO, Series 2018-4, Class MA, 3.50%, due 03/25/58 | |
| | FHLMC Seasoned Credit Risk Transfer Trust CMO, Series 2019-1, Class MA, 3.50%, due 07/25/58 | |
| | FHLMC Seasoned Credit Risk Transfer Trust CMO, Series 2019-2, Class MA, 3.50%, due 08/25/58 | |
| | FHLMC Seasoned Credit Risk Transfer Trust CMO, Series 2019-4, Class MA, 3.00%, due 02/25/59 | |
| | FHLMC Seasoned Credit Risk Transfer Trust CMO, Series 2020-1, Class MA, 2.50%, due 08/25/59 | |
| | FHLMC Seasoned Credit Risk Transfer Trust CMO, Series 2022-1, Class MAU, 3.25%, due 11/25/61 | |
| | FHLMC Structured Agency Credit Risk REMIC Trust CMO, Series 2022-DNA1, Class M1A, 5.56% (SOFR 30-day average + 1.00%), due 01/25/42(d) 144A | |
| | FHLMC Structured Agency Credit Risk REMIC Trust CMO, Series 2022-DNA2, Class M1B, 6.96% (SOFR 30-day average + 2.40%), due 02/25/42(d) 144A | |
| | FHLMC Structured Agency Credit Risk REMIC Trust CMO, Series 2022-DNA3, Class M1B, 7.46% (SOFR 30-day average + 2.90%), due 04/25/42(d) 144A | |
| | FHLMC Structured Agency Credit Risk REMIC Trust CMO, Series 2022-DNA4, Class M1A, 6.76% (SOFR 30-day average + 2.20%), due 05/25/42(d) 144A | |
| | FHLMC Structured Agency Credit Risk REMIC Trust CMO, Series 2022-DNA4, Class M1B, 7.91% (SOFR 30-day average + 3.35%), due 05/25/42(d) 144A | |
| | FHLMC Structured Agency Credit Risk REMIC Trust CMO, Series 2022-DNA5, Class M1B, 9.06% (SOFR 30-day average + 4.50%), due 06/25/42(d) 144A | |
| | Flagstar Mortgage Trust CMO, Series 2020-2, Class A2, 3.00%, due 08/25/50(b) 144A | |
| | Flagstar Mortgage Trust CMO, Series 2021-1, Class A2, 2.50%, due 02/01/51(b) 144A | |
| | Flagstar Mortgage Trust CMO, Series 2021-6INV, Class A4, 2.50%, due 08/25/51(b) 144A | |
| | GCAT Trust CMO, Series 2021-NQM1, Class A1, 0.87%, due 01/25/66(b) 144A | |
96
See accompanying Notes to the Financial Statements.
Mercer Core Fixed Income Fund
Schedule of Investments (Continued)
(showing percentage of net assets)
March 31, 2023
| | | |
| | Mortgage Backed Securities - Private Issuers — continued |
| | GCAT Trust CMO, Series 2021-NQM2, Class A1, 1.04%, due 05/25/66(b) 144A | |
| | GCAT Trust CMO, Series 2021-NQM3, Class A1, 1.09%, due 05/25/66(b) 144A | |
| | GCAT Trust CMO, Series 2023-NQM2, Class A1, 5.84%, due 11/25/67(e) 144A | |
| | GS Mortgage Securities Corp. Trust, Series 2020-UPTN, Class A, 2.75%, due 02/10/37 144A | |
| | GS Mortgage Securities Corp. Trust, Series 2021-RENT, Class A, 5.48% (1 mo. USD LIBOR + 0.70%), due 11/21/35(d) 144A | |
| | GS Mortgage Securities Trust, Series 2015-GC28, Class A4, 3.14%, due 02/10/48 | |
| | GS Mortgage Securities Trust, Series 2015-GC30, Class A3, 3.12%, due 05/10/50 | |
| | GS Mortgage Securities Trust, Series 2020-GC47, Class A4, 2.12%, due 05/12/53 | |
| | GS Mortgage Securities Trust, Series 2020-GSA2, Class A5, 2.01%, due 12/12/53 | |
| | GS Mortgage Securities Trust, Series 2020-GSA2, Class AAB, 1.66%, due 12/12/53 | |
| | GS Mortgage Securities Trust, Series 2021-GSA3, Class A4, 2.37%, due 12/15/54 | |
| | GS Mortgage-Backed Securities Corp. Trust CMO, Series 2021-NQM1, Class A1, 1.02%, due 07/25/61(b) 144A | |
| | GS Mortgage-Backed Securities Trust CMO, Series 2020-NQM1, Class A1, 1.38%, due 09/27/60(b) 144A | |
| | Home RE, Ltd. CMO, Series 2021-2, Class M1A, 5.81% (SOFR 30-day average + 1.25%), due 01/25/34(d) 144A | |
| | Imperial Fund Mortgage Trust CMO, Series 2021-NQM1, Class A1, 1.07%, due 06/25/56(b) 144A | |
| | Imperial Fund Mortgage Trust CMO, Series 2023-NQM1, Class A1, 5.94%, due 02/25/68(e) 144A | |
| | IMT Trust, Series 2017-APTS, Class CFX, 3.50%, due 06/15/34(b) 144A | |
| | INTOWN Mortgage Trust, Series 2022-STAY, Class A, 7.32% (1 mo. TSFR + 2.49%), due 08/15/39(d) 144A | |
| | Irvine Core Office Trust, Series 2013-IRV, Class A2, 3.17%, due 05/15/48(b) 144A | |
| | JPMBB Commercial Mortgage Securities Trust, Series 2014-C19, Class A3, 3.67%, due 04/15/47 | |
| | JPMBB Commercial Mortgage Securities Trust, Series 2015-C32, Class A2, 2.82%, due 11/15/48 | |
| | JPMDB Commercial Mortgage Securities Trust, Series 2016-C2, Class A3A, 2.88%, due 06/15/49 | |
| | JPMDB Commercial Mortgage Securities Trust, Series 2017-C5, Class A4, 3.41%, due 03/15/50 | |
| | JPMorgan Chase Commercial Mortgage Securities Trust, Series 2016-JP2, Class A3, 2.56%, due 08/15/49 | |
| | JPMorgan Chase Commercial Mortgage Securities Trust, Series 2017-JP6, Class A3, 3.11%, due 07/15/50 | |
| | JPMorgan Chase Commercial Mortgage Securities Trust, Series 2019-COR5, Class A2, 3.15%, due 06/13/52 | |
| | JPMorgan Chase Commercial Mortgage Securities Trust, Series 2020-NNN, Class AFX, 2.81%, due 01/16/37 144A | |
| | KNDL Mortgage Trust, Series 2019-KNSQ, Class D, 6.03% (1 mo. USD LIBOR + 1.35%), due 05/15/36(d) 144A | |
| | Legacy Mortgage Asset Trust CMO, Series 2019-PR1, Class A1, 6.86%, due 09/25/59(e) 144A | |
| | Legacy Mortgage Asset Trust CMO, Series 2020-GS1, Class A1, 5.88%, due 10/25/59(e) 144A | |
| | Legacy Mortgage Asset Trust CMO, Series 2021-GS1, Class A1, 1.89%, due 10/25/66(e) 144A | |
| | Life Mortgage Trust, Series 2021-BMR, Class A, 5.64% (1 mo. TSFR + 0.81%), due 03/15/38(d) 144A | |
See accompanying Notes to the Financial Statements.
97
Mercer Core Fixed Income Fund
Schedule of Investments (Continued)
(showing percentage of net assets)
March 31, 2023
| | | |
| | Mortgage Backed Securities - Private Issuers — continued |
| | Life Mortgage Trust, Series 2021-BMR, Class D, 6.34% (1 mo. TSFR + 1.51%), due 03/15/38(d) 144A | |
| | Life Mortgage Trust, Series 2022-BMR2, Class A1, 6.12% (1 mo. TSFR + 1.30%), due 05/15/39(d) 144A | |
| | MetLife Securitization Trust CMO, Series 2020-INV1, Class A2A, 2.50%, due 05/25/50(b) 144A | |
| | MFA Trust CMO, Series 2021-NQM1, Class A1, 1.15%, due 04/25/65(b) 144A | |
| | Morgan Stanley Bank of America Merrill Lynch Trust, Series 2015-C22, Class A4, 3.31%, due 04/15/48 | |
| | Morgan Stanley Bank of America Merrill Lynch Trust, Series 2015-C24, Class A4, 3.73%, due 05/15/48 | |
| | Morgan Stanley Capital I Trust, Series 2015-UBS8, Class A4, 3.81%, due 12/15/48 | |
| | Morgan Stanley Capital I Trust, Series 2016-UB11, Class A3, 2.53%, due 08/15/49 | |
| | Morgan Stanley Capital I Trust, Series 2019-H6, Class A3, 3.16%, due 06/15/52 | |
| | Morgan Stanley Capital I Trust, Series 2020-HR8, Class A4, 2.04%, due 07/15/53 | |
| | Morgan Stanley Capital I Trust, Series 2021-L5, Class A4, 2.73%, due 05/15/54 | |
| | Natixis Commercial Mortgage Securities Trust, Series 2018-285M, Class D, 3.79%, due 11/15/32(b) 144A | |
| | Natixis Commercial Mortgage Securities Trust, Series 2018-ALXA, Class C, 4.32%, due 01/15/43(b) 144A | |
| | New Residential Mortgage Loan Trust CMO, Series 2018-4A, Class A1S, 5.60% (1 mo. USD LIBOR + 0.75%), due 01/25/48(d) 144A | |
| | NYMT Loan Trust CMO, Series 2022-CP1, Class A1, 2.04%, due 07/25/61 144A | |
| | OBX Trust CMO, Series 2020-EXP2, Class A3, 2.50%, due 05/25/60(b) 144A | |
| | OBX Trust CMO, Series 2021-NQM2, Class A1, 1.10%, due 05/25/61(b) 144A | |
| | OBX Trust CMO, Series 2021-NQM3, Class A1, 1.05%, due 07/25/61(b) 144A | |
| | Provident Funding Mortgage Trust CMO, Series 2020-F1, Class A2, 2.00%, due 01/25/36(b) 144A | |
| | PSMC Trust CMO, Series 2021-2, Class A3, 2.50%, due 05/25/51(b) 144A | |
| | Radnor RE, Ltd. CMO, Series 2020-1, Class M1B, 6.30% (1 mo. USD LIBOR + 1.45%), due 01/25/30(d) 144A | |
| | Sequoia Mortgage Trust CMO, Series 2020-3, Class A4, 3.00%, due 04/25/50(b) 144A | |
| | Sequoia Mortgage Trust CMO, Series 2021-1, Class A1, 2.50%, due 03/25/51(b) 144A | |
| | SLG Office Trust, Series 2021-OVA, Class D, 2.85%, due 07/15/41 144A | |
| | SMRT, Series 2022-MINI, Class A, 5.83% (1 mo. TSFR + 1.00%), due 01/15/39(d) 144A | |
| | Starwood Mortgage Residential Trust CMO, Series 2022-1, Class A1, 2.45%, due 12/25/66(b) 144A | |
| | Towd Point Mortgage Trust CMO, Series 2015-1, Class A5, 3.86%, due 10/25/53(b) 144A | |
| | Towd Point Mortgage Trust CMO, Series 2018-1, Class A1, 3.00%, due 01/25/58(b) 144A | |
| | Towd Point Mortgage Trust CMO, Series 2018-4, Class A1, 3.00%, due 06/25/58(b) 144A | |
| | Towd Point Mortgage Trust CMO, Series 2018-5, Class A1A, 3.25%, due 07/25/58(b) 144A | |
| | Towd Point Mortgage Trust CMO, Series 2018-6, Class A1A, 3.75%, due 03/25/58(b) 144A | |
| | Towd Point Mortgage Trust CMO, Series 2019-1, Class A1, 3.75%, due 03/25/58(b) 144A | |
| | Towd Point Mortgage Trust CMO, Series 2019-4, Class A1, 2.90%, due 10/25/59(b) 144A | |
| | Towd Point Mortgage Trust CMO, Series 2019-HY3, Class A1A, 5.85% (1 mo. USD LIBOR + 1.00%), due 10/25/59(d) 144A | |
98
See accompanying Notes to the Financial Statements.
Mercer Core Fixed Income Fund
Schedule of Investments (Continued)
(showing percentage of net assets)
March 31, 2023
| | | |
| | Mortgage Backed Securities - Private Issuers — continued |
| | UBS Commercial Mortgage Trust, Series 2017-C2, Class ASB, 3.26%, due 08/15/50 | |
| | Verus Securitization Trust CMO, Series 2020-5, Class A1, 1.22%, due 05/25/65(e) 144A | |
| | Verus Securitization Trust CMO, Series 2021-3, Class A1, 1.05%, due 06/25/66(b) 144A | |
| | Verus Securitization Trust CMO, Series 2021-4, Class A1, 0.94%, due 07/25/66(b) 144A | |
| | Verus Securitization Trust CMO, Series 2021-5, Class A1, 1.01%, due 09/25/66(b) 144A | |
| | Verus Securitization Trust CMO, Series 2021-R1, Class A1, 0.82%, due 10/25/63(b) 144A | |
| | WaMu Mortgage Pass Through Certificates CMO, Series 2003-AR9, Class 1A7, 4.16%, | |
| | Wells Fargo Commercial Mortgage Trust, Series 2016-BNK1, Class A2, 2.40%, due 08/15/49 | |
| | Wells Fargo Commercial Mortgage Trust, Series 2016-NXS6, Class A3, 2.64%, due 11/15/49 | |
| | Wells Fargo Commercial Mortgage Trust, Series 2017-C38, Class A4, 3.19%, due 07/15/50 | |
| | Wells Fargo Commercial Mortgage Trust, Series 2017-RB1, Class A4, 3.37%, due 03/15/50 | |
| | Wells Fargo Commercial Mortgage Trust, Series 2020-C56, Class A3, 1.94%, due 06/15/53 | |
| | Wells Fargo Commercial Mortgage Trust, Series 2021-C59, Class A3, 1.96%, due 04/15/54 | |
| | Wells Fargo Commercial Mortgage Trust, Series 2021-C60, Class ASB, 2.13%, due 08/15/54 | |
| | WFRBS Commercial Mortgage Trust, Series 2014-C23, Class A5, 3.92%, due 10/15/57 | |
| | | |
| | Mortgage Backed Securities - U.S. Government Agency Obligations — 26.9% |
| | FHLMC Gold, Pool # A89870, 4.50%, due 11/01/39 | |
| | FHLMC Gold, Pool # A96970, 4.00%, due 02/01/41 | |
| | FHLMC Gold, Pool # C91908, 3.00%, due 01/01/37 | |
| | FHLMC Gold, Pool # G06231, 4.00%, due 12/01/40 | |
| | FHLMC Gold, Pool # G06409, 6.00%, due 11/01/39 | |
| | FHLMC Gold, Pool # G06875, 5.50%, due 12/01/38 | |
| | FHLMC Gold, Pool # G07021, 5.00%, due 09/01/39 | |
| | FHLMC Gold, Pool # G07816, 4.50%, due 09/01/42 | |
| | FHLMC Gold, Pool # G08537, 3.00%, due 07/01/43 | |
| | FHLMC Gold, Pool # G08672, 4.00%, due 10/01/45 | |
| | FHLMC Gold, Pool # G08726, 3.00%, due 10/01/46 | |
| | FHLMC Gold, Pool # G08735, 4.50%, due 10/01/46 | |
| | FHLMC Gold, Pool # G08748, 3.50%, due 02/01/47 | |
| | FHLMC Gold, Pool # G08749, 4.00%, due 02/01/47 | |
| | FHLMC Gold, Pool # G08771, 4.00%, due 07/01/47 | |
| | FHLMC Gold, Pool # G08786, 4.50%, due 10/01/47 | |
| | FHLMC Gold, Pool # G16177, 2.00%, due 01/01/32 | |
| | FHLMC Gold, Pool # G16634, 3.00%, due 10/01/31 | |
| | FHLMC Gold, Pool # G60722, 3.00%, due 10/01/46 | |
| | FHLMC Gold, Pool # G60767, 3.50%, due 10/01/46 | |
| | FHLMC Gold, Pool # G60788, 3.50%, due 12/01/46 | |
| | FHLMC Gold, Pool # G60804, 4.50%, due 05/01/42 | |
| | FHLMC Gold, Pool # G60934, 3.50%, due 06/01/45 | |
| | FHLMC Gold, Pool # G60985, 3.00%, due 05/01/47 | |
See accompanying Notes to the Financial Statements.
99
Mercer Core Fixed Income Fund
Schedule of Investments (Continued)
(showing percentage of net assets)
March 31, 2023
| | | |
| | Mortgage Backed Securities - U.S. Government Agency Obligations — continued |
| | FHLMC Gold, Pool # G61748, 3.50%, due 11/01/48 | |
| | FHLMC Gold, Pool # G61995, 4.00%, due 11/01/44 | |
| | FHLMC Gold, Pool # J24414, 2.50%, due 06/01/28 | |
| | FHLMC Gold, Pool # J34888, 2.50%, due 07/01/31 | |
| | FHLMC Gold, Pool # Q09224, 4.00%, due 07/01/42 | |
| | FHLMC Gold, Pool # Q11218, 3.50%, due 09/01/42 | |
| | FHLMC Gold, Pool # Q12052, 3.50%, due 10/01/42 | |
| | FHLMC Gold, Pool # Q12862, 3.50%, due 11/01/42 | |
| | FHLMC Gold, Pool # Q17792, 3.50%, due 05/01/43 | |
| | FHLMC Gold, Pool # Q36815, 4.00%, due 10/01/45 | |
| | FHLMC Gold, Pool # Q41918, 3.50%, due 07/01/46 | |
| | FHLMC Gold, Pool # Q42618, 3.00%, due 08/01/46 | |
| | FHLMC Gold, Pool # Q44455, 3.50%, due 11/01/46 | |
| | FHLMC Gold, Pool # Q44963, 3.50%, due 12/01/46 | |
| | FHLMC Gold, Pool # Q45741, 3.50%, due 01/01/47 | |
| | FHLMC Gold, Pool # Q49494, 4.50%, due 07/01/47 | |
| | FHLMC Gold, Pool # Q52312, 4.00%, due 11/01/47 | |
| | FHLMC Gold, Pool # Q54957, 4.00%, due 03/01/48 | |
| | FHLMC Gold, Pool # V60565, 3.00%, due 06/01/29 | |
| | FHLMC Gold, Pool # V60599, 3.00%, due 09/01/29 | |
| | FHLMC Gold, Pool # V82292, 4.00%, due 04/01/46 | |
| | FHLMC Gold, Pool # V82848, 3.00%, due 12/01/46 | |
| | FHLMC Multifamily Structured Pass Through Certificates, (IO), Series K106, Class X1, 1.35%, due 01/25/30(b) 144A | |
| | FHLMC Non Gold, Pool # 841542, 5.17%, (SOFR 30-day average + 2.34%), due | |
| | FHLMC Reference REMIC CMO, Series R007, Class ZA, 6.00%, due 05/15/36 | |
| | FHLMC REMIC CMO, Series 4682, Class KZ, 3.50%, due 09/15/46 | |
| | FHLMC REMIC CMO, Series 4710, Class KZ, 3.50%, due 08/15/47 | |
| | FHLMC REMIC CMO, Series 4739, Class Z, 3.50%, due 11/15/47 | |
| | FHLMC REMIC CMO, Series 5250, Class NH, 3.00%, due 08/25/52 | |
| | FNMA, Pool # BM4377, 3.79%, (12 mo. USD LIBOR + 1.89%), due 04/01/38(d) | |
| | FNMA, Pool # BM6482, 3.83%, (12 mo. USD LIBOR + 1.58%), due 04/01/47(d) | |
| | FNMA REMIC CMO, Series 2011-59, Class NZ, 5.50%, due 07/25/41 | |
| | FNMA REMIC CMO, Series 2012-134, Class ZC, 2.50%, due 12/25/42 | |
| | FNMA REMIC CMO, Series 2012-28, Class B, 6.50%, due 06/25/39 | |
| | FNMA REMIC CMO, Series 2017-66, Class BD, 3.00%, due 09/25/47 | |
| | FNMA-ACES, Series 2018-M10, Class A1, 3.36%, due 07/25/28(b) | |
| | GNMA CMO, Series 2018-135, Class Z, 3.50%, due 10/20/48 | |
| | GNMA I, Pool # 734152, 4.00%, due 01/15/41 | |
| | GNMA I, Pool # 784369, 4.00%, due 08/15/45 | |
| | GNMA I, Pool # 784605, 4.50%, due 01/15/42 | |
| | GNMA I, Pool # AL8626, 3.00%, due 08/15/45 | |
| | GNMA II, Pool # 004636, 4.50%, due 02/20/40 | |
| | GNMA II, Pool # 004678, 4.50%, due 04/20/40 | |
| | GNMA II, Pool # 004833, 4.00%, due 10/20/40 | |
| | GNMA II, Pool # 004977, 4.00%, due 03/20/41 | |
| | GNMA II, Pool # 004978, 4.50%, due 03/20/41 | |
| | GNMA II, Pool # 005055, 4.50%, due 05/20/41 | |
100
See accompanying Notes to the Financial Statements.
Mercer Core Fixed Income Fund
Schedule of Investments (Continued)
(showing percentage of net assets)
March 31, 2023
| | | |
| | Mortgage Backed Securities - U.S. Government Agency Obligations — continued |
| | GNMA II, Pool # 783637, 3.00%, due 06/20/42 | |
| | GNMA II, Pool # 785283, 2.50%, due 01/20/51 | |
| | GNMA II, Pool # 796468, 4.00%, due 09/20/42 | |
| | GNMA II, Pool # AV9421, 3.50%, due 11/20/46 | |
| | GNMA II, Pool # AY7555, 3.50%, due 04/20/47 | |
| | GNMA II, Pool # MA0462, 3.50%, due 10/20/42 | |
| | GNMA II, Pool # MA0624, 3.00%, due 12/20/42 | |
| | GNMA II, Pool # MA0625, 3.50%, due 12/20/42 | |
| | GNMA II, Pool # MA0698, 3.00%, due 01/20/43 | |
| | GNMA II, Pool # MA0851, 3.00%, due 03/20/43 | |
| | GNMA II, Pool # MA0852, 3.50%, due 03/20/43 | |
| | GNMA II, Pool # MA1156, 3.00%, due 07/20/43 | |
| | GNMA II, Pool # MA1376, 4.00%, due 10/20/43 | |
| | GNMA II, Pool # MA1599, 3.00%, due 01/20/44 | |
| | GNMA II, Pool # MA2371, 3.50%, due 11/20/44 | |
| | GNMA II, Pool # MA2372, 4.00%, due 11/20/44 | |
| | GNMA II, Pool # MA2825, 3.00%, due 05/20/45 | |
| | GNMA II, Pool # MA3310, 3.50%, due 12/20/45 | |
| | GNMA II, Pool # MA3377, 4.00%, due 01/20/46 | |
| | GNMA II, Pool # MA3455, 4.00%, due 02/20/46 | |
| | GNMA II, Pool # MA3456, 4.50%, due 02/20/46 | |
| | GNMA II, Pool # MA3596, 3.00%, due 04/20/46 | |
| | GNMA II, Pool # MA3803, 3.50%, due 07/20/46 | |
| | GNMA II, Pool # MA3873, 3.00%, due 08/20/46 | |
| | GNMA II, Pool # MA3936, 3.00%, due 09/20/46 | |
| | GNMA II, Pool # MA4004, 3.50%, due 10/20/46 | |
| | GNMA II, Pool # MA4071, 4.50%, due 11/20/46 | |
| | GNMA II, Pool # MA4125, 2.50%, due 12/20/46 | |
| | GNMA II, Pool # MA4263, 4.00%, due 02/20/47 | |
| | GNMA II, Pool # MA4585, 3.00%, due 07/20/47 | |
| | GNMA II, Pool # MA4586, 3.50%, due 07/20/47 | |
| | GNMA II, Pool # MA4720, 4.00%, due 09/20/47 | |
| | GNMA II, Pool # MA4838, 4.00%, due 11/20/47 | |
| | GNMA II, Pool # MA5019, 3.50%, due 02/20/48 | |
| | GNMA II, Pool # MA5021, 4.50%, due 02/20/48 | |
| | GNMA II, Pool # MA5079, 4.50%, due 03/20/48 | |
| | GNMA II, Pool # MA5264, 4.00%, due 06/20/48 | |
| | GNMA II, Pool # MA5397, 3.50%, due 08/20/48 | |
| | GNMA II, Pool # MA5466, 4.00%, due 09/20/48 | |
| | GNMA II, Pool # MA5467, 4.50%, due 09/20/48 | |
| | GNMA II, Pool # MA5530, 5.00%, due 10/20/48 | |
| | GNMA II, Pool # MA5762, 3.50%, due 02/20/49 | |
| | GNMA II, Pool # MA5817, 4.00%, due 03/20/49 | |
| | GNMA II, Pool # MA5874, 3.00%, due 04/20/49 | |
| | GNMA II, Pool # MA6038, 3.00%, due 07/20/49 | |
| | GNMA II, Pool # MA6090, 3.50%, due 08/20/49 | |
| | GNMA II, Pool # MA6338, 3.00%, due 12/20/49 | |
| | GNMA II, Pool # MA6409, 3.00%, due 01/20/50 | |
| | GNMA II, Pool # MA7254, 2.00%, due 03/20/51 | |
See accompanying Notes to the Financial Statements.
101
Mercer Core Fixed Income Fund
Schedule of Investments (Continued)
(showing percentage of net assets)
March 31, 2023
| | | |
| | Mortgage Backed Securities - U.S. Government Agency Obligations — continued |
| | GNMA II, Pool # MA7367, 2.50%, due 05/20/51 | |
| | GNMA II, Pool # MA7471, 2.00%, due 07/20/51 | |
| | GNMA II, Pool # MA7534, 2.50%, due 08/20/51 | |
| | GNMA II, Pool # MA7588, 2.00%, due 09/20/51 | |
| | GNMA II, Pool # MA7589, 2.50%, due 09/20/51 | |
| | GNMA II, Pool # MA7649, 2.50%, due 10/20/51 | |
| | GNMA II, Pool # MA7650, 3.00%, due 10/20/51 | |
| | GNMA II, Pool # MA7706, 3.00%, due 11/20/51 | |
| | GNMA II, Pool # MA7767, 2.50%, due 12/20/51 | |
| | GNMA II, Pool # MA7936, 2.50%, due 03/20/52 | |
| | GNMA II, Pool # MA7988, 3.00%, due 04/20/52 | |
| | GNMA II, Pool # MA8642, 2.50%, due 02/20/53 | |
| | GNMA TBA, 4.50%, due 04/20/53 | |
| | UMBS, Pool # 745148, 5.00%, due 01/01/36 | |
| | UMBS, Pool # 932807, 4.00%, due 09/01/40 | |
| | UMBS, Pool # 983471, 5.50%, due 05/01/38 | |
| | UMBS, Pool # 985184, 5.50%, due 08/01/38 | |
| | UMBS, Pool # 995245, 5.00%, due 01/01/39 | |
| | UMBS, Pool # AB6212, 3.00%, due 09/01/42 | |
| | UMBS, Pool # AB6802, 3.50%, due 11/01/42 | |
| | UMBS, Pool # AB7059, 2.50%, due 11/01/42 | |
| | UMBS, Pool # AB8703, 3.00%, due 03/01/38 | |
| | UMBS, Pool # AB9383, 4.00%, due 05/01/43 | |
| | UMBS, Pool # AB9659, 3.00%, due 06/01/43 | |
| | UMBS, Pool # AC3668, 4.50%, due 10/01/39 | |
| | UMBS, Pool # AD9153, 4.50%, due 08/01/40 | |
| | UMBS, Pool # AE0469, 6.00%, due 12/01/39 | |
| | UMBS, Pool # AH4404, 4.00%, due 01/01/41 | |
| | UMBS, Pool # AI1892, 5.00%, due 05/01/41 | |
| | UMBS, Pool # AI4815, 4.50%, due 06/01/41 | |
| | UMBS, Pool # AJ9278, 3.50%, due 12/01/41 | |
| | UMBS, Pool # AJ9317, 4.00%, due 01/01/42 | |
| | UMBS, Pool # AL0215, 4.50%, due 04/01/41(n) | |
| | UMBS, Pool # AL1895, 3.50%, due 06/01/42 | |
| | UMBS, Pool # AL2466, 4.00%, due 09/01/42 | |
| | UMBS, Pool # AL3000, 3.50%, due 12/01/42 | |
| | UMBS, Pool # AL3316, 3.50%, due 03/01/43 | |
| | UMBS, Pool # AL6663, 4.00%, due 03/01/39 | |
| | UMBS, Pool # AL7594, 3.50%, due 08/01/45 | |
| | UMBS, Pool # AL8191, 4.00%, due 12/01/45 | |
| | UMBS, Pool # AO4109, 4.00%, due 06/01/42 | |
| | UMBS, Pool # AQ7923, 3.00%, due 12/01/42 | |
| | UMBS, Pool # AS5133, 3.50%, due 06/01/45 | |
| | UMBS, Pool # AS6286, 4.00%, due 12/01/45 | |
| | UMBS, Pool # AS6304, 4.00%, due 12/01/45 | |
| | UMBS, Pool # AS6452, 3.50%, due 01/01/46 | |
| | UMBS, Pool # AS7693, 2.00%, due 08/01/31 | |
| | UMBS, Pool # AS8073, 2.50%, due 10/01/46 | |
| | UMBS, Pool # AZ3743, 3.50%, due 11/01/45 | |
102
See accompanying Notes to the Financial Statements.
Mercer Core Fixed Income Fund
Schedule of Investments (Continued)
(showing percentage of net assets)
March 31, 2023
| | | |
| | Mortgage Backed Securities - U.S. Government Agency Obligations — continued |
| | UMBS, Pool # BC9468, 3.00%, due 06/01/46 | |
| | UMBS, Pool # BD7043, 4.00%, due 03/01/47 | |
| | UMBS, Pool # BE7192, 4.00%, due 03/01/47 | |
| | UMBS, Pool # BJ0104, 3.50%, due 10/01/47 | |
| | UMBS, Pool # BK1023, 4.50%, due 02/01/48 | |
| | UMBS, Pool # BK7611, 4.50%, due 09/01/48 | |
| | UMBS, Pool # BM1573, 3.50%, due 07/01/47 | |
| | UMBS, Pool # BM1972, 3.50%, due 10/01/37 | |
| | UMBS, Pool # BM3033, 3.00%, due 10/01/47 | |
| | UMBS, Pool # BM3258, 3.00%, due 02/01/47 | |
| | UMBS, Pool # BM3286, 4.50%, due 11/01/47 | |
| | UMBS, Pool # BM3332, 3.50%, due 01/01/48 | |
| | UMBS, Pool # BM3491, 4.50%, due 01/01/38 | |
| | UMBS, Pool # BM3641, 4.00%, due 04/01/48 | |
| | UMBS, Pool # BM4896, 3.00%, due 02/01/47 | |
| | UMBS, Pool # BM5213, 3.00%, due 07/01/45 | |
| | UMBS, Pool # BM5293, 3.50%, due 02/01/49 | |
| | UMBS, Pool # BM5694, 4.00%, due 06/01/48 | |
| | UMBS, Pool # BM5874, 4.00%, due 01/01/48 | |
| | UMBS, Pool # BM5950, 3.00%, due 11/01/48 | |
| | UMBS, Pool # BN6216, 4.50%, due 03/01/49 | |
| | UMBS, Pool # BO1420, 3.50%, due 09/01/49 | |
| | UMBS, Pool # BO5387, 3.50%, due 12/01/49 | |
| | UMBS, Pool # BP2898, 4.00%, due 03/01/50 | |
| | UMBS, Pool # BP3048, 3.00%, due 03/01/50 | |
| | UMBS, Pool # BP5462, 2.50%, due 06/01/50 | |
| | UMBS, Pool # BP5568, 3.00%, due 06/01/50 | |
| | UMBS, Pool # BP6618, 2.50%, due 08/01/50 | |
| | UMBS, Pool # BP9250, 2.50%, due 07/01/50 | |
| | UMBS, Pool # BQ3132, 2.00%, due 10/01/50 | |
| | UMBS, Pool # BQ3138, 2.50%, due 10/01/50 | |
| | UMBS, Pool # BU3058, 2.50%, due 12/01/51 | |
| | UMBS, Pool # BU8763, 3.00%, due 04/01/52 | |
| | UMBS, Pool # BV8474, 3.00%, due 05/01/52 | |
| | UMBS, Pool # BW0046, 5.00%, due 07/01/52 | |
| | UMBS, Pool # CA0623, 4.50%, due 10/01/47 | |
| | UMBS, Pool # CA0655, 3.50%, due 11/01/47 | |
| | UMBS, Pool # CA3828, 4.00%, due 07/01/49 | |
| | UMBS, Pool # CA3986, 5.00%, due 08/01/49 | |
| | UMBS, Pool # CA4149, 3.00%, due 09/01/49 | |
| | UMBS, Pool # CA4831, 4.50%, due 12/01/49 | |
| | UMBS, Pool # CA5229, 3.00%, due 02/01/50 | |
| | UMBS, Pool # CA5354, 3.50%, due 03/01/50 | |
| | UMBS, Pool # CA5571, 4.00%, due 04/01/50 | |
| | UMBS, Pool # CA6097, 3.50%, due 06/01/50 | |
| | UMBS, Pool # CA6635, 2.50%, due 08/01/50 | |
| | UMBS, Pool # CA6738, 3.00%, due 08/01/50 | |
| | UMBS, Pool # CA6777, 4.50%, due 08/01/50 | |
| | UMBS, Pool # CA6799, 2.00%, due 08/01/50 | |
See accompanying Notes to the Financial Statements.
103
Mercer Core Fixed Income Fund
Schedule of Investments (Continued)
(showing percentage of net assets)
March 31, 2023
| | | |
| | Mortgage Backed Securities - U.S. Government Agency Obligations — continued |
| | UMBS, Pool # CA6871, 2.50%, due 08/01/35 | |
| | UMBS, Pool # CA6872, 2.50%, due 08/01/35 | |
| | UMBS, Pool # CA8062, 2.50%, due 12/01/50 | |
| | UMBS, Pool # CA8895, 2.50%, due 02/01/51 | |
| | UMBS, Pool # CA9090, 2.50%, due 02/01/51 | |
| | UMBS, Pool # CA9227, 2.50%, due 02/01/51 | |
| | UMBS, Pool # CB0671, 2.50%, due 06/01/51 | |
| | UMBS, Pool # CB2287, 2.50%, due 12/01/51 | |
| | UMBS, Pool # CB2858, 2.50%, due 02/01/52 | |
| | UMBS, Pool # CB3120, 3.00%, due 03/01/52 | |
| | UMBS, Pool # CB3126, 3.50%, due 03/01/52 | |
| | UMBS, Pool # CB3512, 4.00%, due 05/01/52 | |
| | UMBS, Pool # CB3865, 4.50%, due 06/01/52 | |
| | UMBS, Pool # CB4088, 4.00%, due 07/01/52 | |
| | UMBS, Pool # CB4304, 4.50%, due 08/01/52 | |
| | UMBS, Pool # CB4337, 4.50%, due 08/01/52 | |
| | UMBS, Pool # CB4395, 4.50%, due 08/01/52 | |
| | UMBS, Pool # CB4908, 5.50%, due 10/01/52 | |
| | UMBS, Pool # CB5434, 5.00%, due 01/01/53 | |
| | UMBS, Pool # FM0030, 3.00%, due 02/01/49 | |
| | UMBS, Pool # FM1001, 3.50%, due 11/01/48 | |
| | UMBS, Pool # FM1266, 5.00%, due 07/01/49 | |
| | UMBS, Pool # FM1347, 3.00%, due 12/01/48 | |
| | UMBS, Pool # FM1467, 3.00%, due 12/01/47 | |
| | UMBS, Pool # FM1588, 3.00%, due 10/01/49 | |
| | UMBS, Pool # FM1715, 3.00%, due 12/01/45 | |
| | UMBS, Pool # FM1790, 3.00%, due 11/01/49 | |
| | UMBS, Pool # FM1864, 3.00%, due 11/01/49 | |
| | UMBS, Pool # FM2217, 3.00%, due 03/01/47 | |
| | UMBS, Pool # FM2226, 3.00%, due 09/01/46 | |
| | UMBS, Pool # FM2274, 4.00%, due 08/01/49 | |
| | UMBS, Pool # FM2336, 4.00%, due 01/01/50 | |
| | UMBS, Pool # FM2461, 3.50%, due 03/01/50 | |
| | UMBS, Pool # FM2570, 4.50%, due 04/01/48 | |
| | UMBS, Pool # FM2674, 4.00%, due 03/01/50 | |
| | UMBS, Pool # FM3250, 3.50%, due 05/01/50 | |
| | UMBS, Pool # FM4330, 2.50%, due 10/01/50 | |
| | UMBS, Pool # FM4532, 3.00%, due 09/01/50 | |
| | UMBS, Pool # FM4765, 2.00%, due 11/01/50 | |
| | UMBS, Pool # FM5035, 4.00%, due 07/01/50 | |
| | UMBS, Pool # FM5721, 3.00%, due 12/01/40 | |
| | UMBS, Pool # FM5875, 4.50%, due 04/01/50 | |
| | UMBS, Pool # FM5996, 4.50%, due 03/01/49 | |
| | UMBS, Pool # FM6273, 3.00%, due 12/01/34 | |
| | UMBS, Pool # FM6497, 2.00%, due 03/01/51 | |
| | UMBS, Pool # FM6585, 3.50%, due 11/01/40 | |
| | UMBS, Pool # FM7341, 4.00%, due 03/01/48 | |
| | UMBS, Pool # FM7441, 3.00%, due 05/01/51 | |
| | UMBS, Pool # FM7785, 4.00%, due 05/01/49 | |
104
See accompanying Notes to the Financial Statements.
Mercer Core Fixed Income Fund
Schedule of Investments (Continued)
(showing percentage of net assets)
March 31, 2023
| | | |
| | Mortgage Backed Securities - U.S. Government Agency Obligations — continued |
| | UMBS, Pool # FM7794, 4.00%, due 01/01/50 | |
| | UMBS, Pool # FM8216, 4.00%, due 11/01/48 | |
| | UMBS, Pool # FM8422, 2.50%, due 08/01/51 | |
| | UMBS, Pool # FM8451, 2.50%, due 08/01/51 | |
| | UMBS, Pool # FM8603, 4.00%, due 09/01/49 | |
| | UMBS, Pool # FM9412, 2.50%, due 11/01/51 | |
| | UMBS, Pool # FM9461, 3.50%, due 11/01/51 | |
| | UMBS, Pool # FM9674, 3.50%, due 06/01/49 | |
| | UMBS, Pool # FM9726, 2.50%, due 11/01/51 | |
| | UMBS, Pool # FM9728, 2.50%, due 11/01/51 | |
| | UMBS, Pool # FM9977, 4.00%, due 02/01/50 | |
| | UMBS, Pool # FS0027, 2.50%, due 11/01/51 | |
| | UMBS, Pool # FS0065, 4.50%, due 12/01/50 | |
| | UMBS, Pool # FS0194, 2.50%, due 01/01/52 | |
| | UMBS, Pool # FS0248, 3.00%, due 02/01/50 | |
| | UMBS, Pool # FS0397, 3.00%, due 01/01/52 | |
| | UMBS, Pool # FS0644, 3.00%, due 02/01/52 | |
| | UMBS, Pool # FS0703, 4.00%, due 01/01/49 | |
| | UMBS, Pool # FS0715, 3.00%, due 01/01/52 | |
| | UMBS, Pool # FS1133, 4.00%, due 10/01/51 | |
| | UMBS, Pool # FS1201, 3.00%, due 01/01/50 | |
| | UMBS, Pool # FS1205, 3.50%, due 04/01/52 | |
| | UMBS, Pool # FS1228, 3.00%, due 03/01/52 | |
| | UMBS, Pool # FS1285, 3.50%, due 02/01/52 | |
| | UMBS, Pool # FS1427, 3.00%, due 02/01/50 | |
| | UMBS, Pool # FS1590, 2.50%, due 04/01/52 | |
| | UMBS, Pool # FS1602, 4.00%, due 07/01/49 | |
| | UMBS, Pool # FS1624, 2.50%, due 10/01/51 | |
| | UMBS, Pool # FS1637, 4.00%, due 04/01/52 | |
| | UMBS, Pool # FS1938, 2.50%, due 02/01/52 | |
| | UMBS, Pool # FS1976, 4.00%, due 08/01/51 | |
| | UMBS, Pool # FS2167, 4.50%, due 06/01/52 | |
| | UMBS, Pool # FS2238, 4.00%, due 03/01/51 | |
| | UMBS, Pool # FS2354, 4.00%, due 06/01/52 | |
| | UMBS, Pool # FS2415, 4.50%, due 08/01/52 | |
| | UMBS, Pool # FS2616, 5.00%, due 08/01/52 | |
| | UMBS, Pool # FS2896, 4.50%, due 09/01/52 | |
| | UMBS, Pool # FS2920, 3.00%, due 07/01/36 | |
| | UMBS, Pool # FS3160, 3.00%, due 06/01/52 | |
| | UMBS, Pool # FS3276, 4.50%, due 12/01/37 | |
| | UMBS, Pool # FS3359, 5.50%, due 12/01/52 | |
| | UMBS, Pool # FS3405, 5.50%, due 12/01/52 | |
| | UMBS, Pool # FS3417, 5.00%, due 12/01/52 | |
| | UMBS, Pool # FS3434, 5.50%, due 12/01/52 | |
| | UMBS, Pool # MA2781, 2.50%, due 10/01/46 | |
| | UMBS, Pool # MA2863, 3.00%, due 01/01/47 | |
| | UMBS, Pool # MA3058, 4.00%, due 07/01/47 | |
| | UMBS, Pool # MA3087, 3.50%, due 08/01/47 | |
| | UMBS, Pool # MA3155, 3.00%, due 10/01/32 | |
See accompanying Notes to the Financial Statements.
105
Mercer Core Fixed Income Fund
Schedule of Investments (Continued)
(showing percentage of net assets)
March 31, 2023
| | | |
| | Mortgage Backed Securities - U.S. Government Agency Obligations — continued |
| | UMBS, Pool # MA3182, 3.50%, due 11/01/47 | |
| | UMBS, Pool # MA3211, 4.00%, due 12/01/47 | |
| | UMBS, Pool # MA3238, 3.50%, due 01/01/48 | |
| | UMBS, Pool # MA3332, 3.50%, due 04/01/48 | |
| | UMBS, Pool # MA3364, 3.50%, due 05/01/33 | |
| | UMBS, Pool # MA3385, 4.50%, due 06/01/48 | |
| | UMBS, Pool # MA3414, 3.50%, due 07/01/48 | |
| | UMBS, Pool # MA3442, 3.50%, due 08/01/48 | |
| | UMBS, Pool # MA3521, 4.00%, due 11/01/48 | |
| | UMBS, Pool # MA3871, 3.00%, due 12/01/49 | |
| | UMBS, Pool # MA3937, 3.00%, due 02/01/50 | |
| | UMBS, Pool # MA3960, 3.00%, due 03/01/50 | |
| | UMBS, Pool # MA4014, 3.00%, due 05/01/35 | |
| | UMBS, Pool # MA4018, 2.00%, due 05/01/50 | |
| | UMBS, Pool # MA4048, 3.00%, due 06/01/50 | |
| | UMBS, Pool # MA4120, 2.50%, due 09/01/50 | |
| | UMBS, Pool # MA4158, 2.00%, due 10/01/50 | |
| | UMBS, Pool # MA4181, 1.50%, due 11/01/50 | |
| | UMBS, Pool # MA4204, 2.00%, due 12/01/40 | |
| | UMBS, Pool # MA4208, 2.00%, due 12/01/50 | |
| | UMBS, Pool # MA4209, 1.50%, due 12/01/50 | |
| | UMBS, Pool # MA4232, 2.00%, due 01/01/41 | |
| | UMBS, Pool # MA4237, 2.00%, due 01/01/51 | |
| | UMBS, Pool # MA4268, 2.00%, due 02/01/41 | |
| | UMBS, Pool # MA4281, 2.00%, due 03/01/51 | |
| | UMBS, Pool # MA4305, 2.00%, due 04/01/51 | |
| | UMBS, Pool # MA4325, 2.00%, due 05/01/51 | |
| | UMBS, Pool # MA4333, 2.00%, due 05/01/41 | |
| | UMBS, Pool # MA4356, 2.50%, due 06/01/51 | |
| | UMBS, Pool # MA4380, 3.00%, due 07/01/51 | |
| | UMBS, Pool # MA4398, 2.00%, due 08/01/51 | |
| | UMBS, Pool # MA4399, 2.50%, due 08/01/51 | |
| | UMBS, Pool # MA4414, 2.50%, due 09/01/51 | |
| | UMBS, Pool # MA4437, 2.00%, due 10/01/51 | |
| | UMBS, Pool # MA4493, 2.50%, due 12/01/51 | |
| | UMBS, Pool # MA4512, 2.50%, due 01/01/52 | |
| | UMBS, Pool # MA4548, 2.50%, due 02/01/52 | |
| | UMBS, Pool # MA4549, 3.00%, due 02/01/52 | |
| | UMBS, Pool # MA4600, 3.50%, due 05/01/52 | |
| | UMBS, Pool # MA4644, 4.00%, due 05/01/52 | |
| | UMBS, Pool # MA4656, 4.50%, due 07/01/52 | |
| | UMBS, Pool # MA4686, 5.00%, due 06/01/52 | |
| | UMBS, Pool # MA4733, 4.50%, due 09/01/52 | |
| | UMBS, Pool # MA4839, 4.00%, due 12/01/52 | |
| | UMBS, Pool # QA6328, 3.00%, due 01/01/50 | |
| | UMBS, Pool # QA6367, 3.00%, due 01/01/50 | |
| | UMBS, Pool # QA7234, 3.00%, due 02/01/50 | |
| | UMBS, Pool # QA8518, 3.00%, due 04/01/50 | |
| | UMBS, Pool # QB0220, 3.00%, due 06/01/50 | |
106
See accompanying Notes to the Financial Statements.
Mercer Core Fixed Income Fund
Schedule of Investments (Continued)
(showing percentage of net assets)
March 31, 2023
| | | |
| | Mortgage Backed Securities - U.S. Government Agency Obligations — continued |
| | UMBS, Pool # QB4847, 2.50%, due 10/01/50 | |
| | UMBS, Pool # QB6476, 2.50%, due 12/01/50 | |
| | UMBS, Pool # QC0039, 2.50%, due 03/01/51 | |
| | UMBS, Pool # QC4339, 2.00%, due 07/01/51 | |
| | UMBS, Pool # QC5189, 2.50%, due 08/01/51 | |
| | UMBS, Pool # QC6357, 2.50%, due 09/01/51 | |
| | UMBS, Pool # QC6456, 3.00%, due 09/01/51 | |
| | UMBS, Pool # QD6056, 3.00%, due 02/01/52 | |
| | UMBS, Pool # QD9911, 2.50%, due 04/01/52 | |
| | UMBS, Pool # QE0375, 4.00%, due 04/01/52 | |
| | UMBS, Pool # QE1497, 4.00%, due 05/01/52 | |
| | UMBS, Pool # RA1776, 3.00%, due 12/01/49 | |
| | UMBS, Pool # RA1860, 3.00%, due 12/01/49 | |
| | UMBS, Pool # RA2572, 3.50%, due 05/01/50 | |
| | UMBS, Pool # RA2790, 2.50%, due 06/01/50 | |
| | UMBS, Pool # RA2853, 2.50%, due 06/01/50 | |
| | UMBS, Pool # RA3206, 2.00%, due 08/01/50 | |
| | UMBS, Pool # RA5286, 2.50%, due 05/01/51 | |
| | UMBS, Pool # RA5502, 3.00%, due 06/01/51 | |
| | UMBS, Pool # RA5767, 2.50%, due 09/01/51 | |
| | UMBS, Pool # RA6432, 2.50%, due 12/01/51 | |
| | UMBS, Pool # RA6944, 3.50%, due 03/01/52 | |
| | UMBS, Pool # RA6951, 3.50%, due 03/01/52 | |
| | UMBS, Pool # RA7184, 4.00%, due 04/01/52 | |
| | UMBS, Pool # RA7195, 3.50%, due 04/01/52 | |
| | UMBS, Pool # RA7942, 5.50%, due 09/01/52 | |
| | UMBS, Pool # RA8248, 5.00%, due 11/01/52 | |
| | UMBS, Pool # RB5111, 2.00%, due 05/01/41 | |
| | UMBS, Pool # SB8189, 4.00%, due 11/01/37 | |
| | UMBS, Pool # SB8199, 4.50%, due 12/01/37 | |
| | UMBS, Pool # SB8205, 4.50%, due 01/01/38 | |
| | UMBS, Pool # SB8510, 2.00%, due 02/01/36 | |
| | UMBS, Pool # SD0100, 3.00%, due 10/01/49 | |
| | UMBS, Pool # SD0499, 3.00%, due 08/01/50 | |
| | UMBS, Pool # SD0558, 2.50%, due 03/01/51 | |
| | UMBS, Pool # SD0619, 4.00%, due 07/01/50 | |
| | UMBS, Pool # SD0742, 2.50%, due 11/01/51 | |
| | UMBS, Pool # SD0815, 3.00%, due 01/01/52 | |
| | UMBS, Pool # SD1050, 4.50%, due 07/01/52 | |
| | UMBS, Pool # SD1217, 2.00%, due 03/01/52 | |
| | UMBS, Pool # SD1446, 4.50%, due 08/01/52 | |
| | UMBS, Pool # SD1454, 4.50%, due 08/01/52 | |
| | UMBS, Pool # SD1475, 4.50%, due 08/01/52 | |
| | UMBS, Pool # SD1517, 4.50%, due 09/01/52 | |
| | UMBS, Pool # SD1606, 4.50%, due 09/01/52 | |
| | UMBS, Pool # SD1695, 5.00%, due 10/01/52 | |
| | UMBS, Pool # SD1809, 4.50%, due 09/01/52 | |
| | UMBS, Pool # SD1944, 5.00%, due 12/01/52 | |
| | UMBS, Pool # SD2032, 5.00%, due 12/01/52 | |
See accompanying Notes to the Financial Statements.
107
Mercer Core Fixed Income Fund
Schedule of Investments (Continued)
(showing percentage of net assets)
March 31, 2023
| | | |
| | Mortgage Backed Securities - U.S. Government Agency Obligations — continued |
| | UMBS, Pool # SD2318, 5.00%, due 02/01/53 | |
| | UMBS, Pool # SD7543, 2.50%, due 08/01/51 | |
| | UMBS, Pool # SD7548, 2.50%, due 11/01/51 | |
| | UMBS, Pool # SD7551, 3.00%, due 01/01/52 | |
| | UMBS, Pool # SD8025, 3.50%, due 11/01/49 | |
| | UMBS, Pool # SD8075, 3.50%, due 07/01/50 | |
| | UMBS, Pool # SD8090, 2.00%, due 09/01/50 | |
| | UMBS, Pool # SD8104, 1.50%, due 11/01/50 | |
| | UMBS, Pool # SD8113, 2.00%, due 12/01/50 | |
| | UMBS, Pool # SD8121, 2.00%, due 01/01/51 | |
| | UMBS, Pool # SD8140, 2.00%, due 04/01/51 | |
| | UMBS, Pool # SD8141, 2.50%, due 04/01/51 | |
| | UMBS, Pool # SD8183, 2.50%, due 12/01/51 | |
| | UMBS, Pool # SD8189, 2.50%, due 01/01/52 | |
| | UMBS, Pool # SD8221, 3.50%, due 06/01/52 | |
| | UMBS, Pool # SD8231, 4.50%, due 07/01/52 | |
| | UMBS, Pool # SD8245, 4.50%, due 09/01/52 | |
| | UMBS, Pool # SD8257, 4.50%, due 10/01/52 | |
| | UMBS, Pool # SD8258, 5.00%, due 10/01/52 | |
| | UMBS, Pool # SD8267, 5.00%, due 11/01/52 | |
| | UMBS, Pool # SD8278, 6.00%, due 12/01/52 | |
| | UMBS, Pool # ZM1609, 2.00%, due 03/01/51 | |
| | UMBS, Pool # ZM1609, 3.50%, due 09/01/46 | |
| | UMBS, Pool # ZS4727, 4.00%, due 07/01/47 | |
| | UMBS, Pool # ZS4760, 4.00%, due 03/01/48 | |
| | UMBS, Pool # ZS4763, 3.50%, due 04/01/48 | |
| | UMBS, Pool # ZT0657, 6.00%, due 07/01/40 | |
| | UMBS, Pool # ZT1748, 5.00%, due 01/01/49 | |
| | UMBS TBA, 4.00%, due 06/25/52 | |
| | UMBS TBA, 4.50%, due 04/13/53 | |
| | UMBS TBA, 5.00%, due 04/13/53 | |
| | UMBS TBA, 5.50%, due 04/13/53 | |
| | UMBS TBA, 5.50%, due 05/11/53 | |
| | | |
| | Municipal Obligations — 1.2% |
| | Alabama Economic Settlement Authority, 4.26%, due 09/15/32 | |
| | Bay Area Toll Authority, 2.57%, due 04/01/31 | |
| | Bay Area Toll Authority, 6.26%, due 04/01/49 | |
| | California Health Facilities Financing Authority, 4.19%, due 06/01/37 | |
| | Dallas Fort Worth International Airport, 1.93%, due 11/01/28 | |
| | District of Columbia Water & Sewer Authority, 4.81%, due 10/01/14(i) | |
| | Florida State Board of Administration Finance Corp., 1.71%, due 07/01/27 | |
| | Golden State Tobacco Securitization Corp., 4.21%, due 06/01/50 | |
| | Louisiana Local Government Environmental Facilities & Community Development Authority, 3.62%, due 02/01/29 | |
| | Michigan Finance Authority, 2.37%, due 09/01/49(b) | |
| | Michigan State University, 4.17%, due 08/15/22(i) | |
| | Municipal Electric Authority of Georgia, 6.64%, due 04/01/57 | |
108
See accompanying Notes to the Financial Statements.
Mercer Core Fixed Income Fund
Schedule of Investments (Continued)
(showing percentage of net assets)
March 31, 2023
| | | |
| | Municipal Obligations — continued |
| | New Jersey Transportation Trust Fund Authority, 4.08%, due 06/15/39 | |
| | New Jersey Transportation Trust Fund Authority, 4.13%, due 06/15/42 | |
| | New York City Transitional Finance Authority Future Tax Secured Revenue, 5.77%, due 08/01/36 | |
| | New York State Urban Development Corp., 5.77%, due 03/15/39 | |
| | Port Authority of New York & New Jersey, 1.09%, due 07/01/23 | |
| | State of California, 7.50%, due 04/01/34 | |
| | State of California, 7.55%, due 04/01/39 | |
| | State of Connecticut, 3.98%, due 06/15/29 | |
| | University of Michigan, 4.45%, due 04/01/22(i) | |
| | University of Virginia, 2.58%, due 11/01/51 | |
| | University of Virginia, 4.18%, due 09/01/17(i) | |
| | | |
| | Sovereign Debt Obligations — 0.3% |
| | Argentine Republic Government International Bond, 3.50%, due 07/09/41(e) | |
| | Bermuda Government International Bond, 2.38%, due 08/20/30 144A | |
| | Export-Import Bank of India, 3.88%, due 02/01/28 144A | |
| | Indonesia Government International Bond, 3.50%, due 01/11/28 | |
| | Japan Bank for International Cooperation, 3.38%, due 10/31/23 | |
| | Japan Finance Organization for Municipalities, 1.75%, due 09/05/24 144A | |
| | Korea National Oil Corp., 4.75%, due 04/03/26(c) 144A | |
| | Korea National Oil Corp., 4.88%, due 04/03/28(c) 144A | |
| | Mexico Government International Bond, 3.50%, due 02/12/34 | |
| | Peruvian Government International Bond, 2.78%, due 01/23/31 | |
| | Province of Alberta Canada, 1.30%, due 07/22/30 | |
| | Province of Alberta Canada, 3.30%, due 03/15/28 | |
| | Province of Manitoba Canada, 2.13%, due 06/22/26 | |
| | Province of Quebec Canada, 2.75%, due 04/12/27 | |
| | Qatar Government International Bond, 5.10%, due 04/23/48 144A | |
| | Saudi Government International Bond, 4.38%, due 04/16/29 144A | |
| | Uruguay Government International Bond, 4.98%, due 04/20/55 | |
| | Uruguay Government International Bond, 5.10%, due 06/18/50 | |
| | | |
| | U.S. Government and Agency Obligations — 16.3% |
| | FNMA, 0.88%, due 08/05/30 | |
| | FNMA, 2.50%, due 02/05/24 | |
| | FNMA, 6.63%, due 11/15/30 | |
| | Tennessee Valley Authority, 1.50%, due 09/15/31 | |
| | Tennessee Valley Authority, 7.13%, due 05/01/30 | |
| | U.S. Treasury Bond, 1.13%, due 08/15/40 | |
| | U.S. Treasury Bond, 1.75%, due 08/15/41 | |
| | U.S. Treasury Bond, 1.88%, due 02/15/41 | |
| | U.S. Treasury Bond, 1.88%, due 02/15/51 | |
| | U.S. Treasury Bond, 2.00%, due 11/15/41 | |
| | U.S. Treasury Bond, 2.00%, due 08/15/51 | |
| | U.S. Treasury Bond, 2.25%, due 05/15/41(n) | |
| | U.S. Treasury Bond, 2.25%, due 08/15/49 | |
See accompanying Notes to the Financial Statements.
109
Mercer Core Fixed Income Fund
Schedule of Investments (Continued)
(showing percentage of net assets)
March 31, 2023
| | | |
| | U.S. Government and Agency Obligations — continued |
| | U.S. Treasury Bond, 2.25%, due 02/15/52 | |
| | U.S. Treasury Bond, 2.38%, due 02/15/42 | |
| | U.S. Treasury Bond, 2.38%, due 11/15/49 | |
| | U.S. Treasury Bond, 2.50%, due 02/15/46 | |
| | U.S. Treasury Bond, 2.75%, due 11/15/47 | |
| | U.S. Treasury Bond, 3.00%, due 02/15/49 | |
| | U.S. Treasury Bond, 3.00%, due 08/15/52 | |
| | U.S. Treasury Bond, 3.38%, due 08/15/42 | |
| | U.S. Treasury Bond, 3.38%, due 11/15/48 | |
| | U.S. Treasury Bond, 3.63%, due 08/15/43 | |
| | U.S. Treasury Bond, 3.63%, due 02/15/53 | |
| | U.S. Treasury Bond, 3.88%, due 02/15/43 | |
| | U.S. Treasury Bond, 4.00%, due 11/15/42 | |
| | U.S. Treasury Bond, 4.00%, due 11/15/52 | |
| | U.S. Treasury Inflation Indexed Bonds, 0.13%, due 01/15/30 | |
| | U.S. Treasury Note, 2.75%, due 08/15/32 | |
| | U.S. Treasury Note, 3.13%, due 08/31/27 | |
| | U.S. Treasury Note, 3.50%, due 01/31/28 | |
| | U.S. Treasury Note, 3.50%, due 02/15/33 | |
| | U.S. Treasury Note, 4.00%, due 02/29/28 | |
| | U.S. Treasury Note, 4.00%, due 02/28/30 | |
| | U.S. Treasury STRIPS, 4.01%, due 08/15/30(m) | |
| | U.S. Treasury STRIPS, 5.11%, due 02/15/39(m) | |
| | U.S. Treasury STRIPS, 5.27%, due 02/15/40(m) | |
| | U.S. Treasury STRIPS, 5.42%, due 11/15/40(m) | |
| | U.S. Treasury STRIPS, 5.46%, due 02/15/41(m) | |
| | U.S. Treasury STRIPS, 5.63%, due 11/15/41(m) | |
| | U.S. Treasury STRIPS, 5.71%, due 05/15/42(m) | |
| | U.S. Treasury STRIPS, 5.84%, due 11/15/42(m) | |
| | U.S. Treasury STRIPS, 5.86%, due 02/15/43(m) | |
| | U.S. Treasury STRIPS, 5.96%, due 11/15/43(m) | |
| | U.S. Treasury STRIPS, 6.05%, due 08/15/44(m)(n) | |
| | | |
| | TOTAL DEBT OBLIGATIONS (COST $1,401,474,238) | |
| | | |
| | |
| | |
| | Altera Infrastructure, LP/Teekay Offshore Finance Corp.*(k)(l) | |
| | TOTAL COMMON STOCK (COST $10,197) | |
110
See accompanying Notes to the Financial Statements.
Mercer Core Fixed Income Fund
Schedule of Investments (Continued)
(showing percentage of net assets)
March 31, 2023
| | | |
| | SHORT-TERM INVESTMENT — 1.1% |
| | Mutual Fund - Securities Lending Collateral — 1.1% |
| | State Street Institutional U.S. Government Money Market Fund, Premier Class, | |
| | TOTAL SHORT-TERM INVESTMENT (COST $14,825,703) | |
| | TOTAL INVESTMENTS BEFORE TBA SALE COMMITMENTS — 100.4%
(Cost $1,416,310,138) | |
| | TBA SALE COMMITMENTS — (0.1)% |
| | GNMA TBA, 2.50%, due 04/20/53 | |
| | UMBS TBA, 5.00%, due 04/13/53 | |
| | TOTAL TBA SALE COMMITMENTS (PROCEEDS $1,420,820) | |
| | TOTAL INVESTMENTS NET OF TBA SALE COMMITMENTS — 100.3%
(Cost $1,414,889,318) | |
| | Other Assets and Liabilities (net) — (0.3)% | |
| | | |
| Notes to Schedule of Investments: |
| Non-income producing security. |
| Unless otherwise indicated, all par values are denominated in United States dollars ($). |
| Variable or floating rate security, which interest rate adjusts periodically based on changes in current interest rates and prepayments on the underlying pool of assets. Rate shown is the rate in effect as of period end. |
| |
| Variable or floating rate note. Rate shown is as of March 31, 2023. |
| Step coupon security that pays an initial coupon rate for the first period and then a lower/higher coupon rate for the following periods. Rate shown is current coupon rate. |
| All or a portion of this security is out on loan. |
| Security is currently in default. |
| Security is perpetual and has no stated maturity date. |
| Year of maturity is greater than 2100. |
| Security exempt from registration under Regulation S of the Securities Act of 1933, which exempts from registration securities offered and sold outside the United States. Security may not be offered or sold in the United States except pursuant to an exemption from, or in a transaction not subject to, the registration requirements of the Securities Act of 1933. |
| Level 3 - significant unobservable inputs were used in determining the value of this security in the Fund. |
| Securities are fair valued by the Valuation Committee as approved by the Board of Trustees. The total market value of the securities at year end is $10,521 which represents 0.0% of net assets. The aggregate tax cost of these securities held at March 31, 2023 was $1,575,752. |
| Interest rate presented is yield to maturity. |
See accompanying Notes to the Financial Statements.
111
Mercer Core Fixed Income Fund
Schedule of Investments (Continued)
March 31, 2023
| All or a portion of this security is pledged for open futures and open centrally cleared swaps collateral. |
| The rate disclosed is the 7-day net yield as of March 31, 2023. |
| Represents an investment of securities lending cash collateral. |
| Securities exempt from registration under Rule 144A of the Securities Act of 1933. These securities may be resold in transactions exempt from registration, normally to qualified institutional buyers. The total market value of the securities at year end is $270,749,304 which represents 20.9% of net assets. |
112
See accompanying Notes to the Financial Statements.
Mercer Core Fixed Income Fund
Schedule of Investments (Continued)
March 31, 2023
Forward Foreign Currency Contracts
| | | | Unrealized
Appreciation
(Depreciation) |
| | | | | | |
| | | | | | |
| | | | | | |
| | | | | | |
Futures Contracts
| | | | Market Value/
Unrealized
Appreciation
(Depreciation) |
| | | | |
| U.S. Treasury Note 10-Year | | | |
| U.S. Treasury Note 2-Year | | | |
| U.S. Treasury Note 5-Year | | | |
| | | | |
| | | | |
| | | | |
| | | | |
| | | | |
| | | | |
Centrally Cleared Interest Rate Swaps
| | | | | Upfront
Premiums
Paid
(Received) | | | Unrealized
Appreciation
(Depreciation) |
| | | | | | | | | |
| | | | | | | | | |
| | | | | | | | | |
| | | | | | | | | |
See accompanying Notes to the Financial Statements.
113
Mercer Core Fixed Income Fund
Schedule of Investments (Continued)
March 31, 2023
|
| | Alternative Credit Enhancement Securities |
| | Collateralized Loan Obligation |
| | Collateralized Mortgage Obligation |
| | Constant Maturity Treasury Index |
| | Federal Home Loan Mortgage Corporation |
| | Federal National Mortgage Association |
| | Government National Mortgage Association |
| | |
| | London Interbank Offered Rate |
| | |
| | |
| | Real Estate Investment Trust |
| | Real Estate Mortgage Investment Conduit |
| | Secured Overnight Financing Rate |
| | Separate Trading of Registered Interest and Principal of Securities |
| | |
| | Term Secured Overnight Financing Rate |
| | Uniform Mortgage-Backed Securities are single-class securities backed by fixed-rate mortgage loans purchased by either FHLMC or FNMA |
114
See accompanying Notes to the Financial Statements.
Mercer Core Fixed Income Fund
Schedule of Investments (Continued)
March 31, 2023
Asset Class Summary (Unaudited) | |
| |
| |
| |
| |
| |
Forward Foreign Currency Contracts | |
| |
Other Assets and Liabilities (net) | |
| |
See accompanying Notes to the Financial Statements.
115
Mercer Opportunistic Fixed Income Fund
Schedule of Investments
(showing percentage of net assets)
March 31, 2023
| | | |
| | |
| | Asset Backed Securities — 6.3% |
| | AB BSL CLO 4, Ltd., Series 2023-4A, Class A, 1.00% (3 mo. TSFR + 2.00%), due 04/20/36(b)(c) 144A | |
| | Aegis Asset Backed Securities Trust, Series 2005-5, Class M1, 5.49% (1 mo. USD LIBOR + 0.65%), due 12/25/35(c) | |
| | AIG CLO, Ltd., Series 2019-1A, Class BR, 6.48% (3 mo. TSFR + 1.85%), due 04/18/35(c) 144A | |
| | Aimco CLO 12, Ltd., Series 2020-12A, Class DR, 7.56% (3 mo. TSFR + 2.90%), due 01/17/32(c) 144A | |
| | Alinea CLO, Ltd., Series 2018-1A, Class D, 7.91% (3 mo. USD LIBOR + 3.10%), due 07/20/31(c) 144A | |
| | AMMC CLO 27, Ltd., Series 2022-27A, Class D, 10.61% (3 mo. TSFR + 6.01%), due 01/20/36(c) 144A | |
| | Anchorage Capital CLO, Ltd., Series 2014-3RA, Class E, 10.30% (3 mo. USD LIBOR + 5.50%), due 01/28/31(c) 144A | |
| | Anchorage Capital CLO, Ltd., Series 2021-17A, Class A1, 5.96% (3 mo. USD LIBOR + 1.17%), due 07/15/34(c) 144A | |
| | Apex Credit CLO, Ltd., Series 2019-1A, Class BR, 7.19% (3 mo. USD LIBOR + 2.40%), due 04/18/32(c) 144A | |
| | Apidos CLO XXII, Series 2015-22A, Class DR, 11.56% (3 mo. USD LIBOR + 6.75%), due 04/20/31(c) 144A | |
| | Applebee’s Funding LLC/IHOP Funding LLC, Series 2019-1A, Class A2I, 4.19%, due 06/05/49 144A | |
| | Applebee's Funding LLC/IHOP Funding LLC, Series 2023-1A, Class A2, 7.82%, due 03/05/53(b) 144A | |
| | Ares XXXIIR CLO, Ltd., Series 2014-32RA, Class C, 7.76% (3 mo. USD LIBOR + 2.90%), due 05/15/30(c) 144A | |
| | Asset Backed Securities Corp. Home Equity Loan Trust, Series 2006-HE5, Class M1, 3.12% (1 mo. USD LIBOR + 0.42%), due 07/25/36(c) | |
| | Asset Backed Securities Corp. Home Equity Loan Trust, Series 2007-HE1, Class A4, 4.17% (1 mo. USD LIBOR + 0.14%), due 12/25/36(c) | |
| | Avis Budget Rental Car Funding AESOP LLC, Series 2020-2A, Class C, 4.25%, due 02/20/27 144A | |
| | Bain Capital Credit CLO, Ltd., Series 2021-4A, Class D, 7.91% (3 mo. USD LIBOR + 3.10%), due 10/20/34(c) 144A | |
| | Bain Capital Credit CLO, Ltd., Series 2022-2A, Class D1, 8.30% (3 mo. TSFR + 3.65%), due 04/22/35(c) 144A | |
| | Bain Capital Credit CLO, Ltd., Series 2023-1A, Class AN, 6.57% (3 mo. TSFR + 1.83%), due 04/16/36(c) 144A | |
| | Bain Capital Credit CLO, Ltd., Series 2023-1A, Class D, 9.64% (3 mo. TSFR + 4.90%), due 04/16/36(c) 144A | |
| | Ballyrock CLO, Ltd., Series 2018-1A, Class C, 7.96% (3 mo. USD LIBOR + 3.15%), due 04/20/31(c) 144A | |
| | Ballyrock CLO, Ltd., Series 2019-1A, Class A2R, 6.34% (3 mo. USD LIBOR + 1.55%), due 07/15/32(c) 144A | |
| | Ballyrock CLO, Ltd., Series 2022-19A, Class D, 11.75% (3 mo. TSFR + 7.11%), due 04/20/35(c) 144A | |
| | Barings CLO, Ltd., Series 2016-2A, Class ER2, 11.31% (3 mo. USD LIBOR + 6.50%), due 01/20/32(c) 144A | |
| | Bavarian Sky UK 5 CLO Plc, Series 2014-1A, Class CR2, 8.44% (3 mo. USD LIBOR + 3.63%), due 10/20/34(c) 144A | |
| | BlueMountain CLO XXIX, Ltd., Series 2020-29A, Class ER, 11.68% (3 mo. USD LIBOR + 6.86%), due 07/25/34(c) 144A | |
116
See accompanying Notes to the Financial Statements.
Mercer Opportunistic Fixed Income Fund
Schedule of Investments (Continued)
(showing percentage of net assets)
March 31, 2023
| | | |
| | Asset Backed Securities — continued |
| | Bristol Park CLO, Ltd., Series 2016-1A, Class ER, 11.79% (3 mo. USD LIBOR + 7.00%), due 04/15/29(c) 144A | |
| | Buckhorn Park CLO, Ltd., Series 2019-1A, Class DR, 7.89% (3 mo. USD LIBOR + 3.10%), due 07/18/34(c) 144A | |
| | Canyon Capital CLO, Ltd., Series 2020-1A, Class BR, 6.49% (3 mo. USD LIBOR + 1.70%), due 07/15/34(c) 144A | |
| | Canyon Capital CLO, Ltd., Series 2021-1A, Class E, 11.20% (3 mo. USD LIBOR + 6.41%), due 04/15/34(c) 144A | |
| | Canyon CLO, Ltd., Series 2021-4A, Class B, 6.49% (3 mo. USD LIBOR + 1.70%), due 10/15/34(c) 144A | |
| | Carlyle US CLO, Ltd., Series 2019-2A, Class DR, 11.29% (3 mo. USD LIBOR + 6.50%), due 07/15/32(c) 144A | |
| | Carlyle US CLO, Ltd., Series 2019-4A, Class A2R, 6.41% (3 mo. TSFR + 1.75%), due 04/15/35(c) 144A | |
| | Carlyle US CLO, Ltd., Series 2021-8A, Class B, 6.44% (3 mo. USD LIBOR + 1.65%), due 10/15/34(c) 144A | |
| | CarVal CLO VII-C, Ltd., Series 2023-1A, Class A1, 6.88% (3 mo. TSFR + 2.20%), due 01/20/35(c) 144A | |
| | Catskill Park CLO, Ltd., Series 2017-1A, Class D, 10.81% (3 mo. USD LIBOR + 6.00%), due 04/20/29(c) 144A | |
| | CBAM CLO, Ltd., Series 2018-6A, Class B2R, 7.02% (3 mo. TSFR + 2.36%), due 01/15/31(c) 144A | |
| | CIFC Funding CLO, Ltd., Series 2012-2RA, Class B, 6.36% (3 mo. USD LIBOR + 1.55%), due 01/20/28(c) 144A | |
| | CIFC Funding CLO, Ltd., Series 2017-1A, Class D, 8.32% (3 mo. USD LIBOR + 3.50%), due 04/23/29(c) 144A | |
| | CIFC Funding CLO, Ltd., Series 2017-3A, Class C, 8.46% (3 mo. USD LIBOR + 3.65%), due 07/20/30(c) 144A | |
| | Dryden 64 CLO, Ltd., Series 2018-64A, Class D, 7.44% (3 mo. USD LIBOR + 2.65%), due 04/18/31(c) 144A | |
| | Dryden 70 CLO, Ltd., Series 2018-70A, Class E, 10.88% (3 mo. USD LIBOR + 6.05%), due 01/16/32(c) 144A | |
| | Eaton Vance CLO, Ltd., Series 2020-2A, Class ER, 11.29% (3 mo. USD LIBOR + 6.50%), due 01/15/35(c) 144A | |
| | Elmwood CLO XI, Ltd., Series 2021-4A, Class B, 6.41% (3 mo. USD LIBOR + 1.60%), due 10/20/34(c) 144A | |
| | Falcon Aerospace, Ltd., Series 2017-1, Class A, 4.58%, due 02/15/42(c) 144A | |
| | Fortress Credit BSL CLO XII, Ltd., Series 2021-4A, Class E, 11.92% (3 mo. USD LIBOR + 7.13%), due 10/15/34(c) 144A | |
| | FS Rialto Issuer CLO LLC, Series 2022-FL7, Class A, 7.59% (1 mo. TSFR + 2.90%), due 10/19/39(c) 144A | |
| | Generate CLO 7, Ltd., Series 7A, Class B1, 6.67% (3 mo. USD LIBOR + 1.85%), due 01/22/33(c) 144A | |
| | Gilbert Park CLO, Ltd., Series 2017-1A, Class D, 7.74% (3 mo. USD LIBOR + 2.95%), due 10/15/30(c) 144A | |
| | Golub Capital Partners CLO 66B, Ltd., Series 2023-66A, Class A, 1.00% (3 mo. TSFR + 1.95%), due 04/25/36(b)(c) 144A | |
| | Golub Capital Partners CLO, Ltd., Series 2021-53A, Class E, 11.51% (3 mo. USD LIBOR + 6.70%), due 07/20/34(c) 144A | |
| | Greenwood Park CLO, Ltd., Series 2018-1A, Class E, 9.74% (3 mo. USD LIBOR + 4.95%), due 04/15/31(c) 144A | |
| | Greywolf CLO IV, Ltd., Series 2018-1A, Class D, 10.68% (3 mo. TSFR + 6.01%), due 04/26/31(c) 144A | |
See accompanying Notes to the Financial Statements.
117
Mercer Opportunistic Fixed Income Fund
Schedule of Investments (Continued)
(showing percentage of net assets)
March 31, 2023
| | | |
| | Asset Backed Securities — continued |
| | Greywolf CLO IV, Ltd., Series 2019-1RA, Class CR, 8.54% (3 mo. TSFR + 3.91%), due 04/17/34(c) 144A | |
| | GREYWOLF CLO VI, Ltd., Series 2018-1A, Class A2, 6.56% (3 mo. TSFR + 1.89%), due 04/26/31(c) 144A | |
| | GSAA Home Equity Trust, Series 2007-7, Class A4, 5.39% (1 mo. USD LIBOR + | |
| | Halsey Point CLO I, Ltd., Series 2019-1A, Class F, 12.44% (3 mo. USD LIBOR + 8.20%), due 01/20/33(c) 144A | |
| | Hayfin US CLO XII, Ltd., Series 2018-9A, Class BR, 6.60% (3 mo. USD LIBOR + 1.80%), due 04/28/31(c) 144A | |
| | KeyCorp Student Loan Trust, Series 2005-A, Class 2C, 6.43% (3 mo. USD LIBOR + | |
| | KKR CLO 14, Ltd., Series 14, Class BR, 6.59% (3 mo. USD LIBOR + 1.80%), due 07/15/31(c) 144A | |
| | KREF CLO, Ltd., Series 2022-FL3, Class A, 6.21% (1 mo. TSFR + 1.45%), due 02/17/39(c) 144A | |
| | Long Beach Mortgage Loan Trust, Series 2005-1, Class M4, 6.12% (1 mo. USD LIBOR + 1.28%), due 02/25/35(c) | |
| | Madison Park Funding CLO XLVIII, Ltd., Series 2017-25A, Class A2R, 6.47% (3 mo. USD LIBOR + 1.65%), due 04/25/29(c) 144A | |
| | Madison Park Funding CLO XXV, Ltd., Series 2021-48A, Class B, 5.68% (3 mo. USD LIBOR + 1.45%), due 04/19/33(c) 144A | |
| | Madison Park Funding CLO XXXIX, Ltd., Series 2021-39A, Class D, 7.87% (3 mo. USD LIBOR + 3.05%), due 10/22/34(c) 144A | |
| | Magnetite CLO XII, Ltd., Series 2015-12A, Class ER, 10.47% (3 mo. USD LIBOR + 5.68%), due 10/15/31(c) 144A | |
| | Magnetite CLO XXIV, Ltd., Series 2019-24A, Class BR, 6.41% (3 mo. TSFR + 1.75%), due 04/15/35(c) 144A | |
| | Magnetite CLO XXVII, Ltd., Series 2020-27A, Class AR, 5.95% (3 mo. USD LIBOR + 1.14%), due 10/20/34(c) 144A | |
| | Magnolia Financial X DAC, Series 2020-1, 3.98%, due 08/13/24 144A | |
| | Marathon CLO 14, Ltd., Series 2019-2A, Class BA, 8.11% (3 mo. USD LIBOR + 3.30%), due 01/20/33(c) 144A | |
| | Mercury Financial Credit Card Master Trust, Series 2022-1A, Class B, 3.20%, due 09/21/26 144A | |
| | Mill City Solar Loan, Ltd., Series 2019-1A, Class A, 4.34%, due 03/20/43 144A | |
| | Mosaic Solar Loan Trust, Series 2021-1A, Class D, 3.71%, due 12/20/46 144A | |
| | National Collegiate Student Loan Trust, Series 2007-2, Class A4, 5.14% (1 mo. USD LIBOR + 0.29%), due 01/25/33(c) | |
| | Navient Private Education Refi Student Loan Trust, Series 2018-CA, Class B, 4.22%, due 06/16/42 144A | |
| | Navient Private Education Refi Student Loan Trust, Series 2020-GA, Class B, 2.50%, due 09/16/69 144A | |
| | Neuberger Berman CLO XVIII, Ltd., Series 2014-18A, Class DR2, 10.74% (3 mo. USD LIBOR + 5.92%), due 10/21/30(c) 144A | |
| | Neuberger Berman Loan Advisers CLO 25, Ltd., Series 2017-25A, Class DR, 7.64% (3 mo. USD LIBOR + 2.85%), due 10/18/29(c) 144A | |
| | Neuberger Berman Loan Advisers CLO 33, Ltd., Series 2019-33A, Class DR, 7.69% (3 mo. USD LIBOR + 2.90%), due 10/16/33(c) 144A | |
| | Neuberger Berman Loan Advisers CLO 36, Ltd., Series 2020-36A, Class A1R, 6.06% (3 mo. USD LIBOR + 1.25%), due 04/20/33(c) 144A | |
| | Neuberger Berman Loan Advisers CLO 44, Ltd., Series 2021-44A, Class E, 10.79% (3 mo. USD LIBOR + 6.00%), due 10/16/34(c) 144A | |
118
See accompanying Notes to the Financial Statements.
Mercer Opportunistic Fixed Income Fund
Schedule of Investments (Continued)
(showing percentage of net assets)
March 31, 2023
| | | |
| | Asset Backed Securities — continued |
| | Ocean Trails CLO IX, Series 2020-9A, Class CR, 7.34% (3 mo. USD LIBOR + 2.55%), due 10/15/34(c) 144A | |
| | Ocean Trails CLO X, Series 2020-10A, Class ER, 12.36% (3 mo. USD LIBOR + 7.57%), due 10/15/34(c) 144A | |
| | Ocean Trails CLO XIV, Ltd., Series 2023-14A, Class A1, 6.78% (3 mo. TSFR + 2.00%), due 01/20/35(c) 144A | |
| | OCP CLO, Ltd., Series 2015-9A, Class BR2, 6.38% (3 mo. TSFR + 1.75%), due 01/15/33(c) 144A | |
| | Octagon Investment Partners CLO 35, Ltd., Series 2018-1A, Class C, 6.84% (3 mo. USD LIBOR + 2.60%), due 01/20/31(c) 144A | |
| | OHA Credit Funding CLO 2, Ltd., Series 2019-2A, Class BR, 6.42% (3 mo. USD LIBOR + 1.60%), due 04/21/34(c) 144A | |
| | OHA Credit Funding CLO 4, Ltd., Series 2019-4A, Class BR, 6.47% (3 mo. USD LIBOR + 1.65%), due 10/22/36(c) 144A | |
| | Option One Mortgage Loan Trust, Series 2005-3, Class M4, 5.78% (1 mo. USD LIBOR + 0.93%), due 08/25/35(c) | |
| | Owl Rock CLO III, Ltd., Series 2020-3A, Class A1L, 6.61% (3 mo. USD LIBOR + 1.80%), due 04/20/32(c) 144A | |
| | OZLM CLO XXIII, Ltd., Series 2019-23A, Class B1R, 6.64% (3 mo. USD LIBOR + 1.85%), due 04/15/34(c) 144A | |
| | Palmer Square CLO, Ltd., Series 2021-2A, Class A, 5.94% (3 mo. USD LIBOR + 1.15%), due 07/15/34(c) 144A | |
| | Palmer Square CLO, Ltd., Series 2021-4A, Class B, 6.44% (3 mo. USD LIBOR + 1.65%), due 10/15/34(c) 144A | |
| | Palmer Square Loan Funding CLO, Ltd., Series 2021-2A, Class A2, 6.17% (3 mo. USD LIBOR + 1.25%), due 05/20/29(c) 144A | |
| | Palmer Square Loan Funding CLO, Ltd., Series 2021-2A, Class B, 6.32% (3 mo. USD LIBOR + 1.40%), due 05/20/29(c) 144A | |
| | Palmer Square Loan Funding CLO, Ltd., Series 2022-3A, Class C, 9.41% (3 mo. TSFR + 5.40%), due 04/15/31(c) 144A | |
| | Parallel CLO, Ltd., Series 2017-1A, Class CR, 6.81% (3 mo. USD LIBOR + 2.00%), due 07/20/29(c) 144A | |
| | Park Avenue Institutional Advisers CLO, Ltd., Series 2021-2A, Class B, 6.54% (3 mo. USD LIBOR + 1.75%), due 07/15/34(c) 144A | |
| | Peace Park CLO, Ltd., Series 2021-1A, Class E, 10.81% (3 mo. USD LIBOR + 6.00%), due 10/20/34(c) 144A | |
| | Planet Fitness Master Issuer LLC, Series 2018-1A, Class A2II, 4.67%, due 09/05/48 144A | |
| | PPM CLO, Ltd., Series 2018-1A, Class B2, 6.64% (3 mo. USD LIBOR + 1.85%), due 07/15/31(c) 144A | |
| | Rad CLO 15, Ltd., Series 2021-15A, Class A, 5.90% (3 mo. USD LIBOR + 1.09%), due 01/20/34(c) 144A | |
| | Renaissance Home Equity Loan Trust, Series 2003-2, Class A, 4.45% (1 mo. USD LIBOR + 0.88%), due 08/25/33(c) | |
| | Residential Asset Securities Trust, Series 2006-KS2, Class M3, 5.46% (1 mo. USD LIBOR + 0.62%), due 03/25/36(c) | |
| | Rockford Tower CLO, Ltd., Series 2018-1A, Class A, 6.02% (3 mo. USD LIBOR + 1.10%), due 05/20/31(c) 144A | |
| | Rockford Tower CLO, Ltd., Series 2021-3A, Class B, 6.56% (3 mo. USD LIBOR + 1.75%), due 10/20/34(c) 144A | |
| | RR CLO 18, Ltd., Series 2021-18A, Class D, 11.04% (3 mo. USD LIBOR + 6.25%), due 10/15/34(c) 144A | |
| | Saranac CLO III, Ltd., Series 2014-3A, Class DR, 8.20% (3 mo. USD LIBOR + 3.25%), due 06/22/30(c) 144A | |
See accompanying Notes to the Financial Statements.
119
Mercer Opportunistic Fixed Income Fund
Schedule of Investments (Continued)
(showing percentage of net assets)
March 31, 2023
| | | |
| | Asset Backed Securities — continued |
| | Sculptor CLO XXVI, Ltd., Series 26A, Class E, 12.06% (3 mo. USD LIBOR + 7.25%), due 07/20/34(c) 144A | |
| | Sixth Street CLO XVIII, Ltd., Series 2021-18A, Class D, 7.71% (3 mo. USD LIBOR + 2.90%), due 04/20/34(c) 144A | |
| | SLM Private Credit Student Loan Trust, Series 2003-A, Class A3, 8.30%, due | |
| | SLM Private Credit Student Loan Trust, Series 2003-B, Class A3, 4.30%, due | |
| | SMB Private Education Loan Trust, Series 2021-A, Class D1, 3.86%, due 01/15/53 144A | |
| | Sound Point CLO XXVII, Ltd., Series 2020-2A, Class AR, 6.00% (3 mo. USD LIBOR + 1.18%), due 10/25/34(c) 144A | |
| | Southwick Park CLO LLC, Series 2019-4A, Class DR, 7.76% (3 mo. USD LIBOR + 2.95%), due 07/20/32(c) 144A | |
| | Stonepeak, Series 2021-1A, Class A, 2.68%, due 02/28/33 144A | |
| | Sycamore Tree CLO, Ltd., Series 2023-2A, Class A, 7.01% (3 mo. TSFR + 2.33%), due 04/20/35(c) 144A | |
| | Symphony CLO 37, Ltd., Series 2022-37A, Class A1A, 6.55% (3 mo. TSFR + 2.30%), due 10/20/34(c) 144A | |
| | TCI-Symphony CLO, Ltd., Series 2016-1A, Class DR2, 7.92% (3 mo. USD LIBOR + 3.10%), due 10/13/32(c) 144A | |
| | TCI-Symphony CLO, Ltd., Series 2016-1A, Class ER2, 11.57% (3 mo. USD LIBOR + 6.75%), due 10/13/32(c) 144A | |
| | THL Credit Wind River CLO, Ltd., Series 2017-4A, Class B, 6.37% (3 mo. USD LIBOR + 1.45%), due 11/20/30(c) 144A | |
| | Trinitas CLO XVI, Ltd., Series 2021-16A, Class A1, 5.99% (3 mo. USD LIBOR + 1.18%), due 07/20/34(c) 144A | |
| | TSTAT CLO, Ltd., Series 2022-2A, Class C, 9.31% (3 mo. TSFR + 4.80%), due 01/20/31(c) 144A | |
| | Venture 43 CLO, Ltd., Series 2021-43A, Class D, 8.26% (3 mo. USD LIBOR + 3.47%), due 04/15/34(c) 144A | |
| | VERDE CLO, Ltd., Series 2019-1A, Class DR, 8.04% (3 mo. USD LIBOR + 3.25%), due 04/15/32(c) 144A | |
| | Voya CLO, Ltd., Series 2016-3A, Class A1R, 5.98% (3 mo. USD LIBOR + 1.19%), due 10/18/31(c) 144A | |
| | Voya CLO, Ltd., Series 2017-2A, Class A2AR, 6.44% (3 mo. USD LIBOR + 1.65%), due 06/07/30(c) 144A | |
| | Voya CLO, Ltd., Series 2017-3A, Class DR, 11.76% (3 mo. USD LIBOR + 6.95%), due 04/20/34(c) 144A | |
| | Wellfleet CLO, Ltd., Series 2017-2A, Class C, 8.21% (3 mo. USD LIBOR + 3.40%), due 10/20/29(c) 144A | |
| | Whitebox CLO I, Ltd., Series 2019-1A, Class ANBR, 6.52% (3 mo. USD LIBOR + 1.70%), due 07/24/32(c) 144A | |
| | Whitebox CLO II, Ltd., Series 2020-2A, Class A1R, 6.04% (3 mo. USD LIBOR + 1.22%), due 10/24/34(c) 144A | |
| | Whitebox CLO IV, Ltd., Series 2023-4A, Class A1, 6.93% (3 mo. TSFR + 2.15%), due 04/20/36(c) 144A | |
| | Whitehorse CLO XII, Ltd., Series 2018-12A, Class D, 8.44% (3 mo. USD LIBOR + 3.65%), due 10/15/31(c) 144A | |
| | Wind River CLO, Ltd., Series 2021-4A, Class B, 6.46% (3 mo. USD LIBOR + 1.65%), due 01/20/35(c) 144A | |
120
See accompanying Notes to the Financial Statements.
Mercer Opportunistic Fixed Income Fund
Schedule of Investments (Continued)
(showing percentage of net assets)
March 31, 2023
| | | |
| | Asset Backed Securities — continued |
| | Z Capital Credit Partners CLO, Ltd., Series 2021-1A, Class D, 8.99% (3 mo. USD LIBOR + 4.20%), due 07/15/33(c) 144A | |
| | | |
| | |
| | 19th Holdings Golf, LLC, 2022 Term Loan B, 7.80% (1 mo. SOFR + 3.00%), due | |
| | ACProducts, Inc., 2021 Term Loan B, 9.39% (3 mo. USD LIBOR + 4.25%), due | |
| | Acrisure, LLC, 2020 Term Loan B, 8.36% (1 mo. USD LIBOR + 3.50%), due | |
| | Acrisure, LLC, 2021 First Lien Term Loan B, 9.09% (1 mo. USD LIBOR + 4.25%), due | |
| | Acrisure, LLC, 2022 Incremental Term Loan, 10.45% (3 mo. SOFR + 5.75%), due | |
| | Adevinta ASA, EUR Term Loan B, 6.02% (3 mo. EURIBOR + 3.00%), due 06/26/28(c) | |
| | Adtalem Global Education Inc., 2021 Term Loan B, 8.84% (1 mo. USD LIBOR + | |
| | Allen Media, LLC, 2021 Term Loan B, 10.55% (3 mo. USD LIBOR + 5.50%), due | |
| | Allied Universal Holdco LLC, 2021 USD Incremental Term Loan B, 8.66% (1 mo. SOFR + 3.75%), due 05/12/28(c) | |
| | AllSpring Buyer, LLC, Term Loan B, 8.16% (3 mo. USD LIBOR + 3.00%), due | |
| | Amentum Government Services Holdings, LLC, 2022 Term Loan, 8.76% (3 mo. SOFR + 4.00%), due 02/15/29(c) | |
| | Amentum Government Services Holdings, LLC, 2022 Term Loan, 9.03% (3 mo. SOFR + 4.00%), due 02/15/29(c) | |
| | Amentum Government Services Holdings, LLC, Term Loan B, 8.84% (3 mo. USD LIBOR + 4.00%), due 01/29/27(c) | |
| | American Airlines, Inc., 2021 Term Loan, 9.56% (3 mo. USD LIBOR + 4.75%), due | |
| | AMG Advanced Metallurgical Group NV, 2018 Term Loan B, 8.34% (1 mo. USD LIBOR + 3.50%), due 11/30/28(c) | |
| | AmWINS Group, Inc., 2021 Term Loan B, 7.11% (1 mo. USD LIBOR + 2.25%), due | |
| | Anticimex International AB, 2021 USD Term Loan B1, 8.45% (3 mo. USD LIBOR + | |
| | Apollo Commercial Real Estate Finance, Inc., 2021 Incremental Term Loan B1, 8.34% (1 mo. USD LIBOR + 3.50%), due 03/11/28(c) | |
| | Arctic Canadian Diamond Co., Ltd., 2nd Lien PIK Term Loan, 9.16% (3 mo. USD LIBOR + 4.00%, 12.50% PIK), due 12/31/27(c)(e)(f) | |
| | Aruba Investments, Inc., 2020 EUR Term Loan, 6.93% (1 mo. EURIBOR + 4.00%), due | |
| | Aruba Investments, Inc., 2020 USD Term Loan, 8.59% (1 mo. USD LIBOR + 3.75%), | |
| | Asurion, LLC, 2021 Second Lien Term Loan B4, 10.09% (1 mo. USD LIBOR + | |
| | Asurion, LLC, 2021 Term Loan B9, 8.09% (1 mo. USD LIBOR + 3.25%), due | |
| | Asurion, LLC, 2022 Term Loan B10, 8.91% (3 mo. SOFR + 4.00%), due 08/19/28(c) | |
| | At Home Group Inc., Term Loan B, 9.00% (3 mo. USD LIBOR + 4.25%), due | |
See accompanying Notes to the Financial Statements.
121
Mercer Opportunistic Fixed Income Fund
Schedule of Investments (Continued)
(showing percentage of net assets)
March 31, 2023
| | | |
| | |
| | Athenahealth Group, Inc., 2022 Term Loan B, 8.26% (1 mo. SOFR + 3.50%), due | |
| | Autokiniton US Holdings, Inc., 2021 Term Loan B, 9.42% (1 mo. SOFR + 4.50%), due | |
| | Belron Luxembourg SARL, 2021 EUR Term Loan B, 5.05% (3 mo. EURIBOR + | |
| | Brown Group Holding, LLC, 2022 Incremental Term Loan B2, 8.56% (1 mo. SOFR + | |
| | Brown Group Holding, LLC, 2022 Incremental Term Loan B2, 8.43% (3 mo. SOFR + | |
| | Brown Group Holding, LLC, Term Loan B, 7.36% (1 mo. USD LIBOR + 2.50%), due | |
| | Caesars Entertainment Corp., Term Loan B, 8.16% (1 mo. SOFR + 3.25%), due | |
| | Camelot U.S. Acquisition, LLC, 2020 Incremental Term Loan B, 7.84% (1 mo. USD LIBOR + 3.00%), due 10/30/26(c) | |
| | Camelot U.S. Acquisition, LLC, Term Loan B, 7.84% (1 mo. USD LIBOR + 3.00%), | |
| | Cano Health, LLC, 2022 Term Loan, 8.91% (1 mo. SOFR + 4.00%), due 11/23/27(c) | |
| | Cardinal Parent, Inc., 2020 Term Loan B, 9.66% (3 mo. USD LIBOR + 4.50%), due | |
| | Carnival Corp., EUR Term Loan B, 6.65% (1 mo. EURIBOR + 3.75%), due 06/30/25(c) | |
| | Carriage Purchaser, Inc., 2021 Term Loan B, 9.09% (1 mo. USD LIBOR + 4.25%), due | |
| | CDK Global, Inc., 2022 USD Term Loan B, 9.15% (3 mo. SOFR + 4.25%), due 07/06/29 | |
| | Chamberlain Group, Inc., Term Loan B, 8.09% (1 mo. USD LIBOR + 3.25%), due | |
| | Citadel Securities, LP, 2021 Term Loan B, 7.31% (1 mo. SOFR + 2.50%), due | |
| | City Brewing Company, LLC, Closing Date Term Loan, 8.33% (3 mo. USD LIBOR + | |
| | Clarios Global, LP, 2021 USD Term Loan B, 8.11% (1 mo. USD LIBOR + 3.25%), due | |
| | Clear Channel Outdoor Holdings, Inc., Term Loan B, 8.33% (3 mo. USD LIBOR + | |
| | Cloudera, Inc., 2021 Second Lien Term Loan, 10.84% (1 mo. USD LIBOR + 6.00%), | |
| | ClubCorp Holdings, Inc., 2017 Term Loan B, 7.89% (3 mo. USD LIBOR + 2.75%), due | |
| | Clydesdale Acquisition Holdings, Inc., Term Loan B, 9.08% (1 mo. SOFR + 4.18%), due | |
| | CommScope, Inc., 2019 Term Loan B, 8.09% (1 mo. USD LIBOR + 3.25%), due | |
| | CoreLogic, Inc., Term Loan, 8.38% (1 mo. USD LIBOR + 3.50%), due 06/02/28(c) | |
| | Crown Subsea Communications Holding,Inc., 2023 Incremental Term Loan, 10.14% (3 mo. SOFR + 5.25%), due 04/27/27(c) | |
| | CTC Holdings, LP, Term Loan B, 9.95% (3 mo. SOFR + 5.00%), due 02/20/29(c) | |
| | DCert Buyer, Inc., 2019 Term Loan B, 8.70% (3 mo. SOFR + 4.00%), due 10/16/26(c) | |
| | DCert Buyer, Inc., 2021 2nd Lien Term Loan, 11.70% (3 mo. USD LIBOR + 7.00%), | |
| | Deerfield Dakota Holding, LLC, 2020 USD Term Loan B, 8.56% (1 mo. SOFR + | |
122
See accompanying Notes to the Financial Statements.
Mercer Opportunistic Fixed Income Fund
Schedule of Investments (Continued)
(showing percentage of net assets)
March 31, 2023
| | | |
| | |
| | Deerfield Dakota Holding, LLC, 2021 USD 2nd Lien Term Loan, 11.91% (3 mo. USD LIBOR + 6.75%), due 04/07/28(c) | |
| | DirecTV Financing, LLC, Term Loan, 9.84% (1 mo. USD LIBOR + 5.00%), due | |
| | Dun & Bradstreet Corp. (The), Term Loan, 8.10% (1 mo. USD LIBOR + 3.25%), due | |
| | Electron BidCo Inc., 2021 Term Loan, 7.84% (1 mo. USD LIBOR + 3.00%), due | |
| | Embecta Corp., Term Loan B, 7.79% (6 mo. SOFR + 3.00%), due 03/30/29(c) | |
| | Embecta Corp., Term Loan B, TBD, due 03/30/29(g) | |
| | Empire Today, LLC, 2021 Term Loan B, 9.71% (1 mo. USD LIBOR + 5.00%), due | |
| | Endure Digital, Inc., Term Loan, 8.22% (1 mo. USD LIBOR + 3.50%), due 02/10/28(c) | |
| | EP Purchaser, LLC, 2021 Term Loan B, 8.66% (3 mo. USD LIBOR + 3.50%), due | |
| | Equinox Holdings, Inc., 2020 Term Loan B2, 14.16% (3 mo. USD LIBOR + 9.00%), | |
| | EyeCare Partners, LLC, 2020 Term Loan, 8.59% (1 mo. USD LIBOR + 3.75%), due | |
| | EyeCare Partners, LLC, 2021 2nd Lien Term Loan, 11.59% (1 mo. USD LIBOR + | |
| | EyeCare Partners, LLC, 2021 Incremental Term Loan, 8.59% (1 mo. USD LIBOR + | |
| | EyeCare Partners, LLC, 2022 Incremental Term Loan, 9.41% (1 mo. SOFR + 4.50%), | |
| | Fanatics Commerce Intermediate Holdco, LLC, Term Loan B, 8.09% (1 mo. USD LIBOR + 3.25%), due 11/24/28(c) | |
| | First Brands Group, LLC, 2021 2nd Lien Term Loan, 13.60% (3 mo. USD LIBOR + | |
| | Focus Financial Partners, LLC, 2021 Term Loan B4, 7.31% (1 mo. SOFR + 2.50%), due | |
| | Froneri International, Ltd., 2020 EUR Term Loan B1, 5.07% (6 mo. EURIBOR + | |
| | Gainwell Acquisition Corp., Term Loan B, 9.00% (3 mo. SOFR + 4.00%), due | |
| | Garda World Security Corp., 2021 Term Loan B, 9.11% (1 mo. SOFR + 4.25%), due | |
| | Garda World Security Corp., 2022 Term Loan B, 9.01% (1 mo. SOFR + 4.25%), due | |
| | Genesee & Wyoming, Inc., Term Loan, 7.00% (3 mo. USD LIBOR + 2.00%), due | |
| | Geo Group, Inc. (The), 2022 Tranche 1 Term Loan, TBD, due 03/23/27(g) | |
| | Global Medical Response, Inc., 2020 Term Loan B, 9.24% (3 mo. USD LIBOR + | |
| | Graham Packaging Co. Inc., 2021 Term Loan, 7.84% (1 mo. USD LIBOR + 3.00%), due | |
| | Gray Television, Inc., 2021 Term Loan D, 7.66% (1 mo. USD LIBOR + 3.00%), due | |
| | Great Outdoors Group, LLC, 2021 Term Loan B1, 8.59% (1 mo. USD LIBOR + | |
| | Greystone Select Financial, LLC, Term Loan B, 9.80% (3 mo. USD LIBOR + 5.00%), | |
| | Grifols Worldwide Operations USA, Inc., USD 2019 Term Loan B, 6.84% (1 mo. USD LIBOR + 2.00%), due 11/15/27(c) | |
See accompanying Notes to the Financial Statements.
123
Mercer Opportunistic Fixed Income Fund
Schedule of Investments (Continued)
(showing percentage of net assets)
March 31, 2023
| | | |
| | |
| | Hayward Industries, Inc., 2022 Term Loan, 8.16% (1 mo. SOFR + 3.25%), due | |
| | Howden Group Holdings, Ltd., 2023 USD Term Loan B, TBD, due 03/24/30(g) | |
| | Hudson River Trading, LLC, 2021 Term Loan, 7.84% (1 mo. SOFR + 3.00%), due | |
| | Hyland Software, Inc., 2018 1st Lien Term Loan, 8.34% (1 mo. USD LIBOR + 3.50%), | |
| | II-VI, Inc., 2022 Term Loan B, 7.59% (1 mo. USD LIBOR + 2.75%), due 07/02/29(c) | |
| | Illuminate Buyer, LLC, 2021 Term Loan, 8.34% (1 mo. USD LIBOR + 3.50%), due | |
| | Ingram Micro Inc., 2021 Term Loan B, 8.60% (3 mo. USD LIBOR + 3.50%), due | |
| | IXS Holdings, Inc., 2020 Term Loan B, TBD, due 03/05/27(g) | |
| | Jazz Financing Lux SARL, USD Term Loan, 8.34% (1 mo. USD LIBOR + 3.50%), due | |
| | Jump Financial, LLC, Term Loan B, 9.66% (3 mo. SOFR + 4.50%), due 08/07/28(c) | |
| | Knight Health Holdings, LLC, Term Loan B, 10.09% (1 mo. USD LIBOR + 5.25%), | |
| | Lakeshore Intermediate, LLC, Term Loan, 8.36% (1 mo. USD LIBOR + 3.50%), due | |
| | Leslie's Poolmart, Inc., 2021 Term Loan B, 7.66% (3 mo. USD LIBOR + 2.50%), due | |
| | LIDS Holdings, Inc., Term Loan, 10.39% (3 mo. SOFR + 5.50%), due 12/14/26(c) | |
| | Lonza Group AG, EUR Term Loan B, 7.02% (3 mo. EURIBOR + 4.00%), due | |
| | LRS Holdings, LLC, Term Loan B, 9.09% (1 mo. USD LIBOR + 4.25%), due | |
| | Magenta Buyer, LLC, 2021 USD 1st Lien Term Loan, 9.58% (3 mo. USD LIBOR + | |
| | Magenta Buyer, LLC, 2021 USD 2nd Lien Term Loan, 13.08% (3 mo. USD LIBOR + | |
| | MajorDrive Holdings IV, LLC, Term Loan B, 9.00% (3 mo. USD LIBOR + 4.00%), due | |
| | McGraw-Hill Global Education Holdings, LLC, 2021 Term Loan, 9.59% (1 mo. USD LIBOR + 4.75%), due 07/28/28(c) | |
| | McGraw-Hill Global Education Holdings, LLC, 2021 Term Loan, 9.70% (3 mo. USD LIBOR + 4.75%), due 07/28/28(c) | |
| | McGraw-Hill Global Education Holdings, LLC, 2021 Term Loan, 9.99% (6 mo. USD LIBOR + 4.75%), due 07/28/28(c) | |
| | Medline Borrower, LP, USD Term Loan B, 8.09% (1 mo. USD LIBOR + 3.25%), due | |
| | MH Sub I, LLC, 2020 Incremental Term Loan, 8.59% (1 mo. USD LIBOR + 3.75%), | |
| | Michaels Cos, Inc., 2021 Term Loan B, 9.41% (3 mo. USD LIBOR + 4.25%), due | |
| | MKS Instruments, Inc., 2022 USD Term Loan B, 7.61% (1 mo. SOFR + 2.75%), due | |
| | MRI Software, LLC, 2020 Term Loan B, TBD, due 02/10/26(g) | |
| | MRI Software, LLC, 2020 Term Loan, TBD, due 02/10/26(g) | |
| | NCL Corporation, Ltd., 2022 Term Loan A3, Class C, 7.25% (3 mo. SOFR + 2.35%), | |
| | NCR Corp., 2019 Term Loan, 7.33% (3 mo. USD LIBOR + 2.50%), due 08/28/26(c) | |
| | Neptune Bidco US, Inc., 2022 USD Term Loan B, TBD, due 04/11/29(g) | |
124
See accompanying Notes to the Financial Statements.
Mercer Opportunistic Fixed Income Fund
Schedule of Investments (Continued)
(showing percentage of net assets)
March 31, 2023
| | | |
| | |
| | Olympus Water US Holding Corp., 2021 EUR Term Loan B, TBD, due 11/09/28(g) | |
| | Olympus Water US Holding Corp., 2021 USD Term Loan B, 8.94% (3 mo. USD LIBOR + 3.75%), due 11/09/28(c) | |
| | One Call Corp., 2021 Term Loan, 10.38% (3 mo. USD LIBOR + 5.50%), due | |
| | Organon & Co., EUR Term Loan B, 5.80% (3 mo. EURIBOR + 3.00%), due 06/02/28(c) | |
| | Organon & Co., USD Term Loan, 8.00% (3 mo. USD LIBOR + 3.00%), due 06/02/28(c) | |
| | Oscar AcquisitionCo, LLC, Term Loan B, 9.40% (3 mo. SOFR + 4.50%), due | |
| | Pacific Bells, LLC, Term Loan B, 9.66% (3 mo. USD LIBOR + 4.50%), due 11/10/28(c) | |
| | Parexel International Corp., 2021 1st Lien Term Loan, 8.09% (1 mo. USD LIBOR + | |
| | Paysafe Holdings (US) Corp., EUR Term Loan B2, 5.91% (1 mo. EURIBOR + 3.00%), | |
| | PECF USS Intermediate Holding III Corp., Term Loan B, 9.09% (1 mo. USD LIBOR + | |
| | Peraton Corp., 2nd Lien Term Loan B1, 12.65% (3 mo. USD LIBOR + 7.75%), due | |
| | Peraton Corp., Term Loan B, 8.59% (1 mo. USD LIBOR + 3.75%), due 02/01/28(c) | |
| | PetSmart, Inc., 2021 Term Loan B, 8.66% (1 mo. SOFR + 3.75%), due 02/11/28(c) | |
| | Planview Parent, Inc., Term Loan, 9.16% (3 mo. USD LIBOR + 4.00%), due 12/17/27(c) | |
| | Polyconcept Holding BV, Term Loan B, 10.31% (1 mo. SOFR + 5.50%), due 05/18/29(c) | |
| | Prime Security Services Borrower, LLC, 2021 Term Loan, 7.52% (3 mo. USD LIBOR + | |
| | Proofpoint, Inc., 1st Lien Term Loan, 8.09% (1 mo. USD LIBOR + 3.25%), due | |
| | Quikrete Holdings, Inc., 2021 Term Loan B1, 7.84% (1 mo. USD LIBOR + 3.00%), due | |
| | R.R. Donnelley & Sons Co., 2023 Term Loan B, TBD, due 03/17/28(g) | |
| | Rackspace Technology Global, Inc., 2021 Term Loan B, 7.60% (3 mo. USD LIBOR + | |
| | Radiate Holdco, LLC, 2021 Term Loan B, 8.09% (1 mo. USD LIBOR + 3.25%), due | |
| | Rand Parent, LLC, 2023 Term Loan B, 9.13% (1 mo. SOFR + 0.00%), due 03/17/30(c) | |
| | Redstone Holdco 2 LP, 2021 2nd Lien Term Loan, 12.56% (3 mo. USD LIBOR + | |
| | Redstone Holdco 2 LP, 2021 Term Loan, 9.57% (3 mo. USD LIBOR + 4.75%), due | |
| | Resolute Investment Managers, Inc., 2020 Term Loan C, 9.39% (3 mo. USD LIBOR + | |
| | Roper Industrial Products Investment Co. LLC, USD Term Loan, TBD, due 11/22/29(g) | |
| | RVR Dealership Holdings, LLC, Term Loan B, 8.55% (1 mo. SOFR + 3.75%), due | |
| | Sedgwick Claims Management Services, Inc., 2023 Term Loan B, 8.63% (3 mo. SOFR + 3.75%), due 02/17/28(c) | |
| | Sinclair Television Group, Inc., 2022 Term Loan B4, 8.54% (1 mo. SOFR + 3.75%), due | |
| | SkyMiles IP, Ltd., 2020 Skymiles Term Loan B, 8.56% (3 mo. USD LIBOR + 3.75%), | |
| | Smyrna Ready Mix Concrete, LLC, Term Loan B, 9.04% (1 mo. SOFR + 4.25%), due | |
| | Solis IV BV, USD Term Loan B1, 8.37% (3 mo. SOFR + 3.50%), due 02/26/29(c) | |
See accompanying Notes to the Financial Statements.
125
Mercer Opportunistic Fixed Income Fund
Schedule of Investments (Continued)
(showing percentage of net assets)
March 31, 2023
| | | |
| | |
| | Sotera Health Holdings, LLC, 2023 Incremental Term Loan B, 8.82% (6 mo. SOFR + | |
| | Spencer Spirit IH, LLC, Term Loan B, 10.85% (1 mo. USD LIBOR + 6.00%), due | |
| | SPX Flow, Inc., 2022 Term Loan, 9.41% (1 mo. SOFR + 4.50%), due 04/05/29(c) | |
| | Station Casinos, LLC, 2020 Term Loan B, 7.10% (1 mo. USD LIBOR + 2.25%), due | |
| | Telenet Financing USD, LLC, 2020 USD Term Loan AR, 6.68% (1 mo. USD LIBOR + | |
| | Thermostat Purchaser III, Inc., Term Loan, 9.45% (3 mo. USD LIBOR + 4.50%), due | |
| | Topgolf Callaway Brands Corp., Term Loan B, 8.26% (1 mo. SOFR + 0.00%), due | |
| | Triton Water Holdings, Inc., Term Loan, 8.66% (3 mo. USD LIBOR + 3.50%), due | |
| | TruGreen Limited Partnership, 2020 2nd Lien Term Loan, 13.33% (3 mo. USD LIBOR + 8.50%), due 11/02/28(c) | |
| | Tutor Perini Corp., Term Loan B, 9.61% (1 mo. USD LIBOR + 4.75%), due 08/18/27(c) | |
| | U.S. Renal Care, Inc., 2019 Term Loan B, 9.86% (1 mo. USD LIBOR + 5.00%), due | |
| | Uber Technologies, Inc., 2023 Term Loan B, 7.66% (3 mo. SOFR + 2.75%), due | |
| | UFC Holdings, LLC, 2021 Term Loan B, 7.57% (3 mo. USD LIBOR + 2.75%), due | |
| | Ultimate Software Group, Inc. (The), 2021 Term Loan, 8.03% (3 mo. USD LIBOR + | |
| | United Airlines, Inc., 2021 Term Loan B, 8.57% (3 mo. USD LIBOR + 3.75%), due | |
| | UST Holdings, Ltd., Term Loan, 8.67% (1 mo. SOFR + 3.75%), due 11/20/28(c) | |
| | Verscend Holding Corp., 2021 Term Loan B, 8.84% (1 mo. USD LIBOR + 4.00%), due | |
| | Vertex Aerospace Services Corp., 2021 First Lien Term Loan, 8.34% (1 mo. USD LIBOR + 3.50%), due 12/06/28(c) | |
| | Vertiv Group Corp., 2021 Term Loan B, 7.42% (1 mo. USD LIBOR + 2.75%), due | |
| | VFH Parent LLC, 2022 Term Loan B, 7.86% (1 mo. SOFR + 3.00%), due 01/13/29(c) | |
| | Virgin Media Bristol, LLC, USD Term Loan N, 7.18% (1 mo. USD LIBOR + 2.50%), | |
| | Virgin Pulse, Inc., 2021 Term Loan, 8.84% (1 mo. USD LIBOR + 4.00%), due | |
| | VM Consolidated, Inc., 2021 Term Loan B, 8.09% (1 mo. USD LIBOR + 3.25%), due | |
| | VT Topco, Inc., 2021 2nd Lien Term Loan, 11.59% (1 mo. USD LIBOR + 6.75%), due | |
| | VT Topco, Inc., 2021 Delayed Draw Term Loan, 8.59% (1 mo. USD LIBOR + 3.75%), | |
| | VT Topco, Inc., 2021 Incremental Term Loan, 8.59% (1 mo. USD LIBOR + 3.75%), due | |
| | Western Dental Services Inc., 2021 Term Loan B, 9.34% (1 mo. USD LIBOR + 4.50%), | |
| | Western Dental Services, Inc., 2021 Delayed Draw Term Loan, 9.34% (1 mo. USD LIBOR + 4.50%), due 08/18/28(c) | |
| | Worldwide Express Operations, LLC, 2021 1st Lien Term Loan, 9.16% (3 mo. USD LIBOR + 4.00%), due 07/26/28(c) | |
126
See accompanying Notes to the Financial Statements.
Mercer Opportunistic Fixed Income Fund
Schedule of Investments (Continued)
(showing percentage of net assets)
March 31, 2023
| | | |
| | |
| | WP CPP Holdings, LLC, 2018 Term Loan, 8.58% (3 mo. USD LIBOR + 3.75%), due | |
| | WP CPP Holdings, LLC, 2019 2nd Lien Incremental Term Loan, 12.58% (3 mo. USD LIBOR + 7.75%), due 04/30/26(c) | |
| | | |
| | |
| | Airbnb, Inc., 1.10%, due 03/15/26(h) | |
| | Apollo Commercial Real Estate Finance, Inc. REIT, 5.38%, due 10/15/23 | |
| | Array Technologies, Inc., 1.00%, due 12/01/28 | |
| | Beauty Health Co. (The), 1.25%, due 10/01/26 144A | |
| | BioMarin Pharmaceutical, Inc., 1.25%, due 05/15/27(i) | |
| | Block, Inc., 0.13%, due 03/01/25 | |
| | Booking Holdings, Inc., 0.75%, due 05/01/25 | |
| | Carnival Corp., 5.75%, due 12/01/27 144A | |
| | Cloudflare, Inc., 3.61%, due 08/15/26(h) | |
| | DISH Network Corp., 3.38%, due 08/15/26 | |
| | DISH Network Corp., 15.88%, due 12/15/25(h) | |
| | DraftKings Holdings, Inc., 5.03%, due 03/15/28(h) | |
| | Gannett Co., Inc., 6.00%, due 12/01/27 | |
| | HubSpot, Inc., 0.38%, due 06/01/25 | |
| | Lantheus Holdings, Inc., 2.63%, due 12/15/27 144A | |
| | Liberty Media Corp.-Liberty Formula One, 2.25%, due 08/15/27 144A | |
| | Live Nation Entertainment, Inc., 2.00%, due 02/15/25 | |
| | MercadoLibre, Inc., 2.00%, due 08/15/28 | |
| | MongoDB, Inc., 0.25%, due 01/15/26 | |
| | Pioneer Natural Resources Co., 0.25%, due 05/15/25 | |
| | Royal Caribbean Cruises, Ltd., 6.00%, due 08/15/25 144A | |
| | Sarepta Therapeutics, Inc., 1.50%, due 11/15/24 | |
| | Southwest Airlines Co., 1.25%, due 05/01/25(i) | |
| | Splunk, Inc., 1.13%, due 06/15/27 | |
| | Stem, Inc., 0.50%, due 12/01/28 144A | |
| | Uber Technologies, Inc., 3.76%, due 12/15/25(h)(i) | |
| | Ziff Davis, Inc., 1.75%, due 11/01/26 144A | |
| | Zscaler, Inc., 0.13%, due 07/01/25 | |
| | | |
| | |
| | Abercrombie & Fitch Management Co., 8.75%, due 07/15/25(i) 144A | |
| | ABN AMRO Bank NV, 4.75%, due 07/28/25 144A | |
| | Abu Dhabi Crude Oil Pipeline, LLC, 4.60%, due 11/02/47 144A | |
| | Accelerate360 Holdings LLC, 8.00%, due 03/01/28 144A | |
| | Acuris Finance US, Inc./Acuris Finance SARL, 5.00%, due 05/01/28 144A | |
| | AdaptHealth LLC, 4.63%, due 08/01/29 144A | |
| | AdaptHealth LLC, 6.13%, due 08/01/28 144A | |
| | Adevinta ASA, 3.00%, due 11/15/27 144A | |
| | Adient Global Holdings, Ltd., 3.50%, due 08/15/24(j) | |
| | Adtalem Global Education, Inc., 5.50%, due 03/01/28 144A | |
| | Advanced Drainage Systems, Inc., 6.38%, due 06/15/30(i) 144A | |
See accompanying Notes to the Financial Statements.
127
Mercer Opportunistic Fixed Income Fund
Schedule of Investments (Continued)
(showing percentage of net assets)
March 31, 2023
| | | |
| | Corporate Debt — continued |
| | AerCap Ireland Capital DAC/AerCap Global Aviation Trust, 3.30%, due 01/30/32 | |
| | AerCap Ireland Capital DAC/AerCap Global Aviation Trust, 6.50%, due 07/15/25 | |
| | AES Corp. (The), 2.45%, due 01/15/31 | |
| | AES Panama Generation Holdings SRL, 4.38%, due 05/31/30 144A | |
| | Air Canada, 3.88%, due 08/15/26 144A | |
| | Akbank TAS, 6.80%, due 02/06/26(i) 144A | |
| | Akumin Escrow, Inc., 7.50%, due 08/01/28 144A | |
| | Akumin, Inc., 7.00%, due 11/01/25 144A | |
| | Alibaba Group Holding, Ltd., 3.15%, due 02/09/51 | |
| | Allen Media LLC/Allen Media Co-Issuer, Inc., 10.50%, due 02/15/28 144A | |
| | Allied Universal Holdco LLC/Allied Universal Finance Corp., 6.63%, due 07/15/26 144A | |
| | Allison Transmission, Inc., 4.75%, due 10/01/27 144A | |
| | Altice France Holding SA, 10.50%, due 05/15/27 144A | |
| | AMC Entertainment Holdings, Inc., 7.50%, due 02/15/29 144A | |
| | America Movil SAB de CV, 7.13%, due 12/09/24 | |
| | American Airlines Pass Through Trust, 4.95%, due 08/15/26 | |
| | American Airlines, Inc., 7.25%, due 02/15/28 144A | |
| | American Airlines, Inc., 11.75%, due 07/15/25 144A | |
| | American Airlines, Inc./AAdvantage Loyalty IP, Ltd., 5.50%, due 04/20/26 144A | |
| | American Airlines, Inc./AAdvantage Loyalty IP, Ltd., 5.75%, due 04/20/29 144A | |
| | American News Co. LLC, 8.50% (8.50% Cash or 10.00% PIK), due 09/01/26 144A | |
| | American Tower Corp. REIT, 2.70%, due 04/15/31 | |
| | Ameriprise Financial, Inc., 4.50%, due 05/13/32 | |
| | Anglo American Capital Plc, 2.88%, due 03/17/31(i) 144A | |
| | Anglo American Capital Plc, 3.88%, due 03/16/29 144A | |
| | Anglo American Capital Plc, 3.95%, due 09/10/50 144A | |
| | AngloGold Ashanti Holdings Plc, 3.75%, due 10/01/30 | |
| | Anheuser-Busch InBev Worldwide, Inc., 3.50%, due 06/01/30 | |
| | Antares Holdings, LP, 3.95%, due 07/15/26 144A | |
| | Antero Resources Corp., 7.63%, due 02/01/29(i) 144A | |
| | Aon Corp./Aon Global Holdings Plc, 5.00%, due 09/12/32 | |
| | Apollo Commercial Real Estate Finance, Inc. REIT, 4.63%, due 06/15/29 144A | |
| | ARD Finance SA, 5.00% (5.00% Cash or 5.75% PIK), due 06/30/27(j) | |
| | ARD Finance SA, 6.50% (6.50% Cash or 7.25% PIK), due 06/30/27 144A | |
| | Ardagh Metal Packaging Finance USA LLC/Ardagh Metal Packaging Finance Plc, 4.00%, due 09/01/29 144A | |
| | Ardagh Metal Packaging Finance USA LLC/Ardagh Metal Packaging Finance Plc, 6.00%, due 06/15/27 144A | |
| | Ardagh Packaging Finance Plc/Ardagh Holdings USA, Inc., 5.25%, due 04/30/25 144A | |
| | Ardonagh Midco 2 Plc, 11.50% (11.50% Cash or 12.75% PIK), due 01/15/27 144A | |
| | AT&T, Inc., 3.50%, due 09/15/53 | |
| | AT&T, Inc., 3.55%, due 09/15/55 | |
| | AT&T, Inc., 3.65%, due 09/15/59 | |
| | AT&T, Inc., 3.80%, due 12/01/57 | |
| | AthenaHealth Group, Inc., 6.50%, due 02/15/30(i) 144A | |
| | Australia & New Zealand Banking Group, Ltd., 2.95% (5 yr. CMT + 1.29%), due 07/22/30(c) 144A | |
| | AutoNation, Inc., 4.75%, due 06/01/30 | |
| | Aviation Capital Group LLC, 5.50%, due 12/15/24 144A | |
128
See accompanying Notes to the Financial Statements.
Mercer Opportunistic Fixed Income Fund
Schedule of Investments (Continued)
(showing percentage of net assets)
March 31, 2023
| | | |
| | Corporate Debt — continued |
| | Avient Corp., 7.13%, due 08/01/30 144A | |
| | Avnet, Inc., 5.50%, due 06/01/32 | |
| | Avolon Holdings Funding, Ltd., 4.25%, due 04/15/26 144A | |
| | Avolon Holdings Funding, Ltd., 5.13%, due 10/01/23 144A | |
| | B3 SA - Brasil Bolsa Balcao, 4.13%, due 09/20/31 144A | |
| | Bain Capital Specialty Finance, Inc., 2.55%, due 10/13/26 | |
| | Ball Corp., 3.13%, due 09/15/31 | |
| | Banco Bilbao Vizcaya Argentaria SA, 5.88% (5 yr. EUR swap annual + 5.66%)(c)(j)(k) | |
| | Banco Bilbao Vizcaya Argentaria SA, 6.00% (5 yr. EUR swap annual + 6.46%)(c)(j)(k) | |
| | Banco Mercantil del Norte SA, 7.50% (10 yr. CMT + 5.47%)(c)(i)(k) 144A | |
| | Banco Santander SA, 4.18% (1 yr. CMT + 2.00%), due 03/24/28(c) | |
| | Banco Santander SA, 7.50% (5 yr. USD ICE swap + 4.99%)(c)(j)(k) | |
| | Bank of America Corp., 2.48% (5 yr. CMT + 1.20%), due 09/21/36(c) | |
| | Bank of America Corp., 6.25% (3 mo. USD LIBOR + 3.71%)(c)(k) | |
| | Barclays Plc, 3.33% (1 yr. CMT + 1.30%), due 11/24/42(c) | |
| | Barclays Plc, 5.30% (1 yr. CMT + 2.30%), due 08/09/26(c) | |
| | Barclays Plc, 6.13% (5 yr. CMT + 5.87%)(c)(k) | |
| | Barclays Plc, 6.38% (5 yr. UK Government Bond + 6.02%)(c)(j)(k) | |
| | Barclays Plc, 8.00% (5 yr. CMT + 5.67%)(c)(k) | |
| | Bath & Body Works, Inc., 5.25%, due 02/01/28 | |
| | Bath & Body Works, Inc., 6.63%, due 10/01/30 144A | |
| | Bausch Health Americas, Inc., 9.25%, due 04/01/26 144A | |
| | Bausch Health Cos., Inc., 5.00%, due 01/30/28 144A | |
| | Bausch Health Cos., Inc., 5.50%, due 11/01/25(i) 144A | |
| | Bausch Health Cos., Inc., 6.13%, due 02/01/27(i) 144A | |
| | Bausch Health Cos., Inc., 7.00%, due 01/15/28 144A | |
| | Berry Petroleum Co. LLC, 7.00%, due 02/15/26 144A | |
| | BGC Partners, Inc., 4.38%, due 12/15/25 | |
| | BlackRock TCP Capital Corp., 2.85%, due 02/09/26 | |
| | Blackstone Private Credit Fund, 2.63%, due 12/15/26 | |
| | Blackstone Secured Lending Fund, 2.85%, due 09/30/28 | |
| | Blue Racer Midstream LLC/Blue Racer Finance Corp., 7.63%, due 12/15/25 144A | |
| | BNP Paribas SA, 4.50% (5 yr. CMT + 2.94%)(c)(i)(k) 144A | |
| | BNP Paribas SA, 4.63% (5 yr. CMT + 3.20%)(c)(k) 144A | |
| | BNP Paribas SA, 7.75% (5 yr. CMT + 4.90%)(c)(k) 144A | |
| | Boeing Co. (The), 5.71%, due 05/01/40 | |
| | Boyne USA, Inc., 4.75%, due 05/15/29 144A | |
| | Braskem Netherlands Finance BV, 4.50%, due 01/10/28 144A | |
| | Brighthouse Financial, Inc., 3.85%, due 12/22/51 | |
| | British Telecommunications Plc, 9.63%, due 12/15/30(l) | |
| | Broadcom, Inc., 4.15%, due 04/15/32 144A | |
| | Brunswick Corp., 2.40%, due 08/18/31 | |
| | Builders FirstSource, Inc., 4.25%, due 02/01/32 144A | |
| | Burford Capital Global Finance LLC, 6.88%, due 04/15/30 144A | |
| | Caesars Entertainment, Inc., 4.63%, due 10/15/29(i) 144A | |
| | Caesars Entertainment, Inc., 7.00%, due 02/15/30 144A | |
| | Caesars Entertainment, Inc., 8.13%, due 07/01/27 144A | |
| | CaixaBank SA, 6.21% (SOFR + 2.70%), due 01/18/29(c) 144A | |
| | Callon Petroleum Co., 6.38%, due 07/01/26 | |
See accompanying Notes to the Financial Statements.
129
Mercer Opportunistic Fixed Income Fund
Schedule of Investments (Continued)
(showing percentage of net assets)
March 31, 2023
| | | |
| | Corporate Debt — continued |
| | Callon Petroleum Co., 7.50%, due 06/15/30(i) 144A | |
| | Callon Petroleum Co., 8.00%, due 08/01/28(i) 144A | |
| | Carnival Corp., 4.00%, due 08/01/28 144A | |
| | Carnival Corp., 10.50%, due 06/01/30(i) 144A | |
| | Carnival Plc, 7.88%, due 06/01/27 | |
| | Carriage Purchaser, Inc., 7.88%, due 10/15/29 144A | |
| | Catalent Pharma Solutions, Inc., 2.38%, due 03/01/28(j) | |
| | CCO Holdings LLC/CCO Holdings Capital Corp., 4.25%, due 02/01/31 144A | |
| | CCO Holdings LLC/CCO Holdings Capital Corp., 4.50%, due 05/01/32 | |
| | CCO Holdings LLC/CCO Holdings Capital Corp., 4.75%, due 03/01/30 144A | |
| | CCO Holdings LLC/CCO Holdings Capital Corp., 4.75%, due 02/01/32 144A | |
| | Celulosa Arauco y Constitucion SA, 5.15%, due 01/29/50 144A | |
| | Cemex SAB de CV, 5.13% (5 yr. CMT + 4.53%)(c)(k) 144A | |
| | Cemex SAB de CV, 5.20%, due 09/17/30 144A | |
| | CenterPoint Energy Houston Electric LLC, 5.30%, due 04/01/53 | |
| | Central Parent, Inc./CDK Global, Inc., 7.25%, due 06/15/29 144A | |
| | Chart Industries, Inc., 7.50%, due 01/01/30 144A | |
| | Chart Industries, Inc., 9.50%, due 01/01/31 144A | |
| | Charter Communications Operating LLC/Charter Communications Operating Capital, 3.70%, due 04/01/51 | |
| | Charter Communications Operating LLC/Charter Communications Operating Capital, 3.90%, due 06/01/52 | |
| | Charter Communications Operating LLC/Charter Communications Operating Capital, 5.13%, due 07/01/49 | |
| | Charter Communications Operating LLC/Charter Communications Operating Capital, 5.38%, due 04/01/38 | |
| | Chevron Corp., 3.08%, due 05/11/50 | |
| | Chevron Phillips Chemical Co. LLC/Chevron Phillips Chemical Co., LP, 5.13%, due 04/01/25 144A | |
| | Chord Energy Corp., 6.38%, due 06/01/26 144A | |
| | CHS/Community Health Systems, Inc., 4.75%, due 02/15/31 144A | |
| | CHS/Community Health Systems, Inc., 6.13%, due 04/01/30 144A | |
| | CHS/Community Health Systems, Inc., 8.00%, due 03/15/26 144A | |
| | Cirsa Finance International SARL, 4.50%, due 03/15/27 144A | |
| | Citigroup, Inc., 2.98% (SOFR + 1.42%), due 11/05/30(c) | |
| | Citigroup, Inc., 6.30% (3 mo. TSFR + 3.68%)(c)(i)(k) | |
| | Citigroup, Inc., 7.38% (5 yr. CMT + 3.21%)(c)(k) | |
| | Citigroup, Inc., 9.09% (3 mo. USD LIBOR + 4.23%)(c)(i)(k) | |
| | Clarios Global, LP/Clarios US Finance Co., 8.50%, due 05/15/27(i) 144A | |
| | Clarivate Science Holdings Corp., 4.88%, due 07/01/29(i) 144A | |
| | Clearway Energy Operating LLC, 3.75%, due 02/15/31 144A | |
| | Clearway Energy Operating LLC, 3.75%, due 01/15/32 144A | |
| | Clearway Energy Operating LLC, 4.75%, due 03/15/28 144A | |
| | Clydesdale Acquisition Holdings, Inc., 8.75%, due 04/15/30 144A | |
| | Coca-Cola Icecek AS, 4.50%, due 01/20/29 144A | |
| | Coherent Corp., 5.00%, due 12/15/29(i) 144A | |
| | Coinbase Global, Inc., 3.63%, due 10/01/31 144A | |
| | Colombia Telecomunicaciones SA ESP, 4.95%, due 07/17/30 144A | |
| | Comcast Corp., 4.25%, due 10/15/30 | |
| | Comerica, Inc., 3.70%, due 07/31/23 | |
130
See accompanying Notes to the Financial Statements.
Mercer Opportunistic Fixed Income Fund
Schedule of Investments (Continued)
(showing percentage of net assets)
March 31, 2023
| | | |
| | Corporate Debt — continued |
| | Commercial Metals Co., 3.88%, due 02/15/31 | |
| | Commerzbank AG, 6.13% (5 yr. EUR swap annual + 6.36%)(c)(j)(k) | |
| | CommScope Technologies LLC, 6.00%, due 06/15/25 144A | |
| | CommScope, Inc., 4.75%, due 09/01/29 144A | |
| | CommScope, Inc., 6.00%, due 03/01/26 144A | |
| | CommScope, Inc., 7.13%, due 07/01/28(i) 144A | |
| | Continental Resources, Inc., 5.75%, due 01/15/31 144A | |
| | Cooperatieve Rabobank UA, 4.63% (5 yr. EUR swap annual + 4.10%)(c)(j)(k) | |
| | CoreCivic, Inc., 8.25%, due 04/15/26(i) | |
| | Corp. Nacional del Cobre de Chile, 5.13%, due 02/02/33 144A | |
| | Country Garden Holdings Co., Ltd., 8.00%, due 01/27/24(j) | |
| | Credit Agricole SA, 4.00% (5 yr. EUR swap annual + 4.37%)(c)(j)(k) | |
| | Credit Agricole SA, 4.75% (5 yr. CMT + 3.24%)(c)(k) 144A | |
| | Credit Agricole SA, 7.88% (5 yr. USD swap + 4.90%)(c)(k) 144A | |
| | Credit Agricole SA, 8.13% (5 yr. USD swap + 6.19%)(c)(k) 144A | |
| | Credit Suisse AG, 0.52%, due 08/09/23 | |
| | Credit Suisse AG, 1.00%, due 05/05/23 | |
| | Credit Suisse AG, 4.75%, due 08/09/24 | |
| | Credit Suisse AG, 7.95%, due 01/09/25 | |
| | Credit Suisse AG, (MTN), 3.63%, due 09/09/24 | |
| | Credit Suisse Group AG, 6.54% (SOFR + 3.92%), due 08/12/33(c) 144A | |
| | Crescent Energy Finance LLC, 7.25%, due 05/01/26 144A | |
| | Crowdstrike Holdings, Inc., 3.00%, due 02/15/29(i) | |
| | Crown Castle, Inc. REIT, 3.30%, due 07/01/30 | |
| | CSC Holdings LLC, 5.00%, due 11/15/31 144A | |
| | CSC Holdings LLC, 5.50%, due 04/15/27 144A | |
| | CSC Holdings LLC, 5.75%, due 01/15/30 144A | |
| | CSC Holdings LLC, 6.50%, due 02/01/29 144A | |
| | CVS Health Corp., 5.25%, due 02/21/33 | |
| | Danske Bank AS, 6.47% (1 yr. CMT + 2.10%), due 01/09/26(c) 144A | |
| | Darling Ingredients, Inc., 6.00%, due 06/15/30 144A | |
| | DCP Midstream Operating, LP, 6.75%, due 09/15/37 144A | |
| | Dell International LLC/EMC Corp., 8.35%, due 07/15/46 | |
| | Delta Air Lines, Inc., 7.00%, due 05/01/25 144A | |
| | Deutsche Bank AG, 3.73% (SOFR + 2.76%), due 01/14/32(c) | |
| | Deutsche Bank AG, 3.74% (SOFR + 2.26%), due 01/07/33(c) | |
| | Deutsche Bank AG, 4.79% (5 yr. USD swap + 4.36%)(c)(j)(k) | |
| | Deutsche Bank AG, 6.72% (SOFR + 3.18%), due 01/18/29(c) | |
| | Deutsche Bank AG, 7.08% (SOFR + 3.65%), due 02/10/34(c) | |
| | Deutsche Bank AG, 7.50% (5 yr. USD swap + 5.00%)(c)(k) | |
| | DirecTV Financing LLC/ DirecTV Financing Co-Obligor, Inc., 5.88%, due 08/15/27 144A | |
| | DISH DBS Corp., 5.75%, due 12/01/28 144A | |
| | DISH DBS Corp., 5.88%, due 11/15/24 | |
| | Diversified Healthcare Trust REIT, 4.75%, due 05/01/24 | |
| | Diversified Healthcare Trust REIT, 9.75%, due 06/15/25 | |
| | DP World, Ltd., 5.63%, due 09/25/48 144A | |
| | Dun & Bradstreet Corp. (The), 5.00%, due 12/15/29 144A | |
| | Ecopetrol SA, 4.63%, due 11/02/31 | |
See accompanying Notes to the Financial Statements.
131
Mercer Opportunistic Fixed Income Fund
Schedule of Investments (Continued)
(showing percentage of net assets)
March 31, 2023
| | | |
| | Corporate Debt — continued |
| | Eli Lilly & Co., 5.00%, due 02/27/26 | |
| | Endeavor Energy Resources, LP/EER Finance, Inc., 5.75%, due 01/30/28 144A | |
| | Endeavour Mining Plc, 5.00%, due 10/14/26 144A | |
| | Enel Finance America LLC, 2.88%, due 07/12/41 144A | |
| | Energean Israel Finance, Ltd., 5.88%, due 03/30/31(j) | |
| | Energizer Gamma Acquisition BV, 3.50%, due 06/30/29 144A | |
| | Energy Transfer, LP, 5.35%, due 05/15/45 | |
| | Energy Transfer, LP, 6.25%, due 04/15/49 | |
| | Energy Transfer, LP, 7.13% (5 yr. CMT + 5.31%)(c)(k) | |
| | Energy Transfer, LP, 8.89% (3 mo. USD LIBOR + 4.03%)(c)(i)(k) | |
| | Entegris Escrow Corp., 5.95%, due 06/15/30 144A | |
| | Enterprise Products Operating LLC, 5.05%, due 01/10/26 | |
| | Enterprise Products Operating LLC, 5.38% (3 mo. USD LIBOR + 2.57%), due | |
| | EPR Properties REIT, 3.75%, due 08/15/29 | |
| | EQM Midstream Partners, LP, 6.00%, due 07/01/25 144A | |
| | EQM Midstream Partners, LP, 6.50%, due 07/01/27 144A | |
| | EQM Midstream Partners, LP, 7.50%, due 06/01/30 144A | |
| | EQT Corp., 7.00%, due 02/01/30(l) | |
| | Equifax, Inc., 5.10%, due 12/15/27 | |
| | European Investment Bank, (MTN), 4.25%, due 06/19/24 | |
| | European Investment Bank, (MTN), 7.75%, due 01/30/25 | |
| | FAGE International SA/FAGE USA Dairy Industry, Inc., 5.63%, due 08/15/26 144A | |
| | First Quantum Minerals, Ltd., 6.88%, due 03/01/26(i) 144A | |
| | First Quantum Minerals, Ltd., 6.88%, due 10/15/27 144A | |
| | FirstCash, Inc., 5.63%, due 01/01/30 144A | |
| | Five Point Operating Co., LP/Five Point Capital Corp., 7.88%, due 11/15/25 144A | |
| | Foot Locker, Inc., 4.00%, due 10/01/29 144A | |
| | Ford Motor Co., 3.25%, due 02/12/32 | |
| | Ford Motor Co., 6.10%, due 08/19/32(i) | |
| | Ford Motor Credit Co. LLC, 3.63%, due 06/17/31 | |
| | Ford Motor Credit Co. LLC, 6.95%, due 03/06/26 | |
| | Freeport Indonesia PT, 5.32%, due 04/14/32 144A | |
| | Freeport Indonesia PT, 6.20%, due 04/14/52 144A | |
| | Freeport Minerals Corp., 7.13%, due 11/01/27 | |
| | Freeport-McMoRan, Inc., 4.63%, due 08/01/30 | |
| | Freeport-McMoRan, Inc., 5.45%, due 03/15/43 | |
| | Full House Resorts, Inc., 8.25%, due 02/15/28 144A | |
| | Galaxy Pipeline Assets Bidco, Ltd., 2.94%, due 09/30/40 144A | |
| | Gannett Holdings LLC, 6.00%, due 11/01/26 144A | |
| | Gen Digital, Inc., 7.13%, due 09/30/30(i) 144A | |
| | General Motors Co., 6.60%, due 04/01/36 | |
| | General Motors Financial Co., Inc., 5.00%, due 04/09/27 | |
| | Genesis Energy, LP/Genesis Energy Finance Corp., 8.88%, due 04/15/30 | |
| | GEO Group, Inc. (The), 9.50%, due 12/31/28 144A | |
| | GEO Group, Inc. (The), 10.50%, due 06/30/28 | |
| | Georgia Power Co., 5.13%, due 05/15/52 | |
| | GFL Environmental, Inc., 4.75%, due 06/15/29 144A | |
| | GFL Environmental, Inc., 5.13%, due 12/15/26 144A | |
132
See accompanying Notes to the Financial Statements.
Mercer Opportunistic Fixed Income Fund
Schedule of Investments (Continued)
(showing percentage of net assets)
March 31, 2023
| | | |
| | Corporate Debt — continued |
| | Global Aircraft Leasing Co., Ltd., 6.50% (6.50% Cash or 7.25% PIK), due 09/15/24 144A | |
| | Global Atlantic Fin Co., 4.40%, due 10/15/29 144A | |
| | Gold Fields Orogen Holdings BVI, Ltd., 6.13%, due 05/15/29 144A | |
| | Gray Escrow II, Inc., 5.38%, due 11/15/31 144A | |
| | H&E Equipment Services, Inc., 3.88%, due 12/15/28 144A | |
| | Haemonetics Corp., 6.51%, due 03/01/26(h) | |
| | Hawaiian Brand Intellectual Property, Ltd./HawaiianMiles Loyalty, Ltd., 5.75%, due 01/20/26 144A | |
| | Healthpeak OP, LLC REIT, 3.50%, due 07/15/29 | |
| | Heathrow Funding, Ltd., (MTN), 6.75%, due 12/03/28(j) | |
| | Hertz Corp. (The), 5.00%, due 12/01/29 144A | |
| | Hess Midstream Operations, LP, 5.13%, due 06/15/28 144A | |
| | Highlands Holdings Bond Issuer, Ltd./Highlands Holdings Bond Co-Issuer, Inc., 7.63% (7.63% Cash or 8.38% PIK), due 10/15/25 144A | |
| | Hilcorp Energy I, LP/Hilcorp Finance Co., 6.25%, due 04/15/32 144A | |
| | Howard Midstream Energy Partners LLC, 6.75%, due 01/15/27 144A | |
| | HSBC Holdings Plc, 4.60% (5 yr. CMT + 3.65%)(c)(k) | |
| | HSBC Holdings Plc, 6.00% (5 yr. USD ICE swap + 3.75%)(c)(k) | |
| | HSBC Holdings Plc, 8.00% (5 yr. CMT + 3.86%)(c)(i)(k) | |
| | HSBC Holdings Plc, 8.11% (SOFR + 4.25%), due 11/03/33(c) | |
| | HSBC USA, Inc., 5.63%, due 03/17/25 | |
| | HSE Finance SARL, 5.63%, due 10/15/26 144A | |
| | HTA Group, Ltd., 7.00%, due 12/18/25 144A | |
| | Hudbay Minerals, Inc., 4.50%, due 04/01/26 144A | |
| | Hudbay Minerals, Inc., 6.13%, due 04/01/29 144A | |
| | iHeartCommunications, Inc., 4.75%, due 01/15/28 144A | |
| | iHeartCommunications, Inc., 5.25%, due 08/15/27 144A | |
| | iHeartCommunications, Inc., 6.38%, due 05/01/26 | |
| | IHS Netherlands Holdco BV, 8.00%, due 09/18/27(j) | |
| | IHS Netherlands Holdco BV, 8.00%, due 09/18/27 144A | |
| | IIP Operating Partnership, LP REIT, 5.50%, due 05/25/26 | |
| | Iliad Holding SASU, 6.50%, due 10/15/26 144A | |
| | Illuminate Buyer LLC/Illuminate Holdings IV, Inc., 9.00%, due 07/01/28 144A | |
| | IMA Industria Macchine Automatiche SpA, 3.75%, due 01/15/28 144A | |
| | ING Groep NV, 5.75% (5 yr. CMT + 4.34%)(c)(k) | |
| | ING Groep NV, 6.50% (5 yr. USD swap + 4.45%)(c)(k) | |
| | Intel Corp., 5.20%, due 02/10/33 | |
| | International Business Machines Corp., 4.40%, due 07/27/32 | |
| | International Finance Corp., (MTN), 7.75%, due 01/18/30 | |
| | Intesa Sanpaolo SpA, 4.00%, due 09/23/29 144A | |
| | Intesa Sanpaolo SpA, 4.95% (1 yr. CMT + 2.75%), due 06/01/42(c) 144A | |
| | Intesa Sanpaolo SpA, 5.71%, due 01/15/26 144A | |
| | Itau Unibanco Holding SA, 3.88% (5 yr. CMT + 3.45%), due 04/15/31(c) 144A | |
| | Itau Unibanco Holding SA, 4.63% (5 yr. CMT + 3.22%)(c)(k) 144A | |
| | Jackson Financial, Inc., 3.13%, due 11/23/31(i) | |
| | Jane Street Group/JSG Finance, Inc., 4.50%, due 11/15/29 144A | |
| | Jazz Securities DAC, 4.38%, due 01/15/29 144A | |
| | JBS USA LUX SA/JBS USA Food Co./JBS USA Finance, Inc., 5.75%, due 04/01/33 144A | |
See accompanying Notes to the Financial Statements.
133
Mercer Opportunistic Fixed Income Fund
Schedule of Investments (Continued)
(showing percentage of net assets)
March 31, 2023
| | | |
| | Corporate Debt — continued |
| | John Deere Capital Corp., (MTN), 4.80%, due 01/09/26 | |
| | JPMorgan Chase & Co., 4.32% (SOFR + 1.56%), due 04/26/28(c) | |
| | JPMorgan Chase & Co., 4.91% (SOFR + 2.08%), due 07/25/33(c)(i) | |
| | JPMorgan Chase & Co., 5.72% (SOFR + 2.58%), due 09/14/33(c) | |
| | KazMunayGas National Co. JSC, 4.75%, due 04/19/27 144A | |
| | KazTransGas JSC, 4.38%, due 09/26/27 144A | |
| | Kenbourne Invest SA, 4.70%, due 01/22/28 144A | |
| | Kosmos Energy, Ltd., 7.13%, due 04/04/26 144A | |
| | Ladder Capital Finance Holdings, LLLP/Ladder Capital Finance Corp. REIT, 4.25%, due 02/01/27 144A | |
| | Ladder Capital Finance Holdings, LLLP/Ladder Capital Finance Corp. REIT, 4.75%, due 06/15/29 144A | |
| | Las Vegas Sands Corp., 3.20%, due 08/08/24 | |
| | Las Vegas Sands Corp., 3.50%, due 08/18/26 | |
| | Latam Airlines Group SA, 13.38%, due 10/15/27 144A | |
| | Lazard Group LLC, 4.38%, due 03/11/29 | |
| | Legacy LifePoint Health LLC, 6.75%, due 04/15/25 144A | |
| | Legends Hospitality Holding Co. LLC/Legends Hospitality Co-Issuer, Inc., 5.00%, due 02/01/26 144A | |
| | Leviathan Bond, Ltd., 6.50%, due 06/30/27(j) | |
| | Liberty Interactive LLC, 8.50%, due 07/15/29 | |
| | Liberty Mutual Group, Inc., 4.30%, due 02/01/61 144A | |
| | Liberty Mutual Group, Inc., 4.57%, due 02/01/29 144A | |
| | Liquid Telecommunications Financing Plc, 5.50%, due 09/04/26 144A | |
| | Lloyds Banking Group Plc, 7.50% (5 yr. USD swap + 4.76%)(c)(k) | |
| | Lorca Telecom Bondco SA, 4.00%, due 09/18/27 144A | |
| | LPL Holdings, Inc., 4.00%, due 03/15/29 144A | |
| | Magna International, Inc., 5.98%, due 03/21/26 | |
| | Match Group Holdings II LLC, 5.00%, due 12/15/27(i) 144A | |
| | McClatchy Co. LLC (The), 11.00% (11.00% Cash or 12.50% PIK), due 07/15/27 144A | |
| | Mclaren Finance Plc, 7.50%, due 08/01/26(i) 144A | |
| | MDC Holdings, Inc., 6.00%, due 01/15/43 | |
| | Medline Borrower, LP, 5.25%, due 10/01/29(i) 144A | |
| | Medtronic Global Holdings SCA, 4.25%, due 03/30/28 | |
| | MEG Energy Corp., 5.88%, due 02/01/29 144A | |
| | MEG Energy Corp., 7.13%, due 02/01/27 144A | |
| | MEGlobal Canada ULC, 5.88%, due 05/18/30 144A | |
| | Melco Resorts Finance, Ltd., 4.88%, due 06/06/25(i) 144A | |
| | Melco Resorts Finance, Ltd., 5.25%, due 04/26/26 144A | |
| | Melco Resorts Finance, Ltd., 5.38%, due 12/04/29 144A | |
| | MercadoLibre, Inc., 3.13%, due 01/14/31 | |
| | Merck & Co., Inc., 2.90%, due 12/10/61 | |
| | MetLife, Inc., 4.60%, due 05/13/46 | |
| | MGM China Holdings, Ltd., 5.88%, due 05/15/26(j) | |
| | Michaels Cos, Inc. (The), 5.25%, due 05/01/28 144A | |
| | Michaels Cos, Inc. (The), 7.88%, due 05/01/29 144A | |
| | Micron Technology, Inc., 3.37%, due 11/01/41 | |
| | Micron Technology, Inc., 6.75%, due 11/01/29 | |
| | Midcap Financial Issuer Trust, 6.50%, due 05/01/28 144A | |
| | Millicom International Cellular SA, 4.50%, due 04/27/31(i) 144A | |
134
See accompanying Notes to the Financial Statements.
Mercer Opportunistic Fixed Income Fund
Schedule of Investments (Continued)
(showing percentage of net assets)
March 31, 2023
| | | |
| | Corporate Debt — continued |
| | Millicom International Cellular SA, 6.25%, due 03/25/29 144A | |
| | Minerals Technologies, Inc., 5.00%, due 07/01/28 144A | |
| | MIWD Holdco II LLC/MIWD Finance Corp., 5.50%, due 02/01/30 144A | |
| | Mohegan Tribal Gaming Authority, 13.25%, due 12/15/27 144A | |
| | Moody's Corp., 2.75%, due 08/19/41 | |
| | Morgan Stanley, 4.89% (SOFR + 2.08%), due 07/20/33(c) | |
| | MPT Operating Partnership, LP/MPT Finance Corp. REIT, 3.50%, due 03/15/31 | |
| | MSCI, Inc., 3.88%, due 02/15/31 144A | |
| | NatWest Group Plc, 4.50% (5 yr. UK Government Bond + 3.99%)(c)(k) | |
| | NatWest Group Plc, 6.02% (1 yr. CMT + 2.10%), due 03/02/34(c) | |
| | Navient Corp., (MTN), 5.63%, due 08/01/33 | |
| | NBM US Holdings, Inc., 7.00%, due 05/14/26 144A | |
| | NCL Corp., Ltd., 3.63%, due 12/15/24 144A | |
| | NCL Corp., Ltd., 5.88%, due 03/15/26 144A | |
| | NCL Corp., Ltd., 5.88%, due 02/15/27 144A | |
| | NCR Corp., 5.00%, due 10/01/28 144A | |
| | NCR Corp., 5.13%, due 04/15/29 144A | |
| | NCR Corp., 5.25%, due 10/01/30 144A | |
| | Neptune Bidco US, Inc., 9.29%, due 04/15/29 144A | |
| | Neptune Energy Bondco Plc, 6.63%, due 05/15/25 144A | |
| | Netflix, Inc., 5.88%, due 11/15/28 | |
| | Nexstar Media, Inc., 4.75%, due 11/01/28 144A | |
| | Nexstar Media, Inc., 5.63%, due 07/15/27 144A | |
| | NextEra Energy Capital Holdings, Inc., 6.05%, due 03/01/25 | |
| | NMI Holdings, Inc., 7.38%, due 06/01/25 144A | |
| | Northern Oil and Gas, Inc., 8.13%, due 03/01/28 144A | |
| | Northern Star Resources Ltd., 6.13%, due 04/11/33(b) 144A | |
| | Northwest Acquisitions ULC/Dominion Finco, Inc., 7.13%, due 11/01/22(f)(m) | |
| | Novelis Sheet Ingot GmbH, 3.38%, due 04/15/29 144A | |
| | NTT Finance Corp., 4.37%, due 07/27/27 144A | |
| | Nutrien, Ltd., 4.90%, due 03/27/28 | |
| | Nutrien, Ltd., 5.80%, due 03/27/53 | |
| | NXP BV/NXP Funding LLC/NXP USA, Inc., 5.00%, due 01/15/33 | |
| | Occidental Petroleum Corp., 4.40%, due 08/15/49 | |
| | Occidental Petroleum Corp., 6.45%, due 09/15/36 | |
| | Occidental Petroleum Corp., 7.50%, due 05/01/31 | |
| | OCP SA, 5.13%, due 06/23/51 144A | |
| | Olympus Water US Holding Corp., 4.25%, due 10/01/28 144A | |
| | Olympus Water US Holding Corp., 6.25%, due 10/01/29(i) 144A | |
| | Option Care Health, Inc., 4.38%, due 10/31/29 144A | |
| | Oracle Corp., 3.95%, due 03/25/51 | |
| | Organon & Co./Organon Foreign Debt Co-Issuer BV, 5.13%, due 04/30/31 144A | |
| | Outfront Media Capital LLC/Outfront Media Capital Corp., 4.63%, due 03/15/30 144A | |
| | Oversea-Chinese Banking Corp., Ltd., (MTN), 4.25%, due 06/19/24(j) | |
| | Pactiv LLC, 8.38%, due 04/15/27 | |
| | Papa John's International, Inc., 3.88%, due 09/15/29(i) 144A | |
| | Park-Ohio Industries, Inc., 6.63%, due 04/15/27(i) | |
| | Pattern Energy Operations, LP/Pattern Energy Operations, Inc., 4.50%, due 08/15/28 144A | |
See accompanying Notes to the Financial Statements.
135
Mercer Opportunistic Fixed Income Fund
Schedule of Investments (Continued)
(showing percentage of net assets)
March 31, 2023
| | | |
| | Corporate Debt — continued |
| | Paysafe Finance Plc/Paysafe Holdings US Corp., 4.00%, due 06/15/29(i) 144A | |
| | PerkinElmer, Inc., 2.25%, due 09/15/31 | |
| | Permian Resources Operating LLC, 5.88%, due 07/01/29 144A | |
| | Petrobras Global Finance BV, 6.85%, due 06/05/15(i)(n) | |
| | Petroleos Mexicanos, 6.70%, due 02/16/32 | |
| | Petroleos Mexicanos, 10.00%, due 02/07/33(i) 144A | |
| | Petroleos Mexicanos (GDN), 7.19%, due 09/12/24(j) | |
| | PetSmart, Inc./PetSmart Finance Corp., 7.75%, due 02/15/29 144A | |
| | Phillips 66, 3.30%, due 03/15/52 | |
| | Pinduoduo, Inc., 2.47%, due 12/01/25(h) | |
| | Plains All American Pipeline, LP, 8.97% (3 mo. USD LIBOR + 4.11%)(c)(k) | |
| | Playtika Holding Corp., 4.25%, due 03/15/29 144A | |
| | PLT VII Finance SARL, 4.63%, due 01/05/26 144A | |
| | PM General Purchaser LLC, 9.50%, due 10/01/28 144A | |
| | POSCO, 5.75%, due 01/17/28 144A | |
| | Post Holdings, Inc., 2.50%, due 08/15/27 144A | |
| | Precision Drilling Corp., 6.88%, due 01/15/29 144A | |
| | Precision Drilling Corp., 7.13%, due 01/15/26 144A | |
| | Prime Security Services Borrower LLC/Prime Finance, Inc., 6.25%, due 01/15/28 144A | |
| | Prosperous Ray, Ltd., 4.63%, due 11/12/23(j) | |
| | Prosus NV, 3.06%, due 07/13/31 144A | |
| | Prosus NV, 4.03%, due 08/03/50 144A | |
| | Prosus NV, 4.19%, due 01/19/32 144A | |
| | Prudential Financial, Inc., 5.63% (3 mo. USD LIBOR + 3.92%), due 06/15/43(c) | |
| | QVC, Inc., 4.38%, due 09/01/28 | |
| | QVC, Inc., 5.45%, due 08/15/34 | |
| | Rackspace Technology Global, Inc., 3.50%, due 02/15/28 144A | |
| | Radian Group, Inc., 6.63%, due 03/15/25 | |
| | Radiology Partners, Inc., 9.25%, due 02/01/28 144A | |
| | Range Resources Corp., 4.75%, due 02/15/30(i) 144A | |
| | Range Resources Corp., 8.25%, due 01/15/29 | |
| | Republic Services, Inc., 5.00%, due 04/01/34 | |
| | ROCC Holdings LLC, 9.25%, due 08/15/26 144A | |
| | Rocket Mortgage LLC/Rocket Mortgage Co-Issuer, Inc., 3.63%, due 03/01/29 144A | |
| | Rocket Mortgage LLC/Rocket Mortgage Co-Issuer, Inc., 3.88%, due 03/01/31 144A | |
| | Rockies Express Pipeline LLC, 7.50%, due 07/15/38 144A | |
| | Rolls-Royce Plc, 4.63%, due 02/16/26(j) | |
| | Royal Caribbean Cruises, Ltd., 9.25%, due 01/15/29 144A | |
| | Royal Caribbean Cruises, Ltd., 11.50%, due 06/01/25 144A | |
| | Royal Caribbean Cruises, Ltd., 11.63%, due 08/15/27 144A | |
| | Sabre GLBL, Inc., 11.25%, due 12/15/27(i) 144A | |
| | Saga Plc, 5.50%, due 07/15/26(j) | |
| | Sally Holdings LLC/Sally Capital, Inc., 5.63%, due 12/01/25 | |
| | Sands China, Ltd., 2.80%, due 03/08/27(l) | |
| | Sands China, Ltd., 3.35%, due 03/08/29(l) | |
| | Sands China, Ltd., 5.63%, due 08/08/25(l) | |
| | Sands China, Ltd., 5.90%, due 08/08/28(l) | |
| | Sasol Financing USA LLC, 5.50%, due 03/18/31 | |
| | Saudi Arabian Oil Co., 3.25%, due 11/24/50 144A | |
136
See accompanying Notes to the Financial Statements.
Mercer Opportunistic Fixed Income Fund
Schedule of Investments (Continued)
(showing percentage of net assets)
March 31, 2023
| | | |
| | Corporate Debt — continued |
| | Scientific Games International, Inc., 7.00%, due 05/15/28 144A | |
| | SCIL IV LLC/SCIL USA Holdings LLC, 4.38%, due 11/01/26 144A | |
| | SCIL IV LLC/SCIL USA Holdings LLC, 5.38%, due 11/01/26 144A | |
| | Seagate HDD Cayman, 4.09%, due 06/01/29 144A | |
| | Seagate HDD Cayman, 4.88%, due 06/01/27 | |
| | Sealed Air Corp./Sealed Air Corp. US, 6.13%, due 02/01/28 144A | |
| | Sempra Energy, 3.70%, due 04/01/29 | |
| | SEPLAT Energy Plc, 7.75%, due 04/01/26 144A | |
| | Service Properties Trust REIT, 5.50%, due 12/15/27 | |
| | Service Properties Trust REIT, 7.50%, due 09/15/25 | |
| | Simmons Foods, Inc./Simmons Prepared Foods, Inc./Simmons Pet Food, Inc./Simmons Feed, 4.63%, due 03/01/29 144A | |
| | Sinclair Television Group, Inc., 4.13%, due 12/01/30 144A | |
| | Smyrna Ready Mix Concrete LLC, 6.00%, due 11/01/28 144A | |
| | Societe Generale SA, 7.38% (5 yr. USD swap + 4.30%)(c)(k) 144A | |
| | Societe Generale SA, 9.38% (5 yr. CMT + 5.39%)(c)(k) 144A | |
| | Southwestern Energy Co., 4.75%, due 02/01/32 | |
| | Southwestern Energy Co., 8.38%, due 09/15/28 | |
| | Spirit Loyalty Cayman, Ltd./Spirit IP Cayman, Ltd., 8.00%, due 09/20/25 144A | |
| | Spirit Loyalty Cayman, Ltd./Spirit IP Cayman, Ltd., 8.00%, due 09/20/25 144A | |
| | Standard Chartered Plc, 4.30% (5 yr. CMT + 3.14%)(c)(i)(k) 144A | |
| | Standard Chartered Plc, 6.17% (1 yr. CMT + 2.05%), due 01/09/27(c) 144A | |
| | Starwood Property Trust, Inc. REIT, 4.38%, due 01/15/27 144A | |
| | Stellantis Finance US, Inc., 5.63%, due 01/12/28 144A | |
| | StoneMor, Inc., 8.50%, due 05/15/29 144A | |
| | StoneX Group, Inc., 8.63%, due 06/15/25 144A | |
| | Strathcona Resources, Ltd., 6.88%, due 08/01/26 144A | |
| | Studio City Finance, Ltd., 6.00%, due 07/15/25 144A | |
| | Studio City Finance, Ltd., 6.50%, due 01/15/28 144A | |
| | Suburban Propane Partners, LP/Suburban Energy Finance Corp., 5.00%, due 06/01/31 144A | |
| | Summit Materials LLC/Summit Materials Finance Corp., 5.25%, due 01/15/29 144A | |
| | Summit Midstream Holdings LLC/Summit Midstream Finance Corp., 8.50%, due 10/15/26 144A | |
| | Sunnova Energy Corp., 5.88%, due 09/01/26(i) 144A | |
| | Suzano Austria GmbH, 3.13%, due 01/15/32(i) | |
| | Suzano Austria GmbH, 7.00%, due 03/16/47(i)(j) | |
| | Swire Pacific MTN Financing, Ltd., (MTN), 4.50%, due 10/09/23(j) | |
| | Synchrony Financial, 4.88%, due 06/13/25 | |
| | Tallgrass Energy Partners, LP/Tallgrass Energy Finance Corp., 6.00%, due 12/31/30 144A | |
| | Targa Resources Corp., 5.20%, due 07/01/27 | |
| | Targa Resources Corp., 6.13%, due 03/15/33 | |
| | Teck Resources, Ltd., 6.00%, due 08/15/40 | |
| | Telefonica Emisiones SA, 5.21%, due 03/08/47 | |
| | Teva Pharmaceutical Finance Co. LLC, 6.15%, due 02/01/36(i) | |
| | Teva Pharmaceutical Finance Netherlands II BV, 1.88%, due 03/31/27(j) | |
| | Teva Pharmaceutical Finance Netherlands III BV, 4.75%, due 05/09/27 | |
| | Teva Pharmaceutical Finance Netherlands III BV, 8.13%, due 09/15/31(i) | |
| | Time Warner Cable LLC, 5.25%, due 07/15/42 | |
See accompanying Notes to the Financial Statements.
137
Mercer Opportunistic Fixed Income Fund
Schedule of Investments (Continued)
(showing percentage of net assets)
March 31, 2023
| | | |
| | Corporate Debt — continued |
| | Time Warner Cable LLC, 6.75%, due 06/15/39 | |
| | Titan International, Inc., 7.00%, due 04/30/28 | |
| | TKC Holdings, Inc., 6.88%, due 05/15/28(i) 144A | |
| | T-Mobile USA, Inc., 4.95%, due 03/15/28 | |
| | TMS Issuer SARL, 5.78%, due 08/23/32 144A | |
| | TopBuild Corp., 3.63%, due 03/15/29 144A | |
| | TransAlta Corp., 6.50%, due 03/15/40 | |
| | TransAlta Corp., 7.75%, due 11/15/29 | |
| | TransCanada PipeLines Ltd., 6.20%, due 03/09/26 | |
| | TransDigm, Inc., 6.25%, due 03/15/26 144A | |
| | TransDigm, Inc., 6.75%, due 08/15/28 144A | |
| | TransDigm, Inc., 7.50%, due 03/15/27 | |
| | TransDigm, Inc., 8.00%, due 12/15/25 144A | |
| | Transnet SOC, Ltd., 8.25%, due 02/06/28 144A | |
| | Transocean, Inc., 8.75%, due 02/15/30 144A | |
| | Transportadora de Gas del Sur SA, 6.75%, due 05/02/25 144A | |
| | Triumph Group, Inc., 9.00%, due 03/15/28 144A | |
| | Turk Telekomunikasyon AS, 6.88%, due 02/28/25 144A | |
| | Tutor Perini Corp., 6.88%, due 05/01/25(i) 144A | |
| | UBS Group AG, 4.75% (1 yr. CMT + 1.75%), due 05/12/28(c) 144A | |
| | UBS Group AG, 4.99% (1 yr. CMT + 2.40%), due 08/05/33(c) 144A | |
| | UBS Group AG, 7.00% (5 yr. USD swap + 4.34%)(c)(k) 144A | |
| | UniCredit SpA, 5.46% (5 yr. CMT + 4.75%), due 06/30/35(c) 144A | |
| | UniCredit SpA, 7.30% (5 yr. USD ICE swap + 4.91%), due 04/02/34(c) 144A | |
| | United Airlines Pass Through Trust, 4.88%, due 07/15/27 | |
| | United Airlines Pass Through Trust, 5.88%, due 04/15/29 | |
| | United Airlines, Inc., 4.38%, due 04/15/26 144A | |
| | United Airlines, Inc., 4.63%, due 04/15/29 144A | |
| | United Parcel Service, Inc., 4.88%, due 03/03/33 | |
| | United Rentals North America, Inc., 3.88%, due 02/15/31 | |
| | United Rentals North America, Inc., 5.25%, due 01/15/30 | |
| | United Rentals North America, Inc., 5.50%, due 05/15/27 | |
| | United Rentals North America, Inc., 6.00%, due 12/15/29 144A | |
| | UnitedHealth Group, Inc., 4.50%, due 04/15/33 | |
| | UnitedHealth Group, Inc., 5.88%, due 02/15/53 | |
| | Upbound Group, Inc., 6.38%, due 02/15/29(i) 144A | |
| | US Renal Care, Inc., 10.63%, due 07/15/27 144A | |
| | Utah Acquisition Sub, Inc., 5.25%, due 06/15/46 | |
| | Vale Overseas, Ltd., 6.88%, due 11/10/39 | |
| | Venture Global Calcasieu Pass LLC, 3.88%, due 11/01/33 144A | |
| | Venture Global Calcasieu Pass LLC, 6.25%, due 01/15/30 144A | |
| | Vericast Corp., 11.00%, due 09/15/26 144A | |
| | Verizon Communications, Inc., 2.85%, due 09/03/41 | |
| | Vertiv Group Corp., 4.13%, due 11/15/28 144A | |
| | Viavi Solutions, Inc., 3.75%, due 10/01/29 144A | |
| | Viking Cruises, Ltd., 13.00%, due 05/15/25 144A | |
| | Viking Ocean Cruises Ship VII, Ltd., 5.63%, due 02/15/29 144A | |
| | Viper Energy Partners, LP, 5.38%, due 11/01/27 144A | |
| | Virgin Media Secured Finance Plc, 5.50%, due 05/15/29 144A | |
138
See accompanying Notes to the Financial Statements.
Mercer Opportunistic Fixed Income Fund
Schedule of Investments (Continued)
(showing percentage of net assets)
March 31, 2023
| | | |
| | Corporate Debt — continued |
| | VistaJet Malta Finance Plc/XO Management Holding, Inc., 6.38%, due 02/01/30 144A | |
| | VistaJet Malta Finance Plc/XO Management Holding, Inc., 7.88%, due 05/01/27 144A | |
| | Vmed O2 UK Financing I Plc, 4.75%, due 07/15/31 144A | |
| | VOC Escrow, Ltd., 5.00%, due 02/15/28 144A | |
| | VTR Comunicaciones SpA, 5.13%, due 01/15/28 144A | |
| | Warnermedia Holdings, Inc., 6.41%, due 03/15/26 | |
| | Waste Connections, Inc., 2.95%, due 01/15/52 | |
| | WEA Finance LLC/Westfield UK & Europe Finance Plc REIT, 4.75%, due 09/17/44 144A | |
| | Western Midstream Operating, LP, 3.35%, due 02/01/25(l) | |
| | Western Midstream Operating, LP, 5.30%, due 03/01/48 | |
| | Western Midstream Operating, LP, 5.45%, due 04/01/44 | |
| | Williams Cos., Inc. (The), 8.75%, due 03/15/32 | |
| | WW International, Inc., 4.50%, due 04/15/29 144A | |
| | Wynn Macau, Ltd., 4.88%, due 10/01/24(i) 144A | |
| | Wynn Macau, Ltd., 5.63%, due 08/26/28 144A | |
| | Wynn Resorts Finance LLC/Wynn Resorts Capital Corp., 7.13%, due 02/15/31(i) 144A | |
| | XPO CNW, Inc., 6.70%, due 05/01/34 | |
| | XPO Escrow Sub LLC, 7.50%, due 11/15/27 144A | |
| | Yamana Gold, Inc., 4.63%, due 12/15/27 | |
| | YPF SA, 6.95%, due 07/21/27 144A | |
| | YPF SA, 8.50%, due 07/28/25 144A | |
| | YPF SA, 9.00%, due 02/12/26(l) 144A | |
| | Yum! Brands, Inc., 4.75%, due 01/15/30 144A | |
| | ZF North America Capital, Inc., 4.75%, due 04/29/25 144A | |
| | Ziff Davis, Inc., 4.63%, due 10/15/30(i) 144A | |
| | ZipRecruiter, Inc., 5.00%, due 01/15/30 144A | |
| | | |
| | Mortgage Backed Securities - Private Issuers — 5.3% |
| | Angel Oak Mortgage Trust I LLC CMO, Series 2019-2, Class B1, 5.02%, due 03/25/49(d) 144A | |
| | BANK, Series 2020-BN25, Class AS, 2.84%, due 01/15/63 | |
| | BANK, Series 2023-BNK45, Class A5, 5.20%, due 02/15/56 | |
| | Barclays Commercial Mortgage Trust, Series 2019-C5, Class A4, 3.06%, due 11/15/52 | |
| | BBCCRE Trust, Series 2015-GTP, Class F, 4.56%, due 08/10/33(d) 144A | |
| | BBCMS Mortgage Trust, Series 2020-C6, Class AS, 2.84%, due 02/15/53 | |
| | BBCMS Trust, Series 2018-CBM, Class D, 7.08% (1 mo. USD LIBOR + 2.39%), due 07/15/37(c) 144A | |
| | Benchmark Mortgage Trust, Series 2020-B16, Class AM, 2.94%, due 02/15/53(d) | |
| | BHMS, Series 2018-MZB, Class MZB, 11.32% (1 mo. USD LIBOR + 6.64%), due 07/15/25(c) 144A | |
| | BIG Commercial Mortgage Trust, Series 2022-BIG, Class F, 10.26% (1 mo. TSFR + 5.44%), due 02/15/39(c) 144A | |
| | BRAVO Residential Funding Trust CMO, Series 2022-NQM1, Class A3, 4.09%, due 09/25/61(d) 144A | |
| | BRAVO Residential Funding Trust CMO, Series 2022-NQM2, Class A3, 5.24%, due 11/25/61(d) 144A | |
| | BRAVO Residential Funding Trust CMO, Series 2022-NQM3, Class A3, 5.50%, due 07/25/62(d) 144A | |
See accompanying Notes to the Financial Statements.
139
Mercer Opportunistic Fixed Income Fund
Schedule of Investments (Continued)
(showing percentage of net assets)
March 31, 2023
| | | |
| | Mortgage Backed Securities - Private Issuers — continued |
| | BX Commercial Mortgage Trust, Series 2019-IMC, Class E, 6.83% (1 mo. USD LIBOR + 2.15%), due 04/15/34(c) 144A | |
| | BX Commercial Mortgage Trust, Series 2021-21M, Class A, 5.41% (1 mo. USD LIBOR + 0.73%), due 10/15/36(c) 144A | |
| | BX Commercial Mortgage Trust, Series 2021-ACNT, Class A, 5.54% (1 mo. USD LIBOR + 0.85%), due 11/15/38(c) 144A | |
| | BX Commercial Mortgage Trust, Series 2021-VINO, Class A, 5.34% (1 mo. USD LIBOR + 0.65%), due 05/15/38(c) 144A | |
| | BX Commercial Mortgage Trust, Series 2021-VOLT, Class G, 7.53% (1 mo. USD LIBOR + 2.85%), due 09/15/36(c) 144A | |
| | BX Commercial Mortgage Trust, Series 2021-XL2, Class J, 8.57% (1 mo. USD LIBOR + 3.89%), due 10/15/38(c) 144A | |
| | BX Commercial Mortgage Trust, Series 2022-AHP, Class A, 5.82% (1 mo. TSFR + 0.99%), due 01/17/39(c) 144A | |
| | BX Commercial Mortgage Trust, Series 2022-LP2, Class G, 8.93% (1 mo. TSFR + 4.11%), due 02/15/39(c) 144A | |
| | BX Trust, Series 2018-BILT, Class B, 5.70% (1 mo. USD LIBOR + 1.02%), due 05/15/30(c) 144A | |
| | BX Trust, Series 2021-SDMF, Class F, 6.62% (1 mo. USD LIBOR + 1.94%), due 09/15/34(c) 144A | |
| | BX Trust, Series 2022-LBA6, Class D, 6.83% (1 mo. TSFR + 2.00%), due 01/15/39(c) 144A | |
| | CFCRE Commercial Mortgage Trust, Series 2011-C2, Class D, 5.08%, due 12/15/47(d) 144A | |
| | CFK Trust, Series 2020-MF2, Class F, 3.46%, due 03/15/39(d) 144A | |
| | CGDB Commercial Mortgage Trust, Series 2019-MOB, Class A, 5.63% (1 mo. USD LIBOR + 0.95%), due 11/15/36(c) 144A | |
| | Commercial Mortgage Trust, Series 2012-CR3, Class B, 3.92%, due 10/15/45 144A | |
| | Connecticut Avenue Securities Trust CMO, Series 2022-R04, Class 1M2, 7.66% (SOFR 30-day average + 3.10%), due 03/25/42(c) 144A | |
| | Credit Suisse Mortgage Capital Certificates, Series 2019-ICE4, Class F, 7.33% (1 mo. USD LIBOR + 2.65%), due 05/15/36(c) 144A | |
| | Credit Suisse Mortgage Trust, Series 2019-UVIL, Class A, 3.16%, due 12/15/41 144A | |
| | Credit Suisse Mortgage Trust, Series 2020-TMIC, Class A, 8.18% (1 mo. USD LIBOR + 3.50%), due 12/15/35(c) 144A | |
| | Credit Suisse Mortgage Trust LLC, Series 2014-USA, Class F, 4.37%, due 09/15/37 144A | |
| | DBGS Mortgage Trust, Series 2018-BIOD, Class D, 5.98% (1 mo. USD LIBOR + 1.30%), due 05/15/35(c) 144A | |
| | EFMT CMO, Series 2023-1, Class A3, 6.54%, due 02/25/68(l) 144A | |
| | Ellington Financial Mortgage Trust CMO, Series 2020-1, Class B1, 5.11%, due 05/25/65(d) 144A | |
| | ELP Commercial Mortgage Trust, Series 2021-ELP, Class D, 6.20% (1 mo. USD LIBOR + 1.52%), due 11/15/38(c) 144A | |
| | Extended Stay America Trust, Series 2021-ESH, Class F, 8.39% (1 mo. USD LIBOR + 3.70%), due 07/15/38(c) 144A | |
| | FHLMC Seasoned Credit Risk Transfer Trust CMO, Series 2017-1, Class M1, 4.00%, due 01/25/56(d) 144A | |
| | FHLMC Seasoned Credit Risk Transfer Trust CMO, Series 2017-2, Class M1, 4.00%, due 08/25/56(d) 144A | |
| | FHLMC Seasoned Credit Risk Transfer Trust CMO, Series 2017-3, Class M1, 4.00%, due 07/25/56(d) 144A | |
| | FHLMC Seasoned Credit Risk Transfer Trust CMO, Series 2018-3, Class M, 4.75%, due 08/25/57(d) 144A | |
140
See accompanying Notes to the Financial Statements.
Mercer Opportunistic Fixed Income Fund
Schedule of Investments (Continued)
(showing percentage of net assets)
March 31, 2023
| | | |
| | Mortgage Backed Securities - Private Issuers — continued |
| | FHLMC Seasoned Credit Risk Transfer Trust CMO, Series 2019-1, Class M, 4.75%, due 07/25/58(d) 144A | |
| | FHLMC Seasoned Credit Risk Transfer Trust CMO, Series 2019-3, Class M, 4.75%, due 10/25/58(d) 144A | |
| | FHLMC Seasoned Credit Risk Transfer Trust CMO, Series 2019-4, Class M, 4.50%, due 02/25/59(d) 144A | |
| | FHLMC Seasoned Credit Risk Transfer Trust CMO, Series 2020-1, Class M, 4.25%, due 08/25/59(d) 144A | |
| | FHLMC Seasoned Credit Risk Transfer Trust CMO, Series 2020-2, Class M, 4.25%, due 11/25/59(d) 144A | |
| | FHLMC Seasoned Credit Risk Transfer Trust CMO, Series 2020-3, Class M, 4.25%, due 05/25/60(d) 144A | |
| | FHLMC Seasoned Credit Risk Transfer Trust CMO, Series 2021-1, Class M, 4.25%, due 09/25/60 144A | |
| | FHLMC Structured Agency Credit Risk Debt Notes CMO, Series 2017-HRP1, Class B1, 9.45% (1 mo. USD LIBOR + 4.60%), due 12/25/42(c) | |
| | FHLMC Structured Agency Credit Risk Debt Notes CMO, Series 2017-SPI1, Class B, 4.12%, due 09/25/47(d) 144A | |
| | FHLMC Structured Agency Credit Risk Debt Notes CMO, Series 2018-DNA1, Class B1, 8.00% (1 mo. USD LIBOR + 3.15%), due 07/25/30(c) 144A | |
| | FHLMC Structured Agency Credit Risk Debt Notes CMO, Series 2021-DNA2, Class B1, 7.96% (SOFR 30-day average + 3.40%), due 08/25/33(c) 144A | |
| | FHLMC Structured Agency Credit Risk REMIC Trust CMO, Series 2020-DNA1, Class B1, 7.15% (1 mo. USD LIBOR + 2.30%), due 01/25/50(c) 144A | |
| | FHLMC Structured Agency Credit Risk REMIC Trust CMO, Series 2020-DNA2, Class M2, 6.70% (1 mo. USD LIBOR + 1.85%), due 02/25/50(c) 144A | |
| | FHLMC Structured Agency Credit Risk REMIC Trust CMO, Series 2020-DNA3, Class B1, 9.95% (1 mo. USD LIBOR + 5.10%), due 06/25/50(c) 144A | |
| | FHLMC Structured Agency Credit Risk REMIC Trust CMO, Series 2020-DNA5, Class B1, 9.36% (SOFR 30-day average + 4.80%), due 10/25/50(c) 144A | |
| | FHLMC Structured Agency Credit Risk REMIC Trust CMO, Series 2020-DNA6, Class B1, 7.56% (SOFR 30-day average + 3.00%), due 12/25/50(c) 144A | |
| | FHLMC Structured Agency Credit Risk REMIC Trust CMO, Series 2021-DNA1, Class B2, 9.31% (SOFR 30-day average + 4.75%), due 01/25/51(c) 144A | |
| | FHLMC Structured Agency Credit Risk REMIC Trust CMO, Series 2021-DNA3, Class B1, 8.06% (SOFR 30-day average + 3.50%), due 10/25/33(c) 144A | |
| | FHLMC Structured Agency Credit Risk REMIC Trust CMO, Series 2021-DNA3, Class M2, 6.66% (SOFR 30-day average + 2.10%), due 10/25/33(c) 144A | |
| | FHLMC Structured Agency Credit Risk REMIC Trust CMO, Series 2021-DNA5, Class B1, 7.61% (SOFR 30-day average + 3.05%), due 01/25/34(c) 144A | |
| | FHLMC Structured Agency Credit Risk REMIC Trust CMO, Series 2021-DNA5, Class M2, 6.21% (SOFR 30-day average + 1.65%), due 01/25/34(c) 144A | |
| | FHLMC Structured Agency Credit Risk REMIC Trust CMO, Series 2021-DNA6, Class M2, 6.06% (SOFR 30-day average + 1.50%), due 10/25/41(c) 144A | |
| | FHLMC Structured Agency Credit Risk REMIC Trust CMO, Series 2021-DNA7, Class B1, 8.21% (SOFR 30-day average + 3.65%), due 11/25/41(c) 144A | |
| | FHLMC Structured Agency Credit Risk REMIC Trust CMO, Series 2021-DNA7, Class M2, 6.36% (SOFR 30-day average + 1.80%), due 11/25/41(c) 144A | |
| | FHLMC Structured Agency Credit Risk REMIC Trust CMO, Series 2022-DNA3, Class M1B, 7.46% (SOFR 30-day average + 2.90%), due 04/25/42(c) 144A | |
| | FHLMC Structured Asset Mortgage Investments II Trust CMO, Series 2005-AR2, Class 2A2, 5.41% (1 mo. USD LIBOR + 0.56%), due 05/25/45(c) | |
| | FNMA Connecticut Avenue Securities CMO, Series 2014-C04, Class 1M2, 9.75% (1 mo. USD LIBOR + 4.90%), due 11/25/24(c) 144A | |
See accompanying Notes to the Financial Statements.
141
Mercer Opportunistic Fixed Income Fund
Schedule of Investments (Continued)
(showing percentage of net assets)
March 31, 2023
| | | |
| | Mortgage Backed Securities - Private Issuers — continued |
| | FNMA Connecticut Avenue Securities CMO, Series 2017-C07, Class 1B1, 8.85% (1 mo. USD LIBOR + 4.00%), due 05/25/30(c) 144A | |
| | FNMA Connecticut Avenue Securities CMO, Series 2018-C01, Class 1B1, 8.40% (1 mo. USD LIBOR + 3.55%), due 07/25/30(c) 144A | |
| | FNMA Connecticut Avenue Securities CMO, Series 2018-C05, Class 1B1, 9.10% (1 mo. USD LIBOR + 4.25%), due 01/25/31(c) 144A | |
| | FNMA Connecticut Avenue Securities CMO, Series 2018-C06, Class 1B1, 8.60% (1 mo. USD LIBOR + 3.75%), due 03/25/31(c) 144A | |
| | FNMA Connecticut Avenue Securities Trust CMO, Series 2018-R07, Class 1B1, 9.20% (1 mo. USD LIBOR + 4.35%), due 04/25/31(c) 144A | |
| | FNMA Connecticut Avenue Securities Trust CMO, Series 2019-R07, Class 1B1, 8.25% (1 mo. USD LIBOR + 3.40%), due 10/25/39(c) 144A | |
| | FNMA Connecticut Avenue Securities Trust CMO, Series 2020-R01, Class 1M2, 6.90% (1 mo. USD LIBOR + 2.05%), due 01/25/40(c) 144A | |
| | FNMA Connecticut Avenue Securities Trust CMO, Series 2021-R01, Class 1B1, 7.66% (SOFR 30-day average + 3.10%), due 10/25/41(c) 144A | |
| | FNMA Connecticut Avenue Securities Trust CMO, Series 2021-R03, Class 1B1, 7.31% (SOFR 30-day average + 2.75%), due 12/25/41(c) 144A | |
| | GS Mortgage Securities Corp. Trust, Series 2018-LUAU, Class G, 9.13% (1 mo. USD LIBOR + 4.45%), due 11/15/32(c) 144A | |
| | GS Mortgage Securities Corp. Trust, Series 2020-DUNE, Class A, 5.78% (1 mo. USD LIBOR + 1.10%), due 12/15/36(c) 144A | |
| | GS Mortgage Securities Trust, Series 2011-GC5, Class D, 5.16%, due 08/10/44(d) 144A | |
| | GS Mortgage Securities Trust, Series 2014-GC22, Class D, 4.69%, due 06/10/47(d) 144A | |
| | HarborView Mortgage Loan Trust CMO, Series 2005-9, Class 2A1C, 5.66% (1 mo. USD LIBOR + 0.90%), due 06/20/35(c) | |
| | JPMorgan Chase Commercial Mortgage Securities Trust, Series 2018-PHMZ, Class M, 13.19% (1 mo. USD LIBOR + 8.51%), due 06/15/35(c) 144A | |
| | JPMorgan Chase Commercial Mortgage Securities Trust, Series 2018-WPT, Class FFL, 7.85% (1 mo. USD LIBOR + 3.15%), due 07/05/33(c) 144A | |
| | JPMorgan Chase Commercial Mortgage Securities Trust, Series 2019-BKWD, Class E, 7.53% (1 mo. USD LIBOR + 2.85%), due 09/15/29(c) 144A | |
| | JPMorgan Chase Commercial Mortgage Securities Trust, Series 2019-BKWD, Class F, 8.33% (1 mo. USD LIBOR + 3.65%), due 09/15/29(c) 144A | |
| | JPMorgan Chase Commercial Mortgage Securities Trust, Series 2020-MKST, Class F, 7.78% (1 mo. USD LIBOR + 3.10%), due 12/15/36(c) 144A | |
| | JPMorgan Chase Commercial Mortgage Securities Trust, Series 2020-NNN, Class GFX, 4.69%, due 01/16/37(d) 144A | |
| | JPMorgan Chase Commercial Mortgage Securities Trust, Series 2021-HTL5, Class F, 8.95% (1 mo. USD LIBOR + 4.27%), due 11/15/38(c) 144A | |
| | JPMorgan Chase Commercial Mortgage Securities Trust, Series 2022-NLP, Class D, 6.99% (1 mo. TSFR + 2.17%), due 04/15/37(c) 144A | |
| | KIND Trust, Series 2021-KIND, Class D, 7.24% (1 mo. TSFR + 2.41%), due 08/15/38(c) 144A | |
| | Legacy Mortgage Asset Trust CMO, Series 2020-GS4, Class A1, 3.25%, due 02/25/60(l) 144A | |
| | Legacy Mortgage Asset Trust CMO, Series 2020-GS5, Class A1, 3.25%, due 06/25/60(l) 144A | |
| | Med Trust, Series 2021-MDLN, Class C, 6.49% (1 mo. USD LIBOR + 1.80%), due 11/15/38(c) 144A | |
| | Med Trust, Series 2021-MDLN, Class E, 7.84% (1 mo. USD LIBOR + 3.15%), due 11/15/38(c) 144A | |
| | Med Trust, Series 2021-MDLN, Class G, 9.94% (1 mo. USD LIBOR + 5.25%), due 11/15/38(c) 144A | |
142
See accompanying Notes to the Financial Statements.
Mercer Opportunistic Fixed Income Fund
Schedule of Investments (Continued)
(showing percentage of net assets)
March 31, 2023
| | | |
| | Mortgage Backed Securities - Private Issuers — continued |
| | MHC Commercial Mortgage Trust, Series 2021-MHC, Class A, 5.49% (1 mo. USD LIBOR + 0.80%), due 04/15/38(c) 144A | |
| | MHC Trust, Series 2021-MHC2, Class E, 6.63% (1 mo. USD LIBOR + 1.95%), due 05/15/38(c) 144A | |
| | Morgan Stanley Capital I Trust, Series 2018-MP, Class A, 4.28%, due 07/11/40(d) 144A | |
| | MSBAM Commercial Mortgage Securities Trust, Series 2012-CKSV, Class A2, 3.28%, due 10/15/30 144A | |
| | Multifamily Connecticut Avenue Securities Trust, Series 2019-01, Class M10, 8.10% (1 mo. USD LIBOR + 3.25%), due 10/25/49(c) 144A | |
| | Multifamily Connecticut Avenue Securities Trust, Series 2020-01, Class M10, 8.60% (1 mo. USD LIBOR + 3.75%), due 03/25/50(c) 144A | |
| | Natixis Commercial Mortgage Securities Trust, Series 2019-MILE, Class A, 6.41% (1 mo. TSFR + 1.58%), due 07/15/36(c) 144A | |
| | New Residential Mortgage Loan Trust CMO, Series 2017-5A, Class B4, 4.21%, due 06/25/57(d) 144A | |
| | OBX Trust CMO, Series 2022-NQM6, Class A1, 4.70%, due 07/25/62(l) 144A | |
| | OPG Trust, Series 2021-PORT, Class D, 5.82% (1 mo. USD LIBOR + 1.13%), due 10/15/36(c) 144A | |
| | PMT Credit Risk Transfer Trust CMO, Series 2019-3R, Class A, 8.55% (1 mo. USD LIBOR + 3.70%), due 11/27/31(c) 144A | |
| | Radnor RE, Ltd. CMO, Series 2020-1, Class M1C, 6.60% (1 mo. USD LIBOR + 1.75%), due 01/25/30(c) 144A | |
| | Starwood Retail Property Trust, Series 2014-STAR, Class C, 7.44% (1 mo. USD LIBOR + 2.75%), due 11/15/27(c)(f) 144A | |
| | Starwood Retail Property Trust, Series 2014-STAR, Class D, 8.19% (1 mo. USD LIBOR + 3.50%), due 11/15/27(c)(f) 144A | |
| | Tharaldson Hotel Portfolio Trust, Series 2018-THL, Class E, 8.19% (1 mo. USD LIBOR + 3.48%), due 11/11/34(c) 144A | |
| | Tharaldson Hotel Portfolio Trust, Series 2018-THL, Class F, 8.96% (1 mo. USD LIBOR + 4.25%), due 11/11/34(c) 144A | |
| | Towd Point Mortgage Trust CMO, Series 2017-5, Class B1, 4.21% (1 mo. USD LIBOR + 1.80%), due 02/25/57(c) 144A | |
| | Towd Point Mortgage Trust CMO, Series 2019-4, Class B1B, 3.50%, due 10/25/59(d) 144A | |
| | WaMu Mortgage Pass-Through Certificates Trust CMO, Series 2005-AR1, Class A1B, 5.63% (1 mo. USD LIBOR + 0.78%), due 01/25/45(c) | |
| | WaMu Mortgage Pass-Through Certificates Trust CMO, Series 2005-AR6, Class 2A1A, 5.31% (1 mo. USD LIBOR + 0.46%), due 04/25/45(c) | |
| | WaMu Mortgage Pass-Through Certificates Trust CMO, Series 2006-AR16, Class 2A2, | |
| | Wells Fargo Commercial Mortgage Trust, Series 2017-C42, Class D, 2.80%, due 12/15/50(d) 144A | |
| | Wells Fargo Mortgage Backed Securities Trust CMO, Series 2006-AR5, Class 2A1, | |
| | | |
| | Mortgage Backed Securities - U.S. Government Agency Obligations — 0.0% |
| | FNMA, Pool # BM6224, 2.79%, due 01/01/35(d) | |
| | UMBS, Pool # BM5520, 3.50%, due 02/01/47 | |
| | | |
| | Sovereign Debt Obligations — 32.6% |
| | Abu Dhabi Government International Bond, 3.13%, due 09/30/49 144A | |
See accompanying Notes to the Financial Statements.
143
Mercer Opportunistic Fixed Income Fund
Schedule of Investments (Continued)
(showing percentage of net assets)
March 31, 2023
| | | |
| | Sovereign Debt Obligations — continued |
| | Angolan Government International Bond, 8.75%, due 04/14/32 144A | |
| | Angolan Government International Bond, (MTN), 8.00%, due 11/26/29(j) | |
| | Argentine Republic Government International Bond, 1.00%, due 07/09/29 | |
| | Argentine Republic Government International Bond, 1.50%, due 07/09/46(l) | |
| | Bahrain Government International Bond, (MTN), 5.63%, due 05/18/34(i)(j) | |
| | Bonos de la Tesoreria de la Republica en pesos, 2.30%, due 10/01/28(j) | |
| | Bonos de la Tesoreria de la Republica en pesos, 2.50%, due 03/01/25 | |
| | Bonos de la Tesoreria de la Republica en pesos, 4.50%, due 03/01/26 | |
| | Bonos de la Tesoreria de la Republica en pesos, 4.70%, due 09/01/30(j) | |
| | Bonos de la Tesoreria de la Republica en pesos, 5.00%, due 10/01/28(j) | |
| | Bonos de la Tesoreria de la Republica en pesos, 5.00%, due 03/01/35 | |
| | Bonos de la Tesoreria de la Republica en pesos, 6.00%, due 01/01/43 | |
| | Brazil Letras do Tesouro Nacional, 10.86%, due 01/01/24(h) | |
| | Brazil Letras do Tesouro Nacional, 11.36%, due 07/01/24(h) | |
| | Brazil Letras do Tesouro Nacional, 13.37%, due 07/01/25(h) | |
| | Brazil Letras do Tesouro Nacional, 13.64%, due 01/01/26(h) | |
| | Brazil Notas do Tesouro Nacional Series B Notes, 25.59%, due 05/15/35 | |
| | Brazil Notas do Tesouro Nacional Series B Notes, 25.59%, due 05/15/45 | |
| | Brazil Notas do Tesouro Nacional Series B Notes, 25.59%, due 08/15/50 | |
| | Brazil Notas do Tesouro Nacional Series F Notes, 10.00%, due 01/01/25 | |
| | Brazil Notas do Tesouro Nacional Series F Notes, 10.00%, due 01/01/27 | |
| | Brazil Notas do Tesouro Nacional Series F Notes, 10.00%, due 01/01/29 | |
| | Brazil Notas do Tesouro Nacional Series F Notes, 10.00%, due 01/01/31 | |
| | Brazil Notas do Tesouro Nacional Series F Notes, 10.00%, due 01/01/33 | |
| | Brazilian Government International Bond, 4.63%, due 01/13/28(i) | |
| | Brazilian Government International Bond, 4.75%, due 01/14/50 | |
| | Bundesrepublik Deutschland Bundesanleihe, 0.01%, due 08/15/26(j) | |
| | Chile Government International Bond, 2.55%, due 01/27/32(i) | |
| | Chile Government International Bond, 4.34%, due 03/07/42(i) | |
| | China Government Bond, 1.99%, due 04/09/25 | |
| | China Government Bond, 2.68%, due 05/21/30 | |
| | China Government Bond, 2.85%, due 06/04/27 | |
| | China Government Bond, 3.02%, due 10/22/25 | |
| | China Government Bond, 3.02%, due 05/27/31 | |
| | China Government Bond, 3.13%, due 11/21/29 | |
| | China Government Bond, 3.25%, due 11/22/28 | |
| | China Government Bond, 3.27%, due 11/19/30 | |
| | China Government Bond, 3.28%, due 12/03/27 | |
| | China Government Bond, 3.29%, due 05/23/29 | |
| | China Government Bond, 3.72%, due 04/12/51 | |
| | China Government Bond, 3.81%, due 09/14/50 | |
| | Ciudad Autonoma De Buenos Aires/Government Bonds, 7.50%, due 06/01/27(j) | |
| | Colombia Government International Bond, 3.13%, due 04/15/31 | |
| | Colombia Government International Bond, 4.13%, due 05/15/51 | |
| | Colombia Government International Bond, 4.50%, due 03/15/29 | |
| | Colombia Government International Bond, 7.50%, due 02/02/34 | |
| | Colombian TES, 5.75%, due 11/03/27 | |
| | Colombian TES, 6.00%, due 04/28/28 | |
| | Colombian TES, 6.25%, due 11/26/25 | |
144
See accompanying Notes to the Financial Statements.
Mercer Opportunistic Fixed Income Fund
Schedule of Investments (Continued)
(showing percentage of net assets)
March 31, 2023
| | | |
| | Sovereign Debt Obligations — continued |
| | Colombian TES, 6.25%, due 07/09/36 | |
| | Colombian TES, 7.00%, due 03/26/31 | |
| | Colombian TES, 7.00%, due 03/26/31 | |
| | Colombian TES, 7.00%, due 06/30/32 | |
| | Colombian TES, 7.25%, due 10/18/34 | |
| | Colombian TES, 7.25%, due 10/26/50 | |
| | Colombian TES, 7.50%, due 08/26/26 | |
| | Colombian TES, 7.75%, due 09/18/30 | |
| | Colombian TES, 9.25%, due 05/28/42 | |
| | Colombian TES, 10.00%, due 07/24/24 | |
| | Costa Rica Government International Bond, 7.00%, due 04/04/44(j) | |
| | Czech Republic Government Bond, 0.25%, due 02/10/27 | |
| | Czech Republic Government Bond, 0.95%, due 05/15/30(j) | |
| | Czech Republic Government Bond, 1.00%, due 06/26/26(j) | |
| | Czech Republic Government Bond, 1.20%, due 03/13/31 | |
| | Czech Republic Government Bond, 1.25%, due 02/14/25 | |
| | Czech Republic Government Bond, 1.75%, due 06/23/32 | |
| | Czech Republic Government Bond, 2.00%, due 10/13/33 | |
| | Czech Republic Government Bond, 2.40%, due 09/17/25(j) | |
| | Czech Republic Government Bond, 2.50%, due 08/25/28(j) | |
| | Czech Republic Government Bond, 2.75%, due 07/23/29 | |
| | Czech Republic Government Bond, 4.20%, due 12/04/36(j) | |
| | Czech Republic Government Bond, 6.00%, due 02/26/26 | |
| | Czech Republic Government Bond, 6.08%, due 12/12/24(h) | |
| | Dominican Republic International Bond, 4.88%, due 09/23/32(j) | |
| | Dominican Republic International Bond, 5.50%, due 02/22/29 144A | |
| | Dominican Republic International Bond, 5.50%, due 02/22/29(j) | |
| | Dominican Republic International Bond, 6.00%, due 07/19/28 144A | |
| | Dominican Republic International Bond, 6.00%, due 02/22/33 144A | |
| | Dominican Republic International Bond, 7.05%, due 02/03/31(i) 144A | |
| | Egypt Government Bond, 14.66%, due 10/06/30 | |
| | Egypt Government Bond, 14.82%, due 07/06/31 | |
| | Egypt Government International Bond, 8.88%, due 05/29/50(j) | |
| | Egyptian Financial Co. for Sovereign Taskeek (The), 10.88%, due 02/28/26 144A | |
| | European Investment Bank, (MTN), 8.50%, due 09/17/24(j) | |
| | Export-Import Bank of India, 5.50%, due 01/18/33 144A | |
| | Export-Import Bank of Korea, 5.00%, due 01/11/28 | |
| | Gabon Government International Bond, 7.00%, due 11/24/31 144A | |
| | Guatemala Government Bond, 4.88%, due 02/13/28(j) | |
| | Hungary Government Bond, 1.50%, due 04/22/26 | |
| | Hungary Government Bond, 2.75%, due 12/22/26 | |
| | Hungary Government Bond, 3.00%, due 10/27/27 | |
| | Hungary Government Bond, 3.00%, due 08/21/30 | |
| | Hungary Government Bond, 3.00%, due 10/27/38 | |
| | Hungary Government Bond, 4.00%, due 04/28/51 | |
| | Hungary Government Bond, 4.50%, due 03/23/28 | |
| | Hungary Government Bond, 4.50%, due 05/27/32 | |
| | Hungary Government Bond, 4.75%, due 11/24/32 | |
| | Hungary Government Bond, 5.50%, due 06/24/25 | |
See accompanying Notes to the Financial Statements.
145
Mercer Opportunistic Fixed Income Fund
Schedule of Investments (Continued)
(showing percentage of net assets)
March 31, 2023
| | | |
| | Sovereign Debt Obligations — continued |
| | Hungary Government Bond, 6.75%, due 10/22/28 | |
| | Hungary Government International Bond, 6.13%, due 05/22/28 144A | |
| | Hungary Government International Bond, 6.25%, due 09/22/32 144A | |
| | Indonesia Government International Bond, 3.50%, due 01/11/28 | |
| | Indonesia Government International Bond, 3.55%, due 03/31/32 | |
| | Indonesia Government International Bond, 4.55%, due 01/11/28 | |
| | Indonesia Treasury Bond, 5.50%, due 04/15/26 | |
| | Indonesia Treasury Bond, 6.13%, due 05/15/28 | |
| | Indonesia Treasury Bond, 6.25%, due 06/15/36 | |
| | Indonesia Treasury Bond, 6.38%, due 08/15/28 | |
| | Indonesia Treasury Bond, 6.38%, due 04/15/32 | |
| | Indonesia Treasury Bond, 6.50%, due 06/15/25 | |
| | Indonesia Treasury Bond, 6.50%, due 02/15/31 | |
| | Indonesia Treasury Bond, 6.63%, due 05/15/33 | |
| | Indonesia Treasury Bond, 7.00%, due 05/15/27 | |
| | Indonesia Treasury Bond, 7.00%, due 09/15/30 | |
| | Indonesia Treasury Bond, 7.00%, due 02/15/33 | |
| | Indonesia Treasury Bond, 7.38%, due 05/15/48 | |
| | Indonesia Treasury Bond, 7.50%, due 08/15/32 | |
| | Indonesia Treasury Bond, 7.50%, due 05/15/38 | |
| | Indonesia Treasury Bond, 7.50%, due 04/15/40 | |
| | Indonesia Treasury Bond, 8.25%, due 05/15/29 | |
| | Indonesia Treasury Bond, 8.25%, due 06/15/32 | |
| | Indonesia Treasury Bond, 8.25%, due 05/15/36 | |
| | Indonesia Treasury Bond, 8.38%, due 03/15/24 | |
| | Indonesia Treasury Bond, 8.38%, due 09/15/26 | |
| | Indonesia Treasury Bond, 8.38%, due 03/15/34 | |
| | Indonesia Treasury Bond, 8.38%, due 04/15/39 | |
| | Indonesia Treasury Bond, 8.75%, due 05/15/31 | |
| | Indonesia Treasury Bond, 9.00%, due 03/15/29 | |
| | Indonesia Treasury Bond, 9.50%, due 07/15/31 | |
| | Indonesia Treasury Bond, 10.50%, due 08/15/30 | |
| | Indonesia Treasury Bond, 11.00%, due 09/15/25 | |
| | Ivory Coast Government International Bond, 4.88%, due 01/30/32 144A | |
| | Ivory Coast Government International Bond, 5.75%, due 12/31/32(j)(l) | |
| | Ivory Coast Government International Bond, 6.13%, due 06/15/33(j) | |
| | Ivory Coast Government International Bond, 6.38%, due 03/03/28(j) | |
| | Jordan Government International Bond, 7.75%, due 01/15/28 144A | |
| | Kazakhstan Government International Bond, (MTN), 5.13%, due 07/21/25(j) | |
| | Malaysia Government Bond, 2.63%, due 04/15/31 | |
| | Malaysia Government Bond, 3.50%, due 05/31/27 | |
| | Malaysia Government Bond, 3.58%, due 07/15/32 | |
| | Malaysia Government Bond, 3.73%, due 06/15/28 | |
| | Malaysia Government Bond, 3.76%, due 05/22/40 | |
| | Malaysia Government Bond, 3.83%, due 07/05/34 | |
| | Malaysia Government Bond, 3.84%, due 04/15/33 | |
| | Malaysia Government Bond, 3.88%, due 03/14/25 | |
| | Malaysia Government Bond, 3.89%, due 03/15/27 | |
| | Malaysia Government Bond, 3.89%, due 08/15/29 | |
146
See accompanying Notes to the Financial Statements.
Mercer Opportunistic Fixed Income Fund
Schedule of Investments (Continued)
(showing percentage of net assets)
March 31, 2023
| | | |
| | Sovereign Debt Obligations — continued |
| | Malaysia Government Bond, 3.90%, due 11/30/26 | |
| | Malaysia Government Bond, 3.90%, due 11/16/27 | |
| | Malaysia Government Bond, 3.96%, due 09/15/25 | |
| | Malaysia Government Bond, 4.06%, due 09/30/24 | |
| | Malaysia Government Bond, 4.07%, due 06/15/50 | |
| | Malaysia Government Bond, 4.13%, due 04/15/32 | |
| | Malaysia Government Bond, 4.18%, due 07/15/24 | |
| | Malaysia Government Bond, 4.23%, due 06/30/31 | |
| | Malaysia Government Bond, 4.39%, due 04/15/26 | |
| | Malaysia Government Bond, 4.50%, due 04/30/29 | |
| | Malaysia Government Bond, 4.50%, due 04/15/30 | |
| | Malaysia Government Bond, 4.70%, due 10/15/42 | |
| | Malaysia Government Bond, 4.74%, due 03/15/46 | |
| | Malaysia Government Bond, 4.76%, due 04/07/37 | |
| | Malaysia Government Bond, 4.89%, due 06/08/38 | |
| | Mexican Bonos, 5.00%, due 03/06/25 | |
| | Mexican Bonos, 5.50%, due 03/04/27 | |
| | Mexican Bonos, 5.75%, due 03/05/26 | |
| | Mexican Bonos, 7.50%, due 06/03/27 | |
| | Mexican Bonos, 7.50%, due 05/26/33 | |
| | Mexican Bonos, 7.75%, due 05/29/31 | |
| | Mexican Bonos, 7.75%, due 11/23/34 | |
| | Mexican Bonos, 7.75%, due 11/13/42 | |
| | Mexican Bonos, 8.00%, due 12/07/23 | |
| | Mexican Bonos, 8.00%, due 09/05/24 | |
| | Mexican Bonos, 8.00%, due 11/07/47 | |
| | Mexican Bonos, 8.00%, due 07/31/53 | |
| | Mexican Bonos, 8.00%, due 07/31/53 | |
| | Mexican Bonos, 8.50%, due 05/31/29 | |
| | Mexican Bonos, 8.50%, due 05/31/29 | |
| | Mexican Bonos, 8.50%, due 11/18/38 | |
| | Mexican Bonos, 8.50%, due 11/18/38 | |
| | Mexican Bonos, 10.00%, due 12/05/24 | |
| | Mexican Bonos, 10.00%, due 12/05/24 | |
| | Mexican Bonos, 10.00%, due 11/20/36 | |
| | Mexican Bonos, 10.00%, due 11/20/36 | |
| | Mexican Udibonos, 4.50%, due 11/22/35 | |
| | Mexico Government International Bond, 2.66%, due 05/24/31(i) | |
| | Mexico Government International Bond, 4.88%, due 05/19/33 | |
| | Mongolia Government International Bond, 8.65%, due 01/19/28 144A | |
| | Nigeria Government International Bond, (MTN), 8.38%, due 03/24/29(j) | |
| | Oman Government International Bond, 5.63%, due 01/17/28 144A | |
| | Panama Government International Bond, 4.50%, due 04/01/56 | |
| | Panama Government International Bond, 6.40%, due 02/14/35 | |
| | Paraguay Government International Bond, 5.40%, due 03/30/50(j) | |
| | Peru Government Bond, 5.35%, due 08/12/40 | |
| | Peru Government Bond, 5.40%, due 08/12/34 | |
| | Peru Government Bond, 5.94%, due 02/12/29 | |
| | Peru Government Bond, 6.15%, due 08/12/32 | |
See accompanying Notes to the Financial Statements.
147
Mercer Opportunistic Fixed Income Fund
Schedule of Investments (Continued)
(showing percentage of net assets)
March 31, 2023
| | | |
| | Sovereign Debt Obligations — continued |
| | Peru Government Bond, 6.35%, due 08/12/28 | |
| | Peru Government Bond, 6.90%, due 08/12/37 | |
| | Peru Government Bond, 6.95%, due 08/12/31 | |
| | Peruvian Government International Bond, 2.78%, due 01/23/31 | |
| | Peruvian Government International Bond (GDN), 6.35%, due 08/12/28(j) | |
| | Peruvian Government International Bond (GDN), 6.95%, due 08/12/31(j) | |
| | Peruvian Government International Bond (GDN), 8.20%, due 08/12/26(j) | |
| | Provincia de Buenos Aires/Government Bonds, 5.25%, due 09/01/37(l) 144A | |
| | Provincia de Cordoba, 6.88%, due 12/10/25(l) 144A | |
| | Qatar Government International Bond, 4.82%, due 03/14/49 144A | |
| | Qatar Government International Bond, 5.10%, due 04/23/48 144A | |
| | Republic of Kenya Government International Bond, 8.00%, due 05/22/32(j) | |
| | Republic of Poland Government Bond, 0.25%, due 10/25/26 | |
| | Republic of Poland Government Bond, 1.25%, due 10/25/30 | |
| | Republic of Poland Government Bond, 1.75%, due 04/25/32 | |
| | Republic of Poland Government Bond, 2.50%, due 07/25/26 | |
| | Republic of Poland Government Bond, 2.50%, due 07/25/27 | |
| | Republic of Poland Government Bond, 2.75%, due 04/25/28 | |
| | Republic of Poland Government Bond, 2.75%, due 10/25/29 | |
| | Republic of Poland Government Bond, 3.25%, due 07/25/25 | |
| | Republic of Poland Government Bond, 3.75%, due 05/25/27 | |
| | Republic of South Africa Government Bond, 6.25%, due 03/31/36 | |
| | Republic of South Africa Government Bond, 6.50%, due 02/28/41 | |
| | Republic of South Africa Government Bond, 7.00%, due 02/28/31 | |
| | Republic of South Africa Government Bond, 8.00%, due 01/31/30 | |
| | Republic of South Africa Government Bond, 8.25%, due 03/31/32 | |
| | Republic of South Africa Government Bond, 8.50%, due 01/31/37 | |
| | Republic of South Africa Government Bond, 8.75%, due 01/31/44 | |
| | Republic of South Africa Government Bond, 8.75%, due 02/28/48 | |
| | Republic of South Africa Government Bond, 8.75%, due 02/28/48(i) | |
| | Republic of South Africa Government Bond, 8.88%, due 02/28/35 | |
| | Republic of South Africa Government Bond, 9.00%, due 01/31/40 | |
| | Republic of South Africa Government Bond, 10.50%, due 12/21/26 | |
| | Republic of South Africa Government International Bond, 4.85%, due 09/30/29 | |
| | Republic of South Africa Government International Bond, 5.88%, due 04/20/32 | |
| | Romania Government Bond, 3.25%, due 06/24/26 | |
| | Romania Government Bond, 3.65%, due 09/24/31 | |
| | Romania Government Bond, 4.15%, due 10/24/30 | |
| | Romania Government Bond, 4.25%, due 04/28/36 | |
| | Romania Government Bond, 4.75%, due 10/11/34 | |
| | Romania Government Bond, 4.85%, due 07/25/29 | |
| | Romania Government Bond, 5.00%, due 02/12/29 | |
| | Romania Government Bond, 5.80%, due 07/26/27 | |
| | Romania Government Bond, 6.70%, due 02/25/32 | |
| | Romania Government Bond, 8.25%, due 09/29/32 | |
| | Romanian Government International Bond, 2.75%, due 02/26/26 144A | |
| | Romanian Government International Bond, 3.62%, due 05/26/30 144A | |
| | Romanian Government International Bond, 6.63%, due 09/27/29 144A | |
| | Romanian Government International Bond, 7.13%, due 01/17/33(i) 144A | |
148
See accompanying Notes to the Financial Statements.
Mercer Opportunistic Fixed Income Fund
Schedule of Investments (Continued)
(showing percentage of net assets)
March 31, 2023
| | | |
| | Sovereign Debt Obligations — continued |
| | Russian Federal Bond - OFZ, 5.70%, due 05/17/28(o) | |
| | Russian Federal Bond - OFZ, 6.10%, due 07/18/35(o) | |
| | Russian Federal Bond - OFZ, 6.90%, due 05/23/29(o) | |
| | Russian Federal Bond - OFZ, 7.05%, due 01/19/28(o) | |
| | Russian Federal Bond - OFZ, 7.10%, due 10/16/24(o) | |
| | Russian Federal Bond - OFZ, 7.25%, due 05/10/34(o) | |
| | Russian Federal Bond - OFZ, 7.65%, due 04/10/30(o) | |
| | Russian Federal Bond - OFZ, 7.70%, due 03/23/33(o) | |
| | Russian Federal Bond - OFZ, 7.70%, due 03/16/39(o) | |
| | Russian Federal Bond - OFZ, 7.75%, due 09/16/26(o) | |
| | Russian Federal Bond - OFZ, 8.15%, due 02/03/27(o) | |
| | Russian Federal Bond - OFZ, 8.50%, due 09/17/31(o) | |
| | Serbia International Bond, 1.00%, due 09/23/28 144A | |
| | Serbia International Bond, 6.25%, due 05/26/28(i) 144A | |
| | Thailand Government Bond, 2.13%, due 12/17/26 | |
| | Turkey Government International Bond, 9.38%, due 01/19/33 | |
| | Turkiye Ihracat Kredi Bankasi AS, 9.38%, due 01/31/26 144A | |
| | Uruguay Government International Bond, 8.50%, due 03/15/28(j) | |
| | | |
| | U.S. Government and Agency Obligations — 0.4% |
| | U.S. Treasury Note, 0.13%, due 07/15/23(i) | |
| | U.S. Treasury Note, 1.75%, due 05/15/23(p) | |
| | | |
| | TOTAL DEBT OBLIGATIONS (COST $1,248,698,339) | |
| | | |
| | |
| | |
| | | |
| | |
| | Arctic Canadian Diamond Co., Ltd.*(e)(f) | |
| | TOTAL COMMON STOCKS (COST $0) | |
| | CONVERTIBLE PREFERRED STOCKS — 0.3% |
| | |
| | | |
| | |
| | NextEra Energy, Inc., 6.22% | |
| | TOTAL CONVERTIBLE PREFERRED STOCKS (COST $3,592,976) | |
See accompanying Notes to the Financial Statements.
149
Mercer Opportunistic Fixed Income Fund
Schedule of Investments (Continued)
(showing percentage of net assets)
March 31, 2023
| | | |
| | |
| | PURCHASED CURRENCY OPTIONS — 0.0% |
| | |
| | USD/EUR Option with BNP Paribas S.A., Strike Price EUR 1.09, Expires 05/31/23 | |
| | USD/EUR Option with BNP Paribas S.A., Strike Price EUR 1.09, Expires 05/31/23 | |
| | TOTAL PURCHASED CURRENCY OPTIONS
(PREMIUMS PAID $111,960) | |
| | | |
| | PURCHASED FUTURES OPTIONS — 0.0% |
| | |
| | Euro 90-Day Futures with Citigroup Global Markets, Inc., Strike Price $99.00, Expires 12/18/23 | |
| | |
| | S&P 500 E-mini Futures with JPMorgan Chase Bank LLC, Strike Price $3,600.00, Expires 05/19/23 | |
| | S&P 500 E-mini Futures with JPMorgan Chase Bank LLC, Strike Price $3,800.00, Expires 05/19/23 | |
| | S&P 500 E-mini Futures with JPMorgan Chase Bank LLC, Strike Price $3,700.00, Expires 05/19/23 | |
| | S&P 500 E-mini Futures with JPMorgan Chase Bank LLC, Strike Price $3,600.00, Expires 06/16/23 | |
| | S&P 500 E-mini Futures with JPMorgan Chase Bank LLC, Strike Price $3,700.00, Expires 06/16/23 | |
| | S&P 500 E-mini Futures with JPMorgan Chase Bank LLC, Strike Price $3,800.00, Expires 06/16/23 | |
| | TOTAL PURCHASED FUTURES OPTIONS
(PREMIUMS PAID $600,870) | |
| | TOTAL PURCHASED OPTIONS
(PREMIUMS PAID $712,830) | |
| | | |
| | SHORT-TERM INVESTMENT — 3.2% |
| | Mutual Fund - Securities Lending Collateral — 3.2% |
| | State Street Institutional U.S. Government Money Market Fund, Premier Class, | |
| | TOTAL SHORT-TERM INVESTMENT (COST $43,309,368) | |
| | TOTAL INVESTMENTS — 92.2%
(Cost $1,296,313,513) | |
| | Other Assets and Liabilities (net)(s) — 7.8% | |
| | | |
150
See accompanying Notes to the Financial Statements.
Mercer Opportunistic Fixed Income Fund
Schedule of Investments (Continued)
March 31, 2023
| Notes to Schedule of Investments: |
| Non-income producing security. |
| Unless otherwise indicated, all par values are denominated in United States dollars ($). |
| |
| Variable or floating rate note. Rate shown is as of March 31, 2023. |
| Variable or floating rate security, which interest rate adjusts periodically based on changes in current interest rates and prepayments on the underlying pool of assets. Rate shown is the rate in effect as of period end. |
| Level 3 - significant unobservable inputs were used in determining the value of this security in the Fund. |
| Securities are fair valued by the Valuation Committee as approved by the Board of Trustees. The total market value of the securities at year end is $1,521,917 which represents 0.1% of net assets. The aggregate tax cost of these securities held at March 31, 2023 was $2,785,445. |
| This position represents an unsettled loan commitment at period end. Certain details associated with this purchase are not known prior to the settlement date, including coupon rate, which will be adjusted on settlement date. |
| Interest rate presented is yield to maturity. |
| All or a portion of this security is out on loan. |
| Security exempt from registration under Regulation S of the Securities Act of 1933, which exempts from registration securities offered and sold outside the United States. Security may not be offered or sold in the United States except pursuant to an exemption from, or in a transaction not subject to, the registration requirements of the Securities Act of 1933. |
| Security is perpetual and has no stated maturity date. |
| Step coupon security that pays an initial coupon rate for the first period and then a lower/higher coupon rate for the following periods. Rate shown is current coupon rate. |
| Security is currently in default. |
| Year of maturity is greater than 2100. |
| Illiquid securities represent Russian securities impacted by the Russian/Ukraine crisis. The total market value of the securities at year end is $2,342,914 which represents 0.2% of net assets. The aggregate cost of these securities held at March 31, 2023 was $8,413,179. |
| All or a portion of this security is pledged for forward foreign currency contracts, OTC swaps, and/or OTC options collateral. |
| The rate disclosed is the 7-day net yield as of March 31, 2023. |
| Represents an investment of securities lending cash collateral. |
| As of March 31, 2023, the value of unfunded loan commitments was $59,771 for the Fund. See Notes to the Financial Statements. |
| Securities exempt from registration under Rule 144A of the Securities Act of 1933. These securities may be resold in transactions exempt from registration, normally to qualified institutional buyers. The total market value of the securities at year end is $407,860,381 which represents 30.6% of net assets. |
Forward Foreign Currency Contracts
| | | | Unrealized
Appreciation
(Depreciation) |
| | | | | | |
| | | | | | |
| | | | | | |
See accompanying Notes to the Financial Statements.
151
Mercer Opportunistic Fixed Income Fund
Schedule of Investments (Continued)
March 31, 2023
Forward Foreign Currency Contracts—continued
| | | | Unrealized Appreciation (Depreciation) |
| | | | | Morgan Stanley Capital Services, Inc. | |
| | | | | | |
| | | | | | |
| | | | | Goldman Sachs International | |
| | | | | | |
| | | | | | |
| | | | | | |
| | | | | | |
| | | | | | |
| | | | | Morgan Stanley Capital Services, Inc. | |
| | | | | | |
| | | | | | |
| | | | | | |
| | | | | Morgan Stanley and Co. International Plc | |
| | | | | | |
| | | | | Morgan Stanley and Co. International Plc | |
| | | | | | |
| | | | | Goldman Sachs International | |
| | | | | | |
| | | | | | |
| | | | | Morgan Stanley and Co. International Plc | |
| | | | | Morgan Stanley Capital Services, Inc. | |
| | | | | | |
| | | | | | |
| | | | | | |
| | | | | | |
| | | | | | |
| | | | | | |
| | | | | | |
| | | | | | |
| | | | | | |
| | | | | | |
| | | | | Goldman Sachs International | |
| | | | | | |
| | | | | Morgan Stanley Capital Services, Inc. | |
| | | | | | |
| | | | | | |
| | | | | Morgan Stanley and Co. International Plc | |
| | | | | | |
| | | | | | |
| | | | | | |
| | | | | | |
| | | | | | |
152
See accompanying Notes to the Financial Statements.
Mercer Opportunistic Fixed Income Fund
Schedule of Investments (Continued)
March 31, 2023
Forward Foreign Currency Contracts—continued
| | | | Unrealized Appreciation (Depreciation) |
| | | | | | |
| | | | | | |
| | | | | | |
| | | | | | |
| | | | | | |
| | | | | | |
| | | | | | |
| | | | | | |
| | | | | | |
| | | | | | |
| | | | | Morgan Stanley Capital Services, Inc. | |
| | | | | | |
| | | | | | |
| | | | | | |
| | | | | | |
| | | | | | |
| | | | | | |
| | | | | | |
| | | | | | |
| | | | | | |
| | | | | | |
| | | | | | |
| | | | | | |
| | | | | | |
| | | | | | |
| | | | | Morgan Stanley and Co. International Plc | |
| | | | | Morgan Stanley Capital Services, Inc. | |
| | | | | | |
| | | | | | |
| | | | | | |
| | | | | | |
| | | | | | |
| | | | | | |
| | | | | | |
| | | | | | |
| | | | | | |
| | | | | | |
| | | | | | |
| | | | | Morgan Stanley and Co. International Plc | |
| | | | | Morgan Stanley and Co. International Plc | |
| | | | | | |
| | | | | | |
| | | | | | |
See accompanying Notes to the Financial Statements.
153
Mercer Opportunistic Fixed Income Fund
Schedule of Investments (Continued)
March 31, 2023
Forward Foreign Currency Contracts—continued
| | | | Unrealized Appreciation (Depreciation) |
| | | | | | |
| | | | | | |
| | | | | | |
| | | | | | |
| | | | | | |
| | | | | | |
| | | | | | |
| | | | | | |
| | | | | | |
| | | | | Morgan Stanley and Co. International Plc | |
| | | | | Morgan Stanley Capital Services, Inc. | |
| | | | | | |
| | | | | | |
| | | | | | |
| | | | | Morgan Stanley and Co. International Plc | |
| | | | | | |
| | | | | | |
| | | | | | |
| | | | | | |
| | | | | | |
| | | | | | |
| | | | | | |
| | | | | | |
| | | | | | |
| | | | | | |
| | | | | | |
| | | | | | |
| | | | | | |
| | | | | | |
| | | | | | |
| | | | | | |
| | | | | | |
| | | | | | |
| | | | | | |
| | | | | | |
| | | | | Morgan Stanley and Co. International Plc | |
| | | | | Morgan Stanley and Co. International Plc | |
| | | | | | |
| | | | | | |
| | | | | | |
| | | | | | |
| | | | | Morgan Stanley Capital Services, Inc. | |
| | | | | | |
154
See accompanying Notes to the Financial Statements.
Mercer Opportunistic Fixed Income Fund
Schedule of Investments (Continued)
March 31, 2023
Forward Foreign Currency Contracts—continued
| | | | Unrealized Appreciation (Depreciation) |
| | | | | | |
| | | | | Goldman Sachs International | |
| | | | | | |
| | | | | | |
| | | | | | |
| | | | | | |
| | | | | | |
| | | | | | |
| | | | | Morgan Stanley Capital Services, Inc. | |
| | | | | | |
| | | | | | |
| | | | | | |
| | | | | | |
| | | | | | |
| | | | | | |
| | | | | Morgan Stanley and Co. International Plc | |
| | | | | | |
| | | | | | |
| | | | | | |
| | | | | Morgan Stanley and Co. International Plc | |
| | | | | Morgan Stanley and Co. International Plc | |
| | | | | Morgan Stanley Capital Services, Inc. | |
| | | | | | |
| | | | | | |
| | | | | | |
| | | | | | |
| | | | | | |
| | | | | | |
| | | | | | |
| | | | | | |
| | | | | | |
| | | | | | |
| | | | | | |
| | | | | Morgan Stanley and Co. International Plc | |
| | | | | Morgan Stanley and Co. International Plc | |
| | | | | Morgan Stanley Capital Services, Inc. | |
| | | | | | |
| | | | | | |
| | | | | Morgan Stanley and Co. International Plc | |
| | | | | Morgan Stanley and Co. International Plc | |
| | | | | | |
| | | | | | |
| | | | | | |
See accompanying Notes to the Financial Statements.
155
Mercer Opportunistic Fixed Income Fund
Schedule of Investments (Continued)
March 31, 2023
Forward Foreign Currency Contracts—continued
| | | | Unrealized Appreciation (Depreciation) |
| | | | | | |
| | | | | | |
| | | | | | |
| | | | | | |
| | | | | | |
| | | | | | |
| | | | | | |
| | | | | | |
| | | | | | |
| | | | | | |
| | | | | | |
| | | | | | |
| | | | | | |
| | | | | | |
| | | | | | |
| | | | | Commonwealth Bank of Australia | |
| | | | | | |
| | | | | | |
| | | | | | |
| | | | | | |
| | | | | | |
| | | | | | |
| | | | | | |
| | | | | Morgan Stanley Capital Services, Inc. | |
| | | | | Morgan Stanley Capital Services, Inc. | |
| | | | | Morgan Stanley Capital Services, Inc. | |
| | | | | | |
| | | | | | |
| | | | | State Street Bank and Trust | |
| | | | | | |
| | | | | | |
| | | | | | |
| | | | | | |
| | | | | | |
| | | | | Morgan Stanley and Co. International Plc | |
| | | | | Morgan Stanley Capital Services, Inc. | |
| | | | | | |
| | | | | | |
| | | | | | |
| | | | | | |
| | | | | Goldman Sachs International | |
| | | | | | |
| | | | | | |
156
See accompanying Notes to the Financial Statements.
Mercer Opportunistic Fixed Income Fund
Schedule of Investments (Continued)
March 31, 2023
Forward Foreign Currency Contracts—continued
| | | | Unrealized Appreciation (Depreciation) |
| | | | | | |
| | | | | | |
| | | | | Morgan Stanley and Co. International Plc | |
| | | | | | |
| | | | | | |
| | | | | | |
| | | | | | |
| | | | | | |
| | | | | | |
| | | | | | |
| | | | | | |
| | | | | Morgan Stanley and Co. International Plc | |
| | | | | Morgan Stanley Capital Services, Inc. | |
| | | | | | |
| | | | | | |
| | | | | | |
| | | | | | |
| | | | | | |
| | | | | | |
| | | | | | |
| | | | | | |
| | | | | | |
| | | | | | |
| | | | | | |
| | | | | Morgan Stanley and Co. International Plc | |
| | | | | | |
| | | | | | |
| | | | | | |
| | | | | | |
| | | | | | |
| | | | | | |
| | | | | | |
| | | | | Morgan Stanley and Co. International Plc | |
| | | | | | |
| | | | | | |
| | | | | Morgan Stanley and Co. International Plc | |
| | | | | | |
| | | | | Morgan Stanley and Co. International Plc | |
| | | | | | |
| | | | | | |
| | | | | Goldman Sachs International | |
| | | | | | |
| | | | | | |
See accompanying Notes to the Financial Statements.
157
Mercer Opportunistic Fixed Income Fund
Schedule of Investments (Continued)
March 31, 2023
Forward Foreign Currency Contracts—continued
| | | | Unrealized Appreciation (Depreciation) |
| | | | | | |
| | | | | | |
| | | | | | |
| | | | | | |
| | | | | | |
| | | | | Morgan Stanley and Co. International Plc | |
| | | | | | |
| | | | | | |
| | | | | | |
| | | | | Goldman Sachs International | |
| | | | | | |
| | | | | | |
| | | | | Morgan Stanley and Co. International Plc | |
| | | | | | |
| | | | | | |
| | | | | Goldman Sachs International | |
| | | | | | |
| | | | | | |
| | | | | | |
| | | | | | |
| | | | | | |
| | | | | Morgan Stanley and Co. International Plc | |
| | | | | | |
| | | | | | |
| | | | | | |
| | | | | | |
| | | | | | |
| | | | | | |
| | | | | Morgan Stanley and Co. International Plc | |
| | | | | | |
| | | | | | |
| | | | | | |
| | | | | | |
| | | | | | |
| | | | | | |
| | | | | | |
| | | | | | |
| | | | | | |
| | | | | | |
| | | | | | |
| | | | | | |
158
See accompanying Notes to the Financial Statements.
Mercer Opportunistic Fixed Income Fund
Schedule of Investments (Continued)
March 31, 2023
Futures Contracts
| | | | Market Value/
Unrealized
Appreciation
(Depreciation) |
| | | | |
| 10-Year Australian Bond Futures | | | |
| | | | |
| | | | |
| | | | |
| | | | |
| | | | |
| | | | |
| U.S. Treasury Note 10-Year | | | |
| U.S. Treasury Note 2-Year | | | |
| | | | |
| | | | |
| | | | |
| | | | |
| | | | |
| | | | |
| U.S. Treasury Note 10-Year | | | |
| U.S. Treasury Note 5-Year | | | |
| | | | |
| | | | |
Written Options
Written Currency Options
| | | | |
PUT— USD/EUR Option
Strike @ EUR 1.12
Expires 05/31/2023 | | | | | |
Written Futures Options
| | | | | |
CALL — U.S. Treasury Note 5-Year
Strike @ $112.00
Expires 05/26/2023 | | | | | |
PUT— S&P 500 E-mini Futures Option
Strike @ $3,300.00
Expires 05/19/2023 | | | | | |
See accompanying Notes to the Financial Statements.
159
Mercer Opportunistic Fixed Income Fund
Schedule of Investments (Continued)
March 31, 2023
Written Options—continued
| | | | | |
PUT— S&P 500 E-mini Futures Option
Strike @ $3,500.00
Expires 05/19/2023 | | | | | |
PUT— S&P 500 E-mini Futures Option
Strike @ $3,200.00
Expires 06/16/2023 | | | | | |
PUT— S&P 500 E-mini Futures Option
Strike @ $3,500.00
Expires 06/16/2023 | | | | | |
Total Written Futures Options | | | | | |
| | | | | |
OTC — Interest Rate Swaps
| | | | | | Upfront
Premiums
Paid
(Received) | | | Unrealized
Appreciation
(Depreciation) |
| | | | | | | | | | |
| | | | | | | | | | |
| | | | | | | | | | |
| | | | | | | | | | |
| | | | | | | | | | |
| | | | | | | | | | |
| | | | | | | | | | |
| | | | | | | | | | |
| | | | | | | | | | |
| | | | | | | | | | |
Centrally Cleared Interest Rate Swaps
| | | | | Upfront
Premiums
Paid
(Received) | | | Unrealized
Appreciation
(Depreciation) |
| | | | | | | | | |
| | | | | | | | | |
| | | | | | | | | |
| | | | | | | | | |
| | | | | | | | | |
| | | | | | | | | |
| | | | | | | | | |
| | | | | | | | | |
| | | | | | | | | |
| | | | | | | | | |
| | | | | | | | | |
160
See accompanying Notes to the Financial Statements.
Mercer Opportunistic Fixed Income Fund
Schedule of Investments (Continued)
March 31, 2023
Centrally Cleared Interest Rate Swaps—continued
| | | | | Upfront Premiums Paid (Received) | | | Unrealized Appreciation (Depreciation) |
| | | | | | | | | |
| | | | | | | | | |
| | | | | | | | | |
| | | | | | | | | |
| | | | | | | | | |
| | | | | | | | | |
| | | | | | | | | |
| | | | | | | | | |
| | | | | | | | | |
| | | | | | | | | |
| | | | | | | | | |
| | | | | | | | | |
| | | | | | | | | |
| | | | | | | | | |
| | | | | | | | | |
| | Thai Baht Interest Rate Fixing | | | | | | | |
| | Thai Baht Interest Rate Fixing | | | | | | | |
| | Thai Baht Interest Rate Fixing | | | | | | | |
| | Thai Baht Interest Rate Fixing | | | | | | | |
| | Thai Baht Interest Rate Fixing | | | | | | | |
| | | | | | | | | |
OTC— Credit Default Swaps
Buy Protection
| | | | | | | Unrealized
Appreciation
(Depreciation) | Upfront
Premiums
Paid/
(Received) | |
| | | | | | Daimler AG, 1.40%, 01/12/24 | | | |
Sell Protection
| | | | | | | Unrealized
Appreciation
(Depreciation) | Upfront
Premiums
Paid/
(Received) | |
| | | | | | Volkswagen International Finance N.V., 0.50%, 03/30/21 (Moody’s rating: A3; S&P rating: BBB+) | | | |
Total OTC Credit Default Swaps | | | |
See accompanying Notes to the Financial Statements.
161
Mercer Opportunistic Fixed Income Fund
Schedule of Investments (Continued)
March 31, 2023
Centrally Cleared Credit Default Swaps
Buy Protection
| | | | | | Unrealized
Appreciation
(Depreciation) | Upfront
Premiums
Paid
(Received) | |
| | | | | | | | |
| | | | | | | | |
| | | |
Sell Protection
| | | | | | Unrealized
Appreciation
(Depreciation) | Upfront
Premiums
Paid
(Received) | |
| | | | | | | | |
Total Centrally Cleared Credit Default Swaps | | | |
| The maximum potential amount of future undiscounted payments that the Fund could be required to make under a credit default swap contract would be the notional amount of the contract. These potential amounts would be partially offset by any recovery values of the referenced debt obligation or net amounts received from the settlement of purchased protection credit default swap contracts entered into by the Fund for the same referenced debt obligation. |
| CDX.NA.HY — Markit North America High Yield CDS Index. Represents an index of single name credit default swaps (CDS). All of the companies underlying the single name CDS within the index are rated BB and B. |
U.S. Treasury securities in the amount of $208,175 received at the custodian bank as collateral for forward foreign currency contracts, OTC swaps and/or OTC options.
162
See accompanying Notes to the Financial Statements.
Mercer Opportunistic Fixed Income Fund
Schedule of Investments (Continued)
March 31, 2023
See accompanying Notes to the Financial Statements.
163
Mercer Opportunistic Fixed Income Fund
Schedule of Investments (Continued)
March 31, 2023
|
| | CREST Depository Interest |
| | Collateralized Loan Obligation |
| | Collateralized Mortgage Obligation |
| | Constant Maturity Treasury Index |
| | |
| | Federal Home Loan Mortgage Corporation |
| | Federal National Mortgage Association |
| | |
| | Intercontinental Exchange |
| | London Interbank Offered Rate |
| | |
| | |
| | Prague Interbank Offered Rate |
| | Real Estate Investment Trust |
| | Real Estate Mortgage Investment Conduit |
| | Secured Overnight Financing Rate |
| | Sterling Overnight Index Average |
| | |
| | Mexican Interbank Equilibrium Interest Rate |
| | Term Secured Overnight Financing Rate |
| | Uniform Mortgage-Backed Securities are single-class securities backed by fixed-rate mortgage loans purchased by either FHLMC or FNMA |
| | Warsaw Interbank Offer Rate |
164
See accompanying Notes to the Financial Statements.
Mercer Opportunistic Fixed Income Fund
Schedule of Investments (Continued)
March 31, 2023
Asset Class Summary (Unaudited) | |
Sovereign Debt Obligations | |
| |
| |
| |
Mortgage Backed Securities - Private Issuers | |
| |
| |
U.S. Government and Agency Obligations | |
Convertible Preferred Stocks | |
Mortgage Backed Securities - U.S. Government Agency Obligations | |
| |
Purchased Futures Options | |
Centrally Cleared Interest Rate Swaps | |
Purchased Currency Options | |
| |
| |
Centrally Cleared Credit Default Swaps | |
| |
| |
Forward Foreign Currency Contracts | |
| |
Other Assets and Liabilities (net) | |
| |
See accompanying Notes to the Financial Statements.
165
Mercer Emerging Markets Equity Fund
Schedule of Investments
(showing percentage of net assets)
March 31, 2023
| | | |
| | |
| | |
| | | |
| | B3 SA - Brasil Bolsa Balcao | |
| | | |
| | | |
| | | |
| | BB Seguridade Participacoes SA | |
| | | |
| | | |
| | Locaweb Servicos de Internet SA* | |
| | | |
| | | |
| | | |
| | | |
| | | |
| | | |
| | | |
| | | |
| | | |
| | | |
| | |
| | | |
| | |
| | | |
| | Cia Cervecerias Unidas SA, ADR(a) | |
| | | |
| | |
| | Agricultural Bank of China, Ltd. Class H | |
| | AIMA Technology Group Co., Ltd. Class A | |
| | Air China, Ltd. Class H *(a) | |
| | Airtac International Group | |
| | Alibaba Group Holding, Ltd.* | |
| | Alibaba Group Holding, Ltd., ADR* | |
| | Anhui Guangxin Agrochemical Co., Ltd. Class A | |
| | | |
| | | |
| | Bank of China, Ltd. Class H | |
| | Bank of Jiangsu Co., Ltd. Class A | |
| | Beijing United Information Technology Co., Ltd. Class A | |
| | Beijing Wantai Biological Pharmacy Enterprise Co., Ltd. Class A | |
| | | |
| | | |
| | BOC Hong Kong Holdings, Ltd. | |
| | China Construction Bank Corp. Class H | |
| | China International Capital Corp., Ltd. Class H (a) | |
| | China Literature, Ltd.*(a) | |
166
See accompanying Notes to the Financial Statements.
Mercer Emerging Markets Equity Fund
Schedule of Investments (Continued)
(showing percentage of net assets)
March 31, 2023
| | | |
| | |
| | China Meidong Auto Holdings, Ltd. | |
| | China Mengniu Dairy Co., Ltd.* | |
| | China Merchants Bank Co., Ltd. Class H | |
| | China Pacific Insurance Group Co., Ltd. Class H | |
| | China Petroleum & Chemical Corp. Class H | |
| | China Resources Beer Holdings Co., Ltd. | |
| | China Resources Land, Ltd. | |
| | China Resources Sanjiu Medical & Pharmaceutical Co., Ltd. Class A | |
| | China Shenhua Energy Co., Ltd. Class H | |
| | China Tourism Group Duty Free Corp., Ltd. Class A | |
| | China Yuhua Education Corp., Ltd.*(a) | |
| | Chongqing Brewery Co., Ltd. Class A | |
| | | |
| | Contemporary Amperex Technology Co., Ltd. Class A | |
| | CSPC Pharmaceutical Group, Ltd. | |
| | East Money Information Co., Ltd. Class A | |
| | ENN Energy Holdings, Ltd. | |
| | ENN Natural Gas Co., Ltd. Class A | |
| | Focus Media Information Technology Co., Ltd. Class A | |
| | Foshan Haitian Flavouring & Food Co., Ltd. Class A | |
| | Fuyao Glass Industry Group Co., Ltd. Class H | |
| | Gongniu Group Co., Ltd. Class A | |
| | GoodWe Technologies Co., Ltd. Class A | |
| | Haier Smart Home Co., Ltd. Class H | |
| | Hangzhou First Applied Material Co., Ltd. Class A | |
| | Hangzhou Tigermed Consulting Co., Ltd. Class H | |
| | Han's Laser Technology Industry Group Co., Ltd. Class A | |
| | Henan Shenhuo Coal & Power Co., Ltd. Class A | |
| | Hongfa Technology Co., Ltd. Class A | |
| | Hualan Biological Engineering, Inc. Class A | |
| | Hundsun Technologies, Inc. Class A | |
| | Hygeia Healthcare Holdings Co., Ltd.*(a) | |
| | Industrial & Commercial Bank of China, Ltd. Class H | |
| | | |
| | JinkoSolar Holding Co., Ltd., ADR*(a) | |
| | | |
| | Kingnet Network Co., Ltd. Class A * | |
| | | |
| | Kweichow Moutai Co., Ltd. Class A | |
| | Leader Harmonious Drive Systems Co., Ltd. Class A | |
| | Longfor Group Holdings, Ltd. | |
| | LONGi Green Energy Technology Co., Ltd. Class A | |
| | Luzhou Laojiao Co., Ltd. Class A | |
| | | |
| | Midea Group Co., Ltd. Class A | |
| | MINISO Group Holding, Ltd., ADR | |
| | NARI Technology Co., Ltd. Class A | |
| | | |
| | | |
See accompanying Notes to the Financial Statements.
167
Mercer Emerging Markets Equity Fund
Schedule of Investments (Continued)
(showing percentage of net assets)
March 31, 2023
| | | |
| | |
| | Nexteer Automotive Group, Ltd. | |
| | Ningbo Deye Technology Co., Ltd. Class A | |
| | | |
| | People's Insurance Co. Group of China, Ltd. (The) Class H | |
| | PetroChina Co., Ltd. Class H | |
| | PICC Property & Casualty Co., Ltd. Class H | |
| | Ping An Insurance Group Co. of China, Ltd. Class A | |
| | Ping An Insurance Group Co. of China, Ltd. Class H | |
| | Pylon Technologies Co., Ltd. Class A | |
| | Sany Heavy Industry Co., Ltd. Class A | |
| | Shandong Gold Mining Co., Ltd. Class H (a) | |
| | Shandong Hualu Hengsheng Chemical Co., Ltd. Class A | |
| | Shandong Sinocera Functional Material Co., Ltd. Class A | |
| | Shandong Weigao Group Medical Polymer Co., Ltd. Class H | |
| | Shanghai Friendess Electronic Technology Corp., Ltd. Class A | |
| | Shanghai Moons' Electric Co., Ltd. Class A | |
| | Shanxi Lu'an Environmental Energy Development Co., Ltd. Class A | |
| | Shenzhen Inovance Technology Co., Ltd. Class A | |
| | Shenzhen Mindray Bio-Medical Electronics Co., Ltd. Class A | |
| | Shenzhou International Group Holdings, Ltd. | |
| | Sichuan Road and Bridge Group Co., Ltd. Class A | |
| | | |
| | Sinoseal Holding Co., Ltd. Class A | |
| | Sunac China Holdings, Ltd.*(a) | |
| | Sunny Optical Technology Group Co., Ltd. | |
| | Suzhou Maxwell Technologies Co., Ltd. Class A | |
| | Suzhou Nanomicro Technology Co., Ltd. Class A | |
| | | |
| | Tencent Music Entertainment Group, ADR* | |
| | Thunder Software Technology Co., Ltd. Class A | |
| | Tianqi Lithium Corp. Class A * | |
| | Tingyi Cayman Islands Holding Corp. | |
| | Tofflon Science & Technology Group Co., Ltd. Class A | |
| | Tongcheng Travel Holdings, Ltd.* | |
| | Tongwei Co., Ltd. Class A | |
| | Vipshop Holdings, Ltd., ADR* | |
| | Weichai Power Co., Ltd. Class H | |
| | Wuliangye Yibin Co., Ltd. Class A | |
| | Wuxi Biologics Cayman, Inc.* | |
| | Wuxi Lead Intelligent Equipment Co., Ltd. Class A | |
| | Yadea Group Holdings, Ltd. | |
| | Yankershop Food Co., Ltd. Class A | |
| | YongXing Special Materials Technology Co., Ltd. Class A | |
| | Zhangzhou Pientzehuang Pharmaceutical Co., Ltd. Class A | |
| | Zhejiang Dingli Machinery Co., Ltd. Class A | |
| | Zhejiang Huayou Cobalt Co., Ltd. Class A | |
| | Zhejiang Jiecang Linear Motion Technology Co., Ltd. Class A | |
| | Zhejiang Jingsheng Mechanical & Electrical Co., Ltd. Class A | |
| | Zhejiang Sanhua Intelligent Controls Co., Ltd. Class A | |
168
See accompanying Notes to the Financial Statements.
Mercer Emerging Markets Equity Fund
Schedule of Investments (Continued)
(showing percentage of net assets)
March 31, 2023
| | | |
| | |
| | Zijin Mining Group Co., Ltd. Class H | |
| | | |
| | |
| | | |
| | |
| | | |
| | | |
| | Chow Sang Sang Holdings International, Ltd. | |
| | Hang Lung Properties, Ltd. | |
| | Hong Kong Exchanges & Clearing, Ltd. | |
| | Hongkong Land Holdings, Ltd. | |
| | Sino Biopharmaceutical, Ltd. | |
| | Vinda International Holdings, Ltd. | |
| | Vitasoy International Holdings, Ltd. | |
| | | |
| | |
| | | |
| | |
| | | |
| | | |
| | | |
| | | |
| | | |
| | Britannia Industries, Ltd. | |
| | | |
| | | |
| | Colgate-Palmolive India, Ltd. | |
| | Coromandel International, Ltd. | |
| | | |
| | | |
| | | |
| | Housing Development Finance Corp., Ltd. | |
| | | |
| | | |
| | | |
| | | |
| | InterGlobe Aviation, Ltd.* | |
| | | |
| | Kotak Mahindra Bank, Ltd. | |
| | Reliance Industries, Ltd. | |
| | | |
| | Syngene International, Ltd. | |
| | Tata Consultancy Services, Ltd. | |
| | | |
See accompanying Notes to the Financial Statements.
169
Mercer Emerging Markets Equity Fund
Schedule of Investments (Continued)
(showing percentage of net assets)
March 31, 2023
| | | |
| | |
| | | |
| | | |
| | |
| | Adaro Energy Indonesia Tbk PT | |
| | Astra International Tbk PT | |
| | | |
| | Bank Mandiri Persero Tbk PT | |
| | Bank Rakyat Indonesia Persero Tbk PT | |
| | | |
| | |
| | | |
| | | |
| | | |
| | |
| | | |
| | |
| | Galaxy Entertainment Group, Ltd.* | |
| | | |
| | | |
| | |
| | | |
| | Petronas Chemicals Group Bhd | |
| | | |
| | |
| | Credito Real SAB de CV SOFOM ER* | |
| | Fibra Uno Administracion SA de CV REIT | |
| | Fomento Economico Mexicano SAB de CV, ADR | |
| | | |
| | Grupo Aeroportuario del Pacifico SAB de CV Class B (a) | |
| | Grupo Financiero Banorte SAB de CV Class O | |
| | Kimberly-Clark de Mexico SAB de CV Class A | |
| | Unifin Financiera SAB de CV*(a) | |
| | Wal-Mart de Mexico SAB de CV(a) | |
| | | |
| | |
| | | |
| | |
| | | |
| | |
| | | |
| | | |
170
See accompanying Notes to the Financial Statements.
Mercer Emerging Markets Equity Fund
Schedule of Investments (Continued)
(showing percentage of net assets)
March 31, 2023
| | | |
| | |
| | | |
| | | |
| | |
| | | |
| | |
| | | |
| | |
| | | |
| | Gazprom Neft PJSC(b)(c)(d) | |
| | | |
| | Globaltrans Investment Plc, GDR*(b)(c)(d)(e) | |
| | HeadHunter Group Plc, ADR*(b)(c)(d) | |
| | LSR Group PJSC Class A *(b)(c)(d) | |
| | | |
| | | |
| | Magnit PJSC, ADR*(b)(c)(d)(e) | |
| | Magnitogorsk Iron & Steel Works PJSC*(b)(c)(d) | |
| | MMC Norilsk Nickel PJSC(b)(c)(d) | |
| | MMC Norilsk Nickel PJSC, ADR*(b)(c) | |
| | Mobile Telesystems PJSC, ADR*(b)(c)(d) | |
| | | |
| | Novolipetsk Steel PJSC*(b)(c)(d) | |
| | | |
| | PhosAgro PJSC, ADR*(b)(c)(d) | |
| | PhosAgro PJSC, GDR*(b)(c)(d)(e) | |
| | Polymetal International Plc* | |
| | | |
| | Ros Agro Plc, GDR*(b)(c)(d)(e) | |
| | Sberbank of Russia PJSC*(b)(c)(d) | |
| | Severstal PAO, ADR*(b)(c)(d)(e) | |
| | Surgutneftegas PJSC(b)(c)(d) | |
| | | |
| | TCS Group Holding Plc, GDR*(b)(c)(d)(e) | |
| | TCS Group Holding Plc (London Exchange), GDR*(b)(c)(d)(e) | |
| | X5 Retail Group NV, GDR*(b)(c)(d)(e) | |
| | | |
| | |
| | | |
| | |
| | Singapore Telecommunications, Ltd. | |
| | |
| | | |
| | | |
See accompanying Notes to the Financial Statements.
171
Mercer Emerging Markets Equity Fund
Schedule of Investments (Continued)
(showing percentage of net assets)
March 31, 2023
| | | |
| | |
| | Capitec Bank Holdings, Ltd. | |
| | | |
| | | |
| | | |
| | Growthpoint Properties, Ltd. REIT | |
| | | |
| | | |
| | Standard Bank Group, Ltd. | |
| | | |
| | | |
| | |
| | | |
| | | |
| | | |
| | Hana Financial Group, Inc. | |
| | Hankook Tire & Technology Co., Ltd. | |
| | | |
| | | |
| | | |
| | | |
| | Korea Investment Holdings Co., Ltd. | |
| | | |
| | | |
| | | |
| | | |
| | Samsung Electronics Co., Ltd. | |
| | Samsung Electronics Co., Ltd., GDR(e) | |
| | Samsung Electronics Co., Ltd. (London Exchange), GDR(e) | |
| | Samsung Engineering Co., Ltd.* | |
| | | |
| | Shinhan Financial Group Co., Ltd.(a) | |
| | | |
| | SM Entertainment Co., Ltd.(a) | |
| | Woori Financial Group, Inc. | |
| | | |
| | |
| | | |
| | | |
| | Asia Vital Components Co., Ltd. | |
| | | |
| | | |
| | Cathay Financial Holding Co., Ltd. | |
| | Chailease Holding Co., Ltd. | |
| | | |
| | E.Sun Financial Holding Co., Ltd. | |
| | | |
| | Fubon Financial Holding Co., Ltd. | |
172
See accompanying Notes to the Financial Statements.
Mercer Emerging Markets Equity Fund
Schedule of Investments (Continued)
(showing percentage of net assets)
March 31, 2023
| | | |
| | |
| | | |
| | Gold Circuit Electronics, Ltd. | |
| | | |
| | Largan Precision Co., Ltd. | |
| | | |
| | Lotus Pharmaceutical Co., Ltd.* | |
| | | |
| | Novatek Microelectronics Corp. | |
| | | |
| | Pharmally International Holding Co., Ltd.*(b)(c) | |
| | President Chain Store Corp. | |
| | Taiwan Semiconductor Manufacturing Co., Ltd. | |
| | Taiwan Semiconductor Manufacturing Co., Ltd., ADR | |
| | Uni-President Enterprises Corp. | |
| | | |
| | |
| | | |
| | Bangkok Dusit Medical Services PCL Class F | |
| | PTT Exploration & Production PCL Class F | |
| | | |
| | | |
| | | |
| | |
| | BIM Birlesik Magazalar AS | |
| | | |
| | | |
| | | |
| | |
| | | |
| | |
| | | |
| | TOTAL COMMON STOCKS (COST $1,605,742,828) | |
|
| | |
| | |
| | | |
| | Cia Energetica de Minas Gerais, 12.61% | |
| | Itau Unibanco Holding SA, 5.12% | |
| | | |
| | TOTAL PREFERRED STOCKS (COST $13,216,550) | |
See accompanying Notes to the Financial Statements.
173
Mercer Emerging Markets Equity Fund
Schedule of Investments (Continued)
(showing percentage of net assets)
March 31, 2023
| | | |
|
| | |
| | |
| | Ningbo Yongxin Optics Co., Ltd., Expires 03/14/24*(c) | |
| | TOTAL WARRANT (COST $821,526) | |
| | | |
| | SHORT-TERM INVESTMENT — 1.3% |
| | Mutual Fund - Securities Lending Collateral — 1.3% |
| | State Street Institutional U.S. Government Money Market Fund, Premier Class, | |
| | TOTAL SHORT-TERM INVESTMENT (COST $21,409,984) | |
| | TOTAL INVESTMENTS — 96.5%
(Cost $1,641,190,888) | |
| | Other Assets and Liabilities (net) — 3.5% | |
| | | |
| Notes to Schedule of Investments: |
| Non-income producing security. |
| All or a portion of this security is out on loan. |
| Level 3 - significant unobservable inputs were used in determining the value of this security in the Fund. |
| Securities are fair valued by the Valuation Committee as approved by the Board of Trustees. The total market value of the securities at year end is $1,228,134 which represents 0.1% of net assets. The aggregate tax cost of these securities held at March 31, 2023 was $86,403,581. |
| Illiquid securities represent Russian securities impacted by the Russian/Ukraine crisis. The total market value of the securities at year end is $522,996 which represents 0.0% of net assets. The aggregate cost of these securities held at March 31, 2023 was $85,540,823. |
| Security exempt from registration under Regulation S of the Securities Act of 1933, which exempts from registration securities offered and sold outside the United States. Security may not be offered or sold in the United States except pursuant to an exemption from, or in a transaction not subject to, the registration requirements of the Securities Act of 1933. |
| The rate disclosed is the 7-day net yield as of March 31, 2023. |
| Represents an investment of securities lending cash collateral. |
Futures Contracts
| | | | Market Value/
Unrealized
Appreciation
(Depreciation) |
| | | | |
| MSCI Emerging Markets E-mini Index | | | |
174
See accompanying Notes to the Financial Statements.
Mercer Emerging Markets Equity Fund
Schedule of Investments (Continued)
March 31, 2023
|
| | American Depository Receipt |
| | Global Depository Receipt |
| | Real Estate Investment Trust |
See accompanying Notes to the Financial Statements.
175
Mercer Emerging Markets Equity Fund
Schedule of Investments (Continued)
March 31, 2023
Industry Sector Summary (Unaudited) | |
| |
| |
| |
| |
| |
| |
| |
| |
| |
| |
| |
Other Assets and Liabilities (net) | |
| |
176
See accompanying Notes to the Financial Statements.
Mercer Global Low Volatility Equity Fund
Schedule of Investments
(showing percentage of net assets)
March 31, 2023
| | | |
| | |
| | |
| | | |
| | | |
| | | |
| | Lottery Corp., Ltd. (The) | |
| | | |
| | | |
| | | |
| | | |
| | | |
| | | |
| | | |
| | | |
| | | |
| | |
| | Telekom Austria AG Class A * | |
| | |
| | | |
| | | |
| | | |
| | |
| | RenaissanceRe Holdings, Ltd. | |
| | |
| | | |
| | |
| | | |
| | |
| | | |
| | | |
| | Canadian Pacific Railway, Ltd. | |
| | Canadian Utilities, Ltd. Class A (a) | |
| | E-L Financial Corp., Ltd.(a) | |
| | | |
| | Evertz Technologies, Ltd. | |
| | | |
| | | |
| | Great-West Lifeco, Inc.(a) | |
| | | |
| | | |
| | | |
| | North West Co., Inc. (The) | |
| | | |
| | | |
See accompanying Notes to the Financial Statements.
177
Mercer Global Low Volatility Equity Fund
Schedule of Investments (Continued)
(showing percentage of net assets)
March 31, 2023
| | | |
| | |
| | | |
| | | |
| | | |
| | | |
| | | |
| | | |
| | |
| | CITIC Telecom International Holdings, Ltd. | |
| | Kerry Logistics Network, Ltd. | |
| | | |
| | | |
| | |
| | AP Moller - Maersk AS Class B | |
| | | |
| | | |
| | | |
| | | |
| | Sparekassen Sjaelland-Fyn AS | |
| | | |
| | |
| | | |
| | | |
| | | |
| | | |
| | | |
| | | |
| | | |
| | |
| | | |
| | | |
| | | |
| | | |
| | | |
| | | |
| | | |
| | | |
| | | |
| | | |
| | | |
| | | |
| | | |
| | | |
| | | |
| | | |
| | | |
| | | |
178
See accompanying Notes to the Financial Statements.
Mercer Global Low Volatility Equity Fund
Schedule of Investments (Continued)
(showing percentage of net assets)
March 31, 2023
| | | |
| | |
| | | |
| | | |
| | | |
| | | |
| | | |
| | | |
| | | |
| | | |
| | |
| | Bank of Georgia Group Plc | |
| | |
| | | |
| | | |
| | | |
| | | |
| | | |
| | | |
| | Wuestenrot & Wuerttembergische AG | |
| | | |
| | |
| | Bank of East Asia, Ltd. (The) | |
| | Dah Sing Banking Group, Ltd. | |
| | Emperor International Holdings, Ltd. | |
| | HK Electric Investments & HK Electric Investments, Ltd. | |
| | | |
| | Hong Kong Ferry Holdings Co., Ltd. | |
| | Langham Hospitality Investments and Langham Hospitality Investments, Ltd. | |
| | Miramar Hotel & Investment(a) | |
| | | |
| | Power Assets Holdings, Ltd. | |
| | Regal Hotels International Holdings, Ltd.* | |
| | Regal Real Estate Investment Trust REIT(a) | |
| | SmarTone Telecommunications Holdings, Ltd. | |
| | Transport International Holdings, Ltd. | |
| | | |
| | Wing On Co. International, Ltd. | |
| | | |
| | |
| | | |
| | | |
| | Check Point Software Technologies, Ltd.* | |
| | First International Bank Of Israel, Ltd. (The) | |
| | | |
| | | |
| | | |
| | | |
See accompanying Notes to the Financial Statements.
179
Mercer Global Low Volatility Equity Fund
Schedule of Investments (Continued)
(showing percentage of net assets)
March 31, 2023
| | | |
| | |
| | Rami Levy Chain Stores Hashikma Marketing 2006, Ltd. | |
| | | |
| | | |
| | |
| | | |
| | | |
| | | |
| | | |
| | |
| | | |
| | | |
| | Autobacs Seven Co., Ltd.(a) | |
| | | |
| | | |
| | | |
| | Canon Marketing Japan, Inc. | |
| | | |
| | Chugin Financial Group, Inc. | |
| | | |
| | | |
| | | |
| | | |
| | | |
| | | |
| | | |
| | | |
| | | |
| | Hyakugo Bank, Ltd. (The)(a) | |
| | | |
| | | |
| | | |
| | Kaken Pharmaceutical Co., Ltd. | |
| | | |
| | | |
| | | |
| | | |
| | | |
| | | |
| | | |
| | Maruichi Steel Tube, Ltd. | |
| | McDonald's Holdings Co. Japan, Ltd. | |
| | Megmilk Snow Brand Co., Ltd. | |
| | MEIJI Holdings Co., Ltd.(a) | |
| | Miroku Jyoho Service Co., Ltd. | |
| | Mitsubishi Electric Corp. | |
| | Mitsubishi Shokuhin Co., Ltd. | |
| | Mizuho Financial Group, Inc. | |
180
See accompanying Notes to the Financial Statements.
Mercer Global Low Volatility Equity Fund
Schedule of Investments (Continued)
(showing percentage of net assets)
March 31, 2023
| | | |
| | |
| | Mochida Pharmaceutical Co., Ltd.(a) | |
| | | |
| | Morinaga Milk Industry Co., Ltd.(a) | |
| | | |
| | | |
| | | |
| | NIPPON REIT Investment Corp. REIT | |
| | Nippon Telegraph & Telephone Corp. | |
| | | |
| | Nisshin Oillio Group, Ltd. (The) | |
| | Nissin Foods Holdings Co., Ltd. | |
| | Noevir Holdings Co., Ltd. | |
| | Okinawa Cellular Telephone Co. | |
| | Otsuka Holdings Co., Ltd. | |
| | | |
| | | |
| | | |
| | | |
| | | |
| | Shinmaywa Industries, Ltd.(a) | |
| | Showa Sangyo Co., Ltd.(a) | |
| | SKY Perfect JSAT Holdings, Inc. | |
| | | |
| | | |
| | | |
| | | |
| | Takeda Pharmaceutical Co., Ltd. | |
| | | |
| | | |
| | Toho Holdings Co., Ltd.(a) | |
| | | |
| | | |
| | Toyo Ink SC Holdings Co., Ltd. | |
| | | |
| | | |
| | | |
| | United Super Markets Holdings, Inc. | |
| | Valor Holdings Co., Ltd.(a) | |
| | | |
| | Yamato Holdings Co., Ltd. | |
| | | |
| | Zenkoku Hosho Co., Ltd.(a) | |
| | | |
| | |
| | | |
| | | |
| | Koninklijke Ahold Delhaize NV | |
| | | |
See accompanying Notes to the Financial Statements.
181
Mercer Global Low Volatility Equity Fund
Schedule of Investments (Continued)
(showing percentage of net assets)
March 31, 2023
| | | |
| | |
| | Shell Plc (Amsterdam Exchange) | |
| | | |
| | | |
| | |
| | | |
| | | |
| | | |
| | | |
| | |
| | | |
| | | |
| | | |
| | | |
| | | |
| | | |
| | | |
| | | |
| | | |
| | |
| | | |
| | |
| | | |
| | |
| | | |
| | Great Eastern Holdings, Ltd. | |
| | | |
| | | |
| | Oversea-Chinese Banking Corp., Ltd. | |
| | | |
| | | |
| | Singapore Land Group, Ltd. | |
| | Singapore Technologies Engineering, Ltd. | |
| | | |
| | |
| | Samsung Electronics Co., Ltd., GDR(b) | |
| | |
| | | |
| | Cia de Distribucion Integral Logista Holdings SA | |
| | | |
| | | |
| | |
| | Skandinaviska Enskilda Banken AB Class A * | |
182
See accompanying Notes to the Financial Statements.
Mercer Global Low Volatility Equity Fund
Schedule of Investments (Continued)
(showing percentage of net assets)
March 31, 2023
| | | |
| | |
| | Swedish Orphan Biovitrum AB* | |
| | | |
| | |
| | | |
| | | |
| | Banque Cantonale de Geneve | |
| | Basellandschaftliche Kantonalbank | |
| | Berner Kantonalbank AG(a) | |
| | Chocoladefabriken Lindt & Spruengli AG | |
| | | |
| | Graubuendner Kantonalbank | |
| | | |
| | | |
| | | |
| | | |
| | St. Galler Kantonalbank AG | |
| | | |
| | | |
| | | |
| | | |
| | | |
| | |
| | | |
| | | |
| | | |
| | | |
| | | |
| | | |
| | | |
| | | |
| | Pan African Resources Plc | |
| | | |
| | | |
| | | |
| | Spirent Communications Plc | |
| | | |
| | | |
| | | |
| | |
| | | |
| | | |
| | | |
| | | |
| | | |
| | | |
| | Albertsons Cos., Inc. Class A | |
| | | |
See accompanying Notes to the Financial Statements.
183
Mercer Global Low Volatility Equity Fund
Schedule of Investments (Continued)
(showing percentage of net assets)
March 31, 2023
| | | |
| | United States — continued |
| | | |
| | | |
| | | |
| | | |
| | American Electric Power Co., Inc. | |
| | | |
| | Ameriprise Financial, Inc. | |
| | | |
| | | |
| | | |
| | | |
| | Arch Capital Group, Ltd.* | |
| | Archer-Daniels-Midland Co. | |
| | | |
| | Arthur J. Gallagher & Co. | |
| | | |
| | Automatic Data Processing, Inc. | |
| | | |
| | | |
| | Axis Capital Holdings, Ltd. | |
| | Bank of New York Mellon Corp. (The) | |
| | | |
| | Berkshire Hathaway, Inc. Class B * | |
| | | |
| | BioMarin Pharmaceutical, Inc.* | |
| | Bio-Rad Laboratories, Inc. Class A * | |
| | BJ's Wholesale Club Holdings, Inc.* | |
| | | |
| | | |
| | | |
| | | |
| | CACI International, Inc. Class A * | |
| | Cadence Design Systems, Inc.* | |
| | | |
| | | |
| | Casey's General Stores, Inc. | |
| | | |
| | Cboe Global Markets, Inc. | |
| | | |
| | CH Robinson Worldwide, Inc. | |
| | Charles Schwab Corp. (The) | |
| | Charter Communications, Inc. Class A * | |
| | | |
| | | |
| | | |
| | | |
| | | |
| | | |
| | | |
184
See accompanying Notes to the Financial Statements.
Mercer Global Low Volatility Equity Fund
Schedule of Investments (Continued)
(showing percentage of net assets)
March 31, 2023
| | | |
| | United States — continued |
| | | |
| | | |
| | | |
| | | |
| | | |
| | Consolidated Edison, Inc. | |
| | | |
| | | |
| | | |
| | | |
| | | |
| | Dell Technologies, Inc. Class C | |
| | | |
| | | |
| | | |
| | | |
| | | |
| | | |
| | Estee Lauder Cos., Inc. (The) Class A | |
| | | |
| | | |
| | Expeditors International of Washington, Inc. | |
| | | |
| | Factset Research Systems, Inc. | |
| | First Citizens BancShares, Inc. Class A | |
| | | |
| | | |
| | | |
| | | |
| | | |
| | | |
| | | |
| | | |
| | | |
| | | |
| | Hanover Insurance Group, Inc. (The) | |
| | Hartford Financial Services Group, Inc. (The) | |
| | Hawaiian Electric Industries, Inc. | |
| | | |
| | | |
| | | |
| | Honeywell International, Inc. | |
| | | |
| | Huntington Ingalls Industries, Inc. | |
| | | |
| | | |
| | | |
| | | |
| | | |
See accompanying Notes to the Financial Statements.
185
Mercer Global Low Volatility Equity Fund
Schedule of Investments (Continued)
(showing percentage of net assets)
March 31, 2023
| | | |
| | United States — continued |
| | Intercontinental Exchange, Inc. | |
| | International Business Machines Corp. | |
| | | |
| | | |
| | | |
| | Jazz Pharmaceuticals Plc* | |
| | JB Hunt Transport Services, Inc. | |
| | | |
| | | |
| | | |
| | Keysight Technologies, Inc.* | |
| | | |
| | | |
| | L3Harris Technologies, Inc. | |
| | Laboratory Corp. of America Holdings | |
| | | |
| | | |
| | | |
| | | |
| | | |
| | LyondellBasell Industries NV Class A | |
| | Manhattan Associates, Inc.* | |
| | | |
| | | |
| | | |
| | | |
| | Meta Platforms, Inc. Class A * | |
| | | |
| | | |
| | | |
| | | |
| | | |
| | | |
| | | |
| | | |
| | | |
| | Old Dominion Freight Line, Inc. | |
| | Old Republic International Corp. | |
| | | |
| | O'Reilly Automotive, Inc.* | |
| | | |
| | Packaging Corp. of America | |
| | Penske Automotive Group, Inc. | |
| | | |
| | | |
| | Philip Morris International, Inc. | |
| | | |
| | Procter & Gamble Co. (The) | |
| | | |
186
See accompanying Notes to the Financial Statements.
Mercer Global Low Volatility Equity Fund
Schedule of Investments (Continued)
(showing percentage of net assets)
March 31, 2023
| | | |
| | United States — continued |
| | | |
| | QIAGEN NV (London Exchange)* | |
| | | |
| | Raymond James Financial, Inc. | |
| | Regeneron Pharmaceuticals, Inc.* | |
| | Reinsurance Group of America, Inc. | |
| | Republic Services, Inc. Class A | |
| | | |
| | | |
| | | |
| | | |
| | | |
| | Schneider National, Inc. Class B | |
| | Science Applications International Corp. | |
| | | |
| | | |
| | | |
| | Service Corp. International | |
| | | |
| | SS&C Technologies Holdings, Inc. | |
| | | |
| | | |
| | | |
| | | |
| | | |
| | | |
| | | |
| | Thermo Fisher Scientific, Inc. | |
| | | |
| | Travelers Cos., Inc. (The) | |
| | Tyson Foods, Inc. Class A | |
| | | |
| | United Parcel Service, Inc. Class B | |
| | United Therapeutics Corp.* | |
| | | |
| | | |
| | | |
| | Verizon Communications, Inc. | |
| | Vertex Pharmaceuticals, Inc.* | |
| | | |
| | | |
| | | |
| | | |
| | | |
| | | |
| | | |
| | White Mountains Insurance Group, Ltd. | |
| | | |
| | | |
See accompanying Notes to the Financial Statements.
187
Mercer Global Low Volatility Equity Fund
Schedule of Investments (Continued)
(showing percentage of net assets)
March 31, 2023
| | | |
| | United States — continued |
| | | |
| | | |
| | | |
| | TOTAL COMMON STOCKS (COST $1,000,624,094) | |
|
| | |
| | |
| | Dr. Ing. h.c. F. Porsche AG, 0.00% * | |
| | | |
| | Henkel AG & Co. KGaA, 2.58% | |
| | | |
| | TOTAL PREFERRED STOCKS (COST $895,129) | |
| | | |
| | SHORT-TERM INVESTMENT — 1.4% |
| | Mutual Fund - Securities Lending Collateral — 1.4% |
| | State Street Institutional U.S. Government Money Market Fund, Premier Class, | |
| | TOTAL SHORT-TERM INVESTMENT (COST $16,149,865) | |
| | TOTAL INVESTMENTS — 97.1%
(Cost $1,017,669,088) | |
| | Other Assets and Liabilities (net) — 2.9% | |
| | | |
| Notes to Schedule of Investments: |
| Non-income producing security. |
| All or a portion of this security is out on loan. |
| Security exempt from registration under Regulation S of the Securities Act of 1933, which exempts from registration securities offered and sold outside the United States. Security may not be offered or sold in the United States except pursuant to an exemption from, or in a transaction not subject to, the registration requirements of the Securities Act of 1933. |
| The rate disclosed is the 7-day net yield as of March 31, 2023. |
| Represents an investment of securities lending cash collateral. |
Futures Contracts
| | | | Market Value/
Unrealized
Appreciation
(Depreciation) |
| | | | |
| | | | |
| | | | |
188
See accompanying Notes to the Financial Statements.
Mercer Global Low Volatility Equity Fund
Schedule of Investments (Continued)
March 31, 2023
Futures Contracts—continued
| | | | Market Value/ Unrealized Appreciation (Depreciation) |
| | | | |
| | | | |
| | | | |
|
| | American Depository Receipt |
| | Global Depository Receipt |
| | Real Estate Investment Trust |
See accompanying Notes to the Financial Statements.
189
Mercer Global Low Volatility Equity Fund
Schedule of Investments (Continued)
March 31, 2023
Industry Sector Summary (Unaudited) | |
| |
| |
| |
| |
| |
| |
| |
| |
| |
| |
Other Assets and Liabilities (net) | |
| |
190
See accompanying Notes to the Financial Statements.
Mercer Funds
Statements of Assets and Liabilities
March 31, 2023
| Mercer US Large
Cap Equity Fund | Mercer US
Small/Mid Cap
Equity Fund | Mercer Non-US
Core Equity Fund | Mercer Core
Fixed Income Fund |
| | | | |
Investments, at value(a)(b) | | | | |
Foreign currency, at value(c) | | | | |
Cash and cash equivalents | | | | |
Receivable for investments sold | | | | |
| | | | |
Receivable for Fund shares sold | | | | |
Dividend and interest receivable | | | | |
Cash collateral held at broker on open futures contracts | | | | |
Unrealized appreciation on open forward foreign currency contracts | | | | |
Receivable for variation margin on open futures contracts | | | | |
Receivable for variation margin on open centrally cleared swap contracts | | | | |
Foreign tax reclaims receivable | | | | |
Securities lending income receivable | | | | |
| | | | |
Receivable from affiliate for advisory fee waived | | | | |
| | | | |
| | | | |
Payable for investments purchased | | | | |
Payable for TBA and when-issued securities purchased | | | | |
Obligation to return securities lending collateral | | | | |
Payable for Fund shares repurchased | | | | |
Unrealized depreciation on open forward foreign currency contracts | | | | |
Payable for foreign capital gains tax | | | | |
TBA Sale Commitments, at value(d) | | | | |
Payable to affiliates for: | | | | |
| | | | |
| | | | |
Administrative service fees - Class I | | | | |
Payable for variation margin on open futures contracts | | | | |
Interest payable on TBA securities | | | | |
| | | | |
| | | | |
| | | | |
| | | | |
See accompanying Notes to the Financial Statements.
191
Mercer Funds
Statements of Assets and Liabilities (Continued)
March 31, 2023
| Mercer US Large Cap Equity Fund | Mercer US Small/Mid Cap Equity Fund | Mercer Non-US Core Equity Fund | Mercer Core Fixed Income Fund |
| | | | |
| | | | |
Distributable earnings (Accumulated loss) | | | | |
| | | | |
Net assets attributable to: | | | | |
| | | | |
| | | | |
| | | | |
| | | | |
| | | | |
Net asset value per unit: | | | | |
| | | | |
| | | | |
| | | | |
(b) Securities loaned, at value | | | | |
(c) Foreign currency, at cost | | | | |
(d) Proceeds for TBA Sale Commitments | | | | |
192
See accompanying Notes to the Financial Statements.
Mercer Funds
Statements of Assets and Liabilities (Continued)
March 31, 2023
| Mercer Opportunistic
Fixed Income Fund | Mercer Emerging
Markets Equity Fund | Mercer Global Low
Volatility Equity Fund |
| | | |
Investments, at value(a)(b) | | | |
Foreign currency, at value(c) | | | |
Cash and cash equivalents | | | |
Receivable for investments sold | | | |
Receivable for Fund shares sold | | | |
Dividend and interest receivable | | | |
Cash collateral held at broker on open centrally cleared swap contracts | | | |
Cash collateral held at broker on open futures contracts | | | |
Cash collateral held at broker on open forward foreign currency contracts, open OTC options, and open OTC swaps contracts | | | |
Unrealized appreciation on open forward foreign currency contracts | | | |
Receivable for variation margin on open futures contracts | | | |
OTC — Swap contracts, at value (up-front net premiums paid of $9,254, $— and $—, respectively) | | | |
Receivable for variation margin on open centrally cleared swap contracts | | | |
Foreign tax reclaims receivable | | | |
Securities lending income receivable | | | |
| | | |
Receivable from affiliate for advisory fee waived | | | |
| | | |
| | | |
Payable for investments purchased | | | |
Payable for TBA and when-issued securities purchased | | | |
Obligation to return securities lending collateral | | | |
Payable for Fund shares repurchased | | | |
Unrealized depreciation on open forward foreign currency contracts | | | |
OTC — Swap contracts, at value (up-front net premiums received of $19,195, $— and $—, respectively) | | | |
Cash collateral due to broker on open forward foreign currency contracts, open OTC options, and open OTC swaps contracts | | | |
Payable for foreign capital gains tax | | | |
Written options, at value(d) | | | |
Payable to affiliates for: | | | |
| | | |
| | | |
Payable for variation margin on open futures contracts | | | |
Unrealized loss on unfunded loan commitments | | | |
| | | |
| | | |
| | | |
| | | |
See accompanying Notes to the Financial Statements.
193
Mercer Funds
Statements of Assets and Liabilities (Continued)
March 31, 2023
| Mercer Opportunistic Fixed Income Fund | Mercer Emerging Markets Equity Fund | Mercer Global Low Volatility Equity Fund |
| | | |
| | | |
Distributable earnings (Accumulated loss) | | | |
| | | |
Net assets attributable to: | | | |
| | | |
| | | |
| | | |
Net asset value per unit: | | | |
| | | |
| | | |
(b) Securities loaned, at value | | | |
(c) Foreign currency, at cost | | | |
(d) Premiums on written options | | | |
194
See accompanying Notes to the Financial Statements.
Mercer Funds
Statements of Operations
Year Ended March 31, 2023
| Mercer US Large
Cap Equity Fund | Mercer US
Small/Mid Cap
Equity Fund | Mercer Non-US
Core Equity Fund | Mercer Core
Fixed Income Fund |
| | | | |
| | | | |
| | | | |
| | | | |
Securities lending income | | | | |
| | | | |
| | | | |
| | | | |
| | | | |
Custodian and fund accounting fees | | | | |
| | | | |
| | | | |
| | | | |
| | | | |
| | | | |
Administration service fees: | | | | |
| | | | |
Shareholder service fees: | | | | |
| | | | |
| | | | |
| | | | |
| | | | |
| | | | |
| | | | |
| | | | |
Realized and Unrealized Gain (Loss): | | | | |
Net realized gain (loss) on: | | | | |
| | | | |
| | | | |
| | | | |
Forward foreign currency contracts | | | | |
Foreign currency related transactions | | | | |
| | | | |
Change in net unrealized appreciation (depreciation) on: | | | | |
| | | | |
| | | | |
| | | | |
| | | | |
Forward foreign currency contracts | | | | |
Foreign currency related transactions | | | | |
Change in net unrealized appreciation (depreciation) | | | | |
Net realized and unrealized loss | | | | |
Net decrease in net assets resulting from operations | | | | |
See accompanying Notes to the Financial Statements.
195
Mercer Funds
Statements of Operations (Continued)
Year Ended March 31, 2023
| Mercer Opportunistic
Fixed Income Fund | Mercer Emerging
Markets Equity Fund | Mercer Global Low
Volatility Equity Fund |
| | | |
| | | |
| | | |
| | | |
Securities lending income | | | |
| | | |
| | | |
| | | |
| | | |
Custodian and fund accounting fees | | | |
| | | |
| | | |
| | | |
| | | |
| | | |
| | | |
| | | |
| | | |
| | | |
| | | |
| | | |
Realized and Unrealized Gain (Loss): | | | |
Net realized gain (loss) on: | | | |
| | | |
Purchased option contracts | | | |
| | | |
| | | |
| | | |
Forward foreign currency contracts | | | |
Foreign currency related transactions | | | |
| | | |
Change in net unrealized appreciation (depreciation) on: | | | |
| | | |
Purchased option contracts | | | |
Unfunded loan commitments | | | |
| | | |
| | | |
| | | |
Forward foreign currency contracts | | | |
Foreign currency related transactions | | | |
Change in net unrealized appreciation (depreciation) | | | |
Net realized and unrealized loss | | | |
Net decrease in net assets resulting from operations | | | |
196
See accompanying Notes to the Financial Statements.
Mercer Funds
Statements of Changes in Net Assets
| Mercer US Large
Cap Equity Fund | Mercer US
Small/Mid Cap
Equity Fund |
| | | | |
Increase (decrease) in Net Assets: | | | | |
| | | | |
| | | | |
| | | | |
Change in net unrealized depreciation | | | | |
Net increase (decrease) in net assets resulting from operations | | | | |
Distributions to shareholders (See Note 2): | | | | |
| | | | |
| | | | |
Net share transactions (See Note 7): | | | | |
| | | | |
Increase (decrease) in net assets resulting from net shares transactions | | | | |
Net decrease in net assets | | | | |
| | | | |
| | | | |
| | | | |
See accompanying Notes to the Financial Statements.
197
Mercer Funds
Statements of Changes in Net Assets (Continued)
| Mercer Non-US
Core Equity Fund | Mercer Core
Fixed Income Fund |
| | | | |
Increase (decrease) in Net Assets: | | | | |
| | | | |
| | | | |
| | | | |
Change in net unrealized depreciation | | | | |
Net decrease in net assets resulting from operations | | | | |
Distributions to shareholders (See Note 2): | | | | |
| | | | |
| | | | |
| | | | |
Net share transactions (See Note 7): | | | | |
| | | | |
| | | | |
Increase (decrease) in net assets resulting from net shares transactions | | | | |
Net increase (decrease) in net assets | | | | |
| | | | |
| | | | |
| | | | |
| The Class commenced operations on July 22, 2021. |
| The Class commenced operations on December 27, 2021. |
198
See accompanying Notes to the Financial Statements.
Mercer Funds
Statements of Changes in Net Assets (Continued)
| Mercer Opportunistic
Fixed Income Fund | Mercer Emerging
Markets Equity Fund |
| | | | |
Increase (decrease) in Net Assets: | | | | |
| | | | |
| | | | |
| | | | |
Change in net unrealized appreciation (depreciation) | | | | |
Net decrease in net assets resulting from operations | | | | |
Distributions to shareholders (See Note 2): | | | | |
| | | | |
| | | | |
Net share transactions (See Note 7): | | | | |
| | | | |
Increase in net assets resulting from net shares transactions | | | | |
Net increase (decrease) in net assets | | | | |
| | | | |
| | | | |
| | | | |
See accompanying Notes to the Financial Statements.
199
Mercer Funds
Statements of Changes in Net Assets (Continued)
| Mercer Global Low
Volatility Equity Fund |
| | |
Increase (decrease) in Net Assets: | | |
| | |
| | |
| | |
Change in net unrealized depreciation | | |
Net increase (decrease) in net assets resulting from operations | | |
Distributions to shareholders (See Note 2): | | |
| | |
| | |
Net share transactions (See Note 7): | | |
| | |
Increase (decrease) in net assets resulting from net shares transactions | | |
Net increase (decrease) in net assets | | |
| | |
| | |
| | |
200
See accompanying Notes to the Financial Statements.
Mercer US Large Cap Equity Fund
Financial Highlights
| | | | | |
For a Class Y-3 Share Outstanding
Throughout Each Year: | | | | | |
Net asset value, beginning of year | | | | | |
| | | | | |
Net realized and unrealized gain (loss) on investments | | | | | |
Total from investment operations | | | | | |
Less dividends and distributions: | | | | | |
From net investment income | | | | | |
From net realized capital gains on investments | | | | | |
Total dividends and distributions | | | | | |
Net asset value, end of year | | | | | |
| | | | | |
Ratios/Supplemental Data: | | | | | |
Net investment income to average net assets | | | | | |
Total expenses (before reductions and reimbursements/waivers) to average daily net assets | | | | | |
Net expenses to average daily net assets | | | | | |
| | | | | |
Net assets at end of year (in 000’s) | | | | | |
| The total return would have been lower had certain expenses not been reduced or reimbursed/waived during the years shown. |
| Includes the effects of management fee waivers (see Note 5 of the Notes to the Financial Statements). |
| Portfolio turnover calculation does not include $769,614,365 of securities transferred into the Fund as part of in-kind contributions. |
| Computed using average shares outstanding throughout the year. |
See accompanying Notes to the Financial Statements.
201
Mercer US Small/Mid Cap Equity Fund
Financial Highlights (Continued)
| | | | | |
For a Class Y-3 Share Outstanding
Throughout Each Year: | | | | | |
Net asset value, beginning of year | | | | | |
| | | | | |
Net realized and unrealized gain (loss) on investments | | | | | |
Total from investment operations | | | | | |
Less dividends and distributions: | | | | | |
From net investment income | | | | | |
From net realized capital gains on investments | | | | | |
Total dividends and distributions | | | | | |
Net asset value, end of year | | | | | |
| | | | | |
Ratios/Supplemental Data: | | | | | |
Net investment income to average net assets | | | | | |
Total expenses (before reductions and reimbursements/waivers) to average daily net assets | | | | | |
Net expenses to average daily net assets | | | | | |
| | | | | |
Net assets at end of year (in 000’s) | | | | | |
| The total return would have been lower had certain expenses not been reduced or reimbursed/waived during the years shown. |
| Includes the effects of management fee waivers (see Note 5 of the Notes to the Financial Statements). |
| Portfolio turnover calculation does not include $550,516,305 of securities transferred into the Fund as part of in-kind contributions. |
| Computed using average shares outstanding throughout the year. |
202
See accompanying Notes to the Financial Statements.
Mercer Non-US Core Equity Fund
Financial Highlights (Continued)
| | | | | |
For a Class Y-3 Share Outstanding
Throughout Each Year: | | | | | |
Net asset value, beginning of year | | | | | |
| | | | | |
Net realized and unrealized gain (loss) on investments | | | | | |
Total from investment operations | | | | | |
Less dividends and distributions: | | | | | |
From net investment income | | | | | |
From net realized capital gains on investments | | | | | |
Total dividends and distributions | | | | | |
Net asset value, end of year | | | | | |
| | | | | |
Ratios/Supplemental Data: | | | | | |
Net investment income to average net assets | | | | | |
Total expenses (before reductions and reimbursements/waivers) to average daily net assets | | | | | |
Net expenses to average daily net assets | | | | | |
| | | | | |
Net assets at end of year (in 000’s) | | | | | |
| The total return would have been lower had certain expenses not been reduced or reimbursed/waived during the years shown. |
| Includes the effects of management fee waivers (see Note 5 of the Notes to the Financial Statements). |
| Portfolio turnover calculation does not include $395,102,338 of securities transferred into the Fund as part of in-kind contributions. |
| Computed using average shares outstanding throughout the year. |
See accompanying Notes to the Financial Statements.
203
Mercer Non-US Core Equity Fund
Financial Highlights (Continued)
| | Period Ended
March 31, 2022 |
For a Class I Share Outstanding Throughout Each Year: | | |
Net asset value, beginning of year | | |
| | |
Net realized and unrealized gain (loss) on investments | | |
Total from investment operations | | |
Less dividends and distributions: | | |
From net investment income | | |
From net realized capital gains on investments | | |
Total dividends and distributions | | |
Net asset value, end of year | | |
| | |
Ratios/Supplemental Data: | | |
Net investment income to average net assets | | |
Total expenses (before reductions and reimbursements/waivers) to average daily net assets | | |
Net expenses to average daily net assets | | |
| | |
Net assets at end of year (in 000’s) | | |
| The Class commenced operations on July 22, 2021. |
| The total return would have been lower had certain expenses not been reduced or reimbursed/waived during the years shown. |
| Includes the effects of management fee waivers (see Note 5 of the Notes to the Financial Statements). |
| Computed using average shares outstanding throughout the year. |
| |
| |
204
See accompanying Notes to the Financial Statements.
Mercer Core Fixed Income Fund
Financial Highlights (Continued)
| | | | | |
For a Class Y-3 Share Outstanding
Throughout Each Year: | | | | | |
Net asset value, beginning of year | | | | | |
| | | | | |
Net realized and unrealized gain (loss) on investments | | | | | |
Total from investment operations | | | | | |
Less dividends and distributions: | | | | | |
From net investment income | | | | | |
From net realized capital gains on investments | | | | | |
Total dividends and distributions | | | | | |
Net asset value, end of year | | | | | |
| | | | | |
Ratios/Supplemental Data: | | | | | |
Net investment income to average net assets | | | | | |
Total expenses (before reductions and reimbursements/waivers) to average daily net assets | | | | | |
Net expenses to average daily net assets | | | | | |
| | | | | |
Net assets at end of year (in 000’s) | | | | | |
| The total return would have been lower had certain expenses not been reduced or reimbursed/waived during the years shown. |
| Includes the effects of management fee waivers (see Note 5 of the Notes to the Financial Statements). |
| Includes TBA transactions; excluding these transactions the portfolio turnover rate would have been 125%, 96%, 100%, 139% and 74% for the years ended March 31, 2023, March 31, 2022, March 31, 2021, March 31, 2020 and March 31, 2019, respectively. |
| Computed using average shares outstanding throughout the year. |
See accompanying Notes to the Financial Statements.
205
Mercer Core Fixed Income Fund
Financial Highlights (Continued)
| | Period Ended
March 31, 2022 |
For a Class I Share Outstanding Throughout Each Year: | | |
Net asset value, beginning of year | | |
| | |
Net realized and unrealized gain (loss) on investments | | |
Total from investment operations | | |
Less dividends and distributions: | | |
From net investment income | | |
Total dividends and distributions | | |
Net asset value, end of year | | |
| | |
Ratios/Supplemental Data: | | |
Net investment income to average net assets | | |
Total expenses (before reductions and reimbursements/waivers) to average daily net assets | | |
Net expenses to average daily net assets | | |
| | |
Net assets at end of year (in 000’s) | | |
| The Class commenced operations on December 27, 2021. |
| The total return would have been lower had certain expenses not been reduced or reimbursed/waived during the years shown. |
| Includes the effects of management fee waivers (see Note 5 of the Notes to the Financial Statements). |
| Includes TBA transactions; excluding these transactions the portfolio turnover rate would have been 125% and 96% for the year ended March 31, 2023 and March 31, 2022, respectively. |
| Computed using average shares outstanding throughout the year. |
| |
| |
206
See accompanying Notes to the Financial Statements.
Mercer Opportunistic Fixed Income Fund
Financial Highlights (Continued)
| | | | | |
For a Class Y-3 Share Outstanding
Throughout Each Year: | | | | | |
Net asset value, beginning of year | | | | | |
| | | | | |
Net realized and unrealized gain (loss) on investments | | | | | |
Total from investment operations | | | | | |
Less dividends and distributions: | | | | | |
From net investment income | | | | | |
From net realized capital gains on investments | | | | | |
Total dividends and distributions | | | | | |
Net asset value, end of year | | | | | |
| | | | | |
Ratios/Supplemental Data: | | | | | |
Net investment income to average net assets | | | | | |
Total expenses (before reductions and reimbursements/waivers) to average daily net assets | | | | | |
Net expenses to average daily net assets | | | | | |
| | | | | |
Net assets at end of year (in 000’s) | | | | | |
| The total return would have been lower had certain expenses not been reduced or reimbursed/waived during the years shown. |
| Includes interest expense that amounts to less than 0.01%. |
| Includes the effects of management fee waivers (see Note 5 of the Notes to the Financial Statements). |
| Portfolio turnover calculation does not include $400,305,493 of securities transferred out of the Fund as part of in-kind redemptions. |
| Includes TBA transactions; excluding these transactions the portfolio turnover rate would have remained the same for the year ended March 31, 2020 and 218% for the year ended March 31, 2019, respectively. |
| Computed using average shares outstanding throughout the year. |
See accompanying Notes to the Financial Statements.
207
Mercer Emerging Markets Equity Fund
Financial Highlights (Continued)
| | | | | |
For a Class Y-3 Share Outstanding
Throughout Each Year: | | | | | |
Net asset value, beginning of year | | | | | |
| | | | | |
Net realized and unrealized gain (loss) on investments | | | | | |
Total from investment operations | | | | | |
Less dividends and distributions: | | | | | |
From net investment income | | | | | |
From net realized capital gains on investments | | | | | |
Total dividends and distributions | | | | | |
Net asset value, end of year | | | | | |
| | | | | |
Ratios/Supplemental Data: | | | | | |
Net investment income to average net assets | | | | | |
Total expenses (before reductions and reimbursements/waivers) to average daily net assets | | | | | |
Net expenses to average daily net assets | | | | | |
| | | | | |
Net assets at end of year (in 000’s) | | | | | |
| The total return would have been lower had certain expenses not been reduced or reimbursed/waived during the years shown. |
| Includes interest expense that amounts to less than 0.01%. |
| Includes the effects of management fee waivers (see Note 5 of the Notes to the Financial Statements). |
| Portfolio turnover calculation does not include $10,686,440 of securities transferred into the Fund as part of in-kind contributions. |
| Computed using average shares outstanding throughout the year. |
208
See accompanying Notes to the Financial Statements.
Mercer Global Low Volatility Equity Fund
Financial Highlights (Continued)
| | | | | |
For a Class Y-3 Share Outstanding
Throughout Each Year: | | | | | |
Net asset value, beginning of year | | | | | |
| | | | | |
Net realized and unrealized gain (loss) on investments | | | | | |
Total from investment operations | | | | | |
Less dividends and distributions: | | | | | |
From net investment income | | | | | |
From net realized capital gains on investments | | | | | |
Total dividends and distributions | | | | | |
Net asset value, end of year | | | | | |
| | | | | |
Ratios/Supplemental Data: | | | | | |
Net investment income to average net assets | | | | | |
Total expenses (before reductions and reimbursements/waivers) to average daily net assets | | | | | |
Net expenses to average daily net assets | | | | | |
| | | | | |
Net assets at end of year (in 000’s) | | | | | |
| The total return would have been lower had certain expenses not been reduced or reimbursed/waived during the years shown. |
| Includes the effects of management fee waivers (see Note 5 of the Notes to the Financial Statements). |
| Computed using average shares outstanding throughout the year. |
See accompanying Notes to the Financial Statements.
209
Mercer Funds
Notes to Financial Statements
March 31, 2023
Mercer Funds (the “Trust”) consists of the following seven series: Mercer US Large Cap Equity Fund (“Large Cap”), Mercer US Small/Mid Cap Equity Fund (“Small/Mid Cap”), Mercer Non-US Core Equity Fund (“Non-US Core Equity”), Mercer Core Fixed Income Fund (“Core Fixed”), Mercer Opportunistic Fixed Income Fund (“Opportunistic Fixed”), Mercer Emerging Markets Equity Fund (“Emerging Markets”) and Mercer Global Low Volatility Equity Fund (“Global Low Volatility”) (each a “Fund,” and collectively referred to as the “Funds”). The Trust is a Delaware statutory trust established on March 11, 2005. The Trust is registered as an investment company under the Investment Company Act of 1940, as amended (the “1940 Act”). Mercer Investments LLC (the “Adviser”), a Delaware limited liability company, serves as the investment adviser to the Funds. The Adviser manages each Fund using a “manager of managers” approach by selecting one or more sub-advisers (each a “Sub-adviser,” and collectively referred to as the “Sub-advisers”) to manage each Fund's assets. The Funds are open-end investment companies and accordingly follow the open-end investment company accounting and reporting guidance of the Financial Accounting Standards Board (FASB) Accounting Standard Codification Topic 946: Financial Services — Investment Companies.
Under the 1940 Act, each Fund is classified as diversified.
The investment objectives of the Funds are:
| |
| Long-term total return, which includes capital appreciation and income |
| Long-term total return, comprised primarily of capital appreciation |
| Long-term total return, which includes capital appreciation and income |
| Total return, consisting of both current income and capital appreciation |
| Long-term total return, which includes capital appreciation and income |
| Long-term total return, which includes capital appreciation and income |
| Long-term total return, which includes capital appreciation and income |
Each Fund has registered and is authorized to offer interests in four classes of shares: Adviser Class, Class I, Class Y-2 and Class Y-3. The principal difference between the classes of shares is the level of shareholder service, marketing and administrative fees borne by the classes. As of March 31, 2023, Class Y-3 shares were outstanding in each of the Funds and Class I shares were outstanding in Non-US Core Equity and Core Fixed.
2.
Significant Accounting Policies
The following are significant accounting policies followed by the Funds. These policies are in conformity with accounting principles generally accepted in the United States of America (“GAAP”). The preparation of financial statements in conformity with GAAP requires management to make estimates and assumptions that affect the reported amounts and disclosures in the financial statements. Actual results could differ from these estimates.
Mercer Funds
Notes to Financial Statements (Continued)
March 31, 2023
(a) Security Valuation
Each Fund’s investments are valued as of the close of regular trading on the New York Stock Exchange (“NYSE”) on each day when the NYSE is open. Portfolio securities and exchange-traded funds listed on an exchange normally are valued at the last sale or official closing price on the day on which the securities are valued or, lacking any sales on such day, at the last available bid price using prices as of the close of trading. In cases where securities are traded on more than one exchange, the securities are generally valued on the exchange considered by the Adviser or the applicable Sub-adviser as the primary market for such securities. Securities traded in the over-the-counter (“OTC”) market and listed on the NASDAQ Stock Market (“NASDAQ”) normally are valued at the NASDAQ official closing price; other OTC securities are valued at the last bid price available prior to valuation (other than short-term investments, which are valued as described below). The Funds may invest in securities that are traded in foreign markets. Foreign securities will be converted into U.S. dollar equivalents based on the exchange rate in effect at a uniform time on each business day. Events occurring after the close of trading on foreign exchanges may result in adjustments to the valuation of foreign securities to more accurately reflect their fair value as of the close of regular trading on the NYSE. When valuing foreign equity securities that meet certain criteria that the Adviser, which has been designated as the Funds' Valuation Designee under Rule 2a-5 of the 1940 Act by the Board of Trustees of the Trust (the “Board”), has approved the use of a fair value service that values such securities to reflect market trading that occurs after the close of the applicable foreign markets of comparable securities or other instruments that have a strong correlation to the fair-valued securities. Investments in open-end investment companies are valued at their net asset value (“NAV”) per share.
Certain fixed-income securities may be valued based upon appraisals received from an independent pricing service using a computerized matrix system or based upon appraisals derived from information concerning the securities or similar securities received from a recognized dealer or dealers in those securities. It should be recognized that judgment often plays a greater role in valuing thinly traded securities, as well as bonds and other securities with few dealer quotations, than is the case with respect to securities for which a broader range of dealer quotations and last-sale information is available. Each such determination is based on consideration of relevant factors, and judgment is made by or at the direction of the Valuation Designee. Each Fund values its investments for which market quotations are readily available at market value. Each Fund may value short-term investments that will mature within sixty (60) days or less by using pricing service quotations or at amortized cost, provided that such amortized cost approximates market value.
Derivative financial instruments, such as futures contracts or options contracts that are traded on a national securities exchange, are stated at the last reported sale or settlement price on the day of valuation. Futures traded on inactive markets are valued using broker quotations. OTC derivative financial instruments, such as foreign currency contracts, options contracts, synthetic futures, or swaps agreements, derive their value from underlying asset prices, indices, reference rates, and other inputs or a combination of these factors. These contracts are normally valued on the basis of an independent pricing service providers or broker/dealer quotations. Depending on the derivative type and the terms of the derivative, the value of the derivative financial instruments is assigned by independent pricing service providers using a series of techniques, which may include pricing models. The pricing models use inputs that are observed from actively quoted markets such as issuer details, indices, spreads, interest rates, curves, volatilities, dividends and exchange rates.
Bank loans are valued using an evaluated quote provided by an independent pricing service. Evaluated quotes provided by the pricing service may reflect appropriate factors such as ratings, yield curves, prepayment speeds, tranche type, industry, company performance, spread, individual trading characteristics, institutional size trading in similar groups of securities and other market data.
The Board has designated the Adviser as the Valuation Designee responsible for valuing portfolio securities, subject to continuing Board oversight. The Adviser has appointed a Valuation Committee that
Mercer Funds
Notes to Financial Statements (Continued)
March 31, 2023
is responsible for overseeing the day-to-day process of valuing portfolio securities. With respect to portfolio securities for which market quotations are not readily available or (in the opinion of the Adviser or the applicable Sub-adviser) do not otherwise accurately reflect the fair values of the securities, the Valuation Committee will value such securities at fair value based upon procedures approved by the Board. In that regard, at March 31, 2023, substantially all foreign equity securities held by Non-US Core Equity, Emerging Markets and Global Low Volatility were fair valued using valuations provided by an independent valuation service consistent with the valuation procedures approved by the Board.
The application of fair value pricing represents a good faith determination based on specific procedures performed under the supervision of the Board. Due to the subjective nature of fair value pricing, there can be no assurance that the Fund could realize the fair value assigned to the security if the Fund were to sell the security at approximately the time at which the Fund determines its NAV per share. The Fund’s value for a particular security may be different from the last quoted market price.
The Funds follow a three-tier hierarchy to prioritize the assumptions, referred to as inputs, used in valuation techniques to measure fair value. The three-tier hierarchy of inputs is summarized in the three broad Levels listed below.
•
Level 1 — quoted prices unadjusted in active markets for identical investments
•
Level 2 — other significant observable inputs (including quoted prices for similar investments, interest rates, prepayment speeds, credit risk, etc.)
•
Level 3 — significant unobservable inputs (including the Fund’s own assumptions in determining the fair value of investments)
The inputs or methodology used for valuing securities are not necessarily an indication of the risk associated with investing in those securities.
The assets and liabilities shown in the Statements of Assets and Liabilities related to investments purchased for “to-be-announced” or "TBA" commitments or when-issued securities approximate fair value and are determined using Level 2 inputs, as of March 31, 2023. The assets and liabilities shown in the Statements of Assets and Liabilities related to cash collateral held at broker for futures contracts and swap contracts are determined using Level 1 inputs as of March 31, 2023.
At March 31, 2023, Large Cap and Small/Mid Cap held long-term investments whose value was determined using Level 1 inputs, with corresponding major categories as shown in the Schedule of Investments, as well as the “Mutual Fund - Securities Lending Collateral” and the “Futures Contracts” sections whose values were determined using Level 1 inputs.
Mercer Funds
Notes to Financial Statements (Continued)
March 31, 2023
The following is a summary of the portfolio securities by level based on inputs used as of March 31, 2023 in valuing the assets and liabilities of Non-US Core Equity, Core Fixed, Opportunistic Fixed, Emerging Markets and Global Low Volatility for which fair valuation was used:
Non-US Core Equity
ASSETS VALUATION INPUT
| | | | |
| Quoted Prices
in Active
Markets for
Identical Assets
(Level 1) | Significant
Other
Observable
Inputs
(Level 2) | Significant
Unobservable
Inputs
(Level 3) | |
| | | | |
| | | | |
| | | | |
| | | | |
| | | | |
| | | | |
| | | | |
| | | | |
| | | | |
| | | | |
| | | | |
| | | | |
| | | | |
| | | | |
| | | | |
| | | | |
| | | | |
| | | | |
| | | | |
| | | | |
| | | | |
| | | | |
| | | | |
| | | | |
| | | | |
| | | | |
| | | | |
| | | | |
| | | | |
| | | | |
| | | | |
| | | | |
| | | | |
| | | | |
| | | | |
Mercer Funds
Notes to Financial Statements (Continued)
March 31, 2023
| | | | |
| Quoted Prices in Active Markets for Identical Assets (Level 1) | Significant Other Observable Inputs (Level 2) | Significant Unobservable Inputs (Level 3) | |
| | | | |
| | | | |
| | | | |
| | | | |
| | | | |
| | | | |
| | | | |
| | | | |
| | | | |
| | | | |
| | | | |
| | | | |
| | | | |
Mutual Fund - Securities Lending Collateral | | | | |
| | | | |
| | | | |
| | | | |
| Represents one or more Level 3 securities at $0 value as of March 31, 2023. |
| Futures contracts are valued at unrealized appreciation/depreciation. Only current day’s variation margin, if any, is reported on the Statements of Assets and Liabilities. |
Core Fixed
ASSETS VALUATION INPUT
| Quoted Prices
in Active
Markets for
Identical Assets
(Level 1) | Significant
Other
Observable
Inputs
(Level 2) | Significant
Unobservable
Inputs
(Level 3) | |
| | | | |
| | | | |
| | | | |
Mortgage Backed Securities - Private Issuers | | | | |
Mortgage Backed Securities - U.S. Government Agency Obligations | | | | |
Mercer Funds
Notes to Financial Statements (Continued)
March 31, 2023
| Quoted Prices in Active Markets for Identical Assets (Level 1) | Significant Other Observable Inputs (Level 2) | Significant Unobservable Inputs (Level 3) | |
| | | | |
Sovereign Debt Obligations | | | | |
U.S. Government and Agency Obligations | | | | |
| | | | |
| | | | |
| | | | |
Mutual Fund - Securities Lending Collateral | | | | |
| | | | |
| | | | |
| | | | |
Centrally Cleared Interest Rate | | | | |
Forward Foreign Currency Contract† | | | | |
| | | | |
LIABILITIES VALUATION INPUT
| Quoted Prices
in Active
Markets for
Identical Assets
(Level 1) | Significant
Other
Observable
Inputs
(Level 2) | Significant
Unobservable
Inputs
(Level 3) | |
| | | | |
| | | | |
| | | | |
| | | | |
| | | | |
Forward Foreign Currency Contracts† | | | | |
| | | | |
| Forward foreign currency contracts, Futures contracts and Centrally Cleared Swaps are valued at unrealized appreciation/depreciation. Only current day’s variation margin, if any, is reported on the Statements of Assets and Liabilities. |
Mercer Funds
Notes to Financial Statements (Continued)
March 31, 2023
Opportunistic Fixed
ASSETS VALUATION INPUT
| Quoted Prices
in Active
Markets for
Identical Assets
(Level 1) | Significant
Other
Observable
Inputs
(Level 2) | Significant
Unobservable
Inputs
(Level 3) | |
| | | | |
| | | | |
| | | | |
| | | | |
| | | | |
Mortgage Backed Securities - Private Issuers | | | | |
Mortgage Backed Securities - U.S. Government Agency Obligations | | | | |
Sovereign Debt Obligations | | | | |
U.S. Government and Agency Obligations | | | | |
| | | | |
| | | | |
| | | | |
| | | | |
| | | | |
Convertible Preferred Stocks | | | | |
| | | | |
| | | | |
Total Convertible Preferred Stocks | | | | |
| | | | |
Mutual Fund - Securities Lending Collateral | | | | |
| | | | |
Purchased Currency Options | | | | |
Purchased Futures Options | | | | |
| | | | |
| | | | |
| | | | |
| | | | |
| | | | |
Mercer Funds
Notes to Financial Statements (Continued)
March 31, 2023
| Quoted Prices in Active Markets for Identical Assets (Level 1) | Significant Other Observable Inputs (Level 2) | Significant Unobservable Inputs (Level 3) | |
| | | | |
| | | | |
Centrally Cleared Interest Rate | | | | |
| | | | |
Centrally Cleared Credit Default | | | | |
| | | | |
Forward Foreign Currency Contracts† | | | | |
| | | | |
LIABILITIES VALUATION INPUT
| Quoted Prices
in Active
Markets for
Identical Assets
(Level 1) | Significant
Other
Observable
Inputs
(Level 2) | Significant
Unobservable
Inputs
(Level 3) | |
| | | | |
| | | | |
| | | | |
| | | | |
| | | | |
| | | | |
Centrally Cleared Interest Rate | | | | |
| | | | |
Centrally Cleared Credit Default | | | | |
| | | | |
Forward Foreign Currency Contracts† | | | | |
| | | | |
| | | | |
| | | | |
| | | | |
| | | | |
| Represents one or more Level 3 securities at $0 value as of March 31, 2023. |
| Forward foreign currency contracts, Futures contracts and Centrally Cleared Swaps are valued at unrealized appreciation/depreciation. Only current day’s variation margin, if any, is reported on the Statements of Assets and Liabilities. |
Mercer Funds
Notes to Financial Statements (Continued)
March 31, 2023
Emerging Markets
ASSETS VALUATION INPUT
| | | | |
| Quoted Prices
in Active
Markets for
Identical Assets
(Level 1) | Significant
Other
Observable
Inputs
(Level 2) | Significant
Unobservable
Inputs
(Level 3) | |
| | | | |
| | | | |
| | | | |
| | | | |
| | | | |
| | | | |
| | | | |
| | | | |
| | | | |
| | | | |
| | | | |
| | | | |
| | | | |
| | | | |
| | | | |
| | | | |
| | | | |
| | | | |
| | | | |
| | | | |
| | | | |
| | | | |
| | | | |
| | | | |
| | | | |
| | | | |
| | | | |
| | | | |
| | | | |
| | | | |
| | | | |
| | | | |
| | | | |
| | | | |
Mutual Fund - Securities Lending Collateral | | | | |
Mercer Funds
Notes to Financial Statements (Continued)
March 31, 2023
| | | | |
| Quoted Prices in Active Markets for Identical Assets (Level 1) | Significant Other Observable Inputs (Level 2) | Significant Unobservable Inputs (Level 3) | |
| | | | |
| | | | |
| | | | |
| Futures contracts are valued at unrealized appreciation/depreciation. Only current day’s variation margin, if any, is reported on the Statements of Assets and Liabilities. |
Global Low Volatility
ASSETS VALUATION INPUT
| | | | |
| Quoted Prices
in Active
Markets for
Identical Assets
(Level 1) | Significant
Other
Observable
Inputs
(Level 2) | Significant
Unobservable
Inputs
(Level 3) | |
| | | | |
| | | | |
| | | | |
| | | | |
| | | | |
| | | | |
| | | | |
| | | | |
| | | | |
| | | | |
| | | | |
| | | | |
| | | | |
| | | | |
| | | | |
| | | | |
| | | | |
| | | | |
| | | | |
| | | | |
| | | | |
| | | | |
| | | | |
| | | | |
Mercer Funds
Notes to Financial Statements (Continued)
March 31, 2023
| | | | |
| Quoted Prices in Active Markets for Identical Assets (Level 1) | Significant Other Observable Inputs (Level 2) | Significant Unobservable Inputs (Level 3) | |
| | | | |
| | | | |
| | | | |
| | | | |
| | | | |
| | | | |
| | | | |
| | | | |
| | | | |
Mutual Fund - Securities Lending Collateral | | | | |
| | | | |
| | | | |
| | | | |
| Futures contracts are valued at unrealized appreciation/depreciation. Only current day’s variation margin, if any, is reported on the Statements of Assets and Liabilities. |
Investments in Derivative Instruments
At March 31, 2023 and during the year then ended, the Fund had the following derivatives and transactions in derivatives, grouped into appropriate risk categories:
| | | | | |
| | |
| | |
| | | | | |
Net Realized Gain (Loss)(2) | | |
| | | | | |
Change in Appreciation (Depreciation)(3) | |
| | | | | |
| | |
| | |
| | | | | |
Mercer Funds
Notes to Financial Statements (Continued)
March 31, 2023
| | | | | |
Net Realized Gain (Loss)(2) | | |
| | | | | |
Change in Appreciation (Depreciation)(3) | |
| | | | | |
| | |
| | |
| | | | | |
Net Realized Gain (Loss)(2) | | |
| | | | | |
Forward Foreign Currency Contracts | | | | | |
Total Realized Gain (Loss) | | | | | |
Change in Appreciation (Depreciation)(3) | |
| | | | | |
| | |
| | |
| | | | | |
Forward Foreign Currency Contracts(4) | | | | | |
Centrally Cleared Swap Contracts(5) | | | | | |
| | | | | |
| | |
| | | | | |
Forward Foreign Currency Contracts(6) | | | | | |
| | | | | |
Net Realized Gain (Loss)(2) | | |
| | | | | |
| | | | | |
Forward Foreign Currency Contracts | | | | | |
Total Realized Gain (Loss) | | | | | |
Change in Appreciation (Depreciation)(3) | |
| | | | | |
| | | | | |
Forward Foreign Currency Contracts | | | | | |
Total Change in Appreciation (Depreciation) | | | | | |
Mercer Funds
Notes to Financial Statements (Continued)
March 31, 2023
| | | | | |
| | |
| | |
| | | | | |
| | | | | |
Forward Foreign Currency Contracts(4) | | | | | |
| | | | | |
Centrally Cleared Swap Contracts(5) | | | | | |
| | | | | |
| | |
| | | | | |
| | | | | |
Forward Foreign Currency Contracts(6) | | | | | |
| | | | | |
Centrally Cleared Swap Contracts(5) | | | | | |
| | | | | |
Net Realized Gain (Loss)(2) | | |
| | | | | |
| | | | | |
| | | | | |
| | | | | |
Forward Foreign Currency Contracts | | | | | |
Total Realized Gain (Loss) | | | | | |
Change in Appreciation (Depreciation)(3) | |
| | | | | |
| | | | | |
| | | | | |
| | | | | |
Forward Foreign Currency Contracts | | | | | |
Total Change in Appreciation (Depreciation) | | | | | |
| | |
| | |
| | | | | |
Net Realized Gain (Loss)(2) | | |
| | | | | |
Change in Appreciation (Depreciation)(3) | |
| | | | | |
Mercer Funds
Notes to Financial Statements (Continued)
March 31, 2023
| | | | | |
| | |
| | |
| | | | | |
Net Realized Gain (Loss)(2) | | |
| | | | | |
Change in Appreciation (Depreciation)(3) | |
| | | | | |
| Cumulative appreciation (depreciation) on futures contracts is disclosed within the Schedule of Investments under “Futures Contracts” section. Only current day’s variation margin, if any, are reported within the Statements of Assets and Liabilities. |
| Statements of Operations location: Amounts are included in Net realized gain (loss) on Forward foreign currency contracts, Closed futures contracts, Purchased option contracts, Written option contracts and Swap contracts, if any. |
| Statements of Operations location: Amounts are included in Change in net unrealized appreciation (depreciation) on Forward foreign currency contracts, Open futures contracts, Purchased option contracts, Written option contracts and Swap contracts, if any. |
| Statements of Assets and Liabilities location: Unrealized appreciation on open forward foreign currency contracts. |
| Centrally Cleared Swaps are valued at unrealized appreciation/depreciation on the Schedule of Investments. Only current day's variation margin, if any, is reported on the Statements of Assets and Liabilities. |
| Statements of Assets and Liabilities location: Unrealized depreciation on open forward foreign currency contracts. |
| Statements of Assets and Liabilities location: Investments, at value. |
| Statements of Assets and Liabilities location: Written options, at value. |
For the year ended March 31, 2023, the number of contracts, notional amounts, or shares/units for each derivative |
| | | | | | Forward
Foreign
Currency
Contracts |
| | | | | | |
| | | | | | |
| | | | | | |
| | | | | | |
| | | | | | |
| | | | | | |
| | | | | | |
| Amounts disclosed represent average notional value for the months that the Funds held such derivatives during the year ended March 31, 2023. |
Netting Agreements and Collateral Requirements
In order to better define contractual rights under derivative contracts and to secure rights that will help the Funds mitigate their counterparty risk, a Sub-adviser may, on behalf of a Fund, enter into an International Swaps and Derivatives Association, Inc. Master Agreement (“ISDA Master Agreement”)
Mercer Funds
Notes to Financial Statements (Continued)
March 31, 2023
or similar agreement with its derivative contract counterparties. An ISDA Master Agreement is a bilateral agreement between the Fund and a counterparty that governs OTC derivatives and foreign exchange contracts and typically contains, among other things, collateral posting terms and netting provisions in the event of a default and/or termination event. Under an ISDA Master Agreement, a Fund may, under certain circumstances, offset with the counterparty certain derivative financial instrument’s payables and/or receivables with certain collateral held and/or posted and create a net payment. The provisions of the ISDA Master Agreement typically permit a net payment in the event of default including the bankruptcy or insolvency of the counterparty. Absent an event of default by the counterparty or termination of the agreement, the ISDA Master Agreement does not result in an offset of reported amounts of assets and liabilities in the Statements of Assets and Liabilities across the transactions between the Fund and the applicable counterparty. The right to offset and net payments across all transactions traded under the ISDA Master Agreement could result in a reduction of the Fund's credit risk to such counterparty equal to any amounts payable by the Fund under the applicable transactions, if any. However, bankruptcy or insolvency laws of a particular jurisdiction may impose restrictions on or prohibitions against the right of offset in bankruptcy, insolvency or other events. In addition, certain ISDA Master Agreements allow counterparties to OTC derivatives to terminate derivative contracts prior to maturity in the event a Fund's net assets decline by a stated percentage or the Fund fails to meet the terms of their ISDA Master Agreements, which would cause the Fund to accelerate payment of any net liability owed to the counterparty.
For derivatives traded under an ISDA Master Agreement, the collateral requirements are typically calculated by netting the mark to market amount for each transaction under such agreement and comparing that amount to the value of any collateral currently pledged by the Fund and the counterparty.
Cash collateral that has been pledged to cover obligations of the Fund and cash collateral received from the counterparty, if any, is reported separately on the Statements of Assets and Liabilities as cash collateral held at broker or cash collateral due to broker, respectively. Non-cash collateral pledged by or received by a Fund, if any, is noted in the Schedule of Investments. Generally, the amount of collateral due from or to a party has to exceed a minimum transfer amount threshold before a transfer is required, which is determined each day at the close of business of the Fund, typically based on changes in market values for each transaction under an ISDA Master Agreement and netted into one amount for such agreement and any additional required collateral is delivered to/pledged by the Fund on the next business day. Typically, the Fund and counterparties are not permitted to sell, re-pledge or use the collateral they receive. To the extent amounts due to the Fund from their counterparties are not fully collateralized, contractually or otherwise, the Fund bears the risk of loss from counterparty non-performance. The Fund attempts to mitigate counterparty risk by entering into agreements only with counterparties that they believe have the financial resources to honor their obligations and by monitoring the financial stability of those counterparties.
The Funds are required to disclose both gross and net information for assets and liabilities related to derivatives, repurchase and reverse repurchase agreements, and securities lending and securities borrowings transactions that are eligible for offset or subject to an enforceable master netting or similar agreement. The Funds' derivative assets and liabilities at fair value by risk are presented in the tables above. For financial reporting purposes, the Funds do not offset derivative assets and derivative liabilities that are subject to netting arrangements in the Statements of Assets and Liabilities. Only forward foreign currency contracts, OTC swaps and OTC options assets and liabilities are subject to master netting agreements. An exception to this, Opportunistic Fixed is not a party to an ISDA master agreement with Commonwealth Bank of Australia.
The following tables present the Funds' derivative assets and liabilities by counterparty, net of amounts available for offset under a Master Netting Agreement (“MNA”) and net of related collateral received by the Funds for assets or pledged by the Funds for liabilities as of March 31, 2023.
Mercer Funds
Notes to Financial Statements (Continued)
March 31, 2023
Core Fixed
Offsetting of Financial Assets and Derivative Assets:
| Derivative
Assets Subject
to MNA | Derivative
Assets/(Liabilities)
available for
offset | Non-cash
Collateral
Received | | |
| | | | | |
Offsetting of Financial Liabilities and Derivative Liabilities:
| Derivative
Liabilities Subject
to MNA | Derivative
Assets/(Liabilities)
available for offset | Non-cash
Collateral
Pledged | | |
| | | | | |
| | | | | |
| | | | | |
| Represents the net amount receivable from the counterparty in the event of default. |
| Represents the net amount payable to the counterparty in the event of default. |
| In some instances, the actual collateral received and/or pledged may be more than the derivative asset or liability due to overcollateralization. |
Opportunistic Fixed
Offsetting of Financial Assets and Derivative Assets:
| Derivative
Assets Subject
to MNA | Derivative
Assets/(Liabilities)
available for
offset | Non-cash
Collateral
Received | | |
| | | | | |
| | | | | |
| | | | | |
| | | | | |
| | | | | |
| | | | | |
Goldman Sachs International | | | | | |
| | | | | |
| | | | | |
| | | | | |
| | | | | |
| | | | | |
Morgan Stanley and Co. International Plc | | | | | |
Morgan Stanley Capital Services, Inc. | | | | | |
Mercer Funds
Notes to Financial Statements (Continued)
March 31, 2023
| Derivative Assets Subject to MNA | Derivative Assets/(Liabilities) available for offset | Non-cash Collateral Received | | Net Amount of Derivative Assets(a) |
| | | | | |
| | | | | |
| | | | | |
| | | | | |
| | | | | |
| | | | | |
| | | | | |
Offsetting of Financial Liabilities and Derivative Liabilities:
| Derivative
Liabilities Subject
to MNA | Derivative
Assets/(Liabilities)
available for offset | Non-cash
Collateral
Pledged | | |
| | | | | |
| | | | | |
| | | | | |
| | | | | |
| | | | | |
| | | | | |
Goldman Sachs International | | | | | |
| | | | | |
| | | | | |
| | | | | |
| | | | | |
Morgan Stanley and Co. International Plc | | | | | |
Morgan Stanley Capital Services, Inc. | | | | | |
| | | | | |
| | | | | |
State Street Bank and Trust | | | | | |
| | | | | |
| | | | | |
| | | | | |
| | | | | |
| Represents the net amount receivable from the counterparty in the event of default. |
| Represents the net amount payable to the counterparty in the event of default. |
| In some instances, the actual collateral received and/or pledged may be more than the derivative asset or liability due to overcollateralization. |
Mercer Funds
Notes to Financial Statements (Continued)
March 31, 2023
(b) Securities transactions and related investment income
Security transactions are accounted for on trade date. Dividend income, net of applicable withholding taxes, is recorded on the ex-dividend date or when the Fund is informed of the ex-dividend date, if later. Interest income is recorded on the accrual basis, and is adjusted for amortization of premium and discounts for debt securities. Income is not recognized, nor are premium and discount amortized on securities for which collection is not expected. Withholding taxes on foreign dividends, interest, and capital gains have been provided for in accordance with the respective country's tax rules and rates. Non-cash dividends, if any, are recorded at the fair value of the securities received. Distributions received on securities that represent a return of capital or capital gains are recorded as a reduction of cost of investments and/or as a realized gain. The Funds determine the classification of distributions received as return of capital distributions or capital gain distributions. Interest income on inflation indexed securities is accrued daily based upon an inflation-adjusted principal. Additionally, any increase in the principal or face amount of these securities is recorded as interest income. In determining the net gain or loss on securities sold, the cost of securities is determined on the identified-cost basis.
(c) Cash, cash equivalents and short-term investments
A Fund may invest a portion of its assets in cash and cash equivalents. Cash and cash equivalents are defined as cash and bank balances as well as short-term investments with a maturity of less than three months from the acquisition date.
A Fund may invest a portion of its assets in short-term debt securities (including repurchase agreements and reverse repurchase agreements) of corporations, the U.S. government and its agencies and instrumentalities and banks and finance companies, which may be denominated in any currency.
A Fund may invest a portion of its assets in shares issued by money market mutual funds. A Fund also may invest in collective investment vehicles that are managed by an unaffiliated investment manager, pending investment of the Fund’s assets in portfolio securities. When unusual market conditions warrant, a Fund may make substantial temporary defensive investments in cash equivalents, up to a maximum of 100% of the Fund's net assets. Cash equivalent holdings may be in any currency. When a Fund invests for temporary defensive purposes, such investments may affect the Fund’s ability to achieve its investment objective.
(d) Securities lending
A Fund may lend its portfolio securities to qualified broker/dealers and financial institutions pursuant to agreements, provided: (1) the loan is secured continuously by collateral marked to market daily and maintained in an amount at least equal to the current fair value of the securities loaned; (2) the Fund may call the loan at any time and receive the securities loaned; (3) the Fund will receive any interest or dividends paid on the loaned securities; and (4) the aggregate fair value of securities loaned will not at any time exceed 33 1/3% of the total assets of the Fund. Collateral will consist of U.S. and non-U.S. securities, cash equivalents or irrevocable letters of credit. A liability for cash collateral is reflected in the Statements of Assets and Liabilities, and is categorized as Level 2 within the fair value hierarchy. As with other extensions of credit, there are risks of delay in recovery or even loss of rights in collateral in the event of default or insolvency of a borrower of a Fund’s portfolio securities. A Fund may not retain voting rights on securities while they are on loan.
Certain Funds may from time to time participate in a securities lending program under which the Funds’ custodian, State Street Bank and Trust Company (the “Custodian”), acting as securities lending agent, is authorized to lend the Funds' portfolio securities to qualified broker/dealers and financial institutions that post appropriate collateral. The Custodian has agreed to indemnify the Funds in case of default of any security borrower.
Mercer Funds
Notes to Financial Statements (Continued)
March 31, 2023
Securities on loan are fully collateralized and the collateral was equal to or exceeded the securities on loan at March 31, 2023. If the market value of the collateral at the close of trading on a business day is less than 100% of the market value of the loaned securities at the close of trading on that day, the borrower shall be required to deliver, by the close of business on the following business day, an additional amount of collateral so that the total amount of posted collateral is equal to at least 100% of the market value of all the loaned securities as of such preceding day. Cash collateral is invested in Premier Class Shares of State Street Institutional U.S. Government Money Market Fund. The Custodian receives a portion of the interest earned on any reinvested collateral. The market value of securities on loan to borrowers and the value of collateral held by the Funds with respect to such loans at March 31, 2023 were as follows:
| Market Value of
Loaned Securities | | Value of
Non-Cash Collateral |
| | | |
| | | |
| | | |
| | | |
| | | |
| | | |
| | | |
For Large Cap, Small/Mid Cap, Non-US Core Equity, Emerging Markets and Global Low Volatility, all of the securities on loan collateralized by cash are classified as Common Stocks in each Fund’s Schedule of Investments at March 31, 2023, with a contractual maturity of overnight and continuous. For Core Fixed, all of the securities on loan collateralized by cash are classified as Corporate Debt in each Fund’s Schedule of Investments at March 31, 2023, with a contractual maturity of overnight and continuous.
For Opportunistic Fixed, the values of the security loan obligations are classified as follows at March 31, 2023:
Opportunistic Fixed
| Remaining Contractual Maturity of the Agreements
As of March 31, 2023 |
| | | | | |
Securities Lending Transactions | | | | | |
| | | | | |
| | | | | |
Sovereign Debt Obligations | | | | | |
U.S. Government and Agency Obligations | | | | | |
| | | | | |
Gross amount of recognized liabilities for securities lending transaction | |
Mercer Funds
Notes to Financial Statements (Continued)
March 31, 2023
(e) Swaps
Swap contracts are derivatives in the form of a contract or similar instrument, which is an agreement to exchange the return generated by one instrument for the return generated by another instrument. A Fund may engage in swaps, including but not limited to, interest rate, currency, credit default, index, and total return swaps, and the purchase or sale of related caps, floors, collars, and other derivative instruments. A Fund expects to enter into these transactions to preserve a return or spread on a particular investment or portion of the portfolio, to modify the portfolio’s duration, to protect against any increase in the price of securities the Fund anticipates purchasing at a later date, or to gain exposure to certain markets in the most economical way possible.
Interest rate swaps involve the exchange by a Fund with another party of their respective commitments to receive or pay interest (e.g., an exchange of fixed rate payments for floating rate payments) with respect to a notional amount of principal. Up-front payments received or made are reflected as “up-front net premiums received” or “up-front net premiums paid”, respectively, on the Statements of Assets and Liabilities. Currency swaps involve the exchange of cash flows on a notional amount based on changes in the values of referenced currencies.
The credit default swaps may have as reference obligations of one or more securities that are not currently held by a Fund. The protection “buyer” in a credit default swap agreement is generally obligated to pay the protection “seller” an upfront or a periodic stream of payments over the term of the contract provided that no credit event, such as a default, on a reference obligation has occurred. If a credit event occurs, the seller generally must pay the buyer the “par value” (full notional value) of the swap in exchange for an equal face amount of deliverable obligations of the reference entity described in the swap, or the seller may be required to deliver the related net cash amount, if the swap is cash settled. A Fund may be either the buyer or seller in the transaction. If a Fund is a buyer and no credit event occurs, the Fund may recover nothing if the swap is held through its termination date. However, if a credit event occurs, the buyer generally may elect to receive the full notional value of the swap in exchange for an equal face amount of deliverable obligations of the reference entity whose value may have significantly decreased. As a seller, a Fund generally receives an upfront payment or a fixed rate of income throughout the term of the swap provided that there is no credit event. As the seller, a Fund would effectively add leverage to its portfolio because, in addition to its total net assets, a Fund would be subject to investment exposure on the notional amount of the swap.
The spread of a credit default swap is the annual amount the protection buyer must pay the protection seller over the length of the contract, expressed as a percentage of the notional amount. When spreads rise, market perceived credit risk rises and when spreads fall, market perceived credit risk falls. Wider credit spreads and decreasing market values, when compared to the notional amount of the swap, represent a deterioration of the referenced entity’s credit soundness and an increased market perception that there is a greater likelihood of risk of default or other credit event occurring as defined under the terms of the agreement. For credit default swaps on asset-backed securities and credit indices, the quoted market prices and resulting values, as well as the annual payment rates, serve as an indication of the current status of the payment/performance risk.
In a total return swap, the buyer receives a periodic return equal to the total return of a specified security, securities or index for a specified period of time. In return, the buyer pays the counterparty a fixed or variable stream of payments, typically based upon short-term interest rates, possibly plus or minus an agreed upon spread. During the term of the outstanding swap agreement, changes in the underlying value of the swap are recorded as unrealized gains and losses. Periodic payments received or made are recorded as realized gains or losses. The Fund is exposed to credit loss in the event of nonperformance by the swap counterparty. Risk may also arise from the unanticipated movements in value of exchange rates, interest rates, securities, or the index.
Swaps do not involve the delivery of securities or other underlying assets or principal, and are subject
Mercer Funds
Notes to Financial Statements (Continued)
March 31, 2023
to counterparty risk. If the other party to a swap defaults and fails to consummate the transaction, a Fund’s risk of loss consists of the net amount of interest payments that the Fund is contractually entitled to receive.
The equity swaps in which a Fund may invest involve agreements with a counterparty. The return to the Fund on any equity swap contract will be the total return on the notional amount of the contract as if it were invested in the stocks comprising the contract index in exchange for an interest component based on the notional amount of the agreement. The Fund will only enter into an equity swap contract on a net basis, i.e., the two parties’ obligations are netted out, with the Fund paying or receiving, as the case may be, only the net amount of the payments. Payments under an equity swap contract may be made at the conclusion of the contract or periodically during its term.
Whether a Fund’s use of swaps or swap options will be successful in achieving the Fund’s investment objective will depend on the Sub-adviser’s ability to predict correctly whether certain types of investments are likely to produce greater returns than other investments. Moreover, a Fund bears the risk of loss of the amount expected to be received under a swap contract in the event of the default or bankruptcy of a swap counterparty. The Funds will enter into swap agreements only with counterparties that meet certain standards of creditworthiness.
If there is a default by the counterparty to an uncleared swap, a Fund will be limited to contractual remedies pursuant to the agreements related to the transaction. There is no assurance that a swap counterparty will be able to meet its obligations pursuant to a swap or that, in the event of a default, a Fund will succeed in pursuing contractual remedies. A Fund thus assumes the risk that it may be delayed in, or prevented from, obtaining payments owed to it pursuant to a swap. However, the amount at risk is, subject to some exceptions, generally only the net unrealized gain, if any, on the swap not the entire notional amount. The Sub-adviser that enters into the swap will closely monitor, subject to the oversight of the Derivatives Risk Manager for the Funds, the creditworthiness of swap counterparties in order to minimize the counterparty risk of swaps.
Because swaps are two party contracts that may be subject to contractual restrictions on transferability and termination, and they may have terms of greater than seven (7) days, swap agreements may be considered to be illiquid and subject to a Fund’s limitation on investments in illiquid securities. However, the Trust has adopted procedures pursuant to which the Adviser may determine that swaps (including swap options) are liquid under certain circumstances. To the extent that a swap is not liquid, it may not be possible to initiate a transaction or liquidate a position at an advantageous time or price, which may result in significant losses.
The Dodd-Frank Wall Street Reform and Consumer Protection Act (the “Dodd-Frank Act”) was enacted in July 2010. Among other things, the Dodd-Frank Act sets forth a regulatory framework for certain OTC derivatives, such as swaps. The Dodd-Frank Act requires certain swap transactions to be executed on registered exchanges or through swap execution facilities, cleared through a regulated clearinghouse, and publicly reported. In addition, many market participants who were not previously required to register are regulated as swap dealers or major swap participants, and are, or will be, subject to certain minimum capital and margin requirements and business conduct standards.
Certain standardized swaps, including certain U.S. dollar and non-U.S. dollar denominated interest rate and credit default index swaps, are subject to mandatory clearing, which interposes a central clearing house as the counterparty to each participant's swap, and exchange-trading. Additional swap asset classes are expected to be subject to mandatory clearing and exchange-trading in the future. The counterparty risk for cleared derivatives is generally considered to be lower than for uncleared derivatives, but cleared contracts are not risk-free. It is possible that developments in the swaps market, including potential government regulation, could adversely affect the Funds' ability to terminate existing swap agreements or to realize amounts to be received under such agreements.
Mercer Funds
Notes to Financial Statements (Continued)
March 31, 2023
Central clearing and exchange trading is required by the Commodity Futures Trading Commission (“CFTC”) for many instruments traded in the swaps market. In addition, uncleared swaps that are subject to regulatory collateral requirements could adversely affect a Fund’s ability to enter into swaps in the OTC market. The establishment of a centralized exchange or market for cleared swap transactions may not result in swaps being easier to value or trade. However, swap dealers, major swap participants, and swap counterparties may experience other new and/or additional regulations, requirements, compliance burdens, and associated costs. The legislation and rules promulgated may exert a negative effect on a Fund’s ability to meet its investment objective, either through limits or requirements imposed on the Fund or its counterparties. Specifically, position limits imposed on a Fund or its counterparties may affect that Fund’s ability to invest in futures, options, and swaps in a manner consistent with the Fund’s investment objective and strategies. The requirements prescribed by the Dodd-Frank Act may increase the cost of a Fund’s investments and cost of doing business, which could adversely affect the ability of the Funds to buy or sell derivatives.
In a cleared swap transaction, the Fund typically will be required to post specified levels of margin with the clearinghouse or at the instruction of the clearinghouse; the margin required by a clearinghouse may be greater than the margin the Fund would be required to post in an uncleared derivative transaction. Cash margin is recorded on the Statements of Assets and Liabilities as cash collateral held at broker on open swap contracts. Swap agreements are marked to market daily. Daily changes in valuation of centrally cleared swaps, if any, are recorded as a variation margin payable or receivable for the change in value as appropriate on the Statements of Assets and Liabilities. Only certain derivative transactions are currently eligible for clearing by clearinghouses.
A Fund will accrue for interim payments on swap contracts on a daily basis, with the net amount recorded as interest payable or receivable on the Statements of Assets and Liabilities. Once interim payments are settled in cash, the net amount is recorded as realized gain/loss on swap contracts, in addition to realized gain/loss recorded upon the termination of swap contracts on the Statements of Operations. Fluctuations in the value of swap contracts are recorded for financial statement purposes as unrealized appreciation or depreciation of swap contracts (swap contracts, at value on the Statements of Assets and Liabilities).
Swap agreements are marked to market daily. The change in value, if any, is recorded as unrealized gain or loss in the Statements of Operations. A liquidation payment received or made at the termination of the swap is recorded as realized gain or loss in the Statements of Operations. Net periodic payments are included as part of realized gain (loss) on the Statements of Operations.
The swaps in which a Fund may engage may include instruments under which one party pays a single or periodic fixed amount(s) (or premium), and the other party pays periodic amounts based on the movement of a specified index. The Fund’s maximum risk of loss from counterparty credit risk, as opposed to investment and other types of risk, in respect of swaps is typically the discounted net value of the cash flows to be received from the counterparty over the contract’s remaining life to the extent that such amount is positive, plus the cost of entering into a similar transaction with another counterparty, if possible.
The use of swaps is a highly specialized activity that involves investment techniques and risks different from those associated with ordinary portfolio securities transactions. Like most other investments, swaps are subject to the risk that the market value of the instrument will change in a way detrimental to a Fund’s interest. A Fund bears the risk that Sub-adviser will not accurately forecast future market trends or the values of assets, reference rates, indices, or other economic factors in establishing swap positions for the Fund. If a Sub-adviser attempts to use a swap as a hedge against, or as a substitute for, a portfolio investment, the Fund will be exposed to the risk that the swap will have or will develop imperfect or no correlation with the portfolio investment. This could cause substantial losses for the Fund. While hedging strategies involving swap instruments can reduce the risk of loss, they can also reduce the opportunity for gain or even result in losses by offsetting favorable price movements in
Mercer Funds
Notes to Financial Statements (Continued)
March 31, 2023
other Fund's investments. If the Sub-adviser is incorrect in its forecasts of market values, interest rates, and currency exchange rates, the investment performance of the Fund would be less favorable than it would have been if this investment technique were not used.
During the year ended March 31, 2023, Opportunistic Fixed used swaps to adjust interest rate and yield curve exposure or to manage interest fluctuation and credit exposure. See the Opportunistic Fixed Schedule of Investments for a listing of open swaps as of March 31, 2023.
(f) Futures
A futures contract is a contractual agreement to buy or sell a specific amount of a commodity or financial instrument at a predetermined price on a stipulated future date. A Fund may enter into contracts for the purchase or sale for future delivery of securities, indices and foreign currencies. Futures contracts may be opened to protect against the adverse effects of fluctuations in security prices, interest rates, or foreign exchange rates without actually buying or selling the securities or foreign currency. A Fund also may enter into futures contracts as a low cost method for gaining or reducing exposure to a particular currency or securities market without directly investing in those currencies or securities.
A purchase of a futures contract means the acquisition of a contractual right of a Fund to obtain delivery of the securities or foreign currency underlying the contract at a specified price on a specified future date. When a futures contract is sold, the Fund incurs a contractual obligation to deliver the securities or foreign currency underlying the contract at a specified price on a specified date.
When a Fund enters into a futures contract, it must deliver to the futures commission merchant selected by the Fund an amount referred to as “initial margin.” This amount is maintained by the futures commission merchant in a segregated account at the futures commission merchant. Thereafter, a “variation margin“ may be paid by the Fund to or drawn by the Fund from such account in accordance with controls set for such accounts, depending upon changes in the price of the underlying securities, or currencies, subject to the futures contracts, and the change in value is recorded by the Fund as a variation margin payable or receivable on the Statements of Assets and Liabilities. The Fund recognizes gains and losses on futures contracts in addition to the variation margin, which gains and losses are considered realized at the time the contracts expire or close.
A Fund may enter into futures transactions on domestic exchanges and, to the extent such transactions have been approved by the CFTC for sale to customers in the United States, on foreign exchanges. In addition, a Fund may sell stock index futures in anticipation of, or during a market decline to attempt to offset the decrease in the market value of the Fund’s common stocks that might otherwise result, and the Fund may purchase such contracts in order to offset increases in the cost of common stocks that it intends to purchase. Unlike other futures contracts, a stock index futures contract specifies that no delivery of the actual stocks making up the index will take place. Instead, settlement in cash must occur upon the termination of the contract.
In entering into futures contracts and options on futures contracts, there is a credit risk that a counterparty will not be able to meet its obligations to the Funds. The counterparty for futures contracts and options on futures contracts traded in the United States and on most foreign futures exchanges is the clearinghouse associated with such exchange. In general, clearinghouses are backed by the corporate members of the clearinghouse who are required to share any financial burden resulting from the non-performance by one of its members and, as such, should significantly reduce this credit risk. In cases where the clearinghouse is not backed by the clearing members (i.e., some foreign exchanges), it is normally backed by a consortium of banks or other financial institutions. There can be no assurance that any counterparty, clearing member or clearinghouse will be able to meet its obligations to the Funds.
Mercer Funds
Notes to Financial Statements (Continued)
March 31, 2023
While certain futures contracts provide for the delivery of securities, deliveries usually do not occur. Contracts are generally terminated by entering into offsetting transactions.
Where the futures market is not as developed or where the regulations prevent or make it disadvantageous to trade futures, Emerging Markets will utilize synthetic futures as part of the country selection strategy implementation. A synthetic future generally is an uncleared agreement resembling a total return swap transaction in which a Fund will commit to receive positive or negative returns on one or more specified equity index futures contracts in exchange for an agreed upon payment by the Fund to the counterparty. If the underlying asset declines in value over the term of the total return swap, the Fund may also be required to pay the dollar value of that decline to the counterparty. These are marked to market daily and the change in value is recorded as unrealized gain or loss in the Statements of Operations.
During the year ended March 31, 2023, Large Cap, Small/Mid Cap, Non-US Core Equity, Emerging Markets and Global Low Volatility used futures to equitize cash. Core Fixed and Opportunistic Fixed used futures to adjust interest rate exposure and replicate government bond positions. Emerging Markets also used futures to create passive index exposure to certain domestic emerging market country indices in the Fund. See each Fund's Schedule of Investments for a listing of open futures contracts as of March 31, 2023.
(g) Options
The Funds may purchase and sell (write) put and call options on debt securities, currencies and indices to enhance investment performance, manage duration, or protect against changes in market prices. The Funds may also buy and sell combinations of put and call options on the same underlying security, currency or index. Short (sold) options positions will generally be hedged by the Funds with cash, cash equivalents, current portfolio security holdings, or other options or futures positions.
The Funds may enter into swap options (“swaptions”). A swaption is a contract that gives a counterparty the right (but not the obligation), in return for payment of a premium, to enter into a new swap agreement or to shorten, extend, cancel, or otherwise modify an existing swap agreement, at some designated future time on specified terms. Each Fund may sell (write) and purchase put and call swaptions. Depending on the terms of the particular option agreement, a Fund generally will incur a greater degree of risk when the Fund writes a swaption than the Fund will incur when it purchases a swaption. When a Fund purchases a swaption, the Fund’s risk of loss is limited to the amount of the premium it has paid should it decide to let the swaption expire unexercised. However, when a Fund writes a swaption, upon exercise of the option, the Fund will become obligated according to the terms of the underlying agreement.
When a Fund writes a covered call or a put option, an amount equal to the premium received by the Fund is included in the Fund's Statements of Assets and Liabilities as a liability. The amount of the liability is subsequently marked to market to reflect the current market value of the option written. The Fund receives a premium on the sale of a call option but gives up the opportunity to profit from any increase in stock value above the exercise price of the option, and when the Fund writes a put option, it is exposed to a decline in the price of the underlying security.
Whether an option which a Fund has written expires on its stipulated expiration date or a Fund enters into a closing purchase transaction, the Fund realizes a gain (or loss, if the cost of a closing purchase transaction exceeds the premium received when the option was sold) without regard to any unrealized gain or loss on the underlying security, and the liability related to such option is extinguished. If a call option which the Fund has written is exercised, the Fund realizes a capital gain or loss from the sale of the underlying security, and the cost basis of the lots sold are decreased by the premium originally received. When a put option which a Fund has written is exercised, the amount of the premium originally received will reduce the cost of the security which a Fund purchases upon exercise of the
Mercer Funds
Notes to Financial Statements (Continued)
March 31, 2023
option. Realized gains (losses) on purchased options are included in net realized gain (loss) from investments.
A Fund's use of written options involves, to varying degrees, elements of market risk in excess of the amount recognized in the Statements of Assets and Liabilities. The face or contract amounts of these instruments reflect the extent of the Fund's exposure to market risk. The risks may be caused by an imperfect correlation between movements in the price of the instrument and the price of the underlying securities, currencies and interest rates.
During the year ended March 31, 2023, Opportunistic Fixed used options for tail risk hedging (i.e., hedging strategies designed to protect against large unexpected market movements) and to manage currency, interest rate, duration and volatility exposure. See the Fund's Schedule of Investments for the listing of options as of March 31, 2023.
(h) Forward foreign currency contracts
The Funds may purchase or sell currencies and/or engage in forward foreign currency transactions in order to expedite settlement of portfolio transactions and to manage currency risk.
Forward foreign currency contracts are traded in the inter-bank market conducted directly between currency traders (usually large commercial banks) and their customers. A forward contract generally has no deposit requirement and no commissions are charged at any stage for trades. The Funds will account for forward contracts by marking-to-market each day at current forward contract values. The change in market value is recorded by the Fund as an unrealized gain or loss. When the contract is closed, the Fund recognizes a realized gain or loss equal to the difference between the value of the contract at the time the contract was opened and the value at the time the contract was closed.
The Funds will only enter into forward contracts to sell, for a fixed amount of U.S. dollars or other appropriate currency, an amount of foreign currency, to the extent that the value of the short forward contract is covered by the underlying value of securities denominated in the currency being sold. Alternatively, when a Fund enters into a non-cash settled forward contract to sell an amount of foreign currency, the Fund will maintain segregated assets in an amount equal to the contract’s full, notional value. When a Fund enters into a cash-settled forward contract to sell an amount of foreign currency, the Fund will maintain segregated assets in an amount equal to the net amount owed by the Fund. However, currency contracts with respect to identical currencies, with the same counterparty and same settlement date may be netted against each other and, in such cases, a Fund will maintain segregated assets in an amount equal to the net amount owed by the Fund, in accordance with the Trust’s Segregation and Offsetting Position Procedures. If the additional segregated assets placed in the segregated account decline, additional cash or securities will be placed in the account on a daily basis so that the value of the account will equal the amount of the Fund’s commitments with respect to such contract. The primary risks associated with forward foreign currency contracts include failure of the counterparty to meet the terms of the contract and the value of the foreign currency changing unfavorably.
During the year ended March 31, 2023, Core Fixed and Opportunistic Fixed used forward foreign currency contracts for a variety of purposes, including hedging, risk management, efficient portfolio management, enhancing total returns, or as a substitute for taking a position in the underlying asset. Non-US Core Equity used forward foreign currency contracts to hedge, cross hedge or to actively manage the currency exposures in the Fund. See the Core Fixed and Opportunistic Fixed Schedules of Investments for a listing of open forward foreign currency contracts as of March 31, 2023.
Mercer Funds
Notes to Financial Statements (Continued)
March 31, 2023
(i) Foreign currency translation
The books and records of each Fund are maintained in US dollars. Foreign currencies, investments and other assets and liabilities denominated in foreign currencies are translated into US dollars at the foreign exchange rates prevailing at the end of the period. Purchases and sales of investment securities, income and expenses are translated at exchange rates prevailing on the respective dates of such transactions. Unrealized gains and losses that result from changes in foreign currency exchange rates have been included in the unrealized gains (losses) on foreign currency translations within each Fund's Statement of Operations. Net realized foreign currency gains and losses resulting from changes in exchange rates include foreign currency gains and losses between trade date and settlement date on investment securities transactions, foreign currency transactions and the difference between the amounts of interest and dividends recorded on the books of the Fund and the amount actually received. The portion of foreign currency gains and losses related to fluctuations in exchange rates between the purchase settlement date and subsequent sale trade date is included in realized gains and losses on investment transactions.
(j) When-issued securities/TBA securities
Purchasing securities on a “when-issued” basis is a commitment by a Fund to buy a security before the security is actually issued. A Fund may purchase securities offered on a “when-issued” or “forward delivery” basis such as TBA securities. When so offered, the price, which is generally expressed in yield terms, is fixed at the time the commitment to purchase is made, but delivery and payment for the when-issued or forward delivery securities take place at a later date. During the period between purchase and settlement, no payment is made by the purchaser to the issuer and no interest on the when-issued or forward delivery security accrues to the purchaser. While when-issued or forward delivery securities may be sold prior to the settlement date, it is intended that a Fund will purchase such securities with the purpose of actually acquiring the securities unless a sale appears desirable for investment reasons. At the time a Fund makes the commitment to purchase a security on a when-issued or forward delivery basis, the Fund will record the transaction and reflect the value of the security in determining the Fund's NAV. The market value of when-issued or forward delivery securities may be more or less than the purchase price. Certain risks may arise upon entering into when-issued or forward delivery securities transactions, including the potential inability of counterparties to meet the terms of their contracts, and the issuer’s failure to issue the securities due to political, economic, or other factors. Additionally, losses may arise due to declines in the value of the securities prior to settlement date.
A Fund may enter into TBA commitments to purchase or sell securities for a fixed price at a future date. TBA commitments are considered securities in themselves, and involve a risk of loss if the value of the security to be purchased or sold declines or increases prior to settlement date, which is in addition to the risk of decline in the value of the Portfolio’s other assets. TBA forward sale commitments are valued at the current market value of the underlying securities, according to the procedures described under “Security Valuation”. See the Schedules of Investments for TBA and when-issued securities held as of March 31, 2023.
(k) Real estate investment trusts
The Funds may invest in real estate investment trusts (“REITs”), which pool investors’ funds for investment, primarily in income producing real estate or real estate related loans or interests. A REIT is not taxed on income distributed to its shareholders or unitholders if it complies with regulatory requirements relating to its organization, ownership, assets and income, and with a regulatory requirement to distribute to its shareholders or unitholders at least 90% of its taxable income for each taxable year.
A shareholder in a Fund, by investing in REITs through the Fund, will bear not only the shareholder’s
Mercer Funds
Notes to Financial Statements (Continued)
March 31, 2023
proportionate share of the expenses of the Fund, but also, indirectly, the management expenses of the underlying REITs. REITs depend generally on their ability to generate cash flow to make distributions to shareholders or unitholders, and may be subject to defaults by borrowers and to self-liquidations. In addition, the performance of a REIT may be affected by its failure to qualify for tax-free pass-through of income, or the REIT’s failure to maintain exemption from registration under the 1940 Act. Dividends representing a return of capital are reflected as a reduction of cost and/or as a realized gain when the amount of the return of capital is conclusively determined. See each Fund’s Schedule of Investments for REIT securities held as of March 31, 2023.
(l) Mortgage-related and other asset-backed securities
The Funds may invest in mortgage-backed and asset-backed securities. Mortgage-backed securities represent an interest in a pool of mortgages. Asset-backed securities are structured like mortgage-backed securities, but instead of mortgage loans or interests in mortgage loans, the underlying assets may include such items as motor vehicle installment sales or installment loan contracts, leases of various types of real and personal property, and receivables from credit card agreements. The value of some mortgage or asset-backed securities may be particularly sensitive to changes in prevailing interest rates. Early repayment of principal on some mortgage-related securities may expose the Fund to a lower rate of return upon reinvestment of principal. The value of these securities may fluctuate in response to the market’s perception of the creditworthiness of the issuers. Additionally, although mortgages and mortgage-related securities are generally supported by some form of government or private guarantee and/or insurance, there is no assurance that private guarantors or insurers will meet their obligations.
One type of stripped mortgage-backed security has one class receiving all of the interest from the mortgage assets (the interest-only, or “IO” class), while the other class will receive all of the principal (the principal-only, or “PO” class). Payments received for the IOs are included in interest income on the Statements of Operations. Because principal will not be received at the maturity of an IO, adjustments are made to the cost basis of the security on a daily basis until maturity. These adjustments are included in interest income on the Statements of Operations. Payments received for POs are treated as reductions to the cost and par value of the securities. See the Schedule of Investments for mortgage-backed and asset-backed securities held by Core Fixed and Opportunistic Fixed as of March 31, 2023.
(m) Bank loans
Core Fixed and Opportunistic Fixed may invest in bank loans, which include institutionally-traded floating rate securities generally acquired as an assignment from another holder of, or participation interest in, loans originated by a bank or financial institution (the ‘‘Lender’’) that acts as agent for all holders. The agent administers the terms of the loan, as specified in the loan agreement. The Fund may invest in multiple series or tranches of a loan, which may have varying terms and carry different associated risks. When investing in a loan participation, the Fund has the right to receive payments of principal, interest and any fees to which it is entitled only from the Lender selling the loan agreement and only upon receipt by the Lender of payments from the borrower. The Fund generally has no right to enforce compliance with the terms of the loan agreement with the borrower. As a result, the Fund
Mercer Funds
Notes to Financial Statements (Continued)
March 31, 2023
may be subject to the credit risk of both the borrower and the Lender that is selling the loan agreement. At March 31, 2023, Opportunistic Fixed had the following unfunded loan commitments:
| | | | |
| | | | |
Thermostat Purchaser III, Inc. | | | | |
| | | | |
| | | | |
(n) Indexed securities
The Funds may invest in indexed securities where the redemption values and/or coupons are linked to the prices of other securities, securities indices, or other financial indicators. The Funds use indexed securities to increase or decrease their exposure to different underlying instruments and to gain exposure to markets in which it may be difficult to invest through conventional securities. Indexed securities may be more volatile than their underlying instruments, but any loss is limited to the amount of the original investment.
(o) Taxes and distributions
The Funds intend to qualify each year as regulated investment companies under Subchapter M of the Internal Revenue Code of 1986, as amended (“the Code”). The Funds intend to distribute substantially all of their net investment income and net realized short-term and long-term gains, if any, after giving effect to any available capital loss carryovers for U.S. federal income tax purposes. Therefore, no provision for U.S. federal and state income or excise tax is necessary.
The Funds utilize the provisions of the federal income tax laws that provide for the carryforward of capital losses for prior years, offsetting such losses against any future realized capital gains. Under the Regulated Investment Company Modernization Act of 2010 (the “RIC Modernization Act”), net capital losses recognized after December 22, 2010 may be carried forward indefinitely, and their character is retained as short-term and/or long-term losses, as applicable. Prior to the enactment of the RIC Modernization Act, net capital losses were carried forward for eight years and treated as short-term losses. As a transition rule, the RIC Modernization Act requires that post-enactment net capital losses be used before pre-enactment net capital losses.
On March 31, 2023, the following Funds had deferred capital losses available to be offset against future net capital gains through the indicated expiration dates as follows:
Under current tax rules, regulated investment companies can elect to treat certain late-year ordinary losses incurred and post-October capital losses (capital losses realized after October 31) as arising on the first day of the following taxable year. As of March 31, 2023, Small/Mid Cap has elected to defer current year post-October losses of $5,282,979.
Mercer Funds
Notes to Financial Statements (Continued)
March 31, 2023
As of March 31, 2023, the cost for U.S. federal income tax purposes and gross unrealized appreciation and depreciation in value of investments and derivatives were as follows:
| | Tax Basis
Unrealized
Appreciation | Tax Basis
Unrealized
Depreciation | Net
Unrealized
Appreciation
(Depreciation) |
| | | | |
| | | | |
| | | | |
| | | | |
| | | | |
| | | | |
| | | | |
The temporary differences between book-basis and tax-basis unrealized appreciation/(depreciation) are primarily due to wash sale loss deferrals, investments in passive foreign investment companies, futures contracts mark to market and other basis adjustments. Certain capital accounts in the financial statements are periodically adjusted for permanent differences in order to reflect their tax character. These adjustments have no impact on net assets or the results of operations. These differences primarily relate to swap income, gains and losses from passive foreign investment companies and other basis adjustments during the period ended March 31, 2023.
As of March 31, 2023, the Funds had no uncertain tax positions that would require recognition, de-recognition, or disclosure. Each of the Funds' federal tax returns filed in the 3-year period ended March 31, 2023 remains subject to examination by the Internal Revenue Service.
The Funds’ policy is to declare and pay distributions from net investment income and net realized short-term and long-term gains at least annually. All distributions are paid in shares of the Funds, at NAV, unless the shareholder elects to receive cash distributions. A Fund may distribute such income dividends and capital gains more frequently, if necessary, in order to reduce or eliminate federal excise taxes on the Funds. The amount of any distribution will vary, and there is no guarantee that a Fund will pay either income dividends or capital gains distributions.
During the years ended March 31, 2023 and March 31, 2022, the tax character of distributions (including capital gain dividends, if any, designated pursuant to Section 852 of the Code) paid, were as follows:
Mercer Funds
Notes to Financial Statements (Continued)
March 31, 2023
As of March 31, 2023, the components of distributable earnings on a tax basis were as follows:
| Undistributed
Ordinary
Income | Undistributed
Long-Term
Gains | Capital Losses and
Other Temporary
Differences | Unrealized
Appreciation
(Depreciation) | Total
Distributable
Earnings |
| | | | | |
| | | | | |
| | | | | |
| | | | | |
| | | | | |
| | | | | |
| | | | | |
All other differences are temporary losses related to mostly organizational costs and other timing adjustments.
(p) Allocation of expenses and income
The majority of expenses of the Trust are directly identifiable to an individual Fund. Expenses which are not readily identifiable to a specific Fund are allocated among the applicable Funds, taking into consideration, among other things, the nature and type of expense and the relative size of each applicable Fund.
(q) Redemption fees
While none of the Funds’ share classes have initial or contingent deferred sales charges on purchases of Fund shares, redemptions of Fund shares held less than thirty (30) days may be assessed a 2% short-term trading fee and recorded as paid-in capital.
The Trust has entered into a Credit Agreement on behalf of the Funds (the Credit Agreement) with State Street Bank and Trust Company in order to establish a committed, unsecured revolving line of credit. The current term of the line of credit under the Credit Agreement is through January 22, 2024. Borrowings for each Fund under the Credit Agreement are limited to the lesser of $50,000,000 or 33 1/3% of a Fund’s Adjusted Net Assets provided borrowings did not exceed, in the aggregate, $50,000,000. Under the terms of the Credit Agreement, the Trust pays an annual commitment fee at the rate 0.25% per year on the difference between the total line of credit and the average daily amount of borrowings outstanding. Interest is charged to the Funds based on its borrowings at a variable rate equal to 1% plus the higher of (i) the Federal Funds Rate or (ii) the Federal Reserve Bank of New York Overnight Bank Funding Rate. The Funds did not borrow under the Credit Agreement during the year ended March 31, 2023.
Mercer Funds
Notes to Financial Statements (Continued)
March 31, 2023
In the normal course of business, the Funds enter into contracts that require them to provide a variety of representations or general indemnification for certain liabilities. The Funds' maximum exposure under these arrangements is unknown, as this would involve future claims that may be made against the Funds that have not yet occurred. However, the Funds have not had prior claims or losses pursuant to these contracts and expect the risk of loss to be remote.
5.
Fees and other transactions with affiliates
As of March 31, 2023, the Adviser provides investment advisory services to each Fund pursuant to an investment management agreement. Pursuant to the investment management agreement, each Fund pays the Adviser a fee for managing the Fund’s investments at an annual rate of:
| Investment Advisory Fee* on Net Assets |
| Average net assets
up to
$750 million | Average net assets
in excess of
$750 million up to
$1 billion | Average net assets
in excess of
$1 billion |
| | | |
| | | |
| | | |
| | | |
| | | |
| | | |
| | | |
* Consists of the total advisory fee payable by the Funds to the Adviser. The Adviser is responsible for paying the subadvisory fees. |
The Adviser has contractually agreed, until at least July 31, 2023, to waive any portion of its management fee that exceeds the aggregate amount of the sub-advisory fees that the Adviser is required to pay to a Fund's Sub-adviser. This contractual fee waiver agreement may only be changed or eliminated with the approval of the Fund's Board. The fees waived by the Adviser pursuant to this expense waiver agreement are not subject to reimbursement by the Fund to the Adviser. The fees waived are shown in the Advisory fee waiver line in the Statements of Operations.
With respect to Large Cap, effective February 2, 2023, the Adviser has also contractually agreed, until at least July 31, 2024, to waive fees and/or reimburse Fund expenses' inclusive of management fee waivers, to the extent that total annual fund operating expenses, based on fiscal year to date average net assets, exceed 0.90% for Adviser Class shares, 0.65% for Class I shares, 0.55% for Class Y-2 shares and 0.40% for Class Y-3 shares, excluding, as applicable, acquired fund fees and expenses, interest, taxes, 12b-1 fees, non-12b-1 shareholder administrative services fees, brokerage expenses, dividend and interest expenses on securities sold short, extraordinary expenses and other expenses not incurred in the ordinary course of the Fund’s business. This contractual fee waiver and reimbursement agreement cannot be eliminated prior to July 31, 2024 without the approval of the Fund’s Board of Trustees. The fees waived by the Adviser pursuant to this agreement are not subject to reimbursement by the Fund to the Adviser. As of March 31, 2023, no fees have been waived by the Adviser pursuant to this supplemental expense waiver agreement for Large Cap. The dollar amount is located in Statement of Operations.
The Adviser provides certain internal administrative services to the Adviser Class, Class I and Class Y-2 shares of the Funds, for which the Adviser receives a fee of up to 0.15%, 0.15% and 0.15% of the average daily net assets of the Adviser Class, Class I and Class Y-2 shares of the Funds,
Mercer Funds
Notes to Financial Statements (Continued)
March 31, 2023
respectively. These internal administrative services include attending to shareholder correspondence, assisting with the processing of purchases and redemptions of shares, preparing and disseminating information and documents for use by beneficial shareholders and monitoring, and overseeing non-advisory relationships with entities providing services to the Adviser Class, Class I and Class Y-2 shares, including the transfer agent. As of March 31, 2023, only Non-US Core Equity and Core Fixed had Class I shares outstanding. As of March 31, 2023, there were no Adviser Class, Class I (except for Non-US Core Equity and Core Fixed as noted above) or Class Y-2 shares of any of the Funds outstanding and, as such, the Adviser did not receive any administrative services fees from those classes of those Funds for the period ended March 31, 2023.
The Funds have adopted a plan of marketing and service, or “12b-1 plan,” to finance the provision of certain shareholder services to the owners of Adviser Class shares of the Funds. The plan provides for payments at annual rates (based on average net assets) of up to 0.25% of each Fund’s Adviser Class shares. There were no Advisor Class shares of any of the Funds outstanding as of March 31, 2023, and as a result, no 12b-1 fees were paid by any of the Funds for the period ended March 31, 2023.
6.
Purchases and sales of securities
Cost of purchases and proceeds from sales of securities, excluding short-term investments, for the year ended March 31, 2023, were as follows:
| Long-Term
U.S. Government
Securities | |
| | |
| | |
| | |
| | |
| | |
| | |
| | |
| | |
| Long-Term
U.S. Government
Securities | |
| | |
| | |
| | |
| | |
| | |
| | |
| | |
| | |
| Includes purchases of $1,125,208,747 and sales of $1,124,570,412 for TBA securities. |
Mercer Funds
Notes to Financial Statements (Continued)
March 31, 2023
Each Fund is authorized to issue an unlimited number of shares of beneficial interest without par value. Transactions in Fund shares were as follows:
| | | | |
| | |
| | | | |
| | | | |
| | | | |
Shares issued to shareholders in reinvestment of distributions | | | | |
| | | | |
| | | | |
| | | | |
| | |
| | | | |
| | | | |
| | | | |
Shares issued to shareholders in reinvestment of distributions | | | | |
| | | | |
| | | | |
Mercer Funds
Notes to Financial Statements (Continued)
March 31, 2023
| | | | |
| | |
| | | | |
| | | | |
| | | | |
Shares issued to shareholders in reinvestment of distributions | | | | |
| | | | |
| | | | |
| | | | |
| | | | |
Shares issued to shareholders in reinvestment of distributions | | | | |
| | | | |
| | | | |
| | | | |
| | |
| | | | |
| | | | |
| | | | |
Shares issued to shareholders in reinvestment of distributions | | | | |
| | | | |
| | | | |
| | | | |
| | | | |
Shares issued to shareholders in reinvestment of distributions | | | | |
| | | | |
| | | | |
Mercer Funds
Notes to Financial Statements (Continued)
March 31, 2023
| | | | |
| | |
| | | | |
| | | | |
| | | | |
Shares issued to shareholders in reinvestment of distributions | | | | |
| | | | |
| | | | |
| | | | |
| | |
| | | | |
| | | | |
| | | | |
Shares issued to shareholders in reinvestment of distributions | | | | |
| | | | |
| | | | |
| | | | |
| | |
| | | | |
| | | | |
| | | | |
Shares issued to shareholders in reinvestment of distributions | | | | |
| | | | |
| | | | |
| The Class commenced operations on July 22, 2021. |
| The Class commenced operations on December 27, 2021. |
8.
Recent accounting pronouncements and regulatory updates
In October 2022, the SEC adopted a final rule relating to Tailored Shareholder Reports for Mutual Funds and Exchange-Traded Funds; Fee Information in Investment Company Advertisements. The rule and form amendments will, among other things, require the Funds to transmit concise and visually engaging shareholder reports that highlight key information. The amendments will require that funds tag information in a structured data format and that certain more in-depth information be made
Mercer Funds
Notes to Financial Statements (Continued)
March 31, 2023
available online and available for delivery free of charge to investors on request. The amendments became effective on January 24, 2023. There is an 18-month transition period after the effective date of the amendment.
In the normal course of business, the Funds invest in securities or other instruments and may enter into transactions, and such activities subject each Fund to various risks, including fluctuations in the market (market risk) or failure of an issuer to meet all of its obligations (credit risk). Investments in foreign securities involve certain risks, including foreign currency fluctuations and those related to political or economic instability.
Additional risks associated with certain of the Funds’ investments are described above within the respective security type notes. A more complete description of risks is included in the Funds' prospectus and statement of additional information.
Novel Coronavirus Pandemic: The coronavirus (COVID-19) pandemic and the responses of the U.S. government and various state, local and foreign governments adversely affected global business activities and resulted in significant uncertainty in the global economy and volatility in financial markets. Given the significant global health, market, employment and economic impacts of COVID-19 and the uncertainty of its duration, the Funds cannot reliably predict the ultimate impact of COVID-19 on financial markets or its financial results.
Geopolitical Risk: Russia’s large-scale invasion of Ukraine beginning on February 24, 2022, and the responses by the United States and other countries, have resulted in increased volatility and uncertainty in the financial markets and adversely affected regional and global economies. The United States and other countries have imposed broad-ranging economic sanctions on Russia, certain Russian individuals, banking entities and corporations, and Belarus, as a response to Russia’s invasion of Ukraine and may impose sanctions on other countries that provide military or economic support to Russia. The extent and duration of Russia’s military actions or future escalation of such hostilities, and the extent and impact of the resulting sanctions (including any retaliatory actions or countermeasures that may be taken by those subject to sanctions, including cyber-attacks) are impossible to predict, but could result in significant market disruptions, including in certain industries or sectors, such as the oil and natural gas markets, and may negatively affect global supply chains, inflation and global growth. These and any related events could have a significant impact on a Fund’s performance and the value of the Fund’s investments, even if the Fund does not have direct exposure to Russian issuers or issuers in other countries affected by the invasion.
LIBOR Transition Risk: The market is in the process of transitioning away from a commonly used interest rate, the London Interbank Offered Rate (“LIBOR”). The terms of many investments, financings or other transactions to which a Fund may be a party have been historically tied to LIBOR, which may be a significant factor in determining a Fund’s payment obligations under a derivative investment, the cost of financing to a Fund or an investment’s value or return to a Fund. Although many LIBOR rates were phased out at the end of 2021, a selection of widely used USD LIBOR rates will continue to be published until June 2023 in order to assist with the transition. The process of transitioning to a new rate might lead to increased volatility and illiquidity in markets for instruments whose terms currently include LIBOR. It could also lead to a reduction in the value of some LIBOR-based investments and reduce the effectiveness of new hedges placed against existing LIBOR-based investments.
Banking System Volatility: The Funds maintain substantially all of their respective cash and cash equivalents in accounts with major U.S. and multi-national financial institutions, and their respective deposits at certain of these institutions may exceed insured limits, where applicable. Recent volatility in the banking system (in particular, the closing of Silicon Valley Bank and Signature Bank, and the
Mercer Funds
Notes to Financial Statements (Continued)
March 31, 2023
acquisition of Credit Suisse Group by UBS Group at the behest of Swiss regulators) may impact the viability of such banking and financial services institutions. In the event of failure of any of the financial institutions where a Fund maintains its respective cash and cash equivalents, there can be no assurance that such Fund would be able to access uninsured funds in a timely manner or at all. Any inability to access, or delay in accessing, these funds could adversely affect the business and financial position of the Funds. It is currently unclear what the ultimate effect of the situation will be on the banking sector, private equity industry, real estate market and global financial markets as a whole.
Management has evaluated the impact of subsequent events through May 23, 2023 (i.e., the date the financial statements were issued) for possible adjustment to and/or additional disclosure in the Funds' financial statements. Management has determined that there are no material events that would require adjustment to and/or additional disclosure in the Funds' financial statements through this date.
REPORT OF INDEPENDENT REGISTERED PUBLIC ACCOUNTING FIRM
To the shareholders and the Board of Trustees of Mercer Funds
Opinion on the Financial Statements and Financial Highlights
We have audited the accompanying statements of assets and liabilities of Mercer Funds (the “Funds”) comprising Mercer US Large Cap Equity Fund, Mercer US Small/Mid Cap Equity Fund, Mercer Non-US Core Equity Fund, Mercer Core Fixed Income Fund, Mercer Opportunistic Fixed Income Fund, Mercer Emerging Markets Equity Fund, and Mercer Global Low Volatility Equity Fund, including the schedules of investments as of March 31, 2023, the related statements of operations for the year then ended, the statements of changes in net assets for each of the two years in the period then ended, the financial highlights for each of the five years in the period then ended, and the related notes. In our opinion, the financial statements and financial highlights present fairly, in all material respects, the financial position of each of the funds constituting the Funds as of March 31, 2023, and the results of their operations for the year then ended, the changes in their net assets for each of the two years in the period then ended, and the financial highlights for each of the five years in the period then ended in conformity with accounting principles generally accepted in the United States of America.
Basis for Opinion
These financial statements and financial highlights are the responsibility of the Funds’ management. Our responsibility is to express an opinion on the Funds’ financial statements and financial highlights based on our audits. We are a public accounting firm registered with the Public Company Accounting Oversight Board (United States) (PCAOB) and are required to be independent with respect to the Funds in accordance with the U.S. federal securities laws and the applicable rules and regulations of the Securities and Exchange Commission and the PCAOB.
We conducted our audits in accordance with the standards of the PCAOB. Those standards require that we plan and perform the audit to obtain reasonable assurance about whether the financial statements and financial highlights are free of material misstatement, whether due to error or fraud. The Funds are not required to have, nor were we engaged to perform, an audit of their internal control over financial reporting. As part of our audits we are required to obtain an understanding of internal control over financial reporting but not for the purpose of expressing an opinion on the effectiveness of the Funds’ internal control over financial reporting. Accordingly, we express no such opinion.
Our audits included performing procedures to assess the risks of material misstatement of the financial statements and financial highlights, whether due to error or fraud, and performing procedures that respond to those risks. Such procedures included examining, on a test basis, evidence regarding the amounts and disclosures in the financial statements and financial highlights. Our audits also included evaluating the accounting principles used and significant estimates made by management, as well as evaluating the overall presentation of the financial statements and financial highlights. Our procedures included confirmation of securities owned as of March 31, 2023, by correspondence with the custodian, brokers and agent banks; when replies were not received from brokers or agent banks, we performed other auditing procedures. We believe that our audits provide a reasonable basis for our opinion.
Deloitte & Touche LLP
Boston, Massachusetts
May 23, 2023
We have served as the auditor of one or more Mercer investment companies since 2006.
Mercer Funds
Additional Information (Unaudited)
Proxy Voting
A description of the policies and procedures that the Advisor and each Fund’s Sub-advisers use to determine how to vote proxies relating to the Fund’s portfolio securities can be found in the Funds SAI (Appendix B), and is available, (i) without charge, upon request, by calling 1-888-887-0619, (ii) on the Securities and Exchange Commission’s (“SEC”) website at http://www.sec.gov, and (iii) online on the Funds’ website at http://www.mercer.us/mutual-funds-on-offer. Information about the Funds’ proxy voting decisions are available online at https://viewpoint.glasslewis.com/WD/?siteId=MercerFundsProxy and http://www.sec.gov.
Quarterly Reporting
The Funds file their complete schedule of portfolio holdings with the Securities and Exchange Commission for the first and third quarters of each fiscal year on Form N-PORT, which when filed, will be available on the SEC’s website at http://www.sec.gov. When filed, the Funds’ Form N-PORT may be reviewed and copied at the Commission’s Public Reference Room in Washington, D.C. Information on the operation of the Public Reference Room may be obtained by calling 1-800-SEC-0330.
Federal Tax Information
The amount of long-term capital gains paid for the fiscal year ended March 31, 2023, were as follows:
For the year ended March 31, 2023, Non-US Core Equity and Emerging Markets had foreign tax credits in the amount of $12,656,282 and $8,346,096, respectively, and foreign source income of $137,439,539 and $40,978,046, respectively.
Qualified dividend income (“QDI”) received by the Funds through March 31, 2023, that qualified for a reduced tax rate pursuant to the Internal Revenue Code Section 1(h)(11) are as follows:
Mercer Funds
Additional Information (Unaudited) (Continued)
For corporate shareholders, a portion of the ordinary dividends paid during the Funds’ year ended March 31, 2023, qualified for the dividends received deduction, as follows:
Mercer Funds
Additional Information (Unaudited) (Continued)
Board Approval of a New Subadvisory Agreement for the Period October 1, 2022 through March 31, 2023
Mercer Emerging Markets Equity Fund
At a meeting of the Board held on December 8, 2022 (the “Meeting”), the Board, including the trustees that are not considered “interested persons” (as defined in the 1940 Act) of the Trust (“Independent Trustees”), considered and approved a proposed new subadvisory agreement between the Advisor and Barrow, Hanley, Mewhinney & Strauss, LLC (“Barrow Hanley” and such agreement, the “Barrow Hanley Subadvisory Agreement”) on behalf of the Mercer Emerging Markets Equity Fund (the “Fund”). The Advisor recommended the appointment of Barrow Hanley to replace a subadvisor that previously managed an allocated portion of the Fund’s portfolio, and the Advisor also reallocated that portion of the Fund’s portfolio to Barrow Hanley in connection with such appointment. The changes described herein with respect to the changes in the subadvisory arrangements for the Fund are referred to as the “New Emerging Markets Equity Fund Subadvisor Structure.”
Approval of a New Subadvisory Agreement for the Fund with Barrow, Hanley, Mewhinney & Strauss, LLC
At the Meeting, the Board, including a majority of the Independent Trustees, considered and approved the Barrow Hanley Subadvisory Agreement. In considering the approval of the Barrow Hanley Subadvisory Agreement, the Independent Trustees considered the information and materials from the Advisor and Barrow Hanley that included, as to Barrow Hanley and the Fund: (i) the Barrow Hanley Subadvisory Agreement; (ii) information regarding the review and due diligence process by which the Advisor had selected and evaluated Barrow Hanley and recommended Barrow Hanley for Board approval, and the Advisor’s rationale for recommending that Barrow Hanley be appointed as a subadvisor to the Fund; (iii) information describing the nature, extent, and quality of the services that Barrow Hanley proposed to provide to the Fund; (iv) the investment management business, portfolio management personnel, operations, prior investment experience, and reputation of Barrow Hanley; (v) Barrow Hanley’s brokerage and trading policies and practices; (vi) the level of subadvisory fees to be charged by Barrow Hanley for its services to the Fund, and the fees charged by Barrow Hanley to other accounts that it manages; (vii) the Fund’s management fee waiver agreement (the “Fee Waiver Agreement”), which requires the Advisor to waive any portion of the management fee it is entitled to under the Management Agreement with respect to the Fund that exceeds the aggregate amount of the subadvisory fees that the Advisor is required to pay to the Fund’s subadvisors for the management of their allocated portions of the Fund; (viii) a summary of the compliance program applicable to Barrow Hanley; (ix) information regarding the historical performance returns of Barrow Hanley in managing the investment mandate it would employ for the Fund, and a comparison of such performance to a relevant index; and (x) the financial condition of Barrow Hanley.
In addition, the Independent Trustees considered the presentations made by, and discussions with, representatives of the Advisor, and the Advisor’s favorable assessment of the nature, extent and quality of the subadvisory services expected to be provided to the Fund by Barrow Hanley. During their review of this information, the Independent Trustees considered and analyzed factors that the Independent Trustees deemed relevant with respect to Barrow Hanley, including: the nature, extent, and quality of the services to be provided to the Fund by Barrow Hanley; Barrow Hanley’s management style and investment decision-making process; Barrow Hanley’s historical performance record managing the investment mandate it would employ for the Fund; the qualifications and experience of the members of Barrow Hanley’s portfolio management team; and Barrow Hanley’s staffing levels and overall resources. The Independent Trustees also took into consideration the nature and extent of the oversight duties performed by the Advisor in connection with each of the subadvisors to the Fund, which includes extensive investment management and compliance due diligence with respect to the management and operations of each of the subadvisors. Additionally, the
Mercer Funds
Additional Information (Unaudited) (Continued)
Independent Trustees received assistance and advice from their independent legal counsel regarding legal and industry standards in connection with their duties and responsibilities when approving investment advisory agreements.
In particular, and as to Barrow Hanley, the Board, including all of the Independent Trustees, considered the following factors:
(a) The nature, extent, and quality of the services to be provided by Barrow Hanley. The Independent Trustees reviewed the nature, extent, and quality of the services to be provided by Barrow Hanley to the Fund. The Independent Trustees considered the specific investment management process that Barrow Hanley would employ to manage its allocated portion of the Fund’s investment portfolio (which was described in detail in the materials provided by Barrow Hanley), the qualifications of Barrow Hanley’s portfolio managers and investment management personnel with regard to implementing the investment mandate relating to the allocated portion of the Fund’s investment portfolio that Barrow Hanley would be managing, and the performance record of Barrow Hanley as compared to a relevant index. The Independent Trustees also considered the Advisor’s review, selection, and due diligence process with respect to Barrow Hanley, and the Advisor’s favorable assessment and conclusion as to the nature, extent, and quality of the subadvisory services expected to be provided to the Fund by Barrow Hanley. The Independent Trustees determined that the Fund and its shareholders were likely to benefit from the quality and experience of Barrow Hanley’s portfolio managers and the qualifications of its investment professionals. Based on their consideration and review of the foregoing information, the Independent Trustees concluded that the nature, extent and quality of the subadvisory services anticipated to be provided by Barrow Hanley, as well as Barrow Hanley’s ability to render such services based on Barrow Hanley’s experience, operations and resources, were appropriate for the Fund, in light of the Fund’s investment objective, and the mandate relating to the allocated portion of the Fund’s investment portfolio that Barrow Hanley would manage.
(b) Comparison of the services to be rendered and fees to be paid to Barrow Hanley under other advisory and subadvisory contracts, such as those with other clients. The Independent Trustees considered the services that would be rendered by Barrow Hanley and evaluated the compensation to be paid to Barrow Hanley for those services. The Independent Trustees noted that the services that Barrow Hanley would furnish to the Fund appeared to be generally comparable to the services that Barrow Hanley currently provides to its other advisory and subadvisory clients having similar investment strategies. The Independent Trustees also considered comparisons of the fees to be paid to Barrow Hanley in light of the fees that were charged by Barrow Hanley to its other advisory clients having a similar investment strategy, as provided in its 15(c) Questionnaire responses. The Independent Trustees also considered that the fees agreed to by Barrow Hanley were the result of an arm’s length bargain negotiated by unaffiliated parties and that the Advisor believes such fees are fair and reasonable.
The Independent Trustees considered the review, selection, and due diligence process employed by the Advisor, as discussed at the Meeting, in determining to recommend Barrow Hanley to serve as a subadvisor to the Fund, and the Advisor’s reasons for concluding that the subadvisory fees to be paid by the Advisor to Barrow Hanley for its services to the Fund were fair and reasonable. The Independent Trustees considered that the subadvisory fees of Barrow Hanley would indirectly be borne by the Fund and its shareholders. The Independent Trustees further considered that, as a result of the appointment of Barrow Hanley, the Fund’s subadvisory fees would be reduced and that these cost savings would accrue to the Fund, given the Fee Waiver Agreement and the then-effective subadvisory fee levels. Based on their discussion, the Independent Trustees concluded that, in light of the nature, extent, and quality of the services expected to be provided, the proposed level of fees to be paid to Barrow Hanley with respect to the assets of the Fund to be allocated to Barrow Hanley was supported by the services that were expected to be provided by Barrow Hanley to the Fund. The Independent Trustees also considered the potential “fallout” or ancillary benefits that may accrue to
Mercer Funds
Additional Information (Unaudited) (Continued)
Barrow Hanley from its relationship with the Fund, such as the value derived in the marketplace from its association with the Advisor and the research or other services Barrow Hanley may receive from certain brokers in connection with the execution of the Fund’s brokerage transactions (subject to Barrow Hanley’s duty to seek best execution on behalf of its clients), and concluded that they were reasonable.
The Independent Trustees considered the expected impact of the fees to be paid to Barrow Hanley on the Fund’s overall operating expenses, given the Fee Waiver Agreement. In addition, since the fees to be paid to Barrow Hanley were the result of arm’s-length bargaining between unaffiliated parties, the relevance of Barrow Hanley’s potential profitability was considered by the Independent Trustees in that context. The Independent Trustees also took note of the Advisor’s explanation that the recommended appointment of Barrow Hanley was not affected by the impact that the appointment would have on the Advisor’s revenues and profitability, and the Independent Trustees considered that the Advisor was not realizing a direct profit from the investment advisory services that it provides to the Fund as a result of the Fee Waiver Agreement.
Based on their consideration and review of the foregoing information, the Independent Trustees concluded that, in light of the nature, extent, and quality of the services expected to be provided by Barrow Hanley and the proposed fees to be paid to Barrow Hanley by the Advisor for managing its allocated portion of the Fund, the potential benefits accruing to Barrow Hanley as a result of serving as a subadvisor to the Fund were reasonable in relation to the services that were expected to be provided by Barrow Hanley to the Fund.
(c) Investment performance of the Fund and Barrow Hanley. Because Barrow Hanley was a newly proposed subadvisor to the Fund, the Independent Trustees could not consider Barrow Hanley’s investment performance in managing the Fund as a factor in evaluating the Barrow Hanley Subadvisory Agreement. However, the Independent Trustees reviewed Barrow Hanley’s historical performance record managing the investment mandate it would employ for the Fund as compared to a relevant index and concluded that Barrow Hanley’s historical performance record, viewed together with the other factors considered by the Independent Trustees, supported a decision to approve the Barrow Hanley Subadvisory Agreement.
Conclusion. Following consideration of the foregoing factors, it was reported that no single factor was determinative to the Independent Trustees’ decisions. Based on these factors, along with the determination of the Advisor at the conclusion of its review, selection, and due diligence process to recommend Barrow Hanley be appointed as a subadvisor to the Fund, and such other matters as were deemed relevant, the Independent Trustees concluded that the proposed fee rate for Barrow Hanley was supported by the services that were expected to be provided to the Fund and approval of the Barrow Hanley Subadvisory Agreement was in the best interests of the Fund and its shareholders. As a result, the Board, including a majority of the Independent Trustees, determined to approve the Barrow Hanley Subadvisory Agreement.
Mercer Funds
Additional Information (Unaudited) (Continued)
Discussion of the Operation and Effectiveness of the Funds' Liquidity Risk Management Program
In compliance with Rule 22e-4 under the Investment Company Act of 1940, as amended (the “Liquidity Rule”), the Funds have adopted and implemented a liquidity risk management program (the “Program”) which Mercer Investments LLC, the investment adviser to the Funds (the “Adviser”), believes is reasonably designed to assess and manage each Fund’s liquidity risk. The Board has designated the Adviser to serve as the administrator of the Program pursuant to the Liquidity Rule. The Adviser has established a Liquidity Risk Committee which is appointed to carry out day-to-day responsibilities under the Program. The Liquidity Risk Committee is comprised of representatives from various departments at the Adviser.
At a meeting of the Board held on April 4, 2023, the Adviser provided the Board with a written report addressing the Program’s operation, adequacy and effectiveness of implementation for the period from January 1, 2022 through December 31, 2022 (the “Review Period”). The report noted that the Adviser has concluded that the Program is reasonably designed and adequate to assess and manage each Fund’s liquidity risk, as such term is defined in the Liquidity Rule. In light of its experiences administering the Program during the Review Period, the Adviser has concluded that the Program has been implemented and operated effectively to assess and manage each Fund’s liquidity risk and further believes that the Program has been and continues to be adequately and effectively implemented to monitor and, as applicable, respond to the Funds’ liquidity developments. Additionally, the report noted that no material changes to the Program have occurred during the Review Period or are contemplated. The report also noted that the Liquidity Risk Committee believes that each Fund’s liquidity risk remains within appropriate parameters and that each Fund’s investment strategy is appropriate for an open-end mutual fund. The report further reflected that there were no liquidity events that impacted the Funds’ ability to timely meet redemptions without significant dilution to existing shareholders.
The Liquidity Rule and the Program also require the Funds to classify each portfolio investment into one of four liquidity categories. The Adviser has engaged an independent third-party vendor, which includes the use of that vendor’s proprietary liquidity analytical tool, to assist the Funds in classifying portfolio investments, based on inputs and assumptions adopted by the Liquidity Risk Committee in its reasonable judgment. In classifying portfolio investments, the Liquidity Risk Committee takes into account relevant market, trading and investment-specific considerations as well as the reasonably anticipated trade size of each portfolio investment.
The Liquidity Rule requires funds that do not primarily hold assets that are highly liquid investments to adopt a minimum amount of net assets that must be invested in highly liquid investments that are assets (an “HLIM”). The Liquidity Rule also prohibits the acquisition of illiquid investments if doing so would result in a fund holding more than 15% of its net assets in illiquid investments that are assets. The Program includes provisions reasonably designed to determine, periodically review and comply with the HLIM requirement with respect to the Funds, as applicable, and to comply with the 15% limit on illiquid investments with respect to the Funds.
Mercer Funds
Understanding Your Fund’s Expenses (Unaudited)
As a mutual fund shareholder, you incur different costs: transaction costs, including sales charges (loads) on purchases, redemption fees and certain exchange fees and ongoing costs, including management fees, distribution fees (12b-1 fees), and other fund expenses. These costs are described in more detail in the Funds’ prospectus. The examples below are intended to help you understand the ongoing costs of investing in the Funds and help you compare these with the ongoing costs of investing in other mutual funds. The first line in the table for each Fund shows the actual account values and actual fund expenses you would have paid on a $1,000 investment in the Fund from October 1, 2022 through March 31, 2023. It also shows how much a $1,000 investment would be worth at the close of the period, assuming actual fund returns and expenses. To estimate the expenses you paid over the period, simply divide your account value by $1,000 (for example $8,600 account value divided by $1,000 = $8.60) and multiply the result by the number in the Operating Expenses Incurred column as shown below for your Class. The second line in the table for each Fund provides information about hypothetical account values and hypothetical expenses based on the Fund’s actual expense ratios and an assumed rate of return of 5% per year before expenses, which is not the Fund’s actual return. The hypothetical account values and expenses may not be used to estimate the actual ending account balance or expenses you paid on your investment for the period. You may use this information to compare the ongoing costs of investing in the Fund and other funds. To do so, compare this 5% hypothetical example with the 5% hypothetical examples that appear in the shareholder reports of the other funds. Please note that the expenses shown reflect ongoing costs only, and do not include any transaction costs, such as sales charges, redemption fees or exchange fees. Therefore, the second line in the table of each fund is useful in comparing ongoing costs only, and will not help you determine the relative costs of owning different funds. If transaction costs were included, total costs would be higher.
Large Cap — Class Y-3
Hypothetical Return on $1,000
| | | | | Operating
Expense
Incurred* |
| | | | | |
| | | | | |
| Actual expenses are equal to the Class’ annualized expense ratio of 0.30%, multiplied by the average account value over the period, multiplied by 182/365. |
Small/Mid Cap — Class Y-3
Hypothetical Return on $1,000
| | | | | Operating
Expense
Incurred* |
| | | | | |
| | | | | |
| Actual expenses are equal to the Class’ annualized expense ratio of 0.45%, multiplied by the average account value over the period, multiplied by 182/365. |
Mercer Funds
Understanding Your Fund’s Expenses (Unaudited) (Continued)
Non-US Core Equity — Class Y-3
Hypothetical Return on $1,000
| | | | | Operating
Expense
Incurred* |
| | | | | |
| | | | | |
| Actual expenses are equal to the Class’ annualized expense ratio of 0.38%, multiplied by the average account value over the period, multiplied by 182/365. |
Non-US Core Equity — Class I
Hypothetical Return on $1,000
| | | | | Operating
Expense
Incurred* |
| | | | | |
| | | | | |
| Actual expenses are equal to the Class’ annualized expense ratio of 0.63%, multiplied by the average account value over the period, multiplied by 182/365. |
Core Fixed — Class Y-3
Hypothetical Return on $1,000
| | | | | Operating
Expense
Incurred* |
| | | | | |
| | | | | |
| Actual expenses are equal to the Class’ annualized expense ratio of 0.15%, multiplied by the average account value over the period, multiplied by 182/365. |
Core Fixed — Class I
Hypothetical Return on $1,000
| | | | | Operating
Expense
Incurred* |
| | | | | |
| | | | | |
| Actual expenses are equal to the Class’ annualized expense ratio of 0.40%, multiplied by the average account value over the period, multiplied by 182/365. |
Mercer Funds
Understanding Your Fund’s Expenses (Unaudited) (Continued)
Opportunistic Fixed — Class Y-3
Hypothetical Return on $1,000
| | | | | Operating
Expense
Incurred* |
| | | | | |
| | | | | |
| Actual expenses are equal to the Class’ annualized expense ratio of 0.44%, multiplied by the average account value over the period, multiplied by 182/365. |
Emerging Markets — Class Y-3
Hypothetical Return on $1,000
| | | | | Operating
Expense
Incurred* |
| | | | | |
| | | | | |
| Actual expenses are equal to the Class’ annualized expense ratio of 0.50%, multiplied by the average account value over the period, multiplied by 182/365. |
Global Low Volatility — Class Y-3
Hypothetical Return on $1,000
| | | | | Operating
Expense
Incurred* |
| | | | | |
| | | | | |
| Actual expenses are equal to the Class’ annualized expense ratio of 0.31%, multiplied by the average account value over the period, multiplied by 182/365. |
Trustees and Officers (Unaudited)
The following tables list the Trust’s Trustees and Officers as of the date of this report; their address and age; their position with the Trust; the length of time holding that position with the Trust; their principal occupation(s) during the past five years; the number of portfolios in the fund complex they oversee; and other directorships they hold in companies subject to registration or reporting requirements of the Securities Exchange Act of 1934 (generally called “public companies”) or in registered investment companies. The Trust’s Statement of Additional Information (“SAI”) includes additional information about the Trust’s trustees, including changes subsequent to the date of the report. The SAI is available, without charge, upon request, by calling 1-866-658-9896, or on the SEC website at www.sec.gov.
Independent Trustees
| Position(s)
Held with
Trust | Term of
Office(1) and
Length of
Time
Served | Principal
Occupation(s) During
Past 5 Years | Number of
Portfolios
in Fund
Complex*
Overseen
by Trustee | Other
Directorships
Held by
Trustee |
Harrison M. Bains, Jr. 99 High Street Boston, MA 02110 (79) | | | | | Mr. Bains is a director of Cara Therapeutics, Inc.; Mr. Bains was a director of BG Medicine, Inc.(2007 to 2014) and a trustee of BofA Funds Series Trust (11 portfolios) (2011 to 2016). |
Adela M. Cepeda 99 High Street Boston, MA 02110 (65) | | | Ms. Cepeda was Managing Director of PFM Financial Advisors LLC (a financial advisory firm) from September 2016 to December 2019. Ms. Cepeda was previously Founder and President of A.C. Advisory, Inc. (a financial advisory firm) 1995 — 2016. | | Ms. Cepeda is a director or trustee of: The UBS Funds (12 portfolios); UBS Relationship Funds; SMA Relationship Trust (1 portfolio); Morgan Stanley Pathway Funds (11 portfolios); BMO Financial Corp. (U.S. holding company for BMO Harris Bank N.A.); Ms. Cepeda was a director of Fort Dearborn Income Securities, Inc. (2000 to 2016). |
Gail A. Schneider 99 High Street Boston, MA 02110 (74) | | Chairperson since 2022; Trustee since 2009 | Ms. Schneider is a selfemployed consultant since 2007. Ms. Schneider was previously an Executive Vice President at JPMorgan Chase & Co. | | |
Trustees and Officers (Unaudited) (Continued)
| Position(s) Held with Trust | Term of Office(1) and Length of Time Served | Principal Occupation(s) During Past 5 Years | Number of Portfolios in Fund Complex* Overseen by Trustee | Other Directorships Held by Trustee |
Luis A. Ubiñas 99 High Street Boston, MA 02110 (60) | | | Mr. Ubiñas is retired. Mr. Ubiñas previously served as President of the Ford Foundation (a not-for profit organization) from 2008 to 2013 and prior to that he served as a Senior Partner for McKinsey & Company (a global consulting firm). | | Mr. Ubiñas is a Director of: ATT, Electronic Arts, Inc., and Tanger Factory Outlet Centers, Inc. |
Joan E. Steel 99 High Street Boston, MA 02110 (69) | | | Ms. Steel is the Founder and Chief Executive Officer of Alpha Wealth Advisors LLC since September 2009. Prior to founding her own firm, Ms. Steel was a Senior Vice President, Private Wealth Advisor for the Capital Group, a large global asset manager. | | Ms. Steel was an independent director of The Hershey Trust Company from 2012 to 2016. |
Interested Trustee:
| Position(s)
Held with
Trust | Term of
Office(1) and
Length of
Time
Served | Principal
Occupation(s) During
Past 5 Years | Number of
Portfolios
in Fund
Complex*
Overseen
by Trustee | Other
Directorships
Held by
Trustee |
| Trustee, President, and Chief Executive Officer | | Mr. Joseph is Vice President and US Wealth Distribution Leader for Mercer Investments LLC since December 2015. Prior to December 2015, he was Chief Operating Officer of Mercer Investments LLC. | | Mr. Joseph is a trustee of Mercer Trust Company LLC and was a director of Mercer Investments LLC from January 2017 to March 2019. |
(1) Each Trustee holds office for an indefinite term.
* The “Fund Complex” consists of the Trust, which has seven portfolios.
** Mr. Joseph is considered to be an “interested person,” as defined in the 1940 Act, of the Trust due to his relationship with the Advisor.
Trustees and Officers (Unaudited) (Continued)
Officers:
The executive officers of the Trust not named above are:
| Position(s)
Held with
the Trust | Term of
Office+
and Length
of Time
Served | Principal Occupation(s) During Past 5 Years |
| Vice President and Assistant Treasurer | | Mr. Gouthro is a partner at Mercer and U.S. Chief Operating Officer for Mercer’s U.S. Business Solutions Group. Mr. Gouthro joined Mercer in 2018. Prior to joining Mercer, Mr. Gouthro was at Putnam Investments in various leadership roles in Operations, Technology, and Investments. |
| Vice President and Assistant Treasurer | | Mr. Vallan is a Principal and the Head of Fund Administration at Mercer Investments LLC. Prior to joining Mercer in 2020, Mr. Vallan was Vice President of Fund Administration at J.P. Morgan (from 2017 to 2020). |
| Vice President, Treasurer and Chief Financial Officer | | Mr. Coleman is Head of Investment Operations at Mercer Investments LLC since 2019. Prior to joining Mercer, Mr. Coleman was a Vice President at Fidelity Investments from 2016 to 2018. |
| Vice President and Chief Investment Officer | | Mr. Mavromates is Vice President and Chief Investment Officer of Mercer Investments LLC since 2012. |
| Vice President and Assistant Secretary | | Mr. Dean is Global Chief Counsel Investments since 2018. He has also served as Senior Legal Counsel — Investments for Mercer Investments LLC from 2010 to 2018. |
| Vice President, Chief Legal Officer and Secretary | | Ms. Hulme is Senior Legal Counsel, Investments since 2018. She served as Legal Counsel — Investments for Mercer Investments LLC from 2014 to 2018. Prior to 2014, she was an Associate in the investment management practice group of Bingham McCutchen LLP. |
| | | Mr. Vasquez is a Vice President and Portfolio Manager of Mercer Investments LLC since 2012. |
| | | Ms. Lefkowitz is a Vice President and Senior Portfolio Manager of Mercer Investments LLC. Prior to joining Mercer in 2021, Ms. Lefkowitz held various roles in risk management, portfolio construction, trading and global fixed income portfolio management at Putnam Investments. |
Trustees and Officers (Unaudited) (Continued)
| Position(s) Held with the Trust | Term of Office+ and Length of Time Served | Principal Occupation(s) During Past 5 Years |
| Vice President and Chief Compliance Officer | | Ms. Wong serves as Chief Compliance Officer of Mercer Trust Company LLC since December 2022. Prior to joining Mercer, Ms. Wong was Director – Compliance, Schwab Asset Management from 2019-2022. Ms. Wong also served in various Compliance leadership roles at State Street Corporation from 2009 to 2019, where she was most recently Vice President, Alternative Investment Solutions Risk and Compliance Director. |
| Vice President and Deputy Chief Compliance Officer | | Mr. McKiernan is a Senior Compliance Officer at Mercer Investments LLC. Prior to joining Mercer in 2019, he served as a compliance consultant for Mission Critical Services Corp. From 2004 to 2018, Mr. McKiernan held various positions with Prudential Financial, most recently as Director, PGIM Investments. |
+ Officers of the Trust are elected by the Trustees and serve at the pleasure of the Board.
++ Prior to 2023, Mr. Gouthro and Mr. Coleman each held different positions with the Trust since 2018 and 2019, respectively.
+++ Prior to 2021, Mr. Dean and Ms. Hulme each held different positions with the Trust, since 2010 and 2017, respectively.
Shares of Mercer Funds are distributed by MGI Funds Distributors, LLC.
(b) Not applicable.
As of the end of the period covered by this report, the Registrant has adopted a code of ethics that applies to its principal executive officer, principal financial officer, and any other officers who serve a similar function. During the period covered by this report, there were no amendments to the provisions of this code of ethics, nor were there any waivers, including implicit waivers, granted from the provisions of this code of ethics. A copy of the Registrant’s code of ethics is filed with the Form N-CSR under Item 13(a)(1).
| Item 3. | Audit Committee Financial Expert. |
The Registrant’s Board of Trustees has determined that Joan E. Steel, Adela M. Cepeda, Harrison M. Bains, Jr. and Luis Ubinas are “audit committee financial experts,” as such term is defined in Item 3 of Form N-CSR. Ms. Steel, Ms.Cepeda, Mr. Bains and Mr. Ubinas are “independent” under the standards set forth in Item 3 of Form N-CSR. The designation of Ms. Steel, Ms. Cepeda, Mr. Bains and Mr. Ubinas as “audit committee financial experts” pursuant to Item 3 of Form N-CSR does not (i) impose upon them any duties, obligations, or liabilities that are greater than the duties, obligations and liabilities imposed upon them as a member of the Registrant’s audit committee or Board of Trustees in the absence of such designation; or (ii) affect the duties, obligations or liabilities of any other member of the Registrant’s audit committee or Board of Trustees.
| Item 4. | Principal Accountant Fees and Services. |
(a) Audit Fees – The aggregate fee billed for the fiscal year for professional services rendered by the principal accountant for the audit of the Registrant’s annual financial statements or services that are normally provided by the principal accountant in connection with statutory and regulatory filings or engagements was $405,500 and $391,900 for the fiscal years ended March 31, 2022 and March 31, 2023, respectively.
(b) Audit-Related Fees – There were no fees billed for the fiscal years ended March 31, 2022 and March 31, 2023 for assurance and related services by the principal accountant that are reasonably related to the performance of the audit of the Registrant’s financial statements and are not reported under (a) of this Item.
(c) Tax Fees – The aggregate fee billed in the last fiscal year for professional services rendered by the principal accountant for the review of the Registrant’s tax returns and excise tax calculations was $71,390 and $73,540 for the fiscal years ended March 31, 2022 and March 31, 2023, respectively. Fees in the amount of $31,942 and $72,566 were billed in the fiscal years ended March 31, 2022 and March 31, 2023, respectively, for review of non-US capital gains and the preparation and filing of return of income for Mercer Non-US Core Equity Fund and Mercer Emerging Markets Equity Fund.
(d) All Other Fees – Fees in the amount of $4,500 and $140,676.16 where billed in the fiscal year ended March 31, 2022 and March 31, 2023, respectively, for tax advisory services related to the reclamation of taxes paid by Mercer Non-US Core Equity Fund and Mercer Global Low Volatility Equity Fund in certain European Union countries.
(e) (1) The Registrant’s audit committee pre-approves all audit and non-audit services to be performed by the Registrant’s accountant before the accountant is engaged by the Registrant to perform such services.
(2) There were no services described in (b) through (d) above (including services required to be approved by the audit committee pursuant to paragraph (c)(7)(ii) of Rule 2-01 of Regulation S-X) that were approved by the audit committee pursuant to paragraph (c)(7)(i)(C) of Rule 2-01 of Regulation S-X.
| (f) | None of the hours expended on the principal accountant’s engagement to audit the Registrant’s financial statements for the fiscal year ended March 31, 2023 were attributable to work performed by persons other than the principal accountant’s full-time, permanent employees. |
| (g) | There were no aggregate fees billed for the fiscal year ended March 31, 2023 by the Registrant’s principal accountant for non-audit services rendered to the Registrant, its investment adviser and any entity controlling, controlled by or under common control with the investment adviser that provides ongoing services to the Registrant. |
| Item 5. | Audit Committee of Listed Registrants. |
Not applicable.
| Item 6. | Schedule of Investments. |
The Registrant’s full schedules of investments are included as part of the report to shareholders filed under Item 1 of this Form.
| Item 7. | Disclosure of Proxy Voting Policies and Procedures for Closed-End Management Investment Companies. |
Not applicable.
| Item 8. | Portfolio Managers of Closed-End Investment Companies. |
Not applicable.
| Item 9. | Purchases of Equity Securities by Closed-End Management Investment Company and Affiliated Purchasers. |
Not applicable.
| Item 10. | Submission of Matters to a Vote of Security Holders. |
There have been no material changes to the procedures by which the shareholders may recommend nominees to the Registrant’s Board of Trustees that have been implemented since the Registrant last provided disclosure in response to the requirements of Item 22(b)(15) of Schedule 14A (17 CFR 240.14a-101) or this Item.
| Item 11. | Controls and Procedures. |
(a) The Registrant’s principal executive officer and principal financial officer concluded that the Registrant’s disclosure controls and procedures (as defined in Rule 30a-3(c) under the Investment Company Act of 1940 (17 CFR 270.30a-3(c))) are effective based on the evaluation of the Registrant’s disclosure controls and procedures as of a date within 90 days prior to the filing date of this report.
(b) There were no changes in the Registrant’s internal control over financial reporting (as defined in Rule 30a-3(d) under the Investment Company Act of 1940 (17 CFR 270.30a-3(d))) that occurred during the Registrant’s second fiscal quarter of the period covered by this report that has materially affected, or is reasonably likely to materially affect, the
Registrant’s internal control over financial reporting.
| Item 12. | Disclosure of Securities Lending Activities for Closed-End Management Investment Companies. |
Not applicable.
(a)(1) Code of Ethics for the Registrant’s President, Chief Financial Officer and Chief Investment Officer (as referenced in Item 2 above), attached hereto as Exhibit (a)(1).
(a)(2) Certification of the Principal Executive Officer and Principal Financial Officer of the Registrant as required by Rule 30a-2(a) under the Investment Company Act of 1940 (17 CFR 270.30a-2(a)) is attached hereto as Exhibit 99CERT.
(a)(3) Not applicable.
(b) Certification pursuant to Section 906 of the Sarbanes-Oxley Act of 2002 as required by Rule 30a-2(b), under the Investment Company Act of 1940 (17 CFR 270.30a-2(b)), Rule 15d-14(b) under the Securities Exchange Act of 1934 (17 CFR 240.15d-14(b)) and Section 1350 of Chapter 63 of Title 18 of the United States Code (18 U.S.C. 1350) is attached hereto as Exhibit 99.906CERT.
SIGNATURES
Pursuant to the requirements of the Securities Exchange Act of 1934 and the Investment Company Act of 1940, the Registrant has duly caused this report to be signed on its behalf by the undersigned, thereunto duly authorized.
| | |
| (Registrant) Mercer Funds |
| |
| By (Signature and Title) | | /s/ Richard Joseph |
| | Richard Joseph |
| | President and Chief Executive Officer |
| | (Principal Executive Officer) |
| |
| Date 5/23/23 | | |
Pursuant to the requirements of the Securities Exchange Act of 1934 and the Investment Company Act of 1940, this report has been signed below by the following person on behalf of the Registrant and in the capacities and on the date indicated.
| | |
| By (Signature and Title) | | /s/ Richard Joseph |
| | Richard Joseph |
| | President and Chief Executive Officer |
| | (Principal Executive Officer) |
| |
| Date 5/23/23 | | |
| |
| By (Signature and Title) | | /s/ Jeffrey Coleman |
| | Jeffrey Coleman |
| | Vice President, Treasurer and Chief Financial Officer |
| | (Principal Financial Officer) |
| |
| Date 5/23/23 | | |