UNITED STATES
SECURITIES AND EXCHANGE COMMISSION
Washington, DC 20549
FORM N-CSR
CERTIFIED SHAREHOLDER REPORT OF REGISTERED
MANAGEMENT INVESTMENT COMPANIES
Investment Company Act File Number: 811-21732
Mercer Funds
(Exact Name of Registrant as Specified in Charter)
99 High Street
Boston, MA 02110
(Address of Principal Executive Offices) (Zip Code)
Caroline Hulme, Esq.
Mercer Investments LLC
99 High Street
Boston, MA 02110
(Name and Address of Agent for Service)
Registrant’s Telephone Number, including Area Code:
(617) 747-9500
Date of Fiscal Year End: March 31, 2024
Date of Reporting Period: March 31, 2024
Item 1. Reports to Stockholders.
(a) The Report to Shareholders is attached herewith.
Mercer FundsTM
Annual Report
March 31, 2024
Mercer US Small/Mid Cap Equity Fund |
Mercer Emerging Markets Equity Fund |
Mercer Global Low Volatility Equity Fund |
Mercer Non-US Core Equity Fund |
Mercer Core Fixed Income Fund |
Mercer Opportunistic Fixed Income Fund |
Mercer Short Duration Fixed Income Fund |
This report has been prepared for Mercer Funds shareholders. It is not authorized for distribution to prospective investors unless accompanied or preceded by a current Mercer Funds prospectus. The prospectus contains more complete information about the Funds’ investment objectives, risks, and expenses. Investors are reminded to read the prospectus carefully before investing.
MERCER FUNDS
TABLE OF CONTENTS
Management's Discussion of Fund Performance (Unaudited)Mercer US Small/Mid Cap Equity Fund
Investment Objective and Benchmark
The investment objective of the Fund is to provide long-term total return, comprised primarily of capital appreciation. The benchmark for the Fund is the Russell 2500® Index1.
Investment Strategy
The Fund invests principally in equity securities issued by small-to-medium capitalization U.S. companies. The Fund employs a “core equity” investment strategy by investing in both growth and value oriented equity securities. The Fund may invest in derivative instruments to gain market exposure on cash balances or to reduce market exposure in anticipation of liquidity needs.
Performance
For the fiscal year ended March 31, 2024, the Fund’s Y-3 share class performance was 21.61% compared to its benchmark return of 21.43%. For the fiscal year ended March 31, 2024, the Fund’s I share class has less than a full year of performance history, but from its inception on June 27, 2023 through March 31, 2024, performance was 19.50% compared to its benchmark return of 19.54% for the same period. Performance for the Fund is reported net of fees and operating expenses while the benchmark returns do not include expenses of any kind as indexes are unmanaged.
The Sub-Advisers
As of March 31, 2024, the Fund employed six sub-advisers: Westfield Capital Management Company (Westfield), GW&K Investment Management LLC (GW&K), Loomis, Sayles & Company, LP (Loomis), LSV Asset Management (LSV), River Road Asset Management (River Road) and Parametric Portfolio Associates LLC (Parametric).
Westfield, a traditional growth manager, employs a fundamental, bottom-up approach, which seeks to identify reasonably priced stocks with high earnings growth potential.
GW&K uses a bottom-up fundamental research process in order to identify high quality companies with sustainable long-term earnings growth rates.
Loomis looks to provide a lower volatility approach to high growth investing by seeking companies with high quality business models that have differentiated and sustainable growth opportunities.
LSV, a quantitative value manager, seeks deep value, out-of-favor companies with recent momentum. LSV avoids introducing any judgmental biases or behavioral weaknesses into their investment process.
River Road, a fundamental absolute value manager, focuses on purchasing companies that are priced at a modest discount to their absolute value and possess superior fundamental business characteristics.
Parametric utilizes exchange-traded futures to generate market exposure corresponding to the Fund’s benchmark.
Market Commentary and Fund Performance
Amidst a backdrop of moderating inflation growth, continued strength in economic data, and a pivot towards more supportive monetary policy trends, financial markets broadly performed well over the 2024 fiscal year ending March 31, 2024. Geopolitical tensions remained a concern, and markets experienced periods of volatility. Despite these uncertainties, equities ended the fiscal year near all-time historic highs and credit spreads narrowed. Rapid technological change and advancements in Artificial Intelligence have had a transformative impact, driving innovation and reshaping industries worldwide. The narrative around climate change continues to evolve, and the past year saw an increase in extreme weather events which had broad reaching impact. Supply chain dynamics have shifted, and while COVID-related impacts have moderated, there continue to be a host of challenges to navigate, including cyberattacks targeting supply chain infrastructure, trade tensions, and commodity price fluctuations. Finally, shifting labor market dynamics have been front and center, as we confront demographic shifts such as the aging workforce, remote and hybrid work trends persisting and evolving, and changes in immigration policies and flows.
Management's Discussion of Fund Performance (Unaudited) (Continued)Mercer US Small/Mid Cap Equity Fund
For the 12-month-period ended March 31, 2024, the U.S. equity market, as measured by the Russell 3000® Index2, returned 29.29%. Within the Russell 2500® Index, the Fund’s benchmark, the best performing sectors for the fiscal year were industrials and energy with returns of 33.41% and 27.60%, respectively. Underperforming sectors for the fiscal year were communication services and utilities, with returns of -3.51% and 4.94%, respectively. The top performing industries for the fiscal year were technology hardware and construction materials with returns of 293.77% and 86.49%, respectively. The underperforming industries for the fiscal year were health care technology and diversified telecommunication services with negative returns of -20.63% and -18.33%, respectively.
The Mercer U.S. Small/Mid Cap Equity Fund outperformed the Russell 2500® Index for the period. The Fund’s exposure to size and value helped drive performance for the year. Security selection, particularly in the cyclical sectors such as utilities, financials, energy and materials contributed towards performance while selection in the health care, information technology, industrials, consumer staples and consumer discretionary sectors detracted from performance for the fiscal year. From an allocation standpoint, the Fund’s underweight position in the real estate and communication services sectors coupled with its overweight to the industrials sector contributed towards performance while the Fund’s underweight to the financial sector combined with its overweight to the consumer staples sector detracted from performance.
Westfield outperformed for the fiscal year. Their larger market capitalization bias provided a tailwind towards performance coupled with their strong security selection in the industrials, energy and consumer discretionary sectors.
Loomis’ underperformance for the fiscal year can be attributed to their security selection within the information technology and industrials sectors. In addition, within the information technology sector, their underperformance was driven by not owning specific names due to their investment process that outperformed over the year.
GW&K‘s outperformance was attributed to its strong security selection in the materials sector, particularly within the construction materials and chemicals industries. In addition, their security selection across the information technology, energy and industrials sectors contributed towards their performance for the fiscal year.
LSV’s outperformance for the period was driven by its deep value style being in favor, which is evident with its security selection in multiple sectors to include the utilities, information technology, consumer discretionary, financials and industrials contributing towards performance.
River Road’s outperformance for the period was driven by their exposure to value along with their lower volatility approach to investing. In addition, their lack of exposure to REITs and stock selection in utilities contributed towards performance for the fiscal year.
Parametric utilizes exchange-traded futures replicating the Fund’s benchmark to provide broad, passive, equity market exposure to the Fund’s liquidity sleeve, creating positive returns on assets that would have otherwise been earning cash or cash equivalent returns. Performance differences versus the benchmark are largely a result of cash flow effects related to daily subscription/redemption activity and through financing costs of futures relative to interest earned on cash.
Risk Considerations
The Fund invests in both growth stocks and value stocks. Growth stocks may be particularly sensitive to market conditions. Investing in value stocks involves the risk that an investment made in undervalued securities may not appreciate in value as anticipated or remain undervalued for long periods of time. Investments made in small and mid-capitalization companies may be more volatile and less liquid due to limited resources or product lines and more sensitive to economic factors. The Fund may invest in derivative instruments such as exchange-traded equity futures contracts, which may cause the Fund to experience greater volatility and less liquidity. Derivatives may be more sensitive to changes in market conditions and may amplify the risk of loss for the Fund. The Fund may experience high portfolio turnover which may result in higher transaction costs and capital gains.
Management's Discussion of Fund Performance (Unaudited) (Continued)Mercer US Small/Mid Cap Equity Fund
March 31, 2024
Comparison of Change in Value of a hypothetical $10,000 Investment in Mercer US Small/Mid Cap Equity Class Y-3 Shares vs. the Russell 2500® Index for the period 4/1/14 through 3/31/24
AVERAGE ANNUAL TOTAL RETURNS | | | | |
| | | | |
Mercer US Small/Mid Cap Equity Fund – Class Y-3 – 08/15/2005 | | | | |
Mercer US Small/Mid Cap Equity Fund – Class I – 06/27/2023 | | | | |
| | | | |
1 Russell 2500® Index measures the performance of the small-to mid-cap segment of the U.S. equity universe. The Russell 2500® Index is a subset of the Russell 3000® Index. It includes approximately 2,500 of the smallest securities based on a combination of their market cap and current index membership. The index is unmanaged and cannot be invested in directly.
2 Russell 3000® Index measures the performance of 3,000 stocks and includes all large-cap, mid-cap and small-cap US equities, along with some microcap stocks. The index is designed to represent approximately 98% of investable US equities by market capitalization.
* Mercer US Small/Mid Cap Equity Fund - Class I inception date was June 27, 2023. Return represents cumulative return, not annualized.
The Fund's total annual gross operating expense ratio for Class Y-3 is 0.95% and for Class I is 1.20%. Please see the Fund's most recent Prospectus.
The performance of other classes, when launched, will vary from the performance of the class shown based on the difference in fees and expenses paid by shareholders investing in different share classes. The Fund may charge a 2% redemption fee on shares owned less than 30 days.
Management's Discussion of Fund Performance (Unaudited) (Continued)Mercer US Small/Mid Cap Equity Fund
March 31, 2024
The table and graph assume reinvestment of dividends and capital gains, but do not reflect a deduction of taxes an investor might pay on fund distributions or upon redemption of fund shares. Performance shown reflects a fee waiver and/or expense reimbursement. Without this waiver/reimbursement, returns would have been lower.
The data quoted represents past performance and does not guarantee future results. Current performance of the Fund may be lower or higher than the performance quoted. Please call 1-888-887-0619 or visit the Trust’ s website at https://www.mercer.us/what-we-do/wealth-and-investments/delegated-solutions-us.html for the Fund’s most recent month-end performance. Investment return and principal value will fluctuate so that an investor’s shares, when redeemed, may be worth more or less than when purchased.
Fund holdings and sector allocations are subject to change and are not a recommendation to buy or sell any security. Please see the Schedule of Investments for a complete list of Fund holdings.
Management's Discussion of Fund Performance (Unaudited) (Continued)Mercer Emerging Markets Equity Fund
Investment Objective and Benchmark
The investment objective of the Fund is to provide long-term total return, which includes capital appreciation and income. The benchmark for the Fund is the MSCI Emerging Markets® Index1.
Investment Strategy
The Fund invests principally in equity securities of large, medium and small capitalization companies, located in emerging markets, other investments that are tied economically to emerging markets, as well as in American, European and Global Depositary receipts. Stock index futures and various types of swaps may be used to implement the country selection component of the Fund’s investment strategy. Currency forwards may be used to make stock-selection and country allocation decisions independently of the underlying currency.
Performance
For the fiscal year ended March 31, 2024, the Fund’s Y-3 share class performance was 1.60% compared to its benchmark return of 8.15%. For the period ended March 31, 2024, the Fund’s I share class has less than a full year of performance history, but from its inception on June 27, 2023 through March 31, 2024, performance was 1.10% compared to its benchmark return of 7.40% for the same period. Performance for the Fund is reported net of fees and operating expenses while the benchmark returns do not include expenses of any kind as indexes are unmanaged.
The Sub-Advisers
As of March 31, 2024, the Fund employed six sub-advisers and one sub-sub-adviser: Barrow, Hanley, Mewhinney & Strauss, LLC (Barrow Hanley), William Blair Investment Management LLC (William Blair), Origin Asset Management LLP (Origin), Bennbridge U.S. LLC which utilizes certain personnel of Skerryvore Asset Management LLP (together referred to as Bennbridge/Skerryvore), Schroder Investment Management North America Inc. and Schroder Investment Management North America Limited (as sub-sub-adviser) (together, referred to as Schroders) and Parametric Portfolio Associates LLC (Parametric).
Barrow Hanley manages a fundamentally driven, value oriented strategy. Their process focuses on identifying companies trading in the bottom one third of the Emerging Markets universe from a valuation standpoint, and conducts in-depth fundamental analysis to identify strong companies positioned well for a business turnaround.
William Blair has a quality growth philosophy and process focused on finding those companies that can achieve a higher growth rate for a longer period of time than the market expects. William Blair looks for companies with experienced and motivated management teams, unique business models and attractive financial characteristics.
Origin’s portfolio is managed using a quantitative process focused on companies with high and improving cash flow return on investment, selling at discounted valuations of expected future growth versus historical growth and that also display fundamental and price momentum. The portfolio is managed to have a higher tracking error and high active share.
Bennbridge/Skerryvore manages a high quality, concentrated equity strategy with an emphasis on preservation of capital, and sustainability of the businesses in which they invest. The strategy is low turnover, and concentrated, roughly 30-60 names.
Schroders manages a dedicated China allocation for the Fund to exploit alpha2 opportunities within the country. The strategy is a bottom up, fundamental strategy, relying on a team of experienced analysts and PMs to source and evaluate potential investments. The strategy is based on the belief that investing in quality businesses, with sustainable competitive advantages, and focus on shareholder value, trading at reasonable valuations will outperform over time.
Parametric utilizes exchange-traded futures to generate market exposure corresponding to the Fund’s benchmark.
Management's Discussion of Fund Performance (Unaudited) (Continued)Mercer Emerging Markets Equity Fund
Market Commentary and Fund Performance
Amidst a backdrop of moderating inflation growth, continued strength in economic data, and a pivot towards more supportive monetary policy trends, financial markets broadly performed well over the 2024 fiscal year ending March 31, 2024. Geopolitical tensions remained a concern, and markets experienced periods of volatility. Despite these uncertainties, equities ended the fiscal year near all-time historic highs and credit spreads narrowed. Rapid technological change and advancements in Artificial Intelligence have had a transformative impact, driving innovation and reshaping industries worldwide. The narrative around climate change continues to evolve, and the past year saw an increase in extreme weather events which had broad reaching impact. Supply chain dynamics have shifted, and while COVID-related impacts have moderated, there continue to be a host of challenges to navigate, including cyberattacks targeting supply chain infrastructure, trade tensions, and commodity price fluctuations. Finally, shifting labor market dynamics have been front and center, as we confront demographic shifts such as the aging workforce, remote and hybrid work trends persisting and evolving, and changes in immigration policies and flows.
For the year ended March 31, 2024, U.S. equities, measured using the Russell 1000® Index3, surged nearly 30% on the back of strong performance from technology companies. Compared to the U.S., international developed markets lagged, with the MSCI EAFE® Index4 increasing by 15.3% over the period. The MSCI Emerging Markets® Index (the Fund’s benchmark) experienced weaker growth, rising by 8.2% for the 12-month period ended March 31, 2024. In local currency terms MSCI EAFE® Index and MSCI Emerging Markets® Index posted higher returns, as the US dollar appreciated compared to other major currencies.
Within emerging markets, China continued to lag as its post-COVID recovery sputtered. Investor sentiment was weighed down by concerns over the property market, high youth unemployment, and the lack of large government stimulus efforts to jumpstart the economy and inject much needed confidence in the market. The resulting performance was weak, with the MSCI China Index5 declining by 17% during the year. Despite weakness from China there were bright spots in emerging markets. India, Taiwan, and South Korea all posted strong double digit returns for the year driven by strong economic growth, and in the case of Taiwan and South Korea, world leading semiconductor industries that benefitted from excitement surrounding Artificial Intelligence. Latin America also performed well, particularly Brazil and Mexico, the former benefiting from strong energy markets throughout the fiscal year and the latter benefiting from a shift in supply chains away from China.
From a style standpoint more value-oriented companies (those trading at low stock prices relative to their earnings and cashflows) performed strongly vs more expensive companies. Three of the top five best performing sectors for the year were Energy 37%, Financials 15%, and Industrials 4%, all more typical value-oriented areas of investment. The performance from value was barreled with strong performance form technology 27%, largely driven by semiconductors 37%, and tech hardware 33%. The largest company in the Index, TSMC, rose a staggering 42% during the year and ended at 8.3% of the MSCI Emerging Markets® Index.
For the 12-month period ending March 31, 2024, the Mercer Emerging Markets Equity Fund underperformed the MSCI Emerging Markets® Index by 6.6%. The Fund’s underperformance was driven in large part by weak returns from two sub-advisers, Barrow Hanley and Schroders.
Barrow Hanley, the value-oriented manager in the portfolio, underperformed the MSCI Emerging Markets Index by 8% during the fiscal year. Given their valuation focus, the strategy was underweight to more expensive areas of the market which outperformed, including India, Taiwan, and technology companies broadly. The strategy also suffered from an overweight allocation to China which is cheap on a relative basis but continued to struggle due to a sluggish post-COVID recovery and concerns around the property sector. On the positive side, holdings in Brazil and South Korea contributed.
The William Blair Emerging Markets strategy underperformed the MSCI Emerging Markets® Index by roughly 4.0% over the trailing 12-month period ending March 31, 2024. While William Blair’s quality growth style was a slight headwind, underperformance came largely from specific names and positioning within India, Mexico, and China. Financials were a challenging area as HDFC bank sold off during the period. Underperformance in Mexico was driven by a holding in Grupo Aeroport Del Pacific, which experienced regulatory headwinds during the period. Top contributors included Banco Pactual, MercadoLibre and Taiwanese holdings during the trailing 12-months.
Management's Discussion of Fund Performance (Unaudited) (Continued)Mercer Emerging Markets Equity Fund
Bennbridge/Skerryvore outperformed by 0.6% for the fiscal year ending March 31, 2024. The portfolio continues to be focused on higher quality businesses with strong alignment with minority shareholders. This process has led the team to favor businesses in India and Mexico over China, which was additive to performance over the year. In particular consumer names FEMSA (Mexico), Raia Drogasil (Brazil), and Bajaj Auto (India) along with pharmaceutical company Cipla (India) were among the largest contributors. On the negative side, a relative underweight to the semiconductor complex detracted.
Origin outperformed by 2% during the one-year period ending March 31, 2024. A number of stock characteristics that Origin targets as part of their investment philosophy, including momentum, sentiment, and valuation were largely in favor creating a tailwind to performance. Holdings in Taiwan, Brazil, and China were among the strongest contributors, along with technology and financials companies broadly. On the negative size, South Korean and Indian holdings lagged on a relative basis.
The portion of the Fund allocated to Schroders, which pursues investment opportunities in China, underperformed for the year. Holdings in technology financials and health care were among the largest detractors as a combination of regulatory headwinds and a sluggish consumer spending negatively impacted specific holdings. A relative lack of exposure to large state-owned banks and energy companies, along with selection within the large ecommerce and gaming names were additional headwinds.
Parametric utilizes exchange-traded futures to replicate the Fund’s benchmark, aiming to provide broad, passive, equity market exposure to the Fund’s liquidity sleeve and seeking to create positive returns on assets that would have otherwise been earning cash or cash equivalent returns. Performance differences versus the benchmark are largely a result of cash flow effects related to daily subscription/redemption activity and through financing costs of futures relative to interest earned on cash.
Risk Considerations
The Fund invests in emerging market securities which involves certain risks such as currency volatility, political and social instability and reduced market liquidity. Emerging markets may be more volatile and less liquid than more developed markets and therefore may involve greater risks. Investments made in small and mid-capitalization companies may be more volatile and less liquid due to limited resources or product lines and more sensitive to economic factors. The Fund may invest in derivatives (such as futures, forwards, options, or swaps), which may cause the Fund to experience greater volatility and less liquidity. Derivatives may be more sensitive to changes in market conditions and may amplify the risk of loss for the Fund.
Management's Discussion of Fund Performance (Unaudited) (Continued)Mercer Emerging Markets Equity Fund
March 31, 2024
Comparison of Change in Value of a hypothetical $10,000 Investment in Mercer Emerging Markets Equity Class Y-3 Shares vs. the MSCI Emerging Markets® Index for the period 4/1/14 through 3/31/24
AVERAGE ANNUAL TOTAL RETURNS | | | | |
| | | | |
Mercer Emerging Markets Equity Fund – Class Y-3 – 05/01/2012 | | | | |
Mercer Emerging Markets Equity Fund – Class I – 06/27/2023 | | | | |
MSCI Emerging Markets® Index | | | | |
1 MSCI Emerging Markets® Index measures the performance of equity securities in global emerging markets. The index is unmanaged and cannot be invested in directly.
2 Alpha measures the amount that the investment has returned in comparison to the market index or other broad benchmark that it is compared against.
3 Russell 1000® Index measures the performance of the large cap segment of the U.S. equity universe.
4 MSCI EAFE® Index measures the performance of equity securities in developed markets outside of North America, including Europe, Australasia, and the Far East.
5 The MSCI China Index captures large and mid cap representation across China A shares, H shares, B shares, Red chips, P chips and foreign listings (e.g. ADRs). With 704 constituents, the index covers about 85% of this China equity universe.
* Mercer Emerging Markets Equity Fund - Class I inception date was June 27, 2023. Return represents cumulative return, not annualized.
Management's Discussion of Fund Performance (Unaudited) (Continued)Mercer Emerging Markets Equity Fund
March 31, 2024
The Fund's total annual gross operating expense ratio for Class Y-3 is 0.87% and for Class I is 1.12%. Please see the Fund's most recent Prospectus.
The performance of other classes, when launched, will vary from the performance of the class shown based on the difference in fees and expenses paid by shareholders investing in different share classes. The Fund may charge a 2% redemption fee on shares owned less than 30 days.
The table and graph assume reinvestment of dividends and capital gains, but do not reflect a deduction of taxes an investor might pay on fund distributions or upon redemption of fund shares. Performance shown reflects a fee waiver and/or expense reimbursement. Without this waiver/reimbursement, returns would have been lower.
The data quoted represents past performance and does not guarantee future results. Current performance of the Fund may be lower or higher than the performance quoted. Please call 1-888-887-0619 or visit the Trust’ s website at https://www.mercer.us/what-we-do/wealth-and-investments/delegated-solutions-us.html for the Fund’s most recent month-end performance. Investment return and principal value will fluctuate so that an investor’s shares, when redeemed, may be worth more or less than when purchased.
Fund holdings and sector allocations are subject to change and are not a recommendation to buy or sell any security. Please see the Schedule of Investments for a complete list of Fund holdings.
Management's Discussion of Fund Performance (Unaudited) (Continued)Mercer Global Low Volatility Equity Fund
Investment Objective and Benchmark
The investment objective of the Fund is to provide long-term total return, which includes capital appreciation and income. The benchmark for the Fund is the MSCI World® Index1. Effective April 11, 2024, the Fund's secondary index2 is a blended benchmark consisting of 70% MSCI World Minimum Volatility Index and 30% MSCI World Index.
Investment Strategy
The Fund invests principally in equity securities of U.S. and foreign issuers, of large, medium and small capitalization companies. Stock index futures and various types of swaps may be used to implement the equity security selection component of the Fund’s investment strategy. Currency forwards may be used to make stock- selection and country allocation decisions independently of the underlying currency.
Performance
For the fiscal year ended March 31, 2024, the Fund’s Y-3 share class performance was 18.14% compared to its benchmark return of 25.11% and its secondary benchmark of 15.73%. For the fiscal year ended March 31, 2024, the Fund’s I share class has less than a full year of performance history, but from its inception on June 27, 2023 through March 31, 2024, performance was 15.06% compared to its benchmark return of 20.40% and its secondary benchmark of 13.91% for the same period. Performance for the Fund is reported net of fees and operating expenses while the benchmark returns do not include expenses of any kind as indexes are unmanaged.
The Sub-Advisers
As of March 31, 2024, the Fund employed five sub-advisers: Acadian Asset Management LLC (Acadian), Martingale Asset Management, L.P. (Martingale), Ninety One North America, Inc (Ninety One), Veritas Asset Management LLP (Veritas) and Parametric Portfolio Associates LLC (Parametric).
Acadian is the Fund’s dedicated minimum variance manager for developed economies outside the U.S. The strategy applies a quantitative investment process, using mathematical and statistical methods, to the EAFE + Canada universe of securities and emphasizes low-volatility securities, low correlations between securities and a high degree of portfolio diversification with the goal of constructing a portfolio with lower levels of absolute volatility compared to the benchmark. Additionally, the strategy applies Acadian’s stock forecast and top-down alpha3 model, which measures the active return on an investment for performance as compared with a suitable market index, in order to enhance the returns. The portfolio does not employ tight constraints vs the benchmark across capitalization and/or sectors, enhancing its ability to more effectively manage portfolio volatility.
Martingale is the Fund’s dedicated minimum variance manager for the U.S. region. The strategy uses a systematic process of investing in stocks with lower stock price volatility and attractive fundamental factors such as value, quality and momentum. The portfolio aims to deliver equity-like market returns with lower volatility and less downside risk than the market index. Martingale’s core process includes reconstituting the Russell 1000® Index4 into a proprietary “Stability Index”, which Martingale believes more accurately reflects stock risk properties based on longer-term company fundamentals as well as high frequency short-term risk signals. The strategy is managed against the derived Stability Index, which measures the degree of change (or stability) of the market, by applying stock and industry alpha forecasting models and optimizing to minimize the portfolio’s absolute volatility.
Ninety One manages a concentrated portfolio of exceptionally high-quality companies, operating in stable or growing industries with high barriers to entry and low capital intensity. The team uses bottom up fundamental analysis to select businesses that display the best combination of high quality, sustainable growth and compelling valuations. Fundamental analysis focuses on companies with “franchise” characteristics and competitive advantages. Their evidence suggests that dominant intangible assets (low capital intensity) such as high customer loyalty, brands, patents, licenses, copyrights, and distribution networks are difficult to create and more difficult for competitors to duplicate. Enduring franchises consistently generate high returns on capital and compound shareholder wealth. Companies will have high return on capital investment, high gross margins, low leverage, low capital intensity, above average growth and stable cash flow generation.
Management's Discussion of Fund Performance (Unaudited) (Continued)Mercer Global Low Volatility Equity Fund
Veritas uses an unconstrained, fundamentally driven, rigorous research process with a long-term horizon. Veritas believes that companies with sustainable competitive advantage and benefiting from long-term drivers of growth, purchased at attractive valuations, will deliver performance in excess of the benchmark over time. The strategy may hold up to 20% cash.
Parametric utilizes exchange-traded futures to generate market exposure corresponding to the Fund’s benchmark.
Market Commentary and Fund Performance
Amidst a backdrop of moderating inflation growth, continued strength in economic data, and a pivot towards more supportive monetary policy trends, financial markets broadly performed well over the 2024 fiscal year ending March 31, 2024. Geopolitical tensions remained a concern, and markets experienced periods of volatility. Despite these uncertainties, equities ended the fiscal year near all-time historic highs and credit spreads narrowed. Rapid technological change and advancements in Artificial Intelligence have had a transformative impact, driving innovation and reshaping industries worldwide. The narrative around climate change continues to evolve, and the past year saw an increase in extreme weather events which had broad reaching impact. Supply chain dynamics have shifted, and while COVID-related impacts have moderated, there continue to be a host of challenges to navigate, including cyberattacks targeting supply chain infrastructure, trade tensions, and commodity price fluctuations. Finally, shifting labor market dynamics have been front and center, as we confront demographic shifts such as the aging workforce, remote and hybrid work trends persisting and evolving, and changes in immigration policies and flows.
For the year ended March 31, 2024, U.S. equities, measured using the Russell 1000® Index, surged nearly 30% on the back of strong performance from technology companies. Compared to the U.S., international developed markets lagged, with the MSCI EAFE® Index5 increasing by 15.3% over the period. The MSCI Emerging Markets® Index6 (the Fund’s benchmark) was weaker yet, rising by 8.2% for the 12-month period ended March 31, 2024. In local currency terms MSCI EAFE® Index and MSCI Emerging Markets® Index posted higher returns, as the US dollar appreciated compared to other major currencies.
The Fund’s underperformance for the fiscal year was largely driven by its lower beta7 profile amid the rebound in markets after a challenging calendar year 2022. For the year ending March 31, 2024, the MSCI World Minimum Volatility Index8 underperformed the MSCI World® Index by 13.2%; the US (MSCI USA Minimum Volatility Index9) outperformed its international counterpart (MSCI World ex USA Minimum Volatility Index10) by approximately 7.9%. In the US, strong returns and high momentum driven optimism related to easing monetary policy and Artificial Intelligence challenged active management as well as quality. Market concentration continued, with the Magnificent Seven gaining significant market share; however, investors saw a broadening in market outperformance in Q1 2024. Outside the US, continued economic resilience and moderating inflation served as a headwind for quality.
Martingale underperformed the Russell 1000® Index by approximately 9.0%. Strong bull markets are typically challenging environments for defensive strategies, and the trailing 12 months was no exception. Sector allocation detracted from relative return due to overweighting defensive areas of the market (consumer staples, health care, and utilities) as well as underweighting the higher risk technology sector. Security selection was also negative, reflective of investor exuberance for higher risk securities, particularly in the technology and communication services sectors. Notably, the strategy outperformed the comparably defensive MSCI USA Minimum Volatility Index over this same period.
Acadian underperformed the MSCI EAFE® Index by about 2.5%; both sector allocation, as well as security selection were detractors. From a sector allocation perspective, an overweight to consumer staples accounted for the majority of losses. Losses related to security selection in communication services and information technology were offset by gains in consumer staples.
Performance for Veritas was also challenged over the fiscal year 2024, underperforming the MSCI World® Index by 5.4%, as sector allocation and security selection detracted equally from the portfolio. The strategy’s underweight to information technology and overweight to defensive sectors such as healthcare were headwinds to overall performance. In terms of security selection, healthcare and communication services were the largest detractors.
Management's Discussion of Fund Performance (Unaudited) (Continued)Mercer Global Low Volatility Equity Fund
Ninety One underperformed the MSCI World® Index by 7.6%, as performance remained challenged mainly due to security selection. Security selection in information technology and financials were detractors. From a sector allocation perspective, losses related to the overweight in consumer staples were more than offset by gains from the overweight in information technology, and zero weights in materials, utilities, real estate, and energy.
Parametric utilizes exchange-traded futures to replicate the Fund’s benchmark with beta of 0.8, aiming to provide broad, passive, equity market exposure to the Fund’s liquidity sleeve and seeking to create positive returns on assets that would have otherwise been earning cash or cash equivalent returns. Performance differences versus the benchmark are largely a result of cash flow effects related to daily subscription/redemption activity and through financing costs of futures relative to interest earned on cash.
Risk Considerations
The Fund invests in foreign and emerging market securities which involves certain risks such as currency volatility, political and social instability and reduced market liquidity. Emerging markets may be more volatile and less liquid than more developed markets and therefore may involve greater risks. Investments made in small and mid-capitalization companies may be more volatile and less liquid due to limited resources or product lines and more sensitive to economic factors. The Fund may invest in derivatives (such as futures, forwards, options, or swaps), which may cause the Fund to experience greater volatility and less liquidity. Derivatives may be more sensitive to changes in market conditions and may amplify the risk of loss for the Fund.
Management's Discussion of Fund Performance (Unaudited) (Continued)Mercer Global Low Volatility Equity Fund
March 31, 2024
Comparison of Change in Value of a hypothetical $10,000 Investment in Mercer Global Low Volatility Equity Class Y-3 Shares vs. the MSCI World® Index and the Fund’s Secondary Index for the period 4/1/14 through 3/31/24
AVERAGE ANNUAL TOTAL RETURNS | | | | |
| | | | |
Mercer Global Low Volatility Equity Fund – Class Y-3 – 11/06/2012 | | | | |
Mercer Global Low Volatility Equity Fund – Class I – 06/27/2023 | | | | |
| | | | |
| | | | |
1 MSCI World® Index measures the performance of stocks in 23 developed markets in North America, Europe, and the Asia/Pacific region. The index is unmanaged and cannot be invested in directly.
2 The Secondary Index is a blended benchmark consisting of 70% MSCI World Minimum Volatility Index (reflects no deduction for fees, expenses or taxes) and 30% MSCI World® Index (reflects no deduction for fees, expenses or taxes (other than assumed dividend tax)). The index is unmanaged and cannot be invested in directly.
3 Alpha measures the amount that the investment has returned in comparison to the market index or other broad benchmark that it is compared against.
4 Russell 1000® Index measures the performance of the large cap segment of the U.S. equity universe.
5 MSCI EAFE® Index measures the performance of equity securities in developed markets outside of North America, including Europe, Australasia, and the Far East.
6 MSCI Emerging Markets® Index measures the performance of equity securities in global emerging markets.
Management's Discussion of Fund Performance (Unaudited) (Continued)Mercer Global Low Volatility Equity Fund
March 31, 2024
7 Beta is a measure of how an individual asset moves (on average) when the overall stock market increases or decreases.
8 The MSCI World Minimum Volatility (USD) Index aims to reflect the performance characteristics of a minimum variance strategy applied to the MSCI large and mid cap equity universe across 23 Developed Markets countries.
9 The MSCI USA Minimum Volatility (USD) Index aims to reflect the performance characteristics of a minimum variance strategy applied to the large and mid cap USA equity universe.
10 The MSCI World ex USA Minimum Volatility (USD) Index aims to reflect the performance characteristics of a minimum variance strategy applied to the MSCI large and mid cap equity universe across 22 Developed Markets (DM) countries.
* Mercer Global Low Volatility Equity Fund - Class I inception date was June 27, 2023. Return represents cumulative return, not annualized.
The Fund's total annual gross operating expense ratio for Class Y-3 is 0.80% and for Class I is 1.05%. Please see the Fund's most recent Prospectus.
The performance of other classes, when launched, will vary from the performance of the class shown based on the difference in fees and expenses paid by shareholders investing in different share classes. The Fund may charge a 2% redemption fee on shares owned less than 30 days.
The table and graph assume reinvestment of dividends and capital gains, but do not reflect a deduction of taxes an investor might pay on fund distributions or upon redemption of fund shares. Performance shown reflects a fee waiver and/or expense reimbursement. Without this waiver/reimbursement, returns would have been lower.
The data quoted represents past performance and does not guarantee future results. Current performance of the Fund may be lower or higher than the performance quoted. Please call 1-888-887-0619 or visit the Trust’ s website at https://www.mercer.us/what-we-do/wealth-and-investments/delegated-solutions-us.html for the Fund’s most recent month-end performance. Investment return and principal value will fluctuate so that an investor’s shares, when redeemed, may be worth more or less than when purchased.
Fund holdings and sector allocations are subject to change and are not a recommendation to buy or sell any security. Please see the Schedule of Investments for a complete list of Fund holdings.
Management's Discussion of Fund Performance (Unaudited) (Continued)Mercer Non-US Core Equity Fund
Investment Objective and Benchmark
The investment objective of the Fund is to provide long-term total return, which includes capital appreciation and income. The benchmark for the Fund is the MSCI EAFE® Index1.
Investment Strategy
The Fund invests principally in equity securities issued by non-U.S. companies of any capitalization, located in the world’s developed and emerging capital markets. The Fund employs a “core equity” investment strategy that seeks to meet the Fund’s investment objective by investing in both growth- and value-oriented equity securities.
Performance
For the fiscal year ended March 31, 2024, the Fund’s Y-3 share class performance was 18.29% compared to its benchmark return of 15.32%. For the fiscal year ended March 31, 2024, the Fund’s I share class performance was 18.08% compared to its benchmark return of 15.32%. Performance for the Fund is reported net of fees and operating expenses while the benchmark returns do not include expenses of any kind as indexes are unmanaged.
The Sub-Advisers
As of March 31, 2024, the Fund employed five sub-advisers: Arrowstreet Capital, Limited Partnership (Arrowstreet), American Century Investment Management, Inc. (American Century), Massachusetts Financial Services Company (MFS), LSV Asset Management (LSV) and Parametric Portfolio Associates LLC (Parametric).
Arrowstreet’s strategy seeks to outperform international equity benchmarks through a risk-controlled core approach. Arrowstreet combines sound investment intuition and research with rigorous quantitative tools to identify mispriced stocks around the world. Arrowstreet believes that the key to generating returns in excess of the benchmark involves evaluating the prospects of a security considering the characteristics of the stock itself (direct effects), characteristics of other related stocks (indirect effects) as well as attractiveness of the country and sector basket to which the stock belongs to.
American Century manages its portfolio based on an investment philosophy that companies exhibiting improving or accelerating growth will outperform the market over time. American Century constructs its portfolio through a bottom-up stock selection, which focuses on individual stock selection rather than macroeconomic and market cycles, within a risk aware framework. American Century’s thorough research process seeks to identify companies that are exhibiting an improvement or acceleration in growth where it believes that growth is sustainable but that the earnings power of the company is generally underestimated. American Century can opportunistically invest in emerging market stocks.
MFS’s investment process is based on a fundamental, bottom-up stock selection of high quality companies whose long-term value MFS believes is not adequately reflected in the stock price.
LSV utilizes a quantitative approach, which uses mathematical and statistical methods and seeks deep value stocks that have fallen out of favor with the market, but have recent momentum, either in terms of price or earnings. LSV believes that long-term results are achieved through systematic exploitation of judgmental biases and behavioral weaknesses that influence investor decisions. LSV aims to exploit these biases through the disciplined application of quantitative techniques to drive bottom-up security selection.
Parametric utilizes exchange-traded futures to generate market exposure corresponding to the Fund’s benchmark.
Management's Discussion of Fund Performance (Unaudited) (Continued)Mercer Non-US Core Equity Fund
Market Commentary and Fund Performance
Amidst a backdrop of moderating inflation growth, continued strength in economic data, and a pivot towards more supportive monetary policy trends, financial markets broadly performed well over the 2024 fiscal year ending March 31, 2024. Geopolitical tensions remained a concern, and markets experienced periods of volatility. Despite these uncertainties, equities ended the fiscal year near all-time historic highs and credit spreads narrowed. Rapid technological change and advancements in Artificial Intelligence have had a transformative impact, driving innovation and reshaping industries worldwide. The narrative around climate change continues to evolve, and the past year saw an increase in extreme weather events which had broad reaching impact. Supply chain dynamics have shifted, and while COVID-related impacts have moderated, there continue to be a host of challenges to navigate, including cyberattacks targeting supply chain infrastructure, trade tensions, and commodity price fluctuations. Finally, shifting labor market dynamics have been front and center, as we confront demographic shifts such as the aging workforce, remote and hybrid work trends persisting and evolving, and changes in immigration policies and flows.
In the first quarter of the year, returns were driven by individual country performance particularly in Japan local currency. That was driven by strong foreign investor interest and weaker yen improving prospects for Japanese exporters. In the second half of the fiscal year, Bank of Japan’s policy change of increase in Japanese government bond yields led to higher interest rate expectations. The second half of the year proved strong for information technology companies as there was a risk on environment and technology was boosted by semiconductor stocks. Momentum was the best performing equity style across all major market followed by value. Growth and minimum volatility underperformed for the fiscal year.
For the fiscal year, in Europe, Australia and Far East (EAFE) markets, information technology 31.5%, financials 26.8% and industrials 23.6% were the best performing sectors while consumer staples -5.6%, utilities 3.4% and communication services 7.0% were the worst performers.
Arrowstreet outperformed the Fund’s benchmark by 10.0%. Arrowstreet’s tilt towards value stocks was a tailwind. An overweight to information technology was the largest sector level contributor due to positive selection within Japan and Germany. An overweight and positive security selection within Italian financials also led to positive returns. An overweight to Japan and positive selection within the industrial sector contributed. Communication services was the only sector level detractor. Chinese financials and consumer discretionary also detracted for the fiscal year.
American Century lagged the Fund’s benchmark by 6.4%. Value outperformed growth during the period, particularly in Japan, which was a significant headwind for American Century as a growth manager. The MSCI Japan Value Index2 outperformed the MSCI Japan Growth Index3 by over 18% during the 2024 fiscal year. From a security selection perspective the majority of the underperformance came within financials, industrials and consumer discretionary. Stock selection in health care contributed to performance.
MFS outperformed the Fund’s benchmark by 1.0%. An overweight position in the information technology sector was a major contributor for the fiscal year. Weakness in selection in the consumer discretionary sector offset some of the positive gains. In addition, the portfolio’s currency exposure had a positive impact on relative performance during the period.
LSV outperformed the Fund’s benchmark by 3.9%. Selection within financials drove outperformance for the fiscal year. Consumer staples and consumer discretionary was also additive. An underweight to information technology detracted in the later half of the year.
Parametric utilizes exchange-traded futures replicating the Fund’s benchmark, aiming to provide broad, passive, equity market exposure to the Fund’s liquidity sleeve, and seeking to create positive returns on assets that would have otherwise been earning cash or cash equivalent returns. Performance differences versus the benchmark are largely a result of cash flow effects related to daily subscription/redemption activity and through financing costs of futures relative to interest earned on cash.
Management's Discussion of Fund Performance (Unaudited) (Continued)Mercer Non-US Core Equity Fund
Risk Considerations
The Fund invests in foreign and emerging market securities which involves certain risks such as currency volatility, political and social instability and reduced market liquidity. Emerging markets may be more volatile and less liquid than more developed markets and therefore may involve greater risks. Investments made in small and mid-capitalization companies may be more volatile and less liquid due to limited resources or product lines and more sensitive to economic factors. The Fund may invest in derivative instruments such as exchange-listed equity futures contracts, which may cause the Fund to experience greater volatility and less liquidity. Derivatives may be more sensitive to changes in market conditions and may amplify the risk of loss for the Fund.
Management's Discussion of Fund Performance (Unaudited) (Continued)Mercer Non-US Core Equity Fund
March 31, 2024
Comparison of Change in Value of a hypothetical $10,000 Investment in Mercer Non-US Core Equity Class Y-3 Shares vs. the MSCI EAFE Index® for the period 4/1/14 through 3/31/24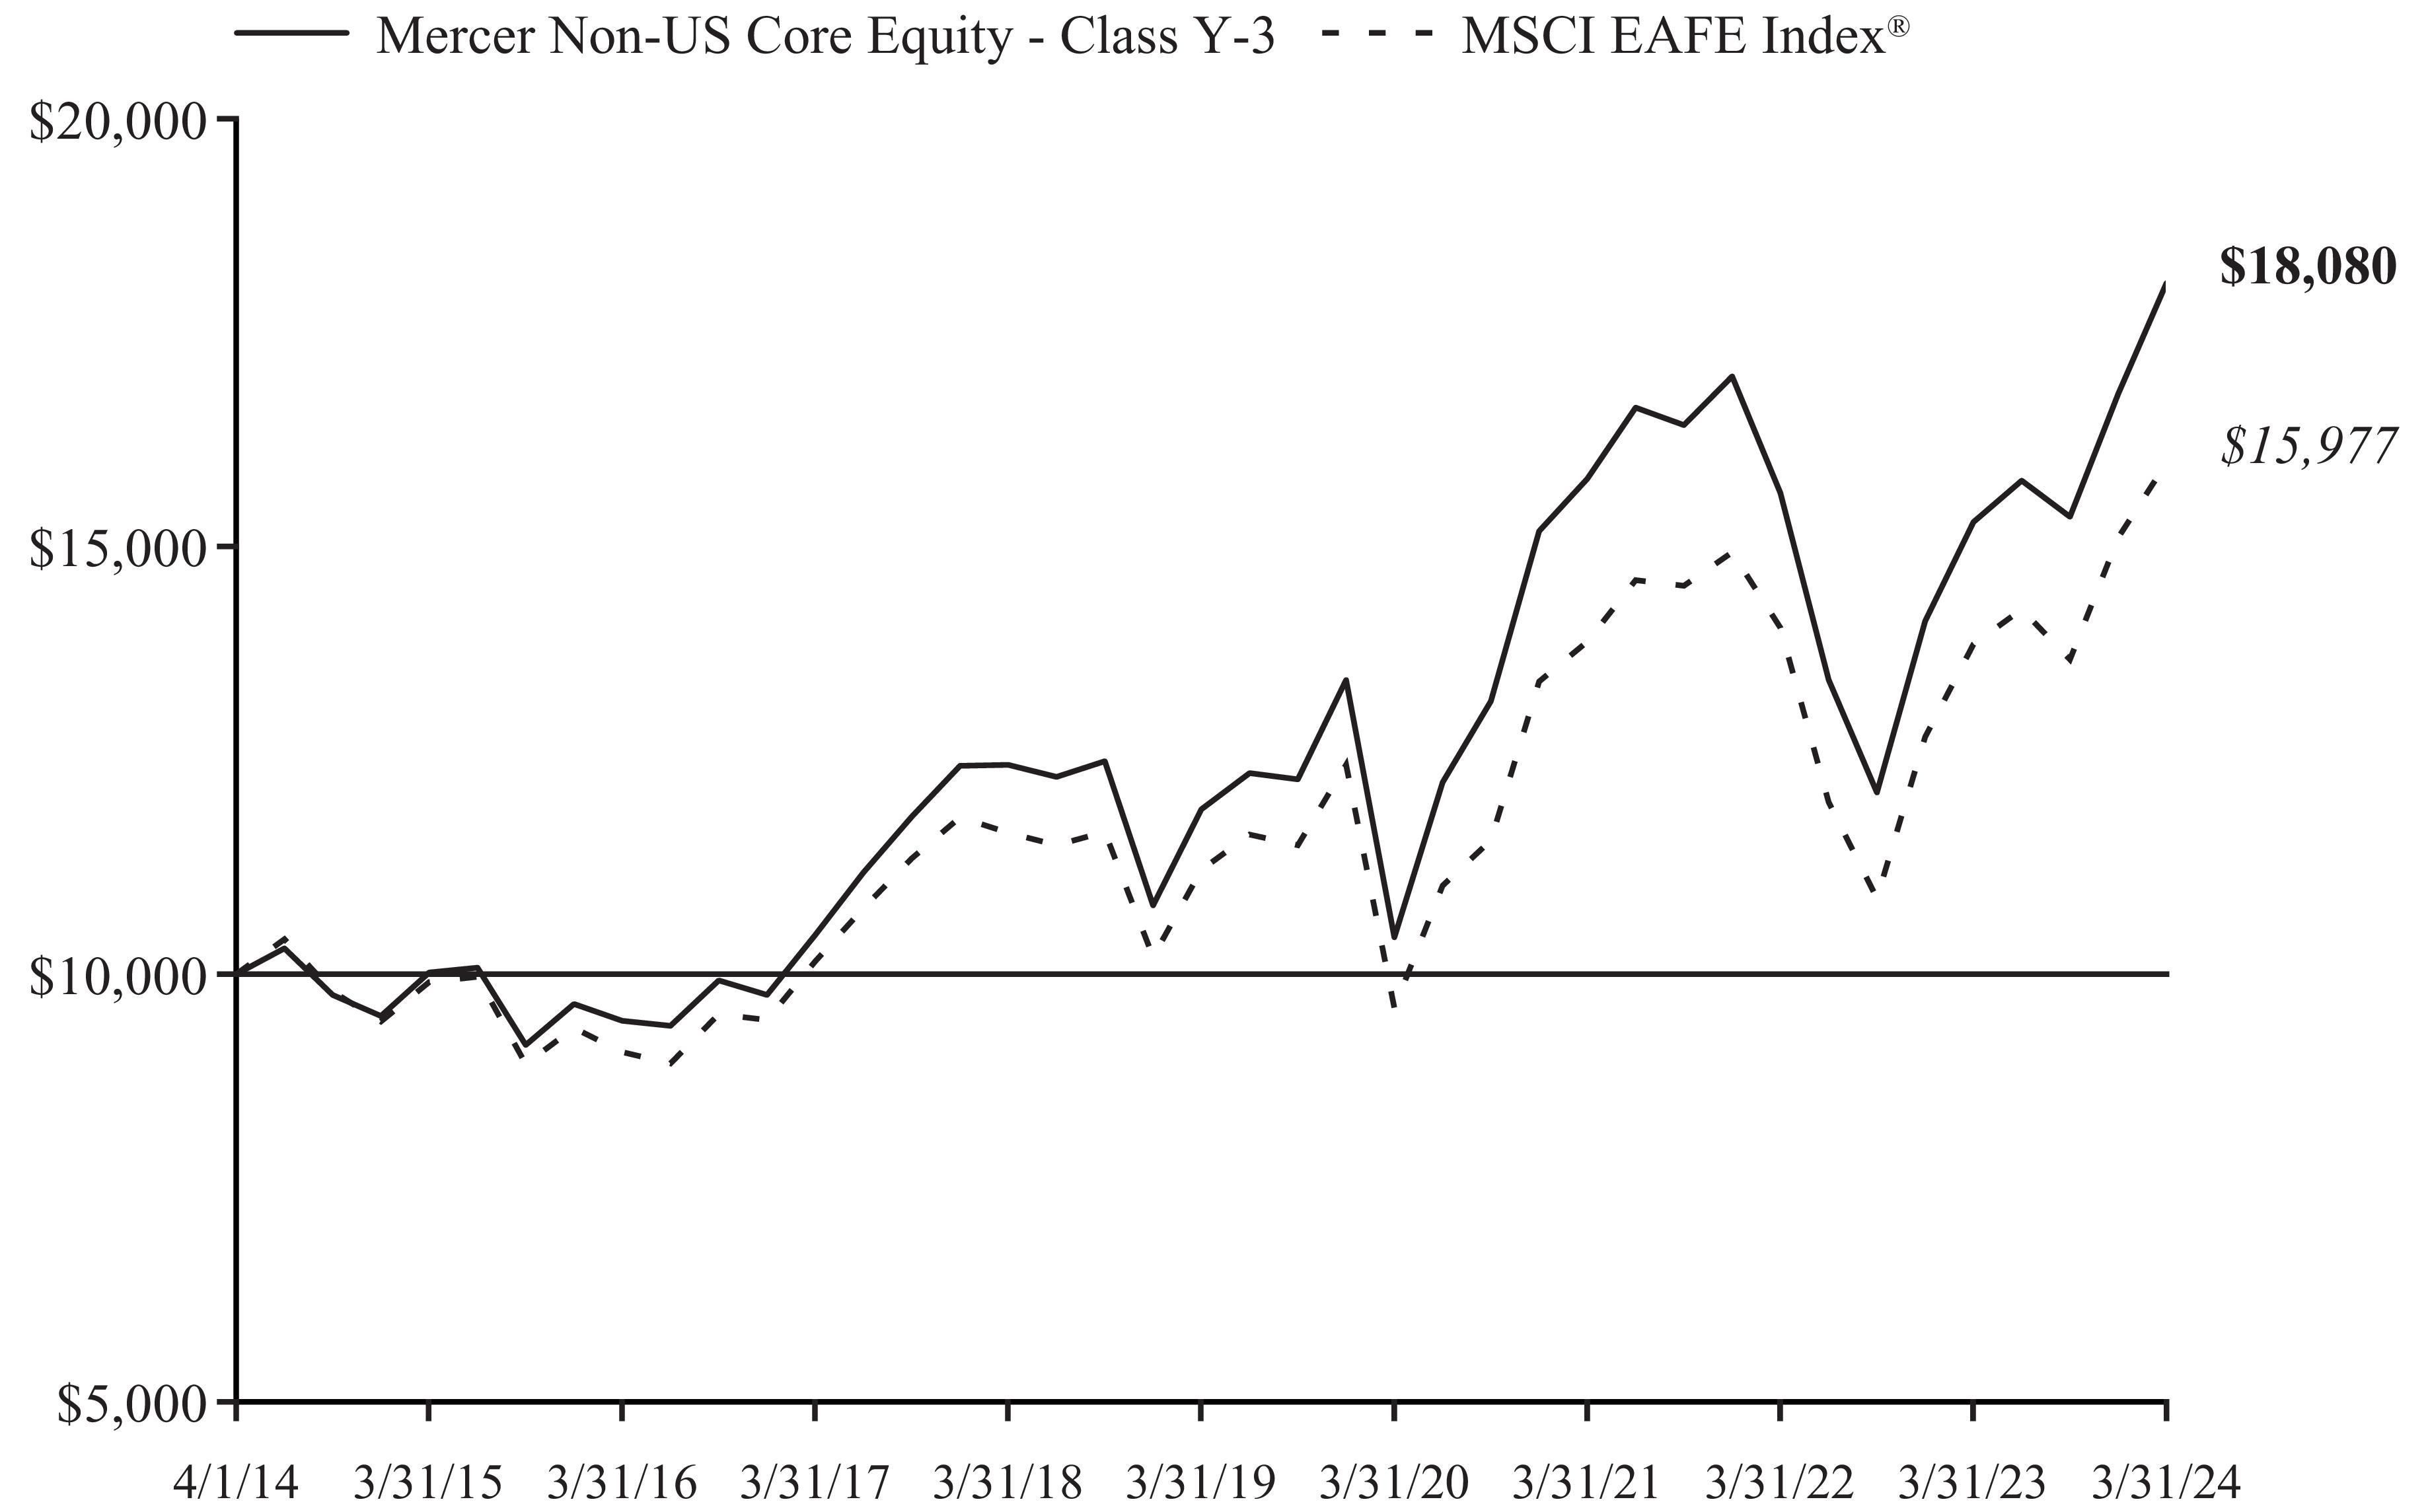
AVERAGE ANNUAL TOTAL RETURNS | | | | |
| | | | |
Mercer Non-US Core Equity Fund – Class Y-3 – 08/18/2006 | | | | |
Mercer Non-US Core Equity Fund – Class I – 07/22/2021 | | | | |
| | | | |
1 MSCI EAFE Index® measures the performance of equity securities in developed markets outside of North America, including Europe, Australasia, and the Far East. The index is unmanaged and cannot be invested in directly.
2 The MSCI Japan Value Index captures large and mid cap Japanese securities exhibiting overall value style characteristics. The value investment style characteristics for index construction are defined using three variables: book value to price, 12-month forward earnings to price and dividend yield.
3 The MSCI Japan Growth Index captures large and mid cap securities exhibiting overall growth style characteristics in Japan.
The Fund's total annual gross operating expense ratio for Class Y-3 is 0.76% and for Class I is 1.01% Please see the Fund's most recent Prospectus.
The performance of other classes, when launched, will vary from the performance of the class shown based on the difference in fees and expenses paid by shareholders investing in different share classes. The Fund may charge a 2% redemption fee on shares owned less than 30 days.
Management's Discussion of Fund Performance (Unaudited) (Continued)Mercer Non-US Core Equity Fund
March 31, 2024
The table and graph assume reinvestment of dividends and capital gains, but do not reflect a deduction of taxes an investor might pay on fund distributions or upon redemption of fund shares. Performance shown reflects a fee waiver and/or expense reimbursement. Without this waiver/reimbursement, returns would have been lower.
The data quoted represents past performance and does not guarantee future results. Current performance of the Fund may be lower or higher than the performance quoted. Please call 1-888-887-0619 or visit the Trust’ s website at https://www.mercer.us/what-we-do/wealth-and-investments/delegated-solutions-us.html for the Fund’s most recent month-end performance. Investment return and principal value will fluctuate so that an investor’s shares, when redeemed, may be worth more or less than when purchased.
Fund holdings and sector allocations are subject to change and are not a recommendation to buy or sell any security. Please see the Schedule of Investments for a complete list of Fund holdings.
Management's Discussion of Fund Performance (Unaudited) (Continued)Mercer Core Fixed Income Fund
Investment Objective and Benchmark
The investment objective of the Fund is to provide total return, consisting of both current income and capital appreciation. The benchmark for the Fund is the Bloomberg U.S. Aggregate Bond™ Index1.
Investment Strategy
The Fund invests principally in investment grade fixed income securities, including government securities, corporate bonds and securitized bonds, such as mortgage and asset-backed securities. The Fund may also invest in non-investment grade bonds (sometimes called high yield or junk bonds), non-U.S. dollar denominated bonds, and bonds issued by issuers located in emerging capital markets. The Fund may also invest in certain derivative instruments, such as options, futures, and swap agreements. The Fund may engage in transactions in derivatives for a variety of purposes, including changing the investment characteristics of its portfolio, enhancing total returns or as a substitute for taking a position in an underlying asset.
Performance
For the fiscal year ended March 31, 2024, the Fund’s Y-3 share class performance was 2.77% compared to its benchmark return of 1.70%. For the period ended March 31, 2024, the Fund’s I share class performance was 2.50% compared to its benchmark return of 1.70%. Performance for the Fund is reported net of fees and operating expenses while the benchmark returns do not include expenses of any kind as indexes are unmanaged.
The Sub-Advisers
As of March 31, 2024, the Fund employed three sub-advisers: Manulife Investment Management (US) LLC (Manulife), Income Research & Management (IR&M) and PGIM Fixed Income, a business unit of PGIM, Inc. (Prudential).
Manulife manages its allocated portion of the Fund by seeking to produce superior results through bottom-up active management of sector allocation and issue selection, combined with yield curve positioning. Duration is also managed in line with the benchmark. The investment team capitalizes on their disciplined investment process and adds value by following a relative value approach to sector allocation and issue selection while engaging in intensive fundamental credit research and identifying points on the yield curve with the greatest return potential.
IR&M manages its allocated portion of the Fund based on the belief that careful security selection and higher portfolio income provide superior returns over the long term. Portfolios are constructed using a disciplined, bottom-up investment approach to select attractive securities from the U.S. fixed income universe. A bottom-up approach focuses on the analysis of individual issuers and de-emphasizes the significance of macroeconomic and market cycles with the assumption individual companies can do well even in an industry that is not performing, at least on a relative basis.
Prudential manages its allocated portion of the Fund by seeking to maximize excess return opportunities from sustainable alpha2 sources, such as sector allocation and bottom-up security selection. This process is coupled with a diligent daily portfolio risk evaluation and monitoring process. Research-based security selection is a major source of added value and incorporates both fundamental analysis, by measuring a security’s intrinsic value to determine if undervalued or overvalued, as well as proprietary models, by using software and other means of analysis to gain a competitive edge, which identify relative value and detailed technical review of issuers across both benchmark and non-benchmark sectors, with an emphasis on credit-oriented sectors.
Management's Discussion of Fund Performance (Unaudited) (Continued)Mercer Core Fixed Income Fund
Market Commentary and Fund Performance
Amidst a backdrop of moderating inflation growth, continued strength in economic data, and a pivot towards more supportive monetary policy trends, financial markets broadly performed well over the 2024 fiscal year ending March 31, 2024. Geopolitical tensions remained a concern, and markets experienced periods of volatility. Despite these uncertainties, equities ended the fiscal year near all-time historic highs and credit spreads narrowed. Rapid technological change and advancements in Artificial Intelligence have had a transformative impact, driving innovation and reshaping industries worldwide. The narrative around climate change continues to evolve, and the past year saw an increase in extreme weather events which had broad reaching impact. Supply chain dynamics have shifted, and while COVID-related impacts have moderated, there continue to be a host of challenges to navigate, including cyberattacks targeting supply chain infrastructure, trade tensions, and commodity price fluctuations. Finally, shifting labor market dynamics have been front and center, as we confront demographic shifts such as the aging workforce, remote and hybrid work trends persisting and evolving, and changes in immigration policies and flows.
For the 12-month period ended March 31, 2024, U.S. fixed income market returns, as measured by the Bloomberg U.S. Aggregate Bond™ Index, were positive, stemming from a tightening in spreads as yields remain elevated. Yields continued to rise over the last twelve months with longer-term yields rising more than short-term yields. The 10-year U.S. Treasury yield increased from 3.48% to 4.20% over the period, while the 2-year U.S. Treasury yield rose from 4.06% to 4.59%. The curve steepened due to long-term interest rates increasing at a faster rate than short-term rates, with the spread between 10-year and 2-year U.S. Treasury yields changing from -58 basis points3 (bps) to -39bps. Interest rates were volatile throughout the period. At the beginning of the fiscal year, markets still had yet to digest how far the Federal Reserve would need to go to tame inflation. As the year progressed, inflation trended lower and markets began pricing in a shift in the Federal Reserve’s approach towards a more accommodative policy, including potential rate cuts. Consequently, rates saw a strong rally in the last two months of 2023, though a series of better than expected economic data in the first quarter of 2024 caused yields to sell off again. Despite ongoing volatility in interest rates, corporate credit spreads continued tightening. Both investment grade and high yield issuers performed well, with spreads in both markets ending the period below long-term averages and approaching historically tight levels.
The Fund’s return was positive in relative terms as it outperformed the Bloomberg U.S. Aggregate Bond™ Index for the fiscal year ended March 31, 2024. The majority of outperformance was due to a combination of positive contributions from security selection and the Fund’s allocation to spread sectors, particularly during the 4th quarter of 2023 and the 1st quarter of 2024 as spreads tightened. Spread sectors are sectors of fixed income securities that provide an additional yield, or spread, over the yield of a risk-free government bond.
The respective performance results of each sub-adviser was in line with expectations based on risk posture. Manulife has the largest share of the risk-allocation within the Fund. Manulife’s sector allocation, led by an out-of-benchmark exposure to high yield corporates, underweight to US Treasuries, and modest overweight to investment grade corporates led the manager to outperform for the fiscal year.
Prudential had a marginally less aggressive allocation to spread sectors relative to Manulife, but was still overweight relative to the Fund’s benchmark. Positioning within high quality structured products, investment grade corporates, and high yield corporates contributed to performance as spreads across these sectors tightened and produced positive excess returns.
IR&M outperformed the Fund’s benchmark over the trailing 12-month period. Their bias towards higher quality corporate bonds as well as their tactical rotation of spread exposure led them to outperform.
Risk Considerations
The Fund is subject to the risks that the underlying bonds in its portfolio are subject to, including credit, prepayment, call and interest rate risk. As interest rates rise, the value of bond prices will decline. The Fund may invest in foreign securities, which may expose the Fund to currency and exchange rate fluctuations, derivatives (such as futures, options, or swaps) and high yield bonds (also known as “junk” bonds). These investments may cause the Fund to experience greater volatility and less liquidity. Derivatives may be more sensitive to changes in market conditions and may amplify the risk of loss for the Fund. The Fund may also experience high portfolio turnover, which may result in higher transaction costs and capital gains.
Management's Discussion of Fund Performance (Unaudited) (Continued)Mercer Core Fixed Income Fund
March 31, 2024
Comparison of Change in Value of a hypothetical $10,000 Investment in Mercer Core Fixed Income Class Y-3 Shares vs. the Bloomberg U.S. Aggregate Bond™ Index for the period 4/1/14 through 3/31/24
AVERAGE ANNUAL TOTAL RETURNS | | | | |
| | | | |
Mercer Core Fixed Income Fund – Class Y-3 – 08/15/2005 | | | | |
Mercer Core Fixed Income Fund – Class I – 12/27/2021 | | | | |
Bloomberg U.S. Aggregate Bond™ Index | | | | |
1 Bloomberg U.S. Aggregate BondTM Index is an index that measures the performance of securities from the Bloomberg U.S. Government/ Corporate Bond Index, Mortgage-Backed Securities Index, Asset-Backed Securities Index, and Commercial Mortgage-Backed Securities Index. The Bloomberg U.S. Aggregate BondTM Index is a broad representation of the investment-grade fixed-income market in the United States and includes U.S. government and corporate debt securities, mortgage- and asset-backed securities, and international U.S. dollar-denominated bonds. All securities contained in the Bloomberg U.S. Aggregate BondTM Index have a minimum term to maturity of one year. The index is unmanaged and cannot be invested in directly.
2 Alpha measures the amount that the investment has returned in comparison to the market index or other broad benchmark that it is compared against.
3 Basis Points: A common unit of measure for interest rates and other percentages in finance. One basis point is equal to 1/100th of 1%, or 0.01%, or 0.0001, and is used to denote the percentage change in a financial instrument.
The Fund's total annual gross operating expense ratio for Class Y-3 is 0.39% and for Class I is 0.64% Please see the Fund's most recent Prospectus.
Management's Discussion of Fund Performance (Unaudited) (Continued)Mercer Core Fixed Income Fund
March 31, 2024
The performance of other classes, when launched, will vary from the performance of the class shown based on the difference in fees and expenses paid by shareholders investing in different share classes. The Fund may charge a 2% redemption fee on shares owned less than 30 days.
The table and graph assume reinvestment of dividends and capital gains, but do not reflect a deduction of taxes an investor might pay on fund distributions or upon redemption of fund shares. Performance shown reflects a fee waiver and/or expense reimbursement. Without this waiver/reimbursement, returns would have been lower.
The data quoted represents past performance and does not guarantee future results. Current performance of the Fund may be lower or higher than the performance quoted. Please call 1-888-887-0619 or visit the Trust’ s website at https://www.mercer.us/what-we-do/wealth-and-investments/delegated-solutions-us.html for the Fund’s most recent month-end performance. Investment return and principal value will fluctuate so that an investor’s shares, when redeemed, may be worth more or less than when purchased.
Fund holdings and sector allocations are subject to change and are not a recommendation to buy or sell any security. Please see the Schedule of Investments for a complete list of Fund holdings.
Management's Discussion of Fund Performance (Unaudited) (Continued)Mercer Opportunistic Fixed Income Fund
Investment Objective and Benchmark
The investment objective of the Fund is to provide long-term total return, which includes capital appreciation and income. The Fund’s primary benchmark is the ICE Bank of America Merrill Lynch Global High Yield 2% Constrained Index Unhedged1. The Fund’s secondary benchmark2 is a blended benchmark consisting of 35% Bloomberg Global Aggregate Corporate Total Return Index Hedged3, 17.5% Bloomberg Global High Yield Index4, 10.5% JP Morgan CEMBI Diversified Index5, 7% S&P/LSTA Leveraged Loan Index6, and 30% JPMorgan GBI-EM Diversified Index7.
Investment Strategy
The Fund invests principally in fixed income securities of U.S. and non-U.S. issuers, including those in emerging and frontier markets. The Fund invests in various strategic and tactical global bond market opportunities without limitations in geography, issuer type, quality and currency denomination. The Fund may invest in derivatives such as futures (including among others, interest rate futures), swaps (currency, interest rate, credit default and total return), forwards, options, and credit-linked notes. The Fund may engage in transactions in derivatives for a variety of purposes, including hedging, risk management, efficient portfolio management, enhance total returns, or as a substitute for taking position in the underlying asset.
Performance
For the fiscal year ended March 31, 2024, the Fund’s Y-3 share class performance was 7.54% compared to its primary benchmark return of 11.09% and secondary benchmark return of 7.67%. For the fiscal year ended March 31, 2024, the Fund's I share class has less than a full year of performance history, but from its inception on June 27, 2023 through March 31, 2024, performance was 5.53% compared to its primary benchmark return of 9.76% and the secondary benchmark of 6.27% for the same period. Performance of the Fund is reported net of fees and operating expenses while the benchmark returns do not include expenses of any kind as indexes are unmanaged.
The Sub-Advisers
As of March 31, 2024, the Fund employed five sub-advisers and one sub-sub-adviser: Western Asset Management Company, LLC and Western Asset Management Company Limited (as sub-sub-adviser) (together referred to as WAMCO), Loomis, Sayles & Company, L.P. (Loomis), BlackRock International Limited (BlackRock), Colchester Global Investors Limited (Colchester) and Ninety One North America, Inc (Ninety One).
In managing its allocated portion of the Fund’s portfolio, Ninety One primarily focuses on investing in local currency debt. Additionally, it has the ability to diversify their investments by allocating a portion to hard currency sovereign and corporate debt. Their investment process incorporates both top-down and bottom-up factors to effectively manage the portfolio. As a defensive-style strategy, Ninety One adopts a total return approach in the Emerging Market Debt (EMD) space. Their objective is to achieve lower volatility over time and mitigate downside risk.
In managing its allocated portion of the Fund’s portfolio, Loomis invests in debt of issuers globally. Loomis produces country specific credit cycle views and forward looking financial market regimes as inputs to portfolio construction. Security selection is then carried out by the investment team with input from a team of credit analysts who maintain a comprehensive database of internal ratings. The investment team will also engage in active duration positioning although security and sector selections are identified as main drivers of performance.
In managing its allocated portion of the Fund’s portfolio, WAMCO employs an active, team-managed investment approach around a long-term, value-oriented investment philosophy. The portfolio seeks to harvest income opportunities by constructing a diversified portfolio that includes investment-grade and high yield corporate credit, non-dollar debt, bank loans, Credit Loan Obligations (CLO), emerging markets sovereign and corporate debt, and a variety of structured credit (Residential Mortgage Backed Security (RMBS), Commercial Mortgage Backed Securities (CMBS), Asset Backed Securities (ABS)). WAMCO seeks to add value through sector rotation, issue selection, duration management, yield curve positioning, and tail risk hedging.
Management's Discussion of Fund Performance (Unaudited) (Continued)Mercer Opportunistic Fixed Income Fund
In managing its allocated portion of the Fund’s portfolio, Colchester invests in sovereign debt issued by emerging market borrowers denominated in each issuer’s local currency. Colchester’s portfolio construction process is based on a quantitative model, using mathematical and statistical methods, that promotes allocation to countries and currencies identified based on attractive real yields for bonds and attractive valuations for currencies, complemented by sound financial characteristics and Environmental, Social and Governance (ESG) considerations.
In managing its allocated portion of the Fund’s portfolio, BlackRock invests in emerging market debt securities denominated in local currency. BlackRock’s portfolio construction process implements a top down philosophy focused on identifying economic or market themes that impact asset prices. The themes inform the team’s market views and portfolios are positioned to benefit from directional moves in the market.
Market Commentary and Fund Performance
Amidst a backdrop of moderating inflation growth, continued strength in economic data, and a pivot towards more supportive monetary policy trends, financial markets broadly performed well over the 2024 fiscal year ending March 31, 2024. Geopolitical tensions remained a concern, and markets experienced periods of volatility. Despite these uncertainties, equities ended the fiscal year near all-time historic highs and credit spreads narrowed. Rapid technological change and advancements in Artificial Intelligence have had a transformative impact, driving innovation and reshaping industries worldwide. The narrative around climate change continues to evolve, and the past year saw an increase in extreme weather events which had broad reaching impact. Supply chain dynamics have shifted, and while COVID-related impacts have moderated, there continue to be a host of challenges to navigate, including cyberattacks targeting supply chain infrastructure, trade tensions, and commodity price fluctuations. Finally, shifting labor market dynamics have been front and center, as we confront demographic shifts such as the aging workforce, remote and hybrid work trends persisting and evolving, and changes in immigration policies and flows.
The period began with a gradual stabilization of markets after the banking crisis earlier in the year. After fears of global recession concerns began to dissipate in June, a broader risk on sentiment spilled over into the EMD asset class. This was informed by a favorable global inflation outlook and resilient global growth led by the US which increased the probability of a soft landing. This optimism began to fade in mid-July, as 10-year US treasury yields began their months long grind higher which proved too strong a headwind for EMD, leading to a significant sell off across the asset class. US treasury yields continued to rise and neared multi-year highs in mid-October 2023. US rates began to rally and continued to do so into the end of the year, acting as a tailwind for the asset class. In late 2023, the relentless rally came to an end as valuations became quite stretched. US rates spent the first quarter of 2024 somewhat range bound with further repricing being the primary risk for the asset class. A broader risk on sentiment saw a notable demand for the riskier parts of the asset class into the end of March 2024, particularly in spread assets with high yielding sovereigns performing strongly.
JPM GBI-EM Global Diversified Index8 of local currency Emerging Market government returned 4.91% in U.S. dollar terms over the 12-month period ending March 31, 2024. The asset class was hit by reduced investor risk appetite, continued volatility in US Treasury yields and geopolitical tensions related to the Israel-Hamas conflict, and the ongoing war in Ukraine.
During the period, WAMCO and Loomis underperformed their component of the Fund’s secondary benchmark with both managers struggling to meaningfully capitalize on opportunistic sector exposures. For WAMCO, high yield corporate credit was the largest contributor as spreads tightened. Duration/curve positioning was a detractor as the positive contribution when U.S. Treasury yields fell during fourth quarter 2023 was offset by the negative contribution when yields rose over the remainder of the period. For Loomis, allocations to Emerging Markets assets, Bank Loans, and Securitized assets also positively affected period absolute performance. These aggregate impacts were only partially offset by negative effect from our allocation to Risk Management tools.
Management's Discussion of Fund Performance (Unaudited) (Continued)Mercer Opportunistic Fixed Income Fund
During the period, Blackrock, Colchester, and Ninety One outperformed their component of the Fund’s secondary benchmark, the JPM GBI-EM Diversified Index government bond benchmark. BlackRock delivered positive active performance over the period, driven entirely by outperformance in the rates segment, whilst the foreign currency exchange (FX) segment slightly detracted from performance. Colchester’s outperformance was from both bond and currency selection. Bond selection contributed 0.76% to relative returns, with the top three bond contributors being the overweight positions in Brazil and Colombia and the underweight position in Turkey. Currency selection contributed 4.66% to relative returns, with the top three currency contributors being the overweight position in the Colombian Peso and underweight positions in the Chinese Yuan and Thai Baht. For Ninety One, 80 basis points9 (bps) of outperformance since inception (June 15, 2023) driven by cautious positioning in more volatile FX markets, especially in Asia. The portfolio also benefitted from not holding Turkish local currency bonds when a shift to more orthodox policymaking post the presidential election resulted in interest rate hikes. In contrast, light positioning in the Mexican Peso held back performance; the currency was helped by the country’s current account balance remaining strong and domestic activity robust.
Risk Considerations
The Fund invests in non-investment grade and emerging market fixed income securities that involve certain risks such as higher volatility, currency fluctuation, political and social instability and reduced market liquidity. The Fund is subject to the risks that the underlying bonds in its portfolio are subject to, including credit, prepayment, call and interest rate risk. As interest rates rise, the value of bond prices will decline. The Fund may invest in foreign securities, which may expose the Fund to currency and exchange rate fluctuations, derivatives (such as futures, options and swaps) and high yield bonds (also known as “junk” bonds). These investments may cause the Fund to experience greater volatility and less liquidity. Derivatives may be more sensitive to changes in market conditions and may amplify the risk of loss for the Fund.
Management's Discussion of Fund Performance (Unaudited) (Continued)Mercer Opportunistic Fixed Income Fund
March 31, 2024
Comparison of Change in Value of a hypothetical $10,000 Investment in Mercer Opportunistic Fixed Income Class Y-3 Shares vs. the ICE Bank of America Merrill Lynch Global High Yield 2% Constrained Index Unhedged and the Fund’s Secondary Index for the period 4/1/14 through 3/31/24
AVERAGE ANNUAL TOTAL RETURNS | | | | |
| | | | |
Mercer Opportunistic Fixed Income Fund – Class Y-3 – 08/21/2013 | | | | |
Mercer Opportunistic Fixed Income Fund – Class I – 06/27/2023 | | | | |
ICE Bank of America Merrill Lynch Global High Yield 2% Constrained Index Unhedged | | | | |
| | | | |
1 ICE Bank of America Merrill Lynch Global High Yield 2.0% Constrained Index Unhedged contains all securities in The Bank of America Merrill Lynch Global High Yield Index but caps issuer exposure at 2%. Index constituents are capitalization-weighted, based on their current amount outstanding, provided the total allocation to an individual issuer does not exceed 2%. Issuers that exceed the limit are reduced to 2% and the face value of each of their bonds is adjusted on a pro-rata basis.
2 The Fund’s secondary benchmark is a blended benchmark consisting of 35% Bloomberg Global Aggregate Corporate Total Return Index Hedged, 17.5% Bloomberg Global High Yield Index, 10.5% JP Morgan CEMBI Diversified Index, 7% S&P/LSTA Leveraged Loan Index, and 30% JP Morgan GBI-EM Diversified Index.
Management's Discussion of Fund Performance (Unaudited) (Continued)Mercer Opportunistic Fixed Income Fund
March 31, 2024
3 Bloomberg Global Aggregate Corporate Total Return Index Hedged is a measure of global investment grade, fixed-rate corporate debt. This multi-currency benchmark includes bonds from developed and emerging markets issuers within the industrial, utility and financial sectors.
4 Bloomberg Global High Yield Index is a multi-currency flagship measure of the global high yield debt market. The index represents the union of the US High Yield, the Pan-European High Yield, and Emerging Markets (EM) Hard Currency High Yield Indices.
5 J.P. Morgan CEMBI Broad Diversified Core Index (CEMBI CORE) tracks the performance of US dollar denominated bonds issued by emerging market corporate entities. The CEMBI CORE follows the methodology of the flagship J.P. Morgan CEMBI Broad Diversified (CEMBIB Dividend) closely, while offering a more liquid and higher credit quality subset.
6 S&P (Standard and Poor’s/LSTA (Loan Syndications and Trading Association) Leveraged Loan 100 Index is designed to measure the performance of the U.S. leveraged loan market based upon market weightings, spreads, and interest payments.
7 J.P. Morgan Government Bond Index-Emerging Markets (GBI-EM) Indices are comprehensive Emerging Markets debt benchmarks that track local currency bonds issued by Emerging Market governments. The GBI-EM Indices are comprised of only those countries from the GBI universe that meet our criteria for an Emerging Market, resulting in 18 countries from four regions. For the Diversified version of the Index, the methodology uses only a limited portion of a country’s current face amount outstanding for calculating weights. The adjusted face amount used in calculating a country’s weight is based on the respective country’s relative size in the index and the average size of all countries.
8 The J.P. Morgan GBI-EM Global Diversified Index consists of regularly traded, fixed-rate, domestic currency government bonds which international investors can readily access. The index excludes countries where local market investing is subject to explicit capital controls, but eligibility consideration does not factor in regulatory/tax hurdles.
9 Basis Points: A common unit of measure for interest rates and other percentages in finance. One basis point is equal to 1/100th of 1%, or 0.01%, or 0.0001, and is used to denote the percentage change in a financial instrument.
* Mercer Opportunistic Fixed Income Fund - Class I inception date was June 27, 2023. Return represents cumulative return, not annualized.
The Fund's total annual gross operating expense ratio for Class Y-3 is 0.88% and for Class I is 1.13%. Please see the Fund's most recent Prospectus.
The performance of other classes, when launched, will vary from the performance of the class shown based on the difference in fees and expenses paid by shareholders investing in different share classes. The Fund may charge a 2% redemption fee on shares owned less than 30 days.
The table and graph assume reinvestment of dividends and capital gains, but do not reflect a deduction of taxes an investor might pay on fund distributions or upon redemption of fund shares. Performance shown reflects a fee waiver and/or expense reimbursement. Without this waiver/reimbursement, returns would have been lower.
The data quoted represents past performance and does not guarantee future results. Current performance of the Fund may be lower or higher than the performance quoted. Please call 1-888-887-0619 or visit the Trust’ s website at https://www.mercer.us/what-we-do/wealth-and-investments/delegated-solutions-us.html for the Fund’s most recent month-end performance. Investment return and principal value will fluctuate so that an investor’s shares, when redeemed, may be worth more or less than when purchased.
Fund holdings and sector allocations are subject to change and are not a recommendation to buy or sell any security. Please see the Schedule of Investments for a complete list of Fund holdings.
Management's Discussion of Fund Performance (Unaudited) (Continued)Mercer Short Duration Fixed Income Fund
Investment Objective and Benchmark
The Fund seeks to outperform the reference benchmark over a full market cycle while providing stability during volatile interest-rate periods and serving as an effective defense against stable or rising rate environments. The benchmark for the Fund is the Bloomberg U.S. Gov/Credit 1-3 Year Index®1.
Investment Strategy
The Fund invests in fixed income securities of U.S. and foreign issuers. The Fund invests primarily in U.S. dollar-denominated, investment grade bonds, including government securities, corporate bonds, and securitized bonds such as mortgage- and asset-backed securities, among others. Under normal circumstances, the Fund will invest at least 80% of its net assets (plus borrowings for investment purposes, if any) in fixed income securities. If the Fund changes this investment policy, the Fund will notify shareholders at least 60 days in advance of the change. The Fund also may invest a significant portion of its assets in any combination of non-investment grade debt instruments (sometimes called “high yield” or “junk bonds”), floating rate senior loans, non-U.S. dollar denominated bonds, and bonds issued by issuers in emerging capital markets, while limiting its investment in non-investment grade bonds to not more than 20% of its net assets. The Fund may also invest in securities that are subject to resale restrictions such as those contained in Rule 144A promulgated under the Securities Act of 1933, as amended. The Fund may invest in derivative instruments, such as options, futures, and swap agreements. The Fund may engage in transactions in derivatives for a variety of purposes, including changing the investment characteristics of its portfolio, enhancing total returns, or as a substitute for taking a position in the underlying asset.
Performance (since inception 12/01/2023)
For the fiscal year ended March 31, 2024, the Fund’s Y-3 share class has less than a full years history, but from its inception through March 31, 2024, performance was 2.15% compared to its benchmark return of 1.62% for the same period. Performance for the Fund is reported net of fees and operating expenses while the benchmark returns do not include expenses of any kind as indexes are unmanaged.
The Sub-Advisers
As of March 31, 2024, the Fund employed three sub-advisers: Aristotle Pacific Capital, LLC (“Aristotle Pacific”), Merganser Capital Management, LLC (“Merganser”) and Voya Investment Management Co. LLC (“Voya IM”),
Aristotle Pacific manages its allocated portion of the Fund using a short maturity corporate credit focused strategy that looks for value across the corporate and structured product landscape. The strategy employs a fundamental approach with a top-down overlay. Aristotle Pacific’s team of portfolio managers and research analysts look at the relative value of each security and assess the macro environment and marketplace for tailwinds and catalysts in the process of sector allocation and individual investment selection. Aristotle Pacific’s approach in constructing portfolios generally results in a yield advantage over the benchmark while continuing to be mindful of the importance of downside protection.
Merganser manages its allocated portion of the Fund based on the belief that careful security selection and higher portfolio income provide superior returns over the long term. Merganser utilizes its boutique size to its advantage, focused on participating in markets that are less crowded which includes investing in liquid, on-the-run issues as well as off-the-run issues that many larger firms often ignore. Portfolios are constructed using a disciplined, bottom-up investment approach to select attractive securities from the investment grade fixed income universe combined with a rigorous relative value assessment. The team focuses on bonds that we believe will perform in various macroeconomic environments.
Voya IM manages its allocated portion of the Fund by seeking to maximize excess return opportunities from sustainable alpha sources, such as a combination of strong bottom-up capabilities in both corporates and securitized. This process is coupled with a diligent daily portfolio risk evaluation and monitoring process. Voya IM takes a thoughtful approach to portfolio construction, where a focus on risk-adjusted returns and risk factor diversification are engrained throughout the process.
Management's Discussion of Fund Performance (Unaudited) (Continued)Mercer Short Duration Fixed Income Fund
Market Commentary and Fund Performance
Amidst a backdrop of moderating inflation growth, continued strength in economic data, and a pivot towards more supportive monetary policy trends, financial markets broadly performed well over the 2024 fiscal year ending March 31, 2024. Geopolitical tensions remained a concern, and markets experienced periods of volatility. Despite these uncertainties, equities ended the fiscal year near all-time historic highs and credit spreads narrowed. Rapid technological change and advancements in AI have had a transformative impact, driving innovation and reshaping industries worldwide. The narrative around climate change continues to evolve, and the past year saw an increase in extreme weather events which had broad reaching impact. Supply chain dynamics have shifted, and while COVID-related impacts have moderated, there continue to be a host of challenges to navigate, including cyberattacks targeting supply chain infrastructure, trade tensions, and commodity price fluctuations. Finally, shifting labor market dynamics have been front and center, as we confront demographic shifts such as the aging workforce, remote and hybrid work trends persisting and evolving, and changes in immigration policies and flows.
The Fund’s return was positive, outperforming the Bloomberg U.S. Aggregate Bond™ Index2 for the fiscal year ended March 31, 2024. Despite the increase in yields, with 2-Year, 10-Year US Treasury yields increasing by 37 basis points3 (bps), 32 bps, shorter duration investment grade fixed income sectors generally produced positive total returns, aided by positive carry, and spread tightening. Returns were supported by short duration Treasury rates generally in the 4% to 5.5% range. 1-3 year Treasuries returned 1.44% for the period. Corporate bonds make up approximately 25% of the index weight. Corporate bonds in the 1–3 year maturity range returned 2.13% benefiting from incremental yield and spread tightening of approximately 18 basis points. High yield bonds and bank loans returned 5.26% and 4.17% respectively as out of index, below investment grade credit out-performed investment grade counterparts. Treasury rates were volatile intra-period but ending rates were only slightly higher for most maturities 3 years and in. To that end, corporate credit valuations look expensive across the curve. Financials remain in focus where 2024 supply expectations are well above 2023.
The respective performance results of each Sub-adviser was in line with expectations. Aristotle Pacific share of the fund returned 2.6% for the four-month period ending on March 31, 2024. The emphasis on credit over government securities was broadly beneficial. The allocation to investment grade corporate bonds averaged approximately 47%. The portfolios higher than benchmark weight in the investment grade corporate bond sleeve and credit selection within that allocation was beneficial to relative performance for the period. Other material positive contributors to relative outperformance included floating rate bank loans holdings 15.5% and Asset Backed Securities (ABS) 20.3%.
For Merganser, the portfolio’s outperformance was predominantly driven by sector selection (underweight US Treasuries, overweight credit). Collateralized Mortgage Backed Securities (CMBS) and Residential Mortgage Backed Securities (RMBS) were top performing sectors, both of which are out of benchmark. Security selection was positive as well, with standout positions in financials, industrials, and CMBS. Certain positions within RMBS detracted, but as previously mentioned, the sector overweight was positive overall. Duration and yield curve positioning had mixed results netting out to a few positive bps of alpha4.
Voya IM investment manager’s asset allocation contributed most positively to performance, with security selection adding more modestly and duration detracting. Within sector allocation, the largest contributor was within our overweight to Asset-Backed Securities (ABS), particularly from our allocation to high quality Collateralized Loan Obligation (CLOs). ABS acted as a safe-haven asset class in a period of market uncertainty, buoyed by the relative strength of the consumer. Our overweight to Investment Grade Corporates also contributed positively as spreads gradually tightened as the probability of a recession grew less and less. Our primary contributor within security selection was within investment grade corporates, where we were overweight financials primarily, as well as A and BBB-rated securities. Duration detracted over the period as the Fed stayed higher for longer amid hot inflation and employment numbers.
Management's Discussion of Fund Performance (Unaudited) (Continued)Mercer Short Duration Fixed Income Fund
Risk Considerations
The Fund is subject to the risks that the underlying bonds in its portfolio are subject to, including credit, prepayment, call and interest rate risk. As interest rates rise, the value of bond prices will decline. The Fund may invest in foreign securities, which may expose the Fund to currency and exchange rate fluctuations, derivatives (such as futures, options, or swaps) and high yield bonds (also known as “junk” bonds). These investments may cause the Fund to experience greater volatility and less liquidity. Derivatives may be more sensitive to changes in market conditions and may amplify the risk of loss for the Fund. The Fund may also experience high portfolio turnover, which may result in higher transaction costs and capital gains. Fund holdings and sector allocations are subject to change and are not a recommendation to buy or sell any security. Please see the Schedule of Investments for a complete list of Fund holdings.
Management's Discussion of Fund Performance (Unaudited) (Continued)Mercer Short Duration Fixed Income Fund
March 31, 2024
Comparison of Change in Value of a hypothetical $10,000 Investment in Mercer Short Duration Fixed Income Fund Class Y-3 Shares vs. the Bloomberg U.S. Gov/Credit 1-3 Year Index® for the period 12/1/23 through 3/31/24
AVERAGE ANNUAL TOTAL RETURNS | | | | |
| | | | |
Mercer Short Duration Fixed Income Fund – Class Y-3 – 12/01/2023 | | | | |
Bloomberg U.S. Gov/Credit 1-3 Year Index® | | | | |
1 Bloomberg U.S. Gov/Credit 1-3 Year Index® is a benchmark index that measures the performance of investment-grade, US dollar-denominated, fixed-rate, taxable corporate and government debt with maturities between 1 and 3 years. It includes both corporate and government bonds that meet the specified criteria. The index is unmanaged and cannot be invested in directly.
2 Bloomberg U.S. Aggregate BondTM Index is an index that measures the performance of securities from the Bloomberg U.S. Government/ Corporate Bond Index, Mortgage-Backed Securities Index, Asset-Backed Securities Index, and Commercial Mortgage-Backed Securities Index. The Bloomberg U.S. Aggregate BondTM Index is a broad representation of the investment-grade fixed-income market in the United States and includes U.S. government and corporate debt securities, mortgage- and asset-backed securities, and international U.S. dollar-denominated bonds. All securities contained in the Bloomberg U.S. Aggregate BondTM Index have a minimum term to maturity of one year.
3 Basis Points: A common unit of measure for interest rates and other percentages in finance. One basis point is equal to 1/100th of 1%, or 0.01%, or 0.0001, and is used to denote the percentage change in a financial instrument.
4 Alpha measures the amount that the investment has returned in comparison to the market index or other broad benchmark that it is compared against.
Management's Discussion of Fund Performance (Unaudited) (Continued)Mercer Short Duration Fixed Income Fund
March 31, 2024
* Mercer Short Duration Fixed Income Fund - Class Y-3 inception date was December 1, 2023. Return represents cumulative return, not annualized.
The Fund's total annual gross operating expense ratio for Class Y-3 is 0.57%. Please see the Fund's most recent Prospectus.
The performance of other classes, when launched, will vary from the performance of the class shown based on the difference in fees and expenses paid by shareholders investing in different share classes. The Fund may charge a 2% redemption fee on shares owned less than 30 days.
The table and graph assume reinvestment of dividends and capital gains, but do not reflect a deduction of taxes an investor might pay on fund distributions or upon redemption of fund shares. Performance shown reflects a fee waiver and/or expense reimbursement. Without this waiver/reimbursement, returns would have been lower.
The data quoted represents past performance and does not guarantee future results. Current performance of the Fund may be lower or higher than the performance quoted. Please call 1-888-887-0619 or visit the Trust’ s website at https://www.mercer.us/what-we-do/wealth-and-investments/delegated-solutions-us.html for the Fund’s most recent month-end performance. Investment return and principal value will fluctuate so that an investor’s shares, when redeemed, may be worth more or less than when purchased.
Fund holdings and sector allocations are subject to change and are not a recommendation to buy or sell any security. Please see the Schedule of Investments for a complete list of Fund holdings.
Mercer US Small/Mid Cap Equity FundSchedule of Investments
(showing percentage of net assets)
March 31, 2024
| | | |
| | |
| | |
| | | |
| | | |
| | | |
| | | |
| | | |
| | | |
| | | |
| | | |
| | | |
| | | |
| | | |
| | | |
| | |
| | AMC Networks, Inc. Class A* | |
| | | |
| | | |
| | | |
| | | |
| | | |
| | | |
| | | |
| | | |
| | Nexstar Media Group, Inc. | |
| | | |
| | Preformed Line Products Co. | |
| | | |
| | | |
| | | |
| | | |
| | | |
| | Consumer, Cyclical — 15.5% |
| | | |
| | Allison Transmission Holdings, Inc. | |
| | American Axle & Manufacturing Holdings, Inc. * | |
| | | |
| | BJ's Wholesale Club Holdings, Inc. * | |
| | | |
| | | |
| | | |
| | Burlington Stores, Inc. * | |
| | | |
| | | |
| | Casey's General Stores, Inc. | |
| | | |
| | | |
| | | |
34
See accompanying Notes to the Financial Statements.
Mercer US Small/Mid Cap Equity FundSchedule of Investments (Continued)
(showing percentage of net assets)
March 31, 2024
| | | |
| | Consumer, Cyclical — continued |
| | | |
| | | |
| | Dick's Sporting Goods, Inc. | |
| | | |
| | | |
| | | |
| | GCI Liberty, Inc. *(b)(c) | |
| | | |
| | | |
| | | |
| | | |
| | Goodyear Tire & Rubber Co. * | |
| | | |
| | | |
| | | |
| | Haverty Furniture Cos., Inc. | |
| | | |
| | | |
| | | |
| | | |
| | | |
| | | |
| | | |
| | | |
| | | |
| | | |
| | | |
| | MSC Industrial Direct Co., Inc. Class A | |
| | | |
| | Nu Skin Enterprises, Inc. Class A | |
| | | |
| | On Holding AG Class A*(a) | |
| | | |
| | | |
| | | |
| | | |
| | | |
| | Red Rock Resorts, Inc. Class A | |
| | Sally Beauty Holdings, Inc. * | |
| | | |
| | SiteOne Landscape Supply, Inc. * | |
| | Skechers USA, Inc. Class A* | |
| | | |
| | | |
| | | |
| | | |
| | | |
| | | |
| | United Airlines Holdings, Inc. * | |
See accompanying Notes to the Financial Statements.
35
Mercer US Small/Mid Cap Equity FundSchedule of Investments (Continued)
(showing percentage of net assets)
March 31, 2024
| | | |
| | Consumer, Cyclical — continued |
| | | |
| | | |
| | WESCO International, Inc. | |
| | | |
| | | |
| | | |
| | Winnebago Industries, Inc. | |
| | | |
| | Consumer, Non-cyclical — 21.7% |
| | | |
| | Acadia Healthcare Co., Inc. * | |
| | | |
| | Albertsons Cos., Inc. Class A | |
| | | |
| | | |
| | | |
| | | |
| | | |
| | | |
| | | |
| | | |
| | Bio-Rad Laboratories, Inc. Class A* | |
| | Booz Allen Hamilton Holding Corp. | |
| | Bright Horizons Family Solutions, Inc. * | |
| | | |
| | | |
| | | |
| | | |
| | | |
| | | |
| | | |
| | | |
| | | |
| | Dun & Bradstreet Holdings, Inc. | |
| | | |
| | | |
| | | |
| | | |
| | | |
| | | |
| | | |
| | Globus Medical, Inc. Class A* | |
| | Grand Canyon Education, Inc. * | |
| | | |
| | Halozyme Therapeutics, Inc. * | |
| | | |
| | | |
| | | |
36
See accompanying Notes to the Financial Statements.
Mercer US Small/Mid Cap Equity FundSchedule of Investments (Continued)
(showing percentage of net assets)
March 31, 2024
| | | |
| | Consumer, Non-cyclical — continued |
| | | |
| | | |
| | Ingles Markets, Inc. Class A | |
| | | |
| | | |
| | Inspire Medical Systems, Inc. * | |
| | | |
| | | |
| | Intra-Cellular Therapies, Inc. * | |
| | Ironwood Pharmaceuticals, Inc. * | |
| | Jazz Pharmaceuticals PLC * | |
| | | |
| | Lantheus Holdings, Inc. * | |
| | | |
| | Legend Biotech Corp. ADR* | |
| | | |
| | | |
| | MarketAxess Holdings, Inc. | |
| | | |
| | | |
| | Merit Medical Systems, Inc. * | |
| | Molson Coors Beverage Co. Class B | |
| | | |
| | Neurocrine Biosciences, Inc. * | |
| | | |
| | Option Care Health, Inc. * | |
| | | |
| | | |
| | Paylocity Holding Corp. * | |
| | | |
| | | |
| | Performance Food Group Co. * | |
| | Prestige Consumer Healthcare, Inc. * | |
| | PROCEPT BioRobotics Corp. *(a) | |
| | | |
| | Quanex Building Products Corp. | |
| | | |
| | | |
| | | |
| | Rocket Pharmaceuticals, Inc. * | |
| | | |
| | Select Medical Holdings Corp. | |
| | Shift4 Payments, Inc. Class A*(a) | |
| | Shockwave Medical, Inc. * | |
| | | |
| | | |
| | Sprouts Farmers Market, Inc. * | |
| | Tandem Diabetes Care, Inc. *(a) | |
| | United Therapeutics Corp. * | |
See accompanying Notes to the Financial Statements.
37
Mercer US Small/Mid Cap Equity FundSchedule of Investments (Continued)
(showing percentage of net assets)
March 31, 2024
| | | |
| | Consumer, Non-cyclical — continued |
| | Universal Health Services, Inc. Class B | |
| | | |
| | | |
| | | |
| | | |
| | | |
| | | |
| | | |
| | Viking Therapeutics, Inc. *(a) | |
| | | |
| | WillScot Mobile Mini Holdings Corp. * | |
| | | |
| | |
| | | |
| | California Resources Corp. | |
| | | |
| | Chesapeake Energy Corp. (a) | |
| | | |
| | | |
| | Delek U.S. Holdings, Inc. | |
| | | |
| | | |
| | | |
| | Magnolia Oil & Gas Corp. Class A | |
| | | |
| | | |
| | | |
| | | |
| | | |
| | | |
| | | |
| | | |
| | | |
| | | |
| | |
| | | |
| | | |
| | American Assets Trust, Inc. REIT | |
| | Annaly Capital Management, Inc. REIT | |
| | Apple Hospitality REIT, Inc. REIT | |
| | | |
| | | |
| | Atlantic Union Bankshares Corp. | |
| | Axis Capital Holdings Ltd. | |
| | | |
| | Bank of NT Butterfield & Son Ltd. | |
| | Blue Owl Capital Corp. (a) | |
38
See accompanying Notes to the Financial Statements.
Mercer US Small/Mid Cap Equity FundSchedule of Investments (Continued)
(showing percentage of net assets)
March 31, 2024
| | | |
| | |
| | | |
| | Brandywine Realty Trust REIT | |
| | Brixmor Property Group, Inc. REIT | |
| | | |
| | | |
| | | |
| | Chimera Investment Corp. REIT | |
| | Citizens Financial Group, Inc. | |
| | City Office REIT, Inc. REIT | |
| | | |
| | CNO Financial Group, Inc. | |
| | | |
| | | |
| | Easterly Government Properties, Inc. REIT | |
| | EastGroup Properties, Inc. REIT | |
| | | |
| | | |
| | | |
| | | |
| | Fidelity National Financial, Inc. | |
| | | |
| | Financial Institutions, Inc. | |
| | | |
| | First Commonwealth Financial Corp. | |
| | | |
| | | |
| | Franklin Street Properties Corp. REIT | |
| | | |
| | Genworth Financial, Inc. Class A* | |
| | | |
| | Hamilton Lane, Inc. Class A | |
| | | |
| | | |
| | Healthpeak Properties, Inc. REIT | |
| | Heritage Insurance Holdings, Inc. * | |
| | Highwoods Properties, Inc. REIT | |
| | | |
| | | |
| | Host Hotels & Resorts, Inc. REIT | |
| | | |
| | Industrial Logistics Properties Trust REIT | |
| | Jefferies Financial Group, Inc. | |
| | | |
| | | |
| | Kinsale Capital Group, Inc. | |
| | Kite Realty Group Trust REIT | |
| | | |
| | LPL Financial Holdings, Inc. | |
| | | |
See accompanying Notes to the Financial Statements.
39
Mercer US Small/Mid Cap Equity FundSchedule of Investments (Continued)
(showing percentage of net assets)
March 31, 2024
| | | |
| | |
| | | |
| | National Storage Affiliates Trust REIT | |
| | | |
| | New Mountain Finance Corp. (a) | |
| | New York Community Bancorp, Inc. (a) | |
| | Newmark Group, Inc. Class A | |
| | NMI Holdings, Inc. Class A* | |
| | Oaktree Specialty Lending Corp. | |
| | OceanFirst Financial Corp. | |
| | Office Properties Income Trust REIT(a) | |
| | | |
| | Omega Healthcare Investors, Inc. REIT | |
| | | |
| | | |
| | Piedmont Office Realty Trust, Inc. REIT Class A | |
| | Pinnacle Financial Partners, Inc. | |
| | | |
| | | |
| | | |
| | | |
| | | |
| | Reinsurance Group of America, Inc. | |
| | Sabra Health Care REIT, Inc. REIT | |
| | Sandy Spring Bancorp, Inc. | |
| | Selective Insurance Group, Inc. | |
| | Service Properties Trust REIT | |
| | StepStone Group, Inc. Class A | |
| | | |
| | Sun Communities, Inc. REIT | |
| | | |
| | | |
| | Tradeweb Markets, Inc. Class A | |
| | | |
| | Universal Insurance Holdings, Inc. | |
| | | |
| | | |
| | | |
| | Victory Capital Holdings, Inc. Class A | |
| | | |
| | | |
| | White Mountains Insurance Group Ltd. | |
| | | |
| | | |
| | | |
| | |
| | Banco Latinoamericano de Comercio Exterior SA | |
40
See accompanying Notes to the Financial Statements.
Mercer US Small/Mid Cap Equity FundSchedule of Investments (Continued)
(showing percentage of net assets)
March 31, 2024
| | | |
| | |
| | | |
| | Advanced Energy Industries, Inc. | |
| | | |
| | Air Transport Services Group, Inc. * | |
| | | |
| | | |
| | | |
| | | |
| | Armstrong World Industries, Inc. | |
| | Arrow Electronics, Inc. * | |
| | | |
| | | |
| | | |
| | | |
| | | |
| | | |
| | Builders FirstSource, Inc. * | |
| | | |
| | Chart Industries, Inc. *(a) | |
| | | |
| | | |
| | | |
| | | |
| | Comfort Systems USA, Inc. | |
| | Covenant Logistics Group, Inc. | |
| | | |
| | | |
| | | |
| | | |
| | | |
| | Gates Industrial Corp. PLC * | |
| | Gibraltar Industries, Inc. * | |
| | | |
| | | |
| | | |
| | | |
| | | |
| | Huntington Ingalls Industries, Inc. | |
| | | |
| | | |
| | | |
| | | |
| | | |
| | Lincoln Electric Holdings, Inc. | |
| | MDU Resources Group, Inc. | |
| | | |
| | Mohawk Industries, Inc. * | |
| | | |
| | | |
See accompanying Notes to the Financial Statements.
41
Mercer US Small/Mid Cap Equity FundSchedule of Investments (Continued)
(showing percentage of net assets)
March 31, 2024
| | | |
| | |
| | NEXTracker, Inc. Class A* | |
| | | |
| | | |
| | | |
| | | |
| | | |
| | | |
| | | |
| | | |
| | | |
| | | |
| | | |
| | | |
| | Schneider National, Inc. Class B | |
| | | |
| | Summit Materials, Inc. Class A* | |
| | | |
| | | |
| | | |
| | | |
| | | |
| | | |
| | | |
| | Universal Logistics Holdings, Inc. | |
| | Vertiv Holdings Co., Class A | |
| | Vishay Intertechnology, Inc. | |
| | | |
| | | |
| | | |
| | |
| | | |
| | | |
| | | |
| | CCC Intelligent Solutions Holdings, Inc. * | |
| | Clearwater Analytics Holdings, Inc. Class A* | |
| | CSG Systems International, Inc. | |
| | | |
| | Descartes Systems Group, Inc. * | |
| | | |
| | | |
| | | |
| | Evolent Health, Inc. Class A* | |
| | | |
| | | |
| | | |
| | | |
| | MACOM Technology Solutions Holdings, Inc. * | |
| | Manhattan Associates, Inc. * | |
42
See accompanying Notes to the Financial Statements.
Mercer US Small/Mid Cap Equity FundSchedule of Investments (Continued)
(showing percentage of net assets)
March 31, 2024
| | | |
| | |
| | MicroStrategy, Inc. Class A*(a) | |
| | | |
| | | |
| | Monolithic Power Systems, Inc. | |
| | | |
| | | |
| | | |
| | | |
| | | |
| | | |
| | | |
| | PowerSchool Holdings, Inc. Class A* | |
| | Privia Health Group, Inc. * | |
| | Procore Technologies, Inc. * | |
| | | |
| | Pure Storage, Inc. Class A* | |
| | | |
| | Silicon Laboratories, Inc. * | |
| | Silicon Motion Technology Corp. ADR | |
| | | |
| | SMART Global Holdings, Inc. * | |
| | Smartsheet, Inc. Class A* | |
| | Super Micro Computer, Inc. * | |
| | | |
| | Tyler Technologies, Inc. * | |
| | | |
| | | |
| | Zebra Technologies Corp. Class A* | |
| | | |
| | |
| | | |
| | | |
| | Northwestern Energy Group, Inc. | |
| | | |
| | | |
| | Portland General Electric Co. | |
| | Southwest Gas Holdings, Inc. | |
| | | |
| | | |
| | | |
| | TOTAL COMMON STOCKS (COST $1,358,373,936) | |
See accompanying Notes to the Financial Statements.
43
Mercer US Small/Mid Cap Equity FundSchedule of Investments (Continued)
(showing percentage of net assets)
March 31, 2024
| | | |
| | Short-Term Investment — 0.4% |
| | Mutual Fund - Securities Lending Collateral — 0.4% |
| | State Street Navigator Securities Lending Government Money Market Portfolio, | |
| | TOTAL SHORT-TERM INVESTMENT (COST $7,104,368) | |
| | TOTAL INVESTMENTS — 96.4%
(Cost $1,365,478,304) | |
| | Other Assets and Liabilities (net) — 3.6% | |
| | | |
| Notes to Schedule of Investments: |
| Non-income producing security. |
| All or a portion of this security is out on loan. |
| Level 3 - significant unobservable inputs were used in determining the value of this security in the Fund. |
| Securities fair valued by the Valuation Committee as approved by the Board of Trustees. The total market value of the securities at year end is $0 which represents 0.0% of net assets. The aggregate cost of these securities held at March 31, 2024 is $0. |
| The rate disclosed is the 7-day net yield as of March 31, 2024. |
| Represents an investment of securities lending cash collateral. |
Futures Contracts
| | | | Market Value/
Unrealized
Appreciation
(Depreciation) |
| | | | |
| Russell 2000 E-mini Index | | | |
| | | | |
| | | | |
|
| | American Depository Receipt |
| | Real Estate Investment Trust |
44
See accompanying Notes to the Financial Statements.
Mercer US Small/Mid Cap Equity FundSchedule of Investments (Continued)
March 31, 2024
Asset Class Summary (Unaudited) | |
| |
| |
| |
Other Assets and Liabilities (net) | |
| |
See accompanying Notes to the Financial Statements.
45
Mercer Emerging Markets Equity FundSchedule of Investments
(showing percentage of net assets)
March 31, 2024
| | | |
| | |
| | |
| | B3 SA - Brasil Bolsa Balcao | |
| | | |
| | | |
| | | |
| | BB Seguridade Participacoes SA | |
| | Cia de Saneamento Basico do Estado de Sao Paulo SABESP | |
| | | |
| | Itau Unibanco Holding SA, ADR | |
| | | |
| | | |
| | | |
| | | |
| | | |
| | | |
| | | |
| | | |
| | | |
| | | |
| | |
| | | |
| | |
| | Cia Cervecerias Unidas SA, ADR(a) | |
| | |
| | 37 Interactive Entertainment Network Technology Group Co. Ltd. Class A | |
| | | |
| | Agricultural Bank of China Ltd. Class H | |
| | Airtac International Group | |
| | Alibaba Group Holding Ltd. | |
| | Alibaba Group Holding Ltd., ADR | |
| | Anjoy Foods Group Co. Ltd. Class A | |
| | Anker Innovations Technology Co. Ltd. Class A | |
| | ANTA Sports Products Ltd. | |
| | APT Medical, Inc. Class A | |
| | Asymchem Laboratories Tianjin Co. Ltd. Class H (a) | |
| | | |
| | Bafang Electric Suzhou Co. Ltd. Class A | |
| | | |
| | Beijing Huafeng Test & Control Technology Co. Ltd. Class A | |
| | Beijing Kingsoft Office Software, Inc. Class A | |
| | Beijing Roborock Technology Co. Ltd. Class A | |
| | Beijing Tiantan Biological Products Corp. Ltd. Class A | |
| | | |
| | BYD Electronic International Co. Ltd. | |
| | Changzhou Xingyu Automotive Lighting Systems Co. Ltd. Class A | |
| | Chaozhou Three-Circle Group Co. Ltd. Class A | |
46
See accompanying Notes to the Financial Statements.
Mercer Emerging Markets Equity FundSchedule of Investments (Continued)
(showing percentage of net assets)
March 31, 2024
| | | |
| | |
| | China Construction Bank Corp. Class H | |
| | China International Capital Corp. Ltd. Class H | |
| | China Literature Ltd.*(a) | |
| | China Mengniu Dairy Co. Ltd. | |
| | China Merchants Bank Co. Ltd. Class H | |
| | China Oilfield Services Ltd. Class H | |
| | China Petroleum & Chemical Corp. Class H | |
| | China Resources Beer Holdings Co. Ltd. | |
| | China Wafer Level CSP Co. Ltd. Class A | |
| | China Yuhua Education Corp. Ltd.* | |
| | Contemporary Amperex Technology Co. Ltd. Class A | |
| | CSPC Pharmaceutical Group Ltd. | |
| | East Money Information Co. Ltd. Class A | |
| | | |
| | Eoptolink Technology, Inc. Ltd. Class A | |
| | Foshan Haitian Flavouring & Food Co. Ltd. Class A | |
| | Fuyao Glass Industry Group Co. Ltd. Class H | |
| | Great Wall Motor Co. Ltd. Class H (a) | |
| | Guangdong Xinbao Electrical Appliances Holdings Co. Ltd. Class A | |
| | Haier Smart Home Co. Ltd. Class H | |
| | Hangzhou Tigermed Consulting Co. Ltd. Class H (a) | |
| | Hisense Visual Technology Co. Ltd. Class A | |
| | Hithink RoyalFlush Information Network Co. Ltd. Class A | |
| | HLA Group Corp. Ltd. Class A | |
| | Hongfa Technology Co. Ltd. Class A | |
| | Hubei Jumpcan Pharmaceutical Co. Ltd. Class A | |
| | Innovent Biologics, Inc.* | |
| | | |
| | Jiangsu Hengrui Pharmaceuticals Co. Ltd. Class A | |
| | Jiangsu King's Luck Brewery JSC Ltd. Class A | |
| | Jiangsu Yoke Technology Co. Ltd. Class A | |
| | Jiangsu Yuyue Medical Equipment & Supply Co. Ltd. Class A | |
| | Jiayou International Logistics Co. Ltd. Class A | |
| | | |
| | Kingsemi Co. Ltd. Class A | |
| | | |
| | | |
| | Kweichow Moutai Co. Ltd. Class A | |
| | | |
| | | |
| | Midea Group Co. Ltd. Class A | |
| | MINISO Group Holding Ltd., ADR(a) | |
| | NARI Technology Co. Ltd. Class A | |
| | | |
| | | |
| | New Oriental Education & Technology Group, Inc., ADR* | |
| | Ningbo Sanxing Medical Electric Co. Ltd. Class A | |
| | OPT Machine Vision Tech Co. Ltd. Class A | |
| | | |
See accompanying Notes to the Financial Statements.
47
Mercer Emerging Markets Equity FundSchedule of Investments (Continued)
(showing percentage of net assets)
March 31, 2024
| | | |
| | |
| | PetroChina Co. Ltd. Class H | |
| | PICC Property & Casualty Co. Ltd. Class H | |
| | Ping An Insurance Group Co. of China Ltd. Class A | |
| | Ping An Insurance Group Co. of China Ltd. Class H | |
| | Proya Cosmetics Co. Ltd. Class A | |
| | Pylon Technologies Co. Ltd. Class A | |
| | Remegen Co. Ltd. Class H *(a) | |
| | Sailun Group Co. Ltd. Class A | |
| | Shaanxi Coal Industry Co. Ltd. Class A | |
| | Shandong Gold Mining Co. Ltd. Class H (a) | |
| | Shandong Sinocera Functional Material Co. Ltd. Class A | |
| | Shandong Weigao Group Medical Polymer Co. Ltd. Class H | |
| | Shenzhen Inovance Technology Co. Ltd. Class A | |
| | Shenzhen New Industries Biomedical Engineering Co. Ltd. Class A | |
| | Shenzhen Transsion Holdings Co. Ltd. Class A | |
| | Shenzhou International Group Holdings Ltd. | |
| | Sichuan Injet Electric Co. Ltd. Class A | |
| | Sieyuan Electric Co. Ltd. Class A | |
| | | |
| | StarPower Semiconductor Ltd. Class A | |
| | Sunac China Holdings Ltd.*(a) | |
| | Sungrow Power Supply Co. Ltd. Class A | |
| | Sunny Optical Technology Group Co. Ltd. | |
| | Suzhou TFC Optical Communication Co. Ltd. Class A | |
| | | |
| | Tencent Music Entertainment Group, ADR* | |
| | Tingyi Cayman Islands Holding Corp. | |
| | Tongcheng Travel Holdings Ltd.* | |
| | Trip.com Group Ltd., ADR* | |
| | Venustech Group, Inc. Class A | |
| | Vipshop Holdings Ltd., ADR | |
| | Willfar Information Technology Co. Ltd. Class A | |
| | WUS Printed Circuit Kunshan Co. Ltd. Class A | |
| | WuXi AppTec Co. Ltd. Class A | |
| | WuXi AppTec Co. Ltd. Class H | |
| | Wuxi Biologics Cayman, Inc.* | |
| | | |
| | Xinyi Glass Holdings Ltd. | |
| | Xinyi Solar Holdings Ltd. | |
| | Yankuang Energy Group Co. Ltd. Class H | |
| | Yantai Jereh Oilfield Services Group Co. Ltd. Class A | |
| | Yifeng Pharmacy Chain Co. Ltd. Class A | |
| | Yizumi Holdings Co. Ltd. Class A | |
| | Zhejiang Dingli Machinery Co. Ltd. Class A | |
| | Zhejiang Sanhua Intelligent Controls Co. Ltd. Class A | |
| | Zhongji Innolight Co. Ltd. Class A | |
| | Zijin Mining Group Co. Ltd. Class H | |
| | | |
48
See accompanying Notes to the Financial Statements.
Mercer Emerging Markets Equity FundSchedule of Investments (Continued)
(showing percentage of net assets)
March 31, 2024
| | | |
| | |
| | | |
| | |
| | | |
| | National Bank of Greece SA* | |
| | | |
| | |
| | | |
| | | |
| | Chow Sang Sang Holdings International Ltd. | |
| | Hang Lung Properties Ltd. | |
| | Hong Kong Exchanges & Clearing Ltd. | |
| | Sino Biopharmaceutical Ltd. | |
| | Techtronic Industries Co. Ltd. | |
| | Vitasoy International Holdings Ltd.(a) | |
| | | |
| | |
| | | |
| | |
| | Adani Ports & Special Economic Zone Ltd. | |
| | Apollo Hospitals Enterprise Ltd. | |
| | | |
| | | |
| | | |
| | | |
| | Bharat Petroleum Corp. Ltd. | |
| | Britannia Industries Ltd. | |
| | | |
| | | |
| | | |
| | Coromandel International Ltd. | |
| | | |
| | | |
| | | |
| | | |
| | | |
| | | |
| | | |
| | InterGlobe Aviation Ltd.* | |
| | | |
| | | |
| | | |
| | | |
| | | |
| | | |
| | | |
See accompanying Notes to the Financial Statements.
49
Mercer Emerging Markets Equity FundSchedule of Investments (Continued)
(showing percentage of net assets)
March 31, 2024
| | | |
| | |
| | | |
| | | |
| | | |
| | Syngene International Ltd. | |
| | Tata Consultancy Services Ltd. | |
| | Tata Consumer Products Ltd. | |
| | | |
| | | |
| | | |
| | | |
| | | |
| | | |
| | |
| | Astra International Tbk. PT | |
| | Bank Central Asia Tbk. PT | |
| | Bank Mandiri Persero Tbk. PT | |
| | Bank Rakyat Indonesia Persero Tbk. PT | |
| | Telkom Indonesia Persero Tbk. PT | |
| | | |
| | |
| | | |
| | | |
| | | |
| | |
| | | |
| | |
| | Polymetal International PLC*(b) | |
| | |
| | Petronas Chemicals Group Bhd. | |
| | | |
| | | |
| | |
| | Credito Real SAB de CV SOFOM ER*(b)(c) | |
| | Fibra Uno Administracion SA de CV, REIT | |
| | Fomento Economico Mexicano SAB de CV | |
| | Fomento Economico Mexicano SAB de CV, ADR | |
| | Grupo Aeroportuario del Pacifico SAB de CV Class B (a) | |
| | Grupo Aeroportuario del Sureste SAB de CV Class B | |
| | Grupo Financiero Banorte SAB de CV Class O | |
| | Grupo Mexico SAB de CV Series B | |
| | Unifin Financiera SAB de CV*(a)(b)(c) | |
| | Wal-Mart de Mexico SAB de CV | |
| | | |
50
See accompanying Notes to the Financial Statements.
Mercer Emerging Markets Equity FundSchedule of Investments (Continued)
(showing percentage of net assets)
March 31, 2024
| | | |
| | |
| | Galaxy Entertainment Group Ltd. | |
| | | |
| | | |
| | |
| | | |
| | |
| | | |
| | |
| | | |
| | | |
| | | |
| | | |
| | |
| | Bank Polska Kasa Opieki SA | |
| | | |
| | Powszechny Zaklad Ubezpieczen SA | |
| | | |
| | |
| | | |
| | |
| | | |
| | Gazprom Neft PJSC(b)(c)(d) | |
| | | |
| | Globaltrans Investment PLC, GDR*(b)(c)(d)(e) | |
| | HeadHunter Group PLC, ADR*(b)(c)(d) | |
| | | |
| | | |
| | | |
| | Magnitogorsk Iron & Steel Works PJSC*(b)(c)(d) | |
| | MMC Norilsk Nickel PJSC(b)(c)(d) | |
| | MMC Norilsk Nickel PJSC, ADR*(b)(c)(d) | |
| | Mobile TeleSystems PJSC, ADR*(b)(c)(d) | |
| | | |
| | Novolipetsk Steel PJSC*(b)(c)(d) | |
| | | |
| | PhosAgro PJSC, ADR*(b)(c)(d)(e) | |
| | PhosAgro PJSC, GDR*(b)(c)(d)(e) | |
| | | |
| | Polyus PJSC, GDR*(b)(c)(d) | |
| | Ros Agro PLC, GDR*(b)(c)(d)(e) | |
| | Sberbank of Russia PJSC(b)(c)(d) | |
| | Severstal PAO, GDR*(b)(c)(d)(e) | |
| | Surgutneftegas PJSC(b)(c)(d) | |
See accompanying Notes to the Financial Statements.
51
Mercer Emerging Markets Equity FundSchedule of Investments (Continued)
(showing percentage of net assets)
March 31, 2024
| | | |
| | |
| | | |
| | TCS Group Holding PLC, GDR*(b)(c)(d)(e)(f) | |
| | TCS Group Holding PLC, GDR*(b)(c)(d)(e)(f) | |
| | X5 Retail Group NV, GDR*(b)(c)(d)(e) | |
| | | |
| | |
| | | |
| | | |
| | | |
| | |
| | | |
| | | |
| | Capitec Bank Holdings Ltd. | |
| | | |
| | | |
| | Growthpoint Properties Ltd., REIT(a) | |
| | | |
| | | |
| | | |
| | | |
| | | |
| | |
| | | |
| | Hana Financial Group, Inc. | |
| | HD Hyundai Electric Co. Ltd. | |
| | | |
| | | |
| | | |
| | | |
| | | |
| | Korea Electric Power Corp. | |
| | Korea Investment Holdings Co. Ltd. | |
| | Samsung Electronics Co. Ltd. | |
| | Samsung Electronics Co. Ltd., GDR(e) | |
| | Shinhan Financial Group Co. Ltd. | |
| | | |
| | | |
| | | |
| | Woori Financial Group, Inc. | |
| | | |
| | |
| | | |
| | | |
| | | |
| | Asia Vital Components Co. Ltd. | |
| | | |
52
See accompanying Notes to the Financial Statements.
Mercer Emerging Markets Equity FundSchedule of Investments (Continued)
(showing percentage of net assets)
March 31, 2024
| | | |
| | |
| | | |
| | | |
| | CTBC Financial Holding Co. Ltd. | |
| | | |
| | | |
| | Evergreen Marine Corp. Taiwan Ltd. | |
| | Fubon Financial Holding Co. Ltd. | |
| | Gold Circuit Electronics Ltd. | |
| | | |
| | Largan Precision Co. Ltd. | |
| | Makalot Industrial Co. Ltd. | |
| | | |
| | Micro-Star International Co. Ltd. | |
| | Novatek Microelectronics Corp. | |
| | President Chain Store Corp. | |
| | Sinbon Electronics Co. Ltd. | |
| | Taiwan Semiconductor Manufacturing Co. Ltd. | |
| | Taiwan Semiconductor Manufacturing Co. Ltd., ADR | |
| | Voltronic Power Technology Corp. | |
| | | |
| | | |
| | |
| | Airports of Thailand PCL Class F | |
| | Bangkok Dusit Medical Services PCL Class F | |
| | Bumrungrad Hospital PCL Class F | |
| | | |
| | PTT Exploration & Production PCL Class F | |
| | | |
| | | |
| | Thai Union Group PCL Class F | |
| | | |
| | |
| | | |
| | BIM Birlesik Magazalar AS | |
| | | |
| | Turkiye Is Bankasi AS Class C | |
| | | |
| | United Arab Emirates — 0.3% |
| | Abu Dhabi National Oil Co. for Distribution PJSC | |
| | First Abu Dhabi Bank PJSC | |
| | | |
| | |
| | | |
| | |
| | | |
See accompanying Notes to the Financial Statements.
53
Mercer Emerging Markets Equity FundSchedule of Investments (Continued)
(showing percentage of net assets)
March 31, 2024
| | | |
| | |
| | Vietnam Dairy Products JSC | |
| | TOTAL COMMON STOCKS (COST $980,568,959) | |
| | | |
| | INVESTMENT COMPANIES — 7.2% |
| | |
| | iShares Core MSCI Emerging Markets ETF | |
| | iShares MSCI Emerging Markets ETF | |
| | Vanguard FTSE Emerging Markets ETF | |
| | TOTAL INVESTMENT COMPANIES (COST $90,413,987) | |
| | | |
| | |
| | |
| | | |
| | Itau Unibanco Holding SA, 6.82% | |
| | Petroleo Brasileiro SA, 8.54% | |
| | | |
| | TOTAL PREFERRED STOCKS (COST $6,732,922) | |
| | | |
| | SHORT-TERM INVESTMENT — 0.6% |
| | Mutual Fund - Securities Lending Collateral — 0.6% |
| | State Street Navigator Securities Lending Government Money Market Portfolio, | |
| | TOTAL SHORT-TERM INVESTMENT (COST $7,756,324) | |
| | TOTAL INVESTMENTS — 80.3%
(Cost $1,085,472,192) | |
| | Other Assets and Liabilities (net) — 19.7% | |
| | | |
| Notes to Schedule of Investments: |
| Non-income producing security. |
| All or a portion of this security is out on loan. |
| Securities fair valued by the Valuation Committee as approved by the Board of Trustees. The total market value of the securities at year end is $464,405 which represents 0.0% of net assets. The aggregate cost of these securities held at March 31, 2024 is $94,698,977. |
| Level 3 - significant unobservable inputs were used in determining the value of this security in the Fund. |
54
See accompanying Notes to the Financial Statements.
Mercer Emerging Markets Equity FundSchedule of Investments (Continued)
March 31, 2024
| Illiquid securities represent Russian securities impacted by the Russian/Ukraine crisis. The total market value of the securities at year end is $446,123 which represents 0.0% of net assets. The aggregate cost of these securities held at March 31, 2024 is $85,541,075. |
| Security exempt from registration under Regulation S of the Securities Act of 1933, which exempts from registration securities offered and sold outside the United States. Security may not be offered or sold in the United States except pursuant to an exemption from, or in a transaction not subject to, the registration requirements of the Securities Act of 1933. |
| Securities are traded on separate exchanges for the same entity. |
| The rate disclosed is the 7-day net yield as of March 31, 2024. |
| Represents an investment of securities lending cash collateral. |
Futures Contracts
| | | | Market Value/
Unrealized
Appreciation
(Depreciation) |
| | | | |
| MSCI Emerging Markets E-mini Index | | | |
|
| | American Depository Receipt |
| | Global Depository Receipt |
| | Real Estate Investment Trust |
See accompanying Notes to the Financial Statements.
55
Mercer Emerging Markets Equity FundSchedule of Investments (Continued)
March 31, 2024
Industry Sector Summary (Unaudited) | |
| |
| |
| |
| |
| |
| |
| |
| |
| |
| |
| |
| |
Other Assets and Liabilities (net) | |
| |
56
See accompanying Notes to the Financial Statements.
Mercer Global Low Volatility Equity FundSchedule of Investments
(showing percentage of net assets)
March 31, 2024
| | | |
| | |
| | |
| | | |
| | | |
| | | |
| | | |
| | Northern Star Resources Ltd. | |
| | | |
| | | |
| | | |
| | | |
| | | |
| | | |
| | | |
| | | |
| | | |
| | | |
| | |
| | | |
| | |
| | RenaissanceRe Holdings Ltd. | |
| | |
| | Alamos Gold, Inc. Class A | |
| | | |
| | | |
| | Canadian National Railway Co. | |
| | Canadian Pacific Kansas City Ltd.(a) | |
| | CCL Industries, Inc. Class B (a) | |
| | Descartes Systems Group, Inc.* | |
| | Dundee Precious Metals, Inc. | |
| | | |
| | | |
| | | |
| | | |
| | | |
| | | |
| | | |
| | | |
| | | |
| | | |
| | | |
| | | |
| | | |
| | | |
| | | |
| | | |
| | Whitecap Resources, Inc.(a) | |
See accompanying Notes to the Financial Statements.
57
Mercer Global Low Volatility Equity FundSchedule of Investments (Continued)
(showing percentage of net assets)
March 31, 2024
| | | |
| | |
| | | |
| | | |
| | |
| | BOC Hong Kong Holdings Ltd. | |
| | CITIC Telecom International Holdings Ltd. | |
| | | |
| | | |
| | |
| | AP Moller - Maersk AS Class B | |
| | | |
| | | |
| | | |
| | | |
| | | |
| | | |
| | | |
| | | |
| | Sparekassen Sjaelland-Fyn AS | |
| | | |
| | | |
| | |
| | | |
| | | |
| | | |
| | | |
| | | |
| | | |
| | | |
| | | |
| | | |
| | | |
| | | |
| | | |
| | | |
| | | |
| | | |
| | | |
| | | |
| | | |
| | | |
| | |
| | Bank of Georgia Group PLC | |
| | |
| | Bayerische Motoren Werke AG | |
| | | |
58
See accompanying Notes to the Financial Statements.
Mercer Global Low Volatility Equity FundSchedule of Investments (Continued)
(showing percentage of net assets)
March 31, 2024
| | | |
| | |
| | | |
| | | |
| | | |
| | Muenchener Rueckversicherungs-Gesellschaft AG in Muenchen | |
| | Pfeiffer Vacuum Technology AG | |
| | | |
| | | |
| | Wuestenrot & Wuerttembergische AG | |
| | | |
| | |
| | | |
| | Dah Sing Banking Group Ltd. | |
| | Emperor International Holdings Ltd. | |
| | HK Electric Investments & HK Electric Investments Ltd.(b) | |
| | | |
| | Hong Kong Ferry Holdings Co. Ltd. | |
| | Jardine Matheson Holdings Ltd. | |
| | Langham Hospitality Investments & Langham Hospitality Investments Ltd. | |
| | Miramar Hotel & Investment | |
| | | |
| | Power Assets Holdings Ltd. | |
| | Regal Hotels International Holdings Ltd.* | |
| | Regal Real Estate Investment Trust, REIT | |
| | SmarTone Telecommunications Holdings Ltd. | |
| | Transport International Holdings Ltd. | |
| | | |
| | Wing On Co. International Ltd. | |
| | | |
| | |
| | Check Point Software Technologies Ltd.* | |
| | First International Bank Of Israel Ltd. | |
| | | |
| | | |
| | | |
| | | |
| | | |
| | | |
| | |
| | | |
| | | |
| | UnipolSai Assicurazioni SpA(a) | |
| | | |
| | |
| | | |
| | | |
| | | |
See accompanying Notes to the Financial Statements.
59
Mercer Global Low Volatility Equity FundSchedule of Investments (Continued)
(showing percentage of net assets)
March 31, 2024
| | | |
| | |
| | | |
| | | |
| | | |
| | Autobacs Seven Co. Ltd.(a) | |
| | | |
| | | |
| | | |
| | Canon Marketing Japan, Inc. | |
| | | |
| | | |
| | Dai Nippon Printing Co. Ltd. | |
| | | |
| | | |
| | | |
| | | |
| | | |
| | | |
| | | |
| | | |
| | Inaba Denki Sangyo Co. Ltd. | |
| | | |
| | Japan Post Holdings Co. Ltd. | |
| | | |
| | Kaken Pharmaceutical Co. Ltd. | |
| | | |
| | | |
| | | |
| | | |
| | Kobayashi Pharmaceutical Co. Ltd. | |
| | Kyorin Pharmaceutical Co. Ltd. | |
| | | |
| | | |
| | | |
| | McDonald's Holdings Co. Japan Ltd. | |
| | | |
| | Megmilk Snow Brand Co. Ltd. | |
| | | |
| | Mitsubishi Electric Corp. | |
| | Mitsubishi Shokuhin Co. Ltd. | |
| | Mochida Pharmaceutical Co. Ltd.(a) | |
| | | |
| | | |
| | | |
| | | |
| | | |
| | | |
| | Nippon Light Metal Holdings Co. Ltd. | |
| | Nippon Telegraph & Telephone Corp. | |
| | Nisshin Oillio Group Ltd. | |
60
See accompanying Notes to the Financial Statements.
Mercer Global Low Volatility Equity FundSchedule of Investments (Continued)
(showing percentage of net assets)
March 31, 2024
| | | |
| | |
| | | |
| | | |
| | Okinawa Cellular Telephone Co. | |
| | | |
| | | |
| | | |
| | | |
| | | |
| | | |
| | | |
| | | |
| | | |
| | | |
| | Senko Group Holdings Co. Ltd.(a) | |
| | | |
| | | |
| | | |
| | Toho Holdings Co. Ltd.(a) | |
| | | |
| | | |
| | | |
| | | |
| | | |
| | | |
| | Zenkoku Hosho Co. Ltd.(a) | |
| | | |
| | |
| | Hikma Pharmaceuticals PLC | |
| | |
| | | |
| | Koninklijke Ahold Delhaize NV | |
| | | |
| | | |
| | | |
| | | |
| | | |
| | |
| | | |
| | |
| | | |
| | | |
| | | |
| | | |
| | | |
| | | |
See accompanying Notes to the Financial Statements.
61
Mercer Global Low Volatility Equity FundSchedule of Investments (Continued)
(showing percentage of net assets)
March 31, 2024
| | | |
| | |
| | | |
| | | |
| | | |
| | | |
| | |
| | | |
| | Great Eastern Holdings Ltd. | |
| | | |
| | Oversea-Chinese Banking Corp. Ltd. | |
| | | |
| | | |
| | | |
| | Singapore Land Group Ltd. | |
| | United Overseas Bank Ltd. | |
| | | |
| | |
| | Samsung Electronics Co. Ltd., GDR(b) | |
| | |
| | | |
| | ACS Actividades de Construccion y Servicios SA | |
| | | |
| | Cia de Distribucion Integral Logista Holdings SA | |
| | | |
| | Industria de Diseno Textil SA | |
| | | |
| | |
| | Skandinaviska Enskilda Banken AB Class A (a) | |
| | | |
| | | |
| | |
| | | |
| | Banque Cantonale de Geneve | |
| | Basellandschaftliche Kantonalbank | |
| | Berner Kantonalbank AG(a) | |
| | | |
| | Chocoladefabriken Lindt & Spruengli AG(a) | |
| | Cie Financiere Richemont SA Class A | |
| | | |
| | | |
| | Graubuendner Kantonalbank | |
| | | |
| | Kuehne & Nagel International AG | |
| | | |
| | Logitech International SA | |
| | | |
62
See accompanying Notes to the Financial Statements.
Mercer Global Low Volatility Equity FundSchedule of Investments (Continued)
(showing percentage of net assets)
March 31, 2024
| | | |
| | |
| | | |
| | | |
| | | |
| | | |
| | |
| | | |
| | | |
| | | |
| | | |
| | | |
| | | |
| | | |
| | London Stock Exchange Group PLC | |
| | | |
| | | |
| | Spirent Communications PLC | |
| | | |
| | | |
| | | |
| | | |
| | |
| | | |
| | | |
| | | |
| | | |
| | | |
| | | |
| | Albertsons Cos., Inc. Class A | |
| | | |
| | | |
| | | |
| | | |
| | | |
| | | |
| | | |
| | Ameriprise Financial, Inc. | |
| | | |
| | | |
| | | |
| | | |
| | | |
| | | |
| | | |
| | Automatic Data Processing, Inc. | |
| | | |
| | Axis Capital Holdings Ltd. | |
| | Bank of New York Mellon Corp. | |
See accompanying Notes to the Financial Statements.
63
Mercer Global Low Volatility Equity FundSchedule of Investments (Continued)
(showing percentage of net assets)
March 31, 2024
| | | |
| | United States — continued |
| | | |
| | Berkshire Hathaway, Inc. Class B * | |
| | | |
| | BioMarin Pharmaceutical, Inc.* | |
| | Bio-Rad Laboratories, Inc. Class A * | |
| | | |
| | | |
| | | |
| | CACI International, Inc. Class A * | |
| | Cadence Design Systems, Inc.* | |
| | | |
| | Casey's General Stores, Inc. | |
| | | |
| | | |
| | Cboe Global Markets, Inc. | |
| | | |
| | | |
| | | |
| | Charter Communications, Inc. Class A * | |
| | | |
| | | |
| | | |
| | | |
| | | |
| | | |
| | | |
| | | |
| | | |
| | | |
| | | |
| | | |
| | Consolidated Edison, Inc. | |
| | | |
| | | |
| | | |
| | | |
| | | |
| | | |
| | | |
| | | |
| | | |
| | | |
| | | |
| | | |
| | | |
| | | |
| | | |
| | FactSet Research Systems, Inc. | |
| | | |
64
See accompanying Notes to the Financial Statements.
Mercer Global Low Volatility Equity FundSchedule of Investments (Continued)
(showing percentage of net assets)
March 31, 2024
| | | |
| | United States — continued |
| | | |
| | | |
| | | |
| | | |
| | | |
| | Grand Canyon Education, Inc.* | |
| | | |
| | | |
| | Hartford Financial Services Group, Inc. | |
| | | |
| | | |
| | | |
| | Honeywell International, Inc. | |
| | | |
| | Huntington Ingalls Industries, Inc. | |
| | | |
| | | |
| | Intercontinental Exchange, Inc. | |
| | International Business Machines Corp. | |
| | | |
| | | |
| | | |
| | JB Hunt Transport Services, Inc. | |
| | | |
| | | |
| | | |
| | | |
| | | |
| | L3Harris Technologies, Inc. | |
| | | |
| | | |
| | | |
| | | |
| | Lululemon Athletica, Inc.* | |
| | Manhattan Associates, Inc.* | |
| | | |
| | | |
| | | |
| | | |
| | | |
| | | |
| | Meta Platforms, Inc. Class A | |
| | | |
| | | |
| | | |
| | | |
| | | |
| | MSC Industrial Direct Co., Inc. Class A | |
| | | |
See accompanying Notes to the Financial Statements.
65
Mercer Global Low Volatility Equity FundSchedule of Investments (Continued)
(showing percentage of net assets)
March 31, 2024
| | | |
| | United States — continued |
| | | |
| | | |
| | Neurocrine Biosciences, Inc.* | |
| | | |
| | | |
| | | |
| | | |
| | | |
| | | |
| | | |
| | | |
| | | |
| | Philip Morris International, Inc. | |
| | | |
| | | |
| | | |
| | | |
| | Public Service Enterprise Group, Inc. | |
| | | |
| | | |
| | Regeneron Pharmaceuticals, Inc.* | |
| | Reinsurance Group of America, Inc. | |
| | | |
| | | |
| | | |
| | | |
| | | |
| | | |
| | Science Applications International Corp. | |
| | | |
| | | |
| | | |
| | | |
| | SS&C Technologies Holdings, Inc. | |
| | | |
| | | |
| | | |
| | | |
| | | |
| | | |
| | Thermo Fisher Scientific, Inc. | |
| | | |
| | | |
| | United Therapeutics Corp.* | |
| | | |
| | | |
| | Verizon Communications, Inc. | |
| | Vertex Pharmaceuticals, Inc.* | |
| | | |
66
See accompanying Notes to the Financial Statements.
Mercer Global Low Volatility Equity FundSchedule of Investments (Continued)
(showing percentage of net assets)
March 31, 2024
| | | |
| | United States — continued |
| | | |
| | | |
| | | |
| | White Mountains Insurance Group Ltd. | |
| | | |
| | | |
| | | |
| | Zoom Video Communications, Inc. Class A * | |
| | | |
| | TOTAL COMMON STOCKS (COST $639,122,559) | |
|
| | |
| | |
| | | |
| | Henkel AG & Co. KGaA, 2.49% | |
| | | |
| | TOTAL PREFERRED STOCKS (COST $1,976,034) | |
|
| | |
| | |
| | Constellation Software, Inc. Expires 03/31/40*(d)(e) 144A | |
| | | |
| | | |
| | SHORT-TERM INVESTMENT — 1.8% |
| | Mutual Fund - Securities Lending Collateral — 1.8% |
| | State Street Navigator Securities Lending Government Money Market Portfolio, | |
| | TOTAL SHORT-TERM INVESTMENT (COST $14,584,436) | |
| | TOTAL INVESTMENTS — 94.9%
(Cost $655,683,029) | |
| | Other Assets and Liabilities (net) — 5.1% | |
| | | |
| Notes to Schedule of Investments: |
| Non-income producing security. |
| All or a portion of this security is out on loan. |
| Security exempt from registration under Regulation S of the Securities Act of 1933, which exempts from registration securities offered and sold outside the United States. Security may not be offered or sold in the United States except pursuant to an exemption from, or in a transaction not subject to, the registration requirements of the Securities Act of 1933. |
| Securities are traded on separate exchanges for the same entity. |
See accompanying Notes to the Financial Statements.
67
Mercer Global Low Volatility Equity FundSchedule of Investments (Continued)
March 31, 2024
| Level 3 - significant unobservable inputs were used in determining the value of this security in the Fund. |
| Securities fair valued by the Valuation Committee as approved by the Board of Trustees. The total market value of the securities at year end is $0 which represents 0.0% of net assets. The aggregate cost of these securities held at March 31, 2024 is $0. |
| The rate disclosed is the 7-day net yield as of March 31, 2024. |
| Represents an investment of securities lending cash collateral. |
| Securities exempt from registration under Rule 144A of the Securities Act of 1933. These securities may be resold in transactions exempt from registration, normally to qualified institutional buyers. The total market value of the securities at year end is $0 which represents 0.0% of net assets. |
Futures Contracts
| | | | Market Value/
Unrealized
Appreciation
(Depreciation) |
| | | | |
| | | | |
| | | | |
| | | | |
| | | | |
| | | | |
|
| | American Depository Receipt |
| | Global Depository Receipt |
| | Real Estate Investment Trust |
68
See accompanying Notes to the Financial Statements.
Mercer Global Low Volatility Equity FundSchedule of Investments (Continued)
March 31, 2024
Industry Sector Summary (Unaudited) | |
| |
| |
| |
| |
| |
| |
| |
| |
| |
| |
| |
Other Assets and Liabilities (net) | |
| |
See accompanying Notes to the Financial Statements.
69
Mercer Non-US Core Equity FundSchedule of Investments
(showing percentage of net assets)
March 31, 2024
| | | |
| | |
| | |
| | | |
| | | |
| | | |
| | | |
| | | |
| | Bank of Queensland Ltd.(a) | |
| | | |
| | | |
| | | |
| | | |
| | | |
| | | |
| | | |
| | Harvey Norman Holdings Ltd.(a) | |
| | | |
| | | |
| | | |
| | | |
| | | |
| | | |
| | | |
| | | |
| | | |
| | | |
| | | |
| | | |
| | | |
| | | |
| | Ventia Services Group Pty. Ltd. | |
| | Viva Energy Group Ltd. 144A | |
| | | |
| | | |
| | Woodside Energy Group Ltd. | |
| | | |
| | |
| | | |
| | | |
| | | |
| | | |
| | | |
| | Raiffeisen Bank International AG | |
| | | |
| | | |
| | |
| | | |
| | | |
70
See accompanying Notes to the Financial Statements.
Mercer Non-US Core Equity FundSchedule of Investments (Continued)
(showing percentage of net assets)
March 31, 2024
| | | |
| | |
| | | |
| | | |
| | | |
| | |
| | NU Holdings Ltd. Class A * | |
| | | |
| | Petroleo Brasileiro SA, ADR | |
| | Petroleo Brasileiro SA, Preferred ADR | |
| | | |
| | Wheaton Precious Metals Corp.(a) | |
| | | |
| | | |
| | |
| | Agnico Eagle Mines Ltd.(a) | |
| | Canadian Pacific Kansas City Ltd.(a) | |
| | Canadian Tire Corp. Ltd. Class A (a) | |
| | | |
| | | |
| | | |
| | |
| | | |
| | |
| | | |
| | Agricultural Bank of China Ltd. Class H | |
| | Bank of China Ltd. Class H | |
| | Budweiser Brewing Co. APAC Ltd. 144A | |
| | BYD Electronic International Co. Ltd. | |
| | China Conch Venture Holdings Ltd. | |
| | China Construction Bank Corp. Class H | |
| | China Medical System Holdings Ltd. | |
| | China Merchants Bank Co. Ltd. Class H | |
| | CSC Financial Co. Ltd. Class H 144A | |
| | CSPC Pharmaceutical Group Ltd. | |
| | Daqo New Energy Corp., ADR* | |
| | Dongfang Electric Corp. Ltd. Class H | |
| | Fu Shou Yuan International Group Ltd. | |
| | Fuyao Glass Industry Group Co. Ltd. Class H 144A | |
| | Geely Automobile Holdings Ltd. | |
| | Hengan International Group Co. Ltd. | |
| | Hua Hong Semiconductor Ltd.* 144A | |
| | Industrial & Commercial Bank of China Ltd. Class H | |
| | | |
| | | |
| | | |
| | | |
| | Pop Mart International Group Ltd. 144A | |
See accompanying Notes to the Financial Statements.
71
Mercer Non-US Core Equity FundSchedule of Investments (Continued)
(showing percentage of net assets)
March 31, 2024
| | | |
| | |
| | Shandong Gold Mining Co. Ltd. Class H 144A | |
| | Shanghai Pharmaceuticals Holding Co. Ltd. Class H | |
| | Sinopharm Group Co. Ltd. Class H | |
| | SITC International Holdings Co. Ltd. | |
| | TravelSky Technology Ltd. Class H | |
| | Wuxi Biologics Cayman, Inc.* 144A | |
| | Xinyi Glass Holdings Ltd. | |
| | Yadea Group Holdings Ltd. 144A | |
| | Yangzijiang Shipbuilding Holdings Ltd. | |
| | Zhongsheng Group Holdings Ltd. | |
| | | |
| | |
| | AP Moller - Maersk AS Class A | |
| | AP Moller - Maersk AS Class B | |
| | | |
| | | |
| | | |
| | | |
| | | |
| | | |
| | | |
| | | |
| | | |
| | | |
| | | |
| | | |
| | |
| | | |
| | |
| | | |
| | | |
| | | |
| | | |
| | | |
| | | |
| | | |
| | | |
| | | |
| | | |
| | |
| | | |
| | | |
| | | |
| | | |
| | | |
| | | |
72
See accompanying Notes to the Financial Statements.
Mercer Non-US Core Equity FundSchedule of Investments (Continued)
(showing percentage of net assets)
March 31, 2024
| | | |
| | |
| | | |
| | | |
| | Cie Generale des Etablissements Michelin SCA | |
| | | |
| | | |
| | | |
| | | |
| | | |
| | | |
| | | |
| | | |
| | | |
| | LVMH Moet Hennessy Louis Vuitton SE | |
| | | |
| | | |
| | | |
| | | |
| | | |
| | | |
| | | |
| | | |
| | | |
| | Television Francaise 1 SA(a) | |
| | | |
| | Ubisoft Entertainment SA* | |
| | | |
| | | |
| | | |
| | |
| | Bank of Georgia Group PLC | |
| | | |
| | | |
| | |
| | | |
| | | |
| | | |
| | | |
| | | |
| | Bayerische Motoren Werke AG | |
| | | |
| | | |
| | | |
| | | |
| | | |
| | | |
| | | |
| | Deutsche Pfandbriefbank AG(a) | |
See accompanying Notes to the Financial Statements.
73
Mercer Non-US Core Equity FundSchedule of Investments (Continued)
(showing percentage of net assets)
March 31, 2024
| | | |
| | |
| | | |
| | | |
| | | |
| | | |
| | | |
| | Fresenius Medical Care AG | |
| | | |
| | | |
| | | |
| | | |
| | | |
| | | |
| | | |
| | | |
| | | |
| | | |
| | | |
| | Muenchener Rueckversicherungs-Gesellschaft AG in Muenchen | |
| | | |
| | | |
| | | |
| | | |
| | | |
| | | |
| | | |
| | | |
| | | |
| | | |
| | | |
| | | |
| | | |
| | | |
| | |
| | | |
| | |
| | Millicom International Cellular SA, SDR* | |
| | |
| | | |
| | Jardine Matheson Holdings Ltd. | |
| | Pacific Basin Shipping Ltd. | |
| | Swire Pacific Ltd. Class A | |
| | Techtronic Industries Co. Ltd. | |
| | Tongda Group Holdings Ltd.* | |
| | United Laboratories International Holdings Ltd. | |
| | | |
| | | |
74
See accompanying Notes to the Financial Statements.
Mercer Non-US Core Equity FundSchedule of Investments (Continued)
(showing percentage of net assets)
March 31, 2024
| | | |
| | |
| | MOL Hungarian Oil & Gas PLC | |
| | | |
| | | |
| | |
| | | |
| | |
| | Golden Agri-Resources Ltd. | |
| | |
| | | |
| | | |
| | Bank of Ireland Group PLC | |
| | | |
| | | |
| | |
| | | |
| | | |
| | Bezeq The Israeli Telecommunication Corp. Ltd. | |
| | First International Bank Of Israel Ltd. | |
| | | |
| | Israel Discount Bank Ltd. Class A | |
| | Mizrahi Tefahot Bank Ltd. | |
| | | |
| | | |
| | | |
| | Teva Pharmaceutical Industries Ltd.* | |
| | | |
| | |
| | | |
| | Assicurazioni Generali SpA | |
| | | |
| | | |
| | | |
| | Banca Monte dei Paschi di Siena SpA* | |
| | Banca Popolare di Sondrio SpA | |
| | | |
| | | |
| | | |
| | | |
| | | |
| | | |
| | | |
| | FinecoBank Banca Fineco SpA | |
| | | |
| | | |
| | | |
See accompanying Notes to the Financial Statements.
75
Mercer Non-US Core Equity FundSchedule of Investments (Continued)
(showing percentage of net assets)
March 31, 2024
| | | |
| | |
| | Mediobanca Banca di Credito Finanziario SpA | |
| | MFE-MediaForEurope NV Class A (a) | |
| | | |
| | | |
| | Ryanair Holdings PLC, ADR | |
| | | |
| | | |
| | | |
| | UnipolSai Assicurazioni SpA(a) | |
| | | |
| | |
| | | |
| | AEON Financial Service Co. Ltd. | |
| | AEON REIT Investment Corp., REIT | |
| | | |
| | | |
| | | |
| | | |
| | | |
| | | |
| | | |
| | | |
| | | |
| | | |
| | ASKA Pharmaceutical Holdings Co. Ltd. | |
| | | |
| | Autobacs Seven Co. Ltd.(a) | |
| | | |
| | | |
| | | |
| | | |
| | | |
| | Chubu Electric Power Co., Inc. | |
| | | |
| | Chugoku Electric Power Co., Inc.(a) | |
| | Citizen Watch Co. Ltd.(a) | |
| | Coca-Cola Bottlers Japan Holdings, Inc. | |
| | | |
| | Cosmo Energy Holdings Co. Ltd. | |
| | | |
| | | |
| | | |
| | Dai-ichi Life Holdings, Inc. | |
| | Daiwa House Industry Co. Ltd. | |
| | Daiwa Securities Group, Inc. | |
| | | |
| | Dowa Holdings Co. Ltd.(a) | |
| | | |
76
See accompanying Notes to the Financial Statements.
Mercer Non-US Core Equity FundSchedule of Investments (Continued)
(showing percentage of net assets)
March 31, 2024
| | | |
| | |
| | | |
| | | |
| | | |
| | Electric Power Development Co. Ltd. | |
| | | |
| | | |
| | | |
| | | |
| | | |
| | | |
| | | |
| | | |
| | Fukuoka Financial Group, Inc.(a) | |
| | | |
| | Furukawa Electric Co. Ltd.(a) | |
| | Futaba Industrial Co. Ltd. | |
| | | |
| | Hankyu Hanshin Holdings, Inc. | |
| | | |
| | | |
| | Hisamitsu Pharmaceutical Co., Inc. | |
| | | |
| | | |
| | Hokkaido Electric Power Co., Inc. | |
| | Hokuhoku Financial Group, Inc. | |
| | | |
| | | |
| | | |
| | Ichinen Holdings Co. Ltd. | |
| | | |
| | | |
| | Iida Group Holdings Co. Ltd.(a) | |
| | | |
| | | |
| | | |
| | | |
| | | |
| | | |
| | | |
| | Japan Exchange Group, Inc. | |
| | Japan Petroleum Exploration Co. Ltd.(a) | |
| | | |
| | Japan Post Holdings Co. Ltd. | |
| | Japan Post Insurance Co. Ltd.(a) | |
| | | |
| | | |
| | Juroku Financial Group, Inc. | |
| | | |
| | | |
See accompanying Notes to the Financial Statements.
77
Mercer Non-US Core Equity FundSchedule of Investments (Continued)
(showing percentage of net assets)
March 31, 2024
| | | |
| | |
| | | |
| | | |
| | Kansai Electric Power Co., Inc. | |
| | | |
| | | |
| | Kawasaki Kisen Kaisha Ltd.(a) | |
| | | |
| | | |
| | | |
| | | |
| | | |
| | | |
| | | |
| | Koito Manufacturing Co. Ltd. | |
| | | |
| | | |
| | | |
| | | |
| | | |
| | | |
| | | |
| | Kyushu Electric Power Co., Inc. | |
| | | |
| | | |
| | | |
| | | |
| | | |
| | Makino Milling Machine Co. Ltd. | |
| | | |
| | | |
| | | |
| | | |
| | Mebuki Financial Group, Inc. | |
| | | |
| | | |
| | | |
| | Mitsubishi Chemical Group Corp. | |
| | Mitsubishi Electric Corp. | |
| | Mitsubishi Gas Chemical Co., Inc.(a) | |
| | Mitsubishi HC Capital, Inc. | |
| | Mitsubishi Motors Corp.(a) | |
| | Mitsubishi UFJ Financial Group, Inc. | |
| | | |
| | | |
| | Mitsui Mining & Smelting Co. Ltd.(a) | |
| | | |
| | | |
| | Mizuho Financial Group, Inc. | |
| | | |
78
See accompanying Notes to the Financial Statements.
Mercer Non-US Core Equity FundSchedule of Investments (Continued)
(showing percentage of net assets)
March 31, 2024
| | | |
| | |
| | Mochida Pharmaceutical Co. Ltd. | |
| | | |
| | Morinaga Milk Industry Co. Ltd. | |
| | MS&AD Insurance Group Holdings, Inc. | |
| | | |
| | | |
| | | |
| | Namura Shipbuilding Co. Ltd. | |
| | Nankai Electric Railway Co. Ltd. | |
| | | |
| | NEC Networks & System Integration Corp. | |
| | | |
| | | |
| | | |
| | | |
| | | |
| | | |
| | NIPPON EXPRESS HOLDINGS, Inc. | |
| | | |
| | Nippon Light Metal Holdings Co. Ltd. | |
| | | |
| | | |
| | | |
| | | |
| | Nippon Telegraph & Telephone Corp. | |
| | Nishi-Nippon Financial Holdings, Inc. | |
| | Nishi-Nippon Railroad Co. Ltd. | |
| | | |
| | | |
| | | |
| | | |
| | | |
| | | |
| | | |
| | | |
| | | |
| | Nomura Research Institute Ltd. | |
| | | |
| | | |
| | | |
| | | |
| | | |
| | OBIC Business Consultants Co. Ltd. | |
| | | |
| | | |
| | Okasan Securities Group, Inc. | |
| | Okinawa Electric Power Co., Inc. | |
| | | |
| | | |
See accompanying Notes to the Financial Statements.
79
Mercer Non-US Core Equity FundSchedule of Investments (Continued)
(showing percentage of net assets)
March 31, 2024
| | | |
| | |
| | Ono Pharmaceutical Co. Ltd.(a) | |
| | | |
| | | |
| | | |
| | Pan Pacific International Holdings Corp. | |
| | | |
| | | |
| | | |
| | | |
| | | |
| | | |
| | Rohto Pharmaceutical Co. Ltd. | |
| | | |
| | | |
| | | |
| | | |
| | | |
| | Santen Pharmaceutical Co. Ltd. | |
| | | |
| | Sanyo Chemical Industries Ltd. | |
| | SCREEN Holdings Co. Ltd.(a) | |
| | Sega Sammy Holdings, Inc. | |
| | | |
| | | |
| | Seino Holdings Co. Ltd.(a) | |
| | Sekisui Chemical Co. Ltd. | |
| | | |
| | | |
| | | |
| | | |
| | Shin-Etsu Chemical Co. Ltd. | |
| | | |
| | SKY Perfect JSAT Holdings, Inc. | |
| | | |
| | | |
| | | |
| | | |
| | | |
| | Stanley Electric Co. Ltd. | |
| | | |
| | | |
| | Sumitomo Bakelite Co. Ltd. | |
| | | |
| | Sumitomo Electric Industries Ltd. | |
| | Sumitomo Forestry Co. Ltd. | |
| | Sumitomo Heavy Industries Ltd. | |
| | Sumitomo Metal Mining Co. Ltd. | |
| | Sumitomo Mitsui Financial Group, Inc. | |
| | Sumitomo Mitsui Trust Holdings, Inc. | |
80
See accompanying Notes to the Financial Statements.
Mercer Non-US Core Equity FundSchedule of Investments (Continued)
(showing percentage of net assets)
March 31, 2024
| | | |
| | |
| | Sumitomo Osaka Cement Co. Ltd.(a) | |
| | Sumitomo Rubber Industries Ltd. | |
| | Sumitomo Seika Chemicals Co. Ltd. | |
| | | |
| | | |
| | | |
| | | |
| | | |
| | | |
| | | |
| | | |
| | Takara Standard Co. Ltd.(a) | |
| | Takasago Thermal Engineering Co. Ltd. | |
| | Takeda Pharmaceutical Co. Ltd.(a) | |
| | Takeuchi Manufacturing Co. Ltd. | |
| | | |
| | | |
| | | |
| | | |
| | | |
| | Tohoku Electric Power Co., Inc. | |
| | | |
| | Tokio Marine Holdings, Inc. | |
| | | |
| | Tokyo Electric Power Co. Holdings, Inc.* | |
| | | |
| | | |
| | Tokyo Kiraboshi Financial Group, Inc. | |
| | | |
| | | |
| | | |
| | | |
| | | |
| | | |
| | | |
| | | |
| | | |
| | | |
| | | |
| | | |
| | | |
| | | |
| | | |
| | | |
| | Warabeya Nichiyo Holdings Co. Ltd. | |
| | | |
| | Yamaguchi Financial Group, Inc. | |
| | | |
| | Yamaichi Electronics Co. Ltd. | |
See accompanying Notes to the Financial Statements.
81
Mercer Non-US Core Equity FundSchedule of Investments (Continued)
(showing percentage of net assets)
March 31, 2024
| | | |
| | |
| | | |
| | | |
| | | |
| | | |
| | |
| | ArcelorMittal SA, ADR NYRS | |
| | | |
| | | |
| | |
| | ABN AMRO Bank NV CVA, GDR 144A | |
| | | |
| | | |
| | | |
| | ASML Holding NV, ADR NYRS | |
| | | |
| | BE Semiconductor Industries NV | |
| | | |
| | | |
| | Koninklijke Ahold Delhaize NV | |
| | | |
| | | |
| | | |
| | | |
| | | |
| | | |
| | | |
| | Van Lanschot Kempen NV, ADR | |
| | | |
| | | |
| | |
| | | |
| | |
| | | |
| | | |
| | | |
| | | |
| | | |
| | | |
| | | |
| | | |
| | Golden Ocean Group Ltd.(b) | |
| | Golden Ocean Group Ltd.(b) | |
| | | |
| | | |
| | | |
| | | |
82
See accompanying Notes to the Financial Statements.
Mercer Non-US Core Equity FundSchedule of Investments (Continued)
(showing percentage of net assets)
March 31, 2024
| | | |
| | |
| | | |
| | | |
| | |
| | Banco Comercial Portugues SA Class R * | |
| | | |
| | | |
| | | |
| | |
| | | |
| | | |
| | MMC Norilsk Nickel PJSC(c)(d)(e) | |
| | | |
| | Rosneft Oil Co. PJSC(c)(d)(e) | |
| | Sberbank of Russia PJSC(c)(d)(e) | |
| | | |
| | | |
| | |
| | | |
| | | |
| | | |
| | Jardine Cycle & Carriage Ltd. | |
| | Singapore Technologies Engineering Ltd. | |
| | | |
| | STMicroelectronics NV(a)(b) | |
| | STMicroelectronics NV, ADR NYRS | |
| | United Overseas Bank Ltd. | |
| | | |
| | |
| | Anglo American Platinum Ltd.(a) | |
| | | |
| | | |
| | | |
| | | |
| | | |
| | |
| | | |
| | | |
| | | |
| | Samsung Electronics Co. Ltd. | |
| | | |
| | | |
| | |
| | | |
| | Banco Bilbao Vizcaya Argentaria SA | |
See accompanying Notes to the Financial Statements.
83
Mercer Non-US Core Equity FundSchedule of Investments (Continued)
(showing percentage of net assets)
March 31, 2024
| | | |
| | |
| | Banco Bilbao Vizcaya Argentaria SA, ADR | |
| | | |
| | | |
| | | |
| | | |
| | | |
| | | |
| | | |
| | | |
| | | |
| | | |
| | |
| | | |
| | | |
| | | |
| | | |
| | Electrolux AB Class B *(a) | |
| | | |
| | | |
| | | |
| | | |
| | H & M Hennes & Mauritz AB Class B (a) | |
| | | |
| | Industrivarden AB Class A | |
| | Industrivarden AB Class C (a) | |
| | | |
| | | |
| | | |
| | | |
| | Skandinaviska Enskilda Banken AB Class A | |
| | | |
| | | |
| | | |
| | Svenska Cellulosa AB SCA Class B (a) | |
| | Svenska Handelsbanken AB Class A | |
| | | |
| | | |
| | Telefonaktiebolaget LM Ericsson, ADR | |
| | Telefonaktiebolaget LM Ericsson Class B (a) | |
| | | |
| | | |
| | | |
| | | |
| | | |
| | |
| | | |
| | | |
84
See accompanying Notes to the Financial Statements.
Mercer Non-US Core Equity FundSchedule of Investments (Continued)
(showing percentage of net assets)
March 31, 2024
| | | |
| | |
| | | |
| | | |
| | | |
| | | |
| | Chocoladefabriken Lindt & Spruengli AG(a) | |
| | Cie Financiere Richemont SA Class A | |
| | | |
| | | |
| | | |
| | | |
| | | |
| | | |
| | | |
| | | |
| | Logitech International SA(b) | |
| | Logitech International SA(b) | |
| | | |
| | | |
| | | |
| | | |
| | | |
| | | |
| | | |
| | | |
| | Swatch Group AG Bearer Shares (a) | |
| | | |
| | | |
| | | |
| | | |
| | | |
| | Zurich Insurance Group AG | |
| | | |
| | |
| | ASE Technology Holding Co. Ltd. | |
| | Chipbond Technology Corp. | |
| | Compeq Manufacturing Co. Ltd. | |
| | Hon Hai Precision Industry Co. Ltd. | |
| | | |
| | Novatek Microelectronics Corp. | |
| | Sino-American Silicon Products, Inc. | |
| | Taiwan Semiconductor Manufacturing Co. Ltd. | |
| | Taiwan Semiconductor Manufacturing Co. Ltd., ADR | |
| | United Microelectronics Corp. | |
| | | |
| | |
| | Quality Houses PCL Class F | |
See accompanying Notes to the Financial Statements.
85
Mercer Non-US Core Equity FundSchedule of Investments (Continued)
(showing percentage of net assets)
March 31, 2024
| | | |
| | |
| | BIM Birlesik Magazalar AS | |
| | | |
| | Turkiye Garanti Bankasi AS | |
| | | |
| | |
| | | |
| | | |
| | Associated British Foods PLC | |
| | | |
| | B&M European Value Retail SA | |
| | Babcock International Group PLC | |
| | | |
| | | |
| | | |
| | | |
| | | |
| | | |
| | | |
| | | |
| | | |
| | | |
| | British American Tobacco PLC | |
| | | |
| | | |
| | CK Hutchison Holdings Ltd. | |
| | | |
| | Crest Nicholson Holdings PLC | |
| | | |
| | | |
| | | |
| | | |
| | | |
| | | |
| | | |
| | | |
| | | |
| | | |
| | | |
| | | |
| | | |
| | London Stock Exchange Group PLC | |
| | | |
| | Marks & Spencer Group PLC | |
| | | |
| | | |
| | Moneysupermarket.com Group PLC | |
| | | |
| | | |
86
See accompanying Notes to the Financial Statements.
Mercer Non-US Core Equity FundSchedule of Investments (Continued)
(showing percentage of net assets)
March 31, 2024
| | | |
| | United Kingdom — continued |
| | Paragon Banking Group PLC | |
| | | |
| | | |
| | | |
| | | |
| | Rolls-Royce Holdings PLC* | |
| | | |
| | | |
| | Spirax-Sarco Engineering PLC | |
| | | |
| | | |
| | | |
| | | |
| | | |
| | | |
| | | |
| | | |
| | | |
| | | |
| | |
| | Agilent Technologies, Inc. | |
| | | |
| | | |
| | Cadence Design Systems, Inc.* | |
| | | |
| | | |
| | | |
| | | |
| | | |
| | | |
| | | |
| | | |
| | James Hardie Industries PLC, CDI* | |
| | Janus Henderson Group PLC | |
| | | |
| | | |
| | | |
| | | |
| | | |
| | | |
| | | |
| | | |
| | | |
| | | |
| | TOTAL COMMON STOCKS (COST $3,066,424,169) | |
See accompanying Notes to the Financial Statements.
87
Mercer Non-US Core Equity FundSchedule of Investments (Continued)
(showing percentage of net assets)
March 31, 2024
| | | |
| | INVESTMENT COMPANIES — 0.3% |
| | |
| | | |
| | iShares MSCI Eurozone ETF | |
| | Vanguard FTSE Developed Markets ETF | |
| | TOTAL INVESTMENT COMPANIES (COST $11,020,362) | |
| | | |
| | |
| | |
| | Petroleo Brasileiro SA, 8.54% | |
| | |
| | Bayerische Motoren Werke AG, 8.59% | |
| | Henkel AG & Co. KGaA, 2.49% | |
| | Porsche Automobil Holding SE, 5.22% | |
| | | |
| | | |
| | | |
| | | |
| | TOTAL PREFERRED STOCKS (COST $47,096,083) | |
| | | |
| | SHORT-TERM INVESTMENT — 4.8% |
| | Mutual Fund - Securities Lending Collateral — 4.8% |
| | State Street Navigator Securities Lending Government Money Market Portfolio, | |
| | TOTAL SHORT-TERM INVESTMENT (COST $183,426,775) | |
| | TOTAL INVESTMENTS — 100.7%
(Cost $3,307,967,389) | |
| | Other Assets and Liabilities (net) — (0.7)% | |
| | | |
| Notes to Schedule of Investments: |
| Non-income producing security. |
| All or a portion of this security is out on loan. |
| Securities are traded on separate exchanges for the same entity. |
| Level 3 - significant unobservable inputs were used in determining the value of this security in the Fund. |
| Securities fair valued by the Valuation Committee as approved by the Board of Trustees. The total market value of the securities at year end is $209,483 which represents 0.0% of net assets. The aggregate cost of these securities held at March 31, 2024 is $29,569,045. |
88
See accompanying Notes to the Financial Statements.
Mercer Non-US Core Equity FundSchedule of Investments (Continued)
March 31, 2024
| Illiquid securities represent Russian securities impacted by the Russian/Ukraine crisis. The total market value of the securities at year end is $209,483 which represents 0.0% of net assets. The aggregate cost of these securities held at March 31, 2024 is $29,569,045. |
| The rate disclosed is the 7-day net yield as of March 31, 2024. |
| Represents an investment of securities lending cash collateral. |
| Securities exempt from registration under Rule 144A of the Securities Act of 1933. These securities may be resold in transactions exempt from registration, normally to qualified institutional buyers. The total market value of the securities at year end is $37,090,160 which represents 1.0% of net assets. |
Futures Contracts
| | | | Market Value/
Unrealized
Appreciation
(Depreciation) |
| | | | |
| | | | |
|
| | American Depository Receipt |
| | CREST Depository Interest |
| | Certificaten Van Aandelen |
| | Global Depository Receipt |
| | |
| | Real Estate Investment Trust |
| | Swedish Depository Receipt |
See accompanying Notes to the Financial Statements.
89
Mercer Non-US Core Equity FundSchedule of Investments (Continued)
March 31, 2024
Industry Sector Summary (Unaudited) | |
| |
| |
| |
| |
| |
| |
| |
| |
| |
| |
| |
| |
Other Assets and Liabilities (net) | |
| |
90
See accompanying Notes to the Financial Statements.
Mercer Core Fixed Income FundSchedule of Investments
(showing percentage of net assets)
March 31, 2024
| | | |
| | |
| | Asset Backed Securities — 10.3% |
| | ABPCI Direct Lending Fund ABS I Ltd., Series 2020-1A, Class A, 3.20%, due 12/20/30 144A | |
| | Aligned Data Centers Issuer LLC, Series 2021-1A, Class A2, 1.94%, due 08/15/46 144A | |
| | Aligned Data Centers Issuer LLC, Series 2023-2A, Class A2, 6.50%, due 11/16/48 144A | |
| | American Express Credit Account Master Trust, Series 2022-3, Class A, 3.75%, due 08/15/27 | |
| | AmeriCredit Automobile Receivables Trust, Series 2021-2, Class C, 1.01%, due 01/19/27 | |
| | AmeriCredit Automobile Receivables Trust, Series 2021-3, Class C, 1.41%, due 08/18/27 | |
| | AmeriCredit Automobile Receivables Trust, Series 2023-1, Class C, 5.80%, due 12/18/28 | |
| | AmeriCredit Automobile Receivables Trust, Series 2023-2, Class C, 6.00%, due 07/18/29 | |
| | AMSR Trust, Series 2021-SFR1, Class A, 1.95%, due 06/17/38 144A | |
| | AMSR Trust, Series 2021-SFR2, Class A, 1.53%, due 08/17/38 144A | |
| | AMSR Trust, Series 2022-SFR3, Class A, 4.00%, due 10/17/39 144A | |
| | Anchorage Capital Europe CLO 6 DAC, Series 6A, Class AR, 5.62% (3 mo. EURIBOR + 1.75%), due 01/22/38(b) 144A | |
| | Applebee's Funding LLC/IHOP Funding LLC, Series 2023-1A, Class A2, 7.82%, due 03/05/53 144A | |
| | Aqua Finance Trust, Series 2021-A, Class A, 1.54%, due 07/17/46 144A | |
| | Arbys Funding LLC, Series 2020-1A, Class A2, 3.24%, due 07/30/50 144A | |
| | Avis Budget Rental Car Funding AESOP LLC, Series 2024-1A, Class A, 5.36%, due 06/20/30 144A | |
| | Avis Budget Rental Car Funding AESOP LLC, Series 2024-3A, Class A, 5.23%, due 12/20/30 144A | |
| | BA Credit Card Trust, Series 2022-A2, Class A2, 5.00%, due 04/15/28 | |
| | Barings Euro CLO DAC, Series 2015-1A, Class ARR, 4.93% (3 mo. EURIBOR + 0.98%), due 07/25/35(b) 144A | |
| | BNPP AM Euro CLO DAC, Series 2018-1A, Class AR, 4.54% (3 mo. EURIBOR + 0.60%), due 04/15/31(b) 144A | |
| | BRE Grand Islander Timeshare Issuer LLC, Series 2019-A, Class A, 3.28%, due 09/26/33 144A | |
| | Capital One Multi-Asset Execution Trust, Series 2023-A1, Class A, 4.42%, due 05/15/28 | |
| | Carlyle Global Market Strategies Euro CLO Ltd., Series 2014-2A, Class AR1, 4.65% (3 mo. EURIBOR + 0.75%), due 11/15/31(b) 144A | |
| | CarMax Auto Owner Trust, Series 2020-4, Class C, 1.30%, due 08/17/26 | |
| | CarMax Auto Owner Trust, Series 2021-2, Class C, 1.34%, due 02/16/27 | |
| | CarMax Auto Owner Trust, Series 2021-3, Class C, 1.25%, due 05/17/27 | |
| | CarMax Auto Owner Trust, Series 2021-4, Class C, 1.38%, due 07/15/27 | |
| | CarMax Auto Owner Trust, Series 2022-1, Class C, 2.20%, due 11/15/27 | |
| | CarMax Auto Owner Trust, Series 2022-1, Class D, 2.47%, due 07/17/28 | |
| | CARS-DB4 LP, Series 2020-1A, Class B1, 4.17%, due 02/15/50 144A | |
| | CF Hippolyta Issuer LLC, Series 2020-1, Class A1, 1.69%, due 07/15/60 144A | |
| | CF Hippolyta Issuer LLC, Series 2021-1A, Class A1, 1.53%, due 03/15/61 144A | |
| | CIFC Funding Ltd., Series 2014-2RA, Class A1, 6.63% (3 mo. USD Term SOFR + 1.31%), due 04/24/30(b) 144A | |
| | CIFC Funding Ltd., Series 2015-1A, Class ARR, 6.69% (3 mo. USD Term SOFR + 1.37%), due 01/22/31(b) 144A | |
| | Citibank Credit Card Issuance Trust, Series 2018-A7, Class A7, 3.96%, due 10/13/30 | |
| | CLI Funding VI LLC, Series 2020-1A, Class A, 2.08%, due 09/18/45 144A | |
| | CLI Funding VIII LLC, Series 2021-1A, Class A, 1.64%, due 02/18/46 144A | |
| | CLI Funding VIII LLC, Series 2022-1A, Class A, 2.72%, due 01/18/47 144A | |
See accompanying Notes to the Financial Statements.
91
Mercer Core Fixed Income FundSchedule of Investments (Continued)
(showing percentage of net assets)
March 31, 2024
| | | |
| | Asset Backed Securities — continued |
| | Commonbond Student Loan Trust, Series 2017-BGS, Class A1, 2.68%, due 09/25/42 144A | |
| | Crown City CLO I, Series 2020-1A, Class A1AR, 6.77% (3 mo. USD Term SOFR + 1.45%), due 07/20/34(b) 144A | |
| | Crown Point CLO 11 Ltd., Series 2021-11A, Class A, 6.70% (3 mo. USD Term SOFR + 1.38%), due 01/17/34(b) 144A | |
| | CVC Cordatus Loan Fund VII DAC, Series 7A, Class ARR, 4.57% (3 mo. EURIBOR + 0.63%), due 09/15/31(b) 144A | |
| | CyrusOne Data Centers Issuer I LLC, Series 2023-1A, Class A2, 4.30%, due 04/20/48 144A | |
| | DataBank Issuer LLC, Series 2021-1A, Class A2, 2.06%, due 02/27/51 144A | |
| | DB Master Finance LLC, Series 2017-1A, Class A2II, 4.03%, due 11/20/47 144A | |
| | DB Master Finance LLC, Series 2021-1A, Class A2I, 2.05%, due 11/20/51 144A | |
| | Diamond Infrastructure Funding LLC, Series 2021-1A, Class C, 3.48%, due 04/15/49 144A | |
| | Domino's Pizza Master Issuer LLC, Series 2017-1A, Class A23, 4.12%, due 07/25/47 144A | |
| | Domino's Pizza Master Issuer LLC, Series 2021-1A, Class A2I, 2.66%, due 04/25/51 144A | |
| | Driven Brands Funding LLC, Series 2020-2A, Class A2, 3.24%, due 01/20/51 144A | |
| | Driven Brands Funding LLC, Series 2021-1A, Class A2, 2.79%, due 10/20/51 144A | |
| | FirstKey Homes Trust, Series 2020-SFR1, Class A, 1.34%, due 08/17/37 144A | |
| | FirstKey Homes Trust, Series 2020-SFR2, Class A, 1.27%, due 10/19/37 144A | |
| | FirstKey Homes Trust, Series 2021-SFR1, Class A, 1.54%, due 08/17/38 144A | |
| | FirstKey Homes Trust, Series 2021-SFR1, Class D, 2.19%, due 08/17/38 144A | |
| | Five Guys Holdings, Inc., Series 2023-1A, Class A2, 7.55%, due 01/26/54 144A | |
| | Ford Credit Auto Owner Trust, Series 2020-C, Class C, 1.04%, due 05/15/28 | |
| | Ford Credit Auto Owner Trust, Series 2022-A, Class C, 2.14%, due 07/15/29 | |
| | Ford Credit Auto Owner Trust, Series 2022-B, Class A4, 3.93%, due 08/15/27 | |
| | Ford Credit Auto Owner Trust, Series 2023-2, Class A, 5.28%, due 02/15/36 144A | |
| | Ford Credit Auto Owner Trust, Series 2023-B, Class B, 5.56%, due 03/15/29 | |
| | Ford Credit Floorplan Master Owner Trust A, Series 2023-1, Class A1, 4.92%, due 05/15/28 144A | |
| | Generate CLO 2 Ltd., Series 2A, Class AR, 6.73% (3 mo. USD Term SOFR + 1.41%), due 01/22/31(b) 144A | |
| | Generate CLO 4 Ltd., Series 4A, Class A1R, 6.67% (3 mo. USD Term SOFR + 1.35%), due 04/20/32(b) 144A | |
| | GM Financial Consumer Automobile Receivables Trust, Series 2021-1, Class C, 1.04%, due 05/17/27 | |
| | GM Financial Consumer Automobile Receivables Trust, Series 2023-3, Class B, 5.72%, due 01/16/29 | |
| | GM Financial Consumer Automobile Receivables Trust, Series 2023-4, Class B, 6.16%, due 04/16/29 | |
| | GM Financial Consumer Automobile Receivables Trust, Series 2023-4, Class C, 6.41%, due 05/16/29 | |
| | GM Financial Revolving Receivables Trust, Series 2024-1, Class A, 4.98%, due 12/11/36 144A | |
| | GMF Floorplan Owner Revolving Trust, Series 2023-2, Class A, 5.34%, due 06/15/30 144A | |
| | Golub Capital Partners ABS Funding Ltd., Series 2020-1A, Class A2, 3.21%, due 01/22/29 144A | |
| | Golub Capital Partners ABS Funding Ltd., Series 2021-1A, Class A2, 2.77%, due 04/20/29 144A | |
92
See accompanying Notes to the Financial Statements.
Mercer Core Fixed Income FundSchedule of Investments (Continued)
(showing percentage of net assets)
March 31, 2024
| | | |
| | Asset Backed Securities — continued |
| | Grosvenor Place CLO DAC, Series 2022-1A, Class A, 5.95% (3 mo. EURIBOR + 2.00%), due 11/24/35(b) 144A | |
| | HI-FI Music IP Issuer LP, Series 2022-1A, Class A2, 3.94%, due 02/01/62 144A | |
| | Home Equity Asset Trust, Series 2003-8, Class M1, 6.52% (1 mo. USD Term SOFR + | |
| | Invesco Euro CLO I DAC, Series 1A, Class A1R, 4.59% (3 mo. EURIBOR + 0.65%), due 07/15/31(b) 144A | |
| | Jack in the Box Funding LLC, Series 2019-1A, Class A23, 4.97%, due 08/25/49 144A | |
| | Jack in the Box Funding LLC, Series 2022-1A, Class A2I, 3.45%, due 02/26/52 144A | |
| | Kubota Credit Owner Trust, Series 2024-1A, Class A3, 5.19%, due 07/17/28 144A | |
| | Madison Park Euro Funding XIV DAC, Series 14A, Class A1R, 4.74% (3 mo. EURIBOR + 0.80%), due 07/15/32(b) 144A | |
| | Madison Park Funding XXXIII Ltd., Series 2019-33A, Class AR, 6.60% (3 mo. USD Term SOFR + 1.29%), due 10/15/32(b) 144A | |
| | Madison Park Funding XXXVIII Ltd., Series 2021-38A, Class A, 6.70% (3 mo. USD Term SOFR + 1.38%), due 07/17/34(b) 144A | |
| | MetroNet Infrastructure Issuer LLC, Series 2023-1A, Class A2, 6.56%, due 04/20/53 144A | |
| | MidOcean Credit CLO III, Series 2014-3A, Class A1R, 6.70% (3 mo. USD Term SOFR + 1.38%), due 04/21/31(b) 144A | |
| | Morgan Stanley ABS Capital I, Inc. Trust, Series 2003-NC10, Class M1, 6.46% (1 mo. USD Term SOFR + 1.13%), due 10/25/33(b) | |
| | Morgan Stanley ABS Capital I, Inc. Trust, Series 2003-NC7, Class M1, 6.49% (1 mo. USD Term SOFR + 1.16%), due 06/25/33(b) | |
| | Navient Private Education Refi Loan Trust, Series 2019-FA, Class A2, 2.60%, due 08/15/68 144A | |
| | Navient Private Education Refi Loan Trust, Series 2020-HA, Class A, 1.31%, due 01/15/69 144A | |
| | Navient Student Loan Trust, Series 2020-2A, Class A1A, 1.32%, due 08/26/69 144A | |
| | Neighborly Issuer LLC, Series 2021-1A, Class A2, 3.58%, due 04/30/51 144A | |
| | Neighborly Issuer LLC, Series 2022-1A, Class A2, 3.70%, due 01/30/52 144A | |
| | New Century Home Equity Loan Trust, Series 2003-A, Class A, 3.93% (1 mo. USD Term SOFR + 0.83%), due 10/25/33(b) 144A | |
| | New Economy Assets Phase 1 Sponsor LLC, Series 2021-1, Class A1, 1.91%, due 10/20/61 144A | |
| | New Economy Assets Phase 1 Sponsor LLC, Series 2021-1, Class B1, 2.41%, due 10/20/61 144A | |
| | NextGear Floorplan Master Owner Trust, Series 2022-1A, Class A2, 2.80%, due 03/15/27 144A | |
| | NextGear Floorplan Master Owner Trust, Series 2024-1A, Class A2, 5.12%, due 03/15/29 144A | |
| | NRZ Excess Spread-Collateralized Notes, Series 2021-FHT1, Class A, 3.10%, due 07/25/26 144A | |
| | OCP CLO Ltd., Series 2015-9A, Class A1R2, 6.57% (3 mo. USD Term SOFR + 1.25%), due 01/15/33(b) 144A | |
| | OZLM Funding IV Ltd., Series 2013-4A, Class A1R, 6.83% (3 mo. USD Term SOFR + 1.51%), due 10/22/30(b) 144A | |
| | OZLM XI Ltd., Series 2015-11A, Class A1R, 6.83% (3 mo. USD Term SOFR + 1.51%), due 10/30/30(b) 144A | |
| | Park Avenue Institutional Advisers CLO Ltd., Series 2018-1A, Class A1AR, 6.58% (3 mo. USD Term SOFR + 1.26%), due 10/20/31(b) 144A | |
| | PFS Financing Corp., Series 2022-A, Class A, 2.47%, due 02/15/27 144A | |
| | PFS Financing Corp., Series 2024-B, Class A, 4.95%, due 02/15/29 144A | |
See accompanying Notes to the Financial Statements.
93
Mercer Core Fixed Income FundSchedule of Investments (Continued)
(showing percentage of net assets)
March 31, 2024
| | | |
| | Asset Backed Securities — continued |
| | Progress Residential Trust, Series 2020-SFR1, Class A, 1.73%, due 04/17/37 144A | |
| | Progress Residential Trust, Series 2021-SFR2, Class A, 1.55%, due 04/19/38 144A | |
| | Progress Residential Trust, Series 2021-SFR8, Class B, 1.68%, due 10/17/38 144A | |
| | Progress Residential Trust, Series 2022-SFR2, Class A, 2.95%, due 04/17/27 144A | |
| | Renaissance Home Equity Loan Trust, Series 2005-2, Class AF4, 5.43%, due 08/25/35(c) | |
| | Retained Vantage Data Centers Issuer LLC, Series 2023-1A, Class A2A, 5.00%, due 09/15/48 144A | |
| | Romark CLO II Ltd., Series 2018-2A, Class A1, 6.76% (3 mo. USD Term SOFR + 1.44%), due 07/25/31(b) 144A | |
| | Santander Drive Auto Receivables Trust, Series 2021-2, Class D, 1.35%, due 07/15/27 | |
| | Santander Drive Auto Receivables Trust, Series 2022-1, Class C, 2.56%, due 04/17/28 | |
| | Santander Drive Auto Receivables Trust, Series 2022-5, Class C, 4.74%, due 10/16/28 | |
| | Santander Drive Auto Receivables Trust, Series 2023-1, Class C, 5.09%, due 05/15/30 | |
| | Santander Drive Auto Receivables Trust, Series 2023-3, Class C, 5.77%, due 11/15/30 | |
| | Santander Drive Auto Receivables Trust, Series 2023-4, Class C, 6.04%, due 12/15/31 | |
| | Santander Drive Auto Receivables Trust, Series 2023-5, Class C, 6.43%, due 02/18/31 | |
| | Santander Drive Auto Receivables Trust, Series 2023-6, Class B, 5.98%, due 04/16/29 | |
| | Santander Drive Auto Receivables Trust, Series 2023-6, Class C, 6.40%, due 03/17/31 | |
| | Santander Drive Auto Receivables Trust, Series 2024-1, Class C, 5.45%, due 03/15/30 | |
| | SBA Small Business Investment Cos., Series 2024-10A, Class 1, 5.04%, due 03/10/34 | |
| | SERVPRO Master Issuer LLC, Series 2024-1A, Class A2, 6.17%, due 01/25/54 144A | |
| | Sesac Finance LLC, Series 2019-1, Class A2, 5.22%, due 07/25/49 144A | |
| | SMB Private Education Loan Trust, Series 2021-A, Class APT2, 1.07%, due 01/15/53 144A | |
| | SMB Private Education Loan Trust, Series 2024-A, Class A1A, 5.24%, due 03/15/56 144A | |
| | Sonic Capital LLC, Series 2020-1A, Class A2I, 3.85%, due 01/20/50 144A | |
| | Sonic Capital LLC, Series 2021-1A, Class A2I, 2.19%, due 08/20/51 144A | |
| | Stack Infrastructure Issuer LLC, Series 2021-1A, Class A2, 1.88%, due 03/26/46 144A | |
| | Sunbird Engine Finance LLC, Series 2020-1A, Class A, 3.67%, due 02/15/45 144A | |
| | Taco Bell Funding LLC, Series 2021-1A, Class A2I, 1.95%, due 08/25/51 144A | |
| | Taco Bell Funding LLC, Series 2021-1A, Class A2II, 2.29%, due 08/25/51 144A | |
| | TCW CLO Ltd., Series 2019-2A, Class A1R, 6.60% (3 mo. USD Term SOFR + 1.28%), due 10/20/32(b) 144A | |
| | TIF Funding II LLC, Series 2021-1A, Class A, 1.65%, due 02/20/46 144A | |
| | Tikehau U.S. CLO IV Ltd., Series 2023-1A, Class A1, 7.51% (3 mo. USD Term SOFR + 2.20%), due 07/15/34(b) 144A | |
| | Toyota Auto Receivables Owner Trust, Series 2023-A, Class A3, 4.63%, due 09/15/27 | |
| | Tricon American Homes Trust, Series 2019-SFR1, Class A, 2.75%, due 03/17/38 144A | |
| | Tricon Residential Trust, Series 2022-SFR2, Class A, 4.85%, due 07/17/40 144A | |
| | Tricon Residential Trust, Series 2023-SFR2, Class A, 5.00%, due 12/17/40 144A | |
| | Trimaran Cavu Ltd., Series 2021-1A, Class A, 6.79% (3 mo. USD Term SOFR + 1.47%), due 04/23/32(b) 144A | |
| | Triton Container Finance VIII LLC, Series 2020-1A, Class A, 2.11%, due 09/20/45 144A | |
| | Triton Container Finance VIII LLC, Series 2021-1A, Class A, 1.86%, due 03/20/46 144A | |
| | U.S. Small Business Administration, Series 2013-20H, Class 1, 3.16%, due 08/01/33 | |
| | U.S. Small Business Administration, Series 2013-20L, Class 1, 3.38%, due 12/01/33 | |
| | U.S. Small Business Administration, Series 2014-20C, Class 1, 3.21%, due 03/01/34 | |
| | U.S. Small Business Administration, Series 2014-20D, Class 1, 3.11%, due 04/01/34 | |
94
See accompanying Notes to the Financial Statements.
Mercer Core Fixed Income FundSchedule of Investments (Continued)
(showing percentage of net assets)
March 31, 2024
| | | |
| | Asset Backed Securities — continued |
| | U.S. Small Business Administration, Series 2014-20I, Class 1, 2.92%, due 09/01/34 | |
| | U.S. Small Business Administration, Series 2019-25F, Class 1, 2.77%, due 06/01/44 | |
| | U.S. Small Business Administration, Series 2020-25D, Class 1, 1.77%, due 04/01/45 | |
| | U.S. Small Business Administration, Series 2022-25D, Class 1, 3.50%, due 04/01/47 | |
| | U.S. Small Business Administration, Series 2022-25E, Class 1, 3.94%, due 05/01/47 | |
| | U.S. Small Business Administration, Series 2022-25G, Class 1, 3.93%, due 07/01/47 | |
| | U.S. Small Business Administration, Series 2022-25J, Class 1, 5.04%, due 10/01/47 | |
| | U.S. Small Business Administration, Series 2023-25D, Class 1, 4.48%, due 04/01/48 | |
| | U.S. Small Business Administration, Series 2023-25E, Class 1, 4.62%, due 05/01/48 | |
| | U.S. Small Business Administration, Series 2023-25F, Class 1, 4.93%, due 06/01/48 | |
| | U.S. Small Business Administration, Series 2023-25J, Class 1, 5.82%, due 10/01/48 | |
| | U.S. Small Business Administration, Series 2023-25L, Class 1, 5.28%, due 12/01/48 | |
| | Vantage Data Centers Issuer LLC, Series 2020-1A, Class A2, 1.65%, due 09/15/45 144A | |
| | Vantage Data Centers LLC, Series 2020-2A, Class A2, 1.99%, due 09/15/45 144A | |
| | Venture XIX CLO Ltd., Series 2014-19A, Class ARR, 6.84% (3 mo. USD Term SOFR + 1.52%), due 01/15/32(b) 144A | |
| | Verizon Master Trust, Series 2021-2, Class A, 0.99%, due 04/20/28 | |
| | VR Funding LLC, Series 2020-1A, Class A, 2.79%, due 11/15/50 144A | |
| | Wellfleet CLO Ltd., Series 2018-3A, Class A1A, 6.83% (3 mo. USD Term SOFR + 1.51%), due 01/20/32(b) 144A | |
| | Wendy's Funding LLC, Series 2019-1A, Class A2I, 3.78%, due 06/15/49 144A | |
| | Wendy's Funding LLC, Series 2021-1A, Class A2I, 2.37%, due 06/15/51 144A | |
| | Willis Engine Structured Trust V, Series 2020-A, Class A, 3.23%, due 03/15/45 144A | |
| | World Omni Select Auto Trust, Series 2021-A, Class C, 1.09%, due 11/15/27 | |
| | Zaxby's Funding LLC, Series 2021-1A, Class A2, 3.24%, due 07/30/51 144A | |
| | | |
| | |
| | 1011778 BC ULC/New Red Finance, Inc., 3.88%, due 01/15/28 144A | |
| | AAR Escrow Issuer LLC, 6.75%, due 03/15/29 144A | |
| | AbbVie, Inc., 3.20%, due 11/21/29 | |
| | AbbVie, Inc., 3.80%, due 03/15/25 | |
| | AbbVie, Inc., 4.05%, due 11/21/39 | |
| | AbbVie, Inc., 4.55%, due 03/15/35 | |
| | AbbVie, Inc., 4.70%, due 05/14/45 | |
| | AbbVie, Inc., 4.75%, due 03/15/45 | |
| | Abu Dhabi National Energy Co. PJSC, 2.00%, due 04/29/28 144A | |
| | AdaptHealth LLC, 5.13%, due 03/01/30(d) 144A | |
| | Advocate Health & Hospitals Corp., 2.21%, due 06/15/30 | |
| | AECOM, 5.13%, due 03/15/27 | |
| | AEP Texas, Inc., 3.80%, due 10/01/47 | |
| | AEP Transmission Co. LLC, 3.80%, due 06/15/49 | |
| | AerCap Ireland Capital DAC/AerCap Global Aviation Trust, 2.45%, due 10/29/26 | |
| | AerCap Ireland Capital DAC/AerCap Global Aviation Trust, 3.00%, due 10/29/28 | |
| | AerCap Ireland Capital DAC/AerCap Global Aviation Trust, 4.45%, due 04/03/26 | |
| | AerCap Ireland Capital DAC/AerCap Global Aviation Trust, 5.10%, due 01/19/29 | |
| | AES Panama Generation Holdings SRL, 4.38%, due 05/31/30 144A | |
| | Aetna, Inc., 4.75%, due 03/15/44 | |
| | Air Canada Pass-Through Trust, 3.60%, due 09/15/28 144A | |
See accompanying Notes to the Financial Statements.
95
Mercer Core Fixed Income FundSchedule of Investments (Continued)
(showing percentage of net assets)
March 31, 2024
| | | |
| | Corporate Debt — continued |
| | Air Canada Pass-Through Trust, 3.70%, due 07/15/27 144A | |
| | Air Canada Pass-Through Trust, 4.13%, due 11/15/26 144A | |
| | Air Canada Pass-Through Trust, 10.50%, due 07/15/26 144A | |
| | Air Lease Corp., 2.10%, due 09/01/28 | |
| | Air Lease Corp., 3.63%, due 12/01/27 | |
| | Aker BP ASA, 2.00%, due 07/15/26 144A | |
| | Aker BP ASA, 3.10%, due 07/15/31 144A | |
| | Aker BP ASA, 3.75%, due 01/15/30 144A | |
| | Aker BP ASA, 4.00%, due 01/15/31 144A | |
| | Alaska Airlines Pass-Through Trust, 8.00%, due 02/15/27 144A | |
| | Albertsons Cos., Inc./Safeway, Inc./New Albertsons LP/Albertsons LLC, 3.50%, due 03/15/29 144A | |
| | Albion Financing 1 SARL/Aggreko Holdings, Inc., 6.13%, due 10/15/26 144A | |
| | Alcoa Nederland Holding BV, 7.13%, due 03/15/31 144A | |
| | Alexandria Real Estate Equities, Inc., 2.00%, due 05/18/32 | |
| | Alfa Desarrollo SpA, 4.55%, due 09/27/51 144A | |
| | Algonquin Power & Utilities Corp., 5.37%, due 06/15/26(c) | |
| | Allied Universal Holdco LLC/Allied Universal Finance Corp., 6.00%, due 06/01/29(d) 144A | |
| | Ally Financial, Inc., 6.99% (SOFR + 3.26%), due 06/13/29(b) | |
| | Ally Financial, Inc., 7.10%, due 11/15/27(d) | |
| | Altria Group, Inc., 3.40%, due 05/06/30 | |
| | Amazon.com, Inc., 4.10%, due 04/13/62 | |
| | Amer Sports Co., 6.75%, due 02/16/31 144A | |
| | Ameren Illinois Co., 4.95%, due 06/01/33 | |
| | American Airlines Pass-Through Trust, 3.70%, due 04/01/28 | |
| | American Airlines Pass-Through Trust, 2.88%, due 01/11/36 | |
| | American Airlines Pass-Through Trust, 3.15%, due 08/15/33 | |
| | American Airlines Pass-Through Trust, 3.25%, due 04/15/30 | |
| | American Airlines Pass-Through Trust, 3.38%, due 11/01/28 | |
| | American Airlines Pass-Through Trust, 3.50%, due 08/15/33 | |
| | American Airlines Pass-Through Trust, 3.58%, due 07/15/29 | |
| | American Airlines Pass-Through Trust, 3.60%, due 04/15/31 | |
| | American Airlines Pass-Through Trust, 3.65%, due 08/15/30 | |
| | American Airlines Pass-Through Trust, 3.85%, due 08/15/29 | |
| | American Airlines Pass-Through Trust, 3.95%, due 01/11/32 | |
| | American Airlines Pass-Through Trust, 4.00%, due 08/15/30 | |
| | American Airlines Pass-Through Trust, 4.10%, due 07/15/29 | |
| | American Airlines, Inc., 7.25%, due 02/15/28(d) 144A | |
| | American Electric Power Co., Inc., 5.63%, due 03/01/33(d) | |
| | American Homes 4 Rent LP, 4.25%, due 02/15/28 | |
| | American Tower Corp., 3.55%, due 07/15/27 | |
| | American Tower Corp., 3.80%, due 08/15/29 | |
| | American Tower Corp., 5.20%, due 02/15/29 | |
| | American Tower Trust #1, 5.49%, due 03/15/28 144A | |
| | AmeriGas Partners LP/AmeriGas Finance Corp., 5.88%, due 08/20/26 | |
| | Amgen, Inc., 2.80%, due 08/15/41 | |
| | Amgen, Inc., 5.25%, due 03/02/30 | |
| | Amgen, Inc., 5.25%, due 03/02/33 | |
96
See accompanying Notes to the Financial Statements.
Mercer Core Fixed Income FundSchedule of Investments (Continued)
(showing percentage of net assets)
March 31, 2024
| | | |
| | Corporate Debt — continued |
| | AmWINS Group, Inc., 6.38%, due 02/15/29 144A | |
| | Anglo American Capital PLC, 4.75%, due 04/10/27 144A | |
| | Anheuser-Busch Cos. LLC/Anheuser-Busch InBev Worldwide, Inc., 4.90%, due 02/01/46 | |
| | Anheuser-Busch InBev Worldwide, Inc., 4.60%, due 04/15/48 | |
| | Antero Midstream Partners LP/Antero Midstream Finance Corp., 5.38%, due 06/15/29 144A | |
| | Antero Midstream Partners LP/Antero Midstream Finance Corp., 6.63%, due 02/01/32 144A | |
| | Antero Midstream Partners LP/Antero Midstream Finance Corp., 7.88%, due 05/15/26 144A | |
| | Antero Resources Corp., 5.38%, due 03/01/30 144A | |
| | Apple, Inc., 3.85%, due 08/04/46 | |
| | Apple, Inc., 4.10%, due 08/08/62(d) | |
| | AptarGroup, Inc., 3.60%, due 03/15/32 | |
| | Aptiv PLC/Aptiv Corp., 3.25%, due 03/01/32(d) | |
| | APX Group, Inc., 5.75%, due 07/15/29 144A | |
| | Aquarion Co., 4.00%, due 08/15/24 144A | |
| | ARES Capital Corp., 2.15%, due 07/15/26 | |
| | ARES Capital Corp., 2.88%, due 06/15/28 | |
| | ARES Capital Corp., 3.25%, due 07/15/25 | |
| | ARES Capital Corp., 5.88%, due 03/01/29 | |
| | Arsenal AIC Parent LLC, 8.00%, due 10/01/30 144A | |
| | Artera Services LLC, 8.50%, due 02/15/31 144A | |
| | Asbury Automotive Group, Inc., 4.63%, due 11/15/29 144A | |
| | Asbury Automotive Group, Inc., 4.75%, due 03/01/30 | |
| | Ascension Health, 2.53%, due 11/15/29 | |
| | Ascension Health, 3.11%, due 11/15/39 | |
| | Ascent Resources Utica Holdings LLC/ARU Finance Corp., 5.88%, due 06/30/29 144A | |
| | Ascent Resources Utica Holdings LLC/ARU Finance Corp., 8.25%, due 12/31/28 144A | |
| | Ashtead Capital, Inc., 2.45%, due 08/12/31(d) 144A | |
| | Ashtead Capital, Inc., 4.25%, due 11/01/29 144A | |
| | Ashtead Capital, Inc., 4.38%, due 08/15/27 144A | |
| | Ashtead Capital, Inc., 5.55%, due 05/30/33 144A | |
| | Ashtead Capital, Inc., 5.80%, due 04/15/34 144A | |
| | Ashtead Capital, Inc., 5.95%, due 10/15/33 144A | |
| | AT&T, Inc., 2.30%, due 06/01/27 | |
| | AT&T, Inc., 2.55%, due 12/01/33 | |
| | AT&T, Inc., 3.50%, due 06/01/41 | |
| | AT&T, Inc., 3.65%, due 09/15/59 | |
| | AT&T, Inc., 4.50%, due 05/15/35 | |
| | AT&T, Inc., 5.40%, due 02/15/34 | |
| | AT&T, Inc., 6.76% (3 mo. USD Term SOFR + 1.44%), due 06/12/24(b) | |
| | Athene Holding Ltd., 3.50%, due 01/15/31 | |
| | Atlantica Transmision Sur SA, 6.88%, due 04/30/43 144A | |
| | Autodesk, Inc., 2.85%, due 01/15/30 | |
| | AutoNation, Inc., 4.75%, due 06/01/30 | |
| | Aviation Capital Group LLC, 6.38%, due 07/15/30(d) 144A | |
| | Bacardi Ltd., 4.70%, due 05/15/28 144A | |
| | BAE Systems Holdings, Inc., 3.85%, due 12/15/25 144A | |
| | BAE Systems PLC, 3.40%, due 04/15/30 144A | |
See accompanying Notes to the Financial Statements.
97
Mercer Core Fixed Income FundSchedule of Investments (Continued)
(showing percentage of net assets)
March 31, 2024
| | | |
| | Corporate Debt — continued |
| | BAE Systems PLC, 5.13%, due 03/26/29 144A | |
| | Ball Corp., 3.13%, due 09/15/31(d) | |
| | Ball Corp., 6.00%, due 06/15/29(d) | |
| | Banco Santander SA, 1.85%, due 03/25/26 | |
| | Banco Santander SA, 4.38%, due 04/12/28 | |
| | Bank of America Corp., 1.66% (SOFR + 0.91%), due 03/11/27(b) | |
| | Bank of America Corp., 2.09% (SOFR + 1.06%), due 06/14/29(b) | |
| | Bank of America Corp., 2.30% (SOFR + 1.22%), due 07/21/32(b) | |
| | Bank of America Corp., 2.50% (3 mo. USD Term SOFR + 1.25%), due 02/13/31(b) | |
| | Bank of America Corp., 2.59% (SOFR + 2.15%), due 04/29/31(b) | |
| | Bank of America Corp., 2.69% (SOFR + 1.32%), due 04/22/32(b) | |
| | Bank of America Corp., 2.88% (3 mo. USD Term SOFR + 1.45%), due 10/22/30(b) | |
| | Bank of America Corp., 3.59% (3 mo. USD Term SOFR + 1.63%), due 07/21/28(b) | |
| | Bank of America Corp., 3.85% (5 yr. CMT + 2.00%), due 03/08/37(b) | |
| | Bank of America Corp., 3.97% (3 mo. USD Term SOFR + 1.33%), due 03/05/29(b) | |
| | Bank of America Corp., 4.27% (3 mo. USD Term SOFR + 1.57%), due 07/23/29(b) | |
| | Bank of America Corp., 4.57% (SOFR + 1.83%), due 04/27/33(b) | |
| | Bank of America Corp., 4.95% (SOFR + 2.04%), due 07/22/28(b) | |
| | Bank of America Corp., 5.13% (3 mo. USD Term SOFR + 3.55%)(b)(e) | |
| | Bank of America Corp., 6.30% (3 mo. USD Term SOFR + 4.81%)(b)(d)(e) | |
| | Bank of Montreal, 7.70% (5 yr. CMT + 3.45%), due 05/26/84(b) | |
| | Bank of New York Mellon Corp., 4.98% (SOFR + 1.09%), due 03/14/30(b) | |
| | Barclays PLC, 3.93% (3 mo. USD LIBOR + 1.61%), due 05/07/25(b) | |
| | Barclays PLC, 4.38% (5 yr. CMT + 3.41%)(b)(e) | |
| | Barclays PLC, 4.97% (3 mo. USD LIBOR + 1.90%), due 05/16/29(b) | |
| | Barclays PLC, 6.49% (SOFR + 2.22%), due 09/13/29(b) | |
| | Barclays PLC, 8.00% (5 yr. CMT + 5.43%)(b)(e) | |
| | BAT Capital Corp., 3.56%, due 08/15/27 | |
| | BAT Capital Corp., 6.34%, due 08/02/30 | |
| | Beacon Roofing Supply, Inc., 4.13%, due 05/15/29 144A | |
| | Berkshire Hathaway Energy Co., 1.65%, due 05/15/31 | |
| | Berkshire Hathaway Energy Co., 5.95%, due 05/15/37 | |
| | Berkshire Hathaway Energy Co., 6.13%, due 04/01/36 | |
| | BHP Billiton Finance USA Ltd., 5.25%, due 09/08/30 | |
| | BlackRock Funding, Inc., 5.00%, due 03/14/34 | |
| | Blackstone Holdings Finance Co. LLC, 1.63%, due 08/05/28 144A | |
| | Blackstone Holdings Finance Co. LLC, 2.80%, due 09/30/50 144A | |
| | Blackstone Holdings Finance Co. LLC, 3.15%, due 10/02/27 144A | |
| | Blackstone Private Credit Fund, 3.25%, due 03/15/27 | |
| | Blackstone Private Credit Fund, 4.00%, due 01/15/29(d) | |
| | Blackstone Private Credit Fund, 7.30%, due 11/27/28(d) 144A | |
| | Block, Inc., 3.50%, due 06/01/31(d) | |
| | BlueLinx Holdings, Inc., 6.00%, due 11/15/29 144A | |
| | BNP Paribas SA, 1.68% (SOFR + 0.91%), due 06/30/27(b) 144A | |
| | BNP Paribas SA, 2.16% (SOFR + 1.22%), due 09/15/29(b) 144A | |
| | BNP Paribas SA, 2.22% (SOFR + 2.07%), due 06/09/26(b) 144A | |
| | BNP Paribas SA, 3.13% (SOFR + 1.56%), due 01/20/33(b) 144A | |
| | BNP Paribas SA, 5.50% (SOFR + 1.59%), due 05/20/30(b) 144A | |
| | BNP Paribas SA, 9.25% (5 yr. CMT + 4.97%)(b)(e) 144A | |
98
See accompanying Notes to the Financial Statements.
Mercer Core Fixed Income FundSchedule of Investments (Continued)
(showing percentage of net assets)
March 31, 2024
| | | |
| | Corporate Debt — continued |
| | BOC Aviation USA Corp., 1.63%, due 04/29/24 144A | |
| | Boeing Co., 2.20%, due 02/04/26 | |
| | Boeing Co., 3.60%, due 05/01/34(d) | |
| | Boeing Co., 3.90%, due 05/01/49 | |
| | Boeing Co., 3.95%, due 08/01/59 | |
| | Booking Holdings, Inc., 4.63%, due 04/13/30 | |
| | BPCE SA, 5.72% (1 yr. CMT + 1.96%), due 01/18/30(b)(d) 144A | |
| | Braskem Idesa SAPI, 6.99%, due 02/20/32(d) 144A | |
| | Braskem Netherlands Finance BV, 4.50%, due 01/31/30 144A | |
| | British Airways Pass-Through Trust, 4.13%, due 03/20/33 144A | |
| | British Airways Pass-Through Trust, 4.25%, due 05/15/34 144A | |
| | British Airways Pass-Through Trust, 8.38%, due 11/15/28 144A | |
| | Brixmor Operating Partnership LP, 2.50%, due 08/16/31(d) | |
| | Broadcom, Inc., 3.14%, due 11/15/35 144A | |
| | Broadcom, Inc., 3.19%, due 11/15/36 144A | |
| | Broadcom, Inc., 3.42%, due 04/15/33 144A | |
| | Broadcom, Inc., 4.11%, due 09/15/28(d) | |
| | Broadcom, Inc., 4.75%, due 04/15/29 | |
| | Brookfield Finance, Inc., 2.72%, due 04/15/31 | |
| | Brookfield Residential Properties, Inc./Brookfield Residential U.S. LLC, 5.00%, due 06/15/29 144A | |
| | Brunswick Corp., 5.85%, due 03/18/29(d) | |
| | Builders FirstSource, Inc., 4.25%, due 02/01/32 144A | |
| | Builders FirstSource, Inc., 6.38%, due 06/15/32 144A | |
| | Builders FirstSource, Inc., 6.38%, due 03/01/34 144A | |
| | Bunge Ltd. Finance Corp., 2.75%, due 05/14/31(d) | |
| | C&W Senior Finance Ltd., 6.88%, due 09/15/27 144A | |
| | Caesars Entertainment, Inc., 6.50%, due 02/15/32 144A | |
| | Caesars Entertainment, Inc., 7.00%, due 02/15/30 144A | |
| | CaixaBank SA, 5.67% (SOFR + 1.78%), due 03/15/30(b) 144A | |
| | Calpine Corp., 3.75%, due 03/01/31 144A | |
| | Canadian Pacific Railway Co., 6.13%, due 09/15/15(f) | |
| | Capital One Financial Corp., 4.93% (SOFR + 2.06%), due 05/10/28(b) | |
| | Carrier Global Corp., 5.90%, due 03/15/34 | |
| | CCM Merger, Inc., 6.38%, due 05/01/26(d) 144A | |
| | CCO Holdings LLC/CCO Holdings Capital Corp., 5.38%, due 06/01/29 144A | |
| | CDW LLC/CDW Finance Corp., 3.25%, due 02/15/29 | |
| | CDW LLC/CDW Finance Corp., 5.50%, due 12/01/24 | |
| | Celulosa Arauco y Constitucion SA, 3.88%, due 11/02/27 | |
| | Cemex SAB de CV, 3.88%, due 07/11/31(d) 144A | |
| | Cemex SAB de CV, 5.20%, due 09/17/30 144A | |
| | Cencora, Inc., 2.80%, due 05/15/30 | |
| | Cenovus Energy, Inc., 3.75%, due 02/15/52(d) | |
| | Cenovus Energy, Inc., 5.40%, due 06/15/47 | |
| | Centene Corp., 2.45%, due 07/15/28 | |
| | Centene Corp., 3.00%, due 10/15/30 | |
| | Centene Corp., 3.38%, due 02/15/30 | |
| | CenterPoint Energy, Inc., 3.70%, due 09/01/49 | |
| | Century Communities, Inc., 3.88%, due 08/15/29 144A | |
See accompanying Notes to the Financial Statements.
99
Mercer Core Fixed Income FundSchedule of Investments (Continued)
(showing percentage of net assets)
March 31, 2024
| | | |
| | Corporate Debt — continued |
| | Charles Schwab Corp., 5.64% (SOFR + 2.21%), due 05/19/29(b) | |
| | Charles Schwab Corp., 6.20% (SOFR + 1.88%), due 11/17/29(b) | |
| | Charter Communications Operating LLC/Charter Communications Operating Capital, | |
| | Charter Communications Operating LLC/Charter Communications Operating Capital, 2.80%, due 04/01/31 | |
| | Charter Communications Operating LLC/Charter Communications Operating Capital, 4.20%, due 03/15/28 | |
| | Charter Communications Operating LLC/Charter Communications Operating Capital, 4.80%, due 03/01/50 | |
| | Charter Communications Operating LLC/Charter Communications Operating Capital, 5.75%, due 04/01/48 | |
| | Charter Communications Operating LLC/Charter Communications Operating Capital, 6.38%, due 10/23/35 | |
| | Charter Communications Operating LLC/Charter Communications Operating Capital, 6.48%, due 10/23/45 | |
| | Cheniere Energy Partners LP, 4.00%, due 03/01/31 | |
| | Cheniere Energy Partners LP, 4.50%, due 10/01/29 | |
| | Cheniere Energy, Inc., 5.65%, due 04/15/34 144A | |
| | Chevron Corp., 2.00%, due 05/11/27(d) | |
| | Cigna Group, 3.40%, due 03/01/27 | |
| | CIMIC Finance USA Pty. Ltd., 7.00%, due 03/25/34(d) 144A | |
| | Citigroup, Inc., 2.56% (SOFR + 1.17%), due 05/01/32(b) | |
| | Citigroup, Inc., 3.20%, due 10/21/26 | |
| | Citigroup, Inc., 3.40%, due 05/01/26 | |
| | Citigroup, Inc., 3.52% (3 mo. USD Term SOFR + 1.41%), due 10/27/28(b) | |
| | Citigroup, Inc., 3.67% (3 mo. USD Term SOFR + 1.65%), due 07/24/28(b) | |
| | Citigroup, Inc., 3.89% (3 mo. USD Term SOFR + 1.82%), due 01/10/28(b) | |
| | Citigroup, Inc., 3.98% (3 mo. USD Term SOFR + 1.60%), due 03/20/30(b) | |
| | Citigroup, Inc., 4.40%, due 06/10/25 | |
| | Citigroup, Inc., 4.41% (SOFR + 3.91%), due 03/31/31(b) | |
| | Citigroup, Inc., 4.60%, due 03/09/26 | |
| | Citigroup, Inc., 4.70% (SOFR + 3.23%)(b)(e) | |
| | Citigroup, Inc., 5.17% (SOFR + 1.36%), due 02/13/30(b) | |
| | Citigroup, Inc., 6.17% (SOFR + 2.66%), due 05/25/34(b) | |
| | Citigroup, Inc., 6.25% (3 mo. USD Term SOFR + 4.78%)(b)(e) | |
| | Citizens Financial Group, Inc., 3.25%, due 04/30/30 | |
| | Civitas Resources, Inc., 8.63%, due 11/01/30 144A | |
| | CNA Financial Corp., 2.05%, due 08/15/30 | |
| | CNO Financial Group, Inc., 5.25%, due 05/30/29 | |
| | Columbia Pipelines Holding Co. LLC, 5.68%, due 01/15/34 144A | |
| | Columbia Pipelines Operating Co. LLC, 5.93%, due 08/15/30 144A | |
| | Columbia Pipelines Operating Co. LLC, 6.04%, due 11/15/33 144A | |
| | Comcast Corp., 2.89%, due 11/01/51 | |
| | Comcast Corp., 3.40%, due 04/01/30 | |
| | Comcast Corp., 3.97%, due 11/01/47 | |
| | Comcast Corp., 6.50%, due 11/15/35 | |
| | Comerica, Inc., 5.98% (SOFR + 2.16%), due 01/30/30(b) | |
| | Comision Federal de Electricidad, 4.69%, due 05/15/29 144A | |
| | CommonSpirit Health, 2.76%, due 10/01/24 | |
100
See accompanying Notes to the Financial Statements.
Mercer Core Fixed Income FundSchedule of Investments (Continued)
(showing percentage of net assets)
March 31, 2024
| | | |
| | Corporate Debt — continued |
| | CommonSpirit Health, 5.32%, due 12/01/34 | |
| | Commonwealth Edison Co., 4.00%, due 03/01/48 | |
| | Concentrix Corp., 6.60%, due 08/02/28(d) | |
| | Connect Finco SARL/Connect U.S. Finco LLC, 6.75%, due 10/01/26 144A | |
| | Consensus Cloud Solutions, Inc., 6.50%, due 10/15/28 144A | |
| | Consolidated Edison Co. of New York, Inc., 4.30%, due 12/01/56 | |
| | Consolidated Edison Co. of New York, Inc., 4.50%, due 12/01/45 | |
| | Constellation Brands, Inc., 2.25%, due 08/01/31 | |
| | Constellation Energy Generation LLC, 6.13%, due 01/15/34(d) | |
| | Constellation Energy Generation LLC, 6.50%, due 10/01/53 | |
| | Constellation Software, Inc., 5.16%, due 02/16/29 144A | |
| | Continental Resources, Inc., 2.88%, due 04/01/32 144A | |
| | Continental Resources, Inc., 4.90%, due 06/01/44 | |
| | Continental Resources, Inc., 5.75%, due 01/15/31 144A | |
| | Corebridge Financial, Inc., 6.88% (5 yr. CMT + 3.85%), due 12/15/52(b) | |
| | Corp. Andina de Fomento, 5.00%, due 01/24/29 | |
| | Coruripe Netherlands BV, 10.00%, due 02/10/27 144A | |
| | CoStar Group, Inc., 2.80%, due 07/15/30 144A | |
| | Cox Communications, Inc., 2.60%, due 06/15/31 144A | |
| | Cox Communications, Inc., 3.35%, due 09/15/26 144A | |
| | Credit Agricole SA, 3.25%, due 01/14/30 144A | |
| | Credit Agricole SA, 6.32% (SOFR + 1.86%), due 10/03/29(b) 144A | |
| | Credit Suisse AG, 7.95%, due 01/09/25 | |
| | CSC Holdings LLC, 3.38%, due 02/15/31 144A | |
| | CVS Health Corp., 3.75%, due 04/01/30 | |
| | CVS Health Corp., 4.78%, due 03/25/38 | |
| | CVS Health Corp., 5.05%, due 03/25/48 | |
| | CVS Health Corp., 5.13%, due 07/20/45 | |
| | CVS Health Corp., 5.25%, due 01/30/31 | |
| | CVS Pass-Through Trust, 5.77%, due 01/10/33 144A | |
| | CVS Pass-Through Trust, 6.94%, due 01/10/30 | |
| | CVS Pass-Through Trust, 7.51%, due 01/10/32 144A | |
| | Dana, Inc., 4.50%, due 02/15/32(d) | |
| | Danske Bank AS, 6.26% (1 yr. CMT + 1.18%), due 09/22/26(b) 144A | |
| | DaVita, Inc., 3.75%, due 02/15/31 144A | |
| | DaVita, Inc., 4.63%, due 06/01/30 144A | |
| | Dealer Tire LLC/DT Issuer LLC, 8.00%, due 02/01/28 144A | |
| | Dell International LLC/EMC Corp., 5.30%, due 10/01/29 | |
| | Dell International LLC/EMC Corp., 5.40%, due 04/15/34 | |
| | Delta Air Lines Pass-Through Trust, 2.00%, due 12/10/29 | |
| | Delta Air Lines, Inc., 4.38%, due 04/19/28(d) | |
| | Delta Air Lines, Inc./SkyMiles IP Ltd., 4.75%, due 10/20/28 144A | |
| | Deutsche Bank AG, 3.74% (SOFR + 2.26%), due 01/07/33(b) | |
| | Deutsche Bank AG, 5.71% (SOFR + 1.59%), due 02/08/28(b) | |
| | Deutsche Bank AG, 6.82% (SOFR + 2.51%), due 11/20/29(b) | |
| | Diamondback Energy, Inc., 3.25%, due 12/01/26 | |
| | Discover Financial Services, 4.10%, due 02/09/27 | |
| | Dominion Energy, Inc., 2.85%, due 08/15/26 | |
| | Dominion Energy, Inc., 3.38%, due 04/01/30 | |
See accompanying Notes to the Financial Statements.
101
Mercer Core Fixed Income FundSchedule of Investments (Continued)
(showing percentage of net assets)
March 31, 2024
| | | |
| | Corporate Debt — continued |
| | DP World Ltd., 2.38%, due 09/25/26 144A | |
| | DTE Electric Co., 2.25%, due 03/01/30 | |
| | DTE Electric Securitization Funding I LLC, 2.64%, due 12/01/27 | |
| | DTE Energy Co., 1.05%, due 06/01/25 | |
| | Duke Energy Carolinas LLC, 3.95%, due 03/15/48 | |
| | Duke Energy Corp., 2.45%, due 06/01/30 | |
| | Duke Energy Corp., 5.75%, due 09/15/33 | |
| | Duke Energy Florida LLC, 3.40%, due 10/01/46 | |
| | Duke Energy Ohio, Inc., 5.25%, due 04/01/33 | |
| | Duke Energy Progress LLC, 3.70%, due 10/15/46 | |
| | Ecopetrol SA, 6.88%, due 04/29/30 | |
| | Ecopetrol SA, 8.63%, due 01/19/29 | |
| | Edison International, 5.25%, due 11/15/28 | |
| | EIG Pearl Holdings SARL, 3.55%, due 08/31/36 144A | |
| | El Paso Natural Gas Co. LLC, 8.38%, due 06/15/32 | |
| | Electricite de France SA, 9.13% (5 yr. CMT + 5.41%)(b)(e) 144A | |
| | Element Fleet Management Corp., 5.64%, due 03/13/27 144A | |
| | Elevance Health, Inc., 3.60%, due 03/15/51(d) | |
| | Elevance Health, Inc., 5.10%, due 01/15/44 | |
| | Embraer Netherlands Finance BV, 7.00%, due 07/28/30 144A | |
| | Emera U.S. Finance LP, 3.55%, due 06/15/26(d) | |
| | EMRLD Borrower LP/Emerald Co.-Issuer, Inc., 6.63%, due 12/15/30 144A | |
| | Enbridge, Inc., 5.50% (3 mo. USD Term SOFR + 3.68%), due 07/15/77(b) | |
| | Enbridge, Inc., 5.75% (5 yr. CMT + 5.31%), due 07/15/80(b) | |
| | Enbridge, Inc., 6.25% (3 mo. USD Term SOFR + 3.90%), due 03/01/78(b) | |
| | Enbridge, Inc., 8.50% (5 yr. CMT + 4.43%), due 01/15/84(b) | |
| | Endeavor Energy Resources LP/EER Finance, Inc., 5.75%, due 01/30/28 144A | |
| | Energean Israel Finance Ltd., 5.38%, due 03/30/28(g) | |
| | Energean Israel Finance Ltd., 5.88%, due 03/30/31(g) | |
| | Energy Transfer LP, 4.20%, due 04/15/27 | |
| | Energy Transfer LP, 5.15%, due 03/15/45 | |
| | Energy Transfer LP, 5.25%, due 04/15/29 | |
| | Energy Transfer LP, 5.30%, due 04/01/44 | |
| | Energy Transfer LP, 5.30%, due 04/15/47 | |
| | Energy Transfer LP, 5.40%, due 10/01/47 | |
| | Energy Transfer LP, 5.50%, due 06/01/27 | |
| | Energy Transfer LP, 6.25%, due 04/15/49 | |
| | Energy Transfer LP, 6.40%, due 12/01/30 | |
| | Energy Transfer LP, 6.50% (5 yr. CMT + 5.69%)(b)(e) | |
| | Energy Transfer LP, 6.55%, due 12/01/33 | |
| | Energy Transfer LP, 7.13% (5 yr. CMT + 5.31%)(b)(e) | |
| | Enterprise Products Operating LLC, 4.90%, due 05/15/46 | |
| | Enterprise Products Operating LLC, 5.25% (3 mo. USD Term SOFR + 3.29%), due | |
| | EQM Midstream Partners LP, 6.38%, due 04/01/29 144A | |
| | EQM Midstream Partners LP, 7.50%, due 06/01/27 144A | |
| | EQM Midstream Partners LP, 7.50%, due 06/01/30 144A | |
| | Equifax, Inc., 5.10%, due 12/15/27 | |
| | Esab Corp., 6.25%, due 04/15/29(h) 144A | |
102
See accompanying Notes to the Financial Statements.
Mercer Core Fixed Income FundSchedule of Investments (Continued)
(showing percentage of net assets)
March 31, 2024
| | | |
| | Corporate Debt — continued |
| | Eskom Holdings SOC Ltd., 6.35%, due 08/10/28 144A | |
| | Essex Portfolio LP, 1.70%, due 03/01/28 | |
| | Eversource Energy, 2.90%, due 10/01/24 | |
| | Eversource Energy, 2.90%, due 03/01/27 | |
| | Exelon Corp., 3.35%, due 03/15/32 | |
| | Exelon Corp., 4.70%, due 04/15/50 | |
| | Exelon Corp., 5.10%, due 06/15/45 | |
| | Fairfax Financial Holdings Ltd., 5.63%, due 08/16/32 | |
| | Fairfax Financial Holdings Ltd., 6.00%, due 12/07/33 144A | |
| | Falabella SA, 4.38%, due 01/27/25 144A | |
| | Ferguson Finance PLC, 3.25%, due 06/02/30 144A | |
| | Ferguson Finance PLC, 4.50%, due 10/24/28 144A | |
| | Fiesta Purchaser, Inc., 7.88%, due 03/01/31 144A | |
| | Fifth Third Bancorp, 6.34% (SOFR + 2.34%), due 07/27/29(b) | |
| | Fifth Third Bancorp, 8.60% (3 mo. USD Term SOFR + 3.29%)(b)(e) | |
| | First Quantum Minerals Ltd., 6.88%, due 10/15/27 144A | |
| | First Quantum Minerals Ltd., 8.63%, due 06/01/31(d) 144A | |
| | FirstEnergy Corp., 2.65%, due 03/01/30 | |
| | FirstEnergy Corp., 3.40%, due 03/01/50 | |
| | FirstEnergy Pennsylvania Electric Co., 3.60%, due 06/01/29 144A | |
| | Florida Power & Light Co., 2.45%, due 02/03/32 | |
| | Flowserve Corp., 3.50%, due 10/01/30 | |
| | FMC Corp., 5.15%, due 05/18/26 | |
| | Ford Motor Co., 3.25%, due 02/12/32 | |
| | Ford Motor Co., 4.75%, due 01/15/43 | |
| | Ford Motor Co., 6.10%, due 08/19/32 | |
| | Ford Motor Credit Co. LLC, 2.90%, due 02/10/29 | |
| | Ford Motor Credit Co. LLC, 3.38%, due 11/13/25 | |
| | Ford Motor Credit Co. LLC, 4.00%, due 11/13/30 | |
| | Ford Motor Credit Co. LLC, 5.11%, due 05/03/29 | |
| | Ford Motor Credit Co. LLC, 5.80%, due 03/08/29(d) | |
| | Ford Motor Credit Co. LLC, 6.80%, due 05/12/28 | |
| | Foundry JV Holdco LLC, 5.88%, due 01/25/34 144A | |
| | Freeport-McMoRan, Inc., 4.25%, due 03/01/30 | |
| | Freeport-McMoRan, Inc., 5.40%, due 11/14/34 | |
| | Freeport-McMoRan, Inc., 5.45%, due 03/15/43 | |
| | Fresenius Medical Care U.S. Finance III, Inc., 2.38%, due 02/16/31(d) 144A | |
| | Full House Resorts, Inc., 8.25%, due 02/15/28(d) 144A | |
| | GA Global Funding Trust, 3.85%, due 04/11/25 144A | |
| | Gap, Inc., 3.63%, due 10/01/29 144A | |
| | Gap, Inc., 3.88%, due 10/01/31 144A | |
| | Gartner, Inc., 4.50%, due 07/01/28 144A | |
| | GCI LLC, 4.75%, due 10/15/28 144A | |
| | GEMS MENASA Cayman Ltd./GEMS Education Delaware LLC, 7.13%, due 07/31/26 144A | |
| | General Motors Co., 5.00%, due 04/01/35 | |
| | General Motors Co., 5.40%, due 04/01/48(d) | |
| | General Motors Financial Co., Inc., 2.40%, due 10/15/28 | |
| | General Motors Financial Co., Inc., 2.70%, due 06/10/31 | |
See accompanying Notes to the Financial Statements.
103
Mercer Core Fixed Income FundSchedule of Investments (Continued)
(showing percentage of net assets)
March 31, 2024
| | | |
| | Corporate Debt — continued |
| | General Motors Financial Co., Inc., 2.90%, due 02/26/25 | |
| | General Motors Financial Co., Inc., 3.10%, due 01/12/32(d) | |
| | General Motors Financial Co., Inc., 3.60%, due 06/21/30 | |
| | General Motors Financial Co., Inc., 6.00%, due 01/09/28 | |
| | Georgia Power Co., 4.95%, due 05/17/33 | |
| | Global Atlantic Fin Co., 4.70% (5 yr. CMT + 3.80%), due 10/15/51(b) 144A | |
| | Global Infrastructure Solutions, Inc., 5.63%, due 06/01/29 144A | |
| | Global Partners LP/GLP Finance Corp., 8.25%, due 01/15/32 144A | |
| | Globo Comunicacao e Participacoes SA, 4.88%, due 01/22/30 144A | |
| | GLP Capital LP/GLP Financing II, Inc., 3.25%, due 01/15/32 | |
| | GLP Capital LP/GLP Financing II, Inc., 4.00%, due 01/15/30 | |
| | GLP Capital LP/GLP Financing II, Inc., 4.00%, due 01/15/31 | |
| | GLP Capital LP/GLP Financing II, Inc., 5.38%, due 04/15/26 | |
| | GN Bondco LLC, 9.50%, due 10/15/31(d) 144A | |
| | Goldman Sachs Group, Inc., 0.86% (SOFR + 0.61%), due 02/12/26(b) | |
| | Goldman Sachs Group, Inc., 1.43% (SOFR + 0.80%), due 03/09/27(b) | |
| | Goldman Sachs Group, Inc., 1.54% (SOFR + 0.82%), due 09/10/27(b) | |
| | Goldman Sachs Group, Inc., 2.38% (SOFR + 1.25%), due 07/21/32(b) | |
| | Goldman Sachs Group, Inc., 2.62% (SOFR + 1.28%), due 04/22/32(b) | |
| | Goldman Sachs Group, Inc., 2.65% (SOFR + 1.26%), due 10/21/32(b) | |
| | Goldman Sachs Group, Inc., 3.27% (3 mo. USD Term SOFR + 1.46%), due 09/29/25(b) | |
| | Goldman Sachs Group, Inc., 3.50%, due 01/23/25 | |
| | Goldman Sachs Group, Inc., 3.75%, due 02/25/26 | |
| | Goldman Sachs Group, Inc., 3.80%, due 03/15/30(d) | |
| | Goldman Sachs Group, Inc., 3.81% (3 mo. USD Term SOFR + 1.42%), due 04/23/29(b) | |
| | Goldman Sachs Group, Inc., 3.85%, due 01/26/27 | |
| | Graphic Packaging International LLC, 3.50%, due 03/01/29 144A | |
| | Graphic Packaging International LLC, 4.13%, due 08/15/24 | |
| | Greensaif Pipelines Bidco SARL, 6.13%, due 02/23/38 144A | |
| | Greensaif Pipelines Bidco SARL, 6.51%, due 02/23/42 144A | |
| | Group 1 Automotive, Inc., 4.00%, due 08/15/28 144A | |
| | H&E Equipment Services, Inc., 3.88%, due 12/15/28(d) 144A | |
| | HCA, Inc., 4.38%, due 03/15/42 | |
| | HCA, Inc., 5.38%, due 02/01/25 | |
| | HCA, Inc., 5.45%, due 04/01/31(d) | |
| | HCA, Inc., 7.75%, due 07/15/36 | |
| | Healthpeak OP LLC, 3.25%, due 07/15/26 | |
| | Hess Midstream Operations LP, 4.25%, due 02/15/30 144A | |
| | Hess Midstream Operations LP, 5.50%, due 10/15/30(d) 144A | |
| | Hilcorp Energy I LP/Hilcorp Finance Co., 6.00%, due 04/15/30 144A | |
| | Hilcorp Energy I LP/Hilcorp Finance Co., 6.25%, due 04/15/32 144A | |
| | Hilton Grand Vacations Borrower Escrow LLC/Hilton Grand Vacations Borrower Escrow, Inc., 5.00%, due 06/01/29 144A | |
| | Hilton Grand Vacations Borrower Escrow LLC/Hilton Grand Vacations Borrower Escrow, Inc., 6.63%, due 01/15/32 144A | |
| | Honeywell International, Inc., 5.25%, due 03/01/54 | |
| | HSBC Holdings PLC, 7.39% (SOFR + 3.35%), due 11/03/28(b) | |
| | Hudbay Minerals, Inc., 4.50%, due 04/01/26 144A | |
| | Huntington Bancshares, Inc., 6.21% (SOFR + 2.02%), due 08/21/29(b) | |
104
See accompanying Notes to the Financial Statements.
Mercer Core Fixed Income FundSchedule of Investments (Continued)
(showing percentage of net assets)
March 31, 2024
| | | |
| | Corporate Debt — continued |
| | Huntington Ingalls Industries, Inc., 4.20%, due 05/01/30 | |
| | Huntsman International LLC, 2.95%, due 06/15/31 | |
| | Huntsman International LLC, 4.50%, due 05/01/29(d) | |
| | Hyundai Capital America, 2.38%, due 10/15/27 144A | |
| | Hyundai Capital America, 5.30%, due 01/08/29 144A | |
| | Hyundai Capital America, 5.68%, due 06/26/28 144A | |
| | IHS Markit Ltd., 4.75%, due 08/01/28 | |
| | ING Groep NV, 5.34% (SOFR + 1.44%), due 03/19/30(b) | |
| | ING Groep NV, 6.11% (SOFR + 2.09%), due 09/11/34(b) | |
| | ING Groep NV, 6.50% (5 yr. USD swap + 4.45%)(b)(d)(e) | |
| | Ingersoll Rand, Inc., 5.40%, due 08/14/28 | |
| | Intel Corp., 5.63%, due 02/10/43 | |
| | IPALCO Enterprises, Inc., 4.25%, due 05/01/30 | |
| | IQVIA, Inc., 6.25%, due 02/01/29 | |
| | Iron Mountain Information Management Services, Inc., 5.00%, due 07/15/32 144A | |
| | Iron Mountain, Inc., 5.25%, due 07/15/30 144A | |
| | Jacobs Entertainment, Inc., 6.75%, due 02/15/29 144A | |
| | JB Poindexter & Co., Inc., 8.75%, due 12/15/31 144A | |
| | JBS USA LUX SA/JBS USA Food Co./JBS USA Finance, Inc., 3.00%, due 02/02/29 | |
| | JBS USA LUX SA/JBS USA Food Co./JBS USA Finance, Inc., 3.63%, due 01/15/32 | |
| | JBS USA LUX SA/JBS USA Food Co./JBS USA Finance, Inc., 3.75%, due 12/01/31 | |
| | JBS USA LUX SA/JBS USA Food Co./JBS USA Finance, Inc., 5.75%, due 04/01/33 | |
| | Jefferies Financial Group, Inc., 5.88%, due 07/21/28 | |
| | JetBlue Pass-Through Trust, 2.75%, due 11/15/33 | |
| | JPMorgan Chase & Co., 2.07% (SOFR + 1.02%), due 06/01/29(b) | |
| | JPMorgan Chase & Co., 2.52% (SOFR + 2.04%), due 04/22/31(b) | |
| | JPMorgan Chase & Co., 2.58% (3 mo. USD Term SOFR + 1.25%), due 04/22/32(b) | |
| | JPMorgan Chase & Co., 2.96% (3 mo. USD Term SOFR + 2.52%), due 05/13/31(b) | |
| | JPMorgan Chase & Co., 2.96% (SOFR + 1.26%), due 01/25/33(b) | |
| | JPMorgan Chase & Co., 3.78% (3 mo. USD Term SOFR + 1.60%), due 02/01/28(b) | |
| | JPMorgan Chase & Co., 4.01% (3 mo. USD Term SOFR + 1.38%), due 04/23/29(b) | |
| | JPMorgan Chase & Co., 4.20% (3 mo. USD Term SOFR + 1.52%), due 07/23/29(b) | |
| | JPMorgan Chase & Co., 4.45% (3 mo. USD Term SOFR + 1.59%), due 12/05/29(b) | |
| | JPMorgan Chase & Co., 4.49% (3 mo. USD Term SOFR + 3.79%), due 03/24/31(b) | |
| | JPMorgan Chase & Co., 4.60% (3 mo. USD Term SOFR + 3.13%)(b)(e) | |
| | JPMorgan Chase & Co., 5.00% (3 mo. USD Term SOFR + 3.38%)(b)(d)(e) | |
| | JPMorgan Chase & Co., 5.01% (SOFR + 1.31%), due 01/23/30(b) | |
| | Kaiser Foundation Hospitals, 2.81%, due 06/01/41 | |
| | KB Home, 4.00%, due 06/15/31 | |
| | KeyCorp, 6.40% (SOFR + 2.42%), due 03/06/35(b) | |
| | Kinder Morgan Energy Partners LP, 7.75%, due 03/15/32 | |
| | Kinder Morgan, Inc., 3.60%, due 02/15/51 | |
| | KKR Group Finance Co. II LLC, 5.50%, due 02/01/43(d) 144A | |
| | KKR Group Finance Co. VII LLC, 3.63%, due 02/25/50 144A | |
| | KKR Group Finance Co. X LLC, 3.25%, due 12/15/51 144A | |
| | Kohl's Corp., 4.63%, due 05/01/31 | |
| | Kraft Heinz Foods Co., 4.38%, due 06/01/46 | |
| | Kraft Heinz Foods Co., 5.00%, due 06/04/42 | |
| | Kyndryl Holdings, Inc., 6.35%, due 02/20/34 | |
See accompanying Notes to the Financial Statements.
105
Mercer Core Fixed Income FundSchedule of Investments (Continued)
(showing percentage of net assets)
March 31, 2024
| | | |
| | Corporate Debt — continued |
| | L3Harris Technologies, Inc., 5.25%, due 06/01/31 | |
| | Lam Research Corp., 2.88%, due 06/15/50 | |
| | Lamb Weston Holdings, Inc., 4.13%, due 01/31/30 144A | |
| | Lamb Weston Holdings, Inc., 4.38%, due 01/31/32 144A | |
| | Lazard Group LLC, 4.38%, due 03/11/29(d) | |
| | LCPR Senior Secured Financing DAC, 5.13%, due 07/15/29 144A | |
| | Leviathan Bond Ltd., 6.50%, due 06/30/27(g) | |
| | Leviathan Bond Ltd., 6.75%, due 06/30/30(g) | |
| | Liberty Mutual Group, Inc., 3.95%, due 10/15/50 144A | |
| | Liberty Mutual Group, Inc., 4.13% (5 yr. CMT + 3.32%), due 12/15/51(b) 144A | |
| | Liberty Mutual Group, Inc., 4.57%, due 02/01/29 144A | |
| | Lincoln National Corp., 3.40%, due 01/15/31(d) | |
| | Lithia Motors, Inc., 3.88%, due 06/01/29 144A | |
| | Lithia Motors, Inc., 4.38%, due 01/15/31 144A | |
| | Lithia Motors, Inc., 4.63%, due 12/15/27 144A | |
| | Lloyds Banking Group PLC, 2.44% (1 yr. CMT + 1.00%), due 02/05/26(b) | |
| | Lloyds Banking Group PLC, 7.50% (5 yr. USD swap + 4.76%)(b)(e) | |
| | LLPL Capital Pte. Ltd., 6.88%, due 02/04/39 144A | |
| | Lowe's Cos., Inc., 3.70%, due 04/15/46 | |
| | Lowe's Cos., Inc., 5.63%, due 04/15/53 | |
| | Lubrizol Corp., 6.50%, due 10/01/34(d) | |
| | LYB International Finance III LLC, 4.20%, due 05/01/50 | |
| | M&T Bank Corp., 5.13% (3 mo. USD Term SOFR + 3.78%)(b)(e) | |
| | Macquarie Bank Ltd., 3.62%, due 06/03/30 144A | |
| | Macquarie Group Ltd., 1.34% (SOFR + 1.07%), due 01/12/27(b) 144A | |
| | Macy's Retail Holdings LLC, 5.88%, due 04/01/29(d) 144A | |
| | Macy's Retail Holdings LLC, 5.88%, due 03/15/30(d) 144A | |
| | Macy's Retail Holdings LLC, 6.13%, due 03/15/32 144A | |
| | Manulife Financial Corp., 3.70%, due 03/16/32(d) | |
| | MARB BondCo PLC, 3.95%, due 01/29/31 144A | |
| | Marriott International, Inc., 5.00%, due 10/15/27 | |
| | Martin Marietta Materials, Inc., 2.50%, due 03/15/30 | |
| | Marvell Technology, Inc., 2.45%, due 04/15/28 | |
| | Masonite International Corp., 3.50%, due 02/15/30(d) 144A | |
| | Massachusetts Institute of Technology, 4.68%, due 07/01/14(f) | |
| | Massachusetts Mutual Life Insurance Co., 3.38%, due 04/15/50 144A | |
| | Massachusetts Mutual Life Insurance Co., 5.67%, due 12/01/52 144A | |
| | MasTec, Inc., 4.50%, due 08/15/28(d) 144A | |
| | Match Group Holdings II LLC, 3.63%, due 10/01/31 144A | |
| | Match Group Holdings II LLC, 4.13%, due 08/01/30 144A | |
| | Mauser Packaging Solutions Holding Co., 7.88%, due 08/15/26 144A | |
| | MC Brazil Downstream Trading SARL, 7.25%, due 06/30/31 144A | |
| | McDonald's Corp., 4.20%, due 04/01/50 | |
| | MDC Holdings, Inc., 2.50%, due 01/15/31 | |
| | MetLife, Inc., 6.40%, due 12/15/66 | |
| | Metropolitan Life Global Funding I, 3.30%, due 03/21/29 144A | |
| | Mexico City Airport Trust, 4.25%, due 10/31/26 144A | |
| | Mexico City Airport Trust, 5.50%, due 07/31/47 144A | |
| | MGM Resorts International, 4.75%, due 10/15/28 | |
106
See accompanying Notes to the Financial Statements.
Mercer Core Fixed Income FundSchedule of Investments (Continued)
(showing percentage of net assets)
March 31, 2024
| | | |
| | Corporate Debt — continued |
| | Michaels Cos., Inc., 5.25%, due 05/01/28 144A | |
| | Michaels Cos., Inc., 7.88%, due 05/01/29 144A | |
| | Microchip Technology, Inc., 5.05%, due 03/15/29 | |
| | Micron Technology, Inc., 2.70%, due 04/15/32 | |
| | Micron Technology, Inc., 4.19%, due 02/15/27(d) | |
| | Micron Technology, Inc., 5.30%, due 01/15/31 | |
| | Micron Technology, Inc., 5.33%, due 02/06/29 | |
| | Micron Technology, Inc., 6.75%, due 11/01/29 | |
| | MidAmerican Energy Co., 4.25%, due 07/15/49 | |
| | Mid-Atlantic Interstate Transmission LLC, 4.10%, due 05/15/28 144A | |
| | Midwest Gaming Borrower LLC/Midwest Gaming Finance Corp., 4.88%, due 05/01/29 144A | |
| | Millicom International Cellular SA, 6.25%, due 03/25/29(d) 144A | |
| | Millicom International Cellular SA, 7.38%, due 04/02/32(h) 144A | |
| | Mohegan Tribal Gaming Authority, 8.00%, due 02/01/26 144A | |
| | Moody's Corp., 3.25%, due 05/20/50(d) | |
| | Morgan Stanley, 1.93% (SOFR + 1.02%), due 04/28/32(b) | |
| | Morgan Stanley, 2.24% (SOFR + 1.18%), due 07/21/32(b) | |
| | Morgan Stanley, 2.48% (SOFR + 1.36%), due 09/16/36(b) | |
| | Morgan Stanley, 2.70% (SOFR + 1.14%), due 01/22/31(b) | |
| | Morgan Stanley, 2.94% (SOFR + 1.29%), due 01/21/33(b) | |
| | Morgan Stanley, 3.13%, due 07/27/26 | |
| | Morgan Stanley, 3.59%, due 07/22/28(i) | |
| | Morgan Stanley, 3.62% (SOFR + 3.12%), due 04/01/31(b) | |
| | Morgan Stanley, 3.77% (3 mo. USD Term SOFR + 1.40%), due 01/24/29(b) | |
| | Morgan Stanley, 4.21% (SOFR + 1.61%), due 04/20/28(b)(d) | |
| | Morgan Stanley, 5.16% (SOFR + 1.59%), due 04/20/29(b) | |
| | Morgan Stanley, 5.17% (SOFR + 1.45%), due 01/16/30(b) | |
| | Motorola Solutions, Inc., 2.30%, due 11/15/30 | |
| | Motorola Solutions, Inc., 2.75%, due 05/24/31 | |
| | Motorola Solutions, Inc., 5.40%, due 04/15/34 | |
| | MPLX LP, 1.75%, due 03/01/26 | |
| | MPLX LP, 4.25%, due 12/01/27 | |
| | MPLX LP, 4.50%, due 04/15/38 | |
| | MPLX LP, 4.70%, due 04/15/48 | |
| | MPLX LP, 4.95%, due 09/01/32 | |
| | MPLX LP, 5.00%, due 03/01/33 | |
| | MPLX LP, 5.20%, due 03/01/47 | |
| | MPT Operating Partnership LP/MPT Finance Corp., 3.50%, due 03/15/31(d) | |
| | MPT Operating Partnership LP/MPT Finance Corp., 5.00%, due 10/15/27(d) | |
| | MSCI, Inc., 3.63%, due 11/01/31 144A | |
| | Mylan, Inc., 5.40%, due 11/29/43 | |
| | National Grid PLC, 5.81%, due 06/12/33 | |
| | National Securities Clearing Corp., 5.00%, due 05/30/28 144A | |
| | Nationstar Mortgage Holdings, Inc., 5.13%, due 12/15/30 144A | |
| | Nationstar Mortgage Holdings, Inc., 5.50%, due 08/15/28 144A | |
| | Nationstar Mortgage Holdings, Inc., 6.00%, due 01/15/27 144A | |
| | NatWest Group PLC, 3.75% (5 yr. CMT + 2.10%), due 11/01/29(b) | |
| | NatWest Group PLC, 6.00% (5 yr. CMT + 5.63%)(b)(e) | |
See accompanying Notes to the Financial Statements.
107
Mercer Core Fixed Income FundSchedule of Investments (Continued)
(showing percentage of net assets)
March 31, 2024
| | | |
| | Corporate Debt — continued |
| | NatWest Markets PLC, 1.60%, due 09/29/26 144A | |
| | NBM U.S. Holdings, Inc., 6.63%, due 08/06/29 144A | |
| | Netflix, Inc., 4.88%, due 04/15/28 | |
| | Netflix, Inc., 5.38%, due 11/15/29 144A | |
| | Netflix, Inc., 5.88%, due 11/15/28 | |
| | Newmont Corp., 2.25%, due 10/01/30(d) | |
| | Newmont Corp., 2.80%, due 10/01/29 | |
| | Newmont Corp., 5.45%, due 06/09/44 | |
| | Newmont Corp./Newcrest Finance Pty. Ltd., 5.35%, due 03/15/34 144A | |
| | News Corp., 3.88%, due 05/15/29 144A | |
| | NextEra Energy Capital Holdings, Inc., 2.25%, due 06/01/30 | |
| | NextEra Energy Capital Holdings, Inc., 5.75%, due 09/01/25 | |
| | NextEra Energy Capital Holdings, Inc., 6.05%, due 03/01/25 | |
| | NextEra Energy Capital Holdings, Inc., 6.70% (5 yr. CMT + 2.36%), due 09/01/54(b) | |
| | NextEra Energy Operating Partners LP, 3.88%, due 10/15/26 144A | |
| | NextEra Energy Operating Partners LP, 4.50%, due 09/15/27 144A | |
| | NiSource, Inc., 1.70%, due 02/15/31 | |
| | NiSource, Inc., 3.60%, due 05/01/30 | |
| | NiSource, Inc., 5.25%, due 03/30/28 | |
| | Nissan Motor Acceptance Co. LLC, 1.85%, due 09/16/26 144A | |
| | Nissan Motor Acceptance Co. LLC, 2.00%, due 03/09/26 144A | |
| | Nomura Holdings, Inc., 2.61%, due 07/14/31(d) | |
| | Norfolk Southern Corp., 4.84%, due 10/01/41 | |
| | Northern States Power Co., 3.60%, due 09/15/47 | |
| | Northrop Grumman Corp., 5.25%, due 05/01/50 | |
| | NOVA Chemicals Corp., 4.88%, due 06/01/24 144A | |
| | Novelis Corp., 4.75%, due 01/30/30 144A | |
| | NRG Energy, Inc., 2.45%, due 12/02/27 144A | |
| | NRG Energy, Inc., 3.63%, due 02/15/31 144A | |
| | NRG Energy, Inc., 3.88%, due 02/15/32 144A | |
| | NRG Energy, Inc., 4.45%, due 06/15/29 144A | |
| | NRG Energy, Inc., 5.25%, due 06/15/29 144A | |
| | NRG Energy, Inc., 5.75%, due 01/15/28 | |
| | NRG Energy, Inc., 7.00%, due 03/15/33 144A | |
| | NRG Energy, Inc., 10.25% (5 yr. CMT + 5.92%)(b)(e) 144A | |
| | NSTAR Electric Co., 3.10%, due 06/01/51(d) | |
| | Nutrien Ltd., 4.90%, due 06/01/43 | |
| | NXP BV/NXP Funding LLC/NXP USA, Inc., 2.70%, due 05/01/25 | |
| | Occidental Petroleum Corp., 4.48%, due 10/10/36(j) | |
| | Occidental Petroleum Corp., 6.45%, due 09/15/36 | |
| | Occidental Petroleum Corp., 6.60%, due 03/15/46 | |
| | Occidental Petroleum Corp., 6.63%, due 09/01/30 | |
| | OCI NV, 6.70%, due 03/16/33 144A | |
| | OneMain Finance Corp., 3.88%, due 09/15/28 | |
| | OneMain Finance Corp., 6.63%, due 01/15/28(d) | |
| | OneMain Finance Corp., 9.00%, due 01/15/29 | |
| | ONEOK, Inc., 3.10%, due 03/15/30 | |
| | ONEOK, Inc., 4.25%, due 09/15/46 | |
| | ONEOK, Inc., 5.65%, due 11/01/28 | |
108
See accompanying Notes to the Financial Statements.
Mercer Core Fixed Income FundSchedule of Investments (Continued)
(showing percentage of net assets)
March 31, 2024
| | | |
| | Corporate Debt — continued |
| | ONEOK, Inc., 6.05%, due 09/01/33 | |
| | ONEOK, Inc., 6.63%, due 09/01/53 | |
| | Oracle Corp., 1.65%, due 03/25/26 | |
| | Oracle Corp., 2.95%, due 04/01/30 | |
| | Oracle Corp., 3.95%, due 03/25/51(d) | |
| | Oracle Corp., 4.30%, due 07/08/34 | |
| | Organon & Co./Organon Foreign Debt Co.-Issuer BV, 4.13%, due 04/30/28 144A | |
| | Ovintiv, Inc., 5.65%, due 05/15/25 | |
| | Ovintiv, Inc., 5.65%, due 05/15/28(d) | |
| | Ovintiv, Inc., 6.25%, due 07/15/33 | |
| | Ovintiv, Inc., 7.20%, due 11/01/31 | |
| | Owens Corning, 3.88%, due 06/01/30 | |
| | Owens Corning, 3.95%, due 08/15/29(d) | |
| | Owens-Brockway Glass Container, Inc., 6.63%, due 05/13/27(d) 144A | |
| | Owens-Brockway Glass Container, Inc., 7.25%, due 05/15/31(d) 144A | |
| | Pacific Gas & Electric Co., 4.95%, due 07/01/50(d) | |
| | Pacific Gas & Electric Co., 5.80%, due 05/15/34 | |
| | PacifiCorp, 2.70%, due 09/15/30 | |
| | Pactiv Evergreen Group Issuer, Inc./Pactiv Evergreen Group Issuer LLC, 4.00%, due 10/15/27 144A | |
| | Panther Escrow Issuer LLC, 7.13%, due 06/01/31(h) 144A | |
| | Paramount Global, 4.20%, due 05/19/32(d) | |
| | Paramount Global, 4.38%, due 03/15/43 | |
| | Paramount Global, 4.95%, due 05/19/50 | |
| | Parkland Corp., 4.50%, due 10/01/29 144A | |
| | Parkland Corp., 4.63%, due 05/01/30 144A | |
| | PECO Energy Co., 3.05%, due 03/15/51 | |
| | PECO Energy Co., 3.70%, due 09/15/47 | |
| | Petroleos Mexicanos, 6.35%, due 02/12/48 | |
| | Petroleos Mexicanos, 6.50%, due 03/13/27 | |
| | Petroleos Mexicanos, 6.50%, due 06/02/41 | |
| | Petroleos Mexicanos, 6.75%, due 09/21/47 | |
| | Petroleos Mexicanos, 6.88%, due 08/04/26 | |
| | Petroleos Mexicanos, 7.69%, due 01/23/50 | |
| | Petroleos Mexicanos, 8.75%, due 06/02/29 | |
| | PG&E Wildfire Recovery Funding LLC, 3.59%, due 06/01/32 | |
| | PG&E Wildfire Recovery Funding LLC, 4.02%, due 06/01/33 | |
| | PG&E Wildfire Recovery Funding LLC, 4.26%, due 06/01/38 | |
| | PG&E Wildfire Recovery Funding LLC, 4.72%, due 06/01/39 | |
| | Philip Morris International, Inc., 5.25%, due 02/13/34 | |
| | Phillips 66 Co., 3.61%, due 02/15/25 | |
| | Piedmont Natural Gas Co., Inc., 3.50%, due 06/01/29 | |
| | Pilgrim's Pride Corp., 6.25%, due 07/01/33 | |
| | Plains All American Pipeline LP/PAA Finance Corp., 3.55%, due 12/15/29 | |
| | PNC Financial Services Group, Inc., 3.40% (5 yr. CMT + 2.60%)(b)(e) | |
| | PNC Financial Services Group, Inc., 5.58% (SOFR + 1.84%), due 06/12/29(b) | |
| | PNC Financial Services Group, Inc., 5.68% (SOFR + 1.90%), due 01/22/35(b) | |
| | PNC Financial Services Group, Inc., 5.94% (SOFR + 1.95%), due 08/18/34(b) | |
| | PNC Financial Services Group, Inc., 6.25% (7 yr. CMT + 2.81%)(b)(e) | |
See accompanying Notes to the Financial Statements.
109
Mercer Core Fixed Income FundSchedule of Investments (Continued)
(showing percentage of net assets)
March 31, 2024
| | | |
| | Corporate Debt — continued |
| | PNC Financial Services Group, Inc., 8.64% (3 mo. USD Term SOFR + 3.30%)(b)(e) | |
| | Popular, Inc., 7.25%, due 03/13/28 | |
| | Prime Security Services Borrower LLC/Prime Finance, Inc., 3.38%, due 08/31/27 144A | |
| | Prime Security Services Borrower LLC/Prime Finance, Inc., 6.25%, due 01/15/28 144A | |
| | Providence St. Joseph Health Obligated Group, 2.75%, due 10/01/26 | |
| | Public Service Electric & Gas Co., 2.70%, due 05/01/50 | |
| | Public Service Electric & Gas Co., 3.00%, due 05/15/27 | |
| | Public Service Electric & Gas Co., 3.20%, due 05/15/29 | |
| | Public Service Enterprise Group, Inc., 2.88%, due 06/15/24 | |
| | Public Storage Operating Co., 2.25%, due 11/09/31 | |
| | QatarEnergy, 2.25%, due 07/12/31 144A | |
| | Qorvo, Inc., 3.38%, due 04/01/31 144A | |
| | Realty Income Corp., 2.10%, due 03/15/28 | |
| | Realty Income Corp., 2.85%, due 12/15/32 | |
| | Realty Income Corp., 3.25%, due 01/15/31 | |
| | Regal Rexnord Corp., 6.05%, due 02/15/26 144A | |
| | Regal Rexnord Corp., 6.40%, due 04/15/33 144A | |
| | Regeneron Pharmaceuticals, Inc., 1.75%, due 09/15/30 | |
| | Resorts World Las Vegas LLC/RWLV Capital, Inc., 4.63%, due 04/16/29 144A | |
| | Resorts World Las Vegas LLC/RWLV Capital, Inc., 4.63%, due 04/06/31(d) 144A | |
| | Resorts World Las Vegas LLC/RWLV Capital, Inc., 8.45%, due 07/27/30 144A | |
| | Roper Technologies, Inc., 1.40%, due 09/15/27 | |
| | Royal Caribbean Cruises Ltd., 6.25%, due 03/15/32 144A | |
| | Royalty Pharma PLC, 1.75%, due 09/02/27 | |
| | RPM International, Inc., 2.95%, due 01/15/32 | |
| | RTX Corp., 1.90%, due 09/01/31 | |
| | Ryder System, Inc., 5.25%, due 06/01/28 | |
| | Sabine Pass Liquefaction LLC, 4.20%, due 03/15/28 | |
| | Sabine Pass Liquefaction LLC, 4.50%, due 05/15/30 | |
| | Sabine Pass Liquefaction LLC, 5.00%, due 03/15/27 | |
| | San Diego Gas & Electric Co., 4.15%, due 05/15/48 | |
| | Sands China Ltd., 5.40%, due 08/08/28 | |
| | Santander Holdings USA, Inc., 2.49% (SOFR + 1.25%), due 01/06/28(b) | |
| | Santander Holdings USA, Inc., 3.24%, due 10/05/26 | |
| | Santander Holdings USA, Inc., 3.45%, due 06/02/25 | |
| | Santander Holdings USA, Inc., 4.40%, due 07/13/27 | |
| | Sasol Financing USA LLC, 5.50%, due 03/18/31 | |
| | Sasol Financing USA LLC, 6.50%, due 09/27/28(d) | |
| | SBA Tower Trust, 6.60%, due 01/15/28 144A | |
| | SBL Holdings, Inc., 5.00%, due 02/18/31 144A | |
| | Schlumberger Holdings Corp., 3.90%, due 05/17/28 144A | |
| | Sempra, 5.50%, due 08/01/33 | |
| | Sensata Technologies, Inc., 3.75%, due 02/15/31 144A | |
| | Simon Property Group LP, 6.75%, due 02/01/40 | |
| | Sirius XM Radio, Inc., 4.00%, due 07/15/28 144A | |
| | Sirius XM Radio, Inc., 5.00%, due 08/01/27 144A | |
| | SMBC Aviation Capital Finance DAC, 2.30%, due 06/15/28 144A | |
| | Societe Generale SA, 1.79% (1 yr. CMT + 1.00%), due 06/09/27(b) 144A | |
| | Societe Generale SA, 2.80% (1 yr. CMT + 1.30%), due 01/19/28(b) 144A | |
110
See accompanying Notes to the Financial Statements.
Mercer Core Fixed Income FundSchedule of Investments (Continued)
(showing percentage of net assets)
March 31, 2024
| | | |
| | Corporate Debt — continued |
| | Societe Generale SA, 5.38% (5 yr. CMT + 4.51%)(b)(e) 144A | |
| | Societe Generale SA, 5.63% (1 yr. CMT + 1.75%), due 01/19/30(b)(d) 144A | |
| | Societe Generale SA, 6.22% (1 yr. CMT + 3.20%), due 06/15/33(b)(d) 144A | |
| | Societe Generale SA, 6.40% (SOFR + 1.05%), due 01/21/26(b) 144A | |
| | Societe Generale SA, 6.45% (1 yr. CMT + 2.55%), due 01/10/29(b) 144A | |
| | Solventum Corp., 5.40%, due 03/01/29 144A | |
| | Solventum Corp., 5.45%, due 03/13/31 144A | |
| | Sotheby's, 7.38%, due 10/15/27(d) 144A | |
| | Southern California Edison Co., 3.45%, due 02/01/52 | |
| | Southern California Edison Co., 4.00%, due 04/01/47 | |
| | Southern Co., 3.25%, due 07/01/26 | |
| | Southern Co., 4.85%, due 06/15/28 | |
| | Southern Co., 5.70%, due 03/15/34 | |
| | Southwest Airlines Co., 2.63%, due 02/10/30(d) | |
| | Southwestern Energy Co., 4.75%, due 02/01/32 | |
| | Sprint LLC, 7.13%, due 06/15/24 | |
| | Standard Industries, Inc., 3.38%, due 01/15/31 144A | |
| | Standard Industries, Inc., 4.38%, due 07/15/30 144A | |
| | Standard Industries, Inc., 4.75%, due 01/15/28 144A | |
| | Standard Industries, Inc., 5.00%, due 02/15/27 144A | |
| | Star Parent, Inc., 9.00%, due 10/01/30(d) 144A | |
| | Starwood Property Trust, Inc., 3.63%, due 07/15/26(d) 144A | |
| | Starwood Property Trust, Inc., 7.25%, due 04/01/29 144A | |
| | State Grid Overseas Investment BVI Ltd., 3.50%, due 05/04/27 144A | |
| | State Street Corp., 3.15% (SOFR + 2.65%), due 03/30/31(b)(d) | |
| | Steel Dynamics, Inc., 3.45%, due 04/15/30 | |
| | Stellantis Finance U.S., Inc., 1.71%, due 01/29/27 144A | |
| | Summit Materials LLC/Summit Materials Finance Corp., 7.25%, due 01/15/31 144A | |
| | Sun Communities Operating LP, 2.30%, due 11/01/28 | |
| | Sunoco LP/Sunoco Finance Corp., 4.50%, due 04/30/30 | |
| | Tallgrass Energy Partners LP/Tallgrass Energy Finance Corp., 6.00%, due 12/31/30 144A | |
| | Talos Production, Inc., 9.00%, due 02/01/29 144A | |
| | Talos Production, Inc., 9.38%, due 02/01/31 144A | |
| | Tapestry, Inc., 7.70%, due 11/27/30 | |
| | Tapestry, Inc., 7.85%, due 11/27/33 | |
| | Targa Resources Corp., 4.95%, due 04/15/52 | |
| | Targa Resources Corp., 6.15%, due 03/01/29 | |
| | Targa Resources Partners LP/Targa Resources Partners Finance Corp., 4.00%, due 01/15/32 | |
| | Taylor Morrison Communities, Inc., 5.13%, due 08/01/30 144A | |
| | Taylor Morrison Communities, Inc., 5.88%, due 06/15/27 144A | |
| | Teachers Insurance & Annuity Association of America, 4.27%, due 05/15/47 144A | |
| | Teachers Insurance & Annuity Association of America, 6.85%, due 12/16/39 144A | |
| | Teledyne Technologies, Inc., 2.75%, due 04/01/31 | |
| | Telesat Canada/Telesat LLC, 5.63%, due 12/06/26 144A | |
| | Tenet Healthcare Corp., 4.38%, due 01/15/30 | |
| | Thermo Fisher Scientific, Inc., 4.98%, due 08/10/30 | |
| | T-Mobile USA, Inc., 3.38%, due 04/15/29 | |
| | T-Mobile USA, Inc., 3.88%, due 04/15/30 | |
See accompanying Notes to the Financial Statements.
111
Mercer Core Fixed Income FundSchedule of Investments (Continued)
(showing percentage of net assets)
March 31, 2024
| | | |
| | Corporate Debt — continued |
| | T-Mobile USA, Inc., 4.50%, due 04/15/50(d) | |
| | Toronto-Dominion Bank, 1.95%, due 01/12/27(d) | |
| | Total Play Telecomunicaciones SA de CV, 6.38%, due 09/20/28 144A | |
| | Transcontinental Gas Pipe Line Co. LLC, 3.95%, due 05/15/50 | |
| | Transcontinental Gas Pipe Line Co. LLC, 4.60%, due 03/15/48 | |
| | TransDigm, Inc., 5.50%, due 11/15/27 | |
| | Travel & Leisure Co., 4.63%, due 03/01/30 144A | |
| | TriNet Group, Inc., 3.50%, due 03/01/29 144A | |
| | Truist Financial Corp., 5.44% (SOFR + 1.62%), due 01/24/30(b) | |
| | Truist Financial Corp., 5.71% (SOFR + 1.92%), due 01/24/35(b) | |
| | Truist Financial Corp., 5.87% (SOFR + 2.36%), due 06/08/34(b) | |
| | Truist Financial Corp., 7.16% (SOFR + 2.45%), due 10/30/29(b) | |
| | Trust Fibra Uno, 7.38%, due 02/13/34 144A | |
| | U.S. Airways Pass-Through Trust, 4.63%, due 12/03/26 | |
| | U.S. Bancorp, 5.38% (SOFR + 1.56%), due 01/23/30(b) | |
| | U.S. Bancorp, 5.68% (SOFR + 1.86%), due 01/23/35(b) | |
| | U.S. Bancorp, 5.84% (SOFR + 2.26%), due 06/12/34(b)(d) | |
| | U.S. Bancorp, 6.79% (SOFR + 1.88%), due 10/26/27(b) | |
| | Uber Technologies, Inc., 4.50%, due 08/15/29(d) 144A | |
| | UBS Group AG, 1.49% (1 yr. CMT + 0.85%), due 08/10/27(b) 144A | |
| | UBS Group AG, 2.10% (1 yr. CMT + 1.00%), due 02/11/32(b) 144A | |
| | UBS Group AG, 4.13%, due 04/15/26 144A | |
| | UBS Group AG, 5.43% (1 yr. CMT + 1.52%), due 02/08/30(b) 144A | |
| | UBS Group AG, 6.30% (1 yr. CMT + 2.00%), due 09/22/34(b) 144A | |
| | UBS Group AG, 9.25% (5 yr. CMT + 4.75%)(b)(e) 144A | |
| | UBS Group AG, 9.25% (5 yr. CMT + 4.76%)(b)(e) 144A | |
| | United Airlines Pass-Through Trust, 3.45%, due 01/07/30 | |
| | United Airlines Pass-Through Trust, 3.65%, due 07/07/27 | |
| | United Airlines Pass-Through Trust, 3.75%, due 03/03/28 | |
| | United Airlines Pass-Through Trust, 4.00%, due 10/11/27 | |
| | United Airlines Pass-Through Trust, 4.55%, due 02/25/33 | |
| | United Airlines Pass-Through Trust, 4.60%, due 09/01/27 | |
| | United Airlines Pass-Through Trust, 4.88%, due 07/15/27 | |
| | United Airlines Pass-Through Trust, 5.80%, due 07/15/37 | |
| | United Airlines Pass-Through Trust, 5.88%, due 04/15/29 | |
| | United Airlines, Inc., 4.38%, due 04/15/26(d) 144A | |
| | United Airlines, Inc., 4.63%, due 04/15/29 144A | |
| | United Rentals North America, Inc., 3.75%, due 01/15/32 | |
| | United Rentals North America, Inc., 3.88%, due 11/15/27 | |
| | United Rentals North America, Inc., 3.88%, due 02/15/31(d) | |
| | United Rentals North America, Inc., 4.88%, due 01/15/28(d) | |
| | United Rentals North America, Inc., 5.25%, due 01/15/30 | |
| | UnitedHealth Group, Inc., 3.05%, due 05/15/41 | |
| | UnitedHealth Group, Inc., 3.25%, due 05/15/51 | |
| | UnitedHealth Group, Inc., 4.75%, due 05/15/52(d) | |
| | UnitedHealth Group, Inc., 5.05%, due 04/15/53 | |
| | Universal Health Services, Inc., 2.65%, due 10/15/30 | |
| | University of Chicago, 2.76%, due 04/01/45 | |
| | University of Southern California, 2.95%, due 10/01/51 | |
112
See accompanying Notes to the Financial Statements.
Mercer Core Fixed Income FundSchedule of Investments (Continued)
(showing percentage of net assets)
March 31, 2024
| | | |
| | Corporate Debt — continued |
| | Valvoline, Inc., 3.63%, due 06/15/31 144A | |
| | Var Energi ASA, 7.50%, due 01/15/28 144A | |
| | Var Energi ASA, 8.00%, due 11/15/32 144A | |
| | Varex Imaging Corp., 7.88%, due 10/15/27 144A | |
| | Vector Group Ltd., 5.75%, due 02/01/29 144A | |
| | Venture Global Calcasieu Pass LLC, 3.88%, due 08/15/29 144A | |
| | Venture Global Calcasieu Pass LLC, 4.13%, due 08/15/31 144A | |
| | Venture Global LNG, Inc., 9.50%, due 02/01/29 144A | |
| | VeriSign, Inc., 2.70%, due 06/15/31 | |
| | Verisk Analytics, Inc., 3.63%, due 05/15/50 | |
| | Verizon Communications, Inc., 1.68%, due 10/30/30 | |
| | Verizon Communications, Inc., 2.55%, due 03/21/31 | |
| | Verizon Communications, Inc., 2.88%, due 11/20/50 | |
| | Verizon Communications, Inc., 3.55%, due 03/22/51(d) | |
| | Viatris, Inc., 2.70%, due 06/22/30 | |
| | Viatris, Inc., 3.85%, due 06/22/40 | |
| | Viatris, Inc., 4.00%, due 06/22/50(d) | |
| | VICI Properties LP, 5.13%, due 05/15/32 | |
| | VICI Properties LP/VICI Note Co., Inc., 3.88%, due 02/15/29 144A | |
| | VICI Properties LP/VICI Note Co., Inc., 4.13%, due 08/15/30 144A | |
| | VICI Properties LP/VICI Note Co., Inc., 4.63%, due 12/01/29 144A | |
| | Virginia Power Fuel Securitization LLC, 4.88%, due 05/01/33 | |
| | Vistra Corp., 8.00% (5 yr. CMT + 6.93%)(b)(e) 144A | |
| | Vistra Operations Co. LLC, 3.55%, due 07/15/24 144A | |
| | Vistra Operations Co. LLC, 3.70%, due 01/30/27 144A | |
| | Vistra Operations Co. LLC, 4.30%, due 07/15/29 144A | |
| | Vistra Operations Co. LLC, 5.00%, due 07/31/27 144A | |
| | Vistra Operations Co. LLC, 6.95%, due 10/15/33 144A | |
| | Vital Energy, Inc., 7.88%, due 04/15/32 144A | |
| | Vodafone Group PLC, 5.63%, due 02/10/53(d) | |
| | Vodafone Group PLC, 7.00% (5 yr. USD swap + 4.87%), due 04/04/79(b) | |
| | WakeMed, 3.29%, due 10/01/52 | |
| | Warnermedia Holdings, Inc., 4.28%, due 03/15/32 | |
| | Warnermedia Holdings, Inc., 5.05%, due 03/15/42 | |
| | Warnermedia Holdings, Inc., 5.14%, due 03/15/52 | |
| | Wells Fargo & Co., 2.39% (SOFR + 2.10%), due 06/02/28(b) | |
| | Wells Fargo & Co., 2.57% (3 mo. USD Term SOFR + 1.26%), due 02/11/31(b) | |
| | Wells Fargo & Co., 2.88% (3 mo. USD Term SOFR + 1.43%), due 10/30/30(b) | |
| | Wells Fargo & Co., 3.35% (SOFR + 1.50%), due 03/02/33(b) | |
| | Wells Fargo & Co., 4.81% (SOFR + 1.98%), due 07/25/28(b) | |
| | Wells Fargo & Co., 5.20% (SOFR + 1.50%), due 01/23/30(b) | |
| | Wells Fargo & Co., 5.88%(d)(e)(i) | |
| | Western Midstream Operating LP, 4.05%, due 02/01/30 | |
| | Westinghouse Air Brake Technologies Corp., 5.61%, due 03/11/34 | |
| | William Carter Co., 5.63%, due 03/15/27 144A | |
| | Williams Cos., Inc., 3.75%, due 06/15/27 | |
| | Williams Cos., Inc., 4.65%, due 08/15/32 | |
| | Williams Cos., Inc., 5.40%, due 03/02/26 | |
| | WMG Acquisition Corp., 3.88%, due 07/15/30 144A | |
See accompanying Notes to the Financial Statements.
113
Mercer Core Fixed Income FundSchedule of Investments (Continued)
(showing percentage of net assets)
March 31, 2024
| | | |
| | Corporate Debt — continued |
| | Wolverine World Wide, Inc., 4.00%, due 08/15/29(d) 144A | |
| | WP Carey, Inc., 2.25%, due 04/01/33 | |
| | XPO, Inc., 7.13%, due 06/01/31(d) 144A | |
| | Yale University, 2.40%, due 04/15/50(d) | |
| | Yamana Gold, Inc., 2.63%, due 08/15/31(d) | |
| | Yara International ASA, 4.75%, due 06/01/28 144A | |
| | Zayo Group Holdings, Inc., 4.00%, due 03/01/27(d) 144A | |
| | | |
| | Mortgage Backed Securities - Private Issuers — 7.6% |
| | Angel Oak Mortgage Trust, Series 2020-R1, Class A1, 0.99%, due 04/25/53(i) 144A | |
| | Angel Oak Mortgage Trust, Series 2021-2, Class A1, 0.99%, due 04/25/66(i) 144A | |
| | Angel Oak Mortgage Trust, Series 2021-4, Class A1, 1.04%, due 01/20/65(i) 144A | |
| | Angel Oak Mortgage Trust, Series 2021-5, Class A1, 0.95%, due 07/25/66(i) 144A | |
| | Angel Oak Mortgage Trust, Series 2024-3, Class A1, 4.80%, due 11/26/68(c) 144A | |
| | Arbor Multifamily Mortgage Securities Trust, Series 2020-MF1, Class A4, 2.50%, due 05/15/53 144A | |
| | Arbor Multifamily Mortgage Securities Trust, Series 2021-MF2, Class A4, 2.25%, due 06/15/54 144A | |
| | Arroyo Mortgage Trust, Series 2021-1R, Class A1, 1.18%, due 10/25/48(i) 144A | |
| | BAMLL Commercial Mortgage Securities Trust, Series 2019-BPR, Class ENM, 3.72%, due 11/05/32(i) 144A | |
| | Bank, Series 2017-BNK5, Class A4, 3.13%, due 06/15/60 | |
| | Bank, Series 2019-BN20, Class A2, 2.76%, due 09/15/62 | |
| | Bank, Series 2019-BN23, Class A2, 2.67%, due 12/15/52 | |
| | Bank, Series 2020-BN26, Class A2, 2.04%, due 03/15/63 | |
| | Bank, Series 2020-BN26, Class A3, 2.16%, due 03/15/63 | |
| | Bank, Series 2021-BN32, Class A4, 2.35%, due 04/15/54 | |
| | Bank, Series 2021-BN34, Class A4, 2.16%, due 06/15/63 | |
| | Bank5, Series 2023-5YR2, Class A3, 6.66%, due 07/15/56(i) | |
| | BBCMS Mortgage Trust, Series 2018-TALL, Class A, 6.25% (1 mo. USD Term SOFR + 0.92%), due 03/15/37(b) 144A | |
| | BBCMS Mortgage Trust, Series 2019-C5, Class A2, 3.04%, due 11/15/52 | |
| | BBCMS Mortgage Trust, Series 2020-C6, Class A2, 2.69%, due 02/15/53 | |
| | BBCMS Mortgage Trust, Series 2022-C14, Class A4, 2.69%, due 02/15/55 | |
| | BBCMS Mortgage Trust, Series 2023-C21, Class A2, 6.30%, due 09/15/56(i) | |
| | Benchmark Mortgage Trust, Series 2019-B12, Class A2, 3.00%, due 08/15/52 | |
| | Benchmark Mortgage Trust, Series 2019-B13, Class A2, 2.89%, due 08/15/57 | |
| | Benchmark Mortgage Trust, Series 2019-B15, Class A4, 2.67%, due 12/15/72 | |
| | Benchmark Mortgage Trust, Series 2020-B17, Class A4, 2.04%, due 03/15/53 | |
| | Benchmark Mortgage Trust, Series 2020-B20, Class A2, 1.75%, due 10/15/53 | |
| | Benchmark Mortgage Trust, Series 2020-IG3, Class A2, 2.48%, due 09/15/48 144A | |
| | Benchmark Mortgage Trust, Series 2021-B23, Class A2, 1.62%, due 02/15/54 | |
| | Benchmark Mortgage Trust, Series 2021-B23, Class A4A1, 1.82%, due 02/15/54 | |
| | Benchmark Mortgage Trust, Series 2021-B24, Class A3, 2.01%, due 03/15/54 | |
| | Benchmark Mortgage Trust, Series 2021-B24, Class A4, 2.26%, due 03/15/54 | |
| | Benchmark Mortgage Trust, Series 2021-B28, Class ASB, 1.98%, due 08/15/54 | |
| | Benchmark Mortgage Trust, Series 2021-B31, Class A4, 2.42%, due 12/15/54 | |
| | Benchmark Mortgage Trust, Series 2022-B33, Class A5, 3.46%, due 03/15/55 | |
| | Benchmark Mortgage Trust, Series 2023-B39, Class A2, 6.57%, due 07/15/56(i) | |
114
See accompanying Notes to the Financial Statements.
Mercer Core Fixed Income FundSchedule of Investments (Continued)
(showing percentage of net assets)
March 31, 2024
| | | |
| | Mortgage Backed Securities - Private Issuers — continued |
| | Benchmark Mortgage Trust, Series 2023-B40, Class A2, 6.93%, due 12/15/56 | |
| | Benchmark Mortgage Trust, Series 2023-V2, Class A3, 5.81%, due 05/15/55(i) | |
| | BMO Mortgage Trust, Series 2023-5C1, Class A3, 6.53%, due 08/15/56(i) | |
| | BMO Mortgage Trust, Series 2023-5C2, Class A3, 7.05%, due 11/15/56(i) | |
| | BRAVO Residential Funding Trust, Series 2021-NQM1, Class A1, 0.94%, due 02/25/49(i) 144A | |
| | BRAVO Residential Funding Trust, Series 2023-RPL1, Class A1, 5.00%, due 05/25/63(i) 144A | |
| | BX Commercial Mortgage Trust, Series 2021-VOLT, Class A, 6.14% (1 mo. USD Term SOFR + 0.81%), due 09/15/36(b) 144A | |
| | BX Trust, Series 2022-CLS, Class A, 5.76%, due 10/13/27 144A | |
| | CD Mortgage Trust, Series 2019-CD8, Class A3, 2.66%, due 08/15/57 | |
| | CF Mortgage Trust, Series 2020-P1, Class A1, 2.84%, due 04/15/25(i) 144A | |
| | CFCRE Commercial Mortgage Trust, Series 2016-C4, Class A3, 3.01%, due 05/10/58 | |
| | CFCRE Commercial Mortgage Trust, Series 2016-C6, Class A2, 2.95%, due 11/10/49 | |
| | CFK Trust, Series 2020-MF2, Class A, 2.39%, due 03/15/39 144A | |
| | Citigroup Commercial Mortgage Trust, Series 2014-GC21, Class XB, 0.41%, due | |
| | Citigroup Commercial Mortgage Trust, Series 2019-C7, Class A3, 2.86%, due 12/15/72 | |
| | Citigroup Commercial Mortgage Trust, Series 2023-SMRT, Class A, 5.82%, due 10/12/40(i) 144A | |
| | COLT Mortgage Loan Trust, Series 2021-2, Class A1, 0.92%, due 08/25/66(i) 144A | |
| | COLT Mortgage Loan Trust, Series 2021-3, Class A1, 0.96%, due 09/27/66(i) 144A | |
| | COLT Mortgage Loan Trust, Series 2021-HX1, Class A1, 1.11%, due 10/25/66(i) 144A | |
| | COLT Trust, Series 2020-RPL1, Class A1, 1.39%, due 01/25/65(i) 144A | |
| | COMM Mortgage Trust, Series 2013-300P, Class D, 4.39%, due 08/10/30(i) 144A | |
| | COMM Mortgage Trust, Series 2015-CR22, Class A5, 3.31%, due 03/10/48 | |
| | COMM Mortgage Trust, Series 2015-CR25, Class A3, 3.51%, due 08/10/48 | |
| | COMM Mortgage Trust, Series 2015-CR27, Class A4, 3.61%, due 10/10/48 | |
| | COMM Mortgage Trust, Series 2017-PANW, Class A, 3.24%, due 10/10/29 144A | |
| | COMM Mortgage Trust, Series 2020-CBM, Class A2, 2.90%, due 02/10/37 144A | |
| | Compass Datacenters Issuer II LLC, Series 2024-1A, Class A1, 5.25%, due 02/25/49 144A | |
| | CSAIL Commercial Mortgage Trust, Series 2017-C8, Class A3, 3.13%, due 06/15/50 | |
| | CSAIL Commercial Mortgage Trust, Series 2017-CX10, Class A4, 3.19%, due 11/15/50 | |
| | CSAIL Commercial Mortgage Trust, Series 2019-C18, Class A3, 2.72%, due 12/15/52 | |
| | CSAIL Commercial Mortgage Trust, Series 2021-C20, Class A2, 2.49%, due 03/15/54 | |
| | CSMC Trust, Series 2018-RPL9, Class A, 3.85%, due 09/25/57(i) 144A | |
| | CSMC Trust, Series 2020-NET, Class A, 2.26%, due 08/15/37 144A | |
| | CSMC Trust, Series 2020-RPL6, Class A1, 3.40%, due 03/25/59(i) 144A | |
| | CSMC Trust, Series 2021-NQM2, Class A1, 1.18%, due 02/25/66(i) 144A | |
| | CSMC Trust, Series 2021-NQM3, Class A1, 1.02%, due 04/25/66(i) 144A | |
| | CSMC Trust, Series 2021-NQM5, Class A1, 0.94%, due 05/25/66(i) 144A | |
| | CSMC Trust, Series 2021-NQM6, Class A1, 1.17%, due 07/25/66(i) 144A | |
| | Ellington Financial Mortgage Trust, Series 2021-1, Class A1, 0.80%, due 02/25/66(i) 144A | |
| | Ellington Financial Mortgage Trust, Series 2021-2, Class A1, 0.93%, due 06/25/66(i) 144A | |
| | Federal Home Loan Mortgage Corp. STACR REMICS Trust, Series 2022-DNA1, Class M1A, 6.32% (SOFR 30-day average + 1.00%), due 01/25/42(b) 144A | |
See accompanying Notes to the Financial Statements.
115
Mercer Core Fixed Income FundSchedule of Investments (Continued)
(showing percentage of net assets)
March 31, 2024
| | | |
| | Mortgage Backed Securities - Private Issuers — continued |
| | Federal Home Loan Mortgage Corp. STACR REMICS Trust, Series 2022-DNA2, Class M1B, 7.72% (SOFR 30-day average + 2.40%), due 02/25/42(b) 144A | |
| | Federal Home Loan Mortgage Corp. STACR REMICS Trust, Series 2022-DNA3, Class M1B, 8.22% (SOFR 30-day average + 2.90%), due 04/25/42(b) 144A | |
| | Federal National Mortgage Association Connecticut Avenue Securities, Series 2023-R02, Class 1M1, 7.62% (SOFR 30-day average + 2.30%), due 01/25/43(b) 144A | |
| | Flagstar Mortgage Trust, Series 2020-2, Class A2, 3.00%, due 08/25/50(i) 144A | |
| | Flagstar Mortgage Trust, Series 2021-1, Class A2, 2.50%, due 02/01/51(i) 144A | |
| | GCAT Trust, Series 2021-NQM1, Class A1, 0.87%, due 01/25/66(i) 144A | |
| | GCAT Trust, Series 2021-NQM2, Class A1, 1.04%, due 05/25/66(i) 144A | |
| | GCAT Trust, Series 2021-NQM3, Class A1, 1.09%, due 05/25/66(i) 144A | |
| | GCAT Trust, Series 2023-NQM2, Class A1, 5.84%, due 11/25/67(c) 144A | |
| | GS Mortgage Securities Corp. Trust, Series 2020-UPTN, Class A, 2.75%, due 02/10/37 144A | |
| | GS Mortgage Securities Trust, Series 2015-GC28, Class A4, 3.14%, due 02/10/48 | |
| | GS Mortgage Securities Trust, Series 2015-GC30, Class A3, 3.12%, due 05/10/50 | |
| | GS Mortgage Securities Trust, Series 2020-GC47, Class A4, 2.12%, due 05/12/53 | |
| | GS Mortgage Securities Trust, Series 2020-GSA2, Class AAB, 1.66%, due 12/12/53 | |
| | GS Mortgage Securities Trust, Series 2021-GSA3, Class A4, 2.37%, due 12/15/54 | |
| | GS Mortgage-Backed Securities Corp. Trust, Series 2021-NQM1, Class A1, 1.02%, due 07/25/61(i) 144A | |
| | GS Mortgage-Backed Securities Trust, Series 2020-NQM1, Class A1, 1.38%, due 09/27/60(i) 144A | |
| | Imperial Fund Mortgage Trust, Series 2021-NQM1, Class A1, 1.07%, due 06/25/56(i) 144A | |
| | Imperial Fund Mortgage Trust, Series 2023-NQM1, Class A1, 5.94%, due 02/25/68(c) 144A | |
| | JP Morgan Chase Commercial Mortgage Securities Trust, Series 2016-JP2, Class A3, 2.56%, due 08/15/49 | |
| | JP Morgan Chase Commercial Mortgage Securities Trust, Series 2020-NNN, Class AFX, 2.81%, due 01/16/37 144A | |
| | JP Morgan Mortgage Trust, Series 2023-4, Class 1A4A, 5.50%, due 11/25/53(i) 144A | |
| | JPMCC Commercial Mortgage Securities Trust, Series 2017-JP6, Class A3, 3.11%, due 07/15/50 | |
| | JPMCC Commercial Mortgage Securities Trust, Series 2019-COR5, Class A2, 3.15%, due 06/13/52 | |
| | JPMDB Commercial Mortgage Securities Trust, Series 2016-C2, Class A3A, 2.88%, due 06/15/49 | |
| | JPMDB Commercial Mortgage Securities Trust, Series 2017-C5, Class A4, 3.41%, due 03/15/50 | |
| | Legacy Mortgage Asset Trust, Series 2019-PR1, Class A1, 7.86%, due 09/25/59(c) 144A | |
| | Legacy Mortgage Asset Trust, Series 2020-GS1, Class A1, 6.88%, due 10/25/59(c) 144A | |
| | Legacy Mortgage Asset Trust, Series 2021-GS1, Class A1, 4.89%, due 10/25/66(c) 144A | |
| | MFA Trust, Series 2021-NQM1, Class A1, 1.15%, due 04/25/65(i) 144A | |
| | Mill City Mortgage Trust, Series 2015-1, Class M3, 3.82%, due 06/25/56(i) 144A | |
| | Morgan Stanley Bank of America Merrill Lynch Trust, Series 2015-C22, Class A4, 3.31%, due 04/15/48 | |
| | Morgan Stanley Bank of America Merrill Lynch Trust, Series 2015-C24, Class A4, 3.73%, due 05/15/48 | |
| | Morgan Stanley Bank of America Merrill Lynch Trust, Series 2016-C30, Class A4, 2.60%, due 09/15/49 | |
| | Morgan Stanley Capital I Trust, Series 2016-UB11, Class A3, 2.53%, due 08/15/49 | |
116
See accompanying Notes to the Financial Statements.
Mercer Core Fixed Income FundSchedule of Investments (Continued)
(showing percentage of net assets)
March 31, 2024
| | | |
| | Mortgage Backed Securities - Private Issuers — continued |
| | Morgan Stanley Capital I Trust, Series 2018-L1, Class A3, 4.14%, due 10/15/51 | |
| | Morgan Stanley Capital I Trust, Series 2019-H6, Class A3, 3.16%, due 06/15/52 | |
| | Morgan Stanley Capital I Trust, Series 2020-HR8, Class A4, 2.04%, due 07/15/53 | |
| | Natixis Commercial Mortgage Securities Trust, Series 2018-ALXA, Class C, 4.32%, due 01/15/43(i) 144A | |
| | New Residential Mortgage Loan Trust, Series 2018-4A, Class A1S, 6.19% (1 mo. USD Term SOFR + 0.86%), due 01/25/48(b) 144A | |
| | NYMT Loan Trust, Series 2022-CP1, Class A1, 2.04%, due 07/25/61 144A | |
| | OBX Trust, Series 2020-EXP2, Class A3, 2.50%, due 05/25/60(i) 144A | |
| | OBX Trust, Series 2021-NQM2, Class A1, 1.10%, due 05/25/61(i) 144A | |
| | OBX Trust, Series 2021-NQM3, Class A1, 1.05%, due 07/25/61(i) 144A | |
| | Provident Funding Mortgage Trust, Series 2020-F1, Class A2, 2.00%, due 01/25/36(i) 144A | |
| | Seasoned Credit Risk Transfer Trust, Series 2018-2, Class MA, 3.50%, due 11/25/57 | |
| | Seasoned Credit Risk Transfer Trust, Series 2018-3, Class MA, 3.50%, due 08/25/57(i) | |
| | Seasoned Credit Risk Transfer Trust, Series 2018-4, Class MA, 3.50%, due 03/25/58 | |
| | Seasoned Credit Risk Transfer Trust, Series 2019-1, Class MA, 3.50%, due 07/25/58 | |
| | Seasoned Credit Risk Transfer Trust, Series 2019-2, Class MA, 3.50%, due 08/25/58 | |
| | Seasoned Credit Risk Transfer Trust, Series 2019-4, Class MA, 3.00%, due 02/25/59 | |
| | Seasoned Credit Risk Transfer Trust, Series 2020-1, Class MA, 2.50%, due 08/25/59 | |
| | Seasoned Credit Risk Transfer Trust, Series 2022-1, Class MAU, 3.25%, due 11/25/61 | |
| | Sequoia Mortgage Trust, Series 2020-3, Class A4, 3.00%, due 04/25/50(i) 144A | |
| | SLG Office Trust, Series 2021-OVA, Class D, 2.85%, due 07/15/41 144A | |
| | Starwood Mortgage Residential Trust, Series 2022-1, Class A1, 2.45%, due 12/25/66(i) 144A | |
| | Towd Point Mortgage Trust, Series 2018-4, Class A1, 3.00%, due 06/25/58(i) 144A | |
| | Towd Point Mortgage Trust, Series 2019-1, Class A1, 3.75%, due 03/25/58(i) 144A | |
| | Towd Point Mortgage Trust, Series 2019-4, Class A1, 2.90%, due 10/25/59(i) 144A | |
| | Towd Point Mortgage Trust, Series 2019-HY3, Class A1A, 6.44% (1 mo. USD Term SOFR + 1.11%), due 10/25/59(b) 144A | |
| | Towd Point Mortgage Trust, Series 2020-4, Class A1, 1.75%, due 10/25/60 144A | |
| | Towd Point Mortgage Trust, Series 2021-SJ2, Class A1B, 2.25%, due 12/25/61(i) 144A | |
| | UBS Commercial Mortgage Trust, Series 2017-C2, Class ASB, 3.26%, due 08/15/50 | |
| | Verus Securitization Trust, Series 2020-5, Class A1, 1.22%, due 05/25/65(c) 144A | |
| | Verus Securitization Trust, Series 2021-3, Class A1, 1.05%, due 06/25/66(i) 144A | |
| | Verus Securitization Trust, Series 2021-4, Class A1, 0.94%, due 07/25/66(i) 144A | |
| | Verus Securitization Trust, Series 2021-5, Class A1, 1.01%, due 09/25/66(i) 144A | |
| | Verus Securitization Trust, Series 2021-R1, Class A1, 0.82%, due 10/25/63(i) 144A | |
| | WaMu Mortgage Pass-Through Certificates Trust, Series 2003-AR9, Class 1A7, 5.69%, | |
| | Wells Fargo Commercial Mortgage Trust, Series 2016-BNK1, Class A2, 2.40%, due 08/15/49 | |
| | Wells Fargo Commercial Mortgage Trust, Series 2016-NXS6, Class A3, 2.64%, due 11/15/49 | |
| | Wells Fargo Commercial Mortgage Trust, Series 2017-C38, Class A4, 3.19%, due 07/15/50 | |
| | Wells Fargo Commercial Mortgage Trust, Series 2017-RB1, Class A4, 3.37%, due 03/15/50 | |
| | Wells Fargo Commercial Mortgage Trust, Series 2020-C56, Class A3, 1.94%, due 06/15/53 | |
See accompanying Notes to the Financial Statements.
117
Mercer Core Fixed Income FundSchedule of Investments (Continued)
(showing percentage of net assets)
March 31, 2024
| | | |
| | Mortgage Backed Securities - Private Issuers — continued |
| | Wells Fargo Commercial Mortgage Trust, Series 2021-C59, Class A3, 1.96%, due 04/15/54 | |
| | Wells Fargo Commercial Mortgage Trust, Series 2021-C60, Class ASB, 2.13%, due 08/15/54 | |
| | WFRBS Commercial Mortgage Trust, Series 2014-C23, Class A5, 3.92%, due 10/15/57 | |
| | | |
| | Mortgage Backed Securities - U.S. Government Agency Obligations — 27.1% |
| | Federal Home Loan Mortgage Corp., Pool # A89870, 4.50%, due 11/01/39 | |
| | Federal Home Loan Mortgage Corp., Pool # A96970, 4.00%, due 02/01/41 | |
| | Federal Home Loan Mortgage Corp., Pool # C91908, 3.00%, due 01/01/37 | |
| | Federal Home Loan Mortgage Corp., Pool # G06231, 4.00%, due 12/01/40 | |
| | Federal Home Loan Mortgage Corp., Pool # G06409, 6.00%, due 11/01/39 | |
| | Federal Home Loan Mortgage Corp., Pool # G06875, 5.50%, due 12/01/38 | |
| | Federal Home Loan Mortgage Corp., Pool # G07021, 5.00%, due 09/01/39 | |
| | Federal Home Loan Mortgage Corp., Pool # G07816, 4.50%, due 09/01/42 | |
| | Federal Home Loan Mortgage Corp., Pool # G08537, 3.00%, due 07/01/43 | |
| | Federal Home Loan Mortgage Corp., Pool # G08672, 4.00%, due 10/01/45 | |
| | Federal Home Loan Mortgage Corp., Pool # G08721, 3.00%, due 09/01/46 | |
| | Federal Home Loan Mortgage Corp., Pool # G08726, 3.00%, due 10/01/46 | |
| | Federal Home Loan Mortgage Corp., Pool # G08735, 4.50%, due 10/01/46 | |
| | Federal Home Loan Mortgage Corp., Pool # G08748, 3.50%, due 02/01/47 | |
| | Federal Home Loan Mortgage Corp., Pool # G08749, 4.00%, due 02/01/47 | |
| | Federal Home Loan Mortgage Corp., Pool # G08771, 4.00%, due 07/01/47 | |
| | Federal Home Loan Mortgage Corp., Pool # G08786, 4.50%, due 10/01/47 | |
| | Federal Home Loan Mortgage Corp., Pool # G16177, 2.00%, due 01/01/32 | |
| | Federal Home Loan Mortgage Corp., Pool # G16634, 3.00%, due 10/01/31 | |
| | Federal Home Loan Mortgage Corp., Pool # G60359, 3.00%, due 12/01/45 | |
| | Federal Home Loan Mortgage Corp., Pool # G60581, 3.50%, due 05/01/46 | |
| | Federal Home Loan Mortgage Corp., Pool # G60722, 3.00%, due 10/01/46 | |
| | Federal Home Loan Mortgage Corp., Pool # G60767, 3.50%, due 10/01/46 | |
| | Federal Home Loan Mortgage Corp., Pool # G60788, 3.50%, due 12/01/46 | |
| | Federal Home Loan Mortgage Corp., Pool # G60804, 4.50%, due 05/01/42 | |
| | Federal Home Loan Mortgage Corp., Pool # G60934, 3.50%, due 06/01/45 | |
| | Federal Home Loan Mortgage Corp., Pool # G60985, 3.00%, due 05/01/47 | |
| | Federal Home Loan Mortgage Corp., Pool # G60989, 3.00%, due 12/01/46 | |
| | Federal Home Loan Mortgage Corp., Pool # G61022, 3.00%, due 04/01/45 | |
| | Federal Home Loan Mortgage Corp., Pool # G61581, 4.00%, due 08/01/48 | |
| | Federal Home Loan Mortgage Corp., Pool # G61748, 3.50%, due 11/01/48 | |
| | Federal Home Loan Mortgage Corp., Pool # G61995, 4.00%, due 11/01/44 | |
| | Federal Home Loan Mortgage Corp., Pool # G67700, 3.50%, due 08/01/46 | |
| | Federal Home Loan Mortgage Corp., Pool # G67701, 3.00%, due 10/01/46 | |
| | Federal Home Loan Mortgage Corp., Pool # G67703, 3.50%, due 04/01/47 | |
| | Federal Home Loan Mortgage Corp., Pool # G67708, 3.50%, due 03/01/48 | |
| | Federal Home Loan Mortgage Corp., Pool # J24414, 2.50%, due 06/01/28 | |
| | Federal Home Loan Mortgage Corp., Pool # J34888, 2.50%, due 07/01/31 | |
| | Federal Home Loan Mortgage Corp., Pool # Q09224, 4.00%, due 07/01/42 | |
| | Federal Home Loan Mortgage Corp., Pool # Q11218, 3.50%, due 09/01/42 | |
| | Federal Home Loan Mortgage Corp., Pool # Q12052, 3.50%, due 10/01/42 | |
118
See accompanying Notes to the Financial Statements.
Mercer Core Fixed Income FundSchedule of Investments (Continued)
(showing percentage of net assets)
March 31, 2024
| | | |
| | Mortgage Backed Securities - U.S. Government Agency Obligations — continued |
| | Federal Home Loan Mortgage Corp., Pool # Q12862, 3.50%, due 11/01/42 | |
| | Federal Home Loan Mortgage Corp., Pool # Q17792, 3.50%, due 05/01/43 | |
| | Federal Home Loan Mortgage Corp., Pool # Q36815, 4.00%, due 10/01/45 | |
| | Federal Home Loan Mortgage Corp., Pool # Q37986, 3.50%, due 12/01/45 | |
| | Federal Home Loan Mortgage Corp., Pool # Q41918, 3.50%, due 07/01/46 | |
| | Federal Home Loan Mortgage Corp., Pool # Q42618, 3.00%, due 08/01/46 | |
| | Federal Home Loan Mortgage Corp., Pool # Q44399, 3.50%, due 11/01/46 | |
| | Federal Home Loan Mortgage Corp., Pool # Q44963, 3.50%, due 12/01/46 | |
| | Federal Home Loan Mortgage Corp., Pool # Q45741, 3.50%, due 01/01/47 | |
| | Federal Home Loan Mortgage Corp., Pool # Q46015, 3.50%, due 02/01/47 | |
| | Federal Home Loan Mortgage Corp., Pool # Q47384, 4.00%, due 04/01/47 | |
| | Federal Home Loan Mortgage Corp., Pool # Q48463, 4.00%, due 06/01/47 | |
| | Federal Home Loan Mortgage Corp., Pool # Q49494, 4.50%, due 07/01/47 | |
| | Federal Home Loan Mortgage Corp., Pool # Q52312, 4.00%, due 11/01/47 | |
| | Federal Home Loan Mortgage Corp., Pool # Q54957, 4.00%, due 03/01/48 | |
| | Federal Home Loan Mortgage Corp., Pool # QA6367, 3.00%, due 01/01/50 | |
| | Federal Home Loan Mortgage Corp., Pool # QA7234, 3.00%, due 02/01/50 | |
| | Federal Home Loan Mortgage Corp., Pool # QA8518, 3.00%, due 04/01/50 | |
| | Federal Home Loan Mortgage Corp., Pool # QB0220, 3.00%, due 06/01/50 | |
| | Federal Home Loan Mortgage Corp., Pool # QB3535, 2.00%, due 09/01/50 | |
| | Federal Home Loan Mortgage Corp., Pool # QB4847, 2.50%, due 10/01/50 | |
| | Federal Home Loan Mortgage Corp., Pool # QB6476, 2.50%, due 12/01/50 | |
| | Federal Home Loan Mortgage Corp., Pool # QC0039, 2.50%, due 03/01/51 | |
| | Federal Home Loan Mortgage Corp., Pool # QC4339, 2.00%, due 07/01/51 | |
| | Federal Home Loan Mortgage Corp., Pool # QC5189, 2.50%, due 08/01/51 | |
| | Federal Home Loan Mortgage Corp., Pool # QC6357, 2.50%, due 09/01/51 | |
| | Federal Home Loan Mortgage Corp., Pool # QD6056, 3.00%, due 02/01/52 | |
| | Federal Home Loan Mortgage Corp., Pool # QD6057, 3.00%, due 02/01/52 | |
| | Federal Home Loan Mortgage Corp., Pool # QD9911, 2.50%, due 04/01/52 | |
| | Federal Home Loan Mortgage Corp., Pool # QE0375, 4.00%, due 04/01/52 | |
| | Federal Home Loan Mortgage Corp., Pool # QE1497, 4.00%, due 05/01/52 | |
| | Federal Home Loan Mortgage Corp., Pool # QN1779, 2.50%, due 03/01/35 | |
| | Federal Home Loan Mortgage Corp., Pool # RA1343, 3.00%, due 09/01/49 | |
| | Federal Home Loan Mortgage Corp., Pool # RA1776, 3.00%, due 12/01/49 | |
| | Federal Home Loan Mortgage Corp., Pool # RA1860, 3.00%, due 12/01/49 | |
| | Federal Home Loan Mortgage Corp., Pool # RA2572, 3.50%, due 05/01/50 | |
| | Federal Home Loan Mortgage Corp., Pool # RA3206, 2.00%, due 08/01/50 | |
| | Federal Home Loan Mortgage Corp., Pool # RA4912, 3.00%, due 03/01/51 | |
| | Federal Home Loan Mortgage Corp., Pool # RA5286, 2.50%, due 05/01/51 | |
| | Federal Home Loan Mortgage Corp., Pool # RA6432, 2.50%, due 12/01/51 | |
| | Federal Home Loan Mortgage Corp., Pool # RA6944, 3.50%, due 03/01/52 | |
| | Federal Home Loan Mortgage Corp., Pool # RA6951, 3.50%, due 03/01/52 | |
| | Federal Home Loan Mortgage Corp., Pool # RA7195, 3.50%, due 04/01/52 | |
| | Federal Home Loan Mortgage Corp., Pool # RA7407, 4.00%, due 05/01/52 | |
| | Federal Home Loan Mortgage Corp., Pool # RA7545, 4.00%, due 06/01/52 | |
| | Federal Home Loan Mortgage Corp., Pool # RA7779, 4.50%, due 08/01/52 | |
| | Federal Home Loan Mortgage Corp., Pool # RA7881, 5.00%, due 09/01/52 | |
| | Federal Home Loan Mortgage Corp., Pool # RA7942, 5.50%, due 09/01/52 | |
| | Federal Home Loan Mortgage Corp., Pool # RA8248, 5.00%, due 11/01/52 | |
See accompanying Notes to the Financial Statements.
119
Mercer Core Fixed Income FundSchedule of Investments (Continued)
(showing percentage of net assets)
March 31, 2024
| | | |
| | Mortgage Backed Securities - U.S. Government Agency Obligations — continued |
| | Federal Home Loan Mortgage Corp., Pool # RB5111, 2.00%, due 05/01/41 | |
| | Federal Home Loan Mortgage Corp., Pool # RC1916, 2.00%, due 06/01/36 | |
| | Federal Home Loan Mortgage Corp., Pool # SB0307, 2.50%, due 02/01/35 | |
| | Federal Home Loan Mortgage Corp., Pool # SB0385, 3.00%, due 07/01/35 | |
| | Federal Home Loan Mortgage Corp., Pool # SB8166, 3.50%, due 06/01/37 | |
| | Federal Home Loan Mortgage Corp., Pool # SB8189, 4.00%, due 11/01/37 | |
| | Federal Home Loan Mortgage Corp., Pool # SB8199, 4.50%, due 12/01/37 | |
| | Federal Home Loan Mortgage Corp., Pool # SB8205, 4.50%, due 01/01/38 | |
| | Federal Home Loan Mortgage Corp., Pool # SB8212, 4.50%, due 02/01/38 | |
| | Federal Home Loan Mortgage Corp., Pool # SB8213, 5.00%, due 02/01/38 | |
| | Federal Home Loan Mortgage Corp., Pool # SB8260, 5.00%, due 10/01/38 | |
| | Federal Home Loan Mortgage Corp., Pool # SB8262, 5.00%, due 09/01/38 | |
| | Federal Home Loan Mortgage Corp., Pool # SB8277, 5.00%, due 01/01/39 | |
| | Federal Home Loan Mortgage Corp., Pool # SB8510, 2.00%, due 02/01/36 | |
| | Federal Home Loan Mortgage Corp., Pool # SD0100, 3.00%, due 10/01/49 | |
| | Federal Home Loan Mortgage Corp., Pool # SD0436, 2.50%, due 09/01/50 | |
| | Federal Home Loan Mortgage Corp., Pool # SD0499, 3.00%, due 08/01/50 | |
| | Federal Home Loan Mortgage Corp., Pool # SD0558, 2.50%, due 03/01/51 | |
| | Federal Home Loan Mortgage Corp., Pool # SD0619, 4.00%, due 07/01/50 | |
| | Federal Home Loan Mortgage Corp., Pool # SD0742, 2.50%, due 11/01/51 | |
| | Federal Home Loan Mortgage Corp., Pool # SD0815, 3.00%, due 01/01/52 | |
| | Federal Home Loan Mortgage Corp., Pool # SD0905, 3.00%, due 03/01/52 | |
| | Federal Home Loan Mortgage Corp., Pool # SD1050, 4.50%, due 07/01/52 | |
| | Federal Home Loan Mortgage Corp., Pool # SD1217, 2.00%, due 03/01/52 | |
| | Federal Home Loan Mortgage Corp., Pool # SD1265, 4.50%, due 06/01/52 | |
| | Federal Home Loan Mortgage Corp., Pool # SD1295, 5.00%, due 07/01/52 | |
| | Federal Home Loan Mortgage Corp., Pool # SD1325, 4.00%, due 08/01/52 | |
| | Federal Home Loan Mortgage Corp., Pool # SD1446, 4.50%, due 08/01/52 | |
| | Federal Home Loan Mortgage Corp., Pool # SD1454, 4.50%, due 08/01/52 | |
| | Federal Home Loan Mortgage Corp., Pool # SD1475, 4.50%, due 08/01/52 | |
| | Federal Home Loan Mortgage Corp., Pool # SD1483, 4.00%, due 08/01/52 | |
| | Federal Home Loan Mortgage Corp., Pool # SD1517, 4.50%, due 09/01/52 | |
| | Federal Home Loan Mortgage Corp., Pool # SD1606, 4.50%, due 09/01/52 | |
| | Federal Home Loan Mortgage Corp., Pool # SD1695, 5.00%, due 10/01/52 | |
| | Federal Home Loan Mortgage Corp., Pool # SD1807, 4.50%, due 07/01/52 | |
| | Federal Home Loan Mortgage Corp., Pool # SD1809, 4.50%, due 09/01/52 | |
| | Federal Home Loan Mortgage Corp., Pool # SD1944, 5.00%, due 12/01/52 | |
| | Federal Home Loan Mortgage Corp., Pool # SD1999, 5.00%, due 12/01/52 | |
| | Federal Home Loan Mortgage Corp., Pool # SD2032, 5.00%, due 12/01/52 | |
| | Federal Home Loan Mortgage Corp., Pool # SD2172, 5.50%, due 02/01/53 | |
| | Federal Home Loan Mortgage Corp., Pool # SD2273, 4.50%, due 12/01/52 | |
| | Federal Home Loan Mortgage Corp., Pool # SD2318, 5.00%, due 02/01/53 | |
| | Federal Home Loan Mortgage Corp., Pool # SD2526, 4.00%, due 08/01/49 | |
| | Federal Home Loan Mortgage Corp., Pool # SD2683, 4.50%, due 04/01/53 | |
| | Federal Home Loan Mortgage Corp., Pool # SD2954, 4.50%, due 04/01/53 | |
| | Federal Home Loan Mortgage Corp., Pool # SD3159, 5.00%, due 06/01/53 | |
| | Federal Home Loan Mortgage Corp., Pool # SD3338, 5.50%, due 06/01/53 | |
| | Federal Home Loan Mortgage Corp., Pool # SD3372, 5.00%, due 07/01/53 | |
| | Federal Home Loan Mortgage Corp., Pool # SD3401, 5.00%, due 07/01/53 | |
120
See accompanying Notes to the Financial Statements.
Mercer Core Fixed Income FundSchedule of Investments (Continued)
(showing percentage of net assets)
March 31, 2024
| | | |
| | Mortgage Backed Securities - U.S. Government Agency Obligations — continued |
| | Federal Home Loan Mortgage Corp., Pool # SD3425, 5.50%, due 07/01/53 | |
| | Federal Home Loan Mortgage Corp., Pool # SD3435, 5.00%, due 07/01/53 | |
| | Federal Home Loan Mortgage Corp., Pool # SD3507, 4.00%, due 04/01/53 | |
| | Federal Home Loan Mortgage Corp., Pool # SD3562, 4.50%, due 08/01/53 | |
| | Federal Home Loan Mortgage Corp., Pool # SD3563, 4.50%, due 08/01/53 | |
| | Federal Home Loan Mortgage Corp., Pool # SD3566, 5.00%, due 08/01/53 | |
| | Federal Home Loan Mortgage Corp., Pool # SD3780, 4.00%, due 08/01/52 | |
| | Federal Home Loan Mortgage Corp., Pool # SD4220, 5.00%, due 09/01/53 | |
| | Federal Home Loan Mortgage Corp., Pool # SD4253, 3.50%, due 07/01/52 | |
| | Federal Home Loan Mortgage Corp., Pool # SD4287, 4.50%, due 09/01/53 | |
| | Federal Home Loan Mortgage Corp., Pool # SD4660, 4.00%, due 08/01/52 | |
| | Federal Home Loan Mortgage Corp., Pool # SD4904, 3.50%, due 07/01/52 | |
| | Federal Home Loan Mortgage Corp., Pool # SD4934, 4.00%, due 04/01/53 | |
| | Federal Home Loan Mortgage Corp., Pool # SD7543, 2.50%, due 08/01/51 | |
| | Federal Home Loan Mortgage Corp., Pool # SD7544, 3.00%, due 07/01/51 | |
| | Federal Home Loan Mortgage Corp., Pool # SD7548, 2.50%, due 11/01/51 | |
| | Federal Home Loan Mortgage Corp., Pool # SD7551, 3.00%, due 01/01/52 | |
| | Federal Home Loan Mortgage Corp., Pool # SD7557, 4.50%, due 12/01/52 | |
| | Federal Home Loan Mortgage Corp., Pool # SD8025, 3.50%, due 11/01/49 | |
| | Federal Home Loan Mortgage Corp., Pool # SD8075, 3.50%, due 07/01/50 | |
| | Federal Home Loan Mortgage Corp., Pool # SD8090, 2.00%, due 09/01/50 | |
| | Federal Home Loan Mortgage Corp., Pool # SD8104, 1.50%, due 11/01/50 | |
| | Federal Home Loan Mortgage Corp., Pool # SD8113, 2.00%, due 12/01/50 | |
| | Federal Home Loan Mortgage Corp., Pool # SD8121, 2.00%, due 01/01/51 | |
| | Federal Home Loan Mortgage Corp., Pool # SD8128, 2.00%, due 02/01/51 | |
| | Federal Home Loan Mortgage Corp., Pool # SD8134, 2.00%, due 03/01/51 | |
| | Federal Home Loan Mortgage Corp., Pool # SD8140, 2.00%, due 04/01/51 | |
| | Federal Home Loan Mortgage Corp., Pool # SD8141, 2.50%, due 04/01/51 | |
| | Federal Home Loan Mortgage Corp., Pool # SD8151, 2.50%, due 06/01/51 | |
| | Federal Home Loan Mortgage Corp., Pool # SD8167, 2.50%, due 09/01/51 | |
| | Federal Home Loan Mortgage Corp., Pool # SD8177, 2.00%, due 11/01/51 | |
| | Federal Home Loan Mortgage Corp., Pool # SD8183, 2.50%, due 12/01/51 | |
| | Federal Home Loan Mortgage Corp., Pool # SD8189, 2.50%, due 01/01/52 | |
| | Federal Home Loan Mortgage Corp., Pool # SD8221, 3.50%, due 06/01/52 | |
| | Federal Home Loan Mortgage Corp., Pool # SD8227, 4.00%, due 07/01/52 | |
| | Federal Home Loan Mortgage Corp., Pool # SD8236, 3.50%, due 08/01/52 | |
| | Federal Home Loan Mortgage Corp., Pool # SD8243, 3.50%, due 09/01/52 | |
| | Federal Home Loan Mortgage Corp., Pool # SD8278, 6.00%, due 12/01/52 | |
| | Federal Home Loan Mortgage Corp., Pool # SD8288, 5.00%, due 01/01/53 | |
| | Federal Home Loan Mortgage Corp., Pool # SD8289, 5.50%, due 01/01/53 | |
| | Federal Home Loan Mortgage Corp., Pool # V60565, 3.00%, due 06/01/29 | |
| | Federal Home Loan Mortgage Corp., Pool # V60599, 3.00%, due 09/01/29 | |
| | Federal Home Loan Mortgage Corp., Pool # V82292, 4.00%, due 04/01/46 | |
| | Federal Home Loan Mortgage Corp., Pool # V82848, 3.00%, due 12/01/46 | |
| | Federal Home Loan Mortgage Corp., Pool # V82980, 3.50%, due 02/01/47 | |
| | Federal Home Loan Mortgage Corp., Pool # ZM1609, 3.50%, due 09/01/46 | |
| | Federal Home Loan Mortgage Corp., Pool # ZS4727, 4.00%, due 07/01/47 | |
| | Federal Home Loan Mortgage Corp., Pool # ZS4760, 4.00%, due 03/01/48 | |
| | Federal Home Loan Mortgage Corp., Pool # ZS4763, 3.50%, due 04/01/48 | |
See accompanying Notes to the Financial Statements.
121
Mercer Core Fixed Income FundSchedule of Investments (Continued)
(showing percentage of net assets)
March 31, 2024
| | | |
| | Mortgage Backed Securities - U.S. Government Agency Obligations — continued |
| | Federal Home Loan Mortgage Corp., Pool # ZS7930, 3.00%, due 01/01/33 | |
| | Federal Home Loan Mortgage Corp., Pool # ZT0536, 3.50%, due 03/01/48 | |
| | Federal Home Loan Mortgage Corp., Pool # ZT0657, 6.00%, due 07/01/40 | |
| | Federal Home Loan Mortgage Corp., Pool # ZT1748, 5.00%, due 01/01/49 | |
| | Federal Home Loan Mortgage Corp., Pool # ZT2100, 3.00%, due 04/01/47 | |
| | Federal Home Loan Mortgage Corp. Multifamily Structured Pass-Through Certificates, Series K106, Class X1, 1.32%, due 01/25/30(i) | |
| | Federal Home Loan Mortgage Corp. Reference REMICS, Series R007, Class ZA, 6.00%, due 05/15/36 | |
| | Federal Home Loan Mortgage Corp. REMICS, Series 5250, Class NH, 3.00%, due 08/25/52 | |
| | Federal National Mortgage Association, Pool # 745148, 5.00%, due 01/01/36 | |
| | Federal National Mortgage Association, Pool # 932807, 4.00%, due 09/01/40 | |
| | Federal National Mortgage Association, Pool # 983471, 5.50%, due 05/01/38 | |
| | Federal National Mortgage Association, Pool # 985184, 5.50%, due 08/01/38 | |
| | Federal National Mortgage Association, Pool # 995245, 5.00%, due 01/01/39 | |
| | Federal National Mortgage Association, Pool # AB5369, 3.50%, due 06/01/42 | |
| | Federal National Mortgage Association, Pool # AB6212, 3.00%, due 09/01/42 | |
| | Federal National Mortgage Association, Pool # AB6802, 3.50%, due 11/01/42 | |
| | Federal National Mortgage Association, Pool # AB7059, 2.50%, due 11/01/42 | |
| | Federal National Mortgage Association, Pool # AB8703, 3.00%, due 03/01/38 | |
| | Federal National Mortgage Association, Pool # AB9383, 4.00%, due 05/01/43 | |
| | Federal National Mortgage Association, Pool # AB9659, 3.00%, due 06/01/43 | |
| | Federal National Mortgage Association, Pool # AC3668, 4.50%, due 10/01/39 | |
| | Federal National Mortgage Association, Pool # AD9153, 4.50%, due 08/01/40 | |
| | Federal National Mortgage Association, Pool # AE0469, 6.00%, due 12/01/39 | |
| | Federal National Mortgage Association, Pool # AH4404, 4.00%, due 01/01/41 | |
| | Federal National Mortgage Association, Pool # AI1892, 5.00%, due 05/01/41 | |
| | Federal National Mortgage Association, Pool # AI4815, 4.50%, due 06/01/41 | |
| | Federal National Mortgage Association, Pool # AJ9278, 3.50%, due 12/01/41 | |
| | Federal National Mortgage Association, Pool # AJ9317, 4.00%, due 01/01/42 | |
| | Federal National Mortgage Association, Pool # AL0215, 4.50%, due 04/01/41 | |
| | Federal National Mortgage Association, Pool # AL1895, 3.50%, due 06/01/42 | |
| | Federal National Mortgage Association, Pool # AL2466, 4.00%, due 09/01/42 | |
| | Federal National Mortgage Association, Pool # AL3000, 3.50%, due 12/01/42 | |
| | Federal National Mortgage Association, Pool # AL3316, 3.50%, due 03/01/43 | |
| | Federal National Mortgage Association, Pool # AL5939, 3.50%, due 09/01/43 | |
| | Federal National Mortgage Association, Pool # AL6663, 4.00%, due 03/01/39 | |
| | Federal National Mortgage Association, Pool # AL7594, 3.50%, due 08/01/45 | |
| | Federal National Mortgage Association, Pool # AL8191, 4.00%, due 12/01/45 | |
| | Federal National Mortgage Association, Pool # AL8673, 3.50%, due 06/01/46 | |
| | Federal National Mortgage Association, Pool # AL9515, 3.50%, due 07/01/46 | |
| | Federal National Mortgage Association, Pool # AL9657, 3.50%, due 01/01/47 | |
| | Federal National Mortgage Association, Pool # AO4109, 4.00%, due 06/01/42 | |
| | Federal National Mortgage Association, Pool # AQ3381, 3.00%, due 11/01/42 | |
| | Federal National Mortgage Association, Pool # AQ7923, 3.00%, due 12/01/42 | |
| | Federal National Mortgage Association, Pool # AR8749, 3.00%, due 03/01/43 | |
| | Federal National Mortgage Association, Pool # AS5133, 3.50%, due 06/01/45 | |
| | Federal National Mortgage Association, Pool # AS5593, 3.50%, due 08/01/45 | |
| | Federal National Mortgage Association, Pool # AS6187, 3.50%, due 11/01/45 | |
122
See accompanying Notes to the Financial Statements.
Mercer Core Fixed Income FundSchedule of Investments (Continued)
(showing percentage of net assets)
March 31, 2024
| | | |
| | Mortgage Backed Securities - U.S. Government Agency Obligations — continued |
| | Federal National Mortgage Association, Pool # AS6188, 3.50%, due 11/01/45 | |
| | Federal National Mortgage Association, Pool # AS6286, 4.00%, due 12/01/45 | |
| | Federal National Mortgage Association, Pool # AS6304, 4.00%, due 12/01/45 | |
| | Federal National Mortgage Association, Pool # AS6452, 3.50%, due 01/01/46 | |
| | Federal National Mortgage Association, Pool # AS7010, 3.50%, due 04/01/46 | |
| | Federal National Mortgage Association, Pool # AS7693, 2.00%, due 08/01/31 | |
| | Federal National Mortgage Association, Pool # AS8073, 2.50%, due 10/01/46 | |
| | Federal National Mortgage Association, Pool # AS8483, 3.00%, due 12/01/46 | |
| | Federal National Mortgage Association, Pool # AS8647, 3.00%, due 01/01/47 | |
| | Federal National Mortgage Association, Pool # AZ3743, 3.50%, due 11/01/45 | |
| | Federal National Mortgage Association, Pool # BC1489, 3.00%, due 08/01/46 | |
| | Federal National Mortgage Association, Pool # BC9078, 4.00%, due 12/01/46 | |
| | Federal National Mortgage Association, Pool # BC9468, 3.00%, due 06/01/46 | |
| | Federal National Mortgage Association, Pool # BD7043, 4.00%, due 03/01/47 | |
| | Federal National Mortgage Association, Pool # BD7118, 3.50%, due 04/01/47 | |
| | Federal National Mortgage Association, Pool # BE2974, 4.00%, due 01/01/47 | |
| | Federal National Mortgage Association, Pool # BE7192, 4.00%, due 03/01/47 | |
| | Federal National Mortgage Association, Pool # BK1023, 4.50%, due 02/01/48 | |
| | Federal National Mortgage Association, Pool # BK7611, 4.50%, due 09/01/48 | |
| | Federal National Mortgage Association, Pool # BM1013, 3.50%, due 03/01/47 | |
| | Federal National Mortgage Association, Pool # BM1277, 4.00%, due 05/01/47 | |
| | Federal National Mortgage Association, Pool # BM1573, 3.50%, due 07/01/47 | |
| | Federal National Mortgage Association, Pool # BM1972, 3.50%, due 10/01/37 | |
| | Federal National Mortgage Association, Pool # BM3033, 3.00%, due 10/01/47 | |
| | Federal National Mortgage Association, Pool # BM3077, 3.00%, due 11/01/47 | |
| | Federal National Mortgage Association, Pool # BM3258, 3.00%, due 02/01/47 | |
| | Federal National Mortgage Association, Pool # BM3286, 4.50%, due 11/01/47 | |
| | Federal National Mortgage Association, Pool # BM3332, 3.50%, due 01/01/48 | |
| | Federal National Mortgage Association, Pool # BM3491, 4.50%, due 01/01/38 | |
| | Federal National Mortgage Association, Pool # BM3628, 3.50%, due 03/01/48 | |
| | Federal National Mortgage Association, Pool # BM3641, 4.00%, due 04/01/48 | |
| | Federal National Mortgage Association, Pool # BM4377, 5.78%, (1 yr. RFUCC Treasury + 1.88%), due 04/01/38(b) | |
| | Federal National Mortgage Association, Pool # BM4426, 3.50%, due 06/01/48 | |
| | Federal National Mortgage Association, Pool # BM4896, 3.00%, due 02/01/47 | |
| | Federal National Mortgage Association, Pool # BM5213, 3.00%, due 07/01/45 | |
| | Federal National Mortgage Association, Pool # BM5293, 3.50%, due 02/01/49 | |
| | Federal National Mortgage Association, Pool # BM5682, 3.50%, due 03/01/49 | |
| | Federal National Mortgage Association, Pool # BM5694, 4.00%, due 06/01/48 | |
| | Federal National Mortgage Association, Pool # BM5874, 4.00%, due 01/01/48 | |
| | Federal National Mortgage Association, Pool # BM5950, 3.00%, due 11/01/48 | |
| | Federal National Mortgage Association, Pool # BM5971, 3.50%, due 06/01/49 | |
| | Federal National Mortgage Association, Pool # BM6482, 5.79%, (1 yr. RFUCC Treasury + 1.58%), due 04/01/47(b) | |
| | Federal National Mortgage Association, Pool # BN6216, 4.50%, due 03/01/49 | |
| | Federal National Mortgage Association, Pool # BO1420, 3.50%, due 09/01/49 | |
| | Federal National Mortgage Association, Pool # BO1439, 3.00%, due 10/01/49 | |
| | Federal National Mortgage Association, Pool # BO5387, 3.50%, due 12/01/49 | |
| | Federal National Mortgage Association, Pool # BP2898, 4.00%, due 03/01/50 | |
See accompanying Notes to the Financial Statements.
123
Mercer Core Fixed Income FundSchedule of Investments (Continued)
(showing percentage of net assets)
March 31, 2024
| | | |
| | Mortgage Backed Securities - U.S. Government Agency Obligations — continued |
| | Federal National Mortgage Association, Pool # BP5462, 2.50%, due 06/01/50 | |
| | Federal National Mortgage Association, Pool # BP5568, 3.00%, due 06/01/50 | |
| | Federal National Mortgage Association, Pool # BP6618, 2.50%, due 08/01/50 | |
| | Federal National Mortgage Association, Pool # BQ3132, 2.00%, due 10/01/50 | |
| | Federal National Mortgage Association, Pool # BQ3138, 2.50%, due 10/01/50 | |
| | Federal National Mortgage Association, Pool # BU8763, 3.00%, due 04/01/52 | |
| | Federal National Mortgage Association, Pool # BV8474, 3.00%, due 05/01/52 | |
| | Federal National Mortgage Association, Pool # BW9918, 5.00%, due 10/01/52 | |
| | Federal National Mortgage Association, Pool # CA0623, 4.50%, due 10/01/47 | |
| | Federal National Mortgage Association, Pool # CA0655, 3.50%, due 11/01/47 | |
| | Federal National Mortgage Association, Pool # CA0855, 3.50%, due 12/01/47 | |
| | Federal National Mortgage Association, Pool # CA1545, 4.00%, due 04/01/48 | |
| | Federal National Mortgage Association, Pool # CA3828, 4.00%, due 07/01/49 | |
| | Federal National Mortgage Association, Pool # CA3986, 5.00%, due 08/01/49 | |
| | Federal National Mortgage Association, Pool # CA4149, 3.00%, due 09/01/49 | |
| | Federal National Mortgage Association, Pool # CA4546, 3.00%, due 11/01/49 | |
| | Federal National Mortgage Association, Pool # CA4831, 4.50%, due 12/01/49 | |
| | Federal National Mortgage Association, Pool # CA5229, 3.00%, due 02/01/50 | |
| | Federal National Mortgage Association, Pool # CA5556, 3.50%, due 04/01/50 | |
| | Federal National Mortgage Association, Pool # CA5571, 4.00%, due 04/01/50 | |
| | Federal National Mortgage Association, Pool # CA6097, 3.50%, due 06/01/50 | |
| | Federal National Mortgage Association, Pool # CA6635, 2.50%, due 08/01/50 | |
| | Federal National Mortgage Association, Pool # CA6738, 3.00%, due 08/01/50 | |
| | Federal National Mortgage Association, Pool # CA6799, 2.00%, due 08/01/50 | |
| | Federal National Mortgage Association, Pool # CA6871, 2.50%, due 08/01/35 | |
| | Federal National Mortgage Association, Pool # CA6872, 2.50%, due 08/01/35 | |
| | Federal National Mortgage Association, Pool # CA6909, 2.50%, due 09/01/50 | |
| | Federal National Mortgage Association, Pool # CA8062, 2.50%, due 12/01/50 | |
| | Federal National Mortgage Association, Pool # CA8895, 2.50%, due 02/01/51 | |
| | Federal National Mortgage Association, Pool # CA9090, 2.50%, due 02/01/51 | |
| | Federal National Mortgage Association, Pool # CA9171, 2.00%, due 02/01/51 | |
| | Federal National Mortgage Association, Pool # CA9227, 2.50%, due 02/01/51 | |
| | Federal National Mortgage Association, Pool # CB0671, 2.50%, due 06/01/51 | |
| | Federal National Mortgage Association, Pool # CB1273, 2.00%, due 08/01/51 | |
| | Federal National Mortgage Association, Pool # CB2095, 3.00%, due 11/01/51 | |
| | Federal National Mortgage Association, Pool # CB2287, 2.50%, due 12/01/51 | |
| | Federal National Mortgage Association, Pool # CB2858, 2.50%, due 02/01/52 | |
| | Federal National Mortgage Association, Pool # CB2889, 3.00%, due 02/01/52 | |
| | Federal National Mortgage Association, Pool # CB3126, 3.50%, due 03/01/52 | |
| | Federal National Mortgage Association, Pool # CB3158, 2.50%, due 03/01/52 | |
| | Federal National Mortgage Association, Pool # CB3512, 4.00%, due 05/01/52 | |
| | Federal National Mortgage Association, Pool # CB3618, 4.00%, due 05/01/52 | |
| | Federal National Mortgage Association, Pool # CB3865, 4.50%, due 06/01/52 | |
| | Federal National Mortgage Association, Pool # CB3910, 4.00%, due 06/01/52 | |
| | Federal National Mortgage Association, Pool # CB4025, 4.50%, due 07/01/52 | |
| | Federal National Mortgage Association, Pool # CB4028, 4.50%, due 07/01/52 | |
| | Federal National Mortgage Association, Pool # CB4088, 4.00%, due 07/01/52 | |
| | Federal National Mortgage Association, Pool # CB4090, 4.00%, due 07/01/52 | |
| | Federal National Mortgage Association, Pool # CB4101, 4.50%, due 07/01/52 | |
124
See accompanying Notes to the Financial Statements.
Mercer Core Fixed Income FundSchedule of Investments (Continued)
(showing percentage of net assets)
March 31, 2024
| | | |
| | Mortgage Backed Securities - U.S. Government Agency Obligations — continued |
| | Federal National Mortgage Association, Pool # CB4300, 4.50%, due 08/01/52 | |
| | Federal National Mortgage Association, Pool # CB4304, 4.50%, due 08/01/52 | |
| | Federal National Mortgage Association, Pool # CB4337, 4.50%, due 08/01/52 | |
| | Federal National Mortgage Association, Pool # CB4352, 5.00%, due 08/01/52 | |
| | Federal National Mortgage Association, Pool # CB4387, 4.50%, due 08/01/52 | |
| | Federal National Mortgage Association, Pool # CB4395, 4.50%, due 08/01/52 | |
| | Federal National Mortgage Association, Pool # CB4620, 5.00%, due 09/01/52 | |
| | Federal National Mortgage Association, Pool # CB4675, 4.50%, due 09/01/52 | |
| | Federal National Mortgage Association, Pool # CB4838, 5.00%, due 10/01/52 | |
| | Federal National Mortgage Association, Pool # CB4908, 5.50%, due 10/01/52 | |
| | Federal National Mortgage Association, Pool # CB5434, 5.00%, due 01/01/53 | |
| | Federal National Mortgage Association, Pool # CB6059, 5.00%, due 04/01/53 | |
| | Federal National Mortgage Association, Pool # CB6247, 5.00%, due 05/01/53 | |
| | Federal National Mortgage Association, Pool # CB6899, 5.00%, due 08/01/53 | |
| | Federal National Mortgage Association, Pool # CB7336, 5.50%, due 10/01/53 | |
| | Federal National Mortgage Association, Pool # FM0030, 3.00%, due 02/01/49 | |
| | Federal National Mortgage Association, Pool # FM1001, 3.50%, due 11/01/48 | |
| | Federal National Mortgage Association, Pool # FM1266, 5.00%, due 07/01/49 | |
| | Federal National Mortgage Association, Pool # FM1347, 3.00%, due 12/01/48 | |
| | Federal National Mortgage Association, Pool # FM1467, 3.00%, due 12/01/47 | |
| | Federal National Mortgage Association, Pool # FM1588, 3.00%, due 10/01/49 | |
| | Federal National Mortgage Association, Pool # FM1715, 3.00%, due 12/01/45 | |
| | Federal National Mortgage Association, Pool # FM1790, 3.00%, due 11/01/49 | |
| | Federal National Mortgage Association, Pool # FM1864, 3.00%, due 11/01/49 | |
| | Federal National Mortgage Association, Pool # FM2217, 3.00%, due 03/01/47 | |
| | Federal National Mortgage Association, Pool # FM2226, 3.00%, due 09/01/46 | |
| | Federal National Mortgage Association, Pool # FM2274, 4.00%, due 08/01/49 | |
| | Federal National Mortgage Association, Pool # FM2336, 4.00%, due 01/01/50 | |
| | Federal National Mortgage Association, Pool # FM2461, 3.50%, due 03/01/50 | |
| | Federal National Mortgage Association, Pool # FM2570, 4.50%, due 04/01/48 | |
| | Federal National Mortgage Association, Pool # FM2674, 4.00%, due 03/01/50 | |
| | Federal National Mortgage Association, Pool # FM3250, 3.50%, due 05/01/50 | |
| | Federal National Mortgage Association, Pool # FM4330, 2.50%, due 10/01/50 | |
| | Federal National Mortgage Association, Pool # FM4765, 2.00%, due 11/01/50 | |
| | Federal National Mortgage Association, Pool # FM4947, 2.00%, due 12/01/50 | |
| | Federal National Mortgage Association, Pool # FM5035, 4.00%, due 07/01/50 | |
| | Federal National Mortgage Association, Pool # FM5721, 3.00%, due 12/01/40 | |
| | Federal National Mortgage Association, Pool # FM5996, 4.50%, due 03/01/49 | |
| | Federal National Mortgage Association, Pool # FM6273, 3.00%, due 12/01/34 | |
| | Federal National Mortgage Association, Pool # FM6497, 2.00%, due 03/01/51 | |
| | Federal National Mortgage Association, Pool # FM6585, 3.50%, due 11/01/40 | |
| | Federal National Mortgage Association, Pool # FM7341, 4.00%, due 03/01/48 | |
| | Federal National Mortgage Association, Pool # FM7441, 3.00%, due 05/01/51 | |
| | Federal National Mortgage Association, Pool # FM7785, 4.00%, due 05/01/49 | |
| | Federal National Mortgage Association, Pool # FM7794, 4.00%, due 01/01/50 | |
| | Federal National Mortgage Association, Pool # FM8161, 2.50%, due 08/01/51 | |
| | Federal National Mortgage Association, Pool # FM8216, 4.00%, due 11/01/48 | |
| | Federal National Mortgage Association, Pool # FM8325, 2.50%, due 07/01/35 | |
| | Federal National Mortgage Association, Pool # FM8422, 2.50%, due 08/01/51 | |
See accompanying Notes to the Financial Statements.
125
Mercer Core Fixed Income FundSchedule of Investments (Continued)
(showing percentage of net assets)
March 31, 2024
| | | |
| | Mortgage Backed Securities - U.S. Government Agency Obligations — continued |
| | Federal National Mortgage Association, Pool # FM8451, 2.50%, due 08/01/51 | |
| | Federal National Mortgage Association, Pool # FM8603, 4.00%, due 09/01/49 | |
| | Federal National Mortgage Association, Pool # FM9412, 2.50%, due 11/01/51 | |
| | Federal National Mortgage Association, Pool # FM9461, 3.50%, due 11/01/51 | |
| | Federal National Mortgage Association, Pool # FM9468, 2.50%, due 11/01/51 | |
| | Federal National Mortgage Association, Pool # FM9674, 3.50%, due 06/01/49 | |
| | Federal National Mortgage Association, Pool # FM9726, 2.50%, due 11/01/51 | |
| | Federal National Mortgage Association, Pool # FM9728, 2.50%, due 11/01/51 | |
| | Federal National Mortgage Association, Pool # FM9977, 4.00%, due 02/01/50 | |
| | Federal National Mortgage Association, Pool # FS0027, 2.50%, due 11/01/51 | |
| | Federal National Mortgage Association, Pool # FS0065, 4.50%, due 12/01/50 | |
| | Federal National Mortgage Association, Pool # FS0194, 2.50%, due 01/01/52 | |
| | Federal National Mortgage Association, Pool # FS0644, 3.00%, due 02/01/52 | |
| | Federal National Mortgage Association, Pool # FS0703, 4.00%, due 01/01/49 | |
| | Federal National Mortgage Association, Pool # FS0715, 3.00%, due 01/01/52 | |
| | Federal National Mortgage Association, Pool # FS0717, 3.00%, due 02/01/52 | |
| | Federal National Mortgage Association, Pool # FS1201, 3.00%, due 01/01/50 | |
| | Federal National Mortgage Association, Pool # FS1205, 3.50%, due 04/01/52 | |
| | Federal National Mortgage Association, Pool # FS1228, 3.00%, due 03/01/52 | |
| | Federal National Mortgage Association, Pool # FS1285, 3.50%, due 02/01/52 | |
| | Federal National Mortgage Association, Pool # FS1427, 3.00%, due 02/01/50 | |
| | Federal National Mortgage Association, Pool # FS1590, 2.50%, due 04/01/52 | |
| | Federal National Mortgage Association, Pool # FS1602, 4.00%, due 07/01/49 | |
| | Federal National Mortgage Association, Pool # FS1624, 2.50%, due 10/01/51 | |
| | Federal National Mortgage Association, Pool # FS1637, 4.00%, due 04/01/52 | |
| | Federal National Mortgage Association, Pool # FS1938, 2.50%, due 02/01/52 | |
| | Federal National Mortgage Association, Pool # FS1976, 4.00%, due 08/01/51 | |
| | Federal National Mortgage Association, Pool # FS2167, 4.50%, due 06/01/52 | |
| | Federal National Mortgage Association, Pool # FS2187, 4.00%, due 06/01/52 | |
| | Federal National Mortgage Association, Pool # FS2238, 4.00%, due 03/01/51 | |
| | Federal National Mortgage Association, Pool # FS2354, 4.00%, due 06/01/52 | |
| | Federal National Mortgage Association, Pool # FS2415, 4.50%, due 08/01/52 | |
| | Federal National Mortgage Association, Pool # FS2616, 5.00%, due 08/01/52 | |
| | Federal National Mortgage Association, Pool # FS2896, 4.50%, due 09/01/52 | |
| | Federal National Mortgage Association, Pool # FS2920, 3.00%, due 07/01/36 | |
| | Federal National Mortgage Association, Pool # FS2969, 4.50%, due 10/01/52 | |
| | Federal National Mortgage Association, Pool # FS3045, 5.00%, due 10/01/52 | |
| | Federal National Mortgage Association, Pool # FS3067, 4.00%, due 07/01/52 | |
| | Federal National Mortgage Association, Pool # FS3139, 4.50%, due 10/01/52 | |
| | Federal National Mortgage Association, Pool # FS3158, 4.50%, due 11/01/52 | |
| | Federal National Mortgage Association, Pool # FS3175, 4.50%, due 11/01/52 | |
| | Federal National Mortgage Association, Pool # FS3276, 4.50%, due 12/01/37 | |
| | Federal National Mortgage Association, Pool # FS3310, 4.50%, due 11/01/37 | |
| | Federal National Mortgage Association, Pool # FS3359, 5.50%, due 12/01/52 | |
| | Federal National Mortgage Association, Pool # FS3405, 5.50%, due 12/01/52 | |
| | Federal National Mortgage Association, Pool # FS3417, 5.00%, due 12/01/52 | |
| | Federal National Mortgage Association, Pool # FS3433, 5.50%, due 12/01/52 | |
| | Federal National Mortgage Association, Pool # FS3560, 4.50%, due 04/01/53 | |
| | Federal National Mortgage Association, Pool # FS3669, 4.00%, due 03/01/46 | |
126
See accompanying Notes to the Financial Statements.
Mercer Core Fixed Income FundSchedule of Investments (Continued)
(showing percentage of net assets)
March 31, 2024
| | | |
| | Mortgage Backed Securities - U.S. Government Agency Obligations — continued |
| | Federal National Mortgage Association, Pool # FS3811, 4.50%, due 12/01/52 | |
| | Federal National Mortgage Association, Pool # FS4223, 4.50%, due 05/01/47 | |
| | Federal National Mortgage Association, Pool # FS4312, 4.50%, due 03/01/53 | |
| | Federal National Mortgage Association, Pool # FS4758, 2.50%, due 01/01/36 | |
| | Federal National Mortgage Association, Pool # FS5171, 3.00%, due 12/01/51 | |
| | Federal National Mortgage Association, Pool # FS5263, 4.50%, due 05/01/53 | |
| | Federal National Mortgage Association, Pool # FS5284, 3.50%, due 09/01/50 | |
| | Federal National Mortgage Association, Pool # FS5373, 2.00%, due 04/01/37 | |
| | Federal National Mortgage Association, Pool # FS5397, 5.00%, due 07/01/53 | |
| | Federal National Mortgage Association, Pool # FS5625, 5.00%, due 08/01/53 | |
| | Federal National Mortgage Association, Pool # FS5829, 5.50%, due 09/01/53 | |
| | Federal National Mortgage Association, Pool # FS5871, 2.00%, due 07/01/51 | |
| | Federal National Mortgage Association, Pool # FS6146, 4.00%, due 05/01/53 | |
| | Federal National Mortgage Association, Pool # FS6158, 4.00%, due 07/01/52 | |
| | Federal National Mortgage Association, Pool # FS6255, 3.50%, due 08/01/52 | |
| | Federal National Mortgage Association, Pool # FS7249, 4.50%, due 10/01/52 | |
| | Federal National Mortgage Association, Pool # MA2516, 3.00%, due 01/01/46 | |
| | Federal National Mortgage Association, Pool # MA2781, 2.50%, due 10/01/46 | |
| | Federal National Mortgage Association, Pool # MA2835, 4.00%, due 12/01/46 | |
| | Federal National Mortgage Association, Pool # MA2863, 3.00%, due 01/01/47 | |
| | Federal National Mortgage Association, Pool # MA2868, 2.50%, due 01/01/32 | |
| | Federal National Mortgage Association, Pool # MA3058, 4.00%, due 07/01/47 | |
| | Federal National Mortgage Association, Pool # MA3076, 2.50%, due 07/01/32 | |
| | Federal National Mortgage Association, Pool # MA3087, 3.50%, due 08/01/47 | |
| | Federal National Mortgage Association, Pool # MA3114, 2.50%, due 08/01/32 | |
| | Federal National Mortgage Association, Pool # MA3124, 2.50%, due 09/01/32 | |
| | Federal National Mortgage Association, Pool # MA3155, 3.00%, due 10/01/32 | |
| | Federal National Mortgage Association, Pool # MA3182, 3.50%, due 11/01/47 | |
| | Federal National Mortgage Association, Pool # MA3211, 4.00%, due 12/01/47 | |
| | Federal National Mortgage Association, Pool # MA3238, 3.50%, due 01/01/48 | |
| | Federal National Mortgage Association, Pool # MA3332, 3.50%, due 04/01/48 | |
| | Federal National Mortgage Association, Pool # MA3364, 3.50%, due 05/01/33 | |
| | Federal National Mortgage Association, Pool # MA3385, 4.50%, due 06/01/48 | |
| | Federal National Mortgage Association, Pool # MA3414, 3.50%, due 07/01/48 | |
| | Federal National Mortgage Association, Pool # MA3442, 3.50%, due 08/01/48 | |
| | Federal National Mortgage Association, Pool # MA3521, 4.00%, due 11/01/48 | |
| | Federal National Mortgage Association, Pool # MA3871, 3.00%, due 12/01/49 | |
| | Federal National Mortgage Association, Pool # MA3937, 3.00%, due 02/01/50 | |
| | Federal National Mortgage Association, Pool # MA3960, 3.00%, due 03/01/50 | |
| | Federal National Mortgage Association, Pool # MA4014, 3.00%, due 05/01/35 | |
| | Federal National Mortgage Association, Pool # MA4018, 2.00%, due 05/01/50 | |
| | Federal National Mortgage Association, Pool # MA4026, 4.00%, due 05/01/50 | |
| | Federal National Mortgage Association, Pool # MA4048, 3.00%, due 06/01/50 | |
| | Federal National Mortgage Association, Pool # MA4120, 2.50%, due 09/01/50 | |
| | Federal National Mortgage Association, Pool # MA4158, 2.00%, due 10/01/50 | |
| | Federal National Mortgage Association, Pool # MA4159, 2.50%, due 10/01/50 | |
| | Federal National Mortgage Association, Pool # MA4181, 1.50%, due 11/01/50 | |
| | Federal National Mortgage Association, Pool # MA4204, 2.00%, due 12/01/40 | |
| | Federal National Mortgage Association, Pool # MA4208, 2.00%, due 12/01/50 | |
See accompanying Notes to the Financial Statements.
127
Mercer Core Fixed Income FundSchedule of Investments (Continued)
(showing percentage of net assets)
March 31, 2024
| | | |
| | Mortgage Backed Securities - U.S. Government Agency Obligations — continued |
| | Federal National Mortgage Association, Pool # MA4209, 1.50%, due 12/01/50 | |
| | Federal National Mortgage Association, Pool # MA4232, 2.00%, due 01/01/41 | |
| | Federal National Mortgage Association, Pool # MA4236, 1.50%, due 01/01/51 | |
| | Federal National Mortgage Association, Pool # MA4237, 2.00%, due 01/01/51 | |
| | Federal National Mortgage Association, Pool # MA4254, 1.50%, due 02/01/51 | |
| | Federal National Mortgage Association, Pool # MA4255, 2.00%, due 02/01/51 | |
| | Federal National Mortgage Association, Pool # MA4268, 2.00%, due 02/01/41 | |
| | Federal National Mortgage Association, Pool # MA4281, 2.00%, due 03/01/51 | |
| | Federal National Mortgage Association, Pool # MA4305, 2.00%, due 04/01/51 | |
| | Federal National Mortgage Association, Pool # MA4325, 2.00%, due 05/01/51 | |
| | Federal National Mortgage Association, Pool # MA4326, 2.50%, due 05/01/51 | |
| | Federal National Mortgage Association, Pool # MA4328, 1.50%, due 05/01/36 | |
| | Federal National Mortgage Association, Pool # MA4329, 2.00%, due 05/01/36 | |
| | Federal National Mortgage Association, Pool # MA4333, 2.00%, due 05/01/41 | |
| | Federal National Mortgage Association, Pool # MA4355, 2.00%, due 06/01/51 | |
| | Federal National Mortgage Association, Pool # MA4356, 2.50%, due 06/01/51 | |
| | Federal National Mortgage Association, Pool # MA4359, 1.50%, due 06/01/36 | |
| | Federal National Mortgage Association, Pool # MA4361, 2.50%, due 06/01/36 | |
| | Federal National Mortgage Association, Pool # MA4378, 2.00%, due 07/01/51 | |
| | Federal National Mortgage Association, Pool # MA4380, 3.00%, due 07/01/51 | |
| | Federal National Mortgage Association, Pool # MA4382, 1.50%, due 07/01/36 | |
| | Federal National Mortgage Association, Pool # MA4398, 2.00%, due 08/01/51 | |
| | Federal National Mortgage Association, Pool # MA4399, 2.50%, due 08/01/51 | |
| | Federal National Mortgage Association, Pool # MA4414, 2.50%, due 09/01/51 | |
| | Federal National Mortgage Association, Pool # MA4418, 2.00%, due 09/01/36 | |
| | Federal National Mortgage Association, Pool # MA4437, 2.00%, due 10/01/51 | |
| | Federal National Mortgage Association, Pool # MA4493, 2.50%, due 12/01/51 | |
| | Federal National Mortgage Association, Pool # MA4497, 2.00%, due 12/01/36 | |
| | Federal National Mortgage Association, Pool # MA4512, 2.50%, due 01/01/52 | |
| | Federal National Mortgage Association, Pool # MA4549, 3.00%, due 02/01/52 | |
| | Federal National Mortgage Association, Pool # MA4579, 3.00%, due 04/01/52 | |
| | Federal National Mortgage Association, Pool # MA4600, 3.50%, due 05/01/52 | |
| | Federal National Mortgage Association, Pool # MA4618, 4.00%, due 04/01/52 | |
| | Federal National Mortgage Association, Pool # MA4644, 4.00%, due 05/01/52 | |
| | Federal National Mortgage Association, Pool # MA4656, 4.50%, due 07/01/52 | |
| | Federal National Mortgage Association, Pool # MA4686, 5.00%, due 06/01/52 | |
| | Federal National Mortgage Association, Pool # MA4761, 5.00%, due 09/01/52 | |
| | Federal National Mortgage Association, Pool # MA4783, 4.00%, due 10/01/52 | |
| | Federal National Mortgage Association, Pool # MA4866, 4.00%, due 01/01/53 | |
| | Federal National Mortgage Association, Pool # MA4894, 6.00%, due 01/01/53 | |
| | Federal National Mortgage Association, Pool # MA4918, 5.00%, due 02/01/53 | |
| | Federal National Mortgage Association, Pool # MA4945, 5.00%, due 03/01/38 | |
| | Federal National Mortgage Association, Pool # MA5311, 5.00%, due 03/01/39 | |
| | Federal National Mortgage Association REMICS, Series 2011-59, Class NZ, 5.50%, due 07/25/41 | |
| | Federal National Mortgage Association REMICS, Series 2012-28, Class B, 6.50%, due 06/25/39 | |
| | Government National Mortgage Association, Pool # 004636, 4.50%, due 02/20/40 | |
| | Government National Mortgage Association, Pool # 004678, 4.50%, due 04/20/40 | |
128
See accompanying Notes to the Financial Statements.
Mercer Core Fixed Income FundSchedule of Investments (Continued)
(showing percentage of net assets)
March 31, 2024
| | | |
| | Mortgage Backed Securities - U.S. Government Agency Obligations — continued |
| | Government National Mortgage Association, Pool # 004833, 4.00%, due 10/20/40 | |
| | Government National Mortgage Association, Pool # 004977, 4.00%, due 03/20/41 | |
| | Government National Mortgage Association, Pool # 004978, 4.50%, due 03/20/41 | |
| | Government National Mortgage Association, Pool # 005055, 4.50%, due 05/20/41 | |
| | Government National Mortgage Association, Pool # 734152, 4.00%, due 01/15/41 | |
| | Government National Mortgage Association, Pool # 783637, 3.00%, due 06/20/42 | |
| | Government National Mortgage Association, Pool # 784369, 4.00%, due 08/15/45 | |
| | Government National Mortgage Association, Pool # 784605, 4.50%, due 01/15/42 | |
| | Government National Mortgage Association, Pool # 785283, 2.50%, due 01/20/51 | |
| | Government National Mortgage Association, Pool # 796468, 4.00%, due 09/20/42 | |
| | Government National Mortgage Association, Pool # AL8626, 3.00%, due 08/15/45 | |
| | Government National Mortgage Association, Pool # AV9421, 3.50%, due 11/20/46 | |
| | Government National Mortgage Association, Pool # AY7555, 3.50%, due 04/20/47 | |
| | Government National Mortgage Association, Pool # MA0462, 3.50%, due 10/20/42 | |
| | Government National Mortgage Association, Pool # MA0624, 3.00%, due 12/20/42 | |
| | Government National Mortgage Association, Pool # MA0625, 3.50%, due 12/20/42 | |
| | Government National Mortgage Association, Pool # MA0698, 3.00%, due 01/20/43 | |
| | Government National Mortgage Association, Pool # MA0851, 3.00%, due 03/20/43 | |
| | Government National Mortgage Association, Pool # MA0852, 3.50%, due 03/20/43 | |
| | Government National Mortgage Association, Pool # MA1156, 3.00%, due 07/20/43 | |
| | Government National Mortgage Association, Pool # MA1376, 4.00%, due 10/20/43 | |
| | Government National Mortgage Association, Pool # MA1599, 3.00%, due 01/20/44 | |
| | Government National Mortgage Association, Pool # MA2371, 3.50%, due 11/20/44 | |
| | Government National Mortgage Association, Pool # MA2372, 4.00%, due 11/20/44 | |
| | Government National Mortgage Association, Pool # MA2825, 3.00%, due 05/20/45 | |
| | Government National Mortgage Association, Pool # MA3310, 3.50%, due 12/20/45 | |
| | Government National Mortgage Association, Pool # MA3377, 4.00%, due 01/20/46 | |
| | Government National Mortgage Association, Pool # MA3455, 4.00%, due 02/20/46 | |
| | Government National Mortgage Association, Pool # MA3456, 4.50%, due 02/20/46 | |
| | Government National Mortgage Association, Pool # MA3596, 3.00%, due 04/20/46 | |
| | Government National Mortgage Association, Pool # MA3803, 3.50%, due 07/20/46 | |
| | Government National Mortgage Association, Pool # MA3873, 3.00%, due 08/20/46 | |
| | Government National Mortgage Association, Pool # MA3936, 3.00%, due 09/20/46 | |
| | Government National Mortgage Association, Pool # MA4004, 3.50%, due 10/20/46 | |
| | Government National Mortgage Association, Pool # MA4071, 4.50%, due 11/20/46 | |
| | Government National Mortgage Association, Pool # MA4125, 2.50%, due 12/20/46 | |
| | Government National Mortgage Association, Pool # MA4263, 4.00%, due 02/20/47 | |
| | Government National Mortgage Association, Pool # MA4585, 3.00%, due 07/20/47 | |
| | Government National Mortgage Association, Pool # MA4586, 3.50%, due 07/20/47 | |
| | Government National Mortgage Association, Pool # MA4720, 4.00%, due 09/20/47 | |
| | Government National Mortgage Association, Pool # MA4838, 4.00%, due 11/20/47 | |
| | Government National Mortgage Association, Pool # MA5019, 3.50%, due 02/20/48 | |
| | Government National Mortgage Association, Pool # MA5021, 4.50%, due 02/20/48 | |
| | Government National Mortgage Association, Pool # MA5079, 4.50%, due 03/20/48 | |
| | Government National Mortgage Association, Pool # MA5264, 4.00%, due 06/20/48 | |
| | Government National Mortgage Association, Pool # MA5397, 3.50%, due 08/20/48 | |
| | Government National Mortgage Association, Pool # MA5466, 4.00%, due 09/20/48 | |
| | Government National Mortgage Association, Pool # MA5467, 4.50%, due 09/20/48 | |
| | Government National Mortgage Association, Pool # MA5530, 5.00%, due 10/20/48 | |
See accompanying Notes to the Financial Statements.
129
Mercer Core Fixed Income FundSchedule of Investments (Continued)
(showing percentage of net assets)
March 31, 2024
| | | |
| | Mortgage Backed Securities - U.S. Government Agency Obligations — continued |
| | Government National Mortgage Association, Pool # MA5762, 3.50%, due 02/20/49 | |
| | Government National Mortgage Association, Pool # MA5817, 4.00%, due 03/20/49 | |
| | Government National Mortgage Association, Pool # MA5874, 3.00%, due 04/20/49 | |
| | Government National Mortgage Association, Pool # MA6038, 3.00%, due 07/20/49 | |
| | Government National Mortgage Association, Pool # MA6090, 3.50%, due 08/20/49 | |
| | Government National Mortgage Association, Pool # MA6338, 3.00%, due 12/20/49 | |
| | Government National Mortgage Association, Pool # MA6409, 3.00%, due 01/20/50 | |
| | Government National Mortgage Association, Pool # MA6865, 2.50%, due 09/20/50 | |
| | Government National Mortgage Association, Pool # MA6931, 2.50%, due 10/20/50 | |
| | Government National Mortgage Association, Pool # MA6995, 2.50%, due 11/20/50 | |
| | Government National Mortgage Association, Pool # MA7135, 2.00%, due 01/20/51 | |
| | Government National Mortgage Association, Pool # MA7254, 2.00%, due 03/20/51 | |
| | Government National Mortgage Association, Pool # MA7312, 2.50%, due 04/20/51 | |
| | Government National Mortgage Association, Pool # MA7367, 2.50%, due 05/20/51 | |
| | Government National Mortgage Association, Pool # MA7534, 2.50%, due 08/20/51 | |
| | Government National Mortgage Association, Pool # MA7589, 2.50%, due 09/20/51 | |
| | Government National Mortgage Association, Pool # MA7650, 3.00%, due 10/20/51 | |
| | Government National Mortgage Association, Pool # MA7706, 3.00%, due 11/20/51 | |
| | Government National Mortgage Association, Pool # MA7829, 3.50%, due 01/20/52 | |
| | Government National Mortgage Association, Pool # MA7883, 3.50%, due 02/20/52 | |
| | Government National Mortgage Association, Pool # MA7938, 3.50%, due 03/20/52 | |
| | Government National Mortgage Association, Pool # MA7939, 4.00%, due 03/20/52 | |
| | Government National Mortgage Association, Pool # MA8150, 4.00%, due 07/20/52 | |
| | Government National Mortgage Association, Pool # MA8642, 2.50%, due 02/20/53 | |
| | Government National Mortgage Association, TBA, 2.00%, due 04/20/54 | |
| | Government National Mortgage Association, TBA, 6.50%, due 05/20/54 | |
| | Uniform Mortgage-Backed Security, TBA, 2.00%, due 05/01/54 | |
| | Uniform Mortgage-Backed Security, TBA, 2.50%, due 04/01/54 | |
| | Uniform Mortgage-Backed Security, TBA, 4.50%, due 05/01/54 | |
| | Uniform Mortgage-Backed Security, TBA, 5.00%, due 04/01/39 | |
| | Uniform Mortgage-Backed Security, TBA, 5.50%, due 04/01/54 | |
| | | |
| | Municipal Obligations — 0.8% |
| | Alabama Economic Settlement Authority, 4.26%, due 09/15/32 | |
| | Bay Area Toll Authority, 6.26%, due 04/01/49 | |
| | California Health Facilities Financing Authority, 4.19%, due 06/01/37 | |
| | Dallas Fort Worth International Airport, 1.93%, due 11/01/28 | |
| | District of Columbia Water & Sewer Authority, 4.81%, due 10/01/14(f) | |
| | Golden State Tobacco Securitization Corp., 4.21%, due 06/01/50 | |
| | Louisiana Local Government Environmental Facilities & Community Development Authority, 3.62%, due 02/01/29 | |
| | Michigan State University, 4.17%, due 08/15/22(f) | |
| | Municipal Electric Authority of Georgia, 6.64%, due 04/01/57 | |
| | New York City Transitional Finance Authority Future Tax Secured Revenue, 5.77%, due 08/01/36 | |
| | New York State Urban Development Corp., 5.77%, due 03/15/39 | |
| | State Board of Administration Finance Corp., 1.71%, due 07/01/27 | |
| | State of California, 7.50%, due 04/01/34 | |
130
See accompanying Notes to the Financial Statements.
Mercer Core Fixed Income FundSchedule of Investments (Continued)
(showing percentage of net assets)
March 31, 2024
| | | |
| | Municipal Obligations — continued |
| | State of California, 7.55%, due 04/01/39 | |
| | State of Connecticut, 3.98%, due 06/15/29 | |
| | State of Connecticut, 4.51%, due 05/15/28 | |
| | University of Michigan, 4.45%, due 04/01/22(f) | |
| | University of Virginia, 2.58%, due 11/01/51 | |
| | University of Virginia, 4.18%, due 09/01/17(f) | |
| | | |
| | Sovereign Debt Obligations — 0.1% |
| | Bermuda Government International Bonds, 2.38%, due 08/20/30 144A | |
| | Export-Import Bank of India, 3.88%, due 02/01/28 144A | |
| | Indonesia Government International Bonds, 3.50%, due 01/11/28 | |
| | Japan Finance Organization for Municipalities, 1.75%, due 09/05/24 144A | |
| | Korea National Oil Corp., 4.75%, due 04/03/26 144A | |
| | Korea National Oil Corp., 4.88%, due 04/03/28 144A | |
| | Mexico Government International Bonds, 3.50%, due 02/12/34 | |
| | Peru Government International Bonds, 2.78%, due 01/23/31 | |
| | Province of Alberta, 1.30%, due 07/22/30 | |
| | Province of Alberta, 3.30%, due 03/15/28 | |
| | Province of Manitoba, 2.13%, due 06/22/26 | |
| | Province of Quebec, 2.75%, due 04/12/27 | |
| | Saudi Government International Bonds, 0.75%, due 07/09/27 144A | |
| | | |
| | U.S. Government and Agency Obligations — 19.9% |
| | Federal National Mortgage Association, 0.88%, due 08/05/30 | |
| | Federal National Mortgage Association, 4.37%, due 03/17/31(j) | |
| | Federal National Mortgage Association, 6.63%, due 11/15/30 | |
| | Tennessee Valley Authority, 1.50%, due 09/15/31 | |
| | Tennessee Valley Authority, 7.13%, due 05/01/30 | |
| | U.S. Treasury Bonds, 1.75%, due 08/15/41 | |
| | U.S. Treasury Bonds, 2.00%, due 11/15/41 | |
| | U.S. Treasury Bonds, 2.00%, due 08/15/51 | |
| | U.S. Treasury Bonds, 2.25%, due 05/15/41(k) | |
| | U.S. Treasury Bonds, 2.25%, due 02/15/52 | |
| | U.S. Treasury Bonds, 2.38%, due 02/15/42 | |
| | U.S. Treasury Bonds, 2.50%, due 02/15/45 | |
| | U.S. Treasury Bonds, 3.00%, due 02/15/49 | |
| | U.S. Treasury Bonds, 3.00%, due 08/15/52 | |
| | U.S. Treasury Bonds, 3.38%, due 08/15/42 | |
| | U.S. Treasury Bonds, 3.38%, due 11/15/48 | |
| | U.S. Treasury Bonds, 3.63%, due 05/15/53 | |
| | U.S. Treasury Bonds, 3.88%, due 05/15/43 | |
| | U.S. Treasury Bonds, 4.00%, due 11/15/42 | |
| | U.S. Treasury Bonds, 4.00%, due 11/15/52 | |
| | U.S. Treasury Bonds, 4.25%, due 02/15/54 | |
| | U.S. Treasury Bonds, 4.38%, due 08/15/43 | |
| | U.S. Treasury Bonds, 4.50%, due 02/15/44 | |
| | U.S. Treasury Bonds, 4.75%, due 11/15/43 | |
See accompanying Notes to the Financial Statements.
131
Mercer Core Fixed Income FundSchedule of Investments (Continued)
(showing percentage of net assets)
March 31, 2024
| | | |
| | U.S. Government and Agency Obligations — continued |
| | U.S. Treasury Bonds, 4.75%, due 11/15/53 | |
| | U.S. Treasury Inflation-Indexed Notes, 0.13%, due 01/15/30 | |
| | U.S. Treasury Notes, 0.38%, due 01/31/26 | |
| | U.S. Treasury Notes, 2.75%, due 08/15/32 | |
| | U.S. Treasury Notes, 3.38%, due 05/15/33 | |
| | U.S. Treasury Notes, 3.88%, due 08/15/33 | |
| | U.S. Treasury Notes, 4.00%, due 12/15/25 | |
| | U.S. Treasury Notes, 4.00%, due 01/31/29 | |
| | U.S. Treasury Notes, 4.00%, due 01/31/31 | |
| | U.S. Treasury Notes, 4.00%, due 02/15/34 | |
| | U.S. Treasury Notes, 4.25%, due 02/28/29 | |
| | U.S. Treasury Notes, 4.25%, due 02/28/31 | |
| | U.S. Treasury STRIPS Coupon, 0.97%, due 08/15/30(j) | |
| | U.S. Treasury STRIPS Coupon, 1.74%, due 02/15/40(j) | |
| | U.S. Treasury STRIPS Coupon, 2.26%, due 11/15/42(j) | |
| | U.S. Treasury STRIPS Coupon, 2.50%, due 11/15/40(j) | |
| | U.S. Treasury STRIPS Coupon, 2.58%, due 02/15/43(j) | |
| | U.S. Treasury STRIPS Coupon, 2.66%, due 08/15/44(j)(l) | |
| | U.S. Treasury STRIPS Coupon, 2.78%, due 11/15/41(j) | |
| | U.S. Treasury STRIPS Coupon, 3.15%, due 11/15/43(j) | |
| | U.S. Treasury STRIPS Coupon, 3.17%, due 05/15/42(j) | |
| | U.S. Treasury STRIPS Coupon, 3.93%, due 02/15/39(j) | |
| | U.S. Treasury STRIPS Coupon, 4.06%, due 02/15/41(j) | |
| | U.S. Treasury STRIPS Coupon, 4.48%, due 08/15/40(j) | |
| | U.S. Treasury STRIPS Coupon, 4.67%, due 11/15/48(j) | |
| | U.S. Treasury STRIPS Coupon, 4.88%, due 02/15/42(j) | |
| | U.S. Treasury STRIPS Coupon, 4.99%, due 02/15/49(j) | |
| | U.S. Treasury STRIPS Coupon, 5.44%, due 05/15/40(j) | |
| | | |
| | TOTAL DEBT OBLIGATIONS (COST $1,917,948,219) | |
| | | |
| | |
| | |
| | Altera Infrastructure LP/Teekay Offshore Finance Corp.*(m)(n) | |
| | TOTAL COMMON STOCK (COST $234,312) | |
| | | |
| | SHORT-TERM INVESTMENTS — 1.9% |
| | Mutual Fund - Securities Lending Collateral — 0.9% |
| | State Street Navigator Securities Lending Government Money Market Portfolio, | |
132
See accompanying Notes to the Financial Statements.
Mercer Core Fixed Income FundSchedule of Investments (Continued)
(showing percentage of net assets)
March 31, 2024
| | | |
| | U.S. Government and Agency Obligation — 1.0% |
| | U.S. Treasury Bills, 5.00%, due 04/11/24(j) | |
| | TOTAL SHORT-TERM INVESTMENTS (COST $35,690,252) | |
| | TOTAL INVESTMENTS BEFORE TBA SALE COMMITMENTS — 100.2%
(Cost $1,953,872,783) | |
| | TBA SALE COMMITMENTS — (0.1)% |
| | Uniform Mortgage-Backed Security, TBA, 2.00%, due 04/01/54 | |
| | Uniform Mortgage-Backed Security, TBA, 3.50%, due 04/01/54 | |
| | TOTAL TBA SALE COMMITMENTS (PROCEEDS $2,947,266) | |
| | TOTAL INVESTMENTS NET OF TBA SALE COMMITMENTS — 100.1%
(Cost $1,950,925,517) | |
| | Other Assets and Liabilities (net) — (0.1)% | |
| | | |
| Notes to Schedule of Investments: |
| Non-income producing security. |
| Unless otherwise indicated, all par values are denominated in United States dollars ($). |
| Variable or floating rate note. Rate shown is as of March 31, 2024. |
| Step coupon security that pays an initial coupon rate for the first period and then a lower/higher coupon rate for the following periods. The rate shown is the rate in effect at March 31, 2024. |
| All or a portion of this security is out on loan. |
| Security is perpetual and has no stated maturity date. |
| Year of maturity is greater than 2100. |
| Security exempt from registration under Regulation S of the Securities Act of 1933, which exempts from registration securities offered and sold outside the United States. Security may not be offered or sold in the United States except pursuant to an exemption from, or in a transaction not subject to, the registration requirements of the Securities Act of 1933. |
| |
| Variable or floating rate security, which interest rate adjusts periodically based on changes in current interest rates and prepayments on the underlying pool of assets. Rate shown is the rate in effect as of period end. |
| Interest rate presented is yield to maturity. |
| All or a portion of this security is pledged for open futures collateral. |
| All or a portion of this security is pledged for open centrally cleared swaps collateral. |
| Level 3 - significant unobservable inputs were used in determining the value of this security in the Fund. |
| Securities fair valued by the Valuation Committee as approved by the Board of Trustees. The total market value of the securities at year end is $26,796 which represents 0.0% of net assets. The aggregate cost of these securities held at March 31, 2024 is $234,312. |
| The rate disclosed is the 7-day net yield as of March 31, 2024. |
| Represents an investment of securities lending cash collateral. |
See accompanying Notes to the Financial Statements.
133
Mercer Core Fixed Income FundSchedule of Investments (Continued)
March 31, 2024
| Securities exempt from registration under Rule 144A of the Securities Act of 1933. These securities may be resold in transactions exempt from registration, normally to qualified institutional buyers. The total market value of the securities at year end is $333,292,131 which represents 17.9% of net assets. |
Forward Foreign Currency Contracts
| | | | Unrealized
Appreciation
(Depreciation) |
| | | | | | |
| | | | | | |
| | | | | | |
| | | | | | |
Futures Contracts
| | | | Market Value/
Unrealized
Appreciation
(Depreciation) |
| | | | |
| U.S. Treasury Note 10-Year | | | |
| U.S. Treasury Note 2-Year | | | |
| U.S. Treasury Note 5-Year | | | |
| | | | |
| | | | |
| | | | |
| | | | |
| | | | |
| | | | |
Centrally Cleared Interest Rate Swaps
| | | | | Upfront
Premiums
Paid
(Received) | | | Unrealized
Appreciation
(Depreciation) |
| | | | | | | | | |
| | | | | | | | | |
| | | | | | | | | |
| | | | | | | | | |
| | | | | | | | | |
| | | | | | | | | |
| | | | | | | | | |
134
See accompanying Notes to the Financial Statements.
Mercer Core Fixed Income FundSchedule of Investments (Continued)
March 31, 2024
|
| | Collateralized Loan Obligation |
| | Constant Maturity Treasury Index |
| | Euro Interbank Offered Rate |
| | London Interbank Offered Rate |
| | Refinitiv USD IBOR Consumer Cash Fallbacks |
| | Secured Overnight Financing Rate |
| | Structured Agency Credit Risk |
| | Separate Trading of Registered Interest and Principal of Securities |
| | |
See accompanying Notes to the Financial Statements.
135
Mercer Core Fixed Income FundSchedule of Investments (Continued)
March 31, 2024
Asset Class Summary (Unaudited) | |
| |
| |
| |
| |
| |
Forward Foreign Currency Contracts | |
| |
Other Assets and Liabilities (net) | |
| |
136
See accompanying Notes to the Financial Statements.
Mercer Opportunistic Fixed Income FundSchedule of Investments
(showing percentage of net assets)
March 31, 2024
| | | |
| | |
| | Asset Backed Securities — 4.6% |
| | 37 Capital CLO 1 Ltd., Series 2021-1A, Class C, 7.83% (3 mo. USD Term SOFR + 2.51%), due 10/15/34(b) 144A | |
| | AB BSL CLO 4 Ltd., Series 2023-4A, Class A, 7.32% (3 mo. USD Term SOFR + 2.00%), due 04/20/36(b) 144A | |
| | Aegis Asset-Backed Securities Trust, Series 2005-5, Class M1, 6.09% (1 mo. USD Term SOFR + 0.76%), due 12/25/35(b) | |
| | AGL CLO 22 Ltd., Series 2022-22A, Class D, 10.32% (3 mo. USD Term SOFR + 5.00%), due 10/20/35(b) 144A | |
| | AIMCO CLO 12 Ltd., Series 2020-12A, Class DR, 8.22% (3 mo. USD Term SOFR + 2.90%), due 01/17/32(b) 144A | |
| | AIMCO CLO 22 Ltd., Series 2024-22A, Class D, 1.00% (3 mo. USD Term SOFR + 3.40%), due 04/19/37(b)(c) 144A | |
| | ALM Ltd., Series 2020-1A, Class D, 11.58% (3 mo. USD Term SOFR + 6.26%), due 10/15/29(b) 144A | |
| | AMMC CLO 27 Ltd., Series 2022-27A, Class D, 11.33% (3 mo. USD Term SOFR + 6.01%), due 01/20/36(b) 144A | |
| | AMMC CLO 30 Ltd., Series 2024-30A, Class D, 9.79% (3 mo. USD Term SOFR + 4.50%), due 01/15/37(b) 144A | |
| | Anchorage Capital CLO 3-R Ltd., Series 2014-3RA, Class E, 11.08% (3 mo. USD Term SOFR + 5.76%), due 01/28/31(b) 144A | |
| | Apex Credit CLO Ltd., Series 2019-1A, Class BR, 7.96% (3 mo. USD Term SOFR + 2.66%), due 04/18/32(b) 144A | |
| | Apex Credit CLO Ltd., Series 2019-2A, Class D, 9.64% (3 mo. USD Term SOFR + 4.31%), due 10/25/32(b) 144A | |
| | Apidos CLO XXII Ltd., Series 2015-22A, Class DR, 12.33% (3 mo. USD Term SOFR + 7.01%), due 04/20/31(b) 144A | |
| | Applebee's Funding LLC/IHOP Funding LLC, Series 2023-1A, Class A2, 7.82%, due 03/05/53 144A | |
| | Asset-Backed Securities Corp. Home Equity Loan Trust, Series 2006-HE5, Class M1, 3.12% (1 mo. USD Term SOFR + 0.53%), due 07/25/36(b) | |
| | Avis Budget Rental Car Funding AESOP LLC, Series 2020-2A, Class C, 4.25%, due 02/20/27 144A | |
| | Bain Capital Credit CLO Ltd., Series 2021-4A, Class D, 8.68% (3 mo. USD Term SOFR + 3.36%), due 10/20/34(b) 144A | |
| | Bain Capital Credit CLO Ltd., Series 2022-2A, Class D1, 8.97% (3 mo. USD Term SOFR + 3.65%), due 04/22/35(b) 144A | |
| | Bain Capital Credit CLO Ltd., Series 2023-1A, Class D, 10.21% (3 mo. USD Term SOFR + 4.90%), due 04/16/36(b) 144A | |
| | Balboa Bay Loan Funding Ltd., Series 2022-1A, Class D, 9.32% (3 mo. USD Term SOFR + 4.00%), due 04/20/34(b) 144A | |
| | Ballyrock CLO 19 Ltd., Series 2022-19A, Class D, 12.43% (3 mo. USD Term SOFR + 7.11%), due 04/20/35(b) 144A | |
| | Ballyrock CLO Ltd., Series 2018-1A, Class C, 8.73% (3 mo. USD Term SOFR + 3.41%), due 04/20/31(b) 144A | |
| | Ballyrock CLO Ltd., Series 2019-1A, Class A2R, 7.13% (3 mo. USD Term SOFR + 1.81%), due 07/15/32(b) 144A | |
| | Barings CLO Ltd., Series 2015-2A, Class DR, 8.53% (3 mo. USD Term SOFR + 3.21%), due 10/20/30(b) 144A | |
| | Barings CLO Ltd., Series 2016-2A, Class ER2, 12.08% (3 mo. USD Term SOFR + 6.76%), due 01/20/32(b) 144A | |
| | BlueMountain CLO XXIX Ltd., Series 2020-29A, Class ER, 12.45% (3 mo. USD Term SOFR + 7.12%), due 07/25/34(b) 144A | |
See accompanying Notes to the Financial Statements.
137
Mercer Opportunistic Fixed Income FundSchedule of Investments (Continued)
(showing percentage of net assets)
March 31, 2024
| | | |
| | Asset Backed Securities — continued |
| | Buckhorn Park CLO Ltd., Series 2019-1A, Class DR, 8.66% (3 mo. USD Term SOFR + 3.36%), due 07/18/34(b) 144A | |
| | Canyon Capital CLO Ltd., Series 2021-1A, Class E, 11.99% (3 mo. USD Term SOFR + 6.67%), due 04/15/34(b) 144A | |
| | Canyon CLO Ltd., Series 2020-1A, Class BR, 7.28% (3 mo. USD Term SOFR + 1.96%), due 07/15/34(b) 144A | |
| | Canyon CLO Ltd., Series 2021-4A, Class B, 7.28% (3 mo. USD Term SOFR + 1.96%), due 10/15/34(b) 144A | |
| | Carlyle Global Market Strategies CLO Ltd., Series 2015-1A, Class DR3, 8.53% (3 mo. USD Term SOFR + 3.21%), due 07/20/31(b) 144A | |
| | Carlyle U.S. CLO Ltd., Series 2019-2A, Class DR, 12.08% (3 mo. USD Term SOFR + 6.76%), due 07/15/32(b) 144A | |
| | Carlyle U.S. CLO Ltd., Series 2019-4A, Class A2R, 7.06% (3 mo. USD Term SOFR + 1.75%), due 04/15/35(b) 144A | |
| | Carlyle U.S. CLO Ltd., Series 2021-8A, Class B, 7.23% (3 mo. USD Term SOFR + 1.91%), due 10/15/34(b) 144A | |
| | CarVal CLO VII-C Ltd., Series 2023-1A, Class A1, 7.52% (3 mo. USD Term SOFR + 2.20%), due 01/20/35(b) 144A | |
| | Catskill Park CLO Ltd., Series 2017-1A, Class D, 11.58% (3 mo. USD Term SOFR + 6.26%), due 04/20/29(b) 144A | |
| | CBAM Ltd., Series 2018-6A, Class B2R, 7.68% (3 mo. USD Term SOFR + 2.36%), due 01/15/31(b) 144A | |
| | CIFC Funding Ltd., Series 2017-3A, Class C, 9.23% (3 mo. USD Term SOFR + 3.91%), due 07/20/30(b) 144A | |
| | CIFC Funding Ltd., Series 2018-1A, Class C, 7.31% (3 mo. USD Term SOFR + 2.01%), due 04/18/31(b) 144A | |
| | Clover CLO LLC, Series 2018-1A, Class DR, 8.68% (3 mo. USD Term SOFR + 3.36%), due 04/20/32(b) 144A | |
| | Clover CLO Ltd., Series 2019-1A, Class BR, 7.15% (3 mo. USD Term SOFR + 1.85%), due 04/18/35(b) 144A | |
| | Driven Brands Funding LLC, Series 2019-1A, Class A2, 4.64%, due 04/20/49 144A | |
| | Dryden 70 CLO Ltd., Series 2018-70A, Class E, 11.63% (3 mo. USD Term SOFR + 6.31%), due 01/16/32(b) 144A | |
| | Dryden 87 CLO Ltd., Series 2021-87A, Class D, 8.53% (3 mo. USD Term SOFR + 3.21%), due 05/20/34(b) 144A | |
| | Eaton Vance CLO Ltd., Series 2020-2A, Class ER, 12.08% (3 mo. USD Term SOFR + 6.76%), due 01/15/35(b) 144A | |
| | Elmwood CLO XI Ltd., Series 2021-4A, Class B, 7.18% (3 mo. USD Term SOFR + 1.86%), due 10/20/34(b) 144A | |
| | Empower CLO Ltd., Series 2023-2A, Class C, 8.71% (3 mo. USD Term SOFR + 3.40%), due 07/15/36(b) 144A | |
| | Falcon Aerospace Ltd., Series 2017-1, 4.58%, due 02/15/42(b)(d) | |
| | Fortress Credit BSL XII Ltd., Series 2021-4A, Class E, 12.71% (3 mo. USD Term SOFR + 7.39%), due 10/15/34(b) 144A | |
| | FS Rialto Issuer LLC, Series 2022-FL7, Class A, 8.22% (1 mo. USD Term SOFR + 2.90%), due 10/19/39(b) 144A | |
| | Gallatin Funding Ltd., Series 2023-1A, Class C1, 9.16% (3 mo. USD Term SOFR + 3.85%), due 10/14/35(b) 144A | |
| | Generate CLO 7 Ltd., Series 7A, Class BR, 7.50% (3 mo. USD Term SOFR + 2.20%), due 04/22/37(b) 144A | |
| | Gilbert Park CLO Ltd., Series 2017-1A, Class D, 8.53% (3 mo. USD Term SOFR + 3.21%), due 10/15/30(b) 144A | |
| | GoldenTree Loan Management U.S. CLO 3 Ltd., Series 2018-3A, Class D, 8.43% (3 mo. USD Term SOFR + 3.11%), due 04/20/30(b) 144A | |
138
See accompanying Notes to the Financial Statements.
Mercer Opportunistic Fixed Income FundSchedule of Investments (Continued)
(showing percentage of net assets)
March 31, 2024
| | | |
| | Asset Backed Securities — continued |
| | Golub Capital Partners CLO 66B Ltd., Series 2023-66A, Class A, 7.27% (3 mo. USD Term SOFR + 1.95%), due 04/25/36(b) 144A | |
| | Greenwood Park CLO Ltd., Series 2018-1A, Class E, 10.53% (3 mo. USD Term SOFR + 5.21%), due 04/15/31(b) 144A | |
| | Greystone CRE Notes, Series 2024-HC3, Class D, 10.66% (1 mo. USD Term SOFR + 5.33%), due 03/15/41(b) 144A | |
| | Greywolf CLO II Ltd., Series 2019-1RA, Class CR, 9.23% (3 mo. USD Term SOFR), due 04/17/34(b) 144A | |
| | Greywolf CLO VI Ltd., Series 2018-1A, Class A2, 7.21% (3 mo. USD Term SOFR + 1.89%), due 04/26/31(b) 144A | |
| | Greywolf CLO VI Ltd., Series 2018-1A, Class D, 11.33% (3 mo. USD Term SOFR + 6.01%), due 04/26/31(b) 144A | |
| | GSAA Home Equity Trust, Series 2007-7, Class A4, 5.98% (1 mo. USD Term SOFR + | |
| | HalseyPoint CLO I Ltd., Series 2019-1A, Class F, 13.78% (3 mo. USD Term SOFR + 8.46%), due 01/20/33(b) 144A | |
| | Hayfin U.S. XII Ltd., Series 2018-9A, Class BR, 7.38% (3 mo. USD Term SOFR + 2.06%), due 04/28/31(b) 144A | |
| | HPS Loan Management Ltd., Series 2023-18A, Class B, 8.27% (3 mo. USD Term SOFR + 2.95%), due 07/20/36(b) 144A | |
| | Katayma CLO II Ltd., Series 2024-2A, Class D, 9.79% (3 mo. USD Term SOFR + 4.50%), due 04/20/37(b) 144A | |
| | KREF Ltd., Series 2022-FL3, Class A, 6.78% (1 mo. USD Term SOFR + 1.45%), due 02/17/39(b) 144A | |
| | Long Beach Mortgage Loan Trust, Series 2005-1, Class M4, 6.72% (1 mo. USD Term SOFR + 1.39%), due 02/25/35(b) | |
| | Madison Park Funding XLVIII Ltd., Series 2021-48A, Class B, 7.02% (3 mo. USD Term SOFR + 1.71%), due 04/19/33(b) 144A | |
| | Madison Park Funding XXV Ltd., Series 2017-25A, Class A2R, 7.24% (3 mo. USD Term SOFR + 1.91%), due 04/25/29(b) 144A | |
| | Madison Park Funding XXVIII Ltd., Series 2018-28A, Class E, 10.83% (3 mo. USD Term SOFR + 5.51%), due 07/15/30(b) 144A | |
| | Madison Park Funding XXXIX Ltd., Series 2021-39A, Class D, 8.63% (3 mo. USD Term SOFR + 3.31%), due 10/22/34(b) 144A | |
| | Magnetite XII Ltd., Series 2015-12A, Class ER, 11.26% (3 mo. USD Term SOFR + 5.94%), due 10/15/31(b) 144A | |
| | Magnetite XXII Ltd., Series 2019-22A, Class DR, 8.68% (3 mo. USD Term SOFR + 3.36%), due 04/15/31(b) 144A | |
| | Magnetite XXIV Ltd., Series 2019-24A, Class BR, 7.06% (3 mo. USD Term SOFR + 1.75%), due 04/15/35(b) 144A | |
| | Magnolia Finance X DAC, Series 2020-1, 8.21%, due 08/13/24(e) | |
| | Mill City Solar Loan Ltd., Series 2019-1A, Class A, 4.34%, due 03/20/43 144A | |
| | Mosaic Solar Loan Trust, Series 2021-1A, Class D, 3.71%, due 12/20/46 144A | |
| | National Collegiate Student Loan Trust, Series 2007-2, Class A4, 5.73% (1 mo. USD Term SOFR + 0.40%), due 01/25/33(b) | |
| | Navient Private Education Refi Loan Trust, Series 2018-CA, Class B, 4.22%, due 06/16/42 144A | |
| | Neighborly Issuer LLC, Series 2023-1A, Class A2, 7.31%, due 01/30/53 144A | |
| | Neuberger Berman CLO XVIII Ltd., Series 2014-18A, Class DR2, 11.50% (3 mo. USD Term SOFR + 6.18%), due 10/21/30(b) 144A | |
| | Neuberger Berman Loan Advisers CLO 25 Ltd., Series 2017-25A, Class DR, 8.41% (3 mo. USD Term SOFR + 3.11%), due 10/18/29(b) 144A | |
| | Neuberger Berman Loan Advisers CLO 31 Ltd., Series 2019-31A, Class DR, 8.83% (3 mo. USD Term SOFR + 3.51%), due 04/20/31(b) 144A | |
See accompanying Notes to the Financial Statements.
139
Mercer Opportunistic Fixed Income FundSchedule of Investments (Continued)
(showing percentage of net assets)
March 31, 2024
| | | |
| | Asset Backed Securities — continued |
| | Neuberger Berman Loan Advisers CLO 33 Ltd., Series 2019-33A, Class DR, 8.48% (3 mo. USD Term SOFR + 3.16%), due 10/16/33(b) 144A | |
| | Neuberger Berman Loan Advisers CLO 34 Ltd., Series 2019-34A, Class CR, 7.42% (3 mo. USD Term SOFR + 2.10%), due 01/20/35(b) 144A | |
| | Neuberger Berman Loan Advisers CLO 44 Ltd., Series 2021-44A, Class E, 11.58% (3 mo. USD Term SOFR + 6.26%), due 10/16/34(b) 144A | |
| | Ocean Trails CLO IX, Series 2020-9A, Class CR, 8.13% (3 mo. USD Term SOFR + 2.81%), due 10/15/34(b) 144A | |
| | Ocean Trails CLO IX, Series 2020-9A, Class DR, 9.33% (3 mo. USD Term SOFR + 4.01%), due 10/15/34(b) 144A | |
| | Ocean Trails CLO XIV Ltd., Series 2023-14A, Class A1, 7.32% (3 mo. USD Term SOFR + 2.00%), due 01/20/35(b) 144A | |
| | OCP CLO Ltd., Series 2015-9A, Class BR2, 7.07% (3 mo. USD Term SOFR + 1.75%), due 01/15/33(b) 144A | |
| | OCP CLO Ltd., Series 2016-11A, Class DR2, 9.02% (3 mo. USD Term SOFR + 3.70%), due 04/26/36(b) 144A | |
| | Octagon Investment Partners 32 Ltd., Series 2017-1A, Class D, 8.98% (3 mo. USD Term SOFR + 3.66%), due 07/15/29(b) 144A | |
| | Octagon Investment Partners 35 Ltd., Series 2018-1A, Class C, 8.18% (3 mo. USD Term SOFR + 2.86%), due 01/20/31(b) 144A | |
| | OHA Credit Funding 2 Ltd., Series 2019-2A, Class BR, 7.18% (3 mo. USD Term SOFR + 1.86%), due 04/21/34(b) 144A | |
| | OHA Credit Funding 4 Ltd., Series 2019-4A, Class BR, 7.23% (3 mo. USD Term SOFR + 1.91%), due 10/22/36(b) 144A | |
| | OHA Credit Funding 7 Ltd., Series 2020-7A, Class AR, 6.61% (3 mo. USD Term SOFR + 1.30%), due 02/24/37(b) 144A | |
| | OHA Loan Funding Ltd., Series 2013-1A, Class DR2, 8.63% (3 mo. USD Term SOFR + 3.31%), due 07/23/31(b) 144A | |
| | Option One Mortgage Loan Trust, Series 2005-3, Class M4, 6.37% (1 mo. USD Term SOFR + 1.04%), due 08/25/35(b) | |
| | Owl Rock CLO III Ltd., Series 2020-3A, Class A1L, 7.38% (3 mo. USD Term SOFR + 2.06%), due 04/20/32(b) 144A | |
| | OZLM XXIII Ltd., Series 2019-23A, Class B1R, 7.43% (3 mo. USD Term SOFR + 2.11%), due 04/15/34(b) 144A | |
| | Palmer Square CLO Ltd., Series 2021-4A, Class B, 7.23% (3 mo. USD Term SOFR + 1.91%), due 10/15/34(b) 144A | |
| | Palmer Square Loan Funding Ltd., Series 2021-2A, Class B, 6.98% (3 mo. USD Term SOFR + 1.66%), due 05/20/29(b) 144A | |
| | Palmer Square Loan Funding Ltd., Series 2022-3A, Class CR, 8.32% (3 mo. USD Term SOFR + 3.00%), due 04/15/31(b) 144A | |
| | Parallel Ltd., Series 2017-1A, Class CR, 7.58% (3 mo. USD Term SOFR + 2.26%), due 07/20/29(b) 144A | |
| | Park Avenue Institutional Advisers CLO Ltd., Series 2021-2A, Class B, 7.33% (3 mo. USD Term SOFR + 2.01%), due 07/15/34(b) 144A | |
| | Peace Park CLO Ltd., Series 2021-1A, Class E, 11.58% (3 mo. USD Term SOFR + 6.26%), due 10/20/34(b) 144A | |
| | Planet Fitness Master Issuer LLC, Series 2018-1A, Class A2II, 4.67%, due 09/05/48 144A | |
| | PPM CLO Ltd., Series 2018-1A, Class B2, 7.43% (3 mo. USD Term SOFR + 2.11%), due 07/15/31(b) 144A | |
| | Rad CLO 21 Ltd., Series 2023-21A, Class D, 9.77% (3 mo. USD Term SOFR + 4.40%), due 01/25/33(b) 144A | |
| | Renaissance Home Equity Loan Trust, Series 2003-2, Class A, 4.30% (1 mo. USD Term SOFR + 0.99%), due 08/25/33(b) | |
140
See accompanying Notes to the Financial Statements.
Mercer Opportunistic Fixed Income FundSchedule of Investments (Continued)
(showing percentage of net assets)
March 31, 2024
| | | |
| | Asset Backed Securities — continued |
| | Residential Asset Securities Corporation Trust, Series 2006-KS2, Class M3, 6.06% (1 mo. USD Term SOFR + 0.73%), due 03/25/36(b) | |
| | Rockford Tower CLO Ltd., Series 2018-1A, Class A, 6.68% (3 mo. USD Term SOFR + 1.36%), due 05/20/31(b) 144A | |
| | Rockford Tower CLO Ltd., Series 2021-3A, Class B, 7.33% (3 mo. USD Term SOFR + 2.01%), due 10/20/34(b) 144A | |
| | RR 18 Ltd., Series 2021-18A, Class D, 11.83% (3 mo. USD Term SOFR + 6.51%), due 10/15/34(b) 144A | |
| | Sculptor CLO XXVI Ltd., Series 26A, Class E, 12.83% (3 mo. USD Term SOFR + 7.51%), due 07/20/34(b) 144A | |
| | Sixth Street CLO XVIII Ltd., Series 2021-18A, Class D, 8.48% (3 mo. USD Term SOFR + 3.16%), due 04/20/34(b) 144A | |
| | SLM Private Credit Student Loan Trust, Series 2003-A, Class A3, 8.30%, due | |
| | SLM Private Credit Student Loan Trust, Series 2003-B, Class A3, 7.96%, due 03/15/33(e) | |
| | SMB Private Education Loan Trust, Series 2021-A, Class D1, 3.86%, due 01/15/53 144A | |
| | SMB Private Education Loan Trust, Series 2023-B, Class B, 5.77%, due 10/16/56 144A | |
| | Southwick Park CLO LLC, Series 2019-4A, Class DR, 8.53% (3 mo. USD Term SOFR + 3.21%), due 07/20/32(b) 144A | |
| | Stonepeak ABS, Series 2021-1A, Class A, 2.68%, due 02/28/33 144A | |
| | Symphony CLO XXV Ltd., Series 2021-25A, Class D, 9.17% (3 mo. USD Term SOFR + 3.86%), due 04/19/34(b) 144A | |
| | Trinitas CLO XXVI Ltd., Series 2023-26A, Class C, 8.27% (3 mo. USD Term SOFR + 2.95%), due 01/20/35(b) 144A | |
| | Trinitas CLO XXVII Ltd., Series 2024-27A, Class D1, 9.55% (3 mo. USD Term SOFR + 4.30%), due 04/18/37(b) 144A | |
| | Valley Stream Park CLO Ltd., Series 2022-1A, Class DR, 9.47% (3 mo. USD Term SOFR + 4.15%), due 10/20/34(b) 144A | |
| | Venture 43 CLO Ltd., Series 2021-43A, Class D, 9.05% (3 mo. USD Term SOFR + 3.73%), due 04/15/34(b) 144A | |
| | Verde CLO Ltd., Series 2019-1A, Class DR, 8.83% (3 mo. USD Term SOFR + 3.51%), due 04/15/32(b) 144A | |
| | Voya CLO Ltd., Series 2017-2A, Class A2AR, 7.23% (3 mo. USD Term SOFR + 1.91%), due 06/07/30(b) 144A | |
| | Voya CLO Ltd., Series 2017-3A, Class DR, 12.53% (3 mo. USD Term SOFR + 7.21%), due 04/20/34(b) 144A | |
| | Warwick Capital CLO 3 Ltd., Series 2024-3A, Class D, 1.00% (3 mo. USD Term SOFR + 4.50%), due 04/20/37(b)(c) 144A | |
| | Whitebox CLO I Ltd., Series 2019-1A, Class ANBR, 7.28% (3 mo. USD Term SOFR + 1.96%), due 07/24/32(b) 144A | |
| | Whitebox CLO II Ltd., Series 2020-2A, Class A1R, 6.80% (3 mo. USD Term SOFR + 1.48%), due 10/24/34(b) 144A | |
| | Wind River CLO Ltd., Series 2021-4A, Class B, 7.23% (3 mo. USD Term SOFR + 1.91%), due 01/20/35(b) 144A | |
| | | |
| | |
| | 1011778 BC Unlimited Liability Co., 2023 Term Loan B5, 7.58% (1 mo. USD Term SOFR + 2.25%), due 09/20/30(b) | |
| | 19th Holdings Golf LLC, 2022 Term Loan B, 8.67% (1 mo. USD Term SOFR + 3.35%), | |
| | Access CIG LLC, 2023 Term Loan TBD, due 08/18/28(f) | |
See accompanying Notes to the Financial Statements.
141
Mercer Opportunistic Fixed Income FundSchedule of Investments (Continued)
(showing percentage of net assets)
March 31, 2024
| | | |
| | |
| | ACProducts, Inc., 2021 Term Loan B, 9.86% (3 mo. USD Term SOFR + 4.25%), due | |
| | Acrisure LLC, 2020 Term Loan B, 8.94% (1 mo. USD Term SOFR + 3.50%), due | |
| | Acrisure LLC, 2021 First Lien Term Loan B, 9.69% (1 mo. USD Term SOFR + 4.25%), | |
| | Acrisure LLC, 2023 Term Loan, 9.83% (1 mo. USD Term SOFR + 4.50%), due | |
| | Adevinta ASA, EUR Term Loan B, 6.33% (1 mo. EURIBOR + 2.50%), due 06/26/28(b) | |
| | Adient US LLC, 2024 Term Loan B2, 8.08% (1 mo. USD Term SOFR + 2.75%), due | |
| | Adtalem Global Education Inc., 2024 Term Loan B, 8.83% (1 mo. USD Term SOFR + | |
| | Advisor Group, Inc., 2023 Term Loan B, 9.83% (1 mo. USD Term SOFR + 4.50%), due | |
| | Advisor Group, Inc., 2024 Term Loan TBD, due 08/17/28(f) | |
| | Agiliti Health, Inc., 2023 Term Loan, 8.32% (3 mo. USD Term SOFR + 3.00%), due | |
| | Agiliti Health, Inc., 2023 Term Loan, 8.33% (3 mo. USD Term SOFR + 3.00%), due | |
| | AI Aqua Merger Sub, Inc., 2023 Incremental Term Loan, 9.57% (SOFR CME + 4.25%), | |
| | AI Aqua Merger Sub, Inc., 2023 Incremental Term Loan, 9.58% (SOFR CME + 4.25%), | |
| | A-L Parent LLC, 2023 Take Back Term Loan, 10.83% (1 mo. USD Term SOFR + | |
| | Allen Media LLC, 2021 Term Loan B, 10.96% (3 mo. USD Term SOFR + 5.50%), due | |
| | Allied Universal Holdco LLC, 2021 USD Incremental Term Loan B, 9.18% (1 mo. USD Term SOFR + 3.75%), due 05/12/28(b) | |
| | Allied Universal Holdco LLC, 2023 Term Loan B, 10.08% (1 mo. USD Term SOFR + | |
| | Amentum Government Services Holdings LLC, 2022 Term Loan, 9.33% (1 mo. USD Term SOFR + 4.00%), due 02/15/29(b) | |
| | Amentum Government Services Holdings LLC, Term Loan B, 9.44% (1 mo. USD Term SOFR + 4.00%), due 01/29/27(b) | |
| | American Airlines, Inc., 2021 Term Loan, 10.33% (3 mo. USD Term SOFR + 4.75%), | |
| | AMG Advanced Metallurgical Group NV, 2018 Term Loan B, 8.94% (1 mo. USD Term SOFR + 3.50%), due 11/30/28(b) | |
| | AmWINS Group, Inc., 2021 Term Loan B, 7.69% (1 mo. USD Term SOFR + 2.25%), | |
| | AmWINS Group, Inc., 2023 Incremental Term Loan B, 8.19% (1 mo. USD Term SOFR + 2.75%), due 02/19/28(b) | |
| | Anticimex International AB, 2021 USD Term Loan B1, 8.46% (3 mo. USD Term SOFR + 3.15%), due 11/16/28(b) | |
| | Apollo Commercial Real Estate Finance, Inc., 2021 Incremental Term Loan B1, 8.94% (1 mo. USD Term SOFR + 3.50%), due 03/11/28(b) | |
| | Apollo Commercial Real Estate Finance, Inc., Term Loan B, 8.19% (1 mo. USD Term SOFR + 2.75%), due 05/15/26(b) | |
| | Arctic Canadian Diamond Co. Ltd., 2nd Lien PIK Term Loan, 10.00% (10.00% Fixed or PIK), due 12/31/27(b)(d)(g) | |
| | Aruba Investments Holdings LLC, 2020 EUR Term Loan, 7.83% (1 mo. EURIBOR + | |
142
See accompanying Notes to the Financial Statements.
Mercer Opportunistic Fixed Income FundSchedule of Investments (Continued)
(showing percentage of net assets)
March 31, 2024
| | | |
| | |
| | Aruba Investments Holdings LLC, 2020 USD Term Loan, 9.43% (1 mo. USD Term SOFR + 0.00%), due 11/24/27(b) | |
| | AssuredPartners, Inc., 2023 Term Loan B4, 9.08% (1 mo. USD Term SOFR + 3.75%), | |
| | Asurion LLC, 2021 Second Lien Term Loan B4, 10.69% (1 mo. USD Term SOFR + | |
| | Asurion LLC, 2021 Term Loan B9, 8.69% (1 mo. USD Term SOFR + 3.25%), due | |
| | Asurion LLC, 2022 Term Loan B10, 9.43% (1 mo. USD Term SOFR + 4.00%), due | |
| | Autokiniton U.S. Holdings, Inc., 2024 Term Loan B, 9.44% (3 mo. USD Term SOFR + | |
| | Barnes Group, Inc., 2024 Term Loan TBD, due 09/03/30(f) | |
| | Bausch & Lomb Corp., 2023 Incremental Term Loan, 9.33% (1 mo. USD Term SOFR + | |
| | Belron Luxembourg SARL, 2021 EUR Term Loan B, 6.35% (3 mo. EURIBOR + | |
| | Blackhawk Network Holdings, Inc., 2024 Term Loan, 10.32% (3 mo. USD Term SOFR + 5.00%), due 03/12/29(b) | |
| | Brookfield WEC Holdings, Inc., 2024 Term Loan, 8.08% (1 mo. USD Term SOFR + | |
| | Brown Group Holding LLC, 2022 Incremental Term Loan B2, 8.34% (3 mo. USD Term SOFR + 3.00%), due 07/02/29(b) | |
| | Brown Group Holding LLC, 2022 Incremental Term Loan B2, 8.31% (3 mo. USD Term SOFR + 3.00%), due 07/02/29(b) | |
| | Brown Group Holding LLC, Term Loan B, 8.18% (1 mo. USD Term SOFR + 2.75%), | |
| | Caesars Entertainment Inc., Term Loan B, 8.66% (3 mo. USD Term SOFR + 3.25%), | |
| | Caesars Entertainment, Inc., 2024 Term Loan B1, 8.04% (3 mo. USD Term SOFR + | |
| | Camelot U.S. Acquisition LLC, 2024 Term Loan B, 8.08% (1 mo. USD Term SOFR + | |
| | Cardinal Parent, Inc., 2020 Term Loan B, 10.00% (3 mo. USD Term SOFR + 4.50%), | |
| | Carnival Corp., 2023 Term Loan B, 8.32% (1 mo. USD Term SOFR + 3.00%), due | |
| | Carriage Purchaser, Inc., 2021 Term Loan B, 9.69% (1 mo. USD Term SOFR + 4.25%), | |
| | CB Poly U.S. Holdings, Inc., Term Loan B, 10.85% (3 mo. USD Term SOFR + 5.50%), | |
| | CCI Buyer, Inc., Term Loan, 9.32% (3 mo. USD Term SOFR + 4.00%), due 12/17/27(b) | |
| | Cengage Learning, Inc., 2024 Term Loan B, 9.58% (3 mo. USD Term SOFR + 4.25%), | |
| | Central Parent, Inc., 2023 Term Loan B, 9.31% (3 mo. USD Term SOFR + 4.00%), due | |
| | Chromalloy Corp., 2024 Term Loan B TBD, due 03/21/31(f) | |
| | Cimpress Public Ltd. Co., USD Term Loan B, 8.94% (1 mo. USD Term SOFR + | |
| | Cinemark USA, Inc., 2023 Term Loan B, 9.08% (1 mo. USD Term SOFR + 3.75%), due | |
| | Cinemark USA, Inc., 2023 Term Loan B, 9.10% (3 mo. USD Term SOFR + 3.75%), due | |
See accompanying Notes to the Financial Statements.
143
Mercer Opportunistic Fixed Income FundSchedule of Investments (Continued)
(showing percentage of net assets)
March 31, 2024
| | | |
| | |
| | Citadel Securities LP, 2024 Term Loan B, 7.58% (1 mo. USD Term SOFR + 2.25%), | |
| | Clarios Global LP, 2024 Term Loan B, 8.33% (1 mo. USD Term SOFR + 3.00%), due | |
| | Clear Channel Outdoor Holdings, Inc., 2024 Term Loan, 9.44% (1 mo. USD Term SOFR + 4.00%), due 08/23/28(b) | |
| | Cloud Software Group, Inc., 2022 USD Term Loan B TBD, due 03/30/29(f) | |
| | Cloudera, Inc., 2021 Second Lien Term Loan, 11.43% (1 mo. USD Term SOFR + | |
| | Cloudera, Inc., 2021 Term Loan, 9.08% (1 mo. USD Term SOFR + 3.75%), due | |
| | Clydesdale Acquisition Holdings, Inc., Term Loan B, 9.11% (1 mo. USD Term SOFR + | |
| | CommScope, Inc., 2019 Term Loan B, 8.58% (1 mo. USD Term SOFR + 3.25%), due | |
| | CoreLogic, Inc., Term Loan, 8.94% (1 mo. USD Term SOFR + 3.50%), due 06/02/28(b) | |
| | Cotiviti Corp., 2024 Term Loan TBD, due 02/21/31(f) | |
| | Cotiviti Corp., 2024 Term Loan TBD, due 02/21/31(f) | |
| | Crown Subsea Communications Holding,Inc., 2024 Term Loan B, 10.07% (3 mo. USD Term SOFR + 4.75%), due 01/30/31(b) | |
| | CTC Holdings LP, Term Loan B, 10.48% (3 mo. USD Term SOFR + 5.00%), due | |
| | DCert Buyer, Inc., 2019 Term Loan B, 9.33% (1 mo. USD Term SOFR + 4.00%), due | |
| | DCert Buyer, Inc., 2021 2nd Lien Term Loan, 12.33% (1 mo. USD Term SOFR + | |
| | Deerfield Dakota Holding LLC, 2020 USD Term Loan B, 9.06% (3 mo. USD Term SOFR + 3.75%), due 04/09/27(b) | |
| | Deerfield Dakota Holding LLC, 2021 USD 2nd Lien Term Loan, 12.32% (3 mo. USD Term SOFR + 6.75%), due 04/07/28(b) | |
| | DirecTV Financing, LLC, 2024 Term Loan, 10.25% (2 mo. USD Term SOFR + 5.00%), | |
| | DirecTV Financing, LLC, 2024 Term Loan TBD, due 08/02/29(f) | |
| | DS Parent, Inc., Term Loan B, 10.81% (3 mo. USD Term SOFR + 5.50%), due | |
| | Dun & Bradstreet Corp., 2024 Term Loan B, 8.08% (1 mo. USD Term SOFR + 2.75%), | |
| | Electron BidCo, Inc., 2021 Term Loan, 8.44% (1 mo. USD Term SOFR + 3.00%), due | |
| | Embecta Corp., Term Loan B, 8.33% (1 mo. USD Term SOFR + 3.00%), due | |
| | Emrld Borrower LP, Term Loan B, 7.79% (3 mo. USD Term SOFR + 2.50%), due | |
| | Endure Digital, Inc., Term Loan, 9.42% (6 mo. USD Term SOFR + 3.50%), due | |
| | EP Purchaser LLC, 2021 Term Loan B, 9.07% (3 mo. USD Term SOFR + 3.50%), due | |
| | EVERTEC Group LLC, 2023 Term Loan B, 8.83% (1 mo. USD Term SOFR + 3.50%), | |
| | EyeCare Partners LLC, 2021 2nd Lien Term Loan, 12.32% (3 mo. USD Term SOFR + | |
| | EyeCare Partners LLC, 2021 Incremental Term Loan, 9.32% (3 mo. USD Term SOFR + | |
144
See accompanying Notes to the Financial Statements.
Mercer Opportunistic Fixed Income FundSchedule of Investments (Continued)
(showing percentage of net assets)
March 31, 2024
| | | |
| | |
| | EyeCare Partners LLC, 2022 Incremental Term Loan, 9.91% (3 mo. USD Term SOFR + | |
| | Fanatics Commerce Intermediate Holdco LLC, Term Loan B, 8.69% (1 mo. USD Term SOFR + 3.25%), due 11/24/28(b) | |
| | First Brands Group LLC, 2021 Term Loan, 10.57% (3 mo. USD Term SOFR + 5.00%), | |
| | First Brands Group LLC, 2022 Incremental Term Loan, 10.57% (3 mo. USD Term SOFR + 5.00%), due 03/30/27(b) | |
| | Flutter Financing BV, Term Loan B, 7.66% (3 mo. USD Term SOFR + 2.25%), due | |
| | Focus Financial Partners LLC, 2021 Term Loan B4, 7.83% (1 mo. USD Term SOFR + | |
| | Four Seasons Hotels, Ltd., 2024 Term Loan B, 7.32% (3 mo. USD Term SOFR + | |
| | Froneri International Ltd., 2020 EUR Term Loan B1, 5.99% (6 mo. EURIBOR + | |
| | Gainwell Acquisition Corp., Term Loan B, 9.41% (3 mo. USD Term SOFR + 4.00%), | |
| | Garda World Security Corp., 2022 Term Loan B, 9.58% (3 mo. USD Term SOFR + | |
| | Genesee & Wyoming, Inc., Term Loan, 7.45% (3 mo. USD Term SOFR + 2.00%), due | |
| | Genesys Cloud Services Holdings II LLC, Term Loan B, 9.19% (1 mo. USD Term SOFR + 3.75%), due 12/01/27(b) | |
| | Geo Group, Inc., 2022 Tranche 1 Term Loan, 12.21% (1 mo. USD Term SOFR + | |
| | Gray Television, Inc., 2021 Term Loan D, 8.44% (1 mo. USD Term SOFR + 3.00%), | |
| | Greystone Select Financial LLC, Term Loan B, 10.57% (3 mo. USD Term SOFR + | |
| | GTCR W Merger Sub LLC, EUR Term Loan B, 7.15% (3 mo. EURIBOR + 3.25%), due | |
| | GTCR W Merger Sub LLC, USD Term Loan B, 8.31% (1 mo. USD Term SOFR + | |
| | Harbor Freight Tools USA, Inc., 2021 Term Loan B, 8.19% (1 mo. USD Term SOFR + | |
| | Hayward Industries, Inc., 2022 Term Loan, 8.68% (1 mo. USD Term SOFR + 3.25%), | |
| | Hayward Industries, Inc., 2022 Term Loan, 10.75% (U.S. (Fed) Prime Rate + 2.25%), | |
| | Howden Group Holdings Ltd., 2023 USD Term Loan B, 9.33% (1 mo. USD Term SOFR + 4.00%), due 04/18/30(b) | |
| | Hudson River Trading LLC, 2021 Term Loan, 8.44% (1 mo. USD Term SOFR + | |
| | II-VI, Inc., 2022 Term Loan B, 8.08% (1 mo. USD Term SOFR + 2.75%), due | |
| | Ingram Micro, Inc., 2023 Term Loan, 8.61% (3 mo. USD Term SOFR + 3.00%), due | |
| | International Textile Group, Inc., 2023 Last Out Term Loan, 6.48% (3 mo. USD SOFR + 1.15%, 5.50% PIK), due 09/30/27(b) | |
| | International Textile Group, Inc., 2023 Term Loan, 13.98% (3 mo. USD Term SOFR + | |
| | IXS Holdings, Inc., 2020 Term Loan B, 9.69% (6 mo. USD Term SOFR + 4.25%), due | |
See accompanying Notes to the Financial Statements.
145
Mercer Opportunistic Fixed Income FundSchedule of Investments (Continued)
(showing percentage of net assets)
March 31, 2024
| | | |
| | |
| | IXS Holdings, Inc., 2020 Term Loan B TBD, due 03/05/27(f) | |
| | Jazz Financing Lux S.a.r.l., 2024 Term Loan B, 8.44% (1 mo. USD Term SOFR + | |
| | Jump Financial LLC, Term Loan B, 9.82% (3 mo. USD Term SOFR + 4.50%), due | |
| | Kaman Corp., 2024 Term Loan TBD, due 03/27/31(f) | |
| | Knight Health Holdings LLC, Term Loan B, 10.70% (1 mo. USD Term SOFR + 5.25%), | |
| | Kohler Energy Co. LLC, EUR Term Loan B TBD, due 01/30/31(f) | |
| | Lakeshore Intermediate LLC, Term Loan, 8.94% (1 mo. USD Term SOFR + 3.50%), | |
| | LIDS Holdings, Inc., Term Loan, 10.98% (3 mo. USD Term SOFR + 5.50%), due | |
| | LifePoint Health, Inc., 2023 Term Loan B, 11.09% (3 mo. USD Term SOFR + 5.50%), | |
| | LifePoint Health, Inc., 2024 Term Loan B TBD, due 11/16/28(f) | |
| | LRS Holdings LLC, Term Loan B, 9.69% (1 mo. USD Term SOFR + 4.25%), due | |
| | Magenta Buyer LLC, 2021 USD 1st Lien Term Loan, 10.57% (3 mo. USD Term SOFR + 5.00%), due 07/27/28(b) | |
| | MajorDrive Holdings IV LLC, Term Loan B, 9.57% (3 mo. USD Term SOFR + 4.00%), | |
| | McGraw-Hill Global Education Holdings LLC, 2021 Term Loan, 10.19% (1 mo. USD Term SOFR + 4.75%), due 07/28/28(b) | |
| | Medline Borrower LP, 2024 Term Loan B TBD, due 10/23/28(f) | |
| | MH Sub I LLC, 2023 Term Loan, 9.58% (1 mo. USD Term SOFR + 4.25%), due | |
| | Michaels Cos., Inc., 2021 Term Loan B, 9.57% (3 mo. USD Term SOFR + 4.25%), due | |
| | MIWD Holdco II LLC, 2024 Term Loan B2 TBD, due 03/21/31(f) | |
| | MKS Instruments, Inc., 2023 Term Loan B, 7.82% (1 mo. USD Term SOFR + 2.50%), | |
| | MPH Acquisition Holdings LLC, 2021 Term Loan B, 9.85% (3 mo. USD Term SOFR + | |
| | MRI Software LLC, 2020 Term Loan, 10.95% (3 mo. USD Term SOFR + 5.50%), due | |
| | MRI Software LLC, 2020 Term Loan B, 10.95% (3 mo. USD Term SOFR + 5.50%), | |
| | Neptune Bidco U.S., Inc., 2022 USD Term Loan A, 10.17% (3 mo. USD Term SOFR + | |
| | Neptune Bidco U.S., Inc., 2022 USD Term Loan B, 10.42% (3 mo. USD Term SOFR + | |
| | Nexus Buyer LLC, 2023 Term Loan B2, 9.83% (1 mo. USD Term SOFR + 4.50%), due | |
| | Nielsen Consumer, inc., 2023 USD Fifth Amendment Incremental Term Loan, 11.58% (1 mo. USD Term SOFR + 6.25%), due 03/06/28(b) | |
| | Olympus Water U.S. Holding Corp., 2021 EUR Term Loan B, 7.90% (3 mo. EURIBOR + 4.00%), due 11/09/28(b) | |
| | Olympus Water U.S. Holding Corp., 2021 USD Term Loan B, 9.32% (3 mo. USD Term SOFR + 3.75%), due 11/09/28(b) | |
| | Ontario Gaming GTA LP, Term Loan B, 9.60% (3 mo. USD Term SOFR + 4.25%), due | |
146
See accompanying Notes to the Financial Statements.
Mercer Opportunistic Fixed Income FundSchedule of Investments (Continued)
(showing percentage of net assets)
March 31, 2024
| | | |
| | |
| | Organon & Co., EUR Term Loan B, 6.84% (1 mo. USD Term SOFR + 3.00%), due | |
| | Oscar AcquisitionCo LLC, Term Loan B, 9.95% (3 mo. USD Term SOFR + 4.50%), due | |
| | Parexel International Corp., 2021 1st Lien Term Loan, 8.69% (1 mo. USD Term SOFR + | |
| | Paysafe Holdings (U.S) Corp., EUR Term Loan B2, 6.83% (1 mo. USD Term SOFR + | |
| | PECF USS Intermediate Holding III Corp., Term Loan B, 9.82% (3 mo. USD Term SOFR + 4.25%), due 12/15/28(b) | |
| | Peer Holding III BV, 2023 USD Term Loan B4, 8.56% (3 mo. USD Term SOFR + | |
| | Peraton Corp., 2nd Lien Term Loan B1, 13.18% (3 mo. USD Term SOFR + 7.75%), due | |
| | Peraton Corp., Term Loan B, 9.08% (1 mo. USD Term SOFR + 3.75%), due 02/01/28(b) | |
| | PetSmart, Inc., 2021 Term Loan B, 9.18% (1 mo. USD Term SOFR + 3.75%), due | |
| | Phoenix Guarantor, Inc., 2024 Term Loan, 8.58% (1 mo. USD Term SOFR + 3.25%), | |
| | Planview Parent, Inc., Term Loan, 9.61% (3 mo. USD Term SOFR + 4.00%), due | |
| | Prime Security Services Borrower LLC, 2023 Term Loan B, 7.83% (3 mo. USD Term SOFR + 2.50%), due 10/14/30(b) | |
| | Project Alpha Intermediate Holding, Inc., 2023 1st Lien Term Loan B, 10.06% (3 mo. USD Term SOFR + 4.75%), due 10/28/30(b) | |
| | Proofpoint, Inc., 1st Lien Term Loan, 8.58% (1 mo. USD Term SOFR + 3.25%), due | |
| | Quikrete Holdings, Inc., 2023 Term Loan B, 8.19% (1 mo. USD Term SOFR + 2.75%), | |
| | Rand Parent LLC, 2023 Term Loan B, 9.57% (3 mo. USD Term SOFR + 4.25%), due | |
| | Redstone Holdco 2 LP, 2021 Term Loan, 10.19% (1 mo. USD Term SOFR + 4.75%), | |
| | Roper Industrial Products Investment Co. LLC, 2023 EUR Term Loan, 8.40% (3 mo. EURIBOR + 4.50%), due 11/22/29(b) | |
| | Roper Industrial Products Investment Co. LLC, 2023 USD Term Loan, 9.35% (3 mo. USD Term SOFR + 4.00%), due 11/22/29(b) | |
| | RSC Acquisition, Inc., 2019 Term Loan, 10.96% (3 mo. USD Term SOFR + 5.50%), | |
| | RSC Acquisition, Inc., 2019 Term Loan, 10.99% (3 mo. USD Term SOFR + 5.50%), | |
| | RSC Acquisition, Inc., 2019 Term Loan, 11.00% (3 mo. USD Term SOFR + 5.50%), | |
| | RSC Acquisition, Inc., 2020 Incremental Term Loan, 10.96% (3 mo. USD Term SOFR + | |
| | RSC Acquisition, Inc., 2020 Incremental Term Loan, 10.99% (3 mo. USD Term SOFR + | |
| | RSC Acquisition, Inc., 2020 Incremental Term Loan, 11.00% (3 mo. USD Term SOFR + | |
| | RSC Acquisition, Inc., 2021 Term Loan C, 10.96% (3 mo. USD Term SOFR + 5.50%), | |
| | RSC Acquisition, Inc., 2021 Term Loan C, 10.99% (3 mo. USD Term SOFR + 5.50%), | |
See accompanying Notes to the Financial Statements.
147
Mercer Opportunistic Fixed Income FundSchedule of Investments (Continued)
(showing percentage of net assets)
March 31, 2024
| | | |
| | |
| | RSC Acquisition, Inc., 2021 Term Loan C, 11.00% (3 mo. USD Term SOFR + 5.50%), | |
| | RSC Acquisition, Inc., 2022 Tranche 2 Delayed Draw Term Loan, 10.96% (3 mo. USD Term SOFR + 5.49%), due 11/01/29(b) | |
| | RSC Acquisition, Inc., 2022 Tranche 2 Delayed Draw Term Loan, 11.00% (3 mo. USD Term SOFR + 5.49%), due 11/01/29(b) | |
| | RSC Acquisition, Inc., 2022 Tranche 2 Delayed Draw Term Loan, 10.99% (3 mo. USD Term SOFR + 5.50%), due 11/01/29(b) | |
| | RSC Acquisition, Inc., 2022 Tranche 2 Delayed Draw Term Loan, 11.33% (3 mo. USD Term SOFR + 6.00%), due 11/01/29(b) | |
| | RSC Acquisition, Inc., 2023 Tranche 2 Delayed Draw Term Loan, 11.31% (3 mo. USD Term SOFR + 6.00%), due 11/01/29(b) | |
| | RSC Acquisition, Inc., 2023 Tranche 2 Delayed Draw Term Loan, 11.34% (3 mo. USD Term SOFR + 6.00%), due 11/01/29(b) | |
| | RSC Acquisition, Inc., 2023 Tranche 2 Delayed Draw Term Loan, 11.34% (3 mo. USD Term SOFR + 6.00%), due 11/01/29(b) | |
| | Ryan LLC, Term Loan, 9.83% (1 mo. USD Term SOFR + 4.50%), due 11/14/30(b) | |
| | Sedgwick Claims Management Services, Inc., 2023 Term Loan B, 9.08% (1 mo. USD Term SOFR + 3.75%), due 02/24/28(b) | |
| | SkyMiles IP Ltd., 2020 Skymiles Term Loan B, 9.07% (3 mo. USD Term SOFR + | |
| | Solis IV BV, USD Term Loan B1, 8.82% (3 mo. USD Term SOFR + 3.50%), due | |
| | Sotera Health Holdings LLC, 2023 Incremental Term Loan B, 9.08% (1 mo. USD Term SOFR + 3.75%), due 12/11/26(b) | |
| | Spencer Spirit IH LLC, Term Loan B, 11.42% (1 mo. USD Term SOFR + 6.00%), due | |
| | SPX FLOW, Inc., 2022 Term Loan, 9.93% (1 mo. USD Term SOFR + 4.50%), due | |
| | Star Parent, Inc., Term Loan B, 9.31% (3 mo. USD Term SOFR + 4.00%), due | |
| | Station Casinos LLC, 2024 Term Loan B TBD, due 03/07/31(f) | |
| | Sycamore Buyer LLC, Term Loan B, 7.69% (1 mo. USD Term SOFR + 2.25%), due | |
| | Thermostat Purchaser III, Inc., Term Loan, 9.99% (3 mo. USD Term SOFR + 4.50%), | |
| | Triton Water Holdings, Inc., 2024 Incremental Term Loan B, 9.33% (3 mo. USD Term SOFR + 4.00%), due 03/31/28(b) | |
| | Triton Water Holdings, Inc., Term Loan, 8.86% (3 mo. USD Term SOFR + 3.25%), due | |
| | Truist Insurance Holdings LLC, 1st Lien Term Loan TBD, due 03/24/31(f) | |
| | Truist Insurance Holdings LLC, 2nd Lien Term Loan TBD, due 03/08/32(f) | |
| | Tutor Perini Corp., Term Loan B TBD, due 08/18/27(f) | |
| | Uber Technologies, Inc., 2023 Term Loan B, 8.08% (3 mo. USD Term SOFR + 2.75%), | |
| | UFC Holdings LLC, 2021 Term Loan B, 8.34% (3 mo. USD Term SOFR + 2.75%), due | |
| | UKG, Inc., 2024 Term Loan B, 8.81% (3 mo. USD Term SOFR + 3.50%), due | |
| | United Airlines, Inc., 2024 Term Loan B, 8.08% (3 mo. USD Term SOFR + 2.75%), due | |
| | USI, Inc., 2023 Acquisition Term Loan, 8.60% (3 mo. USD Term SOFR + 3.25%), due | |
148
See accompanying Notes to the Financial Statements.
Mercer Opportunistic Fixed Income FundSchedule of Investments (Continued)
(showing percentage of net assets)
March 31, 2024
| | | |
| | |
| | UST Holdings Ltd., Term Loan, 8.94% (1 mo. USD Term SOFR + 3.50%), due | |
| | Verscend Holding Corp., 2021 Term Loan B, 9.44% (1 mo. USD Term SOFR + 4.00%), | |
| | Vertex Aerospace Services Corp., 2021 First Lien Term Loan, 8.58% (1 mo. USD Term SOFR + 3.25%), due 12/06/28(b) | |
| | Vertiv Group Corp., 2023 Term Loan B, 7.94% (1 mo. USD Term SOFR + 2.50%), due | |
| | VFH Parent LLC, 2022 Term Loan B, 8.43% (1 mo. USD Term SOFR + 3.00%), due | |
| | Virgin Media Bristol LLC, 2023 USD Term Loan Y, 8.79% (6 mo. USD Term SOFR + | |
| | Virgin Media Bristol LLC, USD Term Loan N, 7.94% (1 mo. USD Term SOFR + | |
| | VM Consolidated, Inc., 2024 Term Loan B, 8.08% (1 mo. USD Term SOFR + 2.75%), | |
| | VT Topco, Inc., 2023 Term Loan B, 9.58% (1 mo. USD Term SOFR + 4.25%), due | |
| | VT Topco, Inc., 2023 Term Loan B TBD, due 08/09/30(f) | |
| | Western Dental Services, Inc., 2021 Delayed Draw Term Loan, 4.50% (3 mo. USD Term SOFR + 4.50%), due 08/18/28(b) | |
| | Western Dental Services, Inc., 2021 Term Loan B, 10.10% (3 mo. USD Term SOFR + | |
| | Wheel Pros LLC, 2023 FILO Term Loan, 14.46% (3 mo. USD Term SOFR + 8.87%), | |
| | Worldwide Express Operations LLC, 2021 1st Lien Term Loan, 9.57% (3 mo. USD Term SOFR + 4.00%), due 07/26/28(b) | |
| | WW International, Inc., 2021 Term Loan B, 8.83% (1 mo. USD Term SOFR + 3.50%), | |
| | | |
| | |
| | Axon Enterprise, Inc., 0.50%, due 12/15/27 | |
| | Block, Inc., 0.13%, due 03/01/25 | |
| | Booking Holdings, Inc., 0.75%, due 05/01/25 | |
| | Carnival Corp., 5.75%, due 12/01/27 | |
| | Cloudflare, Inc., 3.52%, due 08/15/26(h) | |
| | CyberArk Software Ltd., due 11/15/24(h) | |
| | DISH Network Corp., 25.17%, due 12/15/25(h) | |
| | DraftKings Holdings, Inc., 4.49%, due 03/15/28(h) | |
| | DraftKings Holdings, Inc., 4.49%, due 03/15/28(h) | |
| | Fluor Corp., 1.13%, due 08/15/29 144A | |
| | Freshpet, Inc., 3.00%, due 04/01/28 | |
| | Gannett Co., Inc., 6.00%, due 12/01/27 144A | |
| | Guidewire Software, Inc., 1.25%, due 03/15/25 | |
| | HubSpot, Inc., 0.38%, due 06/01/25 | |
| | Liberty Media Corp., 3.75%, due 03/15/28 | |
| | Liberty Media Corp.-Liberty Formula One, 2.25%, due 08/15/27 | |
| | Liberty TripAdvisor Holdings, Inc., 0.50%, due 06/30/51 144A | |
| | Multiplan Corp., 6.00%, (6.00% Cash or 7.00% PIK), due 10/15/27 144A | |
| | NRG Energy, Inc., 2.75%, due 06/01/48 | |
| | Nutanix, Inc., 0.25%, due 10/01/27 | |
See accompanying Notes to the Financial Statements.
149
Mercer Opportunistic Fixed Income FundSchedule of Investments (Continued)
(showing percentage of net assets)
March 31, 2024
| | | |
| | Convertible Debt — continued |
| | Parsons Corp., 2.63%, due 03/01/29 144A | |
| | Royal Caribbean Cruises Ltd., 6.00%, due 08/15/25 | |
| | Sarepta Therapeutics, Inc., 1.25%, due 09/15/27 | |
| | Seagate HDD Cayman, 3.50%, due 06/01/28 144A | |
| | Stem, Inc., 0.50%, due 12/01/28 144A | |
| | TransMedics Group, Inc., 1.50%, due 06/01/28 144A | |
| | Uber Technologies, Inc., Series 2028, 0.88%, due 12/01/28 144A | |
| | Welltower OP LLC, 2.75%, due 05/15/28 144A | |
| | Western Digital Corp., 3.00%, due 11/15/28 144A | |
| | Zillow Group, Inc., 0.75%, due 09/01/24 | |
| | Zscaler, Inc., 0.13%, due 07/01/25 | |
| | | |
| | |
| | ABN AMRO Bank NV, 4.75%, due 07/28/25 144A | |
| | ABN AMRO Bank NV, 6.34% (1 yr. CMT + 1.65%), due 09/18/27(b) 144A | |
| | Abu Dhabi Crude Oil Pipeline LLC, 4.60%, due 11/02/47 144A | |
| | Accelerate360 Holdings LLC, 8.00%, due 03/01/28 144A | |
| | Adani Ports & Special Economic Zone Ltd., 4.38%, due 07/03/29(i) | |
| | Adani Ports & Special Economic Zone Ltd., 5.00%, due 08/02/41 144A | |
| | Adevinta ASA, 3.00%, due 11/15/27 144A | |
| | Adtalem Global Education, Inc., 5.50%, due 03/01/28 144A | |
| | Advanced Drainage Systems, Inc., 5.00%, due 09/30/27 144A | |
| | Advanced Drainage Systems, Inc., 6.38%, due 06/15/30 144A | |
| | AerCap Holdings NV, 5.88% (5 yr. CMT + 4.54%), due 10/10/79(b) | |
| | AerCap Ireland Capital DAC/AerCap Global Aviation Trust, 3.30%, due 01/30/32 | |
| | AerCap Ireland Capital DAC/AerCap Global Aviation Trust, 6.50%, due 07/15/25 | |
| | Air Canada, 3.88%, due 08/15/26 144A | |
| | Akbank TAS, 6.80%, due 02/06/26 144A | |
| | Akumin, Inc., 9.00%, due 08/01/27 144A | |
| | Alibaba Group Holding Ltd., 3.15%, due 02/09/51 | |
| | Allen Media LLC/Allen Media Co.-Issuer, Inc., 10.50%, due 02/15/28 144A | |
| | Allied Universal Holdco LLC/Allied Universal Finance Corp., 6.63%, due 07/15/26 144A | |
| | Allison Transmission, Inc., 4.75%, due 10/01/27 144A | |
| | Ally Financial, Inc., 6.85% (SOFR + 2.82%), due 01/03/30(b) | |
| | Altice Financing SA, 5.75%, due 08/15/29 144A | |
| | Altice France Holding SA, 10.50%, due 05/15/27 144A | |
| | Altice France SA, 5.13%, due 07/15/29(j) 144A | |
| | Altice France SA, 5.50%, due 10/15/29 144A | |
| | Altria Group, Inc., 5.95%, due 02/14/49 | |
| | Ambipar Lux SARL, 9.88%, due 02/06/31 144A | |
| | AMC Entertainment Holdings, Inc., 7.50%, due 02/15/29(j) 144A | |
| | America Movil SAB de CV, 7.13%, due 12/09/24 | |
| | American Airlines Pass-Through Trust, 4.95%, due 08/15/26 | |
| | American Airlines, Inc., 7.25%, due 02/15/28(j) 144A | |
| | American Airlines, Inc., 8.50%, due 05/15/29 144A | |
| | American Airlines, Inc./AAdvantage Loyalty IP Ltd., 5.50%, due 04/20/26 144A | |
| | American Airlines, Inc./AAdvantage Loyalty IP Ltd., 5.75%, due 04/20/29 144A | |
150
See accompanying Notes to the Financial Statements.
Mercer Opportunistic Fixed Income FundSchedule of Investments (Continued)
(showing percentage of net assets)
March 31, 2024
| | | |
| | Corporate Debt — continued |
| | American News Co. LLC, 8.50% (8.50% Cash or 10.00% PIK), due 09/01/26 144A | |
| | Ameriprise Financial, Inc., 4.50%, due 05/13/32 | |
| | AmWINS Group, Inc., 6.38%, due 02/15/29 144A | |
| | Anglo American Capital PLC, 2.88%, due 03/17/31 144A | |
| | Anglo American Capital PLC, 3.88%, due 03/16/29 144A | |
| | Anglo American Capital PLC, 3.95%, due 09/10/50 144A | |
| | AngloGold Ashanti Holdings PLC, 3.75%, due 10/01/30 | |
| | Antares Holdings LP, 3.95%, due 07/15/26 144A | |
| | Antero Resources Corp., 7.63%, due 02/01/29 144A | |
| | AP Moller - Maersk AS, 5.88%, due 09/14/33 144A | |
| | ARD Finance SA, 6.50% (6.50% Cash or 7.25% PIK), due 06/30/27 144A | |
| | Ardagh Metal Packaging Finance USA LLC/Ardagh Metal Packaging Finance PLC, 4.00%, due 09/01/29(j) 144A | |
| | Ardagh Metal Packaging Finance USA LLC/Ardagh Metal Packaging Finance PLC, 6.00%, due 06/15/27 144A | |
| | Ardagh Packaging Finance PLC/Ardagh Holdings USA, Inc., 5.25%, due 08/15/27(j) 144A | |
| | Ardonagh Finco Ltd., 6.88%, due 02/15/31 144A | |
| | Ardonagh Finco Ltd., 7.75%, due 02/15/31 144A | |
| | Ardonagh Group Finance Ltd., 8.88%, due 02/15/32 144A | |
| | ARES Capital Corp., 5.88%, due 03/01/29 | |
| | Ashtead Capital, Inc., 5.80%, due 04/15/34 144A | |
| | Ashtead Capital, Inc., 5.95%, due 10/15/33 144A | |
| | Asian Infrastructure Investment Bank, 9.91%, due 02/08/38(h)(i) | |
| | AT&T, Inc., 3.50%, due 09/15/53 | |
| | AT&T, Inc., 3.65%, due 09/15/59 | |
| | AT&T, Inc., 3.80%, due 12/01/57 | |
| | AthenaHealth Group, Inc., 6.50%, due 02/15/30(j) 144A | |
| | Australia & New Zealand Banking Group Ltd., 2.95% (5 yr. CMT + 1.29%), due 07/22/30(b) 144A | |
| | AutoNation, Inc., 4.75%, due 06/01/30 | |
| | Avient Corp., 7.13%, due 08/01/30 144A | |
| | Avnet, Inc., 5.50%, due 06/01/32 | |
| | Avolon Holdings Funding Ltd., 4.25%, due 04/15/26 144A | |
| | B3 SA - Brasil Bolsa Balcao, 4.13%, due 09/20/31 144A | |
| | Bain Capital Specialty Finance, Inc., 2.55%, due 10/13/26 | |
| | Banco Bilbao Vizcaya Argentaria SA, 7.88% (1 yr. CMT + 3.30%), due 11/15/34(b) | |
| | Banco de Credito e Inversiones SA, 3.50%, due 10/12/27(i) | |
| | Banco de Credito e Inversiones SA, 8.75% (5 yr. CMT + 4.94%)(b)(k) 144A | |
| | Banco do Brasil SA, 6.00%, due 03/18/31 144A | |
| | Banco Mercantil del Norte SA, 7.50% (10 yr. CMT + 5.47%)(b)(k) 144A | |
| | Banco Santander SA, 4.18% (1 yr. CMT + 2.00%), due 03/24/28(b) | |
| | Banco Santander SA, 6.53% (1 yr. CMT + 1.65%), due 11/07/27(b) | |
| | Banco Santander SA, 6.92%, due 08/08/33 | |
| | Banijay Entertainment SASU, 8.13%, due 05/01/29 144A | |
| | Bank of America Corp., 5.20% (SOFR + 1.63%), due 04/25/29(b) | |
| | Bank of America Corp., 6.25% (3 mo. USD Term SOFR + 3.97%)(b)(k) | |
| | Bank of Nova Scotia, 8.00% (5 yr. CMT + 4.02%), due 01/27/84(b) | |
| | Barclays PLC, 6.13% (5 yr. CMT + 5.87%)(b)(k) | |
| | Barclays PLC, 7.12% (SOFR + 3.57%), due 06/27/34(b) | |
See accompanying Notes to the Financial Statements.
151
Mercer Opportunistic Fixed Income FundSchedule of Investments (Continued)
(showing percentage of net assets)
March 31, 2024
| | | |
| | Corporate Debt — continued |
| | Barclays PLC, 8.00% (5 yr. CMT + 5.67%)(b)(k) | |
| | Bath & Body Works, Inc., 5.25%, due 02/01/28 | |
| | Bath & Body Works, Inc., 6.63%, due 10/01/30(j) 144A | |
| | Bath & Body Works, Inc., 7.60%, due 07/15/37 | |
| | Bausch & Lomb Corp., 8.38%, due 10/01/28 144A | |
| | Bausch Health Cos., Inc., 5.50%, due 11/01/25 144A | |
| | Bausch Health Cos., Inc., 6.13%, due 02/01/27 144A | |
| | Bausch Health Cos., Inc., 7.00%, due 01/15/28 144A | |
| | Baytex Energy Corp., 8.50%, due 04/30/30 144A | |
| | BBVA Bancomer SA, 8.13% (5 yr. CMT + 4.21%), due 01/08/39(b) 144A | |
| | Berry Petroleum Co. LLC, 7.00%, due 02/15/26 144A | |
| | BGC Group, Inc., 4.38%, due 12/15/25 | |
| | BlackRock TCP Capital Corp., 2.85%, due 02/09/26 | |
| | Blackstone Private Credit Fund, 2.63%, due 12/15/26 | |
| | Blackstone Secured Lending Fund, 2.85%, due 09/30/28 | |
| | Blue Owl Capital Corp. II, 8.45%, due 11/15/26 144A | |
| | Blue Racer Midstream LLC/Blue Racer Finance Corp., 7.63%, due 12/15/25 144A | |
| | BNP Paribas SA, 4.50% (5 yr. CMT + 2.94%)(b)(j)(k) 144A | |
| | BNP Paribas SA, 4.63% (5 yr. CMT + 3.20%)(b)(k) 144A | |
| | BNP Paribas SA, 7.75% (5 yr. CMT + 4.90%)(b)(k) 144A | |
| | BNP Paribas SA, 8.00% (5 yr. CMT + 3.73%)(b)(k) 144A | |
| | Bombardier, Inc., 7.88%, due 04/15/27 144A | |
| | Boost Newco Borrower LLC, 7.50%, due 01/15/31 144A | |
| | Brighthouse Financial, Inc., 3.85%, due 12/22/51 | |
| | British Telecommunications PLC, 9.63%, due 12/15/30 | |
| | Broadcom, Inc., 4.15%, due 04/15/32 144A | |
| | Builders FirstSource, Inc., 4.25%, due 02/01/32 144A | |
| | Builders FirstSource, Inc., 6.38%, due 03/01/34 144A | |
| | Burford Capital Global Finance LLC, 6.25%, due 04/15/28 144A | |
| | Burford Capital Global Finance LLC, 9.25%, due 07/01/31 144A | |
| | Caesars Entertainment, Inc., 4.63%, due 10/15/29 144A | |
| | Caesars Entertainment, Inc., 6.50%, due 02/15/32 144A | |
| | Caesars Entertainment, Inc., 7.00%, due 02/15/30 144A | |
| | Caesars Entertainment, Inc., 8.13%, due 07/01/27 144A | |
| | CaixaBank SA, 6.04% (SOFR + 2.26%), due 06/15/35(b) 144A | |
| | Capital One Financial Corp., 6.05% (SOFR + 2.26%), due 02/01/35(b)(j) | |
| | Carnival Corp., 4.00%, due 08/01/28 144A | |
| | Carnival Corp., 5.75%, due 03/01/27 144A | |
| | Carnival Corp., 7.63%, due 03/01/26(i) | |
| | Carnival Corp., 10.50%, due 06/01/30 144A | |
| | Carnival Holdings Bermuda Ltd., 10.38%, due 05/01/28 144A | |
| | Carriage Purchaser, Inc., 7.88%, due 10/15/29 144A | |
| | CCO Holdings LLC/CCO Holdings Capital Corp., 4.25%, due 02/01/31 144A | |
| | CCO Holdings LLC/CCO Holdings Capital Corp., 4.75%, due 03/01/30 144A | |
| | Celulosa Arauco y Constitucion SA, 5.15%, due 01/29/50 144A | |
| | Cemex SAB de CV, 5.13% (5 yr. CMT + 4.53%)(b)(k) 144A | |
| | Central Parent, Inc./CDK Global, Inc., 7.25%, due 06/15/29 144A | |
| | Charles Schwab Corp., 2.90%, due 03/03/32 | |
| | Charles Schwab Corp., 5.85% (SOFR + 2.50%), due 05/19/34(b) | |
152
See accompanying Notes to the Financial Statements.
Mercer Opportunistic Fixed Income FundSchedule of Investments (Continued)
(showing percentage of net assets)
March 31, 2024
| | | |
| | Corporate Debt — continued |
| | Chart Industries, Inc., 7.50%, due 01/01/30 144A | |
| | Charter Communications Operating LLC/Charter Communications Operating Capital, | |
| | Charter Communications Operating LLC/Charter Communications Operating Capital, 5.13%, due 07/01/49 | |
| | Charter Communications Operating LLC/Charter Communications Operating Capital, 5.38%, due 04/01/38 | |
| | Chevron Phillips Chemical Co. LLC/Chevron Phillips Chemical Co. LP, 5.13%, due 04/01/25 144A | |
| | Chord Energy Corp., 6.38%, due 06/01/26 144A | |
| | CHS/Community Health Systems, Inc., 5.25%, due 05/15/30 144A | |
| | CHS/Community Health Systems, Inc., 5.63%, due 03/15/27 144A | |
| | CHS/Community Health Systems, Inc., 6.00%, due 01/15/29 144A | |
| | CHS/Community Health Systems, Inc., 6.13%, due 04/01/30(j) 144A | |
| | CHS/Community Health Systems, Inc., 10.88%, due 01/15/32 144A | |
| | Cirsa Finance International SARL, 6.50%, due 03/15/29 144A | |
| | Cirsa Finance International SARL, 7.88%, due 07/31/28 144A | |
| | Citigroup, Inc., 4.00% (5 yr. CMT + 3.60%)(b)(k) | |
| | Citigroup, Inc., 6.30% (3 mo. USD Term SOFR + 3.68%)(b)(k) | |
| | Citigroup, Inc., 7.38% (5 yr. CMT + 3.21%)(b)(j)(k) | |
| | Clarivate Science Holdings Corp., 4.88%, due 07/01/29 144A | |
| | Clean Harbors, Inc., 5.13%, due 07/15/29 144A | |
| | Clear Channel Outdoor Holdings, Inc., 5.13%, due 08/15/27 144A | |
| | Clearway Energy Operating LLC, 3.75%, due 02/15/31 144A | |
| | Clearway Energy Operating LLC, 4.75%, due 03/15/28 144A | |
| | Clydesdale Acquisition Holdings, Inc., 8.75%, due 04/15/30 144A | |
| | Coca-Cola Icecek AS, 4.50%, due 01/20/29 144A | |
| | Coherent Corp., 5.00%, due 12/15/29 144A | |
| | Colombia Telecomunicaciones SA ESP, 4.95%, due 07/17/30 144A | |
| | Comcast Corp., 4.25%, due 10/15/30 | |
| | Comerica, Inc., 5.98% (SOFR + 2.16%), due 01/30/30(b) | |
| | Commercial Metals Co., 3.88%, due 02/15/31 | |
| | Commerzbank AG, 6.13% (5 yr. EUR swap annual + 6.36%)(b)(i)(k) | |
| | CommScope, Inc., 4.75%, due 09/01/29 144A | |
| | CommScope, Inc., 6.00%, due 03/01/26(j) 144A | |
| | Continental Resources, Inc., 5.75%, due 01/15/31 144A | |
| | Cooperatieve Rabobank UA, 4.63% (5 yr. EUR swap annual + 4.10%)(b)(i)(k) | |
| | CoreCivic, Inc., 4.75%, due 10/15/27(j) | |
| | CoreCivic, Inc., 8.25%, due 04/15/29 | |
| | Corp. Nacional del Cobre de Chile, 5.13%, due 02/02/33 144A | |
| | Corp. Nacional del Cobre de Chile, 6.30%, due 09/08/53 144A | |
| | Cosan Luxembourg SA, 7.25%, due 06/27/31 144A | |
| | Coterra Energy, Inc., 3.90%, due 05/15/27 | |
| | Coty, Inc., 5.75%, due 09/15/28 144A | |
| | Country Garden Holdings Co. Ltd., 8.00%, due 01/27/24(i)(l) | |
| | Credicorp Capital Sociedad Titulizadora SA, 10.10%, due 12/15/43(i) | |
| | Credit Agricole SA, 4.00% (5 yr. EUR swap annual + 4.37%)(b)(i)(k) | |
| | Credit Agricole SA, 4.75% (5 yr. CMT + 3.24%)(b)(k) 144A | |
| | Credit Agricole SA, 7.50% (5 yr. GBP SONIA Linked ICE swap + 4.81%)(b)(i)(k) | |
| | Credit Agricole SA, 8.13% (5 yr. USD swap + 6.19%)(b)(j)(k) 144A | |
See accompanying Notes to the Financial Statements.
153
Mercer Opportunistic Fixed Income FundSchedule of Investments (Continued)
(showing percentage of net assets)
March 31, 2024
| | | |
| | Corporate Debt — continued |
| | Credit Suisse AG, 3.63%, due 09/09/24 | |
| | Credit Suisse AG, 4.75%, due 08/09/24 | |
| | Credit Suisse AG, 7.95%, due 01/09/25 | |
| | Crescent Energy Finance LLC, 7.63%, due 04/01/32 144A | |
| | Crescent Energy Finance LLC, 9.25%, due 02/15/28 144A | |
| | Crowdstrike Holdings, Inc., 3.00%, due 02/15/29 | |
| | Crown Castle, Inc., 5.80%, due 03/01/34 | |
| | CSC Holdings LLC, 4.13%, due 12/01/30 144A | |
| | CSC Holdings LLC, 5.38%, due 02/01/28 144A | |
| | CSC Holdings LLC, 5.50%, due 04/15/27 144A | |
| | CSC Holdings LLC, 7.50%, due 04/01/28(j) 144A | |
| | CSC Holdings LLC, 11.25%, due 05/15/28 144A | |
| | CSC Holdings LLC, 11.75%, due 01/31/29 144A | |
| | Cushman & Wakefield U.S. Borrower LLC, 8.88%, due 09/01/31(j) 144A | |
| | Darling Ingredients, Inc., 6.00%, due 06/15/30 144A | |
| | Dell International LLC/EMC Corp., 8.35%, due 07/15/46 | |
| | Deutsche Bank AG, 3.73% (SOFR + 2.76%), due 01/14/32(b) | |
| | Deutsche Bank AG, 6.72% (SOFR + 3.18%), due 01/18/29(b) | |
| | Deutsche Bank AG, 7.08% (SOFR + 3.65%), due 02/10/34(b) | |
| | Deutsche Bank AG, 7.50% (5 yr. USD ICE swap + 5.00%)(b)(k) | |
| | Devon Energy Corp., 5.00%, due 06/15/45 | |
| | Directv Financing LLC, 8.88%, due 02/01/30 144A | |
| | Directv Financing LLC/Directv Financing Co.-Obligor, Inc., 5.88%, due 08/15/27 144A | |
| | Discover Financial Services, 7.96% (SOFR + 3.37%), due 11/02/34(b) | |
| | DISH DBS Corp., 5.13%, due 06/01/29 | |
| | DISH DBS Corp., 5.25%, due 12/01/26 144A | |
| | DISH DBS Corp., 5.75%, due 12/01/28 144A | |
| | DISH DBS Corp., 5.88%, due 11/15/24(j) | |
| | DISH Network Corp., 11.75%, due 11/15/27 144A | |
| | DP World Ltd., 5.63%, due 09/25/48 144A | |
| | Dun & Bradstreet Corp., 5.00%, due 12/15/29(j) 144A | |
| | Ecopetrol SA, 4.63%, due 11/02/31 | |
| | Ecopetrol SA, 8.38%, due 01/19/36 | |
| | Edison International, 5.38% (5 yr. CMT + 4.70%)(b)(k) | |
| | Eli Lilly & Co., 5.00%, due 02/27/26 | |
| | EMRLD Borrower LP/Emerald Co.-Issuer, Inc., 6.38%, due 12/15/30 144A | |
| | Enbridge, Inc., 6.20%, due 11/15/30 | |
| | Endeavor Energy Resources LP/EER Finance, Inc., 5.75%, due 01/30/28 144A | |
| | Endeavour Mining PLC, 5.00%, due 10/14/26 144A | |
| | Endeavour Mining PLC, 5.00%, due 10/14/26(i) | |
| | Enel Finance America LLC, 2.88%, due 07/12/41 144A | |
| | Energean Israel Finance Ltd., 5.88%, due 03/30/31(i) | |
| | Energizer Gamma Acquisition BV, 3.50%, due 06/30/29 144A | |
| | Energy Transfer LP, 5.35%, due 05/15/45 | |
| | Energy Transfer LP, 6.25%, due 04/15/49 | |
| | Energy Transfer LP, 7.13% (5 yr. CMT + 5.31%)(b)(k) | |
| | Energy Transfer LP, 9.60% (3 mo. USD Term SOFR + 4.29%)(b)(k) | |
| | Entegris, Inc., 5.95%, due 06/15/30 144A | |
154
See accompanying Notes to the Financial Statements.
Mercer Opportunistic Fixed Income FundSchedule of Investments (Continued)
(showing percentage of net assets)
March 31, 2024
| | | |
| | Corporate Debt — continued |
| | Enterprise Products Operating LLC, 5.25% (3 mo. USD Term SOFR + 3.29%), due | |
| | Enterprise Products Operating LLC, 5.38% (3 mo. USD Term SOFR + 2.83%), due | |
| | EPR Properties, 3.75%, due 08/15/29 | |
| | EQM Midstream Partners LP, 6.50%, due 07/01/27 144A | |
| | EQM Midstream Partners LP, 7.50%, due 06/01/30 144A | |
| | EQT Corp., 7.00%, due 02/01/30 | |
| | Equifax, Inc., 5.10%, due 12/15/27 | |
| | Eroski S Coop, 10.63%, due 04/30/29 144A | |
| | Esab Corp., 6.25%, due 04/15/29(c) 144A | |
| | Eskom Holdings SOC Ltd., 7.50%, due 09/15/33 | |
| | European Bank for Reconstruction & Development, 4.60%, due 12/09/25 | |
| | European Bank for Reconstruction & Development, 5.20%, due 05/28/24 | |
| | European Investment Bank, 4.25%, due 06/19/24 | |
| | European Investment Bank, 7.75%, due 01/30/25 | |
| | First Abu Dhabi Bank PJSC, 4.50% (5 yr. CMT + 4.14%)(b)(i)(k) | |
| | First Quantum Minerals Ltd., 6.88%, due 10/15/27(j) 144A | |
| | First Quantum Minerals Ltd., 9.38%, due 03/01/29 144A | |
| | FirstCash, Inc., 5.63%, due 01/01/30 144A | |
| | FirstEnergy Corp., 2.65%, due 03/01/30 | |
| | Five Point Operating Co. LP/Five Point Capital Corp., 10.50%, due 01/15/28 144A | |
| | Foot Locker, Inc., 4.00%, due 10/01/29(j) 144A | |
| | Ford Motor Co., 3.25%, due 02/12/32 | |
| | Ford Motor Credit Co. LLC, 3.63%, due 06/17/31 | |
| | Ford Motor Credit Co. LLC, 6.95%, due 03/06/26 | |
| | Fox Corp., 6.50%, due 10/13/33 | |
| | Freeport Indonesia PT, 5.32%, due 04/14/32 144A | |
| | Freeport Indonesia PT, 6.20%, due 04/14/52 144A | |
| | Freeport Minerals Corp., 7.13%, due 11/01/27 | |
| | Freeport-McMoRan, Inc., 4.63%, due 08/01/30 | |
| | Freeport-McMoRan, Inc., 5.45%, due 03/15/43 | |
| | Full House Resorts, Inc., 8.25%, due 02/15/28(j) 144A | |
| | Galaxy Pipeline Assets Bidco Ltd., 2.94%, due 09/30/40 | |
| | Gannett Holdings LLC, 6.00%, due 11/01/26 144A | |
| | Gatwick Airport Finance PLC, 4.38%, due 04/07/26(i) | |
| | Gen Digital, Inc., 7.13%, due 09/30/30(j) 144A | |
| | General Electric Co., 5.88%, due 01/14/38 | |
| | General Motors Co., 6.60%, due 04/01/36 | |
| | General Motors Financial Co., Inc., 5.40%, due 04/06/26 | |
| | GEO Group, Inc., 10.50%, due 06/30/28 | |
| | GFL Environmental, Inc., 4.75%, due 06/15/29(j) 144A | |
| | GFL Environmental, Inc., 6.75%, due 01/15/31 144A | |
| | GGAM Finance Ltd., 8.00%, due 06/15/28 144A | |
| | Global Aircraft Leasing Co. Ltd., 6.50% (6.50% Cash or 7.25% PIK), due 09/15/24 144A | |
| | Global Auto Holdings Ltd./AAG FH U.K. Ltd., 8.38%, due 01/15/29 144A | |
| | Global Auto Holdings Ltd./AAG FH U.K. Ltd., 8.75%, due 01/15/32 144A | |
| | Gold Fields Orogen Holdings BVI Ltd., 6.13%, due 05/15/29 144A | |
| | Gray Television, Inc., 5.38%, due 11/15/31 144A | |
See accompanying Notes to the Financial Statements.
155
Mercer Opportunistic Fixed Income FundSchedule of Investments (Continued)
(showing percentage of net assets)
March 31, 2024
| | | |
| | Corporate Debt — continued |
| | H&E Equipment Services, Inc., 3.88%, due 12/15/28 144A | |
| | HCA, Inc., 7.50%, due 11/06/33(j) | |
| | Heathrow Funding Ltd., 6.75%, due 12/03/28(i) | |
| | Hertz Corp., 5.00%, due 12/01/29(j) 144A | |
| | Highlands Holdings Bond Issuer Ltd./Highlands Holdings Bond Co.-Issuer, Inc., 7.63% (7.625% Cash or 8.375% PIK), due 10/15/25 144A | |
| | Hilcorp Energy I LP/Hilcorp Finance Co., 6.25%, due 04/15/32 144A | |
| | Hilcorp Energy I LP/Hilcorp Finance Co., 8.38%, due 11/01/33 144A | |
| | Howard Midstream Energy Partners LLC, 6.75%, due 01/15/27 144A | |
| | Howard Midstream Energy Partners LLC, 8.88%, due 07/15/28 144A | |
| | Howden U.K. Refinance PLC/Howden U.K. Refinance 2 PLC/Howden U.S. Refinance LLC, 7.25%, due 02/15/31 144A | |
| | HSBC Holdings PLC, 4.60% (5 yr. CMT + 3.65%)(b)(k) | |
| | HSBC Holdings PLC, 7.40% (SOFR + 3.02%), due 11/13/34(b) | |
| | HSBC USA, Inc., 5.63%, due 03/17/25 | |
| | HSE Finance SARL, 5.63%, due 10/15/26 144A | |
| | Hudbay Minerals, Inc., 6.13%, due 04/01/29 144A | |
| | iHeartCommunications, Inc., 5.25%, due 08/15/27(j) 144A | |
| | iHeartCommunications, Inc., 6.38%, due 05/01/26 | |
| | IHS Netherlands Holdco BV, 8.00%, due 09/18/27 144A | |
| | IHS Netherlands Holdco BV, 8.00%, due 09/18/27(i) | |
| | Iliad Holding SASU, 6.50%, due 10/15/26 144A | |
| | Iliad Holding SASU, 7.00%, due 10/15/28 144A | |
| | Illuminate Buyer LLC/Illuminate Holdings IV, Inc., 9.00%, due 07/01/28 144A | |
| | IMA Industria Macchine Automatiche SpA, 3.75%, due 01/15/28 144A | |
| | Indofood CBP Sukses Makmur Tbk. PT, 3.40%, due 06/09/31(i) | |
| | ING Groep NV, 5.75% (5 yr. CMT + 4.34%)(b)(k) | |
| | ING Groep NV, 6.11% (SOFR + 2.09%), due 09/11/34(b) | |
| | ING Groep NV, 6.50% (5 yr. USD swap + 4.45%)(b)(k) | |
| | Intel Corp., 5.70%, due 02/10/53(j) | |
| | Inter-American Development Bank, 7.35%, due 10/06/30 | |
| | International Finance Corp., 7.75%, due 01/18/30 | |
| | Intesa Sanpaolo SpA, 4.00%, due 09/23/29 144A | |
| | Intesa Sanpaolo SpA, 4.95% (1 yr. CMT + 2.75%), due 06/01/42(b) 144A | |
| | Intesa Sanpaolo SpA, 5.71%, due 01/15/26 144A | |
| | Intesa Sanpaolo SpA, 7.20%, due 11/28/33 144A | |
| | Intesa Sanpaolo SpA, 7.78% (1 yr. CMT + 3.90%), due 06/20/54(b) 144A | |
| | Intesa Sanpaolo SpA, 7.80%, due 11/28/53 144A | |
| | Itau Unibanco Holding SA, 4.63% (5 yr. CMT + 3.22%)(b)(k) 144A | |
| | Jackson Financial, Inc., 3.13%, due 11/23/31 | |
| | Jane Street Group/JSG Finance, Inc., 4.50%, due 11/15/29(j) 144A | |
| | Jazz Securities DAC, 4.38%, due 01/15/29 144A | |
| | JB Poindexter & Co., Inc., 8.75%, due 12/15/31 144A | |
| | JBS USA LUX SA/JBS USA Food Co./JBS USA Finance, Inc., 5.75%, due 04/01/33 | |
| | JPMorgan Chase & Co., 4.91% (SOFR + 2.08%), due 07/25/33(b) | |
| | JPMorgan Chase & Co., 5.72% (SOFR + 2.58%), due 09/14/33(b) | |
| | KazMunayGas National Co. JSC, 4.75%, due 04/19/27 144A | |
| | KazMunayGas National Co. JSC, 5.75%, due 04/19/47(i) | |
| | Klabin Austria GmbH, 3.20%, due 01/12/31 144A | |
156
See accompanying Notes to the Financial Statements.
Mercer Opportunistic Fixed Income FundSchedule of Investments (Continued)
(showing percentage of net assets)
March 31, 2024
| | | |
| | Corporate Debt — continued |
| | Kosmos Energy Ltd., 7.13%, due 04/04/26 144A | |
| | Ladder Capital Finance Holdings LLLP/Ladder Capital Finance Corp., 4.75%, due 06/15/29 144A | |
| | Las Vegas Sands Corp., 3.20%, due 08/08/24 | |
| | Las Vegas Sands Corp., 3.50%, due 08/18/26 | |
| | Latam Airlines Group SA, 13.38%, due 10/15/27(j) 144A | |
| | Lazard Group LLC, 4.38%, due 03/11/29 | |
| | Legends Hospitality Holding Co. LLC/Legends Hospitality Co.-Issuer, Inc., 5.00%, due 02/01/26 144A | |
| | Leviathan Bond Ltd., 6.50%, due 06/30/27(i) | |
| | Liberty Mutual Group, Inc., 4.30%, due 02/01/61 144A | |
| | Liberty Mutual Group, Inc., 4.57%, due 02/01/29 144A | |
| | LifePoint Health, Inc., 9.88%, due 08/15/30 144A | |
| | Light & Wonder International, Inc., 7.00%, due 05/15/28 144A | |
| | Liquid Telecommunications Financing PLC, 5.50%, due 09/04/26 144A | |
| | Lloyds Banking Group PLC, 7.50% (5 yr. USD swap + 4.76%)(b)(k) | |
| | Lloyds Banking Group PLC, 8.00% (5 yr. CMT + 3.91%)(b)(k) | |
| | Lloyds Banking Group PLC, 8.50% (5 yr. UK Government Bond + 5.14%)(b)(k) | |
| | Lorca Telecom Bondco SA, 4.00%, due 09/18/27 144A | |
| | Lottomatica SpA, 7.94% (3 mo. EURIBOR + 4.00%), due 12/15/30(b) 144A | |
| | LPL Holdings, Inc., 4.00%, due 03/15/29 144A | |
| | Matador Resources Co., 6.88%, due 04/15/28 144A | |
| | Match Group Holdings II LLC, 5.00%, due 12/15/27 144A | |
| | McClatchy Co. LLC, 11.00% (11.00% Cash or 12.50% PIK), due 07/15/27 144A | |
| | McCormick & Co., Inc., 4.95%, due 04/15/33 | |
| | Mclaren Finance PLC, 7.50%, due 08/01/26 144A | |
| | MDC Holdings, Inc., 6.00%, due 01/15/43 | |
| | Medline Borrower LP, 5.25%, due 10/01/29(j) 144A | |
| | Medline Borrower LP/Medline Co.-Issuer, Inc., 6.25%, due 04/01/29 144A | |
| | Medtronic Global Holdings SCA, 4.25%, due 03/30/28 | |
| | MEG Energy Corp., 5.88%, due 02/01/29(j) 144A | |
| | MEG Energy Corp., 7.13%, due 02/01/27 144A | |
| | MEGlobal Canada ULC, 5.88%, due 05/18/30 144A | |
| | Melco Resorts Finance Ltd., 4.88%, due 06/06/25(j) 144A | |
| | Melco Resorts Finance Ltd., 5.25%, due 04/26/26 144A | |
| | Melco Resorts Finance Ltd., 5.38%, due 12/04/29 144A | |
| | MercadoLibre, Inc., 3.13%, due 01/14/31 | |
| | Met Tower Global Funding, 4.85%, due 01/16/27 144A | |
| | Meta Platforms, Inc., 4.45%, due 08/15/52 | |
| | MGM China Holdings Ltd., 5.88%, due 05/15/26(i) | |
| | Michaels Cos., Inc., 5.25%, due 05/01/28 144A | |
| | Micron Technology, Inc., 3.37%, due 11/01/41 | |
| | Micron Technology, Inc., 5.30%, due 01/15/31 | |
| | Micron Technology, Inc., 6.75%, due 11/01/29 | |
| | Midcap Financial Issuer Trust, 5.63%, due 01/15/30 144A | |
| | Midcap Financial Issuer Trust, 6.50%, due 05/01/28 144A | |
| | Millicom International Cellular SA, 4.50%, due 04/27/31 144A | |
| | Millicom International Cellular SA, 6.25%, due 03/25/29(i) | |
| | Millicom International Cellular SA, 6.25%, due 03/25/29(j) 144A | |
See accompanying Notes to the Financial Statements.
157
Mercer Opportunistic Fixed Income FundSchedule of Investments (Continued)
(showing percentage of net assets)
March 31, 2024
| | | |
| | Corporate Debt — continued |
| | MIWD Holdco II LLC/MIWD Finance Corp., 5.50%, due 02/01/30(j) 144A | |
| | Mohegan Tribal Gaming Authority, 8.00%, due 02/01/26 144A | |
| | Mohegan Tribal Gaming Authority, 13.25%, due 12/15/27 144A | |
| | Morgan Stanley, 4.89% (SOFR + 2.08%), due 07/20/33(b) | |
| | Morgan Stanley, 5.16% (SOFR + 1.59%), due 04/20/29(b) | |
| | Morgan Stanley, 5.42% (SOFR + 1.88%), due 07/21/34(b) | |
| | MPH Acquisition Holdings LLC, 5.75%, due 11/01/28 144A | |
| | MPT Operating Partnership LP/MPT Finance Corp., 5.00%, due 10/15/27(j) | |
| | MPT Operating Partnership LP/MPT Finance Corp., 5.25%, due 08/01/26 | |
| | Nabors Industries Ltd., 7.25%, due 01/15/26(j) 144A | |
| | Nationstar Mortgage Holdings, Inc., 7.13%, due 02/01/32 144A | |
| | NatWest Group PLC, 4.50% (5 yr. UK Government Bond + 3.99%)(b)(k) | |
| | NatWest Group PLC, 5.81% (1 yr. CMT + 1.95%), due 09/13/29(b) | |
| | NBM U.S. Holdings, Inc., 7.00%, due 05/14/26 144A | |
| | NCL Corp. Ltd., 7.75%, due 02/15/29(j) 144A | |
| | NCL Corp. Ltd., 8.13%, due 01/15/29 144A | |
| | NCL Corp. Ltd., 5.88%, due 03/15/26 144A | |
| | NCR Voyix Corp., 5.13%, due 04/15/29 144A | |
| | NCR Voyix Corp., 5.25%, due 10/01/30 144A | |
| | Neptune Bidco U.S., Inc., 9.29%, due 04/15/29 144A | |
| | Neptune Energy Bondco PLC, 6.63%, due 05/15/25 144A | |
| | Netflix, Inc., 5.88%, due 11/15/28 | |
| | Newell Brands, Inc., 5.70%, due 04/01/26 | |
| | Nexstar Media, Inc., 5.63%, due 07/15/27 144A | |
| | NMI Holdings, Inc., 7.38%, due 06/01/25 144A | |
| | Noble Finance II LLC, 8.00%, due 04/15/30 144A | |
| | Northern Oil & Gas, Inc., 8.13%, due 03/01/28 144A | |
| | Northwest Acquisitions ULC/Dominion Finco, Inc., 7.13%, due 11/01/22(l) | |
| | Novelis Sheet Ingot GmbH, 3.38%, due 04/15/29 144A | |
| | NTT Finance Corp., 4.37%, due 07/27/27 144A | |
| | NXP BV/NXP Funding LLC/NXP USA, Inc., 5.00%, due 01/15/33 | |
| | Occidental Petroleum Corp., 2.90%, due 08/15/24 | |
| | Occidental Petroleum Corp., 4.40%, due 08/15/49 | |
| | Occidental Petroleum Corp., 6.45%, due 09/15/36 | |
| | Occidental Petroleum Corp., 7.15%, due 05/15/28 | |
| | Occidental Petroleum Corp., 7.95%, due 06/15/39 | |
| | OCP SA, 5.13%, due 06/23/51 144A | |
| | Olympus Water U.S. Holding Corp., 6.25%, due 10/01/29(j) 144A | |
| | Olympus Water U.S. Holding Corp., 9.63%, due 11/15/28 144A | |
| | Olympus Water U.S. Holding Corp., 9.63%, due 11/15/28(i) | |
| | Option Care Health, Inc., 4.38%, due 10/31/29 144A | |
| | Oracle Corp., 2.88%, due 03/25/31 | |
| | Oracle Corp., 3.95%, due 03/25/51 | |
| | Organon & Co./Organon Foreign Debt Co.-Issuer BV, 4.13%, due 04/30/28 144A | |
| | Organon & Co./Organon Foreign Debt Co.-Issuer BV, 5.13%, due 04/30/31 144A | |
| | Oversea-Chinese Banking Corp. Ltd., 4.25%, due 06/19/24(i) | |
| | Panther Escrow Issuer LLC, 7.13%, due 06/01/31(c) 144A | |
| | Paramount Global, 7.88%, due 07/30/30 | |
| | Park-Ohio Industries, Inc., 6.63%, due 04/15/27 | |
158
See accompanying Notes to the Financial Statements.
Mercer Opportunistic Fixed Income FundSchedule of Investments (Continued)
(showing percentage of net assets)
March 31, 2024
| | | |
| | Corporate Debt — continued |
| | PECF USS Intermediate Holding III Corp., 8.00%, due 11/15/29 144A | |
| | Permian Resources Operating LLC, 5.88%, due 07/01/29 144A | |
| | Permian Resources Operating LLC, 7.00%, due 01/15/32 144A | |
| | Permian Resources Operating LLC, 9.88%, due 07/15/31 144A | |
| | Petrobras Global Finance BV, 6.50%, due 07/03/33(j) | |
| | Petrobras Global Finance BV, 6.85%, due 06/05/15(m) | |
| | Petroleos Mexicanos, 6.70%, due 02/16/32 | |
| | Petroleos Mexicanos, 7.19%, due 09/12/24(i) | |
| | PetSmart, Inc./PetSmart Finance Corp., 4.75%, due 02/15/28 144A | |
| | PetSmart, Inc./PetSmart Finance Corp., 7.75%, due 02/15/29 144A | |
| | Phillips 66, 3.30%, due 03/15/52 | |
| | Plains All American Pipeline LP, 9.68% (3 mo. USD Term SOFR + 4.37%)(b)(k) | |
| | PLT VII Finance SARL, 4.63%, due 01/05/26 144A | |
| | PM General Purchaser LLC, 9.50%, due 10/01/28 144A | |
| | PNC Financial Services Group, Inc., 5.07% (SOFR + 1.93%), due 01/24/34(b) | |
| | PNC Financial Services Group, Inc., 6.04% (SOFR + 2.14%), due 10/28/33(b) | |
| | Power Finance Corp. Ltd., 3.95%, due 04/23/30 144A | |
| | Precision Drilling Corp., 6.88%, due 01/15/29 144A | |
| | Precision Drilling Corp., 7.13%, due 01/15/26 144A | |
| | Prime Security Services Borrower LLC/Prime Finance, Inc., 6.25%, due 01/15/28 144A | |
| | Prosus NV, 3.06%, due 07/13/31 144A | |
| | Prosus NV, 4.03%, due 08/03/50 144A | |
| | Prosus NV, 4.19%, due 01/19/32 144A | |
| | Prosus NV, 4.19%, due 01/19/32(i)(j) | |
| | QazaqGaz NC JSC, 4.38%, due 09/26/27 144A | |
| | QVC, Inc., 4.45%, due 02/15/25(j) | |
| | Rackspace Finance LLC, 3.50%, due 05/15/28 144A | |
| | Raizen Fuels Finance SA, 6.45%, due 03/05/34 144A | |
| | Range Resources Corp., 4.75%, due 02/15/30(j) 144A | |
| | Range Resources Corp., 8.25%, due 01/15/29 | |
| | Rocket Mortgage LLC/Rocket Mortgage Co.-Issuer, Inc., 3.63%, due 03/01/29 144A | |
| | Rockies Express Pipeline LLC, 7.50%, due 07/15/38 144A | |
| | Rolls-Royce PLC, 4.63%, due 02/16/26(i) | |
| | Royal Caribbean Cruises Ltd., 4.25%, due 07/01/26 144A | |
| | Royal Caribbean Cruises Ltd., 5.50%, due 08/31/26 144A | |
| | Royal Caribbean Cruises Ltd., 6.25%, due 03/15/32 144A | |
| | Royal Caribbean Cruises Ltd., 7.25%, due 01/15/30 144A | |
| | Royal Caribbean Cruises Ltd., 7.50%, due 10/15/27 | |
| | Royal Caribbean Cruises Ltd., 8.25%, due 01/15/29 144A | |
| | Royal Caribbean Cruises Ltd., 9.25%, due 01/15/29 144A | |
| | RR Donnelley & Sons Co., 9.75%, due 07/31/28 144A | |
| | Rumo Luxembourg SARL, 4.20%, due 01/18/32 144A | |
| | RXO, Inc., 7.50%, due 11/15/27 144A | |
| | Sabre GLBL, Inc., 11.25%, due 12/15/27 144A | |
| | Saga PLC, 5.50%, due 07/15/26(i) | |
| | Sally Holdings LLC/Sally Capital, Inc., 6.75%, due 03/01/32(j) | |
| | Sammons Financial Group, Inc., 6.88%, due 04/15/34 144A | |
| | Sands China Ltd., 2.30%, due 03/08/27(j) | |
| | Sands China Ltd., 2.85%, due 03/08/29 | |
See accompanying Notes to the Financial Statements.
159
Mercer Opportunistic Fixed Income FundSchedule of Investments (Continued)
(showing percentage of net assets)
March 31, 2024
| | | |
| | Corporate Debt — continued |
| | Sands China Ltd., 5.13%, due 08/08/25 | |
| | Sands China Ltd., 5.40%, due 08/08/28 | |
| | Sasol Financing USA LLC, 5.50%, due 03/18/31 | |
| | Saudi Arabian Oil Co., 3.25%, due 11/24/50 144A | |
| | SCIL IV LLC/SCIL USA Holdings LLC, 4.38%, due 11/01/26 144A | |
| | SCIL IV LLC/SCIL USA Holdings LLC, 5.38%, due 11/01/26 144A | |
| | SCIL IV LLC/SCIL USA Holdings LLC, 9.50%, due 07/15/28(i) | |
| | Sempra, 3.70%, due 04/01/29 | |
| | SEPLAT Energy PLC, 7.75%, due 04/01/26 144A | |
| | Service Properties Trust, 5.50%, due 12/15/27 | |
| | Service Properties Trust, 8.63%, due 11/15/31 144A | |
| | Shelf Drilling Holdings Ltd., 9.63%, due 04/15/29 144A | |
| | SilverBow Resources, Inc., 13.08% (3 mo. USD Term SOFR + 7.75%), due 12/15/28(b) 144A | |
| | Sinclair Television Group, Inc., 4.13%, due 12/01/30 144A | |
| | Smyrna Ready Mix Concrete LLC, 8.88%, due 11/15/31 144A | |
| | Societe Generale SA, 7.13% (1 yr. CMT + 2.95%), due 01/19/55(b) 144A | |
| | Southern Copper Corp., 7.50%, due 07/27/35 | |
| | Southwestern Energy Co., 4.75%, due 02/01/32 | |
| | Spirit Loyalty Cayman Ltd./Spirit IP Cayman Ltd., 8.00%, due 09/20/25 144A | |
| | Spirit Loyalty Cayman Ltd./Spirit IP Cayman Ltd., 8.00%, due 09/20/25(j) 144A | |
| | Standard Chartered PLC, 4.30% (5 yr. CMT + 3.14%)(b)(k) 144A | |
| | Standard Chartered PLC, 4.75% (5 yr. CMT + 3.81%)(b)(i)(k) | |
| | Star Parent, Inc., 9.00%, due 10/01/30(j) 144A | |
| | Starwood Property Trust, Inc., 4.38%, due 01/15/27 144A | |
| | Starwood Property Trust, Inc., 7.25%, due 04/01/29 144A | |
| | State Street Corp., 6.70% (5 yr. CMT + 2.61%)(b)(k) | |
| | Stena International SA, 7.25%, due 01/15/31 144A | |
| | StoneMor, Inc., 8.50%, due 05/15/29 144A | |
| | StoneX Group, Inc., 7.88%, due 03/01/31 144A | |
| | Strathcona Resources Ltd., 6.88%, due 08/01/26 144A | |
| | Studio City Finance Ltd., 6.00%, due 07/15/25 144A | |
| | Studio City Finance Ltd., 6.50%, due 01/15/28 144A | |
| | Suburban Propane Partners LP/Suburban Energy Finance Corp., 5.00%, due 06/01/31 144A | |
| | Summit Materials LLC/Summit Materials Finance Corp., 5.25%, due 01/15/29 144A | |
| | Summit Midstream Holdings LLC/Summit Midstream Finance Corp., 9.00%, due 10/15/26(n) 144A | |
| | Sunnova Energy Corp., 5.88%, due 09/01/26 144A | |
| | Suzano Austria GmbH, 3.13%, due 01/15/32 | |
| | Suzano Austria GmbH, 7.00%, due 03/16/47(i) | |
| | Tallgrass Energy Partners LP/Tallgrass Energy Finance Corp., 6.00%, due 12/31/30 144A | |
| | Targa Resources Corp., 5.20%, due 07/01/27 | |
| | Targa Resources Corp., 6.13%, due 03/15/33 | |
| | Targa Resources Partners LP/Targa Resources Partners Finance Corp., 4.88%, due 02/01/31 | |
| | Teck Resources Ltd., 6.00%, due 08/15/40 | |
| | Telefonica Emisiones SA, 5.21%, due 03/08/47 | |
| | Teva Pharmaceutical Finance Co. LLC, 6.15%, due 02/01/36(j) | |
| | Teva Pharmaceutical Finance Netherlands II BV, 1.88%, due 03/31/27(i) | |
160
See accompanying Notes to the Financial Statements.
Mercer Opportunistic Fixed Income FundSchedule of Investments (Continued)
(showing percentage of net assets)
March 31, 2024
| | | |
| | Corporate Debt — continued |
| | Teva Pharmaceutical Finance Netherlands II BV, 7.38%, due 09/15/29 | |
| | Teva Pharmaceutical Finance Netherlands III BV, 3.15%, due 10/01/26 | |
| | Teva Pharmaceutical Finance Netherlands III BV, 4.10%, due 10/01/46 | |
| | Teva Pharmaceutical Finance Netherlands III BV, 5.13%, due 05/09/29 | |
| | Time Warner Cable LLC, 5.25%, due 07/15/42 | |
| | Time Warner Cable LLC, 6.75%, due 06/15/39 | |
| | Titan International, Inc., 7.00%, due 04/30/28 | |
| | TK Elevator U.S. Newco, Inc., 5.25%, due 07/15/27 144A | |
| | TKC Holdings, Inc., 6.88%, due 05/15/28 144A | |
| | T-Mobile USA, Inc., 3.50%, due 04/15/31 | |
| | T-Mobile USA, Inc., 4.80%, due 07/15/28 | |
| | T-Mobile USA, Inc., 5.15%, due 04/15/34 | |
| | TMS Issuer SARL, 5.78%, due 08/23/32 144A | |
| | TopBuild Corp., 3.63%, due 03/15/29 144A | |
| | TopBuild Corp., 4.13%, due 02/15/32 144A | |
| | Toronto-Dominion Bank, 8.13% (5 yr. CMT + 4.08%), due 10/31/82(b) | |
| | TransAlta Corp., 6.50%, due 03/15/40 | |
| | TransAlta Corp., 7.75%, due 11/15/29 | |
| | TransCanada PipeLines Ltd., 6.20%, due 03/09/26 | |
| | TransDigm, Inc., 6.63%, due 03/01/32 144A | |
| | TransDigm, Inc., 7.13%, due 12/01/31 144A | |
| | Transnet SOC Ltd., 8.25%, due 02/06/28 144A | |
| | Transocean, Inc., 8.00%, due 02/01/27 144A | |
| | Transocean, Inc., 11.50%, due 01/30/27 144A | |
| | Triumph Group, Inc., 9.00%, due 03/15/28 144A | |
| | Truist Financial Corp., 5.12% (SOFR + 1.85%), due 01/26/34(b) | |
| | Truist Financial Corp., 5.87% (SOFR + 2.36%), due 06/08/34(b) | |
| | TSMC Global Ltd., 2.25%, due 04/23/31(i) | |
| | Turk Telekomunikasyon AS, 6.88%, due 02/28/25 144A | |
| | Turkiye Garanti Bankasi AS, 8.38% (5 yr. CMT + 4.09%), due 02/28/34(b)(j) 144A | |
| | Tutor Perini Corp., 6.88%, due 05/01/25(j) 144A | |
| | U.S. Airways Pass-Through Trust, 3.95%, due 05/15/27 | |
| | U.S. Bancorp, 4.84% (SOFR + 1.60%), due 02/01/34(b) | |
| | U.S. Bancorp, 5.84% (SOFR + 2.26%), due 06/12/34(b) | |
| | U.S. Renal Care, Inc., 10.63%, due 06/28/28 144A | |
| | UBS Group AG, 4.75% (1 yr. CMT + 1.75%), due 05/12/28(b) 144A | |
| | UBS Group AG, 4.99% (1 yr. CMT + 2.40%), due 08/05/33(b) 144A | |
| | UBS Group AG, 5.70% (1 yr. CMT + 1.77%), due 02/08/35(b) 144A | |
| | UBS Group AG, 6.54% (SOFR + 3.92%), due 08/12/33(b) 144A | |
| | UBS Group AG, 7.75% (5 yr. USD Secured Overnight Financing Rate ICE swap Rate + 4.16%)(b)(k) 144A | |
| | UBS Group AG, 9.25% (5 yr. CMT + 4.75%)(b)(k) 144A | |
| | UBS Group AG, 9.25% (5 yr. CMT + 4.76%)(b)(k) 144A | |
| | UKG, Inc., 6.88%, due 02/01/31 144A | |
| | UniCredit SpA, 5.46% (5 yr. CMT + 4.75%), due 06/30/35(b) 144A | |
| | UniCredit SpA, 7.30% (5 yr. USD ICE swap + 4.91%), due 04/02/34(b) 144A | |
| | United Airlines Pass-Through Trust, 4.88%, due 07/15/27 | |
| | United Airlines Pass-Through Trust, 5.88%, due 04/15/29 | |
| | United Airlines, Inc., 4.38%, due 04/15/26 144A | |
See accompanying Notes to the Financial Statements.
161
Mercer Opportunistic Fixed Income FundSchedule of Investments (Continued)
(showing percentage of net assets)
March 31, 2024
| | | |
| | Corporate Debt — continued |
| | United Airlines, Inc., 4.63%, due 04/15/29 144A | |
| | United Rentals North America, Inc., 5.25%, due 01/15/30 | |
| | United Rentals North America, Inc., 6.00%, due 12/15/29 144A | |
| | Utah Acquisition Sub, Inc., 5.25%, due 06/15/46 | |
| | Vale Overseas Ltd., 6.88%, due 11/10/39 | |
| | Venture Global Calcasieu Pass LLC, 3.88%, due 08/15/29 144A | |
| | Venture Global Calcasieu Pass LLC, 3.88%, due 11/01/33 144A | |
| | Venture Global Calcasieu Pass LLC, 4.13%, due 08/15/31 144A | |
| | Venture Global Calcasieu Pass LLC, 6.25%, due 01/15/30 144A | |
| | Venture Global LNG, Inc., 8.38%, due 06/01/31 144A | |
| | Venture Global LNG, Inc., 9.88%, due 02/01/32 144A | |
| | Vericast Corp., 11.00%, due 09/15/26 144A | |
| | Verizon Communications, Inc., 2.85%, due 09/03/41 | |
| | Verizon Communications, Inc., 3.55%, due 03/22/51 | |
| | Vertiv Group Corp., 4.13%, due 11/15/28 144A | |
| | Viking Cruises Ltd., 5.88%, due 09/15/27 144A | |
| | Viking Cruises Ltd., 7.00%, due 02/15/29 144A | |
| | Viking Cruises Ltd., 9.13%, due 07/15/31 144A | |
| | Virgin Media Secured Finance PLC, 5.50%, due 05/15/29 144A | |
| | VistaJet Malta Finance PLC/Vista Management Holding, Inc., 7.88%, due 05/01/27(j) 144A | |
| | VistaJet Malta Finance PLC/Vista Management Holding, Inc., 9.50%, due 06/01/28(j) 144A | |
| | Vital Energy, Inc., 7.88%, due 04/15/32 144A | |
| | Vmed O2 U.K. Financing I PLC, 4.75%, due 07/15/31 144A | |
| | VOC Escrow Ltd., 5.00%, due 02/15/28 144A | |
| | Waste Connections, Inc., 2.95%, due 01/15/52 | |
| | Wells Fargo & Co., 5.39% (SOFR + 2.02%), due 04/24/34(b) | |
| | Wells Fargo & Co., 6.30% (SOFR + 1.79%), due 10/23/29(b) | |
| | WESCO Distribution, Inc., 6.63%, due 03/15/32 144A | |
| | Western Midstream Operating LP, 5.30%, due 03/01/48 | |
| | Western Midstream Operating LP, 5.45%, due 04/01/44 | |
| | Williams Cos., Inc., 8.75%, due 03/15/32 | |
| | Winnebago Industries, Inc., 6.25%, due 07/15/28 144A | |
| | WW International, Inc., 4.50%, due 04/15/29 144A | |
| | Wynn Macau Ltd., 4.88%, due 10/01/24 144A | |
| | Wynn Macau Ltd., 5.63%, due 08/26/28 144A | |
| | Wynn Resorts Finance LLC/Wynn Resorts Capital Corp., 7.13%, due 02/15/31 144A | |
| | XPO, Inc., 6.25%, due 06/01/28 144A | |
| | XPO, Inc., 7.13%, due 02/01/32 144A | |
| | Yamana Gold, Inc., 4.63%, due 12/15/27 | |
| | YPF SA, 6.95%, due 07/21/27 144A | |
| | YPF SA, 8.50%, due 07/28/25 144A | |
| | YPF SA, 9.00%, due 02/12/26(n) 144A | |
| | Yum! Brands, Inc., 4.75%, due 01/15/30 144A | |
| | ZF North America Capital, Inc., 4.75%, due 04/29/25 144A | |
| | ZF North America Capital, Inc., 7.13%, due 04/14/30 144A | |
| | Ziff Davis, Inc., 4.63%, due 10/15/30 144A | |
162
See accompanying Notes to the Financial Statements.
Mercer Opportunistic Fixed Income FundSchedule of Investments (Continued)
(showing percentage of net assets)
March 31, 2024
| | | |
| | Corporate Debt — continued |
| | ZipRecruiter, Inc., 5.00%, due 01/15/30(j) 144A | |
| | | |
| | Mortgage Backed Securities - Private Issuers — 5.8% |
| | 280 Park Avenue Mortgage Trust, Series 2017-280P, Class D, 7.15% (1 mo. USD Term SOFR + 1.84%), due 09/15/34(b) 144A | |
| | Angel Oak Mortgage Trust, Series 2022-3, Class A3, 4.13%, due 01/25/67(e) 144A | |
| | Angel Oak Mortgage Trust I LLC, Series 2019-2, Class B1, 5.02%, due 03/25/49(e) 144A | |
| | BANK, Series 2020-BN25, Class AS, 2.84%, due 01/15/63 | |
| | BANK, Series 2022-BNK42, Class A5, 4.49%, due 06/15/55(e) | |
| | BANK, Series 2022-BNK44, Class D, 4.00%, due 11/15/32(e) 144A | |
| | BANK, Series 2023-BNK45, Class A5, 5.20%, due 02/15/56 | |
| | BANK, Series 2023-BNK46, Class XA, 0.62%, due 08/15/56(e) | |
| | BBCCRE Trust, Series 2015-GTP, Class F, 4.56%, due 08/10/33(e) 144A | |
| | BBCMS Mortgage Trust, Series 2019-C5, Class A4, 3.06%, due 11/15/52 | |
| | BBCMS Mortgage Trust, Series 2020-C6, Class AS, 2.84%, due 02/15/53 | |
| | BBCMS Trust, Series 2018-CBM, Class D, 8.01% (1 mo. USD Term SOFR + 2.69%), due 07/15/37(b) 144A | |
| | Benchmark Mortgage Trust, Series 2020-B16, Class AM, 2.94%, due 02/15/53(e) | |
| | Benchmark Mortgage Trust, Series 2023-V3, Class D, 4.00%, due 07/15/56 144A | |
| | BHMS Mortgage Trust, Series 2018-MZB, Class MZB, 12.26% (1 mo. USD Term SOFR + 6.93%), due 07/15/25(b) 144A | |
| | BIG Commercial Mortgage Trust, Series 2022-BIG, Class F, 10.76% (1 mo. USD Term SOFR + 5.44%), due 02/15/39(b) 144A | |
| | BRAVO Residential Funding Trust, Series 2022-NQM1, Class A3, 4.09%, due 09/25/61(e) 144A | |
| | BRAVO Residential Funding Trust, Series 2022-NQM2, Class A3, 5.24%, due 11/25/61(e) 144A | |
| | BRAVO Residential Funding Trust, Series 2022-NQM3, Class A3, 5.50%, due 07/25/62(e) 144A | |
| | BRAVO Residential Funding Trust, Series 2024-NQM2, Class A3, 6.59%, due 02/25/64(n) 144A | |
| | BX Commercial Mortgage Trust, Series 2019-IMC, Class E, 7.52% (1 mo. USD Term SOFR + 2.20%), due 04/15/34(b) 144A | |
| | BX Commercial Mortgage Trust, Series 2021-21M, Class A, 6.17% (1 mo. USD Term SOFR + 0.84%), due 10/15/36(b) 144A | |
| | BX Commercial Mortgage Trust, Series 2021-ACNT, Class A, 6.29% (1 mo. USD Term SOFR + 0.96%), due 11/15/38(b) 144A | |
| | BX Commercial Mortgage Trust, Series 2021-VINO, Class A, 6.09% (1 mo. USD Term SOFR + 0.77%), due 05/15/38(b) 144A | |
| | BX Commercial Mortgage Trust, Series 2021-VOLT, Class G, 8.29% (1 mo. USD Term SOFR + 2.96%), due 09/15/36(b) 144A | |
| | BX Commercial Mortgage Trust, Series 2021-XL2, Class J, 9.33% (1 mo. USD Term SOFR + 4.00%), due 10/15/38(b) 144A | |
| | BX Commercial Mortgage Trust, Series 2022-AHP, Class A, 6.32% (1 mo. USD Term SOFR + 0.99%), due 01/17/39(b) 144A | |
| | BX Commercial Mortgage Trust, Series 2022-LP2, Class G, 9.43% (1 mo. USD Term SOFR + 4.11%), due 02/15/39(b) 144A | |
| | BX Commercial Mortgage Trust, Series 2023-VLT2, Class E, 11.20% (1 mo. USD Term SOFR + 5.87%), due 06/15/40(b) 144A | |
| | BX Trust, Series 2018-BILT, Class B, 6.64% (1 mo. USD Term SOFR + 1.32%), due 05/15/30(b) 144A | |
See accompanying Notes to the Financial Statements.
163
Mercer Opportunistic Fixed Income FundSchedule of Investments (Continued)
(showing percentage of net assets)
March 31, 2024
| | | |
| | Mortgage Backed Securities - Private Issuers — continued |
| | BX Trust, Series 2021-ARIA, Class E, 7.68% (1 mo. USD Term SOFR + 2.36%), due 10/15/36(b) 144A | |
| | BX Trust, Series 2021-SDMF, Class F, 7.38% (1 mo. USD Term SOFR + 2.05%), due 09/15/34(b) 144A | |
| | BX Trust, Series 2022-LBA6, Class D, 7.33% (1 mo. USD Term SOFR + 2.00%), due 01/15/39(b) 144A | |
| | BX Trust, Series 2024-CNYN, Class D, 7.99% (1 mo. USD Term SOFR + 2.69%), due 04/15/29(b)(c) 144A | |
| | Cantor Commercial Real Estate Lending, Series 2019-CF1, Class A2, 3.62%, due 05/15/52 | |
| | CFCRE Commercial Mortgage Trust, Series 2011-C2, Class D, 5.25%, due 12/15/47(e) 144A | |
| | CFK Trust, Series 2020-MF2, Class F, 3.46%, due 03/15/39(e) 144A | |
| | CGDB Commercial Mortgage Trust, Series 2019-MOB, Class A, 6.39% (1 mo. USD Term SOFR + 1.06%), due 11/15/36(b) 144A | |
| | Citigroup Commercial Mortgage Trust, Series 2015-GC29, Class B, 3.76%, due | |
| | Citigroup Commercial Mortgage Trust, Series 2015-P1, Class C, 4.37%, due 09/15/48(e) | |
| | Citigroup Commercial Mortgage Trust, Series 2017-C4, Class A4, 3.47%, due 10/12/50 | |
| | COLT Mortgage Loan Trust, Series 2024-1, Class M1, 6.59%, due 02/25/69(e) 144A | |
| | COMM Mortgage Trust, Series 2012-CR3, Class B, 3.92%, due 10/15/45 144A | |
| | CSAIL Commercial Mortgage Trust, Series 2015-C3, Class C, 4.35%, due 08/15/48(e) | |
| | CSMC Trust, Series 2014-USA, Class F, 4.37%, due 09/15/37 144A | |
| | CSMC Trust, Series 2019-UVIL, Class A, 3.16%, due 12/15/41 144A | |
| | CSMC Trust Capital Certificates, Series 2019-ICE4, Class F, 8.02% (1 mo. USD Term SOFR + 2.70%), due 05/15/36(b) 144A | |
| | DBGS Mortgage Trust, Series 2018-BIOD, Class D, 6.92% (1 mo. USD Term SOFR + 1.60%), due 05/15/35(b) 144A | |
| | Ellington Financial Mortgage Trust, Series 2020-1, Class B1, 5.10%, due 05/25/65(e) 144A | |
| | Ellington Financial Mortgage Trust, Series 2023-1, Class A3, 6.54%, due 02/25/68(n) 144A | |
| | ELP Commercial Mortgage Trust, Series 2021-ELP, Class D, 6.96% (1 mo. USD Term SOFR + 1.63%), due 11/15/38(b) 144A | |
| | Extended Stay America Trust, Series 2021-ESH, Class F, 9.14% (1 mo. USD Term SOFR + 3.81%), due 07/15/38(b) 144A | |
| | Federal Home Loan Mortgage Corp. STACR REMICS Trust, Series 2020-DNA1, Class B1, 7.73% (SOFR 30-day average + 2.41%), due 01/25/50(b) 144A | |
| | Federal Home Loan Mortgage Corp. STACR REMICS Trust, Series 2020-DNA5, Class B1, 10.12% (SOFR 30-day average + 4.80%), due 10/25/50(b) 144A | |
| | Federal Home Loan Mortgage Corp. STACR REMICS Trust, Series 2020-DNA6, Class B1, 8.32% (SOFR 30-day average + 3.00%), due 12/25/50(b) 144A | |
| | Federal Home Loan Mortgage Corp. STACR REMICS Trust, Series 2021-DNA1, Class B2, 10.07% (SOFR 30-day average + 4.75%), due 01/25/51(b) 144A | |
| | Federal Home Loan Mortgage Corp. STACR REMICS Trust, Series 2021-DNA2, Class B1, 8.72% (SOFR 30-day average + 3.40%), due 08/25/33(b) 144A | |
| | Federal Home Loan Mortgage Corp. STACR REMICS Trust, Series 2021-DNA3, Class B1, 8.82% (SOFR 30-day average + 3.50%), due 10/25/33(b) 144A | |
| | Federal Home Loan Mortgage Corp. STACR REMICS Trust, Series 2021-DNA3, Class M2, 7.42% (SOFR 30-day average + 2.10%), due 10/25/33(b) 144A | |
| | Federal Home Loan Mortgage Corp. STACR REMICS Trust, Series 2021-DNA5, Class B1, 8.37% (SOFR 30-day average + 3.05%), due 01/25/34(b) 144A | |
164
See accompanying Notes to the Financial Statements.
Mercer Opportunistic Fixed Income FundSchedule of Investments (Continued)
(showing percentage of net assets)
March 31, 2024
| | | |
| | Mortgage Backed Securities - Private Issuers — continued |
| | Federal Home Loan Mortgage Corp. STACR REMICS Trust, Series 2021-DNA5, Class M2, 6.97% (SOFR 30-day average + 1.65%), due 01/25/34(b) 144A | |
| | Federal Home Loan Mortgage Corp. STACR REMICS Trust, Series 2021-DNA6, Class B1, 8.72% (SOFR 30-day average + 3.40%), due 10/25/41(b) 144A | |
| | Federal Home Loan Mortgage Corp. STACR REMICS Trust, Series 2021-DNA6, Class M2, 6.82% (SOFR 30-day average + 1.50%), due 10/25/41(b) 144A | |
| | Federal Home Loan Mortgage Corp. STACR REMICS Trust, Series 2021-DNA7, Class M2, 7.12% (SOFR 30-day average + 1.80%), due 11/25/41(b) 144A | |
| | Federal Home Loan Mortgage Corp. STACR REMICS Trust, Series 2022-DNA2, Class B1, 10.07% (SOFR 30-day average + 4.75%), due 02/25/42(b) 144A | |
| | Federal Home Loan Mortgage Corp. STACR REMICS Trust, Series 2022-DNA2, Class M2, 9.07% (SOFR 30-day average + 3.75%), due 02/25/42(b) 144A | |
| | Federal Home Loan Mortgage Corp. STACR REMICS Trust, Series 2022-DNA3, Class M1B, 8.22% (SOFR 30-day average + 2.90%), due 04/25/42(b) 144A | |
| | Federal Home Loan Mortgage Corp. STACR REMICS Trust, Series 2022-DNA6, Class M2, 11.07% (SOFR 30-day average + 5.75%), due 09/25/42(b) 144A | |
| | Federal Home Loan Mortgage Corp. STACR Securitized Participation Interests Trust, Series 2017-SPI1, Class B, 4.12%, due 09/25/47(e) 144A | |
| | Federal National Mortgage Association Connecticut Avenue Securities, Series 2017-C07, Class 1B1, 9.43% (SOFR 30-day average + 4.11%), due 05/25/30(b) | |
| | Federal National Mortgage Association Connecticut Avenue Securities, Series 2018-C01, Class 1B1, 8.98% (SOFR 30-day average + 3.66%), due 07/25/30(b) | |
| | Federal National Mortgage Association Connecticut Avenue Securities, Series 2018-C06, Class 1B1, 9.18% (SOFR 30-day average + 3.86%), due 03/25/31(b) | |
| | Federal National Mortgage Association Connecticut Avenue Securities, Series 2018-R07, Class 1B1, 9.78% (SOFR 30-day average + 4.46%), due 04/25/31(b) 144A | |
| | Federal National Mortgage Association Connecticut Avenue Securities, Series 2019-R03, Class 1B1, 9.53% (SOFR 30-day average + 4.21%), due 09/25/31(b) 144A | |
| | Federal National Mortgage Association Connecticut Avenue Securities, Series 2019-R07, Class 1B1, 8.83% (SOFR 30-day average + 3.51%), due 10/25/39(b) 144A | |
| | Federal National Mortgage Association Connecticut Avenue Securities, Series 2020-R01, Class 1B1, 8.68% (SOFR 30-day average + 3.36%), due 01/25/40(b) 144A | |
| | Federal National Mortgage Association Connecticut Avenue Securities, Series 2020-R01, Class 1M2, 7.48% (SOFR 30-day average + 2.16%), due 01/25/40(b) 144A | |
| | Federal National Mortgage Association Connecticut Avenue Securities, Series 2021-R01, Class 1B1, 8.42% (SOFR 30-day average + 3.10%), due 10/25/41(b) 144A | |
| | Federal National Mortgage Association Connecticut Avenue Securities, Series 2021-R03, Class 1B1, 8.07% (SOFR 30-day average + 2.75%), due 12/25/41(b) 144A | |
| | Federal National Mortgage Association Connecticut Avenue Securities, Series 2022-R01, Class 1B1, 8.47% (SOFR 30-day average + 3.15%), due 12/25/41(b) 144A | |
| | Federal National Mortgage Association Connecticut Avenue Securities, Series 2022-R04, Class 1M2, 8.42% (SOFR 30-day average + 3.10%), due 03/25/42(b) 144A | |
| | Federal National Mortgage Association Connecticut Avenue Securities, Series 2023-R06, Class 1B1, 9.22% (SOFR 30-day average + 3.90%), due 07/25/43(b) 144A | |
| | Federal National Mortgage Association Connecticut Avenue Securities, Series 2024-R01, Class 1B1, 8.02% (SOFR 30-day average + 2.70%), due 01/25/44(b) 144A | |
| | Federal National Mortgage Association Connecticut Avenue Securities, Series 2024-R02, Class 1B1, 7.82% (SOFR 30-day average + 2.50%), due 02/25/44(b) 144A | |
| | GS Mortgage Securities Corp. II, Series 2024-70P, Class E, 8.67%, due 03/10/41(e) 144A | |
| | GS Mortgage Securities Corp. Trust, Series 2018-LUAU, Class G, 10.07% (1 mo. USD Term SOFR + 4.75%), due 11/15/32(b) 144A | |
| | GS Mortgage Securities Corp. Trust, Series 2020-DUNE, Class A, 6.69% (1 mo. USD Term SOFR + 1.36%), due 12/15/36(b) 144A | |
| | GS Mortgage Securities Trust, Series 2011-GC5, Class D, 5.15%, due 08/10/44(e) 144A | |
See accompanying Notes to the Financial Statements.
165
Mercer Opportunistic Fixed Income FundSchedule of Investments (Continued)
(showing percentage of net assets)
March 31, 2024
| | | |
| | Mortgage Backed Securities - Private Issuers — continued |
| | GS Mortgage Securities Trust, Series 2014-GC22, Class D, 4.70%, due 06/10/47(e) 144A | |
| | GS Mortgage Securities Trust, Series 2015-GC28, Class D, 4.31%, due 02/10/48(e) 144A | |
| | GS Mortgage Securities Trust, Series 2015-GC32, Class D, 3.35%, due 07/10/48 | |
| | HarborView Mortgage Loan Trust, Series 2005-9, Class 2A1C, 6.34% (1 mo. USD Term SOFR + 1.01%), due 06/20/35(b) | |
| | JP Morgan Chase Commercial Mortgage Securities Trust, Series 2015-JP1, Class C, | |
| | JP Morgan Chase Commercial Mortgage Securities Trust, Series 2018-PHMZ, Class M, 13.95% (1 mo. USD Term SOFR + 8.62%), due 06/15/35(b) 144A | |
| | JP Morgan Chase Commercial Mortgage Securities Trust, Series 2018-WPT, Class FFL, 8.46% (1 mo. USD Term SOFR + 3.14%), due 07/05/33(b) 144A | |
| | JP Morgan Chase Commercial Mortgage Securities Trust, Series 2019-BKWD, Class E, 8.54% (1 mo. USD Term SOFR + 3.21%), due 09/15/29(b) 144A | |
| | JP Morgan Chase Commercial Mortgage Securities Trust, Series 2019-BKWD, Class F, 9.34% (1 mo. USD Term SOFR + 4.01%), due 09/15/29(b) 144A | |
| | JP Morgan Chase Commercial Mortgage Securities Trust, Series 2020-MKST, Class F, 8.79% (1 mo. USD Term SOFR + 3.46%), due 12/15/36(b) 144A | |
| | JP Morgan Chase Commercial Mortgage Securities Trust, Series 2020-NNN, Class GFX, 4.69%, due 01/16/37(e) 144A | |
| | JP Morgan Chase Commercial Mortgage Securities Trust, Series 2021-HTL5, Class F, 9.71% (1 mo. USD Term SOFR + 4.38%), due 11/15/38(b) 144A | |
| | JP Morgan Chase Commercial Mortgage Securities Trust, Series 2022-ACB, Class D, 8.22% (SOFR 30-day average + 2.90%), due 03/15/39(b) 144A | |
| | JP Morgan Chase Commercial Mortgage Securities Trust, Series 2022-NLP, Class D, 7.49% (1 mo. USD Term SOFR + 2.17%), due 04/15/37(b) 144A | |
| | KIND Trust, Series 2021-KIND, Class D, 7.74% (1 mo. USD Term SOFR + 2.41%), due 08/15/38(b) 144A | |
| | Legacy Mortgage Asset Trust, Series 2020-GS4, Class A1, 6.25%, due 02/25/60(n) 144A | |
| | Life Mortgage Trust, Series 2021-BMR, Class F, 7.79% (1 mo. USD Term SOFR + 2.46%), due 03/15/38(b) 144A | |
| | Med Trust, Series 2021-MDLN, Class C, 7.24% (1 mo. USD Term SOFR + 1.91%), due 11/15/38(b) 144A | |
| | Med Trust, Series 2021-MDLN, Class E, 8.59% (1 mo. USD Term SOFR + 3.26%), due 11/15/38(b) 144A | |
| | Med Trust, Series 2021-MDLN, Class G, 10.69% (1 mo. USD Term SOFR + 5.36%), due 11/15/38(b) 144A | |
| | MHC Commercial Mortgage Trust, Series 2021-MHC, Class A, 6.24% (1 mo. USD Term SOFR + 0.92%), due 04/15/38(b) 144A | |
| | MHC Trust, Series 2021-MHC2, Class E, 7.39% (1 mo. USD Term SOFR + 2.06%), due 05/15/38(b) 144A | |
| | Morgan Stanley Capital I Trust, Series 2018-MP, Class A, 4.28%, due 07/11/40(e) 144A | |
| | MSBAM Commercial Mortgage Securities Trust, Series 2012-CKSV, Class A2, 3.28%, due 10/15/30 144A | |
| | MSWF Commercial Mortgage Trust, Series 2023-1, Class A4, 5.47%, due 05/15/56 | |
| | MSWF Commercial Mortgage Trust, Series 2023-2, Class C, 7.02%, due 12/15/56(e) | |
| | Multifamily Connecticut Avenue Securities Trust, Series 2019-01, Class M10, 8.68% (SOFR 30-day average + 3.36%), due 10/25/49(b) 144A | |
| | Multifamily Connecticut Avenue Securities Trust, Series 2020-01, Class M10, 9.18% (SOFR 30-day average + 3.86%), due 03/25/50(b) 144A | |
| | Natixis Commercial Mortgage Securities Trust, Series 2019-MILE, Class A, 6.91% (1 mo. USD Term SOFR + 1.58%), due 07/15/36(b) 144A | |
| | New Residential Mortgage Loan Trust, Series 2017-5A, Class B4, 5.99%, due 06/25/57(e) 144A | |
166
See accompanying Notes to the Financial Statements.
Mercer Opportunistic Fixed Income FundSchedule of Investments (Continued)
(showing percentage of net assets)
March 31, 2024
| | | |
| | Mortgage Backed Securities - Private Issuers — continued |
| | OBX Trust, Series 2022-NQM6, Class A1, 4.70%, due 07/25/62(n) 144A | |
| | OPG Trust, Series 2021-PORT, Class D, 6.57% (1 mo. USD Term SOFR + 1.25%), due 10/15/36(b) 144A | |
| | PMT Credit Risk Transfer Trust, Series 2019-3R, Class A, 9.14% (SOFR 30-day average + 3.81%), due 11/27/31(b) 144A | |
| | Seasoned Credit Risk Transfer Trust, Series 2017-1, Class M1, 4.00%, due 01/25/56(e) 144A | |
| | Seasoned Credit Risk Transfer Trust, Series 2017-2, Class M1, 4.00%, due 08/25/56(e) 144A | |
| | Seasoned Credit Risk Transfer Trust, Series 2017-3, Class M1, 4.00%, due 07/25/56(e) | |
| | Seasoned Credit Risk Transfer Trust, Series 2018-3, Class M, 4.75%, due 08/25/57(e) 144A | |
| | Seasoned Credit Risk Transfer Trust, Series 2019-1, Class M, 4.75%, due 07/25/58(e) 144A | |
| | Seasoned Credit Risk Transfer Trust, Series 2019-3, Class M, 4.75%, due 10/25/58(e) | |
| | Seasoned Credit Risk Transfer Trust, Series 2019-4, Class M, 4.50%, due 02/25/59(e) 144A | |
| | Seasoned Credit Risk Transfer Trust, Series 2020-1, Class M, 4.25%, due 08/25/59(e) 144A | |
| | Seasoned Credit Risk Transfer Trust, Series 2020-2, Class M, 4.25%, due 11/25/59(e) 144A | |
| | Seasoned Credit Risk Transfer Trust, Series 2020-3, Class M, 4.25%, due 05/25/60(e) 144A | |
| | Seasoned Credit Risk Transfer Trust, Series 2021-1, Class M, 4.25%, due 09/25/60 144A | |
| | Seasoned Credit Risk Transfer Trust, Series 2024-1, Class M, 5.00%, due 11/25/63(e) 144A | |
| | SMRT Commercial Mortgage Trust, Series 2022-MINI, Class D, 7.28% (1 mo. USD Term SOFR + 1.95%), due 01/15/39(b) 144A | |
| | Starwood Retail Property Trust, Series 2014-STAR, Class C, 8.50% (U.S. (Fed) Prime Rate + 0.00%), due 11/15/27(b)(d) 144A | |
| | Starwood Retail Property Trust, Series 2014-STAR, Class D, 8.50% (U.S. (Fed) Prime Rate + 0.00%), due 11/15/27(b)(d) 144A | |
| | Structured Asset Mortgage Investments II Trust, Series 2005-AR2, Class 2A2, 6.00% (1 mo. USD Term SOFR + 0.67%), due 05/25/45(b) | |
| | Towd Point Mortgage Trust, Series 2017-5, Class B1, 6.17% (1 mo. USD Term SOFR + 1.91%), due 02/25/57(b) 144A | |
| | Towd Point Mortgage Trust, Series 2019-4, Class B1B, 3.50%, due 10/25/59(e) 144A | |
| | UBS Commercial Mortgage Trust, Series 2017-C7, Class A3, 3.42%, due 12/15/50 | |
| | Verus Securitization Trust, Series 2023-4, Class B1, 8.19%, due 05/25/68(e) 144A | |
| | Verus Securitization Trust, Series 2023-8, Class A3, 6.97%, due 12/25/68(n) 144A | |
| | WaMu Mortgage Pass-Through Certificates Trust, Series 2006-AR16, Class 2A2, 4.36%, | |
| | WB Commercial Mortgage Trust, Series 2024-HQ, Class D, 8.28%, due 03/15/40(e) 144A | |
| | Wells Fargo Commercial Mortgage Trust, Series 2014-LC18, Class B, 3.96%, due 12/15/47 | |
| | Wells Fargo Commercial Mortgage Trust, Series 2017-C42, Class D, 2.80%, due 12/15/50(e) 144A | |
| | Wells Fargo Mortgage-Backed Securities Trust, Series 2006-AR5, Class 2A1, 6.27%, due | |
| | | |
See accompanying Notes to the Financial Statements.
167
Mercer Opportunistic Fixed Income FundSchedule of Investments (Continued)
(showing percentage of net assets)
March 31, 2024
| | | |
| | Mortgage Backed Securities - U.S. Government Agency Obligations — 0.0% |
| | Federal National Mortgage Association, Pool # FS5059, 3.50%, due 11/01/48 | |
| | Sovereign Debt Obligations — 31.9% |
| | Abu Dhabi Government International Bonds, 3.13%, due 09/30/49(i) | |
| | Abu Dhabi Government International Bonds, 3.13%, due 09/30/49 144A | |
| | Angola Government International Bonds, 8.00%, due 11/26/29(i) | |
| | Angola Government International Bonds, 8.75%, due 04/14/32 144A | |
| | Angola Government International Bonds, 9.13%, due 11/26/49(i) | |
| | Argentina Republic Government International Bonds, 1.00%, due 07/09/29 | |
| | Argentina Republic Government International Bonds, 3.63%, due 07/09/35(n) | |
| | Argentina Republic Government International Bonds, 3.63%, due 07/09/46(n) | |
| | Bahamas Government International Bonds, 8.95%, due 10/15/32(i) | |
| | Bahrain Government International Bonds, 5.63%, due 05/18/34(i) | |
| | Bahrain Government International Bonds, 7.50%, due 02/12/36 144A | |
| | Bonos de la Tesoreria de la Republica, 1.90%, due 09/01/30 | |
| | Bonos de la Tesoreria de la Republica, 2.00%, due 03/01/35 | |
| | Bonos de la Tesoreria de la Republica, 3.40%, due 10/01/39(i) | |
| | Bonos de la Tesoreria de la Republica en pesos, 2.30%, due 10/01/28(i) | |
| | Bonos de la Tesoreria de la Republica en pesos, 2.50%, due 03/01/25 | |
| | Bonos de la Tesoreria de la Republica en pesos, 4.50%, due 03/01/26 | |
| | Bonos de la Tesoreria de la Republica en pesos, 4.70%, due 09/01/30(i) | |
| | Bonos de la Tesoreria de la Republica en pesos, 5.00%, due 10/01/28(i) | |
| | Bonos de la Tesoreria de la Republica en pesos, 5.00%, due 03/01/35 | |
| | Bonos de la Tesoreria de la Republica en pesos, 5.80%, due 10/01/34(i) | |
| | Bonos de la Tesoreria de la Republica en pesos, 6.00%, due 04/01/33(i) | |
| | Bonos de la Tesoreria de la Republica en pesos, 7.00%, due 05/01/34(i) | |
| | Brazil Government International Bonds, 4.63%, due 01/13/28(j) | |
| | Brazil Government International Bonds, 4.75%, due 01/14/50 | |
| | Brazil Letras do Tesouro Nacional, 13.11%, due 07/01/25(h) | |
| | Brazil Letras do Tesouro Nacional, Series LTN, 9.89%, due 01/01/25(h) | |
| | Brazil Letras do Tesouro Nacional, Series LTN, 10.06%, due 07/01/27(h) | |
| | Brazil Letras do Tesouro Nacional, Series LTN, 10.45%, due 07/01/26(h) | |
| | Brazil Letras do Tesouro Nacional, Series LTN, 11.49%, due 01/01/26(h) | |
| | Brazil Notas do Tesouro Nacional, 6.00%, due 05/15/35 | |
| | Brazil Notas do Tesouro Nacional, 6.00%, due 08/15/50 | |
| | Brazil Notas do Tesouro Nacional, Series NTNF, 10.00%, due 01/01/25 | |
| | Brazil Notas do Tesouro Nacional, Series NTNF, 10.00%, due 01/01/27 | |
| | Brazil Notas do Tesouro Nacional, Series NTNF, 10.00%, due 01/01/29 | |
| | Brazil Notas do Tesouro Nacional, Series NTNF, 10.00%, due 01/01/31 | |
| | Brazil Notas do Tesouro Nacional, Series NTNF, 10.00%, due 01/01/33 | |
| | Chile Government International Bonds, 2.55%, due 01/27/32(j) | |
| | Chile Government International Bonds, 4.34%, due 03/07/42 | |
| | China Government Bonds, 2.52%, due 08/25/33 | |
| | China Government Bonds, 2.68%, due 05/21/30 | |
| | China Government Bonds, 2.85%, due 06/04/27 | |
| | China Government Bonds, 2.88%, due 02/25/33 | |
| | China Government Bonds, 3.02%, due 10/22/25 | |
| | China Government Bonds, 3.02%, due 05/27/31 | |
| | China Government Bonds, 3.27%, due 11/19/30 | |
168
See accompanying Notes to the Financial Statements.
Mercer Opportunistic Fixed Income FundSchedule of Investments (Continued)
(showing percentage of net assets)
March 31, 2024
| | | |
| | Sovereign Debt Obligations — continued |
| | China Government Bonds, 3.28%, due 12/03/27 | |
| | China Government Bonds, 3.53%, due 10/18/51 | |
| | China Government Bonds, 3.72%, due 04/12/51 | |
| | China Government Bonds, 3.81%, due 09/14/50 | |
| | China Government Bonds, Series 1906, 3.29%, due 05/23/29 | |
| | China Government Bonds, Series 1915, 3.13%, due 11/21/29 | |
| | Colombia Government International Bonds, 4.50%, due 03/15/29 | |
| | Colombia TES, Series B, 5.75%, due 11/03/27 | |
| | Colombia TES, Series B, 6.00%, due 04/28/28 | |
| | Colombia TES, Series B, 6.25%, due 11/26/25 | |
| | Colombia TES, Series B, 6.25%, due 07/09/36 | |
| | Colombia TES, Series B, 7.00%, due 03/26/31 | |
| | Colombia TES, Series B, 7.00%, due 06/30/32 | |
| | Colombia TES, Series B, 7.25%, due 10/18/34 | |
| | Colombia TES, Series B, 7.25%, due 10/26/50 | |
| | Colombia TES, Series B, 7.50%, due 08/26/26 | |
| | Colombia TES, Series B, 7.75%, due 09/18/30 | |
| | Colombia TES, Series B, 9.25%, due 05/28/42 | |
| | Colombia TES, Series B, 13.25%, due 02/09/33 | |
| | Colombia TES, Series G, 7.00%, due 03/26/31 | |
| | Costa Rica Government International Bonds, 7.16%, due 03/12/45(i) | |
| | Czech Republic Government Bonds, Series 103, 2.00%, due 10/13/33 | |
| | Czech Republic Government Bonds, Series 105, 2.75%, due 07/23/29 | |
| | Czech Republic Government Bonds, Series 11Y, 4.90%, due 04/14/34 | |
| | Czech Republic Government Bonds, Series 120, 1.25%, due 02/14/25 | |
| | Czech Republic Government Bonds, Series 121, 1.20%, due 03/13/31 | |
| | Czech Republic Government Bonds, Series 130, 0.05%, due 11/29/29 | |
| | Czech Republic Government Bonds, Series 138, 1.75%, due 06/23/32 | |
| | Czech Republic Government Bonds, Series 145, 3.50%, due 05/30/35 | |
| | Czech Republic Government Bonds, Series 148, 6.00%, due 02/26/26 | |
| | Czech Republic Government Bonds, Series 149, 5.50%, due 12/12/28 | |
| | Czech Republic Government Bonds, Series 150, 5.00%, due 09/30/30 | |
| | Czech Republic Government Bonds, Series 153, 5.75%, due 03/29/29 | |
| | Czech Republic Government Bonds, Series 49, 4.20%, due 12/04/36(i) | |
| | Czech Republic Government Bonds, Series 78, 2.50%, due 08/25/28(i) | |
| | Czech Republic Government Bonds, Series 94, 0.95%, due 05/15/30(i) | |
| | Czech Republic Government Bonds, Series 95, 1.00%, due 06/26/26(i) | |
| | Dominican Republic International Bonds, 4.50%, due 01/30/30(i) | |
| | Dominican Republic International Bonds, 4.88%, due 09/23/32(i) | |
| | Dominican Republic International Bonds, 5.50%, due 02/22/29 144A | |
| | Dominican Republic International Bonds, 5.88%, due 01/30/60(i) | |
| | Dominican Republic International Bonds, 6.00%, due 07/19/28 144A | |
| | Dominican Republic International Bonds, 13.63%, due 02/03/33(i) | |
| | Ecuador Government International Bonds, 3.50%, due 07/31/35(i)(n) | |
| | Ecuador Government International Bonds, 6.00%, due 07/31/30(i)(n) | |
| | Egypt Government Bonds, Series 10Y, 14.82%, due 07/06/31 | |
| | Egypt Government Bonds, Series 10YR, 14.66%, due 10/06/30 | |
| | Egypt Government International Bonds, 5.80%, due 09/30/27(i) | |
| | Egypt Government International Bonds, 7.05%, due 01/15/32(i) | |
See accompanying Notes to the Financial Statements.
169
Mercer Opportunistic Fixed Income FundSchedule of Investments (Continued)
(showing percentage of net assets)
March 31, 2024
| | | |
| | Sovereign Debt Obligations — continued |
| | Egypt Government International Bonds, 7.50%, due 01/31/27(i) | |
| | Egypt Government International Bonds, 7.60%, due 03/01/29(i) | |
| | Egypt Government International Bonds, 8.88%, due 05/29/50(i) | |
| | El Salvador Government International Bonds, 6.38%, due 01/18/27(i) | |
| | European Investment Bank, 8.50%, due 09/17/24(i) | |
| | Export-Import Bank of Korea, 8.00%, due 05/15/24(i) | |
| | Gabon Government International Bonds, 7.00%, due 11/24/31(i) | |
| | Ghana Government International Bonds, 7.75%, due 04/07/29(i) | |
| | Ghana Government International Bonds, 7.75%, due 04/07/29 144A | |
| | Ghana Government International Bonds, 10.75%, due 10/14/30(i) | |
| | Guatemala Government Bonds, 4.38%, due 06/05/27(i) | |
| | Guatemala Government Bonds, 4.88%, due 02/13/28(i) | |
| | Hazine Mustesarligi Varlik Kiralama AS, 8.51%, due 01/14/29 144A | |
| | Honduras Government International Bonds, 5.63%, due 06/24/30(i) | |
| | Hungary Government Bonds, Series 26/D, 2.75%, due 12/22/26 | |
| | Hungary Government Bonds, Series 26/E, 1.50%, due 04/22/26 | |
| | Hungary Government Bonds, Series 26/H, 9.50%, due 10/21/26 | |
| | Hungary Government Bonds, Series 26/H, 9.50%, due 10/21/26 | |
| | Hungary Government Bonds, Series 27/A, 3.00%, due 10/27/27 | |
| | Hungary Government Bonds, Series 28/A, 6.75%, due 10/22/28 | |
| | Hungary Government Bonds, Series 28/B, 4.50%, due 03/23/28 | |
| | Hungary Government Bonds, Series 29/A, 2.00%, due 05/23/29 | |
| | Hungary Government Bonds, Series 30/A, 3.00%, due 08/21/30 | |
| | Hungary Government Bonds, Series 31/A, 3.25%, due 10/22/31 | |
| | Hungary Government Bonds, Series 32/A, 4.75%, due 11/24/32 | |
| | Hungary Government Bonds, Series 32/A, 4.75%, due 11/24/32 | |
| | Hungary Government Bonds, Series 33/A, 2.25%, due 04/20/33 | |
| | Hungary Government Bonds, Series 35/A, 7.00%, due 10/24/35 | |
| | Hungary Government Bonds, Series 38/A, 3.00%, due 10/27/38 | |
| | Hungary Government Bonds, Series 41/A, 3.00%, due 04/25/41 | |
| | Hungary Government Bonds, Series 51/G, 4.00%, due 04/28/51 | |
| | Indonesia Treasury Bonds, Series 100, 6.63%, due 02/15/34 | |
| | Indonesia Treasury Bonds, Series 101, 6.88%, due 04/15/29 | |
| | Indonesia Treasury Bonds, Series FR40, 11.00%, due 09/15/25 | |
| | Indonesia Treasury Bonds, Series FR54, 9.50%, due 07/15/31 | |
| | Indonesia Treasury Bonds, Series FR56, 8.38%, due 09/15/26 | |
| | Indonesia Treasury Bonds, Series FR58, 8.25%, due 06/15/32 | |
| | Indonesia Treasury Bonds, Series FR59, 7.00%, due 05/15/27 | |
| | Indonesia Treasury Bonds, Series FR64, 6.13%, due 05/15/28 | |
| | Indonesia Treasury Bonds, Series FR68, 8.38%, due 03/15/34 | |
| | Indonesia Treasury Bonds, Series FR71, 9.00%, due 03/15/29 | |
| | Indonesia Treasury Bonds, Series FR72, 8.25%, due 05/15/36 | |
| | Indonesia Treasury Bonds, Series FR73, 8.75%, due 05/15/31 | |
| | Indonesia Treasury Bonds, Series FR74, 7.50%, due 08/15/32 | |
| | Indonesia Treasury Bonds, Series FR75, 7.50%, due 05/15/38 | |
| | Indonesia Treasury Bonds, Series FR76, 7.38%, due 05/15/48 | |
| | Indonesia Treasury Bonds, Series FR78, 8.25%, due 05/15/29 | |
| | Indonesia Treasury Bonds, Series FR79, 8.38%, due 04/15/39 | |
| | Indonesia Treasury Bonds, Series FR81, 6.50%, due 06/15/25 | |
170
See accompanying Notes to the Financial Statements.
Mercer Opportunistic Fixed Income FundSchedule of Investments (Continued)
(showing percentage of net assets)
March 31, 2024
| | | |
| | Sovereign Debt Obligations — continued |
| | Indonesia Treasury Bonds, Series FR83, 7.50%, due 04/15/40 | |
| | Indonesia Treasury Bonds, Series FR86, 5.50%, due 04/15/26 | |
| | Indonesia Treasury Bonds, Series FR87, 6.50%, due 02/15/31 | |
| | Indonesia Treasury Bonds, Series FR88, 6.25%, due 06/15/36 | |
| | Indonesia Treasury Bonds, Series FR89, 6.88%, due 08/15/51 | |
| | Indonesia Treasury Bonds, Series FR90, 5.13%, due 04/15/27 | |
| | Indonesia Treasury Bonds, Series FR91, 6.38%, due 04/15/32 | |
| | Indonesia Treasury Bonds, Series FR92, 7.13%, due 06/15/42 | |
| | Indonesia Treasury Bonds, Series FR95, 6.38%, due 08/15/28 | |
| | Indonesia Treasury Bonds, Series FR96, 7.00%, due 02/15/33 | |
| | Indonesia Treasury Bonds, Series FR97, 7.13%, due 06/15/43 | |
| | Indonesia Treasury Bonds, Series FR98, 7.13%, due 06/15/38 | |
| | Ivory Coast Government International Bonds, 6.38%, due 03/03/28(i) | |
| | Ivory Coast Government International Bonds, 7.63%, due 01/30/33 144A | |
| | Ivory Coast Government International Bonds, 8.25%, due 01/30/37 144A | |
| | Jamaica Government International Bonds, 9.63%, due 11/03/30 | |
| | Jordan Government International Bonds, 7.75%, due 01/15/28 144A | |
| | Malaysia Government Bonds, Series 0118, 3.88%, due 03/14/25 | |
| | Malaysia Government Bonds, Series 0119, 3.91%, due 07/15/26 | |
| | Malaysia Government Bonds, Series 0120, 4.07%, due 06/15/50 | |
| | Malaysia Government Bonds, Series 0122, 3.58%, due 07/15/32 | |
| | Malaysia Government Bonds, Series 0123, 4.46%, due 03/31/53 | |
| | Malaysia Government Bonds, Series 0212, 3.89%, due 03/15/27 | |
| | Malaysia Government Bonds, Series 0216, 4.74%, due 03/15/46 | |
| | Malaysia Government Bonds, Series 0219, 3.89%, due 08/15/29 | |
| | Malaysia Government Bonds, Series 0220, 2.63%, due 04/15/31 | |
| | Malaysia Government Bonds, Series 0222, 4.70%, due 10/15/42 | |
| | Malaysia Government Bonds, Series 0223, 3.52%, due 04/20/28 | |
| | Malaysia Government Bonds, Series 0307, 3.50%, due 05/31/27 | |
| | Malaysia Government Bonds, Series 0310, 4.50%, due 04/15/30 | |
| | Malaysia Government Bonds, Series 0311, 4.39%, due 04/15/26 | |
| | Malaysia Government Bonds, Series 0316, 3.90%, due 11/30/26 | |
| | Malaysia Government Bonds, Series 0317, 4.76%, due 04/07/37 | |
| | Malaysia Government Bonds, Series 0318, 4.64%, due 11/07/33 | |
| | Malaysia Government Bonds, Series 0319, 3.48%, due 06/14/24 | |
| | Malaysia Government Bonds, Series 0411, 4.23%, due 06/30/31 | |
| | Malaysia Government Bonds, Series 0412, 4.13%, due 04/15/32 | |
| | Malaysia Government Bonds, Series 0413, 3.84%, due 04/15/33 | |
| | Malaysia Government Bonds, Series 0415, 4.25%, due 05/31/35 | |
| | Malaysia Government Bonds, Series 0417, 3.90%, due 11/16/27 | |
| | Malaysia Government Bonds, Series 0418, 4.89%, due 06/08/38 | |
| | Malaysia Government Bonds, Series 0419, 3.83%, due 07/05/34 | |
| | Malaysia Government Bonds, Series 0513, 3.73%, due 06/15/28 | |
| | Malaysia Government Bonds, Series 0519, 3.76%, due 05/22/40 | |
| | Mexico Bonos, Series M, 5.00%, due 03/06/25 | |
| | Mexico Bonos, Series M, 5.50%, due 03/04/27 | |
| | Mexico Bonos, Series M, 5.75%, due 03/05/26 | |
| | Mexico Bonos, Series M, 7.00%, due 09/03/26 | |
| | Mexico Bonos, Series M, 7.50%, due 05/26/33 | |
See accompanying Notes to the Financial Statements.
171
Mercer Opportunistic Fixed Income FundSchedule of Investments (Continued)
(showing percentage of net assets)
March 31, 2024
| | | |
| | Sovereign Debt Obligations — continued |
| | Mexico Bonos, Series M, 7.75%, due 05/29/31 | |
| | Mexico Bonos, Series M, 7.75%, due 11/23/34 | |
| | Mexico Bonos, Series M, 7.75%, due 11/13/42 | |
| | Mexico Bonos, Series M, 8.00%, due 11/07/47 | |
| | Mexico Bonos, Series M, 8.00%, due 07/31/53 | |
| | Mexico Bonos, Series M, 8.00%, due 07/31/53 | |
| | Mexico Bonos, Series M, 8.50%, due 03/01/29 | |
| | Mexico Bonos, Series M 20, 7.50%, due 06/03/27 | |
| | Mexico Bonos, Series M 20, 8.50%, due 05/31/29 | |
| | Mexico Bonos, Series M 20, 8.50%, due 05/31/29 | |
| | Mexico Bonos, Series M 20, 10.00%, due 12/05/24 | |
| | Mexico Bonos, Series M 20, 10.00%, due 12/05/24 | |
| | Mexico Bonos, Series M 30, 8.50%, due 11/18/38 | |
| | Mexico Bonos, Series M 30, 8.50%, due 11/18/38 | |
| | Mexico Bonos, Series M 30, 10.00%, due 11/20/36 | |
| | Mexico Government International Bonds, 2.66%, due 05/24/31 | |
| | Mexico Government International Bonds, 4.75%, due 03/08/44 | |
| | Mexico Government International Bonds, 4.88%, due 05/19/33 | |
| | Mexico Government International Bonds, 6.00%, due 05/07/36 | |
| | Mexico Government International Bonds, 6.34%, due 05/04/53 | |
| | Mexico Udibonos, Series S, 4.50%, due 12/04/25 | |
| | Mexico Udibonos, Series S, 4.50%, due 11/22/35 | |
| | Mongolia Government International Bonds, 8.65%, due 01/19/28 144A | |
| | Montenegro Government International Bonds, 7.25%, due 03/12/31 144A | |
| | Mozambique International Bonds, 9.00%, due 09/15/31(i)(n) | |
| | Nigeria Government International Bonds, 7.14%, due 02/23/30(i) | |
| | Nigeria Government International Bonds, 8.38%, due 03/24/29(i) | |
| | Nigeria Treasury Bills, Series 364D, 25.01%, due 03/27/25 | |
| | Oman Government International Bonds, 5.63%, due 01/17/28 144A | |
| | Pakistan Government International Bonds, 6.88%, due 12/05/27(i) | |
| | Panama Government International Bonds, 6.40%, due 02/14/35 | |
| | Panama Government International Bonds, 8.00%, due 03/01/38 | |
| | Paraguay Government International Bonds, 5.40%, due 03/30/50(i) | |
| | Paraguay Government International Bonds, 6.00%, due 02/09/36 144A | |
| | Paraguay Government International Bonds, 7.90%, due 02/09/31 | |
| | Peru Government Bonds, 5.35%, due 08/12/40 | |
| | Peru Government Bonds, 5.40%, due 08/12/34 | |
| | Peru Government Bonds, 5.94%, due 02/12/29 | |
| | Peru Government Bonds, 6.15%, due 08/12/32 | |
| | Peru Government Bonds, 6.90%, due 08/12/37 | |
| | Peru Government Bonds, 6.95%, due 08/12/31 | |
| | Peru Government Bonds, 7.30%, due 08/12/33(i) | |
| | Peru Government International Bonds, 5.63%, due 11/18/50 | |
| | Peru Government International Bonds, 5.94%, due 02/12/29(i) | |
| | Peru Government International Bonds, 6.35%, due 08/12/28(i) | |
| | Peru Government International Bonds, 6.90%, due 08/12/37(i) | |
| | Peru Government International Bonds, 6.95%, due 08/12/31(i) | |
| | Peru Government International Bonds, 6.95%, due 08/12/31(i) | |
| | Peru Government International Bonds, 7.30%, due 08/12/33 | |
172
See accompanying Notes to the Financial Statements.
Mercer Opportunistic Fixed Income FundSchedule of Investments (Continued)
(showing percentage of net assets)
March 31, 2024
| | | |
| | Sovereign Debt Obligations — continued |
| | Peru Government International Bonds, 7.30%, due 08/12/33(i) | |
| | Provincia de Buenos Aires/Government Bonds, 6.38%, due 09/01/37(n) 144A | |
| | Provincia de Buenos Aires/Government Bonds, 6.38%, due 09/01/37(i)(n) | |
| | Provincia de Cordoba, 6.88%, due 12/10/25(n) 144A | |
| | Qatar Government International Bonds, 5.10%, due 04/23/48 144A | |
| | Republic of Ghana Government Bonds, Series G10Y, 9.25%, due 02/08/33 | |
| | Republic of Ghana Government Bonds, Series G11Y, 9.40%, due 02/07/34 | |
| | Republic of Ghana Government Bonds, Series G12Y, 9.55%, due 02/06/35 | |
| | Republic of Ghana Government Bonds, Series G13Y, 9.70%, due 02/05/36 | |
| | Republic of Ghana Government Bonds, Series G14Y, 9.85%, due 02/03/37 | |
| | Republic of Ghana Government Bonds, Series G15Y, 10.00%, due 02/02/38 | |
| | Republic of Ghana Government Bonds, Series G4Y, 8.35%, due 02/16/27 | |
| | Republic of Ghana Government Bonds, Series G5Y, 8.50%, due 02/15/28 | |
| | Republic of Ghana Government Bonds, Series G6Y, 8.65%, due 02/13/29 | |
| | Republic of Ghana Government Bonds, Series G7Y, 8.80%, due 02/12/30 | |
| | Republic of Ghana Government Bonds, Series G8Y, 8.95%, due 02/11/31 | |
| | Republic of Ghana Government Bonds, Series G9Y, 9.10%, due 02/10/32 | |
| | Republic of Kenya Government International Bonds, 6.30%, due 01/23/34(i) | |
| | Republic of Kenya Government International Bonds, 7.00%, due 05/22/27(i) | |
| | Republic of Kenya Government International Bonds, 8.00%, due 05/22/32(i) | |
| | Republic of Kenya Government International Bonds, 9.75%, due 02/16/31 144A | |
| | Republic of Poland Government Bonds, Series 0428, 2.75%, due 04/25/28 | |
| | Republic of Poland Government Bonds, Series 0432, 1.75%, due 04/25/32 | |
| | Republic of Poland Government Bonds, Series 0527, 3.75%, due 05/25/27 | |
| | Republic of Poland Government Bonds, Series 0725, 3.25%, due 07/25/25 | |
| | Republic of Poland Government Bonds, Series 0726, 2.50%, due 07/25/26 | |
| | Republic of Poland Government Bonds, Series 0727, 2.50%, due 07/25/27 | |
| | Republic of Poland Government Bonds, Series 0728, 7.50%, due 07/25/28 | |
| | Republic of Poland Government Bonds, Series 1026, 0.25%, due 10/25/26 | |
| | Republic of Poland Government Bonds, Series 1029, 2.75%, due 10/25/29 | |
| | Republic of Poland Government Bonds, Series 1030, 1.25%, due 10/25/30 | |
| | Republic of Poland Government Bonds, Series 1033, 6.00%, due 10/25/33 | |
| | Republic of South Africa Government Bonds, Series 2030, 8.00%, due 01/31/30 | |
| | Republic of South Africa Government Bonds, Series 2032, 8.25%, due 03/31/32 | |
| | Republic of South Africa Government Bonds, Series 2035, 8.88%, due 02/28/35 | |
| | Republic of South Africa Government Bonds, Series 2037, 8.50%, due 01/31/37 | |
| | Republic of South Africa Government Bonds, Series 2040, 9.00%, due 01/31/40 | |
| | Republic of South Africa Government Bonds, Series 2044, 8.75%, due 01/31/44 | |
| | Republic of South Africa Government Bonds, Series 2048, 8.75%, due 02/28/48 | |
| | Republic of South Africa Government Bonds, Series 2048, 8.75%, due 02/28/48 | |
| | Republic of South Africa Government Bonds, Series R186, 10.50%, due 12/21/26 | |
| | Republic of South Africa Government Bonds, Series R209, 6.25%, due 03/31/36 | |
| | Republic of South Africa Government Bonds, Series R213, 7.00%, due 02/28/31 | |
| | Republic of South Africa Government Bonds, Series R214, 6.50%, due 02/28/41 | |
| | Republic of South Africa Government International Bonds, 5.88%, due 04/20/32 | |
| | Republic of Uganda Government Bonds, 15.00%, due 05/20/32 | |
| | Republic of Uganda Government Bonds, Series 15YR, 16.00%, due 05/14/37 | |
| | Republic of Uganda Government Bonds, Series 15YR, 16.38%, due 03/04/32 | |
| | Republic of Uganda Government Bonds, Series 3YR, 14.00%, due 05/29/25 | |
See accompanying Notes to the Financial Statements.
173
Mercer Opportunistic Fixed Income FundSchedule of Investments (Continued)
(showing percentage of net assets)
March 31, 2024
| | | |
| | Sovereign Debt Obligations — continued |
| | Republic of Uzbekistan International Bonds, 3.90%, due 10/19/31(i) | |
| | Romania Government Bonds, 8.75%, due 10/30/28 | |
| | Romania Government Bonds, Series 10Y, 5.00%, due 02/12/29 | |
| | Romania Government Bonds, Series 10Y, 6.70%, due 02/25/32 | |
| | Romania Government Bonds, Series 10Y, 7.20%, due 10/30/33 | |
| | Romania Government Bonds, Series 10Y, 8.25%, due 09/29/32 | |
| | Romania Government Bonds, Series 10YR, 4.15%, due 10/24/30 | |
| | Romania Government Bonds, Series 15Y, 3.65%, due 09/24/31 | |
| | Romania Government Bonds, Series 15Y, 4.75%, due 10/11/34 | |
| | Romania Government Bonds, Series 15YR, 5.80%, due 07/26/27 | |
| | Romania Government Bonds, Series 5Y, 3.25%, due 06/24/26 | |
| | Romania Government Bonds, Series 5Y, 4.25%, due 04/28/36 | |
| | Romania Government Bonds, Series 8Y, 4.85%, due 07/25/29 | |
| | Romania Government International Bonds, 2.75%, due 02/26/26 144A | |
| | Romania Government International Bonds, 3.62%, due 05/26/30 144A | |
| | Romania Government International Bonds, 5.63%, due 02/22/36 144A | |
| | Romania Government International Bonds, 6.63%, due 09/27/29 144A | |
| | Romania Government International Bonds, 7.13%, due 01/17/33 144A | |
| | Russia Federal Bonds - OFZ, Series 6212, 7.05%, due 01/19/28(o) | |
| | Russia Federal Bonds - OFZ, Series 6218, 8.50%, due 09/17/31(o) | |
| | Russia Federal Bonds - OFZ, Series 6221, 7.70%, due 03/23/33(o) | |
| | Russia Federal Bonds - OFZ, Series 6224, 6.90%, due 05/23/29(o) | |
| | Russia Federal Bonds - OFZ, Series 6225, 7.25%, due 05/10/34(o) | |
| | Russia Federal Bonds - OFZ, Series 6228, 7.65%, due 04/10/30(o) | |
| | Russia Federal Bonds - OFZ, Series 6230, 7.70%, due 03/16/39(o) | |
| | Russia Federal Bonds - OFZ, Series 6233, 6.10%, due 07/18/35(o) | |
| | Saudi Government International Bonds, 4.50%, due 10/26/46(i) | |
| | Senegal Government International Bonds, 6.25%, due 05/23/33(i) | |
| | Serbia International Bonds, 1.00%, due 09/23/28 144A | |
| | Serbia Treasury Bonds, Series 8Y, 7.00%, due 10/26/31 | |
| | Sri Lanka Government International Bonds, 6.20%, due 05/11/27(i) | |
| | Thailand Government Bonds, 2.00%, due 12/17/31 | |
| | Thailand Government Bonds, 2.13%, due 12/17/26 | |
| | Thailand Government Bonds, 2.65%, due 06/17/28 | |
| | Thailand Government Bonds, 3.35%, due 06/17/33 | |
| | Thailand Government Bonds, 3.39%, due 06/17/37 | |
| | Thailand Government Bonds, 3.45%, due 06/17/43 | |
| | Thailand Government Bonds, Series ILB, 1.25%, due 03/12/28(i) | |
| | Thailand Government Bonds, Series THAI, 2.75%, due 06/17/52 | |
| | Turkiye Government Bonds, 17.30%, due 07/19/28 | |
| | Turkiye Government Bonds, 26.20%, due 10/05/33 | |
| | Turkiye Government Bonds, 31.08%, due 11/08/28 | |
| | Turkiye Government International Bonds, 7.63%, due 05/15/34(j) | |
| | Turkiye Government International Bonds, 9.38%, due 01/19/33 | |
| | Turkiye Ihracat Kredi Bankasi AS, 9.38%, due 01/31/26 144A | |
| | UAE International Government Bonds, 4.95%, due 07/07/52 144A | |
| | Ukraine Government International Bonds, 7.38%, due 09/25/34(i) | |
| | Ukraine Government International Bonds, 9.75%, due 11/01/30(i) | |
| | Uruguay Government International Bonds, 3.88%, due 07/02/40(j) | |
174
See accompanying Notes to the Financial Statements.
Mercer Opportunistic Fixed Income FundSchedule of Investments (Continued)
(showing percentage of net assets)
March 31, 2024
| | | |
| | Sovereign Debt Obligations — continued |
| | Uruguay Government International Bonds, 4.38%, due 12/15/28 | |
| | Uruguay Government International Bonds, 8.50%, due 03/15/28(i) | |
| | Uruguay Government International Bonds, 9.75%, due 07/20/33 | |
| | Zambia Government International Bonds, 8.97%, due 07/30/27(i) | |
| | | |
| | U.S. Government and Agency Obligations — 0.8% |
| | U.S. Treasury Notes, 2.00%, due 02/15/25(p) | |
| | U.S. Treasury Notes, 3.75%, due 12/31/30 | |
| | U.S. Treasury Notes, 4.00%, due 01/31/29 | |
| | U.S. Treasury Notes, 4.25%, due 01/31/26 | |
| | U.S. Treasury Notes, 4.63%, due 06/30/25(p) | |
| | | |
| | TOTAL DEBT OBLIGATIONS (COST $1,640,044,044) | |
| | | |
| | |
| | |
| | Arctic Canadian Diamond Co. Ltd.*(d)(g) | |
| | |
| | | |
| | TOTAL COMMON STOCKS (COST $0) | |
| | |
| | |
| | Equitrans Midstream Corp., 9.75%(b)(k) | |
| | TOTAL PREFERRED STOCK (COST $900,961) | |
| | | |
| | |
| | PURCHASED CURRENCY OPTION — 0.0% |
| | |
| | AUD/USD Option with BNP Paribas S.A., Strike Price USD 0.67, Expires 04/17/24 | |
| | TOTAL PURCHASED CURRENCY OPTION
(PREMIUMS PAID $43,859) | |
See accompanying Notes to the Financial Statements.
175
Mercer Opportunistic Fixed Income FundSchedule of Investments (Continued)
(showing percentage of net assets)
March 31, 2024
| | | |
| | PURCHASED FUTURES OPTIONS — 0.0% |
| | |
| | S&P 500 E-mini Futures with JPMorgan Chase Bank N.A., Strike Price $4,850.00, Expires 04/19/24 | |
| | S&P 500 E-mini Futures with JPMorgan Chase Bank N.A., Strike Price $4,800.00, Expires 05/17/24 | |
| | S&P 500 E-mini Futures with JPMorgan Chase Bank N.A., Strike Price $4,900.00, Expires 06/21/24 | |
| | | |
| | TOTAL PURCHASED FUTURES OPTIONS
(PREMIUMS PAID $154,901) | |
| | TOTAL PURCHASED OPTIONS
(PREMIUMS PAID $198,760) | |
| | | |
| | SHORT-TERM INVESTMENTS — 3.0% |
| | Mutual Fund - Securities Lending Collateral — 2.1% |
| | State Street Navigator Securities Lending Government Money Market Portfolio, | |
| | U.S. Government and Agency Obligations — 0.2% |
| | U.S. Treasury Bills, 5.34%, due 05/02/24(h) | |
| | U.S. Treasury Bills, 5.35%, due 08/15/24(h) | |
| | | |
| | Sovereign Debt Obligations — 0.7% | |
| | Uruguay Monetary Regulation Bills, 10.11%, due 05/17/24(h) | |
| | Uruguay Monetary Regulation Bills, 9.30%, due 08/09/24(h) | |
| | Egypt Treasury Bills, 30.48%, due 06/18/24 | |
| | Egypt Treasury Bills, 29.46%, due 01/14/25 | |
| | Egypt Treasury Bills, 29.74%, due 03/04/25 | |
| | Egypt Treasury Bills, 30.36%, due 03/11/25 | |
| | Egypt Treasury Bills, 29.43%, due 03/18/25 | |
| | Egypt Treasury Bills, 29.65%, due 12/17/24 | |
| | Egypt Treasury Bills, 27.78%, due 12/24/24 | |
| | | |
| | TOTAL SHORT-TERM INVESTMENTS (COST $52,888,529) | |
| | TOTAL INVESTMENTS — 94.4%
(Cost $1,694,032,294) | |
| | Other Assets and Liabilities (net)(s) — 5.6% | |
| | | |
| Notes to Schedule of Investments: |
| Non-income producing security. |
176
See accompanying Notes to the Financial Statements.
Mercer Opportunistic Fixed Income FundSchedule of Investments (Continued)
March 31, 2024
| Unless otherwise indicated, all par values are denominated in United States dollars ($). |
| Variable or floating rate note. Rate shown is as of March 31, 2024. |
| |
| Securities fair valued by the Valuation Committee as approved by the Board of Trustees. The total market value of the securities at year end is $1,655,948 which represents 0.1% of net assets. The aggregate cost of these securities held at March 31, 2024 is $2,388,548. |
| Variable or floating rate security, which interest rate adjusts periodically based on changes in current interest rates and prepayments on the underlying pool of assets. Rate shown is the rate in effect as of period end. |
| This position represents an unsettled loan commitment at period end. Certain details associated with this purchase are not known prior to the settlement date, including coupon rate, which will be adjusted on settlement date. |
| Level 3 - significant unobservable inputs were used in determining the value of this security in the Fund. |
| Interest rate presented is yield to maturity. |
| Security exempt from registration under Regulation S of the Securities Act of 1933, which exempts from registration securities offered and sold outside the United States. Security may not be offered or sold in the United States except pursuant to an exemption from, or in a transaction not subject to, the registration requirements of the Securities Act of 1933. |
| All or a portion of this security is out on loan. |
| Security is perpetual and has no stated maturity date. |
| Security is currently in default. |
| Year of maturity is greater than 2100. |
| Step coupon security that pays an initial coupon rate for the first period and then a lower/higher coupon rate for the following periods. The rate shown is the rate in effect at March 31, 2024. |
| Illiquid securities represent Russian securities impacted by the Russian/Ukraine crisis. The total market value of the securities at year end is $1,712,546 which represents 0.1% of net assets. The aggregate cost of these securities held at March 31, 2024 is $5,424,523. |
| All or a portion of this security is pledged for forward foreign currency contracts, OTC swaps, and/or OTC options collateral. |
| The rate disclosed is the 7-day net yield as of March 31, 2024. |
| Represents an investment of securities lending cash collateral. |
| As of March 31, 2024, the value of unfunded loan commitments was $604,896 for the Fund. See Notes to the Schedule of Investments. |
| Securities exempt from registration under Rule 144A of the Securities Act of 1933. These securities may be resold in transactions exempt from registration, normally to qualified institutional buyers. The total market value of the securities at year end is $585,528,052 which represents 32.9% of net assets. |
Forward Foreign Currency Contracts
| | | | Unrealized
Appreciation
(Depreciation) |
| | | | | | |
| | | | | | |
| | | | | | |
| | | | | | |
| | | | | | |
See accompanying Notes to the Financial Statements.
177
Mercer Opportunistic Fixed Income FundSchedule of Investments (Continued)
March 31, 2024
Forward Foreign Currency Contracts—continued
| | | | Unrealized Appreciation (Depreciation) |
| | | | | | |
| | | | | | |
| | | | | Goldman Sachs International | |
| | | | | Goldman Sachs International | |
| | | | | | |
| | | | | | |
| | | | | | |
| | | | | | |
| | | | | Morgan Stanley and Co. International PLC | |
| | | | | Morgan Stanley Capital Services, Inc. | |
| | | | | | |
| | | | | | |
| | | | | | |
| | | | | | |
| | | | | | |
| | | | | | |
| | | | | Morgan Stanley and Co. International PLC | |
| | | | | | |
| | | | | | |
| | | | | | |
| | | | | Goldman Sachs International | |
| | | | | | |
| | | | | | |
| | | | | | |
| | | | | | |
| | | | | | |
| | | | | | |
| | | | | Goldman Sachs International | |
| | | | | Goldman Sachs International | |
| | | | | | |
| | | | | | |
| | | | | Morgan Stanley and Co. International PLC | |
| | | | | | |
| | | | | Goldman Sachs International | |
| | | | | | |
| | | | | Morgan Stanley and Co. International PLC | |
| | | | | | |
| | | | | | |
| | | | | | |
| | | | | Goldman Sachs International | |
| | | | | | |
| | | | | | |
| | | | | | |
178
See accompanying Notes to the Financial Statements.
Mercer Opportunistic Fixed Income FundSchedule of Investments (Continued)
March 31, 2024
Forward Foreign Currency Contracts—continued
| | | | Unrealized Appreciation (Depreciation) |
| | | | | | |
| | | | | | |
| | | | | Morgan Stanley Capital Services, Inc. | |
| | | | | | |
| | | | | | |
| | | | | | |
| | | | | | |
| | | | | | |
| | | | | | |
| | | | | Goldman Sachs International | |
| | | | | | |
| | | | | | |
| | | | | | |
| | | | | | |
| | | | | | |
| | | | | | |
| | | | | | |
| | | | | Morgan Stanley and Co. International PLC | |
| | | | | Morgan Stanley and Co. International PLC | |
| | | | | | |
| | | | | | |
| | | | | | |
| | | | | | |
| | | | | Goldman Sachs International | |
| | | | | | |
| | | | | | |
| | | | | | |
| | | | | | |
| | | | | | |
| | | | | | |
| | | | | | |
| | | | | | |
| | | | | Goldman Sachs International | |
| | | | | | |
| | | | | | |
| | | | | Goldman Sachs International | |
| | | | | | |
| | | | | | |
| | | | | Morgan Stanley Capital Services, Inc. | |
| | | | | Merrill Lynch International | |
| | | | | | |
| | | | | | |
| | | | | Goldman Sachs International | |
See accompanying Notes to the Financial Statements.
179
Mercer Opportunistic Fixed Income FundSchedule of Investments (Continued)
March 31, 2024
Forward Foreign Currency Contracts—continued
| | | | Unrealized Appreciation (Depreciation) |
| | | | | | |
| | | | | | |
| | | | | | |
| | | | | Goldman Sachs International | |
| | | | | | |
| | | | | | |
| | | | | | |
| | | | | Morgan Stanley and Co. International PLC | |
| | | | | | |
| | | | | | |
| | | | | | |
| | | | | | |
| | | | | Goldman Sachs International | |
| | | | | | |
| | | | | | |
| | | | | | |
| | | | | | |
| | | | | | |
| | | | | | |
| | | | | | |
| | | | | | |
| | | | | | |
| | | | | | |
| | | | | | |
| | | | | Morgan Stanley and Co. International PLC | |
| | | | | | |
| | | | | Goldman Sachs International | |
| | | | | | |
| | | | | | |
| | | | | | |
| | | | | | |
| | | | | | |
| | | | | | |
| | | | | | |
| | | | | | |
| | | | | Goldman Sachs International | |
| | | | | | |
| | | | | | |
| | | | | | |
| | | | | | |
| | | | | | |
| | | | | | |
| | | | | | |
180
See accompanying Notes to the Financial Statements.
Mercer Opportunistic Fixed Income FundSchedule of Investments (Continued)
March 31, 2024
Forward Foreign Currency Contracts—continued
| | | | Unrealized Appreciation (Depreciation) |
| | | | | | |
| | | | | | |
| | | | | | |
| | | | | | |
| | | | | | |
| | | | | Goldman Sachs International | |
| | | | | | |
| | | | | | |
| | | | | | |
| | | | | Morgan Stanley and Co. International PLC | |
| | | | | | |
| | | | | | |
| | | | | | |
| | | | | | |
| | | | | | |
| | | | | | |
| | | | | Morgan Stanley and Co. International PLC | |
| | | | | | |
| | | | | | |
| | | | | | |
| | | | | | |
| | | | | | |
| | | | | | |
| | | | | Goldman Sachs International | |
| | | | | | |
| | | | | | |
| | | | | | |
| | | | | | |
| | | | | Morgan Stanley and Co. International PLC | |
| | | | | | |
| | | | | Morgan Stanley Capital Services, Inc. | |
| | | | | | |
| | | | | | |
| | | | | | |
| | | | | | |
| | | | | | |
| | | | | | |
| | | | | | |
| | | | | | |
| | | | | | |
| | | | | Morgan Stanley Capital Services, Inc. | |
| | | | | | |
| | | | | | |
See accompanying Notes to the Financial Statements.
181
Mercer Opportunistic Fixed Income FundSchedule of Investments (Continued)
March 31, 2024
Forward Foreign Currency Contracts—continued
| | | | Unrealized Appreciation (Depreciation) |
| | | | | | |
| | | | | | |
| | | | | | |
| | | | | | |
| | | | | | |
| | | | | | |
| | | | | | |
| | | | | | |
| | | | | | |
| | | | | | |
| | | | | | |
| | | | | | |
| | | | | | |
| | | | | Morgan Stanley and Co. International PLC | |
| | | | | Morgan Stanley Capital Services, Inc. | |
| | | | | | |
| | | | | | |
| | | | | | |
| | | | | | |
| | | | | | |
| | | | | Goldman Sachs International | |
| | | | | | |
| | | | | | |
| | | | | | |
| | | | | | |
| | | | | | |
| | | | | | |
| | | | | | |
| | | | | | |
| | | | | | |
| | | | | | |
| | | | | | |
| | | | | | |
| | | | | | |
| | | | | | |
| | | | | | |
| | | | | | |
| | | | | | |
| | | | | Commonwealth Bank of Australia | |
| | | | | | |
| | | | | | |
| | | | | | |
| | | | | | |
182
See accompanying Notes to the Financial Statements.
Mercer Opportunistic Fixed Income FundSchedule of Investments (Continued)
March 31, 2024
Forward Foreign Currency Contracts—continued
| | | | Unrealized Appreciation (Depreciation) |
| | | | | | |
| | | | | | |
| | | | | | |
| | | | | | |
| | | | | | |
| | | | | | |
| | | | | Morgan Stanley Capital Services, Inc. | |
| | | | | Morgan Stanley Capital Services, Inc. | |
| | | | | Morgan Stanley Capital Services, Inc. | |
| | | | | Morgan Stanley Capital Services, Inc. | |
| | | | | Morgan Stanley Capital Services, Inc. | |
| | | | | Morgan Stanley Capital Services, Inc. | |
| | | | | | |
| | | | | | |
| | | | | | |
| | | | | | |
| | | | | | |
| | | | | | |
| | | | | | |
| | | | | | |
| | | | | | |
| | | | | | |
| | | | | | |
| | | | | | |
| | | | | | |
| | | | | | |
| | | | | | |
| | | | | | |
| | | | | | |
| | | | | | |
| | | | | | |
| | | | | Goldman Sachs International | |
| | | | | | |
| | | | | | |
| | | | | | |
| | | | | | |
| | | | | | |
| | | | | | |
| | | | | | |
| | | | | | |
| | | | | | |
| | | | | | |
| | | | | Morgan Stanley and Co. International PLC | |
See accompanying Notes to the Financial Statements.
183
Mercer Opportunistic Fixed Income FundSchedule of Investments (Continued)
March 31, 2024
Forward Foreign Currency Contracts—continued
| | | | Unrealized Appreciation (Depreciation) |
| | | | | | |
| | | | | | |
| | | | | | |
| | | | | | |
| | | | | Goldman Sachs International | |
| | | | | | |
| | | | | | |
| | | | | | |
| | | | | | |
| | | | | | |
| | | | | | |
| | | | | | |
| | | | | | |
| | | | | | |
| | | | | | |
| | | | | | |
| | | | | | |
| | | | | | |
| | | | | | |
| | | | | | |
| | | | | | |
| | | | | Goldman Sachs International | |
| | | | | | |
| | | | | | |
| | | | | | |
| | | | | | |
| | | | | | |
| | | | | | |
| | | | | | |
| | | | | | |
| | | | | Goldman Sachs International | |
| | | | | | |
| | | | | | |
| | | | | | |
| | | | | | |
| | | | | | |
| | | | | | |
| | | | | | |
| | | | | | |
| | | | | | |
| | | | | Goldman Sachs International | |
| | | | | | |
| | | | | | |
184
See accompanying Notes to the Financial Statements.
Mercer Opportunistic Fixed Income FundSchedule of Investments (Continued)
March 31, 2024
Forward Foreign Currency Contracts—continued
| | | | Unrealized Appreciation (Depreciation) |
| | | | | | |
| | | | | | |
| | | | | Morgan Stanley and Co. International PLC | |
| | | | | | |
| | | | | | |
| | | | | | |
| | | | | | |
| | | | | Goldman Sachs International | |
| | | | | | |
| | | | | | |
| | | | | | |
| | | | | | |
| | | | | Morgan Stanley and Co. International PLC | |
| | | | | | |
Futures Contracts
| | | | Market Value/
Unrealized
Appreciation
(Depreciation) |
| | | | |
| 10-Year Australian Bond Futures | | | |
| | | | |
| | | | |
| | | | |
| | | | |
| | | | |
| | | | |
| | | | |
| U.S. Treasury Note 10-Year | | | |
| U.S. Treasury Note 2-Year | | | |
| U.S. Treasury Note 5-Year | | | |
| | | | |
| | | | |
| | | | |
| | | | |
| | | | |
| U.S. Treasury Note 10-Year | | | |
| | | | |
| | | | |
See accompanying Notes to the Financial Statements.
185
Mercer Opportunistic Fixed Income FundSchedule of Investments (Continued)
March 31, 2024
Written Options
Written Futures Options
| | | | | |
PUT— S&P 500 E-mini Futures Option
Strike @ $4,500.00
Expires 04/19/2024 | | | | | |
| | | | | |
OTC — Interest Rate Swaps
| | | | | | Upfront
Premiums
Paid
(Received) | | | Unrealized
Appreciation
(Depreciation) |
| | | | | Merrill Lynch International | | | | | |
| | | | | | | | | | |
| | | | | Merrill Lynch International | | | | | |
| | | | | Merrill Lynch International | | | | | |
| | | | | | | | | | |
| | | | | | | | | | |
| | | | | | | | | | |
| | | | | | | | | | |
| | | | | Merrill Lynch International | | | | | |
| | | | | Merrill Lynch International | | | | | |
| | | | | | | | | | |
| | | | | Merrill Lynch International | | | | | |
| | | | | | | | | | |
| | | | | | | | | | |
| | | | | | | | | | |
| | | | | | | | | | |
| | | | | | | | | | |
| | | | | | | | | | |
| | | | | | | | | | |
| | | | | | | | | | |
| | | | | | | | | | |
| | | | | Goldman Sachs International | | | | | |
| | | | | | | | | | |
| | | | | | | | | | |
| | | | | | | | | | |
| | | | | | | | | | |
| | | | | | | | | | |
| | | | | | | | | | |
| | | | | | | | | | |
| | | | | | | | | | |
| | | | | | | | | | |
| | | | | | | | | | |
| | | | | | | | | | |
186
See accompanying Notes to the Financial Statements.
Mercer Opportunistic Fixed Income FundSchedule of Investments (Continued)
March 31, 2024
OTC — Interest Rate Swaps—continued
| | | | | | Upfront Premiums Paid (Received) | | | Unrealized Appreciation (Depreciation) |
| | | | | | | | | | |
| | | | | | | | | | |
| | | | | | | | | | |
| | | | | | | | | | |
| | | | | | | | | | |
| | | | | | | | | | |
| | | | | | | | | | |
| | | | | | | | | | |
| | | | | | | | | | |
| | | | | | | | | | |
| | | | | | | | | | |
| | | | | | | | | | |
| | | | | | | | | | |
| | | | | | | | | | |
| | | | | | | | | | |
| | | | | | | | | | |
Centrally Cleared Interest Rate Swaps
| | | | | Upfront
Premiums
Paid
(Received) | | | Unrealized
Appreciation
(Depreciation) |
| | | | | | | | | |
| | | | | | | | | |
| | | | | | | | | |
| | | | | | | | | |
| | | | | | | | | |
| | | | | | | | | |
| | | | | | | | | |
| | | | | | | | | |
| | | | | | | | | |
| | | | | | | | | |
| | | | | | | | | |
| | | | | | | | | |
| | | | | | | | | |
| | | | | | | | | |
| | | | | | | | | |
| | | | | | | | | |
| | | | | | | | | |
| | | | | | | | | |
| | | | | | | | | |
| | | | | | | | | |
| | | | | | | | | |
| | | | | | | | | |
See accompanying Notes to the Financial Statements.
187
Mercer Opportunistic Fixed Income FundSchedule of Investments (Continued)
March 31, 2024
Centrally Cleared Interest Rate Swaps—continued
| | | | | Upfront Premiums Paid (Received) | | | Unrealized Appreciation (Depreciation) |
| | | | | | | | | |
| | | | | | | | | |
| | | | | | | | | |
| | | | | | | | | |
| | | | | | | | | |
| | | | | | | | | |
| | | | | | | | | |
| | | | | | | | | |
| | | | | | | | | |
| | | | | | | | | |
| | | | | | | | | |
| | | | | | | | | |
| | | | | | | | | |
| | | | | | | | | |
| | | | | | | | | |
| | | | | | | | | |
| | | | | | | | | |
| | | | | | | | | |
| | | | | | | | | |
| | | | | | | | | |
| | | | | | | | | |
| | | | | | | | | |
| | | | | | | | | |
| | | | | | | | | |
| | | | | | | | | |
| | | | | | | | | |
| | | | | | | | | |
| | | | | | | | | |
| | | | | | | | | |
| | | | | | | | | |
| | Thai Baht Interest Rate Fixing | | | | | | | |
| | Thai Baht Interest Rate Fixing | | | | | | | |
| | Thai Baht Interest Rate Fixing | | | | | | | |
| | | | | | | | | |
OTC— Credit Default Swaps
Buy Protection
| | | | | | | Unrealized
Appreciation
(Depreciation) | Upfront
Premiums
Paid/
(Received) | |
| | | | | | | | | |
| | | | | | Daimler AG, 1.40%, 01/12/24 | | | |
| | | |
188
See accompanying Notes to the Financial Statements.
Mercer Opportunistic Fixed Income FundSchedule of Investments (Continued)
March 31, 2024
OTC— Credit Default Swaps—continued
Sell Protection
| | | | | | | Unrealized
Appreciation
(Depreciation) | Upfront
Premiums
Paid/
(Received) | |
| | | | | | Volkswagen International Finance N.V., 0.50%, 03/30/21 (Moody’s rating: A3; S&P rating: BBB+) | | | |
Total OTC Credit Default Swaps | | | |
Centrally Cleared Credit Default Swaps
Buy Protection
| | | | | | Unrealized
Appreciation
(Depreciation) | Upfront
Premiums
Paid
(Received) | |
| | | | | | | | |
| | | | | Macy's Retail Holdings LLC | | | |
| | | |
Sell Protection
| | | | | | Unrealized
Appreciation
(Depreciation) | Upfront
Premiums
Paid
(Received) | |
| | | | | | | | |
| | | | | | | | |
| | | | | | | | |
| | | | | | | | |
| | | |
Total Centrally Cleared Credit Default Swaps | | | |
| The maximum potential amount of future undiscounted payments that the Fund could be required to make under a credit default swap contract would be the notional amount of the contract. These potential amounts would be partially offset by any recovery values of the referenced debt obligation or net amounts received from the settlement of purchased protection credit default swap contracts entered into by the Fund for the same referenced debt obligation. |
| CDX.EM — Markit CDX Emerging Markets Index. Represents an index composed of fifteen (15) sovereign reference entities that trade in the credit default swaps (CDS) market. |
| CDX.NA.HY — Markit North America High Yield CDS Index. Represents an index of single name credit default swaps (CDS). All of the companies underlying the single name CDS within the index are rated BB and B. |
| CDX.NA.IG — Markit North America Investment Grade CDS Index. Represents an index of one hundred twenty five (125) of the most liquid North American entities with investment grade credit ratings that trade in the CDS market. |
U.S. Treasury securities in the amount of $591,266 received at the custodian bank as collateral for forward foreign currency contracts, OTC swaps and/or OTC options.
See accompanying Notes to the Financial Statements.
189
Mercer Opportunistic Fixed Income FundSchedule of Investments (Continued)
March 31, 2024
190
See accompanying Notes to the Financial Statements.
Mercer Opportunistic Fixed Income FundSchedule of Investments (Continued)
March 31, 2024
|
| | Budapest Interbank Offered Rate |
| | CREST Depository Interest |
| | Chilean Average Chamber Index |
| | Collateralized Loan Obligation |
| | Constant Maturity Treasury Index |
| | |
| | Colombia Overnight Interbank Rate |
| | Euro Interbank Offered Rate |
| | Intercontinental Exchange |
| | Johannesburg Interbank Average Rate |
| | South Korea Three Month Interbank Rate |
| | |
| | Prague Interbank Offered Rate |
| | Secured Overnight Financing Rate |
| | Sterling Overnight Index Average |
| | Structured Agency Credit Risk |
| | |
| | Mexican Interbank Equilibrium Interest Rate |
| | Warsaw Interbank Offer Rate |
See accompanying Notes to the Financial Statements.
191
Mercer Opportunistic Fixed Income FundSchedule of Investments (Continued)
March 31, 2024
Asset Class Summary (Unaudited) | |
| |
Sovereign Debt Obligations | |
| |
Mortgage Backed Securities - Private Issuers | |
| |
U.S. Government and Agency Obligations | |
| |
| |
| |
Forward Foreign Currency Contracts | |
| |
| |
Centrally Cleared Credit Default Swaps | |
Mortgage Backed Securities - U.S. Government Agency Obligations | |
Purchased Futures Options | |
Purchased Currency Option | |
| |
Centrally Cleared Interest Rate Swaps | |
| |
| |
Other Assets and Liabilities (net) | |
| |
192
See accompanying Notes to the Financial Statements.
Mercer Short Duration Fixed Income FundSchedule of Investments
(showing percentage of net assets)
March 31, 2024
| | | |
| | |
| | Asset Backed Securities — 19.9% |
| | AIMCO CLO, Series 2017-AA, Class AR, 6.63% (3 mo. USD Term SOFR + 1.31%), due 04/20/34(b) 144A | |
| | AIMCO CLO 10 Ltd., Series 2019-10A, Class AR, 6.64% (3 mo. USD Term SOFR + 1.32%), due 07/22/32(b) 144A | |
| | American Express Credit Account Master Trust, Series 2023-4, Class A, 5.15%, due 09/15/30 | |
| | AmeriCredit Automobile Receivables Trust, Series 2022-2, Class A2A, 4.20%, due 12/18/25 | |
| | AMMC CLO 22, Ltd., Series 2018-22A, Class A, 6.62% (3 mo. USD Term SOFR + 1.29%), due 04/25/31(b) 144A | |
| | BA Credit Card Trust, Series 2023-A2, Class A2, 4.98%, due 11/15/28 | |
| | Bain Capital CLO Ltd., Series 2024-1A, Class A1, 6.87% (3 mo. USD Term SOFR + 1.55%), due 04/16/37(b) 144A | |
| | Barclays Dryrock Issuance Trust, Series 2023-2, Class A, 6.22% (SOFR 30-day average + 0.90%), due 08/15/28(b) | |
| | Barings CLO Ltd., Series 2024-1A, Class A, 6.90% (3 mo. USD Term SOFR + 1.63%), due 01/20/37(b) 144A | |
| | CarMax Auto Owner Trust, Series 2024-1, Class A3, 4.92%, due 10/16/28 | |
| | Chase Issuance Trust, Series 2024-A2, Class A, 4.63%, due 01/15/31 | |
| | Citibank Credit Card Issuance Trust, Series 2023-A1, Class A1, 5.23%, due 12/08/27 | |
| | Citizens Auto Receivables Trust, Series 2024-1, Class A3, 5.11%, due 04/17/28 144A | |
| | CNH Equipment Trust, Series 2022-B, Class A4, 3.91%, due 03/15/28 | |
| | Discover Card Execution Note Trust, Series 2022-A3, Class A3, 3.56%, due 07/15/27 | |
| | Elmwood CLO IV Ltd., Series 2020-1A, Class A, 6.82% (3 mo. USD Term SOFR + 1.50%), due 04/15/33(b) 144A | |
| | Enterprise Fleet Financing LLC, Series 2022-4, Class A2, 5.76%, due 10/22/29 144A | |
| | FirstKey Homes Trust, Series 2020-SFR2, Class A, 1.27%, due 10/19/37 144A | |
| | Flatiron CLO 18 Ltd., Series 2018-1A, Class A, 6.53% (3 mo. USD Term SOFR + 1.21%), due 04/17/31(b) 144A | |
| | Ford Credit Auto Lease Trust, Series 2023-A, Class C, 5.54%, due 12/15/26 | |
| | Ford Credit Auto Lease Trust, Series 2024-A, Class A4, 5.05%, due 06/15/27 | |
| | Ford Credit Auto Owner Trust, Series 2023-A, Class B, 5.07%, due 01/15/29 | |
| | GM Financial Automobile Leasing Trust, Series 2022-1, Class C, 2.64%, due 02/20/26 | |
| | GM Financial Consumer Automobile Receivables Trust, Series 2021-3, Class A4, 0.73%, due 08/16/27 | |
| | GM Financial Consumer Automobile Receivables Trust, Series 2023-2, Class C, 5.21%, due 12/18/28 | |
| | GM Financial Consumer Automobile Receivables Trust, Series 2023-4, Class A3, 5.78%, due 08/16/28 | |
| | GM Financial Consumer Automobile Receivables Trust, Series 2024-1, Class B, 5.16%, due 08/16/29 | |
| | HPEFS Equipment Trust, Series 2022-1A, Class B, 1.79%, due 05/21/29 144A | |
| | HPEFS Equipment Trust, Series 2022-2A, Class A3, 3.76%, due 09/20/29 144A | |
| | Invesco U.S. CLO Ltd., Series 2023-1A, Class AR, 6.86% (3 mo. USD Term SOFR + 1.57%), due 04/22/37(b) 144A | |
| | John Deere Owner Trust, Series 2023-C, Class A4, 5.39%, due 08/15/30 | |
| | John Deere Owner Trust, Series 2024-A, Class A3, 4.96%, due 11/15/28 | |
| | Kubota Credit Owner Trust, Series 2022-2A, Class A3, 4.09%, due 12/15/26 144A | |
| | Magnetite XII Ltd., Series 2015-12A, Class AR4, 6.47% (3 mo. USD Term SOFR + 1.83%), due 10/15/31(b) 144A | |
| | MVW LLC, Series 2024-1A, Class A, 5.32%, due 02/20/43 144A | |
See accompanying Notes to the Financial Statements.
193
Mercer Short Duration Fixed Income FundSchedule of Investments (Continued)
(showing percentage of net assets)
March 31, 2024
| | | |
| | Asset Backed Securities — continued |
| | Navient Private Education Refi Loan Trust, Series 2020-EA, Class A, 1.69%, due 05/15/69 144A | |
| | Navient Private Education Refi Loan Trust, Series 2020-GA, Class A, 1.17%, due 09/16/69 144A | |
| | Neuberger Berman Loan Advisers CLO 26 Ltd., Series 2017-26A, Class AR, 6.48% (3 mo. USD Term SOFR + 1.18%), due 10/18/30(b) 144A | |
| | Neuberger Berman Loan Advisers CLO 32 Ltd., Series 2019-32A, Class AR, 6.56% (3 mo. USD Term SOFR + 1.25%), due 01/20/32(b) 144A | |
| | Nissan Auto Lease Trust, Series 2024-A, Class A4, 4.97%, due 09/15/28 | |
| | Oaktree CLO Ltd., Series 2022-2A, Class A1R, 6.86% (3 mo. USD Term SOFR + 1.55%), due 07/15/33(b) 144A | |
| | Octagon Loan Funding Ltd., Series 2014-1A, Class ARR, 6.76% (3 mo. USD Term SOFR + 1.44%), due 11/18/31(b) 144A | |
| | Palmer Square Loan Funding Ltd., Series 2021-3A, Class A1, 6.38% (3 mo. USD Term SOFR + 1.06%), due 07/20/29(b) 144A | |
| | Palmer Square Loan Funding Ltd., Series 2021-3A, Class A2, 6.98% (3 mo. USD Term SOFR + 1.66%), due 07/20/29(b) 144A | |
| | PFS Financing Corp., Series 2023-C, Class A, 5.52%, due 10/15/28 144A | |
| | Porsche Financial Auto Securitization Trust, Series 2023-2A, Class A3, 5.79%, due 01/22/29 144A | |
| | Santander Drive Auto Receivables Trust, Series 2022-6, Class A3, 4.49%, due 11/16/26 | |
| | Santander Drive Auto Receivables Trust, Series 2023-6, Class A2, 6.08%, due 05/17/27 | |
| | Santander Drive Auto Receivables Trust, Series 2024-1, Class A3, 5.25%, due 04/17/28 | |
| | SBNA Auto Receivables Trust, Series 2024-A, Class A2, 5.70%, due 03/15/27 144A | |
| | Synchrony Card Funding LLC, Series 2023-A2, Class A, 5.74%, due 10/15/29 | |
| | Tesla Electric Vehicle Trust, Series 2023-1, Class A2A, 5.54%, due 12/21/26 144A | |
| | Tesla Electric Vehicle Trust, Series 2023-1, Class A3, 5.38%, due 06/20/28 144A | |
| | Toyota Auto Receivables Owner Trust, Series 2024-A, Class A3, 4.83%, due 10/16/28 | |
| | Toyota Lease Owner Trust, Series 2023-A, Class A4, 5.05%, due 08/20/27 144A | |
| | Verizon Master Trust, Series 2021-1, Class C, 0.89%, due 05/20/27 | |
| | | |
| | |
| | Allied Universal Holdco LLC, 2021 USD Incremental Term Loan B, 9.18% (1 mo. USD Term SOFR + 3.75%), due 05/12/28(b) | |
| | Applied Systems, Inc., 2024 1st Lien Term Loan, 8.81% (3 mo. USD Term SOFR + | |
| | AssuredPartners, Inc., 2020 Term Loan B, 8.94% (1 mo. USD Term SOFR + 3.50%), | |
| | Carnival Corp., 2021 Incremental Term Loan B, 8.69% (1 mo. USD Term SOFR + | |
| | Deerfield Dakota Holding LLC, 2020 USD Term Loan B, 9.06% (3 mo. USD Term SOFR + 3.75%), due 04/09/27(b) | |
| | Elanco Animal Health, Inc., Term Loan B, 7.18% (1 mo. USD Term SOFR + 1.75%), | |
| | Epicor Software Corp., 2020 Term Loan, 8.69% (1 mo. USD Term SOFR + 3.25%), due | |
| | GTCR W Merger Sub LLC, USD Term Loan B, 8.31% (1 mo. USD Term SOFR + | |
| | Hilton Domestic Operating Co., Inc., 2023 Term Loan B3, 7.18% (1 mo. USD Term SOFR + 1.75%), due 06/21/28(b) | |
| | Medline Borrower LP, USD Term Loan B, 8.44% (1 mo. USD Term SOFR + 3.00%), | |
194
See accompanying Notes to the Financial Statements.
Mercer Short Duration Fixed Income FundSchedule of Investments (Continued)
(showing percentage of net assets)
March 31, 2024
| | | |
| | |
| | Mileage Plus Holdings LLC, 2020 Term Loan B, 10.73% (3 mo. USD Term SOFR + | |
| | NFP Corp., 2020 Term Loan, 8.69% (1 mo. USD Term SOFR + 3.25%), due 02/16/27(b) | |
| | Pathway Vet Alliance LLC, 2021 Term Loan, 9.19% (1 mo. USD Term SOFR + 3.75%), | |
| | Polaris Newco LLC, USD Term Loan B, 9.57% (3 mo. USD Term SOFR + 4.00%), due | |
| | Proampac PG Borrower LLC, 2023 Term Loan, 9.80% (3 mo. USD Term SOFR + | |
| | Proampac PG Borrower LLC, 2023 Term Loan, 9.82% (3 mo. USD Term SOFR + | |
| | Roper Industrial Products Investment Co. LLC, USD Term Loan, 9.35% (3 mo. USD Term SOFR + 4.00%), due 11/22/29(b) | |
| | SBA Senior Finance II LLC, 2024 Term Loan B, 7.34% (1 mo. USD Term SOFR + | |
| | Sophia LP, 2024 Term Loan B, 8.93% (1 mo. USD Term SOFR + 3.50%), due | |
| | Southwire Co., 2018 Term Loan B, 7.18% (1 mo. USD Term SOFR + 1.75%), due | |
| | SRS Distribution, Inc., 2021 Term Loan B, TBD, due 06/02/28(c) | |
| | Titan Acquisition Ltd., 2018 Term Loan B, 8.44% (1 mo. USD Term SOFR + 3.00%), | |
| | TransDigm, Inc., 2023 Term Loan I, 8.57% (3 mo. USD Term SOFR + 3.25%), due | |
| | UKG, Inc., 2024 Term Loan B, 8.81% (3 mo. USD Term SOFR + 3.50%), due | |
| | United Airlines, Inc., 2024 Term Loan B, 8.08% (3 mo. USD Term SOFR + 2.75%), due | |
| | Verscend Holding Corp., 2021 Term Loan B, 9.44% (1 mo. USD Term SOFR + 4.00%), | |
| | | |
| | |
| | 7-Eleven, Inc., 0.95%, due 02/10/26 144A | |
| | AbbVie, Inc., 4.80%, due 03/15/27 | |
| | AbbVie, Inc., 4.80%, due 03/15/29 | |
| | AEP Texas, Inc., 3.85%, due 10/01/25 144A | |
| | AerCap Ireland Capital DAC/AerCap Global Aviation Trust, 1.75%, due 01/30/26 | |
| | AES Corp., 3.30%, due 07/15/25 144A | |
| | AES Corp., 5.45%, due 06/01/28 | |
| | Aflac, Inc., 1.13%, due 03/15/26 | |
| | AGCO Corp., 5.45%, due 03/21/27 | |
| | Alabama Power Co., 3.75%, due 09/01/27 | |
| | Albemarle Corp., 4.65%, due 06/01/27 | |
| | Ameren Corp., 5.70%, due 12/01/26 | |
| | Ameren Illinois Co., 3.80%, due 05/15/28 | |
| | American Airlines Pass-Through Trust, 3.20%, due 12/15/29 | |
| | American Electric Power Co., Inc., 5.20%, due 01/15/29 | |
| | American Express Co., 4.99% (SOFR + 1.00%), due 05/01/26(b) | |
| | American Express Co., 5.10% (SOFR + 1.00%), due 02/16/28(b) | |
| | American Express Co., 5.39% (SOFR + 0.97%), due 07/28/27(b) | |
| | American Honda Finance Corp., 1.30%, due 09/09/26 | |
See accompanying Notes to the Financial Statements.
195
Mercer Short Duration Fixed Income FundSchedule of Investments (Continued)
(showing percentage of net assets)
March 31, 2024
| | | |
| | Corporate Debt — continued |
| | American Honda Finance Corp., 4.95%, due 01/09/26 | |
| | American Honda Finance Corp., 5.80%, due 10/03/25 | |
| | American Tower Corp., 2.75%, due 01/15/27 | |
| | American Tower Corp., 3.65%, due 03/15/27 | |
| | American Tower Corp., 5.25%, due 07/15/28 | |
| | Ameriprise Financial, Inc., 3.00%, due 04/02/25 | |
| | Amgen, Inc., 3.20%, due 11/02/27 | |
| | Amgen, Inc., 5.25%, due 03/02/25 | |
| | Analog Devices, Inc., 2.95%, due 04/01/25 | |
| | Aon North America, Inc., 5.13%, due 03/01/27 | |
| | Aon North America, Inc., 5.15%, due 03/01/29 | |
| | Apple, Inc., 1.13%, due 05/11/25 | |
| | Apple, Inc., 3.25%, due 02/23/26 | |
| | Aquarion Co., 4.00%, due 08/15/24 144A | |
| | Astrazeneca Finance LLC, 4.80%, due 02/26/27 | |
| | AT&T, Inc., 1.70%, due 03/25/26 | |
| | Athene Global Funding, 5.68%, due 02/23/26 144A | |
| | Avangrid, Inc., 3.20%, due 04/15/25 | |
| | Aviation Capital Group LLC, 5.50%, due 12/15/24 144A | |
| | Aviation Capital Group LLC, 6.38%, due 07/15/30 144A | |
| | Avnet, Inc., 6.25%, due 03/15/28 | |
| | Avolon Holdings Funding Ltd., 2.13%, due 02/21/26 144A | |
| | Avolon Holdings Funding Ltd., 2.53%, due 11/18/27 144A | |
| | Baker Hughes Holdings LLC/Baker Hughes Co.-Obligor, Inc., 2.06%, due 12/15/26 | |
| | Ball Corp., 6.88%, due 03/15/28 | |
| | Bank of America Corp., 0.98% (SOFR + 0.69%), due 04/22/25(b) | |
| | Bank of America Corp., 1.32% (SOFR + 1.15%), due 06/19/26(b) | |
| | Bank of America Corp., 1.66% (SOFR + 0.91%), due 03/11/27(b) | |
| | Bank of America Corp., 1.73% (SOFR + 0.96%), due 07/22/27(b) | |
| | Bank of America Corp., 2.02% (3 mo. USD Term SOFR + 0.90%), due 02/13/26(b) | |
| | Bank of America Corp., 3.42% (3 mo. USD Term SOFR + 1.30%), due 12/20/28(b) | |
| | Bank of America Corp., 3.71% (3 mo. USD Term SOFR + 1.77%), due 04/24/28(b) | |
| | Bank of America Corp., 4.38% (SOFR + 1.58%), due 04/27/28(b) | |
| | Bank of America Corp., 4.83% (SOFR + 1.75%), due 07/22/26(b) | |
| | Bank of America Corp., 5.20% (SOFR + 1.63%), due 04/25/29(b) | |
| | Bank of America Corp., 5.93% (SOFR + 1.34%), due 09/15/27(b) | |
| | Bank of Montreal, 5.30%, due 06/05/26 | |
| | Bank of New York Mellon Corp., 3.43% (SOFR + 0.57%), due 06/13/25(b) | |
| | Bank of New York Mellon Corp., 4.41% (SOFR + 1.35%), due 07/24/26(b) | |
| | Bank of New York Mellon Corp., 4.95% (SOFR + 1.03%), due 04/26/27(b) | |
| | Bank of New York Mellon Corp., 4.98% (SOFR + 1.09%), due 03/14/30(b) | |
| | Bank of Nova Scotia, 0.70%, due 04/15/24 | |
| | Bank of Nova Scotia, 1.45%, due 01/10/25 | |
| | Bank of Nova Scotia, 3.45%, due 04/11/25 | |
| | Becton Dickinson & Co., 4.69%, due 02/13/28 | |
| | BHP Billiton Finance USA Ltd., 5.25%, due 09/08/26 | |
| | Black Hills Corp., 1.04%, due 08/23/24 | |
| | Blackstone Holdings Finance Co. LLC, 1.63%, due 08/05/28 144A | |
| | Blackstone Holdings Finance Co. LLC, 2.50%, due 01/10/30 144A | |
196
See accompanying Notes to the Financial Statements.
Mercer Short Duration Fixed Income FundSchedule of Investments (Continued)
(showing percentage of net assets)
March 31, 2024
| | | |
| | Corporate Debt — continued |
| | Blackstone Holdings Finance Co. LLC, 5.90%, due 11/03/27 144A | |
| | Blue Owl Credit Income Corp., 7.75%, due 09/16/27 | |
| | BMW U.S. Capital LLC, 0.80%, due 04/01/24 144A | |
| | BMW U.S. Capital LLC, 1.25%, due 08/12/26 144A | |
| | BMW U.S. Capital LLC, 3.25%, due 04/01/25 144A | |
| | Booz Allen Hamilton, Inc., 3.88%, due 09/01/28 144A | |
| | Booz Allen Hamilton, Inc., 4.00%, due 07/01/29 144A | |
| | Boston Properties LP, 2.75%, due 10/01/26 | |
| | Boston Scientific Corp., 1.90%, due 06/01/25 | |
| | Bristol-Myers Squibb Co., 0.75%, due 11/13/25 | |
| | Bristol-Myers Squibb Co., 4.90%, due 02/22/27 | |
| | Bristol-Myers Squibb Co., 4.90%, due 02/22/29 | |
| | British Airways Pass-Through Trust, 3.35%, due 12/15/30 144A | |
| | British Airways Pass-Through Trust, 4.63%, due 12/20/25 144A | |
| | Broadcom, Inc., 3.46%, due 09/15/26 | |
| | Brookfield Finance, Inc., 4.00%, due 04/01/24 | |
| | Brooklyn Union Gas Co., 4.63%, due 08/05/27 144A | |
| | Bunge Ltd. Finance Corp., 1.63%, due 08/17/25 | |
| | Campbell Soup Co., 5.30%, due 03/20/26 | |
| | Canadian Natural Resources Ltd., 2.05%, due 07/15/25 | |
| | Capital One Financial Corp., 1.88% (SOFR + 0.86%), due 11/02/27(b) | |
| | Capital One Financial Corp., 4.17% (SOFR + 1.37%), due 05/09/25(b) | |
| | Capital One Financial Corp., 5.47% (SOFR + 2.08%), due 02/01/29(b) | |
| | Capital One Financial Corp., 5.70% (SOFR + 1.91%), due 02/01/30(b) | |
| | Cardinal Health, Inc., 5.13%, due 02/15/29 | |
| | Cargill, Inc., 3.50%, due 04/22/25 144A | |
| | Cargill, Inc., 3.63%, due 04/22/27 144A | |
| | Charles Schwab Corp., 5.88%, due 08/24/26 | |
| | Charles Schwab Corp., 6.20% (SOFR + 1.88%), due 11/17/29(b) | |
| | Charles Schwab Corp., 6.41% (SOFR + 1.05%), due 03/03/27(b) | |
| | Charter Communications Operating LLC/Charter Communications Operating Capital, 3.75%, due 02/15/28 | |
| | Cigna Group, 1.25%, due 03/15/26 | |
| | Cigna Group, 5.00%, due 05/15/29 | |
| | Cisco Systems, Inc., 4.80%, due 02/26/27 | |
| | Cisco Systems, Inc., 4.85%, due 02/26/29 | |
| | Citigroup, Inc., 0.98% (SOFR + 0.67%), due 05/01/25(b) | |
| | Citigroup, Inc., 1.46% (SOFR + 0.77%), due 06/09/27(b) | |
| | Citigroup, Inc., 5.61% (SOFR + 1.55%), due 09/29/26(b) | |
| | CNH Industrial Capital LLC, 5.10%, due 04/20/29 | |
| | Comcast Corp., 4.55%, due 01/15/29 | |
| | Comcast Corp., 5.25%, due 11/07/25 | |
| | Concentrix Corp., 6.60%, due 08/02/28 | |
| | Connecticut Light & Power Co., 4.65%, due 01/01/29 | |
| | Consumers Energy Co., 4.90%, due 02/15/29 | |
| | Consumers Securitization Funding LLC, 5.55%, due 03/01/28 | |
| | Corebridge Financial, Inc., 3.65%, due 04/05/27 | |
| | Corebridge Global Funding, 0.90%, due 09/22/25 144A | |
| | Crown Castle, Inc., 5.60%, due 06/01/29 | |
See accompanying Notes to the Financial Statements.
197
Mercer Short Duration Fixed Income FundSchedule of Investments (Continued)
(showing percentage of net assets)
March 31, 2024
| | | |
| | Corporate Debt — continued |
| | CSL Finance PLC, 3.85%, due 04/27/27 144A | |
| | Cummins, Inc., 4.90%, due 02/20/29 | |
| | CVS Health Corp., 1.30%, due 08/21/27 | |
| | Delta Air Lines Pass-Through Trust, 2.50%, due 12/10/29 | |
| | Delta Air Lines Pass-Through Trust, 3.40%, due 10/25/25 | |
| | Delta Air Lines, Inc./SkyMiles IP Ltd., 4.50%, due 10/20/25 144A | |
| | Discover Financial Services, 3.95%, due 11/06/24 | |
| | DTE Energy Co., 4.22%, due 11/01/24(d) | |
| | DTE Energy Co., 5.10%, due 03/01/29 | |
| | Duke Energy Florida Project Finance LLC, 2.54%, due 09/01/31 | |
| | Ecolab, Inc., 1.65%, due 02/01/27 | |
| | Ecolab, Inc., 2.70%, due 11/01/26 | |
| | EIDP, Inc., 4.50%, due 05/15/26 | |
| | Element Fleet Management Corp., 3.85%, due 06/15/25 144A | |
| | Element Fleet Management Corp., 5.64%, due 03/13/27 144A | |
| | Elevance Health, Inc., 3.50%, due 08/15/24 | |
| | Eli Lilly & Co., 4.50%, due 02/09/27 | |
| | Energy Transfer LP, 5.55%, due 02/15/28 | |
| | Entergy Corp., 0.90%, due 09/15/25 | |
| | Entergy Louisiana LLC, 0.95%, due 10/01/24 | |
| | Equinix, Inc., 1.25%, due 07/15/25 | |
| | ERAC USA Finance LLC, 5.00%, due 02/15/29 144A | |
| | Essex Portfolio LP, 3.63%, due 05/01/27 | |
| | Eversource Energy, 2.90%, due 03/01/27 | |
| | Eversource Energy, 4.75%, due 05/15/26 | |
| | Exelon Corp., 5.15%, due 03/15/29 | |
| | Extra Space Storage LP, 3.88%, due 12/15/27 | |
| | Fiserv, Inc., 2.75%, due 07/01/24 | |
| | Fiserv, Inc., 3.20%, due 07/01/26 | |
| | Fiserv, Inc., 5.15%, due 03/15/27 | |
| | Fiserv, Inc., 5.45%, due 03/02/28 | |
| | Flex Ltd., 6.00%, due 01/15/28 | |
| | Florida Power & Light Co., 4.40%, due 05/15/28 | |
| | Ford Motor Credit Co. LLC, 3.38%, due 11/13/25 | |
| | GATX Corp., 5.40%, due 03/15/27 | |
| | GE HealthCare Technologies, Inc., 5.60%, due 11/15/25 | |
| | General Dynamics Corp., 3.25%, due 04/01/25 | |
| | General Motors Financial Co., Inc., 3.80%, due 04/07/25 | |
| | General Motors Financial Co., Inc., 5.25%, due 03/01/26 | |
| | General Motors Financial Co., Inc., 5.40%, due 04/06/26 | |
| | General Motors Financial Co., Inc., 5.40%, due 05/08/27 | |
| | Georgia Power Co., 5.00%, due 02/23/27 | |
| | Georgia-Pacific LLC, 1.75%, due 09/30/25 144A | |
| | Global Payments, Inc., 1.20%, due 03/01/26 | |
| | Goldman Sachs Bank USA, 5.28% (SOFR + 0.78%), due 03/18/27(b) | |
| | Goldman Sachs BDC, Inc., 6.38%, due 03/11/27 | |
| | Goldman Sachs Group, Inc., 2.64% (SOFR + 1.11%), due 02/24/28(b) | |
| | Goldman Sachs Group, Inc., 5.80% (SOFR + 1.08%), due 08/10/26(b) | |
| | Goldman Sachs Group, Inc., 5.84% (SOFR + 0.49%), due 10/21/24(b) | |
198
See accompanying Notes to the Financial Statements.
Mercer Short Duration Fixed Income FundSchedule of Investments (Continued)
(showing percentage of net assets)
March 31, 2024
| | | |
| | Corporate Debt — continued |
| | Graphic Packaging International LLC, 0.82%, due 04/15/24 144A | |
| | Hanover Insurance Group, Inc., 4.50%, due 04/15/26 | |
| | HEICO Corp., 5.25%, due 08/01/28 | |
| | Home Depot, Inc., 2.70%, due 04/15/25 | |
| | Home Depot, Inc., 4.95%, due 09/30/26 | |
| | Honda Motor Co. Ltd., 2.53%, due 03/10/27 | |
| | Honeywell International, Inc., 4.88%, due 09/01/29 | |
| | HP, Inc., 2.20%, due 06/17/25 | |
| | Humana, Inc., 5.75%, due 03/01/28 | |
| | Huntington National Bank, 6.54% (SOFR + 1.19%), due 05/16/25(b) | |
| | Hyundai Capital America, 1.30%, due 01/08/26 144A | |
| | Hyundai Capital America, 5.65%, due 06/26/26 144A | |
| | Hyundai Capital America, 5.95%, due 09/21/26 144A | |
| | Hyundai Capital America, 6.25%, due 11/03/25 144A | |
| | Infor, Inc., 1.75%, due 07/15/25 144A | |
| | Intel Corp., 3.75%, due 08/05/27 | |
| | Intel Corp., 4.88%, due 02/10/26 | |
| | International Business Machines Corp., 6.50%, due 01/15/28 | |
| | Interstate Power & Light Co., 3.25%, due 12/01/24 | |
| | Intuit, Inc., 5.25%, due 09/15/26 | |
| | IPALCO Enterprises, Inc., 3.70%, due 09/01/24 | |
| | IQVIA, Inc., 5.70%, due 05/15/28(e) | |
| | J M Smucker Co., 5.90%, due 11/15/28 | |
| | John Deere Capital Corp., 2.05%, due 01/09/25 | |
| | John Deere Capital Corp., 2.13%, due 03/07/25 | |
| | John Deere Capital Corp., 2.35%, due 03/08/27 | |
| | John Deere Capital Corp., 4.85%, due 03/05/27 | |
| | John Deere Capital Corp., 4.95%, due 07/14/28 | |
| | JPMorgan Chase & Co., 0.82% (3 mo. USD Term SOFR + 0.54%), due 06/01/25(b) | |
| | JPMorgan Chase & Co., 0.97% (3 mo. USD Term SOFR + 0.58%), due 06/23/25(b) | |
| | JPMorgan Chase & Co., 1.47% (SOFR + 0.77%), due 09/22/27(b) | |
| | JPMorgan Chase & Co., 1.58% (SOFR + 0.89%), due 04/22/27(b) | |
| | JPMorgan Chase & Co., 2.07% (SOFR + 1.02%), due 06/01/29(b) | |
| | JPMorgan Chase & Co., 2.08% (SOFR + 1.85%), due 04/22/26(b) | |
| | JPMorgan Chase & Co., 2.30% (SOFR + 1.16%), due 10/15/25(b) | |
| | JPMorgan Chase & Co., 2.60% (SOFR + 0.92%), due 02/24/26(b) | |
| | JPMorgan Chase & Co., 2.95% (SOFR + 1.17%), due 02/24/28(b) | |
| | JPMorgan Chase & Co., 3.51% (3 mo. USD Term SOFR + 1.21%), due 01/23/29(b) | |
| | JPMorgan Chase & Co., 3.96% (3 mo. USD Term SOFR + 1.51%), due 01/29/27(b) | |
| | JPMorgan Chase & Co., 5.01% (SOFR + 1.31%), due 01/23/30(b) | |
| | JPMorgan Chase & Co., 5.04% (SOFR + 1.19%), due 01/23/28(b) | |
| | JPMorgan Chase & Co., 5.30% (SOFR + 1.45%), due 07/24/29(b) | |
| | JPMorgan Chase & Co., 5.55% (SOFR + 1.07%), due 12/15/25(b) | |
| | JPMorgan Chase & Co., 6.07% (SOFR + 1.33%), due 10/22/27(b) | |
| | Kenvue, Inc., 5.50%, due 03/22/25 | |
| | Keurig Dr Pepper, Inc., 5.05%, due 03/15/29 | |
| | Kinder Morgan, Inc., 1.75%, due 11/15/26 | |
| | Kyndryl Holdings, Inc., 2.05%, due 10/15/26 | |
| | L3Harris Technologies, Inc., 5.40%, due 01/15/27 | |
See accompanying Notes to the Financial Statements.
199
Mercer Short Duration Fixed Income FundSchedule of Investments (Continued)
(showing percentage of net assets)
March 31, 2024
| | | |
| | Corporate Debt — continued |
| | Lennox International, Inc., 5.50%, due 09/15/28 | |
| | Liberty Utilities Co., 5.58%, due 01/31/29 144A | |
| | Lloyds Banking Group PLC, 4.72% (1 yr. CMT + 1.75%), due 08/11/26(b) | |
| | Lloyds Banking Group PLC, 5.46% (1 yr. CMT + 1.38%), due 01/05/28(b) | |
| | Lloyds Banking Group PLC, 5.99% (1 yr. CMT + 1.48%), due 08/07/27(b) | |
| | Lockheed Martin Corp., 5.10%, due 11/15/27 | |
| | Lowe's Cos., Inc., 3.35%, due 04/01/27 | |
| | Main Street Capital Corp., 6.95%, due 03/01/29 | |
| | Marriott International, Inc., 4.88%, due 05/15/29 | |
| | Marriott International, Inc., 5.55%, due 10/15/28 | |
| | Meta Platforms, Inc., 3.50%, due 08/15/27 | |
| | Metropolitan Life Global Funding I, 4.40%, due 06/30/27 144A | |
| | Mileage Plus Holdings LLC/Mileage Plus Intellectual Property Assets Ltd., 6.50%, due 06/20/27 144A | |
| | Mondelez International, Inc., 4.75%, due 02/20/29 | |
| | Morgan Stanley, 0.79% (SOFR + 0.53%), due 05/30/25(b) | |
| | Morgan Stanley, 1.16% (SOFR + 0.56%), due 10/21/25(b) | |
| | Morgan Stanley, 1.51% (SOFR + 0.86%), due 07/20/27(b) | |
| | Morgan Stanley, 1.59% (SOFR + 0.88%), due 05/04/27(b) | |
| | Morgan Stanley, 2.48% (SOFR + 1.00%), due 01/21/28(b) | |
| | Morgan Stanley, 2.72% (SOFR + 1.15%), due 07/22/25(b) | |
| | Morgan Stanley, 3.13%, due 07/27/26 | |
| | Morgan Stanley, 5.12% (SOFR + 1.73%), due 02/01/29(b) | |
| | Morgan Stanley, 5.16% (SOFR + 1.59%), due 04/20/29(b) | |
| | Morgan Stanley, 5.86% (SOFR + 0.51%), due 01/22/25(b) | |
| | Morgan Stanley, 6.14% (SOFR + 1.77%), due 10/16/26(b) | |
| | Morgan Stanley, 6.41% (SOFR + 1.83%), due 11/01/29(b) | |
| | Motorola Solutions, Inc., 4.00%, due 09/01/24 | |
| | National Rural Utilities Cooperative Finance Corp., 1.00%, due 10/18/24 | |
| | National Rural Utilities Cooperative Finance Corp., 1.88%, due 02/07/25 | |
| | National Rural Utilities Cooperative Finance Corp., 4.85%, due 02/07/29 | |
| | National Rural Utilities Cooperative Finance Corp., 5.60%, due 11/13/26 | |
| | Nestle Holdings, Inc., 4.13%, due 10/01/27 144A | |
| | New York Life Global Funding, 4.85%, due 01/09/28 144A | |
| | New York State Electric & Gas Corp., 5.65%, due 08/15/28 144A | |
| | NextEra Energy Capital Holdings, Inc., 1.88%, due 01/15/27 | |
| | NextEra Energy Capital Holdings, Inc., 1.90%, due 06/15/28 | |
| | NextEra Energy Capital Holdings, Inc., 4.63%, due 07/15/27 | |
| | NextEra Energy Capital Holdings, Inc., 4.90%, due 02/28/28 | |
| | NextEra Energy Operating Partners LP, 7.25%, due 01/15/29 144A | |
| | Niagara Mohawk Power Corp., 1.96%, due 06/27/30 144A | |
| | NiSource, Inc., 0.95%, due 08/15/25 | |
| | Northwestern Mutual Global Funding, 0.80%, due 01/14/26 144A | |
| | NRG Energy, Inc., 3.75%, due 06/15/24 144A | |
| | Nucor Corp., 2.00%, due 06/01/25 | |
| | Nutrien Ltd., 3.00%, due 04/01/25 | |
| | Nutrien Ltd., 4.90%, due 03/27/28 | |
| | Old Republic International Corp., 4.88%, due 10/01/24 | |
| | ONE Gas, Inc., 5.10%, due 04/01/29 | |
200
See accompanying Notes to the Financial Statements.
Mercer Short Duration Fixed Income FundSchedule of Investments (Continued)
(showing percentage of net assets)
March 31, 2024
| | | |
| | Corporate Debt — continued |
| | Oracle Corp., 1.65%, due 03/25/26 | |
| | Oracle Corp., 2.50%, due 04/01/25 | |
| | Oracle Corp., 2.65%, due 07/15/26 | |
| | Ovintiv, Inc., 5.38%, due 01/01/26 | |
| | Pacific Gas & Electric Co., 5.55%, due 05/15/29 | |
| | Pacific Life Global Funding II, 1.20%, due 06/24/25 144A | |
| | Pacific Life Global Funding II, 1.38%, due 04/14/26 144A | |
| | Penske Truck Leasing Co. LP/PTL Finance Corp., 4.40%, due 07/01/27 144A | |
| | Penske Truck Leasing Co. LP/PTL Finance Corp., 5.35%, due 01/12/27 144A | |
| | Penske Truck Leasing Co. LP/PTL Finance Corp., 6.05%, due 08/01/28 144A | |
| | Pepsico Singapore Financing I Pte. Ltd., 5.91% (SOFR + 0.56%), due 02/16/27(b) | |
| | PepsiCo, Inc., 3.60%, due 02/18/28 | |
| | PepsiCo, Inc., 5.25%, due 11/10/25 | |
| | Pfizer Investment Enterprises Pte. Ltd., 4.45%, due 05/19/26 | |
| | Philip Morris International, Inc., 4.88%, due 02/13/29 | |
| | Phillips 66, 3.85%, due 04/09/25 | |
| | Pioneer Natural Resources Co., 1.13%, due 01/15/26 | |
| | PNC Financial Services Group, Inc., 5.30% (SOFR + 1.34%), due 01/21/28(b) | |
| | PNC Financial Services Group, Inc., 6.62% (SOFR + 1.73%), due 10/20/27(b) | |
| | Principal Life Global Funding II, 5.10%, due 01/25/29 144A | |
| | Prologis LP, 4.88%, due 06/15/28 | |
| | Prologis Targeted U.S. Logistics Fund LP, 5.25%, due 04/01/29 144A | |
| | Prudential Insurance Co. of America, 8.30%, due 07/01/25 144A | |
| | Public Service Enterprise Group, Inc., 0.80%, due 08/15/25 | |
| | Public Service Enterprise Group, Inc., 5.85%, due 11/15/27 | |
| | Public Service Enterprise Group, Inc., 5.88%, due 10/15/28 | |
| | Public Storage Operating Co., 5.13%, due 01/15/29(e) | |
| | Regal Rexnord Corp., 6.05%, due 02/15/26 144A | |
| | Republic Services, Inc., 2.50%, due 08/15/24 | |
| | Rogers Communications, Inc., 5.00%, due 02/15/29 | |
| | Ross Stores, Inc., 4.60%, due 04/15/25 | |
| | Royal Bank of Canada, 1.15%, due 07/14/26 | |
| | Royal Bank of Canada, 1.60%, due 01/21/25 | |
| | Royal Bank of Canada, 4.95%, due 02/01/29 | |
| | Royal Bank of Canada, 5.20%, due 07/20/26 | |
| | RTX Corp., 5.00%, due 02/27/26 | |
| | RTX Corp., 5.75%, due 11/08/26 | |
| | Ryder System, Inc., 5.25%, due 06/01/28 | |
| | Ryder System, Inc., 5.38%, due 03/15/29 | |
| | S&P Global, Inc., 2.45%, due 03/01/27 | |
| | S&P Global, Inc., 2.70%, due 03/01/29 | |
| | Santander Holdings USA, Inc., 4.26% (SOFR + 1.38%), due 06/09/25(b) | |
| | Schlumberger Investment SA, 4.50%, due 05/15/28 | |
| | Sempra, 5.40%, due 08/01/26 | |
| | Sixth Street Specialty Lending, Inc., 3.88%, due 11/01/24 | |
| | Smith & Nephew Plc, 5.15%, due 03/20/27 | |
| | Solventum Corp., 5.45%, due 02/25/27 144A | |
| | Southern California Gas Co., 2.95%, due 04/15/27 | |
| | Southern Co., 5.50%, due 03/15/29 | |
See accompanying Notes to the Financial Statements.
201
Mercer Short Duration Fixed Income FundSchedule of Investments (Continued)
(showing percentage of net assets)
March 31, 2024
| | | |
| | Corporate Debt — continued |
| | Southern Co. Gas Capital Corp., 3.25%, due 06/15/26 | |
| | Spectra Energy Partners LP, 3.38%, due 10/15/26 | |
| | Sprint Capital Corp., 6.88%, due 11/15/28 | |
| | Sprint Spectrum Co. LLC/Sprint Spectrum Co. II LLC/Sprint Spectrum Co. III LLC, 5.15%, due 09/20/29 144A | |
| | State Street Corp., 5.68% (SOFR + 1.48%), due 11/21/29(b) | |
| | Stryker Corp., 3.65%, due 03/07/28 | |
| | Sumitomo Mitsui Financial Group, Inc., 2.70%, due 07/16/24 | |
| | Sumitomo Mitsui Trust Bank Ltd., 0.80%, due 09/16/24 144A | |
| | Suntory Holdings Ltd., 2.25%, due 10/16/24 144A | |
| | Take-Two Interactive Software, Inc., 3.55%, due 04/14/25 | |
| | Tampa Electric Co., 4.90%, due 03/01/29 | |
| | Targa Resources Corp., 6.15%, due 03/01/29 | |
| | Teledyne Technologies, Inc., 0.95%, due 04/01/24 | |
| | Thermo Fisher Scientific, Inc., 5.00%, due 12/05/26 | |
| | T-Mobile USA, Inc., 2.25%, due 02/15/26 | |
| | T-Mobile USA, Inc., 2.63%, due 04/15/26 | |
| | T-Mobile USA, Inc., 3.75%, due 04/15/27 | |
| | T-Mobile USA, Inc., 4.95%, due 03/15/28 | |
| | Toll Brothers Finance Corp., 4.35%, due 02/15/28 | |
| | Toronto-Dominion Bank, 0.70%, due 09/10/24 | |
| | Toronto-Dominion Bank, 1.15%, due 06/12/25 | |
| | Toronto-Dominion Bank, 1.45%, due 01/10/25 | |
| | Toronto-Dominion Bank, 3.77%, due 06/06/25 | |
| | Toronto-Dominion Bank, 4.98%, due 04/05/27 | |
| | Toronto-Dominion Bank, 5.53%, due 07/17/26 | |
| | Toyota Motor Credit Corp., 4.63%, due 01/12/28 | |
| | Toyota Motor Credit Corp., Series B, 5.00%, due 03/19/27 | |
| | Toyota Motor Credit Corp., 5.40%, due 11/20/26 | |
| | Toyota Motor Credit Corp., 5.60%, due 09/11/25 | |
| | Trans-Allegheny Interstate Line Co., 3.85%, due 06/01/25 144A | |
| | TransCanada PipeLines Ltd., 1.00%, due 10/12/24 | |
| | Triton Container International Ltd., 1.15%, due 06/07/24 144A | |
| | Truist Financial Corp., 1.27% (SOFR + 0.61%), due 03/02/27(b) | |
| | Truist Financial Corp., 1.89% (SOFR + 0.86%), due 06/07/29(b) | |
| | Truist Financial Corp., 4.26% (SOFR + 1.46%), due 07/28/26(b)(e) | |
| | Truist Financial Corp., 5.44% (SOFR + 1.62%), due 01/24/30(b) | |
| | Truist Financial Corp., 5.76% (SOFR + 0.40%), due 06/09/25(b) | |
| | Tyson Foods, Inc., 5.40%, due 03/15/29 | |
| | U.S. Airways Pass-Through Trust, 5.90%, due 04/01/26 | |
| | U.S. Bancorp, 2.22% (SOFR + 0.73%), due 01/27/28(b) | |
| | U.S. Bancorp, 5.38% (SOFR + 1.56%), due 01/23/30(b) | |
| | U.S. Bancorp, 5.78% (SOFR + 2.02%), due 06/12/29(b) | |
| | UBS Group AG, 4.49% (1 yr. CMT + 1.55%), due 05/12/26(b) 144A | |
| | UBS Group AG, 4.70% (1 yr. CMT + 2.05%), due 08/05/27(b) 144A | |
| | United Airlines Pass-Through Trust, 5.88%, due 04/15/29 | |
| | UnitedHealth Group, Inc., 2.38%, due 08/15/24 | |
| | UnitedHealth Group, Inc., 2.95%, due 10/15/27 | |
| | UnitedHealth Group, Inc., 3.38%, due 04/15/27 | |
202
See accompanying Notes to the Financial Statements.
Mercer Short Duration Fixed Income FundSchedule of Investments (Continued)
(showing percentage of net assets)
March 31, 2024
| | | |
| | Corporate Debt — continued |
| | Ventas Realty LP, 3.85%, due 04/01/27 | |
| | Veralto Corp., 5.50%, due 09/18/26 144A | |
| | Verizon Communications, Inc., 0.85%, due 11/20/25 | |
| | Verizon Communications, Inc., 2.10%, due 03/22/28 | |
| | Verizon Communications, Inc., 3.50%, due 11/01/24 | |
| | Viatris, Inc., 1.65%, due 06/22/25 | |
| | VICI Properties LP, 4.75%, due 02/15/28 | |
| | VMware LLC, 1.00%, due 08/15/24 | |
| | VMware LLC, 1.40%, due 08/15/26 | |
| | Walmart, Inc., 3.95%, due 09/09/27 | |
| | Walmart, Inc., 4.00%, due 04/15/26 | |
| | Warnermedia Holdings, Inc., 3.76%, due 03/15/27 | |
| | Waste Management, Inc., 4.88%, due 02/15/29 | |
| | WEA Finance LLC/Westfield U.K. & Europe Finance PLC, 3.75%, due 09/17/24 144A | |
| | WEC Energy Group, Inc., 4.75%, due 01/09/26 | |
| | WEC Energy Group, Inc., 5.00%, due 09/27/25 | |
| | WEC Energy Group, Inc., 5.15%, due 10/01/27 | |
| | WEC Energy Group, Inc., 5.60%, due 09/12/26 | |
| | Wells Fargo & Co., 2.16% (3 mo. USD Term SOFR + 1.01%), due 02/11/26(b) | |
| | Wells Fargo & Co., 2.88% (3 mo. USD Term SOFR + 1.43%), due 10/30/30(b) | |
| | Wells Fargo & Co., 3.53% (SOFR + 1.51%), due 03/24/28(b) | |
| | Wells Fargo & Co., 4.54% (SOFR + 1.56%), due 08/15/26(b) | |
| | Wells Fargo & Co., 5.57% (SOFR + 1.74%), due 07/25/29(b) | |
| | Westpac Banking Corp., 5.54%, due 11/17/28 | |
| | Williams Cos., Inc., 4.55%, due 06/24/24 | |
| | Workday, Inc., 3.50%, due 04/01/27 | |
| | WRKCo, Inc., 3.75%, due 03/15/25 | |
| | WW Grainger, Inc., 1.85%, due 02/15/25 | |
| | Zoetis, Inc., 5.40%, due 11/14/25 | |
| | | |
| | Mortgage Backed Securities - Private Issuers — 9.3% |
| | BX Commercial Mortgage Trust, Series 2021-ACNT, Class A, 6.29% (1 mo. USD Term SOFR + 0.96%), due 11/15/38(b) 144A | |
| | BX Commercial Mortgage Trust, Series 2021-XL2, Class A, 6.13% (1 mo. USD Term SOFR + 0.80%), due 10/15/38(b) 144A | |
| | BX Trust, Series 2021-BXMF, Class A, 6.08% (1 mo. USD Term SOFR + 0.75%), due 10/15/26(b) 144A | |
| | BX Trust, Series 2021-RISE, Class A, 6.19% (1 mo. USD Term SOFR + 0.86%), due 11/15/36(b) 144A | |
| | BX Trust, Series 2022-LBA6, Class A, 6.33% (1 mo. USD Term SOFR + 1.00%), due 01/15/39(b) 144A | |
| | BX Trust, Series 2022-VAMF, Class A, 6.18% (1 mo. USD Term SOFR + 0.85%), due 01/15/39(b) 144A | |
| | BX Trust, Series 2024-BIO, Class A, 6.97% (1 mo. USD Term SOFR + 1.64%), due 02/15/41(b) 144A | |
| | Citigroup Commercial Mortgage Trust, Series 2016-GC36, Class A4, 3.35%, due 02/10/49 | |
| | Citigroup Commercial Mortgage Trust, Series 2017-P7, Class A3, 3.44%, due 04/14/50 | |
| | COMM Mortgage Trust, Series 2015-CR26, Class A4, 3.63%, due 10/10/48 | |
See accompanying Notes to the Financial Statements.
203
Mercer Short Duration Fixed Income FundSchedule of Investments (Continued)
(showing percentage of net assets)
March 31, 2024
| | | |
| | Mortgage Backed Securities - Private Issuers — continued |
| | Extended Stay America Trust, Series 2021-ESH, Class A, 6.52% (1 mo. USD Term SOFR + 1.19%), due 07/15/38(b) 144A | |
| | Federal National Mortgage Association REMICS, Series 2006-83, Class FG, 5.93% (SOFR 30-day average + 0.61%), due 09/25/36(b) | |
| | Government National Mortgage Association REMICS, Series 2016-H07, Class FK, 6.44% (1 mo. USD Term SOFR + 1.11%), due 03/20/66(b) | |
| | Government National Mortgage Association REMICS, Series 2016-H16, Class FE, 6.11% (1 yr. USD Term SOFR + 1.10%), due 06/20/66(b) | |
| | JPMBB Commercial Mortgage Securities Trust, Series 2014-C18, Class A5, 4.08%, due 02/15/47 | |
| | JPMBB Commercial Mortgage Securities Trust, Series 2014-C25, Class A5, 3.67%, due 11/15/47 | |
| | JPMBB Commercial Mortgage Securities Trust, Series 2014-C26, Class A4, 3.49%, due 01/15/48 | |
| | JPMBB Commercial Mortgage Securities Trust, Series 2015-C28, Class A4, 3.23%, due 10/15/48 | |
| | Life Mortgage Trust, Series 2021-BMR, Class A, 6.14% (1 mo. USD Term SOFR + 0.81%), due 03/15/38(b) 144A | |
| | MHP Trust, Series 2022-MHIL, Class A, 6.14% (1 mo. USD Term SOFR + 0.81%), due 01/15/27(b) 144A | |
| | Morgan Stanley Bank of America Merrill Lynch Trust, Series 2015-C26, Class A4, 3.25%, due 10/15/48 | |
| | SMRT Commercial Mortgage Trust, Series 2022-MINI, Class A, 6.33% (1 mo. USD Term SOFR + 1.00%), due 01/15/39(b) 144A | |
| | THPT Mortgage Trust, Series 2023-THL, Class A, 6.99%, due 12/10/34(f) 144A | |
| | TTAN, Series 2021-MHC, Class A, 6.29% (1 mo. USD Term SOFR + 0.96%), due 03/15/38(b) 144A | |
| | UBS Commercial Mortgage Trust, Series 2017-C7, Class A3, 3.42%, due 12/15/50 | |
| | WFRBS Commercial Mortgage Trust, Series 2014-C21, Class A5, 3.68%, due 08/15/47 | |
| | WFRBS Commercial Mortgage Trust, Series 2014-C25, Class A5, 3.63%, due 11/15/47 | |
| | | |
| | Mortgage Backed Securities - U.S. Government Agency Obligations — 3.4% |
| | Federal Home Loan Mortgage Corp., Pool # G18575, 3.00%, due 11/01/30 | |
| | Federal Home Loan Mortgage Corp., Pool # G18622, 2.50%, due 12/01/31 | |
| | Federal Home Loan Mortgage Corp., Pool # SB0935, 3.00%, due 07/01/33 | |
| | Federal Home Loan Mortgage Corp., Pool # SB1024, 3.50%, due 02/01/34 | |
| | Federal National Mortgage Association, Pool # BM3919, 3.00%, due 02/01/33 | |
| | Federal National Mortgage Association, Pool # MA3097, 3.50%, due 08/01/27 | |
| | Federal National Mortgage Association, Pool # MA4637, 3.00%, due 06/01/32 | |
| | | |
| | U.S. Government and Agency Obligations — 20.1% |
| | U.S. Treasury Notes, 2.88%, due 04/30/25 | |
| | U.S. Treasury Notes, 3.88%, due 11/30/27 | |
| | U.S. Treasury Notes, 4.00%, due 01/15/27 | |
| | U.S. Treasury Notes, 4.13%, due 07/31/28 | |
| | U.S. Treasury Notes, 4.25%, due 12/31/25 | |
| | U.S. Treasury Notes, 4.25%, due 03/15/27 | |
| | U.S. Treasury Notes, 4.25%, due 02/28/29 | |
| | U.S. Treasury Notes, 4.38%, due 11/30/28 | |
204
See accompanying Notes to the Financial Statements.
Mercer Short Duration Fixed Income FundSchedule of Investments (Continued)
(showing percentage of net assets)
March 31, 2024
| | | |
| | U.S. Government and Agency Obligations — continued |
| | U.S. Treasury Notes, 4.50%, due 03/31/26(g) | |
| | U.S. Treasury Notes, 4.63%, due 02/28/26 | |
| | U.S. Treasury Notes, 4.63%, due 10/15/26 | |
| | | |
| | TOTAL DEBT OBLIGATIONS (COST $57,568,423) | |
| | SHORT-TERM INVESTMENT — 0.2% |
| | Mutual Fund - Securities Lending Collateral — 0.2% |
| | State Street Navigator Securities Lending Government Money Market Portfolio, | |
| | TOTAL SHORT-TERM INVESTMENT (COST $140,013) | |
| | TOTAL INVESTMENTS — 96.4%
(Cost $57,708,436) | |
| | Other Assets and Liabilities (net) — 3.6% | |
| | | |
| Notes to Schedule of Investments: |
| Unless otherwise indicated, all par values are denominated in United States dollars ($). |
| Variable or floating rate note. Rate shown is as of March 31, 2024. |
| This position represents an unsettled loan commitment at period end. Certain details associated with this purchase are not known prior to the settlement date, including coupon rate, which will be adjusted on settlement date. |
| Step coupon security that pays an initial coupon rate for the first period and then a lower/higher coupon rate for the following periods. The rate shown is the rate in effect at March 31, 2024. |
| All or a portion of this security is out on loan. |
| Variable or floating rate security, which interest rate adjusts periodically based on changes in current interest rates and prepayments on the underlying pool of assets. Rate shown is the rate in effect as of period end. |
| |
| The rate disclosed is the 7-day net yield as of March 31, 2024. |
| Represents an investment of securities lending cash collateral. |
| Securities exempt from registration under Rule 144A of the Securities Act of 1933. These securities may be resold in transactions exempt from registration, normally to qualified institutional buyers. The total market value of the securities at period end is $14,682,659 which represents 24.4% of net assets. |
Futures Contracts
| | | | Market Value/
Unrealized
Appreciation
(Depreciation) |
| | | | |
| U.S. Treasury Note 2-Year | | | |
See accompanying Notes to the Financial Statements.
205
Mercer Short Duration Fixed Income FundSchedule of Investments (Continued)
March 31, 2024
| | | | Market Value/ Unrealized Appreciation (Depreciation) |
| | | | |
| | | | |
| | | | |
| U.S. Treasury Note 5-Year | | | |
|
| | Collateralized Loan Obligation |
| | Constant Maturity Treasury Index |
| | Secured Overnight Financing Rate |
| | |
206
See accompanying Notes to the Financial Statements.
Mercer Short Duration Fixed Income FundSchedule of Investments (Continued)
March 31, 2024
Asset Class Summary (Unaudited) | |
| |
U.S. Government and Agency Obligations | |
| |
Mortgage Backed Securities - Private Issuers | |
| |
Mortgage Backed Securities - U.S. Government Agency Obligations | |
| |
| |
Other Assets and Liabilities (net) | |
| |
See accompanying Notes to the Financial Statements.
207
Mercer FundsStatements of Assets and Liabilities
March 31, 2024
| Mercer US
Small/Mid Cap
Equity Fund | Mercer Emerging
Markets Equity Fund | Mercer Global Low
Volatility Equity Fund | Mercer Non-US
Core Equity Fund |
| | | | |
Investments, at value(a)(b) | | | | |
Foreign currency, at value(c) | | | | |
Cash and cash equivalents | | | | |
Receivable for investments sold | | | | |
Receivable for Fund shares sold | | | | |
Dividend and interest receivable | | | | |
Cash collateral held at broker on open futures contracts | | | | |
Receivable for variation margin on open futures contracts | | | | |
Foreign tax reclaims receivable | | | | |
Securities lending income receivable | | | | |
| | | | |
Receivable from affiliate for advisory fee waived | | | | |
| | | | |
| | | | |
Foreign currency overdraft, at value(c) | | | | |
Payable for investments purchased | | | | |
Obligation to return securities lending collateral | | | | |
Payable for Fund shares repurchased | | | | |
Payable for foreign capital gains tax | | | | |
Payable to affiliates for: | | | | |
| | | | |
| | | | |
Administrative service fees - Class I | | | | |
Payable for variation margin on open futures contracts | | | | |
| | | | |
| | | | |
| | | | |
| | | | |
208
See accompanying Notes to the Financial Statements.
Mercer FundsStatements of Assets and Liabilities (Continued)
March 31, 2024
| Mercer US Small/Mid Cap Equity Fund | Mercer Emerging Markets Equity Fund | Mercer Global Low Volatility Equity Fund | Mercer Non-US Core Equity Fund |
| | | | |
| | | | |
Distributable earnings (Accumulated loss) | | | | |
| | | | |
Net assets attributable to: | | | | |
| | | | |
| | | | |
| | | | |
| | | | |
| | | | |
Net asset value per unit: | | | | |
| | | | |
| | | | |
| | | | |
(b) Securities loaned, at value | | | | |
(c) Foreign currency, at cost | | | | |
| The Class commenced operations on June 27, 2023. |
See accompanying Notes to the Financial Statements.
209
Mercer FundsStatements of Assets and Liabilities (Continued)
March 31, 2024
| Mercer Core
Fixed Income Fund | Mercer Opportunistic
Fixed Income Fund | Mercer Short Duration
Fixed Income Fund# |
| | | |
Investments, at value(a)(b) | | | |
Foreign currency, at value(c) | | | |
Cash and cash equivalents | | | |
Receivable for investments sold | | | |
| | | |
Receivable for Fund shares sold | | | |
Dividend and interest receivable | | | |
Cash collateral held at broker on open centrally cleared swap contracts | | | |
Cash collateral held at broker on open futures contracts | | | |
Cash collateral held at broker on open forward foreign currency contracts, open OTC options, and open OTC swaps contracts | | | |
Unrealized appreciation on open forward foreign currency contracts | | | |
Receivable for variation margin on open futures contracts | | | |
Receivable for expenses reimbursed | | | |
OTC — Swap contracts, at value (up-front net premiums paid of $—, $552,651 and $—, respectively) | | | |
Receivable for variation margin on open centrally cleared swap contracts | | | |
Foreign tax reclaims receivable | | | |
Receivable for swap contract premiums | | | |
Securities lending income receivable | | | |
| | | |
Receivable from affiliate for advisory fee waived | | | |
Unrealized gain on unfunded loan commitments | | | |
| | | |
| | | |
Payable for investments purchased | | | |
Payable for TBA and/or when-issued securities purchased | | | |
Obligation to return securities lending collateral | | | |
Payable for Fund shares repurchased | | | |
Unrealized depreciation on open forward foreign currency contracts | | | |
OTC — Swap contracts, at value (up-front net premiums received of $—, $19,195 and $—, respectively) | | | |
Payable for variation margin on open centrally cleared swap | | | |
Cash collateral due to broker on open forward foreign currency contracts, open OTC options, and open OTC swaps contracts | | | |
Payable for foreign capital gains tax | | | |
Written options, at value(d) | | | |
TBA Sale Commitments, at value(e) | | | |
Payable to affiliates for: | | | |
| | | |
| | | |
Administrative service fees - Class I | | | |
Payable for variation margin on open futures contracts | | | |
Interest payable on TBA securities | | | |
210
See accompanying Notes to the Financial Statements.
Mercer FundsStatements of Assets and Liabilities (Continued)
March 31, 2024
| Mercer Core Fixed Income Fund | Mercer Opportunistic Fixed Income Fund | Mercer Short Duration Fixed Income Fund# |
| | | |
| | | |
| | | |
| | | |
See accompanying Notes to the Financial Statements.
211
Mercer FundsStatements of Assets and Liabilities (Continued)
March 31, 2024
| Mercer Core Fixed Income Fund | Mercer Opportunistic Fixed Income Fund | Mercer Short Duration Fixed Income Fund# |
| | | |
| | | |
Distributable earnings (Accumulated loss) | | | |
| | | |
Net assets attributable to: | | | |
| | | |
| | | |
| | | |
| | | |
| | | |
Net asset value per unit: | | | |
| | | |
| | | |
| | | |
(b) Securities loaned, at value | | | |
(c) Foreign currency, at cost | | | |
(d) Premiums on written options | | | |
(e) Proceeds for TBA Sale Commitments | | | |
| The Fund commenced operations on December 1, 2023. |
| The Class commenced operations on June 27, 2023. |
212
See accompanying Notes to the Financial Statements.
Mercer FundsStatements of Operations
Year Ended March 31, 2024
| Mercer US
Small/Mid Cap
Equity Fund | Mercer Emerging
Markets Equity Fund | Mercer Global Low
Volatility Equity Fund | Mercer Non-US
Core Equity Fund |
| | | | |
| | | | |
| | | | |
| | | | |
Securities lending income | | | | |
| | | | |
| | | | |
| | | | |
| | | | |
Custodian and fund accounting fees | | | | |
| | | | |
| | | | |
| | | | |
| | | | |
| | | | |
Administration service fees: | | | | |
| | | | |
Shareholder service fees: | | | | |
| | | | |
| | | | |
| | | | |
| | | | |
| | | | |
| | | | |
Realized and Unrealized Gain (Loss): | | | | |
Net realized gain (loss) on: | | | | |
| | | | |
| | | | |
Foreign currency related transactions | | | | |
| | | | |
Change in net unrealized appreciation (depreciation) on: | | | | |
| | | | |
| | | | |
Foreign currency related transactions | | | | |
Change in net unrealized appreciation (depreciation) | | | | |
Net realized and unrealized gain (loss) | | | | |
Net increase in net assets resulting from operations | | | | |
| The Class commenced operations on June 27, 2023. |
See accompanying Notes to the Financial Statements.
213
Mercer FundsStatements of Operations (Continued)
Year Ended March 31, 2024
| Mercer Core
Fixed Income Fund | Mercer Opportunistic
Fixed Income Fund | |
| | | |
| | | |
| | | |
| | | |
Securities lending income | | | |
| | | |
| | | |
| | | |
| | | |
| | | |
Custodian and fund accounting fees | | | |
| | | |
| | | |
| | | |
| | | |
| | | |
Administration service fees: | | | |
| | | |
Shareholder service fees: | | | |
| | | |
| | | |
| | | |
| | | |
| | | |
| | | |
| | | |
| | | |
Realized and Unrealized Gain (Loss): | | | |
Net realized gain (loss) on: | | | |
| | | |
Purchased option contracts | | | |
| | | |
| | | |
| | | |
Forward foreign currency contracts | | | |
Foreign currency related transactions | | | |
| | | |
Change in net unrealized appreciation (depreciation) on: | | | |
| | | |
Purchased option contracts | | | |
Unfunded loan commitments | | | |
| | | |
| | | |
| | | |
| | | |
Forward foreign currency contracts | | | |
214
See accompanying Notes to the Financial Statements.
Mercer FundsStatements of Operations (Continued)
Year Ended March 31, 2024
| Mercer Core Fixed Income Fund | Mercer Opportunistic Fixed Income Fund | Mercer Short Duration Fixed Income Fund# |
Foreign currency related transactions | | | |
Change in net unrealized appreciation (depreciation) | | | |
Net realized and unrealized gain (loss) | | | |
Net increase in net assets resulting from operations | | | |
| The Fund commenced operations on December 1, 2023. |
| The Class commenced operations on June 27, 2023. |
See accompanying Notes to the Financial Statements.
215
Mercer FundsStatements of Changes in Net Assets
| Mercer US
Small/Mid Cap
Equity Fund | Mercer Emerging
Markets Equity Fund |
| | | | |
Increase (decrease) in Net Assets: | | | | |
| | | | |
| | | | |
| | | | |
Change in net unrealized appreciation (depreciation) | | | | |
Net increase (decrease) in net assets resulting from operations | | | | |
Distributions to shareholders (See Note 2): | | | | |
| | | | |
| | | | |
| | | | |
Net share transactions (See Note 7): | | | | |
| | | | |
| | | | |
Increase (decrease) in net assets resulting from net shares transactions | | | | |
Net increase (decrease) in net assets | | | | |
| | | | |
| | | | |
| | | | |
| The Class commenced operations on June 27, 2023. |
216
See accompanying Notes to the Financial Statements.
Mercer FundsStatements of Changes in Net Assets (Continued)
| Mercer Global Low
Volatility Equity Fund | Mercer Non-US
Core Equity Fund |
| | | | |
Increase (decrease) in Net Assets: | | | | |
| | | | |
| | | | |
| | | | |
Change in net unrealized appreciation (depreciation) | | | | |
Net increase (decrease) in net assets resulting from operations | | | | |
Distributions to shareholders (See Note 2): | | | | |
| | | | |
| | | | |
| | | | |
Net share transactions (See Note 7): | | | | |
| | | | |
| | | | |
Increase (decrease) in net assets resulting from net shares transactions | | | | |
Net increase (decrease) in net assets | | | | |
| | | | |
| | | | |
| | | | |
| The Class commenced operations on June 27, 2023. |
See accompanying Notes to the Financial Statements.
217
Mercer FundsStatements of Changes in Net Assets (Continued)
| Mercer Core
Fixed Income Fund | Mercer Opportunistic
Fixed Income Fund |
| | | | |
Increase (decrease) in Net Assets: | | | | |
| | | | |
| | | | |
| | | | |
Change in net unrealized appreciation (depreciation) | | | | |
Net increase (decrease) in net assets resulting from operations | | | | |
Distributions to shareholders (See Note 2): | | | | |
| | | | |
| | | | |
| | | | |
Net share transactions (See Note 7): | | | | |
| | | | |
| | | | |
Increase (decrease) in net assets resulting from net shares transactions | | | | |
Net increase (decrease) in net assets | | | | |
| | | | |
| | | | |
| | | | |
| The Class commenced operations on June 27, 2023. |
218
See accompanying Notes to the Financial Statements.
Mercer FundsStatements of Changes in Net Assets (Continued)
| Mercer Short Duration
Fixed Income Fund |
| |
Increase (decrease) in Net Assets: | |
| |
| |
| |
Change in net unrealized appreciation | |
Net increase in net assets resulting from operations | |
Distributions to shareholders (See Note 2): | |
| |
| |
Net share transactions (See Note 7): | |
| |
Increase in net assets resulting from net shares transactions | |
Net increase in net assets | |
| |
| |
| |
| The Fund commenced operations on December 1, 2023. |
See accompanying Notes to the Financial Statements.
219
Mercer US Small/Mid Cap Equity FundFinancial Highlights
| | | | | |
For a Class Y-3 Share Outstanding
Throughout Each Year: | | | | | |
Net asset value, beginning of year | | | | | |
| | | | | |
Net realized and unrealized gain (loss) on investments | | | | | |
Total from investment operations | | | | | |
Less dividends and distributions: | | | | | |
From net investment income | | | | | |
From net realized capital gains on investments | | | | | |
Total dividends and distributions | | | | | |
Net asset value, end of year | | | | | |
Total investment return(a) | | | | | |
Ratios/Supplemental Data: | | | | | |
Net investment income to average net assets | | | | | |
Total expenses (before reductions and reimbursements/waivers) to average daily net assets | | | | | |
Net expenses to average daily net assets(b) | | | | | |
| | | | | |
Net assets at end of year (in 000’s) | | | | | |
| The total return would have been lower had certain expenses not been reduced or reimbursed/waived during the years shown. |
| Includes the effects of management fee waivers (see Note 5 of the Notes to the Financial Statements). |
| Portfolio turnover calculation does not include $550,516,305 of securities transferred into the Fund as part of in-kind contributions. |
| Computed using average shares outstanding throughout the year. |
220
See accompanying Notes to the Financial Statements.
Mercer US Small/Mid Cap Equity FundFinancial Highlights (Continued)
| Period Ended
March 31, 2024 |
For a Class I Share Outstanding Throughout The Period: | |
Net asset value, beginning of period | |
| |
Net realized and unrealized gain (loss) on investments | |
Total from investment operations | |
Less dividends and distributions: | |
From net investment income | |
From net realized capital gains on investments | |
Total dividends and distributions | |
Net asset value, end of period | |
Total investment return(b) | |
Ratios/Supplemental Data: | |
Net investment income to average net assets | |
Total expenses (before reductions and reimbursements/waivers) to average daily net assets | |
Net expenses to average daily net assets(c) | |
| |
Net assets at end of period (in 000’s) | |
| The Class commenced operations on June 27, 2023. |
| The total return would have been lower had certain expenses not been reduced or reimbursed/waived during the period shown. |
| Includes the effects of management fee waivers (see Note 5 of the Notes to the Financial Statements). |
| Computed using average shares outstanding throughout the period. |
| |
| |
See accompanying Notes to the Financial Statements.
221
Mercer Emerging Markets Equity FundFinancial Highlights (Continued)
| | | | | |
For a Class Y-3 Share Outstanding
Throughout Each Year: | | | | | |
Net asset value, beginning of year | | | | | |
| | | | | |
Net realized and unrealized gain (loss) on investments | | | | | |
Total from investment operations | | | | | |
Less dividends and distributions: | | | | | |
From net investment income | | | | | |
From net realized capital gains on investments | | | | | |
Total dividends and distributions | | | | | |
Net asset value, end of year | | | | | |
Total investment return(a) | | | | | |
Ratios/Supplemental Data: | | | | | |
Net investment income to average net assets | | | | | |
Total expenses (before reductions and reimbursements/waivers) to average daily net assets | | | | | |
Net expenses to average daily net assets(b) | | | | | |
| | | | | |
Net assets at end of year (in 000’s) | | | | | |
| The total return would have been lower had certain expenses not been reduced or reimbursed/waived during the years shown. |
| Includes the effects of management fee waivers (see Note 5 of the Notes to the Financial Statements). |
| Portfolio turnover calculation does not include $10,686,440 of securities transferred into the Fund as part of in-kind contributions. |
| Computed using average shares outstanding throughout the year. |
222
See accompanying Notes to the Financial Statements.
Mercer Emerging Markets Equity FundFinancial Highlights (Continued)
| Period Ended
March 31, 2024 |
For a Class I Share Outstanding Throughout The Period: | |
Net asset value, beginning of period | |
| |
Net realized and unrealized gain (loss) on investments | |
Total from investment operations | |
Less dividends and distributions: | |
From net investment income | |
Total dividends and distributions | |
Net asset value, end of period | |
Total investment return(c) | |
Ratios/Supplemental Data: | |
Net investment income to average net assets | |
Total expenses (before reductions and reimbursements/waivers) to average daily net assets | |
Net expenses to average daily net assets(d) | |
| |
Net assets at end of period (in 000’s) | |
| The Class commenced operations on June 27, 2023. |
| Amount rounds to less than ($0.01) per share. |
| The total return would have been lower had certain expenses not been reduced or reimbursed/waived during the period shown. |
| Includes the effects of management fee waivers (see Note 5 of the Notes to the Financial Statements). |
| Computed using average shares outstanding throughout the period. |
| |
| |
See accompanying Notes to the Financial Statements.
223
Mercer Global Low Volatility Equity FundFinancial Highlights (Continued)
| | | | | |
For a Class Y-3 Share Outstanding
Throughout Each Year: | | | | | |
Net asset value, beginning of year | | | | | |
| | | | | |
Net realized and unrealized gain (loss) on investments | | | | | |
Total from investment operations | | | | | |
Less dividends and distributions: | | | | | |
From net investment income | | | | | |
From net realized capital gains on investments | | | | | |
Total dividends and distributions | | | | | |
Net asset value, end of year | | | | | |
Total investment return(a) | | | | | |
Ratios/Supplemental Data: | | | | | |
Net investment income to average net assets | | | | | |
Total expenses (before reductions and reimbursements/waivers) to average daily net assets | | | | | |
Net expenses to average daily net assets(b) | | | | | |
| | | | | |
Net assets at end of year (in 000’s) | | | | | |
| The total return would have been lower had certain expenses not been reduced or reimbursed/waived during the years shown. |
| Includes the effects of management fee waivers (see Note 5 of the Notes to the Financial Statements). |
| Computed using average shares outstanding throughout the year. |
224
See accompanying Notes to the Financial Statements.
Mercer Global Low Volatility Equity FundFinancial Highlights (Continued)
| Period Ended
March 31, 2024 |
For a Class I Share Outstanding Throughout The Period: | |
Net asset value, beginning of period | |
| |
Net realized and unrealized gain (loss) on investments | |
Total from investment operations | |
Less dividends and distributions: | |
From net investment income | |
From net realized capital gains on investments | |
Total dividends and distributions | |
Net asset value, end of period | |
Total investment return(b) | |
Ratios/Supplemental Data: | |
Net investment income to average net assets | |
Total expenses (before reductions and reimbursements/waivers) to average daily net assets | |
Net expenses to average daily net assets(c) | |
| |
Net assets at end of period (in 000’s) | |
| The Class commenced operations on June 27, 2023. |
| The total return would have been lower had certain expenses not been reduced or reimbursed/waived during the period shown. |
| Includes the effects of management fee waivers (see Note 5 of the Notes to the Financial Statements). |
| Computed using average shares outstanding throughout the period. |
| |
| |
See accompanying Notes to the Financial Statements.
225
Mercer Non-US Core Equity FundFinancial Highlights (Continued)
| | | | | |
For a Class Y-3 Share Outstanding
Throughout Each Year: | | | | | |
Net asset value, beginning of year | | | | | |
| | | | | |
Net realized and unrealized gain (loss) on investments | | | | | |
Total from investment operations | | | | | |
Less dividends and distributions: | | | | | |
From net investment income | | | | | |
From net realized capital gains on investments | | | | | |
Total dividends and distributions | | | | | |
Net asset value, end of year | | | | | |
Total investment return(a) | | | | | |
Ratios/Supplemental Data: | | | | | |
Net investment income to average net assets | | | | | |
Total expenses (before reductions and reimbursements/waivers) to average daily net assets | | | | | |
Net expenses to average daily net assets(b) | | | | | |
| | | | | |
Net assets at end of year (in 000’s) | | | | | |
| The total return would have been lower had certain expenses not been reduced or reimbursed/waived during the years shown. |
| Includes the effects of management fee waivers (see Note 5 of the Notes to the Financial Statements). |
| Portfolio turnover calculation does not include $395,102,338 of securities transferred into the Fund as part of in-kind contributions. |
| Computed using average shares outstanding throughout the year. |
226
See accompanying Notes to the Financial Statements.
Mercer Non-US Core Equity FundFinancial Highlights (Continued)
| | | Period Ended
March 31, 2022 |
For a Class I Share Outstanding Throughout Each Year: | | | |
Net asset value, beginning of year | | | |
| | | |
Net realized and unrealized gain (loss) on investments | | | |
Total from investment operations | | | |
Less dividends and distributions: | | | |
From net investment income | | | |
From net realized capital gains on investments | | | |
Total dividends and distributions | | | |
Net asset value, end of year | | | |
Total investment return(b) | | | |
Ratios/Supplemental Data: | | | |
Net investment income to average net assets | | | |
Total expenses (before reductions and reimbursements/waivers) to average daily net assets | | | |
Net expenses to average daily net assets(c) | | | |
| | | |
Net assets at end of year (in 000’s) | | | |
| The Class commenced operations on July 22, 2021. |
| The total return would have been lower had certain expenses not been reduced or reimbursed/waived during the years shown. |
| Includes the effects of management fee waivers (see Note 5 of the Notes to the Financial Statements). |
| Computed using average shares outstanding throughout the year. |
| |
| |
See accompanying Notes to the Financial Statements.
227
Mercer Core Fixed Income FundFinancial Highlights (Continued)
| | | | | |
For a Class Y-3 Share Outstanding
Throughout Each Year: | | | | | |
Net asset value, beginning of year | | | | | |
| | | | | |
Net realized and unrealized gain (loss) on investments | | | | | |
Total from investment operations | | | | | |
Less dividends and distributions: | | | | | |
From net investment income | | | | | |
From net realized capital gains on investments | | | | | |
Total dividends and distributions | | | | | |
Net asset value, end of year | | | | | |
Total investment return(a) | | | | | |
Ratios/Supplemental Data: | | | | | |
Net investment income to average net assets | | | | | |
Total expenses (before reductions and reimbursements/waivers) to average daily net assets | | | | | |
Net expenses to average daily net assets(b) | | | | | |
Portfolio turnover rate(c) | | | | | |
Net assets at end of year (in 000’s) | | | | | |
| The total return would have been lower had certain expenses not been reduced or reimbursed/waived during the years shown. |
| Includes the effects of management fee waivers (see Note 5 of the Notes to the Financial Statements). |
| Includes TBA transactions; excluding these transactions the portfolio turnover rate would have been 95%, 125%, 96%, 100% and 139% for the years ended March 31, 2024, March 31, 2023, March 31, 2022, March 31, 2021 and March 31, 2020, respectively. |
| Portfolio turnover calculation does not include $192,237,977 of securities transferred into the Fund as part of in-kind contributions. |
| Computed using average shares outstanding throughout the year. |
228
See accompanying Notes to the Financial Statements.
Mercer Core Fixed Income FundFinancial Highlights (Continued)
| | | Period Ended
March 31, 2022 |
For a Class I Share Outstanding Throughout Each Year: | | | |
Net asset value, beginning of year | | | |
| | | |
Net realized and unrealized gain (loss) on investments | | | |
Total from investment operations | | | |
Less dividends and distributions: | | | |
From net investment income | | | |
Total dividends and distributions | | | |
Net asset value, end of year | | | |
Total investment return(b) | | | |
Ratios/Supplemental Data: | | | |
Net investment income to average net assets | | | |
Total expenses (before reductions and reimbursements/waivers) to average daily net assets | | | |
Net expenses to average daily net assets(c) | | | |
Portfolio turnover rate(d) | | | |
Net assets at end of year (in 000’s) | | | |
| The Class commenced operations on December 27, 2021. |
| The total return would have been lower had certain expenses not been reduced or reimbursed/waived during the years shown. |
| Includes the effects of management fee waivers (see Note 5 of the Notes to the Financial Statements). |
| Includes TBA transactions; excluding these transactions the portfolio turnover rate would have been 95%, 125% and 96% for the years ended March 31, 2024, March 31, 2023 and period ended March 31, 2022, respectively. |
| Portfolio turnover calculation does not include $192,237,977 of securities transferred into the Fund as part of in-kind contributions. |
| Computed using average shares outstanding throughout the year. |
| |
| |
See accompanying Notes to the Financial Statements.
229
Mercer Opportunistic Fixed Income FundFinancial Highlights (Continued)
| | | | | |
For a Class Y-3 Share Outstanding
Throughout Each Year: | | | | | |
Net asset value, beginning of year | | | | | |
| | | | | |
Net realized and unrealized gain (loss) on investments | | | | | |
Total from investment operations | | | | | |
Less dividends and distributions: | | | | | |
From net investment income | | | | | |
From net realized capital gains on investments | | | | | |
Total dividends and distributions | | | | | |
Net asset value, end of year | | | | | |
Total investment return(a) | | | | | |
Ratios/Supplemental Data: | | | | | |
Net investment income to average net assets | | | | | |
Total expenses (before reductions and reimbursements/waivers) to average daily net assets | | | | | |
Net expenses to average daily net assets(b) | | | | | |
| | | | | |
Net assets at end of year (in 000’s) | | | | | |
| The total return would have been lower had certain expenses not been reduced or reimbursed/waived during the years shown. |
| Includes the effects of management fee waivers (see Note 5 of the Notes to the Financial Statements). |
| Portfolio turnover calculation does not include $400,305,493 of securities transferred out of the Fund as part of in-kind redemptions. |
| Includes TBA transactions; excluding these transactions the portfolio turnover rate would have remained the same for the year ended March 31, 2020. |
| Computed using average shares outstanding throughout the year. |
230
See accompanying Notes to the Financial Statements.
Mercer Opportunistic Fixed Income FundFinancial Highlights (Continued)
| Period Ended
March 31, 2024 |
For a Class I Share Outstanding Throughout The Period: | |
Net asset value, beginning of period | |
| |
Net realized and unrealized gain (loss) on investments | |
Total from investment operations | |
Less dividends and distributions: | |
From net investment income | |
Total dividends and distributions | |
Net asset value, end of period | |
Total investment return(b) | |
Ratios/Supplemental Data: | |
Net investment income to average net assets | |
Total expenses (before reductions and reimbursements/waivers) to average daily net assets | |
Net expenses to average daily net assets(c) | |
| |
Net assets at end of period (in 000’s) | |
| The Class commenced operations on June 27, 2023. |
| The total return would have been lower had certain expenses not been reduced or reimbursed/waived during the period shown. |
| Includes the effects of management fee waivers (see Note 5 of the Notes to the Financial Statements). |
| Computed using average shares outstanding throughout the period. |
| |
| |
See accompanying Notes to the Financial Statements.
231
Mercer Short Duration Fixed Income FundFinancial Highlights (Continued)
| Period Ended
March 31, 2024 |
For a Class Y-3 Share Outstanding
Throughout the Period: | |
Net asset value, beginning of period | |
| |
Net realized and unrealized gain (loss) on investments | |
Total from investment operations | |
Less dividends and distributions: | |
From net investment income | |
Total dividends and distributions | |
Net asset value, end of period | |
Total investment return(b) | |
Ratios/Supplemental Data: | |
Net investment income to average net assets | |
Total expenses (before reductions and reimbursements/waivers) to average daily net assets | |
Net expenses to average daily net assets(c) | |
| |
Net assets at end of period (in 000’s) | |
| The Fund commenced operations on December 1, 2023. |
| The total return would have been lower had certain expenses not been reduced or reimbursed/waived during the period shown. |
| Includes the effects of management fee waivers (see Note 5 of the Notes to the Financial Statements). |
| Computed using average shares outstanding throughout the period. |
| |
| |
232
See accompanying Notes to the Financial Statements.
Mercer FundsNotes to Financial Statements
March 31, 2024
Mercer Funds (the “Trust”) consists of the following seven series: Mercer US Small/Mid Cap Equity Fund (“Small/Mid Cap”), Mercer Emerging Markets Equity Fund (“Emerging Markets”), Mercer Global Low Volatility Equity Fund (“Global Low Volatility”), Mercer Non-US Core Equity Fund (“Non-US Core Equity”), Mercer Core Fixed Income Fund (“Core Fixed”), Mercer Opportunistic Fixed Income Fund (“Opportunistic Fixed”) and Mercer Short Duration Fixed Income Fund (“Short Duration Fixed”) (each a “Fund,” and collectively referred to as the “Funds”). The Trust is a Delaware statutory trust established on March 11, 2005. The Trust is registered as an investment company under the Investment Company Act of 1940, as amended (the “1940 Act”). Mercer Investments LLC (the “Adviser”), a Delaware limited liability company, serves as the investment adviser to the Funds. The Adviser manages each Fund using a “manager of managers” approach by selecting one or more sub-advisers (each a “Sub-adviser,” and collectively referred to as the “Sub-advisers”) to manage each Fund's assets. The Funds are open-end investment companies and accordingly follow the open-end investment company accounting and reporting guidance of the Financial Accounting Standards Board (FASB) Accounting Standard Codification Topic 946: Financial Services — Investment Companies.
Under the 1940 Act, each Fund is classified as diversified.
Investment Objectives:
The investment objective for Small/Mid Cap is to provide long-term total return, comprised primarily of capital appreciation. The investment objective for Core Fixed Fund and Short Duration Fixed is to provide total return, consisting of both current income and capital appreciation. The investment objective for the remaining Funds, Non-US Core Equity, Opportunistic Fixed, Emerging Markets and Global Low Volatility is to provide long-term total return, which includes capital appreciation and income.
Each Fund has registered and is authorized to offer interests in four classes of shares: Adviser Class, Class I, Class Y-2 and Class Y-3. The principal difference among the classes of shares is the level of shareholder service, marketing and administrative fees borne by the classes. As of March 31, 2024, Class Y-3 shares were outstanding in each of the Funds and Class I shares were outstanding in each of the Funds except Short Duration Fixed.
2.
Significant accounting policies
The following are significant accounting policies followed by the Funds. These policies are in conformity with accounting principles generally accepted in the United States of America (“GAAP”). The preparation of financial statements in conformity with GAAP requires management to make estimates and assumptions that affect the reported amounts and disclosures in the financial statements. Actual results could differ from these estimates.
(a) Security Valuation
Each Fund’s investments are valued as of the close of regular trading on the New York Stock Exchange (“NYSE”) on each day when the NYSE is open. Portfolio securities and exchange-traded funds listed on an exchange normally are valued at the last sale or official closing price on the day on which the securities are valued. In cases where securities are traded on more than one exchange, the securities are generally valued on the exchange considered by the Adviser or the applicable Sub-adviser as the primary market for such securities.
The Funds may invest in securities that are traded in foreign markets. Foreign securities will be converted into U.S. dollar equivalents based on the exchange rate in effect at a uniform time on each business day. Events occurring after the close of trading on foreign exchanges may result in
Mercer FundsNotes to Financial Statements (Continued)
March 31, 2024
adjustments to the valuation of foreign securities to more accurately reflect their fair value as of the close of regular trading on the NYSE. When valuing foreign equity securities that meet certain criteria that the Adviser, which has been designated as the Funds' Valuation Designee under Rule 2a-5 of the 1940 Act by the Board of Trustees of the Trust (the “Board”), has approved the use of a fair value service that values such securities to reflect market trading that occurs after the close of the applicable foreign markets of comparable securities or other instruments that have a strong correlation to the fair-valued securities. Investments in open-end investment companies are valued at their net asset value (“NAV”) per share.
Fixed income securities are valued using at a mean price upon market close by an independent pricing service. The Fund may value short-term investments that will mature within sixty (60) days or less by using pricing service quotations or at amortized cost, provided that such amortized cost approximates market value.
It should be recognized that judgment often plays a greater role in valuing thinly traded securities, as well as bonds and other securities with few dealer quotations, than is the case with respect to securities for which a broader range of dealer quotations and last-sale information is available. Each such determination is based on consideration of relevant factors, and judgment is made by or at the direction of the Valuation Designee.
Derivative financial instruments, such as futures contracts or options contracts that are traded on a national securities exchange, are stated at the last reported sale or settlement price on the day of valuation. Futures traded on inactive markets are valued using broker quotations. Over-the-counter (“OTC”) derivative financial instruments, such as foreign currency contracts, options contracts, synthetic futures, or swaps agreements, derive their value from underlying asset prices, indices, reference rates, and other inputs or a combination of these factors. These contracts are normally valued on the basis of an independent pricing service providers or broker/dealer quotations. Depending on the derivative type and the terms of the derivative, the value of the derivative financial instruments is assigned by independent pricing service providers using a series of techniques, which may include pricing models. The pricing models use inputs that are observed from actively quoted markets such as issuer details, indices, spreads, interest rates, curves, volatilities, dividends and exchange rates.
Bank loans are valued using an evaluated quote provided by an independent pricing service. Evaluated quotes provided by the pricing service may reflect appropriate factors such as ratings, yield curves, prepayment speeds, tranche type, industry, company performance, spread, individual trading characteristics, institutional size trading in similar groups of securities and other market data.
The Board has designated the Adviser as the Valuation Designee responsible for valuing portfolio securities, subject to continuing Board oversight. The Adviser has appointed a Valuation Committee that is responsible for overseeing the day-to-day process of valuing portfolio securities. With respect to portfolio securities for which market quotations are not readily available or (in the opinion of the Adviser or the applicable Sub-adviser) do not otherwise accurately reflect the fair values of the securities, the Valuation Committee will value such securities at fair value based upon procedures approved by the Board. Depending on market movements throughout the year ended March 31, 2024, substantially all foreign equity securities held by Non-US Core Equity, Emerging Markets and Global Low Volatility may be fair valued using valuations provided by an independent valuation service consistent with the valuation procedures approved by the Board.
The application of fair value pricing represents a good faith determination based on specific procedures performed under the supervision of the Board. Due to the subjective nature of fair value pricing, there can be no assurance that the Fund could realize the fair value assigned to the security if the Fund were to sell the security at approximately the time at which the Fund determines its NAV per share. The Fund’s value for a particular security may be different from the last quoted market price.
Mercer FundsNotes to Financial Statements (Continued)
March 31, 2024
The Funds follow a three-tier hierarchy to prioritize the assumptions, referred to as inputs, used in valuation techniques to measure fair value. The three-tier hierarchy of inputs is summarized in the three broad Levels listed below.
•
Level 1 — quoted prices unadjusted in active markets for identical investments
•
Level 2 — other significant observable inputs (including quoted prices for similar investments, interest rates, prepayment speeds, credit risk, etc.)
•
Level 3 — significant unobservable inputs (including the Fund’s own assumptions in determining the fair value of investments)
The inputs or methodology used for valuing securities are not necessarily an indication of the risk associated with investing in those securities.
The assets and liabilities shown in the Statements of Assets and Liabilities related to investments purchased for “to-be-announced” or “TBA” commitments or when-issued securities approximate fair value and are determined using Level 2 inputs as of March 31, 2024. The assets and liabilities shown in the Statements of Assets and Liabilities related to cash collateral held at broker for futures contracts and swap contracts are determined using Level 1 inputs as of March 31, 2024.
The following is a summary of the portfolio securities by level based on inputs used as of March 31, 2024 in valuing the assets and liabilities of the Funds for which fair valuation was used:
Small/Mid Cap
ASSETS VALUATION INPUT
| Quoted Prices
in Active
Markets for
Identical Assets
(Level 1) | Significant
Other
Observable
Inputs
(Level 2) | Significant
Unobservable
Inputs
(Level 3) | |
| | | | |
| | | | |
| | | | |
| | | | |
| | | | |
| | | | |
| | | | |
| | | | |
| | | | |
| | | | |
| | | | |
| | | | |
| | | | |
Mutual Fund - Securities Lending Collateral | | | | |
Mercer FundsNotes to Financial Statements (Continued)
March 31, 2024
| Quoted Prices in Active Markets for Identical Assets (Level 1) | Significant Other Observable Inputs (Level 2) | Significant Unobservable Inputs (Level 3) | |
| | | | |
| | | | |
| | | | |
| Represents one or more Level 3 securities at $0 value as of March 31, 2024. |
| Futures contracts are valued at unrealized appreciation/depreciation. Only current day’s variation margin, if any, is reported on the Statements of Assets and Liabilities. |
Emerging Markets
ASSETS VALUATION INPUT
| | | | |
| Quoted Prices
in Active
Markets for
Identical Assets
(Level 1) | Significant
Other
Observable
Inputs
(Level 2) | Significant
Unobservable
Inputs
(Level 3) | |
| | | | |
| | | | |
| | | | |
| | | | |
| | | | |
| | | | |
| | | | |
| | | | |
| | | | |
| | | | |
| | | | |
| | | | |
| | | | |
| | | | |
| | | | |
| | | | |
| | | | |
| | | | |
| | | | |
| | | | |
| | | | |
| | | | |
| | | | |
| | | | |
| | | | |
Mercer FundsNotes to Financial Statements (Continued)
March 31, 2024
| | | | |
| Quoted Prices in Active Markets for Identical Assets (Level 1) | Significant Other Observable Inputs (Level 2) | Significant Unobservable Inputs (Level 3) | |
| | | | |
| | | | |
| | | | |
| | | | |
| | | | |
| | | | |
| | | | |
| | | | |
| | | | |
| | | | |
| | | | |
| | | | |
Mutual Fund - Securities Lending Collateral | | | | |
| | | | |
| | | | |
| | | | |
| Represents one or more Level 2 securities at $0 value as of March 31, 2024 |
| Futures contracts are valued at unrealized appreciation/depreciation. Only current day’s variation margin, if any, is reported on the Statements of Assets and Liabilities. |
Global Low Volatility
ASSETS VALUATION INPUT
| | | | |
| Quoted Prices
in Active
Markets for
Identical Assets
(Level 1) | Significant
Other
Observable
Inputs
(Level 2) | Significant
Unobservable
Inputs
(Level 3) | |
| | | | |
| | | | |
| | | | |
| | | | |
Mutual Fund - Securities Lending Collateral | | | | |
Mercer FundsNotes to Financial Statements (Continued)
March 31, 2024
| | | | |
| Quoted Prices in Active Markets for Identical Assets (Level 1) | Significant Other Observable Inputs (Level 2) | Significant Unobservable Inputs (Level 3) | |
| | | | |
| | | | |
| | | | |
LIABILITIES VALUATION INPUT
| Quoted Prices
in Active
Markets for
Identical Assets
(Level 1) | Significant
Other
Observable
Inputs
(Level 2) | Significant
Unobservable
Inputs
(Level 3) | |
| | | | |
| | | | |
| | | | |
| Represents one or more Level 3 securities at $0 value as of March 31, 2024. |
| Futures contracts are valued at unrealized appreciation/depreciation. Only current day’s variation margin, if any, is reported on the Statements of Assets and Liabilities. |
Non-US Core Equity
ASSETS VALUATION INPUT
| | | | |
| Quoted Prices
in Active
Markets for
Identical Assets
(Level 1) | Significant
Other
Observable
Inputs
(Level 2) | Significant
Unobservable
Inputs
(Level 3) | |
| | | | |
| | | | |
| | | | |
| | | | |
| | | | |
| | | | |
| | | | |
| | | | |
| | | | |
| | | | |
| | | | |
| | | | |
Mercer FundsNotes to Financial Statements (Continued)
March 31, 2024
| | | | |
| Quoted Prices in Active Markets for Identical Assets (Level 1) | Significant Other Observable Inputs (Level 2) | Significant Unobservable Inputs (Level 3) | |
| | | | |
| | | | |
| | | | |
| | | | |
| | | | |
| | | | |
| | | | |
| | | | |
| | | | |
| | | | |
| | | | |
| | | | |
| | | | |
| | | | |
| | | | |
| | | | |
| | | | |
| | | | |
| | | | |
| | | | |
| | | | |
| | | | |
| | | | |
| | | | |
| | | | |
| | | | |
| | | | |
| | | | |
| | | | |
| | | | |
| | | | |
| | | | |
| | | | |
Mutual Fund - Securities Lending Collateral | | | | |
Mercer FundsNotes to Financial Statements (Continued)
March 31, 2024
| | | | |
| Quoted Prices in Active Markets for Identical Assets (Level 1) | Significant Other Observable Inputs (Level 2) | Significant Unobservable Inputs (Level 3) | |
| | | | |
| | | | |
| | | | |
| Futures contracts are valued at unrealized appreciation/depreciation. Only current day’s variation margin, if any, is reported on the Statements of Assets and Liabilities. |
Core Fixed
ASSETS VALUATION INPUT
| Quoted Prices
in Active
Markets for
Identical Assets
(Level 1) | Significant
Other
Observable
Inputs
(Level 2) | Significant
Unobservable
Inputs
(Level 3) | |
| | | | |
| | | | |
| | | | |
Mutual Fund - Securities Lending Collateral | | | | |
U.S. Government and Agency Obligation | | | | |
Total Short-Term Investments | | | | |
Forward Foreign Currency Contracts† | | | | |
| | | | |
| | | | |
| | | | |
Centrally Cleared Interest Rate | | | | |
| | | | |
LIABILITIES VALUATION INPUT
| Quoted Prices
in Active
Markets for
Identical Assets
(Level 1) | Significant
Other
Observable
Inputs
(Level 2) | Significant
Unobservable
Inputs
(Level 3) | |
| | | | |
Mercer FundsNotes to Financial Statements (Continued)
March 31, 2024
| Quoted Prices in Active Markets for Identical Assets (Level 1) | Significant Other Observable Inputs (Level 2) | Significant Unobservable Inputs (Level 3) | |
Forward Foreign Currency Contracts† | | | | |
| | | | |
| | | | |
| | | | |
| | | | |
| | | | |
Centrally Cleared Interest Rate | | | | |
| | | | |
| Forward foreign currency contracts, Futures contracts and Centrally Cleared Swaps are valued at unrealized appreciation/depreciation. Only current day's variation margin, if any, is reported on the Statements of Assets and Liabilities. |
Opportunistic Fixed
ASSETS VALUATION INPUT
| Quoted Prices
in Active
Markets for
Identical Assets
(Level 1) | Significant
Other
Observable
Inputs
(Level 2) | Significant
Unobservable
Inputs
(Level 3) | |
| | | | |
| | | | |
| | | | |
| | | | |
| | | | |
Mortgage Backed Securities - Private Issuers | | | | |
Mortgage Backed Securities - U.S. Government Agency Obligations | | | | |
Sovereign Debt Obligations | | | | |
U.S. Government and Agency Obligations | | | | |
| | | | |
| | | | |
| | | | |
| | | | |
| | | | |
| | | | |
Mercer FundsNotes to Financial Statements (Continued)
March 31, 2024
| Quoted Prices in Active Markets for Identical Assets (Level 1) | Significant Other Observable Inputs (Level 2) | Significant Unobservable Inputs (Level 3) | |
| | | | |
Mutual Fund - Securities Lending Collateral | | | | |
Sovereign Debt Obligations | | | | |
U.S. Government and Agency Obligations | | | | |
Total Short-Term Investments | | | | |
| | | | |
Purchased Currency Option | | | | |
Purchased Futures Options | | | | |
| | | | |
Forward Foreign Currency Contracts† | | | | |
| | | | |
| | | | |
| | | | |
| | | | |
Centrally Cleared Interest Rate | | | | |
| | | | |
Centrally Cleared Credit Default | | | | |
| | | | |
| | | | |
LIABILITIES VALUATION INPUT
| Quoted Prices
in Active
Markets for
Identical Assets
(Level 1) | Significant
Other
Observable
Inputs
(Level 2) | Significant
Unobservable
Inputs
(Level 3) | |
Forward Foreign Currency Contracts† | | | | |
| | | | |
| | | | |
| | | | |
| | | | |
| | | | |
| | | | |
Mercer FundsNotes to Financial Statements (Continued)
March 31, 2024
| Quoted Prices in Active Markets for Identical Assets (Level 1) | Significant Other Observable Inputs (Level 2) | Significant Unobservable Inputs (Level 3) | |
| | | | |
| | | | |
Centrally Cleared Interest Rate | | | | |
| | | | |
Centrally Cleared Credit Default | | | | |
| | | | |
| | | | |
| Forward foreign currency contracts, Futures contracts and Centrally Cleared Swaps are valued at unrealized appreciation/depreciation. Only current day's variation margin, if any, is reported on the Statements of Assets and Liabilities. |
Short Duration Fixed
ASSETS VALUATION INPUT
| Quoted Prices
in Active
Markets for
Identical Assets
(Level 1) | Significant
Other
Observable
Inputs
(Level 2) | Significant
Unobservable
Inputs
(Level 3) | |
| | | | |
| | | | |
Mutual Fund - Securities Lending Collateral | | | | |
Mercer FundsNotes to Financial Statements (Continued)
March 31, 2024
| Quoted Prices in Active Markets for Identical Assets (Level 1) | Significant Other Observable Inputs (Level 2) | Significant Unobservable Inputs (Level 3) | |
| | | | |
| | | | |
| | | | |
LIABILITIES VALUATION INPUT
| Quoted Prices
in Active
Markets for
Identical Assets
(Level 1) | Significant
Other
Observable
Inputs
(Level 2) | Significant
Unobservable
Inputs
(Level 3) | |
| | | | |
| | | | |
| | | | |
| | | | |
| | | | |
| Futures contracts are valued at unrealized appreciation/depreciation. Only current day’s variation margin, if any, is reported on the Statements of Assets and Liabilities. |
(b) Investments in derivative instruments
(b) 1.
Foreign currency translation
The books and records of each Fund are maintained in US dollars. Foreign currencies, investments and other assets and liabilities denominated in foreign currencies are translated into US dollars at the foreign exchange rates prevailing at the end of the period. Purchases and sales of investment securities, income and expenses are translated at exchange rates prevailing on the respective dates of such transactions. Unrealized gains and losses that result from changes in foreign currency exchange rates have been included in the unrealized gains (losses) on foreign currency translations within each Fund's Statement of Operations. Net realized foreign currency gains and losses resulting from changes in exchange rates include foreign currency gains and losses between trade date and settlement date on investment securities transactions, foreign currency transactions and the difference between the amounts of interest and dividends recorded on the books of the Fund and the amount actually received. The portion of foreign currency gains and losses related to fluctuations in exchange rates between the purchase settlement date and subsequent sale trade date is included in realized gains and losses on investment transactions.
(b) 2.
Forward foreign currency contracts
The Funds may purchase or sell currencies and/or engage in forward foreign currency transactions in order to expedite settlement of portfolio transactions and to manage currency risk.
Forward foreign currency contracts are traded in the inter-bank market conducted directly between currency traders (usually large commercial banks) and their customers. A forward contract generally has
Mercer FundsNotes to Financial Statements (Continued)
March 31, 2024
no deposit requirement and no commissions are charged at any stage for trades. The Funds will account for forward contracts by marking-to-market each day at current forward contract values. The change in market value is recorded by the Fund as an unrealized gain or loss. When the contract is closed, the Fund recognizes a realized gain or loss equal to the difference between the value of the contract at the time the contract was opened and the value at the time the contract was closed.
During the year ended March 31, 2024, Core Fixed and Opportunistic Fixed used forward foreign currency contracts for a variety of purposes, including hedging, risk management, efficient portfolio management, enhancing total returns, or as a substitute for taking a position in the underlying asset. See the Core Fixed and Opportunistic Fixed Schedules of Investments for a listing of open forward foreign currency contracts as of March 31, 2024.
A futures contract is a contractual agreement to buy or sell a specific amount of a commodity or financial instrument at a predetermined price on a stipulated future date. A Fund may enter into contracts for the purchase or sale for future delivery of securities, indices and foreign currencies. Futures contracts may be opened to protect against the adverse effects of fluctuations in security prices, interest rates, or foreign exchange rates without actually buying or selling the securities or foreign currency. A Fund also may enter into futures contracts as a low cost method for gaining or reducing exposure to a particular currency or securities market without directly investing in those currencies or securities.
A purchase of a futures contract means the acquisition of a contractual right of a Fund to obtain delivery of the securities or foreign currency underlying the contract at a specified price on a specified future date. When a futures contract is sold, the Fund incurs a contractual obligation to deliver the securities or foreign currency underlying the contract at a specified price on a specified date.
When a Fund enters into a futures contract, it must deliver to the futures commission merchant selected by the Fund an amount referred to as “initial margin.” This amount is maintained by the futures commission merchant in a segregated account at the futures commission merchant. Thereafter, a “variation margin“ may be paid by the Fund to or drawn by the Fund from such account in accordance with controls set for such accounts, depending upon changes in the price of the underlying securities, or currencies, subject to the futures contracts, and the change in value is recorded by the Fund as a variation margin payable or receivable on the Statements of Assets and Liabilities. The Fund recognizes gains and losses on futures contracts in addition to the variation margin, which gains and losses are considered realized at the time the contracts expire or close.
A Fund may enter into futures transactions on domestic exchanges and, to the extent such transactions have been approved by the Commodity Futures Trading Commission (“CFTC”) for sale to customers in the United States, on foreign exchanges. In addition, a Fund may sell stock index futures in anticipation of, or during a market decline to attempt to offset the decrease in the market value of the Fund’s common stocks that might otherwise result, and the Fund may purchase such contracts in order to offset increases in the cost of common stocks that it intends to purchase. Unlike other futures contracts, a stock index futures contract specifies that no delivery of the actual stocks making up the index will take place. Instead, settlement in cash must occur upon the termination of the contract.
In entering into futures contracts and options on futures contracts, there is a credit risk that a counterparty will not be able to meet its obligations to the Funds. The counterparty for futures contracts and options on futures contracts traded in the United States and on most foreign futures exchanges is the clearinghouse associated with such exchange. In general, clearinghouses are backed by the corporate members of the clearinghouse who are required to share any financial burden resulting from the non-performance by one of its members and, as such, should significantly reduce this credit risk. In cases where the clearinghouse is not backed by the clearing members (i.e., some foreign exchanges), it
Mercer FundsNotes to Financial Statements (Continued)
March 31, 2024
is normally backed by a consortium of banks or other financial institutions. There can be no assurance that any counterparty, clearing member or clearinghouse will be able to meet its obligations to the Funds.
While certain futures contracts provide for the delivery of securities, deliveries usually do not occur. Contracts are generally terminated by entering into offsetting transactions.
Where the futures market is not as developed or where the regulations prevent or make it disadvantageous to trade futures, Emerging Markets will utilize synthetic futures as part of the country selection strategy implementation. A synthetic future generally is an uncleared agreement resembling a total return swap transaction in which a Fund will commit to receive positive or negative returns on one or more specified equity index futures contracts in exchange for an agreed upon payment by the Fund to the counterparty. If the underlying asset declines in value over the term of the total return swap, the Fund may also be required to pay the dollar value of that decline to the counterparty. These are marked to market daily and the change in value is recorded as unrealized gain or loss in the Statements of Operations.
During the year ended March 31, 2024, Small/Mid Cap, Non-US Core Equity, Emerging Markets and Global Low Volatility used futures to equitize cash. Core Fixed, Opportunistic Fixed and Short Duration Fixed used futures to adjust interest rate exposure and replicate government bond positions. Emerging Markets and Global Low Volatility also used futures to create passive index exposure to certain emerging market country indices in the Fund. See each Fund's Schedule of Investments for a listing of open futures contracts as of March 31, 2024.
The Funds may purchase and sell (write) put and call options on debt securities, currencies and indices to enhance investment performance, manage duration, or protect against changes in market prices. The Funds may also buy and sell combinations of put and call options on the same underlying security, currency or index. Short (sold) options positions will generally be hedged by the Funds with cash, cash equivalents, current portfolio security holdings, or other options or futures positions.
The Funds may enter into swap options (“swaptions”). A swaption is a contract that gives a counterparty the right (but not the obligation), in return for payment of a premium, to enter into a new swap agreement or to shorten, extend, cancel, or otherwise modify an existing swap agreement, at some designated future time on specified terms. Each Fund may sell (write) and purchase put and call swaptions. Depending on the terms of the particular option agreement, a Fund generally will incur a greater degree of risk when the Fund writes a swaption than the Fund will incur when it purchases a swaption. When a Fund purchases a swaption, the Fund’s risk of loss is limited to the amount of the premium it has paid should it decide to let the swaption expire unexercised. However, when a Fund writes a swaption, upon exercise of the option, the Fund will become obligated according to the terms of the underlying agreement.
When a Fund writes a covered call or a put option, an amount equal to the premium received by the Fund is included in the Fund's Statements of Assets and Liabilities as a liability. The amount of the liability is subsequently marked to market to reflect the current market value of the option written. The Fund receives a premium on the sale of a call option but gives up the opportunity to profit from any increase in stock value above the exercise price of the option, and when the Fund writes a put option, it is exposed to a decline in the price of the underlying security.
Whether an option which a Fund has written expires on its stipulated expiration date or a Fund enters into a closing purchase transaction, the Fund realizes a gain (or loss, if the cost of a closing purchase transaction exceeds the premium received when the option was sold) without regard to any unrealized gain or loss on the underlying security, and the liability related to such option is extinguished. If a call
Mercer FundsNotes to Financial Statements (Continued)
March 31, 2024
option which the Fund has written is exercised, the Fund realizes a capital gain or loss from the sale of the underlying security, and the cost basis of the lots sold are decreased by the premium originally received. When a put option which a Fund has written is exercised, the amount of the premium originally received will reduce the cost of the security which a Fund purchases upon exercise of the option. Realized gains (losses) on purchased options are included in net realized gain (loss) from investments.
A Fund's use of written options involves, to varying degrees, elements of market risk in excess of the amount recognized in the Statements of Assets and Liabilities. The face or contract amounts of these instruments reflect the extent of the Fund's exposure to market risk. The risks may be caused by an imperfect correlation between movements in the price of the instrument and the price of the underlying securities, currencies and interest rates.
During the year ended March 31, 2024, Core Fixed used options to manage interest rate and volatility exposure. During the year ended March 31, 2024, Opportunistic Fixed used options for tail risk hedging (i.e., hedging strategies designed to protect against large unexpected market movements) and to manage currency, interest rate, duration and volatility exposure. See the Opportunistic Fixed Schedule of Investments for the listing of options as of March 31, 2024.
Swap contracts are derivatives in the form of a contract or similar instrument, which is an agreement to exchange the return generated by one instrument for the return generated by another instrument. A Fund may engage in swaps, including but not limited to, interest rate, currency, credit default, index, and total return swaps, and the purchase or sale of related caps, floors, collars, and other derivative instruments. A Fund expects to enter into these transactions to preserve a return or spread on a particular investment or portion of the portfolio, to modify the portfolio’s duration, to protect against any increase in the price of securities the Fund anticipates purchasing at a later date, or to gain exposure to certain markets in the most economical way possible.
Interest rate swaps involve the exchange by a Fund with another party of their respective commitments to receive or pay interest (e.g., an exchange of fixed rate payments for floating rate payments) with respect to a notional amount of principal. Up-front payments received or made are reflected as “up-front net premiums received” or “up-front net premiums paid”, respectively, on the Statements of Assets and Liabilities. Currency swaps involve the exchange of cash flows on a notional amount based on changes in the values of referenced currencies.
The credit default swaps may have as reference obligations of one or more securities that are not currently held by a Fund. The protection “buyer” in a credit default swap agreement is generally obligated to pay the protection “seller” an upfront or a periodic stream of payments over the term of the contract provided that no credit event, such as a default, on a reference obligation has occurred. If a credit event occurs, the seller generally must pay the buyer the “par value” (full notional value) of the swap in exchange for an equal face amount of deliverable obligations of the reference entity described in the swap, or the seller may be required to deliver the related net cash amount, if the swap is cash settled. A Fund may be either the buyer or seller in the transaction. If a Fund is a buyer and no credit event occurs, the Fund may recover nothing if the swap is held through its termination date. However, if a credit event occurs, the buyer generally may elect to receive the full notional value of the swap in exchange for an equal face amount of deliverable obligations of the reference entity whose value may have significantly decreased. As a seller, a Fund generally receives an upfront payment or a fixed rate of income throughout the term of the swap provided that there is no credit event. As the seller, a Fund would effectively add leverage to its portfolio because, in addition to its total net assets, a Fund would be subject to investment exposure on the notional amount of the swap.
The spread of a credit default swap is the annual amount the protection buyer must pay the protection
Mercer FundsNotes to Financial Statements (Continued)
March 31, 2024
seller over the length of the contract, expressed as a percentage of the notional amount. When spreads rise, market perceived credit risk rises and when spreads fall, market perceived credit risk falls. Wider credit spreads and decreasing market values, when compared to the notional amount of the swap, represent a deterioration of the referenced entity’s credit soundness and an increased market perception that there is a greater likelihood of risk of default or other credit event occurring as defined under the terms of the agreement. For credit default swaps on asset-backed securities and credit indices, the quoted market prices and resulting values, as well as the annual payment rates, serve as an indication of the current status of the payment/performance risk.
In a total return swap, the buyer receives a periodic return equal to the total return of a specified security, securities or index for a specified period of time. In return, the buyer pays the counterparty a fixed or variable stream of payments, typically based upon short-term interest rates, possibly plus or minus an agreed upon spread. During the term of the outstanding swap agreement, changes in the underlying value of the swap are recorded as unrealized gains and losses. Periodic payments received or made are recorded as realized gains or losses. The Fund is exposed to credit loss in the event of nonperformance by the swap counterparty. Risk may also arise from the unanticipated movements in value of exchange rates, interest rates, securities, or the index.
Swaps do not involve the delivery of securities or other underlying assets or principal, and are subject to counterparty risk. If the other party to a swap defaults and fails to consummate the transaction, a Fund’s risk of loss consists of the net amount of interest payments that the Fund is contractually entitled to receive.
The equity swaps in which a Fund may invest involve agreements with a counterparty. The return to the Fund on any equity swap contract will be the total return on the notional amount of the contract as if it were invested in the stocks comprising the contract index in exchange for an interest component based on the notional amount of the agreement. The Fund will only enter into an equity swap contract on a net basis, i.e., the two parties’ obligations are netted out, with the Fund paying or receiving, as the case may be, only the net amount of the payments. Payments under an equity swap contract may be made at the conclusion of the contract or periodically during its term.
Whether a Fund’s use of swaps or swap options will be successful in achieving the Fund’s investment objective will depend on the Sub-adviser’s ability to predict correctly whether certain types of investments are likely to produce greater returns than other investments. Moreover, a Fund bears the risk of loss of the amount expected to be received under a swap contract in the event of the default or bankruptcy of a swap counterparty. The Funds will enter into swap agreements only with counterparties that meet certain standards of creditworthiness.
If there is a default by the counterparty to an uncleared swap, a Fund will be limited to contractual remedies pursuant to the agreements related to the transaction. There is no assurance that a swap counterparty will be able to meet its obligations pursuant to a swap or that, in the event of a default, a Fund will succeed in pursuing contractual remedies. A Fund thus assumes the risk that it may be delayed in, or prevented from, obtaining payments owed to it pursuant to a swap. However, the amount at risk is, subject to some exceptions, generally only the net unrealized gain, if any, on the swap not the entire notional amount. The Sub-adviser that enters into the swap will closely monitor, subject to the oversight of the Derivatives Risk Manager for the Funds, the creditworthiness of swap counterparties in order to minimize the counterparty risk of swaps.
Because swaps are two party contracts that may be subject to contractual restrictions on transferability and termination, and they may have terms of greater than seven (7) days, swap agreements may be considered to be illiquid and subject to a Fund’s limitation on investments in illiquid securities. However, the Trust has adopted procedures pursuant to which the Adviser may determine that swaps (including swap options) are liquid under certain circumstances. To the extent that a swap is not liquid, it may not be possible to initiate a transaction or liquidate a position at an advantageous time or price,
Mercer FundsNotes to Financial Statements (Continued)
March 31, 2024
which may result in significant losses.
The Dodd-Frank Wall Street Reform and Consumer Protection Act (the “Dodd-Frank Act”) was enacted in July 2010. Among other things, the Dodd-Frank Act sets forth a regulatory framework for certain OTC derivatives, such as swaps. The Dodd-Frank Act requires certain swap transactions to be executed on registered exchanges or through swap execution facilities, cleared through a regulated clearinghouse, and publicly reported. In addition, many market participants who were not previously required to register are regulated as swap dealers or major swap participants, and are, or will be, subject to certain minimum capital and margin requirements and business conduct standards.
Certain standardized swaps, including certain U.S. dollar and non-U.S. dollar denominated interest rate and credit default index swaps, are subject to mandatory clearing, which interposes a central clearing house as the counterparty to each participant's swap, and exchange-trading. Additional swap asset classes are expected to be subject to mandatory clearing and exchange-trading in the future. The counterparty risk for cleared derivatives is generally considered to be lower than for uncleared derivatives, but cleared contracts are not risk-free. It is possible that developments in the swaps market, including potential government regulation, could adversely affect the Funds' ability to terminate existing swap agreements or to realize amounts to be received under such agreements.
Central clearing and exchange trading is required by the CFTC for many instruments traded in the swaps market. In addition, uncleared swaps that are subject to regulatory collateral requirements could adversely affect a Fund’s ability to enter into swaps in the OTC market. The establishment of a centralized exchange or market for cleared swap transactions may not result in swaps being easier to value or trade. However, swap dealers, major swap participants, and swap counterparties may experience other new and/or additional regulations, requirements, compliance burdens, and associated costs. The legislation and rules promulgated may exert a negative effect on a Fund’s ability to meet its investment objective, either through limits or requirements imposed on the Fund or its counterparties. Specifically, position limits imposed on a Fund or its counterparties may affect that Fund’s ability to invest in futures, options, and swaps in a manner consistent with the Fund’s investment objective and strategies. The requirements prescribed by the Dodd-Frank Act may increase the cost of a Fund’s investments and cost of doing business, which could adversely affect the ability of the Funds to buy or sell derivatives.
In a cleared swap transaction, the Fund typically will be required to post specified levels of margin with the clearinghouse or at the instruction of the clearinghouse; the margin required by a clearinghouse may be greater than the margin the Fund would be required to post in an uncleared derivative transaction. Cash margin is recorded on the Statements of Assets and Liabilities as cash collateral held at broker on open swap contracts. Swap agreements are marked to market daily. Daily changes in valuation of centrally cleared swaps, if any, are recorded as a variation margin payable or receivable for the change in value as appropriate on the Statements of Assets and Liabilities. Only certain derivative transactions are currently eligible for clearing by clearinghouses.
A Fund will accrue for interim payments on swap contracts on a daily basis, with the net amount recorded as interest payable or receivable on the Statements of Assets and Liabilities. Once interim payments are settled in cash, the net amount is recorded as realized gain/loss on swap contracts, in addition to realized gain/loss recorded upon the termination of swap contracts on the Statements of Operations. Fluctuations in the value of swap contracts are recorded for financial statement purposes as unrealized appreciation or depreciation of swap contracts (swap contracts, at value on the Statements of Assets and Liabilities).
Swap agreements are marked to market daily. The change in value, if any, is recorded as unrealized gain or loss in the Statements of Operations. A liquidation payment received or made at the termination of the swap is recorded as realized gain or loss in the Statements of Operations. Net periodic payments are included as part of realized gain (loss) on the Statements of Operations.
Mercer FundsNotes to Financial Statements (Continued)
March 31, 2024
The swaps in which a Fund may engage may include instruments under which one party pays a single or periodic fixed amount(s) (or premium), and the other party pays periodic amounts based on the movement of a specified index. The Fund’s maximum risk of loss from counterparty credit risk, as opposed to investment and other types of risk, in respect of swaps is typically the discounted net value of the cash flows to be received from the counterparty over the contract’s remaining life to the extent that such amount is positive, plus the cost of entering into a similar transaction with another counterparty, if possible.
The use of swaps is a highly specialized activity that involves investment techniques and risks different from those associated with ordinary portfolio securities transactions. Like most other investments, swaps are subject to the risk that the market value of the instrument will change in a way detrimental to a Fund’s interest. A Fund bears the risk that Sub-adviser will not accurately forecast future market trends or the values of assets, reference rates, indices, or other economic factors in establishing swap positions for the Fund. If a Sub-adviser attempts to use a swap as a hedge against, or as a substitute for, a portfolio investment, the Fund will be exposed to the risk that the swap will have or will develop imperfect or no correlation with the portfolio investment. This could cause substantial losses for the Fund. While hedging strategies involving swap instruments can reduce the risk of loss, they can also reduce the opportunity for gain or even result in losses by offsetting favorable price movements in other Fund's investments. If the Sub-adviser is incorrect in its forecasts of market values, interest rates, and currency exchange rates, the investment performance of the Fund would be less favorable than it would have been if this investment technique were not used.
During the year ended March 31, 2024, Core Fixed and Opportunistic Fixed used swaps to adjust interest rate and yield curve exposure or to manage interest fluctuation and credit exposure. See Core Fixed and Opportunistic Fixed Schedules of Investments for a listing of open swaps as of March 31, 2024.
(b) 6.
Derivatives risk exposures
At March 31, 2024 and during the year then ended, the Funds had the following derivatives and transactions in derivatives, grouped into appropriate risk categories:
| | | | | |
| | |
| | |
| | | | | |
Net Realized Gain (Loss)(2) | | |
| | | | | |
Change in Appreciation (Depreciation)(3) | |
| | | | | |
| | |
| | |
| | | | | |
Net Realized Gain (Loss)(2) | | |
| | | | | |
Mercer FundsNotes to Financial Statements (Continued)
March 31, 2024
| | | | | |
Change in Appreciation (Depreciation)(3) | |
| | | | | |
| | |
| | |
| | | | | |
| | |
| | | | | |
Net Realized Gain (Loss)(2) | | |
| | | | | |
Change in Appreciation (Depreciation)(3) | |
| | | | | |
| | |
| | |
| | | | | |
Net Realized Gain (Loss)(2) | | |
| | | | | |
Change in Appreciation (Depreciation)(3) | |
| | | | | |
| | |
| | |
| | | | | |
Forward Foreign Currency Contracts(4) | | | | | |
Centrally Cleared Swap Contracts(5) | | | | | |
| | | | | |
| | |
| | | | | |
Forward Foreign Currency Contracts(6) | | | | | |
Centrally Cleared Swap Contracts(5) | | | | | |
| | | | | |
Mercer FundsNotes to Financial Statements (Continued)
March 31, 2024
| | | | | |
Net Realized Gain (Loss)(2) | | |
| | | | | |
| | | | | |
| | | | | |
Forward Foreign Currency Contracts | | | | | |
Total Realized Gain (Loss) | | | | | |
Change in Appreciation (Depreciation)(3) | |
| | | | | |
| | | | | |
Forward Foreign Currency Contracts | | | | | |
Total Change in Appreciation (Depreciation) | | | | | |
| | |
| | |
| | | | | |
| | | | | |
Forward Foreign Currency Contracts(4) | | | | | |
| | | | | |
Centrally Cleared Swap Contracts(5) | | | | | |
| | | | | |
| | |
| | | | | |
| | | | | |
Forward Foreign Currency Contracts(6) | | | | | |
| | | | | |
Centrally Cleared Swap Contracts(5) | | | | | |
| | | | | |
Net Realized Gain (Loss)(2) | | |
| | | | | |
| | | | | |
| | | | | |
| | | | | |
Forward Foreign Currency Contracts | | | | | |
Total Realized Gain (Loss) | | | | | |
Mercer FundsNotes to Financial Statements (Continued)
March 31, 2024
| | | | | |
Change in Appreciation (Depreciation)(3) | |
| | | | | |
| | | | | |
| | | | | |
| | | | | |
Forward Foreign Currency Contracts | | | | | |
Total Change in Appreciation (Depreciation) | | | | | |
| | |
| | |
| | | | | |
| | |
| | | | | |
Net Realized Gain (Loss)(2) | | |
| | | | | |
Change in Appreciation (Depreciation)(3) | |
| | | | | |
| Cumulative appreciation (depreciation) on futures contracts is disclosed within the Schedule of Investments under “Futures Contracts” section. Only current day’s variation margin, if any, are reported within the Statements of Assets and Liabilities. |
| Statements of Operations location: Amounts are included in Net realized gain (loss) on Forward foreign currency contracts, Closed futures contracts, Purchased option contracts, Written option contracts and Swap contracts, if any. |
| Statements of Operations location: Amounts are included in Change in net unrealized appreciation (depreciation) on Forward foreign currency contracts, Open futures contracts, Purchased option contracts, Written option contracts and Swap contracts, if any. |
| Statements of Assets and Liabilities location: Unrealized appreciation on open forward foreign currency contracts. |
| Centrally Cleared Swaps are valued at unrealized appreciation/depreciation on the Schedule of Investments. Only current day's variation margin, if any, is reported on the Statement(s) of Assets and Liabilities. |
| Statements of Assets and Liabilities location: Unrealized depreciation on open forward foreign currency contracts. |
| Statements of Assets and Liabilities location: Investments, at value. |
| Statements of Assets and Liabilities location: Written options, at value. |
Mercer FundsNotes to Financial Statements (Continued)
March 31, 2024
For the year ended March 31, 2024, the number of contracts, notional amounts, or shares/units for each derivative |
| | | | | | Forward
Foreign
Currency
Contracts |
| | | | | | |
| | | | | | |
| | | | | | |
| | | | | | |
| | | | | | |
| | | | | | |
| | | | | | |
| Amounts disclosed represent average notional value for the months that the Funds held such derivatives during the year ended March 31, 2024. |
(b) 7.
Netting agreements and collateral requirements
In order to better define contractual rights under derivative contracts and to secure rights that will help the Funds mitigate their counterparty risk, a Sub-adviser may, on behalf of a Fund, enter into an International Swaps and Derivatives Association, Inc. Master Agreement (“ISDA Master Agreement”) or similar agreement with its derivative contract counterparties. An ISDA Master Agreement is a bilateral agreement between the Fund and a counterparty that governs OTC derivatives and foreign exchange contracts and typically contains, among other things, collateral posting terms and netting provisions in the event of a default and/or termination event. Under an ISDA Master Agreement, a Fund may, under certain circumstances, offset with the counterparty certain derivative financial instrument’s payables and/or receivables with certain collateral held and/or posted and create a net payment. The provisions of the ISDA Master Agreement typically permit a net payment in the event of default including the bankruptcy or insolvency of the counterparty. Absent an event of default by the counterparty or termination of the agreement, the ISDA Master Agreement does not result in an offset of reported amounts of assets and liabilities in the Statements of Assets and Liabilities across the transactions between the Fund and the applicable counterparty. The right to offset and net payments across all transactions traded under the ISDA Master Agreement could result in a reduction of the Fund's credit risk to such counterparty equal to any amounts payable by the Fund under the applicable transactions, if any. However, bankruptcy or insolvency laws of a particular jurisdiction may impose restrictions on or prohibitions against the right of offset in bankruptcy, insolvency or other events. In addition, certain ISDA Master Agreements allow counterparties to OTC derivatives to terminate derivative contracts prior to maturity in the event a Fund's net assets decline by a stated percentage or the Fund fails to meet the terms of their ISDA Master Agreements, which would cause the Fund to accelerate payment of any net liability owed to the counterparty.
For derivatives traded under an ISDA Master Agreement, the collateral requirements are typically calculated by netting the mark to market amount for each transaction under such agreement and comparing that amount to the value of any collateral currently pledged by the Fund and the counterparty.
Cash collateral that has been pledged to cover obligations of the Fund and cash collateral received from the counterparty, if any, is reported separately on the Statements of Assets and Liabilities as cash collateral held at broker or cash collateral due to broker, respectively. Non-cash collateral pledged by or received by a Fund, if any, is noted in the Schedule of Investments. Generally, the amount of collateral
Mercer FundsNotes to Financial Statements (Continued)
March 31, 2024
due from or to a party has to exceed a minimum transfer amount threshold before a transfer is required, which is determined each day at the close of business of the Fund, typically based on changes in market values for each transaction under an ISDA Master Agreement and netted into one amount for such agreement and any additional required collateral is delivered to/pledged by the Fund on the next business day. Typically, the Fund and counterparties are not permitted to sell, re-pledge or use the collateral they receive. To the extent amounts due to the Fund from their counterparties are not fully collateralized, contractually or otherwise, the Fund bears the risk of loss from counterparty non-performance. The Fund attempts to mitigate counterparty risk by entering into agreements only with counterparties that they believe have the financial resources to honor their obligations and by monitoring the financial stability of those counterparties.
The Funds are required to disclose both gross and net information for assets and liabilities related to derivatives, repurchase and reverse repurchase agreements, and securities lending and securities borrowings transactions that are eligible for offset or subject to an enforceable master netting or similar agreement. The Funds' derivative assets and liabilities at fair value by risk are presented in the tables above. For financial reporting purposes, the Funds do not offset derivative assets and derivative liabilities that are subject to netting arrangements in the Statements of Assets and Liabilities. Only forward foreign currency contracts, OTC swaps and OTC options assets and liabilities are subject to master netting agreements. An exception to this, Opportunistic Fixed is not a party to an ISDA master agreement with Commonwealth Bank of Australia.
The following tables present the Funds' derivative assets and liabilities by counterparty, net of amounts available for offset under a Master Netting Agreement (“MNA”) and net of related collateral received by the Funds for assets or pledged by the Funds for liabilities as of March 31, 2024.
Core Fixed
Offsetting of financial assets and derivative assets:
| Derivative
Assets Subject
to MNA | Derivative
Assets/(Liabilities)
available for
offset | Non-cash
Collateral
Received | | |
| | | | | |
| | | | | |
| | | | | |
Offsetting of financial liabilities and derivative liabilities:
| Derivative
Liabilities Subject
to MNA | Derivative
Assets/(Liabilities)
available for offset | Non-cash
Collateral
Pledged | | |
| | | | | |
| Represents the net amount receivable from the counterparty in the event of default. |
| Represents the net amount payable to the counterparty in the event of default. |
| In some instances, the actual collateral received and/or pledged may be more than the derivative asset or liability due to overcollateralization. |
Mercer FundsNotes to Financial Statements (Continued)
March 31, 2024
Opportunistic Fixed
Offsetting of financial assets and derivative assets:
| Derivative
Assets Subject
to MNA | Derivative
Assets/(Liabilities)
available for
offset | Non-cash
Collateral
Received | | |
| | | | | |
| | | | | |
| | | | | |
| | | | | |
| | | | | |
| | | | | |
Goldman Sachs International | | | | | |
| | | | | |
| | | | | |
| | | | | |
| | | | | |
Merrill Lynch International | | | | | |
| | | | | |
Morgan Stanley and Co. International PLC | | | | | |
Morgan Stanley Capital Services, Inc. | | | | | |
| | | | | |
| | | | | |
| | | | | |
| | | | | |
| | | | | |
| | | | | |
| | | | | |
Offsetting of financial liabilities and derivative liabilities:
| Derivative
Liabilities Subject
to MNA | Derivative
Assets/(Liabilities)
available for offset | Non-cash
Collateral
Pledged | | |
| | | | | |
| | | | | |
| | | | | |
| | | | | |
| | | | | |
| | | | | |
Goldman Sachs International | | | | | |
| | | | | |
| | | | | |
Mercer FundsNotes to Financial Statements (Continued)
March 31, 2024
| Derivative Liabilities Subject to MNA | Derivative Assets/(Liabilities) available for offset | Non-cash Collateral Pledged | | Net Amount of Derivative Liabilities(b) |
| | | | | |
| | | | | |
Merrill Lynch International | | | | | |
| | | | | |
Morgan Stanley and Co. International PLC | | | | | |
Morgan Stanley Capital Services, Inc. | | | | | |
| | | | | |
| | | | | |
| | | | | |
| | | | | |
| | | | | |
| | | | | |
| Represents the net amount receivable from the counterparty in the event of default. |
| Represents the net amount payable to the counterparty in the event of default. |
| In some instances, the actual collateral received and/or pledged may be more than the derivative asset or liability due to overcollateralization. |
(c) Investments in other securities
Core Fixed, Opportunistic Fixed and Short Duration Fixed may invest in bank loans, which include institutionally-traded floating rate securities generally acquired as an assignment from another holder of, or participation interest in, loans originated by a bank or financial institution (the ‘‘Lender’’) that acts as agent for all holders. The agent administers the terms of the loan, as specified in the loan agreement. The Fund may invest in multiple series or tranches of a loan, which may have varying terms and carry different associated risks. When investing in a loan participation, the Fund has the right to receive payments of principal, interest and any fees to which it is entitled only from the Lender selling the loan agreement and only upon receipt by the Lender of payments from the borrower. The Fund generally has no right to enforce compliance with the terms of the loan agreement with the borrower. As a result, the Fund may be subject to the credit risk of both the borrower and the Lender that is selling the loan agreement. At March 31, 2024, Opportunistic Fixed had the following unfunded loan commitments:
Mercer FundsNotes to Financial Statements (Continued)
March 31, 2024
The Funds may invest in indexed securities where the redemption values and/or coupons are linked to the prices of other securities, securities indices, or other financial indicators. The Funds use indexed securities to increase or decrease their exposure to different underlying instruments and to gain exposure to markets in which it may be difficult to invest through conventional securities. Indexed securities may be more volatile than their underlying instruments, but any loss is limited to the amount of the original investment.
(c) 3.
Mortgage-related and other asset-backed securities
The Funds may invest in mortgage-backed and asset-backed securities. Mortgage-backed securities represent an interest in a pool of mortgages. Asset-backed securities are structured like mortgage-backed securities, but instead of mortgage loans or interests in mortgage loans, the underlying assets may include such items as motor vehicle installment sales or installment loan contracts, leases of various types of real and personal property, and receivables from credit card agreements. The value of some mortgage or asset-backed securities may be particularly sensitive to changes in prevailing interest rates. Early repayment of principal on some mortgage-related securities may expose the Fund to a lower rate of return upon reinvestment of principal. The value of these securities may fluctuate in response to the market’s perception of the creditworthiness of the issuers. Additionally, although mortgages and mortgage-related securities are generally supported by some form of government or private guarantee and/or insurance, there is no assurance that private guarantors or insurers will meet their obligations.
One type of stripped mortgage-backed security has one class receiving all of the interest from the mortgage assets (the interest-only, or “IO” class), while the other class will receive all of the principal (the principal-only, or “PO” class). Payments received for the IOs are included in interest income on the Statements of Operations. Because principal will not be received at the maturity of an IO, adjustments are made to the cost basis of the security on a daily basis until maturity. These adjustments are included in interest income on the Statements of Operations. Payments received for POs are treated as reductions to the cost and par value of the securities. See the Schedule of Investments for mortgage-backed and asset-backed securities held by Core Fixed, Opportunistic Fixed and Short Duration Fixed as of March 31, 2024.
(c) 4.
Real estate investment trusts
The Funds may invest in real estate investment trusts (“REITs”), which pool investors’ funds for investment, primarily in income producing real estate or real estate related loans or interests. A REIT is not taxed on income distributed to its shareholders or unitholders if it complies with regulatory requirements relating to its organization, ownership, assets and income, and with a regulatory requirement to distribute to its shareholders or unitholders at least 90% of its taxable income for each taxable year.
A shareholder in a Fund, by investing in REITs through the Fund, will bear not only the shareholder’s proportionate share of the expenses of the Fund, but also, indirectly, the management expenses of the underlying REITs. REITs depend generally on their ability to generate cash flow to make distributions to shareholders or unitholders, and may be subject to defaults by borrowers and to self-liquidations. In addition, the performance of a REIT may be affected by its failure to qualify for tax-free pass-through of income, or the REIT’s failure to maintain exemption from registration under the 1940 Act. Dividends representing a return of capital are reflected as a reduction of cost and/or as a realized gain when the amount of the return of capital is conclusively determined. See each Fund’s Schedule of Investments for REIT securities held as of March 31, 2024.
Mercer FundsNotes to Financial Statements (Continued)
March 31, 2024
(c) 5.
When-issued securities/TBA securities
Purchasing securities on a “when-issued” basis is a commitment by a Fund to buy a security before the security is actually issued. A Fund may purchase securities offered on a “when-issued” or “forward delivery” basis such as TBA securities. When so offered, the price, which is generally expressed in yield terms, is fixed at the time the commitment to purchase is made, but delivery and payment for the when-issued or forward delivery securities take place at a later date. During the period between purchase and settlement, no payment is made by the purchaser to the issuer and no interest on the when-issued or forward delivery security accrues to the purchaser. While when-issued or forward delivery securities may be sold prior to the settlement date, it is intended that a Fund will purchase such securities with the purpose of actually acquiring the securities unless a sale appears desirable for investment reasons. At the time a Fund makes the commitment to purchase a security on a when-issued or forward delivery basis, the Fund will record the transaction and reflect the value of the security in determining the Fund's NAV. The market value of when-issued or forward delivery securities may be more or less than the purchase price. Certain risks may arise upon entering into when-issued or forward delivery securities transactions, including the potential inability of counterparties to meet the terms of their contracts, and the issuer’s failure to issue the securities due to political, economic, or other factors. Additionally, losses may arise due to declines in the value of the securities prior to settlement date.
A Fund may enter into TBA commitments to purchase or sell securities for a fixed price at a future date. TBA commitments are considered securities in themselves, and involve a risk of loss if the value of the security to be purchased or sold declines or increases prior to settlement date, which is in addition to the risk of decline in the value of the Portfolio’s other assets. TBA forward sale commitments are valued at the current market value of the underlying securities, according to the procedures described under “Security Valuation”. See the Schedules of Investments for TBA and when-issued securities held as of March 31, 2024.
(d) Securities transactions and related investment income
Security transactions are accounted for on trade date. Dividend income, net of applicable withholding taxes, is recorded on the ex-dividend date or when the Fund is informed of the ex-dividend date, if later. Interest income is recorded on the accrual basis, and is adjusted for amortization of premium and discounts for debt securities. Income is not recognized, nor are premium and discount amortized on securities for which collection is not expected. Withholding taxes on foreign dividends, interest, and capital gains have been provided for in accordance with the respective country's tax rules and rates. Non-cash dividends, if any, are recorded at the fair value of the securities received. Distributions received on securities that represent a return of capital or capital gains are recorded as a reduction of cost of investments and/or as a realized gain. The Funds determine the classification of distributions received as return of capital distributions or capital gain distributions. Interest income on inflation indexed securities is accrued daily based upon an inflation-adjusted principal. Additionally, any increase in the principal or face amount of these securities is recorded as interest income. In determining the net gain or loss on securities sold, the cost of securities is determined on the identified-cost basis.
(e) Cash, cash equivalents and short-term investments
A Fund may invest a portion of its assets in cash and cash equivalents. Cash and cash equivalents are defined as cash and bank balances as well as short-term investments with a maturity of less than three months from the acquisition date. The cost of cash and cash equivalents approximates fair value.
A Fund may invest a portion of its assets in short-term debt securities (including repurchase agreements and reverse repurchase agreements) of corporations, the U.S. government and its agencies and instrumentalities and banks and finance companies, which may be denominated in any currency.
Mercer FundsNotes to Financial Statements (Continued)
March 31, 2024
A Fund may invest a portion of its assets in shares issued by money market mutual funds. A Fund also may invest in collective investment vehicles that are managed by an unaffiliated investment manager, pending investment of the Fund’s assets in portfolio securities. When unusual market conditions warrant, a Fund may make substantial temporary defensive investments in cash equivalents, up to a maximum of 100% of the Fund's net assets. Cash equivalent holdings may be in any currency. When a Fund invests for temporary defensive purposes, such investments may affect the Fund’s ability to achieve its investment objective.
(f) Securities lending
A Fund may lend its portfolio securities to qualified broker/dealers and financial institutions pursuant to agreements, provided: (1) the loan is secured continuously by collateral marked to market daily and maintained in an amount at least equal to the current fair value of the securities loaned; (2) the Fund may call the loan at any time and receive the securities loaned; (3) the Fund will receive any interest or dividends paid on the loaned securities; and (4) the aggregate fair value of securities loaned will not at any time exceed 33 1/3% of the total assets of the Fund. Collateral will consist of U.S. and non-U.S. securities, cash equivalents or irrevocable letters of credit. As of period end March 31, 2024, securities on loan were collateralized by Cash and/or U.S. Government Obligations. A liability for cash collateral is reflected in the Statements of Assets and Liabilities, and is categorized as Level 2 within the fair value hierarchy. As with other extensions of credit, there are risks of delay in recovery or even loss of rights in collateral in the event of default or insolvency of a borrower of a Fund’s portfolio securities. A Fund may not retain voting rights on securities while they are on loan.
Certain Funds may from time to time participate in a securities lending program under which the Funds’ custodian, State Street Bank and Trust Company (the “Custodian”), acting as securities lending agent, is authorized to lend the Funds' portfolio securities to qualified broker/dealers and financial institutions that post appropriate collateral. The Custodian has agreed to indemnify the Funds in case of default of any security borrower.
Securities on loan are fully collateralized and the collateral was equal to or exceeded the securities on loan at March 31, 2024. If the market value of the collateral at the close of trading on a business day is less than 100% of the market value of the loaned securities at the close of trading on that day, the borrower shall be required to deliver, by the close of business on the following business day, an additional amount of collateral so that the total amount of posted collateral is equal to at least 100% of the market value of all the loaned securities as of such preceding day. Cash collateral is invested in State Street Navigator Securities Lending Government Money Market Portfolio. The Custodian receives a portion of the interest earned on any reinvested collateral. The market value of securities on loan to borrowers and the value of collateral held by the Funds with respect to such loans at March 31, 2024 were as follows:
| Market Value of
Loaned Securities | | Value of
Non-Cash Collateral |
| | | |
| | | |
| | | |
| | | |
| | | |
| | | |
| | | |
Mercer FundsNotes to Financial Statements (Continued)
March 31, 2024
For Small/Mid Cap, Emerging Markets, Global Low Volatility and Non-US Core Equity, all of the securities on loan collateralized by cash are classified as Common Stocks in each Fund’s Schedule of Investments at March 31, 2024, with a contractual maturity of overnight and continuous. For Core Fixed and Short Duration Fixed, all of the securities on loan collateralized by cash are classified as Corporate Debt in each Fund’s Schedule of Investments at March 31, 2024, with a contractual maturity of overnight and continuous.
For Opportunistic Fixed, the values of the security loan obligations are classified as follows at March 31, 2024:
Opportunistic Fixed
| Remaining Contractual Maturity of the Agreements
As of March 31, 2024 |
| | | | | |
Securities Lending Transactions | | | | | |
| | | | | |
Sovereign Debt Obligations | | | | | |
| | | | | |
Gross amount of recognized liabilities for securities lending transaction | |
(g) Taxes and distributions
The Funds intend to qualify each year as regulated investment companies under Subchapter M of the Internal Revenue Code of 1986, as amended (“the Code”). The Funds intend to distribute substantially all of their net investment income and net realized short-term and long-term gains, if any, after giving effect to any available capital loss carryovers for U.S. federal income tax purposes. Therefore, no provision for U.S. federal and state income or excise tax is necessary.
The Funds utilize the provisions of the federal income tax laws that provide for the carryforward of capital losses for prior years, offsetting such losses against any future realized capital gains. Under the Regulated Investment Company Modernization Act of 2010 (the “RIC Modernization Act”), net capital losses recognized after December 22, 2010 may be carried forward indefinitely, and their character is retained as short-term and/or long-term losses, as applicable. Prior to the enactment of the RIC Modernization Act, net capital losses were carried forward for eight years and treated as short-term losses. As a transition rule, the RIC Modernization Act requires that post-enactment net capital losses be used before pre-enactment net capital losses.
On March 31, 2024, the following Funds had deferred capital losses available to be offset against future net capital gains through the indicated expiration dates as follows:
Under current tax rules, regulated investment companies can elect to treat certain late-year ordinary
Mercer FundsNotes to Financial Statements (Continued)
March 31, 2024
losses incurred and post-October capital losses (capital losses realized after October 31) as arising on the first day of the following taxable year. As of March 31, 2024, no Funds have elected to defer current year post-October losses.
As of March 31, 2024, the cost for U.S. federal income tax purposes and gross unrealized appreciation and depreciation in value of investments and derivatives were as follows:
| | Tax Basis
Unrealized
Appreciation | Tax Basis
Unrealized
Depreciation | Net
Unrealized
Appreciation
(Depreciation) |
| | | | |
| | | | |
| | | | |
| | | | |
| | | | |
| | | | |
| | | | |
The temporary differences between book-basis and tax-basis unrealized appreciation/(depreciation) are primarily due to wash sale loss deferrals, investments in passive foreign investment companies, futures contracts mark to market and other basis adjustments. Certain capital accounts in the financial statements are periodically adjusted for permanent differences in order to reflect their tax character. These adjustments have no impact on net assets or the results of operations. These differences primarily relate to swap income, gains and losses from passive foreign investment companies and other basis adjustments during the period ended March 31, 2024.
As of March 31, 2024, the Funds had no uncertain tax positions that would require recognition, de-recognition, or disclosure. Each of the Funds' federal tax returns filed in the 3-year period ended March 31, 2024 remains subject to examination by the Internal Revenue Service.
The Funds’ policy is to declare and pay distributions from net investment income and net realized short-term and long-term gains at least annually. All distributions are paid in shares of the Funds, at NAV, unless the shareholder elects to receive cash distributions. A Fund may distribute such income dividends and capital gains more frequently, if necessary, in order to reduce or eliminate federal excise taxes on the Funds. The amount of any distribution will vary, and there is no guarantee that a Fund will pay either income dividends or capital gains distributions.
During the years ended March 31, 2024 and March 31, 2023, the tax character of distributions (including capital gain dividends, if any, designated pursuant to Section 852 of the Code) paid, were as follows:
Mercer FundsNotes to Financial Statements (Continued)
March 31, 2024
As of March 31, 2024, the components of distributable earnings on a tax basis were as follows:
| Undistributed
Ordinary
Income | Undistributed
Long-Term
Gains | Capital Losses and
Other Temporary
Differences | Unrealized
Appreciation
(Depreciation) | Total
Distributable
Earnings |
| | | | | |
| | | | | |
| | | | | |
| | | | | |
| | | | | |
| | | | | |
| | | | | |
All other differences are temporary losses related to mostly organizational costs and other timing adjustments.
(h) Allocation of expenses and income
The majority of expenses of the Trust are directly identifiable to an individual Fund. Expenses which are not readily identifiable to a specific Fund are allocated among the applicable Funds, taking into consideration, among other things, the nature and type of expense and the relative size of each applicable Fund.
(i) Redemption fees
While none of the Funds’ share classes have initial or contingent deferred sales charges on purchases of Fund shares, redemptions of Fund shares held less than thirty (30) days may be assessed a 2% short-term trading fee and recorded as paid-in capital.
The Trust has entered into a Credit Agreement on behalf of the Funds (the “Credit Agreement”) with State Street Bank and Trust Company in order to establish a committed, unsecured revolving line of credit. The current term of the line of credit under the Credit Agreement is through January 20, 2025. Borrowings for each Fund under the Credit Agreement are limited to the lesser of $50,000,000 or 33 1/3% of a Fund’s Adjusted Net Assets provided borrowings did not exceed, in the aggregate, $50,000,000. Under the terms of the Credit Agreement, the Trust pays an annual commitment fee at the rate 0.25% per year on the difference between the total line of credit and the average daily amount of borrowings outstanding. Interest is charged to the Funds based on its borrowings at a variable rate equal to 1% plus the higher of (i) the Federal Funds Rate or (ii) the Federal Reserve Bank of New York Overnight Bank Funding Rate. The Funds did not borrow under the Credit Agreement during the year ended March 31, 2024.
Mercer FundsNotes to Financial Statements (Continued)
March 31, 2024
In the normal course of business, the Funds enter into contracts that require them to provide a variety of representations or general indemnification for certain liabilities. The Funds' maximum exposure under these arrangements is unknown, as this would involve future claims that may be made against the Funds that have not yet occurred. However, the Funds have not had prior claims or losses pursuant to these contracts and expect the risk of loss to be remote.
5.
Fees and other transactions with affiliates
As of March 31, 2024, the Adviser provides investment advisory services to each Fund pursuant to an investment management agreement. Pursuant to the investment management agreement, each Fund pays the Adviser a fee for managing the Fund’s investments at an annual rate of:
| Investment Advisory Fee* on Net Assets |
| Average net assets
up to
$750 million | Average net assets
in excess of
$750 million up to
$1 billion | Average net assets
in excess of
$1 billion |
| | | |
| | | |
| | | |
| | | |
| | | |
| | | |
| | | |
* Consists of the total advisory fee payable by the Funds to the Adviser. The Adviser is responsible for paying the subadvisory fees. |
The Adviser has contractually agreed, until at least July 31, 2024, to waive any portion of its management fee that exceeds the aggregate amount of the sub-advisory fees that the Adviser is required to pay to a Fund's Sub-adviser. This contractual fee waiver agreement may only be changed or eliminated with the approval of the Fund's Board. The fees waived by the Adviser pursuant to this expense waiver agreement are not subject to reimbursement by the Fund to the Adviser. The fees waived are shown in the Advisory fee waiver line in the Statements of Operations. With respect to Short Duration Fixed, the Adviser has contractually agreed to waive fees until at least July 31, 2025.
With respect to Short Duration Fixed, the Adviser has also contractually agreed, until at least July 31, 2025, to waive fees and/or reimburse Fund expenses to the extent that annual fund operating expenses, net of the management fee waiver described in the note above, exceed 0.70% for Adviser Class shares, 0.45% for Class I shares, 0.35% for Class Y-2 shares and 0.20% for Class Y-3 shares, excluding, as applicable, acquired fund fees and expenses, interest, taxes, 12b-1 fees, non-12b-1 shareholder administrative services fees, brokerage expenses, dividend and interest expenses on securities sold short, extraordinary expenses and other expenses not incurred in the ordinary course of the Fund’s business. This contractual fee waiver and reimbursement agreement cannot be eliminated prior to July 31, 2025 without the approval of the Fund’s Board of Trustees. The fees waived by the Adviser pursuant to this agreement are not subject to reimbursement by the Fund to the Adviser. The fees waived and/or reimbursed are shown in the Expense reimbursement line in the Statements of Operations.
The Adviser provides certain internal administrative services to the Adviser Class, Class I and Class Y-2 shares of the Funds, for which the Adviser receives a fee of 0.15%, 0.15% and 0.15% of the average daily net assets of the Adviser Class, Class I and Class Y-2 shares of the Funds, respectively.
Mercer FundsNotes to Financial Statements (Continued)
March 31, 2024
These internal administrative services include attending to shareholder correspondence, assisting with the processing of purchases and redemptions of shares, preparing and disseminating information and documents for use by beneficial shareholders and monitoring, and overseeing non-advisory relationships with entities providing services to the Adviser Class, Class I and Class Y-2 shares, including the transfer agent. As of March 31, 2024, all Funds had Class I shares outstanding, except for Short Duration Fixed. As of March 31, 2024, there were no Adviser Class or Class Y-2 shares of any of the Funds outstanding and, as such, the Adviser did not receive any administrative services fees from those classes of those Funds for the period ended March 31, 2024.
The Funds have adopted a plan of marketing and service, or “12b-1 plan,” to finance the provision of certain shareholder services to the owners of Adviser Class shares of the Funds. The plan provides for payments at annual rates (based on average net assets) of up to 0.25% of each Fund’s Adviser Class shares. There were no Advisor Class shares of any of the Funds outstanding as of March 31, 2024, and as a result, no 12b-1 fees were paid by any of the Funds for the period ended March 31, 2024.
6.
Purchases and sales of securities
Cost of purchases and proceeds from sales of securities, excluding short-term investments and in-kind transactions, if any, for the year ended March 31, 2024, were as follows:
| Long-Term
U.S. Government
Securities | |
| | |
| | |
| | |
| | |
| | |
| | |
| | |
| | |
| Long-Term
U.S. Government
Securities | |
| | |
| | |
| | |
| | |
| | |
| | |
| | |
| | |
| Includes purchases of $533,123,338 and sales of $539,494,039 for TBA securities. |
Mercer FundsNotes to Financial Statements (Continued)
March 31, 2024
Each Fund is authorized to issue an unlimited number of shares of beneficial interest without par value. Transactions in Fund shares were as follows:
| | | | |
| | |
| | | | |
| | | | |
| | | | |
Shares issued to shareholders in reinvestment of distributions | | | | |
| | | | |
| | | | |
| | | | |
| | | | |
Shares issued to shareholders in reinvestment of distributions | | | | |
| | | | |
| | | | |
| | | | |
| | |
| | | | |
| | | | |
| | | | |
Shares issued to shareholders in reinvestment of distributions | | | | |
| | | | |
| | | | |
| | | | |
| | | | |
| | | | |
| | | | |
Mercer FundsNotes to Financial Statements (Continued)
March 31, 2024
| | | | |
| | |
| | | | |
| | | | |
| | | | |
Shares issued to shareholders in reinvestment of distributions | | | | |
| | | | |
| | | | |
| | | | |
| | | | |
| | | | |
| | | | |
| | | | |
| | |
| | | | |
| | | | |
| | | | |
Shares issued to shareholders in reinvestment of distributions | | | | |
| | | | |
| | | | |
| | | | |
| | | | |
Shares issued to shareholders in reinvestment of distributions | | | | |
| | | | |
| | | | |
Mercer FundsNotes to Financial Statements (Continued)
March 31, 2024
| | | | |
| | |
| | | | |
| | | | |
| | | | |
Shares issued through in-kind contributions** | | | | |
Shares issued to shareholders in reinvestment of distributions | | | | |
| | | | |
| | | | |
| | | | |
| | | | |
Shares issued to shareholders in reinvestment of distributions | | | | |
| | | | |
| | | | |
| | | | |
| | |
| | | | |
| | | | |
| | | | |
Shares issued to shareholders in reinvestment of distributions | | | | |
| | | | |
| | | | |
| | | | |
| | | | |
| | | | |
| | | | |
Mercer FundsNotes to Financial Statements (Continued)
March 31, 2024
| | |
| Period Ended
March 31, 2024 |
| | |
| | |
| | |
Shares issued to shareholders in reinvestment of distributions | | |
| | |
| | |
| The Class commenced operations on June 27, 2023. |
| On April 27, 2023, Core Fixed received securities in-kind valued at $192,237,977 from Mercer Diversified Bond Fund. This resulted in the issuance of 21,336,068 shares valued at $192,237,977. |
| The Fund commenced operations on December 1, 2023. |
8.
Recent accounting pronouncements and regulatory updates
In October 2022, the SEC adopted a final rule relating to Tailored Shareholder Reports for Mutual Funds and Exchange-Traded Funds; Fee Information in Investment Company Advertisements. The rule and form amendments require, among other things, the Funds to transmit concise and visually engaging shareholder reports that highlight key information. The amendments require that funds tag information in a structured data format and that certain more in-depth information be made available online and available for delivery free of charge to investors on request. The amendments became effective on January 24, 2023. There is an 18-month transition period after the effective date of the amendment.
In the normal course of business, the Funds invest in securities or other instruments and may enter into transactions, and such activities subject each Fund to various risks, including fluctuations in the market (market risk) or failure of an issuer to meet all of its obligations (credit risk). Investments in foreign securities involve certain risks, including foreign currency fluctuations and those related to political or economic instability.
Additional risks associated with certain of the Funds’ investments are described above within the respective security type notes. A more complete description of risks is included in the Funds' prospectus and statement of additional information.
Global Economies Risk: Economies and financial markets throughout the world are increasingly interconnected. Events or circumstances in one or more countries or regions could be highly disruptive to, and have profound impacts on, global economies or markets. As a result, whether or not the Funds invest in securities of issuers located in or with significant exposure to the countries directly affected, the value and liquidity of the Funds' investments may go down.
In recent years, the COVID-19 pandemic, the large expansion of government deficits and debt as a result of government actions to mitigate the effects of the pandemic, the Russian invasion of Ukraine and the rise of inflation have resulted in extreme volatility in the global economy and in global financial markets. These events could be prolonged and could continue to adversely affect the value and liquidity of the Funds' investments, impair the Funds' ability to satisfy redemption requests, and negatively impact the Funds' performance.
Mercer FundsNotes to Financial Statements (Continued)
March 31, 2024
Management has evaluated the impact of subsequent events through May 23, 2024, the date the financial statements were issued for possible adjustment to and/or additional disclosure in the Funds' financial statements. Management has determined that there are no material events that would require adjustment to and/or additional disclosure in the Funds' financial statements through this date.
REPORT OF INDEPENDENT REGISTERED PUBLIC ACCOUNTING FIRM
To the shareholders and the Board of Trustees of Mercer Funds
Opinion on the Financial Statements and Financial Highlights
We have audited the accompanying statements of assets and liabilities of Mercer Funds comprising the Mercer US Small/Mid Cap Equity Fund, Mercer Emerging Markets Equity Fund, Mercer Global Low Volatility Equity Fund, Mercer Non-US Core Equity Fund, Mercer Core Fixed Income Fund, Mercer Opportunistic Fixed Income Fund, and Mercer Short Duration Fixed Income Fund (the “Funds”), including the schedules of investments as of March 31, 2024, the related statements of operations for the year then ended, the statements of changes in net assets for each of the two years in the period then ended, and the financial highlights for each of the five years in the period then ended for the Funds, except Mercer Short Duration Fixed Income Fund; the related statements of operations, changes in net assets, and financial highlights for the period from December 1, 2023 (commencement of operations) through March 31, 2024, for Mercer Short Duration Fixed Income Fund; and the related notes.
In our opinion, the financial statements and financial highlights present fairly, in all material respects, the financial position of the Funds, except Mercer Short Duration Fixed Income Fund, as of March 31, 2024, and the results of their operations for the year then ended, the changes in their net assets for each of the two years in the period then ended, and the financial highlights for each of the five years in the period then ended in conformity with accounting principles generally accepted in the United States of America. Also, in our opinion, the financial statements and financial highlights present fairly, in all material respects, the financial position of Mercer Short Duration Fixed Income Fund as of March 31, 2024, and the results of its operations, changes in its net assets, and the financial highlights for the period from December 1, 2023 (commencement of operations) through March 31, 2024 in conformity with accounting principles generally accepted in the United States of America.
Basis for Opinion
These financial statements and financial highlights are the responsibility of the Funds’ management. Our responsibility is to express an opinion on the Funds’ financial statements and financial highlights based on our audits. We are a public accounting firm registered with the Public Company Accounting Oversight Board (United States) (PCAOB) and are required to be independent with respect to the Funds in accordance with the U.S. federal securities laws and the applicable rules and regulations of the Securities and Exchange Commission and the PCAOB.
We conducted our audits in accordance with the standards of the PCAOB. Those standards require that we plan and perform the audit to obtain reasonable assurance about whether the financial statements and financial highlights are free of material misstatement, whether due to error or fraud. The Funds are not required to have, nor were we engaged to perform, an audit of their internal control over financial reporting. As part of our audits we are required to obtain an understanding of internal control over financial reporting but not for the purpose of expressing an opinion on the effectiveness of the Funds’ internal control over financial reporting. Accordingly, we express no such opinion.
Our audits included performing procedures to assess the risks of material misstatement of the financial statements and financial highlights, whether due to error or fraud, and performing procedures that respond to those risks. Such procedures included examining, on a test basis, evidence regarding the amounts and disclosures in the financial statements and financial highlights. Our audits also included evaluating the accounting principles used and significant estimates made by management, as well as evaluating the overall presentation of the financial statements and financial highlights. Our procedures included confirmation of securities owned as of March 31, 2024, by correspondence with the custodian, brokers and agent banks; when replies were not received from brokers or agent banks, we performed other auditing procedures. We believe that our audits provide a reasonable basis for our opinion.
/s/ Deloitte & Touche LLP
Boston, Massachusetts
May 23, 2024
We have served as the auditor of one or more Mercer investment companies since 2006.
Mercer FundsAdditional Information (Unaudited)
Proxy Voting
A description of the policies and procedures that the Adviser and each Fund’s Sub-advisers use to determine how to vote proxies relating to the Fund’s portfolio securities can be found in the Funds Statement of Additional Information (“SAI”) (Appendix B), and is available, (i) without charge, upon request, by calling 1-888-887-0619, (ii) on the Securities and Exchange Commission’s (“SEC”) website at http://www.sec.gov, and (iii) online on the Funds’ website at http://www.mercer.us/mutual-funds-on-offer. Information about the Funds’ proxy voting decisions are available online at https://viewpoint.glasslewis.com/WD/?siteId=MercerFundsProxy and http://www.sec.gov.
Quarterly Reporting
The Funds file their complete schedule of portfolio holdings with the SEC for the first and third quarters of each fiscal year on Form N-PORT, which when filed, will be available on the SEC’s website at http://www.sec.gov. When filed, the Funds’ Form N-PORT may be reviewed and copied at the SEC’s Public Reference Room in Washington, D.C. Information on the operation of the Public Reference Room may be obtained by calling 1-800-SEC-0330.
Federal Tax Information
The amount of long-term capital gains paid for the fiscal year ended March 31, 2024, were as follows:
For the year ended March 31, 2024, Emerging Markets and Non-US Core Equity had foreign tax credits in the amount of $8,788,313 and $11,549,351, respectively, and foreign source income of $43,456,395 and $129,742,252, respectively.
Qualified dividend income received by the Funds through March 31, 2024, that qualified for a reduced tax rate pursuant to the Code Section 1(h)(11) are as follows:
Mercer FundsAdditional Information (Unaudited) (Continued)
For corporate shareholders, a portion of the ordinary dividends paid during the Funds’ year ended March 31, 2024 qualified for the dividends received deduction, as follows:
Mercer FundsAdditional Information (Unaudited) (Continued)
Board Approval of an Investment Management Agreement and Subadvisory Agreements for the Period October 1, 2023 through March 31, 2024
Mercer Short Duration Fixed Income Fund
At a meeting of the Board held on October 4-5, 2023 (the “October Meeting”), the Board, including the trustees that are not considered “interested persons” (as defined in the 1940 Act) of the Trust (“Independent Trustees”), considered and approved a proposed investment management agreement between the Trust, on behalf of the Mercer Short Duration Fixed Income Fund (the “Fund”), and the Adviser (the “Investment Management Agreement”). In addition, the Board, including the Independent Trustees, considered and approved proposed subadvisory agreements between the Adviser and Aristotle Pacific Capital, LLC (“Aristotle”), Merganser Capital Management, LLC (“Merganser”), and Voya Investment Management Co. LLC (“Voya”), on behalf of the Fund (each, a “Subadvisory Agreement” and together, the “Subadvisory Agreements.”) The Adviser recommended the approval of the Investment Management Agreement and the Subadvisory Agreements in connection with the launch of the Fund, a new series of the Trust, effective as of October 31, 2023.
Approval of the Investment Management Agreement for the Fund
At the October Meeting, the Board, including the Independent Trustees, considered and approved the Investment Management Agreement between the Trust, on behalf of the Fund, and the Adviser.
In considering the approval of the Investment Management Agreement with respect to the Adviser’s management of the assets of the Fund, the Independent Trustees reviewed the information and materials furnished by the Adviser that were prepared for the special meeting of the Board held on August 14, 2023, and the October Meeting (together, the “Meetings”), which included:
(i) information describing the nature, extent, and quality of the services that the Adviser is expected to provide to the Fund; the fees that the Adviser proposed to charge to the Fund for these services; and a comparison of those fees to the fees paid by a peer group of funds (“expense group”) determined by Broadridge, an independent, nationally recognized provider of investment company data, to be generally comparable to the Fund and as contained in the report prepared by Broadridge (the “Broadridge Report”);
(ii) the Fund’s management fee waiver agreement (the “Fee Waiver Agreement”), which requires the Adviser to waive any portion of the management fee it is entitled to under the Investment Management Agreement that exceeds the aggregate amount of the subadvisory fees that the Adviser is required to pay to the Fund’s subadvisers (the “Subadvisers”) for the management of their allocated portions of the Fund’s assets;
(iii) the supplemental expense limitation agreement for the Fund to waive fees and/or reimburse Fund expenses to the extent that annual fund operating expenses (i.e., net expenses after operation of the Fee Waiver Agreement) exceed certain levels for each share class, with certain exceptions (together with the Fee Waiver Agreement, the “Fee Waiver Arrangements”); and
(iv) information comparing the Fund’s expected operating expenses to those of the expense group.
The Independent Trustees also considered presentations made by, and discussions held with, representatives of the Adviser at the Meetings. The Independent Trustees noted the Adviser’s statement that there were no material changes or updates to the information provided by the Adviser in connection with the Investment Management Agreement renewal process under Section 15(c) of the 1940 Act, which was addressed at the June 12-13, 2023 meeting of the Board, except for organizational matters involving an addition to the Adviser’s investment team.
During their review of this information, the Independent Trustees considered the factors that they deemed relevant with respect to the Adviser, including: the nature, extent, and quality of the services that were proposed to be provided by the Adviser to the Fund; the Adviser’s investment management personnel and operations; the Fund’s expected expense levels, including the effect of the Fee Waiver Arrangements on Fund expenses; the fact that the Adviser would not realize a direct profit from the investment advisory services it would provide to the
Mercer FundsAdditional Information (Unaudited) (Continued)
Fund under the Investment Management Agreement as a result of the Fee Waiver Agreement; and any ancillary benefits to the Adviser and its affiliates of the Adviser’s relationship with the Fund. The Independent Trustees also considered the nature, extent, and quality of the non-advisory services that the Adviser and its affiliates would provide to the Fund. Additionally, the Independent Trustees received assistance from, and met separately with, their independent legal counsel and were provided with a written description of their statutory responsibilities and the legal standards that are applicable to approvals of advisory agreements.
In their consideration of the approval of the Investment Management Agreement, the Independent Trustees considered the following factors:
(a) The nature, extent, and quality of the services to be provided by the Adviser. The Independent Trustees reviewed the services to be provided by the Adviser to the Fund. In connection with the investment advisory services to be provided to the Fund, the Independent Trustees considered the qualifications, experience, and capabilities of the Adviser’s portfolio management and leadership team and other investment personnel, and the extent of care and conscientiousness with which Adviser personnel performed their duties with respect to the other series of the Trust.
In this regard, the Independent Trustees considered that, while the Adviser would focus primarily on the selection, evaluation, and oversight of the Fund’s Subadvisers, consistent with the Trust’s multi-manager structure, the Adviser would have various other responsibilities as the Fund’s investment adviser, including: the provision of investment advice; the allocation of the Fund’s assets among multiple Subadvisers, and the fee negotiation process whereby the Adviser would seek to achieve an appropriate and competitive level of fees and fee structure, and the Adviser’s continual monitoring of the ongoing appropriateness and competitiveness of each subadvisory fee and fee structure; the monitoring of each Subadviser’s investment performance and processes; the monitoring of each Subadviser’s compliance with the Fund’s investment objective, policies, and limitations, including portfolio investment guidelines; the review of each Subadviser’s portfolio security brokerage and trading practices, as well as the use of derivatives or other complex financial instruments; the implementation of certain risk management programs; and oversight of general Fund compliance with relevant law.
In considering the services to be provided by the Adviser in connection with the review, selection, evaluation and monitoring of Subadvisers for the Fund, the Independent Trustees noted the fact that the Adviser has access to, through its other business divisions, significant manager research and related services that an investment adviser to a fund complex of similar size as the Fund might not otherwise be able to provide.
The Independent Trustees also considered the nature, extent, and quality of the non-investment advisory and administrative services to be provided to the Fund by the Adviser, such as supervision of the Fund’s third-party service providers and certain shareholder administrative services for Class I shares of the Fund (as applicable). The Independent Trustees considered the Adviser’s capabilities in providing the administrative, legal and compliance services needed to support management of the Fund, and also considered the scope and substance of the Adviser’s regulatory and compliance policies, procedures, and systems.
Based on their consideration and review of the foregoing, the Independent Trustees determined that the Fund will benefit from the nature, extent, and quality of these services, and concluded that such services supported the approval of the Investment Management Agreement with the Adviser.
(b) The costs of the services to be provided and the profits to be realized by the Adviser and its affiliates from the Adviser’s relationship with the Fund. The Independent Trustees compared the Fund’s contractual and actual management fee and total expense ratio (i.e., net expense ratio after the Fee Waiver Arrangements and including Rule 12b-1/non-12b-1 fees) to the Fund’s respective expense group as identified by Broadridge in the Broadridge Report. The Independent Trustees noted that the contractual management fee for each class of the Fund fell within the second quintile (with the first quintile having the lowest expenses) of the Fund’s expense group. The Independent Trustees considered that the actual management for each class of the Fund (i.e., after the Fee Waiver Arrangements) fell within the first quintile, except for Class Y-2 shares of the Fund, which fell
Mercer FundsAdditional Information (Unaudited) (Continued)
within the second quintile. With respect to total expense ratios, the Independent Trustees noted that Class Y-3 and Class Y-2 shares of the Fund fell within the 1st quintile, while Class I shares fell within the second quintile and Adviser Class shares fell within the fourth quintile. The Independent Trustees considered that the Fund information was provided on a pro forma basis.
The Independent Trustees also considered the Fee Waiver Arrangements and their effect on the Adviser’s actual management fee and the Fund’s total expense ratio and further considered that the Adviser had agreed to the Fee Waiver Arrangements through at least July 31, 2025. It was noted that the Adviser does not manage other funds, including registered investment companies, or other client accounts that are comparable to the Fund and, therefore, the Adviser could not provide relevant information regarding the Adviser’s fees for servicing such funds or accounts.
Regarding the level of profitability being realized by the Adviser in connection with its management of the Fund, the Independent Trustees took note of the Adviser’s explanation that it would not realize a direct profit from the investment advisory services it would provide to the Fund as a result of the Fee Waiver Agreement.
Based on their consideration and review of the foregoing, the Independent Trustees concluded that, in light of the nature, extent and quality of the advisory services to be provided by the Adviser to the Fund, the information provided regarding the fees paid to, and the costs to be incurred by, the Adviser supported the approval of the Investment Management Agreement.
(c) Ancillary benefits that may accrue to the Adviser or its affiliates. The Independent Trustees also considered the other relationships that the Adviser and its affiliates have with the Trust, and any ancillary or “fall-out” benefits realized by the Adviser and its affiliates from its relationship with the Trust. The Independent Trustees took into consideration the Adviser’s previous discussions of the ancillary benefits that the firm (along with its affiliates) may realize by managing each series of the Trust, to the extent that potential investors view the Adviser and its affiliates as providing a diverse array of investment products, and managing different asset classes, which were available through multiple investment vehicles, as well as the benefits to the Adviser stemming from its ability to negotiate global fee arrangements from time to time with certain of the Subadvisers that manage (or an affiliate manages) assets for series of the Trust along with assets for other accounts of the Adviser or its affiliates.
The Independent Trustees also noted that the Adviser will provide or procure, as applicable, certain non-distribution related shareholder administrative services pursuant to a shareholder administrative services plan for the Adviser Class, Class I, and Class Y-2 shares of the Fund (the “Shareholder Services Plan”), and a shareholder administrative services agreement with the Adviser for such classes (the “Administrative Services Agreement”), and that the Adviser would be entitled to receive compensation from the Fund for acting in that capacity to the extent classes of such shares are issued.
The Independent Trustees noted the shareholder administrative servicing fees to be paid to the Adviser with respect to Class I shares under the Administrative Services Agreement and considered that such compensation would be accrued from the fees paid by the Funds under the Shareholder Services Plan. The Independent Trustees also considered the services to be provided or procured by the Adviser to the Fund under the Administrative Services Agreement, including but not limited to, attending to shareholder or shareholder-related correspondence and inquiries, assisting with exchanges and the processing of purchases and redemptions of shares, maintaining account records, processing dividend payments, preparing and distributing documents for shareholder use, and/or providing certain monitoring and oversight services.
Based on their consideration and review of the foregoing, the Independent Trustees concluded that these potential benefits that would accrue to the Adviser and its affiliates by virtue of their relationships with the Fund appeared to be reasonable.
(d) The extent to which economies of scale will be realized as the Fund grows and whether fee levels reflected these economies of scale for the benefit of Fund shareholders. The Independent Trustees took into
Mercer FundsAdditional Information (Unaudited) (Continued)
consideration the fact that the advisory fee schedule for the Fund includes breakpoints at the levels of $750 million in assets and at $1 billion in assets. The Independent Trustees noted that, as a result of the Fee Waiver Agreement, any decreases in the advisory fee for the Fund under the Investment Management Agreement resulting from the Fund passing certain asset level thresholds would not result in a decrease in the fee paid by that Fund under the current Fee Waiver Agreement, which requires that the Adviser waive any portion of its management fee that exceeds the aggregate fees paid to a Fund’s Subadvisers.
(e) The investment performance of the Funds and the Adviser. The Independent Trustees recognized that the Fund was a new fund with no performance history and, therefore, the Independent Trustees could not consider the Adviser’s investment performance in managing the Fund as a factor in evaluating the Investment Management Agreement. The Independent Trustees considered the unique investment management considerations that the Fund’s multi-manager structure requires and its experience in that regard.
In light of the foregoing considerations, the Independent Trustees concluded that the Adviser’s experience in managing the other series of the Trust indicated that the Adviser’s management of the Fund will benefit the Fund and its shareholders.
Conclusion. Following consideration of the foregoing factors, it was reported that no single factor was determinative to the decisions of the Independent Trustees. Based on these factors, and such other matters as were deemed relevant, the Independent Trustees concluded that the approval of the Investment Management Agreement as it relates to the Fund was in the best interests of the Fund and its shareholders, and the Board, including a majority of the Independent Trustees, approved the Investment Management Agreement.
Approval of the Subadvisory Agreements for the Fund
At the October Meeting, the Board, including the Independent Trustees, also recommended the appointment of Aristotle, Merganser, and Voya (each a “Subadviser” and together, the “Subadvisers”) to serve as subadvisers to the Fund. In considering the approval of each of the subadvisory agreements with Aristotle, Merganser, and Voya, (each, a “Subadvisory Agreement” and together, the “Subadvisory Agreements”), the Independent Trustees considered the information and materials furnished by the Adviser. In addition, the Independent Trustees considered presentations made by, and discussions held with, representatives of the Adviser and representatives of each Subadviser at the Meetings. In connection with their review of this information, the Independent Trustees considered the Subadvisers’ answers and responses to the questions and information requests contained in a 15(c) subadviser questionnaire submitted to the Subadvisers.
During their review of this information, the Independent Trustees considered the factors they deemed relevant with respect to each Subadviser, including, but not limited to: the nature, extent, and quality of the services that were to be provided to the Fund by the Subadviser and each Subadviser’s historical performance record managing the investment mandate it would employ for the Fund. The Independent Trustees also took into consideration the nature and extent of the oversight duties to be performed by the Adviser in connection with each of the Subadvisers, which includes extensive investment management and compliance due diligence with respect to the management and operations of each of the Subadvisers. Additionally, the Independent Trustees received assistance from, and met separately with, their independent legal counsel and were provided with a written description of their statutory responsibilities and the legal standards that are applicable to the approvals of advisory agreements.
In consideration of the approval of the Subadvisory Agreements, the Independent Trustees considered the following factors:
(a) The nature, extent, and quality of the advisory services to be provided by the Subadvisers. The Independent Trustees reviewed the nature, extent, and quality of the advisory services that each Subadviser would provide to the Fund. The Independent Trustees considered the specific investment management process that would be employed by each Subadviser to manage the assets that would be allocated to the Subadviser (which had been discussed with each Subadviser and described in detail in the materials provided by the
Mercer FundsAdditional Information (Unaudited) (Continued)
Adviser and the Subadvisers); the qualifications, experience, and capabilities of the Subadviser; certain financial considerations relating to the Subadviser; information regarding legal, regulatory and compliance matters with respect to the Subadviser; and information provided regarding the Subadviser’s brokerage practices.
The Independent Trustees also considered the Adviser’s review, selection, and due diligence process employed by the Adviser in deciding to recommend each Subadviser as a Subadviser to the Fund; the Adviser’s assessment and conclusion as to the nature, extent, and quality of the subadvisory services that were to be provided by the Subadviser and the Adviser’s recommendation that each Subadvisory Agreement be approved. The Independent Trustees determined that the Fund would benefit from the quality and experience of the each Subadviser’s portfolio managers.
Based on their consideration and review of the foregoing, the Independent Trustees determined that the Fund would benefit from the nature, extent, and quality of the subadvisory services that were to be provided by each Subadviser, and would benefit from each Subadviser’s ability to provide these services, and concluded that such services supported the approval of each Subadvisory Agreement.
(b) The costs of the services to be provided and the profits to be realized by each Subadviser and its affiliates from the Subadviser’s relationship with the Fund. The Independent Trustees took account of the Adviser’s assessment and conclusion that the compensation payable to each Subadviser for its services to the Fund, including the fee structure, was competitive, fair and reasonable in light of the nature, extent and quality of the services to be furnished to the Fund, and the Adviser’s recommendation at the October Meeting that the Subadvisory Agreements be approved, including in light of the fact that the Subadvisers’ fees would be indirectly borne by the Fund and its shareholders.
The Independent Trustees considered the expected impact of the subadvisory fees on the Fund’s overall operating expenses, given the Fee Waiver Arrangements. In addition, since the fees paid by the Adviser to each Subadviser were the result of arm’s-length bargaining between unaffiliated parties, the relevance of each Subadviser’s profitability was considered by the Independent Trustees in that context. The Independent Trustees also considered the information provided with respect to each Subadviser regarding the fees charged to other comparable clients of the Subadviser (as applicable).
Based on their consideration and review of the foregoing, the Independent Trustees concluded that, in light of the nature, extent and quality of the subadvisory services to be provided by each Subadviser, the information provided regarding the fees to be paid to each Subadviser with respect to the Fund assets that would be allocated to the Subadviser supported the approval of the Subadvisory Agreements.
(c) Ancillary Benefits. The Independent Trustees considered whether there were any ancillary or “fall-out” benefits that may accrue to each Subadviser as a result of their proposed relationships with the Fund. As part of their review, the Independent Trustees noted that certain Subadvisers may experience benefits due to their relationships with the Fund, which include reputational and marketing benefits.
The Independent Trustees took into account the foregoing potential benefits that would accrue to the Subadvisers by virtue of their relationships with the Fund in determining to approve the Subadvisory Agreements.
(d) The extent to which economies of scale would be realized as the Fund grows, and whether fee levels reflected sharing of these economies of scale for the benefit of Fund shareholders. With respect to economies of scale, the Independent Trustees considered each Subadviser’s fee schedule for providing services to the Fund and noted that each of the Subadvisory Agreements included breakpoints that would reduce the Subadviser’s fee as the allocated portion of the Fund (and/or certain assets globally for Aristotle and Voya with respect to the Adviser and its affiliates) managed by the Subadviser increased. It was noted that the benefit of breakpoints would indirectly go to the Fund, given the Fee Waiver Agreement.
(e) The investment performance of the Fund and the Subadvisers. Because the Subadvisers were newly proposed Subadvisers to the Fund, and the Fund was a new fund, the Independent Trustees could not consider the
Mercer FundsAdditional Information (Unaudited) (Continued)
Subadviser’s investment performance in managing the Fund as a factor in evaluating the Subadvisory Agreements. However, the Independent Trustees considered the historical performance record of each Subadviser managing the investment mandate it would employ for the Fund as compared to a relevant index and the Adviser’s explanations with respect to the role of each Subadviser’s investment strategy in supporting the Fund’s multi-manager structure. The Independent Trustees also considered the Adviser’s conclusions, and the reasons supporting the Adviser’s conclusions, that the performance record of each Subadviser, including on an absolute basis and relative to each Subadviser’s benchmark index over different time periods, supported the approval of its Subadvisory Agreement.
Conclusion. Following consideration of the foregoing factors, it was reported that no single factor was determinative to the decisions of the Independent Trustees. Based on these factors, along with the determinations of the Adviser at the conclusion of its review and due diligence process and such other matters as were deemed relevant, the Independent Trustees concluded that the approval of the Subadvisory Agreements was in the best interests of the Fund and the Board, including a majority of the Independent Trustees, approved each of the Subadvisory Agreements.
Mercer FundsAdditional Information (Unaudited) (Continued)
Discussion of the Operation and Effectiveness of the Funds Liquidity Risk Management Program
In compliance with Rule 22e-4 under the 1940 Act, as amended (the “Liquidity Rule”), the Funds have adopted and implemented a liquidity risk management program (the “Program”) which the Adviser believes is reasonably designed and adequate to assess and manage each Fund’s liquidity risk. The Board has designated the Adviser to serve as the administrator of the Program pursuant to the Liquidity Rule. The Adviser has established a Liquidity Risk Committee which is appointed to carry out day-to-day responsibilities under the Program. The Liquidity Risk Committee is comprised of representatives from various departments at the Adviser.
At a meeting of the Board held on April 4, 2024, the Adviser provided the Board with a written report addressing the Program’s operation, adequacy and effectiveness of implementation for the period from January 1, 2023, through December 31, 2023 (the “Review Period”) and any material changes to the Program that may have occurred during the Review Period. The report noted that the Adviser has concluded that the Program is reasonably designed and adequate to assess and manage each Fund’s liquidity risk, as such term is defined in the Liquidity Rule. In light of its experiences administering the Program during the Review Period, the Adviser has concluded that the Program has been implemented and operated effectively to assess and manage each Fund’s liquidity risk and further believes that the Program has been and continues to be adequately and effectively implemented to monitor and, as applicable, respond to the Funds’ liquidity developments. Additionally, the report noted that no material changes to the Program have occurred during the Review Period or are contemplated. The report also noted that the Liquidity Risk Committee believes that each Fund’s liquidity risk remains within appropriate parameters and that each Fund’s investment strategy is appropriate for an open-end mutual fund. The report further reflected that there were no liquidity events that impacted the Funds’ ability to timely meet redemptions without significant dilution to existing shareholders.
The Liquidity Rule and the Program also require the Funds to classify each portfolio investment into one of four liquidity categories. The Adviser has engaged an independent third-party vendor, which includes the use of that vendor’s proprietary liquidity analytical tool, to assist the Funds in classifying portfolio investments, based on inputs and assumptions adopted by the Liquidity Risk Committee in its reasonable judgment. In classifying portfolio investments, the Liquidity Risk Committee takes into account relevant market, trading and investment-specific considerations as well as the reasonably anticipated trade size of each portfolio investment.
The Liquidity Rule requires funds that do not primarily hold assets that are highly liquid investments to adopt a minimum amount of net assets that must be invested in highly liquid investments that are assets (an “HLIM”). The Liquidity Rule also prohibits the acquisition of illiquid investments if doing so would result in a fund holding more than 15% of its net assets in illiquid investments that are assets. The Program includes provisions reasonably designed to determine, periodically review and comply with the HLIM requirement with respect to the Funds, as applicable, and to comply with the 15% limit on illiquid investments with respect to the Funds.
Mercer FundsUnderstanding Your Fund’s Expenses (Unaudited)
As a mutual fund shareholder, you incur different costs: transaction costs, including sales charges (loads) on purchases, redemption fees and certain exchange fees and ongoing costs, including management fees, distribution fees (12b-1 fees), and other fund expenses. These costs are described in more detail in the Funds’ prospectus. The examples below are intended to help you understand the ongoing costs of investing in the Funds and help you compare these with the ongoing costs of investing in other mutual funds. The first line in the table for each Fund shows the actual account values and actual fund expenses you would have paid on a $1,000 investment in the Fund from October 1, 2023 through March 31, 2024. It also shows how much a $1,000 investment would be worth at the close of the period, assuming actual fund returns and expenses. To estimate the expenses you paid over the period, simply divide your account value by $1,000 (for example $8,600 account value divided by $1,000 = $8.60) and multiply the result by the number in the Operating Expenses Incurred column as shown below for your Class. The second line in the table for each Fund provides information about hypothetical account values and hypothetical expenses based on the Fund’s actual expense ratios and an assumed rate of return of 5% per year before expenses, which is not the Fund’s actual return. The hypothetical account values and expenses may not be used to estimate the actual ending account balance or expenses you paid on your investment for the period. You may use this information to compare the ongoing costs of investing in the Fund and other funds. To do so, compare this 5% hypothetical example with the 5% hypothetical examples that appear in the shareholder reports of the other funds. Please note that the expenses shown reflect ongoing costs only, and do not include any transaction costs, such as sales charges, redemption fees or exchange fees. Therefore, the second line in the table of each fund is useful in comparing ongoing costs only, and will not help you determine the relative costs of owning different funds. If transaction costs were included, total costs would be higher.
Small/Mid Cap — Class Y-3
Hypothetical Return on $1,000
| | | | | Operating
Expense
Incurred# |
| | | | | |
| | | | | |
| Actual expenses are equal to the Class’ annualized expense ratio of 0.47%, multiplied by the average account value over the period, multiplied by 183/366. |
Small/Mid Cap — Class I
Hypothetical Return on $1,000
| | | | | Operating
Expense
Incurred# |
| | | | | |
| | | | | |
| Actual expenses are equal to the Class’ annualized expense ratio of 0.73%, multiplied by the average account value over the period, multiplied by 183/366. |
Mercer FundsUnderstanding Your Fund’s Expenses (Unaudited) (Continued)
Emerging Markets — Class Y-3
Hypothetical Return on $1,000
| | | | | Operating
Expense
Incurred# |
| | | | | |
| | | | | |
| Actual expenses are equal to the Class’ annualized expense ratio of 0.48%, multiplied by the average account value over the period, multiplied by 183/366. |
Emerging Markets — Class I
Hypothetical Return on $1,000
| | | | | Operating
Expense
Incurred# |
| | | | | |
| | | | | |
| Actual expenses are equal to the Class’ annualized expense ratio of 0.73%, multiplied by the average account value over the period, multiplied by 183/366. |
Global Low Volatility — Class Y-3
Hypothetical Return on $1,000
| | | | | Operating
Expense
Incurred# |
| | | | | |
| | | | | |
| Actual expenses are equal to the Class’ annualized expense ratio of 0.33%, multiplied by the average account value over the period, multiplied by 183/366. |
Global Low Volatility — Class I
Hypothetical Return on $1,000
| | | | | Operating
Expense
Incurred# |
| | | | | |
| | | | | |
| Actual expenses are equal to the Class’ annualized expense ratio of 0.58%, multiplied by the average account value over the period, multiplied by 183/366. |
Mercer FundsUnderstanding Your Fund’s Expenses (Unaudited) (Continued)
Non-US Core Equity — Class Y-3
Hypothetical Return on $1,000
| | | | | Operating
Expense
Incurred# |
| | | | | |
| | | | | |
| Actual expenses are equal to the Class’ annualized expense ratio of 0.39%, multiplied by the average account value over the period, multiplied by 183/366. |
Non-US Core Equity — Class I
Hypothetical Return on $1,000
| | | | | Operating
Expense
Incurred# |
| | | | | |
| | | | | |
| Actual expenses are equal to the Class’ annualized expense ratio of 0.64%, multiplied by the average account value over the period, multiplied by 183/366. |
Core Fixed — Class Y-3
Hypothetical Return on $1,000
| | | | | Operating
Expense
Incurred# |
| | | | | |
| | | | | |
| Actual expenses are equal to the Class’ annualized expense ratio of 0.15%, multiplied by the average account value over the period, multiplied by 183/366. |
Core Fixed — Class I
Hypothetical Return on $1,000
| | | | | Operating
Expense
Incurred# |
| | | | | |
| | | | | |
| Actual expenses are equal to the Class’ annualized expense ratio of 0.40%, multiplied by the average account value over the period, multiplied by 183/366. |
Mercer FundsUnderstanding Your Fund’s Expenses (Unaudited) (Continued)
Opportunistic Fixed — Class Y-3
Hypothetical Return on $1,000
| | | | | Operating
Expense
Incurred# |
| | | | | |
| | | | | |
| Actual expenses are equal to the Class’ annualized expense ratio of 0.44%, multiplied by the average account value over the period, multiplied by 183/366. |
Opportunistic Fixed — Class I
Hypothetical Return on $1,000
| | | | | Operating
Expense
Incurred# |
| | | | | |
| | | | | |
| Actual expenses are equal to the Class’ annualized expense ratio of 0.69%, multiplied by the average account value over the period, multiplied by 183/366. |
Short Duration Fixed — Class Y-3*
Hypothetical Return on $1,000
| | | | | Operating
Expense
Incurred# |
| | | | | |
| | | | | |
| The Fund commenced operations on December 1, 2023. |
| Actual expenses are equal to the Class’ annualized expense ratio of 0.20%, multiplied by the average account value over the period, multiplied by 122/366. |
Trustees and Officers (Unaudited)
The following tables list the Trust’s Trustees and Officers as of the date of this report; their address and age; their position with the Trust; the length of time holding that position with the Trust; their principal occupation(s) during the past five years; the number of portfolios in the fund complex they oversee; and other directorships they hold in companies subject to registration or reporting requirements of the Securities Exchange Act of 1934 (generally called “public companies”) or in registered investment companies. The Trust’s SAI includes additional information about the Trust’s trustees, including changes subsequent to the date of the report. The SAI is available, without charge, upon request, by calling 1-866-658-9896, or on the SEC website at www.sec.gov.
Independent Trustees
| Position(s)
Held with
Trust | Term of
Office(1) and
Length of
Time
Served | Principal
Occupation(s) During
Past 5 Years | Number of
Portfolios
in Fund
Complex*
Overseen
by Trustee | Other
Directorships
Held by
Trustee |
Adela M. Cepeda 99 High Street Boston, MA 02110 (66) | | | Ms. Cepeda was Managing Director of PFM Financial Advisors LLC (a financial advisory firm) from September 2016 to December 2019. Ms. Cepeda was previously Founder and President of A.C. Advisory, Inc. (a financial advisory firm) 1995 — 2016. | | Ms. Cepeda is a director or trustee of: The UBS Funds (12 portfolios); SMA Relationship Trust (1 portfolio); Morgan Stanley Pathway Funds (11 portfolios); BMO Financial Corp. (U.S. holding company for BMO Harris Bank N.A.); Ms. Cepeda was a director of Fort Dearborn Income Securities, Inc. (2000 to 2016) and UBS Relationship Funds (2004 to 2023). |
Gail A. Schneider 99 High Street Boston, MA 02110 (75) | | Chairperson since 2022; Trustee since 2009 | Ms. Schneider is a self-employed consultant since 2007. Ms. Schneider was previously an Executive Vice President at JPMorgan Chase & Co. | | |
Luis A. Ubiñas 99 High Street Boston, MA 02110 (61) | | | Mr. Ubiñas is retired. Mr. Ubiñas previously served as President of the Ford Foundation (a not-for profit organization) from 2008 to 2013 and prior to that he served as a Senior Partner for McKinsey & Company (a global consulting firm). | | Mr. Ubiñas is a Director of: ATT, Electronic Arts, Inc., and Tanger Factory Outlet Centers, Inc. |
Trustees and Officers (Unaudited) (Continued)
| Position(s) Held with Trust | Term of Office(1) and Length of Time Served | Principal Occupation(s) During Past 5 Years | Number of Portfolios in Fund Complex* Overseen by Trustee | Other Directorships Held by Trustee |
Joan E. Steel 99 High Street Boston, MA 02110 (70) | | | Ms. Steel is the Founder and Chief Executive Officer of Alpha Wealth Advisors LLC since September 2009. Prior to founding her own firm, Ms. Steel was a Senior Vice President, Private Wealth Advisor for the Capital Group, a large global asset manager. | | Ms. Steel was an independent director of The Hershey Trust Company from 2012 to 2016. |
(1) Each Trustee holds office for an indefinite term.
* The “Fund Complex” consists of the Trust, which has seven portfolios.
Officers:
The executive officers of the Trust not named above are:
| Position(s)
Held with
the Trust | Term of
Office+
and Length
of Time
Served | Principal Occupation(s) During Past 5 Years |
| President and Chief Executive Officer | | Ms. Kruse is a Partner and the U.S. Outsourced Chief Investment Office (OCIO) Leader for Mercer. Prior to joining Mercer in 2021, Ms. Kruse was investment director for Willis Towers Watson from 2007 to 2021. |
| Vice President and Assistant Treasurer | | Mr. Gouthro is a partner at Mercer and U.S. Chief Operating Officer for Mercer’s U.S. Business Solutions Group. Mr. Gouthro joined Mercer in 2018. Prior to joining Mercer, Mr. Gouthro was at Putnam Investments in various leadership roles in Operations, Technology, and Investments. |
| Vice President and Assistant Treasurer | | Mr. Vallan is a Vice President and Head of Fund Administration of Mercer Investments LLC. Prior to joining Mercer in 2020, Mr. Vallan was Vice President of Fund Administration at J.P. Morgan (from 2017 to 2020). |
| Vice President, Treasurer and Chief Financial Officer | | Mr. Coleman is Head of Investment Operations at Mercer Investments LLC since 2019. Prior to joining Mercer, Mr. Coleman was a Vice President at Fidelity Investments from 2016 to 2018. |
Trustees and Officers (Unaudited) (Continued)
| Position(s) Held with the Trust | Term of Office+ and Length of Time Served | Principal Occupation(s) During Past 5 Years |
| Vice President, Chief Investment Officer | | Ms. Aganga is a Vice President and Chief Investment Officer, Investments at Mercer Investments LLC since 2023. Prior to joining Mercer, Ms. Aganga was a Managing Director within BlackRock's US Outsourced CIO business from 2018 to 2023. Prior to BlackRock, Ms. Aganga spent several years at Goldman Sachs. |
| Vice President and Assistant Secretary | | Mr. Dean is Mercer Chief Counsel since May 2024 and Global Chief Counsel Investments since 2018. He has also served as Senior Legal Counsel — Investments for Mercer Investments LLC from 2010 to 2018. |
| Vice President, Chief Legal Officer and Secretary | | Ms. Hulme is Chief Investment Funds and Solutions Counsel, US & Canada for Mercer Investments LLC since 2023. She served as Senior Legal Counsel, Investments from 2018 to 2023. |
| Vice President and Assistant Secretary | | Mr. Earley is Senior Legal Counsel, Investments at Mercer Investments LLC since 2022. Prior to joining Mercer, he was in private practice as Counsel in the corporate practice group of Morse, Barnes- Brown & Pendleton, P.C. from 2021 to 2022, and as a Senior Associate in the investment management practice group at Morgan, Lewis & Bockius LLP from 2015 to 2020. |
| | | Mr. Vasquez is a Vice President and Portfolio Manager of Mercer Investments LLC since 2012. |
| | | Ms. Lefkowitz is a Vice President and Senior Portfolio Manager of Mercer Investments LLC. Prior to joining Mercer in 2021, Ms. Lefkowitz held various roles in risk management, portfolio construction, trading and global fixed income portfolio management at Putnam Investments. |
| Vice President and Chief Compliance Officer | | Ms. Wong serves as Chief Compliance Officer of Mercer Trust Company LLC since December 2022. Prior to joining Mercer, Ms. Wong was Director – Compliance, Schwab Asset Management from 2019-2022. Ms. Wong also served in various Compliance leadership roles at State Street Corporation from 2009 to 2019, where she was most recently Vice President, Alternative Investment Solutions Risk and Compliance Director. |
+ Officers of the Trust are elected by the Trustees and serve at the pleasure of the Board.
++ Prior to 2023, Mr. Gouthro and Mr. Coleman each held different positions with the Trust since 2018 and 2019, respectively.
+++ Prior to 2021, Mr. Dean and Ms. Hulme each held different positions with the Trust, since 2010 and 2017, respectively.
Shares of Mercer Funds are distributed by MGI Funds Distributors, LLC.
(b) Not applicable.
Item 2. Code of Ethics.
As of the end of the period covered by this report, the Registrant has adopted a code of ethics that applies to its President, Chief Financial Officer and Chief Investment Officer. During the period covered by this report, there were no amendments to a provision of its code of ethics, nor were there any waivers, including implicit waivers granted from a provision of the code of ethics. A copy of the Registrant’s code of ethics is filed with the Form N-CSR under Item 13(a)(1).
Item 3. Audit Committee Financial Expert.
The Registrant’s Board of Trustees has determined that the Registrant has at least one audit committee financial expert serving on its audit committee. The audit committee financial experts serving on the Registrant’s audit committee are Joan E. Steel and Adela Cepeda and Luis A. Ubiñas, all of which are “independent” as defined in Item 3(a)(2) of this Form.
Item 4. Principal Accountant Fees and Services.
(a) Audit Fees – The aggregate fee billed for the fiscal year for professional services rendered by the principal accountant for the audit of the Registrant’s annual financial statements or services that are normally provided by the principal accountant in connection with statutory and regulatory filings or engagements was $418,245 and $388,850 for the fiscal years ended March 31, 2023, and March 31, 2024, respectively.
(b) Audit-Related Fees – There were no fees billed for the fiscal years ended March 31, 2023, and March 31, 2024, for assurance and related services by the principal accountant that are reasonably related to the performance of the audit of the Registrant’s financial statements and are not reported under (a) of this Item.
(c) Tax Fees – The aggregate fee billed in the last fiscal year for professional services rendered by the principal accountant for the review of the Registrant’s tax returns and excise tax calculations was $73,540 and $85,110 for the fiscal years ended March 31, 2023, and March 31, 2024, respectively. Fees in the amount of $72,566 the year ended March 31, 2023, respectively for review of non-US capital gains and the preparation and filing of return of income for the Mercer Non-US Core Equity Fund and the Mercer Emerging Markets Equity Fund.
(d) All Other Fees – Fees in the amount of $140,676.16 were billed in the fiscal year ended March 31, 2023, respectively for tax advisory services related to the reclamation of taxes paid by the Mercer Non-US Core Equity Fund and the Mercer Global Low Volatility Equity Fund in certain European Union countries.
(e) (1) The Registrant’s audit committee pre-approves all audit and non-audit services to be performed by the Registrant’s accountant before the accountant is engaged by the Registrant to perform such services.
(2) There were no services described in (b) through (d) above (including services required to be approved by the audit committee pursuant to paragraph (c)(7)(ii) of Rule 2-01 of Regulation S-X) that were approved by the audit committee pursuant to paragraph (c)(7)(i)(C) of Rule 2-01 of Regulation S-X.
(f) None of the hours expended on the principal accountant’s engagement to audit the Registrant’s financial statements for the fiscal year ended March 31, 2024, were attributable to work performed by persons other than the principal accountant’s full-time, permanent employees.
(g) There were no aggregate fees billed for the fiscal year ended March 31, 2024, by the Registrant’s principal accountant for non-audit services rendered to the Registrant, its investment adviser and any entity controlling, controlled by or under common control with the investment adviser that provides ongoing services to the Registrant.
(h) Not applicable.
Item 5. Audit Committee of Listed Registrants.
Not applicable.
Item 6. Schedule of Investments.
The Registrant’s full schedules of investments are included as part of the report to shareholders filed under Item 1 of this Form.
Item 7. Disclosure of Proxy Voting Policies and Procedures for Closed-End Management Investment Companies.
Not applicable.
Item 8. Portfolio Managers of Closed-End Investment Companies.
Not applicable.
Item 9. Purchases of Equity Securities by Closed-End Management Investment Company and Affiliated Purchasers.
Not applicable.
Item 10. Submission of Matters to a Vote of Security Holders.
There have been no material changes to the procedures by which the shareholders may recommend nominees to the Registrant’s Board of Directors, where those changes were implemented after the Registrant last provided disclosure in response to the requirements of Item 22(b)(15) of Schedule 14A (17 CFR 240.14a-101), or this Item.
Item 11. Controls and Procedures.
(a) The Registrant’s Principal Executive Officer and Principal Financial Officer concluded that the Registrant’s disclosure controls and procedures (as defined in Rule 30a-3(c) under the Investment Company Act of 1940 (17 CFR 270.30a-3(c))), are effective based on the evaluation of Registrant’s disclosure controls and procedures as of a date within 90 days prior to the filing date of this report.
(b) There were no changes in the Registrant’s internal control over financial reporting (as defined in Rule 30a-3(d) under the Investment Company Act of 1940 (17 CFR 270.30a-3(d))), that occurred during the Registrant’s second fiscal quarter of the period covered by this report that has materially affected, or is reasonably likely to materially affect, the Registrant’s internal control over financial reporting.
Item 12. Disclosure of Securities Lending Activities for Closed-End Management Investment Companies.
Not applicable.
Item 13. Exhibits.
(a)(1) Code of Ethics for the Registrant’s President, Chief Financial Officer and Chief Investment Officer (as referenced in Item 2 above), attached hereto as Exhibit (a)(1).
(a)(2) Certification of the Principal Executive Officer and Principal Financial Officer of the Registrant as required by Rule 30a-2(a) under the Investment Company Act of 1940 (17 CFR 270.30a-2(a)) is attached hereto as Exhibit 99CERT.
(a)(3) Not applicable.
(b) Certification pursuant to Section 906 of the Sarbanes-Oxley Act of 2002 as required by Rule 30a-2(b), under the Investment Company Act of 1940 (17 CFR 270.30a-2(b)), Rule 15d-14(b) under the Securities Exchange Act of 1934 (17 CFR 240.15d-14(b)) and Section 1350 of Chapter 63 of Title 18 of the United States Code (18 U.S.C. 1350) is attached hereto as Exhibit 99.906CERT.
SIGNATURES
Pursuant to the requirements of the Securities Exchange Act of 1934 and the Investment Company Act of 1940, the Registrant has duly caused this report to be signed on its behalf by the undersigned, thereunto duly authorized.
| | |
| (Registrant) Mercer Funds |
| |
| By (Signature and Title) | | /s/ Jennifer Kruse |
| | Jennifer Kruse President and Chief Executive Officer (Principal Executive Officer) |
|
| Date 5/23/24 |
Pursuant to the requirements of the Securities Exchange Act of 1934 and the Investment Company Act of 1940, this report has been signed below by the following person on behalf of the Registrant and in the capacities and on the date indicated.
| | |
| By (Signature and Title) | | /s/ Jennifer Kruse |
| | Jennifer Kruse President and Chief Executive Officer (Principal Executive Officer) |
|
| Date 5/23/24 |
| |
| By (Signature and Title) | | /s/ Jeffrey Coleman |
| | Jeffrey Coleman Vice President, Treasurer and Chief Financial Officer (Principal Financial Officer) |
|
| Date 5/23/24 |
