Table of Contents
UNITED STATES
SECURITIES AND EXCHANGE COMMISSION
Washington, DC 20549
FORMN-CSR
CERTIFIED SHAREHOLDER REPORT OF REGISTERED
MANAGEMENT INVESTMENT COMPANIES
Investment Company Act File Number:811-21732
Mercer Funds
(Exact Name of Registrant as Specified in Charter)
99 High Street
Boston, MA 02110
(Address of Principal Executive Offices)(Zip Code)
Colin J. Dean, Esq.
Mercer Investment Management, Inc.
99 High Street
Boston, MA 02110
(Name and Address of Agent for Service)
Registrant’s Telephone Number, including Area Code: (617)747-9500
Date of Fiscal Year End: March 31, 2019
Date of Reporting Period: March 31, 2019
Table of Contents
Item 1. Reports to Stockholders.
The Report to Shareholders is attached herewith.
Table of Contents

Mercer Funds™
Annual Report
Mercer US Large Cap Equity Fund
Mercer US Small/Mid Cap Equity Fund
Mercer Non-US Core Equity Fund
Mercer Core Fixed Income Fund
Mercer Opportunistic Fixed Income Fund
Mercer Emerging Markets Equity Fund
Mercer Global Low Volatility Equity Fund
This report has been prepared for Mercer Funds shareholders. It is not authorized for distribution to prospective investors unless accompanied or preceded by a current Mercer Funds prospectus. The prospectus contains more complete information about the Funds’ investment objectives, risks, and expenses. Investors are reminded to read the prospectus carefully before investing.
March 31, 2019
Table of Contents
MERCER FUNDS
| Page | ||
| 1 | ||
| 30 | ||
| 199 | ||
| 203 | ||
| 205 | ||
| 209 | ||
| 216 | ||
| 256 | ||
| 257 | ||
| 264 | ||
| 267 | ||
Table of Contents
Mercer US Large Cap Equity Fund
Investment Objective and Benchmark
The investment objective of the Fund is long-term total return, which includes capital appreciation and income. The benchmark for the Fund is the Russell 1000 Index.
Investment Strategy
The Fund invests principally in equity securities (such as common stock) issued by large capitalization U.S. companies. The Fund employs a “core equity” investment strategy by investing in both growth and value oriented equity securities. The Fund may invest in derivative instruments to gain market exposure on cash balances or to reduce market exposure in anticipation of liquidity needs.
Performance
For the fiscal year ended March 31, 2019, the Fund’sY-3 share class performance was 4.81% compared to its benchmark, the Russell 1000 Index, return of 9.3%. Performance for the Fund is reported net of fees and operating expenses while the benchmark returns do not include expenses of any kind as indexes are unmanaged.
TheSub-Advisors
As of March 31, 2019, the Fund employed six subadvisors: HS Management Partners, LLC (HS), Columbia Management Investment Advisers (Columbia), AJO LP (AJO), Brandywine Global Investment Management, LLC (Brandywine), O’Shaughnessy Asset Management, LLC (OSAM) and Parametric Portfolio Associates LLC (Parametric).
HS is a growth manager that invests in quality businesses with strong management that trade at attractive valuations.
Columbia is an aggressive growth manager, following a high conviction, concentrated strategy that focuses on financially strong companies that are growing earnings faster than the broader equity market.
AJO is a quantitative manager that relies on a combination of value, management, momentum, and sentiment factors to evaluate securities.
Brandywine, a deep value manager, focuses on cheap stocks that trade at a significant discount to intrinsic value, with strong free cash flows and quality balance sheets.
OSAM is a yield focused quantitative value manager that seeks stocks that are ranked high based on valuation, quality and shareholder yield.
Parametric utilizes exchange-traded futures to generate exposure corresponding to the Fund’s benchmark.
Market Commentary and Fund Performance
For the12-month-period ended March 31, 2019, the U.S. equity market, as measured by the Russell 3000 Index, increased 8.8%. In 2018, U.S. equity market ended the year in negative territory for the first time since 2008. Markets fell sharply during the fourth quarter erasing gains from the prior three quarters. Weakness in the fourth quarter resulted from fears of slowing global growth, uncertainty surrounding trade negotiations with China, and Brexit, as well as the U.S. Federal Reserve’s (“Fed”) decision to halt interest rate hikes. In parallel with these macro worries, energy prices plummeted as the market struggled to absorb enormous capacity from US shale producers and Iran. During this period, markets shifted to a decidedlyrisk-off mood, favoring larger, more stable
1
Table of Contents
Mercer US Large Cap Equity Fund
companies in the staples and utilities sectors, and selling more cyclical technology and financial shares. Despite their underperformance during the selloff in the fourth quarter of 2018, growth stocks outperformed value stocks for the year.
During the first quarter of 2019, markets did an about face, buying beaten down cyclicals, deeper value names, and growth equities. During this period, the Russell 3000 Index was up 14.0%, largely erasing losses from the previous quarter. The shift in sentiment came on the tails of dovish fed policy, optimism over trade negotiations with China, and continued strong business fundamentals and employment figures. For the12-month-period ended March 31, 2019 smaller capitalization stocks have made a comeback, with the Russell 2000 Index posting its best start to the year since 1991.
Within the Russell 1000 Index, the Fund’s benchmark, the best performing sectors for the fiscal year were real estate, utilities, and information technology, with returns of 21.8%, 21.3%, and 21.0% respectively. Financials was the laggard with returns of-2.7%. The best performing industries were independent power and renewable electricity, life sciences tools & services, and software, with returns of 43.7%, 33.6%, and 33.5% respectively.
The Mercer U.S. Large Cap Equity Fund underperformed the Russell 1000 Index for the period. Five of the Fund’s sixsub-advisors underperformed their respective benchmarks, with performance from the value-oriented managers detracting the most. From a sector perspective, overweight allocations to energy, financials, and staples were the largest detractors.
Columbia underperformed its benchmark for the period, with losses being driven by holdings in semiconductors, and entertainment. Offsetting these areas was strong performance from healthcare, and online retail names sectors.
HS outperformed its benchmark for the period. Holdings in media as well as overweight allocations to restaurants and specialty retail all contributed. Offsetting gains was an underweight allocation to technology and overweight allocation to staples.
AJO underperformed for the period. Style exposures to value and smaller capitalization companies, were detractors relative to their core benchmark. From an industry perspective, overweight allocations to auto components, airlines, and household durables also weighed on relative underperformance. Brandywine underperformed its benchmark for the period, with all of its underperformance coming in the volatile fourth quarter of 2018. Sector positioning was a large detractor for the period, specifically overweight allocations to energy, airlines, and household durables, and an underweight allocation to health care and utilities. From a style perspective, its higher beta and deeper value positioning also weighed on performance.
OSAM underperformed for the period, in part due to the underperformance of value and shareholder yield, 2 key components of their selection process. From a sector perspective, overweight allocations to energy and financials detracted, as did an underweight position in health care.
Parametric utilizes exchange-traded futures replicating the Fund’s benchmark, aimingto provide broad, passive, equity market exposure to the Fund’s liquidity sleeve, and seeking to create positive returns on assets that would have otherwise been earning cash or cash equivalent returns. Performance differences versus the benchmark are largely a result of cash flow effects related to daily subscription/redemption activity and through financing costs of futures relative to interest earned on cash.
Risk Considerations
The Fund invests in both growth stocks and value stocks. Growth stocks may be particularly sensitive to market conditions. Investing in value stocks involves the risk that an investment made in undervalued securities may not appreciate in value as anticipated or remain undervalued for long periods of time.
2
Table of Contents
Mercer US Large Cap Equity Fund
The Fund may invest in derivative instruments such as exchange-listed equity futures contracts, which may cause the Fund to experience greater volatility and less liquidity. Derivatives may be more sensitive to changes in market conditions and may amplify the risk of loss for the Fund. The Fund may experience high portfolio turnover which may result in higher transaction costs and capital gains.
3
Table of Contents
Mercer Funds
March 31, 2019
Comparison of Change in Value of a $10,000 Investment in
Mercer US Large Cap Equity Shares vs. the
Russell 1000® Index
As of March 31, 2019
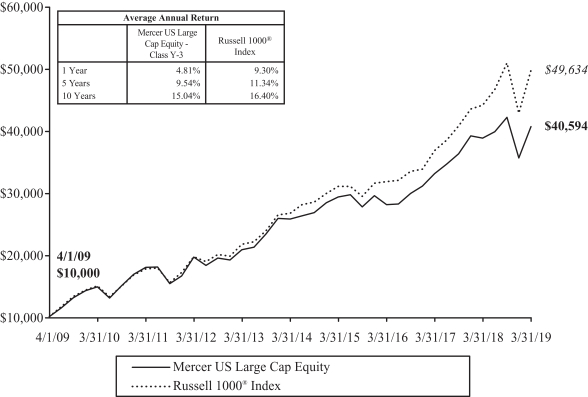
This graph shows the performance of the Mercer US Large Cap Equity Fund ClassY-3 shares versus the Russell 1000® Index from April 1, 2009 through March 31, 2019. The performance of other classes, when launched, will vary from the performance of the class shown based on the difference in fees and expenses paid by shareholders investing in different share classes. The Fund may charge a 2% redemption fee on shares owned less than 30 days.
The table and graph assume reinvestment of dividends and capital gains, but do not reflect a deduction of taxes an investor might pay on fund distributions or upon redemption of fund shares. Performance shown reflects a fee waiver and/or expense reimbursement. Without this waiver/reimbursement, returns would have been lower.
The data quoted represents past performance and does not guarantee future results. Current performance of the Fund may be lower or higher than the performance quoted. Please call 1-866-658-9896 for the Fund’s most recentmonth-end performance. Investment return and principal value will fluctuate so that an investor’s shares, when redeemed, may be worth more or less than when purchased.
4
Table of Contents
Mercer US Small/Mid Cap Equity Fund
Investment Objective and Benchmark
The investment objective of the Fund is to provide long-term total return, comprised primarily of capital appreciation. The benchmark for the Fund is the Russell 2500 Index.
Investment Strategy
The Fund invests principally in equity securities issued bysmall-to-medium capitalization U.S. companies. The Fund employs a “core equity” investment strategy by investing in both growth and value oriented equity securities. The Fund may invest in derivative instruments to gain market exposure on cash balances or to reduce market exposure in anticipation of liquidity needs.
Performance
For the fiscal year ended March 31, 2019, the Fund’sY-3 share class performance was 0.19% compared to its benchmark, the Russell 2500 Index, return of 4.48%. Performance for the Fund is reported net of fees and operating expenses while the benchmark returns do not include expenses of any kind as indexes are unmanaged.
TheSub-Advisors
As of March 31, 2019, the Fund employed sixsub-advisors: Westfield Capital Management Company (Westfield), GW&K Investment Management, LLC (GW&K), Loomis, Sayles & Company L.P. (Loomis), LSV Asset Management (LSV), BNY Mellon Asset Management North America Corporation (Mellon) and Parametric Portfolio Associates LLC (Parametric).
Westfield, a traditional growth manager, employs a fundamental,bottom-up approach which seeks to identify reasonably priced stocks with high earnings growth potential.
GW&K uses abottom-up fundamental research process in order to identify high quality companies with sustainable long-term earnings growth rates.
Loomis looks to provide a lower volatility approach to high growth investing by seeking companies with high quality business models that have differentiated and sustainable growth opportunities.
LSV, a quantitative value manager, seeks deep value,out-of-favor companies with recent momentum. LSV avoids introducing any judgmental biases or behavioral weaknesses into their investment process.
Mellon, a fundamental intrinsic value manager, focuses on purchasing companies that are priced at a large discount from intrinsic value, underappreciated and temporarily dislocated (contrarian view).
Parametric utilizes exchange traded futures to generate market exposure corresponding to the Fund’s benchmark.
Market Commentary and Fund Performance
For the12-month-period ended March 31, 2019, the U.S. equity market, as measured by the Russell 3000 Index, increased 8.8%. In 2018, U.S. equity market ended the year in negative territory for the first time since 2008. Markets fell sharply during the fourth quarter erasing gains from the prior three quarters. Weakness in the fourth quarter resulted from fears of slowing global growth, uncertainty surrounding trade negotiations with China and Brexit, as well as the U.S. Federal Reserve’s (“Fed”) decision to halt interest rate hikes. In parallel with these macro worries, energy prices plummeted as the market struggled to absorb enormous capacity from U.S. shale producers and Iran. During this period, markets shifted to a decidedlyrisk-off mood, favoring larger, more stable companies in the staples and utilities sectors, and selling more cyclical technology and financial shares. Despite their underperformance during the selloff in the fourth quarter of 2018, growth stocks outperformed value stocks for the year.
5
Table of Contents
Mercer US Small/Mid Cap Equity Fund
During the first quarter of 2019, markets did an about face, buying beaten down cyclicals, deeper value names, and growth equities. During the first quarter of 2019, the Russell 3000 was up 14.0%, largely erasing losses from the previous quarter. The shift in sentiment came on the tails of dovish Fed policy, optimism over trade negotiations with China, and continued strong business fundamentals and employment figures. For the year, smaller cap stocks have made a comeback, with the Russell 2000 posting its best start to the year since 1991.
Within the Russell 2500 Index, the Fund’s benchmark, the best performing sectors for the fiscal year were utilities and information technology with positive returns of 23.23% and 19.28%, respectively. Underperforming sectors for the fiscal year were energy and materials, with negative returns of-17.96% and-5.67%, respectively. The top performing industries for the fiscal year were health care technology and life sciences tools & services with positive returns of 33.69% and 30.66%, respectively. The underperforming industries for the fiscal year were automobiles and construction materials with negative returns of-30.31% and-30.11%, respectively.
The Mercer U.S. Small/Mid Cap Equity Fund underperformed the Russell 2500 Index for the period. Despite the Fund’s exposure to quality, which helped drive performance for the year, its exposure to relatively larger market capitalization size companies, coupled with its exposure to value from a style perspective as well as security selection, were the primary drivers to the Fund’s underperformance. Specifically, security selection in the information technology, consumer discretionary and financial sectors detracted from performance for the fiscal year despite strong security selection in the energy sector.
Westfield underperformed for the fiscal year. The relative weakness was driven by security selection in the health care, information technology and consumer discretionary sectors, which offset more moderate relative strength in the industrials and consumer staples sectors. In addition, its overweight position to the materials and energy sectors detracted from performance from an allocation standpoint.
Loomis underperformed for the fiscal year primarily due to its security selection in the information technology and industrials sectors, despite its strong security selection in the communication services sector.
GW&K‘s outperformance was attributed to its higher quality stance and security selection, particularly in the materials and industrials sectors.
LSV’s underperformance for the period was driven by its deep value style being truly out of favor. This was evident with its security selection in multiple sectors to include the industrials, materials, financials, information technology, consumer discretionary and real estate sectors weighing on performance.
Mellon’s underperformance for the period was driven by their allocation decisions. In particular, Mellon’s underweight to the real estate and utilities sectors combined with an overweight to the energy, information technology and consumer discretionary sectors detracted from performance.
Parametric utilizes exchange-traded futures replicating the Fund’s benchmark, aiming to provide broad, passive, equity market exposure to the Fund’s liquidity sleeve, and seeking to create positive returns on assets that would have otherwise been earning cash or cash equivalent returns. Performance differences versus the benchmark are largely a result of cash flow effects related to daily subscription/redemption activity and through financing costs of futures relative to interest earned on cash.
Risk Considerations
The Fund invests in both growth stocks and value stocks. Growth stocks may be particularly sensitive to market conditions. Investing in value stocks involves the risk that an investment made in undervalued securities may not appreciate in value as anticipated or remain undervalued for long periods of time. Investments made in small and
6
Table of Contents
Mercer US Small/Mid Cap Equity Fund
mid-capitalization companies may be more volatile and less liquid due to limited resources or product lines and more sensitive to economic factors. The Fund may invest in derivative instruments such as exchange-listed equity futures contracts, which may cause the Fund to experience greater volatility and less liquidity. Derivatives may be more sensitive to changes in market conditions and may amplify the risk of loss for the Fund. The Fund may experience high portfolio turnover which may result in higher transaction costs and capital gains.
7
Table of Contents
Mercer Funds
March 31, 2019
Comparison of Change in Value of a $10,000 Investment in
Mercer US Small/Mid Cap Equity Shares vs. the
Russell 2500™ Index
As of March 31, 2019
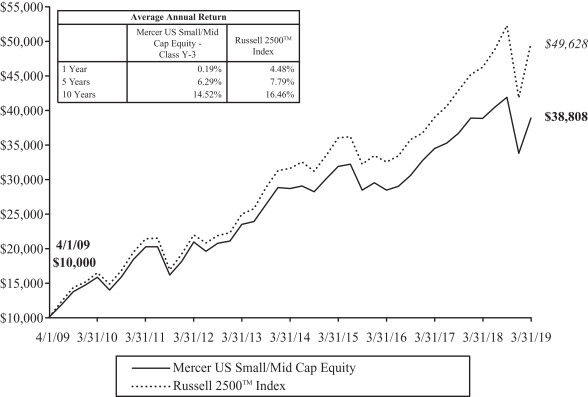
This graph shows the performance of the Mercer US Small/Mid Cap Equity Fund ClassY-3 shares versus the Russell 2500™ Index from April 1, 2009 through March 31, 2019. The performance of other classes, when launched, will vary from the performance of the class shown based on the difference in fees and expenses paid by shareholders investing in different share classes. The Fund may charge a 2% redemption fee on shares owned less than 30 days.
The table and graph assume reinvestment of dividends and capital gains, but do not reflect a deduction of taxes an investor might pay on fund distributions or upon redemption of fund shares. Performance shown reflects a fee waiver and/or expense reimbursement. Without this waiver/reimbursement, returns would have been lower.
The data quoted represents past performance and does not guarantee future results. Current performance of the Fund may be lower or higher than the performance quoted. Please call 1-866-658-9896 for the Fund’s most recentmonth-end performance. Investment return and principal value will fluctuate so that an investor’s shares, when redeemed, may be worth more or less than when purchased.
8
Table of Contents
MercerNon-US Core Equity Fund
Investment Objective and Benchmark
The investment objective of the Fund is to provide long-term total return, which includes capital appreciation and income. The benchmark for the Fund is the MSCI EAFE Index.
Investment Strategy
The Fund invests principally in equity securities issued bynon-U.S. companies of any capitalization, located in the world’s developed and emerging capital markets. The Fund employs a “core equity” investment strategy that seeks to meet the Fund’s investment objective by investing in both growth- and value-oriented equity securities.
Performance
For the fiscal year ended March 31, 2019, the Fund’sY-3 share class performance was-4.00% compared to its benchmark return of-3.71%. Performance for the Fund is reported net of fees and operating expenses while the benchmark returns do not include expenses of any kind as indexes are unmanaged.
TheSub-Advisors
As of March 31, 2019, the Fund employed fivesub-advisors: Arrowstreet Capital, Limited Partnership (Arrowstreet), American Century Investment Management, Inc. (American Century), MFS Investment Management (MFS), LSV Asset Management (LSV) and Parametric Portfolio Associates LLC (Parametric).
Arrowstreet’s strategy seeks to outperform international equity benchmarks through a risk-controlled core approach. Arrowstreet combines sound investment intuition and research with rigorous quantitative tools to identify mispriced stocks around the world. Arrowstreet believes that the key to generating return in excess of the benchmark involves evaluating the prospects of a security considering both the characteristics of the stock itself (direct effects) as well as the characteristics of other related stocks (indirect effects).
American Century manages its portfolio based on an investment philosophy that companies exhibiting improving or accelerating growth will outperform the market over time. American Century constructs its portfolio through abottom-up stock selection within a risk aware framework. American Century’s thorough research process seeks to identify companies that are exhibiting an improvement or acceleration in growth where it believes that growth is sustainable but that the earnings power of the company is generally underestimated. American Century will invest primarily in equity securities of companies located inNon-U.S. developed markets.
MFS manages a value portfolio, which focuses on stocks whose long-term value they believe is not adequately reflected in the stock price. MFS invests opportunistically in emerging markets.
LSV utilizes a quantitative approach which seeks deep value stocks that have fallen out of favor with the market, but have recent momentum, either in terms of price or earnings. LSV believes that long-term results are achieved through systematic exploitation of judgmental biases and behavioral weaknesses that influence investor decisions. LSV aims to exploit these biases through the disciplined application of quantitative techniques to drivebottom-up security selection.
Parametric utilizes exchange-traded futures to generate market exposure corresponding to the Fund’s benchmark.
Market Commentary and Fund Performance
As a group, global developed equity markets rose, as measured by the MSCI World Index, which increased 4.0% during the12-month period ended March 31, 2019. U.S. equities rallied considerably, with the Russell 1000 Index up 9.3% for the fiscal year. Outside of the US, international developed markets did not perform as well, as the MSCI EAFE Index (the Fund’s benchmark) returned-3.7% over the period ended March 31, 2019.
9
Table of Contents
MercerNon-US Core Equity Fund
During the second and third quarters of 2018, equity markets rallied after correcting in the first quarter of the year. U.S. stocks easily outpaced international equities as the benefits of the corporate tax cuts flowed through to U.S. corporate earnings. As always, there were numerous concerns on the minds of global investors during this period including: tightening financial conditions (two Federal Reserve rate hikes during this period and the termination of asset purchases by the European Central Bank despite an uncertain growth outlook), ongoing trade tensions, slowing global growth, cautious forward guidance in corporate earnings reports. For investors in Europe, uncertainty surrounding the passage of the Brexit deal, protests in France and slowing growth weighed on market returns. Emerging markets equity markets fell throughout most of 2018 after peaking in January. Chinese economic growth continued to trend lower and equity market investors also had to consider the effects of continued U.S.-China trade tensions. Manufacturing growth, in the largest component of the emerging markets benchmark, landed at the slowest pace seen in more than two years.
In contrast to the second and third quarters, the fourth quarter of 2018 proved to be a rocky ride in global equity markets with volatility increasing materially. Global equity markets began to fall swiftly as economic indicators softened across developed markets at the same time most central banks remained determined to continue down the path of monetary tightening. Although emerging markets weathered the fourth quarter’s globalsell-off relatively well, they still lagged developed equities by close to 6% during calendar year 2018. Rising rates and difficult trade negotiations had hit emerging markets earlier in the year.
In a sharp reversal, and despite slowing global growth and cautious forward guidance in corporate earnings reports, developed and emerging equity markets rallied significantly during the first quarter of 2019. The rally was driven by promising progress on trade negotiations, a solid fourth quarter 2018 earnings season and the U.S. Federal Reserve’s (“Fed”) increasing flexibility over the future interest rate policy and balance sheet reductions. In the first quarter, China led the rally in emerging market equities, as investors anticipated a U.S.-China trade resolution. Improved manufacturing reports and the news that the index provider MSCI plans to increase theChina-A share weight in its equity indexes provided more tailwinds for Chinese equities.
American Century provides the growth allocation for the Fund. It outperformed its benchmark, the MSCI EAFE Index, for the fiscal year driven by stock selection. Stock selection in financials, health care, energy and consumer discretionary generated excess returns. Excess returns were hindered, however, by the rotation and outperformance of low volatility, defensive stocks during the latter half of calendar 2018.
MFS continued its strong performance and again outperformed the Fund’s benchmark. MFS’s sizable overweight to consumer staples and technology, as well as its stock selection within both sectors, strongly contributed to its relative performance. A meaningful underweight to financials, and positive selection in consumer discretionary and industrials also aided relative returns. A slight drag on the relative performance was MFS’s underweights to both the energy and utilities sectors.
LSV underperformed the benchmark during this period, driven by its deep value style being out of favor. This was evident with its negative security selection in multiple sectors, including materials, industrials and consumer discretionary. LSV also suffered from an underweight to healthcare and an overweight to financials. LSV’s exposure to small cap stocks was a drag on relative performance as well.
Arrowstreet’s outperformance was driven by both positive allocation and stock selection. Its largest sector overweight, healthcare, was a top contributor to performance. On a stock selection basis, financial company securities, particularly Japanese and Italian issuers, were the main contributors to results. Selection within the consumer discretionary sector, particularly French issuers, offset gains during the trailingone-year.
Parametric utilizes exchange-traded futures replicating the Fund’s benchmark, aiming to provide broad, passive, equity market exposure to the Fund’s liquidity sleeve, and seeking to create positive returns on assets that would
10
Table of Contents
MercerNon-US Core Equity Fund
have otherwise been earning cash or cash equivalent returns. Performance differences versus the benchmark are largely a result of cash flow effects related to daily subscription/redemption activity and through financing costs of futures relative to interest earned on cash.
Risk Considerations
The Fund invests in foreign and emerging market securities which involves certain risks such as currency volatility, political and social instability and reduced market liquidity. Emerging markets may be more volatile and less liquid than more developed markets and therefore may involve greater risks. Investments made in small andmid-capitalization companies may be more volatile and less liquid due to limited resources or product lines and more sensitive to economic factors. The Fund may invest in derivative instruments such as exchange-listed equity futures contracts, which may cause the Fund to experience greater volatility and less liquidity. Derivatives may be more sensitive to changes in market conditions and may amplify the risk of loss for the Fund. The Fund may experience high portfolio turnover which may result in higher transaction costs and capital gains.
11
Table of Contents
Mercer Funds
March 31, 2019
Comparison of Change in Value of a $10,000 Investment in
MercerNon-US Core Equity Shares vs. the
MSCI EAFE Index
As of March 31, 2019
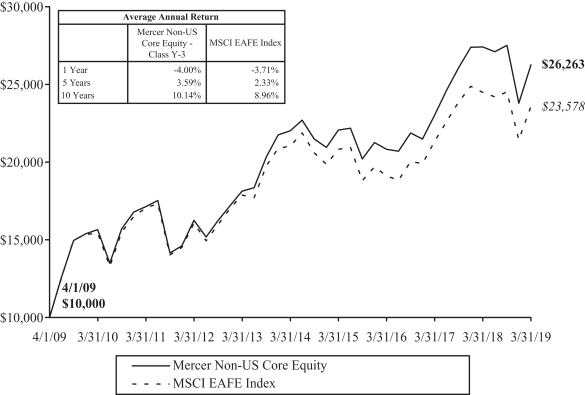
This graph shows the performance of the MercerNon-US Core Equity Fund ClassY-3 shares versus the MSCI EAFE Index from April 1, 2009 through March 31, 2019. The performance of other classes, when launched, will vary from the performance of the class shown based on the difference in fees and expenses paid by shareholders investing in different share classes. The Fund may charge a 2% redemption fee on shares owned less than 30 days.
The table and graph assume reinvestment of dividends and capital gains, but do not reflect a deduction of taxes an investor might pay on fund distributions or upon redemption of fund shares. Performance shown reflects a fee waiver and/or expense reimbursement. Without this waiver/reimbursement, returns would have been lower.
The data quoted represents past performance and does not guarantee future results. Current performance of the Fund may be lower or higher than the performance quoted. Please call 1-866-658-9896 for the Fund’s most recentmonth-end performance. Investment return and principal value will fluctuate so that an investor’s shares, when redeemed, may be worth more or less than when purchased.
12
Table of Contents
Mercer Core Fixed Income Fund
Investment Objective and Benchmark
The investment objective of the Fund is to provide total return, consisting of both current income and capital appreciation. The benchmark for the Fund is the Bloomberg Barclays U.S. Aggregate Bond™ Index.
Investment Strategy
The Fund invests principally in investment grade fixed income securities, including government securities, corporate bonds and securitized bonds such as mortgage and asset-backed securities. The Fund may also invest innon-investment grade bonds,non-U.S. dollar denominated bonds, bonds issued by issuers located in emerging capital markets, and certain derivative instruments. The Fund may invest in derivative instruments, such as options, futures, and swap agreements. The Fund may engage in transactions in derivatives for a variety of purposes, including changing the investment characteristics of its portfolio, enhancing total returns or as a substitute for taking a position in an underlying asset.
Performance
For the fiscal year ended March 31, 2019, the Fund’sY-3 share class performance was 4.37% compared to its benchmark return of 4.48%. Performance for the Fund is reported net of fees and operating expenses while the benchmark returns do not include expenses of any kind as indexes are unmanaged.
TheSub-Advisors
As of March 31, 2019, the Fund employed threesub-advisors, Manulife Asset Management (Manulife), Income Research & Management (IR&M) and PGIM Fixed Income, a business unit of PGIM, Inc. (Prudential).
Manulife manages its allocated portion of the Fund by seeking to produce superior results by anticipating shifts in the business cycle and moderating risk relative to the direction of interest rates. The investment team capitalizes on these shifts by using a research-driven process to identify attractive sectors as well as mispriced securities within those sectors.
IR&M manages its allocated portion of the Fund based on the belief that careful security selection and higher portfolio income provide superior returns over the long term. Portfolios are constructed using a disciplined,bottom-up investment approach to select attractive securities from the U.S fixed income universe.
Prudential manages its allocated portion of the Fund by seeking to maximize excess return opportunities from sustainable alpha sources such as sector allocation and bottom- up security selection. This process is coupled with a diligent daily portfolio risk evaluation and monitoring process. Research-based security selection is a major source of added value and incorporates both fundamental analysis as well as proprietary models that identify relative value and detailed technical review of issuers across both benchmark andnon-benchmark sectors, with an emphasis on credit-oriented sectors.
Market Commentary and Fund Performance
For the12-month period ended March 31, 2019, U.S. fixed income market returns, as measured by the Barclay U.S. Aggregate Bond Index, were positive. Generally, price increases of fixed income securities that are not backed by a U.S. Government Guarantee (including Corporate Bonds, Asset Backed Securities, and Commercial Mortgage Backed Securities) more than offset the general drop in prices of U.S. Government securities resulting from rising interest rates during the earlier part of the fiscal year. Intermediate U.S. Treasury rates decreased 0.33% while longer-term interest rates decreased 0.16% year-over-year (with some interim volatility). Yields for the2-year Treasury Note, also referred to as the short end of the Treasury curve, stayed the same year-over-year at 2.27%. The curve flattened throughout most of 2018 and the short end of the curve inverted briefly in
13
Table of Contents
Mercer Core Fixed Income Fund
December. Critically though, the spread between the2-year and10-year Treasury yields narrowed from approximately 50 to 20 basis points by the last day of 2018, and thus remains positive.
U.S. economic growth accelerated from 2.2% in 2017 to 2.9% in 2018. The unemployment rate fell to 3.7%, its lowest rate in 50 years, and wage growth rose from 2.5% to 3.1% over 2018. However, 2018 was a tumultuous period for U.S. and global fixed income markets as central banks moved toward tighter monetary policy and global liquidity declined for the first time in nearly a decade, leading to higher volatility, especially in the riskier segments of the fixed income market. While spreads ground tighter during the first half of the period, a sharprisk-off sentiment took hold of the corporate bond market in the latter part of 2018. This sentiment was supported by idiosyncratic events, a drop in oil prices, weak earnings forecasts, poor U.S. Federal Reserve (“Fed”) policy communication to the market, and increased recession fears. The period also saw a strong U.S. dollar versusnon-U.S. developed and emerging market currencies, Trump administration’s protectionist trade policies escalated trade tension and tariffs between the U.S. and China continued to add volatility in the global financial markets. As a result, investors were aggressively shedding risky assets at the end of 2018 and spreads widened materially. However, risk markets rebounded after the correction seen at the end of 2018, with spreads tightening approximately 140 basis points over the first quarter of 2019. Returns from fixed income securities that are not backed by a U.S. Government guarantee (including corporate bonds, asset backed securities, and commercial mortgage backed securities) were generally positive, as these securities benefitted from strong demand for higher yields. Lower credit quality rated corporate bonds (i.e., high yield or “junk” bonds) tended to provide greater excess returns during the12-month period than the higher credit quality rated corporate bonds (i.e., investment-grade bonds), benefitting from the renewed equity market strength in the latter part of the period, as well as the Fed pausing on raising rates and a continuation of solid earnings.
With Treasury rates staying on hold for longer and the Federal Open Market Committee expressing it will practice patience with increasing the Fed funds target rate given its assessment of slower growth and muted inflation pressures, this more accommodative monetary policy was a welcome development for yield seeking investors. Global investment grade corporate bonds outperformed similar duration Treasuries.
The Fund’s return was positive in absolute terms and it also outperformed in relation to the Bloomberg Barclays U.S. Aggregate Bond Index for the fiscal year ended March 31, 2019. The Fund was helped by its strategic overweight to spread sectors, including an allocation to high yield.
The respective performance results of eachSub-advisor correlated with their risk posture, as more risk translated into more returns in this“risk-on” period. Manulife has the largest share of the risk allocation within the Fund. Manulife’s bias towards corporate credit and its approximate 13% allocation to relatively “higher quality” high yield bonds, led it to have the strongest returns among the Fund’sSub-Advisors for the fiscal year. Manulife also benefited from lower exposure to the2-year and5-year key rates, as yields declined towards the latter part of the period.
Prudential had a less aggressive allocation to spread sectors than Manulife, but it was nonetheless overweight to the spread sectors as spreads tightened, which helped it outperform the index. Prudential also had similar curve positioning to Manulife, with an overweight to the middle end of the curve, and an underweight to the low end that added to outperformance. Prudential also had an overweight to commercial mortgage backed securities, which contributed 17 basis points during the period to its performance.
Similarly, IR&M’s overall underweight to Treasuries benefited the portfolio during the latter part of the period when spread sectors rebounded, but hurt the portfolio in the fourth quarter’srisk-off environment. IR&M’s bias towards higher quality corporate bonds helped it outperform the index, but to a lesser extent than the other two managers who held more lower quality bonds and thus saw a bigger rebound in the beginning of 2019’s spread tightening environment. IR&M’s relative performance was driven by security selection, particularly within the finance, industrial, and utility sectors. Itsout-of-benchmark allocation to Small Business Administration loans detracted as returns from the sector trailed versus comparable corporate and securitized sectors.
14
Table of Contents
Mercer Core Fixed Income Fund
Risk Considerations
The Fund is subject to the risks that the underlying bonds in its portfolio are subject to, including credit, prepayment, call and interest rate risk. As interest rates rise, the value of bond prices will decline. The Fund may invest in foreign securities, which may expose the Fund to currency and exchange rate fluctuations, derivatives (such as futures, options, or swaps) and high yield bonds (also known as “junk” bonds). These investments may cause the Fund to experience greater volatility and less liquidity. Derivatives may be more sensitive to changes in market conditions and may amplify the risk of loss for the Fund. The Fund may experience high portfolio turnover which may result in higher transaction costs and capital gains.
15
Table of Contents
Mercer Funds
March 31, 2019
Comparison of Change in Value of a $10,000 Investment in
Mercer Core Fixed Income Shares vs. the
Bloomberg Barclays U.S. Aggregate Bond™ Index
As of March 31, 2019
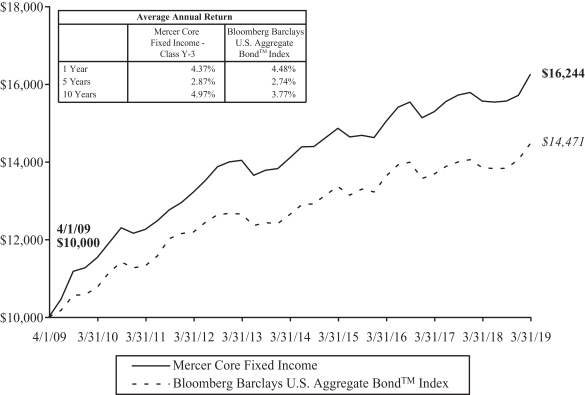
This graph shows the performance of the Mercer Core Fixed Income Fund ClassY-3 shares versus the Bloomberg Barclays U.S. Aggregate Bond™ Index from April 1, 2009 through March 31, 2019. The performance of other classes, when launched, will vary from the performance of the class shown based on the difference in fees and expenses paid by shareholders investing in different share classes. The Fund may charge a 2% redemption fee on shares owned less than 30 days.
The table and graph assume reinvestment of dividends and capital gains, but do not reflect a deduction of taxes an investor might pay on fund distributions or upon redemption of fund shares. Performance shown reflects a fee waiver and/or expense reimbursement. Without this waiver/reimbursement, returns would have been lower.
The data quoted represents past performance and does not guarantee future results. Current performance of the Fund may be lower or higher than the performance quoted. Please call 1-866-658-9896 for the Fund’s most recentmonth-end performance. Investment return and principal value will fluctuate so that an investor’s shares, when redeemed, may be worth more or less than when purchased.
16
Table of Contents
Mercer Opportunistic Fixed Income Fund
Investment Objective and Benchmark
The investment objective of the Fund is to provide long-term total return, which includes capital appreciation and income. The Fund’s primary benchmark is the ICE Bank of America Merrill Lynch Global High Yield 2.0% Constrained Index Unhedged. The Fund’s secondary benchmark is a blended benchmark consisting of 50% JP Morgan Government Bond Index — Emerging Markets Global Diversified and 50% Bank of America Merrill Lynch Global High Yield 2.0% Constrained Index Unhedged.
Investment Strategy
The Fund invests principally in fixed income securities of U.S. andnon-U.S. issuers, including those in emerging and frontier markets. The Fund invests in various strategic and tactical global bond market opportunities without limitations in geography, issuer type, quality and currency denomination. The Fund may invest in derivatives such as futures (including among others, interest rate futures), swaps (currency, interest rate, credit default and total return), forwards, options, and credit-linked notes. The Fund may engage in transactions in derivatives for a variety of purposes, including hedging, risk management, efficient portfolio management, enhance total returns, or as a substitute for taking position in the underlying asset.
Performance
For the fiscal year ended March 31, 2019, the Fund’sY-3 share class performance was-5.15% compared to its primary benchmark return of 3.18% and secondary benchmark return of-2.22%. Performance for the Fund is reported net of fees and operating expenses while the benchmark returns do not include expenses of any kind as indexes are unmanaged.
TheSub-Advisors
As of March 31, 2019, the Fund employed fivesub-advisors and twosub-subadvisors, Western Asset Management Company and Western Asset Management Company Limited (assub-subadvisor) (together referred to as WAMCO), Loomis, Sayles & Company LP (Loomis), BlackRock International Limited (BlackRock), Colchester Global Investors Limited (Colchester), and T. Rowe Price Associates, Inc. and T. Rowe Price International Limited (assub-subadvisor) (together referred to as T. Rowe). WAMCO, Loomis, BlackRock, and Colchester began managing the Fund in June 2018, and T. Rowe began managing the Fund in September 2018. Before being terminated in June 2018, Franklin Advisers, Inc. (Franklin) and Investec Asset Management Limited (Investec) were thesub-advisors to the Fund.
In managing its allocated portion of the Fund’s portfolio, Loomis invests in debt of issuers globally. Loomis produces country and credit cycle views as inputs to portfolio construction. Security selection is then carried out by a team of credit analysts who maintain a comprehensive database of internal ratings. The team will also engage in active duration positioning although security and sector selection are identified as main drivers of performance.
In managing its allocated portion of the Fund’s portfolio, WAMCO invests in credit securities across sectors and geographies. The strategy focuses on global valuations in credit and volatility conditions. The strategy seeks a blend of income and capital appreciation by dynamically rotating across sectors such as global corporates, emerging markets, and structured credit, and tactically managing overall portfolio duration.
In managing its allocated portion of the Fund’s portfolio, Colchester invests in sovereign debt issued by emerging market borrowers and those denominated in local emerging market currencies. Colchester’s portfolio construction process is based on a quantitative model that promotes allocation to countries and currencies identified based on attractive real yields and sound financial characteristics.
17
Table of Contents
Mercer Opportunistic Fixed Income Fund
In managing its allocated portion of the Fund’s portfolio, BlackRock invests in emerging market debt securities denominated in local currency. BlackRock’s portfolio construction process implements a top down philosophy focused on identifying economic or market themes that impact asset prices. The themes inform the team’s market views and portfolios are positioned to benefit from directional moves in the market.
In managing its allocated portion of the Fund’s portfolio, T. Rowe employs an absolute return bond strategy which, through a risk-awaremind-set, is expected to provide downside protection over shorter periods of time, and achieve its target through incremental alpha generation. The strategy may take sizable positions in credit and emerging markets, although will do so from a long and short perspective, reducing the level of overall beta. A large driver of returns will be duration management and country selection, although currency and sector selection are also expected to contribute.
Market Commentary and Fund Performance
For the12-month period ended March 31, 2019, U.S. and global fixed income markets experienced a tumultuous period as central banks moved toward tighter monetary policy and global liquidity declined for the first time in nearly a decade, leading to higher volatility, especially in the riskier segments of the fixed income market. While spreads ground tighter during the first half of the period, a sharprisk-off sentiment took hold of the corporate bond market in the latter part of 2018. This sentiment was supported by idiosyncratic events, a drop in oil prices, weak earnings forecasts, poor U.S. Federal Reserve (“Fed”) policy communication to the market, and increased recession fears. The period also saw a strong U.S. dollar versus non-U.S. developed and emerging market currencies, Trump administration’s protectionist trade policies escalated trade tension and tariffs between the U.S. and China continued to add volatility in the global financial markets. As a result, investors were aggressively shedding risky assets at the end of 2018 and spreads widened materially. However, risk markets rebounded after the correction seen at the end of 2018, with spreads tightening approximately 140 basis points over the first quarter of 2019.
After declining early in the period, U.S. Treasury securities prices generally moved upward at a slow rate. U.S. Treasury yields reached highs for the period in November 2018 as a result of market perception of a brewing recession and rising U.S. inflation. The ICE Bank of America Merrill Lynch Global High Yield 2% Constrained Index Unhedged experienced a massive widening in its yield spread (i.e., the difference in yield of the securities comprising the index over U.S. Treasuries, which is a measure of risk premium), ending the Fund’s fiscal year with a yield spread of 526 basis points and an overall effective yield of 7.77%, and sharply underperforming investment grade bonds in thisrisk-off environment.
Unhedged emerging markets (“EM”) local currency bonds produced average positive returns over the period, driven by weaker EM currency markets given the strength of the U.S. dollar. Declining EM inflation numbers and uncertainty around a plethora of elections ultimately resulted in modest inflows into the asset class over the period. While massive distortions in global asset allocation favored developed markets and worked against emerging markets through the fourth quarter’srisk-off environment, the beginning of 2019 saw this unwind, which benefited emerging market local markets.
During the period, WAMCO and Loomis outperformed the 50/50 benchmark, benefiting from ending the period overweight to spread sectors which rebounded in 2019 as risk and liquidity returned to the markets. However, as both strategies were underweight in high yield relative to the 50/50 benchmark during the fourth quarter’s spread widening environment, the structural under-representation of high yield in the portfolios did not offer the Fund as much rebound during the first quarter of 2019.
During the period, Colchester outperformed in emerging markets, measured against the JP Morgan Global Diversified Emerging Market government bond benchmark for its strategy. However, general weakness in emerging market currencies versus the U.S. dollar has reduced the overall return in absolute terms, underperforming the Fund’s benchmark.
18
Table of Contents
Mercer Opportunistic Fixed Income Fund
BlackRock ended the period, outperforming the JP Morgan Global Diversified Emerging Market government bond index, benefiting from overweight to Brazil bonds and the Turkish lira.
During the period, T. Rowe underperformed itsT-Bill + 200 benchmark. This was driven by risk markets rebounding after the December 2018 correction, and T. Rowe’s defensive sector positioning detracting from returns during the latter part of the period. Short positioning in the Eurozone via positions in Germany and France also detracted as weaker growth data saw aflight-to-quality in those regions. Currency positioning also dragged on performance as the decision to maintain a short dollar stance detracted during the period.
Prior to their removal from the Fund in June 2018, Franklin Templeton unperformed during the period primarily because of the portfolio’s overall lower-quality bias, which was detrimental in therisk-off period at the beginning of the period. Its exposure to higher-beta energy names was also adversely impacted from the market volatility during the period.
Prior to their removal from the Fund in June 2018, Investec outperformed during the period driven by both country and currency allocation decisions. Positions in South African and Egyptian bonds added to performance while an overweight to Indonesia bonds detracted from returns. From a currency perspective, their continued overweight to the Malaysian ringgit added value to the portfolio.
Risk Considerations
The Fund invests innon-investment grade and emerging market fixed income securities which involves certain risks such as higher volatility, currency fluctuation, political and social instability and reduced market liquidity. The Fund is subject to the risks that the underlying bonds in its portfolio are subject to, including credit, prepayment, call and interest rate risk. As interest rates rise, the value of bond prices will decline. The Fund may invest in foreign securities, which may expose the Fund to currency and exchange rate fluctuations, derivatives (such as futures, options, or swaps) and high yield bonds (also known as “junk” bonds). These investments may cause the Fund to experience greater volatility and less liquidity. Derivatives may be more sensitive to changes in market conditions and may amplify the risk of loss for the Fund. The Fund may experience high portfolio turnover which may result in higher transaction costs and capital gains.
19
Table of Contents
Mercer Funds
March 31, 2019
Comparison of Change in Value of a $10,000 Investment in
Mercer Opportunistic Fixed Income Shares vs. the
ICE Bank of America Merrill Lynch Global High Yield 2% Constrained Index Unhedged and the Fund’s Secondary Index1
As of March 31, 2019
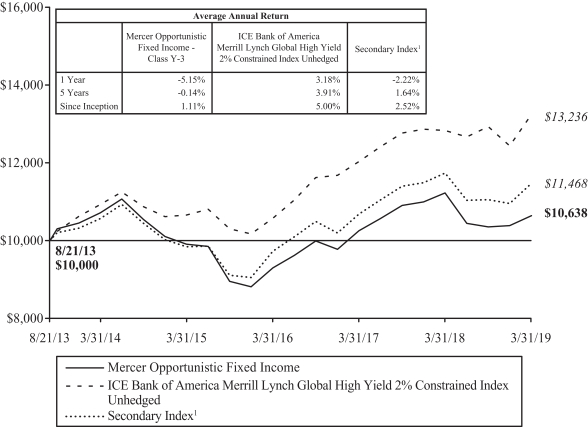
This graph shows the performance of the Mercer Opportunistic Fixed Income Fund Class Y-3 shares versus the ICE Bank of America Merrill Lynch Global High Yield 2% Constrained Index Unhedged and the Fund’s Secondary Index1 from August 21, 2013, which is the inception date of the Fund, through March 31, 2019. The performance of other classes, when launched, will vary from the performance of the class shown based on the difference in fees and expenses paid by shareholders investing in different share classes. The Fund may charge a 2% redemption fee on shares owned less than 30 days.
The table and graph assume reinvestment of dividends and capital gains, but do not reflect a deduction of taxes an investor might pay on fund distributions or upon redemption of fund shares. Performance shown reflects a fee waiver and/or expense reimbursement. Without this waiver/reimbursement, returns would have been lower.
1 The Mercer Opportunistic Fixed Income Fund’s Secondary Index is a blended benchmark consisting of 50% JP Morgan Government Bond Index — Emerging Markets Global Diversified USD Unhedged and 50% Bank of America Merrill Lynch Global High Yield 2% Constrained Index Unhedged.
The data quoted represents past performance and does not guarantee future results. Current performance of the Fund may be lower or higher than the performance quoted. Please call 1-866-658-9896 for the Fund’s most recentmonth-end performance. Investment return and principal value will fluctuate so that an investor’s shares, when redeemed, may be worth more or less than when purchased.
20
Table of Contents
Mercer Emerging Markets Equity Fund
Investment Objective and Benchmark
The investment objective of the Fund is to provide long-term total return, which includes capital appreciation and income. The benchmark for the Fund is the MSCI Emerging Markets Index.
Investment Strategy
The Fund invests principally in equity securities of large, medium and small capitalization companies, located in emerging markets, other investments that are tied economically to emerging markets, as well as in American, European and Global Depository receipts. Stock index futures and various types of swaps may be used to implement the country selection component of the Fund’s investment strategy. Currency forwards may be used to make stock-selection and country allocation decisions independently of the underlying currency.
Performance
For the fiscal year ended March 31, 2019, the Fund’sY-3 share class performance was-10.20% compared to its benchmark return of-7.41%. Performance for the Fund is reported net of fees and operating expenses while the benchmark returns do not include expenses of any kind as indexes are unmanaged.
TheSub-Advisors
As of March 31, 2019, the Fund employed sevensub-advisors: AQR Capital Management, LLC (AQR), Dimensional Fund Advisors LP (DFA), Janus Capital Management LLC (Janus), Mondrian Investment Partners Limited (Mondrian), Copper Rock Capital Partners LLC (Copper Rock), William Blair Investment Management, LLC (William Blair) and Parametric Portfolio Associates LLC (Parametric).
AQR employs a systematic, research-driven investment approach focused on generating excess return relative to the benchmark from currency, country and security selection strategies. AQR’s proprietary investment process uses fundamental factors, such as value, momentum and quality within its models. AQR uses quantitative tools to construct optimized portfolios based on this diversified set of fundamental factors, along with estimates of risk and transactions costs.
DFA benefits from a robust research platform, which includes close ties to academia, its clear and long-standing focus on exploiting risk premiums, most notably value and size, along with the new addition profitability, and a systematic approach to building and trading its portfolios. DFA’s process is repeatable and results in broad consistent exposures to the risk premiums.
Janus’ emerging markets strategy is based on the importance of limiting the potential for permanent loss of capital by investing with businesses and management teams that have a track record of generating value for shareholders. The strategy is managed with a long-term, unconstrained, absolute returnmind-set, and singular focus on identifying and investing in companies with sustainable, enduring business models.
Copper Rock specializes in small cap equity investing using a blend of quantitative and fundamental analyses to identify companies with superior growth relative to their peers. Copper Rock’s portfolio typically exhibits factor exposures to growth, momentum and quality.
Mondrian is an experienced value manager that uses a Dividend Discount Model to analyze and find attractive companies focused on the domestic oriented growth of emerging markets. Along with emerging market domiciled companies, Mondrian’s management team will also consider any company globally that generates at least 25% of revenues/profits from emerging/frontier markets.
21
Table of Contents
Mercer Emerging Markets Equity Fund
William Blair has a quality growth philosophy and process focused on finding those companies that can achieve a higher growth rate for a longer period of time than the market expects. William Blair looks for companies with experienced and motivated management teams, unique business models and attractive financial characteristics.
Parametric utilizes exchange-traded futures to generate market exposure corresponding to the Fund’s benchmark.
Market Commentary and Fund Performance
As a group, global developed equity markets rose, as measured by the MSCI World Index, which increased 4.0% during the12-month period ended March 31, 2019. U.S. equities rallied considerably, with the Russell 1000 Index up 9.3% for the fiscal year. Outside of the U.S., international developed markets did not perform as well, as the MSCI EAFE Index returned-3.7% over the period. The MSCI Emerging Markets Index (the Fund’s benchmark) returned-7.4% for the12-month period ended March 31, 2019.
During the second and third quarters of 2018, equity markets rallied after correcting in the first quarter of the year. U.S. stocks easily outpaced international equities as the benefits of the corporate tax cuts flowed through to U.S. corporate earnings. As always, there were plenty of concerns on the minds of global investors during this period including: tightening financial conditions (two Federal Reserve rate hikes during this period and the termination of asset purchases by the European Central Bank despite an uncertain growth outlook, ongoing trade tensions, slowing global growth, cautious forward guidance in corporate earnings reports. For investors in Europe, uncertainty surrounding the passage of the Brexit deal, protests in France and slowing growth weighed on market returns. Emerging markets equity markets fell throughout most of 2018 after peaking in January. Chinese economic growth continued to trend lower and equity market investors also had consider the effects of continued U.S.-China trade tensions. Manufacturing growth, in the largest component of the emerging markets benchmark, landed at the slowest pace seen in more than two years.
In contrast to the second and third quarters, the fourth quarter of 2018 proved to be a rocky ride in global equity markets with volatility increasing materially. Global equity markets began to fall swiftly as economic indicators softened across developed markets at the same time most central banks remained determined to continue down the path of monetary tightening. Although emerging markets weathered the fourth quarter’s globalsell-off relatively well, they still lagged developed equities by close to 6% during calendar year 2018. Rising rates and difficult trade negotiations had hit emerging markets earlier in the year.
In a sharp reversal, and despite slowing global growth and cautious forward guidance in corporate earnings reports, developed and emerging equity markets rallied significantly during the first quarter of 2019. The rally was driven by promising progress on trade negotiations, a solid fourth quarter 2018 earnings season and the U.S. Federal Reserve’s (“Fed”) increasing flexibility over the future interest rate policy and balance sheet reductions. In the first quarter of 2019, China led the rally in emerging market equities, as investors anticipated a U.S.-China trade resolution. Improved manufacturing reports and the news that the index provider MSCI plans to increase theChina-A share weight in its equity indexes provided more tailwinds for Chinese equities.
In this environment, the Mercer Emerging Markets Equity Fund underperformed the MSCI Emerging Markets Index (“MSCI EM Index”) by 2.9% (net) for the12-month period ended March 31, 2019. Negative stock selection was the largest driver of the Fund’s underperformance. Collectively, the managers struggled to generate alpha, mainly in the energy, industrials and materials sectors. Positive stock selection was generated in the consumer discretionary and consumer staples sectors. In terms of sector allocation, the Fund lost ground relative to the benchmark due to an underweight to energy and an overweight to the healthcare sector. An overweight to the communication services sector was beneficial to relative returns. At a country level, the Fund held an underweight to South Korea, which helped relative performance.
22
Table of Contents
Mercer Emerging Markets Equity Fund
The Mercer Emerging Markets Equity Fund has a larger weighting to smaller capitalization stocks versus the MSCI EM Index. That overweight generated negative returns during this period, as smaller cap emerging markets stocks as a group underperformed larger cap stocks. Offsetting some of the relative losses, caused by an overweight to small cap stocks, was the Fund’s overweight to higher dividend yielding securities. Higher dividend yielding securities were sought by investors as they can often provide some downside protection during market corrections.
Among thesub-advisors DFA, Mondrian and William Blair generated positive relative returns over the period. AQR and CopperRock trailed the MSCI EM Index. Janus performed close to the benchmark return.
AQR trailed the MSCI EM Index significantly during the trailing12-month period. Stock selection was the primary driver of this underperformance, while country and currency selection also detracted over the period. From an investment theme perspective, the value and momentum themes were the main detractors from performance over this period.
Copper Rock trailed the Fund’s benchmark during this period as small cap emerging market stocks underperformed large cap stocks. Copper Rock also trailed the MSCI Emerging Markets Small Cap Index over the last year due to negative stock selection. The strategy’s intentional overweight to earnings momentum provided positive allocation, however the correlated overweight to price momentum was a drag on relative performance. The underweight to the utilities sector also hurt.
DFA outperformed the benchmark for the period, benefiting from positive stock selection. With low relative price (value) stocks generally outperforming high relative price (growth) stocks, DFA’s focus on value stocks was the primary driver of outperformance relative to the style-neutral index.
The Janus portfolio performed in line with the MSCI EM Index during the trailing 12 months. The strategy has benefitted from its higher exposure to consumer focused sectors. Also, the portfolio’s underweight to banks was beneficial to relative performance. What hurt relative performance over the last year was exposure to smaller capitalization companies along with a higher exposure to the South African Rand versus the benchmark weight.
William Blair outperformed the benchmark during the year, as the portfolio’s focus on quality growth companies was rewarded by the market. Positive stock selection and an underweight to South Korea were drivers of positive relative performance. The strategy’s underweight to companies with high leverage and an overweight allocation to India also proved to be beneficial to relative returns.
Mondrian outperformed the MSCI EM Index during the trailing12-month period. The strategy’s focus on defensive, quality companies helped boost relative performance as markets corrected during this period. Mondrian was also boosted by its higher weighting to dividend yield versus the benchmark, as investors tended to prefer stable, income oriented companies during the market drop. An underweight to the South African Rand also generated positive relative gains.
Parametric utilizes exchange-traded futures replicating the Fund’s benchmark, aiming to provide broad, passive, equity market exposure to the Fund’s liquidity sleeve, and seeking to create positive returns on assets that would have otherwise been earning cash or cash equivalent returns. Performance differences versus the benchmark are largely a result of cash flow effects related to daily subscription/redemption activity and through financing costs of futures relative to interest earned on cash.
Risk Considerations
The Fund invests in emerging market securities which involves certain risks such as currency volatility, political and social instability and reduced market liquidity. Emerging markets may be more volatile and less liquid than more developed markets and therefore may involve greater risks. Investments made in small andmid-capitalization
23
Table of Contents
Mercer Emerging Markets Equity Fund
companies may be more volatile and less liquid due to limited resources or product lines and more sensitive to economic factors. The Fund may invest in derivatives (such as futures, forwards, options, or swaps), which may cause the Fund to experience greater volatility and less liquidity. Derivatives may be more sensitive to changes in market conditions and may amplify the risk of loss for the Fund. The Fund may experience high portfolio turnover which may result in higher transaction costs and capital gains.
24
Table of Contents
Mercer Funds
March 31, 2019
Comparison of Change in Value of a $10,000 Investment in
Mercer Emerging Markets Equity Shares vs. the
MSCI Emerging Markets Index
As of March 31, 2019
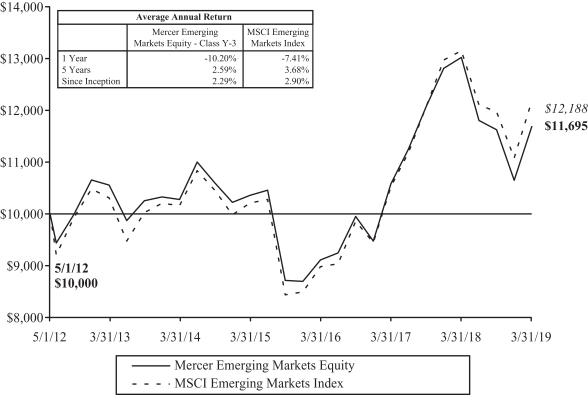
This graph shows the performance of the Mercer Emerging Markets Equity Fund Class Y-3 shares versus the MSCI Emerging Markets Index from May 1, 2012, which is the inception date of the Fund, through March 31, 2019. The performance of other classes, when launched, will vary from the performance of the class shown based on the difference in fees and expenses paid by shareholders investing in different share classes. The Fund may charge a 2% redemption fee on shares owned less than 30 days.
The table and graph assume reinvestment of dividends and capital gains, but do not reflect a deduction of taxes an investor might pay on fund distributions or upon redemption of fund shares. Performance shown reflects a fee waiver and/or expense reimbursement. Without this waiver/reimbursement, returns would have been lower.
The data quoted represents past performance and does not guarantee future results. Current performance of the Fund may be lower or higher than the performance quoted. Please call 1-866-658-9896 for the Fund’s most recentmonth-end performance. Investment return and principal value will fluctuate so that an investor’s shares, when redeemed, may be worth more or less than when purchased.
25
Table of Contents
Mercer Global Low Volatility Equity Fund
Investment Objective and Benchmark
The investment objective of the Fund is to provide long-term total return, which includes capital appreciation and income. The benchmark for the Fund is the MSCI World Index.
Investment Strategy
The Fund invests principally in equity securities of U.S. and foreign issuers, of large, medium and small capitalization companies. Stock index futures and various types of swaps may be used to implement the equity security selection component of the Fund’s investment strategy. Currency forwards may be used to make stock-selection and country allocation decisions independently of the underlying currency.
Performance
For the fiscal year ended March 31, 2019, the Fund’sY-3 share class performance was 6.92% compared to its benchmark return of 4.01%. Performance for the Fund is reported net of fees and operating expenses while the benchmark returns do not include expenses of any kind as indexes are unmanaged.
TheSub-Advisors
As of March 31, 2019, the Fund employed fivesub-advisors, Acadian Asset Management LLC (Acadian), Martingale Asset Management, L.P. (Martingale), Wellington Management Company LLP (Wellington), Veritas Asset Management LLC (Veritas) and Parametric Portfolio Associates LLC (Parametric). Wellington and Veritas weresub-advisors for only part of the year, having been added in December, 2018. Before being terminated in December of 2018, MFG Asset Management (MFG) was also asub-advisor to the Fund.
Acadian’s process uses both risk analysis and stock forecasts to build the portfolio. The process uses a risk model to determine the systematic risk and the level of volatility of each stock in the investable universe. Once a stock’s risk is determined, Acadian uses its stock forecast model as an overlay to determine the optimal mix of securities. Acadian’s security return forecasting model incorporates five categories including value, growth, risk, macroeconomic, and technical factors.
Martingale’s approach to low volatility investing is built around a risk-adjusted market index methodology which promotes broad and stable diversification combined with a valuation overlay that favors low risk companies with stronger fundamentals. Martingale’s systematic stock evaluation incorporates measures of relative valuation, growth and quality, along with each security’s risk properties.
Wellington uses abottom-up strategy with a focus on companies that are often overlooked by other investors, but where there is a high degree of stability and predictability that should drive returns. Wellington believes that stability of cash flows is undervalued in companies that do not meet the specific criteria of growth, quality or value investors, or in companies in areas of the market (small capitalization, certain sectors or geographies) not normally associated with stability.
Veritas uses a long-term, unconstrained, fundamentally driven rigorous research process with a long term horizon. Veritas believes that companies with sustainable competitive advantages, benefitting from long-term drivers of growth and purchased at attractive valuations, will deliver performance in excess of a benchmark over time. The strategy may hold up to 20% cash. Veritas has a clear focus on the characteristics of companies it seeks to invest in by structuring them as a mix of sector specialists and generalists.
Parametric utilizes exchange-traded futures to generate market exposure corresponding to the Fund’s benchmark.
26
Table of Contents
Mercer Global Low Volatility Equity Fund
Market Commentary and Fund Performance
As a group, global developed equity markets rose, as measured by the MSCI World Index (the Fund’s benchmark), which increased 4.0% during the12-month period ended March 31, 2019. U.S. equities rallied considerably, with the Russell 1000 Index up 9.3% for the fiscal year. Outside of the U.S., international developed markets did not perform as well, as the MSCI EAFE Index returned-3.7% over the period. The MSCI Emerging Markets Index returned-7.4% for the12-month period ended March 31, 2019.
During the second and third quarters of 2018, equity markets rallied after correcting in the first quarter of the year. U.S. stocks easily outpaced international equities as the benefits of the corporate tax cuts flowed through to U.S. corporate earnings. As always, there were plenty of concerns on the minds of global investors during this period including: tightening financial conditions (two Federal Reserve rate hikes during this period and the termination of asset purchases by the European Central Bank despite an uncertain growth outlook, ongoing trade tensions, slowing global growth, cautious forward guidance in corporate earnings reports. For investors in Europe, uncertainty surrounding the passage of the Brexit deal, protests in France and slowing growth weighed on market returns. Emerging markets equity markets fell throughout most of 2018 after peaking in January. Chinese economic growth continued to trend lower and equity market investors also had to consider the effects of continued U.S.-China trade tensions. Manufacturing growth, in the largest component of the emerging markets benchmark, landed at the slowest pace seen in more than two years.
In contrast to the second and third quarters, the fourth quarter of 2018 proved to be a rocky ride in global equity markets with volatility increasing materially. Global equity markets began to fall swiftly as economic indicators softened across developed markets at the same time most central banks remained determined to continue down the path of monetary tightening. Although emerging markets weathered the fourth quarter’s globalsell-off relatively well, they still lagged developed equities by close to 6% during calendar year 2018. Rising rates and difficult trade negotiations had hit emerging markets earlier in the year.
In a sharp reversal, and despite slowing global growth and cautious forward guidance in corporate earnings reports, developed and emerging equity markets rallied significantly during the first quarter of 2019. The rally was driven by promising progress on trade negotiations, a solid fourth quarter 2018 earnings season and the U.S. Federal Reserve’s (“Fed”) increasing flexibility over the future interest rate policy and balance sheet reductions. In the first quarter of 2019, China led the rally in emerging market equities, as investors anticipated a U.S.-China trade resolution. Improved manufacturing reports and the news that the index provider MSCI plans to increase theChina-A share weight in its equity indexes provided more tailwinds for Chinese equities.
The Mercer Global Low Volatility Equity Fund returned 6.92%, outperforming the MSCI World Index by 4.01% for the12-month period ended March 31, 2019. The Fund’s defensive posture — lower beta and volatility — led to significant outperformance during the marketsell-off in Q4 2018. During the Q1 2019 market rally, the Fund underperformed only moderately, thus preserving its positive active return for the fiscal year.
The Martingale strategy, which provides U.S. large cap exposure for the Fund, outperformed Russell 1000 Index by 1.65%. The defensive nature of the strategy led to a strong outperformance during the 2018year-endsell-off. This helped to secure positive relative return for the fiscal year despite the fact that the strategy lagged in performance during periods of market rally in Q2 of 2018 and Q1 of 2019. From a style perspective, the main contributors to the outperformance were having lower beta and being overweight to higher dividend yield stocks. Martingale held overweight positions in defensive sectors such as health care, real estate and utilities, as well as IT services and software industries, and held underweight positions in banks, which were contributing factors to outperformance. An overweight allocation tomid-capitalization stocks as well as weak security selection within information technology and consumer discretionary sectors were the largest detractors from relative performance.
27
Table of Contents
Mercer Global Low Volatility Equity Fund
The Acadian strategy, which provides international equity exposure for the Fund, outperformed the MSCI World ex US Index by 0.69%. The defensive nature of the strategy led to an outperformance during the 2018year-endsell-off. Although the strategy lagged during the periods of market rally, it finished the fiscal year with positive relative performance. The main contributor to outperformance was lower beta. In addition, being overweight to defensive sectors such as health care and utilities and underweight to cyclical sectors such as automobiles and capital goods added to outperformance. An overweight allocation tomid-capitalization stocks as well weak security selection within the retail and material and mining industries were the largest detractors from relative performance.
During the period when MFG was in the Fund, it significantly outperformed its benchmark, MSCI World. The outperformance was driven by lower beta achieved through large cash allocation, significant overweight to information technology sector as well as strong security selection.
Wellington was added to the Fund on December 19, 2018. Since inception until March 31, 2019, it outperformed its benchmark, MSCI World, by 2.97%. The outperformance came predominately from strong security selection in the industrials, health care, materials, and real estate sectors. Not holding bank stocks, one of the worst performingsub-sectors, also added to the positive relative performance. Security selection within utilities, an underweight allocation to information technology, and an overweight allocation tomid-capitalization stocks detracted from relative performance.
Veritas was added to the Fund on December 19, 2018. Since inception until March 31, 2019, it underperformed its benchmark, MSCI World, by 1.35%. Allocation to cash, and being overweight to health care and media industries detracted from the performance. Being underweight to Japan, as well as strong security selection in communications services, consumer staples, industrials and financials contributed positively to the performance.
Parametric utilizes exchange-traded futures replicating the Fund’s benchmark, aiming to provide broad, passive, equity market exposure to the Fund’s liquidity sleeve and seeking to create positive returns on assets that would have otherwise been earning cash or cash equivalent returns. Performance differences versus the benchmark are largely a result of cash flow effects related to daily subscription/redemption activity and through financing costs of futures relative to interest earned on cash.
Risk Considerations
The Fund invests in foreign and emerging market securities which involves certain risks such as currency volatility, political and social instability and reduced market liquidity. Emerging markets may be more volatile and less liquid than more developed markets and therefore may involve greater risks. Investments made in small andmid-capitalization companies may be more volatile and less liquid due to limited resources or product lines and more sensitive to economic factors. The Fund may invest in derivatives (such as futures, forwards, options, or swaps), which may cause the Fund to experience greater volatility and less liquidity. Derivatives may be more sensitive to changes in market conditions and may amplify the risk of loss for the Fund. The Fund may experience high portfolio turnover which may result in higher transaction costs and capital gains.
28
Table of Contents
Mercer Funds
March 31, 2019
Comparison of Change in Value of a $10,000 Investment in
Mercer Global Low Volatility Equity Shares vs. the
MSCI World Index
As of March 31, 2019
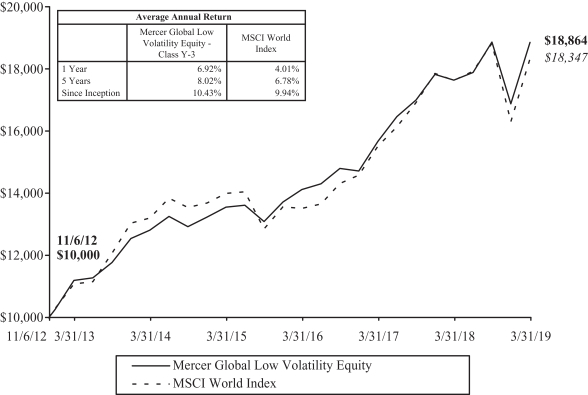
This graph shows the performance of the Mercer Global Low Volatility Equity Fund Class Y-3 shares versus the MSCI World Index from November 6, 2012, which is the inception date of the Fund, through March 31, 2019. The performance of other classes, when launched, will vary from the performance of the class shown based on the difference in fees and expenses paid by shareholders investing in different share classes. The Fund may charge a 2% redemption fee on shares owned less than 30 days.
The table and graph assume reinvestment of dividends and capital gains, but do not reflect a deduction of taxes an investor might pay on fund distributions or upon redemption of fund shares. Performance shown reflects a fee waiver and/or expense reimbursement. Without this waiver/reimbursement, returns would have been lower.
The data quoted represents past performance and does not guarantee future results. Current performance of the Fund may be lower or higher than the performance quoted. Please call 1-866-658-9896 for the Fund’s most recentmonth-end performance. Investment return and principal value will fluctuate so that an investor’s shares, when redeemed, may be worth more or less than when purchased.
29
Table of Contents
Mercer US Large Cap Equity Fund
(showing percentage of net assets)
March 31, 2019
| Shares | Description | Value ($) | ||||||||
COMMON STOCKS — 95.2% |
| |||||||||
| Aerospace & Defense — 0.5% | ||||||||||
| 23,109 | Spirit AeroSystems Holdings, Inc. Class A | 2,115,167 | ||||||||
|
| |||||||||
| Agriculture — 0.3% | ||||||||||
| 15,920 | Altria Group, Inc. | 914,286 | ||||||||
| 1,087 | Philip Morris International, Inc. | 96,080 | ||||||||
|
| |||||||||
| 1,010,366 | ||||||||||
|
| |||||||||
| Airlines — 2.0% | ||||||||||
| 55,103 | American Airlines Group, Inc. | 1,750,071 | ||||||||
| 58,282 | Delta Air Lines, Inc. | 3,010,265 | ||||||||
| 19,412 | Southwest Airlines Co. | 1,007,677 | ||||||||
| 26,515 | United Continental Holdings, Inc.* | 2,115,367 | ||||||||
|
| |||||||||
| 7,883,380 | ||||||||||
|
| |||||||||
| Apparel — 2.0% | ||||||||||
| 20,897 | Canada Goose Holdings, Inc.* ‡ | 1,003,474 | ||||||||
| 29,150 | LVMH Moet Hennessy Louis Vuitton SE, ADR‡ | 2,148,647 | ||||||||
| 46,897 | NIKE, Inc. Class B | 3,949,196 | ||||||||
| 5,038 | Ralph Lauren Corp. Class A | 653,328 | ||||||||
|
| |||||||||
| 7,754,645 | ||||||||||
|
| |||||||||
| Auto Manufacturers — 0.9% | ||||||||||
| 61,503 | General Motors Co. | 2,281,761 | ||||||||
| 18,165 | PACCAR, Inc. | 1,237,763 | ||||||||
|
| |||||||||
| 3,519,524 | ||||||||||
|
| |||||||||
| Auto Parts & Equipment — 0.6% | ||||||||||
| 14,865 | Goodyear Tire & Rubber Co. (The) | 269,800 | ||||||||
| 39,894 | Magna International, Inc. Class A | 1,942,439 | ||||||||
|
| |||||||||
| 2,212,239 | ||||||||||
|
| |||||||||
| Banks — 5.1% | ||||||||||
| 181,600 | Banco Santander SA, ADR‡ | 840,808 | ||||||||
| 79,491 | Bank of America Corp. | 2,193,157 | ||||||||
| 4,051 | BB&T Corp. | 188,493 | ||||||||
| 119,464 | Citigroup, Inc. | 7,433,050 | ||||||||
| 38,849 | Citizens Financial Group, Inc. | 1,262,593 | ||||||||
| 15,663 | Comerica, Inc. | 1,148,411 | ||||||||
| 108,259 | Fifth Third Bancorp | 2,730,292 | ||||||||
| 19,550 | JPMorgan Chase & Co. | 1,979,046 | ||||||||
| 135,363 | Regions Financial Corp. | 1,915,386 | ||||||||
| 4,005 | Wells Fargo & Co. | 193,522 | ||||||||
|
| |||||||||
| 19,884,758 | ||||||||||
|
| |||||||||
See accompanying Notes to the Financial Statements.
30
Table of Contents
Mercer US Large Cap Equity Fund
Schedule of Investments (Continued)
(showing percentage of net assets)
March 31, 2019
| Shares | Description | Value ($) | ||||||||
| Beverages — 3.9% | ||||||||||
| 50,550 | Anheuser-Busch InBev SA, ADR‡ | 4,244,683 | ||||||||
| 110,717 | Coca-Cola Co. (The) | 5,188,199 | ||||||||
| 9,948 | Diageo Plc, ADR‡ | 1,627,592 | ||||||||
| 20,800 | Molson Coors Brewing Co. Class B | 1,240,720 | ||||||||
| 15,820 | Monster Beverage Corp.* | 863,456 | ||||||||
| 16,164 | PepsiCo, Inc. | 1,980,898 | ||||||||
|
| |||||||||
| 15,145,548 | ||||||||||
|
| |||||||||
| Biotechnology — 2.1% | ||||||||||
| 14,557 | Alexion Pharmaceuticals, Inc.* | 1,967,815 | ||||||||
| 15,090 | Amgen, Inc. | 2,866,798 | ||||||||
| 14,312 | Exact Sciences Corp.* ‡ | 1,239,706 | ||||||||
| 8,800 | Gilead Sciences, Inc. | 572,088 | ||||||||
| 5,324 | Illumina, Inc.* | 1,654,114 | ||||||||
|
| |||||||||
| 8,300,521 | ||||||||||
|
| |||||||||
| Building Materials — 0.2% | ||||||||||
| 23,660 | Masco Corp. | 930,075 | ||||||||
|
| |||||||||
| Chemicals — 1.3% | ||||||||||
| 14,920 | DowDuPont, Inc. | 795,385 | ||||||||
| �� | 11,600 | Eastman Chemical Co. | 880,208 | |||||||
| 24,000 | Huntsman Corp. | 539,760 | ||||||||
| 12,052 | Mosaic Co. (The) | 329,140 | ||||||||
| 5,905 | Sherwin-Williams Co. (The) | 2,543,343 | ||||||||
|
| |||||||||
| 5,087,836 | ||||||||||
|
| |||||||||
| Commercial Services — 2.9% | ||||||||||
| 24,439 | New Oriental Education & Technology Group, Inc., ADR* | 2,201,710 | ||||||||
| 20,710 | PayPal Holdings, Inc.* | 2,150,526 | ||||||||
| 24,173 | Quanta Services, Inc. | 912,289 | ||||||||
| 14,624 | Robert Half International, Inc. | 952,900 | ||||||||
| 7,297 | S&P Global, Inc. | 1,536,383 | ||||||||
| 26,828 | Square, Inc. Class A* | 2,009,954 | ||||||||
| 77,350 | Weight Watchers International, Inc.* ‡ | 1,558,602 | ||||||||
|
| |||||||||
| 11,322,364 | ||||||||||
|
| |||||||||
| Computers — 1.4% | ||||||||||
| 3,193 | Apple, Inc. | 606,510 | ||||||||
| 17,959 | Cognizant Technology Solutions Corp. Class A | 1,301,130 | ||||||||
| 63,730 | HP, Inc. | 1,238,274 | ||||||||
| 12,542 | NetApp, Inc. | 869,662 | ||||||||
| 30,056 | Seagate Technology Plc | 1,439,382 | ||||||||
|
| |||||||||
| 5,454,958 | ||||||||||
|
| |||||||||
| Cosmetics & Personal Care — 0.2% | ||||||||||
| 13,845 | Colgate-Palmolive Co. | 948,936 | ||||||||
|
| |||||||||
See accompanying Notes to the Financial Statements.
31
Table of Contents
Mercer US Large Cap Equity Fund
Schedule of Investments (Continued)
(showing percentage of net assets)
March 31, 2019
| Shares | Description | Value ($) | ||||||||
| Distribution & Wholesale — 0.3% | ||||||||||
| 25,781 | HD Supply Holdings, Inc.* | 1,117,606 | ||||||||
|
| |||||||||
| Diversified Financial Services — 6.1% | ||||||||||
| 109,101 | Ally Financial, Inc. | 2,999,187 | ||||||||
| 14,600 | American Express Co. | 1,595,780 | ||||||||
| 28,029 | Ameriprise Financial, Inc. | 3,590,515 | ||||||||
| 128,166 | Charles Schwab Corp. (The) | 5,480,378 | ||||||||
| 14,925 | Discover Financial Services | 1,062,063 | ||||||||
| 15,900 | E*TRADE Financial Corp. | 738,237 | ||||||||
| 35,873 | Franklin Resources, Inc.‡ | 1,188,831 | ||||||||
| 39,200 | Invesco, Ltd. | 756,952 | ||||||||
| 3,368 | Mastercard, Inc. Class A | 792,996 | ||||||||
| 49,300 | SLM Corp. | 488,563 | ||||||||
| 31,137 | Synchrony Financial | 993,270 | ||||||||
| 4,092 | T. Rowe Price Group, Inc. | 409,691 | ||||||||
| 15,348 | Visa, Inc. Class A‡ | 2,397,204 | ||||||||
| 69,015 | Western Union Co. (The)‡ | 1,274,707 | ||||||||
|
| |||||||||
| 23,768,374 | ||||||||||
|
| |||||||||
| Electric — 0.7% | ||||||||||
| 58,848 | AES Corp. | 1,063,972 | ||||||||
| 28,962 | Exelon Corp. | 1,451,865 | ||||||||
| 3,360 | NRG Energy, Inc. | 142,733 | ||||||||
|
| |||||||||
| 2,658,570 | ||||||||||
|
| |||||||||
| Electrical Components & Equipment — 0.2% | ||||||||||
| 7,267 | AMETEK, Inc. | 602,943 | ||||||||
|
| |||||||||
| Electronics — 0.5% | ||||||||||
| 10,117 | Agilent Technologies, Inc. | 813,205 | ||||||||
| 698 | Mettler-Toledo International, Inc.* | 504,654 | ||||||||
| 1,996 | Waters Corp.* | 502,413 | ||||||||
|
| |||||||||
| 1,820,272 | ||||||||||
|
| |||||||||
| Food — 2.8% | ||||||||||
| 56,804 | Conagra Brands, Inc. | 1,575,743 | ||||||||
| 651 | Hershey Co. (The) | 74,754 | ||||||||
| 63,563 | Kroger Co. (The) | 1,563,650 | ||||||||
| 43,200 | Nestle SA, ADR | 4,117,824 | ||||||||
| 17,673 | Sysco Corp. | 1,179,850 | ||||||||
| 31,289 | Tyson Foods, Inc. Class A | 2,172,395 | ||||||||
|
| |||||||||
| 10,684,216 | ||||||||||
|
| |||||||||
| Health Care - Products — 1.6% | ||||||||||
| 6,154 | Align Technology, Inc.* | 1,749,767 | ||||||||
| 8,170 | Edwards Lifesciences Corp.* | 1,563,166 | ||||||||
| 11,489 | IDEXX Laboratories, Inc.* | 2,568,940 | ||||||||
See accompanying Notes to the Financial Statements.
32
Table of Contents
Mercer US Large Cap Equity Fund
Schedule of Investments (Continued)
(showing percentage of net assets)
March 31, 2019
| Shares | Description | Value ($) | ||||||||
| Health Care - Products — continued | ||||||||||
| 3,600 | Zimmer Biomet Holdings, Inc. | 459,720 | ||||||||
|
| |||||||||
| 6,341,593 | ||||||||||
|
| |||||||||
| Health Care - Services — 1.0% | ||||||||||
| 14,192 | Centene Corp.* | 753,595 | ||||||||
| 4,128 | DaVita, Inc.* | 224,109 | ||||||||
| 968 | HCA Healthcare, Inc. | 126,208 | ||||||||
| 4,557 | Humana, Inc. | 1,212,162 | ||||||||
| 6,808 | UnitedHealth Group, Inc. | 1,683,346 | ||||||||
|
| |||||||||
| 3,999,420 | ||||||||||
|
| |||||||||
| Home Builders — 0.7% | ||||||||||
| 23,600 | D.R. Horton, Inc. | 976,568 | ||||||||
| 66,468 | PulteGroup, Inc. | 1,858,445 | ||||||||
|
| |||||||||
| 2,835,013 | ||||||||||
|
| |||||||||
| Home Furnishings — 0.0% | ||||||||||
| 774 | Whirlpool Corp. | 102,857 | ||||||||
|
| |||||||||
| Housewares — 0.1% | ||||||||||
| 11,900 | Tupperware Brands Corp. | 304,402 | ||||||||
|
| |||||||||
| Insurance — 2.8% | ||||||||||
| 4,081 | Aon Plc | 696,627 | ||||||||
| 10,416 | Berkshire Hathaway, Inc. Class B* | 2,092,470 | ||||||||
| 27,399 | Hartford Financial Services Group, Inc. (The) | 1,362,278 | ||||||||
| 15,644 | Lincoln National Corp. | 918,303 | ||||||||
| 81,325 | MetLife, Inc. | 3,462,005 | ||||||||
| 4,005 | Prudential Financial, Inc. | 367,979 | ||||||||
| 37,511 | Voya Financial, Inc. | 1,874,050 | ||||||||
|
| |||||||||
| 10,773,712 | ||||||||||
|
| |||||||||
| Internet — 9.5% | ||||||||||
| 14,486 | Alibaba Group Holding, Ltd., ADR* | 2,642,971 | ||||||||
| 3,603 | Alphabet, Inc. Class A* | 4,240,335 | ||||||||
| 3,155 | Alphabet, Inc. Class C* | 3,701,793 | ||||||||
| 1,845 | Amazon.com, Inc.* | 3,285,484 | ||||||||
| 2,014 | Booking Holdings, Inc.* | 3,514,249 | ||||||||
| 10,952 | CDW Corp. | 1,055,444 | ||||||||
| 33,691 | Ctrip.com International, Ltd., ADR* | 1,471,960 | ||||||||
| 153,153 | eBay, Inc. | 5,688,102 | ||||||||
| 5,240 | Expedia Group, Inc. | 623,560 | ||||||||
| 4,417 | F5 Networks, Inc.* | 693,160 | ||||||||
| 44,412 | Facebook, Inc. Class A* | 7,403,036 | ||||||||
| 1,527 | IAC/InterActiveCorp* | 320,838 | ||||||||
| 2,654 | MercadoLibre, Inc.* | 1,347,515 | ||||||||
| 6,475 | VeriSign, Inc.* | 1,175,601 | ||||||||
|
| |||||||||
| 37,164,048 | ||||||||||
|
| |||||||||
See accompanying Notes to the Financial Statements.
33
Table of Contents
Mercer US Large Cap Equity Fund
Schedule of Investments (Continued)
(showing percentage of net assets)
March 31, 2019
| Shares | Description | Value ($) | ||||||||
| Iron & Steel — 0.2% | ||||||||||
| 19,190 | Steel Dynamics, Inc. | 676,831 | ||||||||
|
| |||||||||
| Leisure Time — 0.5% | ||||||||||
| 5,600 | Carnival Corp. | 284,032 | ||||||||
| 32,640 | Norwegian Cruise Line Holdings, Ltd.* | 1,793,894 | ||||||||
|
| |||||||||
| 2,077,926 | ||||||||||
|
| |||||||||
| Lodging — 1.3% | ||||||||||
| 39,338 | Marriott International, Inc. Class A | 4,920,790 | ||||||||
|
| |||||||||
| Machinery - Diversified — 0.6% | ||||||||||
| 19,693 | Cognex Corp. | 1,001,586 | ||||||||
| 6,941 | Dover Corp. | 651,066 | ||||||||
| 4,799 | Rockwell Automation, Inc. | 842,032 | ||||||||
|
| |||||||||
| 2,494,684 | ||||||||||
|
| |||||||||
| Media — 3.5% | ||||||||||
| 20,182 | CBS Corp. Class B | 959,251 | ||||||||
| 1,221 | Charter Communications, Inc. Class A* | 423,577 | ||||||||
| 116,950 | Comcast Corp. Class A | 4,675,661 | ||||||||
| 20,767 | Viacom, Inc. Class B | 582,930 | ||||||||
| 62,710 | Walt Disney Co. (The) | 6,962,691 | ||||||||
|
| |||||||||
| 13,604,110 | ||||||||||
|
| |||||||||
| Mining — 0.4% | ||||||||||
| 38,700 | Freeport-McMoRan, Inc. | 498,843 | ||||||||
| 26,400 | Newmont Mining Corp. | 944,328 | ||||||||
|
| |||||||||
| 1,443,171 | ||||||||||
|
| |||||||||
| Miscellaneous - Manufacturing — 0.1% | ||||||||||
| 9,140 | Textron, Inc. | 463,032 | ||||||||
|
| |||||||||
| Oil & Gas — 5.5% | ||||||||||
| 29,067 | Anadarko Petroleum Corp. | 1,321,967 | ||||||||
| 58,673 | BP Plc, ADR | 2,565,183 | ||||||||
| 78,900 | Canadian Natural Resources, Ltd. | 2,169,750 | ||||||||
| 14,093 | Chevron Corp. | 1,735,976 | ||||||||
| 55,564 | ConocoPhillips | 3,708,341 | ||||||||
| 2,592 | Devon Energy Corp. | 81,803 | ||||||||
| 3,247 | Hess Corp. | 195,567 | ||||||||
| 9,548 | HollyFrontier Corp. | 470,430 | ||||||||
| 48,509 | Marathon Petroleum Corp. | 2,903,264 | ||||||||
| 29,740 | Phillips 66 | 2,830,356 | ||||||||
| 4,813 | Pioneer Natural Resources Co. | 732,924 | ||||||||
| 10,100 | Royal Dutch Shell Plc Class B, ADR | 645,895 | ||||||||
| 23,134 | Valero Energy Corp. | 1,962,457 | ||||||||
|
| |||||||||
| 21,323,913 | ||||||||||
|
| |||||||||
See accompanying Notes to the Financial Statements.
34
Table of Contents
Mercer US Large Cap Equity Fund
Schedule of Investments (Continued)
(showing percentage of net assets)
March 31, 2019
| Shares | Description | Value ($) | ||||||||
| Oil & Gas Services — 0.7% | ||||||||||
| 22,100 | Halliburton Co. | 647,530 | ||||||||
| 45,800 | Schlumberger, Ltd. | 1,995,506 | ||||||||
|
| |||||||||
| 2,643,036 | ||||||||||
|
| |||||||||
| Packaging & Containers — 0.9% | ||||||||||
| 19,800 | Crown Holdings, Inc.* | 1,080,486 | ||||||||
| 6,359 | Packaging Corp. of America | 631,957 | ||||||||
| 39,659 | Sealed Air Corp. | 1,826,694 | ||||||||
|
| |||||||||
| 3,539,137 | ||||||||||
|
| |||||||||
| Pharmaceuticals — 4.9% | ||||||||||
| 3,893 | AbbVie, Inc. | 313,737 | ||||||||
| 1,995 | Allergan Plc | 292,088 | ||||||||
| 59,607 | Bristol-Myers Squibb Co. | 2,843,850 | ||||||||
| 34,818 | Cardinal Health, Inc. | 1,676,487 | ||||||||
| 18,800 | CVS Health Corp. | 1,013,884 | ||||||||
| 13,400 | Horizon Pharma Plc* | 354,162 | ||||||||
| 3,900 | Jazz Pharmaceuticals Plc* | 557,505 | ||||||||
| 23,292 | Johnson & Johnson | 3,255,989 | ||||||||
| 7,061 | McKesson Corp. | 826,561 | ||||||||
| 24,837 | Merck & Co., Inc. | 2,065,693 | ||||||||
| 19,300 | Mylan NV* | 546,962 | ||||||||
| 80,403 | Pfizer, Inc. | 3,414,715 | ||||||||
| 6,140 | Sarepta Therapeutics, Inc.* ‡ | 731,826 | ||||||||
| 9,640 | Zoetis, Inc. | 970,459 | ||||||||
|
| |||||||||
| 18,863,918 | ||||||||||
|
| |||||||||
| Private Equity — 0.9% | ||||||||||
| 45,020 | Blackstone Group, LP (The)* | 1,574,349 | ||||||||
| 89,030 | KKR & Co., Inc. Class A‡ | 2,091,315 | ||||||||
|
| |||||||||
| 3,665,664 | ||||||||||
|
| |||||||||
| Real Estate — 0.3% | ||||||||||
| 26,746 | CBRE Group, Inc. Class A* | 1,322,590 | ||||||||
|
| |||||||||
| REITS — 0.5% | ||||||||||
| 5,662 | Apartment Investment & Management Co. REIT Class A | 284,742 | ||||||||
| 6,230 | SBA Communications Corp. REIT* | 1,243,882 | ||||||||
| 27,700 | Two Harbors Investment Corp. REIT | 374,781 | ||||||||
|
| |||||||||
| 1,903,405 | ||||||||||
|
| |||||||||
| Retail — 9.7% | ||||||||||
| 443 | AutoZone, Inc.* | 453,685 | ||||||||
| 27,793 | Best Buy Co., Inc. | 1,974,971 | ||||||||
| 16,600 | Darden Restaurants, Inc. | 2,016,402 | ||||||||
| 13,725 | Dunkin’ Brands Group, Inc. | 1,030,747 | ||||||||
| 7,753 | Foot Locker, Inc. | 469,832 | ||||||||
| 24,615 | Home Depot, Inc. (The) | 4,723,372 | ||||||||
See accompanying Notes to the Financial Statements.
35
Table of Contents
Mercer US Large Cap Equity Fund
Schedule of Investments (Continued)
(showing percentage of net assets)
March 31, 2019
| Shares | Description | Value ($) | ||||||||
| Retail — continued | ||||||||||
| 11,371 | Kohl’s Corp. | 781,984 | ||||||||
| 1,910 | Lululemon Athletica, Inc.* | 312,992 | ||||||||
| 24,125 | McDonald’s Corp. | 4,581,337 | ||||||||
| 42,490 | Starbucks Corp. | 3,158,707 | ||||||||
| 23,325 | Tiffany & Co.‡ | 2,461,954 | ||||||||
| 6,430 | Ulta Salon Cosmetics & Fragrance, Inc.* | 2,242,334 | ||||||||
| 9,736 | Walgreens Boots Alliance, Inc. | 615,997 | ||||||||
| 46,850 | Walmart, Inc. | 4,569,280 | ||||||||
| 71,300 | Williams-Sonoma, Inc.‡ | 4,012,051 | ||||||||
| 44,293 | Yum! Brands, Inc. | 4,420,884 | ||||||||
|
| |||||||||
| 37,826,529 | ||||||||||
|
| |||||||||
| Semiconductors — 2.8% | ||||||||||
| 53,261 | Applied Materials, Inc. | 2,112,331 | ||||||||
| 4,889 | Intel Corp. | 262,539 | ||||||||
| 5,900 | IPG Photonics Corp.* ‡ | 895,502 | ||||||||
| 9,598 | KLA-Tencor Corp. | 1,146,097 | ||||||||
| 1,299 | Lam Research Corp. | 232,534 | ||||||||
| 14,900 | Marvell Technology Group, Ltd. | 296,361 | ||||||||
| 36,509 | Micron Technology, Inc.* | 1,508,917 | ||||||||
| 19,212 | NVIDIA Corp. | 3,449,707 | ||||||||
| 3,615 | NXP Semiconductors NV | 319,530 | ||||||||
| 12,580 | QUALCOMM, Inc. | 717,438 | ||||||||
|
| |||||||||
| 10,940,956 | ||||||||||
|
| |||||||||
| Shipbuilding — 0.3% | ||||||||||
| 5,363 | Huntington Ingalls Industries, Inc. | 1,111,214 | ||||||||
|
| |||||||||
| Software — 7.5% | ||||||||||
| 36,032 | Activision Blizzard, Inc. | 1,640,537 | ||||||||
| 8,302 | Adobe, Inc.* | 2,212,400 | ||||||||
| 4,296 | ANSYS, Inc.* | 784,922 | ||||||||
| 15,068 | Cadence Design Systems, Inc.* | 956,969 | ||||||||
| 16,144 | CDK Global, Inc. | 949,590 | ||||||||
| 9,603 | Cerner Corp.* | 549,388 | ||||||||
| 37,749 | Citrix Systems, Inc. | 3,762,065 | ||||||||
| 6,582 | Electronic Arts, Inc.* | 668,929 | ||||||||
| 6,135 | Intuit, Inc. | 1,603,750 | ||||||||
| 57,351 | Microsoft Corp. | 6,763,977 | ||||||||
| 13,128 | MSCI, Inc. Class A | 2,610,371 | ||||||||
| 7,072 | Oracle Corp. | 379,837 | ||||||||
| 15,514 | salesforce.com, Inc.* | 2,456,952 | ||||||||
| 8,618 | ServiceNow, Inc.* | 2,124,251 | ||||||||
| 13,610 | Splunk, Inc.* | 1,695,806 | ||||||||
| 1,597 | Synopsys, Inc.* | 183,895 | ||||||||
|
| |||||||||
| 29,343,639 | ||||||||||
|
| |||||||||
See accompanying Notes to the Financial Statements.
36
Table of Contents
Mercer US Large Cap Equity Fund
Schedule of Investments (Continued)
(showing percentage of net assets)
March 31, 2019
| Shares | Description | Value ($) | ||||||||
| Telecommunications — 3.4% | ||||||||||
| 66,000 | AT&T, Inc. | 2,069,760 | ||||||||
| 83,097 | Cisco Systems, Inc. | 4,486,407 | ||||||||
| 45,387 | Corning, Inc. | 1,502,310 | ||||||||
| 104,573 | Juniper Networks, Inc. | 2,768,047 | ||||||||
| 1,450 | Rogers Communications, Inc. Class B | 78,039 | ||||||||
| 14,013 | T-Mobile US, Inc.* | 968,298 | ||||||||
| 23,441 | Verizon Communications, Inc. | 1,386,067 | ||||||||
|
| |||||||||
| 13,258,928 | ||||||||||
|
| |||||||||
| Textiles — 0.3% | ||||||||||
| 8,300 | Mohawk Industries, Inc.* | 1,047,045 | ||||||||
|
| |||||||||
| Transportation — 0.9% | ||||||||||
| 6,842 | CSX Corp. | 511,918 | ||||||||
| 14,433 | Expeditors International of Washington, Inc. | 1,095,465 | ||||||||
| 10,261 | Union Pacific Corp. | 1,715,639 | ||||||||
|
| |||||||||
| 3,323,022 | ||||||||||
|
| |||||||||
| Trucking & Leasing — 0.3% | ||||||||||
| 23,700 | AerCap Holdings NV* | 1,102,998 | ||||||||
|
| |||||||||
TOTAL COMMON STOCKS (COST $337,514,954) | 370,639,881 | |||||||||
|
| |||||||||
| Par Value ($) | Description | Value ($) | ||||||||
SHORT-TERM INVESTMENTS — 1.7% |
| |||||||||
| Mutual Fund - Securities Lending Collateral — 1.6% | ||||||||||
| 6,158,462 | State Street Institutional U.S. Government Money Market Fund, Premier Class, 2.39%## *** | 6,158,462 | ||||||||
|
| |||||||||
| U.S. Government and Agency Obligations — 0.1% | ||||||||||
| 600,000 | United States Treasury Bill, 2.41%, due 09/12/19** ‡‡ | 593,543 | ||||||||
|
| |||||||||
TOTAL SHORT-TERM INVESTMENTS (COST $6,751,777) | 6,752,005 | |||||||||
|
| |||||||||
TOTAL INVESTMENTS — 96.9% (Cost $344,266,731) | 377,391,886 | |||||||||
Other Assets and Liabilities (net) — 3.1% | 12,023,012 | |||||||||
|
| |||||||||
| NET ASSETS — 100.0% | $389,414,898 | |||||||||
|
| |||||||||
See accompanying Notes to the Financial Statements.
37
Table of Contents
Mercer US Large Cap Equity Fund
Schedule of Investments (Continued)
March 31, 2019
Notes to Schedule of Investments: | ||||||||
| ADR — American Depository Receipt | ||||||||
| REIT — Real Estate Investment Trust | ||||||||
| ## | The rate disclosed is the 7 day net yield as of March 31, 2019. | |||||||
| * | Non-income producing security | |||||||
| ** | All or a portion of this security is pledged for open futures collateral. | |||||||
| *** | Represents an investment of securities lending cash collateral. | |||||||
| ‡ | All or a portion of this security is out on loan. | |||||||
| ‡‡ | Interest rate presented is yield to maturity. | |||||||
See accompanying Notes to the Financial Statements.
38
Table of Contents
Mercer US Large Cap Equity Fund
Schedule of Investments (Continued)
March 31, 2019
Futures Contracts
Number of | Description | Expiration Date | Notional | Market Value/ | ||||||||||||||||
| Buys | ||||||||||||||||||||
| 100 | S&P 500 E-mini Index | Jun 2019 | $ | 14,189,000 | $ | 165,846 | ||||||||||||||
| 6 | S&P Mid 400 E-mini Index | Jun 2019 | 1,140,600 | 11,387 | ||||||||||||||||
|
| |||||||||||||||||||
| $ | 177,233 | |||||||||||||||||||
|
| |||||||||||||||||||
See accompanying Notes to the Financial Statements.
39
Table of Contents
Mercer US Large Cap Equity Fund
Schedule of Investments (Continued)
March 31, 2019
| Asset Class Summary (Unaudited) | % of Net Assets | ||||
Common Stocks | 95.2 | ||||
Futures Contracts | 0.0 | ||||
Short-Term Investments | 1.7 | ||||
Other Assets and Liabilities (net) | 3.1 | ||||
|
| ||||
| 100.0 | % | ||||
|
| ||||
See accompanying Notes to the Financial Statements.
40
Table of Contents
Mercer US Small/Mid Cap Equity Fund
Schedule of Investments
(showing percentage of net assets)
March 31, 2019
| Shares | Description | Value ($) | ||||||||
COMMON STOCKS — 95.5% |
| |||||||||
| Aerospace & Defense — 1.5% | ||||||||||
| 23,713 | HEICO Corp. | 2,249,652 | ||||||||
| 34,100 | Spirit AeroSystems Holdings, Inc. Class A | 3,121,173 | ||||||||
| 12,585 | Teledyne Technologies, Inc.* | 2,982,771 | ||||||||
| 7,214 | TransDigm Group, Inc.* | 3,275,084 | ||||||||
| 79,471 | Wesco Aircraft Holdings, Inc.* | 698,550 | ||||||||
|
| |||||||||
| 12,327,230 | ||||||||||
|
| |||||||||
| Agriculture — 0.1% | ||||||||||
| 52,472 | Darling Ingredients, Inc.* | 1,136,019 | ||||||||
|
| |||||||||
| Airlines — 0.8% | ||||||||||
| 22,100 | Alaska Air Group, Inc. | 1,240,252 | ||||||||
| 111,000 | JetBlue Airways Corp.* | 1,815,960 | ||||||||
| 63,940 | SkyWest, Inc. | 3,471,303 | ||||||||
|
| |||||||||
| 6,527,515 | ||||||||||
|
| |||||||||
| Apparel — 1.5% | ||||||||||
| 22,200 | Capri Holdings, Ltd.* | 1,015,650 | ||||||||
| 31,425 | Carter’s, Inc. | 3,167,326 | ||||||||
| 17,459 | Columbia Sportswear Co. | 1,818,879 | ||||||||
| 10,150 | Ralph Lauren Corp. Class A | 1,316,252 | ||||||||
| 100,714 | Skechers U.S.A., Inc. Class A* | 3,384,997 | ||||||||
| 55,139 | Under Armour, Inc. Class A* | 1,165,638 | ||||||||
|
| |||||||||
| 11,868,742 | ||||||||||
|
| |||||||||
| Auto Manufacturers — 0.2% | ||||||||||
| 93,900 | Wabash National Corp. | 1,272,345 | ||||||||
|
| |||||||||
| Auto Parts & Equipment — 1.8% | ||||||||||
| 38,200 | Allison Transmission Holdings, Inc. | 1,715,944 | ||||||||
| 29,204 | Altra Industrial Motion Corp. | 906,784 | ||||||||
| 64,700 | American Axle & Manufacturing Holdings, Inc.* | 925,857 | ||||||||
| 30,100 | BorgWarner, Inc. | 1,156,141 | ||||||||
| 8,800 | Cooper-Standard Holdings, Inc.* | 413,248 | ||||||||
| 126,046 | Delphi Technologies Plc | 2,427,646 | ||||||||
| 61,600 | Goodyear Tire & Rubber Co. (The) | 1,118,040 | ||||||||
| 6,800 | Lear Corp. | 922,828 | ||||||||
| 73,200 | Meritor, Inc.* | 1,489,620 | ||||||||
| 27,700 | Tenneco, Inc. Class A | 613,832 | ||||||||
| 39,700 | Tower International, Inc. | 834,891 | ||||||||
| 9,175 | Visteon Corp.* | 617,937 | ||||||||
| 7,034 | WABCO Holdings, Inc.* | 927,292 | ||||||||
|
| |||||||||
| 14,070,060 | ||||||||||
|
| |||||||||
| Banks — 5.1% | ||||||||||
| 46,000 | Associated Banc-Corp. | 982,100 | ||||||||
| 52,700 | BankUnited, Inc. | 1,760,180 | ||||||||
See accompanying Notes to the Financial Statements.
41
Table of Contents
Mercer US Small/Mid Cap Equity Fund
Schedule of Investments (Continued)
(showing percentage of net assets)
March 31, 2019
| Shares | Description | Value ($) | ||||||||
| Banks — continued | ||||||||||
| 35,727 | Chemical Financial Corp. | 1,470,523 | ||||||||
| 40,300 | CIT Group, Inc. | 1,933,191 | ||||||||
| 24,232 | Columbia Banking System, Inc. | 792,144 | ||||||||
| 47,440 | East-West Bancorp, Inc. | 2,275,697 | ||||||||
| 120,631 | First BanCorp/Puerto Rico | 1,382,431 | ||||||||
| 145,700 | First Horizon National Corp. | 2,036,886 | ||||||||
| 18,923 | First Interstate BancSystem, Inc. Class A | 753,514 | ||||||||
| 39,691 | Glacier Bancorp, Inc. | 1,590,418 | ||||||||
| 48,700 | Hanmi Financial Corp. | 1,035,849 | ||||||||
| 91,700 | Hope Bancorp, Inc. | 1,199,436 | ||||||||
| 40,779 | Pinnacle Financial Partners, Inc. | 2,230,611 | ||||||||
| 21,100 | Popular, Inc. | 1,099,943 | ||||||||
| 16,000 | Preferred Bank/Los Angeles CA | 719,520 | ||||||||
| 154,500 | Regions Financial Corp. | 2,186,175 | ||||||||
| 19,130 | Signature Bank/New York NY | 2,449,979 | ||||||||
| 6,632 | SVB Financial Group* | 1,474,692 | ||||||||
| 119,400 | TCF Financial Corp. | 2,470,386 | ||||||||
| 29,607 | Texas Capital Bancshares, Inc.* | 1,616,246 | ||||||||
| 15,972 | UMB Financial Corp. | 1,022,847 | ||||||||
| 37,981 | Webster Financial Corp. | 1,924,497 | ||||||||
| 79,965 | Western Alliance Bancorp* | 3,281,764 | ||||||||
| 62,700 | Zions Bancorp NA | 2,847,207 | ||||||||
|
| |||||||||
| 40,536,236 | ||||||||||
|
| |||||||||
| Biotechnology — 2.6% | ||||||||||
| 53,770 | Acceleron Pharma, Inc.* ‡ | 2,504,069 | ||||||||
| 22,690 | Alnylam Pharmaceuticals, Inc.* ‡ | 2,120,381 | ||||||||
| 7,873 | Argenx SE, ADR* ‡ | 982,865 | ||||||||
| 16,670 | Bio-Rad Laboratories, Inc. Class A* | 5,095,686 | ||||||||
| 28,737 | Blueprint Medicines Corp.* | 2,300,397 | ||||||||
| 58,100 | Innoviva, Inc.* | 815,143 | ||||||||
| 113,010 | Medicines Co. (The)* ‡ | 3,158,629 | ||||||||
| 14,677 | Sage Therapeutics, Inc.* | 2,334,377 | ||||||||
| 13,700 | United Therapeutics Corp.* | 1,607,969 | ||||||||
|
| |||||||||
| 20,919,516 | ||||||||||
|
| |||||||||
| Building Materials — 1.6% | ||||||||||
| 16,900 | Apogee Enterprises, Inc. | 633,581 | ||||||||
| 49,124 | Eagle Materials, Inc. | 4,141,153 | ||||||||
| 13,115 | Lennox International, Inc. | 3,467,606 | ||||||||
| 14,841 | Louisiana-Pacific Corp. | 361,824 | ||||||||
| 26,500 | Owens Corning | 1,248,680 | ||||||||
| 87,353 | Summit Materials, Inc. Class A* ‡ | 1,386,292 | ||||||||
| 42,743 | US Concrete, Inc.* | 1,770,415 | ||||||||
|
| |||||||||
| 13,009,551 | ||||||||||
|
| |||||||||
| Chemicals — 3.3% | ||||||||||
| 43,353 | Cabot Corp. | 1,804,785 | ||||||||
| 13,100 | Celanese Corp. | 1,291,791 | ||||||||
See accompanying Notes to the Financial Statements.
42
Table of Contents
Mercer US Small/Mid Cap Equity Fund
Schedule of Investments (Continued)
(showing percentage of net assets)
March 31, 2019
| Shares | Description | Value ($) | ||||||||
| Chemicals — continued | ||||||||||
| 46,300 | Chemours Co. (The) | 1,720,508 | ||||||||
| 26,400 | Eastman Chemical Co. | 2,003,232 | ||||||||
| 258,361 | Huntsman Corp. | 5,810,539 | ||||||||
| 21,340 | Ingevity Corp.* | 2,253,717 | ||||||||
| 5,088 | Methanex Corp. | 289,304 | ||||||||
| 105,003 | Orion Engineered Carbons SA | 1,994,007 | ||||||||
| 13,130 | Quaker Chemical Corp. | 2,630,333 | ||||||||
| 60,021 | RPM International, Inc. | 3,483,619 | ||||||||
| 34,090 | W.R. Grace & Co. | 2,660,384 | ||||||||
| 7,294 | Westlake Chemical Corp. | 494,971 | ||||||||
|
| |||||||||
| 26,437,190 | ||||||||||
|
| |||||||||
| Coal — 0.1% | ||||||||||
| 8,600 | Arch Coal, Inc. Class A‡ | 784,922 | ||||||||
|
| |||||||||
| Commercial Services — 7.4% | ||||||||||
| 21,732 | Adtalem Global Education, Inc.* | 1,006,626 | ||||||||
| 87,113 | Booz Allen Hamilton Holding Corp. Class A | 5,064,750 | ||||||||
| 14,974 | Bright Horizons Family Solutions, Inc.* | 1,903,345 | ||||||||
| 45,336 | Cardtronics Plc Class A* | 1,613,055 | ||||||||
| 10,966 | CoStar Group, Inc.* | 5,114,762 | ||||||||
| 17,692 | Equifax, Inc. | 2,096,502 | ||||||||
| 48,330 | Evo Payments, Inc. Class A* ‡ | 1,403,987 | ||||||||
| 34,659 | Gartner, Inc.* | 5,257,077 | ||||||||
| 29,904 | Global Payments, Inc. | 4,082,494 | ||||||||
| 20,012 | Grand Canyon Education, Inc.* | 2,291,574 | ||||||||
| 23,951 | Green Dot Corp. Class A* | 1,452,628 | ||||||||
| 75,943 | Laureate Education, Inc. Class A* | 1,136,867 | ||||||||
| 9,425 | LSC Communications, Inc. | 61,545 | ||||||||
| 29,000 | ManpowerGroup, Inc. | 2,398,010 | ||||||||
| 25,078 | MarketAxess Holdings, Inc. | 6,171,194 | ||||||||
| 7,072 | Morningstar, Inc. | 891,001 | ||||||||
| 71,087 | Nielsen Holdings Plc | 1,682,629 | ||||||||
| 20,803 | Paylocity Holding Corp.* | 1,855,420 | ||||||||
| 100,074 | Ritchie Bros Auctioneers, Inc. | 3,402,516 | ||||||||
| 25,133 | RR Donnelley & Sons Co. | 118,628 | ||||||||
| 45,380 | Total System Services, Inc. | 4,311,554 | ||||||||
| 53,335 | TransUnion | 3,564,911 | ||||||||
| 9,964 | WEX, Inc.* | 1,912,988 | ||||||||
|
| |||||||||
| 58,794,063 | ||||||||||
|
| |||||||||
| Computers — 2.2% | ||||||||||
| 22,931 | EPAM Systems, Inc.* | 3,878,320 | ||||||||
| 37,270 | Fortinet, Inc.* | 3,129,562 | ||||||||
| 11,469 | Leidos Holdings, Inc. | 735,048 | ||||||||
| 34,110 | Lumentum Holdings, Inc.* ‡ | 1,928,580 | ||||||||
| 63,100 | NCR Corp.* ‡ | 1,721,999 | ||||||||
| 92,780 | Pure Storage, Inc. Class A* ‡ | 2,021,676 | ||||||||
| 43,539 | Rapid7, Inc.* | 2,203,509 | ||||||||
See accompanying Notes to the Financial Statements.
43
Table of Contents
Mercer US Small/Mid Cap Equity Fund
Schedule of Investments (Continued)
(showing percentage of net assets)
March 31, 2019
| Shares | Description | Value ($) | ||||||||
| Computers — continued | ||||||||||
| 42,200 | Seagate Technology Plc | 2,020,958 | ||||||||
|
| |||||||||
| 17,639,652 | ||||||||||
|
| |||||||||
| Distribution & Wholesale — 1.3% | ||||||||||
| 29,592 | Dorman Products, Inc.* | 2,606,759 | ||||||||
| 24,781 | KAR Auction Services, Inc. | 1,271,513 | ||||||||
| 19,458 | Pool Corp. | 3,209,986 | ||||||||
| 25,400 | ScanSource, Inc.* | 909,828 | ||||||||
| 17,564 | SiteOne Landscape Supply, Inc.* ‡ | 1,003,783 | ||||||||
| 32,500 | Triton International, Ltd. | 1,010,750 | ||||||||
|
| |||||||||
| 10,012,619 | ||||||||||
|
| |||||||||
| Diversified Financial Services — 2.8% | ||||||||||
| 109,269 | Ally Financial, Inc. | 3,003,805 | ||||||||
| 27,137 | Artisan Partners Asset Management, Inc. Class A | 683,038 | ||||||||
| 30,700 | Deluxe Corp. | 1,342,204 | ||||||||
| 25,822 | E*TRADE Financial Corp. | 1,198,915 | ||||||||
| 18,000 | Federal Agricultural Mortgage Corp. Class C | 1,303,740 | ||||||||
| 88,109 | Jefferies Financial Group, Inc. | 1,655,568 | ||||||||
| 30,600 | Lazard, Ltd. Class A | 1,105,884 | ||||||||
| 39,200 | Legg Mason, Inc. | 1,072,904 | ||||||||
| 26,630 | LPL Financial Holdings, Inc. | 1,854,780 | ||||||||
| 96,000 | Navient Corp. | 1,110,720 | ||||||||
| 71,841 | OneMain Holdings, Inc. | 2,280,952 | ||||||||
| 33,035 | Raymond James Financial, Inc. | 2,656,344 | ||||||||
| 128,942 | SLM Corp. | 1,277,815 | ||||||||
| 73,600 | Western Union Co. (The)‡ | 1,359,392 | ||||||||
|
| |||||||||
| 21,906,061 | ||||||||||
|
| |||||||||
| Electric — 1.1% | ||||||||||
| 58,700 | AES Corp. | 1,061,296 | ||||||||
| 27,000 | Entergy Corp. | 2,582,010 | ||||||||
| 45,452 | OGE Energy Corp. | 1,959,890 | ||||||||
| 38,937 | Portland General Electric Co. | 2,018,494 | ||||||||
| 42,162 | PPL Corp. | 1,338,222 | ||||||||
|
| |||||||||
| 8,959,912 | ||||||||||
|
| |||||||||
| Electrical Components & Equipment — 0.2% | ||||||||||
| 33,893 | Generac Holdings, Inc.* | 1,736,338 | ||||||||
|
| |||||||||
| Electronics — 2.6% | ||||||||||
| 29,824 | Advanced Energy Industries, Inc.* | 1,481,656 | ||||||||
| 21,700 | Arrow Electronics, Inc.* | 1,672,202 | ||||||||
| 22,700 | Avnet, Inc. | 984,499 | ||||||||
| 37,000 | Flex, Ltd.* | 370,000 | ||||||||
| 30,570 | FLIR Systems, Inc. | 1,454,521 | ||||||||
| 44,000 | Jabil, Inc. | 1,169,960 | ||||||||
| 21,223 | Keysight Technologies, Inc.* | 1,850,646 | ||||||||
See accompanying Notes to the Financial Statements.
44
Table of Contents
Mercer US Small/Mid Cap Equity Fund
Schedule of Investments (Continued)
(showing percentage of net assets)
March 31, 2019
| Shares | Description | Value ($) | ||||||||
| Electronics — continued | ||||||||||
| 3,763 | Mettler-Toledo International, Inc.* | 2,720,649 | ||||||||
| 31,323 | National Instruments Corp. | 1,389,488 | ||||||||
| 43,100 | Sanmina Corp.* | 1,243,435 | ||||||||
| 18,578 | Sensata Technologies Holding Plc* | 836,381 | ||||||||
| 7,906 | SYNNEX Corp. | 754,153 | ||||||||
| 43,527 | Trimble, Inc.* | 1,758,491 | ||||||||
| 68,200 | TTM Technologies, Inc.* | 799,986 | ||||||||
| 117,800 | Vishay Intertechnology, Inc.‡ | 2,175,766 | ||||||||
|
| |||||||||
| 20,661,833 | ||||||||||
|
| |||||||||
| Energy-Alternate Sources — 0.1% | ||||||||||
| 10,800 | First Solar, Inc.* | 570,672 | ||||||||
|
| |||||||||
| Engineering & Construction — 0.6% | ||||||||||
| 61,880 | Exponent, Inc. | 3,571,714 | ||||||||
| 11,389 | Fluor Corp. | 419,115 | ||||||||
| 9,609 | TopBuild Corp.* | 622,855 | ||||||||
|
| |||||||||
| 4,613,684 | ||||||||||
|
| |||||||||
| Entertainment — 1.6% | ||||||||||
| 31,690 | Eldorado Resorts, Inc.* | 1,479,606 | ||||||||
| 36,700 | Live Nation Entertainment, Inc.* ‡ | 2,331,918 | ||||||||
| 8,338 | Madison Square Garden Co. (The) Class A* | 2,444,118 | ||||||||
| 62,647 | Penn National Gaming, Inc.* | 1,259,205 | ||||||||
| 31,340 | Six Flags Entertainment Corp. | 1,546,629 | ||||||||
| 16,916 | Vail Resorts, Inc. | 3,675,847 | ||||||||
|
| |||||||||
| 12,737,323 | ||||||||||
|
| |||||||||
| Environmental Control — 0.2% | ||||||||||
| 80,600 | Covanta Holding Corp. | 1,395,186 | ||||||||
|
| |||||||||
| Food — 1.4% | ||||||||||
| 22,700 | Ingles Markets, Inc. Class A | 626,974 | ||||||||
| 21,264 | Ingredion, Inc. | 2,013,488 | ||||||||
| 12,460 | JM Smucker Co. (The) | 1,451,590 | ||||||||
| 70,857 | Nomad Foods, Ltd.* | 1,449,026 | ||||||||
| 40,460 | Performance Food Group Co.* | 1,603,834 | ||||||||
| 64,700 | Pilgrim’s Pride Corp.* | 1,442,163 | ||||||||
| 29,600 | SpartanNash Co. | 469,752 | ||||||||
| 56,665 | Sprouts Farmers Market, Inc.* | 1,220,564 | ||||||||
| 9,424 | US Foods Holding Corp.* | 328,992 | ||||||||
| 18,909 | Weis Markets, Inc. | 771,676 | ||||||||
|
| |||||||||
| 11,378,059 | ||||||||||
|
| |||||||||
| Forest Products & Paper — 0.2% | ||||||||||
| 20,500 | Clearwater Paper Corp.* | 399,340 | ||||||||
| 35,400 | Schweitzer-Mauduit International, Inc. | 1,370,688 | ||||||||
|
| |||||||||
| 1,770,028 | ||||||||||
|
| |||||||||
See accompanying Notes to the Financial Statements.
45
Table of Contents
Mercer US Small/Mid Cap Equity Fund
Schedule of Investments (Continued)
(showing percentage of net assets)
March 31, 2019
| Shares | Description | Value ($) | ||||||||
| Gas — 0.3% | ||||||||||
| 33,300 | National Fuel Gas Co.‡ | 2,029,968 | ||||||||
|
| |||||||||
| Hand & Machine Tools — 0.5% | ||||||||||
| 19,509 | Lincoln Electric Holdings, Inc. | 1,636,220 | ||||||||
| 24,900 | Regal Beloit Corp. | 2,038,563 | ||||||||
|
| |||||||||
| 3,674,783 | ||||||||||
|
| |||||||||
| Health Care - Products — 3.4% | ||||||||||
| 22,366 | Globus Medical, Inc. Class A* | 1,105,104 | ||||||||
| 31,542 | Haemonetics Corp.* | 2,759,294 | ||||||||
| 11,271 | ICU Medical, Inc.* | 2,697,488 | ||||||||
| 29,061 | Insulet Corp.* ‡ | 2,763,411 | ||||||||
| 63,100 | Lantheus Holdings, Inc.* | 1,544,688 | ||||||||
| 8,645 | LivaNova Plc* | 840,726 | ||||||||
| 28,960 | Merit Medical Systems, Inc.* | 1,790,597 | ||||||||
| 6,564 | Penumbra, Inc.* ‡ | 964,974 | ||||||||
| 46,940 | STERIS Plc | 6,009,728 | ||||||||
| 41,394 | West Pharmaceutical Services, Inc. | 4,561,619 | ||||||||
| 66,780 | Wright Medical Group NV* ‡ | 2,100,231 | ||||||||
|
| |||||||||
| 27,137,860 | ||||||||||
|
| |||||||||
| Health Care - Services — 1.5% | ||||||||||
| 34,362 | Acadia Healthcare Co., Inc.* ‡ | 1,007,150 | ||||||||
| 54,807 | Catalent, Inc.* | 2,224,616 | ||||||||
| 16,380 | Charles River Laboratories International, Inc.* | 2,379,195 | ||||||||
| 10,721 | ICON Plc, ADR* | 1,464,274 | ||||||||
| 14,089 | LHC Group, Inc.* | 1,561,907 | ||||||||
| 29,910 | Quest Diagnostics, Inc. | 2,689,507 | ||||||||
| 3,738 | WellCare Health Plans, Inc.* | 1,008,326 | ||||||||
|
| |||||||||
| 12,334,975 | ||||||||||
|
| |||||||||
| Home Builders — 1.3% | ||||||||||
| 15,123 | Cavco Industries, Inc.* | 1,777,406 | ||||||||
| 52,322 | KB Home | 1,264,623 | ||||||||
| 53,136 | MDC Holdings, Inc. | 1,544,132 | ||||||||
| 134,970 | PulteGroup, Inc. | 3,773,761 | ||||||||
| 13,200 | Thor Industries, Inc. | 823,284 | ||||||||
| 60,900 | TRI Pointe Group, Inc.* | 769,776 | ||||||||
|
| |||||||||
| 9,952,982 | ||||||||||
|
| |||||||||
| Home Furnishings — 0.2% | ||||||||||
| 23,400 | Ethan Allen Interiors, Inc. | 447,642 | ||||||||
| 5,800 | Whirlpool Corp. | 770,762 | ||||||||
|
| |||||||||
| 1,218,404 | ||||||||||
|
| |||||||||
| Household Products & Wares — 0.4% | ||||||||||
| 29,280 | Avery Dennison Corp. | 3,308,640 | ||||||||
|
| |||||||||
See accompanying Notes to the Financial Statements.
46
Table of Contents
Mercer US Small/Mid Cap Equity Fund
Schedule of Investments (Continued)
(showing percentage of net assets)
March 31, 2019
| Shares | Description | Value ($) | ||||||||
| Housewares — 0.4% | ||||||||||
| 44,323 | Toro Co. (The) | 3,051,195 | ||||||||
|
| |||||||||
| Insurance — 3.8% | ||||||||||
| 43,065 | Arthur J. Gallagher & Co. | 3,363,377 | ||||||||
| 51,900 | Assured Guaranty, Ltd. | 2,305,917 | ||||||||
| 134,700 | CNO Financial Group, Inc. | 2,179,446 | ||||||||
| 75,020 | Essent Group, Ltd.* | 3,259,619 | ||||||||
| 12,400 | Everest Re Group, Ltd. | 2,677,904 | ||||||||
| 18,600 | HCI Group, Inc. | 794,778 | ||||||||
| 66,600 | Heritage Insurance Holdings, Inc. | 972,360 | ||||||||
| 41,625 | James River Group Holdings, Ltd. | 1,668,330 | ||||||||
| 20,417 | Kemper Corp. | 1,554,550 | ||||||||
| 42,000 | Lincoln National Corp. | 2,465,400 | ||||||||
| 170,000 | MGIC Investment Corp.* | 2,242,300 | ||||||||
| 17,800 | Reinsurance Group of America, Inc. Class A | 2,527,244 | ||||||||
| 63,300 | Universal Insurance Holdings, Inc. | 1,962,300 | ||||||||
| 73,600 | Unum Group | 2,489,888 | ||||||||
|
| |||||||||
| 30,463,413 | ||||||||||
|
| |||||||||
| Internet — 1.1% | ||||||||||
| 32,227 | Cogent Communications Holdings, Inc. | 1,748,315 | ||||||||
| 58,566 | Criteo SA, ADR* | 1,173,077 | ||||||||
| 5,000 | F5 Networks, Inc.* | 784,650 | ||||||||
| 40,520 | GoDaddy, Inc. Class A* | 3,046,699 | ||||||||
| 20,295 | Zendesk, Inc.* | 1,725,075 | ||||||||
|
| |||||||||
| 8,477,816 | ||||||||||
|
| |||||||||
| Investment Companies — 0.4% | ||||||||||
| 57,300 | Ares Capital Corp. | 982,122 | ||||||||
| 59,200 | New Mountain Finance Corp. | 803,344 | ||||||||
| 104,525 | Oaktree Specialty Lending Corp. | 541,439 | ||||||||
| 105,900 | Prospect Capital Corp.‡ | 690,468 | ||||||||
|
| |||||||||
| 3,017,373 | ||||||||||
|
| |||||||||
| Iron & Steel — 0.3% | ||||||||||
| 14,000 | Reliance Steel & Aluminum Co. | 1,263,640 | ||||||||
| 40,300 | United States Steel Corp. | 785,447 | ||||||||
|
| |||||||||
| 2,049,087 | ||||||||||
|
| |||||||||
| Leisure Time — 1.2% | ||||||||||
| 19,100 | Brunswick Corp. | 961,303 | ||||||||
| 36,900 | Harley-Davidson, Inc.‡ | 1,315,854 | ||||||||
| 66,625 | Norwegian Cruise Line Holdings, Ltd.* | 3,661,710 | ||||||||
| 29,019 | Planet Fitness, Inc. Class A* | 1,994,185 | ||||||||
| 18,625 | Polaris Industries, Inc. | 1,572,509 | ||||||||
|
| |||||||||
| 9,505,561 | ||||||||||
|
| |||||||||
See accompanying Notes to the Financial Statements.
47
Table of Contents
Mercer US Small/Mid Cap Equity Fund
Schedule of Investments (Continued)
(showing percentage of net assets)
March 31, 2019
| Shares | Description | Value ($) | ||||||||
| Lodging — 0.1% | ||||||||||
| 14,900 | Wyndham Destinations, Inc. | 603,301 | ||||||||
|
| |||||||||
| Machinery - Construction & Mining — 0.2% | ||||||||||
| 26,400 | Oshkosh Corp. | 1,983,432 | ||||||||
|
| |||||||||
| Machinery - Diversified — 2.2% | ||||||||||
| 53,600 | Briggs & Stratton Corp. | 634,088 | ||||||||
| 33,536 | Cactus, Inc.* | 1,193,882 | ||||||||
| 55,863 | Cognex Corp. | 2,841,192 | ||||||||
| 42,970 | Flowserve Corp. | 1,939,666 | ||||||||
| 124,404 | Gardner Denver Holdings, Inc.* | 3,459,675 | ||||||||
| 38,579 | Graco, Inc. | 1,910,432 | ||||||||
| 11,908 | Middleby Corp. (The)* ‡ | 1,548,397 | ||||||||
| 15,093 | Nordson Corp. | 2,000,124 | ||||||||
| 27,559 | Wabtec Corp. | 2,031,650 | ||||||||
|
| |||||||||
| 17,559,106 | ||||||||||
|
| |||||||||
| Media — 0.9% | ||||||||||
| 50,343 | Altice USA, Inc. Class A | 1,081,368 | ||||||||
| 22,900 | AMC Networks, Inc. Class A* ‡ | 1,299,804 | ||||||||
| 137,100 | Entercom Communications Corp. Class A‡ | 719,775 | ||||||||
| 15,874 | Nexstar Media Group, Inc. Class A | 1,720,265 | ||||||||
| 29,613 | Sinclair Broadcast Group, Inc. Class A | 1,139,508 | ||||||||
| 67,300 | TEGNA, Inc. | 948,930 | ||||||||
|
| |||||||||
| 6,909,650 | ||||||||||
|
| |||||||||
| Metal Fabricate & Hardware — 0.6% | ||||||||||
| 38,100 | Global Brass & Copper Holdings, Inc. | 1,312,164 | ||||||||
| 20,075 | RBC Bearings, Inc.* | 2,552,938 | ||||||||
| 28,375 | Sun Hydraulics Corp. | 1,319,721 | ||||||||
|
| |||||||||
| 5,184,823 | ||||||||||
|
| |||||||||
| Mining — 0.5% | ||||||||||
| 118,552 | Goldcorp, Inc. | 1,356,235 | ||||||||
| 442,981 | Kinross Gold Corp.* | 1,523,855 | ||||||||
| 78,618 | Pan American Silver Corp. | 1,041,688 | ||||||||
|
| |||||||||
| 3,921,778 | ||||||||||
|
| |||||||||
| Miscellaneous - Manufacturing — 1.2% | ||||||||||
| 13,113 | AptarGroup, Inc. | 1,395,092 | ||||||||
| 31,810 | Crane Co. | 2,691,762 | ||||||||
| 57,742 | Hexcel Corp. | 3,993,437 | ||||||||
| 35,700 | Trinseo SA | 1,617,210 | ||||||||
|
| |||||||||
| 9,697,501 | ||||||||||
|
| |||||||||
| Multi-National — 0.1% | ||||||||||
| 33,800 | Banco Latinoamericano de Comercio Exterior SA | 673,296 | ||||||||
|
| |||||||||
See accompanying Notes to the Financial Statements.
48
Table of Contents
Mercer US Small/Mid Cap Equity Fund
Schedule of Investments (Continued)
(showing percentage of net assets)
March 31, 2019
| Shares | Description | Value ($) | ||||||||
| Office & Business Equipment — 0.8% | ||||||||||
| 93,800 | Pitney Bowes, Inc. | 644,406 | ||||||||
| 47,000 | Xerox Corp. | 1,503,060 | ||||||||
| 21,590 | Zebra Technologies Corp. Class A* | 4,523,753 | ||||||||
|
| |||||||||
| 6,671,219 | ||||||||||
|
| |||||||||
| Oil & Gas — 3.3% | ||||||||||
| 141,988 | Cabot Oil & Gas Corp. | 3,705,887 | ||||||||
| 148,233 | Callon Petroleum Co.* ‡ | 1,119,159 | ||||||||
| 62,900 | Carrizo Oil & Gas, Inc.* ‡ | 784,363 | ||||||||
| 57,678 | Delek US Holdings, Inc. | 2,100,633 | ||||||||
| 34,455 | Diamondback Energy, Inc. | 3,498,216 | ||||||||
| 117,600 | Gulfport Energy Corp.* | 943,152 | ||||||||
| 25,200 | HollyFrontier Corp. | 1,241,604 | ||||||||
| 37,300 | Laredo Petroleum, Inc.* | 115,257 | ||||||||
| 61,343 | Matador Resources Co.* ‡ | 1,185,760 | ||||||||
| 146,969 | Parsley Energy, Inc. Class A* | 2,836,502 | ||||||||
| 153,819 | PBF Energy, Inc. Class A | 4,789,923 | ||||||||
| 190,000 | Southwestern Energy Co.* ‡ | 891,100 | ||||||||
| 134,000 | SRC Energy, Inc.* | 686,080 | ||||||||
| 117,500 | W&T Offshore, Inc.* | 810,750 | ||||||||
| 134,370 | WPX Energy, Inc.* | 1,761,591 | ||||||||
|
| |||||||||
| 26,469,977 | ||||||||||
|
| |||||||||
| Oil & Gas Services — 0.3% | ||||||||||
| 12,513 | Dril-Quip, Inc.* ‡ | 573,721 | ||||||||
| 68,800 | McDermott International, Inc.* ‡ | 511,872 | ||||||||
| 93,149 | Superior Energy Services, Inc.* | 435,006 | ||||||||
| 28,800 | US Silica Holdings, Inc.‡ | 499,968 | ||||||||
|
| |||||||||
| 2,020,567 | ||||||||||
|
| |||||||||
| Packaging & Containers — 0.9% | ||||||||||
| 37,886 | Berry Global Group, Inc.* | 2,040,919 | ||||||||
| 74,600 | Owens-Illinois, Inc. | 1,415,908 | ||||||||
| 16,400 | Packaging Corp. of America | 1,629,832 | ||||||||
| 47,900 | WestRock Co. | 1,836,965 | ||||||||
|
| |||||||||
| 6,923,624 | ||||||||||
|
| |||||||||
| Pharmaceuticals — 4.5% | ||||||||||
| 28,195 | Aerie Pharmaceuticals, Inc.* | 1,339,263 | ||||||||
| 24,290 | Agios Pharmaceuticals, Inc.* ‡ | 1,638,118 | ||||||||
| 42,037 | Amneal Pharmaceuticals, Inc.* ‡ | 595,664 | ||||||||
| 11,489 | Ascendis Pharma AS, ADR* | 1,352,255 | ||||||||
| 57,300 | Clovis Oncology, Inc.* | 1,422,186 | ||||||||
| 32,811 | G1 Therapeutics, Inc.* | 544,663 | ||||||||
| 39,168 | Horizon Pharma Plc* | 1,035,210 | ||||||||
| 42,838 | Jazz Pharmaceuticals Plc* | 6,123,692 | ||||||||
| 50,275 | Lannett Co., Inc.* ‡ | 395,664 | ||||||||
| 36,800 | Mallinckrodt Plc* ‡ | 800,032 | ||||||||
See accompanying Notes to the Financial Statements.
49
Table of Contents
Mercer US Small/Mid Cap Equity Fund
Schedule of Investments (Continued)
(showing percentage of net assets)
March 31, 2019
| Shares | Description | Value ($) | ||||||||
| Pharmaceuticals — continued | ||||||||||
| 64,876 | Mylan NV* | 1,838,586 | ||||||||
| 55,680 | Neurocrine Biosciences, Inc.* | 4,905,408 | ||||||||
| 53,800 | Owens & Minor, Inc. | 220,580 | ||||||||
| 19,136 | PRA Health Sciences, Inc.* | 2,110,509 | ||||||||
| 58,081 | Premier, Inc. Class A* | 2,003,214 | ||||||||
| 20,695 | Sarepta Therapeutics, Inc.* ‡ | 2,466,637 | ||||||||
| 668,191 | TherapeuticsMD, Inc.* | 3,254,090 | ||||||||
| 60,858 | Zogenix, Inc.* ‡ | 3,347,799 | ||||||||
|
| |||||||||
| 35,393,570 | ||||||||||
|
| |||||||||
| Pipelines — 0.2% | ||||||||||
| 19,299 | Cheniere Energy, Inc.* | 1,319,280 | ||||||||
|
| |||||||||
| Real Estate — 0.2% | ||||||||||
| 217,148 | Newmark Group, Inc. Class A | 1,811,014 | ||||||||
|
| |||||||||
| REITS — 6.9% | ||||||||||
| 60,911 | American Campus Communities, Inc. REIT | 2,898,145 | ||||||||
| 253,100 | Annaly Capital Management, Inc. REIT | 2,528,469 | ||||||||
| 80,900 | Brixmor Property Group, Inc. REIT | 1,486,133 | ||||||||
| 163,500 | Cedar Realty Trust, Inc. REIT | 555,900 | ||||||||
| 99,300 | Chimera Investment Corp. REIT‡ | 1,860,882 | ||||||||
| 104,500 | City Office, Inc. REIT | 1,181,895 | ||||||||
| 43,300 | CoreCivic, Inc. REIT | 842,185 | ||||||||
| 16,211 | CoreSite Realty Corp. REIT | 1,734,901 | ||||||||
| 102,513 | Easterly Government Properties, Inc. REIT | 1,846,259 | ||||||||
| 109,500 | Franklin Street Properties Corp. REIT | 787,305 | ||||||||
| 35,400 | Gaming and Leisure Properties, Inc. REIT | 1,365,378 | ||||||||
| 76,000 | Hospitality Properties Trust REIT | 1,999,560 | ||||||||
| 48,140 | Industrial Logistics Properties Trust REIT | 970,984 | ||||||||
| 203,400 | Lexington Realty Trust REIT | 1,842,804 | ||||||||
| 35,100 | Mack-Cali Realty Corp. REIT | 779,220 | ||||||||
| 116,500 | Medical Properties Trust, Inc. REIT | 2,156,415 | ||||||||
| 14,981 | Mid-America Apartment Communities, Inc. REIT | 1,637,873 | ||||||||
| 39,583 | Office Properties Income Trust REIT | 1,094,074 | ||||||||
| 105,470 | Physicians Realty Trust REIT | 1,983,891 | ||||||||
| 95,600 | Piedmont Office Realty Trust, Inc. REIT Class A | 1,993,260 | ||||||||
| 56,600 | Preferred Apartment Communities, Inc. REIT Class A‡ | 838,812 | ||||||||
| 67,480 | QTS Realty Trust, Inc. REIT Class A‡ | 3,035,925 | ||||||||
| 6,248 | Retail Value, Inc. REIT | 194,750 | ||||||||
| 69,400 | RLJ Lodging Trust REIT | 1,219,358 | ||||||||
| 52,300 | Sabra Healthcare, Inc. REIT | 1,018,281 | ||||||||
| 139,600 | Senior Housing Properties Trust REIT | 1,644,488 | ||||||||
| 81,300 | SITE Centers Corp. REIT | 1,107,306 | ||||||||
| 20,100 | Spirit Realty Capital, Inc. REIT | 798,573 | ||||||||
| 89,900 | Starwood Property Trust, Inc. REIT | 2,009,265 | ||||||||
| 230,063 | Summit Hotel Properties, Inc. REIT | 2,625,019 | ||||||||
| 43,853 | Sun Communities, Inc. REIT | 5,197,458 | ||||||||
| 221,500 | VEREIT, Inc. REIT | 1,853,955 | ||||||||
See accompanying Notes to the Financial Statements.
50
Table of Contents
Mercer US Small/Mid Cap Equity Fund
Schedule of Investments (Continued)
(showing percentage of net assets)
March 31, 2019
| Shares | Description | Value ($) | ||||||||
| REITS — continued | ||||||||||
| 70,800 | Xenia Hotels & Resorts, Inc. REIT | 1,551,228 | ||||||||
|
| |||||||||
| 54,639,951 | ||||||||||
|
| |||||||||
| Retail — 4.5% | ||||||||||
| 35,400 | American Eagle Outfitters, Inc. | 784,818 | ||||||||
| 28,807 | BJ’s Restaurants, Inc. | 1,361,995 | ||||||||
| 33,400 | Bloomin’ Brands, Inc. | 683,030 | ||||||||
| 34,877 | Burlington Stores, Inc.* | 5,464,528 | ||||||||
| 8,219 | Casey’s General Stores, Inc. | 1,058,361 | ||||||||
| 16,100 | Children’s Place (The), Inc.‡ | 1,566,208 | ||||||||
| 17,260 | Dave & Buster’s Entertainment, Inc. | 860,756 | ||||||||
| 44,300 | Dick’s Sporting Goods, Inc.‡ | 1,630,683 | ||||||||
| 16,800 | Dillard’s, Inc. Class A‡ | 1,209,936 | ||||||||
| 48,314 | Five Below, Inc.* | 6,003,015 | ||||||||
| 39,400 | Foot Locker, Inc. | 2,387,640 | ||||||||
| 69,438 | Gap, Inc. (The) | 1,817,887 | ||||||||
| 28,200 | Kohl’s Corp. | 1,939,314 | ||||||||
| 15,560 | Lithia Motors, Inc. Class A‡ | 1,443,190 | ||||||||
| 62,160 | Michaels Cos., Inc. (The)* ‡ | 709,867 | ||||||||
| 285,900 | Office Depot, Inc. | 1,037,817 | ||||||||
| 13,000 | Signet Jewelers, Ltd. | 353,080 | ||||||||
| 47,400 | Sonic Automotive, Inc. Class A‡ | 701,994 | ||||||||
| 59,912 | Texas Roadhouse, Inc. Class A | 3,725,927 | ||||||||
| 23,900 | Williams-Sonoma, Inc.‡ | 1,344,853 | ||||||||
|
| |||||||||
| 36,084,899 | ||||||||||
|
| |||||||||
| Savings & Loans — 0.1% | ||||||||||
| 33,800 | Berkshire Hills Bancorp, Inc. | 920,712 | ||||||||
|
| |||||||||
| Semiconductors — 2.3% | ||||||||||
| 26,400 | Diodes, Inc.* | 916,080 | ||||||||
| 53,100 | Entegris, Inc.‡ | 1,895,139 | ||||||||
| 60,700 | Kulicke & Soffa Industries, Inc. | 1,342,077 | ||||||||
| 90,540 | Marvell Technology Group, Ltd. | 1,800,841 | ||||||||
| 242,140 | ON Semiconductor Corp.* | 4,980,820 | ||||||||
| 18,850 | Power Integrations, Inc. | 1,318,369 | ||||||||
| 23,016 | Semtech Corp.* | 1,171,744 | ||||||||
| 34,480 | Silicon Laboratories, Inc.* | 2,788,053 | ||||||||
| 52,548 | Teradyne, Inc. | 2,093,512 | ||||||||
|
| |||||||||
| 18,306,635 | ||||||||||
|
| |||||||||
| Shipbuilding — 0.3% | ||||||||||
| 10,900 | Huntington Ingalls Industries, Inc. | 2,258,480 | ||||||||
|
| |||||||||
| Software — 7.5% | ||||||||||
| 12,378 | ANSYS, Inc.* | 2,261,584 | ||||||||
| 104,117 | Black Knight, Inc.* | 5,674,377 | ||||||||
| 11,597 | Bottomline Technologies, Inc.* | 580,894 | ||||||||
See accompanying Notes to the Financial Statements.
51
Table of Contents
Mercer US Small/Mid Cap Equity Fund
Schedule of Investments (Continued)
(showing percentage of net assets)
March 31, 2019
| Shares | Description | Value ($) | ||||||||
| Software — continued | ||||||||||
| 12,327 | Broadridge Financial Solutions, Inc. | 1,278,187 | ||||||||
| 27,010 | Ceridian HCM Holding, Inc.* | 1,385,613 | ||||||||
| 92,850 | Cloudera, Inc.* | 1,015,779 | ||||||||
| 12,099 | CommVault Systems, Inc.* | 783,289 | ||||||||
| 28,347 | Covetrus, Inc.* | 902,852 | ||||||||
| 30,230 | Envestnet, Inc.* | 1,976,740 | ||||||||
| 13,881 | Everbridge, Inc.* ‡ | 1,041,214 | ||||||||
| 91,373 | Evolent Health, Inc. Class A* | 1,149,472 | ||||||||
| 21,860 | First Data Corp. Class A* | 574,262 | ||||||||
| 52,834 | Guidewire Software, Inc.* | 5,133,351 | ||||||||
| 12,628 | HubSpot, Inc.* ‡ | 2,098,900 | ||||||||
| 19,277 | j2 Global, Inc.‡ | 1,669,388 | ||||||||
| 4,104 | Jack Henry & Associates, Inc. | 569,389 | ||||||||
| 21,783 | Medidata Solutions, Inc.* ‡ | 1,595,387 | ||||||||
| 8,824 | MSCI, Inc. Class A | 1,754,564 | ||||||||
| 17,010 | New Relic, Inc.* | 1,678,887 | ||||||||
| 122,071 | Nuance Communications, Inc.* | 2,066,662 | ||||||||
| 22,790 | PTC, Inc.* | 2,100,782 | ||||||||
| 54,250 | RealPage, Inc.* ‡ | 3,292,433 | ||||||||
| 18,045 | Splunk, Inc.* | 2,248,407 | ||||||||
| 51,822 | SS&C Technologies Holdings, Inc. | 3,300,543 | ||||||||
| 55,693 | Talend SA, ADR* | 2,816,395 | ||||||||
| 15,350 | Twilio, Inc. Class A* ‡ | 1,982,913 | ||||||||
| 14,743 | Tyler Technologies, Inc.* | 3,013,469 | ||||||||
| 13,323 | Ultimate Software Group, Inc. (The)* | 4,398,322 | ||||||||
| 11,811 | Veeva Systems, Inc. Class A* | 1,498,344 | ||||||||
|
| |||||||||
| 59,842,399 | ||||||||||
|
| |||||||||
| Telecommunications — 0.9% | ||||||||||
| 126,998 | Ciena Corp.* | 4,742,105 | ||||||||
| 84,300 | Juniper Networks, Inc. | 2,231,421 | ||||||||
|
| |||||||||
| 6,973,526 | ||||||||||
|
| |||||||||
| Transportation — 1.9% | ||||||||||
| 31,300 | Atlas Air Worldwide Holdings, Inc.* | 1,582,528 | ||||||||
| 118,302 | Euronav NV | 964,161 | ||||||||
| 33,116 | J.B. Hunt Transport Services, Inc. | 3,354,319 | ||||||||
| 73,185 | Knight-Swift Transportation Holdings, Inc. | 2,391,686 | ||||||||
| 10,330 | Old Dominion Freight Line, Inc. | 1,491,549 | ||||||||
| 24,200 | Ryder System, Inc. | 1,500,158 | ||||||||
| 65,795 | Schneider National, Inc. Class B | 1,384,985 | ||||||||
| 37,600 | Scorpio Tankers, Inc. | 745,984 | ||||||||
| 41,611 | Werner Enterprises, Inc. | 1,421,016 | ||||||||
|
| |||||||||
| 14,836,386 | ||||||||||
|
| |||||||||
TOTAL COMMON STOCKS (COST $682,411,957) | 758,291,939 | |||||||||
|
| |||||||||
See accompanying Notes to the Financial Statements.
52
Table of Contents
Mercer US Small/Mid Cap Equity Fund
Schedule of Investments (Continued)
(showing percentage of net assets)
March 31, 2019
| Shares | Description | Value ($) | ||||||||
RIGHTS — 0.0% |
| |||||||||
| Mining — 0.0% | ||||||||||
| 407,516 | Pan American Silver Corp. Expires 2/22/29* **** ¤ | 93,008 | ||||||||
|
| |||||||||
TOTAL RIGHTS (COST $99,747) | 93,008 | |||||||||
|
| |||||||||
| Par Value ($) | Description | Value ($) | ||||||||
SHORT-TERM INVESTMENTS — 0.5% |
| |||||||||
| Mutual Fund - Securities Lending Collateral — 0.3% | ||||||||||
| 2,502,353 | State Street Institutional U.S. Government Money Market Fund, Premier Class, 2.39%## *** | 2,502,353 | ||||||||
|
| |||||||||
| U.S. Government and Agency Obligations — 0.2% | ||||||||||
| 1,600,000 | United States Treasury Bill, 2.41%, due 09/12/19** ‡‡ | 1,582,780 | ||||||||
|
| |||||||||
TOTAL SHORT-TERM INVESTMENTS (COST $4,084,524) | 4,085,133 | |||||||||
|
| |||||||||
TOTAL INVESTMENTS — 96.0% (Cost $686,596,228) | 762,470,080 | |||||||||
Other Assets and Liabilities (net) — 4.0% | 31,933,162 | |||||||||
|
| |||||||||
| NET ASSETS — 100.0% | $794,403,242 | |||||||||
|
| |||||||||
Notes to Schedule of Investments: |
| |||||||||
| ADR — American Depository Receipt |
| |||||||||
| REIT — Real Estate Investment Trust |
| |||||||||
| ## | The rate disclosed is the 7 day net yield as of March 31, 2019. | |||||||||
| * | Non-income producing security | |||||||||
| ** | All or a portion of this security is pledged for open futures collateral. | |||||||||
| *** | Represents an investment of securities lending cash collateral. | |||||||||
| ¤ | Illiquid security. The total market value of the securities at year end is $93,008 which represents 0.0% of net assets. The aggregate tax cost of these securities held at March 31, 2019 was $99,747. | |||||||||
| ‡ | All or a portion of this security is out on loan. | |||||||||
| ‡‡ | Interest rate presented is yield to maturity. | |||||||||
| **** | Security fair valued by the Valuation Committee as approved by the Board of Trustees. The total market value of the security at year end is $93,008 which represents 0.0% of net assets. The aggregate tax cost of these securities held at March 31, 2019 was $99,747. | |||||||||
See accompanying Notes to the Financial Statements.
53
Table of Contents
Mercer US Small/Mid Cap Equity Fund
Schedule of Investments (Continued)
March 31, 2019
Futures Contracts
Number of | Description | Expiration Date | Notional | Market Value/ | ||||||||||||||||
| Buys | ||||||||||||||||||||
| 156 | Russell 2000 E-mini Index | Jun 2019 | $ | 12,041,640 | $ | 102,994 | ||||||||||||||
| 69 | S&P Mid 400 E-mini Index | Jun 2019 | 13,116,900 | 252,786 | ||||||||||||||||
|
| |||||||||||||||||||
| $ | 355,780 | |||||||||||||||||||
|
| |||||||||||||||||||
See accompanying Notes to the Financial Statements.
54
Table of Contents
Mercer US Small/Mid Cap Equity Fund
Schedule of Investments (Continued)
March 31, 2019
| Asset Class Summary (Unaudited) | % of Net Assets | ||||
Common Stocks | 95.5 | ||||
Futures Contracts | 0.0 | ||||
Rights | 0.0 | ||||
Short-Term Investments | 0.5 | ||||
Other Assets and Liabilities (net) | 4.0 | ||||
|
| ||||
| 100.0 | % | ||||
|
| ||||
See accompanying Notes to the Financial Statements.
55
Table of Contents
MercerNon-US Core Equity Fund
Schedule of Investments
(showing percentage of net assets)
March 31, 2019
| Shares | Description | Value ($) | ||||||||
COMMON STOCKS — 93.4% |
| |||||||||
| Australia — 3.9% | ||||||||||
| 123,800 | AGL Energy, Ltd. | 1,914,482 | ||||||||
| 83,091 | ALS, Ltd. | 447,990 | ||||||||
| 49,220 | Altium, Ltd. | 1,130,018 | ||||||||
| 53,234 | Appen, Ltd. | 842,513 | ||||||||
| 717,900 | Asaleo Care, Ltd.* | 456,414 | ||||||||
| 154,500 | Australia & New Zealand Banking Group, Ltd. | 2,856,768 | ||||||||
| 294,129 | BGP Holdings Plc* **** ¤ | — | ||||||||
| 217,813 | BHP Group, Ltd. | 5,955,305 | ||||||||
| 196,300 | BlueScope Steel, Ltd. | 1,945,211 | ||||||||
| 366,016 | Brambles, Ltd. | 3,057,593 | ||||||||
| 42,705 | Breville Group, Ltd. | 493,862 | ||||||||
| 459,365 | Coca-Cola Amatil, Ltd. | 2,822,580 | ||||||||
| 116,188 | Computershare, Ltd. | 1,409,683 | ||||||||
| 91,530 | CSL, Ltd. | 12,674,672 | ||||||||
| 593,400 | CSR, Ltd. | 1,399,452 | ||||||||
| 246,584 | Downer EDI, Ltd. | 1,345,236 | ||||||||
| 520,600 | Fortescue Metals Group, Ltd. | 2,629,336 | ||||||||
| 1,233,793 | Genworth Mortgage Insurance Australia, Ltd.‡ | 2,094,655 | ||||||||
| 802,800 | Harvey Norman Holdings, Ltd.‡ | 2,292,481 | ||||||||
| 37,366 | IDP Education, Ltd. | 386,731 | ||||||||
| 199,614 | Iluka Resources, Ltd. | 1,276,162 | ||||||||
| 490,000 | Inghams Group, Ltd.‡ | 1,521,072 | ||||||||
| 93,026 | IRESS, Ltd. | 863,679 | ||||||||
| 225,600 | Lendlease Group | 1,983,956 | ||||||||
| 27,500 | Macquarie Group, Ltd. | 2,528,171 | ||||||||
| 975,300 | Metcash, Ltd. | 1,835,931 | ||||||||
| 1,454,500 | Mirvac Group REIT | 2,841,311 | ||||||||
| 968,970 | Qantas Airways, Ltd. | 3,895,822 | ||||||||
| 184,789 | QBE Insurance Group, Ltd. | 1,615,870 | ||||||||
| 72,900 | Retail Food Group, Ltd.* ‡ | 13,205 | ||||||||
| 129,357 | Rio Tinto, Ltd. | 8,996,825 | ||||||||
| 885,320 | Scentre Group REIT | 2,584,725 | ||||||||
| 509,317 | South32, Ltd. | 1,349,489 | ||||||||
| 240,885 | Steadfast Group, Ltd. | 542,427 | ||||||||
| 489,740 | Treasury Wine Estates, Ltd. | 5,193,949 | ||||||||
| 40,879 | WiseTech Global, Ltd.‡ | 671,368 | ||||||||
|
| |||||||||
Total Australia | 83,868,944 | |||||||||
|
| |||||||||
| Austria — 0.7% | ||||||||||
| 256,080 | Erste Group Bank AG* | 9,419,791 | ||||||||
| 59,174 | OMV AG | 3,213,873 | ||||||||
| 17,974 | Vienna Insurance Group AG Wiener Versicherung Gruppe | 462,170 | ||||||||
| 50,100 | voestalpine AG | 1,522,817 | ||||||||
|
| |||||||||
Total Austria | 14,618,651 | |||||||||
|
| |||||||||
See accompanying Notes to the Financial Statements.
56
Table of Contents
MercerNon-US Core Equity Fund
Schedule of Investments (Continued)
(showing percentage of net assets)
March 31, 2019
| Shares | Description | Value ($) | ||||||||
| Belgium — 0.9% | ||||||||||
| 50,100 | Ageas | 2,418,955 | ||||||||
| 25,037 | Anheuser-Busch InBev SA/NV, ADR | 2,102,357 | ||||||||
| 11,634 | Bekaert SA‡ | 273,544 | ||||||||
| 118,260 | KBC Group NV | 8,270,051 | ||||||||
| 97,400 | Proximus SADP | 2,811,789 | ||||||||
| 11,682 | Tessenderlo Group SA* | 394,170 | ||||||||
| 33,307 | UCB SA | 2,863,249 | ||||||||
|
| |||||||||
Total Belgium | 19,134,115 | |||||||||
|
| |||||||||
| Bermuda — 0.2% | ||||||||||
| 1,197,700 | Esprit Holdings, Ltd.* | 257,850 | ||||||||
| 153,756 | Hiscox, Ltd. | 3,125,488 | ||||||||
| 68,000 | Kerry Properties, Ltd. | 303,620 | ||||||||
| 743,000 | Shenzhen International Holdings, Ltd. | 1,576,874 | ||||||||
|
| |||||||||
Total Bermuda | 5,263,832 | |||||||||
|
| |||||||||
| Brazil — 0.8% | ||||||||||
| 179,800 | Cia de Saneamento Basico do Estado de Sao Paulo* | 1,940,437 | ||||||||
| 674,100 | JBS SA | 2,757,580 | ||||||||
| 780,959 | Localiza Rent a Car SA* | 6,634,248 | ||||||||
| 119,600 | Magazine Luiza SA | 5,312,039 | ||||||||
| 217,800 | Sao Martinho SA | 1,026,403 | ||||||||
|
| |||||||||
Total Brazil | 17,670,707 | |||||||||
|
| |||||||||
| Canada — 0.8% | ||||||||||
| 133,030 | Canada Goose Holdings, Inc.* | 6,388,100 | ||||||||
| 26,468 | Descartes Systems Group (The), Inc.* | 962,473 | ||||||||
| 7,502 | Fairfax Financial Holdings, Ltd. | 3,475,982 | ||||||||
| 168,200 | Seven Generations Energy, Ltd.* | 1,214,963 | ||||||||
| 77,710 | Thomson Reuters Corp. | 4,599,371 | ||||||||
|
| |||||||||
Total Canada | 16,640,889 | |||||||||
|
| |||||||||
| Cayman Islands — 1.6% | ||||||||||
| 50,180 | Alibaba Group Holding, Ltd., ADR* | 9,155,341 | ||||||||
| 2,026,000 | China Resources Cement Holdings, Ltd. | 2,090,536 | ||||||||
| 228,000 | CK Asset Holdings, Ltd. | 2,027,325 | ||||||||
| 1,211,000 | IGG, Inc. | 1,678,441 | ||||||||
| 3,714,000 | Jiangnan Group, Ltd.* | 203,443 | ||||||||
| 3,247,000 | Lee & Man Paper Manufacturing, Ltd. | 2,767,206 | ||||||||
| 171,750 | Tencent Holdings, Ltd. | 7,898,362 | ||||||||
| 9,510,000 | Tongda Group Holdings, Ltd. | 1,053,981 | ||||||||
| 3,279,000 | WH Group, Ltd. | 3,508,761 | ||||||||
| 2,084,000 | Xinyi Glass Holdings, Ltd. | 2,389,315 | ||||||||
| 4,934,000 | Xinyi Solar Holdings, Ltd. | 2,375,878 | ||||||||
|
| |||||||||
Total Cayman Islands | 35,148,589 | |||||||||
|
| |||||||||
See accompanying Notes to the Financial Statements.
57
Table of Contents
MercerNon-US Core Equity Fund
Schedule of Investments (Continued)
(showing percentage of net assets)
March 31, 2019
| Shares | Description | Value ($) | ||||||||
| China — 0.1% | ||||||||||
| 1,195,500 | China Railway Construction Corp., Ltd. Class H | 1,565,582 | ||||||||
| 628,600 | Shanghai Pharmaceuticals Holding Co., Ltd. Class H | 1,369,316 | ||||||||
|
| |||||||||
Total China | 2,934,898 | |||||||||
|
| |||||||||
| Denmark — 0.9% | ||||||||||
| 15,634 | Carlsberg AS Class B | 1,954,529 | ||||||||
| 127,200 | Danske Bank A/S | 2,234,583 | ||||||||
| 34,600 | DFDS AS‡ | 1,433,199 | ||||||||
| 25,395 | GN Store Nord AS | 1,180,248 | ||||||||
| 40,919 | ISS AS | 1,246,283 | ||||||||
| 26,075 | Jyske Bank AS‡ | 1,008,307 | ||||||||
| 130,340 | Novo Nordisk AS, ADR | 6,818,085 | ||||||||
| 15,846 | Pandora AS | 742,649 | ||||||||
| 2,485 | Rockwool International AS Class B | 582,692 | ||||||||
| 10,326 | Royal Unibrew AS | 762,571 | ||||||||
| 18,190 | Scandinavian Tobacco Group AS Class A | 227,079 | ||||||||
| 10,560 | SimCorp AS | 1,020,478 | ||||||||
| 34,575 | Sydbank AS‡ | 717,642 | ||||||||
|
| |||||||||
Total Denmark | 19,928,345 | |||||||||
|
| |||||||||
| Finland — 1.4% | ||||||||||
| 37,108 | Kemira OYJ‡ | 459,167 | ||||||||
| 36,570 | Kesko OYJ Class B | 2,227,237 | ||||||||
| 84,440 | Neste OYJ‡ | 9,007,277 | ||||||||
| 865,079 | Nokia OYJ | 4,928,650 | ||||||||
| 19,841 | Nokian Renkaat OYJ‡ | 664,789 | ||||||||
| 386,373 | Nordea Bank Abp‡ | 2,947,170 | ||||||||
| 4,576 | Orion OYJ Class B‡ | 171,717 | ||||||||
| 501,000 | Outokumpu OYJ‡ | 1,821,530 | ||||||||
| 43,982 | Sampo OYJ Class A | 1,995,655 | ||||||||
| 15,262 | Tieto OYJ‡ | 466,125 | ||||||||
| 143,274 | UPM-Kymmene OYJ‡ | 4,182,755 | ||||||||
| 32,521 | Uponor OYJ | 372,100 | ||||||||
| 55,268 | Wartsila OYJ Abp‡ | 892,700 | ||||||||
|
| |||||||||
Total Finland | 30,136,872 | |||||||||
|
| |||||||||
| France — 9.1% | ||||||||||
| 77,440 | Airbus SE | 10,251,817 | ||||||||
| 16,700 | Arkema SA | 1,591,260 | ||||||||
| 319,686 | AXA SA | 8,051,459 | ||||||||
| 64,200 | BNP Paribas SA | 3,071,625 | ||||||||
| 78,800 | Bouygues SA | 2,818,106 | ||||||||
| 54,475 | Cie de Saint-Gobain | 1,976,314 | ||||||||
| 35,627 | Cie Generale des Etablissements Michelin SCA | 4,216,398 | ||||||||
| 136,676 | CNP Assurances | 3,011,015 | ||||||||
| 258,348 | Danone SA | 19,926,009 | ||||||||
| 111,343 | Dassault Systemes SE‡ | 16,596,601 | ||||||||
| 101,485 | Electricite de France SA | 1,389,080 | ||||||||
See accompanying Notes to the Financial Statements.
58
Table of Contents
MercerNon-US Core Equity Fund
Schedule of Investments (Continued)
(showing percentage of net assets)
March 31, 2019
| Shares | Description | Value ($) | ||||||||
| France — continued | ||||||||||
| 411,316 | Engie SA | 6,133,316 | ||||||||
| 33,224 | EssilorLuxottica SA | 3,632,816 | ||||||||
| 56,300 | Eutelsat Communications SA | 985,861 | ||||||||
| 15,500 | Faurecia SA | 652,308 | ||||||||
| 10,833 | Gaztransport Et Technigaz SA | 986,487 | ||||||||
| 21,734 | Imerys SA | 1,084,515 | ||||||||
| 42,863 | IPSOS | 1,074,233 | ||||||||
| 19,443 | Kaufman & Broad SA | 795,106 | ||||||||
| 20,953 | Kering SA | 12,027,040 | ||||||||
| 61,332 | L’Oreal SA | 16,514,218 | ||||||||
| 16,554 | Lagardere SCA | 426,029 | ||||||||
| 120,765 | Legrand SA | 8,089,954 | ||||||||
| 4,474 | LVMH Moet Hennessy Louis Vuitton SE | 1,647,248 | ||||||||
| 48,100 | Metropole Television SA | 887,909 | ||||||||
| 536,500 | Natixis SA | 2,874,093 | ||||||||
| 35,500 | Neopost SA | 850,637 | ||||||||
| 13,623 | Nexans SA | 405,818 | ||||||||
| 36,500 | Nexity SA | 1,782,805 | ||||||||
| 272,700 | Orange SA | 4,439,917 | ||||||||
| 79,430 | Pernod Ricard SA | 14,270,075 | ||||||||
| 66,645 | Peugeot SA | 1,626,855 | ||||||||
| 45,393 | Renault SA | 3,002,615 | ||||||||
| 141,477 | Sanofi | 12,508,434 | ||||||||
| 123,740 | Schneider Electric SE | 9,717,565 | ||||||||
| 125,353 | Societe Generale SA | 3,627,898 | ||||||||
| 42,074 | Television Francaise 1 SA | 387,863 | ||||||||
| 167,100 | TOTAL SA | 9,291,349 | ||||||||
| 128,511 | Vivendi SA | 3,727,232 | ||||||||
|
| |||||||||
Total France | 196,349,880 | |||||||||
|
| |||||||||
| Germany — 8.0% | ||||||||||
| 20,567 | Aareal Bank AG | 634,614 | ||||||||
| 21,405 | adidas AG | 5,205,895 | ||||||||
| 41,428 | Allianz SE | 9,223,475 | ||||||||
| 30,500 | Aurubis AG | 1,635,975 | ||||||||
| 47,300 | BASF SE | 3,480,351 | ||||||||
| 177,783 | Bayer AG | 11,498,321 | ||||||||
| 34,200 | Bayerische Motoren Werke AG | 2,640,101 | ||||||||
| 59,746 | Brenntag AG | 3,079,238 | ||||||||
| 23,517 | Continental AG | 3,543,693 | ||||||||
| 101,479 | Covestro AG | 5,585,617 | ||||||||
| 37,605 | Daimler AG | 2,206,244 | ||||||||
| 45,444 | Deutsche Boerse AG | 5,832,362 | ||||||||
| 215,602 | Deutsche Lufthansa AG | 4,736,465 | ||||||||
| 231,624 | Deutsche Telekom AG | 3,847,869 | ||||||||
| 213,376 | Deutsche Wohnen SE | 10,357,442 | ||||||||
| 90,105 | Deutz AG | 754,761 | ||||||||
| 52,725 | DIC Asset AG | 594,391 | ||||||||
| 572,053 | E.ON SE | 6,366,771 | ||||||||
See accompanying Notes to the Financial Statements.
59
Table of Contents
MercerNon-US Core Equity Fund
Schedule of Investments (Continued)
(showing percentage of net assets)
March 31, 2019
| Shares | Description | Value ($) | ||||||||
| Germany — continued | ||||||||||
| 102,746 | Evonik Industries AG | 2,801,143 | ||||||||
| 119,895 | GEA Group AG | 3,143,472 | ||||||||
| 29,409 | HeidelbergCement AG | 2,118,685 | ||||||||
| 32,384 | HUGO BOSS AG | 2,213,741 | ||||||||
| 280,037 | Infineon Technologies AG | 5,560,863 | ||||||||
| 212,353 | Kloeckner & Co. SE | 1,562,978 | ||||||||
| 11,472 | Koenig & Bauer AG | 480,989 | ||||||||
| 31,290 | LEG Immobilien AG | 3,845,413 | ||||||||
| 22,512 | Leoni AG | 439,325 | ||||||||
| 15,614 | Merck KGaA | 1,782,146 | ||||||||
| 144,700 | METRO AG | 2,403,026 | ||||||||
| 18,733 | Muenchener Rueckversicherungs-Gesellschaft AG in Muenchen | 4,438,247 | ||||||||
| 5,736 | Nemetschek SE | 978,981 | ||||||||
| 30,256 | ProSiebenSat.1 Media SE | 432,136 | ||||||||
| 28,400 | Rheinmetall AG | 2,961,844 | ||||||||
| 122,650 | RWE AG | 3,291,449 | ||||||||
| 64,586 | SAP SE | 7,469,599 | ||||||||
| 66,495 | Siemens AG | 7,163,255 | ||||||||
| 17,797 | Siltronic AG | 1,571,491 | ||||||||
| 36,192 | Software AG | 1,225,241 | ||||||||
| 223,615 | Symrise AG | 20,167,234 | ||||||||
| 119,689 | TAG Immobilien AG | 2,956,641 | ||||||||
| 42,000 | Talanx AG* | 1,620,407 | ||||||||
| 53,370 | Uniper SE | 1,611,424 | ||||||||
| 176,189 | Vonovia SE | 9,143,878 | ||||||||
| 21,414 | Wacker Neuson SE | 509,748 | ||||||||
|
| |||||||||
Total Germany | 173,116,941 | |||||||||
|
| |||||||||
| Hong Kong — 1.3% | ||||||||||
| 1,704,800 | AIA Group, Ltd. | 16,972,098 | ||||||||
| 3,160,000 | Champion REIT | 2,737,342 | ||||||||
| 347,000 | Link REIT | 4,057,937 | ||||||||
| 109,500 | Swire Pacific, Ltd. Class A | 1,408,863 | ||||||||
| 291,000 | Wheelock & Co., Ltd. | 2,131,542 | ||||||||
|
| |||||||||
Total Hong Kong | 27,307,782 | |||||||||
|
| |||||||||
| Hungary — 0.1% | ||||||||||
| 229,600 | MOL Hungarian Oil & Gas Plc | 2,627,520 | ||||||||
|
| |||||||||
| India — 0.4% | ||||||||||
| 228,390 | HDFC Bank, Ltd. | 7,635,529 | ||||||||
|
| |||||||||
| Indonesia — 0.4% | ||||||||||
| 3,118,400 | Bank Central Asia Tbk PT | 6,076,938 | ||||||||
| 3,540,700 | Bank Negara Indonesia Persero Tbk PT* | 2,337,260 | ||||||||
|
| |||||||||
Total Indonesia | 8,414,198 | |||||||||
|
| |||||||||
See accompanying Notes to the Financial Statements.
60
Table of Contents
MercerNon-US Core Equity Fund
Schedule of Investments (Continued)
(showing percentage of net assets)
March 31, 2019
| Shares | Description | Value ($) | ||||||||
| Ireland — 0.5% | ||||||||||
| 313,147 | C&C Group Plc | 1,125,175 | ||||||||
| 55,545 | Kerry Group Plc Class A | 6,205,685 | ||||||||
| 40,718 | Ryanair Holdings Plc, ADR* | 3,051,407 | ||||||||
|
| |||||||||
Total Ireland | 10,382,267 | |||||||||
|
| |||||||||
| Israel — 0.4% | ||||||||||
| 112,540 | Bank LeumiLe-Israel BM | 735,207 | ||||||||
| 25,451 | Check Point Software Technologies, Ltd.* | 3,219,297 | ||||||||
| 7,941 | Hilan, Ltd. | 215,671 | ||||||||
| 39,793 | Israel Chemicals, Ltd. | 207,004 | ||||||||
| 52,434 | Israel Discount Bank, Ltd. Class A | 181,024 | ||||||||
| 18,213 | Nice, Ltd., ADR* | 2,231,275 | ||||||||
| 81,500 | Teva Pharmaceutical Industries, Ltd.* | 1,268,753 | ||||||||
| 893 | Wix.com, Ltd.* | 107,901 | ||||||||
|
| |||||||||
Total Israel | 8,166,132 | |||||||||
|
| |||||||||
| Italy — 2.6% | ||||||||||
| 1,985,117 | A2A SpA | 3,625,450 | ||||||||
| 26,270 | Anima Holding Spa | 107,488 | ||||||||
| 152,475 | Assicurazioni Generali SpA | 2,824,908 | ||||||||
| 9,841 | Banca IFIS SpA | 162,545 | ||||||||
| 290,435 | BPER Banca | 1,187,384 | ||||||||
| 64,986 | Davide Campari-Milano SpA | 638,483 | ||||||||
| 2,878,668 | Enel SpA | 18,437,108 | ||||||||
| 619,796 | ENI SpA | 10,963,805 | ||||||||
| 142,005 | Italgas SpA | 877,615 | ||||||||
| 133,129 | Leonardo SpA | 1,548,653 | ||||||||
| 69,132 | Mediaset SpA* ‡ | 211,295 | ||||||||
| 243,600 | Mediobanca Banca di Credito Finanziario SpA | 2,533,400 | ||||||||
| 5,249 | Reply SpA | 338,306 | ||||||||
| 307,265 | Saras SpA | 569,616 | ||||||||
| 126,384 | Snam SpA | 649,807 | ||||||||
| 300,863 | Societa Cattolica di Assicurazioni SC | 2,876,571 | ||||||||
| 46,100 | Societa Iniziative Autostradali e Servizi SpA | 799,227 | ||||||||
| 2,018,251 | Telecom Italia SpA* ‡ | 1,256,377 | ||||||||
| 965,129 | Telecom Italia SpA (Savings Shares) | 548,783 | ||||||||
| 286,265 | UniCredit SpA | 3,673,332 | ||||||||
| 609,469 | Unipol Gruppo SpA | 3,038,479 | ||||||||
|
| |||||||||
Total Italy | 56,868,632 | |||||||||
|
| |||||||||
| Japan — 21.1% | ||||||||||
| 251,400 | Advantest Corp. | 5,844,082 | ||||||||
| 1,600 | AEON REIT Investment Corp. REIT | 1,887,880 | ||||||||
| 92,700 | AGC, Inc./Japan | 3,249,546 | ||||||||
| 4,700 | Aica Kogyo Co., Ltd. | 156,688 | ||||||||
| 18,800 | Aisin Seiki Co., Ltd. | 671,762 | ||||||||
| 28,400 | Altech Corp. | 473,911 | ||||||||
| 51,800 | Amano Corp. | 1,220,062 | ||||||||
See accompanying Notes to the Financial Statements.
61
Table of Contents
MercerNon-US Core Equity Fund
Schedule of Investments (Continued)
(showing percentage of net assets)
March 31, 2019
| Shares | Description | Value ($) | ||||||||
| Japan — continued | ||||||||||
| 70,300 | Asahi Diamond Industrial Co., Ltd.‡ | 485,244 | ||||||||
| 211,200 | Astellas Pharma, Inc. | 3,164,613 | ||||||||
| 33,600 | Benefit One, Inc.‡ | 659,341 | ||||||||
| 58,700 | Broadleaf Co., Ltd. | 308,654 | ||||||||
| 29,400 | Capcom Co., Ltd. | 658,734 | ||||||||
| 46,000 | Central Glass Co., Ltd. | 1,009,893 | ||||||||
| 8,400 | Central Japan Railway Co. | 1,951,159 | ||||||||
| 209,394 | Chiba Bank, Ltd. (The) | 1,136,972 | ||||||||
| 170,000 | Chubu Electric Power Co., Inc. | 2,654,786 | ||||||||
| 113,300 | Citizen Watch Co., Ltd. | 631,577 | ||||||||
| 16,000 | Computer Engineering & Consulting, Ltd. | 298,938 | ||||||||
| 198,700 | Dai-ichi Life Holdings, Inc. | 2,760,994 | ||||||||
| 6,000 | Daiwabo Holdings Co., Ltd. | 345,304 | ||||||||
| 72,100 | DIC Corp. | 2,107,273 | ||||||||
| 4,300 | Digital Arts, Inc. | 351,583 | ||||||||
| 6,400 | Disco Corp.‡ | 911,849 | ||||||||
| 215,100 | DMG Mori Co., Ltd.‡ | 2,660,450 | ||||||||
| 8,700 | DTS Corp. | 321,480 | ||||||||
| 25,800 | East Japan Railway Co. | 2,489,443 | ||||||||
| 35,800 | Ebara Corp. | 1,009,134 | ||||||||
| 13,900 | Eisai Co., Ltd. | 780,239 | ||||||||
| 38,100 | Enplas Corp.‡ | 980,339 | ||||||||
| 26,300 | ESPEC Corp. | 490,192 | ||||||||
| 9,900 | Ezaki Glico Co., Ltd.‡ | 520,558 | ||||||||
| 65,000 | Fancl Corp. | 1,679,541 | ||||||||
| 42,700 | Ferrotec Holdings Corp.‡ | 426,672 | ||||||||
| 33,900 | Foster Electric Co., Ltd. | 509,028 | ||||||||
| 52,500 | Fuji Corp.‡ | 699,146 | ||||||||
| 402,900 | Fujikura, Ltd.‡ | 1,517,905 | ||||||||
| 107,400 | Fukuoka Financial Group, Inc. | 2,383,109 | ||||||||
| 7,400 | Fukushima Industries Corp. | 237,674 | ||||||||
| 26,400 | Funai Soken Holdings, Inc. | 635,165 | ||||||||
| 20,800 | Furukawa Electric Co., Ltd.‡ | 524,487 | ||||||||
| 62,800 | Futaba Corp.‡ | 953,759 | ||||||||
| 17,200 | Futaba Industrial Co., Ltd.‡ | 84,691 | ||||||||
| 6,500 | Fuyo General Lease Co., Ltd. | 321,814 | ||||||||
| 205,294 | Hachijuni Bank, Ltd. (The)‡ | 851,334 | ||||||||
| 326,100 | Hazama Ando Corp. | 2,183,133 | ||||||||
| 49,300 | Hino Motors, Ltd. | 415,120 | ||||||||
| 43,100 | Hirose Electric Co., Ltd.‡ | 4,528,644 | ||||||||
| 79,200 | Hitachi Chemical Co., Ltd.‡ | 1,754,514 | ||||||||
| 20,500 | Hitachi High-Technologies Corp. | 839,929 | ||||||||
| 308,500 | Hitachi, Ltd. | 9,992,072 | ||||||||
| 111,000 | Honda Motor Co., Ltd. | 3,003,524 | ||||||||
| 12,400 | Horiba, Ltd. | 688,982 | ||||||||
| 69,500 | Hosiden Corp. | 582,071 | ||||||||
| 152,200 | Hoya Corp. | 10,050,412 | ||||||||
| 36,700 | IBJ Leasing Co., Ltd. | 866,728 | ||||||||
| 61,900 | Ichiyoshi Securities Co., Ltd. | 433,974 | ||||||||
See accompanying Notes to the Financial Statements.
62
Table of Contents
MercerNon-US Core Equity Fund
Schedule of Investments (Continued)
(showing percentage of net assets)
March 31, 2019
| Shares | Description | Value ($) | ||||||||
| Japan — continued | ||||||||||
| 17,800 | IHI Corp. | 427,612 | ||||||||
| 48,700 | Ines Corp. | 580,343 | ||||||||
| 39,700 | Infocom Corp. | 660,322 | ||||||||
| 74,800 | Infomart Corp.‡ | 910,967 | ||||||||
| 7,500 | Internet Initiative Japan, Inc. | 151,714 | ||||||||
| 177,100 | Isuzu Motors, Ltd. | 2,326,453 | ||||||||
| 132,500 | Ito En, Ltd. | 6,883,272 | ||||||||
| 234,400 | ITOCHU Corp. | 4,240,737 | ||||||||
| 40,000 | JAC Recruitment Co., Ltd. | 883,227 | ||||||||
| 70,600 | Japan Airlines Co., Ltd. | 2,486,962 | ||||||||
| 153,300 | Japan Aviation Electronics Industry, Ltd.‡ | 2,134,303 | ||||||||
| 380,800 | Japan Post Holdings Co., Ltd. | 4,458,751 | ||||||||
| 655 | Japan Rental Housing Investments, Inc. REIT | 521,941 | ||||||||
| 36,400 | Japan Steel Works, Ltd. (The)‡ | 670,548 | ||||||||
| 248,900 | Japan Tobacco, Inc. | 6,172,747 | ||||||||
| 20,500 | Justsystems Corp. | 522,108 | ||||||||
| 19,900 | Kaken Pharmaceutical Co., Ltd. | 904,341 | ||||||||
| 52,400 | Kaneka Corp. | 1,962,307 | ||||||||
| 132,600 | Kanematsu Corp.‡ | 1,515,463 | ||||||||
| 94,200 | Kansai Electric Power Co., Inc. (The) | 1,388,936 | ||||||||
| 97,500 | Kansai Paint Co., Ltd.‡ | 1,859,534 | ||||||||
| 160,908 | Kao Corp. | 12,673,767 | ||||||||
| 67,600 | Kawasaki Heavy Industries, Ltd.‡ | 1,667,326 | ||||||||
| 529,500 | KDDI Corp. | 11,409,473 | ||||||||
| 85,400 | Keihin Corp.‡ | 1,398,065 | ||||||||
| 17,100 | Keyence Corp. | 10,655,346 | ||||||||
| 26,800 | Kintetsu World Express, Inc. | 408,229 | ||||||||
| 31,100 | Koa Corp. | 418,376 | ||||||||
| 75,800 | Kobayashi Pharmaceutical Co., Ltd. | 6,396,278 | ||||||||
| 177,600 | Komatsu, Ltd. | 4,124,505 | ||||||||
| 35,500 | Komori Corp.‡ | 401,554 | ||||||||
| 33,000 | Konami Holdings Corp. | 1,432,579 | ||||||||
| 215,500 | Konica Minolta, Inc.‡ | 2,120,247 | ||||||||
| 9,186 | Kose Corp. | 1,687,233 | ||||||||
| 33,500 | KYB Corp.* ‡ | 822,632 | ||||||||
| 29,400 | Kyocera Corp. | 1,726,521 | ||||||||
| 59,300 | Kyowa Hakko Kirin Co., Ltd. | 1,291,169 | ||||||||
| 13,600 | Makino Milling Machine Co., Ltd. | 560,293 | ||||||||
| 16,700 | Mani, Inc. | 816,253 | ||||||||
| 335,200 | Marubeni Corp. | 2,316,737 | ||||||||
| 345,900 | Mebuki Financial Group, Inc. | 884,399 | ||||||||
| 79,200 | Medipal Holdings Corp. | 1,881,881 | ||||||||
| 84,600 | MISUMI Group, Inc.‡ | 2,103,439 | ||||||||
| 375,100 | Mitsubishi Chemical Holdings Corp. | 2,641,306 | ||||||||
| 124,400 | Mitsubishi Corp. | 3,454,900 | ||||||||
| 190,900 | Mitsubishi Electric Corp. | 2,453,406 | ||||||||
| 118,900 | Mitsubishi Gas Chemical Co., Inc.‡ | 1,696,193 | ||||||||
| 33,200 | Mitsubishi Shokuhin Co., Ltd.‡ | 868,656 | ||||||||
| 514,600 | Mitsubishi UFJ Financial Group, Inc. | 2,557,076 | ||||||||
See accompanying Notes to the Financial Statements.
63
Table of Contents
MercerNon-US Core Equity Fund
Schedule of Investments (Continued)
(showing percentage of net assets)
March 31, 2019
| Shares | Description | Value ($) | ||||||||
| Japan — continued | ||||||||||
| 136,900 | Mitsui & Co., Ltd. | 2,125,515 | ||||||||
| 3,003,500 | Mizuho Financial Group, Inc. | 4,648,322 | ||||||||
| 6,600 | Mochida Pharmaceutical Co., Ltd. | 338,691 | ||||||||
| 330,400 | MonotaRO Co., Ltd.‡ | 7,346,202 | ||||||||
| 128,700 | MS&AD Insurance Group Holdings, Inc. | 3,918,498 | ||||||||
| 23,600 | NEC Networks & System Integration Corp. | 570,357 | ||||||||
| 46,400 | NET One Systems Co., Ltd. | 1,168,332 | ||||||||
| 8,800 | NGK Insulators, Ltd. | 127,844 | ||||||||
| 8,500 | Nichiha Corp. | 234,223 | ||||||||
| 149,800 | Nihon Kohden Corp. | 4,452,654 | ||||||||
| 37,500 | Nihon Unisys, Ltd. | 993,360 | ||||||||
| 24,100 | Nikkiso Co., Ltd. | 281,314 | ||||||||
| 51,500 | Nippon Electric Glass Co., Ltd. | 1,365,610 | ||||||||
| 434,000 | Nippon Light Metal Holdings Co., Ltd. | 952,812 | ||||||||
| 56,200 | Nippon Soda Co., Ltd. | 1,484,653 | ||||||||
| 204,700 | Nippon Telegraph & Telephone Corp. | 8,697,693 | ||||||||
| 113,100 | Nipro Corp.‡ | 1,460,179 | ||||||||
| 305,100 | Nissan Motor Co., Ltd.‡ | 2,503,427 | ||||||||
| 34,900 | Nisshin Oillio Group, Ltd. (The) | 1,031,061 | ||||||||
| 171,400 | Nisshinbo Holdings, Inc.‡ | 1,497,437 | ||||||||
| 4,900 | Nissin Electric Co., Ltd. | 44,934 | ||||||||
| 20,700 | Nissin Foods Holdings Co., Ltd. | 1,421,331 | ||||||||
| 44,500 | Nissin Kogyo Co., Ltd. | 557,632 | ||||||||
| 30,900 | Nitto Denko Corp. | 1,623,377 | ||||||||
| 37,400 | Nohmi Bosai, Ltd. | 611,254 | ||||||||
| 11,400 | Nomura Co., Ltd. | 321,344 | ||||||||
| 105,600 | Nomura Research Institute, Ltd. | 4,798,916 | ||||||||
| 307,841 | North Pacific Bank, Ltd. | 770,402 | ||||||||
| 232,500 | NSK, Ltd. | 2,178,276 | ||||||||
| 675,200 | NTN Corp.‡ | 2,000,864 | ||||||||
| 107,100 | NTT Data Corp. | 1,181,453 | ||||||||
| 53,400 | Obic Co., Ltd. | 5,384,144 | ||||||||
| 67,100 | Oki Electric Industry Co., Ltd.‡ | 792,942 | ||||||||
| 47,200 | Olympus Corp. | 512,575 | ||||||||
| 93,900 | Omron Corp.‡ | 4,394,471 | ||||||||
| 50,200 | Ono Pharmaceutical Co., Ltd. | 983,727 | ||||||||
| 11,600 | Oracle Corp. Japan | 778,678 | ||||||||
| 372,900 | ORIX Corp. | 5,355,058 | ||||||||
| 27,600 | Otsuka Holdings Co., Ltd. | 1,084,450 | ||||||||
| 112,200 | Pan Pacific International Holdings Corp. | 7,430,329 | ||||||||
| 334,000 | Panasonic Corp. | 2,879,368 | ||||||||
| 29,600 | Prima Meat Packers, Ltd. | 549,292 | ||||||||
| 367,200 | Recruit Holdings Co., Ltd. | 10,486,689 | ||||||||
| 79,700 | Relia, Inc. | 694,859 | ||||||||
| 178,800 | Renesas Electronics Corp.* | 827,082 | ||||||||
| 714,000 | Resona Holdings, Inc. | 3,094,419 | ||||||||
| 133,000 | Rohto Pharmaceutical Co., Ltd. | 3,414,970 | ||||||||
| 24,800 | Royal Holdings Co., Ltd. | 620,196 | ||||||||
| 15,400 | Ryobi, Ltd. | 345,608 | ||||||||
See accompanying Notes to the Financial Statements.
64
Table of Contents
MercerNon-US Core Equity Fund
Schedule of Investments (Continued)
(showing percentage of net assets)
March 31, 2019
| Shares | Description | Value ($) | ||||||||
| Japan — continued | ||||||||||
| 7,700 | Sankyu, Inc. | 375,661 | ||||||||
| 359,400 | Santen Pharmaceutical Co., Ltd. | 5,354,389 | ||||||||
| 61,800 | Sanwa Holdings Corp. | 735,335 | ||||||||
| 3,300 | Sanyo Denki Co., Ltd. | 118,363 | ||||||||
| 28,400 | Sawai Pharmaceutical Co., Ltd. | 1,644,703 | ||||||||
| 29,500 | SCREEN Holdings Co., Ltd.‡ | 1,188,689 | ||||||||
| 21,100 | SCSK Corp. | 940,764 | ||||||||
| 73,600 | Secom Co., Ltd. | 6,305,057 | ||||||||
| 55,400 | Seibu Holdings, Inc. | 969,506 | ||||||||
| 82,500 | Seiko Epson Corp.‡ | 1,263,383 | ||||||||
| 512,700 | Senshu Ikeda Holdings, Inc. | 1,315,506 | ||||||||
| 60,500 | Seven & i Holdings Co., Ltd. | 2,282,586 | ||||||||
| 47,100 | Shin-Etsu Chemical Co., Ltd. | 3,948,936 | ||||||||
| 46,000 | Shin-Etsu Polymer Co., Ltd. | 339,956 | ||||||||
| 35,500 | Shindengen Electric Manufacturing Co., Ltd. | 1,310,182 | ||||||||
| 177,200 | Shinsei Bank, Ltd. | 2,521,480 | ||||||||
| 21,400 | Shionogi & Co., Ltd. | 1,324,776 | ||||||||
| 107,000 | Shiseido Co., Ltd. | 7,721,091 | ||||||||
| 45,900 | Showa Corp. | 585,543 | ||||||||
| 9,500 | SMC Corp./Japan | 3,564,485 | ||||||||
| 50,000 | Sohgo Security Services Co., Ltd.‡ | 2,177,350 | ||||||||
| 896,700 | Sojitz Corp. | 3,159,534 | ||||||||
| 110,000 | Sompo Holdings, Inc. | 4,072,639 | ||||||||
| 32,900 | Star Micronics Co., Ltd. | 500,849 | ||||||||
| 558,300 | Sumitomo Chemical Co., Ltd. | 2,597,683 | ||||||||
| 183,400 | Sumitomo Corp. | 2,536,797 | ||||||||
| 136,600 | Sumitomo Electric Industries, Ltd. | 1,812,324 | ||||||||
| 101,600 | Sumitomo Mitsui Financial Group, Inc. | 3,557,859 | ||||||||
| 125,700 | Sumitomo Rubber Industries, Ltd.‡ | 1,508,150 | ||||||||
| 32,900 | Sumitomo Warehouse Co., Ltd. (The)‡ | 414,650 | ||||||||
| 110,900 | Suruga Bank, Ltd.* ‡ | 513,996 | ||||||||
| 5,900 | Sushiro Global Holdings, Ltd. | 406,180 | ||||||||
| 51,200 | Systena Corp. | 556,014 | ||||||||
| 32,600 | T Hasegawa Co., Ltd.‡ | 525,735 | ||||||||
| 85,000 | T&D Holdings, Inc. | 893,888 | ||||||||
| 30,900 | Taiheiyo Cement Corp. | 1,030,140 | ||||||||
| 21,600 | Taikisha, Ltd. | 656,674 | ||||||||
| 173,704 | Takeda Pharmaceutical Co., Ltd., ADR | 3,538,350 | ||||||||
| 148,300 | Teijin, Ltd. | 2,446,545 | ||||||||
| 447,400 | Terumo Corp. | 13,662,303 | ||||||||
| 10,500 | TIS, Inc. | 497,086 | ||||||||
| 90,700 | Tohoku Electric Power Co., Inc. | 1,157,053 | ||||||||
| 121,100 | Tokai Tokyo Financial Holdings, Inc. | 438,732 | ||||||||
| 83,400 | Tokio Marine Holdings, Inc. | 4,040,211 | ||||||||
| 198,000 | Tokyo Electric Power Co. Holdings, Inc.* | 1,252,202 | ||||||||
| 8,700 | Tokyo Electron, Ltd. | 1,257,623 | ||||||||
| 61,300 | Tokyo Gas Co., Ltd. | 1,657,872 | ||||||||
| 63,500 | Tokyu Construction Co., Ltd. | 476,171 | ||||||||
| 92,000 | Tokyu Corp. | 1,606,686 | ||||||||
See accompanying Notes to the Financial Statements.
65
Table of Contents
MercerNon-US Core Equity Fund
Schedule of Investments (Continued)
(showing percentage of net assets)
March 31, 2019
| Shares | Description | Value ($) | ||||||||
| Japan — continued | ||||||||||
| 47,500 | Topcon Corp. | 560,464 | ||||||||
| 52,100 | Tosoh Corp. | 810,084 | ||||||||
| 64,500 | Towa Pharmaceutical Co., Ltd.‡ | 1,697,506 | ||||||||
| 24,600 | Toyo Ink SC Holdings Co., Ltd. | 552,297 | ||||||||
| 146,400 | Toyo Suisan Kaisha, Ltd. | 5,575,064 | ||||||||
| 70,700 | Toyoda Gosei Co., Ltd. | 1,497,229 | ||||||||
| 65,800 | Toyota Motor Corp. | 3,856,391 | ||||||||
| 64,300 | TS Tech Co., Ltd. | 1,850,255 | ||||||||
| 14,800 | Tsubakimoto Chain Co. | 528,166 | ||||||||
| 88,300 | Ube Industries, Ltd. | 1,814,903 | ||||||||
| 33,900 | Ulvac, Inc.‡ | 980,079 | ||||||||
| 58,400 | Unipres Corp. | 912,261 | ||||||||
| 13,800 | Universal Entertainment Corp.‡ | 416,425 | ||||||||
| 72,770 | USS Co., Ltd. | 1,350,405 | ||||||||
| 4,900 | V Technology Co., Ltd.‡ | 621,105 | ||||||||
| 25,700 | Valor Holdings Co., Ltd. | 622,735 | ||||||||
| 31,600 | WATAMI Co., Ltd. | 460,218 | ||||||||
| 78,400 | Yamaha Motor Co., Ltd. | 1,537,755 | ||||||||
| 165,100 | Yokogawa Electric Corp. | 3,417,302 | ||||||||
| 73,000 | Yokohama Rubber Co., Ltd. (The) | 1,355,992 | ||||||||
|
| |||||||||
Total Japan | 454,401,682 | |||||||||
|
| |||||||||
| Luxembourg — 0.6% | ||||||||||
| 75,944 | ArcelorMittal | 1,539,873 | ||||||||
| 1,678,774 | B&M European Value Retail SA | 8,172,602 | ||||||||
| 76,390 | SES SA Class A Fiduciary, ADR | 1,189,263 | ||||||||
| 99,841 | Subsea 7 SA | 1,237,056 | ||||||||
|
| |||||||||
Total Luxembourg | 12,138,794 | |||||||||
|
| |||||||||
| Malaysia — 0.1% | ||||||||||
| 748,700 | Tenaga Nasional Bhd | 2,321,749 | ||||||||
|
| |||||||||
| Netherlands — 4.8% | ||||||||||
| 10,390 | Adyen NV* | 8,143,154 | ||||||||
| 846,180 | Aegon NV | 4,070,370 | ||||||||
| 19 | AerCap Holdings NV* | 884 | ||||||||
| 45,382 | Akzo Nobel NV | 4,025,107 | ||||||||
| 30,650 | Arcadis NV‡ | 477,685 | ||||||||
| 50,696 | ASML Holding NV | 9,517,693 | ||||||||
| 32,439 | ASR Nederland NV | 1,351,335 | ||||||||
| 18,923 | Core Laboratories NV | 1,304,362 | ||||||||
| 14,999 | Euronext NV | 951,552 | ||||||||
| 84,175 | Heineken NV | 8,892,055 | ||||||||
| 146,400 | ING Groep NV | 1,772,730 | ||||||||
| 121,830 | InterXion Holding NV* | 8,129,716 | ||||||||
| 150,800 | Koninklijke Ahold Delhaize NV | 4,017,254 | ||||||||
| 91,545 | Koninklijke DSM NV | 9,987,202 | ||||||||
| 855,453 | Koninklijke KPN NV | 2,714,501 | ||||||||
| 91,850 | Koninklijke Philips NV | 3,745,303 | ||||||||
See accompanying Notes to the Financial Statements.
66
Table of Contents
MercerNon-US Core Equity Fund
Schedule of Investments (Continued)
(showing percentage of net assets)
March 31, 2019
| Shares | Description | Value ($) | ||||||||
| Netherlands — continued | ||||||||||
| 55,537 | Koninklijke Philips NV ADR | 2,269,242 | ||||||||
| 29,468 | Koninklijke Volkerwessels NV | 608,160 | ||||||||
| 30,295 | Koninklijke Vopak NV | 1,451,154 | ||||||||
| 139,712 | NN Group NV | 5,809,104 | ||||||||
| 26,267 | Randstad NV‡ | 1,282,100 | ||||||||
| 94,386 | SBM Offshore NV | 1,796,913 | ||||||||
| 155,156 | Signify NV | 4,155,073 | ||||||||
| 89,100 | STMicroelectronics NV ADR | 1,323,135 | ||||||||
| 125,377 | Unilever NV | 7,289,565 | ||||||||
| 45,846 | Wolters Kluwer NV | 3,124,725 | ||||||||
| 170,980 | Yandex NV Class A* | 5,871,453 | ||||||||
|
| |||||||||
Total Netherlands | 104,081,527 | |||||||||
|
| |||||||||
| New Zealand — 0.1% | ||||||||||
| 251,580 | Air New Zealand, Ltd. | 434,949 | ||||||||
| 363,746 | SKY Network Television, Ltd. | 320,016 | ||||||||
| 275,288 | Trade Me Group, Ltd. | 1,205,332 | ||||||||
| 78,410 | Z Energy, Ltd. | 334,757 | ||||||||
|
| |||||||||
Total New Zealand | 2,295,054 | |||||||||
|
| |||||||||
| Norway — 0.8% | ||||||||||
| 100,400 | Austevoll Seafood ASA | 1,189,187 | ||||||||
| 315,447 | DNB ASA | 5,816,919 | ||||||||
| 70,993 | Elkem ASA* | 251,933 | ||||||||
| 170,559 | Equinor ASA | 3,740,312 | ||||||||
| 30,048 | Equinor ASA, ADR | 660,154 | ||||||||
| 105,666 | Norwegian Finans Holding ASA* | 822,103 | ||||||||
| 30,370 | Ocean Yield ASA‡ | 225,352 | ||||||||
| 87,267 | Orkla ASA | 670,848 | ||||||||
| 69,427 | SpareBank 1 SMN‡ | 704,622 | ||||||||
| 209,533 | Storebrand ASA | 1,633,616 | ||||||||
| 43,589 | Telenor ASA | 874,149 | ||||||||
|
| |||||||||
Total Norway | 16,589,195 | |||||||||
|
| |||||||||
| Philippines — 0.0% | ||||||||||
| 6,261,800 | Vista Land & Lifescapes, Inc. | 862,175 | ||||||||
|
| |||||||||
| Poland — 0.1% | ||||||||||
| 521,100 | PGE Polska Grupa Energetyczna SA* | 1,351,053 | ||||||||
|
| |||||||||
| Portugal — 0.0% | ||||||||||
| 782,528 | Banco Espirito Santo SA* **** ¤ ^ | — | ||||||||
| 247,142 | Sonae SGPS SA | 255,858 | ||||||||
|
| |||||||||
Total Portugal | 255,858 | |||||||||
|
| |||||||||
| Russia — 0.4% | ||||||||||
| 426,500 | Gazprom PJSC, ADR | 1,925,221 | ||||||||
| 29,100 | LUKOIL PJSC, ADR | 2,601,831 | ||||||||
See accompanying Notes to the Financial Statements.
67
Table of Contents
MercerNon-US Core Equity Fund
Schedule of Investments (Continued)
(showing percentage of net assets)
March 31, 2019
| Shares | Description | Value ($) | ||||||||
| Russia — continued | ||||||||||
| 92,600 | MMC Norilsk Nickel PJSC, ADR | 1,955,712 | ||||||||
| 26,100 | Tatneft PJSC, ADR | 1,806,120 | ||||||||
|
| |||||||||
Total Russia | 8,288,884 | |||||||||
|
| |||||||||
| Singapore — 0.2% | ||||||||||
| 171,000 | United Overseas Bank, Ltd. | 3,180,133 | ||||||||
| 1,713,900 | Yangzijiang Shipbuilding Holdings, Ltd. | 1,898,007 | ||||||||
|
| |||||||||
Total Singapore | 5,078,140 | |||||||||
|
| |||||||||
| South Africa — 0.1% | ||||||||||
| 1,003,000 | Old Mutual, Ltd. | 1,472,943 | ||||||||
|
| |||||||||
| South Korea — 0.5% | ||||||||||
| 62,900 | Kia Motors Corp. | 1,958,871 | ||||||||
| 150,725 | Samsung Electronics Co., Ltd. | 5,928,880 | ||||||||
| 8,800 | SK Telecom Co., Ltd. | 1,949,784 | ||||||||
|
| |||||||||
Total South Korea | 9,837,535 | |||||||||
|
| |||||||||
| Spain — 2.1% | ||||||||||
| 191,197 | Amadeus IT Group SA | 15,328,547 | ||||||||
| 614,700 | Banco Santander SA | 2,860,599 | ||||||||
| 38,971 | Cia de Distribucion Integral Logista Holdings SA | 918,930 | ||||||||
| 334,800 | Distribuidora Internacional de Alimentacion SA‡ | 244,730 | ||||||||
| 200,300 | Ence Energia y Celulosa SA | 1,115,538 | ||||||||
| 64,465 | Endesa SA | 1,646,024 | ||||||||
| 498,640 | Iberdrola SA | 4,381,761 | ||||||||
| 363,227 | International Consolidated Airlines Group SA | 2,423,312 | ||||||||
| 20,191 | Let’s GOWEX SA* **** ¤ ^ ‡ | — | ||||||||
| 564,700 | Mapfre SA | 1,557,284 | ||||||||
| 51,575 | Naturgy Energy Group SA | 1,443,721 | ||||||||
| 596,506 | Repsol SA | 10,220,945 | ||||||||
| 428,784 | Telefonica SA | 3,596,025 | ||||||||
|
| |||||||||
Total Spain | 45,737,416 | |||||||||
|
| |||||||||
| Sweden — 2.8% | ||||||||||
| 53,122 | AF POYRY AB* ‡ | 887,724 | ||||||||
| 45,458 | Axfood AB | 847,868 | ||||||||
| 156,571 | Boliden AB | 4,466,560 | ||||||||
| 161,429 | Cloetta AB Class B | 417,700 | ||||||||
| 67,233 | Getinge AB | 784,662 | ||||||||
| 183,501 | Hexagon AB Class B | 9,595,160 | ||||||||
| 52,161 | Hexpol AB | 439,488 | ||||||||
| 95,264 | Lindab International AB | 868,903 | ||||||||
| 264,247 | Lundin Petroleum AB | 8,968,438 | ||||||||
| 72,244 | Nyfosa AB* | 433,839 | ||||||||
| 128,773 | Resurs Holding AB | 799,686 | ||||||||
| 189,200 | Sandvik AB | 3,080,138 | ||||||||
| 645,800 | SAS AB* | 1,302,002 | ||||||||
See accompanying Notes to the Financial Statements.
68
Table of Contents
MercerNon-US Core Equity Fund
Schedule of Investments (Continued)
(showing percentage of net assets)
March 31, 2019
| Shares | Description | Value ($) | ||||||||
| Sweden — continued | ||||||||||
| 171,900 | SKF AB Class B‡ | 2,861,510 | ||||||||
| 373,358 | Svenska Handelsbanken AB Class A‡ | 3,948,812 | ||||||||
| 108,375 | Swedbank AB Class A | 1,534,727 | ||||||||
| 33,519 | Swedish Match AB | 1,712,576 | ||||||||
| 34,165 | Swedish Orphan Biovitrum AB* | 803,358 | ||||||||
| 1,129,028 | Telefonaktiebolaget LM Ericsson Class B | 10,397,677 | ||||||||
| 75,051 | Telefonaktiebolaget LM Ericsson Class B, ADR | 688,968 | ||||||||
| 13,317 | Vitrolife AB | 303,876 | ||||||||
| 268,900 | Volvo AB Class B‡ | 4,174,701 | ||||||||
|
| |||||||||
Total Sweden | 59,318,373 | |||||||||
|
| |||||||||
| Switzerland — 8.5% | ||||||||||
| 14,476 | Ascom Holding AG | 193,905 | ||||||||
| 9,800 | Autoneum Holding AG‡ | 1,129,672 | ||||||||
| 79 | BKW AG | 5,386 | ||||||||
| 62 | Chocoladefabriken Lindt & Spruengli AG | 421,468 | ||||||||
| 43,412 | Cie Financiere Richemont SA | 3,162,071 | ||||||||
| 112,500 | Credit Suisse Group AG* | 1,310,937 | ||||||||
| 4,795 | Geberit AG | 1,959,599 | ||||||||
| 6,440 | Givaudan SA | 16,450,808 | ||||||||
| 918 | Inficon Holding AG* ‡ | 511,127 | ||||||||
| 30,042 | Julius Baer Group, Ltd.* | 1,213,565 | ||||||||
| 37,890 | Lonza Group AG* | 11,748,601 | ||||||||
| 34,290 | Nestle SA, ADR | 3,268,523 | ||||||||
| 319,718 | Nestle SA | 30,466,149 | ||||||||
| 230,352 | Novartis AG | 22,153,946 | ||||||||
| 57,700 | Novartis AG, ADR | 5,547,278 | ||||||||
| 142,447 | Roche Holding AG | 39,241,224 | ||||||||
| 9,370 | Schindler Holding AG | 1,941,930 | ||||||||
| 2,794 | SGS SA | 6,952,035 | ||||||||
| 61,600 | Sika AG | 8,603,836 | ||||||||
| 12,800 | Swiss Life Holding AG* | 5,635,907 | ||||||||
| 46,900 | Swiss Re AG | 4,581,215 | ||||||||
| 5,400 | Swisscom AG‡ | 2,640,627 | ||||||||
| 7,465 | Temenos AG* | 1,100,374 | ||||||||
| 715,947 | UBS Group AG* | 8,677,056 | ||||||||
| 15,200 | Zurich Insurance Group AG | 5,030,545 | ||||||||
|
| |||||||||
Total Switzerland | 183,947,784 | |||||||||
|
| |||||||||
| Taiwan — 0.6% | ||||||||||
| 565,000 | Charoen Pokphand Enterprise | 949,595 | ||||||||
| 1,419,000 | Compeq Manufacturing Co., Ltd. | 1,091,167 | ||||||||
| 940,000 | Fubon Financial Holding Co., Ltd. | 1,402,962 | ||||||||
| 258,238 | Taiwan Semiconductor Manufacturing Co., Ltd., ADR | 10,577,429 | ||||||||
|
| |||||||||
Total Taiwan | 14,021,153 | |||||||||
|
| |||||||||
See accompanying Notes to the Financial Statements.
69
Table of Contents
MercerNon-US Core Equity Fund
Schedule of Investments (Continued)
(showing percentage of net assets)
March 31, 2019
| Shares | Description | Value ($) | ||||||||
| Thailand — 0.1% | ||||||||||
| 16,831,100 | Quality Houses PCL Class F ¤ | 1,569,877 | ||||||||
| 16,156,000 | Sansiri PCL Class F ¤ | 666,909 | ||||||||
|
| |||||||||
Total Thailand | 2,236,786 | |||||||||
|
| |||||||||
| Turkey — 0.1% | ||||||||||
| 278,300 | TAV Havalimanlari Holding AS | 1,149,731 | ||||||||
|
| |||||||||
| United Kingdom — 14.3% | ||||||||||
| 339,008 | 3i Group Plc | 4,350,300 | ||||||||
| 98,576 | Aggreko Plc | 1,011,154 | ||||||||
| 172,385 | Anglo American Plc‡ | 4,612,702 | ||||||||
| 91,678 | Ashtead Group Plc | 2,213,016 | ||||||||
| 30,658 | Associated British Foods Plc | 974,354 | ||||||||
| 211,713 | AstraZeneca Plc, ADR | 8,559,557 | ||||||||
| 165,920 | AstraZeneca Plc | 13,264,001 | ||||||||
| 148,250 | Avast Plc* | 547,271 | ||||||||
| 20,895 | AVEVA Group Plc | 878,351 | ||||||||
| 262,527 | Babcock International Group Plc | 1,688,194 | ||||||||
| 1,191,636 | BAE Systems Plc | 7,490,523 | ||||||||
| 280,200 | Barratt Developments Plc | 2,187,767 | ||||||||
| 48,300 | Bellway Plc | 1,916,442 | ||||||||
| 33,600 | Berkeley Group Holdings Plc | 1,615,136 | ||||||||
| 148,850 | BHP Group Plc, ADR | 7,186,478 | ||||||||
| 1,177,100 | BP Plc | 8,566,388 | ||||||||
| 84,523 | British American Tobacco Plc, ADR | 3,526,300 | ||||||||
| 18,857 | British American Tobacco Plc | 784,818 | ||||||||
| 129,300 | Britvic Plc | 1,604,814 | ||||||||
| 1,192,600 | BT Group Plc | 3,464,683 | ||||||||
| 937,313 | Centamin Plc | 1,088,237 | ||||||||
| 1,284,086 | Centrica Plc | 1,910,827 | ||||||||
| 619,383 | Compass Group Plc | 14,563,890 | ||||||||
| 208,800 | Crest Nicholson Holdings Plc | 1,006,685 | ||||||||
| 19,574 | Croda International Plc | 1,284,988 | ||||||||
| 641,621 | Diageo Plc | 26,235,705 | ||||||||
| 751,600 | Dixons Carphone Plc | 1,437,229 | ||||||||
| 44,534 | EMIS Group Plc | 609,315 | ||||||||
| 1,308,680 | EnQuest Plc* | 324,343 | ||||||||
| 301,893 | Experian Plc | 8,178,408 | ||||||||
| 91,295 | Ferrexpo Plc | 294,550 | ||||||||
| 701,600 | Firstgroup Plc* | 831,483 | ||||||||
| 76,465 | Galliford Try Plc | 664,086 | ||||||||
| 178,868 | GlaxoSmithKline Plc, ADR | 7,474,894 | ||||||||
| 405,272 | GlaxoSmithKline Plc | 8,432,539 | ||||||||
| 47,696 | Greggs Plc | 1,142,944 | ||||||||
| 361,694 | Halma Plc | 7,880,228 | ||||||||
| 240,893 | Hammerson Plc REIT | 1,054,062 | ||||||||
| 49,999 | IG Group Holdings Plc | 338,786 | ||||||||
| 356,913 | IMI Plc | 4,455,425 | ||||||||
| 112,000 | Imperial Brands Plc | 3,830,239 | ||||||||
See accompanying Notes to the Financial Statements.
70
Table of Contents
MercerNon-US Core Equity Fund
Schedule of Investments (Continued)
(showing percentage of net assets)
March 31, 2019
| Shares | Description | Value ($) | ||||||||
| United Kingdom — continued | ||||||||||
| 201,900 | Inchcape Plc | 1,502,220 | ||||||||
| 30,282 | InterContinental Hotels Group Plc | 1,821,032 | ||||||||
| 90,357 | Intertek Group Plc | 5,718,619 | ||||||||
| 278,234 | IWG Plc | 903,482 | ||||||||
| 641,500 | J Sainsbury Plc | 1,970,232 | ||||||||
| 3,370 | KAZ Minerals Plc | 28,693 | ||||||||
| 973,798 | Kingfisher Plc | 2,979,396 | ||||||||
| 5,315,800 | Lloyds Banking Group Plc | 4,304,286 | ||||||||
| 180,980 | London Stock Exchange Group Plc | 11,204,096 | ||||||||
| 569,000 | Man Group Plc | 1,006,870 | ||||||||
| 676,700 | Marks & Spencer Group Plc | 2,459,268 | ||||||||
| 309,291 | Meggitt Plc | 2,026,393 | ||||||||
| 46,200 | Micro Focus International Plc, ADR | 1,191,498 | ||||||||
| 484,800 | Mitchells & Butlers Plc* | 1,710,695 | ||||||||
| 256,118 | Moneysupermarket.com Group Plc | 1,241,827 | ||||||||
| 55,240 | National Grid Plc, ADR | 3,084,602 | ||||||||
| 277,200 | Paragon Banking Group Plc | 1,574,134 | ||||||||
| 12,912 | Pearson Plc, ADR | 141,774 | ||||||||
| 201,790 | Petrofac, Ltd. | 1,287,893 | ||||||||
| 530,254 | Pets at Home Group Plc | 1,095,843 | ||||||||
| 40,305 | Prudential Plc, ADR | 1,621,067 | ||||||||
| 1,132,996 | QinetiQ Group Plc | 4,446,769 | ||||||||
| 334,333 | Quilter Plc | 639,712 | ||||||||
| 146,326 | Reckitt Benckiser Group Plc | 12,168,570 | ||||||||
| 222,500 | Redrow Plc* | 1,742,472 | ||||||||
| 146,472 | RELX Plc* | 3,133,079 | ||||||||
| 192,666 | RELX Plc (London Exchange) | 4,121,043 | ||||||||
| 11,123 | Renishaw Plc | 537,141 | ||||||||
| 245,328 | Rentokil Initial Plc | 1,129,411 | ||||||||
| 226,599 | Restaurant Group Plc (The) | 348,418 | ||||||||
| 84,972 | Rightmove Plc | 564,686 | ||||||||
| 64,435 | Rio Tinto Plc | 3,745,547 | ||||||||
| 201,064 | Rio Tinto Plc, ADR | 11,832,616 | ||||||||
| 130,625 | Rotork Plc | 481,357 | ||||||||
| 280,600 | Royal Dutch Shell Plc Class B | 8,877,641 | ||||||||
| 275,200 | Royal Mail Plc | 854,543 | ||||||||
| 66,039 | Safestore Holdings Plc REIT | 513,301 | ||||||||
| 70,752 | Savills Plc | 833,890 | ||||||||
| 376,251 | Senior Plc | 1,069,778 | ||||||||
| 358,442 | Smith & Nephew Plc | 7,113,446 | ||||||||
| 93,606 | Spectris Plc | 3,061,531 | ||||||||
| 62,690 | Spirax-Sarco Engineering Plc | 5,873,384 | ||||||||
| 790,500 | Stagecoach Group Plc | 1,582,174 | ||||||||
| 181,500 | Tate & Lyle Plc | 1,716,544 | ||||||||
| 1,395,319 | Taylor Wimpey Plc | 3,189,981 | ||||||||
| 39,292 | Ultra Electronics Holdings Plc | 817,143 | ||||||||
| 72,420 | Unilever Plc, ADR | 4,180,082 | ||||||||
| 64,304 | UNITE Group Plc (The) REIT | 768,786 | ||||||||
| 1,296,195 | Vodafone Group Plc | 2,361,232 | ||||||||
See accompanying Notes to the Financial Statements.
71
Table of Contents
MercerNon-US Core Equity Fund
Schedule of Investments (Continued)
(showing percentage of net assets)
March 31, 2019
| Shares | Description | Value ($) | ||||||||
| United Kingdom — continued | ||||||||||
| 690,051 | Wm Morrison Supermarkets Plc | 2,046,064 | ||||||||
|
| |||||||||
Total United Kingdom | 308,105,373 | |||||||||
|
| |||||||||
| United States — 2.0% | ||||||||||
| 65,666 | Analog Devices, Inc. | 6,912,660 | ||||||||
| 31,396 | ANSYS, Inc.* | 5,736,363 | ||||||||
| 202,754 | Cadence Design Systems, Inc.* | 12,876,907 | ||||||||
| 124,025 | Colgate-Palmolive Co. | 8,500,673 | ||||||||
| 44,253 | DENTSPLY SIRONA, Inc. | 2,194,506 | ||||||||
| — | International Flavors & Fragrances, Inc. | 57 | ||||||||
| 27,359 | Nordson Corp. | 3,625,615 | ||||||||
| 1,876 | NVIDIA Corp. | 336,855 | ||||||||
| 36,658 | Texas Instruments, Inc. | 3,888,314 | ||||||||
|
| |||||||||
Total United States | 44,071,950 | |||||||||
|
| |||||||||
TOTAL COMMON STOCKS (COST $1,887,749,184) | 2,013,777,878 | |||||||||
|
| |||||||||
INVESTMENT COMPANIES — 1.0% |
| |||||||||
| United States — 1.0% | ||||||||||
| 297,594 | iShares MSCI EAFE ETF | 19,301,947 | ||||||||
| 29,600 | iShares MSCI Eurozone ETF | 1,142,560 | ||||||||
|
| |||||||||
Total United States | 20,444,507 | |||||||||
|
| |||||||||
TOTAL INVESTMENT COMPANIES (COST $19,017,986) | 20,444,507 | |||||||||
|
| |||||||||
PREFERRED STOCKS — 1.0% |
| |||||||||
| Brazil — 0.1% | ||||||||||
| 517,660 | Itausa — Investimentos Itau SA, 3.44% | 1,593,537 | ||||||||
|
| |||||||||
| Germany — 0.9% | ||||||||||
| 149,521 | Henkel AG & Co. KGaA, 2.16% | 15,277,957 | ||||||||
| 29,593 | Porsche Automobil Holding SE, 3.08% | 1,858,802 | ||||||||
| 79,983 | Schaeffler AG, 7.65% | 650,935 | ||||||||
| 14,800 | Volkswagen AG, 2.83% | 2,331,862 | ||||||||
|
| |||||||||
Total Germany | 20,119,556 | |||||||||
|
| |||||||||
| Sweden — 0.0% | ||||||||||
| 23,917 | Klovern AB, 6.02% | 868,978 | ||||||||
|
| |||||||||
TOTAL PREFERRED STOCKS (COST $24,557,534) | 22,582,071 | |||||||||
|
| |||||||||
RIGHTS — 0.0% |
| |||||||||
| Sweden — 0.0% | ||||||||||
| 55,121 | AF POYRY AB* ‡ | 112,912 | ||||||||
|
| |||||||||
TOTAL RIGHTS (COST $—) | 112,912 | |||||||||
|
| |||||||||
See accompanying Notes to the Financial Statements.
72
Table of Contents
MercerNon-US Core Equity Fund
Schedule of Investments (Continued)
(showing percentage of net assets)
March 31, 2019
| Par Value ($) | Description | Value ($) | ||||||||
SHORT-TERM INVESTMENTS — 2.8% |
| |||||||||
| Mutual Fund - Securities Lending Collateral — 2.6% | ||||||||||
| 56,574,708 | State Street Institutional U.S. Government Money Market Fund, Premier Class, 2.39%## *** | 56,574,708 | ||||||||
|
| |||||||||
| U.S. Government and Agency Obligations — 0.2% | ||||||||||
| 4,000,000 | United States Treasury Bill, 2.41%, due 09/12/19** ‡‡ | 3,956,950 | ||||||||
|
| |||||||||
TOTAL SHORT-TERM INVESTMENTS (COST $60,530,136) | 60,531,658 | |||||||||
|
| |||||||||
TOTAL INVESTMENTS — 98.2% (Cost $1,991,854,840) | 2,117,449,026 | |||||||||
Other Assets and Liabilities (net) — 1.8% | 38,135,820 | |||||||||
|
| |||||||||
| NET ASSETS — 100.0% | $2,155,584,846 | |||||||||
|
| |||||||||
Notes to Schedule of Investments: | ||||||||||
| ADR — American Depository Receipt | ||||||||||
| REIT — Real Estate Investment Trust | ||||||||||
| ## | The rate disclosed is the 7 day net yield as of March 31, 2019. | |||||||||
| * | Non-income producing security | |||||||||
| ** | All or a portion of this security is pledged for open futures collateral. | |||||||||
| *** | Represents an investment of securities lending cash collateral. | |||||||||
| **** | Securities fair valued by the Valuation Committee as approved by the Board of Trustees. The total market value of the securities at year end is $0 which represents 0.0% of net assets. The aggregate tax cost of these securities held at March 31, 2019 was $1,457,972. | |||||||||
| ¤ | Illiquid security. The total market value of the securities at year end is $2,236,786 which represents 0.1% of net assets. The aggregate tax cost of these securities held at March 31, 2019 was $3,575,553. | |||||||||
| ^ | Level 3 — significant unobservable inputs were used in determining the value of this portfolio security. | |||||||||
| ‡ | All or a portion of this security is out on loan. | |||||||||
| ‡‡ | Interest rate presented is yield to maturity. | |||||||||
See accompanying Notes to the Financial Statements.
73
Table of Contents
MercerNon-US Core Equity Fund
Schedule of Investments (Continued)
March 31, 2019
Forward Foreign Currency Contracts
Currency Purchased | Currency Sold | Settlement | Counterparty | Unrealized | ||||||||||||||||
| USD | 20,179,100 | JPY | 2,204,429,000 | 08/22/19 | Citibank N.A. | $ | 42,087 | |||||||||||||
|
| |||||||||||||||||||
Currency Abbreviations
| JPY | — Japanese Yen |
| USD | — U.S. Dollar |
Futures Contracts
Number of | Description | Expiration Date | Notional | Market Value/ | ||||||||||||||
| Buys | ||||||||||||||||||
| 678 | MSCI EAFE Index | Jun 2019 | $ | 63,270,960 | $ | 1,374,326 | ||||||||||||
|
| |||||||||||||||||
See accompanying Notes to the Financial Statements.
74
Table of Contents
MercerNon-US Core Equity Fund
Schedule of Investments (Continued)
March 31, 2019
| Industry Sector Summary (Unaudited) | % of Net Assets | ||||
Pharmaceuticals | 8.5 | ||||
Banks | 5.6 | ||||
Insurance | 5.4 | ||||
Food | 4.7 | ||||
Chemicals | 4.5 | ||||
Commercial Services | 3.9 | ||||
Oil & Gas | 3.9 | ||||
Software | 3.8 | ||||
Beverages | 3.3 | ||||
Telecommunications | 3.3 | ||||
Electric | 3.1 | ||||
Cosmetics & Personal Care | 2.9 | ||||
Mining | 2.7 | ||||
Semiconductors | 2.6 | ||||
Health Care — Products | 2.4 | ||||
Electronics | 2.2 | ||||
Machinery — Diversified | 2.0 | ||||
Retail | 1.8 | ||||
Internet | 1.6 | ||||
Auto Manufacturers | 1.5 | ||||
Building Materials | 1.5 | ||||
Diversified Financial Services | 1.5 | ||||
Real Estate | 1.5 | ||||
Household Products & Wares | 1.3 | ||||
Apparel | 1.2 | ||||
Auto Parts & Equipment | 1.2 | ||||
Electrical Components & Equipment | 1.2 | ||||
Aerospace & Defense | 1.1 | ||||
Computers | 1.1 | ||||
Distribution & Wholesale | 1.1 | ||||
Machinery — Construction & Mining | 1.0 | ||||
Unaffiliated Funds | 1.0 | ||||
Agriculture | 0.9 | ||||
Miscellaneous — Manufacturing | 0.9 | ||||
Airlines | 0.8 | ||||
Engineering & Construction | 0.7 | ||||
Food Service | 0.7 | ||||
Home Builders | 0.7 | ||||
Metal Fabricate & Hardware | 0.7 | ||||
REITS | 0.7 | ||||
Biotechnology | 0.6 | ||||
Transportation | 0.6 | ||||
Iron & Steel | 0.5 | ||||
Media | 0.5 | ||||
Gas | 0.4 | ||||
Oil & Gas Services | 0.4 | ||||
Forest Products & Paper | 0.3 | ||||
Hand & Machine Tools | 0.2 | ||||
Holding Companies — Diversified | 0.2 | ||||
Office & Business Equipment | 0.2 | ||||
Private Equity | 0.2 | ||||
See accompanying Notes to the Financial Statements.
75
Table of Contents
MercerNon-US Core Equity Fund
Schedule of Investments (Continued)
March 31, 2019
| Industry Sector Summary (Unaudited) | % of Net Assets | ||||
Energy-Alternate Sources | 0.1 | ||||
Home Furnishings | 0.1 | ||||
Leisure Time | 0.1 | ||||
Lodging | 0.1 | ||||
Packaging & Containers | 0.1 | ||||
Pipelines | 0.1 | ||||
Shipbuilding | 0.1 | ||||
Water | 0.1 | ||||
Advertising | 0.0 | ||||
Entertainment | 0.0 | ||||
Housewares | 0.0 | ||||
Storage/Warehousing | 0.0 | ||||
Trucking & Leasing | 0.0 | ||||
Short-Term Investments and Other Assets and Liabilities (net) | 4.6 | ||||
|
| ||||
| 100.0 | % | ||||
|
| ||||
See accompanying Notes to the Financial Statements.
76
Table of Contents
Mercer Core Fixed Income Fund
Schedule of Investments
(showing percentage of net assets)
March 31, 2019
| Par Value ($) | Description | Value ($) | ||||||||
DEBT OBLIGATIONS — 97.6% |
| |||||||||
| Asset Backed Securities — 14.3% | ||||||||||
| 165,768 | AccessLex Institute,Series 2005-1, Class A4, 2.82% (3 mo. USD LIBOR plus 0.210%), due 06/22/37† | 160,699 | ||||||||
| 559,617 | AccessLex Institute,Series 2006-1, Class A3, 2.85% (3 mo. USD LIBOR plus 0.200%), due 08/25/37† | 548,329 | ||||||||
| 240,487 | AccessLex Institute,Series 2007-A, Class A3, 2.95% (3 mo. USD LIBOR plus 0.300%), due 05/25/36† | 237,193 | ||||||||
| 290,000 | Ally Auto Receivables Trust,Series 2017-4, Class A4, 1.96%, due 07/15/22 | 287,093 | ||||||||
| 563,000 | Ally Master Owner Trust,Series 2018-1, Class A2, 2.70%, due 01/17/23 | 562,896 | ||||||||
| 250,000 | ALM CLO VIII, Ltd.,Series 2013-8A, Class A1R, 4.28% (3 mo. USD LIBOR plus 1.490%), due 10/15/28† 144A | 250,175 | ||||||||
| 200,000 | AmeriCredit Automobile Receivables Trust,Series 2017-3, Class C, 2.69%, due 06/19/23 | 199,550 | ||||||||
| 500,000 | AmeriCredit Automobile Receivables Trust,Series 2017-4, Class C, 2.60%, due 09/18/23 | 497,553 | ||||||||
| 400,000 | AmeriCredit Automobile Receivables Trust,Series 2018-1, Class C, 3.50%, due 01/18/24 | 405,586 | ||||||||
| 170,000 | AmeriCredit Automobile Receivables Trust,Series 2018-2, Class C, 3.59%, due 06/18/24 | 172,909 | ||||||||
| 141,000 | AmeriCredit Automobile Receivables Trust,Series 2018-3, Class C, 3.74%, due 10/18/24 | 144,331 | ||||||||
| 100,000 | AmeriCredit Automobile Receivables Trust,Series 2019-1, Class B, 3.13%, due 02/18/25 | 100,845 | ||||||||
| 200,000 | AmeriCredit Automobile Receivables Trust,Series 2019-1, Class C, 3.36%, due 02/18/25 | 202,009 | ||||||||
| 375,250 | Applebee’s Funding LLC/IHOP Funding LLC,Series 2014-1, Class A2, 4.28%, due 09/05/44 144A | 377,057 | ||||||||
| 251,550 | Arbys Funding LLC,Series 2015-1A, Class A2, 4.97%, due 10/30/45 144A | 258,318 | ||||||||
| 258,365 | Asset Backed Securities Corp Home Equity Loan Trust,Series 2003-HE7, Class M1, 3.46% (1 mo. USD LIBOR plus 0.975%), due 12/15/33† | 259,106 | ||||||||
| 72,486 | Asset-Backed Pass-Through Certificates,Series 2004-R2, Class A1A, 3.18% (1 mo. USD LIBOR plus 0.690%), due 04/25/34† | 72,830 | ||||||||
| 1,000,000 | Atlas Senior Loan Fund CLO V, Ltd.,Series 2014-1A, Class AR2, 4.04% (3 mo. USD LIBOR plus 1.260%), due 07/16/29† 144A | 996,501 | ||||||||
| 167,000 | Avis Budget Rental Car Funding AESOP LLC,Series 2019-1A, Class A, 3.45%, due 03/20/23 144A | 168,943 | ||||||||
| 250,000 | Battalion CLO VIII, Ltd.,Series 2015-8A, Class A1R, 4.12% (3 mo. USD LIBOR plus 1.340%), due 07/18/30† 144A | 250,094 | ||||||||
| 500,000 | Battalion CLO X, Ltd.,Series 2016-10A, Class A1, 4.33% (3 mo. USD LIBOR plus 1.550%), due 01/24/29† 144A | 500,125 | ||||||||
| 402 | Bear Stearns Asset Backed Securities Trust,Series 2004-SD3, Class A3, 3.63% (1 mo. USD LIBOR plus 1.140%), due 09/25/34† | 403 | ||||||||
| 250,000 | Benefit Street Partners CLO XII, Ltd.,Series 2017-12A, Class A1, 4.04% (3 mo. USD LIBOR plus 1.250%), due 10/15/30† 144A | 249,515 | ||||||||
| 250,000 | BlueMountain CLO, Ltd.,Series 2015-1A, Class A1R, 4.13% (3 mo. USD LIBOR plus 1.330%), due 04/13/27† 144A | 250,066 | ||||||||
| 5,000 | Capital One Multi-Asset Execution Trust,Series 2017-A4, Class A4, 1.99%, due 07/17/23 | 4,959 | ||||||||
See accompanying Notes to the Financial Statements.
77
Table of Contents
Mercer Core Fixed Income Fund
Schedule of Investments (Continued)
(showing percentage of net assets)
March 31, 2019
| Par Value ($) | Description | Value ($) | ||||||||
| Asset Backed Securities — continued | ||||||||||
| 500,000 | Carlyle Global Market Strategies CLO, Ltd.,Series 2012-4A, Class AR, 4.21% (3 mo. USD LIBOR plus 1.450%), due 01/20/29† 144A | 500,119 | ||||||||
| 500,000 | Carlyle Global Market Strategies CLO, Ltd.,Series 2017-1A, Class A1B, 3.99% (3 mo. USD LIBOR plus 1.230%), due 04/20/31† 144A | 499,491 | ||||||||
| 255,000 | CarMax Auto Owner Trust,Series 2018-1, Class A3, 2.48%, due 11/15/22 | 254,620 | ||||||||
| 930,000 | Citibank Credit Card Issuance Trust,Series 2018-A1, Class A1, 2.49%, due 01/20/23 | 928,971 | ||||||||
| 1,300,000 | Citibank Credit Card Issuance Trust,Series 2018-A7, Class A7, 3.96%, due 10/13/30 | 1,394,750 | ||||||||
| 253,521 | CLI Funding LLC,Series 2018-1A, Class A, 4.03%, due 04/18/43 144A | 255,600 | ||||||||
| 292,000 | CNH Equipment Trust,Series 2018-B, Class A3, 3.19%, due 11/15/23 | 295,394 | ||||||||
| 324,225 | Coinstar Funding LLC,Series 2017-1A, Class A2, 5.22%, due 04/25/47 144A | 330,667 | ||||||||
| 223,000 | Collegiate Funding Services Education Loan Trust,Series 2005-A, Class A4, 2.80% (3 mo. USD LIBOR plus 0.200%), due 03/28/35† | 211,201 | ||||||||
| 627,737 | Commonbond Student Loan Trust,Series 2017-BGS, Class A1, 2.68%, due 09/25/42 144A | 618,740 | ||||||||
| 380,183 | CSMC Trust, Series 2018-RPL8, Class A1, 4.13%, due 07/25/58◆◆ 144A | 382,261 | ||||||||
| 326,400 | DB Master Finance LLC,Series 2015-1A, Class A2II, 3.98%, due 02/20/45 144A | 326,765 | ||||||||
| 1,087,238 | DB Master Finance LLC,Series 2017-1A, Class A2I, 3.63%, due 11/20/47 144A | 1,089,347 | ||||||||
| 148,125 | DB Master Finance LLC,Series 2017-1A, Class A2II, 4.03%, due 11/20/47 144A | 148,901 | ||||||||
| 496,000 | DB Master Finance LLC,Series 2019-1A, Class A2I, 3.79%, due 05/20/49†††† 144A | 499,819 | ||||||||
| 245,000 | DLL LLC,Series 2018-ST2, Class A3, 3.46%, due 01/20/22 144A | 247,553 | ||||||||
| 384,150 | Domino’s Pizza Master Issuer LLC,Series 2017-1A, Class A23, 4.12%, due 07/25/47 144A | 390,614 | ||||||||
| 853,010 | Domino’s Pizza Master Issuer LLC,Series 2017-1A, Class A2I, 4.02% (3 mo. USD LIBOR plus 1.250%), due 07/25/47† 144A | 853,078 | ||||||||
| 601,455 | Domino’s Pizza Master Issuer LLC,Series 2018-1A, Class A2I, 4.12%, due 07/25/48 144A | 612,044 | ||||||||
| 314,579 | Drive Auto Receivables Trust,Series 2018-1, Class B, 2.88%, due 02/15/22 | 314,603 | ||||||||
| 333,788 | Driven Brands Funding LLC,Series 2015-1A, Class A2, 5.22%, due 07/20/45 144A | 346,652 | ||||||||
| 326,000 | Enterprise Fleet Financing LLC,Series 2018-3, Class A2, 3.38%, due 05/20/24 144A | 328,953 | ||||||||
| 490,000 | Evergreen Credit Card Trust,Series 2018-1, Class A, 2.95%, due 03/15/23 144A | 493,084 | ||||||||
| 127,725 | FOCUS Brands Funding LLC,Series 2017-1A, Class A2I, 3.86%, due 04/30/47 144A | 130,077 | ||||||||
| 113,000 | Ford Credit Auto Owner Trust,Series 2017-B, Class A4, 1.87%, due 09/15/22 | 111,446 | ||||||||
| 285,000 | Ford Credit Auto Owner Trust,Series 2017-C, Class A4, 2.16%, due 03/15/23 | 282,427 | ||||||||
| 350,000 | Ford Credit Auto Owner Trust,Series 2018-B, Class A3, 3.24%, due 04/15/23 | 354,263 | ||||||||
| 1,900,000 | Ford Credit Floorplan Master Owner Trust,Series 2018-2, Class A, 3.17%, due 03/15/25 | 1,929,768 | ||||||||
| 2,564,000 | Ford Credit Floorplan Master Owner Trust,Series 2018-3, Class A1, 3.52%, due 10/15/23 | 2,613,378 | ||||||||
| 201,541 | Fremont Home Loan Trust,Series 2004-B, Class M1, 3.36% (1 mo. USD LIBOR plus 0.870%), due 05/25/34† | 200,274 | ||||||||
| 100,000 | GM Financial Consumer Automobile Receivables Trust,Series 2018-4, Class C, 3.62%, due 06/17/24 | 101,659 | ||||||||
| 1,245,000 | GM Financial Consumer Automobile Receivables Trust,Series 2019-1, Class A3, 2.97%, due 11/16/23 | 1,255,586 | ||||||||
| 936,000 | Goal Capital Funding Trust,Series 2005-2, Class A4, 2.85% (3 mo. USD LIBOR plus 0.200%), due 08/25/44† | 920,751 | ||||||||
| 390,000 | Golden Credit Card Trust,Series 2018-1A, Class A, 2.62%, due 01/15/23 144A | 389,548 | ||||||||
| 259,567 | Hilton Grand Vacations Trust,Series 2017-AA, Class A, 2.66%, due 12/26/28 144A | 257,677 | ||||||||
| 104,351 | Hilton Grand Vacations Trust,Series 2018-AA, Class A, 3.54%, due 02/25/32 144A | 105,859 | ||||||||
See accompanying Notes to the Financial Statements.
78
Table of Contents
Mercer Core Fixed Income Fund
Schedule of Investments (Continued)
(showing percentage of net assets)
March 31, 2019
| Par Value ($) | Description | Value ($) | ||||||||
| Asset Backed Securities — continued | ||||||||||
| 194,138 | Home Equity Asset Trust,Series 2003-8, Class M1, 3.57% (1 mo. USD LIBOR plus 1.080%), due 04/25/34† | 195,020 | ||||||||
| 125,000 | Honda Auto Receivables Owner Trust,Series 2017-2, Class A4, 1.87%, due 09/15/23 | 123,353 | ||||||||
| 145,000 | Honda Auto Receivables Owner Trust,Series 2017-3, Class A4, 1.98%, due 11/20/23 | 143,366 | ||||||||
| 226,000 | Honda Auto Receivables Owner Trust,Series 2018-2, Class A3, 3.01%, due 05/18/22 | 227,444 | ||||||||
| 170,000 | Honda Auto Receivables Owner Trust,Series 2018-3, Class A3, 2.95%, due 08/22/22 | 171,204 | ||||||||
| 221,000 | Hyundai Auto Receivables Trust,Series 2018-B, Class A3, 3.20%, due 12/15/22 | 223,467 | ||||||||
| 500,000 | ICG US CLO, Ltd.,Series 2017-2A, Class A1, 4.05% (3 mo. USD LIBOR plus 1.280%), due 10/23/29† 144A | 498,301 | ||||||||
| 572,107 | Invitation Homes Trust, Series 2018-SFR1, Class A, 3.18%, due 03/17/37◆◆ 144A | 565,306 | ||||||||
| 188,336 | KeyCorp Student Loan Trust,Series 2004-A, Class 1A2, 3.00% (3 mo. USD LIBOR plus 0.240%), due 10/27/42† | 183,209 | ||||||||
| 500,000 | Laurel Road Prime Student Loan Trust,Series 2017-C, Class A2B, 2.81%, due 11/25/42 144A | 495,688 | ||||||||
| 735,452 | Limerock CLO III LLC,Series 2014-3A, Class A1R, 3.96% (3 mo. USD LIBOR plus 1.200%), due 10/20/26† 144A | 735,728 | ||||||||
| 2,370,000 | Mercedes-Benz Auto Receivables Trust,Series 2016-1, Class A4, 1.46%, due 12/15/22 | 2,340,661 | ||||||||
| 750,000 | MidOcean Credit CLO III,Series 2014-3A, Class A1R, 3.88%, due 04/21/31◆◆ 144A | 740,224 | ||||||||
| 165,180 | Mill City Mortgage Loan Trust,Series 2018-3, Class A1, 3.50%, due 08/25/58◆◆ 144A | 166,971 | ||||||||
| 210,000 | MMAF Equipment Finance LLC,Series 2017-B, Class A3, 2.21%, due 10/17/22 144A | 208,489 | ||||||||
| 161,000 | MMAF Equipment Finance LLC,Series 2019-A, Class A3, 2.84%, due 11/13/23 144A | 161,546 | ||||||||
| 147,505 | Morgan Stanley ABS Capital I, Inc., Series 2003-NC10, Class M1, 3.51% (1 mo. USD LIBOR plus 1.020%), due 10/25/33† | 146,445 | ||||||||
| 74,530 | Morgan Stanley ABS Capital I, Inc.,Series 2003-NC7, Class M1, 3.54% (1 mo. USD LIBOR plus 1.050%), due 06/25/33† | 75,470 | ||||||||
| 217,237 | MVW Owner Trust,Series 2018-1A, Class A, 3.45%, due 01/21/36 144A | 220,446 | ||||||||
| 408,521 | Navient Private Education Loan Trust,Series 2016-AA, Class A2A, 3.91%, due 12/15/45 144A | 417,888 | ||||||||
| 419,000 | Nelnet Student Loan Trust,Series 2006-1, Class A6, 3.10% (3 mo. USD LIBOR plus 0.450%), due 08/23/36† 144A | 410,795 | ||||||||
| 242,761 | New Century Home Equity Loan Trust,Series 2003-A, Class A, 3.21% (1 mo. USD LIBOR plus 0.720%), due 10/25/33† 144A | 237,720 | ||||||||
| 236,277 | New Residential Mortgage LLC, Series 2018-FNT1, Class A, 3.61%, due 05/25/23 144A | 238,515 | ||||||||
| 148,234 | New Residential Mortgage LLC, Series 2018-FNT2, Class A, 3.79%, due 07/25/54 144A | 149,544 | ||||||||
| 401,021 | NewResidential Mortgage Loan Trust,Series 2018-1A, Class A1A, 4.00%, due 12/25/57◆◆ 144A | 410,859 | ||||||||
| 120,000 | NextGear Floorplan Master Owner Trust,Series 2018-1A, Class A2, 3.22%, due 02/15/23 144A | 120,491 | ||||||||
| 2,050,000 | NextGear Floorplan Master Owner Trust,Series 2018-2A, Class A2, 3.69%, due 10/15/23 144A | 2,087,576 | ||||||||
| 330,000 | Nissan Auto Receivables Owner Trust,Series 2017-B, Class A4, 1.95%, due 10/16/23 | 326,248 | ||||||||
| 600,000 | North Carolina State Education Assistance Authority,Series 2011-2, Class A3, 3.57% (3 mo. USD LIBOR plus 0.800%), due 07/25/36† | 605,826 | ||||||||
| 91,546 | NRZ Excess Spread-Collateralized Notes, Series 2018-PLS1, Class A, 3.19%, due 01/25/23 144A | 91,182 | ||||||||
See accompanying Notes to the Financial Statements.
79
Table of Contents
Mercer Core Fixed Income Fund
Schedule of Investments (Continued)
(showing percentage of net assets)
March 31, 2019
| Par Value ($) | Description | Value ($) | ||||||||
| Asset Backed Securities — continued | ||||||||||
| 237,859 | NRZ Excess Spread-Collateralized Notes, Series 2018-PLS2, Class A, 3.27%, due 02/25/23 144A | 237,832 | ||||||||
| 250,000 | OCP CLO, Ltd.,Series 2017-13A, Class A1A, 4.05% (3 mo. USD LIBOR plus 1.260%), due 07/15/30† 144A | 250,107 | ||||||||
| 1,300,000 | OneMain Direct Auto Receivables Trust,Series 2017-2A, Class B, 2.55%, due 11/14/23 144A | 1,292,386 | ||||||||
| 300,000 | OneMain Direct Auto Receivables Trust,Series 2017-2A, Class C, 2.82%, due 07/15/24 144A | 298,434 | ||||||||
| 700,000 | OneMain Financial Issuance Trust,Series 2017-1A, Class A2, 3.29% (1 mo. USD LIBOR plus 0.800%), due 09/14/32† 144A | 702,513 | ||||||||
| 170,000 | OneMain Financial Issuance Trust,Series 2018-1A, Class A, 3.30%, due 03/14/29 144A | 170,894 | ||||||||
| 108,000 | Oxford Finance Funding LLC,Series 2019-1A, Class A2, 4.46%, due 02/15/27 144A | 109,320 | ||||||||
| 750,000 | OZLM Funding IV CLO, Ltd.,Series 2013-4A, Class A1R, 4.01% (3 mo. USD LIBOR plus 1.250%), due 10/22/30† 144A | 744,940 | ||||||||
| 750,000 | OZLM IX CLO, Ltd.,Series 2014-9A, Class A1AR, 3.75% (1 mo. USD LIBOR plus 1.280%), due 10/20/31† 144A | 745,969 | ||||||||
| 250,000 | OZLM XI CLO, Ltd.,Series 2015-11A, Class A1R, 4.00% (1 mo. USD LIBOR plus 1.250%), due 10/30/30† 144A | 248,057 | ||||||||
| 750,000 | OZLM XV CLO, Ltd.,Series 2016-15A, Class A1, 4.25% (3 mo. USD LIBOR plus 1.490%), due 01/20/29† 144A | 750,198 | ||||||||
| 750,000 | Palmer Square CLO Ltd.,Series 2018-2A, Class A1A, 3.88%, due 07/16/31◆◆ 144A | 741,061 | ||||||||
| 500,000 | Palmer Square CLO, Ltd.,Series 2015-1A, Class A1R, 3.94% (3 mo. USD LIBOR plus 1.300%), due 05/21/29† 144A | 500,054 | ||||||||
| 240,000 | PFS Financing Corp.,Series 2018-B, Class A, 2.89%, due 02/15/23 144A | 239,723 | ||||||||
| 650,000 | Progress Residential Trust, Series 2019-SFR1, Class A, 3.42%, due 08/17/35 144A | 656,855 | ||||||||
| 9,725 | Renaissance Home Equity Loan Trust,Series 2005-2, Class AF4, 4.93%, due 08/25/35†† | 9,903 | ||||||||
| 250,000 | Romark CLO II, Ltd.,Series 2018-2A, Class A1, 3.95%, due 07/25/31◆◆ 144A | 247,345 | ||||||||
| 300,000 | Santander Drive Auto Receivables Trust,Series 2017-3, Class C, 2.76%, due 12/15/22 | 299,562 | ||||||||
| 300,000 | Santander Drive Auto Receivables Trust,Series 2018-1, Class C, 2.96%, due 03/15/24 | 300,313 | ||||||||
| 500,000 | Santander Drive Auto Receivables Trust,Series 2018-2, Class C, 3.35%, due 07/17/23 | 502,635 | ||||||||
| 430,000 | Santander Drive Auto Receivables Trust,Series 2018-3, Class C, 3.51%, due 08/15/23 | 432,642 | ||||||||
| 500,000 | Santander Drive Auto Receivables Trust,Series 2018-5, Class C, 3.81%, due 12/16/24 | 507,718 | ||||||||
| 295,543 | Saxon Asset Securities Trust,Series 2005-1, Class M1, 3.13% (1 mo. USD LIBOR plus 0.690%), due 05/25/35† | 293,312 | ||||||||
| 130,973 | Sierra Timeshare Receivables Funding LLC,Series 2018-2A, Class A, 3.50%, due 06/20/35 144A | 132,633 | ||||||||
| 154,000 | Sierra Timeshare Receivables Funding LLC,Series 2019-1A, Class A, 3.20%, due 01/20/36 144A | 155,047 | ||||||||
| 500,000 | Silver Creek CLO, Ltd.,Series 2014-1A, Class AR, 4.00% (3 mo. USD LIBOR plus 1.240%), due 07/20/30† 144A | 498,285 | ||||||||
| 105,186 | SLM Private Credit Student Loan Trust,Series 2006-A, Class A5, 2.90% (3 mo. USD LIBOR plus 0.290%), due 06/15/39† | 102,326 | ||||||||
| 3,088,900 | Small Business Administration Participation Certificates,Series 2013-20H, Class 1, 3.16%, due 08/01/33 | 3,114,434 | ||||||||
| 2,766,924 | Small Business Administration Participation Certificates,Series 2014-20C, Class 1, 3.21%, due 03/01/34 | 2,822,608 | ||||||||
See accompanying Notes to the Financial Statements.
80
Table of Contents
Mercer Core Fixed Income Fund
Schedule of Investments (Continued)
(showing percentage of net assets)
March 31, 2019
| Par Value ($) | Description | Value ($) | ||||||||
| Asset Backed Securities — continued | ||||||||||
| 1,194,757 | Small Business Administration Participation Certificates,Series 2014-20D, Class 1, 3.11%, due 04/01/34 | 1,212,235 | ||||||||
| 882,008 | Small Business Administration Participation Certificates,Series 2014-20I, Class 1, 2.92%, due 09/01/34 | 886,420 | ||||||||
| 150,024 | SMB Private Education Loan Trust,Series 2015-C, Class A2A, 2.75%, due 07/15/27 144A | 149,804 | ||||||||
| 1,750,000 | Sound Point CLOVII-R, Ltd.,Series 2014-3RA, Class A1, 3.53% (1 mo. USD LIBOR plus 1.250%), due 10/23/31† 144A | 1,744,057 | ||||||||
| 500,000 | Sound Point CLO XVI, Ltd.,Series 2017-2A, Class A, 4.05% (3 mo. USD LIBOR plus 1.280%), due 07/25/30† 144A | 498,902 | ||||||||
| 345,966 | SpringCastle America Funding LLC,Series 2016-AA, Class A, 3.05%, due 04/25/29 144A | 345,953 | ||||||||
| 3,235,375 | STORE Master Funding I LLC,Series 2015-1A, Class A1, 3.75%, due 04/20/45 144A | 3,246,333 | ||||||||
| 1,196,372 | STORE Master Funding LLC,Series 2014-1A, Class A2, 5.00%, due 04/20/44 144A | 1,205,385 | ||||||||
| 798,065 | SunTrust Student Loan Trust,Series 2006-1A, Class A4, 2.95% (3 mo. USD LIBOR plus 0.190%), due 10/28/37† 144A | 788,796 | ||||||||
| 286,283 | Taco Bell Funding LLC,Series 2018-1A, Class A2I, 4.32%, due 11/25/48 144A | 294,914 | ||||||||
| 750,000 | Telos CLO,Series 2013-3A, Class AR, 4.07% (3 mo. USD LIBOR plus 1.300%), due 07/17/26† 144A | 750,280 | ||||||||
| 119,000 | Textainer Marine Containers VII, Ltd.,Series 2018-1A, Class A, 4.11%, due 07/20/43 144A | 120,681 | ||||||||
| 1,000,000 | TICP CLO VI, Ltd.,Series 2016-6A, Class A, 4.34% (3 mo. USD LIBOR plus 1.550%), due 01/15/29† 144A | 1,000,157 | ||||||||
| 250,000 | TICP CLO VII, Ltd.,Series 2017-7A, Class AS, 4.02% (3 mo. USD LIBOR plus 1.230%), due 07/15/29† 144A | 249,735 | ||||||||
| 115,000 | Towd Point Mortgage Trust,Series 2015-1, Class A5, 3.91%, due 10/25/53◆◆ 144A | 119,538 | ||||||||
| 265,000 | Towd Point Mortgage Trust,Series 2015-2, Class 1M2, 3.78%, due 11/25/60◆◆ 144A | 273,299 | ||||||||
| 725,340 | Towd Point Mortgage Trust,Series 2017-4, Class A1, 2.75%, due 06/25/57◆◆ 144A | 715,874 | ||||||||
| 803,555 | Towd Point Mortgage Trust,Series 2017-6, Class A1, 2.75%, due 10/25/57◆◆ 144A | 789,291 | ||||||||
| 781,428 | Towd Point Mortgage Trust,Series 2018-1, Class A1, 3.00%, due 01/25/58◆◆ 144A | 775,246 | ||||||||
| 254,627 | Towd Point Mortgage Trust,Series 2018-3, Class A1, 3.75%, due 05/25/58◆◆ 144A | 258,177 | ||||||||
| 376,374 | Towd Point Mortgage Trust,Series 2018-4, Class A1, 3.00%, due 06/25/58◆◆ 144A | 373,192 | ||||||||
| 284,116 | Towd Point Mortgage Trust,Series 2018-5, Class A1, 3.25%, due 07/25/58◆◆ 144A | 283,465 | ||||||||
| 201,829 | Towd Point Mortgage Trust,Series 2019-1, Class A1, 3.75%, due 03/25/58◆◆ 144A | 205,574 | ||||||||
| 108,323 | Towd Point Mortgage Trust,Series 2018-5, Class A1A, 3.25%, due 07/25/58◆◆ 144A | 108,203 | ||||||||
| 424,886 | Towd Point Mortgage Trust,Series 2018-6, Class A1A, 3.75%, due 03/25/58◆◆ 144A | 431,114 | ||||||||
| 300,000 | Toyota Auto Receivables Owner Trust,Series 2017-C, Class A4, 1.98%, due 12/15/22 | 296,095 | ||||||||
| 460,000 | Toyota Auto Receivables Owner Trust,Series 2018-C, Class A3, 3.02%, due 12/15/22 | 464,253 | ||||||||
| 750,000 | Trinitas CLO V, Ltd.,Series 2016-5A, Class A, 4.47% (3 mo. USD LIBOR plus 1.700%), due 10/25/28† 144A | 750,250 | ||||||||
| 500,000 | Trinitas CLO VI, Ltd.,Series 2017-6A, Class A, 4.09% (3 mo. USD LIBOR plus 1.320%), due 07/25/29† 144A | 500,342 | ||||||||
| 220,500 | Triton Container Finance V LLC,Series 2018-1A, Class A, 3.95%, due 03/20/43 144A | 223,206 | ||||||||
| 182,996 | Vantage Data Centers Issuer LLC,Series 2018-1A, Class A2, 4.07%, due 02/16/43 144A | 185,880 | ||||||||
| 500,000 | Venture XIX CLO, Ltd.,Series 2014-19A, Class ARR, 4.05%, due 01/15/32◆◆ 144A | 496,658 | ||||||||
| 215,404 | VSE VOI Mortgage LLC,Series 2017-A, Class A, 2.33%, due 03/20/35 144A | 211,667 | ||||||||
| 57,024 | Wachovia Student Loan Trust,Series 2006-1, Class B, 3.01% (3 mo. USD LIBOR plus 0.240%), due 04/25/40† 144A | 54,043 | ||||||||
See accompanying Notes to the Financial Statements.
81
Table of Contents
Mercer Core Fixed Income Fund
Schedule of Investments (Continued)
(showing percentage of net assets)
March 31, 2019
| Par Value ($) | Description | Value ($) | ||||||||
| Asset Backed Securities — continued | ||||||||||
| 500,000 | Wellfleet CLO, Ltd.,Series 2018-3A, Class A1A, 4.07% (1 mo. USD LIBOR plus 1.250%), due 01/20/32† 144A | 496,028 | ||||||||
| 152,792 | Westgate Resorts LLC,Series 2017-1A, Class A, 3.05%, due 12/20/30 144A | 151,947 | ||||||||
| 153,000 | Westlake Automobile Receivables Trust,Series 2019-1A, Class C, 3.45%, due 03/15/24 144A | 153,857 | ||||||||
| 317,000 | World Omni Automobile Lease Securitization Trust,Series 2018-B, Class A3, 3.19%, due 12/15/21 | 319,837 | ||||||||
| 250,000 | Zais CLO 6, Ltd.,Series 2017-1A, Class A1, 4.16% (3 mo. USD LIBOR plus 1.370%), due 07/15/29† 144A | 250,139 | ||||||||
|
| |||||||||
| 78,339,940 | ||||||||||
|
| |||||||||
| Corporate Debt — 35.3% | ||||||||||
| 235,000 | 3M Co. (MTN), 3.25%, due 02/14/24‡ | 242,262 | ||||||||
| 300,000 | AbbVie, Inc., 3.60%, due 05/14/25 | 300,949 | ||||||||
| 500,000 | AbbVie, Inc., 4.50%, due 05/14/35 | 489,838 | ||||||||
| 133,326 | ABY Transmision Sur SA, 6.88%, due 04/30/43 144A | 149,326 | ||||||||
| 175,000 | Activision Blizzard, Inc., 3.40%, due 09/15/26 | 171,608 | ||||||||
| 111,000 | Advanced Micro Devices, Inc., 7.00%, due 07/01/24‡ | 116,481 | ||||||||
| 250,000 | AECOM, 5.13%, due 03/15/27 | 242,813 | ||||||||
| 400,000 | AEP Texas, Inc., 3.80%, due 10/01/47 | 381,002 | ||||||||
| 200,000 | AerCap Ireland Capital DAC/AerCap Global Aviation Trust, 4.63%, due 10/30/20 | 204,774 | ||||||||
| 200,000 | AerCap Ireland Capital DAC/AerCap Global Aviation Trust, 5.00%, due 10/01/21 | 207,604 | ||||||||
| 370,000 | Aetna, Inc., 4.75%, due 03/15/44 | 361,546 | ||||||||
| 220,000 | Ahern Rentals, Inc., 7.38%, due 05/15/23 144A | 203,775 | ||||||||
| 780,008 | Air Canada Pass Through Trust,Series 2015-1, Class A, 3.60%, due 09/15/28 144A | 777,512 | ||||||||
| 194,967 | Air Canada Pass ThroughTrust,Series 2017-1, Class B, 3.70%, due 07/15/27 144A | 189,186 | ||||||||
| 134,791 | Air Canada Pass ThroughTrust,Series 2013-1, Class A, 4.13%, due 11/15/26 144A | 137,675 | ||||||||
| 1,908,000 | Air Lease Corp., 3.25%, due 03/01/25‡ | 1,838,923 | ||||||||
| 117,000 | Aircastle, Ltd., 4.40%, due 09/25/23 | 119,209 | ||||||||
| 165,000 | Aircastle, Ltd., 5.50%, due 02/15/22 | 173,167 | ||||||||
| 141,000 | Alimentation Couche-Tard, Inc., 2.70%, due 07/26/22 144A | 139,592 | ||||||||
| 640,000 | Allergan Funding SCS, 4.55%, due 03/15/35 | 627,774 | ||||||||
| 290,000 | Ally Financial, Inc., 5.13%, due 09/30/24 | 305,587 | ||||||||
| 130,000 | Altice Financing SA, 6.63%, due 02/15/23 144A | 133,250 | ||||||||
| 365,000 | Amazon.com, Inc., 3.15%, due 08/22/27 | 367,800 | ||||||||
| 225,000 | Amazon.com, Inc., 4.05%, due 08/22/47 | 238,594 | ||||||||
| 340,000 | AMC Networks, Inc., 5.00%, due 04/01/24 | 342,516 | ||||||||
| 244,285 | American Airlines Pass ThroughTrust,Series 2015-1, Class A, 3.38%, due 11/01/28 | 241,011 | ||||||||
| 145,941 | American Airlines Pass ThroughTrust,Series 2017-2, Class A, 3.60%, due 04/15/31 | 141,093 | ||||||||
| 189,000 | American Airlines Pass ThroughTrust,Series 2017-1, Class AA, 3.65%, due 02/15/29 | 190,482 | ||||||||
| 129,334 | American Airlines Pass ThroughTrust,Series 2015-1, Class B, 3.70%, due 11/01/24 | 127,873 | ||||||||
| 124,200 | American Airlines Pass ThroughTrust,Series 2017-1, Class A, 4.00%, due 08/15/30 | 125,775 | ||||||||
| 225,435 | American Airlines Pass ThroughTrust,Series 2016-1, Class A, 4.10%, due 07/15/29 | 230,003 | ||||||||
| 2,584,712 | American Airlines Pass ThroughTrust,Series 2013-2, Class A, 4.95%, due 07/15/24 | 2,679,701 | ||||||||
| 76,579 | American Airlines Pass ThroughTrust,Series 2001-1, Class A, 6.98%, due 11/23/22 | 78,358 | ||||||||
| 255,000 | American Express Co., 2.50%, due 08/01/22 | 252,136 | ||||||||
| 195,000 | American Homes 4 Rent, LP REIT, 4.25%, due 02/15/28 | 193,177 | ||||||||
| 341,000 | American Tower Corp. REIT, 3.55%, due 07/15/27 | 335,871 | ||||||||
| 145,000 | American Tower Corp. REIT, 4.70%, due 03/15/22 | 151,768 | ||||||||
See accompanying Notes to the Financial Statements.
82
Table of Contents
Mercer Core Fixed Income Fund
Schedule of Investments (Continued)
(showing percentage of net assets)
March 31, 2019
| Par Value ($) | Description | Value ($) | ||||||||
| Corporate Debt — continued | ||||||||||
| 135,000 | AmeriGas Partners, LP/AmeriGas Finance Corp., 5.50%, due 05/20/25 | 135,169 | ||||||||
| 319,000 | Anadarko Petroleum Corp., 4.85%, due 03/15/21 | 330,799 | ||||||||
| 4,000,000 | Anadarko Petroleum Corp., 6.89%, due 10/10/36‡‡ | 1,780,906 | ||||||||
| 255,000 | Andeavor Logistics, LP, 6.88%◆ ††††† | 256,424 | ||||||||
| 86,000 | Andeavor Logistics, LP/Tesoro Logistics Finance Corp., 4.25%, due 12/01/27‡ | 86,566 | ||||||||
| 140,000 | Andeavor Logistics, LP/Tesoro Logistics Finance Corp., 5.25%, due 01/15/25 | 145,455 | ||||||||
| 145,000 | Andeavor Logistics, LP/Tesoro Logistics Finance Corp., 6.38%, due 05/01/24 | 152,431 | ||||||||
| 150,000 | Anglo American Capital Plc, 4.75%, due 04/10/27 144A | 152,999 | ||||||||
| 1,295,000 | Anheuser-Busch Cos. LLC/Anheuser-Busch InBev Worldwide, Inc., 4.90%, due 02/01/46 144A | 1,302,692 | ||||||||
| 200,000 | Anheuser-Busch InBev Worldwide, Inc., 4.60%, due 04/15/48 | 192,453 | ||||||||
| 135,000 | Antero Midstream Partners LP/Antero Midstream Finance Corp., 5.38%, due 09/15/24 | 136,728 | ||||||||
| 189,000 | Antero Resources Corp., 5.13%, due 12/01/22 | 190,710 | ||||||||
| 5,000 | Anthem, Inc., 5.10%, due 01/15/44 | 5,469 | ||||||||
| 225,000 | Aquarion Co., 4.00%, due 08/15/24 144A | 229,666 | ||||||||
| 295,000 | Aquarius & Investments Plc for Swiss Reinsurance Co., Ltd., Reg S, 6.38% (USD 5 year swap rate plus 5.210%), due 09/01/24† ‡‡‡ | 298,349 | ||||||||
| 188,000 | Archrock Partners, LP/Archrock Partners Finance Corp., 6.00%, due 04/01/21 | 187,918 | ||||||||
| 168,000 | Archrock Partners, LP/Archrock Partners Finance Corp., 6.00%, due 10/01/22 | 170,100 | ||||||||
| 204,000 | Arconic, Inc., 5.13%, due 10/01/24 | 208,981 | ||||||||
| 175,000 | Ardagh Packaging Finance Plc/Ardagh Holdings USA, Inc., 6.00%, due 02/15/25 144A | 175,438 | ||||||||
| 174,000 | Ares Capital Corp., 3.63%, due 01/19/22 | 174,430 | ||||||||
| 140,000 | Ashtead Capital, Inc., 4.38%, due 08/15/27 144A | 135,800 | ||||||||
| 140,000 | ASP AMC Merger Sub, Inc., 8.00%, due 05/15/25 144A | 63,700 | ||||||||
| 150,000 | AT&T, Inc., 2.63%, due 12/01/22 | 148,174 | ||||||||
| 2,000,000 | AT&T, Inc., 3.21%, due 11/27/22‡‡ 144A | 1,787,404 | ||||||||
| 619,000 | AT&T, Inc., 3.40%, due 05/15/25 | 613,098 | ||||||||
| 25,000 | AT&T, Inc., 4.30%, due 02/15/30 | 25,311 | ||||||||
| 278,000 | AT&T, Inc., 4.35%, due 03/01/29 | 284,253 | ||||||||
| 10,000 | AT&T, Inc., 4.45%, due 05/15/21 | 10,322 | ||||||||
| 855,000 | AT&T, Inc., 4.85%, due 03/01/39 | 861,769 | ||||||||
| 110,000 | AT&T, Inc., 5.25%, due 03/01/37 | 115,414 | ||||||||
| 130,000 | Australia & New Zealand Banking Group, Ltd., 6.75% (USISDA05 plus 5.168%)† ††††† ‡ 144A | 137,760 | ||||||||
| 147,000 | Avolon Holdings Funding, Ltd., 5.13%, due 10/01/23 144A | 149,940 | ||||||||
| 105,000 | AXA SA, 8.60%, due 12/15/30 | 137,648 | ||||||||
| 160,000 | Azul Investments LLP, 5.88%, due 10/26/24 144A | 152,400 | ||||||||
| 200,000 | Banco Santander SA, 3.85%, due 04/12/23 | 201,819 | ||||||||
| 100,000 | Banco Santander SA, 4.38%, due 04/12/28 | 101,210 | ||||||||
| 137,000 | Banff Merger Sub, Inc., 9.75%, due 09/01/26 144A | 133,233 | ||||||||
| 470,000 | Bank of America Corp., 3.50%, due 04/19/26 | 474,442 | ||||||||
| 420,000 | Bank of America Corp., 5.13% (3 mo. USD LIBOR plus 3.387%)† ††††† ‡ | 419,144 | ||||||||
| 270,000 | Bank of America Corp.,Series DD, 6.30% (3 mo. USD LIBOR plus 4.553%)† ††††† ‡ | 293,543 | ||||||||
| 755,000 | Bank of America Corp., (MTN), 3.59% (3 mo. USD LIBOR plus 1.370%), due 07/21/28† ‡ | 753,431 | ||||||||
| 385,000 | Bank of America Corp., (MTN), 3.82% (3 mo. USD LIBOR plus 1.575%), due 01/20/28† | 390,539 | ||||||||
| 273,000 | Bank of America Corp., (MTN),Series L, 3.95%, due 04/21/25 | 277,946 | ||||||||
| 500,000 | Bank of America Corp., (MTN), 4.13%, due 01/22/24 | 524,213 | ||||||||
See accompanying Notes to the Financial Statements.
83
Table of Contents
Mercer Core Fixed Income Fund
Schedule of Investments (Continued)
(showing percentage of net assets)
March 31, 2019
| Par Value ($) | Description | Value ($) | ||||||||
| Corporate Debt — continued | ||||||||||
| 135,000 | Bank of America Corp., (MTN), 4.20%, due 08/26/24 | 139,802 | ||||||||
| 210,000 | Bank of America Corp., (MTN), 4.27% (1 mo. USD LIBOR plus 1.310%), due 07/23/29† | 218,842 | ||||||||
| 513,000 | Bank of America Corp., (MTN), 4.33%, due 03/15/50◆ | 529,204 | ||||||||
| 1,105,000 | Bank of America Corp., (MTN), 4.45%, due 03/03/26 | 1,152,645 | ||||||||
| 200,000 | Bank of Montreal (MTN), 2.90%, due 03/26/22 | 200,281 | ||||||||
| 575,000 | Barclays Plc, 3.68%, due 01/10/23 | 574,646 | ||||||||
| 190,000 | Barclays Plc, 4.38%, due 01/12/26 | 191,378 | ||||||||
| 400,000 | Barclays Plc, 4.97%, due 05/16/29† | 413,855 | ||||||||
| 190,000 | Barclays Plc, 7.75% (1 mo. USD LIBOR plus 4.842%)† ††††† | 190,434 | ||||||||
| 770,000 | BAT Capital Corp., 3.22%, due 08/15/24 | 753,335 | ||||||||
| 225,000 | Bausch Health Cos., Inc., 6.13%, due 04/15/25‡ 144A | 223,313 | ||||||||
| 255,000 | Bayer US Finance II LLC, 3.23%, due 06/25/21◆◆ 144A | 252,890 | ||||||||
| 335,000 | Bayer US Finance II LLC, 3.50%, due 06/25/21 144A | 336,463 | ||||||||
| 85,000 | Berkshire Hathaway Energy Co., 5.95%, due 05/15/37 | 105,528 | ||||||||
| 1,312,000 | Berkshire Hathaway Energy Co., 6.13%, due 04/01/36 | 1,649,804 | ||||||||
| 105,000 | BHP Billiton Finance USA, Ltd., 6.25% (USD 5 year swap rate plus 4.971%), due 10/19/75† 144A | 109,570 | ||||||||
| 1,099,000 | Blackstone Holdings Finance Co. LLC, 4.75%, due 02/15/23 144A | 1,166,321 | ||||||||
| 145,000 | BMW US Capital LLC, 3.10%, due 04/12/21 144A | 145,958 | ||||||||
| 110,000 | BMW US Capital LLC, 3.21%, due 04/12/21 144A◆◆ | 109,971 | ||||||||
| 510,000 | BNP Paribas SA, 3.38%, due 01/09/25 144A | 499,990 | ||||||||
| 1,835,000 | Boston Properties, LP REIT, 5.63%, due 11/15/20 | 1,905,776 | ||||||||
| 169,000 | Boston Scientific Corp., 3.45%, due 03/01/24 | 172,143 | ||||||||
| 170,000 | BPCE SA, 4.50%, due 03/15/25 144A | 171,101 | ||||||||
| 240,000 | BPCE SA, 5.70%, due 10/22/23 144A | 256,156 | ||||||||
| 190,000 | Braskem Netherlands Finance BV, 4.50%, due 01/10/28 144A | 185,440 | ||||||||
| 305,000 | Brighthouse Financial, Inc., 3.70%, due 06/22/27 | 276,857 | ||||||||
| 98,792 | British Airways Pass ThroughTrust,Series 2018-1, Class A, 4.13%, due 03/20/33 144A | 100,575 | ||||||||
| 140,000 | C&W Senior Financing DAC, 6.88%, due 09/15/27 144A | 141,050 | ||||||||
| 130,000 | Cablevision Systems Corp., 5.88%, due 09/15/22 | 136,175 | ||||||||
| 485,000 | Canadian Imperial Bank of Commerce, 2.70%, due 02/02/21 | 485,518 | ||||||||
| 859,000 | Canadian Pacific Railway Co., 6.13%, due 09/15/15# | 1,056,351 | ||||||||
| 958,000 | Capital One Financial Corp., 3.20%, due 01/30/23 | 959,785 | ||||||||
| 155,000 | Capital One Financial Corp., 3.50%, due 06/15/23 | 156,984 | ||||||||
| 155,000 | Capital One Financial Corp., 3.90%, due 01/29/24 | 158,546 | ||||||||
| 82,000 | CBS Corp., 3.38%, due 03/01/22 | 82,669 | ||||||||
| 120,000 | CBS Corp., 3.70%, due 08/15/24 | 122,045 | ||||||||
| 115,000 | CCM Merger, Inc., 6.00%, due 03/15/22 144A | 118,306 | ||||||||
| 210,000 | CCO Holdings LLC/CCO Holdings Capital Corp., 5.88%, due 05/01/27‡ 144A | 218,463 | ||||||||
| 715,000 | Celgene Corp., 2.25%, due 08/15/21 | 703,985 | ||||||||
| 156,000 | Celgene Corp., 3.25%, due 02/20/23 | 157,379 | ||||||||
| 130,000 | Cemex SAB de CV, 6.13%, due 05/05/25 144A | 134,875 | ||||||||
| 200,000 | Cengage Learning, Inc., 9.50%, due 06/15/24‡ 144A | 166,500 | ||||||||
| 225,000 | Cenovus Energy, Inc., 4.45%, due 09/15/42 | 199,386 | ||||||||
| 250,000 | Cenovus Energy, Inc., 5.40%, due 06/15/47‡ | 247,933 | ||||||||
| 163,000 | Centene Corp., 5.38%, due 06/01/26 144A | 170,539 | ||||||||
| 125,000 | CenterPoint Energy, Inc., 2.50%, due 09/01/22‡ | 122,061 | ||||||||
See accompanying Notes to the Financial Statements.
84
Table of Contents
Mercer Core Fixed Income Fund
Schedule of Investments (Continued)
(showing percentage of net assets)
March 31, 2019
| Par Value ($) | Description | Value ($) | ||||||||
| Corporate Debt — continued | ||||||||||
| 350,000 | Charter Communications Operating LLC/Charter Communications Operating Capital, 4.20%, due 03/15/28 | 347,627 | ||||||||
| 5,000 | Charter Communications Operating LLC/Charter Communications Operating Capital, 4.46%, due 07/23/22 | 5,175 | ||||||||
| 370,000 | Charter Communications Operating LLC/Charter Communications Operating Capital, 5.75%, due 04/01/48 | 387,075 | ||||||||
| 1,846,000 | Charter Communications Operating LLC/Charter Communications Operating Capital, 6.38%, due 10/23/35 | 2,061,081 | ||||||||
| 620,000 | Charter Communications Operating LLC/Charter Communications Operating Capital, 6.48%, due 10/23/45 | 695,989 | ||||||||
| 276,000 | Chemours Co. (The), 6.63%, due 05/15/23 | 286,375 | ||||||||
| 250,000 | Cheniere Corpus Christi Holdings LLC, 5.13%, due 06/30/27 | 262,812 | ||||||||
| 133,000 | Cheniere Corpus Christi Holdings LLC, 5.88%, due 03/31/25 | 144,970 | ||||||||
| 101,000 | Chesapeake Energy Corp., 7.50%, due 10/01/26‡ | 99,717 | ||||||||
| 540,000 | Cigna Corp., 4.38%, due 10/15/28 144A | 560,638 | ||||||||
| 135,000 | Cimarex Energy Co., 4.38%, due 06/01/24 | 140,310 | ||||||||
| 225,000 | Cincinnati Bell, Inc., 7.00%, due 07/15/24‡ 144A | 208,256 | ||||||||
| 2,447,000 | Citigroup, Inc., 3.40%, due 05/01/26 | 2,434,870 | ||||||||
| 310,000 | Citigroup, Inc., 3.67% (3 mo. USD LIBOR plus 1.390%), due 07/24/28† | 309,464 | ||||||||
| 1,110,000 | Citigroup, Inc., 3.89% (3 mo. USD LIBOR plus 1.563%), due 01/10/28† | 1,128,128 | ||||||||
| 180,000 | Citigroup, Inc., 4.40%, due 06/10/25 | 186,523 | ||||||||
| 344,000 | Citigroup, Inc., 4.60%, due 03/09/26 | 359,672 | ||||||||
| 110,000 | Citigroup, Inc., 5.50%, due 09/13/25 | 120,675 | ||||||||
| 130,000 | Citigroup, Inc., 5.90% (3 mo. USD LIBOR plus 4.230%)† ††††† | 132,514 | ||||||||
| 230,000 | Citigroup, Inc., 5.95% (3 mo. USD LIBOR plus 4.068%)† ††††† | 234,160 | ||||||||
| 550,000 | Citigroup, Inc., 5.95% (3 mo. USD LIBOR plus 4.095%)† ††††† | 555,613 | ||||||||
| 120,000 | Citigroup, Inc., 6.13% (3 mo. USD LIBOR plus 4.478%)† ††††† ‡ | 122,447 | ||||||||
| 295,000 | Citigroup, Inc.,Series T, 6.25% (3 mo. USD LIBOR plus 4.517%)† ††††† ‡ | 310,763 | ||||||||
| 231,000 | Citrix Systems, Inc., 4.50%, due 12/01/27 | 227,529 | ||||||||
| 180,000 | Clear Channel Worldwide Holdings, Inc.,Series B, 6.50%, due 11/15/22 | 184,725 | ||||||||
| 158,000 | Clearway Energy Operating LLC, 5.38%, due 08/15/24 | 158,395 | ||||||||
| 1,024,000 | Cleveland Clinic Foundation (The), 4.86%, due 01/01/14# | 1,134,684 | ||||||||
| 535,000 | CNAC HK Finbridge Co., Ltd., Reg S, 3.50%, due 07/19/22‡‡‡ | 535,071 | ||||||||
| 196,000 | CNO Financial Group, Inc., 5.25%, due 05/30/25 | 203,473 | ||||||||
| 153,000 | Colorado Interstate Gas Co. LLC/Colorado Interstate Issuing Corp., 4.15%, due 08/15/26 144A | 155,778 | ||||||||
| 130,000 | Columbia Pipeline Group, Inc., 4.50%, due 06/01/25 | 135,801 | ||||||||
| 5,000 | Comcast Corp., 3.97%, due 11/01/47 | 4,831 | ||||||||
| 20,000 | Comcast Corp., 6.50%, due 11/15/35 | 25,346 | ||||||||
| 54,000 | Commercial Metals Co., 5.38%, due 07/15/27 | 52,110 | ||||||||
| 350,000 | Commonwealth Edison Co., 4.00%, due 03/01/48 | 359,356 | ||||||||
| 201,000 | CommScope Finance LLC, 8.25%, due 03/01/27 144A | 209,040 | ||||||||
| 130,000 | Comunicaciones Celulares SA Via Comcel Trust, 6.88%, due 02/06/24 144A | 135,444 | ||||||||
| 862,000 | Conagra Brands, Inc., 3.80%, due 10/22/21 | 878,546 | ||||||||
| 45,000 | Concho Resources, Inc., 4.88%, due 10/01/47 | 47,568 | ||||||||
| 65,000 | Consolidated Edison Co. of New York, Inc., 4.30%, due 12/01/56 | 65,846 | ||||||||
| 190,000 | Constellation Brands, Inc., 3.20%, due 02/15/23‡ | 191,315 | ||||||||
| 1,053,162 | Continental Airlines Pass ThroughTrust,Series 2007-1, Class A, 5.98%, due 10/19/23 | 1,108,980 | ||||||||
| 353,000 | Continental Resources, Inc., 5.00%, due 09/15/22 | 355,907 | ||||||||
See accompanying Notes to the Financial Statements.
85
Table of Contents
Mercer Core Fixed Income Fund
Schedule of Investments (Continued)
(showing percentage of net assets)
March 31, 2019
| Par Value ($) | Description | Value ($) | ||||||||
| Corporate Debt — continued | ||||||||||
| 935,000 | Cooperatieve Rabobank UA, 3.88%, due 09/26/23 144A | 963,179 | ||||||||
| 595,000 | Corp. Andina de Fomento, 2.13%, due 09/27/21 | 582,808 | ||||||||
| 55,000 | Corp. Andina de Fomento, 2.75%, due 01/06/23 | 54,346 | ||||||||
| 1,526,000 | Cox Communications, Inc., 3.35%, due 09/15/26 144A | 1,488,474 | ||||||||
| 118,000 | Credit Acceptance Corp., 6.13%, due 02/15/21 | 118,369 | ||||||||
| 250,000 | Credit Agricole SA, 3.75%, due 04/24/23 144A | 252,892 | ||||||||
| 175,000 | Credit Agricole SA, 7.88% (USD 5 year swap rate plus 4.898%)† ††††† ‡ 144A | 188,276 | ||||||||
| 200,000 | Credit Suisse Group AG, 7.50% (1 mo. USD LIBOR plus 4.600%)† ††††† 144A | 205,867 | ||||||||
| 500,000 | Credit Suisse Group Funding Guernsey, Ltd., 3.45%, due 04/16/21 | 505,404 | ||||||||
| 125,000 | Credito Real SAB de CV SOFOM ER, 9.13%◆ ††††† 144A | 121,719 | ||||||||
| 170,000 | Crown Castle Holdings GS V LLC/Crown Castle GS III Corp. REIT, 3.85%, due 04/15/23 | 174,155 | ||||||||
| 125,000 | CSC Holdings LLC, 7.50%, due 04/01/28‡ 144A | 134,569 | ||||||||
| 216,000 | CSI Compressco, LP/CSI Compressco Finance, Inc., 7.25%, due 08/15/22 | 190,080 | ||||||||
| 189,000 | CSI Compressco, LP/CSI Compressco Finance, Inc., 7.50%, due 04/01/25 144A | 181,440 | ||||||||
| 1,160,000 | CVS Health Corp., 2.75%, due 12/01/22 | 1,144,621 | ||||||||
| 440,000 | CVS Health Corp., 3.35%, due 03/09/21 | 443,519 | ||||||||
| 50,000 | CVS Health Corp., 4.78%, due 03/25/38 | 49,588 | ||||||||
| 415,000 | CVS Health Corp., 5.05%, due 03/25/48 | 418,704 | ||||||||
| 120,000 | CVS Health Corp., 5.13%, due 07/20/45 | 122,138 | ||||||||
| 1,983,262 | CVS Pass-Through Trust, 7.51%, due 01/10/32 144A | 2,358,868 | ||||||||
| 160,000 | Cydsa SAB DE CV, 6.25%, due 10/04/27 144A | 153,802 | ||||||||
| 286,000 | Daimler Finance North America LLC, 3.75%, due 11/05/21 144A | 291,139 | ||||||||
| 187,000 | Danske Bank AS, 5.00%, due 01/12/22 144A | 191,860 | ||||||||
| 265,000 | DaVita, Inc., 5.00%, due 05/01/25‡ | 254,930 | ||||||||
| 578,000 | DCP Midstream Operating, LP, 5.35%, due 03/15/20‡ 144A | 589,658 | ||||||||
| 290,000 | DCP Midstream Operating, LP, 5.85% (3 mo. USD LIBOR plus 3.850%), due 05/21/43† 144A | 271,875 | ||||||||
| 212,000 | DCP Midstream, LP,Series A, 7.38% (1 mo. USD LIBOR plus 5.148%)† ††††† | 208,338 | ||||||||
| 292,000 | Dell International LLC/EMC Corp., 4.90%, due 10/01/26 144A | 296,836 | ||||||||
| 296,000 | Dell International LLC/EMC Corp., 5.30%, due 10/01/29 144A | 299,185 | ||||||||
| 375,000 | Dell International LLC/EMC Corp., 6.02%, due 06/15/26 144A | 403,676 | ||||||||
| 366,000 | Dell International LLC/EMC Corp., 8.35%, due 07/15/46 144A | 442,329 | ||||||||
| 812,597 | Delta Air Lines Pass ThroughTrust,Series 2007-1, Class A, 6.82%, due 02/10/24 | 889,672 | ||||||||
| 290,000 | Delta Air Lines, Inc., 3.63%, due 03/15/22 | 291,836 | ||||||||
| 143,000 | Delta Air Lines, Inc., 3.80%, due 04/19/23 | 144,635 | ||||||||
| 225,000 | Delta Air Lines, Inc., 4.38%, due 04/19/28 | 220,661 | ||||||||
| 300,000 | Deutsche Bank AG, 5.00%, due 02/14/22 | 306,789 | ||||||||
| 375,000 | Deutsche Bank AG, (MTN), 3.38%, due 05/12/21 | 372,878 | ||||||||
| 132,000 | Diamondback Energy, Inc., 4.75%, due 11/01/24 144A | 135,439 | ||||||||
| 622,000 | Digital Realty Trust, LP REIT, 3.70%, due 08/15/27 | 616,453 | ||||||||
| 272,000 | Discover Financial Services, 3.95%, due 11/06/24 | 277,117 | ||||||||
| 70,000 | Discover Financial Services, 4.10%, due 02/09/27 | 70,028 | ||||||||
| 600,000 | Discovery Communications LLC, 2.80%, due 06/15/20 144A | 597,483 | ||||||||
| 245,000 | Dollar Tree, Inc., 3.47%, due 04/17/20◆◆ | 245,056 | ||||||||
| 411,000 | Dollar Tree, Inc., 4.20%, due 05/15/28 | 409,946 | ||||||||
| 115,000 | Dominion Energy, Inc., 2.85%, due 08/15/26 | 110,496 | ||||||||
| 325,000 | DTE Electric Co., 4.05%, due 05/15/48 | 339,258 | ||||||||
| 1,839,000 | Duke Energy Corp., 3.55%, due 09/15/21 | 1,868,265 | ||||||||
See accompanying Notes to the Financial Statements.
86
Table of Contents
Mercer Core Fixed Income Fund
Schedule of Investments (Continued)
(showing percentage of net assets)
March 31, 2019
| Par Value ($) | Description | Value ($) | ||||||||
| Corporate Debt — continued | ||||||||||
| 420,000 | Duke Energy Florida LLC, 3.40%, due 10/01/46 | 391,505 | ||||||||
| 195,000 | Duke Energy Progress LLC, 3.70%, due 10/15/46 | 190,640 | ||||||||
| 190,000 | El Paso Natural Gas Co. LLC, 8.38%, due 06/15/32 | 250,194 | ||||||||
| 80,000 | Eldorado Resorts, Inc., 6.00%, due 09/15/26‡ | 81,600 | ||||||||
| 275,000 | Electricite de France SA, 5.25% (USD 10 year swap rate plus 3.709%)† ††††† 144A | 276,880 | ||||||||
| 102,000 | Embraer Netherlands Finance BV, 5.05%, due 06/15/25 | 107,993 | ||||||||
| 250,000 | Embraer Overseas, Ltd., 5.70%, due 09/16/23 144A | 268,440 | ||||||||
| 308,000 | Emera US Finance, LP, 3.55%, due 06/15/26 | 304,986 | ||||||||
| 199,000 | Enable Midstream Partners, LP, 3.90%, due 05/15/24 | 197,708 | ||||||||
| 255,000 | Enable Midstream Partners, LP, 4.95%, due 05/15/28 | 258,428 | ||||||||
| 265,000 | Enbridge Energy Partners, LP, 4.38%, due 10/15/20 | 270,860 | ||||||||
| 205,000 | Enbridge, Inc., 5.50% (3 mo. USD LIBOR plus 3.418%), due 07/15/77† | 194,027 | ||||||||
| 185,000 | Enbridge, Inc., 6.25% (1 mo. USD LIBOR plus 3.641%), due 03/01/78† | 184,260 | ||||||||
| 265,000 | Encana Corp., 6.50%, due 08/15/34 | 317,023 | ||||||||
| 70,000 | Energy Transfer Operating, LP, 4.20%, due 04/15/27 | 70,335 | ||||||||
| 263,000 | Energy Transfer Operating, LP, 4.25%, due 03/15/23 | 270,291 | ||||||||
| 270,000 | Energy Transfer Operating, LP, 4.95%, due 06/15/28 | 283,444 | ||||||||
| 160,000 | Energy Transfer Operating, LP, 5.15%, due 03/15/45 | 154,034 | ||||||||
| 109,000 | Energy Transfer Operating, LP, 5.88%, due 01/15/24 | 119,146 | ||||||||
| 177,000 | Enova International, Inc., 8.50%, due 09/15/25 144A | 165,716 | ||||||||
| 355,000 | Enterprise Products Operating LLC, 5.25% (1 mo. USD LIBOR plus 3.033%), due 08/16/77◆ | 328,899 | ||||||||
| 45,000 | Equifax, Inc., 7.00%, due 07/01/37 | 51,421 | ||||||||
| 134,000 | Equinix, Inc. REIT, 5.38%, due 05/15/27 | 141,075 | ||||||||
| 2,045,000 | Escrow GCB General Motors, 8.38%, due 07/15/49* ***** ^ | — | ||||||||
| 769,000 | Exelon Corp., 5.10%, due 06/15/45 | 861,512 | ||||||||
| 912,000 | Exelon Generation Co. LLC, 4.25%, due 06/15/22 | 946,429 | ||||||||
| 300,000 | Exelon Generation Co. LLC, 5.20%, due 10/01/19 | 303,369 | ||||||||
| 345,000 | Expedia Group, Inc., 3.80%, due 02/15/28 | 333,233 | ||||||||
| 365,000 | Expedia Group, Inc., 5.00%, due 02/15/26 | 386,761 | ||||||||
| 1,270,000 | Express Scripts Holding Co., 3.40%, due 03/01/27 | 1,238,146 | ||||||||
| 770,000 | FedEx Corp., 4.05%, due 02/15/48 | 692,202 | ||||||||
| 1,360,000 | Ferguson Finance Plc, 4.50%, due 10/24/28 144A | 1,370,102 | ||||||||
| 157,000 | Fifth Third Bancorp, 5.10% (3 mo. USD LIBOR plus 3.033%)† ††††† | 150,559 | ||||||||
| 245,000 | FirstEnergy Corp.,Series C, 7.38%, due 11/15/31 | 324,355 | ||||||||
| 200,000 | FLIR Systems, Inc., 3.13%, due 06/15/21 | 199,425 | ||||||||
| 395,000 | Ford Motor Credit Co. LLC, 3.81%, due 10/12/21 | 391,493 | ||||||||
| 395,000 | Ford Motor Credit Co. LLC, 5.88%, due 08/02/21 | 409,142 | ||||||||
| 160,000 | Freedom Mortgage Corp., 8.13%, due 11/15/24‡ 144A | 142,800 | ||||||||
| 72,000 | Freedom Mortgage Corp., 8.25%, due 04/15/25‡ 144A | 64,260 | ||||||||
| 131,000 | GCI LLC, 6.88%, due 04/15/25 | 137,386 | ||||||||
| 1,355,000 | GE Capital International Funding Co. Unlimited Co., 2.34%, due 11/15/20 | 1,338,717 | ||||||||
| 563,000 | GE Capital International Funding Co. Unlimited Co., 4.42%, due 11/15/35 | 521,320 | ||||||||
| 80,000 | General Electric Co., (MTN), 4.38%, due 09/16/20 | 81,552 | ||||||||
| 305,000 | General Motors Co., 4.00%, due 04/01/25 | 301,280 | ||||||||
| 345,000 | General Motors Co., 4.88%, due 10/02/23 | 358,986 | ||||||||
| 1,045,000 | General Motors Financial Co., Inc., 3.50%, due 07/10/19 | 1,047,001 | ||||||||
| 305,000 | General Motors Financial Co., Inc., 3.55%, due 04/09/21 | 306,786 | ||||||||
| 160,000 | General Motors Financial Co., Inc., 3.65%, due 04/09/21◆◆ | 158,830 | ||||||||
See accompanying Notes to the Financial Statements.
87
Table of Contents
Mercer Core Fixed Income Fund
Schedule of Investments (Continued)
(showing percentage of net assets)
March 31, 2019
| Par Value ($) | Description | Value ($) | ||||||||
| Corporate Debt — continued | ||||||||||
| 266,000 | General Motors Financial Co., Inc., 4.00%, due 01/15/25 | 260,750 | ||||||||
| 1,085,000 | General Motors Financial Co., Inc., 4.15%, due 06/19/23 | 1,095,794 | ||||||||
| 229,000 | General Motors Financial Co., Inc., 4.30%, due 07/13/25 | 227,931 | ||||||||
| 281,000 | GlaxoSmithKline Capital Plc, 3.00%, due 06/01/24 | 282,599 | ||||||||
| 379,000 | GLP Capital, LP/GLP Financing II, Inc. REIT, 5.38%, due 04/15/26 | 396,965 | ||||||||
| 265,000 | Goldcorp, Inc., 3.63%, due 06/09/21 | 267,435 | ||||||||
| 919,000 | Goldman Sachs Group (The), Inc., 2.63%, due 04/25/21 | 915,591 | ||||||||
| 140,000 | Goldman Sachs Group (The), Inc., 3.50%, due 01/23/25 | 139,760 | ||||||||
| �� | 85,000 | Goldman Sachs Group (The), Inc., 3.75%, due 02/25/26 | 85,365 | |||||||
| 320,000 | Goldman Sachs Group (The), Inc., 3.81%, due 04/23/29◆ | 317,297 | ||||||||
| 777,000 | Goldman Sachs Group (The), Inc., 3.85%, due 01/26/27 | 780,682 | ||||||||
| 125,000 | Goldman Sachs Group (The), Inc., 5.30% (3 mo. USD LIBOR plus 3.834%)† ††††† ‡ | 125,997 | ||||||||
| 465,000 | Goldman Sachs Group (The), Inc., 5.38% (3 mo. USD LIBOR plus 3.922%)† ††††† | 469,164 | ||||||||
| 130,000 | Goldman Sachs Group (The), Inc., 5.75%, due 01/24/22 | 139,482 | ||||||||
| 50,000 | Graham Holdings Co., 5.75%, due 06/01/26 144A | 52,625 | ||||||||
| 175,000 | Greenko Dutch BV, 4.88%, due 07/24/22 144A | 172,637 | ||||||||
| 42,000 | Greif, Inc., 6.50%, due 03/01/27 144A | 43,050 | ||||||||
| 84,000 | H&E Equipment Services, Inc., 5.63%, due 09/01/25‡ | 84,105 | ||||||||
| 160,000 | HCA, Inc., 5.25%, due 04/15/25 | 172,027 | ||||||||
| 147,000 | HCA, Inc., 5.25%, due 06/15/26 | 157,729 | ||||||||
| 150,000 | HCA, Inc., 5.38%, due 02/01/25 | 159,375 | ||||||||
| 140,000 | HCA, Inc., 7.50%, due 02/15/22 | 154,742 | ||||||||
| 45,000 | Hewlett Packard Enterprise Co., 2.10%, due 10/04/19 144A | 44,815 | ||||||||
| 85,000 | Hilton Domestic Operating Co., Inc., 5.13%, due 05/01/26 144A | 86,640 | ||||||||
| 97,000 | Hilton Grand Vacations Borrower LLC/Hilton Grand Vacations Borrower, Inc., 6.13%, due 12/01/24 | 101,123 | ||||||||
| 440,000 | HSBC Holdings Plc, 3.28%, due 05/18/21◆◆ | 439,921 | ||||||||
| 320,000 | HSBC Holdings Plc, 3.95% (1 mo. USD LIBOR plus 0.987%), due 05/18/24† | 326,501 | ||||||||
| 195,000 | HSBC Holdings Plc, 6.88% (USISDA05 plus 5.514%)† ††††† ‡ | 203,607 | ||||||||
| 297,000 | Huntington Ingalls Industries, Inc., 5.00%, due 11/15/25‡ 144A | 305,167 | ||||||||
| 224,000 | Husky Energy, Inc., 3.95%, due 04/15/22 | 229,276 | ||||||||
| 252,000 | IHS Markit, Ltd., 4.00%, due 03/01/26 144A | 252,378 | ||||||||
| 125,000 | IHS Markit, Ltd., 4.75%, due 02/15/25 144A | 130,436 | ||||||||
| 135,000 | IHS Markit, Ltd., 4.75%, due 08/01/28 | 141,421 | ||||||||
| 110,000 | IHS Markit, Ltd., 5.00%, due 11/01/22 144A | 115,313 | ||||||||
| 220,000 | ING Bank NV, 5.80%, due 09/25/23 144A | 237,317 | ||||||||
| 200,000 | Instituto Costarricense de Electricidad, 6.38%, due 05/15/43 144A | 159,750 | ||||||||
| 130,000 | International Game Technology Plc, 6.50%, due 02/15/25 144A | 135,850 | ||||||||
| 100,000 | IQVIA, Inc., 4.88%, due 05/15/23 144A | 102,260 | ||||||||
| 107,000 | j2 Cloud Services LLC/j2 GlobalCo-Obligor, Inc., 6.00%, due 07/15/25 144A | 111,548 | ||||||||
| 122,000 | Jacobs Entertainment, Inc., 7.88%, due 02/01/24 144A | 128,100 | ||||||||
| 52,000 | JB Poindexter & Co., Inc., 7.13%, due 04/15/26 144A | 52,407 | ||||||||
| 190,000 | Jefferies Financial Group, Inc, 5.50%, due 10/18/23 | 198,995 | ||||||||
| 500,000 | Jefferies Group LLC, 5.13%, due 01/20/23 | 529,963 | ||||||||
| 235,000 | Jefferies Group LLC/Jefferies Group Capital Finance, Inc., 4.15%, due 01/23/30‡ | 215,378 | ||||||||
| 228,000 | Jefferies Group LLC/Jefferies Group Capital Finance, Inc., 4.85%, due 01/15/27 | 229,380 | ||||||||
| 1,002,000 | JPMorgan Chase & Co., 3.20%, due 01/25/23 | 1,016,357 | ||||||||
| 230,000 | JPMorgan Chase & Co., 3.20%, due 06/15/26 | 228,728 | ||||||||
| 1,430,000 | JPMorgan Chase & Co., 3.38%, due 05/01/23 | 1,445,473 | ||||||||
See accompanying Notes to the Financial Statements.
88
Table of Contents
Mercer Core Fixed Income Fund
Schedule of Investments (Continued)
(showing percentage of net assets)
March 31, 2019
| Par Value ($) | Description | Value ($) | ||||||||
| Corporate Debt — continued | ||||||||||
| 440,000 | JPMorgan Chase & Co., 3.51% (1 mo. USD LIBOR plus 0.610%), due 06/18/22† | 446,277 | ||||||||
| 625,000 | JPMorgan Chase & Co., 3.96%, due 11/15/48◆ | 610,260 | ||||||||
| 340,000 | JPMorgan Chase & Co., 4.01%, due 04/23/29◆ | 349,512 | ||||||||
| 90,000 | JPMorgan Chase & Co., 4.35%, due 08/15/21 | 93,190 | ||||||||
| 555,000 | JPMorgan Chase & Co., 5.30% (3 mo. USD LIBOR plus 3.800%)† ††††† | 560,941 | ||||||||
| 280,000 | JPMorgan Chase & Co.,Series S, 6.75% (3 mo. USD LIBOR plus 3.780%)† ††††† ‡ | 307,136 | ||||||||
| 250,000 | JPMorgan Chase Bank NA, 3.09%, due 04/26/21◆ | 250,529 | ||||||||
| 843,000 | Juniper Networks, Inc., 4.60%, due 03/15/21 | 865,977 | ||||||||
| 200,000 | KazMunayGas National Co. JSC, 3.88%, due 04/19/22‡ 144A | 202,052 | ||||||||
| 322,000 | Keurig Dr Pepper, Inc., 3.55%, due 05/25/21 144A | 325,586 | ||||||||
| 120,000 | Kinder Morgan Energy Partners, LP, 7.75%, due 03/15/32 | 155,011 | ||||||||
| 110,000 | Kinder Morgan Inc., 3.15%, due 01/15/23 | 110,275 | ||||||||
| 1,240,000 | KKR Group Finance Co. II LLC, 5.50%, due 02/01/43 144A | 1,329,342 | ||||||||
| 688,000 | KKR Group Finance Co. LLC, 6.38%, due 09/29/20 144A | 720,938 | ||||||||
| 167,000 | KLA-Tencor Corp., 4.10%, due 03/15/29 | 170,302 | ||||||||
| 105,000 | Klabin Finance SA, 4.88%, due 09/19/27 144A | 102,113 | ||||||||
| 360,000 | Kraft Heinz Foods Co., 3.50%, due 06/06/22 | 364,091 | ||||||||
| 155,000 | Kraft Heinz Foods Co., 4.88%, due 02/15/25 144A | 158,586 | ||||||||
| 129,000 | Kratos Defense & Security Solutions, Inc., 6.50%, due 11/30/25 144A | 136,256 | ||||||||
| 300,000 | L Brands, Inc., 5.63%, due 10/15/23‡ | 307,875 | ||||||||
| 47,000 | Ladder Capital Finance Holdings LLLP/Ladder Capital Finance Corp., 5.25%, due 03/15/22 144A | 47,823 | ||||||||
| 88,000 | Ladder Capital Finance Holdings LLLP/Ladder Capital Finance Corp., 5.25%, due 10/01/25 144A | 84,700 | ||||||||
| 225,000 | Lam Research Corp., 3.75%, due 03/15/26 | 229,416 | ||||||||
| 187,000 | Lam Research Corp., 4.88%, due 03/15/49 | 197,247 | ||||||||
| 110,000 | Laureate Education, Inc., 8.25%, due 05/01/25 144A | 119,900 | ||||||||
| 145,000 | Lazard Group LLC, 4.38%, due 03/11/29 | 146,829 | ||||||||
| 154,000 | Lear Corp., 5.25%, due 01/15/25 | 160,163 | ||||||||
| 470,000 | Lehman Brothers Holdings Capital Trust VII, (MTN), 5.86%***** ††† ††††† ¤ | 165 | ||||||||
| 270,000 | Lehman Brothers Holdings, Inc., (MTN), 6.75%, due 12/28/17***** ††† ¤ | 95 | ||||||||
| 890,000 | Lehman Brothers Holdings, Inc., Subordinated Note, 6.50%, due 07/19/17***** ††† ¤ | 312 | ||||||||
| 254,000 | Liberty Mutual Group, Inc., 4.25%, due 06/15/23 144A | 263,318 | ||||||||
| 2,133,000 | Liberty Mutual Group, Inc., 4.57%, due 02/01/29 144A | 2,220,325 | ||||||||
| 236,000 | Liberty Mutual Group, Inc., 7.80%, due 03/07/87 144A | 270,559 | ||||||||
| 105,000 | Lions Gate Capital Holdings LLC, 5.88%, due 11/01/24 144A | 108,544 | ||||||||
| 145,000 | Liquid Telecommunications Financing Plc, 8.50%, due 07/13/22 144A | 149,643 | ||||||||
| 800,000 | Lloyds Bank Plc, 3.30%, due 05/07/21‡ | 806,545 | ||||||||
| 465,000 | Lloyds Banking Group Plc, 4.45%, due 05/08/25 | 483,055 | ||||||||
| 180,000 | Lloyds Banking Group Plc, 7.50% (USD 5 year swap rate plus 4.760%)† ††††† ‡ | 185,850 | ||||||||
| 473,000 | Lockheed Martin Corp., 4.70%, due 05/15/46 | 533,748 | ||||||||
| 127,000 | LSC Communications, Inc., 8.75%, due 10/15/23‡ 144A | 134,938 | ||||||||
| 140,000 | M&T Bank Corp.,Series F, 5.13% (3 mo. USD LIBOR plus 3.520%)† ††††† ‡ | 140,207 | ||||||||
| 270,000 | Macquarie Bank, Ltd., 4.88%, due 06/10/25 144A | 279,138 | ||||||||
| 1,484,000 | Macquarie Group, Ltd., 4.15%, due 03/27/24◆◆ 144A | 1,510,896 | ||||||||
| 55,000 | Magellan Midstream Partners, LP, 4.25%, due 09/15/46 | 53,686 | ||||||||
| 200,000 | Magellan Midstream Partners, LP, 5.15%, due 10/15/43 | 217,488 | ||||||||
| 230,000 | Martin Marietta Materials, Inc., 4.25%, due 07/02/24 | 238,605 | ||||||||
| 255,000 | Marvell Technology Group, Ltd., 4.88%, due 06/22/28‡ | 263,847 | ||||||||
See accompanying Notes to the Financial Statements.
89
Table of Contents
Mercer Core Fixed Income Fund
Schedule of Investments (Continued)
(showing percentage of net assets)
March 31, 2019
| Par Value ($) | Description | Value ($) | ||||||||
| Corporate Debt — continued | ||||||||||
| 135,000 | Masco Corp., 4.45%, due 04/01/25 | 138,751 | ||||||||
| 460,000 | Massachusetts Institute of Technology, 4.68%, due 07/01/14# | 537,424 | ||||||||
| 145,000 | McGraw-Hill Global Education Holdings LLC/McGraw-Hill Global Education Finance, 7.88%, due 05/15/24‡ 144A | 116,544 | ||||||||
| 241,000 | MDC Partners, Inc., 6.50%, due 05/01/24‡ 144A | 200,633 | ||||||||
| 170,000 | MEDNAX, Inc., 5.25%, due 12/01/23 144A | 172,550 | ||||||||
| 154,000 | MEDNAX, Inc., 6.25%, due 01/15/27‡ 144A | 155,925 | ||||||||
| 145,000 | MetLife, Inc., 6.40%, due 12/15/66 | 155,721 | ||||||||
| 185,000 | Mexichem SAB de CV, 5.50%, due 01/15/48 144A | 173,208 | ||||||||
| 63,000 | MGIC Investment Corp., 5.75%, due 08/15/23 | 66,780 | ||||||||
| 155,000 | Microchip Technology, Inc., 3.92%, due 06/01/21 144A | 156,420 | ||||||||
| 380,000 | Microchip Technology, Inc., 4.33%, due 06/01/23 144A | 387,930 | ||||||||
| 220,000 | Micron Technology, Inc., 4.98%, due 02/06/26 | 224,619 | ||||||||
| 344,000 | Micron Technology, Inc., 5.33%, due 02/06/29 | 353,435 | ||||||||
| 645,000 | Microsoft Corp., 4.00%, due 02/12/55 | 676,357 | ||||||||
| 213,000 | Microsoft Corp., 4.45%, due 11/03/45 | 241,771 | ||||||||
| 450,000 | Mitsubishi UFJ Financial Group, Inc., 3.22%, due 03/07/22 | 453,779 | ||||||||
| 1,483,000 | Morgan Stanley, 3.13%, due 07/27/26 | 1,445,052 | ||||||||
| 945,000 | Morgan Stanley, 3.59% (3 mo. USD LIBOR plus 1.340%), due 07/22/28† | 938,658 | ||||||||
| 921,000 | Morgan Stanley, 3.88%, due 04/29/24 | 947,819 | ||||||||
| 325,000 | Morgan Stanley, 5.45% (3 mo. USD LIBOR plus 3.610%)† ††††† ‡ | 326,219 | ||||||||
| 695,000 | Morgan Stanley, (MTN), 3.77%, due 01/24/29◆ | 698,125 | ||||||||
| 190,000 | Morgan Stanley, (MTN), 3.88%, due 01/27/26 | 194,445 | ||||||||
| 333,000 | Motorola Solutions, Inc., 4.60%, due 02/23/28 | 336,028 | ||||||||
| 190,000 | MPLX, LP, 4.00%, due 03/15/28 | 189,002 | ||||||||
| 250,000 | MPLX, LP, 4.50%, due 04/15/38 | 237,835 | ||||||||
| 100,000 | MPLX, LP, 4.80%, due 02/15/29 | 105,362 | ||||||||
| 25,000 | MPLX, LP, 5.20%, due 03/01/47 | 25,406 | ||||||||
| 145,000 | MTN Mauritius Investment, Ltd., 4.76%, due 11/11/24 144A | 138,074 | ||||||||
| 154,000 | Murphy Oil Corp., 5.75%, due 08/15/25 | 158,886 | ||||||||
| 135,000 | Mylan NV, 5.25%, due 06/15/46 | 121,697 | ||||||||
| 170,000 | Mylan, Inc., 5.20%, due 04/15/48 | 153,594 | ||||||||
| 195,000 | Myriad International Holdings BV, 5.50%, due 07/21/25 144A | 209,099 | ||||||||
| 44,000 | National CineMedia LLC, 6.00%, due 04/15/22 | 44,660 | ||||||||
| 102,000 | Nationstar Mortgage Holdings, Inc., 8.13%, due 07/15/23‡ 144A | 105,315 | ||||||||
| 83,000 | Nationstar Mortgage Holdings, Inc., 9.13%, due 07/15/26 144A | 84,453 | ||||||||
| 220,000 | Natura Cosmeticos SA, 5.38%, due 02/01/23 144A | 220,000 | ||||||||
| 175,000 | Netflix, Inc., 4.88%, due 04/15/28 | 173,688 | ||||||||
| 260,000 | Netflix, Inc., 5.88%, due 11/15/28 144A | 275,275 | ||||||||
| 445,000 | New England Power Co., 3.80%, due 12/05/47 144A | 427,104 | ||||||||
| 63,000 | Newfield Exploration Co., 5.63%, due 07/01/24 | 68,919 | ||||||||
| 97,000 | Newfield Exploration Co., 5.75%, due 01/30/22 | 103,645 | ||||||||
| 260,000 | NextEra Energy Capital Holdings, Inc., 3.55%, due 05/01/27 | 261,329 | ||||||||
| 165,000 | Nippon Life Insurance Co., 5.10% (USISDA05 plus 3.650%), due 10/16/44† 144A | 172,668 | ||||||||
| 670,000 | NiSource, Inc., 3.49%, due 05/15/27 | 668,363 | ||||||||
| 135,000 | Nissan Motor Acceptance Corp., 3.65%, due 09/21/21 144A | 135,790 | ||||||||
| 780,000 | Noble Energy, Inc., 4.15%, due 12/15/21 | 799,113 | ||||||||
| 115,000 | Norbord, Inc., 6.25%, due 04/15/23 144A | 118,306 | ||||||||
| 195,000 | Northern States Power Co., 3.60%, due 09/15/47 | 190,759 | ||||||||
See accompanying Notes to the Financial Statements.
90
Table of Contents
Mercer Core Fixed Income Fund
Schedule of Investments (Continued)
(showing percentage of net assets)
March 31, 2019
| Par Value ($) | Description | Value ($) | ||||||||
| Corporate Debt — continued | ||||||||||
| 220,000 | Northern States Power Co., 4.13%, due 05/15/44 | 230,828 | ||||||||
| 143,000 | NRG Energy, Inc., 6.25%, due 05/01/24 | 148,005 | ||||||||
| 315,000 | Nutrien, Ltd., 4.90%, due 06/01/43 | 322,512 | ||||||||
| 370,000 | NXP BV/NXP Funding LLC, 4.63%, due 06/01/23 144A | 385,170 | ||||||||
| 163,000 | NXP BV/NXP Funding LLC, 4.88%, due 03/01/24‡ 144A | 172,302 | ||||||||
| 117,000 | Omega Healthcare Investors, Inc. REIT, 4.50%, due 01/15/25 | 118,964 | ||||||||
| 139,000 | ONEOK Partners, LP, 5.00%, due 09/15/23 | 147,814 | ||||||||
| 200,000 | ONEOK, Inc., 4.95%, due 07/13/47 | 197,451 | ||||||||
| 100,000 | Owens Corning, 4.20%, due 12/15/22 | 102,631 | ||||||||
| 155,000 | Oztel Holdings SPC, Ltd., 6.63%, due 04/24/28 144A | 151,570 | ||||||||
| 155,000 | Parsley Energy LLC/Parsley Finance Corp., 5.63%, due 10/15/27‡ 144A | 155,000 | ||||||||
| 205,000 | PECO Energy Co., 3.70%, due 09/15/47 | 200,833 | ||||||||
| 1,700,000 | Penske Truck Leasing Co. LP/PTL Finance Corp., 3.90%, due 02/01/24 144A | 1,721,264 | ||||||||
| 155,000 | Petrobras Global Finance BV, 5.30%, due 01/27/25 | 157,637 | ||||||||
| 227,000 | Petrobras Global Finance BV, 5.75%, due 02/01/29 | 225,411 | ||||||||
| 80,000 | Petrobras Global Finance BV, 6.25%, due 03/17/24 | 86,200 | ||||||||
| 280,000 | Petrobras Global Finance BV, 7.38%, due 01/17/27 | 308,658 | ||||||||
| 190,000 | Petroleos Mexicanos, 4.88%, due 01/24/22 | 192,092 | ||||||||
| 155,000 | Petroleos Mexicanos, 5.50%, due 01/21/21 | 157,945 | ||||||||
| 76,000 | Petroleos Mexicanos, 6.35%, due 02/12/48 | 67,385 | ||||||||
| 255,000 | Petroleos Mexicanos, 6.50%, due 06/02/41 | 231,461 | ||||||||
| 520,000 | Petroleos Mexicanos, 6.75%, due 09/21/47 | 478,660 | ||||||||
| 350,000 | Petroleos Mexicanos, 6.88%, due 08/04/26 | 365,680 | ||||||||
| 1,006,000 | Phillips 66 Partners, LP, 3.61%, due 02/15/25 | 1,005,143 | ||||||||
| 774,000 | Phillips 66 Partners, LP, 3.75%, due 03/01/28 | 763,341 | ||||||||
| 65,000 | Plains All American Pipeline, LP/PAA Finance Corp., 4.70%, due 06/15/44 | 60,475 | ||||||||
| 50,000 | Plains All American Pipeline, LP/PAA Finance Corp., 5.15%, due 06/01/42 | 47,933 | ||||||||
| 315,000 | PNC Bank NA, 2.45%, due 07/28/22‡ | 313,932 | ||||||||
| 152,000 | PNC Financial Services Group (The), Inc., 3.50%, due 01/23/24 | 155,710 | ||||||||
| 155,000 | PNC Financial Services Group (The), Inc.,Series R, 4.85% (3 mo. USD LIBOR plus 3.040%)† ††††† | 152,904 | ||||||||
| 343,000 | PNC Financial Services Group (The), Inc.,Series O, 6.75% (3 mo. USD LIBOR plus 3.678%)† ††††† | 364,571 | ||||||||
| 540,000 | PPL Capital Funding, Inc., 5.00%, due 03/15/44 | 588,417 | ||||||||
| 63,000 | Prime Security Services Borrower LLC/Prime Finance, Inc., 9.25%, due 05/15/23 144A | 66,308 | ||||||||
| 90,000 | Providence St. Joseph Health Obligated Group, 2.75%, due 10/01/26 | 85,559 | ||||||||
| 415,000 | Prudential Financial, Inc., 5.88% (3 mo. USD LIBOR plus 4.175%), due 09/15/42† | 439,580 | ||||||||
| 445,000 | Public Service Electric & Gas Co., (MTN), 3.00%, due 05/15/27 | 438,631 | ||||||||
| 355,000 | Public Service Electric & Gas Co., (MTN), 3.70%, due 05/01/28 | 369,357 | ||||||||
| 170,000 | QEP Resources, Inc., 6.88%, due 03/01/21 | 175,100 | ||||||||
| 65,000 | Qorvo, Inc., 5.50%, due 07/15/26 144A | 67,282 | ||||||||
| 170,000 | Quicken Loans, Inc., 5.25%, due 01/15/28 144A | 159,800 | ||||||||
| 205,000 | Quicken Loans, Inc., 5.75%, due 05/01/25 144A | 206,743 | ||||||||
| 200,000 | QVC, Inc., 4.38%, due 03/15/23 | 202,973 | ||||||||
| 125,000 | QVC, Inc., 5.13%, due 07/02/22 | 131,022 | ||||||||
| 130,000 | QVC, Inc., 5.45%, due 08/15/34 | 126,503 | ||||||||
| 175,000 | Rackspace Hosting, Inc., 8.63%, due 11/15/24‡ 144A | 156,342 | ||||||||
| 87,000 | Radian Group, Inc., 4.50%, due 10/01/24 | 86,130 | ||||||||
| 49,000 | Radian Group, Inc., 5.25%, due 06/15/20‡ | 50,409 | ||||||||
See accompanying Notes to the Financial Statements.
91
Table of Contents
Mercer Core Fixed Income Fund
Schedule of Investments (Continued)
(showing percentage of net assets)
March 31, 2019
| Par Value ($) | Description | Value ($) | ||||||||
| Corporate Debt — continued | ||||||||||
| 52,000 | Radiate Holdco LLC/Radiate Finance, Inc., 6.88%, due 02/15/23 144A | 51,740 | ||||||||
| 62,000 | Refinitiv US Holdings, Inc., 8.25%, due 11/15/26 144A | 60,993 | ||||||||
| 38,000 | Refinitiv US Holdings, Inc., 6.25%, due 05/15/26 144A | 38,618 | ||||||||
| 328,000 | Regions Bank, 3.37% (1 mo. USD LIBOR plus 0.500%), due 08/13/21† | 329,609 | ||||||||
| 300,000 | Regions Financial Corp., 2.75%, due 08/14/22 | 297,834 | ||||||||
| 120,000 | Regions Financial Corp., 3.80%, due 08/14/23 | 123,419 | ||||||||
| 490,000 | Royal Bank of Canada, (MTN), 3.14%, due 04/30/21◆◆ | 491,235 | ||||||||
| 780,000 | Royal Bank of Scotland Group Plc, 3.88%, due 09/12/23 | 783,693 | ||||||||
| 382,000 | Royal Bank of Scotland Group Plc, 8.63% (USD 5 year swap rate plus 7.598%)† ††††† | 407,785 | ||||||||
| 151,000 | Sabine Pass Liquefaction LLC, 4.20%, due 03/15/28 | 152,195 | ||||||||
| 215,000 | Sabine Pass Liquefaction LLC, 5.75%, due 05/15/24 | 237,058 | ||||||||
| 76,000 | Sabine Pass Liquefaction LLC, 5.88%, due 06/30/26 | 84,602 | ||||||||
| 320,000 | Sally Holdings LLC/Sally Capital, Inc., 5.63%, due 12/01/25‡ | 319,200 | ||||||||
| 290,000 | San Diego Gas & Electric Co., 4.15%, due 05/15/48 | 290,901 | ||||||||
| 155,000 | Santander Holdings USA, Inc., 3.40%, due 01/18/23 | 155,003 | ||||||||
| 275,000 | Santander Holdings USA, Inc., 3.70%, due 03/28/22 | 278,391 | ||||||||
| 200,000 | Santander Holdings USA, Inc., 4.45%, due 12/03/21 | 206,156 | ||||||||
| 170,000 | Santander UK Group Holdings Plc, 4.75%, due 09/15/25 144A | 169,259 | ||||||||
| 200,000 | SASOL Financing USA LLC, 5.88%, due 03/27/24 | 212,220 | ||||||||
| 200,000 | SASOL Financing USA LLC, 6.50%, due 09/27/28 | 218,442 | ||||||||
| 310,000 | SBA Tower Trust REIT, 3.72%, due 04/09/48 144A | 314,418 | ||||||||
| 400,000 | Schlumberger Holdings Corp., 3.00%, due 12/21/20 144A | 401,829 | ||||||||
| 170,000 | Select Medical Corp., 6.38%, due 06/01/21 | 170,850 | ||||||||
| 922,000 | SES SA, 3.60%, due 04/04/23 144A | 916,896 | ||||||||
| 485,000 | Shire Acquisitions Investments Ireland DAC, 2.88%, due 09/23/23 | 478,929 | ||||||||
| 715,000 | Shire Acquisitions Investments Ireland DAC, 3.20%, due 09/23/26 | 692,092 | ||||||||
| 120,000 | Simmons Foods, Inc., 5.75%, due 11/01/24‡ 144A | 105,900 | ||||||||
| 850,000 | Simon Property Group, LP REIT, 6.75%, due 02/01/40 | 1,146,881 | ||||||||
| 315,000 | Sirius XM Radio, Inc., 5.00%, due 08/01/27 144A | 316,370 | ||||||||
| 145,000 | Sirius XM Radio, Inc., 5.38%, due 07/15/26 144A | 148,669 | ||||||||
| 35,000 | SM Energy Co., 6.63%, due 01/15/27‡ | 33,425 | ||||||||
| 195,000 | Societe Generale SA, 7.38% (USD 5 year swap rate plus 6.238%)† ††††† 144A | 201,581 | ||||||||
| 335,000 | Southern California Edison Co., 4.00%, due 04/01/47 | 312,452 | ||||||||
| 1,318,000 | Southern Co. (The), 3.25%, due 07/01/26 | 1,292,213 | ||||||||
| 1,260,000 | Southern Co. Gas Capital Corp., 2.45%, due 10/01/23 | 1,225,050 | ||||||||
| 62,000 | Springleaf Finance Corp., 6.88%, due 03/15/25 | 64,093 | ||||||||
| 135,000 | Sprint Capital Corp., 6.88%, due 11/15/28 | 130,106 | ||||||||
| 50,000 | Sprint Communications, Inc., 7.00%, due 03/01/20 144A | 51,438 | ||||||||
| 170,000 | Sprint Corp., 7.88%, due 09/15/23 | 178,500 | ||||||||
| 396,875 | Sprint Spectrum Co. LLC/Sprint Spectrum Co. II LLC/Sprint Spectrum Co. III LLC, 3.36%, due 03/20/23 144A | 397,748 | ||||||||
| 280,000 | Standard Industries, Inc./NJ, 5.38%, due 11/15/24 144A | 288,050 | ||||||||
| 67,000 | State Street Corp., 3.61% (3 mo. USD LIBOR plus 1.000%), due 06/01/77† | 53,026 | ||||||||
| 18,000 | Stearns Holdings LLC, 9.38%, due 08/15/20 144A | 16,920 | ||||||||
| 133,000 | Stifel Financial Corp., 4.25%, due 07/18/24 | 136,968 | ||||||||
| 922,000 | Sunoco Logistics Partners Operations, LP, 3.45%, due 01/15/23 | 926,147 | ||||||||
| 265,000 | Sunoco Logistics Partners Operations, LP, 3.90%, due 07/15/26 | 263,596 | ||||||||
| 166,000 | Sunoco Logistics Partners Operations, LP, 4.40%, due 04/01/21‡ | 170,296 | ||||||||
| 157,000 | Sunoco Logistics Partners Operations, LP, 5.40%, due 10/01/47 | 157,059 | ||||||||
See accompanying Notes to the Financial Statements.
92
Table of Contents
Mercer Core Fixed Income Fund
Schedule of Investments (Continued)
(showing percentage of net assets)
March 31, 2019
| Par Value ($) | Description | Value ($) | ||||||||
| Corporate Debt — continued | ||||||||||
| 245,000 | SunTrust Bank/Atlanta GA, 2.45%, due 08/01/22 | 241,912 | ||||||||
| 175,000 | Synchrony Financial, 2.70%, due 02/03/20 | 174,803 | ||||||||
| 303,000 | Syngenta Finance NV, 4.44%, due 04/24/23‡ 144A | 309,291 | ||||||||
| 152,000 | Tallgrass Energy Partners, LP/Tallgrass Energy Finance Corp., 4.75%, | 153,473 | ||||||||
| 145,000 | Targa Resources Partners, LP/Targa Resources Partners Finance Corp., 5.88%, due 04/15/26 144A | 153,990 | ||||||||
| 270,000 | Taylor Morrison Communities, Inc./Taylor Morrison Holdings II, Inc., 5.25%, due 04/15/21 144A | 270,756 | ||||||||
| 605,000 | Teachers Insurance & Annuity Association of America, 4.27%, due 05/15/47 144A | 621,748 | ||||||||
| 34,000 | Teachers Insurance & Annuity Association of America, 6.85%, due 12/16/39 144A | 46,794 | ||||||||
| 40,000 | Team Health Holdings, Inc., 6.38%, due 02/01/25‡ 144A | 32,750 | ||||||||
| 311,000 | Tech Data Corp., 4.95%, due 02/15/27 | 315,585 | ||||||||
| 160,000 | Teekay Offshore Partners LP/Teekay Offshore Finance Corp., 8.50%, | 157,600 | ||||||||
| 120,000 | Telecom Argentina SA, 6.50%, due 06/15/21 144A | 120,000 | ||||||||
| 223,000 | Telecom Italia Capital SA, 7.20%, due 07/18/36 | 227,549 | ||||||||
| 140,000 | Telecom Italia SpA, 5.30%, due 05/30/24 144A | 141,225 | ||||||||
| 845,000 | Telefonaktiebolaget LM Ericsson, 4.13%, due 05/15/22 | 858,664 | ||||||||
| 138,000 | Tervita Escrow Corp., 7.63%, due 12/01/21 144A | 137,655 | ||||||||
| 1,303,000 | Teva Pharmaceutical Finance Netherlands III BV, 3.15%, due 10/01/26 | 1,065,735 | ||||||||
| 145,000 | Teva Pharmaceutical Finance Netherlands III BV, 6.75%, due 03/01/28‡ | 146,305 | ||||||||
| 70,000 | Time Warner Cable LLC, 4.13%, due 02/15/21 | 71,116 | ||||||||
| 380,000 | Time Warner Cable LLC, 8.25%, due 04/01/19 | 380,000 | ||||||||
| 240,000 | Toronto-Dominion Bank, (MTN) (The), 3.25%, due 03/11/24 | 243,013 | ||||||||
| 500,000 | Transcontinental Gas Pipe Line Co. LLC, 4.60%, due 03/15/48 | 510,103 | ||||||||
| 165,000 | Tribune Media Co., 5.88%, due 07/15/22 | 169,228 | ||||||||
| 55,000 | Trident Merger Sub, Inc., 6.63%, due 11/01/25 144A | 51,700 | ||||||||
| 300,000 | UBS Group Funding Switzerland AG, 2.86% (1 mo. USD LIBOR plus 0.954%), due 08/15/23† 144A | 295,695 | ||||||||
| 962,000 | UBS Group Funding Switzerland AG, 4.13%, due 04/15/26 144A | 995,707 | ||||||||
| 185,000 | UBS Group Funding Switzerland AG, 7.00%◆ ††††† 144A | 187,889 | ||||||||
| 174,962 | United Airlines Pass ThroughTrust,Series 2016-1, Class A, 3.45%, due 01/07/30 | 172,042 | ||||||||
| 266,991 | United Airlines Pass ThroughTrust,Series 2016-1, Class B, 3.65%, due 07/07/27 | 263,915 | ||||||||
| 215,588 | United Airlines Pass ThroughTrust,Series 2014-2, Class A, 3.75%, due 03/03/28 | 217,517 | ||||||||
| 2,295,833 | United Airlines Pass Through Trust,Series 2014-1, Class A, 4.00%, due 10/11/27 | 2,343,242 | ||||||||
| 150,000 | United Airlines Pass ThroughTrust,Series 2019-1 Class A, 4.55%, due 08/25/31 | 154,068 | ||||||||
| 66,689 | United Airlines Pass ThroughTrust,Series 2018-1, Class B, 4.60%, due 09/01/27 | 67,790 | ||||||||
| 123,747 | United Airlines Pass ThroughTrust,Series 2014-2, Class B, 4.63%, due 03/03/24 | 125,782 | ||||||||
| 460,000 | United Rentals North America, Inc., 4.88%, due 01/15/28 | 448,592 | ||||||||
| 170,000 | United Rentals North America, Inc., 5.50%, due 07/15/25 | 174,250 | ||||||||
| 105,000 | United Rentals North America, Inc., 5.88%, due 09/15/26 | 108,938 | ||||||||
| 135,000 | Universal Health Services, Inc., 4.75%, due 08/01/22 144A | 136,519 | ||||||||
| 165,000 | Universal Health Services, Inc., 5.00%, due 06/01/26 144A | 168,506 | ||||||||
| 120,000 | UPC Holding BV, 5.50%, due 01/15/28 144A | 120,000 | ||||||||
| 111,354 | US Airways Pass ThroughTrust,Series 2012-1, Class A, 5.90%, due 04/01/26 | 121,003 | ||||||||
| 96,972 | US Airways Pass ThroughTrust,Series 2010-1, Class A, 6.25%, due 10/22/24 | 104,114 | ||||||||
| 85,000 | US Concrete, Inc., 6.38%, due 06/01/24 | 86,488 | ||||||||
| 490,000 | Valero Energy Corp., 3.40%, due 09/15/26 | 479,871 | ||||||||
See accompanying Notes to the Financial Statements.
93
Table of Contents
Mercer Core Fixed Income Fund
Schedule of Investments (Continued)
(showing percentage of net assets)
March 31, 2019
| Par Value ($) | Description | Value ($) | ||||||||
| Corporate Debt — continued | ||||||||||
| 156,000 | Ventas Realty, LP REIT, 3.50%, due 02/01/25 | 156,183 | ||||||||
| 135,000 | VEREIT Operating Partnership, LP REIT, 4.60%, due 02/06/24 | 138,992 | ||||||||
| 70,000 | VeriSign, Inc., 4.75%, due 07/15/27 | 70,271 | ||||||||
| 70,000 | VeriSign, Inc., 5.25%, due 04/01/25 | 73,588 | ||||||||
| 137,000 | Verisk Analytics, Inc., 4.00%, due 06/15/25 | 142,986 | ||||||||
| 250,000 | Verizon Communications, Inc., 4.50%, due 08/10/33 | 264,614 | ||||||||
| 175,000 | Verizon Communications, Inc., 4.67%, due 03/15/55 | 178,574 | ||||||||
| 839,000 | Verizon Communications, Inc., 4.86%, due 08/21/46 | 895,218 | ||||||||
| 500,000 | Verizon Communications, Inc., 5.01%, due 04/15/49 | 546,686 | ||||||||
| 140,000 | Viacom, Inc., 6.25% (3 mo. USD LIBOR plus 3.899%), due 02/28/57† | 140,350 | ||||||||
| 118,000 | Vista Outdoor, Inc., 5.88%, due 10/01/23‡ | 110,330 | ||||||||
| 281,000 | Vodafone Group Plc, 7.00%, due 04/04/79 | 285,642 | ||||||||
| 683,000 | Volkswagen Group of America Finance LLC, 4.63%, due 11/13/25 144A | 707,293 | ||||||||
| 310,000 | Voya Financial, Inc., 5.65% (3 mo. USD LIBOR plus 3.580%), due 05/15/53† | 305,807 | ||||||||
| 1,178,000 | Voya Financial, Inc., 3.13%, due 07/15/24 | 1,164,041 | ||||||||
| 401,000 | Warner Media LLC, 3.80%, due 02/15/27 | 399,746 | ||||||||
| 485,000 | Wells Fargo & Co.,Series U, 5.88% (3 mo. USD LIBOR plus 3.990%)† ††††† ‡ | 518,681 | ||||||||
| 185,000 | Wells Fargo & Co.,Series K, 6.38% (3 mo. USD LIBOR plus 3.770%)† ††††† | 186,388 | ||||||||
| 708,000 | Welltower, Inc. REIT, 4.50%, due 01/15/24 | 746,852 | ||||||||
| 60,000 | West Corp., 8.50%, due 10/15/25‡ 144A | 51,900 | ||||||||
| 172,000 | Western Digital Corp., 4.75%, due 02/15/26 | 164,690 | ||||||||
| 170,000 | WestRock RKT Co., 3.50%, due 03/01/20 | 170,852 | ||||||||
| 225,000 | Williams Cos. (The), Inc., 3.75%, due 06/15/27‡ | 223,582 | ||||||||
| 250,000 | Williams Cos. (The), Inc., 4.55%, due 06/24/24 | 264,039 | ||||||||
| 160,000 | Williams Cos. (The), Inc., 5.75%, due 06/24/44 | 176,240 | ||||||||
| 85,000 | WMG Acquisition Corp., 4.88%, due 11/01/24 144A | 86,488 | ||||||||
| 117,000 | WMG Acquisition Corp., 5.50%, due 04/15/26 144A | 120,364 | ||||||||
| 50,000 | WPX Energy, Inc., 5.25%, due 09/15/24 | 50,750 | ||||||||
| 99,000 | Wyndham Destinations, Inc., 5.40%, due 04/01/24 | 100,980 | ||||||||
| 116,000 | XPO Logistics, Inc., 6.50%, due 06/15/22‡ 144A | 118,610 | ||||||||
| 175,000 | YPF SA, 8.50%, due 07/28/25 144A | 172,375 | ||||||||
|
| |||||||||
| 194,009,401 | ||||||||||
|
| |||||||||
| Mortgage Backed Securities - Private Issuers — 10.0% | ||||||||||
| 75,383 | Angel Oak Mortgage Trust I LLC,Series 2018-1, Class A1, 3.26%, | 75,302 | ||||||||
| 175,774 | Angel Oak Mortgage Trust I LLC,Series 2018-3, Class A1, 3.65%, | 177,095 | ||||||||
| 644,764 | Arroyo Mortgage Trust,Series 2018-1, Class A1, 3.76%, due 04/25/48◆◆ 144A | 653,330 | ||||||||
| 200,000 | Barclays Commercial Mortgage Trust, Series 2015-SRCH, Class D, 4.96%, due 08/10/35◆◆ 144A | 210,310 | ||||||||
| 191,000 | Barclays Commercial Mortgage Trust, Series 2018-TALL, Class B, 3.45%, due 03/15/37◆◆ 144A | 190,118 | ||||||||
| 207,000 | Barclays Commercial Mortgage Trust, Series 2018-TALL, Class E, 4.92%, due 03/15/37◆◆ 144A | 206,654 | ||||||||
| 126,868 | Bellemeade Re, Ltd.,Series 2017-1, Class M1, 4.19%, due 10/25/27◆◆ 144A | 128,044 | ||||||||
| 293,000 | Bellemeade Re, Ltd.,Series 2018-1A, Class M1B, 4.09%, due 04/25/28◆◆ 144A | 294,327 | ||||||||
| 132,431 | Bellemeade Re, Ltd.,Series 2018-2A, Class M1A, 3.44%, due 08/25/28◆◆ 144A | 132,522 | ||||||||
| 235,000 | BENCHMARK Mortgage Trust,Series 2019-B10, Class A2, 3.61%, due 03/15/62†††† | 243,582 | ||||||||
| 215,000 | BX Commercial Mortgage Trust, Series 2018-BIOA, Class D, 3.80% (1 mo. USD LIBOR plus 1.321%), due 03/15/37† 144A | 214,820 | ||||||||
| 700,000 | CFCRE Commercial Mortgage Trust,Series 2016-C4, Class A3, 3.01%, due 05/10/58 | 689,852 | ||||||||
See accompanying Notes to the Financial Statements.
94
Table of Contents
Mercer Core Fixed Income Fund
Schedule of Investments (Continued)
(showing percentage of net assets)
March 31, 2019
| Par Value ($) | Description | Value ($) | ||||||||
| Mortgage Backed Securities - Private Issuers — continued | ||||||||||
| 240,000 | CGDBB Commercial Mortgage Trust, Series 2017-BIOC, Class E, 4.63% (1 mo. LIBOR plus 2.150%), due 07/15/32† 144A | 240,254 | ||||||||
| 206,000 | CHT Mortgage Trust, Series 2017-CSMO, Class D, 4.73%, due 11/15/36◆◆ 144A | 206,683 | ||||||||
| 178,565 | CIM Trust,Series 2017-2, Class A1, 4.49% (1 mo. USD LIBOR plus 2.000%), due 12/25/57† 144A | 180,178 | ||||||||
| 719,925 | CIM Trust,Series 2017-3, Class A1, 4.49%, due 01/25/57◆◆ 144A | 732,981 | ||||||||
| 337,087 | CIM Trust,Series 2017-6, Class A1, 3.02%, due 06/25/57◆◆ 144A | 331,073 | ||||||||
| 1,772,000 | Citigroup Commercial Mortgage Trust,Series 2016-P5, Class A2, 2.40%, due 10/10/49 | 1,752,528 | ||||||||
| 115,000 | Citigroup Commercial Mortgage Trust, Series 2017-1500, Class E, 4.98%, due 07/15/32◆◆ 144A | 113,690 | ||||||||
| 27,500,000 | Citigroup Commercial Mortgage Trust, (IO), Series 2014-GC21, Class XB, 0.46%, due 05/10/47◆◆ | 616,055 | ||||||||
| 205,000 | Cold Storage Trust, Series 2017-ICE3, Class D, 4.58% (1 mo. LIBOR plus 2.100%), due 04/15/36† 144A | 205,162 | ||||||||
| 67,627 | COLT Mortgage Loan Trust,Series 2018-2, Class A1, 3.47%, due 07/27/48◆◆ 144A | 67,868 | ||||||||
| 157,000 | COLT Mortgage Loan Trust,Series 2019-2, Class A1, 3.34%, due 05/25/49◆◆ 144A | 157,000 | ||||||||
| 221,000 | Commercial Mortgage Pass Through Certificates,Series 2012-LC4, Class B, 4.93%, due 12/10/44◆◆ | 228,702 | ||||||||
| 235,000 | Commercial Mortgage Pass Through Certificates, Series 2013-300P, Class D, 4.39%, due 08/10/30◆◆ 144A | 242,297 | ||||||||
| 72,946 | Commercial Mortgage Pass Through Certificates,Series 2013-LC6, Class A3, 2.67%, due 01/10/46 | 72,739 | ||||||||
| 576,781 | Commercial Mortgage Pass Through Certificates, Series 2014-UBS2, Class A2, 2.82%, due 03/10/47 | 576,348 | ||||||||
| 1,200,000 | Commercial Mortgage Pass Through Certificates, Series 2015-CR25, Class A3, 3.51%, due 08/10/48 | 1,231,400 | ||||||||
| 1,197,000 | Commercial Mortgage Pass Through Certificates, Series 2018-COR3, Class A3, 4.23%, due 05/10/51 | 1,287,692 | ||||||||
| 53,000,000 | Commercial Mortgage Pass Through Certificates, (IO), Series 2014-CR17, Class XB, 0.22%, due 05/10/47◆◆ 144A | 602,022 | ||||||||
| 187,963 | Credit Suisse Mortgage Trust, 3.43%, due 08/30/37◆◆ ‡‡‡‡ | 187,963 | ||||||||
| 305,000 | Credit Suisse Mortgage Trust,Series 2006-OMA, Class B2, 5.54%, due 05/15/23 144A | 310,050 | ||||||||
| 728,220 | Credit Suisse Mortgage Trust,Series 2017-HL1, Class A3, 3.50%, | 730,834 | ||||||||
| 851,249 | Credit Suisse Mortgage Trust, Series 2018-RPL9, Class A, 3.85%, | 866,875 | ||||||||
| 1,100,000 | CSAIL Commercial Mortgage Trust,Series 2017-C8, Class A3, 3.13%, due 06/15/50 | 1,095,228 | ||||||||
| 775,000 | CSAIL Commercial Mortgage Trust, Series 2017-CX10, Class A4, 3.19%, due 11/15/50 | 773,095 | ||||||||
| 480,000 | FHLMC Structured Agency Credit Risk Debt Notes, Series 2016-HQA4, Class M2, 3.79% (1 mo. USD LIBOR plus 1.300%), due 04/25/29† | 482,721 | ||||||||
| 455,314 | FHLMC Structured Agency Credit Risk Debt Notes, Series 2017-DNA1, Class M1, 3.69% (1 mo. USD LIBOR plus 1.200%), due 07/25/29† | 457,412 | ||||||||
| 1,125,497 | FHLMC Structured Agency Credit Risk Debt Notes, Series 2017-DNA3, Class M1, 3.24% (1 mo. USD LIBOR plus 0.750%), due 03/25/30† | 1,125,250 | ||||||||
| 102,204 | FNMA Connecticut Avenue Securities,Series 2016-C04, Class 1M1, 3.94% (1 mo. USD LIBOR plus 1.450%), due 01/25/29† | 102,607 | ||||||||
| 220,000 | GAHR Commercial Mortgage Trust,Series 2015-NRF, Class EFX, 3.38%, due 12/15/34◆◆ 144A | 217,977 | ||||||||
See accompanying Notes to the Financial Statements.
95
Table of Contents
Mercer Core Fixed Income Fund
Schedule of Investments (Continued)
(showing percentage of net assets)
March 31, 2019
| Par Value ($) | Description | Value ($) | ||||||||
| Mortgage Backed Securities - Private Issuers — continued | ||||||||||
| 174,000 | GAHR Commercial Mortgage Trust,Series 2015-NRF, Class DFX, 3.38%, due 12/15/34◆◆ 144A | 172,967 | ||||||||
| 144,755 | Galton Funding Mortgage Trust,Series 2018-1, Class A43, 3.50%, | 145,334 | ||||||||
| 85,000 | Great Wolf Trust, Series 2017-WOLF, Class E, 5.73%, due 09/15/34◆◆ 144A | 85,284 | ||||||||
| 1,217,389 | GS Mortgage Securities Trust, Series 2012-GCJ7, Class A4, 3.38%, due 05/10/45 | 1,230,686 | ||||||||
| 900,000 | GS Mortgage Securities Trust, Series 2015-GC28, Class A4, 3.14%, due 02/10/48 | 906,189 | ||||||||
| 100,000 | Hilton Orlando Trust,Series 2018-ORL, Class D, 4.18%, due 12/15/34◆◆ 144A | 100,223 | ||||||||
| 100,000 | Hudsons Bay Simon JV Trust, Series 2015-HBFL, Class DFL, 6.38% (1 mo. LIBOR plus 3.650%), due 08/05/34† 144A | 100,311 | ||||||||
| 170,000 | IMT Trust, Series 2017-APTS, Class CFX, 3.50%, due 06/15/34◆◆ 144A | 169,405 | ||||||||
| 902,035 | JP Morgan Mortgage Trust,Series 2016-1, Class A5, 3.50%, due 05/25/46◆◆ 144A | 906,968 | ||||||||
| 1,725,000 | JPMBB Commercial Mortgage Securities Trust,Series 2014-C19, Class A3, 3.67%, due 04/15/47 | 1,751,189 | ||||||||
| 824,000 | JPMBB Commercial Mortgage Securities Trust,Series 2015-C32, Class A2, 2.82%, due 11/15/48 | 822,701 | ||||||||
| 700,000 | JPMDB Commercial Mortgage Securities Trust,Series 2016-C2, Class A3A, 2.88%, due 06/15/49 | 692,387 | ||||||||
| 1,300,000 | JPMDB Commercial Mortgage Securities Trust,Series 2017-C5, Class A4, 3.41%, due 03/15/50 | 1,326,693 | ||||||||
| 1,187,287 | JPMorgan Chase Commercial Mortgage Securities Trust,Series 2011-C3, Class A4, 4.72%, due 02/15/46 144A | 1,219,593 | ||||||||
| 500,000 | JPMorgan Chase Commercial Mortgage Securities Trust,Series 2013-C13, Class A3, 3.53%, due 01/15/46 | 499,638 | ||||||||
| 760,000 | JPMorgan Chase Commercial Mortgage Securities Trust,Series 2016-JP2, Class A3, 2.56%, due 08/15/49 | 736,115 | ||||||||
| 1,600,000 | JPMorgan Chase Commercial Mortgage Securities Trust,Series 2017-JP6, Class A3, 3.11%, due 07/15/50 | 1,594,202 | ||||||||
| 148,000 | JPMorgan Chase Commercial Mortgage Securities Trust,Series 2018-PHH, Class A, 3.39%, due 06/15/35◆◆ 144A | 147,812 | ||||||||
| 578,905 | JPMorgan Mortgage Trust,Series 2016-4, Class A5, 3.50%, due 10/25/46◆◆ 144A | 581,517 | ||||||||
| 1,357,561 | JPMorgan Mortgage Trust,Series 2017-2, Class A5, 3.50%, due 05/25/47◆◆ 144A | 1,361,591 | ||||||||
| 1,128,960 | JPMorgan Mortgage Trust,Series 2018-4, Class A15, 3.50%, due 10/25/48◆◆ 144A | 1,133,745 | ||||||||
| 277,227 | Lehman XS Trust,Series 2006-GP4, Class 1A1, 2.69% (1 mo. USD LIBOR plus 0.205%), due 08/25/46† | 274,275 | ||||||||
| 222,869 | LSTAR Securities Investment, Ltd.,Series 2017-8, Class A, 4.14%, | 225,292 | ||||||||
| 187,057 | MetLife Securization Trust,Series 2018-1A, Class A, 3.75%, due 03/25/57◆◆ 144A | 189,975 | ||||||||
| 100,000 | Morgan Stanley Bank of America Merrill Lynch Trust,Series 2013-C7, Class A4, 2.92%, due 02/15/46 | 100,401 | ||||||||
| 1,600,000 | Morgan Stanley Capital I Trust, Series 2016-UB11, Class A3, 2.53%, due 08/15/49 | 1,541,287 | ||||||||
| 212,000 | Morgan Stanley Capital I Trust,Series 2017-CLS, Class D, 3.88%, | 211,929 | ||||||||
| 95,000 | Natixis Commercial Mortgage Securities Trust, Series 2018-285M, Class D, 3.79%, due 11/15/32◆◆ 144A | 94,905 | ||||||||
| 165,000 | Natixis Commercial Mortgage Securities Trust, Series 2018-ALXA, Class C, 4.32%, due 01/15/43◆◆ 144A | 168,819 | ||||||||
| 254,058 | New Residential Mortgage Loan Trust,Series 2018-4A, Class A1S, 3.24% (1 mo. USD LIBOR plus 0.750%), due 01/25/48† 144A | 252,890 | ||||||||
See accompanying Notes to the Financial Statements.
96
Table of Contents
Mercer Core Fixed Income Fund
Schedule of Investments (Continued)
(showing percentage of net assets)
March 31, 2019
| Par Value ($) | Description | Value ($) | ||||||||
| Mortgage Backed Securities - Private Issuers — continued | ||||||||||
| 40,742 | Provident Funding Mortgage Loan Trust,Series 2005-1, Class 2A1, 4.70%, due 05/25/35◆◆ | 40,830 | ||||||||
| 330,000 | Radnor RE Ltd.,Series 2018-1, Class M1, 3.89%, due 03/25/28◆◆ 144A | 329,485 | ||||||||
| 1,911,735 | Small Business Administration Participation Certificates,Series 2013-20L, Class 1, 3.38%, due 12/01/33 | 1,945,178 | ||||||||
| 290,000 | STACR Trust, Series 2018-DNA3, Class M1, 3.24% (1 mo. USD LIBOR plus 0.750%), due 09/25/48† 144A | 289,820 | ||||||||
| 111,741 | Starwood Mortgage Residential Trust, Series 2018-IMC1, Class A1, 3.79%, due 03/25/48◆◆ 144A | 112,928 | ||||||||
| 675,000 | UBS Commercial Mortgage Trust,Series 2017-C2, Class ASB, 3.26%, due 08/15/50 | 685,471 | ||||||||
| 2,272,000 | UBS-Barclays Commercial Mortgage Trust,Series 2012-C3, Class A4, 3.09%, due 08/10/49 | 2,295,723 | ||||||||
| 1,453,919 | UBS-Barclays Commercial Mortgage Trust,Series 2013-C5, Class A3, 2.92%, due 03/10/46 | 1,462,520 | ||||||||
| 1,523,797 | UBS-Citigroup Commercial Mortgage Trust,Series 2011-C1, Class A3, 3.60%, due 01/10/45 | 1,545,080 | ||||||||
| 395,239 | Verus Securitization Trust,Series 2018-3, Class A1, 4.11%, due 10/25/58◆◆ 144A | 403,009 | ||||||||
| 240,000 | VNO Mortgage Trust, Series 2013-PENN, Class D, 3.95%, due 12/13/29◆◆ 144A | 240,790 | ||||||||
| 18,670 | WaMu Mortgage Pass Through Certificates,Series 2003-AR9, Class 1A7, 4.35%, due 09/25/33◆◆ | 19,273 | ||||||||
| 188,000 | Wells Fargo Commercial Mortgage Trust, Series 2013-120B, Class C, 2.71%, due 03/18/28◆◆ 144A | 186,345 | ||||||||
| 1,500,000 | Wells Fargo Commercial Mortgage Trust, Series 2016-BNK1, Class A2, 2.40%, due 08/15/49 | 1,437,546 | ||||||||
| 3,000,000 | Wells Fargo Commercial Mortgage Trust, Series 2016-NXS6, Class A3, 2.64%, due 11/15/49 | 2,909,327 | ||||||||
| 950,000 | Wells Fargo Commercial Mortgage Trust,Series 2017-C38, Class A4, 3.19%, due 07/15/50 | 948,776 | ||||||||
| 1,400,000 | Wells Fargo Commercial Mortgage Trust,Series 2017-RB1, Class A4, 3.37%, due 03/15/50 | 1,415,873 | ||||||||
| 110,000 | Wells Fargo Commercial Mortgage Trust,Series 2017-SMP, Class D, 4.13%, due 12/15/34◆◆ 144A | 110,078 | ||||||||
| 1,360,000 | WF-RBS Commercial Mortgage Trust,Series 2011-C4, Class A4, 4.90%, due 06/15/44◆◆ 144A | 1,408,375 | ||||||||
|
| |||||||||
| 54,941,390 | ||||||||||
|
| |||||||||
| Mortgage Backed Securities - U.S. Government Agency Obligations — 25.8% | ||||||||||
| 602,535 | FHLMC Gold, Pool # A89870, 4.50%, due 11/01/39 | 638,243 | ||||||||
| 463,990 | FHLMC Gold, Pool # A96970, 4.00%, due 02/01/41 | 481,814 | ||||||||
| 787,729 | FHLMC Gold, Pool # C91908, 3.00%, due 01/01/37 | 795,715 | ||||||||
| 627,514 | FHLMC Gold, Pool # G06231, 4.00%, due 12/01/40 | 651,634 | ||||||||
| 286,330 | FHLMC Gold, Pool # G06409, 6.00%, due 11/01/39 | 315,663 | ||||||||
| 153,488 | FHLMC Gold, Pool # G06875, 5.50%, due 12/01/38 | 168,723 | ||||||||
| 571,039 | FHLMC Gold, Pool # G07021, 5.00%, due 09/01/39 | 615,504 | ||||||||
| 806,293 | FHLMC Gold, Pool # G08672, 4.00%, due 10/01/45 | 833,296 | ||||||||
| 196,407 | FHLMC Gold, Pool # G08735, 4.50%, due 10/01/46 | 206,007 | ||||||||
| 101,049 | FHLMC Gold, Pool # G08748, 3.50%, due 02/01/47 | 102,767 | ||||||||
| 575,753 | FHLMC Gold, Pool # G08771, 4.00%, due 07/01/47 | 595,030 | ||||||||
| 858,658 | FHLMC Gold, Pool # G08805, 4.00%, due 03/01/48 | 886,494 | ||||||||
See accompanying Notes to the Financial Statements.
97
Table of Contents
Mercer Core Fixed Income Fund
Schedule of Investments (Continued)
(showing percentage of net assets)
March 31, 2019
| Par Value ($) | Description | Value ($) | ||||||||
| Mortgage Backed Securities - U.S. Government Agency Obligations — continued | ||||||||||
| 259,013 | FHLMC Gold, Pool # G16177, 2.00%, due 01/01/32 | 252,466 | ||||||||
| 1,706,497 | FHLMC Gold, Pool # G16634, 3.00%, due 10/01/31 | 1,728,173 | ||||||||
| 1,754,787 | FHLMC Gold, Pool # G60564, 5.00%, due 02/01/42 | 1,895,759 | ||||||||
| 1,598,307 | FHLMC Gold, Pool # G60722, 3.00%, due 10/01/46 | 1,594,238 | ||||||||
| 684,669 | FHLMC Gold, Pool # G60767, 3.50%, due 10/01/46 | 699,131 | ||||||||
| 393,493 | FHLMC Gold, Pool # G60788, 3.50%, due 12/01/46 | 401,836 | ||||||||
| 1,586,307 | FHLMC Gold, Pool # G60804, 4.50%, due 05/01/42 | 1,679,505 | ||||||||
| 1,784,002 | FHLMC Gold, Pool # G60931, 3.00%, due 02/01/47 | 1,784,711 | ||||||||
| 1,964,450 | FHLMC Gold, Pool # G60934, 3.50%, due 06/01/45 | 2,010,552 | ||||||||
| 1,747,385 | FHLMC Gold, Pool # G61242, 4.50%, due 12/01/45 | 1,834,260 | ||||||||
| 1,397,722 | FHLMC Gold, Pool # G61748, 3.50%, due 11/01/48 | 1,428,116 | ||||||||
| 1,273,112 | FHLMC Gold, Pool # G67703, 3.50%, due 04/01/47 | 1,302,611 | ||||||||
| 180,129 | FHLMC Gold, Pool # J16432, 3.50%, due 08/01/26 | 184,832 | ||||||||
| 190,257 | FHLMC Gold, Pool # J17763, 3.50%, due 01/01/27 | 195,209 | ||||||||
| 607,471 | FHLMC Gold, Pool # J34888, 2.50%, due 07/01/31 | 605,013 | ||||||||
| 1,131,834 | FHLMC Gold, Pool # Q09224, 4.00%, due 07/01/42 | 1,187,605 | ||||||||
| 253,857 | FHLMC Gold, Pool # Q11218, 3.50%, due 09/01/42 | 259,525 | ||||||||
| 498,640 | FHLMC Gold, Pool # Q12052, 3.50%, due 10/01/42 | 509,791 | ||||||||
| 1,000,371 | FHLMC Gold, Pool # Q12862, 3.50%, due 11/01/42 | 1,023,894 | ||||||||
| 474,242 | FHLMC Gold, Pool # Q17792, 3.50%, due 05/01/43 | 485,396 | ||||||||
| 1,915,209 | FHLMC Gold, Pool # Q34842, 3.00%, due 07/01/45 | 1,915,672 | ||||||||
| 1,470,592 | FHLMC Gold, Pool # Q36815, 4.00%, due 10/01/45 | 1,519,764 | ||||||||
| 2,003,237 | FHLMC Gold, Pool # Q41918, 3.50%, due 07/01/46 | 2,049,645 | ||||||||
| 1,357,673 | FHLMC Gold, Pool # Q42618, 3.00%, due 08/01/46 | 1,353,798 | ||||||||
| 1,464,152 | FHLMC Gold, Pool # Q44455, 3.50%, due 11/01/46 | 1,494,811 | ||||||||
| 1,460,374 | FHLMC Gold, Pool # Q45741, 3.50%, due 01/01/47 | 1,494,213 | ||||||||
| 226,647 | FHLMC Gold, Pool # Q49494, 4.50%, due 07/01/47 | 237,712 | ||||||||
| 944,653 | FHLMC Gold, Pool # Q54957, 4.00%, due 03/01/48 | 977,096 | ||||||||
| 1,265,552 | FHLMC Gold, Pool # Q60989, 3.00%, due 12/01/46 | 1,261,938 | ||||||||
| 416,324 | FHLMC Gold, Pool # V60565, 3.00%, due 06/01/29 | 421,945 | ||||||||
| 1,054,177 | FHLMC Gold, Pool # V60599, 3.00%, due 09/01/29 | 1,068,392 | ||||||||
| 1,399,504 | FHLMC Gold, Pool # V82292, 4.00%, due 04/01/46 | 1,455,025 | ||||||||
| 1,682,685 | FHLMC Gold, Pool # V82515, 3.50%, due 06/01/46 | 1,715,419 | ||||||||
| 399,625 | FHLMC Gold, Pool # V82848, 3.00%, due 12/01/46 | 399,041 | ||||||||
| 550,000 | FHLMC Multifamily Structured Pass Through Certificates, Series K059, Class AM, 3.17%, due 09/25/26◆◆ | 561,299 | ||||||||
| 325,000 | FHLMC Multifamily Structured Pass Through Certificates, Series K083, Class AM, 4.03%, due 10/25/28◆◆ | 352,248 | ||||||||
| 200,000 | FHLMC Multifamily Structured Pass Through Certificates, Series K086, Class AM, 3.92%, due 11/25/28◆◆ | 215,072 | ||||||||
| 900,000 | FHLMC Multifamily Structured Pass Through Certificates, Series K157, Class A2, 3.99%, due 05/25/33◆◆ | 966,002 | ||||||||
| 480,000 | FHLMC Multifamily Structured Pass Through Certificates, Series W5FX, Class AFX, 2.97%, due 04/25/28◆◆ | 487,061 | ||||||||
| 32,621,400 | FHLMC Multifamily Structured Pass Through Certificates, (IO), Series K006, Class AX1, 0.94%, due 01/25/20◆◆ | 157,454 | ||||||||
| 21,009,360 | FHLMC Multifamily Structured Pass Through Certificates, (IO), Series K007, Class X1, 1.03%, due 04/25/20◆◆ | 159,883 | ||||||||
See accompanying Notes to the Financial Statements.
98
Table of Contents
Mercer Core Fixed Income Fund
Schedule of Investments (Continued)
(showing percentage of net assets)
March 31, 2019
| Par Value ($) | Description | Value ($) | ||||||||
| Mortgage Backed Securities - U.S. Government Agency Obligations — continued | ||||||||||
| 25,896,647 | FHLMC Multifamily Structured Pass Through Certificates, (IO), Series K025, Class X1, 0.84%, due 10/25/22◆◆ | 660,056 | ||||||||
| 94,983 | FHLMC Reference REMIC, Series R007, Class ZA, 6.00%, due 05/15/36 | 106,878 | ||||||||
| 938,792 | FHLMC REMIC, Series 4777, Class CB, 3.50%, due 10/15/45 | 958,526 | ||||||||
| 3,986 | FNMA, Pool # 254548, 5.50%, due 12/01/32 | 4,312 | ||||||||
| 1,807,022 | FNMA, Pool # 254903, 5.00%, due 10/01/33 | 1,945,096 | ||||||||
| 2,000,316 | FNMA, Pool # 725027, 5.00%, due 11/01/33 | 2,153,383 | ||||||||
| 1,218,749 | FNMA, Pool # 725331, 4.00%, due 01/01/34 | 1,266,285 | ||||||||
| 1,384,527 | FNMA, Pool # 735676, 5.00%, due 07/01/35 | 1,490,087 | ||||||||
| 502,319 | FNMA, Pool # 745148, 5.00%, due 01/01/36 | 540,900 | ||||||||
| 581,945 | FNMA, Pool # 932807, 4.00%, due 09/01/40 | 603,877 | ||||||||
| 492,127 | FNMA, Pool # 983471, 5.50%, due 05/01/38 | 529,280 | ||||||||
| 609,369 | FNMA, Pool # 985184, 5.50%, due 08/01/38 | 655,589 | ||||||||
| 399,472 | FNMA, Pool # 995245, 5.00%, due 01/01/39 | 429,401 | ||||||||
| 878,400 | FNMA, Pool # AB6212, 3.00%, due 09/01/42 | 879,260 | ||||||||
| 1,238,194 | FNMA, Pool # AB6802, 3.50%, due 11/01/42 | 1,264,931 | ||||||||
| 283,680 | FNMA, Pool # AB7059, 2.50%, due 11/01/42 | 276,920 | ||||||||
| 269,867 | FNMA, Pool # AB9383, 4.00%, due 05/01/43 | 282,037 | ||||||||
| 1,621,708 | FNMA, Pool # AB9659, 3.00%, due 06/01/43 | 1,623,301 | ||||||||
| 541,160 | FNMA, Pool # AD9153, 4.50%, due 08/01/40 | 572,233 | ||||||||
| 312,202 | FNMA, Pool # AE0469, 6.00%, due 12/01/39 | 344,607 | ||||||||
| 321,179 | FNMA, Pool # AE7685, 4.00%, due 10/01/40 | 333,285 | ||||||||
| 1,341,884 | FNMA, Pool # AH4404, 4.00%, due 01/01/41 | 1,392,470 | ||||||||
| 195,425 | FNMA, Pool # AI1892, 5.00%, due 05/01/41 | 211,346 | ||||||||
| 975,117 | FNMA, Pool # AJ9278, 3.50%, due 12/01/41 | 996,172 | ||||||||
| 494,521 | FNMA, Pool # AJ9317, 4.00%, due 01/01/42 | 513,162 | ||||||||
| 1,000,425 | FNMA, Pool # AL0215, 4.50%, due 04/01/41** | 1,058,179 | ||||||||
| 1,519,420 | FNMA, Pool # AL1895, 3.50%, due 06/01/42 | 1,552,229 | ||||||||
| 863,411 | FNMA, Pool # AL3000, 3.50%, due 12/01/42 | 882,059 | ||||||||
| 1,120,343 | FNMA, Pool # AL3316, 3.50%, due 03/01/43 | 1,144,533 | ||||||||
| 231 | FNMA, Pool # AL3873, 3.50%, due 07/01/43 | 236 | ||||||||
| 1,137,891 | FNMA, Pool # AL6301, 4.50%, due 06/01/42 | 1,202,122 | ||||||||
| 1,343,255 | FNMA, Pool # AL6663, 4.00%, due 03/01/39 | 1,388,892 | ||||||||
| 606,679 | FNMA, Pool # AL6839, 5.00%, due 04/01/42 | 654,405 | ||||||||
| 1,769,793 | FNMA, Pool # AL7521, 5.00%, due 06/01/39 | 1,909,957 | ||||||||
| 3,303,501 | FNMA, Pool # AL7594, 3.50%, due 08/01/45 | 3,370,748 | ||||||||
| 1,170,938 | FNMA, Pool # AL8191, 4.00%, due 12/01/45 | 1,214,910 | ||||||||
| 206,337 | FNMA, Pool # AO4109, 4.00%, due 06/01/42 | 214,116 | ||||||||
| 487,042 | FNMA, Pool # AQ7923, 3.00%, due 12/01/42 | 487,520 | ||||||||
| 1,218,145 | FNMA, Pool # AS5133, 3.50%, due 06/01/45 | 1,239,549 | ||||||||
| 341,522 | FNMA, Pool # AS6286, 4.00%, due 12/01/45 | 353,317 | ||||||||
| 552,583 | FNMA, Pool # AS6304, 4.00%, due 12/01/45 | 571,669 | ||||||||
| 731,432 | FNMA, Pool # AS6452, 3.50%, due 01/01/46 | 744,286 | ||||||||
| 297,109 | FNMA, Pool # AS7693, 2.00%, due 08/01/31 | 289,402 | ||||||||
| 428,352 | FNMA, Pool # AS8073, 2.50%, due 10/01/46 | 416,414 | ||||||||
| 902,340 | FNMA, Pool # AT0232, 3.00%, due 03/01/43 | 903,227 | ||||||||
| 415,603 | FNMA, Pool # AX3719, 3.50%, due 07/01/27 | 425,835 | ||||||||
| 349,792 | FNMA, Pool # AZ3743, 3.50%, due 11/01/45 | 355,938 | ||||||||
| 2,951,755 | FNMA, Pool # BD7043, 4.00%, due 03/01/47 | 3,066,599 | ||||||||
See accompanying Notes to the Financial Statements.
99
Table of Contents
Mercer Core Fixed Income Fund
Schedule of Investments (Continued)
(showing percentage of net assets)
March 31, 2019
| Par Value ($) | Description | Value ($) | ||||||||
| Mortgage Backed Securities - U.S. Government Agency Obligations — continued | ||||||||||
| 2,643,509 | FNMA, Pool # BE7192, 4.00%, due 03/01/47 | 2,737,216 | ||||||||
| 1,545,663 | FNMA, Pool # BH1207, 4.00%, due 06/01/47 | 1,601,449 | ||||||||
| 929 | FNMA, Pool # BM1105, 5.00%, due 07/01/41 | 999 | ||||||||
| 1,557,263 | FNMA, Pool # BM1573, 3.50%, due 07/01/47 | 1,592,152 | ||||||||
| 1,472,434 | FNMA, Pool # BM1655, 5.00%, due 11/01/44 | 1,584,396 | ||||||||
| 1,672,630 | FNMA, Pool # BM1972, 3.50%, due 10/01/37 | 1,716,456 | ||||||||
| 967,799 | FNMA, Pool # BM3033, 3.00%, due 10/01/47 | 965,165 | ||||||||
| 1,088,864 | FNMA, Pool # BM3116, 3.00%, due 02/01/47 | 1,090,272 | ||||||||
| 294,711 | FNMA, Pool # BM3258, 3.00%, due 02/01/47 | 295,009 | ||||||||
| 802,908 | FNMA, Pool # BM3286, 4.50%, due 11/01/47 | 840,662 | ||||||||
| 1,006,291 | FNMA, Pool # BM3491, 4.50%, due 01/01/38 | 1,057,757 | ||||||||
| 1,737,687 | FNMA, Pool # BM3641, 4.00%, due 04/01/48 | 1,810,362 | ||||||||
| 3,051,761 | FNMA, Pool # BM3820, 4.00%, due 02/01/47 | 3,179,386 | ||||||||
| 1,638,210 | FNMA, Pool # BM4425, 5.00%, due 07/01/47 | 1,761,848 | ||||||||
| 1,479,285 | FNMA, Pool # CA0655, 3.50%, due 11/01/47 | 1,507,578 | ||||||||
| 1,504,098 | FNMA, Pool # CA1560, 4.50%, due 04/01/48 | 1,586,878 | ||||||||
| 2,102,550 | FNMA, Pool # CA2057, 4.50%, due 07/01/48 | 2,200,380 | ||||||||
| 9,721 | FNMA, Pool # MA2064, 3.00%, due 10/01/24 | 9,904 | ||||||||
| 424,078 | FNMA, Pool # MA3385, 4.50%, due 06/01/48 | 443,727 | ||||||||
| 1,132,884 | FNMA REMIC,Series 2011-59, Class NZ, 5.50%, due 07/25/41 | 1,256,127 | ||||||||
| 29,282 | FNMA REMIC,Series 2012-28, Class B, 6.50%, due 06/25/39 | 31,368 | ||||||||
| 1,700,000 | FNMA-ACES,Series 2015-M10, Class A2, 3.09%, due 04/25/27◆◆ | 1,715,923 | ||||||||
| 808,003 | FNMA-ACES,Series 2015-M8, Class AB2, 2.83%, due 01/25/25◆◆ | 815,270 | ||||||||
| 500,000 | FNMA-ACES,Series 2016-M7, Class AB2, 2.38%, due 09/25/26 | 484,455 | ||||||||
| 500,000 | FNMA-ACES,Series 2017-M1, Class A2, 2.42%, due 10/25/26◆◆ | 486,156 | ||||||||
| 1,700,000 | FNMA-ACES,Series 2017-M8, Class A2, 3.06%, due 05/25/27◆◆ | 1,716,577 | ||||||||
| 438,970 | FNMA-ACES,Series 2018-M10, Class A1, 3.38%, due 07/25/28◆◆ | 456,838 | ||||||||
| 367,043 | GNMA, Pool # 004636, 4.50%, due 02/20/40 | 386,709 | ||||||||
| 67,930 | GNMA, Pool # 004678, 4.50%, due 04/20/40 | 71,567 | ||||||||
| 438,447 | GNMA, Pool # 004833, 4.00%, due 10/20/40 | 456,736 | ||||||||
| 378,034 | GNMA, Pool # 004977, 4.00%, due 03/20/41 | 393,838 | ||||||||
| 980,504 | GNMA, Pool # 004978, 4.50%, due 03/20/41 | 1,033,025 | ||||||||
| 1,536,951 | GNMA, Pool # 005055, 4.50%, due 05/20/41 | 1,619,325 | ||||||||
| 560 | GNMA, Pool # 005334, 5.00%, due 03/20/42 | 604 | ||||||||
| 668,353 | GNMA, Pool # 734152, 4.00%, due 01/15/41 | 695,353 | ||||||||
| 53,197 | GNMA, Pool # 783637, 3.00%, due 06/20/42 | 53,541 | ||||||||
| 423,462 | GNMA, Pool # AL8626, 3.00%, due 08/15/45 | 425,689 | ||||||||
| 78,668 | GNMA, Pool # MA0624, 3.00%, due 12/20/42 | 79,176 | ||||||||
| 356,544 | GNMA, Pool # MA0625, 3.50%, due 12/20/42 | 365,582 | ||||||||
| 204,100 | GNMA, Pool # MA0698, 3.00%, due 01/20/43 | 205,416 | ||||||||
| 700,343 | GNMA, Pool # MA0851, 3.00%, due 03/20/43 | 704,862 | ||||||||
| 119,300 | GNMA, Pool # MA1156, 3.00%, due 07/20/43 | 120,069 | ||||||||
| 167,513 | GNMA, Pool # MA1599, 3.00%, due 01/20/44 | 168,593 | ||||||||
| 339,973 | GNMA, Pool # MA2372, 4.00%, due 11/20/44 | 353,698 | ||||||||
| 334,145 | GNMA, Pool # MA3377, 4.00%, due 01/20/46 | 346,419 | ||||||||
| 614,589 | GNMA, Pool # MA3873, 3.00%, due 08/20/46 | 618,556 | ||||||||
| 239,493 | GNMA, Pool # MA4125, 2.50%, due 12/20/46 | 234,576 | ||||||||
| 485,613 | GNMA I, Pool # 784605, 4.50%, due 01/15/42 | 511,395 | ||||||||
| 1,298,675 | GNMA II, Pool # AV9421, 3.50%, due 11/20/46 | 1,330,511 | ||||||||
See accompanying Notes to the Financial Statements.
100
Table of Contents
Mercer Core Fixed Income Fund
Schedule of Investments (Continued)
(showing percentage of net assets)
March 31, 2019
| Par Value ($) | Description | Value ($) | ||||||||
| Mortgage Backed Securities - U.S. Government Agency Obligations — continued | ||||||||||
| 923,843 | GNMA II, Pool # AY7555, 3.50%, due 04/20/47 | 946,539 | ||||||||
| 553,871 | GNMA II, Pool # MA0462, 3.50%, due 10/20/42 | 567,920 | ||||||||
| 553,120 | GNMA II, Pool # MA0852, 3.50%, due 03/20/43 | 569,524 | ||||||||
| 474,579 | GNMA II, Pool # MA2371, 3.50%, due 11/20/44 | 485,658 | ||||||||
| 379,746 | GNMA II, Pool # MA2825, 3.00%, due 05/20/45 | 382,195 | ||||||||
| 857,166 | GNMA II, Pool # MA3456, 4.50%, due 02/20/46 | 902,479 | ||||||||
| 1,779,221 | GNMA II, Pool # MA3803, 3.50%, due 07/20/46 | 1,821,557 | ||||||||
| 318,625 | GNMA II, Pool # MA4071, 4.50%, due 11/20/46 | 336,574 | ||||||||
| 577,660 | GNMA II, Pool # MA4263, 4.00%, due 02/20/47 | 596,930 | ||||||||
| 438,502 | GNMA II, Pool # MA5021, 4.50%, due 02/20/48 | 456,855 | ||||||||
| 147,561 | GNMA II, Pool # MA5079, 4.50%, due 03/20/48 | 153,377 | ||||||||
|
| |||||||||
| 141,435,697 | ||||||||||
|
| |||||||||
| Municipal Obligations — 1.0% | ||||||||||
| 60,000 | Alabama Economic Settlement Authority, 4.26%, due 09/15/32 | 63,124 | ||||||||
| 300,000 | Bay Area Toll Authority, 6.26%, due 04/01/49 | 428,490 | ||||||||
| 90,000 | District of Columbia Water & Sewer Authority, 4.81%, due 10/01/14# | 103,849 | ||||||||
| 464,000 | Municipal Electric Authority of Georgia, 6.64%, due 04/01/57 | 522,858 | ||||||||
| 2,049,000 | New Jersey Economic Development Authority, 2.94%, due 02/15/20‡‡ | 1,997,201 | ||||||||
| 1,000,000 | State of California General Obligation, 7.55%, due 04/01/39 | 1,520,570 | ||||||||
| 695,000 | State of Illinois, General Obligation, 5.00%, due 11/01/22 | 749,551 | ||||||||
| 105,000 | University of Virginia, 4.18%, due 09/01/17# | 108,837 | ||||||||
|
| |||||||||
| 5,494,480 | ||||||||||
|
| |||||||||
| Sovereign Debt Obligations — 1.2% | ||||||||||
| 288,000 | Argentine Republic Government International Bond, 5.88%, due 01/11/28 | 221,796 | ||||||||
| 135,000 | Colombia Government International Bond, 7.38%, due 09/18/37 | 177,019 | ||||||||
| 215,000 | Export-Import Bank of India, 3.88%, due 02/01/28‡ 144A | 212,947 | ||||||||
| 600,000 | Hashemite Kingdom of Jordan Government AID Bond, 3.00%, due 06/30/25 | 617,042 | ||||||||
| 400,000 | Hungary Government International Bond, 5.75%, due 11/22/23 | 443,044 | ||||||||
| 200,000 | Indonesia Government International Bond, 4.45%, due 02/11/24 | 208,916 | ||||||||
| 220,000 | Indonesia Government International Bond, 5.88%, due 01/15/24 144A | 243,009 | ||||||||
| 200,000 | Japan Bank for International Cooperation, 3.38%, due 10/31/23 | 206,490 | ||||||||
| 200,000 | Panama Government International Bond, 4.00%, due 09/22/24 | 209,400 | ||||||||
| 250,000 | Province of Alberta Canada, 3.30%, due 03/15/28 | 259,519 | ||||||||
| 100,000 | Province of Manitoba Canada, 2.13%, due 06/22/26 | 95,767 | ||||||||
| 220,000 | Province of Ontario Canada, 3.40%, due 10/17/23‡ | 227,799 | ||||||||
| 220,000 | Province of Quebec Canada, 2.75%, due 04/12/27 | 220,520 | ||||||||
| 150,000 | Provincia de Buenos Aires, 7.88%, due 06/15/27 144A | 109,875 | ||||||||
| 246,000 | Qatar Government International Bond, 3.38%, due 03/14/24‡ 144A | 248,691 | ||||||||
| 520,000 | Qatar Government International Bond, 5.10%, due 04/23/48 144A | 570,700 | ||||||||
| 375,000 | Saudi Government International Bond, 2.88%, due 03/04/23 144A | 372,028 | ||||||||
| 235,000 | Saudi Government International Bond, 4.00%, due 04/17/25 144A | 241,097 | ||||||||
| 445,000 | Saudi Government International Bond, 4.38%, due 04/16/29 144A | 464,525 | ||||||||
| 330,000 | Saudi Government International Bond, 5.25%, due 01/16/50 144A | 352,725 | ||||||||
| 400,000 | Tokyo Metropolitan Government, 2.50%, due 06/08/22 144A | 397,559 | ||||||||
| 300,000 | Turkey Government International Bond, 7.00%, due 06/05/20‡ | 303,413 | ||||||||
| 140,000 | Uruguay Government International Bond, 5.10%, due 06/18/50 | 149,975 | ||||||||
|
| |||||||||
| 6,553,856 | ||||||||||
|
| |||||||||
See accompanying Notes to the Financial Statements.
101
Table of Contents
Mercer Core Fixed Income Fund
Schedule of Investments (Continued)
(showing percentage of net assets)
March 31, 2019
| Par Value ($) | Description | Value ($) | ||||||||
| U.S. Government and Agency Obligations — 10.0% | ||||||||||
| 140,000 | FHLMC, 1.38%, due 08/15/19 | 139,463 | ||||||||
| 270,000 | FNMA, 2.38%, due 01/19/23 | 270,874 | ||||||||
| 315,000 | FNMA, 2.50%, due 02/05/24 | 318,175 | ||||||||
| 310,000 | FNMA, 6.63%, due 11/15/30*** | 427,449 | ||||||||
| 25,000 | Tennessee Valley Authority, 7.13%, due 05/01/30 | 35,154 | ||||||||
| 4,360,000 | U.S. Treasury Bond, 2.75%, due 11/15/42 | 4,339,988 | ||||||||
| 2,788,000 | U.S. Treasury Bond, 2.75%, due 11/15/47 | 2,748,467 | ||||||||
| 4,165,000 | U.S. Treasury Bond, 3.00%, due 02/15/47 | 4,323,059 | ||||||||
| 1,015,000 | U.S. Treasury Bond, 3.00%, due 02/15/48 | 1,050,406 | ||||||||
| 3,383,000 | U.S. Treasury Bond, 3.00%, due 08/15/48 | 3,502,660 | ||||||||
| 6,202,000 | U.S. Treasury Bond, 3.38%, due 11/15/48 | 6,903,722 | ||||||||
| 6,896,000 | U.S. Treasury Bond, 4.50%, due 05/15/38 | 8,870,249 | ||||||||
| 2,994,000 | U.S. Treasury Note, 2.38%, due 02/29/24 | 3,013,941 | ||||||||
| 1,551,000 | U.S. Treasury Note, 2.63%, due 05/15/21 | 1,562,087 | ||||||||
| 7,570,000 | U.S. Treasury Note, 2.63%, due 02/15/29 | 7,710,015 | ||||||||
| 7,928,000 | U.S. Treasury Note, 2.88%, due 09/30/23 | 8,142,304 | ||||||||
| 1,292,000 | U.S. Treasury Note, 2.88%, due 08/15/28 | 1,342,595 | ||||||||
|
| |||||||||
| 54,700,608 | ||||||||||
|
| |||||||||
TOTAL DEBT OBLIGATIONS (COST $539,392,651) | 535,475,372 | |||||||||
|
| |||||||||
| Number of Contracts | Notional Value ($) | Description | Value ($) | |||||||
OPTIONS PURCHASED — 0.0% |
| |||||||||
| Purchased Futures Options — 0.0% | ||||||||||
| Put Options — 0.0% | ||||||||||
| 48 | 10,228,500 | U.S. Treasury Note2-Year Futures Option with JP Morgan Securities LLC, Strike Price $ 106.00, Expires 04/26/19 | 750 | |||||||
| 48 | 10,228,500 | U.S. Treasury Note2-Year Futures Option with JP Morgan Securities LLC, Strike Price $ 106.63, Expires 04/26/19 | 18,750 | |||||||
| 81 | 9,382,078 | U.S. Treasury Note5-Year Futures Option with JP Morgan Securities LLC, Strike Price $ 115.00, Expires 04/26/19 | 5,063 | |||||||
|
| |||||||||
TOTAL FUTURES OPTIONS PURCHASED | 24,563 | |||||||||
|
| |||||||||
TOTAL OPTIONS PURCHASED (PREMIUMS PAID $23,074) | 24,563 | |||||||||
|
| |||||||||
| Par Value ($) | Description | Value ($) | ||||||||
SHORT-TERM INVESTMENTS — 1.4% |
| |||||||||
| Certificate of Deposit — 0.1% | ||||||||||
| 430,000 | Ford Motor Credit Co., 3.66%, due 04/09/19‡‡ 144A | 429,599 | ||||||||
|
| |||||||||
TOTAL CERTIFICATES OF DEPOSIT (COST $429,708) | 429,599 | |||||||||
|
| |||||||||
See accompanying Notes to the Financial Statements.
102
Table of Contents
Mercer Core Fixed Income Fund
Schedule of Investments (Continued)
(showing percentage of net assets)
March 31, 2019
| Par Value ($) | Description | Value ($) | ||||||||
| Mutual Fund - Securities Lending Collateral — 1.1% | ||||||||||
| 6,309,277 | State Street Institutional U.S. Government Money Market Fund, Premier Class, 2.39%**** | 6,309,277 | ||||||||
|
| |||||||||
TOTAL MUTUAL FUND - SECURITIES LENDING COLLATERAL | 6,309,277 | |||||||||
|
| |||||||||
| U.S. Government and Agency Obligations — 0.2% | ||||||||||
| 922,000 | U.S. Treasury Bill, 2.31%, due 05/16/19‡‡ | 919,283 | ||||||||
|
| |||||||||
TOTAL U.S. GOVERNMENT AND AGENCY OBLIGATIONS | 919,283 | |||||||||
|
| |||||||||
TOTAL SHORT-TERM INVESTMENTS (COST $7,658,232) | 7,658,159 | |||||||||
|
| |||||||||
TOTAL INVESTMENTS — 99.0% (Cost $547,073,957) | 543,158,094 | |||||||||
Other Assets and Liabilities (net) — 1.0% | 5,442,382 | |||||||||
|
| |||||||||
| NET ASSETS — 100.0% | $548,600,476 | |||||||||
|
| |||||||||
| Notes to Schedule of Investments: | ||||||||||
| ACES — Alternative Credit Enhancement Securities | ||||||||||
| CLO — Collateralized Loan Obligation | ||||||||||
| FHLMC — Federal Home Loan Mortgage Corporation | ||||||||||
| FNMA — Federal National Mortgage Association | ||||||||||
| GNMA — Government National Mortgage Association | ||||||||||
| IO — Interest Only | ||||||||||
| MTN — Medium Term Note | ||||||||||
| REIT — Real Estate Investment Trust | ||||||||||
| REMIC — Real Estate Mortgage Investment Conduit | ||||||||||
| # | Year of maturity is greater than 2100. | |||||||||
| * | Non-income producing security | |||||||||
| ** | All or a portion of this security is pledged for open futures collateral. | |||||||||
| *** | All or a portion of this security is pledged for open futures and open centrally cleared swaps collateral. | |||||||||
| **** | Represents an investment of securities lending cash collateral. | |||||||||
| ***** | Securities fair valued by the Valuation Committee as approved by the Board of Trustees. The total market value of the securities at year end is $572 which represents 0.0% of net assets. The aggregate tax cost of these securities held at March 31, 2019 was $1,565,555. | |||||||||
| ¤ | Illiquid security. The total market value of the securities at year end is $572 which represents 0.0% of net assets. The aggregate tax cost of these securities held at March 31, 2019 was $1,565,555. | |||||||||
��
See accompanying Notes to the Financial Statements.
103
Table of Contents
Mercer Core Fixed Income Fund
Schedule of Investments (Continued)
March 31, 2019
| ^ | Level 3 — significant unobservable inputs were used in determining the value of this portfolio security. | |||||||
| † | Variable or floating rate note. Rate shown is as of March 31, 2019. | |||||||
| ◆ | Variable rate security. Security may be issued at a fixed coupon rate, which converts to a variable rate at a specified date. Rate shown is the rate in effect as of period end. | |||||||
| ◆◆ | Variable or floating rate security, which interest rate adjusts periodically based on changes in current interest rates and prepayments on the underlying pool of assets. Rate shown is the rate in effect as of period end. | |||||||
| †† | Debt obligation initially issued in zero coupon form which converts to coupon form at a specific rate and date. The rate shown is the rate at period end. | |||||||
| ††† | Security is currently in default. | |||||||
| †††† | When-issued security. | |||||||
| ††††† | Security is perpetual and has no stated maturity date. | |||||||
| ‡ | All or a portion of this security is out on loan. | |||||||
| ‡‡ | Interest rate presented is yield to maturity. | |||||||
| ‡‡‡ | Security exempt from registration under Regulation S of the Securities Act of 1933, which exempts from registration securities offered and sold outside the United States. Security may not be offered or sold in the United States except pursuant to an exemption from, or in a transaction not subject to, the registration requirements of the Securities Act of 1933. | |||||||
| ‡‡‡‡ | Restricted securities are not registered under the Securities Act of 1933 and are subject to legal restrictions on resale. These securities generally may be resold in transactions exempt from registration or to the public if the securities are subsequently registered. Disposal of these securities may involve time-consuming negotiations and prompt sale at an acceptable price may be difficult. As of year end, the market value of restricted securities was $187,963, which is 0.0% of net assets. See details shown in the Restricted Securities table that follows. | |||||||
| 144A | Securities exempt from registration under Rule 144A of the Securities Act of 1933. These securities may be resold in transactions exempt from registration, normally to qualified institutional buyers. The total market value of the securities at year end is $117,877,694 which represents 21.5% of net assets. | |||||||
See accompanying Notes to the Financial Statements.
104
Table of Contents
Mercer Core Fixed Income Fund
Schedule of Investments (Continued)
March 31, 2019
At March 31, 2019, the Fund held the following restricted security:
Restricted Security | Acquistion | Principal | Cost | Value | ||||||||||
Credit Suisse Mortgage Trust, 3.43%, due 08/30/2037 | 11/28/18 | $187,963 | $ | 187,963 | $ | 187,963 | ||||||||
|
| |||||||||||||
| $ | 187,963 | |||||||||||||
|
| |||||||||||||
Futures Contracts
Number of | Description | Expiration Date | Notional | Market Value/ | ||||||||||||||
| Buys | ||||||||||||||||||
| 168 | U.S. Treasury Note 10-Year | Jun 2019 | $ | 20,868,750 | $ | 301,167 | ||||||||||||
| 77 | U.S. Treasury Note2-Year | Jun 2019 | 16,408,219 | 59,336 | ||||||||||||||
| 190 | U.S. Treasury Note5-Year | Jun 2019 | 22,007,344 | 183,532 | ||||||||||||||
| 28 | U.S. Ultra10-Year | Jun 2019 | 3,717,875 | 74,392 | ||||||||||||||
| 111 | U.S. Ultra Bond | Jun 2019 | 18,648,000 | 674,358 | ||||||||||||||
|
| |||||||||||||||||
| $ | 1,292,785 | |||||||||||||||||
|
| |||||||||||||||||
| Sales | ||||||||||||||||||
| 49 | U.S. Long Bond | Jun 2019 | $ | 7,333,156 | $ | (187,872 | ) | |||||||||||
|
| |||||||||||||||||
Written Options
Written Futures Options
Type of Contract | Counterparty | Number of Contracts | Notional Value | Premiums Received | Value at March 31, 2019 | ||||||||||||||||||||
PUT — U.S. Treasury Note2-Year Futures Option | JP Morgan Securities LLC | 96 | $ | (20,457,000 | ) | $ | (5,867 | ) | $ | (6,000 | ) | ||||||||||||||
Strike @ $ 106.25 | |||||||||||||||||||||||||
Expires 04/26/2019 | |||||||||||||||||||||||||
Centrally Cleared Interest Rate Swaps
Payments | Payments Made by Fund | Maturity Date | Upfront Premiums Paid (Received) | Notional | Market | Unrealized Appreciation (Depreciation) | ||||||||||||||
| Overnight Federal Funds Effective Rate (12M) | 2.58% | 08/15/28 | $ | (123,603 | ) | $ | 6,783,600 | $ | (257,050 | ) | $ | (133,447 | ) | |||||||
| Overnight Federal Funds Effective Rate (12M) | 2.41% | 02/12/25 | 117 | 2,295,000 | (46,845 | ) | (46,962 | ) | ||||||||||||
| Overnight Federal Funds Effective Rate (12M) | 2.37% | 03/23/21 | 92 | 4,545,000 | (20,931 | ) | (21,023 | ) | ||||||||||||
| Overnight Federal Funds Effective Rate (12M) | 2.07% | 02/15/27 | (336 | ) | 920,000 | 1,394 | 1,730 | |||||||||||||
| Overnight Federal Funds Effective Rate (12M) | 1.96% | 02/15/27 | 102 | 265,000 | 2,395 | 2,293 | ||||||||||||||
| Overnight Federal Funds Effective Rate (12M) | 1.95% | 03/29/24 | 124 | 4,490,000 | 16,124 | 16,000 | ||||||||||||||
| 3-Month USD LIBOR | 3.11% | 07/31/25 | 340 | 2,709,000 | (127,236 | ) | (127,576 | ) | ||||||||||||
| 3-Month USD LIBOR | 3.00% | 05/31/25 | 50 | 120,000 | (4,762 | ) | (4,812 | ) | ||||||||||||
| 3-Month USD LIBOR | 2.84% | 08/15/28 | (3,212 | ) | 1,662,000 | (62,122 | ) | (58,910 | ) | |||||||||||
| 3-Month USD LIBOR | 2.66% | 11/15/43 | 103 | 145,000 | (1,993 | ) | (2,096 | ) | ||||||||||||
| 3-Month USD LIBOR | 2.33% | 11/15/24 | 12,963 | 3,810,000 | (6,241 | ) | (19,204 | ) | ||||||||||||
| 3-Month USD LIBOR | 2.29% | 05/15/27 | 101 | 130,000 | 613 | 512 | ||||||||||||||
See accompanying Notes to the Financial Statements.
105
Table of Contents
Mercer Core Fixed Income Fund
Schedule of Investments (Continued)
March 31, 2019
Centrally Cleared Interest Rate Swaps — continued
Payments | Payments Made by Fund | Maturity Date | Upfront Premiums Paid (Received) | Notional | Market | Unrealized Appreciation (Depreciation) | ||||||||||||||
| 3-Month USD LIBOR | 2.21% | 01/08/26 | $ | — | $ | 7,920,000 | $ | 56,082 | $ | 56,082 | ||||||||||
| 3-Month USD LIBOR | 2.18% | 08/15/24 | 1,488 | 385,000 | 2,369 | 881 | ||||||||||||||
| 3-Month USD LIBOR | 2.17% | 08/15/24 | 10,977 | 7,885,000 | 50,728 | 39,751 | ||||||||||||||
| 12-Month USD LIBOR | 1.90% | 02/15/27 | 797 | 390,000 | 5,402 | 4,605 | ||||||||||||||
| 12-Month USD LIBOR | 1.82% | 02/15/27 | 20,041 | 1,447,000 | 27,979 | 7,938 | ||||||||||||||
|
| |||||||||||||||||||
| $ | (284,238 | ) | ||||||||||||||||||
|
| |||||||||||||||||||
See accompanying Notes to the Financial Statements.
106
Table of Contents
Mercer Core Fixed Income Fund
Schedule of Investments (Continued)
March 31, 2019
| Asset Class Summary (Unaudited) | % of Net Assets | ||||
Debt Obligations | 97.6 | ||||
Futures Contracts | 0.2 | ||||
Options Purchased | 0.0 | ||||
Written Options | 0.0 | ||||
Swaps | (0.1 | ) | |||
Short-Term Investments | 1.4 | ||||
Other Assets and Liabilities (net) | 0.9 | ||||
|
| ||||
| 100.0 | % | ||||
|
| ||||
See accompanying Notes to the Financial Statements.
107
Table of Contents
Mercer Opportunistic Fixed Income Fund
Schedule of Investments
(showing percentage of net assets)
March 31, 2019
| Par Value** | Description | Value ($) | ||||||||
DEBT OBLIGATIONS — 91.9% |
| |||||||||
| Asset Backed Securities — 2.5% | ||||||||||
| 1,090,000 | Aegis Asset Backed Securities Trust,Series 2005-5, Class M1, 2.92% (1 mo. USD LIBOR plus 0.430%), due 12/25/35† | 1,059,075 | ||||||||
| 250,000 | AMMC CLO 20, Ltd.,Series 2017-20A, Class D, 6.17% (3 mo. USD LIBOR plus 3.400%), due 04/17/29† 144A | 250,388 | ||||||||
| 888,750 | Applebee’s Funding LLC/IHOP Funding LLC,Series 2014-1, Class A2, 4.28%, due 09/05/44 144A | 893,029 | ||||||||
| 1,290,000 | Asset Backed Securities Corp. Home Equity Loan Trust Series OOMC,Series 2006-HE5, Class M1, 2.77% (1 mo. USD LIBOR plus 0.280%), due 07/25/36† | 1,026,582 | ||||||||
| 660,000 | Avery Point VI CLO, Ltd.,Series 2015-6A, Class DR, 5.68%, due 08/05/27◆◆ 144A | 652,428 | ||||||||
| 790,000 | BMW Vehicle Lease Trust,Series 2018-1, Class A3, 3.26%, due 07/20/21 | 796,957 | ||||||||
| 385,000 | California Republic Auto Receivables Trust,Series 2018-1, Class C, 3.87%, due 10/16/23 | 393,247 | ||||||||
| 380,000 | California Street CLO IX, LP,Series 2012-9A, Class ER, 9.96% (3 mo. USD LIBOR plus 7.180%), due 10/16/28† 144A | 381,369 | ||||||||
| 600,000 | Catskill Park CLO, Ltd.,Series 2017-1A, Class D, 8.76% (3 mo. USD LIBOR plus 6.000%), due 04/20/29† 144A | 579,147 | ||||||||
| 200,000 | CCG Receivables Trust,Series 2018-1, Class C, 3.42%, due 06/16/25 144A | 200,621 | ||||||||
| 330,000 | Cent CLO 24, Ltd.,Series 2015-24A, Class CR, 5.94%, due 10/15/26◆◆ 144A | 326,807 | ||||||||
| 609,150 | Coinstar Funding LLC,Series 2017-1A, Class A2, 5.22%, due 04/25/47 144A | 621,253 | ||||||||
| 129,773 | Colony Starwood Homes Trust,Series 2016-2A, Class B, 4.23% (1 mo. USD LIBOR plus 1.750%), due 12/17/33† 144A | 129,901 | ||||||||
| 250,000 | Cumberland Park CLO, Ltd.,Series 2015-2A, Class ER, 8.41%, due 07/20/28◆◆ 144A | 248,018 | ||||||||
| 371,593 | Diamond Resorts Owner Trust,Series 2018-1, Class C, 4.53%, due 01/21/31 144A | 376,904 | ||||||||
| 650,000 | DT Auto Owner Trust,Series 2018-2A, Class D, 4.15%, due 03/15/24 144A | 662,108 | ||||||||
| 225,000 | First Investors Auto Owner Trust,Series 2016-2A, Class D, 3.35%, due 11/15/22 144A | 225,028 | ||||||||
| 250,000 | Greywolf CLO, Ltd.,Series 2019-1A, Class C, 1.00%, due 04/17/30◆◆ †††† 144A | 248,125 | ||||||||
| 524,599 | GSAA Home Equity Trust,Series 2007-7, Class A4, 2.76% (1 mo. USD LIBOR plus 0.270%), due 07/25/37† | 505,659 | ||||||||
| 500,000 | Invitation Homes Trust, Series 2018-SFR1, Class E, 4.48%, due 03/17/37◆◆ 144A | 499,066 | ||||||||
| 250,000 | LCM CLO XXII, Ltd., Series 22A, Class DR, 8.26%, due 10/20/28◆◆ 144A | 235,590 | ||||||||
| 370,851 | Legacy Mortgage Asset Trust,Series 2019-GS1, Class A1, 4.00%, due 01/25/59†† 144A | 373,876 | ||||||||
| 232,375 | MAPS, Ltd.,Series 2018-1A, Class A, 4.21%, due 05/15/43 144A | 234,725 | ||||||||
| 232,375 | MAPS, Ltd.,Series 2018-1A, Class B, 5.19%, due 05/15/43 144A | 234,466 | ||||||||
| 1,500,000 | Mill City Solar Loan2019-1, Ltd.,Series 2019-1A, Class A, 4.34%, due 03/20/43 144A | 1,517,133 | ||||||||
| 575,000 | Navient Private Education Refi Loan Trust,Series 2018-CA, Class B, 4.22%, due 06/16/42 144A | 600,221 | ||||||||
| 250,000 | Neuberger Berman CLO XVII, Ltd.,Series 2014-17A, Class ER, 9.31% (3 mo. USD LIBOR plus 6.550%), due 04/22/29† 144A | 240,773 | ||||||||
| 500,000 | Oaktree CLO, Ltd.,Series 2015-1A, Class DR, 7.96%, due 10/20/27◆◆ 144A | 482,947 | ||||||||
| 250,000 | Octagon Investment Partners CLO XXIII, Ltd.,Series 2015-1A, Class ER, 8.54%, due 07/15/27◆◆ 144A | 248,747 | ||||||||
| 730,000 | OneMain Financial Issuance Trust,Series 2015-2A, Class D, 5.64%, due 07/18/25 144A | 733,616 | ||||||||
| 280,000 | OneMain Financial Issuance Trust,Series 2018-1A, Class D, 4.08%, due 03/14/29 144A | 282,418 | ||||||||
See accompanying Notes to the Financial Statements.
108
Table of Contents
Mercer Opportunistic Fixed Income Fund
Schedule of Investments (Continued)
(showing percentage of net assets)
March 31, 2019
| Par Value** | Description | Value ($) | ||||||||
| Asset Backed Securities — continued | ||||||||||
| 530,000 | OZLM VII CLO, Ltd.,Series 2014-7RA, Class CR, 5.77%, due 07/17/29◆◆ 144A | 512,232 | ||||||||
| 750,000 | OZLM XII CLO, Ltd.,Series 2015-12A, Class CR, 5.75%, due 04/30/27◆◆ 144A | 749,599 | ||||||||
| 711,425 | Planet Fitness Master Issuer LLC,Series 2018-1A, Class A2II, 4.67%, due 09/05/48 144A | 735,381 | ||||||||
| 180,000 | Saranac CLO III, Ltd.,Series 2014-3A, Class DR, 5.86%, due 06/22/30◆◆ 144A | 175,325 | ||||||||
| 292,000 | SLM Private Credit Student Loan Trust,Series 2003-A, Class A3, 4.28% (28 day ARS), due 06/15/32† | 292,354 | ||||||||
| 139,000 | SLM Private Credit Student Loan Trust,Series 2003-B, Class A3, 4.30% (28 day ARS), due 03/15/33† | 140,070 | ||||||||
| 750,000 | THL Credit Wind River CLO, Ltd.,Series 2016-1A, Class ER, 8.34%, due 07/15/28◆◆ 144A | 728,346 | ||||||||
| 361,602 | VOLT LXVIII LLC, Series 2018-NPL4, Class A1A, 4.34%, due 07/27/48†† 144A | 363,837 | ||||||||
| 500,000 | Voya CLO, Ltd.,Series 2015-2A, Class ER, 8.17%, due 07/23/27◆◆ 144A | 479,150 | ||||||||
| 260,000 | Westlake Automobile Receivables Trust,Series 2018-3A, Class D, 4.00%, due 10/16/23 144A | 264,423 | ||||||||
| 410,000 | Whitehorse CLO XII, Ltd.,Series 2018-12A, Class D, 6.08%, due 10/15/31◆◆ 144A | 404,433 | ||||||||
|
| |||||||||
| 20,105,374 | ||||||||||
|
| |||||||||
| Bank Loans — 5.1% | ||||||||||
| 506,146 | Albany Molecular Research, Inc., 2017 1st Lien Term Loan, 5.75% (1 mo. USD LIBOR plus 3.250%), due 08/30/24† | 498,132 | ||||||||
| 763,351 | Albertsons, LLC, USD 2017 Term Loan B5, 5.61% (3 mo. USD LIBOR plus 3.000%), due 12/21/22† | 758,170 | ||||||||
| 503,528 | American Axle & Manufacturing, Inc., Term Loan B, 4.74% (1 mo. USD LIBOR plus 2.250%), due 04/06/24† | 492,933 | ||||||||
| 506,127 | American Builders & Contractors Supply Co., Inc., 2018 Term Loan B, 4.50% (1 mo. USD LIBOR plus 2.000%), due 10/31/23 | 493,428 | ||||||||
| 1,388,230 | Asurion LLC, 2018 Term Loan B6, 5.50% (1 mo. USD LIBOR plus 3.000%), due 11/03/23† | 1,381,940 | ||||||||
| 398,995 | Asurion LLC, 2018 Term Loan B7, 5.50% (1 mo. USD LIBOR plus 3.000%), due 11/03/24† | 396,938 | ||||||||
| 569,724 | Avolon TLB Borrower 1 (US) LLC, Term Loan B3, 4.49% (1 mo. USD LIBOR plus 2.000%), due 01/15/25† | 566,067 | ||||||||
| 1,083,205 | Bass Pro Group, LLC, Term Loan B, 7.50% (1 mo. USD LIBOR plus 5.000%), due 09/25/24† | 1,061,535 | ||||||||
| 157,047 | Beacon Roofing Supply, Inc., 2017 Term Loan B, 4.75% (1 mo. USD LIBOR plus 2.250%), due 01/02/25† | 153,137 | ||||||||
| 330,000 | Berry Global, Inc., Term Loan Q, 4.61% (2 mo. USD LIBOR plus 2.000%), due 10/01/22† | 328,494 | ||||||||
| 505,827 | Boyd Gaming Corp., Term Loan B3, 4.66% (1 mo. USD LIBOR plus 2.250%), due 09/15/23† | 501,021 | ||||||||
| 208,425 | BrightView Landscapes, LLC, 2018 1st Lien Term Loan B, 5.00% (1 mo. USD LIBOR plus 2.500%), due 08/15/25† | 207,638 | ||||||||
| 506,156 | Caesars Resort Collection, LLC, 2017 1st Lien Term Loan B, 5.25% (1 mo. USD LIBOR plus 2.750%), due 12/22/24† | 501,185 | ||||||||
| 898,939 | Camelot UK Holdco, Ltd., 2017 Repriced Term Loan, 5.75% (1 mo. USD LIBOR plus 3.250%), due 10/03/23† | 894,444 | ||||||||
| 320,331 | Catalent Pharma Solutions, Inc., USD Term Loan B, 4.75% (1 mo. USD LIBOR plus 2.250%), due 05/20/24† | 319,387 | ||||||||
See accompanying Notes to the Financial Statements.
109
Table of Contents
Mercer Opportunistic Fixed Income Fund
Schedule of Investments (Continued)
(showing percentage of net assets)
March 31, 2019
| Par Value** | Description | Value ($) | ||||||||
| Bank Loans — continued | ||||||||||
| 506,005 | CEC Entertainment, Inc., Term Loan B, 5.75% (1 mo. USD LIBOR plus 3.250%), due 02/14/21† | 490,825 | ||||||||
| 1,246,518 | Change Healthcare Holdings LLC, 2017 Term Loan B, 5.25% (1 mo. USD LIBOR plus 2.750%), due 03/01/24† | 1,230,936 | ||||||||
| 660,000 | CommScope, Inc., 2019 Term Loan B, 3.25%, due 04/06/26### | 661,399 | ||||||||
| 932,932 | Delek US Holdings, Inc., 2018 Term Loan B, 4.75% (1 mo. USD LIBOR plus 2.250%), due 03/31/25† | 925,935 | ||||||||
| 506,156 | Dell International LLC, 2017 Term Loan B, 4.50% (1 mo. USD LIBOR plus 2.000%), due 09/07/23† | 500,968 | ||||||||
| 833,326 | Falcon Aerospace, Ltd., 2017 Term Loan A, 4.58%, due 02/15/42 144A | 820,826 | ||||||||
| 345,703 | First Data Corp., 2017 USD Term Loan, 4.49% (1 mo. USD LIBOR plus 2.000%), due 07/08/22† | 345,217 | ||||||||
| 360,000 | First Data Corp., 2024 USD Term Loan, 4.49% (1 mo. USD LIBOR plus 2.000%), due 04/26/24† | 359,325 | ||||||||
| 1,002,310 | Four Seasons Hotels, Ltd., New 1st Lien Term Loan, 4.50% (1 mo. USD LIBOR plus 2.000%), due 11/30/23† | 995,920 | ||||||||
| 633,009 | GFL Environmental Inc., 2018 USD Term Loan B, 5.50% (1 mo. USD LIBOR plus 3.000%), due 05/30/25† | 614,810 | ||||||||
| 267,975 | Global Business Travel Holdings, Ltd., 2018 Term Loan B, 5.19% (3 mo. USD LIBOR plus 2.500%), due 08/13/25† | 267,975 | ||||||||
| 481,707 | Golden Nugget, Inc., 2017 Incremental Term Loan B, 5.23% (3 mo. USD LIBOR plus 2.750%), due 10/04/23† | 477,492 | ||||||||
| 507,236 | GrafTech Finance, Inc., 2018 Term Loan B, 6.00% (1 mo. USD LIBOR plus 3.500%), due 02/12/25† | 504,700 | ||||||||
| 379,048 | Hyland Software, Inc., 2018 Term Loan 3, 6.00% (1 mo. USD LIBOR plus 3.500%), due 07/01/24† | 379,107 | ||||||||
| 130,000 | Intelsat Jackson Holdings S.A., 2017 Term Loan B3, 4.75%, due 11/27/23### | 127,806 | ||||||||
| 398,990 | Intrawest Resorts Holdings, Inc., Term Loan B1, 4.00%, due 07/31/24### | 397,577 | ||||||||
| 359,093 | IRB Holding Corp., 1st Lien Term Loan, 5.74% (1 mo. USD LIBOR plus 3.250%), due 02/05/25† | 350,902 | ||||||||
| 506,057 | Jaguar Holding Co. II, 2018 Term Loan, 5.00% (1 mo. USD LIBOR plus 2.500%), due 08/18/22† | 501,422 | ||||||||
| 754,228 | JBS USA, LLC, 2017 Term Loan B, 5.00% (1 mo. USD LIBOR plus 2.500%), due 10/30/22† | 749,703 | ||||||||
| 703,680 | Kraton Polymers, LLC, 2018 USD Term Loan, 5.00% (1 mo. USD LIBOR plus 2.500%), due 03/05/25† | 699,612 | ||||||||
| 510,000 | Level 3 Financing, Inc., 2017 Term Loan B, 4.74% (1 mo. USD LIBOR plus 2.500%), due 02/22/24† | 504,900 | ||||||||
| 977,557 | Life Time, Inc., 2017 Term Loan B, 5.38% (3 mo. USD LIBOR plus 2.750%), due 06/10/22† | 966,967 | ||||||||
| 39,900 | McAfee, LLC, 2018 USD Term Loan B, 3.75%, due 09/30/24† ### | 39,845 | ||||||||
| 1,006,397 | MEG Energy Corp., 2017 Term Loan B, 6.00% (1 mo. USD LIBOR plus 3.500%), due 12/31/23† | 1,002,623 | ||||||||
| 981,039 | Meredith Corp., 2018 Term Loan B, 5.25% (1 mo. USD LIBOR plus 2.750%), due 01/31/25† | 979,813 | ||||||||
| 610,143 | Messer Industries GmbH, 2018 USD Term Loan, 5.10% (3 mo. USD LIBOR plus 2.500%), due 03/01/26† ### | 599,465 | ||||||||
| 505,328 | MGM Growth Properties Operating Partnership, LP, 2016 Term Loan B, 4.50% (1 mo. USD LIBOR plus 2.000%), due 03/21/25† | 498,590 | ||||||||
See accompanying Notes to the Financial Statements.
110
Table of Contents
Mercer Opportunistic Fixed Income Fund
Schedule of Investments (Continued)
(showing percentage of net assets)
March 31, 2019
| Par Value** | Description | Value ($) | ||||||||
| Bank Loans — continued | ||||||||||
| 378,706 | Michaels Stores, Inc., 2018 Term Loan B, 5.00% (1 mo. USD LIBOR plus 2.500%), due 01/30/23† | 371,368 | ||||||||
| 519,645 | Microchip Technology, Inc., 2018 Term Loan B, 4.50% (1 mo. USD LIBOR plus 2.000%), due 05/29/25† | 514,364 | ||||||||
| 793,909 | Midas Intermediate Holdco II, LLC, Incremental Term Loan B, 5.35% (1 mo. USD LIBOR plus 2.750%), due 08/18/21◆◆ | 774,557 | ||||||||
| 220,000 | MKS Instruments, Inc., 2018 Term Loan B5, 4.74% (1 mo. USD LIBOR plus 2.250%), due 02/02/26† | 220,046 | ||||||||
| 473,322 | MPH Acquisition Holdings LLC, 2016 Term Loan B, 5.35% (3 mo. USD LIBOR plus 2.750%), due 06/07/23† | 458,708 | ||||||||
| 385,598 | Natgasoline LLC, Term Loan B, 6.13% (3 mo. USD LIBOR plus 3.500%), due 11/14/25† | 386,071 | ||||||||
| 410,000 | Panther BF Aggregator 2 L P, Term Loan B, 3.50%, due 03/18/26† ### | 405,890 | ||||||||
| 306,632 | Post Holdings, Inc., 2017 Series A Incremental Term Loan, 4.49% (1 mo. USD LIBOR plus 2.000%), due 05/24/24† | 304,716 | ||||||||
| 274,759 | PQ Corp., 2018 Term Loan B, 5.24% (3 mo. USD LIBOR plus 2.500%), due 02/08/25† | 272,011 | ||||||||
| 506,136 | Prime Security Services Borrower, LLC, 2016 1st Lien Term Loan, 5.25% (1 mo. USD LIBOR plus 2.750%), due 05/02/22† | 501,798 | ||||||||
| 565,739 | Quikrete Holdings, Inc., 2016 1st Lien Term Loan, 5.25% (1 mo. USD LIBOR plus 2.750%), due 11/15/23† | 551,596 | ||||||||
| 357,568 | Reynolds Group Holdings, Inc., USD 2017 Term Loan, 5.25% (1 mo. USD LIBOR plus 2.750%), due 02/05/23† | 353,833 | ||||||||
| 506,165 | Scientific Games International, Inc., 2018 Term Loan B5, 5.33% (1 mo. USD LIBOR plus 2.750%), due 08/14/24† | 493,059 | ||||||||
| 368,799 | Sophia, L.P., 2017 Term Loan B, 5.85% (3 mo. USD LIBOR plus 3.250%), due 09/30/22† | 366,609 | ||||||||
| 759,190 | Sprint Communications, Inc., 1st Lien Term Loan B, 5.00% (1 mo. USD LIBOR plus 2.500%), due 02/02/24† | 737,838 | ||||||||
| 250,000 | Starfruit Finco B.V, 2018 USD Term Loan B, 5.74% (1 mo. USD LIBOR plus 3.250%), due 10/01/25† | 246,795 | ||||||||
| 373,209 | Stars Group Holdings B.V. (The), 2018 USD Incremental Term Loan, 6.10% (3 mo. USD LIBOR plus 3.500%), due 07/10/25† | 373,063 | ||||||||
| 650,242 | Telenet Financing USD LLC, USD Term Loan AN, 4.73% (1 mo. USD LIBOR plus 2.250%), due 08/15/26† | 638,050 | ||||||||
| 490,625 | Trans Union, LLC, Term Loan B3, 4.50% (1 mo. USD LIBOR plus 2.000%), due 04/10/23† | 486,901 | ||||||||
| 318,729 | Travelport Finance (Luxembourg) S.a.r.l., 2018 Term Loan B, 5.18% (3 mo. USD LIBOR plus 2.500%), due 03/17/25† | 318,604 | ||||||||
| 320,000 | Travelport Finance (Luxembourg) S.a.r.l., 2019 Term Loan, 4.75%, due 03/13/26### | 312,600 | ||||||||
| 835,935 | TTM Technologies, Inc., 2017 Term Loan, 4.99% (1 mo. USD LIBOR plus 2.500%), due 09/28/24† | 826,530 | ||||||||
| 763,557 | Uber Technologies, 2018 Incremental Term Loan, 5.98% (1 mo. USD LIBOR plus 3.500%), due 07/13/23† | 760,375 | ||||||||
| 1,140,559 | Uber Technologies, 2018 Term Loan, 6.49% (1 mo. USD LIBOR plus 4.000%), due 04/04/25† | 1,144,408 | ||||||||
| 249,873 | UPC Financing Partnership, USD Term Loan AR, 4.98% (1 mo. USD LIBOR plus 2.500%), due 01/15/26† | 249,263 | ||||||||
| 401,198 | USI, Inc., 2017 Repriced Term Loan, 5.60% (3 mo. USD LIBOR plus 3.000%), due 05/16/24† | 388,661 | ||||||||
See accompanying Notes to the Financial Statements.
111
Table of Contents
Mercer Opportunistic Fixed Income Fund
Schedule of Investments (Continued)
(showing percentage of net assets)
March 31, 2019
| Par Value** | Description | Value ($) | ||||||||
| Bank Loans — continued | ||||||||||
| 882,891 | Valeant Pharmaceuticals International, Inc., 2018 Term Loan B, 5.48% (1 mo. USD LIBOR plus 3.000%), due 06/02/25† | 877,533 | ||||||||
| 510,000 | VICI Properties 1 LLC, Replacement Term Loan B, 4.49% (1 mo. USD LIBOR plus 2.000%), due 12/20/24† | 502,541 | ||||||||
| 1,052,466 | Vistra Operations Co. LLC, 2016 Term Loan B2, 4.75% (1 mo. USD LIBOR plus 2.250%), due 12/14/23† | 1,047,993 | ||||||||
| 250,000 | VVC Holding Corp., 2019 Term Loan B, 7.20% (3 mo. USD LIBOR plus 4.500%), due 02/11/26† | 246,667 | ||||||||
| 1,039,643 | Wall Street Systems Delaware, Inc., 2017 Term Loan B, 5.65% (1 mo. USD LIBOR plus 3.000%), due 11/21/24† | 1,004,555 | ||||||||
| 139,646 | Wink Holdco,, Inc., 1st Lien Term Loan B, 5.50% (1 mo. USD LIBOR plus 3.000%), due 12/02/24† | 135,370 | ||||||||
| 985,000 | Ziggo Secured Finance Partnership, USD Term Loan E, 4.98% (1 mo. USD LIBOR plus 2.500%), due 04/15/25† | 960,991 | ||||||||
|
| |||||||||
| 41,782,473 | ||||||||||
|
| |||||||||
| Convertible Debt — 0.2% | ||||||||||
| 130,000 | Chegg, Inc., 0.13%, due 03/15/25 144A | 128,721 | ||||||||
| 220,000 | DISH Network Corp., 3.38%, due 08/15/26 | 187,440 | ||||||||
| 750,000 | Liberty Media Corp., 2.13%, due 03/31/48 144A | 723,750 | ||||||||
| 90,000 | Twitter, Inc., 0.25%, due 06/15/24 144A | 83,509 | ||||||||
| 320,000 | Twitter, Inc., 1.00%, due 09/15/21 | 301,908 | ||||||||
| 80,000 | Western Digital Corp., 1.50%, due 02/01/24 144A | 70,561 | ||||||||
|
| |||||||||
| 1,495,889 | ||||||||||
|
| |||||||||
| Corporate Debt — 26.4% | ||||||||||
| 400,000 | 1011778 BC ULC/New Red Finance, Inc., 4.25%, due 05/15/24‡ 144A | 397,000 | ||||||||
| 1,000,000 | 1MDB Global Investments, Ltd., Reg S, 4.40%, due 03/09/23‡‡‡ | 938,523 | ||||||||
| 490,000 | ABN AMRO Bank NV, 4.75%, due 07/28/25‡ 144A | 509,818 | ||||||||
| 245,000 | AerCap Ireland Capital DAC/AerCap Global Aviation Trust, 4.45%, due 04/03/26†††† | 245,781 | ||||||||
| 175,000 | AerCap Ireland Capital DAC/AerCap Global Aviation Trust, 4.88%, due 01/16/24 | 182,071 | ||||||||
| 1,115,000 | AES Corp., 5.50%, due 04/15/25 | 1,159,600 | ||||||||
| 775,000 | AHP Health Partners, Inc., 9.75%, due 07/15/26‡ 144A | 838,937 | ||||||||
| 1,000,000 | Air Lease Corp., 3.50%, due 01/15/22 | 1,009,622 | ||||||||
| 640,000 | Alcoa Nederland Holding BV, 6.13%, due 05/15/28 144A | 660,800 | ||||||||
| 1,200,000 | Altice France SA/France, 7.38%, due 05/01/26 144A | 1,179,000 | ||||||||
| 900,000 | Altice Luxembourg SA, 7.75%, due 05/15/22 144A | 903,375 | ||||||||
| 50,000 | Altria Group, Inc., 4.40%, due 02/14/26 | 51,439 | ||||||||
| 180,000 | Altria Group, Inc., 4.80%, due 02/14/29 | 185,734 | ||||||||
| 10,540,000 | MXN | America Movil SAB de CV, 7.13%, due 12/09/24 | 497,183 | |||||||
| 440,000 | American Axle & Manufacturing, Inc., 6.50%, due 04/01/27‡ | 427,482 | ||||||||
| 640,000 | American Media LLC, 10.50%, due 12/31/26 144A | 630,400 | ||||||||
| 180,000 | Amkor Technology, Inc., 6.63%, due 09/15/27 144A | 183,038 | ||||||||
| 200,000 | Anglo American Capital Plc, 4.00%, due 09/11/27 144A | 194,609 | ||||||||
| 670,000 | Anheuser-Busch InBev Worldwide, Inc., 5.55%, due 01/23/49 | 736,411 | ||||||||
| 50,000 | Anheuser-Busch InBev Worldwide, Inc., 5.80%, due 01/23/59 | 55,679 | ||||||||
| 640,000 | Aon Corp., 4.50%, due 12/15/28 | 676,070 | ||||||||
| 350,000 | ArcelorMittal, 7.00%, due 10/15/39 | 399,124 | ||||||||
| 645,000 | Archer-Daniels-Midland Co., 4.50%, due 03/15/49 | 710,041 | ||||||||
See accompanying Notes to the Financial Statements.
112
Table of Contents
Mercer Opportunistic Fixed Income Fund
Schedule of Investments (Continued)
(showing percentage of net assets)
March 31, 2019
| Par Value** | Description | Value ($) | ||||||||
| Corporate Debt — continued | ||||||||||
| 1,430,000 | Ardonagh Midco 3 Plc, 8.63%, due 07/15/23‡ 144A | 1,229,800 | ||||||||
| 715,000 | Ardonagh Midco 3 Plc, Reg S, 8.63%, due 07/15/23‡‡‡ | 614,900 | ||||||||
| 450,000 | EUR | Arion Banki HF, (MTN), 1.63%, due 12/01/21‡‡‡ | 513,240 | |||||||
| 330,000 | Ashtead Capital, Inc., 5.25%, due 08/01/26 144A | 339,075 | ||||||||
| 370,000 | ASP AMC Merger Sub, Inc., 8.00%, due 05/15/25 144A | 168,350 | ||||||||
| 730,000 | AT&T, Inc., 4.85%, due 03/01/39 | 735,779 | ||||||||
| 260,000 | Avolon Holdings Funding, Ltd., 5.13%, due 10/01/23 144A | 265,200 | ||||||||
| 800,000 | Banco Bilbao Vizcaya Argentaria SA, 6.13%◆ ††††† | 714,748 | ||||||||
| 400,000 | EUR | Banco Bilbao Vizcaya Argentaria SA, Reg S, 5.88%◆ ††††† ‡‡‡ | 437,331 | |||||||
| 455,000 | Banco BTG Pactual SA/Cayman Islands, 7.75%, due 02/15/29◆ 144A | 452,725 | ||||||||
| 320,000 | Banco Mercantil del Norte SA, 7.63% (10 year CMT plus 5.353%)† ††††† 144A | 321,600 | ||||||||
| 1,000,000 | Banco Santander SA, 4.38%, due 04/12/28 | 1,012,101 | ||||||||
| 600,000 | EUR | Banco Santander SA, Reg S, 4.75%◆ ††††† ‡‡‡ | 586,949 | |||||||
| 700,000 | Barclays Bank Plc, 7.63%, due 11/21/22 | 761,659 | ||||||||
| 300,000 | Barclays Plc, 4.97%, due 05/16/29◆ | 310,391 | ||||||||
| 1,315,000 | Barclays Plc, 8.00%◆ ††††† | 1,346,231 | ||||||||
| 380,000 | Bausch Health Americas, Inc., 8.50%, due 01/31/27 144A | 403,750 | ||||||||
| 122,000 | Bausch Health Cos., Inc., 5.63%, due 12/01/21 144A | 122,037 | ||||||||
| 350,000 | Bausch Health Cos., Inc., 6.13%, due 04/15/25 144A | 347,375 | ||||||||
| 150,000 | Bausch Health Cos., Inc., 7.00%, due 03/15/24 144A | 159,075 | ||||||||
| 150,000 | Beacon Roofing Supply, Inc., 4.88%, due 11/01/25‡ 144A | 142,313 | ||||||||
| 349,000 | Becton Dickinson and Co., 3.48%, due 12/29/20◆◆ | 349,037 | ||||||||
| 482,000 | Berry Petroleum Co. LLC, 7.00%, due 02/15/26 144A | 479,590 | ||||||||
| 650,000 | BioScrip, Inc., 8.88%, due 02/15/21 | 659,750 | ||||||||
| 400,000 | Blue Racer Midstream LLC/Blue Racer Finance Corp., 6.63%, due 07/15/26‡ 144A | 410,000 | ||||||||
| 1,035,000 | BNP Paribas SA, 5.13%◆ ††††† 144A | 906,593 | ||||||||
| 710,000 | BNP Paribas SA, 5.20%, due 01/10/30◆ ‡ 144A | 767,147 | ||||||||
| 750,000 | Bombardier, Inc., 7.88%, due 04/15/27 144A | 774,600 | ||||||||
| 335,000 | Bombardier, Inc., 8.75%, due 12/01/21 144A | 371,431 | ||||||||
| 180,000 | BP Capital Markets America, Inc., 3.94%, due 09/21/28 | 188,750 | ||||||||
| 440,000 | Braskem Netherlands Finance BV, 4.50%, due 01/10/28 144A | 429,440 | ||||||||
| 645,000 | British Telecommunications Plc, 5.13%, due 12/04/28 | 691,048 | ||||||||
| 2,005,000 | Broadcom, Inc., 4.25%, due 04/15/26 144A | 1,990,183 | ||||||||
| 650,000 | Bruin E&P Partners LLC, 8.88%, due 08/01/23 144A | 625,625 | ||||||||
| 800,000 | EUR | CaixaBank SA, (MTN), Reg S, 2.75% (5 year EUR swap plus 2.350%), due 07/14/28† ‡‡‡ | 911,381 | |||||||
| 600,000 | EUR | CaixaBank SA, Reg S, 5.25%◆ ††††† ‡‡‡ | 591,415 | |||||||
| 1,600,000 | Capital One NA/Mclean VA, 2.35%, due 01/31/20 | 1,592,278 | ||||||||
| 320,000 | Carriage Services, Inc., 6.63%, due 06/01/26 144A | 328,800 | ||||||||
| 220,000 | CCO Holdings LLC/CCO Holdings Capital Corp., 5.00%, due 02/01/28 144A | 217,503 | ||||||||
| 630,000 | CCO Holdings LLC/CCO Holdings Capital Corp., 5.13%, due 02/15/23 | 642,600 | ||||||||
| 200,000 | CCO Holdings LLC/CCO Holdings Capital Corp., 5.25%, due 09/30/22 | 204,125 | ||||||||
| 965,000 | CCO Holdings LLC/CCO Holdings Capital Corp., 5.50%, due 05/01/26 144A | 998,775 | ||||||||
| 385,000 | CCO Holdings LLC/CCO Holdings Capital Corp., 5.75%, due 02/15/26 144A | 403,769 | ||||||||
| 330,000 | Centene Corp., 5.38%, due 06/01/26 144A | 345,263 | ||||||||
| 250,000 | Charter Communications Operating LLC/Charter Communications Operating Capital, 4.20%, due 03/15/28 | 248,305 | ||||||||
| 150,000 | Charter Communications Operating LLC/Charter Communications Operating Capital, 5.38%, due 04/01/38 | 151,025 | ||||||||
See accompanying Notes to the Financial Statements.
113
Table of Contents
Mercer Opportunistic Fixed Income Fund
Schedule of Investments (Continued)
(showing percentage of net assets)
March 31, 2019
| Par Value** | Description | Value ($) | ||||||||
| Corporate Debt — continued | ||||||||||
| 760,000 | Chesapeake Energy Corp., 8.00%, due 06/15/27 | 752,400 | ||||||||
| 1,000,000 | Cigna Corp., 3.26%, due 09/17/21◆◆ 144A | 999,733 | ||||||||
| 1,000,000 | Cigna Corp., 3.75%, due 07/15/23 144A | 1,025,879 | ||||||||
| 765,000 | Cigna Corp., 4.38%, due 10/15/28 144A | 794,237 | ||||||||
| 605,000 | Cigna Corp., 4.90%, due 12/15/48 144A | 625,228 | ||||||||
| 460,000 | Cirsa Finance International Sarl, 7.88%, due 12/20/23 144A | 477,025 | ||||||||
| 635,000 | EUR | Cirsa Finance International Sarl, Reg S, 6.25%, due 12/20/23‡‡‡ | 754,945 | |||||||
| 500,000 | CIT Group, Inc., 5.25%, due 03/07/25 | 533,275 | ||||||||
| 170,000 | Citigroup, Inc., 4.65%, due 07/30/45 | 181,056 | ||||||||
| 1,315,000 | Citigroup, Inc., 6.30% (3 mo. USD LIBOR plus 3.423%)† ††††† | 1,338,782 | ||||||||
| 860,000 | Clear Channel Worldwide Holdings, Inc., 9.25%, due 02/15/24 144A | 913,750 | ||||||||
| 170,000 | Cleaver-Brooks, Inc., 7.88%, due 03/01/23 144A | 157,675 | ||||||||
| 280,000 | Cogent Communications Group, Inc., 5.38%, due 03/01/22 144A | 287,700 | ||||||||
| 420,000 | Comcast Corp., 3.24%, due 10/01/21◆◆ | 420,604 | ||||||||
| 580,000 | Comcast Corp., 4.25%, due 10/15/30 | 616,736 | ||||||||
| 460,000 | Comcast Corp., 4.70%, due 10/15/48 | 499,422 | ||||||||
| 885,000 | CONSOL Energy, Inc., 11.00%, due 11/15/25 144A | 1,006,687 | ||||||||
| 250,000 | Cooperatieve Rabobank UA, 3.75%, due 07/21/26 | 246,318 | ||||||||
| 600,000 | EUR | Cooperatieve Rabobank UA, Reg S, 4.63%◆◆ ††††† ‡‡‡ | 685,500 | |||||||
| 460,000 | CoreCivic, Inc. REIT, 4.63%, due 05/01/23 | 444,475 | ||||||||
| 525,000 | Corp. Nacional del Cobre de Chile, 4.50%, due 09/16/25 144A | 557,409 | ||||||||
| 280,000 | Country Garden Holdings Co., Ltd., Reg S, 7.25%, due 04/04/21‡‡‡ | 283,646 | ||||||||
| 630,000 | Covey Park Energy LLC/Covey Park Finance Corp., 7.50%, due 05/15/25 144A | 585,900 | ||||||||
| 575,000 | Credit Agricole SA, 7.88% (USD 5 year swap rate plus 4.898%)† ††††† 144A | 618,622 | ||||||||
| 400,000 | Credit Agricole SA, 8.13% (USD 5 year swap rate plus 6.185%)† ††††† 144A | 450,380 | ||||||||
| 300,000 | EUR | Credit Agricole SA, Reg S, 6.50% (5 year EUR swap plus 5.120%)† ††††† ‡‡‡ | 361,126 | |||||||
| 930,000 | Credit Suisse Group AG, 7.25%◆ ††††† 144A | 934,859 | ||||||||
| 1,425,000 | Credit Suisse Group Funding Guernsey, Ltd., 2.75%, due 03/26/20 | 1,423,490 | ||||||||
| 1,210,000 | CSC Holdings LLC, 6.50%, due 02/01/29 144A | 1,290,919 | ||||||||
| 760,000 | CVS Health Corp., 4.30%, due 03/25/28 | 770,768 | ||||||||
| 800,000 | CVS Health Corp., 4.78%, due 03/25/38 | 793,409 | ||||||||
| 590,000 | CVS Health Corp., 5.05%, due 03/25/48 | 595,265 | ||||||||
| 1,100,000 | DAE Funding LLC, 5.75%, due 11/15/23 144A | 1,133,000 | ||||||||
| 200,000 | Danske Bank AS, 5.00%, due 01/12/22 144A | 205,198 | ||||||||
| 250,000 | EUR | Danske Bank AS, Reg S, 5.75% (6 year EUR swap plus 4.640%)† ††††† ‡‡‡ | 281,407 | |||||||
| 250,000 | DCP Midstream Operating, LP, 6.75%, due 09/15/37 144A | 258,750 | ||||||||
| 1,272,000 | Diamondback Energy, Inc., 4.75%, due 11/01/24 144A | 1,305,136 | ||||||||
| 1,100,000 | DISH DBS Corp., 7.75%, due 07/01/26‡ | 959,750 | ||||||||
| 330,000 | Dow Chemical Co. (The), 5.55%, due 11/30/48 144A | 368,455 | ||||||||
| 430,000 | DP World, Ltd., 5.63%, due 09/25/48 144A | 448,608 | ||||||||
| 110,000 | Eclipse Resources Corp., 8.88%, due 07/15/23 | 105,358 | ||||||||
| 1,115,000 | Ecopetrol SA, 4.13%, due 01/16/25 | 1,128,949 | ||||||||
| 625,000 | Electricite de France SA, 4.50%, due 09/21/28 144A | 645,645 | ||||||||
| 685,000 | Enel Finance International NV, 3.50%, due 04/06/28 144A | 644,452 | ||||||||
| 80,000 | Energy Transfer Operating, LP, 6.25%, due 04/15/49 | 89,734 | ||||||||
| 625,000 | Enterprise Products Operating LLC, 4.80%, due 02/01/49 | 665,791 | ||||||||
| 24,500,000 | ZAR | Eskom Holdings SOC, Ltd., (MTN), 7.50%, due 09/15/33 | 1,293,128 | |||||||
| 130,000 | EUR | Europcar Mobility Group, Reg S, 5.75%, due 06/15/22‡‡‡ | 149,931 | |||||||
| 25,575,000 | BRL | European Investment Bank, (MTN), 6.34%, due 08/27/21‡‡ | 5,683,187 | |||||||
See accompanying Notes to the Financial Statements.
114
Table of Contents
Mercer Opportunistic Fixed Income Fund
Schedule of Investments (Continued)
(showing percentage of net assets)
March 31, 2019
| Par Value** | Description | Value ($) | ||||||||
| Corporate Debt — continued | ||||||||||
| 63,050,000 | MXN | European Investment Bank, (MTN), Reg S, 4.00%, due 02/25/20‡‡‡ | 3,124,173 | |||||||
| 9,280,000,000 | IDR | European Investment Bank, (MTN), Reg S, 6.95%, due 02/06/20‡‡‡ | 648,590 | |||||||
| 8,150,000 | ZAR | European Investment Bank, (MTN), Reg S, 8.50%, due 09/17/24‡‡‡ | 583,279 | |||||||
| 160,000 | Extraction Oil & Gas, Inc., 5.63%, due 02/01/26 144A | 123,600 | ||||||||
| 200,000 | Extraction Oil & Gas, Inc., 7.38%, due 05/15/24 144A | 168,000 | ||||||||
| 200,000 | First Data Corp., 5.75%, due 01/15/24 144A | 206,400 | ||||||||
| 640,000 | First Quantum Minerals, Ltd., 6.50%, due 03/01/24 144A | 601,600 | ||||||||
| 2,070,000 | First Quantum Minerals, Ltd., 7.25%, due 04/01/23 144A | 2,031,187 | ||||||||
| 390,000 | Five Point Operating Co., LP/Five Point Capital Corp., 7.88%, due 11/15/25 144A | 374,400 | ||||||||
| 1,530,000 | Ford Motor Credit Co. LLC, 2.98%, due 08/03/22 | 1,462,990 | ||||||||
| 160,000 | Fox Corp., 4.71%, due 01/25/29 144A | 171,704 | ||||||||
| 50,000 | Fox Corp., 5.48%, due 01/25/39 144A | 55,382 | ||||||||
| 740,000 | Freeport-McMoRan, Inc., 5.45%, due 03/15/43 | 651,207 | ||||||||
| 220,000 | GBP | Garfunkelux Holdco 3 SA, Reg S, 8.50%, due 11/01/22‡‡‡ | 260,484 | |||||||
| 530,000 | Gazprom OAO Via Gaz Capital SA, 4.95%, due 03/23/27 144A | 531,588 | ||||||||
| 315,000 | General Electric Co., 4.13%, due 10/09/42 | 273,928 | ||||||||
| 555,000 | General Electric Co., 4.50%, due 03/11/44 | 507,857 | ||||||||
| 540,000 | General Electric Co., (MTN), 6.88%, due 01/10/39 | 639,491 | ||||||||
| 682,000 | General Motors Financial Co., Inc., 4.15%, due 06/19/23 | 688,785 | ||||||||
| 675,000 | General Motors Financial Co., Inc., 4.20%, due 11/06/21 | 687,045 | ||||||||
| 340,000 | Genesis Energy, LP/Genesis Energy Finance Corp., 6.00%, due 05/15/23‡ | 343,400 | ||||||||
| 210,000 | GEO Group (The), Inc. REIT, 5.88%, due 01/15/22 | 203,700 | ||||||||
| 70,000 | GEO Group (The), Inc. REIT, 5.88%, due 10/15/24 | 61,600 | ||||||||
| 320,000 | GEO Group (The), Inc. REIT, 6.00%, due 04/15/26 | 269,600 | ||||||||
| 605,000 | Geopark, Ltd., 6.50%, due 09/21/24 144A | 609,538 | ||||||||
| 400,000 | Glencore Funding LLC, 4.00%, due 03/27/27 144A | 388,540 | ||||||||
| 750,000 | Glencore Funding LLC, 4.88%, due 03/12/29 144A | 755,680 | ||||||||
| 100,000 | Goldman Sachs Group (The), Inc., 3.50%, due 11/16/26 | 98,760 | ||||||||
| 100,000 | Goldman Sachs Group (The), Inc., 5.15%, due 05/22/45¤ | 105,912 | ||||||||
| 600,000 | GTP Acquisition Partners I LLC, 3.48%, due 06/15/50 144A | 606,901 | ||||||||
| 860,000 | Gulfport Energy Corp., 6.00%, due 10/15/24 | 784,870 | ||||||||
| 220,000 | Gulfport Energy Corp., 6.38%, due 05/15/25 | 199,925 | ||||||||
| 150,000 | Gulfport Energy Corp., 6.38%, due 01/15/26 | 133,500 | ||||||||
| 1,295,000 | Hanesbrands, Inc., 4.88%, due 05/15/26 144A | 1,284,122 | ||||||||
| 410,000 | Harley-Davidson Financial Services, Inc., Series S, 3.55%, due 05/21/21 144A | 409,251 | ||||||||
| 515,000 | HCA, Inc., 5.00%, due 03/15/24 | 546,598 | ||||||||
| 600,000 | HCA, Inc., 5.50%, due 06/15/47 | 638,819 | ||||||||
| 950,000 | HCA, Inc., 5.63%, due 09/01/28 | 1,007,000 | ||||||||
| 60,000,000 | INR | HDFC Bank, Ltd., Reg S, 8.10%, due 03/22/25‡‡‡ | 856,532 | |||||||
| 820,000 | Hexion, Inc., 6.63%, due 04/15/20 | 692,900 | ||||||||
| 1,000,000 | Hilton Worldwide Finance LLC/Hilton Worldwide Finance Corp., 4.88%, due 04/01/27 | 1,015,000 | ||||||||
| 400,000 | HSBC Holdings Plc, 4.58%, due 06/19/29◆ | 420,804 | ||||||||
| 400,000 | HSBC Holdings Plc, 6.50%◆ ††††† | 396,374 | ||||||||
| 250,000 | EUR | HSBC Holdings Plc, Reg S, 5.25% (5 year EUR swap plus 4.383%)† ††††† ‡‡‡ | 297,211 | |||||||
| 120,000 | Hudbay Minerals, Inc., 7.25%, due 01/15/23 144A | 124,800 | ||||||||
| 400,000 | HudBay Minerals, Inc., 7.63%, due 01/15/25 144A | 412,500 | ||||||||
| 380,000 | ICICI Bank Ltd/Hong Kong, Reg S, 5.75%, due 11/16/20‡‡‡ | 394,258 | ||||||||
| 20,000 | Indigo Natural Resources LLC, 6.88%, due 02/15/26 144A | 17,800 | ||||||||
| 500,000 | Intelsat Jackson Holdings SA, 5.50%, due 08/01/23 | 446,250 | ||||||||
See accompanying Notes to the Financial Statements.
115
Table of Contents
Mercer Opportunistic Fixed Income Fund
Schedule of Investments (Continued)
(showing percentage of net assets)
March 31, 2019
| Par Value** | Description | Value ($) | ||||||||
| Corporate Debt — continued | ||||||||||
| 375,000 | Intelsat Jackson Holdings SA, 9.50%, due 09/30/22 144A | 433,125 | ||||||||
| 35,350,000,000 | IDR | Inter-American Development Bank, (MTN), Reg S, 7.88%, due 03/14/23‡‡‡ | 2,533,582 | |||||||
| 700,000 | InterGen NV, 7.00%, due 06/30/23 | 635,250 | ||||||||
| 1,515,000 | Intesa Sanpaolo SpA, 5.02%, due 06/26/24 144A | 1,465,311 | ||||||||
| 550,000 | Intesa Sanpaolo SpA, 5.71%, due 01/15/26 144A | 537,425 | ||||||||
| 540,000 | iStar, Inc. REIT, 5.25%, due 09/15/22 | 531,225 | ||||||||
| 1,225,000 | Itau Unibanco Holding SA/Cayman Island, 6.13%◆ ††††† 144A | 1,205,645 | ||||||||
| 260,000 | j2 Cloud Services LLC/j2 GlobalCo-Obligor, Inc., 6.00%, due 07/15/25 144A | 271,050 | ||||||||
| 320,000 | Jack Ohio Finance LLC/Jack Ohio Finance 1 Corp., 10.25%, due 11/15/22 144A | 344,000 | ||||||||
| 580,000 | EUR | James Hardie Industries Plc, 3.63%, due 10/01/26 144A | 664,490 | |||||||
| 360,000 | JB Poindexter & Co., Inc., 7.13%, due 04/15/26 144A | 362,819 | ||||||||
| 1,000,000 | JPMorgan Chase & Co., 4.63%, due 05/10/21 | 1,037,764 | ||||||||
| 568,994 | K2016470219 South Africa, Ltd., 3.00% (3.00% Cash or PIK), due 12/31/22¤ | 1,735 | ||||||||
| 123,799 | K2016470260 South Africa, Ltd., 25.00% (25.00% Cash or PIK), due 12/31/22¤ | 4,642 | ||||||||
| 710,000 | KazMunayGas National Co. JSC, 4.75%, due 04/19/27 144A | 729,766 | ||||||||
| 440,000 | KazTransGas JSC, 4.38%, due 09/26/27 144A | 427,742 | ||||||||
| 950,000 | KLX Energy Services Holdings, Inc., 11.50%, due 11/01/25 144A | 988,000 | ||||||||
| 1,335,000 | Kosmos Energy, Ltd., 7.13%, due 04/04/26†††† 144A | 1,326,322 | ||||||||
| 555,000 | EUR | Kraton Polymers LLC/Kraton Polymers Capital Corp., Reg S, 5.25%, due 05/15/26‡‡‡ | 634,486 | |||||||
| 450,000 | L Brands, Inc., 5.25%, due 02/01/28‡ | 401,625 | ||||||||
| 420,000 | L Brands, Inc., 5.63%, due 10/15/23‡ | 431,025 | ||||||||
| 650,000 | Lamar Media Corp., 5.75%, due 02/01/26 144A | 681,688 | ||||||||
| 300,000 | Lamb Weston Holdings, Inc., 4.88%, due 11/01/26 144A | 305,625 | ||||||||
| 3,390,000 | EUR | Landsbankinn HF, (MTN), Reg S, 1.38%, due 03/14/22‡‡‡ | 3,837,701 | |||||||
| 655,000 | Lazard Group LLC, 4.38%, due 03/11/29 | 663,263 | ||||||||
| 500,000 | Lennar Corp., 4.75%, due 11/29/27 | 502,109 | ||||||||
| 200,000 | Levi Strauss & Co., 5.00%, due 05/01/25 | 207,000 | ||||||||
| 400,000 | Lions Gate Capital Holdings LLC, 6.38%, due 02/01/24 144A | 420,000 | ||||||||
| 400,000 | Lloyds Banking Group Plc, 4.65%, due 03/24/26 | 405,037 | ||||||||
| 450,000 | EUR | Lloyds Banking Group Plc, Reg S, 6.38% (5 year EUR swap plus 5.290%)† ††††† ‡‡‡ | 520,745 | |||||||
| 1,305,000 | Lonestar Resources America, Inc., 11.25%, due 01/01/23 144A | 1,272,375 | ||||||||
| 800,000 | Macquarie Group, Ltd., 5.03%, due 01/15/30◆ 144A | 849,520 | ||||||||
| 170,000 | Magellan Health, Inc., 4.90%, due 09/22/24 | 162,180 | ||||||||
| 460,000 | Match Group, Inc., 5.00%, due 12/15/27‡ 144A | 465,750 | ||||||||
| 830,000 | McDermott Technology Americas, Inc./McDermott Technology US, Inc., 10.63%, due 05/01/24 144A | 689,937 | ||||||||
| 990,000 | MEG Energy Corp., 7.00%, due 03/31/24 144A | 928,125 | ||||||||
| 300,000 | Mercer International, Inc., 6.50%, due 02/01/24 | 308,250 | ||||||||
| 1,185,000 | Meredith Corp., 6.88%, due 02/01/26 | 1,250,175 | ||||||||
| 650,000 | Microchip Technology, Inc., 3.92%, due 06/01/21 144A | 655,954 | ||||||||
| 280,000 | Microchip Technology, Inc., 4.33%, due 06/01/23 144A | 285,843 | ||||||||
| 315,000 | Micron Technology, Inc., 4.64%, due 02/06/24 | 323,341 | ||||||||
| 440,000 | MidAmerican Energy Co., 4.25%, due 07/15/49 | 468,771 | ||||||||
| 1,000,000 | Midstates Petroleum Co., Inc./Midstates Petroleum Co. LLC, 9.25%, due 06/01/21* **** ^ | — | ||||||||
| 850,000 | Millicom International Cellular SA, 6.25%, due 03/25/29 144A | 866,838 | ||||||||
| 200,000 | Millicom International Cellular SA, 6.63%, due 10/15/26 144A | 210,250 | ||||||||
| 595,000 | Mitsubishi UFJ Financial Group, Inc., 3.74%, due 03/07/29 | 610,912 | ||||||||
| 1,000,000 | Morgan Stanley, (MTN), 2.50%, due 04/21/21 | 993,871 | ||||||||
See accompanying Notes to the Financial Statements.
116
Table of Contents
Mercer Opportunistic Fixed Income Fund
Schedule of Investments (Continued)
(showing percentage of net assets)
March 31, 2019
| Par Value** | Description | Value ($) | ||||||||
| Corporate Debt — continued | ||||||||||
| 400,000 | MPT Operating Partnership, LP/MPT Finance Corp. REIT, 5.00%, due 10/15/27 | 408,000 | ||||||||
| 420,000 | Myriad International Holdings BV, 4.85%, due 07/06/27 144A | 432,346 | ||||||||
| 615,000 | Nationstar Mortgage Holdings, Inc., 8.13%, due 07/15/23‡ 144A | 634,987 | ||||||||
| 505,000 | Nationstar Mortgage Holdings, Inc., 9.13%, due 07/15/26 144A | 513,838 | ||||||||
| 500,000 | Navient Corp., 6.75%, due 06/25/25 | 497,025 | ||||||||
| 260,000 | NCL Corp., Ltd., Class C, 4.75%, due 12/15/21 144A | 263,575 | ||||||||
| 350,000 | Neovia Logistics Services LLC/SPL Logistics Finance Corp., 8.88%, due 08/01/20 144A | 334,250 | ||||||||
| 300,000 | Netflix, Inc., 5.88%, due 11/15/28 144A | 317,625 | ||||||||
| 270,000 | Netflix, Inc., 6.38%, due 05/15/29‡ 144A | 292,613 | ||||||||
| 170,000 | Newmark Group, Inc., 6.13%, due 11/15/23 | 175,367 | ||||||||
| 430,000 | NGPL PipeCo LLC, Senior Note, 7.77%, due 12/15/37 144A | 518,150 | ||||||||
| 41,000,000 | SEK | Nordea Hypotek AB, (MTN), Reg S, 1.25%, due 05/19/21‡‡‡ | 4,535,147 | |||||||
| 30,000 | Northern Oil and Gas, Inc., 9.50% (9.50% Cash or PIK), due 05/15/23 | 31,200 | ||||||||
| 450,000 | Northwest Acquisitions ULC/Dominion Finco, Inc., 7.13%, due 11/01/22 144A | 397,125 | ||||||||
| 905,000 | NRG Energy, Inc., 7.25%, due 05/15/26 | 999,066 | ||||||||
| 570,000 | Oversea-Chinese Banking Corp., Ltd., (MTN), Reg S, 4.25%, due 06/19/24‡‡‡ | 588,267 | ||||||||
| 110,000 | Pacific Gas & Electric Co., 3.25%, due 09/15/21††† | 100,650 | ||||||||
| 470,000 | Pactiv LLC, 8.38%, due 04/15/27 | 481,750 | ||||||||
| 140,000 | Park Aerospace Holdings, Ltd., 4.50%, due 03/15/23 144A | 139,650 | ||||||||
| 310,000 | Park-Ohio Industries, Inc., 6.63%, due 04/15/27 | 310,000 | ||||||||
| 440,000 | Perusahaan Listrik Negara PT, 4.13%, due 05/15/27 144A | 434,254 | ||||||||
| 920,000 | Petrobras Global Finance BV, 5.30%, due 01/27/25 | 935,649 | ||||||||
| 1,100,000 | Petrobras Global Finance BV, 5.75%, due 02/01/29 | 1,092,300 | ||||||||
| 720,000 | Petrobras Global Finance BV, 6.85%, due 06/05/15# | 699,084 | ||||||||
| 1,575,000 | Petrobras Global Finance BV, 6.90%, due 03/19/49 | 1,561,455 | ||||||||
| 1,515,000 | Petroleos Mexicanos, 4.88%, due 01/24/22 | 1,531,680 | ||||||||
| 8,487,700 | MXN | Petroleos Mexicanos, Reg S, 7.19%, due 09/12/24‡‡‡ | 368,650 | |||||||
| 763,000 | Polaris Intermediate Corp., 8.50% (8.50% Cash or PIK), due 12/01/22 144A | 755,561 | ||||||||
| 70,000 | Prime Security Services Borrower LLC/Prime Finance, Inc., 5.25%, due 04/15/24†††† 144A | 70,175 | ||||||||
| 220,000 | Prime Security Services Borrower LLC/Prime Finance, Inc., 5.75%, due 04/15/26†††† 144A | 220,596 | ||||||||
| 441,000 | Prime Security Services Borrower LLC/Prime Finance, Inc., 9.25%, due 05/15/23 144A | 464,153 | ||||||||
| 280,000 | Prosperous Ray, Ltd., Reg S, 4.63%, due 11/12/23‡‡‡ | 294,134 | ||||||||
| 920,000 | Prudential Financial, Inc., 5.70%, due 09/15/48◆ | 932,443 | ||||||||
| 830,000 | QNB Finansbank AS, 6.88%, due 09/07/24 144A | 800,845 | ||||||||
| 1,000,000 | Quicken Loans, Inc., 5.75%, due 05/01/25 144A | 1,008,500 | ||||||||
| 150,000 | Range Resources Corp., 4.88%, due 05/15/25‡ | 139,875 | ||||||||
| 270,000 | Range Resources Corp., 5.00%, due 03/15/23‡ | 265,613 | ||||||||
| 1,000,000 | EUR | RCI Banque SA, (MTN), Reg S, 2.25%, due 03/29/21‡‡‡ | 1,170,392 | |||||||
| 264,000 | Refinitiv US Holdings, Inc., 8.25%, due 11/15/26 144A | 259,710 | ||||||||
| 155,000 | Refinitiv US Holdings, Inc., 6.25%, due 05/15/26 144A | 157,519 | ||||||||
| 180,000 | RegionalCare Hospital Partners Holdings, Inc., 8.25%, due 05/01/23 144A | 191,588 | ||||||||
| 380,000 | Resolute Forest Products, Inc., 5.88%, due 05/15/23 | 378,100 | ||||||||
| 445,000 | Royal Bank of Scotland Group Plc, 4.27%, due 03/22/25◆ | 450,233 | ||||||||
| 300,000 | Royal Bank of Scotland Group Plc, 4.89%, due 05/18/29◆ | 311,726 | ||||||||
| 795,000 | RPM International, Inc., 4.55%, due 03/01/29 | 806,744 | ||||||||
| 70,000 | Sally Holdings LLC/Sally Capital, Inc., 5.63%, due 12/01/25‡ | 69,825 | ||||||||
See accompanying Notes to the Financial Statements.
117
Table of Contents
Mercer Opportunistic Fixed Income Fund
Schedule of Investments (Continued)
(showing percentage of net assets)
March 31, 2019
| Par Value** | Description | Value ($) | ||||||||
| Corporate Debt — continued | ||||||||||
| 400,000 | Sands China, Ltd., 5.13%, due 08/08/25 | 417,475 | ||||||||
| 1,000,000 | EUR | Santander Consumer Finance SA, Reg S, 0.88%, due 01/24/22‡‡‡ | 1,142,923 | |||||||
| 590,000 | Santander UK Group Holdings Plc, 4.75%, due 09/15/25 144A | 587,427 | ||||||||
| 500,000 | Scientific Games International, Inc., 10.00%, due 12/01/22‡ | 527,300 | ||||||||
| 180,000 | Seagate HDD Cayman, 4.75%, due 06/01/23 | 182,128 | ||||||||
| 40,000 | Service Corp. International, Senior Note, 7.50%, due 04/01/27 | 46,200 | ||||||||
| 1,420,000 | Shelf Drilling Holdings, Ltd., 8.25%, due 02/15/25 144A | 1,356,100 | ||||||||
| 200,000 | Silversea Cruise Finance, Ltd., 7.25%, due 02/01/25 144A | 217,300 | ||||||||
| 765,000 | Societe Generale SA, 4.75%, due 09/14/28‡ 144A | 805,073 | ||||||||
| 240,000 | Southern California Edison Co., 4.20%, due 03/01/29 | 244,177 | ||||||||
| 405,000 | Southern California Edison Co., 4.88%, due 03/01/49 | 430,752 | ||||||||
| 555,000 | Southern Copper Corp., 3.88%, due 04/23/25 | 563,528 | ||||||||
| 1,055,000 | Southern Copper Corp., 5.88%, due 04/23/45 | 1,186,566 | ||||||||
| 320,000 | Speedway Motorsports, Inc., 5.13%, due 02/01/23 | 322,800 | ||||||||
| 280,000 | Sprint Capital Corp., 6.88%, due 11/15/28 | 269,850 | ||||||||
| 540,000 | Sprint Corp., 7.13%, due 06/15/24 | 549,450 | ||||||||
| 225,000 | Sprint Corp., 7.88%, due 09/15/23 | 236,250 | ||||||||
| 1,310,000 | SS&C Technologies, Inc., 5.50%, due 09/30/27 144A | 1,325,556 | ||||||||
| 775,000 | Standard Chartered Plc, 4.30%, due 02/19/27 144A | 776,770 | ||||||||
| 585,000 | Standard Chartered Plc, 7.75% (USD 5 year swap rate plus 5.723%)† ††††† 144A | 613,130 | ||||||||
| 110,000 | Standard Industries, Inc./NJ, 4.75%, due 01/15/28 144A | 105,325 | ||||||||
| 420,000 | Standard Industries, Inc./NJ, 6.00%, due 10/15/25 144A | 441,878 | ||||||||
| 1,585,000 | Stillwater Mining Co., 7.13%, due 06/27/25 144A | 1,552,745 | ||||||||
| 620,000 | Suzano Austria GmbH, 6.00%, due 01/15/29 144A | 661,980 | ||||||||
| 260,000 | Suzano Austria GmbH, Reg S, 5.75%, due 07/14/26‡‡‡ | 277,706 | ||||||||
| 16,600,000 | SEK | Swedbank Hypotek AB, (MTN), Reg S, 1.00%, due 06/15/22‡‡‡ | 1,832,978 | |||||||
| 370,000 | Swire Pacific MTN Financing, Ltd. (MTN), Reg S, 4.50%, due 10/09/23‡‡‡ | 391,329 | ||||||||
| 395,000 | Synchrony Financial, 4.38%, due 03/19/24 | 400,530 | ||||||||
| 525,000 | Synchrony Financial, 4.50%, due 07/23/25 | 527,468 | ||||||||
| 890,000 | Synchrony Financial, 5.15%, due 03/19/29 | 906,758 | ||||||||
| 250,000 | T-Mobile USA, Inc., 6.38%, due 03/01/25 | 260,950 | ||||||||
| 10,000 | Targa Resources Partners, LP/Targa Resources Partners Finance Corp., 6.50%, due 07/15/27 144A | 10,813 | ||||||||
| 310,000 | Targa Resources Partners, LP/Targa Resources Partners Finance Corp., 6.88%, due 01/15/29 144A | 337,513 | ||||||||
| 230,000 | Teck Resources, Ltd., 5.40%, due 02/01/43 | 227,534 | ||||||||
| 90,000 | Teck Resources, Ltd., 6.00%, due 08/15/40 | 93,266 | ||||||||
| 800,000 | Telecom Italia SpA, 5.30%, due 05/30/24 144A | 807,000 | ||||||||
| 200,000 | Telefonica Emisiones SA, 5.21%, due 03/08/47 | 203,086 | ||||||||
| 100,000 | EUR | Telefonica Europe BV, Reg S, 5.88% (10 year EUR swap plus 4.301%)† ††††† ‡‡‡ | 125,057 | |||||||
| 1,000,000 | Telenet Finance Luxembourg Notes Sarl, 5.50%, due 03/01/28 144A | 985,000 | ||||||||
| 400,000 | EUR | Telenet Finance Luxembourg Notes Sarl, Reg S, 3.50%, due 03/01/28‡‡‡ | 450,716 | |||||||
| 100,000 | Tenet Healthcare Corp., 8.13%, due 04/01/22 | 107,960 | ||||||||
| 1,230,000 | Tesla, Inc., 5.30%, due 08/15/25 144A | 1,068,562 | ||||||||
| 1,370,000 | EUR | Teva Pharmaceutical Finance Netherlands II BV, Reg S, 1.13%, due 10/15/24‡‡‡ | 1,347,836 | |||||||
| 360,000 | Teva Pharmaceutical Finance Netherlands III BV, 2.80%, due 07/21/23 | 321,382 | ||||||||
| 300,000 | Teva Pharmaceutical Finance Netherlands III BV, 6.00%, due 04/15/24 | 301,176 | ||||||||
| 870,000 | TransDigm, Inc., 6.25%, due 03/15/26 144A | 908,280 | ||||||||
| 2,880,000 | ZAR | Transnet SOC, Ltd., (MTN), Reg S, 9.50%, due 05/13/21‡‡‡ | 201,513 | |||||||
See accompanying Notes to the Financial Statements.
118
Table of Contents
Mercer Opportunistic Fixed Income Fund
Schedule of Investments (Continued)
(showing percentage of net assets)
March 31, 2019
| Par Value** | Description | Value ($) | ||||||||
| Corporate Debt — continued | ||||||||||
| 859,950 | Transocean Pontus, Ltd., 6.13%, due 08/01/25 144A | 874,999 | ||||||||
| 590,000 | Transportadora de Gas del Sur SA, 6.75%, due 05/02/25 144A | 558,140 | ||||||||
| 1,160,000 | Uber Technologies, Inc., 7.50%, due 11/01/23‡ 144A | 1,212,200 | ||||||||
| 340,000 | UBS Group Funding Switzerland AG, 7.00%◆ ††††† 144A | 345,309 | ||||||||
| 325,000 | UniCredit SpA, 5.86% (5 year USD ICE swap plus 3.703%), due 06/19/32† 144A | 299,916 | ||||||||
| 755,000 | UniCredit SpA, 7.30%, due 04/02/34◆ †††† 144A | 762,196 | ||||||||
| 700,000 | UniCredit SpA, 7.83%, due 12/04/23 144A | 780,157 | ||||||||
| 285,000 | EUR | UniCredit SpA, Reg S, 6.63% (5 year EUR swap plus 6.387%)† ††††† ‡‡‡ | 311,889 | |||||||
| 655,000 | UniCredit SpA, Reg S, 8.00% (5 year USD swap plus 5.180%)† ††††† ‡‡‡ | 614,854 | ||||||||
| 800,000 | Union Pacific Corp., 4.50%, due 09/10/48 | 850,357 | ||||||||
| 90,000 | United Rentals North America, Inc., 4.63%, due 07/15/23 | 91,744 | ||||||||
| 500,000 | United Rentals North America, Inc., 4.88%, due 01/15/28 | 487,600 | ||||||||
| 350,000 | United Rentals North America, Inc., 5.88%, due 09/15/26 | 363,125 | ||||||||
| 90,000 | United Rentals North America, Inc., 6.50%, due 12/15/26‡ | 94,950 | ||||||||
| 700,000 | Univision Communications, Inc., 5.13%, due 05/15/23‡ 144A | 666,312 | ||||||||
| 200,000 | Univision Communications, Inc., 6.75%, due 09/15/22 144A | 204,000 | ||||||||
| 500,000 | UPCB Finance IV, Ltd., 5.38%, due 01/15/25 144A | 508,750 | ||||||||
| 380,000 | Vale Overseas, Ltd., 6.88%, due 11/10/39 | 437,950 | ||||||||
| 390,000 | Verizon Communications, Inc., 3.88%, due 02/08/29 | 399,701 | ||||||||
| 100,000 | Verizon Communications, Inc., 4.52%, due 09/15/48 | 102,786 | ||||||||
| 670,000 | Viacom, Inc., 6.88%, due 04/30/36 | 787,147 | ||||||||
| 300,000 | Vine Oil & Gas LP/Vine Oil & Gas Finance Corp., 8.75%, due 04/15/23 144A | 240,000 | ||||||||
| 1,025,000 | Vine Oil & Gas LP/Vine Oil & Gas Finance Corp., 9.75%, due 04/15/23 144A | 850,750 | ||||||||
| 500,000 | Virgin Media Secured Finance Plc, 5.50%, due 08/15/26 144A | 510,000 | ||||||||
| 117,000 | GBP | Virgin Media Secured Finance Plc, Reg S, 5.50%, due 01/15/25‡‡‡ | 156,459 | |||||||
| 855,000 | GBP | Virgin Media Secured Finance Plc, Reg S, 6.25%, due 03/28/29‡‡‡ | 1,182,066 | |||||||
| 1,090,000 | Vistra Operations Co. LLC, 5.63%, due 02/15/27 144A | 1,137,687 | ||||||||
| 750,000 | VOC Escrow, Ltd., 5.00%, due 02/15/28 144A | 733,125 | ||||||||
| 270,000 | Vodafone Group Plc, 4.38%, due 05/30/28 | 274,692 | ||||||||
| 10,000 | Vodafone Group Plc, 5.25%, due 05/30/48 | 9,929 | ||||||||
| 350,000 | WEA Finance LLC/Westfield UK & Europe Finance Plc REIT, 4.75%, due 09/17/44 144A | 370,623 | ||||||||
| 450,000 | Weight Watchers International, Inc., 8.63%, due 12/01/25‡ 144A | 406,125 | ||||||||
| 2,500,000 | Wells Fargo Bank NA, 3.27%, due 07/23/21◆◆ | 2,504,232 | ||||||||
| 325,000 | William Carter Co., 5.63%, due 03/15/27 144A | 337,188 | ||||||||
| 680,000 | Williams Cos. (The), Inc., 8.75%, due 03/15/32‡ | 946,857 | ||||||||
| 765,000 | Windstream Services LLC/Windstream Finance Corp., 8.63%, due 10/31/25††† 144A | 729,619 | ||||||||
| 300,000 | WPX Energy, Inc., 8.25%, due 08/01/23 | 339,000 | ||||||||
| 1,230,000 | XPO CNW, Inc., 6.70%, due 05/01/34 | 1,070,100 | ||||||||
| 70,000 | XPO Logistics, Inc., 6.13%, due 09/01/23 144A | 70,788 | ||||||||
| 290,000 | Yamana Gold, Inc., 4.63%, due 12/15/27 | 283,993 | ||||||||
| 650,000 | Yingde Gases Investment, Ltd., 6.25%, due 01/19/23 144A | 656,941 | ||||||||
| 710,000 | YPF SA, Reg S, 8.50%, due 03/23/21‡ ‡‡‡ | 719,052 | ||||||||
|
| |||||||||
| 214,276,461 | ||||||||||
|
| |||||||||
| Mortgage Backed Securities - Private Issuers — 2.4% | ||||||||||
| 620,000 | Barclays Commercial Mortgage Securities Trust,Series 2018-CBM, Class D, 4.87%, due 07/15/37◆◆ 144A | 622,435 | ||||||||
| 2,000,000 | BBCCRE Trust,Series 2015-GTP, Class F, 4.56%, due 08/10/33◆◆ 144A | 1,729,529 | ||||||||
See accompanying Notes to the Financial Statements.
119
Table of Contents
Mercer Opportunistic Fixed Income Fund
Schedule of Investments (Continued)
(showing percentage of net assets)
March 31, 2019
| Par Value** | Description | Value ($) | ||||||||
| Mortgage Backed Securities - Private Issuers — continued | ||||||||||
| 1,000,000 | BHMS,Series 2018-MZB, Class MZB, 9.12%, due 07/15/20◆◆ 144A | 1,008,698 | ||||||||
| 530,000 | BX Trust,Series 2017-IMC, Class A, 3.53%, due 10/15/32◆◆ 144A | 528,795 | ||||||||
| 1,500,000 | BX Trust, Series 2018-BILT, 3.50%, due 05/15/30◆◆ 144A | 1,493,187 | ||||||||
| 640,000 | CFCRE Commercial Mortgage Trust,Series 2011-C2, Class D, 5.76%, due 12/15/47◆◆ 144A | 665,699 | ||||||||
| 337,882 | Citigroup Mortgage Loan Trust,Series 2018-A, Class A1, 4.00%, due 01/25/68◆◆ 144A | 340,775 | ||||||||
| 1,500,000 | FNMA Connecticut Avenue Securities,Series 2017-C03, Class 1B1, 7.34% (1 mo. USD LIBOR plus 4.850%), due 10/25/29† 144A | 1,670,010 | ||||||||
| 1,920,000 | FNMA Connecticut Avenue Securities,Series 2018-C05, Class 1B1, 6.74%, due 01/25/31◆◆ 144A | 1,949,626 | ||||||||
| 1,580,000 | FNMA Connecticut Avenue Securities,Series 2018-C05, Class 1M2, 4.84%, due 01/25/31◆◆ 144A | 1,588,825 | ||||||||
| 665,000 | Freddie Mac Seasoned Credit Risk Transfer Trust,Series 2018-3, Class M, 4.75%, due 08/25/57◆◆ 144A | 634,455 | ||||||||
| 440,000 | Freddie Mac Seasoned Credit Risk Transfer Trust,Series 2019-1, Class M, 4.75%, due 07/25/58◆◆ 144A | 410,720 | ||||||||
| 860,000 | GAHR Commercial Mortgage Trust,Series 2015-NRF, Class EFX, 3.38%, due 12/15/34◆◆ 144A | 852,092 | ||||||||
| 410,000 | GS Mortgage Securities Trust,Series 2011-GC5, Class D, 5.39%, due 08/10/44◆◆ 144A | 398,531 | ||||||||
| 1,390,000 | JPMorgan Chase Commercial Mortgage Securities Trust, Series 2018-PHMZ, Class M, 10.69%, due 06/15/35◆◆ 144A | 1,383,133 | ||||||||
| 1,145,618 | Motel 6 Trust, Series 2017-MTL6, Class E, 5.73%, due 08/15/34◆◆ 144A | 1,153,063 | ||||||||
| 230,000 | Starwood Retail Property Trust, Series 2014-STAR, Class C, 4.98% (1 mo. USD LIBOR plus 2.500%), due 11/15/27† 144A | 221,143 | ||||||||
| 300,000 | Starwood Retail Property Trust, Series 2014-STAR, Class D, 5.73% (1 mo. USD LIBOR plus 3.250%), due 11/15/27† 144A | 268,654 | ||||||||
| 1,337,885 | Structured Asset Mortgage Investments II Trust,Series 2005-AR2, Class 2A2, 3.05% (1 mo. USD LIBOR plus 0.560%), due 05/25/45† | 1,142,472 | ||||||||
| 988,265 | WaMu Mortgage Pass-Through Certificates Trust,Series 2005-AR1, Class A1B, 3.27% (1 mo. USD LIBOR plus 0.780%), due 01/25/45† | 974,107 | ||||||||
| 208,096 | Wells Fargo Mortgage Backed Securities Trust,Series 2006-3, Class A11, 5.50%, due 03/25/36 | 209,755 | ||||||||
|
| |||||||||
| 19,245,704 | ||||||||||
|
| |||||||||
| Mortgage Backed Securities - U.S. Government Agency Obligations — 2.5% | ||||||||||
| 2,382,853 | FNMA, Pool # MA3461, 3.00%, due 09/01/33 | 2,405,777 | ||||||||
| 1,573,158 | FNMA, Pool # BM5520, 3.50%, due 02/01/47 | 1,600,761 | ||||||||
| 65,386 | FNMA, Pool # MA3472, 5.00%, due 09/01/48 | 68,775 | ||||||||
| 592,114 | GNMA II Pool, Pool # MA5595, 4.00%, due 11/20/48 | 611,866 | ||||||||
| 14,772,645 | GNMA II Pool, Pool # MA5652, 4.50%, due 12/20/48 | 15,417,137 | ||||||||
|
| |||||||||
| 20,104,316 | ||||||||||
|
| |||||||||
| Sovereign Debt Obligations — 39.9% | ||||||||||
| 440,000 | Abu Dhabi Government International Bond, 4.13%, due 10/11/47 144A | 445,236 | ||||||||
| 103,115,000 | ARS | Argentina POM Politica Monetaria, 67.55%, due 06/21/20◆◆ | 2,653,048 | |||||||
| 300,000 | Argentine Republic Government International Bond, 4.63%, due 01/11/23 | 246,450 | ||||||||
| 2,735,000 | Argentine Republic Government International Bond, 5.88%, due 01/11/28 | 2,106,292 | ||||||||
See accompanying Notes to the Financial Statements.
120
Table of Contents
Mercer Opportunistic Fixed Income Fund
Schedule of Investments (Continued)
(showing percentage of net assets)
March 31, 2019
| Par Value** | Description | Value ($) | ||||||||
| Sovereign Debt Obligations — continued | ||||||||||
| 1,775,000 | Argentine Republic Government International Bond, 6.88%, due 04/22/21 | 1,625,012 | ||||||||
| 615,000 | Argentine Republic Government International Bond, 6.88%, due 01/11/48 | 454,331 | ||||||||
| 15,700,000 | AUD | Australia Government Bond, Reg S, 2.75%, due 04/21/24‡‡‡ | 11,863,119 | |||||||
| 1,645,000 | Bahrain Government International Bond, Reg S, 6.00%, due 09/19/44‡‡‡ | 1,535,591 | ||||||||
| 1,230,000 | Bahrain Government International Bond, Reg S, 6.13%, due 08/01/23‡‡‡ | 1,289,194 | ||||||||
| 3,815,000,000 | CLP | Bonos de la Tesoreria de la Republica en pesos, 4.50%, due 03/01/21 | 5,722,795 | |||||||
| 5,475,000,000 | CLP | Bonos de la Tesoreria de la Republica en pesos, 4.50%, due 03/01/26 | 8,321,547 | |||||||
| 615,000,000 | CLP | Bonos de la Tesoreria de la Republica en pesos, 5.00%, due 03/01/35 | 976,203 | |||||||
| 675,000,000 | CLP | Bonos de la Tesoreria de la Republica en pesos, 6.00%, due 01/01/43¤ | 1,223,140 | |||||||
| 2,574,000 | BRL | Brazil Letras do Tesouro Nacional, 7.53%, due 07/01/21‡‡ | 563,202 | |||||||
| 2,393,000 | BRL | Brazil Letras do Tesouro Nacional, 7.98%, due 01/01/22‡‡ | 501,263 | |||||||
| 1,415,000 | BRL | Brazil Notas do Tesouro Nacional Serie B, 6.00%, due 08/15/50 | 1,441,543 | |||||||
| 1,800,000 | BRL | Brazil Notas do Tesouro Nacional Series B, 6.00%, due 08/15/20 | 1,540,241 | |||||||
| 812,000 | BRL | Brazil Notas do Tesouro Nacional Series B, 6.00%, due 05/15/45 | 808,866 | |||||||
| 27,078,000 | BRL | Brazil Notas do Tesouro Nacional Series F, 10.00%, due 01/01/21 | 7,271,393 | |||||||
| 36,944,000 | BRL | Brazil Notas do Tesouro Nacional Series F, 10.00%, due 01/01/23 | 10,047,793 | |||||||
| 22,663,000 | BRL | Brazil Notas do Tesouro Nacional Series F, 10.00%, due 01/01/25 | 6,197,131 | |||||||
| 5,353,000 | BRL | Brazil Notas do Tesouro Nacional Series F, 10.00%, due 01/01/29 | 1,467,415 | |||||||
| 500,000 | Colombia Government International Bond, 4.50%, due 03/15/29 | 528,750 | ||||||||
| 23,271,100,000 | COP | Colombian TES, 6.00%, due 04/28/28 | 7,111,614 | |||||||
| 13,167,400,000 | COP | Colombian TES, 7.00%, due 05/04/22 | 4,342,599 | |||||||
| 2,764,800,000 | COP | Colombian TES, 7.00%, due 06/30/32 | 885,735 | |||||||
| 10,595,800,000 | COP | Colombian TES, 7.50%, due 08/26/26 | 3,597,838 | |||||||
| 4,800,100,000 | COP | Colombian TES, 7.75%, due 09/18/30 | 1,642,353 | |||||||
| 7,353,300,000 | COP | Colombian TES, 10.00%, due 07/24/24 | 2,754,690 | |||||||
| 7,778,200,000 | COP | Colombian TES, 11.00%, due 07/24/20 | 2,642,202 | |||||||
| 560,000 | EUR | Cyprus Government International Bond, (MTN), Reg S, 2.38%, due 09/25/28‡‡‡ | 675,493 | |||||||
| 170,000 | EUR | Cyprus Government International Bond, (MTN), Reg S, 2.75%, due 06/27/24‡‡‡ | 210,755 | |||||||
| 319,000 | EUR | Cyprus Government International Bond, (MTN), Reg S, 2.75%, due 02/26/34‡‡‡ | 383,012 | |||||||
| 2,890,000 | EUR | Cyprus Government International Bond, (MTN), Reg S, 3.75%, due 07/26/23‡‡‡ | 3,697,183 | |||||||
| 904,000 | EUR | Cyprus Government International Bond, (MTN), Reg S, 4.25%, due 11/04/25‡‡‡ | 1,224,961 | |||||||
| 4,960,000 | CZK | Czech Republic Government Bond, 0.25%, due 02/10/27 | 191,193 | |||||||
| 16,180,000 | CZK | Czech Republic Government Bond, 2.75%, due 07/23/29 | 761,179 | |||||||
| 45,420,000 | CZK | Czech Republic Government Bond, Reg S, 0.95%, due 05/15/30‡‡‡ | 1,782,260 | |||||||
| 15,820,000 | CZK | Czech Republic Government Bond, Reg S, 1.00%, due 06/26/26‡‡‡ | 651,452 | |||||||
| 9,820,000 | CZK | Czech Republic Government Bond, Reg S, 2.40%, due 09/17/25‡‡‡ | 445,008 | |||||||
| 590,000 | Ecuador Government International Bond, 9.63%, due 06/02/27 144A | 615,812 | ||||||||
| 210,000 | Ecuador Government International Bond, 10.75%, due 01/31/29 144A | 232,102 | ||||||||
| 990,000 | Egypt Government International Bond, 7.60%, due 03/01/29 144A | 1,018,677 | ||||||||
| 415,000 | Egypt Government International Bond, 8.70%, due 03/01/49 144A | 432,652 | ||||||||
| 900,000 | Ghana Government International Bond, 7.63%, due 05/16/29 144A | 881,935 | ||||||||
| 200,000 | Ghana Government International Bond, 8.13%, due 03/26/32 144A | 199,560 | ||||||||
| 134,180,000 | HUF | Hungary Government Bond, 3.00%, due 08/21/30 | 474,581 | |||||||
| 550,540,000 | HUF | �� | Hungary Government Bond, 0.50%, due 04/21/21 | 1,918,710 | ||||||
| 100,670,000 | HUF | Hungary Government Bond, 1.75%, due 10/26/22 | 357,135 | |||||||
| 61,510,000 | HUF | Hungary Government Bond, 2.50%, due 10/24/24 | 221,660 | |||||||
| 153,290,000 | HUF | Hungary Government Bond, 2.75%, due 12/22/26 | 547,099 | |||||||
| 625,890,000 | HUF | Hungary Government Bond, 3.00%, due 06/26/24 | 2,328,951 | |||||||
| 368,760,000 | HUF | Hungary Government Bond, 3.00%, due 10/27/27 | 1,344,888 | |||||||
See accompanying Notes to the Financial Statements.
121
Table of Contents
Mercer Opportunistic Fixed Income Fund
Schedule of Investments (Continued)
(showing percentage of net assets)
March 31, 2019
| Par Value** | Description | Value ($) | ||||||||
| Sovereign Debt Obligations — continued | ||||||||||
| 187,110,000 | HUF | Hungary Government Bond, 5.50%, due 06/24/25 | 785,600 | |||||||
| 245,700,000 | HUF | Hungary Government Bond, 6.75%, due 10/22/28 | 1,153,356 | |||||||
| 1,970,000 | Indonesia Government International Bond, (MTN), Reg S, 5.25%, due 01/17/42‡‡‡ | 2,124,121 | ||||||||
| 6,489,000,000 | IDR | Indonesia Treasury Bond, 5.63%, due 05/15/23 | 433,533 | |||||||
| 17,252,000,000 | IDR | Indonesia Treasury Bond, 6.13%, due 05/15/28 | 1,099,694 | |||||||
| 15,805,000,000 | IDR | Indonesia Treasury Bond, 6.63%, due 05/15/33 | 975,104 | |||||||
| 38,125,000,000 | IDR | Indonesia Treasury Bond, 7.00%, due 05/15/27 | 2,583,745 | |||||||
| 37,602,000,000 | IDR | Indonesia Treasury Bond, 7.50%, due 08/15/32 | 2,535,204 | |||||||
| 40,578,000,000 | IDR | Indonesia Treasury Bond, 7.50%, due 05/15/38 | 2,690,601 | |||||||
| 19,199,000,000 | IDR | Indonesia Treasury Bond, 8.13%, due 05/15/24 | 1,407,581 | |||||||
| 20,765,000,000 | IDR | Indonesia Treasury Bond, 8.25%, due 05/15/29 | 1,526,898 | |||||||
| 25,940,000,000 | IDR | Indonesia Treasury Bond, 8.25%, due 06/15/32 | 1,854,127 | |||||||
| 28,685,000,000 | IDR | Indonesia Treasury Bond, 8.25%, due 05/15/36 | 2,055,993 | |||||||
| 22,105,000,000 | IDR | Indonesia Treasury Bond, 8.38%, due 03/15/24 | 1,629,374 | |||||||
| 3,026,000,000 | IDR | Indonesia Treasury Bond, 8.38%, due 09/15/26 | 223,497 | |||||||
| 41,618,000,000 | IDR | Indonesia Treasury Bond, 8.38%, due 03/15/34 | 3,007,251 | |||||||
| 33,069,000,000 | IDR | Indonesia Treasury Bond, 8.38%, due 04/15/39 | 2,383,546 | |||||||
| 36,373,000,000 | IDR | Indonesia Treasury Bond, 8.75%, due 05/15/31 | 2,733,132 | |||||||
| 9,364,000,000 | IDR | Indonesia Treasury Bond, 9.00%, due 03/15/29 | 717,034 | |||||||
| 9,536,000,000 | IDR | Indonesia Treasury Bond, 9.50%, due 07/15/31 | 752,334 | |||||||
| 3,815,000,000 | IDR | Indonesia Treasury Bond, 10.50%, due 08/15/30 | 320,882 | |||||||
| 3,360,000 | ILS | Israel Government Bond — Fixed, 1.25%, due 11/30/22 | 940,583 | |||||||
| 5,210,000 | ILS | Israel Government Bond — Fixed, 3.75%, due 03/31/47 | 1,616,605 | |||||||
| 7,010,000 | ILS | Israel Government Bond — Fixed, 5.50%, due 01/31/42 | 2,821,290 | |||||||
| 2,969,000 | EUR | Italy Buoni Poliennali Del Tesoro, Reg S, 3.45%, due 03/01/48‡‡‡ | 3,340,172 | |||||||
| 500,000 | Kazakhstan Government International Bond, (MTN), Reg S, 5.13%, due 07/21/25‡‡‡ | 546,033 | ||||||||
| 630,000 | Kuwait International Government Bond, 3.50%, due 03/20/27 144A | 644,836 | ||||||||
| 2,189,000 | MYR | Malaysia Government Bond, 3.42%, due 08/15/22 | 535,190 | |||||||
| 3,257,000 | MYR | Malaysia Government Bond, 3.48%, due 03/15/23 | 794,869 | |||||||
| 26,273,000 | MYR | Malaysia Government Bond, 3.62%, due 11/30/21 | 6,464,529 | |||||||
| 15,793,000 | MYR | Malaysia Government Bond, 3.80%, due 08/17/23 | 3,897,863 | |||||||
| 4,513,000 | MYR | Malaysia Government Bond, 3.84%, due 04/15/33 | 1,075,557 | |||||||
| 16,000,000 | MYR | Malaysia Government Bond, 3.88%, due 03/10/22 | 3,972,625 | |||||||
| 3,566,000 | MYR | Malaysia Government Bond, 3.88%, due 03/14/25 | 880,959 | |||||||
| 391,000 | MYR | Malaysia Government Bond, 3.89%, due 03/15/27 | 96,307 | |||||||
| 15,700,000 | MYR | Malaysia Government Bond, 3.96%, due 09/15/25 | 3,906,671 | |||||||
| 1,207,000 | MYR | Malaysia Government Bond, 4.06%, due 09/30/24 | 300,329 | |||||||
| 989,000 | MYR | Malaysia Government Bond, 4.13%, due 04/15/32 | 242,707 | |||||||
| 979,000 | MYR | Malaysia Government Bond, 4.16%, due 07/15/21 | 243,693 | |||||||
| 903,000 | MYR | Malaysia Government Bond, 4.23%, due 06/30/31 | 225,700 | |||||||
| 3,565,000 | MYR | Malaysia Government Bond, 4.50%, due 04/15/30 | 917,039 | |||||||
| 807,000 | MYR | Malaysia Government Bond, 4.74%, due 03/15/46 | 200,329 | |||||||
| 360,000 | MYR | Malaysia Government Bond, 4.76%, due 04/07/37 | 92,974 | |||||||
| 1,420,000 | MYR | Malaysia Government Bond, 4.89%, due 06/08/38 | 374,330 | |||||||
| 8,600,000 | MYR | Malaysia Government Bond, 4.92%, due 07/06/48 | 2,216,321 | |||||||
| 66,423,100 | MXN | Mexican Bonos, 5.75%, due 03/05/26 | 3,028,188 | |||||||
| 45,229,400 | MXN | Mexican Bonos, 6.50%, due 06/10/21 | 2,272,721 | |||||||
| 88,957,000 | MXN | Mexican Bonos, 6.50%, due 06/09/22 | 4,420,999 | |||||||
| 4,470,200 | MXN | Mexican Bonos, 7.25%, due 12/09/21 | 227,380 | |||||||
| 218,606,400 | MXN | Mexican Bonos, 7.50%, due 06/03/27 | 10,923,502 | |||||||
See accompanying Notes to the Financial Statements.
122
Table of Contents
Mercer Opportunistic Fixed Income Fund
Schedule of Investments (Continued)
(showing percentage of net assets)
March 31, 2019
| Par Value** | Description | Value ($) | ||||||||
| Sovereign Debt Obligations — continued | ||||||||||
| 18,184,500 | MXN | Mexican Bonos, 7.75%, due 05/29/31 | 906,792 | |||||||
| 17,577,600 | MXN | Mexican Bonos, 7.75%, due 11/23/34 | 862,845 | |||||||
| 50,977,400 | MXN | Mexican Bonos, 7.75%, due 11/13/42 | 2,443,288 | |||||||
| 17,577,500 | MXN | Mexican Bonos, 8.00%, due 06/11/20 | 909,572 | |||||||
| 17,338,800 | MXN | Mexican Bonos, 8.00%, due 12/07/23 | 900,536 | |||||||
| 41,841,200 | MXN | Mexican Bonos, 8.00%, due 11/07/47 | 2,049,338 | |||||||
| 22,670,300 | MXN | Mexican Bonos, 8.50%, due 05/31/29 | 1,202,358 | |||||||
| 16,250,700 | MXN | Mexican Bonos, 8.50%, due 11/18/38 | 844,458 | |||||||
| 42,869,200 | MXN | Mexican Bonos, 10.00%, due 12/05/24 | 2,428,323 | |||||||
| 62,997,800 | MXN | Mexican Bonos, 10.00%, due 11/20/36 | 3,740,928 | |||||||
| 22,743,825 | MXN | Mexican Udibonos, 4.00%, due 11/30/28 | 1,184,712 | |||||||
| 17,517,877 | MXN | Mexican Udibonos, 4.50%, due 11/22/35 | 955,695 | |||||||
| 740,000 | Mexico Government International Bond, 3.60%, due 01/30/25 | 741,480 | ||||||||
| 1,365,000 | Oman Government International Bond, Reg S, 6.50%, due 03/08/47‡‡‡ | 1,198,373 | ||||||||
| 920,000 | Oman Government International Bond, Reg S, 6.75%, due 01/17/48‡‡‡ | 819,651 | ||||||||
| 5,427,000 | PEN | Peruvian Government International Bond, Reg S, 6.35%, due 08/12/28‡‡‡ | 1,774,448 | |||||||
| 1,493,000 | PEN | Peruvian Government International Bond, Reg S (GDN), 5.70%, due 08/12/24‡‡‡ | 475,790 | |||||||
| 5,434,000 | PEN | Peruvian Government International Bond, Reg S (GDN), 6.95%, due 08/12/31‡‡‡ | 1,852,153 | |||||||
| 4,326,000 | PEN | Peruvian Government International Bond, Reg S (GDN), 8.20%, due 08/12/26‡‡‡ | 1,567,280 | |||||||
| 58,000,000 | PHP | Philippine Government International Bond, 3.90%, due 11/26/22 | 1,071,293 | |||||||
| 9,000,000 | PHP | Philippine Government International Bond, 4.95%, due 01/15/21 | 171,739 | |||||||
| 20,000,000 | PHP | Philippine Government International Bond, 6.25%, due 01/14/36 | 413,826 | |||||||
| 4,530,000 | PLN | Poland Government Bond, 2.50%, due 01/25/23 | 1,205,144 | |||||||
| 8,324,000 | PLN | Poland Government Bond, 2.50%, due 07/25/26 | 2,169,644 | |||||||
| 8,598,000 | PLN | Poland Government Bond, 2.50%, due 07/25/27 | 2,216,079 | |||||||
| 19,683,000 | PLN | Poland Government Bond, 3.25%, due 07/25/25 | 5,397,121 | |||||||
| 1,710,000 | Provincia de Buenos Aires/Argentina, 6.50%, due 02/15/23 144A | 1,397,925 | ||||||||
| 150,000 | Provincia de Buenos Aires/Argentina, 7.88%, due 06/15/27 144A | 109,875 | ||||||||
| 480,000 | Qatar Government International Bond, 4.00%, due 03/14/29 144A | 495,447 | ||||||||
| 590,000 | Qatar Government International Bond, 4.82%, due 03/14/49‡ 144A | 621,879 | ||||||||
| 590,000 | Qatar Government International Bond, 5.10%, due 04/23/48 144A | 647,525 | ||||||||
| 3,143,000 | PLN | Republic of Poland Government Bond, 2.50%, due 04/25/24 | 831,883 | |||||||
| 9,702,000 | PLN | Republic of Poland Government Bond, 2.75%, due 04/25/28 | 2,533,779 | |||||||
| 11,025,115 | ZAR | Republic of South Africa Government Bond, 8.75%, due 01/31/44 | 692,625 | |||||||
| 2,175,000 | RON | Romania Government Bond, 3.25%, due 04/29/24 | 489,853 | |||||||
| 2,690,000 | RON | Romania Government Bond, 3.40%, due 03/08/22 | 624,026 | |||||||
| 1,395,000 | RON | Romania Government Bond, 3.65%, due 09/24/31 | 284,321 | |||||||
| 16,725,000 | RON | Romania Government Bond, 4.25%, due 06/28/23 | 3,949,644 | |||||||
| 12,515,000 | RON | Romania Government Bond, 5.00%, due 02/12/29 | 2,970,409 | |||||||
| 6,960,000 | RON | Romania Government Bond, 5.80%, due 07/26/27 | 1,774,811 | |||||||
| 93,267,000 | RUB | Russian Federal Bond — OFZ, 6.90%, due 05/23/29 | 1,290,519 | |||||||
| 116,631,000 | RUB | Russian Federal Bond — OFZ, 7.00%, due 08/16/23 | 1,720,799 | |||||||
| 320,480,000 | RUB | Russian Federal Bond — OFZ, 7.05%, due 01/19/28 | 4,553,111 | |||||||
| 207,439,000 | RUB | Russian Federal Bond — OFZ, 7.10%, due 10/16/24 | 3,040,770 | |||||||
| 22,536,000 | RUB | Russian Federal Bond — OFZ, 7.25%, due 05/10/34 | 311,611 | |||||||
| 110,781,000 | RUB | Russian Federal Bond — OFZ, 7.40%, due 12/07/22 | 1,671,019 | |||||||
| 123,888,000 | RUB | Russian Federal Bond — OFZ, 7.50%, due 08/18/21 | 1,880,077 | |||||||
| 120,966,000 | RUB | Russian Federal Bond — OFZ, 7.70%, due 03/23/33 | 1,751,956 | |||||||
| 183,718,000 | RUB | Russian Federal Bond — OFZ, 7.75%, due 09/16/26 | 2,746,087 | |||||||
| 107,362,000 | RUB | Russian Federal Bond — OFZ, 8.15%, due 02/03/27 | 1,643,747 | |||||||
See accompanying Notes to the Financial Statements.
123
Table of Contents
Mercer Opportunistic Fixed Income Fund
Schedule of Investments (Continued)
(showing percentage of net assets)
March 31, 2019
| Par Value** | Description | Value ($) | ||||||||
| Sovereign Debt Obligations — continued | ||||||||||
| 84,440,000 | RUB | Russian Federal Bond — OFZ, 8.50%, due 09/17/31 | 1,309,892 | |||||||
| 460,000 | Saudi Government International Bond, 5.25%, due 01/16/50 144A | 491,678 | ||||||||
| 930,000 | Senegal Government International Bond, 6.25%, due 05/23/33 144A | 895,363 | ||||||||
| 49,421,000 | ZAR | South Africa Government Bond, 6.25%, due 03/31/36 | 2,490,551 | |||||||
| 6,213,819 | ZAR | South Africa Government Bond, 6.75%, due 03/31/21 | 429,867 | |||||||
| 8,620,240 | ZAR | South Africa Government Bond, 7.00%, due 02/28/31 | 501,240 | |||||||
| 5,017,838 | ZAR | South Africa Government Bond, 7.75%, due 02/28/23 | 348,139 | |||||||
| 14,682,195 | ZAR | South Africa Government Bond, 8.00%, due 01/31/30 | 939,134 | |||||||
| 14,291,364 | ZAR | South Africa Government Bond, 8.25%, due 03/31/32 | 909,798 | |||||||
| 19,357,188 | ZAR | South Africa Government Bond, 8.50%, due 01/31/37 | 1,206,121 | |||||||
| 29,431,348 | ZAR | South Africa Government Bond, 8.75%, due 02/28/48 | 1,843,279 | |||||||
| 8,648,505 | ZAR | South Africa Government Bond, 8.88%, due 02/28/35 | 565,241 | |||||||
| 16,379,685 | ZAR | South Africa Government Bond, 9.00%, due 01/31/40 | 1,058,067 | |||||||
| 145,735,528 | ZAR | South Africa Government Bond, 10.50%, due 12/21/26 | 11,155,583 | |||||||
| 7,979,000 | THB | Thailand Government Bond, 2.00%, due 12/17/22 | 252,027 | |||||||
| 157,350,000 | THB | Thailand Government Bond, 2.13%, due 12/17/26 | 4,889,958 | |||||||
| 14,520,000 | THB | Thailand Government Bond, 2.40%, due 12/17/23 | 464,210 | |||||||
| 42,246,000 | THB | Thailand Government Bond, 2.88%, due 12/17/28 | 1,381,819 | |||||||
| 19,725,000 | THB | Thailand Government Bond, 3.60%, due 06/17/67 | 636,678 | |||||||
| 37,230,000 | THB | Thailand Government Bond, 3.65%, due 06/20/31 | 1,298,772 | |||||||
| 31,590,000 | THB | Thailand Government Bond, 4.00%, due 06/17/66 | 1,099,756 | |||||||
| 38,540,000 | THB | Thailand Government Bond, 4.88%, due 06/22/29 | 1,465,430 | |||||||
| 96,998,616 | THB | Thailand Government Bond, Reg S, 1.25%, due 03/12/28‡‡‡ | 2,869,365 | |||||||
| 7,038,068 | TRY | Turkey Government Bond, 4.00%, due 04/01/20 | 1,242,027 | |||||||
| 7,580,000 | TRY | Turkey Government Bond, 9.00%, due 07/24/24 | 888,197 | |||||||
| 8,270,000 | TRY | Turkey Government Bond, 10.60%, due 02/11/26 | 1,007,108 | |||||||
| 6,573,043 | TRY | Turkey Government Bond, 11.00%, due 03/02/22 | 904,003 | |||||||
| 5,105,000 | TRY | Turkey Government Bond, 12.40%, due 03/08/28 | 670,474 | |||||||
| 369,000 | Turkey Government International Bond, 6.63%, due 02/17/45 | 318,836 | ||||||||
| 21,388,000 | UYU | Uruguay Government International Bond, Reg S, 8.50%, due 03/15/28‡‡‡ | 558,916 | |||||||
|
| |||||||||
| 324,243,845 | ||||||||||
|
| |||||||||
| U.S. Government and Agency Obligations — 12.9% | ||||||||||
| 700,000 | U.S. Treasury Bond, 3.13%, due 05/15/48 | 742,410 | ||||||||
| 270,000 | U.S. Treasury Bond, 3.38%, due 11/15/48 | 300,549 | ||||||||
| 2,824,222 | U.S. Treasury Inflation Indexed Bond, 1.00%, due 02/15/48 | 2,884,730 | ||||||||
| 2,110,506 | U.S. Treasury Inflation Indexed Bonds, 1.00%, due 02/15/49 | 2,165,826 | ||||||||
| 6,500,000 | U.S. Treasury Note, 1.38%, due 06/30/23 | 6,273,770 | ||||||||
| 15,600,000 | U.S. Treasury Note, 1.50%, due 10/31/19(a) | 15,514,688 | ||||||||
| 4,070,000 | U.S. Treasury Note, 1.63%, due 03/15/20 | 4,040,349 | ||||||||
| 4,819,100 | U.S. Treasury Note, 2.25%, due 03/31/20(b) | 4,811,476 | ||||||||
| 16,230,000 | U.S. Treasury Note, 2.25%, due 08/15/27 | 16,078,161 | ||||||||
| 15,810,000 | U.S. Treasury Note, 2.25%, due 11/15/27 | 15,645,415 | ||||||||
| 17,000,000 | U.S. Treasury Note, 2.50%, due 05/31/20 | 17,023,242 | ||||||||
| 19,200,000 | U.S. Treasury Note, 2.50%, due 02/28/26 | 19,420,875 | ||||||||
| 90,000 | U.S. Treasury Note, 2.63%, due 02/15/29 | 91,665 | ||||||||
|
| |||||||||
| 104,993,156 | ||||||||||
|
| |||||||||
TOTAL DEBT OBLIGATIONS (COST $747,332,968) | 746,247,218 | |||||||||
|
| |||||||||
See accompanying Notes to the Financial Statements.
124
Table of Contents
Mercer Opportunistic Fixed Income Fund
Schedule of Investments (Continued)
(showing percentage of net assets)
March 31, 2019
| Shares | Description | Value ($) | ||||||||
COMMON STOCKS — 0.1% |
| |||||||||
| Diversified Financial Services — 0.0% | ||||||||||
| 7,396,155 | Edcon Holdings, Ltd. 1* **** ¤ ^ | — | ||||||||
| 736,020 | Edcon Holdings, Ltd. 2* **** ¤ ^ | — | ||||||||
|
| |||||||||
| — | ||||||||||
|
| |||||||||
| Oil & Gas — 0.1% | ||||||||||
| 8,511 | Birch Permian Holdings, Inc.* **** ¤ | 95,749 | ||||||||
| 66,347 | Birch Permian Holdings, Inc.* **** ¤ | 746,404 | ||||||||
| 14,783 | Nine Point Energy, LLC* **** ¤ | — | ||||||||
|
| |||||||||
| 842,153 | ||||||||||
|
| |||||||||
TOTAL COMMON STOCKS (COST $1,610,355) | 842,153 | |||||||||
|
| |||||||||
CONVERTIBLE PREFERRED STOCK — 0.1% |
| |||||||||
| Health Care - Products — 0.1% | ||||||||||
| 689 | Danaher Corp., 4.75%* | 725,510 | ||||||||
|
| |||||||||
| Oil & Gas — 0.0% | ||||||||||
| 322 | Nine Point Energy Holdings, Inc., 0.00%* **** ¤ | 230,420 | ||||||||
|
| |||||||||
TOTAL CONVERTIBLE PREFERRED STOCK (COST $989,884) | 955,930 | |||||||||
|
| |||||||||
PREFERRED STOCK — 0.0% |
| |||||||||
| Investment Company — 0.0% | ||||||||||
| 2,450 | B. Riley Financial, Inc., 6.88%* ‡ | 62,059 | ||||||||
|
| |||||||||
TOTAL PREFERRED STOCK (COST $61,250) | 62,059 | |||||||||
|
| |||||||||
| Notional Value | Description | Value ($) | ||||||||
OPTIONS PURCHASED — 0.1% |
| |||||||||
PURCHASED CURRENCY OPTIONS — 0.1% |
| |||||||||
| Call Options — 0.0% | ||||||||||
| 1,600,000 | USD | USD/EUR Option with JPMorgan Chase Bank N.A., Strike Price USD 1.14, Expires 06/20/19 | 24,416 | |||||||
| 9,530,000 | USD | USD/KRW Option with HSBC Bank USA, N.A., Strike Price KRW 1,130.00, Expires 05/07/19 | 101,237 | |||||||
| 9,800,000 | USD | EUR/USD Option with HSBC Bank USA, N.A., Strike Price USD 1.14, Expires 04/10/19 | 2,313 | |||||||
| 3,450,000 | USD | USD/CAD Option with Morgan Stanley & Co., Strike Price CAD 1.34, Expires 04/26/19 | 15,266 | |||||||
| 1,510,000 | USD | USD/AUD Option with JPMorgan Chase Bank N.A., Strike Price AUD 0.70, Expires 05/13/19 | 7,231 | |||||||
| 4,110,000 | USD | USD/CNH Option with Citibank N.A., Strike Price CNH 6.78, Expires 04/29/19 | 8,175 | |||||||
| Put Options — 0.1% | ||||||||||
| 5,900,000 | USD | USD/BRL Option with JPMorgan Chase Bank N.A., Strike Price BRL 3.78, Expires 04/09/19 | 9,818 | |||||||
See accompanying Notes to the Financial Statements.
125
Table of Contents
Mercer Opportunistic Fixed Income Fund
Schedule of Investments (Continued)
(showing percentage of net assets)
March 31, 2019
| Notional Value | Description | Value ($) | ||||||||
| Put Options — continued | ||||||||||
| 4,850,000 | USD | GBP/USD Option with HSBC Bank USA, N.A., Strike Price USD 1.30, Expires 04/02/19 | 25,981 | |||||||
| 3,700,000 | USD | USD/ZAR Option with JPMorgan Chase Bank N.A., Strike Price ZAR 13.85, Expires 05/24/19 | 26,677 | |||||||
| 7,400,000 | USD | USD/JPY Option with HSBC Bank USA, N.A., Strike Price JPY 108.00, Expires 07/24/19 | 66,112 | |||||||
| 5,200,000 | EUR | EUR/USD Option with JPMorgan Chase Bank N.A., Strike Price USD 1.12, Expires 05/31/19 | 39,167 | |||||||
| 5,100,000 | EUR | EUR/USD Option with Citibank N.A., Strike Price USD 1.12, Expires 06/07/19 | 40,624 | |||||||
| 5,000,000 | EUR | EUR/HUF Option with Natwest Markets Plc, Strike Price HUF 324.00, Expires 04/16/19 | 56,597 | |||||||
| 800,000 | USD | USD/BRL Option with Citibank N.A., Strike Price BRL 3.82, Expires 06/24/19 | 13,009 | |||||||
| 7,977,910 | USD | USD/MXN Option with JPMorgan Chase Bank N.A., Strike Price MXN 19.15, Expires 06/12/19 | 64,230 | |||||||
| 12,300,000 | USD | USD/JPY Option with HSBC Bank USA, N.A., Strike Price JPY 108.00, Expires 07/24/19 | 109,888 | |||||||
| 1,530,000 | USD | USD/AUD Option with Citibank N.A., Strike Price USD 0.74, Expires 04/02/19 | 2 | |||||||
|
| |||||||||
TOTAL CURRENCY OPTIONS PURCHASED (PREMIUMS PAID $804,499) | 610,743 | |||||||||
|
| |||||||||
| Number of Contracts | Notional Value ($) | Description | Value ($) | |||||||
PURCHASED FUTURES OPTIONS — 0.0% |
| |||||||||
| Call Options — 0.0% | ||||||||||
| 790 | 98,132,813 | U.S. Treasury Note10-Year Futures Option with JPMorgan Securities LLC, Strike Price $ 124.50, Expires 04/26/19 | 320,937 | |||||||
| Put Options — 0.0% | ||||||||||
| 1,750 | 4,966,150 | S&P 500E-mini Futures Option with UBS Securities LLC, Strike Price $ 2,600.00, Expires 06/21/19 | 35,000 | |||||||
| 750 | 2,128,350 | S&P 500E-mini Futures Option with UBS Securities LLC, Strike Price $ 2,550.00, Expires 05/17/19 | 4,687 | |||||||
| 450 | 1,277,010 | S&P 500E-mini Futures Option with UBS Securities LLC, Strike Price $ 2,600.00, Expires 05/17/19 | 3,938 | |||||||
| 400 | 1,135,120 | S&P 500E-mini Futures Option with UBS Securities LLC, Strike Price $ 2,500.00, Expires 05/17/19 | 1,800 | |||||||
| 14 | 1,739,063 | U.S. Treasury Note10-Year Futures Option with UBS Securities LLC, Strike Price $ 124.00, Expires 05/24/19 | 8,750 | |||||||
|
| |||||||||
TOTAL FUTURES OPTIONS PURCHASED (PREMIUMS PAID $573,967) | 375,112 | |||||||||
|
| |||||||||
See accompanying Notes to the Financial Statements.
126
Table of Contents
Mercer Opportunistic Fixed Income Fund
Schedule of Investments (Continued)
(showing percentage of net assets)
March 31, 2019
| Number of Contracts | Notional Value ($) | Description | Value ($) | |||||||
PURCHASED INDEX OPTIONS — 0.0% |
| |||||||||
| Put Options — 0.0% | ||||||||||
| 1,000 | 7,378,770 | NASDAQ 100 Stock Index Option with Citigroup Global Markets Inc., Strike Price $ 7,000.00, Expires 05/17/19 | 65,930 | |||||||
| 4,300 | 12,530,114 | S&P 500 Index Option with Citigroup Global Markets Inc., Strike Price $ 2,800.00, Expires 05/17/19 | 163,400 | |||||||
| 5,600 | 16,318,288 | S&P 500 Index Option with Citigroup Global Markets Inc., Strike Price $ 2,800.00, Expires 04/18/19 | 102,480 | |||||||
|
| |||||||||
TOTAL INDEX OPTIONS PURCHASED (PREMIUMS PAID $416,795) | 331,810 | |||||||||
|
| |||||||||
PURCHASED SWAPTIONS — 0.0% |
| |||||||||
| Put Swaptions — 0.0% | ||||||||||
| 5,770,000 | 5,770,000 | CDX.NA.HY Index Option with Morgan Stanley & Co., Strike Price $ 103.00, Expires 04/17/19 | 3,466 | |||||||
| 11,430,000 | 11,430,000 | CDX.NA.HY Index Option with JPMorgan Chase Bank N.A., Strike Price $ 103.00, Expires 04/17/19 | 6,866 | |||||||
| 12,060,000 | 12,060,000 | CDX.NA.HY Index Option with BNP Paribas S.A., Strike Price $ 103.50, Expires 04/17/19 | 6,616 | |||||||
| 5,140,000 | 5,140,000 | CDX.NA.HY Index Option with JPMorgan Chase Bank N.A., Strike Price $ 103.50, Expires 04/17/19 | 2,820 | |||||||
|
| |||||||||
TOTAL PURCHASED SWAPTIONS (PREMIUMS PAID $307,949) | 19,768 | |||||||||
|
| |||||||||
TOTAL OPTIONS PURCHASED (PREMIUMS PAID $2,103,210) | 1,337,433 | |||||||||
|
| |||||||||
| Par Value ($) | Description | Value ($) | ||||||||
SHORT-TERM INVESTMENTS — 3.7% |
| |||||||||
| Certificate of Deposit — 0.1% | ||||||||||
| 650,000 | CNH Industrial Capital, 5.06%, due 04/03/19‡‡ | 649,731 | ||||||||
|
| |||||||||
| Investment Company — 1.0% | ||||||||||
| 7,973,220 | T. Rowe Price Government Reserve Fund, 2.49%, due 09/19/34 | 7,973,220 | ||||||||
|
| |||||||||
| 7,973,220 | ||||||||||
|
| |||||||||
| Mutual Fund - Securities Lending Collateral — 1.0% | ||||||||||
| 7,793,870 | State Street Institutional U.S. Government Money Market Fund, Premier Class, 2.39%## *** | 7,793,870 | ||||||||
|
| |||||||||
| Sovereign Debt Obligations — 0.7% | ||||||||||
| 80,600,000 | EGP | Egypt Treasury Bills, 18.30%, due 04/09/19‡‡ | 4,630,058 | |||||||
| 1,150,000 | EGP | Egypt Treasury Bills, 17.60%, due 04/23/19‡‡ | 65,633 | |||||||
| 19,675,000 | EGP | Egypt Treasury Bills, 17.36%, due 06/04/19‡‡ | 1,101,369 | |||||||
| 3,800,000 | EGP | Egypt Treasury Bills, 15.02%, due 04/23/19‡‡ | 216,874 | |||||||
|
| |||||||||
TOTAL SOVEREIGN DEBT OBLIGATIONS | 6,013,934 | |||||||||
|
| |||||||||
See accompanying Notes to the Financial Statements.
127
Table of Contents
Mercer Opportunistic Fixed Income Fund
Schedule of Investments (Continued)
(showing percentage of net assets)
March 31, 2019
| Par Value ($) | Description | Value ($) | ||||||||
| U.S. Government and Agency Obligations — 0.9% | ||||||||||
| 7,100,000 | U.S. Treasury Bill, 2.37%, due 06/27/19‡‡ | 7,059,804 | ||||||||
|
| |||||||||
TOTAL U.S. GOVERNMENT AND AGENCY OBLIGATIONS (COST $7,059,155) | 7,059,804 | |||||||||
|
| |||||||||
TOTAL SHORT-TERM INVESTMENTS (COST $29,311,922) | 29,490,559 | |||||||||
|
| |||||||||
TOTAL INVESTMENTS — 95.9% (Cost $781,409,589) | 778,935,352 | |||||||||
Other Assets and Liabilities (net) — 4.1% | 33,645,112 | |||||||||
|
| |||||||||
| NET ASSETS — 100.0% | $812,580,464 | |||||||||
|
| |||||||||
Notes to Schedule of Investments: | ||||||||||
| ARS — Auction Rate Security | ||||||||||
| CDX.NA.HY — Markit North America High Yield CDS Index | ||||||||||
| CLO — Collateralized Loan Obligation | ||||||||||
| CMT — Constant Maturing Treasury Rate | ||||||||||
| FNMA — Federal National Mortgage Association | ||||||||||
| GDN — Global Depository Note | ||||||||||
| GNMA — Government National Mortgage Association | ||||||||||
| MTN — Medium Term Note | ||||||||||
| PIK — Payment In Kind | ||||||||||
| REIT — Real Estate Investment Trust | ||||||||||
| # | Year of maturity is greater than 2100. | |||||||||
| ## | The rate disclosed is the 7 day net yield as of March 31, 2019. | |||||||||
| ### | This position represents an unsettled loan commitment at period end. Certain details associated with this purchase are not known prior to the settlement date, including coupon rate, which will be adjusted on settlement date. | |||||||||
| * | Non-income producing security | |||||||||
| ** | Unless otherwise indicated, all par values are denominated in United States dollars ($). | |||||||||
| *** | Represents an investment of securities lending cash collateral. | |||||||||
| **** | Securities fair valued by the Valuation Committee as approved by the Board of Trustees. The total market value of the securities at year end is $1,072,573 which represents 0.1% of net assets. The aggregate tax cost of these securities held at March 31, 2019 was $1,911,239. | |||||||||
| ¤ | Illiquid security. The total market value of the securities at year end is $2,408,002 which represents 0.3% of net assets. The aggregate tax cost of these securities held at March 31, 2019 was $4,301,870. | |||||||||
| ^ | Level 3 — significant unobservable inputs were used in determining the value of this portfolio security. | |||||||||
| ◆ | Variable rate security. Security may be issued at a fixed coupon rate, which converts to a variable rate at a specified date. Rate shown is the rate in effect as of period end. | |||||||||
See accompanying Notes to the Financial Statements.
128
Table of Contents
Mercer Opportunistic Fixed Income Fund
Schedule of Investments (Continued)
March 31, 2019
| ◆◆ | Variable or floating rate security, which interest rate adjusts periodically based on changes in current interest rates and prepayments on the underlying pool of assets. Rate shown is the rate in effect as of period end. | |||||||
| † | Variable or floating rate note. Rate shown is as of March 31, 2019. | |||||||
| †† | Debt obligation initially issued in zero coupon form which converts to coupon form at a specific rate and date. The rate shown is the rate at period end. | |||||||
| ††† | Security is currently in default. | |||||||
| †††† | When-issued security. | |||||||
| ††††† | Security is perpetual and has no stated maturity date. | |||||||
| ‡ | All or a portion of this security is out on loan. | |||||||
| ‡‡ | Interest rate presented is yield to maturity. | |||||||
| ‡‡‡ | Security exempt from registration under Regulation S of the Securities Act of 1933, which exempts from registration securities offered and sold outside the United States. Security may not be offered or sold in the United States except pursuant to an exemption from, or in a transaction not subject to, the registration requirements of the Securities Act of 1933. | |||||||
| (a) | All or a portion of this security is pledged for open futures and open centrally cleared swaps collateral. | |||||||
| (b) | All or a portion of this security is pledged for open forward foreign currency contracts collateral. | |||||||
| 144A | Securities exempt from registration under Rule 144A of the Securities Act of 1933. These securities may be resold in transactions exempt from registration, normally to qualified institutional buyers. The total market value of the securities at year end is $135,717,517 which represents 16.7% of net assets. | |||||||
See accompanying Notes to the Financial Statements.
129
Table of Contents
Mercer Opportunistic Fixed Income Fund
Schedule of Investments (Continued)
March 31, 2019
Forward Foreign Currency Contracts
Currency Purchased | Currency Sold | Settlement | Counterparty | Unrealized | ||||||||||||||||
| ARS | 11,236,850 | USD | 242,749 | 05/22/19 | Citibank N.A. | $ | (594 | ) | ||||||||||||
| ARS | 4,899,240 | USD | 117,347 | 04/11/19 | HSBC Bank Plc | (5,739 | ) | |||||||||||||
| ARS | 9,702,280 | USD | 233,228 | 04/22/19 | HSBC Bank Plc | (15,532 | ) | |||||||||||||
| ARS | 4,899,240 | USD | 113,540 | 05/16/19 | HSBC Bank Plc | (7,117 | ) | |||||||||||||
| ARS | 8,830,190 | USD | 199,327 | 05/22/19 | HSBC Bank Plc | (9,036 | ) | |||||||||||||
| ARS | 28,214,000 | USD | 642,761 | 04/24/19 | JPMorgan Chase Bank N.A. | (11,434 | ) | |||||||||||||
| ARS | 28,213,000 | USD | 680,980 | 04/26/19 | JPMorgan Chase Bank N.A. | (51,394 | ) | |||||||||||||
| ARS | 54,900,000 | USD | 1,310,888 | 04/29/19 | JPMorgan Chase Bank N.A. | (90,753 | ) | |||||||||||||
| ARS | 2,946,270 | USD | 73,786 | 04/11/19 | Morgan Stanley & Co. | (6,668 | ) | |||||||||||||
| ARS | 37,688,435 | USD | 902,717 | 05/16/19 | Morgan Stanley & Co. | (84,040 | ) | |||||||||||||
| AUD | 550,000 | USD | 395,578 | 04/17/19 | Citibank N.A. | (4,766 | ) | |||||||||||||
| AUD | 4,726,466 | USD | 3,383,242 | 04/26/19 | HSBC Bank USA, N.A. | (24,194 | ) | |||||||||||||
| AUD | 545,000 | USD | 387,564 | 04/26/19 | JPMorgan Chase Bank N.A. | (238 | ) | |||||||||||||
| BRL | 3,781,441 | USD | 972,593 | 04/02/19 | BNP Paribas S.A. | (925 | ) | |||||||||||||
| BRL | 5,400,000 | USD | 1,397,359 | 04/11/19 | Citibank N.A. | (10,620 | ) | |||||||||||||
| BRL | 6,025,360 | USD | 1,559,542 | 04/11/19 | HSBC Bank Plc | (12,209 | ) | |||||||||||||
| BRL | 11,095,832 | USD | 2,847,495 | 04/02/19 | HSBC Bank USA, N.A. | 3,658 | ||||||||||||||
| BRL | 12,554,164 | USD | 3,254,109 | 04/02/19 | JPMorgan Chase Bank N.A. | (28,226 | ) | |||||||||||||
| BRL | 19,106,226 | USD | 4,980,809 | 04/02/19 | Morgan Stanley & Co. | (71,328 | ) | |||||||||||||
| BRL | 8,121,590 | USD | 2,142,142 | 04/11/19 | Morgan Stanley & Co. | (56,489 | ) | |||||||||||||
| CAD | 400,000 | USD | 304,603 | 04/01/19 | Barclays Bank Plc | (5,191 | ) | |||||||||||||
| CAD | 400,000 | USD | 297,846 | 04/17/19 | JPMorgan Chase Bank N.A. | 1,690 | ||||||||||||||
| CHF | 1,950,000 | USD | 1,956,417 | 05/24/19 | Bank of America N.A. | 11,209 | ||||||||||||||
| CHF | 1,949,000 | USD | 1,954,090 | 05/24/19 | HSBC Bank USA, N.A. | 12,527 | ||||||||||||||
| CHF | 205,000 | USD | 204,848 | 05/24/19 | JPMorgan Chase Bank N.A. | 2,005 | ||||||||||||||
| CHF | 1,950,000 | USD | 1,954,816 | 05/24/19 | Morgan Stanley & Co. | 12,810 | ||||||||||||||
| CLP | 1,029,173,000 | USD | 1,515,272 | 04/05/19 | Barclays Bank Plc | (2,830 | ) | |||||||||||||
| CLP | 2,058,346,000 | USD | 3,020,987 | 04/05/19 | BNP Paribas S.A. | 3,899 | ||||||||||||||
| CLP | 100,370,950 | USD | 150,617 | 04/11/19 | Credit Suisse | (3,113 | ) | |||||||||||||
| CLP | 2,058,346,000 | USD | 3,093,768 | 04/05/19 | Deutsche Bank AG | (68,882 | ) | |||||||||||||
| CLP | 1,969,737,260 | USD | 2,963,437 | 04/11/19 | HSBC Bank Plc | (68,733 | ) | |||||||||||||
| CLP | 1,029,173,000 | USD | 1,516,836 | 04/05/19 | JPMorgan Chase Bank N.A. | (4,393 | ) | |||||||||||||
| CLP | 237,388,810 | USD | 353,799 | 04/11/19 | JPMorgan Chase Bank N.A. | (4,935 | ) | |||||||||||||
| CLP | 69,421,000 | USD | 104,162 | 04/24/19 | JPMorgan Chase Bank N.A. | (2,139 | ) | |||||||||||||
| CLP | 1,029,175,293 | USD | 1,513,048 | 04/05/19 | Morgan Stanley & Co. | (602 | ) | |||||||||||||
| COP | 10,867,743,680 | USD | 3,444,770 | 04/11/19 | HSBC Bank Plc | (34,968 | ) | |||||||||||||
| CZK | 25,428,000 | USD | 1,121,936 | 04/12/19 | Barclays Bank Plc | (16,284 | ) | |||||||||||||
| CZK | 1,810,490 | USD | 79,819 | 04/11/19 | HSBC Bank Plc | (1,098 | ) | |||||||||||||
| CZK | 8,729,889 | USD | 382,310 | 04/11/19 | JPMorgan Chase Bank N.A. | (2,730 | ) | |||||||||||||
| CZK | 57,198,000 | USD | 2,491,039 | 04/15/19 | JPMorgan Chase Bank N.A. | (3,772 | ) | |||||||||||||
| CZK | 2,223,981 | USD | 97,402 | 04/11/19 | Morgan Stanley & Co. | (702 | ) | |||||||||||||
| CZK | 77,218,250 | USD | 3,404,685 | 04/11/19 | Natwest Markets Plc | (47,200 | ) | |||||||||||||
| EUR | 285,000 | USD | 322,474 | 04/23/19 | Bank of America N.A. | (1,895 | ) | |||||||||||||
| EUR | 4,165,000 | USD | 4,749,350 | 04/30/19 | Bank of America N.A. | (61,638 | ) | |||||||||||||
| EUR | 555,000 | USD | 623,543 | 04/01/19 | BNP Paribas S.A. | (361 | ) | |||||||||||||
| EUR | 1,160,000 | USD | 1,323,108 | 04/17/19 | Citibank N.A. | (18,950 | ) | |||||||||||||
| EUR | 4,129,610 | USD | 4,714,062 | 04/11/19 | Deutsche Bank AG | (73,585 | ) | |||||||||||||
| EUR | 1,050,960 | USD | 1,186,630 | 04/11/19 | JPMorgan Chase Bank N.A. | (5,657 | ) | |||||||||||||
See accompanying Notes to the Financial Statements.
130
Table of Contents
Mercer Opportunistic Fixed Income Fund
Schedule of Investments (Continued)
March 31, 2019
Forward Foreign Currency Contracts — continued
Currency Purchased | Currency Sold | Settlement | Counterparty | Unrealized | ||||||||||||||||
| EUR | 1,170,000 | USD | 1,320,914 | 04/17/19 | JPMorgan Chase Bank N.A. | $ | (5,513 | ) | ||||||||||||
| EUR | 788,000 | USD | 894,903 | 04/30/19 | JPMorgan Chase Bank N.A. | (8,008 | ) | |||||||||||||
| EUR | 5,616,820 | USD | 6,365,366 | 04/11/19 | Toronto Dominion Bank | (53,699 | ) | |||||||||||||
| GBP | 759,590 | USD | 1,003,637 | 04/17/19 | Citibank N.A. | (13,100 | ) | |||||||||||||
| GBP | 696,000 | USD | 923,996 | 05/24/19 | HSBC Bank USA, N.A. | (14,731 | ) | |||||||||||||
| HUF | 224,191,370 | USD | 787,620 | 04/11/19 | Citibank N.A. | (4,409 | ) | |||||||||||||
| HUF | 67,612,350 | USD | 245,713 | 04/11/19 | HSBC Bank Plc | (9,510 | ) | |||||||||||||
| HUF | 321,369,000 | USD | 1,159,831 | 04/01/19 | JPMorgan Chase Bank N.A. | (37,893 | ) | |||||||||||||
| HUF | 21,003,980 | USD | 75,665 | 04/11/19 | JPMorgan Chase Bank N.A. | (2,288 | ) | |||||||||||||
| HUF | 26,455,000 | USD | 93,679 | 07/02/19 | JPMorgan Chase Bank N.A. | (699 | ) | |||||||||||||
| HUF | 64,948,770 | USD | 231,560 | 04/11/19 | Toronto Dominion Bank | (4,662 | ) | |||||||||||||
| IDR | 6,160,504,180 | USD | 431,647 | 04/11/19 | Citibank N.A. | 490 | ||||||||||||||
| IDR | 47,461,964,354 | USD | 3,337,247 | 04/11/19 | HSBC Bank Plc | (7,967 | ) | |||||||||||||
| IDR | 3,540,566,820 | USD | 250,642 | 04/11/19 | JPMorgan Chase Bank N.A. | (2,284 | ) | |||||||||||||
| IDR | 50,844,781,000 | USD | 3,550,117 | 04/24/19 | JPMorgan Chase Bank N.A. | 10,490 | ||||||||||||||
| IDR | 7,040,885,520 | USD | 489,145 | 04/11/19 | Morgan Stanley & Co. | 4,747 | ||||||||||||||
| ILS | 10,654,874 | USD | 2,961,209 | 04/16/19 | Bank of America N.A. | (22,684 | ) | |||||||||||||
| ILS | 2,321,850 | USD | 635,695 | 04/16/19 | Barclays Bank Plc | 4,651 | ||||||||||||||
| ILS | 5,177,265 | USD | 1,439,795 | 04/16/19 | BNP Paribas S.A. | (11,948 | ) | |||||||||||||
| ILS | 385,164 | USD | 107,170 | 04/16/19 | Credit Suisse | (945 | ) | |||||||||||||
| ILS | 5,178,030 | USD | 1,438,695 | 04/16/19 | Morgan Stanley & Co. | (10,638 | ) | |||||||||||||
| INR | 4,319,000 | USD | 60,259 | 04/05/19 | BNP Paribas S.A. | 2,068 | ||||||||||||||
| INR | 104,125,780 | USD | 1,503,861 | 04/11/19 | Citibank N.A. | (2,645 | ) | |||||||||||||
| INR | 106,718,000 | USD | 1,524,216 | 07/12/19 | Credit Suisse | (2,612 | ) | |||||||||||||
| INR | 6,477,000 | USD | 90,408 | 04/05/19 | Deutsche Bank AG | 3,059 | ||||||||||||||
| INR | 13,073,240 | USD | 187,182 | 04/11/19 | Deutsche Bank AG | 1,299 | ||||||||||||||
| INR | 42,523,030 | USD | 609,082 | 04/11/19 | HSBC Bank Plc | 3,987 | ||||||||||||||
| INR | 173,854,000 | USD | 2,427,253 | 04/05/19 | HSBC Bank USA, N.A. | 81,593 | ||||||||||||||
| INR | 8,954,980 | USD | 129,360 | 04/11/19 | Natwest Markets Plc | (254 | ) | |||||||||||||
| JPY | 14,670,000 | USD | 132,631 | 04/26/19 | BNP Paribas S.A. | 192 | ||||||||||||||
| JPY | 190,646,930 | USD | 1,710,026 | 04/11/19 | Citibank N.A. | 13,664 | ||||||||||||||
| JPY | 139,440,000 | USD | 1,298,034 | 04/17/19 | Citibank N.A. | (36,605 | ) | |||||||||||||
| JPY | 303,301,000 | USD | 2,795,609 | 04/26/19 | HSBC Bank USA, N.A. | (49,496 | ) | |||||||||||||
| JPY | 131,282,470 | USD | 1,185,815 | 04/11/19 | JPMorgan Chase Bank N.A. | 1,145 | ||||||||||||||
| JPY | 108,702,000 | USD | 992,114 | 04/26/19 | JPMorgan Chase Bank N.A. | (7,917 | ) | |||||||||||||
| JPY | 1,002,314,000 | USD | 9,110,248 | 04/26/19 | Morgan Stanley & Co. | (35,210 | ) | |||||||||||||
| JPY | 280,232,460 | USD | 2,536,392 | 04/11/19 | Toronto Dominion Bank | (2,735 | ) | |||||||||||||
| KRW | 3,873,991,890 | USD | 3,441,713 | 07/12/19 | HSBC Bank USA, N.A. | (17,972 | ) | |||||||||||||
| KZT | 119,073,000 | USD | 311,506 | 05/20/19 | Citibank N.A. | (704 | ) | |||||||||||||
| KZT | 91,879,480 | USD | 239,425 | 06/13/19 | Citibank N.A. | (666 | ) | |||||||||||||
| KZT | 76,998,480 | USD | 200,648 | 06/18/19 | HSBC Bank Plc | (749 | ) | |||||||||||||
| KZT | 49,920,210 | USD | 128,660 | 04/03/19 | Natwest Markets Plc | 2,827 | ||||||||||||||
| KZT | 128,190,390 | USD | 334,119 | 04/08/19 | Natwest Markets Plc | 3,199 | ||||||||||||||
| KZT | 15,349,920 | USD | 39,896 | 04/15/19 | Natwest Markets Plc | 439 | ||||||||||||||
| KZT | 168,534,120 | USD | 433,584 | 05/06/19 | Natwest Markets Plc | 7,441 | ||||||||||||||
| KZT | 51,940,050 | USD | 135,261 | 05/08/19 | Natwest Markets Plc | 608 | ||||||||||||||
| KZT | 93,418,380 | USD | 245,354 | 05/22/19 | Natwest Markets Plc | (1,603 | ) | |||||||||||||
| KZT | 80,328,400 | USD | 211,030 | 05/28/19 | Natwest Markets Plc | (1,662 | ) | |||||||||||||
See accompanying Notes to the Financial Statements.
131
Table of Contents
Mercer Opportunistic Fixed Income Fund
Schedule of Investments (Continued)
March 31, 2019
Forward Foreign Currency Contracts — continued
Currency Purchased | Currency Sold | Settlement | Counterparty | Unrealized | ||||||||||||||||
| MXN | 9,694,965 | USD | 502,602 | 04/17/19 | Barclays Bank Plc | $ | (3,988 | ) | ||||||||||||
| MXN | 409,562 | USD | 21,506 | 05/24/19 | BNP Paribas S.A. | (565 | ) | |||||||||||||
| MXN | 29,239,150 | USD | 1,554,098 | 04/11/19 | Citibank N.A. | (48,870 | ) | |||||||||||||
| MXN | 22,505,035 | USD | 1,159,916 | 04/17/19 | Citibank N.A. | (2,477 | ) | |||||||||||||
| MXN | 18,325,920 | USD | 951,406 | 04/11/19 | HSBC Bank Plc | (7,989 | ) | |||||||||||||
| MXN | 46,481,000 | USD | 2,394,403 | 05/24/19 | HSBC Bank USA, N.A. | (17,825 | ) | |||||||||||||
| MXN | 20,406,000 | USD | 1,049,717 | 04/01/19 | JPMorgan Chase Bank N.A. | 2,274 | ||||||||||||||
| MXN | 3,505,000 | USD | 179,183 | 07/02/19 | JPMorgan Chase Bank N.A. | (1,075 | ) | |||||||||||||
| MXN | 14,200,000 | USD | 731,608 | 04/11/19 | Morgan Stanley & Co. | (593 | ) | |||||||||||||
| MXN | 6,690,190 | USD | 348,810 | 04/11/19 | Natwest Markets Plc | (4,400 | ) | |||||||||||||
| MXN | 7,505,900 | USD | 385,937 | 04/11/19 | Toronto Dominion Bank | 466 | ||||||||||||||
| MYR | 18,202,191 | USD | 4,474,482 | 04/05/19 | HSBC Bank USA, N.A. | (16,197 | ) | |||||||||||||
| MYR | 7,498,730 | USD | 1,839,756 | 04/11/19 | Morgan Stanley & Co. | (3,330 | ) | |||||||||||||
| MYR | 14,084,810 | USD | 3,448,229 | 05/16/19 | Morgan Stanley & Co. | (1,533 | ) | |||||||||||||
| PEN | 1,599,500 | USD | 481,614 | 04/11/19 | HSBC Bank Plc | (124 | ) | |||||||||||||
| PEN | 224,000 | USD | 67,856 | 04/24/19 | JPMorgan Chase Bank N.A. | (477 | ) | |||||||||||||
| PEN | 129,000 | USD | 39,079 | 04/25/19 | JPMorgan Chase Bank N.A. | (278 | ) | |||||||||||||
| PHP | 103,170,000 | USD | 1,949,178 | 04/24/19 | JPMorgan Chase Bank N.A. | 10,789 | ||||||||||||||
| PHP | 30,140,340 | USD | 576,220 | 04/11/19 | Morgan Stanley & Co. | (2,810 | ) | |||||||||||||
| PLN | 1,455,000 | USD | 379,770 | 05/17/19 | Bank of America N.A. | 281 | ||||||||||||||
| PLN | 2,304,000 | USD | 603,006 | 05/17/19 | BNP Paribas S.A. | (1,194 | ) | |||||||||||||
| PLN | 350,890 | USD | 92,333 | 04/11/19 | Citibank N.A. | (782 | ) | |||||||||||||
| PLN | 4,263,700 | USD | 1,126,712 | 04/11/19 | Deutsche Bank AG | (14,268 | ) | |||||||||||||
| PLN | 22,456,700 | USD | 5,847,185 | 04/11/19 | HSBC Bank Plc | 11,998 | ||||||||||||||
| PLN | 33,288,000 | USD | 8,856,688 | 04/01/19 | JPMorgan Chase Bank N.A. | (174,032 | ) | |||||||||||||
| PLN | 3,525,000 | USD | 929,613 | 04/15/19 | JPMorgan Chase Bank N.A. | (9,792 | ) | |||||||||||||
| PLN | 32,230,000 | USD | 8,466,517 | 07/02/19 | JPMorgan Chase Bank N.A. | (35,943 | ) | |||||||||||||
| PLN | 240,210 | USD | 63,115 | 04/11/19 | Morgan Stanley & Co. | (441 | ) | |||||||||||||
| RON | 1,167,000 | USD | 276,895 | 04/18/19 | BNP Paribas S.A. | (2,887 | ) | |||||||||||||
| RON | 23,409,000 | USD | 5,612,077 | 04/01/19 | JPMorgan Chase Bank N.A. | (112,618 | ) | |||||||||||||
| RON | 2,730,150 | USD | 650,325 | 04/11/19 | JPMorgan Chase Bank N.A. | (9,129 | ) | |||||||||||||
| RON | 1,309,000 | USD | 310,305 | 04/18/19 | JPMorgan Chase Bank N.A. | (2,956 | ) | |||||||||||||
| RON | 23,236,000 | USD | 5,476,959 | 07/02/19 | JPMorgan Chase Bank N.A. | (35,477 | ) | |||||||||||||
| RUB | 236,241,100 | USD | 3,628,887 | 04/11/19 | HSBC Bank Plc | (37,902 | ) | |||||||||||||
| RUB | 28,305,120 | USD | 438,579 | 04/11/19 | JPMorgan Chase Bank N.A. | (8,326 | ) | |||||||||||||
| RUB | 77,601,490 | USD | 1,200,065 | 04/11/19 | Morgan Stanley & Co. | (20,484 | ) | |||||||||||||
| SEK | 35,720,000 | USD | 3,863,420 | 05/17/19 | JPMorgan Chase Bank N.A. | 593 | ||||||||||||||
| THB | 85,858,000 | USD | 2,705,893 | 04/05/19 | Bank of America N.A. | (220 | ) | |||||||||||||
| THB | 352,570,300 | USD | 11,068,673 | 04/11/19 | HSBC Bank Plc | 43,690 | ||||||||||||||
| THB | 42,929,000 | USD | 1,358,233 | 04/05/19 | HSBC Bank USA, N.A. | (5,396 | ) | |||||||||||||
| THB | 85,856,022 | USD | 2,708,445 | 04/05/19 | JPMorgan Chase Bank N.A. | (2,834 | ) | |||||||||||||
| TRY | 9,003,000 | USD | 1,613,090 | 04/12/19 | BNP Paribas S.A. | (44,729 | ) | |||||||||||||
| TRY | 7,575,000 | USD | 1,382,020 | 04/11/19 | Citibank N.A. | (61,143 | ) | |||||||||||||
| TRY | 26,716,316 | USD | 4,798,719 | 04/11/19 | HSBC Bank Plc | (140,107 | ) | |||||||||||||
| TRY | 4,683,000 | USD | 855,406 | 04/01/19 | JPMorgan Chase Bank N.A. | (26,499 | ) | |||||||||||||
| TRY | 1,146,960 | USD | 206,380 | 04/11/19 | JPMorgan Chase Bank N.A. | (6,381 | ) | |||||||||||||
| TRY | 6,813,000 | USD | 1,260,476 | 04/12/19 | JPMorgan Chase Bank N.A. | (73,622 | ) | |||||||||||||
| TRY | 25,123,000 | USD | 4,522,130 | 04/15/19 | JPMorgan Chase Bank N.A. | (158,278 | ) | |||||||||||||
See accompanying Notes to the Financial Statements.
132
Table of Contents
Mercer Opportunistic Fixed Income Fund
Schedule of Investments (Continued)
March 31, 2019
Forward Foreign Currency Contracts — continued
Currency Purchased | Currency Sold | Settlement | Counterparty | Unrealized | ||||||||||||||||
| TRY | 4,935,460 | USD | 892,875 | 04/11/19 | Natwest Markets Plc | $ | (32,263 | ) | ||||||||||||
| TRY | 960,000 | USD | 172,706 | 04/11/19 | Toronto Dominion Bank | (5,308 | ) | |||||||||||||
| TWD | 74,626,000 | USD | 2,418,603 | 04/10/19 | Barclays Bank Plc | 3,918 | ||||||||||||||
| TWD | 4,411,000 | USD | 143,219 | 04/10/19 | HSBC Bank USA, N.A. | (28 | ) | |||||||||||||
| TWD | 149,253,000 | USD | 4,835,671 | 04/10/19 | State Street Bank London | 9,400 | ||||||||||||||
| ZAR | 16,261,751 | USD | 1,138,922 | 04/05/19 | Bank of America N.A. | (11,714 | ) | |||||||||||||
| ZAR | 57,817,022 | USD | 4,006,031 | 04/05/19 | Barclays Bank Plc | 1,642 | ||||||||||||||
| ZAR | 17,426,368 | USD | 1,220,018 | 04/05/19 | BNP Paribas S.A. | (12,083 | ) | |||||||||||||
| ZAR | 10,271,390 | USD | 710,052 | 04/11/19 | Citibank N.A. | 1,405 | ||||||||||||||
| ZAR | 18,987,230 | USD | 1,332,487 | 04/11/19 | Deutsche Bank AG | (17,320 | ) | |||||||||||||
| ZAR | 11,145,000 | USD | 782,379 | 04/11/19 | HSBC Bank Plc | (10,411 | ) | |||||||||||||
| ZAR | 8,145,239 | USD | 570,070 | 04/05/19 | HSBC Bank USA, N.A. | (5,471 | ) | |||||||||||||
| ZAR | 15,547,000 | USD | 1,075,869 | 04/01/19 | JPMorgan Chase Bank N.A. | 2,193 | ||||||||||||||
| ZAR | 12,170,000 | USD | 842,217 | 04/11/19 | JPMorgan Chase Bank N.A. | 749 | ||||||||||||||
| ZAR | 12,946,570 | USD | 897,454 | 04/11/19 | Morgan Stanley & Co. | (698 | ) | |||||||||||||
| ZAR | 3,473,460 | USD | 239,818 | 04/11/19 | State Street Bank London | 774 | ||||||||||||||
| USD | 290,678 | ARS | 11,912,000 | 05/15/19 | Citibank N.A. | 31,578 | ||||||||||||||
| USD | 35,787 | AUD | 50,000 | 04/17/19 | Barclays Bank Plc | 258 | ||||||||||||||
| USD | 4,597,831 | AUD | 6,497,265 | 04/26/19 | BNP Paribas S.A. | (19,704 | ) | |||||||||||||
| USD | 803,989 | AUD | 1,121,350 | 04/17/19 | Citibank N.A. | 7,195 | ||||||||||||||
| USD | 1,194,573 | AUD | 1,685,376 | 04/26/19 | Deutsche Bank AG | (3,206 | ) | |||||||||||||
| USD | 9,350,367 | AUD | 13,211,453 | 04/26/19 | HSBC Bank USA, N.A. | (38,867 | ) | |||||||||||||
| USD | 442,524 | AUD | 624,422 | 04/26/19 | Morgan Stanley & Co. | (1,245 | ) | |||||||||||||
| USD | 92,265 | AUD | 130,000 | 04/26/19 | State Street Bank London | (124 | ) | |||||||||||||
| USD | 970,422 | BRL | 3,781,441 | 04/02/19 | BNP Paribas S.A. | (1,247 | ) | |||||||||||||
| USD | 663,408 | BRL | 2,581,020 | 04/11/19 | Citibank N.A. | 593 | ||||||||||||||
| USD | 2,758,628 | BRL | 10,481,830 | 04/11/19 | Deutsche Bank AG | 66,856 | ||||||||||||||
| USD | 2,852,839 | BRL | 11,095,832 | 04/02/19 | HSBC Bank Plc | 1,686 | ||||||||||||||
| USD | 391,093 | BRL | 1,479,013 | 04/11/19 | HSBC Bank Plc | 11,277 | ||||||||||||||
| USD | 3,223,517 | BRL | 12,554,164 | 04/02/19 | JPMorgan Chase Bank N.A. | (2,366 | ) | |||||||||||||
| USD | 606,738 | BRL | 2,342,010 | 04/11/19 | JPMorgan Chase Bank N.A. | 5,302 | ||||||||||||||
| USD | 2,779,489 | BRL | 10,658,200 | 04/24/19 | JPMorgan Chase Bank N.A. | 44,369 | ||||||||||||||
| USD | 5,813,351 | BRL | 22,319,200 | 04/25/19 | JPMorgan Chase Bank N.A. | 86,087 | ||||||||||||||
| USD | 2,704,109 | BRL | 10,507,898 | 06/04/19 | JPMorgan Chase Bank N.A. | 15,311 | ||||||||||||||
| USD | 4,914,823 | BRL | 19,106,226 | 04/02/19 | Morgan Stanley & Co. | 5,342 | ||||||||||||||
| USD | 1,958,227 | BRL | 7,519,567 | 04/11/19 | Morgan Stanley & Co. | 27,174 | ||||||||||||||
| USD | 646,471 | BRL | 2,493,440 | 04/11/19 | Natwest Markets Plc | 6,147 | ||||||||||||||
| USD | 2,400,250 | CAD | 3,228,000 | 04/26/19 | Bank of America N.A. | (17,537 | ) | |||||||||||||
| USD | 180,985 | CAD | 240,000 | 04/17/19 | Barclays Bank Plc | 1,264 | ||||||||||||||
| USD | 304,623 | CAD | 400,000 | 04/01/19 | JPMorgan Chase Bank N.A. | 5,210 | ||||||||||||||
| USD | 500,088 | CAD | 660,000 | 04/17/19 | JPMorgan Chase Bank N.A. | 5,855 | ||||||||||||||
| USD | 2,288,960 | CAD | 3,050,000 | 04/26/19 | JPMorgan Chase Bank N.A. | 4,496 | ||||||||||||||
| USD | 771,048 | CLP | 517,604,477 | 04/05/19 | Barclays Bank Plc | 10,391 | ||||||||||||||
| USD | 1,514,982 | CLP | 1,029,173,000 | 06/07/19 | Barclays Bank Plc | 2,461 | ||||||||||||||
| USD | 1,585,334 | CLP | 1,093,801,000 | 04/05/19 | BNP Paribas S.A. | (22,084 | ) | |||||||||||||
| USD | 3,020,676 | CLP | 2,058,346,000 | 06/07/19 | BNP Paribas S.A. | (4,366 | ) | |||||||||||||
| USD | 319,644 | CLP | 218,828,470 | 04/11/19 | Citibank N.A. | (1,944 | ) | |||||||||||||
| USD | 227,989 | CLP | 154,850,150 | 04/11/19 | Credit Suisse | 423 | ||||||||||||||
See accompanying Notes to the Financial Statements.
133
Table of Contents
Mercer Opportunistic Fixed Income Fund
Schedule of Investments (Continued)
March 31, 2019
Forward Foreign Currency Contracts — continued
Currency Purchased | Currency Sold | Settlement | Counterparty | Unrealized | ||||||||||||||||
| USD | 346,806 | CLP | 236,087,900 | 04/11/19 | Deutsche Bank AG | $ | (147 | ) | ||||||||||||
| USD | 3,092,374 | CLP | 2,058,346,000 | 06/07/19 | Deutsche Bank AG | 67,332 | ||||||||||||||
| USD | 1,041,206 | CLP | 693,855,720 | 04/11/19 | HSBC Bank Plc | 21,523 | ||||||||||||||
| USD | 68,195 | CLP | 44,968,000 | 04/05/19 | HSBC Bank USA, N.A. | 2,112 | ||||||||||||||
| USD | 3,146,365 | CLP | 2,187,604,816 | 04/05/19 | JPMorgan Chase Bank N.A. | (68,476 | ) | |||||||||||||
| USD | 1,566,201 | CLP | 1,049,609,000 | 04/24/19 | JPMorgan Chase Bank N.A. | 23,669 | ||||||||||||||
| USD | 1,516,679 | CLP | 1,029,173,000 | 06/07/19 | JPMorgan Chase Bank N.A. | 4,158 | ||||||||||||||
| USD | 4,744,444 | CLP | 3,281,403,000 | 04/05/19 | JPMorgan Chase Bank N.A. London | (77,810 | ) | |||||||||||||
| USD | 118,100 | CLP | 78,832,000 | 04/05/19 | Morgan Stanley & Co. | 2,251 | ||||||||||||||
| USD | 620,857 | CLP | 413,491,030 | 04/11/19 | Morgan Stanley & Co. | 13,196 | ||||||||||||||
| USD | 1,512,892 | CLP | 1,029,175,293 | 06/07/19 | Morgan Stanley & Co. | 368 | ||||||||||||||
| USD | 1,216,589 | CNH | 8,187,680 | 04/11/19 | JPMorgan Chase Bank N.A. | (1,713 | ) | |||||||||||||
| USD | 262,354 | COP | 839,271,320 | 04/11/19 | Credit Suisse | (971 | ) | |||||||||||||
| USD | 132,818 | COP | 417,911,860 | 04/11/19 | Deutsche Bank AG | 1,696 | ||||||||||||||
| USD | 1,101,433 | COP | 3,446,922,620 | 04/11/19 | HSBC Bank Plc | 19,947 | ||||||||||||||
| USD | 2,321,948 | COP | 7,311,235,000 | 04/24/19 | JPMorgan Chase Bank N.A. | 29,873 | ||||||||||||||
| USD | 303,916 | COP | 960,070,640 | 04/11/19 | Morgan Stanley & Co. | 2,690 | ||||||||||||||
| USD | 354,688 | CZK | 8,140,000 | 04/11/19 | Citibank N.A. | 757 | ||||||||||||||
| USD | 538,204 | CZK | 12,250,000 | 04/11/19 | HSBC Bank Plc | 5,568 | ||||||||||||||
| USD | 324,553 | EUR | 285,000 | 04/23/19 | Bank of America N.A. | 3,974 | ||||||||||||||
| USD | 5,561,756 | EUR | 4,853,000 | 04/30/19 | Bank of America N.A. | 99,701 | ||||||||||||||
| USD | 2,351,737 | EUR | 2,030,000 | 04/17/19 | Barclays Bank Plc | 69,461 | ||||||||||||||
| USD | 1,483,129 | EUR | 1,298,925 | 04/30/19 | Barclays Bank Plc | 21,188 | ||||||||||||||
| USD | 632,921 | EUR | 555,000 | 04/01/19 | BNP Paribas S.A. | 9,738 | ||||||||||||||
| USD | 766,812 | EUR | 682,000 | 04/30/19 | BNP Paribas S.A. | (780 | ) | |||||||||||||
| USD | 625,183 | EUR | 555,000 | 05/02/19 | BNP Paribas S.A. | 425 | ||||||||||||||
| USD | 2,682,386 | EUR | 2,321,002 | 04/17/19 | Citibank N.A. | 72,944 | ||||||||||||||
| USD | 281,280 | EUR | 248,000 | 04/30/19 | Credit Suisse | 2,156 | ||||||||||||||
| USD | 587,466 | EUR | 520,000 | 04/08/19 | Deutsche Bank AG | 3,286 | ||||||||||||||
| USD | 821,961 | EUR | 729,840 | 04/11/19 | Deutsche Bank AG | 1,834 | ||||||||||||||
| USD | 925,929 | EUR | 815,000 | 04/23/19 | Deutsche Bank AG | 9,185 | ||||||||||||||
| USD | 521,663 | EUR | 454,398 | 04/30/19 | Deutsche Bank AG | 10,238 | ||||||||||||||
| USD | 776,535 | EUR | 680,000 | 04/04/19 | Goldman Sachs & Co. | 12,867 | ||||||||||||||
| USD | 550,854 | EUR | 484,510 | 04/11/19 | HSBC Bank Plc | 6,406 | ||||||||||||||
| USD | 2,240,247 | EUR | 1,963,649 | 04/30/19 | HSBC Bank USA, N.A. | 30,157 | ||||||||||||||
| USD | 1,577,819 | EUR | 1,391,680 | 04/11/19 | JPMorgan Chase Bank N.A. | 13,976 | ||||||||||||||
| USD | 4,381,225 | EUR | 3,822,415 | 04/17/19 | JPMorgan Chase Bank N.A. | 83,784 | ||||||||||||||
| USD | 7,108,130 | EUR | 6,206,000 | 04/30/19 | JPMorgan Chase Bank N.A. | 123,272 | ||||||||||||||
| USD | 652,674 | EUR | 576,710 | 04/11/19 | Toronto Dominion Bank | 4,621 | ||||||||||||||
| USD | 649,116 | EUR | 570,000 | 04/23/19 | UBS AG London | 7,957 | ||||||||||||||
| USD | 195,238 | GBP | 150,000 | 04/17/19 | Barclays Bank Plc | (368 | ) | |||||||||||||
| USD | 171,552 | GBP | 129,513 | 05/24/19 | JPMorgan Chase Bank N.A. | 2,354 | ||||||||||||||
| USD | 987,953 | GBP | 761,763 | 05/24/19 | Morgan Stanley & Co. | (7,226 | ) | |||||||||||||
| USD | 228,415 | HUF | 63,850,000 | 04/11/19 | Citibank N.A. | 5,356 | ||||||||||||||
| USD | 6,078,944 | HUF | 1,697,122,952 | 04/11/19 | HSBC Bank Plc | 150,061 | ||||||||||||||
| USD | 1,160,335 | HUF | 321,369,000 | 04/01/19 | JPMorgan Chase Bank N.A. | 38,396 | ||||||||||||||
| USD | 179,506 | HUF | 49,635,660 | 04/11/19 | JPMorgan Chase Bank N.A. | 6,104 | ||||||||||||||
| USD | 122,242 | IDR | 1,742,200,000 | 04/11/19 | Citibank N.A. | 34 | ||||||||||||||
See accompanying Notes to the Financial Statements.
134
Table of Contents
Mercer Opportunistic Fixed Income Fund
Schedule of Investments (Continued)
March 31, 2019
Forward Foreign Currency Contracts — continued
Currency Purchased | Currency Sold | Settlement | Counterparty | Unrealized | ||||||||||||||||
| USD | 988,229 | IDR | 14,389,112,712 | 04/17/19 | Citibank N.A. | $ | (20,334 | ) | ||||||||||||
| USD | 188,764 | IDR | 2,721,403,500 | 04/11/19 | Credit Suisse | (2,133 | ) | |||||||||||||
| USD | 886,512 | IDR | 12,665,509,390 | 04/11/19 | Deutsche Bank AG | (1,927 | ) | |||||||||||||
| USD | 1,214,573 | IDR | 17,348,225,160 | 04/11/19 | HSBC Bank Plc | (2,341 | ) | |||||||||||||
| USD | 64,594 | IDR | 921,051,810 | 04/11/19 | JPMorgan Chase Bank N.A. | (14 | ) | |||||||||||||
| USD | 1,666,816 | IDR | 23,893,582,000 | 04/24/19 | JPMorgan Chase Bank N.A. | (6,427 | ) | |||||||||||||
| USD | 210,571 | ILS | 761,602 | 04/16/19 | Bank of America N.A. | 527 | ||||||||||||||
| USD | 3,790,587 | ILS | 13,937,673 | 04/16/19 | Barclays Bank Plc | (53,307 | ) | |||||||||||||
| USD | 2,665,523 | ILS | 9,746,774 | 04/16/19 | BNP Paribas S.A. | (22,556 | ) | |||||||||||||
| USD | 1,859,750 | ILS | 6,837,000 | 04/16/19 | HSBC Bank USA, N.A. | (25,837 | ) | |||||||||||||
| USD | 735,150 | ILS | 2,651,048 | 04/16/19 | JPMorgan Chase Bank N.A. | 4,013 | ||||||||||||||
| USD | 2,604,810 | ILS | 9,542,103 | 04/16/19 | Morgan Stanley & Co. | (26,823 | ) | |||||||||||||
| USD | 1,544,176 | INR | 106,718,000 | 04/05/19 | Credit Suisse | 4,154 | ||||||||||||||
| USD | 4,792,550 | INR | 335,810,480 | 04/11/19 | HSBC Bank Plc | (48,939 | ) | |||||||||||||
| USD | 1,128,413 | INR | 77,932,000 | 04/05/19 | HSBC Bank USA, N.A. | 3,795 | ||||||||||||||
| USD | 165,895 | JPY | 18,426,060 | 04/11/19 | Citibank N.A. | (700 | ) | |||||||||||||
| USD | 745,588 | JPY | 82,650,000 | 04/17/19 | Citibank N.A. | (2,096 | ) | |||||||||||||
| USD | 881,809 | JPY | 98,211,000 | 04/26/19 | HSBC Bank USA, N.A. | (7,402 | ) | |||||||||||||
| USD | 428,172 | JPY | 47,590,530 | 04/11/19 | JPMorgan Chase Bank N.A. | (2,107 | ) | |||||||||||||
| USD | 4,706,516 | JPY | 518,844,000 | 04/26/19 | JPMorgan Chase Bank N.A. | 8,858 | ||||||||||||||
| USD | 1,857,858 | JPY | 204,094,990 | 04/11/19 | Morgan Stanley & Co. | 12,580 | ||||||||||||||
| USD | 596,224 | JPY | 66,364,770 | 04/11/19 | State Street Bank London | (3,798 | ) | |||||||||||||
| USD | 3,477,239 | KRW | 3,873,991,890 | 07/12/19 | HSBC Bank USA, N.A. | 53,499 | ||||||||||||||
| USD | 1,156,061 | MXN | 22,764,000 | 05/24/19 | Bank of America N.A. | (7,864 | ) | |||||||||||||
| USD | 3,681,962 | MXN | 71,437,309 | 05/24/19 | BNP Paribas S.A. | 29,365 | ||||||||||||||
| USD | 321,702 | MXN | 6,201,260 | 04/11/19 | Citibank N.A. | 2,462 | ||||||||||||||
| USD | 1,012,059 | MXN | 19,627,450 | 04/11/19 | HSBC Bank Plc | 1,640 | ||||||||||||||
| USD | 4,230,650 | MXN | 82,282,523 | 05/24/19 | HSBC Bank USA, N.A. | 23,537 | ||||||||||||||
| USD | 1,059,386 | MXN | 20,406,000 | 04/01/19 | JPMorgan Chase Bank N.A. | 7,394 | ||||||||||||||
| USD | 683,774 | MXN | 13,015,420 | 04/11/19 | JPMorgan Chase Bank N.A. | 13,742 | ||||||||||||||
| USD | 770,736 | MXN | 15,033,000 | 04/15/19 | JPMorgan Chase Bank N.A. | (2,664 | ) | |||||||||||||
| USD | 2,535,191 | MXN | 49,567,000 | 05/24/19 | JPMorgan Chase Bank N.A. | 825 | ||||||||||||||
| USD | 2,728,619 | MXN | 53,105,948 | 05/24/19 | Morgan Stanley & Co. | 13,308 | ||||||||||||||
| USD | 1,414,046 | MXN | 27,585,360 | 04/11/19 | Natwest Markets Plc | (6,045 | ) | |||||||||||||
| USD | 888,946 | MYR | 3,642,191 | 04/05/19 | BNP Paribas S.A. | (3,140 | ) | |||||||||||||
| USD | 1,738,460 | MYR | 7,104,215 | 06/14/19 | Deutsche Bank AG | 1,051 | ||||||||||||||
| USD | 1,769,739 | MYR | 7,280,000 | 04/05/19 | HSBC Bank USA, N.A. | (13,360 | ) | |||||||||||||
| USD | 4,467,344 | MYR | 18,202,191 | 06/14/19 | HSBC Bank USA, N.A. | 15,812 | ||||||||||||||
| USD | 1,770,041 | MYR | 7,280,000 | 04/05/19 | JPMorgan Chase Bank N.A. | (13,058 | ) | |||||||||||||
| USD | 605,311 | MYR | 2,470,420 | 04/11/19 | Morgan Stanley & Co. | 309 | ||||||||||||||
| USD | 2,220,496 | MYR | 9,061,130 | 05/16/19 | Morgan Stanley & Co. | 3,145 | ||||||||||||||
| USD | 271,464 | PEN | 895,450 | 04/11/19 | Citibank N.A. | 1,911 | ||||||||||||||
| USD | 4,194,013 | PEN | 13,896,440 | 04/11/19 | HSBC Bank Plc | 10,836 | ||||||||||||||
| USD | 1,407,643 | PEN | 4,669,010 | 04/11/19 | Morgan Stanley & Co. | 2,154 | ||||||||||||||
| USD | 324,239 | PHP | 17,256,000 | 04/12/19 | Barclays Bank Plc | (4,015 | ) | |||||||||||||
| USD | 509,309 | PHP | 26,931,020 | 04/11/19 | HSBC Bank Plc | (3,046 | ) | |||||||||||||
| USD | 1,260,668 | PHP | 67,166,000 | 04/12/19 | JPMorgan Chase Bank N.A. London | (17,002 | ) | |||||||||||||
| USD | 1,359,423 | PLN | 5,150,000 | 04/11/19 | Citibank N.A. | 15,734 | ||||||||||||||
See accompanying Notes to the Financial Statements.
135
Table of Contents
Mercer Opportunistic Fixed Income Fund
Schedule of Investments (Continued)
March 31, 2019
Forward Foreign Currency Contracts — continued
Currency Purchased | Currency Sold | Settlement | Counterparty | Unrealized | ||||||||||||||||
| USD | 603,801 | PLN | 2,310,000 | 04/11/19 | HSBC Bank Plc | $ | 1,099 | |||||||||||||
| USD | 8,722,551 | PLN | 33,288,000 | 04/01/19 | JPMorgan Chase Bank N.A. | 39,894 | ||||||||||||||
| USD | 200,758 | PLN | 767,000 | 04/15/19 | JPMorgan Chase Bank N.A. | 616 | ||||||||||||||
| USD | 1,136,143 | PLN | 4,320,000 | 04/11/19 | State Street Bank London | 9,011 | ||||||||||||||
| USD | 366,597 | PLN | 1,390,000 | 04/11/19 | Toronto Dominion Bank | 3,932 | ||||||||||||||
| USD | 988,978 | RON | 4,170,817 | 04/18/19 | Bank of America N.A. | 9,683 | ||||||||||||||
| USD | 216,183 | RON | 879,000 | 04/18/19 | Barclays Bank Plc | 9,796 | ||||||||||||||
| USD | 1,458,657 | RON | 6,004,079 | 04/18/19 | BNP Paribas S.A. | 48,918 | ||||||||||||||
| USD | 1,127,412 | RON | 4,747,800 | 04/11/19 | Citibank N.A. | 12,355 | ||||||||||||||
| USD | 470,614 | RON | 1,972,820 | 04/11/19 | Deutsche Bank AG | 7,283 | ||||||||||||||
| USD | 1,164,306 | RON | 4,911,320 | 04/11/19 | HSBC Bank Plc | 10,847 | ||||||||||||||
| USD | 5,530,126 | RON | 23,409,000 | 04/01/19 | JPMorgan Chase Bank N.A. | 30,667 | ||||||||||||||
| USD | 738,673 | RON | 3,110,930 | 04/11/19 | JPMorgan Chase Bank N.A. | 8,048 | ||||||||||||||
| USD | 432,400 | RON | 1,758,010 | 04/18/19 | JPMorgan Chase Bank N.A. | 19,625 | ||||||||||||||
| USD | 833,839 | RUB | 54,990,000 | 04/17/19 | Barclays Bank Plc | (1,170 | ) | |||||||||||||
| USD | 1,354,116 | RUB | 91,870,000 | 04/17/19 | Citibank N.A. | (40,906 | ) | |||||||||||||
| USD | 2,445,666 | RUB | 162,655,100 | 04/11/19 | HSBC Bank Plc | (26,775 | ) | |||||||||||||
| USD | 2,400,560 | RUB | 157,992,000 | 04/24/19 | JPMorgan Chase Bank N.A. | 4,391 | ||||||||||||||
| USD | 2,782,348 | RUB | 184,313,510 | 04/11/19 | Morgan Stanley & Co. | (19,311 | ) | |||||||||||||
| USD | 4,137,964 | SEK | 38,051,474 | 05/17/19 | Bank of America N.A. | 21,743 | ||||||||||||||
| USD | 2,707,173 | THB | 85,858,000 | 06/14/19 | Bank of America N.A. | (3,374 | ) | |||||||||||||
| USD | 1,696,694 | THB | 53,663,022 | 04/05/19 | Barclays Bank Plc | 5,592 | ||||||||||||||
| USD | 304,082 | THB | 9,700,850 | 04/11/19 | Credit Suisse | (1,671 | ) | |||||||||||||
| USD | 306,723 | THB | 9,767,600 | 04/11/19 | Deutsche Bank AG | (1,133 | ) | |||||||||||||
| USD | 1,764,658 | THB | 55,909,350 | 04/11/19 | HSBC Bank Plc | 2,499 | ||||||||||||||
| USD | 1,691,965 | THB | 53,660,000 | 04/05/19 | HSBC Bank USA, N.A. | 958 | ||||||||||||||
| USD | 1,359,055 | THB | 42,929,000 | 06/14/19 | HSBC Bank USA, N.A. | 3,781 | ||||||||||||||
| USD | 3,382,574 | THB | 107,320,000 | 04/05/19 | JPMorgan Chase Bank N.A. | 560 | ||||||||||||||
| USD | 655,512 | THB | 20,800,000 | 04/11/19 | JPMorgan Chase Bank N.A. | (65 | ) | |||||||||||||
| USD | 5,128,898 | THB | 162,345,000 | 04/25/19 | JPMorgan Chase Bank N.A. | 10,282 | ||||||||||||||
| USD | 3,711,749 | THB | 117,850,710 | 06/14/19 | JPMorgan Chase Bank N.A. | (8,812 | ) | |||||||||||||
| USD | 1,155,909 | THB | 36,626,750 | 04/11/19 | Morgan Stanley & Co. | 1,501 | ||||||||||||||
| USD | 2,091,636 | THB | 66,245,510 | 04/11/19 | Natwest Markets Plc | 3,701 | ||||||||||||||
| USD | 1,133,400 | TRY | 6,249,000 | 04/12/19 | Bank of America N.A. | 44,797 | ||||||||||||||
| USD | 1,685,319 | TRY | 9,567,000 | 04/12/19 | Barclays Bank Plc | 18,706 | ||||||||||||||
| USD | 1,174,353 | TRY | 6,555,530 | 04/11/19 | Citibank N.A. | 31,245 | ||||||||||||||
| USD | 270,428 | TRY | 1,500,860 | 04/11/19 | HSBC Bank Plc | 8,718 | ||||||||||||||
| USD | 854,544 | TRY | 4,683,000 | 04/01/19 | JPMorgan Chase Bank N.A. | 25,635 | ||||||||||||||
| USD | 77,618 | TRY | 442,690 | 04/11/19 | JPMorgan Chase Bank N.A. | 424 | ||||||||||||||
| USD | 2,527,208 | TRY | 14,551,000 | 04/15/19 | JPMorgan Chase Bank N.A. | (294 | ) | |||||||||||||
| USD | 87,667 | TRY | 510,000 | 05/02/19 | JPMorgan Chase Bank N.A. | 492 | ||||||||||||||
| USD | 315,083 | TRY | 1,743,560 | 04/11/19 | Morgan Stanley & Co. | 11,053 | ||||||||||||||
| USD | 398,033 | TRY | 2,247,330 | 04/11/19 | Natwest Markets Plc | 6,159 | ||||||||||||||
| USD | 2,198,170 | TWD | 67,386,000 | 04/10/19 | Barclays Bank Plc | 10,676 | ||||||||||||||
| USD | 2,428,441 | TWD | 74,626,000 | 07/12/19 | Barclays Bank Plc | (8,168 | ) | |||||||||||||
| USD | 4,679,796 | TWD | 143,768,000 | 04/10/19 | BNP Paribas S.A. | 12,779 | ||||||||||||||
| USD | 555,090 | TWD | 17,136,000 | 04/10/19 | HSBC Bank USA, N.A. | (1,181 | ) | |||||||||||||
| USD | 4,853,756 | TWD | 149,253,000 | 07/12/19 | State Street Bank London | (19,496 | ) | |||||||||||||
See accompanying Notes to the Financial Statements.
136
Table of Contents
Mercer Opportunistic Fixed Income Fund
Schedule of Investments (Continued)
March 31, 2019
Forward Foreign Currency Contracts — continued
Currency Purchased | Currency Sold | Settlement | Counterparty | Unrealized | ||||||||||||||||
| USD | 2,780,445 | ZAR | 37,712,000 | 04/05/19 | Barclays Bank Plc | $ | 166,381 | |||||||||||||
| USD | 1,908,734 | ZAR | 26,097,000 | 04/05/19 | BNP Paribas S.A. | 99,781 | ||||||||||||||
| USD | 2,407,924 | ZAR | 34,797,820 | 04/11/19 | Citibank N.A. | (2,375 | ) | |||||||||||||
| USD | 297,986 | ZAR | 4,301,840 | 04/11/19 | HSBC Bank Plc | 15 | ||||||||||||||
| USD | 1,132,248 | ZAR | 15,547,000 | 04/01/19 | JPMorgan Chase Bank N.A. | 54,186 | ||||||||||||||
| USD | 986,219 | ZAR | 13,329,379 | 04/05/19 | JPMorgan Chase Bank N.A. | 62,273 | ||||||||||||||
| USD | 553,899 | ZAR | 8,134,880 | 04/11/19 | JPMorgan Chase Bank N.A. | (9,570 | ) | |||||||||||||
| USD | 4,023,343 | ZAR | 58,231,000 | 04/15/19 | JPMorgan Chase Bank N.A. | (8,157 | ) | |||||||||||||
| USD | 550,462 | ZAR | 8,105,000 | 07/02/19 | JPMorgan Chase Bank N.A. | (5,457 | ) | |||||||||||||
| USD | 1,659,547 | ZAR | 22,512,000 | 04/05/19 | Morgan Stanley & Co. | 99,093 | ||||||||||||||
| USD | 1,038,199 | ZAR | 14,979,250 | 04/11/19 | Morgan Stanley & Co. | 649 | ||||||||||||||
| USD | 731,005 | ZAR | 10,570,520 | 04/11/19 | Natwest Markets Plc | (1,171 | ) | |||||||||||||
| USD | 853,994 | ZAR | 12,392,240 | 04/11/19 | State Street Bank London | (4,365 | ) | |||||||||||||
| USD | 305,029 | ZAR | 4,403,290 | 04/11/19 | Toronto Dominion Bank | 30 | ||||||||||||||
|
| |||||||||||||||||||
| $ | (462,318 | ) | ||||||||||||||||||
|
| |||||||||||||||||||
Futures Contracts
Number of | Description | Expiration Date | Notional | Market Value/ | ||||||||||||||||
| Buys | ||||||||||||||||||||
| 10 | 10 Yr Australian Bond Futures | Jun 2019 | $ | 984,236 | $ | 12,084 | ||||||||||||||
| 21 | Euro-BTP | Jun 2019 | 3,052,883 | (7,703 | ) | |||||||||||||||
| 110 | U.S. Long Bond | Jun 2019 | 16,462,187 | 250,818 | ||||||||||||||||
| 360 | U.S. Treasury Note10-Year | Jun 2019 | 44,718,750 | 146,288 | ||||||||||||||||
| 1 | U.S. Treasury Note2-Year | Jun 2019 | 213,094 | 740 | ||||||||||||||||
| 43 | U.S. Ultra Bond | Jun 2019 | 7,224,000 | 218,375 | ||||||||||||||||
|
| |||||||||||||||||||
| $ | 620,602 | |||||||||||||||||||
|
| |||||||||||||||||||
| Sales | ||||||||||||||||||||
| 36 | Euro-Bund | Jun 2019 | $ | 6,723,894 | $ | (144,975 | ) | |||||||||||||
| 30 | Euro-OAT | Jun 2019 | 5,479,620 | (145,199 | ) | |||||||||||||||
| 5 | Long Gilt Futures | Jun 2019 | 842,878 | (12,779 | ) | |||||||||||||||
| 133 | U.S. Treasury Note5-Year | Jun 2019 | 15,405,141 | (23,246 | ) | |||||||||||||||
| 35 | U.S. Ultra10-Year | Jun 2019 | 4,647,344 | 7,040 | ||||||||||||||||
| 13 | U.S. Ultra Bond | Jun 2019 | 2,184,000 | 1,499 | ||||||||||||||||
| 73 | U.S. Ultra Bond | Jun 2019 | 12,264,000 | (575,620 | ) | |||||||||||||||
|
| |||||||||||||||||||
| $ | (893,280 | ) | ||||||||||||||||||
|
| |||||||||||||||||||
See accompanying Notes to the Financial Statements.
137
Table of Contents
Mercer Opportunistic Fixed Income Fund
Schedule of Investments (Continued)
March 31, 2019
Written Options
Written Currency Options
Type of Contract | Counterparty | Notional Value | Premiums Received | Value at March 31, 2019 | |||||||||||||||||||||||
CALL — USD/BRL Option | Citibank N.A. | USD | (800,000 | ) | $ | (14,850 | ) | $ | (14,638 | ) | |||||||||||||||||
Strike @ $4.02 | |||||||||||||||||||||||||||
Expires 06/24/2019 | |||||||||||||||||||||||||||
CALL — USD/CAD Option | JPMorgan Chase Bank N.A. | USD | (1,600,000 | ) | (7,600 | ) | (4,421 | ) | |||||||||||||||||||
Strike @ $1.37 | |||||||||||||||||||||||||||
Expires 06/10/2019 | |||||||||||||||||||||||||||
CALL — USD/EUR Option | JPMorgan Chase Bank N.A. | USD | (700,000 | ) | (3,644 | ) | (1,964 | ) | |||||||||||||||||||
Strike @ $1.10 | |||||||||||||||||||||||||||
Expires 06/07/2019 | |||||||||||||||||||||||||||
CALL — USD/EUR Option | Citibank N.A. | USD | (800,000 | ) | (3,796 | ) | (4,864 | ) | |||||||||||||||||||
|
|
|
| ||||||||||||||||||||||||
Strike @ $1.11 | |||||||||||||||||||||||||||
Expires 06/24/2019 | |||||||||||||||||||||||||||
Total Written Currency Options |
| $ | (29,890 | ) | $ | (25,887 | ) | ||||||||||||||||||||
|
|
|
| ||||||||||||||||||||||||
Written Futures Options
Type of Contract | Counterparty | Number of Contracts | Notional Value | Premiums Received | Value at March 31, 2019 | ||||||||||||||||||||
CALL — U.S. Treasury Note10-Year Futures Option | UBS Securities LLC | 14 | $ | (1,739,063 | ) | $ | (7,413 | ) | $ | (6,344 | ) | ||||||||||||||
Strike @ $125.00 | |||||||||||||||||||||||||
Expires 05/24/2019 | |||||||||||||||||||||||||
CALL — U.S. Treasury Note5-Year Futures Option | UBS Securities LLC | 20 | (2,316,563 | ) | (4,809 | ) | (13,750 | ) | |||||||||||||||||
Strike @ $115.25 | |||||||||||||||||||||||||
Expires 04/26/2019 | |||||||||||||||||||||||||
CALL — U.S. Treasury Note5-Year Futures Option | UBS Securities LLC | 14 | (1,621,594 | ) | (5,116 | ) | (9,078 | ) | |||||||||||||||||
Strike @ $115.50 | |||||||||||||||||||||||||
Expires 05/24/2019 | |||||||||||||||||||||||||
PUT — S&P 500E-mini Futures Option | UBS Securities LLC | 9 | (1,277,010 | ) | (7,519 | ) | (1,507 | ) | |||||||||||||||||
Strike @ $2,450.00 | |||||||||||||||||||||||||
Expires 05/17/2019 | |||||||||||||||||||||||||
PUT — S&P 500E-mini Futures Option | UBS Securities LLC | 15 | (2,128,350 | ) | (5,031 | ) | (1,500 | ) | |||||||||||||||||
Strike @ $2,350.00 | |||||||||||||||||||||||||
Expires 05/17/2019 | |||||||||||||||||||||||||
PUT — S&P 500E-mini Futures | UBS Securities LLC | 35 | (4,966,150 | ) | (15,689 | ) | (12,688 | ) | |||||||||||||||||
|
|
|
| ||||||||||||||||||||||
Option | |||||||||||||||||||||||||
Strike @ $2,400.00 | |||||||||||||||||||||||||
Expires 06/21/2019 | |||||||||||||||||||||||||
Total Written Futures Options |
| $ | (45,577 | ) | $ | (44,867 | ) | ||||||||||||||||||
|
|
|
| ||||||||||||||||||||||
See accompanying Notes to the Financial Statements.
138
Table of Contents
Mercer Opportunistic Fixed Income Fund
Schedule of Investments (Continued)
March 31, 2019
Written Swaptions
Type of Contract | Counterparty | Notional Value | Premiums Received | Value at March 31, 2019 | |||||||||||||||||||||
CALL — CDX.NA.IG Index Option | BNP Paribas S.A. | USD | (24,500,000 | ) | $ | (37,485 | ) | $ | (41,852 | ) | |||||||||||||||
Strike @ $65.00 | |||||||||||||||||||||||||
Expires 05/15/2019 | |||||||||||||||||||||||||
PUT — CDX.NA.HY Index | Merrill Lynch Capital Services, Inc. | USD | (6,750,000 | ) | (23,153 | ) | (6,674 | ) | |||||||||||||||||
|
|
|
| ||||||||||||||||||||||
Option | |||||||||||||||||||||||||
Strike @ $101.00 | |||||||||||||||||||||||||
Expires 05/15/2019 | |||||||||||||||||||||||||
Total Written Swaptions |
| $ | (60,638 | ) | $ | (48,526 | ) | ||||||||||||||||||
|
|
|
| ||||||||||||||||||||||
Total Written Options |
| $ | (136,105 | ) | $ | (119,280 | ) | ||||||||||||||||||
|
|
|
| ||||||||||||||||||||||
OTC — Interest Rate Swaps
Payments | Payments | Maturity | Counterparty | Upfront | Notional Value | Market Value | Unrealized Appreciation (Depreciation) | |||||||||||||
| 12-Month US CPI | 2.32% | 09/14/23 | HSBC Sec. New York | $ — | $ | 11,300,000 | $ | (278,793 | ) | $ | (278,793 | ) | ||||||||
| 12-Month US CPI | 1.95% | 03/28/24 | Merrill Lynch Capital Services, Inc. | — | 2,150,000 | (1,871 | ) | (1,871 | ) | |||||||||||
| 12-Month US CPI | 1.90% | 01/15/24 | HSBC Sec. New York | — | 1,635,000 | (4,696 | ) | (4,696 | ) | |||||||||||
|
|
|
|
| ||||||||||||||||
| $ — | $ | (285,360 | ) | $ | (285,360 | ) | ||||||||||||||
|
|
|
|
| ||||||||||||||||
Centrally Cleared Interest Rate Swaps
Payments | Payments Made by Fund | Maturity Date | Upfront Premiums Paid (Received) | Notional Value | Market Value | Unrealized Appreciation (Depreciation) | ||||||||||||||||||||||||
3-Month USD CDOR | 3.01% | 10/31/48 | $ | — | CAD | 150,000 | $ | (16,937 | ) | $ | (16,937 | ) | ||||||||||||||||||
3-Month USD CDOR | 2.94% | 09/25/48 | — | CAD | 40,000 | (4,088 | ) | (4,088 | ) | |||||||||||||||||||||
3-Month USD CDOR | 2.81% | 09/12/48 | — | CAD | 1,860,000 | (147,862 | ) | (147,862 | ) | |||||||||||||||||||||
3-Month USD CDOR | 2.43% | 03/20/49 | 1 | CAD | 150,000 | (2,513 | ) | (2,514 | ) | |||||||||||||||||||||
3-Month USD HIBOR | 2.95% | 11/12/23 | — | HKD | 35,000,000 | (197,788 | ) | (197,788 | ) | |||||||||||||||||||||
3-Month USD HIBOR | 2.10% | 03/22/24 | — | HKD | 8,500,000 | (6,486 | ) | (6,486 | ) | |||||||||||||||||||||
3-Month USD LIBOR | 2.88% | 05/15/44 | 10,379 | USD | 1,924,000 | (93,833 | ) | (104,212 | ) | |||||||||||||||||||||
3-Month USD LIBOR | 2.75% | 08/15/44 | (10,220 | ) | USD | 2,295,000 | (56,859 | ) | (46,639 | ) | ||||||||||||||||||||
3-Month USD LIBOR | 2.50% | 01/31/26 | (122,884 | ) | USD | 9,095,000 | (100,589 | ) | 22,295 | |||||||||||||||||||||
3-Month USD LIBOR | 2.25% | 12/31/25 | 3,064 | USD | 2,232,000 | 9,241 | 6,177 | |||||||||||||||||||||||
6-Month USD EURIBOR | 0.86% | 12/11/28 | — | EUR | 9,900,000 | (454,847 | ) | (454,847 | ) | |||||||||||||||||||||
6-Month USD LIBOR | 1.45% | 03/08/69 | — | GBP | 520,000 | (36,523 | ) | (36,523 | ) | |||||||||||||||||||||
6-Month USD LIBOR | 1.27% | 10/26/21 | 656 | GBP | 1,348,000 | (10,533 | ) | (11,189 | ) | |||||||||||||||||||||
6-Month USD LIBOR | 0.58% | 03/22/29 | — | EUR | 1,200,000 | (15,390 | ) | (15,390 | ) | |||||||||||||||||||||
6-Month USD PRIBOR | 1.87% | 03/27/24 | — | CZK | 6,700,820 | (803 | ) | (803 | ) | |||||||||||||||||||||
6-Month USD PRIBOR | 1.87% | 03/28/24 | — | CZK | 20,102,459 | (2,420 | ) | (2,420 | ) | |||||||||||||||||||||
6-Month USD PRIBOR | 1.86% | 03/29/24 | — | CZK | 76,656,060 | (7,144 | ) | (7,144 | ) | |||||||||||||||||||||
6-Month USD PRIBOR | 1.83% | 04/01/24 | — | CZK | 3,832,803 | (162 | ) | (162 | ) | |||||||||||||||||||||
See accompanying Notes to the Financial Statements.
139
Table of Contents
Mercer Opportunistic Fixed Income Fund
Schedule of Investments (Continued)
March 31, 2019
Centrally Cleared Interest Rate Swaps — continued
Payments | Payments Made by Fund | Maturity Date | Upfront Premiums Paid (Received) | Notional Value | Market Value | Unrealized Appreciation (Depreciation) | ||||||||||||||||||||||||
6-Month USD PRIBOR | 1.83% | 04/01/24 | $ | — | CZK | 3,832,803 | $ | (142 | ) | $ | (142 | ) | ||||||||||||||||||
6-Month USD PRIBOR | 1.82% | 04/02/24 | — | CZK | 8,176,646 | (131 | ) | (131 | ) | |||||||||||||||||||||
6-Month USD PRIBOR | 1.80% | 04/01/24 | — | CZK | 3,832,803 | 105 | 105 | |||||||||||||||||||||||
6-Month USD PRIBOR | 1.79% | 04/01/24 | — | CZK | 3,832,803 | 187 | 187 | |||||||||||||||||||||||
6-Month USD PRIBOR | 1.78% | 04/01/24 | — | CZK | 3,832,803 | 269 | 269 | |||||||||||||||||||||||
6-Month USD WIBOR | 2.98% | 09/17/28 | — | PLN | 34,190,000 | (575,738 | ) | (575,738 | ) | |||||||||||||||||||||
6-Month USD WIBOR | 2.97% | 11/12/28 | — | PLN | 8,400,000 | (139,519 | ) | (139,519 | ) | |||||||||||||||||||||
6-Month USD WIBOR | 2.93% | 11/05/28 | — | PLN | 1,135,000 | (17,692 | ) | (17,692 | ) | |||||||||||||||||||||
6-Month USD WIBOR | 2.47% | 01/14/29 | — | PLN | 3,300,000 | (16,217 | ) | (16,217 | ) | |||||||||||||||||||||
6-Month USD WIBOR | 2.33% | 03/25/29 | — | PLN | 7,660,000 | (11,275 | ) | (11,275 | ) | |||||||||||||||||||||
|
| |||||||||||||||||||||||||||||
| $ | (1,786,685 | ) | ||||||||||||||||||||||||||||
|
| |||||||||||||||||||||||||||||
OTC — Credit Default Swaps
Buy Protection
| Notional Amount* | Currency | Expiration Date | Counterparty | Receive (Pay) Fixed Rate | Deliverable | Unrealized Appreciation (Depreciation) | Upfronts Premiums Paid/ (Received) | Value | ||||||||||||||||||||||
| 5,640,000 | USD | 12/20/23 | JPMorgan Chase Bank N.A. | (1.00 | %) | Bank of China Ltd., 3.13%, 01/23/19 | $ | (61,080 | ) | $ | (56,485 | ) | $ | (117,565 | ) | |||||||||||||||
| 820,000 | USD | 12/20/23 | Barclays Bank Plc | (1.00 | %) | Bank of China Ltd., 3.13%, 01/23/19 | (9,481 | ) | (7,612 | ) | (17,093 | ) | ||||||||||||||||||
| 345,000 | EUR | 06/20/24 | Barclays Bank Plc | (1.00 | %) | Bayerische Motoren Werke Aktiengesellschaft, 0.13%, 01/12/21 | 107 | (6,283 | ) | (6,176 | ) | |||||||||||||||||||
| 100,000 | EUR | 12/20/23 | JPMorgan Chase Bank N.A. | (1.00%) | Bayerische Motoren Werke Aktiengesellschaft, 0.13%, 01/12/21 | 218 | (2,254 | ) | (2,036 | ) | ||||||||||||||||||||
| 1,620,000 | EUR | 12/20/23 | JPMorgan Chase Bank N.A. | (1.00%) | Bayerische Motoren Werke Aktiengesellschaft, 0.13%, 01/12/21 | 6,358 | (39,342 | ) | (32,984 | ) | ||||||||||||||||||||
| 950,000 | EUR | 12/20/23 | JPMorgan Chase Bank N.A. | (1.00%) | Bayerische Motoren Werke Aktiengesellschaft, 0.13%, 01/12/21 | (9,948 | ) | (9,395 | ) | (19,343 | ) | |||||||||||||||||||
| 200,000 | EUR | 12/20/23 | JPMorgan Chase Bank N.A. | (1.00%) | Bayerische Motoren Werke Aktiengesellschaft, 0.13%, 01/12/21 | (2,289 | ) | (1,783 | ) | (4,072 | ) | |||||||||||||||||||
| 757,576 | USD | 11/17/59 | Credit Suisse | (3.00%) | CMBX.NA.BBB-.10** | (1,467 | ) | 41,887 | 40,420 | |||||||||||||||||||||
| 1,627,217 | USD | 11/17/59 | Morgan Stanley & Co. | (3.00%) | CMBX.NA.BBB-.10** | (4,975 | ) | 91,793 | 86,818 | |||||||||||||||||||||
| 115,207 | USD | 11/17/59 | Credit Suisse | (3.00%) | CMBX.NA.BBB-.10** | (65 | ) | 6,213 | 6,148 | |||||||||||||||||||||
| 480,000 | EUR | 06/20/24 | Merrill Lynch Capital Services, Inc. | (1.00%) | Daimler AG, 0.63%, 03/05/20 | 75 | (5,612 | ) | (5,537 | ) | ||||||||||||||||||||
| 100,000 | EUR | 12/20/23 | JPMorgan Chase Bank N.A. | (1.00%) | Daimler AG, 0.63%, 03/05/20 | (275 | ) | (1,205 | ) | (1,480 | ) | |||||||||||||||||||
See accompanying Notes to the Financial Statements.
140
Table of Contents
Mercer Opportunistic Fixed Income Fund
Schedule of Investments (Continued)
March 31, 2019
Buy Protection — continued
| Notional Amount* | Currency | Expiration Date | Counterparty | Receive (Pay) Fixed Rate | Deliverable | Unrealized Appreciation (Depreciation) | Upfronts Premiums Paid/ (Received) | Value | ||||||||||||||||||||
| 909,474 | EUR | 12/20/23 | JPMorgan Chase Bank N.A. | (1.00%) | Daimler AG, 0.63%, 03/05/20 | $ | (5,295 | ) | $ | (8,163 | ) | $ | (13,458 | ) | ||||||||||||||
| 710,526 | EUR | 12/20/23 | JPMorgan Chase Bank N.A. | (1.00%) | Daimler AG, 0.63%, 03/05/20 | (8,007 | ) | (2,507 | ) | (10,514 | ) | |||||||||||||||||
| 310,000 | EUR | 12/20/23 | Barclays Bank Plc | (1.00%) | Daimler AG, 0.63%, 03/05/20 | (2,547 | ) | (2,040 | ) | (4,587 | ) | |||||||||||||||||
| 335,893 | EUR | 12/20/23 | JPMorgan Chase Bank N.A. | (1.00%) | Daimler AG, 0.63%, 03/05/20 | (2,760 | ) | (2,210 | ) | (4,970 | ) | |||||||||||||||||
| 202,107 | EUR | 12/20/23 | Morgan Stanley & Co. | (1.00%) | Daimler AG, 0.63%, 03/05/20 | (2,108 | ) | (882 | ) | (2,990 | ) | |||||||||||||||||
| 212,000 | EUR | 12/20/23 | Barclays Bank Plc | (1.00%) | Daimler AG, 0.63%, 03/05/20 | (2,039 | ) | (1,098 | ) | (3,137 | ) | |||||||||||||||||
| 415,000 | EUR | 12/20/23 | JPMorgan Chase Bank N.A. | (1.00%) | Daimler AG, 0.63%, 03/05/20 | (4,552 | ) | (1,589 | ) | (6,141 | ) | |||||||||||||||||
| 415,000 | EUR | 12/20/23 | JPMorgan Chase Bank N.A. | (1.00%) | Daimler AG, 0.63%, 03/05/20 | (4,100 | ) | (2,041 | ) | (6,141 | ) | |||||||||||||||||
| 200,000 | EUR | 12/20/23 | JPMorgan Chase Bank N.A. | (1.00%) | Daimler AG, 0.63%, 03/05/20 | (2,849 | ) | (111 | ) | (2,960 | ) | |||||||||||||||||
| 960,000 | USD | 12/20/20 | Barclays Bank Plc | (5.00%) | Ford Motor Co., 4.35%, 03/30/2019 | (2,532 | ) | (64,910 | ) | (67,442 | ) | |||||||||||||||||
| 191,071 | EUR | 06/20/24 | Merrill Lynch Capital Services, Inc. | (5.00%) | Glencore International AG, 6.50%, 02/27/19 | 1,370 | (39,050 | ) | (37,680 | ) | ||||||||||||||||||
| 170,000 | EUR | 12/20/23 | JPMorgan Chase Bank N.A. | (5.00%) | Glencore International AG, 0.0338, 09/30/20 | (2,213 | ) | (29,987 | ) | (32,200 | ) | |||||||||||||||||
| 4,060,000 | EUR | 12/20/23 | JPMorgan Chase Bank N.A. | (5.00%) | Glencore International AG, 6.50%, 02/27/19 | (64,953 | ) | (704,056 | ) | (769,009 | ) | |||||||||||||||||
| 600,000 | EUR | 12/20/23 | JPMorgan Chase Bank N.A. | (5.00%) | Glencore International AG, 6.50%, 02/27/19 | (16,161 | ) | (97,485 | ) | (113,646 | ) | |||||||||||||||||
| 120,000 | USD | 06/20/24 | Barclays Bank Plc | (1.00%) | Kingdom of Bahrain, 5.50%, 03/31/20 | 904 | 7,970 | 8,874 | ||||||||||||||||||||
| 1,000,000 | USD | 12/20/23 | JPMorgan Chase Bank N.A. | (1.00%) | Kingdom of Bahrain, 5.50%, 03/31/20 | (14,414 | ) | 78,228 | 63,814 | |||||||||||||||||||
| 213,889 | USD | 12/20/23 | JPMorgan Chase Bank N.A. | (1.00%) | Kingdom of Bahrain, 5.50%, 03/31/20 | 468 | 13,181 | 13,649 | ||||||||||||||||||||
| 324,074 | USD | 12/20/23 | Barclays Bank Plc | (1.00%) | Kingdom of Bahrain, 5.50%, 03/31/20 | (1,388 | ) | 22,069 | 20,681 | |||||||||||||||||||
| 162,037 | USD | 12/20/23 | JPMorgan Chase Bank N.A. | (1.00%) | Kingdom of Bahrain, 5.50%, 03/31/20 | (1,050 | ) | 11,390 | 10,340 | |||||||||||||||||||
| 525,000 | USD | 12/20/23 | Barclays Bank Plc | (1.00%) | Republic of South Africa, 5.50%, 03/09/20 | (9,218 | ) | 28,819 | 19,601 | |||||||||||||||||||
| 80,000 | USD | 06/20/24 | Merrill Lynch Capital Services, Inc. | (1.00%) | Republic of South Africa, 5.50%, 03/09/20 | 73 | 3,649 | 3,722 | ||||||||||||||||||||
| 200,000 | EUR | 12/20/23 | Morgan Stanley & Co. | (1.00%) | Volkswagen Aktiengesellschaft, 5.50%, 03/30/21 | (1,885 | ) | 2,415 | 530 | |||||||||||||||||||
| 215,909 | EUR | 12/20/23 | Barclays Bank Plc | (1.00%) | Volkswagen Aktiengesellschaft, 5.50%, 03/30/21 | (2,226 | ) | 2,798 | 572 | |||||||||||||||||||
See accompanying Notes to the Financial Statements.
141
Table of Contents
Mercer Opportunistic Fixed Income Fund
Schedule of Investments (Continued)
March 31, 2019
Buy Protection — continued
| Notional Amount* | Currency | Expiration Date | Counterparty | Receive (Pay) Fixed Rate | Deliverable | Unrealized Appreciation (Depreciation) | Upfronts Premiums Paid/ (Received) | Value | ||||||||||||||||||||||
| 323,864 | EUR | 12/20/23 | Barclays Bank Plc | (1.00%) | Volkswagen Aktiengesellschaft, 5.50%, 03/30/21 | $ | (3,043 | ) | $ | 3,901 | $ | 858 | ||||||||||||||||||
| 107,955 | EUR | 12/20/23 | Barclays Bank Plc | (1.00%) | Volkswagen Aktiengesellschaft, 5.50%, 03/30/21 | (991 | ) | 1,277 | 286 | |||||||||||||||||||||
| 302,272 | EUR | 12/20/23 | JPMorgan Chase Bank N.A. | (1.00%) | Volkswagen Aktiengesellschaft, 5.50%, 03/30/21 | (3,119 | ) | 3,919 | 800 | |||||||||||||||||||||
| 1,620,000 | EUR | 12/20/23 | JPMorgan Chase Bank N.A. | (1.00%) | Volkswagen Aktiengesellschaft, 5.50%, 03/30/21 | 5,256 | (964 | ) | 4,292 | |||||||||||||||||||||
| 100,000 | EUR | 12/20/23 | JPMorgan Chase Bank N.A. | (1.00%) | Volkswagen Aktiengesellschaft, 5.50%, 03/30/21 | 893 | (628 | ) | 265 | |||||||||||||||||||||
| 350,000 | EUR | 06/20/24 | Barclays Bank Plc | (1.00%) | Volkswagen Aktiengesellschaft, 5.50%, 03/30/21 | 2,042 | 1,214 | 3,256 | ||||||||||||||||||||||
|
|
|
|
|
| |||||||||||||||||||||||||
| $ | (229,266 | ) | $ | (766,969 | ) | $ | (996,235 | ) | ||||||||||||||||||||||
|
|
|
|
|
| |||||||||||||||||||||||||
Sell Protection | ||||||||||||||||||||||||||||||
| 810,000 | EUR | 12/20/23 | JPMorgan Chase Bank N.A. | 5.00 | % | ArcelorMittal SA, 2.88%, 07/06/20 (Moody’s rating: Baa3; S&P rating:BBB-) | (21,628 | ) | 163,925 | 142,297 | ||||||||||||||||||||
| 114,583 | EUR | 12/20/23 | Barclays Bank Plc | 5.00 | % | ArcelorMittal SA, 2.88%, 07/06/20 (Moody’s rating: Baa3; S&P rating:BBB-) | 1,156 | 18,973 | 20,129 | |||||||||||||||||||||
| 114,583 | EUR | 12/20/23 | BNP Paribas S.A. | 5.00 | % | ArcelorMittal SA, 2.88%, 07/06/20 (Moody’s rating: Baa3; S&P rating:BBB-) | 1,017 | 19,112 | 20,129 | |||||||||||||||||||||
| 150,000 | EUR | 12/20/23 | JPMorgan Chase Bank N.A. | 5.00 | % | ArcelorMittal SA, 2.88%, 07/06/20 (Moody’s rating: Baa3; S&P rating:BBB-) | 2,874 | 23,477 | 26,351 | |||||||||||||||||||||
|
|
|
|
|
| |||||||||||||||||||||||||
| $ | (16,581 | ) | $ | 225,487 | $ | 208,906 | ||||||||||||||||||||||||
|
|
|
|
|
| |||||||||||||||||||||||||
Centrally Cleared Credit Default Swaps
Buy Protection
| Notional Amount* | Currency | Expiration Date | Receive | Deliverable | Unrealized Appreciation (Depreciation) | Upfront Premiums Paid (Received) | Value | |||||||||||||||||||
| 290,000 | USD | 06/20/24 | (5.00%) | CDX.NA.HY.30*** | $ | (1,656 | ) | $ | (17,620 | ) | $ | (19,276 | ) | |||||||||||||
| 24,500,000 | USD | 06/20/24 | (5.00%) | CDX.NA.IG.31**** | (232,002 | ) | (1,396,500 | ) | (1,628,502 | ) | ||||||||||||||||
| 45,450,000 | USD | 06/20/24 | (1.00%) | CDX.NA.IG.31**** | (83,089 | ) | (730,414 | ) | (813,503 | ) | ||||||||||||||||
| 19,300,000 | EUR | 06/20/24 | (1.00%) | iTraxx Europe Crossover S30 Index | (6,134 | ) | (385,863 | ) | (391,997 | ) | ||||||||||||||||
|
|
|
|
|
| |||||||||||||||||||||
| $ | (322,881 | ) | $ | (2,530,397 | ) | $ | (2,853,278 | ) | ||||||||||||||||||
|
|
|
|
|
| |||||||||||||||||||||
See accompanying Notes to the Financial Statements.
142
Table of Contents
Mercer Opportunistic Fixed Income Fund
Schedule of Investments (Continued)
March 31, 2019
| * | The maximum potential amount of future undiscounted payments that the Fund could be required to make under a credit default swap contract would be the notional amount of the contract. These potential amounts would be partially offset by any recovery values of the referenced debt obligation or net amounts received from the settlement of purchased protection credit default swap contracts entered into by the Fund for the same referenced debt obligation. | |||||||
| ** | The CMBX Index tracks the performance of a basket of twenty five commercial mortgage backed securities. TheBBB- tranche represents underlying security tranches with an initial rating ofBBB-. | |||||||
| *** | CDX.NA.HY — Markit North America High Yield CDS Index. Represents an index of single name credit default swaps (CDS). All of the companies underlying the single name CDS within the index are rated BB and B. | |||||||
| **** | CDX.NA.IG — Markit North America Investment Grade CDS Index. Represents an investment grade index of single name credit default swaps (CDS). All of the companies underlying the single name CDS within the index are rated investment grade or higher. Rating represents a weighted average of the credit ratings of all the companies underlying the single name CDS within the index. | |||||||
U.S. Treasury securities in the amount of $72,880 received at the custodian bank as collateral for forward foreign currency contracts, OTC swaps and/or OTC options.
Currency Abbreviations
| ARS | — Argentine Peso |
| AUD | — Australian Dollar |
| BRL | — Brazilian Real |
| CAD | — Canadian Dollar |
| CLP | — Chilean Peso |
| CNH | — Chinese Yuan Renminbi |
| COP | — Colombian Peso |
| CZK | — Czech Koruna |
| EGP | — Egyptian Pound |
| EUR | — Euro Currency |
| GBP | — British Pound Sterling |
| HKD | — Hong Kong Dollar |
| HUF | — Hungarian Forint |
| IDR | — Indonesian Rupiah |
| ILS | — Israeli Shekel |
| INR | — Indian Rupee |
| JPY | — Japanese Yen |
| KRW | — South Korean Won |
| KZT | — Kazakhstani Tenge |
| MXN | — Mexican Peso |
| MYR | — Malaysian Ringgit |
| PEN | — Peruvian Nuevo Sol |
| PHP | — Philippines Peso |
| PLN | — Polish Zloty |
| RON | — Romanian New Leu |
| RUB | — Russian Ruble |
| SEK | — Swedish Krona |
| THB | — Thai Baht |
| TRY | — Turkish New Lira |
| TWD | — Taiwan Dollar |
See accompanying Notes to the Financial Statements.
143
Table of Contents
Mercer Opportunistic Fixed Income Fund
Schedule of Investments (Continued)
March 31, 2019
Currency Abbreviations — continued
| USD | — U.S. Dollar |
| UYU | — Uruguayan Peso |
| ZAR | — South African Rand |
See accompanying Notes to the Financial Statements.
144
Table of Contents
Mercer Opportunistic Fixed Income Fund
Schedule of Investments (Continued)
March 31, 2019
| Asset Class Summary (Unaudited) | % of Net Assets | ||||
Sovereign Debt Obligations | 39.9 | ||||
Corporate Debt | 26.4 | ||||
U.S. Government and Agency Obligations | 12.9 | ||||
Bank Loans | 5.1 | ||||
Asset Backed Securities | 2.5 | ||||
Mortgage Backed Securities — U.S. Government Agency Obligations | 2.5 | ||||
Mortgage Backed Securities — Private Issuers | 2.4 | ||||
Convertible Debt | 0.2 | ||||
Convertible Preferred Stock | 0.1 | ||||
Common Stocks | 0.1 | ||||
Purchased Currency Options | 0.1 | ||||
Purchased Futures Options | 0.0 | ||||
Purchased Index Options | 0.0 | ||||
Preferred Stock | 0.0 | ||||
Purchased Swaptions | 0.0 | ||||
Written Currency Options | 0.0 | ||||
Written Futures Options | 0.0 | ||||
Written Swaptions | 0.0 | ||||
Futures Contracts | 0.0 | ||||
OTC Interest Rate Swaps | 0.0 | ||||
OTC Credit Default Swaps | (0.1 | ) | |||
Centrally Cleared Interest Rate Swaps | (0.2 | ) | |||
Centrally Cleared Credit Default Swaps | (0.4 | ) | |||
Forward Foreign Currency Contracts | (7.5 | ) | |||
Short-Term Investments | 3.7 | ||||
Other Assets and Liabilities (net) | 12.3 | ||||
|
| ||||
| 100.0 | % | ||||
|
| ||||
See accompanying Notes to the Financial Statements.
145
Table of Contents
Mercer Emerging Markets Equity Fund
Schedule of Investments
(showing percentage of net assets)
March 31, 2019
| Shares | Description | Value ($) | ||||||||
COMMON STOCKS — 89.9% |
| |||||||||
| Australia — 0.5% | ||||||||||
| 258,437 | Newcrest Mining, Ltd. | 4,683,143 | ||||||||
|
| |||||||||
| Bermuda — 1.7% | ||||||||||
| 336,000 | Beijing Enterprises Water Group, Ltd.* | 207,594 | ||||||||
| 136,000 | China Oriental Group Co., Ltd. | 85,412 | ||||||||
| 52,000 | China Resources Gas Group, Ltd. | 245,097 | ||||||||
| 510,688 | COSCO SHIPPING Ports, Ltd. | 551,677 | ||||||||
| 748,000 | CP Pokphand Co., Ltd. | 67,654 | ||||||||
| 24,668 | Credicorp, Ltd. | 5,919,087 | ||||||||
| 460,000 | Gemdale Properties & Investment Corp., Ltd. | 58,599 | ||||||||
| 1,829,000 | Haier Electronics Group Co., Ltd.* | 5,312,289 | ||||||||
| 224,000 | Hopson Development Holdings, Ltd. | 218,294 | ||||||||
| 13,900 | Jardine Matheson Holdings, Ltd. | 866,804 | ||||||||
| 1,264,000 | Joy City Property, Ltd. | 175,512 | ||||||||
| 408,000 | K Wah International Holdings, Ltd. | 251,558 | ||||||||
| 212,000 | Kunlun Energy Co., Ltd. | 221,454 | ||||||||
| 132,500 | Luye Pharma Group, Ltd.‡ 144A | 115,790 | ||||||||
| 1,500,000 | Nan Hai Corp., Ltd. | 30,382 | ||||||||
| 209,000 | Nine Dragons Paper Holdings, Ltd. | 199,150 | ||||||||
| 51,000 | Shenzhen International Holdings, Ltd. | 108,238 | ||||||||
| 771,000 | Sihuan Pharmaceutical Holdings Group, Ltd. | 186,613 | ||||||||
| 224,000 | United Energy Group, Ltd.‡ | 43,373 | ||||||||
| 568,000 | Yue Yuen Industrial Holdings, Ltd. | 1,953,643 | ||||||||
|
| |||||||||
Total Bermuda | 16,818,220 | |||||||||
|
| |||||||||
| Brazil — 5.3% | ||||||||||
| 535,048 | Ambev SA, ADR | 2,300,706 | ||||||||
| 416,121 | B3 SA — Brasil Bolsa Balcao | 3,434,439 | ||||||||
| 67,450 | Banco Bradesco SA, ADR | 735,879 | ||||||||
| 118,750 | Banco Bradesco SA | 1,154,942 | ||||||||
| 7,744 | Banco BTG Pactual SA | 72,033 | ||||||||
| 214,300 | Banco do Brasil SA | 2,682,811 | ||||||||
| 12,800 | Banco Santander Brasil SA | 144,620 | ||||||||
| 74,000 | BB Seguridade Participacoes SA | 504,273 | ||||||||
| 27,000 | BRF SA* | 157,142 | ||||||||
| 237,914 | CCR SA | 717,710 | ||||||||
| 270,900 | Centrais Eletricas Brasileiras SA* | 2,553,979 | ||||||||
| 12,932 | Cia Brasileira de Distribuicao, ADR | 301,057 | ||||||||
| 149,900 | Cia de Saneamento Basico do Estado de Sao Paulo, ADR | 1,585,942 | ||||||||
| 169,644 | Cia Energetica de Minas Gerais, ADR‡ | 605,629 | ||||||||
| 76,985 | Cia Siderurgica Nacional SA* | 321,455 | ||||||||
| 37,600 | Cielo SA | 91,688 | ||||||||
| 10,394 | Cosan SA | 113,910 | ||||||||
| 173,300 | Cyrela Brazil Realty SA Empreendimentos e Participacoes | 724,514 | ||||||||
| 62,100 | Duratex SA | 175,049 | ||||||||
| 100,520 | Embraer SA, ADR | 1,910,885 | ||||||||
| 181,700 | Embraer SA | 861,414 | ||||||||
| 117,005 | Engie Brasil Energia SA | 1,284,088 | ||||||||
See accompanying Notes to the Financial Statements.
146
Table of Contents
Mercer Emerging Markets Equity Fund
Schedule of Investments (Continued)
(showing percentage of net assets)
March 31, 2019
| Shares | Description | Value ($) | ||||||||
| Brazil — continued | ||||||||||
| 139,700 | Fleury SA | 732,297 | ||||||||
| 10,900 | Grendene SA | 23,471 | ||||||||
| 800 | Guararapes Confeccoes SA | 29,601 | ||||||||
| 229,400 | Hypera SA | 1,526,700 | ||||||||
| 171,300 | IRB Brasil Resseguros SA | 4,016,529 | ||||||||
| 337,015 | Itau Unibanco Holding SA, ADR | 2,969,102 | ||||||||
| 106,700 | JBS SA | 436,484 | ||||||||
| 469,676 | Kroton Educacional SA | 1,279,278 | ||||||||
| 1,255 | LOG Commercial Properties e Participacoes SA* | 5,476 | ||||||||
| 278,000 | MRV Engenharia e Participacoes SA | 999,363 | ||||||||
| 122,100 | Multiplan Empreendimentos Imobiliarios SA | 733,849 | ||||||||
| 110,900 | Notre Dame Intermedica Participacoes SA | 934,687 | ||||||||
| 65,200 | Petrobras Distribuidora SA | 387,846 | ||||||||
| 326,700 | Petroleo Brasileiro SA | 2,614,977 | ||||||||
| 40,182 | Porto Seguro SA | 555,797 | ||||||||
| 285,687 | Raia Drogasil SA | 4,793,628 | ||||||||
| 22,300 | Sao Martinho SA | 105,091 | ||||||||
| 226,934 | Sul America SA | 1,737,707 | ||||||||
| 17,964 | Suzano Papel e Celulose SA | 214,874 | ||||||||
| 96,211 | TIM Participacoes SA, ADR‡ | 1,450,862 | ||||||||
| 8,072 | Usinas Siderurgicas de Minas Gerais SA Usiminas | 24,164 | ||||||||
| 205,784 | Vale SA Class B, ADR | 2,687,539 | ||||||||
| 163,002 | Vale SA | 2,133,179 | ||||||||
| 291,600 | WEG SA | 1,348,716 | ||||||||
|
| |||||||||
Total Brazil | 54,175,382 | |||||||||
|
| |||||||||
| British Virgin Islands — 0.1% | ||||||||||
| 44,431 | Hollysys Automation Technologies, Ltd. | 930,385 | ||||||||
|
| |||||||||
| Cayman Islands — 12.0% | ||||||||||
| 8,333 | 58.com, Inc., ADR* | 547,311 | ||||||||
| 368,000 | Agile Group Holdings, Ltd. | 595,367 | ||||||||
| 153,870 | Alibaba Group Holding, Ltd., ADR* ‡ | 28,073,581 | ||||||||
| 382,000 | ANTA Sports Products, Ltd. | 2,598,590 | ||||||||
| 5,208,000 | Anton Oilfield Services Group* | 816,036 | ||||||||
| 24,000 | Asia Cement China Holdings Corp. | 23,633 | ||||||||
| 14,313 | Baidu, Inc., ADR* | 2,359,498 | ||||||||
| 13,052 | Baozun, Inc., ADR* | 542,180 | ||||||||
| 2,340,000 | Beijing Enterprises Clean Energy Group, Ltd.* ‡ | 38,752 | ||||||||
| 160,000 | Bosideng International Holdings, Ltd. | 39,134 | ||||||||
| 84,000 | CAR, Inc.* ‡ | 72,444 | ||||||||
| 42,000 | Casetek Holdings, Ltd. | 68,954 | ||||||||
| 557,880 | Chailease Holding Co., Ltd. | 2,280,718 | ||||||||
| 765,000 | China Aoyuan Group, Ltd. | 922,878 | ||||||||
| 619,000 | China Evergrande Group‡ | 2,058,090 | ||||||||
| 35,000 | China High Speed Transmission Equipment Group Co., Ltd.‡ | 30,319 | ||||||||
| 360,000 | China Lesso Group Holdings, Ltd. | 232,970 | ||||||||
| 2,196,000 | China Medical System Holdings, Ltd. | 2,128,875 | ||||||||
| 499,000 | China Mengniu Dairy Co., Ltd.* | 1,856,165 | ||||||||
See accompanying Notes to the Financial Statements.
147
Table of Contents
Mercer Emerging Markets Equity Fund
Schedule of Investments (Continued)
(showing percentage of net assets)
March 31, 2019
| Shares | Description | Value ($) | ||||||||
| Cayman Islands — continued | ||||||||||
| 2,028,000 | China Resources Cement Holdings, Ltd. | 2,092,599 | ||||||||
| 396,000 | China Resources Land, Ltd. | 1,775,706 | ||||||||
| 200,000 | China SCE Group Holdings, Ltd. | 104,204 | ||||||||
| 360,000 | China State Construction International Holdings, Ltd. | 337,072 | ||||||||
| 96,000 | China Tianrui Group Cement Co., Ltd.* ‡ | 81,081 | ||||||||
| 166,500 | China ZhengTong Auto Services Holdings, Ltd. | 92,477 | ||||||||
| 550,400 | China Zhongwang Holdings, Ltd.‡ | 300,093 | ||||||||
| 1,144,000 | Chinasoft International, Ltd.* ‡ | 706,807 | ||||||||
| 69,000 | Chlitina Holding, Ltd. | 659,318 | ||||||||
| 206,000 | CIFI Holdings Group Co., Ltd. | 156,141 | ||||||||
| 50,000 | CIMC Enric Holdings, Ltd. | 51,274 | ||||||||
| 452,000 | Country Garden Holdings Co., Ltd.‡ | 705,931 | ||||||||
| 18,160 | Country Garden Services Holdings Co., Ltd.* | 33,822 | ||||||||
| 22,446 | Ctrip.com International, Ltd., ADR* | 980,666 | ||||||||
| 79,000 | Dongyue Group, Ltd. | 54,847 | ||||||||
| 485,000 | ENN Energy Holdings, Ltd. | 4,689,393 | ||||||||
| 949,000 | Fu Shou Yuan International Group, Ltd. | 870,426 | ||||||||
| 172,000 | Fufeng Group, Ltd.* | 90,273 | ||||||||
| 445,000 | Fullshare Holdings, Ltd.* ‡ | 59,523 | ||||||||
| 128,000 | Future Land Development Holdings, Ltd. | 158,493 | ||||||||
| 4,630,000 | GCL-Poly Energy Holdings, Ltd.* ‡ | 324,397 | ||||||||
| 13,000 | General Interface Solution Holding, Ltd. | 48,507 | ||||||||
| 5,000 | Ginko International Co., Ltd. | 37,800 | ||||||||
| 39,000 | Golden Eagle Retail Group, Ltd.‡ | 46,204 | ||||||||
| 187,500 | Greentown China Holdings, Ltd. | 187,262 | ||||||||
| 183,000 | Haitian International Holdings, Ltd. | 415,891 | ||||||||
| 209,500 | Hengan International Group Co., Ltd.‡ | 1,836,139 | ||||||||
| 93,290 | Huazhu Group, Ltd., ADR‡ | 3,931,241 | ||||||||
| 32,541 | JD.com, Inc., ADR* | 981,111 | ||||||||
| 105,398 | Jiayuan International Group, Ltd. | 55,720 | ||||||||
| 271,000 | Kaisa Group Holdings, Ltd.* | 122,900 | ||||||||
| 165,000 | Kingboard Holdings, Ltd. | 585,386 | ||||||||
| 667,500 | Kingboard Laminates Holdings, Ltd. | 701,517 | ||||||||
| 273,000 | Kingsoft Corp., Ltd. | 694,155 | ||||||||
| 253,500 | KWG Group Holdings, Ltd. | 305,817 | ||||||||
| 164,000 | Lee & Man Paper Manufacturing, Ltd. | 139,766 | ||||||||
| 641,000 | Li Ning Co., Ltd.* | 1,006,009 | ||||||||
| 44,500 | Longfor Group Holdings, Ltd. | 156,743 | ||||||||
| 46,000 | Minth Group, Ltd. | 144,740 | ||||||||
| 6,310 | Momo, Inc., ADR* | 241,294 | ||||||||
| 13,330 | NetEase, Inc., ADR | 3,218,528 | ||||||||
| 5,970 | New Oriental Education & Technology Group, Inc., ADR* | 537,837 | ||||||||
| 48,000 | Nexteer Automotive Group, Ltd. | 59,312 | ||||||||
| 415,000 | Powerlong Real Estate Holdings, Ltd. | 217,282 | ||||||||
| 65,000 | Ronshine China Holdings, Ltd.* | 103,173 | ||||||||
| 448,400 | Sands China, Ltd. | 2,253,439 | ||||||||
| 581,500 | Semiconductor Manufacturing International Corp.* ‡ | 588,171 | ||||||||
| 273,000 | Shenzhou International Group Holdings, Ltd. | 3,658,571 | ||||||||
| 296,000 | Shimao Property Holdings, Ltd. | 925,713 | ||||||||
See accompanying Notes to the Financial Statements.
148
Table of Contents
Mercer Emerging Markets Equity Fund
Schedule of Investments (Continued)
(showing percentage of net assets)
March 31, 2019
| Shares | Description | Value ($) | ||||||||
| Cayman Islands — continued | ||||||||||
| 409,000 | Shui On Land, Ltd. | 101,078 | ||||||||
| 1,776,000 | Sino Biopharmaceutical, Ltd. | 1,619,903 | ||||||||
| 694,000 | SOHO China, Ltd.* | 291,747 | ||||||||
| 948,000 | SSY Group, Ltd. | 881,585 | ||||||||
| 98,000 | Sunac China Holdings, Ltd. | 488,130 | ||||||||
| 78,447 | TAL Education Group, ADR* | 2,830,368 | ||||||||
| 468,800 | Tencent Holdings, Ltd. | 21,558,965 | ||||||||
| 115,004 | Tencent Music Entertainment Group, ADR* | 2,081,572 | ||||||||
| 612,000 | Tingyi Cayman Islands Holding Corp. | 1,008,832 | ||||||||
| 101,000 | TPK Holding Co., Ltd. | 190,724 | ||||||||
| 795,000 | Uni-President China Holdings, Ltd. | 779,814 | ||||||||
| 27,000 | Vinda International Holdings, Ltd. | 52,212 | ||||||||
| 23,125 | Vipshop Holdings, Ltd., ADR* | 185,694 | ||||||||
| 2,039 | Weibo Corp., ADR* | 126,398 | ||||||||
| 2,931,000 | WH Group, Ltd. | 3,136,377 | ||||||||
| 99,000 | Wisdom Marine Lines Co., Ltd.* | 96,846 | ||||||||
| 394,000 | Xiabuxiabu Catering Management China Holdings Co., Ltd.* | 686,618 | ||||||||
| 347,097 | Xinyi Solar Holdings, Ltd. | 167,138 | ||||||||
| 50,500 | Xtep International Holdings, Ltd. | 36,090 | ||||||||
| 1,825,008 | Yuzhou Properties Co., Ltd. | 1,101,986 | ||||||||
| 4,431 | YY, Inc., ADR* | 372,248 | ||||||||
| 268,000 | Zhen Ding Technology Holding, Ltd. | 832,160 | ||||||||
| 24,500 | Zhongsheng Group Holdings, Ltd. | 60,798 | ||||||||
| 14,429 | ZTO Express Cayman, Inc., ADR | 263,762 | ||||||||
|
| |||||||||
Total Cayman Islands | 121,761,311 | |||||||||
|
| |||||||||
| Chile — 1.5% | ||||||||||
| 5,942,039 | Aguas Andinas SA Class A | 3,378,485 | ||||||||
| 7,739,404 | Banco de Chile | 1,139,514 | ||||||||
| 10,083 | Banco de Credito e Inversiones SA | 644,625 | ||||||||
| 35,136 | Banco Santander Chile, ADR | 1,045,296 | ||||||||
| 25,885 | CAP SA | 307,360 | ||||||||
| 247,327 | Cencosud SA | 428,195 | ||||||||
| 132,797 | Cia Cervecerias Unidas SA, ADR | 3,912,200 | ||||||||
| 37,312 | Empresa Nacional de Telecomunicaciones SA | 388,542 | ||||||||
| 163,274 | Empresas CMPC SA | 575,859 | ||||||||
| 90,533 | Empresas COPEC SA | 1,149,485 | ||||||||
| 84,335 | Enel Americas SA, ADR | 753,112 | ||||||||
| 931,109 | Enel Americas SA | 165,540 | ||||||||
| 42,201 | Enel Chile SA, ADR | 218,601 | ||||||||
| 151,852 | Grupo Security SA | 61,703 | ||||||||
| 6,701 | Inversiones Aguas Metropolitanas SA | 10,241 | ||||||||
| 33,710,081 | Itau CorpBanca | 297,234 | ||||||||
| 3,100 | Latam Airlines Group SA, ADR‡ | 32,798 | ||||||||
| 47,022 | Ripley Corp. SA | 38,358 | ||||||||
| 105,226 | Sigdo Koppers SA | 193,295 | ||||||||
| 73,289 | SMU SA* | 19,117 | ||||||||
| 21,395 | Vina Concha y Toro SA | 44,521 | ||||||||
|
| |||||||||
Total Chile | 14,804,081 | |||||||||
|
| |||||||||
See accompanying Notes to the Financial Statements.
149
Table of Contents
Mercer Emerging Markets Equity Fund
Schedule of Investments (Continued)
(showing percentage of net assets)
March 31, 2019
| Shares | Description | Value ($) | ||||||||
| China — 9.1% | ||||||||||
| 2,304,000 | Agricultural Bank of China, Ltd. Class H | 1,062,488 | ||||||||
| 52,000 | Air China, Ltd. Class H | 63,990 | ||||||||
| 410,000 | Aluminum Corp. of China, Ltd. Class H* | 150,944 | ||||||||
| 260,000 | Angang Steel Co., Ltd. Class H‡ | 190,116 | ||||||||
| 35,500 | Anhui Conch Cement Co., Ltd. Class H | 216,845 | ||||||||
| 2,925 | Autohome, Inc. Class H, ADR* ‡ | 307,476 | ||||||||
| 207,000 | AviChina Industry & Technology Co., Ltd. Class H | 132,112 | ||||||||
| 1,220,500 | BAIC Motor Corp., Ltd. Class H 144A | 797,606 | ||||||||
| 10,704,000 | Bank of China, Ltd. Class H | 4,854,329 | ||||||||
| 144,500 | Bank of Chongqing Co., Ltd. Class H | 92,407 | ||||||||
| 767,000 | Bank of Communications Co., Ltd. Class H | 628,260 | ||||||||
| 159,000 | Bank of Zhengzhou Co., Ltd. Class H* ‡ 144A | 73,120 | ||||||||
| 283,000 | BBMG Corp. Class H‡ | 103,827 | ||||||||
| 1,246,000 | Beijing Capital International Airport Co., Ltd. Class H | 1,182,517 | ||||||||
| 342,000 | Beijing Capital Land, Ltd. Class H | 130,701 | ||||||||
| 234,000 | Beijing North Star Co., Ltd. Class H | 79,292 | ||||||||
| 18,500 | BYD Co., Ltd. Class H‡ | 111,472 | ||||||||
| 28,000 | Central China Securities Co., Ltd. Class H | 8,561 | ||||||||
| 196,000 | China BlueChemical, Ltd. Class H | 63,669 | ||||||||
| 1,214,000 | China Cinda Asset Management Co., Ltd. Class H | 337,138 | ||||||||
| 798,000 | China CITIC Bank Corp., Ltd. Class H | 508,283 | ||||||||
| 475,000 | China Coal Energy Co., Ltd. Class H | 196,657 | ||||||||
| 568,000 | China Communications Construction Co., Ltd. Class H | 587,540 | ||||||||
| 1,332,000 | China Communications Services Corp., Ltd. Class H | 1,187,778 | ||||||||
| 11,968,000 | China Construction Bank Corp. Class H | 10,260,529 | ||||||||
| 48,000 | China Eastern Airlines Corp., Ltd. Class H | 34,059 | ||||||||
| 1,640,000 | China Energy Engineering Corp., Ltd. Class H‡ | 198,473 | ||||||||
| 244,000 | China Everbright Bank Co., Ltd. Class H | 115,318 | ||||||||
| 308,500 | China Galaxy Securities Co., Ltd. Class H | 202,786 | ||||||||
| 1,574,000 | China Huarong Asset Management Co., Ltd. Class H 144A | 334,853 | ||||||||
| 45,200 | China International Capital Corp., Ltd. Class H‡ 144A | 104,680 | ||||||||
| 50,100 | China International Marine Containers Group Co., Ltd. Class H | 64,077 | ||||||||
| 368,410 | China International Travel Service Corp., Ltd. Class A | 3,841,876 | ||||||||
| 191,000 | China Life Insurance Co., Ltd. Class H | 513,392 | ||||||||
| 2,053,000 | China Longyuan Power Group Corp., Ltd. Class H | 1,427,956 | ||||||||
| 289,000 | China Machinery Engineering Corp. Class H | 147,262 | ||||||||
| 106,000 | China Merchants Bank Co., Ltd. Class H | 515,150 | ||||||||
| 14,800 | China Merchants Securities Co., Ltd. Class H 144A | 20,965 | ||||||||
| 582,000 | China Minsheng Banking Corp., Ltd. Class H | 422,601 | ||||||||
| 3,270,000 | China National Building Material Co., Ltd. Class H | 2,578,526 | ||||||||
| 106,000 | China Oilfield Services, Ltd. Class H | 114,508 | ||||||||
| 77,800 | China Pacific Insurance Group Co., Ltd. Class H | 305,255 | ||||||||
| 6,612,000 | China Petroleum & Chemical Corp. Class H | 5,213,827 | ||||||||
| 203,500 | China Railway Construction Corp., Ltd. Class H | 266,496 | ||||||||
| 415,000 | China Railway Group, Ltd. Class H | 378,525 | ||||||||
| 47,000 | China Railway Signal & Communication Corp., Ltd. Class H 144A | 37,181 | ||||||||
| 1,314,000 | China Reinsurance Group Corp. Class H | 277,867 | ||||||||
| 581,500 | China Shenhua Energy Co., Ltd. Class H | 1,325,977 | ||||||||
| 72,000 | China Southern Airlines Co., Ltd. Class H | 64,388 | ||||||||
See accompanying Notes to the Financial Statements.
150
Table of Contents
Mercer Emerging Markets Equity Fund
Schedule of Investments (Continued)
(showing percentage of net assets)
March 31, 2019
| Shares | Description | Value ($) | ||||||||
| China — continued | ||||||||||
| 124,500 | China Vanke Co., Ltd. Class H | 523,379 | ||||||||
| 533,000 | Chongqing Rural Commercial Bank Co., Ltd. Class H | 307,580 | ||||||||
| 66,000 | CITIC Securities Co., Ltd. Class H | 153,693 | ||||||||
| 416,000 | COSCO SHIPPING Development Co., Ltd. Class H* | 54,584 | ||||||||
| 436,000 | COSCO SHIPPING Energy Transportation Co., Ltd. Class H | 249,938 | ||||||||
| 151,000 | COSCO SHIPPING Holdings Co., Ltd. Class H* ‡ | 62,709 | ||||||||
| 22,000 | CRRC Corp., Ltd. Class H | 20,739 | ||||||||
| 30,000 | CSSC Offshore and Marine Engineering Group Co., Ltd. Class H* ‡ | 32,828 | ||||||||
| 202,000 | Dalian Port PDA Co., Ltd. Class H‡ | 27,277 | ||||||||
| 22,600 | Dongjiang Environmental Co., Ltd. Class H‡ | 26,141 | ||||||||
| 60,200 | Everbright Securities Co., Ltd. Class H‡ 144A | 59,894 | ||||||||
| 29,600 | Fuyao Glass Industry Group Co., Ltd. Class H 144A | 99,359 | ||||||||
| 39,200 | GF Securities Co., Ltd. Class H | 56,329 | ||||||||
| 459,500 | Great Wall Motor Co., Ltd. Class H‡ | 344,774 | ||||||||
| 450,000 | Guangshen Railway Co., Ltd. Class H | 175,415 | ||||||||
| 86,800 | Guangzhou Automobile Group Co., Ltd. Class H | 102,502 | ||||||||
| 12,000 | Guangzhou Baiyunshan Pharmaceutical Holdings Co., Ltd. Class H | 52,892 | ||||||||
| 641,600 | Guangzhou R&F Properties Co., Ltd. Class H | 1,387,826 | ||||||||
| 17,400 | Guotai Junan Securities Co., Ltd. Class H‡ 144A | 38,790 | ||||||||
| 333,600 | Haitong Securities Co., Ltd. Class H | 431,770 | ||||||||
| 305,000 | Harbin Bank Co., Ltd. Class H 144A | 73,434 | ||||||||
| 43,000 | Hisense Home Appliances Group Co., Ltd. Class H | 60,474 | ||||||||
| 3,366,000 | Huaneng Renewables Corp., Ltd. Class H | 934,768 | ||||||||
| 47,200 | Huatai Securities Co., Ltd. Class H‡ 144A | 94,401 | ||||||||
| 67,100 | Huishang Bank Corp., Ltd. Class H | 28,806 | ||||||||
| 6,523,000 | Industrial & Commercial Bank of China, Ltd. Class H | 4,778,024 | ||||||||
| 38,100 | Inner Mongolia Yitai Coal Co., Ltd. Class H | 33,004 | ||||||||
| 214,908 | Jiangsu Hengrui Medicine Co., Ltd. Class A | 2,092,093 | ||||||||
| 288,000 | Jiangxi Copper Co., Ltd. Class H | 382,290 | ||||||||
| 175,000 | Kingdee International Software Group Co., Ltd.‡ | 202,422 | ||||||||
| 40,313 | Kweichow Moutai Co., Ltd. Class A | 5,122,898 | ||||||||
| 82,100 | Legend Holdings Corp. Class H 144A | 218,063 | ||||||||
| 7,410 | Livzon Pharmaceutical Group, Inc. Class H | 25,770 | ||||||||
| 3,573,000 | Lonking Holdings, Ltd. Class H | 1,156,112 | ||||||||
| 1,602,000 | Maanshan Iron & Steel Co., Ltd. Class H | 783,659 | ||||||||
| 162,000 | Metallurgical Corp. of China, Ltd. Class H | 47,878 | ||||||||
| 342,100 | Midea Group Co., Ltd. Class A | 2,480,660 | ||||||||
| 22,300 | New China Life Insurance Co., Ltd. Class H | 113,631 | ||||||||
| 2,417,000 | People’s Insurance Co. Group of China, Ltd. (The) Class H | 1,034,544 | ||||||||
| 5,324,000 | PetroChina Co., Ltd. Class H | 3,452,144 | ||||||||
| 2,729,000 | PICC Property & Casualty Co., Ltd. Class H | 3,100,998 | ||||||||
| 1,066,500 | Ping An Insurance Group Co. of China, Ltd. Class H | 11,942,159 | ||||||||
| 233,000 | Postal Savings Bank of China Co., Ltd. Class H 144A | 133,271 | ||||||||
| 354,000 | Qingdao Port International Co., Ltd. Class H* 144A | 248,478 | ||||||||
| 82,500 | Qinhuangdao Port Co., Ltd. Class H | 19,338 | ||||||||
| 16,297 | Red Star Macalline Group Corp., Ltd. Class H 144A | 15,757 | ||||||||
| 208,900 | SAIC Motor Corp., Ltd. Class A | 810,396 | ||||||||
| 40,500 | Shandong Chenming Paper Holdings, Ltd. Class H | 26,054 | ||||||||
| 604,000 | Shandong Weigao Group Medical Polymer Co., Ltd. Class H | 577,074 | ||||||||
See accompanying Notes to the Financial Statements.
151
Table of Contents
Mercer Emerging Markets Equity Fund
Schedule of Investments (Continued)
(showing percentage of net assets)
March 31, 2019
| Shares | Description | Value ($) | ||||||||
| China — continued | ||||||||||
| 162,000 | Shanghai Electric Group Co., Ltd. Class H‡ | 61,498 | ||||||||
| 9,000 | Shanghai Fosun Pharmaceutical Group Co., Ltd. Class H | 32,503 | ||||||||
| 144,000 | Shanghai Jin Jiang International Hotels Group Co., Ltd. Class H | 38,889 | ||||||||
| 129,400 | Shanghai Pharmaceuticals Holding Co., Ltd. Class H | 281,880 | ||||||||
| 58,500 | Shengjing Bank Co., Ltd. Class H‡ 144A | 32,492 | ||||||||
| 5,967 | SINA Corp. Class H* | 353,485 | ||||||||
| 873,500 | Sinopec Engineering Group Co., Ltd. Class H | 852,363 | ||||||||
| 2,150,000 | Sinopec Shanghai Petrochemical Co., Ltd. Class H | 1,024,338 | ||||||||
| 36,400 | Sinopharm Group Co., Ltd. Class H | 151,629 | ||||||||
| 198,000 | Sinotrans, Ltd. Class H | 85,002 | ||||||||
| 63,000 | Tong Ren Tang Technologies Co., Ltd. Class H | 84,589 | ||||||||
| 20,000 | Tsingtao Brewery Co., Ltd. Class H | 94,268 | ||||||||
| 65,000 | Weichai Power Co., Ltd. Class H | 103,835 | ||||||||
| 3,380,000 | West China Cement, Ltd. | 447,799 | ||||||||
| 50,000 | Xinhua Winshare Publishing and Media Co., Ltd. Class H | 38,917 | ||||||||
| 376,400 | Xinjiang Goldwind Science & Technology Co., Ltd. Class H‡ | 541,828 | ||||||||
| 16,500 | Yangtze Optical Fibre and Cable Joint Stock, Ltd. Co. Class H‡ 144A | 44,246 | ||||||||
| 1,776,000 | Yanzhou Coal Mining Co., Ltd. Class H | 1,744,337 | ||||||||
| 169,400 | YiChang HEC ChangJiang Pharmaceutical Co., Ltd. Class H | 733,712 | ||||||||
| 94,000 | Zhejiang Expressway Co., Ltd. Class H | 107,771 | ||||||||
| 30,300 | Zhuzhou CRRC Times Electric Co., Ltd. Class H | 179,099 | ||||||||
| 172,000 | Zijin Mining Group Co., Ltd. Class H | 71,211 | ||||||||
| 20,000 | ZTE Corp. Class H* ‡ | 60,128 | ||||||||
|
| |||||||||
Total China | 93,196,493 | |||||||||
|
| |||||||||
| Colombia — 0.1% | ||||||||||
| 61,705 | Almacenes Exito SA | 281,263 | ||||||||
| 1,263 | Banco de Bogota SA | 26,168 | ||||||||
| 1,200 | Bancolombia SA, ADR | 61,272 | ||||||||
| 2,350 | Bancolombia SA | 29,214 | ||||||||
| 9,433 | Cementos Argos SA | 23,334 | ||||||||
| 4,791 | Corp. Financiera Colombiana SA* | 39,856 | ||||||||
| 32,325 | Grupo Argos SA | 183,672 | ||||||||
| 14,750 | Grupo de Inversiones Suramericana SA | 169,657 | ||||||||
| 2,902 | Grupo Nutresa SA | 23,486 | ||||||||
|
| |||||||||
Total Colombia | 837,922 | |||||||||
|
| |||||||||
| Cyprus — 0.1% | ||||||||||
| 43,241 | TCS Group Holding Plc, Reg S, GDR‡‡‡ | 767,095 | ||||||||
|
| |||||||||
| Czech Republic — 0.1% | ||||||||||
| 14,808 | CEZ AS | 347,915 | ||||||||
| 18,993 | Komercni Banka AS | 776,072 | ||||||||
|
| |||||||||
Total Czech Republic | 1,123,987 | |||||||||
|
| |||||||||
See accompanying Notes to the Financial Statements.
152
Table of Contents
Mercer Emerging Markets Equity Fund
Schedule of Investments (Continued)
(showing percentage of net assets)
March 31, 2019
| Shares | Description | Value ($) | ||||||||
| Egypt — 0.3% | ||||||||||
| 711,280 | Commercial International Bank Egypt SAE, GDR | 2,763,323 | ||||||||
| 34,948 | Commercial International Bank Egypt SAE (London Exchange), GDR¤ | 135,773 | ||||||||
|
| |||||||||
Total Egypt | 2,899,096 | |||||||||
|
| |||||||||
| France — 0.2% | ||||||||||
| 23,815 | Sanofi | 2,105,560 | ||||||||
|
| |||||||||
| Greece — 0.1% | ||||||||||
| 742 | Bank of Greece | 11,664 | ||||||||
| 24,347 | Ellaktor SA* | 44,288 | ||||||||
| 90,793 | Eurobank Ergasias SA* | 72,382 | ||||||||
| 2,059 | GEK Terna Holding Real Estate Construction SA* | 11,375 | ||||||||
| 2,981 | Hellenic Petroleum SA | 28,619 | ||||||||
| 66,064 | JUMBO SA | 1,105,281 | ||||||||
| 1,016 | Motor Oil Hellas Corinth Refineries SA | 23,615 | ||||||||
| 8,869 | Mytilineos Holdings SA | 89,726 | ||||||||
| 11,435 | National Bank of Greece SA* | 19,979 | ||||||||
|
| |||||||||
Total Greece | 1,406,929 | |||||||||
|
| |||||||||
| Hong Kong — 4.2% | ||||||||||
| 116,000 | Beijing Enterprises Holdings, Ltd. | 657,584 | ||||||||
| 70,500 | BYD Electronic International Co., Ltd.‡ | 90,887 | ||||||||
| 412,000 | China Agri-Industries Holdings, Ltd. | 141,183 | ||||||||
| 316,000 | China Everbright, Ltd. | 626,368 | ||||||||
| 654,000 | China Jinmao Holdings Group, Ltd. | 426,561 | ||||||||
| 310,875 | China Merchants Port Holdings Co., Ltd. | 662,148 | ||||||||
| 1,176,480 | China Mobile, Ltd. | 11,989,681 | ||||||||
| 457,000 | China Overseas Grand Oceans Group, Ltd. | 248,586 | ||||||||
| 680,000 | China Overseas Land & Investment, Ltd. | 2,581,418 | ||||||||
| 730,000 | China Resources Beer Holdings Co., Ltd. | 3,073,459 | ||||||||
| 22,000 | China Resources Pharmaceutical Group, Ltd. 144A | 31,109 | ||||||||
| 416,000 | China Resources Power Holdings Co., Ltd. | 625,329 | ||||||||
| 968,000 | China South City Holdings, Ltd. | 155,374 | ||||||||
| 635,400 | China Taiping Insurance Holdings Co., Ltd. | 1,894,071 | ||||||||
| 232,000 | China Traditional Chinese Medicine Holdings Co., Ltd. | 138,019 | ||||||||
| 720,000 | China Travel International Investment Hong Kong, Ltd. | 183,441 | ||||||||
| 1,014,000 | China Unicom Hong Kong, Ltd. | 1,285,269 | ||||||||
| 771,000 | CITIC, Ltd. | 1,151,105 | ||||||||
| 4,618,000 | CNOOC, Ltd. | 8,647,775 | ||||||||
| 1,106,000 | CSPC Pharmaceutical Group, Ltd. | 2,057,032 | ||||||||
| 651,000 | Far East Horizon, Ltd. | 689,981 | ||||||||
| 269,500 | Fosun International, Ltd. | 456,608 | ||||||||
| 404,000 | Guangdong Investment, Ltd. | 780,214 | ||||||||
| 49,000 | Hua Hong Semiconductor, Ltd.‡ 144A | 114,854 | ||||||||
| 402,000 | Lenovo Group, Ltd. | 361,546 | ||||||||
| 176,000 | MMG, Ltd.* | 71,522 | ||||||||
| 704,000 | Poly Property Group Co., Ltd. | 274,427 | ||||||||
| 165,000 | Shanghai Industrial Holdings, Ltd. | 388,436 | ||||||||
| 1,072,000 | Shenzhen Investment, Ltd. | 409,684 | ||||||||
See accompanying Notes to the Financial Statements.
153
Table of Contents
Mercer Emerging Markets Equity Fund
Schedule of Investments (Continued)
(showing percentage of net assets)
March 31, 2019
| Shares | Description | Value ($) | ||||||||
| Hong Kong — continued | ||||||||||
| 1,010,000 | Sino-Ocean Group Holding, Ltd. | 442,602 | ||||||||
| 538,000 | Sinotruk Hong Kong, Ltd.‡ | 1,144,542 | ||||||||
| 135,500 | Sun Art Retail Group, Ltd. | 132,049 | ||||||||
| 2,296,000 | Yuexiu Property Co., Ltd. | 552,798 | ||||||||
|
| |||||||||
Total Hong Kong | 42,485,662 | |||||||||
|
| |||||||||
| Hungary — 0.6% | ||||||||||
| 42,349 | MOL Hungarian Oil & Gas Plc | 484,638 | ||||||||
| 92,172 | OTP Bank Nyrt | 4,054,475 | ||||||||
| 61,344 | Richter Gedeon Nyrt | 1,156,461 | ||||||||
|
| |||||||||
Total Hungary | 5,695,574 | |||||||||
|
| |||||||||
| India — 11.7% | ||||||||||
| 2,729 | ACC, Ltd. | 65,827 | ||||||||
| 51,815 | Adani Enterprises, Ltd. | 109,651 | ||||||||
| 62,785 | Adani Gas, Ltd.* | 116,915 | ||||||||
| 47,779 | Adani Green Energy, Ltd.* | 25,588 | ||||||||
| 15,817 | Adani Ports & Special Economic Zone, Ltd. | 86,717 | ||||||||
| 104,805 | Adani Power, Ltd.* | 72,543 | ||||||||
| 862,710 | Aditya Birla Capital, Ltd.* | 1,202,999 | ||||||||
| 115,690 | Ambuja Cements, Ltd. | 392,870 | ||||||||
| 839 | Anveshan Heavy Engineering, Ltd.* | 6,770 | ||||||||
| 89,636 | Apollo Tyres, Ltd. | 287,702 | ||||||||
| 4,534 | Arvind Fashions, Ltd.* | 67,482 | ||||||||
| 22,672 | Arvind, Ltd. | 29,700 | ||||||||
| 13,321 | Ashok Leyland, Ltd. | 17,518 | ||||||||
| 98,842 | Asian Paints, Ltd. | 2,125,941 | ||||||||
| 366 | Atul, Ltd. | 18,729 | ||||||||
| 11,307 | Aurobindo Pharma, Ltd. | 128,372 | ||||||||
| 53,644 | Axis Bank, Ltd.* | 600,286 | ||||||||
| 26,896 | Bajaj Auto, Ltd. | 1,124,759 | ||||||||
| 75,516 | Bajaj Finance, Ltd. | 3,292,618 | ||||||||
| 1,132 | Bajaj Finserv, Ltd. | 114,957 | ||||||||
| 8,555 | Bajaj Holdings & Investment, Ltd. | 420,161 | ||||||||
| 101,945 | Bank of Baroda* | 189,468 | ||||||||
| 56,800 | Bata India, Ltd. | 1,149,529 | ||||||||
| 7,878 | Bharat Electronics, Ltd. | 10,587 | ||||||||
| 279,435 | Bharat Heavy Electricals, Ltd. | 302,528 | ||||||||
| 163,218 | Bharat Petroleum Corp., Ltd. | 937,252 | ||||||||
| 117,759 | Bharti Airtel, Ltd. | 563,594 | ||||||||
| 24,223 | Bharti Infratel, Ltd. | 109,305 | ||||||||
| 1,542 | Birla Corp., Ltd. | 11,662 | ||||||||
| 43,464 | Britannia Industries, Ltd. | 1,934,846 | ||||||||
| 2,962 | Cadila Healthcare, Ltd. | �� | 14,760 | |||||||
| 27,266 | Canara Bank* | 114,732 | ||||||||
| 2,737 | Ceat, Ltd. | 44,223 | ||||||||
| 9,046 | Chambal Fertilizers and Chemicals, Ltd. | 21,729 | ||||||||
| 38,562 | Cholamandalam Investment and Finance Co., Ltd. | 807,172 | ||||||||
| 555,580 | Cipla, Ltd. | 4,230,107 | ||||||||
See accompanying Notes to the Financial Statements.
154
Table of Contents
Mercer Emerging Markets Equity Fund
Schedule of Investments (Continued)
(showing percentage of net assets)
March 31, 2019
| Shares | Description | Value ($) | ||||||||
| India — continued | ||||||||||
| 21,936 | City Union Bank, Ltd. | 64,755 | ||||||||
| 250,000 | Coal India, Ltd. | 853,302 | ||||||||
| 6,287 | Container Corp. Of India, Ltd. | 47,737 | ||||||||
| 1,181 | Coromandel International, Ltd. | 8,797 | ||||||||
| 288,628 | DCB Bank, Ltd. | 850,364 | ||||||||
| 2,717 | DCM Shriram, Ltd. | 16,222 | ||||||||
| 48,369 | Dewan Housing Finance Corp., Ltd. | 104,349 | ||||||||
| 102,560 | DLF, Ltd. | 298,760 | ||||||||
| 4,833 | Dr. Reddy’s Laboratories, Ltd. | 194,087 | ||||||||
| 555 | eClerx Services, Ltd. | 9,197 | ||||||||
| 32,652 | Edelweiss Financial Services, Ltd. | 92,689 | ||||||||
| 16,647 | EIH, Ltd. | 49,983 | ||||||||
| 16,885 | Engineers India, Ltd. | 28,554 | ||||||||
| 97,195 | Escorts, Ltd. | 1,116,252 | ||||||||
| 10,155 | Exide Industries, Ltd. | 31,971 | ||||||||
| 297,098 | Federal Bank, Ltd. | 411,713 | ||||||||
| 1,156 | Finolex Cables, Ltd. | 7,919 | ||||||||
| 1,488 | Finolex Industries, Ltd. | 10,482 | ||||||||
| 21,744 | Firstsource Solutions, Ltd. | 14,752 | ||||||||
| 743,739 | GAIL India, Ltd. | 3,757,613 | ||||||||
| 11,419 | Glenmark Pharmaceuticals, Ltd. | 106,319 | ||||||||
| 226,986 | Grasim Industries, Ltd. | 2,817,870 | ||||||||
| 4,827 | Great Eastern Shipping Co., Ltd. (The) | 19,841 | ||||||||
| 8,935 | Gujarat Fluorochemicals, Ltd. | 142,779 | ||||||||
| 1,719 | Gujarat Narmada Valley Fertilizers & Chemicals, Ltd. | 7,611 | ||||||||
| 26,889 | Gujarat Pipavav Port, Ltd. | 38,233 | ||||||||
| 32,753 | Gujarat State Petronet, Ltd. | 89,831 | ||||||||
| 36,616 | HCL Technologies, Ltd. Class T | 574,545 | ||||||||
| 21,924 | HDFC Bank, Ltd., ADR | 2,541,211 | ||||||||
| 56,677 | HDFC Bank, Ltd. | 1,894,824 | ||||||||
| 330,630 | HDFC Life Insurance Co., Ltd. | 1,803,133 | ||||||||
| 6,556 | Hero MotoCorp, Ltd. | 241,524 | ||||||||
| 860,438 | Hindalco Industries, Ltd. | 2,544,984 | ||||||||
| 33,143 | Hindustan Petroleum Corp., Ltd. | 135,730 | ||||||||
| 97,987 | Hindustan Unilever, Ltd. | 2,413,783 | ||||||||
| 241,375 | Housing Development Finance Corp., Ltd. | 6,843,169 | ||||||||
| 35,388 | ICICI Bank, Ltd., ADR | 405,546 | ||||||||
| 221,189 | ICICI Bank, Ltd. | 1,274,291 | ||||||||
| 422,223 | IDFC Bank, Ltd.* | 338,266 | ||||||||
| 264,117 | IDFC, Ltd. | 176,904 | ||||||||
| 461,973 | Indiabulls Housing Finance, Ltd., ADR | 5,739,735 | ||||||||
| 58,726 | Indiabulls Real Estate, Ltd.* | 77,991 | ||||||||
| 325,697 | Indian Oil Corp., Ltd. | 765,641 | ||||||||
| 175,224 | Indraprastha Gas, Ltd. | 772,984 | ||||||||
| 119,487 | IndusInd Bank, Ltd. | 3,071,907 | ||||||||
| 332,086 | Infosys, Ltd., ADR‡ | 3,629,700 | ||||||||
| 735,547 | Infosys, Ltd. | 7,879,989 | ||||||||
| 5,075 | Ipca Laboratories, Ltd. | 71,647 | ||||||||
| 73,641 | Jindal Steel & Power, Ltd.* | 191,185 | ||||||||
See accompanying Notes to the Financial Statements.
155
Table of Contents
Mercer Emerging Markets Equity Fund
Schedule of Investments (Continued)
(showing percentage of net assets)
March 31, 2019
| Shares | Description | Value ($) | ||||||||
| India — continued | ||||||||||
| 21,551 | JM Financial, Ltd. | 29,429 | ||||||||
| 134,159 | JSW Energy, Ltd.* | 140,792 | ||||||||
| 24,265 | JSW Steel, Ltd. | 102,594 | ||||||||
| 59,365 | Jubilant Foodworks, Ltd. | 1,241,202 | ||||||||
| 64,714 | Jubilant Life Sciences, Ltd. | 620,283 | ||||||||
| 124,460 | Just Dial, Ltd.* | 1,080,660 | ||||||||
| 79,783 | Kajaria Ceramics, Ltd. | 681,337 | ||||||||
| 1,991 | Kalpataru Power Transmission, Ltd. | 13,616 | ||||||||
| 100,410 | Karur Vysya Bank, Ltd. (The) | 103,345 | ||||||||
| 19,360 | KPIT Engineering, Ltd.* **** ¤ | 24,509 | ||||||||
| 19,360 | KPIT Technologies, Ltd.* | 27,667 | ||||||||
| 25,418 | L&T Finance Holdings, Ltd. | 55,899 | ||||||||
| 49,676 | Larsen & Toubro, Ltd. | 990,903 | ||||||||
| 71,752 | LIC Housing Finance, Ltd. | 549,986 | ||||||||
| 14,877 | Lupin, Ltd. | 158,692 | ||||||||
| 17,661 | Mahindra & Mahindra Financial Services, Ltd. | 107,177 | ||||||||
| 31,314 | Mahindra & Mahindra, Ltd. | 305,117 | ||||||||
| 12,324 | Mahindra CIE Automotive, Ltd.* | 41,540 | ||||||||
| 74,227 | Manappuram Finance, Ltd. | 133,668 | ||||||||
| 17,612 | Maruti Suzuki India, Ltd. | 1,696,243 | ||||||||
| 889,072 | Motherson Sumi Systems, Ltd. | 1,922,526 | ||||||||
| 2,375 | Motilal Oswal Financial Services, Ltd. | 20,539 | ||||||||
| 71,742 | Mphasis, Ltd. | 1,035,094 | ||||||||
| 2,011 | MRF, Ltd. | 1,680,792 | ||||||||
| 8,766 | Muthoot Finance, Ltd.* | 77,695 | ||||||||
| 1,711 | Natco Pharma, Ltd. | 14,077 | ||||||||
| 124,982 | National Aluminium Co., Ltd. | 100,040 | ||||||||
| 79,506 | NCC, Ltd. | 129,574 | ||||||||
| 61,886 | NIIT Technologies, Ltd. | 1,183,673 | ||||||||
| 10,817 | Oberoi Realty, Ltd. | 81,508 | ||||||||
| 550 | ODISHA CEMENT, Ltd. | 7,856 | ||||||||
| 160,101 | Oil & Natural Gas Corp., Ltd. | 369,775 | ||||||||
| 13,380 | PC Jeweller, Ltd. | 15,896 | ||||||||
| 4,508 | Persistent Systems, Ltd. | 40,997 | ||||||||
| 683,819 | Petronet LNG, Ltd. | 2,472,705 | ||||||||
| 1,284 | Pfizer, Ltd. | 60,702 | ||||||||
| 5,384 | Piramal Enterprises, Ltd. | 214,043 | ||||||||
| 1,849 | PNB Housing Finance, Ltd. 144A | 23,125 | ||||||||
| 149,632 | Power Finance Corp., Ltd. | 264,164 | ||||||||
| 20,022 | Prestige Estates Projects, Ltd. | 72,834 | ||||||||
| 177,823 | Radico Khaitan, Ltd. | 1,016,241 | ||||||||
| 8,780 | Rain Industries, Ltd. | 12,947 | ||||||||
| 5,787 | Rajesh Exports, Ltd. | 55,422 | ||||||||
| 1,045 | Ramco Cements, Ltd. (The) | 11,103 | ||||||||
| 101,677 | RBL Bank, Ltd. 144A | 995,121 | ||||||||
| 157,497 | REC, Ltd. | 346,709 | ||||||||
| 34,104 | Reliance Capital, Ltd. | 100,330 | ||||||||
| 224,986 | Reliance Industries, Ltd. | 4,426,809 | ||||||||
| 2,210 | Reliance Industries, Ltd. (London Exchange), GDR | 88,621 | ||||||||
See accompanying Notes to the Financial Statements.
156
Table of Contents
Mercer Emerging Markets Equity Fund
Schedule of Investments (Continued)
(showing percentage of net assets)
March 31, 2019
| Shares | Description | Value ($) | ||||||||
| India — continued | ||||||||||
| 191,600 | Reliance Power, Ltd.* | 31,253 | ||||||||
| 2,509 | Sadbhav Engineering, Ltd. | 9,000 | ||||||||
| 2,984 | Shriram City Union Finance, Ltd. | 79,904 | ||||||||
| 10,340 | Shriram Transport Finance Co., Ltd. | 190,299 | ||||||||
| 3,149 | Sobha, Ltd. | 23,415 | ||||||||
| 1,607 | SRF, Ltd. | 55,836 | ||||||||
| 61,065 | State Bank of India* | 282,561 | ||||||||
| 2,196 | State Bank of India, Reg S, GDR* ‡‡‡ | 101,565 | ||||||||
| 33,085 | Steel Authority of India, Ltd.* | 25,694 | ||||||||
| 194,949 | Sterlite Technologies, Ltd. | 614,606 | ||||||||
| 6,618 | Strides Pharma Science, Ltd. | 45,053 | ||||||||
| 37,691 | Sun Pharmaceutical Industries, Ltd. | 259,960 | ||||||||
| 1,498 | Sundaram Finance, Ltd. | 33,517 | ||||||||
| 4,518 | Tata Chemicals, Ltd. | 38,674 | ||||||||
| 326,403 | Tata Consultancy Services, Ltd. | 9,423,399 | ||||||||
| 78,855 | Tata Global Beverages, Ltd. | 232,439 | ||||||||
| 98,846 | Tata Motors, Ltd.* | 248,132 | ||||||||
| 31,521 | Tata Steel, Ltd. | 236,902 | ||||||||
| 39,975 | Tech Mahindra, Ltd. | 448,020 | ||||||||
| 13,380 | Thomas Cook India, Ltd. | 49,638 | ||||||||
| 48,175 | TV18 Broadcast, Ltd.* | 24,618 | ||||||||
| 1,134 | UltraTech Cement, Ltd. | 65,457 | ||||||||
| 56,007 | Union Bank of India* | 76,886 | ||||||||
| 217,171 | UPL, Ltd. | 3,003,245 | ||||||||
| 1,183 | Vardhman Textiles, Ltd. | 18,614 | ||||||||
| 790,943 | Vedanta, Ltd. | 2,109,942 | ||||||||
| 1,344,021 | Vodafone Idea, Ltd.* | 348,252 | ||||||||
| 26,227 | Welspun India, Ltd. | 22,526 | ||||||||
| 63,184 | Wipro, Ltd., ADR‡ | 251,472 | ||||||||
| 59,461 | Wipro, Ltd. | 218,703 | ||||||||
| 3,632 | Wockhardt, Ltd.* | 23,215 | ||||||||
| 94,528 | Yes Bank, Ltd. | 374,564 | ||||||||
|
| |||||||||
Total India | 119,243,208 | |||||||||
|
| |||||||||
| Indonesia — 2.6% | ||||||||||
| 12,160,100 | Adaro Energy Tbk PT | 1,148,549 | ||||||||
| 70,800 | AKR Corporindo Tbk PT | 23,467 | ||||||||
| 1,091,400 | Aneka Tambang Tbk PT | 67,829 | ||||||||
| 128,100 | Astra Agro Lestari Tbk PT | 100,978 | ||||||||
| 478,600 | Astra International Tbk PT | 246,190 | ||||||||
| 438,500 | Bank Central Asia Tbk PT | 854,521 | ||||||||
| 104,300 | Bank Danamon Indonesia Tbk PT | 68,117 | ||||||||
| 2,914,900 | Bank Mandiri Persero Tbk PT | 1,525,000 | ||||||||
| 799,500 | Bank Maybank Indonesia Tbk PT | 15,047 | ||||||||
| 3,431,100 | Bank Negara Indonesia Persero Tbk PT | 2,264,911 | ||||||||
| 624,500 | Bank Pan Indonesia Tbk PT* | 63,152 | ||||||||
| 876,500 | Bank Pembangunan Daerah Jawa Barat Dan Banten Tbk PT | 123,719 | ||||||||
| 956,700 | Bank Pembangunan Daerah Jawa Timur Tbk PT* | 43,669 | ||||||||
| 23,957,100 | Bank Rakyat Indonesia Persero Tbk PT | 6,931,408 | ||||||||
See accompanying Notes to the Financial Statements.
157
Table of Contents
Mercer Emerging Markets Equity Fund
Schedule of Investments (Continued)
(showing percentage of net assets)
March 31, 2019
| Shares | Description | Value ($) | ||||||||
| Indonesia — continued | ||||||||||
| 717,600 | Bank Tabungan Negara Persero Tbk PT | 122,959 | ||||||||
| 285,600 | Barito Pacific Tbk PT | 72,002 | ||||||||
| 850,000 | BFI Finance Indonesia Tbk PT | 39,396 | ||||||||
| 336,400 | Bukit Asam Tbk PT | 99,219 | ||||||||
| 1,075,000 | Bumi Serpong Damai Tbk PT* | 106,066 | ||||||||
| 3,729,200 | Ciputra Development Tbk PT | 261,882 | ||||||||
| 394,700 | Indah Kiat Pulp & Paper Corp. Tbk PT | 238,372 | ||||||||
| 68,500 | Indo Tambangraya Megah Tbk PT | 115,089 | ||||||||
| 3,700 | Indocement Tunggal Prakarsa Tbk PT | 5,690 | ||||||||
| 276,500 | Indofood Sukses Makmur Tbk PT | 123,784 | ||||||||
| 764,900 | Japfa Comfeed Indonesia Tbk PT | 94,270 | ||||||||
| 1,055,000 | Jaya Real Property Tbk PT | 44,082 | ||||||||
| 2,110,500 | Medco Energi Internasional Tbk PT* | 131,906 | ||||||||
| 1,350,100 | Media Nusantara Citra Tbk PT | 71,108 | ||||||||
| 131,500 | Pabrik Kertas Tjiwi Kimia Tbk PT | 101,811 | ||||||||
| 5,398,000 | Perusahaan Gas Negara Persero Tbk PT | 890,822 | ||||||||
| 878,500 | PP Persero Tbk PT | 128,320 | ||||||||
| 1,935,500 | PP Properti Tbk PT | 19,980 | ||||||||
| 282,600 | Semen Gresik Persero Tbk PT | 276,845 | ||||||||
| 108,800 | Siloam International Hospitals Tbk PT* | 29,034 | ||||||||
| 892,500 | Summarecon Agung Tbk PT | 58,915 | ||||||||
| 14,102,300 | Telekomunikasi Indonesia Persero Tbk PT | 3,911,804 | ||||||||
| 730,800 | Unilever Indonesia Tbk PT | 2,526,238 | ||||||||
| 1,035,310 | United Tractors Tbk PT | 1,966,653 | ||||||||
| 113,000 | Vale Indonesia Tbk PT* | 26,901 | ||||||||
| 2,870,800 | Waskita Beton Precast Tbk PT | 81,044 | ||||||||
| 407,500 | Waskita Karya Persero Tbk PT | 56,804 | ||||||||
| 6,079,100 | Wijaya Karya Persero Tbk PT | 922,111 | ||||||||
| 577,200 | XL Axiata Tbk PT* | 109,441 | ||||||||
|
| |||||||||
Total Indonesia | 26,109,105 | |||||||||
|
| |||||||||
| Isle of Man — 0.0% | ||||||||||
| 25,196 | NEPI Rockcastle Plc | 212,173 | ||||||||
|
| |||||||||
| Japan — 0.2% | ||||||||||
| 60,500 | Honda Motor Co., Ltd. | 1,637,056 | ||||||||
| 59,000 | Isuzu Motors, Ltd. | 775,046 | ||||||||
|
| |||||||||
Total Japan | 2,412,102 | |||||||||
|
| |||||||||
| Luxembourg — 0.0% | ||||||||||
| 16,364 | Kernel Holding SA | 210,000 | ||||||||
|
| |||||||||
| Malaysia — 1.3% | ||||||||||
| 54,700 | Aeon Co. M Bhd | 19,696 | ||||||||
| 3,152,615 | AirAsia Group Bhd | 2,054,123 | ||||||||
| 337,500 | Alliance Bank Malaysia Bhd | 338,120 | ||||||||
| 306,700 | AMMB Holdings Bhd | 342,572 | ||||||||
| 52,400 | Axiata Group Bhd | 53,266 | ||||||||
| 1,600 | Batu Kawan Bhd | 6,655 | ||||||||
See accompanying Notes to the Financial Statements.
158
Table of Contents
Mercer Emerging Markets Equity Fund
Schedule of Investments (Continued)
(showing percentage of net assets)
March 31, 2019
| Shares | Description | Value ($) | ||||||||
| Malaysia — continued | ||||||||||
| 14,900 | BIMB Holdings Bhd | 15,730 | ||||||||
| 81,500 | Boustead Holdings Bhd | 25,353 | ||||||||
| 71,300 | Bumi Armada Bhd* | 3,318 | ||||||||
| 47,500 | Cahya Mata Sarawak Bhd | 38,861 | ||||||||
| 291,320 | CIMB Group Holdings Bhd | 367,495 | ||||||||
| 164,700 | Dialog Group Bhd | 127,887 | ||||||||
| 199,100 | DRB-Hicom Bhd | 92,661 | ||||||||
| 312,500 | Eco World Development Group Bhd* | 71,188 | ||||||||
| 337,000 | FGV Holdings Bhd* | 97,406 | ||||||||
| 264,100 | Gamuda Bhd | 186,309 | ||||||||
| 428,900 | Genting Bhd | 697,586 | ||||||||
| 1,494,300 | Genting Malaysia Bhd | 1,171,282 | ||||||||
| 12,100 | Genting Plantations Bhd | 31,417 | ||||||||
| 7,800 | Hengyuan Refining Co. Bhd | 11,139 | ||||||||
| 170,300 | Hong Leong Bank Bhd | 846,807 | ||||||||
| 10,800 | Hong Leong Financial Group Bhd | 50,740 | ||||||||
| 50,000 | IHH Healthcare Bhd | 70,667 | ||||||||
| 540,500 | IJM Corp. Bhd | 293,916 | ||||||||
| 328,300 | IOI Properties Group Bhd | 106,150 | ||||||||
| 34,500 | Lotte Chemical Titan Holding Bhd 144A | 34,648 | ||||||||
| 43,900 | Magnum Bhd | 25,593 | ||||||||
| 321,300 | Mah Sing Group Bhd | 73,193 | ||||||||
| 338,056 | Malayan Banking Bhd | 767,613 | ||||||||
| 829,900 | Malaysia Airports Holdings Bhd | 1,471,764 | ||||||||
| 316,174 | Malaysia Building Society Bhd | 73,961 | ||||||||
| 212,900 | Malaysian Resources Corp. Bhd | 46,152 | ||||||||
| 100,400 | MISC Bhd | 164,526 | ||||||||
| 123,600 | MMC Corp. Bhd | 29,973 | ||||||||
| 60,300 | Oriental Holdings Bhd | 95,121 | ||||||||
| 503,700 | Petronas Chemicals Group Bhd | 1,130,163 | ||||||||
| 68,900 | Petronas Gas Bhd | 297,371 | ||||||||
| 11,700 | Pos Malaysia BHD | 5,245 | ||||||||
| 105,800 | Public Bank Bhd | 600,203 | ||||||||
| 154,600 | RHB Bank Bhd | 215,853 | ||||||||
| 1,152,800 | Sapura Energy Bhd* | 94,596 | ||||||||
| 7,800 | Scientex BHD | 16,336 | ||||||||
| 318,400 | Sime Darby Bhd | 173,921 | ||||||||
| 181,600 | Sime Darby Property Bhd | 49,376 | ||||||||
| 58,900 | SP Setia Bhd Group | 32,750 | ||||||||
| 298,900 | Sunway Bhd | 123,001 | ||||||||
| 65,600 | Supermax Corp. Bhd | 23,621 | ||||||||
| 411,000 | UEM Sunrise Bhd | 82,552 | ||||||||
| 17,500 | UMW Holdings Bhd | 24,562 | ||||||||
| 164,000 | UOA Development Bhd | 86,369 | ||||||||
| 145,300 | VS Industry Bhd | 38,082 | ||||||||
| 57,200 | Yinson Holdings Bhd | 64,451 | ||||||||
| 737,900 | YTL Corp. Bhd | 191,592 | ||||||||
|
| |||||||||
Total Malaysia | 13,152,932 | |||||||||
|
| |||||||||
See accompanying Notes to the Financial Statements.
159
Table of Contents
Mercer Emerging Markets Equity Fund
Schedule of Investments (Continued)
(showing percentage of net assets)
March 31, 2019
| Shares | Description | Value ($) | ||||||||
| Mexico — 3.4% | ||||||||||
| 42,023 | ALEATICA SAB de CV | 45,711 | ||||||||
| 1,346,655 | Alfa SAB de CV Class A | 1,428,749 | ||||||||
| 19,000 | Alpek SAB de CV | 25,438 | ||||||||
| 95,100 | Arca Continental SAB de CV | 529,491 | ||||||||
| 418,088 | Banco del Bajio SA‡ 144A | 830,895 | ||||||||
| 10,037 | Banco Santander Mexico SA Institucion de Banca Multiple Grupo Financiero Santand, ADR | 67,950 | ||||||||
| 62,866 | Banco Santander Mexico SA Institucion de Banca Multiple Grupo Financiero Santand Class B‡ | 85,917 | ||||||||
| 8,331 | Becle SAB de CV | 12,794 | ||||||||
| 130,050 | Cemex SAB de CV, ADR* | 603,432 | ||||||||
| 15,200 | Coca-Cola Femsa SAB de CV Series L | 100,505 | ||||||||
| 15,700 | El Puerto de Liverpool SAB de CV | 99,166 | ||||||||
| 95,500 | Elementia SAB de CV* 144A | 54,993 | ||||||||
| 1,670,056 | Fibra Uno Administracion SA de CV REIT | 2,303,080 | ||||||||
| 69,615 | Fomento Economico Mexicano SAB de CV, ADR | 6,424,072 | ||||||||
| 12,016 | Fomento Economico Mexicano SAB de CV | 110,834 | ||||||||
| 310,500 | Gentera SAB de CV | 241,549 | ||||||||
| 30,570 | Gruma SAB de CV Class B | 313,273 | ||||||||
| 87,700 | Grupo Aeromexico SAB de CV* ‡ | 91,328 | ||||||||
| 197,100 | Grupo Aeroportuario del Centro Norte SAB de CV | 1,111,930 | ||||||||
| 306,100 | Grupo Aeroportuario del Pacifico SAB de CV Class B | 2,715,489 | ||||||||
| 591 | Grupo Aeroportuario del Sureste SAB de CV, ADR | 95,600 | ||||||||
| 31,002 | Grupo Bimbo SAB de CV Series A | 64,713 | ||||||||
| 12,600 | Grupo Carso SAB de CV SeriesA-1‡ | 49,361 | ||||||||
| 33,217 | Grupo Cementos de Chihuahua SAB de CV | 183,145 | ||||||||
| 107,100 | Grupo Comercial Chedraui SA de CV | 208,706 | ||||||||
| 9,583 | Grupo Elektra SAB DE CV‡ | 518,888 | ||||||||
| 1,010,626 | Grupo Financiero Banorte SAB de CV Series O | 5,494,033 | ||||||||
| 213,400 | Grupo Financiero Inbursa SAB de CV Series O | 295,498 | ||||||||
| 34,200 | Grupo Lala SAB de CV‡ | 44,378 | ||||||||
| 363,660 | Grupo Mexico SAB de CV Series B | 996,257 | ||||||||
| 76,700 | Grupo Sanborns SAB de CV | 73,942 | ||||||||
| 19,886 | Grupo Televisa SAB, ADR | 219,939 | ||||||||
| 57,100 | Industrias Bachoco SAB de CV Series B | 219,510 | ||||||||
| 9,108 | Industrias CH SAB de CV Series B* ‡ | 40,447 | ||||||||
| 15,414 | Industrias Penoles SAB de CV | 192,485 | ||||||||
| 448,179 | Mexichem SAB de CV | 1,072,071 | ||||||||
| 220,500 | Minera Frisco SAB de CV Class A* ‡ | 50,244 | ||||||||
| 247,700 | Nemak SAB de CV‡ 144A | 143,404 | ||||||||
| 14,495 | Organizacion Soriana SAB de CV Class B* ‡ | 16,813 | ||||||||
| 12,412 | Promotora y Operadora de Infraestructura SAB de CV | 123,151 | ||||||||
| 1,809 | Promotora y Operadora de Infraestructura SAB de CV Series L | 11,378 | ||||||||
| 22,100 | Vitro SAB de CV Series A | 56,955 | ||||||||
| 2,600,500 | Wal-Mart de Mexico SAB de CV | 6,956,564 | ||||||||
|
| |||||||||
Total Mexico | 34,324,078 | |||||||||
|
| |||||||||
See accompanying Notes to the Financial Statements.
160
Table of Contents
Mercer Emerging Markets Equity Fund
Schedule of Investments (Continued)
(showing percentage of net assets)
March 31, 2019
| Shares | Description | Value ($) | ||||||||
| Netherlands — 0.8% | ||||||||||
| 46,515 | Heineken Holding NV | 4,664,082 | ||||||||
| 90,474 | Yandex NV Class A* | 3,106,877 | ||||||||
|
| |||||||||
Total Netherlands | 7,770,959 | |||||||||
|
| |||||||||
| Nigeria — 0.1% | ||||||||||
| 14,791,916 | Guaranty Trust Bank Plc | 1,477,143 | ||||||||
|
| |||||||||
| Papua New Guinea — 0.2% | ||||||||||
| 404,463 | Oil Search, Ltd. | 2,255,385 | ||||||||
|
| |||||||||
| Philippines — 0.5% | ||||||||||
| 688,400 | Alliance Global Group, Inc. | 211,856 | ||||||||
| 6,935 | Ayala Corp. | 124,146 | ||||||||
| 191,300 | Ayala Land, Inc. | 163,576 | ||||||||
| 23,039 | Bank of the Philippine Islands | 36,943 | ||||||||
| 176,100 | BDO Unibank, Inc. | 448,718 | ||||||||
| 135,700 | China Banking Corp. | 69,388 | ||||||||
| 156,900 | DMCI Holdings, Inc. | 35,856 | ||||||||
| 204,200 | Emperador, Inc. | 28,699 | ||||||||
| 6,070 | GT Capital Holdings, Inc. | 107,679 | ||||||||
| 20,340 | International Container Terminal Services, Inc. | 50,627 | ||||||||
| 240,310 | JG Summit Holdings, Inc. | 290,605 | ||||||||
| 1,801,000 | Megaworld Corp. | 198,930 | ||||||||
| 252,100 | Metro Pacific Investments Corp. | 23,285 | ||||||||
| 154,854 | Metropolitan Bank & Trust Co. | 235,628 | ||||||||
| 548,200 | Petron Corp. | 67,755 | ||||||||
| 46,140 | Philippine National Bank* | 50,085 | ||||||||
| 31,520 | Pilipinas Shell Petroleum Corp. | 29,653 | ||||||||
| 5,745 | PLDT, Inc. | 125,819 | ||||||||
| 24,000 | Puregold Price Club, Inc. | 21,984 | ||||||||
| 29,100 | Rizal Commercial Banking Corp. | 14,797 | ||||||||
| 246,500 | Robinsons Land Corp. | 115,012 | ||||||||
| 38,420 | Robinsons Retail Holdings, Inc. | 57,802 | ||||||||
| 30,470 | San Miguel Corp. | 100,967 | ||||||||
| 12,670 | San Miguel Food and Beverage, Inc. | 26,059 | ||||||||
| 40,030 | Security Bank Corp. | 131,883 | ||||||||
| 49,700 | Semirara Mining & Power Corp. | 20,775 | ||||||||
| 159,300 | SM Prime Holdings, Inc. | 121,045 | ||||||||
| 4,270 | Top Frontier Investment Holdings, Inc.* | 21,224 | ||||||||
| 28,020 | Union Bank of the Philippines | 32,470 | ||||||||
| 755,930 | Universal Robina Corp. | 2,188,181 | ||||||||
| 912,600 | Vista Land & Lifescapes, Inc. | 125,654 | ||||||||
|
| |||||||||
Total Philippines | 5,277,101 | |||||||||
|
| |||||||||
| Poland — 0.8% | ||||||||||
| 22,554 | Alior Bank SA* | 351,501 | ||||||||
| 22,601 | Asseco Poland SA | 305,957 | ||||||||
| 1,414 | Bank Handlowy w Warszawie SA | 24,895 | ||||||||
| 29,838 | Bank Millennium SA* | 69,578 | ||||||||
See accompanying Notes to the Financial Statements.
161
Table of Contents
Mercer Emerging Markets Equity Fund
Schedule of Investments (Continued)
(showing percentage of net assets)
March 31, 2019
| Shares | Description | Value ($) | ||||||||
| Poland — continued | ||||||||||
| 2,112 | Bank Polska Kasa Opieki SA | 60,597 | ||||||||
| 21,510 | Cyfrowy Polsat SA* | 144,079 | ||||||||
| 37,983 | Dino Polska SA* | 1,198,780 | ||||||||
| 67,330 | Enea SA* | 153,667 | ||||||||
| 9,123 | Grupa Azoty SA | 98,039 | ||||||||
| 28,496 | Grupa Lotos SA | 619,890 | ||||||||
| 61,470 | Jastrzebska Spolka Weglowa SA* | 978,043 | ||||||||
| 49,706 | KGHM Polska Miedz SA* | 1,387,259 | ||||||||
| 769 | mBank SA | 85,287 | ||||||||
| 373,088 | PGE Polska Grupa Energetyczna SA* | 967,303 | ||||||||
| 33,462 | Polski Koncern Naftowy ORLEN SA | 852,206 | ||||||||
| 522,040 | Polskie Gornictwo Naftowe i Gazownictwo SA | 851,718 | ||||||||
| 13,359 | Powszechna Kasa Oszczednosci Bank Polski SA | 134,432 | ||||||||
| 17,314 | Powszechny Zaklad Ubezpieczen SA | 182,902 | ||||||||
| 231,480 | Tauron Polska Energia SA* | 122,205 | ||||||||
|
| |||||||||
Total Poland | 8,588,338 | |||||||||
|
| |||||||||
| Qatar — 0.1% | ||||||||||
| 5,502 | Industries Qatar QSC | 187,241 | ||||||||
| 1,312 | Qatar Islamic Bank SAQ | 54,649 | ||||||||
| 20,302 | Qatar National Bank QPSC | 1,006,527 | ||||||||
|
| |||||||||
Total Qatar | 1,248,417 | |||||||||
|
| |||||||||
| Russia — 1.5% | ||||||||||
| 551,440 | Gazprom PJSC, ADR | 2,489,200 | ||||||||
| 271,337 | Gazprom PJSC (OTC Exchange), ADR‡ | 1,226,443 | ||||||||
| 45,651 | LUKOIL PJSC (Euroclear Shares), ADR | 4,090,330 | ||||||||
| 6,698 | Magnitogorsk Iron & Steel Works PJSC, Reg S, GDR‡‡‡ | 60,014 | ||||||||
| 16,808 | MMC Norilsk Nickel PJSC, ADR | 354,985 | ||||||||
| 274,884 | Mobile Telesystems PJSC, ADR | 2,078,123 | ||||||||
| 4,578 | Novatek PJSC, Reg S, GDR‡‡‡ | 784,669 | ||||||||
| 18,957 | Novolipetsk Steel PJSC, GDR | 486,626 | ||||||||
| 83,399 | Rosneft Oil Co. PJSC, Reg S, GDR‡‡‡ | 523,746 | ||||||||
| 23,672 | Sberbank of Russia PJSC, ADR | 313,891 | ||||||||
| 122,406 | Severstal PJSC, Reg S, GDR‡‡‡ | 1,909,534 | ||||||||
| 88,066 | Surgutneftegas PJSC, ADR | 326,725 | ||||||||
| 303,080 | VTB Bank PJSC, Reg S, GDR‡‡‡ | 346,117 | ||||||||
|
| |||||||||
Total Russia | 14,990,403 | |||||||||
|
| |||||||||
| Singapore — 0.2% | ||||||||||
| 398,500 | Singapore Telecommunications, Ltd. | 888,498 | ||||||||
| 69,980 | United Overseas Bank, Ltd. | 1,301,437 | ||||||||
|
| |||||||||
Total Singapore | 2,189,935 | |||||||||
|
| |||||||||
| South Africa — 5.8% | ||||||||||
| 59,657 | Absa Group, Ltd.‡ | 629,199 | ||||||||
| 38,082 | AECI, Ltd. | 252,872 | ||||||||
| 100,936 | African Rainbow Minerals, Ltd. | 1,187,750 | ||||||||
See accompanying Notes to the Financial Statements.
162
Table of Contents
Mercer Emerging Markets Equity Fund
Schedule of Investments (Continued)
(showing percentage of net assets)
March 31, 2019
| Shares | Description | Value ($) | ||||||||
| South Africa — continued | ||||||||||
| 1,461 | Anglo American Platinum, Ltd. | 74,578 | ||||||||
| 29,204 | AngloGold Ashanti, Ltd., ADR‡ | 382,572 | ||||||||
| 27,376 | AngloGold Ashanti, Ltd.‡ | 363,697 | ||||||||
| 43,907 | Aspen Pharmacare Holdings, Ltd. | 283,087 | ||||||||
| 257,596 | AVI, Ltd. | 1,612,783 | ||||||||
| 66,687 | Barloworld, Ltd. | 587,276 | ||||||||
| 106,375 | Bid Corp., Ltd. | 2,198,128 | ||||||||
| 143,407 | Bidvest Group, Ltd. (The) | 1,924,192 | ||||||||
| 39,231 | Capitec Bank Holdings, Ltd. | 3,672,460 | ||||||||
| 161,042 | Clicks Group, Ltd. | 2,057,072 | ||||||||
| 9,617 | Discovery, Ltd. | 91,227 | ||||||||
| 3,329 | Distell Group Holdings, Ltd.‡ | 29,739 | ||||||||
| 177,789 | Exxaro Resources, Ltd. | 2,026,150 | ||||||||
| 636,201 | FirstRand, Ltd.‡ | 2,777,513 | ||||||||
| 52,276 | Foschini Group, Ltd. (The) | 590,863 | ||||||||
| 442,132 | Gold Fields, Ltd., ADR | 1,649,152 | ||||||||
| 43,509 | Gold Fields, Ltd. | 160,746 | ||||||||
| 250,718 | Growthpoint Properties, Ltd. REIT | 424,549 | ||||||||
| 20,455 | Imperial Logistics, Ltd.‡ | 84,919 | ||||||||
| 54,823 | Investec, Ltd. | 320,622 | ||||||||
| 46,715 | Italtile, Ltd. | 43,731 | ||||||||
| 216,604 | KAP Industrial Holdings, Ltd. | 105,589 | ||||||||
| 1,689 | Kumba Iron Ore, Ltd.‡ | 50,396 | ||||||||
| 38,874 | Liberty Holdings, Ltd. | 272,337 | ||||||||
| 72,170 | Life Healthcare Group Holdings, Ltd. | 134,319 | ||||||||
| 470,749 | MMI Holdings, Ltd.‡ | 541,543 | ||||||||
| 25,690 | Mondi, Ltd. | 567,874 | ||||||||
| 11,078 | Motus Holdings, Ltd.‡ | 62,852 | ||||||||
| 142,347 | Mr Price Group, Ltd. | 1,870,684 | ||||||||
| 65,904 | MTN Group, Ltd.‡ | 404,987 | ||||||||
| 36,662 | Naspers, Ltd. Class N | 8,471,035 | ||||||||
| 19,631 | Nedbank Group, Ltd.‡ | 342,002 | ||||||||
| 44,298 | Netcare, Ltd. | 71,725 | ||||||||
| 7,817 | Northam Platinum, Ltd.* | 34,420 | ||||||||
| 186,389 | Old Mutual, Ltd.‡ | 282,661 | ||||||||
| 139,430 | Pick n Pay Stores, Ltd. | 642,077 | ||||||||
| 12,375 | Pioneer Foods Group, Ltd. | 68,752 | ||||||||
| 470,452 | PPC, Ltd.* | 153,324 | ||||||||
| 8,037 | PSG Group, Ltd. | 145,735 | ||||||||
| 467,772 | Redefine Properties, Ltd. REIT | 314,632 | ||||||||
| 345,642 | Remgro, Ltd. | 4,440,228 | ||||||||
| 50,029 | Reunert, Ltd. | 246,307 | ||||||||
| 74,875 | RMB Holdings, Ltd.‡ | 394,487 | ||||||||
| 38,975 | Sanlam, Ltd.‡ | 199,344 | ||||||||
| 269,496 | Sappi, Ltd. | 1,245,517 | ||||||||
| 7,568 | Sasol, Ltd., ADR‡ | 234,154 | ||||||||
| 40,499 | Sasol, Ltd. | 1,263,729 | ||||||||
| 202,383 | Shoprite Holdings, Ltd. | 2,225,880 | ||||||||
| 568,362 | Sibanye Gold, Ltd.* | 619,942 | ||||||||
See accompanying Notes to the Financial Statements.
163
Table of Contents
Mercer Emerging Markets Equity Fund
Schedule of Investments (Continued)
(showing percentage of net assets)
March 31, 2019
| Shares | Description | Value ($) | ||||||||
| South Africa — continued | ||||||||||
| 17,032 | Spar Group, Ltd. (The) | 226,617 | ||||||||
| 166,962 | Standard Bank Group, Ltd. | 2,144,500 | ||||||||
| 93,635 | Super Group, Ltd.* | 216,082 | ||||||||
| 81,164 | Telkom SA SOC, Ltd. | 410,400 | ||||||||
| 326,550 | Tiger Brands, Ltd. | 6,000,572 | ||||||||
| 34,879 | Tongaat Hulett, Ltd. | 52,145 | ||||||||
| 268,188 | Truworths International, Ltd. | 1,290,427 | ||||||||
| 41,502 | Tsogo Sun Holdings, Ltd. | 55,571 | ||||||||
| 9,158 | Vodacom Group, Ltd. | 70,762 | ||||||||
| 52,776 | Woolworths Holdings, Ltd. | 170,098 | ||||||||
|
| |||||||||
Total South Africa | 59,468,583 | |||||||||
|
| |||||||||
| South Korea — 9.4% | ||||||||||
| 17,799 | AfreecaTV Co., Ltd. | 857,726 | ||||||||
| 302 | Asia Cement Co., Ltd. | 31,395 | ||||||||
| 18,126 | Asiana Airlines, Inc.* | 56,050 | ||||||||
| 4,361 | BGF Co., Ltd. | 31,427 | ||||||||
| 592 | Binggrae Co., Ltd. | 34,995 | ||||||||
| 76,962 | BNK Financial Group, Inc. | 452,917 | ||||||||
| 16,145 | Cheil Worldwide, Inc. | 344,207 | ||||||||
| 434 | CJ CheilJedang Corp. | 123,497 | ||||||||
| 826 | CJ Corp. | 90,597 | ||||||||
| 4,081 | CJ Hello Co., Ltd. | 33,292 | ||||||||
| 448 | CJ Logistics Corp.* | 65,319 | ||||||||
| 2,932 | Daekyo Co., Ltd. | 15,989 | ||||||||
| 11,234 | Daelim Industrial Co., Ltd. | 954,064 | ||||||||
| 3,287 | Daesang Corp. | 82,095 | ||||||||
| 3,025 | Daewoo Shipbuilding & Marine Engineering Co., Ltd.* | 74,486 | ||||||||
| 3,137 | Daou Technology, Inc. | 58,451 | ||||||||
| 2,211 | DB HiTek Co., Ltd. | 24,348 | ||||||||
| 2,778 | DB Insurance Co., Ltd. | 168,134 | ||||||||
| 48,210 | DGB Financial Group, Inc. | 346,996 | ||||||||
| 18,298 | Dongkuk Steel Mill Co., Ltd.* | 118,806 | ||||||||
| 50 | Dongwon F&B Co., Ltd. | 11,255 | ||||||||
| 287 | Dongwon Industries Co., Ltd. | 58,912 | ||||||||
| 3,027 | Doosan Bobcat, Inc. | 82,402 | ||||||||
| 852 | Doosan Corp. | 69,505 | ||||||||
| 16,679 | Doosan Heavy Industries & Construction Co., Ltd.* ‡ | 98,302 | ||||||||
| 13,049 | Doosan Infracore Co., Ltd.* | 81,046 | ||||||||
| 3,169 | E-MART, Inc. | 480,194 | ||||||||
| 7,243 | Eugene Corp. | 42,433 | ||||||||
| 20,251 | Fila Korea, Ltd. | 1,391,576 | ||||||||
| 4,455 | GS Engineering & Construction Corp. | 167,195 | ||||||||
| 8,233 | GS Holdings Corp. | 382,964 | ||||||||
| 363 | GS Home Shopping, Inc. | 57,211 | ||||||||
| 1,535 | GS Retail Co., Ltd. | 52,943 | ||||||||
| 859 | Halla Holdings Corp. | 30,800 | ||||||||
| 98,800 | Hana Financial Group, Inc. | 3,168,285 | ||||||||
| 2,051 | Handsome Co., Ltd. | 80,497 | ||||||||
See accompanying Notes to the Financial Statements.
164
Table of Contents
Mercer Emerging Markets Equity Fund
Schedule of Investments (Continued)
(showing percentage of net assets)
March 31, 2019
| Shares | Description | Value ($) | ||||||||
| South Korea — continued | ||||||||||
| 538 | Hanil Cement Co., Ltd. | 68,488 | ||||||||
| 442 | Hanil Holdings Co., Ltd. | 21,300 | ||||||||
| 3,259 | Hanjin Kal Corp. | 73,788 | ||||||||
| 1,291 | Hanjin Transportation Co., Ltd. | 41,229 | ||||||||
| 8,806 | Hankook Tire Co., Ltd. | 290,534 | ||||||||
| 776 | Hansol Paper Co., Ltd. | 10,084 | ||||||||
| 10,091 | Hanwha Aerospace Co., Ltd.* | 305,815 | ||||||||
| 23,695 | Hanwha Chemical Corp. | 436,284 | ||||||||
| 9,719 | Hanwha Corp. | 260,292 | ||||||||
| 16,935 | Hanwha General Insurance Co., Ltd. | 77,133 | ||||||||
| 107,871 | Hanwha Life Insurance Co., Ltd. | 380,129 | ||||||||
| 5,185 | Harim Holdings Co., Ltd. | 52,987 | ||||||||
| 6,201 | HDC Holdings Co., Ltd. | 103,523 | ||||||||
| 3,159 | HDC Hyundai DevelopmentCo-Engineering & Construction Series E | 141,099 | ||||||||
| 2,951 | Hite Jinro Co., Ltd. | 48,096 | ||||||||
| 156 | Hyosung Advanced Materials Corp.* | 17,248 | ||||||||
| 111 | Hyosung Chemical Corp. | 13,739 | ||||||||
| 774 | Hyosung Corp. | 51,482 | ||||||||
| 150 | Hyosung TNC Co., Ltd. | 22,861 | ||||||||
| 1,417 | Hyundai Construction Equipment Co., Ltd. | 59,484 | ||||||||
| 5,900 | Hyundai Department Store Co., Ltd. | 524,976 | ||||||||
| 52,745 | Hyundai Engineering & Construction Co., Ltd. | 2,481,352 | ||||||||
| 618 | Hyundai Glovis Co., Ltd. | 69,961 | ||||||||
| 7,291 | Hyundai Greenfood Co., Ltd. | 91,852 | ||||||||
| 1,163 | Hyundai Heavy Industries Co., Ltd.* | 121,925 | ||||||||
| 955 | Hyundai Heavy Industries Holdings Co., Ltd. | 280,165 | ||||||||
| 1,027 | Hyundai Home Shopping Network Corp. | 98,620 | ||||||||
| 537 | Hyundai Livart Furniture Co., Ltd. | 9,722 | ||||||||
| 34,159 | Hyundai Marine & Fire Insurance Co., Ltd. | 1,140,539 | ||||||||
| 5,196 | Hyundai Mipo Dockyard Co., Ltd. | 269,161 | ||||||||
| 6,147 | Hyundai Mobis Co., Ltd. | 1,129,107 | ||||||||
| 12,299 | Hyundai Motor Co. | 1,294,803 | ||||||||
| 8,145 | Hyundai Steel Co. | 322,184 | ||||||||
| 3,661 | Hyundai Wia Corp. | 130,623 | ||||||||
| 23,114 | Industrial Bank of Korea | 286,100 | ||||||||
| 2,322 | IS Dongseo Co., Ltd. | 64,233 | ||||||||
| 47,860 | JB Financial Group Co., Ltd. | 234,852 | ||||||||
| 35,071 | KB Financial Group, Inc. | 1,293,033 | ||||||||
| 1,323 | KCC Corp. | 371,223 | ||||||||
| 26,900 | Kia Motors Corp. | 837,737 | ||||||||
| 2,041 | KISWIRE, Ltd. | 44,592 | ||||||||
| 10,952 | KIWOOM Securities Co., Ltd. | 782,492 | ||||||||
| 8,443 | Koh Young Technology, Inc. | 635,959 | ||||||||
| 889 | Kolon Corp. | 26,315 | ||||||||
| 3,072 | Kolon Industries, Inc. | 136,942 | ||||||||
| 5,615 | Korea Asset In Trust Co., Ltd. | 20,677 | ||||||||
| 64,013 | Korea Electric Power Corp.* | 1,686,185 | ||||||||
| 787 | Korea Electric Terminal Co., Ltd. | 42,571 | ||||||||
| 15,801 | Korea Investment Holdings Co., Ltd. | 864,454 | ||||||||
See accompanying Notes to the Financial Statements.
165
Table of Contents
Mercer Emerging Markets Equity Fund
Schedule of Investments (Continued)
(showing percentage of net assets)
March 31, 2019
| Shares | Description | Value ($) | ||||||||
| South Korea — continued | ||||||||||
| 2,429 | Korea Line Corp.* | 45,259 | ||||||||
| 6,849 | Korea Petrochemical Ind Co., Ltd. | 947,311 | ||||||||
| 3,595 | Korea Zinc Co., Ltd. | 1,472,712 | ||||||||
| 4,635 | Korean Air Lines Co., Ltd. | 130,054 | ||||||||
| 30,323 | Korean Reinsurance Co. | 244,433 | ||||||||
| 61,770 | KT Corp., ADR | 768,419 | ||||||||
| 2,427 | KT Skylife Co., Ltd. | 25,230 | ||||||||
| 1,039 | KT&G Corp. | 94,737 | ||||||||
| 15,544 | Kumho Petrochemical Co., Ltd. | 1,303,664 | ||||||||
| 670 | Kumho Tire Co., Inc.* | 2,579 | ||||||||
| 6,138 | LF Corp. | 135,186 | ||||||||
| 7,583 | LG Chem, Ltd. | 2,445,052 | ||||||||
| 77,778 | LG Corp. | 5,310,365 | ||||||||
| 24,582 | LG Display Co., Ltd.* ‡ | 422,297 | ||||||||
| 3,066 | LG Electronics, Inc. | 202,851 | ||||||||
| 2,064 | LG Hausys, Ltd. | 110,373 | ||||||||
| 3,545 | LG Household & Health Care, Ltd. | 4,425,394 | ||||||||
| 691 | LG Innotek Co., Ltd. | 71,529 | ||||||||
| 8,961 | LG International Corp. | 126,706 | ||||||||
| 5,498 | LG Uplus Corp. | 74,834 | ||||||||
| 1,034 | LIG Nex1 Co., Ltd. | 35,845 | ||||||||
| 817 | Lotte Chemical Corp. | 209,090 | ||||||||
| 8 | Lotte Chilsung Beverage Co., Ltd. | 12,482 | ||||||||
| 1,164 | Lotte Fine Chemical Co., Ltd. | 45,223 | ||||||||
| 40 | Lotte Food Co., Ltd. | 22,377 | ||||||||
| 1,597 | Lotte Himart Co., Ltd. | 72,035 | ||||||||
| 3,884 | Lotte Shopping Co., Ltd. | 609,067 | ||||||||
| 1,775 | LS Corp. | 81,784 | ||||||||
| 1,410 | Mando Corp. | 35,526 | ||||||||
| 1,004 | Medy-Tox, Inc. | 516,373 | ||||||||
| 2,483 | Meritz Financial Group, Inc. | 31,062 | ||||||||
| 2,886 | Meritz Fire & Marine Insurance Co., Ltd. | 61,783 | ||||||||
| 30,315 | Meritz Securities Co., Ltd. | 130,463 | ||||||||
| 65,536 | Mirae Asset Daewoo Co., Ltd. | 423,204 | ||||||||
| 13,550 | Mirae Asset Life Insurance Co., Ltd. | 61,358 | ||||||||
| 29,184 | Modetour Network, Inc. | 593,913 | ||||||||
| 2,471 | Namhae Chemical Corp. | 24,272 | ||||||||
| 5,629 | Nexen Tire Corp. | 49,194 | ||||||||
| 11,431 | NH Investment & Securities Co., Ltd. | 135,448 | ||||||||
| 363 | NHN Entertainment Corp.* | 28,302 | ||||||||
| 2,817 | Nong Shim Co., Ltd. | 766,851 | ||||||||
| 2,020 | OCI Co., Ltd. | 165,323 | ||||||||
| 5,055 | Orion Corp. | 445,335 | ||||||||
| 4,005 | Orion Holdings Corp. | 65,450 | ||||||||
| 12,140 | Pan Ocean Co., Ltd.* | 43,957 | ||||||||
| 3,347 | Poongsan Corp. | 85,216 | ||||||||
| 21,870 | POSCO | 4,874,557 | ||||||||
| 3,308 | Posco International Corp. | 51,728 | ||||||||
| 1,326 | S&T Motiv Co., Ltd. | 45,092 | ||||||||
See accompanying Notes to the Financial Statements.
166
Table of Contents
Mercer Emerging Markets Equity Fund
Schedule of Investments (Continued)
(showing percentage of net assets)
March 31, 2019
| Shares | Description | Value ($) | ||||||||
| South Korea — continued | ||||||||||
| 1,400 | Samsung C&T Corp. | 131,971 | ||||||||
| 6,619 | Samsung Card Co., Ltd. | 200,593 | ||||||||
| 675,095 | Samsung Electronics Co., Ltd. | 26,555,362 | ||||||||
| 914 | Samsung Fire & Marine Insurance Co., Ltd. | 242,370 | ||||||||
| 11,648 | Samsung Heavy Industries Co., Ltd.* | 84,761 | ||||||||
| 8,690 | Samsung Life Insurance Co., Ltd. | 643,845 | ||||||||
| 173 | Samsung SDI Co., Ltd. | 32,692 | ||||||||
| 1,777 | Samsung SDS Co., Ltd. | 367,893 | ||||||||
| 13,625 | Samsung Securities Co., Ltd. | 399,711 | ||||||||
| 1,020 | Samyang Corp. | 54,455 | ||||||||
| 1,103 | Samyang Holdings Corp. | 80,167 | ||||||||
| 4,072 | Seah Besteel Corp. | 68,698 | ||||||||
| 1,034 | Sebang Global Battery Co., Ltd. | 42,085 | ||||||||
| 24,141 | SFA Engineering Corp. | 920,893 | ||||||||
| 85,437 | Shinhan Financial Group Co., Ltd. | 3,161,267 | ||||||||
| 4,166 | Shinsegae International, Inc. | 1,099,213 | ||||||||
| 511 | Shinsegae, Inc. | 151,936 | ||||||||
| 27,551 | Silicon Works Co., Ltd. | 1,025,487 | ||||||||
| 1,679 | Sindoh Co., Ltd. | 69,077 | ||||||||
| 1,594 | SK Discovery Co., Ltd. | 37,213 | ||||||||
| 1,185 | SK Gas, Ltd. | 95,418 | ||||||||
| 921 | SK Holdings Co., Ltd. | 219,479 | ||||||||
| 10,614 | SK Hynix, Inc. | 693,823 | ||||||||
| 1,750 | SK Innovation Co., Ltd. | 276,738 | ||||||||
| 45,410 | SK Networks Co., Ltd. | 242,032 | ||||||||
| 590 | SK Telecom Co., Ltd. | 130,724 | ||||||||
| 1,417 | SKC Co., Ltd. | 45,128 | ||||||||
| 3,982 | SL Corp. | 77,177 | ||||||||
| 11,279 | Soulbrain Co., Ltd. | 525,645 | ||||||||
| 7,760 | Ssangyong Motor Co.* | 34,866 | ||||||||
| 127 | Taekwang Industrial Co., Ltd. | 181,029 | ||||||||
| 6,785 | Taeyoung Engineering & Construction Co., Ltd. | 74,120 | ||||||||
| 14,048 | Tongyang Life Insurance Co., Ltd. | 56,868 | ||||||||
| 5,297 | Wonik Holdings Co., Ltd.* | 22,586 | ||||||||
| 44,465 | Woori Financial Group, Inc. | 538,625 | ||||||||
| 86 | Young Poong Corp. | 60,611 | ||||||||
| 1,900 | Youngone Corp. | 54,568 | ||||||||
| 1,790 | Youngone Holdings Co., Ltd. | 100,925 | ||||||||
| 10,268 | Yuanta Securities Korea Co., Ltd.* | 27,952 | ||||||||
| 3,705 | Yuhan Corp. | 783,367 | ||||||||
|
| |||||||||
Total South Korea | 95,680,926 | |||||||||
|
| |||||||||
| Spain — 0.0% | ||||||||||
| 16,331 | CEMEX Latam Holdings SA* | 24,608 | ||||||||
|
| |||||||||
| Switzerland — 0.4% | ||||||||||
| 75,494 | ABB, Ltd. | 1,418,308 | ||||||||
| 50,026 | Coca-Cola HBC AG* | 1,704,624 | ||||||||
See accompanying Notes to the Financial Statements.
167
Table of Contents
Mercer Emerging Markets Equity Fund
Schedule of Investments (Continued)
(showing percentage of net assets)
March 31, 2019
| Shares | Description | Value ($) | ||||||||
| Switzerland — continued | ||||||||||
| 8,583 | Nestle SA | 817,880 | ||||||||
|
| |||||||||
Total Switzerland | 3,940,812 | |||||||||
|
| |||||||||
| Taiwan — 9.8% | ||||||||||
| 21,000 | A-DATA Technology Co., Ltd. | 27,152 | ||||||||
| 413,000 | Acer, Inc.* | 264,653 | ||||||||
| 39,000 | Ardentec Corp. | 36,064 | ||||||||
| 94,000 | ASE Technology Holding Co., Ltd.* | 205,869 | ||||||||
| 959,000 | Asia Cement Corp. | 1,247,738 | ||||||||
| 513,000 | Asustek Computer, Inc. | 3,711,783 | ||||||||
| 857,000 | AU Optronics Corp. | 315,600 | ||||||||
| 261,000 | Bioteque Corp. | 1,016,207 | ||||||||
| 21,000 | Brighton-Best International Taiwan, Inc. | 24,291 | ||||||||
| 537,140 | Capital Securities Corp. | 167,309 | ||||||||
| 18,000 | Catcher Technology Co., Ltd. | 138,414 | ||||||||
| 1,046,000 | Cathay Financial Holding Co., Ltd. | 1,525,533 | ||||||||
| 158,000 | Cathay Real Estate Development Co., Ltd. | 123,548 | ||||||||
| 23,062 | Center Laboratories, Inc.* | 62,256 | ||||||||
| 428,480 | Chang Hwa Commercial Bank, Ltd. | 256,500 | ||||||||
| 206,000 | Cheng Loong Corp. | 137,019 | ||||||||
| 53,000 | Cheng Shin Rubber Industry Co., Ltd. | 72,139 | ||||||||
| 118,000 | Cheng Uei Precision Industry Co., Ltd. | 150,082 | ||||||||
| 22,110 | Chicony Electronics Co., Ltd. | 51,436 | ||||||||
| 12,000 | Chilisin Electronics Corp. | 34,964 | ||||||||
| 103,000 | Chin-Poon Industrial Co., Ltd. | 127,328 | ||||||||
| 3,301,000 | China Airlines, Ltd. | 1,056,046 | ||||||||
| 3,193,000 | China Development Financial Holding Corp. | 1,067,079 | ||||||||
| 995,600 | China General Plastics Corp. | 733,282 | ||||||||
| 725,840 | China Life Insurance Co., Ltd. | 615,847 | ||||||||
| 214,000 | ChinaMan-Made Fiber Corp. | 69,434 | ||||||||
| 439,000 | China Petrochemical Development Corp.* | 172,350 | ||||||||
| 838,000 | China Steel Corp. | 687,899 | ||||||||
| 31,000 | Chipbond Technology Corp. | 71,414 | ||||||||
| 56,944 | ChipMOS Technologies, Inc. | 48,407 | ||||||||
| 9,000 | Chong Hong Construction Co., Ltd. | 26,281 | ||||||||
| 155,000 | Chung Hung Steel Corp.* | 57,332 | ||||||||
| 117,000 | Chung Hwa Pulp Corp. | 37,203 | ||||||||
| 886,000 | Compal Electronics, Inc. | 550,507 | ||||||||
| 143,000 | Compeq Manufacturing Co., Ltd. | 109,963 | ||||||||
| 120,000 | Coretronic Corp. | 189,225 | ||||||||
| 2,536,120 | CTBC Financial Holding Co., Ltd. | 1,682,765 | ||||||||
| 29,000 | CTCI Corp. | 45,165 | ||||||||
| 66,000 | Darwin Precisions Corp. | 44,114 | ||||||||
| 209,000 | Delta Electronics, Inc. | 1,078,211 | ||||||||
| 31,000 | Depo Auto Parts Ind Co., Ltd. | 68,597 | ||||||||
| 44,000 | E Ink Holdings, Inc. | 49,253 | ||||||||
| 3,186,878 | E.Sun Financial Holding Co., Ltd. | 2,455,780 | ||||||||
| 77,000 | EnTie Commercial Bank Co., Ltd. | 33,728 | ||||||||
| 208,000 | Epistar Corp. | 167,369 | ||||||||
See accompanying Notes to the Financial Statements.
168
Table of Contents
Mercer Emerging Markets Equity Fund
Schedule of Investments (Continued)
(showing percentage of net assets)
March 31, 2019
| Shares | Description | Value ($) | ||||||||
| Taiwan — continued | ||||||||||
| 87,740 | Eternal Materials Co., Ltd. | 69,747 | ||||||||
| 638,342 | Eva Airways Corp. | 312,745 | ||||||||
| 147,000 | Evergreen International Storage & Transport Corp. | 64,150 | ||||||||
| 480,549 | Evergreen Marine Corp. Taiwan, Ltd. | 186,323 | ||||||||
| 116,000 | Everlight Electronics Co., Ltd. | 117,617 | ||||||||
| 304,000 | Far Eastern Department Stores, Ltd. | 161,762 | ||||||||
| 633,720 | Far Eastern International Bank | 230,290 | ||||||||
| 385,000 | Far Eastern New Century Corp. | 380,372 | ||||||||
| 34,000 | Feng Hsin Steel Co., Ltd. | 66,631 | ||||||||
| 15,000 | Feng TAY Enterprise Co., Ltd. | 106,098 | ||||||||
| 2,028,381 | First Financial Holding Co., Ltd. | 1,388,648 | ||||||||
| 31,000 | FLEXium Interconnect, Inc. | 93,340 | ||||||||
| 33,000 | Formosa Advanced Technologies Co., Ltd. | 37,903 | ||||||||
| 566,000 | Formosa Chemicals & Fibre Corp. | 2,056,813 | ||||||||
| 115,000 | Formosa Plastics Corp. | 408,575 | ||||||||
| 126,000 | Foxconn Technology Co., Ltd. | 251,424 | ||||||||
| 829,997 | Fubon Financial Holding Co., Ltd. | 1,238,781 | ||||||||
| 17,000 | Getac Technology Corp. | 28,351 | ||||||||
| 496,000 | Giant Manufacturing Co., Ltd. | 3,540,501 | ||||||||
| 91,000 | Gigabyte Technology Co., Ltd. | 144,972 | ||||||||
| 30,000 | Globalwafers Co., Ltd. | 294,934 | ||||||||
| 245,000 | Grand Pacific Petrochemical | 190,385 | ||||||||
| 117,000 | Grape King Bio, Ltd. | 755,439 | ||||||||
| 54,570 | Great Wall Enterprise Co., Ltd. | 62,501 | ||||||||
| 18,000 | Greatek Electronics, Inc. | 24,821 | ||||||||
| 801,000 | HannStar Display Corp. | 177,246 | ||||||||
| 44,000 | Highwealth Construction Corp. | 72,523 | ||||||||
| 9,000 | Holy Stone Enterprise Co., Ltd. | 33,874 | ||||||||
| 795,200 | Hon Hai Precision Industry Co., Ltd. | 1,896,374 | ||||||||
| 422,115 | Hua Nan Financial Holdings Co., Ltd. | 265,701 | ||||||||
| 23,000 | Huaku Development Co., Ltd. | 55,223 | ||||||||
| 891,800 | Hung Sheng Construction, Ltd. | 859,378 | ||||||||
| 18,000 | IEI Integration Corp. | 19,799 | ||||||||
| 1,432,000 | Innolux Corp. | 464,626 | ||||||||
| 47,796 | International CSRC Investment Holdings Co. | 64,823 | ||||||||
| 324,000 | Inventec Corp. | 246,518 | ||||||||
| 54,000 | Kenda Rubber Industrial Co., Ltd. | 51,774 | ||||||||
| 19,000 | Kerry TJ Logistics Co., Ltd. | 22,717 | ||||||||
| 85,000 | King Yuan Electronics Co., Ltd. | 72,395 | ||||||||
| 157,000 | King’s Town Bank Co., Ltd. | 163,008 | ||||||||
| 338,000 | Kinpo Electronics | 124,472 | ||||||||
| 81,000 | Kinsus Interconnect Technology Corp. | 118,528 | ||||||||
| 264,000 | Lite-On Technology Corp., ADR | 384,173 | ||||||||
| 190,462 | Long Chen Paper Co., Ltd. | 105,364 | ||||||||
| 14,000 | Lung Yen Life Service Corp. | 28,254 | ||||||||
| 59,000 | Macronix International | 40,009 | ||||||||
| 138,000 | Makalot Industrial Co., Ltd. | 967,148 | ||||||||
| 26,000 | MediaTek, Inc. | 238,315 | ||||||||
| 330,000 | Mega Financial Holding Co., Ltd. | 300,336 | ||||||||
See accompanying Notes to the Financial Statements.
169
Table of Contents
Mercer Emerging Markets Equity Fund
Schedule of Investments (Continued)
(showing percentage of net assets)
March 31, 2019
| Shares | Description | Value ($) | ||||||||
| Taiwan — continued | ||||||||||
| 114,480 | Mercuries & Associates Holding, Ltd. | 66,674 | ||||||||
| 284,445 | Mercuries Life Insurance Co., Ltd.* | 104,289 | ||||||||
| 242,000 | Micro-Star International Co., Ltd. | 679,191 | ||||||||
| 47,000 | Nan Kang Rubber Tire Co., Ltd. | 47,579 | ||||||||
| 130,000 | Nan Ya Plastics Corp. | 332,798 | ||||||||
| 599,000 | Nanya Technology Corp. | 1,193,316 | ||||||||
| 20,000 | Nien Made Enterprise Co., Ltd. | 176,181 | ||||||||
| 317,000 | O-Bank Co., Ltd. | 80,637 | ||||||||
| 33,000 | Oriental Union Chemical Corp. | 27,946 | ||||||||
| 28,000 | Pan Jit International, Inc.* | 24,211 | ||||||||
| 188,000 | Pegatron Corp. | 325,121 | ||||||||
| 16,000 | Phison Electronics Corp. | 156,779 | ||||||||
| 581,000 | Pou Chen Corp. | 707,858 | ||||||||
| 391,000 | Powertech Technology, Inc. | 923,567 | ||||||||
| 236,000 | President Chain Store Corp. | 2,323,973 | ||||||||
| 28,000 | President Securities Corp. | 12,673 | ||||||||
| 382,000 | Primax Electronics, Ltd. | 752,337 | ||||||||
| 324,000 | Prince Housing & Development Corp. | 121,945 | ||||||||
| 91,000 | Qisda Corp., ADR | 58,313 | ||||||||
| 73,000 | Quanta Computer, Inc. | 136,902 | ||||||||
| 428,000 | Radiant Opto-Electronics Corp. | 1,369,244 | ||||||||
| 78,000 | Radium Life Tech Co., Ltd.* | 37,582 | ||||||||
| 68,000 | Realtek Semiconductor Corp. | 401,551 | ||||||||
| 31,000 | Rechi Precision Co., Ltd. | 25,447 | ||||||||
| 64,000 | Ruentex Industries, Ltd. | 167,992 | ||||||||
| 20,000 | San Fang Chemical Industry Co., Ltd. | 14,958 | ||||||||
| 117,000 | Sanyang Motor Co., Ltd. | 76,683 | ||||||||
| 45,000 | Shihlin Electric & Engineering Corp. | 61,323 | ||||||||
| 4,511,903 | Shin Kong Financial Holding Co., Ltd. | 1,329,248 | ||||||||
| 23,000 | Shin Zu Shing Co., Ltd. | 81,715 | ||||||||
| 340,000 | Shinkong Synthetic Fibers Corp. | 153,891 | ||||||||
| 33,000 | Sigurd Microelectronics Corp. | 32,229 | ||||||||
| 123,000 | Simplo Technology Co., Ltd. | 1,085,511 | ||||||||
| 942,480 | SinoPac Financial Holdings Co., Ltd. | 348,608 | ||||||||
| 78,000 | Sunny Friend Environmental Technology Co., Ltd. | 609,919 | ||||||||
| 401,000 | Sunonwealth Electric Machine Industry Co., Ltd. | 459,282 | ||||||||
| 75,000 | Synnex Technology International Corp. | 90,037 | ||||||||
| 45,530 | TA Chen Stainless Pipe | 67,142 | ||||||||
| 542,825 | Taichung Commercial Bank Co., Ltd. | 200,782 | ||||||||
| 180,000 | TaiDoc Technology Corp. | 981,165 | ||||||||
| 901,263 | Taishin Financial Holding Co., Ltd. | 410,855 | ||||||||
| 1,510,680 | Taiwan Business Bank | 588,185 | ||||||||
| 422,000 | Taiwan Cement Corp. | 564,803 | ||||||||
| 1,884,900 | Taiwan Cooperative Financial Holding Co., Ltd. | 1,192,568 | ||||||||
| 241,000 | Taiwan Glass Industry Corp. | 107,518 | ||||||||
| 48,000 | Taiwan Hon Chuan Enterprise Co., Ltd. | 76,546 | ||||||||
| 404,266 | Taiwan Semiconductor Manufacturing Co., Ltd., ADR | 16,558,735 | ||||||||
| 476,000 | Taiwan Semiconductor Manufacturing Co., Ltd. | 3,791,567 | ||||||||
| 28,000 | Taiwan Shin Kong Security Co., Ltd. | 34,704 | ||||||||
See accompanying Notes to the Financial Statements.
170
Table of Contents
Mercer Emerging Markets Equity Fund
Schedule of Investments (Continued)
(showing percentage of net assets)
March 31, 2019
| Shares | Description | Value ($) | ||||||||
| Taiwan — continued | ||||||||||
| 52,000 | Tatung Co., Ltd.* | 40,999 | ||||||||
| 47,616 | TCI Co., Ltd. | 651,967 | ||||||||
| 404,000 | Teco Electric and Machinery Co., Ltd. | 275,271 | ||||||||
| 225,000 | Ton Yi Industrial Corp. | 95,634 | ||||||||
| 15,000 | Tong Hsing Electronic Industries, Ltd. | 50,372 | ||||||||
| 78,000 | Tong Yang Industry Co., Ltd. | 100,092 | ||||||||
| 20,000 | Transcend Information, Inc. | 45,424 | ||||||||
| 23,000 | Tripod Technology Corp. | 74,253 | ||||||||
| 27,000 | TSRC Corp. | 24,091 | ||||||||
| 243,000 | Tung Ho Steel Enterprise Corp. | 167,543 | ||||||||
| 67,000 | TXC Corp. | 70,108 | ||||||||
| 80,000 | U-Ming Marine Transport Corp. | 80,596 | ||||||||
| 5,549,015 | Uni-President Enterprises Corp. | 13,467,216 | ||||||||
| 410,000 | Unimicron Technology Corp. | 393,764 | ||||||||
| 204,970 | Union Bank Of Taiwan | 71,160 | ||||||||
| 35,700 | Unitech Printed Circuit Board Corp. | 24,093 | ||||||||
| 1,153,000 | United Microelectronics Corp. | 435,828 | ||||||||
| 230,040 | UPC Technology Corp. | 92,925 | ||||||||
| 243,780 | USI Corp. | 95,312 | ||||||||
| 49,000 | Wah Lee Industrial Corp. | 84,580 | ||||||||
| 565,000 | Walsin Lihwa Corp. | 323,559 | ||||||||
| 331,000 | Walsin Technology Corp. | 2,147,921 | ||||||||
| 118,000 | Wan Hai Lines, Ltd. | 61,449 | ||||||||
| 642,224 | Waterland Financial Holdings Co., Ltd. | 218,794 | ||||||||
| 553,000 | Winbond Electronics Corp. | 264,653 | ||||||||
| 576,447 | Wistron Corp. | 443,270 | ||||||||
| 28,560 | Wistron NeWeb Corp. | 75,059 | ||||||||
| 98,720 | WPG Holdings, Ltd. | 128,763 | ||||||||
| 36,000 | WT Microelectronics Co., Ltd. | 47,481 | ||||||||
| 166,000 | Yang Ming Marine Transport Corp.* | 46,589 | ||||||||
| 341,000 | YFY, Inc. | 131,109 | ||||||||
| 312,090 | Yieh Phui Enterprise Co., Ltd. | 100,957 | ||||||||
| 1,148,000 | Yuanta Financial Holding Co., Ltd. | 653,701 | ||||||||
| 258,000 | Yulon Motor Co., Ltd. | 162,817 | ||||||||
| 8,000 | Yung Chi Paint & Varnish Manufacturing Co., Ltd. | 19,416 | ||||||||
| 35,000 | Yungtay Engineering Co., Ltd. | 72,679 | ||||||||
|
| |||||||||
Total Taiwan | 100,210,362 | |||||||||
|
| |||||||||
| Thailand — 2.5% | ||||||||||
| 1,837,800 | Airports of Thailand PCL | 3,908,981 | ||||||||
| 379,100 | AP Thailand PCL Class F¤ | 84,218 | ||||||||
| 92,100 | Bangchak Corp. PCL Class F¤ | 93,595 | ||||||||
| 85,600 | Bangkok Airways PCL Class F¤ | 31,829 | ||||||||
| 57,500 | Bangkok Bank PCL, NVDR | 375,059 | ||||||||
| 42,900 | Bangkok Life Assurance PCL, NVDR | 37,175 | ||||||||
| 543,100 | Banpu PCL Class F¤ | 277,240 | ||||||||
| 184,600 | Charoen Pokphand Foods PCL Class F | 148,331 | ||||||||
| 1,307,900 | CP ALL PCL Class F | 3,080,685 | ||||||||
| 15,800 | Electricity Generating PCL Class N, NVDR | 145,379 | ||||||||
See accompanying Notes to the Financial Statements.
171
Table of Contents
Mercer Emerging Markets Equity Fund
Schedule of Investments (Continued)
(showing percentage of net assets)
March 31, 2019
| Shares | Description | Value ($) | ||||||||
| Thailand — continued | ||||||||||
| 57,200 | Esso Thailand PCL Class F¤ | 19,827 | ||||||||
| 338,500 | Golden Land Property Development PCL Class F¤ | 89,065 | ||||||||
| 114,600 | Hana Microelectronics PCL Class F¤ | 111,946 | ||||||||
| 349,200 | IRPC PCL Class F | 62,721 | ||||||||
| 147,900 | Kasikornbank PCL, NVDR | 873,838 | ||||||||
| 379,600 | Kasikornbank PCL Class F | 2,248,773 | ||||||||
| 24,100 | Kiatnakin Bank PCL Class F¤ | 52,779 | ||||||||
| 1,127,600 | Krung Thai Bank PCL, NVDR | 682,210 | ||||||||
| 369,600 | Krung Thai Bank PCL Class F | 223,612 | ||||||||
| 741,600 | Krungthai Card PCL Class F¤ | 823,740 | ||||||||
| 43,600 | MBK PCL Class F¤ | 28,577 | ||||||||
| 510,900 | Muangthai Capital PCL Class F¤ | 708,354 | ||||||||
| 69,700 | Precious Shipping PCL Class F* ¤ | 17,790 | ||||||||
| 318,500 | Pruksa Holding PCL Class F¤ | 180,652 | ||||||||
| 551,900 | PTT Exploration & Production PCL Class N, NVDR | 2,182,557 | ||||||||
| 46,100 | PTT Exploration & Production PCL Class F | 182,308 | ||||||||
| 574,200 | PTT Global Chemical PCL, NVDR | 1,216,794 | ||||||||
| 167,100 | PTT Global Chemical PCL Class F | 354,103 | ||||||||
| 1,865,100 | PTT PCL, NVDR | 2,821,011 | ||||||||
| 387,000 | PTT PCL Class F | 582,299 | ||||||||
| 2,363,200 | Sansiri PCL Class F¤ | 97,551 | ||||||||
| 194,300 | Siam Commercial Bank PCL (The) Class F | 808,180 | ||||||||
| 1,015,800 | Sino-Thai Engineering & Construction PCL Class F¤ | 771,413 | ||||||||
| 70,000 | Sri Trang Agro-Industry PCL Class F¤ | 28,234 | ||||||||
| 361,600 | Star Petroleum Refining PCL Class F¤ | 124,198 | ||||||||
| 113,200 | Supalai PCL Class F¤ | 67,417 | ||||||||
| 262,000 | Thai Airways International PCL Class F* ¤ | 101,547 | ||||||||
| 362,200 | Thai Oil PCL, NVDR | 793,222 | ||||||||
| 82,800 | Thai Oil PCL Class F¤ | 181,333 | ||||||||
| 92,200 | Thai Union Group PCL Class F¤ | 56,072 | ||||||||
| 146,200 | Thanachart Capital PCL Class F¤ | 251,076 | ||||||||
| 255,400 | Tisco Financial Group PCL Class F¤ | 710,227 | ||||||||
| 1,448,000 | TMB Bank PCL Class F¤ | 93,081 | ||||||||
| 346,800 | True Corp. PCL Class F | 52,017 | ||||||||
| 14,000 | Vinythai PCL Class F¤ | 10,896 | ||||||||
|
| |||||||||
Total Thailand | 25,791,912 | |||||||||
|
| |||||||||
| Turkey — 0.4% | ||||||||||
| 269,384 | Akbank T.A.S.* | 301,350 | ||||||||
| 4,992 | Anadolu Efes Biracilik Ve Malt Sanayii AS | 15,472 | ||||||||
| 162,637 | Arcelik AS | 486,506 | ||||||||
| 8,486 | Aygaz AS | 14,465 | ||||||||
| 28,851 | BIM Birlesik Magazalar AS | 389,133 | ||||||||
| 3,454 | Coca-Cola Icecek AS | 18,549 | ||||||||
| 87,117 | Dogan Sirketler Grubu Holding AS* | 17,579 | ||||||||
| 31,339 | Enka Insaat ve Sanayi AS | 25,461 | ||||||||
| 13,646 | Eregli Demir ve Celik Fabrikalari TAS | 22,028 | ||||||||
| 15,339 | Ford Otomotiv Sanayi AS | 132,441 | ||||||||
| 88,701 | Kardemir Karabuk Demir Celik Sanayi ve Ticaret AS Class D* | 37,681 | ||||||||
See accompanying Notes to the Financial Statements.
172
Table of Contents
Mercer Emerging Markets Equity Fund
Schedule of Investments (Continued)
(showing percentage of net assets)
March 31, 2019
| Shares | Description | Value ($) | ||||||||
| Turkey — continued | ||||||||||
| 26,827 | Kardemir Karabuk Demir Celik Sanayi ve Ticaret AS Class A* | 11,111 | ||||||||
| 23,713 | KOC Holding AS | 67,534 | ||||||||
| 22,782 | Koza Anadolu Metal Madencilik Isletmeleri AS* | 22,501 | ||||||||
| 8,732 | Pegasus Hava Tasimaciligi AS* | 42,040 | ||||||||
| 30,173 | Soda Sanayii AS | 40,056 | ||||||||
| 172,482 | TAV Havalimanlari Holding AS | 712,569 | ||||||||
| 125,332 | Tekfen Holding AS | 500,033 | ||||||||
| 49,611 | Trakya Cam Sanayii AS | 29,154 | ||||||||
| 26,298 | Turk Hava Yollari AO* | 60,187 | ||||||||
| 98,151 | Turkiye Garanti Bankasi AS | 144,892 | ||||||||
| 298,141 | Turkiye Halk Bankasi AS | 336,686 | ||||||||
| 322,135 | Turkiye Is Bankasi AS Class C | 313,605 | ||||||||
| 386,900 | Turkiye Sinai Kalkinma Bankasi AS* | 52,047 | ||||||||
| 92,896 | Turkiye Sise ve Cam Fabrikalari AS | 95,862 | ||||||||
| 72,860 | Turkiye Vakiflar Bankasi TAO Series D | 58,421 | ||||||||
| 99,335 | Yapi ve Kredi Bankasi AS* | 37,451 | ||||||||
|
| |||||||||
Total Turkey | 3,984,814 | |||||||||
|
| |||||||||
| United Arab Emirates — 0.2% | ||||||||||
| 85,401 | Abu Dhabi Commercial Bank PJSC | 220,414 | ||||||||
| 1,883,411 | Emaar Malls PJSC | 892,199 | ||||||||
| 55,296 | Emirates Telecommunications Group Co. PJSC | 251,407 | ||||||||
| 113,451 | First Abu Dhabi Bank PJSC | 471,335 | ||||||||
|
| |||||||||
Total United Arab Emirates | 1,835,355 | |||||||||
|
| |||||||||
| United Kingdom — 1.0% | ||||||||||
| 381,173 | Cairn Energy Plc* | 804,137 | ||||||||
| 86,981 | GlaxoSmithKline Plc | 1,809,823 | ||||||||
| 51,510 | Mondi Plc | 1,139,700 | ||||||||
| 102,600 | Unilever Plc | 5,875,806 | ||||||||
| 88,564 | WPP Plc | 935,691 | ||||||||
|
| |||||||||
Total United Kingdom | 10,565,157 | |||||||||
|
| |||||||||
| United States — 1.1% | ||||||||||
| 27,845 | Citigroup, Inc. | 1,732,516 | ||||||||
| 19,335 | Cognizant Technology Solutions Corp. Class A | 1,400,821 | ||||||||
| 13,945 | Johnson & Johnson | 1,949,371 | ||||||||
| 10,829 | Microsoft Corp. | 1,277,172 | ||||||||
| 14,626 | PPG Industries, Inc. | 1,650,837 | ||||||||
| 64,511 | Southern Copper Corp. | 2,559,796 | ||||||||
| 18,515 | Yum China Holdings, Inc. | 831,509 | ||||||||
|
| |||||||||
Total United States | 11,402,022 | |||||||||
|
| |||||||||
TOTAL COMMON STOCKS (COST $918,966,708) | 916,056,670 | |||||||||
|
| |||||||||
See accompanying Notes to the Financial Statements.
173
Table of Contents
Mercer Emerging Markets Equity Fund
Schedule of Investments (Continued)
(showing percentage of net assets)
March 31, 2019
| Shares | Description | Value ($) | ||||||||
PREFERRED STOCKS — 1.8% |
| |||||||||
| Brazil — 1.7% | ||||||||||
| 91,300 | Banco Bradesco SA, 2.64% | 1,007,380 | ||||||||
| 230,800 | Banco do Estado do Rio Grande do Sul SA, 8.64% Series B | 1,434,605 | ||||||||
| 21,400 | Braskem SA, 3.88% | 279,893 | ||||||||
| 10,500 | Cia Brasileira de Distribuicao, 1.90% | 246,764 | ||||||||
| 365,400 | Gerdau SA, 2.84% | 1,421,527 | ||||||||
| 523,955 | Itau Unibanco Holding SA, 4.19% | 4,635,447 | ||||||||
| 695,262 | Itausa — Investimentos Itau SA, 3.44% | 2,140,257 | ||||||||
| 653,400 | Petroleo Brasileiro SA, 3.08% | 4,711,156 | ||||||||
| 384,300 | Randon SA Implementos e Participacoes, 1.05% | 957,862 | ||||||||
| 115,200 | Usinas Siderurgicas de Minas Gerais SA, 1.34% Series A | 297,199 | ||||||||
|
| |||||||||
Total Brazil | 17,132,090 | |||||||||
|
| |||||||||
| Colombia — 0.0% | ||||||||||
| 5,238 | Banco Davivienda SA, 2.06% | 61,498 | ||||||||
| 15,537 | Grupo Argos SA, 2.19% | 72,186 | ||||||||
| 6,424 | Grupo de Inversiones Suramericana SA, 1.51% | 69,373 | ||||||||
|
| |||||||||
Total Colombia | 203,057 | |||||||||
|
| |||||||||
| Germany — 0.1% | ||||||||||
| 12,612 | Bayerische Motoren Werke AG, 6.36% | 829,857 | ||||||||
|
| |||||||||
| South Korea — 0.0% | ||||||||||
| 123 | CJ Corp., 0.00%* **** ¤ | 3,973 | ||||||||
| 14,035 | Samsung Electronics Co., Ltd., 2.80% | 448,215 | ||||||||
|
| |||||||||
Total South Korea | 452,188 | |||||||||
|
| |||||||||
TOTAL PREFERRED STOCKS (COST $17,176,811) | 18,617,192 | |||||||||
|
| |||||||||
RIGHTS — 0.0% |
| |||||||||
| Hong Kong — 0.0% | ||||||||||
| 71,516 | Xinjiang Goldwind Science & Technology Co., Ltd., Expires 04/26/2019* **** ¤ | 28,151 | ||||||||
|
| |||||||||
| India — 0.0% | ||||||||||
| 3,077,100 | Vodafone Idea, Ltd., Expires 04/24/2019* **** ¤ | 242,081 | ||||||||
|
| |||||||||
| South Korea — 0.0% | ||||||||||
| 9,682 | Doosan Heavy Industries & Construction Co., Ltd., Expires 04/26/2019* **** ¤ | 9,724 | ||||||||
|
| |||||||||
TOTAL RIGHTS (COST $705,617) | 279,956 | |||||||||
|
| |||||||||
| Par Value ($) | Description | Value ($) | ||||||||
SHORT-TERM INVESTMENTS — 1.5% |
| |||||||||
| Investment Fund — 0.6% | ||||||||||
| 5,491,115 | State Street Institutional Treasury Plus Money Market Fund, Institutional Class, 2.34%## ***** | 5,491,115 | ||||||||
|
| |||||||||
See accompanying Notes to the Financial Statements.
174
Table of Contents
Mercer Emerging Markets Equity Fund
Schedule of Investments (Continued)
(showing percentage of net assets)
March 31, 2019
| Par Value ($) | Description | Value ($) | ||||||||
| MUTUAL FUND - SECURITIES LENDING COLLATERAL — 0.6% | ||||||||||
| 6,377,010 | State Street Institutional U.S. Government Money Market Fund, Premier Class, 2.39%## *** | 6,377,010 | ||||||||
|
| |||||||||
| U.S. Government and Agency Obligations — 0.3% | ||||||||||
| 1,700,000 | United States Treasury Bill, 2.36%, due 05/30/19** ‡‡ | 1,693,460 | ||||||||
| 1,000,000 | United States Treasury Bill, 2.41%, due 09/12/19** ‡‡ | 989,237 | ||||||||
|
| |||||||||
TOTAL U.S. GOVERNMENT AND AGENCY OBLIGATIONS | 2,682,697 | |||||||||
|
| |||||||||
TOTAL SHORT-TERM INVESTMENTS (COST $14,550,084) | 14,550,822 | |||||||||
|
| |||||||||
TOTAL INVESTMENTS — 93.2% (Cost $951,399,220) | 949,504,640 | |||||||||
Other Assets and Liabilities (net) — 6.8% | 69,142,531 | |||||||||
|
| |||||||||
| NET ASSETS — 100.0% | $1,018,647,171 | |||||||||
|
| |||||||||
See accompanying Notes to the Financial Statements.
175
Table of Contents
Mercer Emerging Markets Equity Fund
Schedule of Investments (Continued)
March 31, 2019
Notes to Schedule of Investments: | ||||||||||
| ADR — American Depository Receipt | ||||||||||
| GDR — Global Depository Receipt | ||||||||||
| NVDR —Non-Voting Depository Receipt | ||||||||||
| REIT — Real Estate Investment Trust | ||||||||||
| ## | The rate disclosed is the 7 day net yield as of March 31, 2019. | |||||||||
| * | Non-income producing security | |||||||||
| ** | All or a portion of this security is pledged for open futures collateral. | |||||||||
| *** | Represents an investment of securities lending cash collateral. | |||||||||
| **** | Securities fair valued by the Valuation Committee as approved by the Board of Trustees. The total market value of the securities at year end is $308,438 which represents 0.0% of net assets. The aggregate tax cost of these securities held at March 31, 2019 was $734,929. | |||||||||
| ***** | Security has been segregated to cover collateral requirements on open synthetic futures contracts. | |||||||||
| ¤ | Illiquid security. The total market value of the securities at year end is $5,456,868 which represents 0.5% of net assets. The aggregate tax cost of these securities held at March 31, 2019 was $5,922,175. | |||||||||
| ‡ | All or a portion of this security is out on loan. | |||||||||
| ‡‡ | Interest rate presented is yield to maturity. | |||||||||
| ‡‡‡ | Security exempt from registration under Regulation S of the Securities Act of 1933, which exempts from registration securities offered and sold outside the United States. Security may not be offered or sold in the United States except pursuant to an exemption from, or in a transaction not subject to, the registration requirements of the Securities Act of 1933. | |||||||||
| 144A | Securities exempt from registration under Rule 144A of the Securities Act of 1933. These securities may be resold in transactions exempt from registration, normally to qualified institutional buyers. The total market value of the securities at year end is $4,770,529 which represents 0.5% of net assets. | |||||||||
See accompanying Notes to the Financial Statements.
176
Table of Contents
Mercer Emerging Markets Equity Fund
Schedule of Investments (Continued)
March 31, 2019
Forward Foreign Currency Contracts
Currency Purchased | Currency Sold | Settlement | Counterparty | Unrealized | ||||||||||||||||
| BRL | 15,722,000 | USD | 4,162,420 | 06/19/19 | Citibank N.A. London | $ | (144,471 | ) | ||||||||||||
| CLP | 50,743,000 | USD | 76,885 | 06/19/19 | Citibank N.A. London | (2,313 | ) | |||||||||||||
| CNH | 48,591,000 | USD | 7,239,964 | 06/19/19 | Citibank N.A. London | (11,130 | ) | |||||||||||||
| COP | 11,900,000,000 | USD | 3,795,992 | 06/19/19 | Citibank N.A. London | (75,636 | ) | |||||||||||||
| CZK | 63,000,000 | USD | 2,791,195 | 06/19/19 | Citibank N.A. London | (46,750 | ) | |||||||||||||
| EUR | 610,000 | USD | 697,335 | 06/19/19 | Citibank N.A. London | (7,888 | ) | |||||||||||||
| HKD | 361,676,000 | USD | 46,239,169 | 06/19/19 | Citibank N.A. London | (57,042 | ) | |||||||||||||
| HUF | 1,014,650,000 | USD | 3,662,240 | 06/19/19 | Citibank N.A. London | (99,509 | ) | |||||||||||||
| IDR | 2,749,255,000 | USD | 191,028 | 06/19/19 | Citibank N.A. London | 119 | ||||||||||||||
| ILS | 10,000 | USD | 2,780 | 06/19/19 | Citibank N.A. London | (10 | ) | |||||||||||||
| INR | 2,720,153,000 | USD | 38,439,830 | 06/19/19 | Citibank N.A. London | 436,809 | ||||||||||||||
| KRW | 3,469,716,000 | USD | 3,071,164 | 06/19/19 | Citibank N.A. London | (7,107 | ) | |||||||||||||
| MXN | 915,698,000 | USD | 46,750,389 | 06/19/19 | Citibank N.A. London | (122,595 | ) | |||||||||||||
| PEN | 400,000 | USD | 120,609 | 06/19/19 | Citibank N.A. London | (540 | ) | |||||||||||||
| PHP | 539,010,000 | USD | 10,272,484 | 06/19/19 | Citibank N.A. London | (77,078 | ) | |||||||||||||
| PLN | 46,433,000 | USD | 12,232,645 | 06/19/19 | Citibank N.A. London | (91,715 | ) | |||||||||||||
| RUB | 1,098,037,000 | USD | 16,427,379 | 06/19/19 | Citibank N.A. London | 100,682 | ||||||||||||||
| SGD | 16,104,000 | USD | 11,946,205 | 06/19/19 | Citibank N.A. London | (39,597 | ) | |||||||||||||
| THB | 17,112,000 | USD | 542,793 | 06/19/19 | Citibank N.A. London | (2,491 | ) | |||||||||||||
| TWD | 49,051,000 | USD | 1,597,489 | 06/19/19 | Citibank N.A. London | 1,734 | ||||||||||||||
| ZAR | 70,238,000 | USD | 4,928,649 | 06/19/19 | Citibank N.A. London | (103,483 | ) | |||||||||||||
| USD | 25,066,661 | BRL | 96,451,000 | 06/19/19 | Citibank N.A. London | 417,429 | ||||||||||||||
| USD | 22,911,681 | CLP | 15,178,959,000 | 06/19/19 | Citibank N.A. London | 604,510 | ||||||||||||||
| USD | 32,684,777 | CNH | 219,310,000 | 06/19/19 | Citibank N.A. London | 58,243 | ||||||||||||||
| USD | 3,926,241 | COP | 12,200,000,000 | 06/19/19 | Citibank N.A. London | 112,094 | ||||||||||||||
| USD | 2,343,785 | CZK | 52,845,000 | 06/19/19 | Citibank N.A. London | 41,718 | ||||||||||||||
| USD | 34,174 | EUR | 30,000 | 06/19/19 | Citibank N.A. London | 267 | ||||||||||||||
| USD | 12,818,709 | HKD | 100,337,200 | 06/19/19 | Citibank N.A. London | 6,730 | ||||||||||||||
| USD | 4,277,852 | IDR | 61,775,676,775 | 06/19/19 | Citibank N.A. London | (17,208 | ) | |||||||||||||
| USD | 714,049 | ILS | 2,563,000 | 06/19/19 | Citibank N.A. London | 4,051 | ||||||||||||||
| USD | 1,212,697 | INR | 84,917,000 | 06/19/19 | Citibank N.A. London | (943 | ) | |||||||||||||
| USD | 41,015,067 | KRW | 45,992,677,000 | 06/19/19 | Citibank N.A. London | 399,599 | ||||||||||||||
| USD | 5,974,935 | MXN | 116,421,000 | 06/19/19 | Citibank N.A. London | 46,720 | ||||||||||||||
| USD | 90,444 | PEN | 300,000 | 06/19/19 | Citibank N.A. London | 393 | ||||||||||||||
| USD | 1,198,752 | PLN | 4,534,000 | 06/19/19 | Citibank N.A. London | 13,238 | ||||||||||||||
| USD | 2,446,217 | RUB | 160,163,000 | 06/19/19 | Citibank N.A. London | 35,384 | ||||||||||||||
| USD | 7,595,841 | SGD | 10,260,000 | 06/19/19 | Citibank N.A. London | 10,036 | ||||||||||||||
| USD | 1,877,093 | THB | 58,987,000 | 06/19/19 | Citibank N.A. London | 14,611 | ||||||||||||||
| USD | 9,270,626 | TWD | 284,742,000 | 06/19/19 | Citibank N.A. London | (12,892 | ) | |||||||||||||
| USD | 16,001,397 | ZAR | 228,607,000 | 06/19/19 | Citibank N.A. London | 296,698 | ||||||||||||||
|
| |||||||||||||||||||
| $ | 1,680,667 | |||||||||||||||||||
|
| |||||||||||||||||||
See accompanying Notes to the Financial Statements.
177
Table of Contents
Mercer Emerging Markets Equity Fund
Schedule of Investments (Continued)
March 31, 2019
Currency Abbreviations
| BRL | — Brazilian Real |
| CLP | — Chilean Peso |
| CNH | — Chinese Yuan Renminbi |
| COP | — Colombian Peso |
| CZK | — Czech Koruna |
| EUR | — Euro Currency |
| HKD | — Hong Kong Dollar |
| HUF | — Hungarian Forint |
| IDR | — Indonesian Rupiah |
| ILS | — Israeli Shekel |
| INR | — Indian Rupee |
| KRW | — South Korean Won |
| MXN | — Mexican Peso |
| PEN | — Peruvian Nuevo Sol |
| PHP | — Philippines Peso |
| PLN | — Polish Zloty |
| RUB | — Russian Ruble |
| SGD | — Singapore Dollar |
| THB | — Thai Baht |
| TWD | — Taiwan Dollar |
| USD | — U.S. Dollar |
| ZAR | — South African Rand |
Futures Contracts
Number of | Description | Expiration Date | Notional | Market Value/ | ||||||||||||||||
| Buys | ||||||||||||||||||||
| 42 | FTSE Bursa Malaysia KLCI Index | Apr 2019 | $ | 846,687 | $ | (85 | ) | |||||||||||||
| 80 | HSCEI Futures | Apr 2019 | 5,795,706 | 63,709 | ||||||||||||||||
| 45 | KOSPI 200 Index | Jun 2019 | 2,747,335 | (5,548 | ) | |||||||||||||||
| 689 | MSCI Emerging Markets E-mini Index | Jun 2019 | 36,427,430 | 153,800 | ||||||||||||||||
| 118 | MSCI Singapore IX ETS | Apr 2019 | 3,133,599 | 8,009 | ||||||||||||||||
| 137 | MSCI Taiwan Stock Index | Apr 2019 | 5,352,590 | 53,831 | ||||||||||||||||
| 126 | SET50 Index | Jun 2019 | 860,302 | 4,593 | ||||||||||||||||
|
| |||||||||||||||||||
| $ | 278,309 | |||||||||||||||||||
|
| |||||||||||||||||||
| Sales | ||||||||||||||||||||
| 161 | FTSE/JSE Top 40 Index | Jun 2019 | $ | 5,669,455 | $ | (23,213 | ) | |||||||||||||
| 44 | Mexico Bolsa Index | Jun 2019 | 987,496 | (30,765 | ) | |||||||||||||||
|
| |||||||||||||||||||
| $ | (53,978 | ) | ||||||||||||||||||
|
| |||||||||||||||||||
See accompanying Notes to the Financial Statements.
178
Table of Contents
Mercer Emerging Markets Equity Fund
Schedule of Investments (Continued)
March 31, 2019
Synthetic Futures
Number of | Reference Entity | Expiration Date | Counterparty | Notional Value | Value | |||||||||||||||||
| 18,250 | Hang Seng China Enterprises Index | 04/29/2019 | Goldman Sachs International | $ | 26,291,321 | $ | 157,519 | |||||||||||||||
| 21,250,000 | KOSPI 200 Index | 06/13/2019 | Goldman Sachs International | 5,209,078 | (3,452 | ) | ||||||||||||||||
| 7,991 | MSCI China Net Return HKD Index | 06/19/2019 | Goldman Sachs International | 594,221 | (3,665 | ) | ||||||||||||||||
| 7,272 | MSCI China Net Return HKD Index | 06/19/2019 | Goldman Sachs International | 534,559 | 3,001 | |||||||||||||||||
| 730 | MSCI Daily TR Net Israel Index | 06/19/2019 | Goldman Sachs International | 101,707 | (994 | ) | ||||||||||||||||
| 11 | MSCI Singapore Net Return Index | 06/19/2019 | Goldman Sachs International | 45,950 | 50 | |||||||||||||||||
| 900 | Tel Aviv 35 Index | 04/26/2019 | Goldman Sachs International | 388,255 | (5,755 | ) | ||||||||||||||||
| (103,500 | ) | BIST 30 Futures | 04/30/2019 | Goldman Sachs International | 2,613,875 | 241,582 | ||||||||||||||||
| (980 | ) | DTOP Index Futures | 06/20/2019 | Goldman Sachs International | 739,422 | 2,602 | ||||||||||||||||
| (455 | ) | Ibovespa Futures Index | 04/17/2019 | Goldman Sachs International | 11,602,593 | 33,726 | ||||||||||||||||
| (147 | ) | MSCI Brazil Net Return BRL Index | 06/19/2019 | Goldman Sachs International | 40,535 | (371 | ) | |||||||||||||||
| (200 | ) | MSCI Mexico Net Index | 06/19/2019 | Goldman Sachs International | 9,417 | (126 | ) | |||||||||||||||
| (5,477 | ) | MSCI Mexico Net Index | 06/19/2019 | Goldman Sachs International | 250,798 | (6,898 | ) | |||||||||||||||
| (790 | ) | MSCI Poland Index | 06/19/2019 | Goldman Sachs International | 42,492 | 124 | ||||||||||||||||
| (4,940 | ) | MSCI South Africa Net Return Index | 06/19/2019 | Goldman Sachs International | 327,294 | (4,091 | ) | |||||||||||||||
| (1,342 | ) | MSCI South Africa Net Return Index | 06/19/2019 | Goldman Sachs International | 88,950 | (969 | ) | |||||||||||||||
| (62,146 | ) | MSCI South Africa Net Return Index | 06/19/2019 | Goldman Sachs International | 4,171,193 | (44,085 | ) | |||||||||||||||
| (3,080 | ) | WIG20 Futures Index | 06/21/2019 | Goldman Sachs International | 1,875,291 | (2,089 | ) | |||||||||||||||
|
| |||||||||||||||||||||
| $ | 366,109 | |||||||||||||||||||||
|
| |||||||||||||||||||||
See accompanying Notes to the Financial Statements.
179
Table of Contents
Mercer Emerging Markets Equity Fund
Schedule of Investments (Continued)
March 31, 2019
| Industry Sector Summary (Unaudited) | % of Net Assets | ||||
Banks | 12.3 | ||||
Internet | 6.8 | ||||
Diversified Financial Services | 5.9 | ||||
Oil & Gas | 5.6 | ||||
Semiconductors | 5.3 | ||||
Food | 4.3 | ||||
Retail | 4.0 | ||||
Insurance | 3.8 | ||||
Computers | 3.3 | ||||
Beverages | 3.0 | ||||
Telecommunications | 2.7 | ||||
Chemicals | 2.6 | ||||
Pharmaceuticals | 2.3 | ||||
Mining | 2.2 | ||||
Engineering & Construction | 2.1 | ||||
Real Estate | 2.1 | ||||
Iron & Steel | 1.6 | ||||
Building Materials | 1.5 | ||||
Electric | 1.3 | ||||
Electronics | 1.3 | ||||
Gas | 1.3 | ||||
Holding Companies — Diversified | 1.3 | ||||
Apparel | 1.1 | ||||
Auto Manufacturers | 1.0 | ||||
Cosmetics & Personal Care | 1.0 | ||||
Leisure Time | 1.0 | ||||
Software | 1.0 | ||||
Commercial Services | 0.9 | ||||
Home Furnishings | 0.9 | ||||
Coal | 0.8 | ||||
Lodging | 0.8 | ||||
Distribution & Wholesale | 0.7 | ||||
Preferred Stocks | 0.7 | ||||
Auto Parts & Equipment | 0.6 | ||||
Household Products & Wares | 0.6 | ||||
Water | 0.6 | ||||
Forest Products & Paper | 0.4 | ||||
Aerospace & Defense | 0.3 | ||||
Airlines | 0.3 | ||||
Electrical Components & Equipment | 0.3 | ||||
Machinery — Diversified | 0.3 | ||||
Pipelines | 0.3 | ||||
REITS | 0.3 | ||||
Health Care — Services | 0.2 | ||||
Oil & Gas Services | 0.2 | ||||
Advertising | 0.1 | ||||
Biotechnology | 0.1 | ||||
Environmental Control | 0.1 | ||||
Home Builders | 0.1 | ||||
Investment Companies | 0.1 | ||||
Machinery — Construction & Mining | 0.1 | ||||
See accompanying Notes to the Financial Statements.
180
Table of Contents
Mercer Emerging Markets Equity Fund
Schedule of Investments (Continued)
March 31, 2019
| Industry Sector Summary (Unaudited) | % of Net Assets | ||||
Miscellaneous — Manufacturing | 0.1 | ||||
Textiles | 0.1 | ||||
Agriculture | 0.0 | ||||
Energy-Alternate Sources | 0.0 | ||||
Food Service | 0.0 | ||||
Housewares | 0.0 | ||||
Media | 0.0 | ||||
Metal Fabricate & Hardware | 0.0 | ||||
Office & Business Equipment | 0.0 | ||||
Packaging & Containers | 0.0 | ||||
Shipbuilding | 0.0 | ||||
Transportation | 0.0 | ||||
Trucking & Leasing | 0.0 | ||||
Short-Term Investments and Other Assets and Liabilities (net) | 8.3 | ||||
|
| ||||
| 100.0 | % | ||||
|
| ||||
See accompanying Notes to the Financial Statements.
181
Table of Contents
Mercer Global Low Volatility Equity Fund
Schedule of Investments
(showing percentage of net assets)
March 31, 2019
| Shares | Description | Value ($) | ||||||||
COMMON STOCKS — 93.4% |
| |||||||||
| Australia — 1.4% | ||||||||||
| 34,756 | AGL Energy, Ltd. | 537,478 | ||||||||
| 55,180 | Ansell, Ltd. | 996,390 | ||||||||
| 43,720 | Newcrest Mining, Ltd. | 792,251 | ||||||||
| 5,369 | Northern Star Resources, Ltd. | 34,134 | ||||||||
| 205,729 | Regis Resources, Ltd. | 774,540 | ||||||||
| 17,871 | Rio Tinto, Ltd. | 1,242,934 | ||||||||
| 18,141 | Saracen Mineral Holdings, Ltd.* | 37,371 | ||||||||
| 292,051 | Sonic Healthcare, Ltd. | 5,095,178 | ||||||||
| 217,573 | Telstra Corp., Ltd. | 513,116 | ||||||||
| 87,264 | Wesfarmers, Ltd. | 2,147,883 | ||||||||
| 46,853 | Woolworths Group, Ltd. | 1,011,774 | ||||||||
|
| |||||||||
Total Australia | 13,183,049 | |||||||||
|
| |||||||||
| Austria — 0.4% | ||||||||||
| 26,711 | EVN AG | 389,302 | ||||||||
| 11,455 | Flughafen Wien AG | 496,483 | ||||||||
| 9,486 | Oesterreichische Post AG | 401,556 | ||||||||
| 34,645 | Telekom Austria AG Class A* | 252,079 | ||||||||
| 5,968 | UNIQA Insurance Group AG | 59,506 | ||||||||
| 15,100 | Vienna Insurance Group AG Wiener Versicherung Gruppe | 388,270 | ||||||||
| 58,329 | voestalpine AG | 1,772,942 | ||||||||
|
| |||||||||
Total Austria | 3,760,138 | |||||||||
|
| |||||||||
| Belgium — 0.4% | ||||||||||
| 6,105 | Ackermans & van Haaren NV* | 921,997 | ||||||||
| 18,633 | Colruyt SA | 1,378,764 | ||||||||
| 6,583 | D’ieteren SA/NV | 260,928 | ||||||||
| 19,006 | Elia System Operator SA/NV* | 1,333,805 | ||||||||
| 2,360 | Financiere de Tubize SA‡ | 167,740 | ||||||||
|
| |||||||||
Total Belgium | 4,063,234 | |||||||||
|
| |||||||||
| Bermuda — 1.6% | ||||||||||
| 4,500 | Arch Capital Group, Ltd.* | 145,440 | ||||||||
| 32,000 | Assured Guaranty, Ltd. | 1,421,760 | ||||||||
| 27,320 | Axis Capital Holdings, Ltd. | 1,496,590 | ||||||||
| 4,346 | Bunge, Ltd. | 230,642 | ||||||||
| 149,500 | CK Infrastructure Holdings, Ltd. | 1,227,431 | ||||||||
| 21,000 | Clear Media, Ltd. | 18,138 | ||||||||
| 342,000 | Emperor International Holdings, Ltd. | 105,868 | ||||||||
| 19,196 | Enstar Group, Ltd.* | 3,340,104 | ||||||||
| 8,914 | Everest Re Group, Ltd. | 1,925,068 | ||||||||
| 61,329 | Genpact, Ltd. | 2,157,554 | ||||||||
| 12,000 | Guoco Group, Ltd. | 173,963 | ||||||||
| 85,000 | Hongkong Land Holdings, Ltd. | 604,350 | ||||||||
| 173 | Hudson, Ltd. Class A* | 2,379 | ||||||||
| 300,000 | Regal Hotels International Holdings, Ltd. | 188,409 | ||||||||
| 12,573 | RenaissanceRe Holdings, Ltd. | 1,804,226 | ||||||||
See accompanying Notes to the Financial Statements.
182
Table of Contents
Mercer Global Low Volatility Equity Fund
Schedule of Investments (Continued)
(showing percentage of net assets)
March 31, 2019
| Shares | Description | Value ($) | ||||||||
| Bermuda — continued | ||||||||||
| 7,500 | Soundwill Holdings, Ltd. | 11,465 | ||||||||
| 58,000 | Transport International Holdings, Ltd. | 175,109 | ||||||||
| 3,000 | Wing On Co. International, Ltd. | 10,471 | ||||||||
| 32,000 | Wing Tai Properties, Ltd. | 24,051 | ||||||||
|
| |||||||||
Total Bermuda | 15,063,018 | |||||||||
|
| |||||||||
| Canada — 5.5% | ||||||||||
| 55,200 | Algonquin Power & Utilities Corp. | 621,023 | ||||||||
| 25,412 | Atco, Ltd. Class I | 855,975 | ||||||||
| 38,100 | Bank of Montreal | 2,851,618 | ||||||||
| 24,300 | Bank of Nova Scotia (The)‡ | 1,293,987 | ||||||||
| 48,301 | BCE, Inc. | 2,144,081 | ||||||||
| 33,389 | Canadian Imperial Bank of Commerce | 2,639,229 | ||||||||
| 68,174 | Canadian National Railway Co. | 6,104,761 | ||||||||
| 1,619 | Canadian Utilities, Ltd. Class A | 44,209 | ||||||||
| 6,400 | Cogeco, Inc. | 376,733 | ||||||||
| 1,316 | Constellation Software, Inc. | 1,115,588 | ||||||||
| 8,384 | Fairfax Financial Holdings, Ltd. | 3,884,648 | ||||||||
| 26,000 | Fortis, Inc. | 961,218 | ||||||||
| 39,376 | George Weston, Ltd. | 2,832,172 | ||||||||
| 102,648 | Intact Financial Corp. | 8,688,526 | ||||||||
| 46,000 | Just Energy Group, Inc. | 155,979 | ||||||||
| 1,600 | Lululemon Athletica, Inc.* | 262,192 | ||||||||
| 22,400 | Maple Leaf Foods, Inc. | 518,271 | ||||||||
| 39,600 | National Bank of Canada | 1,787,699 | ||||||||
| 12,700 | North West Co. (The), Inc. | 273,878 | ||||||||
| 92,267 | OceanaGold Corp. | 290,072 | ||||||||
| 21,400 | Quebecor, Inc. Class B | 524,768 | ||||||||
| 57,900 | Rogers Communications, Inc. Class B | 3,114,842 | ||||||||
| 29,100 | Royal Bank of Canada | 2,196,087 | ||||||||
| 52,100 | Toronto-Dominion Bank (The) | 2,828,169 | ||||||||
| 71,708 | Waste Connections, Inc. | 6,352,612 | ||||||||
|
| |||||||||
Total Canada | 52,718,337 | |||||||||
|
| |||||||||
| Denmark — 0.2% | ||||||||||
| 17,199 | Carlsberg AS Class B | 2,150,182 | ||||||||
| 4,688 | H Lundbeck AS‡ | 203,071 | ||||||||
| 1,102 | Matas AS | 10,906 | ||||||||
|
| |||||||||
Total Denmark | 2,364,159 | |||||||||
|
| |||||||||
| Finland — 0.2% | ||||||||||
| 16,871 | Aktia Bank OYJ | 177,502 | ||||||||
| 25,690 | Fortum OYJ‡ | 525,863 | ||||||||
| 21,988 | Kesko OYJ Class B | 1,339,143 | ||||||||
|
| |||||||||
Total Finland | 2,042,508 | |||||||||
|
| |||||||||
| France — 4.4% | ||||||||||
| 3,959 | Accor SA* | 160,522 | ||||||||
| 45,708 | Airbus SE | 6,051,008 | ||||||||
See accompanying Notes to the Financial Statements.
183
Table of Contents
Mercer Global Low Volatility Equity Fund
Schedule of Investments (Continued)
(showing percentage of net assets)
March 31, 2019
| Shares | Description | Value ($) | ||||||||
| France — continued | ||||||||||
| 7,119 | AXA SA | 179,296 | ||||||||
| 5,215 | Caisse Regionale de Credit Agricole Mutuel Nord de France‡ | 139,950 | ||||||||
| 112,012 | Credit Agricole SA | 1,354,572 | ||||||||
| 27,824 | Edenred | 1,267,495 | ||||||||
| 1,503 | Electricite de France SA | 20,572 | ||||||||
| 113,229 | Engie SA | 1,688,408 | ||||||||
| 5,600 | IPSOS | 140,347 | ||||||||
| 3,105 | Korian SA | 125,791 | ||||||||
| 77,112 | Lagardere SCA | 1,984,533 | ||||||||
| 552 | Manutan International | 38,181 | ||||||||
| 36,602 | Metropole Television SA | 675,660 | ||||||||
| 169,975 | Orange SA | 2,767,418 | ||||||||
| 44,548 | Peugeot SA | 1,087,450 | ||||||||
| 96,131 | Rubis SCA | 5,248,076 | ||||||||
| 54,593 | Safran SA | 7,493,894 | ||||||||
| 304 | Savencia SA | 21,641 | ||||||||
| 74 | Societe Fonciere Lyonnaise SA REIT | 5,401 | ||||||||
| 52,919 | Societe Generale SA | 1,531,553 | ||||||||
| 44,231 | Suez | 586,541 | ||||||||
| 97,444 | Veolia Environnement SA | 2,180,641 | ||||||||
| 1,091 | Vetoquinol SA | 70,072 | ||||||||
| 3,235 | Vilmorin & Cie SA | 171,450 | ||||||||
| 68,183 | Vinci SA | 6,639,220 | ||||||||
|
| |||||||||
Total France | 41,629,692 | |||||||||
|
| |||||||||
| Germany — 1.5% | ||||||||||
| 47,243 | Aareal Bank AG | 1,457,726 | ||||||||
| 66,316 | Brenntag AG | 3,417,848 | ||||||||
| 158,790 | Deutsche Telekom AG | 2,637,909 | ||||||||
| 4,176 | Hornbach Baumarkt AG | 74,649 | ||||||||
| 3,385 | Hornbach Holding AG & Co. KGaA | 169,898 | ||||||||
| 14,946 | McKesson Europe AG | 439,691 | ||||||||
| 28,642 | Merck KGaA | 3,269,132 | ||||||||
| 39,830 | RHOEN-KLINIKUM AG | 1,148,490 | ||||||||
| 50,401 | Salzgitter AG | 1,458,961 | ||||||||
| 6,310 | TAG Immobilien AG | 155,874 | ||||||||
| 1,712 | TLG Immobilien AG | 51,595 | ||||||||
| 7,475 | Wuestenrot & Wuerttembergische AG | 143,693 | ||||||||
|
| |||||||||
Total Germany | 14,425,466 | |||||||||
|
| |||||||||
| Hong Kong — 2.2% | ||||||||||
| 574,800 | AIA Group, Ltd. | 5,722,408 | ||||||||
| 1,101,000 | Champion REIT | 953,739 | ||||||||
| 260,000 | CLP Holdings, Ltd. | 3,014,032 | ||||||||
| 1,712,000 | Guangdong Investment, Ltd. | 3,306,253 | ||||||||
| 239,000 | HK Electric Investments & HK Electric Investments, Ltd. | 244,177 | ||||||||
| 1,892,000 | HKT Trust & HKT, Ltd. | 3,041,681 | ||||||||
| 174,469 | Hong Kong & China Gas Co., Ltd. | 418,284 | ||||||||
| 16,000 | Hong Kong Ferry Holdings Co., Ltd. | 18,079 | ||||||||
See accompanying Notes to the Financial Statements.
184
Table of Contents
Mercer Global Low Volatility Equity Fund
Schedule of Investments (Continued)
(showing percentage of net assets)
March 31, 2019
| Shares | Description | Value ($) | ||||||||
| Hong Kong — continued | ||||||||||
| 49,000 | Kowloon Development Co., Ltd. | 61,172 | ||||||||
| 249,000 | Langham Hospitality Investments and Langham Hospitality Investments, Ltd. | 100,869 | ||||||||
| 38,000 | Liu Chong Hing Investment, Ltd. | 67,190 | ||||||||
| 12,000 | Miramar Hotel & Investment | 25,957 | ||||||||
| 360,000 | Power Assets Holdings, Ltd. | 2,497,086 | ||||||||
| 347,000 | Regal Real Estate Investment Trust REIT | 106,532 | ||||||||
| 545,000 | Sunlight Real Estate Investment Trust REIT | 407,538 | ||||||||
| 49,500 | Swire Pacific, Ltd. Class A | 636,883 | ||||||||
|
| |||||||||
Total Hong Kong | 20,621,880 | |||||||||
|
| |||||||||
| Ireland — 2.2% | ||||||||||
| 21,137 | Accenture Plc Class A | 3,720,535 | ||||||||
| 24,300 | Allergan Plc | 3,557,763 | ||||||||
| 5,340 | ICON Plc, ADR* | 729,337 | ||||||||
| 83,701 | Irish Residential Properties Plc REIT | 149,434 | ||||||||
| 14,500 | Jazz Pharmaceuticals Plc* | 2,072,775 | ||||||||
| 38,306 | Medtronic Plc | 3,488,910 | ||||||||
| 46,052 | STERIS Plc* | 5,896,038 | ||||||||
| 48,092 | Total Produce Plc | 91,800 | ||||||||
| 5,900 | Willis Towers Watson Plc | 1,036,335 | ||||||||
|
| |||||||||
Total Ireland | 20,742,927 | |||||||||
|
| |||||||||
| Israel — 0.7% | ||||||||||
| 266,154 | Bank Hapoalim BM | 1,762,211 | ||||||||
| 31,897 | Bank LeumiLe-Israel BM | 208,378 | ||||||||
| 3,121 | FIBI Holdings, Ltd. | 87,111 | ||||||||
| 14,841 | First International Bank Of Israel, Ltd.* | 349,501 | ||||||||
| 331,092 | Israel Discount Bank, Ltd. Class A | 1,143,065 | ||||||||
| 3,616,989 | Isramco Negev 2, LP* | 386,678 | ||||||||
| 152,052 | Oil Refineries, Ltd.* | 74,364 | ||||||||
| 1,957 | Paz Oil Co., Ltd. | 292,362 | ||||||||
| 5,902 | Rami Levy Chain Stores Hashikma Marketing 2006, Ltd. | 298,243 | ||||||||
| 56,884 | Strauss Group, Ltd. | 1,362,953 | ||||||||
| 2,288 | Taro Pharmaceutical Industries, Ltd. | 247,310 | ||||||||
|
| |||||||||
Total Israel | 6,212,176 | |||||||||
|
| |||||||||
| Japan — 5.0% | ||||||||||
| 7,100 | Aeon Hokkaido Corp. | 48,366 | ||||||||
| 26,400 | Alpen Co., Ltd. | 407,860 | ||||||||
| 165,500 | Astellas Pharma, Inc. | 2,479,846 | ||||||||
| 1,900 | AT-Group Co., Ltd. | 34,847 | ||||||||
| 17,800 | Chugoku Electric Power Co., Inc. (The)‡ | 222,088 | ||||||||
| 52,900 | DCM Holdings Co., Ltd.‡ | 493,227 | ||||||||
| 15,400 | DyDo Group Holdings, Inc.‡ | 694,276 | ||||||||
| 50,600 | EDION Corp.‡ | 441,610 | ||||||||
| 20 | Frontier Real Estate Investment Corp. REIT | 83,932 | ||||||||
| 2,500 | J-Oil Mills, Inc. | 93,057 | ||||||||
| 30 | Japan Logistics Fund, Inc. REIT | 63,667 | ||||||||
See accompanying Notes to the Financial Statements.
185
Table of Contents
Mercer Global Low Volatility Equity Fund
Schedule of Investments (Continued)
(showing percentage of net assets)
March 31, 2019
| Shares | Description | Value ($) | ||||||||
| Japan — continued | ||||||||||
| 74,800 | Japan Post Bank Co., Ltd.‡ | 817,032 | ||||||||
| 182,200 | Japan Post Holdings Co., Ltd. | 2,133,362 | ||||||||
| 84 | Japan Rental Housing Investments, Inc. REIT | 66,936 | ||||||||
| 9,300 | Japan Tobacco, Inc. | 230,641 | ||||||||
| 1,200 | Kadoya Sesame Mills, Inc. | 56,268 | ||||||||
| 4,600 | Kaken Pharmaceutical Co., Ltd. | 209,044 | ||||||||
| 17,700 | Kato Sangyo Co., Ltd. | 583,683 | ||||||||
| 49,000 | KDDI Corp. | 1,055,834 | ||||||||
| 600 | KFC Holdings Japan, Ltd. | 10,782 | ||||||||
| 2,400 | Kohnan Shoji Co., Ltd. | 59,564 | ||||||||
| 56,200 | Komeri Co., Ltd. | 1,376,503 | ||||||||
| 66,300 | KYORIN Holdings, Inc. | 1,294,433 | ||||||||
| 58,400 | LIXIL VIVA Corp. | 740,783 | ||||||||
| 157,100 | Marui Group Co., Ltd.‡ | 3,172,232 | ||||||||
| 63,300 | Matsumotokiyoshi Holdings Co., Ltd. | 2,107,426 | ||||||||
| 89,100 | Medipal Holdings Corp. | 2,117,116 | ||||||||
| 8,000 | Mitsubishi Shokuhin Co., Ltd. | 209,315 | ||||||||
| 59,600 | Mitsubishi Tanabe Pharma Corp. | 796,390 | ||||||||
| 4,900 | Mitsui Sugar Co., Ltd. | 120,679 | ||||||||
| 1,563,900 | Mizuho Financial Group, Inc. | 2,420,347 | ||||||||
| 7,400 | Mizuno Corp.‡ | 171,487 | ||||||||
| 30,000 | Mochida Pharmaceutical Co., Ltd. | 1,539,504 | ||||||||
| 45,000 | Nichi-iko Pharmaceutical Co., Ltd. | 596,829 | ||||||||
| 16,800 | Nippon Flour Mills Co., Ltd. | 288,386 | ||||||||
| 47,700 | Nippon Telegraph & Telephone Corp. | 2,026,771 | ||||||||
| 30,100 | Nisshin Oillio Group, Ltd. (The) | 889,253 | ||||||||
| 115,800 | NTT DOCOMO, Inc. | 2,564,789 | ||||||||
| 13,500 | Ohsho Food Service Corp. | 854,994 | ||||||||
| 10,500 | Okinawa Cellular Telephone Co. | 333,921 | ||||||||
| 23,250 | Okinawa Electric Power Co., Inc. (The) | 395,955 | ||||||||
| 50 | Orix JREIT, Inc. REIT | 85,874 | ||||||||
| 4,400 | Sawai Pharmaceutical Co., Ltd. | 254,813 | ||||||||
| 2,700 | Seiko Holdings Corp.‡ | 64,277 | ||||||||
| 46,300 | Seven & i Holdings Co., Ltd. | 1,746,838 | ||||||||
| 15,200 | Showa Sangyo Co., Ltd. | 411,705 | ||||||||
| 5,100 | Softbank Corp.‡ | 57,458 | ||||||||
| 232,800 | Sony Financial Holdings, Inc. | 4,391,619 | ||||||||
| 4,600 | St. Marc Holdings Co., Ltd. | 103,441 | ||||||||
| 13,400 | Suzuken Co., Ltd. | 776,022 | ||||||||
| 400 | Taisho Pharmaceutical Holdings Co., Ltd. | 38,126 | ||||||||
| 61,600 | Toho Holdings Co., Ltd.‡ | 1,537,704 | ||||||||
| 312,400 | Tokyo Electric Power Co. Holdings, Inc.* | 1,975,697 | ||||||||
| 41,400 | Tsumura & Co. | 1,258,626 | ||||||||
| 6,000 | United Super Markets Holdings, Inc. | 59,358 | ||||||||
| 43,000 | Vital KSK Holdings, Inc.‡ | 424,231 | ||||||||
| 5,800 | Yellow Hat, Ltd. | 76,296 | ||||||||
| 1,500 | ZERIA Pharmaceutical Co., Ltd. | 25,925 | ||||||||
|
| |||||||||
Total Japan | 47,591,045 | |||||||||
|
| |||||||||
See accompanying Notes to the Financial Statements.
186
Table of Contents
Mercer Global Low Volatility Equity Fund
Schedule of Investments (Continued)
(showing percentage of net assets)
March 31, 2019
| Shares | Description | Value ($) | ||||||||
| Liberia — 0.0% | ||||||||||
| 1,798 | Royal Caribbean Cruises, Ltd. | 206,087 | ||||||||
|
| |||||||||
| Luxembourg — 0.2% | ||||||||||
| 78,039 | Atento SA* | 281,721 | ||||||||
| 362,452 | B&M European Value Retail SA | 1,764,487 | ||||||||
|
| |||||||||
Total Luxembourg | 2,046,208 | |||||||||
|
| |||||||||
| Netherlands — 1.6% | ||||||||||
| 10,824 | ForFarmers NV | 89,087 | ||||||||
| 7,961 | Heineken Holding NV | 798,253 | ||||||||
| 22,927 | Koninklijke Ahold Delhaize NV | 610,767 | ||||||||
| 16,052 | LyondellBasell Industries NV Class A | 1,349,652 | ||||||||
| 7,071 | NN Group NV | 294,006 | ||||||||
| 3,200 | NXP Semiconductors NV | 282,848 | ||||||||
| 29,100 | QIAGEN NV* | 1,183,788 | ||||||||
| 7,226 | Sligro Food Group NV | 259,233 | ||||||||
| 176,351 | Unilever NV, ADR | 10,253,253 | ||||||||
|
| |||||||||
Total Netherlands | 15,120,887 | |||||||||
|
| |||||||||
| New Zealand — 0.6% | ||||||||||
| 253,622 | Argosy Property, Ltd. | 221,402 | ||||||||
| 225,864 | Contact Energy, Ltd. | 1,069,032 | ||||||||
| 38,340 | Ebos Group, Ltd. | 575,253 | ||||||||
| 63,681 | FonterraCo-operative Group, Ltd. | 184,579 | ||||||||
| 19,925 | Freightways, Ltd. | 112,244 | ||||||||
| 115,729 | Genesis Energy, Ltd. | 254,145 | ||||||||
| 69,101 | Goodman Property Trust REIT | 81,530 | ||||||||
| 458,079 | Infratil, Ltd. | 1,302,749 | ||||||||
| 49,518 | Kiwi Property Group, Ltd. REIT | 50,150 | ||||||||
| 35,536 | Mainfreight, Ltd. | 868,844 | ||||||||
| 142,620 | Mercury NZ, Ltd. | 379,341 | ||||||||
| 56,455 | Metlifecare, Ltd. | 192,126 | ||||||||
| 23,860 | Restaurant Brands New Zealand, Ltd. | 142,385 | ||||||||
| 18,019 | Summerset Group Holdings, Ltd. | 81,107 | ||||||||
| 6,801 | Trustpower, Ltd. | 30,659 | ||||||||
| 68,690 | Vector, Ltd. | 167,711 | ||||||||
| 3,702 | Warehouse Group, Ltd. (The) | 5,504 | ||||||||
| 63,531 | Z Energy, Ltd. | 271,234 | ||||||||
|
| |||||||||
Total New Zealand | 5,989,995 | |||||||||
|
| |||||||||
| Norway — 0.7% | ||||||||||
| 55,028 | DNB ASA | 1,014,729 | ||||||||
| 4,194 | Olav Thon Eiendomsselskap ASA | 73,832 | ||||||||
| 347,148 | Orkla ASA | 2,668,633 | ||||||||
| 145,254 | Telenor ASA | 2,912,974 | ||||||||
|
| |||||||||
Total Norway | 6,670,168 | |||||||||
|
| |||||||||
See accompanying Notes to the Financial Statements.
187
Table of Contents
Mercer Global Low Volatility Equity Fund
Schedule of Investments (Continued)
(showing percentage of net assets)
March 31, 2019
| Shares | Description | Value ($) | ||||||||
| Panama — 0.1% | ||||||||||
| 28,209 | Carnival Corp. | 1,430,760 | ||||||||
|
| |||||||||
| Portugal — 0.0% | ||||||||||
| 99,893 | REN — Redes Energeticas Nacionais SGPS SA | 285,123 | ||||||||
|
| |||||||||
| Puerto Rico — 0.2% | ||||||||||
| 34,400 | Popular, Inc. | 1,793,272 | ||||||||
|
| |||||||||
| Singapore — 0.4% | ||||||||||
| 14,000 | AIMS AMP Capital Industrial REIT | 14,677 | ||||||||
| 27,600 | Fraser and Neave, Ltd. | 36,882 | ||||||||
| 48,500 | Frasers Hospitality Trust REIT | 26,318 | ||||||||
| 64,272 | Hong Leong Finance, Ltd. | 129,066 | ||||||||
| 366,200 | Keppel Infrastructure Trust | 125,716 | ||||||||
| 263,100 | Olam International, Ltd. | 384,598 | ||||||||
| 310,100 | OUE, Ltd.‡ | 389,199 | ||||||||
| 1,689,176 | Sheng Siong Group, Ltd. | 1,296,968 | ||||||||
| 116,100 | Singapore Airlines, Ltd. | 828,000 | ||||||||
| 582,649 | SPH REIT | 451,666 | ||||||||
| 33,000 | United Industrial Corp., Ltd. | 70,653 | ||||||||
|
| |||||||||
Total Singapore | 3,753,743 | |||||||||
|
| |||||||||
| Spain — 0.9% | ||||||||||
| 30,146 | Aena SME SA | 5,432,834 | ||||||||
| 1,020 | Cia de Distribucion Integral Logista Holdings SA | 24,052 | ||||||||
| 8,273 | Iberdrola SA | 72,698 | ||||||||
| 56,647 | International Consolidated Airlines Group SA | 377,927 | ||||||||
| 39,502 | Viscofan SA‡ | 2,472,781 | ||||||||
|
| |||||||||
Total Spain | 8,380,292 | |||||||||
|
| |||||||||
| Sweden — 1.4% | ||||||||||
| 91,216 | Axfood AB | 1,701,332 | ||||||||
| 15,343 | Bilia AB Class A | 131,259 | ||||||||
| 51,696 | Cloetta AB Class B | 133,764 | ||||||||
| 46,899 | Dios Fastigheter AB | 385,798 | ||||||||
| 82,325 | ICA Gruppen AB‡ | 3,310,645 | ||||||||
| 42,161 | Nyfosa AB* | 253,185 | ||||||||
| 1,461 | Pandox AB Class B | 26,211 | ||||||||
| 310,000 | Svenska Handelsbanken AB Class A‡ | 3,278,708 | ||||||||
| 64,496 | Swedish Match AB | 3,295,274 | ||||||||
| 214,322 | Telia Co. AB | 969,328 | ||||||||
|
| |||||||||
Total Sweden | 13,485,504 | |||||||||
|
| |||||||||
| Switzerland — 3.8% | ||||||||||
| 9,262 | Allreal Holding AG* | 1,576,372 | ||||||||
| 449 | Alpiq Holding AG* | 28,854 | ||||||||
| 1,093 | Banque Cantonale de Geneve | 218,403 | ||||||||
| 887 | Barry Callebaut AG | 1,601,392 | ||||||||
See accompanying Notes to the Financial Statements.
188
Table of Contents
Mercer Global Low Volatility Equity Fund
Schedule of Investments (Continued)
(showing percentage of net assets)
March 31, 2019
| Shares | Description | Value ($) | ||||||||
| Switzerland — continued | ||||||||||
| 74 | Basellandschaftliche Kantonalbank | 67,915 | ||||||||
| 579 | Basler Kantonalbank‡ | 44,185 | ||||||||
| 93 | Bell Food Group AG | 26,801 | ||||||||
| 336 | Berner Kantonalbank AG | 81,647 | ||||||||
| 17,306 | BKW AG | 1,179,915 | ||||||||
| 686 | Chubb, Ltd. | 96,095 | ||||||||
| 159 | Emmi AG | 139,857 | ||||||||
| 607 | Helvetia Holding AG | 370,575 | ||||||||
| 1,003 | Intershop Holding AG | 511,622 | ||||||||
| 180 | Luzerner Kantonalbank AG | 85,671 | ||||||||
| 78,438 | Nestle SA | 7,474,411 | ||||||||
| 114,640 | Novartis AG | 11,025,423 | ||||||||
| 13,487 | Roche Holding AG | 3,715,392 | ||||||||
| 2,341 | Sonova Holding AG | 463,076 | ||||||||
| 6,896 | Swiss Life Holding AG* | 3,036,345 | ||||||||
| 5,472 | Swisscom AG‡ | 2,675,835 | ||||||||
| 3,202 | Tamedia AG | 324,733 | ||||||||
| 5,020 | Valora Holding AG* ‡ | 1,383,663 | ||||||||
|
| |||||||||
Total Switzerland | 36,128,182 | |||||||||
|
| |||||||||
| United Kingdom — 4.5% | ||||||||||
| 19,514 | AG Barr Plc | 205,202 | ||||||||
| 13,603 | Aon Plc | 2,322,032 | ||||||||
| 573,900 | BAE Systems Plc | 3,607,487 | ||||||||
| 247,502 | Britvic Plc | 3,071,885 | ||||||||
| 400,530 | Central Asia Metals Plc | 1,236,929 | ||||||||
| 230,345 | Centrica Plc | 342,773 | ||||||||
| 1,824 | Coca-Cola European Partners Plc* | 94,374 | ||||||||
| 1,491 | Craneware Plc | 47,211 | ||||||||
| 17,789 | Cranswick Plc | 630,959 | ||||||||
| 61,686 | Diageo Plc | 2,522,323 | ||||||||
| 343,277 | EI Group Plc* | 952,764 | ||||||||
| 2,065 | EMIS Group Plc | 28,253 | ||||||||
| 40,303 | GCP Student Living Plc REIT | 80,246 | ||||||||
| 18,575 | Greggs Plc | 445,114 | ||||||||
| 271,383 | Halfords Group Plc | 820,412 | ||||||||
| 343,941 | Hansteen Holdings Plc REIT | 436,520 | ||||||||
| 59,149 | Imperial Brands Plc | 2,022,811 | ||||||||
| 252,523 | Inchcape Plc | 1,878,877 | ||||||||
| 395,462 | Legal & General Group Plc | 1,418,640 | ||||||||
| 258,175 | Lloyds Banking Group Plc | 209,048 | ||||||||
| 273,661 | Marston’s Plc | 366,222 | ||||||||
| 116,422 | National Express Group Plc | 615,917 | ||||||||
| 52,772 | Paragon Banking Group Plc | 299,676 | ||||||||
| 11,691 | QinetiQ Group Plc | 45,885 | ||||||||
| 103,022 | Reckitt Benckiser Group Plc | 8,567,379 | ||||||||
| 472,411 | Rolls-Royce Holdings Plc* | 5,559,877 | ||||||||
| 22,475 | Secure Income Plc REIT | 120,366 | ||||||||
| 12,962 | Smith & Nephew Plc | 257,237 | ||||||||
See accompanying Notes to the Financial Statements.
189
Table of Contents
Mercer Global Low Volatility Equity Fund
Schedule of Investments (Continued)
(showing percentage of net assets)
March 31, 2019
| Shares | Description | Value ($) | ||||||||
| United Kingdom — continued | ||||||||||
| 17,741 | SSP Group Plc | 160,042 | ||||||||
| 67,886 | Tate & Lyle Plc | 642,035 | ||||||||
| 593,804 | Tritax Big Box Plc REIT | 1,111,114 | ||||||||
| 2,187 | Unilever Plc | 125,247 | ||||||||
| 24,545 | WH Smith Plc | 678,687 | ||||||||
| 814,768 | Wm Morrison Supermarkets Plc | 2,415,861 | ||||||||
|
| |||||||||
Total United Kingdom | 43,339,405 | |||||||||
|
| |||||||||
| United States — 53.3% | ||||||||||
| 28,400 | Abbott Laboratories | 2,270,296 | ||||||||
| 8,875 | Adobe, Inc.* | 2,365,099 | ||||||||
| 53,283 | AGNC Investment Corp. REIT | 959,094 | ||||||||
| 24,500 | Akamai Technologies, Inc.* | 1,756,895 | ||||||||
| 2,785 | Alleghany Corp.* | 1,705,534 | ||||||||
| 24,705 | Allstate Corp. (The) | 2,326,717 | ||||||||
| 10,244 | Alphabet, Inc. Class A* | 12,056,061 | ||||||||
| 45,487 | Altria Group, Inc. | 2,612,318 | ||||||||
| 35,671 | Amdocs, Ltd. | 1,930,158 | ||||||||
| 29,678 | Ameren Corp. | 2,182,817 | ||||||||
| 27,313 | American Electric Power Co., Inc. | 2,287,464 | ||||||||
| 91,957 | American Express Co. | 10,050,900 | ||||||||
| 19,702 | American Financial Group, Inc. | 1,895,529 | ||||||||
| 3,100 | American National Insurance Co. | 374,542 | ||||||||
| 57,795 | American Tower Corp. REIT | 11,389,083 | ||||||||
| 2,600 | AmerisourceBergen Corp. Class A | 206,752 | ||||||||
| 56,083 | AMETEK, Inc. | 4,653,207 | ||||||||
| 153,044 | Annaly Capital Management, Inc. REIT | 1,528,910 | ||||||||
| 10,246 | ANSYS, Inc.* | 1,872,047 | ||||||||
| 7,113 | Anthem, Inc. | 2,041,289 | ||||||||
| 5,503 | Apartment Investment & Management Co. REIT Class A | 276,721 | ||||||||
| 46,492 | Apple Hospitality, Inc. REIT | 757,820 | ||||||||
| 7,175 | Archer-Daniels-Midland Co. | 309,458 | ||||||||
| 22,684 | Arthur J. Gallagher & Co. | 1,771,620 | ||||||||
| 141,388 | AT&T, Inc. | 4,433,928 | ||||||||
| 8,131 | Atmos Energy Corp. | 836,924 | ||||||||
| 35,691 | Automatic Data Processing, Inc. | 5,701,280 | ||||||||
| 1,400 | AutoZone, Inc.* | 1,433,768 | ||||||||
| 8,900 | AvalonBay Communities, Inc. REIT | 1,786,497 | ||||||||
| 110,778 | Avangrid, Inc. | 5,577,672 | ||||||||
| 136,933 | Ball Corp. | 7,922,943 | ||||||||
| 111,339 | Baxter International, Inc. | 9,052,974 | ||||||||
| 2,080 | Becton Dickinson and Co. | 519,438 | ||||||||
| 5,172 | Berkshire Hathaway, Inc. Class B* | 1,039,003 | ||||||||
| 1,900 | Black Knight, Inc.* | 103,550 | ||||||||
| 8,380 | Boeing Co. (The) | 3,196,300 | ||||||||
| 925 | Booking Holdings, Inc.* | 1,614,042 | ||||||||
| 15,300 | Boston Properties, Inc. REIT | 2,048,364 | ||||||||
| 8,912 | Bright Horizons Family Solutions, Inc.* | 1,132,804 | ||||||||
| 32,655 | Bristol-Myers Squibb Co. | 1,557,970 | ||||||||
See accompanying Notes to the Financial Statements.
190
Table of Contents
Mercer Global Low Volatility Equity Fund
Schedule of Investments (Continued)
(showing percentage of net assets)
March 31, 2019
| Shares | Description | Value ($) | ||||||||
| United States — continued | ||||||||||
| 4,000 | Broadcom, Inc. | 1,202,840 | ||||||||
| 17,680 | Broadridge Financial Solutions, Inc. | 1,833,239 | ||||||||
| 11,748 | Brown & Brown, Inc. | 346,683 | ||||||||
| 79,786 | BWX Technologies, Inc.‡ | 3,955,790 | ||||||||
| 1,600 | Cable One, Inc. | 1,570,208 | ||||||||
| 37,035 | Cadence Design Systems, Inc.* | 2,352,093 | ||||||||
| 17,400 | Camden Property Trust REIT | 1,766,100 | ||||||||
| 5,200 | Capital One Financial Corp. | 424,788 | ||||||||
| 10,863 | CDK Global, Inc. | 638,962 | ||||||||
| 60,398 | CenterPoint Energy, Inc. | 1,854,219 | ||||||||
| 34,200 | Charter Communications, Inc. Class A* | 11,864,322 | ||||||||
| 4,800 | Chemed Corp. | 1,536,336 | ||||||||
| 7,700 | Chevron Corp. | 948,486 | ||||||||
| 45,094 | Chimera Investment Corp. REIT‡ | 845,062 | ||||||||
| 44,100 | Cigna Corp.* | 7,092,162 | ||||||||
| 10,000 | Cinemark Holdings, Inc. | 399,900 | ||||||||
| 25,913 | Cintas Corp. | 5,237,276 | ||||||||
| 20,800 | Citrix Systems, Inc. | 2,072,928 | ||||||||
| 76,364 | Clean Harbors, Inc.* | 5,462,317 | ||||||||
| 13,500 | Clorox Co. (The) | 2,166,210 | ||||||||
| 300 | CME Group, Inc. | 49,374 | ||||||||
| 27,983 | CMS Energy Corp. | 1,554,176 | ||||||||
| 11,600 | CNA Financial Corp. | 502,860 | ||||||||
| 34,300 | Coca-Cola Co. (The) | 1,607,298 | ||||||||
| 30,192 | Cognizant Technology Solutions Corp. Class A | 2,187,410 | ||||||||
| 28,900 | Colgate-Palmolive Co. | 1,980,806 | ||||||||
| 2,200 | Columbia Sportswear Co. | 229,196 | ||||||||
| 206,800 | Comcast Corp. Class A | 8,267,864 | ||||||||
| 20,500 | ConocoPhillips | 1,368,170 | ||||||||
| 5,649 | Consolidated Edison, Inc. | 479,092 | ||||||||
| 13,149 | Cooper Cos., Inc. (The) | 3,894,339 | ||||||||
| 48,131 | Copart, Inc.* | 2,916,257 | ||||||||
| 700 | Costco Wholesale Corp. | 169,498 | ||||||||
| 123,900 | CVS Health Corp. | 6,681,927 | ||||||||
| 38,965 | Danaher Corp. | 5,144,159 | ||||||||
| 21,015 | Darden Restaurants, Inc. | 2,552,692 | ||||||||
| 13,100 | Delta Air Lines, Inc. | 676,615 | ||||||||
| 149,500 | DENTSPLY SIRONA, Inc. | 7,413,705 | ||||||||
| 300 | Dollar General Corp. | 35,790 | ||||||||
| 437 | Domino’s Pizza, Inc. | 112,790 | ||||||||
| 17,677 | DTE Energy Co. | 2,205,029 | ||||||||
| 4,300 | Dunkin’ Brands Group, Inc. | 322,930 | ||||||||
| 45,868 | Edison International | 2,840,147 | ||||||||
| 28,667 | Eli Lilly & Co. | 3,719,830 | ||||||||
| 30,100 | Encompass Health Corp. | 1,757,840 | ||||||||
| 21,545 | Entergy Corp. | 2,060,348 | ||||||||
| 16,500 | EPR Properties REIT | 1,268,850 | ||||||||
| 16,566 | Equity LifeStyle Properties, Inc. REIT | 1,893,494 | ||||||||
| 14,800 | Equity Residential REIT | 1,114,736 | ||||||||
See accompanying Notes to the Financial Statements.
191
Table of Contents
Mercer Global Low Volatility Equity Fund
Schedule of Investments (Continued)
(showing percentage of net assets)
March 31, 2019
| Shares | Description | Value ($) | ||||||||
| United States — continued | ||||||||||
| 5,058 | Erie Indemnity Co. Class A | 902,954 | ||||||||
| 7,067 | Essex Property Trust, Inc. REIT | 2,044,059 | ||||||||
| 7,300 | Estee Lauder Cos., Inc. (The) Class A | 1,208,515 | ||||||||
| 56,362 | Exelon Corp. | 2,825,427 | ||||||||
| 33,300 | Exxon Mobil Corp. | 2,690,640 | ||||||||
| 52,162 | Facebook, Inc. Class A* | 8,694,884 | ||||||||
| 2,200 | Fair Isaac Corp.* | 597,586 | ||||||||
| 69,762 | Fidelity National Information Services, Inc. | 7,890,082 | ||||||||
| 28,383 | First American Financial Corp. | 1,461,724 | ||||||||
| 2,600 | First Citizens BancShares, Inc. Class A | 1,058,720 | ||||||||
| 41,818 | FirstEnergy Corp. | 1,740,047 | ||||||||
| 13,838 | Fiserv, Inc.* ‡ | 1,221,619 | ||||||||
| 60,800 | Flowers Foods, Inc. | 1,296,256 | ||||||||
| 9,400 | Fortinet, Inc.* | 789,318 | ||||||||
| 21,300 | Gaming and Leisure Properties, Inc. REIT | 821,541 | ||||||||
| 2,500 | General Mills, Inc. | 129,375 | ||||||||
| 1,500 | Graham Holdings Co. Class B | 1,024,770 | ||||||||
| 65,500 | H&R Block, Inc.‡ | 1,568,070 | ||||||||
| 12,846 | Hanover Insurance Group, Inc. (The) | 1,466,628 | ||||||||
| 59,705 | HCA Healthcare, Inc. | 7,784,338 | ||||||||
| 20,126 | Hershey Co. (The) | 2,311,069 | ||||||||
| 20,616 | Highwoods Properties, Inc. REIT | 964,416 | ||||||||
| 18,086 | Hill-Rom Holdings, Inc. | 1,914,584 | ||||||||
| 68,766 | Hologic, Inc.* | 3,328,274 | ||||||||
| 6,364 | Home Depot, Inc. (The) | 1,221,188 | ||||||||
| 18,843 | Honeywell International, Inc. | 2,994,530 | ||||||||
| 25,300 | Hormel Foods Corp.‡ | 1,132,428 | ||||||||
| 37,563 | Hospitality Properties Trust REIT | 988,283 | ||||||||
| 6,843 | Humana, Inc. | 1,820,238 | ||||||||
| 7,726 | Huntington Ingalls Industries, Inc. | 1,600,827 | ||||||||
| 4,200 | ICU Medical, Inc.* | 1,005,186 | ||||||||
| 19,203 | Ingredion, Inc. | 1,818,332 | ||||||||
| 8,900 | Intel Corp. | 477,930 | ||||||||
| 2,600 | Intercontinental Exchange, Inc. | 197,964 | ||||||||
| 20,484 | International Business Machines Corp. | 2,890,292 | ||||||||
| 13,338 | Intuit, Inc. | 3,486,687 | ||||||||
| 7,542 | Jack Henry & Associates, Inc. | 1,046,377 | ||||||||
| 5,179 | JM Smucker Co. (The) | 603,354 | ||||||||
| 36,190 | Johnson & Johnson | 5,059,000 | ||||||||
| 16,238 | Kellogg Co. | 931,736 | ||||||||
| 1,900 | Kohl’s Corp. | 130,663 | ||||||||
| 13,300 | Kroger Co. (The) | 327,180 | ||||||||
| 22,100 | Lamb Weston Holdings, Inc. | 1,656,174 | ||||||||
| 19,028 | Liberty Property Trust REIT | 921,336 | ||||||||
| 7,575 | Lockheed Martin Corp. | 2,273,712 | ||||||||
| 4,000 | Lowe’s Cos., Inc. | 437,880 | ||||||||
| 9,332 | M&T Bank Corp. | 1,465,311 | ||||||||
| 24,000 | Macquarie Infrastructure Corp. | 989,280 | ||||||||
| 9,559 | Mastercard, Inc. Class A | 2,250,667 | ||||||||
See accompanying Notes to the Financial Statements.
192
Table of Contents
Mercer Global Low Volatility Equity Fund
Schedule of Investments (Continued)
(showing percentage of net assets)
March 31, 2019
| Shares | Description | Value ($) | ||||||||
| United States — continued | ||||||||||
| 3,459 | McCormick & Co., Inc.‡ | 521,029 | ||||||||
| 19,796 | McDonald’s Corp. | 3,759,260 | ||||||||
| 4,100 | McKesson Corp. | 479,946 | ||||||||
| 45,234 | Merck & Co., Inc. | 3,762,112 | ||||||||
| 5,740 | Mercury General Corp. | 287,402 | ||||||||
| 873 | Mettler-Toledo International, Inc.* | 631,179 | ||||||||
| 43,900 | MFA Financial, Inc. REIT | 319,153 | ||||||||
| 103,943 | Microsoft Corp. | 12,259,037 | ||||||||
| 1,225 | Mid-America Apartment Communities, Inc. REIT | 133,929 | ||||||||
| 22,847 | Middleby Corp. (The)* ‡ | 2,970,795 | ||||||||
| 37,300 | Mondelez International, Inc. Class A | 1,862,016 | ||||||||
| 5,792 | Morningstar, Inc. | 729,734 | ||||||||
| 71,420 | Motorola Solutions, Inc. | 10,028,796 | ||||||||
| 1,400 | MSCI, Inc. Class A | 278,376 | ||||||||
| 6,300 | National Instruments Corp. | 279,468 | ||||||||
| 49,451 | Newmont Mining Corp.‡ | 1,768,862 | ||||||||
| 12,770 | NextEra Energy, Inc. | 2,468,696 | ||||||||
| 2,490 | Northrop Grumman Corp. | 671,304 | ||||||||
| 4,500 | Nu Skin Enterprises, Inc. Class A | 215,370 | ||||||||
| 400 | O’Reilly Automotive, Inc.* | 155,320 | ||||||||
| 5,200 | OGE Energy Corp. | 224,224 | ||||||||
| 21,700 | Old Republic International Corp. | 453,964 | ||||||||
| 29,707 | Omnicom Group, Inc.‡ | 2,168,314 | ||||||||
| 71,314 | Oracle Corp. | 3,830,275 | ||||||||
| 45,949 | Packaging Corp. of America | 4,566,412 | ||||||||
| 16,700 | Paychex, Inc. | 1,339,340 | ||||||||
| 33,948 | PepsiCo, Inc. | 4,160,327 | ||||||||
| 91,034 | Pfizer, Inc. | 3,866,214 | ||||||||
| 75,500 | Philip Morris International, Inc. | 6,673,445 | ||||||||
| 9,900 | Phillips 66 | 942,183 | ||||||||
| 21,400 | Pinnacle West Capital Corp. | 2,045,412 | ||||||||
| 16,400 | Post Holdings, Inc.* | 1,794,160 | ||||||||
| 17,109 | Premier, Inc. Class A* | 590,089 | ||||||||
| 42,580 | Procter & Gamble Co. (The) | 4,430,449 | ||||||||
| 35,483 | Progressive Corp. (The) | 2,557,969 | ||||||||
| 21,630 | Prologis, Inc. REIT | 1,556,278 | ||||||||
| 500 | Public Storage REIT | 108,890 | ||||||||
| 11,181 | Raytheon Co. | 2,035,836 | ||||||||
| 10,620 | Reinsurance Group of America, Inc. Class A | 1,507,828 | ||||||||
| 31,104 | Republic Services, Inc. Class A | 2,500,140 | ||||||||
| 1,200 | ResMed, Inc. | 124,764 | ||||||||
| 2,600 | Robert Half International, Inc. | 169,416 | ||||||||
| 15,200 | Royal Gold, Inc. | 1,382,136 | ||||||||
| 21,100 | S&P Global, Inc. | 4,442,605 | ||||||||
| 53,800 | Sabre Corp. | 1,150,782 | ||||||||
| 31 | Seaboard Corp. | 132,826 | ||||||||
| 68,843 | Service Corp. International | 2,764,046 | ||||||||
| 12,200 | Simon Property Group, Inc. REIT | 2,222,962 | ||||||||
| 16,800 | Southern Co. (The) | 868,224 | ||||||||
See accompanying Notes to the Financial Statements.
193
Table of Contents
Mercer Global Low Volatility Equity Fund
Schedule of Investments (Continued)
(showing percentage of net assets)
March 31, 2019
| Shares | Description | Value ($) | ||||||||
| United States — continued | ||||||||||
| 1,885 | Spirit AeroSystems Holdings, Inc. Class A | 172,534 | ||||||||
| 42,549 | Starbucks Corp. | 3,163,093 | ||||||||
| 18,700 | STORE Capital Corp. REIT | 626,450 | ||||||||
| 14,753 | Stryker Corp. | 2,914,013 | ||||||||
| 14,196 | Sun Communities, Inc. REIT | 1,682,510 | ||||||||
| 21,372 | Synopsys, Inc.* | 2,460,986 | ||||||||
| 35,447 | Sysco Corp. | 2,366,442 | ||||||||
| 11,800 | Target Corp. | 947,068 | ||||||||
| 74,140 | TD Ameritrade Holding Corp. | 3,706,259 | ||||||||
| 27,000 | TFS Financial Corp. | 444,690 | ||||||||
| 31,147 | Thermo Fisher Scientific, Inc. | 8,525,557 | ||||||||
| 4,600 | TJX Cos., Inc. (The) | 244,766 | ||||||||
| 53,090 | Torchmark Corp. | 4,350,725 | ||||||||
| 10,193 | Total System Services, Inc. | 968,437 | ||||||||
| 100 | Tractor Supply Co. | 9,776 | ||||||||
| 17,563 | Travelers Cos., Inc. (The) | 2,408,941 | ||||||||
| 400 | TreeHouse Foods, Inc.* | 25,820 | ||||||||
| 15,300 | Two Harbors Investment Corp. REIT | 207,009 | ||||||||
| 30,279 | Tyson Foods, Inc. Class A | 2,102,271 | ||||||||
| 36,664 | UDR, Inc. REIT | 1,666,745 | ||||||||
| 34,687 | UGI Corp. | 1,922,354 | ||||||||
| 8,000 | United Continental Holdings, Inc.* | 638,240 | ||||||||
| 1,300 | United States Cellular Corp.* | 59,683 | ||||||||
| 34,902 | UnitedHealth Group, Inc. | 8,629,869 | ||||||||
| 19,650 | Universal Health Services, Inc. Class B | 2,628,580 | ||||||||
| 23,359 | US Bancorp | 1,125,670 | ||||||||
| 31,000 | US Foods Holding Corp.* | 1,082,210 | ||||||||
| 14,043 | Varian Medical Systems, Inc.* | 1,990,174 | ||||||||
| 1,400 | VeriSign, Inc.* | 254,184 | ||||||||
| 72,012 | Verizon Communications, Inc. | 4,258,070 | ||||||||
| 5,800 | VF Corp. | 504,078 | ||||||||
| 7,600 | Walgreens Boots Alliance, Inc. | 480,852 | ||||||||
| 35,236 | Walmart, Inc. | 3,436,567 | ||||||||
| 27,385 | Waste Management, Inc. | 2,845,575 | ||||||||
| 1,685 | Waters Corp.* | 424,131 | ||||||||
| 2,800 | WEC Energy Group, Inc. | 221,424 | ||||||||
| 19,059 | Xcel Energy, Inc. | 1,071,306 | ||||||||
| 48,765 | Yum China Holdings, Inc. | 2,190,036 | ||||||||
| 21,771 | Yum! Brands, Inc. | 2,172,964 | ||||||||
| 7,767 | Zimmer Biomet Holdings, Inc. | 991,846 | ||||||||
|
| |||||||||
Total United States | 509,689,581 | |||||||||
|
| |||||||||
TOTAL COMMON STOCKS (COST $804,764,960) | 892,736,836 | |||||||||
|
| |||||||||
PREFERRED STOCKS — 0.0% |
| |||||||||
| Japan — 0.0% | ||||||||||
| 67 | Shinkin Central Bank, 2.72% Class A | 144,732 | ||||||||
|
| |||||||||
See accompanying Notes to the Financial Statements.
194
Table of Contents
Mercer Global Low Volatility Equity Fund
Schedule of Investments (Continued)
(showing percentage of net assets)
March 31, 2019
| Shares | Description | Value ($) | ||||||||
| Sweden — 0.0% | ||||||||||
| 3,600 | Akelius Residential Property AB, 5.76% | 134,098 | ||||||||
|
| |||||||||
TOTAL PREFERRED STOCKS (COST $259,373) | 278,830 | |||||||||
|
| |||||||||
RIGHTS — 0.0% |
| |||||||||
| Singapore — 0.0% | ||||||||||
| 43,212 | Keppel Infrastructure Trust, Expires 04/04/2019* **** ¤ | 766 | ||||||||
|
| |||||||||
TOTAL RIGHTS (COST $—) | 766 | |||||||||
|
| |||||||||
| Par Value ($) | Description | Value ($) | ||||||||
SHORT-TERM INVESTMENTS — 2.2% |
| |||||||||
| Mutual Fund - Securities Lending Collateral — 2.0% | ||||||||||
| 18,747,378 | State Street Institutional U.S. Government Money Market Fund, Premier Class, 2.39%## ** | 18,747,378 | ||||||||
| U.S. Government and Agency Obligations — 0.2% | ||||||||||
| 1,650,000 | United States Treasury Bill, 2.41%, due 09/12/19*** ‡‡ | 1,632,242 | ||||||||
|
| |||||||||
TOTAL SHORT-TERM INVESTMENTS (COST $20,378,992) | 20,379,620 | |||||||||
|
| |||||||||
TOTAL INVESTMENTS — 95.6% (Cost $825,403,325) | 913,396,052 | |||||||||
Other Assets and Liabilities (net) — 4.4% | 42,481,703 | |||||||||
|
| |||||||||
| NET ASSETS — 100.0% | $955,877,755 | |||||||||
|
| |||||||||
Notes to Schedule of Investments: |
| |||||||||
| ADR — American Depository Receipt | ||||||||||
| REIT — Real Estate Investment Trust | ||||||||||
| ## | The rate disclosed is the 7 day net yield as of March 31, 2019. | |||||||||
| * | Non-income producing security | |||||||||
| ** | Represents an investment of securities lending cash collateral. | |||||||||
| *** | All or a portion of this security is held for open futures collateral. | |||||||||
| **** | Securities fair valued by the Valuation Committee as approved by the Board of Trustees. The total market value of the security at year end is $766 which represents 0.0% of net assets. The aggregate tax cost of this security held at March 31, 2019 was $0. | |||||||||
| ¤ | Illiquid security. The total market value of the securities at year end is $766 which represents 0.0% of net assets. The aggregate tax cost of these securities held at March 31, 2019 was $0. | |||||||||
| ‡ | All or a portion of this security is out on loan. | |||||||||
| ‡‡ | Interest rate presented is yield to maturity. | |||||||||
See accompanying Notes to the Financial Statements.
195
Table of Contents
Mercer Global Low Volatility Equity Fund
Schedule of Investments (Continued)
March 31, 2019
Futures Contracts
Number of | Description | Expiration Date | Notional | Market Value/ | ||||||||||||||
| Buys | ||||||||||||||||||
| 13 | Canadian Dollar | Jun 2019 | $ | 975,390 | $ | (1,855 | ) | |||||||||||
| 87 | MSCI EAFE Index | Jun 2019 | 8,118,840 | 180,350 | ||||||||||||||
| 106 | S&P 500 E-mini Index | Jun 2019 | 15,040,340 | 439,301 | ||||||||||||||
| 7 | S&P/TSX 60 Index | Jun 2019 | 1,002,987 | 7,577 | ||||||||||||||
|
| |||||||||||||||||
| $ | 625,373 | |||||||||||||||||
|
| |||||||||||||||||
See accompanying Notes to the Financial Statements.
196
Table of Contents
Mercer Global Low Volatility Equity Fund
Schedule of Investments (Continued)
March 31, 2019
| Industry Sector Summary (Unaudited) | % of Net Assets | ||||
Pharmaceuticals | 7.5 | ||||
Insurance | 7.4 | ||||
Food | 6.5 | ||||
Preferred Stocks | 5.7 | ||||
Electric | 5.4 | ||||
Software | 5.0 | ||||
Telecommunications | 4.8 | ||||
REITS | 4.5 | ||||
Health Care — Services | 4.1 | ||||
Retail | 4.1 | ||||
Banks | 3.6 | ||||
Aerospace & Defense | 3.2 | ||||
Commercial Services | 2.9 | ||||
Media | 2.8 | ||||
Internet | 2.4 | ||||
Cosmetics & Personal Care | 1.9 | ||||
Diversified Financial Services | 1.9 | ||||
Environmental Control | 1.9 | ||||
Agriculture | 1.6 | ||||
Beverages | 1.6 | ||||
Engineering & Construction | 1.6 | ||||
Computers | 1.4 | ||||
Packaging & Containers | 1.3 | ||||
Household Products & Wares | 1.1 | ||||
Gas | 1.0 | ||||
Transportation | 0.9 | ||||
Mining | 0.7 | ||||
Oil & Gas | 0.7 | ||||
Water | 0.7 | ||||
Chemicals | 0.6 | ||||
Distribution & Wholesale | 0.5 | ||||
Electrical Components & Equipment | 0.5 | ||||
Real Estate | 0.5 | ||||
Electronics | 0.4 | ||||
Iron & Steel | 0.4 | ||||
Machinery — Construction & Mining | 0.4 | ||||
Airlines | 0.3 | ||||
Machinery — Diversified | 0.3 | ||||
Advertising | 0.2 | ||||
Semiconductors | 0.2 | ||||
Shipbuilding | 0.2 | ||||
Apparel | 0.1 | ||||
Auto Manufacturers | 0.1 | ||||
Energy-Alternate Sources | 0.1 | ||||
Health Care — Products | 0.1 | ||||
Holding Companies — Diversified | 0.1 | ||||
Leisure Time | 0.1 | ||||
Miscellaneous — Manufacturing | 0.1 | ||||
Biotechnology | 0.0 | ||||
Entertainment | 0.0 | ||||
Investment Companies | 0.0 | ||||
See accompanying Notes to the Financial Statements.
197
Table of Contents
Mercer Global Low Volatility Equity Fund
Schedule of Investments (Continued)
March 31, 2019
| Industry Sector Summary (Unaudited) | % of Net Assets | ||||
Lodging | 0.0 | ||||
Private Equity | 0.0 | ||||
Savings & Loans | 0.0 | ||||
Short-Term Investments and Other Assets and Liabilities (net) | 6.6 | ||||
|
| ||||
| 100.0 | % | ||||
|
| ||||
See accompanying Notes to the Financial Statements.
198
Table of Contents
Mercer Funds
Statements of Assets and Liabilities
March 31, 2019
| Mercer US Large Cap Equity Fund | Mercer US Small/Mid Cap Equity Fund | Mercer Non-US Core Equity Fund | Mercer Core Fixed Income Fund | |||||||||||||||||
Assets |
| |||||||||||||||||||
Investments, at value(a) | $ | 377,391,886 | $ | 762,470,080 | $ | 2,117,449,026 | $ | 543,158,094 | ||||||||||||
Foreign currency, at value(b) | — | 17,177 | 5,201,367 | — | ||||||||||||||||
Cash and cash equivalents | 17,497,958 | 35,684,656 | 76,139,168 | 8,559,022 | ||||||||||||||||
Receivable for investments sold | 875,850 | 3,108,804 | 11,446,259 | 253,541 | ||||||||||||||||
Dividend and interest receivable | 399,582 | 855,715 | 9,014,198 | 3,765,783 | ||||||||||||||||
Foreign tax reclaims receivable | 190,900 | 32,256 | 4,160,706 | 817 | ||||||||||||||||
Cash collateral held at broker on open centrally cleared swap contracts | — | — | — | 1,150,134 | ||||||||||||||||
Receivable for variation margin on open futures contracts | 117,842 | 79,992 | 229,289 | — | ||||||||||||||||
Cash collateral held at broker on open futures contracts | 400,000 | — | — | — | ||||||||||||||||
Unrealized appreciation on open forward foreign currency contracts | — | — | 42,087 | — | ||||||||||||||||
Prepaid expenses | 3,143 | 5,805 | 13,946 | 5,167 | ||||||||||||||||
Receivable for variation margin on open centrally cleared swap contracts | — | — | — | 122,856 | ||||||||||||||||
Securities lending income receivable | 3,271 | 9,670 | 40,050 | 2,123 | ||||||||||||||||
|
|
|
|
|
|
|
| |||||||||||||
Total assets | 396,880,432 | 802,264,155 | 2,223,736,096 | 557,017,537 | ||||||||||||||||
|
|
|
|
|
|
|
| |||||||||||||
Liabilities |
| |||||||||||||||||||
Obligation to return securities lending collateral | 6,158,462 | 2,502,353 | 56,574,708 | 6,309,277 | ||||||||||||||||
Payable for investments purchased | 958,064 | 4,474,993 | 9,613,852 | 807,584 | ||||||||||||||||
Payable for TBA and when-issued securities purchased | — | — | — | 738,279 | ||||||||||||||||
Payable for variation margin on open futures contracts | — | — | — | 129,462 | ||||||||||||||||
Payable for foreign capital gains tax | — | — | 23,278 | — | ||||||||||||||||
Payable for Fund shares repurchased | — | — | — | 10,000 | ||||||||||||||||
Written options, at value(c) | — | — | — | 6,000 | ||||||||||||||||
Payable to affiliate for: |
| |||||||||||||||||||
Advisory fees | 177,953 | 605,821 | 1,294,225 | 168,749 | ||||||||||||||||
Trustees fees | 7,342 | 14,813 | 39,881 | 10,676 | ||||||||||||||||
Accrued expenses | 163,713 | 262,933 | 605,306 | 237,034 | ||||||||||||||||
|
|
|
|
|
|
|
| |||||||||||||
Total liabilities | 7,465,534 | 7,860,913 | 68,151,250 | 8,417,061 | ||||||||||||||||
|
|
|
|
|
|
|
| |||||||||||||
Net assets | $ | 389,414,898 | $ | 794,403,242 | $ | 2,155,584,846 | $ | 548,600,476 | ||||||||||||
|
|
|
|
|
|
|
| |||||||||||||
See accompanying Notes to the Financial Statements.
199
Table of Contents
Mercer Funds
Statements of Assets and Liabilities (Continued)
March 31, 2019
| Mercer US Large Cap Equity Fund | Mercer US Small/Mid Cap Equity Fund | Mercer Non-US Core Equity Fund | Mercer Core Fixed Income Fund | |||||||||||||||||
Net assets consist of: |
| |||||||||||||||||||
Paid-in capital | $ | 348,479,336 | $ | 721,175,196 | $ | 2,044,132,937 | $ | 560,333,048 | ||||||||||||
Distributable earnings (Accumulated loss) | 40,935,562 | 73,228,046 | 111,451,909 | (11,732,572 | ) | |||||||||||||||
|
|
|
|
|
|
|
| |||||||||||||
Net assets | $ | 389,414,898 | $ | 794,403,242 | $ | 2,155,584,846 | $ | 548,600,476 | ||||||||||||
|
|
|
|
|
|
|
| |||||||||||||
Net assets attributable to: |
| |||||||||||||||||||
Class Y-3 shares | $ | 389,414,898 | $ | 794,403,242 | $ | 2,155,584,846 | $ | 548,600,476 | ||||||||||||
|
|
|
|
|
|
|
| |||||||||||||
Shares outstanding: |
| |||||||||||||||||||
Class Y-3 | 45,382,750 | 78,439,281 | 218,299,337 | 54,858,871 | ||||||||||||||||
|
|
|
|
|
|
|
| |||||||||||||
Net asset value per unit: |
| |||||||||||||||||||
Class Y-3 | $ | 8.58 | $ | 10.13 | $ | 9.87 | $ | 10.00 | ||||||||||||
|
|
|
|
|
|
|
| |||||||||||||
(a) Investments, at cost | $ | 344,266,731 | $ | 686,596,228 | $ | 1,991,854,840 | $ | 547,073,957 | ||||||||||||
|
|
|
|
|
|
|
| |||||||||||||
(b) Foreign currency, at cost | $ | — | $ | 17,221 | $ | 5,215,890 | $ | — | ||||||||||||
|
|
|
|
|
|
|
| |||||||||||||
(c) Premiums on written options | $ | — | $ | — | $ | — | $ | 5,867 | ||||||||||||
|
|
|
|
|
|
|
| |||||||||||||
See accompanying Notes to the Financial Statements.
200
Table of Contents
Mercer Funds
Statements of Assets and Liabilities (Continued)
March 31, 2019
| Mercer Opportunistic Fixed Income Fund | Mercer Emerging Markets Equity Fund | Mercer Global Low Volatility Equity Fund | |||||||||||||
Assets |
| ||||||||||||||
Investments, at value(a) | $ | 778,935,352 | $ | 949,504,640 | $ | 913,396,052 | |||||||||
Foreign currency, at value(b) | 5,772,922 | 4,891,129 | 496,677 | ||||||||||||
Cash and cash equivalents | 26,539,170 | 71,022,960 | 57,705,698 | ||||||||||||
Receivable for investments sold | 30,978,997 | 2,286,428 | 2,192,656 | ||||||||||||
Dividend and interest receivable | 9,898,640 | 2,563,319 | 2,301,578 | ||||||||||||
Unrealized appreciation on open forward foreign currency contracts | 2,754,284 | 2,601,065 | — | ||||||||||||
Cash collateral held at broker on open futures contracts | 1,411,795 | 1,677,639 | — | ||||||||||||
Receivable for TBA securities sold | 1,850,283 | — | — | ||||||||||||
Cash collateral held at broker on open forward foreign currency contracts, open options, and open OTC swaps contracts | 1,327,808 | — | — | ||||||||||||
Foreign tax reclaims receivable | 97,549 | 61,473 | 1,063,388 | ||||||||||||
Receivable for variation margin on open futures contracts | 37,457 | 420,032 | 117,757 | ||||||||||||
OTC — Swap contracts, at value(up-front net premiums paid of $544,618, $-, and $-, respectively) | 493,832 | — | — | ||||||||||||
Cash collateral held at broker on open centrally cleared swap contracts | 481,685 | — | — | ||||||||||||
Receivable for Fund shares sold | — | 136,442 | — | ||||||||||||
Receivable for swap contract premiums | 99,612 | — | — | ||||||||||||
Prepaid expenses | 4,185 | 7,081 | 6,425 | ||||||||||||
Synthetic futures, at value | — | 438,604 | — | ||||||||||||
Receivable for variation margin on open centrally cleared swap contracts | 514,999 | — | — | ||||||||||||
Securities lending income receivable | 7,900 | 12,207 | 13,312 | ||||||||||||
|
|
|
|
|
| ||||||||||
Total assets | 861,206,470 | 1,035,623,019 | 977,293,543 | ||||||||||||
|
|
|
|
|
| ||||||||||
Liabilities |
| ||||||||||||||
Payable for investments purchased | 29,736,099 | 4,674,661 | 1,744,804 | ||||||||||||
Obligation to return securities lending collateral | 7,793,870 | 6,377,010 | 18,747,378 | ||||||||||||
Payable for TBA and when-issued securities purchased | 4,711,124 | — | — | ||||||||||||
Unrealized depreciation on open forward foreign currency contracts | 3,216,602 | 920,398 | — | ||||||||||||
Cash collateral on open forward foreign currency contracts due to broker | — | 2,550,423 | — | ||||||||||||
OTC — Swap contracts, at value(up-front net premiums received of $1,086,100, $-, and $-, respectively) | 1,566,521 | — | — | ||||||||||||
Payable for foreign capital gains tax | 138,875 | 1,023,394 | — | ||||||||||||
Cash collateral on open forward foreign currency contracts, open options, and open OTC swap contracts due to broker | 400,000 | — | — | ||||||||||||
Written options, at value(c) | 119,280 | — | — | ||||||||||||
Synthetic futures, at value | — | 72,495 | — | ||||||||||||
Variation margin payable on open futures contracts | 39,634 | — | — | ||||||||||||
Payable for closed synthetic futures contracts | — | 218,050 | — | ||||||||||||
Payable to affiliate for: | |||||||||||||||
Advisory fees | 545,643 | 684,591 | 601,347 | ||||||||||||
Trustees fees | 15,176 | 18,872 | 17,741 | ||||||||||||
Accrued expenses | 343,182 | 435,954 | 304,518 | ||||||||||||
|
|
|
|
|
| ||||||||||
Total liabilities | 48,626,006 | 16,975,848 | 21,415,788 | ||||||||||||
|
|
|
|
|
| ||||||||||
Net assets | $ | 812,580,464 | $ | 1,018,647,171 | $ | 955,877,755 | |||||||||
|
|
|
|
|
| ||||||||||
See accompanying Notes to the Financial Statements.
201
Table of Contents
Mercer Funds
Statements of Assets and Liabilities (Continued)
March 31, 2019
| Mercer Opportunistic Fixed Income Fund | Mercer Emerging Markets Equity Fund | Mercer Global Low Volatility Equity Fund | |||||||||||||
Net assets consist of: |
| ||||||||||||||
Paid-in capital | $ | 852,122,810 | $ | 1,041,442,885 | $ | 788,124,091 | |||||||||
Distributable earnings (Accumulated loss) | (39,542,346 | ) | (22,795,714 | ) | 167,753,664 | ||||||||||
|
|
|
|
|
| ||||||||||
Net assets | $ | 812,580,464 | $ | 1,018,647,171 | $ | 955,877,755 | |||||||||
|
|
|
|
|
| ||||||||||
Net assets attributable to: |
| ||||||||||||||
Class Y-3 shares | $ | 812,580,464 | $ | 1,018,647,171 | $ | 955,877,755 | |||||||||
|
|
|
|
|
| ||||||||||
Shares outstanding: |
| ||||||||||||||
Class Y-3 | 89,533,785 | 112,580,369 | 72,788,611 | ||||||||||||
|
|
|
|
|
| ||||||||||
Net asset value per unit: |
| ||||||||||||||
Class Y-3 | $ | 9.08 | $ | 9.05 | $ | 13.13 | |||||||||
|
|
|
|
|
| ||||||||||
(a) Investments, at cost | $ | 781,409,589 | $ | 951,399,220 | $ | 825,403,325 | |||||||||
|
|
|
|
|
| ||||||||||
(b) Foreign currency, at cost | $ | 5,779,438 | $ | 4,896,527 | $ | 498,210 | |||||||||
|
|
|
|
|
| ||||||||||
(c) Premiums on written options | $ | 136,105 | $ | — | $ | — | |||||||||
|
|
|
|
|
| ||||||||||
See accompanying Notes to the Financial Statements.
202
Table of Contents
Mercer Funds
For the Year Ended March 31, 2019
| Mercer US Large Cap Equity Fund | Mercer US Small/Mid Cap Equity Fund | Mercer Non-US Core Equity Fund | Mercer Core Fixed Income Fund | |||||||||||||||||
Investment Income: | ||||||||||||||||||||
Dividends | $ | 7,797,564 | $ | 10,285,545 | $ | 63,089,481 | $ | — | ||||||||||||
Interest | 154,992 | 354,971 | 1,004,445 | 26,911,042 | ||||||||||||||||
Securities lending income | 61,915 | 133,289 | 526,498 | 54,505 | ||||||||||||||||
Withholding taxes | (93,479 | ) | (28,941 | ) | (5,596,785 | ) | — | |||||||||||||
Non-cash dividends | — | 1,112,838 | — | — | ||||||||||||||||
Other income | 1,625 | 184,599 | 1,205 | 17,191 | ||||||||||||||||
|
|
|
|
|
|
|
| |||||||||||||
Total investment income | 7,922,617 | 12,042,301 | 59,024,844 | 26,982,738 | ||||||||||||||||
|
|
|
|
|
|
|
| |||||||||||||
Expenses: | ||||||||||||||||||||
Advisory fees | 2,292,322 | 7,464,579 | 14,861,742 | 2,618,409 | ||||||||||||||||
Custodian and fund accounting fees | 113,296 | 195,675 | 534,911 | 179,134 | ||||||||||||||||
Audit fees | 58,509 | 62,173 | 96,466 | 83,903 | ||||||||||||||||
Transfer agent fees | 24,296 | 25,160 | 25,262 | 25,126 | ||||||||||||||||
Legal fees | 114,799 | 226,914 | 590,987 | 178,930 | ||||||||||||||||
Trustees fees | 36,060 | 69,315 | 176,128 | 60,286 | ||||||||||||||||
Registration fees | 26,406 | 26,406 | 26,106 | 26,406 | ||||||||||||||||
Miscellaneous | 43,645 | 79,871 | 193,737 | 68,000 | ||||||||||||||||
|
|
|
|
|
|
|
| |||||||||||||
Total expenses | 2,709,333 | 8,150,093 | 16,505,339 | 3,240,194 | ||||||||||||||||
|
|
|
|
|
|
|
| |||||||||||||
Net investment income | 5,213,284 | 3,892,208 | 42,519,505 | 23,742,544 | ||||||||||||||||
|
|
|
|
|
|
|
| |||||||||||||
Realized and Unrealized Gain (Loss): | ||||||||||||||||||||
Net realized gain (loss) on: | ||||||||||||||||||||
Investments | 46,761,711 | 65,479,343 | 19,953,845 | (7,616,114 | ) | |||||||||||||||
Purchased option contracts | — | — | — | (22,388 | ) | |||||||||||||||
Swap contracts | — | — | — | 460,897 | ||||||||||||||||
Closed futures contracts | 751,520 | (3,047,398 | ) | (9,800,826 | ) | 1,179,585 | ||||||||||||||
Written option contracts | — | — | — | 6,467 | ||||||||||||||||
Forward foreign currency contracts | — | — | 1,478,708 | — | ||||||||||||||||
Foreign currency related transactions | (89 | ) | (120 | ) | (1,843,013 | ) | — | |||||||||||||
|
|
|
|
|
|
|
| |||||||||||||
Net realized gain (loss) | 47,513,142 | 62,431,825 | 9,788,714 | (5,991,553 | ) | |||||||||||||||
|
|
|
|
|
|
|
| |||||||||||||
Change in net unrealized appreciation | ||||||||||||||||||||
Investments | (31,727,501 | ) | (63,400,513 | ) | (134,016,885 | ) | 10,670,492 | |||||||||||||
Purchased option contracts | — | — | — | 1,489 | ||||||||||||||||
Swap contracts | — | — | — | (1,228,628 | ) | |||||||||||||||
Open futures contracts | 752,122 | 1,338,458 | 3,401,830 | 300,806 | ||||||||||||||||
Written option contracts | — | — | — | (133 | ) | |||||||||||||||
Forward foreign currency contracts | — | — | 146,907 | — | ||||||||||||||||
Foreign currency related translations | (15 | ) | (1,746 | ) | (163,626 | ) | 814 | |||||||||||||
|
|
|
|
|
|
|
| |||||||||||||
Change in net unrealized appreciation (depreciation) | (30,975,394 | ) | (62,063,801 | ) | (130,631,774 | ) | 9,744,840 | |||||||||||||
|
|
|
|
|
|
|
| |||||||||||||
Net realized and unrealized gain (loss) | 16,537,748 | 368,024 | (120,843,060 | ) | 3,753,287 | |||||||||||||||
|
|
|
|
|
|
|
| |||||||||||||
Net increase (decrease) in net assets | $ | 21,751,032 | $ | 4,260,232 | $ | (78,323,555 | ) | $ | 27,495,831 | |||||||||||
|
|
|
|
|
|
|
| |||||||||||||
See accompanying Notes to the Financial Statements.
203
Table of Contents
Mercer Funds
Statements of Operations (Continued)
For the Year Ended March 31, 2019
| Mercer Opportunistic Fixed Income Fund | Mercer Emerging Markets Equity Fund | Mercer Global Low Volatility Equity Fund | |||||||||||||
Investment Income: | |||||||||||||||
Dividends | $ | 90,627 | $ | 29,230,357 | $ | 21,871,501 | |||||||||
Interest | 38,542,731 | 788,334 | 752,796 | ||||||||||||
Securities lending income | 53,296 | 193,266 | 150,665 | ||||||||||||
Withholding taxes | (462,254 | ) | (3,343,681 | ) | (1,211,014 | ) | |||||||||
Other income | 99,612 | 8,083 | — | ||||||||||||
|
|
|
|
|
| ||||||||||
Total investment income | 38,324,012 | 26,876,359 | 21,563,948 | ||||||||||||
|
|
|
|
|
| ||||||||||
Expenses: | |||||||||||||||
Advisory fees | 5,416,210 | 8,238,932 | 7,217,299 | ||||||||||||
Custodian and fund accounting fees | 354,683 | 662,762 | 226,798 | ||||||||||||
Audit fees | 84,957 | 159,138 | 68,369 | ||||||||||||
Transfer agent fees | 24,563 | 25,073 | 24,688 | ||||||||||||
Legal fees | 209,198 | 285,820 | 264,420 | ||||||||||||
Trustees fees | 57,403 | 86,466 | 80,603 | ||||||||||||
Registration fees | 28,255 | 27,880 | 27,805 | ||||||||||||
Interest expense | 242 | 8,544 | — | ||||||||||||
Miscellaneous | 73,834 | 114,455 | 93,993 | ||||||||||||
|
|
|
|
|
| ||||||||||
Total expenses | 6,249,345 | 9,609,070 | 8,003,975 | ||||||||||||
|
|
|
|
|
| ||||||||||
Net investment income | 32,074,667 | 17,267,289 | 13,559,973 | ||||||||||||
|
|
|
|
|
| ||||||||||
Realized and Unrealized Gain (Loss): | |||||||||||||||
Net realized gain (loss) on: | |||||||||||||||
Investments | (42,693,422 | ) | (13,982,877 | ) | 67,696,987 | ||||||||||
Purchased option contracts | (734,704 | ) | — | — | |||||||||||
Swap contracts | (1,046,207 | ) | — | — | |||||||||||
Closed futures contracts | (1,059,568 | ) | (8,694,962 | ) | (1,449,083 | ) | |||||||||
Written option contracts | 108,576 | — | — | ||||||||||||
Forward foreign currency contracts | (5,452,322 | ) | (7,071,037 | ) | — | ||||||||||
Foreign currency related transactions | (3,121,548 | ) | (594,935 | ) | (242,112 | ) | |||||||||
|
|
|
|
|
| ||||||||||
Net realized gain (loss) | (53,999,195 | ) | (30,343,811 | ) | 66,005,792 | ||||||||||
|
|
|
|
|
| ||||||||||
Change in net unrealized appreciation (depreciation) on: | |||||||||||||||
Investments | (3,669,772 | ) | (106,087,535 | ) | (17,178,664 | ) | |||||||||
Purchased option contracts | (765,777 | ) | — | — | |||||||||||
Swap contracts | (2,640,773 | ) | — | — | |||||||||||
Open futures contracts | (271,487 | ) | (150,693 | ) | 1,745,774 | ||||||||||
Written option contracts | 16,825 | — | — | ||||||||||||
Forward foreign currency contracts | (253,772 | ) | 1,772,163 | — | |||||||||||
Foreign currency related translations | (108,503 | ) | (1,059,946 | ) | (35,326 | ) | |||||||||
|
|
|
|
|
| ||||||||||
Change in net unrealized appreciation (depreciation) | (7,693,259 | ) | (105,526,011 | ) | (15,468,216 | ) | |||||||||
|
|
|
|
|
| ||||||||||
Net realized and unrealized gain (loss) | (61,692,454 | ) | (135,869,822 | ) | 50,537,576 | ||||||||||
|
|
|
|
|
| ||||||||||
Net increase (decrease) in net assets resulting from operations | $ | (29,617,787 | ) | $ | (118,602,533 | ) | $ | 64,097,549 | |||||||
|
|
|
|
|
| ||||||||||
See accompanying Notes to the Financial Statements.
204
Table of Contents
Mercer Funds
Statements of Changes in Net Assets
| Mercer US Large Cap Equity Fund | Mercer US Small/Mid Cap Equity Fund | |||||||||||||||||||
| Year Ended March 31, 2019 | Year Ended March 31, 2018 | Year Ended March 31, 2019 | Year Ended March 31, 2018 | |||||||||||||||||
Increase (decrease) in Net Assets: |
| |||||||||||||||||||
Operations: |
| |||||||||||||||||||
Net investment income (loss) | $ | 5,213,284 | $ | 7,604,697 | $ | 3,892,208 | $ | 3,035,340 | ||||||||||||
Net realized gain (loss) | 47,513,142 | 104,190,636 | 62,431,825 | 117,950,083 | ||||||||||||||||
Change in net unrealized appreciation (depreciation) | (30,975,394 | ) | (12,497,608 | ) | (62,063,801 | ) | (3,633,592 | ) | ||||||||||||
|
|
|
|
|
|
|
| |||||||||||||
Net increase in net assets resulting from operations | 21,751,032 | 99,297,725 | 4,260,232 | 117,351,831 | ||||||||||||||||
|
|
|
|
|
|
|
| |||||||||||||
Distributions to shareholders (See Note 2): |
| |||||||||||||||||||
Class Y-3 | (97,267,079 | ) | (72,475,376 | ) | (134,114,544 | ) | (94,877,327 | ) | ||||||||||||
|
|
|
|
|
|
|
| |||||||||||||
Total distributions | (97,267,079 | ) | (72,475,376 | )(a) | (134,114,544 | ) | (94,877,327 | )(b) | ||||||||||||
|
|
|
|
|
|
|
| |||||||||||||
Net share transactions (See Note 7): |
| |||||||||||||||||||
Class Y-3 | (47,626,675 | ) | (115,323,720 | ) | 16,313,503 | (86,986,239 | ) | |||||||||||||
|
|
|
|
|
|
|
| |||||||||||||
Increase (decrease) in net assets resulting from net shares transactions | (47,626,675 | ) | (115,323,720 | ) | 16,313,503 | (86,986,239 | ) | |||||||||||||
|
|
|
|
|
|
|
| |||||||||||||
Net decrease in net assets | (123,142,722 | ) | (88,501,371 | ) | (113,540,809 | ) | (64,511,735 | ) | ||||||||||||
|
|
|
|
|
|
|
| |||||||||||||
Net assets: |
| |||||||||||||||||||
Beginning of year | 512,557,620 | 601,058,991 | 907,944,051 | 972,455,786 | ||||||||||||||||
|
|
|
|
|
|
|
| |||||||||||||
End of year | $ | 389,414,898 | $ | 512,557,620 | $ | 794,403,242 | $ | 907,944,051 | ||||||||||||
|
|
|
|
|
|
|
| |||||||||||||
| (a) | Included in total distributions was $(7,533,062) from net investment income and $(64,942,314) from net realized gains as of year ended March 31, 2018. The undistributed net investment income was $1,244,427 at year ended March 31, 2018. See Note 2 for more details on Disclosure Update and Simplification. |
| (b) | Included in total distributions was $(4,249,847) from net investment income and $(90,627,480) from net realized gains as of year ended March 31, 2018. The distributions in excess of net investment income was $(623) at year ended March 31, 2018. See Note 2 for more details on Disclosure Update and Simplification. |
See accompanying Notes to the Financial Statements.
205
Table of Contents
Mercer Funds
Statements of Changes in Net Assets (Continued)
| MercerNon-US Core Equity Fund | Mercer Core Fixed Income Fund | |||||||||||||||||||
| Year Ended March 31, 2019 | Year Ended March 31, 2018 | Year Ended March 31, 2019 | Year Ended March 31, 2018 | |||||||||||||||||
Increase (decrease) in Net Assets: |
| |||||||||||||||||||
Operations: |
| |||||||||||||||||||
Net investment income (loss) | $ | 42,519,505 | $ | 38,658,876 | $ | 23,742,544 | $ | 22,379,987 | ||||||||||||
Net realized gain (loss) | 9,788,714 | 298,158,773 | (5,991,553 | ) | (570,639 | ) | ||||||||||||||
Change in net unrealized appreciation (depreciation) | (130,631,774 | ) | 77,034,628 | 9,744,840 | (8,324,350 | ) | ||||||||||||||
|
|
|
|
|
|
|
| |||||||||||||
Net increase (decrease) in net assets resulting from operations | (78,323,555 | ) | 413,852,277 | 27,495,831 | 13,484,998 | |||||||||||||||
|
|
|
|
|
|
|
| |||||||||||||
Distributions to shareholders (See Note 2): |
| |||||||||||||||||||
Class Y-3 | (218,880,784 | ) | (170,790,191 | ) | (24,784,732 | ) | (19,914,504 | ) | ||||||||||||
|
|
|
|
|
|
|
| |||||||||||||
Total distributions | (218,880,784 | ) | (170,790,191 | )(a) | (24,784,732 | ) | (19,914,504 | )(b) | ||||||||||||
|
|
|
|
|
|
|
| |||||||||||||
Net share transactions (See Note 7): |
| |||||||||||||||||||
Class Y-3 | 293,490,399 | (354,867,675 | ) | (312,057,324 | ) | 98,773,232 | ||||||||||||||
|
|
|
|
|
|
|
| |||||||||||||
Increase (decrease) in net assets resulting from net shares transactions | 293,490,399 | (354,867,675 | ) | (312,057,324 | ) | 98,773,232 | ||||||||||||||
|
|
|
|
|
|
|
| |||||||||||||
Net increase (decrease) in net assets | (3,713,940 | ) | (111,805,589 | ) | (309,346,225 | ) | 92,343,726 | |||||||||||||
|
|
|
|
|
|
|
| |||||||||||||
Net assets: |
| |||||||||||||||||||
Beginning of year | 2,159,298,786 | 2,271,104,375 | 857,946,701 | 765,602,975 | ||||||||||||||||
|
|
|
|
|
|
|
| |||||||||||||
End of year | $ | 2,155,584,846 | $ | 2,159,298,786 | $ | 548,600,476 | $ | 857,946,701 | ||||||||||||
|
|
|
|
|
|
|
| |||||||||||||
| (a) | Included in total distributions was $(45,496,553) from net investment income and $(125,293,638) from net realized gains as of year ended March 31, 2018. The distributions in excess of net investment income was $(502,673) at year ended March 31, 2018. See Note 2 for more details on Disclosure Update and Simplification. |
| (b) | Included in total distributions was $(19,914,504) from net investment income and $0 from net realized gains as of year ended March 31, 2018. The undistributed net investment income was $6,112,251 at year ended March 31, 2018. See Note 2 for more details on Disclosure Update and Simplification. |
See accompanying Notes to the Financial Statements.
206
Table of Contents
Mercer Funds
Statements of Changes in Net Assets (Continued)
| Mercer Opportunistic Fixed Income Fund | Mercer Emerging Markets Equity Fund | |||||||||||||||||||
| Year Ended March 31, 2019 | Year Ended March 31, 2018 | Year Ended March 31, 2019 | Year Ended March 31, 2018 | |||||||||||||||||
Increase (decrease) in Net Assets: |
| |||||||||||||||||||
Operations: |
| |||||||||||||||||||
Net investment income (loss) | $ | 32,074,667 | $ | 33,165,244 | $ | 17,267,289 | $ | 23,614,533 | ||||||||||||
Net realized gain (loss) | (53,999,195 | ) | 7,176,468 | (30,343,811 | ) | 341,364,374 | ||||||||||||||
Change in net unrealized appreciation (depreciation) | (7,693,259 | ) | 13,909,550 | (105,526,011 | ) | (47,488,518 | ) | |||||||||||||
|
|
|
|
|
|
|
| |||||||||||||
Net increase (decrease) in net assets resulting from operations | (29,617,787 | ) | 54,251,262 | (118,602,533 | ) | 317,490,389 | ||||||||||||||
|
|
|
|
|
|
|
| |||||||||||||
Distributions to shareholders (See Note 2): |
| |||||||||||||||||||
Class Y-3 | (15,919,968 | ) | (23,966,710 | ) | (142,768,325 | ) | (36,403,991 | ) | ||||||||||||
|
|
|
|
|
|
|
| |||||||||||||
Total distributions | (15,919,968 | ) | (23,966,710 | )(a) | (142,768,325 | ) | (36,403,991 | )(b) | ||||||||||||
|
|
|
|
|
|
|
| |||||||||||||
Net share transactions (See Note 7): |
| |||||||||||||||||||
Class Y-3 | 210,895,795 | 58,079,251 | 163,890,739 | (646,948,904 | ) | |||||||||||||||
|
|
|
|
|
|
|
| |||||||||||||
Increase (decrease) in net assets resulting from net shares transactions | 210,895,795 | 58,079,251 | 163,890,739 | (646,948,904 | ) | |||||||||||||||
|
|
|
|
|
|
|
| |||||||||||||
Net increase (decrease) in net assets | 165,358,040 | 88,363,803 | (97,480,119 | ) | (365,862,506 | ) | ||||||||||||||
|
|
|
|
|
|
|
| |||||||||||||
Net assets: |
| |||||||||||||||||||
Beginning of year | 647,222,424 | 558,858,621 | 1,116,127,290 | 1,481,989,796 | ||||||||||||||||
|
|
|
|
|
|
|
| |||||||||||||
End of year | $ | 812,580,464 | $ | 647,222,424 | $ | 1,018,647,171 | $ | 1,116,127,290 | ||||||||||||
|
|
|
|
|
|
|
| |||||||||||||
| (a) | Included in total distributions was $(23,966,710) from net investment income and $0 from net realized gains as of year ended March 31, 2018. The undistributed net investment income was $16,141,517 at year ended March 31, 2018. See Note 2 for more details on Disclosure Update and Simplification. |
| (b) | Included in total distributions was $(36,403,991) from net investment income and $0 from net realized gains as of year ended March 31, 2018. The distributions in excess of net investment income was $(1,949,655) at year ended March 31, 2018. See Note 2 for more details on Disclosure Update and Simplification. |
See accompanying Notes to the Financial Statements.
207
Table of Contents
Mercer Funds
Statements of Changes in Net Assets (Continued)
| Mercer Global Low Volatility Equity Fund | ||||||||||
| Year Ended March 31, 2019 | Year Ended March 31, 2018 | |||||||||
Increase (decrease) in Net Assets: |
| |||||||||
Operations: |
| |||||||||
Net investment income (loss) | $ | 13,559,973 | $ | 15,564,976 | ||||||
Net realized gain (loss) | 66,005,792 | 151,397,171 | ||||||||
Change in net unrealized appreciation (depreciation) | (15,468,216 | ) | (17,711,022 | ) | ||||||
|
|
|
| |||||||
Net increase in net assets resulting from operations | 64,097,549 | 149,251,125 | ||||||||
|
|
|
| |||||||
Distributions to shareholders (See Note 2): |
| |||||||||
Class Y-3 | — | (146,523,040 | ) | |||||||
|
|
|
| |||||||
Total distributions | — | (146,523,040 | )(a) | |||||||
|
|
|
| |||||||
Net share transactions (See Note 7): |
| |||||||||
Class Y-3 | (28,829,907 | ) | (331,977,749 | ) | ||||||
|
|
|
| |||||||
Decrease in net assets resulting from net shares transactions | (28,829,907 | ) | (331,977,749 | ) | ||||||
|
|
|
| |||||||
Net increase (decrease) in net assets | 35,267,642 | (329,249,664 | ) | |||||||
|
|
|
| |||||||
Net assets: |
| |||||||||
Beginning of year | 920,610,113 | 1,249,859,777 | ||||||||
|
|
|
| |||||||
End of year | $ | 955,877,755 | $ | 920,610,113 | ||||||
|
|
|
| |||||||
| (a) | Included in total distributions was $(18,085,932) from net investment income and $(128,437,108) from net realized gains as of year ended March 31, 2018. The distributions in excess of net investment income was $(661,448) at year ended March 31, 2018. See Note 2 for more details on Disclosure Update and Simplification. |
See accompanying Notes to the Financial Statements.
208
Table of Contents
Mercer US Large Cap Equity Fund
| Year Ended 3/31/2019 | Year Ended 3/31/2018 | Year Ended 3/31/2017 | Year Ended 3/31/2016 | Year Ended 3/31/2015 | |||||||||||||||||||||
For aClass Y-3 Share Outstanding Throughout Each Period: | |||||||||||||||||||||||||
Net asset value at beginning of year | $ | 10.85 | $ | 10.61 | $ | 9.34 | $ | 11.11 | $ | 13.16 | |||||||||||||||
|
|
|
|
|
|
|
|
|
| ||||||||||||||||
Net investment income† | 0.12 | 0.14 | 0.11 | (a) | 0.04 | 0.05 | |||||||||||||||||||
Net realized and unrealized gain (loss) on investments | 0.18 | 1.68 | 1.54 | (0.43 | ) | 1.63 | |||||||||||||||||||
|
|
|
|
|
|
|
|
|
| ||||||||||||||||
Total from investment operations | 0.30 | 1.82 | 1.65 | (0.39 | ) | 1.68 | |||||||||||||||||||
|
|
|
|
|
|
|
|
|
| ||||||||||||||||
Less dividends and distributions: |
| ||||||||||||||||||||||||
From net investment income | (0.14 | ) | (0.16 | ) | (0.08 | ) | (0.05 | ) | (0.04 | ) | |||||||||||||||
From net realized gain on investments | (2.43 | ) | (1.42 | ) | (0.30 | ) | (1.33 | ) | (3.69 | ) | |||||||||||||||
|
|
|
|
|
|
|
|
|
| ||||||||||||||||
Total dividends and distributions | (2.57 | ) | (1.58 | ) | (0.38 | ) | (1.38 | ) | (3.73 | ) | |||||||||||||||
|
|
|
|
|
|
|
|
|
| ||||||||||||||||
Net asset value at end of year | $ | 8.58 | $ | 10.85 | $ | 10.61 | $ | 9.34 | $ | 11.11 | |||||||||||||||
|
|
|
|
|
|
|
|
|
| ||||||||||||||||
Total investment return | 4.81 | % | 17.26 | % | 17.74 | % | (4.09 | )% | 13.63 | %(b) | |||||||||||||||
Ratios/Supplemental Data: | |||||||||||||||||||||||||
Net investment income to average net assets | 1.21 | % | 1.28 | % | 1.14 | %(a) | 0.33 | % | 0.37 | % | |||||||||||||||
Net expenses to average daily net assets | 0.63 | % | 0.60 | % | 0.61 | %(d) | 0.63 | %(c) | 0.60 | %(c) | |||||||||||||||
Total expenses (before reductions and reimbursements) to average daily net assets | 0.63 | % | 0.60 | % | 0.61 | % | 0.63 | %(c) | 0.63 | %(c) | |||||||||||||||
Portfolio turnover rate | 74 | % | 64 | % | 84 | % | 66 | % | 118 | % | |||||||||||||||
Net assets at end of year (in 000’s) | $ | 389,415 | $ | 512,558 | $ | 601,059 | $ | 301,260 | $ | 362,698 | |||||||||||||||
| (a) | Includes anon-recurring refund for overbilling of prior years’ custody fees, a portion of which was paid to the Advisor for prior years’ reimbursement of expenses. This amounted to less than $0.01 per share and less than 0.01% of average net assets. |
| (b) | The total return would have been lower had certain expenses not been reduced or reimbursed during the periods shown. |
| (c) | Includes interest expense that amounts to less than 0.01%. |
| (d) | Includes a repayment to the Advisor, referenced above, for prior years’ reimbursement of expenses. The amount is less than 0.01% of average net assets. |
| † | Computed using average shares outstanding throughout the year. |
See accompanying Notes to the Financial Statements.
209
Table of Contents
Mercer US Small/Mid Cap Equity Fund
Financial Highlights (Continued)
| Year Ended 3/31/2019 | Year Ended 3/31/2018 | Year Ended 3/31/2017 | Year Ended 3/31/2016 | Year Ended 3/31/2015 | |||||||||||||||||||||
For aClass Y-3 Share Outstanding Throughout Each Period: | |||||||||||||||||||||||||
Net asset value at beginning of year | $ | 12.29 | $ | 12.12 | $ | 10.30 | $ | 12.23 | $ | 12.44 | |||||||||||||||
|
|
|
|
|
|
|
|
|
| ||||||||||||||||
Net investment income (loss)† | 0.05 | 0.04 | 0.04 | (a) | (0.02 | ) | (0.03 | ) | |||||||||||||||||
Net realized and unrealized gain (loss) on investments | (0.23 | ) | 1.46 | 2.13 | (1.28 | ) | 1.32 | ||||||||||||||||||
|
|
|
|
|
|
|
|
|
| ||||||||||||||||
Total from investment operations | (0.18 | ) | 1.50 | 2.17 | (1.30 | ) | 1.29 | ||||||||||||||||||
|
|
|
|
|
|
|
|
|
| ||||||||||||||||
Less dividends and distributions: | |||||||||||||||||||||||||
From net investment income | (0.05 | ) | (0.06 | ) | (0.08 | ) | — | — | |||||||||||||||||
From net realized gain on investments | (1.93 | ) | (1.27 | ) | (0.27 | ) | (0.63 | ) | (1.50 | ) | |||||||||||||||
|
|
|
|
|
|
|
|
|
| ||||||||||||||||
Total dividends and distributions | (1.98 | ) | (1.33 | ) | (0.35 | ) | (0.63 | ) | (1.50 | ) | |||||||||||||||
|
|
|
|
|
|
|
|
|
| ||||||||||||||||
Net asset value at end of year | $ | 10.13 | $ | 12.29 | $ | 12.12 | $ | 10.30 | $ | 12.23 | |||||||||||||||
|
|
|
|
|
|
|
|
|
| ||||||||||||||||
Total investment return | 0.19 | % | 12.64 | % | 21.24 | % | (10.78 | )% | 11.11 | %(b) | |||||||||||||||
Ratios/Supplemental Data: | |||||||||||||||||||||||||
Net investment income (loss) to average net assets | 0.47 | % | 0.31 | % | 0.40 | %(a) | (0.18 | )% | (0.25 | )% | |||||||||||||||
Net expenses to average daily net assets | 0.98 | % | 0.95 | % | 0.97 | %(d) | 0.98 | %(c) | 0.98 | %(c) | |||||||||||||||
Total expenses (before reductions and reimbursements) to average daily net assets | 0.98 | % | 0.95 | % | 0.97 | % | 0.98 | %(c) | 0.99 | %(c) | |||||||||||||||
Portfolio turnover rate | 47 | % | 49 | % | 106 | % | 68 | % | 75 | % | |||||||||||||||
Net assets at end of year (in 000’s) | $ | 794,403 | $ | 907,944 | $ | 972,456 | $ | 427,426 | $ | 470,893 | |||||||||||||||
| (a) | Includes anon-recurring refund for overbilling of prior years’ custody fees, a portion of which was paid to the Advisor for prior years’ reimbursement of expenses. This amounted to less than $0.01 per share and less than 0.01% of average net assets. |
| (b) | The total return would have been lower had certain expenses not been reduced or reimbursed during the periods shown. |
| (c) | Includes interest expense that amounts to less than 0.01%. |
| (d) | Includes a repayment to the Advisor, referenced above, for prior years’ reimbursement of expenses. The amount is less than 0.01% of average net assets. |
| † | Computed using average shares outstanding throughout the year. |
See accompanying Notes to the Financial Statements.
210
Table of Contents
MercerNon-US Core Equity Fund
Financial Highlights (Continued)
| Year Ended 3/31/2019 | Year Ended 3/31/2018 | Year Ended 3/31/2017 | Year Ended 3/31/2016 | Year Ended 3/31/2015 | |||||||||||||||||||||
For aClass Y-3 Share Outstanding Throughout Each Period: | |||||||||||||||||||||||||
Net asset value at beginning of year | $ | 11.51 | $ | 10.44 | $ | 9.61 | $ | 10.64 | $ | 11.92 | |||||||||||||||
|
|
|
|
|
|
|
|
|
| ||||||||||||||||
Net investment income† | 0.22 | 0.19 | 0.18 | (a) | 0.16 | 0.19 | |||||||||||||||||||
Net realized and unrealized gain (loss) on investments | (0.76 | ) | 1.75 | 0.83 | (0.76 | ) | (0.22 | ) | |||||||||||||||||
|
|
|
|
|
|
|
|
|
| ||||||||||||||||
Total from investment operations | (0.54 | ) | 1.94 | 1.01 | (0.60 | ) | (0.03 | ) | |||||||||||||||||
|
|
|
|
|
|
|
|
|
| ||||||||||||||||
Less dividends and distributions: |
| ||||||||||||||||||||||||
From net investment income | (0.20 | ) | (0.23 | ) | (0.18 | ) | (0.17 | ) | (0.27 | ) | |||||||||||||||
From net realized gain on investments | (0.90 | ) | (0.64 | ) | — | (0.26 | ) | (0.98 | ) | ||||||||||||||||
|
|
|
|
|
|
|
|
|
| ||||||||||||||||
Total dividends and distributions | (1.10 | ) | (0.87 | ) | (0.18 | ) | (0.43 | ) | (1.25 | ) | |||||||||||||||
|
|
|
|
|
|
|
|
|
| ||||||||||||||||
Net asset value at end of year | $ | 9.87 | $ | 11.51 | $ | 10.44 | $ | 9.61 | $ | 10.64 | |||||||||||||||
|
|
|
|
|
|
|
|
|
| ||||||||||||||||
Total investment return | (4.00 | )% | 18.80 | % | 10.62 | % | (5.64 | )% | 0.19 | %(b) | |||||||||||||||
Ratios/Supplemental Data: |
| ||||||||||||||||||||||||
Net investment income to average net assets | 2.03 | % | 1.64 | % | 1.81 | %(a) | 1.60 | % | 1.72 | % | |||||||||||||||
Net expenses to average daily net assets | 0.79 | % | 0.79 | %(c) | 0.82 | %(c)(d) | 0.83 | %(c) | 0.84 | %(c) | |||||||||||||||
Total expenses (before reductions and reimbursements) to average daily net assets | 0.79 | % | 0.79 | %(c) | 0.81 | %(c) | 0.83 | %(c) | 0.84 | %(c) | |||||||||||||||
Portfolio turnover rate | 81 | % | 81 | % | 81 | % | 109 | % | 101 | % | |||||||||||||||
Net assets at end of year (in 000’s) | $ | 2,155,585 | $ | 2,159,299 | $ | 2,271,104 | $ | 1,941,634 | $ | 2,072,981 | |||||||||||||||
| (a) | Includes anon-recurring refund for overbilling of prior years’ custody fees, a portion of which was paid to the Advisor for prior years’ reimbursement of expenses. This amounted to less than $0.01 per share and is 0.01% of average net assets. |
| (b) | The total return would have been lower had certain expenses not been reduced or reimbursed during the periods shown. |
| (c) | Includes interest expense that amounts to less than 0.01%. |
| (d) | Includes a repayment to the Advisor, referenced above, for prior years’ reimbursement of expenses. The amount is 0.01% of average net assets. |
| † | Computed using average shares outstanding throughout the year. |
See accompanying Notes to the Financial Statements.
211
Table of Contents
Mercer Core Fixed Income Fund
Financial Highlights (Continued)
| Year Ended 3/31/2019 | Year Ended 3/31/2018 | Year Ended 3/31/2017 | Year Ended 3/31/2016 | Year Ended 3/31/2015 | |||||||||||||||||||||
For aClass Y-3 Share Outstanding Throughout Each Period: | |||||||||||||||||||||||||
Net asset value at beginning of year | $ | 9.90 | $ | 9.96 | $ | 10.15 | $ | 10.43 | $ | 10.42 | |||||||||||||||
|
|
|
|
|
|
|
|
|
| ||||||||||||||||
Net investment income† | 0.31 | 0.27 | 0.25 | (a) | 0.29 | 0.28 | |||||||||||||||||||
Net realized and unrealized gain (loss) on investments | 0.11 | (0.09 | ) | (0.09 | ) | (0.17 | ) | 0.28 | |||||||||||||||||
|
|
|
|
|
|
|
|
|
| ||||||||||||||||
Total from investment operations | 0.42 | 0.18 | 0.16 | 0.12 | 0.56 | ||||||||||||||||||||
|
|
|
|
|
|
|
|
|
| ||||||||||||||||
Less dividends and distributions: |
| ||||||||||||||||||||||||
From net investment income | (0.32 | ) | (0.24 | ) | (0.25 | ) | (0.30 | ) | (0.33 | ) | |||||||||||||||
From net realized gain on investments | — | — | (0.10 | ) | (0.10 | ) | (0.22 | ) | |||||||||||||||||
|
|
|
|
|
|
|
|
|
| ||||||||||||||||
Total dividends and distributions | (0.32 | ) | (0.24 | ) | (0.35 | ) | (0.40 | ) | (0.55 | ) | |||||||||||||||
|
|
|
|
|
|
|
|
|
| ||||||||||||||||
Net asset value at end of year | $ | 10.00 | $ | 9.90 | $ | 9.96 | $ | 10.15 | $ | 10.43 | |||||||||||||||
|
|
|
|
|
|
|
|
|
| ||||||||||||||||
Total investment return | 4.37 | % | 1.80 | % | 1.58 | % | 1.26 | % | 5.43 | %(b) | |||||||||||||||
Ratios/Supplemental Data: |
| ||||||||||||||||||||||||
Net investment income to average net assets | 3.17 | % | 2.71 | % | 2.43 | %(a) | 2.80 | % | 2.66 | % | |||||||||||||||
Net expenses to average daily net assets | 0.43 | % | 0.43 | % | 0.43 | %(c)(d) | 0.42 | % | 0.40 | % | |||||||||||||||
Total expenses (before reductions and reimbursements) to average daily net assets | 0.43 | % | 0.43 | % | 0.43 | %(c) | 0.42 | % | 0.42 | % | |||||||||||||||
Portfolio turnover rate | 80 | %(e) | 113 | %(e) | 151 | % | 88 | % | 192 | % | |||||||||||||||
Net assets at end of year (in 000’s) | $ | 548,600 | $ | 857,947 | $ | 765,603 | $ | 783,875 | $ | 892,649 | |||||||||||||||
| (a) | Includes anon-recurring refund for overbilling of prior years’ custody fees, a portion of which was paid to the Advisor for prior years’ reimbursement of expenses. This amounted to less than $0.01 per share and less than 0.01% of average net assets. |
| (b) | The total return would have been lower had certain expenses not been reduced or reimbursed during the periods shown. |
| (c) | Includes interest expense that amounts to less than 0.01%. |
| (d) | Includes a repayment to the Advisor, referenced above, for prior years’ reimbursement of expenses. The amount is less than 0.01% of average net assets. |
| (e) | Includes TBA transactions; excluding these transactions the portfolio turnover rate would have been 74% and 81% for the years ended March 31, 2019 and March 31, 2018, respectively. |
| † | Computed using average shares outstanding throughout the year. |
See accompanying Notes to the Financial Statements.
212
Table of Contents
Mercer Opportunistic Fixed Income Fund
Financial Highlights (Continued)
| Year Ended 3/31/2019 | Year Ended 3/31/2018 | Year Ended 3/31/2017 | Year Ended 3/31/2016 | Year Ended 3/31/2015 | |||||||||||||||||||||
For aClass Y-3 Share Outstanding Throughout Each Period: | |||||||||||||||||||||||||
Net asset value at beginning of year | $ | 9.80 | $ | 9.31 | $ | 8.44 | $ | 9.13 | $ | 10.43 | |||||||||||||||
|
|
|
|
|
|
|
|
|
| ||||||||||||||||
Net investment income† | 0.43 | 0.53 | 0.51 | (a) | 0.54 | 0.56 | |||||||||||||||||||
Net realized and unrealized gain (loss) on investments | (0.94 | ) | 0.33 | 0.36 | (1.12 | ) | (1.32 | ) | |||||||||||||||||
|
|
|
|
|
|
|
|
|
| ||||||||||||||||
Total from investment operations | (0.51 | ) | 0.86 | 0.87 | (0.58 | ) | (0.76 | ) | |||||||||||||||||
|
|
|
|
|
|
|
|
|
| ||||||||||||||||
Less dividends and distributions: |
| ||||||||||||||||||||||||
From net investment income | (0.21 | ) | (0.37 | ) | — | (0.07 | ) | (0.47 | ) | ||||||||||||||||
From net realized gain on investments | — | — | — | (0.04 | ) | (0.07 | ) | ||||||||||||||||||
|
|
|
|
|
|
|
|
|
| ||||||||||||||||
Total dividends and distributions | (0.21 | ) | (0.37 | ) | — | (0.11 | ) | (0.54 | ) | ||||||||||||||||
|
|
|
|
|
|
|
|
|
| ||||||||||||||||
Net asset value at end of year | $ | 9.08 | $ | 9.80 | $ | 9.31 | $ | 8.44 | $ | 9.13 | |||||||||||||||
|
|
|
|
|
|
|
|
|
| ||||||||||||||||
Total investment return | (5.15 | )% | 9.42 | % | 10.31 | %(b) | (6.25 | )%(b) | (7.36 | )%(b) | |||||||||||||||
Ratios/Supplemental Data: |
| ||||||||||||||||||||||||
Net investment income to average net assets | 4.74 | % | 5.49 | % | 5.75 | %(a) | 6.28 | % | 5.55 | % | |||||||||||||||
Net expenses to average daily net assets | 0.92 | %(c) | 0.92 | %(c) | 0.94 | %(c)(d) | 0.90 | %(c) | 0.90 | %(c) | |||||||||||||||
Total expenses (before reductions and reimbursements) to average daily net assets | 0.92 | %(c) | 0.92 | %(c) | 0.94 | %(c) | 0.95 | %(c) | 0.97 | %(c) | |||||||||||||||
Portfolio turnover rate | 243 | %(e) | 72 | % | 55 | % | 53 | % | 58 | % | |||||||||||||||
Net assets at end of year (in 000’s) | $ | 812,580 | $ | 647,222 | $ | 558,859 | $ | 414,262 | $ | 395,939 | |||||||||||||||
| (a) | Includes anon-recurring refund for overbilling of prior years’ custody fees, a portion of which was paid to the Advisor for prior years’ reimbursement of expenses. This amounted to less than $0.01 per share and less than 0.01% of average net assets. |
| (b) | The total return would have been lower had certain expenses not been reduced or reimbursed during the periods shown. |
| (c) | Includes interest expense that amounts to less than 0.01%. |
| (d) | Includes a repayment to the Advisor, referenced above, for prior years’ reimbursement of expenses. The amount is less than 0.01% of average net assets. |
| (e) | Includes TBA transactions; excluding these transactions the portfolio turnover rate would have been 218% for the year ended March 31, 2019. |
| † | Computed using average shares outstanding throughout the year. |
See accompanying Notes to the Financial Statements.
213
Table of Contents
Mercer Emerging Markets Equity Fund
Financial Highlights (Continued)
| Year Ended 3/31/2019 | Year Ended 3/31/2018 | Year Ended 3/31/2017 | Year Ended 3/31/2016 | Year Ended 3/31/2015 | |||||||||||||||||||||
For aClass Y-3 Share Outstanding Throughout Each Period: | |||||||||||||||||||||||||
Net asset value at beginning of year | $ | 11.75 | $ | 9.77 | $ | 8.59 | $ | 9.88 | $ | 9.99 | |||||||||||||||
|
|
|
|
|
|
|
|
|
| ||||||||||||||||
Net investment income† | 0.17 | 0.18 | 0.14 | (a) | 0.16 | 0.17 | |||||||||||||||||||
Net realized and unrealized gain (loss) on investments | (1.48 | ) | 2.05 | 1.22 | (1.36 | ) | (0.09 | ) | |||||||||||||||||
|
|
|
|
|
|
|
|
|
| ||||||||||||||||
Total from investment operations | (1.31 | ) | 2.23 | 1.36 | (1.20 | ) | 0.08 | ||||||||||||||||||
|
|
|
|
|
|
|
|
|
| ||||||||||||||||
Less dividends and distributions: |
| ||||||||||||||||||||||||
From net investment income | (0.01 | ) | (0.25 | ) | (0.18 | ) | (0.09 | ) | (0.19 | ) | |||||||||||||||
From net realized gain on investments | (1.38 | ) | — | — | — | — | |||||||||||||||||||
|
|
|
|
|
|
|
|
|
| ||||||||||||||||
Total dividends and distributions | (1.39 | ) | (0.25 | ) | (0.18 | ) | (0.09 | ) | (0.19 | ) | |||||||||||||||
|
|
|
|
|
|
|
|
|
| ||||||||||||||||
Net asset value at end of year | $ | 9.05 | $ | 11.75 | $ | 9.77 | $ | 8.59 | $ | 9.88 | |||||||||||||||
|
|
|
|
|
|
|
|
|
| ||||||||||||||||
Total investment return | (10.20 | )% | 22.92 | % | 16.14 | % | (12.06 | )% | 0.81 | %(b) | |||||||||||||||
Ratios/Supplemental Data: |
| ||||||||||||||||||||||||
Net investment income to average net assets | 1.66 | % | 1.62 | % | 1.52 | %(a) | 1.79 | % | 1.66 | % | |||||||||||||||
Net expenses to average daily net assets | 0.92 | %(c) | 0.95 | %(c) | 1.00 | %(c)(d) | 1.00 | %(c) | 0.98 | %(c) | |||||||||||||||
Total expenses (before reductions and reimbursements) to average daily net assets | 0.92 | %(c) | 0.95 | %(c) | 0.99 | %(c) | 1.00 | %(c) | 1.00 | %(c) | |||||||||||||||
Portfolio turnover rate | 57 | % | 93 | % | 89 | % | 66 | % | 46 | % | |||||||||||||||
Net assets at end of year (in 000’s) | $ | 1,018,647 | $ | 1,116,127 | $ | 1,481,990 | $ | 1,150,136 | $ | 1,087,355 | |||||||||||||||
| (a) | Includes anon-recurring refund for overbilling of prior years’ custody fees, a portion of which was paid to the Advisor for prior years’ reimbursement of expenses. This amounted to less than $0.01 per share and less than 0.01% of average net assets. |
| (b) | The total return would have been lower had certain expenses not been reduced or reimbursed during the periods shown. |
| (c) | Includes interest expense that amounts to less than 0.01%. |
| (d) | Includes a repayment to the Advisor, referenced above, for prior years’ reimbursement of expenses. The amount is 0.01% of average net assets. |
| † | Computed using average shares outstanding throughout the year. |
See accompanying Notes to the Financial Statements.
214
Table of Contents
Mercer Global Low Volatility Equity Fund
Financial Highlights (Continued)
| Year Ended 3/31/2019 | Year Ended 3/31/2018 | Year Ended 3/31/2017 | Year Ended 3/31/2016 | Year Ended 3/31/2015 | |||||||||||||||||||||
For aClass Y-3 Share Outstanding Throughout Each Period: | |||||||||||||||||||||||||
Net asset value at beginning of year | $ | 12.28 | $ | 12.62 | $ | 11.81 | $ | 12.11 | $ | 12.27 | |||||||||||||||
|
|
|
|
|
|
|
|
|
| ||||||||||||||||
Net investment income† | 0.18 | 0.18 | 0.16 | (a) | 0.15 | 0.15 | |||||||||||||||||||
Net realized and unrealized gain on investments | 0.67 | 1.39 | 1.11 | 0.33 | 0.54 | ||||||||||||||||||||
|
|
|
|
|
|
|
|
|
| ||||||||||||||||
Total from investment operations | 0.85 | 1.57 | 1.27 | 0.48 | 0.69 | ||||||||||||||||||||
|
|
|
|
|
|
|
|
|
| ||||||||||||||||
Less dividends and distributions: |
| ||||||||||||||||||||||||
From net investment income | — | (0.18 | ) | (0.14 | ) | (0.14 | ) | (0.19 | ) | ||||||||||||||||
From net realized gain on investments | — | (1.73 | ) | (0.32 | ) | (0.64 | ) | (0.66 | ) | ||||||||||||||||
|
|
|
|
|
|
|
|
|
| ||||||||||||||||
Total dividends and distributions | — | (1.91 | ) | (0.46 | ) | (0.78 | ) | (0.85 | ) | ||||||||||||||||
|
|
|
|
|
|
|
|
|
| ||||||||||||||||
Net asset value at end of year | $ | 13.13 | $ | 12.28 | $ | 12.62 | $ | 11.81 | $ | 12.11 | |||||||||||||||
|
|
|
|
|
|
|
|
|
| ||||||||||||||||
Total investment return | 6.92 | % | 12.47 | % | 11.02 | % | 4.13 | % | 5.80 | %(b) | |||||||||||||||
Ratios/Supplemental Data: |
| ||||||||||||||||||||||||
Net investment income to average net assets | 1.40 | % | 1.35 | % | 1.34 | %(a) | 1.23 | % | 1.25 | % | |||||||||||||||
Net expenses to average daily net assets | 0.83 | % | 0.80 | %(c) | 0.81 | %(c) | 0.82 | %(c) | 0.85 | %(c) | |||||||||||||||
Total expenses (before reductions and reimbursements/recapture) to average daily net assets | 0.83 | % | 0.80 | %(c) | 0.81 | %(c) | 0.82 | %(c) | 0.84 | %(c) | |||||||||||||||
Portfolio turnover rate | 80 | % | 36 | % | 55 | % | 31 | % | 84 | % | |||||||||||||||
Net assets at end of year (in 000’s) | $ | 955,878 | $ | 920,610 | $ | 1,249,860 | $ | 952,386 | $ | 819,052 | |||||||||||||||
| (a) | Includes anon-recurring refund for overbilling of prior years’ custody fees, a portion of which was paid to the Advisor for prior years’ reimbursement of expenses. This amounted to less than $0.01 per share and less than 0.01% of average net assets. |
| (b) | The total return would have been lower had certain expenses not been reduced or reimbursed during the periods shown. |
| (c) | Includes interest expense that amounts to less than 0.01%. |
| † | Computed using average shares outstanding throughout the year. |
See accompanying Notes to the Financial Statements.
215
Table of Contents
Mercer Funds
Notes to the Financial Statements
March 31, 2019
| 1. | Organization |
Mercer Funds (the “Trust”) consists of the following seven series: Mercer US Large Cap Equity Fund (“Large Cap”), Mercer US Small/Mid Cap Equity Fund (“Small/Mid Cap”), MercerNon-US Core Equity Fund(“Non-US Core Equity”), Mercer Core Fixed Income Fund (“Core Fixed”), Mercer Opportunistic Fixed Income Fund (“Opportunistic Fixed”), Mercer Emerging Markets Equity Fund (“Emerging Markets”) and Mercer Global Low Volatility Equity Fund (“Global Low Volatility”) (each a “Fund,” and collectively referred to as the “Funds”). The Trust is a Delaware statutory trust established on March 11, 2005. The Trust is registered as an investment company under the Investment Company Act of 1940 (the “1940 Act”). The Funds’ investment advisor is Mercer Investments LLC, successor to Mercer Investment Management, Inc.1 (the “Advisor”). The Advisor manages each Fund using a “manager of managers” approach by selecting one or more subadvisors (each a “Subadvisor,” and collectively referred to as the “Subadvisors”) to manage each Fund’s assets. The Funds areopen-end investment companies and accordingly follow theopen-end investment company accounting and reporting guidance of the Financial Accounting Standards Board (FASB) Accounting Standard Codification Topic 946: Financial Services — Investment Companies.
Under the 1940 Act, each Fund is classified as diversified.
The investment objectives of the Funds are:
Fund | Investment Objective | |
| Large Cap | Long-term total return, which includes capital appreciation and income | |
| Small/Mid Cap | Long-term total return, comprised primarily of capital appreciation | |
| Non-US Core Equity | Long-term total return, which includes capital appreciation and income | |
| Core Fixed | Total return, consisting of both current income and capital appreciation | |
| Opportunistic Fixed | Long-term total return, which includes capital appreciation and income | |
| Emerging Markets | Long-term total return, which includes capital appreciation and income | |
| Global Low Volatility | Long-term total return, which includes capital appreciation and income |
Each Fund has registered and is authorized to offer interests in four classes of shares: Adviser Class (formerly Class S), Class I (formerlyClass Y-1),Class Y-2 andClass Y-3. The principal difference between the classes of shares is the level of shareholder service, marketing and administrative fees borne by the classes. As of March 31, 2019, only theClass Y-3 shares of each Fund had commenced operations.
| 2. | Significant Accounting Policies |
In August 2018, the Securities and Exchange Commission (“SEC”) adopted Disclosure Update and Simplification, which amends certain disclosure requirements effective for filings subsequent to
| 1 | Effective March 28, 2019, Mercer Investment Management, Inc., a Delaware corporation, converted to a Delaware limited liability company and was renamed Mercer Investments LLC. |
216
Table of Contents
Mercer Funds
Notes to the Financial Statements (Continued)
March 31, 2019
November 5, 2018. As of March 31, 2019, Management has adopted the amendments. The amendment requires presentation of the total, rather than the components, of distributable earnings (accumulated loss) on the Statements of Assets and Liabilities. The amendment requires presentation of the total distributions, rather than the components, on the Statements of Changes in Net Assets and removal of the requirement for disclosure of undistributed net investment income on a book basis. This amendment facilitates compliance of the disclosure of information without significantly altering the information provided to investors.
In August 2018, FASB issued Accounting Standards UpdateNo. 2018-13 “Fair Value Measurement (Topic 820)Disclosure Framework — Changes to the Disclosure Requirements for Fair Value Measurement”, which amends the disclosure requirements for fair value measurements by modifying or removing certain disclosures and adding certain new disclosures. The amendments are effective for fiscal years, and interim periods within those fiscal years, beginning after December 15, 2019. As of March 31, 2019, Management has adopted the amendments.
In March 2017, FASB issued Accounting Standards UpdateNo. 2017-08 “Premium Amortization of Purchased Callable Debt Securities”, which amends the amortization period for certain purchased callable debt securities. Under the standards update, the premium amortization of purchased callable debt securities that have explicit,non-contingent call features and are callable at fixed prices will be amortized to the earliest call date. The guidance will be applied on a modified retrospective basis and is effective for fiscal years, and their interim periods, beginning after December 15, 2018. Management is currently evaluating the impact of this standard’s update to the Funds.
The following are significant accounting policies followed by the Funds. These policies are in conformity with accounting principles generally accepted in the United States of America (“GAAP”). The preparation of financial statements in conformity with GAAP requires management to make estimates and assumptions that affect the reported amounts and disclosures in the financial statements. Actual results could differ from these estimates.
(a) Security Valuation
Each Fund’s investments are valued as of the close of regular trading on the New York Stock Exchange (“NYSE”) on each day when the NYSE is open. Portfolio securities and exchange-traded funds listed on an exchange normally are valued at the last sale or official closing price on the day on which the securities are valued or, lacking any sales on such day, at the last available bid price using prices as of the close of trading. In cases where securities are traded on more than one exchange, the securities are generally valued on the exchange considered by the Advisor or the applicable Subadvisor as the primary market for such securities. Securities traded in theover-the-counter (“OTC”) market and listed on the NASDAQ Stock Market (“NASDAQ”) normally are valued at the NASDAQ Official Closing Price; other OTC securities are valued at the last bid price available prior to valuation (other than short-term investments, which are valued as described below). The Funds may invest in securities that are traded in foreign markets. Foreign securities will be converted into U.S. dollar equivalents based on the exchange rate in effect at a uniform time on each business day. Events occurring after the close of trading on foreign exchanges may result in adjustments to the valuation of foreign securities to more accurately reflect their fair value as of the close of regular trading on the New York Stock Exchange. When valuing foreign equity securities that meet certain criteria, the Board of Trustees of the Trust (the “Board”) has approved the use of a fair value service that values such securities to reflect market trading that occurs after the close of the applicable foreign markets of comparable securities or other instruments that have a strong correlation to the fair-valued securities. Investments inopen-end investment companies are valued at their net asset value (“NAV”) per share.
217
Table of Contents
Mercer Funds
Notes to the Financial Statements (Continued)
March 31, 2019
Certain fixed-income securities may be valued based upon appraisals received from an independent pricing service using a computerized matrix system or based upon appraisals derived from information concerning the securities or similar securities received from a recognized dealer or dealers in those securities. It should be recognized that judgment often plays a greater role in valuing thinly traded securities, as well as bonds and other securities with few dealer quotations, than is the case with respect to securities for which a broader range of dealer quotations and last-sale information is available. Each such determination is based on consideration of relevant factors, and judgment is made by or at the direction of the Board. Each Fund values its investments for which market quotations are readily available at market value. Each Fund may value short-term investments that will mature within 60 days or less by using pricing service quotations or at amortized cost, provided that such amortized cost approximates market value.
Derivative financial instruments, such as futures contracts or options contracts that are traded on a national securities exchange, are stated at the last reported sale or settlement price on the day of valuation. Futures traded on inactive markets are valued using broker quotations. OTC derivative financial instruments, such as foreign currency contracts, options contracts, synthetic futures, or swaps agreements, derive their value from underlying asset prices, indices, reference rates, and other inputs or a combination of these factors. These contracts are normally valued on the basis of an independent pricing service providers or broker dealer quotations. Depending on the derivative type and the terms of the derivative, the value of the derivative financial instruments is assigned by independent pricing service providers using a series of techniques, which may include pricing models. The pricing models use inputs that are observed from actively quoted markets such as issuer details, indices, spreads, interest rates, curves, volatilities, dividends and exchange rates.
Bank loans are valued using an evaluated quote provided by an independent pricing service. Evaluated quotes provided by the pricing service may reflect appropriate factors such as ratings, yield curves, prepayment speeds, tranche type, industry, company performance, spread, individual trading characteristics, institutional size trading in similar groups of securities and other market data.
The Board has delegated its responsibility for valuing portfolio securities to the Advisor, subject to continuing Board oversight. The Advisor has appointed a Valuation Committee that is responsible for overseeing theday-to-day process of valuing portfolio securities. With respect to portfolio securities for which market quotations are not readily available or (in the opinion of the Advisor or the applicable Subadvisor) do not otherwise accurately reflect the fair values of the securities, the Valuation Committee will value such securities at fair value based upon procedures approved by the Board.
The application of fair value pricing represents a good faith determination based on specific procedures performed under the supervision of the Board. Due to the subjective nature of fair value pricing, there can be no assurance that a Fund could realize the fair value assigned to the security if the Fund were to sell the security at approximately the time at which the Fund determines its NAV per share. A Fund’s value for a particular security may be different from the last quoted market price.
The Funds follow a three-tier hierarchy to prioritize the assumptions, referred to as inputs, used in valuation techniques to measure fair value. The three-tier hierarchy of inputs is summarized in the three broad Levels listed below.
| • | Level 1 — quoted prices unadjusted in active markets for identical investments |
| • | Level 2 —other significant observable inputs (including quoted prices for similar investments, interest rates, prepayment speeds, credit risk, etc.) |
218
Table of Contents
Mercer Funds
Notes to the Financial Statements (Continued)
March 31, 2019
| • | Level 3 — significant unobservable inputs (including the Fund’s own assumptions in determining the fair value of investments) |
The inputs or methodology used for valuing securities are not necessarily an indication of the risk associated with investing in those securities.
The assets and liabilities shown in the Statements of Assets and Liabilities related to investments purchased for“to-be-announced” (“TBA”), TBA commitments or when-issued securities approximate fair value and are determined using Level 2 inputs, as of March 31, 2019. The assets and liabilities shown in the Statements of Assets and Liabilities related to cash collateral held at broker for futures contracts and swap contracts are determined using Level 1 inputs as of March 31, 2019.
At March 31, 2019, Large Cap held long-term investments whose value was determined using Level 1 inputs, with corresponding major categories as shown in the schedule of investments, Futures Contracts and State Street Institutional U.S. Government Money Market Fund, Premier Class whose value was determined using Level 1 inputs and short-term investment positions in a United States Treasury Bill, as shown in the schedule of investments, whose value was determined using Level 2 inputs.
The following is a summary of the portfolio securities by level based on inputs used as of March 31, 2019 in valuing the assets and liabilities of Small/Mid Cap,Non-US Core Equity, Core Fixed, Opportunistic Fixed, Emerging Markets and Global Low Volatility for which fair valuation was used:
Small/Mid Cap
ASSETS VALUATION INPUT
Description | Quoted Prices in Active Markets for Identical Assets (Level 1) | Significant Other Observable Inputs (Level 2) | Significant Unobservable Inputs (Level 3) | Total | ||||||||||||
Common Stocks | $ | 758,291,939 | $ | — | $ | — | $ | 758,291,939 | ||||||||
|
|
|
|
|
|
|
| |||||||||
Total Common Stocks | 758,291,939 | — | — | 758,291,939 | ||||||||||||
|
|
|
|
|
|
|
| |||||||||
Rights |
| |||||||||||||||
Mining | — | 93,008 | — | 93,008 | ||||||||||||
|
|
|
|
|
|
|
| |||||||||
Total Rights | — | 93,008 | — | 93,008 | ||||||||||||
|
|
|
|
|
|
|
| |||||||||
Short-Term Investments |
| |||||||||||||||
Mutual Fund - Securities Lending Collateral | 2,502,353 | — | — | 2,502,353 | ||||||||||||
U.S. Government and Agency Obligations | — | 1,582,780 | — | 1,582,780 | ||||||||||||
|
|
|
|
|
|
|
| |||||||||
Total Short-Term Investments | 2,502,353 | 1,582,780 | — | 4,085,133 | ||||||||||||
|
|
|
|
|
|
|
| |||||||||
Futures Contracts† |
| |||||||||||||||
Buys | 355,780 | — | — | 355,780 | ||||||||||||
|
|
|
|
|
|
|
| |||||||||
Total Futures Contracts | 355,780 | — | — | 355,780 | ||||||||||||
|
|
|
|
|
|
|
| |||||||||
Total | $ | 761,150,072 | $ | 1,675,788 | $ | — | $ | 762,825,860 | ||||||||
|
|
|
|
|
|
|
| |||||||||
| † | Futures contracts are valued at unrealized appreciation/depreciation. Only current day’s variation margin, if any, is reported on the Statements of Assets and Liabilities. |
219
Table of Contents
Mercer Funds
Notes to the Financial Statements (Continued)
March 31, 2019
Non-US Core Equity
ASSETS VALUATION INPUT
Description | Quoted Prices in Active Markets for Identical Assets (Level 1) | Significant Other Observable Inputs (Level 2) | Significant Unobservable Inputs (Level 3) | Total | ||||||||||||
Common Stocks |
| |||||||||||||||
Australia | $ | 83,868,944 | $ | 0 | * | $ | — | $ | 83,868,944 | |||||||
Austria | 14,618,651 | — | — | 14,618,651 | ||||||||||||
Belgium | 19,134,115 | — | — | 19,134,115 | ||||||||||||
Bermuda | 5,263,832 | — | — | 5,263,832 | ||||||||||||
Brazil | 17,670,707 | — | — | 17,670,707 | ||||||||||||
Canada | 16,640,889 | — | — | 16,640,889 | ||||||||||||
Cayman Islands | 35,148,589 | — | — | 35,148,589 | ||||||||||||
China | 2,934,898 | — | — | 2,934,898 | ||||||||||||
Denmark | 19,928,345 | — | — | 19,928,345 | ||||||||||||
Finland | 30,136,872 | — | — | 30,136,872 | ||||||||||||
France | 196,349,880 | — | — | 196,349,880 | ||||||||||||
Germany | 173,116,941 | — | — | 173,116,941 | ||||||||||||
Hong Kong | 27,307,782 | — | — | 27,307,782 | ||||||||||||
Hungary | 2,627,520 | — | — | 2,627,520 | ||||||||||||
India | 7,635,529 | — | — | 7,635,529 | ||||||||||||
Indonesia | 8,414,198 | — | — | 8,414,198 | ||||||||||||
Ireland | 10,382,267 | — | — | 10,382,267 | ||||||||||||
Israel | 8,166,132 | — | — | 8,166,132 | ||||||||||||
Italy | 56,868,632 | — | — | 56,868,632 | ||||||||||||
Japan | 454,401,682 | — | — | 454,401,682 | ||||||||||||
Luxembourg | 12,138,794 | — | — | 12,138,794 | ||||||||||||
Malaysia | 2,321,749 | — | — | 2,321,749 | ||||||||||||
Netherlands | 104,081,527 | — | — | 104,081,527 | ||||||||||||
New Zealand | 2,295,054 | — | — | 2,295,054 | ||||||||||||
Norway | 16,589,195 | — | — | 16,589,195 | ||||||||||||
Philippines | 862,175 | — | — | 862,175 | ||||||||||||
Poland | 1,351,053 | — | — | 1,351,053 | ||||||||||||
Portugal | 255,858 | — | 0 | ** | 255,858 | |||||||||||
Russia | 8,288,884 | — | — | 8,288,884 | ||||||||||||
Singapore | 5,078,140 | — | — | 5,078,140 | ||||||||||||
South Africa | 1,472,943 | — | — | 1,472,943 | ||||||||||||
South Korea | 9,837,535 | — | — | 9,837,535 | ||||||||||||
Spain | 45,737,416 | — | 0 | ** | 45,737,416 | |||||||||||
Sweden | 59,318,373 | — | — | 59,318,373 | ||||||||||||
Switzerland | 183,947,784 | — | — | 183,947,784 | ||||||||||||
Taiwan | 14,021,153 | — | — | 14,021,153 | ||||||||||||
Thailand | — | 2,236,786 | — | 2,236,786 | ||||||||||||
Turkey | 1,149,731 | — | — | 1,149,731 | ||||||||||||
United Kingdom | 308,105,373 | — | — | 308,105,373 | ||||||||||||
United States | 44,071,950 | — | — | 44,071,950 | ||||||||||||
|
|
|
|
|
|
|
| |||||||||
Total Common Stocks | 2,011,541,092 | 2,236,786 | 0 | 2,013,777,878 | ||||||||||||
|
|
|
|
|
|
|
| |||||||||
220
Table of Contents
Mercer Funds
Notes to the Financial Statements (Continued)
March 31, 2019
Description | Quoted Prices in Active Markets for Identical Assets (Level 1) | Significant Other Observable Inputs (Level 2) | Significant Unobservable Inputs (Level 3) | Total | ||||||||||||
Investment Companies | ||||||||||||||||
United States | $ | 20,444,507 | $ | — | $ | — | $ | 20,444,507 | ||||||||
|
|
|
|
|
|
|
| |||||||||
Total Investment Companies | 20,444,507 | — | — | 20,444,507 | ||||||||||||
|
|
|
|
|
|
|
| |||||||||
Preferred Stocks | ||||||||||||||||
Brazil | 1,593,537 | — | — | 1,593,537 | ||||||||||||
Germany | 20,119,556 | — | — | 20,119,556 | ||||||||||||
Sweden | 868,978 | — | — | 868,978 | ||||||||||||
|
|
|
|
|
|
|
| |||||||||
Total Preferred Stocks | 22,582,071 | — | — | 22,582,071 | ||||||||||||
|
|
|
|
|
|
|
| |||||||||
Rights |
| |||||||||||||||
Sweden | 112,912 | — | — | 112,912 | ||||||||||||
|
|
|
|
|
|
|
| |||||||||
Total Rights | 112,912 | — | — | 112,912 | ||||||||||||
|
|
|
|
|
|
|
| |||||||||
Short-Term Investments |
| |||||||||||||||
Mutual Fund - Securities Lending Collateral | 56,574,708 | — | — | 56,574,708 | ||||||||||||
U.S. Government and Agency Obligations | — | 3,956,950 | — | 3,956,950 | ||||||||||||
|
|
|
|
|
|
|
| |||||||||
Total Short-Term Investments | 56,574,708 | 3,956,950 | — | 60,531,658 | ||||||||||||
|
|
|
|
|
|
|
| |||||||||
Futures Contracts† |
| |||||||||||||||
Buys | 1,374,326 | — | — | 1,374,326 | ||||||||||||
|
|
|
|
|
|
|
| |||||||||
Total Futures Contracts | 1,374,326 | — | — | 1,374,326 | ||||||||||||
|
|
|
|
|
|
|
| |||||||||
Forward Foreign Currency Contracts† | — | 42,087 | — | 42,087 | ||||||||||||
|
|
|
|
|
|
|
| |||||||||
Total Forward Foreign Currency Contracts | — | 42,087 | — | 42,087 | ||||||||||||
|
|
|
|
|
|
|
| |||||||||
Total | $ | 2,112,629,616 | $ | 6,235,823 | $ | 0 | $ | 2,118,865,439 | ||||||||
|
|
|
|
|
|
|
| |||||||||
| * | Represents one or more Level 2 securities at $0 value as of March 31, 2019. |
| ** | Represents one or more Level 3 securities at $0 value as of March 31, 2019. |
| † | Forward foreign currency contracts and Futures contracts are valued at unrealized appreciation/depreciation. Only current day’s variation margin, if any, is reported on the Statements of Assets and Liabilities. |
221
Table of Contents
Mercer Funds
Notes to the Financial Statements (Continued)
March 31, 2019
Core Fixed
ASSETS VALUATION INPUT
Description | Quoted Prices in Active Markets for Identical Assets (Level 1) | Significant Other Observable Inputs (Level 2) | Significant Unobservable Inputs (Level 3) | Total | ||||||||||||
Debt Obligations |
| |||||||||||||||
Asset Backed Securities | $ | — | $ | 78,339,940 | $ | — | $ | 78,339,940 | ||||||||
Corporate Debt | — | 194,009,401 | 0 | ** | 194,009,401 | |||||||||||
Mortgage Backed Securities - Private Issuers | — | 54,941,390 | — | 54,941,390 | ||||||||||||
Mortgage Backed Securities - U.S. Government Agency Obligations | — | 141,435,697 | — | 141,435,697 | ||||||||||||
Municipal Obligations | — | 5,494,480 | — | 5,494,480 | ||||||||||||
Sovereign Debt Obligations | — | 6,553,856 | — | 6,553,856 | ||||||||||||
U.S. Government and Agency Obligations | — | 54,700,608 | — | 54,700,608 | ||||||||||||
|
|
|
|
|
|
|
| |||||||||
Total Debt Obligations | — | 535,475,372 | 0 | 535,475,372 | ||||||||||||
|
|
|
|
|
|
|
| |||||||||
Short-Term Investments |
| |||||||||||||||
Certificates of Deposit | — | 429,599 | — | 429,599 | ||||||||||||
Mutual Fund - Securities Lending Collateral | 6,309,277 | — | — | 6,309,277 | ||||||||||||
U.S. Government and Agency Obligations | — | 919,283 | — | 919,283 | ||||||||||||
|
|
|
|
|
|
|
| |||||||||
Total Short-Term Investments | 6,309,277 | 1,348,882 | — | 7,658,159 | ||||||||||||
|
|
|
|
|
|
|
| |||||||||
Options Purchased | 24,563 | — | — | 24,563 | ||||||||||||
|
|
|
|
|
|
|
| |||||||||
Futures Contracts† |
| |||||||||||||||
Buys | 1,292,785 | — | — | 1,292,785 | ||||||||||||
|
|
|
|
|
|
|
| |||||||||
Total Futures Contracts | 1,292,785 | — | — | 1,292,785 | ||||||||||||
|
|
|
|
|
|
|
| |||||||||
Swaps |
| |||||||||||||||
Centrally Cleared Interest Rate Swaps† | — | 129,792 | — | 129,792 | ||||||||||||
|
|
|
|
|
|
|
| |||||||||
Total Swaps | — | 129,792 | — | 129,792 | ||||||||||||
|
|
|
|
|
|
|
| |||||||||
Total | $ | 7,626,625 | $ | 536,954,046 | $ | 0 | $ | 544,580,671 | ||||||||
|
|
|
|
|
|
|
| |||||||||
222
Table of Contents
Mercer Funds
Notes to the Financial Statements (Continued)
March 31, 2019
LIABILITIES VALUATION INPUT
Description | Quoted Prices in Active Markets for Identical Assets (Level 1) | Significant Other Observable Inputs (Level 2) | Significant Unobservable Inputs (Level 3) | Total | ||||||||||||
Futures Contracts† |
| |||||||||||||||
Sales | $ | (187,872 | ) | $ | — | $ | — | $ | (187,872 | ) | ||||||
|
|
|
|
|
|
|
| |||||||||
Total Futures Contracts | (187,872 | ) | — | — | (187,872 | ) | ||||||||||
|
|
|
|
|
|
|
| |||||||||
Swaps |
| |||||||||||||||
Centrally Cleared Interest Rate Swaps† | — | (414,030 | ) | — | (414,030 | ) | ||||||||||
|
|
|
|
|
|
|
| |||||||||
Total Swaps | — | (414,030 | ) | — | (414,030 | ) | ||||||||||
|
|
|
|
|
|
|
| |||||||||
Written Options | (6,000 | ) | — | — | (6,000 | ) | ||||||||||
|
|
|
|
|
|
|
| |||||||||
Total | $ | (193,872 | ) | $ | (414,030 | ) | $ | — | $ | (607,902 | ) | |||||
|
|
|
|
|
|
|
| |||||||||
| ** | Represents one or more Level 3 securities at $0 value as of March 31, 2019. |
| † | Futures contracts and Centrally Cleared Swaps are valued at unrealized appreciation/depreciation. Only current day’s variation margin, if any, is reported on the Statements of Assets and Liabilities. |
Opportunistic Fixed
ASSETS VALUATION INPUT
Description | Quoted Prices in Active Markets for Identical Assets (Level 1) | Significant Other Observable Inputs (Level 2) | Significant Unobservable Inputs (Level 3) | Total | ||||||||||||
Debt Obligations |
| |||||||||||||||
Asset Backed Securities | $ | — | $ | 20,105,374 | $ | — | $ | 20,105,374 | ||||||||
Bank Loans | — | 41,782,473 | — | 41,782,473 | ||||||||||||
Convertible Debt | — | 1,495,889 | — | 1,495,889 | ||||||||||||
Corporate Debt | — | 214,276,461 | 0 | ** | 214,276,461 | |||||||||||
Mortgage Backed Securities - Private Issuers | — | 19,245,704 | — | 19,245,704 | ||||||||||||
Mortgage Backed Securities - U.S. Government Agency Obligations | — | 20,104,316 | — | 20,104,316 | ||||||||||||
Sovereign Debt Obligations | — | 324,243,845 | — | 324,243,845 | ||||||||||||
U.S. Government and Agency Obligations | — | 104,993,156 | — | 104,993,156 | ||||||||||||
|
|
|
|
|
|
|
| |||||||||
Total Debt Obligations | — | 746,247,218 | 0 | 746,247,218 | ||||||||||||
|
|
|
|
|
|
|
| |||||||||
Common Stocks |
| |||||||||||||||
Diversified Financial Services | — | — | 0 | ** | — | |||||||||||
Oil & Gas | — | 842,153 | — | 842,153 | ||||||||||||
|
|
|
|
|
|
|
| |||||||||
Total Common Stocks | — | 842,153 | 0 | 842,153 | ||||||||||||
|
|
|
|
|
|
|
| |||||||||
223
Table of Contents
Mercer Funds
Notes to the Financial Statements (Continued)
March 31, 2019
Description | Quoted Prices in Active Markets for Identical Assets (Level 1) | Significant Other Observable Inputs (Level 2) | Significant Unobservable Inputs (Level 3) | Total | ||||||||||||
Convertible Preferred Stock |
| |||||||||||||||
Health Care - Products | $ | 725,510 | $ | — | $ | — | $ | 725,510 | ||||||||
Oil & Gas | — | 230,420 | — | 230,420 | ||||||||||||
|
|
|
|
|
|
|
| |||||||||
Total Convertible Preferred Stock | 725,510 | 230,420 | — | 955,930 | ||||||||||||
|
|
|
|
|
|
|
| |||||||||
Preferred Stocks |
| |||||||||||||||
Investment Companies | 62,059 | — | — | 62,059 | ||||||||||||
|
|
|
|
|
|
|
| |||||||||
Total Preferred Stocks | 62,059 | — | — | 62,059 | ||||||||||||
|
|
|
|
|
|
|
| |||||||||
Short-Term Investments |
| |||||||||||||||
Certificates of Deposit | — | 649,731 | — | 649,731 | ||||||||||||
Investment Company | — | 7,973,220 | — | 7,973,220 | ||||||||||||
Mutual Fund - Securities Lending Collateral | 7,793,870 | — | — | 7,793,870 | ||||||||||||
Sovereign Debt Obligations | — | 6,013,934 | — | 6,013,934 | ||||||||||||
U.S. Government and Agency Obligations | — | 7,059,804 | — | 7,059,804 | ||||||||||||
|
|
|
|
|
|
|
| |||||||||
Total Short-Term Investments | 7,793,870 | 21,696,689 | — | 29,490,559 | ||||||||||||
|
|
|
|
|
|
|
| |||||||||
Options Purchased | 706,922 | 630,511 | — | 1,337,433 | ||||||||||||
|
|
|
|
|
|
|
| |||||||||
Futures Contracts† |
| |||||||||||||||
Buys | 628,305 | — | — | 628,305 | ||||||||||||
Sales | 8,539 | — | — | 8,539 | ||||||||||||
|
|
|
|
|
|
|
| |||||||||
Total Futures Contracts | 636,844 | — | — | 636,844 | ||||||||||||
|
|
|
|
|
|
|
| |||||||||
Swaps |
| |||||||||||||||
Centrally Cleared Interest Rate Swaps† | — | 29,033 | — | 29,033 | ||||||||||||
OTC Credit Default Swaps | — | 493,832 | — | 493,832 | ||||||||||||
|
|
|
|
|
|
|
| |||||||||
Total Swaps | — | 522,865 | — | 522,865 | ||||||||||||
|
|
|
|
|
|
|
| |||||||||
Forward Foreign Currency Contracts† | — | 2,754,284 | — | 2,754,284 | ||||||||||||
|
|
|
|
|
|
|
| |||||||||
Total Forward Foreign Currency Contracts | — | 2,754,284 | — | 2,754,284 | ||||||||||||
|
|
|
|
|
|
|
| |||||||||
Total | $ | 9,925,205 | $ | 772,924,140 | $ | 0 | $ | 782,849,345 | ||||||||
|
|
|
|
|
|
|
| |||||||||
224
Table of Contents
Mercer Funds
Notes to the Financial Statements (Continued)
March 31, 2019
LIABILITIES VALUATION INPUT
Description | Quoted Prices in Active Markets for Identical Assets (Level 1) | Significant Other Observable Inputs (Level 2) | Significant Unobservable Inputs (Level 3) | Total | ||||||||||||
Futures Contracts† |
| |||||||||||||||
Buys | $ | (7,703 | ) | $ | — | $ | — | $ | (7,703 | ) | ||||||
Sales | (901,819 | ) | — | — | (901,819 | ) | ||||||||||
|
|
|
|
|
|
|
| |||||||||
Total Futures Contracts | (909,522 | ) | — | — | (909,522 | ) | ||||||||||
|
|
|
|
|
|
|
| |||||||||
Swaps |
| |||||||||||||||
OTC Interest Rate Swaps | — | (285,360 | ) | — | (285,360 | ) | ||||||||||
Centrally Cleared Interest Rate Swaps† | — | (1,815,718 | ) | — | (1,815,718 | ) | ||||||||||
OTC Credit Default Swaps | — | (1,281,161 | ) | — | (1,281,161 | ) | ||||||||||
Centrally Cleared Credit Default Swaps† | — | (322,881 | ) | — | (322,881 | ) | ||||||||||
|
|
|
|
|
|
|
| |||||||||
Total Swaps | — | (3,705,120 | ) | — | (3,705,120 | ) | ||||||||||
|
|
|
|
|
|
|
| |||||||||
Forward Foreign Currency Contracts† | — | (3,216,602 | ) | — | (3,216,602 | ) | ||||||||||
|
|
|
|
|
|
|
| |||||||||
Total Forward Foreign Currency Contracts | — | (3,216,602 | ) | — | (3,216,602 | ) | ||||||||||
|
|
|
|
|
|
|
| |||||||||
Written Options | (44,867 | ) | (74,413 | ) | — | (119,280 | ) | |||||||||
|
|
|
|
|
|
|
| |||||||||
Total | $ | (954,389 | ) | $ | (6,996,135 | ) | $ | — | $ | (7,950,524 | ) | |||||
|
|
|
|
|
|
|
| |||||||||
| ** | Represents one or more Level 3 securities at $0 value as of March 31, 2019. |
| † | Forward foreign currency contracts, Futures contracts and Centrally Cleared Swaps are valued at unrealized appreciation/depreciation. Only current day’s variation margin, if any, is reported on the Statements of Assets and Liabilities. |
Emerging Markets
ASSETS VALUATION INPUT
Description | Quoted Prices in Active Markets for Identical Assets (Level 1) | Significant Other Observable Inputs (Level 2) | Significant Unobservable Inputs (Level 3) | Total | ||||||||||||
Common Stocks |
| |||||||||||||||
Australia | $ | 4,683,143 | $ | — | $ | — | $ | 4,683,143 | ||||||||
Bermuda | 16,818,220 | — | — | 16,818,220 | ||||||||||||
Brazil | 54,175,382 | — | — | 54,175,382 | ||||||||||||
British Virgin Islands | 930,385 | — | — | 930,385 | ||||||||||||
Cayman Islands | 121,761,311 | — | — | 121,761,311 | ||||||||||||
Chile | 14,804,081 | — | — | 14,804,081 | ||||||||||||
China | 93,196,493 | — | — | 93,196,493 | ||||||||||||
Colombia | 837,922 | — | — | 837,922 | ||||||||||||
Cyprus | 767,095 | — | — | 767,095 | ||||||||||||
225
Table of Contents
Mercer Funds
Notes to the Financial Statements (Continued)
March 31, 2019
Description | Quoted Prices in Active Markets for Identical Assets (Level 1) | Significant Other Observable Inputs (Level 2) | Significant Unobservable Inputs (Level 3) | Total | ||||||||||||
Czech Republic | $ | 1,123,987 | $ | — | $ | — | $ | 1,123,987 | ||||||||
Egypt | 2,899,096 | — | — | 2,899,096 | ||||||||||||
France | 2,105,560 | — | — | 2,105,560 | ||||||||||||
Greece | 1,406,929 | — | — | 1,406,929 | ||||||||||||
Hong Kong | 42,485,662 | — | — | 42,485,662 | ||||||||||||
Hungary | 5,695,574 | — | — | 5,695,574 | ||||||||||||
India | 119,218,699 | 24,509 | — | 119,243,208 | ||||||||||||
Indonesia | 26,109,105 | — | — | 26,109,105 | ||||||||||||
Isle of Man | 212,173 | — | — | 212,173 | ||||||||||||
Japan | 2,412,102 | — | — | 2,412,102 | ||||||||||||
Luxembourg | 210,000 | — | — | 210,000 | ||||||||||||
Malaysia | 13,152,932 | — | — | 13,152,932 | ||||||||||||
Mexico | 34,324,078 | — | — | 34,324,078 | ||||||||||||
Netherlands | 7,770,959 | — | — | 7,770,959 | ||||||||||||
Nigeria | 1,477,143 | — | — | 1,477,143 | ||||||||||||
Papua New Guinea | 2,255,385 | — | — | 2,255,385 | ||||||||||||
Philippines | 5,277,101 | — | — | 5,277,101 | ||||||||||||
Poland | 8,588,338 | — | — | 8,588,338 | ||||||||||||
Qatar | 1,248,417 | — | — | 1,248,417 | ||||||||||||
Russia | 14,990,403 | — | — | 14,990,403 | ||||||||||||
Singapore | 2,189,935 | — | — | 2,189,935 | ||||||||||||
South Africa | 59,468,583 | — | — | 59,468,583 | ||||||||||||
South Korea | 95,680,926 | — | — | 95,680,926 | ||||||||||||
Spain | 24,608 | — | — | 24,608 | ||||||||||||
Switzerland | 3,940,812 | — | — | 3,940,812 | ||||||||||||
Taiwan | 100,210,362 | — | — | 100,210,362 | ||||||||||||
Thailand | 15,930,019 | 9,861,893 | — | 25,791,912 | ||||||||||||
Turkey | 3,984,814 | — | — | 3,984,814 | ||||||||||||
United Arab Emirates | 1,835,355 | — | — | 1,835,355 | ||||||||||||
United Kingdom | 10,565,157 | — | — | 10,565,157 | ||||||||||||
United States | 11,402,022 | — | — | 11,402,022 | ||||||||||||
|
|
|
|
|
|
|
| |||||||||
Total Common Stocks | 906,170,268 | 9,886,402 | — | 916,056,670 | ||||||||||||
|
|
|
|
|
|
|
| |||||||||
Preferred Stocks |
| |||||||||||||||
Brazil | 17,132,090 | — | — | 17,132,090 | ||||||||||||
Colombia | 203,057 | — | — | 203,057 | ||||||||||||
Germany | 829,857 | — | — | 829,857 | ||||||||||||
South Korea | 448,215 | 3,973 | — | 452,188 | ||||||||||||
|
|
|
|
|
|
|
| |||||||||
Total Preferred Stocks | 18,613,219 | 3,973 | — | 18,617,192 | ||||||||||||
|
|
|
|
|
|
|
| |||||||||
Rights |
| |||||||||||||||
Hong Kong | — | 28,151 | — | 28,151 | ||||||||||||
India | — | 242,081 | — | 242,081 | ||||||||||||
South Korea | — | 9,724 | — | 9,724 | ||||||||||||
|
|
|
|
|
|
|
| |||||||||
Total Rights | — | 279,956 | — | 279,956 | ||||||||||||
|
|
|
|
|
|
|
| |||||||||
226
Table of Contents
Mercer Funds
Notes to the Financial Statements (Continued)
March 31, 2019
Description | Quoted Prices in Active Markets for Identical Assets (Level 1) | Significant Other Observable Inputs (Level 2) | Significant Unobservable Inputs (Level 3) | Total | ||||||||||||
Short-Term Investments |
| |||||||||||||||
Investment Fund | $ | 5,491,115 | $ | — | $ | — | $ | 5,491,115 | ||||||||
Mutual Fund - Securities Lending Collateral | 6,377,010 | — | — | 6,377,010 | ||||||||||||
U.S. Government and Agency Obligations | — | 2,682,697 | — | 2,682,697 | ||||||||||||
|
|
|
|
|
|
|
| |||||||||
Total Short-Term Investments | 11,868,125 | 2,682,697 | — | 14,550,822 | ||||||||||||
|
|
|
|
|
|
|
| |||||||||
Futures Contracts† |
| |||||||||||||||
Buys | 283,942 | — | — | 283,942 | ||||||||||||
|
|
|
|
|
|
|
| |||||||||
Total Futures Contracts | 283,942 | — | — | 283,942 | ||||||||||||
|
|
|
|
|
|
|
| |||||||||
Synthetic Futures |
| |||||||||||||||
Long | — | 160,570 | — | 160,570 | ||||||||||||
Short | — | 278,034 | — | 278,034 | ||||||||||||
|
|
|
|
|
|
|
| |||||||||
Total Synthetic Futures | — | 438,604 | — | 438,604 | ||||||||||||
|
|
|
|
|
|
|
| |||||||||
Forward Foreign Currency Contracts† | — | 2,601,065 | — | 2,601,065 | ||||||||||||
|
|
|
|
|
|
|
| |||||||||
Total Forward Foreign Currency Contracts | — | 2,601,065 | — | 2,601,065 | ||||||||||||
|
|
|
|
|
|
|
| |||||||||
Total | $ | 936,935,554 | $ | 15,892,697 | $ | — | $ | 952,828,251 | ||||||||
|
|
|
|
|
|
|
| |||||||||
LIABILITIES VALUATION INPUT
Description | Quoted Prices in Active Markets for Identical Assets (Level 1) | Significant Other Observable Inputs (Level 2) | Significant Unobservable Inputs (Level 3) | Total | ||||||||||||
Futures Contracts† |
| |||||||||||||||
Buys | $ | (5,633 | ) | $ | — | $ | — | $ | (5,633 | ) | ||||||
Sales | (53,978 | ) | — | — | (53,978 | ) | ||||||||||
|
|
|
|
|
|
|
| |||||||||
Total Futures Contracts | (59,611 | ) | — | — | (59,611 | ) | ||||||||||
|
|
|
|
|
|
|
| |||||||||
Synthetic Futures |
| |||||||||||||||
Long | — | (13,866 | ) | — | (13,866 | ) | ||||||||||
Short | — | (58,629 | ) | — | (58,629 | ) | ||||||||||
|
|
|
|
|
|
|
| |||||||||
Total Synthetic Futures | — | (72,495 | ) | — | (72,495 | ) | ||||||||||
|
|
|
|
|
|
|
| |||||||||
Forward Foreign Currency Contracts† | — | (920,398 | ) | — | (920,398 | ) | ||||||||||
|
|
|
|
|
|
|
| |||||||||
Total Forward Foreign Currency Contracts | — | (920,398 | ) | — | (920,398 | ) | ||||||||||
|
|
|
|
|
|
|
| |||||||||
Total | $ | (59,611 | ) | $ | (992,893 | ) | $ | — | $ | (1,052,504 | ) | |||||
|
|
|
|
|
|
|
| |||||||||
| † | Forward foreign currency contracts and Futures contracts are valued at unrealized appreciation/depreciation. Only current day’s variation margin, if any, is reported on the Statements of Assets and Liabilities. |
227
Table of Contents
Mercer Funds
Notes to the Financial Statements (Continued)
March 31, 2019
Global Low Volatility
ASSETS VALUATION INPUT
Description | Quoted Prices in Active Markets for Identical Assets (Level 1) | Significant Other Observable Inputs (Level 2) | Significant Unobservable Inputs (Level 3) | Total | ||||||||||||
Common Stocks | $ | 892,736,836 | $ | — | $ | — | $ | 892,736,836 | ||||||||
|
|
|
|
|
|
|
| |||||||||
Total Common Stocks | 892,736,836 | — | — | 892,736,836 | ||||||||||||
|
|
|
|
|
|
|
| |||||||||
Preferred Stocks |
| |||||||||||||||
Japan | 144,732 | — | — | 144,732 | ||||||||||||
Sweden | 134,098 | — | — | 134,098 | ||||||||||||
|
|
|
|
|
|
|
| |||||||||
Total Preferred Stocks | 278,830 | — | — | 278,830 | ||||||||||||
|
|
|
|
|
|
|
| |||||||||
Rights |
| |||||||||||||||
Singapore | — | 766 | — | 766 | ||||||||||||
|
|
|
|
|
|
|
| |||||||||
Total Rights | — | 766 | — | 766 | ||||||||||||
|
|
|
|
|
|
|
| |||||||||
Short-Term Investments |
| |||||||||||||||
Mutual Fund - Securities Lending Collateral | 18,747,378 | — | — | 18,747,378 | ||||||||||||
U.S. Government and Agency Obligations | — | 1,632,242 | — | 1,632,242 | ||||||||||||
|
|
|
|
|
|
|
| |||||||||
Total Short-Term Investments | 18,747,378 | 1,632,242 | — | 20,379,620 | ||||||||||||
|
|
|
|
|
|
|
| |||||||||
Futures Contracts† |
| |||||||||||||||
Buys | 627,228 | — | — | 627,228 | ||||||||||||
|
|
|
|
|
|
|
| |||||||||
Total Futures Contracts | 627,228 | — | — | 627,228 | ||||||||||||
|
|
|
|
|
|
|
| |||||||||
Total | $ | 912,390,272 | $ | 1,633,008 | $ | — | $ | 914,023,280 | ||||||||
|
|
|
|
|
|
|
| |||||||||
LIABILITIES VALUATION INPUT
Description | Quoted Prices in Active Markets for Identical Assets (Level 1) | Significant Other Observable Inputs (Level 2) | Significant Unobservable Inputs (Level 3) | Total | ||||||||||||
Futures Contracts† |
| |||||||||||||||
Buys | $ | (1,855 | ) | $ | — | $ | — | $ | (1,855 | ) | ||||||
|
|
|
|
|
|
|
| |||||||||
Total Futures Contracts | (1,855 | ) | — | — | (1,855 | ) | ||||||||||
|
|
|
|
|
|
|
| |||||||||
Total | $ | (1,855 | ) | $ | — | $ | — | $ | (1,855 | ) | ||||||
|
|
|
|
|
|
|
| |||||||||
| † | Futures contracts are valued at unrealized appreciation/depreciation. Only current day’s variation margin, if any, is reported on the Statements of Assets and Liabilities. |
228
Table of Contents
Mercer Funds
Notes to the Financial Statements (Continued)
March 31, 2019
Investments in Derivative Instruments
At March 31, 2019 and during the period then ended, the Funds had the following derivatives and transactions in derivatives, grouped into appropriate risk categories:
Large Cap
| ASSET DERIVATIVES |
| |||||||
| Equity Risk | Total | |||||||
Futures Contracts(3) | $ | 177,233 | $ | 177,233 | ||||
|
|
|
| |||||
Total Value | $ | 177,233 | $ | 177,233 | ||||
|
|
|
| |||||
| NET REALIZED GAIN (LOSS) |
| |||||||
| Equity Risk | Total | |||||||
Futures Contracts(7) | $ | 751,520 | $ | 751,520 | ||||
|
|
|
| |||||
Total Realized Gain (Loss) | $ | 751,520 | $ | 751,520 | ||||
|
|
|
| |||||
| CHANGE IN APPRECIATION (DEPRECIATION) |
| |||||||
| Equity Risk | Total | |||||||
Futures Contracts(12) | $ | 752,122 | $ | 752,122 | ||||
|
|
|
| |||||
Total Change in Appreciation (Depreciation) | $ | 752,122 | $ | 752,122 | ||||
|
|
|
| |||||
| NUMBER OF CONTRACTS, NOTIONAL AMOUNTS OR SHARES/UNITS(16) |
| |||||||
| Equity Risk | Total | |||||||
Futures Contracts | 101 | 101 | ||||||
Small/Mid Cap
| ASSET DERIVATIVES |
| |||||||
| Equity Risk | Total | |||||||
Futures Contracts(3) | $ | 355,780 | $ | 355,780 | ||||
|
|
|
| |||||
Total Value | $ | 355,780 | $ | 355,780 | ||||
|
|
|
| |||||
| NET REALIZED GAIN (LOSS) |
| |||||||
| Equity Risk | Total | |||||||
Futures Contracts(7) | $ | (3,047,398 | ) | $ | (3,047,398 | ) | ||
|
|
|
| |||||
Total Realized Gain (Loss) | $ | (3,047,398 | ) | $ | (3,047,398 | ) | ||
|
|
|
| |||||
| CHANGE IN APPRECIATION (DEPRECIATION) |
| |||||||
| Equity Risk | Total | |||||||
Futures Contracts(12) | $ | 1,338,458 | $ | 1,338,458 | ||||
|
|
|
| |||||
Total Change in Appreciation (Depreciation) | $ | 1,338,458 | $ | 1,338,458 | ||||
|
|
|
| |||||
229
Table of Contents
Mercer Funds
Notes to the Financial Statements (Continued)
March 31, 2019
| NUMBER OF CONTRACTS, NOTIONAL AMOUNTS OR SHARES/UNITS(16) |
| |||||||
| Equity Risk | Total | |||||||
Futures Contracts | $ | 276 | $ | 276 | ||||
Non-US Core Equity
| ASSET DERIVATIVES |
| |||||||||||
| Foreign Currency Risk | Equity Risk | Total | ||||||||||
Futures Contracts(3) | $ | — | $ | 1,374,326 | $ | 1,374,326 | ||||||
Forward Foreign Currency Contracts(2) | 42,087 | — | 42,087 | |||||||||
|
|
|
|
|
| |||||||
Total Value | $ | 42,087 | $ | 1,374,326 | $ | 1,416,413 | ||||||
|
|
|
|
|
| |||||||
| NET REALIZED GAIN (LOSS) |
| |||||||||||
| Foreign Currency Risk | Equity Risk | Total | ||||||||||
Futures Contracts(7) | $ | — | $ | (9,800,826 | ) | $ | (9,800,826 | ) | ||||
Forward Foreign Currency Contracts(6) | 1,478,708 | — | 1,478,708 | |||||||||
|
|
|
|
|
| |||||||
Total Realized Gain (Loss) | $ | 1,478,708 | $ | (9,800,826 | ) | $ | (8,322,118 | ) | ||||
|
|
|
|
|
| |||||||
| CHANGE IN APPRECIATION (DEPRECIATION) |
| |||||||||||
| Foreign Currency Risk | Equity Risk | Total | ||||||||||
Futures Contracts(12) | $ | — | $ | 3,401,830 | $ | 3,401,830 | ||||||
Forward Foreign Currency Contracts(11) | 146,907 | — | 146,907 | |||||||||
|
|
|
|
|
| |||||||
Total Change in Appreciation (Depreciation) | $ | 146,907 | $ | 3,401,830 | $ | 3,548,737 | ||||||
|
|
|
|
|
| |||||||
| NUMBER OF CONTRACTS, NOTIONAL AMOUNTS OR SHARES/UNITS(16) |
| |||||||||||
| Foreign Currency Risk | Equity Risk | Total | ||||||||||
Futures Contracts | — | 933 | 933 | |||||||||
Forward Foreign Currency Contracts | (19,714,853 | ) | — | (19,714,853 | ) | |||||||
Core Fixed
| ASSET DERIVATIVES |
| |||||||
| Interest Rate Risk | Total | |||||||
Options Purchased(1) | $ | 24,563 | $ | 24,563 | ||||
Futures Contracts(3) | 1,292,785 | 1,292,785 | ||||||
Centrally Cleared Swap Contracts** | 129,792 | 129,792 | ||||||
|
|
|
| |||||
Total Value | $ | 1,447,140 | $ | 1,447,140 | ||||
|
|
|
| |||||
230
Table of Contents
Mercer Funds
Notes to the Financial Statements (Continued)
March 31, 2019
| LIABILITY DERIVATIVES |
| |||||||
| Interest Rate Risk | Total | |||||||
Options Written(5) | $ | (6,000 | ) | $ | (6,000 | ) | ||
Futures Contracts(3) | (187,872 | ) | (187,872 | ) | ||||
Centrally Cleared Swap Contracts** | (414,030 | ) | (414,030 | ) | ||||
|
|
|
| |||||
Total Value | $ | (607,902 | ) | $ | (607,902 | ) | ||
|
|
|
| |||||
| NET REALIZED GAIN (LOSS) |
| |||||||
| Interest Rate Risk | Total | |||||||
Options Purchased(8) | $ | (22,388 | ) | $ | (22,388 | ) | ||
Options Written(9) | 6,467 | 6,467 | ||||||
Swaps Contracts(10) | 460,897 | 460,897 | ||||||
Futures Contracts(7) | 1,179,585 | 1,179,585 | ||||||
|
|
|
| |||||
Total Realized Gain (Loss) | $ | 1,624,561 | $ | 1,624,561 | ||||
|
|
|
| |||||
| CHANGE IN APPRECIATION (DEPRECIATION) |
| |||||||
| Interest Rate Risk | Total | |||||||
Options Purchased(13) | $ | 1,489 | $ | 1,489 | ||||
Options Written(14) | (133 | ) | (133 | ) | ||||
Swaps Contracts(15) | (1,228,628 | ) | (1,228,628 | ) | ||||
Futures Contracts(12) | 300,806 | 300,806 | ||||||
|
|
|
| |||||
Total Change in Appreciation (Depreciation) | $ | (926,466 | ) | $ | (926,466 | ) | ||
|
|
|
| |||||
| NUMBER OF CONTRACTS, NOTIONAL AMOUNTS OR SHARES/UNITS(16) |
| |||||||
| Interest Rate Risk | Total | |||||||
Options Purchased | 136,667 | 136,667 | ||||||
Options Written | (149,000 | ) | (149,000 | ) | ||||
Swaps Contracts | 326,684,900 | 326,684,900 | ||||||
Futures Contracts | 696 | 696 | ||||||
Opportunistic Fixed
| ASSET DERIVATIVES |
| |||||||||||||||||||
| Credit Risk | Foreign Currency Risk | Interest Rate Risk | Equity Risk | Total | ||||||||||||||||
Options Purchased(1) | $ | 19,768 | $ | 610,743 | $ | 329,687 | $ | 377,235 | $ | 1,337,433 | ||||||||||
Futures Contracts(3) | — | — | 636,844 | — | 636,844 | |||||||||||||||
Forward Foreign Currency Contracts(2) | — | 2,754,284 | — | — | 2,754,284 | |||||||||||||||
OTC Swaps Contracts | 493,832 | — | — | — | 493,832 | |||||||||||||||
Centrally Cleared Swap Contracts** | — | — | 29,033 | — | 29,033 | |||||||||||||||
|
|
|
|
|
|
|
|
|
| |||||||||||
Total Value | $ | 513,600 | $ | 3,365,027 | $ | 995,564 | $ | 377,235 | $ | 5,251,426 | ||||||||||
|
|
|
|
|
|
|
|
|
| |||||||||||
231
Table of Contents
Mercer Funds
Notes to the Financial Statements (Continued)
March 31, 2019
| LIABILITY DERIVATIVES |
| |||||||||||||||||||
| Credit Risk | Foreign Currency Risk | Interest Rate Risk | Equity Risk | Total | ||||||||||||||||
Options Written(5) | $ | (48,526 | ) | $ | (25,887 | ) | $ | (29,172 | ) | $ | (15,695 | ) | $ | (119,280 | ) | |||||
Forward Foreign Currency Contracts(4) | — | (3,216,602 | ) | — | — | (3,216,602 | ) | |||||||||||||
Futures Contracts(3) | — | — | (909,522 | ) | — | (909,522 | ) | |||||||||||||
OTC Swaps Contracts | (1,281,161 | ) | — | (285,360 | ) | — | (1,566,521 | ) | ||||||||||||
Centrally Cleared Swap Contracts** | (322,881 | ) | — | (1,815,718 | ) | — | (2,138,599 | ) | ||||||||||||
|
|
|
|
|
|
|
|
|
| |||||||||||
Total Value | $ | (1,652,568 | ) | $ | (3,242,489 | ) | $ | (3,039,772 | ) | $ | (15,695 | ) | $ | (7,950,524 | ) | |||||
|
|
|
|
|
|
|
|
|
| |||||||||||
| NET REALIZED GAIN (LOSS) |
| |||||||||||||||||||
| Credit Risk | Foreign Currency Risk | Interest Rate Risk | Equity Risk | Total | ||||||||||||||||
Options Purchased(8) | $ | (421,296 | ) | $ | (499,760 | ) | $ | (19,253 | ) | $ | 205,605 | $ | (734,704 | ) | ||||||
Options Written(9) | 40,115 | 47,660 | 40,237 | (19,436 | ) | 108,576 | ||||||||||||||
Swaps Contracts(10) | (950,961 | ) | — | (95,246 | ) | — | (1,046,207 | ) | ||||||||||||
Futures Contracts(7) | — | — | (1,059,568 | ) | — | (1,059,568 | ) | |||||||||||||
Forward Foreign Currency Contracts(6)† | — | (5,452,322 | ) | — | — | (5,452,322 | ) | |||||||||||||
|
|
|
|
|
|
|
|
|
| |||||||||||
Total Realized Gain (Loss) | $ | (1,332,142 | ) | $ | (5,904,422 | ) | $ | (1,133,830 | ) | $ | 186,169 | $ | (8,184,225 | ) | ||||||
|
|
|
|
|
|
|
|
|
| |||||||||||
| CHANGE IN APPRECIATION (DEPRECIATION) |
| |||||||||||||||||||
| Credit Risk | Foreign Currency Risk | Interest Rate Risk | Equity Risk | Total | ||||||||||||||||
Options Purchased(13) | $ | (288,181 | ) | $ | (193,756 | ) | $ | (166,726 | ) | $ | (117,114 | ) | $ | (765,777 | ) | |||||
Options Written(14) | 12,112 | 4,003 | (11,833 | ) | 12,543 | 16,825 | ||||||||||||||
Swaps Contracts(15) | (568,728 | ) | — | (2,072,045 | ) | — | (2,640,773 | ) | ||||||||||||
Futures Contracts(12) | — | — | (271,487 | ) | — | (271,487 | ) | |||||||||||||
Forward Foreign Currency Contracts(11)† | — | (253,772 | ) | — | — | (253,772 | ) | |||||||||||||
|
|
|
|
|
|
|
|
|
| |||||||||||
Total Change in Appreciation (Depreciation) | $ | (844,797 | ) | $ | (443,525 | ) | $ | (2,522,091 | ) | $ | (104,571 | ) | $ | (3,914,984 | ) | |||||
|
|
|
|
|
|
|
|
|
| |||||||||||
| NUMBER OF CONTRACTS, NOTIONAL AMOUNTS OR SHARES/UNITS(16) |
| |||||||||||||||||||
| Credit Risk | Foreign Currency Risk | Interest Rate Risk | Equity Risk | Total | ||||||||||||||||
Options Purchased | 39,200,000 | 51,087,938 | 7,990,375 | 13,025 | 98,291,338 | |||||||||||||||
Options Written | (24,725,000 | ) | (3,270,200 | ) | (2,977,286 | ) | (65,969 | ) | (31,038,455 | ) | ||||||||||
Swaps Contracts | 87,612,541 | — | 56,472,955 | — | 144,085,496 | |||||||||||||||
Futures Contracts | — | — | 1,036 | — | 1,036 | |||||||||||||||
Forward Foreign Currency Contracts† | — | (27,778,896 | ) | — | — | (27,778,896 | ) | |||||||||||||
232
Table of Contents
Mercer Funds
Notes to the Financial Statements (Continued)
March 31, 2019
Emerging Markets
| ASSET DERIVATIVES |
| |||||||||||
| Foreign Currency Risk | Equity Risk | Total | ||||||||||
Futures Contracts(3) | $ | — | $ | 283,942 | $ | 283,942 | ||||||
Forward Foreign Currency Contracts(2) | 2,601,065 | — | 2,601,065 | |||||||||
Synthetic Futures | — | 438,604 | 438,604 | |||||||||
|
|
|
|
|
| |||||||
Total Value | $ | 2,601,065 | $ | 722,546 | $ | 3,323,611 | ||||||
|
|
|
|
|
| |||||||
| LIABILITY DERIVATIVES |
| |||||||||||
| Foreign Currency Risk | Equity Risk | Total | ||||||||||
Forward Foreign Currency Contracts(4) | $ | (920,398 | ) | $ | — | $ | (920,398 | ) | ||||
Futures Contracts(3) | — | (59,611 | ) | (59,611 | ) | |||||||
Synthetic Futures | — | (72,495 | ) | (72,495 | ) | |||||||
|
|
|
|
|
| |||||||
Total Value | $ | (920,398 | ) | $ | (132,106 | ) | $ | (1,052,504 | ) | |||
|
|
|
|
|
| |||||||
| NET REALIZED GAIN (LOSS) |
| |||||||||||
| Foreign Currency Risk | Equity Risk | Total | ||||||||||
Futures Contracts(7)†† | $ | — | $ | (8,694,962 | ) | $ | (8,694,962 | ) | ||||
Forward Foreign Currency Contracts(6) | (7,071,037 | ) | — | (7,071,037 | ) | |||||||
|
|
|
|
|
| |||||||
Total Realized Gain (Loss) | $ | (7,071,037 | ) | $ | (8,694,962 | ) | $ | (15,765,999 | ) | |||
|
|
|
|
|
| |||||||
| CHANGE IN APPRECIATION (DEPRECIATION) |
| |||||||||||
| Foreign Currency Risk | Equity Risk | Total | ||||||||||
Futures Contracts(12)†† | $ | — | $ | (150,693 | ) | $ | (150,693 | ) | ||||
Forward Foreign Currency Contracts(11) | 1,772,163 | — | 1,772,163 | |||||||||
|
|
|
|
|
| |||||||
Total Change in Appreciation (Depreciation) | $ | 1,772,163 | $ | (150,693 | ) | $ | 1,621,470 | |||||
|
|
|
|
|
| |||||||
| NUMBER OF CONTRACTS, NOTIONAL AMOUNTS OR SHARES/UNITS(16) |
| |||||||||||
| Foreign Currency Risk | Equity Risk | Total | ||||||||||
Futures Contracts†† | — | 10,736,489 | 10,736,489 | |||||||||
Forward Foreign Currency Contracts | 28,886,551 | — | 28,886,551 | |||||||||
Global Low Volatility
| ASSET DERIVATIVES |
| |||||||||||
| Foreign Currency Risk | Equity Risk | Total | ||||||||||
Futures Contracts(3) | $ | — | $ | 627,228 | $ | 627,228 | ||||||
|
|
|
|
|
| |||||||
Total Value | $ | — | $ | 627,228 | $ | 627,228 | ||||||
|
|
|
|
|
| |||||||
233
Table of Contents
Mercer Funds
Notes to the Financial Statements (Continued)
March 31, 2019
| LIABILITY DERIVATIVES |
| |||||||||||
| Foreign Currency Risk | Equity Risk | Total | ||||||||||
Futures Contracts(3) | $ | (1,855 | ) | $ | — | $ | (1,855 | ) | ||||
|
|
|
|
|
| |||||||
Total Value | $ | (1,855 | ) | $ | — | $ | (1,855 | ) | ||||
|
|
|
|
|
| |||||||
| NET REALIZED GAIN (LOSS) |
| |||||||||||
| Foreign Currency Risk | Equity Risk | Total | ||||||||||
Futures Contracts(7) | $ | (12,126 | ) | $ | (1,436,957 | ) | $ | (1,449,083 | ) | |||
|
|
|
|
|
| |||||||
Total Realized Gain (Loss) | $ | (12,126 | ) | $ | (1,436,957 | ) | $ | (1,449,083 | ) | |||
|
|
|
|
|
| |||||||
| CHANGE IN APPRECIATION (DEPRECIATION) |
| |||||||||||
| Foreign Currency Risk | Equity Risk | Total | ||||||||||
Futures Contracts(12) | $ | (12,050 | ) | $ | 1,757,824 | $ | 1,745,774 | |||||
|
|
|
|
|
| |||||||
Total Change in Appreciation (Depreciation) | $ | (12,050 | ) | $ | 1,757,824 | $ | 1,745,774 | |||||
|
|
|
|
|
| |||||||
| NUMBER OF CONTRACTS, NOTIONAL AMOUNTS OR SHARES/UNITS(16) |
| |||||||||||
| Foreign Currency Risk | Equity Risk | Total | ||||||||||
Futures Contracts | 14 | 221 | 235 | |||||||||
| ** | Centrally Cleared Swaps are valued at unrealized appreciation/depreciation on the Schedule of Investments. Only current day’s variation margin, if any, is reported on the Statement of Assets and Liabilities. |
| † | Includes Cross Currency Foreign Currency Contracts. |
| †† | Includes Synthetic Futures. |
| (1) | Statements of Assets and Liabilities location: Investments, at value. |
| (2) | Statements of Assets and Liabilities location: Unrealized appreciation on open forward foreign currency contracts. |
| (3) | Cumulative appreciation (depreciation) on futures contracts is disclosed within the Schedule of Investments under the open “Futures Contracts” section. Only current day’s variation margin, if any, are reported within the Statements of Assets and Liabilities. Synthetic futures are presented as Synthetic futures, at value within the Statements of Assets and Liabilities. |
| (4) | Statements of Assets and Liabilities location: Unrealized depreciation on open forward foreign currency contracts. |
| (5) | Statements of Assets and Liabilities location: Written options, at value. |
| (6) | Statements of Operations location: Amounts are included in Net realized gain (loss) on Forward foreign currency contracts. |
| (7) | Statements of Operations location: Amounts are included in Net realized gain (loss) on Closed futures contracts. |
| (8) | Statements of Operations location: Amounts are included in Net realized gain (loss) on Purchased option contracts. |
234
Table of Contents
Mercer Funds
Notes to the Financial Statements (Continued)
March 31, 2019
| (9) | Statements of Operations location: Amounts are included in Net realized gain (loss) on Written option contracts. |
| (10) | Statements of Operations location: Amounts are included in Net realized gain (loss) on Swap contracts. |
| (11) | Statements of Operations location: Amounts are included in Change in net unrealized appreciation (depreciation) on Forward foreign currency contracts. |
| (12) | Statements of Operations location: Amounts are included in Change in net unrealized appreciation (depreciation) on Open futures contracts. |
| (13) | Statements of Operations location: Amounts are included in Change in net unrealized appreciation (depreciation) on Purchased option contracts. |
| (14) | Statements of Operations location: Amounts are included in Change in net unrealized appreciation (depreciation) on Written option contracts. |
| (15) | Statements of Operations location: Amounts are included in Change in net unrealized appreciation (depreciation) on Swap contracts. |
| (16) | Amounts disclosed represent average number of contracts, notional amounts, or shares outstanding for the time period that the Fund held such derivatives during the year ended March 31, 2019. |
Netting Agreements and Collateral Requirements
In order to better define contractual rights under derivative contracts and to secure rights that will help the Funds mitigate their counterparty risk, asub-adviser may, on behalf of the Funds, enter into an International Swaps and Derivatives Association, Inc. Master Agreement (“ISDA Master Agreement”) or similar agreement with its derivative contract counterparties. An ISDA Master Agreement is a bilateral agreement between the Funds and a counterparty that governs OTC derivatives and foreign exchange contracts and typically contains, among other things, collateral posting terms and netting provisions in the event of a default and/or termination event. Under an ISDA Master Agreement, the Funds may, under certain circumstances, offset with the counterparty certain derivative financial instrument’s payables and/or receivables with certain collateral held and/or posted and create a net payment. The provisions of the ISDA Master Agreement typically permit a net payment in the event of default including the bankruptcy or insolvency of the counterparty. Absent an event of default by the counterparty or termination of the agreement, the ISDA Master Agreement does not result in an offset of reported amounts of assets and liabilities in the Statement of Assets and Liabilities across the transactions between the Funds and the applicable counterparty. The right to offset and net payments across all transactions traded under the ISDA Master Agreement could result in a reduction of the Funds’ credit risk to such counterparty equal to any amounts payable by the Funds under the applicable transactions, if any. However, bankruptcy or insolvency laws of a particular jurisdiction may impose restrictions on or prohibitions against the right of offset in bankruptcy, insolvency or other events. In addition, certain ISDA Master Agreements allow counterparties to OTC derivatives to terminate derivative contracts prior to maturity in the event a Fund’s net assets decline by a stated percentage or the Funds fail to meet the terms of their ISDA Master Agreements, which would cause the Funds to accelerate payment of any net liability owed to the counterparty.
For derivatives traded under an ISDA Master Agreement, the collateral requirements are typically calculated by netting the mark to market amount for each transaction under such agreement and comparing that amount to the value of any collateral currently pledged by the Funds and the counterparty.
Cash collateral that has been pledged to cover obligations of the Funds and cash collateral received from the counterparty, if any, is reported separately on the Statement of Assets and Liabilities as cash
235
Table of Contents
Mercer Funds
Notes to the Financial Statements (Continued)
March 31, 2019
collateral held at broker or cash collateral due to broker, respectively.Non-cash collateral pledged by or received by the Funds, if any, is noted in the Schedule of Investments. Generally, the amount of collateral due from or to a party has to exceed a minimum transfer amount threshold before a transfer is required, which is determined each day at the close of business of the Funds, typically based on changes in market values for each transaction under an ISDA Master Agreement and netted into one amount for such agreement and any additional required collateral is delivered to/pledged by the Funds on the next business day. Typically, the Funds and counterparties are not permitted to sell,re-pledge or use the collateral they receive. To the extent amounts due to the Funds from their counterparties are not fully collateralized, contractually or otherwise, the Funds bear the risk of loss from counterpartynon-performance. The Funds attempt to mitigate counterparty risk by entering into agreements only with counterparties that they believe have the financial resources to honor their obligations and by monitoring the financial stability of those counterparties.
The Funds are required to disclose both gross and net information for assets and liabilities related to derivatives, repurchase and reverse repurchase agreements, and securities lending and securities borrowings transactions that are eligible for offset or subject to an enforceable master netting or similar agreement. The Funds’ derivative assets and liabilities at fair value by risk are presented in the tables above. For financial reporting purposes the Funds do not offset derivative assets and derivative liabilities that are subject to netting arrangements in the Statements of Assets and Liabilities.
The following tables present the Funds’ derivative assets and liabilities by counterparty, net of amounts available for offset under a Master Netting Agreement (“MNA”) and net of related collateral received by the Funds for assets or pledged by the Funds for liabilities as of March 31, 2019.
Non-US Core Equity
Offsetting of Financial Assets and Derivative Assets:
Counterparty | Derivative Assets Subject to MNA | Derivative Assets/(Liabilities) available for offset | Cash Collateral Received* | Net Amount of Derivative Assets(a) | ||||||||||||
Citibank N.A. | $ | 42,087 | $ | — | $ | — | $ | 42,087 | ||||||||
|
|
|
|
|
|
|
| |||||||||
| $ | 42,087 | $ | — | $ | — | $ | 42,087 | |||||||||
|
|
|
|
|
|
|
| |||||||||
| (a) | Represents the net amount receivable from the counterparty in the event of default. |
| * | In some instances, the actual collateral received and/or pledged may be more than the derivative asset or liability due to overcollateralization. |
Opportunistic Fixed
Offsetting of Financial Assets and Derivative Assets:
Counterparty | Derivative Assets Subject to MNA | Derivative Assets/(Liabilities) available for offset | Cash Collateral Received* | Net Amount of Derivative Assets(a) | ||||||||||||
Bank of America N.A. | $ | 191,915 | $ | (126,926 | ) | $ | — | $ | 64,989 | |||||||
Barclays Bank Plc | 400,642 | (193,756 | ) | (100,000 | ) | 106,886 | ||||||||||
BNP Paribas S.A. | 233,910 | (190,421 | ) | — | 43,489 | |||||||||||
Citibank N.A. | 259,533 | (259,533 | ) | — | — | |||||||||||
Credit Suisse | 53,301 | (11,445 | ) | — | 41,856 | |||||||||||
Deutsche Bank AG | 173,119 | (173,119 | ) | — | — | |||||||||||
236
Table of Contents
Mercer Funds
Notes to the Financial Statements (Continued)
March 31, 2019
Counterparty | Derivative Assets Subject to MNA | Derivative Assets/(Liabilities) available for offset | Cash Collateral Received* | Net Amount of Derivative Assets(a) | ||||||||||||
Goldman Sachs & Co. | $ | 12,867 | $ | — | $ | — | $ | 12,867 | ||||||||
HSBC Bank Plc | 311,797 | (311,797 | ) | — | — | |||||||||||
HSBC Bank USA, N.A. | 536,960 | (237,957 | ) | — | 299,003 | |||||||||||
JPMorgan Chase Bank N.A. | 1,259,102 | (1,259,102 | ) | — | — | |||||||||||
Merrill Lynch Capital Services, Inc. | 3,722 | (3,722 | ) | — | — | |||||||||||
Morgan Stanley & Co. | 318,450 | (318,450 | ) | — | — | |||||||||||
Natwest Markets Plc | 87,118 | (87,118 | ) | — | — | |||||||||||
State Street Bank London | 19,185 | (19,185 | ) | — | — | |||||||||||
Toronto Dominion Bank | 9,049 | (9,049 | ) | — | — | |||||||||||
UBS AG London | 7,957 | — | — | 7,957 | ||||||||||||
|
|
|
|
|
|
|
| |||||||||
| $ | 3,878,627 | $ | (3,201,580 | ) | $ | (100,000 | ) | $ | 577,047 | |||||||
|
|
|
|
|
|
|
| |||||||||
Offsetting of Financial Liabilities and Derivative Liabilities:
Counterparty | Derivative Liabilities Subject to MNA | Derivative Assets/(Liabilities) available for offset | Cash Collateral Pledged* | Net Amount of Derivative Liabilities(b) | ||||||||||||
Bank of America N.A. | $ | (126,926 | ) | $ | 126,926 | $ | — | $ | — | |||||||
Barclays Bank Plc | (193,756 | ) | 193,756 | — | — | |||||||||||
BNP Paribas S.A. | (190,421 | ) | 190,421 | — | — | |||||||||||
Citibank N.A. | (294,188 | ) | 259,533 | 34,655 | — | |||||||||||
Credit Suisse | (11,445 | ) | 11,445 | — | — | |||||||||||
Deutsche Bank AG | (180,468 | ) | 173,119 | 7,349 | — | |||||||||||
HSBC Bank Plc | (450,292 | ) | 311,797 | 40,000 | (98,495 | ) | ||||||||||
HSBC Bank USA, N.A. | (237,957 | ) | 237,957 | — | — | |||||||||||
HSBC Sec. New York | (283,489 | ) | — | — | (283,489 | ) | ||||||||||
JPMorgan Chase Bank N.A. | (2,200,074 | ) | 1,259,102 | 887,282 | (53,690 | ) | ||||||||||
JPMorgan Chase Bank N.A. London | (94,812 | ) | — | 94,812 | — | |||||||||||
Merrill Lynch Capital Services, Inc. | (51,762 | ) | 3,722 | — | (48,040 | ) | ||||||||||
Morgan Stanley & Co. | (353,161 | ) | 318,450 | 34,711 | — | |||||||||||
Natwest Markets Plc | (94,598 | ) | 87,118 | — | (7,480 | ) | ||||||||||
State Street Bank London | (27,783 | ) | 19,185 | — | (8,598 | ) | ||||||||||
Toronto Dominion Bank | (66,404 | ) | 9,049 | — | (57,355 | ) | ||||||||||
|
|
|
|
|
|
|
| |||||||||
| $ | (4,857,536 | ) | $ | 3,201,580 | $ | 1,098,809 | $ | (557,147 | ) | |||||||
|
|
|
|
|
|
|
| |||||||||
| (a) | Represents the net amount receivable from the counterparty in the event of default. |
| (b) | Represents the net amount payable to the counterparty in the event of default. |
| * | In some instances, the actual collateral received and/or pledged may be more than the derivative asset or liability due to overcollateralization. |
237
Table of Contents
Mercer Funds
Notes to the Financial Statements (Continued)
March 31, 2019
Emerging Markets
Offsetting of Financial Assets and Derivative Assets:
Counterparty | Derivative Assets Subject to MNA | Derivative Assets/(Liabilities) available for offset | Cash Collateral Received* | Net Amount of Derivative Assets(a) | ||||||||||||
Citibank N.A. London | $ | 2,601,065 | $ | (920,398 | ) | $ | (1,680,667 | ) | $ | — | ||||||
Goldman Sachs International | 438,604 | (72,495 | ) | — | 366,109 | |||||||||||
|
|
|
|
|
|
|
| |||||||||
| $ | 3,039,669 | $ | (992,893 | ) | $ | (1,680,667 | ) | $ | 366,109 | |||||||
|
|
|
|
|
|
|
| |||||||||
Offsetting of Financial Liabilities and Derivative Liabilities:
Counterparty | Derivative Liabilities Subject to MNA | Derivative Assets/(Liabilities) available for offset | Cash Collateral Pledged* | Net Amount of Derivative Liabilities(b) | ||||||||||||
Citibank N.A. London | $ | (920,398 | ) | $ | 920,398 | $ | — | $ | — | |||||||
Goldman Sachs International | (72,495 | ) | 72,495 | — | — | |||||||||||
|
|
|
|
|
|
|
| |||||||||
| $ | (992,893 | ) | $ | 992,893 | $ | — | $ | — | ||||||||
|
|
|
|
|
|
|
| |||||||||
| (a) | Represents the net amount receivable from the counterparty in the event of default. |
| (b) | Represents the net amount payable to the counterparty in the event of default. |
| * | In some instances, the actual collateral received and/or pledged may be more than the derivative asset or liability due to overcollateralization. |
(b) Security transactions and related investment income
Security transactions are accounted for on trade date. Dividend income, net of applicable withholding taxes, is recorded on theex-dividend date or when the Fund is informed of theex-dividend date, if later. Interest income is recorded on the accrual basis, and is adjusted for amortization of premium and discounts for debt securities. Income is not recognized, nor are premium and discount amortized, on securities for which collection is not expected. Withholding taxes on foreign dividend, interest, and capital gains have been provided for in accordance with the respective country’s tax rules and rates.Non-cash dividends, if any, are recorded at the fair value of the securities received. Interest income on inflation indexed securities is accrued daily based upon an inflation-adjusted principal. Additionally, any increase in the principal or face amount of these securities is recorded as interest income. In determining the net gain or loss on securities sold, the cost of securities is determined on the identified-cost basis.
(c) Cash, cash equivalents and short term investments
A Fund may invest a portion of its assets in cash and cash equivalents. Cash and cash equivalents are defined as cash and bank balances as well as short-term investments with a maturity of less than three months from the acquisition date.
A Fund may invest a portion of its assets in short-term debt securities (including repurchase agreements and reverse repurchase agreements) of corporations, the U.S. government and its agencies and instrumentalities and banks and finance companies, which may be denominated in any currency.
A Fund may invest a portion of its assets in shares issued by money market mutual funds. A Fund also may invest in collective investment vehicles that are managed by an unaffiliated investment manager,
238
Table of Contents
Mercer Funds
Notes to the Financial Statements (Continued)
March 31, 2019
pending investment of the Fund’s assets in portfolio securities. When unusual market conditions warrant, a Fund may make substantial temporary defensive investments in cash equivalents, up to a maximum of 100% of the Fund’s net assets. Cash equivalent holdings may be in any currency. When a Fund invests for temporary defensive purposes, such investments may affect the Fund’s ability to achieve its investment objective.
(d) Securities lending
A Fund may lend its portfolio securities to qualified broker/dealers and financial institutions pursuant to agreements, provided: (1) the loan is secured continuously by collateral marked to market daily and maintained in an amount at least equal to the current fair value of the securities loaned; (2) the Fund may call the loan at any time and receive the securities loaned; (3) the Fund will receive any interest or dividends paid on the loaned securities; and (4) the aggregate fair value of securities loaned will not at any time exceed 33 1/3% of the total assets of the Fund. Collateral will consist of U.S. andnon-U.S. securities, cash equivalents or irrevocable letters of credit. A liability for cash collateral is reflected in the Statements of Assets and Liabilities, and is categorized as Level 1 within the fair value hierarchy. As with other extensions of credit, there are risks of delay in recovery or even loss of rights in collateral in the event of default or insolvency of a borrower of a Fund’s portfolio securities. A Fund may not retain voting rights on securities while they are on loan.
Certain Funds may from time to time participate in a securities lending program under which the Funds’ custodian, State Street Bank and Trust Company (the “Custodian”) acting as securities lending agent, is authorized to lend Fund portfolio securities to qualified broker/dealers and financial institutions that post appropriate collateral. The Custodian has agreed to indemnify the Funds in case of default of any security borrower.
Securities on loan are fully collateralized and the collateral was equal to or exceeded the securities on loan at March 31, 2019. If the market value of the collateral at the close of trading on a business day is less than 100% of the market value of the loaned securities at the close of trading on that day, the borrower shall be required to deliver, by the close of business on the following business day, an additional amount of collateral, so that the total amount of posted collateral is equal to at least 100% of the market value of all the loaned securities as of such preceding day. Cash collateral is invested in the State Street Institutional U.S. Government Money Market Fund, Premier Class. The Custodian receives a portion of the interest earned on any reinvested collateral. The market value of securities on loan to borrowers and the value of collateral held by the Funds with respect to such loans at March 31, 2019 were as follows:
| Market Value of Loaned Securities | Value of Cash Collateral | Value of Non-Cash Collateral | ||||||||||
Large Cap | $ | 23,880,189 | $ | 6,158,462 | $ | 18,117,904 | ||||||
Small/Mid Cap | 65,557,775 | 2,502,353 | 64,268,452 | |||||||||
Non-US Core Equity | 95,020,855 | 56,574,708 | 43,445,397 | |||||||||
Core Fixed | 14,114,102 | 6,309,277 | 8,081,878 | |||||||||
Opportunistic Fixed | 15,522,169 | 7,793,870 | 8,049,853 | |||||||||
Emerging Markets | 19,707,305 | 6,377,010 | 14,223,093 | |||||||||
Global Low Volatility | 27,015,409 | 18,747,378 | 9,400,994 | |||||||||
For Large Cap, Small/Mid Cap,Non-US Core Equity, Emerging Markets and Global Low Volatility, all of the securities on loan collateralized by cash are classified as Common Stocks in each Fund’s Schedule of Investments at March 31, 2019, with a contractual maturity of overnight and continuous.
239
Table of Contents
Mercer Funds
Notes to the Financial Statements (Continued)
March 31, 2019
For Core Fixed and Opportunistic Fixed, the values of the security loan obligations are classified as follows at March 31, 2019:
Core Fixed
| Remaining Contractual Maturity of the Agreements As of March 31, 2019 | ||||||||||||||||||||
| Overnight and Continuous | <30 days | Between 30 & 90 days | >90 days | Total | ||||||||||||||||
Securities Lending Transactions |
| |||||||||||||||||||
Corporate Debt | $ | 5,848,004 | $ | — | $ | — | $ | — | $ | 5,848,004 | ||||||||||
Sovereign Debt Obligations | 461,273 | — | — | — | 461,273 | |||||||||||||||
|
|
|
|
|
|
|
|
|
| |||||||||||
Total | $ | 6,309,277 | $ | — | $ | — | $ | — | $ | 6,309,277 | ||||||||||
|
|
|
|
|
|
|
|
|
| |||||||||||
Total Borrowings | $ | 6,309,277 | $ | — | $ | — | $ | — | $ | 6,309,277 | ||||||||||
|
|
|
|
|
|
|
|
|
| |||||||||||
Gross amount of recognized liabilities for securities lending transactions |
| $ | 6,309,277 | |||||||||||||||||
|
| |||||||||||||||||||
Opportunistic Fixed
| Remaining Contractual Maturity of the Agreements As of March 31, 2019 | ||||||||||||||||||||
| Overnight and Continuous | <30 days | Between 30 & 90 days | >90 days | Total | ||||||||||||||||
Securities Lending Transactions |
| |||||||||||||||||||
Corporate Debt | $ | 7,143,640 | $ | — | $ | — | $ | — | $ | 7,143,640 | ||||||||||
Preferred Stocks | 15,667 | — | — | — | 15,667 | |||||||||||||||
Sovereign Debt Obligations | 634,563 | — | — | — | 634,563 | |||||||||||||||
|
|
|
|
|
|
|
|
|
| |||||||||||
Total | $ | 7,793,870 | $ | — | $ | — | $ | — | $ | 7,793,870 | ||||||||||
|
|
|
|
|
|
|
|
|
| |||||||||||
Total Borrowings | $ | 7,793,870 | $ | — | $ | — | $ | — | $ | 7,793,870 | ||||||||||
|
|
|
|
|
|
|
|
|
| |||||||||||
Gross amount of recognized liabilities for securities lending transactions |
| $ | 7,793,870 | |||||||||||||||||
|
| |||||||||||||||||||
(e) Swaps
Swap contracts are derivatives in the form of a contract or similar instrument, which is an agreement to exchange the return generated by one instrument for the return generated by another instrument. A Fund may engage in swaps, including, but not limited to, interest rate, currency, credit default, and index swaps, and the purchase or sale of related caps, floors, collars, and other derivative instruments. A Fund expects to enter into these transactions to preserve a return or spread on a particular investment or portion of the portfolio, to modify the portfolio’s duration, to protect against any increase in the price of securities the Fund anticipates purchasing at a later date, or to gain exposure to certain markets in the most economical way possible.
Interest rate swaps involve the exchange by a Fund with another party of their respective commitments to receive or pay interest (e.g., an exchange of fixed rate payments for floating rate payments) with respect to a notional amount of principal.Up-front payments received or made are reflected as“up-front net premiums received” or“up-front net premiums paid”, respectively, on the Statement of Assets and Liabilities. Currency swaps involve the exchange of cash flows on a notional amount based on changes in the values of referenced currencies.
240
Table of Contents
Mercer Funds
Notes to the Financial Statements (Continued)
March 31, 2019
The credit default swap agreements may have as reference obligations one or more securities that are not currently held by a Fund. The protection “buyer” in a credit default swap agreement is generally obligated to pay the protection “seller” an upfront or a periodic stream of payments over the term of the contract provided that no credit event, such as a default, on a reference obligation has occurred. If a credit event occurs, the seller generally must pay the buyer the “par value” (full notional value) of the swap in exchange for an equal face amount of deliverable obligations of the reference entity described in the swap, or the seller may be required to deliver the related net cash amount, if the swap is cash settled. A Fund may be either the buyer or seller in the transaction. If a Fund is a buyer and no credit event occurs, the Fund may recover nothing if the swap is held through its termination date. However, if a credit event occurs, the buyer generally may elect to receive the full notional value of the swap in exchange for an equal face amount of deliverable obligations of the reference entity whose value may have significantly decreased. As a seller, a Fund generally receives an upfront payment or a fixed rate of income throughout the term of the swap provided that there is no credit event. As the seller, a Fund would effectively add leverage to its portfolio because, in addition to its total net assets, a Fund would be subject to investment exposure on the notional amount of the swap.
The spread of a credit default swap is the annual amount the protection buyer must pay the protection seller over the length of the contract, expressed as a percentage of the notional amount. When spreads rise, market perceived credit risk rises and when spreads fall, market perceived credit risk falls. Wider credit spreads and decreasing market values, when compared to the notional amount of the swap, represent a deterioration of the referenced entity’s credit worthiness and an increased market perception that there is a greater likelihood of risk of default or other credit event occurring as defined under the terms of the agreement. For credit default swap agreements on asset-backed securities and credit indices, the quoted market prices and resulting values, as well as the annual payment rates, serve as an indication of the current status of the payment/performance risk.
Swaps do not involve the delivery of securities or other underlying assets or principal, and are subject to counterparty risk. If the other party to a swap defaults and fails to consummate the transaction, a Fund’s risk of loss consists of the net amount of interest payments that the Fund is contractually entitled to receive.
The equity swaps in which the Funds may invest involve agreements with a counterparty. The return to the Funds on any equity swap contract will be the total return on the notional amount of the contract as if it were invested in the stocks comprising the contract index in exchange for an interest component based on the notional amount of the agreement. The Funds will only enter into an equity swap contract on a net basis,i.e., the two parties’ obligations are netted out, with the Funds paying or receiving, as the case may be, only the net amount of the payments. Payments under an equity swap contract may be made at the conclusion of the contract or periodically during its term.
Whether a Fund’s use of swap agreements or swap options will be successful in achieving the Fund’s investment objective will depend on the Subadvisor’s ability to predict correctly whether certain types of investments are likely to produce greater returns than other investments. Moreover, a Fund bears the risk of loss of the amount expected to be received under a swap agreement in the event of the default or bankruptcy of a swap agreement counterparty. The Funds will enter into swap agreements only with counterparties that meet certain standards of creditworthiness.
If there is a default by the counterparty to a swap contract, a Fund will be limited to contractual remedies pursuant to the agreements related to the transaction. There is no assurance that a swap contract counterparty will be able to meet its obligations pursuant to a swap contract or that, in the event
241
Table of Contents
Mercer Funds
Notes to the Financial Statements (Continued)
March 31, 2019
of a default, a Fund will succeed in pursuing contractual remedies. A Fund thus assumes the risk that it may be delayed in, or prevented from, obtaining payments owed to it pursuant to a swap contract. However, the amount at risk is only the net unrealized gain, if any, on the swap at the time of default, and not the entire notional amount. The Subadvisor that enters into the swap agreementwill closely monitor, subject to the oversight of the Board, the creditworthiness of swap counterparties in order to minimize the counterparty risk of swaps.
Because swaps are two party contracts that may be subject to contractual restrictions on transferability and termination, and they may have terms of greater than seven days, swap agreements may be considered to be illiquid and subject to a Fund’s limitation on investments in illiquid securities. However, the Trust has adopted procedures pursuant to which the Advisor may determine that swaps (including swap options) are liquid under certain circumstances. To the extent that a swap is not liquid, it may not be possible to initiate a transaction or liquidate a position at an advantageous time or price, which may result in significant losses.
Under the Dodd-Frank Wall Street Reform and Consumer Protection Act (the “Dodd-Frank Act”) enacted in 2010, a regulatory framework for certain OTC derivatives, such as swaps was enacted. The Dodd-Frank Act requires certain swap transactions to be executed on registered exchanges or through swap execution facilities, cleared through a regulated clearinghouse, and publicly reported. In addition, many market participants who were not previously required to register are regulated as swap dealers or swap participants, and are subject to certain minimum capital and margin requirements and business conduct standards.
The swaps market is largely unregulated. It is possible that developments in the swaps market, including potential government regulation, could adversely affect the Funds’ ability to terminate existing swap agreements or to realize amounts to be received under such agreements.
Certain clearinghouses currently offer clearing for limited types of derivatives transactions, principally credit and interest derivatives. In a cleared derivative transaction, a Fund typically enters into the transaction with a financial institution counterparty, and performance of the transaction is effectively guaranteed by a central clearinghouse, thereby reducing or eliminating the Fund’s exposure to the credit risk of the original counterparty.
The Fund typically will be required to post specified levels of margin with the clearinghouse or at the instruction of the clearinghouse; the margin required by a clearinghouse may be greater than the margin the Fund would be required to post in an uncleared derivative transaction. Cash margin is recorded on the Statements of Assets and Liabilities as cash collateral held at broker on open swap contracts. Swap agreements are marked to market daily. Daily changes in valuation of centrally cleared swaps, if any, are recorded as a variation margin payable or receivable for the change in value as appropriate on the Statements of Assets and Liabilities. Only a limited number of derivative transactions are currently eligible for clearing by clearinghouses.
A Fund will accrue for interim payments on swap contracts on a daily basis, with the net amount recorded as interest payable or receivable on the Statements of Assets and Liabilities. Once interim payments are settled in cash, the net amount is recorded as realized gain/loss on swap contracts, in addition to realized gain/loss recorded upon the termination of swap contracts on the Statements of Operations. Fluctuations in the value of swap contracts are recorded for financial statement purposes as unrealized appreciation or depreciation of swap contracts (swap contracts, at value on the Statements of Assets and Liabilities).
242
Table of Contents
Mercer Funds
Notes to the Financial Statements (Continued)
March 31, 2019
Swap agreements are marked to market daily. The change in value, if any, is recorded as unrealized gain or loss in the Statements of Operations. A liquidation payment received or made at the termination of the swap is recorded as realized gain or loss in the Statements of Operations. Net periodic payments are included as part of realized gain (loss) on the Statements of Operations.
The swaps in which the Fund may engage may include instruments under which one party pays a single or periodic fixed amount(s) (or premium), and the other party pays periodic amounts based on the movement of a specified index. The Fund’s maximum risk of loss from counterparty credit risk, as opposed to investment and other types of risk, in respect of swaps is typically the discounted net value of the cash flows to be received from the counterparty over the contract’s remaining life to the extent that such amount is positive, plus the cost of entering into a similar transaction with another counterparty, if possible.
The use of swaps is a highly specialized activity that involves investment techniques and risks different from those associated with ordinary portfolio securities transactions. If the Advisor or Subadvisor is incorrect in its forecasts of market values, interest rates, and currency exchange rates, the investment performance of the Fund would be less favorable than it would have been if this investment technique were not used.
Like most other investments, swap agreements are subject to the risk that the market value of the instrument will change in a way detrimental to a Fund’s interest. A Fund bears the risk that Subadvisor will not accurately forecast future market trends or the values of assets, reference rates, indexes, or other economic factors in establishing swap positions for the Fund. If a Subadvisor attempts to use a swap as a hedge against, or as a substitute for, a portfolio investment, the Fund will be exposed to the risk that the swap will have or will develop imperfect or no correlation with the portfolio investment. This could cause substantial losses for the Fund. While hedging strategies involving swap instruments can reduce the risk of loss, they can also reduce the opportunity for gain or even result in losses by offsetting favorable price movements in other Fund investments.
During the year ended March 31, 2019, Core Fixed and Opportunistic Fixed used swap agreements to adjust interest rate and yield curve exposure or to manage credit exposure. See the Core Fixed and Opportunistic Fixed Schedules of Investments for a listing of open swap agreements as of March 31, 2019.
(f) Futures
A futures contract is a contractual agreement to buy or sell a specific amount of a commodity or financial instrument at a predetermined price on a stipulated future date. A Fund may enter into contracts for the purchase or sale for future delivery of securities, indices and foreign currencies. Futures contracts may be opened to protect against the adverse effects of fluctuations in security prices, interest rates, or foreign exchange rates without actually buying or selling the securities or foreign currency. A Fund also may enter into futures contracts as a low cost method for gaining or reducing exposure to a particular currency or securities market without directly investing in those currencies or securities.
A purchase of a futures contract means the acquisition of a contractual right of a Fund to obtain delivery of the securities or foreign currency underlying the contract at a specified price on a specified future date. When a futures contract is sold, a Fund incurs a contractual obligation to deliver the securities or foreign currency underlying the contract at a specified price on a specified date.
243
Table of Contents
Mercer Funds
Notes to the Financial Statements (Continued)
March 31, 2019
When a Fund enters into a futures contract, it must deliver to the futures commission merchant selected by the Fund an amount referred to as “initial margin.” This amount is maintained by the futures commission merchant in a segregated account at the custodian bank. Futures contracts are marked to market daily, depending upon changes in the price of the underlying securities subject to the futures contracts, and the change in value is recorded by the Fund as a variation margin payable or receivable on the Statements of Assets and Liabilities. The Fund recognizes gains and losses on futures contracts in addition to the variation margin, which gains and losses are considered realized at the time the contracts expire or close.
A Fund may enter into futures transactions on domestic exchanges and, to the extent such transactions have been approved by the Commodity Futures Trading Commission (“CFTC”) for sale to customers in the United States, or on foreign exchanges. In addition, a Fund may sell stock index futures in anticipation of, or during a market decline to attempt to offset the decrease in the market value of the Fund’s common stocks that might otherwise result, and a Fund may purchase such contracts in order to offset increases in the cost of common stocks that it intends to purchase. Unlike other futures contracts, a stock index futures contract specifies that no delivery of the actual stocks making up the index will take place. Instead, settlement in cash must occur upon the termination of the contract.
In entering into futures contracts and options on futures contracts, there is a credit risk that a counterparty will not be able to meet its obligations to the Fund. The counterparty for futures contracts and options on futures contracts traded in the United States and on most foreign futures exchanges is the clearinghouse associated with such exchange. In general, clearinghouses are backed by the corporate members of the clearinghouse who are required to share any financial burden resulting from thenon-performance by one of its members and, as such, should significantly reduce this credit risk. In cases where the clearinghouse is not backed by the clearing members (i.e., some foreign exchanges), it is normally backed by a consortium of banks or other financial institutions. There can be no assurance that any counterparty, clearing member or clearinghouse will be able to meet its obligations to the Fund.
While futures contracts provide for the delivery of securities, deliveries usually do not occur. Contracts are generally terminated by entering into offsetting transactions.
Where the futures market is not as developed or where the regulations prevent or make it disadvantageous to trade futures, Emerging Markets will utilize synthetic futures as part of the country selection strategy implementation. A synthetic future operates like a total return swap transaction in which there’s a commitment to receive positive or negative returns in exchange for equity index futures. If the underlying asset declines in value over the term of the total return swap, the Fund may also be required to pay the dollar value of that decline to the counterparty. These are marked to market daily and the change in value is recorded as unrealized gain or loss in the Statement of Operations.
During the year ended March 31, 2019, Large Cap, Small/Mid Cap,Non-US Core Equity, Emerging Markets and Global Low Volatility used futures to equitize cash. Core Fixed and Opportunistic Fixed used futures to adjust interest rate exposure and replicate government bond positions. Emerging Markets also used futures to create passive index exposure to certain domestic emerging market country indices in the Fund. See each Fund’s Schedule of Investments for a listing of open futures contracts as of March 31, 2019.
(g) Options
The Funds may purchase and sell (write) put and call options on debt securities, currencies and indices to enhance investment performance, manage duration, or protect against changes in market prices. The
244
Table of Contents
Mercer Funds
Notes to the Financial Statements (Continued)
March 31, 2019
Funds may also buy and sell combinations of put and call options on the same underlying security, currency or index. Short (sold) options positions will generally be hedged by the Funds with cash, cash equivalents, current portfolio security holdings, or other options or futures positions.
The Funds may enter into swap options (“swaptions”). A swaption is a contract that gives a counterparty the right (but not the obligation), in return for payment of a premium, to enter into a new swap agreement or to shorten, extend, cancel, or otherwise modify an existing swap agreement, at some designated future time on specified terms. Each Fund may sell (write) and purchase put and call swaptions. Depending on the terms of the particular option agreement, a Fund generally will incur a greater degree of risk when the Fund writes a swaption than the Fund will incur when it purchases a swaption. When a Fund purchases a swaption, the Fund’s risk of loss is limited to the amount of the premium it has paid should it decide to let the swaption expire unexercised. However, when a Fund writes a swaption, upon exercise of the option, the Fund will become obligated according to the terms of the underlying agreement.
When the Fund writes a covered call or a put option, an amount equal to the premium received by the Fund is included in the Fund’s Statement of Assets and Liabilities as a liability. The amount of the liability is subsequently marked to market to reflect the current market value of the option written. The Fund receives a premium on the sale of a call option but gives up the opportunity to profit from any increase in stock value above the exercise price of the option, and when the Fund writes a put option, it is exposed to a decline in the price of the underlying security.
Whether an option which the Fund has written expires on its stipulated expiration date or the Fund enters into a closing purchase transaction, the Fund realizes a gain (or loss, if the cost of a closing purchase transaction exceeds the premium received when the option was sold) without regard to any unrealized gain or loss on the underlying security, and the liability related to such option is extinguished. If a call option which the Fund has written is exercised, the Fund realizes a capital gain or loss from the sale of the underlying security, and the cost basis of the lots sold are decreased by the premium originally received. When a put option which a Fund has written is exercised, the amount of the premium originally received will reduce the cost of the security which a Fund purchases upon exercise of the option. Realized gains (losses) on purchased options are included in net realized gain (loss) from investments.
The Funds’ use of written options involves, to varying degrees, elements of market risk in excess of the amount recognized in the Statements of Assets and Liabilities. The face or contract amounts of these instruments reflect the extent of the Fund’s exposure to market risk. The risks may be caused by an imperfect correlation between movements in the price of the instrument and the price of the underlying securities, currencies and interest rates.
During the year ended March 31, 2019, Core Fixed and Opportunistic Fixed used options to manage interest rate and volatility exposure.
(h) Forward foreign currency contracts
The Funds may purchase or sell currencies and/or engage in forward foreign currency transactions in order to expedite settlement of portfolio transactions and to manage currency risk.
Forward foreign currency contracts are traded in the inter-bank market conducted directly between currency traders (usually large commercial banks) and their customers. A forward contract generally has no deposit requirement and no commissions are charged at any stage for trades. The Funds will account for forward contracts bymarking-to-market each day at current forward contract values. The change in
245
Table of Contents
Mercer Funds
Notes to the Financial Statements (Continued)
March 31, 2019
market value is recorded by the Fund as an unrealized gain or loss. When the contract is closed, the Fund recognizes a realized gain or loss equal to the difference between the value of the contract at the time the contract was opened and the value at the time the contract was closed.
The Funds will only enter into forward contracts to sell, for a fixed amount of U.S. dollars or other appropriate currency, an amount of foreign currency, to the extent that the value of the short forward contract is covered by the underlying value of securities denominated in the currency being sold. Alternatively, when a Fund enters into a forward contract to sell an amount of foreign currency, the Custodian or the Fund’ssub-custodian will segregate assets in a segregated account of the Fund in an amount not less than the value of the Fund’s total assets committed to the consummation of such forward contract. If the additional segregated assets placed in the segregated account decline, additional cash or securities will be placed in the account on a daily basis so that the value of the account will equal the amount of the Fund’s commitments with respect to such contract. The primary risks associated with forward foreign currency contracts include failure of the counterparty to meet the terms of the contract and the value of the foreign currency changing unfavorably.
During the year ended March 31, 2019, Opportunistic Fixed used forward foreign currency contracts for a variety of purposes, including hedging, risk management, efficient portfolio management, enhancing total returns, or as a substitute for taking a position in the underlying asset.Non-US Core Equity and Emerging Markets used forward foreign currency contracts to hedge, cross hedge or to actively manage the currency exposures in the Funds. See theNon-US Core Equity, Opportunistic Fixed and Emerging Markets Schedules of Investments for a listing of open forward foreign currency contracts as of March 31, 2019.
(i) Foreign currency translation
The books and records of each Fund are maintained in US dollars. Foreign currencies, investments and other assets and liabilities denominated in foreign currencies are translated into US dollars at the foreign exchange rates prevailing at the end of the period. Purchases and sales of investment securities, income and expenses are translated at exchange rates prevailing on the respective dates of such transactions. Unrealized gains and losses that result from changes in foreign currency exchange rates have been included in the unrealized gains (losses) on foreign currency translations within each Fund’s Statement of Operations. Net realized foreign currency gains and losses resulting from changes in exchange rates include foreign currency gains and losses between trade date and settlement date on investment securities transactions, foreign currency transactions and the difference between the amounts of interest and dividends recorded on the books of the Fund and the amount actually received. The portion of foreign currency gains and losses related to fluctuations in exchange rates between the purchase settlement date and subsequent sale trade date is included in realized gains and losses on investment transactions.
(j) When-issued securities/TBA securities
Purchasing securities on a “when-issued” basis is a commitment by a Fund to buy a security before the security is actually issued. A Fund may purchase securities offered on a “when-issued” or “forward delivery” basis such as TBA securities. When so offered, the price, which is generally expressed in yield terms, is fixed at the time the commitment to purchase is made, but delivery and payment for the when-issued or forward delivery securities take place at a later date. During the period between purchase and settlement, no payment is made by the purchaser to the issuer and no interest on the when-issued or forward delivery security accrues to the purchaser. While when-issued or forward delivery securities may be sold prior to the settlement date, it is intended that a Fund will purchase such securities with the purpose of actually acquiring the securities unless a sale appears desirable for investment reasons. At the
246
Table of Contents
Mercer Funds
Notes to the Financial Statements (Continued)
March 31, 2019
time a Fund makes the commitment to purchase a security on a when-issued or forward delivery basis, the Fund will record the transaction and reflect the value of the security in determining the Fund’s NAV. The market value of when-issued or forward delivery securities may be more or less than the purchase price. Certain risks may arise upon entering into when-issued or forward delivery securities transactions, including the potential inability of counterparties to meet the terms of their contracts, and the issuer’s failure to issue the securities due to political, economic, or other factors. Additionally, losses may arise due to declines in the value of the securities prior to settlement date.
A Fund may enter into TBA commitments to purchase or sell securities for a fixed price at a future date. TBA commitments are considered securities in themselves, and involve a risk of loss if the value of the security to be purchased or sold declines or increases prior to settlement date, which is in addition to the risk of decline in the value of the Portfolio’s other assets. TBA forward sale commitments are valued at the current market value of the underlying securities, according to the procedures described under “Security Valuation”.
See the Schedules of Investments for TBA and when-issued securities held as of March 31, 2019.
(k) Real estate investment trusts
The Funds may invest in real estate investment trusts (“REITs”), which pool investors’ funds for investment, primarily in income producing real estate or real estate-related loans or interests. A REIT is not taxed on income distributed to its shareholders or unitholders if it complies with regulatory requirements relating to its organization, ownership, assets and income, and with a regulatory requirement to distribute to its shareholders or unitholders at least 90% of its taxable income for each taxable year.
A shareholder in a Fund, by investing in REITs through the Fund, will bear not only the shareholder’s proportionate share of the expenses of the Fund, but also, indirectly, the management expenses of the underlying REITs. REITs depend generally on their ability to generate cash flow to make distributions to shareholders or unitholders, and may be subject to defaults by borrowers and to self-liquidations. In addition, the performance of a REIT may be affected by its failure to qualify fortax-free pass-through of income, or the REIT’s failure to maintain exemption from registration under the 1940 Act.Dividends representing a return of capital are reflected as a reduction of cost and/or as a realized gain when the amount of the return of capital is conclusively determined. See each Fund’s Schedule of Investments for REIT securities held as of March 31, 2019.
(l) Mortgage-related and other asset-backed securities
The Funds may invest in mortgage-backed and asset-backed securities. Mortgage-backed securities represent an interest in a pool of mortgages. Asset-backed securities are structured like mortgage-backed securities, but instead of mortgage loans or interests in mortgage loans, the underlying assets may include such items as motor vehicle installment sales or installment loan contracts, leases of various types of real and personal property, and receivables from credit card agreements. The value of some mortgage or asset-backed securities may be particularly sensitive to changes in prevailing interest rates. Early repayment of principal on some mortgage-related securities may expose the Fund to a lower rate of return upon reinvestment of principal. The value of these securities may fluctuate in response to the market’s perception of the creditworthiness of the issuers. Additionally, although mortgages and mortgage-related securities are generally supported by some form of government or private guarantee and/or insurance, there is no assurance that private guarantors or insurers will meet their obligations.
247
Table of Contents
Mercer Funds
Notes to the Financial Statements (Continued)
March 31, 2019
One type of stripped mortgage-backed security has one class receiving all of the interest from the mortgage assets (the interest-only, or “IO” class), while the other class will receive all of the principal (the principal-only, or “PO” class). Payments received for the IOs are included in interest income on the Statements of Operations. Because principal will not be received at the maturity of an IO, adjustments are made to the cost basis of the security on a daily basis until maturity. These adjustments are included in interest income on the Statements of Operations. Payments received for POs are treated as reductions to the cost and par value of the securities. See the Schedules of Investments for mortgage-backed and asset-backed securities held by Core Fixed and Opportunistic Fixed as of March 31, 2019.
(m) Bank loans
Core Fixed and Opportunistic Fixed may invest in bank loans, which include institutionally-traded floating rate securities generally acquired as an assignment from another holder of, or participation interest in, loans originated by a bank or financial institution (the ‘‘Lender’’) that acts as agent for all holders. The agent administers the terms of the loan, as specified in the loan agreement. The Fund may invest in multiple series or tranches of a loan, which may have varying terms and carry different associated risks. When investing in a loan participation, the Fund has the right to receive payments of principal, interest and any fees to which it is entitled only from the Lender selling the loan agreement and only upon receipt by the Lender of payments from the borrower. The Fund generally has no right to enforce compliance with the terms of the loan agreement with the borrower. As a result, the Fund may be subject to the credit risk of both the borrower and the Lender that is selling the loan agreement. At March 31, 2019, the Funds held no unfunded loan commitments.
(n) Indexed securities
The Funds may invest in indexed securities where the redemption values and/or coupons are linked to the prices of other securities, securities indices, or other financial indicators. The Funds use indexed securities to increase or decrease their exposure to different underlying instruments and to gain exposure to markets in which it may be difficult to invest through conventional securities. Indexed securities may be more volatile than their underlying instruments, but any loss is limited to the amount of the original investment.
(o) Taxes and distributions
The Funds intend to qualify each year as regulated investment companies under Subchapter M of the Internal Revenue Code of 1986, as amended (“the Code”). The Funds intend to distribute substantially all of their net investment income and net realized short-term and long-term gains, if any, after giving effect to any available capital loss carryovers for U.S. federal income tax purposes. Therefore, no provision for U.S. federal and state income or excise tax is necessary.
The Funds utilize the provisions of the federal income tax laws that provide for the carryforward of capital losses for prior years, offsetting such losses against any future realized capital gains. Under the Regulated Investment Company Modernization Act of 2010 (the “Act”), net capital losses recognized after December 22, 2010 may be carried forward indefinitely, and their character is retained as short-term and/or long-term losses. Previously, net capital losses were carried forward for eight years and treated as short-term losses. As a transition rule, the Act requires that post-enactment net capital losses be used beforepre-enactment net capital losses.
248
Table of Contents
Mercer Funds
Notes to the Financial Statements (Continued)
March 31, 2019
On March 31, 2019, the following Funds had deferred capital losses available to be offset against future net capital gains through the indicated expiration dates as follows:
| Unlimited | ||||
Core Fixed | $ | 12,448,296 | ||
Opportunistic Fixed | 24,454,111 | |||
Emerging Markets | 23,002,286 | |||
Under current tax rules, regulated investment companies can elect to treat certain late-year ordinary losses incurred and post-October capital losses (capital losses realized after October 31) as arising on the first day of the following taxable year. As of March 31, 2019, Large Cap,Non-US Core Equity, Core Fixed and Opportunistic Fixed, have elected to defer current year post-October losses of $1,207,308, $10,121,411, $140,070 and $2,964,727, respectively. Opportunistic Fixed has elected to defer late-year ordinary losses of$3,447,091 as arising on April 1, 2019.
As of March 31, 2019, the cost for U.S. federal income tax purposes and gross unrealized appreciation and depreciation in value of investments and derivatives were as follows:
| Federal Income Tax Cost | Tax Basis Unrealized Appreciation | Tax Basis Unrealized Depreciation | Net Unrealized Appreciation (Depreciation) | |||||||||||||
Large Cap | $ | 347,650,015 | $ | 44,276,399 | $ | (14,357,295 | ) | $ | 29,919,104 | |||||||
Small/Mid Cap | 690,994,016 | 122,194,218 | (50,363,461 | ) | 71,830,757 | |||||||||||
Non-US Core Equity | 2,012,915,441 | 224,924,177 | (118,972,996 | ) | 105,951,181 | |||||||||||
Core Fixed | 547,208,292 | 7,200,715 | (11,250,913 | ) | (4,050,198 | ) | ||||||||||
Opportunistic Fixed | 785,340,031 | 12,312,618 | (18,717,297 | ) | (6,404,679 | ) | ||||||||||
Emerging Markets | 960,002,449 | 74,732,671 | (85,230,480 | ) | (10,497,809 | ) | ||||||||||
Global Low Volatility | 826,690,281 | 109,534,122 | (22,828,351 | ) | 86,705,771 | |||||||||||
The temporary differences between book-basis andtax-basis unrealized appreciation/(depreciation) are primarily due to wash sale loss deferrals, investments in passive foreign investment companies and other basis adjustments. Certain capital accounts in the financial statements are periodically adjusted for permanent differences in order to reflect their tax character. These differences primarily relate to swap income, gains and losses from passive foreign investment companies and other basis adjustments during the period ended March 31, 2019.
As of March 31, 2019, the Funds had no uncertain tax positions that would require recognition, derecognition, or disclosure. Each of the Funds’ federal tax returns filed in the3-year period ended March 31, 2019 remains subject to examination by the Internal Revenue Service.
The Funds’ policy is to declare and pay distributions from net investment income and net realized short-term and long-term gains at least annually. All distributions are paid in shares of the Funds, at NAV, unless the shareholder elects to receive cash distributions. A Fund may distribute such income dividends and capital gains more frequently, if necessary, in order to reduce or eliminate federal excise taxes on the Funds. The amount of any distribution will vary, and there is no guarantee that a Fund will pay either income dividends or capital gains distributions.
249
Table of Contents
Mercer Funds
Notes to the Financial Statements (Continued)
March 31, 2019
During the years ended March 31, 2019 and March 31, 2018, the tax character of distributions (including capital gain dividends, if any, designated pursuant to Section 852 of the Code) paid, were as follows:
| 2019 | 2018 | |||||||||||||||||||||||
| Ordinary Income | Long-Term Capital Gains | Return of Capital | Ordinary Income | Long-Term Capital Gains | Return of Capital | |||||||||||||||||||
Large Cap | $ | 18,203,269 | $ | 79,063,810 | $ | — | $ | 35,003,064 | $ | 37,472,312 | $ | — | ||||||||||||
Small/Mid Cap | 13,103,133 | 121,011,411 | — | 44,310,010 | 50,567,317 | — | ||||||||||||||||||
Non-US Core Equity | 71,614,415 | 147,266,369 | — | 97,125,234 | 73,664,957 | — | ||||||||||||||||||
Core Fixed | 24,784,732 | — | — | 19,914,504 | — | — | ||||||||||||||||||
Opportunistic Fixed | 15,919,968 | — | — | 23,966,710 | — | — | ||||||||||||||||||
Emerging Markets | 39,741,557 | 103,026,768 | — | 36,403,991 | — | — | ||||||||||||||||||
Global Low Volatility | — | — | — | 82,662,535 | 63,860,505 | — | ||||||||||||||||||
As of March 31, 2019, the components of distributable earnings on a tax basis were as follows:
| Undistributed Ordinary Income | Undistributed Long-Term Gains | Capital Losses Other Temporary Differences | Unrealized Appreciation (Depreciation) | Total Distributable Earnings | ||||||||||||||||
Large Cap | $ | — | $ | 12,225,577 | $ | (1,209,368 | ) | $ | 29,919,353 | $ | 40,935,562 | |||||||||
Small/Mid Cap | — | 1,397,695 | (362 | ) | 71,830,713 | 73,228,046 | ||||||||||||||
Non-US Core Equity | 15,759,711 | — | (10,123,605 | ) | 105,815,803 | 111,451,909 | ||||||||||||||
Core Fixed | 5,193,265 | — | (12,590,727 | ) | (4,335,110 | ) | (11,732,572 | ) | ||||||||||||
Opportunistic Fixed | — | — | (30,873,673 | ) | (8,668,673 | ) | (39,542,346 | ) | ||||||||||||
Emerging Markets | 12,150,992 | — | (23,002,286 | ) | (11,944,420 | ) | (22,795,714 | ) | ||||||||||||
Global Low Volatility | 13,667,359 | 67,398,170 | — | 86,688,135 | 167,753,664 | |||||||||||||||
All other differences are temporary losses related to mostly organizational costs and other timing adjustments.
(p) Allocation of expenses and income
The majority of expenses of the Trust are directly identifiable to an individual Fund. Expenses which are not readily identifiable to a specific Fund are allocated among the applicable Funds, taking into consideration, among other things, the nature and type of expense and the relative size of each applicable Fund.
(q) Redemption fees
While none of the Funds’ classes have initial or contingent deferred sales charges on purchases of Fund shares, redemptions of Fund shares held less than 30 days may be assessed a 2% short-term trading fee and recorded aspaid-in capital.
| 3. | Credit agreement |
The Trust entered into a Credit Agreement on behalf of the Funds (“the Agreement”) with a bank pursuant to a committed, unsecured revolving line of credit through December 13, 2019. Borrowings for each Fund under the Agreement are limited to the lesser of $50,000,000 or 33 1/3% of a Fund’s Adjusted Net Assets provided borrowings did not exceed, in the aggregate, $50,000,000. Under the terms of the Agreement the Trust pays an annual commitment fee at the rate 0.25% per year on the difference between the total line of credit and the average daily amount of borrowings outstanding. Interest is charged to the Funds based on its borrowings at a variable rate equal to the higher of the Overnight Federal Funds Rate or30-Day LIBOR plus 1.00%. The Funds did not borrow under the Agreement during the year ended March 31, 2019.
250
Table of Contents
Mercer Funds
Notes to the Financial Statements (Continued)
March 31, 2019
| 4. | Indemnities |
In the normal course of business, the Funds enter into contracts that require them to provide a variety of representations or general indemnification for certain liabilities. The Funds’ maximum exposure under these arrangements is unknown, as this would involve future claims that may be made against the Funds that have not yet occurred. However, the Funds have not had prior claims or losses pursuant to these contracts and expect the risk of loss to be remote.
| 5. | Fees and other transactions with affiliates |
As of March 31, 2019, the Advisor provides investment advisory services to each Fund pursuant to an investment management agreement. Pursuant to the investment management agreement, each Fund pays the Advisor a fee for managing the Fund’s investments at an annual rate of:
| Investment Advisory Fee* on Net Assets | ||||||||||||
| Average net assets up to $750 million | Average net assets in excess of $750 million up to $1 billion | Average net assets in excess of $1 billion | ||||||||||
Large Cap | 0.53 | % | 0.51 | % | 0.46 | % | ||||||
Small/Mid Cap | 0.90 | % | 0.88 | % | 0.83 | % | ||||||
Non-US Core Equity | 0.75 | % | 0.73 | % | 0.68 | % | ||||||
Core Fixed | 0.35 | % | 0.33 | % | 0.28 | % | ||||||
Opportunistic Fixed | 0.80 | % | 0.78 | % | 0.73 | % | ||||||
Emerging Markets | 0.80 | % | 0.78 | % | 0.73 | % | ||||||
Global Low Volatility | 0.75 | % | 0.73 | % | 0.68 | % | ||||||
| * | Consists of the total advisory fee payable by the Funds to the Advisor. The Advisor is responsible for paying the subadvisory fees. |
Such fees as referenced above are shown in the Advisory fees line in the Statements of Operations. The Advisor provides certain internal administrative services to the Class S,Class Y-1 andClass Y-2 shares of the Funds, for which the Advisor receives a fee of 0.15%, 0.10% and 0.05% of the average daily net assets of the Class S,Class Y-1 andClass Y-2 shares of the Funds, respectively. These internal administrative services include attending to shareholder correspondence, assisting with the processing of purchases and redemptions of shares, preparing and disseminating information and documents for use by beneficial shareholders and monitoring and overseeingnon-advisory relationships with entities providing services to the Class S,Class Y-1 andClass Y-2 shares, including the transfer agent. However, Class S,Class Y-1 andClass Y-2 shares have not commenced operations.2
As of March 31, 2019, the Funds have adopted a plan of marketing and service, or“12b-1 plan” to finance the provision of certain shareholder services to the owners of Class S andClass Y-1 shares of the Funds (collectively referred to as the “plans”). The plan provides for payments at annual rates (based on average net assets) of up to 0.25% of each Fund’s Class S andClass Y-1 shares. However, Class S andClass Y-1 shares have not commenced operations.2
| 2 | Effective April 1, 2019, Class S and Class Y-1 shares were redesignated as Adviser Class and Class I shares, respectively, and changes to the 12b-1 Plans that applied to those share classes, as well as the administrative services fees that applied to those share classes and Class Y-2 shares, were adopted. Further information about these changes can be found in the Funds’ prospectus and statement of additional information, as filed with the SEC on March 29, 2019. |
251
Table of Contents
Mercer Funds
Notes to Financial Statements (Continued)
March 31, 2019 (Unaudited)
Pursuant to the Funds’ expense reimbursement agreement, the Advisor can recapture certain amounts waived or reimbursed over the12-month period ended July 31, 2016 with respect to Opportunistic Fixed Income Fund. The following amounts were available for recapture as of July 31, 2018:
| Expenses Reimbursed in the 12-Months Ended July 31, 2016 | ||||
| Subject to Recapture until July 31, 2019 | ||||
Opportunistic Fixed | $ | 176,732 | ||
| 6. | Purchases and sales of securities |
Cost of purchases and proceeds from sales of securities, excluding short-term investments, for the year ended March 31, 2019, were as follows:
| Long-Term U.S. Government Securities | Other Long-Term Securities | |||||||
Purchases | ||||||||
Large Cap | $ | — | $ | 307,564,377 | ||||
Small/Mid Cap | — | 373,024,394 | ||||||
Non-US Core Equity | — | 1,782,429,655 | ||||||
Core Fixed | 455,134,152 | * | 131,197,650 | |||||
Opportunistic Fixed | 631,659,611 | ** | 1,024,640,484 | |||||
Emerging Markets | — | 568,266,679 | ||||||
Global Low Volatility | — | 733,932,157 | ||||||
Sales | ||||||||
Large Cap | — | 438,243,661 | ||||||
Small/Mid Cap | — | 485,438,855 | ||||||
Non-US Core Equity | — | 1,598,477,633 | ||||||
Core Fixed | 587,827,278 | * | 314,419,289 | |||||
Opportunistic Fixed | 527,102,260 | ** | 960,220,418 | |||||
Emerging Markets | — | 538,889,205 | ||||||
Global Low Volatility | — | 699,491,499 | ||||||
| * | Includes purchases of $50,311,891 and sales of $53,541,479 for TBA securities. |
| ** | Includes purchases of $158,043,758 and sales of $157,908,493 for TBA securities. |
252
Table of Contents
Mercer Funds
Notes to the Financial Statements (Continued)
March 31, 2019
| 7. | Share transactions |
Each Fund is authorized to issue an unlimited number of shares of beneficial interest without par value. Transactions in Fund shares were as follows:
Large Cap
| Year Ended March 31, 2019 | Year Ended March 31, 2018 | |||||||||||||||
| Shares | Amount | Shares | Amount | |||||||||||||
Class Y-3: | ||||||||||||||||
Shares sold | 1,111,242 | $ | 9,300,085 | 943,101 | $ | 10,994,675 | ||||||||||
Shares issued to shareholders in reinvestment of distributions | 12,312,288 | 97,267,079 | 6,716,902 | 72,475,376 | ||||||||||||
Shares repurchased | (15,278,614 | ) | (154,193,839 | ) | (17,080,246 | ) | (198,793,771 | ) | ||||||||
|
|
|
|
|
|
|
| |||||||||
Net decrease | (1,855,084 | ) | $ | (47,626,675 | ) | (9,420,243 | ) | $ | (115,323,720 | ) | ||||||
|
|
|
|
|
|
|
| |||||||||
Small/Mid Cap
| Year Ended March 31, 2019 | Year Ended March 31, 2018 | |||||||||||||||
| Shares | Amount | Shares | Amount | |||||||||||||
Class Y-3: | ||||||||||||||||
Shares sold | 9,955,444 | $ | 115,835,355 | 3,618,044 | $ | 45,259,896 | ||||||||||
Shares issued to shareholders in reinvestment of distributions | 14,532,788 | 134,114,544 | 7,880,177 | 94,877,327 | ||||||||||||
Shares repurchased | (19,938,961 | ) | (233,636,396 | ) | (17,836,232 | ) | (227,123,462 | ) | ||||||||
|
|
|
|
|
|
|
| |||||||||
Net increase (decrease) | 4,549,271 | $ | 16,313,503 | (6,338,011 | ) | $ | (86,986,239 | ) | ||||||||
|
|
|
|
|
|
|
| |||||||||
Non-US Core Equity
| Year Ended March 31, 2019 | Year Ended March 31, 2018 | |||||||||||||||
| Shares | Amount | Shares | Amount | |||||||||||||
Class Y-3: | ||||||||||||||||
Shares sold | 36,986,983 | $ | 391,777,967 | 20,842,524 | $ | 238,966,126 | ||||||||||
Shares issued to shareholders in reinvestment of distributions | 23,739,781 | 218,880,784 | 15,114,176 | 170,790,191 | ||||||||||||
Shares repurchased | (29,969,109 | ) | (317,168,352 | ) | (66,027,147 | ) | (764,623,992 | ) | ||||||||
|
|
|
|
|
|
|
| |||||||||
Net increase (decrease) | 30,757,655 | $ | 293,490,399 | (30,070,447 | ) | $ | (354,867,675 | ) | ||||||||
|
|
|
|
|
|
|
| |||||||||
253
Table of Contents
Mercer Funds
Notes to the Financial Statements (Continued)
March 31, 2019
Core Fixed
| Year Ended March 31, 2019 | Year Ended March 31, 2018 | |||||||||||||||
| Shares | Amount | Shares | Amount | |||||||||||||
Class Y-3: | ||||||||||||||||
Shares sold | 11,872,441 | $ | 116,813,300 | 19,178,104 | $ | 194,169,216 | ||||||||||
Shares issued to shareholders in reinvestment of distributions | 2,581,743 | 24,784,732 | 1,981,543 | 19,914,504 | ||||||||||||
Shares repurchased | (46,284,747 | ) | (453,655,356 | ) | (11,313,719 | ) | (115,310,488 | ) | ||||||||
|
|
|
|
|
|
|
| |||||||||
Net increase (decrease) | (31,830,563 | ) | $ | (312,057,324 | ) | 9,845,928 | $ | 98,773,232 | ||||||||
|
|
|
|
|
|
|
| |||||||||
Opportunistic Fixed
| Year Ended March 31, 2019 | Year Ended March 31, 2018 | |||||||||||||||
| Shares | Amount | Shares | Amount | |||||||||||||
Class Y-3: | ||||||||||||||||
Shares sold | 30,437,722 | $ | 274,937,746 | 16,750,989 | $ | 163,306,702 | ||||||||||
Shares issued to shareholders in reinvestment of distributions | 1,807,034 | 15,919,968 | 2,533,479 | 23,966,710 | ||||||||||||
Shares repurchased | (8,780,534 | ) | (79,961,919 | ) | (13,267,089 | ) | (129,194,161 | ) | ||||||||
|
|
|
|
|
|
|
| |||||||||
Net increase | 23,464,222 | $ | 210,895,795 | 6,017,379 | $ | 58,079,251 | ||||||||||
|
|
|
|
|
|
|
| |||||||||
Emerging Markets
| Year Ended March 31, 2019 | Year Ended March 31, 2018 | |||||||||||||||
| Shares | Amount | Shares | Amount | |||||||||||||
Class Y-3: | ||||||||||||||||
Shares sold | 21,266,136 | $ | 218,061,043 | 24,627,345 | $ | 268,542,786 | ||||||||||
Shares issued to shareholders in reinvestment of distributions | 16,996,229 | 142,768,325 | 3,267,863 | 36,403,991 | ||||||||||||
Shares redeemed throughin-kind redemption* | — | — | (53,685,733 | ) | (604,905,874 | ) | ||||||||||
Shares repurchased | (20,683,889 | ) | (196,938,629 | ) | (30,832,913 | ) | (346,989,807 | ) | ||||||||
|
|
|
|
|
|
|
| |||||||||
Net increase (decrease) | 17,578,476 | $ | 163,890,739 | (56,623,438 | ) | $ | (646,948,904 | ) | ||||||||
|
|
|
|
|
|
|
| |||||||||
| * | The Fund had a redemptionin-kind on November 17, 2017. |
254
Table of Contents
Mercer Funds
Notes to the Financial Statements (Continued)
March 31, 2019
Global Low Volatility
| Year Ended March 31, 2019 | Year Ended March 31, 2018 | |||||||||||||||
| Shares | Amount | Shares | Amount | |||||||||||||
Class Y-3: | ||||||||||||||||
Shares sold | 16,031,898 | $ | 200,221,293 | 17,880,974 | $ | 233,315,310 | ||||||||||
Shares issued to shareholders in reinvestment of distributions | — | — | 11,581,479 | 146,523,040 | ||||||||||||
Shares redeemed throughin-kind redemption* | — | — | (39,626,273 | ) | (531,155,034 | ) | ||||||||||
Shares repurchased | (18,205,264 | ) | (229,051,200 | ) | (13,917,801 | ) | (180,661,065 | ) | ||||||||
|
|
|
|
|
|
|
| |||||||||
Net decrease | (2,173,366 | ) | $ | (28,829,907 | ) | (24,081,621 | ) | $ | (331,977,749 | ) | ||||||
|
|
|
|
|
|
|
| |||||||||
| * | The Fund had a redemptionin-kind on October 13, 2017. |
On November 17, 2017, Emerging Markets transferred securitiesin-kind valued at $325,402,466 and cash of $279,503,408 for a redemption. This resulted in 53,685,733 units redeemed which are shown in the Statements of Changes in Net Assets. This transfer also resulted in a realized gain of $75,577,986 which is shown on the Statements of Operations.
On October 13, 2017, Global Low Volatility transferred securitiesin-kind valued at $483,152,037 and cash of $48,002,998 for a redemption. This resulted in 39,626,273 units redeemed which are shown in the Statements of Changes in Net Assets. This transfer also resulted in a realized gain of $81,952,311 which is shown on the Statements of Operations.
| 8. | Subsequent events |
Management has evaluated the impact of subsequent events through May 24, 2019, the date the financial statements were available to be issued for possible adjustment to and/or disclosure in the Funds’ financial statements. Management has determined that there are no material events that would require adjustment and/or disclosure in the Funds’ financial statements through this date.
On January 10, 2019, The Board of the Trust approved an agreement to commence operations for the Adviser Class, Class I andClass Y-2 shares that were previously authorized but not offered as shares. The principal difference between the classes of shares is the level of shareholder service, marketing and administrative fees borne by the classes. Further information can be found in the Funds’ prospectus and statement of additional information, as filed with the SEC on March 29, 2019.
255
Table of Contents
REPORT OF INDEPENDENT REGISTERED PUBLIC ACCOUNTING FIRM
To the Board of Trustees and Shareholders of Mercer Funds:
Opinion on the Financial Statements and Financial Highlights
We have audited the accompanying statements of assets and liabilities of Mercer Funds comprising Mercer US Large Cap Equity Fund, Mercer US Small/Mid Cap Equity Fund, Mercer Non-US Core Equity Fund, Mercer Core Fixed Income Fund, Mercer Opportunistic Fixed Income Fund, Mercer Emerging Markets Equity Fund, and Mercer Global Low Volatility Equity Fund (the “Funds”), including the schedules of investments, as of March 31, 2019, the related statements of operations for the year then ended, the statements of changes in net assets for each of the two years in the period then ended, the financial highlights for each of the five years ended in the period then ended, and the related notes. In our opinion, the financial statements and financial highlights present fairly, in all material respects, the financial position of each of the funds constituting the Mercer Funds as of March 31, 2019, and the results of their operations, the changes in their net assets for each of the two years in the period then ended, and the financial highlights for each of the five years in the period then ended in conformity with accounting principles generally accepted in the United States of America.
Basis for Opinion
These financial statements and financial highlights are the responsibility of the Funds’ management. Our responsibility is to express an opinion on the Funds’ financial statements and financial highlights based on our audits. We are a public accounting firm registered with the Public Company Accounting Oversight Board (United States) (PCAOB) and are required to be independent with respect to the Funds in accordance with the U.S. federal securities laws and the applicable rules and regulations of the Securities and Exchange Commission and the PCAOB.
We conducted our audits in accordance with the standards of the PCAOB. Those standards require that we plan and perform the audits to obtain reasonable assurance about whether the financial statements and financial highlights are free of material misstatement, whether due to error or fraud. The Funds are not required to have, nor were we engaged to perform, an audit of their internal control over financial reporting. As part of our audits we are required to obtain an understanding of internal control over financial reporting but not for the purpose of expressing an opinion on the effectiveness of the Funds’ internal control over financial reporting. Accordingly, we express no such opinion.
Our audits included performing procedures to assess the risks of material misstatement of the financial statements and financial highlights, whether due to error or fraud, and performing procedures that respond to those risks. Such procedures included examining, on a test basis, evidence regarding the amounts and disclosures in the financial statements and financial highlights. Our audits also included evaluating the accounting principles used and significant estimates made by management, as well as evaluating the overall presentation of the financial statements and financial highlights. Our procedures included confirmation of securities owned as of March 31, 2019, by correspondence with the custodian, brokers and agent banks; when replies were not received from brokers or agent banks, we performed other auditing procedures. We believe that our audits provide a reasonable basis for our opinion.
Boston, Massachusetts
May 24, 2019
We have served as the auditor of one or more of the Mercer investment companies since 2006.
Table of Contents
Mercer Funds
Additional Information (Unaudited)
Proxy Voting
A description of the policies and procedures that the Advisor and each Fund’s Subadvisors use to determine how to vote proxies relating to the Fund’s portfolio securities is available, without charge, upon request, by calling1-866-658-9896, and on the Securities and Exchange Commission’s (“SEC”) website at http://www.sec.gov. Information about Funds’ proxy voting decisions are available without charge, online on the Funds’ website athttp://www.mercer.us/mutual-funds-on-offer.
Quarterly Reporting
The Funds file their complete schedule of portfolio holdings with the Securities and Exchange Commission for the first and third quarters of each fiscal year on FormN-Q, which when filed, will be available on the SEC’s website at http://www.sec.gov. When filed, the Funds’ FormN-Q may be reviewed and copied at the Commission’s Public Reference Room in Washington, D.C. Information on the operation of the Public Reference Room may be obtained by calling1-800-SEC-0330.
Federal Tax Information
The amount of long-term capital gains paid for the fiscal year ended March 31, 2019, the amount of long-term capital gains paid were as follows:
Fund | ||||
Large Cap | $ | 79,063,810 | ||
Small/Mid Cap | 121,011,411 | |||
Non-US Core Equity | 147,266,369 | |||
Emerging Markets | 103,026,768 | |||
For the year ended March 31, 2019,Non-US Core Equity and Emerging Markets had foreign tax credits in the amount of $4,093,717 and $3,134,820, respectively, and foreign source income of $61,881,890 and $28,892,553, respectively.
Qualified dividend income (“QDI”) received by the Funds through March 31, 2019, that qualified for a reduced tax rate pursuant to the Internal Revenue Code Section 1(h)(11) are as follows:
Fund | QDI | |||
Large Cap | $ | 7,163,847 | ||
Small/Mid Cap | 7,323,908 | |||
Non-US Core Equity | 45,784,465 | |||
Emerging Markets | 16,240,935 | |||
For corporate shareholders, a portion of the ordinary dividends paid during the Funds’ year ended March 31, 2019, qualified for the dividends received deduction, as follows:
Fund | ||||
Large Cap | 47.73 | % | ||
Small/Mid Cap | 73.28 | % | ||
Non-US Core Equity | 0.82 | % | ||
Emerging Markets | 0.55 | % | ||
257
Table of Contents
Mercer Funds
Additional Information (Unaudited) (Continued)
Board Approval of New Subadvisory Agreements for One of the Funds During the Period October 1, 2018 through March 31, 2019
Mercer Global Low Volatility Equity Fund
At a meeting of the Board of Trustees held on December 3, 2018 (the “Meeting”), the Trustees, including the Independent Trustees, considered and approved proposed new subadvisory agreements between the Advisor and two newly proposed subadvisors with respect to the Mercer Global Low Volatility Equity Fund (the “Fund”). The Advisor recommended the two proposed new subadvisors to replace one of the subadvisors that previously managed an allocated portion of the Fund’s portfolio, and the Advisor also reallocated assets among the Fund’s current subadvisors in connection with such appointments. The changes described herein with respect to the changes in the subadvisory arrangements for the Fund are referred to collectively below as the “New Subadvisor Structure.”
Approval of a New Subadvisory Agreement for the Fund with Wellington Management Company LLP
At the Meeting, the Trustees, including the Independent Trustees, first considered and approved a proposed new subadvisory agreement between the Advisor and Wellington Management Company LLP (“Wellington”) on behalf of the Fund (the “Wellington Subadvisory Agreement”). The Advisor recommended the appointment of Wellington, along with one other new subadvisor, to replace a subadvisor to the Fund that the Advisor intended to terminate as a subadvisor, as well as the reallocation of assets of the Fund among the Fund’s remaining subadvisors, and the Advisor had presented the Board with the recommendation to retain Wellington as part of the New Subadvisor Structure based upon the Advisor’s determination that Wellington was qualified to serve as a new subadvisor to the Fund, based upon the Advisor’s analysis of Wellington.
In considering the approval of the Wellington Subadvisory Agreement, the Independent Trustees considered the information and materials from the Advisor and Wellington that included, as to Wellington and the Fund: (i) the Wellington Subadvisory Agreement; (ii) information regarding the process by which the Advisor had reviewed, selected, and recommended Wellington for the Board’s approval, and the Advisor’s rationale for recommending that Wellington be appointed as a subadvisor to the Fund; (iii) the nature, extent, and quality of the services that Wellington proposed to provide to the Fund; (iv) the investment management business, portfolio management personnel, operations, prior investment experience, and reputation of Wellington; (v) Wellington’s brokerage and trading policies and practices; (vi) the level of subadvisory fees to be charged by Wellington for its services to the Fund, and the fees charged to other accounts that Wellington manages; (vii) the compliance program applicable to Wellington; (viii) information regarding the historical performance returns of Wellington managing the investment mandate it would employ for the Fund as well as longer-term historical returns for an investment mandate similar to the investment mandate it would employ for the Fund, and a comparison of such performance to a relevant index; and (ix) the financial condition of Wellington.
In addition, the Independent Trustees considered presentations made by, and discussions held with, representatives of the Advisor and the Advisor’s favorable assessment of the nature, extent and quality of the subadvisory services expected to be provided to the Fund by Wellington. The Independent Trustees considered and analyzed factors that the Independent Trustees deemed relevant with respect to Wellington, including: the nature, extent, and quality of the services to be provided to the Fund by Wellington; Wellington’s management style and investment decision-making process; Wellington’s historical performance record managing the investment mandate it would employ for the Fund as well as longer-term historical performance returns for an investment mandate similar to the investment mandate it would employ for the Fund; the qualifications and experience of the members of Wellington’s
258
Table of Contents
Mercer Funds
Additional Information (Unaudited) (Continued)
portfolio management team; and Wellington’s staffing levels and overall resources. The Independent Trustees also took into consideration the nature and extent of the oversight duties performed by the Advisor in connection with each of the subadvisors to the Fund, which includes extensive management and compliance due diligence with respect to the management and operations of each of the subadvisors. Additionally, the Independent Trustees received assistance and advice from their independent legal counsel regarding legal and industry standards in connection with their duties and responsibilities when approving investment advisory agreements.
In particular, and as to Wellington, the Board, including all of the Independent Trustees, considered the following factors:
(a) The nature, extent, and quality of the services to be provided by Wellington. The Independent Trustees reviewed the nature, extent, and quality of the services to be provided by Wellington to the Fund. The Independent Trustees discussed the specific investment management process that Wellington indicated that it will employ to manage its allocated portion of the Fund’s investment portfolio (which was described in detail in the materials provided by Wellington), the qualifications of Wellington’s portfolio managers and investment management personnel with regard to implementing the investment mandate relating to the allocated portion of the Fund’s investment portfolio that Wellington would be managing, and the performance record of Wellington as compared to a relevant index. The Independent Trustees considered Wellington’s infrastructure and resources, and whether Wellington’s organization appeared to support Wellington’s strategy adequately. The Independent Trustees also discussed the Advisor’s review, selection, and due diligence process with respect to Wellington, and the Advisor’s favorable assessment as to the nature, extent, and quality of the subadvisory services expected to be provided to the Fund by Wellington. The Independent Trustees determined that the Fund and its shareholders would benefit from the quality and experience of Wellington’s portfolio managers and the qualifications of its investment professionals. Based on their consideration and review of the foregoing information, the Independent Trustees concluded that the nature, extent and quality of the subadvisory services anticipated to be provided by Wellington, as well as Wellington’s ability to render such services based on Wellington’s experience, operations and resources, were appropriate for the Fund, in light of the Fund’s investment objective, and the mandate relating to the allocated portion of the Fund’s investment portfolio that Wellington would manage.
(b) Comparison of the services to be rendered and fees to be paid to Wellington under other advisory and subadvisory contracts, such as those with other clients. The Independent Trustees discussed the services that would be rendered by Wellington and evaluated the compensation to be paid to Wellington by the Advisor for those services. The Independent Trustees noted that the services that Wellington would furnish to the Fund appeared to be comparable to the services that Wellington currently provides to its other advisory and subadvisory clients having similar investment strategies. The Independent Trustees also considered comparisons of the fees that will be paid to Wellington by the Advisor in light of the fees that were charged by Wellington to its other advisory clients, as disclosed in the Form ADV, Part 2A (Firm Brochure) provided and in its 15(c) Questionnaire responses, including commingled and separate accounts. The Independent Trustees also considered that the fees agreed to by Wellington were the result of anarm’s-length bargain negotiated by unaffiliated parties and that the Advisor believes such fees are fair and reasonable.
The Independent Trustees considered the review, selection, and due diligence process employed by the Advisor in determining to recommend Wellington to serve as a subadvisor to the Fund, and the Advisor’s reasons for concluding that the subadvisory fees to be paid by the Advisor to Wellington for its services to the Fund were fair and reasonable. The Independent Trustees emphasized in their discussions that the subadvisory fees of Wellington would be paid by the Advisor, and were not
259
Table of Contents
Mercer Funds
Additional Information (Unaudited) (Continued)
additional fees to be borne by the Fund or its shareholders. Based on their discussion, the Independent Trustees concluded that, in light of the nature, extent, and quality of the services to be provided, the proposed level of fees to be paid to Wellington with respect to the assets of the Fund to be allocated to Wellington was supported by the services that were expected to be provided by Wellington to the Fund. The Independent Trustees also considered the potential “fallout” or ancillary benefits that may accrue to Wellington from its relationship with the Fund and concluded that they were reasonable.
The Independent Trustees recognized that, because the subadvisory fees would be paid by the Advisor, and not the Fund, an analysis of economies of scale and profitability was more appropriate in the context of the Board’s consideration of the Management Agreement with the Advisor. In addition, since the fees to be paid to Wellington were the result ofarm’s-length bargaining between unaffiliated parties, and given the Advisor’s economic incentive to negotiate a reasonable fee, the potential profitability of Wellington was not considered relevant to the Independent Trustees’ deliberations. The Independent Trustees took note of the Advisor’s explanation that the recommended appointment of Wellington was not affected by the impact that the appointment would have on the Advisor’s revenues and profitability, and recalled that the Advisor had demonstrated that the appointment of Wellington may result in increased profitability for the Advisor as a result of decreased subadvisory fees that will be paid out of the Advisor’s resources, taking into account the New Subadvisor Structure. On the basis of these considerations, the Independent Trustees concluded that, in light of the nature, extent and quality of the services expected to be provided by Wellington and the proposed fees to be paid to Wellington by the Advisor for managing its allocated portion of the Fund, the potential benefits accruing to Wellington as a result of serving as a subadvisor to the Fund were reasonable in relation to the services that were expected to be provided by Wellington to the Fund.
(c) Investment performance of the Fund and Wellington. Because Wellington was a newly proposed subadvisor to the Fund, the Independent Trustees could not consider Wellington’s investment performance in managing the Fund as a factor in evaluating the Wellington Subadvisory Agreement. However, the Independent Trustees reviewed Wellington’s historical performance record managing the investment mandate it would employ for the Fund, as well as longer-term historical performance returns for an investment mandate similar to the investment mandate it would employ for the Fund. The Independent Trustees also compared the historical investment performance of Wellington to a relevant index and concluded that Wellington’s historical performance record, viewed together with the other factors considered by the Independent Trustees, supported a decision to approve the Wellington Subadvisory Agreement.
Conclusion. Following consideration of the foregoing factors, it was reported that no single factor was determinative to the Independent Trustees’ decisions. Based on these factors, along with the determination of the Advisor at the conclusion of its review, selection, and due diligence process to recommend Wellington be appointed as a subadvisor to the Fund, and such other matters as were deemed relevant, the Independent Trustees concluded that the proposed fee rate for Wellington was supported by the services that were expected to be provided to the Fund and approval of the proposed Wellington Subadvisory Agreement was in the best interests of the Fund and its shareholders. As a result, the Board, including a majority of the Independent Trustees, determined to approve the Wellington Subadvisory Agreement.
Approval of a New Subadvisory Agreement for the Fund with Veritas Asset Management LLP
At the Meeting, the Trustees, including the Independent Trustees, also considered and approved a proposed new subadvisory agreement between the Advisor and Veritas Asset Management LLP (“Veritas”) on behalf of the Fund (the “Veritas Subadvisory Agreement”). The Advisor recommended the appointment of Veritas, along with one other new subadvisor, to replace a subadvisor to the Fund
260
Table of Contents
Mercer Funds
Additional Information (Unaudited) (Continued)
that the Advisor intended to terminate as a subadvisor, as well as the reallocation of assets of the Fund among the Fund’s remaining subadvisors, and the Advisor had presented the Board with the recommendation to retain Veritas as part of the New Subadvisor Structure based upon the Advisor’s determination that Veritas was qualified to serve as a new subadvisor to the Fund, based upon the Advisor’s analysis of Veritas.
In considering the approval of the Veritas Subadvisory Agreement, the Independent Trustees considered the information and materials from the Advisor and Veritas that included, as to Veritas and the Fund: (i) the Veritas Subadvisory Agreement; (ii) information regarding the process by which the Advisor had reviewed, selected, and recommended Veritas for the Board’s approval, and the Advisor’s rationale for recommending that Veritas be appointed as a subadvisor to the Fund; (iii) the nature, extent, and quality of the services that Veritas proposed to provide to the Fund; (iv) the investment management business, portfolio management personnel, operations, prior investment experience, and reputation of Veritas; (v) Veritas’s brokerage and trading policies and practices; (vi) the level of subadvisory fees to be charged by Veritas for its services to the Fund, and the fees charged to other accounts that Veritas manages; (vii) the compliance program applicable to Veritas, along with supplemental information regarding such compliance program; (viii) information regarding the historical performance returns of Veritas managing the investment mandate it would employ for the Fund, and a comparison of such performance to a relevant index; and (ix) the financial condition of Veritas.
In addition, the Independent Trustees considered presentations made by, and discussions held with, representatives of the Advisor and the Advisor’s favorable assessment of the nature, extent and quality of the subadvisory services expected to be provided to the Fund by Veritas. The Independent Trustees considered and analyzed factors that the Independent Trustees deemed relevant with respect to Veritas, including: the nature, extent, and quality of the services to be provided to the Fund by Veritas; Veritas’s management style and investment decision-making process; Veritas’s historical performance record managing the investment mandate it would employ for the Fund; the qualifications and experience of the members of Veritas’s portfolio management team; and Veritas’s staffing levels and overall resources. The Independent Trustees also took into consideration the nature and extent of the oversight duties performed by the Advisor in connection with each of the subadvisors to the Fund, which includes extensive management and compliance due diligence with respect to the management and operations of each of the subadvisors. Additionally, the Independent Trustees received assistance and advice from their independent legal counsel regarding legal and industry standards in connection with their duties and responsibilities when approving investment advisory agreements.
In particular, and as to Veritas, the Board, including all of the Independent Trustees, considered the following factors:
(a) The nature, extent, and quality of the services to be provided by Veritas. The Independent Trustees reviewed the nature, extent, and quality of the services to be provided by Veritas to the Fund. The Independent Trustees discussed the specific investment management process that Veritas indicated that it will employ to manage its allocated portion of the Fund’s investment portfolio (which was described in detail in the materials provided by Veritas), the qualifications of Veritas’s portfolio managers and investment management personnel with regard to implementing the investment mandate relating to the allocated portion of the Fund’s investment portfolio that Veritas would be managing, and the performance record of Veritas as compared to a relevant index. The Independent Trustees considered Veritas’s infrastructure and resources, and whether Veritas’s organization appeared to support Veritas’s strategy adequately. The Independent Trustees also discussed the Advisor’s review, selection, and due diligence process with respect to Veritas, and the Advisor’s favorable assessment as to the nature, extent, and quality of the subadvisory services expected to be provided to the Fund by Veritas. The
261
Table of Contents
Mercer Funds
Additional Information (Unaudited) (Continued)
Independent Trustees determined that the Fund and its shareholders would benefit from the quality and experience of Veritas’s portfolio managers and the qualifications of its investment professionals. Based on their consideration and review of the foregoing information, the Independent Trustees concluded that the nature, extent and quality of the subadvisory services anticipated to be provided by Veritas, as well as Veritas’s ability to render such services based on Veritas’s experience, operations and resources, were appropriate for the Fund, in light of the Fund’s investment objective, and the mandate relating to the allocated portion of the Fund’s investment portfolio that Veritas would manage.
(b) Comparison of the services to be rendered and fees to be paid to Veritas under other advisory and subadvisory contracts, such as those with other clients. The Independent Trustees discussed the services that would be rendered by Veritas and evaluated the compensation to be paid to Veritas by the Advisor for those services. The Independent Trustees noted that the services that Veritas would furnish to the Fund appeared to be comparable to the services that Veritas currently provides to its other third-party subadvisory clients having similar investment strategies. The Independent Trustees also considered comparisons of the fees that will be paid to Veritas by the Advisor in light of the fees that were charged by Veritas to its other advisory clients, as disclosed in the Form ADV, Part 2A (Firm Brochure) provided and in its 15(c) Questionnaire responses, including commingled and separate accounts. The Independent Trustees also considered that the fees agreed to by Veritas were the result of anarm’s-length bargain negotiated by unaffiliated parties and that the Advisor believes such fees are fair and reasonable.
The Independent Trustees considered the review, selection, and due diligence process employed by the Advisor in determining to recommend Veritas to serve as a subadvisor to the Fund, and the Advisor’s reasons for concluding that the subadvisory fees to be paid by the Advisor to Veritas for its services to the Fund were fair and reasonable. The Independent Trustees emphasized in their discussions that the subadvisory fees of Veritas would be paid by the Advisor, and were not additional fees to be borne by the Fund or its shareholders. Based on their discussion, the Independent Trustees concluded that, in light of the nature, extent, and quality of the services to be provided, the proposed level of fees to be paid to Veritas with respect to the assets of the Fund to be allocated to Veritas was supported by the services that were expected to be provided by Veritas to the Fund. The Independent Trustees also considered the potential “fallout” or ancillary benefits that may accrue to Veritas from its relationship with the Fund and concluded that they were reasonable.
The Independent Trustees recognized that, because the subadvisory fees would be paid by the Advisor, and not the Fund, an analysis of economies of scale and profitability was more appropriate in the context of the Board’s consideration of the Management Agreement with the Advisor. In addition, since the fees to be paid to Veritas were the result ofarm’s-length bargaining between unaffiliated parties, and given the Advisor’s economic incentive to negotiate a reasonable fee, the potential profitability of Veritas was not considered relevant to the Independent Trustees’ deliberations. The Independent Trustees took note of the Advisor’s explanation that the recommended appointment of Veritas was not affected by the impact that the appointment would have on the Advisor’s revenues and profitability, and recalled that the Advisor had demonstrated that the appointment of Veritas may result in increased profitability for the Advisor as a result of decreased subadvisory fees that will be paid out of the Advisor’s resources, taking into account the New Subadvisor Structure. On the basis of these considerations, the Independent Trustees concluded that, in light of the nature, extent and quality of the services expected to be provided by Veritas and the proposed fees to be paid to Veritas by the Advisor for managing its allocated portion of the Fund, the potential benefits accruing to Veritas as a result of serving as a subadvisor to the Fund were reasonable in relation to the services that were expected to be provided by Veritas to the Fund.
262
Table of Contents
Mercer Funds
Additional Information (Unaudited) (Continued)
(c) Investment performance of the Fund and Veritas. Because Veritas was a newly proposed subadvisor to the Fund, the Independent Trustees could not consider Veritas’s investment performance in managing the Fund as a factor in evaluating the Veritas Subadvisory Agreement. However, the Independent Trustees reviewed Veritas’s historical performance record managing the investment mandate it would employ for the Fund. The Independent Trustees also compared the historical investment performance of Veritas to a relevant index and concluded that Veritas’s historical performance record, viewed together with the other factors considered by the Independent Trustees, supported a decision to approve the Veritas Subadvisory Agreement.
Conclusion. Following consideration of the foregoing factors, it was reported that no single factor was determinative to the Independent Trustees’ decisions. Based on these factors, along with the determination of the Advisor at the conclusion of its review, selection, and due diligence process to recommend Veritas be appointed as a subadvisor to the Fund, and such other matters as were deemed relevant, the Independent Trustees concluded that the proposed fee rate for Veritas was supported by the services that were expected to be provided to the Fund and approval of the proposed Veritas Subadvisory Agreement was in the best interests of the Fund and its shareholders. As a result, the Board, including a majority of the Independent Trustees, determined to approve the Veritas Subadvisory Agreement.
263
Table of Contents
Mercer Funds
Understanding Your Fund’s Expenses (Unaudited)
As a mutual fund shareholder, you incur different costs: transaction costs, including sales charges (loads) on purchases, redemption fees and certain exchange fees and ongoing costs, including management fees, distribution fees(12b-1 fees), and other fund expenses. These costs are described in more detail in the Funds’ prospectus. The examples below are intended to help you understand the ongoing costs of investing in the Funds and help you compare these with the ongoing costs of investing in other mutual funds. The first line in the table for each Fund shows the actual account values and actual fund expenses you would have paid on a $1,000 investment in the Fund from October 1, 2018 through March 31, 2019. It also shows how much a $1,000 investment would be worth at the close of the period, assuming actual fund returns and expenses. To estimate the expenses you paid over the period, simply divide your account value by $1,000 (for example $8,600 account value divided by $1,000 = $8.60) and multiply the result by the number in the Operating Expenses Incurred column as shown below for your Class. The second line in the table for each Fund provides information about hypothetical account values and hypothetical expenses based on the Fund’s actual expense ratios and an assumed rate of return of 5% per year before expenses, which is not the Fund’s actual return. The hypothetical account values and expenses may not be used to estimate the actual ending account balance or expenses you paid on your investment for the period. You may use this information to compare the ongoing costs of investing in the Fund and other funds. To do so, compare this 5% hypothetical example with the 5% hypothetical examples that appear in the shareholder reports of the other funds. Please note that the expenses shown reflect ongoing costs only, and do not include any transaction costs, such as sales charges, redemption fees or exchange fees. Therefore, the second line in the table of each fund is useful in comparing ongoing costs only, and will not help you determine the relative costs of owning different funds. If transaction costs were included, total costs would be higher.
Large Cap —Class Y-3
Hypothetical Return on $1,000
| Expense Ratio | Beginning Amount | Ending Value | Avg Value | Operating Expense Incurred* | ||||||||||||||||
Actual | 0.64 | % | 1,000.00 | 964.60 | 982.30 | 3.13 | ||||||||||||||
Hypothetical | 0.64 | % | 1,000.00 | 1,021.74 | 1,010.87 | 3.23 | ||||||||||||||
| * | Actual expenses are equal to the Class’ annualized expense ratio of 0.64%, multiplied by the average account value over the period, multiplied by 182/365 |
Small/Mid Cap —Class Y-3
Hypothetical Return on $1,000
| Expense Ratio | Beginning Amount | Ending Value | Avg Value | Operating Expense Incurred* | ||||||||||||||||
Actual | 1.00 | % | 1,000.00 | 927.90 | 963.95 | 4.81 | ||||||||||||||
Hypothetical | 1.00 | % | 1,000.00 | 1,019.95 | 1,009.98 | 5.04 | ||||||||||||||
| * | Actual expenses are equal to the Class’ annualized expense ratio of 1.00%, multiplied by the average account value over the period, multiplied by 182/365 |
264
Table of Contents
Mercer Funds
Understanding Your Fund’s Expenses (Unaudited) (Continued)
Non-US Core Equity —Class Y-3
Hypothetical Return on $1,000
| Expense Ratio | Beginning Amount | Ending Value | Avg Value | Operating Expense Incurred* | ||||||||||||||||
Actual | 0.81 | % | 1,000.00 | 955.00 | 977.50 | 3.95 | ||||||||||||||
Hypothetical | 0.81 | % | 1,000.00 | 1,020.89 | 1,010.45 | 4.08 | ||||||||||||||
| * | Actual expenses are equal to the Class’ annualized expense ratio of 0.81%, multiplied by the average account value over the period, multiplied by 182/365 |
Core Fixed —Class Y-3
Hypothetical Return on $1,000
| Expense Ratio | Beginning Amount | Ending Value | Avg Value | Operating Expense Incurred* | ||||||||||||||||
Actual | 0.45 | % | 1,000.00 | 1,043.70 | 1,021.85 | 2.29 | ||||||||||||||
Hypothetical | 0.45 | % | 1,000.00 | 1,022.69 | 1,011.35 | 2.27 | ||||||||||||||
| * | Actual expenses are equal to the Class’ annualized expense ratio of 0.45%, multiplied by the average account value over the period, multiplied by 182/365 |
Opportunistic Fixed —Class Y-3
Hypothetical Return on $1,000
| Expense Ratio | Beginning Amount | Ending Value | Avg Value | Operating Expense Incurred* | ||||||||||||||||
Actual | 0.94 | %** | 1,000.00 | 1,028.20 | 1,014.10 | 4.75 | ||||||||||||||
Hypothetical | 0.94 | %** | 1,000.00 | 1,020.24 | 1,010.12 | 4.73 | ||||||||||||||
| * | Actual expenses are equal to the Class’ annualized expense ratio of 0.94%, multiplied by the average account value over the period, multiplied by 182/365 |
| ** | Includes interest expense that amounts to less than 0.01%. |
Emerging Markets — Class Y3
Hypothetical Return on $1,000
| Expense Ratio | Beginning Amount | Ending Value | Avg Value | Operating Expense Incurred* | ||||||||||||||||
Actual | 0.95 | %** | 1,000.00 | 1,004.90 | 1,002.45 | 4.75 | ||||||||||||||
Hypothetical | 0.95 | %** | 1,000.00 | 1,020.19 | 1,010.10 | 4.78 | ||||||||||||||
| * | Actual expenses are equal to the Class’ annualized expense ratio of 0.95%, multiplied by the average account value over the period, multiplied by 182/365 |
| ** | Includes interest expense that amounts to less than 0.01%. |
265
Table of Contents
Mercer Funds
Understanding Your Fund’s Expenses (Unaudited) (Continued)
Global Low Volatility — Class Y3
Hypothetical Return on $1,000
| Expense Ratio | Beginning Amount | Ending Value | Avg Value | Operating Expense Incurred* | ||||||||||||||||
Actual | 0.85 | % | 1,000.00 | 999.20 | 999.60 | 4.24 | ||||||||||||||
Hypothetical | 0.85 | % | 1,000.00 | 1,020.69 | 1,010.35 | 4.28 | ||||||||||||||
| * | Actual expenses are equal to the Class’ annualized expense ratio of 0.85%, multiplied by the average account value over the period, multiplied by 182/365 |
266
Table of Contents
Mercer Funds
Trustees and Officers (Unaudited)
The following tables list the Trust’s Trustees and Officers as of the date of this report; their address and age; their position with the Trust; the length of time holding that position with the Trust; their principal occupation(s) during the past five years; the number of portfolios in the fund complex they oversee; and other directorships they hold in companies subject to registration or reporting requirements of the Securities Exchange Act of 1934 (generally called “public companies”) or in registered investment companies. The Trust’s Statement of Additional Information (“SAI”) includes additional information about the Trust’s trustees, including changes subsequent to the date of the report. The SAI is available, without charge, upon request, by calling1-866-658-9896, or on the SEC website at www.sec.gov.
Independent Trustees
Name, Address | Position(s) | Term of | Principal | Number of Portfolios in Fund Complex* Overseen by Trustee | Other | ||||||||
Harrison M. Bains, Jr. 99 High Street Boston, MA 02110 (75) | Trustee | Trustee since 2005 | Mr. Bains is retired. | 7 | Mr. Bains is a director of Cara Therapeutics, Inc.; Mr. Bains was a director of BG Medicine, Inc. (2007 to 2014) and a trustee of BofA Funds Series Trust (11 portfolios) (2011 to 2016). | ||||||||
Adela M. Cepeda 99 High Street Boston, MA 02110 (60) | Chairperson and Trustee | Chairperson since 2018; Trustee since 2005 | Ms. Cepeda is Managing Director of PFM Financial Advisors LLC (a financial advisory firm) since September 2016. Ms. Cepeda was previously Founder and President of A.C. Advisory, Inc. (a financial advisory firm) 1995 — 2016. | 7 | Ms. Cepeda is a director or trustee of: The UBS Funds (15 portfolios); UBS Relationship Funds (11 portfolios); SMA Relationship Trust (5 portfolios); Consulting Group Capital Markets Funds (9 portfolios); BMO Financial Corp. (U.S. holding company for BMO Harris Bank N.A.); Ms. Cepeda was a director of Fort Dearborn Income Securities, Inc. (2000 to 2016) | ||||||||
267
Table of Contents
Mercer Funds
Trustees and Officers (Unaudited) (Continued)
Name, Address | Position(s) | Term of | Principal | Number of Portfolios in Fund Complex* Overseen by Trustee | Other | ||||||||
Gail A. Schneider 99 High Street Boston, MA 02110 (69) | Trustee | Trustee since 2009 | Ms. Schneider is a self-employed consultant since 2007. | 7 | None | ||||||||
Interested Trustee:
Name, Address | Position(s) | Term of | Principal | Number of Portfolios in Fund Complex* Overseen by Trustee | Other | ||||||||
Richard S. Joseph** (53) | Trustee, President, and Chief Executive Officer | Since 2016 | Mr. Joseph is President and Head of the US Mercer Delegated Solutions of Mercer Investments LLC (formerly known as Mercer Investment Management, Inc.) since December 2015. Prior to December 2015, he was Chief Operating Officer of Mercer Investment Management, Inc. since 2005. | 7 | Mr. Joseph is a trustee of Mercer Trust Company and a director of Mercer Investments LLC (formerly known as Mercer Investment Management, Inc.) | ||||||||
| (1) | Each Trustee holds office for an indefinite term. |
| * | The “Fund Complex” consists of the Trust, which has seven portfolios. |
| ** | Mr. Joseph is considered to be an “interested person,” as defined in the 1940 Act, of the Trust due to his relationship with the Advisor. |
268
Table of Contents
Mercer Funds
Trustees and Officers (Unaudited) (Continued)
Officers:
The executive officers of the Trust not named above are:
Name and Age | Position(s) | Term of | Principal Occupation(s) During Past 5 Years | |||
Stephen Gouthro (51) | Vice President, Treasurer and Chief Financial Officer | Since 2018 | Mr. Gouthro is a partner at Mercer and U.S. Chief Operating Officer for Mercer’s U.S. Business Solutions Group. Mr. Gouthro joined Mercer in 2018. Prior to joining Mercer, Mr. Gouthro was at Putnam Investments in various leadership roles in Operations, Technology, and Investments. | |||
Carol Ann McMahon (46) | Vice President and Assistant Treasurer | Since 2017 | Ms. McMahon is a Partner and Global COO for Wealth, Global Business Solutions since 2016 and US COO in January 2017. Prior to 2016, Ms. McMahon held the position of European COO since 2006. | |||
Jennifer La Belle (50) | Vice President and Assistant Treasurer | Since 2018 | Ms. La Belle is a Principal for Mercer Investments LLC (formerly known as Mercer Investment Management, Inc.). Ms. La Belle joined Mercer in August 2015 with primary responsibilities related to the treasury functions for the Mercer Funds. Before joining Mercer, Ms. La Belle was a Vice President at State Street with over 19 years working in Fund Administration. | |||
Stan Mavromates (57) | Vice President and Chief Investment Officer | Since 2012 | Mr. Mavromates is Vice President and Chief Investment Officer of Mercer Investments LLC (formerly known as Mercer Investment Management, Inc.) since 2012. | |||
Colin Dean (41) | Vice President, Chief Legal Officer and Secretary | Since 2017 | Mr. Dean is Global Chief Counsel, Investments since 2018. He has served as Senior Legal Counsel — Investments for Mercer Investments LLC (formerly known as Mercer Investment Management, Inc.) and Mercer Investment Consulting LLC since 2010. | |||
Caroline Hulme (33) | Vice President and Assistant Secretary | Since 2017 | Ms. Hulme is Senior Legal Counsel, Investments since 2018. She served as Legal Counsel — Investments for Mercer Investments LLC (formerly known as Mercer Investment Management, Inc.) and Mercer Investment Consulting LLC since 2014. Prior to 2014, she was an Associate in the investment management practice group of Bingham McCutchen LLP | |||
Larry Vasquez (51) | Vice President | Since 2012 | Mr. Vasquez is a Vice President and Portfolio Manager of Mercer Investments LLC (formerly known as Mercer Investment Management, Inc.) since 2012. | |||
Robert Phay (50) | Vice President and Chief Compliance Officer | Since 2016 | Mr. Phay is the Chief Compliance Officer — Investments of Mercer Investments LLC (formerly known as Mercer Investment Management, Inc.) and Mercer Investment Consulting LLC since March 2015. Mr. Phay most recently served in various compliance and legal positions for Commonfund, including Chief Compliance Officer (September 2011 — February 2015), Acting General Counsel (January 2015 — February 2015), and Associate General Counsel (July 2006 — December 2014). | |||
269
Table of Contents
Mercer Funds
Trustees and Officers (Unaudited) (Continued)
Name and Age | Position(s) | Term of | Principal Occupation(s) During Past 5 Years | |||
Alec Rapaport (47) | Vice President | Since 2019 | Mr. Rapaport is a Vice President and Portfolio Manager of Mercer Investments LLC (formerly known as Mercer Investment Management, Inc.) since 2019. Prior to that, Mr. Rapaport was an independent consultant, and before that he worked at Commonfund Asset Management Company from 2000 to 2016, holding various positions, which included Team Head, Managing Director Fixed Income & Commodities. |
| † | Officers of the Trust are elected by the Trustees and serve at the pleasure of the Board. |
270
Table of Contents
Shares of Mercer Funds are distributed by MGI Funds Distributors, LLC.
Table of Contents
Item 2. Code of Ethics.
As of the end of the period covered by this report, the Registrant has adopted a code of ethics that applies to its President, Chief Financial Officer and Chief Investment Officer. During the period covered by this report, there were no amendments to a provision of its code of ethics, nor were there any waivers, including implicit waivers granted from a provision of the code of ethics. A copy of the Registrant’s code of ethics is filed with the FormN-CSR under Item 12(a)(1).
Item 3. Audit Committee Financial Expert.
The Registrant’s Board of Trustees has determined that the Registrant has at least one audit committee financial expert serving on its audit committee. The audit committee financial expert serving on the Registrant’s audit committee is Harrison M. Bains, Jr., who is “independent” as defined in Item 3(a)(2) of this Form.
Item 4. Principal Accountant Fees and Services.
(a) Audit Fees – The aggregate fee billed for the fiscal year for professional services rendered by the principal accountant for the audit of the Registrant’s annual financial statements or services that are normally provided by the principal accountant in connection with statutory and regulatory filings or engagements was $381,430 and $351,430 for the fiscal years ended March 31, 2018 and March 31, 2019, respectively.
(b) Audit-Related Fees– There were no fees billed for the fiscal years ended March 31, 2018 and March 31, 2019 for assurance and related services by the principal accountant that are reasonably related to the performance of the audit of the Registrant’s financial statements and are not reported under (a) of this Item.
(c) Tax Fees – The aggregate fee billed in the last fiscal year for professional services rendered by the principal accountant for the review of the Registrant’s tax returns and excise tax calculations was $68,188 and $67,954 for the fiscal years ended March 31, 2018 and March 31, 2019, respectively. Fees in the amount of $115,612 and $73,105 were billed in the fiscal years ended March 31, 2018 and March 31, 2019, respectively for review ofnon-US capital gains and the preparation and filing of return of income for the MercerNon-US Core Equity Fund and the Mercer Emerging Markets Equity Fund.
(d) All Other Fees – Fees in the amount of $24,000 were billed in the fiscal year ended March 31, 2018 for tax advisory services related to the reclamation of taxes paid by the MercerNon-US Core Equity Fund in certain European Union countries.
(e) (1) The Registrant’s audit committeepre-approves all audit andnon-audit services to be performed by the Registrant’s accountant before the accountant is engaged by the Registrant to perform such services.
(2) There were no services described in (b) through (d) above (including services required to be approved by the audit committee pursuant to paragraph (c)(7)(ii) ofRule 2-01 of RegulationS-X) that were approved by the audit committee pursuant to paragraph (c)(7)(i)(C) ofRule 2-01 of RegulationS-X.
| (f) | None of the hours expended on the principal accountant’s engagement to audit the Registrant’s financial statements for the fiscal year ended March 31, 2019 were attributable to work performed by persons other than the principal accountant’s full-time, permanent employees. |
| (g) | There were no aggregate fees billed for the fiscal year ended March 31, 2019 by the Registrant’s principal accountant fornon-audit services rendered to the Registrant, its investment adviser and any entity controlling, controlled by or under common control with the investment adviser that provides ongoing services to the Registrant. |
| (h) | Not applicable. |
Item 5. Audit Committee of Listed Registrants.
Not applicable.
Table of Contents
Item 6. Schedule of Investments.
The Registrant’s full schedules of investments are included as part of the report to shareholders filed under Item 1 of this Form.
Item 7. Disclosure of Proxy Voting Policies and Procedures forClosed-End Management Investment Companies.
Not applicable.
Item 8. Portfolio Managers ofClosed-End Investment Companies.
Not applicable.
Item 9. Purchases of Equity Securities byClosed-End Management Investment Company and Affiliated Purchasers.
Not applicable.
Item 10. Submission of Matters to a Vote of Security Holders.
There have been no material changes to the procedures by which the shareholders may recommend nominees to the Registrant’s Board of Directors, where those changes were implemented after the Registrant last provided disclosure in response to the requirements of Item 22(b)(15) of Schedule 14A (17 CFR240.14a-101), or this Item.
Item 11. Controls and Procedures.
(a) The Registrant’s Principal Executive Officer and Principal Financial Officer concluded that the Registrant’s disclosure controls and procedures (as defined in Rule30a-3(c) under the Investment Company Act of 1940 (17 CFR270.30a-3(c))), are effective based on the evaluation of Registrant’s disclosure controls and procedures as of a date within 90 days prior to the filing date of this report.
(b) There were no changes in the Registrant’s internal control over financial reporting (as defined in Rule30a-3(d) under the Investment Company Act of 1940 (17 CFR270.30a-3(d))), that occurred during the Registrant’s second fiscal quarter of the period covered by this report that has materially affected, or is reasonably likely to materially affect, the Registrant’s internal control over financial reporting.
Item 12. Exhibits.
(a)(1) Code of Ethics for the Registrant’s President, Chief Financial Officer and Chief Investment Officer (as referenced in Item 2 above), attached hereto as Exhibit (a)(1).
(a)(2) Certification of the Principal Executive Officer and Principal Financial Officer of the Registrant as required by Rule30a-2(a) under the Investment Company Act of 1940 (17 CFR270.30a-2(a)) is attached hereto as Exhibit 99CERT.
(a)(3) Not applicable.
(b) Certification pursuant to Section 906 of the Sarbanes-Oxley Act of 2002 as required by Rule30a-2(b), under the Investment Company Act of 1940 (17 CFR270.30a-2(b)), Rule15d-14(b) under the Securities Exchange Act of 1934 (17 CFR240.15d-14(b)) and Section 1350 of Chapter 63 of Title 18 of the United States Code (18 U.S.C. 1350) is attached hereto as Exhibit 99.906CERT.
Table of Contents
SIGNATURES
Pursuant to the requirements of the Securities Exchange Act of 1934 and the Investment Company Act of 1940, the Registrant has duly caused this report to be signed on its behalf by the undersigned, thereunto duly authorized.
| (Registrant) | Mercer Funds | |
| By (Signature and Title) | /S/ Richard Joseph | |
| Richard Joseph | ||
| President and Chief Executive Officer | ||
| (Principal Executive Officer) | ||
| Date May 24, 2019 | ||
Pursuant to the requirements of the Securities Exchange Act of 1934 and the Investment Company Act of 1940, this report has been signed below by the following person on behalf of the Registrant and in the capacities and on the date indicated.
| By (Signature and Title) | /S/ Richard Joseph | |
| Richard Joseph | ||
| President and Chief Executive Officer | ||
| (Principal Executive Officer) | ||
| Date May 24, 2019 | ||
| By (Signature and Title) | /S/ Stephen Gouthro | |
| Stephen Gouthro | ||
| Vice President, Treasurer and Chief Financial Officer | ||
| (Principal Financial Officer) | ||
| Date May 24, 2019 | ||