UNITED STATES
SECURITIES AND EXCHANGE COMMISSION
Washington, DC 20549
FORM N-CSR
CERTIFIED SHAREHOLDER REPORT OF REGISTERED
MANAGEMENT INVESTMENT COMPANIES
Investment Company Act File Number: 811-21732
Mercer Funds
(Exact Name of Registrant as Specified in Charter)
99 High Street
Boston, MA 02110
(Address of Principal Executive Offices)(Zip Code)
Colin J. Dean, Esq.
Mercer Investment Management, Inc.
99 High Street
Boston, MA 02110
(Name and Address of Agent for Service)
Registrant’s Telephone Number, including Area Code: (617) 747-9500
Date of Fiscal Year End: March 31, 2018
Date of Reporting Period: March 31, 2018
Item 1. Reports to Stockholders.
The Report to Shareholders is attached herewith.

Mercer Funds™
Annual Report
Mercer US Large Cap Equity Fund
Mercer US Small/Mid Cap Equity Fund
Mercer Non-US Core Equity Fund
Mercer Core Fixed Income Fund
Mercer Opportunistic Fixed Income Fund
Mercer Emerging Markets Equity Fund
Mercer Global Low Volatility Equity Fund
This report has been prepared for Mercer Funds shareholders. It is not authorized for distribution to prospective investors unless accompanied or preceded by a current Mercer Funds prospectus. The prospectus contains more complete information about the Funds’ investment objectives, risks, and expenses. Investors are reminded to read the prospectus carefully before investing.
March 31, 2018
MERCER FUNDS
TABLE OF CONTENTS
Mercer US Large Cap Equity Fund
Investment Objective and Benchmark
The investment objective of the Fund is long-term total return, which includes capital appreciation and income. The benchmark for the Fund is the Russell 1000 Index.
Investment Strategy
The Fund invests principally in equity securities (such as common stock) issued by large capitalization U.S. companies. The Fund employs a “core equity” investment strategy by investing in both growth and value oriented equity securities. The Fund may invest in derivative instruments to gain market exposure on cash balances or to reduce market exposure in anticipation of liquidity needs.
Performance
For the fiscal year ended March 31, 2018, the Fund’s Y-3 share class performance was 17.26% compared to its benchmark, the Russell 1000 Index, return of 13.98%. Performance for the Fund is reported net of fees and operating expenses while the benchmark returns do not include expenses of any kind as indexes are unmanaged.
The Sub-Advisors
As of March 31, 2018, the Fund employed six subadvisors: HS Management Partners, LLC (HS), Columbia Management Investment Advisers (Columbia), Parametric Portfolio Associates LLC (Parametric), AJO LP (AJO), Brandywine Global Investment Management, LLC (Brandywine), and O’Shaughnessy Asset Management, LLC (OSAM).
AJO is a quantitative manager that relies on a combination of value, management, momentum, and sentiment factors to evaluate securities. Columbia is an aggressive growth manager, following a high conviction, concentrated strategy that focuses on financially strong companies that are growing earnings faster than the broader equity market. HS is a growth manager that invests in quality businesses with strong management that trade at attractive valuations. Brandywine, a deep value manager, focuses on cheap stocks that trade at a significant discount to intrinsic value, that have strong free cash flows and quality balance sheets. OSAM is a yield focused quantitative value manager that seeks stocks that are ranked high based on valuation, quality and shareholder yield. Parametric utilizes exchange-traded futures to generate exposure corresponding to the Fund’s benchmark, the Russell 1000 Index.
Market Commentary and Fund Performance
For the 12-month-period ended March 31, 2018, the U.S. equity market, as measured by the Russell 3000 Index, increased 13.63%. In 2017, strength in the U.S. equity market was supported by strong corporate earnings results, relatively benign inflation, low volatility, falling unemployment, steady wage gains and rising consumer and business sentiment. From a style perspective, growth meaningfully outperformed value across the market capitalization spectrum. Despite some negative headlines, including geopolitical tension, political uncertainty and concerns over the economic impacts of the devastating hurricanes in August and September of 2017, the U.S. equity market continued its slow and steady march forward. Tax reform took center stage at the end of 2017, when the new tax bill was signed into law, which boosted investor optimism, giving further support to equity prices. The Federal Reserve raised rates three times over the course of the Fund’s fiscal year and announced plans for further modest increases throughout 2018.
After a strong start to 2018, markets were jolted in February by fears of rising interest rates, inflation, and wages weighing on equity markets. During this period, market volatility, as measured by the CBOE Volatility Index (VIX), increased, reaching a high of 37.32 on February 5, 2018, as compared to a low of 9.15 on January 3, 2018. From a style perspective growth stocks continued to lead the market in the first quarter of 2018, outperforming
1
Mercer US Large Cap Equity Fund
value stocks across market capitalization ranges. However, unlike in 2017, smaller capitalization stocks outperformed larger capitalization stocks for the first quarter 2018.
Within the Russell 1000 Index, the Fund’s benchmark, the best performing sectors for the fiscal year were information technology, financials, and consumer discretionary, with returns of 28.0%, 17.8%, and 16.4% respectively. Telecommunication services was the laggard with returns of -5.3%. The best performing industries were internet & direct marketing, personal products, and aerospace & defense, with returns of 55.3%, 45.3%, and 42.0% respectively.
The Mercer U.S. Large Cap Equity Fund outperformed the Russell 1000 Index for the period. Strong contributions from growth managers, as well as the Fund’s exposure to momentum were the primary contributors to the Fund’s outperformance. From a sector perspective, security selection in the information technology, consumer staples and energy sectors drove performance. Detracting from performance was poor security selection within industrials and health care.
Columbia outperformed its benchmark for the period. Results were driven by strong stock selection within information technology, particularly among software and internet service names. HS underperformed its benchmark for the period. Large overweight allocations to consumer sectors, and stock selection within the consumer discretionary sector caused performance to lag. AJO outperformed for the period, despite its value style. Exposure to momentum and quality factors, as well as strong stock selection within energy and technology were among the largest contributors to AJO’s performance. Brandywine outperformed its benchmark for the period due to strong stock selection within the information technology and energy sectors. Sector positioning also benefitted Brandywine’s strategy, particularly its underweight allocations to real estate, utilities, and telecommunication services, and its overweight allocations to financials and consumer discretionary stocks. O’Shaughnessy outperformed for the period, with positive returns being driven by helpful interaction effects between its quality, momentum, valuation and yield selection criteria. From a sector perspective, this drove positive effects from positioning and O’Shaughnessy’s stock selection in the energy, industrials, and consumer discretionary sectors. Parametric utilizes exchange-traded futures replicating the Fund’s benchmark to provide broad, passive, equity market exposure to the Fund’s liquidity sleeve, creating positive returns on assets that would have otherwise been earning cash or cash equivalent returns. Performance differences versus the benchmark are largely a result of cash flow effects related to daily subscription/redemption activity and through financing costs of futures relative to interest earned on cash.
Risk Considerations
The Fund invests in both growth stocks and value stocks. Growth stocks may be particularly sensitive to market conditions. Investing in value stocks involves the risk that an investment made in undervalued securities may not appreciate in value as anticipated or remain undervalued for long periods of time.
The Fund may invest in derivative instruments such as exchange-listed equity futures contracts, which may cause the Fund to experience greater volatility and less liquidity. Derivatives may be more sensitive to changes in market conditions and may amplify the risk of loss for the Fund. The Fund may experience high portfolio turnover which may result in higher transaction costs and capital gains.
2
Mercer Funds
March 31, 2018
Comparison of Change in Value of a $10,000 Investment in
Mercer US Large Cap Equity Shares vs. the
Russell 1000® Index and the Fund’s Prior Index1
As of March 31, 2018
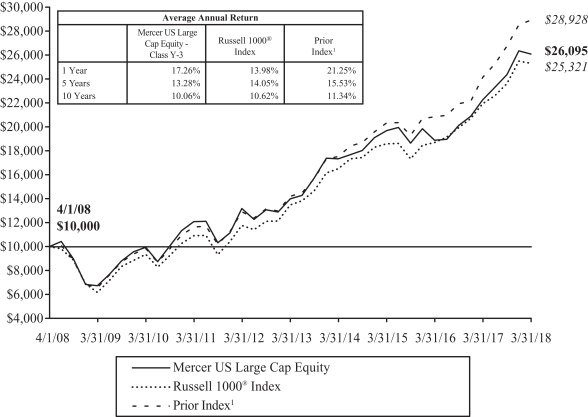
This graph shows the performance of the Mercer US Large Cap Equity Fund Class Y-3 shares versus the Russell 1000® Index and the Fund’s Prior Index1 from April 1, 2008 through March 31, 2018. The performance of other classes, when launched, will vary from the performance of the class shown based on the difference in fees and expenses paid by shareholders investing in different share classes. The Fund may charge a 2% redemption fee on shares owned less than 30 days.
The table and graph assume reinvestment of dividends and capital gains, but do not reflect a deduction of taxes an investor might pay on fund distributions or upon redemption of fund shares. Performance shown reflects a fee waiver and/or expense reimbursement. Without this waiver/reimbursement, returns would have been lower.
1 Effective as of June 27, 2016, the Fund changed its primary benchmark from the Russell 1000® Growth Index to the Russell 1000® Index in connection with a change to the Fund’s principal investment strategies because it was determined that this index is more reflective of the Fund’s current investment style.
The data quoted represents past performance and does not guarantee future results. Current performance of the Fund may be lower or higher than the performance quoted. Please call 1-866-658-9896 for the Fund’s most recent month-end performance. Investment return and principal value will fluctuate so that an investor’s shares, when redeemed, may be worth more or less than when purchased.
3
Mercer US Small/Mid Cap Equity Fund
Investment Objective and Benchmark
The investment objective of the Fund is to provide long-term total return, comprised primarily of capital appreciation. The benchmark for the Fund is the Russell 2500 Index.
Investment Strategy
The Fund invests principally in equity securities issued by small-to-medium capitalization U.S. companies. The Fund employs a “core equity” investment strategy by investing in both growth and value oriented equity securities. The Fund may invest in derivative instruments to gain market exposure on cash balances or to reduce market exposure in anticipation of liquidity needs.
Performance
For the fiscal year ended March 31, 2018, the Fund’s Y-3 share class performance was 12.64% compared to its benchmark, the Russell 2500 Index, return of 12.31%. Performance for the Fund is reported net of fees and operating expenses while the benchmark returns do not include expenses of any kind as indexes are unmanaged.
The Sub-Advisors
As of March 31, 2018, the Fund employed six sub-advisors: Westfield Capital Management Company (Westfield), Parametric Portfolio Associates LLC (Parametric), GW&K Investment Management, LLC (GW&K), Loomis, Sayles & Company L.P. (Loomis), LSV Asset Management (LSV) and BNY Mellon Asset Management North America Corporation. GW&K uses a bottom-up fundamental research process in order to identify companies with sustainable long-term earnings growth rates. Westfield, a traditional growth manager, employs a fundamental, bottom-up approach which seeks to identify reasonably priced stocks with high earnings growth potential. Loomis looks to provide a lower volatility approach to high growth investing by seeking companies with high quality business models that have differentiated and sustainable growth opportunities. LSV, a quantitative value manager, seeks deep value, out-of-favor companies with recent momentum. LSV avoids introducing any judgmental biases or behavioral weaknesses into their investment process. BNY Mellon Asset Management North America, a fundamental intrinsic value manager, focuses on purchasing companies that are at a large discount, underappreciated and temporarily dislocated (contrarian view). BNY Mellon Asset Management North America was added as a sub-advisor to the Fund in February 2018, replacing NWQ Investment Management Company, LLC (NWQ). Parametric utilizes exchange traded futures to generate market exposure corresponding to the Fund’s benchmark.
Market Commentary and Fund Performance
For the 12-month-period ended March 31, 2018, the U.S. equity market, as measured by the Russell 3000 Index, increased 13.63%. In 2017, strength in the U.S. equity market was supported by strong corporate earnings results, relatively benign inflation, low volatility, falling unemployment, steady wage gains and rising consumer and business sentiment. From a style perspective, growth meaningfully outperformed value across the market capitalization spectrum. Despite some negative headlines, including geopolitical tension, political uncertainty and concerns over the economic impacts of the devastating hurricanes in August and September of 2017, the U.S. equity market continued its slow and steady march forward. Tax reform took center stage at the end of 2017, when the new tax bill was signed into law, which boosted investor optimism, giving further support to equity prices. The Federal Reserve raised rates three times over the course of the Fund’s fiscal year and announced plans for further modest increases throughout 2018.
After a strong start to 2018, markets were jolted in February by fears of rising interest rates, inflation, and wages, which weighed on equity markets. During this period, market volatility, as measured by the CBOE Volatility
4
Mercer US Small/Mid Cap Equity Fund
Index (VIX), increased, reaching a high of 37.32 on February 5, 2018 as compared to a low of 9.15 on January 3, 2018. From a style perspective growth stocks continued to lead the market outperforming value stocks across market capitalization ranges in the first quarter of 2018. However, unlike in 2017, smaller capitalization stocks outperformed larger capitalization stocks for the first quarter of 2018.
Within the Russell 2500 Index, the Fund’s benchmark, the best performing sectors for the fiscal year were information technology and health care with positive returns of 24.42% and 22.34%, respectively. Underperforming sectors for the fiscal year were energy and real estate, with negative returns of -15.56% and -3.18%, respectively. The top performing industries for the fiscal year were air freight & logistics and internet software & services with positive returns of 58.41% and 54.36%, respectively. The underperforming industries for the fiscal year were transportation infrastructure and energy equipment & services with negative returns of -49.70% and -30.92%, respectively.
The Mercer U.S. Small/Mid Cap Equity Fund outperformed the Russell 2500 Index for the period. The Fund’s exposure to momentum, coupled with strong security selection, were the primary drivers to the Fund’s outperformance. Specifically, strong security selection in the industrials and energy sectors drove performance for the fiscal year despite poor security selection in the consumer staples and real estate sectors.
Westfield outperformed for the fiscal year due to its strong security selection in the industrials and consumer discretionary sectors. In addition, their underweight in the materials and energy sectors from an allocation standpoint helped drive their outperformance. Loomis outperformed for the fiscal year due to its strong security selection in the consumer discretionary, industrials and information technology sectors. GW&K‘s outperformance was attributed to its security selection in the information technology and consumer discretionary sectors. In addition, GW&K’s underweight in the energy sector and overweight in the information technology sector helped contribute to its outperformance. For the period that NWQ was a subadvisor in the fund, its outperformance was driven by its allocation decisions. In particular, NWQ’s underweight to the real estate sector and overweight within the information technology and materials sectors drove its outperformance. LSV’s underperformance for the period was driven by its security selection in the information technology, real estate and health care sectors. BNY Mellon Asset Management North America underperformed for the short period that it was a subadvisor to the Fund during the Fund’s fiscal year 2018. In particular, the strategy’s underperformance was driven by its underweight to the real estate and utilities sectors. In addition, BNY Mellon Asset Management North America’s security selection within the financials and consumer discretionary sectors detracted from performance. Parametric utilizes exchange-traded futures replicating the Fund’s benchmark to provide broad, passive, equity market exposure to the Fund’s liquidity sleeve, creating positive returns on assets that would have otherwise been earning cash or cash equivalent returns. Performance differences versus the benchmark are largely a result of cash flow effects related to daily subscription/redemption activity and through financing costs of futures relative to interest earned on cash.
Risk Considerations
The Fund invests in both growth stocks and value stocks. Growth stocks may be particularly sensitive to market conditions. Investing in value stocks involves the risk that an investment made in undervalued securities may not appreciate in value as anticipated or remain undervalued for long periods of time. Investments made in small and mid-capitalization companies may be more volatile and less liquid due to limited resources or product lines and more sensitive to economic factors. The Fund may invest in derivative instruments such as exchange-listed equity futures contracts, which may cause the Fund to experience greater volatility and less liquidity. Derivatives may be more sensitive to changes in market conditions and may amplify the risk of loss for the Fund. The Fund may experience high portfolio turnover which may result in higher transaction costs and capital gains.
5
Mercer Funds
March 31, 2018
Comparison of Change in Value of a $10,000 Investment in
Mercer US Small/Mid Cap Equity Shares vs. the
Russell 2500™ Index and the Fund’s Prior Index1
As of March 31, 2018
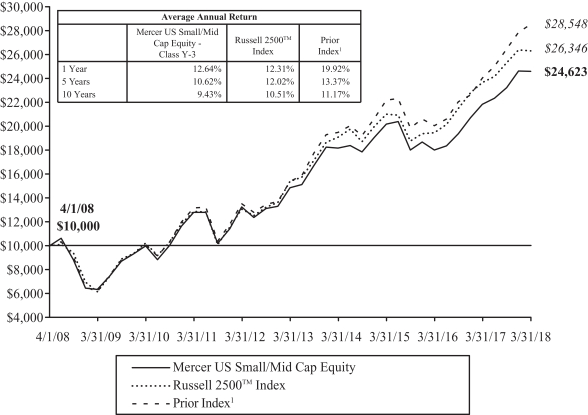
This graph shows the performance of the Mercer US Small/Mid Cap Equity Fund Class Y-3 shares versus the Russell 2500™ Index and the Fund’s Prior Index1 from April 1, 2008 through March 31, 2018. The performance of other classes, when launched, will vary from the performance of the class shown based on the difference in fees and expenses paid by shareholders investing in different share classes. The Fund may charge a 2% redemption fee on shares owned less than 30 days.
The table and graph assume reinvestment of dividends and capital gains, but do not reflect a deduction of taxes an investor might pay on fund distributions or upon redemption of fund shares. Performance shown reflects a fee waiver and/or expense reimbursement. Without this waiver/reimbursement, returns would have been lower.
1 Effective as of June 27, 2016, the Fund changed its primary benchmark from the Russell 2500TM Growth Index to the Russell 2500TM Index in connection with a change to the Fund’s principal investment strategies because it was determined that this index is more reflective of the Fund’s current investment style.
The data quoted represents past performance and does not guarantee future results. Current performance of the Fund may be lower or higher than the performance quoted. Please call 1-866-658-9896 for the Fund’s most recent month-end performance. Investment return and principal value will fluctuate so that an investor’s shares, when redeemed, may be worth more or less than when purchased.
6
Mercer Non-US Core Equity Fund
Investment Objective and Benchmark
The investment objective of the Fund is to provide long-term total return, which includes capital appreciation and income. The benchmark for the Fund is the MSCI EAFE Index.
Investment Strategy
The Fund invests principally in equity securities issued by non-U.S. companies of any capitalization, located in the world’s developed and emerging capital markets. The Fund employs a “core equity” investment strategy that seeks to meet the Fund’s investment objective by investing in both growth- and value-oriented equity securities.
Performance
For the fiscal year ended March 31, 2018, the Fund’s Y-3 share class performance was 18.80% compared to its benchmark return of 14.80%. Performance for the Fund is reported net of fees and operating expenses while the benchmark returns do not include expenses of any kind as indexes are unmanaged.
The Sub-Advisors
As of March 31, 2018, the Fund employed five sub-advisors: Arrowstreet Capital, Limited Partnership (Arrowstreet), American Century Investment Management, Inc. (American Century), MFS Investment Management (MFS), LSV Asset Management (LSV) and Parametric Portfolio Associates LLC (Parametric).
Arrowstreet’s strategy seeks to outperform international equity benchmarks through a risk-controlled core approach. Arrowstreet combines sound investment intuition and research with rigorous quantitative tools to identify mispriced stocks around the world. Arrowstreet believes that the key to generating return in excess of the benchmark involves evaluating the prospects of a security considering both the characteristics of the stock itself (direct effects) as well as the characteristics of other related stocks (indirect effects). American Century manages its portfolio based on an investment philosophy that companies exhibiting improving or accelerating growth will outperform the market over time. American Century constructs its portfolio through bottom-up stock selection within a risk aware framework. American Century’s thorough research process seeks to identify companies that are exhibiting an improvement or acceleration in growth where it believes that growth is sustainable but that the earnings power of the company is generally underestimated. American Century will invest primarily in equity securities of companies located in Non-U.S. developed markets. MFS manages a value portfolio, which focuses on stocks whose long-term value they believe is not adequately reflected in the stock price. MFS invests opportunistically in emerging markets. LSV utilizes a quantitative approach which seeks deep value stocks that have fallen out of favor with the market, but have recent momentum, either in terms of price or earnings. LSV believes that long-term results are achieved through systematic exploitation of judgmental biases and behavioral weaknesses that influence investor decisions. LSV aims to exploit these biases through the disciplined application of quantitative techniques to drive bottom-up security selection. Parametric utilizes exchange-traded futures to generate market exposure corresponding to the Fund’s benchmark.
Market Commentary and Fund Performance
The MSCI EAFE Index (the Fund’s benchmark) returned 14.8% for the 12-month period ended March 31, 2018. Generally, global equity markets performed well, as measured by the MSCI World Index, which rose 13.6% during the period. U.S. equities rallied, with the Russell 1000 Index up 14.0% for the fiscal year. Emerging markets also performed well, as the MSCI Emerging Markets Index returned 24.9%, over the period.
Global equity markets rose steadily from the end of the first quarter of 2017 until late January 2018. Since the recent peak in January 2018, global equity markets dropped over 9% (measured by the MSCI All Country World Index) by the end of the first quarter of 2018.
7
Mercer Non-US Core Equity Fund
Over the year ended March 31, 2018, global equity markets were boosted by synchronized global growth, unusually subdued volatility and strong corporate earnings growth. Growth outside the U.S. was also helped by the continued easy monetary policies of the European Central Bank and the Bank of Japan. Developed international equity markets (MSCI EAFE Index) rose by almost 15% during this period and Emerging markets (MSCI Emerging Markets Index) delivered even greater gains (25%), though there was a wide disparity in returns across countries.
Despite these strong returns, equity market investors had a number of reasons to worry including: rising tensions with North Korea, risk of rising protectionism, uncertainty resulting from European elections, the Catalan independence movement in Spain, struggles in the German parliament to form a coalition government, Brexit negotiations, monetary tightening by the Federal Reserve and a rise in both inflation and global bond rates.
The recent losses suffered by global equity markets, which began at the end of January 2018, have been attributed to investor concerns around rising inflation, a drop in global economic surprise indexes (Citigroup Economic Surprise Indices), concerns that imposition of tariffs could negatively impact growth, and a loss in positive momentum for some of the largest technology companies, which had outperformed in the prior year.
In this environment, the Mercer Non-US Core Equity Fund outperformed the MSCI EAFE Index by 4.00% for the 12-month period ended March 31, 2018. During this period, the Fund’s outperformance was driven by positive stock selection in all 11 sectors. The Fund’s overall overweight to the technology sector was also beneficial to relative returns.
American Century provides the growth allocation for the Fund. Stock selection in Information technology, financials, industrials, consumer discretionary and consumer staples generated excess returns. Growth stocks outperformed value stocks during the period which was a tailwind to performance. The American Century portfolio may make opportunistic, off-benchmark bets in Emerging Market companies which helped generate outperformance over this time period. Stock selection in Europe generated strong relative returns, while investments in Emerging Market technology stocks also added to results.
MFS, a manager that has outperformed significantly over the last few years, continued this trend over the period. Similar to the American Century strategy, much of the outperformance generated by MFS came from the technology sector. The MFS portfolio also holds a sizeable overweight to the consumer staples sector. Despite the underperformance of the consumer staples sector versus the benchmark, MFS was able to make up some of the drag on performance caused by an overweight to this sector through positive stock selection.
Arrowstreet beat the Fund’s benchmark during this period through stock selection and an overweight to the technology sector. The biggest contributor to Arrowstreet’s outperformance was stock selection in the materials and technology sectors.
LSV is the dedicated value manager in the Fund. Value stocks underperformed growth stocks during this period. Despite this headwind, the LSV portfolio generated outperformance from positive stock selection in 8 out of 11 sectors. LSV’s underweight to the consumer staples sector was also beneficial to relative returns.
Parametric utilizes exchange-traded futures replicating the Fund’s benchmark to provide broad, passive, equity market exposure to the Fund’s liquidity sleeve, creating positive returns on assets that would have otherwise been earning cash or cash equivalent returns. Performance differences versus the benchmark are largely a result of cash flow effects related to daily subscription/redemption activity and through financing costs of futures relative to interest earned on cash.
8
Mercer Non-US Core Equity Fund
Risk Considerations
The Fund invests in foreign and emerging market securities which involves certain risks such as currency volatility, political and social instability and reduced market liquidity. Emerging markets may be more volatile and less liquid than more developed markets and therefore may involve greater risks. Investments made in small and mid-capitalization companies may be more volatile and less liquid due to limited resources or product lines and more sensitive to economic factors. The Fund may invest in derivative instruments such as exchange-listed equity futures contracts, which may cause the Fund to experience greater volatility and less liquidity. Derivatives may be more sensitive to changes in market conditions and may amplify the risk of loss for the Fund. The Fund may experience high portfolio turnover which may result in higher transaction costs and capital gains.
9
Mercer Funds
March 31, 2018
Comparison of Change in Value of a $10,000 Investment in
Mercer Non-US Core Equity Shares vs. the
MSCI EAFE Index
As of March 31, 2018
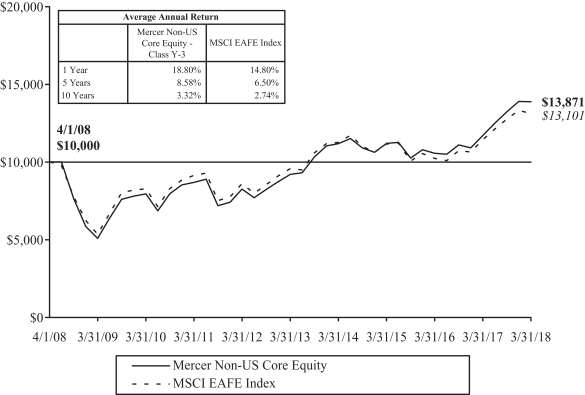
This graph shows the performance of the Mercer Non-US Core Equity Fund Class Y-3 shares versus the MSCI EAFE Index from April 1, 2008 through March 31, 2018. The performance of other classes, when launched, will vary from the performance of the class shown based on the difference in fees and expenses paid by shareholders investing in different share classes. The Fund may charge a 2% redemption fee on shares owned less than 30 days.
The table and graph assume reinvestment of dividends and capital gains, but do not reflect a deduction of taxes an investor might pay on fund distributions or upon redemption of fund shares. Performance shown reflects a fee waiver and/or expense reimbursement. Without this waiver/reimbursement, returns would have been lower.
The data quoted represents past performance and does not guarantee future results. Current performance of the Fund may be lower or higher than the performance quoted. Please call 1-866-658-9896 for the Fund’s most recent month-end performance. Investment return and principal value will fluctuate so that an investor’s shares, when redeemed, may be worth more or less than when purchased.
10
Mercer Core Fixed Income Fund
Investment Objective and Benchmark
The investment objective of the Fund is to provide total return, consisting of both current income and capital appreciation. The benchmark for the Fund is the Bloomberg Barclays U.S. Aggregate Bond™ Index.
Investment Strategy
The Fund invests principally in investment grade fixed income securities, including government securities, corporate bonds and securitized bonds such as mortgage and asset-backed securities. The Fund may also invest in non-investment grade bonds, non-U.S. dollar denominated bonds, bonds issued by issuers located in emerging capital markets, and certain derivative instruments. The Fund may invest in derivative instruments, such as options, futures, and swap agreements. The Fund may engage in transactions in derivatives for a variety of purposes, including changing the investment characteristics of its portfolio, enhancing total returns or as a substitute for taking a position in an underlying asset.
Performance
For the fiscal year ended March 31, 2018, the Fund’s Y-3 share class performance was 1.80% compared to its benchmark return of 1.20%. Performance for the Fund is reported net of fees and operating expenses while the benchmark returns do not include expenses of any kind as indexes are unmanaged.
The Sub-Advisors
As of March 31, 2018, the Fund employed three sub-advisors, Manulife Asset Management (Manulife), Income Research & Management (IR&M) and Prudential Fixed Income, a business unit of PGIM, Inc. (Prudential).
Manulife manages its allocated portion of the Fund by seeking to produce superior results by anticipating shifts in the business cycle and moderating risk relative to the direction of interest rates. The investment team capitalizes on these shifts by using a research-driven process to identify attractive sectors as well as mispriced securities within those sectors. IR&M manages its allocated portion based on the belief that careful security selection and higher portfolio income provide superior returns over the long term. Portfolios are constructed using a disciplined, bottom-up investment approach to select attractive securities from the U.S fixed income universe. Prudential manages its allocated portion of the Fund by seeking to maximize excess return opportunities from sustainable alpha sources such as sector allocation and bottom up security selection. This process is coupled with a diligent daily portfolio risk evaluation and monitoring process. Research-based security selection is a major source of added value and incorporates both fundamental analysis as well as proprietary models that identify relative value and detailed technical review of issuers across both benchmark and non-benchmark sectors, with an emphasis on credit-oriented sectors.
Market Commentary and Fund Performance
For the 12 month period ended March 31, 2018, U.S. fixed income market returns, as measured by the Bloomberg Barclays U.S. Aggregate index, were positive. Generally, price increases of fixed income securities that are not backed by a U.S. Government Guarantee (including Corporate Bonds, Asset Backed Securities, and Commercial Mortgage Backed Securities) more than offset the general drop in prices of U.S. Government securities resulting from rising interest rates. Intermediate U.S. Treasury rates increased 0.64% while longer term interest rates decreased -0.05% year-over-year (with some interim volatility). Yields for the two year Treausry Note, also referred to as the short end of the Treasury curve, rose year-over-year by 1.01% as the Federal Reserve raised short term interest rates three times over the period. 2017 confounded many of the initial expectations of a bear market for bonds and turned out to be yet another solid year for fixed income with broad benchmarks generally outperforming cash and, as expected, the higher-yielding sectors putting in particularly impressive
11
Mercer Core Fixed Income Fund
performances. U.S. economic growth accelerated from 1.5% in 2016 to an estimated 2.3% in 2017. Encouragingly, in 2017 a significant source of growth was stronger investment by businesses — a trend that the tax reform package, which passed in December 2017, is likely to continue to foster in 2018. In addition, a rebound in corporate profits, a weakening dollar, and broad-based, synchronized growth among U.S. trading partners contributed to the improvement in growth in 2017. Strong consumer spending, meanwhile, has been supported by a drop in the household saving rate over the past two years and a modest pick-up in borrowing. Proposed tax cuts for an estimated 60% of households are expected to continue supporting consumption in 2018. Despite volatility during the first 2 quarters of the period ended March 31, 2018, interest rates moved steadily higher in the latter 2 quarters as the Fed announced that it would begin the balance sheet normalization process. Foreign purchases of U.S. Treasuries continued at a strong pace, and this helped to temper the effect of the rise in interest rates, especially in the 10 year and longer portion of the Treasury curve, also referred to as the long end of the curve.
Returns from fixed income securities that are not backed by a U.S. Government guarantee (including corporate bonds, asset backed securities, and commercial mortgage backed securities) were generally positive, as these securities benefitted from strong demand for higher yields. Lower credit quality rated corporate bonds (i.e., high yield or “junk” bonds) tended to provide greater excess returns during the 12-month period than the higher credit quality rated corporate bonds (i.e., investment-grade bonds). Investment-grade corporate bond issuers continued to issue record amounts of new bonds to take advantage of low interest rates, once again exceeding the record breaking issuance of the prior year.
With Treasury rates rising so significantly during the 12-month period, positive total return was driven almost entirely from outperformance of the spread sectors (i.e., non-Treasury securities). Spread sectors provided higher returns in relation to similar-duration Treasuries while registering moderate gains in absolute terms. The Fund’s return was positive in absolute terms and it also outperformed in relation to the Bloomberg Barclays U.S. Aggregate Bond Index for the fiscal year ended March 31, 2018. The Fund was helped by its strategic overweight to spread sectors, including an allocation to high yield.
The respective performance results of each Sub-advisor correlated with their risk posture, as more risk translated into more returns in this “risk-on” period. Manulife has the largest share of the risk allocation within the Fund. Manulife’s bias towards corporate credit and its approximate 15% allocation to relatively “higher quality” high yield bonds, led it to have the strongest returns among the Fund’s Sub-Advisors for the 2018 fiscal year. Manulife had an overweight to the long end of the yield curve and an underweight to the middle, or two to ten year portion of the yield curve, which was also a driver of returns over the period as the long end yields fell slightly and prices for those bonds went up in value, while the yields in the middle of the curve rose significantly, and prices for those bonds declined. Manulife carried an underweight to securities issued by utility companies, which detracted from returns over the year.
Prudential had a less aggressive allocation to spread sectors than Manulife, but it was nonetheless overweight to the spread sectors as spreads tightened, which helped it outperform the index. Prudential also had similar curve positioning to Manulife, with an overweight to the long end of the curve, and an underweight to the middle which added to outperformance. Prudential also had a large overweight to commercial mortgage backed securities, an asset class that had strong performance over the period.
Similarly, IR&M’s overall underweight to Treasury bonds over the period was beneficial to the Fund, as the spread sector outperformed Treasuries. IR&M’s underweight to agency mortgage backed securities, coupled with security selection within that sector, was also a major contributor to its outperformance of the index. IR&M’s bias towards higher quality corporate bonds helped it outperform the index, but to a lesser extent than the other two managers who held more lower-quality bonds. IR&M’s investment in Small Business Administration loans detracted from returns over the year.
12
Mercer Core Fixed Income Fund
Risk Considerations
The Fund is subject to the risks that the underlying bonds in its portfolio are subject to, including credit, prepayment, call and interest rate risk. As interest rates rise, the value of bond prices will decline. The Fund may invest in foreign securities, which may expose the Fund to currency and exchange rate fluctuations, derivatives (such as futures, options, or swaps) and high yield bonds (also known as “junk” bonds). These investments may cause the Fund to experience greater volatility and less liquidity. Derivatives may be more sensitive to changes in market conditions and may amplify the risk of loss for the Fund. The Fund may experience high portfolio turnover which may result in higher transaction costs and capital gains.
13
Mercer Funds
March 31, 2018
Comparison of Change in Value of a $10,000 Investment in
Mercer Core Fixed Income Shares vs. the
Bloomberg Barclays U.S. Aggregate Bond™ Index
As of March 31, 2018
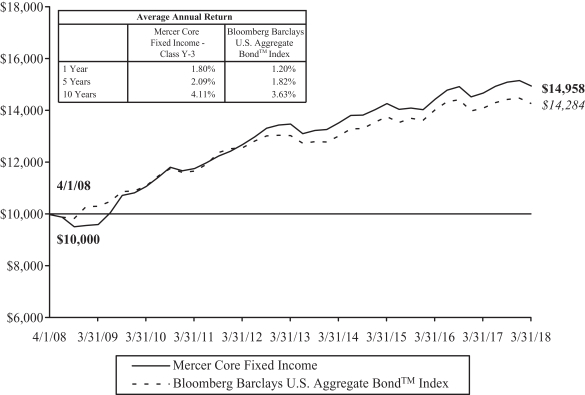
This graph shows the performance of the Mercer Core Fixed Income Fund Class Y-3 shares versus the Bloomberg Barclays U.S. Aggregate Bond™ Index from April 1, 2008 through March 31, 2018. The performance of other classes, when launched, will vary from the performance of the class shown based on the difference in fees and expenses paid by shareholders investing in different share classes. The Fund may charge a 2% redemption fee on shares owned less than 30 days.
The table and graph assume reinvestment of dividends and capital gains, but do not reflect a deduction of taxes an investor might pay on fund distributions or upon redemption of fund shares. Performance shown reflects a fee waiver and/or expense reimbursement. Without this waiver/reimbursement, returns would have been lower.
The data quoted represents past performance and does not guarantee future results. Current performance of the Fund may be lower or higher than the performance quoted. Please call 1-866-658-9896 for the Fund’s most recent month-end performance. Investment return and principal value will fluctuate so that an investor’s shares, when redeemed, may be worth more or less than when purchased.
14
Mercer Opportunistic Fixed Income Fund
Investment Objective and Benchmark
The investment objective of the Fund is to provide long-term total return, which includes capital appreciation and income. The Fund’s primary benchmark is the Bank of America Merrill Lynch Global High Yield 2.0% Constrained Index Unhedged. The Fund’s secondary benchmark is a blended benchmark consisting of 50% JP Morgan Government Bond Index — Emerging Markets Global Diversified and 50% Bank of America Merrill Lynch Global High Yield 2.0% Constrained Index Unhedged.
Investment Strategy
The Fund invests principally in fixed income securities of U.S. and non-U.S. issuers, including those in emerging and frontier markets. The Fund invests in various strategic and tactical global bond market opportunities without limitations in geography, issuer type, quality and currency denomination. The Fund may invest in derivatives such as futures (including among others, interest rate futures), swaps (currency, interest rate, credit default and total return), forwards, options, and credit-linked notes. The Fund may engage in transactions in derivatives for a variety of purposes, including hedging, risk management, efficient portfolio management, enhance total returns, or as a substitute for taking position in the underlying asset.
Performance
For the fiscal year ended March 31, 2018, the Fund’s Y-3 share class performance was 9.42% compared to its primary benchmark return of 6.67% and secondary benchmark return of 9.82%. Performance for the Fund is reported net of fees and operating expenses while the benchmark returns do not include expenses of any kind as indexes are unmanaged.
The Sub-Advisors
As of March 31, 2018, the Fund employed two sub-advisors, Franklin Advisers, Inc. (Franklin) and Investec Asset Management Limited (Investec).
In managing its allocated portion of the Fund’s portfolio, Franklin typically invests in non-investment grade securities issued globally. Franklin is a research driven, fundamental investor that relies on a team of analysts to provide in-depth industry expertise, using both qualitative and quantitative analysis to evaluate issuers. Although bottom-up security selection forms the core part of Franklin’s process, it uses industry attractiveness when selecting investments.
In managing its allocated portion of the Fund’s portfolio, Investec invests in public sector, sovereign and corporate bonds issued by emerging market borrowers and those denominated in local emerging market currencies. Investec’s portfolio construction process promotes allocation to countries and currencies identified based on economic fundamentals, valuations and market price behavior.
Market Commentary and Fund Performance
For the 12-month period ended March 31, 2018, U.S. and global fixed income markets experienced a volatile period driven by a few broad underlying factors: a recovery in the physical commodities markets; stable economic growth in China; a weak U.S. dollar versus developed and emerging market currencies; and significant oil price recovery, which created mixed effects on energy importer and exporter economies. Towards the end of the period, the Trump administration’s protectionist trade policies and escalating trade tensions between the U.S. and China contributed to volatility in global financial markets.
The passage of the U.S. tax reform bill in December 2017, along with expectations for stronger U.S. economic growth and higher inflation, pressured total returns for U.S. Treasury securities and boosted total returns for
15
Mercer Opportunistic Fixed Income Fund
lower rated corporate bonds (i.e., high yield or “junk” bonds) and for non-U.S. dollar-denominated bonds. After rising early in the period, U.S. Treasury securities prices generally moved lower. U.S. Treasury yields reached highs for the period in February 2018 as a result of market perception that President Trump’s pro-growth agenda and the U.S. tax reform bill could lead to an overheating in the U.S. economy, which could in turn lead to the U.S. Federal Reserve to raise interest rates at a faster-than-expected pace. The Bank of America Merrill Lynch Global High Yield 2% Constrained Index Unhedged experienced a tightening in its yield spread (i.e., the difference in yield of the securities comprising the index over U.S. Treasuries, which is a measure of risk premium), ending the Fund’s fiscal year with a yield spread of 361 basis points and an overall effective yield of 5.69%. Additionally, rising oil prices and a weak U.S. dollar positively influenced global bond prices. Low corporate default rates, stable business fundamentals and the perception of a synchronized global economic growth provided positive momentum, which led high yield bonds to outperform investment-grade bonds in a rising rate environment.
Unhedged emerging markets (“EM”) local currency bonds produced a solid positive return over the year, supported by falling bond yields and rising EM currency markets (relative to the U.S. dollar). On the bond side, generally falling EM inflation numbers and supportive valuations helped drive yields lower (bond prices higher) as they attracted strong inflows into the asset class. Rising commodity prices, more balanced current accounts and positive political developments in key EM countries were supportive of currency returns relative to the U.S. dollar.
During the 12-month period ended March 31, 2018, The Fund was tactically overweight to emerging market debt (“EMD”) compared to global high yield (55% to 45%). This contributed to the Fund’s performance as the absolute return for EMD was 12.52% versus 6.67% for global high yield over the period. During the period, Investec outperformed the JPMorgan Global Bond Index — Emerging Markets Global Diversified. The Fund benefited materially from Investec’s overweight position in the Malaysian ringgit. The Fund’s currency exposure had a positive impact during the second half of the period, due to a combination of booming economic activity data, a material trade surplus, and rising oil & gas prices. An off-benchmark position in unhedged Egyptian treasury bills also added to the Fund’s positive performance. These securities benefited from a mild strengthening in the spot price, their high carry return, and Egypt’s successful implementation of an International Monetary Fund reform program, which includes adopting the value-added tax as well allowing the exchange rate to be determined by market forces. Gains were partly offset by positions in Mexico, both from being underweight when Mexican securities generally outperformed and from being overweight when Mexican securities generally underperformed. Franklin underperformed the ICE Bank of America Merrill Lynch Global High Yield 2% Constrained Index Unhedged. This underperformance was driven primarily by security selection within the health care, retailers, metals, and mining sectors. Quality allocation was another detractor, particularly within the energy-related portion of the portfolio. Franklin’s exposure to foreign currencies also weighed on performance over the period, primarily from the Fund’s underweighted exposure to the euro and British pound sterling. In contrast, industry allocation contributed to performance, driven primarily by underweight positioning in the wired and wireless communication sectors and an overweight positioning in utilities.
Risk Considerations
The Fund invests in non-investment grade and emerging market fixed income securities which involves certain risks such as higher volatility, currency fluctuation, political and social instability and reduced market liquidity. The Fund is subject to the risks that the underlying bonds in its portfolio are subject to, including credit, prepayment, call and interest rate risk. As interest rates rise, the value of bond prices will decline. The Fund may invest in foreign securities, which may expose the Fund to currency and exchange rate fluctuations, derivatives (such as futures, options, or swaps) and high yield bonds (also known as “junk” bonds). These investments may cause the Fund to experience greater volatility and less liquidity. Derivatives may be more sensitive to changes in market conditions and may amplify the risk of loss for the Fund. The Fund may experience high portfolio turnover which may result in higher transaction costs and capital gains.
16
Mercer Funds
March 31, 2018
Comparison of Change in Value of a $10,000 Investment in
Mercer Opportunistic Fixed Income Shares vs. the
Bank of America ML Global High Yield 2% Constrained Index Unhedged and the Fund’s Secondary Index1
As of March 31, 2018
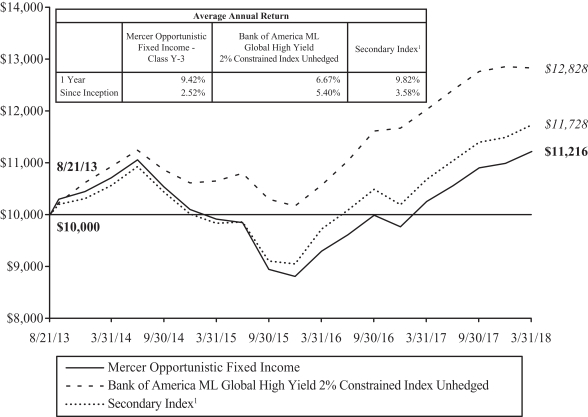
This graph shows the performance of the Mercer Opportunistic Fixed Income Fund Class Y-3 shares versus the Bank of America ML Global High Yield 2% Constrained Index Unhedged and the Fund’s Secondary Index1 from August 21, 2013, which is the inception date of the Fund, through March 31, 2018. The performance of other classes, when launched, will vary from the performance of the class shown based on the difference in fees and expenses paid by shareholders investing in different share classes. The Fund may charge a 2% redemption fee on shares owned less than 30 days.
The table and graph assume reinvestment of dividends and capital gains, but do not reflect a deduction of taxes an investor might pay on fund distributions or upon redemption of fund shares. Performance shown reflects a fee waiver and/or expense reimbursement. Without this waiver/reimbursement, returns would have been lower.
1 The Mercer Opportunistic Fixed Income Fund’s Secondary Index is a blended benchmark consisting of 50% JP Morgan Government Bond Index — Emerging Markets Global Diversified USD Unhedged and 50% Bank of America ML Global High Yield 2% Constrained Index Unhedged.
The data quoted represents past performance and does not guarantee future results. Current performance of the Fund may be lower or higher than the performance quoted. Please call 1-866-658-9896 for the Fund’s most recent month-end performance. Investment return and principal value will fluctuate so that an investor’s shares, when redeemed, may be worth more or less than when purchased.
17
Mercer Emerging Markets Equity Fund
Investment Objective and Benchmark
The investment objective of the Fund is to provide long-term total return, which includes capital appreciation and income. The benchmark for the Fund is the MSCI Emerging Markets Index.
Investment Strategy
The Fund invests principally in equity securities of large, medium and small capitalization companies, located in emerging markets, other investments that are tied economically to emerging markets, as well as in American, European and Global Depository receipts. Stock index futures and various types of swaps may be used to implement the country selection component of the Fund’s investment strategy. Currency forwards may be used to make stock-selection and country allocation decisions independently of the underlying currency.
Performance
For the fiscal year ended March 31, 2018, the Fund’s Y-3 share class performance was 22.92% compared to its benchmark return of 24.93%. Performance for the Fund is reported net of fees and operating expenses while the benchmark returns do not include expenses of any kind as indexes are unmanaged.
The Sub-Advisors
As of March 31, 2018, the Fund employed seven sub-advisors: AQR Capital Management, LLC (AQR), Dimensional Fund Advisors (DFA), Janus Henderson Investors (Janus Henderson), Mondrian Investment Partners Limited (Mondrian), Copper Rock Capital Partners LLC (Copper Rock), William Blair Investment Management, LLC (William Blair) and Parametric Portfolio Associates LLC (Parametric). DFA and Janus Henderson were added to the Fund in March 2018. The addition of these two new managers added more quality and broad value exposure to the portfolio. Investec and KBI were terminated in March 2018.
AQR employs a systematic, research-driven investment approach focused on generating excess return relative to the benchmark from currency, country and security selection strategies. AQR’s proprietary investment process uses fundamental factors, such as value, momentum and quality within its models. AQR uses quantitative tools to construct optimized portfolios based on this diversified set of fundamental factors, along with estimates of risk and transactions costs. DFA benefits from a robust research platform, which includes close ties to academia, its clear and long-standing focus on exploiting risk premiums, most notably value and size, along with the new addition profitability, and a systematic approach to building and trading its portfolios. DFA’s process is repeatable and results in broad consistent exposures to the risk premiums. Janus Henderson’s emerging markets strategy is based on the importance of limiting the potential for permanent loss of capital by investing with businesses and management teams that have a track record of generating value for shareholders. The strategy is managed with a long-term, unconstrained, absolute return mind-set, and singular focus on identifying and investing in companies with sustainable, enduring business models. Copper Rock specializes in small cap equity investing using a blend of quantitative and fundamental analyses to identify companies with superior growth relative to their peers. Copper Rock’s portfolio typically exhibits factor exposures to growth, momentum and quality. Mondrian is an experienced value manager that uses a Dividend Discount Model to analyze and find attractive companies focused on the domestic oriented growth of emerging markets. Along with emerging market domiciled companies, Mondrian’s management team will also consider any company globally that generates at least 25% of revenues/profits from emerging/frontier markets. William Blair has a quality growth philosophy and process focused on finding those companies that can achieve a higher growth rate for a longer period of time than the market expects. William Blair looks for companies with experienced and motivated management teams, unique business models and attractive financial characteristics. Parametric utilizes exchange-traded futures to generate market exposure corresponding to the Fund’s benchmark.
18
Mercer Emerging Markets Equity Fund
Market Commentary and Fund Performance
The MSCI Emerging Markets Index (the Fund’s benchmark) returned 24.9% for the 12-month period ended March 31, 2018. Generally, global equity markets performed well, as measured by the MSCI World Index, which rose 13.6% during the 12-month period ended March 31, 2018. U.S. equities rallied, with the Russell 1000 Index up 14.0% for the fiscal year. International developed markets also performed well, as the MSCI EAFE Index returned 14.8% over the period.
Global equity markets rose steadily from the end of the first quarter of 2017 until late January 2018. Since the recent peak in January 2018, global equity markets dropped over 9% (measured by the MSCI All Country World Index) by the end of the first quarter of 2018.
Over the year ended March 31, 2018, global equity markets were boosted by synchronized global growth, unusually subdued volatility and strong corporate earnings growth. Growth outside the US was also helped by the continued easy monetary policies of the European Central Bank and the Bank of Japan. Developed international equity markets (MSCI EAFE Index) rose by almost 15% during this period and Emerging markets (MSCI Emerging Markets Index) delivered even greater gains (25%), though there was a wide disparity in returns across countries.
Despite these strong returns, equity market investors had a number of reasons to worry including: rising tensions with North Korea, risk of rising protectionism, uncertainty resulting from European elections, the Catalan independence movement in Spain, struggles in the German parliament to form a coalition government, Brexit negotiations, monetary tightening by the Federal Reserve and a rise in both inflation and global bond rates.
The recent losses suffered by global equity markets, which began at the end of January 2018, have been attributed to investor concerns around rising inflation, a drop in global economic surprise indexes (Citigroup Economic Surprise Indices), concerns that imposition of tariffs could negatively impact growth, and a loss in positive momentum for some of the largest technology companies, which had outperformed in the prior year.
In this environment, the Mercer Emerging Markets Equity Fund underperformed the MSCI Emerging Markets Index by 2.0% for the 12-month period ended March 31, 2018. Underperformance during the period can be attributed primarily to the Fund’s smaller allocation to specific Chinese and South Korean technology stocks.
Intentionally, the Mercer Emerging Markets Equity Fund holds a greater weighting to value stocks compared with its benchmark. Value stocks have tended to outperform growth stocks historically. At the very basic level, value managers, and managers that use valuation criteria as a material part of their investment processes, focus on investing in stocks that sell at lower prices compared to their peers.
During the period ended March 31, 2018, much of the strong performance by the MSCI Emerging Markets Index was attributable to a small number of stocks with large index weights. A handful of technology companies were selling at higher valuations than the Fund’s sub-advisors considered justified. Due to their large weighting within the benchmark, the Fund’s underweight to a few of these technology stocks was the biggest source of underperformance over the period.
In addition, the Fund’s relative performance was also negatively affected by stock selection within the telecommunications sector. Collectively, the sub-advisors in the Fund generated positive returns through stock selection in the majority of sectors. However, these returns were not great enough to offset the relative losses taken in the technology sector.
Among the sub-advisors, AQR, William Blair and CopperRock generated positive relative returns over the period. Mondrian trailed the Index.
19
Mercer Emerging Markets Equity Fund
AQR beat the MSCI Emerging Markets Index for the period. AQR’s strategy outperformance versus the benchmark was driven by positive performance generated by its momentum focus and positive performance in stock selection within the consumer discretionary sector.
William Blair’s outperformance was due to broad positive stock selection. William Blair generated positive selection in 8 out of 11 sectors. The strategy also benefitted from an overweight to the technology sector.
The largest detractor at the sub advisor level was Mondrian. Mondrian’s focus on value stocks was a headwind to relative performance. Mondrian did not hold the top performing technology companies in the MSCI Emerging Markets Index, and it was 15% underweight to the technology sector overall, which was the best performing sector in the Index during this timeframe.
CopperRock, contributed positively to the Fund’s relative performance as a result of positive stock selection, particularly in the consumer and materials sectors. CopperRock is the dedicated small market capitalization sub-advisor for the Fund.
Prior to their removal from the Fund, KBI underperformed during the period as their focus on undervalued companies led to them not investing in many of the strongest performing Chinese technology companies during this period.
Prior to their removal from the Fund, Investec outperformed during this period as their focus on earnings revision momentum kept them invested in many of the top performing technology stocks.
Parametric utilizes exchange-traded futures replicating the Fund’s benchmark to provide broad, passive, equity market exposure to the Fund’s liquidity sleeve, creating positive returns on assets that would have otherwise been earning cash or cash equivalent returns. Performance differences versus the benchmark are largely a result of cash flow effects related to daily subscription/redemption activity and through financing costs of futures relative to interest earned on cash.
Risk Considerations
The Fund invests in emerging market securities which involves certain risks such as currency volatility, political and social instability and reduced market liquidity. Emerging markets may be more volatile and less liquid than more developed markets and therefore may involve greater risks. Investments made in small and mid-capitalization companies may be more volatile and less liquid due to limited resources or product lines and more sensitive to economic factors. The Fund may invest in derivatives (such as futures, forwards, options, or swaps), which may cause the Fund to experience greater volatility and less liquidity. Derivatives may be more sensitive to changes in market conditions and may amplify the risk of loss for the Fund. The Fund may experience high portfolio turnover which may result in higher transaction costs and capital gains.
20
Mercer Funds
March 31, 2018
Comparison of Change in Value of a $10,000 Investment in
Mercer Emerging Markets Equity Shares vs. the
MSCI Emerging Markets Index
As of March 31, 2018
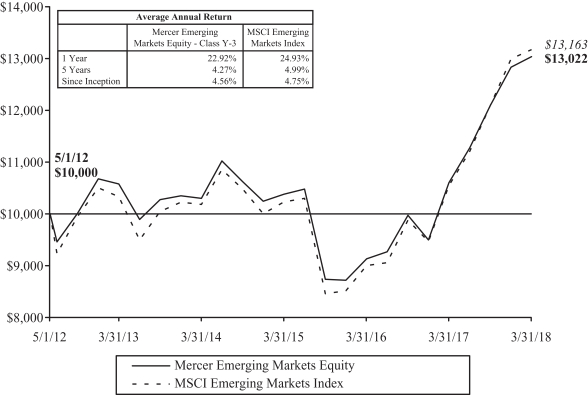
This graph shows the performance of the Mercer Emerging Markets Equity Fund Class Y-3 shares versus the MSCI Emerging Markets Index from May 1, 2012, which is the inception date of the Fund, through March 31, 2018. The performance of other classes, when launched, will vary from the performance of the class shown based on the difference in fees and expenses paid by shareholders investing in different share classes. The Fund may charge a 2% redemption fee on shares owned less than 30 days.
The table and graph assume reinvestment of dividends and capital gains, but do not reflect a deduction of taxes an investor might pay on fund distributions or upon redemption of fund shares. Performance shown reflects a fee waiver and/or expense reimbursement. Without this waiver/reimbursement, returns would have been lower.
The data quoted represents past performance and does not guarantee future results. Current performance of the Fund may be lower or higher than the performance quoted. Please call 1-866-658-9896 for the Fund’s most recent month-end performance. Investment return and principal value will fluctuate so that an investor’s shares, when redeemed, may be worth more or less than when purchased.
21
Mercer Global Low Volatility Equity Fund
Investment Objective and Benchmark
The investment objective of the Fund is to provide long-term total return, which includes capital appreciation and income. The benchmark for the Fund is the MSCI World Index.
Investment Strategy
The Fund invests principally in equity securities of U.S. and foreign issuers, of large, medium and small capitalization companies. Stock index futures and various types of swaps may be used to implement the equity security selection component of the Fund’s investment strategy. Currency forwards may be used to make stock-selection and country allocation decisions independently of the underlying currency.
Performance
For the fiscal year ended March 31, 2018, the Fund’s Y-3 share class performance was 12.47% compared to its benchmark return of 13.59%. Performance for the Fund is reported net of fees and operating expenses while the benchmark returns do not include expenses of any kind as indexes are unmanaged.
The Sub-Advisors
As of March 31, 2018, the Fund employed four sub-advisors, Acadian Asset Management LLC (Acadian), MFG Asset Management (MFG), Martingale Asset Management, L.P. (Martingale) and Parametric Portfolio Associates LLC (Parametric).
Acadian’s process uses both risk analysis and stock forecasts to build the portfolio. The process uses a risk model to determine the systematic risk and the level of volatility of each stock in the investable universe. Once a stock’s risk is determined, Acadian uses its stock forecast model as an overlay to determine the optimal mix of securities. Acadian’s security return forecasting model incorporates five categories including value, growth, risk, macroeconomic, and technical factors.
MFG screens the universe of investable global stocks to identify high quality companies based on key quality criteria: the sustainability of a company’s competitive advantages; the predictability and reliability of future cash flows and earnings; the extent to which management will act in the best interest of shareholders; and re-investment potential. MFG then evaluates investment opportunities quantitatively incorporating both long-term intrinsic value and three-year forecast total shareholder returns using MFG’s proprietary forecasts. MFG determines portfolio construction by each stock’s ranking based on the qualitative assessment of the key criteria, the quantitative assessment driven by valuation, and detailed macroeconomic research within a robust risk management framework. From time to time, MFG may hold up to 20% of its portion of the Fund in cash if warranted by its assessment of the macro environment.
Martingale’s approach to low volatility investing is built around a risk-adjusted market index methodology which promotes broad and stable diversification combined with a valuation overlay that favors low risk companies with stronger fundamentals. Martingale’s systematic stock evaluation incorporates measures of relative valuation, growth and quality, along with each security’s risk properties.
Parametric utilizes exchange-traded futures to generate market exposure corresponding to the Fund’s benchmark.
Market Commentary and Fund Performance
Global equity markets, as measured by the MSCI World Index (the Fund’s benchmark), rose 13.59% during the 12-month period ended March 31, 2018. U.S. equities rallied with the S&P 500 Index up 14.10% for the fiscal year. The MSCI EAFE Index and MSCI Emerging Markets Index returned 14.80% and 24.93%, respectively, over the same time period.
22
Mercer Global Low Volatility Equity Fund
Markets rose steadily from the end of the first quarter of 2017 until late January 2018. Performance was boosted by synchronized global growth, unusually subdued volatility and strong corporate earnings growth. The US tax reform package, which was signed into law at the end of 2017, boosted investor optimism. Growth outside the US was also helped by the continued easy monetary policies of the European Central Bank and the Bank of Japan. The best performers over the period were growth technology stocks. Value and defensive stocks significantly lagged behind.
The recent losses suffered by global equity markets, which began at the end of January 2018, have been attributed to investor concerns around rising inflation, concerns that imposition of tariffs could negatively impact growth, and a loss in positive momentum for some of the largest technology companies, which had outperformed in the prior year.
The Mercer Global Low Volatility Equity Fund returned 12.47%, underperforming the MSCI World Index by 1.12% for the 12-month period ended March 31, 2018. The Fund’s defensive posture — lower risk and volatility — was a negative contributor to performance for the Fund as these factors underperformed. Additionally, being underweight the euro in the period when it appreciated significantly versus the US dollar was one of the main drags on the Fund’s performance. Another detractor to the Fund’s performance was its allocation to cash.
While Martingale and Acadian, which employ defensive strategies, struggled to beat their respective benchmarks, MFG showed solid outperformance.
The main driver for MFG’s outperformance was overweight to the technology sector, which was one of the strongest performing sectors for the period ended March 31, 2018. Significant underweight to the euro and MFG’s allocation to cash in the portfolio were its main performance detractors.
The Martingale strategy, which provides U.S. large cap exposure for the Fund, trailed the Russell 1000 Index primarily due to sector allocation. The strategy generally holds overweight allocations to consumer staples, utilities and real estate investment trusts (REITs), as these sectors tend to be lower volatility sectors. These three sectors were among the worst performing sectors during the period. In addition, the Martingale strategy was also underweight the technology sector, which performed well during the period. Having only a minimal allocation to energy, however, helped the strategy’s performance.
The Acadian strategy, which provides international equity exposure for the Fund, underperformed compared to the MSCI EAFE Index, mainly as a result of an overweight allocation to under-performing sectors. While stock selection was positive during the period, Acadian held overweight positions in consumer staples, utilities, telecom and pharmaceuticals, which trailed the stronger performance of the technology, consumer discretionary and industrials sectors. Holding higher weights in underperforming sectors caused Acadian’s portfolio to trail the MSCI EAFE Index.
Parametric utilizes exchange-traded futures replicating the Fund’s benchmark to provide broad, passive, equity market exposure to the Fund’s liquidity sleeve, creating positive returns on assets that would have otherwise been earning cash or cash equivalent returns. Performance differences versus the benchmark are largely a result of cash flow effects related to daily subscription/redemption activity and through financing costs of futures relative to interest earned on cash.
Risk Considerations
The Fund invests in foreign and emerging market securities which involves certain risks such as currency volatility, political and social instability and reduced market liquidity. Emerging markets may be more volatile and less liquid than more developed markets and therefore may involve greater risks. Investments made in small and mid-capitalization companies may be more volatile and less liquid due to limited resources or product lines and more sensitive to economic factors. The Fund may invest in derivatives (such as futures, forwards, options,
23
Mercer Global Low Volatility Equity Fund
or swaps), which may cause the Fund to experience greater volatility and less liquidity. Derivatives may be more sensitive to changes in market conditions and may amplify the risk of loss for the Fund. The Fund may experience high portfolio turnover which may result in higher transaction costs and capital gains.
24
Mercer Funds
March 31, 2018
Comparison of Change in Value of a $10,000 Investment in
Mercer Global Low Volatility Equity Shares vs. the
MSCI World Index
As of March 31, 2018
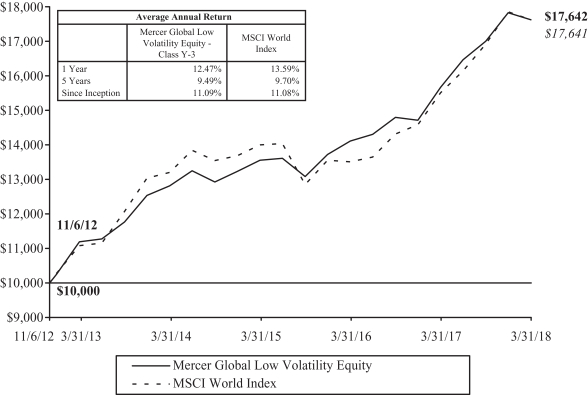
This graph shows the performance of the Mercer Global Low Volatility Equity Fund Class Y-3 shares versus the MSCI World Index from November 6, 2012, which is the inception date of the Fund, through March 31, 2018. The performance of other classes, when launched, will vary from the performance of the class shown based on the difference in fees and expenses paid by shareholders investing in different share classes. The Fund may charge a 2% redemption fee on shares owned less than 30 days.
The table and graph assume reinvestment of dividends and capital gains, but do not reflect a deduction of taxes an investor might pay on fund distributions or upon redemption of fund shares. Performance shown reflects a fee waiver and/or expense reimbursement. Without this waiver/reimbursement, returns would have been lower.
The data quoted represents past performance and does not guarantee future results. Current performance of the Fund may be lower or higher than the performance quoted. Please call 1-866-658-9896 for the Fund’s most recent month-end performance. Investment return and principal value will fluctuate so that an investor’s shares, when redeemed, may be worth more or less than when purchased.
25
Mercer US Large Cap Equity Fund
Schedule of Investments
(showing percentage of net assets)
March 31, 2018
| | | | | | | | | | |
| Shares | | | | | Description | | Value ($) | |
| | |
| | | | | | COMMON STOCKS — 95.4% | |
| | |
| | | | | | Aerospace & Defense — 1.4% | |
| | | |
| | 10,391 | | | | | Boeing Co. (The) | | | 3,407,001 | |
| | 1,550 | | | | | Lockheed Martin Corp. | | | 523,791 | |
| | 4,688 | | | | | Northrop Grumman Corp. | | | 1,636,675 | |
| | 10,272 | | | | | Spirit AeroSystems Holdings, Inc. Class A | | | 859,766 | |
| | 6,702 | | | | | United Technologies Corp. | | | 843,246 | |
| | | | | | | | | | |
| | | | | | | | | 7,270,479 | |
| | | | | | | | | | |
| | |
| | | | | | Agriculture — 0.3% | |
| | | |
| | 13,982 | | | | | Altria Group, Inc. | | | 871,358 | |
| | 6,032 | | | | | Philip Morris International, Inc. | | | 599,581 | |
| | | | | | | | | | |
| | | | | | | | | 1,470,939 | |
| | | | | | | | | | |
| | |
| | | | | | Airlines — 2.5% | |
| | | |
| | 81,875 | | | | | American Airlines Group, Inc. | | | 4,254,225 | |
| | 67,476 | | | | | Delta Air Lines, Inc. | | | 3,698,360 | |
| | 35,093 | | | | | Southwest Airlines Co. | | | 2,010,127 | |
| | 38,079 | | | | | United Continental Holdings, Inc.* | | | 2,645,348 | |
| | | | | | | | | | |
| | | | | | | | | 12,608,060 | |
| | | | | | | | | | |
| | |
| | | | | | Apparel — 1.4% | |
| | | |
| | 33,600 | | | | | Hanesbrands, Inc.‡ | | | 618,912 | |
| | 42,850 | | | | | LVMH Moet Hennessy Louis Vuitton SE, ADR‡ | | | 2,641,702 | |
| | 15,003 | | | | | Michael Kors Holdings, Ltd.* | | | 931,386 | |
| | 34,966 | | | | | NIKE, Inc. Class B | | | 2,323,141 | |
| | 1,541 | | | | | Ralph Lauren Corp. | | | 172,284 | |
| | 5,141 | | | | | VF Corp. | | | 381,051 | |
| | | | | | | | | | |
| | | | | | | | | 7,068,476 | |
| | | | | | | | | | |
| | |
| | | | | | Auto Manufacturers — 1.0% | |
| | | |
| | 39,424 | | | | | Fiat Chrysler Automobiles NV | | | 808,981 | |
| | 115,262 | | | | | General Motors Co. | | | 4,188,621 | |
| | | | | | | | | | |
| | | | | | | | | 4,997,602 | |
| | | | | | | | | | |
| | |
| | | | | | Auto Parts & Equipment — 1.3% | |
| | | |
| | 43,700 | | | | | Goodyear Tire & Rubber Co. (The) | | | 1,161,546 | |
| | 14,125 | | | | | Lear Corp. | | | 2,628,521 | |
| | 48,602 | | | | | Magna International, Inc. Class A | | | 2,738,723 | |
| | | | | | | | | | |
| | | | | | | | | 6,528,790 | |
| | | | | | | | | | |
| | |
| | | | | | Banks — 5.5% | |
| | | |
| | 157,563 | | | | | Bank of America Corp. | | | 4,725,314 | |
| | 23,900 | | | | | BNP Paribas SA, ADR | | | 890,156 | |
| | 8,691 | | | | | CIT Group, Inc. | | | 447,587 | |
| | 121,773 | | | | | Citigroup, Inc. | | | 8,219,677 | |
| | 44,282 | | | | | Citizens Financial Group, Inc. | | | 1,858,958 | |
| | 60,716 | | | | | Fifth Third Bancorp | | | 1,927,733 | |
| | 24,179 | | | | | First Republic Bank | | | 2,239,217 | |
| | | | | | |
| 26 | | See accompanying Notes to the Financial Statements. | | | | |
Mercer US Large Cap Equity Fund
Schedule of Investments (Continued)
(showing percentage of net assets)
March 31, 2018
| | | | | | | | | | |
| Shares | | | | | Description | | Value ($) | |
| | |
| | | | | | Banks — continued | |
| | | |
| | 3,078 | | | | | Goldman Sachs Group (The), Inc. | | | 775,225 | |
| | 37,209 | | | | | JPMorgan Chase & Co. | | | 4,091,874 | |
| | 16,612 | | | | | Morgan Stanley | | | 896,384 | |
| | 129,478 | | | | | Regions Financial Corp. | | | 2,405,701 | |
| | | | | | | | | | |
| | | | | | | | | 28,477,826 | |
| | | | | | | | | | |
| | |
| | | | | | Beverages — 4.7% | |
| | | |
| | 31,425 | | | | | Anheuser-Busch InBev SA, ADR | | | 3,454,864 | |
| | 156,225 | | | | | Coca-Cola Co. (The) | | | 6,784,852 | |
| | 31,780 | | | | | Diageo Plc, ADR | | | 4,303,647 | |
| | 69,550 | | | | | Heineken NV, ADR | | | 3,745,963 | |
| | 15,100 | | | | | Molson Coors Brewing Co. Class B | | | 1,137,483 | |
| | 36,203 | | | | | Monster Beverage Corp.* | | | 2,071,174 | |
| | 26,191 | | | | | PepsiCo, Inc. | | | 2,858,748 | |
| | | | | | | | | | |
| | | | | | | | | 24,356,731 | |
| | | | | | | | | | |
| | |
| | | | | | Biotechnology — 2.5% | |
| | | |
| | 16,538 | | | | | Alexion Pharmaceuticals, Inc.* | | | 1,843,325 | |
| | 3,314 | | | | | Biogen, Inc.* | | | 907,439 | |
| | 27,474 | | | | | Celgene Corp.* | | | 2,450,956 | |
| | 32,459 | | | | | Gilead Sciences, Inc. | | | 2,447,084 | |
| | 9,225 | | | | | Illumina, Inc.* | | | 2,180,975 | |
| | 4,100 | | | | | Shire Plc, ADR | | | 612,499 | |
| | 13,839 | | | | | Vertex Pharmaceuticals, Inc.* | | | 2,255,480 | |
| | | | | | | | | | |
| | | | | | | | | 12,697,758 | |
| | | | | | | | | | |
| | |
| | | | | | Building Materials — 0.4% | |
| | | |
| | 47,276 | | | | | Masco Corp. | | | 1,911,841 | |
| | | | | | | | | | |
| | |
| | | | | | Chemicals — 2.0% | |
| | | |
| | 33,076 | | | | | Celanese Corp. Series A | | | 3,314,546 | |
| | 7,720 | | | | | DowDuPont, Inc. | | | 491,841 | |
| | 7,200 | | | | | Eastman Chemical Co. | | | 760,176 | |
| | 54,994 | | | | | LyondellBasell Industries NV Class A | | | 5,811,766 | |
| | | | | | | | | | |
| | | | | | | | | 10,378,329 | |
| | | | | | | | | | |
| | |
| | | | | | Commercial Services — 3.0% | |
| | | |
| | 37,700 | | | | | AerCap Holdings NV * | | | 1,912,144 | |
| | 18,700 | | | | | Macquarie Infrastructure Corp. | | | 690,591 | |
| | 3,664 | | | | | ManpowerGroup, Inc. | | | 421,726 | |
| | 17,791 | | | | | New Oriental Education & Technology Group, Inc., ADR | | | 1,559,381 | |
| | 39,741 | | | | | PayPal Holdings, Inc.* | | | 3,015,150 | |
| | 36,265 | | | | | Quanta Services, Inc.* | | | 1,245,703 | |
| | 22,479 | | | | | Robert Half International, Inc. | | | 1,301,309 | |
| | 4,562 | | | | | S&P Global, Inc. | | | 871,616 | |
| | 7,285 | | | | | United Rentals, Inc.* | | | 1,258,338 | |
| | 153,492 | | | | | Western Union Co. (The) | | | 2,951,651 | |
| | | | | | | | | | |
| | | | | | | | | 15,227,609 | |
| | | | | | | | | | |
| | | | | | |
| | See accompanying Notes to the Financial Statements. | | | 27 | |
Mercer US Large Cap Equity Fund
Schedule of Investments (Continued)
(showing percentage of net assets)
March 31, 2018
| | | | | | | | | | |
| Shares | | | | | Description | | Value ($) | |
| | |
| | | | | | Computers — 2.4% | |
| | | |
| | 26,757 | | | | | Apple, Inc. | | | 4,489,289 | |
| | 26,683 | | | | | Cognizant Technology Solutions Corp. Class A | | | 2,147,982 | |
| | 35,777 | | | | | Hewlett Packard Enterprise Co. | | | 627,529 | |
| | 73,051 | | | | | HP, Inc. | | | 1,601,278 | |
| | 1,991 | | | | | International Business Machines Corp. | | | 305,479 | |
| | 19,856 | | | | | NetApp, Inc. | | | 1,224,917 | |
| | 24,164 | | | | | Seagate Technology Plc | | | 1,414,077 | |
| | 7,627 | | | | | Western Digital Corp. | | | 703,743 | |
| | | | | | | | | | |
| | | | | | | | | 12,514,294 | |
| | | | | | | | | | |
| | |
| | | | | | Cosmetics & Personal Care — 1.8% | |
| | | |
| | 2,240 | | | | | Colgate-Palmolive Co. | | | 160,563 | |
| | 114,227 | | | | | Procter & Gamble Co. (The) | | | 9,055,917 | |
| | | | | | | | | | |
| | | | | | | | | 9,216,480 | |
| | | | | | | | | | |
| | |
| | | | | | Distribution & Wholesale — 0.3% | |
| | | |
| | 4,836 | | | | | W.W. Grainger, Inc. | | | 1,365,058 | |
| | | | | | | | | | |
| | |
| | | | | | Diversified Financial Services — 4.7% | |
| | | |
| | 102,353 | | | | | Ally Financial, Inc. | | | 2,778,884 | |
| | 14,265 | | | | | American Express Co. | | | 1,330,639 | |
| | 38,176 | | | | | Ameriprise Financial, Inc. | | | 5,647,758 | |
| | 40,514 | | | | | Charles Schwab Corp. (The) | | | 2,115,641 | |
| | 42,488 | | | | | Discover Financial Services | | | 3,056,162 | |
| | 15,958 | | | | | Mastercard, Inc. Class A | | | 2,795,203 | |
| | 20,514 | | | | | Navient Corp. | | | 269,144 | |
| | 26,100 | | | | | OneMain Holdings, Inc.* | | | 781,434 | |
| | 62,000 | | | | | Santander Consumer USA Holdings, Inc. | | | 1,010,600 | |
| | 59,300 | | | | | SLM Corp.* | | | 664,753 | |
| | 33,762 | | | | | Synchrony Financial | | | 1,132,040 | |
| | 20,328 | | | | | Visa, Inc. Class A‡ | | | 2,431,635 | |
| | | | | | | | | | |
| | | | | | | | | 24,013,893 | |
| | | | | | | | | | |
| | |
| | | | | | Electric — 0.6% | |
| | | |
| | 84,552 | | | | | AES Corp. | | | 961,356 | |
| | 3,488 | | | | | CenterPoint Energy, Inc. | | | 95,571 | |
| | 24,374 | | | | | Entergy Corp. | | | 1,920,184 | |
| | 2,048 | | | | | Pinnacle West Capital Corp. | | | 163,431 | |
| | | | | | | | | | |
| | | | | | | | | 3,140,542 | |
| | | | | | | | | | |
| | |
| | | | | | Electronics — 1.0% | |
| | | |
| | 10,877 | | | | | Agilent Technologies, Inc. | | | 727,671 | |
| | 98,228 | | | | | Corning, Inc. | | | 2,738,597 | |
| | 225 | | | | | Mettler-Toledo International, Inc.* | | | 129,382 | |
| | 14,789 | | | | | TE Connectivity, Ltd. | | | 1,477,421 | |
| | | | | | | | | | |
| | | | | | | | | 5,073,071 | |
| | | | | | | | | | |
| | | | | | |
| 28 | | See accompanying Notes to the Financial Statements. | | | | |
Mercer US Large Cap Equity Fund
Schedule of Investments (Continued)
(showing percentage of net assets)
March 31, 2018
| | | | | | | | | | |
| Shares | | | | | Description | | Value ($) | |
| | |
| | | | | | Engineering & Construction — 0.2% | |
| | | |
| | 20,100 | | | | | AECOM* | | | 716,163 | |
| | 8,341 | | | | | Jacobs Engineering Group, Inc. | | | 493,370 | |
| | | | | | | | | | |
| | | | | | | | | 1,209,533 | |
| | | | | | | | | | |
| | |
| | | | | | Entertainment — 0.1% | |
| | | |
| | 7,200 | | | | | Cinemark Holdings, Inc.‡ | | | 271,224 | |
| | | | | | | | | | |
| | |
| | | | | | Food — 5.2% | |
| | | |
| | 85,402 | | | | | Conagra Brands, Inc. | | | 3,149,626 | |
| | 20,209 | | | | | General Mills, Inc. | | | 910,618 | |
| | 52,788 | | | | | Hershey Co. (The) | | | 5,223,900 | |
| | 94,975 | | | | | Kellogg Co.‡ | | | 6,174,325 | |
| | 55,581 | | | | | Kroger Co. (The) | | | 1,330,609 | |
| | 86,300 | | | | | Nestle SA, ADR | | | 6,822,015 | |
| | 47,853 | | | | | Sysco Corp. | | | 2,869,266 | |
| | 6,322 | | | | | Tyson Foods, Inc. Class A | | | 462,707 | |
| | | | | | | | | | |
| | | | | | | | | 26,943,066 | |
| | | | | | | | | | |
| | |
| | | | | | Health Care - Products — 1.1% | |
| | | |
| | 28,692 | | | | | Baxter International, Inc. | | | 1,866,128 | |
| | 11,147 | | | | | Edwards Lifesciences Corp.* | | | 1,555,229 | |
| | 9,259 | | | | | IDEXX Laboratories, Inc.* | | | 1,772,080 | |
| | 4,400 | | | | | Zimmer Biomet Holdings, Inc. | | | 479,776 | |
| | | | | | | | | | |
| | | | | | | | | 5,673,213 | |
| | | | | | | | | | |
| | |
| | | | | | Health Care - Services — 1.4% | |
| | | |
| | 3,722 | | | | | Aetna, Inc. | | | 629,018 | |
| | 4,914 | | | | | Centene Corp.* | | | 525,159 | |
| | 7,515 | | | | | DaVita, Inc.* | | | 495,539 | |
| | 6,676 | | | | | Humana, Inc. | | | 1,794,709 | |
| | 10,722 | | | | | Laboratory Corp. of America Holdings* | | | 1,734,284 | |
| | 5,873 | | | | | Quest Diagnostics, Inc. | | | 589,062 | |
| | 5,969 | | | | | UnitedHealth Group, Inc. | | | 1,277,366 | |
| | | | | | | | | | |
| | | | | | | | | 7,045,137 | |
| | | | | | | | | | |
| | |
| | | | | | Home Builders — 1.1% | |
| | | |
| | 68,781 | | | | | D.R. Horton, Inc. | | | 3,015,359 | |
| | 97,999 | | | | | PulteGroup, Inc. | | | 2,889,990 | |
| | | | | | | | | | |
| | | | | | | | | 5,905,349 | |
| | | | | | | | | | |
| | |
| | | | | | Housewares — 0.1% | |
| | | |
| | 11,600 | | | | | Tupperware Brands Corp. | | | 561,208 | |
| | | | | | | | | | |
| | |
| | | | | | Insurance — 3.4% | |
| | 115,862 | | | | | Aegon NV, ADR‡ | | | 784,386 | |
| | 21,530 | | | | | Allstate Corp. (The) | | | 2,041,044 | |
| | 10,716 | | | | | Berkshire Hathaway, Inc. Class B* | | | 2,137,628 | |
| | 66,000 | | | | | Hartford Financial Services Group (The), Inc. | | | 3,400,320 | |
| | | | | | |
| | See accompanying Notes to the Financial Statements. | | | 29 | |
Mercer US Large Cap Equity Fund
Schedule of Investments (Continued)
(showing percentage of net assets)
March 31, 2018
| | | | | | | | | | |
| Shares | | | | | Description | | Value ($) | |
| | |
| | | | | | Insurance — continued | |
| | | |
| | 26,092 | | | | | Lincoln National Corp. | | | 1,906,282 | |
| | 33,007 | | | | | MetLife, Inc. | | | 1,514,691 | |
| | 19,853 | | | | | Prudential Financial, Inc. | | | 2,055,778 | |
| | 30,700 | | | | | Radian Group, Inc. | | | 584,528 | |
| | 37,899 | | | | | Unum Group | | | 1,804,371 | |
| | 28,018 | | | | | Voya Financial, Inc. | | | 1,414,909 | |
| | | | | | | | | | |
| | | | | | | | | 17,643,937 | |
| | | | | | | | | | |
| | |
| | | | | | Internet — 4.8% | |
| | | |
| | 13,549 | | | | | Alibaba Group Holding, Ltd., ADR* ‡ | | | 2,486,783 | |
| | 1,511 | | | | | Alphabet, Inc. Class A* | | | 1,567,119 | |
| | 2,465 | | | | | Alphabet, Inc. Class C* | | | 2,543,362 | |
| | 2,274 | | | | | Amazon.com, Inc.* | | | 3,291,251 | |
| | 1,704 | | | | | Booking Holdings, Inc.* | | | 3,544,985 | |
| | 31,426 | | | | | Ctrip.com International, Ltd., ADR* | | | 1,465,080 | |
| | 76,576 | | | | | eBay, Inc.* | | | 3,081,418 | |
| | 7,254 | | | | | F5 Networks, Inc.* | | | 1,049,001 | |
| | 16,996 | | | | | Facebook, Inc. Class A* | | | 2,715,791 | |
| | 3,661 | | | | | MercadoLibre, Inc. | | | 1,304,744 | |
| | 13,401 | | | | | VeriSign, Inc.* ‡ | | | 1,588,823 | |
| | | | | | | | | | |
| | | | | | | | | 24,638,357 | |
| | | | | | | | | | |
| | |
| | | | | | Investment Company — 0.3% | |
| | | |
| | 67,944 | | | | | Leucadia National Corp. | | | 1,544,367 | |
| | | | | | | | | | |
| | |
| | | | | | Iron & Steel — 0.4% | |
| | | |
| | 12,340 | | | | | Reliance Steel & Aluminum Co. | | | 1,058,031 | |
| | 20,826 | | | | | Steel Dynamics, Inc. | | | 920,926 | |
| | | | | | | | | | |
| | | | | | | | | 1,978,957 | |
| | | | | | | | | | |
| | |
| | | | | | Leisure Time — 1.1% | |
| | | |
| | 70,100 | | | | | Carnival Corp. | | | 4,597,158 | |
| | 12,200 | | | | | Norwegian Cruise Line Holdings, Ltd.* | | | 646,234 | |
| | 3,898 | | | | | Royal Caribbean Cruises, Ltd. | | | 458,950 | |
| | | | | | | | | | |
| | | | | | | | | 5,702,342 | |
| | | | | | | | | | |
| | |
| | | | | | Lodging — 0.6% | |
| | | |
| | 12,883 | | | | | Las Vegas Sands Corp. | | | 926,288 | |
| | 14,301 | | | | | Wyndham Worldwide Corp. | | | 1,636,463 | |
| | 1,808 | | | | | Wynn Resorts, Ltd. | | | 329,707 | |
| | | | | | | | | | |
| | | | | | | | | 2,892,458 | |
| | | | | | | | | | |
| | |
| | | | | | Machinery - Diversified — 0.6% | |
| | | |
| | 32,901 | | | | | Cognex Corp. | | | 1,710,523 | |
| | 9,538 | | | | | Cummins, Inc. | | | 1,546,014 | |
| | | | | | | | | | |
| | | | | | | | | 3,256,537 | |
| | | | | | | | | | |
| | | | | | |
| 30 | | See accompanying Notes to the Financial Statements. | | | | |
Mercer US Large Cap Equity Fund
Schedule of Investments (Continued)
(showing percentage of net assets)
March 31, 2018
| | | | | | | | | | |
| Shares | | | | | Description | | Value ($) | |
| | |
| | | | | | Media — 5.0% | |
| | | |
| | 16,679 | | | | | CBS Corp. Class B | | | 857,134 | |
| | 228,775 | | | | | Comcast Corp. Class A | | | 7,817,242 | |
| | 78,045 | | | | | News Corp. Class A | | | 1,233,111 | |
| | 104,960 | | | | | Sirius XM Holdings, Inc.‡ | | | 654,950 | |
| | 4,359 | | | | | Thomson Reuters Corp. (New York Exchange) | | | 168,475 | |
| | 72,325 | | | | | Time Warner, Inc. | | | 6,840,499 | |
| | 81,950 | | | | | Walt Disney Co. (The) | | | 8,231,058 | |
| | | | | | | | | | |
| | | | | | | | | 25,802,469 | |
| | | | | | | | | | |
| | |
| | | | | | Mining — 0.1% | |
| | | |
| | 18,775 | | | | | Teck Resources, Ltd. Class B | | | 483,644 | |
| | | | | | | | | | |
| | |
| | | | | | Miscellaneous - Manufacturing — 0.1% | |
| | | |
| | 4,900 | | | | | Eaton Corp. Plc | | | 391,559 | |
| | 20,145 | | | | | General Electric Co. | | | 271,555 | |
| | | | | | | | | | |
| | | | | | | | | 663,114 | |
| | | | | | | | | | |
| | |
| | | | | | Oil & Gas — 5.9% | |
| | | |
| | 18,800 | | | | | Anadarko Petroleum Corp. | | | 1,135,708 | |
| | 12,167 | | | | | Andeavor | | | 1,223,513 | |
| | 91,173 | | | | | BP Plc, ADR | | | 3,696,153 | |
| | 95,000 | | | | | Canadian Natural Resources, Ltd. | | | 2,989,650 | |
| | 4,763 | | | | | Chevron Corp. | | | 543,173 | |
| | 59,149 | | | | | ConocoPhillips | | | 3,506,944 | |
| | 51,200 | | | | | Devon Energy Corp. | | | 1,627,648 | |
| | 2,001 | | | | | Exxon Mobil Corp. | | | 149,295 | |
| | 22,800 | | | | | Helmerich & Payne, Inc.‡ | | | 1,517,568 | |
| | 38,051 | | | | | Marathon Oil Corp. | | | 613,763 | |
| | 56,650 | | | | | Marathon Petroleum Corp. | | | 4,141,681 | |
| | 5,660 | | | | | Phillips 66 | | | 542,907 | |
| | 8,065 | | | | | Pioneer Natural Resources Co. | | | 1,385,406 | |
| | 60,234 | | | | | Southwestern Energy Co.* | | | 260,813 | |
| | 72,440 | | | | | Valero Energy Corp. | | | 6,720,259 | |
| | | | | | | | | | |
| | | | | | | | | 30,054,481 | |
| | | | | | | | | | |
| | |
| | | | | | Oil & Gas Services — 0.4% | |
| | | |
| | 23,700 | | | | | Oceaneering International, Inc. | | | 439,398 | |
| | 25,200 | | | | | Schlumberger, Ltd. | | | 1,632,456 | |
| | | | | | | | | | |
| | | | | | | | | 2,071,854 | |
| | | | | | | | | | |
| | |
| | | | | | Packaging & Containers — 0.4% | |
| | | |
| | 20,700 | | | | | Crown Holdings, Inc.* | | | 1,050,525 | |
| | 25,508 | | | | | Sealed Air Corp.‡ | | | 1,091,487 | |
| | | | | | | | | | |
| | | | | | | | | 2,142,012 | |
| | | | | | | | | | |
| | |
| | | | | | Pharmaceuticals — 4.8% | |
| | | |
| | 4,800 | | | | | AbbVie, Inc. | | | 454,320 | |
| | 52,790 | | | | | Bristol-Myers Squibb Co. | | | 3,338,968 | |
| | | | | | |
| | See accompanying Notes to the Financial Statements. | | | 31 | |
Mercer US Large Cap Equity Fund
Schedule of Investments (Continued)
(showing percentage of net assets)
March 31, 2018
| | | | | | | | | | |
| Shares | | | | | Description | | Value ($) | |
| | |
| | | | | | Pharmaceuticals — continued | |
| | | |
| | 38,604 | | | | | CVS Health Corp. | | | 2,401,555 | |
| | 11,585 | | | | | Eli Lilly & Co. | | | 896,331 | |
| | 36,462 | | | | | Express Scripts Holding Co.* | | | 2,518,795 | |
| | 47,900 | | | | | Horizon Pharma Plc* | | | 680,180 | |
| | 3,500 | | | | | Jazz Pharmaceuticals Plc* | | | 528,465 | |
| | 31,170 | | | | | Johnson & Johnson | | | 3,994,435 | |
| | 16,400 | | | | | Mallinckrodt Plc* ‡ | | | 237,472 | |
| | 13,866 | | | | | McKesson Corp. | | | 1,953,303 | |
| | 35,291 | | | | | Merck & Co., Inc. | | | 1,922,301 | |
| | 23,300 | | | | | Mylan NV* | | | 959,261 | |
| | 114,025 | | | | | Pfizer, Inc. | | | 4,046,747 | |
| | 11,700 | | | | | Portola Pharmaceuticals, Inc.* ‡ | | | 382,122 | |
| | 1,360 | | | | | Zoetis, Inc. | | | 113,574 | |
| | | | | | | | | | |
| | | | | | | | | 24,427,829 | |
| | | | | | | | | | |
| | |
| | | | | | Pipelines — 0.2% | |
| | | |
| | 67,100 | | | | | Kinder Morgan, Inc. | | | 1,010,526 | |
| | | | | | | | | | |
| | |
| | | | | | Private Equity — 1.0% | |
| | | |
| | 63,520 | | | | | Blackstone Group, LP (The)* | | | 2,029,464 | |
| | 145,530 | | | | | KKR & Co., LP* | | | 2,954,259 | |
| | | | | | | | | | |
| | | | | | | | | 4,983,723 | |
| | | | | | | | | | |
| | |
| | | | | | Real Estate — 0.4% | |
| | | |
| | 42,349 | | | | | CBRE Group, Inc. Class A* | | | 1,999,720 | |
| | | | | | | | | | |
| | |
| | | | | | Retail — 8.8% | |
| | | |
| | 10,400 | | | | | Advance Auto Parts, Inc. | | | 1,232,920 | |
| | 78,964 | | | | | Bed Bath & Beyond, Inc. | | | 1,657,454 | |
| | 42,457 | | | | | Best Buy Co., Inc. | | | 2,971,565 | |
| | 8,012 | | | | | Costco Wholesale Corp. | | | 1,509,701 | |
| | 53,775 | | | | | Darden Restaurants, Inc. | | | 4,584,319 | |
| | 22,000 | | | | | Dick’s Sporting Goods, Inc. | | | 771,100 | |
| | 26,325 | | | | | Dunkin’ Brands Group, Inc.‡ | | | 1,571,339 | |
| | 2,894 | | | | | Foot Locker, Inc. | | | 131,793 | |
| | 15,258 | | | | | Gap, Inc. (The) | | | 476,050 | |
| | 29,533 | | | | | Kohl’s Corp. | | | 1,934,707 | |
| | 4,201 | | | | | Lowe’s Cos., Inc. | | | 368,638 | |
| | 12,678 | | | | | Macy’s, Inc. | | | 377,044 | |
| | 50,732 | | | | | McDonald’s Corp. | | | 7,933,470 | |
| | 19,340 | | | | | Nordstrom, Inc. | | | 936,249 | |
| | 10,933 | | | | | Ross Stores, Inc. | | | 852,555 | |
| | 43,283 | | | | | Target Corp. | | | 3,005,139 | |
| | 31,785 | | | | | Ulta Salon Cosmetics & Fragrance, Inc.* | | | 6,492,722 | |
| | 4,566 | | | | | Walgreens Boots Alliance, Inc. | | | 298,936 | |
| | 89,601 | | | | | Walmart, Inc. | | | 7,971,801 | |
| | | | | | | | | | |
| | | | | | | | | 45,077,502 | |
| | | | | | | | | | |
| | | | | | |
| 32 | | See accompanying Notes to the Financial Statements. | | | | |
Mercer US Large Cap Equity Fund
Schedule of Investments (Continued)
(showing percentage of net assets)
March 31, 2018
| | | | | | | | | | |
| Shares | | | | | Description | | Value ($) | |
| | |
| | | | | | Semiconductors — 2.3% | |
| | | |
| | 73,540 | | | | | Applied Materials, Inc. | | | 4,089,559 | |
| | 10,577 | | | | | KLA-Tencor Corp. | | | 1,152,999 | |
| | 5,036 | | | | | Lam Research Corp. | | | 1,023,114 | |
| | 60,872 | | | | | Micron Technology, Inc.* | | | 3,173,866 | |
| | 9,945 | | | | | NVIDIA Corp. | | | 2,303,163 | |
| | | | | | | | | | |
| | | | | | | | | 11,742,701 | |
| | | | | | | | | | |
| | |
| | | | | | Shipbuilding — 0.2% | |
| | | |
| | 4,318 | | | | | Huntington Ingalls Industries, Inc. | | | 1,113,008 | |
| | | | | | | | | | |
| | |
| | | | | | Software �� 6.8% | |
| | | |
| | 30,665 | | | | | Activision Blizzard, Inc. | | | 2,068,661 | |
| | 11,259 | | | | | Adobe Systems, Inc.* | | | 2,432,845 | |
| | 87,478 | | | | | Cadence Design Systems, Inc.* | | | 3,216,566 | |
| | 16,144 | | | | | CDK Global, Inc. | | | 1,022,561 | |
| | 24,411 | | | | | Citrix Systems, Inc.* | | | 2,265,341 | |
| | 73,100 | | | | | First Data Corp. Class A* | | | 1,169,600 | |
| | 12,047 | | | | | Intuit, Inc. | | | 2,088,347 | |
| | 100,523 | | | | | Microsoft Corp. | | | 9,174,734 | |
| | 17,417 | | | | | MSCI, Inc. Class A | | | 2,603,319 | |
| | 19,839 | | | | | salesforce.com, Inc.* | | | 2,307,276 | |
| | 15,142 | | | | | ServiceNow, Inc.* | | | 2,505,244 | |
| | 20,916 | | | | | Splunk, Inc.* | | | 2,057,925 | |
| | 22,122 | | | | | Synopsys, Inc.* | | | 1,841,435 | |
| | | | | | | | | | |
| | | | | | | | | 34,753,854 | |
| | | | | | | | | | |
| | |
| | | | | | Telecommunications — 1.8% | |
| | | |
| | 38,500 | | | | | AT&T, Inc. | | | 1,372,525 | |
| | 53,298 | | | | | CenturyLink, Inc. | | | 875,686 | |
| | 52,160 | | | | | Cisco Systems, Inc. | | | 2,237,143 | |
| | 13,918 | | | | | Motorola Solutions, Inc. | | | 1,465,565 | |
| | 28,536 | | | | | Telstra Corp., Ltd., ADR | | | 344,144 | |
| | 60,141 | | | | | Verizon Communications, Inc. | | | 2,875,943 | |
| | | | | | | | | | |
| | | | | | | | | 9,171,006 | |
| | | | | | | | | | |
| | | |
| | | | | | TOTAL COMMON STOCKS (COST $424,228,249) | | | 489,080,906 | |
| | | | | | | | | | |
| | | |
| Par Value ($) | | | | | Description | | Value ($) | |
| | |
| | | | | | SHORT-TERM INVESTMENTS — 4.9% | |
| | |
| | | | | | Bank Deposit — 4.3% | |
| | | |
| | 21,705,877 | | | | | State Street Bank & Trust Euro Time Deposit, 0.28%, due 04/02/18 | | | 21,705,877 | |
| | | | | | | | | | |
| | |
| | | | | | Mutual Fund - Securities Lending Collateral — 0.5% | |
| | | |
| | 2,508,628 | | | | | State Street Institutional U.S. Government Money Market Fund, Premier Class,
1.58%## *** | | | 2,508,628 | |
| | | | | | | | | | |
| | | | | | |
| | See accompanying Notes to the Financial Statements. | | | 33 | |
Mercer US Large Cap Equity Fund
Schedule of Investments (Continued)
(showing percentage of net assets)
March 31, 2018
| | | | | | | | | | |
| Par Value ($) | | | | | Description | | Value ($) | |
| | |
| | | | | | U.S. Government and Agency Obligations — 0.1% | |
| | | |
| | 550,000 | | | | | United States Treasury Bill, 0.99%, due 04/05/18** ‡‡ | | | 549,926 | |
| | | | | | | | | | |
| | | |
| | | | | | TOTAL SHORT-TERM INVESTMENTS (COST $24,764,432) | | | 24,764,431 | |
| | | | | | | | | | |
| | | |
| | | | | | TOTAL INVESTMENTS — 100.3% (Cost $448,992,681) | | | 513,845,337 | |
| | | |
| | | | | | Other Assets and Liabilities (net) — (0.3)% | | | (1,287,717 | ) |
| | | | | | | | | | |
| | | |
| | | | | | NET ASSETS — 100.0% | | $ | 512,557,620 | |
| | | | | | | | | | |
| | | |
| | | | | | Notes to Schedule of Investments: | | | | |
| | | |
| | | | | | ADR — American Depository Receipt | | | | |
| | | |
| | | | ## | | The rate disclosed is the 7 day net yield as of March 31, 2018. | | | | |
| | | |
| | | | * | | Non-income producing security | | | | |
| | | |
| | | | ** | | All or a portion of this security is pledged for open futures collateral. | | | | |
| | | |
| | | | *** | | Represents an investment of securities lending cash collateral. | | | | |
| | | |
| | | | ‡ | | All or a portion of this security is out on loan. | | | | |
| | | |
| | | | ‡‡ | | Interest rate presented is yield to maturity. | | | | |
| | | | | | |
| 34 | | See accompanying Notes to the Financial Statements. | | | | |
Mercer US Large Cap Equity Fund
Schedule of Investments (Continued)
March 31, 2018
Futures Contracts
| | | | | | | | | | | | | | | | | | |
Number of Contracts | | | | | Description | | | | Expiration Date | | Notional Value | | | Market Value/ Unrealized Appreciation (Depreciation) | |
| | Buys | | | | | | | | | | | | | | | | | |
| | 141 | | | | | S&P 500 E-mini Index | | | | Jun 2018 | | $ | 18,633,150 | | | $ | (537,465 | ) |
| | 11 | | | | | S&P Mid 400 E-mini Index | | | | Jun 2018 | | | 2,071,410 | | | | (37,424 | ) |
| | | | | | | | | | | | | | | | | | |
| | | | $ | (574,889 | ) |
| | | | | | | | | | | | | | | | | | |
| | | | | | |
| | See accompanying Notes to the Financial Statements. | | | 35 | |
Mercer US Large Cap Equity Fund
Schedule of Investments (Continued)
March 31, 2018
| | | | | |
| Asset Class Summary (Unaudited) | | % of Net Assets |
Common Stocks | | | | 95.4 | |
Futures Contracts | | | | (0.1 | ) |
Short-Term Investments | | | | 4.9 | |
Other Assets and Liabilities (net) | | | | (0.2 | ) |
| | | | | |
| | | | 100.0 | % |
| | | | | |
| | | | | | |
| 36 | | See accompanying Notes to the Financial Statements. | | | | |
Mercer US Small/Mid Cap Equity Fund
Schedule of Investments
(showing percentage of net assets)
March 31, 2018
| | | | | | | | | | |
| Shares | | | | | Description | | Value ($) | |
| | |
| | | | | | COMMON STOCKS — 96.0% | |
| | |
| | | | | | Aerospace & Defense — 1.7% | |
| | | |
| | 27,448 | | | | | HEICO Corp.‡ | | | 2,382,761 | |
| | 34,620 | | | | | KLX, Inc.* | | | 2,460,097 | |
| | 15,500 | | | | | Moog, Inc. Class A* | | | 1,277,355 | |
| | 50,900 | | | | | Spirit AeroSystems Holdings, Inc. Class A | | | 4,260,330 | |
| | 14,685 | | | | | Teledyne Technologies, Inc.* | | | 2,748,591 | |
| | 8,404 | | | | | TransDigm Group, Inc. | | | 2,579,524 | |
| | | | | | | | | | |
| | | | | | | | | 15,708,658 | |
| | | | | | | | | | |
| | |
| | | | | | Agriculture — 0.2% | |
| | | |
| | 27,600 | | | | | Bunge, Ltd. | | | 2,040,744 | |
| | | | | | | | | | |
| | |
| | | | | | Airlines — 0.8% | |
| | | |
| | 24,100 | | | | | Alaska Air Group, Inc. | | | 1,493,236 | |
| | 111,000 | | | | | JetBlue Airways Corp.* | | | 2,255,520 | |
| | 68,746 | | | | | SkyWest, Inc. | | | 3,739,783 | |
| | | | | | | | | | |
| | | | | | | | | 7,488,539 | |
| | | | | | | | | | |
| | |
| | | | | | Apparel — 0.8% | |
| | | |
| | 29,044 | | | | | Carter’s, Inc. | | | 3,023,481 | |
| | 17,673 | | | | | Columbia Sportswear Co. | | | 1,350,747 | |
| | 39,700 | | | | | Michael Kors Holdings, Ltd.* | | | 2,464,576 | |
| | | | | | | | | | |
| | | | | | | | | 6,838,804 | |
| | | | | | | | | | |
| | |
| | | | | | Auto Manufacturers — 0.2% | |
| | | |
| | 93,900 | | | | | Wabash National Corp. | | | 1,954,059 | |
| | | | | | | | | | |
| | |
| | | | | | Auto Parts & Equipment — 2.4% | |
| | | |
| | 29,800 | | | | | Allison Transmission Holdings, Inc. | | | 1,163,988 | |
| | 30,100 | | | | | BorgWarner, Inc. | | | 1,511,923 | |
| | 8,800 | | | | | Cooper-Standard Holdings, Inc.* | | | 1,080,728 | |
| | 64,980 | | | | | Dana, Inc. | | | 1,673,885 | |
| | 61,906 | | | | | Delphi Technologies Plc | | | 2,949,821 | |
| | 30,239 | | | | | Dorman Products, Inc.* | | | 2,002,124 | |
| | 81,300 | | | | | Goodyear Tire & Rubber Co. (The) | | | 2,160,954 | |
| | 62,013 | | | | | Horizon Global Corp.* ‡ | | | 510,987 | |
| | 16,500 | | | | | Lear Corp. | | | 3,070,485 | |
| | 27,700 | | | | | Tenneco, Inc. | | | 1,519,899 | |
| | 39,700 | | | | | Tower International, Inc. | | | 1,101,675 | |
| | 9,673 | | | | | Visteon Corp.* | | | 1,066,351 | |
| | 12,388 | | | | | WABCO Holdings, Inc.* | | | 1,658,382 | |
| | | | | | | | | | |
| | | | | | | | | 21,471,202 | |
| | | | | | | | | | |
| | |
| | | | | | Banks — 6.1% | |
| | | |
| | 86,975 | | | | | BankUnited, Inc. | | | 3,477,260 | |
| | 21,400 | | | | | Bryn Mawr Bank Corp. | | | 940,530 | |
| | 40,300 | | | | | CIT Group, Inc. | | | 2,075,450 | |
| | 34,710 | | | | | Columbia Banking System, Inc. | | | 1,456,084 | |
| | | | | | |
| | See accompanying Notes to the Financial Statements. | | | 37 | |
Mercer US Small/Mid Cap Equity Fund
Schedule of Investments (Continued)
(showing percentage of net assets)
March 31, 2018
| | | | | | | | | | |
| Shares | | | | | Description | | Value ($) | |
| | |
| | | | | | Banks — continued | |
| | | |
| | 50,044 | | | | | East-West Bancorp, Inc. | | | 3,129,752 | |
| | 39,200 | | | | | Fidelity Southern Corp. | | | 904,344 | |
| | 56,597 | | | | | First Interstate BancSystem, Inc. | | | 2,238,411 | |
| | 46,677 | | | | | Glacier Bancorp, Inc.‡ | | | 1,791,463 | |
| | 52,387 | | | | | Great Western Bancorp, Inc. | | | 2,109,624 | |
| | 48,700 | | | | | Hanmi Financial Corp. | | | 1,497,525 | |
| | 57,976 | | | | | Home BancShares, Inc. | | | 1,322,433 | |
| | 91,700 | | | | | Hope Bancorp, Inc. | | | 1,668,023 | |
| | 61,872 | | | | | KeyCorp | | | 1,209,598 | |
| | 95,100 | | | | | Old National Bancorp | | | 1,607,190 | |
| | 26,583 | | | | | Pinnacle Financial Partners, Inc. | | | 1,706,629 | |
| | 251,000 | | | | | Regions Financial Corp. | | | 4,663,580 | |
| | 20,877 | | | | | Signature Bank* | | | 2,963,490 | |
| | 18,375 | | | | | SVB Financial Group* | | | 4,410,184 | |
| | 162,200 | | | | | TCF Financial Corp. | | | 3,699,782 | |
| | 23,164 | | | | | Texas Capital Bancshares, Inc.* | | | 2,082,444 | |
| | 19,276 | | | | | UMB Financial Corp. | | | 1,395,390 | |
| | 39,311 | | | | | Webster Financial Corp. | | | 2,177,829 | |
| | 65,901 | | | | | Western Alliance Bancorp* | | | 3,829,507 | |
| | 60,500 | | | | | Zions Bancorporation | | | 3,190,165 | |
| | | | | | | | | | |
| | | | | | | | | 55,546,687 | |
| | | | | | | | | | |
| | |
| | | | | | Biotechnology — 1.3% | |
| | | |
| | 49,080 | | | | | Acceleron Pharma, Inc.* ‡ | | | 1,919,028 | |
| | 70,523 | | | | | Amicus Therapeutics, Inc.* ‡ | | | 1,060,666 | |
| | 7,220 | | | | | Avexis, Inc.* | | | 892,248 | |
| | 10,540 | | | | | Bio-Rad Laboratories, Inc. Class A* | | | 2,635,843 | |
| | 60,520 | | | | | Medicines Co. (The)* ‡ | | | 1,993,529 | |
| | 14,379 | | | | | Sage Therapeutics, Inc.* | | | 2,316,025 | |
| | 11,400 | | | | | United Therapeutics Corp.* | | | 1,280,904 | |
| | | | | | | | | | |
| | | | | | | | | 12,098,243 | |
| | | | | | | | | | |
| | |
| | | | | | Building Materials — 2.0% | |
| | | |
| | 129,360 | | | | | Builders FirstSource, Inc.* | | | 2,566,502 | |
| | 38,752 | | | | | Eagle Materials, Inc. | | | 3,993,394 | |
| | 17,875 | | | | | Lennox International, Inc. | | | 3,653,114 | |
| | 26,500 | | | | | Owens Corning | | | 2,130,600 | |
| | 18,755 | | | | | Simpson Manufacturing Co., Inc. | | | 1,080,100 | |
| | 103,593 | | | | | Summit Materials, Inc. Class A* | | | 3,136,796 | |
| | 24,675 | | | | | US Concrete, Inc.* | | | 1,490,370 | |
| | | | | | | | | | |
| | | | | | | | | 18,050,876 | |
| | | | | | | | | | |
| | |
| | | | | | Chemicals — 3.4% | |
| | | |
| | 57,950 | | | | | Axalta Coating Systems, Ltd.* | | | 1,749,510 | |
| | 41,202 | | | | | Cabot Corp. | | | 2,295,775 | |
| | 25,200 | | | | | Celanese Corp. Series A | | | 2,525,292 | |
| | 26,400 | | | | | Eastman Chemical Co. | | | 2,787,312 | |
| | 223,556 | | | | | Huntsman Corp. | | | 6,539,013 | |
| | 20,787 | | | | | Ingevity Corp.* | | | 1,531,794 | |
| | | | | | |
| 38 | | See accompanying Notes to the Financial Statements. | | | | |
Mercer US Small/Mid Cap Equity Fund
Schedule of Investments (Continued)
(showing percentage of net assets)
March 31, 2018
| | | | | | | | | | |
| Shares | | | | | Description | | Value ($) | |
| | |
| | | | | | Chemicals — continued | |
| | | |
| | 21,591 | | | | | Methanex Corp. | | | 1,309,494 | |
| | 93,660 | | | | | Orion Engineered Carbons SA | | | 2,538,186 | |
| | 15,497 | | | | | Quaker Chemical Corp. | | | 2,295,571 | |
| | 72,059 | | | | | RPM International, Inc. | | | 3,435,053 | |
| | 40,420 | | | | | W.R. Grace & Co. | | | 2,474,917 | |
| | 14,656 | | | | | Westlake Chemical Corp. | | | 1,629,014 | |
| | | | | | | | | | |
| | | | | | | | | 31,110,931 | |
| | | | | | | | | | |
| | |
| | | | | | Coal — 0.1% | |
| | | |
| | 7,439 | | | | | Arch Coal, Inc. | | | 683,495 | |
| | | | | | | | | | |
| | |
| | | | | | Commercial Services — 8.7% | |
| | | |
| | 68,796 | | | | | Avis Budget Group, Inc.* | | | 3,222,405 | |
| | 69,985 | | | | | Booz Allen Hamilton Holding Corp. | | | 2,709,819 | |
| | 24,356 | | | | | Bright Horizons Family Solutions, Inc.* | | | 2,428,780 | |
| | 15,400 | | | | | Carriage Services, Inc. | | | 425,964 | |
| | 29,883 | | | | | CoStar Group, Inc.* | | | 10,837,967 | |
| | 57,359 | | | | | Deluxe Corp. | | | 4,245,140 | |
| | 62,366 | | | | | Gartner, Inc.* | | | 7,335,489 | |
| | 24,151 | | | | | Grand Canyon Education, Inc.* | | | 2,533,923 | |
| | 33,065 | | | | | Green Dot Corp. Class A* | | | 2,121,450 | |
| | 39,484 | | | | | Healthcare Services Group, Inc.‡ | | | 1,716,764 | |
| | 37,552 | | | | | HealthEquity, Inc.* | | | 2,273,398 | |
| | 37,062 | | | | | IHS Markit, Ltd.* | | | 1,787,871 | |
| | 44,291 | | | | | Live Nation Entertainment, Inc.* | | | 1,866,423 | |
| | 9,425 | | | | | LSC Communications, Inc. | | | 164,466 | |
| | 29,000 | | | | | ManpowerGroup, Inc. | | | 3,337,900 | |
| | 32,607 | | | | | MarketAxess Holdings, Inc. | | | 7,090,066 | |
| | 46,617 | | | | | Nielsen Holdings Plc | | | 1,481,954 | |
| | 25,663 | | | | | Paylocity Holding Corp.* | | | 1,314,716 | |
| | 113,115 | | | | | Ritchie Bros Auctioneers, Inc. | | | 3,559,729 | |
| | 37,860 | | | | | Robert Half International, Inc. | | | 2,191,715 | |
| | 25,133 | | | | | RR Donnelley & Sons Co. | | | 219,411 | |
| | 33,780 | | | | | Sotheby’s* | | | 1,733,252 | |
| | 53,070 | | | | | Total System Services, Inc. | | | 4,577,818 | |
| | 78,901 | | | | | TransUnion* | | | 4,479,999 | |
| | 73,600 | | | | | Western Union Co. (The)‡ | | | 1,415,328 | |
| | 22,800 | | | | | WEX, Inc.* | | | 3,570,936 | |
| | | | | | | | | | |
| | | | | | | | | 78,642,683 | |
| | | | | | | | | | |
| | |
| | | | | | Computers — 2.3% | |
| | | |
| | 24,300 | | | | | Amdocs, Ltd. | | | 1,621,296 | |
| | 77,300 | | | | | Convergys Corp. | | | 1,748,526 | |
| | 15,048 | | | | | EPAM Systems, Inc.* | | | 1,723,297 | |
| | 60,100 | | | | | Fortinet, Inc.* | | | 3,220,158 | |
| | 48,439 | | | | | Lumentum Holdings, Inc.* | | | 3,090,408 | |
| | 33,846 | | | | | Mercury Systems, Inc.* | | | 1,635,439 | |
| | 140,570 | | | | | NCR Corp.* | | | 4,430,766 | |
| | 42,200 | | | | | Seagate Technology Plc | | | 2,469,544 | |
| | | | | | |
| | See accompanying Notes to the Financial Statements. | | | 39 | |
Mercer US Small/Mid Cap Equity Fund
Schedule of Investments (Continued)
(showing percentage of net assets)
March 31, 2018
| | | | | | | | | | |
| Shares | | | | | Description | | Value ($) | |
| | |
| | | | | | Computers — continued | |
| | | |
| | 69,336 | | | | | VeriFone Systems, Inc.* | | | 1,066,388 | |
| | | | | | | | | | |
| | | | | | | | | 21,005,822 | |
| | | | | | | | | | |
| | |
| | | | | | Distribution & Wholesale — 0.5% | |
| | | |
| | 33,971 | | | | | KAR Auction Services, Inc. | | | 1,841,228 | |
| | 11,944 | | | | | Pool Corp. | | | 1,746,452 | |
| | 25,400 | | | | | ScanSource, Inc.* | | | 902,970 | |
| | | | | | | | | | |
| | | | | | | | | 4,490,650 | |
| | | | | | | | | | |
| | |
| | | | | | Diversified Financial Services — 3.5% | |
| | | |
| | 194,001 | | | | | Ally Financial, Inc. | | | 5,267,127 | |
| | 31,920 | | | | | Artisan Partners Asset Management, Inc. Class A | | | 1,062,936 | |
| | 35,692 | | | | | E*TRADE Financial Corp.* | | | 1,977,694 | |
| | 35,362 | | | | | Eaton Vance Corp. | | | 1,968,603 | |
| | 18,000 | | | | | Federal Agricultural Mortgage Corp. Class C | | | 1,566,360 | |
| | 42,900 | | | | | Lazard, Ltd. Class A | | | 2,254,824 | |
| | 54,700 | | | | | Legg Mason, Inc. | | | 2,223,555 | |
| | 28,910 | | | | | LPL Financial Holdings, Inc. | | | 1,765,534 | |
| | 96,000 | | | | | Navient Corp. | | | 1,259,520 | |
| | 100,444 | | | | | OneMain Holdings, Inc.* | | | 3,007,293 | |
| | 26,135 | | | | | Raymond James Financial, Inc. | | | 2,336,730 | |
| | 22,344 | | | | | SEI Investments Co. | | | 1,673,789 | |
| | 252,332 | | | | | SLM Corp.* | | | 2,828,642 | |
| | 19,594 | | | | | Stifel Financial Corp. | | | 1,160,553 | |
| | 31,562 | | | | | WageWorks, Inc.* | | | 1,426,602 | |
| | | | | | | | | | |
| | | | | | | | | 31,779,762 | |
| | | | | | | | | | |
| | |
| | | | | | Electric — 1.1% | |
| | | |
| | 58,900 | | | | | AES Corp. | | | 669,693 | |
| | 23,100 | | | | | CenterPoint Energy, Inc. | | | 632,940 | |
| | 27,000 | | | | | Entergy Corp. | | | 2,127,060 | |
| | 133,331 | | | | | OGE Energy Corp. | | | 4,369,257 | |
| | 46,085 | | | | | Portland General Electric Co. | | | 1,866,903 | |
| | 12,900 | | | | | SCANA Corp. | | | 484,395 | |
| | | | | | | | | | |
| | | | | | | | | 10,150,248 | |
| | | | | | | | | | |
| | |
| | | | | | Electrical Components & Equipment — 0.5% | |
| | | |
| | 19,219 | | | | | Advanced Energy Industries, Inc.* | | | 1,228,094 | |
| | 30,400 | | | | | Energizer Holdings, Inc.‡ | | | 1,811,232 | |
| | 34,733 | | | | | Generac Holdings, Inc.* | | | 1,594,592 | |
| | | | | | | | | | |
| | | | | | | | | 4,633,918 | |
| | | | | | | | | | |
| | |
| | | | | | Electronics — 2.5% | |
| | | |
| | 21,700 | | | | | Arrow Electronics, Inc.* | | | 1,671,334 | |
| | 45,300 | | | | | Avnet, Inc. | | | 1,891,728 | |
| | 11,322 | | | | | Coherent, Inc.* | | | 2,121,743 | |
| | 117,400 | | | | | Flex, Ltd.* | | | 1,917,142 | |
| | 75,873 | | | | | FLIR Systems, Inc. | | | 3,794,409 | |
| | | | | | |
| 40 | | See accompanying Notes to the Financial Statements. | | | | |
Mercer US Small/Mid Cap Equity Fund
Schedule of Investments (Continued)
(showing percentage of net assets)
March 31, 2018
| | | | | | | | | | |
| Shares | | | | | Description | | Value ($) | |
| | |
| | | | | | Electronics — continued | |
| | | |
| | 34,000 | | | | | Jabil, Inc. | | | 976,820 | |
| | 2,037 | | | | | Mettler-Toledo International, Inc.* | | | 1,171,336 | |
| | 42,552 | | | | | National Instruments Corp. | | | 2,151,855 | |
| | 3,574 | | | | | Rogers Corp.* | | | 427,236 | |
| | 43,100 | | | | | Sanmina Corp.* | | | 1,127,065 | |
| | 7,548 | | | | | Tech Data Corp.* | | | 642,561 | |
| | 44,757 | | | | | Trimble, Inc.* | | | 1,605,881 | |
| | 68,200 | | | | | TTM Technologies, Inc.* | | | 1,042,778 | |
| | 117,800 | | | | | Vishay Intertechnology, Inc.‡ | | | 2,191,080 | |
| | | | | | | | | | |
| | | | | | | | | 22,732,968 | |
| | | | | | | | | | |
| | |
| | | | | | Energy-Alternate Sources — 0.1% | |
| | | |
| | 61,000 | | | | | Renewable Energy Group, Inc.* ‡ | | | 780,800 | |
| | | | | | | | | | |
| | |
| | | | | | Engineering & Construction — 1.2% | |
| | | |
| | 37,900 | | | | | Chicago Bridge & Iron Co. NV‡ | | | 545,760 | |
| | 43,726 | | | | | Exponent, Inc. | | | 3,439,050 | |
| | 44,900 | | | | | Fluor Corp. | | | 2,569,178 | |
| | 36,880 | | | | | MasTec, Inc.* | | | 1,735,204 | |
| | 32,750 | | | | | TopBuild Corp.* | | | 2,506,030 | |
| | | | | | | | | | |
| | | | | | | | | 10,795,222 | |
| | | | | | | | | | |
| | |
| | | | | | Entertainment — 0.9% | |
| | | |
| | 72,149 | | | | | Lions Gate Entertainment Corp. Class B | | | 1,737,348 | |
| | 21,126 | | | | | Penn National Gaming, Inc.* | | | 554,769 | |
| | 27,170 | | | | | Six Flags Entertainment Corp.‡ | | | 1,691,604 | |
| | 19,209 | | | | | Vail Resorts, Inc. | | | 4,258,635 | |
| | | | | | | | | | |
| | | | | | | | | 8,242,356 | |
| | | | | | | | | | |
| | |
| | | | | | Food — 1.3% | |
| | | |
| | 35,438 | | | | | Blue Buffalo Pet Products, Inc.* | | | 1,410,787 | |
| | 22,700 | | | | | Ingles Markets, Inc. Class A | | | 768,395 | |
| | 64,700 | | | | | Pilgrim’s Pride Corp.* | | | 1,592,267 | |
| | 47,570 | | | | | Pinnacle Foods, Inc. | | | 2,573,537 | |
| | 20,600 | | | | | Sanderson Farms, Inc.‡ | | | 2,451,812 | |
| | 29,600 | | | | | SpartanNash Co. | | | 509,416 | |
| | 59,061 | | | | | Sprouts Farmers Market, Inc.* | | | 1,386,162 | |
| | 24,263 | | | | | US Foods Holding Corp.* | | | 795,098 | |
| | 18,609 | | | | | Weis Markets, Inc. | | | 762,597 | |
| | | | | | | | | | |
| | | | | | | | | 12,250,071 | |
| | | | | | | | | | |
| | |
| | | | | | Forest Products & Paper — 0.3% | |
| | | |
| | 27,100 | | | | | Clearwater Paper Corp.* | | | 1,059,610 | |
| | 35,400 | | | | | Schweitzer-Mauduit International, Inc. | | | 1,385,910 | |
| | | | | | | | | | |
| | | | | | | | | 2,445,520 | |
| | | | | | | | | | |
| | |
| | | | | | Hand & Machine Tools — 0.4% | |
| | | |
| | 23,120 | | | | | Lincoln Electric Holdings, Inc. | | | 2,079,644 | |
| | | | | | |
| | See accompanying Notes to the Financial Statements. | | | 41 | |
Mercer US Small/Mid Cap Equity Fund
Schedule of Investments (Continued)
(showing percentage of net assets)
March 31, 2018
| | | | | | | | | | |
| Shares | | | | | Description | | Value ($) | |
| | |
| | | | | | Hand & Machine Tools — continued | |
| | | |
| | 18,100 | | | | | Regal Beloit Corp. | | | 1,327,635 | |
| | | | | | | | | | |
| | | | | | | | | 3,407,279 | |
| | | | | | | | | | |
| | |
| | | | | | Health Care - Products — 3.2% | |
| | | |
| | 4,153 | | | | | ABIOMED, Inc.* | | | 1,208,481 | |
| | 24,107 | | | | | Cantel Medical Corp. Class B | | | 2,685,761 | |
| | 24,771 | | | | | DENTSPLY SIRONA, Inc. | | | 1,246,229 | |
| | 13,455 | | | | | ICU Medical, Inc.* | | | 3,396,042 | |
| | 10,707 | | | | | IDEXX Laboratories, Inc.* | | | 2,049,213 | |
| | 25,700 | | | | | Integer Holdings Corp.* | | | 1,453,335 | |
| | 53,473 | | | | | K2M Group Holdings, Inc.* ‡ | | | 1,013,313 | |
| | 34,142 | | | | | Merit Medical Systems, Inc.* | | | 1,548,340 | |
| | 17,071 | | | | | Penumbra, Inc.* ‡ | | | 1,974,261 | |
| | 78,925 | | | | | STERIS Plc | | | 7,368,438 | |
| | 46,616 | | | | | West Pharmaceutical Services, Inc. | | | 4,115,727 | |
| | 67,886 | | | | | Wright Medical Group NV* ‡ | | | 1,346,858 | |
| | | | | | | | | | |
| | | | | | | | | 29,405,998 | |
| | | | | | | | | | |
| | |
| | | | | | Health Care - Services — 1.4% | |
| | | |
| | 40,631 | | | | | Acadia Healthcare Co., Inc.* ‡ | | | 1,591,923 | |
| | 56,600 | | | | | Ensign Group, Inc. (The) | | | 1,488,580 | |
| | 36,130 | | | | | Envision Healthcare Corp.* ‡ | | | 1,388,476 | |
| | 18,253 | | | | | ICON Plc, ADR* | | | 2,156,409 | |
| | 31,700 | | | | | LifePoint Health, Inc.* | | | 1,489,900 | |
| | 21,160 | | | | | Quest Diagnostics, Inc. | | | 2,122,348 | |
| | 10,467 | | | | | WellCare Health Plans, Inc.* | | | 2,026,725 | |
| | | | | | | | | | |
| | | | | | | | | 12,264,361 | |
| | | | | | | | | | |
| | |
| | | | | | Home Builders — 0.9% | |
| | | |
| | 14,879 | | | | | Cavco Industries, Inc.* | | | 2,585,226 | |
| | 30,800 | | | | | MDC Holdings, Inc. | | | 859,936 | |
| | 60,700 | | | | | PulteGroup, Inc. | | | 1,790,043 | |
| | 13,200 | | | | | Thor Industries, Inc. | | | 1,520,244 | |
| | 60,900 | | | | | TRI Pointe Group, Inc.* | | | 1,000,587 | |
| | | | | | | | | | |
| | | | | | | | | 7,756,036 | |
| | | | | | | | | | |
| | |
| | | | | | Home Furnishings — 0.1% | |
| | | |
| | 23,400 | | | | | Ethan Allen Interiors, Inc. | | | 537,030 | |
| | | | | | | | | | |
| | |
| | | | | | Household Products & Wares — 0.3% | |
| | | |
| | 28,860 | | | | | Avery Dennison Corp. | | | 3,066,375 | |
| | | | | | | | | | |
| | |
| | | | | | Housewares — 0.7% | |
| | | |
| | 83,087 | | | | | Newell Rubbermaid, Inc. | | | 2,117,057 | |
| | 53,307 | | | | | Toro Co. (The) | | | 3,329,022 | |
| | 18,900 | | | | | Tupperware Brands Corp. | | | 914,382 | |
| | | | | | | | | | |
| | | | | | | | | 6,360,461 | |
| | | | | | | | | | |
| | | | | | |
| 42 | | See accompanying Notes to the Financial Statements. | | | | |
Mercer US Small/Mid Cap Equity Fund
Schedule of Investments (Continued)
(showing percentage of net assets)
March 31, 2018
| | | | | | | | | | |
| Shares | | | | | Description | | Value ($) | |
| | |
| | | | | | Insurance — 4.3% | |
| | | |
| | 45,485 | | | | | Arthur J. Gallagher & Co. | | | 3,126,184 | |
| | 29,000 | | | | | Aspen Insurance Holdings, Ltd. | | | 1,300,650 | |
| | 11,000 | | | | | Assurant, Inc. | | | 1,005,510 | |
| | 64,200 | | | | | Assured Guaranty, Ltd. | | | 2,324,040 | |
| | 134,700 | | | | | CNO Financial Group, Inc. | | | 2,918,949 | |
| | 77,880 | | | | | Essent Group, Ltd.* | | | 3,314,573 | |
| | 12,400 | | | | | Everest Re Group, Ltd. | | | 3,184,568 | |
| | 18,600 | | | | | HCI Group, Inc. | | | 709,776 | |
| | 66,600 | | | | | Heritage Insurance Holdings, Inc.‡ | | | 1,009,656 | |
| | 49,265 | | | | | James River Group Holdings, Ltd. | | | 1,747,429 | |
| | 48,000 | | | | | Lincoln National Corp. | | | 3,506,880 | |
| | 357,192 | | | | | MGIC Investment Corp.* | | | 4,643,496 | |
| | 37,974 | | | | | ProAssurance Corp. | | | 1,843,638 | |
| | 20,200 | | | | | Reinsurance Group of America, Inc. | | | 3,110,800 | |
| | 63,300 | | | | | Universal Insurance Holdings, Inc. | | | 2,019,270 | |
| | 73,600 | | | | | Unum Group | | | 3,504,096 | |
| | | | | | | | | | |
| | | | | | | | | 39,269,515 | |
| | | | | | | | | | |
| | |
| | | | | | Internet — 0.6% | |
| | | |
| | 38,893 | | | | | Cogent Communications Holdings, Inc. | | | 1,687,956 | |
| | 10,700 | | | | | F5 Networks, Inc.* | | | 1,547,327 | |
| | 51,451 | | | | | Rapid7, Inc.* | | | 1,315,602 | |
| | 24,492 | | | | | Zendesk, Inc.* | | | 1,172,432 | |
| | | | | | | | | | |
| | | | | | | | | 5,723,317 | |
| | | | | | | | | | |
| | |
| | | | | | Investment Companies — 0.7% | |
| | | |
| | 57,300 | | | | | Ares Capital Corp. | | | 909,351 | |
| | 44,650 | | | | | Cannae Holdings, Inc.* | | | 842,099 | |
| | 129,153 | | | | | Leucadia National Corp. | | | 2,935,648 | |
| | 59,200 | | | | | New Mountain Finance Corp. | | | 778,480 | |
| | 104,525 | | | | | Oaktree Specialty Lending Corp. | | | 440,050 | |
| | 66,200 | | | | | Prospect Capital Corp.‡ | | | 433,610 | |
| | | | | | | | | | |
| | | | | | | | | 6,339,238 | |
| | | | | | | | | | |
| | |
| | | | | | Leisure Time — 1.2% | |
| | | |
| | 31,400 | | | | | Brunswick Corp. | | | 1,864,846 | |
| | 36,900 | | | | | Harley-Davidson, Inc.‡ | | | 1,582,272 | |
| | 14,775 | | | | | LCI Industries | | | 1,538,816 | |
| | 89,267 | | | | | Planet Fitness, Inc. Class A* | | | 3,371,615 | |
| | 21,952 | | | | | Polaris Industries, Inc.‡ | | | 2,513,943 | |
| | | | | | | | | | |
| | | | | | | | | 10,871,492 | |
| | | | | | | | | | |
| | |
| | | | | | Lodging — 0.5% | |
| | | |
| | 89,340 | | | | | Boyd Gaming Corp.‡ | | | 2,846,372 | |
| | 13,400 | | | | | Wyndham Worldwide Corp. | | | 1,533,362 | |
| | | | | | | | | | |
| | | | | | | | | 4,379,734 | |
| | | | | | | | | | |
| | | | | | |
| | See accompanying Notes to the Financial Statements. | | | 43 | |
Mercer US Small/Mid Cap Equity Fund
Schedule of Investments (Continued)
(showing percentage of net assets)
March 31, 2018
| | | | | | | | | | |
| Shares | | | | | Description | | Value ($) | |
| | |
| | | | | | Machinery - Construction & Mining — 0.2% | |
| | | |
| | 16,791 | | | | | BWX Technologies, Inc. | | | 1,066,732 | |
| | 13,600 | | | | | Oshkosh Corp. | | | 1,050,872 | |
| | | | | | | | | | |
| | | | | | | | | 2,117,604 | |
| | | | | | | | | | |
| | |
| | | | | | Machinery - Diversified — 3.4% | |
| | | |
| | 35,244 | | | | | Altra Industrial Motion Corp. | | | 1,619,462 | |
| | 53,600 | | | | | Briggs & Stratton Corp. | | | 1,147,576 | |
| | 51,110 | | | | | Cognex Corp. | | | 2,657,209 | |
| | 59,640 | | | | | Flowserve Corp. | | | 2,584,201 | |
| | 137,717 | | | | | Gardner Denver Holdings, Inc.* | | | 4,225,157 | |
| | 45,587 | | | | | Graco, Inc. | | | 2,084,238 | |
| | 33,878 | | | | | Middleby Corp. (The)* ‡ | | | 4,193,758 | |
| | 17,890 | | | | | Nordson Corp. | | | 2,439,122 | |
| | 32,422 | | | | | Wabtec Corp.‡ | | | 2,639,151 | |
| | 52,579 | | | | | Zebra Technologies Corp. Class A* | | | 7,318,471 | |
| | | | | | | | | | |
| | | | | | | | | 30,908,345 | |
| | | | | | | | | | |
| | |
| | | | | | Media — 0.7% | |
| | | |
| | 14,800 | | | | | AMC Networks, Inc. Class A* ‡ | | | 765,160 | |
| | 34,193 | | | | | Nexstar Media Group, Inc. Class A‡ | | | 2,273,834 | |
| | 78,059 | | | | | Sinclair Broadcast Group, Inc. Class A | | | 2,443,247 | |
| | 67,300 | | | | | TEGNA, Inc. | | | 766,547 | |
| | | | | | | | | | |
| | | | | | | | | 6,248,788 | |
| | | | | | | | | | |
| | |
| | | | | | Metal Fabricate & Hardware — 0.7% | |
| | | |
| | 45,900 | | | | | Global Brass & Copper Holdings, Inc. | | | 1,535,355 | |
| | 24,131 | | | | | RBC Bearings, Inc.* | | | 2,997,070 | |
| | 34,244 | | | | | Sun Hydraulics Corp. | | | 1,834,109 | |
| | | | | | | | | | |
| | | | | | | | | 6,366,534 | |
| | | | | | | | | | |
| | |
| | | | | | Mining — 0.4% | |
| | | |
| | 69,690 | | | | | Goldcorp, Inc. | | | 963,116 | |
| | 319,925 | | | | | Kinross Gold Corp.* | | | 1,263,704 | |
| | 235,628 | | | | | Tahoe Resources, Inc. | | | 1,105,095 | |
| | | | | | | | | | |
| | | | | | | | | 3,331,915 | |
| | | | | | | | | | |
| | |
| | | | | | Miscellaneous - Manufacturing — 2.1% | |
| | | |
| | 45,400 | | | | | American Outdoor Brands Corp.* ‡ | | | 468,528 | |
| | 42,320 | | | | | AO Smith Corp. | | | 2,691,129 | |
| | 15,499 | | | | | AptarGroup, Inc. | | | 1,392,275 | |
| | 36,670 | | | | | Crane Co. | | | 3,400,776 | |
| | 59,688 | | | | | Hexcel Corp. | | | 3,855,248 | |
| | 36,300 | | | | | ITT, Inc. | | | 1,777,974 | |
| | 16,127 | | | | | John Bean Technologies Corp. | | | 1,828,802 | |
| | 12,800 | | | | | Textron, Inc. | | | 754,816 | |
| | 35,700 | | | | | Trinseo SA | | | 2,643,585 | |
| | | | | | | | | | |
| | | | | | | | | 18,813,133 | |
| | | | | | | | | | |
| | | | | | |
| 44 | | See accompanying Notes to the Financial Statements. | | | | |
Mercer US Small/Mid Cap Equity Fund
Schedule of Investments (Continued)
(showing percentage of net assets)
March 31, 2018
| | | | | | | | | | |
| Shares | | | | | Description | | Value ($) | |
| | |
| | | | | | Multi-National — 0.1% | |
| | | |
| | 47,900 | | | | | Banco Latinoamericano de Comercio Exterior SA | | | 1,365,150 | |
| | | | | | | | | | |
| | |
| | | | | | Office & Business Equipment — 0.6% | |
| | | |
| | 93,800 | | | | | Pitney Bowes, Inc. | | | 1,021,482 | |
| | 143,516 | | | | | Xerox Corp. | | | 4,130,391 | |
| | | | | | | | | | |
| | | | | | | | | 5,151,873 | |
| | | | | | | | | | |
| | |
| | | | | | Oil & Gas — 2.9% | |
| | | |
| | 52,903 | | | | | Andeavor | | | 5,319,926 | |
| | 22,805 | | | | | Cabot Oil & Gas Corp. | | | 546,864 | |
| | 175,006 | | | | | Callon Petroleum Co.* ‡ | | | 2,317,079 | |
| | 74,700 | | | | | Carrizo Oil & Gas, Inc.* ‡ | | | 1,195,200 | |
| | 38,932 | | | | | Delek US Holdings, Inc. | | | 1,584,532 | |
| | 18,100 | | | | | Diamond Offshore Drilling, Inc.* ‡ | | | 265,346 | |
| | 32,676 | | | | | Diamondback Energy, Inc.* | | | 4,134,168 | |
| | 62,698 | | | | | Matador Resources Co.* ‡ | | | 1,875,297 | |
| | 23,100 | | | | | Murphy USA, Inc.* | | | 1,681,680 | |
| | 58,300 | | | | | Par Pacific Holdings, Inc.* | | | 1,001,011 | |
| | 68,306 | | | | | Parsley Energy, Inc. Class A* | | | 1,980,191 | |
| | 48,400 | | | | | PBF Energy, Inc. Class A | | | 1,640,760 | |
| | 76,072 | | | | | QEP Resources, Inc.* | | | 744,745 | |
| | 32,347 | | | | | RSP Permian, Inc.* | | | 1,516,427 | |
| | 60,860 | | | | | WPX Energy, Inc.* | | | 899,511 | |
| | | | | | | | | | |
| | | | | | | | | 26,702,737 | |
| | | | | | | | | | |
| | |
| | | | | | Oil & Gas Services — 0.5% | |
| | | |
| | 38,942 | | | | | Dril-Quip, Inc.* | | | 1,744,602 | |
| | 59,700 | | | | | Matrix Service Co.* | | | 817,890 | |
| | 38,302 | | | | | Oil States International, Inc.* | | | 1,003,512 | |
| | 110,140 | | | | | Superior Energy Services, Inc.* | | | 928,480 | |
| | | | | | | | | | |
| | | | | | | | | 4,494,484 | |
| | | | | | | | | | |
| | |
| | | | | | Packaging & Containers — 0.6% | |
| | | |
| | 32,343 | | | | | Berry Global Group, Inc.* | | | 1,772,720 | |
| | 74,600 | | | | | Owens-Illinois, Inc.* | | | 1,615,836 | |
| | 18,920 | | | | | Packaging Corp. of America | | | 2,132,284 | |
| | | | | | | | | | |
| | | | | | | | | 5,520,840 | |
| | | | | | | | | | |
| | |
| | | | | | Pharmaceuticals — 3.3% | |
| | | |
| | 33,287 | | | | | Alkermes Plc* ‡ | | | 1,929,314 | |
| | 64,816 | | | | | Catalent, Inc.* | | | 2,661,345 | |
| | 16,400 | | | | | Eagle Pharmaceuticals, Inc.* ‡ | | | 864,116 | |
| | 61,128 | | | | | Impax Laboratories, Inc.* | | | 1,188,940 | |
| | 88,447 | | | | | Ironwood Pharmaceuticals, Inc.* ‡ | | | 1,364,737 | |
| | 42,751 | | | | | Jazz Pharmaceuticals Plc* | | | 6,454,973 | |
| | 50,275 | | | | | Lannett Co., Inc.* ‡ | | | 806,914 | |
| | 36,800 | | | | | Mallinckrodt Plc* | | | 532,864 | |
| | 35,710 | | | | | Nektar Therapeutics* ‡ | | | 3,794,544 | |
| | | | | | |
| | See accompanying Notes to the Financial Statements. | | | 45 | |
Mercer US Small/Mid Cap Equity Fund
Schedule of Investments (Continued)
(showing percentage of net assets)
March 31, 2018
| | | | | | | | | | |
| Shares | | | | | Description | | Value ($) | |
| | |
| | | | | | Pharmaceuticals — continued | |
| | | |
| | 21,333 | | | | | Neurocrine Biosciences, Inc.* ‡ | | | 1,769,146 | |
| | 53,800 | | | | | Owens & Minor, Inc.‡ | | | 836,590 | |
| | 30,965 | | | | | Pacira Pharmaceuticals, Inc.* ‡ | | | 964,560 | |
| | 15,225 | | | | | PRA Health Sciences, Inc.* | | | 1,263,066 | |
| | 68,451 | | | | | Premier, Inc. Class A* ‡ | | | 2,143,201 | |
| | 736,117 | | | | | TherapeuticsMD, Inc.* | | | 3,584,890 | |
| | | | | | | | | | |
| | | | | | | | | 30,159,200 | |
| | | | | | | | | | |
| | |
| | | | | | Real Estate — 0.2% | |
| | | |
| | 21,890 | | | | | FirstService Corp. | | | 1,601,910 | |
| | | | | | | | | | |
| | |
| | | | | | REITS — 5.9% | |
| | | |
| | 73,114 | | | | | American Campus Communities, Inc. REIT | | | 2,823,663 | |
| | 227,300 | | | | | Annaly Capital Management, Inc. REIT | | | 2,370,739 | |
| | 50,900 | | | | | Brixmor Property Group, Inc. REIT | | | 776,225 | |
| | 163,500 | | | | | Cedar Realty Trust, Inc. REIT | | | 644,190 | |
| | 99,300 | | | | | Chimera Investment Corp. REIT | | | 1,728,813 | |
| | 52,000 | | | | | City Office, Inc. REIT | | | 601,120 | |
| | 19,190 | | | | | Coresite Realty Corp. REIT | | | 1,923,989 | |
| | 121,700 | | | | | DDR Corp. REIT | | | 892,061 | |
| | 95,291 | | | | | Easterly Government Properties, Inc. REIT‡ | | | 1,943,936 | |
| | 109,500 | | | | | Franklin Street Properties Corp. REIT | | | 920,895 | |
| | 58,700 | | | | | Government Properties Income Trust REIT‡ | | | 801,842 | |
| | 91,400 | | | | | Hospitality Properties Trust REIT | | | 2,316,076 | |
| | 18,400 | | | | | Independence Realty Trust, Inc. REIT | | | 168,912 | |
| | 67,760 | | | | | Industrial Logistics Properties Trust REIT* ‡ | | | 1,378,238 | |
| | 59,000 | | | | | InfraREIT, Inc. REIT | | | 1,146,370 | |
| | 227,800 | | | | | Lexington Realty Trust REIT | | | 1,792,786 | |
| | 71,800 | | | | | Mack-Cali Realty Corp. REIT | | | 1,199,778 | |
| | 159,000 | | | | | Medical Properties Trust, Inc. REIT | | | 2,067,000 | |
| | 17,727 | | | | | Mid-America Apartment Communities, Inc. REIT | | | 1,617,412 | |
| | 57,600 | | | | | MTGE Investment Corp. REIT | | | 1,031,040 | |
| | 124,878 | | | | | Physicians Realty Trust REIT | | | 1,944,350 | |
| | 95,600 | | | | | Piedmont Office Realty Trust, Inc. REIT Class A | | | 1,681,604 | |
| | 56,600 | | | | | Preferred Apartment Communities, Inc. REIT | | | 803,154 | |
| | 38,740 | | | | | QTS Realty Trust, Inc. REIT Class A | | | 1,403,163 | |
| | 84,500 | | | | | RLJ Lodging Trust REIT | | | 1,642,680 | |
| | 68,800 | | | | | Sabra Healthcare, Inc. REIT‡ | | | 1,214,320 | |
| | 95,800 | | | | | Select Income REIT | | | 1,866,184 | |
| | 139,600 | | | | | Senior Housing Properties Trust REIT | | | 2,186,136 | |
| | 89,900 | | | | | Starwood Property Trust, Inc. REIT‡ | | | 1,883,405 | |
| | 225,437 | | | | | Summit Hotel Properties, Inc. REIT | | | 3,068,198 | |
| | 52,340 | | | | | Sun Communities, Inc. REIT | | | 4,782,306 | |
| | 181,900 | | | | | VEREIT, Inc. REIT | | | 1,266,024 | |
| | 70,800 | | | | | Xenia Hotels & Resorts, Inc. REIT | | | 1,396,176 | |
| | | | | | | | | | |
| | | | | | | | | 53,282,785 | |
| | | | | | | | | | |
| | |
| | | | | | Retail — 4.2% | |
| | | |
| | 78,700 | | | | | American Eagle Outfitters, Inc. | | | 1,568,491 | |
| | | | | | |
| 46 | | See accompanying Notes to the Financial Statements. | | | | |
Mercer US Small/Mid Cap Equity Fund
Schedule of Investments (Continued)
(showing percentage of net assets)
March 31, 2018
| | | | | | | | | | |
| Shares | | | | | Description | | Value ($) | |
| | |
| | | | | | Retail — continued | |
| | 113,804 | | | | | Arcos Dorados Holdings, Inc. Class A | | | 1,041,307 | |
| | 38,461 | | | | | BJ’s Restaurants, Inc. | | | 1,726,899 | |
| | 72,100 | | | | | Bloomin’ Brands, Inc. | | | 1,750,588 | |
| | 74,592 | | | | | BMC Stock Holdings, Inc.* | | | 1,458,274 | |
| | 59,340 | | | | | Brinker International, Inc.‡ | | | 2,142,174 | |
| | 46,945 | | | | | Burlington Stores, Inc. * | | | 6,250,727 | |
| | 14,903 | | | | | Dave & Buster’s Entertainment, Inc.* | | | 622,051 | |
| | 29,700 | | | | | Dick’s Sporting Goods, Inc. | | | 1,040,985 | |
| | 16,800 | | | | | Dillard’s, Inc. Class A‡ | | | 1,349,712 | |
| | 31,896 | | | | | Five Below, Inc.* | | | 2,339,253 | |
| | 62,993 | | | | | Floor & Decor Holdings, Inc.* ‡ | | | 3,283,195 | |
| | 30,300 | | | | | Foot Locker, Inc. | | | 1,379,862 | |
| | 34,100 | | | | | Kohl’s Corp.‡ | | | 2,233,891 | |
| | 22,121 | | | | | Lithia Motors, Inc. Class A‡ | | | 2,223,603 | |
| | 72,926 | | | | | Michaels Cos., Inc. (The)* | | | 1,437,371 | |
| | 156,608 | | | | | Office Depot, Inc. | | | 336,707 | |
| | 29,804 | | | | | PriceSmart, Inc.‡ | | | 2,490,124 | |
| | 60,400 | | | | | Sonic Automotive, Inc. Class A‡ | | | 1,144,580 | |
| | 18,296 | | | | | Texas Roadhouse, Inc. Class A | | | 1,057,143 | |
| | 23,900 | | | | | Williams-Sonoma, Inc.‡ | | | 1,260,964 | |
| | | | | | | | | | |
| | | | | | | | | 38,137,901 | |
| | | | | | | | | | |
| | |
| | | | | | Savings & Loans — 0.2% | |
| | | |
| | 33,800 | | | | | Berkshire Hills Bancorp, Inc. | | | 1,282,710 | |
| | 44,600 | | | | | United Financial Bancorp, Inc. | | | 722,520 | |
| | | | | | | | | | |
| | | | | | | | | 2,005,230 | |
| | | | | | | | | | |
| | |
| | | | | | Semiconductors — 1.9% | |
| | | |
| | 166,285 | | | | | Advanced Micro Devices, Inc.* | | | 1,671,164 | |
| | 60,700 | | | | | Kulicke & Soffa Industries, Inc.* | | | 1,518,107 | |
| | 26,395 | | | | | Maxim Integrated Products, Inc. | | | 1,589,507 | |
| | 11,870 | | | | | MKS Instruments, Inc. | | | 1,372,766 | |
| | 133,300 | | | | | ON Semiconductor Corp.* | | | 3,260,518 | |
| | 22,234 | | | | | Power Integrations, Inc. | | | 1,519,694 | |
| | 41,113 | | | | | Silicon Laboratories, Inc.* | | | 3,696,059 | |
| | 54,140 | | | | | Teradyne, Inc. | | | 2,474,739 | |
| | | | | | | | | | |
| | | | | | | | | 17,102,554 | |
| | | | | | | | | | |
| | |
| | | | | | Shipbuilding — 0.1% | |
| | | |
| | 4,400 | | | | | Huntington Ingalls Industries, Inc. | | | 1,134,144 | |
| | | | | | | | | | |
| | |
| | | | | | Software — 7.3% | |
| | | |
| | 103,840 | | | | | Acxiom Corp.* | | | 2,358,206 | |
| | 14,203 | | | | | ANSYS, Inc.* | | | 2,225,468 | |
| | 88,028 | | | | | Black Knight, Inc.* | | | 4,146,119 | |
| | 38,044 | | | | | Blackbaud, Inc.‡ | | | 3,873,260 | |
| | 16,536 | | | | | Broadridge Financial Solutions, Inc. | | | 1,813,834 | |
| | 53,782 | | | | | Callidus Software, Inc.* | | | 1,933,463 | |
| | 14,918 | | | | | Commvault Systems, Inc.* | | | 853,310 | |
| | | | | | |
| | See accompanying Notes to the Financial Statements. | | | 47 | |
Mercer US Small/Mid Cap Equity Fund
Schedule of Investments (Continued)
(showing percentage of net assets)
March 31, 2018
| | | | | | | | | | |
| Shares | | | | | Description | | Value ($) | |
| | |
| | | | | | Software — continued | |
| | 35,858 | | | | | Cotiviti Holdings, Inc.* | | | 1,234,949 | |
| | 9,425 | | | | | Donnelley Financial Solutions, Inc.* | | | 161,827 | |
| | 124,093 | | | | | Evolent Health, Inc.* | | | 1,768,325 | |
| | 98,038 | | | | | First Data Corp. Class A* | | | 1,568,608 | |
| | 26,084 | | | | | Guidewire Software, Inc.* | | | 2,108,370 | |
| | 21,646 | | | | | HubSpot, Inc.* ‡ | | | 2,344,262 | |
| | 21,564 | | | | | j2 Global, Inc. | | | 1,701,831 | |
| | 28,436 | | | | | MSCI, Inc. Class A | | | 4,250,329 | |
| | 32,000 | | | | | New Relic, Inc.* | | | 2,371,840 | |
| | 178,805 | | | | | Nuance Communications, Inc.* | | | 2,816,179 | |
| | 57,479 | | | | | PTC, Inc.* | | | 4,483,937 | |
| | 63,300 | | | | | RealPage, Inc.* ‡ | | | 3,259,950 | |
| | 25,945 | | | | | Splunk, Inc.* | | | 2,552,728 | |
| | 55,292 | | | | | SS&C Technologies Holdings, Inc. | | | 2,965,863 | |
| | 81,981 | | | | | Talend SA, ADR* | | | 3,944,926 | |
| | 24,337 | | | | | Tyler Technologies, Inc.* | | | 5,134,133 | |
| | 16,168 | | | | | Ultimate Software Group, Inc. (The)* ‡ | | | 3,940,142 | |
| | 28,516 | | | | | Veeva Systems, Inc. Class A* | | | 2,082,238 | |
| | | | | | | | | | |
| | | | | | | | | 65,894,097 | |
| | | | | | | | | | |
| | |
| | | | | | Telecommunications — 2.4% | |
| | | |
| | 198,394 | | | | | Ciena Corp.* | | | 5,138,405 | |
| | 56,090 | | | | | CommScope Holding Co., Inc.* | | | 2,241,917 | |
| | 36,561 | | | | | GTT Communications, Inc.* ‡ | | | 2,073,009 | |
| | 219,355 | | | | | Infinera Corp.* | | | 2,382,195 | |
| | 96,600 | | | | | Juniper Networks, Inc. | | | 2,350,278 | |
| | 23,558 | | | | | LogMeIn, Inc. | | | 2,722,127 | |
| | 20,900 | | | | | Plantronics, Inc. | | | 1,261,733 | |
| | 179,704 | | | | | Viavi Solutions, Inc.* | | | 1,746,723 | |
| | 60,340 | | | | | Zayo Group Holdings, Inc.* | | | 2,061,214 | |
| | | | | | | | | | |
| | | | | | | | | 21,977,601 | |
| | | | | | | | | | |
| | |
| | | | | | Transportation — 2.1% | |
| | | |
| | 31,300 | | | | | Atlas Air Worldwide Holdings, Inc.* | | | 1,892,085 | |
| | 38,142 | | | | | J.B. Hunt Transport Services, Inc. | | | 4,468,335 | |
| | 61,834 | | | | | Knight-Swift Transportation Holdings, Inc. | | | 2,844,982 | |
| | 13,320 | | | | | Old Dominion Freight Line, Inc. | | | 1,957,640 | |
| | 24,200 | | | | | Ryder System, Inc. | | | 1,761,518 | |
| | 77,981 | | | | | Schneider National, Inc. Class B‡ | | | 2,032,185 | |
| | 374,039 | | | | | Scorpio Tankers, Inc. | | | 733,117 | |
| | 27,768 | | | | | Werner Enterprises, Inc. | | | 1,013,532 | |
| | 24,061 | | | | | XPO Logistics, Inc.* ‡ | | | 2,449,651 | |
| | | | | | | | | | |
| | | | | | | | | 19,153,045 | |
| | | | | | | | | | |
| | | |
| | | | | | TOTAL COMMON STOCKS (COST $732,518,597) | | | 871,792,964 | |
| | | | | | | | | | |
| | | | | | |
| 48 | | See accompanying Notes to the Financial Statements. | | | | |
Mercer US Small/Mid Cap Equity Fund
Schedule of Investments (Continued)
(showing percentage of net assets)
March 31, 2018
| | | | | | | | | | |
| Par Value ($) | | | | | Description | | Value ($) | |
| | |
| | | | | | SHORT-TERM INVESTMENTS — 6.0% | |
| | |
| | | | | | Bank Deposit — 4.2% | |
| | | |
| | 37,511,463 | | | | | State Street Bank & Trust Euro Time Deposit, 0.28%, due 04/02/18 | | | 37,511,463 | |
| | | | | | | | | | |
| | |
| | | | | | Mutual Fund - Securities Lending Collateral — 1.7% | |
| | | |
| | 15,377,859 | | | | | State Street Institutional U.S. Government Money Market Fund, Premier Class, 1.58%## *** | | | 15,377,859 | |
| | | | | | | | | | |
| | |
| | | | | | U.S. Government and Agency Obligations — 0.1% | |
| | | |
| | 1,150,000 | | | | | United States Treasury Bill, 0.99%, due 04/05/18** ‡‡ | | | 1,149,845 | |
| | | | | | | | | | |
| | | |
| | | | | | TOTAL SHORT-TERM INVESTMENTS (COST $54,039,169) | | | 54,039,167 | |
| | | | | | | | | | |
| | | |
| | | | | | TOTAL INVESTMENTS — 102.0% (Cost $786,557,766) | | | 925,832,131 | |
| | | |
| | | | | | Other Assets and Liabilities (net) — (2.0)% | | | (17,888,080 | ) |
| | | | | | | | | | |
| | | |
| | | | | | NET ASSETS — 100.0% | | $ | 907,944,051 | |
| | | | | | | | | | |
| | | |
| | | | | | Notes to Schedule of Investments: | | | | |
| | | |
| | | | | | ADR — American Depository Receipt | | | | |
| | | |
| | | | | | REIT — Real Estate Investment Trust | | | | |
| | | |
| | | | ## | | The rate disclosed is the 7 day net yield as of March 31, 2018. | | | | |
| | | |
| | | | * | | Non-income producing security | | | | |
| | | |
| | | | ** | | All or a portion of this security is pledged for open futures collateral. | | | | |
| | | |
| | | | *** | | Represents an investment of securities lending cash collateral. | | | | |
| | | |
| | | | ‡ | | All or a portion of this security is out on loan. | | | | |
| | | |
| | | | ‡‡ | | Interest rate presented is yield to maturity. | | | | |
| | | | | | |
| | See accompanying Notes to the Financial Statements. | | | 49 | |
Mercer US Small/Mid Cap Equity Fund
Schedule of Investments (Continued)
March 31, 2018
Futures Contracts
| | | | | | | | | | | | | | | | | | | | |
Number of Contracts | | | | | Description | | | | Expiration Date | | | Notional Value | | | Market Value/ Unrealized Appreciation (Depreciation) | |
| | Buys | | | | | | | | | | | | | | | | | | | |
| | 139 | | | | | Russell 2000 Mini Index | | | | | Jun 2018 | | | $ | 10,641,840 | | | $ | (475,473 | ) |
| | 73 | | | | | S&P Mid 400 E-mini Index | | | | | Jun 2018 | | | | 13,746,630 | | | | (507,205 | ) |
| | | | | | | | | | | | | | | | | | | | |
| | | | $ | (982,678 | ) |
| | | | | | | | | | | | | | | | | | | | |
| | | | | | |
| 50 | | See accompanying Notes to the Financial Statements. | | | | |
Mercer US Small/Mid Cap Equity Fund
Schedule of Investments (Continued)
March 31, 2018
| | | | | |
| Asset Class Summary (Unaudited) | | % of Net Assets |
Common Stocks | | | | 96.0 | |
Futures Contracts | | | | (0.2 | ) |
Short-Term Investments | | | | 6.0 | |
Other Assets and Liabilities (net) | | | | (1.8 | ) |
| | | | | |
| | | | 100.0 | % |
| | | | | |
| | | | | | |
| | See accompanying Notes to the Financial Statements. | | | 51 | |
Mercer Non-US Core Equity Fund
Schedule of Investments
(showing percentage of net assets)
March 31, 2018
| | | | | | | | | | |
| Shares | | | | | Description | | Value ($) | |
| | |
| | | | | | COMMON STOCKS — 90.3% | |
| | |
| | | | | | Australia — 4.1% | |
| | | |
| | 49,220 | | | | | Altium, Ltd. | | | 760,154 | |
| | 186,895 | | | | | Aristocrat Leisure, Ltd. | | | 3,479,738 | |
| | 1,100,400 | | | | | Asaleo Care, Ltd. | | | 1,088,835 | |
| | 11,759 | | | | | ASX, Ltd. | | | 508,349 | |
| | 154,500 | | | | | Australia & New Zealand Banking Group, Ltd. | | | 3,201,248 | |
| | 294,129 | | | | | BGP Holdings Plc* **** ¤ | | | — | |
| | 178,020 | | | | | BHP Billiton, Ltd. | | | 3,932,737 | |
| | 155,700 | | | | | BlueScope Steel, Ltd. | | | 1,828,560 | |
| | 570,326 | | | | | Brambles, Ltd. | | | 4,383,605 | |
| | 149,401 | | | | | carsales.com, Ltd. | | | 1,558,747 | |
| | 254,300 | | | | | Coca-Cola Amatil, Ltd. | | | 1,699,505 | |
| | 4,035 | | | | | Cochlear, Ltd. | | | 565,429 | |
| | 94,959 | | | | | Crown Resorts, Ltd. | | | 930,307 | |
| | 139,568 | | | | | CSL, Ltd. | | | 16,760,717 | |
| | 593,400 | | | | | CSR, Ltd. | | | 2,371,956 | |
| | 1,105,906 | | | | | Evolution Mining, Ltd. | | | 2,584,826 | |
| | 328,100 | | | | | Fortescue Metals Group, Ltd. | | | 1,096,756 | |
| | 987,052 | | | | | Genworth Mortgage Insurance Australia, Ltd.‡ | | | 1,759,593 | |
| | 365,400 | | | | | Harvey Norman Holdings, Ltd.‡ | | | 1,044,568 | |
| | 104,447 | | | | | Iluka Resources, Ltd. | | | 853,730 | |
| | 156,800 | | | | | Lendlease Group | | | 2,094,416 | |
| | 27,500 | | | | | Macquarie Group, Ltd. | | | 2,191,174 | |
| | 130,170 | | | | | McMillan Shakespeare, Ltd. | | | 1,697,661 | |
| | 788,200 | | | | | Metcash, Ltd. | | | 1,902,544 | |
| | 718,587 | | | | | Nine Entertainment Co. Holdings, Ltd. | | | 1,262,851 | |
| | 154,144 | | | | | Orica, Ltd. | | | 2,108,981 | |
| | 95,663 | | | | | OZ Minerals, Ltd. | | | 663,251 | |
| | 1,344,268 | | | | | Qantas Airways, Ltd. | | | 6,039,850 | |
| | 247,116 | | | | | QBE Insurance Group, Ltd. | | | 1,833,209 | |
| | 249,400 | | | | | Retail Food Group, Ltd.‡ | | | 178,085 | |
| | 67,137 | | | | | Rio Tinto, Ltd. | | | 3,768,584 | |
| | 155,233 | | | | | Santos, Ltd.* | | | 609,261 | |
| | 279,509 | | | | | Steadfast Group, Ltd. | | | 541,547 | |
| | 963,340 | | | | | Treasury Wine Estates, Ltd. | | | 12,564,466 | |
| | | | | | | | | | |
| | | | | | Total Australia | | | 87,865,240 | |
| | | | | | | | | | |
| | |
| | | | | | Austria — 1.0% | |
| | | |
| | 302,631 | | | | | Erste Group Bank AG* | | | 15,212,675 | |
| | 23,146 | | | | | Oesterreichische Post AG | | | 1,151,026 | |
| | 31,900 | | | | | OMV AG | | | 1,859,216 | |
| | 29,780 | | | | | Vienna Insurance Group AG | | | 997,332 | |
| | 50,100 | | | | | Voestalpine AG | | | 2,627,757 | |
| | | | | | | | | | |
| | | | | | Total Austria | | | 21,848,006 | |
| | | | | | | | | | |
| | |
| | | | | | Belgium — 1.3% | |
| | | |
| | 50,100 | | | | | Ageas | | | 2,588,869 | |
| | 52,364 | | | | | Anheuser-Busch InBev SA/NV, ADR | | | 5,756,898 | |
| | 20,439 | | | | | Bekaert SA | | | 871,283 | |
| | | | | | |
| 52 | | See accompanying Notes to the Financial Statements. | | | | |
Mercer Non-US Core Equity Fund
Schedule of Investments (Continued)
(showing percentage of net assets)
March 31, 2018
| | | | | | | | | | |
| Shares | | | | | Description | | Value ($) | |
| | |
| | | | | | Belgium — continued | |
| | | |
| | 13,779 | | | | | KBC Ancora | | | 850,207 | |
| | 128,480 | | | | | KBC Group NV | | | 11,193,615 | |
| | 1,695 | | | | | Melexis NV | | | 168,938 | |
| | 129,530 | | | | | Umicore SA | | | 6,868,237 | |
| | | | | | | | | | |
| | | | | | Total Belgium | | | 28,298,047 | |
| | | | | | | | | | |
| | |
| | | | | | Bermuda — 0.2% | |
| | | |
| | 1,444,133 | | | | | Esprit Holdings, Ltd.* | | | 494,133 | |
| | 182,079 | | | | | Hiscox, Ltd. | | | 3,722,015 | |
| | 52,900 | | | | | Hongkong Land Holdings, Ltd. | | | 365,683 | |
| | | | | | | | | | |
| | | | | | Total Bermuda | | | 4,581,831 | |
| | | | | | | | | | |
| | |
| | | | | | Brazil — 0.9% | |
| | | |
| | 674,100 | | | | | JBS SA | | | 1,896,388 | |
| | 1,353,200 | | | | | Localiza Rent a Car SA | | | 11,693,316 | |
| | 652,900 | | | | | Lojas Renner SA | | | 6,747,838 | |
| | | | | | | | | | |
| | | | | | Total Brazil | | | 20,337,542 | |
| | | | | | | | | | |
| | |
| | | | | | Canada — 1.2% | |
| | | |
| | 2,452,230 | | | | | Bombardier, Inc. Class B* | | | 7,132,722 | |
| | 79,425 | | | | | Canadian National Railway Co. | | | 5,808,350 | |
| | 8,406 | | | | | Fairfax Financial Holdings, Ltd. | | | 4,258,062 | |
| | 526,580 | | | | | First Quantum Minerals, Ltd. | | | 7,388,662 | |
| | 37,269 | | | | | Thomson Reuters Corp. (New York Exchange) | | | 1,440,447 | |
| | | | | | | | | | |
| | | | | | Total Canada | | | 26,028,243 | |
| | | | | | | | | | |
| | |
| | | | | | Cayman Islands — 1.8% | |
| | | |
| | 55,220 | | | | | Alibaba Group Holding, Ltd., ADR* | | | 10,135,079 | |
| | 2,388,000 | | | | | China Resources Cement Holdings, Ltd. | | | 2,083,753 | |
| | 537,500 | | | | | CK Asset Holdings, Ltd. | | | 4,548,297 | |
| | 3,714,000 | | | | | Jiangnan Group, Ltd. | | | 231,787 | |
| | 2,741,000 | | | | | Lee & Man Paper Manufacturing, Ltd. | | | 2,922,643 | |
| | 91,098 | | | | | Melco Resorts & Entertainment, Ltd., ADR | | | 2,640,020 | |
| | 262,800 | | | | | Sands China, Ltd. | | | 1,426,977 | |
| | 204,650 | | | | | Tencent Holdings, Ltd. | | | 10,893,561 | |
| | 473,600 | | | | | Wynn Macau, Ltd. | | | 1,736,770 | |
| | 1,314,000 | | | | | Xinyi Glass Holdings, Ltd.* | | | 2,005,006 | |
| | | | | | | | | | |
| | | | | | Total Cayman Islands | | | 38,623,893 | |
| | | | | | | | | | |
| | |
| | | | | | China — 0.1% | |
| | | |
| | 905,000 | | | | | China Railway Construction Corp., Ltd. Class H | | | 914,074 | |
| | 628,600 | | | | | Shanghai Pharmaceuticals Holding Co., Ltd. Class H | | | 1,692,766 | |
| | | | | | | | | | |
| | | | | | Total China | | | 2,606,840 | |
| | | | | | | | | | |
| | |
| | | | | | Denmark — 1.1% | |
| | | |
| | 127,200 | | | | | Danske Bank AS | | | 4,751,914 | |
| | 113,150 | | | | | DSV AS | | | 8,919,564 | |
| | 25,521 | | | | | Jyske Bank AS | | | 1,511,501 | |
| | | | | | |
| | See accompanying Notes to the Financial Statements. | | | 53 | |
Mercer Non-US Core Equity Fund
Schedule of Investments (Continued)
(showing percentage of net assets)
March 31, 2018
| | | | | | | | | | |
| Shares | | | | | Description | | Value ($) | |
| | |
| | | | | | Denmark — continued | |
| | | |
| | 133,342 | | | | | Novo Nordisk AS Class B | | | 6,558,525 | |
| | 12,327 | | | | | Royal Unibrew AS | | | 819,273 | |
| | 33,840 | | | | | Sydbank AS | | | 1,247,403 | |
| | 25,305 | | | | | Tryg AS | | | 589,999 | |
| | | | | | | | | | |
| | | | | | Total Denmark | | | 24,398,179 | |
| | | | | | | | | | |
| | |
| | | | | | Finland — 0.9% | |
| | | |
| | 174,967 | | | | | Fortum OYJ‡ | | | 3,760,291 | |
| | 41,255 | | | | | Kesko OYJ Class B | | | 2,364,841 | |
| | 41,005 | | | | | Kone OYJ Class B | | | 2,047,222 | |
| | 181,173 | | | | | Nokia OYJ | | | 1,000,973 | |
| | 92,261 | | | | | Stora Enso OYJ Class R‡ | | | 1,697,410 | |
| | 194,424 | | | | | UPM-Kymmene OYJ | | | 7,211,312 | |
| | 64,926 | | | | | Wartsila OYJ Abp | | | 1,435,708 | |
| | | | | | | | | | |
| | | | | | Total Finland | | | 19,517,757 | |
| | | | | | | | | | |
| | |
| | | | | | France — 7.1% | |
| | | |
| | 13,800 | | | | | Arkema SA | | | 1,801,159 | |
| | 6,807 | | | | | Atos SE | | | 931,539 | |
| | 392,240 | | | | | AXA SA | | | 10,437,103 | |
| | 138,698 | | | | | BNP Paribas SA | | | 10,278,815 | |
| | 28,853 | | | | | Casino Guichard Perrachon SA‡ | | | 1,414,043 | |
| | 30,999 | | | | | Cie Generale des Etablissements Michelin SCA | | | 4,579,851 | |
| | 131,851 | | | | | CNP Assurances | | | 3,327,500 | |
| | 149,327 | | | | | Danone SA | | | 12,088,774 | |
| | 51,412 | | | | | Dassault Systemes SE | | | 6,990,220 | |
| | 45,997 | | | | | Edenred | | | 1,599,743 | |
| | 229,737 | | | | | Engie SA | | | 3,836,239 | |
| | 3,919 | | | | | Eramet* | | | 540,200 | |
| | 71,800 | | | | | Eutelsat Communications SA | | | 1,423,084 | |
| | 5,346 | | | | | Hermes International | | | 3,168,305 | |
| | 42,863 | | | | | IPSOS | | | 1,684,547 | |
| | 18,520 | | | | | Kering SA | | | 8,875,920 | |
| | 44,667 | | | | | L’Oreal SA | | | 10,085,717 | |
| | 104,754 | | | | | Legrand SA | | | 8,217,653 | |
| | 4,214 | | | | | LVMH Moet Hennessy Louis Vuitton SE | | | 1,298,918 | |
| | 223,200 | | | | | Natixis SA | | | 1,831,182 | |
| | 54,563 | | | | | Neopost SA | | | 1,437,940 | |
| | 144,400 | | | | | Orange SA | | | 2,451,112 | |
| | 77,747 | | | | | Pernod Ricard SA | | | 12,945,130 | |
| | 162,788 | | | | | Peugeot SA | | | 3,918,389 | |
| | 16,000 | | | | | Renault SA | | | 1,942,851 | |
| | 4,011 | | | | | Safran SA | | | 424,843 | |
| | 160,978 | | | | | Sanofi | | | 12,929,122 | |
| | 106,077 | | | | | Schneider Electric SE* | | | 9,326,078 | |
| | 55,000 | | | | | Societe Generale SA | | | 2,990,833 | |
| | 132,900 | | | | | Total SA | | | 7,549,512 | |
| | 17,945 | | | | | UBISOFT Entertainment SA* | | | 1,515,123 | |
| | 103,818 | | | | | Veolia Environnement SA | | | 2,460,801 | |
| | | | | | | | | | |
| | | | | | Total France | | | 154,302,246 | |
| | | | | | | | | | |
| | | | | | |
| 54 | | See accompanying Notes to the Financial Statements. | | | | |
Mercer Non-US Core Equity Fund
Schedule of Investments (Continued)
(showing percentage of net assets)
March 31, 2018
| | | | | | | | | | |
| Shares | | | | | Description | | Value ($) | |
| | |
| | | | | | Germany — 8.7% | |
| | | |
| | 24,491 | | | | | Aareal Bank AG | | | 1,167,814 | |
| | 78,515 | | | | | Adidas AG | | | 19,005,589 | |
| | 27,551 | | | | | Allianz SE | | | 6,223,339 | |
| | 16,400 | | | | | Aurubis AG | | | 1,379,954 | |
| | 23,200 | | | | | BASF SE | | | 2,356,687 | |
| | 77,192 | | | | | Bayer AG | | | 8,724,087 | |
| | 53,935 | | | | | Bayerische Motoren Werke AG | | | 5,850,462 | |
| | 3,135 | | | | | Bechtle AG | | | 254,184 | |
| | 27,694 | | | | | Beiersdorf AG | | | 3,134,517 | |
| | 62,285 | | | | | Brenntag AG | | | 3,704,857 | |
| | 193,562 | | | | | CECONOMY AG | | | 2,230,988 | |
| | 32,014 | | | | | Continental AG | | | 8,838,761 | |
| | 20,454 | | | | | Covestro AG | | | 2,012,338 | |
| | 37,605 | | | | | Daimler AG | | | 3,193,936 | |
| | 173,139 | | | | | Deutsche Lufthansa AG | | | 5,527,999 | |
| | 92,924 | | | | | Deutsche Post AG | | | 4,061,523 | |
| | 221,621 | | | | | Deutsche Wohnen SE | | | 10,339,326 | |
| | 116,064 | | | | | Deutz AG | | | 1,064,724 | |
| | 130,389 | | | | | E.ON SE | | | 1,448,217 | |
| | 68,600 | | | | | Evonik Industries AG | | | 2,419,257 | |
| | 19,000 | | | | | Fresenius Medical Care AG & Co. KGaA, ADR | | | 970,520 | |
| | 40,650 | | | | | Fresenius Medical Care AG & Co. KGaA | | | 4,148,599 | |
| | 117,352 | | | | | GEA Group AG | | | 4,989,923 | |
| | 97,160 | | | | | HeidelbergCement AG | | | 9,541,539 | |
| | 548,650 | | | | | Infineon Technologies AG | | | 14,691,186 | |
| | 1,204 | | | | | Isra Vision AG | | | 253,632 | |
| | 31,472 | | | | | LEG Immobilien AG | | | 3,539,246 | |
| | 35,240 | | | | | Leoni AG | | | 2,253,269 | |
| | 84,200 | | | | | Metro AG | | | 1,490,283 | |
| | 8,500 | | | | | Muenchener Rueckversicherungs-Gesellschaft AG in Muenchen | | | 1,975,875 | |
| | 5,736 | | | | | Nemetschek SE | | | 643,212 | |
| | 15,700 | | | | | Rheinmetall AG | | | 2,230,984 | |
| | 83,986 | | | | | SAP SE | | | 8,784,521 | |
| | 13,931 | | | | | SAP SE, ADR | | | 1,464,984 | |
| | 7,345 | | | | | Siltronic AG* | | | 1,256,718 | |
| | 84,012 | | | | | Symrise AG | | | 6,761,377 | |
| | 111,059 | | | | | TAG Immobilien AG | | | 2,302,973 | |
| | 52,401 | | | | | Talanx AG* | | | 2,279,386 | |
| | 24,117 | | | | | United Internet AG | | | 1,518,100 | |
| | 218,942 | | | | | Vonovia SE | | | 10,852,541 | |
| | 10,505 | | | | | Wacker Chemie AG | | | 1,725,267 | |
| | 14,020 | | | | | Wirecard AG | | | 1,656,473 | |
| | 159,710 | | | | | Zalando SE* | | | 8,708,549 | |
| | | | | | | | | | |
| | | | | | Total Germany | | | 186,977,716 | |
| | | | | | | | | | |
| | |
| | | | | | Gibraltar — 0.0% | |
| | | |
| | 82,098 | | | | | 888 Holdings Plc | | | 311,860 | |
| | | | | | | | | | |
| | | | | | |
| | See accompanying Notes to the Financial Statements. | | | 55 | |
Mercer Non-US Core Equity Fund
Schedule of Investments (Continued)
(showing percentage of net assets)
March 31, 2018
| | | | | | | | | | |
| Shares | | | | | Description | | Value ($) | |
| | |
| | | | | | Hong Kong — 1.9% | |
| | | |
| | 2,768,000 | | | | | AIA Group, Ltd. | | | 23,629,614 | |
| | 3,160,000 | | | | | Champion REIT¤ | | | 2,258,877 | |
| | 74,000 | | | | | Galaxy Entertainment Group, Ltd. | | | 678,327 | |
| | 78,200 | | | | | Hong Kong Exchanges and Clearing, Ltd. | | | 2,570,374 | |
| | 347,000 | | | | | Link REIT | | | 2,975,942 | |
| | 134,000 | | | | | Sun Hung Kai Properties, Ltd. | | | 2,134,564 | |
| | 16,500 | | | | | Swire Pacific, Ltd. Class A | | | 167,411 | |
| | 210,400 | | | | | Swire Properties, Ltd. | | | 739,840 | |
| | 2,446,000 | | | | | WH Group, Ltd. | | | 2,629,144 | |
| | 101,000 | | | | | Wharf Holdings, Ltd. (The) | | | 349,878 | |
| | 284,000 | | | | | Wheelock & Co., Ltd. | | | 2,082,759 | |
| | | | | | | | | | |
| | | | | | Total Hong Kong | | | 40,216,730 | |
| | | | | | | | | | |
| | |
| | | | | | Hungary — 0.1% | |
| | | |
| | 229,600 | | | | | MOL Hungarian Oil & Gas Plc | | | 2,516,002 | |
| | | | | | | | | | |
| | |
| | | | | | India — 0.4% | |
| | | |
| | 215,970 | | | | | HDFC Bank, Ltd. | | | 6,302,569 | |
| | 423,100 | | | | | KPIT Technologies, Ltd. | | | 1,422,805 | |
| | | | | | | | | | |
| | | | | | Total India | | | 7,725,374 | |
| | | | | | | | | | |
| | |
| | | | | | Indonesia — 0.5% | |
| | | |
| | 14,638,700 | | | | | Bank Mandiri Persero Tbk PT | | | 8,187,616 | |
| | 3,540,700 | | | | | Bank Negara Indonesia Persero Tbk PT | | | 2,240,507 | |
| | | | | | | | | | |
| | | | | | Total Indonesia | | | 10,428,123 | |
| | | | | | | | | | |
| | |
| | | | | | Ireland — 0.9% | |
| | | |
| | 313,147 | | | | | C&C Group Plc | | | 1,027,317 | |
| | 58,729 | | | | | Kerry Group Plc Class A | | | 5,968,974 | |
| | 98,543 | | | | | Ryanair Holdings Plc, ADR* | | | 12,106,008 | |
| | | | | | | | | | |
| | | | | | Total Ireland | | | 19,102,299 | |
| | | | | | | | | | |
| | |
| | | | | | Israel — 0.3% | |
| | | |
| | 112,540 | | | | | Bank Leumi Le-Israel BM | | | 679,088 | |
| | 42,293 | | | | | Check Point Software Technologies, Ltd.* | | | 4,201,387 | |
| | 952,345 | | | | | El Al Israel Airlines | | | 317,748 | |
| | 2,134 | | | | | Frutarom Industries, Ltd. | | | 195,988 | |
| | 50,800 | | | | | Teva Pharmaceutical Industries, Ltd. | | | 866,170 | |
| | 238 | | | | | Tower Semiconductor, Ltd.* | | | 6,449 | |
| | | | | | | | | | |
| | | | | | Total Israel | | | 6,266,830 | |
| | | | | | | | | | |
| | |
| | | | | | Italy — 1.8% | |
| | | |
| | 1,214,000 | | | | | A2A SpA | | | 2,324,105 | |
| | 38,323 | | | | | ASTM SpA | | | 967,663 | |
| | 179,315 | | | | | Autogrill SpA | | | 2,311,885 | |
| | 22,689 | | | | | Banca Farmafactoring SpA* | | | 166,066 | |
| | 27,808 | | | | | Banca Generali SpA | | | 897,668 | |
| | 582,400 | | | | | Enel SpA | | | 3,566,721 | |
| | | | | | |
| 56 | | See accompanying Notes to the Financial Statements. | | | | |
Mercer Non-US Core Equity Fund
Schedule of Investments (Continued)
(showing percentage of net assets)
March 31, 2018
| | | | | | | | | | |
| Shares | | | | | Description | | Value ($) | |
| | |
| | | | | | Italy — continued | |
| | | |
| | 358,001 | | | | | ENI SpA | | | 6,307,740 | |
| | 1,780,858 | | | | | Intesa Sanpaolo SpA | | | 6,491,240 | |
| | 324,820 | | | | | Leonardo SpA | | | 3,754,899 | |
| | 127,100 | | | | | Mediobanca Banca di Credito Finanziario SpA | | | 1,495,453 | |
| | 328,489 | | | | | Piaggio & C SpA | | | 915,050 | |
| | 24,597 | | | | | Reply SpA | | | 1,359,447 | |
| | 167,166 | | | | | Societa Cattolica di Assicurazioni SC | | | 1,784,115 | |
| | 163,172 | | | | | Sogefi SpA* ‡ | | | 589,220 | |
| | 124,570 | | | | | UniCredit SpA* | | | 2,612,470 | |
| | 609,469 | | | | | Unipol Gruppo SpA | | | 2,987,559 | |
| | | | | | | | | | |
| | | | | | Total Italy | | | 38,531,301 | |
| | | | | | | | | | |
| | |
| | | | | | Japan — 23.5% | |
| | | |
| | 5,600 | | | | | Aida Engineering, Ltd. | | | 67,716 | |
| | 17,800 | | | | | Alfresa Holdings Corp. | | | 396,337 | |
| | 6,100 | | | | | Amano Corp. | | | 164,674 | |
| | 19,500 | | | | | Aoyama Trading Co., Ltd. | | | 768,265 | |
| | 28,300 | | | | | Asahi Glass Co., Ltd. | | | 1,172,181 | |
| | 130,700 | | | | | Asahi Kasei Corp. | | | 1,719,316 | |
| | 373,100 | | | | | Astellas Pharma, Inc. | | | 5,662,279 | |
| | 23,400 | | | | | Azbil Corp. | | | 1,090,240 | |
| | 57,700 | | | | | Brother Industries, Ltd. | | | 1,341,722 | |
| | 5,300 | | | | | Canon, Inc., ADR | | | 193,185 | |
| | 122,700 | | | | | Canon, Inc. | | | 4,445,351 | |
| | 61,000 | | | | | Central Glass Co., Ltd. | | | 1,421,326 | |
| | 26,800 | | | | | Central Japan Railway Co. | | | 5,072,722 | |
| | 206,294 | | | | | Chiba Bank, Ltd. (The) | | | 1,658,499 | |
| | 4,700 | | | | | Chugai Pharmaceutical Co., Ltd. | | | 235,552 | |
| | 4,600 | | | | | Ci:z Holdings Co., Ltd. | | | 229,243 | |
| | 205,100 | | | | | Citizen Watch Co., Ltd.‡ | | | 1,473,403 | |
| | 15,700 | | | | | Cosmo Energy Holdings Co., Ltd. | | | 508,571 | |
| | 77,300 | | | | | Dai-ichi Life Holdings, Inc. | | | 1,411,897 | |
| | 62,200 | | | | | Daiichi Sanyko Co., Ltd. | | | 2,062,221 | |
| | 13,500 | | | | | Daiichikosho Co., Ltd. | | | 715,938 | |
| | 33,300 | | | | | Daiwa House Industry Co., Ltd. | | | 1,283,780 | |
| | 535,246 | | | | | Daiwa Securities Group, Inc. | | | 3,415,811 | |
| | 30,200 | | | | | Denka Co., Ltd. | | | 1,012,346 | |
| | 87,700 | | | | | Denso Corp. | | | 4,799,379 | |
| | 72,100 | | | | | DIC Corp. | | | 2,416,892 | |
| | 24,900 | | | | | Dip Corp. | | | 789,027 | |
| | 1,100 | | | | | Disco Corp. | | | 237,377 | |
| | 164,500 | | | | | Don Quijote Holdings Co., Ltd. | | | 9,450,823 | |
| | 53,000 | | | | | East Japan Railway Co. | | | 4,914,772 | |
| | 99,500 | | | | | EDION Corp.‡ | | | 1,158,260 | |
| | 21,900 | | | | | en-japan, Inc.‡ | | | 1,270,550 | |
| | 20,900 | | | | | Enplas Corp. | | | 698,632 | |
| | 17,300 | | | | | Exedy Corp. | | | 545,759 | |
| | 44,700 | | | | | FCC Co., Ltd. | | | 1,256,308 | |
| | 2,100 | | | | | Ferrotec Holdings Corp. | | | 52,880 | |
| | | | | | |
| | See accompanying Notes to the Financial Statements. | | | 57 | |
Mercer Non-US Core Equity Fund
Schedule of Investments (Continued)
(showing percentage of net assets)
March 31, 2018
| | | | | | | | | | |
| Shares | | | | | Description | | Value ($) | |
| | |
| | | | | | Japan — continued | |
| | | |
| | 71,000 | | | | | Fuji Electric Holdings Co., Ltd. | | | 480,009 | |
| | 36,300 | | | | | Fuji Machine Manufacturing Co., Ltd. | | | 711,323 | |
| | 8,400 | | | | | Fuji Seal International, Inc.‡ | | | 339,633 | |
| | 329,200 | | | | | Fujikura, Ltd. | | | 2,234,907 | |
| | 54,000 | | | | | Fujitec Co., Ltd. | | | 710,860 | |
| | 227,000 | | | | | Fujitsu, Ltd. | | | 1,397,646 | |
| | 3,197 | | | | | Glory, Ltd. | | | 114,082 | |
| | 202,294 | | | | | Hachijuni Bank, Ltd. (The) | | | 1,084,227 | |
| | 51,200 | | | | | Hankyu Hanshin Holdings, Inc. | | | 1,899,238 | |
| | 3,400 | | | | | Hikari Tsushin, Inc. | | | 543,808 | |
| | 33,300 | | | | | Hino Motors, Ltd. | | | 428,657 | |
| | 35,700 | | | | | Hirose Electric Co., Ltd.‡ | | | 4,907,701 | |
| | 40,500 | | | | | Hitachi Construction Machinery Co., Ltd.‡ | | | 1,563,258 | |
| | 1,041,000 | | | | | Hitachi, Ltd. | | | 7,544,925 | |
| | 74,600 | | | | | Honda Motor Co., Ltd. | | | 2,567,334 | |
| | 1,800 | | | | | Horiba, Ltd. | | | 139,464 | |
| | 77,100 | | | | | Hoya Corp. | | | 3,845,938 | |
| | 36,700 | | | | | IBJ Leasing Co., Ltd. | | | 1,035,261 | |
| | 183,300 | | | | | Inpex Corp. | | | 2,268,197 | |
| | 4,700 | | | | | Iriso Electronics Co., Ltd.‡ | | | 288,585 | |
| | 177,100 | | | | | Isuzu Motors, Ltd. | | | 2,717,698 | |
| | 134,400 | | | | | Ito En, Ltd. | | | 5,282,482 | |
| | 204,000 | | | | | Itochu Corp. | | | 3,963,949 | |
| | 106,000 | | | | | Japan Airlines Co., Ltd. | | | 4,267,908 | |
| | 34,900 | | | | | Japan Petroleum Exploration Co., Ltd.‡ | | | 797,105 | |
| | 23,200 | | | | | Japan Steel Works, Ltd. (The) | | | 740,611 | |
| | 137,900 | | | | | Japan Tobacco, Inc. | | | 3,975,566 | |
| | 63,400 | | | | | JFE Holdings, Inc. | | | 1,277,836 | |
| | 37,400 | | | | | JSR Corp. | | | 841,544 | |
| | 43,500 | | | | | Juki Corp. | | | 611,495 | |
| | 114,400 | | | | | K’s Holdings Corp. | | | 1,582,345 | |
| | 241,000 | | | | | Kajima Corp. | | | 2,236,643 | |
| | 27,800 | | | | | Kaken Pharmaceutical Co., Ltd. | | | 1,641,599 | |
| | 65,600 | | | | | Kamigumi Co., Ltd. | | | 1,465,591 | |
| | 228,000 | | | | | Kaneka Corp. | | | 2,261,777 | |
| | 194,700 | | | | | Kanematsu Corp. | | | 2,676,553 | |
| | 94,200 | | | | | Kansai Electric Power Co., Inc. (The) | | | 1,210,827 | |
| | 250,008 | | | | | Kao Corp. | | | 18,761,766 | |
| | 522,900 | | | | | KDDI Corp. | | | 13,356,444 | |
| | 75,600 | | | | | Keihin Corp. | | | 1,541,145 | |
| | 32,300 | | | | | Keisei Electric Railway Co., Ltd. | | | 993,145 | |
| | 8,800 | | | | | Keyence Corp. | | | 5,464,523 | |
| | 36,100 | | | | | Kintetsu World Express, Inc. | | | 678,212 | |
| | 117,900 | | | | | Kirin Holdings Co., Ltd. | | | 3,140,120 | |
| | 77,500 | | | | | Kobayashi Pharmaceutical Co., Ltd. | | | 5,596,615 | |
| | 108,300 | | | | | Kobe Steel, Ltd.* | | | 1,085,546 | |
| | 418,700 | | | | | Komatsu, Ltd. | | | 13,964,541 | |
| | 36,700 | | | | | Konami Holdings Corp. | | | 1,929,036 | |
| | 215,500 | | | | | Konica Minolta, Inc.‡ | | | 1,848,011 | |
| | | | | | |
| 58 | | See accompanying Notes to the Financial Statements. | | | | |
Mercer Non-US Core Equity Fund
Schedule of Investments (Continued)
(showing percentage of net assets)
March 31, 2018
| | | | | | | | | | |
| Shares | | | | | Description | | Value ($) | |
| | |
| | | | | | Japan — continued | |
| | | |
| | 8,986 | | | | | Kose Corp.‡ | | | 1,881,695 | |
| | 58,800 | | | | | Kuraray Co., Ltd. | | | 999,628 | |
| | 28,600 | | | | | KYB Corp. | | | 1,358,063 | |
| | 1,500 | | | | | Kyocera Corp., ADR | | | 83,597 | |
| | 30,900 | | | | | Kyocera Corp. | | | 1,744,463 | |
| | 13,600 | | | | | Lintec Corp. | | | 395,148 | |
| | 8,500 | | | | | Mandom Corp. | | | 293,324 | |
| | 399,400 | | | | | Marubeni Corp. | | | 2,891,378 | |
| | 5,600 | | | | | Maruwa Co., Ltd. | | | 443,366 | |
| | 338,800 | | | | | Mebuki Financial Group, Inc. | | | 1,302,954 | |
| | 184,000 | | | | | Meidensha Corp. | | | 702,435 | |
| | 12,700 | | | | | Meitec Corp. | | | 703,366 | |
| | 11,200 | | | | | Menicon Co., Ltd. | | | 278,447 | |
| | 9,100 | | | | | Milbon Co., Ltd. | | | 402,591 | |
| | 104,100 | | | | | MISUMI Group, Inc. | | | 2,859,202 | |
| | 275,500 | | | | | Mitsubishi Chemical Holdings Corp. | | | 2,669,513 | |
| | 19,600 | | | | | Mitsubishi Corp. | | | 520,732 | |
| | 212,900 | | | | | Mitsubishi Electric Corp. | | | 3,406,200 | |
| | 126,200 | | | | | Mitsubishi Gas Chemical Co., Inc. | | | 3,024,765 | |
| | 52,500 | | | | | Mitsubishi Shokuhin Co., Ltd.‡ | | | 1,505,642 | |
| | 1,773,900 | | | | | Mizuho Financial Group, Inc. | | | 3,192,520 | |
| | 232,000 | | | | | MonotaRO Co., Ltd.‡ | | | 8,333,239 | |
| | 128,700 | | | | | MS&AD Insurance Group Holdings, Inc. | | | 4,060,071 | |
| | 7,300 | | | | | Nabtesco Corp. | | | 281,772 | |
| | 62,900 | | | | | NEC Corp. | | | 1,769,007 | |
| | 140,600 | | | | | Nexon Co., Ltd.* | | | 2,326,808 | |
| | 5,500 | | | | | Nidec Corp. | | | 847,626 | |
| | 133,500 | | | | | Nihon Kohden Corp. | | | 3,716,911 | |
| | 41,600 | | | | | Nihon M&A Center, Inc.‡ | | | 1,431,650 | |
| | 46,300 | | | | | Nihon Unisys, Ltd. | | | 998,704 | |
| | 43,400 | | | | | Nintendo Co., Ltd. | | | 19,122,934 | |
| | 33,300 | | | | | Nippon Express Co., Ltd. | | | 2,229,394 | |
| | 248,000 | | | | | Nippon Soda Co., Ltd. | | | 1,403,818 | |
| | 85,600 | | | | | Nippon Steel & Sumitomo Metal Corp. | | | 1,880,624 | |
| | 130,300 | | | | | Nippon Telegraph & Telephone Corp. | | | 6,003,479 | |
| | 26,900 | | | | | Nishi-Nippon Financial Holdings, Inc. | | | 312,126 | |
| | 22,100 | | | | | Nissan Chemical Industries, Ltd. | | | 918,496 | |
| | 305,100 | | | | | Nissan Motor Co., Ltd.‡ | | | 3,167,188 | |
| | 130,000 | | | | | Nisshinbo Holdings, Inc. | | | 1,749,224 | |
| | 23,300 | | | | | Nissin Foods Holdings Co., Ltd. | | | 1,616,869 | |
| | 2,000 | | | | | Nitori Holdings Co., Ltd. | | | 353,644 | |
| | 21,100 | | | | | Nitto Denko Corp. | | | 1,582,847 | |
| | 15,800 | | | | | Noevir Holdings Co., Ltd. | | | 1,139,502 | |
| | 452,800 | | | | | Nomura Holdings, Inc. | | | 2,619,726 | |
| | 141,300 | | | | | Nomura Research Institute, Ltd. | | | 6,696,305 | |
| | 301,141 | | | | | North Pacific Bank, Ltd. | | | 1,005,219 | |
| | 39,800 | | | | | NTT Data Corp. | | | 423,635 | |
| | 2,300 | | | | | Obara Group, Inc. | | | 136,248 | |
| | 65,200 | | | | | Obic Co., Ltd. | | | 5,425,670 | |
| | | | | | |
| | See accompanying Notes to the Financial Statements. | | | 59 | |
Mercer Non-US Core Equity Fund
Schedule of Investments (Continued)
(showing percentage of net assets)
March 31, 2018
| | | | | | | | | | |
| Shares | | | | | Description | | Value ($) | |
| | |
| | | | | | Japan — continued | |
| | | |
| | 132,000 | | | | | Oji Holdings Corp. | | | 848,970 | |
| | 24,300 | | | | | Okumura Corp.‡ | | | 958,519 | |
| | 35,200 | | | | | Olympus Corp. | | | 1,337,170 | |
| | 78,500 | | | | | Omron Corp. | | | 4,620,686 | |
| | 57,500 | | | | | Orix Corp. | | | 1,014,563 | |
| | 70,200 | | | | | Penta-Ocean Construction Co., Ltd. | | | 514,206 | |
| | 217,700 | | | | | Pola Orbis Holdings, Inc. | | | 8,924,984 | |
| | 148,000 | | | | | Prima Meat Packers, Ltd. | | | 848,895 | |
| | 38,700 | | | | | Qol Co., Ltd. | | | 759,444 | |
| | 492,800 | | | | | Recruit Holdings Co., Ltd. | | | 12,253,969 | |
| | 482,600 | | | | | Resona Holdings, Inc. | | | 2,550,270 | |
| | 71,700 | | | | | Ricoh Co., Ltd.‡ | | | 708,573 | |
| | 42,800 | | | | | Rohm Co., Ltd. | | | 4,076,765 | |
| | 150,700 | | | | | Rohto Pharmaceutical Co., Ltd. | | | 4,215,632 | |
| | 26,000 | | | | | Round One Corp. | | | 411,697 | |
| | 24,800 | | | | | Royal Holdings Co., Ltd. | | | 676,957 | |
| | 3,400 | | | | | Ryohin Keikaku Co., Ltd. | | | 1,141,326 | |
| | 78,000 | | | | | Sanken Electric Co., Ltd. | | | 570,607 | |
| | 360,900 | | | | | Santen Pharmaceutical Co., Ltd. | | | 5,819,873 | |
| | 4,300 | | | | | Sanyo Denki Co., Ltd. | | | 332,355 | |
| | 25,300 | | | | | Sawai Pharmaceutical Co., Ltd.‡ | | | 1,110,964 | |
| | 3,700 | | | | | SCREEN Holdings Co., Ltd. | | | 339,558 | |
| | 72,200 | | | | | Secom Co., Ltd. | | | 5,376,812 | |
| | 16,799 | | | | | Seiko Holdings Corp. | | | 406,588 | |
| | 104,700 | | | | | Seino Holdings Co., Ltd. | | | 1,927,622 | |
| | 264,300 | | | | | Senshu Ikeda Holdings, Inc. | | | 994,076 | |
| | 4,700 | | | | | Seria Co., Ltd.‡ | | | 237,762 | |
| | 71,000 | | | | | Seven & i Holdings Co., Ltd. | | | 3,046,958 | |
| | 9,800 | | | | | Shima Seiki Manufacturing, Ltd.‡ | | | 680,978 | |
| | 42,400 | | | | | Shimizu Corp. | | | 373,567 | |
| | 54,300 | | | | | Shin-Etsu Chemical Co., Ltd. | | | 5,618,914 | |
| | 24,200 | | | | | Shindengen Electric Manufacturing Co., Ltd. | | | 1,599,680 | |
| | 34,500 | | | | | Shionogi & Co., Ltd.‡ | | | 1,781,284 | |
| | 80,100 | | | | | Shiseido Co., Ltd. | | | 5,131,371 | |
| | 6,500 | | | | | SMC Corp. | | | 2,632,393 | |
| | 43,500 | | | | | Sohgo Security Services Co., Ltd. | | | 2,151,481 | |
| | 896,700 | | | | | Sojitz Corp. | | | 2,875,174 | |
| | 46,200 | | | | | Sompo Holdings, Inc. | | | 1,860,164 | |
| | 88,100 | | | | | Sony Corp. | | | 4,262,930 | |
| | 33,400 | | | | | Sparx Group Co., Ltd. | | | 90,449 | |
| | 290,300 | | | | | Start Today Co., Ltd. | | | 7,757,711 | |
| | 341,000 | | | | | Sumitomo Chemical Co., Ltd. | | | 1,987,964 | |
| | 196,400 | | | | | Sumitomo Corp. | | | 3,307,498 | |
| | 91,600 | | | | | Sumitomo Electric Industries, Ltd. | | | 1,398,332 | |
| | 174,041 | | | | | Sumitomo Mitsui Financial Group, Inc. | | | 7,295,485 | |
| | 102,300 | | | | | Sumitomo Rubber Industries, Ltd. | | | 1,877,664 | |
| | 83,700 | | | | | Suzuki Motor Corp.‡ | | | 4,509,647 | |
| | 10,000 | | | | | Sysmex Corp. | | | 906,441 | |
| | 59,000 | | | | | Takeda Pharmaceutical Co., Ltd. | | | 2,875,383 | |
| | | | | | |
| 60 | | See accompanying Notes to the Financial Statements. | | | | |
Mercer Non-US Core Equity Fund
Schedule of Investments (Continued)
(showing percentage of net assets)
March 31, 2018
| | | | | | | | | | |
| Shares | | | | | Description | | Value ($) | |
| | |
| | | | | | Japan — continued | |
| | | |
| | 44,100 | | | | | Takuma Co., Ltd. | | | 482,674 | |
| | 100,500 | | | | | Terumo Corp. | | | 5,282,511 | |
| | 9,100 | | | | | THK Co., Ltd. | | | 376,493 | |
| | 10,500 | | | | | TIS, Inc. | | | 415,656 | |
| | 59,200 | | | | | Tobu Railway Co., Ltd. | | | 1,784,071 | |
| | 35,200 | | | | | Tocalo Co., Ltd.‡ | | | 429,284 | |
| | 24,700 | | | | | Tokyo Century Corp.‡ | | | 1,530,541 | |
| | 526,900 | | | | | Tokyo Electric Power Co. Holdings, Inc.* | | | 2,031,302 | |
| | 33,100 | | | | | Tokyo Electron, Ltd. | | | 6,229,398 | |
| | 56,300 | | | | | Tokyo Gas Co., Ltd. | | | 1,493,657 | |
| | 7,000 | | | | | Tokyo Ohka Kogyo Co., Ltd. | | | 251,105 | |
| | 10,700 | | | | | Tokyo Seimitsu Co., Ltd. | | | 432,125 | |
| | 15,000 | | | | | Tokyu Construction Co., Ltd. | | | 160,931 | |
| | 51,700 | | | | | Tokyu Corp. | | | 806,005 | |
| | 22,700 | | | | | Toridoll Holdings Corp. | | | 827,104 | |
| | 543,000 | | | | | Toshiba Corp.* | | | 1,572,581 | |
| | 60,000 | | | | | Toshiba Machine Co., Ltd. | | | 422,003 | |
| | 4,600 | | | | | TOTO, Ltd. | | | 237,461 | |
| | 19,700 | | | | | Towa Pharmaceutical Co., Ltd. | | | 1,232,948 | |
| | 166,000 | | | | | Toyo Ink SC Holdings Co., Ltd.‡ | | | 1,030,183 | |
| | 134,100 | | | | | Toyo Suisan Kaisha, Ltd. | | | 5,201,340 | |
| | 45,900 | | | | | Toyoda Gosei Co., Ltd. | | | 1,067,763 | |
| | 47,400 | | | | | Toyota Motor Corp. | | | 3,041,890 | |
| | 5,100 | | | | | Trend Micro, Inc. | | | 304,513 | |
| | 49,200 | | | | | TS Tech Co., Ltd. | | | 1,949,958 | |
| | 88,300 | | | | | Ube Industries, Ltd. | | | 2,578,011 | |
| | 3,400 | | | | | Ulvac, Inc. | | | 190,860 | |
| | 13,300 | | | | | United Arrows, Ltd. | | | 512,741 | |
| | 40,800 | | | | | Ushio, Inc.‡ | | | 547,836 | |
| | 69,570 | | | | | USS Co., Ltd. | | | 1,406,446 | |
| | 74,700 | | | | | Valor Holdings Co., Ltd. | | | 2,022,906 | |
| | 60,200 | | | | | West Japan Railway Co. | | | 4,206,358 | |
| | 19,400 | | | | | Yakult Honsha Co., Ltd. | | | 1,435,618 | |
| | 6,900 | | | | | Yamaha Corp. | | | 303,315 | |
| | 92,400 | | | | | Yamaha Motor Co., Ltd. | | | 2,762,877 | |
| | 97,662 | | | | | Yamato Holdings Co., Ltd.‡ | | | 2,450,504 | |
| | 63,200 | | | | | Yamazen Corp. | | | 660,228 | |
| | 103,100 | | | | | Yokogawa Electric Corp. | | | 2,130,830 | |
| | 73,000 | | | | | Yokohama Rubber Co., Ltd. (The) | | | 1,690,635 | |
| | 22,350 | | | | | Zenrin Co., Ltd. | | | 472,219 | |
| | | | | | | | | | |
| | | | | | Total Japan | | | 506,305,877 | |
| | | | | | | | | | |
| | |
| | | | | | Luxembourg — 0.6% | |
| | | |
| | 1,721,690 | | | | | B&M European Value Retail SA | | | 9,463,051 | |
| | 64,540 | | | | | SAF-Holland SA | | | 1,303,163 | |
| | 73,038 | | | | | Tenaris SA | | | 1,262,106 | |
| | | | | | | | | | |
| | | | | | Total Luxembourg | | | 12,028,320 | |
| | | | | | | | | | |
| | | | | | |
| | See accompanying Notes to the Financial Statements. | | | 61 | |
Mercer Non-US Core Equity Fund
Schedule of Investments (Continued)
(showing percentage of net assets)
March 31, 2018
| | | | | | | | | | |
| Shares | | | | | Description | | Value ($) | |
| | |
| | | | | | Malaysia — 0.1% | |
| | | |
| | 748,700 | | | | | Tenaga Nasional Bhd | | | 3,143,456 | |
| | | | | | | | | | |
| | |
| | | | | | Mexico — 0.3% | |
| | | |
| | 1,198,220 | | | | | Grupo Financiero Banorte SAB de CV Series O | | | 7,270,777 | |
| | | | | | | | | | |
| | |
| | | | | | Netherlands — 3.4% | |
| | | |
| | 28,145 | | | | | Aalberts Industries NV | | | 1,436,222 | |
| | 469,272 | | | | | Aegon NV | | | 3,167,473 | |
| | 26,290 | | | | | Core Laboratories NV | | | 2,845,104 | |
| | 22,417 | | | | | Euronext NV | | | 1,639,779 | |
| | 20,889 | | | | | EXOR NV | | | 1,491,725 | |
| | 6,400 | | | | | Ferrari NV | | | 771,328 | |
| | 2,586 | | | | | Ferrari NV | | | 311,335 | |
| | 82,391 | | | | | Heineken NV | | | 8,862,786 | |
| | 638,684 | | | | | ING Groep NV | | | 10,781,946 | |
| | 22,184 | | | | | Koninklijke DSM NV | | | 2,204,827 | |
| | 125,942 | | | | | Koninklijke Philips NV | | | 4,837,597 | |
| | 147,627 | | | | | NN Group NV | | | 6,553,075 | |
| | 71,100 | | | | | Philips Lighting NV | | | 2,673,542 | |
| | 566,857 | | | | | RELX NV | | | 11,754,295 | |
| | 85,778 | | | | | STMicroelectronics NV (Euronext Exchange)‡ | | | 1,902,696 | |
| | 93,710 | | | | | Unilever NV, ADR | | | 5,294,700 | |
| | 199,450 | | | | | Yandex NV Class A* | | | 7,868,302 | |
| | | | | | | | | | |
| | | | | | Total Netherlands | | | 74,396,732 | |
| | | | | | | | | | |
| | |
| | | | | | New Zealand — 0.1% | |
| | | |
| | 480,326 | | | | | Air New Zealand, Ltd. | | | 1,121,869 | |
| | 363,746 | | | | | Sky Network Television, Ltd. | | | 603,225 | |
| | 330,102 | | | | | Trade Me Group, Ltd.¤ | | | 1,056,910 | |
| | | | | | | | | | |
| | | | | | Total New Zealand | | | 2,782,004 | |
| | | | | | | | | | |
| | |
| | | | | | Norway — 0.6% | |
| | | |
| | 339,665 | | | | | DNB ASA | | | 6,616,969 | |
| | 46,800 | | | | | Salmar ASA | | | 1,927,405 | |
| | 69,427 | | | | | SpareBank 1 SMN | | | 716,978 | |
| | 70,600 | | | | | Statoil ASA | | | 1,669,511 | |
| | 43,753 | | | | | Storebrand ASA | | | 357,653 | |
| | 45,693 | | | | | Telenor ASA | | | 1,037,654 | |
| | 19,400 | | | | | Yara International ASA | | | 822,865 | |
| | | | | | | | | | |
| | | | | | Total Norway | | | 13,149,035 | |
| | | | | | | | | | |
| | |
| | | | | | Philippines — 0.0% | |
| | | |
| | 6,261,800 | | | | | Vista Land & Lifescapes, Inc. | | | 782,462 | |
| | | | | | | | | | |
| | |
| | | | | | Poland — 0.1% | |
| | | |
| | 423,743 | | | | | PGE Polska Grupa Energetyczna SA* | | | 1,231,155 | |
| | | | | | | | | | |
| | | | | | |
| 62 | | See accompanying Notes to the Financial Statements. | | | | |
Mercer Non-US Core Equity Fund
Schedule of Investments (Continued)
(showing percentage of net assets)
March 31, 2018
| | | | | | | | | | |
| Shares | | | | | Description | | Value ($) | |
| | |
| | | | | | Portugal — 0.4% | |
| | | |
| | 782,528 | | | | | Banco Espirito Santo SA* **** ¤ ^ | | | — | |
| | 423,330 | | | | | Jeronimo Martins SGPS SA | | | 7,716,498 | |
| | 302,546 | | | | | Navigator Co. SA (The) | | | 1,784,143 | |
| | | | | | | | | | |
| | | | | | Total Portugal | | | 9,500,641 | |
| | | | | | | | | | |
| | |
| | | | | | Russia — 0.3% | |
| | | |
| | 297,500 | | | | | Gazprom PJSC, ADR | | | 1,451,044 | |
| | 29,100 | | | | | LUKOIL PJSC, ADR | | | 2,014,302 | |
| | 49,400 | | | | | MMC Norilsk Nickel PJSC, (London Exchange), ADR | | | 916,789 | |
| | 26,100 | | | | | Tatneft PJSC, (London Exchange), ADR | | | 1,649,638 | |
| | | | | | | | | | |
| | | | | | Total Russia | | | 6,031,773 | |
| | | | | | | | | | |
| | |
| | | | | | Singapore — 0.4% | |
| | | |
| | 129,800 | | | | | Best World International, Ltd. | | | 183,470 | |
| | 167,300 | | | | | DBS Group Holdings, Ltd. | | | 3,528,778 | |
| | 2,032,600 | | | | | Genting Singapore Plc | | | 1,684,310 | |
| | 123,800 | | | | | United Overseas Bank, Ltd. | | | 2,610,280 | |
| | 1,713,900 | | | | | Yangzijiang Shipbuilding Holdings, Ltd. | | | 1,595,714 | |
| | | | | | | | | | |
| | | | | | Total Singapore | | | 9,602,552 | |
| | | | | | | | | | |
| | |
| | | | | | South Korea — 0.4% | |
| | | |
| | 35,889 | | | | | Kia Motors Corp. | | | 1,043,774 | |
| | 2,278 | | | | | Samsung Electronics Co., Ltd. | | | 5,259,554 | |
| | 6,440 | | | | | SK Telecom Co., Ltd. | | | 1,410,770 | |
| | | | | | | | | | |
| | | | | | Total South Korea | | | 7,714,098 | |
| | | | | | | | | | |
| | |
| | | | | | Spain — 1.3% | |
| | | |
| | 231,224 | | | | | Amadeus IT Group SA Class A | | | 17,085,463 | |
| | 309,821 | | | | | Banco Santander SA | | | 2,019,688 | |
| | 334,800 | | | | | Distribuidora Internacional de Alimentacion SA‡ | | | 1,421,377 | |
| | 200,232 | | | | | Ence Energia y Celulosa SA | | | 1,509,612 | |
| | 252,600 | | | | | Iberdrola SA | | | 1,857,023 | |
| | 20,191 | | | | | Let’s GOWEX SA* **** ¤ ^ ‡ | | | — | |
| | 564,700 | | | | | Mapfre SA | | | 1,877,289 | |
| | 116,600 | | | | | Repsol SA | | | 2,070,581 | |
| | | | | | | | | | |
| | | | | | Total Spain | | | 27,841,033 | |
| | | | | | | | | | |
| | |
| | | | | | Sweden — 1.6% | |
| | | |
| | 43,711 | | | | | Atlas Copco AB Class B | | | 1,696,307 | |
| | 139,931 | | | | | Boliden AB | | | 4,918,313 | |
| | 13,792 | | | | | Evolution Gaming Group AB | | | 753,837 | |
| | 121,794 | | | | | Hennes & Mauritz AB Class B‡ | | | 1,821,549 | |
| | 69,121 | | | | | Industrivarden AB Class C | | | 1,602,676 | |
| | 26,893 | | | | | Industrivarden AB Class A | | | 652,031 | |
| | 46,351 | | | | | Investor AB Class B | | | 2,057,055 | |
| | 304,264 | | | | | Lundin Petroleum AB* | | | 7,666,753 | |
| | 230,914 | | | | | Nordea Bank AB | | | 2,459,528 | |
| | 10,747 | | | | | Paradox Interactive AB | | | 161,352 | |
| | | | | | |
| | See accompanying Notes to the Financial Statements. | | | 63 | |
Mercer Non-US Core Equity Fund
Schedule of Investments (Continued)
(showing percentage of net assets)
March 31, 2018
| | | | | | | | | | |
| Shares | | | | | Description | | Value ($) | |
| | |
| | | | | | Sweden — continued | |
| | | |
| | 368,300 | | | | | SAS AB* ‡ | | | 876,133 | |
| | 115,000 | | | | | SKF AB Class B‡ | | | 2,344,272 | |
| | 245,521 | | | | | SSAB AB Class B* | | | 1,139,391 | |
| | 407,451 | | | | | Svenska Handelsbanken AB Class A‡ | | | 5,096,805 | |
| | 160,212 | | | | | Telefonaktiebolaget LM Ericsson Class B, ADR | | | 1,025,357 | |
| | 1,859 | | | | | Vitrolife AB | | | 131,345 | |
| | | | | | | | | | |
| | | | | | Total Sweden | | | 34,402,704 | |
| | | | | | | | | | |
| | |
| | | | | | Switzerland — 6.8% | |
| | | |
| | 27,122 | | | | | Adecco Group AG | | | 1,929,234 | |
| | 14,476 | | | | | Ascom Holding AG | | | 307,221 | |
| | 8,200 | | | | | Autoneum Holding AG | | | 2,228,746 | |
| | 2,569 | | | | | Bucher Industries AG | | | 1,071,541 | |
| | 2,864 | | | | | Cembra Money Bank AG* | | | 254,157 | |
| | 55 | | | | | Chocoladefabriken Lindt & Spruengli AG | | | 340,515 | |
| | 66,212 | | | | | Cie Financiere Richemont SA | | | 5,937,905 | |
| | 47,076 | | | | | Coca-Cola HBC AG* | | | 1,741,541 | |
| | 6,429 | | | | | Comet Holding AG* | | | 888,510 | |
| | 112,500 | | | | | Credit Suisse Group AG* | | | 1,884,534 | |
| | 58,048 | | | | | GAM Holding AG* | | | 975,072 | |
| | 3,490 | | | | | Geberit AG | | | 1,540,883 | |
| | 6,193 | | | | | Givaudan SA | | | 14,092,617 | |
| | 194,206 | | | | | Julius Baer Group, Ltd.* | | | 11,938,255 | |
| | 2,696 | | | | | Kuehne + Nagel International AG | | | 423,804 | |
| | 67,514 | | | | | Lonza Group AG* | | | 15,899,184 | |
| | 318,112 | | | | | Nestle SA | | | 25,141,700 | |
| | 31,169 | | | | | Novartis AG | | | 2,517,423 | |
| | 92,812 | | | | | OC Oerlikon Corp. AG Class R* | | | 1,637,082 | |
| | 12,986 | | | | | Oriflame Holding AG | | | 621,231 | |
| | 13,077 | | | | | Pargesa Holding SA | | | 1,158,424 | |
| | 4,378 | | | | | Rieter Holding AG* | | | 855,418 | |
| | 66,808 | | | | | Roche Holding AG | | | 15,297,473 | |
| | 9,172 | | | | | Schindler Holding AG | | | 1,975,017 | |
| | 2,707 | | | | | SGS SA | | | 6,643,982 | |
| | 178 | | | | | Sika AG | | | 1,392,868 | |
| | 7,574 | | | | | Sonova Holding AG | | | 1,201,871 | |
| | 1,914 | | | | | Straumann Holding AG | | | 1,204,778 | |
| | 21,545 | | | | | Swiss Life Holding AG* | | | 7,663,033 | |
| | 49,500 | | | | | Swiss Re AG | | | 5,031,845 | |
| | 17,648 | | | | | Temenos Group AG* | | | 2,114,099 | |
| | 555,466 | | | | | UBS Group AG* | | | 9,764,407 | |
| | | | | | | | | | |
| | | | | | Total Switzerland | | | 145,674,370 | |
| | | | | | | | | | |
| | |
| | | | | | Taiwan — 1.1% | |
| | | |
| | 591,000 | | | | | Charoen Pokphand Enterprise | | | 1,325,630 | |
| | 1,419,000 | | | | | Compeq Manufacturing Co., Ltd. | | | 1,462,460 | |
| | 608,000 | | | | | Fubon Financial Holding Co., Ltd. | | | 1,046,802 | |
| | 313,077 | | | | | Taiwan Semiconductor Manufacturing Co., Ltd., ADR | | | 13,700,250 | |
| | 731,000 | | | | | Taiwan Semiconductor Manufacturing Co., Ltd. | | | 6,167,507 | |
| | | | | | | | | | |
| | | | | | Total Taiwan | | | 23,702,649 | |
| | | | | | | | | | |
| | | | | | |
| 64 | | See accompanying Notes to the Financial Statements. | | | | |
Mercer Non-US Core Equity Fund
Schedule of Investments (Continued)
(showing percentage of net assets)
March 31, 2018
| | | | | | | | | | |
| Shares | | | | | Description | | Value ($) | |
| | |
| | | | | | Thailand — 0.1% | |
| | | |
| | 16,831,100 | | | | | Quality Houses PCL | | | 1,571,692 | |
| | 23,666,400 | | | | | Sansiri PCL | | | 1,271,492 | |
| | | | | | | | | | |
| | | | | | Total Thailand | | | 2,843,184 | |
| | | | | | | | | | |
| | |
| | | | | | Turkey — 0.1% | |
| | | |
| | 208,146 | | | | | TAV Havalimanlari Holding AS | | | 1,254,740 | |
| | | | | | | | | | |
| | |
| | | | | | United Kingdom — 12.7% | |
| | | |
| | 321,924 | | | | | 3i Group Plc | | | 3,886,377 | |
| | 38,991 | | | | | Acacia Mining Plc | | | 78,198 | |
| | 124,242 | | | | | Anglo American Plc‡ | | | 2,902,142 | |
| | 157,874 | | | | | Antofagasta Plc | | | 2,043,472 | |
| | 298,787 | | | | | Ashtead Group Plc | | | 8,146,295 | |
| | 1,075,536 | | | | | BAE Systems Plc | | | 8,784,212 | |
| | 211,562 | | | | | Barratt Developments Plc | | | 1,575,656 | |
| | 61,900 | | | | | Bellway Plc | | | 2,651,323 | |
| | 42,500 | | | | | Berkeley Group Holdings Plc | | | 2,261,679 | |
| | 42,142 | | | | | BHP Billiton Plc, ADR | | | 1,674,302 | |
| | 32,604 | | | | | Bodycote Plc | | | 410,010 | |
| | 759,300 | | | | | BP Plc | | | 5,112,012 | |
| | 79,059 | | | | | British American Tobacco Plc | | | 4,588,810 | |
| | 129,300 | | | | | Britvic Plc | | | 1,239,259 | |
| | 398,700 | | | | | BT Group Plc | | | 1,273,790 | |
| | 76,805 | | | | | Bunzl Plc | | | 2,258,794 | |
| | 349,974 | | | | | Carillion Plc**** ‡ | | | 69,714 | |
| | 47,376 | | | | | Carnival Plc | | | 3,052,283 | |
| | 570,622 | | | | | Centrica Plc | | | 1,139,278 | |
| | 660,382 | | | | | Compass Group Plc | | | 13,492,443 | |
| | 150,255 | | | | | Crest Nicholson Holdings Plc | | | 958,696 | |
| | 20,852 | | | | | Croda International Plc | | | 1,337,910 | |
| | 37,901 | | | | | Dechra Pharmaceuticals Plc | | | 1,397,773 | |
| | 611,280 | | | | | Diageo Plc | | | 20,676,698 | |
| | 124,081 | | | | | Electrocomponents Plc | | | 1,045,825 | |
| | 163,447 | | | | | Experian Plc | | | 3,530,270 | |
| | 112,460 | | | | | Ferguson Plc | | | 8,457,965 | |
| | 701,600 | | | | | Firstgroup Plc* | | | 809,325 | |
| | 57,349 | | | | | Galliford Try Plc | | | 672,345 | |
| | 519,300 | | | | | GKN Plc | | | 3,375,900 | |
| | 263,600 | | | | | GlaxoSmithKline Plc | | | 5,120,479 | |
| | 1,015,306 | | | | | Glencore Plc* | | | 5,051,241 | |
| | 47,696 | | | | | Greggs Plc | | | 822,810 | |
| | 426,768 | | | | | Halma Plc | | | 7,067,673 | |
| | 978,811 | | | | | Hays Plc | | | 2,588,009 | |
| | 146,590 | | | | | IG Group Holdings Plc | | | 1,642,501 | |
| | 372,970 | | | | | IMI Plc | | | 5,660,304 | |
| | 46,559 | | | | | Imperial Brands Plc | | | 1,586,429 | |
| | 415,799 | | | | | Inchcape Plc | | | 4,033,402 | |
| | 31,876 | | | | | InterContinental Hotels Group Plc | | | 1,911,126 | |
| | 71,726 | | | | | Intermediate Capital Group Plc | | | 989,600 | |
| | | | | | |
| | See accompanying Notes to the Financial Statements. | | | 65 | |
Mercer Non-US Core Equity Fund
Schedule of Investments (Continued)
(showing percentage of net assets)
March 31, 2018
| | | | | | | | | | |
| Shares | | | | | Description | | Value ($) | |
| | |
| | | | | | United Kingdom — continued | |
| | | |
| | 71,405 | | | | | Intertek Group Plc | | | 4,673,147 | |
| | 1,030,700 | | | | | J Sainsbury Plc | | | 3,453,970 | |
| | 111,416 | | | | | Jardine Lloyd Thompson Group Plc | | | 2,005,315 | |
| | 1,019,072 | | | | | Kingfisher Plc | | | 4,193,041 | |
| | 216,459 | | | | | Legal & General Group Plc | | | 783,993 | |
| | 4,197,051 | | | | | Lloyds Banking Group Plc | | | 3,813,313 | |
| | 252,050 | | | | | London Stock Exchange Group Plc | | | 14,602,656 | |
| | 489,400 | | | | | Marks & Spencer Group Plc | | | 1,857,183 | |
| | 309,291 | | | | | Meggitt Plc | | | 1,875,847 | |
| | 400,400 | | | | | Mitchells & Butlers Plc | | | 1,405,311 | |
| | 256,118 | | | | | Moneysupermarket.com Group Plc | | | 1,031,139 | |
| | 1,003,000 | | | | | Old Mutual Plc | | | 3,372,236 | |
| | 248,545 | | | | | Pagegroup Plc | | | 1,872,734 | |
| | 277,200 | | | | | Paragon Banking Group Plc | | | 1,831,727 | |
| | 1,132,996 | | | | | QinetiQ Group Plc | | | 3,282,430 | |
| | 146,899 | | | | | Reckitt Benckiser Group Plc | | | 12,446,283 | |
| | 187,599 | | | | | Redrow Plc | | | 1,568,905 | |
| | 192,666 | | | | | RELX Plc | | | 3,963,644 | |
| | 29,900 | | | | | Renishaw Plc | | | 1,893,259 | |
| | 602,266 | | | | | Rentokil Initial Plc | | | 2,297,974 | |
| | 92,700 | | | | | Restaurant Group Plc (The)‡ | | | 330,392 | |
| | 13,824 | | | | | Rightmove Plc | | | 843,674 | |
| | 14,810 | | | | | Rio Tinto Plc | | | 751,823 | |
| | 97,957 | | | | | Rio Tinto Plc, ADR | | | 5,047,724 | |
| | 35,304 | | | | | Royal Dutch Shell Plc Class A, ADR | | | 2,252,748 | |
| | 79,900 | | | | | Royal Dutch Shell Plc Class B | | | 2,574,404 | |
| | 35,426 | | | | | Royal Dutch Shell Plc (Amsterdam Exchange) Class A | | | 1,129,267 | |
| | 275,200 | | | | | Royal Mail Plc | | | 2,089,519 | |
| | 55,684 | | | | | Sage Group Plc (The) | | | 500,197 | |
| | 239,381 | | | | | Senior Plc | | | 1,010,768 | |
| | 358,442 | | | | | Smith & Nephew Plc | | | 6,699,727 | |
| | 77,198 | | | | | Sophos Group Plc | | | 470,167 | |
| | 118,975 | | | | | Spectris Plc | | | 4,502,737 | |
| | 131,892 | | | | | Spirax-Sarco Engineering Plc | | | 10,660,271 | |
| | 56,100 | | | | | SSE Plc | | | 1,005,309 | |
| | 232,817 | | | | | Stagecoach Group Plc | | | 431,804 | |
| | 561,000 | | | | | Taylor Wimpey Plc | | | 1,455,056 | |
| | 1,026,447 | | | | | Thomas Cook Group Plc | | | 1,703,449 | |
| | 376,090 | | | | | Weir Group Plc (The) | | | 10,539,410 | |
| | 60,600 | | | | | William Hill Plc | | | 281,085 | |
| | 690,051 | | | | | WM Morrison Supermarkets Plc | | | 2,067,398 | |
| | | | | | | | | | |
| | | | | | Total United Kingdom | | | 273,947,366 | |
| | | | | | | | | | |
| | | |
| | | | | | United States — 2.1% | | | | |
| | | |
| | 47,708 | | | | | Analog Devices, Inc. | | | 4,347,630 | |
| | 47,025 | | | | | ANSYS, Inc.* | | | 7,368,347 | |
| | 236,319 | | | | | Cadence Design Systems, Inc.* | | | 8,689,450 | |
| | 152,302 | | | | | Colgate-Palmolive Co. | | | 10,917,007 | |
| | 67,052 | | | | | DENTSPLY SIRONA, Inc. | | | 3,373,386 | |
| | | | | | |
| 66 | | See accompanying Notes to the Financial Statements. | | | | |
Mercer Non-US Core Equity Fund
Schedule of Investments (Continued)
(showing percentage of net assets)
March 31, 2018
| | | | | | | | | | |
| Shares | | | | | Description | | Value ($) | |
| | | |
| | | | | | United States — continued | | | | |
| | | |
| | 34,269 | | | | | Nordson Corp. | | | 4,672,236 | |
| | 60,072 | | | | | Texas Instruments, Inc. | | | 6,240,880 | |
| | | | | | | | | | |
| | | | | | Total United States | | | 45,608,936 | |
| | | | | | | | | | |
| | | |
| | | | | | TOTAL COMMON STOCKS (COST $1,697,412,697) | | | 1,949,697,923 | |
| | | | | | | | | | |
| | |
| | | | | | INVESTMENT COMPANY — 0.9% | |
| | |
| | | | | | United States — 0.9% | |
| | | |
| | 286,827 | | | | | iShares MSCI EAFE ETF | | | 19,986,105 | |
| | | | | | | | | | |
| | | |
| | | | | | TOTAL INVESTMENT COMPANY (COST $16,653,343) | | | 19,986,105 | |
| | | | | | | | | | |
| | |
| | | | | | PREFERRED STOCKS — 1.0% | |
| | |
| | | | | | Brazil — 0.1% | |
| | | |
| | 470,600 | | | | | Itausa — Investimentos Itau SA, 5.08% | | | 1,952,574 | |
| | | | | | | | | | |
| | |
| | | | | | Germany — 0.9% | |
| | | |
| | 9,637 | | | | | Bayerische Motoren Werke AG, 4.47% | | | 902,930 | |
| | 103,274 | | | | | Henkel AG & Co. KGaA, 1.72% | | | 13,574,091 | |
| | 28,368 | | | | | Porsche Automobil Holding SE, 1.46% | | | 2,357,600 | |
| | 14,800 | | | | | Volkswagen AG, 1.20% | | | 2,942,342 | |
| | | | | | | | | | |
| | | | | | Total Germany | | | 19,776,963 | |
| | | | | | | | | | |
| | | |
| | | | | | TOTAL PREFERRED STOCKS (COST $17,811,535) | | | 21,729,537 | |
| | | | | | | | | | |
| | |
| | | | | | RIGHTS — 0.0% | |
| | |
| | | | | | United Kingdom — 0.0% | |
| | | |
| | 19,116 | | | | | Galliford Try Plc Expires 04/13/18* | | | 75,086 | |
| | | | | | | | | | |
| | | | | | TOTAL RIGHTS (COST $—) | | | 75,086 | |
| | | | | | | | | | |
| | | |
| Par Value ($) | | | | | Description | | Value ($) | |
| | |
| | | | | | SHORT-TERM INVESTMENTS — 9.7% | |
| | |
| | | | | | Bank Deposit — 7.1% | |
| | | |
| | 152,762,482 | | | | | State Street Bank & Trust Euro Time Deposit, 0.28%, due 04/02/18 | | | 152,762,482 | |
| | | | | | | | | | |
| | |
| | | | | | Mutual Fund - Securities Lending Collateral — 2.4% | |
| | | |
| $ | 51,739,136 | | | | | State Street Institutional U.S. Government Money Market Fund, Premier Class, 1.58%## *** | | | 51,739,136 | |
| | | | | | | | | | |
| | |
| | | | | | U.S. Government and Agency Obligations — 0.2% | |
| | | |
| | 3,300,000 | | | | | United States Treasury Bill, 0.99%, due 04/05/18** ‡‡ | | | 3,299,554 | |
| | | | | | | | | | |
| | | |
| | | | | | TOTAL SHORT-TERM INVESTMENTS (COST $207,801,177) | | | 207,801,172 | |
| | | | | | | | | | |
| | | |
| | | | | | TOTAL INVESTMENTS — 101.9% (Cost $1,939,678,752) | | | 2,199,289,823 | |
| | | |
| | | | | | Other Assets and Liabilities (net) — (1.9)% | | | (39,991,037 | ) |
| | | | | | | | | | |
| | | |
| | | | | | NET ASSETS — 100.0% | | $ | 2,159,298,786 | |
| | | | | | | | | | |
| | | | | | |
| | See accompanying Notes to the Financial Statements. | | | 67 | |
Mercer Non-US Core Equity Fund
Schedule of Investments (Continued)
March 31, 2018
| | | | | | | | | | |
| | | |
| | | | | | Notes to Schedule of Investments: | | | | |
| | | |
| | | | | | ADR — American Depository Receipt | | | | |
| | | |
| | | | | | REIT — Real Estate Investment Trust | | | | |
| | | |
| | | | ## | | The rate disclosed is the 7 day net yield as of March 31, 2018. | | | | |
| | | |
| | | | * | | Non-income producing security | | | | |
| | | |
| | | | ** | | All or a portion of this security is pledged for open futures collateral. | | | | |
| | | |
| | | | *** | | Represents an investment of securities lending cash collateral. | | | | |
| | | |
| | | | **** | | Securities fair valued by the Valuation Committee as approved by the Board of Trustees. The total market value of the securities at year end is $69,714 which represents 0.0% of net assets. The aggregate tax cost of these securities held at March 31, 2018 was $3,412,150. | | | | |
| | | |
| | | | ¤ | | Illiquid security. The total market value of the securities at year end is $3,315,787 which represents 0.2% of net assets. The aggregate tax cost of these securities held at March 31, 2018 was $4,400,853. | | | | |
| | | |
| | | | ^ | | Level 3 — significant unobservable inputs were used in determining the value of this portfolio security. | | | | |
| | | |
| | | | ‡ | | All or a portion of this security is out on loan. | | | | |
| | | |
| | | | ‡‡ | | Interest rate presented is yield to maturity. | | | | |
| | | | | | |
| 68 | | See accompanying Notes to the Financial Statements. | | | | |
Mercer Non-US Core Equity Fund
Schedule of Investments (Continued)
March 31, 2018
Forward Foreign Currency Contracts
| | | | | | | | | | | | | | | | | | |
Currency Purchased | | | Currency Sold | | | Settlement
Date | | Counterparty | | Unrealized
Appreciation
(Depreciation) | |
| USD | | | 724,130 | | | JPY | | | 76,000,000 | | | 08/22/18 | | Morgan Stanley Capital | | $ | 2,518 | |
| USD | | | 20,103,320 | | | JPY | | | 2,128,429,000 | | | 08/23/18 | | State Street Bank and Trust | | | (107,338 | ) |
| | | | | | | | | | | | | | | | | | |
| | $ | (104,820 | ) |
| | | | | | | | | | | | | | | | | | |
Currency Abbreviations
Futures Contracts
| | | | | | | | | | | | | | | | | | | | |
Number of Contracts | | | | | Description | | | | Expiration Date | | | Notional Value | | | Market Value/ Unrealized Appreciation (Depreciation) | |
| | Buys | | | | | | | | | | | | | | | | | | | |
| | 1,347 | | | | | MSCI EAFE Index | | | | | Jun 2018 | | | $ | 134,740,410 | | | $ | (2,027,504 | ) |
| | | | | | | | | | | | | | | | | | | | |
| | | | | | |
| | See accompanying Notes to the Financial Statements. | | | 69 | |
Mercer Non-US Core Equity Fund
Schedule of Investments (Continued)
March 31, 2018
| | | | | |
| Industry Sector Summary (Unaudited) | | % of Net Assets |
Banks | | | | 6.5 | |
Chemicals | | | | 4.7 | |
Insurance | | | | 4.7 | |
Food | | | | 4.3 | |
Commercial Services | | | | 4.0 | |
Pharmaceuticals | | | | 3.8 | |
Diversified Financial Services | | | | 3.6 | |
Retail | | | | 3.6 | |
Beverages | | | | 3.5 | |
Semiconductors | | | | 3.2 | |
Software | | | | 3.0 | |
Cosmetics & Personal Care | | | | 2.8 | |
Internet | | | | 2.8 | |
Oil & Gas | | | | 2.3 | |
Transportation | | | | 2.3 | |
Electronics | | | | 2.2 | |
Auto Parts & Equipment | | | | 2.1 | |
Electrical Components & Equipment | | | | 2.0 | |
Real Estate | | | | 1.9 | |
Auto Manufacturers | | | | 1.8 | |
Mining | | | | 1.7 | |
Machinery — Diversified | | | | 1.6 | |
Telecommunications | | | | 1.5 | |
Airlines | | | | 1.4 | |
Distribution & Wholesale | | | | 1.3 | |
Health Care — Products | | | | 1.2 | |
Household Products & Wares | | | | 1.2 | |
Electric | | | | 1.1 | |
Miscellaneous — Manufacturing | | | | 1.1 | |
Apparel | | | | 1.0 | |
Building Materials | | | | 1.0 | |
Machinery — Construction & Mining | | | | 0.9 | |
Media | | | | 0.9 | |
Toys, Games & Hobbies | | | | 0.9 | |
Unaffiliated Fund | | | | 0.9 | |
Biotechnology | | | | 0.8 | |
Aerospace & Defense | | | | 0.7 | |
Home Builders | | | | 0.7 | |
Iron & Steel | | | | 0.7 | |
Food Service | | | | 0.6 | |
Agriculture | | | | 0.5 | |
Forest Products & Paper | | | | 0.5 | |
Holding Companies — Diversified | | | | 0.5 | |
Lodging | | | | 0.5 | |
Computers | | | | 0.4 | |
Gas | | | | 0.4 | |
Metal Fabricate & Hardware | | | | 0.4 | |
Investment Companies | | | | 0.3 | |
Leisure Time | | | | 0.3 | |
REITS | | | | 0.3 | |
Engineering & Construction | | | | 0.2 | |
| | | | | | |
| 70 | | See accompanying Notes to the Financial Statements. | | | | |
Mercer Non-US Core Equity Fund
Schedule of Investments (Continued)
March 31, 2018
| | | | | |
| Industry Sector Summary (Unaudited) | | % of Net Assets |
Entertainment | | | | 0.2 | |
Hand & Machine Tools | | | | 0.2 | |
Health Care — Services | | | | 0.2 | |
Home Furnishings | | | | 0.2 | |
Advertising | | | | 0.1 | |
Energy-Alternate Sources | | | | 0.1 | |
Office & Business Equipment | | | | 0.1 | |
Oil & Gas Services | | | | 0.1 | |
Packaging & Containers | | | | 0.1 | |
Shipbuilding | | | | 0.1 | |
Textiles | | | | 0.1 | |
Water | | | | 0.1 | |
Short-Term Investments and Other Assets and Liabilities (net) | | | | 7.8 | |
| | | | | |
| | | | 100.0 | % |
| | | | | |
| | | | | | |
| | See accompanying Notes to the Financial Statements. | | | 71 | |
Mercer Core Fixed Income Fund
Schedule of Investments
(showing percentage of net assets)
March 31, 2018
| | | | | | | | | | |
| Par Value ($) | | | | | Description | | Value ($) | |
| | | |
| | | | | | DEBT OBLIGATIONS — 99.1% | | | | |
| | | |
| | | | | | Asset Backed Securities — 12.5% | | | | |
| | | |
| | 750,000 | | | | | A Voce CLO, Ltd., Series 2014-1A, Class A1R, 2.88% (3 mo. USD LIBOR plus 1.160%), due 07/15/26† 144A | | | 749,812 | |
| | 170,000 | | | | | AccessLex Institute, Series 2005-1, Class A4, 1.87% (3 mo. USD LIBOR plus 0.210%), due 06/22/37† | | | 163,811 | |
| | 311,881 | | | | | AccessLex Institute, Series 2006-1, Class A3, 2.14% (3 mo. USD LIBOR plus 0.200%), due 08/25/37† | | | 306,059 | |
| | 420,000 | | | | | Ally Auto Receivables Trust, Series 2017-3, Class A3, 1.74%, due 09/15/21 | | | 414,900 | |
| | 290,000 | | | | | Ally Auto Receivables Trust, Series 2017-4, Class A4, 1.96%, due 07/15/22 | | | 284,286 | |
| | 245,000 | | | | | Ally Auto Receivables Trust, Series 2018-1, Class A3, 2.35%, due 06/15/22 | | | 243,562 | |
| | 848,000 | | | | | Ally Master Owner Trust, Series 2018-1, Class A2, 2.70%, due 01/17/23 | | | 842,943 | |
| | 250,000 | | | | | ALM CLO VIII, Ltd., Series 2013-8A, Class A1R, 3.21% (3 mo. USD LIBOR plus 1.490%), due 10/15/28† 144A | | | 251,360 | |
| | 400,000 | | | | | ALM CLO XII, Ltd., Series 2015-12A, Class A1R, 2.77% (3 mo. USD LIBOR plus 1.050%), due 04/16/27† 144A | | | 400,093 | |
| | 108,909 | | | | | American Airlines Pass Through Trust, Series 2001-1, Class A, 6.98%, due 11/23/22 | | | 112,993 | |
| | 1,000,000 | | | | | American Express Credit Account Master Trust, Series 2013-1, Class B, 2.48% (1 mo. USD LIBOR plus 0.700%), due 02/16/21† | | | 1,001,670 | |
| | 815,000 | | | | | American Express Credit Account Master Trust, Series 2017-1, Class A, 1.93%, due 09/15/22 | | | 804,184 | |
| | 1,300,000 | | | | | American Express Credit Account Master Trust, Series 2017-2, Class A, 2.23% (1 mo. USD LIBOR plus 0.450%), due 09/16/24† | | | 1,312,882 | |
| | 400,000 | | | | | American Express Credit Account Master Trust, Series 2017-5, Class A, 2.16% (1 mo. USD LIBOR plus 0.380%), due 02/18/25† | | | 403,048 | |
| | 200,000 | | | | | AmeriCredit Automobile Receivables Trust, Series 2017-3, Class C, 2.69%, due 06/19/23 | | | 197,393 | |
| | 500,000 | | | | | AmeriCredit Automobile Receivables Trust, Series 2017-4, Class C, 2.60%, due 09/18/23 | | | 491,258 | |
| | 562,594 | | | | | Ameriquest Mortgage Securities, Inc., Series 2003-9, Class AV1, 2.63% (1 mo. USD LIBOR plus 0.760%), due 09/25/33† | | | 563,135 | |
| | 781,075 | | | | | Applebee’s Funding LLC/IHOP Funding LLC, Series 2014-1, Class A2, 4.28%, due 09/05/44 144A | | | 767,348 | |
| | 650,038 | | | | | Arbys Funding LLC, Series 2015-1A, Class A2, 4.97%, due 10/30/45 144A | | | 649,533 | |
| | 286,502 | | | | | Asset Backed Securities Corp Home Equity Loan Trust, Series 2003-HE7, Class M1, 2.75% (1 mo. USD LIBOR plus 0.975%), due 12/15/33† | | | 286,907 | |
| | 95,697 | | | | | Asset-Backed Pass-Through Certificates, Series 2004-R2, Class A1A, 2.56% (1 mo. USD LIBOR plus 0.690%), due 04/25/34† | | | 96,223 | |
| | 1,000,000 | | | | | Atlas Senior Loan Fund CLO V, Ltd., Series 2014-1A, Class AR2, 2.98% (3 mo. USD LIBOR plus 1.260%), due 07/16/29† 144A | | | 1,006,248 | |
| | 1,000,000 | | | | | Avis Budget Rental Car Funding AESOP LLC, Series 2015-1A, Class A, 2.50%, due 07/20/21 144A | | | 989,641 | |
| | 1,000,000 | | | | | Avis Budget Rental Car Funding AESOP LLC, Series 2015-2A, Class A, 2.63%, due 12/20/21 144A | | | 991,219 | |
| | 1,125,000 | | | | | BA Credit Card Trust, Series 2017-A1, Class A1, 1.95%, due 08/15/22 | | | 1,109,650 | |
| | 250,000 | | | | | Battalion CLO VIII, Ltd., Series 2015-8A, Class A1R, 3.07% (3 mo. USD LIBOR plus 1.340%), due 07/18/30† 144A | | | 252,241 | |
| | 500,000 | | | | | Battalion CLO X, Ltd., Series 2016-10A, Class A1, 3.29% (3 mo. USD LIBOR plus 1.550%), due 01/24/29† 144A | | | 504,378 | |
| | 16,823 | | | | | Bear Stearns Asset Backed Securities Trust, Series 2004-SD3, Class A3, 3.01% (1 mo. USD LIBOR plus 0.570%), due 09/25/34† | | | 16,895 | |
| | | | | | |
| 72 | | See accompanying Notes to the Financial Statements. | | | | |
Mercer Core Fixed Income Fund
Schedule of Investments (Continued)
(showing percentage of net assets)
March 31, 2018
| | | | | | | | | | |
| Par Value ($) | | | | | Description | | Value ($) | |
| | | |
| | | | | | Asset Backed Securities — continued | | | | |
| | | |
| | 500,000 | | | | | Benefit Street Partners CLO V, Ltd., Series 2014-VA, Class AR, 2.94% (3 mo. USD LIBOR plus 1.200%), due 10/20/26† 144A | | | 500,159 | |
| | 250,000 | | | | | Benefit Street Partners CLO XII, Ltd., Series 2017-12A, Class A1, 2.60% (3 mo. USD LIBOR plus 1.250%), due 10/15/30† 144A | | | 251,598 | |
| | 250,000 | | | | | BlueMountain CLO, Ltd., Series 2015-1A, Class A1R, 3.05% (3 mo. USD LIBOR plus 1.330%), due 04/13/27† 144A | | | 251,574 | |
| | 315,000 | | | | | BMW Vehicle Owner Trust, Series 2016-A, Class A4, 1.37%, due 12/27/22 | | | 308,048 | |
| | 400,000 | | | | | BMW Vehicle Owner Trust, Series 2018-A, Class A3, 2.35%, due 04/25/22 | | | 397,358 | |
| | 947,500 | | | | | Cabela’s Credit Card Master Note Trust, Series 2016-1, Class A1, 1.78%, due 06/15/22 | | | 937,719 | |
| | 425,000 | | | | | California Republic Auto Receivables Trust, Series 2016-2, Class A4, 1.83%, due 12/15/21 | | | 420,252 | |
| | 860,000 | | | | | Capital One Multi-Asset Execution Trust, Series 2016-A3, Class A3, 1.34%, due 04/15/22 | | | 847,680 | |
| | 1,005,000 | | | | | Capital One Multi-Asset Execution Trust, Series 2017-A1, Class A1, 2.00%, due 01/17/23 | | | 991,888 | |
| | 5,000 | | | | | Capital One Multi-Asset Execution Trust, Series 2017-A4, Class A4, 1.99%, due 07/17/23 | | | 4,914 | |
| | 500,000 | | | | | Carlyle Global Market Strategies CLO, Ltd., Series 2012-4A, Class AR, 3.19% (3 mo. USD LIBOR plus 1.450%), due 01/20/29† 144A | | | 503,684 | |
| | 250,000 | | | | | Carlyle Global Market Strategies CLO, Ltd., Series 2014-3A, Class A1AR, 2.91% (3 mo. USD LIBOR plus 1.150%), due 07/27/26† 144A | | | 250,147 | |
| | 500,000 | | | | | Carlyle Global Market Strategies CLO, Ltd., Series 2017-1A, Class A1B, 2.97% (3 mo. USD LIBOR plus 1.230%), due 04/20/31† 144A | | | 502,477 | |
| | 270,000 | | | | | CarMax Auto Owner Trust, Series 2015-2, Class A4, 1.80%, due 03/15/21 | | | 267,890 | |
| | 160,000 | | | | | CarMax Auto Owner Trust, Series 2015-3, Class A4, 1.98%, due 02/16/21 | | | 158,569 | |
| | 280,000 | | | | | CarMax Auto Owner Trust, Series 2016-2, Class A4, 1.68%, due 09/15/21 | | | 275,017 | |
| | 255,000 | | | | | CarMax Auto Owner Trust, Series 2018-1, Class A3, 2.48%, due 11/15/22 | | | 253,246 | |
| | 255,000 | | | | | Chrysler Capital Auto Receivables Trust, Series 2016-BA, Class A4, 1.87%, due 02/15/22 144A | | | 251,438 | |
| | 1,020,000 | | | | | Citibank Credit Card Issuance Trust, Series 2016-A1, Class A1, 1.75%, due 11/19/21 | | | 1,005,289 | |
| | 800,000 | | | | | Citibank Credit Card Issuance Trust, Series 2017-A5, Class A5, 2.47% (1 mo. LIBOR plus 0.620%), due 04/22/26† | | | 806,491 | |
| | 800,000 | | | | | Citibank Credit Card Issuance Trust, Series 2017-A7, Class A7, 2.08% (1 mo. LIBOR plus 0.370%), due 08/08/24† | | | 803,718 | |
| | 930,000 | | | | | Citibank Credit Card Issuance Trust, Series 2018-A1, Class A1, 2.49%, due 01/20/23 | | | 922,599 | |
| | 352,520 | | | | | CKE Restaurant Holdings, Inc., Series 2013-1A, Class A2, 4.47%, due 03/20/43 144A | | | 353,954 | |
| | 270,000 | | | | | CNH Equipment Trust, Series 2017-C, Class A3, 2.08%, due 02/15/23 | | | 266,252 | |
| | 332,488 | | | | | Coinstar Funding LLC, Series 2017-1A, Class A2, 5.22%, due 04/25/47 144A | | | 341,894 | |
| | 835,890 | | | | | Commonbond Student Loan Trust, Series 2017-BGS, Class A1, 2.68%, due 09/25/42 144A | | | 821,158 | |
| | 426,800 | | | | | DB Master Finance LLC, Series 2015-1A, Class A2II, 3.98%, due 02/20/45 144A | | | 431,039 | |
| | 1,098,248 | | | | | DB Master Finance LLC, Series 2017-1A, Class A2I, 3.63%, due 11/20/47 144A | | | 1,094,689 | |
| | 129,675 | | | | | DB Master Finance LLC, Series 2017-1A, Class A2II, 4.03%, due 11/20/47 144A | | | 130,837 | |
| | 1,070,000 | | | | | Discover Card Execution Note Trust, Series 2017-A6, Class A6, 1.88%, due 02/15/23 | | | 1,051,177 | |
| | 517,400 | | | | | Domino’s Pizza Master Issuer LLC, Series 2017-1A, Class A23, 4.12%, due 07/25/47 144A | �� | | 523,898 | |
| | 400,000 | | | | | Drive Auto Receivables Trust, Series 2018-1, Class B, 2.88%, due 02/15/22 | | | 399,447 | |
| | 449,650 | | | | | Driven Brands Funding LLC, Series 2015-1A, Class A2, 5.22%, due 07/20/45 144A | | | 463,102 | |
| | 250,000 | | | | | Eaton Vance CLO, Ltd., Series 2014-1A, Class AR, 2.92% (3 mo. USD LIBOR plus 1.200%), due 07/15/26† 144A | | | 250,272 | |
| | | | | | |
| | See accompanying Notes to the Financial Statements. | | | 73 | |
Mercer Core Fixed Income Fund
Schedule of Investments (Continued)
(showing percentage of net assets)
March 31, 2018
| | | | | | | | | | |
| Par Value ($) | | | | | Description | | Value ($) | |
| | | |
| | | | | | Asset Backed Securities — continued | | | | |
| | | |
| | 490,000 | | | | | Evergreen Credit Card Trust, Series 2018-1, Class A, 2.95%, due 03/15/23†††† 144A | | | 489,947 | |
| | 250,000 | | | | | Flagship CLO VIII, Ltd., Series 2014-8A, Class AR, 2.97% (3 mo. USD LIBOR plus 1.250%), due 01/16/26† 144A | | | 250,299 | |
| | 124,063 | | | | | FOCUS Brands Funding LLC, Series 2017-1A, Class A2I, 3.86%, due 04/30/47‡‡‡‡ | | | 124,945 | |
| | 255,000 | | | | | Ford Credit Auto Owner Trust, Series 2016-B, Class A4, 1.52%, due 08/15/21 | | | 250,285 | |
| | 343,000 | | | | | Ford Credit Auto Owner Trust, Series 2016-C, Class A4, 1.40%, due 02/15/22 | | | 333,287 | |
| | 113,000 | | | | | Ford Credit Auto Owner Trust, Series 2017-B, Class A4, 1.87%, due 09/15/22 | | | 110,238 | |
| | 285,000 | | | | | Ford Credit Auto Owner Trust, Series 2017-C, Class A4, 2.16%, due 03/15/23 | | | 280,144 | |
| | 455,000 | | | | | Ford Credit Floorplan Master Owner Trust, Series 2017-2, Class A1, 2.16%, due 09/15/22 | | | 448,745 | |
| | 900,000 | | | | | Ford Credit Floorplan Master Owner Trust, Series 2017-3, Class A, 2.48%, due 09/15/24 | | | 884,723 | |
| | 2,900,000 | | | | | Ford Credit Floorplan Master Owner Trust, Series 2018-2, Class A, 3.17%, due 03/15/25 | | | 2,913,262 | |
| | 400,000 | | | | | GM Financial Consumer Automobile Receivables Trust, Series 2017-2A, Class A3, 1.86%, due 12/16/21‡‡‡‡ | | | 394,295 | |
| | 936,000 | | | | | Goal Capital Funding Trust, Series 2005-2, Class A4, 2.14% (3 mo. USD LIBOR plus 0.200%), due 08/25/44† | | | 916,592 | |
| | 390,000 | | | | | Golden Credit Card Trust, Series 2018-1A, Class A, 2.62%, due 01/15/23 144A | | | 387,730 | |
| | 300,000 | | | | | Hertz Vehicle Financing II LP, Series 2016-3A, Class A, 2.27%, due 07/25/20 144A | | | 297,478 | |
| | 242,817 | | | | | Hilton Grand Vacations Trust, Series 2017-AA, Class A, 2.66%, due 12/26/28 144A | | | 239,652 | |
| | 224,497 | | | | | Home Equity Asset Trust, Series 2003-8, Class M1, 2.95% (1 mo. USD LIBOR plus 1.080%), due 04/25/34† | | | 226,790 | |
| | 510,000 | | | | | Honda Auto Receivables Owner Trust, Series 2016-4, Class A4, 1.36%, due 01/18/23 | | | 497,693 | |
| | 560,000 | | | | | Honda Auto Receivables Owner Trust, Series 2017-1, Class A3, 1.72%, due 07/21/21 | | | 553,864 | |
| | 125,000 | | | | | Honda Auto Receivables Owner Trust, Series 2017-2, Class A4, 1.87%, due 09/15/23 | | | 121,915 | |
| | 145,000 | | | | | Honda Auto Receivables Owner Trust, Series 2017-3, Class A4, 1.98%, due 11/20/23 | | | 142,413 | |
| | 880,000 | | | | | Huntington Auto Trust, Series 2016-1, Class A4, 1.93%, due 04/15/22 | | | 868,029 | |
| | 345,000 | | | | | Hyundai Auto Lease Securitization Trust, Series 2018-A, Class A3, 2.81%, due 04/15/21 144A | | | 344,999 | |
| | 450,000 | | | | | Hyundai Auto Receivables Trust, Series 2017-A, Class A3, 1.76%, due 08/16/21 | | | 444,325 | |
| | 750,000 | | | | | ICG US CLO, Ltd., Series 2014-3A, Class A1AR, 2.98% (3 mo. USD LIBOR plus 1.230%), due 01/25/27† | | | 750,684 | |
| | 500,000 | | | | | ICG US CLO, Ltd., Series 2017-2A, Class A1, 2.60% (3 mo. USD LIBOR plus 1.280%), due 10/23/29† 144A | | | 503,184 | |
| | 1,114,968 | | | | | Invitation Homes Trust, Series 2015-SFR3, Class A, 3.05% (1 mo. USD LIBOR plus 1.300%), due 08/17/32† 144A | | | 1,116,675 | |
| | 165,000 | | | | | John Deere Owner Trust, Series 2018-A, Class A3, 2.66%, due 04/18/22 | | | 164,809 | |
| | 193,125 | | | | | KeyCorp Student Loan Trust, Series 2004-A, Class 1A2, 2.00% (3 mo. USD LIBOR plus 0.240%), due 10/27/42† | | | 189,570 | |
| | 500,000 | | | | | KVK CLO, Ltd., Series 2014-1A, Class A1R, 3.14% (3 mo. USD LIBOR plus 1.300%), due 05/15/26† 144A | | | 500,514 | |
| | 500,000 | | | | | KVK CLO, Ltd., Series 2014-2A, Class AR, 2.90% (3 mo. USD LIBOR plus 1.180%), due 07/15/26† 144A | | | 500,460 | |
| | 500,000 | | | | | Laurel Road Prime Student Loan Trust, Series 2017-C, Class A2B, 2.81%, due 11/25/42 144A | | | 491,132 | |
| | 750,000 | | | | | Limerock CLO III LLC, Series 2014-3A, Class A1R, 2.94% (3 mo. USD LIBOR plus 1.200%), due 10/20/26† 144A | | | 750,908 | |
| | 3,370,000 | | | | | Mercedes-Benz Auto Receivables Trust, Series 2016-1, Class A4, 1.46%, due 12/15/22 | | | 3,296,118 | |
| | 1,570,000 | | | | | MMAF Equipment Finance LLC, Series 2014-AA, Class A5, 2.33%, due 12/08/25 144A | | | 1,547,313 | |
| | 700,000 | | | | | MMAF Equipment Finance LLC, Series 2017-AA, Class A4, 2.41%, due 08/16/24 144A | | | 689,141 | |
| | | | | | |
| 74 | | See accompanying Notes to the Financial Statements. | | | | |
Mercer Core Fixed Income Fund
Schedule of Investments (Continued)
(showing percentage of net assets)
March 31, 2018
| | | | | | | | | | |
| Par Value ($) | | | | | Description | | Value ($) | |
| | | |
| | | | | | Asset Backed Securities — continued | | | | |
| | | |
| | 360,000 | | | | | MMAF Equipment Finance LLC, Series 2017-B, Class A3, 2.21%, due 10/17/22‡‡‡‡ | | | 354,764 | |
| | 185,274 | | | | | Morgan Stanley ABS Capital I, Inc., Series 2003-NC10, Class M1, 2.89% (1 mo. USD LIBOR plus 1.020%), due 10/25/33† | | | 183,966 | |
| | 106,176 | | | | | Morgan Stanley ABS Capital I, Inc., Series 2003-NC7, Class M1, 2.92% (1 mo. USD LIBOR plus 1.050%), due 06/25/33† | | | 105,298 | |
| | 250,000 | | | | | Mountain View CLO, Ltd., Series 2014-1A, Class AR, 2.96% (3 mo. USD LIBOR plus 1.240%), due 10/15/26† 144A | | | 250,296 | |
| | 219,000 | | | | | Nelnet Student Loan Trust, Series 2006-1, Class A6, 2.37% (3 mo. USD LIBOR plus 0.450%), due 08/23/36† 144A | | | 215,288 | |
| | 260,762 | | | | | New Century Home Equity Loan Trust, Series 2003-A, Class A, 2.59% (1 mo. USD LIBOR plus 0.720%), due 10/25/33† 144A | | | 254,173 | |
| | 485,247 | | | | | New Residential Mortgage Trust, Series 2018-1A, Class A1A, 4.00%, due 12/25/57◆◆ 144A | | | 498,071 | |
| | 2,211,000 | | | | | NextGear Floorplan Master Owner Trust, Series 2015-2A, Class A, 2.38%, due 10/15/20 144A | | | 2,208,948 | |
| | 105,000 | | | | | NextGear Floorplan Master Owner Trust, Series 2018-1A, Class A2, 3.22%, due 02/15/23‡‡‡‡ | | | 105,213 | |
| | 610,000 | | | | | Nissan Auto Receivables Owner Trust, Series 2015-B, Class A4, 1.79%, due 01/17/22 | | | 603,548 | |
| | 280,000 | | | | | Nissan Auto Receivables Owner Trust, Series 2017-A, Class A3, 1.74%, due 08/16/21 | | | 276,704 | |
| | 330,000 | | | | | Nissan Auto Receivables Owner Trust, Series 2017-B, Class A4, 1.95%, due 10/16/23 | | | 322,552 | |
| | 600,000 | | | | | North Carolina State Education Assistance Authority, Series 2011-2, Class A3, 2.55% (3 mo. USD LIBOR plus 0.800%), due 07/25/36† | | | 595,848 | |
| | 117,824 | | | | | NRZ Excess Spread-Collateralized Notes, Series 2018-PLS1, Class A, 3.19%, due 01/25/23‡‡‡‡ | | | 117,232 | |
| | 216,558 | | | | | NRZ Excess Spread-Collateralized Notes, Series 2018-PLS2, Class A, 3.27%, due 02/25/23‡‡‡‡ | | | 216,078 | |
| | 250,000 | | | | | OCP CLO, Ltd., Series 2017-13A, Class A1A, 2.98% (3 mo. USD LIBOR plus 1.260%), due 07/15/30† 144A | | | 253,112 | |
| | 29,420 | | | | | OneMain Direct Auto Receivables Trust, Series 2016-1A, Class A, 2.04%, due 01/15/21 144A | | | 29,403 | |
| | 1,592,910 | | | | | OneMain Direct Auto Receivables Trust, Series 2017-1A, Class A, 2.16%, due 10/15/20 144A | | | 1,584,572 | |
| | 1,300,000 | | | | | OneMain Direct Auto Receivables Trust, Series 2017-2A, Class B, 2.55%, due 11/14/23 144A | | | 1,277,591 | |
| | 300,000 | | | | | OneMain Direct Auto Receivables Trust, Series 2017-2A, Class C, 2.82%, due 07/15/24 144A | | | 295,180 | |
| | 324,553 | | | | | OneMain Financial Issuance Trust, Series 2015-2A, Class A, 2.57%, due 07/18/25 144A | | | 324,519 | |
| | 700,000 | | | | | OneMain Financial Issuance Trust, Series 2017-1A, Class A2, 2.57% (1 mo. USD LIBOR plus 0.800%), due 09/14/32† 144A | | | 702,357 | |
| | 270,000 | | | | | OneMain Financial Issuance Trust, Series 2018-1A, Class A, 3.30%, due 03/14/29 144A | | | 270,703 | |
| | 500,000 | | | | | OZLM Funding II CLO, Ltd., Series 2012-2A, Class A1R, 3.21% (3 mo. USD LIBOR plus 1.440%), due 10/30/27† 144A | | | 500,751 | |
| | 750,000 | | | | | OZLM Funding IV CLO, Ltd., Series 2013-4A, Class A1R, 2.99% (3 mo. USD LIBOR plus 1.490%), due 10/22/30† 144A | | | 754,797 | |
| | 250,000 | | | | | OZLM XI CLO, Ltd., Series 2015-11A, Class A1R, 3.02% (3 mo. USD LIBOR plus 1.250%), due 10/30/30† 144A | | | 250,983 | |
| | 750,000 | | | | | OZLM XV CLO, Ltd., Series 2016-15A, Class A1, 3.23% (3 mo. USD LIBOR plus 1.490%), due 01/20/29† 144A | | | 755,095 | |
| | 500,000 | | | | | Palmer Square CLO, Ltd., Series 2015-1A, Class A1R, 3.19% (3 mo. USD LIBOR plus 1.300%), due 05/21/29† 144A | | | 501,733 | |
| | | | | | |
| | See accompanying Notes to the Financial Statements. | | | 75 | |
Mercer Core Fixed Income Fund
Schedule of Investments (Continued)
(showing percentage of net assets)
March 31, 2018
| | | | | | | | | | |
| Par Value ($) | | | | | Description | | Value ($) | |
| | | |
| | | | | | Asset Backed Securities — continued | | | | |
| | | |
| | 340,000 | | | | | PFS Financing Corp., Series 2018-B, Class A, 2.89%, due 02/15/23‡‡‡‡ | | | 338,492 | |
| | 500,000 | | | | | Regatta IV Funding CLO, Ltd., Series 2014-1A, Class A1R, 2.77% (3 mo. USD LIBOR plus 1.020%), due 07/25/26† 144A | | | 500,143 | |
| | 500,000 | | | | | Regatta VII Funding CLO, Ltd., Series 2016-1A, Class A1, 3.72% (3 mo. USD LIBOR plus 1.520%), due 12/20/28† 144A | | | 503,226 | |
| | 12,418 | | | | | Renaissance Home Equity Loan Trust, Series 2005-2, Class AF4, 4.93%, due 08/25/35†† | | | 12,681 | |
| | 300,000 | | | | | Santander Drive Auto Receivables Trust, Series 2017-3, Class C, 2.76%, due 12/15/22 | | | 297,243 | |
| | 300,000 | | | | | Santander Drive Auto Receivables Trust, Series 2018-1, Class C, 2.96%, due 03/15/24 | | | 298,681 | |
| | 390,945 | | | | | Saxon Asset Securities Trust, Series 2005-1, Class M1, 2.56% (1 mo. USD LIBOR plus 0.690%), due 05/25/35† | | | 391,862 | |
| | 260,478 | | | | | Sierra Timeshare Receivables Funding LLC, Series 2013-3A, Class A, 2.20%, due 10/20/30 144A | | | 259,648 | |
| | 500,000 | | | | | Silver Creek CLO, Ltd., Series 2014-1A, Class AR, 2.98% (3 mo. USD LIBOR plus 1.240%), due 07/20/30† 144A | | | 502,680 | |
| | 3,596,515 | | | | | Small Business Administration Participation Certificates, Series 2013-20H, Class 1, 3.16%, due 08/01/33 | | | 3,642,309 | |
| | 3,361,243 | | | | | Small Business Administration Participation Certificates, Series 2014-20C, Class 1, 3.21%, due 03/01/34 | | | 3,414,859 | |
| | 1,418,431 | | | | | Small Business Administration Participation Certificates, Series 2014-20D, Class 1, 3.11%, due 04/01/34 | | | 1,433,066 | |
| | 1,007,851 | | | | | Small Business Administration Participation Certificates, Series 2014-20I, Class 1, 2.92%, due 09/01/34 | | | 1,005,139 | |
| | 218,205 | | | | | SoFi Professional Loan Program, Series 2017-E, Class A2A, 1.86%, due 11/26/40 144A | | | 215,940 | |
| | 1,300,000 | | | | | SoFi Professional Loan Program, Series 2017-F, Class A2FX, 2.84%, due 01/25/41 144A | | | 1,280,239 | |
| | 500,000 | | | | | Sound Point CLO XVI, Ltd., Series 2017-2A, Class A, 3.03% (3 mo. USD LIBOR plus 1.280%), due 07/25/30† 144A | | | 502,390 | |
| | 496,205 | | | | | SpringCastle America Funding LLC, Series 2016-AA, Class A, 3.05%, due 04/25/29 144A | | | 496,118 | |
| | 759,198 | | | | | Springleaf Funding Trust, Series 2015-AA, Class A, 3.16%, due 11/15/24 144A | | | 759,977 | |
| | 3,251,875 | | | | | STORE Master Funding I LLC, Series 2015-1A, Class A1, 3.75%, due 04/20/45 144A | | | 3,212,826 | |
| | 1,202,502 | | | | | STORE Master Funding LLC, Series 2014-1A, Class A2, 5.00%, due 04/20/44 144A | | | 1,240,031 | |
| | 935,168 | | | | | SunTrust Student Loan Trust, Series 2006-1A, Class A4, 1.95% (3 mo. USD LIBOR plus 0.190%), due 10/28/37† 144A | | | 924,567 | |
| | 429,563 | | | | | Taco Bell Funding LLC, Series 2016-1A, Class A2I, 3.83%, due 05/25/46 144A | | | 432,789 | |
| | 750,000 | | | | | Telos CLO, Series 2013-3A, Class AR, 3.03% (3 mo. USD LIBOR plus 1.300%), due 07/17/26† 144A | | | 756,091 | |
| | 1,000,000 | | | | | TICP CLO VI, Ltd., Series 2016-6A, Class A, 3.27% (3 mo. USD LIBOR plus 1.550%), due 01/15/29† 144A | | | 1,006,818 | |
| | 250,000 | | | | | TICP CLO VII, Ltd., Series 2017-7A, Class AS, 2.95% (3 mo. USD LIBOR plus 1.230%), due 07/15/29† 144A | | | 251,302 | |
| | 115,000 | | | | | Towd Point Mortgage Trust, Series 2015-1, Class A5, 3.57%, due 10/25/53◆◆ 144A | | | 118,873 | |
| | 265,000 | | | | | Towd Point Mortgage Trust, Series 2015-2, Class 1M2, 3.57%, due 11/25/60◆◆ 144A | | | 278,488 | |
| | 464,580 | | | | | Towd Point Mortgage Trust, Series 2016-5, Class A1, 2.50%, due 10/25/56◆◆ 144A | | | 459,302 | |
| | 136,423 | | | | | Towd Point Mortgage Trust, Series 2017-1, Class A1, 2.75%, due 10/25/56◆◆ 144A | | | 135,253 | |
| | 115,047 | | | | | Towd Point Mortgage Trust, Series 2017-2, Class A1, 2.75%, due 04/25/57◆◆ 144A | | | 114,339 | |
| | 1,095,953 | | | | | Towd Point Mortgage Trust, Series 2017-4, Class A1, 2.75%, due 06/25/57◆◆ 144A | | | 1,083,403 | |
| | 1,094,538 | | | | | Towd Point Mortgage Trust, Series 2017-6, Class A1, 2.75%, due 10/25/57◆◆ 144A | | | 1,081,934 | |
| | 943,193 | | | | | Towd Point Mortgage Trust, Series 2018-1, Class A1, 3.00%, due 01/25/58◆◆ 144A | | | 940,396 | |
| | 265,000 | | | | | Toyota Auto Receivables Owner Trust, Series 2016-C, Class A4, 1.32%, due 11/15/21 | | | 259,499 | |
| | 425,000 | | | | | Toyota Auto Receivables Owner Trust, Series 2017-A, Class A3, 1.73%, due 02/16/21 | | | 420,643 | |
| | | | | | |
| 76 | | See accompanying Notes to the Financial Statements. | | | | |
Mercer Core Fixed Income Fund
Schedule of Investments (Continued)
(showing percentage of net assets)
March 31, 2018
| | | | | | | | | | |
| Par Value ($) | | | | | Description | | Value ($) | |
| | | |
| | | | | | Asset Backed Securities — continued | | | | |
| | | |
| | 590,000 | | | | | Toyota Auto Receivables Owner Trust, Series 2017-B, Class A3, 1.76%, due 07/15/21 | | | 583,320 | |
| | 300,000 | | | | | Toyota Auto Receivables Owner Trust, Series 2017-C, Class A4, 1.98%, due 12/15/22 | | | 293,921 | |
| | 315,000 | | | | | Toyota Auto Receivables Owner Trust, Series 2018-A, Class A3, 2.35%, due 05/16/22 | | | 312,892 | |
| | 750,000 | | | | | Trinitas CLO V, Ltd., Series 2016-5A, Class A, 3.45% (3 mo. USD LIBOR plus 1.700%), due 10/25/28† 144A | | | 754,200 | |
| | 500,000 | | | | | Trinitas CLO VI, Ltd., Series 2017-6A, Class A, 3.07% (3 mo. USD LIBOR plus 1.320%), due 07/25/29† 144A | | | 503,011 | |
| | 245,000 | | | | | Triton Container Finance V LLC, Series 2018-1A, Class A, 3.95%, due 03/20/43‡‡‡‡ | | | 245,000 | |
| | 184,846 | | | | | Vantage Data Centers Issuer LLC, Series 2018-1A, Class A2, 4.07%, due 02/16/43‡‡‡‡ | | | 186,754 | |
| | 1,953,000 | | | | | Verizon Owner Trust, Series 2016-1A, Class A, 1.42%, due 01/20/21 144A | | | 1,937,907 | |
| | 2,530,000 | | | | | Verizon Owner Trust, Series 2017-1A, Class A, 2.06%, due 09/20/21 144A | | | 2,505,747 | |
| | 77,699 | | | | | VOLT LVII LLC, Series 2017-NPL4, Class A1, 3.38%, due 04/25/47†† 144A | | | 77,731 | |
| | 99,693 | | | | | VOLT LX LLC, Series 2017-NPL7, Class A1, 3.25%, due 06/25/47†† 144A | | | 99,516 | |
| | 440,000 | | | | | Volvo Financial Equipment LLC, Series 2018-1A, Class A3, 2.54%, due 02/15/22 144A | | | 438,218 | |
| | 238,740 | | | | | VSE VOI Mortgage LLC, Series 2017-A, Class A, 2.33%, due 03/20/35‡‡‡‡ | | | 232,908 | |
| | 65,203 | | | | | Wachovia Student Loan Trust, Series 2006-1, Class B, 1.99% (3 mo. USD LIBOR plus 0.240%), due 04/25/40† 144A | | | 62,361 | |
| | 500,000 | | | | | Wellfleet CLO, Ltd., Series 2016-2A, Class A1, 3.39% (3 mo. USD LIBOR plus 1.650%), due 10/20/28† 144A | | | 503,337 | |
| | 455,845 | | | | | West CLO, Ltd., Series 2013-1A, Class A1AR, 2.95% (3 mo. USD LIBOR plus 1.160%), due 11/07/25† 144A | | | 456,132 | |
| | 213,483 | | | | | Westgate Resorts LLC, Series 2017-1A, Class A, 3.05%, due 12/20/30‡‡‡‡ | | | 212,193 | |
| | 145,000 | | | | | World Omni Auto Receivables Trust, Series 2017-B, Class A3, 1.95%, due 02/15/23 | | | 142,142 | |
| | 410,000 | | | | | World Omni Auto Receivables Trust, Series 2018-A, Class A3, 2.50%, due 04/17/23 | | | 407,934 | |
| | 250,000 | | | | | Zais CLO 6, Ltd., Series 2017-1A, Class A1, 3.09% (3 mo. USD LIBOR plus 1.370%), due 07/15/29† 144A | | | 251,589 | |
| | | | | | | | | | |
| | | | 106,862,139 | |
| | | | | | | | | | |
| | |
| | | | | | Corporate Debt — 35.9% | |
| | | |
| | 20,000 | | | | | 21st Century Fox America, Inc., 6.75%, due 01/09/38 | | | 26,258 | |
| | 775,000 | | | | | Abbott Laboratories, 2.90%, due 11/30/21 | | | 767,460 | |
| | 812,000 | | | | | AbbVie, Inc., 3.20%, due 11/06/22 | | | 802,429 | |
| | 720,000 | | | | | AbbVie, Inc., 3.60%, due 05/14/25 | | | 710,681 | |
| | 500,000 | | | | | AbbVie, Inc., 4.50%, due 05/14/35 | | | 513,600 | |
| | 243,457 | | | | | Abengoa Transmision Sur SA, 6.88%, due 04/30/43 144A | | | 267,194 | |
| | 344,000 | | | | | Activision Blizzard, Inc., 3.40%, due 09/15/26 | | | 335,971 | |
| | 380,000 | | | | | Activision Blizzard, Inc., 6.13%, due 09/15/23 144A | | | 397,527 | |
| | 161,000 | | | | | Advanced Micro Devices, Inc., 7.00%, due 07/01/24 | | | 169,855 | |
| | 347,000 | | | | | AECOM, 5.13%, due 03/15/27 | | | 335,098 | |
| | 400,000 | | | | | AEP Texas, Inc., 3.80%, due 10/01/47 | | | 381,495 | |
| | 175,000 | | | | | AEP Transmission Co. LLC, 3.75%, due 12/01/47 144A | | | 165,996 | |
| | 340,000 | | | | | AerCap Global Aviation Trust, 6.50% (3 mo. USD LIBOR plus 4.300%), due 06/15/45† 144A | | | 368,475 | |
| | 280,000 | | | | | AerCap Ireland Capital DAC/AerCap Global Aviation Trust, 3.75%, due 05/15/19 | | | 281,829 | |
| | 355,000 | | | | | AerCap Ireland Capital DAC/AerCap Global Aviation Trust, 4.63%, due 10/30/20 | | | 365,632 | |
| | 330,000 | | | | | AerCap Ireland Capital DAC/AerCap Global Aviation Trust, 5.00%, due 10/01/21 | | | 343,782 | |
| | 370,000 | | | | | Aetna, Inc., 4.75%, due 03/15/44 | | | 382,656 | |
| | 315,000 | | | | | Agrium, Inc., 4.90%, due 06/01/43 | | | 328,854 | |
| | 150,000 | | | | | Agrium, Inc., 5.25%, due 01/15/45 | | | 164,055 | |
| | | | | | |
| | See accompanying Notes to the Financial Statements. | | | 77 | |
Mercer Core Fixed Income Fund
Schedule of Investments (Continued)
(showing percentage of net assets)
March 31, 2018
| | | | | | | | | | |
| Par Value ($) | | | | | Description | | Value ($) | |
| | |
| | | | | | Corporate Debt — continued | |
| | | |
| | 390,000 | | | | | Ahern Rentals, Inc., 7.38%, due 05/15/23‡ 144A | | | 380,250 | |
| | 168,318 | | | | | Air Canada 2013-1 Class A Pass Through Trust, 4.13%, due 11/15/26‡‡‡‡ | | | 170,178 | |
| | 250,000 | | | | | Air Canada 2013-1 Class C Pass Through Trust, 6.63%, due 05/15/18 144A | | | 251,250 | |
| | 1,890,275 | | | | | Air Canada 2015-1 Class A Pass Through Trust, 3.60%, due 09/15/28 144A | | | 1,862,583 | |
| | 180,000 | | | | | Air Canada 2017-1 Class B Pass Through Trust, 3.70%, due 07/15/27‡‡‡‡ | | | 176,668 | |
| | 1,908,000 | | | | | Air Lease Corp., 3.25%, due 03/01/25 | | | 1,823,072 | |
| | 155,000 | | | | | Aircastle, Ltd., 5.50%, due 02/15/22‡ | | | 162,363 | |
| | 40,000 | | | | | Aircastle, Ltd., 7.63%, due 04/15/20 | | | 42,950 | |
| | 210,000 | | | | | Alimentation Couche-Tard, Inc., 2.70%, due 07/26/22‡ 144A | | | 203,802 | |
| | 335,000 | | | | | Allergan Funding SCS, 3.80%, due 03/15/25‡ | | | 329,596 | |
| | 605,000 | | | | | Allergan Funding SCS, 4.55%, due 03/15/35 | | | 594,013 | |
| | 39,000 | | | | | Allergan Funding SCS, 4.75%, due 03/15/45‡ | | | 38,404 | |
| | 225,000 | | | | | Ally Financial, Inc., 3.25%, due 11/05/18‡ | | | 225,562 | |
| | 465,000 | | | | | Ally Financial, Inc., 5.13%, due 09/30/24 | | | 476,044 | |
| | 200,000 | | | | | Altice Financing SA, 6.63%, due 02/15/23 144A | | | 198,500 | |
| | 135,000 | | | | | Altria Group, Inc., 2.85%, due 08/09/22 | | | 132,263 | |
| | 595,000 | | | | | Amazon.com, Inc., 3.15%, due 08/22/27‡ 144A | | | 575,236 | |
| | 226,000 | | | | | Amazon.com, Inc., 3.88%, due 08/22/37 144A | | | 225,963 | |
| | 585,000 | | | | | Amazon.com, Inc., 4.05%, due 08/22/47 144A | | | 587,959 | |
| | 307,000 | | | | | AMC Entertainment Holdings, Inc., 6.13%, due 05/15/27‡ | | | 303,961 | |
| | 340,000 | | | | | AMC Networks, Inc., 5.00%, due 04/01/24‡ | | | 336,828 | |
| | 620,000 | | | | | America Movil SAB de CV, 5.00%, due 03/30/20 | | | 640,512 | |
| | 3,618,544 | | | | | American Airlines Pass Through Trust, Series 2013-2, Class A, 4.95%, due 07/15/24 | | | 3,768,352 | |
| | 141,463 | | | | | American Airlines Pass Through Trust, Series 2015-1, Class A, 3.38%, due 11/01/28 | | | 138,634 | |
| | 282,142 | | | | | American Airlines Pass Through Trust, Series 2016-1, Class A, 4.10%, due 07/15/29 | | | 283,680 | |
| | 219,108 | | | | | American Airlines Pass Through Trust, Series 2017-1, Class A, 4.00%, due 08/15/30 | | | 219,029 | |
| | 259,470 | | | | | American Airlines Pass Through Trust, Series 2017-1, Class AA, 3.65%, due 02/15/29 | | | 258,043 | |
| | 150,000 | | | | | American Airlines Pass Through Trust, Series 2017-2, Class A, 3.60%, due 04/15/31 | | | 147,963 | |
| | 455,000 | | | | | American Express Co., 2.50%, due 08/01/22 | | | 439,334 | |
| | 1,003,000 | | | | | American Express Credit Corp., 1.88%, due 05/03/19 | | | 993,857 | |
| | 290,000 | | | | | American Homes 4 Rent, LP, 4.25%, due 02/15/28 | | | 284,747 | |
| | 235,000 | | | | | American Tower Corp. REIT, 3.40%, due 02/15/19 | | | 235,888 | |
| | 471,000 | | | | | American Tower Corp. REIT, 3.55%, due 07/15/27 | | | 446,512 | |
| | 235,000 | | | | | American Tower Corp. REIT, 4.70%, due 03/15/22 | | | 245,471 | |
| | 180,000 | | | | | AmeriGas Partners, LP/AmeriGas Finance Corp., 5.50%, due 05/20/25 | | | 174,600 | |
| | 813,000 | | | | | Amgen, Inc., 4.66%, due 06/15/51 | | | 842,801 | |
| | 295,000 | | | | | Anadarko Petroleum Corp., 6.20%, due 03/15/40 | | | 348,888 | |
| | 6,000,000 | | | | | Anadarko Petroleum Corp., 6.98%, due 10/10/36‡‡ | | | 2,566,015 | |
| | 156,000 | | | | | Andeavor Logistics, LP/Tesoro Logistics Finance Corp., 4.25%, due 12/01/27 | | | 152,379 | |
| | 240,000 | | | | | Anglo American Capital Plc, 4.75%, due 04/10/27‡ ‡‡‡‡ | | | 243,147 | |
| | 465,000 | | | | | Anheuser-Busch InBev Finance, Inc., 4.70%, due 02/01/36 | | | 493,474 | |
| | 2,280,000 | | | | | Anheuser-Busch InBev Finance, Inc., 4.90%, due 02/01/46 | | | 2,468,534 | |
| | 275,000 | | | | | Anheuser-Busch InBev Worldwide, Inc., 4.60%, due 04/15/48†††† | | | 285,162 | |
| | 340,000 | | | | | Anheuser-Busch InBev Worldwide, Inc., 5.38%, due 01/15/20 | | | 355,840 | |
| | 350,000 | | | | | Anixter, Inc., 5.63%, due 05/01/19 | | | 358,750 | |
| | 230,000 | | | | | Antero Midstream Partners, LP/Antero Midstream Finance Corp., 5.38%, due 09/15/24 | | | 232,875 | |
| | 244,000 | | | | | Antero Resources Corp., 5.13%, due 12/01/22 | | | 247,050 | |
| | 5,000 | | | | | Anthem, Inc., 5.10%, due 01/15/44 | | | 5,415 | |
| | 295,000 | | | | | Aquarius & Investments Plc for Swiss Reinsurance Co., Ltd., Reg S, 6.38% (USD 5 year swap rate plus 5.210%), due 09/01/24† ‡‡‡ | | | 303,850 | |
| | | | | | |
| 78 | | See accompanying Notes to the Financial Statements. | | | | |
Mercer Core Fixed Income Fund
Schedule of Investments (Continued)
(showing percentage of net assets)
March 31, 2018
| | | | | | | | | | |
| Par Value ($) | | | | | Description | | Value ($) | |
| | |
| | | | | | Corporate Debt — continued | |
| | | |
| | 314,000 | | | | | Arconic, Inc., 5.13%, due 10/01/24‡ | | | 320,476 | |
| | 269,000 | | | | | Ares Capital Corp., 3.63%, due 01/19/22 | | | 265,313 | |
| | 240,000 | | | | | Ashtead Capital, Inc., 4.38%, due 08/15/27 144A | | | 228,600 | |
| | 180,000 | | | | | ASP AMC Merger Sub, Inc., 8.00%, due 05/15/25 144A | | | 169,650 | |
| | 150,000 | | | | | AT&T, Inc., 2.63%, due 12/01/22‡ | | | 144,495 | |
| | 2,079,000 | | | | | AT&T, Inc., 3.40%, due 05/15/25 | | | 2,006,343 | |
| | 5,000,000 | | | | | AT&T, Inc., 3.63%, due 11/27/22‡‡ 144A | | | 4,266,391 | |
| | 120,000 | | | | | AT&T, Inc., 3.88%, due 08/15/21 | | | 122,212 | |
| | 10,000 | | | | | AT&T, Inc., 4.45%, due 05/15/21 | | | 10,353 | |
| | 394,000 | | | | | AT&T, Inc., 4.75%, due 05/15/46 | | | 384,132 | |
| | 45,000 | | | | | AT&T, Inc., 4.90%, due 08/14/37 | | | 45,393 | |
| | 110,000 | | | | | AT&T, Inc., 5.25%, due 03/01/37 | | | 116,714 | |
| | 50,000 | | | | | AT&T, Inc., 5.30%, due 08/14/58 | | | 50,628 | |
| | 640,000 | | | | | AT&T, Inc., 5.45%, due 03/01/47‡ | | | 681,815 | |
| | 425,000 | | | | | Australia & New Zealand Banking Group, Ltd., 2.13%, due 08/19/20‡ | | | 416,479 | |
| | 200,000 | | | | | Australia & New Zealand Banking Group, Ltd., 6.75% (USISDA05 plus 5.168%)† ††††† ‡ ‡‡‡‡ | | | 213,000 | |
| | 354,000 | | | | | Autodesk, Inc., 3.50%, due 06/15/27 | | | 338,584 | |
| | 190,000 | | | | | AXA SA, 8.60%, due 12/15/30 | | | 258,875 | |
| | 260,000 | | | | | Azul Investments LLP, 5.88%, due 10/26/24‡‡‡‡ | | | 256,750 | |
| | 260,000 | | | | | BAC Capital Trust XIV, 4.00% (3 mo. USD LIBOR plus 0.400%)† ††††† | | | 223,275 | |
| | 2,160,000 | | | | | BAE Systems Holdings, Inc., 6.38%, due 06/01/19 144A | | | 2,248,783 | |
| | 87,000 | | | | | Bank of America Corp., 2.60%, due 01/15/19 | | | 87,096 | |
| | 2,526,000 | | | | | Bank of America Corp., 3.50%, due 04/19/26 | | | 2,484,426 | |
| | 755,000 | | | | | Bank of America Corp., 3.59% (3 mo. USD LIBOR plus 1.370%), due 07/21/28† ‡ | | | 734,171 | |
| | 420,000 | | | | | Bank of America Corp., 5.13% (3 mo. USD LIBOR plus 3.387%)† ††††† | | | 425,355 | |
| | 270,000 | | | | | Bank of America Corp., 6.30% (3 mo. USD LIBOR plus 4.553%)† ††††† | | | 290,250 | |
| | 740,000 | | | | | Bank of America Corp., (MTN), 3.30%, due 01/11/23 | | | 738,322 | |
| | 378,000 | | | | | Bank of America Corp., (MTN), 3.95%, due 04/21/25 | | | 375,010 | |
| | 500,000 | | | | | Bank of America Corp., (MTN), 4.13%, due 01/22/24 | | | 515,060 | |
| | 165,000 | | | | | Bank of America Corp., (MTN), 4.20%, due 08/26/24 | | | 167,727 | |
| | 124,000 | | | | | Bank of America Corp., (MTN), 4.25%, due 10/22/26 | | | 125,002 | |
| | 270,000 | | | | | Bank of America Corp., (MTN), 4.44% (3 mo. USD LIBOR plus 1.990%), due 01/20/48† | | | 282,563 | |
| | 1,330,000 | | | | | Bank of America Corp., (MTN), 4.45%, due 03/03/26 | | | 1,360,904 | |
| | 425,000 | | | | | Banque Federative du Credit Mutuel SA, 2.20%, due 07/20/20 144A | | | 416,159 | |
| | 670,000 | | | | | Barclays Bank Plc, 2.65%, due 01/11/21 | | | 660,676 | |
| | 380,000 | | | | | Barclays Plc, 3.20%, due 08/10/21‡ | | | 375,611 | |
| | 300,000 | | | | | Barclays Plc, 3.68%, due 01/10/23‡ | | | 297,717 | |
| | 325,000 | | | | | Barclays Plc, 4.38%, due 01/12/26 | | | 325,889 | |
| | 200,000 | | | | | Barclays Plc, 4.95%, due 01/10/47 | | | 205,923 | |
| | 770,000 | | | | | BAT Capital Corp., 3.22%, due 08/15/24 144A | | | 743,431 | |
| | 375,000 | | | | | Becton Dickinson and Co., 2.13%, due 06/06/19 | | | 370,861 | |
| | 1,060,000 | | | | | Becton Dickinson and Co., 3.70%, due 06/06/27 | | | 1,025,371 | |
| | 1,395,000 | | | | | Berkshire Hathaway Energy Co., 6.13%, due 04/01/36 | | | 1,783,100 | |
| | 105,000 | | | | | BHP Billiton Finance USA, Ltd., 6.25% (USD 5 year swap rate plus 4.971%), due 10/19/75† 144A | | | 110,828 | |
| | 1,099,000 | | | | | Blackstone Holdings Finance Co. LLC, 4.75%, due 02/15/23 144A | | | 1,160,781 | |
| | 760,000 | | | | | BNP Paribas SA, 3.38%, due 01/09/25‡ 144A | | | 736,238 | |
| | 170,000 | | | | | Boardwalk Pipelines, LP, 4.45%, due 07/15/27 | | | 165,588 | |
| | | | | | |
| | See accompanying Notes to the Financial Statements. | | | 79 | |
Mercer Core Fixed Income Fund
Schedule of Investments (Continued)
(showing percentage of net assets)
March 31, 2018
| | | | | | | | | | |
| Par Value ($) | | | | | Description | | Value ($) | |
| | |
| | | | | | Corporate Debt — continued | |
| | | |
| | 1,835,000 | | | | | Boston Properties, LP REIT, 5.63%, due 11/15/20 | | | 1,942,731 | |
| | 280,000 | | | | | BPCE SA, 4.50%, due 03/15/25 144A | | | 281,572 | |
| | 415,000 | | | | | BPCE SA, 5.70%, due 10/22/23 144A | | | 445,482 | |
| | 205,000 | | | | | Braskem Finance, Ltd., 7.00%, due 05/07/20 144A | | | 218,411 | |
| | 310,000 | | | | | Braskem Netherlands Finance BV, 4.50%, due 01/10/28‡ 144A | | | 302,141 | |
| | 530,000 | | | | | Brighthouse Financial, Inc., 3.70%, due 06/22/27‡ 144A | | | 492,671 | |
| | 255,377 | | | | | British Airways 2013-1 Class A Pass Through Trust, 4.63%, due 12/20/25 144A | | | 265,579 | |
| | 59,135 | | | | | British Airways 2013-1 Class B Pass Through Trust, 5.63%, due 12/20/21 144A | | | 60,838 | |
| | 95,000 | | | | | British Airways 2018-1 Class AA Pass Through Trust, 3.80%, due 03/20/33‡ 144A | | | 95,950 | |
| | 425,000 | | | | | Broadcom Corp./Broadcom Cayman Finance, Ltd., 2.38%, due 01/15/20 | | | 419,251 | |
| | 1,022,000 | | | | | Broadcom Corp./Broadcom Cayman Finance, Ltd., 3.88%, due 01/15/27 | | | 995,810 | |
| | 272,000 | | | | | Bunge, Ltd. Finance Corp., 8.50%, due 06/15/19 | | | 289,084 | |
| | 245,000 | | | | | C&W Senior Financing Designated Activity Co., 6.88%, due 09/15/27‡ ‡‡‡‡ | | | 245,000 | |
| | 305,000 | | | | | CA, Inc., 3.60%, due 08/15/22 | | | 308,003 | |
| | 165,000 | | | | | Cablevision SA, 6.50%, due 06/15/21 144A | | | 172,425 | |
| | 195,000 | | | | | Cablevision Systems Corp., 5.88%, due 09/15/22‡ | | | 193,966 | |
| | 725,000 | | | | | Canadian Imperial Bank of Commerce, 2.70%, due 02/02/21‡ | | | 717,797 | |
| | 933,000 | | | | | Canadian Natural Resources, Ltd., 2.95%, due 01/15/23 | | | 906,948 | |
| | 859,000 | | | | | Canadian Pacific Railway Co., 6.13%, due 09/15/15# ‡ | | | 1,078,244 | |
| | 200,000 | | | | | Capital One Financial Corp., 2.40%, due 10/30/20 | | | 196,162 | |
| | 310,000 | | | | | Capital One Financial Corp., 2.45%, due 04/24/19 | | | 308,692 | |
| | 958,000 | | | | | Capital One Financial Corp., 3.20%, due 01/30/23 | | | 935,988 | |
| | 585,000 | | | | | Capital One Financial Corp., 3.75%, due 07/28/26 | | | 557,542 | |
| | 340,000 | | | | | Capital One Financial Corp., 4.20%, due 10/29/25 | | | 337,433 | |
| | 122,000 | | | | | CBS Corp., 3.38%, due 03/01/22 | | | 121,583 | |
| | 195,000 | | | | | CBS Corp., 3.70%, due 08/15/24 | | | 194,058 | |
| | 175,000 | | | | | CCM Merger, Inc., 6.00%, due 03/15/22‡‡‡‡ | | | 177,187 | |
| | 210,000 | | | | | CCO Holdings LLC/CCO Holdings Capital Corp., 5.88%, due 05/01/27 144A | | | 210,525 | |
| | 39,000 | | | | | CDW LLC/CDW Finance Corp., 5.00%, due 09/01/25 | | | 39,000 | |
| | 234,000 | | | | | Celgene Corp., 2.88%, due 08/15/20 | | | 233,206 | |
| | 248,000 | | | | | Celgene Corp., 2.88%, due 02/19/21 | | | 246,411 | |
| | 235,000 | | | | | Cemex SAB de CV, 6.13%, due 05/05/25‡ 144A | | | 245,034 | |
| | 225,000 | | | | | Cengage Learning, Inc., 9.50%, due 06/15/24‡ 144A | | | 173,812 | |
| | 380,000 | | | | | Cenovus Energy, Inc., 4.45%, due 09/15/42 | | | 340,343 | |
| | 250,000 | | | | | Cenovus Energy, Inc., 5.40%, due 06/15/47‡ | | | 252,553 | |
| | 350,000 | | | | | Centene Corp., 5.63%, due 02/15/21‡ | | | 360,500 | |
| | 205,000 | | | | | CenterPoint Energy, Inc., 2.50%, due 09/01/22 | | | 198,873 | |
| | 520,000 | | | | | Charter Communications Operating LLC/Charter Communications Operating Capital, 4.20%, due 03/15/28 | | | 498,757 | |
| | 5,000 | | | | | Charter Communications Operating LLC/Charter Communications Operating Capital, 4.46%, due 07/23/22 | | | 5,112 | |
| | 1,846,000 | | | | | Charter Communications Operating LLC/Charter Communications Operating Capital, 6.38%, due 10/23/35 | | | 2,067,610 | |
| | 815,000 | | | | | Charter Communications Operating LLC/Charter Communications Operating Capital, 6.48%, due 10/23/45 | | | 897,598 | |
| | 386,000 | | | | | Chemours Co. (The), 6.63%, due 05/15/23‡ | | | 406,747 | |
| | 192,000 | | | | | Cheniere Corpus Christi Holdings LLC, 5.13%, due 06/30/27 | | | 191,280 | |
| | 133,000 | | | | | Cheniere Corpus Christi Holdings LLC, 5.88%, due 03/31/25 | | | 139,650 | |
| | 125,000 | | | | | CHS/Community Health Systems, Inc., 5.13%, due 08/01/21 | | | 116,875 | |
| | 89,000 | | | | | CHS/Community Health Systems, Inc., 8.00%, due 11/15/19‡ | | | 80,323 | |
| | | | | | |
| 80 | | See accompanying Notes to the Financial Statements. | | | | |
Mercer Core Fixed Income Fund
Schedule of Investments (Continued)
(showing percentage of net assets)
March 31, 2018
| | | | | | | | | | |
| Par Value ($) | | | | | Description | | Value ($) | |
| | |
| | | | | | Corporate Debt — continued | |
| | | |
| | 205,000 | | | | | Cimarex Energy Co., 4.38%, due 06/01/24 | | | 211,236 | |
| | 335,000 | | | | | Cincinnati Bell, Inc., 7.00%, due 07/15/24 144A | | | 301,500 | |
| | 400,000 | | | | | Citigroup, Inc., 2.35%, due 08/02/21 | | | 388,700 | |
| | 1,374,000 | | | | | Citigroup, Inc., 2.70%, due 03/30/21‡ | | | 1,354,975 | |
| | 465,000 | | | | | Citigroup, Inc., 2.75%, due 04/25/22 | | | 453,393 | |
| | 983,000 | | | | | Citigroup, Inc., 3.40%, due 05/01/26 | | | 951,749 | |
| | 789,000 | | | | | Citigroup, Inc., 3.44% (3 mo. USD LIBOR plus 1.430%), due 09/01/23† | | | 808,725 | |
| | 1,110,000 | | | | | Citigroup, Inc., 3.89% (3 mo. USD LIBOR plus 1.563%), due 01/10/28† | | | 1,105,211 | |
| | 140,000 | | | | | Citigroup, Inc., 4.28% (3 mo. USD LIBOR plus 1.839%), due 04/24/48† ‡ | | | 142,262 | |
| | 180,000 | | | | | Citigroup, Inc., 4.40%, due 06/10/25 | | | 183,388 | |
| | 584,000 | | | | | Citigroup, Inc., 4.60%, due 03/09/26‡ | | | 600,028 | |
| | 520,000 | | | | | Citigroup, Inc., 4.75%, due 05/18/46 | | | 530,453 | |
| | 361,000 | | | | | Citigroup, Inc., 5.88% (3 mo. USD LIBOR plus 4.059%)† ††††† ‡ | | | 373,184 | |
| | 130,000 | | | | | Citigroup, Inc., 5.90% (3 mo. USD LIBOR plus 4.230%)† ††††† | | | 134,388 | |
| | 230,000 | | | | | Citigroup, Inc., 5.95% (3 mo. USD LIBOR plus 4.068%)† ††††† | | | 237,049 | |
| | 550,000 | | | | | Citigroup, Inc., 5.95% (3 mo. USD LIBOR plus 4.095%)† ††††† | | | 570,974 | |
| | 120,000 | | | | | Citigroup, Inc., 6.13% (3 mo. USD LIBOR plus 4.478%)† ††††† ‡ | | | 126,402 | |
| | 385,000 | | | | | Citigroup, Inc., 6.25% (3 mo. USD LIBOR plus 4.517%)† ††††† | | | 407,137 | |
| | 390,000 | | | | | Citizens Bank NA/Providence RI, 2.20%, due 05/26/20 | | | 382,074 | |
| | 401,000 | | | | | Citrix Systems, Inc., 4.50%, due 12/01/27 | | | 399,133 | |
| | 250,000 | | | | | Clear Channel Worldwide Holdings, Inc., 6.50%, due 11/15/22‡ | | | 256,425 | |
| | 1,223,000 | | | | | Cleveland Clinic Foundation (The), 4.86%, due 01/01/14# | | | 1,336,019 | |
| | 585,000 | | | | | CNAC HK Finbridge Co., Ltd., Reg S, 3.50%, due 07/19/22‡‡‡ | | | 566,023 | |
| | 300,000 | | | | | CNO Financial Group, Inc., 5.25%, due 05/30/25 | | | 300,000 | |
| | 233,000 | | | | | Colorado Interstate Gas Co. LLC/Colorado Interstate Issuing Corp., 4.15%, due 08/15/26 144A | | | 228,190 | |
| | 380,000 | | | | | Columbia Pipeline Group, Inc., 4.50%, due 06/01/25 | | | 384,097 | |
| | 130,000 | | | | | Comcast Corp., 3.97%, due 11/01/47‡ | | | 123,574 | |
| | 369,000 | | | | | Comcast Corp., 4.05%, due 11/01/52 | | | 347,286 | |
| | 1,930,000 | | | | | Comcast Corp., 4.25%, due 01/15/33 | | | 2,002,972 | |
| | 79,000 | | | | | Comcast Corp., 6.40%, due 05/15/38 | | | 100,690 | |
| | 20,000 | | | | | Comcast Corp., 6.50%, due 11/15/35 | | | 25,580 | |
| | 73,000 | | | | | Commercial Metals Co., 5.38%, due 07/15/27 | | | 72,088 | |
| | 350,000 | | | | | Commonwealth Edison Co., 4.00%, due 03/01/48 | | | 352,700 | |
| | 200,000 | | | | | Comunicaciones Celulares SA Via Comcel Trust, 6.88%, due 02/06/24 144A | | | 209,678 | |
| | 45,000 | | | | | Concho Resources, Inc., 4.88%, due 10/01/47 | | | 47,952 | |
| | 190,000 | | | | | ConocoPhillips Co., 4.95%, due 03/15/26‡ | | | 207,739 | |
| | 575,000 | | | | | ConocoPhillips Holding Co., 6.95%, due 04/15/29‡ | | | 732,872 | |
| | 65,000 | | | | | Consolidated Edison Co. of New York, Inc., 4.30%, due 12/01/56 | | | 67,701 | |
| | 400,000 | | | | | Consumers Energy Co., 3.25%, due 08/15/46 | | | 358,944 | |
| | 1,164,691 | | | | | Continental Airlines Pass Through Trust, Series 2007-1, Class A, 5.98%, due 10/19/23 | | | 1,248,211 | |
| | 171,876 | | | | | Continental Airlines Pass Through Trust, Series 2012-1, Class B, 6.25%, due 10/11/21 | | | 178,537 | |
| | 518,000 | | | | | Continental Resources, Inc., 5.00%, due 09/15/22 | | | 526,417 | |
| | 195,000 | | | | | Cooperatieve Rabobank UA, 11.00% (3 mo. USD LIBOR plus 10.868%) † ††††† 144A | | | 213,966 | |
| | 820,000 | | | | | Corp. Andina de Fomento, 2.13%, due 09/27/21 | | | 796,343 | |
| | 55,000 | | | | | Corp. Andina de Fomento, 2.75%, due 01/06/23 | | | 53,868 | |
| | 1,526,000 | | | | | Cox Communications, Inc., 3.35%, due 09/15/26 144A | | | 1,455,594 | |
| | 205,000 | | | | | Credit Acceptance Corp., 6.13%, due 02/15/21 | | | 207,501 | |
| | 300,000 | | | | | Credit Agricole SA, 7.88% (USD 5 year swap rate plus 4.898%)† ††††† ‡ 144A | | | 326,748 | |
| | | | | | |
| | See accompanying Notes to the Financial Statements. | | | 81 | |
Mercer Core Fixed Income Fund
Schedule of Investments (Continued)
(showing percentage of net assets)
March 31, 2018
| | | | | | | | | | |
| Par Value ($) | | | | | Description | | Value ($) | |
| | |
| | | | | | Corporate Debt — continued | |
| | | |
| | 250,000 | | | | | Credit Agricole SA, 8.13% (USD 5 year swap rate plus 6.283%), due 09/19/33† 144A | | | 255,417 | |
| | 500,000 | | | | | Credit Suisse Group Funding Guernsey, Ltd., 3.13%, due 12/10/20 | | | 497,534 | |
| | 215,000 | | | | | Credito Real SAB de CV SOFOM ER, 9.13%◆ ††††† ‡‡‡‡ | | | 221,181 | |
| | 230,000 | | | | | Crown Castle Holdings GS V LLC/Crown Castle GS III Corp REIT, 3.85%, due 04/15/23 | | | 231,252 | |
| | 357,000 | | | | | Crown Castle Towers LLC, 4.88%, due 08/15/40 144A | | | 369,690 | |
| | 275,000 | | | | | CSI Compressco, LP/CSI Compressco Finance, Inc., 7.25%, due 08/15/22 | | | 259,875 | |
| | 125,000 | | | | | CSI Compressco, LP/CSI Compressco Finance, Inc., 7.50%, due 04/01/25 144A | | | 126,563 | |
| | 1,160,000 | | | | | CVS Health Corp., 2.75%, due 12/01/22 | | | 1,117,781 | |
| | 675,000 | | | | | CVS Health Corp., 3.35%, due 03/09/21 | | | 679,145 | |
| | 50,000 | | | | | CVS Health Corp., 4.78%, due 03/25/38 | | | 50,837 | |
| | 720,000 | | | | | CVS Health Corp., 5.05%, due 03/25/48 | | | 760,251 | |
| | 120,000 | | | | | CVS Health Corp., 5.13%, due 07/20/45 | | | 127,755 | |
| | 2,830,558 | | | | | CVS Pass-Through Trust, 7.51%, due 01/10/32 144A | | | 3,359,840 | |
| | 245,000 | | | | | Cydsa SAB DE CV, 6.25%, due 10/04/27 144A | | | 244,081 | |
| | 1,615,000 | | | | | Daimler Finance North America LLC, 2.20%, due 05/05/20 144A | | | 1,585,418 | |
| | 375,000 | | | | | DaVita, Inc., 5.00%, due 05/01/25 | | | 363,394 | |
| | 240,000 | | | | | DCP Midstream Operating LP, 5.85% (3 mo. USD LIBOR plus 3.850%), due 05/21/43† 144A | | | 228,000 | |
| | 210,000 | | | | | DCP Midstream Operating LP, 9.75%, due 03/15/19 144A | | | 222,600 | |
| | 578,000 | | | | | DCP Midstream Operating, LP, 5.35%, due 03/15/20 144A | | | 596,785 | |
| | 215,000 | | | | | Dell International LLC/EMC Corp., 3.48%, due 06/01/19 144A | | | 216,034 | |
| | 640,000 | | | | | Dell International LLC/EMC Corp., 6.02%, due 06/15/26 144A | | | 690,324 | |
| | 55,000 | | | | | Dell International LLC/EMC Corp., 7.13%, due 06/15/24 144A | | | 58,863 | |
| | 250,000 | | | | | Dell International LLC/EMC Corp., 8.35%, due 07/15/46 144A | | | 318,534 | |
| | 63,020 | | | | | Delta Air Lines Pass Through Trust, Series 2007-1, Class A, 6.20%, due 01/02/20 | | | 63,847 | |
| | 885,964 | | | | | Delta Air Lines Pass Through Trust, Series 2007-1, Class A, 6.82%, due 02/10/24 | | | 980,186 | |
| | 405,000 | | | | | Delta Air Lines, Inc., 3.63%, due 03/15/22 | | | 404,871 | |
| | 375,000 | | | | | Deutsche Bank AG, (MTN), 3.38%, due 05/12/21 | | | 370,920 | |
| | 250,000 | | | | | Dexia Credit Local SA, 1.88%, due 09/15/21 144A | | | 241,956 | |
| | 235,000 | | | | | Digicel, Ltd., 6.75%, due 03/01/23 144A | | | 212,647 | |
| | 622,000 | | | | | Digital Realty Trust, LP REIT, 3.70%, due 08/15/27 | | | 600,552 | |
| | 665,000 | | | | | Discover Financial Services, 3.75%, due 03/04/25 | | | 646,439 | |
| | 412,000 | | | | | Discover Financial Services, 3.95%, due 11/06/24 | | | 408,151 | |
| | 120,000 | | | | | Discover Financial Services, 4.10%, due 02/09/27 | | | 119,254 | |
| | 72,000 | | | | | Discover Financial Services, 5.20%, due 04/27/22 | | | 75,569 | |
| | 35,000 | | | | | Discovery Communications LLC, 5.00%, due 09/20/37‡ | | | 34,990 | |
| | 125,000 | | | | | Discovery Communications LLC, 5.20%, due 09/20/47‡ | | | 125,201 | |
| | 264,000 | | | | | Dominion Energy, Inc., 2.58%, due 07/01/20 | | | 260,807 | |
| | 115,000 | | | | | Dominion Energy, Inc., 2.85%, due 08/15/26 | | | 106,769 | |
| | 400,000 | | | | | Dominion Energy, Inc., 4.45%, due 03/15/21 | | | 412,689 | |
| | 400,000 | | | | | Dow Chemical Co. (The), 4.38%, due 11/15/42 | | | 399,711 | |
| | 2,589,000 | | | | | Duke Energy Corp., 3.55%, due 09/15/21 | | | 2,614,862 | |
| | 420,000 | | | | | Duke Energy Florida LLC, 3.40%, due 10/01/46 | | | 383,422 | |
| | 195,000 | | | | | Duke Energy Progress LLC, 3.70%, due 10/15/46 | | | 189,645 | |
| | 274,000 | | | | | eBay, Inc., 2.15%, due 06/05/20 | | | 269,019 | |
| | 190,000 | | | | | El Paso Natural Gas Co. LLC, 8.38%, due 06/15/32 | | | 248,109 | |
| | 874,000 | | | | | Electricite de France SA, 3.63%, due 10/13/25 144A | | | 875,273 | |
| | 440,000 | | | | | Electricite de France SA, 5.25% (USSW10 plus 3.709%)† ††††† 144A | | | 442,530 | |
| | | | | | |
| 82 | | See accompanying Notes to the Financial Statements. | | | | |
Mercer Core Fixed Income Fund
Schedule of Investments (Continued)
(showing percentage of net assets)
March 31, 2018
| | | | | | | | | | |
| Par Value ($) | | | | | Description | | Value ($) | |
| | |
| | | | | | Corporate Debt — continued | |
| | | |
| | 494,000 | | | | | Electronic Arts, Inc., 4.80%, due 03/01/26 | | | 529,969 | |
| | 373,000 | | | | | Emera US Finance, LP, 3.55%, due 06/15/26 | | | 356,839 | |
| | 355,000 | | | | | Enbridge Energy Partners, LP, 4.38%, due 10/15/20 | | | 363,078 | |
| | 230,000 | | | | | Enbridge Energy Partners, LP, 5.49% (3 mo. USD LIBOR plus 3.798%), due 10/01/77† | | | 225,315 | |
| | 320,000 | | | | | Enbridge, Inc., 5.50% (3 mo. USD LIBOR plus 3.418%), due 07/15/77† | | | 304,800 | |
| | 245,000 | | | | | Enbridge, Inc., 6.25%, due 03/01/78◆ | | | 243,520 | |
| | 540,000 | | | | | Encana Corp., 6.50%, due 08/15/34‡ | | | 644,613 | |
| | 179,000 | | | | | Energy Transfer Equity, LP, 5.88%, due 01/15/24 | | | 185,265 | |
| | 295,000 | | | | | Energy Transfer LP, 5.15%, due 03/15/45 | | | 270,529 | |
| | 110,000 | | | | | Energy Transfer Partners, LP, 4.20%, due 04/15/27‡ | | | 106,390 | |
| | 93,000 | | | | | Energy Transfer Partners, LP, 9.70%, due 03/15/19 | | | 98,662 | |
| | 110,000 | | | | | EnerSys, 5.00%, due 04/30/23 144A | | | 112,200 | |
| | 307,000 | | | | | EnLink Midstream Partners, LP, 4.85%, due 07/15/26‡ | | | 310,683 | |
| | 200,000 | | | | | EnLink Midstream Partners, LP, 6.00%◆ ††††† ‡ | | | 187,159 | |
| | 54,000 | | | | | Enova International, Inc., 8.50%, due 09/01/24 144A | | | 57,240 | |
| | 201,000 | | | | | Enova International, Inc., 9.75%, due 06/01/21‡ | | | 212,557 | |
| | 55,000 | | | | | Enterprise Products Operating LLC, 3.70%, due 02/15/26 | | | 54,594 | |
| | 460,000 | | | | | Enterprise Products Operating LLC, 3.75%, due 02/15/25 | | | 462,733 | |
| | 480,000 | | | | | Enterprise Products Operating LLC, 5.25%, due 08/16/77◆ | | | 468,000 | |
| | 285,000 | | | | | Enterprise Products Operating LLC, 5.48% (3 mo. USD LIBOR plus 3.708%), due 08/01/66† | | | 286,086 | |
| | 70,000 | | | | | Equifax, Inc., 7.00%, due 07/01/37 | | | 86,154 | |
| | 174,000 | | | | | Equinix, Inc. REIT, 5.38%, due 05/15/27 | | | 177,045 | |
| | 1,934,000 | | | | | ERAC USA Finance LLC, 2.80%, due 11/01/18 144A | | | 1,934,347 | |
| | 2,045,000 | | | | | Escrow GCB General Motors, 8.38%, due 07/15/49* **** ¤ ^ ††† | | | — | |
| | 120,000 | | | | | Exela Intermediate LLC/Exela Finance, Inc., 10.00%, due 07/15/23 144A | | | 121,950 | |
| | 1,169,000 | | | | | Exelon Corp., 5.10%, due 06/15/45 | | | 1,307,512 | |
| | 912,000 | | | | | Exelon Generation Co. LLC, 4.25%, due 06/15/22‡ | | | 942,702 | |
| | 530,000 | | | | | Expedia, Inc., 3.80%, due 02/15/28 | | | 493,225 | |
| | 555,000 | | | | | Expedia, Inc., 5.00%, due 02/15/26 | | | 573,539 | |
| | 495,000 | | | | | Express Scripts Holding Co., 2.60%, due 11/30/20 | | | 486,422 | |
| | 1,270,000 | | | | | Express Scripts Holding Co., 3.40%, due 03/01/27‡ | | | 1,195,458 | |
| | 405,000 | | | | | Fidelity National Information Services, Inc., 2.85%, due 10/15/18 | | | 405,239 | |
| | 302,000 | | | | | Fidelity National Information Services, Inc., 3.63%, due 10/15/20 | | | 305,972 | |
| | 1,303,000 | | | | | Fifth Third Bancorp, 2.88%, due 07/27/20 | | | 1,301,192 | |
| | 272,000 | | | | | Fifth Third Bancorp, 5.10% (3 mo. USD LIBOR plus 3.033%)† ††††† ‡ | | | 268,600 | |
| | 245,000 | | | | | FirstEnergy Corp., Series C, 7.38%, due 11/15/31‡ | | | 323,005 | |
| | 250,000 | | | | | Flagstar Bancorp, Inc., 6.13%, due 07/15/21 | | | 263,870 | |
| | 761,000 | | | | | Ford Motor Co., 4.75%, due 01/15/43‡ | | | 696,399 | |
| | 250,000 | | | | | Ford Motor Credit Co. LLC, 3.34%, due 03/18/21 | | | 248,692 | |
| | 595,000 | | | | | Ford Motor Credit Co. LLC, 5.88%, due 08/02/21 | | | 635,374 | |
| | 580,000 | | | | | Ford Motor Credit Co. LLC, 8.13%, due 01/15/20 | | | 628,174 | |
| | 240,000 | | | | | Freedom Mortgage Corp., 8.13%, due 11/15/24 144A | | | 246,600 | |
| | 155,000 | | | | | FS Investment Corp., 4.00%, due 07/15/19 | | | 155,823 | |
| | 140,000 | | | | | FS Investment Corp., 4.25%, due 01/15/20 | | | 141,338 | |
| | 221,000 | | | | | GCI, Inc., 6.88%, due 04/15/25 | | | 232,602 | |
| | 80,000 | | | | | General Electric Co., (MTN), 4.38%, due 09/16/20 | | | 82,074 | |
| | 450,000 | | | | | General Motors Co., 4.00%, due 04/01/25 | | | 445,511 | |
| | 450,000 | | | | | General Motors Co., 4.88%, due 10/02/23 | | | 470,146 | |
| | | | | | |
| | See accompanying Notes to the Financial Statements. | | | 83 | |
Mercer Core Fixed Income Fund
Schedule of Investments (Continued)
(showing percentage of net assets)
March 31, 2018
| | | | | | | | | | |
| Par Value ($) | | | | | Description | | Value ($) | |
| | |
| | | | | | Corporate Debt — continued | |
| | | |
| | 1,045,000 | | | | | General Motors Financial Co., Inc., 3.50%, due 07/10/19 | | | 1,050,720 | |
| | 460,000 | | | | | General Motors Financial Co., Inc., 4.00%, due 01/15/25 | | | 454,170 | |
| | 1,430,000 | | | | | General Motors Financial Co., Inc., 4.20%, due 03/01/21 | | | 1,458,047 | |
| | 394,000 | | | | | General Motors Financial Co., Inc., 4.30%, due 07/13/25 | | | 395,143 | |
| | 475,000 | | | | | Gilead Sciences, Inc., 2.50%, due 09/01/23 | | | 458,174 | |
| | 185,000 | | | | | GLP Capital, LP/GLP Financing II, Inc., 5.38%, due 04/15/26 | | | 188,237 | |
| | 265,000 | | | | | Goldcorp, Inc., 3.63%, due 06/09/21 | | | 267,348 | |
| | 625,000 | | | | | Goldman Sachs Group (The), Inc., 2.30%, due 12/13/19 | | | 618,572 | |
| | 919,000 | | | | | Goldman Sachs Group (The), Inc., 2.63%, due 04/25/21 | | | 900,743 | |
| | 140,000 | | | | | Goldman Sachs Group (The), Inc., 3.50%, due 01/23/25 | | | 137,460 | |
| | 85,000 | | | | | Goldman Sachs Group (The), Inc., 3.75%, due 02/25/26 | | | 83,657 | |
| | 1,070,000 | | | | | Goldman Sachs Group (The), Inc., 3.81%, due 04/23/29◆ | | | 1,050,195 | |
| | 930,000 | | | | | Goldman Sachs Group (The), Inc., 3.85%, due 01/26/27 | | | 919,316 | |
| | 290,000 | | | | | Goldman Sachs Group (The), Inc., 5.15%, due 05/22/45 | | | 312,822 | |
| | 125,000 | | | | | Goldman Sachs Group (The), Inc., 5.30% (3 mo. USD LIBOR plus 3.834%)† ††††† | | | 125,625 | |
| | 565,000 | | | | | Goldman Sachs Group (The), Inc., 5.38% (3 mo. USD LIBOR plus 3.922%)† ††††† ‡ | | | 580,724 | |
| | 130,000 | | | | | Goldman Sachs Group (The), Inc., 5.75%, due 01/24/22 | | | 140,740 | |
| | 1,462,000 | | | | | Goldman Sachs Group (The), Inc., (MTN), 7.50%, due 02/15/19 | | | 1,521,144 | |
| | 280,000 | | | | | Greenko Dutch BV, 4.88%, due 07/24/22‡‡‡‡ | | | 270,810 | |
| | 248,000 | | | | | Gulfport Energy Corp., 6.00%, due 10/15/24 | | | 236,530 | |
| | 124,000 | | | | | H&E Equipment Services, Inc., 5.63%, due 09/01/25 | | | 125,395 | |
| | 465,000 | | | | | Hartford Financial Services Group, Inc. (The), 8.13% (3 mo. USD LIBOR plus 4.603%), due 06/15/68† | | | 470,812 | |
| | 390,000 | | | | | HCA, Inc., 5.25%, due 04/15/25‡ | | | 399,633 | |
| | 262,000 | | | | | HCA, Inc., 5.25%, due 06/15/26 | | | 266,061 | |
| | 460,000 | | | | | HCA, Inc., 5.88%, due 03/15/22 | | | 485,875 | |
| | 195,000 | | | | | HCA, Inc., 7.50%, due 02/15/22 | | | 214,744 | |
| | 110,000 | | | | | Hess Corp., 5.80%, due 04/01/47 | | | 116,039 | |
| | 418,000 | | | | | Hewlett Packard Enterprise Co., 2.10%, due 10/04/19 144A | | | 412,643 | |
| | 175,000 | | | | | Hewlett Packard Enterprise Co., 2.85%, due 10/05/18 | | | 175,202 | |
| | 105,000 | | | | | Hilton Grand Vacations Borrower LLC/Hilton Grand Vacations Borrower, Inc., 6.13%, due 12/01/24 | | | 111,956 | |
| | 305,000 | | | | | HSBC Holdings Plc, 6.88% (USISDA05 plus 5.514%)† ††††† ‡ | | | 322,919 | |
| | 95,000 | | | | | Humana, Inc., 3.95%, due 03/15/27 | | | 94,599 | |
| | 1,260,000 | | | | | Husky Energy, Inc., 7.25%, due 12/15/19 | | | 1,345,866 | |
| | 120,000 | | | | | IHS Markit, Ltd., 4.00%, due 03/01/26 144A | | | 115,800 | |
| | 90,000 | | | | | IHS Markit, Ltd., 4.75%, due 02/15/25 144A | | | 91,575 | |
| | 110,000 | | | | | IHS Markit, Ltd., 5.00%, due 11/01/22 144A | | | 114,675 | |
| | 385,000 | | | | | ING Bank NV, 5.80%, due 09/25/23 144A | | | 416,630 | |
| | 200,000 | | | | | Instituto Costarricense de Electricidad, 6.38%, due 05/15/43 144A | | | 177,380 | |
| | 200,000 | | | | | International Game Technology Plc, 6.50%, due 02/15/25 144A | | | 215,250 | |
| | 220,000 | | | | | International Lease Finance Corp., 5.88%, due 04/01/19 | | | 226,058 | |
| | 310,000 | | | | | International Paper Co., 4.40%, due 08/15/47 | | | 296,704 | |
| | 54,000 | | | | | IPALCO Enterprises, Inc., 3.70%, due 09/01/24 | | | 52,930 | |
| | 58,000 | | | | | Iridium Communications, Inc., 10.25%, due 04/15/23‡ 144A | | | 59,740 | |
| | 196,000 | | | | | Iron Mountain, Inc. REIT, 4.88%, due 09/15/27 144A | | | 182,770 | |
| | 350,000 | | | | | Iron Mountain, Inc. REIT, 6.00%, due 08/15/23 | | | 363,513 | |
| | 105,000 | | | | | Israel Electric Corp., Ltd., 7.25%, due 01/15/19 144A | | | 108,261 | |
| | 325,000 | | | | | Israel Electric Corp., Ltd., 9.38%, due 01/28/20 144A | | | 358,550 | |
| | | | | | |
| 84 | | See accompanying Notes to the Financial Statements. | | | | |
Mercer Core Fixed Income Fund
Schedule of Investments (Continued)
(showing percentage of net assets)
March 31, 2018
| | | | | | | | | | |
| Par Value ($) | | | | | Description | | Value ($) | |
| | |
| | | | | | Corporate Debt — continued | |
| | | |
| | 107,000 | | | | | j2 Cloud Services LLC/j2 Global Co-Obligor, Inc., 6.00%, due 07/15/25 144A | | | 110,076 | |
| | 110,000 | | | | | Jacobs Entertainment, Inc., 7.88%, due 02/01/24 144A | | | 116,875 | |
| | 500,000 | | | | | Jefferies Group LLC, 5.13%, due 01/20/23 | | | 529,649 | |
| | 584,000 | | | | | Jefferies Group LLC, 8.50%, due 07/15/19‡ | | | 621,897 | |
| | 340,000 | | | | | Jefferies Group LLC/Jefferies Group Capital Finance, Inc., 4.15%, due 01/23/30 | | | 317,093 | |
| | 418,000 | | | | | Jefferies Group LLC/Jefferies Group Capital Finance, Inc., 4.85%, due 01/15/27 | | | 428,221 | |
| | 580,000 | | | | | Johnson & Johnson, 3.40%, due 01/15/38 | | | 558,880 | |
| | 560,000 | | | | | JPMorgan Chase & Co., 2.40%, due 06/07/21 | | | 546,874 | |
| | 1,802,000 | | | | | JPMorgan Chase & Co., 3.20%, due 01/25/23 | | | 1,786,119 | |
| | 380,000 | | | | | JPMorgan Chase & Co., 3.20%, due 06/15/26 | | | 364,930 | |
| | 300,000 | | | | | JPMorgan Chase & Co., 3.25%, due 09/23/22 | | | 299,297 | |
| | 1,430,000 | | | | | JPMorgan Chase & Co., 3.38%, due 05/01/23 | | | 1,412,844 | |
| | 800,000 | | | | | JPMorgan Chase & Co., 3.96%, due 11/15/48◆ | | | 771,960 | |
| | 820,000 | | | | | JPMorgan Chase & Co., 4.25%, due 10/15/20 | | | 844,105 | |
| | 90,000 | | | | | JPMorgan Chase & Co., 4.35%, due 08/15/21 | | | 93,263 | |
| | 200,000 | | | | | JPMorgan Chase & Co., 4.50%, due 01/24/22 | | | 208,188 | |
| | 1,000,000 | | | | | JPMorgan Chase & Co., 5.30% (3 mo. USD LIBOR plus 3.800%)† ††††† | | | 1,029,500 | |
| | 420,000 | | | | | JPMorgan Chase & Co., 6.75% (3 mo. USD LIBOR plus 3.780%)† ††††† ‡ | | | 458,745 | |
| | 822,000 | | | | | Juniper Networks, Inc., 3.13%, due 02/26/19 | | | 823,246 | |
| | 237,000 | | | | | Juniper Networks, Inc., 3.30%, due 06/15/20 | | | 237,226 | |
| | 843,000 | | | | | Juniper Networks, Inc., 4.60%, due 03/15/21 | | | 867,690 | |
| | 200,000 | | | | | KazMunayGas National Co. JSC, 3.88%, due 04/19/22 144A | | | 199,682 | |
| | 2,500,000 | | | | | Kinder Morgan Energy Partners, LP, 4.15%, due 02/01/24 | | | 2,510,980 | |
| | 185,000 | | | | | Kinder Morgan Energy Partners, LP, 7.75%, due 03/15/32 | | | 231,769 | |
| | 1,240,000 | | | | | KKR Group Finance Co. II LLC, 5.50%, due 02/01/43 144A | | | 1,333,997 | |
| | 688,000 | | | | | KKR Group Finance Co. LLC, 6.38%, due 09/29/20 144A | | | 739,870 | |
| | 200,000 | | | | | Klabin Finance SA, 4.88%, due 09/19/27 144A | | | 192,750 | |
| | 360,000 | | | | | Kraft Heinz Foods Co., 3.50%, due 06/06/22 | | | 359,823 | |
| | 95,000 | | | | | Kraft Heinz Foods Co., 4.38%, due 06/01/46 | | | 87,453 | |
| | 235,000 | | | | | Kraft Heinz Foods Co., 4.88%, due 02/15/25 144A | | | 245,123 | |
| | 170,000 | | | | | Kraft Heinz Foods Co., 5.00%, due 07/15/35 | | | 176,768 | |
| | 148,000 | | | | | Kraft Heinz Foods Co., 5.20%, due 07/15/45 | | | 150,961 | |
| | 349,000 | | | | | Kraft Heinz Foods Co., 5.38%, due 02/10/20 | | | 363,443 | |
| | 204,000 | | | | | Kratos Defense & Security Solutions, Inc., 6.50%, due 11/30/25 144A | | | 211,395 | |
| | 400,000 | | | | | Kroger Co. (The), Senior Note, 6.15%, due 01/15/20 | | | 422,136 | |
| | 180,000 | | | | | Kronos Acquisition Holdings, Inc., 9.00%, due 08/15/23 144A | | | 171,450 | |
| | 300,000 | | | | | L Brands, Inc., 5.63%, due 10/15/23‡ | | | 313,500 | |
| | 221,000 | | | | | L Brands, Inc., 6.63%, due 04/01/21 | | | 235,917 | |
| | 120,000 | | | | | L Brands, Inc., 6.88%, due 11/01/35 | | | 117,000 | |
| | 82,000 | | | | | Ladder Capital Finance Holdings LLP/Ladder Capital Finance Corp., 5.25%, due 03/15/22‡ 144A | | | 82,205 | |
| | 133,000 | | | | | Ladder Capital Finance Holdings LLP/Ladder Capital Finance Corp., 5.25%, due 10/01/25 144A | | | 126,350 | |
| | 150,000 | | | | | Laureate Education, Inc., 8.25%, due 05/01/25‡ 144A | | | 161,250 | |
| | 251,000 | | | | | Lear Corp., 5.25%, due 01/15/25 | | | 265,327 | |
| | 470,000 | | | | | Lehman Brothers Holdings Capital Trust VII, (MTN), 5.86%**** ††† ††††† | | | 165 | |
| | 270,000 | | | | | Lehman Brothers Holdings, Inc., (MTN), Series I, 6.75%, due 12/28/17**** ††† | | | 95 | |
| | 890,000 | | | | | Lehman Brothers Holdings, Inc., Subordinated Note, 6.50%, due 07/19/17**** ††† | | | 312 | |
| | 290,000 | | | | | Leucadia National Corp., 5.50%, due 10/18/23 | | | 298,475 | |
| | 1,150,000 | | | | | Liberty Mutual Group, Inc., 4.25%, due 06/15/23 144A | | | 1,175,065 | |
| | | | | | |
| | See accompanying Notes to the Financial Statements. | | | 85 | |
Mercer Core Fixed Income Fund
Schedule of Investments (Continued)
(showing percentage of net assets)
March 31, 2018
| | | | | | | | | | |
| Par Value ($) | | | | | Description | | Value ($) | |
| | |
| | | | | | Corporate Debt — continued | |
| | | |
| | 1,237,000 | | | | | Liberty Mutual Group, Inc., 4.95%, due 05/01/22 144A | | | 1,307,365 | |
| | 386,000 | | | | | Liberty Mutual Group, Inc., Junior Subordinated Note, Series A, 7.80%, due 03/07/87 144A | | | 478,640 | |
| | 105,000 | | | | | Lions Gate Capital Holdings LLC, 5.88%, due 11/01/24 144A | | | 109,725 | |
| | 230,000 | | | | | Liquid Telecommunications Financing Plc, 8.50%, due 07/13/22 144A | | | 242,203 | |
| | 300,000 | | | | | Lloyds Banking Group Plc, 7.50% (USD 5 year swap rate plus 4.760%)† ††††† | | | 325,875 | |
| | 645,000 | | | | | Lloyds Banking Group Plc, Subordinated Note, 4.65%, due 03/24/26 | | | 648,426 | |
| | 1,268,000 | | | | | Lockheed Martin Corp., 4.70%, due 05/15/46‡ | | | 1,381,519 | |
| | 247,000 | | | | | LSC Communications, Inc., 8.75%, due 10/15/23 144A | | | 255,102 | |
| | 492,000 | | | | | LyondellBasell Industries NV, 5.00%, due 04/15/19 | | | 499,548 | |
| | 240,000 | | | | | M&T Bank Corp., 5.13% (3 mo. USD LIBOR plus 3.520%)† ††††† | | | 239,700 | |
| | 300,000 | | | | | Macquarie Bank, Ltd., 4.88%, due 06/10/25‡ 144A | | | 304,634 | |
| | 1,484,000 | | | | | Macquarie Group, Ltd., 4.15%, due 03/27/24◆ 144A | | | 1,491,519 | |
| | 355,000 | | | | | Macy’s Retail Holdings, Inc., 3.63%, due 06/01/24‡ | | | 341,907 | |
| | 55,000 | | | | | Magellan Midstream Partners, LP, 4.25%, due 09/15/46 | | | 53,497 | |
| | 400,000 | | | | | Magellan Midstream Partners, LP, 5.15%, due 10/15/43 | | | 437,563 | |
| | 700,000 | | | | | Marriott International, Inc., 3.13%, due 06/15/26 | | | 664,630 | |
| | 230,000 | | | | | Martin Marietta Materials, Inc., 4.25%, due 07/02/24 | | | 235,709 | |
| | 225,000 | | | | | Masco Corp., 4.38%, due 04/01/26 | | | 229,191 | |
| | 225,000 | | | | | Masco Corp., 4.45%, due 04/01/25 | | | 230,833 | |
| | 725,000 | | | | | Massachusetts Institute of Technology, 4.68%, due 07/01/14# | | | 812,141 | |
| | 17,000 | | | | | Match Group, Inc., 5.00%, due 12/15/27‡ 144A | | | 16,788 | |
| | 199,000 | | | | | Match Group, Inc., 6.38%, due 06/01/24 | | | 212,432 | |
| | 894,000 | | | | | McDonald’s Corp., 3.35%, due 04/01/23‡ | | | 899,963 | |
| | 175,000 | | | | | McGraw-Hill Global Education Holdings LLC/McGraw-Hill Global Education Finance, 7.88%, due 05/15/24 144A | | | 167,960 | |
| | 239,000 | | | | | MDC Partners, Inc., 6.50%, due 05/01/24 144A | | | 233,622 | |
| | 270,000 | | | | | MEDNAX, Inc., 5.25%, due 12/01/23 144A | | | 272,025 | |
| | 70,000 | | | | | Medtronic, Inc., 3.13%, due 03/15/22 | | | 70,091 | |
| | 190,000 | | | | | Medtronic, Inc., 3.15%, due 03/15/22 | | | 190,421 | |
| | 384,000 | | | | | Medtronic, Inc., 4.38%, due 03/15/35 | | | 408,168 | |
| | 310,000 | | | | | Meredith Corp., 6.88%, due 02/01/26 144A | | | 318,912 | |
| | 275,000 | | | | | MetLife, Inc., 6.40%, due 12/15/66‡ | | | 302,156 | |
| | 250,000 | | | | | MetLife, Inc., 9.25%, due 04/08/38 144A | | | 341,250 | |
| | 295,000 | | | | | Mexichem SAB de CV, 5.50%, due 01/15/48 144A | | | 275,456 | |
| | 63,000 | | | | | MGIC Investment Corp., 5.75%, due 08/15/23 | | | 66,308 | |
| | 410,000 | | | | | Microsoft Corp., 3.95%, due 08/08/56 | | | 408,724 | |
| | 1,104,000 | | | | | Microsoft Corp., 4.25%, due 02/06/47 | | | 1,190,816 | |
| | 455,000 | | | | | Microsoft Corp., 4.45%, due 11/03/45 | | | 504,945 | |
| | 700,000 | | | | | Microsoft Corp., 4.50%, due 02/06/57 | | | 769,480 | |
| | 165,630 | | | | | Miran Mid-Atlantic Series C Pass Through Trust, 10.06%, due 12/30/28 | | | 166,458 | |
| | 277,000 | | | | | Molson Coors Brewing Co., 1.45%, due 07/15/19 | | | 271,972 | |
| | 230,000 | | | | | Molson Coors Brewing Co., 3.00%, due 07/15/26 | | | 213,416 | |
| | 380,000 | | | | | Mondelez International Holdings Netherlands BV, 1.63%, due 10/28/19 144A | | | 372,314 | |
| | 921,000 | | | | | Morgan Stanley, 3.88%, due 04/29/24 | | | 929,767 | |
| | 135,000 | | | | | Morgan Stanley, 3.97% (3 mo. USD LIBOR plus 1.455%), due 07/22/38† | | | 132,326 | |
| | 520,000 | | | | | Morgan Stanley, 4.38%, due 01/22/47 | | | 533,445 | |
| | 325,000 | | | | | Morgan Stanley, 5.45% (3 mo. USD LIBOR plus 3.610%)† ††††† | | | 331,263 | |
| | 295,000 | | | | | Morgan Stanley, (MTN), 3.77%, due 01/24/29◆ | | | 290,788 | |
| | 305,000 | | | | | Morgan Stanley, (MTN), 3.88%, due 01/27/26 | | | 305,041 | |
| | | | | | |
| 86 | | See accompanying Notes to the Financial Statements. | | | | |
Mercer Core Fixed Income Fund
Schedule of Investments (Continued)
(showing percentage of net assets)
March 31, 2018
| | | | | | | | | | |
| Par Value ($) | | | | | Description | | Value ($) | |
| | |
| | | | | | Corporate Debt — continued | |
| | | |
| | 1,720,000 | | | | | Morgan Stanley, (MTN), 4.10%, due 05/22/23 | | | 1,745,146 | |
| | 345,000 | | | | | Morgan Stanley, (MTN), 5.50%, due 01/26/20 | | | 360,230 | |
| | 1,000,000 | | | | | Morgan Stanley, (MTN), Series F, 6.63%, due 04/01/18 | | | 1,000,000 | |
| | 1,982,000 | | | | | Morgan Stanley, (MTN), 7.30%, due 05/13/19 | | | 2,077,398 | |
| | 238,000 | | | | | Motorola Solutions, Inc., 4.60%, due 02/23/28‡ | | | 240,032 | |
| | 295,000 | | | | | MPLX, LP, 4.00%, due 03/15/28‡ | | | 291,318 | |
| | 250,000 | | | | | MPLX, LP, 4.50%, due 04/15/38 | | | 247,640 | |
| | 25,000 | | | | | MPLX, LP, 5.20%, due 03/01/47 | | | 26,223 | |
| | 225,000 | | | | | MTN Mauritius Investment, Ltd., 4.76%, due 11/11/24 144A | | | 216,444 | |
| | 154,000 | | | | | Murphy Oil Corp., 5.75%, due 08/15/25 | | | 152,075 | |
| | 194,000 | | | | | Mylan NV, 2.50%, due 06/07/19 | | | 192,548 | |
| | 366,000 | | | | | Mylan NV, 3.95%, due 06/15/26 | | | 355,605 | |
| | 545,000 | | | | | Mylan, Inc., 4.55%, due 04/15/28†††† 144A | | | 546,976 | |
| | 360,000 | | | | | Myriad International Holdings BV, 5.50%, due 07/21/25 144A | | | 382,790 | |
| | 44,000 | | | | | National CineMedia LLC, 6.00%, due 04/15/22 | | | 44,660 | |
| | 235,000 | | | | | Nationstar Mortgage LLC/Nationstar Capital Corp., 7.88%, due 10/01/20 | | | 240,287 | |
| | 330,000 | | | | | Natura Cosmeticos SA, 5.38%, due 02/01/23 144A | | | 329,752 | |
| | 175,000 | | | | | Navient Corp., (MTN), 8.45%, due 06/15/18 | | | 176,925 | |
| | 335,000 | | | | | NetApp, Inc., 2.00%, due 09/27/19 | | | 329,931 | |
| | 255,000 | | | | | Netflix, Inc., 4.88%, due 04/15/28 144A | | | 245,527 | |
| | 445,000 | | | | | New England Power Co., 3.80%, due 12/05/47‡ 144A | | | 432,609 | |
| | 170,000 | | | | | Newell Brands, Inc., 4.20%, due 04/01/26‡ | | | 168,472 | |
| | 123,000 | | | | | Newfield Exploration Co., 5.63%, due 07/01/24‡ | | | 130,380 | |
| | 103,000 | | | | | Newfield Exploration Co., 5.75%, due 01/30/22 | | | 108,150 | |
| | 205,000 | | | | | NextEra Energy Capital Holdings, Inc., 2.30%, due 04/01/19 | | | 203,952 | |
| | 435,000 | | | | | NextEra Energy Capital Holdings, Inc., 3.55%, due 05/01/27 | | | 423,536 | |
| | 95,000 | | | | | NextEra Energy Operating Partners, LP, 4.50%, due 09/15/27‡ 144A | | | 89,894 | |
| | 285,000 | | | | | Nippon Life Insurance Co., 5.10% (USISDA05 plus 3.650%), due 10/16/44† 144A | | | 297,112 | |
| | 670,000 | | | | | NiSource Finance Corp., 3.49%, due 05/15/27 | | | 648,762 | |
| | 780,000 | | | | | Noble Energy, Inc., 4.15%, due 12/15/21 | | | 797,708 | |
| | 200,000 | | | | | Noble Energy, Inc., 5.05%, due 11/15/44 | | | 209,826 | |
| | 135,000 | | | | | Nokia OYJ, 4.38%, due 06/12/27 | | | 127,069 | |
| | 205,000 | | | | | Norbord, Inc., 6.25%, due 04/15/23 144A | | | 216,787 | |
| | 195,000 | | | | | Northern States Power Co., 3.60%, due 09/15/47 | | | 186,519 | |
| | 220,000 | | | | | Northern States Power Co., 4.13%, due 05/15/44 | | | 229,685 | |
| | 188,132 | | | | | Northwest Airlines Pass Through Trust, Series 2007-1, Class A, 7.03%, due 05/01/21 | | | 198,281 | |
| | 370,000 | | | | | NOVA Chemicals Corp., 5.00%, due 05/01/25‡ 144A | | | 356,014 | |
| | 80,000 | | | | | Novelis Corp., 5.88%, due 09/30/26 144A | | | 78,600 | |
| | 569,000 | | | | | NRG Energy, Inc., 6.25%, due 05/01/24‡ | | | 588,915 | |
| | 270,000 | | | | | NRG Energy, Inc., 6.63%, due 01/15/27‡ | | | 277,425 | |
| | 320,000 | | | | | NRG Yield Operating LLC, 5.38%, due 08/15/24 | | | 322,800 | |
| | 225,000 | | | | | NRG Yield, Inc., 3.25%, due 06/01/20 144A | | | 223,371 | |
| | 70,000 | | | | | NuStar Logistics, LP, 5.63%, due 04/28/27‡ | | | 68,075 | |
| | 560,000 | | | | | NXP BV/NXP Funding LLC, 4.63%, due 06/01/23 144A | | | 571,368 | |
| | 325,000 | | | | | NXP BV/NXP Funding LLC, 5.75%, due 03/15/23 | | | 334,344 | |
| | 80,000 | | | | | Olin Corp., 5.00%, due 02/01/30 | | | 76,700 | |
| | 210,000 | | | | | Omega Healthcare Investors, Inc. REIT, 4.50%, due 01/15/25 | | | 205,619 | |
| | 277,000 | | | | | Omega Healthcare Investors, Inc. REIT, 4.95%, due 04/01/24 | | | 283,075 | |
| | 195,000 | | | | | Omega Healthcare Investors, Inc. REIT, 5.25%, due 01/15/26 | | | 198,283 | |
| | | | | | |
| | See accompanying Notes to the Financial Statements. | | | 87 | |
Mercer Core Fixed Income Fund
Schedule of Investments (Continued)
(showing percentage of net assets)
March 31, 2018
| | | | | | | | | | |
| Par Value ($) | | | | | Description | | Value ($) | |
| | |
| | | | | | Corporate Debt — continued | |
| | | |
| | 139,000 | | | | | ONEOK Partners, LP, 5.00%, due 09/15/23 | | | 146,785 | |
| | 200,000 | | | | | ONEOK, Inc., 4.95%, due 07/13/47‡ | | | 203,710 | |
| | 175,000 | | | | | Open Text Corp., 5.88%, due 06/01/26 144A | | | 180,416 | |
| | 385,000 | | | | | Oracle Corp., 3.80%, due 11/15/37 | | | 381,492 | |
| | 320,000 | | | | | Oracle Corp., 4.30%, due 07/08/34 | | | 338,416 | |
| | 250,000 | | | | | Owens Corning, 4.20%, due 12/15/22 | | | 255,995 | |
| | 460,000 | | | | | Pacific Gas & Electric Co., 6.05%, due 03/01/34‡ | | | 549,765 | |
| | 205,000 | | | | | PECO Energy Co., 3.70%, due 09/15/47 | | | 196,829 | |
| | 730,000 | | | | | Penske Truck Leasing Co. LP/PTL Finance Corp., 2.50%, due 06/15/19 144A | | | 726,550 | |
| | 155,000 | | | | | Petrobras Global Finance BV, 5.30%, due 01/27/25 144A | | | 153,256 | |
| | 506,000 | | | | | Petrobras Global Finance BV, 5.63%, due 05/20/43‡ | | | 443,382 | |
| | 185,000 | | | | | Petrobras Global Finance BV, 5.75%, due 02/01/29 | | | 179,289 | |
| | 420,000 | | | | | Petrobras Global Finance BV, 7.38%, due 01/17/27 | | | 455,910 | |
| | 320,000 | | | | | Petroleos Mexicanos, 4.88%, due 01/24/22 | | | 328,768 | |
| | 80,000 | | | | | Petroleos Mexicanos, 5.38%, due 03/13/22 | | | 83,360 | |
| | 255,000 | | | | | Petroleos Mexicanos, 5.50%, due 01/21/21 | | | 265,774 | |
| | 255,000 | | | | | Petroleos Mexicanos, 6.50%, due 06/02/41 | | | 253,725 | |
| | 630,000 | | | | | Petroleos Mexicanos, 6.75%, due 09/21/47 | | | 639,059 | |
| | 350,000 | | | | | Petroleos Mexicanos, 6.88%, due 08/04/26 | | | 385,525 | |
| | 1,006,000 | | | | | Phillips 66 Partners, LP, 3.61%, due 02/15/25 | | | 985,611 | |
| | 774,000 | | | | | Phillips 66 Partners, LP, 3.75%, due 03/01/28‡ | | | 749,198 | |
| | 115,000 | | | | | Plains All American Pipeline, LP/PAA Finance Corp., 4.70%, due 06/15/44 | | | 103,041 | |
| | 250,000 | | | | | Plains All American Pipeline, LP/PAA Finance Corp., 4.90%, due 02/15/45 | | | 230,720 | |
| | 515,000 | | | | | PNC Bank NA, 2.45%, due 07/28/22 | | | 499,075 | |
| | 595,000 | | | | | PNC Bank NA, 2.50%, due 01/22/21 | | | 586,549 | |
| | 1,190,000 | | | | | PNC Bank NA, 2.95%, due 01/30/23 | | | 1,164,614 | |
| | 270,000 | | | | | PNC Financial Services Group (The), Inc., 4.85% (3 mo. USD LIBOR plus 3.040%)† ††††† | | | 271,188 | |
| | 513,000 | | | | | PNC Financial Services Group (The), Inc., 6.75% (3 mo. USD LIBOR plus 3.678%)† ††††† | | | 557,503 | |
| | 200,000 | | | | | Popular, Inc., 7.00%, due 07/01/19 | | | 205,000 | |
| | 60,000 | | | | | Post Holdings, Inc., 5.63%, due 01/15/28 144A | | | 57,525 | |
| | 540,000 | | | | | PPL Capital Funding, Inc., 5.00%, due 03/15/44 | | | 594,052 | |
| | 252,000 | | | | | Priceline Group (The), Inc., 2.75%, due 03/15/23 | | | 243,464 | |
| | 134,000 | | | | | Prime Security Services Borrower LLC/Prime Finance, Inc., 9.25%, due 05/15/23‡ 144A | | | 145,548 | |
| | 95,000 | | | | | Private Export Funding Corp., 1.88%, due 07/15/18 | | | 95,001 | |
| | 90,000 | | | | | Providence St. Joseph Health Obligated Group, 2.75%, due 10/01/26 | | | 85,060 | |
| | 598,000 | | | | | Prudential Financial, Inc., 5.88% (3 mo. USD LIBOR plus 4.175%), due 09/15/42† ‡ | | | 630,142 | |
| | 1,000,000 | | | | | Prudential Financial, Inc., 7.38%, due 06/15/19 | | | 1,053,611 | |
| | 445,000 | | | | | Public Service Electric & Gas Co., (MTN), 3.00%, due 05/15/27 | | | 428,550 | |
| | 170,000 | | | | | QEP Resources, Inc., 6.88%, due 03/01/21‡ | | | 181,050 | |
| | 225,000 | | | | | Quicken Loans, Inc., 5.25%, due 01/15/28 144A | | | 210,937 | |
| | 370,000 | | | | | Quicken Loans, Inc., 5.75%, due 05/01/25 144A | | | 370,925 | |
| | 175,000 | | | | | Quintiles IMS, Inc., 4.88%, due 05/15/23 144A | | | 179,156 | |
| | 340,000 | | | | | QVC, Inc., 4.38%, due 03/15/23 | | | 340,664 | |
| | 265,000 | | | | | QVC, Inc., 5.13%, due 07/02/22 | | | 273,589 | |
| | 300,000 | | | | | QVC, Inc., 5.45%, due 08/15/34 | | | 289,881 | |
| | 132,000 | | | | | Radian Group, Inc., 4.50%, due 10/01/24 | | | 129,360 | |
| | 79,000 | | | | | Radian Group, Inc., 5.25%, due 06/15/20 | | | 81,666 | |
| | 82,000 | | | | | Radiate Holdco LLC/Radiate Finance, Inc., 6.88%, due 02/15/23 144A | | | 79,745 | |
| | | | | | |
| 88 | | See accompanying Notes to the Financial Statements. | | | | |
Mercer Core Fixed Income Fund
Schedule of Investments (Continued)
(showing percentage of net assets)
March 31, 2018
| | | | | | | | | | |
| Par Value ($) | | | | | Description | | Value ($) | |
| | |
| | | | | | Corporate Debt — continued | |
| | | |
| | 1,358,000 | | | | | Realty Income Corp. REIT, 4.13%, due 10/15/26 | | | 1,372,875 | |
| | 495,000 | | | | | Regions Financial Corp., 2.75%, due 08/14/22 | | | 481,461 | |
| | 355,000 | | | | | Revlon Consumer Products Corp., 6.25%, due 08/01/24‡ | | | 220,544 | |
| | 930,000 | | | | | Royal Bank of Scotland Group Plc, 3.88%, due 09/12/23 | | | 919,547 | |
| | 205,000 | | | | | Royal Bank of Scotland Group Plc, 8.00% (USD 5 year swap rate plus 5.720%)† ††††† ‡ | | | 225,244 | |
| | 200,000 | | | | | Royal Bank of Scotland Group Plc, 8.63% (USD 5 year swap rate plus 7.598%)† ††††† | | | 217,750 | |
| | 231,000 | | | | | Sabine Pass Liquefaction LLC, 4.20%, due 03/15/28 | | | 228,099 | |
| | 217,000 | | | | | Sabine Pass Liquefaction LLC, 5.00%, due 03/15/27 | | | 225,599 | |
| | 385,000 | | | | | Sabine Pass Liquefaction LLC, 5.75%, due 05/15/24 | | | 414,924 | |
| | 136,000 | | | | | Sabine Pass Liquefaction LLC, 5.88%, due 06/30/26‡ | | | 148,881 | |
| | 320,000 | | | | | Sally Holdings LLC/Sally Capital, Inc., 5.63%, due 12/01/25‡ | | | 318,000 | |
| | 47,000 | | | | | Santander Holdings USA, Inc., 2.70%, due 05/24/19 | | | 46,898 | |
| | 255,000 | | | | | Santander Holdings USA, Inc., 3.40%, due 01/18/23 | | | 249,358 | |
| | 445,000 | | | | | Santander Holdings USA, Inc., 3.70%, due 03/28/22 | | | 446,341 | |
| | 380,000 | | | | | Santander UK Group Holdings Plc, 4.75%, due 09/15/25 144A | | | 382,886 | |
| | 320,000 | | | | | Select Medical Corp., 6.38%, due 06/01/21 | | | 326,000 | |
| | 1,402,000 | | | | | Sempra Energy, 2.40%, due 03/15/20 | | | 1,384,348 | |
| | 922,000 | | | | | SES SA, 3.60%, due 04/04/23‡ 144A | | | 904,067 | |
| | 218,000 | | | | | Sherwin-Williams Co. (The), 2.25%, due 05/15/20 | | | 214,492 | |
| | 495,000 | | | | | Shire Acquisitions Investments Ireland DAC, 1.90%, due 09/23/19 | | | 487,005 | |
| | 485,000 | | | | | Shire Acquisitions Investments Ireland DAC, 2.88%, due 09/23/23 | | | 463,599 | |
| | 865,000 | | | | | Shire Acquisitions Investments Ireland DAC, 3.20%, due 09/23/26 | | | 808,040 | |
| | 110,000 | | | | | Simmons Foods, Inc., 5.75%, due 11/01/24 144A | | | 99,963 | |
| | 850,000 | | | | | Simon Property Group, LP REIT, 6.75%, due 02/01/40 | | | 1,139,008 | |
| | 230,000 | | | | | Sinclair Television Group, Inc., 5.63%, due 08/01/24‡ 144A | | | 228,850 | |
| | 500,000 | | | | | Sinopec Group Overseas Development 2015, Ltd., 2.50%, due 04/28/20 144A | | | 492,743 | |
| | 485,000 | | | | | Sirius XM Radio, Inc., 5.00%, due 08/01/27‡ 144A | | | 458,325 | |
| | 315,000 | | | | | Sirius XM Radio, Inc., 5.38%, due 07/15/26 144A | | | 311,850 | |
| | 210,000 | | | | | Sixsigma Networks Mexico SA de CV, 8.25%, due 11/07/21‡ 144A | | | 222,075 | |
| | 335,000 | | | | | Societe Generale SA, 7.38% (USD 5 year swap rate plus 6.238%)† ††††† 144A | | | 357,194 | |
| | 325,000 | | | | | Societe Generale SA, 8.00% (USISDA05 plus 5.873%)† ††††† ‡ 144A | | | 364,406 | |
| | 200,000 | | | | | Societe Generale SA, (MTN), Reg S, 8.25% (USD 5 year swap rate plus 6.394%)† ††††† ‡‡‡ | | | 206,517 | |
| | 335,000 | | | | | Southern California Edison Co., 4.00%, due 04/01/47 | | | 334,854 | |
| | 1,318,000 | | | | | Southern Co. (The), 3.25%, due 07/01/26 | | | 1,254,635 | |
| | 1,260,000 | | | | | Southern Co. Gas Capital Corp., 2.45%, due 10/01/23 | | | 1,197,830 | |
| | 630,000 | | | | | Southern Copper Corp., 5.25%, due 11/08/42 | | | 660,956 | |
| | 255,000 | | | | | Southern Power Co., 1.95%, due 12/15/19 | | | 250,641 | |
| | 979,000 | | | | | Spirit Airlines Pass Through Trust, 3.38%, due 08/15/31 | | | 953,657 | |
| | 102,000 | | | | | Springleaf Finance Corp., 6.88%, due 03/15/25 | | | 102,638 | |
| | 255,000 | | | | | Sprint Capital Corp., 6.88%, due 11/15/28 | | | 238,425 | |
| | 150,000 | | | | | Sprint Communications, Inc., 7.00%, due 03/01/20 144A | | | 157,875 | |
| | 250,000 | | | | | Sprint Nextel Corp., 9.00%, due 11/15/18 144A | | | 258,125 | |
| | 643,125 | | | | | Sprint Spectrum Co. LLC/Sprint Spectrum Co. II LLC/Sprint Spectrum Co. III LLC, 3.36%, due 03/20/23 144A | | | 640,713 | |
| | 340,000 | | | | | Standard Chartered Plc, 2.10%, due 08/19/19 144A | | | 335,210 | |
| | 280,000 | | | | | Standard Industries, Inc./NJ, 5.38%, due 11/15/24 144A | | | 284,900 | |
| | 293,000 | | | | | State Street Corp., 3.12% (3 mo. USD LIBOR plus 1.000%), due 06/01/77† | | | 265,927 | |
| | 395,000 | | | | | State Street Corp., 5.25% (3 mo. USD LIBOR plus 3.597%)† ††††† ‡ | | | 405,862 | |
| | | | | | |
| | See accompanying Notes to the Financial Statements. | | | 89 | |
Mercer Core Fixed Income Fund
Schedule of Investments (Continued)
(showing percentage of net assets)
March 31, 2018
| | | | | | | | | | |
| Par Value ($) | | | | | Description | | Value ($) | |
| | |
| | | | | | Corporate Debt — continued | |
| | | |
| | 18,000 | | | | | Stearns Holdings LLC, 9.38%, due 08/15/20 144A | | | 18,405 | |
| | 310,000 | | | | | Stifel Financial Corp., 4.25%, due 07/18/24 | | | 311,849 | |
| | 470,000 | | | | | Sumitomo Mitsui Trust Bank, Ltd., 2.05%, due 03/06/19 144A | | | 466,480 | |
| | 922,000 | | | | | Sunoco Logistics Partners Operations, LP, 3.45%, due 01/15/23‡ | | | 896,820 | |
| | 460,000 | | | | | Sunoco Logistics Partners Operations, LP, 3.90%, due 07/15/26 | | | 437,732 | |
| | 271,000 | | | | | Sunoco Logistics Partners Operations, LP, 4.40%, due 04/01/21 | | | 276,985 | |
| | 142,000 | | | | | Sunoco Logistics Partners Operations, LP, 5.40%, due 10/01/47 | | | 135,764 | |
| | 405,000 | | | | | SunTrust Bank/Atlanta GA, 2.45%, due 08/01/22 | | | 390,595 | |
| | 495,000 | | | | | SunTrust Bank/Atlanta GA, 2.59%, due 01/29/21◆ | | | 491,923 | |
| | 175,000 | | | | | Synchrony Financial, 2.70%, due 02/03/20 | | | 173,226 | |
| | 275,000 | | | | | T-Mobile USA, Inc., 4.75%, due 02/01/28‡ | | | 264,687 | |
| | 95,000 | | | | | Tapstone Energy LLC/Tapstone Energy Finance Corp., 9.75%, due 06/01/22 144A | | | 79,325 | |
| | 270,000 | | | | | Taylor Morrison Communities, Inc./Taylor Morrison Holdings II, Inc., 5.25%, due 04/15/21 144A | | | 272,678 | |
| | 760,000 | | | | | Teachers Insurance & Annuity Association of America, 4.27%, due 05/15/47 144A | | | 761,995 | |
| | 34,000 | | | | | Teachers Insurance & Annuity Association of America, 6.85%, due 12/16/39 144A | | | 45,454 | |
| | 60,000 | | | | | Team Health Holdings, Inc., 6.38%, due 02/01/25‡ 144A | | | 51,756 | |
| | 536,000 | | | | | Tech Data Corp., 4.95%, due 02/15/27‡ | | | 538,270 | |
| | 330,000 | | | | | Telecom Italia Capital SA, Guaranteed Senior Note, 7.20%, due 07/18/36 | | | 388,575 | |
| | 240,000 | | | | | Telecom Italia SpA, 5.30%, due 05/30/24 144A | | | 245,100 | |
| | 1,414,000 | | | | | Telefonaktiebolaget LM Ericsson, 4.13%, due 05/15/22 | | | 1,405,162 | |
| | 260,000 | | | | | Telefonos de Mexico SAB de CV, 5.50%, due 11/15/19 | | | 270,097 | |
| | 90,000 | | | | | Tenet Healthcare Corp., 4.38%, due 10/01/21 | | | 88,875 | |
| | 60,000 | | | | | Tervita Escrow Corp., 7.63%, due 12/01/21 144A | | | 61,174 | |
| | 140,000 | | | | | Tesoro Logistics, LP/Tesoro Logistics Finance Corp., 5.25%, due 01/15/25 | | | 142,506 | |
| | 270,000 | | | | | Tesoro Logistics, LP/Tesoro Logistics Finance Corp., 6.38%, due 05/01/24 | | | 287,212 | |
| | 1,650,000 | | | | | Teva Pharmaceutical Finance Netherlands III BV, 3.15%, due 10/01/26‡ | | | 1,326,932 | |
| | 225,000 | | | | | Teva Pharmaceutical Finance Netherlands III BV, 6.75%, due 03/01/28‡ 144A | | | 222,725 | |
| | 220,000 | | | | | Thermo Fisher Scientific, Inc., 3.60%, due 08/15/21 | | | 222,153 | |
| | 70,000 | | | | | Time Warner Cable LLC, 4.13%, due 02/15/21 | | | 70,801 | |
| | 380,000 | | | | | Time Warner Cable LLC, 8.25%, due 04/01/19 | | | 398,885 | |
| | 491,000 | | | | | Time Warner, Inc., 3.80%, due 02/15/27 | | | 475,596 | |
| | 260,000 | | | | | Time Warner, Inc., 4.70%, due 01/15/21 | | | 270,456 | |
| | 200,000 | | | | | Time Warner, Inc., 4.75%, due 03/29/21 | | | 209,005 | |
| | 500,000 | | | | | Transcontinental Gas Pipe Line Co. LLC, 4.60%, due 03/15/48 144A | | | 485,897 | |
| | 75,000 | | | | | Trident Merger Sub, Inc., 6.63%, due 11/01/25 144A | | | 73,313 | |
| | 77,000 | | | | | Tutor Perini Corp., 6.88%, due 05/01/25‡ 144A | | | 79,503 | |
| | 500,000 | | | | | UBS AG/London, 2.45%, due 12/01/20 144A | | | 491,299 | |
| | 1,812,000 | | | | | UBS Group Funding Jersey, Ltd., 4.13%, due 04/15/26 144A | | | 1,821,369 | |
| | 495,000 | | | | | UBS Group Funding Switzerland AG, 2.86%, due 08/15/23◆ 144A | | | 478,971 | |
| | 3,097,086 | | | | | United Airlines Pass Through Trust, Series 2014-1, Class A, 4.00%, due 10/11/27 | | | 3,136,140 | |
| | 419,216 | | | | | United Airlines Pass Through Trust, Series 2014-2, Class A, 3.75%, due 03/03/28 | | | 416,932 | |
| | 201,909 | | | | | United Airlines Pass Through Trust, Series 2014-2, Class B, 4.63%, due 03/03/24 | | | 204,847 | |
| | 248,273 | | | | | United Airlines Pass Through Trust, Series 2016-1, Class A, 3.45%, due 01/07/30 | | | 243,349 | |
| | 257,000 | | | | | United Airlines Pass Through Trust, Series 2016-1, Class B, 3.65%, due 07/07/27 | | | 252,074 | |
| | 415,000 | | | | | United Rentals North America, Inc., 4.88%, due 01/15/28 | | | 401,512 | |
| | 220,000 | | | | | United Rentals North America, Inc., 5.50%, due 07/15/25 | | | 226,050 | |
| | 105,000 | | | | | United Rentals North America, Inc., 5.88%, due 09/15/26‡ | | | 109,594 | |
| | 130,000 | | | | | UnitedHealth Group, Inc., 4.20%, due 01/15/47 | | | 131,837 | |
| | | | | | |
| 90 | | See accompanying Notes to the Financial Statements. | | | | |
Mercer Core Fixed Income Fund
Schedule of Investments (Continued)
(showing percentage of net assets)
March 31, 2018
| | | | | | | | | | |
| Par Value ($) | | | | | Description | | Value ($) | |
| | |
| | | | | | Corporate Debt — continued | |
| | | |
| | 390,000 | | | | | UnitedHealth Group, Inc., 4.38%, due 03/15/42 | | | 407,901 | |
| | 230,000 | | | | | Universal Health Services, Inc., 4.75%, due 08/01/22 144A | | | 234,173 | |
| | 275,000 | | | | | Universal Health Services, Inc., 5.00%, due 06/01/26 144A | | | 277,750 | |
| | 178,753 | | | | | US Airways Pass Through Trust, Series 2010-1, Class A, 6.25%, due 10/22/24 | | | 193,080 | |
| | 203,520 | | | | | US Airways Pass Through Trust, Series 2012-1, Class A, 5.90%, due 04/01/26 | | | 220,229 | |
| | 350,000 | | | | | US Bank NA/Cincinnati OH, 2.00%, due 01/24/20 | | | 345,307 | |
| | 145,000 | | | | | US Concrete, Inc., 6.38%, due 06/01/24 | | | 151,163 | |
| | 44,000 | | | | | USA Compression Partners, LP/USA Compression Finance Corp., 6.88%, due 04/01/26 144A | | | 44,770 | |
| | 210,000 | | | | | Vale Overseas, Ltd., 6.25%, due 08/10/26 | | | 235,725 | |
| | 340,000 | | | | | Valeant Pharmaceuticals International, Inc., 6.13%, due 04/15/25‡ 144A | | | 294,695 | |
| | 490,000 | | | | | Valero Energy Corp., 3.40%, due 09/15/26‡ | | | 470,997 | |
| | 115,000 | | | | | Vector Group, Ltd., 6.13%, due 02/01/25 144A | | | 115,288 | |
| | 200,000 | | | | | Vedanta Resources Plc, 6.38%, due 07/30/22 144A | | | 203,000 | |
| | 379,000 | | | | | Ventas Realty, LP REIT, 3.50%, due 02/01/25 | | | 369,588 | |
| | 2,000,000 | | | | | Ventas Realty, LP/Ventas Capital Corp. REIT, 2.70%, due 04/01/20 | | | 1,984,632 | |
| | 260,000 | | | | | VEREIT Operating Partnership, LP REIT, 4.60%, due 02/06/24 | | | 263,679 | |
| | 130,000 | | | | | VeriSign, Inc., 4.75%, due 07/15/27 | | | 125,125 | |
| | 170,000 | | | | | VeriSign, Inc., 5.25%, due 04/01/25‡ | | | 173,400 | |
| | 494,000 | | | | | Verisk Analytics, Inc., 4.00%, due 06/15/25 | | | 497,910 | |
| | 255,000 | | | | | Verizon Communications, Inc., 4.40%, due 11/01/34 | | | 252,573 | |
| | 250,000 | | | | | Verizon Communications, Inc., 4.50%, due 08/10/33 | | | 253,780 | |
| | 1,017,000 | | | | | Verizon Communications, Inc., 4.52%, due 09/15/48 | | | 983,894 | |
| | 310,000 | | | | | Verizon Communications, Inc., 4.67%, due 03/15/55‡ | | | 296,126 | |
| | 1,074,000 | | | | | Verizon Communications, Inc., 4.86%, due 08/21/46 | | | 1,088,033 | |
| | 255,000 | | | | | Verizon Communications, Inc., 5.01%, due 08/21/54 | | | 256,457 | |
| | 207,000 | | | | | Viacom, Inc., 4.38%, due 03/15/43 | | | 186,169 | |
| | 482,000 | | | | | Viacom, Inc., 5.85%, due 09/01/43 | | | 521,400 | |
| | 230,000 | | | | | Viacom, Inc., 6.25% (3 mo. USD LIBOR plus 3.899%), due 02/28/57† ‡ | | | 233,846 | |
| | 824,000 | | | | | Virginia Electric & Power Co., 3.15%, due 01/15/26 | | | 797,966 | |
| | 223,000 | | | | | Vista Outdoor, Inc., 5.88%, due 10/01/23‡ | | | 209,062 | |
| | 290,000 | | | | | VMware, Inc., 2.95%, due 08/21/22 | | | 278,204 | |
| | 325,000 | | | | | Voya Financial, Inc., 5.65% (3 mo. USD LIBOR plus 3.580%), due 05/15/53† | | | 332,312 | |
| | 1,178,000 | | | | | Voya Financial, Inc., 3.13%, due 07/15/24 | | | 1,135,441 | |
| | 855,000 | | | | | WEA Finance LLC/Westfield UK & Europe Finance Plc REIT, 2.70%, due 09/17/19 144A | | | 851,221 | |
| | 1,298,000 | | | | | Wells Fargo & Co., 3.07%, due 01/24/23‡ | | | 1,277,270 | |
| | 735,000 | | | | | Wells Fargo & Co., 5.88% (3 mo. USD LIBOR plus 3.990%)† ††††† ‡ | | | 774,139 | |
| | 315,000 | | | | | Wells Fargo & Co., Series K, Class A, 7.98% (3 mo. USD LIBOR plus 3.770%)† ††††† | | | 319,911 | |
| | 90,000 | | | | | Wells Fargo & Co., (MTN), 4.60%, due 04/01/21 | | | 93,479 | |
| | 265,000 | | | | | Wells Fargo & Co., (MTN), 4.65%, due 11/04/44 | | | 267,903 | |
| | 740,000 | | | | | Wells Fargo Bank NA, 2.40%, due 01/15/20 | | | 734,089 | |
| | 708,000 | | | | | Welltower, Inc. REIT, 4.50%, due 01/15/24 | | | 733,114 | |
| | 115,000 | | | | | West Corp., 8.50%, due 10/15/25‡ 144A | | | 111,838 | |
| | 319,000 | | | | | Western Digital Corp., 4.75%, due 02/15/26‡ | | | 318,896 | |
| | 606,000 | | | | | Westpac Banking Corp., 2.15%, due 03/06/20 | | | 597,023 | |
| | 170,000 | | | | | WestRock RKT Co., 3.50%, due 03/01/20 | | | 171,399 | |
| | 1,000,000 | | | | | Weyerhaeuser Co. REIT, 7.38%, due 10/01/19 | | | 1,064,267 | |
| | 465,000 | | | | | Williams Cos. (The), Inc., 4.55%, due 06/24/24‡ | | | 470,566 | |
| | 275,000 | | | | | Williams Cos. (The), Inc., 5.75%, due 06/24/44 | | | 292,187 | |
| | | | | | |
| | See accompanying Notes to the Financial Statements. | | | 91 | |
Mercer Core Fixed Income Fund
Schedule of Investments (Continued)
(showing percentage of net assets)
March 31, 2018
| | | | | | | | | | |
| Par Value ($) | | | | | Description | | Value ($) | |
| | |
| | | | | | Corporate Debt — continued | |
| | | |
| | 315,000 | | | | | Williams Partners, LP, 3.75%, due 06/15/27 | | | 301,729 | |
| | 135,000 | | | | | Williams Partners, LP, 4.85%, due 03/01/48 | | | 134,157 | |
| | 201,000 | | | | | Windstream Services LLC/Windstream Finance Corp., 7.75%, due 10/15/20‡ | | | 168,840 | |
| | 80,000 | | | | | WM Wrigley Jr Co., 2.40%, due 10/21/18 144A | | | 79,911 | |
| | 320,000 | | | | | WM Wrigley Jr Co., 2.90%, due 10/21/19 144A | | | 320,231 | |
| | 90,000 | | | | | WM Wrigley Jr Co., 3.38%, due 10/21/20 144A | | | 90,794 | |
| | 145,000 | | | | | WMG Acquisition Corp., 4.88%, due 11/01/24‡ 144A | | | 144,638 | |
| | 62,000 | | | | | WMG Acquisition Corp., 5.50%, due 04/15/26 144A | | | 62,465 | |
| | 90,000 | | | | | WPX Energy, Inc., 5.25%, due 09/15/24 | | | 89,100 | |
| | 172,000 | | | | | WPX Energy, Inc., 6.00%, due 01/15/22‡ | | | 177,590 | |
| | 261,000 | | | | | XPO Logistics, Inc., 6.50%, due 06/15/22‡ 144A | | | 270,135 | |
| | 310,000 | | | | | YPF SA, 8.50%, due 07/28/25 144A | | | 342,962 | |
| | 105,000 | | | | | Zayo Group LLC/Zayo Capital, Inc., 5.75%, due 01/15/27 144A | | | 102,900 | |
| | 200,000 | | | | | Zimmer Biomet Holdings, Inc., 3.55%, due 04/01/25 | | | 194,365 | |
| | | | | | | | | | |
| | | | 307,966,432 | |
| | | | | | | | | | |
| | |
| | | | | | Mortgage Backed Securities - Private Issuers — 10.1% | |
| | | |
| | 450,000 | | | | | Americold LLC, Series 2010-ARTA, Class D, 7.44%, due 01/14/29 144A | | | 486,157 | |
| | 120,000 | | | | | Angel Oak Mortgage Trust I LLC, Series 2018-1, Class A1, 3.26%, due 04/27/48◆◆ 144A | | | 120,000 | |
| | 113,000 | | | | | AOA Mortgage Trust, Series 2015-1177, Class C, 3.01%, due 12/13/29◆◆ 144A | | | 110,470 | |
| | 264,000 | | | | | Barclays Commercial Mortgage Trust, Series 2015-MSQ, Class D, 3.99%, due 09/15/32◆◆ 144A | | | 257,360 | |
| | 1,350,000 | | | | | Barclays Commercial Mortgage Trust, Series 2016-ETC, Class A, 2.94%, due 08/14/36 144A | | | 1,287,288 | |
| | 134,314 | | | | | Bayview Opportunity Master Fund IIIb Trust, Series 2017-CRT2, Class M, 3.65% (1 mo. USD LIBOR plus 2.000%), due 11/25/27† 144A | | | 133,132 | |
| | 330,000 | | | | | BBCMS Mortgage Trust, Series 2015-SRCH, Class D, 4.96%, due 08/10/35◆◆ ‡‡‡‡ | | | 342,413 | |
| | 301,000 | | | | | BBCMS Mortgage Trust, Series 2018-TALL, Class B, 2.75%, due 03/15/37◆◆ ‡‡‡‡ | | | 299,930 | |
| | 207,000 | | | | | BBCMS Mortgage Trust, Series 2018-TALL, Class E, 4.21%, due 03/15/37◆◆ ‡‡‡‡ | | | 206,150 | |
| | 225,953 | | | | | Bear Stearns ALT-A Trust, Series 2004-12, Class 1A3, 2.57% (1 mo. USD LIBOR plus 0.700%), due 01/25/35† | | | 226,611 | |
| | 171,396 | | | | | Bellemeade Re, Ltd., Series 2017-1, Class M1, 3.57%, due 10/25/27◆◆ 144A | | | 172,410 | |
| | 1,100,000 | | | | | Benchmark Mortgage Trust, Series 2018-B3, Class A4, 3.76%, due 04/10/51†††† | | | 1,120,554 | |
| | 130,000 | | | | | BWAY Mortgage Trust, Series 2015-1740, Class D, 3.79%, due 01/10/35◆◆ 144A | | | 124,882 | |
| | 190,000 | | | | | BX Commercial Mortgage Trust, Series 2018-BIOA, Class D, 2.97%, due 03/15/37◆◆ ‡‡‡‡ | | | 189,199 | |
| | 355,000 | | | | | BXP Trust, Series 2017-GM, Class D, 3.42%, due 06/13/39◆◆ 144A | | | 338,038 | |
| | 366,000 | | | | | CD Mortgage Trust, Series 2017-CD3, Class C, 4.56%, due 02/10/50◆◆ | | | 374,614 | |
| | 700,000 | | | | | CFCRE Commercial Mortgage Trust, Series 2016-C4, Class A3, 3.01%, due 05/10/58 | | | 674,089 | |
| | 100,000 | | | | | CGDB Commercial Mortgage Trust, Series 2017-BIO, Class E, 4.28% (1 mo. LIBOR plus 2.500%), due 05/15/30† 144A | | | 100,558 | |
| | 240,000 | | | | | CGDBB Commercial Mortgage Trust, Series 2017-BIOC, Class E, 3.93% (1 mo. LIBOR plus 2.150%), due 07/15/32† ‡‡‡‡ | | | 239,955 | |
| | 351,000 | | | | | CHT Mortgage Trust, Series 2017-CSMO, Class D, 4.03%, due 11/15/36◆◆ ‡‡‡‡ | | | 352,891 | |
| | 896,741 | | | | | CIM Trust, Series 2017-3, 3.66%, due 01/25/57◆◆ 144A | | | 918,365 | |
| | 400,965 | | | | | CIM Trust, Series 2017-6, 3.02%, due 06/25/57◆◆ 144A | | | 394,911 | |
| | 1,000,000 | | | | | Citigroup Commercial Mortgage Trust, Series 2013-GC17, Class A2, 2.96%, due 11/10/46 | | | 1,000,410 | |
| | | | | | |
| 92 | | See accompanying Notes to the Financial Statements. | | | | |
Mercer Core Fixed Income Fund
Schedule of Investments (Continued)
(showing percentage of net assets)
March 31, 2018
| | | | | | | | | | |
| Par Value ($) | | | | | Description | | Value ($) | |
| | |
| | | | | | Mortgage Backed Securities - Private Issuers — continued | |
| | | |
| | 1,600,000 | | | | | Citigroup Commercial Mortgage Trust, Series 2014-GC23, Class A3, 3.36%, due 07/10/47 | | | 1,604,434 | |
| | 1,500,000 | | | | | Citigroup Commercial Mortgage Trust, Series 2015-GC27, Class A4, 2.88%, due 02/10/48 | | | 1,457,850 | |
| | 1,772,000 | | | | | Citigroup Commercial Mortgage Trust, Series 2016-P5, Class A2, 2.40%, due 10/10/49 | | | 1,737,737 | |
| | 115,000 | | | | | Citigroup Commercial Mortgage Trust, Series 2017-1500, Class E, 4.28%, due 07/15/32◆◆ ‡‡‡‡ | | | 115,071 | |
| | 820,000 | | | | | Citigroup Commercial Mortgage Trust, Series 2017-MDRC, Class D, 3.84% (1 mo. LIBOR plus 2.250%), due 07/15/30† ‡‡‡‡ | | | 820,260 | |
| | 1,400,000 | | | | | Citigroup Commercial Mortgage Trust, Series 2017-P8, Class A3, 3.20%, due 09/15/50 | | | 1,367,313 | |
| | 27,500,000 | | | | | Citigroup Commercial Mortgage Trust, (IO), Series 2014-GC21, Class XB, 0.33%, due 05/10/47¤ ◆◆ | | | 703,181 | |
| | 140,000 | | | | | CLNS Trust, Series 2017-IKPR, Class C, 2.84% (1 mo. LIBOR plus 1.100%), due 06/11/32† 144A | | | 140,274 | |
| | 315,000 | | | | | Cold Storage Trust, Series 2017-ICE3, Class D, 3.88% (1 mo. LIBOR plus 2.100%), due 04/15/36† 144A | | | 316,850 | |
| | 221,000 | | | | | Commercial Mortgage Pass Through Certificates, Series 2012-LC4, Class B, 4.93%, due 12/10/44◆◆ | | | 227,620 | |
| | 405,000 | | | | | Commercial Mortgage Pass Through Certificates, Series 2013-300P, Class D, 4.39%, due 08/10/30◆◆ 144A | | | 412,349 | |
| | 460,000 | | | | | Commercial Mortgage Pass Through Certificates, Series 2013-CR11, Class B, 5.16%, due 08/10/50◆◆ | | | 488,591 | |
| | 225,000 | | | | | Commercial Mortgage Pass Through Certificates, Series 2013-CR13, Class C, 4.74%, due 11/10/46◆◆ | | | 231,219 | |
| | 144,102 | | | | | Commercial Mortgage Pass Through Certificates, Series 2013-CR8, Class A2, 2.37%, due 06/10/46 | | | 143,992 | |
| | 1,250,000 | | | | | Commercial Mortgage Pass Through Certificates, Series 2013-CR8, Class A4, 3.33%, due 06/10/46 | | | 1,259,216 | |
| | 91,443 | | | | | Commercial Mortgage Pass Through Certificates, Series 2013-LC6, Class A3, 2.67%, due 01/10/46 | | | 89,542 | |
| | 397,000 | | | | | Commercial Mortgage Pass Through Certificates, Series 2014-CR16, Class C, 4.90%, due 04/10/47◆◆ | | | 412,995 | |
| | 1,600,000 | | | | | Commercial Mortgage Pass Through Certificates, Series 2014-CR20, Class A3, 3.33%, due 11/10/47 | | | 1,599,249 | |
| | 425,000 | | | | | Commercial Mortgage Pass Through Certificates, Series 2014-FL4, Class D, 4.20% (1 mo. LIBOR plus 2.450%), due 07/13/31† 144A | | | 423,608 | |
| | 195,000 | | | | | Commercial Mortgage Pass Through Certificates, Series 2014-PAT, Class D, 3.87% (1 mo. LIBOR plus 2.150%), due 08/13/27† 144A | | | 195,014 | |
| | 390,000 | | | | | Commercial Mortgage Pass Through Certificates, Series 2014-TWC, Class D, 3.97% (1 mo. LIBOR plus 2.250%), due 02/13/32† 144A | | | 391,981 | |
| | 2,150,000 | | | | | Commercial Mortgage Pass Through Certificates, Series 2014-UBS2, Class A2, 2.82%, due 03/10/47 | | | 2,154,029 | |
| | 1,200,000 | | | | | Commercial Mortgage Pass Through Certificates, Series 2015-CR25, Class A3, 3.51%, due 08/10/48 | | | 1,203,537 | |
| | 250,000 | | | | | Commercial Mortgage Pass Through Certificates, Series 2015-CR27, Class B, 4.36%, due 10/10/48◆◆ | | | 257,298 | |
| | 53,000,000 | | | | | Commercial Mortgage Pass Through Certificates, (IO), Series 2014-CR17, Class XB, 0.21%, due 05/10/47◆◆ ‡‡‡‡ | | | 697,862 | |
| | 355,000 | | | | | Core Industrial Trust, Series 2015-CALW, Class F, 3.85%, due 02/10/34◆◆ 144A | | | 346,646 | |
| | | | | | |
| | See accompanying Notes to the Financial Statements. | | | 93 | |
Mercer Core Fixed Income Fund
Schedule of Investments (Continued)
(showing percentage of net assets)
March 31, 2018
| | | | | | | | | | |
| Par Value ($) | | | | | Description | | Value ($) | |
| | |
| | | | | | Mortgage Backed Securities - Private Issuers — continued | |
| | | |
| | 515,000 | | | | | Credit Suisse Mortgage Trust, Series 2006-OMA, Class B2, 5.54%, due 05/15/23‡‡‡‡ | | | 532,069 | |
| | 248,260 | | | | | Credit Suisse Mortgage Trust, Series 2017-6R, 2.72%, due 02/01/47 144A | | | 248,260 | |
| | 831,857 | | | | | Credit Suisse Mortgage Trust, Series 2017-HL1, Class A3, 3.50%, due 06/25/47 144A | | | 833,630 | |
| | 430,000 | | | | | Credit Suisse Mortgage Trust, Series 2018, 3.07%, due 12/04/46 144A | | | 430,000 | |
| | 1,100,000 | | | | | CSAIL Commercial Mortgage Trust, Series 2017-C8, Class A3, 3.13%, due 06/15/50 | | | 1,064,379 | |
| | 775,000 | | | | | CSAIL Commercial Mortgage Trust, Series 2017-CX10, Class A4, 3.19%, due 11/15/50 | | | 753,505 | |
| | 115,000 | | | | | DBJPM Mortgage Trust, Series 2016-C3, Class C, 3.49%, due 09/10/49◆◆ | | | 108,177 | |
| | 210,000 | | | | | DBJPM Mortgage Trust, Series 2017-C6, Class C, 4.17%, due 06/10/50◆◆ | | | 207,310 | |
| | 232,755 | | | | | Fremont Home Loan Trust, Series 2004-B, Class M1, 2.74% (1 mo. USD LIBOR plus 0.870%), due 05/25/34† | | | 233,646 | |
| | 339,000 | | | | | GAHR Commercial Mortgage Trust, Series 2015-NRF, Class DFX, 3.38%, due 12/15/34◆◆ 144A | | | 336,826 | |
| | 170,000 | | | | | GAHR Commercial Mortgage Trust, Series 2015-NRF, Class EFX, 3.38%, due 12/15/34◆◆ 144A | | | 168,006 | |
| | 206,999 | | | | | Galton Funding Mortgage Trust, Series 2018-1, Class A43, 3.50%, due 11/25/57◆◆ ‡‡‡‡ | | | 208,102 | |
| | 26,440 | | | | | GMACM Mortgage Loan Trust, Series 2004-AR2, Class 3A, 4.06%, due 08/19/34◆◆ | | | 25,644 | |
| | 85,000 | | | | | Great Wolf Trust, Series 2017-WOLF, Class E, 5.03%, due 09/15/34◆◆ ‡‡‡‡ | | | 85,766 | |
| | 145,000 | | | | | GS Mortgage Securities Corp. Trust, Series 2018-CHLL, Class E, 3.94%, due 02/15/37◆◆ ‡‡‡‡ | | | 145,474 | |
| | 1,365,080 | | | | | GS Mortgage Securities Trust, Series 2012-GCJ7, Class A4, 3.38%, due 05/10/45 | | | 1,379,753 | |
| | 161,286 | | | | | GS Mortgage Securities Trust, Series 2013-GC13, Class A2, 2.81%, due 07/10/46 | | | 161,186 | |
| | 155,000 | | | | | GS Mortgage Securities Trust, Series 2014-NEW, Class C, 3.79%, due 01/10/31 144A | | | 155,806 | |
| | 260,000 | | | | | GS Mortgage Securities Trust, Series 2015-590M, Class C, 3.81%, due 10/10/35◆◆ 144A | | | 259,535 | |
| | 900,000 | | | | | GS Mortgage Securities Trust, Series 2015-GC28, Class A4, 3.14%, due 02/10/48 | | | 886,340 | |
| | 325,000 | | | | | GS Mortgage Securities Trust, Series 2016-RENT, Class D, 4.07%, due 02/10/29◆◆ 144A | | | 325,576 | |
| | 200,000 | | | | | GS Mortgage Securities Trust, Series 2017-485L, Class C, 3.98%, due 02/10/37◆◆ 144A | | | 200,119 | |
| | 165,000 | | | | | GS Mortgage Securities Trust, Series 2017-GS5, Class C, 4.30%, due 03/10/50◆◆ | | | 165,464 | |
| | 165,000 | | | | | GS Mortgage Securities Trust, Series 2017-GS6, Class C, 4.32%, due 05/10/50◆◆ | | | 167,324 | |
| | 100,000 | | | | | Hilton Orlando Trust, Series 2018-ORL, Class D, 3.48%, due 12/15/34◆◆ ‡‡‡‡ | | | 100,482 | |
| | 280,000 | | | | | Hilton USA Trust, Series 2016-HHV, Class D, 4.19%, due 11/05/38◆◆ 144A | | | 272,166 | |
| | 100,000 | | | | | Hudsons Bay Simon JV Trust, Series 2015-HBFL, Class DFL, 5.34% (1 mo. LIBOR plus 3.650%), due 08/05/34† 144A | | | 100,274 | |
| | 170,000 | | | | | IMT Trust, Series 2017-APTS, Class CFX, 3.50%, due 06/15/34◆◆ ‡‡‡‡ | | | 165,480 | |
| | 760,000 | | | | | JP Morgan Chase Commercial Mortgage Securities Trust, Series 2016-JP2, Class A3, 2.56%, due 08/15/49 | | | 712,044 | |
| | 177,000 | | | | | JP Morgan Chase Commercial Mortgage Securities Trust, Series 2016-JP3, Class C, 3.48%, due 08/15/49◆◆ | | | 165,710 | |
| | 1,082,891 | | | | | JP Morgan Mortgage Trust, Series 2016-1, Class A5, 3.50%, due 05/25/46 144A | | | 1,089,828 | |
| | 1,725,000 | | | | | JPMBB Commercial Mortgage Securities Trust, Series 2014-C19, Class A3, 3.67%, due 04/15/47 | | | 1,757,107 | |
| | 415,000 | | | | | JPMBB Commercial Mortgage Securities Trust, Series 2014-C19, Class C, 4.66%, due 04/15/47◆◆ | | | 423,768 | |
| | 824,000 | | | | | JPMBB Commercial Mortgage Securities Trust, Series 2015-C32, Class A2, 2.82%, due 11/15/48 | | | 821,096 | |
| | 700,000 | | | | | JPMDB Commercial Mortgage Securities Trust, Series 2016-C2, Class A3A, 2.88%, due 06/15/49 | | | 672,559 | |
| | | | | | |
| 94 | | See accompanying Notes to the Financial Statements. | | | | |
Mercer Core Fixed Income Fund
Schedule of Investments (Continued)
(showing percentage of net assets)
March 31, 2018
| | | | | | | | | | |
| Par Value ($) | | | | | Description | | Value ($) | |
| | |
| | | | | | Mortgage Backed Securities - Private Issuers — continued | |
| | | |
| | 1,300,000 | | | | | JPMDB Commercial Mortgage Securities Trust, Series 2017-C5, Class A4, 3.41%, due 03/15/50 | | | 1,292,337 | |
| | 1,331,000 | | | | | JPMorgan Chase Commercial Mortgage Securities Trust, Series 2011-C3, Class A4, 4.72%, due 02/15/46 144A | | | 1,382,071 | |
| | 500,000 | | | | | JPMorgan Chase Commercial Mortgage Securities Trust, Series 2013-C13, Class A3, 3.53%, due 01/15/46 | | | 504,897 | |
| | 443,058 | | | | | JPMorgan Chase Commercial Mortgage Securities Trust, Series 2014-FL5, Class C, 3.69% (1 mo. USD LIBOR plus 2.100%), due 07/15/31† 144A | | | 443,007 | |
| | 18,000 | | | | | JPMorgan Chase Commercial Mortgage Securities Trust, Series 2014-PHH, Class C, 4.13% (1 mo. USD LIBOR plus 2.100%), due 08/15/27† 144A | | | 18,033 | |
| | 455,000 | | | | | JPMorgan Chase Commercial Mortgage Securities Trust, Series 2015-MAR7, Class C, 4.49%, due 06/05/32 144A | | | 454,121 | |
| | 171,000 | | | | | JPMorgan Chase Commercial Mortgage Securities Trust, Series 2015-SGP, Class B, 4.53% (1 mo. USD LIBOR plus 2.750%), due 07/15/36† 144A | | | 171,791 | |
| | 1,600,000 | | | | | JPMorgan Chase Commercial Mortgage Securities Trust, Series 2017-JP6, Class A3, 3.11%, due 07/15/50 | | | 1,581,126 | |
| | 686,784 | | | | | JPMorgan Mortgage Trust, Series 2016-4, Class A5, 3.50%, due 10/25/46 144A | | | 690,754 | |
| | 1,511,131 | | | | | JPMorgan Mortgage Trust, Series 2017-2, Class A5, 3.50%, due 05/25/47 144A | | | 1,515,145 | |
| | 755,356 | | | | | JPMorgan Mortgage Trust, Series 2017-3, Class 1A5, 3.50%, due 08/25/47◆◆ 144A | | | 757,362 | |
| | 650,186 | | | | | Lehman XS Trust, Series 2006-GP4, Class 1A1, 2.08% (1 mo. USD LIBOR plus 0.205%), due 08/25/46† | | | 626,969 | |
| | 336,413 | | | | | LSTAR Securities Investment, Ltd., Series 2017-3, Class A1, 3.66% (1 mo. USD LIBOR plus 2.000%), due 04/01/22† 144A | | | 336,833 | |
| | 1,121,312 | | | | | LSTAR Securities Investment, Ltd., Series 2017-4, Class A, 3.66% (1 mo. USD LIBOR plus 2.000%), due 05/01/22† 144A | | | 1,123,691 | |
| | 760,222 | | | | | LSTAR Securities Investment, Ltd., Series 2017-5, Class A, 3.66% (1 mo. USD LIBOR plus 2.000%), due 05/01/22† 144A | | | 761,855 | |
| | 403,865 | | | | | LSTAR Securities Investment, Ltd., Series 2017-8, Class A, 3.31%, due 11/01/22◆◆ 144A | | | 406,221 | |
| | 220,000 | | | | | MAD Mortgage Trust, Series 2017-330M, Class D, 3.71%, due 08/15/34◆◆ ‡‡‡‡ | | | 217,198 | |
| | 100,000 | | | | | Morgan Stanley Bank of America Merrill Lynch Trust, Series 2013-C7, Class A4, 2.92%, due 02/15/46 | | | 98,774 | |
| | 765,000 | | | | | Morgan Stanley Capital I Trust, Series 2014-150E, Class D, 4.30%, due 09/09/32◆◆ 144A | | | 771,302 | |
| | 315,000 | | | | | Morgan Stanley Capital I Trust, Series 2015-XLF1, Class C, 3.98% (1 mo. USD LIBOR plus 2.200%), due 08/14/31† 144A | | | 316,603 | |
| | 1,600,000 | | | | | Morgan Stanley Capital I Trust, Series 2016-UB11, Class A3, 2.53%, due 08/15/49 | | | 1,493,193 | |
| | 342,000 | | | | | Morgan Stanley Capital I Trust, Series 2017-CLS, Class D, 3.18%, due 11/15/34◆◆ ‡‡‡‡ | | | 342,984 | |
| | 125,000 | | | | | Morgan Stanley Services Group, Inc. Trust, Series 2017-237P, Class D, 3.86%, due 09/13/39‡‡‡‡ | | | 119,408 | |
| | 180,000 | | | | | Morgan Stanley Services Group, Inc. Trust, Series 2017-237P, Class E, 3.86%, due 09/13/39‡‡‡‡ | | | 168,030 | |
| | 455,000 | | | | | MSCG Trust, Series 2016-SNR, Class D, 6.55%, due 11/15/34 144A | | | 456,437 | |
| | 55,000 | | | | | MSDB Trust, Series 2017-712F, Class C, 3.63%, due 07/11/39◆◆ ‡‡‡‡ | | | 54,266 | |
| | 95,000 | | | | | Natixis Commercial Mortgage Securities Trust, Series 2018-285M, Class D, 3.79%, due 11/15/32◆◆ ‡‡‡‡ | | | 92,744 | |
| | 165,000 | | | | | Natixis Commercial Mortgage Securities Trust, Series 2018-ALXA, Class C, 4.32%, due 01/15/43◆◆ ‡‡‡‡ | | | 168,658 | |
| | | | | | |
| | See accompanying Notes to the Financial Statements. | | | 95 | |
Mercer Core Fixed Income Fund
Schedule of Investments (Continued)
(showing percentage of net assets)
March 31, 2018
| | | | | | | | | | |
| Par Value ($) | | | | | Description | | Value ($) | |
| | |
| | | | | | Mortgage Backed Securities - Private Issuers — continued | |
| | | |
| | 290,000 | | | | | Olympic Tower Mortgage Trust, Series 2017-OT, Class D, 3.95%, due 05/10/39◆◆ 144A | | | 286,648 | |
| | 160,000 | | | | | One Market Plaza Trust, Series 2017-1MKT, Class D, 4.15%, due 02/10/32 144A | | | 158,812 | |
| | 85,039 | | | | | Provident Funding Mortgage Loan Trust, Series 2005-1, Class 2A1, 3.64%, due 05/25/35◆◆ | | | 83,584 | |
| | 330,000 | | | | | Radnor RE Ltd., Series 2018-1, Class M1, 3.25%, due 03/25/28◆◆ 144A | | | 330,212 | |
| | 810,559 | | | | | Sequoia Mortgage Trust, Series 2017-4, Class A4, 3.50%, due 07/25/47 144A | | | 814,485 | |
| | 2,156,263 | | | | | Small Business Administration Participation Certificates, Series 2013-20L, Class 1, 3.38%, due 12/01/33 | | | 2,187,857 | |
| | 315,000 | | | | | TMSQ Mortgage Trust, Series 2014-1500, Class D, 3.83%, due 10/10/36◆◆ 144A | | | 298,065 | |
| | 215,000 | | | | | UBS Commercial Mortgage Trust, Series 2012-C1, Class B, 4.82%, due 05/10/45 | | | 226,994 | |
| | 675,000 | | | | | UBS Commercial Mortgage Trust, Series 2017-C2, Class ASB, 3.26%, due 08/15/50 | | | 673,258 | |
| | 1,400,000 | | | | | UBS Commercial Mortgage Trust, Series 2017-C5, Class A4, 3.21%, due 11/15/50 | | | 1,363,651 | |
| | 550,000 | | | | | UBS Commercial Mortgage Trust, Series 2018-C9, Class A3, 3.85%, due 03/15/51 | | | 559,176 | |
| | 2,272,000 | | | | | UBS-Barclays Commercial Mortgage Trust, Series 2012-C3, Class A4, 3.09%, due 08/10/49 | | | 2,267,823 | |
| | 1,678,450 | | | | | UBS-Barclays Commercial Mortgage Trust, Series 2013-C5, Class A3, 2.92%, due 03/10/46 | | | 1,664,280 | |
| | 1,523,797 | | | | | UBS-Citigroup Commercial Mortgage Trust, Series 2011-C1, Class A3, 3.60%, due 01/10/45 | | | 1,544,353 | |
| | 490,000 | | | | | VNDO Mortgage Trust, Series 2013-PENN, Class D, 3.95%, due 12/13/29◆◆ 144A | | | 489,349 | |
| | 445,000 | | | | | VNDO Mortgage Trust, Series 2016-350P, Class D, 3.90%, due 01/10/35◆◆ 144A | | | 434,046 | |
| | 23,199 | | | | | WaMu Mortgage Pass Through Certificates, Series 2003-AR9, Class 1A7, 3.34%, due 09/25/33◆◆ | | | 23,893 | |
| | 363,000 | | | | | Wells Fargo Commercial Mortgage Trust, Series 2013-120B, Class C, 2.71%, due 03/18/28◆◆ 144A | | | 357,691 | |
| | 55,000 | | | | | Wells Fargo Commercial Mortgage Trust, Series 2013-BTC, Class E, 3.55%, due 04/16/35◆◆ 144A | | | 52,168 | |
| | 260,000 | | | | | Wells Fargo Commercial Mortgage Trust, Series 2015-LC22, Class B, 4.54%, due 09/15/58◆◆ | | | 272,804 | |
| | 1,500,000 | | | | | Wells Fargo Commercial Mortgage Trust, Series 2016-BNK1, Class A2, 2.40%, due 08/15/49 | | | 1,388,183 | |
| | 3,000,000 | | | | | Wells Fargo Commercial Mortgage Trust, Series 2016-NXS6, Class A3, 2.64%, due 11/15/49 | | | 2,830,488 | |
| | 950,000 | | | | | Wells Fargo Commercial Mortgage Trust, Series 2017-C38, Class A4, 3.19%, due 07/15/50 | | | 927,391 | |
| | 1,500,000 | | | | | Wells Fargo Commercial Mortgage Trust, Series 2017-C41, Class A3, 3.21%, due 11/15/50 | | | 1,465,054 | |
| | 1,400,000 | | | | | Wells Fargo Commercial Mortgage Trust, Series 2017-RB1, Class A4, 3.37%, due 03/15/50 | | | 1,388,291 | |
| | 200,000 | | | | | Wells Fargo Commercial Mortgage Trust, Series 2017-RB1, Class C, 4.31%, due 03/15/50◆◆ | | | 199,292 | |
| | 110,000 | | | | | Wells Fargo Commercial Mortgage Trust, Series 2017-SMP, Class D, 3.55%, due 12/15/34◆◆ ‡‡‡‡ | | | 110,252 | |
| | 2,560,000 | | | | | WF-RBS Commercial Mortgage Trust, Series 2011-C4, Class A4, 4.90%, due 06/15/44 144A | | | 2,690,559 | |
| | 1,462,000 | | | | | WF-RBS Commercial Mortgage Trust, Series 2013-C12, Class A4, 3.20%, due 03/15/48 | | | 1,460,248 | |
| | 195,000 | | | | | WF-RBS Commercial Mortgage Trust, Series 2013-C15, Class B, 4.48%, due 08/15/46◆◆ | | | 201,453 | |
| | | | | | |
| 96 | | See accompanying Notes to the Financial Statements. | | | | |
Mercer Core Fixed Income Fund
Schedule of Investments (Continued)
(showing percentage of net assets)
March 31, 2018
| | | | | | | | | | |
| Par Value ($) | | | | | Description | | Value ($) | |
| | |
| | | | | | Mortgage Backed Securities - Private Issuers — continued | |
| | | |
| | 170,000 | | | | | Worldwide Plaza Trust, Series 2017-WWP, Class D, 3.60%, due 11/10/36◆◆ ‡‡‡‡ | | | 161,205 | |
| | | | | | | | | | |
| | | | 86,907,891 | |
| | | | | | | | | | |
| | |
| | | | | | Mortgage Backed Securities - U.S. Government Agency Obligations — 24.5% | |
| | | |
| | 86,425 | | | | | FHLMC Gold, Pool # G16177, 2.00%, due 01/01/32 | | | 82,633 | |
| | 454,667 | | | | | FHLMC Gold, Pool # J35715, 2.50%, due 11/01/31 | | | 445,621 | |
| | 631,162 | | | | | FHLMC Gold, Pool # J26100, 3.00%, due 10/01/28 | | | 632,124 | |
| | 523,481 | | | | | FHLMC Gold, Pool # V60565, 3.00%, due 06/01/29 | | | 523,278 | |
| | 565,717 | | | | | FHLMC Gold, Pool # V60603, 3.00%, due 09/01/29 | | | 565,431 | |
| | 1,262,533 | | | | | FHLMC Gold, Pool # V60599, 3.00%, due 09/01/29 | | | 1,262,045 | |
| | 872,869 | | | | | FHLMC Gold, Pool # C91908, 3.00%, due 01/01/37 | | | 867,522 | |
| | 2,932,715 | | | | | FHLMC Gold, Pool # G60039, 3.00%, due 04/01/43 | | | 2,883,839 | |
| | 2,160,645 | | | | | FHLMC Gold, Pool # Q34842, 3.00%, due 07/01/45 | | | 2,114,409 | |
| | 1,507,642 | | | | | FHLMC Gold, Pool # Q42618, 3.00%, due 08/01/46 | | | 1,473,030 | |
| | 1,436,786 | | | | | FHLMC Gold, Pool # G08721, 3.00%, due 09/01/46 | | | 1,403,698 | |
| | 1,788,804 | | | | | FHLMC Gold, Pool # G60722, 3.00%, due 10/01/46 | | | 1,749,203 | |
| | 440,471 | | | | | FHLMC Gold, Pool # V82848, 3.00%, due 12/01/46 | | | 431,317 | |
| | 1,401,013 | | | | | FHLMC Gold, Pool # G60989, 3.00%, due 12/01/46 | | | 1,369,110 | |
| | 1,914,092 | | | | | FHLMC Gold, Pool # G08741, 3.00%, due 01/01/47 | | | 1,868,204 | |
| | 1,991,464 | | | | | FHLMC Gold, Pool # G60931, 3.00%, due 02/01/47 | | | 1,953,143 | |
| | 233,667 | | | | | FHLMC Gold, Pool # J16432, 3.50%, due 08/01/26 | | | 238,698 | |
| | 242,703 | | | | | FHLMC Gold, Pool # J17763, 3.50%, due 01/01/27 | | | 247,931 | |
| | 292,517 | | | | | FHLMC Gold, Pool # Q11218, 3.50%, due 09/01/42 | | | 294,827 | |
| | 556,381 | | | | | FHLMC Gold, Pool # Q12052, 3.50%, due 10/01/42 | | | 560,775 | |
| | 1,119,400 | | | | | FHLMC Gold, Pool # Q12862, 3.50%, due 11/01/42 | | | 1,128,185 | |
| | 539,156 | | | | | FHLMC Gold, Pool # Q17792, 3.50%, due 05/01/43 | | | 543,414 | |
| | 2,238,465 | | | | | FHLMC Gold, Pool # G60934, 3.50%, due 06/01/45 | | | 2,256,147 | |
| | 1,925,047 | | | | | FHLMC Gold, Pool # V82515, 3.50%, due 06/01/46 | | | 1,934,721 | |
| | 2,368,619 | | | | | FHLMC Gold, Pool # Q41917, 3.50%, due 07/01/46 | | | 2,379,733 | |
| | 2,452,687 | | | | | FHLMC Gold, Pool # Q41918, 3.50%, due 07/01/46 | | | 2,468,394 | |
| | 726,476 | | | | | FHLMC Gold, Pool # G60767, 3.50%, due 10/01/46 | | | 729,795 | |
| | 590,469 | | | | | FHLMC Gold, Pool # Q44399, 3.50%, due 11/01/46 | | | 593,385 | |
| | 445,214 | | | | | FHLMC Gold, Pool # G60788, 3.50%, due 12/01/46 | | | 447,728 | |
| | 1,662,715 | | | | | FHLMC Gold, Pool # Q45741, 3.50%, due 01/01/47 | | | 1,673,384 | |
| | 112,449 | | | | | FHLMC Gold, Pool # G08748, 3.50%, due 02/01/47 | | | 112,915 | |
| | 483,220 | | | | | FHLMC Gold, Pool # G67703, 3.50%, due 04/01/47 | | | 486,320 | |
| | 810,219 | | | | | FHLMC Gold, Pool # V83495, 3.50%, due 10/01/47 | | | 812,919 | |
| | 77,233 | | | | | FHLMC Gold, Pool # V83453, 3.50%, due 10/01/47 | | | 77,490 | |
| | 1,251,037 | | | | | FHLMC Gold, Pool # G61194, 3.50%, due 11/01/47 | | | 1,257,939 | |
| | 348,784 | | | | | FHLMC Gold, Pool # G14678, 4.00%, due 12/01/26 | | | 359,777 | |
| | 491,866 | | | | | FHLMC Gold, Pool # G30700, 4.00%, due 04/01/34 | | | 512,607 | |
| | 708,737 | | | | | FHLMC Gold, Pool # G06231, 4.00%, due 12/01/40 | | | 734,050 | |
| | 527,868 | | | | | FHLMC Gold, Pool # A96970, 4.00%, due 02/01/41 | | | 546,742 | |
| | 1,570,413 | | | | | FHLMC Gold, Pool # Q04020, 4.00%, due 10/01/41 | | | 1,626,654 | |
| | 1,283,898 | | | | | FHLMC Gold, Pool # Q09224, 4.00%, due 07/01/42 | | | 1,331,793 | |
| | 1,675,896 | | | | | FHLMC Gold, Pool # Q36815, 4.00%, due 10/01/45 | | | 1,727,886 | |
| | 952,653 | | | | | FHLMC Gold, Pool # G08672, 4.00%, due 10/01/45 | | | 982,251 | |
| | 1,564,066 | | | | | FHLMC Gold, Pool # V82292, 4.00%, due 04/01/46 | | | 1,614,001 | |
| | 1,883,164 | | | | | FHLMC Gold, Pool # G61043, 4.00%, due 07/01/47 | | | 1,944,915 | |
| | | | | | |
| | See accompanying Notes to the Financial Statements. | | | 97 | |
Mercer Core Fixed Income Fund
Schedule of Investments (Continued)
(showing percentage of net assets)
March 31, 2018
| | | | | | | | | | |
| Par Value ($) | | | | | Description | | Value ($) | |
| | |
| | | | | | Mortgage Backed Securities - U.S. Government Agency Obligations — continued | |
| | | |
| | 715,402 | | | | | FHLMC Gold, Pool # A89870, 4.50%, due 11/01/39 | | | 757,252 | |
| | 786,911 | | | | | FHLMC Gold, Pool # Q02552, 4.50%, due 08/01/41 | | | 831,076 | |
| | 124,911 | | | | | FHLMC Gold, Pool # G07515, 4.50%, due 09/01/41 | | | 132,216 | |
| | 1,909,238 | | | | | FHLMC Gold, Pool # G60804, 4.50%, due 05/01/42 | | | 2,007,452 | |
| | 520,617 | | | | | FHLMC Gold, Pool # G08568, 4.50%, due 01/01/44 | | | 546,149 | |
| | 1,616,771 | | | | | FHLMC Gold, Pool # G60700, 4.50%, due 09/01/45 | | | 1,705,179 | |
| | 1,968,477 | | | | | FHLMC Gold, Pool # G61242, 4.50%, due 12/01/45 | | | 2,069,391 | |
| | 224,730 | | | | | FHLMC Gold, Pool # G08735, 4.50%, due 10/01/46 | | | 235,485 | |
| | 685,029 | | | | | FHLMC Gold, Pool # G07021, 5.00%, due 09/01/39 | | | 738,533 | |
| | 2,116,409 | | | | | FHLMC Gold, Pool # G60564, 5.00%, due 02/01/42 | | | 2,283,283 | |
| | 1,837,040 | | | | | FHLMC Gold, Pool # G60806, 5.00%, due 12/01/44 | | | 1,986,459 | |
| | 204,140 | | | | | FHLMC Gold, Pool # G01749, 5.50%, due 01/01/35 | | | 225,290 | |
| | 188,594 | | | | | FHLMC Gold, Pool # G06875, 5.50%, due 12/01/38 | | | 208,316 | |
| | 349,653 | | | | | FHLMC Gold, Pool # G06409, 6.00%, due 11/01/39 | | | 392,068 | |
| | 1,000,000 | | | | | FHLMC Multifamily Structured Pass Through Certificates, Series K053, Class A2, 3.00%, due 12/25/25 | | | 993,184 | |
| | 550,000 | | | | | FHLMC Multifamily Structured Pass Through Certificates, Series K059, Class AM, 3.17%, due 09/25/26◆◆ | | | 548,145 | |
| | 1,700,000 | | | | | FHLMC Multifamily Structured Pass Through Certificates, Series K069, Class A2, 3.19%, due 09/25/27◆◆ | | | 1,695,339 | |
| | 350,000 | | | | | FHLMC Multifamily Structured Pass Through Certificates, Series K069, Class AM, 3.25%, due 09/25/27◆◆ | | | 348,590 | |
| | 2,800,000 | | | | | FHLMC Multifamily Structured Pass Through Certificates, Series K071, Class A2, 3.29%, due 11/25/27 | | | 2,810,015 | |
| | 1,300,000 | | | | | FHLMC Multifamily Structured Pass Through Certificates, Series K071, Class AM, 3.36%, due 11/25/27◆◆ | | | 1,306,113 | |
| | 600,000 | | | | | FHLMC Multifamily Structured Pass Through Certificates, Series KS03, Class A4, 3.16%, due 05/25/25◆◆ | | | 598,272 | |
| | 33,378,465 | | | | | FHLMC Multifamily Structured Pass Through Certificates, (IO), Series K006, Class AX1, 0.96%, due 01/25/20¤ ◆◆ | | | 479,595 | |
| | 21,681,037 | | | | | FHLMC Multifamily Structured Pass Through Certificates, (IO), Series K007, Class X1, 1.04%, due 04/25/20¤ ◆◆ | | | 374,746 | |
| | 27,015,383 | | | | | FHLMC Multifamily Structured Pass Through Certificates, (IO), Series K025, Class X1, 0.87%, due 10/25/22¤ ◆◆ | | | 872,373 | |
| | 116,267 | | | | | FHLMC Reference REMIC, Series R007, Class ZA, 6.00%, due 05/15/36 | | | 127,831 | |
| | 119,664 | | | | | FHLMC Structured Agency Credit Risk Debt Notes, Series 2015-DNA1, Class M1, 2.77% (1 mo. USD LIBOR plus 0.900%), due 10/25/27† | | | 119,740 | |
| | 15,582 | | | | | FHLMC Structured Agency Credit Risk Debt Notes, Series 2016-DNA1, Class M1, 3.07% (1 mo. USD LIBOR plus 1.450%), due 07/25/28† | | | 15,594 | |
| | 280,000 | | | | | FHLMC Structured Agency Credit Risk Debt Notes, Series 2016-DNA3, Class M2, 3.87% (1 mo. USD LIBOR plus 2.000%), due 12/25/28† | | | 285,163 | |
| | 480,000 | | | | | FHLMC Structured Agency Credit Risk Debt Notes, Series 2016-HQA4, Class M2, 3.17% (1 mo. USD LIBOR plus 1.300%), due 04/25/29† | | | 487,283 | |
| | 626,014 | | | | | FHLMC Structured Agency Credit Risk Debt Notes, Series 2017-DNA1, Class M1, 3.07% (1 mo. USD LIBOR plus 1.200%), due 07/25/29† | | | 631,575 | |
| | 1,211,455 | | | | | FHLMC Structured Agency Credit Risk Debt Notes, Series 2017-DNA3, Class M1, 2.37% (1 mo. USD LIBOR plus 0.750%), due 03/25/30† | | | 1,215,245 | |
| | 900,000 | | | | | FNMA, 2.38%, due 01/19/23 | | | 889,288 | |
| | 310,000 | | | | | FNMA, 6.63%, due 11/15/30 | | | 425,037 | |
| | 340,741 | | | | | FNMA, Pool # AS7693, 2.00%, due 08/01/31 | | | 325,812 | |
| | | | | | |
| 98 | | See accompanying Notes to the Financial Statements. | | | | |
Mercer Core Fixed Income Fund
Schedule of Investments (Continued)
(showing percentage of net assets)
March 31, 2018
| | | | | | | | | | |
| Par Value ($) | | | | | Description | | Value ($) | |
| | |
| | | | | | Mortgage Backed Securities - U.S. Government Agency Obligations — continued | |
| | | |
| | 558,845 | | | | | FNMA, Pool # AO7971, 2.50%, due 06/01/27 | | | 552,193 | |
| | 309,130 | | | | | FNMA, Pool # AB7059, 2.50%, due 11/01/42 | | | 292,911 | |
| | 463,027 | | | | | FNMA, Pool # AS8073, 2.50%, due 10/01/46 | | | 436,811 | |
| | 13,309 | | | | | FNMA, Pool # MA2064, 3.00%, due 10/01/24 | | | 13,408 | |
| | 976,472 | | | | | FNMA, Pool # AS8610, 3.00%, due 01/01/32 | | | 976,119 | |
| | 2,682,805 | | | | | FNMA, Pool # MA3312, 3.00%, due 03/01/33 | | | 2,682,380 | |
| | 971,085 | | | | | FNMA, Pool # AB6212, 3.00%, due 09/01/42 | | | 956,397 | |
| | 553,451 | | | | | FNMA, Pool # AQ7923, 3.00%, due 12/01/42 | | | 545,127 | |
| | 1,297,164 | | | | | FNMA, Pool # AB7505, 3.00%, due 01/01/43 | | | 1,277,604 | |
| | 1,028,434 | | | | | FNMA, Pool # AR2001, 3.00%, due 02/01/43 | | | 1,012,910 | |
| | 1,008,891 | | | | | FNMA, Pool # AT0232, 3.00%, due 03/01/43 | | | 993,652 | |
| | 1,837,101 | | | | | FNMA, Pool # AB9659, 3.00%, due 06/01/43 | | | 1,809,312 | |
| | 169,868 | | | | | FNMA, Pool # AY7121, 3.00%, due 04/01/45 | | | 166,873 | |
| | 879,801 | | | | | FNMA, Pool # AZ0611, 3.00%, due 04/01/45 | | | 860,326 | |
| | 765,519 | | | | | FNMA, Pool # AS7729, 3.00%, due 08/01/46 | | | 749,001 | |
| | 494,833 | | | | | FNMA, Pool # AS8483, 3.00%, due 12/01/46 | | | 483,205 | |
| | 1,205,777 | | | | | FNMA, Pool # BM3116, 3.00%, due 02/01/47 | | | 1,183,927 | |
| | 328,744 | | | | | FNMA, Pool # BM3258, 3.00%, due 02/01/47 | | | 322,729 | |
| | 1,071,868 | | | | | FNMA, Pool # BM3033, 3.00%, due 10/01/47 | | | 1,048,358 | |
| | 529,734 | | | | | FNMA, Pool # AX3719, 3.50%, due 07/01/27 | | | 540,819 | |
| | 936,570 | | | | | FNMA, Pool # MA2164, 3.50%, due 02/01/35 | | | 954,309 | |
| | 1,379,707 | | | | | FNMA, Pool # BM1972, 3.50%, due 10/01/37 | | | 1,405,093 | |
| | 1,097,633 | | | | | FNMA, Pool # AJ9278, 3.50%, due 12/01/41 | | | 1,108,311 | |
| | 1,739,060 | | | | | FNMA, Pool # AL1895, 3.50%, due 06/01/42 | | | 1,755,998 | |
| | 962,077 | | | | | FNMA, Pool # AP2422, 3.50%, due 08/01/42 | | | 970,832 | |
| | 1,414,279 | | | | | FNMA, Pool # AB6802, 3.50%, due 11/01/42 | | | 1,427,816 | |
| | 932,243 | | | | | FNMA, Pool # AL3000, 3.50%, due 12/01/42 | | | 940,585 | |
| | 1,252,814 | | | | | FNMA, Pool # AL3316, 3.50%, due 03/01/43 | | | 1,263,852 | |
| | 2,163,265 | | | | | FNMA, Pool # AL3873, 3.50%, due 07/01/43 | | | 2,181,820 | |
| | 1,417,590 | | | | | FNMA, Pool # AS5133, 3.50%, due 06/01/45 | | | 1,423,930 | |
| | 1,161,923 | | | | | FNMA, Pool # AY5617, 3.50%, due 06/01/45 | | | 1,167,294 | |
| | 4,676,335 | | | | | FNMA, Pool # AL7594, 3.50%, due 08/01/45 | | | 4,700,154 | |
| | 1,267,357 | | | | | FNMA, Pool # AZ4775, 3.50%, due 10/01/45 | | | 1,272,628 | |
| | 401,101 | | | | | FNMA, Pool # AZ3743, 3.50%, due 11/01/45 | | | 402,647 | |
| | 526,870 | | | | | FNMA, Pool # AS6332, 3.50%, due 12/01/45 | | | 528,735 | |
| | 818,939 | | | | | FNMA, Pool # AS6452, 3.50%, due 01/01/46 | | | 821,841 | |
| | 1,247,185 | | | | | FNMA, Pool # AL9153, 3.50%, due 09/01/46 | | | 1,258,388 | |
| | 1,854,472 | | | | | FNMA, Pool # BM1568, 3.50%, due 07/01/47 | | | 1,870,985 | |
| | 1,731,899 | | | | | FNMA, Pool # BM1573, 3.50%, due 07/01/47 | | | 1,742,583 | |
| | 1,580,523 | | | | | FNMA, Pool # CA0655, 3.50%, due 11/01/47 | | | 1,589,035 | |
| | 2,054,368 | | | | | FNMA, Pool # MA3182, 3.50%, due 11/01/47 | | | 2,061,663 | |
| | 1,239,616 | | | | | FNMA, Pool # MA1689, 4.00%, due 12/01/33 | | | 1,291,536 | |
| | 1,444,923 | | | | | FNMA, Pool # 725331, 4.00%, due 01/01/34 | | | 1,498,549 | |
| | 547,099 | | | | | FNMA, Pool # MA2019, 4.00%, due 09/01/34 | | | 569,910 | |
| | 2,246,912 | | | | | FNMA, Pool # AL9621, 4.00%, due 01/01/37 | | | 2,333,068 | |
| | 1,557,298 | | | | | FNMA, Pool # AL6663, 4.00%, due 03/01/39 | | | 1,607,257 | |
| | 667,455 | | | | | FNMA, Pool # 932807, 4.00%, due 09/01/40 | | | 690,259 | |
| | 370,709 | | | | | FNMA, Pool # AE7685, 4.00%, due 10/01/40 | | | 383,340 | |
| | 1,530,930 | | | | | FNMA, Pool # AH4404, 4.00%, due 01/01/41 | | | 1,583,101 | |
| | 567,779 | | | | | FNMA, Pool # AJ9317, 4.00%, due 01/01/42 | | | 587,514 | |
| | | | | | |
| | See accompanying Notes to the Financial Statements. | | | 99 | |
Mercer Core Fixed Income Fund
Schedule of Investments (Continued)
(showing percentage of net assets)
March 31, 2018
| | | | | | | | | | |
| Par Value ($) | | | | | Description | | Value ($) | |
| | |
| | | | | | Mortgage Backed Securities - U.S. Government Agency Obligations — continued | |
| | | |
| | 237,739 | | | | | FNMA, Pool # AO4109, 4.00%, due 06/01/42 | | | 245,808 | |
| | 318,370 | | | | | FNMA, Pool # AB9383, 4.00%, due 05/01/43 | | | 329,264 | |
| | 1,383,546 | | | | | FNMA, Pool # AL8191, 4.00%, due 12/01/45 | | | 1,426,946 | |
| | 1,172,794 | | | | | FNMA, Pool # AS6304, 4.00%, due 12/01/45 | | | 1,204,910 | |
| | 389,922 | | | | | FNMA, Pool # AS6286, 4.00%, due 12/01/45 | | | 400,599 | |
| | 1,738,778 | | | | | FNMA, Pool # BD1412, 4.00%, due 06/01/46 | | | 1,795,675 | |
| | 3,291,918 | | | | | FNMA, Pool # BD7043, 4.00%, due 03/01/47 | | | 3,396,693 | |
| | 3,140,701 | | | | | FNMA, Pool # BE7192, 4.00%, due 03/01/47 | | | 3,235,680 | |
| | 1,845,731 | | | | | FNMA, Pool # BH1207, 4.00%, due 06/01/47 | | | 1,901,659 | |
| | 1,737,306 | | | | | FNMA, Pool # BH9320, 4.00%, due 09/01/47 | | | 1,792,072 | |
| | 947,107 | | | | | FNMA, Pool # AL9737, 4.50%, due 08/01/38 | | | 997,012 | |
| | 731,378 | | | | | FNMA, Pool # 995243, 4.50%, due 08/01/38 | | | 770,659 | |
| | 620,192 | | | | | FNMA, Pool # AD9153, 4.50%, due 08/01/40 | | | 656,430 | |
| | 1,110,391 | | | | | FNMA, Pool # AL0215, 4.50%, due 04/01/41** | | | 1,175,125 | |
| | 1,343,702 | | | | | FNMA, Pool # AL6301, 4.50%, due 06/01/42 | | | 1,419,295 | |
| | 929,805 | | | | | FNMA, Pool # AL8936, 4.50%, due 05/01/46 | | | 975,424 | |
| | 2,177,169 | | | | | FNMA, Pool # 254903, 5.00%, due 10/01/33 | | | 2,351,854 | |
| | 768,260 | | | | | FNMA, Pool # 725027, 5.00%, due 11/01/33 | | | 832,394 | |
| | 951,677 | | | | | FNMA, Pool # 735676, 5.00%, due 07/01/35 | | | 1,027,896 | |
| | 605,232 | | | | | FNMA, Pool # 745148, 5.00%, due 01/01/36 | | | 653,360 | |
| | 471,017 | | | | | FNMA, Pool # 995245, 5.00%, due 01/01/39 | | | 507,109 | |
| | 1,109,847 | | | | | FNMA, Pool # AL7521, 5.00%, due 06/01/39 | | | 1,198,471 | |
| | 229,720 | | | | | FNMA, Pool # AI1892, 5.00%, due 05/01/41 | | | 249,144 | |
| | 703,544 | | | | | FNMA, Pool # AI1971, 5.00%, due 05/01/41 | | | 761,038 | |
| | 1,211,746 | | | | | FNMA, Pool # BM1105, 5.00%, due 07/01/41 | | | 1,308,005 | |
| | 1,588,879 | | | | | FNMA, Pool # AL0761, 5.00%, due 09/01/41 | | | 1,719,218 | |
| | 546,038 | | | | | FNMA, Pool # AL5955, 5.00%, due 01/01/42 | | | 590,617 | |
| | 712,383 | | | | | FNMA, Pool # AL6839, 5.00%, due 04/01/42 | | | 770,454 | |
| | 427,695 | | | | | FNMA, Pool # AL5788, 5.00%, due 05/01/42 | | | 462,897 | |
| | 1,752,681 | | | | | FNMA, Pool # BM1655, 5.00%, due 11/01/44 | | | 1,891,990 | |
| | 4,837 | | | | | FNMA, Pool # 254548, 5.50%, due 12/01/32 | | | 5,308 | |
| | 355,161 | | | | | FNMA, Pool # 704235, 5.50%, due 05/01/33 | | | 388,331 | |
| | 60,916 | | | | | FNMA, Pool # 990906, 5.50%, due 10/01/35 | | | 66,965 | |
| | 335,059 | | | | | FNMA, Pool # 849077, 5.50%, due 01/01/36 | | | 367,924 | |
| | 595,117 | | | | | FNMA, Pool # 983471, 5.50%, due 05/01/38 | | | 649,937 | |
| | 685,966 | | | | | FNMA, Pool # 985184, 5.50%, due 08/01/38 | | | 747,206 | |
| | 372,939 | | | | | FNMA, Pool # AE0469, 6.00%, due 12/01/39 | | | 418,751 | |
| | 1,354,812 | | | | | FNMA, Series 2011-59, Class NZ, 5.50%, due 07/25/41 | | | 1,484,572 | |
| | 43,432 | | | | | FNMA, Series 2012-28, Class B, 6.50%, due 06/25/39 | | | 46,739 | |
| | 107,235 | | | | | FNMA Connecticut Avenue Securities, Series 2016-C02, Class 1M1, 4.02% (1 mo. USD LIBOR plus 2.150%), due 09/25/28† | | | 108,046 | |
| | 138,078 | | | | | FNMA Connecticut Avenue Securities, Series 2016-C03, Class 2M1, 4.07% (1 mo. USD LIBOR plus 2.200%), due 10/25/28† | | | 139,062 | |
| | 215,727 | | | | | FNMA Connecticut Avenue Securities, Series 2016-C04, Class 1M1, 3.32% (1 mo. USD LIBOR plus 1.450%), due 01/25/29† | | | 217,482 | |
| | 1,690,000 | | | | | FNMA TBA, 3.50%, due 12/01/44 | | | 1,693,664 | |
| | 500,000 | | | | | FNMA TBA, 4.50%, due 04/01/42 | | | 522,725 | |
| | 1,200,000 | | | | | FNMA-ACES, Series 2014-M4, Class A2, 3.35%, due 03/25/24◆◆ | | | 1,224,571 | |
| | 233,183 | | | | | FNMA-ACES, Series 2014-M4, Class AB2, 3.21%, due 03/25/24 | | | 229,108 | |
| | 1,700,000 | | | | | FNMA-ACES, Series 2015-M10, Class A2, 3.09%, due 04/25/27 ◆◆ | | | 1,687,240 | |
| | | | | | |
| 100 | | See accompanying Notes to the Financial Statements. | | | | |
Mercer Core Fixed Income Fund
Schedule of Investments (Continued)
(showing percentage of net assets)
March 31, 2018
| | | | | | | | | | |
| Par Value ($) | | | | | Description | | Value ($) | |
| | |
| | | | | | Mortgage Backed Securities - U.S. Government Agency Obligations — continued | |
| | | |
| | 1,281,563 | | | | | FNMA-ACES, Series 2015-M8, Class AB2, 2.83%, due 01/25/25 ◆◆ | | | 1,255,615 | |
| | 500,000 | | | | | FNMA-ACES, Series 2016-M7, Class AB2, 2.38%, due 09/25/26 | | | 468,762 | |
| | 500,000 | | | | | FNMA-ACES, Series 2017-M1, Class A2, 2.42%, due 10/25/26 ◆◆ | | | 473,049 | |
| | 2,350,000 | | | | | FNMA-ACES, Series 2017-M4, Class A2, 2.60%, due 12/25/26 ◆◆ | | | 2,247,252 | |
| | 1,700,000 | | | | | FNMA-ACES, Series 2017-M8, Class A2, 3.06%, due 05/25/27 ◆◆ | | | 1,676,932 | |
| | 265,708 | | | | | GNMA, Pool # MA4125, 2.50%, due 12/20/46 | | | 253,302 | |
| | 62,128 | | | | | GNMA, Pool # 783637, 3.00%, due 06/20/42 | | | 61,386 | |
| | 91,176 | | | | | GNMA, Pool # MA0624, 3.00%, due 12/20/42 | | | 90,161 | |
| | 236,625 | | | | | GNMA, Pool # MA0698, 3.00%, due 01/20/43 | | | 234,016 | |
| | 812,157 | | | | | GNMA, Pool # MA0851, 3.00%, due 03/20/43 | | | 803,369 | |
| | 139,366 | | | | | GNMA, Pool # MA1156, 3.00%, due 07/20/43 | | | 137,858 | |
| | 192,335 | | | | | GNMA, Pool # MA1599, 3.00%, due 01/20/44 | | | 190,254 | |
| | 488,325 | | | | | GNMA, Pool # AL8626, 3.00%, due 08/15/45 | | | 481,413 | |
| | 1,280,963 | | | | | GNMA, Pool # MA3873, 3.00%, due 08/20/46 | | | 1,264,020 | |
| | 459,952 | | | | | GNMA, Pool # MA4261, 3.00%, due 02/20/47 | | | 453,572 | |
| | 413,099 | | | | | GNMA, Pool # MA0625, 3.50%, due 12/20/42 | | | 419,561 | |
| | 1,490,625 | | | | | GNMA, Pool # MA2754, 3.50%, due 04/20/45 | | | 1,507,978 | |
| | 515,516 | | | | | GNMA, Pool # 004833, 4.00%, due 10/20/40 | | | 539,182 | |
| | 773,103 | | | | | GNMA, Pool # 734152, 4.00%, due 01/15/41 | | | 801,139 | |
| | 439,537 | | | | | GNMA, Pool # 004977, 4.00%, due 03/20/41 | | | 459,756 | |
| | 410,555 | | | | | GNMA, Pool # MA2372, 4.00%, due 11/20/44 | | | 425,175 | |
| | 403,785 | | | | | GNMA, Pool # MA3377, 4.00%, due 01/20/46 | | | 417,927 | |
| | 438,641 | | | | | GNMA, Pool # 004636, 4.50%, due 02/20/40 | | | 461,334 | |
| | 80,740 | | | | | GNMA, Pool # 004678, 4.50%, due 04/20/40 | | | 84,918 | |
| | 1,165,877 | | | | | GNMA, Pool # 004978, 4.50%, due 03/20/41 | | | 1,226,321 | |
| | 1,827,113 | | | | | GNMA, Pool # 005055, 4.50%, due 05/20/41 | | | 1,922,021 | |
| | 263,360 | | | | | GNMA, Pool # 005334, 5.00%, due 03/20/42 | | | 285,612 | |
| | 447,324 | | | | | GNMA II, Pool # MA2825, 3.00%, due 05/20/45 | | | 441,929 | |
| | 496,788 | | | | | GNMA II, Pool # MA3936, 3.00%, due 09/20/46 | | | 490,457 | |
| | 648,344 | | | | | GNMA II, Pool # MA0462, 3.50%, due 10/20/42 | | | 658,486 | |
| | 645,023 | | | | | GNMA II, Pool # MA0852, 3.50%, due 03/20/43 | | | 655,114 | |
| | 2,076,786 | | | | | GNMA II, Pool # MA3803, 3.50%, due 07/20/46 | | | 2,099,685 | |
| | 1,454,382 | | | | | GNMA II, Pool # AV9421, 3.50%, due 11/20/46 | | | 1,475,122 | |
| | 944,625 | | | | | GNMA II, Pool # AY7555, 3.50%, due 04/20/47 | | | 958,629 | |
| | 1,470,457 | | | | | GNMA II, Pool # MA4263, 4.00%, due 02/20/47 | | | 1,513,339 | |
| | 391,756 | | | | | GNMA II, Pool # MA4071, 4.50%, due 11/20/46 | | | 412,642 | |
| | 1,000,000 | | | | | GNMA TBA, 4.00%, due 03/01/45 | | | 1,026,387 | |
| | | | | | | | | | |
| | | | 210,633,171 | |
| | | | | | | | | | |
| | |
| | | | | | Municipal Obligations — 1.1% | |
| | | |
| | 60,000 | | | | | Alabama Economic Settlement Authority, 4.26%, due 09/15/32 | | | 62,592 | |
| | 300,000 | | | | | Bay Area Toll Authority, 6.26%, due 04/01/49 | | | 422,739 | |
| | 170,000 | | | | | California Educational Facilities Authority, 5.00%, due 06/01/46 | | | 223,477 | |
| | 90,000 | | | | | District of Columbia Water & Sewer Authority, 4.81%, due 10/01/14# | | | 101,822 | |
| | 900,000 | | | | | Energy Northwest, 2.80%, due 07/01/21 | | | 900,459 | |
| | 464,000 | | | | | Municipal Electric Authority of Georgia, 6.64%, due 04/01/57 | | | 577,954 | |
| | 1,150,000 | | | | | New Jersey Economic Development Authority, 2.98%, due 02/15/19‡‡ | | | 1,125,585 | |
| | 2,049,000 | | | | | New Jersey Economic Development Authority, 3.19%, due 02/15/20‡‡ | | | 1,942,554 | |
| | 705,000 | | | | | State Board of Administration Finance Corp., 2.64%, due 07/01/21 | | | 700,911 | |
| | | | | | |
| | See accompanying Notes to the Financial Statements. | | | 101 | |
Mercer Core Fixed Income Fund
Schedule of Investments (Continued)
(showing percentage of net assets)
March 31, 2018
| | | | | | | | | | |
| Par Value ($) | | | | | Description | | Value ($) | |
| | |
| | | | | | Municipal Obligations — continued | |
| | | |
| | 700,000 | | | | | State of California General Obligation, 7.50%, due 04/01/34 | | | 1,011,801 | |
| | 1,000,000 | | | | | State of California General Obligation, 7.55%, due 04/01/39 | | | 1,526,500 | |
| | 695,000 | | | | | State of Illinois, General Obligation, 5.00%, due 11/01/22 | | | 727,338 | |
| | 305,000 | | | | | University of Texas System (The), 5.00%, due 08/15/47 | | | 391,166 | |
| | 105,000 | | | | | University of Virginia, 4.18%, due 09/01/17# | | | 105,605 | |
| | | | | | | | | | |
| | | | 9,820,503 | |
| | | | | | | | | | |
| | |
| | | | | | Sovereign Debt Obligations — 1.1% | |
| | | |
| | 245,000 | | | | | Argentine Republic Government International Bond, 5.88%, due 01/11/28 | | | 230,882 | |
| | 130,000 | | | | | Argentine Republic Government International Bond, 6.88%, due 01/26/27 | | | 132,730 | |
| | 195,000 | | | | | Argentine Republic Government International Bond, 7.50%, due 04/22/26 | | | 208,553 | |
| | 250,000 | | | | | Canada Pension Plan Investment Board Capital, Inc., 2.75%, due 11/02/27 144A | | | 242,933 | |
| | 135,000 | | | | | Colombia Government International Bond, 7.38%, due 09/18/37 | | | 173,475 | |
| | 200,000 | | | | | Development Bank of Japan, Inc., 2.13%, due 09/01/22 144A | | | 193,491 | |
| | 265,000 | | | | | Egypt Government International Bond, 5.58%, due 02/21/23 144A | | | 269,327 | |
| | 215,000 | | | | | Export-Import Bank of India, 3.88%, due 02/01/28 144A | | | 208,741 | |
| | 600,000 | | | | | Hashemite Kingdom of Jordan Government AID Bond, 3.00%, due 06/30/25 | | | 604,856 | |
| | 812,000 | | | | | Hungary Government International Bond, 5.75%, due 11/22/23 | | | 898,519 | |
| | 420,000 | | | | | Indonesia Government International Bond, 4.35%, due 01/11/48 | | | 401,092 | |
| | 420,000 | | | | | Indonesia Government International Bond, 5.88%, due 01/15/24 144A | | | 463,113 | |
| | 200,000 | | | | | Japan Bank for International Cooperation/Japan, 1.50%, due 07/21/21 | | | 191,225 | |
| | 200,000 | | | | | Japan Bank for International Cooperation/Japan, 2.13%, due 06/01/20 | | | 197,476 | |
| | 200,000 | | | | | Japan Bank for International Cooperation/Japan, 2.13%, due 07/21/20 | | | 197,259 | |
| | 200,000 | | | | | Japan Bank for International Cooperation/Japan, 2.13%, due 11/16/20 | | | 196,646 | |
| | 200,000 | | | | | Japan Bank for International Cooperation/Japan, 2.25%, due 02/24/20 | | | 198,365 | |
| | 200,000 | | | | | Japan Finance Organization for Municipalities, 2.13%, due 04/13/21 144A | | | 194,897 | |
| | 400,000 | | | | | Japan Finance Organization for Municipalities, 2.13%, due 10/25/23 144A | | | 379,055 | |
| | 400,000 | | | | | Japan Finance Organization for Municipalities, 2.63%, due 04/20/22 144A | | | 393,709 | |
| | 200,000 | | | | | Panama Government International Bond, 3.75%, due 03/16/25 | | | 201,550 | |
| | 200,000 | | | | | Panama Government International Bond, 4.00%, due 09/22/24 | | | 205,800 | |
| | 250,000 | | | | | Province of Alberta Canada, 3.30%, due 03/15/28 | | | 252,307 | |
| | 100,000 | | | | | Province of Manitoba Canada, 2.13%, due 06/22/26 | | | 92,540 | |
| | 165,000 | | | | | Province of Ontario Canada, 2.25%, due 05/18/22 | | | 160,496 | |
| | 115,000 | | | | | Province of Ontario Canada, 2.55%, due 02/12/21 | | | 114,409 | |
| | 390,000 | | | | | Province of Quebec Canada, 2.75%, due 04/12/27 | | | 377,523 | |
| | 150,000 | | | | | Provincia de Buenos Aires, 7.88%, due 06/15/27 144A | | | 156,000 | |
| | 310,000 | | | | | Saudi Government International Bond, 2.38%, due 10/26/21 144A | | | 298,901 | |
| | 375,000 | | | | | Saudi Government International Bond, 2.88%, due 03/04/23 144A | | | 361,444 | |
| | 400,000 | | | | | Tokyo Metropolitan Government, 2.50%, due 06/08/22 144A | | | 391,388 | |
| | 400,000 | | | | | Turkey Government International Bond, 7.00%, due 06/05/20 | | | 424,407 | |
| | 140,000 | | | | | Uruguay Government International Bond, 5.10%, due 06/18/50 | | | 143,850 | |
| | | | | | | | | | |
| | | | 9,156,959 | |
| | | | | | | | | | |
| | |
| | | | | | U.S. Government and Agency Obligations — 13.9% | |
| | | |
| | 320,000 | | | | | Federal Home Loan Mortgage Corp., 1.38%, due 08/15/19 | | | 316,317 | |
| | 85,000 | | | | | Federal Home Loan Mortgage Corp., 1.63%, due 09/29/20 | | | 83,438 | |
| | 25,000 | | | | | Tennessee Valley Authority, 7.13%, due 05/01/30 | | | 35,033 | |
| | 9,343,000 | | | | | U.S. Treasury Bond, 2.50%, due 05/15/46 | | | 8,496,660 | |
| | 6,320,000 | | | | | U.S. Treasury Bond, 2.75%, due 11/15/42 | | | 6,101,886 | |
| | | | | | |
| 102 | | See accompanying Notes to the Financial Statements. | | | | |
Mercer Core Fixed Income Fund
Schedule of Investments (Continued)
(showing percentage of net assets)
March 31, 2018
| | | | | | | | | | |
| Par Value ($) | | | | | Description | | Value ($) | |
| | |
| | | | | | U.S. Government and Agency Obligations — continued | |
| | | |
| | 1,759,000 | | | | | U.S. Treasury Bond, 2.75%, due 08/15/47 | | | 1,681,494 | |
| | 10,337,000 | | | | | U.S. Treasury Bond, 2.75%, due 11/15/47 | | | 9,883,949 | |
| | 250,000 | | | | | U.S. Treasury Bond, 2.88%, due 05/15/43 | | | 246,489 | |
| | 3,941,000 | | | | | U.S. Treasury Bond, 3.00%, due 05/15/45 | | | 3,966,709 | |
| | 6,125,000 | | | | | U.S. Treasury Bond, 3.00%, due 02/15/47 | | | 6,158,975 | |
| | 215,000 | | | | | U.S. Treasury Bond, 3.75%, due 11/15/43 | | | 245,629 | |
| | 7,041,000 | | | | | U.S. Treasury Bond, 4.50%, due 02/15/36 | | | 8,702,648 | |
| | 5,665,000 | | | | | U.S. Treasury Bond, 4.50%, due 05/15/38 | | | 7,091,651 | |
| | 898,734 | | | | | U.S. Treasury Inflation Indexed Note, 0.38%, due 07/15/25 | | | 887,759 | |
| | 10,083,000 | | | | | U.S. Treasury Note, 0.75%, due 08/15/19 | | | 9,885,869 | |
| | 11,444,000 | | | | | U.S. Treasury Note, 1.75%, due 05/31/22 | | | 11,099,115 | |
| | 705,000 | | | | | U.S. Treasury Note, 1.88%, due 04/30/22 | | | 687,650 | |
| | 110,000 | | | | | U.S. Treasury Note, 2.00%, due 06/30/24 | | | 105,869 | |
| | 140,000 | | | | | U.S. Treasury Note, 2.13%, due 09/30/21***** | | | 138,419 | |
| | 575,000 | | | | | U.S. Treasury Note, 2.13%, due 05/15/25***** | | | 553,842 | |
| | 2,725,000 | | | | | U.S. Treasury Note, 2.25%, due 02/29/20 | | | 2,723,989 | |
| | 5,958,000 | | | | | U.S. Treasury Note, 2.25%, due 02/15/27 | | | 5,727,360 | |
| | 6,577,000 | | | | | U.S. Treasury Note, 2.25%, due 11/15/27 | | | 6,301,074 | |
| | 9,055,000 | | | | | U.S. Treasury Note, 2.38%, due 01/31/23***** | | | 8,981,782 | |
| | 6,615,000 | | | | | U.S. Treasury Note, 2.38%, due 08/15/24 | | | 6,504,276 | |
| | 3,465,000 | | | | | U.S. Treasury Note, 2.50%, due 03/31/23†††† | | | 3,454,646 | |
| | 2,626,000 | | | | | U.S. Treasury Note, 2.63%, due 02/28/23 | | | 2,634,309 | |
| | 1,025,000 | | | | | U.S. Treasury Note, 2.75%, due 02/28/25 | | | 1,029,404 | |
| | 5,526,000 | | | | | U.S. Treasury Note, 2.75%, due 02/15/28 | | | 5,529,562 | |
| | | | | | | | | | |
| | | | 119,255,803 | |
| | | | | | | | | | |
| | | |
| | | | | | TOTAL DEBT OBLIGATIONS (COST $865,190,742) | | | 850,602,898 | |
| | | | | | | | | | |
| | |
| | | | | | SHORT-TERM INVESTMENTS — 3.9% | |
| | |
| | | | | | Bank Deposit — 1.8% | |
| | 15,479,973 | | | | | State Street Bank & Trust Euro Time Deposit, 0.28%, due 04/02/18 | | | 15,479,973 | |
| | | | | | | | | | |
| | | | | | TOTAL BANK DEPOSITS (Cost $15,479,973) | | | 15,479,973 | |
| | | | | | | | | | |
| | |
| | | | | | Mutual Fund - Securities Lending Collateral — 2.1% | |
| | 17,738,370 | | | | | State Street Institutional U.S. Government Money Market Fund, Premier Class, 1.58%## *** | | | 17,738,370 | |
| | | | | | | | | | |
| | | | | | TOTAL MUTUAL FUND - SECURITIES LENDING COLLATERAL (Cost $17,738,370) | | | 17,738,370 | |
| | | | | | | | | | |
| | | |
| | | | | | TOTAL SHORT-TERM INVESTMENTS (COST $33,218,343) | | | 33,218,343 | |
| | | | | | | | | | |
| | | |
| | | | | | TOTAL INVESTMENTS — 103.0%
(Cost $898,409,085) | | | 883,821,241 | |
| | | |
| | | | | | Other Assets and Liabilities (net) — (3.0)% | | | (25,874,540 | ) |
| | | | | | | | | | |
| | | |
| | | | | | NET ASSETS — 100.0% | | $ | 857,946,701 | |
| | | | | | | | | | |
| | | | | | |
| | See accompanying Notes to the Financial Statements. | | | 103 | |
Mercer Core Fixed Income Fund
Schedule of Investments (Continued)
March 31, 2018
| | | | | | | | | | |
| | | | | | Notes to Schedule of Investments: | | | | |
| | | |
| | | | | | ACES — Alternative Credit Enhancement Securities | | | | |
| | | |
| | | | | | CLO — Collateralized Loan Obligation | | | | |
| | | |
| | | | | | FHLMC — Federal Home Loan Mortgage Corporation | | | | |
| | | |
| | | | | | FNMA — Federal National Mortgage Association | | | | |
| | | |
| | | | | | GNMA — Government National Mortgage Association | | | | |
| | | |
| | | | | | IO — Interest Only | | | | |
| | | |
| | | | | | MTN — Medium Term Note | | | | |
| | | |
| | | | | | REIT — Real Estate Investment Trust | | | | |
| | | |
| | | | | | REMIC — Real Estate Mortgage Investment Conduit | | | | |
| | | |
| | | | | | TBA — To Be Announced | | | | |
| | | |
| | | | # | | Year of maturity is greater than 2100. | | | | |
| | | |
| | | | ## | | The rate disclosed is the 7 day net yield as of March 31, 2018. | | | | |
| | | |
| | | | * | | Non-income producing security | | | | |
| | | |
| | | | ** | | All or a portion of this security is pledged for open futures collateral. | | | | |
| | | |
| | | | *** | | Represents an investment of securities lending cash collateral. | | | | |
| | | |
| | | | **** | | Securities fair valued by the Valuation Committee as approved by the Board of Trustees. The total market value of the securities at year end is $572 which represents 0.0% of net assets. The aggregate tax cost of these securities held at March 31, 2018 was $1,565,555. | | | | |
| | | |
| | | | ***** | | All or a portion of this security is pledged for open swaps collateral. | | | | |
| | | |
| | | | ¤ | | Illiquid security. The total market value of the securities at year end is $2,429,895 which represents 0.3% of net assets. The aggregate tax cost of these securities held at March 31, 2018 was $5,428,689. | | | | |
| | | |
| | | | ^ | | Level 3 — significant unobservable inputs were used in determining the value of this portfolio security. | | | | |
| | | |
| | | | † | | Variable or floating rate note. Rate shown is as of March 31, 2018. | | | | |
| | | |
| | | | ◆ | | Variable rate security. Security may be issued at a fixed coupon rate, which converts to a variable rate at a specified date. Rate shown is the rate in effect as of period end. | | | | |
| | | |
| | | | ◆◆ | | Variable or floating rate security, which interest rate adjusts periodically based on changes in current interest rates and prepayments on the underlying pool of assets. Rate shown is the rate in effect as of period end. | | | | |
| | | |
| | | | †† | | Debt obligation initially issued in zero coupon form which converts to coupon form at a specific rate and date. The rate shown is the rate at period end. | | | | |
| | | |
| | | | ††† | | Security is currently in default. | | | | |
| | | |
| | | | †††† | | When-issued security. | | | | |
| | | |
| | | | ††††† | | Security is perpetual and has no stated maturity date. | | | | |
| | | |
| | | | ‡ | | All or a portion of this security is out on loan. | | | | |
| | | |
| | | | ‡‡ | | Interest rate presented is yield to maturity. | | | | |
| | | | | | |
| 104 | | See accompanying Notes to the Financial Statements. | | | | |
Mercer Core Fixed Income Fund
Schedule of Investments (Continued)
March 31, 2018
| | | | | | | | | | |
| | | |
| | | | ‡‡‡ | | Security exempt from registration under Regulation S of the Securities Act of 1933, which exempts from registration securities offered and sold outside the United States. Security may not be offered or sold in the United States except pursuant to an exemption from, or in a transaction not subject to, the registration requirements of the Securities Act of 1933. | | | | |
| | | |
| | | | ‡‡‡‡ | | Restricted securities are not registered under the Securities Act of 1933 and are subject to legal restrictions on resale. These securities generally may be resold in transactions exempt from registration or to the public if the securities are subsequently registered. Disposal of these securities may involve time-consuming negotiations and prompt sale at an acceptable price may be difficult. As of year end, the market value of restricted securities was $10,437,644, which is 1.2% of net assets. See details shown in the Restricted Securities table that follows. | | | | |
| | | |
| | | | 144A | | Securities exempt from registration under Rule 144A of the Securities Act of 1933. These securities may be resold in transactions exempt from registration, normally to qualified institutional buyers. The total market value of the securities at year end is $155,210,078 which represents 18.1% of net assets. | | | | |
| | | | | | |
| | See accompanying Notes to the Financial Statements. | | | 105 | |
Mercer Core Fixed Income Fund
Schedule of Investments (Continued)
March 31, 2018
At March 31, 2018, the Fund held the following restricted securities:
| | | | | | | | | | | | | | |
Restricted Securities | | | | Acquisition Date | | Principal Amount | | Cost | | | Value | |
Air Canada 2013-1 Class A Pass Through Trust, 4.13%, due 11/15/26 | | | | 12/14/17 | | $168,318 | | $ | 176,924 | | | $ | 170,178 | |
Air Canada 2017-1 Class B Pass Through Trust, 3.70%, due 07/15/27 | | | | 12/07/17 | | 180,000 | | | 180,000 | | | | 176,668 | |
Anglo American Capital Plc, 4.75%, due 04/10/27 | | | | 09/27/17 | | 240,000 | | | 250,100 | | | | 243,147 | |
Australia & New Zealand Banking Group, Ltd., 6.75% (USISDA05 plus 5.168%) | | | | 06/07/16 | | 200,000 | | | 200,000 | | | | 213,000 | |
Azul Investments LLP, 5.88%, due 10/26/24 | | | | 10/19/17 | | 260,000 | | | 258,761 | | | | 256,750 | |
BBCMS Mortgage Trust, Series 2015-SRCH, Class D, 4.96%, due 08/10/35 | | | | 10/20/17 | | 330,000 | | | 350,380 | | | | 342,413 | |
BBCMS Mortgage Trust, Series 2018-TALL, Class B, 2.75%, due 03/15/37 | | | | 03/19/18 | | 301,000 | | | 299,182 | | | | 299,930 | |
BBCMS Mortgage Trust, Series 2018-TALL, Class E, 4.21%, due 03/15/37 | | | | 03/19/18 | | 207,000 | | | 205,436 | | | | 206,150 | |
BX Commercial Mortgage Trust, Series 2018-BIOA, Class D, 2.97%, due 03/15/37 | | | | 03/02/18 | | 190,000 | | | 188,849 | | | | 189,199 | |
C&W Senior Financing Designated Activity Co., 6.88%, due 09/15/27 | | | | 08/10/17 | | 245,000 | | | 245,000 | | | | 245,000 | |
CCM Merger, Inc., 6.00%, due 03/15/22 | | | | 11/28/17 | | 175,000 | | | 179,877 | | | | 177,187 | |
CGDBB Commercial Mortgage Trust, Series 2017-BIOC, Class E, 3.93% (1 mo. LIBOR plus 2.150%), due 07/15/32 | | | | 08/03/17 | | 240,000 | | | 240,000 | | | | 239,955 | |
CHT Mortgage Trust, Series 2017-CSMO, Class D, 4.03%, due 11/15/36 | | | | 12/01/17 | | 351,000 | | | 351,000 | | | | 352,891 | |
Citigroup Commercial Mortgage Trust, Series 2017-1500, Class E, 4.28%, due 07/15/32 | | | | 08/18/17 | | 115,000 | | | 115,000 | | | | 115,071 | |
Citigroup Commercial Mortgage Trust, Series 2017-MDRC, Class D, 3.84% (1 mo. LIBOR plus 2.250%), due 07/15/30 | | | | 07/14/17 | | 820,000 | | | 820,000 | | | | 820,260 | |
Commercial Mortgage Pass Through Certificates, (IO), Series 2014-CR17, ClassXB, 0.21%, due 05/10/47 | | | | 05/01/14 | | 53,000,000 | | | 1,059,119 | | | | 697,862 | |
Credit Suisse Mortgage Trust, Series 2006-OMA, Class B2, 5.54%, due 05/15/23 | | | | 06/29/16 | | 515,000 | | | 571,189 | | | | 532,069 | |
Credito Real SAB de CV SOFOM ER, 9.13% | | | | 11/21/17 | | 215,000 | | | 215,000 | | | | 221,181 | |
FOCUS Brands Funding LLC, Series 2017-1A, Class A2I, 3.86%, due 04/30/47 | | | | 03/21/17 | | 124,063 | | | 124,063 | | | | 124,945 | |
Galton Funding Mortgage Trust, Series 2018-1, Class A43, 3.50%, due 11/25/57 | | | | 01/25/18 | | 206,999 | | | 208,914 | | | | 208,102 | |
GM Financial Consumer Automobile Receivables Trust, Series 2017-2A, Class A3, 1.86%, due 12/16/21 | | | | 07/11/17 | | 400,000 | | | 399,975 | | | | 394,295 | |
Great Wolf Trust, Series 2017-WOLF, Class E, 5.03%, due 09/15/34 | | | | 01/30/18 | | 85,000 | | | 85,770 | | | | 85,766 | |
Greenko Dutch BV, 4.88%, due 07/24/22 | | | | 07/17/17 | | 280,000 | | | 280,000 | | | | 270,810 | |
GS Mortgage Securities Corp. Trust, Series 2018-CHLL, Class E, 3.94%, due 02/15/37 | | | | 02/16/18 | | 145,000 | | | 145,000 | | | | 145,474 | |
Hilton Orlando Trust, Series 2018-ORL, Class D, 3.48%, due 12/15/34 | | | | 02/14/18 | | 100,000 | | | 100,000 | | | | 100,482 | |
IMT Trust, Series 2017-APTS, Class CFX, 3.50%, due 06/15/34 | | | | 06/29/17 | | 170,000 | | | 169,864 | | | | 165,480 | |
MAD Mortgage Trust, Series 2017-330M, Class D, 3.71%, due 08/15/34 | | | | 07/28/17 | | 220,000 | | | 222,200 | | | | 217,198 | |
MMAF Equipment Finance LLC, Series 2017-B, Class A3, 2.21%, due 10/17/22 | | | | 11/14/17 | | 360,000 | | | 359,992 | | | | 354,764 | |
| | | | | | |
| 106 | | See accompanying Notes to the Financial Statements. | | | | |
Mercer Core Fixed Income Fund
Schedule of Investments (Continued)
March 31, 2018
| | | | | | | | | | | | | | |
Restricted Securities | | | | Acquisition Date | | Principal Amount | | Cost | | | Value | |
Morgan Stanley Capital I Trust, Series 2017-CLS, Class D, 3.18%, due 11/15/34 | | | | 11/21/17 | | $342,000 | | $ | 342,537 | | | $ | 342,984 | |
Morgan Stanley Services Group, Inc. Trust, Series 2017-237P, Class D, 3.86%, due 09/13/39 | | | | 08/11/17 | | 125,000 | | | 123,109 | | | | 119,408 | |
Morgan Stanley Services Group, Inc. Trust, Series 2017-237P, Class E, 3.86%, due 09/13/39 | | | | 08/11/17 | | 180,000 | | | 165,415 | | | | 168,030 | |
MSDB Trust, Series 2017-712F, Class C, 3.63%, due 07/11/39 | | | | 07/13/17 | | 55,000 | | | 55,486 | | | | 54,266 | |
Natixis Commercial Mortgage Securities Trust, Series 2018-285M, Class D, 3.79%, due 11/15/32 | | | | 01/17/18 | | 95,000 | | | 93,661 | | | | 92,744 | |
Natixis Commercial Mortgage Securities Trust, Series 2018-ALXA, Class C, 4.32%, due 01/15/43 | | | | 02/09/18 | | 165,000 | | | 167,518 | | | | 168,658 | |
NextGear Floorplan Master Owner Trust, Series 2018-1A, Class A2, 3.22%, due 02/15/23 | | | | 03/16/18 | | 105,000 | | | 104,967 | | | | 105,213 | |
NRZ Excess Spread-Collateralized Notes, Series 2018-PLS1, Class A, 3.19%, due 01/25/23 | | | | 01/24/18 | | 117,824 | | | 117,823 | | | | 117,232 | |
NRZ Excess Spread-Collateralized Notes, Series 2018-PLS2, Class A, 3.27%, due 02/25/23 | | | | 02/09/18 | | 216,558 | | | 216,555 | | | | 216,078 | |
PFS Financing Corp., Series 2018-B, Class A, 2.89%, due 02/15/23 | | | | 02/06/18 | | 340,000 | | | 339,985 | | | | 338,492 | |
Triton Container Finance V LLC, Series 2018-1A, Class A, 3.95%, due 03/20/43 | | | | 03/13/18 | | 245,000 | | | 244,954 | | | | 245,000 | |
Vantage Data Centers Issuer LLC, Series 2018-1A, Class A2, 4.07%, due 02/16/43 | | | | 02/09/18 | | 184,846 | | | 184,846 | | | | 186,754 | |
VSE VOI Mortgage LLC, Series 2017-A, Class A, 2.33%, due 03/20/35 | | | | 09/13/17 | | 238,740 | | | 238,692 | | | | 232,908 | |
Wells Fargo Commercial Mortgage Trust, Series 2017-SMP, Class D, 3.55%, due 12/15/34 | | | | 12/14/17 | | 110,000 | | | 110,000 | | | | 110,252 | |
Westgate Resorts LLC, Series 2017-1A, Class A, 3.05%, due 12/20/30 | | | | 03/30/17 | | 213,483 | | | 213,225 | | | | 212,193 | |
Worldwide Plaza Trust, Series 2017-WWP, Class D, 3.60%, due 11/10/36 | | | | 10/31/17 | | 170,000 | | | 166,227 | | | | 161,205 | |
| | | | | | | | | | | | | | |
| | | | | | | | | | | | $ | 10,437,644 | |
| | | | | | | | | | | | | | |
Futures Contracts
| | | | | | | | | | | | | | | | | | | | |
Number of Contracts | | | | | Description | | | | Expiration Date | | | Notional Value | | | Market Value/ Unrealized Appreciation (Depreciation) | |
| | Buys | | | | | | | | | | | | | | | | | | | |
| | 174 | | | | | U.S. Treasury Note 10-Year | | | | | Jun 2018 | | | $ | 21,078,469 | | | $ | 157,579 | |
| | 190 | | | | | U.S. Treasury Note 2-Year | | | | | Jun 2018 | | | | 40,395,781 | | | | 32,632 | |
| | 348 | | | | | U.S. Treasury Note 5-Year | | | | | Jun 2018 | | | | 39,832,406 | | | | 170,507 | |
| | 82 | | | | | U.S. Ultra Bond | | | | | Jun 2018 | | | | 13,158,438 | | | | 534,546 | |
| | | | | | | | | | | | | | | | | | | | |
| | | | $ | 895,264 | |
| | | | | | | | | | | | | | | | | | | | |
| | Sales | | | | | | | | | | | | | | | | | | | |
| | 70 | | | | | 90 Day Euro | | | | | Dec 2018 | | | $ | 17,063,375 | | | $ | 96,072 | |
| | 40 | | | | | U.S. Long Bond | | | | | Jun 2018 | | | | 5,865,000 | | | | (150,169 | ) |
| | 20 | | | | | U.S. Ultra 10-Year | | | | | Jun 2018 | | | | 2,597,188 | | | | (37,060 | ) |
| | | | | | | | | | | | | | | | | | | | |
| | | | $ | (91,157 | ) |
| | | | | | | | | | | | | | | | | | | | |
| | | | | | |
| | See accompanying Notes to the Financial Statements. | | | 107 | |
Mercer Core Fixed Income Fund
Schedule of Investments (Continued)
March 31, 2018
Centrally Cleared Interest Rate Swaps
| | | | | | | | | | | | | | | | | | | | | | | | | | | |
Payments Received by Fund | | Payments Made by Fund | | Maturity
Date | | Upfront
Premiums
Paid
(Received) | | Notional
Value | | Market
Value | | Unrealized
Appreciation
(Depreciation) |
3-Month USD LIBOR | | 1.46% | | 08/15/23 | | | $ | 221,842 | | | | $ | 4,480,000 | | | | $ | 278,370 | | | | $ | 56,528 | |
3-Month USD LIBOR | | 2.17% | | 08/15/24 | | | | 104 | | | | | 745,000 | | | | | 23,856 | | | | | 23,752 | |
3-Month USD LIBOR | | 2.18% | | 08/15/24 | | | | 11,133 | | | | | 3,080,000 | | | | | 97,312 | | | | | 86,179 | |
3-Month USD LIBOR | | 2.17% | | 08/15/24 | | | | 10,977 | | | | | 7,885,000 | | | | | 251,716 | | | | | 240,739 | |
3-Month USD LIBOR | | 2.29% | | 05/15/27 | | | | 101 | | | | | 130,000 | | | | | 4,890 | | | | | 4,789 | |
Overnight Federal Funds Effective Rate (12M) | | 1.71% | | 09/30/19 | | | | 2,051 | | | | | 6,165,000 | | | | | 34,886 | | | | | 32,835 | |
3-Month USD LIBOR | | 2.33% | | 11/15/24 | | | | 12,963 | | | | | 3,810,000 | | | | | 89,497 | | | | | 76,534 | |
3-Month USD LIBOR | | 2.66% | | 11/15/43 | | | | 103 | | | | | 145,000 | | | | | 4,858 | | | | | 4,755 | |
3-Month USD LIBOR | | 2.21% | | 01/08/26 | | | | — | | | | | 7,920,000 | | | | | 297,349 | | | | | 297,349 | |
3-Month USD LIBOR | | 1.20% | | 05/31/23 | | | | — | | | | | 1,170,000 | | | | | 84,427 | | | | | 84,427 | |
Overnight Federal Funds Effective Rate (12M) | | 1.82% | | 02/15/27 | | | | 20,041 | | | | | 1,447,000 | | | | | 66,558 | | | | | 46,517 | |
2.01% | | 3-Month USD LIBOR | | 08/31/21 | | | | 15,446 | | | | | 1,875,000 | | | | | (38,872 | ) | | | | (54,318 | ) |
3-Month USD LIBOR | | 2.15% | | 02/15/24 | | | | (2,135 | ) | | | | 1,953,000 | | | | | 59,096 | | | | | 61,231 | |
3-Month USD LIBOR | | 2.18% | | 02/15/24 | | | | (2,166 | ) | | | | 1,090,000 | | | | | 31,044 | | | | | 33,210 | |
3-Month USD LIBOR | | 2.17% | | 02/15/24 | | | | (952 | ) | | | | 630,000 | | | | | 18,512 | | | | | 19,464 | |
3-Month USD LIBOR | | 2.11% | | 02/15/24 | | | | — | | | | | 235,000 | | | | | 7,572 | | | | | 7,572 | |
2.34% | | 3-Month USD LIBOR | | 02/15/36 | | | | (9,613 | ) | | | | 1,460,000 | | | | | (104,768 | ) | | | | (95,155 | ) |
1.76% | | 3-Month USD LIBOR | | 11/30/21 | | | | 119 | | | | | 4,655,000 | | | | | (146,499 | ) | | | | (146,618 | ) |
Overnight Federal Funds Effective Rate (12M) | | 1.90% | | 02/15/27 | | | | 797 | | | | | 390,000 | | | | | 15,586 | | | | | 14,789 | |
Overnight Federal Funds Effective Rate (12M) | | 2.07% | | 02/15/27 | | | | (336 | ) | | | | 920,000 | | | | | 24,280 | | | | | 24,616 | |
Overnight Federal Funds Effective Rate (12M) | | 1.50% | | 06/30/19 | | | | (1,218 | ) | | | | 2,795,000 | | | | | 18,088 | | | | | 19,306 | |
Overnight Federal Funds Effective Rate (12M) | | 1.49% | | 06/30/19 | | | | (4,677 | ) | | | | 13,105,000 | | | | | 87,396 | | | | | 92,073 | |
Overnight Federal Funds Effective Rate (12M) | | 1.96% | | 02/15/27 | | | | 102 | | | | | 265,000 | | | | | 9,187 | | | | | 9,085 | |
Overnight Federal Funds Effective Rate (12M) | | 1.84% | | 12/31/19 | | | | 7,647 | | | | | 2,545,000 | | | | | 13,065 | | | | | 5,418 | |
Overnight Federal Funds Effective Rate (12M) | | 1.95% | | 12/31/19 | | | | 1,758 | | | | | 4,875,000 | | | | | 15,811 | | | | | 14,053 | |
Overnight Federal Funds Effective Rate (12M) | | 2.04% | | 12/31/19 | | | | 104 | | | | | 1,695,000 | | | | | 2,874 | | | | | 2,770 | |
Overnight Federal Funds Effective Rate (03M) | | 1.42% | | 02/14/25 | | | | 103 | | | | | 500,000 | | | | | 2,170 | | | | | 2,067 | |
Overnight Federal Funds Effective Rate (12M) | | 2.11% | | 12/31/19 | | | | 201 | | | | | 1,710,000 | | | | | 949 | | | | | 748 | |
Overnight Federal Funds Effective Rate (12M) | | 2.41% | | 02/12/25 | | | | 117 | | | | | 2,295,000 | | | | | (4,734 | ) | | | | (4,851 | ) |
Overnight Federal Funds Effective Rate (12M) | | 2.35% | | 05/31/22 | | | | 102 | | | | | 455,000 | | | | | (440 | ) | | | | (542 | ) |
Overnight Federal Funds Effective Rate (12M) | | 2.37% | | 03/23/21 | | | | 112 | | | | | 5,545,000 | | | | | (14,820 | ) | | | | (14,932 | ) |
| | | | | | | | | | | | | | | | | | | | | | | | | |
| | | | | | | | | | | | | | | | | | | | | | $ | 944,390 | |
| | | | | | | | | | | | | | | | | | | | | | | | | |
| | | | | | |
| 108 | | See accompanying Notes to the Financial Statements. | | | | |
Mercer Core Fixed Income Fund
Schedule of Investments (Continued)
March 31, 2018
| | | | | |
| Asset Class Summary (Unaudited) | | % of Net Assets |
Debt Obligations | | | | 99.1 | |
Swaps | | | | 0.1 | |
Futures Contracts | | | | 0.1 | |
Short-Term Investments | | | | 3.9 | |
Other Assets and Liabilities (net) | | | | (3.2 | ) |
| | | | | |
| | | | 100.0 | % |
| | | | | |
| | | | | | |
| | See accompanying Notes to the Financial Statements. | | | 109 | |
Mercer Opportunistic Fixed Income Fund
Schedule of Investments
(showing percentage of net assets)
March 31, 2018
| | | | | | | | | | |
| Par Value** | | | | | Description | | Value ($) | |
| | |
| | | | | | DEBT OBLIGATIONS — 94.0% | |
| | |
| | | | | | Corporate Debt — 41.4% | |
| | | |
| | 2,500,000 | | | | | 1011778 BC ULC/New Red Finance, Inc., 5.00%, due 10/15/25 144A | | | 2,393,000 | |
| | 2,000,000 | | | | | 24 Hour Fitness Worldwide, Inc., 8.00%, due 06/01/22‡ 144A | | | 2,009,800 | |
| | 800,000 | EUR | | | | Adient Global Holdings, Ltd., 3.50%, due 08/15/24 144A | | | 1,001,890 | |
| | 2,000,000 | | | | | Aircastle, Ltd., 4.13%, due 05/01/24 | | | 1,965,000 | |
| | 700,000 | | | | | Aker BP ASA, 5.88%, due 03/31/25 144A | | | 710,500 | |
| | 2,500,000 | | | | | Allison Transmission, Inc., 5.00%, due 10/01/24 144A | | | 2,484,375 | |
| | 2,300,000 | | | | | Altice US Finance I Corp., 5.50%, due 05/15/26 144A | | | 2,253,770 | |
| | 1,000,000 | | | | | AMC Entertainment Holdings, Inc., 5.88%, due 11/15/26‡ | | | 985,000 | |
| | 10,540,000 | MXN | | | | America Movil SAB de CV, 7.13%, due 12/09/24 | | | 544,978 | |
| | 1,000,000 | | | | | Aramark Services, Inc., 5.00%, due 02/01/28 144A | | | 981,250 | |
| | 1,000,000 | | | | | Ardagh Packaging Finance Plc/Ardagh Holdings USA, Inc., 6.00%, due 06/30/21 144A | | | 1,023,750 | |
| | 1,000,000 | | | | | Ardagh Packaging Finance Plc/Ardagh Holdings USA, Inc., 7.25%, due 05/15/24 144A | | | 1,067,500 | |
| | 2,000,000 | | | | | Ascend Learning LLC, 6.88%, due 08/01/25 144A | | | 2,060,000 | |
| | 1,500,000 | EUR | | | | Avantor, Inc., 4.75%, due 10/01/24 144A | | | 1,838,341 | |
| | 2,000,000 | | | | | Axalta Coating Systems LLC, 4.88%, due 08/15/24 144A | | | 2,012,500 | |
| | 2,000,000 | | | | | B&G Foods, Inc., 5.25%, due 04/01/25 | | | 1,868,100 | |
| | 1,000,000 | EUR | | | | Ball Corp., 4.38%, due 12/15/23 | | | 1,393,828 | |
| | 1,000,000 | | | | | Bank of America Corp., Series M, 8.13% (3 mo. USD LIBOR plus 3.640%)† ††††† | | | 1,005,250 | |
| | 2,000,000 | | | | | Beacon Escrow Corp., 4.88%, due 11/01/25 144A | | | 1,915,000 | |
| | 2,000,000 | | | | | Bill Barrett Corp., 8.75%, due 06/15/25 | | | 2,170,000 | |
| | 1,558,000 | | | | | Blackboard, Inc., 9.75%, due 10/15/21‡ 144A | | | 1,332,090 | |
| | 1,600,000 | | | | | Block Communications, Inc., 6.88%, due 02/15/25 144A | | | 1,616,928 | |
| | 2,200,000 | | | | | Boyne USA, Inc., 7.25%, due 05/01/25 144A†††† | | | 2,268,750 | |
| | 900,000 | | | | | BreitBurn Energy Partners, LP/BreitBurn Finance Corp., 7.88%, due 04/15/22††† | | | 9,000 | |
| | 2,400,000 | | | | | BWAY Holding Co., 7.25%, due 04/15/25 144A | | | 2,454,000 | |
| | 15,000 | | | | | California Resources Corp., 5.50%, due 09/15/21 | | | 11,625 | |
| | 36,000 | | | | | California Resources Corp., 6.00%, due 11/15/24 | | | 22,140 | |
| | 1,293,000 | | | | | California Resources Corp., 8.00%, due 12/15/22‡ 144A | | | 1,019,854 | |
| | 500,000 | | | | | Calpine Corp., 5.25%, due 06/01/26 144A | | | 484,375 | |
| | 2,500,000 | | | | | Calpine Corp., 5.75%, due 01/15/25‡ | | | 2,293,750 | |
| | 2,200,000 | | | | | Catalent Pharma Solutions, Inc., 4.88%, due 01/15/26 144A | | | 2,150,500 | |
| | 600,000 | | | | | CCO Holdings LLC/CCO Holdings Capital Corp., 5.25%, due 09/30/22 | | | 610,131 | |
| | 2,500,000 | | | | | CCO Holdings LLC/CCO Holdings Capital Corp., 5.75%, due 02/15/26 144A | | | 2,493,775 | |
| | 2,000,000 | | | | | CDW LLC/CDW Finance Corp., 5.00%, due 09/01/25 | | | 2,000,000 | |
| | 2,000,000 | | | | | Cemex Finance LLC, 6.00%, due 04/01/24 144A | | | 2,065,000 | |
| | 1,500,000 | | | | | Centene Corp., 4.75%, due 05/15/22 | | | 1,526,250 | |
| | 600,000 | | | | | CenturyLink, Inc., 6.75%, due 12/01/23‡ | | | 586,500 | |
| | 302,197 | | | | | CHC Group LLC/CHC Finance, Ltd., 9.44%, due 10/01/20‡‡ | | | 391,345 | |
| | 400,000 | | | | | Chemours Co. (The), 5.38%, due 05/15/27 | | | 402,000 | |
| | 1,800,000 | EUR | | | | Chemours Co. (The), 6.13%, due 05/15/23 | | | 2,323,330 | |
| | 1,600,000 | | | | | Cheniere Corpus Christi Holdings LLC, 5.88%, due 03/31/25 | | | 1,680,000 | |
| | 1,900,000 | | | | | Cheniere Energy Partners, LP, 5.25%, due 10/01/25 144A | | | 1,878,625 | |
| | 800,000 | | | | | CHS/Community Health Systems, Inc., 6.25%, due 03/31/23 | | | 741,000 | |
| | 2,000,000 | | | | | CHS/Community Health Systems, Inc., 6.88%, due 02/01/22‡ | | | 1,167,500 | |
| | 1,500,000 | | | | | Citigroup, Inc., 6.30% (3 mo. USD LIBOR plus 3.423%)† ††††† ‡ | | | 1,567,500 | |
| | 200,000 | | | | | Clear Channel Worldwide Holdings, Inc., 6.50%, due 11/15/22 | | | 205,140 | |
| | 800,000 | | | | | Clear Channel Worldwide Holdings, Inc., 7.63%, due 03/15/20 | | | 802,000 | |
| | 2,400,000 | | | | | Cloud Crane LLC, 10.13%, due 08/01/24 144A | | | 2,664,000 | |
| | | | | | |
| 110 | | See accompanying Notes to the Financial Statements. | | | | |
Mercer Opportunistic Fixed Income Fund
Schedule of Investments (Continued)
(showing percentage of net assets)
March 31, 2018
| | | | | | | | | | |
| Par Value** | | | | | Description | | Value ($) | |
| | |
| | | | | | Corporate Debt — continued | |
| | | |
| | 1,300,000 | EUR | | | | CMA CGM SA, 6.50%, due 07/15/22 144A | | | 1,621,050 | |
| | 1,000,000 | | | | | CNH Industrial Capital LLC, 3.88%, due 10/15/21 | | | 1,001,860 | |
| | 900,000 | | | | | CNX Resources Corp., 8.00%, due 04/01/23 | | | 954,563 | |
| | 1,500,000 | EUR | | | | Codere Finance 2 Luxembourg SA, 6.75%, due 11/01/21 144A | | | 1,938,571 | |
| | 600,000 | EUR | | | | Colfax Corp., 3.25%, due 05/15/25 144A | | | 747,440 | |
| | 2,000,000 | | | | | CommScope Technologies LLC, 6.00%, due 06/15/25 144A | | | 2,091,000 | |
| | 2,400,000 | | | | | Concordia International Corp., 7.00%, due 04/15/23‡‡‡‡ | | | 168,000 | |
| | 300,000 | | | | | Concordia International Corp., 9.00%, due 04/01/22‡ ‡‡‡‡ | | | 273,000 | |
| | 1,300,000 | EUR | | | | Cott Corp., 5.50%, due 07/01/24 144A | | | 1,704,224 | |
| | 1,000,000 | | | | | Cott Holdings, Inc., 5.50%, due 04/01/25 144A | | | 990,000 | |
| | 800,000 | | | | | Crestwood Midstream Partners, LP/Crestwood Midstream Finance Corp., 5.75%, due 04/01/25 | | | 796,000 | |
| | 1,500,000 | | | | | Crestwood Midstream Partners, LP/Crestwood Midstream Finance Corp., 6.25%, due 04/01/23 | | | 1,518,750 | |
| | 1,100,000 | | | | | Crown Americas LLC/Crown Americas Capital Corp. VI, 4.75%, due 02/01/26 144A | | | 1,067,000 | |
| | 2,200,000 | | | | | CSC Holdings LLC, 5.38%, due 02/01/28 144A | | | 2,083,598 | |
| | 800,000 | | | | | CSI Compressco, LP/CSI Compressco Finance, Inc., 7.25%, due 08/15/22 | | | 756,000 | |
| | 1,500,000 | EUR | | | | CTC BondCo GmbH, 5.25%, due 12/15/25 144A | | | 1,837,173 | |
| | 1,200,000 | | | | | DAE Funding LLC, 5.00%, due 08/01/24 144A | | | 1,138,500 | |
| | 2,000,000 | | | | | DaVita, Inc., 5.13%, due 07/15/24 | | | 1,956,250 | |
| | 1,000,000 | | | | | Digicel Group, Ltd., 7.13%, due 04/01/22 144A | | | 783,750 | |
| | 1,000,000 | | | | | Digicel, Ltd., 6.00%, due 04/15/21 144A | | | 942,500 | |
| | 1,000,000 | | | | | DISH DBS Corp., 5.00%, due 03/15/23 | | | 902,500 | |
| | 1,700,000 | | | | | DISH DBS Corp., 5.88%, due 11/15/24 | | | 1,521,500 | |
| | 1,900,000 | | | | | Dynegy, Inc., 8.00%, due 01/15/25 144A | | | 2,075,750 | |
| | 500,000 | | | | | Dynegy, Inc., 8.13%, due 01/30/26 144A | | | 553,750 | |
| | 1,000,000 | | | | | Eagle Holding Co. II LLC, 7.63% (7.63% Cash or 8.38% PIK), due 05/15/22 144A | | | 1,010,000 | |
| | 500,000 | | | | | Endo Dac/Endo Finance LLC/Endo Finco, Inc., 6.00%, due 07/15/23 144A | | | 380,000 | |
| | 1,500,000 | | | | | Endo Dac/Endo Finance LLC/Endo Finco, Inc., 6.00%, due 02/01/25 144A | | | 1,083,750 | |
| | 1,500,000 | | | | | Energy Transfer Equity, LP, 4.25%, due 03/15/23 | | | 1,458,750 | |
| | 1,108,965 | | | | | EnQuest Plc, (MTN), Reg S, 7.00% (7.00% Cash or PIK), due 10/15/23‡‡‡ 144A | | | 993,910 | |
| | 400,000 | EUR | | | | Equinix, Inc. REIT, 2.88%, due 10/01/25 | | | 475,091 | |
| | 1,500,000 | | | | | Equinix, Inc. REIT, 5.38%, due 04/01/23 | | | 1,539,375 | |
| | 100,000 | | | | | Escrow GCB Penn Virginia Corp., 8.50%, due 05/01/20**** ^ ††† | | | — | |
| | 27,500,000 | ZAR | | | | Eskom Holdings SOC, (MTN), Ltd., 7.50%, due 09/15/33 | | | 1,874,363 | |
| | 500,000 | EUR | | | | Europcar Groupe SA, 4.13%, due 11/15/24 144A | | | 615,648 | |
| | 9,280,000,000 | IDR | | | | European Investment Bank, Reg S, 6.95%, due 02/06/20‡‡‡ | | | 690,633 | |
| | 24,240,000,000 | IDR | | | | European Investment Bank, Reg S, 7.20%, due 07/09/19‡‡‡ | | | 1,797,825 | |
| | 8,150,000 | ZAR | | | | European Investment Bank, Reg S, 8.50%, due 09/17/24‡‡‡ | | | 706,532 | |
| | 2,000,000 | EUR | | | | Federal-Mogul LLC/Federal-Mogul Financing Corp., 5.00%, due 07/15/24 144A | | | 2,419,423 | |
| | 300,000 | | | | | Ferrellgas Partners, LP/Ferrellgas Partners Finance Corp., 8.63%, due 06/15/20 | | | 276,750 | |
| | 1,500,000 | | | | | Ferrellgas, LP/Ferrellgas Finance Corp., 6.75%, due 06/15/23‡ | | | 1,372,500 | |
| | 1,000,000 | | | | | Fiat Chrysler Automobiles NV, 4.50%, due 04/15/20 | | | 1,011,340 | |
| | 649,000,000 | COP | | | | Financiera de Desarrollo Territorial SA Findeter, Reg S, 7.88%, due 08/12/24‡‡‡ | | | 237,876 | |
| | 2,000,000 | | | | | First Data Corp., 5.75%, due 01/15/24 144A | | | 2,020,000 | |
| | 1,600,000 | | | | | First Quantum Minerals, Ltd., 7.00%, due 02/15/21 144A | | | 1,608,000 | |
| | 700,000 | | | | | First Quantum Minerals, Ltd., 7.25%, due 04/01/23 144A | | | 693,000 | |
| | 1,800,000 | | | | | FirstCash, Inc., 5.38%, due 06/01/24 144A | | | 1,837,710 | |
| | 400,000 | | | | | FMG Resources August 2006 Pty, Ltd., 5.13%, due 03/15/23‡ 144A | | | 398,260 | |
| | | | | | |
| | See accompanying Notes to the Financial Statements. | | | 111 | |
Mercer Opportunistic Fixed Income Fund
Schedule of Investments (Continued)
(showing percentage of net assets)
March 31, 2018
| | | | | | | | | | |
| Par Value** | | | | | Description | | Value ($) | |
| | |
| | | | | | Corporate Debt — continued | |
| | | |
| | 1,200,000 | | | | | FMG Resources August 2006 Pty, Ltd., 5.13%, due 05/15/24‡ 144A | | | 1,187,988 | |
| | 400,000 | EUR | | | | Galapagos Holding SA, 7.00%, due 06/15/22 144A | | | 409,739 | |
| | 449,000 | EUR | | | | Galapagos SA/Luxembourg, 5.38%, due 06/15/21 144A | | | 539,714 | |
| | 500,000 | | | | | Golden Nugget, Inc., 6.75%, due 10/15/24 144A | | | 503,745 | |
| | 2,500,000 | | | | | Goodyear Tire & Rubber Co. (The), 5.00%, due 05/31/26 | | | 2,440,625 | |
| | 700,000 | | | | | Grinding Media, Inc./Moly-Cop AltaSteel Ltd., 7.38%, due 12/15/23 144A | | | 736,750 | |
| | 1,900,000 | | | | | H&E Equipment Services, Inc., 5.63%, due 09/01/25 | | | 1,921,375 | |
| | 1,500,000 | EUR | | | | Hanesbrands Finance Luxembourg SCA, 3.50%, due 06/15/24 144A | | | 1,943,351 | |
| | 1,000,000 | | | | | Hanesbrands, Inc., 4.88%, due 05/15/26 144A | | | 975,000 | |
| | 2,000,000 | | | | | HCA, Inc., 5.00%, due 03/15/24 | | | 2,025,000 | |
| | 2,000,000 | | | | | Horizon Pharma, Inc., 6.63%, due 05/01/23‡ | | | 2,000,000 | |
| | 400,000 | | | | | Horizon Pharma, Inc./Horizon Pharma USA, Inc., 8.75%, due 11/01/24 144A | | | 428,000 | |
| | 1,000,000 | | | | | iHeartCommunications, Inc., 9.00%, due 03/01/21††† | | | 796,250 | |
| | 500,000 | | | | | iHeartCommunications, Inc., 9.00%, due 09/15/22††† | | | 397,500 | |
| | 1,600,000 | | | | | IHS Markit, Ltd., 4.00%, due 03/01/26 144A | | | 1,544,000 | |
| | 2,000,000 | EUR | | | | Infor US, Inc., 5.75%, due 05/15/22 | | | 2,512,707 | |
| | 2,000,000 | | | | | Intelsat Jackson Holdings SA, 5.50%, due 08/01/23‡ | | | 1,615,000 | |
| | 8,860,000,000 | IDR | | | | Inter-American Development Bank, 7.35%, due 09/12/18 | | | 650,141 | |
| | 35,350,000,000 | IDR | | | | Inter-American Development Bank, 7.88%, due 03/14/23 | | | 2,777,284 | |
| | 2,700,000 | | | | | InterGen NV, 7.00%, due 06/30/23 144A | | | 2,706,750 | |
| | 2,000,000 | | | | | Itron, Inc., 5.00%, due 01/15/26 144A | | | 1,975,600 | |
| | 2,000,000 | | | | | Jack Ohio Finance LLC/Jack Ohio Finance 1 Corp., 6.75%, due 11/15/21 144A | | | 2,070,000 | |
| | 1,300,000 | | | | | Jaguar Holding Co. II/Pharmaceutical Product Development LLC, 6.38%, due 08/01/23 144A | | | 1,317,875 | |
| | 500,000 | | | | | Jeld-Wen, Inc., 4.63%, due 12/15/25 144A | | | 477,500 | |
| | 600,000 | | | | | Jeld-Wen, Inc., 4.88%, due 12/15/27 144A | | | 568,500 | |
| | 1,000,000 | | | | | JPMorgan Chase & Co., 6.00% (3 mo. USD LIBOR plus 3.300%)† ††††† | | | 1,033,570 | |
| | 560,585 | | | | | K2016470219 South Africa, Ltd., 3.00% (3.00% Cash or PIK), due 12/31/22‡‡‡‡ | | | 27,693 | |
| | 97,817 | | | | | K2016470260 South Africa, Ltd., 25.00% (25.00% Cash or PIK), due 12/31/22‡‡‡‡ | | | 46,463 | |
| | 1,500,000 | | | | | Lamb Weston Holdings, Inc., 4.88%, due 11/01/26 144A | | | 1,490,625 | |
| | 1,000,000 | EUR | | | | LKQ European Holdings BV, 4.13%, due 04/01/28 144A†††† | | | 1,232,133 | |
| | 400,000 | EUR | | | | LSF10 Wolverine Investments SCA, 5.00%, due 03/15/24 144A | | | 498,028 | |
| | 1,500,000 | | | | | Martin Midstream Partners, LP/Martin Midstream Finance Corp., 7.25%, due 02/15/21 | | | 1,507,500 | |
| | 1,000,000 | | | | | Midstates Petroleum Co., Inc./Midstates Petroleum Co. LLC, 9.25%, due 06/01/21**** ¤ ^ | | | — | |
| | 1,900,000 | | | | | MPT Operating Partnership, LP/MPT Finance Corp. REIT, 5.00%, due 10/15/27 | | | 1,867,320 | |
| | 500,000 | | | | | MPT Operating Partnership, LP/MPT Finance Corp. REIT, 5.25%, due 08/01/26 | | | 500,625 | |
| | 2,500,000 | | | | | Multi-Color Corp., 4.88%, due 11/01/25 144A | | | 2,343,750 | |
| | 800,000 | | | | | Murray Energy Corp., 11.25%, due 04/15/21 144A | | | 304,000 | |
| | 500,000 | | | | | Navient Corp., 6.75%, due 06/25/25 | | | 508,125 | |
| | 2,500,000 | | | | | Navient Corp., 7.25%, due 09/25/23 | | | 2,625,000 | |
| | 200,000 | EUR | | | | Netflix, Inc., 3.63%, due 05/15/27 144A | | | 242,634 | |
| | 1,000,000 | | | | | Netflix, Inc., 4.38%, due 11/15/26‡ | | | 950,000 | |
| | 500,000 | | | | | Netflix, Inc., 5.88%, due 02/15/25 | | | 525,000 | |
| | 1,100,000 | | | | | New Gold, Inc., 6.38%, due 05/15/25 144A | | | 1,127,500 | |
| | 2,000,000 | | | | | Nexstar Broadcasting, Inc., 5.63%, due 08/01/24 144A | | | 1,964,400 | |
| | 1,600,000 | | | | | Northwest Acquisitions ULC/Dominion Finco, Inc., 7.13%, due 11/01/22 144A | | | 1,636,000 | |
| | 1,200,000 | | | | | Novelis Corp., 5.88%, due 09/30/26 144A | | | 1,179,000 | |
| | 1,400,000 | | | | | Novelis Corp., 6.25%, due 08/15/24 144A | | | 1,438,500 | |
| | | | | | |
| 112 | | See accompanying Notes to the Financial Statements. | | | | |
Mercer Opportunistic Fixed Income Fund
Schedule of Investments (Continued)
(showing percentage of net assets)
March 31, 2018
| | | | | | | | | | |
| Par Value** | | | | | Description | | Value ($) | |
| | |
| | | | | | Corporate Debt — continued | |
| | | |
| | 1,500,000 | | | | | NRG Yield Operating LLC, 5.38%, due 08/15/24 | | | 1,513,125 | |
| | 1,500,000 | | | | | Oceaneering International, Inc., 6.00%, due 02/01/28 | | | 1,485,944 | |
| | 700,000 | | | | | OI European Group BV, 4.00%, due 03/15/23 144A | | | 668,500 | |
| | 1,700,000 | EUR | | | | Orano SA, Reg S, 3.13%, due 03/20/23‡‡‡ | | | 2,144,196 | |
| | 2,000,000 | | | | | Owens-Brockway Glass Container, Inc., 5.00%, due 01/15/22 144A | | | 2,026,900 | |
| | 1,000,000 | EUR | | | | Paprec Holding SA, 4.00%, due 03/31/25 144A | | | 1,238,060 | |
| | 1,000,000 | | | | | Park Aerospace Holdings, Ltd., 5.50%, due 02/15/24 144A | | | 972,500 | |
| | 61,562,400 | MXN | | | | Petroleos Mexicanos, Reg S, 7.19%, due 09/12/24‡ ‡‡ ‡‡‡ | | | 3,049,200 | |
| | 2,300,000 | | | | | PetSmart, Inc., 8.88%, due 06/01/25 144A | | | 1,322,500 | |
| | 2,000,000 | | | | | Plastipak Holdings, Inc., 6.25%, due 10/15/25 144A | | | 2,005,000 | |
| | 2,300,000 | | | | | Platform Specialty Products Corp., 5.88%, due 12/01/25 144A | | | 2,251,125 | |
| | 400,000 | | | | | Polaris Intermediate Corp., 8.50% (8.50% Cash or PIK), due 12/01/22 144A | | | 409,004 | |
| | 2,000,000 | | | | | Post Holdings, Inc., 5.00%, due 08/15/26 144A | | | 1,905,000 | |
| | 1,300,000 | | | | | Prestige Brands, Inc., 6.38%, due 03/01/24 144A | | | 1,339,000 | |
| | 1,000,000 | EUR | | | | PSPC Escrow Corp., 6.00%, due 02/01/23 144A | | | 1,282,925 | |
| | 2,000,000 | | | | | PulteGroup, Inc., 5.00%, due 01/15/27 | | | 1,951,900 | |
| | 1,400,000 | | | | | QEP Resources, Inc., 5.25%, due 05/01/23‡ | | | 1,354,556 | |
| | 500,000 | | | | | QEP Resources, Inc., 5.63%, due 03/01/26‡ | | | 474,375 | |
| | 2,000,000 | | | | | Qorvo, Inc., 7.00%, due 12/01/25 | | | 2,181,660 | |
| | 1,000,000 | EUR | | | | Quintiles IMS, Inc., 3.25%, due 03/15/25 144A | | | 1,236,082 | |
| | 1,000,000 | | | | | Sanchez Energy Corp., 6.13%, due 01/15/23 | | | 734,375 | |
| | 1,300,000 | EUR | | | | Schoeller Allibert Group, 8.00%, due 10/01/21 144A | | | 1,677,747 | |
| | 800,000 | EUR | | | | Sealed Air Corp., 4.50%, due 09/15/23 144A | | | 1,107,633 | |
| | 1,600,000 | EUR | | | | Selecta Group BV, 5.88%, due 02/01/24 144A | | | 1,952,717 | |
| | 600,000 | EUR | | | | SIG Combibloc Holdings SCA, 7.75%, due 02/15/23 144A | | | 768,958 | |
| | 1,500,000 | | | | | Sprint Communications, Inc., 6.00%, due 11/15/22 | | | 1,475,625 | |
| | 1,500,000 | | | | | Sprint Corp., 7.13%, due 06/15/24 | | | 1,466,250 | |
| | 500,000 | | | | | Sprint Corp., 7.63%, due 02/15/25‡ | | | 492,500 | |
| | 1,000,000 | | | | | Steel Dynamics, Inc., 5.50%, due 10/01/24 | | | 1,033,700 | |
| | 1,900,000 | | | | | SunCoke Energy Partners, LP/SunCoke Energy Partners Finance Corp., 7.50%, due 06/15/25 144A | | | 1,966,500 | |
| | 700,000 | | | | | Sunoco, LP / Sunoco Finance Corp., 4.88%, due 01/15/23 144A | | | 676,375 | |
| | 1,800,000 | | | | | Symantec Corp., 5.00%, due 04/15/25 144A | | | 1,819,890 | |
| | 1,000,000 | | | | | T-Mobile USA, Inc., 5.13%, due 04/15/25 | | | 1,007,500 | |
| | 800,000 | | | | | T-Mobile USA, Inc., 6.00%, due 04/15/24 | | | 835,280 | |
| | 1,700,000 | | | | | T-Mobile USA, Inc., 6.38%, due 03/01/25 | | | 1,780,750 | |
| | 2,200,000 | | | | | Talen Energy Supply LLC, 6.50%, due 06/01/25‡ | | | 1,562,000 | |
| | 1,600,000 | | | | | Talen Energy Supply LLC, 10.50%, due 01/15/26 144A | | | 1,382,000 | |
| | 2,200,000 | | | | | Tempo Acquisition LLC/Tempo Acquisition Finance Corp., 6.75%, due 06/01/25 144A | | | 2,202,750 | |
| | 1,800,000 | | | | | Tenet Healthcare Corp., 8.13%, due 04/01/22 | | | 1,883,250 | |
| | 1,600,000 | | | | | Tennant Co., 5.63%, due 05/01/25 | | | 1,640,000 | |
| | 2,000,000 | | | | | Terex Corp., 5.63%, due 02/01/25 144A | | | 2,005,000 | |
| | 1,200,000 | GBP | | | | Tesco Plc, 6.13%, due 02/24/22 | | | 1,898,209 | |
| | 2,000,000 | | | | | Texas Competitive Electric Holdings Co. LLC/TCEH Finance, Inc., 11.50%, due 10/01/20††† | | | 20,000 | |
| | 2,880,000 | ZAR | | | | Transnet SOC, Ltd., Reg S, 9.50%, due 05/13/21‡‡‡ | | | 242,986 | |
| | 2,000,000 | | | | | United Rentals North America, Inc., 5.88%, due 09/15/26 | | | 2,087,500 | |
| | 800,000 | EUR | | | | Unitymedia Hessen GmbH & Co. KG/Unitymedia NRW GmbH, 4.00%, due 01/15/25 144A | | | 1,039,420 | |
| | | | | | |
| | See accompanying Notes to the Financial Statements. | | | 113 | |
Mercer Opportunistic Fixed Income Fund
Schedule of Investments (Continued)
(showing percentage of net assets)
March 31, 2018
| | | | | | | | | | |
| Par Value** | | | | | Description | | Value ($) | |
| | |
| | | | | | Corporate Debt — continued | |
| | | |
| | 1,200,000 | EUR | | | | UPCB Finance IV, Ltd., 4.00%, due 01/15/27 144A | | | 1,524,596 | |
| | 1,000,000 | | | | | Valeant Pharmaceuticals International, Inc., 5.50%, due 03/01/23 144A | | | 880,000 | |
| | 1,000,000 | | | | | Valeant Pharmaceuticals International, Inc., 5.63%, due 12/01/21 144A | | | 958,750 | |
| | 600,000 | | | | | Valeant Pharmaceuticals International, Inc., 6.13%, due 04/15/25 144A | | | 520,050 | |
| | 2,400,000 | | | | | Vertiv Group Corp., 9.25%, due 10/15/24 144A | | | 2,520,000 | |
| | 450,000 | GBP | | | | Virgin Media Secured Finance Plc, 5.50%, due 01/15/25 144A | | | 647,910 | |
| | 1,000,000 | | | | | Virgin Media Secured Finance Plc, 5.50%, due 08/15/26 144A | | | 974,370 | |
| | 900,000 | | | | | Weatherford International, Ltd., 7.75%, due 06/15/21‡ | | | 842,625 | |
| | 1,100,000 | | | | | Weatherford International, Ltd., 8.25%, due 06/15/23‡ | | | 961,917 | |
| | 2,200,000 | | | | | Weekley Homes LLC/Weekley Finance Corp., 6.63%, due 08/15/25 144A | | | 2,183,500 | |
| | 3,000,000 | | | | | West Corp., 8.50%, due 10/15/25‡ 144A | | | 2,917,500 | |
| | 1,400,000 | | | | | WPX Energy, Inc., 8.25%, due 08/01/23 | | | 1,575,000 | |
| | 2,000,000 | | | | | Wynn Las Vegas LLC/Wynn Las Vegas Capital Corp., 5.25%, due 05/15/27 144A | | | 1,965,000 | |
| | 1,800,000 | | | | | Wynn Macau, Ltd., 5.50%, due 10/01/27 144A | | | 1,768,500 | |
| | 1,900,000 | EUR | | | | Ziggo Secured Finance BV, 4.25%, due 01/15/27 144A | | | 2,365,116 | |
| | | | | | | | | | |
| | | | 268,117,966 | |
| | | | | | | | | | |
| | |
| | | | | | Sovereign Debt Obligations — 52.6% | |
| | | |
| | 2,770,000,000 | CLP | | | | Bonos de la Tesoreria de la Republica en pesos, 5.00%, due 03/01/35 | | | 4,603,971 | |
| | 1,325,000,000 | CLP | | | | Bonos de la Tesoreria de la Republica en pesos, 6.00%, due 01/01/43 | | | 2,463,278 | |
| | 42,921,000 | BRL | | | | Brazil Letras do Tesouro Nacional, 6.30%, due 07/01/19‡‡ | | | 11,952,845 | |
| | 49,000,000 | BRL | | | | Brazil Letras do Tesouro Nacional, 6.99%, due 01/01/20‡‡ | | | 13,096,236 | |
| | 7,391,000 | BRL | | | | Brazil Letras do Tesouro Nacional, 7.59%, due 07/01/20‡‡ | | | 1,890,778 | |
| | 14,583,000 | BRL | | | | Brazil Notas do Tesouro Nacional Series F, 10.00%, due 01/01/21 | | | 4,609,496 | |
| | 15,617,000 | BRL | | | | Brazil Notas do Tesouro Nacional Series F, 10.00%, due 01/01/23 | | | 4,909,692 | |
| | 38,954,000 | BRL | | | | Brazil Notas do Tesouro Nacional Series F, 10.00%, due 01/01/25 | | | 12,216,603 | |
| | 8,000,000 | BRL | | | | Brazil Notas do Tesouro Nacional Series F, 10.00%, due 01/01/27 | | | 2,485,385 | |
| | 12,692,000 | BRL | | | | Brazil Notas do Tesouro Nacional Series F, 10.00%, due 01/01/29 | | | 3,918,047 | |
| | 27,308,200,000 | COP | | | | Colombian TES, 6.00%, due 04/28/28 | | | 9,448,758 | |
| | 9,113,600,000 | COP | | | | Colombian TES, 7.00%, due 05/04/22 | | | 3,440,210 | |
| | 7,190,900,000 | COP | | | | Colombian TES, 7.00%, due 06/30/32 | | | 2,611,933 | |
| | 12,733,900,000 | COP | | | | Colombian TES, 7.50%, due 08/26/26 | | | 4,912,762 | |
| | 2,113,000,000 | COP | | | | Colombian TES, 7.75%, due 09/18/30 | | | 827,483 | |
| | 14,734,900,000 | COP | | | | Colombian TES, 10.00%, due 07/24/24 | | | 6,349,127 | |
| | 6,945,200,000 | COP | | | | Colombian TES, 11.00%, due 07/24/20 | | | 2,809,652 | |
| | 36,000,000 | CZK | | | | Czech Republic Government Bond, 0.25%, due 02/10/27 | | | 1,540,858 | |
| | 4,970,000 | CZK | | | | Czech Republic Government Bond, Reg S, 2.50%, due 08/25/28‡‡‡ | | | 255,799 | |
| | 8,900,000,000 | IDR | | | | Indonesia Treasury Bond, 6.13%, due 05/15/28 | | | 623,501 | |
| | 15,988,000,000 | IDR | | | | Indonesia Treasury Bond, 6.63%, due 05/15/33 | | | 1,136,608 | |
| | 75,680,000,000 | IDR | | | | Indonesia Treasury Bond, 7.50%, due 08/15/32 | | | 5,641,300 | |
| | 53,321,000,000 | IDR | | | | Indonesia Treasury Bond, 7.50%, due 05/15/38 | | | 3,925,247 | |
| | 8,113,000,000 | IDR | | | | Indonesia Treasury Bond, 8.25%, due 05/15/36 | | | 636,282 | |
| | 50,513,000,000 | IDR | | | | Indonesia Treasury Bond, 8.38%, due 03/15/34 | | | 3,999,213 | |
| | 38,839,000,000 | IDR | | | | Indonesia Treasury Bond, 8.75%, due 05/15/31 | | | 3,192,034 | |
| | 33,162,000,000 | IDR | | | | Indonesia Treasury Bond, 9.00%, due 03/15/29 | | | 2,771,464 | |
| | 3,006,000,000 | IDR | | | | Indonesia Treasury Bond, 10.50%, due 08/15/30 | | | 277,339 | |
| | 35,777,986 | ARS | | | | Letras del Banco Central de la Republica Argentina, 0.01%, due 05/16/18 | | | 1,723,890 | |
| | 21,117,960 | ARS | | | | Letras del Banco Central de la Republica Argentina, 0.01%, due 07/18/18 | | | 975,578 | |
| | 7,478,730 | ARS | | | | Letras del Banco Central de la Republica Argentina, 0.01%, due 08/15/18 | | | 339,344 | |
| | | | | | |
| 114 | | See accompanying Notes to the Financial Statements. | | | | |
Mercer Opportunistic Fixed Income Fund
Schedule of Investments (Continued)
(showing percentage of net assets)
March 31, 2018
| | | | | | | | | | |
| Par Value** | | | | | Description | | Value ($) | |
| | |
| | | | | | Sovereign Debt Obligations — continued | |
| | | |
| | 120,000 | MYR | | | | Malaysia Government Bond, 3.48%, due 03/15/23 | | | 30,630 | |
| | 1,497,000 | MYR | | | | Malaysia Government Bond, 3.49%, due 03/31/20 | | | 387,625 | |
| | 23,291,000 | MYR | | | | Malaysia Government Bond, 3.58%, due 09/28/18 | | | 6,035,910 | |
| | 23,235,000 | MYR | | | | Malaysia Government Bond, 3.62%, due 11/30/21 | | | 6,042,422 | |
| | 1,497,000 | MYR | | | | Malaysia Government Bond, 3.66%, due 10/15/20 | | | 389,645 | |
| | 1,119,000 | MYR | | | | Malaysia Government Bond, 3.76%, due 03/15/19 | | | 291,033 | |
| | 13,017,000 | MYR | | | | Malaysia Government Bond, 3.80%, due 08/17/23 | | | 3,368,331 | |
| | 4,513,000 | MYR | | | | Malaysia Government Bond, 3.84%, due 04/15/33 | | | 1,092,869 | |
| | 999,000 | MYR | | | | Malaysia Government Bond, 3.89%, due 03/15/27 | | | 254,379 | |
| | 8,779,000 | MYR | | | | Malaysia Government Bond, 3.96%, due 09/15/25 | | | 2,271,076 | |
| | 174,000 | MYR | | | | Malaysia Government Bond, 4.16%, due 07/15/21 | | | 45,961 | |
| | 16,055,000 | MYR | | | | Malaysia Government Bond, 4.18%, due 07/15/24 | | | 4,215,060 | |
| | 2,939,000 | MYR | | | | Malaysia Government Bond, 4.25%, due 05/31/35 | | | 736,371 | |
| | 12,774,000 | MYR | | | | Malaysia Government Bond, 4.38%, due 11/29/19 | | | 3,358,624 | |
| | 1,068,000 | MYR | | | | Malaysia Government Bond, 4.39%, due 04/15/26 | | | 283,014 | |
| | 4,915,000 | MYR | | | | Malaysia Government Investment Issue, 4.07%, due 09/30/26 | | | 1,258,250 | |
| | 143,564,300 | MXN | | | | Mexican Bonos, 5.75%, due 03/05/26 | | | 7,149,311 | |
| | 61,224,900 | MXN | | | | Mexican Bonos, 6.50%, due 06/10/21 | | | 3,288,337 | |
| | 123,732,900 | MXN | | | | Mexican Bonos, 6.50%, due 06/09/22 | | | 6,609,324 | |
| | 18,283,700 | MXN | | | | Mexican Bonos, 7.50%, due 06/03/27 | | | 1,014,764 | |
| | 7,197,300 | MXN | | | | Mexican Bonos, 8.50%, due 05/31/29 | | | 428,049 | |
| | 324,617,100 | MXN | | | | Mexican Bonos, 10.00%, due 12/05/24 | | | 20,419,035 | |
| | 2,924,000 | PEN | | | | Peruvian Government International Bond, 6.90%, due 08/12/37 | | | 1,046,068 | |
| | 4,050,000 | PEN | | | | Peruvian Government International Bond, Reg S, 5.70%, due 08/12/24‡‡‡ | | | 1,367,317 | |
| | 14,864,000 | PEN | | | | Peruvian Government International Bond, Reg S, 6.15%, due 08/12/32‡‡‡ | | | 5,085,575 | |
| | 5,543,000 | PEN | | | | Peruvian Government International Bond, Reg S, 6.35%, due 08/12/28‡‡‡ | | | 1,930,255 | |
| | 9,580,000 | PEN | | | | Peruvian Government International Bond, Reg S, 6.90%, due 08/12/37‡‡‡ | | | 3,427,268 | |
| | 7,112,000 | PEN | | | | Peruvian Government International Bond, Reg S, 6.95%, due 08/12/31‡‡‡ | | | 2,600,632 | |
| | 1,937,000 | PEN | | | | Peruvian Government International Bond, Reg S, 7.84%, due 08/12/20‡‡‡ | | | 670,849 | |
| | 3,135,000 | PEN | | | | Peruvian Government International Bond, Reg S, 8.20%, due 08/12/26‡‡‡ | | | 1,212,592 | |
| | 15,465,000 | PLN | | | | Poland Government Bond, 2.50%, due 07/25/26 | | | 4,353,524 | |
| | 25,997,000 | PLN | | | | Poland Government Bond, 2.50%, due 07/25/27 | | | 7,224,636 | |
| | 10,311,000 | PLN | | | | Poland Government Bond, 3.25%, due 07/25/25 | | | 3,084,209 | |
| | 9,302,000 | PLN | | | | Poland Government Bond, 4.00%, due 10/25/23 | | | 2,925,732 | |
| | 472,641,000 | RUB | | | | Russian Federal Bond — OFZ, 6.70%, due 05/15/19 | | | 8,272,533 | |
| | 254,542,000 | RUB | | | | Russian Federal Bond — OFZ, 7.10%, due 10/16/24 | | | 4,535,252 | |
| | 263,471,000 | RUB | | | | Russian Federal Bond — OFZ, 7.40%, due 12/07/22 | | | 4,781,426 | |
| | 705,473,000 | RUB | | | | Russian Federal Bond — OFZ, 7.70%, due 03/23/33 | | | 12,827,217 | |
| | 190,436,000 | RUB | | | | Russian Federal Bond — OFZ, 7.75%, due 09/16/26 | | | 3,507,334 | |
| | 41,565,000 | RUB | | | | Russian Federal Bond — OFZ, 8.50%, due 09/17/31 | | | 812,729 | |
| | 8,430,000 | ZAR | | | | South Africa Government Bond, 6.25%, due 03/31/36 | | | 554,752 | |
| | 14,734,514 | ZAR | | | | South Africa Government Bond, 7.25%, due 01/15/20 | | | 1,254,210 | |
| | 156,558,645 | ZAR | | | | South Africa Government Bond, 8.25%, due 03/31/32 | | | 12,995,368 | |
| | 72,510,000 | ZAR | | | | South Africa Government Bond, 8.50%, due 01/31/37 | | | 5,963,790 | |
| | 95,500,000 | ZAR | | | | South Africa Government Bond, 8.88%, due 02/28/35 | | | 8,181,603 | |
| | 27,600,000 | ZAR | | | | South Africa Government Bond, 9.00%, due 01/31/40 | | | 2,359,145 | |
| | 68,000,000 | ZAR | | | | South Africa Government Bond, 10.50%, due 12/21/26 | | | 6,640,025 | |
| | 44,000,000 | THB | | | | Thailand Government Bond, 1.88%, due 06/17/22 | | | 1,418,687 | |
| | 123,887,000 | THB | | | | Thailand Government Bond, 2.13%, due 12/17/26 | | | 3,882,199 | |
| | | | | | |
| | See accompanying Notes to the Financial Statements. | | | 115 | |
Mercer Opportunistic Fixed Income Fund
Schedule of Investments (Continued)
(showing percentage of net assets)
March 31, 2018
| | | | | | | | | | |
| Par Value** | | | | | Description | | Value ($) | |
| | |
| | | | | | Sovereign Debt Obligations — continued | |
| | | |
| | 35,347,000 | THB | | | | Thailand Government Bond, 2.88%, due 06/17/46 | | | 1,047,564 | |
| | 63,266,000 | THB | | | | Thailand Government Bond, 3.40%, due 06/17/36 | | | 2,091,640 | |
| | 175,480,000 | THB | | | | Thailand Government Bond, 3.63%, due 06/16/23 | | | 6,106,766 | |
| | 33,000,000 | THB | | | | Thailand Government Bond, 3.65%, due 06/20/31 | | | 1,142,804 | |
| | 59,291,000 | THB | | | | Thailand Government Bond, 3.85%, due 12/12/25 | | | 2,109,588 | |
| | 1,717,000 | THB | | | | Thailand Government Bond, 4.68%, due 06/29/44 | | | 68,638 | |
| | 29,935,000 | THB | | | | Thailand Government Bond, 4.88%, due 06/22/29 | | | 1,165,171 | |
| | 48,987,426 | THB | | | | Thailand Government Bond, Reg S, 1.25%, due 03/12/28‡‡‡ | | | 1,516,362 | |
| | 1,710,885 | TRY | | | | Turkey Government Bond, 8.50%, due 09/14/22 | | | 366,890 | |
| | 17,710,216 | TRY | | | | Turkey Government Bond, 9.00%, due 07/24/24 | | | 3,813,504 | |
| | 73,532,653 | TRY | | | | Turkey Government Bond, 10.70%, due 08/17/22 | | | 17,040,182 | |
| | 2,820,043 | TRY | | | | Turkey Government Bond, 11.00%, due 03/02/22 | | | 662,049 | |
| | 9,027,220 | UYU | | | | Uruguay Government International Bond, 4.38%, due 12/15/28 | | | 345,310 | |
| | 33,998,000 | UYU | | | | Uruguay Government International Bond, Reg S, 8.50%, due 03/15/28‡‡‡ | | | 1,109,513 | |
| | | | | | | | | | |
| | | | 340,055,641 | |
| | | | | | | | | | |
| | | |
| | | | | | TOTAL DEBT OBLIGATIONS (COST $604,386,984) | | | 608,173,607 | |
| | | | | | | | | | |
| | | |
| Shares | | | | | Description | | Value ($) | |
| | |
| | | | | | COMMON STOCKS — 0.4% | |
| | |
| | | | | | Diversified Financial Services — 0.0% | |
| | | |
| | 7,396,155 | | | | | Edcon Holdings, Ltd. 1* **** ¤ ^ | | | — | |
| | 736,020 | | | | | Edcon Holdings, Ltd. 2* **** ¤ ^ | | | — | |
| | | | | | | | | | |
| | | | | | | | | — | |
| | | | | | | | | | |
| | |
| | | | | | Oil & Gas — 0.4% | |
| | | |
| | 43,602 | | | | | Goodrich Petroleum Corp.* | | | 478,314 | |
| | 73,737 | | | | | Halcon Resources Corp.* | | | 359,099 | |
| | 40,603 | | | | | Linn Energy, Inc.* | | | 1,560,780 | |
| | 466 | | | | | Midstates Petroleum Co., Inc.* | | | 6,212 | |
| | 14,783 | | | | | Nine Point Energy, LLC* ¤ | | | 147,830 | |
| | | | | | | | | | |
| | | | | | | | | 2,552,235 | |
| | | | | | | | | | |
| | |
| | | | | | Transportation — 0.0% | |
| | | |
| | 11,563 | | | | | CHC Group LLC* | | | 1 | |
| | | | | | | | | | |
| | | |
| | | | | | TOTAL COMMON STOCKS (COST $4,394,665) | | | 2,552,236 | |
| | | | | | | | | | |
| | | |
| | | | | | CONVERTIBLE PREFERRED STOCK — 0.1% | | | | |
| | | |
| | | | | | Oil & Gas — 0.1% | | | | |
| | | |
| | 322 | | | | | Nine Point Energy Holdings, Inc., 0.00%* **** ¤ | | | 373,694 | |
| | | | | | | | | | |
| | | |
| | | | | | TOTAL CONVERTIBLE PREFERRED STOCK (COST $300,884) | | | 373,694 | |
| | | | | | | | | | |
| | | |
| | | | | | WARRANTS — 0.0% | | | | |
| | | |
| | | | | | Oil & Gas — 0.0% | | | | |
| | | |
| | 3,095 | | | | | Energy XXI Gulf Coast, Inc. Strike Price $43.66, Expires 12/30/21* | | | 93 | |
| | 3,495 | | | | | Halcon Resources Corp. Strike Price $14.04, Expires 09/09/20* | | | 1,817 | |
| | | | | | |
| 116 | | See accompanying Notes to the Financial Statements. | | | | |
Mercer Opportunistic Fixed Income Fund
Schedule of Investments (Continued)
(showing percentage of net assets)
March 31, 2018
| | | | | | | | | | |
| Shares | | | | | Description | | Value ($) | |
| | | |
| | | | | | Oil & Gas — continued | | | | |
| | | |
| | 3,303 | | | | | Midstates Petroleum Co., Inc. Strike Price $46.00, Expires 04/21/20* ¤ | | | 33 | |
| | | | | | | | | | |
| | | | | | | | | 1,943 | |
| | | | | | | | | | |
| | | |
| | | | | | TOTAL WARRANTS (COST $86,597) | | | 1,943 | |
| | | | | | | | | | |
| | | |
| Par Value ($) | | | | | Description | | Value ($) | |
| | | |
| | | | | | SHORT-TERM INVESTMENTS — 6.9% | | | | |
| | | |
| | | | | | Bank Deposit — 2.5% | | | | |
| | | |
| | 16,415,519 | | | | | State Street Bank & Trust Euro Time Deposit, 0.28%, due 04/02/18 | | | 16,415,519 | |
| | | | | | | | | | |
| | |
| | | | | | Mutual Fund - Securities Lending Collateral — 3.3% | |
| | | |
| | 21,465,843 | | | | | State Street Institutional U.S. Government Money Market Fund, Premier Class, 1.58%## *** | | | 21,465,843 | |
| | | | | | | | | | |
| | | |
| Par Value** | | | | | Description | | Value ($) | |
| | |
| | | | | | Sovereign Debt Obligations — 1.1% | |
| | | |
| | 637,567,000 | NGN | | | | Nigeria OMO Treasury Bill, 0.01%, due 04/05/18‡‡ | | | 1,771,265 | |
| | 322,408,000 | NGN | | | | Nigeria OMO Treasury Bill, 14.11%, due 07/05/18‡‡ | | | 863,645 | |
| | 238,978,000 | NGN | | | | Nigeria OMO Treasury Bill, 13.40%, due 06/07/18‡‡ | | | 647,754 | |
| | 638,310,000 | NGN | | | | Nigeria OMO Treasury Bill, 9.00%, due 04/12/18‡‡ | | | 1,768,098 | |
| | 408,975,000 | NGN | | | | Nigeria OMO Treasury Bill, 14.55%, due 08/23/18‡‡ | | | 1,074,118 | |
| | 448,861,000 | NGN | | | | Nigeria OMO Treasury Bill, 14.53%, due 08/30/18‡‡ | | | 1,175,867 | |
| | | | | | | | | | |
| | | | | | TOTAL SOVEREIGN DEBT OBLIGATIONS | | | 7,300,747 | |
| | | | | | | | | | |
| | | |
| | | | | | TOTAL SHORT-TERM INVESTMENTS (COST $45,153,147) | | | 45,182,109 | |
| | | | | | | | | | |
| | | |
| | | | | | TOTAL INVESTMENTS — 101.4% (Cost $654,322,277) | | | 656,283,589 | |
| | | |
| | | | | | Other Assets and Liabilities (net) — (1.4)% | | | (9,061,165 | ) |
| | | | | | | | | | |
| | | |
| | | | | | NET ASSETS — 100.0% | | $ | 647,222,424 | |
| | | �� | | | | | | | |
| | | | | | |
| | See accompanying Notes to the Financial Statements. | | | 117 | |
Mercer Opportunistic Fixed Income Fund
Schedule of Investments (Continued)
March 31, 2018
| | | | | | | | | | |
| | | |
| | | | | | Notes to Schedule of Investments: | | | | |
| | | |
| | | | | | MTN — Medium Term Note | | | | |
| | | |
| | | | | | PIK — Payment In Kind | | | | |
| | | |
| | | | | | REIT — Real Estate Investment Trust | | | | |
| | | |
| | | | ## | | The rate disclosed is the 7 day net yield as of March 31, 2018. | | | | |
| | | |
| | | | * | | Non-income producing security | | | | |
| | | |
| | | | ** | | Unless otherwise indicated, all par values are denominated in United States dollars ($). | | | | |
| | | |
| | | | *** | | Represents an investment of securities lending cash collateral. | | | | |
| | | |
| | | | **** | | Securities fair valued by the Valuation Committee as approved by the Board of Trustees. The total market value of the securities at year end is $373,694 which represents 0.1% of net assets. The aggregate tax cost of these securities held at March 31, 2018 was $402,653. | | | | |
| | | |
| | | | ¤ | | Illiquid security. The total market value of the securities at year end is $521,557 which represents 0.1% of net assets. The aggregate tax cost of these securities held at March 31, 2018 was $1,173,173. | | | | |
| | | |
| | | | ^ | | Level 3 — significant unobservable inputs were used in determining the value of this portfolio security. | | | | |
| | | |
| | | | † | | Variable or floating rate note. Rate shown is as of March 31, 2018. | | | | |
| | | |
| | | | ††† | | Security is currently in default. | | | | |
| | | |
| | | | †††† | | When-issued security. | | | | |
| | | |
| | | | ††††† | | Security is perpetual and has no stated maturity date. | | | | |
| | | |
| | | | ‡ | | All or a portion of this security is out on loan. | | | | |
| | | |
| | | | ‡‡ | | Interest rate presented is yield to maturity. | | | | |
| | | |
| | | | ‡‡‡ | | Security exempt from registration under Regulation S of the Securities Act of 1933, which exempts from registration securities offered and sold outside the United States. Security may not be offered or sold in the United States except pursuant to an exemption from, or in a transaction not subject to, the registration requirements of the Securities Act of 1933. | | | | |
| | | |
| | | | ‡‡‡‡ | | Restricted securities are not registered under the Securities Act of 1933 and are subject to legal restrictions on resale. These securities generally may be resold in transactions exempt from registration or to the public if the securities are subsequently registered. Disposal of these securities may involve time-consuming negotiations and prompt sale at an acceptable price may be difficult. As of year end, the market value of restricted securities was $515,156, which is 0.1% of net assets. See details shown in the Restricted Securities table that follows. | | | | |
| | | |
| | | | 144A | | Securities exempt from registration under Rule 144A of the Securities Act of 1933. These securities may be resold in transactions exempt from registration, normally to qualified institutional buyers. The total market value of the securities at year end is $158,135,540 which represents 24.4% of net assets. | | | | |
| | | | | | |
| 118 | | See accompanying Notes to the Financial Statements. | | | | |
Mercer Opportunistic Fixed Income Fund
Schedule of Investments (Continued)
March 31, 2018
At March 31, 2018, the Fund held the following restricted securities:
| | | | | | | | | | | | | | | | |
Restricted Securities | | | | Acquisition
Date | | | Principal
Amount | | Cost | | | Value | |
Concordia International Corp., 7.00%, due 04/15/23 | | | | | 04/13/15 | | | $2,400,000 | | $ | 2,221,937 | | | $ | 168,000 | |
Concordia International Corp., 9.00%, due 04/01/22 | | | | | 10/06/16 | | | 300,000 | | | 300,000 | | | | 273,000 | |
K2016470219 South Africa, Ltd., 3.00% (3.00% Cash or PIK), due 12/31/22 | | | | | 08/23/13 | | | 560,585 | | | 995,753 | | | | 27,693 | |
K2016470260 South Africa, Ltd., 25.00% (25.00% Cash or PIK), due 12/31/22 | | | | | 01/30/16 | | | 97,817 | | | 97,817 | | | | 46,463 | |
| | | | | | | | | | | | | | | | |
| | | | | | | | | | | | | | $ | 515,156 | |
| | | | | | | | | | | | | | | | |
Forward Foreign Currency Contracts
| | | | | | | | | | | | | | | | | | |
Currency Purchased | | | Currency Sold | | | Settlement
Date | | Counterparty | | Unrealized
Appreciation
(Depreciation) | |
| BRL | | | 13,792,197 | | | USD | | | 4,223,998 | | | 06/04/18 | | Goldman Sachs International | | $ | (95,957 | ) |
| CLP | | | 6,624,069,324 | | | USD | | | 10,998,870 | | | 06/20/18 | | Citibank N.A. | | | (19,325 | ) |
| CNH | | | 68,749,900 | | | USD | | | 10,786,498 | | | 06/20/18 | | Goldman Sachs International | | | 114,182 | |
| COP | | | 3,442,385,581 | | | USD | | | 1,203,968 | | | 06/20/18 | | Goldman Sachs International | | | 25,429 | |
| CZK | | | 71,940,000 | | | EUR | | | 2,712,803 | | | 06/20/18 | | Goldman Sachs International | | | 144,286 | |
| CZK | | | 128,810,000 | | | EUR | | | 4,863,498 | | | 12/19/18 | | JPMorgan Chase Bank N.A. London | | | 243,615 | |
| CZK | | | 289,950,000 | | | USD | | | 13,999,847 | | | 06/20/18 | | Citibank N.A. | | | 104,981 | |
| CZK | | | 84,130,000 | | | USD | | | 3,764,159 | | | 06/20/18 | | Goldman Sachs International | | | 328,406 | |
| CZK | | | 11,910,000 | | | USD | | | 526,836 | | | 12/19/18 | | HSBC Bank plc | | | 60,370 | |
| CZK | | | 90,131,700 | | | USD | | | 3,816,391 | | | 12/19/18 | | JPMorgan Chase Bank N.A. London | | | 627,428 | |
| EGP | | | 199,810,350 | | | USD | | | 11,119,599 | | | 06/20/18 | | Goldman Sachs International | | | 5,520 | |
| EGP | | | 61,379,650 | | | USD | | | 3,411,686 | | | 06/20/18 | | JPMorgan Chase Bank N.A. London | | | 5,834 | |
| EUR | | | 590,000 | | | USD | | | 730,889 | | | 06/20/18 | | Citibank N.A. | | | (1,157 | ) |
| EUR | | | 2,580,000 | | | USD | | | 3,176,754 | | | 06/20/18 | | Goldman Sachs International | | | 14,279 | |
| GBP | | | 1,222,000 | | | USD | | | 1,616,902 | | | 04/19/18 | | Deutsche Bank AG London | | | 98,407 | |
| HUF | | | 657,050,000 | | | USD | | | 2,578,588 | | | 06/20/18 | | Goldman Sachs International | | | 22,689 | |
| IDR | | | 35,435,131,188 | | | USD | | | 2,546,619 | | | 06/20/18 | | Citibank N.A. | | | 10,971 | |
| IDR | | | 98,078,640,000 | | | USD | | | 7,042,376 | | | 06/20/18 | | Goldman Sachs International | | | 36,612 | |
| IDR | | | 30,742,560,000 | | | USD | | | 2,223,211 | | | 06/20/18 | | JPMorgan Chase Bank N.A. London | | | (4,316 | ) |
| IDR | | | 24,441,270,000 | | | USD | | | 1,762,168 | | | 06/20/18 | | Standard Chartered Bank | | | 1,921 | |
| ILS | | | 31,370,000 | | | USD | | | 9,170,906 | | | 06/20/18 | | Citibank N.A. | | | (193,562 | ) |
| KRW | | | 9,707,220,000 | | | USD | | | 9,094,692 | | | 06/20/18 | | Citibank N.A. | | | 37,277 | |
| MXN | | | 83,185,936 | | | USD | | | 4,502,628 | | | 06/20/18 | | Goldman Sachs International | | | (201 | ) |
| MYR | | | 28,580,000 | | | USD | | | 7,291,550 | | | 06/20/18 | | Standard Chartered Bank | | | 80,083 | |
| PLN | | | 26,557,469 | | | USD | | | 7,795,948 | | | 06/20/18 | | Citibank N.A. | | | (31,589 | ) |
| PLN | | | 88,329,731 | | | USD | | | 25,940,041 | | | 06/20/18 | | JPMorgan Chase Bank N.A. London | | | (115,903 | ) |
| RUB | | | 54,221,981 | | | USD | | | 942,991 | | | 06/20/18 | | Goldman Sachs International | | | (8,131 | ) |
| SGD | | | 11,680,000 | | | USD | | | 8,837,042 | | | 06/21/18 | | Citibank N.A. | | | 86,620 | |
| THB | | | 371,492,317 | | | USD | | | 11,891,292 | | | 06/20/18 | | Citibank N.A. | | | 19,966 | |
| THB | | | 86,241,556 | | | USD | | | 2,765,704 | | | 06/20/18 | | JPMorgan Chase Bank N.A. London | | | (517 | ) |
| THB | | | 131,601,726 | | | USD | | | 4,218,342 | | | 06/20/18 | | Standard Chartered Bank | | | 1,240 | |
| TRY | | | 86,433,324 | | | USD | | | 22,227,563 | | | 09/19/18 | | Citibank N.A. | | | (1,488,273 | ) |
| TRY | | | 12,760,000 | | | USD | | | 3,165,939 | | | 06/20/18 | | Goldman Sachs International | | | (18,567 | ) |
| TRY | | | 12,568,645 | | | USD | | | 3,161,340 | | | 09/19/18 | | Goldman Sachs International | | | (145,550 | ) |
| | | | | | |
| | See accompanying Notes to the Financial Statements. | | | 119 | |
Mercer Opportunistic Fixed Income Fund
Schedule of Investments (Continued)
March 31, 2018
Forward Foreign Currency Contracts — continued
| | | | | | | | | | | | | | | | | | |
Currency Purchased | | | Currency Sold | | | Settlement
Date | | Counterparty | | Unrealized
Appreciation
(Depreciation) | |
| TRY | | | 4,010,000 | | | USD | | | 988,225 | | | 06/20/18 | | JPMorgan Chase Bank N.A. London | | $ | 879 | |
| TRY | | | 12,973,472 | | | USD | | | 3,434,180 | | | 09/19/18 | | Standard Chartered Bank | | | (321,253 | ) |
| ZAR | | | 86,830,000 | | | USD | | | 7,361,595 | | | 06/20/18 | | Citibank N.A. | | | (109,212 | ) |
| ZAR | | | 60,450,000 | | | USD | | | 5,058,950 | | | 06/20/18 | | Goldman Sachs International | | | (9,928 | ) |
| EUR | | | 6,942,683 | | | PLN | | | 29,450,000 | | | 06/20/18 | | Citibank N.A. | | | (23,071 | ) |
| USD | | | 14,284,285 | | | BRL | | | 47,080,000 | | | 06/04/18 | | Goldman Sachs International | | | 193,118 | |
| USD | | | 7,004,789 | | | BRL | | | 23,160,000 | | | 06/04/18 | | JPMorgan Chase Bank N.A. London | | | 72,940 | |
| USD | | | 1,689,260 | | | CZK | | | 36,930,000 | | | 06/20/18 | | Citibank N.A. | | | (107,227 | ) |
| USD | | | 1,198,954 | | | EUR | | | 965,500 | | | 06/20/18 | | Citibank N.A. | | | 4,790 | |
| USD | | | 4,288,868 | | | HUF | | | 1,079,255,000 | | | 06/20/18 | | Standard Chartered Bank | | | 16,071 | |
| USD | | | 841,729 | | | INR | | | 55,540,000 | | | 06/20/18 | | Citibank N.A. | | | (2,067 | ) |
| USD | | | 465,454 | | | INR | | | 30,660,401 | | | 06/20/18 | | Goldman Sachs International | | | (357 | ) |
| USD | | | 17,134,113 | | | INR | | | 1,128,949,599 | | | 06/20/18 | | Standard Chartered Bank | | | (17,561 | ) |
| USD | | | 12,059,327 | | | MXN | | | 228,655,700 | | | 06/20/18 | | Citibank N.A. | | | (316,630 | ) |
| USD | | | 536,886 | | | MXN | | | 10,130,000 | | | 06/20/18 | | Goldman Sachs International | | | (11,399 | ) |
| USD | | | 16,398,397 | | | PEN | | | 53,622,759 | | | 06/20/18 | | Citibank N.A. | | | (178,292 | ) |
| USD | | | 3,303,736 | | | PHP | | | 174,342,000 | | | 06/20/18 | | Citibank N.A. | | | (24,627 | ) |
| USD | | | 4,848,706 | | | PHP | | | 255,008,000 | | | 06/20/18 | | Standard Chartered Bank | | | (19,651 | ) |
| USD | | | 3,841,710 | | | RON | | | 14,530,500 | | | 06/20/18 | | Citibank N.A. | | | 4,516 | |
| USD | | | 9,884,572 | | | SGD | | | 12,933,468 | | | 06/20/18 | | Citibank N.A. | | | 3,502 | |
| USD | | | 8,007,333 | | | SGD | | | 10,465,232 | | | 06/20/18 | | Standard Chartered Bank | | | 11,977 | |
| USD | | | 1,237,517 | | | THB | | | 38,850,000 | | | 06/21/18 | | JPMorgan Chase Bank N.A. London | | | (8,182 | ) |
| USD | | | 21,773,206 | | | TRY | | | 85,935,002 | | | 06/20/18 | | Citibank N.A. | | | 576,541 | |
| USD | | | 1,403,512 | | | TRY | | | 5,520,000 | | | 06/21/18 | | Citibank N.A. | | | 42,370 | |
| USD | | | 6,580,824 | | | TRY | | | 28,140,000 | | | 09/19/18 | | Citibank N.A. | | | (171,243 | ) |
| USD | | | 2,965,624 | | | TWD | | | 86,175,104 | | | 06/20/18 | | Citibank N.A. | | | (6,327 | ) |
| USD | | | 5,431,150 | | | TWD | | | 157,611,662 | | | 06/20/18 | | Goldman Sachs International | | | (4,459 | ) |
| USD | | | 3,136,829 | | | TWD | | | 91,231,534 | | | 06/20/18 | | JPMorgan Chase Bank N.A. London | | | (9,505 | ) |
| USD | | | 10,238,892 | | | TWD | | | 297,091,700 | | | 06/20/18 | | Standard Chartered Bank | | | (7,013 | ) |
| USD | | | 1,545,579 | | | ZAR | | | 18,579,900 | | | 06/20/18 | | Citibank N.A. | | | (6,287 | ) |
| USD | | | 19,810,666 | | | ZAR | | | 233,960,000 | | | 06/20/18 | | Goldman Sachs International | | | 269,406 | |
| USD | | | 1,480,106 | | | ZAR | | | 17,690,000 | | | 06/20/18 | | JPMorgan Chase Bank N.A. London | | | 2,567 | |
| | | | | | | | | | | | | | | | | | |
| | $ | (208,546 | ) |
| | | | | | | | | | | | | | | | | | |
Cash in the amount of $130,000 has been received at the custodian bank as collateral for forward foreign currency contracts.
| | | | | | |
| 120 | | See accompanying Notes to the Financial Statements. | | | | |
Mercer Opportunistic Fixed Income Fund
Schedule of Investments (Continued)
March 31, 2018
Currency Abbreviations
| CNH | — Chinese Yuan Renminbi |
| GBP | — British Pound Sterling |
| PEN | — Peruvian Nouveau Sol |
Futures Contracts
| | | | | | | | | | | | | | | | | | | | |
Number of Contracts | | | | | Description | | | | Expiration Date | | | Notional Value | | | Market Value/ Unrealized Appreciation (Depreciation) | |
| | Buys | | | | | | | | | | | | | | | | | | | |
| | 430 | | | | | South Africa Government Bond, Series R2030 | | | | | May 2018 | | | $ | 3,601,091 | | | $ | 130,544 | |
| | 843 | | | | | South Africa Government Bond, Series R2035 | | | | | May 2018 | | | | 7,332,598 | | | | (55,832 | ) |
| | 105 | | | | | South Africa Government Bond, Series R207 | | | | | May 2018 | | | | 913,013 | | | | 1,821 | |
| | 253 | | | | | South Africa Government Bond, Series R208 | | | | | May 2018 | | | | 2,136,163 | | | | 11,808 | |
| | | | | | | | | | | | | | | | | | | | |
| | | | $ | 88,341 | |
| | | | | | | | | | | | | | | | | | | | |
| | Sales | | | | | | | | | | | | | | | | | | | |
| | 242 | | | | | South Africa Government Bond, Series R209 | | | | | May 2018 | | | $ | 1,599,158 | | | $ | 936 | |
| | 187 | | | | | U.S. Treasury Note 5-Year | | | | | Jun 2018 | | | | 21,404,195 | | | | (90,468 | ) |
| | | | | | | | | | | | | | | | | | | | |
| | | | $ | (89,532 | ) |
| | | | | | | | | | | | | | | | | | | | |
| | | | | | |
| | See accompanying Notes to the Financial Statements. | | | 121 | |
Mercer Opportunistic Fixed Income Fund
Schedule of Investments (Continued)
March 31, 2018
| | | | | |
| Asset Class Summary (Unaudited) | | % of Net Assets |
Sovereign Debt Obligations | | | | 52.6 | |
Corporate Debt | | | | 41.4 | |
Forward Foreign Currency Contracts | | | | 9.2 | |
Common Stocks | | | | 0.4 | |
Convertible Preferred Stock | | | | 0.1 | |
Warrants | | | | 0.0 | |
Futures Contracts | | | | 0.0 | |
Short-Term Investments | | | | 6.9 | |
Other Assets and Liabilities (net) | | | | (10.6 | ) |
| | | | | |
| | | | 100.0 | % |
| | | | | |
| | | | | | |
| 122 | | See accompanying Notes to the Financial Statements. | | | | |
Mercer Emerging Markets Equity Fund
Schedule of Investments
(showing percentage of net assets)
March 31, 2018
| | | | | | | | | | |
| Shares | | | | | Description | | Value ($) | |
| | |
| | | | | | COMMON STOCKS — 90.0% | |
| | |
| | | | | | Argentina — 0.3% | |
| | | |
| | 25,764 | | | | | Grupo Financiero Galicia SA, ADR | | | 1,694,241 | |
| | 93,781 | | | | | YPF SA, ADR | | | 2,027,545 | |
| | | | | | | | | | |
| | | | | | Total Argentina | | | 3,721,786 | |
| | | | | | | | | | |
| | |
| | | | | | Australia — 0.4% | |
| | | |
| | 308,834 | | | | | Newcrest Mining, Ltd. | | | 4,636,880 | |
| | | | | | | | | | |
| | |
| | | | | | Bermuda — 1.1% | |
| | | |
| | 278,000 | | | | | Beijing Enterprises Water Group, Ltd. | | | 156,353 | |
| | 118,000 | | | | | China Oriental Group Co., Ltd. | | | 81,288 | |
| | 52,000 | | | | | China Resources Gas Group, Ltd. | | | 181,612 | |
| | 552,000 | | | | | COSCO SHIPPING Ports, Ltd. | | | 465,820 | |
| | 748,000 | | | | | CP Pokphand Co., Ltd. | | | 58,402 | |
| | 25,662 | | | | | Credicorp, Ltd. | | | 5,826,300 | |
| | 460,000 | | | | | Gemdale Properties & Investment Corp., Ltd. | | | 55,744 | |
| | 224,000 | | | | | Hopson Development Holdings, Ltd. | | | 257,887 | |
| | 13,400 | | | | | Jardine Matheson Holdings, Ltd. | | | 826,561 | |
| | 1,264,000 | | | | | Joy City Property, Ltd. | | | 204,295 | |
| | 408,000 | | | | | K Wah International Holdings, Ltd. | | | 274,380 | |
| | 182,000 | | | | | Kunlun Energy Co., Ltd. | | | 158,171 | |
| | 132,500 | | | | | Luye Pharma Group, Ltd.‡ | | | 128,086 | |
| | 1,500,000 | | | | | Nan Hai Corp., Ltd. | | | 41,963 | |
| | 163,000 | | | | | Nine Dragons Paper Holdings, Ltd. | | | 247,074 | |
| | 101,500 | | | | | Shenzhen International Holdings, Ltd. | | | 223,595 | |
| | 410,000 | | | | | Sihuan Pharmaceutical Holdings Group, Ltd. | | | 122,185 | |
| | 702,000 | | | | | United Energy Group, Ltd. | | | 61,037 | |
| | 670,500 | | | | | Yue Yuen Industrial Holdings, Ltd. | | | 2,677,866 | |
| | | | | | | | | | |
| | | | | | Total Bermuda | | | 12,048,619 | |
| | | | | | | | | | |
| | |
| | | | | | Brazil — 5.6% | |
| | | |
| | 266,582 | | | | | AMBEV SA, ADR | | | 1,938,051 | |
| | 394,100 | | | | | B3 SA — Brasil Bolsa Balcao | | | 3,164,800 | |
| | 505,055 | | | | | Banco Bradesco SA | | | 5,845,910 | |
| | 250,766 | | | | | Banco Bradesco SA, ADR | | | 2,979,100 | |
| | 265,900 | | | | | Banco do Brasil SA | | | 3,282,548 | |
| | 42,200 | | | | | Banco Santander Brasil SA | | | 506,740 | |
| | 87,734 | | | | | Banco Santander Brasil SA, ADR | | | 1,054,563 | |
| | 27,000 | | | | | BRF SA* | | | 185,465 | |
| | 589,014 | | | | | CCR SA | | | 2,215,271 | |
| | 79,700 | | | | | Cia Siderurgica Nacional SA* | | | 211,024 | |
| | 267,380 | | | | | Cielo SA | | | 1,664,488 | |
| | 41,400 | | | | | Duratex SA | | | 147,608 | |
| | 181,700 | | | | | Embraer SA | | | 1,178,131 | |
| | 139,546 | | | | | Embraer SA, ADR | | | 3,628,196 | |
| | 322,100 | | | | | Engie Brasil Energia SA | | | 3,795,113 | |
| | 77,400 | | | | | Iguatemi Empresa de Shopping Centers SA | | | 914,287 | |
| | 114,500 | | | | | Iochpe Maxion SA | | | 901,572 | |
| | | | | | |
| | See accompanying Notes to the Financial Statements. | | | 123 | |
Mercer Emerging Markets Equity Fund
Schedule of Investments (Continued)
(showing percentage of net assets)
March 31, 2018
| | | | | | | | | | |
| Shares | | | | | Description | | Value ($) | |
| | |
| | | | | | Brazil — continued | |
| | | |
| | 63,400 | | | | | IRB Brasil Resseguros SA | | | 798,509 | |
| | 337,315 | | | | | Itau Unibanco Holding SA, ADR | | | 5,262,114 | |
| | 106,700 | | | | | JBS SA | | | 300,170 | |
| | 30,200 | | | | | Klabin SA | | | 188,091 | |
| | 554,600 | | | | | Kroton Educacional SA | | | 2,269,395 | |
| | 96,900 | | | | | Localiza Rent a Car SA | | | 837,335 | |
| | 204,600 | | | | | Lojas Renner SA | | | 2,114,578 | |
| | 5,600 | | | | | M Dias Branco SA | | | 85,948 | |
| | 28,600 | | | | | Magazine Luiza SA | | | 842,528 | |
| | 115,800 | | | | | MRV Engenharia e Participacoes SA | | | 566,178 | |
| | 326,700 | | | | | Petroleo Brasileiro SA* | | | 2,296,219 | |
| | 51,700 | | | | | Porto Seguro SA | | | 755,371 | |
| | 50,500 | | | | | Qualicorp SA | | | 338,530 | |
| | 128,500 | | | | | Raia Drogasil SA | | | 2,891,985 | |
| | 22,300 | | | | | Sao Martinho SA | | | 117,619 | |
| | 228,144 | | | | | Sul America SA | | | 1,506,728 | |
| | 31,900 | | | | | Suzano Papel e Celulose SA | | | 320,190 | |
| | 82,117 | | | | | Tim Participacoes SA, ADR‡ | | | 1,779,475 | |
| | 8,072 | | | | | Usinas Siderurgicas de Minas Gerais SA* | | | 29,897 | |
| | 244,300 | | | | | Vale SA | | | 3,102,631 | |
| | 201,666 | | | | | Vale SA, ADR‡ | | | 2,565,191 | |
| | | | | | | | | | |
| | | | | | Total Brazil | | | 62,581,549 | |
| | | | | | | | | | |
| | |
| | | | | | British Virgin Islands — 0.1% | |
| | | |
| | 32,023 | | | | | Hollysys Automation Technologies, Ltd. | | | 791,609 | |
| | | | | | | | | | |
| | |
| | | | | | Cayman Islands — 11.5% | |
| | | |
| | 9,061 | | | | | 58.com, Inc., ADR* | | | 723,611 | |
| | 55,000 | | | | | AAC Technologies Holdings, Inc. | | | 1,005,670 | |
| | 368,000 | | | | | Agile Group Holdings, Ltd. | | | 770,646 | |
| | 59,000 | | | | | Airtac International Group | | | 1,015,811 | |
| | 124,827 | | | | | Alibaba Group Holding, Ltd., ADR* ‡ | | | 22,910,748 | |
| | 330,000 | | | | | ANTA Sports Products, Ltd. | | | 1,679,777 | |
| | 14,313 | | | | | Baidu, Inc., ADR* | | | 3,194,518 | |
| | 2,340,000 | | | | | Beijing Enterprises Clean Energy Group, Ltd.* | | | 76,617 | |
| | 48,942 | | | | | Bizlink Holding, Inc. | | | 394,463 | |
| | 84,000 | | | | | CAR, Inc.* | | | 75,855 | |
| | 42,000 | | | | | Casetek Holdings, Ltd. | | | 124,457 | |
| | 172,000 | | | | | Chailease Holding Co., Ltd. | | | 610,557 | |
| | 123,000 | | | | | China Aoyuan Property Group, Ltd. | | | 114,808 | |
| | 693,000 | | | | | China Evergrande Group* ‡ | | | 2,217,393 | |
| | 35,000 | | | | | China High Speed Transmission Equipment Group Co., Ltd. | | | 55,212 | |
| | 360,000 | | | | | China Lesso Group Holdings, Ltd. | | | 275,002 | |
| | 16,156 | | | | | China Lodging Group, Ltd., ADR | | | 2,127,907 | |
| | 152,000 | | | | | China Medical System Holdings, Ltd. | | | 347,910 | |
| | 515,000 | | | | | China Mengniu Dairy Co., Ltd. | | | 1,782,749 | |
| | 1,802,000 | | | | | China Resources Cement Holdings, Ltd. | | | 1,572,414 | |
| | 396,000 | | | | | China Resources Land, Ltd. | | | 1,459,129 | |
| | 200,000 | | | | | China SCE Property Holdings, Ltd. | | | 104,924 | |
| | | | | | |
| 124 | | See accompanying Notes to the Financial Statements. | | | | |
Mercer Emerging Markets Equity Fund
Schedule of Investments (Continued)
(showing percentage of net assets)
March 31, 2018
| | | | | | | | | | |
| Shares | | | | | Description | | Value ($) | |
| | |
| | | | | | Cayman Islands — continued | |
| | | |
| | 116,000 | | | | | China State Construction International Holdings, Ltd. | | | 142,457 | |
| | 96,000 | | | | | China Tianrui Group Cement Co., Ltd.* | | | 70,122 | |
| | 961,000 | | | | | China Yongda Automobiles Services Holdings, Ltd. | | | 1,026,597 | |
| | 128,500 | | | | | China ZhengTong Auto Services Holdings, Ltd. | | | 94,087 | |
| | 550,400 | | | | | China Zhongwang Holdings, Ltd. | | | 328,510 | |
| | 1,652,000 | | | | | Chinasoft International, Ltd.* | | | 1,493,494 | |
| | 206,000 | | | | | CIFI Holdings Group Co., Ltd. | | | 181,992 | |
| | 64,000 | | | | | CIMC Enric Holdings, Ltd.* | | | 61,835 | |
| | 435,000 | | | | | Country Garden Holdings Co., Ltd. | | | 908,391 | |
| | 67,274 | | | | | Ctrip.com International, Ltd., ADR* | | | 3,136,314 | |
| | 79,000 | | | | | Dongyue Group, Ltd. | | | 77,274 | |
| | 840,000 | | | | | Fu Shou Yuan International Group, Ltd. | | | 836,598 | |
| | 172,000 | | | | | Fufeng Group, Ltd. | | | 102,787 | |
| | 352,500 | | | | | Fullshare Holdings, Ltd.* ‡ | | | 196,944 | |
| | 212,000 | | | | | Future Land Development Holdings, Ltd. | | | 181,661 | |
| | 8,220,000 | | | | | GCL-Poly Energy Holdings, Ltd.* | | | 1,024,079 | |
| | 1,737,000 | | | | | Geely Automobile Holdings, Ltd. | | | 5,073,380 | |
| | 5,000 | | | | | Ginko International Co., Ltd. | | | 37,298 | |
| | 39,000 | | | | | Golden Eagle Retail Group, Ltd. | | | 44,596 | |
| | 80,010 | | | | | Gourmet Master Co., Ltd. | | | 1,035,901 | |
| | 603,000 | | | | | Haitian International Holdings, Ltd. | | | 1,833,958 | |
| | 32,541 | | | | | JD.com, Inc., ADR* | | | 1,317,585 | |
| | 104,000 | | | | | Jiayuan International Group, Ltd.* ‡ | | | 150,370 | |
| | 237,000 | | | | | Kaisa Group Holdings, Ltd.* | | | 134,672 | |
| | 152,500 | | | | | Kingboard Chemical Holdings, Ltd. | | | 707,866 | |
| | 120,000 | | | | | Kingboard Laminates Holdings, Ltd. | | | 175,826 | |
| | 87,000 | | | | | Kingsoft Corp., Ltd. | | | 279,716 | |
| | 156,500 | | | | | KWG Property Holding, Ltd. | | | 216,999 | |
| | 164,000 | | | | | Lee & Man Paper Manufacturing, Ltd. | | | 174,868 | |
| | 148,500 | | | | | Li Ning Co., Ltd.* | | | 153,338 | |
| | 88,000 | | | | | Logan Property Holdings Co., Ltd. | | | 135,838 | |
| | 44,500 | | | | | Longfor Properties Co., Ltd. | | | 137,424 | |
| | 42,000 | | | | | Minth Group, Ltd. | | | 192,535 | |
| | 15,702 | | | | | NetEase, Inc., ADR | | | 4,402,684 | |
| | 5,970 | | | | | New Oriental Education & Technology Group, Inc., ADR | | | 523,271 | |
| | 415,000 | | | | | Powerlong Real Estate Holdings, Ltd. | | | 220,313 | |
| | 65,000 | | | | | Ronshine China Holdings, Ltd.* | | | 95,626 | |
| | 371,600 | | | | | Sands China, Ltd. | | | 2,017,750 | |
| | 165,500 | | | | | Semiconductor Manufacturing International Corp.* | | | 218,711 | |
| | 295,000 | | | | | Shenzhou International Group Holdings, Ltd. | | | 3,143,072 | |
| | 296,000 | | | | | Shimao Property Holdings, Ltd. | | | 847,604 | |
| | 1,649,000 | | | | | Sino Biopharmaceutical, Ltd. | | | 3,286,404 | |
| | 694,000 | | | | | SOHO China, Ltd. | | | 365,565 | |
| | 55,900 | | | | | Sunny Optical Technology Group Co., Ltd. | | | 1,054,649 | |
| | 86,103 | | | | | TAL Education Group, ADR | | | 3,193,560 | |
| | 58,667 | | | | | Tarena International, Inc., ADR | | | 658,244 | |
| | 627,700 | | | | | Tencent Holdings, Ltd. | | | 33,412,599 | |
| | 1,124,000 | | | | | Tianneng Power International, Ltd. | | | 1,345,157 | |
| | 1,272,000 | | | | | Tingyi Cayman Islands Holding Corp. | | | 2,659,617 | |
| | | | | | |
| | See accompanying Notes to the Financial Statements. | | | 125 | |
Mercer Emerging Markets Equity Fund
Schedule of Investments (Continued)
(showing percentage of net assets)
March 31, 2018
| | | | | | | | | | |
| Shares | | | | | Description | | Value ($) | |
| | |
| | | | | | Cayman Islands — continued | |
| | | |
| | 4,750,000 | | | | | Tongda Group Holdings, Ltd.‡ | | | 916,189 | |
| | 1 | | | | | Tongda Hong Tai Holdings, Ltd.* | | | — | |
| | 101,000 | | | | | TPK Holding Co., Ltd.* | | | 251,833 | |
| | 149,000 | | | | | Uni-President China Holdings, Ltd. | | | 129,583 | |
| | 27,000 | | | | | Vinda International Holdings, Ltd. | | | 47,534 | |
| | 18,568 | | | | | Vipshop Holdings, Ltd., ADR* | | | 308,600 | |
| | 2,039 | | | | | Weibo Corp., ADR* ‡ | | | 243,742 | |
| | 99,000 | | | | | Wisdom Marine Lines Co., Ltd.* | | | 93,713 | |
| | 566,500 | | | | | Xiabuxiabu Catering Management China Holdings Co., Ltd. | | | 1,085,577 | |
| | 526,000 | | | | | Xinyi Glass Holdings, Ltd.* | | | 802,613 | |
| | 334,000 | | | | | Xinyi Solar Holdings, Ltd. | | | 136,132 | |
| | 18,276 | | | | | Yirendai, Ltd., ADR | | | 735,243 | |
| | 1,278,000 | | | | | Yuzhou Properties Co., Ltd. | | | 878,923 | |
| | 2,500 | | | | | YY, Inc., ADR* | | | 263,000 | |
| | 23,000 | | | | | Zhen Ding Technology Holding, Ltd. | | | 54,351 | |
| | 61,000 | | | | | Zhongsheng Group Holdings, Ltd. | | | 167,595 | |
| | 28,300 | | | | | ZTO Express Cayman, Inc., ADR‡ | | | 424,217 | |
| | | | | | | | | | |
| | | | | | Total Cayman Islands | | | 128,289,161 | |
| | | | | | | | | | |
| | |
| | | | | | Chile — 1.6% | |
| | | |
| | 5,894,606 | | | | | Aguas Andinas SA¤ | | | 3,847,928 | |
| | 8,496,190 | | | | | Banco de Chile | | | 1,433,147 | |
| | 9,225 | | | | | Banco de Credito e Inversiones SA | | | 689,286 | |
| | 40,912 | | | | | Banco Santander Chile, ADR | | | 1,370,961 | |
| | 25,885 | | | | | CAP SA | | | 298,921 | |
| | 157,579 | | | | | Cencosud SA | | | 482,738 | |
| | 139,105 | | | | | Cia Cervecerias Unidas SA, ADR | | | 4,091,078 | |
| | 37,312 | | | | | Empresa Nacional de Telecomunicaciones SA | | | 432,426 | |
| | 162,466 | | | | | Empresas CMPC SA | | | 619,108 | |
| | 53,616 | | | | | Empresas COPEC SA | | | 835,023 | |
| | 1,611,229 | | | | | Enel Americas SA | | | 378,805 | |
| | 73,224 | | | | | Enel Chile SA, ADR | | | 468,634 | |
| | 23,047 | | | | | Latam Airlines Group SA, ADR‡ | | | 354,693 | |
| | 105,226 | | | | | Sigdo Koppers SA | | | 203,979 | |
| | 43,837 | | | | | Sociedad Quimica y Minera de Chile SA, ADR‡ | | | 2,154,588 | |
| | | | | | | | | | |
| | | | | | Total Chile | | | 17,661,315 | |
| | | | | | | | | | |
| | |
| | | | | | China — 7.6% | |
| | | |
| | 2,304,000 | | | | | Agricultural Bank of China, Ltd. Class H | | | 1,324,922 | |
| | 174,000 | | | | | Air China, Ltd. Class H | | | 224,288 | |
| | 240,000 | | | | | Aluminum Corp. of China, Ltd.* | | | 134,439 | |
| | 260,000 | | | | | Angang Steel Co., Ltd.‡ | | | 251,333 | |
| | 92,500 | | | | | Anhui Conch Cement Co., Ltd. Class H | | | 510,265 | |
| | 223,000 | | | | | AviChina Industry & Technology Co., Ltd. Class H | | | 158,201 | |
| | 69,500 | | | | | BAIC Motor Corp., Ltd. | | | 86,029 | |
| | 8,621,000 | | | | | Bank of China, Ltd. Class H | | | 4,685,304 | |
| | 144,500 | | | | | Bank of Chongqing Co., Ltd. | | | 113,456 | |
| | 767,000 | | | | | Bank of Communications Co., Ltd. Class H | | | 605,903 | |
| | 159,000 | | | | | Bank of Zhengzhou Co., Ltd. | | | 82,803 | |
| | | | | | |
| 126 | | See accompanying Notes to the Financial Statements. | | | | |
Mercer Emerging Markets Equity Fund
Schedule of Investments (Continued)
(showing percentage of net assets)
March 31, 2018
| | | | | | | | | | |
| Shares | | | | | Description | | Value ($) | |
| | |
| | | | | | China — continued | |
| | | |
| | 131,000 | | | | | BBMG Corp. | | | 59,633 | |
| | 1,502,000 | | | | | Beijing Capital International Airport Co., Ltd. Class H | | | 2,033,072 | |
| | 342,000 | | | | | Beijing Capital Land, Ltd. | | | 211,567 | |
| | 234,000 | | | | | Beijing North Star Co., Ltd. | | | 81,219 | |
| | 18,500 | | | | | BYD Co., Ltd.‡ | | | 145,776 | |
| | 917,000 | | | | | China Cinda Asset Management Co., Ltd. Class H | | | 336,622 | |
| | 798,000 | | | | | China CITIC Bank Corp., Ltd. Class H | | | 550,415 | |
| | 475,000 | | | | | China Coal Energy Co., Ltd. Class H | | | 191,672 | |
| | 447,000 | | | | | China Communications Construction Co., Ltd. Class H | | | 462,133 | |
| | 1,872,000 | | | | | China Communications Services Corp., Ltd. Class H | | | 1,123,107 | |
| | 15,434,000 | | | | | China Construction Bank Corp. Class H | | | 16,037,128 | |
| | 48,000 | | | | | China Eastern Airlines Corp., Ltd. | | | 35,299 | |
| | 1,640,000 | | | | | China Energy Engineering Corp., Ltd. | | | 303,649 | |
| | 244,000 | | | | | China Everbright Bank Co., Ltd. Class H | | | 118,213 | |
| | 190,000 | | | | | China Galaxy Securities Co., Ltd. Class H | | | 127,448 | |
| | 1,053,000 | | | | | China Huarong Asset Management Co., Ltd. | | | 446,058 | |
| | 45,200 | | | | | China International Capital Corp., Ltd. Class H | | | 91,547 | |
| | 24,700 | | | | | China International Marine Containers Group Co., Ltd. Class H | | | 38,732 | |
| | 224,000 | | | | | China Life Insurance Co., Ltd. Class H | | | 622,341 | |
| | 289,000 | | | | | China Machinery Engineering Corp. | | | 153,987 | |
| | 1,201,500 | | | | | China Merchants Bank Co., Ltd. Class H | | | 4,984,076 | |
| | 14,800 | | | | | China Merchants Securities Co., Ltd. | | | 21,328 | |
| | 485,000 | | | | | China Minsheng Banking Corp., Ltd. Class H‡ | | | 475,698 | |
| | 1,482,000 | | | | | China National Building Material Co., Ltd.‡ | | | 1,631,076 | |
| | 102,000 | | | | | China Oilfield Services, Ltd. Class H | | | 107,243 | |
| | 77,800 | | | | | China Pacific Insurance Group Co., Ltd. | | | 352,324 | |
| | 2,390,000 | | | | | China Petroleum & Chemical Corp. Class H | | | 2,119,116 | |
| | 203,500 | | | | | China Railway Construction Corp., Ltd. Class H | | | 205,540 | |
| | 415,000 | | | | | China Railway Group, Ltd. Class H | | | 289,162 | |
| | 84,000 | | | | | China Railway Signal & Communication Corp., Ltd. | | | 66,162 | |
| | 1,314,000 | | | | | China Reinsurance Group Corp. | | | 274,017 | |
| | 358,000 | | | | | China Shenhua Energy Co., Ltd. Class H | | | 899,533 | |
| | 250,000 | | | | | China Southern Airlines Co., Ltd. Class H | | | 263,230 | |
| | 124,500 | | | | | China Vanke Co., Ltd. Class H | | | 574,089 | |
| | 1,437,000 | | | | | Chongqing Rural Commercial Bank Co., Ltd. Class H | | | 1,109,426 | |
| | 66,000 | | | | | CITIC Securities Co., Ltd. | | | 152,817 | |
| | 416,000 | | | | | COSCO SHIPPING Development Co., Ltd.* | | | 77,823 | |
| | 436,000 | | | | | COSCO SHIPPING Energy Transportation Co., Ltd. Class H | | | 225,342 | |
| | 151,000 | | | | | COSCO SHIPPING Holdings Co., Ltd.* | | | 75,608 | |
| | 123,000 | | | | | CRRC Corp., Ltd. Class H | | | 105,657 | |
| | 30,000 | | | | | CSSC Offshore and Marine Engineering Group Co., Ltd. | | | 42,308 | |
| | 202,000 | | | | | Dalian Port PDA Co., Ltd. | | | 34,160 | |
| | 1,538,000 | | | | | Dongfeng Motor Group Co., Ltd. Class H | | | 1,794,535 | |
| | 22,600 | | | | | Dongjiang Environmental Co., Ltd. | | | 30,459 | |
| | 74,000 | | | | | Everbright Securities Co., Ltd. | | | 86,215 | |
| | 29,600 | | | | | Fuyao Glass Industry Group Co., Ltd. | | | 114,957 | |
| | 39,200 | | | | | GF Securities Co., Ltd. | | | 72,673 | |
| | 168,000 | | | | | Great Wall Motor Co., Ltd. Class H‡ | | | 169,793 | |
| | 450,000 | | | | | Guangshen Railway Co., Ltd. | | | 267,933 | |
| | | | | | |
| | See accompanying Notes to the Financial Statements. | | | 127 | |
Mercer Emerging Markets Equity Fund
Schedule of Investments (Continued)
(showing percentage of net assets)
March 31, 2018
| | | | | | | | | | |
| Shares | | | | | Description | | Value ($) | |
| | |
| | | | | | China — continued | |
| | | |
| | 62,000 | | | | | Guangzhou Automobile Group Co., Ltd. Class H | | | 115,163 | |
| | 12,000 | | | | | Guangzhou Baiyunshan Pharmaceutical Holdings Co., Ltd. | | | 37,232 | |
| | 642,400 | | | | | Guangzhou R&F Properties Co., Ltd. Class H | | | 1,621,193 | |
| | 17,400 | | | | | Guotai Junan Securities Co., Ltd.* | | | 37,918 | |
| | 333,600 | | | | | Haitong Securities Co., Ltd. Class H | | | 444,071 | |
| | 305,000 | | | | | Harbin Bank Co., Ltd.* | | | 87,549 | |
| | 43,000 | | | | | Hisense Kelon Electrical Holdings Co., Ltd. | | | 49,417 | |
| | 1,542,000 | | | | | Huaneng Renewables Corp., Ltd. | | | 579,374 | |
| | 47,200 | | | | | Huatai Securities Co., Ltd. | | | 91,480 | |
| | 61,000 | | | | | Huishang Bank Corp., Ltd. | | | 30,189 | |
| | 10,887,000 | | | | | Industrial & Commercial Bank of China, Ltd. Class H | | | 9,440,613 | |
| | 38,100 | | | | | Inner Mongolia Yitai Coal Co., Ltd. | | | 46,987 | |
| | 288,000 | | | | | Jiangxi Copper Co., Ltd. Class H | | | 415,284 | |
| | 214,000 | | | | | Kingdee International Software Group Co., Ltd.* ‡ | | | 217,848 | |
| | 82,100 | | | | | Legend Holdings Corp. | | | 272,866 | |
| | 102,900 | | | | | Livzon Pharmaceutical Group, Inc. | | | 836,816 | |
| | 2,840,000 | | | | | Lonking Holdings, Ltd. Class H | | | 1,218,379 | |
| | 2,272,000 | | | | | Maanshan Iron & Steel Co., Ltd.* | | | 984,707 | |
| | 162,000 | | | | | Metallurgical Corp. of China, Ltd. | | | 46,483 | |
| | 22,300 | | | | | New China Life Insurance Co., Ltd. Class H | | | 105,035 | |
| | 912,000 | | | | | People’s Insurance Co. Group of China, Ltd. (The) Class H | | | 430,636 | |
| | 1,994,000 | | | | | PetroChina Co., Ltd. Class H | | | 1,387,080 | |
| | 702,000 | | | | | PICC Property & Casualty Co., Ltd. Class H | | | 1,241,525 | |
| | 1,147,500 | | | | | Ping An Insurance Group Co., of China Ltd. Class H | | | 11,807,068 | |
| | 584,000 | | | | | Postal Savings Bank of China Co., Ltd. | | | 370,553 | |
| | 354,000 | | | | | Qingdao Port International Co., Ltd. | | | 263,451 | |
| | 82,500 | | | | | Qinhuangdao Port Co., Ltd. | | | 23,398 | |
| | 30,200 | | | | | Red Star Macalline Group Corp., Ltd. | | | 35,357 | |
| | 27,000 | | | | | Shandong Chenming Paper Holdings, Ltd. | | | 45,987 | |
| | 208,000 | | | | | Shandong Weigao Group Medical Polymer Co., Ltd. Class H | | | 139,228 | |
| | 162,000 | | | | | Shanghai Electric Group Co., Ltd. Class H* | | | 56,332 | |
| | 9,000 | | | | | Shanghai Fosun Pharmaceutical Group Co., Ltd. | | | 55,977 | |
| | 144,000 | | | | | Shanghai Jin Jiang International Hotels Group Co., Ltd. | | | 59,441 | |
| | 49,400 | | | | | Shanghai Pharmaceuticals Holding Co., Ltd. Class H | | | 133,030 | |
| | 58,500 | | | | | Shengjing Bank Co., Ltd. | | | 43,846 | |
| | 5,967 | | | | | SINA Corp. Class H* | | | 622,179 | |
| | 410,500 | | | | | Sinopec Engineering Group Co., Ltd. Class H | | | 413,048 | |
| | 1,142,000 | | | | | Sinopec Shanghai Petrochemical Co., Ltd. Class H | | | 698,131 | |
| | 65,200 | | | | | Sinopharm Group Co., Ltd. Class H | | | 327,980 | |
| | 63,000 | | | | | Tong Ren Tang Technologies Co., Ltd. | | | 105,941 | |
| | 20,000 | | | | | Tsingtao Brewery Co., Ltd. Class H | | | 105,440 | |
| | 848,000 | | | | | Weichai Power Co., Ltd. Class H | | | 958,499 | |
| | 50,000 | | | | | Xinhua Winshare Publishing and Media Co., Ltd. | | | 40,072 | |
| | 35,000 | | | | | Xinjiang Goldwind Science & Technology Co., Ltd. | | | 56,589 | |
| | 16,500 | | | | | Yangtze Optical Fibre and Cable Joint Stock, Ltd. Co. | | | 77,380 | |
| | 114,000 | | | | | Yanzhou Coal Mining Co., Ltd. Class H | | | 147,399 | |
| | 118,000 | | | | | Zhaojin Mining Industry Co., Ltd. Class H‡ | | | 93,025 | |
| | 30,300 | | | | | Zhuzhou CRRC Times Electric Co., Ltd. Class H | | | 147,910 | |
| | | | | | |
| 128 | | See accompanying Notes to the Financial Statements. | | | | |
Mercer Emerging Markets Equity Fund
Schedule of Investments (Continued)
(showing percentage of net assets)
March 31, 2018
| | | | | | | | | | |
| Shares | | | | | Description | | Value ($) | |
| | |
| | | | | | China — continued | |
| | | |
| | 172,000 | | | | | Zijin Mining Group Co., Ltd. Class H | | | 77,939 | |
| | 20,000 | | | | | ZTE Corp.* | | | 65,998 | |
| | | | | | | | | | |
| | | | | | Total China | | | 84,677,904 | |
| | | | | | | | | | |
| | |
| | | | | | Colombia — 0.1% | |
| | | |
| | 61,705 | | | | | Almacenes Exito SA | | | 366,044 | |
| | 1,263 | | | | | Banco de Bogota SA | | | 30,673 | |
| | 2,350 | | | | | Bancolombia SA | | | 25,560 | |
| | 1,200 | | | | | Bancolombia SA, ADR | | | 50,424 | |
| | 20,071 | | | | | Grupo Argos SA | | | 135,822 | |
| | 19,770 | | | | | Grupo de Inversiones Suramericana SA | | | 264,481 | |
| | | | | | | | | | |
| | | | | | Total Colombia | | | 873,004 | |
| | | | | | | | | | |
| | |
| | | | | | Cyprus — 0.1% | |
| | | |
| | 55,148 | | | | | TCS Group Holding Plc, GDR | | | 1,211,547 | |
| | | | | | | | | | |
| | |
| | | | | | Czech Republic — 0.3% | |
| | | |
| | 15,627 | | | | | CEZ AS | | | 389,989 | |
| | 73,099 | | | | | Komercni Banka AS | | | 3,336,366 | |
| | | | | | | | | | |
| | | | | | Total Czech Republic | | | 3,726,355 | |
| | | | | | | | | | |
| | |
| | | | | | Egypt — 0.3% | |
| | | |
| | 574,691 | | | | | Commercial International Bank Egypt SAE, GDR | | | 2,921,351 | |
| | | | | | | | | | |
| | |
| | | | | | France — 0.2% | |
| | | |
| | 28,496 | | | | | Sanofi | | | 2,288,687 | |
| | | | | | | | | | |
| | |
| | | | | | Greece — 0.1% | |
| | | |
| | 59,802 | | | | | JUMBO SA | | | 1,070,367 | |
| | | | | | | | | | |
| | |
| | | | | | Hong Kong — 4.6% | |
| | | |
| | 333,500 | | | | | Beijing Enterprises Holdings, Ltd. | | | 1,754,870 | |
| | 1,256,000 | | | | | Brilliance China Automotive Holdings, Ltd. | | | 2,641,691 | |
| | 70,500 | | | | | BYD Electronic International Co., Ltd.‡ | | | 133,487 | |
| | 132,000 | | | | | China Everbright International, Ltd. | | | 186,380 | |
| | 316,000 | | | | | China Everbright, Ltd. | | | 667,255 | |
| | 306,000 | | | | | China Merchants Port Holdings Co., Ltd. | | | 679,143 | |
| | 1,003,980 | | | | | China Mobile, Ltd. | | | 9,185,807 | |
| | 457,000 | | | | | China Overseas Grand Oceans Group, Ltd. | | | 224,048 | |
| | 840,000 | | | | | China Overseas Land & Investment, Ltd. | | | 2,952,892 | |
| | 110,500 | | | | | China Resources Pharmaceutical Group, Ltd. | | | 155,756 | |
| | 862,000 | | | | | China Resources Power Holdings Co., Ltd. | | | 1,585,071 | |
| | 968,000 | | | | | China South City Holdings, Ltd. | | | 220,523 | |
| | 401,200 | | | | | China Taiping Insurance Holdings Co., Ltd. | | | 1,344,946 | |
| | 232,000 | | | | | China Traditional Chinese Medicine Holdings Co., Ltd. | | | 172,118 | |
| | 720,000 | | | | | China Travel International Investment Hong Kong, Ltd. | | | 256,943 | |
| | 646,000 | | | | | China Unicom Hong Kong, Ltd.* | | | 823,664 | |
| | 557,000 | | | | | CITIC, Ltd. | | | 785,797 | |
| | | | | | |
| | See accompanying Notes to the Financial Statements. | | | 129 | |
Mercer Emerging Markets Equity Fund
Schedule of Investments (Continued)
(showing percentage of net assets)
March 31, 2018
| | | | | | | | | | |
| Shares | | | | | Description | | Value ($) | |
| | |
| | | | | | Hong Kong — continued | |
| | | |
| | 2,539,000 | | | | | CNOOC, Ltd. | | | 3,746,786 | |
| | 2,130,000 | | | | | CSPC Pharmaceutical Group, Ltd. | | | 5,733,924 | |
| | 651,000 | | | | | Far East Horizon, Ltd. | | | 692,989 | |
| | 879,000 | | | | | Fosun International, Ltd. | | | 1,928,784 | |
| | 1,923,000 | | | | | Haier Electronics Group Co., Ltd.* | | | 6,924,195 | |
| | 110,000 | | | | | Hua Hong Semiconductor, Ltd. | | | 220,171 | |
| | 402,000 | | | | | Lenovo Group, Ltd. | | | 206,771 | |
| | 704,000 | | | | | Poly Property Group Co., Ltd.* | | | 350,265 | |
| | 165,000 | | | | | Shanghai Industrial Holdings, Ltd. | | | 432,563 | |
| | 3,164,000 | | | | | Shenzhen Investment, Ltd. | | | 1,350,285 | |
| | 1,010,000 | | | | | Sino-Ocean Group Holding, Ltd. | | | 738,624 | |
| | 224,500 | | | | | Sinotruk Hong Kong, Ltd. | | | 267,717 | |
| | 1,872,500 | | | | | Sun Art Retail Group, Ltd. | | | 2,205,166 | |
| | 2,057,500 | | | | | WH Group, Ltd. | | | 2,211,555 | |
| | 2,296,000 | | | | | Yuexiu Property Co., Ltd. | | | 545,540 | |
| | | | | | | | | | |
| | | | | | Total Hong Kong | | | 51,325,726 | |
| | | | | | | | | | |
| | |
| | | | | | Hungary — 0.5% | |
| | | |
| | 42,349 | | | | | MOL Hungarian Oil & Gas Plc | | | 464,069 | |
| | 94,970 | | | | | OTP Bank Plc | | | 4,281,059 | |
| | 18,499 | | | | | Richter Gedeon Nyrt | | | 386,997 | |
| | | | | | | | | | |
| | | | | | Total Hungary | | | 5,132,125 | |
| | | | | | | | | | |
| | |
| | | | | | India — 9.7% | |
| | | |
| | 2,729 | | | | | ACC, Ltd. | | | 63,083 | |
| | 62,785 | | | | | Adani Enterprises, Ltd. | | | 155,435 | |
| | 104,805 | | | | | Adani Power, Ltd.* | | | 38,734 | |
| | 1,117,472 | | | | | Aditya Birla Capital, Ltd.* | | | 2,521,811 | |
| | 67,149 | | | | | Ambuja Cements, Ltd. | | | 243,506 | |
| | 89,636 | | | | | Apollo Tyres, Ltd. | | | 383,106 | |
| | 13,937 | | | | | Arvind, Ltd. | | | 83,453 | |
| | 102,561 | | | | | Asian Paints, Ltd. | | | 1,766,854 | |
| | 15,273 | | | | | Aurobindo Pharma, Ltd. | | | 132,269 | |
| | 130,191 | | | | | Axis Bank, Ltd. | | | 1,025,707 | |
| | 53,198 | | | | | Bajaj Auto, Ltd. | | | 2,251,057 | |
| | 100,974 | | | | | Bajaj Finance, Ltd. | | | 2,772,534 | |
| | 1,132 | | | | | Bajaj Finserv, Ltd. | | | 89,043 | |
| | 8,555 | | | | | Bajaj Holdings & Investment, Ltd. | | | 352,662 | |
| | 101,945 | | | | | Bank of Baroda | | | 223,771 | |
| | 1,125,752 | | | | | Bharat Heavy Electricals, Ltd. | | | 1,413,899 | |
| | 285,718 | | | | | Bharat Petroleum Corp., Ltd. | | | 1,879,528 | |
| | 117,759 | | | | | Bharti Airtel, Ltd. | | | 725,961 | |
| | 19,211 | | | | | Bharti Infratel, Ltd. | | | 99,215 | |
| | 11,840 | | | | | Britannia Industries, Ltd. | | | 908,049 | |
| | 24,080 | | | | | Cadila Healthcare, Ltd. | | | 140,152 | |
| | 27,266 | | | | | Canara Bank | | | 112,108 | |
| | 10,679 | | | | | Cipla, Ltd. | | | 89,748 | |
| | 27,422 | | | | | City Union Bank, Ltd. | | | 72,879 | |
| �� | 2,515 | | | | | Container Corp. Of India, Ltd. | | | 48,243 | |
| | | | | | |
| 130 | | See accompanying Notes to the Financial Statements. | | | | |
Mercer Emerging Markets Equity Fund
Schedule of Investments (Continued)
(showing percentage of net assets)
March 31, 2018
| | | | | | | | | | |
| Shares | | | | | Description | | Value ($) | |
| | |
| | | | | | India — continued | |
| | | |
| | 2,717 | | | | | DCM Shriram, Ltd. | | | 17,934 | |
| | 48,369 | | | | | Dewan Housing Finance Corp., Ltd. | | | 389,299 | |
| | 74,104 | | | | | Dilip Buildcon, Ltd. | | | 1,152,565 | |
| | 102,560 | | | | | DLF, Ltd. | | | 318,999 | |
| | 6,591 | | | | | Dr. Reddy’s Laboratories, Ltd. | | | 210,555 | |
| | 16,647 | | | | | EIH, Ltd. | | | 40,929 | |
| | 16,885 | | | | | Engineers India, Ltd. | | | 41,536 | |
| | 23,567 | | | | | Exide Industries, Ltd. | | | 80,856 | |
| | 297,098 | | | | | Federal Bank, Ltd. | | | 412,468 | |
| | 565,383 | | | | | GAIL India, Ltd.**** | | | 2,880,660 | |
| | 15,660 | | | | | Glenmark Pharmaceuticals, Ltd. | | | 127,112 | |
| | 453,986 | | | | | Grasim Industries, Ltd. | | | 7,304,156 | |
| | 8,935 | | | | | Gujarat Fluorochemicals, Ltd. | | | 109,954 | |
| | 33,173 | | | | | Gujarat State Petronet, Ltd. | | | 99,828 | |
| | 71,348 | | | | | HCL Technologies, Ltd. Class T | | | 1,064,753 | |
| | 30,525 | | | | | HDFC Bank, Ltd. | | | 890,799 | |
| | 26,262 | | | | | HDFC Bank, Ltd., ADR | | | 2,593,898 | |
| | 260,702 | | | | | HDFC Standard Life Insurance Co., Ltd. | | | 1,829,429 | |
| | 26,237 | | | | | Hero MotoCorp Ltd. | | | 1,428,023 | |
| | 210,588 | | | | | Hindalco Industries, Ltd. | | | 700,874 | |
| | 33,143 | | | | | Hindustan Petroleum Corp., Ltd. | | | 175,774 | |
| | 6,373 | | | | | Hindustan Unilever, Ltd. | | | 131,326 | |
| | 344,047 | | | | | Housing Development Finance Corp., Ltd. | | | 9,652,252 | |
| | 215,954 | | | | | ICICI Bank, Ltd. | | | 929,788 | |
| | 1,344,021 | | | | | Idea Cellular, Ltd.* | | | 1,578,991 | |
| | 422,223 | | | | | IDFC Bank, Ltd. | | | 308,123 | |
| | 264,117 | | | | | IDFC, Ltd. | | | 200,499 | |
| | 85,932 | | | | | Indiabulls Housing Finance, Ltd. | | | 1,657,726 | |
| | 58,726 | | | | | Indiabulls Real Estate, Ltd.* | | | 162,403 | |
| | 150,734 | | | | | Indian Oil Corp., Ltd. | | | 413,430 | |
| | 227,163 | | | | | Indraprastha Gas, Ltd. | | | 982,896 | |
| | 66,335 | | | | | IndusInd Bank, Ltd. | | | 1,843,694 | |
| | 399,164 | | | | | Infosys, Ltd. | | | 7,016,373 | |
| | 189,404 | | | | | Infosys, Ltd., ADR‡ | | | 3,380,861 | |
| | 5,075 | | | | | Ipca Laboratories, Ltd. | | | 52,069 | |
| | 161,347 | | | | | ITC, Ltd. | | | 635,800 | |
| | 372,926 | | | | | Jain Irrigation Systems, Ltd. | | | 618,044 | |
| | 73,641 | | | | | Jindal Steel & Power, Ltd.* | | | 249,280 | |
| | 21,551 | | | | | JM Financial, Ltd. | | | 42,914 | |
| | 134,159 | | | | | JSW Energy, Ltd. | | | 152,427 | |
| | 115,591 | | | | | JSW Steel, Ltd. | | | 513,498 | |
| | 55,687 | | | | | Jubilant Life Sciences, Ltd. | | | 716,273 | |
| | 109,161 | | | | | Karnataka Bank, Ltd. (The) | | | 193,520 | |
| | 91,282 | | | | | Karur Vysya Bank, Ltd. (The) | | | 141,312 | |
| | 394,006 | | | | | L&T Finance Holdings, Ltd. | | | 956,314 | |
| | 14,600 | | | | | Larsen & Toubro, Ltd. | | | 295,939 | |
| | 71,752 | | | | | LIC Housing Finance, Ltd. | | | 593,250 | |
| | 13,008 | | | | | Lupin, Ltd. | | | 147,274 | |
| | 17,661 | | | | | Mahindra & Mahindra Financial Services, Ltd. | | | 124,781 | |
| | | | | | |
| | See accompanying Notes to the Financial Statements. | | | 131 | |
Mercer Emerging Markets Equity Fund
Schedule of Investments (Continued)
(showing percentage of net assets)
March 31, 2018
| | | | | | | | | | |
| Shares | | | | | Description | | Value ($) | |
| | |
| | | | | | India — continued | |
| | | |
| | 8,571 | | | | | Mahindra CIE Automotive, Ltd.* | | | 28,455 | |
| | 46,752 | | | | | Manappuram Finance, Ltd. | | | 78,324 | |
| | 30,625 | | | | | Maruti Suzuki India, Ltd. | | | 4,180,398 | |
| | 74,279 | | | | | Mphasis, Ltd. | | | 953,607 | |
| | 3,868 | | | | | MRF, Ltd. | | | 4,329,485 | |
| | 31,886 | | | | | Muthoot Finance, Ltd. | | | 198,852 | |
| | 58,259 | | | | | Natco Pharma, Ltd. | | | 673,303 | |
| | 915,420 | | | | | National Aluminium Co., Ltd. | | | 940,658 | |
| | 10,817 | | | | | Oberoi Realty, Ltd. | | | 84,978 | |
| | 61,951 | | | | | Oil & Natural Gas Corp., Ltd. | | | 169,534 | |
| | 13,380 | | | | | PC Jeweller, Ltd. | | | 66,287 | |
| | 1,284 | | | | | Pfizer Ltd. | | | 42,779 | |
| | 2,360 | | | | | Piramal Enterprises, Ltd. | | | 88,922 | |
| | 1,071,584 | | | | | Power Finance Corp., Ltd. | | | 1,406,514 | |
| | 12,851 | | | | | Prestige Estates Projects, Ltd. | | | 58,328 | |
| | 8,780 | | | | | Rain Industries, Ltd. | | | 51,389 | |
| | 4,496 | | | | | Rajesh Exports, Ltd. | | | 50,951 | |
| | 5,236 | | | | | RBL Bank, Ltd. | | | 38,346 | |
| | 157,511 | | | | | Reliance Capital, Ltd. | | | 1,040,117 | |
| | 250,138 | | | | | Reliance Industries, Ltd. | | | 3,397,115 | |
| | 25,001 | | | | | Reliance Industries, Ltd. (London Exchange), GDR 144A | | | 677,934 | |
| | 191,600 | | | | | Reliance Power, Ltd.* | | | 106,564 | |
| | 157,497 | | | | | Rural Electrification Corp., Ltd. | | | 301,471 | |
| | 2,507 | | | | | Shriram City Union Finance, Ltd. | | | 83,999 | |
| | 8,607 | | | | | Shriram Transport Finance Co., Ltd. | | | 191,251 | |
| | 511,781 | | | | | Srei Infrastructure Finance, Ltd. | | | 605,489 | |
| | 1,607 | | | | | SRF, Ltd. | | | 49,003 | |
| | 95,853 | | | | | State Bank of India | | | 368,530 | |
| | 4,605 | | | | | State Bank of India, Ltd., Reg S, GDR‡‡‡ | | | 177,901 | |
| | 30,315 | | | | | Sun Pharmaceutical Industries, Ltd. | | | 232,383 | |
| | 1,498 | | | | | Sundaram Finance, Ltd. | | | 38,740 | |
| | 209,939 | | | | | Tata Consultancy Services, Ltd. | | | 9,204,305 | |
| | 99,158 | | | | | Tata Global Beverages, Ltd. | | | 400,388 | |
| | 98,846 | | | | | Tata Motors, Ltd.* | | | 502,613 | |
| | 9,583 | | | | | Tata Motors, Ltd., ADR* | | | 246,283 | |
| | 146,885 | | | | | Tata Steel, Ltd. | | | 1,294,433 | |
| | 160,759 | | | | | Tech Mahindra, Ltd. | | | 1,585,095 | |
| | 9,840 | | | | | Thomas Cook India, Ltd. | | | 41,931 | |
| | 48,175 | | | | | TV18 Broadcast, Ltd.* | | | 50,862 | |
| | 56,007 | | | | | Union Bank of India* | | | 82,045 | |
| | 145,733 | | | | | Vedanta, Ltd. | | | 628,645 | |
| | 38,751 | | | | | Wipro, Ltd. | | | 169,415 | |
| | 78,341 | | | | | Wipro, Ltd., ADR‡ | | | 404,240 | |
| | 45,474 | | | | | Yes Bank, Ltd. | | | 216,580 | |
| | | | | | | | | | |
| | | | | | Total India | | | 108,692,707 | |
| | | | | | | | | | |
| | |
| | | | | | Indonesia — 2.3% | |
| | | |
| | 10,407,100 | | | | | Adaro Energy Tbk PT | | | 1,620,342 | |
| | 128,100 | | | | | Astra Agro Lestari Tbk PT | | | 125,661 | |
| | | | | | |
| 132 | | See accompanying Notes to the Financial Statements. | | | | |
Mercer Emerging Markets Equity Fund
Schedule of Investments (Continued)
(showing percentage of net assets)
March 31, 2018
| | | | | | | | | | |
| Shares | | | | | Description | | Value ($) | |
| | |
| | | | | | Indonesia — 2.3% | |
| | | |
| | 478,600 | | | | | Astra International Tbk PT | | | 254,947 | |
| | 138,300 | | | | | Bank Central Asia Tbk PT | | | 234,808 | |
| | 1,426,400 | | | | | Bank Mandiri Persero Tbk PT | | | 797,804 | |
| | 799,500 | | | | | Bank Maybank Indonesia Tbk PT | | | 15,944 | |
| | 3,141,600 | | | | | Bank Negara Indonesia Persero Tbk PT | | | 1,987,962 | |
| | 624,500 | | | | | Bank Pan Indonesia Tbk PT* | | | 48,665 | |
| | 595,200 | | | | | Bank Pembangunan Daerah Jawa Barat Dan Banten Tbk PT | | | 89,276 | |
| | 956,700 | | | | | Bank Pembangunan Daerah Jawa Timur Tbk PT | | | 43,846 | |
| | 25,839,300 | | | | | Bank Rakyat Indonesia Persero Tbk PT | | | 6,782,031 | |
| | 4,658,700 | | | | | Bank Tabungan Negara Persero Tbk PT | | | 1,289,265 | |
| | 244,100 | | | | | Bank Tabungan Pensiunan Nasional Tbk PT | | | 59,482 | |
| | 188,400 | | | | | Barito Pacific Tbk PT* | | | 31,736 | |
| | 850,000 | | | | | BFI Finance Indonesia Tbk PT | | | 49,466 | |
| | 1,400,700 | | | | | Bumi Serpong Damai Tbk PT | | | 181,893 | |
| | 3,729,200 | | | | | Ciputra Development Tbk PT | | | 319,326 | |
| | 52,400 | | | | | Gudang Garam Tbk PT | | | 276,665 | |
| | 505,800 | | | | | Indah Kiat Pulp & Paper Corp. Tbk PT | | | 406,258 | |
| | 15,600 | | | | | Indo Tambangraya Megah Tbk PT | | | 32,338 | |
| | 147,300 | | | | | Indofood CBP Sukses Makmur Tbk PT | | | 88,733 | |
| | 1,244,900 | | | | | Indofood Sukses Makmur Tbk PT | | | 652,615 | |
| | 1,191,600 | | | | | Japfa Comfeed Indonesia Tbk PT | | | 128,398 | |
| | 1,055,000 | | | | | Jaya Real Property Tbk PT | | | 63,901 | |
| | 2,110,500 | | | | | Medco Energi Internasional Tbk PT* | | | 186,584 | |
| | 1,350,100 | | | | | Media Nusantara Citra Tbk PT | | | 139,705 | |
| | 240,700 | | | | | Pabrik Kertas Tjiwi Kimia Tbk PT | | | 121,253 | |
| | 3,170,500 | | | | | Perusahaan Gas Negara Persero Tbk PT | | | 533,387 | |
| | 878,500 | | | | | PP Persero Tbk PT* | | | 167,388 | |
| | 1,935,500 | | | | | PP Properti Tbk PT* | | | 23,820 | |
| | 259,000 | | | | | Semen Gresik Persero Tbk PT | | | 195,185 | |
| | 108,800 | | | | | Siloam International Hospitals Tbk PT* | | | 63,293 | |
| | 892,500 | | | | | Summarecon Agung Tbk PT | | | 58,642 | |
| | 14,777,200 | | | | | Telekomunikasi Indonesia Persero Tbk PT | | | 3,878,257 | |
| | 657,800 | | | | | Unilever Indonesia Tbk PT | | | 2,370,237 | |
| | 640,210 | | | | | United Tractors Tbk PT | | | 1,493,899 | |
| | 2,870,800 | | | | | Waskita Beton Precast Tbk PT* | | | 86,738 | |
| | 3,105,000 | | | | | Waskita Karya Persero Tbk PT* | | | 560,268 | |
| | 875,100 | | | | | Wijaya Karya Persero Tbk PT* | | | 107,309 | |
| | 577,200 | | | | | XL Axiata Tbk PT* | | | 105,999 | |
| | | | | | | | | | |
| | | | | | Total Indonesia | | | 25,673,326 | |
| | | | | | | | | | |
| | |
| | | | | | Isle of Man — 0.0% | |
| | | |
| | 25,196 | | | | | NEPI Rockcastle Plc‡ | | | 246,725 | |
| | | | | | | | | | |
| | |
| | | | | | Japan — 0.2% | |
| | | |
| | 57,300 | | | | | Honda Motor Co., Ltd. | | | 1,971,960 | |
| | | | | | | | | | |
| | |
| | | | | | Luxembourg — 0.0% | |
| | | |
| | 16,364 | | | | | Kernel Holding SA | | | 239,284 | |
| | | | | | | | | | |
| | | | | | |
| | See accompanying Notes to the Financial Statements. | | | 133 | |
Mercer Emerging Markets Equity Fund
Schedule of Investments (Continued)
(showing percentage of net assets)
March 31, 2018
| | | | | | | | | | |
| Shares | | | | | Description | | Value ($) | |
| | |
| | | | | | Malaysia — 1.6% | |
| | | |
| | 3,352,615 | | | | | AirAsia Bhd | | | 3,406,354 | |
| | 358,000 | | | | | Alliance Financial Group Bhd | | | 404,462 | |
| | 306,700 | | | | | AMMB Holdings Bhd | | | 308,444 | |
| | 75,100 | | | | | Axiata Group Bhd | | | 105,816 | |
| | 1,600 | | | | | Batu Kawan Bhd | | | 7,487 | |
| | 81,500 | | | | | Boustead Holdings Bhd | | | 53,519 | |
| | 47,500 | | | | | Cahya Mata Sarawak Bhd | | | 48,507 | |
| | 422,300 | | | | | CIMB Group Holdings Bhd | | | 784,989 | |
| | 199,100 | | | | | DRB-Hicom Bhd | | | 125,596 | |
| | 312,500 | | | | | Eco World Development Group Bhd* | | | 80,791 | |
| | 306,100 | | | | | Felda Global Ventures Holdings Bhd | | | 134,532 | |
| | 88,500 | | | | | Gamuda Bhd | | | 118,519 | |
| | 323,800 | | | | | Genting Bhd | | | 730,810 | |
| | 1,309,200 | | | | | Genting Malaysia Bhd | | | 1,658,501 | |
| | 12,100 | | | | | Genting Plantations Bhd | | | 32,096 | |
| | 141,400 | | | | | Hong Leong Bank Bhd | | | 687,260 | |
| | 18,800 | | | | | Hong Leong Financial Group Bhd | | | 93,611 | |
| | 50,000 | | | | | IHH Healthcare Bhd | | | 78,206 | |
| | 590,100 | | | | | IJM Corp. Bhd | | | 408,859 | |
| | 374,500 | | | | | IOI Properties Group Bhd | | | 156,848 | |
| | 321,300 | | | | | Mah Sing Group Bhd | | | 83,066 | |
| | 1,008,200 | | | | | Malayan Banking Bhd | | | 2,762,906 | |
| | 1,135,800 | | | | | Malaysia Airports Holdings Bhd | | | 2,598,715 | |
| | 301,400 | | | | | Malaysia Building Society Bhd | | | 87,272 | |
| | 127,800 | | | | | MISC Bhd | | | 232,934 | |
| | 123,600 | | | | | MMC Corp. Bhd | | | 54,003 | |
| | 60,300 | | | | | Oriental Holdings Bhd | | | 97,122 | |
| | 245,000 | | | | | Public Bank Bhd | | | 1,520,165 | |
| | 66,000 | | | | | RHB Bank Bhd | | | 89,240 | |
| | 1,152,800 | | | | | Sapura Energy Bhd | | | 162,429 | |
| | 298,900 | | | | | Sunway Bhd | | | 117,458 | |
| | 411,000 | | | | | UEM Sunrise Bhd* | | | 107,319 | |
| | 153,300 | | | | | UOA Development Bhd | | | 95,912 | |
| | 57,200 | | | | | Yinson Holdings Bhd | | | 59,152 | |
| | 874,700 | | | | | YTL Corp. Bhd | | | 305,286 | |
| | | | | | | | | | |
| | | | | | Total Malaysia | | | 17,798,186 | |
| | | | | | | | | | |
| | |
| | | | | | Mexico — 2.8% | |
| | | |
| | 677,800 | | | | | Alfa SAB de CV Class A | | | 872,950 | |
| | 256,600 | | | | | Alsea SAB de CV | | | 898,275 | |
| | 64,099 | | | | | America Movil SAB de CV Series L, ADR | | | 1,223,650 | |
| | 10,037 | | | | | Banco Santander Mexico SA Institucion de Banca Multiple Grupo Financiero Santand, ADR | | | 71,965 | |
| | 153,000 | | | | | Cemex SAB de CV, ADR* | | | 1,012,860 | |
| | 15,200 | | | | | Coca-Cola Femsa SAB de CV | | | 100,296 | |
| | 19,100 | | | | | El Puerto de Liverpool SAB de CV | | | 141,641 | |
| | 95,500 | | | | | Elementia SAB de CV* ‡ | | | 104,508 | |
| | 1,733,096 | | | | | Fibra Uno Administracion SA de CV REIT | | | 2,609,295 | |
| | 40,512 | | | | | Fomento Economico Mexicano SAB de CV, ADR | | | 3,704,012 | |
| | | | | | |
| 134 | | See accompanying Notes to the Financial Statements. | | | | |
Mercer Emerging Markets Equity Fund
Schedule of Investments (Continued)
(showing percentage of net assets)
March 31, 2018
| | | | | | | | | | |
| Shares | | | | | Description | | Value ($) | |
| | |
| | | | | | Mexico — continued | |
| | | |
| | 31,500 | | | | | Fomento Economico Mexicano SAB de CV | | | 288,202 | |
| | 497,500 | | | | | Gentera SAB de CV‡ | | | 363,367 | |
| | 87,700 | | | | | Grupo Aeromexico SAB de CV* | | | 140,170 | |
| | 175,100 | | | | | Grupo Aeroportuario del Pacifico SAB de CV Class B | | | 1,737,849 | |
| | 12,600 | | | | | Grupo Carso SAB de CV Series A-1 | | | 44,547 | |
| | 48,900 | | | | | Grupo Cementos de Chihuahua SAB de CV | | | 263,229 | |
| | 107,100 | | | | | Grupo Comercial Chedraui SA de CV | | | 228,118 | |
| | 12,520 | | | | | Grupo Elektra SAB DE CV‡ | | | 350,851 | |
| | 1,247,700 | | | | | Grupo Financiero Banorte SAB de CV Series O | | | 7,571,021 | |
| | 213,400 | | | | | Grupo Financiero Inbursa SAB de CV Series O‡ | | | 355,494 | |
| | 34,200 | | | | | Grupo Lala SAB de CV‡ | | | 46,677 | |
| | 108,800 | | | | | Grupo Mexico SAB de CV Series B | | | 366,967 | |
| | 76,700 | | | | | Grupo Sanborns SAB de CV | | | 83,682 | |
| | 21,100 | | | | | Grupo Televisa SAB, ADR | | | 336,756 | |
| | 57,100 | | | | | Industrias Bachoco SAB de CV | | | 294,361 | |
| | 3,815 | | | | | Industrias Penoles SAB de CV | | | 78,050 | |
| | 455,600 | | | | | Mexichem SAB de CV | | | 1,401,576 | |
| | 220,500 | | | | | Minera Frisco SAB de CV* ‡ | | | 129,795 | |
| | 247,700 | | | | | Nemak SAB de CV | | | 204,308 | |
| | 32,023 | | | | | OHL Mexico SAB de CV | | | 60,324 | |
| | 58,545 | | | | | Promotora y Operadora de Infraestructura SAB de CV | | | 582,194 | |
| | 22,100 | | | | | Vitro SAB de CV Series A | | | 72,755 | |
| | 1,930,600 | | | | | Wal-Mart de Mexico SAB de CV | | | 4,891,748 | |
| | | | | | | | | | |
| | | | | | Total Mexico | | | 30,631,493 | |
| | | | | | | | | | |
| | |
| | | | | | Netherlands — 0.8% | |
| | | |
| | 45,674 | | | | | Heineken Holding NV | | | 4,707,329 | |
| | 117,569 | | | | | Yandex NV Class A* | | | 4,638,097 | |
| | | | | | | | | | |
| | | | | | Total Netherlands | | | 9,345,426 | |
| | | | | | | | | | |
| | |
| | | | | | Nigeria — 0.2% | |
| | | |
| | 14,424,151 | | | | | Guaranty Trust Bank Plc | | | 1,796,464 | |
| | | | | | | | | | |
| | |
| | | | | | Philippines — 0.6% | |
| | | |
| | 688,400 | | | | | Alliance Global Group, Inc.* | | | 174,667 | |
| | 4,445 | | | | | Ayala Corp. | | | 81,269 | |
| | 9,600 | | | | | Bank of the Philippine Islands | | | 21,625 | |
| | 226,550 | | | | | BDO Unibank, Inc. | | | 605,687 | |
| | 119,600 | | | | | China Banking Corp. | | | 80,805 | |
| | 156,900 | | | | | DMCI Holdings, Inc. | | | 36,676 | |
| | 204,200 | | | | | Emperador, Inc.* | | | 29,152 | |
| | 457,000 | | | | | Energy Development Corp.* | | | 49,003 | |
| | 5,320 | | | | | GT Capital Holdings, Inc. | | | 119,800 | |
| | 449,490 | | | | | International Container Terminal Services, Inc. | | | 863,520 | |
| | 221,620 | | | | | JG Summit Holdings, Inc. | | | 266,907 | |
| | 43,720 | | | | | Jollibee Foods Corp. | | | 251,175 | |
| | 1,801,000 | | | | | Megaworld Corp. | | | 162,347 | |
| | 4,417,800 | | | | | Metro Pacific Investments Corp. | | | 444,733 | |
| | 51,774 | | | | | Metropolitan Bank & Trust Co.¤ | | | 85,472 | |
| | | | | | |
| | See accompanying Notes to the Financial Statements. | | | 135 | |
Mercer Emerging Markets Equity Fund
Schedule of Investments (Continued)
(showing percentage of net assets)
March 31, 2018
| | | | | | | | | | |
| Shares | | | | | Description | | Value ($) | |
| | |
| | | | | | Philippines — continued | |
| | | |
| | 548,200 | | | | | Petron Corp. | | | 97,288 | |
| | 46,140 | | | | | Philippine National Bank* | | | 47,781 | |
| | 31,520 | | | | | Pilipinas Shell Petroleum Corp. | | | 32,937 | |
| | 29,100 | | | | | Rizal Commercial Banking Corp. | | | 25,439 | |
| | 38,420 | | | | | Robinsons Retail Holdings, Inc. | | | 65,968 | |
| | 30,470 | | | | | San Miguel Corp. | | | 78,506 | |
| | 1,950 | | | | | San Miguel Pure Foods Co., Inc. | | | 22,553 | |
| | 73,070 | | | | | Security Bank Corp. | | | 337,771 | |
| | 28,195 | | | | | SM Investments Corp. | | | 498,743 | |
| | 4,270 | | | | | Top Frontier Investment Holdings, Inc.* | | | 22,632 | |
| | 28,020 | | | | | Union Bank of the Philippines | | | 48,345 | |
| | 792,820 | | | | | Universal Robina Corp. | | | 2,314,784 | |
| | 912,600 | | | | | Vista Land & Lifescapes, Inc. | | | 114,037 | |
| | | | | | | | | | |
| | | | | | Total Philippines | | | 6,979,622 | |
| | | | | | | | | | |
| | |
| | | | | | Poland — 0.7% | |
| | | |
| | 24,799 | | | | | Alior Bank SA* | | | 533,407 | |
| | 22,601 | | | | | Asseco Poland SA | | | 297,893 | |
| | 29,838 | | | | | Bank Millennium SA* | | | 71,833 | |
| | 11,237 | | | | | CCC SA | | | 766,237 | |
| | 52,028 | | | | | Cyfrowy Polsat SA | | | 379,192 | |
| | 67,330 | | | | | Enea SA | | | 181,431 | |
| | 9,123 | | | | | Grupa Azoty SA | | | 149,193 | |
| | 17,742 | | | | | Grupa Lotos SA | | | 273,932 | |
| | 63,442 | | | | | Jastrzebska Spolka Weglowa SA* | | | 1,503,990 | |
| | 13,561 | | | | | KGHM Polska Miedz SA | | | 345,292 | |
| | 35 | | | | | LPP SA | | | 89,373 | |
| | 380 | | | | | mBank SA* | | | 46,528 | |
| | 265,644 | | | | | PGE Polska Grupa Energetyczna SA* | | | 771,810 | |
| | 52,746 | | | | | Polski Koncern Naftowy ORLEN SA | | | 1,297,945 | |
| | 74,099 | | | | | Powszechna Kasa Oszczednosci Bank Polski SA* | | | 876,147 | |
| | 598,169 | | | | | Tauron Polska Energia SA* | | | 424,911 | |
| | | | | | | | | | |
| | | | | | Total Poland | | | 8,009,114 | |
| | | | | | | | | | |
| | |
| | | | | | Qatar — 0.1% | |
| | | |
| | 19,623 | | | | | Qatar National Bank QPSC | | | 701,622 | |
| | | | | | | | | | |
| | |
| | | | | | Russia — 1.5% | |
| | | |
| | 251,215 | | | | | Gazprom PJSC, ADR | | | 1,225,291 | |
| | 688,753 | | | | | Gazprom PJSC (OTC Exchange), ADR‡ | | | 3,395,552 | |
| | 19,346 | | | | | LUKOIL PJSC, ADR | | | 1,339,130 | |
| | 22,392 | | | | | LUKOIL PJSC (Euroclear Shares), ADR | | | 1,544,776 | |
| | 6,698 | | | | | Magnitogorsk Iron & Steel Works PJSC, GDR | | | 66,578 | |
| | 64,974 | | | | | MMC Norilsk Nickel PJSC, ADR‡ | | | 1,215,014 | |
| | 15,748 | | | | | MMC Norilsk Nickel PJSC, (London Exchange), ADR | | | 292,259 | |
| | 55,129 | | | | | Mobile Telesystems PJSC, ADR | | | 627,919 | |
| | 4,578 | | | | | Novatek PJSC, Reg S, GDR‡‡‡ | | | 627,994 | |
| | 53,782 | | | | | Novolipetsk Steel PJSC, GDR | | | 1,341,660 | |
| | 23,890 | | | | | Rosneft Oil Co. PJSC, Reg S, GDR‡‡‡ | | | 130,965 | |
| | | | | | |
| 136 | | See accompanying Notes to the Financial Statements. | | | | |
Mercer Emerging Markets Equity Fund
Schedule of Investments (Continued)
(showing percentage of net assets)
March 31, 2018
| | | | | | | | | | |
| Shares | | | | | Description | | Value ($) | |
| | |
| | | | | | Russia — continued | |
| | | |
| | 59,509 | | | | | Rosneft Oil Co. PJSC, Reg S, (London Exchange), GDR‡‡‡ | | | 326,813 | |
| | 15,201 | | | | | Sberbank of Russia PJSC, ADR | | | 283,499 | |
| | 126,619 | | | | | Severstal PJSC, Reg S, GDR‡‡‡ | | | 1,913,038 | |
| | 88,066 | | | | | Surgutneftegas OJSC, ADR | | | 430,997 | |
| | 12,860 | | | | | Tatneft PJSC, (London Exchange), ADR | | | 812,810 | |
| | 303,080 | | | | | VTB Bank PJSC, Reg S, GDR‡‡‡ | | | 593,431 | |
| | | | | | | | | | |
| | | | | | Total Russia | | | 16,167,726 | |
| | | | | | | | | | |
| | |
| | | | | | Singapore — 0.3% | |
| | | |
| | 392,000 | | | | | Singapore Telecommunications, Ltd. | | | 1,010,400 | |
| | 75,380 | | | | | United Overseas Bank, Ltd. | | | 1,589,361 | |
| | 946,400 | | | | | Yanlord Land Group, Ltd. | | | 1,226,462 | |
| | | | | | | | | | |
| | | | | | Total Singapore | | | 3,826,223 | |
| | | | | | | | | | |
| | |
| | | | | | South Africa — 6.9% | |
| | | |
| | 38,082 | | | | | AECI, Ltd. | | | 371,733 | |
| | 68,062 | | | | | African Rainbow Minerals, Ltd. | | | 583,145 | |
| | 1,461 | | | | | Anglo American Platinum, Ltd. | | | 39,969 | |
| | 92,622 | | | | | AngloGold Ashanti, Ltd. | | | 875,963 | |
| | 10,624 | | | | | Aspen Pharmacare Holdings, Ltd. | | | 232,927 | |
| | 82,552 | | | | | AVI, Ltd. | | | 771,625 | |
| | 83,848 | | | | | Barclays Africa Group, Ltd. | | | 1,345,038 | |
| | 117,879 | | | | | Barloworld, Ltd. | | | 1,655,117 | |
| | 163,645 | | | | | Bid Corp., Ltd. | | | 3,562,034 | |
| | 282,183 | | | | | Bidvest Group, Ltd. (The) | | | 5,346,873 | |
| | 47,260 | | | | | Capitec Bank Holdings, Ltd. | | | 3,478,265 | |
| | 106,269 | | | | | Coronation Fund Managers, Ltd. | | | 724,046 | |
| | 9,617 | | | | | Discovery, Ltd. | | | 138,500 | |
| | 3,329 | | | | | Distell Group, Ltd. | | | 38,496 | |
| | 329,812 | | | | | Exxaro Resources, Ltd. | | | 3,036,364 | |
| | 791,646 | | | | | FirstRand, Ltd.‡ | | | 4,476,500 | |
| | 22,695 | | | | | Foschini Group, Ltd. (The) | | | 429,229 | |
| | 43,509 | | | | | Gold Fields, Ltd. | | | 175,359 | |
| | 133,800 | | | | | Gold Fields, Ltd., ADR‡ | | | 537,876 | |
| | 250,718 | | | | | Growthpoint Properties, Ltd. REIT | | | 604,714 | |
| | 69,679 | | | | | Imperial Holdings, Ltd.‡ | | | 1,375,654 | |
| | 27,464 | | | | | Investec, Ltd. | | | 214,041 | |
| | 46,715 | | | | | Italtile, Ltd. | | | 58,533 | |
| | 172,297 | | | | | KAP Industrial Holdings, Ltd. | | | 125,681 | |
| | 1,689 | | | | | Kumba Iron Ore, Ltd.‡ | | | 40,499 | |
| | 38,874 | | | | | Liberty Holdings, Ltd. | | | 412,083 | |
| | 72,170 | | | | | Life Healthcare Group Holdings, Ltd. | | | 169,221 | |
| | 502,322 | | | | | MMI Holdings, Ltd. | | | 932,881 | |
| | 3,232 | | | | | Mondi, Ltd. | | | 88,094 | |
| | 93,573 | | | | | Mr Price Group, Ltd. | | | 2,253,844 | |
| | 63,978 | | | | | MTN Group, Ltd.‡ | | | 647,642 | |
| | 50,712 | | | | | Naspers, Ltd. Class N | | | 12,411,758 | |
| | 19,631 | | | | | Nedbank Group, Ltd. | | | 473,919 | |
| | 60,585 | | | | | Pick n Pay Stores, Ltd. | | | 353,148 | |
| | | | | | |
| | See accompanying Notes to the Financial Statements. | | | 137 | |
Mercer Emerging Markets Equity Fund
Schedule of Investments (Continued)
(showing percentage of net assets)
March 31, 2018
| | | | | | | | | | |
| Shares | | | | | Description | | Value ($) | |
| | |
| | | | | | South Africa — continued | |
| | | |
| | 12,375 | | | | | Pioneer Foods Group, Ltd. | | | 129,608 | |
| | 470,452 | | | | | PPC, Ltd.* | | | 312,579 | |
| | 467,772 | | | | | Redefine Properties, Ltd. | | | 457,887 | |
| | 191,119 | | | | | Remgro, Ltd. | | | 3,585,615 | |
| | 58,970 | | | | | Reunert, Ltd. | | | 370,857 | |
| | 39,355 | | | | | RMB Holdings, Ltd. | | | 256,776 | |
| | 38,975 | | | | | Sanlam, Ltd. | | | 281,048 | |
| | 213,327 | | | | | Sappi, Ltd. | | | 1,372,853 | |
| | 8,300 | | | | | Sasol, Ltd., ADR | | | 282,449 | |
| | 40,499 | | | | | Sasol, Ltd. | | | 1,379,311 | |
| | 58,331 | | | | | Shoprite Holdings, Ltd. | | | 1,244,826 | |
| | 546,502 | | | | | Sibanye Gold, Ltd. | | | 540,970 | |
| | 7,077 | | | | | Spar Group, Ltd. (The) | | | 120,947 | |
| | 352,282 | | | | | Standard Bank Group, Ltd. | | | 6,510,224 | |
| | 226,858 | | | | | Super Group, Ltd.* | | | 690,550 | |
| | 126,779 | | | | | Telkom SA SOC, Ltd. | | | 568,611 | |
| | 332,700 | | | | | Tiger Brands, Ltd. | | | 10,443,558 | |
| | 34,879 | | | | | Tongaat Hulett, Ltd. | | | 300,335 | |
| | 11,228 | | | | | Truworths International, Ltd.‡ | | | 102,799 | |
| | 41,502 | | | | | Tsogo Sun Holdings, Ltd. | | | 81,699 | |
| | 75,045 | | | | | Woolworths Holdings, Ltd. | | | 380,438 | |
| | | | | | | | | | |
| | | | | | Total South Africa | | | 77,394,711 | |
| | | | | | | | | | |
| | |
| | | | | | South Korea — 11.5% | |
| | | |
| | 1,572 | | | | | AMOREPACIFIC Group | | | 209,423 | |
| | 11,613 | | | | | Asiana Airlines, Inc.* | | | 51,915 | |
| | 592 | | | | | Binggrae Co., Ltd. | | | 33,824 | |
| | 52,650 | | | | | BNK Financial Group, Inc. | | | 513,707 | |
| | 7,408 | | | | | Celltrion, Inc.* ‡ | | | 2,151,024 | |
| | 434 | | | | | CJ CheilJedang Corp. | | | 130,904 | |
| | 826 | | | | | CJ Corp. | | | 123,214 | |
| | 7,439 | | | | | CJ Hello Co., Ltd. | | | 58,554 | |
| | 448 | | | | | CJ Logistics Corp.* | | | 57,792 | |
| | 326 | | | | | CJ O Shopping Co., Ltd. | | | 68,326 | |
| | 2,932 | | | | | Daekyo Co., Ltd. | | | 21,896 | |
| | 6,283 | | | | | Daelim Industrial Co., Ltd. | | | 438,554 | |
| | 3,287 | | | | | Daesang Corp. | | | 79,716 | |
| | 9,213 | | | | | Daewoo Shipbuilding & Marine Engineering Co., Ltd.* | | | 238,558 | |
| | 3,137 | | | | | Daou Technology, Inc. | | | 64,600 | |
| | 2,778 | | | | | DB Insurance Co., Ltd. | | | 169,406 | |
| | 33,701 | | | | | DGB Financial Group, Inc. | | | 368,343 | |
| | 18,298 | | | | | Dongkuk Steel Mill Co., Ltd. | | | 173,384 | |
| | 148 | | | | | Dongwon Industries Co., Ltd. | | | 42,627 | |
| | 3,027 | | | | | Doosan Bobcat, Inc. | | | 89,171 | |
| | 1,340 | | | | | Doosan Corp. | | | 133,887 | |
| | 12,049 | | | | | Doosan Heavy Industries & Construction Co., Ltd.* | | | 179,735 | |
| | 31,394 | | | | | Doosan Infracore Co., Ltd.* | | | 284,811 | |
| | 25,217 | | | | | Douzone Bizon Co., Ltd. | | | 1,369,795 | |
| | 588 | | | | | E-MART, Inc. | | | 150,875 | |
| | | | | | |
| 138 | | See accompanying Notes to the Financial Statements. | | | | |
Mercer Emerging Markets Equity Fund
Schedule of Investments (Continued)
(showing percentage of net assets)
March 31, 2018
| | | | | | | | | | |
| Shares | | | | | Description | | Value ($) | |
| | |
| | | | | | South Korea — continued | |
| | | |
| | 1,058 | | | | | Fila Korea, Ltd. | | | 107,696 | |
| | 5,050 | | | | | GS Holdings Corp. | | | 294,216 | |
| | 363 | | | | | GS Home Shopping, Inc. | | | 64,195 | |
| | 1,535 | | | | | GS Retail Co., Ltd. | | | 47,019 | |
| | 60,464 | | | | | Hana Financial Group, Inc. | | | 2,595,204 | |
| | 4,511 | | | | | Handsome Co., Ltd. | | | 140,506 | |
| | 981 | | | | | Hanil Cement Co., Ltd. | | | 102,159 | |
| | 4,965 | | | | | Hanjin Kal Corp. | | | 97,353 | |
| | 2,099 | | | | | Hankook Tire Co., Ltd. | | | 105,551 | |
| | 23,695 | | | | | Hanwha Chemical Corp. | | | 662,455 | |
| | 24,187 | | | | | Hanwha Corp. | | | 888,377 | |
| | 16,935 | | | | | Hanwha General Insurance Co., Ltd. | | | 136,637 | |
| | 133,627 | | | | | Hanwha Life Insurance Co., Ltd. | | | 776,012 | |
| | 11,891 | | | | | Hanwha Techwin Co., Ltd.* | | | 330,213 | |
| | 1,792 | | | | | Hite Jinro Co., Ltd. | | | 37,743 | |
| | 6,567 | | | | | Hotel Shilla Co., Ltd. | | | 590,839 | |
| | 1,223 | | | | | Hyosung Corp. | | | 140,555 | |
| | 3,212 | | | | | Hyundai Department Store Co., Ltd. | | | 279,042 | |
| | 8,749 | | | | | Hyundai Development Co-Engineering & Construction | | | 315,601 | |
| | 17,788 | | | | | Hyundai Engineering & Construction Co., Ltd. | | | 729,276 | |
| | 1,000 | | | | | Hyundai Glovis Co., Ltd. | | | 158,551 | |
| | 6,602 | | | | | Hyundai Greenfood Co., Ltd. | | | 86,714 | |
| | 3,154 | | | | | Hyundai Heavy Industries Co., Ltd.* | | | 390,588 | |
| | 1,942 | | | | | Hyundai Home Shopping Network Corp. | | | 194,036 | |
| | 28,779 | | | | | Hyundai Marine & Fire Insurance Co., Ltd. | | | 1,050,289 | |
| | 2,598 | | | | | Hyundai Mipo Dockyard Co., Ltd.* | | | 243,738 | |
| | 6,387 | | | | | Hyundai Mobis Co., Ltd. | | | 1,435,113 | |
| | 14,471 | | | | | Hyundai Motor Co. | | | 1,948,202 | |
| | 955 | | | | | Hyundai Robotics Co., Ltd.* | | | 391,085 | |
| | 4,362 | | | | | Hyundai Rotem Co., Ltd.* | | | 64,659 | |
| | 8,145 | | | | | Hyundai Steel Co. | | | 389,713 | |
| | 3,661 | | | | | Hyundai Wia Corp. | | | 189,936 | |
| | 39,259 | | | | | HyVision System, Inc. | | | 688,754 | |
| | 23,114 | | | | | Industrial Bank of Korea | | | 332,864 | |
| | 13,699 | | | | | Innocean Worldwide, Inc. | | | 818,676 | |
| | 1,889 | | | | | IS Dongseo Co., Ltd. | | | 54,939 | |
| | 34,939 | | | | | JB Financial Group Co., Ltd. | | | 202,901 | |
| | 83,732 | | | | | Jusung Engineering Co., Ltd. | | | 844,468 | |
| | 39,649 | | | | | KB Financial Group, Inc. | | | 2,257,899 | |
| | 1,323 | | | | | KCC Corp. | | | 428,836 | |
| | 26,900 | | | | | Kia Motors Corp. | | | 782,344 | |
| | 2,041 | | | | | KISWIRE, Ltd. | | | 58,689 | |
| | 12,178 | | | | | KIWOOM Securities Co., Ltd. | | | 1,239,622 | |
| | 11,772 | | | | | Koh Young Technology, Inc. | | | 1,102,210 | |
| | 666 | | | | | Kolon Corp. | | | 31,366 | |
| | 1,998 | | | | | Kolon Industries, Inc. | | | 126,339 | |
| | 5,105 | | | | | Korea Asset In Trust Co., Ltd. | | | 29,263 | |
| | 29,789 | | | | | Korea Electric Power Corp. | | | 918,068 | |
| | 787 | | | | | Korea Electric Terminal Co., Ltd. | | | 39,575 | |
| | | | | | |
| | See accompanying Notes to the Financial Statements. | | | 139 | |
Mercer Emerging Markets Equity Fund
Schedule of Investments (Continued)
(showing percentage of net assets)
March 31, 2018
| | | | | | | | | | |
| Shares | | | | | Description | | Value ($) | |
| | |
| | | | | | South Korea — continued | |
| | | |
| | 10,124 | | | | | Korea Investment Holdings Co., Ltd. | | | 785,491 | |
| | 1,259 | | | | | Korea Line Corp.* | | | 31,950 | |
| | 4,525 | | | | | Korea Petrochemical Ind Co., Ltd. | | | 1,265,081 | |
| | 4,211 | | | | | Korea Zinc Co., Ltd. | | | 1,892,362 | |
| | 2,808 | | | | | Korean Air Lines Co., Ltd. | | | 89,042 | |
| | 30,323 | | | | | Korean Reinsurance Co. | | | 322,888 | |
| | 2,427 | | | | | KT Skylife Co., Ltd. | | | 27,779 | |
| | 5,155 | | | | | KT&G Corp. | | | 483,629 | |
| | 14,281 | | | | | Kumho Tire Co., Inc.* | | | 61,832 | |
| | 6,868 | | | | | Kwangju Bank Co., Ltd. | | | 73,455 | |
| | 6,138 | | | | | LF Corp. | | | 160,375 | |
| | 9,060 | | | | | LG Chem, Ltd. | | | 3,276,696 | |
| | 111,519 | | | | | LG Corp. | | | 9,008,149 | |
| | 24,582 | | | | | LG Display Co., Ltd. | | | 603,077 | |
| | 19,074 | | | | | LG Electronics, Inc. | | | 1,959,474 | |
| | 2,064 | | | | | LG Hausys, Ltd. | | | 151,619 | |
| | 1,366 | | | | | LG Household & Health Care, Ltd. | | | 1,548,108 | |
| | 9,621 | | | | | LG International Corp. | | | 246,415 | |
| | 12,131 | | | | | LG Uplus Corp. | | | 139,417 | |
| | 480 | | | | | LIG Nex1 Co., Ltd. | | | 21,683 | |
| | 9,189 | | | | | Loen Entertainment, Inc. | | | 946,573 | |
| | 2,470 | | | | | Lotte Chemical Corp. | | | 1,003,387 | |
| | 14,995 | | | | | LOTTE Himart Co., Ltd. | | | 1,012,890 | |
| | 2,591 | | | | | Lotte Shopping Co., Ltd. | | | 570,025 | |
| | 1,011 | | | | | LS Corp. | | | 70,663 | |
| | 119 | | | | | Mando Corp. | | | 25,901 | |
| | 472 | | | | | Medy-Tox, Inc. | | | 324,187 | |
| | 2,483 | | | | | Meritz Financial Group, Inc. | | | 34,476 | |
| | 2,886 | | | | | Meritz Fire & Marine Insurance Co., Ltd. | | | 56,994 | |
| | 22,519 | | | | | Meritz Securities Co., Ltd. | | | 90,317 | |
| | 34,622 | | | | | Modetour Network, Inc. | | | 1,278,146 | |
| | 2,471 | | | | | Namhae Chemical Corp. | | | 32,919 | |
| | 2,112 | | | | | NCSoft Corp. | | | 832,198 | |
| | 4,702 | | | | | Nexen Tire Corp. | | | 55,362 | |
| | 23,719 | | | | | NH Investment & Securities Co., Ltd. | | | 314,874 | |
| | 168 | | | | | Nong Shim Co., Ltd. | | | 48,230 | |
| | 8,510 | | | | | OCI Co., Ltd. | | | 1,253,467 | |
| | 10,929 | | | | | Orion Corp. Republic of Korea | | | 1,312,423 | |
| | 12,140 | | | | | Pan Ocean Co., Ltd.* | | | 59,225 | |
| | 3,347 | | | | | Poongsan Corp. | | | 123,248 | |
| | 11,048 | | | | | POSCO | | | 3,373,791 | |
| | 11,949 | | | | | Posco Daewoo Corp. | | | 256,715 | |
| | 1,326 | | | | | S&T Motiv Co., Ltd. | | | 48,517 | |
| | 1,097 | | | | | Samsung C&T Corp. | | | 144,085 | |
| | 6,619 | | | | | Samsung Card Co., Ltd. | | | 222,620 | |
| | 14,672 | | | | | Samsung Electronics Co., Ltd. | | | 33,875,403 | |
| | 914 | | | | | Samsung Fire & Marine Insurance Co., Ltd. | | | 231,951 | |
| | 59,905 | | | | | Samsung Heavy Industries Co., Ltd.* ‡ | | | 433,874 | |
| | 6,736 | | | | | Samsung Life Insurance Co., Ltd. | | | 733,067 | |
| | | | | | |
| 140 | | See accompanying Notes to the Financial Statements. | | | | |
Mercer Emerging Markets Equity Fund
Schedule of Investments (Continued)
(showing percentage of net assets)
March 31, 2018
| | | | | | | | | | |
| Shares | | | | | Description | | Value ($) | |
| | |
| | | | | | South Korea — continued | |
| | | |
| | 8,380 | | | | | Samsung SDS Co., Ltd. | | | 2,008,716 | |
| | 13,625 | | | | | Samsung Securities Co., Ltd. | | | 502,996 | |
| | 1,020 | | | | | Samyang Corp. | | | 82,392 | |
| | 1,103 | | | | | Samyang Holdings Corp. | | | 101,411 | |
| | 4,072 | | | | | Seah Besteel Corp. | | | 98,562 | |
| | 27,178 | | | | | Seegene, Inc.* | | | 888,595 | |
| | 132,598 | | | | | Shinhan Financial Group Co., Ltd. | | | 5,685,082 | |
| | 292 | | | | | Shinsegae International, Inc. | | | 26,326 | |
| | 899 | | | | | Shinsegae, Inc. | | | 301,522 | |
| | 19,665 | | | | | Silicon Works Co., Ltd. | | | 688,155 | |
| | 3,171 | | | | | SillaJen, Inc.* | | | 318,320 | |
| | 1,679 | | | | | Sindoh Co., Ltd. | | | 104,908 | |
| | 1,174 | | | | | SK Gas, Ltd. | | | 105,736 | |
| | 921 | | | | | SK Holdings Co., Ltd. | | | 255,761 | |
| | 102,895 | | | | | SK Hynix, Inc. | | | 7,848,169 | |
| | 1,750 | | | | | SK Innovation Co., Ltd. | | | 346,421 | |
| | 45,410 | | | | | SK Networks Co., Ltd. | | | 246,242 | |
| | 14,117 | | | | | SK Telecom Co., Ltd. | | | 3,092,522 | |
| | 2,399 | | | | | SKC Co., Ltd. | | | 86,089 | |
| | 3,982 | | | | | SL Corp. | | | 77,518 | |
| | 1,626 | | | | | Ssangyong Cement Industrial Co., Ltd. | | | 36,459 | |
| | 4,627 | | | | | Ssangyong Motor Co.* | | | 21,553 | |
| | 127 | | | | | Taekwang Industrial Co., Ltd. | | | 149,769 | |
| | 12,906 | | | | | Taeyoung Engineering & Construction Co., Ltd. | | | 130,767 | |
| | 14,048 | | | | | Tongyang Life Insurance Co., Ltd. | | | 98,055 | |
| | 25,528 | | | | | Value Added Technology Co., Ltd. | | | 952,001 | |
| | 5,297 | | | | | Wonik Holdings Co., Ltd.* | | | 36,526 | |
| | 60,318 | | | | | Woori Bank | | | 829,026 | |
| | 86 | | | | | Young Poong Corp. | | | 73,986 | |
| | 2,426 | | | | | Youngone Corp. | | | 63,842 | |
| | 1,790 | | | | | Youngone Holdings Co., Ltd. | | | 92,363 | |
| | 10,268 | | | | | Yuanta Securities Korea Co., Ltd.* | | | 43,108 | |
| | | | | | | | | | |
| | | | | | Total South Korea | | | 128,451,075 | |
| | | | | | | | | | |
| | |
| | | | | | Spain — 0.0% | |
| | | |
| | 16,331 | | | | | CEMEX Latam Holdings SA* | | | 52,296 | |
| | | | | | | | | | |
| | |
| | | | | | Switzerland — 0.1% | |
| | | |
| | 14,791 | | | | | Nestle SA | | | 1,168,994 | |
| | | | | | | | | | |
| | |
| | | | | | Taiwan — 9.7% | |
| | | |
| | 21,000 | | | | | A-DATA Technology Co., Ltd. | | | 54,378 | |
| | 518,000 | | | | | Advanced Semiconductor Engineering, Inc. | | | 745,845 | |
| | 39,000 | | | | | Ardentec Corp. | | | 51,029 | |
| | 502,000 | | | | | Asia Cement Corp. | | | 488,106 | |
| | 412,000 | | | | | Asustek Computer, Inc. | | | 3,878,794 | |
| | 1,092,000 | | | | | AU Optronics Corp. | | | 510,822 | |
| | 502,000 | | | | | Capital Securities Corp. | | | 194,554 | |
| | 29,000 | | | | | Career Technology MFG. Co., Ltd. | | | 42,570 | |
| | | | | | |
| | See accompanying Notes to the Financial Statements. | | | 141 | |
Mercer Emerging Markets Equity Fund
Schedule of Investments (Continued)
(showing percentage of net assets)
March 31, 2018
| | | | | | | | | | |
| Shares | | | | | Description | | Value ($) | |
| | |
| | | | | | Taiwan — continued | |
| | | |
| | 200,000 | | | | | Catcher Technology Co., Ltd. | | | 2,441,335 | |
| | 862,000 | | | | | Cathay Financial Holding Co., Ltd. | | | 1,537,092 | |
| | 158,000 | | | | | Cathay Real Estate Development Co., Ltd. | | | 84,265 | |
| | 22,000 | | | | | Center Laboratories, Inc.* | | | 45,423 | |
| | 412,000 | | | | | Chang Hwa Commercial Bank, Ltd. | | | 240,217 | |
| | 206,000 | | | | | Cheng Loong Corp. | | | 115,516 | |
| | 53,000 | | | | | Cheng Shin Rubber Industry Co., Ltd. | | | 85,525 | |
| | 118,000 | | | | | Cheng Uei Precision Industry Co., Ltd. | | | 165,929 | |
| | 22,000 | | | | | Chicony Electronics Co., Ltd. | | | 56,666 | |
| | 103,000 | | | | | Chin-Poon Industrial Co., Ltd. | | | 181,929 | |
| | 2,853,000 | | | | | China Airlines, Ltd.* | | | 1,053,930 | |
| | 3,874,000 | | | | | China Development Financial Holding Corp. | | | 1,372,597 | |
| | 1,120,399 | | | | | China General Plastics Corp. | | | 1,210,432 | |
| | 433,000 | | | | | China Life Insurance Co., Ltd. | | | 445,850 | |
| | 1,140,000 | | | | | China Steel Corp. | | | 918,819 | |
| | 48,000 | | | | | China Synthetic Rubber Corp. | | | 79,514 | |
| | 31,000 | | | | | Chipbond Technology Corp. | | | 71,554 | |
| | 67,000 | | | | | ChipMOS TECHNOLOGIES, Inc. | | | 54,805 | |
| | 90,000 | | | | | Chung Hung Steel Corp.* | | | 35,806 | |
| | 117,000 | | | | | Chung Hwa Pulp Corp. | | | 45,745 | |
| | 1,101,000 | | | | | Compal Electronics, Inc. | | | 748,776 | |
| | 53,000 | | | | | Compeq Manufacturing Co., Ltd. | | | 53,623 | |
| | 120,000 | | | | | Coretronic Corp. | | | 177,384 | |
| | 2,794,120 | | | | | CTBC Financial Holding Co., Ltd. | | | 2,031,599 | |
| | 59,000 | | | | | CTCI Corp. | | | 96,118 | |
| | 35,000 | | | | | Darwin Precisions Corp. | | | 30,730 | |
| | 275,000 | | | | | Delta Electronics, Inc. | | | 1,226,121 | |
| | 31,000 | | | | | Depo Auto Parts Ind Co., Ltd. | | | 89,841 | |
| | 738,000 | | | | | E Ink Holdings, Inc. | | | 1,265,562 | |
| | 781,643 | | | | | E.Sun Financial Holding Co., Ltd. | | | 523,715 | |
| | 187,800 | | | | | Elite Advanced Laser Corp. | | | 721,391 | |
| | 77,000 | | | | | EnTie Commercial Bank Co., Ltd. | | | 36,048 | |
| | 208,000 | | | | | Epistar Corp.* | | | 308,893 | |
| | 82,000 | | | | | Eternal Materials Co., Ltd. | | | 82,965 | |
| | 899,000 | | | | | Eva Airways Corp. | | | 461,815 | |
| | 147,000 | | | | | Evergreen International Storage & Transport Corp. | | | 66,298 | |
| | 600,000 | | | | | Evergreen Marine Corp. Taiwan, Ltd.* | | | 311,018 | |
| | 116,000 | | | | | Everlight Electronics Co., Ltd. | | | 178,633 | |
| | 304,000 | | | | | Far Eastern Department Stores, Ltd. | | | 169,428 | |
| | 617,000 | | | | | Far Eastern International Bank | | | 207,592 | |
| | 304,000 | | | | | Far Eastern New Century Corp. | | | 276,297 | |
| | 47,000 | | | | | Feng Hsin Iron & Steel Co. | | | 96,073 | |
| | 31,720 | | | | | Feng TAY Enterprise Co., Ltd. | | | 141,971 | |
| | 2,621,021 | | | | | First Financial Holding Co., Ltd. | | | 1,823,464 | |
| | 31,000 | | | | | FLEXium Interconnect, Inc. | | | 106,321 | |
| | 48,000 | | | | | Formosa Advanced Technologies Co., Ltd. | | | 54,738 | |
| | 430,000 | | | | | Formosa Chemicals & Fibre Corp. | | | 1,600,130 | |
| | 175,000 | | | | | Formosa Petrochemical Corp. | | | 711,236 | |
| | 115,000 | | | | | Formosa Plastics Corp. | | | 408,221 | |
| | | | | | |
| 142 | | See accompanying Notes to the Financial Statements. | | | | |
Mercer Emerging Markets Equity Fund
Schedule of Investments (Continued)
(showing percentage of net assets)
March 31, 2018
| | | | | | | | | | |
| Shares | | | | | Description | | Value ($) | |
| | |
| | | | | | Taiwan — continued | |
| | | |
| | 847,997 | | | | | Fubon Financial Holding Co., Ltd. | | | 1,457,974 | |
| | 38,000 | | | | | Getac Technology Corp. | | | 55,390 | |
| | 624,000 | | | | | Giant Manufacturing Co., Ltd. | | | 3,295,812 | |
| | 28,000 | | | | | Gigabyte Technology Co., Ltd. | | | 63,477 | |
| | 245,000 | | | | | Grand Pacific Petrochemical | | | 257,545 | |
| | 138,000 | | | | | Grape King Bio, Ltd. | | | 1,190,349 | |
| | 51,000 | | | | | Great Wall Enterprise Co., Ltd. | | | 59,996 | |
| | 28,000 | | | | | Greatek Electronics, Inc. | | | 53,586 | |
| | 801,000 | | | | | HannStar Display Corp. | | | 278,840 | |
| | 44,000 | | | | | Highwealth Construction Corp. | | | 67,908 | |
| | 63,000 | | | | | Hiwin Technologies Corp. | | | 916,144 | |
| | 529,164 | | | | | Hon Hai Precision Industry Co., Ltd. | | | 1,649,532 | |
| | 784,897 | | | | | Hua Nan Financial Holdings Co., Ltd. | | | 473,786 | |
| | 73,000 | | | | | Huaku Development Co., Ltd. | | | 180,516 | |
| | 48,000 | | | | | Hung Sheng Construction, Ltd. | | | 51,610 | |
| | 20,000 | | | | | IEI Integration Corp. | | | 25,997 | |
| | 867,000 | | | | | Innolux Corp. | | | 391,023 | |
| | 1,162,000 | | | | | Inventec Corp. | | | 918,616 | |
| | 54,000 | | | | | Kenda Rubber Industrial Co., Ltd. | | | 67,785 | |
| | 19,000 | | | | | Kerry TJ Logistics Co., Ltd. | | | 24,697 | |
| | 926,000 | | | | | King Yuan Electronics Co., Ltd. | | | 960,713 | |
| | 157,000 | | | | | King’s Town Bank Co., Ltd. | | | 198,963 | |
| | 338,000 | | | | | Kinpo Electronics | | | 119,402 | |
| | 81,000 | | | | | Kinsus Interconnect Technology Corp. | | | 156,127 | |
| | 5,000 | | | | | Largan Precision Co., Ltd. | | | 574,476 | |
| | 27,000 | | | | | LCY Chemical Corp. | | | 41,162 | |
| | 803,312 | | | | | Lite-On Technology Corp. | | | 1,129,741 | |
| | 186,000 | | | | | Long Chen Paper Co., Ltd. | | | 206,369 | |
| | 14,000 | | | | | Lung Yen Life Service Corp. | | | 30,490 | |
| | 121,000 | | | | | MediaTek, Inc. | | | 1,412,371 | |
| | 1,378,000 | | | | | Mega Financial Holding Co., Ltd. | | | 1,187,728 | |
| | 106,000 | | | | | Mercuries & Associates Holding, Ltd. | | | 91,614 | |
| | 234,000 | | | | | Mercuries Life Insurance Co., Ltd.* | | | 124,396 | |
| | 459,000 | | | | | Micro-Star International Co., Ltd. | | | 1,502,281 | |
| | 47,000 | | | | | Nan Kang Rubber Tire Co., Ltd. | | | 41,266 | |
| | 130,000 | | | | | Nan Ya Plastics Corp. | | | 366,053 | |
| | 71,000 | | | | | Nanya Technology Corp. | | | 223,891 | |
| | 15,000 | | | | | Nien Made Enterprise Co., Ltd. | | | 144,305 | |
| | 62,000 | | | | | Novatek Microelectronics Corp. | | | 281,751 | |
| | 317,000 | | | | | O-Bank Co., Ltd. | | | 94,697 | |
| | 53,000 | | | | | Oriental Union Chemical Corp.* | | | 54,714 | |
| | 28,000 | | | | | Pan Jit International, Inc. | | | 47,536 | |
| | 188,000 | | | | | Pegatron Corp. | | | 471,983 | |
| | 109,000 | | | | | Phison Electronics Corp. | | | 1,153,291 | |
| | 774,000 | | | | | Pou Chen Corp. | | | 1,039,366 | |
| | 741,000 | | | | | Powertech Technology, Inc. | | | 2,324,269 | |
| | 267,000 | | | | | Primax Electronics, Ltd. | | | 569,585 | |
| | 324,000 | | | | | Prince Housing & Development Corp. | | | 133,347 | |
| | 333,000 | | | | | Qisda Corp. | | | 248,976 | |
| | | | | | |
| | See accompanying Notes to the Financial Statements. | | | 143 | |
Mercer Emerging Markets Equity Fund
Schedule of Investments (Continued)
(showing percentage of net assets)
March 31, 2018
| | | | | | | | | | |
| Shares | | | | | Description | | Value ($) | |
| | |
| | | | | | Taiwan — continued | |
| | | |
| | 73,000 | | | | | Quanta Computer, Inc. | | | 147,217 | |
| | 43,000 | | | | | Radiant Opto-Electronics Corp. | | | 105,446 | |
| | 288,000 | | | | | Realtek Semiconductor Corp. | | | 1,284,083 | |
| | 31,000 | | | | | Rechi Precision Co., Ltd. | | | 32,375 | |
| | 30,000 | | | | | Ruentex Industries, Ltd.* | | | 58,031 | |
| | 20,000 | | | | | San Fang Chemical Industry Co., Ltd. | | | 22,396 | |
| | 148,000 | | | | | Sanyang Motor Co., Ltd. | | | 108,626 | |
| | 45,000 | | | | | Shihlin Electric & Engineering Corp. | | | 63,510 | |
| | 2,078,000 | | | | | Shin Kong Financial Holding Co., Ltd. | | | 821,815 | |
| | 47,000 | | | | | Shin Zu Shing Co., Ltd. | | | 143,948 | |
| | 340,000 | | | | | Shinkong Synthetic Fibers Corp. | | | 112,296 | |
| | 33,000 | | | | | Sigurd Microelectronics Corp. | | | 41,311 | |
| | 17,000 | | | | | Simplo Technology Co., Ltd. | | | 106,698 | |
| | 29,000 | | | | | Sino-American Silicon Products, Inc.* | | | 106,921 | |
| | 1,216,534 | | | | | SinoPac Financial Holdings Co., Ltd. | | | 433,423 | |
| | 120,000 | | | | | Sunny Friend Environmental Technology Co., Ltd. | | | 944,542 | |
| | 186,000 | | | | | Synnex Technology International Corp. | | | 277,755 | |
| | 61,000 | | | | | TA Chen Stainless Pipe | | | 60,672 | |
| | 593,000 | | | | | Taichung Commercial Bank Co., Ltd. | | | 207,449 | |
| | 1,219,870 | | | | | Taishin Financial Holding Co., Ltd. | | | 597,592 | |
| | 717,000 | | | | | Taiwan Business Bank | | | 214,434 | |
| | 2,064,000 | | | | | Taiwan Cooperative Financial Holding Co., Ltd. | | | 1,217,574 | |
| | 241,000 | | | | | Taiwan Glass Industry Corp.* | | | 145,475 | |
| | 79,000 | | | | | Taiwan Hon Chuan Enterprise Co., Ltd. | | | 151,730 | |
| | 212,000 | | | | | Taiwan Semiconductor Manufacturing Co., Ltd. | | | 1,799,568 | |
| | 599,666 | | | | | Taiwan Semiconductor Manufacturing Co., Ltd., ADR | | | 26,241,384 | |
| | 28,000 | | | | | Taiwan Shin Kong Security Co., Ltd. | | | 37,260 | |
| | 101,000 | | | | | Tatung Co., Ltd.* | | | 77,767 | |
| | 95,000 | | | | | TCI Co., Ltd. | | | 1,360,308 | |
| | 527,000 | | | | | Teco Electric and Machinery Co., Ltd. | | | 445,809 | |
| | 225,000 | | | | | Ton Yi Industrial Corp. | | | 101,091 | |
| | 15,000 | | | | | Tong Hsing Electronic Industries, Ltd. | | | 64,050 | |
| | 37,000 | | | | | Tong Yang Industry Co., Ltd. | | | 66,495 | |
| | 20,000 | | | | | Transcend Information, Inc. | | | 59,334 | |
| | 23,000 | | | | | Tripod Technology Corp. | | | 75,334 | |
| | 243,000 | | | | | Tung Ho Steel Enterprise Corp. | | | 206,271 | |
| | 91,000 | | | | | TXC Corp. | | | 122,969 | |
| | 44,000 | | | | | U-Ming Marine Transport Corp.* | | | 53,044 | |
| | 3,982,015 | | | | | Uni-President Enterprises Corp. | | | 9,358,148 | |
| | 410,000 | | | | | Unimicron Technology Corp. | | | 265,065 | |
| | 199,000 | | | | | Union Bank Of Taiwan | | | 65,043 | |
| | 1,153,000 | | | | | United Microelectronics Corp. | | | 608,986 | |
| | 213,000 | | | | | UPC Technology Corp. | | | 138,435 | |
| | 239,000 | | | | | USI Corp. | | | 119,676 | |
| | 49,000 | | | | | Wah Lee Industrial Corp. | | | 97,640 | |
| | 565,000 | | | | | Walsin Lihwa Corp. | | | 342,988 | |
| | 118,000 | | | | | Wan Hai Lines, Ltd. | | | 72,442 | |
| | 602,000 | | | | | Waterland Financial Holdings Co., Ltd. | | | 210,598 | |
| | 149,000 | | | | | Winbond Electronics Corp. | | | 99,906 | |
| | | | | | |
| 144 | | See accompanying Notes to the Financial Statements. | | | | |
Mercer Emerging Markets Equity Fund
Schedule of Investments (Continued)
(showing percentage of net assets)
March 31, 2018
| | | | | | | | | | |
| Shares | | | | | Description | | Value ($) | |
| | |
| | | | | | Taiwan — continued | |
| | | |
| | 560,000 | | | | | Wistron Corp. | | | 481,119 | |
| | 28,000 | | | | | Wistron NeWeb Corp. | | | 73,368 | |
| | 328,000 | | | | | WPG Holdings, Ltd. | | | 430,854 | |
| | 341,000 | | | | | YFY, Inc.* | | | 151,454 | |
| | 303,000 | | | | | Yieh Phui Enterprise Co., Ltd. | | | 113,793 | |
| | 995,000 | | | | | Yuanta Financial Holding Co., Ltd. | | | 455,577 | |
| | 258,000 | | | | | Yulon Motor Co., Ltd. | | | 199,979 | |
| | 8,000 | | | | | Yung Chi Paint & Varnish Manufacturing Co., Ltd. | | | 22,526 | |
| | 35,000 | | | | | Yungtay Engineering Co., Ltd. | | | 66,742 | |
| | | | | | | | | | |
| | | | | | Total Taiwan | | | 108,116,836 | |
| | | | | | | | | | |
| | | |
| | | | | | Thailand — 2.9% | | | | |
| | | |
| | 1,880,700 | | | | | Airports of Thailand PCL | | | 3,978,810 | |
| | 379,100 | | | | | AP Thailand PCL Class F | | | 95,990 | |
| | 92,100 | | | | | Bangchak Corp. PCL Class F | | | 108,576 | |
| | 3,000 | | | | | Bangkok Bank PCL | | | 20,723 | |
| | 42,900 | | | | | Bangkok Life Assurance PCL, NVDR | | | 43,902 | |
| | 543,100 | | | | | Banpu PCL | | | 345,490 | |
| | 21,900 | | | | | Bumrungrad Hospital PCL, NVDR | | | 149,175 | |
| | 385,100 | | | | | Charoen Pokphand Foods PCL | | | 311,481 | |
| | 2,053,900 | | | | | CP All PCL Class F | | | 5,714,400 | |
| | 338,500 | | | | | Golden Land Property Development PCL | | | 102,297 | |
| | 78,200 | | | | | Hana Microelectronics PCL | | | 80,651 | |
| | 975,100 | | | | | Home Product Center PCL Class N, NVDR | | | 442,802 | |
| | 349,200 | | | | | IRPC PCL Class F | | | 81,521 | |
| | 506,300 | | | | | IRPC PCL, NVDR | | | 119,815 | |
| | 444,000 | | | | | Kasikornbank PCL | | | 3,010,170 | |
| | 461,800 | | | | | Kasikornbank PCL, NVDR | | | 3,130,847 | |
| | 24,100 | | | | | Kiatnakin Bank PCL Class F | | | 55,608 | |
| | 369,600 | | | | | Krung Thai Bank PCL | | | 224,998 | |
| | 1,261,100 | | | | | Krung Thai Bank PCL, NVDR | | | 762,225 | |
| | 142,700 | | | | | Krungthai Card PCL Class F | | | 1,474,242 | |
| | 80,300 | | | | | MBK PCL Class F | | | 57,702 | |
| | 619,400 | | | | | Mega Lifesciences PCL Class F | | | 822,037 | |
| | 789,200 | | | | | Muangthai Leasing PCL Class F | | | 961,815 | |
| | 69,700 | | | | | Precious Shipping PCL Class F* | | | 26,203 | |
| | 318,500 | | | | | Pruksa Holding PCL Class F | | | 221,313 | |
| | 65,800 | | | | | PTT Exploration & Production PCL Class N, NVDR | | | 240,937 | |
| | 163,900 | | | | | PTT Exploration & Production PCL (Foreign Shares) | | | 605,150 | |
| | 78,900 | | | | | PTT Global Chemical PCL | | | 239,980 | |
| | 1,125,300 | | | | | PTT Global Chemical PCL, NVDR | | | 3,400,731 | |
| | 38,700 | | | | | PTT PCL | | | 681,052 | |
| | 8,400 | | | | | PTT PCL, NVDR | | | 148,283 | |
| | 53,100 | | | | | Robinson PCL Class N, NVDR | | | 107,406 | |
| | 2,363,200 | | | | | Sansiri PCL | | | 125,878 | |
| | 194,300 | | | | | Siam Commercial Bank PCL (The) | | | 885,441 | |
| | 2,074,900 | | | | | Star Petroleum Refining PCL Class F | | | 1,061,669 | |
| | 86,800 | | | | | Supalai PCL | | | 60,909 | |
| | 262,000 | | | | | Thai Airways International PCL Class F* | | | 128,547 | |
| | | | | | |
| | See accompanying Notes to the Financial Statements. | | | 145 | |
Mercer Emerging Markets Equity Fund
Schedule of Investments (Continued)
(showing percentage of net assets)
March 31, 2018
| | | | | | | | | | |
| Shares | | | | | Description | | Value ($) | |
| | | |
| | | | | | Thailand — continued | | | | |
| | | |
| | 39,400 | | | | | Thai Oil PCL | | | 114,737 | |
| | 686,500 | | | | | Thai Oil PCL, NVDR | | | 2,014,275 | |
| | 146,200 | | | | | Thanachart Capital PCL | | | 243,682 | |
| | 1,448,000 | | | | | TMB Bank PCL | | | 116,692 | |
| | 2,708,600 | | | | | TMB Bank PCL, NVDR | | | 221,747 | |
| | 346,800 | | | | | True Corp. PCL Class F | | | 77,367 | |
| | | | | | | | | | |
| | | | | | Total Thailand | | | 32,817,276 | |
| | | | | | | | | | |
| | | |
| | | | | | Turkey — 1.0% | | | | |
| | | |
| | 195,670 | | | | | Akbank Turk AS | | | 471,714 | |
| | 8,486 | | | | | Aygaz AS | | | 30,997 | |
| | 7,110 | | | | | BIM Birlesik Magazalar AS | | | 129,048 | |
| | 24,301 | | | | | Ford Otomotiv Sanayi AS | | | 382,176 | |
| | 26,827 | | | | | Kardemir Karabuk Demir Celik Sanayi ve Ticaret AS, Class A* | | | 25,463 | |
| | 88,701 | | | | | Kardemir Karabuk Demir Celik Sanayi ve Ticaret AS, Class D* | | | 88,670 | |
| | 669,396 | | | | | KOC Holding AS | | | 2,761,128 | |
| | 4,098 | | | | | Pegasus Hava Tasimaciligi AS* | | | 36,890 | |
| | 41,613 | | | | | Soda Sanayii AS | | | 57,985 | |
| | 114,022 | | | | | TAV Havalimanlari Holding AS | | | 687,344 | |
| | 177,125 | | | | | Tekfen Holding AS | | | 762,352 | |
| | 20,431 | | | | | Tofas Turk Otomobil Fabrikasi AS | | | 139,459 | |
| | 44,849 | | | | | Trakya Cam Sanayii AS | | | 58,192 | |
| | 660,748 | | | | | Turk Hava Yollari AO* | | | 3,187,483 | |
| | 65,673 | | | | | Turkiye Garanti Bankasi AS | | | 181,366 | |
| | 131,148 | | | | | Turkiye Halk Bankasi AS | | | 296,303 | |
| | 152,678 | | | | | Turkiye Is Bankasi | | | 275,186 | |
| | 331,629 | | | | | Turkiye Sinai Kalkinma Bankasi AS | | | 128,921 | |
| | 752,979 | | | | | Turkiye Sise ve Cam Fabrikalari AS | | | 980,808 | |
| | 72,860 | | | | | Turkiye Vakiflar Bankasi TAO Series D | | | 119,735 | |
| | 51,140 | | | | | Yapi ve Kredi Bankasi AS* | | | 57,318 | |
| | | | | | | | | | |
| | | | | | Total Turkey | | | 10,858,538 | |
| | | | | | | | | | |
| | |
| | | | | | United Arab Emirates — 0.1% | |
| | | |
| | 1,883,387 | | | | | Emaar Malls PJSC | | | 1,101,668 | |
| | 33,028 | | | | | Emirates Telecommunications Group Co. PJSC | | | 158,978 | |
| | | | | | | | | | |
| | | | | | Total United Arab Emirates | | | 1,260,646 | |
| | | | | | | | | | |
| | | |
| | | | | | United Kingdom — 1.0% | | | | |
| | | |
| | 527,598 | | | | | Cairn Energy Plc* | | | 1,526,867 | |
| | 117,155 | | | | | GlaxoSmithKline Plc | | | 2,275,758 | |
| | 87,959 | | | | | Unilever Plc | | | 4,886,894 | |
| | 7,738,000 | | | | | West China Cement, Ltd.* | | | 1,483,641 | |
| | 55,603 | | | | | WPP Plc | | | 883,628 | |
| | | | | | | | | | |
| | | | | | Total United Kingdom | | | 11,056,788 | |
| | | | | | | | | | |
| | |
| | | | | | United States — 1.6% | |
| | | |
| | 26,812 | | | | | Citigroup, Inc. | | | 1,809,810 | |
| | 15,900 | | | | | Cognizant Technology Solutions Corp. Class A | | | 1,279,950 | |
| | 18,414 | | | | | Microsoft Corp. | | | 1,680,646 | |
| | | | | | |
| 146 | | See accompanying Notes to the Financial Statements. | | | | |
Mercer Emerging Markets Equity Fund
Schedule of Investments (Continued)
(showing percentage of net assets)
March 31, 2018
| | | | | | | | | | |
| Shares | | | | | Description | | Value ($) | |
| | |
| | | | | | United States — continued | |
| | | |
| | 10,108 | | | | | Monsanto Co. | | | 1,179,503 | |
| | 47,998 | | | | | Pfizer, Inc. | | | 1,703,449 | |
| | 86,073 | | | | | Southern Copper Corp.‡ | | | 4,663,435 | |
| | 134,967 | | | | | Yum China Holdings, Inc. | | | 5,601,130 | |
| | | | | | | | | | |
| | | | | | Total United States | | | 17,917,923 | |
| | | | | | | | | | |
| | | |
| | | | | | TOTAL COMMON STOCKS (COST $903,967,678) | | | 1,004,132,946 | |
| | | | | | | | | | |
| | | |
| | | | | | PREFERRED STOCKS — 1.9% | | | | |
| | | |
| | | | | | Brazil — 1.8% | | | | |
| | | |
| | 83,000 | | | | | Banco Bradesco SA, 3.21% | | | 986,430 | |
| | 62,900 | | | | | Banco do Estado do Rio Grande do Sul SA, 5.30% | | | 383,615 | |
| | 10,500 | | | | | Cia Brasileira de Distribuicao, 0.97% | | | 210,247 | |
| | 313,970 | | | | | Itau Unibanco Holding SA, 5.77% | | | 4,847,094 | |
| | 408,866 | | | | | Itausa — Investimentos Itau SA, 5.08% | | | 1,696,432 | |
| | 1,680,500 | | | | | Petroleo Brasileiro SA, 0.00%* | | | 10,825,462 | |
| | 378,800 | | | | | Usinas Siderurgicas de Minas Gerais SA, 0.00% Series A* | | | 1,244,583 | |
| | | | | | | | | | |
| | | | | | Total Brazil | | | 20,193,863 | |
| | | | | | | | | | |
| | |
| | | | | | Colombia — 0.0% | |
| | | |
| | 5,238 | | | | | Banco Davivienda SA, 2.65% | | | 56,569 | |
| | 13,496 | | | | | Grupo Argos SA/Colombia, 1.78% | | | 79,639 | |
| | 8,638 | | | | | Grupo de Inversiones Suramericana SA, 1.41% | | | 110,282 | |
| | | | | | | | | | |
| | | | | | Total Colombia | | | 246,490 | |
| | | | | | | | | | |
| | |
| | | | | | Germany — 0.1% | |
| | | |
| | 11,750 | | | | | Bayerische Motoren Werke AG, 4.47% | | | 1,100,906 | |
| | | | | | | | | | |
| | | |
| | | | | | TOTAL PREFERRED STOCKS (COST $17,571,063) | | | 21,541,259 | |
| | | | | | | | | | |
| | |
| | | | | | RIGHTS — 0.0% | |
| | |
| | | | | | South Korea — 0.0% | |
| | | |
| | 31,585 | | | | | Samsung Heavy Industries Co., Ltd., Expires 04/03/18* | | | 57,783 | |
| | | | | | | | | | |
| | | |
| | | | | | TOTAL RIGHTS (COST $—) | | | 57,783 | |
| | | | | | | | | | |
| | | |
| Par Value ($) | | | | | Description | | Value ($) | |
| | |
| | | | | | SHORT-TERM INVESTMENTS — 8.2% | |
| | |
| | | | | | Bank Deposit — 6.7% | |
| | | |
| | 74,518,086 | | | | | State Street Bank & Trust Euro Time Deposit, 0.28%, due 04/02/18 | | | 74,518,086 | |
| | | | | | | | | | |
| | |
| | | | | | Investment Fund — 0.5% | |
| | | |
| | 6,061,741 | | | | | State Street Institutional Treasury Plus Money Market Fund, Premier Class, 1.55%## ***** | | | 6,061,741 | |
| | | | | | | | | | |
| | | |
| | | | | | Mutual Fund - Securities Lending Collateral — 0.8% | | | | |
| | | |
| | 8,417,141 | | | | | State Street Institutional U.S. Government Money Market Fund, Premier Class, 1.58%## *** | | | 8,417,141 | |
| | | | | | |
| | See accompanying Notes to the Financial Statements. | | | 147 | |
Mercer Emerging Markets Equity Fund
Schedule of Investments (Continued)
(showing percentage of net assets)
March 31, 2018
| | | | | | | | | | |
| Par Value ($) | | | | | Description | | Value ($) | |
| | | |
| | | | | | U.S. Government and Agency Obligations — 0.2% | | | | |
| | | |
| | 1,700,000 | | | | | United States Treasury Bill, 0.99%, due 04/05/18** ‡‡ | | | 1,699,770 | |
| | 700,000 | | | | | United States Treasury Bill, 1.64%, due 06/07/18** ‡‡ | | | 697,874 | |
| | | | | | | | | | |
| | | | | | TOTAL U.S. GOVERNMENT AND AGENCY OBLIGATIONS (COST $2,397,936) | | | 2,397,644 | |
| | | | | | | | | | |
| | | |
| | | | | | TOTAL SHORT-TERM INVESTMENTS (COST $91,394,904) | | | 91,394,612 | |
| | | | | | | | | | |
| | | |
| | | | | | TOTAL INVESTMENTS — 100.1% (Cost $1,012,933,645) | | | 1,117,126,600 | |
| | | |
| | | | | | Other Assets and Liabilities (net) — (0.1)% | | | (999,310 | ) |
| | | | | | | | | | |
| | | |
| | | | | | NET ASSETS — 100.0% | | $ | 1,116,127,290 | |
| | | | | | | | | | |
| | | |
| | | | | | Notes to Schedule of Investments: | | | | |
| | | |
| | | | | | ADR — American Depository Receipt | | | | |
| | | |
| | | | | | GDR — Global Depository Receipt | | | | |
| | | |
| | | | | | NVDR — Non-Voting Depository Receipt | | | | |
| | | |
| | | | | | REIT — Real Estate Investment Trust | | | | |
| | | |
| | | | ## | | The rate disclosed is the 7 day net yield as of March 31, 2018. | | | | |
| | | |
| | | | * | | Non-income producing security | | | | |
| | | |
| | | | ** | | All or a portion of this security is pledged for open futures collateral. | | | | |
| | | |
| | | | *** | | Represents an investment of securities lending cash collateral. | | | | |
| | | |
| | | | **** | | Securities fair valued by the Valuation Committee as approved by the Board of Trustees. The total market value of the securities at year end is $2,880,660 which represents 0.3% of net assets. The aggregate tax cost of these securities held at March 31, 2018 was $2,840,738. | | | | |
| | | |
| | | | ***** | | Security has been segregated to cover collateral requirements on open synthetic futures contracts. | | | | |
| | | |
| | | | ¤ | | Illiquid security. The total market value of the securities at year end is $3,933,400 which represents 0.4% of net assets. The aggregate tax cost of these securities held at March 31, 2018 was $4,030,272. | | | | |
| | | |
| | | | ‡ | | All or a portion of this security is out on loan. | | | | |
| | | |
| | | | ‡‡ | | Interest rate presented is yield to maturity. | | | | |
| | | |
| | | | ‡‡‡ | | Security exempt from registration under Regulation S of the Securities Act of 1933, which exempts from registration securities offered and sold outside the United States. Security may not be offered or sold in the United States except pursuant to an exemption from, or in a transaction not subject to, the registration requirements of the Securities Act of 1933. | | | | |
| | | |
| | | | 144A | | Securities exempt from registration under Rule 144A of the Securities Act of 1933. These securities may be resold in transactions exempt from registration, normally to qualified institutional buyers. The total market value of the securities at year end is $677,934 which represents 0.1% of net assets. | | | | |
| | | | | | |
| 148 | | See accompanying Notes to the Financial Statements. | | | | |
Mercer Emerging Markets Equity Fund
Schedule of Investments (Continued)
March 31, 2018
Forward Foreign Currency Contracts
| | | | | | | | | | | | | | | | | | |
Currency Purchased | | | Currency Sold | | | Settlement
Date | | Counterparty | | Unrealized
Appreciation
(Depreciation) | |
| BRL | | | 20,075,000 | | | USD | | | 6,153,109 | | | 06/20/18 | | Citibank N.A. London | | $ | (153,723 | ) |
| CLP | | | 6,080,269,000 | | | USD | | | 10,201,254 | | | 06/20/18 | | Citibank N.A. London | | | (123,070 | ) |
| CNH | | | 41,876,000 | | | USD | | | 6,583,725 | | | 06/20/18 | | Citibank N.A. London | | | 55,947 | |
| COP | | | 8,187,000,000 | | | USD | | | 2,845,517 | | | 06/20/18 | | Citibank N.A. London | | | 78,350 | |
| CZK | | | 299,310,000 | | | USD | | | 14,589,364 | | | 06/20/18 | | Citibank N.A. London | | | (29,213 | ) |
| HKD | | | 198,153,000 | | | USD | | | 25,392,681 | | | 06/20/18 | | Citibank N.A. London | | | (81,113 | ) |
| HUF | | | 2,460,122,000 | | | USD | | | 9,727,748 | | | 06/20/18 | | Citibank N.A. London | | | 11,934 | |
| ILS | | | 1,140,000 | | | USD | | | 330,868 | | | 06/20/18 | | Citibank N.A. London | | | (4,627 | ) |
| INR | | | 11,456,000 | | | USD | | | 173,791 | | | 06/20/18 | | Citibank N.A. London | | | 255 | |
| KRW | | | 2,406,820,000 | | | USD | | | 2,240,474 | | | 06/20/18 | | Citibank N.A. London | | | 23,718 | |
| MXN | | | 569,822,000 | | | USD | | | 29,945,092 | | | 06/20/18 | | Citibank N.A. London | | | 896,444 | |
| PEN | | | 800,000 | | | USD | | | 244,642 | | | 06/20/18 | | Citibank N.A. London | | | 2,667 | |
| PHP | | | 3,022,000 | | | USD | | | 57,200 | | | 06/20/18 | | Citibank N.A. London | | | 493 | |
| PLN | | | 82,269,000 | | | USD | | | 24,285,741 | | | 06/20/18 | | Citibank N.A. London | | | (233,522 | ) |
| RUB | | | 309,207,000 | | | USD | | | 5,404,327 | | | 06/20/18 | | Citibank N.A. London | | | (73,183 | ) |
| SGD | | | 30,780,000 | | | USD | | | 23,447,724 | | | 06/20/18 | | Citibank N.A. London | | | 67,958 | |
| THB | | | 23,000,000 | | | USD | | | 738,396 | | | 06/20/18 | | Citibank N.A. London | | | (940 | ) |
| TRY | | | 86,293,000 | | | USD | | | 21,920,724 | | | 06/20/18 | | Citibank N.A. London | | | (635,756 | ) |
| TWD | | | 416,101,000 | | | USD | | | 14,366,667 | | | 06/20/18 | | Citibank N.A. London | | | (16,447 | ) |
| ZAR | | | 123,593,000 | | | USD | | | 10,343,311 | | | 06/20/18 | | Citibank N.A. London | | | (20,336 | ) |
| USD | | | 26,788,359 | | | BRL | | | 87,955,000 | | | 06/20/18 | | Citibank N.A. London | | | 503,128 | |
| USD | | | 6,993,601 | | | CLP | | | 4,242,340,000 | | | 06/20/18 | | Citibank N.A. London | | | (38,174 | ) |
| USD | | | 12,774,834 | | | CNH | | | 81,206,000 | | | 06/20/18 | | Citibank N.A. London | | | (100,829 | ) |
| USD | | | 2,089,159 | | | COP | | | 6,000,000,000 | | | 06/20/18 | | Citibank N.A. London | | | (53,653 | ) |
| USD | | | 4,456,864 | | | CZK | | | 91,155,000 | | | 06/20/18 | | Citibank N.A. London | | | 22,563 | |
| USD | | | 11,358,362 | | | HKD | | | 88,734,000 | | | 06/20/18 | | Citibank N.A. London | | | 23,701 | |
| USD | | | 13,882,497 | | | IDR | | | 192,139,428,775 | | | 06/20/18 | | Citibank N.A. London | | | 14,517 | |
| USD | | | 13,715,613 | | | ILS | | | 47,420,000 | | | 06/20/18 | | Citibank N.A. London | | | 145,143 | |
| USD | | | 9,362,451 | | | INR | | | 616,132,000 | | | 06/20/18 | | Citibank N.A. London | | | 1,807 | |
| USD | | | 33,171,578 | | | KRW | | | 35,662,737,000 | | | 06/20/18 | | Citibank N.A. London | | | (377,780 | ) |
| USD | | | 2,569,741 | | | MXN | | | 48,273,000 | | | 06/20/18 | | Citibank N.A. London | | | (43,029 | ) |
| USD | | | 214,393 | | | PEN | | | 700,000 | | | 06/20/18 | | Citibank N.A. London | | | (2,001 | ) |
| USD | | | 16,831,857 | | | PHP | | | 884,000,000 | | | 06/20/18 | | Citibank N.A. London | | | (44,584 | ) |
| USD | | | 9,535,704 | | | PLN | | | 32,406,000 | | | 06/20/18 | | Citibank N.A. London | | | 61,464 | |
| USD | | | 83,433 | | | RUB | | | 4,808,000 | | | 06/20/18 | | Citibank N.A. London | | | 537 | |
| USD | | | 3,998,190 | | | SGD | | | 5,256,000 | | | 06/20/18 | | Citibank N.A. London | | | (17,354 | ) |
| USD | | | 928,566 | | | THB | | | 28,892,000 | | | 06/20/18 | | Citibank N.A. London | | | 2,195 | |
| USD | | | 6,978,268 | | | TRY | | | 28,157,000 | | | 06/20/18 | | Citibank N.A. London | | | 33,084 | |
| USD | | | 752,177 | | | TWD | | | 21,738,000 | | | 06/20/18 | | Citibank N.A. London | | | 2,491 | |
| USD | | | 1,743,316 | | | ZAR | | | 20,759,000 | | | 06/20/18 | | Citibank N.A. London | | | 9,442 | |
| | | | | | | | | | | | | | | | | | |
| | $ | (91,496 | ) |
| | | | | | | | | | | | | | | | | | |
| | | | | | |
| | See accompanying Notes to the Financial Statements. | | | 149 | |
Mercer Emerging Markets Equity Fund
Schedule of Investments (Continued)
March 31, 2018
Currency Abbreviations
| CNH | — Chinese Yuan Renminbi |
| PEN | — Peruvian Nouveau Sol |
Futures Contracts
| | | | | | | | | | | | | | | | | | | | |
Number of Contracts | | | | | Description | | | | Expiration Date | | | Notional Value | | | Market Value/ Unrealized Appreciation (Depreciation) | |
| | Buys | | | | | | | | | | | | | | | | | | | |
| | 1 | | | | | FTSE Bursa Malaysia KLCI Index | | | | | Apr 2018 | | | $ | 24,108 | | | $ | — | |
| | 58 | | | | | KOSPI 200 Index | | | | | Jun 2018 | | | | 4,294,633 | | | | 19,914 | |
| | 9 | | | | | Mexico Bolsa Index | | | | | Jun 2018 | | | | 228,591 | | | | (5,737 | ) |
| | 603 | | | | | MSCI Emerging Markets E-mini Index | | | | | Jun 2018 | | | | 35,812,170 | | | | (527,587 | ) |
| | 53 | | | | | MSCI Singapore Index | | | | | Apr 2018 | | | | 1,593,274 | | | | 30,817 | |
| | 25 | | | | | MSCI Taiwan Index | | | | | Apr 2018 | | | | 1,019,250 | | | | 3,318 | |
| | 189 | | | | | SET50 Index | | | | | Jun 2018 | | | | 1,408,283 | | | | (25,899 | ) |
| | | | | | | | | | | | | | | | | | | | |
| | | | $ | (505,174 | ) |
| | | | | | | | | | | | | | | | | | | | |
| | Sales | | | | | | | | | | | | | | | | | | | |
| | 314 | | | | | FTSE/JSE Top 40 Index | | | | | Jun 2018 | | | $ | 13,087,364 | | | $ | 968,711 | |
| | 422 | | | | | SGX Nifty 50 Index | | | | | Apr 2018 | | | | 8,644,670 | | | | (177,224 | ) |
| | | | | | | | | | | | | | | | | | | | |
| | | | $ | 791,487 | |
| | | | | | | | | | | | | | | | | | | | |
| | | | | | |
| 150 | | See accompanying Notes to the Financial Statements. | | | | |
Mercer Emerging Markets Equity Fund
Schedule of Investments (Continued)
March 31, 2018
Synthetic Futures
| | | | | | | | | | | | | | | | | | | | | | |
Number of Contracts Long (Short) | | Reference Entity | | Expiration
Date | | Counterparty | | Notional Value | | Value |
| | | (5,300 | ) | | BIST 30 Futures | | | | 04/30/2018 | | | Goldman Sachs International | | | | 187,147 | | | | | (75 | ) |
| | | 8,750 | | | Hang Seng China Enterprises Index | | | | 04/27/2018 | | | Goldman Sachs International | | | | 13,546,209 | | | | | (112,754 | ) |
| | | (1,621 | ) | | MSCI Poland Net Return Index | | | | 06/20/2018 | | | Goldman Sachs International | | | | 97,743 | | | | | 5,882 | |
| | | 66,500,000 | | | KOSPI 200 Index | | | | 06/14/2018 | | | Goldman Sachs International | | | | 19,201,728 | | | | | 393,726 | |
| | | (135 | ) | | Ibovespa Futures Index | | | | 04/18/2018 | | | Goldman Sachs International | | | | 3,339,192 | | | | | (161,796 | ) |
| | | 9,921 | | | MSCI China Net Return Index | | | | 06/20/2018 | | | Goldman Sachs International | | | | 820,829 | | | | | (38,150 | ) |
| | | 304 | | | MSCI Singapore Net Return SGD Index | | | | 06/20/2018 | | | Goldman Sachs International | | | | 1,380,549 | | | | | (21,352 | ) |
| | | (47,742 | ) | | MSCI South Africa Net Return Index | | | | 06/20/2018 | | | Goldman Sachs International | | | | 4,293,333 | | | | | 375,247 | |
| | | 14,800 | | | MSCI Taiwan Stock Index | | | | 04/27/2018 | | | Goldman Sachs International | | | | 6,007,401 | | | | | 26,560 | |
| | | 22,600 | | | Taiwan Stock Index | | | | 04/18/2018 | | | Goldman Sachs International | | | | 8,497,505 | | | | | (34,742 | ) |
| | | 6,300 | | | Tel Aviv 35 Index | | | | 04/27/2018 | | | Goldman Sachs International | | | | 2,611,656 | | | | | (23,217 | ) |
| | | (1,120 | ) | | WIG20 Futures Index | | | | 06/15/2018 | | | Goldman Sachs International | | | | 777,082 | | | | | 45,491 | |
| | | | | | | | | | | | | | | | | | | | | | | |
| | | | | | | | | | | | | | | | | | | | | $ | 454,820 | |
| | | | | | | | | | | | | | | | | | | | | | | |
| | | | | | |
| | See accompanying Notes to the Financial Statements. | | | 151 | |
Mercer Emerging Markets Equity Fund
Schedule of Investments (Continued)
March 31, 2018
| | | | | |
Industry Sector Summary (Unaudited) | | % of Net Assets |
Banks | | | | 13.8 | |
Semiconductors | | | | 7.4 | |
Internet | | | | 6.9 | |
Diversified Financial Services | | | | 6.8 | |
Oil & Gas | | | | 4.5 | |
Retail | | | | 3.8 | |
Food | | | | 3.7 | |
Insurance | | | | 3.0 | |
Telecommunications | | | | 2.7 | |
Computers | | | | 2.3 | |
Holding Companies — Diversified | | | | 2.3 | |
Real Estate | | | | 2.2 | |
Chemicals | | | | 2.1 | |
Mining | | | | 2.1 | |
Auto Manufacturers | | | | 2.0 | |
Pharmaceuticals | | | | 2.0 | |
Electronics | | | | 1.6 | |
Engineering & Construction | | | | 1.6 | |
Home Furnishings | | | | 1.6 | |
Building Materials | | | | 1.5 | |
Beverages | | | | 1.4 | |
Iron & Steel | | | | 1.4 | |
Commercial Services | | | | 1.3 | |
Media | | | | 1.1 | |
Electric | | | | 0.9 | |
Software | | | | 0.9 | |
Airlines | | | | 0.8 | |
Auto Parts & Equipment | | | | 0.8 | |
Apparel | | | | 0.7 | |
Coal | | | | 0.7 | |
Gas | | | | 0.7 | |
Leisure Time | | | | 0.7 | |
Lodging | | | | 0.7 | |
Electrical Components & Equipment | | | | 0.5 | |
Machinery — Diversified | | | | 0.5 | |
Miscellaneous — Manufacturing | | | | 0.5 | |
Water | | | | 0.5 | |
Aerospace & Defense | | | | 0.4 | |
Biotechnology | | | | 0.3 | |
Food Service | | | | 0.3 | |
Forest Products & Paper | | | | 0.3 | |
REITS | | | | 0.3 | |
Advertising | | | | 0.2 | |
Agriculture | | | | 0.2 | |
Cosmetics & Personal Care | | | | 0.2 | |
Energy-Alternate Sources | | | | 0.2 | |
Home Builders | | | | 0.2 | |
Household Products & Wares | | | | 0.2 | |
Machinery — Construction & Mining | | | | 0.2 | |
Metal Fabricate & Hardware | | | | 0.2 | |
Shipbuilding | | | | 0.2 | |
| | | | | | |
| 152 | | See accompanying Notes to the Financial Statements. | | | | |
Mercer Emerging Markets Equity Fund
Schedule of Investments (Continued)
March 31, 2018
| | | | | |
Industry Sector Summary (Unaudited) | | % of Net Assets |
Distribution & Wholesale | | | | 0.1 | |
Entertainment | | | | 0.1 | |
Environmental Control | | | | 0.1 | |
Housewares | | | | 0.1 | |
Transportation | | | | 0.1 | |
Hand & Machine Tools | | | | 0.0 | |
Health Care — Products | | | | 0.0 | |
Health Care — Services | | | | 0.0 | |
Investment Companies | | | | 0.0 | |
Office & Business Equipment | | | | 0.0 | |
Oil & Gas Services | | | | 0.0 | |
Packaging & Containers | | | | 0.0 | |
Pipelines | | | | 0.0 | |
Textiles | | | | 0.0 | |
Trucking & Leasing | | | | 0.0 | |
Short-Term Investments and Other Assets and Liabilities (net) | | | | 8.1 | |
| | | | | |
| | | | 100.0 | % |
| | | | | |
| | | | | | |
| | See accompanying Notes to the Financial Statements. | | | 153 | |
Mercer Global Low Volatility Equity Fund
Schedule of Investments
(showing percentage of net assets)
March 31, 2018
| | | | | | | | | | |
| Shares | | | | | Description | | Value ($) | |
| | |
| | | | | | COMMON STOCKS — 87.7% | |
| | |
| | | | | | Australia — 1.1% | |
| | | |
| | 63,495 | | | | | AGL Energy, Ltd. | | | 1,062,454 | |
| | 119,739 | | | | | BHP Billiton, Ltd. | | | 2,645,220 | |
| | 1,207 | | | | | Cochlear, Ltd. | | | 169,138 | |
| | 99,259 | | | | | Crown Resorts, Ltd. | | | 972,434 | |
| | 13,695 | | | | | Elders, Ltd. | | | 78,852 | |
| | 47,315 | | | | | Rio Tinto, Ltd. | | | 2,655,921 | |
| | 22,313 | | | | | South32, Ltd. | | | 55,545 | |
| | 63,852 | | | | | Wesfarmers, Ltd. | | | 2,046,111 | |
| | 7,783 | | | | | Woolworths Group, Ltd. | | | 157,533 | |
| | | | | | | | | | |
| | | | | | Total Australia | | | 9,843,208 | |
| | | | | | | | | | |
| | |
| | | | | | Austria — 0.6% | |
| | | |
| | 2,622 | | | | | Erste Group Bank AG* | | | 131,803 | |
| | 26,711 | | | | | EVN AG | | | 521,341 | |
| | 12,455 | | | | | Flughafen Wien AG | | | 511,447 | |
| | 19,106 | | | | | Raiffeisen Bank International AG* | | | 744,050 | |
| | 55,377 | | | | | Telekom Austria AG* | | | 527,768 | |
| | 13,457 | | | | | Verbund AG | | | 391,066 | |
| | 58,329 | | | | | Voestalpine AG | | | 3,059,369 | |
| | | | | | | | | | |
| | | | | | Total Austria | | | 5,886,844 | |
| | | | | | | | | | |
| | |
| | | | | | Bahamas — 0.0% | |
| | | |
| | 145 | | | | | United International Enterprises | | | 32,194 | |
| | | | | | | | | | |
| | |
| | | | | | Belgium — 0.4% | |
| | | |
| | 7,033 | | | | | Bekaert SA | | | 299,806 | |
| | 10,594 | | | | | Colruyt SA | | | 585,398 | |
| | 18,498 | | | | | Elia System Operator SA | | | 1,155,955 | |
| | 756 | | | | | Financiere de Tubize SA | | | 56,883 | |
| | 5,282 | | | | | KBC Group NV | | | 460,186 | |
| | 16,445 | | | | | UCB SA | | | 1,340,824 | |
| | | | | | | | | | |
| | | | | | Total Belgium | | | 3,899,052 | |
| | | | | | | | | | |
| | |
| | | | | | Bermuda — 1.2% | |
| | | |
| | 17,934 | | | | | Arch Capital Group, Ltd.* | | | 1,534,971 | |
| | 10,420 | | | | | Axis Capital Holdings, Ltd. | | | 599,879 | |
| | 21,946 | | | | | Bunge, Ltd. | | | 1,622,687 | |
| | 175,500 | | | | | CK Infrastructure Holdings, Ltd. | | | 1,442,411 | |
| | 21,000 | | | | | Clear Media, Ltd. | | | 16,146 | |
| | 6,414 | | | | | Everest Re Group, Ltd. | | | 1,647,244 | |
| | 37,529 | | | | | Genpact, Ltd. | | | 1,200,553 | |
| | 29,000 | | | | | Guoco Group, Ltd. | | | 385,337 | |
| | 300,000 | | | | | Regal Hotels International Holdings, Ltd. | | | 213,622 | |
| | 9,273 | | | | | RenaissanceRe Holdings, Ltd. | | | 1,284,403 | |
| | 7,500 | | | | | Soundwill Holdings, Ltd. | | | 13,950 | |
| | 58,000 | | | | | Transport International Holdings, Ltd. | | | 171,033 | |
| | 873 | | | | | White Mountains Insurance Group, Ltd. | | | 718,060 | |
| | | | | | |
| 154 | | See accompanying Notes to the Financial Statements. | | | | |
Mercer Global Low Volatility Equity Fund
Schedule of Investments (Continued)
(showing percentage of net assets)
March 31, 2018
| | | | | | | | | | |
| Shares | | | | | Description | | Value ($) | |
| | |
| | | | | | Bermuda — continued | |
| | | |
| | 3,000 | | | | | Wing On Co. International, Ltd. | | | 11,134 | |
| | 32,000 | | | | | Wing Tai Properties, Ltd. | | | 24,706 | |
| | | | | | | | | | |
| | | | | | Total Bermuda | | | 10,886,136 | |
| | | | | | | | | | |
| | |
| | | | | | Canada — 3.2% | |
| | | |
| | 14,600 | | | | | Artis Real Estate Investment Trust REIT | | | 153,899 | |
| | 37,012 | | | | | Atco, Ltd. Class I | | | 1,187,944 | |
| | 34,000 | | | | | Bank of Montreal | | | 2,566,515 | |
| | 8,200 | | | | | Bank of Nova Scotia (The) | | | 504,752 | |
| | 42,779 | | | | | BCE, Inc. | | | 1,841,208 | |
| | 30,189 | | | | | Canadian Imperial Bank of Commerce‡ | | | 2,662,861 | |
| | 400 | | | | | Canadian Real Estate Investment Trust REIT | | | 15,578 | |
| | 20,600 | | | | | Canadian Tire Corp., Ltd. Class A | | | 2,706,721 | |
| | 1,619 | | | | | Canadian Utilities, Ltd. Class A | | | 43,186 | |
| | 6,400 | | | | | Cogeco, Inc.‡ | | | 339,993 | |
| | 1,900 | | | | | Frontera Energy Corp.* ‡ | | | 53,069 | |
| | 33,488 | | | | | George Weston, Ltd. | | | 2,694,105 | |
| | 4,700 | | | | | Great-West Lifeco, Inc. | | | 119,865 | |
| | 45,100 | | | | | Loblaw Cos., Ltd. | | | 2,276,951 | |
| | 48,900 | | | | | Maple Leaf Foods, Inc. | | | 1,190,972 | |
| | 15,300 | | | | | Power Financial Corp. | | | 382,841 | |
| | 60,300 | | | | | Rogers Communications, Inc. Class B | | | 2,691,225 | |
| | 34,500 | | | | | Royal Bank of Canada | | | 2,663,130 | |
| | 110,892 | | | | | Shaw Communications, Inc. Class B | | | 2,134,838 | |
| | 5,000 | | | | | Stelco Holdings, Inc. | | | 84,545 | |
| | 5,100 | | | | | Sun Life Financial, Inc. | | | 209,301 | |
| | 48,200 | | | | | Toronto-Dominion Bank (The) | | | 2,733,296 | |
| | | | | | | | | | |
| | | | | | Total Canada | | | 29,256,795 | |
| | | | | | | | | | |
| | |
| | | | | | Cayman Islands — 0.1% | |
| | | |
| | 20,000 | | | | | CK Hutchison Holdings, Ltd. | | | 240,447 | |
| | 156,000 | | | | | Lifestyle International Holdings, Ltd.‡ | | | 256,687 | |
| | | | | | | | | | |
| | | | | | Total Cayman Islands | | | 497,134 | |
| | | | | | | | | | |
| | |
| | | | | | Denmark — 0.3% | |
| | | |
| | 22,340 | | | | | Carlsberg AS Class B | | | 2,668,592 | |
| | 7,982 | | | | | GN Store Nord AS | | | 283,137 | |
| | 1,102 | | | | | Matas AS | | | 11,930 | |
| | 601 | | | | | Schouw & Co. AS | | | 59,594 | |
| | | | | | | | | | |
| | | | | | Total Denmark | | | 3,023,253 | |
| | | | | | | | | | |
| | |
| | | | | | Finland — 0.6% | |
| | | |
| | 58,106 | | | | | Fortum OYJ‡ | | | 1,248,781 | |
| | 46,202 | | | | | Kesko OYJ Class B | | | 2,648,416 | |
| | 43,867 | | | | | Orion OYJ Class B | | | 1,343,172 | |
| | 20,112 | | | | | Raisio OYJ Class V | | | 89,567 | |
| | | | | | | | | | |
| | | | | | Total Finland | | | 5,329,936 | |
| | | | | | | | | | |
| | | | | | |
| | See accompanying Notes to the Financial Statements. | | | 155 | |
Mercer Global Low Volatility Equity Fund
Schedule of Investments (Continued)
(showing percentage of net assets)
March 31, 2018
| | | | | | | | | | |
| Shares | | | | | Description | | Value ($) | |
| | |
| | | | | | France — 2.1% | |
| | | |
| | 8,111 | | | | | Aeroports de Paris | | | 1,767,254 | |
| | 22,570 | | | | | BNP Paribas SA | | | 1,672,648 | |
| | 5,215 | | | | | Caisse Regionale de Credit Agricole Mutuel Nord de France | | | 136,061 | |
| | 139,645 | | | | | Credit Agricole SA | | | 2,271,052 | |
| | 1,234 | | | | | Dassault Aviation SA | | | 2,357,110 | |
| | 1,487 | | | | | Ipsen SA* | | | 230,791 | |
| | 15,922 | | | | | Lagardere SCA | | | 454,823 | |
| | 552 | | | | | Manutan International | | | 61,318 | |
| | 43,768 | | | | | Metropole Television SA | | | 1,127,131 | |
| | 34,663 | | | | | Rallye SA‡ | | | 520,681 | |
| | 73,448 | | | | | Sanofi | | | 5,899,055 | |
| | 304 | | | | | Savencia SA | | | 32,612 | |
| | 74 | | | | | Societe Fonciere Lyonnaise SA REIT | | | 5,411 | |
| | 106,987 | | | | | Veolia Environnement SA | | | 2,535,916 | |
| | 1,091 | | | | | Vetoquinol SA | | | 74,086 | |
| | 3,493 | | | | | Vilmorin & Cie SA | | | 304,168 | |
| | | | | | | | | | |
| | | | | | Total France | | | 19,450,117 | |
| | | | | | | | | | |
| | |
| | | | | | Germany — 2.4% | |
| | | |
| | 43,530 | | | | | Aareal Bank AG | | | 2,075,657 | |
| | 22,910 | | | | | Aurubis AG | | | 1,927,729 | |
| | 1,022 | | | | | Beiersdorf AG | | | 115,674 | |
| | 13,233 | | | | | CECONOMY AG | | | 152,523 | |
| | 7,147 | | | | | CTS Eventim AG & Co. KGaA | | | 335,200 | |
| | 53,046 | | | | | Deutsche Post AG | | | 2,318,535 | |
| | 12,539 | | | | | Fielmann AG | | | 1,014,464 | |
| | 4,176 | | | | | Hornbach Baumarkt AG | | | 143,901 | |
| | 3,385 | | | | | Hornbach Holding AG & Co. KGaA | | | 285,068 | |
| | 656 | | | | | KWS Saat SE | | | 254,891 | |
| | 42,913 | | | | | Mckesson Europe AG | | | 1,414,901 | |
| | 19,845 | | | | | Merck KGaA | | | 1,902,904 | |
| | 48,737 | | | | | Rhoen-Klinikum AG | | | 1,642,247 | |
| | 48,544 | | | | | Salzgitter AG | | | 2,487,470 | |
| | 54,774 | | | | | SAP SE | | | 5,729,090 | |
| | 11,163 | | | | | Wuestenrot & Wuerttembergische AG | | | 263,610 | |
| | | | | | | | | | |
| | | | | | Total Germany | | | 22,063,864 | |
| | | | | | | | | | |
| | |
| | | | | | Hong Kong — 1.2% | |
| | | |
| | 279,500 | | | | | CLP Holdings, Ltd. | | | 2,857,096 | |
| | 2,188,000 | | | | | HKT Trust & HKT, Ltd. | | | 2,753,928 | |
| | 1,056,790 | | | | | Hong Kong & China Gas Co., Ltd. | | | 2,178,783 | |
| | 16,000 | | | | | Hong Kong Ferry Holdings Co., Ltd. | | | 18,347 | |
| | 28,000 | | | | | Kowloon Development Co., Ltd. | | | 31,564 | |
| | 249,000 | | | | | Langham Hospitality Investments and Langham Hospitality Investments, Ltd. | | | 106,648 | |
| | 38,000 | | | | | Liu Chong Hing Investment, Ltd. | | | 61,582 | |
| | 263,500 | | | | | Power Assets Holdings, Ltd. | | | 2,359,308 | |
| | 347,000 | | | | | Regal Real Estate Investment Trust REIT | | | 105,941 | |
| | 545,000 | | | | | Sunlight Real Estate Investment Trust REIT | | | 370,645 | |
| | | | | | | | | | |
| | | | | | Total Hong Kong | | | 10,843,842 | |
| | | | | | | | | | |
| | | | | | |
| 156 | | See accompanying Notes to the Financial Statements. | | | | |
Mercer Global Low Volatility Equity Fund
Schedule of Investments (Continued)
(showing percentage of net assets)
March 31, 2018
| | | | | | | | | | |
| Shares | | | | | Description | | Value ($) | |
| | |
| | | | | | Ireland — 0.6% | |
| | | |
| | 14,637 | | | | | Accenture Plc Class A | | | 2,246,780 | |
| | 66,753 | | | | | Hibernia Plc REIT | | | 118,534 | |
| | 2,332 | | | | | ICON Plc* | | | 275,503 | |
| | 83,701 | | | | | Irish Residential Properties Plc REIT | | | 143,470 | |
| | 2,045 | | | | | Kerry Group Plc Class A | | | 207,846 | |
| | 29,506 | | | | | Medtronic Plc | | | 2,366,971 | |
| | 48,092 | | | | | Total Produce Plc | | | 142,149 | |
| | | | | | | | | | |
| | | | | | Total Ireland | | | 5,501,253 | |
| | | | | | | | | | |
| | |
| | | | | | Israel — 0.7% | |
| | | |
| | 3,242 | | | | | Amot Investments, Ltd. | | | 17,403 | |
| | 266,154 | | | | | Bank Hapoalim BM | | | 1,828,243 | |
| | 31,897 | | | | | Bank Leumi Le-Israel BM | | | 192,473 | |
| | 3,121 | | | | | FIBI Holdings, Ltd. | | | 79,053 | |
| | 14,841 | | | | | First International Bank Of Israel, Ltd. | | | 313,225 | |
| | 35,721 | | | | | Gazit-Globe, Ltd. | | | 353,420 | |
| | 331,092 | | | | | Israel Discount Bank, Ltd. Class A* | | | 951,308 | |
| | 2,333 | | | | | Paz Oil Co., Ltd. | | | 343,145 | |
| | 7,577 | | | | | Rami Levy Chain Stores Hashikma Marketing 2006, Ltd. | | | 380,351 | |
| | 83,832 | | | | | Shufersal, Ltd. | | | 534,178 | |
| | 58,852 | | | | | Strauss Group, Ltd. | | | 1,267,921 | |
| | | | | | | | | | |
| | | | | | Total Israel | | | 6,260,720 | |
| | | | | | | | | | |
| | |
| | | | | | Italy — 0.3% | |
| | | |
| | 99,086 | | | | | Banca Mediolanum SpA | | | 864,966 | |
| | 479,486 | | | | | Parmalat SpA‡ | | | 1,765,917 | |
| | | | | | | | | | |
| | | | | | Total Italy | | | 2,630,883 | |
| | | | | | | | | | |
| | |
| | | | | | Japan — 5.1% | |
| | | |
| | 118,800 | | | | | Aeon Co., Ltd.‡ | | | 2,121,867 | |
| | 7,100 | | | | | Aeon Hokkaido Corp. | | | 52,741 | |
| | 44,900 | | | | | Alfresa Holdings Corp. | | | 999,748 | |
| | 41,100 | | | | | Alpen Co., Ltd. | | | 916,296 | |
| | 212,800 | | | | | Astellas Pharma, Inc. | | | 3,229,518 | |
| | 1,900 | | | | | AT-Group Co., Ltd. | | | 50,113 | |
| | 18,700 | | | | | Canon, Inc. | | | 677,490 | |
| | 2,400 | | | | | Cawachi, Ltd. | | | 59,058 | |
| | 65,500 | | | | | Daiichi Sanyko Co., Ltd. | | | 2,171,631 | |
| | 16,800 | | | | | DyDo Group Holdings, Inc. | | | 1,053,653 | |
| | 93,700 | | | | | EDION Corp.‡ | | | 1,090,744 | |
| | 1,272 | | | | | Invesco Office J-Reit, Inc. REIT | | | 181,082 | |
| | 142,600 | | | | | Japan Post Bank Co., Ltd. | | | 1,914,742 | |
| | 144,500 | | | | | Japan Post Holdings Co., Ltd. | | | 1,740,522 | |
| | 67,200 | | | | | Japan Tobacco, Inc. | | | 1,937,331 | |
| | 30,800 | | | | | K’s Holdings Corp. | | | 426,016 | |
| | 1,200 | | | | | Kadoya Sesame Mills, Inc. | | | 72,891 | |
| | 17,700 | | | | | Kato Sangyo Co., Ltd. | | | 619,958 | |
| | 600 | | | | | KFC Holdings Japan, Ltd. | | | 11,267 | |
| | | | | | |
| | See accompanying Notes to the Financial Statements. | | | 157 | |
Mercer Global Low Volatility Equity Fund
Schedule of Investments (Continued)
(showing percentage of net assets)
March 31, 2018
| | | | | | | | | | |
| Shares | | | | | Description | | Value ($) | |
| | |
| | | | | | Japan — continued | |
| | | |
| | 4,900 | | | | | Kirin Holdings Co., Ltd. | | | 130,505 | |
| | 24,700 | | | | | Komeri Co., Ltd. | | | 658,202 | |
| | 66,300 | | | | | KYORIN Holdings, Inc. | | | 1,246,203 | |
| | 18,300 | | | | | McDonald’s Holdings Co., Japan Ltd. | | | 856,925 | |
| | 91,500 | | | | | Medipal Holdings Corp. | | | 1,875,599 | |
| | 10,000 | | | | | Mitsubishi Shokuhin Co., Ltd. | | | 286,789 | |
| | 130,900 | | | | | Mitsubishi Tanabe Pharma Corp. | | | 2,560,151 | |
| | 11,200 | | | | | Mitsui Sugar Co., Ltd. | | | 432,835 | |
| | 15,000 | | | | | Mochida Pharmaceutical Co., Ltd. | | | 1,055,007 | |
| | 20,400 | | | | | Nippon Flour Mills Co., Ltd. | | | 316,310 | |
| | 124,100 | | | | | Nippon Light Metal Holdings Co., Ltd. | | | 332,567 | |
| | 33 | | | | | NIPPON REIT Investment Corp. REIT | | | 100,381 | |
| | 37,900 | | | | | Nippon Telegraph & Telephone Corp. | | | 1,746,215 | |
| | 30,100 | | | | | Nisshin Oillio Group, Ltd. (The) | | | 827,856 | |
| | 115,800 | | | | | NTT DoCoMo, Inc. | | | 2,957,882 | |
| | 14,600 | | | | | Ohsho Food Service Corp. | | | 722,106 | |
| | 10,500 | | | | | Okinawa Cellular Telephone Co. | | | 386,530 | |
| | 31,960 | | | | | Okinawa Electric Power Co., Inc. (The) | | | 919,583 | |
| | 50,200 | | | | | Seven & i Holdings Co., Ltd. | | | 2,154,328 | |
| | 10,800 | | | | | Shimachu Co., Ltd.‡ | | | 345,275 | |
| | 13,000 | | | | | Showa Sangyo Co., Ltd. | | | 338,110 | |
| | 4,600 | | | | | St. Marc Holdings Co., Ltd. | | | 133,221 | |
| | 10,700 | | | | | Suzuken Co., Ltd. | | | 442,186 | |
| | 6,500 | | | | | Taisho Pharmaceutical Holdings Co., Ltd. | | | 639,304 | |
| | 46,400 | | | | | Takeda Pharmaceutical Co., Ltd. | | | 2,261,318 | |
| | 50,200 | | | | | Toho Holdings Co., Ltd. | | | 1,182,898 | |
| | 54,600 | | | | | Tsumura & Co. | | | 1,876,474 | |
| | 43,000 | | | | | Vital KSK Holdings, Inc. | | | 423,329 | |
| | 17,800 | | | | | Yodogawa Steel Works, Ltd. | | | 480,023 | |
| | 3,700 | | | | | ZERIA Pharmaceutical Co., Ltd. | | | 74,035 | |
| | | | | | | | | | |
| | | | | | Total Japan | | | 47,088,815 | |
| | | | | | | | | | |
| | |
| | | | | | Liberia — 0.1% | |
| | | |
| | 8,298 | | | | | Royal Caribbean Cruises, Ltd. | | | 977,006 | |
| | | | | | | | | | |
| | |
| | | | | | Luxembourg — 0.5% | |
| | | |
| | 52,664 | | | | | Aperam SA | | | 2,518,875 | |
| | 25,105 | | | | | ArcelorMittal* | | | 795,896 | |
| | 119,684 | | | | | Atento SA | | | 933,535 | |
| | 719 | | | | | Millicom International Cellular SA | | | 49,755 | |
| | | | | | | | | | |
| | | | | | Total Luxembourg | | | 4,298,061 | |
| | | | | | | | | | |
| | |
| | | | | | Netherlands — 0.5% | |
| | | |
| | 4,560 | | | | | ABN AMRO Group NV, ADR* ‡ | | | 68,583 | |
| | 33,857 | | | | | ForFarmers NV | | | 473,224 | |
| | 11,880 | | | | | Heineken Holding NV | | | 1,224,396 | |
| | 13,352 | | | | | LyondellBasell Industries NV Class A | | | 1,411,039 | |
| | 59,619 | | | | | QIAGEN NV* | | | 1,926,290 | |
| | | | | | | | | | |
| | | | | | Total Netherlands | | | 5,103,532 | |
| | | | | | | | | | |
| | | | | | |
| 158 | | See accompanying Notes to the Financial Statements. | | | | |
Mercer Global Low Volatility Equity Fund
Schedule of Investments (Continued)
(showing percentage of net assets)
March 31, 2018
| | | | | | | | | | |
| Shares | | | | | Description | | Value ($) | |
| | |
| | | | | | New Zealand — 0.6% | |
| | | |
| | 253,622 | | | | | Argosy Property, Ltd. | | | 183,220 | |
| | 320,956 | | | | | Contact Energy, Ltd. | | | 1,220,019 | |
| | 38,340 | | | | | Ebos Group, Ltd. | | | 497,707 | |
| | 9,453 | | | | | Fisher & Paykel Healthcare Corp., Ltd. | | | 90,634 | |
| | 39,953 | | | | | Fonterra Co-operative Group, Ltd.‡ | | | 170,592 | |
| | 23,487 | | | | | Freightways, Ltd. | | | 128,505 | |
| | 115,729 | | | | | Genesis Energy, Ltd. | | | 198,949 | |
| | 100,669 | | | | | Goodman Property Trust REIT | | | 96,734 | |
| | 458,079 | | | | | Infratil, Ltd. | | | 1,027,047 | |
| | 197,290 | | | | | Kiwi Property Group, Ltd. REIT | | | 191,126 | |
| | 35,536 | | | | | Mainfreight, Ltd. | | | 632,348 | |
| | 303,644 | | | | | Mercury NZ, Ltd. | | | 707,349 | |
| | 34,251 | | | | | Metlifecare, Ltd. | | | 144,778 | |
| | 50,278 | | | | | Summerset Group Holdings, Ltd. | | | 252,834 | |
| | 6,801 | | | | | Trustpower, Ltd. | | | 27,525 | |
| | 68,690 | | | | | Vector, Ltd. | | | 156,304 | |
| | 3,702 | | | | | Warehouse Group, Ltd. (The) | | | 5,375 | |
| | | | | | | | | | |
| | | | | | Total New Zealand | | | 5,731,046 | |
| | | | | | | | | | |
| | |
| | | | | | Norway — 0.8% | |
| | | |
| | 1,431 | | | | | Atea ASA* | | | 23,226 | |
| | 7,575 | | | | | Austevoll Seafood ASA | | | 75,846 | |
| | 239,449 | | | | | Norsk Hydro ASA | | | 1,409,843 | |
| | 2,111 | | | | | Olav Thon Eiendomsselskap ASA | | | 38,407 | |
| | 258,218 | | | | | Orkla ASA | | | 2,771,510 | |
| | 116,872 | | | | | Telenor ASA | | | 2,654,077 | |
| | | | | | | | | | |
| | | | | | Total Norway | | | 6,972,909 | |
| | | | | | | | | | |
| | |
| | | | | | Panama — 0.2% | |
| | | |
| | 25,409 | | | | | Carnival Corp. | | | 1,666,322 | |
| | | | | | | | | | |
| | |
| | | | | | Portugal — 0.0% | |
| | | |
| | 87,084 | | | | | REN — Redes Energeticas Nacionais SGPS SA | | | 268,712 | |
| | | | | | | | | | |
| | |
| | | | | | Puerto Rico — 0.1% | |
| | | |
| | 15,600 | | | | | Popular, Inc. | | | 649,272 | |
| | | | | | | | | | |
| | |
| | | | | | Singapore — 0.8% | |
| | | |
| | 14,000 | | | | | AIMS AMP Capital Industrial REIT | | | 14,551 | |
| | 308,200 | | | | | Cache Logistics Trust REIT | | | 196,137 | |
| | 27,600 | | | | | Fraser and Neave, Ltd. | | | 45,109 | |
| | 116,800 | | | | | Frasers Hospitality Trust REIT | | | 68,746 | |
| | 65,700 | | | | | Hong Leong Finance, Ltd. | | | 134,860 | |
| | 667,200 | | | | | Keppel Infrastructure Trust | | | 272,833 | |
| | 263,100 | | | | | Olam International, Ltd.‡ | | | 471,599 | |
| | 518,400 | | | | | OUE, Ltd. | | | 724,062 | |
| | 1,182,500 | | | | | Sheng Siong Group, Ltd. | | | 840,311 | |
| | 113,200 | | | | | SIA Engineering Co., Ltd. | | | 275,147 | |
| | 205,400 | | | | | Singapore Airlines, Ltd. | | | 1,705,610 | |
| | | | | | |
| | See accompanying Notes to the Financial Statements. | | | 159 | |
Mercer Global Low Volatility Equity Fund
Schedule of Investments (Continued)
(showing percentage of net assets)
March 31, 2018
| | | | | | | | | | |
| Shares | | | | | Description | | Value ($) | |
| | |
| | | | | | Singapore — continued | |
| | | |
| | 792,900 | | | | | Singapore Telecommunications, Ltd. | | | 2,043,741 | |
| | 699,700 | | | | | SPH REIT | | | 531,108 | |
| | 33,000 | | | | | United Industrial Corp., Ltd. | | | 82,037 | |
| | | | | | | | | | |
| | | | | | Total Singapore | | | 7,405,851 | |
| | | | | | | | | | |
| | |
| | | | | | Spain — 0.1% | |
| | | |
| | 50,156 | | | | | Ebro Foods SA | | | 1,275,245 | |
| | | | | | | | | | |
| | |
| | | | | | Sweden — 1.3% | |
| | | |
| | 6,163 | | | | | AAK AB | | | 542,631 | |
| | 109,254 | | | | | Axfood AB | | | 1,863,809 | |
| | 74,746 | | | | | Boliden AB | | | 2,627,182 | |
| | 41,137 | | | | | Clas Ohlson AB Class B | | | 447,423 | |
| | 38,010 | | | | | Essity AB Class B* | | | 1,047,909 | |
| | 37,115 | | | | | Granges AB | | | 436,168 | |
| | 64,985 | | | | | ICA Gruppen AB | | | 2,293,908 | |
| | 528 | | | | | Mekonomen AB | | | 8,995 | |
| | 32,061 | | | | | Svenska Cellulosa AB SCA Class B | | | 340,791 | |
| | 60,082 | | | | | Swedish Match AB | | | 2,723,253 | |
| | 4,139 | | | | | Swedish Orphan Biovitrum AB* | | | 73,679 | |
| | | | | | | | | | |
| | | | | | Total Sweden | | | 12,405,748 | |
| | | | | | | | | | |
| | |
| | | | | | Switzerland — 5.2% | |
| | | |
| | 13,135 | | | | | ABB, Ltd. | | | 312,279 | |
| | 13,513 | | | | | Adecco Group AG | | | 961,203 | |
| | 9,262 | | | | | Allreal Holding AG* | | | 1,522,096 | |
| | 449 | | | | | Alpiq Holding AG* | | | 35,195 | |
| | 1,081 | | | | | Baloise Holding AG | | | 165,167 | |
| | 1,093 | | | | | Banque Cantonale de Geneve | | | 198,070 | |
| | 1,072 | | | | | Barry Callebaut AG | | | 2,091,937 | |
| | 27 | | | | | Basellandschaftliche Kantonalbank | | | 25,663 | |
| | 579 | | | | | Basler Kantonalbank | | | 46,941 | |
| | 680 | | | | | Bell Food Group AG | | | 261,871 | |
| | 336 | | | | | Berner Kantonalbank AG | | | 62,617 | |
| | 17,306 | | | | | BKW AG | | | 1,148,790 | |
| | 686 | | | | | Chubb, Ltd. | | | 93,824 | |
| | 165 | | | | | Cie Financiere Tradition SA | | | 17,922 | |
| | 2,700 | | | | | Coca-Cola HBC AG* | | | 99,884 | |
| | 549 | | | | | Conzzeta AG | | | 655,197 | |
| | 2,813 | | | | | Dufry AG* | | | 368,226 | |
| | 142 | | | | | EMS-Chemie Holding AG | | | 89,506 | |
| | 8,803 | | | | | Flughafen Zurich AG | | | 1,939,968 | |
| | 1,409 | | | | | Intershop Holding AG | | | 738,979 | |
| | 16,346 | | | | | Julius Baer Group, Ltd.* | | | 1,004,823 | |
| | 98 | | | | | Luzerner Kantonalbank AG | | | 52,824 | |
| | 17 | | | | | Metall Zug AG Class B | | | 58,480 | |
| | 171,307 | | | | | Nestle SA | | | 13,539,097 | |
| | 168,310 | | | | | Novartis AG | | | 13,593,873 | |
| | 7,361 | | | | | Roche Holding AG | | | 1,685,497 | |
| | | | | | |
| 160 | | See accompanying Notes to the Financial Statements. | | | | |
Mercer Global Low Volatility Equity Fund
Schedule of Investments (Continued)
(showing percentage of net assets)
March 31, 2018
| | | | | | | | | | |
| Shares | | | | | Description | | Value ($) | |
| | |
| | | | | | Switzerland — continued | |
| | | |
| | 1,386 | | | | | Siegfried Holding AG* | | | 466,440 | |
| | 38 | | | | | St. Galler Kantonalbank AG | | | 21,004 | |
| | 4,493 | | | | | Swiss Life Holding AG* | | | 1,598,051 | |
| | 207 | | | | | Swisscom AG‡ | | | 102,490 | |
| | 1,597 | | | | | Swissquote Group Holding SA | | | 96,823 | |
| | 560 | | | | | Tamedia AG | | | 78,400 | |
| | 5,020 | | | | | Valora Holding AG | | | 1,715,543 | |
| | 8,378 | | | | | Vifor Pharma AG | | | 1,289,946 | |
| | 4,064 | | | | | Zurich Insurance Group AG* | | | 1,331,311 | |
| | | | | | | | | | |
| | | | | | Total Switzerland | | | 47,469,937 | |
| | | | | | | | | | |
| | |
| | | | | | United Kingdom — 5.2% | |
| | | |
| | 3,635 | | | | | Abcam Plc | | | 63,248 | |
| | 15,629 | | | | | AG Barr Plc | | | 144,163 | |
| | 4,103 | | | | | Aon Plc | | | 575,774 | |
| | 14,959 | | | | | Atrium European Real Estate, Ltd.* | | | 73,643 | |
| | 132,896 | | | | | Aviva Plc | | | 925,986 | |
| | 247,502 | | | | | Britvic Plc | | | 2,372,151 | |
| | 937 | | | | | Carnival Plc | | | 60,368 | |
| | 348,639 | | | | | Central Asia Metals Plc | | | 1,562,677 | |
| | 230,345 | | | | | Centrica Plc | | | 459,896 | |
| | 55,603 | | | | | Coca-Cola European Partners Plc | | | 2,316,421 | |
| | 1,491 | | | | | Craneware Plc | | | 36,913 | |
| | 13,182 | | | | | Cranswick Plc | | | 526,384 | |
| | 80,201 | | | | | Diageo Plc | | | 2,712,819 | |
| | 2,065 | | | | | EMIS Group Plc | | | 23,526 | |
| | 32,381 | | | | | Ferroglobe Plc* | | | 347,448 | |
| | 49,573 | | | | | GlaxoSmithKline Plc | | | 962,965 | |
| | 11,731 | | | | | Greggs Plc | | | 202,373 | |
| | 152,398 | | | | | Halfords Group Plc | | | 697,845 | |
| | 18,479 | | | | | Hansteen Holdings Plc REIT | | | 33,124 | |
| | 9,524 | | | | | Headlam Group Plc | | | 59,485 | |
| | 10,853 | | | | | Hill & Smith Holdings Plc | | | 202,495 | |
| | 31,709 | | | | | Imperial Brands Plc | | | 1,080,437 | |
| | 67,267 | | | | | Inchcape Plc | | | 652,514 | |
| | 148,232 | | | | | JD Sports Fashion Plc | | | 698,097 | |
| | 16,429 | | | | | John Menzies Plc | | | 144,779 | |
| | 538,363 | | | | | Kingfisher Plc | | | 2,215,131 | |
| | 114,887 | | | | | Legal & General Group Plc | | | 416,109 | |
| | 2,505,043 | | | | | Lloyds Banking Group Plc | | | 2,276,006 | |
| | 22,091 | | | | | LondonMetric Property Plc REIT | | | 55,221 | |
| | 57,322 | | | | | National Express Group Plc | | | 311,420 | |
| | 36,307 | | | | | Pagegroup Plc | | | 273,566 | |
| | 11,691 | | | | | QinetiQ Group Plc | | | 33,870 | |
| | 33,732 | | | | | Reckitt Benckiser Group Plc | | | 2,858,005 | |
| | 533,589 | | | | | Rentokil Initial Plc | | | 2,035,933 | |
| | 18,633 | | | | | Segro Plc REIT | | | 157,315 | |
| | 99,511 | | | | | Smith & Nephew Plc | | | 1,859,985 | |
| | 40,724 | | | | | Softcat Plc | | | 389,878 | |
| | | | | | |
| | See accompanying Notes to the Financial Statements. | | | 161 | |
Mercer Global Low Volatility Equity Fund
Schedule of Investments (Continued)
(showing percentage of net assets)
March 31, 2018
| | | | | | | | | | |
| Shares | | | | | Description | | Value ($) | |
| | |
| | | | | | United Kingdom — continued | |
| | | |
| | 97,447 | | | | | SSE Plc | | | 1,746,246 | |
| | 18,333 | | | | | SSP Group Plc | | | 157,445 | |
| | 29,139 | | | | | St. Modwen Properties Plc | | | 158,351 | |
| | 10,555 | | | | | Superdry Plc | | | 231,897 | |
| | 27,345 | | | | | TBC Bank Group Plc | | | 706,204 | |
| | 3,281,295 | | | | | Tesco Plc | | | 9,480,032 | |
| | 593,804 | | | | | Tritax Big Box Plc REIT | | | 1,202,489 | |
| | 712,941 | | | | | Vodafone Group Plc | | | 1,951,892 | |
| | 97,771 | | | | | WH Smith Plc | | | 2,673,988 | |
| | | | | | | | | | |
| | | | | | Total United Kingdom | | | 48,126,514 | |
| | | | | | | | | | |
| | |
| | | | | | United States — 52.4% | |
| | | |
| | 11,979 | | | | | 3M Co. | | | 2,629,630 | |
| | 13,575 | | | | | Adobe Systems, Inc.* | | | 2,933,286 | |
| | 4,500 | | | | | Affiliated Managers Group, Inc. | | | 853,110 | |
| | 53,283 | | | | | AGNC Investment Corp. REIT | | | 1,008,114 | |
| | 885 | | | | | Alleghany Corp. | | | 543,779 | |
| | 19,205 | | | | | Allstate Corp. (The) | | | 1,820,634 | |
| | 5,737 | | | | | Alphabet, Inc. Class A* | | | 5,950,072 | |
| | 19,603 | | | | | Alphabet, Inc. Class C* | | | 20,226,179 | |
| | 48,387 | | | | | Altria Group, Inc. | | | 3,015,478 | |
| | 25,871 | | | | | Amdocs, Ltd. | | | 1,726,113 | |
| | 28,278 | | | | | Ameren Corp. | | | 1,601,383 | |
| | 25,513 | | | | | American Electric Power Co., Inc. | | | 1,749,937 | |
| | 4,757 | | | | | American Express Co. | | | 443,733 | |
| | 13,702 | | | | | American Financial Group, Inc. | | | 1,537,638 | |
| | 300 | | | | | American Tower Corp. REIT | | | 43,602 | |
| | 126,844 | | | | | Annaly Capital Management, Inc. REIT | | | 1,322,983 | |
| | 8,446 | | | | | ANSYS, Inc.* | | | 1,323,404 | |
| | 7,113 | | | | | Anthem, Inc. | | | 1,562,726 | |
| | 42,092 | | | | | Apple Hospitality, Inc. REIT | | | 739,556 | |
| | 100,550 | | | | | Apple, Inc. | | | 16,870,279 | |
| | 37,311 | | | | | Aramark | | | 1,476,023 | |
| | 7,175 | | | | | Archer-Daniels-Midland Co. | | | 311,180 | |
| | 23,084 | | | | | Arthur J. Gallagher & Co. | | | 1,586,563 | |
| | 49,188 | | | | | AT&T, Inc. | | | 1,753,552 | |
| | 8,131 | | | | | Atmos Energy Corp. | | | 684,955 | |
| | 4,200 | | | | | AvalonBay Communities, Inc. REIT | | | 690,732 | |
| | 1,884 | | | | | Bank of New York Mellon Corp. (The) | | | 97,083 | |
| | 28,439 | | | | | Baxter International, Inc. | | | 1,849,673 | |
| | 9,880 | | | | | Becton Dickinson and Co. | | | 2,140,996 | |
| | 16,472 | | | | | Berkshire Hathaway, Inc. Class B* | | | 3,285,835 | |
| | 60,754 | | | | | BGC Partners, Inc. Class A | | | 817,141 | |
| | 800 | | | | | BlackRock, Inc. | | | 433,376 | |
| | 9,580 | | | | | Boeing Co. (The) | | | 3,141,090 | |
| | 125 | | | | | Booking Holdings, Inc.* | | | 260,049 | |
| | 7,612 | | | | | Bright Horizons Family Solutions, Inc.* | | | 759,069 | |
| | 22,655 | | | | | Bristol-Myers Squibb Co. | | | 1,432,929 | |
| | 18,980 | | | | | Broadridge Financial Solutions, Inc. | | | 2,081,916 | |
| | | | | | |
| 162 | | See accompanying Notes to the Financial Statements. | | | | |
Mercer Global Low Volatility Equity Fund
Schedule of Investments (Continued)
(showing percentage of net assets)
March 31, 2018
| | | | | | | | | | |
| Shares | | | | | Description | | Value ($) | |
| | |
| | | | | | United States — continued | |
| | | |
| | 44,548 | | | | | Brown & Brown, Inc. | | | 1,133,301 | |
| | 50,378 | | | | | CA, Inc. | | | 1,707,814 | |
| | 15,460 | | | | | Cabot Corp. | | | 861,431 | |
| | 12,035 | | | | | Cadence Design Systems, Inc.* | | | 442,527 | |
| | 16,784 | | | | | Campbell Soup Co.‡ | | | 726,915 | |
| | 6,018 | | | | | Carlisle Cos., Inc. | | | 628,339 | |
| | 1,800 | | | | | Carter’s, Inc. | | | 187,380 | |
| | 21,463 | | | | | CDK Global, Inc. | | | 1,359,466 | |
| | 60,998 | | | | | CenterPoint Energy, Inc. | | | 1,671,345 | |
| | 32,694 | | | | | Chimera Investment Corp. REIT | | | 569,203 | |
| | 10,370 | | | | | Cigna Corp. | | | 1,739,464 | |
| | 10,669 | | | | | Clorox Co. (The) | | | 1,420,151 | |
| | 35,783 | | | | | CMS Energy Corp. | | | 1,620,612 | |
| | 23,292 | | | | | Cognizant Technology Solutions Corp. Class A | | | 1,875,006 | |
| | 22,960 | | | | | Comcast Corp. Class A | | | 784,543 | |
| | 36,437 | | | | | Conagra Brands, Inc. | | | 1,343,797 | |
| | 21,649 | | | | | Consolidated Edison, Inc. | | | 1,687,323 | |
| | 4,056 | | | | | Constellation Brands, Inc. Class A | | | 924,444 | |
| | 6,663 | | | | | Cooper Cos., Inc. (The) | | | 1,524,561 | |
| | 36,176 | | | | | Copart, Inc.* | | | 1,842,444 | |
| | 10,045 | | | | | CoreLogic, Inc.* | | | 454,335 | |
| | 43,173 | | | | | Costco Wholesale Corp. | | | 8,135,088 | |
| | 15,363 | | | | | Crane Co. | | | 1,424,765 | |
| | 101,393 | | | | | Crown Castle International Corp. REIT | | | 11,113,687 | |
| | 23,822 | | | | | Danaher Corp. | | | 2,332,412 | |
| | 20,815 | | | | | Darden Restaurants, Inc. | | | 1,774,479 | |
| | 2,808 | | | | | DCT Industrial Trust, Inc. REIT | | | 158,203 | |
| | 437 | | | | | Domino’s Pizza, Inc. | | | 102,066 | |
| | 13,477 | | | | | DTE Energy Co. | | | 1,406,999 | |
| | 7,113 | | | | | DXC Technology Co. | | | 715,070 | |
| | 239,969 | | | | | eBay, Inc.* | | | 9,656,353 | |
| | 15,268 | | | | | Edison International | | | 971,961 | |
| | 2,000 | | | | | Edwards Lifesciences Corp.* | | | 279,040 | |
| | 7,118 | | | | | Electronic Arts, Inc.* | | | 862,986 | |
| | 30,267 | | | | | Eli Lilly & Co. | | | 2,341,758 | |
| | 8,545 | | | | | Entergy Corp. | | | 673,175 | |
| | 14,366 | | | | | Equity LifeStyle Properties, Inc. REIT | | | 1,260,904 | |
| | 2,458 | | | | | Erie Indemnity Co. Class A | | | 289,159 | |
| | 4,867 | | | | | Essex Property Trust, Inc. REIT | | | 1,171,390 | |
| | 47,162 | | | | | Exelon Corp. | | | 1,839,790 | |
| | 7,800 | | | | | Express Scripts Holding Co.* | | | 538,824 | |
| | 35,400 | | | | | Exxon Mobil Corp. | | | 2,641,194 | |
| | 1,958 | | | | | F5 Networks, Inc.* | | | 283,146 | |
| | 141,556 | | | | | Facebook, Inc. Class A* | | | 22,619,233 | |
| | 4,305 | | | | | FedEx Corp. | | | 1,033,674 | |
| | 17,621 | | | | | Fidelity National Information Services, Inc. | | | 1,696,902 | |
| | 24,883 | | | | | First American Financial Corp. | | | 1,460,134 | |
| | 51,618 | | | | | FirstEnergy Corp. | | | 1,755,528 | |
| | 17,038 | | | | | Fiserv, Inc.* | | | 1,214,980 | |
| | | | | | |
| | See accompanying Notes to the Financial Statements. | | | 163 | |
Mercer Global Low Volatility Equity Fund
Schedule of Investments (Continued)
(showing percentage of net assets)
March 31, 2018
| | | | | | | | | | |
| Shares | | | | | Description | | Value ($) | |
| | |
| | | | | | United States — continued | |
| | | |
| | 26,700 | | | | | Fortinet, Inc.* | | | 1,430,586 | |
| | 21,500 | | | | | Gaming and Leisure Properties, Inc. REIT | | | 719,605 | |
| | 10,198 | | | | | General Dynamics Corp. | | | 2,252,738 | |
| | 11,969 | | | | | General Mills, Inc. | | | 539,323 | |
| | 10,346 | | | | | Hanover Insurance Group, Inc. (The) | | | 1,219,690 | |
| | 8,298 | | | | | Hawaiian Electric Industries, Inc. | | | 285,285 | |
| | 144,038 | | | | | HCA Healthcare, Inc. | | | 13,971,686 | |
| | 15,626 | | | | | Hershey Co. (The) | | | 1,546,349 | |
| | 5,116 | | | | | Highwoods Properties, Inc. REIT | | | 224,183 | |
| | 15,986 | | | | | Hill-Rom Holdings, Inc. | | | 1,390,782 | |
| | 18,400 | | | | | Hilton Grand Vacations, Inc.* | | | 791,568 | |
| | 6,364 | | | | | Home Depot, Inc. (The) | | | 1,134,319 | |
| | 19,043 | | | | | Honeywell International, Inc. | | | 2,751,904 | |
| | 10,900 | | | | | Hormel Foods Corp.‡ | | | 374,088 | |
| | 31,163 | | | | | Hospitality Properties Trust REIT | | | 789,670 | |
| | 6,243 | | | | | Humana, Inc. | | | 1,678,306 | |
| | 6,826 | | | | | Huntington Ingalls Industries, Inc. | | | 1,759,470 | |
| | 12,603 | | | | | Ingredion, Inc. | | | 1,624,779 | |
| | 19,420 | | | | | Intel Corp. | | | 1,011,394 | |
| | 1,310 | | | | | Intercontinental Exchange, Inc. | | | 95,001 | |
| | 17,784 | | | | | International Business Machines Corp. | | | 2,728,599 | |
| | 14,138 | | | | | Intuit, Inc. | | | 2,450,822 | |
| | 1,600 | | | | | Intuitive Surgical, Inc.* | | | 660,528 | |
| | 4,742 | | | | | Jack Henry & Associates, Inc. | | | 573,545 | |
| | 5,179 | | | | | JM Smucker Co. (The) | | | 642,248 | |
| | 28,190 | | | | | Johnson & Johnson | | | 3,612,548 | |
| | 1,400 | | | | | Jones Lang Lasalle, Inc. | | | 244,496 | |
| | 16,600 | | | | | KAR Auction Services, Inc. | | | 899,720 | |
| | 14,038 | | | | | Kellogg Co.‡ | | | 912,610 | |
| | 1,248 | | | | | Kimberly-Clark Corp. | | | 137,442 | |
| | 3,681 | | | | | KLA-Tencor Corp. | | | 401,266 | |
| | 225,445 | | | | | Kraft Heinz Co. (The) | | | 14,042,969 | |
| | 2,800 | | | | | L3 Technologies, Inc. | | | 582,400 | |
| | 10,108 | | | | | Landstar System, Inc. | | | 1,108,342 | |
| | 3,400 | | | | | Lear Corp. | | | 632,706 | |
| | 19,628 | | | | | Liberty Property Trust REIT | | | 779,820 | |
| | 7,075 | | | | | Lockheed Martin Corp. | | | 2,390,855 | |
| | 188,878 | | | | | Lowe’s Cos., Inc. | | | 16,574,044 | |
| | 10,332 | | | | | M&T Bank Corp. | | | 1,904,808 | |
| | 5,891 | | | | | ManpowerGroup, Inc. | | | 678,054 | |
| | 91,198 | | | | | Mastercard, Inc. Class A | | | 15,974,242 | |
| | 2,059 | | | | | McCormick & Co., Inc. | | | 219,057 | |
| | 72,925 | | | | | McDonald’s Corp. | | | 11,404,011 | |
| | 45,234 | | | | | Merck & Co., Inc. | | | 2,463,896 | |
| | 5,740 | | | | | Mercury General Corp. | | | 263,294 | |
| | 873 | | | | | Mettler-Toledo International, Inc.* | | | 502,001 | |
| | 123,062 | | | | | MFA Financial, Inc. REIT | | | 926,657 | |
| | 179,092 | | | | | Microsoft Corp. | | | 16,345,727 | |
| | 1,225 | | | | | Mid-America Apartment Communities, Inc. REIT | | | 111,769 | |
| | | | | | |
| 164 | | See accompanying Notes to the Financial Statements. | | | | |
Mercer Global Low Volatility Equity Fund
Schedule of Investments (Continued)
(showing percentage of net assets)
March 31, 2018
| | | | | | | | | | |
| Shares | | | | | Description | | Value ($) | |
| | |
| | | | | | United States — continued | |
| | | |
| | 5,392 | | | | | Morningstar, Inc. | | | 515,044 | |
| | 18,731 | | | | | Motorola Solutions, Inc. | | | 1,972,374 | |
| | 8,485 | | | | | Nasdaq, Inc. | | | 731,577 | |
| | 1,497 | | | | | NewMarket Corp. | | | 601,315 | |
| | 9,351 | | | | | Newmont Mining Corp. | | | 365,344 | |
| | 12,770 | | | | | NextEra Energy, Inc. | | | 2,085,724 | |
| | 4,180 | | | | | Northern Trust Corp. | | | 431,083 | |
| | 5,990 | | | | | Northrop Grumman Corp. | | | 2,091,229 | |
| | 800 | | | | | Nu Skin Enterprises, Inc. Class A | | | 58,968 | |
| | 17,907 | | | | | Omnicom Group, Inc. | | | 1,301,302 | |
| | 299,397 | | | | | Oracle Corp. | | | 13,697,413 | |
| | 29,300 | | | | | Park Hotels & Resorts, Inc. REIT | | | 791,686 | |
| | 23,548 | | | | | PepsiCo, Inc. | | | 2,570,264 | |
| | 94,434 | | | | | Pfizer, Inc. | | | 3,351,463 | |
| | 2,507 | | | | | PG&E Corp. | | | 110,133 | |
| | 32,759 | | | | | Philip Morris International, Inc. | | | 3,256,245 | |
| | 32,444 | | | | | Piedmont Office Realty Trust, Inc. REIT Class A | | | 570,690 | |
| | 3,170 | | | | | Pilgrim’s Pride Corp.* | | | 78,014 | |
| | 11,600 | | | | | Pinnacle Foods, Inc. | | | 627,560 | |
| | 2,737 | | | | | PPG Industries, Inc. | | | 305,449 | |
| | 16,409 | | | | | Premier, Inc. Class A* ‡ | | | 513,766 | |
| | 24,620 | | | | | Principal Financial Group, Inc. | | | 1,499,604 | |
| | 26,080 | | | | | Procter & Gamble Co. (The) | | | 2,067,622 | |
| | 28,783 | | | | | Progressive Corp. (The) | | | 1,753,748 | |
| | 27,666 | | | | | Prologis, Inc. REIT | | | 1,742,681 | |
| | 5,428 | | | | | Public Service Enterprise Group, Inc. | | | 272,703 | |
| | 10,781 | | | | | Raytheon Co. | | | 2,326,755 | |
| | 10,220 | | | | | Reinsurance Group of America, Inc. | | | 1,573,880 | |
| | 27,704 | | | | | Republic Services, Inc. | | | 1,834,836 | |
| | 2,600 | | | | | Robert Half International, Inc. | | | 150,514 | |
| | 1,200 | | | | | S&P Global, Inc. | | | 229,272 | |
| | 31 | | | | | Seaboard Corp. | | | 132,215 | |
| | 5,185 | | | | | Spirit AeroSystems Holdings, Inc. Class A | | | 433,984 | |
| | 2,800 | | | | | Spirit Realty Capital, Inc. REIT | | | 21,728 | |
| | 322,037 | | | | | Starbucks Corp. | | | 18,642,722 | |
| | 3,100 | | | | | State Street Corp. | | | 309,163 | |
| | 12,653 | | | | | Stryker Corp. | | | 2,036,121 | |
| | 12,296 | | | | | Sun Communities, Inc. REIT | | | 1,123,486 | |
| | 22,972 | | | | | Synopsys, Inc.* | | | 1,912,189 | |
| | 32,244 | | | | | Synovus Financial Corp. | | | 1,610,265 | |
| | 31,147 | | | | | Sysco Corp. | | | 1,867,574 | |
| | 2,621 | | | | | T-Mobile US, Inc.* | | | 159,986 | |
| | 1,123 | | | | | Teleflex, Inc. | | | 286,343 | |
| | 13,425 | | | | | Telephone & Data Systems, Inc. | | | 376,303 | |
| | 21,633 | | | | | Texas Instruments, Inc. | | | 2,247,452 | |
| | 447 | | | | | Thermo Fisher Scientific, Inc. | | | 92,288 | |
| | 7,542 | | | | | Torchmark Corp. | | | 634,810 | |
| | 18,493 | | | | | Total System Services, Inc. | | | 1,595,206 | |
| | 13,263 | | | | | Travelers Cos., Inc. (The) | | | 1,841,700 | |
| | | | | | |
| | See accompanying Notes to the Financial Statements. | | | 165 | |
Mercer Global Low Volatility Equity Fund
Schedule of Investments (Continued)
(showing percentage of net assets)
March 31, 2018
| | | | | | | | | | |
| Shares | | | | | Description | | Value ($) | |
| | |
| | | | | | United States — continued | |
| | | |
| | 8,616 | | | | | Tupperware Brands Corp. | | | 416,842 | |
| | 22,079 | | | | | Tyson Foods, Inc. Class A | | | 1,615,962 | |
| | 38,164 | | | | | UDR, Inc. REIT | | | 1,359,402 | |
| | 27,687 | | | | | UGI Corp. | | | 1,229,857 | |
| | 13,602 | | | | | UnitedHealth Group, Inc. | | | 2,910,828 | |
| | 31,259 | | | | | US Bancorp | | | 1,578,579 | |
| | 4,243 | | | | | Varian Medical Systems, Inc.* | | | 520,404 | |
| | 16,684 | | | | | Vectren Corp. | | | 1,066,441 | |
| | 7,612 | | | | | Verizon Communications, Inc. | | | 364,006 | |
| | 154,842 | | | | | Visa, Inc. Class A‡ | | | 18,522,200 | |
| | 29,236 | | | | | Walmart, Inc. | | | 2,601,127 | |
| | 23,985 | | | | | Waste Management, Inc. | | | 2,017,618 | |
| | 1,685 | | | | | Waters Corp.* | | | 334,725 | |
| | 291,655 | | | | | Wells Fargo & Co. | | | 15,285,639 | |
| | 17,200 | | | | | WP Carey, Inc. REIT | | | 1,066,228 | |
| | 2,059 | | | | | Xcel Energy, Inc. | | | 93,643 | |
| | 27,065 | | | | | Yum China Holdings, Inc. | | | 1,123,197 | |
| | 162,429 | | | | | Yum! Brands, Inc. | | | 13,827,581 | |
| | 7,667 | | | | | Zimmer Biomet Holdings, Inc. | | | 836,010 | |
| | | | | | | | | | |
| | | | | | Total United States | | | 482,292,383 | |
| | | | | | | | | | |
| | | |
| | | | | | TOTAL COMMON STOCKS (COST $702,142,610) | | | 807,136,584 | |
| | | | | | | | | | |
| | |
| | | | | | INVESTMENT COMPANY — 0.0% | |
| | |
| | | | | | United Kingdom — 0.0% | |
| | | |
| | 264,129 | | | | | Renewables Infrastructure Group, Ltd. (The) | | | 393,701 | |
| | | | | | | | | | |
| | | |
| | | | | | TOTAL INVESTMENT COMPANY (COST $375,311) | | | 393,701 | |
| | | | | | | | | | |
| | |
| | | | | | PREFERRED STOCKS — 0.2% | |
| | |
| | | | | | Germany — 0.2% | |
| | | |
| | 9,456 | | | | | Henkel AG & Co. KGaA, 1.72% | | | 1,242,875 | |
| | | | | | | | | | |
| | |
| | | | | | Japan — 0.0% | |
| | | |
| | 72 | | | | | Shinkin Central Bank, 2.78% Class A | | | 158,285 | |
| | | | | | | | | | |
| | |
| | | | | | Sweden — 0.0% | |
| | | |
| | 2,443 | | | | | Akelius Residential Property AB, 5.93% | | | 97,740 | |
| | | | | | | | | | |
| | | |
| | | | | | TOTAL PREFERRED STOCKS (COST $1,339,870) | | | 1,498,900 | |
| | | | | | | | | | |
| | | |
| Par Value ($) | | | | | Description | | Value ($) | |
| | | |
| | | | | | SHORT-TERM INVESTMENTS — 12.3% | | | | |
| | | |
| | | | | | Bank Deposit — 11.6% | | | | |
| | | |
| | 106,985,801 | | | | | State Street Bank & Trust Euro Time Deposit, 0.28%, due 04/02/18 | | | 106,985,801 | |
| | | | | | | | | | |
| | | | | | |
| 166 | | See accompanying Notes to the Financial Statements. | | | | |
Mercer Global Low Volatility Equity Fund
Schedule of Investments (Continued)
(showing percentage of net assets)
March 31, 2018
| | | | | | | | | | |
| Par Value ($) | | | | | Description | | Value ($) | |
| | | |
| | | | | | Mutual Fund - Securities Lending Collateral — 0.5% | | | | |
| | | |
| | 4,305,160 | | | | | State Street Institutional U.S. Government Money Market Fund, Premier Class, 1.58%## ** | | | 4,305,160 | |
| | | |
| | | | | | U.S. Government and Agency Obligations — 0.2% | | | | |
| | | |
| | 2,150,000 | | | | | United States Treasury Bill, 0.99%, due 04/05/18*** ‡‡ | | | 2,149,710 | |
| | | | | | | | | | |
| | | |
| | | | | | TOTAL SHORT-TERM INVESTMENTS (COST $113,440,674) | | | 113,440,671 | |
| | | | | | | | | | |
| | | |
| | | | | | TOTAL INVESTMENTS — 100.2% (Cost $817,298,465) | | | 922,469,856 | |
| | | |
| | | | | | Other Assets and Liabilities (net) — (0.2)% | | | (1,859,743 | ) |
| | | | | | | | | | |
| | | |
| | | | | | NET ASSETS — 100.0% | | $ | 920,610,113 | |
| | | | | | | | | | |
| | | |
| | | | | | Notes to Schedule of Investments: | | | | |
| | | |
| | | | | | ADR — American Depository Receipt | | | | |
| | | |
| | | | | | REIT — Real Estate Investment Trust | | | | |
| | | |
| | | | ## | | The rate disclosed is the 7 day net yield as of March 31, 2018. | | | | |
| | | |
| | | | * | | Non-income producing security | | | | |
| | | |
| | | | ** | | Represents an investment of securities lending cash collateral. | | | | |
| | | |
| | | | *** | | All or a portion of this security is held for open futures collateral. | | | | |
| | | |
| | | | ‡ | | All or a portion of this security is out on loan. | | | | |
| | | |
| | | | ‡‡ | | Interest rate presented is yield to maturity. | | | | |
| | | | | | |
| | See accompanying Notes to the Financial Statements. | | | 167 | |
Mercer Global Low Volatility Equity Fund
Schedule of Investments (Continued)
March 31, 2018
Futures Contracts
| | | | | | | | | | | | | | | | | | | | |
Number of Contracts | | | | | Description | | | | Expiration Date | | | Notional Value | | | Market Value/ Unrealized Appreciation (Depreciation) | |
| | Buys | | | | | | | | | | | | | | | | | | | |
| | 17 | | | | | Canadian Dollar | | | | | Jun 2018 | | | $ | 1,319,625 | | | $ | 10,195 | |
| | 134 | | | | | MSCI EAFE Index | | | | | Jun 2018 | | | | 13,404,020 | | | | (202,641 | ) |
| | 165 | | | | | S&P 500 E-mini Index | | | | | Jun 2018 | | | | 21,804,750 | | | | (900,955 | ) |
| | 9 | | | | | S&P/TSX 60 Index | | | | | Jun 2018 | | | | 1,264,921 | | | | (27,000 | ) |
| | | | | | | | | | | | | | | | | | | | |
| | | | $ | (1,120,401 | ) |
| | | | | | | | | | | | | | | | | | | | |
| | | | | | |
| 168 | | See accompanying Notes to the Financial Statements. | | | | |
Mercer Global Low Volatility Equity Fund
Schedule of Investments (Continued)
March 31, 2018
| | | | | |
| Industry Sector Summary (Unaudited) | | % of Net Assets |
Retail | | | | 10.7 | |
Food | | | | 9.3 | |
Pharmaceuticals | | | | 7.4 | |
Internet | | | | 6.3 | |
Software | | | | 5.7 | |
Banks | | | | 5.5 | |
Diversified Financial Services | | | | 4.1 | |
Insurance | | | | 4.1 | |
Electric | | | | 3.9 | |
REITS | | | | 3.3 | |
Computers | | | | 3.2 | |
Health Care — Services | | | | 2.6 | |
Telecommunications | | | | 2.5 | |
Health Care — Products | | | | 2.4 | |
Beverages | | | | 1.8 | |
Aerospace & Defense | | | | 1.7 | |
Agriculture | | | | 1.6 | |
Mining | | | | 1.3 | |
Commercial Services | | | | 1.0 | |
Iron & Steel | | | | 1.0 | |
Engineering & Construction | | | | 0.7 | |
Household Products & Wares | | | | 0.7 | |
Gas | | | | 0.6 | |
Miscellaneous — Manufacturing | | | | 0.6 | |
Transportation | | | | 0.6 | |
Real Estate | | | | 0.5 | |
Chemicals | | | | 0.4 | |
Electronics | | | | 0.4 | |
Environmental Control | | | | 0.4 | |
Leisure Time | | | | 0.4 | |
Media | | | | 0.4 | |
Cosmetics & Personal Care | | | | 0.3 | |
Oil & Gas | | | | 0.3 | |
Semiconductors | | | | 0.3 | |
Water | | | | 0.3 | |
Airlines | | | | 0.2 | |
Distribution & Wholesale | | | | 0.2 | |
Food Service | | | | 0.2 | |
Lodging | | | | 0.2 | |
Machinery — Diversified | | | | 0.2 | |
Metal Fabricate & Hardware | | | | 0.2 | |
Shipbuilding | | | | 0.2 | |
Advertising | | | | 0.1 | |
Auto Parts & Equipment | | | | 0.1 | |
Apparel | | | | 0.0 | |
Biotechnology | | | | 0.0 | |
Electrical Components & Equipment | | | | 0.0 | |
Energy-Alternate Sources | | | | 0.0 | |
Holding Companies — Diversified | | | | 0.0 | |
Housewares | | | | 0.0 | |
Investment Companies | | | | 0.0 | |
Machinery — Construction & Mining | | | | 0.0 | |
Short-Term Investments and Other Assets and Liabilities (net) | | | | 12.1 | |
| | | | | |
| | | | 100.0 | % |
| | | | | |
| | | | | | |
| | See accompanying Notes to the Financial Statements. | | | 169 | |
Mercer Funds
Statements of Assets and Liabilities
March 31, 2018
| | | | | | | | | | | | | | | | | | | | |
| | | Mercer US Large
Cap Equity Fund | | Mercer US
Small/Mid Cap
Equity Fund | | Mercer Non-US
Core Equity Fund | | Mercer Core Fixed
Income Fund |
Assets | | | | | | | | | | | | | | | | | | | | |
Investments, at value(a) | | | $ | 513,845,337 | | | | $ | 925,832,131 | | | | $ | 2,199,289,823 | | | | $ | 883,821,241 | |
Foreign currency, at value(b) | | | | — | | | | | — | | | | | 4,812,857 | | | | | — | |
Cash | | | | 109,241 | | | | | 225,918 | | | | | — | | | | | 32,392 | |
Receivable for investments sold | | | | 513,924 | | | | | 3,425,043 | | | | | 18,066,731 | | | | | 7,696,407 | |
Receivable for TBA securities sold | | | | — | | | | | — | | | | | — | | | | | 1,540,246 | |
Dividend and interest receivable | | | | 572,994 | | | | | 888,792 | | | | | 6,435,630 | | | | | 5,559,916 | |
Cash collateral held at broker on open centrally cleared swap contracts | | | | — | | | | | — | | | | | — | | | | | 150,000 | |
Cash collateral held at broker on open futures contracts | | | | 500,000 | | | | | — | | | | | 3,200,000 | | | | | — | |
Unrealized appreciation on open forward foreign currency contracts | | | | — | | | | | — | | | | | 2,518 | | | | | — | |
Receivable for variation margin on open futures contracts | | | | 303,918 | | | | | 292,253 | | | | | 1,330,656 | | | | | 138,724 | |
Foreign tax reclaims receivable | | | | 184,689 | | | | | 51,298 | | | | | 3,181,677 | | | | | 1,747 | |
Securities lending income receivable | | | | 6,963 | | | | | 17,629 | | | | | 76,070 | | | | | 7,272 | |
Prepaid expenses | | | | 3,316 | | | | | 5,330 | | | | | 13,133 | | | | | 4,394 | |
| | | | | | | | | | | | | | | | | | | | |
Total assets | | | | 516,040,382 | | | | | 930,738,394 | | | | | 2,236,409,095 | | | | | 898,952,339 | |
| | | | | | | | | | | | | | | | | | | | |
| | | | |
Liabilities | | | | | | | | | | | | | | | | | | | | |
Payable for investments purchased | | | | 600,459 | | | | | 3,580,578 | | | | | 20,707,386 | | | | | 14,120,616 | |
Payable for TBA and when-issued securities purchased | | | | — | | | | | — | | | | | — | | | | | 8,374,976 | |
Payable for Fund shares repurchased | | | | — | | | | | 2,942,165 | | | | | 37,000 | | | | | 300,000 | |
Due to custodian | | | | — | | | | | — | | | | | 2,822,918 | | | | | — | |
Payable for variation margin on open centrally cleared swap contracts | | | | — | | | | | — | | | | | — | | | | | 26,561 | |
Unrealized depreciation on open forward foreign currency contracts | | | | — | | | | | — | | | | | 107,338 | | | | | — | |
Obligation to return securities lending collateral | | | | 2,508,628 | | | | | 15,377,859 | | | | | 51,739,136 | | | | | 17,738,370 | |
Payable to affiliate for: | | | | | | | | | | | | | | | | | | | | |
Advisory fees | | | | 239,710 | | | | | 710,078 | | | | | 1,299,287 | | | | | 251,848 | |
Trustees fees | | | | 9,545 | | | | | 16,920 | | | | | 39,320 | | | | | 15,402 | |
Payable for foreign capital gains tax | | | | — | | | | | — | | | | | 26,897 | | | | | — | |
Accrued expenses | | | | 124,420 | | | | | 166,743 | | | | | 331,027 | | | | | 177,865 | |
| | | | | | | | | | | | | | | | | | | | |
Total liabilities | | | | 3,482,762 | | | | | 22,794,343 | | | | | 77,110,309 | | | | | 41,005,638 | |
| | | | | | | | | | | | | | | | | | | | |
Net assets | | | $ | 512,557,620 | | | | $ | 907,944,051 | | | | $ | 2,159,298,786 | | | | $ | 857,946,701 | |
| | | | | | | | | | | | | | | | | | | | |
| | | | | | |
| 170 | | See accompanying Notes to the Financial Statements. | | | | |
Mercer Funds
Statements of Assets and Liabilities (Continued)
March 31, 2018
| | | | | | | | | | | | | | | | | | | | |
| | | Mercer US Large
Cap Equity Fund | | Mercer US
Small/Mid Cap
Equity Fund | | Mercer Non-US
Core Equity Fund | | Mercer Core Fixed
Income Fund |
Net assets consist of: | | | | | | | | | | | | | | | | | | | | |
Paid-in capital | | | $ | 396,096,947 | | | | $ | 704,861,693 | | | | $ | 1,750,642,535 | | | | $ | 872,390,372 | |
Accumulated undistributed (distributions in excess of) net investment income | | | | 1,244,427 | | | | | (623 | ) | | | | (502,673 | ) | | | | 6,112,251 | |
Accumulated net realized gain (loss) | | | | 50,938,215 | | | | | 64,790,679 | | | | | 151,650,746 | | | | | (7,716,575 | ) |
Net unrealized appreciation (depreciation) on investments, futures contracts, swap contracts, forward foreign currency contracts and foreign currencies | | | | 64,278,031 | | | | | 138,292,302 | | | | | 257,508,178 | | | | | (12,839,347 | ) |
| | | | | | | | | | | | | | | | | | | | |
Net assets | | | $ | 512,557,620 | | | | $ | 907,944,051 | | | | $ | 2,159,298,786 | | | | $ | 857,946,701 | |
| | | | | | | | | | | | | | | | | | | | |
| | | | |
Net assets attributable to: | | | | | | | | | | | | | | | | | | | | |
Class Y-3 shares | | | $ | 512,557,620 | | | | $ | 907,944,051 | | | | $ | 2,159,298,786 | | | | $ | 857,946,701 | |
| | | | | | | | | | | | | | | | | | | | |
| | | | |
Shares outstanding: | | | | | | | | | | | | | | | | | | | | |
Class Y-3 | | | | 47,237,834 | | | | | 73,890,010 | | | | | 187,541,682 | | | | | 86,689,434 | |
| | | | | | | | | | | | | | | | | | | | |
| | | | |
Net asset value per share: | | | | | | | | | | | | | | | | | | | | |
Class Y-3 | | | $ | 10.85 | | | | $ | 12.29 | | | | $ | 11.51 | | | | $ | 9.90 | |
| | | | | | | | | | | | | | | | | | | | |
| | | | |
(a) Investments, at cost | | | $ | 448,992,681 | | | | $ | 786,557,766 | | | | $ | 1,939,678,752 | | | | $ | 898,409,085 | |
| | | | | | | | | | | | | | | | | | | | |
(b) Foreign currency, at cost | | | $ | — | | | | $ | — | | | | $ | 4,829,579 | | | | $ | — | |
| | | | | | | | | | | | | | | | | | | | |
| | | | | | |
| | See accompanying Notes to the Financial Statements. | | | 171 | |
Mercer Funds
Statements of Assets and Liabilities (Continued)
March 31, 2018
| | | | | | | | | | | | | | | |
| | | Mercer
Opportunistic Fixed
Income Fund | | Mercer Emerging
Markets Equity
Fund | | Mercer Global Low
Volatility Equity
Fund |
Assets | | | | | | | | | | | | | | | |
Investments, at value(a) | | | $ | 656,283,589 | | | | $ | 1,117,126,600 | | | | $ | 922,469,856 | |
Foreign currency, at value(b) | | | | 537,599 | | | | | 2,361,633 | | | | | 706,725 | |
Cash | | | | 3,596,699 | | | | | 571,484 | | | | | 258,159 | |
Cash collateral segregated on open forward foreign currency contracts | | | | 4,610,000 | | | | | — | | | | | — | |
Receivable for investments sold | | | | — | | | | | 4,664,970 | | | | | 1,763,660 | |
Receivable for Fund shares sold | | | | — | | | | | 195,990 | | | | | — | |
Dividend and interest receivable | | | | 11,641,136 | | | | | 2,783,694 | | | | | 1,567,432 | |
Cash collateral held at broker on open forward foreign currency contracts | | | | — | | | | | 17,787 | | | | | — | |
Cash collateral held at broker on open futures contracts | | | | 553,589 | | | | | 1,689,313 | | | | | — | |
Unrealized appreciation on open forward foreign currency contracts | | | | 3,268,793 | | | | | 1,957,838 | | | | | — | |
Receivable for variation margin on open futures contracts | | | | 1,056,284 | | | | | 769,931 | | | | | 437,647 | |
Synthetic futures, at value | | | | — | | | | | 846,906 | | | | | — | |
Foreign tax reclaims receivable | | | | 143,215 | | | | | 58,412 | | | | | 1,007,376 | |
Securities lending income receivable | | | | 9,960 | | | | | 13,400 | | | | | 16,071 | |
Prepaid expenses | | | | 3,181 | | | | | 9,093 | | | | | 7,300 | |
| | | | | | | | | | | | | | | |
Total assets | | | | 681,704,045 | | | | | 1,133,067,051 | | | | | 928,234,226 | |
| | | | | | | | | | | | | | | |
| | | |
Liabilities | | | | | | | | | | | | | | | |
Payable for investments purchased | | | | 4,150,142 | | | | | 4,324,263 | | | | | 2,489,666 | |
Payable for TBA and when-issued securities purchased | | | | 3,429,850 | | | | | — | | | | | — | |
Payable for variation margin on open futures contracts | | | | — | | | | | 123,517 | | | | | — | |
Payable for Fund shares repurchased | | | | 80,000 | | | | | 60,007 | | | | | 54,500 | |
Payable for closed synthetic futures contracts | | | | — | | | | | 168,030 | | | | | — | |
Synthetic futures, at value | | | | — | | | | | 392,086 | | | | | — | |
Cash collateral on open forward foreign currency contracts due to broker | | | | 1,000,000 | | | | | — | | | | | — | |
Unrealized depreciation on open forward foreign currency contracts | | | | 3,477,339 | | | | | 2,049,334 | | | | | — | |
Obligation to return securities lending collateral | | | | 21,465,843 | | | | | 8,417,141 | | | | | 4,305,160 | |
Payable to affiliate for: | | | | | | | | | | | | | | | |
Advisory fees | | | | 429,491 | | | | | 759,096 | | | | | 592,153 | |
Trustees fees | | | | 11,262 | | | | | 20,578 | | | | | 16,873 | |
Payable for foreign capital gains tax | | | | 251,414 | | | | | 304,844 | | | | | — | |
Accrued expenses | | | | 186,280 | | | | | 320,865 | | | | | 165,761 | |
| | | | | | | | | | | | | | | |
Total liabilities | | | | 34,481,621 | | | | | 16,939,761 | | | | | 7,624,113 | |
| | | | | | | | | | | | | | | |
Net assets | | | $ | 647,222,424 | | | | $ | 1,116,127,290 | | | | $ | 920,610,113 | |
| | | | | | | | | | | | | | | |
| | | | | | |
| 172 | | See accompanying Notes to the Financial Statements. | | | | |
Mercer Funds
Statements of Assets and Liabilities (Continued)
March 31, 2018
| | | | | | | | | | | | | | | |
| | | Mercer
Opportunistic Fixed
Income Fund | | Mercer Emerging
Markets Equity
Fund | | Mercer Global Low
Volatility Equity
Fund |
Net assets consist of: | | | | | | | | | | | | | | | |
Paid-in capital | | | $ | 641,227,016 | | | | $ | 880,995,404 | | | | $ | 817,976,309 | |
Accumulated undistributed (distributions in excess of) net investment income | | | | 16,141,517 | | | | | (1,949,655 | ) | | | | (661,448 | ) |
Accumulated net realized gain (loss) | | | | (11,753,152 | ) | | | | 132,525,936 | | | | | (766,738 | ) |
Net unrealized appreciation on investments, futures contracts, forward foreign currency contracts and foreign currencies | | | | 1,607,043 | | | | | 104,555,605 | | | | | 104,061,990 | |
| | | | | | | | | | | | | | | |
Net assets | | | $ | 647,222,424 | | | | $ | 1,116,127,290 | | | | $ | 920,610,113 | |
| | | | | | | | | | | | | | | |
| | | |
Net assets attributable to: | | | | | | | | | | | | | | | |
Class Y-3 shares | | | $ | 647,222,424 | | | | $ | 1,116,127,290 | | | | $ | 920,610,113 | |
| | | | | | | | | | | | | | | |
| | | |
Shares outstanding: | | | | | | | | | | | | | | | |
Class Y-3 | | | | 66,069,563 | | | | | 95,001,893 | | | | | 74,961,977 | |
| | | | | | | | | | | | | | | |
| | | |
Net asset value per share: | | | | | | | | | | | | | | | |
Class Y-3 | | | $ | 9.80 | | | | $ | 11.75 | | | | $ | 12.28 | |
| | | | | | | | | | | | | | | |
| | | |
(a) Investments, at cost | | | $ | 654,322,277 | | | | $ | 1,012,933,645 | | | | $ | 817,298,465 | |
| | | | | | | | | | | | | | | |
(b) Foreign currency, at cost | | | $ | 542,774 | | | | $ | 2,361,036 | | | | $ | 704,686 | |
| | | | | | | | | | | | | | | |
| | | | | | |
| | See accompanying Notes to the Financial Statements. | | | 173 | |
Mercer Funds
Statements of Operations
For the Year Ended March 31, 2018
| | | | | | | | | | | | | | | | | | | | |
| | | Mercer US Large
Cap Equity Fund | | Mercer US
Small/Mid Cap
Equity Fund | | Mercer Non-US
Core Equity Fund | | Mercer Core Fixed
Income Fund |
Investment Income: | | | | | | | | | | | | | | | | | | | | |
Interest | | | $ | 30,663 | | | | $ | 80,742 | | | | $ | 179,138 | | | | $ | 25,846,077 | |
Dividends | | | | 11,166,711 | | | | | 11,763,325 | | | | | 61,462,934 | | | | | — | |
Securities lending income | | | | 96,753 | | | | | 396,238 | | | | | 680,030 | | | | | 65,925 | |
Withholding taxes | | | | (125,167 | ) | | | | (19,473 | ) | | | | (4,954,378 | ) | | | | (2,775 | ) |
Other income | | | | 7,866 | | | | | 33,026 | | | | | 2,020 | | | | | 44,927 | |
| | | | | | | | | | | | | | | | | | | | |
Total investment income | | | | 11,176,826 | | | | | 12,253,858 | | | | | 57,369,744 | | | | | 25,954,154 | |
| | | | | | | | | | | | | | | | | | | | |
| | | | |
Expenses: | | | | | | | | | | | | | | | | | | | | |
Advisory fees | | | | 3,139,093 | | | | | 8,662,902 | | | | | 16,689,055 | | | | | 2,873,107 | |
Custodian and fund accounting fees | | | | 169,571 | | | | | 182,422 | | | | | 1,151,691 | | | | | 316,696 | |
Audit fees | | | | 61,070 | | | | | 71,156 | | | | | 183,336 | | | | | 104,235 | |
Transfer agent fees | | | | 21,994 | | | | | 22,349 | | | | | 22,249 | | | | | 21,848 | |
Legal fees | | | | 54,845 | | | | | 98,597 | | | | | 217,513 | | | | | 79,729 | |
Trustees fees | | | | 33,276 | | | | | 55,191 | | | | | 133,279 | | | | | 47,553 | |
Registration fees | | | | 8,905 | | | | | 24,672 | | | | | 15,966 | | | | | 24,051 | |
Interest expense | | | | — | | | | | — | | | | | 10 | | | | | — | |
Miscellaneous | | | | 83,375 | | | | | 101,229 | | | | | 297,769 | | | | | 106,948 | |
| | | | | | | | | | | | | | | | | | | | |
Total expenses | | | | 3,572,129 | | | | | 9,218,518 | | | | | 18,710,868 | | | | | 3,574,167 | |
| | | | | | | | | | | | | | | | | | | | |
Net investment income | | | | 7,604,697 | | | | | 3,035,340 | | | | | 38,658,876 | | | | | 22,379,987 | |
| | | | | | | | | | | | | | | | | | | | |
| | | | |
Realized and Unrealized Gain (Loss): | | | | | | | | | | | | | | | | | | | | |
Net realized gain (loss) on: | | | | | | | | | | | | | | | | | | | | |
Investments | | | | 102,112,973 | | | | | 113,792,115 | | | | | 283,705,746 | | | | | 636,466 | |
Purchased option contracts | | | | — | | | | | — | | | | | — | | | | | (320,028 | ) |
Swap contracts | | | | — | | | | | — | | | | | — | | | | | 5,900 | |
Closed futures contracts | | | | 2,077,277 | | | | | 4,157,909 | | | | | 14,398,086 | | | | | (1,039,395 | ) |
Written option contracts | | | | — | | | | | — | | | | | — | | | | | 157,878 | |
Forward foreign currency contracts | | | | — | | | | | — | | | | | 122,300 | | | | | — | |
Foreign currency related transactions | | | | 386 | | | | | 59 | | | | | (67,359 | ) | | | | (11,460 | ) |
| | | | | | | | | | | | | | | | | | | | |
Net realized gain (loss) | | | | 104,190,636 | | | | | 117,950,083 | | | | | 298,158,773 | | | | | (570,639 | ) |
| | | | | | | | | | | | | | | | | | | | |
Change in net unrealized appreciation (depreciation) on: | | | | | | | | | | | | | | | | | | | | |
Investments | | | | (11,925,378 | ) | | | | (2,417,491 | ) | | | | 79,545,324 | | | | | (9,644,642 | ) |
Purchased option contracts | | | | — | | | | | — | | | | | — | | | | | 2,072 | |
TBA Sale Commitments | | | | — | | | | | — | | | | | — | | | | | 5,859 | |
Swap contracts | | | | — | | | | | — | | | | | — | | | | | 718,196 | |
Open futures contracts | | | | (572,245 | ) | | | | (1,218,200 | ) | | | | (2,594,886 | ) | | | | 588,751 | |
Written option contracts | | | | — | | | | | — | | | | | — | | | | | (1,800 | ) |
Forward foreign currency contracts | | | | — | | | | | — | | | | | (123,227 | ) | | | | — | |
Foreign currency related translations | | | | 15 | | | | | 2,099 | | | | | 207,417 | | | | | 7,214 | |
| | | | | | | | | | | | | | | | | | | | |
Change in net unrealized appreciation (depreciation) | | | | (12,497,608 | ) | | | | (3,633,592 | ) | | | | 77,034,628 | | | | | (8,324,350 | ) |
| | | | | | | | | | | | | | | | | | | | |
Net realized and unrealized gain (loss) | | | | 91,693,028 | | | | | 114,316,491 | | | | | 375,193,401 | | | | | (8,894,989 | ) |
| | | | | | | | | | | | | | | | | | | | |
| | | | |
Net increase in net assets resulting from operations | | | $ | 99,297,725 | | | | $ | 117,351,831 | | | | $ | 413,852,277 | | | | $ | 13,484,998 | |
| | | | | | | | | | | | | | | | | | | | |
| | | | | | |
| 174 | | See accompanying Notes to the Financial Statements. | | | | |
Mercer Funds
Statements of Operations (Continued)
For the Year Ended March 31, 2018
| | | | | | | | | | | | | | | |
| | | Mercer
Opportunistic Fixed
Income Fund | | Mercer Emerging
Markets Equity
Fund | | Mercer Global Low
Volatility Equity
Fund |
Investment Income: | | | | | | | | | | | | | | | |
Interest | | | $ | 38,861,973 | | | | $ | 240,408 | | | | $ | 164,937 | |
Dividends | | | | 29,345 | | | | | 41,516,076 | | | | | 25,724,922 | |
Securities lending income | | | | 160,608 | | | | | 114,625 | | | | | 147,009 | |
Withholding taxes | | | | (450,685 | ) | | | | (4,422,869 | ) | | | | (1,238,586 | ) |
Other income | | | | 132,984 | | | | | 277 | | | | | — | |
| | | | | | | | | | | | | | | |
Total investment income | | | | 38,734,225 | | | | | 37,448,517 | | | | | 24,798,282 | |
| | | | | | | | | | | | | | | |
| | | |
Expenses: | | | | | | | | | | | | | | | |
Advisory fees | | | | 4,833,867 | | | | | 11,275,103 | | | | | 8,446,764 | |
Custodian and fund accounting fees | | | | 428,325 | | | | | 1,802,590 | | | | | 334,925 | |
Audit fees | | | | 86,972 | | | | | 247,077 | | | | | 90,624 | |
Transfer agent fees | | | | 22,267 | | | | | 23,473 | | | | | 21,753 | |
Legal fees | | | | 55,937 | | | | | 135,880 | | | | | 109,641 | |
Trustees fees | | | | 34,615 | | | | | 81,822 | | | | | 63,447 | |
Registration fees | | | | 16,399 | | | | | 16,647 | | | | | 15,149 | |
Interest expense | | | | 4,965 | | | | | 60,070 | | | | | 125 | |
Miscellaneous | | | | 85,634 | | | | | 191,322 | | | | | 150,878 | |
| | | | | | | | | | | | | | | |
Total expenses | | | | 5,568,981 | | | | | 13,833,984 | | | | | 9,233,306 | |
| | | | | | | | | | | | | | | |
Net investment income | | | | 33,165,244 | | | | | 23,614,533 | | | | | 15,564,976 | |
| | | | | | | | | | | | | | | |
| | | |
Realized and Unrealized Gain (Loss): | | | | | | | | | | | | | | | |
Net realized gain (loss) on: | | | | | | | | | | | | | | | |
Investments | | | | (460,611 | ) | | | | 240,440,627 | | | | | 60,323,222 | |
In-kind redemptions | | | | — | | | | | 75,577,986 | | | | | 81,952,311 | |
Closed futures contracts | | | | 1,494,242 | | | | | 27,176,024 | | | | | 9,205,761 | |
Forward foreign currency contracts | | | | 7,247,205 | | | | | (1,603,325 | ) | | | | — | |
Foreign currency related transactions | | | | (1,104,368 | ) | | | | (226,938 | ) | | | | (84,123 | ) |
| | | | | | | | | | | | | | | |
Net realized gain | | | | 7,176,468 | | | | | 341,364,374 | | | | | 151,397,171 | |
| | | | | | | | | | | | | | | |
Change in net unrealized appreciation (depreciation) on: | | | | | | | | | | | | | | | |
Investments | | | | 14,561,713 | | | | | (47,645,580 | ) | | | | (16,367,262 | ) |
Open futures contracts | | | | 108,249 | | | | | (1,883,941 | ) | | | | (1,393,799 | ) |
Forward foreign currency contracts | | | | (875,636 | ) | | | | (74,546 | ) | | | | — | |
Foreign currency related translations | | | | 115,224 | | | | | 2,115,549 | | | | | 50,039 | |
| | | | | | | | | | | | | | | |
Change in net unrealized appreciation (depreciation) | | | | 13,909,550 | | | | | (47,488,518 | ) | | | | (17,711,022 | ) |
| | | | | | | | | | | | | | | |
Net realized and unrealized gain (loss) | | | | 21,086,018 | | | | | 293,875,856 | | | | | 133,686,149 | |
| | | | | | | | | | | | | | | |
| | | |
Net increase in net assets resulting from operations | | | $ | 54,251,262 | | | | $ | 317,490,389 | | | | $ | 149,251,125 | |
| | | | | | | | | | | | | | | |
| | | | | | |
| | See accompanying Notes to the Financial Statements. | | | 175 | |
Mercer Funds
Statements of Changes in Net Assets
| | | | | | | | | | | | | | | | | | | | |
| | | Mercer US Large Cap
Equity Fund | | Mercer US Small/Mid
Cap Equity Fund |
| | | Year Ended
March 31, 2018 | | Year Ended
March 31, 2017 | | Year Ended
March 31, 2018 | | Year Ended
March 31, 2017 |
Increase (decrease) in Net Assets: | | | | | | | | | | | | | | | | | | | | |
Operations: | | | | | | | | | | | | | | | | | | | | |
Net investment income (loss) | | | $ | 7,604,697 | | | | $ | 6,011,362 | | | | $ | 3,035,340 | | | | $ | 3,352,783 | |
Net realized gain (loss) | | | | 104,190,636 | | | | | 21,505,233 | | | | | 117,950,083 | | | | | 67,704,689 | |
Change in net unrealized appreciation (depreciation) | | | | (12,497,608 | ) | | | | 75,394,273 | | | | | (3,633,592 | ) | | | | 112,674,843 | |
| | | | | | | | | | | | | | | | | | | | |
Net increase in net assets resulting from operations | | | | 99,297,725 | | | | | 102,910,868 | | | | | 117,351,831 | | | | | 183,732,315 | |
| | | | | | | | | | | | | | | | | | | | |
Distributions to shareholders from: | | | | | | | | | | | | | | | | | | | | |
Net investment income | | | | | | | | | | | | | | | | | | | | |
Class Y-3 | | | | (7,533,062 | ) | | | | (4,340,709 | ) | | | | (4,249,847 | ) | | | | (6,503,271 | ) |
| | | | | | | | | | | | | | | | | | | | |
Total distributions from net investment income | | | | (7,533,062 | ) | | | | (4,340,709 | ) | | | | (4,249,847 | ) | | | | (6,503,271 | ) |
| | | | | | | | | | | | | | | | | | | | |
Net realized gains | | | | | | | | | | | | | | | | | | | | |
Class Y-3 | | | | (64,942,314 | ) | | | | (16,932,342 | ) | | | | (90,627,480 | ) | | | | (22,642,529 | ) |
| | | | | | | | | | | | | | | | | | | | |
Total distributions from net realized gains | | | | (64,942,314 | ) | | | | (16,932,342 | ) | | | | (90,627,480 | ) | | | | (22,642,529 | ) |
| | | | | | | | | | | | | | | | | | | | |
Net share transactions (See Note 7): | | | | | | | | | | | | | | | | | | | | |
Class Y-3 | | | | (115,323,720 | ) | | | | 218,161,247 | | | | | (86,986,239 | ) | | | | 390,443,708 | |
| | | | | | | | | | | | | | | | | | | | |
Increase (decrease) in net assets resulting from net shares transactions | | | | (115,323,720 | ) | | | | 218,161,247 | | | | | (86,986,239 | ) | | | | 390,443,708 | |
| | | | | | | | | | | | | | | | | | | | |
Net increase (decrease) in net assets | | | | (88,501,371 | ) | | | | 299,799,064 | | | | | (64,511,735 | ) | | | | 545,030,223 | |
Net assets: | | | | | | | | | | | | | | | | | | | | |
Beginning of year | | | | 601,058,991 | | | | | 301,259,927 | | | | | 972,455,786 | | | | | 427,425,563 | |
| | | | | | | | | | | | | | | | | | | | |
End of year | | | $ | 512,557,620 | | | | $ | 601,058,991 | | | | $ | 907,944,051 | | | | $ | 972,455,786 | |
| | | | | | | | | | | | | | | | | | | | |
Undistributed (distributions in excess of) net investment income included in net assets at end of year | | | $ | 1,244,427 | | | | $ | 1,596,941 | | | | $ | (623 | ) | | | $ | (884 | ) |
| | | | | | | | | | | | | | | | | | | | |
| | | | | | |
| 176 | | See accompanying Notes to the Financial Statements. | | | | |
Mercer Funds
Statements of Changes in Net Assets (Continued)
| | | | | | | | | | | | | | | | | | | | |
| | | Mercer Non-US Core
Equity Fund | | Mercer Core Fixed
Income Fund |
| | | Year Ended
March 31, 2018 | | Year Ended
March 31, 2017 | | Year Ended
March 31, 2018 | | Year Ended
March 31, 2017 |
Increase (decrease) in Net Assets: | | | | | | | | | | | | | | | | | | | | |
Operations: | | | | | | | | | | | | | | | | | | | | |
Net investment income (loss) | | | $ | 38,658,876 | | | | $ | 37,553,915 | | | | $ | 22,379,987 | | | | $ | 20,075,933 | |
Net realized gain (loss) | | | | 298,158,773 | | | | | 22,455,558 | | | | | (570,639 | ) | | | | 862,609 | |
Change in net unrealized appreciation (depreciation) | | | | 77,034,628 | | | | | 155,153,562 | | | | | (8,324,350 | ) | | | | (9,988,310 | ) |
| | | | | | | | | | | | | | | | | | | | |
Net increase in net assets resulting from operations | | | | 413,852,277 | | | | | 215,163,035 | | | | | 13,484,998 | | | | | 10,950,232 | |
| | | | | | | | | | | | | | | | | | | | |
Distributions to shareholders from: | | | | | | | | | | | | | | | | | | | | |
Net investment income | | | | | | | | | | | | | | | | | | | | |
Class Y-3 | | | | (45,496,553 | ) | | | | (37,187,651 | ) | | | | (19,914,504 | ) | | | | (21,073,131 | ) |
| | | | | | | | | | | | | | | | | | | | |
Total distributions from net investment income | | | | (45,496,553 | ) | | | | (37,187,651 | ) | | | | (19,914,504 | ) | | | | (21,073,131 | ) |
| | | | | | | | | | | | | | | | | | | | |
Net realized gains | | | | | | | | | | | | | | | | | | | | |
Class Y-3 | | | | (125,293,638 | ) | | | | — | | | | | — | | | | | (8,462,989 | ) |
| | | | | | | | | | | | | | | | | | | | |
Total distributions from net realized gains | | | | (125,293,638 | ) | | | | — | | | | | — | | | | | (8,462,989 | ) |
| | | | | | | | | | | | | | | | | | | | |
Net share transactions (See Note 7): | | | | | | | | | | | | | | | | | | | | |
Class Y-3 | | | | (354,867,675 | ) | | | | 151,494,721 | | | | | 98,773,232 | | | | | 313,880 | |
| | | | | | | | | | | | | | | | | | | | |
Increase (decrease) in net assets resulting from net shares transactions | | | | (354,867,675 | ) | | | | 151,494,721 | | | | | 98,773,232 | | | | | 313,880 | |
| | | | | | | | | | | | | | | | | | | | |
Net increase (decrease) in net assets | | | | (111,805,589 | ) | | | | 329,470,105 | | | | | 92,343,726 | | | | | (18,272,008 | ) |
Net assets: | | | | | | | | | | | | | | | | | | | | |
Beginning of year | | | | 2,271,104,375 | | | | | 1,941,634,270 | | | | | 765,602,975 | | | | | 783,874,983 | |
| | | | | | | | | | | | | | | | | | | | |
End of year | | | $ | 2,159,298,786 | | | | $ | 2,271,104,375 | | | | $ | 857,946,701 | | | | $ | 765,602,975 | |
| | | | | | | | | | | | | | | | | | | | |
Undistributed (distributions in excess of) net investment income included in net assets at end of year | | | $ | (502,673 | ) | | | $ | (1,107,717 | ) | | | $ | 6,112,251 | | | | $ | 3,400,638 | |
| | | | | | | | | | | | | | | | | | | | |
| | | | | | |
| | See accompanying Notes to the Financial Statements. | | | 177 | |
Mercer Funds
Statements of Changes in Net Assets (Continued)
| | | | | | | | | | | | | | | | | | | | |
| | | Mercer Opportunistic
Fixed Income Fund | | Mercer Emerging
Markets Equity Fund |
| | | Year Ended
March 31, 2018 | | Year Ended
March 31, 2017 | | Year Ended
March 31, 2018 | | Year Ended
March 31, 2017 |
Increase (decrease) in Net Assets: | | | | | | | | | | | | | | | | | | | | |
Operations: | | | | | | | | | | | | | | | | | | | | |
Net investment income (loss) | | | $ | 33,165,244 | | | | $ | 28,430,898 | | | | $ | 23,614,533 | | | | $ | 19,614,437 | |
Net realized gain (loss) | | | | 7,176,468 | | | | | (23,937,398 | ) | | | | 341,364,374 | | | | | 4,480,393 | |
Change in net unrealized appreciation (depreciation) | | | | 13,909,550 | | | | | 41,657,609 | | | | | (47,488,518 | ) | | | | 177,622,353 | |
| | | | | | | | | | | | | | | | | | | | |
Net increase in net assets resulting from operations | | | | 54,251,262 | | | | | 46,151,109 | | | | | 317,490,389 | | | | | 201,717,183 | |
| | | | | | | | | | | | | | | | | | | | |
Distributions to shareholders from: | | | | | | | | | | | | | | | | | | | | |
Net investment income | | | | | | | | | | | | | | | | | | | | |
Class Y-3 | | | | (23,966,710 | ) | | | | — | | | | | (36,403,991 | ) | | | | (26,250,811 | ) |
| | | | | | | | | | | | | | | | | | | | |
Total distributions from net investment income | | | | (23,966,710 | ) | | | | — | | | | | (36,403,991 | ) | | | | (26,250,811 | ) |
| | | | | | | | | | | | | | | | | | | | |
Net share transactions (See Note 7): | | | | | | | | | | | | | | | | | | | | |
Class Y-3 | | | | 58,079,251 | | | | | 98,445,823 | | | | | (646,948,904 | ) | | | | 156,387,071 | |
| | | | | | | | | | | | | | | | | | | | |
Increase (decrease) in net assets resulting from net shares transactions | | | | 58,079,251 | | | | | 98,445,823 | | | | | (646,948,904 | ) | | | | 156,387,071 | |
| | | | | | | | | | | | | | | | | | | | |
Net increase (decrease) in net assets | | | | 88,363,803 | | | | | 144,596,932 | | | | | (365,862,506 | ) | | | | 331,853,443 | |
Net assets: | | | | | | | | | | | | | | | | | | | | |
Beginning of year | | | | 558,858,621 | | | | | 414,261,689 | | | | | 1,481,989,796 | | | | | 1,150,136,353 | |
| | | | | | | | | | | | | | | | | | | | |
End of year | | | $ | 647,222,424 | | | | $ | 558,858,621 | | | | $ | 1,116,127,290 | | | | $ | 1,481,989,796 | |
| | | | | | | | | | | | | | | | | | | | |
Undistributed (distributions in excess of) net investment income included in net assets at end of year | | | $ | 16,141,517 | | | | $ | 4,387,125 | | | | $ | (1,949,655 | ) | | | $ | 10,803,027 | |
| | | | | | | | | | | | | | | | | | | | |
| | | | | | |
| 178 | | See accompanying Notes to the Financial Statements. | | | | |
Mercer Funds
Statements of Changes in Net Assets (Continued)
| | | | | | | | | | |
| | | Mercer Global Low
Volatility Equity Fund |
| | | Year Ended
March 31, 2018 | | Year Ended
March 31, 2017 |
Increase (decrease) in Net Assets: | | | | | | | | | | |
Operations: | | | | | | | | | | |
Net investment income (loss) | | | $ | 15,564,976 | | | | $ | 14,491,313 | |
Net realized gain (loss) | | | | 151,397,171 | | | | | 33,621,829 | |
Change in net unrealized appreciation (depreciation) | | | | (17,711,022 | ) | | | | 66,569,212 | |
| | | | | | | | | | |
Net increase in net assets resulting from operations | | | | 149,251,125 | | | | | 114,682,354 | |
| | | | | | | | | | |
Distributions to shareholders from: | | | | | | | | | | |
Net investment income | | | | | | | | | | |
Class Y-3 | | | | (18,085,932 | ) | | | | (12,612,013 | ) |
| | | | | | | | | | |
Total distributions from net investment income | | | | (18,085,932 | ) | | | | (12,612,013 | ) |
| | | | | | | | | | |
Net realized gains | | | | | | | | | | |
Class Y-3 | | | | (128,437,108 | ) | | | | (28,619,153 | ) |
| | | | | | | | | | |
Total distributions from net realized gains | | | | (128,437,108 | ) | | | | (28,619,153 | ) |
| | | | | | | | | | |
Net share transactions (See Note 7): | | | | | | | | | | |
Class Y-3 | | | | (331,977,749 | ) | | | | 224,023,068 | |
| | | | | | | | | | |
Increase (decrease) in net assets resulting from net shares transactions | | | | (331,977,749 | ) | | | | 224,023,068 | |
| | | | | | | | | | |
Net increase (decrease) in net assets | | | | (329,249,664 | ) | | | | 297,474,256 | |
Net assets: | | | | | | | | | | |
Beginning of year | | | | 1,249,859,777 | | | | | 952,385,521 | |
| | | | | | | | | | |
End of year | | | $ | 920,610,113 | | | | $ | 1,249,859,777 | |
| | | | | | | | | | |
Undistributed (distributions in excess of) net investment income included in net assets at end of year | | | $ | (661,448 | ) | | | $ | 3,071,515 | |
| | | | | | | | | | |
| | | | | | |
| | See accompanying Notes to the Financial Statements. | | | 179 | |
Mercer US Large Cap Equity Fund
Financial Highlights
| | | | | | | | | | | | | | | | | | | | | | | | | |
| | | Year Ended
03/31/18 | | Year Ended
03/31/17 | | Year Ended
03/31/16 | | Year Ended
03/31/15 | | Year Ended
03/31/14 |
For a Class Y-3 Share Outstanding Throughout Each Period: | | | | | | | | | | | | | | | | | | | | | | | | | |
| | | | | |
Net asset value at beginning of year | | | $ | 10.61 | | | | $ | 9.34 | | | | $ | 11.11 | | | | $ | 13.16 | | | | $ | 13.56 | |
| | | | | | | | | | | | | | | | | | | | | | | | | |
| | | | | |
Net investment income† | | | | 0.14 | | | | | 0.11 | (a) | | | | 0.04 | | | | | 0.05 | | | | | 0.07 | |
Net realized and unrealized gain (loss) on investments | | | | 1.68 | | | | | 1.54 | | | | | (0.43 | ) | | | | 1.63 | | | | | 3.11 | |
| | | | | | | | | | | | | | | | | | | | | | | | | |
| | | | | |
Total from investment operations | | | | 1.82 | | | | | 1.65 | | | | | (0.39 | ) | | | | 1.68 | | | | | 3.18 | |
| | | | | | | | | | | | | | | | | | | | | | | | | |
Less dividends and distributions: | |
From net investment income | | | | (0.16 | ) | | | | (0.08 | ) | | | | (0.05 | ) | | | | (0.04 | ) | | | | (0.09 | ) |
From net realized gain on investments | | | | (1.42 | ) | | | | (0.30 | ) | | | | (1.33 | ) | | | | (3.69 | ) | | | | (3.49 | ) |
| | | | | | | | | | | | | | | | | | | | | | | | | |
| | | | | |
Total dividends and distributions | | | | (1.58 | ) | | | | (0.38 | ) | | | | (1.38 | ) | | | | (3.73 | ) | | | | (3.58 | ) |
| | | | | | | | | | | | | | | | | | | | | | | | | |
| | | | | |
Net asset value at end of year | | | $ | 10.85 | | | | $ | 10.61 | | | | $ | 9.34 | | | | $ | 11.11 | | | | $ | 13.16 | |
| | | | | | | | | | | | | | | | | | | | | | | | | |
Total investment return | | | | 17.26 | % | | | | 17.74 | % | | | | (4.09 | )% | | | | 13.63 | %(b) | | | | 23.99 | %(b) |
| | | | | |
Ratios/Supplemental Data: | | | | | | | | | | | | | | | | | | | | | | | | | |
Net investment income to average net assets | | | | 1.28 | % | | | | 1.14 | %(a) | | | | 0.33 | % | | | | 0.37 | % | | | | 0.48 | % |
Net expenses to average daily net assets | | | | 0.60 | % | | | | 0.61 | %(d) | | | | 0.63 | %(c) | | | | 0.60 | %(c) | | | | 0.57 | % |
Total expenses (before reductions and reimbursements) to average daily net assets | | | | 0.60 | % | | | | 0.61 | % | | | | 0.63 | %(c) | | | | 0.63 | %(c) | | | | 0.63 | % |
Portfolio turnover rate | | | | 64 | % | | | | 84 | % | | | | 66 | % | | | | 118 | % | | | | 50 | % |
Net assets at end of year (in 000’s) | | | $ | 512,558 | | | | $ | 601,059 | | | | $ | 301,260 | | | | $ | 362,698 | | | | $ | 358,862 | |
| (a) | Includes a non-recurring refund for overbilling of prior years’ custody fees, a portion of which was paid to the Advisor for prior years’ reimbursement of expenses. This amounted to less than $0.01 per share and less than 0.01% of average net assets. |
| (b) | The total return would have been lower had certain expenses not been reduced or reimbursed during the periods shown. |
| (c) | Includes interest expense that amounts to less than 0.01%. |
| (d) | Includes a repayment to the Advisor, referenced above, for prior years’ reimbursement of expenses. The amount is less than 0.01% of average net assets. |
| † | Computed using average shares outstanding throughout the year. |
| | | | | | |
| 180 | | See accompanying Notes to the Financial Statements. | | | | |
Mercer US Small/Mid Cap Equity Fund
Financial Highlights (Continued)
| | | | | | | | | | | | | | | | | | | | | | | | | |
| | | Year Ended
03/31/18 | | Year Ended
03/31/17 | | Year Ended
03/31/16 | | Year Ended
03/31/15 | | Year Ended
03/31/14 |
For a Class Y-3 Share Outstanding Throughout Each Period: | | | | | | | | | | | | | | | | | | | | | | | | | |
| | | | | |
Net asset value at beginning of year | | | $ | 12.12 | | | | $ | 10.30 | | | | $ | 12.23 | | | | $ | 12.44 | | | | $ | 11.94 | |
| | | | | | | | | | | | | | | | | | | | | | | | | |
| | | | | |
Net investment income (loss)† | | | | 0.04 | | | | | 0.04 | (a) | | | | (0.02 | ) | | | | (0.03 | ) | | | | (0.02 | ) |
Net realized and unrealized gain (loss) on investments | | | | 1.46 | | | | | 2.13 | | | | | (1.28 | ) | | | | 1.32 | | | | | 2.63 | |
| | | | | | | | | | | | | | | | | | | | | | | | | |
| | | | | |
Total from investment operations | | | | 1.50 | | | | | 2.17 | | | | | (1.30 | ) | | | | 1.29 | | | | | 2.61 | |
| | | | | | | | | | | | | | | | | | | | | | | | | |
Less dividends and distributions: | |
From net investment income | | | | (0.06 | ) | | | | (0.08 | ) | | | | — | | | | | — | | | | | — | |
From net realized gain on investments | | | | (1.27 | ) | | | | (0.27 | ) | | | | (0.63 | ) | | | | (1.50 | ) | | | | (2.11 | ) |
| | | | | | | | | | | | | | | | | | | | | | | | | |
| | | | | |
Total dividends and distributions | | | | (1.33 | ) | | | | (0.35 | ) | | | | (0.63 | ) | | | | (1.50 | ) | | | | (2.11 | ) |
| | | | | | | | | | | | | | | | | | | | | | | | | |
| | | | | |
Net asset value at end of year | | | $ | 12.29 | | | | $ | 12.12 | | | | $ | 10.30 | | | | $ | 12.23 | | | | $ | 12.44 | |
| | | | | | | | | | | | | | | | | | | | | | | | | |
Total investment return | | | | 12.64 | % | | | | 21.24 | % | | | | (10.78 | )% | | | | 11.11 | %(b) | | | | 22.34 | %(b) |
| | | | | |
Ratios/Supplemental Data: | | | | | | | | | | | | | | | | | | | | | | | | | |
Net investment income (loss) to average net assets | | | | 0.31 | % | | | | 0.40 | %(a) | | | | (0.18 | )% | | | | (0.25 | )% | | | | (0.17 | )% |
Net expenses to average daily net assets | | | | 0.95 | % | | | | 0.97 | %(d) | | | | 0.98 | %(c) | | | | 0.98 | %(c) | | | | 0.97 | % |
Total expenses (before reductions and reimbursements) to average daily net assets | | | | 0.95 | % | | | | 0.97 | % | | | | 0.98 | %(c) | | | | 0.99 | %(c) | | | | 0.99 | % |
Portfolio turnover rate | | | | 49 | % | | | | 106 | % | | | | 68 | % | | | | 75 | % | | | | 67 | % |
Net assets at end of year (in 000’s) | | | $ | 907,944 | | | | $ | 972,456 | | | | $ | 427,426 | | | | $ | 470,893 | | | | $ | 397,360 | |
| (a) | Includes a non-recurring refund for overbilling of prior years’ custody fees, a portion of which was paid to the Advisor for prior years’ reimbursement of expenses. This amounted to less than $0.01 per share and less than 0.01% of average net assets. |
| (b) | The total return would have been lower had certain expenses not been reduced or reimbursed during the periods shown. |
| (c) | Includes interest expense that amounts to less than 0.01%. |
| (d) | Includes a repayment to the Advisor, referenced above, for prior years’ reimbursement of expenses. The amount is less than 0.01% of average net assets. |
| † | Computed using average shares outstanding throughout the year. |
| | | | | | |
| | See accompanying Notes to the Financial Statements. | | | 181 | |
Mercer Non-US Core Equity Fund
Financial Highlights (Continued)
| | | | | | | | | | | | | | | | | | | | | | | | | |
| | | Year Ended
03/31/18 | | Year Ended
03/31/17 | | Year Ended
03/31/16 | | Year Ended
03/31/15 | | Year Ended
03/31/14 |
For a Class Y-3 Share Outstanding Throughout Each Period: | | | | | | | | | | | | | | | | | | | | | | | | | |
| | | | | |
Net asset value at beginning of year | | | $ | 10.44 | | | | $ | 9.61 | | | | $ | 10.64 | | | | $ | 11.92 | | | | $ | 10.58 | |
| | | | | | | | | | | | | | | | | | | | | | | | | |
| | | | | |
Net investment income† | | | | 0.19 | | | | | 0.18 | (a) | | | | 0.16 | | | | | 0.19 | | | | | 0.29 | |
Net realized and unrealized gain (loss) on investments | | | | 1.75 | | | | | 0.83 | | | | | (0.76 | ) | | | | (0.22 | ) | | | | 1.94 | |
| | | | | | | | | | | | | | | | | | | | | | | | | |
| | | | | |
Total from investment operations | | | | 1.94 | | | | | 1.01 | | | | | (0.60 | ) | | | | (0.03 | ) | | | | 2.23 | |
| | | | | | | | | | | | | | | | | | | | | | | | | |
Less dividends and distributions: | |
From net investment income | | | | (0.23 | ) | | | | (0.18 | ) | | | | (0.17 | ) | | | | (0.27 | ) | | | | (0.33 | ) |
From net realized gain on investments | | | | (0.64 | ) | | | | — | | | | | (0.26 | ) | | | | (0.98 | ) | | | | (0.56 | ) |
| | | | | | | | | | | | | | | | | | | | | | | | | |
| | | | | |
Total dividends and distributions | | | | (0.87 | ) | | | | (0.18 | ) | | | | (0.43 | ) | | | | (1.25 | ) | | | | (0.89 | ) |
| | | | | | | | | | | | | | | | | | | | | | | | | |
| | | | | |
Net asset value at end of year | | | $ | 11.51 | | | | $ | 10.44 | | | | $ | 9.61 | | | | $ | 10.64 | | | | $ | 11.92 | |
| | | | | | | | | | | | | | | | | | | | | | | | | |
Total investment return | | | | 18.80 | % | | | | 10.62 | % | | | | (5.64 | )% | | | | 0.19 | %(b) | | | | 21.48 | %(b) |
| | | | | |
Ratios/Supplemental Data: | | | | | | | | | | | | | | | | | | | | | | | | | |
Net investment income to average net assets | | | | 1.64 | % | | | | 1.81 | %(a) | | | | 1.60 | % | | | | 1.72 | % | | | | 2.52 | % |
Net expenses to average daily net assets | | | | 0.79 | %(c) | | | | 0.82 | %(c)(d) | | | | 0.83 | %(c) | | | | 0.84 | %(c) | | | | 0.85 | % |
Total expenses (before reductions and reimbursements) to average daily net assets | | | | 0.79 | %(c) | | | | 0.81 | %(c) | | | | 0.83 | %(c) | | | | 0.84 | %(c) | | | | 0.86 | % |
Portfolio turnover rate | | | | 81 | % | | | | 81 | % | | | | 109 | % | | | | 101 | % | | | | 95 | %(e) |
Net assets at end of year (in 000’s) | | | $ | 2,159,299 | | | | $ | 2,271,104 | | | | $ | 1,941,634 | | | | $ | 2,072,981 | | | | $ | 1,881,476 | |
| (a) | Includes a non-recurring refund for overbilling of prior years’ custody fees, a portion of which was paid to the Advisor for prior years’ reimbursement of expenses. This amounted to less than $0.01 per share and is 0.01% of average net assets. |
| (b) | The total return would have been lower had certain expenses not been reduced or reimbursed during the periods shown. |
| (c) | Includes interest expense that amounts to less than 0.01%. |
| (d) | Includes a repayment to the Advisor, referenced above, for prior years’ reimbursement of expenses. The amount is 0.01% of average net assets. |
| (e) | Portfolio turnover calculation does not include $177,821,966 of securities transferred out of the Fund as part of an in-kind redemption. |
| † | Computed using average shares outstanding throughout the year. |
| | | | | | |
| 182 | | See accompanying Notes to the Financial Statements. | | | | |
Mercer Core Fixed Income Fund
Financial Highlights (Continued)
| | | | | | | | | | | | | | | | | | | | | | | | | |
| | | Year Ended
03/31/18 | | Year Ended
03/31/17 | | Year Ended
03/31/16 | | Year Ended
03/31/15 | | Year Ended
03/31/14 |
For a Class Y-3 Share Outstanding Throughout Each Period: | | | | | | | | | | | | | | | | | | | | | | | | | |
| | | | | |
Net asset value at beginning of year | | | $ | 9.96 | | | | $ | 10.15 | | | | $ | 10.43 | | | | $ | 10.42 | | | | $ | 10.68 | |
| | | | | | | | | | | | | | | | | | | | | | | | | |
| | | | | |
Net investment income† | | | | 0.27 | | | | | 0.25 | (a) | | | | 0.29 | | | | | 0.28 | | | | | 0.24 | |
Net realized and unrealized gain (loss) on investments | | | | (0.09 | ) | | | | (0.09 | ) | | | | (0.17 | ) | | | | 0.28 | | | | | (0.19 | ) |
| | | | | | | | | | | | | | | | | | | | | | | | | |
| | | | | |
Total from investment operations | | | | 0.18 | | | | | 0.16 | | | | | 0.12 | | | | | 0.56 | | | | | 0.05 | |
| | | | | | | | | | | | | | | | | | | | | | | | | |
Less dividends and distributions: | |
From net investment income | | | | (0.24 | ) | | | | (0.25 | ) | | | | (0.30 | ) | | | | (0.33 | ) | | | | (0.25 | ) |
From net realized gain on investments | | | | — | | | | | (0.10 | ) | | | | (0.10 | ) | | | | (0.22 | ) | | | | (0.06 | ) |
| | | | | | | | | | | | | | | | | | | | | | | | | |
| | | | | |
Total dividends and distributions | | | | (0.24 | ) | | | | (0.35 | ) | | | | (0.40 | ) | | | | (0.55 | ) | | | | (0.31 | ) |
| | | | | | | | | | | | | | | | | | | | | | | | | |
| | | | | |
Net asset value at end of year | | | $ | 9.90 | | | | $ | 9.96 | | | | $ | 10.15 | | | | $ | 10.43 | | | | $ | 10.42 | |
| | | | | | | | | | | | | | | | | | | | | | | | | |
Total investment return | | | | 1.80 | % | | | | 1.58 | % | | | | 1.26 | % | | | | 5.43 | %(b) | | | | 0.44 | %(b) |
| | | | | |
Ratios/Supplemental Data: | | | | | | | | | | | | | | | | | | | | | | | | | |
Net investment income to average net assets | | | | 2.71 | % | | | | 2.43 | %(a) | | | | 2.80 | % | | | | 2.66 | % | | | | 2.32 | % |
Net expenses to average daily net assets | | | | 0.43 | % | | | | 0.43 | %(c)(d) | | | | 0.42 | % | | | | 0.40 | % | | | | 0.37 | % |
Total expenses (before reductions and reimbursements) to average daily net assets | | | | 0.43 | % | | | | 0.43 | %(c) | | | | 0.42 | % | | | | 0.42 | % | | | | 0.43 | % |
Portfolio turnover rate | | | | 113 | %(f) | | | | 151 | % | | | | 88 | % | | | | 192 | % | | | | 187 | %(e) |
Net assets at end of year (in 000’s) | | | $ | 857,947 | | | | $ | 765,603 | | | | $ | 783,875 | | | | $ | 892,649 | | | | $ | 1,076,439 | |
| (a) | Includes a non-recurring refund for overbilling of prior years’ custody fees, a portion of which was paid to the Advisor for prior years’ reimbursement of expenses. This amounted to less than $0.01 per share and less than 0.01% of average net assets. |
| (b) | The total return would have been lower had certain expenses not been reduced or reimbursed during the periods shown. |
| (c) | Includes interest expense that amounts to less than 0.01%. |
| (d) | Includes a repayment to the Advisor, referenced above, for prior years’ reimbursement of expenses. The amount is less than 0.01% of average net assets. |
| (e) | Excludes treasury dollar roll transactions. The Portfolio turnover rate including treasury dollar roll transactions was 251% for the year ended March 31, 2014. |
| (f) | Includes TBA transactions; excluding these transactions the portfolio turnover rate would have been 81% for the year. |
| † | Computed using average shares outstanding throughout the year. |
| | | | | | |
| | See accompanying Notes to the Financial Statements. | | | 183 | |
Mercer Opportunistic Fixed Income Fund
Financial Highlights (Continued)
| | | | | | | | | | | | | | | | | | | | | | | | | |
| | | Year Ended
03/31/18 | | Year Ended
03/31/17 | | Year Ended
03/31/16 | | Year Ended
03/31/15 | | Period Ended
03/31/14(a) |
For a Class Y-3 Share Outstanding Throughout Each Period: | | | | | | | | | | | | | | | | | | | | | | | | | |
| | | | | |
Net asset value at beginning of year | | | $ | 9.31 | | | | $ | 8.44 | | | | $ | 9.13 | | | | $ | 10.43 | | | | $ | 10.00 | |
| | | | | | | | | | | | | | | | | | | | | | | | | |
| | | | | |
Net investment income† | | | | 0.53 | | | | | 0.51 | (b) | | | | 0.54 | | | | | 0.56 | | | | | 0.34 | |
Net realized and unrealized gain (loss) on investments | | | | 0.33 | | | | | 0.36 | | | | | (1.12 | ) | | | | (1.32 | ) | | | | 0.35 | |
| | | | | | | | | | | | | | | | | | | | | | | | | |
| | | | | |
Total from investment operations | | | | 0.86 | | | | | 0.87 | | | | | (0.58 | ) | | | | (0.76 | ) | | | | 0.69 | |
| | | | | | | | | | | | | | | | | | | | | | | | | |
Less dividends and distributions: | |
From net investment income | | | | (0.37 | ) | | | | — | | | | | (0.07 | ) | | | | (0.47 | ) | | | | (0.22 | ) |
From net realized gain on investments | | | | — | | | | | — | | | | | (0.04 | ) | | | | (0.07 | ) | | | | (0.04 | ) |
| | | | | | | | | | | | | | | | | | | | | | | | | |
| | | | | |
Total dividends and distributions | | | | (0.37 | ) | | | | — | | | | | (0.11 | ) | | | | (0.54 | ) | | | | (0.26 | ) |
| | | | | | | | | | | | | | | | | | | | | | | | | |
| | | | | |
Net asset value at end of year | | | $ | 9.80 | | | | $ | 9.31 | | | | $ | 8.44 | | | | $ | 9.13 | | | | $ | 10.43 | |
| | | | | | | | | | | | | | | | | | | | | | | | | |
Total investment return | | | | 9.42 | % | | | | 10.31 | %(c) | | | | (6.25 | )%(c) | | | | (7.36 | )%(c) | | | | 7.00 | %(c)** |
| | | | | |
Ratios/Supplemental Data: | | | | | | | | | | | | | | | | | | | | | | | | | |
Net investment income to average net assets | | | | 5.49 | % | | | | 5.75 | %(b) | | | | 6.28 | % | | | | 5.55 | % | | | | 5.52 | %* |
Net expenses to average daily net assets | | | | 0.92 | %(d) | | | | 0.94 | %(d)(e) | | | | 0.90 | %(d) | | | | 0.90 | %(d) | | | | 0.90 | %* |
Total expenses (before reductions and reimbursements) to average daily net assets | | | | 0.92 | %(d) | | | | 0.94 | %(d) | | | | 0.95 | %(d) | | | | 0.97 | %(d) | | | | 1.17 | %* |
Portfolio turnover rate | | | | 72 | % | | | | 55 | % | | | | 53 | % | | | | 58 | % | | | | 28 | %** |
Net assets at end of year (in 000’s) | | | $ | 647,222 | | | | $ | 558,859 | | | | $ | 414,262 | | | | $ | 395,939 | | | | $ | 260,581 | |
| (a) | The Fund commenced operations on August 21, 2013. |
| (b) | Includes a non-recurring refund for overbilling of prior years’ custody fees, a portion of which was paid to the Advisor for prior years’ reimbursement of expenses. This amounted to less than $0.01 per share and less than 0.01% of average net assets. |
| (c) | The total return would have been lower had certain expenses not been reduced or reimbursed during the periods shown. |
| (d) | Includes interest expense that amounts to less than 0.01%. |
| (e) | Includes a repayment to the Advisor, referenced above, for prior years’ reimbursement of expenses. The amount is less than 0.01% of average net assets. |
| † | Computed using average shares outstanding throughout the year. |
| | | | | | |
| 184 | | See accompanying Notes to the Financial Statements. | | | | |
Mercer Emerging Markets Equity Fund
Financial Highlights (Continued)
| | | | | | | | | | | | | | | | | | | | | | | | | |
| | | Year Ended
03/31/18 | | Year Ended
03/31/17 | | Year Ended
03/31/16 | | Year Ended
03/31/15 | | Year Ended
03/31/14 |
For a Class Y-3 Share Outstanding Throughout Each Period: | | | | | | | | | | | | | | | | | | | | | | | | | |
| | | | | |
Net asset value at beginning of year | | | $ | 9.77 | | | | $ | 8.59 | | | | $ | 9.88 | | | | $ | 9.99 | | | | $ | 10.49 | |
| | | | | | | | | | | | | | | | | | | | | | | | | |
| | | | | |
Net investment income† | | | | 0.18 | | | | | 0.14 | (a) | | | | 0.16 | | | | | 0.17 | | | | | 0.18 | |
Net realized and unrealized gain (loss) on investments | | | | 2.05 | | | | | 1.22 | | | | | (1.36 | ) | | | | (0.09 | ) | | | | (0.46 | ) |
| | | | | | | | | | | | | | | | | | | | | | | | | |
| | | | | |
Total from investment operations | | | | 2.23 | | | | | 1.36 | | | | | (1.20 | ) | | | | 0.08 | | | | | (0.28 | ) |
| | | | | | | | | | | | | | | | | | | | | | | | | |
Less dividends and distributions: | |
From net investment income | | | | (0.25 | ) | | | | (0.18 | ) | | | | (0.09 | ) | | | | (0.19 | ) | | | | (0.19 | ) |
From net realized gain on investments | | | | — | | | | | — | | | | | — | | | | | — | | | | | (0.03 | ) |
| | | | | | | | | | | | | | | | | | | | | | | | | |
| | | | | |
Total dividends and distributions | | | | (0.25 | ) | | | | (0.18 | ) | | | | (0.09 | ) | | | | (0.19 | ) | | | | (0.22 | ) |
| | | | | | | | | | | | | | | | | | | | | | | | | |
| | | | | |
Net asset value at end of year | | | $ | 11.75 | | | | $ | 9.77 | | | | $ | 8.59 | | | | $ | 9.88 | | | | $ | 9.99 | |
| | | | | | | | | | | | | | | | | | | | | | | | | |
Total investment return | | | | 22.92 | % | | | | 16.14 | % | | | | (12.06 | )% | | | | 0.81 | %(b) | | | | (2.61 | )%(b) |
| | | | | |
Ratios/Supplemental Data: | | | | | | | | | | | | | | | | | | | | | | | | | |
Net investment income to average net assets | | | | 1.62 | % | | | | 1.52 | %(a) | | | | 1.79 | % | | | | 1.66 | % | | | | 1.77 | % |
Net expenses to average daily net assets | | | | 0.95 | %(c) | | | | 1.00 | %(c)(d) | | | | 1.00 | %(c) | | | | 0.98 | %(c) | | | | 0.95 | %(c) |
Total expenses (before reductions and reimbursements) to average daily net assets | | | | 0.95 | %(c) | | | | 0.99 | %(c) | | | | 1.00 | %(c) | | | | 1.00 | %(c) | | | | 1.04 | %(c) |
Portfolio turnover rate | | | | 93 | % | | | | 89 | % | | | | 66 | % | | | | 46 | % | | | | 64 | % |
Net assets at end of year (in 000’s) | | | $ | 1,116,127 | | | | $ | 1,481,990 | | | | $ | 1,150,136 | | | | $ | 1,087,355 | | | | $ | 862,923 | |
| (a) | Includes a non-recurring refund for overbilling of prior years’ custody fees, a portion of which was paid to the Advisor for prior years’ reimbursement of expenses. This amounted to less than $0.01 per share and less than 0.01% of average net assets. |
| (b) | The total return would have been lower had certain expenses not been reduced or reimbursed during the periods shown. |
| (c) | Includes interest expense that amounts to less than 0.01%. |
| (d) | Includes a repayment to the Advisor, referenced above, for prior years’ reimbursement of expenses. The amount is 0.01% of average net assets. |
| † | Computed using average shares outstanding throughout the year. |
| | | | | | |
| | See accompanying Notes to the Financial Statements. | | | 185 | |
Mercer Global Low Volatility Equity Fund
Financial Highlights (Continued)
| | | | | | | | | | | | | | | | | | | | | | | | | |
| | | Year Ended
03/31/18 | | Year Ended
03/31/17 | | Year Ended
03/31/16 | | Year Ended
03/31/15 | | Year Ended
03/31/14 |
For a Class Y-3 Share Outstanding Throughout Each Period: | | | | | | | | | | | | | | | | | | | | | | | | | |
| | | | | |
Net asset value at beginning of year | | | $ | 12.62 | | | | $ | 11.81 | | | | $ | 12.11 | | | | $ | 12.27 | | | | $ | 11.19 | |
| | | | | | | | | | | | | | | | | | | | | | | | | |
| | | | | |
Net investment income† | | | | 0.18 | | | | | 0.16 | (a) | | | | 0.15 | | | | | 0.15 | | | | | 0.14 | |
Net realized and unrealized gain on investments | | | | 1.39 | | | | | 1.11 | | | | | 0.33 | | | | | 0.54 | | | | | 1.45 | |
| | | | | | | | | | | | | | | | | | | | | | | | | |
| | | | | |
Total from investment operations | | | | 1.57 | | | | | 1.27 | | | | | 0.48 | | | | | 0.69 | | | | | 1.59 | |
| | | | | | | | | | | | | | | | | | | | | | | | | |
Less dividends and distributions: | |
From net investment income | | | | (0.18 | ) | | | | (0.14 | ) | | | | (0.14 | ) | | | | (0.19 | ) | | | | (0.16 | ) |
From net realized gain on investments | | | | (1.73 | ) | | | | (0.32 | ) | | | | (0.64 | ) | | | | (0.66 | ) | | | | (0.35 | ) |
| | | | | | | | | | | | | | | | | | | | | | | | | |
| | | | | |
Total dividends and distributions | | | | (1.91 | ) | | | | (0.46 | ) | | | | (0.78 | ) | | | | (0.85 | ) | | | | (0.51 | ) |
| | | | | | | | | | | | | | | | | | | | | | | | | |
| | | | | |
Net asset value at end of year | | | $ | 12.28 | | | | $ | 12.62 | | | | $ | 11.81 | | | | $ | 12.11 | | | | $ | 12.27 | |
| | | | | | | | | | | | | | | | | | | | | | | | | |
Total investment return | | | | 12.47 | % | | | | 11.02 | % | | | | 4.13 | % | | | | 5.80 | %(b) | | | | 14.40 | %(b) |
| | | | | |
Ratios/Supplemental Data: | | | | | | | | | | | | | | | | | | | | | | | | | |
Net investment income to average net assets | | | | 1.35 | % | | | | 1.34 | %(a) | | | | 1.23 | % | | | | 1.25 | % | | | | 1.20 | % |
Net expenses to average daily net assets | | | | 0.80 | %(c) | | | | 0.81 | %(c) | | | | 0.82 | %(c) | | | | 0.85 | %(c) | | | | 0.85 | % |
Total expenses (before reductions and reimbursements/recapture) to average daily net assets | | | | 0.80 | %(c) | | | | 0.81 | %(c) | | | | 0.82 | %(c) | | | | 0.84 | %(c) | | | | 0.84 | % |
Portfolio turnover rate | | | | 36 | % | | | | 55 | % | | | | 31 | % | | | | 84 | % | | | | 46 | % |
Net assets at end of year (in 000’s) | | | $ | 920,610 | | | | $ | 1,249,860 | | | | $ | 952,386 | | | | $ | 819,052 | | | | $ | 742,641 | |
| (a) | Includes a non-recurring refund for overbilling of prior years’ custody fees, a portion of which was paid to the Advisor for prior years’ reimbursement of expenses. This amounted to less than $0.01 per share and less than 0.01% of average net assets. |
| (b) | The total return would have been lower had certain expenses not been reduced or reimbursed during the periods shown. |
| (c) | Includes interest expense that amounts to less than 0.01%. |
| † | Computed using average shares outstanding throughout the year. |
| | | | | | |
| 186 | | See accompanying Notes to the Financial Statements. | | | | |
Mercer Funds
Notes to the Financial Statements
March 31, 2018
Mercer Funds (the “Trust”) consists of the following seven series: Mercer US Large Cap Equity Fund (“Large Cap”), Mercer US Small/Mid Cap Equity Fund (“Small/Mid Cap”), Mercer Non-US Core Equity Fund (“Non-US Core Equity”), Mercer Core Fixed Income Fund (“Core Fixed”), Mercer Opportunistic Fixed Income Fund (“Opportunistic Fixed”), Mercer Emerging Markets Equity Fund (“Emerging Markets”) and Mercer Global Low Volatility Equity Fund (“Global Low Volatility”) (each a “Fund,” and collectively referred to as the “Funds”). The Trust is a Delaware statutory trust established on March 11, 2005. The Trust is registered as an investment company under the Investment Company Act of 1940 (the “1940 Act”). The Funds’ investment advisor is Mercer Investment Management, Inc. (the “Advisor”). The Advisor manages each Fund using a “manager of managers” approach by selecting one or more subadvisors (each a “Subadvisor,” and collectively referred to as the “Subadvisors”) to manage each Fund’s assets. The Funds are open-end investment companies and accordingly follow the open-end investment company accounting and reporting guidance of the Financial Accounting Standards Board (FASB) Accounting Standard Codification Topic 946: Financial Services — Investment Companies.
Under the 1940 Act, each Fund is classified as diversified.
The investment objectives of the Funds are:
| | |
Fund | | Investment Objective |
| Large Cap | | Long-term total return, which includes capital appreciation and income |
| Small/Mid Cap | | Long-term total return, comprised primarily of capital appreciation |
| Non-US Core Equity | | Long-term total return, which includes capital appreciation and income |
| Core Fixed | | Total return, consisting of both current income and capital appreciation |
| Opportunistic Fixed | | Long-term total return, which includes capital appreciation and income |
| Emerging Markets | | Long-term total return, which includes capital appreciation and income |
| Global Low Volatility | | Long-term total return, which includes capital appreciation and income |
Each Fund has registered and is authorized to offer interests in four classes of shares: Class S, Class Y-1, Class Y-2 and Class Y-3. The principal difference between the classes of shares is the level of shareholder service, marketing and administrative fees borne by the classes. As of March 31, 2018, only the Class Y-3 shares of each Fund had commenced operations.
| 2. | Significant Accounting Policies |
In March 2017, FASB issued Accounting Standards Update No. 2017-08 “Premium Amortization of Purchased Callable Debt Securities”, which amends the amortization period for certain purchased callable debt securities. Under the standards update, the premium amortization of purchased callable debt securities that have explicit, non-contingent call features and are callable at fixed prices will be amortized to the earliest call date. The guidance will be applied on a modified retrospective basis and is
187
Mercer Funds
Notes to the Financial Statements (Continued)
March 31, 2018
effective for fiscal years, and their interim periods, beginning after December 15, 2018. Management is currently evaluating the impact of this standard’s update to the Funds.
The following are significant accounting policies followed by the Funds. These policies are in conformity with accounting principles generally accepted in the United States of America (“GAAP”). The preparation of financial statements in conformity with GAAP requires management to make estimates and assumptions that affect the reported amounts and disclosures in the financial statements. Actual results could differ from these estimates.
(a) Security Valuation
Each Fund’s investments are valued as of the close of regular trading on the New York Stock Exchange (“NYSE”) on each day when the NYSE is open. Portfolio securities listed on an exchange normally are valued at the last sale or official closing price on the day on which the securities are valued or, lacking any sales on such day, at the last available bid price using prices as of the close of trading. In cases where securities are traded on more than one exchange, the securities are generally valued on the exchange considered by the Advisor or the applicable Subadvisor as the primary market for such securities. Securities traded in the over-the-counter (“OTC”) market and listed on the NASDAQ Stock Market (“NASDAQ”) normally are valued at the NASDAQ Official Closing Price; other OTC securities are valued at the last bid price available prior to valuation (other than short-term investments, which are valued as described below). The Funds may invest in securities that are traded in foreign markets. Foreign securities will be converted into U.S. dollar equivalents based on the exchange rate in effect at a uniform time on each business day. Events occurring after the close of trading on foreign exchanges may result in adjustments to the valuation of foreign securities to more accurately reflect their fair value as of the close of regular trading on the New York Stock Exchange. When valuing foreign equity securities that meet certain criteria, the Board of Trustees of the Trust (the “Board”) has approved the use of a fair value service that values such securities to reflect market trading that occurs after the close of the applicable foreign markets of comparable securities or other instruments that have a strong correlation to the fair-valued securities. Investments in open-end investment companies are valued at their net asset value (“NAV”) per share.
Certain fixed-income securities may be valued based upon appraisals received from an independent pricing service using a computerized matrix system or based upon appraisals derived from information concerning the securities or similar securities received from a recognized dealer or dealers in those securities. It should be recognized that judgment often plays a greater role in valuing thinly traded securities, as well as bonds and other securities with few dealer quotations, than is the case with respect to securities for which a broader range of dealer quotations and last-sale information is available. Each such determination is based on consideration of relevant factors, and judgment is made by or at the direction of the Board. Each Fund values its investments for which market quotations are readily available at market value. Each Fund may value short-term investments that will mature within 60 days or less by using pricing service quotations or at amortized cost, provided that such amortized cost approximates market value.
Derivative financial instruments, such as futures contracts or options contracts that are traded on a national securities exchange, are stated at the last reported sale or settlement price on the day of valuation. Futures traded on inactive markets are valued using broker quotations. OTC derivative financial instruments, such as foreign currency contracts, options contracts, synthetic futures, or swaps agreements, derive their value from underlying asset prices, indices, reference rates, and other inputs or a combination of these factors. These contracts are normally valued on the basis of an independent
188
Mercer Funds
Notes to the Financial Statements (Continued)
March 31, 2018
pricing service providers or broker dealer quotations. Depending on the derivative type and the terms of the derivative, the value of the derivative financial instruments is assigned by independent pricing service providers using a series of techniques, which may include pricing models. The pricing models use inputs that are observed from actively quoted markets such as issuer details, indices, spreads, interest rates, curves, volatilities, dividends and exchange rates.
Senior secured floating rate loans and senior secured floating rate debt securities are valued using an evaluated quote provided by an independent pricing service. Evaluated quotes provided by the pricing service may reflect appropriate factors such as ratings, yield curves, prepayment speeds, tranche type, industry, company performance, spread, individual trading characteristics, institutional size trading in similar groups of securities and other market data.
The Board has delegated its responsibility for valuing portfolio securities to the Advisor, subject to continuing Board oversight. The Advisor has appointed a Valuation Committee that is responsible for overseeing the day-to-day process of valuing portfolio securities. With respect to portfolio securities for which market quotations are not readily available or (in the opinion of the Advisor or the applicable Subadvisor) do not otherwise accurately reflect the fair values of the securities, the Valuation Committee will value such securities at fair value based upon procedures approved by the Board.
The application of fair value pricing represents a good faith determination based on specific procedures performed under the supervision of the Board. Due to the subjective nature of fair value pricing, there can be no assurance that a Fund could realize the fair value assigned to the security if the Fund were to sell the security at approximately the time at which the Fund determines its NAV per share. A Fund’s value for a particular security may be different from the last quoted market price.
The Funds follow a three-tier hierarchy to prioritize the assumptions, referred to as inputs, used in valuation techniques to measure fair value. The three-tier hierarchy of inputs is summarized in the three broad Levels listed below.
| | • | | Level 1 — quoted prices unadjusted in active markets for identical investments |
| | • | | Level 2 — other significant observable inputs (including quoted prices for similar investments, interest rates, prepayment speeds, credit risk, etc.) |
| | • | | Level 3 — significant unobservable inputs (including the Fund’s own assumptions in determining the fair value of investments) |
The inputs or methodology used for valuing securities are not necessarily an indication of the risk associated with investing in those securities.
The assets and liabilities shown in the Statements of Assets and Liabilities related to investments purchased for “to-be-announced” (“TBA”), TBA commitments or when-issued securities approximate fair value and are determined using Level 2 inputs, as of March 31, 2018. The assets and liabilities shown in the Statements of Assets and Liabilities related to cash collateral held at broker for futures contracts and swap contracts are determined using Level 1 inputs as of March 31, 2018.
At March 31, 2018, Large Cap and Small/Mid Cap held long-term investments whose value was determined using Level 1 inputs, with corresponding major categories as shown in the schedule of investments, Futures Contracts and State Street Institutional U.S. Government Money Market Fund, Premier Class whose value was determined using Level 1 inputs and short-term investment positions in a Euro Time Deposit and a United States Treasury Bill, as shown in the schedule of investments, whose value was determined using Level 2 inputs.
189
Mercer Funds
Notes to the Financial Statements (Continued)
March 31, 2018
The following is a summary of the portfolio securities by level based on inputs used as of March 31, 2018 in valuing the assets and liabilities of Non-US Core Equity, Core Fixed, Opportunistic Fixed, Emerging Markets and Global Low Volatility for which fair valuation was used:
Non-US Core Equity
ASSETS VALUATION INPUT
| | | | | | | | | | | | | | | | |
Description | | Quoted Prices
in Active
Markets for
Identical Assets
(Level 1) | | | Significant
Other
Observable
Inputs
(Level 2) | | | Significant
Unobservable
Inputs
(Level 3) | | | Total | |
Common Stocks | | | | | | | | | |
Australia | | $ | — | | | $ | 87,865,240 | | | $ | — | | | $ | 87,865,240 | |
Austria | | | — | | | | 21,848,006 | | | | — | | | | 21,848,006 | |
Belgium | | | 5,756,898 | | | | 22,541,149 | | | | — | | | | 28,298,047 | |
Bermuda | | | — | | | | 4,581,831 | | | | — | | | | 4,581,831 | |
Brazil | | | 20,337,542 | | | | — | | | | — | | | | 20,337,542 | |
Canada | | | 26,028,243 | | | | — | | | | — | | | | 26,028,243 | |
Cayman Islands | | | 12,775,099 | | | | 25,848,794 | | | | — | | | | 38,623,893 | |
China | | | — | | | | 2,606,840 | | | | — | | | | 2,606,840 | |
Denmark | | | — | | | | 24,398,179 | | | | — | | | | 24,398,179 | |
Finland | | | — | | | | 19,517,757 | | | | — | | | | 19,517,757 | |
France | | | — | | | | 154,302,246 | | | | — | | | | 154,302,246 | |
Germany | | | 2,435,504 | | | | 184,542,212 | | | | — | | | | 186,977,716 | |
Gibraltar | | | — | | | | 311,860 | | | | — | | | | 311,860 | |
Hong Kong | | | — | | | | 40,216,730 | | | | — | | | | 40,216,730 | |
Hungary | | | — | | | | 2,516,002 | | | | — | | | | 2,516,002 | |
India | | | — | | | | 7,725,374 | | | | — | | | | 7,725,374 | |
Indonesia | | | — | | | | 10,428,123 | | | | — | | | | 10,428,123 | |
Ireland | | | 12,106,008 | | | | 6,996,291 | | | | — | | | | 19,102,299 | |
Israel | | | 4,201,387 | | | | 2,065,443 | | | | — | | | | 6,266,830 | |
Italy | | | — | | | | 38,531,301 | | | | — | | | | 38,531,301 | |
Japan | | | 506,305,877 | | | | — | | | | — | | | | 506,305,877 | |
Luxembourg | | | — | | | | 12,028,320 | | | | — | | | | 12,028,320 | |
Malaysia | | | 3,143,456 | | | | — | | | | — | | | | 3,143,456 | |
Mexico | | | — | | | | 7,270,777 | | | | — | | | | 7,270,777 | |
Netherlands | | | 11,484,734 | | | | 62,911,998 | | | | — | | | | 74,396,732 | |
New Zealand | | | — | | | | 2,782,004 | | | | — | | | | 2,782,004 | |
Norway | | | — | | | | 13,149,035 | | | | — | | | | 13,149,035 | |
Philippines | | | — | | | | 782,462 | | | | — | | | | 782,462 | |
Poland | | | — | | | | 1,231,155 | | | | — | | | | 1,231,155 | |
Portugal | | | — | | | | 9,500,641 | | | | 0 | ** | | | 9,500,641 | |
Russia | | | 2,014,302 | | | | 4,017,471 | | | | — | | | | 6,031,773 | |
Singapore | | | — | | | | 9,602,552 | | | | — | | | | 9,602,552 | |
South Korea | | | 7,714,098 | | | | — | | | | — | | | | 7,714,098 | |
Spain | | | — | | | | 27,841,033 | | | | 0 | ** | | | 27,841,033 | |
Sweden | | | 1,025,357 | | | | 33,377,347 | | | | — | | | | 34,402,704 | |
Switzerland | | | — | | | | 145,674,370 | | | | — | | | | 145,674,370 | |
Taiwan | | | 23,702,649 | | | | — | | | | — | | | | 23,702,649 | |
Thailand | | | 2,843,184 | | | | — | | | | — | | | | 2,843,184 | |
Turkey | | | 1,254,740 | | | | — | | | | — | | | | 1,254,740 | |
190
Mercer Funds
Notes to the Financial Statements (Continued)
March 31, 2018
| | | | | | | | | | | | | | | | |
Description | | Quoted Prices
in Active
Markets for
Identical Assets
(Level 1) | | | Significant
Other
Observable
Inputs
(Level 2) | | | Significant
Unobservable
Inputs
(Level 3) | | | Total | |
United Kingdom | | $ | 8,974,774 | | | $ | 264,972,592 | | | $ | — | | | $ | 273,947,366 | |
United States | | | 45,608,936 | | | | — | | | | — | | | | 45,608,936 | |
| | | | | | | | | | | | | | | | |
Total Common Stocks | | | 697,712,788 | | | | 1,251,985,135 | | | | 0 | | | | 1,949,697,923 | |
| | | | | | | | | | | | | | | | |
Investment Companies | | | | | | | | | |
United States | | | 19,986,105 | | | �� | — | | | | — | | | | 19,986,105 | |
| | | | | | | | | | | | | | | | |
Total Investment Companies | | | 19,986,105 | | | | — | | | | — | | | | 19,986,105 | |
| | | | | | | | | | | | | | | | |
Preferred Stocks | | | | | | | | | |
Brazil | | | 1,952,574 | | | | — | | | | — | | | | 1,952,574 | |
Germany | | | — | | | | 19,776,963 | | | | — | | | | 19,776,963 | |
| | | | | | | | | | | | | | | | |
Total Preferred Stocks | | | 1,952,574 | | | | 19,776,963 | | | | — | | | | 21,729,537 | |
| | | | | | | | | | | | | | | | |
Rights | | | | | | | | | |
United Kingdom | | | 75,086 | | | | — | | | | — | | | | 75,086 | |
| | | | | | | | | | | | | | | | |
Total Rights | | | 75,086 | | | | — | | | | — | | | | 75,086 | |
| | | | | | | | | | | | | | | | |
Short-Term Investments | | | | | | | | | |
Bank Deposits | | | — | | | | 152,762,482 | | | | — | | | | 152,762,482 | |
Mutual Fund - Securities Lending Collateral | | | 51,739,136 | | | | — | | | | — | | | | 51,739,136 | |
U.S. Government and Agency Obligations | | | — | | | | 3,299,554 | | | | — | | | | 3,299,554 | |
| | | | | | | | | | | | | | | | |
Total Short-Term Investments | | | 51,739,136 | | | | 156,062,036 | | | | — | | | | 207,801,172 | |
| | | | | | | | | | | | | | | | |
Forward Foreign Currency Contracts† | | | — | | | | 2,518 | | | | — | | | | 2,518 | |
| | | | | | | | | | | | | | | | |
Total Forward Foreign Currency Contracts | | | — | | | | 2,518 | | | | — | | | | 2,518 | |
| | | | | | | | | | | | | | | | |
Total | | $ | 771,465,689 | | | $ | 1,427,826,652 | | | $ | 0 | | | $ | 2,199,292,341 | |
| | | | | | | | | | | | | | | | |
LIABILITIES VALUATION INPUT
| | | | | | | | | | | | | | | | |
Description | | Quoted Prices
in Active
Markets for
Identical Assets
(Level 1) | | | Significant
Other
Observable
Inputs
(Level 2) | | | Significant
Unobservable
Inputs
(Level 3) | | | Total | |
Futures Contracts† | | | | | | | | | |
Buys | | $ | (2,027,504 | ) | | $ | — | | | $ | — | | | $ | (2,027,504 | ) |
| | | | | | | | | | | | | | | | |
Total Futures Contracts | | | (2,027,504 | ) | | | — | | | | — | | | | (2,027,504 | ) |
| | | | | | | | | | | | | | | | |
Forward Foreign Currency Contracts† | | | — | | | | (107,338 | ) | | | — | | | | (107,338 | ) |
| | | | | | | | | | | | | | | | |
Total Forward Foreign Currency Contracts | | | — | | | | (107,338 | ) | | | — | | | | (107,338 | ) |
| | | | | | | | | | | | | | | | |
Total | | $ | (2,027,504 | ) | | $ | (107,338 | ) | | $ | — | | | $ | (2,134,842 | ) |
| | | | | | | | | | | | | | | | |
| | ** | Represents one or more Level 3 securities at $0 value as of March 31, 2018. |
191
Mercer Funds
Notes to the Financial Statements (Continued)
March 31, 2018
| | † | Forward foreign currency contracts and Futures contracts are valued at unrealized appreciation/depreciation. Only current day’s variation margin on Futures contracts and Centrally Cleared Swaps, if any, is reported on the Statements of Assets and Liabilities. |
Core Fixed
ASSETS VALUATION INPUT
| | | | | | | | | | | | | | | | |
Description | | Quoted Prices
in Active
Markets for
Identical Assets
(Level 1) | | | Significant
Other
Observable
Inputs
(Level 2) | | | Significant
Unobservable
Inputs
(Level 3) | | | Total | |
Debt Obligations | | | | | | | | | |
Asset Backed Securities | | $ | — | | | $ | 106,862,139 | | | $ | — | | | $ | 106,862,139 | |
Corporate Debt | | | — | | | | 307,966,432 | | | | 0 | ** | | | 307,966,432 | |
Mortgage Backed Securities - Private Issuers | | | — | | | | 86,907,891 | | | | — | | | | 86,907,891 | |
Mortgage Backed Securities - U.S. Government Agency Obligations | | | — | | | | 210,633,171 | | | | — | | | | 210,633,171 | |
Municipal Obligations | | | — | | | | 9,820,503 | | | | — | | | | 9,820,503 | |
Sovereign Debt Obligations | | | — | | | | 9,156,959 | | | | — | | | | 9,156,959 | |
U.S. Government and Agency Obligations | | | — | | | | 119,255,803 | | | | — | | | | 119,255,803 | |
| | | | | | | | | | | | | | | | |
Total Debt Obligations | | | — | | | | 850,602,898 | | | | 0 | | | | 850,602,898 | |
| | | | | | | | | | | | | | | | |
Short-Term Investments | | | | | | | | | |
Bank Deposits | | | — | | | | 15,479,973 | | | | — | | | | 15,479,973 | |
Mutual Fund - Securities Lending Collateral | | | 17,738,370 | | | | — | | | | — | | | | 17,738,370 | |
| | | | | | | | | | | | | | | | |
Total Short-Term Investments | | | 17,738,370 | | | | 15,479,973 | | | | — | | | | 33,218,343 | |
| | | | | | | | | | | | | | | | |
Futures Contracts† | | | | | | | | | |
Buys | | | 895,264 | | | | — | | | | — | | | | 895,264 | |
Sales | | | 96,072 | | | | — | | | | — | | | | 96,072 | |
| | | | | | | | | | | | | | | | |
Total Futures Contracts | | | 991,336 | | | | — | | | | — | | | | 991,336 | |
| | | | | | | | | | | | | | | | |
Swaps | | | | | | | | | | | | | | | | |
Centrally Cleared Interest Rate Swaps† | | | — | | | | 1,260,806 | | | | — | | | | 1,260,806 | |
| | | | | | | | | | | | | | | | |
Total Swaps | | | — | | | | 1,260,806 | | | | — | | | | 1,260,806 | |
| | | | | | | | | | | | | | | | |
Total | | $ | 18,729,706 | | | $ | 867,343,677 | | | $ | 0 | | | $ | 886,073,383 | |
| | | | | | | | | | | | | | | | |
192
Mercer Funds
Notes to the Financial Statements (Continued)
March 31, 2018
LIABILITIES VALUATION INPUT
| | | | | | | | | | | | | | | | |
Description | | Quoted Prices
in Active
Markets for
Identical Assets
(Level 1) | | | Significant
Other
Observable
Inputs
(Level 2) | | | Significant
Unobservable
Inputs
(Level 3) | | | Total | |
Futures Contracts† | | | | | | | | | |
Sales | | $ | (187,229 | ) | | $ | — | | | $ | — | | | $ | (187,229 | ) |
| | | | | | | | | | | | | | | | |
Total Futures Contracts | | | (187,229 | ) | | | — | | | | — | | | | (187,229 | ) |
| | | | | | | | | | | | | | | | |
Swaps | | | | | | | | | |
Centrally Cleared Interest Rate Swaps† | | | — | | | | (316,416 | ) | | | — | | | | (316,416 | ) |
| | | | | | | | | | | | | | | | |
Total Swaps | | | — | | | | (316,416 | ) | | | — | | | | (316,416 | ) |
| | | | | | | | | | | | | | | | |
Total | | $ | (187,229 | ) | | $ | (316,416 | ) | | $ | — | | | $ | (503,645 | ) |
| | | | | | | | | | | | | | | | |
| | ** | Represents one or more Level 3 securities at $0 value as of March 31, 2018. |
| | † | Futures contracts and Centrally Cleared Swaps are valued at unrealized appreciation/depreciation. Only current day’s variation margin on Futures contracts and Centrally Cleared Swaps, if any, is reported on the Statements of Assets and Liabilities. |
Opportunistic Fixed
ASSETS VALUATION INPUT
| | | | | | | | | | | | | | | | |
Description | | Quoted Prices
in Active
Markets for
Identical Assets
(Level 1) | | | Significant
Other
Observable
Inputs
(Level 2) | | | Significant
Unobservable
Inputs
(Level 3) | | | Total | |
Debt Obligations | | | | | | | | | |
Corporate Debt | | $ | — | | | $ | 268,117,966 | | | $ | 0 | ** | | $ | 268,117,966 | |
Sovereign Debt Obligations | | | — | | | | 340,055,641 | | | | — | | | | 340,055,641 | |
| | | | | | | | | | | | | | | | |
Total Debt Obligations | | | — | | | | 608,173,607 | | | | 0 | | | | 608,173,607 | |
| | | | | | | | | | | | | | | | |
Common Stocks | | | | | | | | | |
Diversified Financial Services | | | — | | | | — | | | | 0 | ** | | | — | |
Oil & Gas | | | 2,404,405 | | | | 147,830 | | | | — | | | | 2,552,235 | |
Transportation | | | — | | | | 1 | | | | — | | | | 1 | |
| | | | | | | | | | | | | | | | |
Total Common Stocks | | | 2,404,405 | | | | 147,831 | | | | 0 | | | | 2,552,236 | |
| | | | | | | | | | | | | | | | |
Convertible Preferred Stock | | | | | | | | | |
Oil & Gas | | | — | | | | 373,694 | | | | — | | | | 373,694 | |
| | | | | | | | | | | | | | | | |
Total Convertible Preferred Stock | | | — | | | | 373,694 | | | | — | | | | 373,694 | |
| | | | | | | | | | | | | | | | |
Warrants | | | | | | | | | |
Oil & Gas | | | — | | | | 1,943 | | | | — | | | | 1,943 | |
| | | | | | | | | | | | | | | | |
Total Warrants | | | — | | | | 1,943 | | | | — | | | | 1,943 | |
| | | | | | | | | | | | | | | | |
193
Mercer Funds
Notes to the Financial Statements (Continued)
March 31, 2018
| | | | | | | | | | | | | | | | |
Description | | Quoted Prices
in Active
Markets for
Identical Assets
(Level 1) | | | Significant
Other
Observable
Inputs
(Level 2) | | | Significant
Unobservable
Inputs
(Level 3) | | | Total | |
Short-Term Investments | | | | | | | | | | | | | | | | |
Bank Deposits | | $ | — | | | $ | 16,415,519 | | | $ | — | | | $ | 16,415,519 | |
Mutual Fund - Securities Lending Collateral | | | 21,465,843 | | | | — | | | | — | | | | 21,465,843 | |
Sovereign Debt Obligations | | | — | | | | 7,300,747 | | | | — | | | | 7,300,747 | |
| | | | | | | | | | | | | | | | |
Total Short-Term Investments | | | 21,465,843 | | | | 23,716,266 | | | | — | | | | 45,182,109 | |
| | | | | | | | | | | | | | | | |
Futures Contracts† | | | | | | | | | |
Buys | | | 144,173 | | | | — | | | | — | | | | 144,173 | |
Sales | | | 936 | | | | — | | | | — | | | | 936 | |
| | | | | | | | | | | | | | | | |
Total Futures Contracts | | | 145,109 | | | | — | | | | — | | | | 145,109 | |
| | | | | | | | | | | | | | | | |
Forward Foreign Currency Contracts† | | | — | | | | 3,268,793 | | | | — | | | | 3,268,793 | |
| | | | | | | | | | | | | | | | |
Total Forward Foreign Currency Contracts | | | — | | | | 3,268,793 | | | | — | | | | 3,268,793 | |
| | | | | | | | | | | | | | | | |
Total | | $ | 24,015,357 | | | $ | 635,682,134 | | | $ | 0 | | | $ | 659,697,491 | |
| | | | | | | | | | | | | | | | |
LIABILITIES VALUATION INPUT
| | | | | | | | | | | | | | | | |
Description | | Quoted Prices
in Active
Markets for
Identical Assets
(Level 1) | | | Significant
Other
Observable
Inputs
(Level 2) | | | Significant
Unobservable
Inputs
(Level 3) | | | Total | |
Futures Contracts† | | | | | | | | | |
Buys | | $ | (55,832 | ) | | $ | — | | | $ | — | | | $ | (55,832 | ) |
Sales | | | (90,468 | ) | | | — | | | | — | | | | (90,468 | ) |
| | | | | | | | | | | | | | | | |
Total Futures Contracts | | | (146,300 | ) | | | — | | | | — | | | | (146,300 | ) |
| | | | | | | | | | | | | | | | |
Forward Foreign Currency Contracts† | | | — | | | | (3,477,339 | ) | | | — | | | | (3,477,339 | ) |
| | | | | | | | | | | | | | | | |
Total Forward Foreign Currency Contracts | | | — | | | | (3,477,339 | ) | | | — | | | | (3,477,339 | ) |
| | | | | | | | | | | | | | | | |
Total | | $ | (146,300 | ) | | $ | (3,477,339 | ) | | $ | — | | | $ | (3,623,639 | ) |
| | | | | | | | | | | | | | | | |
| | ** | Represents one or more Level 3 securities at $0 value as of March 31, 2018. |
| | † | Forward foreign currency contracts and Futures contracts are valued at unrealized appreciation/depreciation. Only current day’s variation margin on Futures contracts and Centrally Cleared Swaps, if any, is reported on the Statements of Assets and Liabilities. |
194
Mercer Funds
Notes to the Financial Statements (Continued)
March 31, 2018
Emerging Markets
ASSETS VALUATION INPUT
| | | | | | | | | | | | | | | | |
Description | | Quoted Prices
in Active
Markets for
Identical Assets
(Level 1) | | | Significant
Other
Observable
Inputs
(Level 2) | | | Significant
Unobservable
Inputs
(Level 3) | | | Total | |
Common Stocks | | | | | | | | | |
Argentina | | $ | 3,721,786 | | | $ | — | | | $ | — | | | $ | 3,721,786 | |
Australia | | | — | | | | 4,636,880 | | | | — | | | | 4,636,880 | |
Bermuda | | | 5,826,300 | | | | 6,222,319 | | | | — | | | | 12,048,619 | |
Brazil | | | 62,581,549 | | | | — | | | | — | | | | 62,581,549 | |
British Virgin Islands | | | 791,609 | | | | — | | | | — | | | | 791,609 | |
Cayman Islands | | | 47,781,628 | | | | 80,507,533 | | | | — | | | | 128,289,161 | |
Chile | | | 17,661,315 | | | | — | | | | — | | | | 17,661,315 | |
China | | | 622,179 | | | | 84,055,725 | | | | — | | | | 84,677,904 | |
Colombia | | | 50,424 | | | | 822,580 | | | | — | | | | 873,004 | |
Cyprus | | | — | | | | 1,211,547 | | | | — | | | | 1,211,547 | |
Czech Republic | | | — | | | | 3,726,355 | | | | — | | | | 3,726,355 | |
Egypt | | | — | | | | 2,921,351 | | | | — | | | | 2,921,351 | |
France | | | — | | | | 2,288,687 | | | | — | | | | 2,288,687 | |
Greece | | | — | | | | 1,070,367 | | | | — | | | | 1,070,367 | |
Hong Kong | | | — | | | | 51,325,726 | | | | — | | | | 51,325,726 | |
Hungary | | | — | | | | 5,132,125 | | | | — | | | | 5,132,125 | |
India | | | 6,625,282 | | | | 102,067,425 | | | | — | | | | 108,692,707 | |
Indonesia | | | — | | | | 25,673,326 | | | | — | | | | 25,673,326 | |
Isle of Man | | | — | | | | 246,725 | | | | — | | | | 246,725 | |
Japan | | | 1,971,960 | | | | — | | | | — | | | | 1,971,960 | |
Luxembourg | | | — | | | | 239,284 | | | | — | | | | 239,284 | |
Malaysia | | | 17,798,186 | | | | — | | | | — | | | | 17,798,186 | |
Mexico | | | 6,349,243 | | | | 24,282,250 | | | | — | | | | 30,631,493 | |
Netherlands | | | 4,638,097 | | | | 4,707,329 | | | | — | | | | 9,345,426 | |
Nigeria | | | — | | | | 1,796,464 | | | | — | | | | 1,796,464 | |
Philippines | | | — | | | | 6,979,622 | | | | — | | | | 6,979,622 | |
Poland | | | — | | | | 8,009,114 | | | | — | | | | 8,009,114 | |
Qatar | | | — | | | | 701,622 | | | | — | | | | 701,622 | |
Russia | | | 7,652,088 | | | | 8,515,638 | | | | — | | | | 16,167,726 | |
Singapore | | | — | | | | 3,826,223 | | | | — | | | | 3,826,223 | |
South Africa | | | 820,325 | | | | 76,574,386 | | | | — | | | | 77,394,711 | |
South Korea | | | 128,451,075 | | | | — | | | | — | | | | 128,451,075 | |
Spain | | | — | | | | 52,296 | | | | — | | | | 52,296 | |
Switzerland | | | — | | | | 1,168,994 | | | | — | | | | 1,168,994 | |
Taiwan | | | 108,116,836 | | | | — | | | | — | | | | 108,116,836 | |
Thailand | | | 20,611,092 | | | | 12,206,184 | | | | — | | | | 32,817,276 | |
Turkey | | | 10,858,538 | | | | — | | | | — | | | | 10,858,538 | |
United Arab Emirates | | | — | | | | 1,260,646 | | | | — | | | | 1,260,646 | |
United Kingdom | | | — | | | | 11,056,788 | | | | — | | | | 11,056,788 | |
United States | | | 17,917,923 | | | | — | | | | — | | | | 17,917,923 | |
| | | | | | | | | | | | | | | | |
Total Common Stocks | | | 470,847,435 | | | | 533,285,511 | | | | — | | | | 1,004,132,946 | |
| | | | | | | | | | | | | | | | |
195
Mercer Funds
Notes to the Financial Statements (Continued)
March 31, 2018
| | | | | | | | | | | | | | | | |
Description | | Quoted Prices
in Active
Markets for
Identical Assets
(Level 1) | | | Significant
Other
Observable
Inputs
(Level 2) | | | Significant
Unobservable
Inputs
(Level 3) | | | Total | |
Preferred Stocks | | | | | | | | | | | | | | | | |
Brazil | | $ | 20,193,863 | | | $ | — | | | $ | — | | | $ | 20,193,863 | |
Colombia | | | — | | | | 246,490 | | | | — | | | | 246,490 | |
Germany | | | — | | | | 1,100,906 | | | | — | | | | 1,100,906 | |
| | | | | | | | | | | | | | | | |
Total Preferred Stocks | | | 20,193,863 | | | | 1,347,396 | | | | — | | | | 21,541,259 | |
| | | | | | | | | | | | | | | | |
Rights | | | | | | | | | | | | | | | | |
South Korea | | | 57,783 | | | | — | | | | — | | | | 57,783 | |
| | | | | | | | | | | | | | | | |
Total Rights | | | 57,783 | | | | — | | | | — | | | | 57,783 | |
| | | | | | | | | | | | | | | | |
Short-Term Investments | | | | | | | | | | | | | | | | |
Bank Deposits | | | — | | | | 74,518,086 | | | | — | | | | 74,518,086 | |
Investment Fund | | | 6,061,741 | | | | — | | | | — | | | | 6,061,741 | |
Mutual Fund - Securities Lending Collateral | | | 8,417,141 | | | | — | | | | — | | | | 8,417,141 | |
U.S. Government and Agency Obligations | | | — | | | | 2,397,644 | | | | — | | | | 2,397,644 | |
| | | | | | | | | | | | | | | | |
Total Short-Term Investments | | | 14,478,882 | | | | 76,915,730 | | | | — | | | | 91,394,612 | |
| | | | | | | | | | | | | | | | |
Futures Contracts† | | | | | | | | | | | | | | | | |
Buys | | | 54,049 | | | | — | | | | — | | | | 54,049 | |
Sales | | | 968,711 | | | | — | | | | — | | | | 968,711 | |
| | | | | | | | | | | | | | | | |
Total Futures Contracts | | | 1,022,760 | | | | — | | | | — | | | | 1,022,760 | |
| | | | | | | | | | | | | | | | |
Synthetic Futures | | | | | | | | | | | | | | | | |
Long | | | — | | | | 846,906 | | | | — | | | | 846,906 | |
| | | | | | | | | | | | | | | | |
Total Synthetic Futures | | | — | | | | 846,906 | | | | — | | | | 846,906 | |
| | | | | | | | | | | | | | | | |
Forward Foreign Currency Contracts† | | | — | | | | 1,957,838 | | | | — | | | | 1,957,838 | |
| | | | | | | | | | | | | | | | |
Total Forward Foreign Currency Contracts | | | — | | | | 1,957,838 | | | | — | | | | 1,957,838 | |
| | | | | | | | | | | | | | | | |
Total | | $ | 506,600,723 | | | $ | 614,353,381 | | | $ | — | | | $ | 1,120,954,104 | |
| | | | | | | | | | | | | | | | |
LIABILITIES VALUATION INPUT
| | | | | | | | | | | | | | | | |
Description | | Quoted Prices
in Active
Markets for
Identical Assets
(Level 1) | | | Significant
Other
Observable
Inputs
(Level 2) | | | Significant
Unobservable
Inputs
(Level 3) | | | Total | |
Futures Contracts† | | | | | | | | | | | | | | | | |
Buys | | $ | (559,223 | ) | | $ | — | | | $ | — | | | $ | (559,223 | ) |
Sales | | | (177,224 | ) | | | — | | | | — | | | | (177,224 | ) |
| | | | | | | | | | | | | | | | |
Total Futures Contracts | | | (736,447 | ) | | | — | | | | — | | | | (736,447 | ) |
| | | | | | | | | | | | | | | | |
196
Mercer Funds
Notes to the Financial Statements (Continued)
March 31, 2018
| | | | | | | | | | | | | | | | |
Description | | Quoted Prices
in Active
Markets for
Identical Assets
(Level 1) | | | Significant
Other
Observable
Inputs
(Level 2) | | | Significant
Unobservable
Inputs
(Level 3) | | | Total | |
Synthetic Futures | | | | | | | | | |
Long | | $ | — | | | $ | (392,086 | ) | | $ | — | | | $ | (392,086 | ) |
| | | | | | | | | | | | | | | | |
Total Synthetic Futures | | | — | | | | (392,086 | ) | | | — | | | | (392,086 | ) |
| | | | | | | | | | | | | | | | |
Forward Foreign Currency Contracts† | | | — | | | | (2,049,334 | ) | | | — | | | | (2,049,334 | ) |
| | | | | | | | | | | | | | | | |
Total Forward Foreign Currency Contracts | | | — | | | | (2,049,334 | ) | | | — | | | | (2,049,334 | ) |
| | | | | | | | | | | | | | | | |
Total | | $ | (736,447 | ) | | $ | (2,441,420 | ) | | $ | — | | | $ | (3,177,867 | ) |
| | | | | | | | | | | | | | | | |
| | † | Forward foreign currency contracts and Futures contracts are valued at unrealized appreciation/depreciation. Only current day’s variation margin on Futures contracts and Centrally Cleared Swaps, if any, is reported on the Statements of Assets and Liabilities. |
Global Low Volatility
ASSETS VALUATION INPUT
| | | | | | | | | | | | | | | | |
Description | | Quoted Prices
in Active
Markets for
Identical Assets
(Level 1) | | | Significant
Other
Observable
Inputs
(Level 2) | | | Significant
Unobservable
Inputs
(Level 3) | | | Total | |
Common Stocks | | | | | | | | | |
Australia | | $ | — | | | $ | 9,843,208 | | | $ | — | | | $ | 9,843,208 | |
Austria | | | — | | | | 5,886,844 | | | | — | | | | 5,886,844 | |
Bahamas | | | — | | | | 32,194 | | | | — | | | | 32,194 | |
Belgium | | | — | | | | 3,899,052 | | | | — | | | | 3,899,052 | |
Bermuda | | | 8,607,797 | | | | 2,278,339 | | | | — | | | | 10,886,136 | |
Canada | | | 29,256,795 | | | | — | | | | — | | | | 29,256,795 | |
Cayman Islands | | | — | | | | 497,134 | | | | — | | | | 497,134 | |
Denmark | | | — | | | | 3,023,253 | | | | — | | | | 3,023,253 | |
Finland | | | — | | | | 5,329,936 | | | | — | | | | 5,329,936 | |
France | | | — | | | | 19,450,117 | | | | — | | | | 19,450,117 | |
Germany | | | — | | | | 22,063,864 | | | | — | | | | 22,063,864 | |
Hong Kong | | | — | | | | 10,843,842 | | | | — | | | | 10,843,842 | |
Ireland | | | 4,889,254 | | | | 611,999 | | | | — | | | | 5,501,253 | |
Israel | | | — | | | | 6,260,720 | | | | — | | | | 6,260,720 | |
Italy | | | — | | | | 2,630,883 | | | | — | | | | 2,630,883 | |
Japan | | | 47,088,815 | | | | — | | | | — | | | | 47,088,815 | |
Liberia | | | 977,006 | | | | — | | | | — | | | | 977,006 | |
Luxembourg | | | 983,290 | | | | 3,314,771 | | | | — | | | | 4,298,061 | |
Netherlands | | | 3,405,912 | | | | 1,697,620 | | | | — | | | | 5,103,532 | |
New Zealand | | | — | | | | 5,731,046 | | | | — | | | | 5,731,046 | |
Norway | | | — | | | | 6,972,909 | | | | — | | | | 6,972,909 | |
Panama | | | 1,666,322 | | | | — | | | | — | | | | 1,666,322 | |
Portugal | | | — | | | | 268,712 | | | | — | | | | 268,712 | |
Puerto Rico | | | 649,272 | | | | — | | | | — | | | | 649,272 | |
197
Mercer Funds
Notes to the Financial Statements (Continued)
March 31, 2018
| | | | | | | | | | | | | | | | |
Description | | Quoted Prices
in Active
Markets for
Identical Assets
(Level 1) | | | Significant
Other
Observable
Inputs
(Level 2) | | | Significant
Unobservable
Inputs
(Level 3) | | | Total | |
Singapore | | $ | — | | | $ | 7,405,851 | | | $ | — | | | $ | 7,405,851 | |
Spain | | | — | | | | 1,275,245 | | | | — | | | | 1,275,245 | |
Sweden | | | — | | | | 12,405,748 | | | | — | | | | 12,405,748 | |
Switzerland | | | 93,824 | | | | 47,376,113 | | | | — | | | | 47,469,937 | |
United Kingdom | | | 3,239,643 | | | | 44,886,871 | | | | — | | | | 48,126,514 | |
United States | | | 482,292,383 | | | | — | | | | — | | | | 482,292,383 | |
| | | | | | | | | | | | | | | | |
Total Common Stocks | | | 583,150,313 | | | | 223,986,271 | | | | — | | | | 807,136,584 | |
| | | | | | | | | | | | | | | | |
Investment Companies | | | | | | | | | | | | | | | | |
United Kingdom | | | — | | | | 393,701 | | | | — | | | | 393,701 | |
| | | | | | | | | | | | | | | | |
Total Investment Companies | | | — | | | | 393,701 | | | | — | | | | 393,701 | |
| | | | | | | | | | | | | | | | |
Preferred Stocks | | | | | | | | | |
Germany | | | — | | | | 1,242,875 | | | | — | | | | 1,242,875 | |
Japan | | | 158,285 | | | | — | | | | — | | | | 158,285 | |
Sweden | | | — | | | | 97,740 | | | | — | | | | 97,740 | |
| | | | | | | | | | | | | | | | |
Total Preferred Stocks | | | 158,285 | | | | 1,340,615 | | | | — | | | | 1,498,900 | |
| | | | | | | | | | | | | | | | |
Short-Term Investments | | | | | | | | | | | | | | | | |
Bank Deposits | | | — | | | | 106,985,801 | | | | — | | | | 106,985,801 | |
Mutual Fund - Securities Lending Collateral | | | 4,305,160 | | | | — | | | | — | | | | 4,305,160 | |
U.S. Government and Agency Obligations | | | — | | | | 2,149,710 | | | | — | | | | 2,149,710 | |
| | | | | | | | | | | | | | | | |
Total Short-Term Investments | | | 4,305,160 | | | | 109,135,511 | | | | — | | | | 113,440,671 | |
| | | | | | | | | | | | | | | | |
Futures Contracts† | | | | | | | | | |
Buys | | | 10,195 | | | | — | | | | — | | | | 10,195 | |
| | | | | | | | | | | | | | | | |
Total Futures Contracts | | | 10,195 | | | | — | | | | — | | | | 10,195 | |
| | | | | | | | | | | | | | | | |
Total | | $ | 587,623,953 | | | $ | 334,856,098 | | | $ | — | | | $ | 922,480,051 | |
| | | | | | | | | | | | | | | | |
LIABILITIES VALUATION INPUT
| | | | | | | | | | | | | | | | |
Description | | Quoted Prices
in Active
Markets for
Identical Assets
(Level 1) | | | Significant
Other
Observable
Inputs
(Level 2) | | | Significant
Unobservable
Inputs
(Level 3) | | | Total | |
Futures Contracts† | | | | | | | | | |
Buys | | $ | (1,130,596 | ) | | $ | — | | | $ | — | | | $ | (1,130,596 | ) |
| | | | | | | | | | | | | | | | |
Total Futures Contracts | | | (1,130,596 | ) | | | — | | | | — | | | | (1,130,596 | ) |
| | | | | | | | | | | | | | | | |
Total | | $ | (1,130,596 | ) | | $ | — | | | $ | — | | | $ | (1,130,596 | ) |
| | | | | | | | | | | | | | | | |
| | † | Futures contracts are valued at unrealized appreciation/depreciation. Only current day’s variation margin on Futures contracts and Centrally Cleared Swaps, if any, is reported on the Statements of Assets and Liabilities. |
198
Mercer Funds
Notes to the Financial Statements (Continued)
March 31, 2018
The following tables show transfers between Level 1 and Level 2 of the fair value hierarchy:
Non-US Core Equity
| | | | | | | | | | | | | | | | |
| | | Transfers In | | | Transfers Out | |
| | | Level 1 — Quoted
Prices | | | Level 2 — Other
Significant
Observable Inputs | | | Level 1 — Quoted
Prices | | | Level 2 — Other
Significant
Observable Inputs | |
Common Stocks | | $ | — | | | $ | 1,007,533,280 | * | | $ | 1,007,533,280 | * | | $ | — | |
| | | | | | | | | | | | | | | | |
Opportunistic Fixed
| | | | | | | | | | | | | | | | |
| | | Transfers In | | | Transfers Out | |
| | | Level 1 — Quoted
Prices | | | Level 2 — Other
Significant
Observable Inputs | | | Level 1 — Quoted
Prices | | | Level 2 — Other
Significant
Observable Inputs | |
Common Stocks | | $ | 478,314 | ** | | $ | — | | | $ | — | | | $ | 478,314 | ** |
| | | | | | | | | | | | | | | | |
Emerging Markets
| | | | | | | | | | | | | | | | |
| | | Transfers In | | | Transfers Out | |
| | | Level 1 — Quoted
Prices | | | Level 2 — Other
Significant
Observable Inputs | | | Level 1 — Quoted
Prices | | | Level 2 — Other
Significant
Observable Inputs | |
Common Stocks | | $ | 5,795,921 | ** | | $ | 346,793,329 | * | | $ | 346,793,329 | * | | $ | 5,795,921 | ** |
| | | | | | | | | | | | | | | | |
Global Low Volatility
| | | | | | | | | | | | | | | | |
| | | Transfers In | | | Transfers Out | |
| | | Level 1 — Quoted
Prices | | | Level 2 — Other
Significant
Observable Inputs | | | Level 1 — Quoted
Prices | | | Level 2 — Other
Significant
Observable Inputs | |
Common Stocks | | $ | 50,113 | ** | | $ | 161,216,085 | * | | $ | 161,216,085 | * | | $ | 50,113 | ** |
| | | | | | | | | | | | | | | | |
| | * | Transfers occurred between Level 1 and Level 2 as a result of foreign securities not receiving an exchange traded price. |
| | ** | Transfers occurred between Level 1 and Level 2 as a result of foreign securities receiving an exchange traded price. |
For financial statement reporting purposes, the Funds recognize transfers between Levels as of the end of the reporting period.
199
Mercer Funds
Notes to the Financial Statements (Continued)
March 31, 2018
Investments in Derivative Instruments
At March 31, 2018 and during the period then ended, the Funds had the following derivatives and transactions in derivatives, grouped into appropriate risk categories:
Large Cap
| | | | | | | | |
| LIABILITY DERIVATIVES | |
| | | Equity Risk | | | Total | |
Futures Contracts(2) | | $ | (574,889 | ) | | $ | (574,889 | ) |
| | | | | | | | |
Total Value | | $ | (574,889 | ) | | $ | (574,889 | ) |
| | | | | | | | |
| | |
| | | | | | | | |
| NET REALIZED GAIN (LOSS) | |
| | | Equity Risk | | | Total | |
Futures Contracts(5) | | $ | 2,077,277 | | | $ | 2,077,277 | |
| | | | | | | | |
Total Realized Gain (Loss) | | $ | 2,077,277 | | | $ | 2,077,277 | |
| | | | | | | | |
| | |
| | | | | | | | |
| CHANGE IN APPRECIATION (DEPRECIATION) | |
| | | Equity Risk | | | Total | |
Futures Contracts(10) | | $ | (572,245 | ) | | $ | (572,245 | ) |
| | | | | | | | |
Total Change in Appreciation (Depreciation) | | $ | (572,245 | ) | | $ | (572,245 | ) |
| | | | | | | | |
| | |
| | | | | | | | |
| NUMBER OF CONTRACTS, NOTIONAL AMOUNTS OR SHARES/UNITS(14) | |
| | | Equity Risk | | | Total | |
Futures Contracts | | | 88 | | | | 88 | |
Small/Mid Cap
| | | | | | | | |
| LIABILITY DERIVATIVES | |
| | | Equity Risk | | | Total | |
Futures Contracts(2) | | $ | (982,678 | ) | | $ | (982,678 | ) |
| | | | | | | | |
Total Value | | $ | (982,678 | ) | | $ | (982,678 | ) |
| | | | | | | | |
| | |
| | | | | | | | |
| NET REALIZED GAIN (LOSS) | |
| | | Equity Risk | | | Total | |
Futures Contracts(5) | | $ | 4,157,909 | | | $ | 4,157,909 | |
| | | | | | | | |
Total Realized Gain (Loss) | | $ | 4,157,909 | | | $ | 4,157,909 | |
| | | | | | | | |
| | |
| | | | | | | | |
| CHANGE IN APPRECIATION (DEPRECIATION) | |
| | | Equity Risk | | | Total | |
Futures Contracts(10) | | $ | (1,218,200 | ) | | $ | (1,218,200 | ) |
| | | | | | | | |
Total Change in Appreciation (Depreciation) | | $ | (1,218,200 | ) | | $ | (1,218,200 | ) |
| | | | | | | | |
| | |
| | | | | | | | |
200
Mercer Funds
Notes to the Financial Statements (Continued)
March 31, 2018
| | | | | | | | |
| NUMBER OF CONTRACTS, NOTIONAL AMOUNTS OR SHARES/UNITS(14) | |
| | | Equity Risk | | | Total | |
Futures Contracts | | | 286 | | | | 286 | |
Non-US Core Equity
| | | | | | | | | | | | |
| ASSET DERIVATIVES | | | | | | | | | | | | |
| | | Foreign
Currency Risk | | | Equity Risk | | | Total | |
Forward Foreign Currency Contracts(1) | | $ | 2,518 | | | $ | — | | | $ | 2,518 | |
| | | | | | | | | | | | |
Total Value | | $ | 2,518 | | | $ | | | | $ | 2,518 | |
| | | | | | | | | | | | |
| | | |
| | | | | | | | | | | | |
| LIABILITY DERIVATIVES | | | | | | | | | | | | |
| | | Foreign
Currency Risk | | | Equity Risk | | | Total | |
Forward Foreign Currency Contracts(3) | | $ | (107,338 | ) | | $ | — | | | $ | (107,338 | ) |
Futures Contracts(2) | | | — | | | | (2,027,504 | ) | | | (2,027,504 | ) |
| | | | | | | | | | | | |
Total Value | | $ | (107,338 | ) | | $ | (2,027,504 | ) | | $ | (2,134,842 | ) |
| | | | | | | | | | | | |
| | | |
| | | | | | | | | | | | |
| NET REALIZED GAIN (LOSS) | | | | | | | | | | | | |
| | | Foreign
Currency Risk | | | Equity Risk | | | Total | |
Futures Contracts(5) | | $ | — | | | $ | 14,398,086 | | | $ | 14,398,086 | |
Forward Foreign Currency Contracts(4) | | | 122,300 | | | | — | | | | 122,300 | |
| | | | | | | | | | | | |
Total Realized Gain (Loss) | | $ | 122,300 | | | $ | 14,398,086 | | | $ | 14,520,386 | |
| | | | | | | | | | | | |
| | | |
| | | | | | | | | | | | |
| CHANGE IN APPRECIATION (DEPRECIATION) | |
| | | Foreign
Currency Risk | | | Equity Risk | | | Total | |
Futures Contracts(10) | | $ | — | | | $ | (2,594,886 | ) | | $ | (2,594,886 | ) |
Forward Foreign Currency Contracts(9) | | | (123,227 | ) | | | — | | | | (123,227 | ) |
| | | | | | | | | | | | |
Total Change in Appreciation (Depreciation) | | $ | (123,227 | ) | | $ | (2,594,886 | ) | | $ | (2,718,113 | ) |
| | | | | | | | | | | | |
| | | |
| | | | | | | | | | | | |
| NUMBER OF CONTRACTS, NOTIONAL AMOUNTS OR SHARES/UNITS(14) | |
| | | Foreign
Currency Risk | | | Equity Risk | | | Total | |
Futures Contracts | | | — | | | | 805 | | | | 805 | |
Forward Foreign Currency Contracts | | | (15,288,738 | ) | | | — | | | | (15,288,738 | ) |
201
Mercer Funds
Notes to the Financial Statements (Continued)
March 31, 2018
Core Fixed
| | | | | | | | | | | | |
| ASSET DERIVATIVES | | | | | | | | | | | | |
| | | Credit Risk | | | Interest
Rate Risk | | | Total | |
Futures Contracts(2) | | $ | — | | | $ | 991,336 | | | $ | 991,336 | |
Centrally Cleared Swap Contracts** | | | — | | | | 1,260,806 | | | | 1,260,806 | |
| | | | | | | | | | | | |
Total Value | | $ | — | | | $ | 2,252,142 | | | $ | 2,252,142 | |
| | �� | | | | | | | | | | |
| | | |
| | | | | | | | | | | | |
| LIABILITY DERIVATIVES | | | | | | | | | | | | |
| | | Credit Risk | | | Interest
Rate Risk | | | Total | |
Futures Contracts(2) | | $ | — | | | $ | (187,229 | ) | | $ | (187,229 | ) |
Centrally Cleared Swap Contracts** | | | — | | | | (316,416 | ) | | | (316,416 | ) |
| | | | | | | | | | | | |
Total Value | | $ | — | | | $ | (503,645 | ) | | $ | (503,645 | ) |
| | | | | | | | | | | | |
| | | |
| | | | | | | | | | | | |
| NET REALIZED GAIN (LOSS) | | | | | | | | | | | | |
| | | Credit Risk | | | Interest
Rate Risk | | | Total | |
Options Purchased(6) | | $ | — | | | $ | (320,028 | ) | | $ | (320,028 | ) |
Options Written(7) | | | — | | | | 157,878 | | | | 157,878 | |
Swaps Contracts(8) | | | (51,022 | ) | | | 56,922 | | | | 5,900 | |
Futures Contracts(5) | | | — | | | | (1,039,395 | ) | | | (1,039,395 | ) |
| | | | | | | | | | | | |
Total Realized Gain (Loss) | | $ | (51,022 | ) | | $ | (1,144,623 | ) | | $ | (1,195,645 | ) |
| | | | | | | | | | | | |
| | | |
| | | | | | | | | | | | |
| CHANGE IN APPRECIATION (DEPRECIATION) | |
| | | Credit Risk | | | Interest
Rate Risk | | | Total | |
Options Purchased(11) | | $ | — | | | $ | 2,072 | | | $ | 2,072 | |
Options Written(12) | | | — | | | | (1,800 | ) | | | (1,800 | ) |
Swaps Contracts(13) | | | 26,705 | | | | 691,491 | | | | 718,196 | |
Futures Contracts(10) | | | — | | | | 588,751 | | | | 588,751 | |
| | | | | | | | | | | | |
Total Change in Appreciation (Depreciation) | | $ | 26,705 | | | $ | 1,280,514 | | | $ | 1,307,219 | |
| | | | | | | | | | | | |
| | | |
| | | | | | | | | | | | |
| NUMBER OF CONTRACTS, NOTIONAL AMOUNTS OR SHARES/UNITS(14) | |
| | | Credit Risk | | | Interest
Rate Risk | | | Total | |
Options Purchased | | | — | | | | 267,571 | | | | 267,571 | |
Options Written | | | — | | | | (288,833 | ) | | | (288,833 | ) |
Swaps Contracts | | | 17,000,000 | | | | 93,533,167 | | | | 110,533,167 | |
Futures Contracts | | | — | | | | 814 | | | | 814 | |
202
Mercer Funds
Notes to the Financial Statements (Continued)
March 31, 2018
Opportunistic Fixed
| | | | | | | | | | | | |
| ASSET DERIVATIVES | | | | | | | | | | | | |
| | | Foreign
Currency Risk | | | Interest
Rate Risk | | | Total | |
Futures Contracts(2) | | $ | — | | | $ | 145,109 | | | $ | 145,109 | |
Forward Foreign Currency Contracts(1)† | | | 3,268,793 | | | | — | | | | 3,268,793 | |
| | | | | | | | | | | | |
Total Value | | $ | 3,268,793 | | | $ | 145,109 | | | $ | 3,413,902 | |
| | | | | | | | | | | | |
| | | |
| | | | | | | | | | | | |
| LIABILITY DERIVATIVES | | | | | | | | | | | | |
| | | Foreign
Currency Risk | | | Interest
Rate Risk | | | Total | |
Forward Foreign Currency Contracts(3)† | | $ | (3,477,339 | ) | | $ | — | | | $ | (3,477,339 | ) |
Futures Contracts(2) | | | — | | | | (146,300 | ) | | | (146,300 | ) |
| | | | | | | | | | | | |
Total Value | | $ | (3,477,339 | ) | | $ | (146,300 | ) | | $ | (3,623,639 | ) |
| | | | | | | | | | | | |
| | | |
| | | | | | | | | | | | |
| NET REALIZED GAIN (LOSS) | | | | | | | | | | | | |
| | | Foreign
Currency Risk | | | Interest
Rate Risk | | | Total | |
Futures Contracts(5) | | $ | — | | | $ | 1,494,242 | | | $ | 1,494,242 | |
Forward Foreign Currency Contracts(4)† | | | 7,247,205 | | | | — | | | | 7,247,205 | |
| | | | | | | | | | | | |
Total Realized Gain (Loss) | | $ | 7,247,205 | | | $ | 1,494,242 | | | $ | 8,741,447 | |
| | | | | | | | | | | | |
| | | |
| | | | | | | | | | | | |
| CHANGE IN APPRECIATION (DEPRECIATION) | |
| | | Foreign
Currency Risk | | | Interest
Rate Risk | | | Total | |
Futures Contracts(10) | | $ | — | | | $ | 108,249 | | | $ | 108,249 | |
Forward Foreign Currency Contracts(9)† | | | (875,636 | ) | | | — | | | | (875,636 | ) |
| | | | | | | | | | | | |
Total Change in Appreciation (Depreciation) | | $ | (875,636 | ) | | $ | 108,249 | | | $ | (767,387 | ) |
| | | | | | | | | | | | |
| | | |
| | | | | | | | | | | | |
| NUMBER OF CONTRACTS, NOTIONAL AMOUNTS OR SHARES/UNITS(14) | |
| | | Foreign
Currency Risk | | | Interest
Rate Risk | | | Total | |
Futures Contracts | | | — | | | | 2,345 | | | | 2,345 | |
Forward Foreign Currency Contracts† | | | 13,971,420 | | | | — | | | | 13,971,420 | |
Emerging Markets
| | | | | | | | | | | | |
| ASSET DERIVATIVES | |
| | | Foreign
Currency Risk | | | Equity Risk | | | Total | |
Futures Contracts(2)†† | | $ | — | | | $ | 1,869,666 | | | $ | 1,869,666 | |
Forward Foreign Currency Contracts(1) | | | 1,957,838 | | | | — | | | | 1,957,838 | |
| | | | | | | | | | | | |
Total Value | | $ | 1,957,838 | | | $ | 1,869,666 | | | $ | 3,827,504 | |
| | | | | | | | | | | | |
| | | |
| | | | | | | | | | | | |
203
Mercer Funds
Notes to the Financial Statements (Continued)
March 31, 2018
| | | | | | | | | | | | |
| LIABILITY DERIVATIVES | |
| | | Foreign
Currency Risk | | | Equity Risk | | | Total | |
Forward Foreign Currency Contracts(3) | | $ | (2,049,334 | ) | | $ | — | | | $ | (2,049,334 | ) |
Futures Contracts(2)†† | | | — | | | | (1,128,533 | ) | | | (1,128,533 | ) |
| | | | | | | | | | | | |
Total Value | | $ | (2,049,334 | ) | | $ | (1,128,533 | ) | | $ | (3,177,867 | ) |
| | | | | | | | | | | | |
| | | |
| | | | | | | | | | | | |
| NET REALIZED GAIN (LOSS) | |
| | | Foreign
Currency Risk | | | Equity Risk | | | Total | |
Futures Contracts(5)†† | | $ | — | | | $ | 27,176,024 | | | $ | 27,176,024 | |
Forward Foreign Currency Contracts(4) | | | (1,603,325 | ) | | | — | | | | (1,603,325 | ) |
| | | | | | | | | | | | |
Total Realized Gain (Loss) | | $ | (1,603,325 | ) | | $ | 27,176,024 | | | $ | 25,572,699 | |
| | | | | | | | | | | | |
| | | |
| | | | | | | | | | | | |
| CHANGE IN APPRECIATION (DEPRECIATION) | |
| | | Foreign
Currency Risk | | | Equity Risk | | | Total | |
Futures Contracts(10)†† | | $ | — | | | $ | (1,883,941 | ) | | $ | (1,883,941 | ) |
Forward Foreign Currency Contracts(9) | | | (74,546 | ) | | | — | | | | (74,546 | ) |
| | | | | | | | | | | | |
Total Change in Appreciation (Depreciation) | | $ | (74,546 | ) | | $ | (1,883,941 | ) | | $ | (1,958,487 | ) |
| | | | | | | | | | | | |
| | | |
| | | | | | | | | | | | |
| NUMBER OF CONTRACTS, NOTIONAL AMOUNTS OR SHARES/UNITS(14) | |
| | | Foreign
Currency Risk | | | Equity Risk | | | Total | |
Futures Contracts | | | — | | | | 16,861,138 | | | | 16,861,138 | |
Forward Foreign Currency Contracts | | | 34,099,690 | | | | — | | | | 34,099,690 | |
Global Low Volatility
| | | | | | | | | | | | |
| ASSET DERIVATIVES | |
| | | Foreign
Currency Risk | | | Equity Risk | | | Total | |
Futures Contracts(2) | | $ | 10,195 | | | $ | — | | | $ | 10,195 | |
| | | | | | | | | | | | |
Total Value | | $ | 10,195 | | | $ | — | | | $ | 10,195 | |
| | | | | | | | | | | | |
| | | |
| | | | | | | | | | | | |
| LIABILITY DERIVATIVES | |
| | | Foreign
Currency Risk | | | Equity Risk | | | Total | |
Futures Contracts(2) | | $ | — | | | $ | (1,130,596 | ) | | $ | (1,130,596 | ) |
| | | | | | | | | | | | |
Total Value | | $ | — | | | $ | (1,130,596 | ) | | $ | (1,130,596 | ) |
| | | | | | | | | | | | |
| | | |
| | | | | | | | | | | | |
204
Mercer Funds
Notes to the Financial Statements (Continued)
March 31, 2018
| | | | | | | | | | | | |
| NET REALIZED GAIN (LOSS) | |
| | | Foreign
Currency Risk | | | Equity Risk | | | Total | |
Futures Contracts(5) | | $ | 116,472 | | | $ | 9,089,289 | | | $ | 9,205,761 | |
| | | | | | | | | | | | |
Total Realized Gain (Loss) | | $ | 116,472 | | | $ | 9,089,289 | | | $ | 9,205,761 | |
| | | | | | | | | | | | |
| | | |
| | | | | | | | | | | | |
| CHANGE IN APPRECIATION (DEPRECIATION) | |
| | | Foreign
Currency Risk | | | Equity Risk | | | Total | |
Futures Contracts(10) | | $ | (7,739 | ) | | $ | (1,386,060 | ) | | $ | (1,393,799 | ) |
| | | | | | | | | | | | |
Total Change in Appreciation (Depreciation) | | $ | (7,739 | ) | | $ | (1,386,060 | ) | | $ | (1,393,799 | ) |
| | | | | | | | | | | | |
| | | |
| | | | | | | | | | | | |
| NUMBER OF CONTRACTS, NOTIONAL AMOUNTS OR SHARES/UNITS(14) | |
| | | Foreign
Currency Risk | | | Equity Risk | | | Total | |
Futures Contracts | | | 20 | | | | 366 | | | | 386 | |
| | ** | Centrally Cleared Swaps are valued at unrealized appreciation/depreciation on the Schedule of Investments. Only current day’s variation margin, if any, is reported on the Statement of Assets and Liabilities. |
| | † | Includes Cross Currency Foreign Currency Contracts. |
| | †† | Includes Synthetic Futures. |
| | (1) | Statements of Assets and Liabilities location: Unrealized appreciation on open forward foreign currency contracts. |
| | (2) | Cumulative appreciation (depreciation) on futures contracts is disclosed within the Schedule of Investments under the open “Futures Contracts” section. Only current day’s variation margin, if any, are reported within the Statements of Assets and Liabilities. Synthetic futures are presented as Synthetic futures, at value within the Statements of Assets and Liabilities. |
| | (3) | Statements of Assets and Liabilities location: Unrealized depreciation on open forward foreign currency contracts. |
| | (4) | Statements of Operations location: Amounts are included in Net realized gain (loss) on Forward foreign currency contracts. |
| | (5) | Statements of Operations location: Amounts are included in Net realized gain (loss) on Closed futures contracts. |
| | (6) | Statements of Operations location: Amounts are included in Net realized gain (loss) on Purchased option contracts. |
| | (7) | Statements of Operations location: Amounts are included in Net realized gain (loss) on Written option contracts. |
| | (8) | Statements of Operations location: Amounts are included in Net realized gain (loss) on Swap contracts. |
| | (9) | Statements of Operations location: Amounts are included in Change in net unrealized appreciation (depreciation) on Forward foreign currency contracts. |
| | (10) | Statements of Operations location: Amounts are included in Change in net unrealized appreciation (depreciation) on Open futures contracts. |
| | (11) | Statements of Operations location: Amounts are included in Change in net unrealized appreciation (depreciation) on Purchased option contracts. |
205
Mercer Funds
Notes to the Financial Statements (Continued)
March 31, 2018
| | (12) | Statements of Operations location: Amounts are included in Change in net unrealized appreciation (depreciation) on Written option contracts. |
| | (13) | Statements of Operations location: Amounts are included in Change in net unrealized appreciation (depreciation) on Swap contracts. |
| | (14) | Amounts disclosed represent average number of contracts, notional amounts, or shares outstanding for the time period that the Fund held such derivatives during the year ended March 31, 2018. |
Netting Agreements and Collateral Requirements
In order to better define contractual rights under derivative contracts and to secure rights that will help the Funds mitigate their counterparty risk, a sub-adviser may, on behalf of the Funds, enter into an International Swaps and Derivatives Association, Inc. Master Agreement (“ISDA Master Agreement”) or similar agreement with its derivative contract counterparties. An ISDA Master Agreement is a bilateral agreement between the Funds and a counterparty that governs OTC derivatives and foreign exchange contracts and typically contains, among other things, collateral posting terms and netting provisions in the event of a default and/or termination event. Under an ISDA Master Agreement, the Funds may, under certain circumstances, offset with the counterparty certain derivative financial instrument’s payables and/or receivables with certain collateral held and/or posted and create a net payment. The provisions of the ISDA Master Agreement typically permit a net payment in the event of default including the bankruptcy or insolvency of the counterparty. Absent an event of default by the counterparty or termination of the agreement, the ISDA Master Agreement does not result in an offset of reported amounts of assets and liabilities in the Statement of Assets and Liabilities across the transactions between the Funds and the applicable counterparty. The right to offset and net payments across all transactions traded under the ISDA Master Agreement could result in a reduction of the Funds’ credit risk to such counterparty equal to any amounts payable by the Funds under the applicable transactions, if any. However, bankruptcy or insolvency laws of a particular jurisdiction may impose restrictions on or prohibitions against the right of offset in bankruptcy, insolvency or other events. In addition, certain ISDA Master Agreements allow counterparties to OTC derivatives to terminate derivative contracts prior to maturity in the event a Fund’s net assets decline by a stated percentage or the Funds fail to meet the terms of their ISDA Master Agreements, which would cause the Funds to accelerate payment of any net liability owed to the counterparty.
For derivatives traded under an ISDA Master Agreement, the collateral requirements are typically calculated by netting the mark to market amount for each transaction under such agreement and comparing that amount to the value of any collateral currently pledged by the Funds and the counterparty.
Cash collateral that has been pledged to cover obligations of the Funds and cash collateral received from the counterparty, if any, is reported separately on the Statement of Assets and Liabilities as cash collateral held at broker or cash collateral due to broker, respectively. Non-cash collateral pledged by or received by the Funds, if any, is noted in the Schedule of Investments. Generally, the amount of collateral due from or to a party has to exceed a minimum transfer amount threshold before a transfer is required, which is determined each day at the close of business of the Funds, typically based on changes in market values for each transaction under an ISDA Master Agreement and netted into one amount for such agreement and any additional required collateral is delivered to/pledged by the Funds on the next business day. Typically, the Funds and counterparties are not permitted to sell, re-pledge or use the collateral they receive. To the extent amounts due to the Funds from their counterparties are not fully collateralized, contractually or otherwise, the Funds bear the risk of loss from counterparty non-performance. The Funds attempt to mitigate counterparty risk by entering into agreements only with counterparties that they believe have the financial resources to honor their obligations and by monitoring the financial stability of those counterparties.
206
Mercer Funds
Notes to the Financial Statements (Continued)
March 31, 2018
The Funds are required to disclose both gross and net information for assets and liabilities related to derivatives, repurchase and reverse repurchase agreements, and securities lending and securities borrowings transactions that are eligible for offset or subject to an enforceable master netting or similar agreement. The Funds’ derivative assets and liabilities at fair value by risk are presented in the tables above. For financial reporting purposes the Funds do not offset derivative assets and derivative liabilities that are subject to netting arrangements in the Statements of Assets and Liabilities.
The following tables present the Funds’ derivative assets and liabilities by counterparty, net of amounts available for offset under a Master Netting Agreement (“MNA”) and net of related collateral received by the Funds for assets or pledged by the Funds for liabilities as of March 31, 2018.
Non-US Core Equity
Offsetting of Financial Assets and Derivative Assets:
| | | | | | | | | | | | | | | | |
Counterparty | | Derivative
Assets Subject
to MNA | | | Derivative
Assets/(Liabilities)
available for offset | | | Cash
Collateral
Received* | | | Net Amount
of Derivative
Assets(a) | |
Morgan Stanley Capital | | $ | 2,518 | | | $ | — | | | $ | — | | | $ | 2,518 | |
| | | | | | | | | | | | | | | | |
| | $ | 2,518 | | | $ | — | | | $ | — | | | $ | 2,518 | |
| | | | | | | | | | | | | | | | |
Offsetting of Financial Liabilities and Derivative Liabilities:
| | | | | | | | | | | | | | | | |
Counterparty | | Derivative
Liabilities Subject
to MNA | | | Derivative
Assets/(Liabilities)
available for offset | | | Cash
Collateral
Pledged* | | | Net Amount
of Derivative
Assets(b) | |
State Street Bank and Trust | | $ | (107,338 | ) | | $ | — | | | $ | — | | | $ | (107,338 | ) |
| | | | | | | | | | | | | | | | |
| | $ | (107,338 | ) | | $ | — | | | $ | — | | | $ | (107,338 | ) |
| | | | | | | | | | | | | | | | |
| | (a) | Represents the net amount receivable from the counterparty in the event of default. |
| | (b) | Represents the net amount payable to the counterparty in the event of default. |
| | * | In some instances, the actual collateral received and/or pledged may be more than the derivative asset or liability due to overcollateralization. |
Opportunistic Fixed
Offsetting of Financial Assets and Derivative Assets:
| | | | | | | | | | | | | | | | |
Counterparty | | Derivative
Assets Subject
to MNA | | | Derivative
Assets/(Liabilities)
available for offset | | | Cash
Collateral
Received* | | | Net Amount
of Derivative
Assets(a) | |
Citibank N.A. | | $ | 891,534 | | | $ | (891,534 | ) | | $ | — | | | $ | — | |
Deutsche Bank AG London | | | 98,407 | | | | — | | | | (98,407 | ) | | | — | |
Goldman Sachs International | | | 1,153,927 | | | | (294,549 | ) | | | — | | | | 859,378 | |
HSBC Bank plc | | | 60,370 | | | | — | | | | — | | | | 60,370 | |
JPMorgan Chase Bank N.A. London | | | 953,263 | | | | (138,423 | ) | | | (814,840 | ) | | | — | |
Standard Chartered Bank | | | 111,292 | | | | (111,292 | ) | | | — | | | | — | |
| | | | | | | | | | | | | | | | |
| | $ | 3,268,793 | | | $ | (1,435,798 | ) | | $ | (913,247 | ) | | $ | 919,748 | |
| | | | | | | | | | | | | | | | |
207
Mercer Funds
Notes to the Financial Statements (Continued)
March 31, 2018
Offsetting of Financial Liabilities and Derivative Liabilities:
| | | | | | | | | | | | | | | | |
Counterparty | | Derivative
Liabilities Subject
to MNA | | | Derivative
Assets/(Liabilities)
available for offset | | | Cash
Collateral
Pledged* | | | Net Amount
of Derivative
Assets(b) | |
Citibank N.A. | | $ | (2,678,889 | ) | | $ | 891,534 | | | $ | 1,460,000 | | | $ | (327,355 | ) |
Goldman Sachs International | | | (294,549 | ) | | | 294,549 | | | | — | | | | — | |
JPMorgan Chase Bank N.A. London | | | (138,423 | ) | | | 138,423 | | | | — | | | | — | |
Standard Chartered Bank | | | (365,478 | ) | | | 111,292 | | | | 254,186 | | | | — | |
| | | | | | | | | | | | | | | | |
| | $ | (3,477,339 | ) | | $ | 1,435,798 | | | $ | 1,714,186 | | | $ | (327,355 | ) |
| | | | | | | | | | | | | | | | |
| | (a) | Represents the net amount receivable from the counterparty in the event of default. |
| | (b) | Represents the net amount payable to the counterparty in the event of default. |
| | * | In some instances, the actual collateral received and/or pledged may be more than the derivative asset or liability due to overcollateralization. |
Emerging Markets
Offsetting of Financial Assets and Derivative Assets:
| | | | | | | | | | | | | | | | |
Counterparty | | Derivative
Assets Subject
to MNA | | | Derivative
Assets/(Liabilities)
available for offset | | | Cash
Collateral
Received* | | | Net Amount
of Derivative
Assets(a) | |
Citibank N.A. London | | $ | 1,957,838 | | | $ | (1,957,838 | ) | | $ | — | | | $ | — | |
Goldman Sachs International | | | 846,906 | | | | (392,086 | ) | | | — | | | | 454,820 | |
| | | | | | | | | | | | | | | | |
| | $ | 2,804,744 | | | $ | (2,349,924 | ) | | $ | — | | | $ | 454,820 | |
| | | | | | | | | | | | | | | | |
Offsetting of Financial Liabilities and Derivative Liabilities:
| | | | | | | | | | | | | | | | |
Counterparty | | Derivative
Liabilities Subject
to MNA | | | Derivative
Assets/(Liabilities)
available for offset | | | Cash
Collateral
Pledged* | | | Net Amount
of Derivative
Assets(b) | |
Citibank N.A. London | | $ | (2,049,334 | ) | | $ | 1,957,838 | | | $ | 17,787 | | | $ | (73,709 | ) |
Goldman Sachs International | | | (392,086 | ) | | | 392,086 | | | | — | | | | — | |
| | | | | | | | | | | | | | | | |
| | $ | (2,441,420 | ) | | $ | 2,349,924 | | | $ | 17,787 | | | $ | (73,709 | ) |
| | | | | | | | | | | | | | | | |
| | (a) | Represents the net amount receivable from the counterparty in the event of default. |
| | (b) | Represents the net amount payable to the counterparty in the event of default. |
| | * | In some instances, the actual collateral received and/or pledged may be more than the derivative asset or liability due to overcollateralization. |
(b) Security transactions and related investment income
Security transactions are accounted for on trade date. Dividend income, net of applicable withholding taxes, is recorded on the ex-dividend date or when the Fund is informed of the ex-dividend date, if later. Interest income is recorded on the accrual basis, and is adjusted for amortization of premium and discounts for debt securities. Income is not recognized, nor are premium and discount amortized, on securities for which collection is not expected. Withholding taxes on foreign dividend, interest, and capital gains have been provided for in accordance with the respective country’s tax rules and rates.
208
Mercer Funds
Notes to the Financial Statements (Continued)
March 31, 2018
Non-cash dividends, if any, are recorded at the fair value of the securities received. Interest income on inflation indexed securities is accrued daily based upon an inflation-adjusted principal. Additionally, any increase in the principal or face amount of these securities is recorded as interest income. In determining the net gain or loss on securities sold, the cost of securities is determined on the identified-cost basis.
(c) Cash and short term investments
A Fund may invest a portion of its assets in short-term debt securities (including repurchase agreements and reverse repurchase agreements) of corporations, the U.S. government and its agencies and instrumentalities and banks and finance companies, which may be denominated in any currency.
A Fund may invest a portion of its assets in shares issued by money market mutual funds. A Fund also may invest in collective investment vehicles that are managed by an unaffiliated investment manager, pending investment of the Fund’s assets in portfolio securities. When unusual market conditions warrant, a Fund may make substantial temporary defensive investments in cash equivalents, up to a maximum of 100% of the Fund’s net assets. Cash equivalent holdings may be in any currency. When a Fund invests for temporary defensive purposes, such investments may affect the Fund’s ability to achieve its investment objective.
(d) Securities lending
A Fund may lend its portfolio securities to qualified broker/dealers and financial institutions pursuant to agreements, provided: (1) the loan is secured continuously by collateral marked-to-market daily and maintained in an amount at least equal to the current fair value of the securities loaned; (2) the Fund may call the loan at any time and receive the securities loaned; (3) the Fund will receive any interest or dividends paid on the loaned securities; and (4) the aggregate fair value of securities loaned will not at any time exceed 33 1/3% of the total assets of the Fund. Collateral will consist of U.S. and non-U.S. securities, cash equivalents or irrevocable letters of credit. A liability for cash collateral is reflected in the Statements of Assets and Liabilities, and is categorized as Level 2 within the fair value hierarchy. As with other extensions of credit, there are risks of delay in recovery or even loss of rights in collateral in the event of default or insolvency of a borrower of a Fund’s portfolio securities. A Fund may not retain voting rights on securities while they are on loan.
Certain Funds may from time to time participate in a securities lending program under which the Funds’ custodian, State Street Bank and Trust Company (the “Custodian”) acting as securities lending agent, is authorized to lend Fund portfolio securities to qualified broker/dealers and financial institutions that post appropriate collateral. The Custodian has agreed to indemnify the Funds in case of default of any security borrower.
Securities on loan are fully collateralized and the collateral was equal to or exceeded the securities on loan at March 31, 2018. If the market value of the collateral at the close of trading on a business day is less than 100% of the market value of the loaned securities at the close of trading on that day, the borrower shall be required to deliver, by the close of business on the following business day, an additional amount of collateral, so that the total amount of posted collateral is equal to at least 100% of the market value of all the loaned securities as of such preceding day. Cash collateral is invested in the State Street Institutional U.S. Government Money Market Fund, Premier Class. The Custodian receives
209
Mercer Funds
Notes to the Financial Statements (Continued)
March 31, 2018
a portion of the interest earned on any reinvested collateral. The market value of securities on loan to borrowers and the value of collateral held by the Funds with respect to such loans at March 31, 2018 were as follows:
| | | | | | | | | | | | |
| | | Market Value of
Loaned Securities | | | Value of
Cash Collateral | | | Value of
Non-Cash Collateral | |
Large Cap | | $ | 17,925,982 | | | $ | 2,508,628 | | | $ | 15,817,382 | |
Small/Mid Cap | | | 95,420,909 | | | | 15,377,859 | | | | 80,924,997 | |
Non-US Core Equity | | | 63,600,715 | | | | 51,739,136 | | | | 14,674,720 | |
Core Fixed | | | 40,079,819 | | | | 17,738,370 | | | | 23,155,245 | |
Opportunistic Fixed | | | 21,009,625 | | | | 21,465,843 | | | | — | |
Emerging Markets | | | 23,443,044 | | | | 8,417,141 | | | | 15,798,771 | |
Global Low Volatility | | | 21,014,493 | | | | 4,305,160 | | | | 17,295,482 | |
For Large Cap, Small/Mid Cap, Non-US Core Equity, Emerging Markets and Global Low Volatility, all of the securities on loan collateralized by cash are classified as Common Stocks in each Fund’s Schedule of Investments at March 31, 2018, with a contractual maturity of overnight and continuous.
For Core Fixed and Opportunistic Fixed, all of the securities on loan collateralized by cash are classified as Corporate Debt in each Fund’s Schedule of Investments at March 31, 2018, with a contractual maturity of overnight and continuous.
(e) Swaps
Swap contracts are derivatives in the form of a contract or similar instrument, which is an agreement to exchange the return generated by one instrument for the return generated by another instrument. A Fund may engage in swaps, including, but not limited to, interest rate, currency, credit default, and index swaps, and the purchase or sale of related caps, floors, collars, and other derivative instruments. A Fund expects to enter into these transactions to preserve a return or spread on a particular investment or portion of the portfolio, to modify the portfolio’s duration, to protect against any increase in the price of securities the Fund anticipates purchasing at a later date, or to gain exposure to certain markets in the most economical way possible.
Interest rate swaps involve the exchange by a Fund with another party of their respective commitments to receive or pay interest (e.g., an exchange of fixed rate payments for floating rate payments) with respect to a notional amount of principal. Up-front payments received or made are reflected as “up-front net premiums received” or “up-front net premiums paid”, respectively, on the Statement of Assets and Liabilities. Currency swaps involve the exchange of cash flows on a notional amount based on changes in the values of referenced currencies.
The credit default swap agreements may have as reference obligations one or more securities that are not currently held by a Fund. The protection “buyer” in a credit default swap agreement is generally obligated to pay the protection “seller” an upfront or a periodic stream of payments over the term of the contract provided that no credit event, such as a default, on a reference obligation has occurred. If a credit event occurs, the seller generally must pay the buyer the “par value” (full notional value) of the swap in exchange for an equal face amount of deliverable obligations of the reference entity described in the swap, or the seller may be required to deliver the related net cash amount, if the swap is cash settled. A Fund may be either the buyer or seller in the transaction. If a Fund is a buyer and no credit event occurs, the Fund may recover nothing if the swap is held through its termination date. However, if a credit event occurs, the buyer generally may elect to receive the full notional value of the swap in exchange for an equal face amount of deliverable obligations of the reference entity whose value may
210
Mercer Funds
Notes to the Financial Statements (Continued)
March 31, 2018
have significantly decreased. As a seller, a Fund generally receives an upfront payment or a fixed rate of income throughout the term of the swap provided that there is no credit event. As the seller, a Fund would effectively add leverage to its portfolio because, in addition to its total net assets, a Fund would be subject to investment exposure on the notional amount of the swap.
The spread of a credit default swap is the annual amount the protection buyer must pay the protection seller over the length of the contract, expressed as a percentage of the notional amount. When spreads rise, market perceived credit risk rises and when spreads fall, market perceived credit risk falls. Wider credit spreads and decreasing market values, when compared to the notional amount of the swap, represent a deterioration of the referenced entity’s credit worthiness and an increased market perception that there is a greater likelihood of risk of default or other credit event occurring as defined under the terms of the agreement. For credit default swap agreements on asset-backed securities and credit indices, the quoted market prices and resulting values, as well as the annual payment rates, serve as an indication of the current status of the payment/performance risk.
Swaps do not involve the delivery of securities or other underlying assets or principal, and are subject to counterparty risk. If the other party to a swap defaults and fails to consummate the transaction, a Fund’s risk of loss consists of the net amount of interest payments that the Fund is contractually entitled to receive.
The equity swaps in which the Funds may invest involve agreements with a counterparty. The return to the Funds on any equity swap contract will be the total return on the notional amount of the contract as if it were invested in the stocks comprising the contract index in exchange for an interest component based on the notional amount of the agreement. The Funds will only enter into an equity swap contract on a net basis, i.e., the two parties’ obligations are netted out, with the Funds paying or receiving, as the case may be, only the net amount of the payments. Payments under an equity swap contract may be made at the conclusion of the contract or periodically during its term.
Whether a Fund’s use of swap agreements or swap options will be successful in achieving the Fund’s investment objective will depend on the Subadvisor’s ability to predict correctly whether certain types of investments are likely to produce greater returns than other investments. Moreover, a Fund bears the risk of loss of the amount expected to be received under a swap agreement in the event of the default or bankruptcy of a swap agreement counterparty. The Funds will enter into swap agreements only with counterparties that meet certain standards of creditworthiness.
If there is a default by the counterparty to a swap contract, a Fund will be limited to contractual remedies pursuant to the agreements related to the transaction. There is no assurance that a swap contract counterparty will be able to meet its obligations pursuant to a swap contract or that, in the event of a default, a Fund will succeed in pursuing contractual remedies. A Fund thus assumes the risk that it may be delayed in, or prevented from, obtaining payments owed to it pursuant to a swap contract. However, the amount at risk is only the net unrealized gain, if any, on the swap at the time of default, and not the entire notional amount. The Subadvisor that enters into the swap agreement will closely monitor, subject to the oversight of the Board, the creditworthiness of swap counterparties in order to minimize the counterparty risk of swaps.
Because swaps are two party contracts that may be subject to contractual restrictions on transferability and termination, and they may have terms of greater than seven days, swap agreements may be considered to be illiquid and subject to a Fund’s limitation on investments in illiquid securities. However, the Trust has adopted procedures pursuant to which the Advisor may determine that swaps
211
Mercer Funds
Notes to the Financial Statements (Continued)
March 31, 2018
(including swap options) are liquid under certain circumstances. To the extent that a swap is not liquid, it may not be possible to initiate a transaction or liquidate a position at an advantageous time or price, which may result in significant losses.
Under the Dodd-Frank Wall Street Reform and Consumer Protection Act (the “Dodd-Frank Act”) enacted in 2010, a regulatory framework for certain OTC derivatives, such as swaps was enacted. The Dodd-Frank Act requires certain swap transactions to be executed on registered exchanges or through swap execution facilities, cleared through a regulated clearinghouse, and publicly reported. In addition, many market participants who were not previously required to register are regulated as swap dealers or swap participants, and are subject to certain minimum capital and margin requirements and business conduct standards.
The swaps market is largely unregulated. It is possible that developments in the swaps market, including potential government regulation, could adversely affect the Funds’ ability to terminate existing swap agreements or to realize amounts to be received under such agreements.
Certain clearinghouses currently offer clearing for limited types of derivatives transactions, principally credit and interest derivatives. In a cleared derivative transaction, a Fund typically enters into the transaction with a financial institution counterparty, and performance of the transaction is effectively guaranteed by a central clearinghouse, thereby reducing or eliminating the Fund’s exposure to the credit risk of the original counterparty.
The Fund typically will be required to post specified levels of margin with the clearinghouse or at the instruction of the clearinghouse; the margin required by a clearinghouse may be greater than the margin the Fund would be required to post in an uncleared derivative transaction. Cash margin is recorded on the Statements of Assets and Liabilities as cash collateral held at broker on open swap contracts. Swap agreements are marked to market daily. Daily changes in valuation of centrally cleared swaps, if any, are recorded as a receivable or payable for the change in value as appropriate on the Statements of Assets and Liabilities. Only a limited number of derivative transactions are currently eligible for clearing by clearinghouses.
A Fund will accrue for interim payments on swap contracts on a daily basis, with the net amount recorded as interest payable or receivable on swap contracts on the Statements of Assets and Liabilities. Once interim payments are settled in cash, the net amount is recorded as realized gain/loss on swap contracts, in addition to realized gain/loss recorded upon the termination of swap contracts on the Statements of Operations. Fluctuations in the value of swap contracts are recorded for financial statement purposes as unrealized appreciation or depreciation of swap contracts (swap contracts, at value on the Statements of Assets and Liabilities).
Swap agreements are marked to market daily. The change in value, if any, is recorded as unrealized gain or loss in the Statements of Operations. A liquidation payment received or made at the termination of the swap is recorded as realized gain or loss in the Statements of Operations. Net periodic payments are included as part of realized gain (loss) on the Statements of Operations.
The swaps in which the Fund may engage may include instruments under which one party pays a single or periodic fixed amount(s) (or premium), and the other party pays periodic amounts based on the movement of a specified index. The Fund’s maximum risk of loss from counterparty credit risk, as opposed to investment and other types of risk, in respect of swaps is typically the discounted net value of the cash flows to be received from the counterparty over the contract’s remaining life to the extent that such amount is positive, plus the cost of entering into a similar transaction with another counterparty, if possible.
212
Mercer Funds
Notes to the Financial Statements (Continued)
March 31, 2018
The use of swaps is a highly specialized activity that involves investment techniques and risks different from those associated with ordinary portfolio securities transactions. If the Advisor or Subadvisor is incorrect in its forecasts of market values, interest rates, and currency exchange rates, the investment performance of the Fund would be less favorable than it would have been if this investment technique were not used.
Like most other investments, swap agreements are subject to the risk that the market value of the instrument will change in a way detrimental to a Fund’s interest. A Fund bears the risk that Subadvisor will not accurately forecast future market trends or the values of assets, reference rates, indexes, or other economic factors in establishing swap positions for the Fund. If a Subadvisor attempts to use a swap as a hedge against, or as a substitute for, a portfolio investment, the Fund will be exposed to the risk that the swap will have or will develop imperfect or no correlation with the portfolio investment. This could cause substantial losses for the Fund. While hedging strategies involving swap instruments can reduce the risk of loss, they can also reduce the opportunity for gain or even result in losses by offsetting favorable price movements in other Fund investments.
During the year ended March 31, 2018, Core Fixed used swap agreements to adjust interest rate and yield curve exposure or to manage credit exposure. See the Core Fixed Schedule of Investments for a listing of open swap agreements as of March 31, 2018.
(f) Futures
A futures contract is a contractual agreement to buy or sell a specific amount of a commodity or financial instrument at a predetermined price on a stipulated future date. A Fund may enter into contracts for the purchase or sale for future delivery of securities, indices and foreign currencies. Futures contracts may be opened to protect against the adverse effects of fluctuations in security prices, interest rates, or foreign exchange rates without actually buying or selling the securities or foreign currency. A Fund also may enter into futures contracts as a low cost method for gaining or reducing exposure to a particular currency or securities market without directly investing in those currencies or securities.
A purchase of a futures contract means the acquisition of a contractual right of a Fund to obtain delivery of the securities or foreign currency underlying the contract at a specified price on a specified future date. When a futures contract is sold, a Fund incurs a contractual obligation to deliver the securities or foreign currency underlying the contract at a specified price on a specified date.
When a Fund enters into a futures contract, it must deliver to the futures commission merchant selected by the Fund an amount referred to as “initial margin.” This amount is maintained by the futures commission merchant in a segregated account at the custodian bank. Futures contracts are marked-to-market daily, depending upon changes in the price of the underlying securities subject to the futures contracts, and the change in value is recorded by the Fund as a variation margin payable or receivable. The Fund recognizes gains and losses on futures contracts in addition to the variation margin, which gains and losses are considered realized at the time the contracts expire or close.
A Fund may enter into futures transactions on domestic exchanges and, to the extent such transactions have been approved by the Commodity Futures Trading Commission (“CFTC”) for sale to customers in the United States, or on foreign exchanges. In addition, a Fund may sell stock index futures in anticipation of, or during a market decline to attempt to offset the decrease in the market value of the Fund’s common stocks that might otherwise result, and a Fund may purchase such contracts in order to offset increases in the cost of common stocks that it intends to purchase. Unlike other futures contracts,
213
Mercer Funds
Notes to the Financial Statements (Continued)
March 31, 2018
a stock index futures contract specifies that no delivery of the actual stocks making up the index will take place. Instead, settlement in cash must occur upon the termination of the contract.
In entering into futures contracts and options on futures contracts, there is a credit risk that a counterparty will not be able to meet its obligations to the Fund. The counterparty for futures contracts and options on futures contracts traded in the United States and on most foreign futures exchanges is the clearinghouse associated with such exchange. In general, clearinghouses are backed by the corporate members of the clearinghouse who are required to share any financial burden resulting from the non-performance by one of its members and, as such, should significantly reduce this credit risk. In cases where the clearinghouse is not backed by the clearing members (i.e., some foreign exchanges), it is normally backed by a consortium of banks or other financial institutions. There can be no assurance that any counterparty, clearing member or clearinghouse will be able to meet its obligations to the Fund.
While futures contracts provide for the delivery of securities, deliveries usually do not occur. Contracts are generally terminated by entering into offsetting transactions.
Where the futures market is not as developed or where the regulations prevent or make it disadvantageous to trade futures, Emerging Markets will utilize synthetic futures as part of the country selection strategy implementation. A synthetic future operates like a swap transaction and uses equity index swaps on equity index futures. These are marked to market daily and the change in value is recorded as unrealized gain or loss in the Statement of Operations.
During the year ended March 31, 2018, Large Cap, Small/Mid Cap, Non-US Core Equity, Emerging Markets and Global Low Volatility used futures to equitize cash. Core Fixed and Opportunistic Fixed used futures to adjust interest rate exposure and replicate government bond positions. Emerging Markets also used futures to create passive index exposure to certain domestic emerging market country indices in the Fund. See each Fund’s Schedule of Investments for a listing of open futures contracts as of March 31, 2018.
(g) Options
The Funds may purchase and sell (write) put and call options on debt securities, currencies and indices to enhance investment performance, manage duration, or protect against changes in market prices. The Funds may also buy and sell combinations of put and call options on the same underlying security, currency or index. Short (sold) options positions will generally be hedged by the Funds with cash, cash equivalents, current portfolio security holdings, or other options or futures positions.
The Funds may enter into swap options (“swaptions”). A swaption is a contract that gives a counterparty the right (but not the obligation), in return for payment of a premium, to enter into a new swap agreement or to shorten, extend, cancel, or otherwise modify an existing swap agreement, at some designated future time on specified terms. Each Fund may sell (write) and purchase put and call swaptions. Depending on the terms of the particular option agreement, a Fund generally will incur a greater degree of risk when the Fund writes a swaption than the Fund will incur when it purchases a swaption. When a Fund purchases a swaption, the Fund’s risk of loss is limited to the amount of the premium it has paid should it decide to let the swaption expire unexercised. However, when a Fund writes a swaption, upon exercise of the option, the Fund will become obligated according to the terms of the underlying agreement.
When the Fund writes a covered call or a put option, an amount equal to the premium received by the Fund is included in the Fund’s Statement of Assets and Liabilities as a liability. The amount of the
214
Mercer Funds
Notes to the Financial Statements (Continued)
March 31, 2018
liability is subsequently marked-to-market to reflect the current market value of the option written. The Fund receives a premium on the sale of a call option but gives up the opportunity to profit from any increase in stock value above the exercise price of the option, and when the Fund writes a put option, it is exposed to a decline in the price of the underlying security.
Whether an option which the Fund has written expires on its stipulated expiration date or the Fund enters into a closing purchase transaction, the Fund realizes a gain (or loss, if the cost of a closing purchase transaction exceeds the premium received when the option was sold) without regard to any unrealized gain or loss on the underlying security, and the liability related to such option is extinguished. If a call option which the Fund has written is exercised, the Fund realizes a capital gain or loss from the sale of the underlying security, and the cost basis of the lots sold are decreased by the premium originally received. When a put option which a Fund has written is exercised, the amount of the premium originally received will reduce the cost of the security which a Fund purchases upon exercise of the option. Realized gains (losses) on purchased options are included in net realized gain (loss) from investments.
The Funds’ use of written options involves, to varying degrees, elements of market risk in excess of the amount recognized in the Statements of Assets and Liabilities. The face or contract amounts of these instruments reflect the extent of the Fund’s exposure to market risk. The risks may be caused by an imperfect correlation between movements in the price of the instrument and the price of the underlying securities, currencies and interest rates.
During the year ended March 31, 2018, Core Fixed used options to manage interest rate and volatility exposure.
(h) Forward foreign currency contracts
The Funds may purchase or sell currencies and/or engage in forward foreign currency transactions in order to expedite settlement of portfolio transactions and to manage currency risk.
Forward foreign currency contracts are traded in the inter-bank market conducted directly between currency traders (usually large commercial banks) and their customers. A forward contract generally has no deposit requirement and no commissions are charged at any stage for trades. The Funds will account for forward contracts by marking-to-market each day at current forward contract values. The change in market value is recorded by the Fund as an unrealized gain or loss. When the contract is closed, the Fund recognizes a realized gain or loss equal to the difference between the value of the contract at the time the contract was opened and the value at the time the contract was closed.
The Funds will only enter into forward contracts to sell, for a fixed amount of U.S. dollars or other appropriate currency, an amount of foreign currency, to the extent that the value of the short forward contract is covered by the underlying value of securities denominated in the currency being sold. Alternatively, when a Fund enters into a forward contract to sell an amount of foreign currency, the Custodian or the Fund’s sub-custodian will segregate assets in a segregated account of the Fund in an amount not less than the value of the Fund’s total assets committed to the consummation of such forward contract. If the additional segregated assets placed in the segregated account decline, additional cash or securities will be placed in the account on a daily basis so that the value of the account will equal the amount of the Fund’s commitments with respect to such contract.
During the year ended March 31, 2018, Opportunistic Fixed used forward foreign currency contracts for a variety of purposes, including hedging, risk management, efficient portfolio management, enhancing
215
Mercer Funds
Notes to the Financial Statements (Continued)
March 31, 2018
total returns, or as a substitute for taking a position in the underlying asset. Non-US Core Equity and Emerging Markets used forward foreign currency contracts to hedge, cross hedge or to actively manage the currency exposures in the Funds. See the Non-US Core Equity, Opportunistic Fixed and Emerging Markets Schedules of Investments for a listing of open forward foreign currency contracts as of March 31, 2018.
(i) Foreign currency translation
The books and records of each Fund are maintained in US dollars. Foreign currencies, investments and other assets and liabilities denominated in foreign currencies are translated into US dollars at the foreign exchange rates prevailing at the end of the period. Purchases and sales of investment securities, income and expenses are translated at exchange rates prevailing on the respective dates of such transactions. Unrealized gains and losses that result from changes in foreign currency exchange rates have been included in the unrealized gains (losses) on foreign currency translations within each Fund’s Statement of Operations. Net realized foreign currency gains and losses resulting from changes in exchange rates include foreign currency gains and losses between trade date and settlement date on investment securities transactions, foreign currency transactions and the difference between the amounts of interest and dividends recorded on the books of the Fund and the amount actually received. The portion of foreign currency gains and losses related to fluctuations in exchange rates between the purchase settlement date and subsequent sale trade date is included in realized gains and losses on investment transactions.
(j) When-issued securities/TBA securities
Purchasing securities on a “when-issued” basis is a commitment by a Fund to buy a security before the security is actually issued. A Fund may purchase securities offered on a “when-issued” or “forward delivery” basis such as TBA securities. When so offered, the price, which is generally expressed in yield terms, is fixed at the time the commitment to purchase is made, but delivery and payment for the when-issued or forward delivery securities take place at a later date. During the period between purchase and settlement, no payment is made by the purchaser to the issuer and no interest on the when-issued or forward delivery security accrues to the purchaser. While when-issued or forward delivery securities may be sold prior to the settlement date, it is intended that a Fund will purchase such securities with the purpose of actually acquiring the securities unless a sale appears desirable for investment reasons. At the time a Fund makes the commitment to purchase a security on a when-issued or forward delivery basis, the Fund will record the transaction and reflect the value of the security in determining the Fund’s NAV. The market value of when-issued or forward delivery securities may be more or less than the purchase price. Certain risks may arise upon entering into when-issued or forward delivery securities transactions, including the potential inability of counterparties to meet the terms of their contracts, and the issuer’s failure to issue the securities due to political, economic, or other factors. Additionally, losses may arise due to declines in the value of the securities prior to settlement date.
A Fund may enter into TBA commitments to purchase or sell securities for a fixed price at a future date. TBA commitments are considered securities in themselves, and involve a risk of loss if the value of the security to be purchased or sold declines or increases prior to settlement date, which is in addition to the risk of decline in the value of the Portfolio’s other assets. TBA forward sale commitments are valued at the current market value of the underlying securities, according to the procedures described under “Security Valuation”.
See the Schedules of Investments for TBA and when-issued securities held as of March 31, 2018.
216
Mercer Funds
Notes to the Financial Statements (Continued)
March 31, 2018
(k) Real estate investment trusts
The Funds may invest in real estate investment trusts (“REITs”), which pool investors’ funds for investment, primarily in income producing real estate or real estate-related loans or interests. A REIT is not taxed on income distributed to its shareholders or unitholders if it complies with regulatory requirements relating to its organization, ownership, assets and income, and with a regulatory requirement to distribute to its shareholders or unitholders at least 90% of its taxable income for each taxable year.
A shareholder in a Fund, by investing in REITs through the Fund, will bear not only the shareholder’s proportionate share of the expenses of the Fund, but also, indirectly, the management expenses of the underlying REITs. REITs depend generally on their ability to generate cash flow to make distributions to shareholders or unitholders, and may be subject to defaults by borrowers and to self-liquidations. In addition, the performance of a REIT may be affected by its failure to qualify for tax-free pass-through of income, or the REIT’s failure to maintain exemption from registration under the 1940 Act. Dividends representing a return of capital are reflected as a reduction of cost and/or as a realized gain when the amount of the return of capital is conclusively determined. See each Fund’s Schedule of Investments for REIT securities held as of March 31, 2018.
(l) Mortgage-related and other asset-backed securities
The Funds may invest in mortgage-backed and asset-backed securities. Mortgage-backed securities represent an interest in a pool of mortgages. Asset-backed securities are structured like mortgage-backed securities, but instead of mortgage loans or interests in mortgage loans, the underlying assets may include such items as motor vehicle installment sales or installment loan contracts, leases of various types of real and personal property, and receivables from credit card agreements. The value of some mortgage or asset-backed securities may be particularly sensitive to changes in prevailing interest rates. Early repayment of principal on some mortgage-related securities may expose the Fund to a lower rate of return upon reinvestment of principal. The value of these securities may fluctuate in response to the market’s perception of the creditworthiness of the issuers. Additionally, although mortgages and mortgage-related securities are generally supported by some form of government or private guarantee and/or insurance, there is no assurance that private guarantors or insurers will meet their obligations.
One type of stripped mortgage-backed security has one class receiving all of the interest from the mortgage assets (the interest-only, or “IO” class), while the other class will receive all of the principal (the principal-only, or “PO” class). Payments received for the IOs are included in interest income on the Statements of Operations. Because principal will not be received at the maturity of an IO, adjustments are made to the cost basis of the security on a daily basis until maturity. These adjustments are included in interest income on the Statements of Operations. Payments received for POs are treated as reductions to the cost and par value of the securities. See the Schedule of Investments for mortgage-backed and asset-backed securities held by Core Fixed as of March 31, 2018.
(m) Bank loans
Core Fixed may invest in bank loans, which include institutionally-traded floating rate securities generally acquired as an assignment from another holder of, or participation interest in, loans originated by a bank or financial institution (the ‘‘Lender’’) that acts as agent for all holders. The agent administers the terms of the loan, as specified in the loan agreement. The Fund may invest in multiple series or tranches of a loan, which may have varying terms and carry different associated risks. When investing in a loan participation, the Fund has the right to receive payments of principal, interest and any fees to
217
Mercer Funds
Notes to the Financial Statements (Continued)
March 31, 2018
which it is entitled only from the Lender selling the loan agreement and only upon receipt by the Lender of payments from the borrower. The Fund generally has no right to enforce compliance with the terms of the loan agreement with the borrower. As a result, the Fund may be subject to the credit risk of both the borrower and the Lender that is selling the loan agreement. At March 31, 2018, the Funds held no unfunded loan commitments.
(n) Indexed securities
The Funds may invest in indexed securities where the redemption values and/or coupons are linked to the prices of other securities, securities indices, or other financial indicators. The Funds use indexed securities to increase or decrease their exposure to different underlying instruments and to gain exposure to markets in which it may be difficult to invest through conventional securities. Indexed securities may be more volatile than their underlying instruments, but any loss is limited to the amount of the original investment.
(o) Taxes and distributions
The Funds intend to qualify each year as regulated investment companies under Subchapter M of the Internal Revenue Code of 1986, as amended (“the Code”). The Funds intend to distribute substantially all of their net investment income and net realized short-term and long-term gains, if any, after giving effect to any available capital loss carryovers for U.S. federal income tax purposes. Therefore, no provision for U.S. federal and state income or excise tax is necessary.
The Funds utilize the provisions of the federal income tax laws that provide for the carryforward of capital losses for prior years, offsetting such losses against any future realized capital gains. Under the Regulated Investment Company Modernization Act of 2010 (the “Act”), net capital losses recognized after December 22, 2010 may be carried forward indefinitely, and their character is retained as short-term and/or long-term losses. Previously, net capital losses were carried forward for eight years and treated as short-term losses. As a transition rule, the Act requires that post-enactment net capital losses be used before pre-enactment net capital losses.
On March 31, 2018, the following Funds had deferred capital losses available to be offset against future net capital gains through the indicated expiration dates as follows:
| | | | |
| | | Unlimited | |
Core Fixed | | $ | 3,470,495 | |
Opportunistic Fixed | | | 10,657,166 | |
During the year ended March 31, 2018, Non-US Core Equity, Opportunistic Fixed and Emerging Markets utilized capital loss carryforwards of $400,838, $2,727,683 and $114,057,357, respectively.
Under current tax rules, regulated investment companies can elect to treat certain late-year ordinary losses incurred and post-October capital losses (capital losses realized after October 31) as arising on the first day of the following taxable year. As of March 31, 2018, Core Fixed and Opportunistic Fixed have elected to defer current year post-October losses of $2,568,556 and $680,988, respectively.
218
Mercer Funds
Notes to the Financial Statements (Continued)
March 31, 2018
As of March 31, 2018, the cost for U.S. federal income tax purposes and gross unrealized appreciation and depreciation in value of investments and derivatives were as follows:
| | | | | | | | | | | | | | | | |
| | | Federal
Income Tax
Cost | | | Tax Basis
Unrealized
Appreciation | | | Tax Basis
Unrealized
Depreciation | | | Net
Unrealized
Appreciation
(Depreciation) | |
Large Cap | | $ | 450,950,633 | | | $ | 73,775,831 | | | $ | (11,456,016 | ) | | $ | 62,319,815 | |
Small/Mid Cap | | | 788,983,213 | | | | 169,409,862 | | | | (32,560,944 | ) | | | 136,848,918 | |
Non-US Core Equity | | | 1,955,735,382 | | | | 305,232,792 | | | | (63,810,493 | ) | | | 241,422,299 | |
Core Fixed | | | 900,043,968 | | | | 5,566,121 | | | | (20,984,741 | ) | | | (15,418,620 | ) |
Opportunistic Fixed | | | 654,827,743 | | | | 23,487,628 | | | | (22,031,782 | ) | | | 1,455,846 | |
Emerging Markets | | | 1,022,970,130 | | | | 120,759,324 | | | | (26,746,582 | ) | | | 94,012,742 | |
Global Low Volatility | | | 818,726,651 | | | | 119,651,850 | | | | (17,002,047 | ) | | | 102,649,803 | |
The temporary differences between book-basis and tax-basis unrealized appreciation/(depreciation) are primarily due to wash sale loss deferrals, investments in passive foreign investment companies and other basis adjustments. Certain capital accounts in the financial statements are periodically adjusted for permanent differences in order to reflect their tax character. These differences primarily relate to redemptions in-kind during the period ended March 31, 2018.
As of March 31, 2018, the Funds had no uncertain tax positions that would require recognition, derecognition, or disclosure. Each of the Funds’ federal tax returns filed in the 3-year period ended March 31, 2018 remains subject to examination by the Internal Revenue Service.
The Funds’ policy is to declare and pay distributions from net investment income and net realized short-term and long-term gains at least annually. All distributions are paid in shares of the Funds, at NAV, unless the shareholder elects to receive cash distributions. A Fund may distribute such income dividends and capital gains more frequently, if necessary, in order to reduce or eliminate federal excise taxes on the Funds. The amount of any distribution will vary, and there is no guarantee that a Fund will pay either income dividends or capital gains distributions.
During the years ended March 31, 2018 and March 31, 2017, the tax character of distributions (including capital gain dividends, if any, designated pursuant to Section 852 of the Code) paid, were as follows:
| | | | | | | | | | | | | | | | | | | | | | | | |
| | | 2018 | | | 2017 | |
| | | Ordinary
Income | | | Long-Term
Capital
Gains | | | Return of
Capital | | | Ordinary
Income | | | Long-Term
Capital Gains | | | Return of
Capital | |
Large Cap | | $ | 35,003,064 | | | $ | 37,472,312 | | | $ | — | | | $ | 4,865,519 | | | $ | 16,407,532 | | | $ | — | |
Small/Mid Cap | | | 44,310,010 | | | | 50,567,317 | | | | — | | | | 10,867,942 | | | | 18,277,858 | | | | — | |
Non-US Core Equity | | | 97,125,234 | | | | 73,664,957 | | | | — | | | | 37,187,651 | | | | — | | | | — | |
Core Fixed | | | 19,914,504 | | | | — | | | | — | | | | 24,864,792 | | | | 4,671,328 | | | | — | |
Opportunistic Fixed | | | 23,966,710 | | | | — | | | | — | | | | — | | | | — | | | | — | |
Emerging Markets | | | 36,403,991 | | | | — | | | | — | | | | 26,250,811 | | | | — | | | | — | |
Global Low Volatility | | | 82,662,535 | | | | 63,860,505 | | | | — | | | | 16,812,054 | | | | 24,419,112 | | | | — | |
219
Mercer Funds
Notes to the Financial Statements (Continued)
March 31, 2018
As of March 31, 2018, the components of distributable earnings on a tax basis were as follows:
| | | | | | | | | | | | | | | | | | | | |
| | | Undistributed
Ordinary
Income | | | Undistributed
Long-Term
Gains | | | Capital Losses
Other Temporary
Differences | | | Unrealized
Appreciation
(Depreciation) | | | Total
Distributable
Earnings | |
Large Cap | | $ | 11,852,280 | | | $ | 42,291,876 | | | $ | (3,562 | ) | | $ | 62,320,079 | | | $ | 116,460,673 | |
Small/Mid Cap | | | 8,494,651 | | | | 57,738,797 | | | | (623 | ) | | | 136,849,533 | | | | 203,082,358 | |
Non-US Core Equity | | | 41,944,530 | | | | 125,263,290 | | | | (3,117 | ) | | | 241,451,548 | | | | 408,656,251 | |
Core Fixed | | | 6,073,685 | | | | — | | | | (6,043,126 | ) | | | (14,474,230 | ) | | | (14,443,671 | ) |
Opportunistic Fixed | | | 15,919,968 | | | | — | | | | (11,346,672 | ) | | | 1,422,112 | | | | 5,995,408 | |
Emerging Markets | | | 38,527,084 | | | | 102,085,682 | | | | — | | | | 94,519,120 | | | | 235,131,886 | |
Global Low Volatility | | | — | | | | — | | | | — | | | | 102,633,804 | | | | 102,633,804 | |
All other differences are temporary losses related to mostly organizational costs and other timing adjustments.
(p) Allocation of expenses and income
The majority of expenses of the Trust are directly identifiable to an individual Fund. Expenses which are not readily identifiable to a specific Fund are allocated among the applicable Funds, taking into consideration, among other things, the nature and type of expense and the relative size of each applicable Fund.
(q) Redemption fees
While none of the Funds’ classes have initial or contingent deferred sales charges on purchases of Fund shares, redemptions of Fund shares held less than 30 days may be assessed a 2% short-term trading fee and recorded as paid-in capital.
The Trust entered into a Credit Agreement on behalf of the Funds (“the Agreement”) with a bank pursuant to a committed, unsecured revolving line of credit through December 13, 2018. Borrowings for each Fund under the Agreement are limited to the lesser of $50,000,000 or 33 1/3% of a Fund’s Adjusted Net Assets provided borrowings did not exceed, in the aggregate, $50,000,000. Under the terms of the Agreement the Trust pays an annual commitment fee at the rate 0.25% per year on the difference between the total line of credit and the average daily amount of borrowings outstanding. Interest is charged to the Funds based on its borrowings at a variable rate equal to the higher of the Overnight Federal Funds Rate or 30-Day LIBOR plus 1.00%. The Funds did not borrow under the Agreement during the year ended March 31, 2018.
In the normal course of business, the Funds enter into contracts that require them to provide a variety of representations or general indemnification for certain liabilities. The Funds’ maximum exposure under these arrangements is unknown, as this would involve future claims that may be made against the Funds that have not yet occurred. However, the Funds have not had prior claims or losses pursuant to these contracts and expect the risk of loss to be remote.
220
Mercer Funds
Notes to the Financial Statements (Continued)
March 31, 2018
| 5. | Fees and other transactions with affiliates |
The Advisor provides investment advisory services to each Fund pursuant to an investment management agreement. Pursuant to the investment management agreement, each Fund pays the Advisor a fee for managing the Fund’s investments at an annual rate of:
| | | | | | | | | | | | |
| | | Investment Advisory Fee* on Net Assets | |
| | | Average net assets
up to
$750 million | | | Average net assets
in excess of
$750 million up to
$1 billion | | | Average net assets
in excess of
$1 billion | |
Large Cap | | | 0.53 | % | | | 0.51 | % | | | 0.46 | % |
Small/Mid Cap | | | 0.90 | % | | | 0.88 | % | | | 0.83 | % |
Non-US Core Equity | | | 0.75 | % | | | 0.73 | % | | | 0.68 | % |
Core Fixed | | | 0.35 | % | | | 0.33 | % | | | 0.28 | % |
Opportunistic Fixed | | | 0.80 | % | | | 0.78 | % | | | 0.73 | % |
Emerging Markets | | | 0.80 | % | | | 0.78 | % | | | 0.73 | % |
Global Low Volatility | | | 0.75 | % | | | 0.73 | % | | | 0.68 | % |
| | * | Consists of the total advisory fee payable by the Funds to the Advisor. The Advisor is responsible for paying the subadvisory fees. |
Such fees as referenced above are shown in the Advisory fees line in the Statements of Operations. The Advisor provides certain internal administrative services to the Class S, Class Y-1 and Class Y-2 shares of the Funds, for which the Advisor receives a fee of 0.15%, 0.10% and 0.05% of the average daily net assets of the Class S, Class Y-1 and Class Y-2 shares of the Funds, respectively. These internal administrative services include attending to shareholder correspondence, assisting with the processing of purchases and redemptions of shares, preparing and disseminating information and documents for use by beneficial shareholders and monitoring and overseeing non-advisory relationships with entities providing services to the Class S, Class Y-1 and Class Y-2 shares, including the transfer agent. However, Class S, Class Y-1 and Class Y-2 shares have not commenced operations.
The Funds have adopted a plan of marketing and service, or “12b-1 plan” to finance the provision of certain shareholder services to the owners of Class S and Class Y-1 shares of the Funds (collectively referred to as the “plans”). The plan provides for payments at annual rates (based on average net assets) of up to 0.25% of each Fund’s Class S and Class Y-1 shares. However, Class S and Class Y-1 shares have not commenced operations.
Pursuant to the Funds’ expense reimbursement agreement, the Advisor can recapture certain amounts waived or reimbursed over the 12-month period ended July 31, 2016 with respect to Opportunistic Fixed Income Fund. The following amounts were available for recapture as of July 31, 2017:
| | | | | | | | |
| | | Expenses Reimbursed in the
12-Months Ended July 31, | |
| | | 2015 | | | 2016 | |
| | | Subject to Recapture until July 31, | |
| | | 2018 | | | 2019 | |
Opportunistic Fixed | | $ | 208,082 | | | $ | 176,732 | |
221
Mercer Funds
Notes to the Financial Statements (Continued)
March 31, 2018
| 6. | Purchases and sales of securities |
Cost of purchases and proceeds from sales of securities, excluding short-term investments, for the year ended March 31, 2018, were as follows:
| | | | | | | | |
| | | Long-Term
U.S. Government Securities | | | Other Long-Term
Securities | |
Purchases | | | | | | | | |
Large Cap | | $ | — | | | $ | 361,578,699 | |
Small/Mid Cap | | | — | | | | 446,365,924 | |
Non-US Core Equity | | | — | | | | 1,812,579,403 | |
Core Fixed | | | 818,913,291 | * | | | 210,886,022 | |
Opportunistic Fixed | | | — | | | | 452,295,721 | |
Emerging Markets | | | — | | | | 1,228,928,205 | |
Global Low Volatility | | | — | | | | 437,208,339 | |
Sales | | | | | | | | |
Large Cap | | | — | | | | 550,587,411 | |
Small/Mid Cap | | | — | | | | 617,626,882 | |
Non-US Core Equity | | | — | | | | 2,322,927,741 | |
Core Fixed | | | 740,897,125 | * | | | 174,578,109 | |
Opportunistic Fixed | | | — | | | | 404,700,500 | |
Emerging Markets | | | — | | | | 1,505,384,642 | |
Global Low Volatility | | | — | | | | 372,494,974 | |
| | * | Includes purchases of $258,427,837 and sales of $264,757,784 for TBA securities. |
Each Fund is authorized to issue an unlimited number of shares of beneficial interest without par value. Transactions in Fund shares were as follows:
Large Cap
| | | | | | | | | | | | | | | | |
| | | Year Ended
March 31, 2018 | | | Year Ended
March 31, 2017 | |
| | | Shares | | | Amount | | | Shares | | | Amount | |
Class Y-3: | | | | | | | | | | | | | | | | |
Shares sold | | | 943,101 | | | $ | 10,994,675 | | | | 3,013,075 | | | $ | 29,359,225 | |
Shares issued through acquisition (see Note 8) | | | — | | | | — | | | | 30,126,230 | | | | 274,762,972 | |
Shares issued to shareholders in reinvestment of distributions | | | 6,716,902 | | | | 72,475,376 | | | | 2,091,745 | | | | 21,273,051 | |
Shares repurchased | | | (17,080,246 | ) | | | (198,793,771 | ) | | | (10,819,328 | ) | | | (107,234,001 | ) |
| | | | | | | | | | | | | | | | |
Net increase (decrease) | | | (9,420,243 | ) | | $ | (115,323,720 | ) | | | 24,411,722 | | | $ | 218,161,247 | |
| | | | | | | | | | | | | | | | |
222
Mercer Funds
Notes to the Financial Statements (Continued)
March 31, 2018
Small/Mid Cap
| | | | | | | | | | | | | | | | |
| | | Year Ended
March 31, 2018 | | | Year Ended
March 31, 2017 | |
| | | Shares | | | Amount | | | Shares | | | Amount | |
Class Y-3: | | | | | | | | | | | | | | | | |
Shares sold | | | 3,618,044 | | | $ | 45,259,896 | | | | 4,542,072 | | | $ | 49,111,330 | |
Shares issued through acquisition (see Note 8) | | | — | | | | — | | | | 44,707,680 | | | | 461,393,851 | |
Shares issued to shareholders in reinvestment of distributions | | | 7,880,177 | | | | 94,877,327 | | | | 2,514,737 | | | | 29,145,800 | |
Shares repurchased | | | (17,836,232 | ) | | | (227,123,462 | ) | | | (13,020,694 | ) | | | (149,207,273 | ) |
| | | | | | | | | | | | | | | | |
Net increase (decrease) | | | (6,338,011 | ) | | $ | (86,986,239 | ) | | | 38,743,795 | | | $ | 390,443,708 | |
| | | | | | | | | | | | | | | | |
Non-US Core Equity
| | | | | | | | | | | | | | | | |
| | | Year Ended
March 31, 2018 | | | Year Ended
March 31, 2017 | |
| | | Shares | | | Amount | | | Shares | | | Amount | |
Class Y-3: | | | | | | | | | | | | | | | | |
Shares sold | | | 20,842,524 | | | $ | 238,966,126 | | | | 30,189,177 | | | $ | 298,749,804 | |
Shares issued to shareholders in reinvestment of distributions | | | 15,114,176 | | | | 170,790,191 | | | | 3,873,714 | | | | 37,187,651 | |
Shares repurchased | | | (66,027,147 | ) | | | (764,623,992 | ) | | | (18,541,674 | ) | | | (184,442,734 | ) |
| | | | | | | | | | | | | | | | |
Net increase (decrease) | | | (30,070,447 | ) | | $ | (354,867,675 | ) | | | 15,521,217 | | | $ | 151,494,721 | |
| | | | | | | | | | | | | | | | |
Core Fixed
| | | | | | | | | | | | | | | | |
| | | Year Ended
March 31, 2018 | | | Year Ended
March 31, 2017 | |
| | | Shares | | | Amount | | | Shares | | | Amount | |
Class Y-3: | | | | | | | | | | | | | | | | |
Shares sold | | | 19,178,104 | | | $ | 194,169,216 | | | | 21,634,648 | | | $ | 222,899,384 | |
Shares issued to shareholders in reinvestment of distributions | | | 1,981,543 | | | | 19,914,504 | | | | 3,023,144 | | | | 29,536,120 | |
Shares repurchased | | | (11,313,719 | ) | | | (115,310,488 | ) | | | (25,081,385 | ) | | | (252,121,624 | ) |
| | | | | | | | | | | | | | | | |
Net increase (decrease) | | | 9,845,928 | | | $ | 98,773,232 | | | | (423,593 | ) | | $ | 313,880 | |
| | | | | | | | | | | | | | | | |
Opportunistic Fixed
| | | | | | | | | | | | | | | | |
| | | Year Ended
March 31, 2018 | | | Year Ended
March 31, 2017 | |
| | | Shares | | | Amount | | | Shares | | | Amount | |
Class Y-3: | | | | | | | | | | | | | | | | |
Shares sold | | | 16,750,989 | | | $ | 163,306,702 | | | | 17,780,404 | | | $ | 159,120,616 | |
Shares issued to shareholders in reinvestment of distributions | | | 2,533,479 | | | | 23,966,710 | | | | — | | | | — | |
Shares repurchased | | | (13,267,089 | ) | | | (129,194,161 | ) | | | (6,812,473 | ) | | | (60,674,793 | ) |
| | | | | | | | | | | | | | | | |
Net increase | | | 6,017,379 | | | $ | 58,079,251 | | | | 10,967,931 | | | $ | 98,445,823 | |
| | | | | | | | | | | | | | | | |
223
Mercer Funds
Notes to the Financial Statements (Continued)
March 31, 2018
Emerging Markets
| | | | | | | | | | | | | | | | |
| | | Year Ended
March 31, 2018 | | | Year Ended
March 31, 2017 | |
| | | Shares | | | Amount | | | Shares | | | Amount | |
Class Y-3: | | | | | | | | | | | | | | | | |
Shares sold | | | 24,627,345 | | | $ | 268,542,786 | | | | 32,571,851 | | | $ | 293,233,025 | |
Shares issued to shareholders in reinvestment of distributions | | | 3,267,863 | | | | 36,403,991 | | | | 3,007,053 | | | | 26,250,811 | |
Shares redeemed through in-kind redemption* | | | (53,685,733 | ) | | | (604,905,874 | ) | | | — | | | | — | |
Shares repurchased | | | (30,832,913 | ) | | | (346,989,807 | ) | | | (17,835,590 | ) | | | (163,096,765 | ) |
| | | | | | | | | | | | | | | | |
Net increase (decrease) | | | (56,623,438 | ) | | $ | (646,948,904 | ) | | | 17,743,314 | | | $ | 156,387,071 | |
| | | | | | | | | | | | | | | | |
| | * | The Fund had a redemption in-kind on November 17, 2017. |
Global Low Volatility
| | | | | | | | | | | | | | | | |
| | | Year Ended
March 31, 2018 | | | Year Ended
March 31, 2017 | |
| | | Shares | | | Amount | | | Shares | | | Amount | |
Class Y-3: | | | | | | | | | | | | | | | | |
Shares sold | | | 17,880,974 | | | $ | 233,315,310 | | | | 27,192,594 | | | $ | 332,279,779 | |
Shares issued to shareholders in reinvestment of distributions | | | 11,581,479 | | | | 146,523,040 | | | | 3,485,306 | | | | 41,231,166 | |
Shares redeemed through in-kind redemption* | | | (39,626,273 | ) | | | (531,155,034 | ) | | | — | | | | — | |
Shares repurchased | | | (13,917,801 | ) | | | (180,661,065 | ) | | | (12,271,880 | ) | | | (149,487,877 | ) |
| | | | | | | | | | | | | | | | |
Net increase (decrease) | | | (24,081,621 | ) | | $ | (331,977,749 | ) | | | 18,406,020 | | | $ | 224,023,068 | |
| | | | | | | | | | | | | | | | |
| | * | The Fund had a redemption in-kind on October 13, 2017. |
On November 17, 2017, Emerging Markets transferred securities in-kind valued at $325,402,466 and cash of $279,503,408 for a redemption. This resulted in 53,685,733 units redeemed which are shown in the Statements of Changes in Net Assets. This transfer also resulted in a realized gain of $75,577,986 which is shown on the Statements of Operations.
On October 13, 2017, Global Low Volatility transferred securities in-kind valued at $483,152,037 and cash of $48,002,997 for a redemption. This resulted in 39,626,273 units redeemed which are shown in the Statements of Changes in Net Assets. This transfer also resulted in a realized gain of $81,952,311 which is shown on the Statements of Operations.
At the close of business on June 24, 2016, Large Cap, formerly Mercer US Large Cap Growth Equity Fund, with Class Y-3 net assets of $267,918,751 acquired all of the assets and liabilities of Large Cap Value, each a series of the Trust, in a tax-free reorganization. The acquisition was accomplished by a tax-free exchange of 30,880,775 Class Y-3 shares of Large Cap Value valued at $274,762,972 for 30,126,230 Class Y-3 shares of Large Cap. Large Cap Value’s net assets on June 24, 2016 were $274,762,972 for Class Y-3, including investments valued at $273,909,251 with a cost basis of
224
Mercer Funds
Notes to the Financial Statements (Continued)
March 31, 2018
$281,311,613. For financial reporting purposes, assets received, liabilities assumed, and shares issued by Large Cap were recorded at fair value; however, the cost basis of the investments received by Large Cap from Large Cap Value were carried forward to align ongoing reporting of Large Cap’s realized and unrealized gains and losses with amounts distributable to shareholders for tax purposes. The aggregate net assets of Large Cap immediately after the acquisition was $542,681,723, which included $7,402,474 of acquired unrealized depreciation on investments and foreign currency transactions from Large Cap Value.
Assuming the acquisition had been completed on April 1, 2016, Large Cap’s pro-forma results of operations for the year ended March 31, 2017 are as follows:
| | | | |
Net investment income | | $ | 7,338,647 | (a) |
Net realized and unrealized gain on investments | | | 90,015,237 | (b) |
| | | | |
Net increase in net assets from operations | | $ | 97,353,884 | |
| | | | |
Because the combined investment portfolios have been managed as a single integrated portfolio since the acquisition was completed, it is not practicable to separate the amounts of revenue and earnings of Large Cap Value that have been included in the Fund’s Statement of Operations since June 24, 2016.
| | (a) | $6,011,362 net investment income as reported at March 31, 2017 plus $1,258,593 from Large Cap Value pre-merger net investment income, plus $13,667 in lower net advisory fees, plus $55,025 of pro-forma eliminated other expenses. |
| | (b) | $76,775,639 unrealized appreciation as reported at March 31, 2017 minus $8,099,693 pro-forma March 31, 2016 unrealized appreciation, plus $21,505,233 net realized gain as reported at March 31, 2017 minus $165,942 in net realized loss from Large Cap Value pre-merger. |
At the close of business on June 24, 2016, Small/Mid Cap, formerly Mercer US Small/Mid Cap Growth Equity Fund, with Class Y-3 net assets of $440,701,905 acquired all of the assets and liabilities of Small/Mid Cap Value, each a series of the Trust, in a tax-free reorganization. The acquisition was accomplished by a tax-free exchange of 53,005,209 Class Y-3 shares of Small/Mid Cap Value valued at $461,393,851 for 44,707,680 Class Y-3 shares of Small/Mid Cap. Small/Mid Cap Value’s net assets on June 24, 2016 were $461,393,851 for Class Y-3, including investments valued at $461,246,059 with a cost basis of $459,083,775. For financial reporting purposes, assets received, liabilities assumed, and shares issued by Small/Mid Cap were recorded at fair value; however, the cost basis of the investments received by Small/Mid Cap from Small/Mid Cap Value were carried forward to align ongoing reporting of Small/Mid Cap’s realized and unrealized gains and losses with amounts distributable to shareholders for tax purposes. The aggregate net assets of Small/Mid Cap immediately after the acquisition was $902,095,756, which included $2,162,284 of acquired unrealized appreciation on investments from Small/Mid Cap Value.
Assuming the acquisition had been completed on April 1, 2016, Small/Mid Cap’s pro-forma results of operations for the period ended March 31, 2017 are as follows:
| | | | |
Net investment income | | $ | 3,676,399 | (a) |
Net realized and unrealized gain on investments | | | 177,784,445 | (b) |
| | | | |
Net increase in net assets from operations | | $ | 181,460,844 | |
| | | | |
Because the combined investment portfolios have been managed as a single integrated portfolio since the acquisition was completed, it is not practicable to separate the amounts of revenue and earnings of Small/Mid Cap Value that have been included in the Fund’s Statement of Operations since June 24, 2016.
225
Mercer Funds
Notes to the Financial Statements (Continued)
March 31, 2018
| | (a) | $3,352,783 net investment income as reported at March 31, 2017 plus $259,669 from Small/Mid Cap Value pre-merger net investment income, plus $7,289 in lower net advisory fees, plus $56,658 of pro-forma eliminated other expenses. |
| | (b) | $141,925,894 unrealized appreciation as reported at March 31, 2017 minus $35,608,850 pro-forma March 31, 2016 unrealized appreciation, plus $67,704,689 net realized gain as reported at March 31, 2017 plus $3,762,712 in net realized gain from Small/Mid Cap Value pre-merger, respectively. |
Management has evaluated the impact of subsequent events through May 30, 2018, the date the financial statements were available to be issued for possible adjustment to and/or disclosure in the Funds’ financial statements. Management has determined that there are no material events that would require adjustment and/or disclosure in the Funds’ financial statements through this date.
226
Mercer Funds
Additional Information (Unaudited)
Proxy Voting
A description of the policies and procedures that the Advisor and each Fund’s Subadvisors use to determine how to vote proxies relating to the Fund’s portfolio securities is available, without charge, upon request, by calling 1-866-658-9896, and on the Securities and Exchange Commission’s (“SEC”) website at http://www.sec.gov. Information about Funds’ proxy voting decisions are available without charge, online on the Funds’ website at http://www.mercer.us/mutual-funds-on-offer.
Quarterly Reporting
The Funds file their complete schedule of portfolio holdings with the Securities and Exchange Commission for the first and third quarters of each fiscal year on Form N-Q, which when filed, will be available on the SEC’s website at http://www.sec.gov. When filed, the Funds’ Form N-Q may be reviewed and copied at the Commission’s Public Reference Room in Washington, D.C. Information on the operation of the Public Reference Room may be obtained by calling 1-800-SEC-0330.
Federal Tax Information
The amount of long-term capital gains paid for the fiscal year ended March 31, 2018, the amount of long-term capital gains paid were as follows:
| | | | |
Fund | | | |
Large Cap | | $ | 37,472,312 | |
Small/Mid Cap | | | 50,567,317 | |
Non-US Core Equity | | | 73,664,957 | |
Global Low Volatility | | | 63,860,505 | |
For the year ended March 31, 2018, Non-US Core Equity and Emerging Markets had foreign tax credits in the amount of $3,798,788 and $4,241,528, respectively, and foreign source income of $50,635,634 and $39,302,843, respectively.
Qualified dividend income (“QDI”) received by the Funds through March 31, 2018, that qualified for a reduced tax rate pursuant to the Internal Revenue Code Section 1(h)(11) are as follows:
| | | | |
Fund | | QDI | |
Large Cap | | $ | 9,820,830 | |
Small/Mid Cap | | | 7,237,183 | |
Non-US Core Equity | | | 46,416,559 | |
Emerging Markets | | | 23,736,143 | |
Global Low Volatility | | | 19,744,564 | |
For corporate shareholders, a portion of the ordinary dividends paid during the Funds’ year ended March 31, 2018, qualified for the dividends received deduction, as follows:
| | | | |
Fund | | | |
Large Cap | | | 28.51% | |
Small/Mid Cap | | | 21.66% | |
Non-US Core Equity | | | 0.51% | |
Emerging Markets | | | 0.48% | |
Global Low Volatility | | | 34.95% | |
228
Mercer Funds
Additional Information (Unaudited) (Continued)
Board Approval of New Subadvisory Agreements for Certain of the Funds during the period October 1, 2017 through March 31, 2018
Mercer US Small/Mid Cap Equity Fund
Mercer Emerging Markets Equity Fund
At a meeting of the Board of Trustees held on January 23, 2018 (the “January Meeting”), the Trustees, including the Independent Trustees, considered and approved proposed new subadvisory agreements between the Advisor and certain newly proposed subadvisors with respect to each of: (i) the Mercer US Small/Mid Cap Equity Fund (the “Small/Mid Cap Fund”) and (ii) the Mercer Emerging Markets Equity Fund (the “Emerging Markets Fund”).
Mercer US Small/Mid Cap Equity Fund
Approval of a New Subadvisory Agreement for the Fund with BNY Mellon Asset Management North America Corporation
At the January Meeting, the Trustees, including the Independent Trustees, first considered and approved a proposed new subadvisory agreement between the Advisor and BNY Mellon Asset Management North America Corporation (“BNY Mellon AMNA”) on behalf of the Small/Mid Cap Fund (the “BNY Mellon AMNA Subadvisory Agreement”). The Advisor recommended the appointment of BNY Mellon AMNA to replace a subadvisor to the Fund that the Advisor intended to terminate as a subadvisor, and the Advisor had presented the Board with the recommendation to retain BNY Mellon AMNA based upon the Advisor’s determination that BNY Mellon AMNA was qualified to serve as a new subadvisor to the Fund, based upon the Advisor’s analysis of BNY Mellon AMNA. Effective as of February 1, 2018, BNY Mellon AMNA became the successor to the investment management business and operations of The Boston Company Asset Management, LLC (the “Boston Company”), and references herein to BNY Mellon AMNA are therefore also deemed to include reference to the Boston Company, as applicable.
In considering the approval of the BNY Mellon AMNA Subadvisory Agreement, the Independent Trustees considered the information and materials from the Advisor and BNY Mellon AMNA that included, as to BNY Mellon AMNA and the Fund: (i) the BNY Mellon AMNA Subadvisory Agreement; (ii) information regarding the process by which the Advisor had reviewed, selected, and recommended BNY Mellon AMNA for the Board’s approval, and the Advisor’s rationale for recommending that BNY Mellon AMNA be appointed as a subadvisor to the Fund; (iii) the nature, extent, and quality of the services that BNY Mellon AMNA proposed to provide to the Fund; (iv) the investment management business, portfolio management personnel, operations, prior investment experience, and reputation of BNY Mellon AMNA (as successor to the Boston Company); (v) the brokerage and trading policies and practices applicable to BNY Mellon AMNA; (vi) the level of subadvisory fees to be charged by BNY Mellon AMNA for its services to the Fund, and the fees charged to other accounts that BNY Mellon AMNA manages (as successor to the Boston Company); (vii) a summary of the compliance program applicable to BNY Mellon AMNA; (viii) information regarding the historical performance returns of BNY Mellon AMNA (as successor to the Boston Company) managing the investment mandate it would employ for the Fund, and a comparison of such performance to a relevant index; and (ix) the financial condition of BNY Mellon AMNA.
In addition, the Independent Trustees considered presentations made by, and discussions held with, representatives of the Advisor and the Advisor’s favorable assessment of the nature, extent and quality of the subadvisory services expected to be provided to the Fund by BNY Mellon AMNA. The Independent Trustees considered and analyzed factors that the Independent Trustees deemed relevant
229
Mercer Funds
Additional Information (Unaudited) (Continued)
with respect to BNY Mellon AMNA, including: the nature, extent, and quality of the services to be provided to the Fund by BNY Mellon AMNA; BNY Mellon AMNA’s management style and investment decision-making process; BNY Mellon AMNA’s historical performance record managing the investment mandate it would employ for the Fund; the qualifications and experience of the members of BNY Mellon AMNA’s portfolio management team; and BNY Mellon AMNA’s staffing levels and overall resources. The Independent Trustees also took into consideration the nature and extent of the oversight duties performed by the Advisor in connection with each of the Subadvisors, which includes extensive management and compliance due diligence with respect to the management and operations of each of the Subadvisors. Additionally, the Independent Trustees received assistance and advice from their independent legal counsel regarding legal and industry standards in connection with their duties and responsibilities when approving investment advisory agreements.
In particular, and as to BNY Mellon AMNA, the Board, including all of the Independent Trustees, considered the following factors:
(a) The nature, extent, and quality of the services to be provided by BNY Mellon AMNA. The Independent Trustees reviewed the nature, extent, and quality of the services to be provided by BNY Mellon AMNA to the Fund. The Independent Trustees discussed the specific investment management process that BNY Mellon AMNA indicated that it will employ to manage its allocated portion of the Fund’s investment portfolio (which was described in detail in the materials provided by BNY Mellon AMNA), the qualifications of BNY Mellon AMNA’s portfolio managers and investment management personnel with regard to implementing the investment mandate relating to the allocated portion of the Fund’s investment portfolio that BNY Mellon AMNA would be managing, and the performance record of BNY Mellon AMNA as compared to a relevant index. The Independent Trustees considered BNY Mellon AMNA’s infrastructure and resources, and whether BNY Mellon AMNA’s organization appeared to support BNY Mellon AMNA’s strategy adequately. The Independent Trustees also discussed the Advisor’s review, selection, and due diligence process with respect to BNY Mellon AMNA, and the Advisor’s favorable assessment as to the nature, extent, and quality of the subadvisory services expected to be provided to the Fund by BNY Mellon AMNA. The Independent Trustees determined that the Fund and its shareholders would benefit from the quality and experience of BNY Mellon AMNA’s portfolio managers and the qualifications of its investment professionals. Based on their consideration and review of the foregoing information, the Independent Trustees concluded that the nature, extent and quality of the subadvisory services anticipated to be provided by BNY Mellon AMNA, as well as BNY Mellon AMNA’s ability to render such services based on the experience of its predecessor firms, and their operations and resources, were appropriate for the Fund, in light of the Fund’s investment objective, and the mandate relating to the allocated portion of the Fund’s investment portfolio that BNY Mellon AMNA would manage.
(b) Comparison of the services to be rendered and fees to be paid to BNY Mellon AMNA under other advisory and subadvisory contracts, such as those with other clients. The Independent Trustees discussed the services that would be rendered by BNY Mellon AMNA and evaluated the compensation to be paid to BNY Mellon AMNA by the Advisor for those services. The Independent Trustees noted that the services that BNY Mellon AMNA would furnish to the Fund appeared to be comparable to the services that BNY Mellon AMNA currently provides to its other advisory and subadvisory clients having similar investment strategies. The Independent Trustees also considered comparisons of the fees that will be paid to BNY Mellon AMNA by the Advisor in light of the fees that were charged by BNY Mellon AMNA to its other advisory clients, as disclosed in the Form ADV, Part 2A (Firm Brochure) provided and in its 15(c) Questionnaire responses, including commingled and separate accounts. The Independent Trustees also considered that the fees agreed to by BNY Mellon AMNA were the result of an arm’s length bargain negotiated by unaffiliated parties and that the Advisor believes such fees are fair
230
Mercer Funds
Additional Information (Unaudited) (Continued)
and reasonable. The Independent Trustees also noted that, while BNY Mellon AMNA’s fee schedule did include breakpoints, the benefit of the breakpoints would go to the Advisor, and not to the Fund, and would be reflected in the Advisor’s profitability, which had been reviewed by the Independent Trustees.
The Independent Trustees considered the review, selection, and due diligence process employed by the Advisor in determining to recommend BNY Mellon AMNA to serve as a subadvisor to the Fund, and the Advisor’s reasons for concluding that the subadvisory fees to be paid by the Advisor to BNY Mellon AMNA for its services to the Fund were fair and reasonable. The Independent Trustees emphasized in their discussions that the subadvisory fees of BNY Mellon AMNA would be paid by the Advisor, and were not additional fees to be borne by the Fund or its shareholders. Based on their discussion, the Independent Trustees concluded that, in light of the nature, extent, and quality of the services to be provided, the proposed level of fees to be paid to BNY Mellon AMNA with respect to the assets of the Fund to be allocated to BNY Mellon AMNA was supported by the services that were expected to be provided by BNY Mellon AMNA to the Fund. The Independent Trustees also considered the potential “fallout” or ancillary benefits that may accrue to BNY Mellon AMNA from its relationship with the Fund and concluded that they were reasonable.
The Independent Trustees recognized that, because the subadvisory fees would be paid by the Advisor, and not the Fund, an analysis of economies of scale and profitability was more appropriate in the context of the Board’s consideration of the Management Agreement with the Advisor. In addition, since the fees to be paid to BNY Mellon AMNA were the result of arm’s-length bargaining between unaffiliated parties, and given the Advisor’s economic incentive to negotiate a reasonable fee, the potential profitability of BNY Mellon AMNA was not considered relevant to the Independent Trustees’ deliberations. The Independent Trustees took note of the Advisor’s explanation that the recommended appointment of BNY Mellon AMNA was not affected by the impact that the appointment would have on the Advisor’s revenues and profitability, and recalled that the Advisor had demonstrated that the appointment of BNY Mellon AMNA may result in reduced profitability for the Advisor as a result of increased subadvisory fees that will be paid out of the Advisor’s resources. On the basis of these considerations, the Independent Trustees concluded that, in light of the nature, extent and quality of the services expected to be provided by BNY Mellon AMNA and the proposed fees to be paid to BNY Mellon AMNA by the Advisor for managing its allocated portion of the Fund, the potential benefits accruing to BNY Mellon AMNA as a result of serving as a Subadvisor to the Fund were reasonable in relation to the services that were expected to be provided by BNY Mellon AMNA to the Fund.
(c) Investment performance of the Fund and BNY Mellon AMNA. Because BNY Mellon AMNA was a newly proposed Subadvisor to the Fund, the Independent Trustees could not consider BNY Mellon AMNA’s investment performance in managing the Fund as a factor in evaluating the BNY Mellon AMNA Subadvisory Agreement. However, the Independent Trustees reviewed BNY Mellon AMNA’s historical performance record in managing the investment mandate it would employ for the Fund, as well as the historical performance record for other accounts that were comparable to the Fund. The Independent Trustees also compared the historical investment performance of BNY Mellon AMNA to a relevant index and concluded that BNY Mellon AMNA’s historical performance record, viewed together with the other factors considered by the Independent Trustees, supported a decision to approve the BNY Mellon AMNA Subadvisory Agreement.
Conclusion. Following consideration of the foregoing factors, it was reported that no single factor was determinative to the Independent Trustees’ decisions. Based on these factors, along with the determination of the Advisor at the conclusion of its review, selection, and due diligence process to recommend BNY Mellon AMNA be appointed as a Subadvisor to the Fund, and such other matters as were deemed relevant, the Independent Trustees concluded that the proposed fee rate for BNY Mellon
231
Mercer Funds
Additional Information (Unaudited) (Continued)
AMNA was supported by the services that were expected to be provided to the Fund and approval of the proposed BNY Mellon AMNA Subadvisory Agreement was in the best interests of the Fund and its shareholders. As a result, the Board, including a majority of the Independent Trustees, determined to approve the BNY Mellon AMNA Subadvisory Agreement.
Mercer Emerging Markets Equity Fund
Approval of a New Subadvisory Agreement for the Fund with Dimensional Fund Advisors LP
At the January Meeting, the Trustees, including the Independent Trustees, next considered and approved a proposed new subadvisory agreement between the Advisor and Dimensional Fund Advisors LP (“Dimensional”) on behalf of the Emerging Markets Fund (the “Dimensional Subadvisory Agreement”). The Advisor recommended the appointment of Dimensional to replace a subadvisor to the Fund that the Advisor intended to terminate as a subadvisor, and the Advisor had presented the Board with the recommendation to retain Dimensional based upon the Advisor’s determination that Dimensional was qualified to serve as a new subadvisor to the Fund, based upon the Advisor’s analysis of Dimensional.
In considering the approval of the Dimensional Subadvisory Agreement, the Independent Trustees considered the information and materials from the Advisor and Dimensional that included, as to Dimensional and the Fund: (i) the Dimensional Subadvisory Agreement; (ii) information regarding the process by which the Advisor had reviewed, selected, and recommended Dimensional for the Board’s approval, and the Advisor’s rationale for recommending that Dimensional be appointed as a subadvisor to the Fund; (iii) the nature, extent, and quality of the services that Dimensional proposed to provide to the Fund; (iv) the investment management business, portfolio management personnel, operations, prior investment experience, and reputation of Dimensional; (v) Dimensional’s brokerage and trading policies and practices; (vi) the level of subadvisory fees to be charged by Dimensional for its services to the Fund, and the fees charged to other accounts that Dimensional manages; (vii) a summary of Dimensional’s compliance program; (viii) information regarding Dimensional’s historical performance returns managing an investment mandate similar to the investment mandate it would employ for the Fund, as well as simulated historical performance returns for the investment mandate it would employ for the Fund, and a comparison of such performance to a relevant index; and (ix) the financial condition of Dimensional.
In addition, the Independent Trustees considered presentations made by, and discussions held with, representatives of the Advisor and the Advisor’s favorable assessment of the nature, extent and quality of the subadvisory services expected to be provided to the Fund by Dimensional. The Independent Trustees considered and analyzed factors that the Independent Trustees deemed relevant with respect to Dimensional, including: the nature, extent, and quality of the services to be provided to the Fund by Dimensional; Dimensional’s management style and investment decision-making process; Dimensional’s historical performance record managing an investment mandate similar to the investment mandate it would employ for the Fund, as well as simulated historical performance returns for the investment mandate it would employ for the Fund; the qualifications and experience of the members of Dimensional’s portfolio management team; and Dimensional’s staffing levels and overall resources. The Independent Trustees also took into consideration the nature and extent of the oversight duties performed by the Advisor in connection with each of the Subadvisors, which includes extensive management and compliance due diligence with respect to the management and operations of each of the Subadvisors. Additionally, the Independent Trustees received assistance and advice from their independent legal counsel regarding legal and industry standards in connection with their duties and responsibilities when approving investment advisory agreements.
232
Mercer Funds
Additional Information (Unaudited) (Continued)
In particular, and as to Dimensional, the Board, including all of the Independent Trustees, considered the following factors:
(a) The nature, extent, and quality of the services to be provided by Dimensional. The Independent Trustees reviewed the nature, extent, and quality of the services to be provided by Dimensional to the Fund. The Independent Trustees discussed the specific investment management process that Dimensional indicated that it will employ to manage its allocated portion of the Fund’s investment portfolio (which was described in detail in the materials provided by Dimensional), the qualifications of Dimensional’s portfolio managers and investment management personnel with regard to implementing the investment mandate relating to the allocated portion of the Fund’s investment portfolio that Dimensional would be managing, and the performance record of Dimensional as compared to a relevant index. The Independent Trustees considered Dimensional’s infrastructure and resources, and whether Dimensional’s organization appeared to support Dimensional’s strategy adequately. The Independent Trustees also discussed the Advisor’s review, selection, and due diligence process with respect to Dimensional, and the Advisor’s favorable assessment as to the nature, extent, and quality of the subadvisory services expected to be provided to the Fund by Dimensional. The Independent Trustees determined that the Fund and its shareholders would benefit from the quality and experience of Dimensional’s portfolio managers and the qualifications of its investment professionals. Based on their consideration and review of the foregoing information, the Independent Trustees concluded that the nature, extent and quality of the subadvisory services anticipated to be provided by Dimensional, as well as Dimensional’s ability to render such services based on Dimensional’s experience, operations and resources, were appropriate for the Fund, in light of the Fund’s investment objective, and the mandate relating to the allocated portion of the Fund’s investment portfolio that Dimensional would manage.
(b) Comparison of the services to be rendered and fees to be paid to Dimensional under other advisory and subadvisory contracts, such as those with other clients. The Independent Trustees discussed the services that would be rendered by Dimensional and evaluated the compensation to be paid to Dimensional by the Advisor for those services. The Independent Trustees noted that the services that Dimensional would furnish to the Fund appeared to be comparable to the services that Dimensional currently provides to its other third-party subadvisory clients having similar investment strategies. The Independent Trustees also considered comparisons of the fees that will be paid to Dimensional by the Advisor in light of the fees that were charged by Dimensional to its other advisory clients, as disclosed in Dimensional’s Form ADV, Part 2A (Firm Brochure) and in its 15(c) Questionnaire responses, including commingled and separate accounts. The Independent Trustees also considered that the fees agreed to by Dimensional were the result of an arm’s length bargain negotiated by unaffiliated parties and that the Advisor believes such fees are fair and reasonable. The Independent Trustees also noted that, while Dimensional’s fee schedule did include breakpoints, the benefit of the breakpoints would go to the Advisor, and not to the Fund, and would be reflected in the Advisor’s profitability, which had been reviewed by the Independent Trustees.
The Independent Trustees considered the review, selection, and due diligence process employed by the Advisor in determining to recommend Dimensional to serve as a subadvisor to the Fund, and the Advisor’s reasons for concluding that the subadvisory fees to be paid by the Advisor to Dimensional for its services to the Fund were fair and reasonable. The Independent Trustees emphasized in their discussions that the subadvisory fees of Dimensional would be paid by the Advisor, and were not additional fees to be borne by the Fund or its shareholders. Based on their discussion, the Independent Trustees concluded that, in light of the nature, extent, and quality of the services to be provided, the proposed level of fees to be paid to Dimensional with respect to the assets of the Fund to be allocated to Dimensional was supported by the services that were expected to be provided by Dimensional to the Fund. The Independent Trustees also considered the potential “fallout” or ancillary benefits that may accrue to Dimensional from its relationship with the Fund and concluded that they were reasonable.
233
Mercer Funds
Additional Information (Unaudited) (Continued)
The Independent Trustees recognized that, because the subadvisory fees would be paid by the Advisor, and not the Fund, an analysis of economies of scale and profitability was more appropriate in the context of the Board’s consideration of the Management Agreement with the Advisor. In addition, since the fees to be paid to Dimensional were the result of arm’s-length bargaining between unaffiliated parties, and given the Advisor’s economic incentive to negotiate a reasonable fee, the potential profitability of Dimensional was not considered relevant to the Independent Trustees’ deliberations. The Independent Trustees took note of the Advisor’s explanation that the recommended appointment of Dimensional was not affected by the impact that the appointment would have on the Advisor’s revenues and profitability, and recalled that the Advisor had demonstrated that the appointment of Dimensional may result in increased profitability for the Advisor as a result of reduced subadvisory fees that will be paid out of the Advisor’s resources. On the basis of these considerations, the Independent Trustees concluded that, in light of the nature, extent and quality of the services expected to be provided by Dimensional and the proposed fees to be paid to Dimensional by the Advisor for managing its allocated portion of the Fund, the potential benefits accruing to Dimensional as a result of serving as a Subadvisor to the Fund were reasonable in relation to the services that were expected to be provided by Dimensional to the Fund.
(c) Investment performance of the Fund and Dimensional. Because Dimensional was a newly proposed Subadvisor to the Fund, the Independent Trustees could not consider Dimensional’s investment performance in managing the Fund as a factor in evaluating the Dimensional Subadvisory Agreement. However, the Independent Trustees reviewed Dimensional’s historical performance record in managing an investment mandate similar to the investment mandate it would employ for the Fund, as well as simulated historical performance returns for the investment mandate it would employ for the Fund. The Independent Trustees also compared the historical investment performance of Dimensional to a relevant index and concluded that Dimensional’s historical performance record, viewed together with the other factors considered by the Independent Trustees, supported a decision to approve the Dimensional Subadvisory Agreement.
Conclusion. Following consideration of the foregoing factors, it was reported that no single factor was determinative to the Independent Trustees’ decisions. Based on these factors, along with the determination of the Advisor at the conclusion of its review, selection, and due diligence process to recommend Dimensional be appointed as a Subadvisor to the Fund, and such other matters as were deemed relevant, the Independent Trustees concluded that the proposed fee rate for Dimensional was supported by the services that were expected to be provided to the Fund and approval of the proposed Dimensional Subadvisory Agreement was in the best interests of the Fund and its shareholders. As a result, the Board, including a majority of the Independent Trustees, determined to approve the Dimensional Subadvisory Agreement.
Approval of a New Subadvisory Agreement for the Fund with Janus Capital Management LLC
At the January Meeting, the Trustees, including the Independent Trustees, then considered and approved a proposed new subadvisory agreement between the Advisor and Janus Capital Management LLC (“Janus”) on behalf of the Emerging Markets Fund (the “Janus Subadvisory Agreement”). The Advisor recommended the appointment of Janus to replace a subadvisor to the Fund that the Advisor intended to terminate as a subadvisor, and the Advisor had presented the Board with the recommendation to retain Janus based upon the Advisor’s determination that Janus was qualified to serve as a new subadvisor to the Fund, based upon the Advisor’s analysis of Janus. It was noted that in connection with the subadvisory services that Janus would be providing to the Fund, Janus would be utilizing the services of its affiliate, Henderson Global Investors Limited (“HGIL”), under a participating affiliate arrangement in accordance with relevant SEC guidance. Janus has a personnel-sharing arrangement with HGIL pursuant to which HGIL and the portfolio managers are considered “associated persons” of Janus.
234
Mercer Funds
Additional Information (Unaudited) (Continued)
In considering the approval of the Janus Subadvisory Agreement, the Independent Trustees took into consideration Janus’ proposed use of its affiliate HGIL, by means of a participating affiliate arrangement pursuant to which certain advisory personnel at HGIL, would be providing investment advisory services to the Fund. The Independent Trustees also considered the information and materials from the Advisor and Janus that included, as to Janus and the Fund: (i) the Janus Subadvisory Agreement; (ii) information regarding the process by which the Advisor had reviewed, selected, and recommended Janus for the Board’s approval, and the Advisor’s rationale for recommending that Janus be appointed as a subadvisor to the Fund; (iii) the nature, extent, and quality of the services that Janus proposed to provide to the Fund; (iv) the investment management business, portfolio management personnel, operations, prior investment experience, and reputation of Janus; (v) Janus’ brokerage and trading policies and practices; (vi) the level of subadvisory fees to be charged by Janus for its services to the Fund, and the fees charged to other accounts that Janus manages; (vii) a summary of Janus’ compliance program; (viii) information regarding Janus’ historical performance returns managing the investment mandate it would employ for the Fund as well as longer-term historical performance returns for an investment mandate similar to the investment mandate it would employ for the Fund, and a comparison of such performance to a relevant index; and (ix) the financial condition of Janus.
In addition, the Independent Trustees considered presentations made by, and discussions held with, representatives of the Advisor and the Advisor’s favorable assessment of the nature, extent and quality of the subadvisory services expected to be provided to the Fund by Janus. The Independent Trustees considered and analyzed factors that the Independent Trustees deemed relevant with respect to Janus, including: the nature, extent, and quality of the services to be provided to the Fund by Janus and by HGIL, as a result of the use of the participating affiliate arrangement; Janus’ management style and investment decision-making process; Janus’ historical performance record managing the investment mandate it would employ for the Fund as well as longer-term historical performance returns for an investment mandate similar to the investment mandate it would employ for the Fund; the qualifications and experience of the members of Janus’ portfolio management team; and Janus’ staffing levels and overall resources. The Independent Trustees also took into consideration the nature and extent of the oversight duties performed by the Advisor in connection with each of the Subadvisors, which includes extensive management and compliance due diligence with respect to the management and operations of each of the Subadvisors. Additionally, the Independent Trustees received assistance and advice from their independent legal counsel regarding legal and industry standards in connection with their duties and responsibilities when approving investment advisory agreements.
In particular, and as to Janus, the Board, including all of the Independent Trustees, considered the following factors:
(a) The nature, extent, and quality of the services to be provided by Janus. The Independent Trustees reviewed the nature, extent, and quality of the services to be provided by Janus to the Fund. The Independent Trustees discussed the specific investment management process that Janus indicated that it will employ to manage its allocated portion of the Fund’s investment portfolio (which was described in detail in the materials provided by Janus), the qualifications of Janus’ portfolio managers and investment management personnel with regard to implementing the investment mandate relating to the allocated portion of the Fund’s investment portfolio that Janus would be managing, and the performance record of Janus as compared to a relevant index. The Independent Trustees considered Janus’ infrastructure and resources, and whether Janus’ organization appeared to support Janus’ strategy adequately. The Independent Trustees also discussed the Advisor’s review, selection, and due diligence process with respect to Janus, and the Advisor’s favorable assessment as to the nature, extent, and quality of the subadvisory services expected to be provided to the Fund by Janus. The Independent Trustees determined that the Fund and its shareholders would benefit from the quality and experience of
235
Mercer Funds
Additional Information (Unaudited) (Continued)
Janus’ portfolio managers and the qualifications of its investment professionals. Based on their consideration and review of the foregoing information, the Independent Trustees concluded that the nature, extent and quality of the subadvisory services anticipated to be provided by Janus, as well as Janus’ ability to render such services based on Janus’ experience, operations and resources, were appropriate for the Fund, in light of the Fund’s investment objective, and the mandate relating to the allocated portion of the Fund’s investment portfolio that Janus would manage.
(b) Comparison of the services to be rendered and fees to be paid to Janus under other advisory and subadvisory contracts, such as those with other clients. The Independent Trustees discussed the services that would be rendered by Janus and evaluated the compensation to be paid to Janus by the Advisor for those services. The Independent Trustees noted that the services that Janus would furnish to the Fund appeared to be comparable to the services that Janus currently provides to its other advisory client having a similar investment strategy. The Independent Trustees also considered comparisons of the fees that will be paid to Janus by the Advisor in light of the fees that were charged by Janus to its other advisory clients, as disclosed in Janus’ Form ADV, Part 2A (Firm Brochure) and in its 15(c) Questionnaire responses, including commingled and separate accounts. The Independent Trustees also considered that the fees agreed to by Janus were the result of an arm’s length bargain negotiated by unaffiliated parties and that the Advisor believes such fees are fair and reasonable.
The Independent Trustees considered the review, selection, and due diligence process employed by the Advisor in determining to recommend Janus to serve as a subadvisor to the Fund, and the Advisor’s reasons for concluding that the subadvisory fees to be paid by the Advisor to Janus for its services to the Fund were fair and reasonable. The Independent Trustees emphasized in their discussions that the subadvisory fees of Janus would be paid by the Advisor, and were not additional fees to be borne by the Fund or its shareholders. Based on their discussion, the Independent Trustees concluded that, in light of the nature, extent, and quality of the services to be provided, the proposed level of fees to be paid to Janus with respect to the assets of the Fund to be allocated to Janus was supported by the services that were expected to be provided by Janus to the Fund. The Independent Trustees also considered the potential “fallout” or ancillary benefits that may accrue to Janus from its relationship with the Fund and concluded that they were reasonable.
The Independent Trustees recognized that, because the subadvisory fees would be paid by the Advisor, and not the Fund, an analysis of economies of scale and profitability was more appropriate in the context of the Board’s consideration of the Management Agreement with the Advisor. In addition, since the fees to be paid to Janus were the result of arm’s-length bargaining between unaffiliated parties, and given the Advisor’s economic incentive to negotiate a reasonable fee, the potential profitability of Janus was not considered relevant to the Independent Trustees’ deliberations. The Independent Trustees took note of the Advisor’s explanation that the recommended appointment of Janus was not affected by the impact that the appointment would have on the Advisor’s revenues and profitability, and recalled that the Advisor had demonstrated that the appointment of Janus may result in reduced profitability for the Advisor as a result of increased subadvisory fees that will be paid out of the Advisor’s resources. On the basis of these considerations, the Independent Trustees concluded that, in light of the nature, extent and quality of the services expected to be provided by Janus and the proposed fees to be paid to Janus by the Advisor for managing its allocated portion of the Fund, the potential benefits accruing to Janus as a result of serving as a Subadvisor to the Fund were reasonable in relation to the services that were expected to be provided by Janus to the Fund.
(c) Investment performance of the Fund and Janus. Because Janus was a newly proposed Subadvisor to the Fund, the Independent Trustees could not consider Janus’ investment performance in managing the Fund as a factor in evaluating the Janus Subadvisory Agreement. However, the Independent Trustees
236
Mercer Funds
Additional Information (Unaudited) (Continued)
reviewed Janus’ historical performance record managing the investment mandate it would employ for the Fund, as well as longer-term historical performance returns for an investment mandate similar to the investment mandate it would employ for the Fund and the historical performance returns for an account that was comparable to the Fund. The Independent Trustees also compared the historical investment performance of Janus to a relevant index and concluded that Janus’ historical performance record, viewed together with the other factors considered by the Independent Trustees, supported a decision to approve the Janus Subadvisory Agreement.
Conclusion. Following consideration of the foregoing factors, it was reported that no single factor was determinative to the Independent Trustees’ decisions. Based on these factors, along with the determination of the Advisor at the conclusion of its review, selection, and due diligence process to recommend Janus be appointed as a Subadvisor to the Fund, and such other matters as were deemed relevant, the Independent Trustees concluded that the proposed fee rate for Janus was supported by the services that were expected to be provided to the Fund and approval of the proposed Janus Subadvisory Agreement was in the best interests of the Fund and its shareholders. As a result, the Board, including a majority of the Independent Trustees, determined to approve the Janus Subadvisory Agreement.
237
Mercer Funds
Understanding Your Fund’s Expenses (Unaudited)
As a mutual fund shareholder, you incur different costs: transaction costs, including sales charges (loads) on purchases, redemption fees and certain exchange fees and ongoing costs, including management fees, distribution fees (12b-1 fees), and other fund expenses. These costs are described in more detail in the Funds’ prospectus. The examples below are intended to help you understand the ongoing costs of investing in the Funds and help you compare these with the ongoing costs of investing in other mutual funds. The first line in the table for each Fund shows the actual account values and actual fund expenses you would have paid on a $1,000 investment in the Fund from October 1, 2017 through March 31, 2018. It also shows how much a $1,000 investment would be worth at the close of the period, assuming actual fund returns and expenses. To estimate the expenses you paid over the period, simply divide your account value by $1,000 (for example $8,600 account value divided by $1,000 = $8.60) and multiply the result by the number in the Operating Expenses Incurred column as shown below for your Class. The second line in the table for each Fund provides information about hypothetical account values and hypothetical expenses based on the Fund’s actual expense ratios and an assumed rate of return of 5% per year before expenses, which is not the Fund’s actual return. The hypothetical account values and expenses may not be used to estimate the actual ending account balance or expenses you paid on your investment for the period. You may use this information to compare the ongoing costs of investing in the Fund and other funds. To do so, compare this 5% hypothetical example with the 5% hypothetical examples that appear in the shareholder reports of the other funds. Please note that the expenses shown reflect ongoing costs only, and do not include any transaction costs, such as sales charges, redemption fees or exchange fees. Therefore, the second line in the table of each fund is useful in comparing ongoing costs only, and will not help you determine the relative costs of owning different funds. If transaction costs were included, total costs would be higher.
Large Cap — Class Y-3
Hypothetical Return on $1,000
| | | | | | | | | | | | | | | | | | | | | | | | | |
| | | Expense
Ratio | | Beginning
Amount | | Ending
Value | | Avg
Value | | Operating
Expense
Incurred* |
Actual | | | | 0.60% | | | | | 1,000.00 | | | | | 1,069.70 | | | | | 1,034.85 | | | | | 3.10 | |
Hypothetical | | | | 0.60% | | | | | 1,000.00 | | | | | 1,021.94 | | | | | 1,010.97 | | | | | 3.02 | |
| * | Actual expenses are equal to the Class’ annualized expense ratio of 0.60%, multiplied by the average account value over the period, multiplied by 182/365 |
Small/Mid Cap — Class Y-3
Hypothetical Return on $1,000
| | | | | | | | | | | | | | | | | | | | | | | | | |
| | | Expense
Ratio | | Beginning
Amount | | Ending
Value | | Avg
Value | | Operating
Expense
Incurred* |
Actual | | | | 0.96% | | | | | 1,000.00 | | | | | 1,058.20 | | | | | 1,029.10 | | | | | 4.93 | |
Hypothetical | | | | 0.96% | | | | | 1,000.00 | | | | | 1,020.14 | | | | | 1,010.07 | | | | | 4.84 | |
| * | Actual expenses are equal to the Class’ annualized expense ratio of 0.96%, multiplied by the average account value over the period, multiplied by 182/365 |
238
Mercer Funds
Understanding Your Fund’s Expenses (Unaudited) (Continued)
Non-US Core Equity — Class Y-3
Hypothetical Return on $1,000
| | | | | | | | | | | | | | | | | | | | | | | | | |
| | | Expense
Ratio | | Beginning
Amount | | Ending
Value | | Avg
Value | | Operating
Expense
Incurred* |
Actual | | | | 0.79%** | | | | | 1,000.00 | | | | | 1,049.30 | | | | | 1,024.65 | | | | | 4.04 | |
Hypothetical | | | | 0.79%** | | | | | 1,000.00 | | | | | 1,020.99 | | | | | 1,010.50 | | | | | 3.98 | |
| * | Actual expenses are equal to the Class’ annualized expense ratio of 0.79%, multiplied by the average account value over the period, multiplied by 182/365 |
| ** | Includes interest expense that amounts to less than 0.01%. |
Core Fixed — Class Y-3
Hypothetical Return on $1,000
| | | | | | | | | | | | | | | | | | | | | | | | | |
| | | Expense
Ratio | | Beginning
Amount | | Ending
Value | | Avg
Value | | Operating
Expense
Incurred* |
Actual | | | | 0.43% | | | | | 1,000.00 | | | | | 990.10 | | | | | 995.05 | | | | | 2.13 | |
Hypothetical | | | | 0.43% | | | | | 1,000.00 | | | | | 1,022.79 | | | | | 1,011.40 | | | | | 2.17 | |
| * | Actual expenses are equal to the Class’ annualized expense ratio of 0.43%, multiplied by the average account value over the period, multiplied by 182/365 |
Opportunistic Fixed — Class Y-3
Hypothetical Return on $1,000
| | | | | | | | | | | | | | | | | | | | | | | | | |
| | | Expense
Ratio | | Beginning
Amount | | Ending
Value | | Avg
Value | | Operating
Expense
Incurred* |
Actual | | | | 0.92%** | | | | | 1,000.00 | | | | | 1,029.00 | | | | | 1,014.50 | | | | | 4.65 | |
Hypothetical | | | | 0.92%** | | | | | 1,000.00 | | | | | 1,020.34 | | | | | 1,010.17 | | | | | 4.63 | |
| * | Actual expenses are equal to the Class’ annualized expense ratio of 0.92%, multiplied by the average account value over the period, multiplied by 182/365 |
| ** | Includes interest expense that amounts to less than 0.01%. |
Emerging Markets — Class Y3
Hypothetical Return on $1,000
| | | | | | | | | | | | | | | | | | | | | | | | | |
| | | Expense
Ratio | | Beginning
Amount | | Ending
Value | | Avg
Value | | Operating
Expense
Incurred* |
Actual | | | | 0.94%** | | | | | 1,000.00 | | | | | 1,078.10 | | | | | 1,039.05 | | | | | 4.87 | |
Hypothetical | | | | 0.94%** | | | | | 1,000.00 | | | | | 1,020.24 | | | | | 1,010.12 | | | | | 4.73 | |
| * | Actual expenses are equal to the Class’ annualized expense ratio of 0.94%, multiplied by the average account value over the period, multiplied by 182/365 |
| ** | Includes interest expense that amounts to less than 0.01%. |
239
Mercer Funds
Understanding Your Fund’s Expenses (Unaudited) (Continued)
Global Low Volatility — Class Y3
Hypothetical Return on $1,000
| | | | | | | | | | | | | | | | | | | | | | | | | |
| | | Expense
Ratio | | Beginning
Amount | | Ending
Value | | Avg
Value | | Operating
Expense
Incurred* |
Actual | | | | 0.79%** | | | | | 1,000.00 | | | | | 1,036.80 | | | | | 1,018.40 | | | | | 4.01 | |
Hypothetical | | | | 0.79%** | | | | | 1,000.00 | | | | | 1,020.99 | | | | | 1,010.50 | | | | | 3.98 | |
| * | Actual expenses are equal to the Class’ annualized expense ratio of 0.79%, multiplied by the average account value over the period, multiplied by 182/365 |
| ** | Includes interest expense that amounts to less than 0.01%. |
240
Mercer Funds
Trustees and Officers (Unaudited)
The following tables list the Trust’s Trustees and Officers as of the date of this report; their address and age; their position with the Trust; the length of time holding that position with the Trust; their principal occupation(s) during the past five years; the number of portfolios in the fund complex they oversee; and other directorships they hold in companies subject to registration or reporting requirements of the Securities Exchange Act of 1934 (generally called “public companies”) or in registered investment companies. The Trust’s Statement of Additional Information (“SAI”) includes additional information about the Trust’s trustees, including changes subsequent to the date of the report. The SAI is available, without charge, upon request, by calling 1-866-658-9896, or on the SEC website at www.sec.gov.
Independent Trustees
| | | | | | | | | | | | | |
Name, Address and Age | | Position(s)
Held with
Trust | | Term of
Office(1) and
Length of
Time
Served | | Principal
Occupation(s) During
Past 5 Years | | Number of
Portfolios
in Fund
Complex*
Overseen
by Trustee | | Other
Directorships
Held by
Trustee |
Harrison M. Bains, Jr. 99 High Street Boston, MA 02110 (74) | | Trustee | | Trustee since 2005 | | Mr. Bains is retired. | | | | 7 | | | Mr. Bains is a director of Cara Therapeutics, Inc.; Mr. Bains was a director of BG Medicine, Inc.(2007 to 2014) and a trustee of BofA Funds Series Trust (11 portfolios) (2011 to 2016). |
| | | | | |
Adela M. Cepeda A.C. Advisory, Inc. 150 North Wacker Drive, Suite 2160 Chicago, IL 60606 (60) | | Chairperson and Trustee | | Chairperson since 2018; Trustee since 2005 | | Ms. Cepeda is Managing Director of PFM Financial Advisors LLC (a financial advisory firm) since September 2016. Ms. Cepeda was previously Founder and President of A.C. Advisory, Inc. (a financial advisory firm) 1995 — 2016. | | | | 7 | | | Ms. Cepeda is a director or trustee of: The UBS Funds (15 portfolios); UBS Relationship Funds (11 portfolios); SMA Relationship Trust (5 portfolios); Consulting Group Capital Markets Funds (9 portfolios); BMO Financial Corp. (U.S. holding company for BMO Harris Bank N.A.); Ms. Cepeda was a director of Fort Dearborn Income Securities, Inc. (2000 to 2016). |
| | | | | |
Gail A. Schneider 99 High Street Boston, MA 02110 (69) | | Trustee | | Trustee Since 2009 | | Ms. Schneider is a self-employed consultant since 2007. | | | | 7 | | | None |
241
Mercer Funds
Trustees and Officers (Unaudited) (Continued)
Interested Trustee:
| | | | | | | | | | | | | |
Name, Address and Age | | Position(s)
Held with
Trust | | Term of
Office(1) and
Length of
Time
Served | | Principal
Occupation(s) During
Past 5 Years | | Number of
Portfolios
in Fund
Complex*
Overseen
by Trustee | | Other
Directorships
Held by
Trustee |
Richard S. Joseph** (53) | | Trustee, President, and Chief Executive Officer | | Since 2016 | | Mr. Joseph is President and Head of the US Mercer Delegated Solutions of Mercer Investment Management, Inc. since December 2015. Prior to December 2015, he was Chief Operating Officer of Mercer Investment Management, Inc. since 2005. | | | | 7 | | | Mr. Joseph is a trustee of Mercer Trust Company and a director of Mercer Investment Management, Inc. |
| (1) | Each Trustee holds office for an indefinite term. |
| * | The “Fund Complex” consists of the Trust, which has seven portfolios. |
| ** | Mr. Joseph is considered to be an “interested person,” as defined in the 1940 Act, of the Trust due to his relationship with the Advisor. |
242
Mercer Funds
Trustees and Officers (Unaudited) (Continued)
Officers:
The executive officers of the Trust not named above are:
| | | | | | |
Name and Age | | Position(s)
Held with
the Trust | | Term of
Office† and
Length of
Time
Served | | Principal Occupation(s) During Past 5 Years |
Janice Desmond (67) | | Treasurer and Chief Financial Officer | | Since 2015 | | Ms. Desmond is a Senior Manager, Investment Operations and is a CPA. She has served as Head of Fund Administration for Mercer Investment Management, Inc. since 2010. |
| | | |
Carol Ann McMahon (46) | | Vice President and Assistant Treasurer | | Since 2017 | | Ms. McMahon is a Partner and Global COO for Wealth, Global Business Solutions since 2016 and US COO in January 2017. Prior to 2016, Ms. McMahon held the position of European COO since 2006. |
| | | |
Stan Mavromates (57) | | Vice President and Chief Investment Officer | | Since 2012 | | Mr. Mavromates is Vice President and Chief Investment Officer of Mercer Investment Management, Inc. since 2012. |
| | | |
Colin Dean (41) | | Vice President, Chief Legal Officer, and Secretary | | Since 2017 | | Mr. Dean is Global Chief Counsel, Investments since 2018. He has served as Senior Legal Counsel — Investments for Mercer Investment Management, Inc. and Mercer Investment Consulting LLC since 2010. |
| | | |
Caroline Hulme (32) | | Vice President and Assistant Secretary | | Since 2017 | | Ms. Hulme is Senior Legal Counsel, Investments since 2018. She served as Legal Counsel — Investments for Mercer Investment Management, Inc. and Mercer Investment Consulting LLC since 2014. Prior to 2014, she was an Associate in the investment management practice group of Bingham McCutchen LLP. |
| | | |
Larry Vasquez (51) | | Vice President | | Since 2012 | | Mr. Vasquez is a Vice President and Portfolio Manager of Mercer Investment Management, Inc. since 2012. |
| | | |
Robert Phay (50) | | Vice President and Chief Compliance Officer | | Since 2016 | | Mr. Phay is the Chief Risk and Compliance Officer — Investments of Mercer Investment Management, Inc. and Mercer Investment Consulting, Inc. since March 2015. Mr. Phay most recently served in various compliance and legal positions for Commonfund, including Chief Compliance Officer (September 2011 — February 2015), Acting General Counsel (January 2015 — February 2015), and Associate General Counsel (July 2006 — December 2014). |
| † | Officers of the Trust are elected by the Trustees and serve at the pleasure of the Board. |
243
Shares of Mercer Funds are distributed by MGI Funds Distributors, LLC.
Item 2. Code of Ethics.
As of the end of the period covered by this report, the Registrant has adopted a code of ethics that applies to its President, Chief Financial Officer and Chief Investment Officer. During the period covered by this report, there were no amendments to a provision of its code of ethics, nor were there any waivers, including implicit waivers granted from a provision of the code of ethics. A copy of the Registrant’s code of ethics is filed with the Form N-CSR under Item 12(a)(1).
Item 3. Audit Committee Financial Expert.
The Registrant’s Board of Trustees has determined that the Registrant has at least one audit committee financial expert serving on its audit committee. The audit committee financial expert serving on the Registrant’s audit committee is Harrison M. Bains, Jr., who is “independent” as defined in Item 3(a)(2) of this Form.
Item 4. Principal Accountant Fees and Services.
(a) Audit Fees – The aggregate fee billed for the fiscal year for professional services rendered by the principal accountant for the audit of the Registrant’s annual financial statements or services that are normally provided by the principal accountant in connection with statutory and regulatory filings or engagements was $370,194 and $351,430 for the fiscal years ended March 31, 2017 and March 31, 2018, respectively.
(b) Audit-Related Fees – There were no fees billed for the fiscal years ended March 31, 2017 and March 31, 2018 for assurance and related services by the principal accountant that are reasonably related to the performance of the audit of the Registrant’s financial statements and are not reported under (a) of this Item.
(c) Tax Fees – The aggregate fee billed in the last fiscal year for professional services rendered by the principal accountant for the review of the Registrant’s tax returns and excise tax calculations was $84,933 and $68,188 for the fiscal years ended March 31, 2017 and March 31, 2018, respectively. Fees in the amount of $69,367 and $115,612 were billed in the fiscal years ended March 31, 2017 and March 31, 2018, respectively for review of non-US capital gains and the preparation and filing of return of income for the Mercer Non-US Core Equity Fund and the Mercer Emerging Markets Equity Fund.
(d) All Other Fees – Fees in the amount of $0 and $24,000 were billed in the fiscal years ended March 31, 2017 and March 31, 2018, respectively for tax advisory services related to the reclamation of taxes paid by the Mercer Non-US Core Equity Fund in certain European Union countries. Fees in the amount of $5,000 were billed in the fiscal year ended March 31, 2017 related to the issuance of consents for inclusion in the N14 filing of Mercer US Large Cap Value Equity Fund into Mercer US Large Cap Growth Equity Fund and Mercer US Small/Mid Value Equity Fund into Mercer US Small/Mid Growth Equity Fund on June 24, 2016.
(e) (1) The Registrant’s audit committee pre-approves all audit and non-audit services to be performed by the Registrant’s accountant before the accountant is engaged by the Registrant to perform such services.
(2) There were no services described in (b) through (d) above (including services required to be approved by the audit committee pursuant to paragraph (c)(7)(ii) of Rule 2-01 of Regulation S-X) that were approved by the audit committee pursuant to paragraph (c)(7)(i)(C) of Rule 2-01 of Regulation S-X.
| (f) | None of the hours expended on the principal accountant’s engagement to audit the Registrant’s financial statements for the fiscal year ended March 31, 2018 were attributable to work performed by persons other than the principal accountant’s full-time, permanent employees. |
| (g) | There were no aggregate fees billed for the fiscal year ended March 31, 2018 by the Registrant’s principal accountant for non-audit services rendered to the Registrant, its investment adviser and any entity controlling, controlled by or under common control with the investment adviser that provides ongoing services to the Registrant. |
Item 5. Audit Committee of Listed Registrants.
Not applicable.
Item 6. Schedule of Investments.
The Registrant’s full schedules of investments are included as part of the report to shareholders filed under Item 1 of this Form.
Item 7. Disclosure of Proxy Voting Policies and Procedures for Closed-End Management Investment Companies.
Not applicable.
Item 8. Portfolio Managers of Closed-End Investment Companies.
Not applicable.
Item 9. Purchases of Equity Securities by Closed-End Management Investment Company and Affiliated Purchasers.
Not applicable.
Item 10. Submission of Matters to a Vote of Security Holders.
There have been no material changes to the procedures by which the shareholders may recommend nominees to the
Registrant’s Board of Directors, where those changes were implemented after the Registrant last provided disclosure
in response to the requirements of Item 22(b)(15) of Schedule 14A (17 CFR 240.14a-101), or this Item.
Item 11. Controls and Procedures.
(a) The Registrant’s Principal Executive Officer and Principal Financial Officer concluded that the Registrant’s disclosure controls and procedures (as defined in Rule 30a-3(c) under the Investment Company Act of 1940 (17 CFR 270.30a-3(c))), are effective based on the evaluation of Registrant’s disclosure controls and procedures as of a date within 90 days prior to the filing date of this report.
(b) There were no changes in the Registrant’s internal control over financial reporting (as defined in Rule 30a-3(d) under the Investment Company Act of 1940 (17 CFR 270.30a-3(d))), that occurred during the Registrant’s second fiscal quarter of the period covered by this report that has materially affected, or is reasonably likely to materially affect, the Registrant’s internal control over financial reporting.
Item 12. Exhibits.
(a)(1) Code of Ethics for the Registrant’s President, Chief Financial Officer and Chief Investment Officer (as referenced in Item 2 above), attached hereto as Exhibit (a)(1).
(a)(2) Certification of the Principal Executive Officer and Principal Financial Officer of the Registrant as required by Rule 30a-2(a) under the Investment Company Act of 1940 (17 CFR 270.30a-2(a)) is attached hereto as Exhibit 99CERT.
(a)(3) Not applicable.
(b) Certification pursuant to Section 906 of the Sarbanes-Oxley Act of 2002 as required by Rule 30a-2(b), under the Investment Company Act of 1940 (17 CFR 270.30a-2(b)), Rule 15d-14(b) under the Securities Exchange Act of 1934 (17 CFR 240.15d-14(b)) and Section 1350 of Chapter 63 of Title 18 of the United States Code (18 U.S.C. 1350) is attached hereto as Exhibit 99.906CERT.
SIGNATURES
Pursuant to the requirements of the Securities Exchange Act of 1934 and the Investment Company Act of 1940, the Registrant has duly caused this report to be signed on its behalf by the undersigned, thereunto duly authorized.
| | | | | | | | |
| (Registrant) | | Mercer Funds | | | | | | |
| | | | | | | | |
| By (Signature and Title) | | By: /S/ Richard Joseph | | | | | | |
| | Richard Joseph President and Chief Executive Officer (Principal Executive Officer) | | | | | | |
Pursuant to the requirements of the Securities Exchange Act of 1934 and the Investment Company Act of 1940, this report has been signed below by the following person on behalf of the Registrant and in the capacities and on the date indicated.
| | | | | | | | |
| By (Signature and Title) | | By: /S/ Richard Joseph | | | | | | |
| | Richard Joseph President and Chief Executive Officer (Principal Executive Officer) | | | | | | |
| | | | | | | | |
| By (Signature and Title) | | By: /S/ Janice Desmond | | | | | | |
| | Janice Desmond Treasurer and Chief Financial Officer | | | | | | |