UNITED STATES
SECURITIES AND EXCHANGE COMMISSION
Washington, D.C. 20549
FORM N-CSR
CERTIFIED SHAREHOLDER REPORT OF REGISTERED MANAGEMENT
INVESTMENT COMPANIES
Investment Company Act file number: 811-21744
Name of Fund: FDP Series, Inc.
FDP BlackRock Capital Appreciation Fund
FDP BlackRock CoreAlpha Bond Fund
FDP BlackRock Equity Dividend Fund
FDP BlackRock International Fund
Fund Address: 100 Bellevue Parkway, Wilmington, DE 19809
Name and address of agent for service: John M. Perlowski, Chief Executive Officer, FDP Series, Inc., 55
East 52nd Street, New York, NY 10055
Registrant’s telephone number, including area code: (800) 441-7762
Date of fiscal year end: 05/31/2018
Date of reporting period: 05/31/2018
Item 1 – Report to Stockholders
MAY 31, 2018
| | |
ANNUAL REPORT | |  |
FDP Series, Inc.
| Ø | | FDP BlackRock Capital Appreciation Fund |
| Ø | | FDP BlackRock CoreAlpha Bond Fund |
| Ø | | FDP BlackRock Equity Dividend Fund |
| Ø | | FDP BlackRock International Fund |
|
| Not FDIC Insured • May Lose Value • No Bank Guarantee |
The Markets in Review
Dear Shareholder,
In the 12 months ended May 31, 2018, the strongest corporate profits in seven years drove the equity market higher, while rising interest rates constrained bond returns. Though the market’s appetite for risk remained healthy, risk taking varied by asset class, as bond investors cautiously shifted to higher-quality securities, and stock investors continued to embrace risk by investing abroad.
Strong equity performance worldwide was underpinned by the global economic expansion, driven by synchronized growth across the most influential economies. Emerging markets stocks posted the highest return, as accelerating growth in China, the second-largest economy in the world, improved the outlook for corporate profits in most developing nations.
Short-term U.S. Treasury interest rates rose the fastest, while longer-term rates slightly increased, leading to a substantial flattening of the yield curve. The annual return for the three-month U.S. Treasury bill surpassed 1.0%, but remained well below the annual headline inflation rate of 2.8%. In contrast, the ten-year U.S. Treasury — a bellwether of the bond market — posted a negative return, as rising inflation expectations drove yields higher. Although the fundamentals in credit markets remained relatively solid, investment-grade bonds declined slightly, and high-yield bonds posted modest returns.
Even though it faced rising pressure to boost interest rates in 2017, the U.S. Federal Reserve (the “Fed”) increased short-term interest rates just three times during the reporting period. The Fed also announced plans to reduce its $4.4 trillion balance sheet by $420 billion in 2018, which began the process of gradually reversing its unprecedented stimulus measures after the financial crisis. By contrast, the European Central Bank and the Bank of Japan continued to expand their balance sheets despite nascent signs of sustained economic growth.
The U.S. economy continued to gain momentum despite the Fed’s modest reduction of economic stimulus, as unemployment dipped below 4.0%, wages increased, and the number of job openings reached a record high. Strong economic performance may justify a more rapid pace of rate hikes in 2018, as the headline inflation rate and investors’ expectations for inflation have already surpassed the Fed’s target of 2.0%.
While U.S. monetary policy is seeking to restrain economic growth and inflation, fiscal policy has produced new sources of growth that could nourish the economy for the next few years. Corporate tax cuts and repatriation of capital held abroad could encourage a virtuous cycle of business spending, while lower individual tax rates coupled with the robust job market may refresh consumer spending. Proposed infrastructure spending would deliver growth from the government sector, generate demand, and improve economic activity in other sectors.
We continue to believe the primary risks to economic expansion are trade protectionism, rapidly rising interest rates, and geopolitical tension. Given the deflationary forces of technology and globalization, a substantial increase in inflation is unlikely to materialize as long as the unemployment rate remains above 3.0%. However, we are closely monitoring trade protectionism and the rise of populism in Western nations. In particular, the outcome of trade negotiations between the United States and China is likely to influence the global growth trajectory and set the tone for free trade in many other nations.
In this environment, investors need to think globally, extend their scope across a broad array of asset classes, and be nimble as market conditions change. We encourage you to talk with your financial advisor and visit blackrock.com for further insight about investing in today’s markets.
Sincerely,

Rob Kapito
President, BlackRock Advisors, LLC

Rob Kapito
President, BlackRock Advisors, LLC
| | | | |
| Total Returns as of May 31, 2018 |
| | | 6-month | | 12-month |
U.S. large cap equities
(S&P 500® Index) | | 3.16% | | 14.38% |
U.S. small cap equities
(Russell 2000® Index) | | 6.47 | | 20.76 |
International equities
(MSCI Europe, Australasia, Far East Index) | | 0.03 | | 7.97 |
Emerging market equities
(MSCI Emerging Markets Index) | | 0.89 | | 14.03 |
3-month Treasury bills
(ICE BofAML 3-Month U.S. Treasury Bill Index) | | 0.75 | | 1.28 |
U.S. Treasury securities
(ICE BofAML 10-Year U.S. Treasury Index) | | (2.42) | | (3.40) |
U.S. investment grade bonds
(Bloomberg Barclays U.S. Aggregate Bond Index) | | (1.04) | | (0.37) |
Tax-exempt municipal bonds
(S&P Municipal Bond Index) | | 0.80 | | 1.26 |
U.S. high yield bonds
(Bloomberg Barclays U.S. Corporate High Yield 2% Issuer Capped Index) | | 0.06 | | 2.35 |
| Past performance is no guarantee of future results. Index performance is shown for illustrative purposes only. You cannot invest directly in an index. |
| | |
| 2 | | THIS PAGEISNOT PARTOF YOUR FUND REPORT |
Table of Contents
FDP Series, Inc. is part of the Funds Diversified PortfoliosSM (“FDP”) Service. You may receive separate shareholder reports for other funds available through the Service.

| | |
| Fund Summary as of May 31, 2018 | | FDP BlackRock Capital Appreciation Fund |
Investment Objective
FDP BlackRock Capital Appreciation Fund’s (the “Fund”) investment objective is to seek long-term growth of capital.
On September 12, 2017, the Board of Directors approved a proposal to change the name of the Fund from “FDP BlackRock Janus Growth Fund” and certain changes to the Fund’s investment objective and strategies. The Board also approved the termination of the Fund’s sub-advisory agreement with Janus Capital Management LLC. In addition, the Fund’s Manager determined to change the benchmark index against which the Fund compares its performance. All of these changes became effective on November 28, 2017.
Portfolio Management Commentary
How did the Fund perform?
For the 12-month period ended May 31, 2018, the Fund’s Institutional and Investor A Shares outperformed its primary benchmark, the Russell 1000® Growth Index, while the Fund’s Investor C Shares underperformed. For the same period, the Fund outperformed its secondary benchmark, the S&P 500® Index. The following discussion of relative performance pertains to the Russell 1000® Growth Index for the period, since the new portfolio management team assumed responsibility on November 28, 2017.
What factors influenced performance?
Consumer discretionary was the largest contributor to performance on a sector basis, and within the sector internet & direct marketing retail holdings had the most positive impact. Selection within hotels, restaurants & leisure and an underweight to media also added value within the sector. Health care and consumer staples were additional sources of strength. An underweight to biotechnology and positioning in pharmaceuticals proved advantageous within health care, while stock selection in the beverage sub-sector benefited performance within consumer staples. The top individual contributors were Netflix, Inc. and Amazon.com, Inc. Netflix outperformed based on strong financial results throughout the period, while Amazon posted favorable results as continued underperformance among traditional retailers focused investors on Amazon’s opportunities to gain market share. Additional contributions to Fund performance came from positions in Domino’s Pizza, Inc. and the software firm Adobe Systems, Inc.
Conversely, the Fund’s positioning within information technology (“IT”) detracted from performance during the period, with internet software & services holdings having the most negative impact within the sector. Additionally, an underweight to technology hardware, storage & peripherals weighed on performance. The Fund’s materials positioning also hindered results, though to a much lesser degree. The largest individual detractor was the Chinese internet product and services firm Tencent Holdings Ltd., which pulled back amid fears of a slowdown in PC gaming and margin contraction. The Fund maintained an overweight in Tencent in view of the company’s growth opportunities, especially in payments, mobile gaming and advertising. Elsewhere, an underweight to Apple Inc. detracted during the period. The Fund maintained its underweight position based on a mature smartphone market, increasingly challenging competitive dynamics and a lack of innovative products. In addition, a lack of a Fund holding in aircraft manufacturer Boeing Co. and a position in the flooring company Mohawk Industries, Inc. weighed on results.
Describe recent portfolio activity.
Due to a combination of trading activity and market movements during the period from November 28, 2017 through May 31, 2018, the Fund’s weighting increased most notably in the industrials sector, specifically road & rail and professional services. IT exposure also was increased, particularly within the software and internet software & services industries. The Fund’s weighting in the health care sector decreased, especially in biotechnology. Holdings in the chemicals sub-sector of materials also declined.
Describe portfolio positioning at period end.
Relative to the Russell 1000® Growth Index, the Fund’s largest overweights were in the financials, consumer discretionary, and IT sectors. Industrials and consumer staples were the Fund’s largest sector underweights.
The views expressed reflect the opinions of BlackRock as of the date of this report and are subject to change based on changes in market, economic or other conditions. These views are not intended to be a forecast of future events and are no guarantee of future results.
| | |
| 4 | | 2018 BLACKROCK ANNUAL REPORTTO SHAREHOLDERS |
| | |
| Fund Summary as of May 31, 2018 (continued) | | FDP BlackRock Capital Appreciation Fund |
TOTAL RETURN BASED ON A $10,000 INVESTMENT
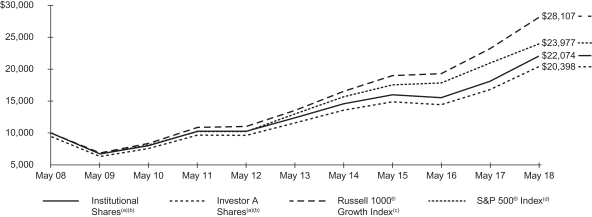
| (a) | Assuming maximum sales charges, if any, transaction costs and other operating expenses, including advisory fees. Institutional Shares do not have a sales charge. |
| (b) | The Fund pursues its investment objective by investing primarily in a diversified portfolio consisting primarily of common stocks of U.S. companies that Fund management believes have exhibited above-average growth rates in earnings over the long term. The Fund’s total returns from January 30, 2016 to November 27, 2017 are the returns of the fund when it followed a different investment objective and different investment strategies under the name FDP BlackRock Janus Growth Fund. The Fund’s total returns prior to January 30, 2016 are the returns of the Fund when it followed different investment strategies under the name Marsico Growth FDP Fund. |
| (c) | A float-adjusted, market capitalization–weighted index measures the performance of the large cap growth segment of the U.S. equity universe and consists of those Russell 1000® securities with higher price-to-book ratios and higher forecasted growth values. |
| (d) | An unmanaged index that covers 500 leading companies and captures approximately 80% coverage of available market capitalization. |
Performance Summary for the Period Ended May 31, 2018
| | | | | | | | | | | | | | | | | | | | | | | | | | | | | | | | | | | | | | | | |
| | | | | | | | | Average Annual Total Returns (b)(e) | |
| | | | | | | | | 1 Year | | | | | | 5 Years | | | | | | 10 Years | |
| | | 6-Month
Total Returns | | | | | | w/o sales
charge | | | w/sales
charge | | | | | | w/o sales
charge | | | w/sales
charge | | | | | | w/o sales
charge | | | w/sales
charge | |
Institutional | | | 12.88 | % | | | | | | | 21.93 | % | | | N/A | | | | | | | | 12.22 | % | | | N/A | | | | | | | | 8.24 | % | | | N/A | |
Investor A | | | 12.69 | | | | | | | | 21.56 | | | | 15.18 | % | | | | | | | 11.94 | | | | 10.74 | % | | | | | | | 7.97 | | | | 7.39 | % |
Investor C | | | 12.33 | | | | | | | | 20.66 | | | | 19.66 | | | | | | | | 11.09 | | | | 11.09 | | | | | | | | 7.15 | | | | 7.15 | |
Russell 1000® Growth Index | | | 7.06 | | | | | | | | 21.02 | | | | N/A | | | | | | | | 15.69 | | | | N/A | | | | | | | | 10.89 | | | | N/A | |
S&P 500® Index | | | 3.16 | | | | | | | | 14.38 | | | | N/A | | | | | | | | 12.98 | | | | N/A | | | | | | | | 9.14 | | | | N/A | |
| | (e) | Assuming maximum sales charges, if any. Average annual total returns with and without sales charges reflect reductions for distribution and service fees. See “About Fund Performance” on page 12 for a detailed description of share classes, including any related sales charges and fees. | |
N/A — Not applicable as share class and index do not have a sales charge.
Past performance is not indicative of future results.
Performance results may include adjustments made for financial reporting purposes in accordance with U.S. generally accepted accounting principles.
Expense Example
| | | | | | | | | | | | | | | | | | | | | | | | | | | | | | | | |
| | | Actual | | | | | | Hypothetical (g) | | | | |
| | | Beginning
Account Value
(12/01/17) | | | Ending
Account Value
(05/31/18) | | | Expenses
Paid During
the Period (f) | | | | | | Beginning
Account Value
(12/01/17) | | | Ending
Account Value (05/31/18) | | | Expenses
Paid During
the Period (f) | | | Annualized
Expense
Ratio | |
Institutional | | $ | 1,000.00 | | | $ | 1,128.80 | | | $ | 5.63 | | | | | | | $ | 1,000.00 | | | $ | 1,019.65 | | | $ | 5.34 | | | | 1.06 | % |
Investor A | | | 1,000.00 | | | | 1,126.90 | | | | 7.00 | | | | | | | | 1,000.00 | | | | 1,018.35 | | | | 6.64 | | | | 1.32 | |
Investor C | | | 1,000.00 | | | | 1,123.30 | | | | 10.80 | | | | | | | | 1,000.00 | | | | 1,014.76 | | | | 10.25 | | | | 2.04 | |
| | (f) | For each class of the Fund, expenses are equal to the annualized net expense ratio for the class, multiplied by the average account value over the period, multiplied by 182/365 (to reflect the one-half year period shown). | |
| | (g) | Hypothetical 5% annual return before expenses is calculated by prorating the number of days in the most recent fiscal half year divided by 365. | |
See “Disclosure of Expenses” on page 12 for further information on how expenses were calculated.
| | |
| Fund Summary as of May 31, 2018 | | FDP BlackRock CoreAlpha Bond Fund |
Investment Objective
FDP BlackRock CoreAlpha Bond Fund’s (the “Fund”) investment objective is to seek to provide a combination of income and capital growth.
Portfolio Management Commentary
How did the Fund perform?
For the 12-month period ended May 31, 2018, the Fund underperformed the benchmark, its Bloomberg Barclays U.S. Aggregate Bond Index.
What factors influenced performance?
During the period, the Fund’s positioning with respect to residential mortgage-backed securities (“MBS”) was the largest detractor from performance relative to the benchmark. Specifically, the Fund’s pool selection within 30-year MBS and a preference for higher coupons constrained performance as the yield curve flattened.
Selection within corporate credit contributed positively to performance due principally to the Fund’s positioning within consumer non-cyclicals. In particular, an overweight position in health care and security selection within pharmaceuticals added to relative returns. Asset allocation also contributed as the Fund was overweight in securitized sectors including MBS, asset-backed securities (“ABS”) and commercial mortgage-backed securities for most of the period. This positioning benefited performance as these sectors experienced continued spread tightening and provided incremental income.
During the period, the Fund employed derivatives as part of its investment strategy. The Fund used futures contracts as a means to manage certain risks and free up capital to purchase corporate bonds. While the Fund’s use of futures contracts detracted from Fund performance, the negative impact was offset by the positive contribution from the asset allocation to corporates.
Describe recent portfolio activity.
During the 12-month period, the Fund maintained an overweight position in industrials while increasing its overweights to consumer cyclicals and technology. The Fund decreased its overweight in non-cyclicals. Within basic materials, the Fund shifted from a slight underweight to metals to an overweight. Lastly, an overweight to the energy sector was reduced by moving to a slight underweight to the independent energy segment.
Describe portfolio positioning at period end.
Relative to the Bloomberg Barclays U.S. Aggregate Bond Index, the Fund was underweight in U.S. Treasury securities. Within spread sectors, the Fund was overweight in investment-grade corporate credit, agency MBS and ABS, with underweights in transportation and real estate investment trusts. The Fund held an out-of-benchmark allocation in high yield corporate credit. Within investment grade credit, the portfolio was overweight in the consumer sectors, banking names and select issues within communications.
The views expressed reflect the opinions of BlackRock as of the date of this report and are subject to change based on changes in market, economic or other conditions. These views are not intended to be a forecast of future events and are no guarantee of future results.
| | |
| 6 | | 2018 BLACKROCK ANNUAL REPORTTO SHAREHOLDERS |
| | |
| Fund Summary as of May 31, 2018 (continued) | | FDP BlackRock CoreAlpha Bond Fund |
TOTAL RETURN BASED ON A $10,000 INVESTMENT
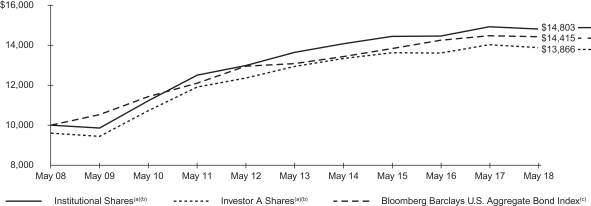
| (a) | Assuming maximum sales charges, if any, transaction costs and other operating expenses, including advisory fees. Institutional Shares do not have a sales charge. |
| (b) | The Fund invests, under normal circumstances, at least 80% of its assets in bonds and futures and other instruments that have economic characteristics similar to bonds. For the purposes of this strategy, “bonds” include the following: obligations issued or guaranteed by the U.S. Government, its agencies or instrumentalities; mortgage-backed securities issued or guaranteed by the U.S. Government or its agencies or instrumentalities, including U.S. agency mortgage pass-through securities; commercial mortgage-backed securities; debt obligations of U.S. issuers; municipal securities; asset-backed securities; and U.S.-registered dollar-denominated debt obligations of foreign issuers. The Fund’s total return prior to March 10, 2017 are the returns of the Fund when it followed a different investment objective and investment strategies under the name FDP BlackRock Franklin Templeton Total Return Fund. |
| (c) | A market-weighted index, comprised of investment-grade U.S. Treasury bonds, government-related bonds, corporate bonds, mortgage-backed pass-through securities, commercial mortgage-backed securities and asset-backed securities (“ABS”) that are publicly offered for sale in the United States with $250 million or more of outstanding face value and at least one year to maturity. |
Performance Summary for the Period Ended May 31, 2018
| | | | | | | | | | | | | | | | | | | | | | | | | | | | | | | | | | | | | | | | | | | | |
| | | | | | | | | | | | Average Annual Total Returns (b)(d) | |
| | | | | | | | | | | | 1 Year | | | | | | 5 Years | | | | | | 10 Years | |
| | | Standardized
30-Day Yields | | | 6-Month
Total Returns | | | | | | w/o sales
charge | | | w/sales
charge | | | | | | w/o sales
charge | | | w/sales
charge | | | | | | w/o sales
charge | | | w/sales
charge | |
Institutional | | | 3.04 | % | | | (1.47 | )% | | | | | | | (0.79 | )% | | | N/A | | | | | | | | 1.66 | % | | | N/A | | | | | | | | 4.00 | % | | | N/A | |
Investor A | | | 2.67 | | | | (1.60 | ) | | | | | | | (1.13 | ) | | | (5.09 | )% | | | | | | | 1.41 | | | | 0.58 | % | | | | | | | 3.74 | | | | 3.32 | % |
Investor C | | | 2.25 | | | | (1.86 | ) | | | | | | | (1.68 | ) | | | (2.64 | ) | | | | | | | 0.84 | | | | 0.84 | | | | | | | | 3.17 | | | | 3.17 | |
Bloomberg Barclays U.S. Aggregate Bond Index | | | — | | | | (1.04 | ) | | | | | | | (0.37 | ) | | | N/A | | | | | | | | 1.98 | | | | N/A | | | | | | | | 3.72 | | | | N/A | |
| | (d) | Assuming maximum sales charges, if any. Average annual total returns with and without sales charges reflect reductions for distribution and service fees. See “About Fund Performance” on page 12 for a detailed description of share classes, including any related sales charges and fees. | |
N/A — Not applicable as share class and index do not have a sales charge.
Past performance is not indicative of future results.
Performance results may include adjustments made for financial reporting purposes in accordance with U.S. generally accepted accounting principles.
Expense Example
| | | | | | | | | | | | | | | | | | | | | | | | | | | | | | | | |
| | | Actual | | | | | | Hypothetical (f) | | | | |
| | | Beginning
Account Value (12/01/17) | | | Ending
Account Value
(05/31/18) | | | Expenses
Paid During
the Period (e) | | | | | | Beginning
Account Value (12/01/17) | | | Ending
Account Value (05/31/18) | | | Expenses
Paid During
the Period (e) | | | Annualized
Expense
Ratio | |
Institutional | | $ | 1,000.00 | | | $ | 985.30 | | | $ | 3.81 | | | | | | | $ | 1,000.00 | | | $ | 1,021.09 | | | $ | 3.88 | | | | 0.77 | % |
Investor A | | | 1,000.00 | | | | 984.00 | | | | 5.05 | | | | | | | | 1,000.00 | | | | 1,019.85 | | | | 5.14 | | | | 1.02 | |
Investor C | | | 1,000.00 | | | | 981.40 | | | | 7.71 | | | | | | | | 1,000.00 | | | | 1,017.15 | | | | 7.85 | | | | 1.56 | |
| | (e) | For each class of the Fund, expenses are equal to the annualized net expense ratio for the class, multiplied by the average account value over the period, multiplied by 182/365 (to reflect the one-half year period shown). | |
| | (f) | Hypothetical 5% annual return before expenses is calculated by prorating the number of days in the most recent fiscal half year divided by 365. | |
See “Disclosure of Expenses” on page 12 for further information on how expenses were calculated.
| | |
| Fund Summary as of May 31, 2018 | | FDP BlackRock Equity Dividend Fund |
Investment Objective
FDP BlackRock Equity Dividend Fund’s (the “Fund”) investment objective is to seek long-term total return and current income.
On September 12, 2017, the Board of Directors approved a proposal to change the name of the Fund from “FDP BlackRock Invesco Value Fund” and certain changes to the Fund’s investment objective and strategies. The Board also approved the termination of the Fund’s sub-advisory agreement with Invesco Advisers, Inc. All of these changes became effective on November 28, 2017.
Portfolio Management Commentary
How did the Fund perform?
For the 12-month period ended May 31, 2018, the Fund outperformed its benchmark, the Russell 1000® Value Index.
What factors influenced performance?
During the period, stock selection in the health care sector made the largest contribution to relative performance, and was strongest within the pharmaceuticals and health care providers & services industries. An underweight stance and stock selection in consumer staples also contributed and was especially notable within the beverages industry. Additionally, stock selection in the energy sector was positive for returns, particularly within the oil, gas & consumable fuels industry. Stock selection in the industrials and telecommunication services sectors also helped performance.
Stock selection in financials detracted from returns. This was most evident within the insurance industry, where a small overweight negatively impacted returns. Selection in the consumer discretionary sector also was subtractive, principally within the media segment. In addition, stock selection in materials and an underweight to the semiconductor industry weighed on performance.
Describe recent portfolio activity.
Through a combination of portfolio trading and market activity, the Fund gradually increased its overweight in the health care sector during the period, especially within pharmaceuticals. The Fund also gradually increased exposure to consumer staples. Additionally, the Fund moved from an overweight position to an underweight in the industrials sector, mainly by trimming exposure within aerospace & defense as well as air freight & logistics. Finally, the Fund maintained its underweights to real estate and consumer discretionary.
Describe portfolio positioning at period end.
Relative to the Russell 1000® Value Index, the Fund ended the period with its largest overweights in health care and information technology, and also maintained a strong overweight to the banking industry. The Fund had substantial underweights in real estate, consumer discretionary, industrials, utilities and materials.
The views expressed reflect the opinions of BlackRock as of the date of this report and are subject to change based on changes in market, economic or other conditions. These views are not intended to be a forecast of future events and are no guarantee of future results.
| | |
| 8 | | 2018 BLACKROCK ANNUAL REPORTTO SHAREHOLDERS |
| | |
| Fund Summary as of May 31, 2018 (continued) | | FDP BlackRock Equity Dividend Fund |
TOTAL RETURN BASED ON A $10,000 INVESTMENT
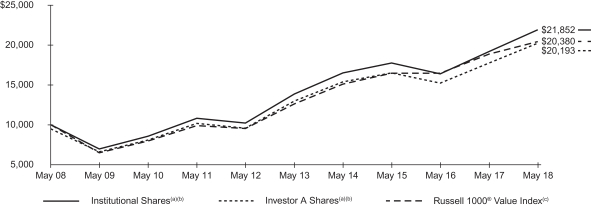
| (a) | Assuming maximum sales charges, if any, transaction costs and other operating expenses, including advisory fees. Institutional Shares do not have a sales charge. |
| (b) | The Fund pursues its investment objective by investing under normal circumstances, at least 80% of its assets in equity securities and at least 80% of its assets in dividend paying securities. The Fund’s total returns prior to November 28, 2017 are the returns of the Fund when it followed a different investment objective and different investment strategies under the name FDP BlackRock Invesco Value Fund. |
| (c) | A float-adjusted, market capitalization–weighted index that is a subset of the Russell 1000® Index that consists of those Russell 1000® securities with lower price-to-book ratios and lower expected growth values |
Performance Summary for the Period Ended May 31, 2018
| | | | | | | | | | | | | | | | | | | | | | | | | | | | | | | | | | | | | | | | |
| | | | | | | | | Average Annual Total Returns (b)(d) | |
| | | | | | | | | 1 Year | | | | | | 5 Years | | | | | | 10 Years | |
| | | 6-Month
Total Returns | | | | | | w/o sales
charge | | | w/sales
charge | | | | | | w/o sales
charge | | | w/sales
charge | | | | | | w/o sales
charge | | | w/sales
charge | |
Institutional | | | 0.27 | % | | | | | | | 14.13 | % | | | N/A | | | | | | | | 9.56 | % | | | N/A | | | | | | | | 8.13 | % | | | N/A | |
Investor A | | | 0.18 | | | | | | | | 13.89 | | | | 7.91 | % | | | | | | | 9.28 | | | | 8.11 | % | | | | | | | 7.86 | | | | 7.28 | % |
Investor C | | | (0.16 | ) | | | | | | | 13.03 | | | | 12.07 | | | | | | | | 8.47 | | | | 8.47 | | | | | | | | 7.05 | | | | 7.05 | |
Russell 1000® Value Index | | | (0.50 | ) | | | | | | | 8.25 | | | | N/A | | | | | | | | 10.09 | | | | N/A | | | | | | | | 7.38 | | | | N/A | |
| | (d) | Assuming maximum sales charges, if any. Average annual total returns with and without sales charges reflect reductions for distribution and service fees. See “About Fund Performance” on page 12 for a detailed description of share classes, including any related sales charges and fees. | |
N/A — Not applicable as share class and index do not have a sales charge.
Past performance is not indicative of future results.
Performance results may include adjustments made for financial reporting purposes in accordance with U.S. generally accepted accounting principles.
Expense Example
| | | | | | | | | | | | | | | | | | | | | | | | | | | | | | | | |
| | | Actual | | | | | | Hypothetical (f) | | | | |
| | | Beginning
Account Value
(12/07/17) | | | Ending
Account Value
(05/31/18) | | | Expenses
Paid During
the Period (e) | | | | | | Beginning
Account Value
(12/07/17) | | | Ending
Account Value (05/31/18) | | | Expenses
Paid During
the Period (e) | | | Annualized
Expense
Ratio | |
Institutional | | $ | 1,000.00 | | | $ | 1,002.70 | | | $ | 4.79 | | | | | | | $ | 1,000.00 | | | $ | 1,002.14 | | | $ | 4.84 | | | | 0.96 | % |
Investor A | | | 1,000.00 | | | | 1,001.80 | | | | 6.09 | | | | | | | | 1,000.00 | | | | 1,018.85 | | | | 6.14 | | | | 1.22 | |
Investor C | | | 1,000.00 | | | | 998.40 | | | | 9.67 | | | | | | | | 1,000.00 | | | | 1,015.26 | | | | 9.75 | | | | 1.94 | |
| | (e) | For each class of the Fund, expenses are equal to the annualized net expense ratio for the class, multiplied by the average account value over the period, multiplied by 182/365 (to reflect the one-half year period shown). | |
| | (f) | Hypothetical 5% annual return before expenses is calculated by prorating the number of days in the most recent fiscal half year divided by 365. | |
See “Disclosure of Expenses” on page 12 for further information on how expenses were calculated.
| | |
| Fund Summary as of May 31, 2018 | | FDP BlackRock International Fund |
Investment Objective
FDP BlackRock International Fund’s (the “Fund”) investment objective is to seek long-term capital growth.
On September 12, 2017, the Board of Directors approved a proposal to change the name of the Fund from “FDP BlackRock MFS Research International Fund” and certain changes to the Fund’s investment objective and strategies. The Board also approved the termination of the Fund’s sub-advisory agreement with Massachusetts Financial Services Company and the entering into of a sub-advisory agreement with BlackRock International Limited. In addition, the Fund’s Manager determined to remove the MSCI EAFE Index as a benchmark index against which the Fund compares its performance. All of these changes became effective on November 28, 2017.
Portfolio Management Commentary
How did the Fund perform?
For the 12-month period ended May 31, 2018, the Fund underperformed its benchmark, the MSCI All Country World ex USA Index, and its former primary benchmark, the MSCI EAFE Index. The following discussion of relative performance pertains to the MSCI All Country World ex USA Index for the period, since the new portfolio management team assumed responsibility on November 28, 2017.
What factors influenced performance?
Stock selection within information technology (“IT”) was the largest detractor from performance since the Fund’s new strategy was put in place. Stock selection in consumer staples and financials also detracted. The largest individual detractors were the Chinese internet IT company NetEase, Inc., the multinational Spanish banking group Banco Bilbao Vizcaya SA and British American Tobacco PLC. NetEase’s share price came under pressure on concerns surrounding rising first quarter marketing expenses for new video games and pressure on margins.
Conversely, positive stock selection within the consumer discretionary sector was the largest contributor to performance since the Fund’s current management team and strategy were put in place on November 28, 2017. Positive stock selection within energy and materials also contributed. The largest individual contributors to performance were the Brazilian bank Itau Unibanco Holding SA, the British luxury fashion firm Burberry Group PLC, and the Brazilian metals and mining company Vale SA. Shares of Itau Unibanco posted good performance based on more favorable fee income, accelerating loan growth, stable costs and lower taxes.
Describe recent portfolio activity.
On November 28, 2017, the Fund was transitioned to its current management team and strategy, driving a meaningful change in portfolio positioning. Since then, the team reduced the Fund’s consumer staples exposure from a meaningful overweight to a neutral weight. By contrast, the Fund’s consumer discretionary exposure was increased from a neutral weight to a meaningful overweight. From a geographic perspective, these changes resulted in a significant reduction in exposure to the United Kingdom, along with modestly increased exposure to Europe ex-U.K. and the Pacific Basin.
Describe portfolio positioning at period end.
At period end, the Fund’s largest sector overweight positions were in consumer discretionary and financials, while the largest underweights were to industrials and telecommunications. In country terms, the largest overweight exposures were to Spain, the United Kingdom and China, while the largest underweights were in Canada, Australia and South Korea.
The views expressed reflect the opinions of BlackRock as of the date of this report and are subject to change based on changes in market, economic or other conditions. These views are not intended to be a forecast of future events and are no guarantee of future results.
| | |
| 10 | | 2018 BLACKROCK ANNUAL REPORTTO SHAREHOLDERS |
| | |
| Fund Summary as of May 31, 2018 (continued) | | FDP BlackRock International Fund |
TOTAL RETURN BASED ON A $10,000 INVESTMENT
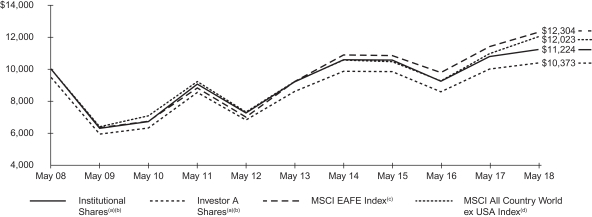
| (a) | Assuming maximum sales charges, if any, transaction costs and other operating expenses, including advisory fees. Institutional Shares do not have a sales charge. |
| (b) | The Fund pursues its investment objective by investing at least 75% of its total assets in global equity securities of any market capitalization, selected for their above-average return potential. The Fund’s total returns prior to November 28, 2017 are the returns of the Fund when it followed a different investment objective and different investment strategies under the name FDP BlackRock MFS Research International Fund. |
| (c) | A free-float adjusted market capitalization index designed to measure equity performance of developed markets, excluding the United States and Canada. Effective November 28, 2017, the Fund no longer measures its performance against the MSCI EAFE Index. |
| (d) | A free float-adjusted market capitalization index designed to measure the combined equity market performance of developed and emerging market countries, excluding the United States. |
Performance Summary for the Period Ended May 31, 2018
| | | | | | | | | | | | | | | | | | | | | | | | | | | | | | | | | | | | | | | | |
| | | | | | | | | Average Annual Total Returns (b)(e) | |
| | | | | | | | | 1 Year | | | | | | 5 Years | | | | | | 10 Years | |
| | | 6-Month
Total Returns | | | | | | w/o sales
charge | | | w/sales
charge | | | | | | w/o sales
charge | | | w/sales
charge | | | | | | w/o sales
charge | | | w/sales
charge | |
Institutional | | | (3.06 | )% | | | | | | | 4.02 | % | | | N/A | | | | | | | | 4.04 | % | | | N/A | | | | | | | | 1.16 | % | | | N/A | |
Investor A | | | (3.15 | ) | | | | | | | 3.71 | | | | (1.73 | )% | | | | | | | 3.80 | | | | 2.69 | % | | | | | | | 0.91 | | | | 0.37 | % |
Investor C | | | (3.53 | ) | | | | | | | 2.90 | | | | 1.90 | | | | | | | | 3.00 | | | | 3.00 | | | | | | | | 0.15 | | | | 0.15 | |
MSCI All Country World ex USA Index | | | 0.27 | | | | | | |
| 9.67
|
| | | N/A | | | | | | | | 5.46 | | | | N/A | | | | | | | | 1.86 | | | | N/A | |
MSCI EAFE Index | | | 0.03 | | | | | | | | 7.97 | | | | N/A | | | | | | | | 5.93 | | | | N/A | | | | | | | | 2.09 | | | | N/A | |
| | (e) | Assuming maximum sales charges, if any. Average annual total returns with and without sales charges reflect reductions for distribution and service fees. See “About Fund Performance” on page 12 for a detailed description of share classes, including any related sales charges and fees. | |
N/A — Not applicable as share class and index do not have a sales charge.
Past performance is not indicative of future results.
Performance results may include adjustments made for financial reporting purposes in accordance with U.S. generally accepted accounting principles.
Expense Example
| | | | | | | | | | | | | | | | | | | | | | | | | | | | | | | | |
| | | Actual | | | | | | Hypothetical (g) | | | | |
| | | Beginning
Account Value
(12/01/17) | | | Ending
Account Value
(05/31/18) | | | Expenses
Paid During
the Period (f) | | | | | | Beginning
Account Value
(12/01/17) | | | Ending
Account Value
(05/31/18) | | | Expenses
Paid During
the Period (f) | | | Annualized
Expense
Ratio | |
Institutional | | $ | 1,000.00 | | | $ | 969.40 | | | $ | 6.09 | | | | | | | $ | 1,000.00 | | | $ | 1,018.75 | | | $ | 6.24 | | | | 1.24 | % |
Investor A | | | 1,000.00 | | | | 968.50 | | | | 7.36 | | | | | | | | 1,000.00 | | | | 1,017.45 | | | | 7.54 | | | | 1.50 | |
Investor C | | | 1,000.00 | | | | 964.70 | | | | 10.92 | | | | | | | | 1,000.00 | | | | 1,013.81 | | | | 11.20 | | | | 2.23 | |
| | (f) | For each class of the Fund, expenses are equal to the annualized net expense ratio for the class, multiplied by the average account value over the period, multiplied by 182/365 (to reflect the one-half year period shown). | |
| | (g) | Hypothetical 5% annual return before expenses is calculated by prorating the number of days in the most recent fiscal half year divided by 365. | |
See “Disclosure of Expenses” on page 12 for further information on how expenses were calculated.
About Fund Performance
Shares are only available for purchase through the FDP Service.
Institutional Shares are not subject to any sales charge. These shares bear no ongoing distribution or service fees and are available only to certain eligible investors.
Investor A Shares (for all Funds except FDP BlackRock CoreAlpha Bond Fund) are subject to a maximum initial sales charge (front-end load) of 5.25% and a service fee of 0.25% per year (but no distribution fee). Investor A Shares for FDP BlackRock CoreAlpha Bond Fund are subject to a maximum initial sales charge (front-end load) of 4.00% and a service fee of 0.25% per year (but no distribution fee). Certain redemptions of these shares may be subject to a contingent deferred sales charge (“CDSC”) where no initial sales charge was paid at the time of purchase.
Investor C Shares (for all Funds except FDP BlackRock CoreAlpha Bond Fund) are subject to a distribution fee of 0.75% per year and a service fee of 0.25% per year. Investor C Shares for FDP BlackRock CoreAlpha Bond Fund are subject to a distribution fee of 0.55% per year and a service fee of 0.25% per year. In addition, these shares for all Funds are subject to a 1.00% CDSC if redeemed within one year of purchase.
Performance information reflects past performance and does not guarantee future results. Current performance may be lower or higher than the performance data quoted. Refer to www.blackrock.com to obtain performance data current to the most recent month end. Performance results do not reflect the deduction of taxes that a shareholder would pay on fund distributions or the redemption of fund shares. Figures shown in the performance tables on the previous pages assume reinvestment of all distributions, if any, at net asset value (“NAV”) on the ex-dividend/payable date. Investment return and principal value of shares will fluctuate so that shares, when redeemed, may be worth more or less than their original cost. Distributions paid to each class of shares will vary because of the different levels of service, distribution and transfer agency fees applicable to each class, which are deducted from the income available to be paid to shareholders.
BlackRock Advisors, LLC (the “Manager”), the Funds’ investment adviser, has contractually agreed to waive and/or reimburse a portion of the Funds’ expenses. Without such waiver and/or reimbursement, the Funds’ performance would have been lower. The Manager is under no obligation to continue waiving and/or reimbursing its fees after the applicable termination date of such agreement. Effective November 28, 2017, the Manager agreed to contractually waive a portion of its investment advisory fee of its management fee payable by FDP BlackRock Capital Appreciation Fund, FDP BlackRock Equity Dividend Fund and FDP BlackRock International Fund, so that the management fee is 0.65%, 0.60% and 0.75% of average daily net assets, respectively, through September 30, 2019. Also, effective March 10, 2017, the Manager has agreed to contractually waive its management fee payable by FDP BlackRock CoreAlpha Bond Fund so that the management fee is 0.32% of average daily net assets through September 30, 2018. These contractual waiver agreements may be terminated upon 90 days’ notice by a majority of the non-interested directors of FDP Series, Inc. or by a vote of a majority of the outstanding voting securities of the relevant Fund. Regarding the voluntary waivers, the Manager is under no obligation to waive or to continue waiving its fees and such waivers may be reduced or discontinued at any time. Without such contractual or voluntary waivers, the performance of the Funds would have been lower. See Note 6 of the Notes to Financial Statements for additional information on waivers and reimbursements.
Disclosure of Expenses
Shareholders of these Funds may incur the following charges: (a) transactional expenses, such as sales charges; and (b) operating expenses, including investment advisory fees, service and distribution fees, including 12b-1 fees, acquired fund fees and expenses and other fund expenses. The expense examples on previous pages (which are based on a hypothetical investment of $1,000 invested on December 1, 2017 and held through May 31, 2018) are intended to assist shareholders both in calculating expenses based on an investment in each Fund and in comparing these expenses with similar costs of investing in other mutual funds.
The expense examples provide information about actual account values and actual expenses. In order to estimate the expenses a shareholder paid during the period covered by this report, shareholders can divide their account value by $1,000 and then multiply the result by the number corresponding to their Fund and share class under the heading entitled “Expenses Paid During the Period.”
The expense examples also provide information about hypothetical account values and hypothetical expenses based on a Fund’s actual expense ratio and an assumed rate of return of 5% per year before expenses. In order to assist shareholders in comparing the ongoing expenses of investing in these Funds and other funds, compare the 5% hypothetical examples with the 5% hypothetical examples that appear in shareholder reports of other funds.
The expenses shown in the expense examples are intended to highlight shareholders’ ongoing costs only and do not reflect any transactional expenses, such as sales charges, if any. Therefore, the hypothetical examples are useful in comparing ongoing expenses only, and will not help shareholders determine the relative total expenses of owning different funds. If these transactional expenses were included, shareholder expenses would have been higher.
Derivative Financial Instruments
The Funds may invest in various derivative financial instruments. These instruments are used to obtain exposure to a security, commodity, index, market, and/or other assets without owning or taking physical custody of securities, commodities and/or other referenced assets or to manage market, equity, credit, interest rate, foreign currency exchange rate, commodity and/or other risks. Derivative financial instruments may give rise to a form of economic leverage and involve risks, including the imperfect correlation between the value of a derivative financial instrument and the underlying asset, possible default of the counterparty to the transaction or illiquidity of the instrument. The Funds’ successful use of a derivative financial instrument depends on the investment adviser’s ability to predict pertinent market movements accurately, which cannot be assured. The use of these instruments may result in losses greater than if they had not been used, may limit the amount of appreciation a Fund can realize on an investment and/or may result in lower distributions paid to shareholders. The Funds’ investments in these instruments, if any, are discussed in detail in the Notes to Financial Statements.
| | |
| 12 | | 2018 BLACKROCK ANNUAL REPORTTO SHAREHOLDERS |
Portfolio Information as of May 31, 2018
FDP BlackRock Capital Appreciation Fund
TEN LARGEST HOLDINGS
| | | | |
| Holding | | Percent of
Net Assets | |
Amazon.com, Inc. | | | 9 | % |
Microsoft Corp. | | | 6 | |
Alphabet, Inc. | | | 5 | |
Visa, Inc. | | | 5 | |
UnitedHealth Group, Inc. | | | 5 | |
Netflix, Inc. | | | 3 | |
Booking Holdings, Inc. | | | 3 | |
Facebook, Inc. | | | 3 | |
Tencent Holdings Ltd. | | | 3 | |
Adobe Systems, Inc. | | | 2 | |
SECTOR ALLOCATION
| | | | |
| Sector | | Percent of
Net Assets | |
Information Technology | | | 42 | % |
Consumer Discretionary | | | 23 | |
Health Care | | | 11 | |
Financials | | | 8 | |
Industrials | | | 8 | |
Consumer Staples | | | 3 | |
Materials | | | 3 | |
Short Term Securities | | | 1 | |
Energy | | | 1 | |
Real Estate | | | 1 | |
Liabilities in Excess of Other Assets | | | (1 | ) |
FDP BlackRock CoreAlpha Bond Fund
PORTFOLIO COMPOSITION
| | | | |
| Asset Type | | Percent of
Total Investments (a) | |
Corporate Bonds | | | 47 | % |
U.S. Government Sponsored Agency Securities | | | 38 | |
Asset-Backed Securities | | | 13 | |
Non-Agency Mortgage-Backed Securities | | | 2 | |
Foreign Agency Obligations | | | 1 | |
Municipal Bonds | | | 1 | |
Floating Rate Loan Interests | | | — | (b) |
TBA Sale Commitments | | | (2 | ) |
| | (a) | Total investments exclude short-term securities. | |
| | (b) | Represents less than 1% of total investments. | |
Portfolio Information as of May 31, 2018 (continued)
FDP BlackRock Equity Dividend Fund
TEN LARGEST HOLDINGS
| | | | |
| Holding | | Percent of
Net Assets | |
JPMorgan Chase & Co. | | | 4 | % |
Bank of America Corp. | | | 4 | |
Pfizer, Inc. | | | 4 | |
Citigroup, Inc. | | | 3 | |
Wells Fargo & Co. | | | 3 | |
Oracle Corp. | | | 3 | |
Microsoft Corp. | | | 3 | |
Suncor Energy, Inc. | | | 2 | |
Anthem, Inc. | | | 2 | |
Verizon Communications, Inc. | | | 2 | |
SECTOR ALLOCATION
| | | | |
| Sector | | Percent of
Net Assets | |
Financials | | | 27 | % |
Health Care | | | 19 | |
Energy | | | 12 | |
Information Technology | | | 11 | |
Consumer Staples | | | 7 | |
Industrials | | | 6 | |
Utilities | | | 5 | |
Consumer Discretionary | | | 4 | |
Short Term Securities | | | 4 | |
Materials | | | 2 | |
Telecommunication Services | | | 3 | |
FDP BlackRock International Fund
TEN LARGEST HOLDINGS
| | | | |
| Holding | | Percent of
Net Assets | |
Sony Corp. | | | 5 | % |
Bayer AG, Registered Shares | | | 4 | |
Banco Bilbao Vizcaya Argentaria SA | | | 4 | |
Ping An Insurance Group Co of China LTD | | | 4 | |
ITV PLC | | | 4 | |
Engie SA | | | 4 | |
ICICI Bank Ltd. | | | 4 | |
BioMarin Pharmaceutical, Inc. | | | 3 | |
Net Ease, Inc. — ADR | | | 3 | |
Bank of China LTD., Class H | | | 3 | |
GEOGRAPHIC ALLOCATION
| | | | |
| Country | | Percent of
Net Assets | |
United Kingdom | | | 17 | % |
Japan | | | 14 | |
China | | | 14 | |
Spain | | | 10 | |
United States | | | 10 | |
Germany | | | 7 | |
France | | | 9 | |
India | | | 4 | |
Netherlands | | | 3 | |
Mexico | | | 2 | |
Italy | | | 2 | |
Switzerland | | | 2 | |
Portugal | | | 2 | |
Hong Kong | | | 2 | |
Singapore | | | 2 | |
| | |
| 14 | | 2018 BLACKROCK ANNUAL REPORTTO SHAREHOLDERS |
| | |
Schedule of Investments May 31, 2018 | | FDP BlackRock Capital Appreciation Fund (Percentages shown are based on Net Assets) |
| | | | | | | | |
| Security | | Shares | | | Value | |
| Common Stocks — 100.0% | |
|
| Aerospace & Defense — 1.0% | |
TransDigm Group, Inc. | | | 2,468 | | | $ | 824,584 | |
| | | | | | | | |
| Automobiles — 0.9% | |
Tesla, Inc.(a) | | | 2,388 | | | | 679,935 | |
| | | | | | | | |
| Banks — 3.0% | |
Bank of America Corp. | | | 54,773 | | | | 1,590,608 | |
First Republic Bank | | | 7,866 | | | | 783,454 | |
| | | | | | | | |
| | | | 2,374,062 | |
| Beverages — 2.8% | |
Constellation Brands, Inc., Class A | | | 7,064 | | | | 1,575,837 | |
Dr. Pepper Snapple Group, Inc. | | | 5,879 | | | | 701,365 | |
| | | | | | | | |
| | | | 2,277,202 | |
| Biotechnology — 0.8% | |
Vertex Pharmaceuticals, Inc.(a) | | | 4,414 | | | | 679,756 | |
| | | | | | | | |
| Capital Markets — 3.1% | |
E*Trade Financial Corp.(a) | | | 20,740 | | | | 1,313,879 | |
S&P Global, Inc. | | | 6,031 | | | | 1,191,122 | |
| | | | | | | | |
| | | | 2,505,001 | |
| Chemicals — 1.7% | |
DowDuPont, Inc. | | | 7,166 | | | | 459,412 | |
Sherwin-Williams Co. | | | 2,438 | | | | 924,612 | |
| | | | | | | | |
| | | | 1,384,024 | |
| Construction Materials — 1.2% | |
Vulcan Materials Co. | | | 7,366 | | | | 940,933 | |
| | | | | | | | |
| Diversified Financial Services — 1.5% | |
Berkshire Hathaway, Inc., Class B(a) | | | 6,456 | | | | 1,236,518 | |
| | | | | | | | |
| Diversified Telecommunication Services — 0.4% | |
Zayo Group Holdings, Inc.(a) | | | 9,052 | | | | 315,010 | |
| | | | | | | | |
| Electrical Equipment — 0.5% | |
Rockwell Automation, Inc. | | | 2,188 | | | | 383,797 | |
| | | | | | | | |
| Equity Real Estate Investment Trusts (REITs) — 1.1% | |
SBA Communications Corp.(a) | | | 5,734 | | | | 906,373 | |
| | | | | | | | |
| Food Products — 0.5% | |
Bunge Ltd. | | | 5,467 | | | | 380,230 | |
| | | | | | | | |
| Health Care Equipment & Supplies — 3.2% | |
Becton Dickinson & Co. | | | 5,116 | | | | 1,133,654 | |
Boston Scientific Corp.(a) | | | 47,297 | | | | 1,437,356 | |
| | | | | | | | |
| | | | 2,571,010 | |
| Health Care Providers & Services — 4.6% | |
UnitedHealth Group, Inc. | | | 15,210 | | | | 3,673,367 | |
| | | | | | | | |
| Hotels, Restaurants & Leisure — 1.0% | |
Domino’s Pizza, Inc. | | | 3,317 | | | | 834,159 | |
| | | | | | | | |
| Household Durables — 0.7% | |
Mohawk Industries, Inc.(a) | | | 2,861 | | | | 583,758 | |
| | | | | | | | |
| Industrial Conglomerates — 1.9% | |
Honeywell International, Inc. | | | 4,948 | | | | 731,859 | |
Roper Technologies, Inc. | | | 2,778 | | | | 766,144 | |
| | | | | | | | |
| | | | 1,498,003 | |
| Internet & Direct Marketing Retail — 15.4% | |
Amazon.com, Inc.(a) | | | 4,353 | | | | 7,093,736 | |
Booking Holdings, Inc.(a) | | | 1,235 | | | | 2,604,516 | |
Netflix, Inc.(a) | | | 7,629 | | | | 2,682,356 | |
| | | | | | | | |
| | | | 12,380,608 | |
| Internet Software & Services — 13.4% | |
Alibaba Group Holding Ltd. — ADR(a) | | | 3,092 | | | | 612,247 | |
Alphabet, Inc., Class A(a) | | | 3,653 | | | | 4,018,300 | |
| | | | | | | | |
| Security | | Shares | | | Value | |
| Internet Software & Services (continued) | |
Facebook, Inc., Class A(a) | | | 13,492 | | | $ | 2,587,496 | |
MercadoLibre, Inc. | | | 3,612 | | | | 1,050,478 | |
Tencent Holdings Ltd. | | | 49,600 | | | | 2,532,185 | |
| | | | | | | | |
| | | | 10,800,706 | |
| IT Services — 8.5% | |
Mastercard, Inc., Class A | | | 9,003 | | | | 1,711,650 | |
PayPal Holdings, Inc.(a) | | | 16,006 | | | | 1,313,613 | |
Visa, Inc., Class A | | | 29,378 | | | | 3,840,292 | |
| | | | | | | | |
| | | | 6,865,555 | |
| Life Sciences Tools & Services — 1.6% | |
Illumina, Inc.(a) | | | 4,709 | | | | 1,282,920 | |
| | | | | | | | |
| Machinery — 0.5% | |
Caterpillar, Inc. | | | 2,759 | | | | 419,120 | |
| | | | | | | | |
| Oil, Gas & Consumable Fuels — 0.5% | |
Pioneer Natural Resources Co. | | | 2,147 | | | | 414,586 | |
| | | | | | | | |
| Pharmaceuticals — 1.0% | |
Zoetis, Inc. | | | 9,119 | | | | 763,260 | |
| | | | | | | | |
| Professional Services — 2.7% | |
CoStar Group, Inc.(a) | | | 3,115 | | | | 1,187,500 | |
Equifax, Inc. | | | 8,304 | | | | 946,324 | |
| | | | | | | | |
| | | | 2,133,824 | |
| Road & Rail — 1.8% | |
Union Pacific Corp. | | | 10,317 | | | | 1,472,855 | |
| | | | | | | | |
| Semiconductors & Semiconductor Equipment — 5.3% | |
Applied Materials, Inc. | | | 15,007 | | | | 762,055 | |
ASML Holding NV — NY Shares | | | 6,091 | | | | 1,197,795 | |
Broadcom Inc. | | | 3,811 | | | | 960,639 | |
NVIDIA Corp. | | | 5,441 | | | | 1,372,166 | |
| | | | | | | | |
| | | | 4,292,655 | |
| Software — 14.6% | |
Activision Blizzard, Inc. | | | 9,196 | | | | 652,088 | |
Adobe Systems, Inc.(a) | | | 7,746 | | | | 1,930,923 | |
Autodesk, Inc.(a) | | | 9,338 | | | | 1,205,536 | |
Electronic Arts, Inc.(a) | | | 11,006 | | | | 1,440,795 | |
Microsoft Corp. | | | 51,165 | | | | 5,057,149 | |
salesforce.com, Inc.(a) | | | 7,634 | | | | 987,305 | |
Workday, Inc., Class A(a) | | | 3,459 | | | | 452,991 | |
| | | | | | | | |
| | | | 11,726,787 | |
| Specialty Retail — 3.5% | |
Home Depot, Inc. | | | 6,335 | | | | 1,181,794 | |
Ulta Salon Cosmetics & Fragrance, Inc.(a) | | | 6,693 | | | | 1,652,569 | |
| | | | | | | | |
| | | | 2,834,363 | |
| Textiles, Apparel & Luxury Goods — 1.3% | |
NIKE, Inc., Class B | | | 14,698 | | | | 1,055,316 | |
| | | | | | | | |
Total Long-Term Investments — 100.0%
(Cost — $61,210,695) | | | | 80,490,277 | |
| | | | | | | | |
|
| Short-Term Securities — 0.7% | |
BlackRock Liquidity Funds, T-Fund,
Institutional Class, 1.61%(b)(c) | | | 562,638 | | | | 562,638 | |
| | | | | | | | |
Total Short-Term Securities — 0.7%
(Cost — $562,638) | | | | 562,638 | |
| | | | | | | | |
| |
Total Investments — 100.7%
(Cost — $61,773,333) | | | | 81,052,915 | |
Liabilities in Excess of Other Assets — (0.7)% | | | | (571,741 | ) |
| | | | | | | | |
Net Assets — 100.0% | | | $ | 80,481,174 | |
| | | | | | | | |
| | | | |
| SCHEDULES OF INVESTMENTS | | | 15 | |
| | |
Schedule of Investments (continued) May 31, 2018 | | FDP BlackRock Capital Appreciation Fund |
| (a) | Non-income producing security. |
| (b) | Annualized 7-day yield as of period end. |
| (c) | During the year ended May 31, 2018, investments in issuers considered to be an affiliate of the Fund for purposes of Section 2(a)(3) of the Investment Company Act of 1940, as amended, were as follows: |
| | | | | | | | | | | | | | | | | | | | | | | | | | | | |
| Affiliated | | Shares
Held at
05/31/17 | | | Net
Activity | | | Shares
Held at
05/31/18 | | | Value at
05/31/18 | | | Income | | | Net
Realized
Gain (Loss) (a) | | | Change in
Unrealized
Appreciation
(Depreciation) | |
BlackRock Liquidity Funds, T-Fund, Institutional Class | | | — | | | | 562,638 | | | | 562,638 | | | $ | 562,638 | | | $ | 3,982 | | | $ | 4 | | | $ | — | |
| | | | | | | | | | | | | | | | | | | | | | | | | | | | |
| | (a) | Includes net capital gain distributions, if applicable. | |
For Fund compliance purposes, the Fund’s industry classifications refer to one or more of the industry sub-classifications used by one or more widely recognized market indexes or rating group indexes, and/or as defined by the investment adviser. These definitions may not apply for purposes of this report, which may combine such industry sub-classifications for reporting ease.
Fair Value Hierarchy as of Period End
Various inputs are used in determining the fair value of investments. For information about the Fund’s policy regarding valuation of investments, refer to the Notes to Financial Statements.
The following table summarizes the Fund’s investments categorized in the disclosure hierarchy:
| | | | | | | | | | | | | | | | |
| | | Level 1 | | | Level 2 | | | Level 3 | | | Total | |
Assets: | | | | | | | | | | | | | | | | |
Investments: | | | | | | | | | | | | | | | | |
Common Stocks: | | | | | | | | | | | | | | | | |
Aerospace & Defense | | $ | 824,584 | | | $ | — | | | $ | — | | | $ | 824,584 | |
Automobiles | | | 679,935 | | | | — | | | | — | | | | 679,935 | |
Banks | | | 2,374,062 | | | | — | | | | — | | | | 2,374,062 | |
Beverages | | | 2,277,202 | | | | — | | | | — | | | | 2,277,202 | |
Biotechnology | | | 679,756 | | | | — | | | | — | | | | 679,756 | |
Capital Markets | | | 2,505,001 | | | | — | | | | — | | | | 2,505,001 | |
Chemicals | | | 1,384,024 | | | | — | | | | — | | | | 1,384,024 | |
Construction Materials | | | 940,933 | | | | — | | | | — | | | | 940,933 | |
Diversified Financial Services | | | 1,236,518 | | | | — | | | | — | | | | 1,236,518 | |
Diversified Telecommunication Services | | | 315,010 | | | | — | | | | — | | | | 315,010 | |
Electrical Equipment | | | 383,797 | | | | — | | | | — | | | | 383,797 | |
Equity Real Estate Investment Trusts (REITs) | | | 906,373 | | | | — | | | | — | | | | 906,373 | |
Food Products | | | 380,230 | | | | — | | | | — | | | | 380,230 | |
Health Care Equipment & Supplies | | | 2,571,010 | | | | — | | | | — | | | | 2,571,010 | |
Health Care Providers & Services | | | 3,673,367 | | | | — | | | | — | | | | 3,673,367 | |
Hotels, Restaurants & Leisure | | | 834,159 | | | | — | | | | — | | | | 834,159 | |
Household Durables | | | 583,758 | | | | — | | | | — | | | | 583,758 | |
Industrial Conglomerates | | | 1,498,003 | | | | — | | | | — | | | | 1,498,003 | |
Internet & Direct Marketing Retail | | | 12,380,608 | | | | — | | | | — | | | | 12,380,608 | |
Internet Software & Services | | | 8,268,521 | | | | 2,532,185 | | | | — | | | | 10,800,706 | |
IT Services | | | 6,865,555 | | | | — | | | | — | | | | 6,865,555 | |
Life Sciences Tools & Services | | | 1,282,920 | | | | — | | | | — | | | | 1,282,920 | |
Machinery | | | 419,120 | | | | — | | | | — | | | | 419,120 | |
Oil, Gas & Consumable Fuels | | | 414,586 | | | | — | | | | — | | | | 414,586 | |
Pharmaceuticals | | | 763,260 | | | | — | | | | — | | | | 763,260 | |
Professional Services | | | 2,133,824 | | | | — | | | | — | | | | 2,133,824 | |
Road & Rail | | | 1,472,855 | | | | — | | | | — | | | | 1,472,855 | |
Semiconductors & Semiconductor Equipment | | | 4,292,655 | | | | — | | | | — | | | | 4,292,655 | |
Software | | | 11,726,787 | | | | — | | | | — | | | | 11,726,787 | |
Specialty Retail | | | 2,834,363 | | | | — | | | | — | | | | 2,834,363 | |
Textiles, Apparel & Luxury Goods | | | 1,055,316 | | | | — | | | | — | | | | 1,055,316 | |
Short-Term Securities: | | | | | | | | | | | | | | | | |
Money Market Funds | | | 562,638 | | | | — | | | | — | | | | 562,638 | |
| | | | | | | | | | | | | | | | |
| | $ | 78,520,730 | | | $ | 2,532,185 | | | $ | — | | | $ | 81,052,915 | |
| | | | | | | | | | | | | | | | |
During the year ended May 31, 2018, there were no transfers between levels.
See notes to financial statements.
| | |
| 16 | | 2018 BLACKROCK ANNUAL REPORTTO SHAREHOLDERS |
| | |
Schedule of Investments May 31, 2018 | | FDP BlackRock CoreAlpha Bond Fund (Percentages shown are based on Net Assets) |
| | | | | | | | | | | | |
Security | | Shares | | | Value | |
Common Stocks — 0.0% | |
| | |
| Diversified Financial Services — 0.0% | | | | | | | |
HoldCo 2 NPV, Class A(a)(b) | | | | | | | 1,643,590 | | | $ | — | |
HoldCo 2 NPV, Class B(a)(b) | | | | | | | 163,560 | | | | — | |
| | | | | | | | |
Total Common Stocks — 0.0%
(Cost $—) | | | | — | |
| | | | | | | | |
| | |
| | | Par
(000) | | | | |
| Asset-Backed Securities — 14.2% | |
AmeriCredit Automobile Receivables Trust, Series 2017-3, Class C, 2.69%, 06/19/23 | | | USD | | | | 450 | | | | 443,588 | |
Ameriquest Mortgage Securities, Inc., Series 2004-R4, Class M1, (1 mo. LIBOR US + 0.83%), 2.78%, 06/25/34(c) | | | | | | | 119 | | | | 119,506 | |
Argent Securities, Inc., Series 2005-W2, Class A2C, (1 mo. LIBOR US + 0.36%), 2.32%, 10/25/35(c) | | | | | | | 94 | | | | 93,654 | |
AVANT Loans Funding Trust(d): | | | | | | | | | | | | |
Series 2016-B, Class B, 7.80%, 09/15/20 | | | | | | | 40 | | | | 40,084 | |
Series 2018-A, Class A, 3.09%, 06/15/21 | | | | | | | 190 | | | | 189,995 | |
Chase Funding Mortgage Loan Asset-Backed Certificates, Series 2004-2, Class 2A2, (1 mo. LIBOR US + 0.50%), 2.46%, 02/26/35(c) | | | | | | | 119 | | | | 115,991 | |
Chase Issuance Trust, Series 2013-A6, Class A6, (1 mo. LIBOR + 0.42%), 2.34%, 07/15/20(c) | | | | | | | 880 | | | | 880,429 | |
Citibank Credit Card Issuance Trust, Series 2013-A7, Class A7, (1 mo. LIBOR + 0.43%), 2.36%, 09/10/20(c) | | | | | | | 560 | | | | 560,560 | |
CLUB Credit Trust, Series 2018-NP1, Class A, 2.99%, 05/15/24(d) | | | | | | | 338 | | | | 337,983 | |
Conseco Financial Corp., Series 1996-9, Class M1, 7.63%, 08/15/27(e) | | | | | | | 70 | | | | 74,870 | |
Countrywide Asset-Backed Certificates: | | | | | | | | | | | | |
Series 2004-1, Class M1, (1 mo. LIBOR US + 0.75%), 2.71%, 03/25/34(c) | | | | | | | 43 | | | | 43,602 | |
Series 2005-11, Class AF4, 4.48%, 03/25/34(e) | | | | | | | 700 | | | | 705,942 | |
Drive Auto Receivables Trust: | | | | | | | | | | | | |
Series 2016-CA, Class C, 3.02%, 11/15/21(d) | | | | | | | 800 | | | | 801,265 | |
Series 2017-1, Class C, 2.84%, 04/15/22 | | | | | | | 800 | | | | 799,323 | |
Series 2017-2, Class C, 2.75%, 09/15/23 | | | | | | | 590 | | | | 588,628 | |
Series 2017-3, Class C, 2.80%, 07/15/22 | | | | | | | 400 | | | | 399,018 | |
Series 2017-3, Class D, 3.53%, 12/15/23 | | | | | | | 500 | | | | 499,278 | |
Exeter Automobile Receivables Trust(d): | | | | | | | | | | | | |
Series 2015-1A, Class C, 4.10%, 12/15/20 | | | | | | | 300 | | | | 301,955 | |
Series 2017-2A, Class A, 2.11%, 06/15/21 | | | | | | | 251 | | | | 250,305 | |
GSAA Home Equity Trust, Series 2005-5, Class M3, (1 mo. LIBOR US + 0.95%), 2.90%, 02/25/35(c) | | | | | | | 134 | | | | 134,361 | |
Home Equity Mortgage Trust, Series 2004-4, Class M3, (1 mo. LIBOR US + 0.98%), 2.93%, 12/25/34(c) | | | | | | | 77 | | | | 76,974 | |
Invitation Homes Trust, Series 2015-SFR3, Class C, (1 mo. LIBOR + 2.00%), 3.92%, 08/17/32(c)(d) | | | | | | | 500 | | | | 500,651 | |
Marlette Funding Trust, Class A(d): | | | | | | | | | | | | |
Series 2017-1A, 2.83%, 03/15/24 | | | | | | | 225 | | | | 225,298 | |
Series 2017-2A, 2.39%, 07/15/24 | | | | | | | 340 | | | | 339,061 | |
Morgan Stanley ABS Capital I Trust, Inc., Series 2005-WMC1, Class M2, (1 mo. LIBOR US + 0.74%), 2.69%, 01/25/35(c) | | | | | | | 20 | | | | 20,106 | |
National Collegiate Student Loan Trust(c): | | | | | | | | | | | | |
Series 2006-2, Class A3, (1 mo. LIBOR US + 0.21%), 2.17%, 11/25/27 | | | | | | | 311 | | | | 309,231 | |
Series 2006-3, Class A4, (1 mo. LIBOR US + 0.27%), 2.23%, 03/26/29 | | | | | | | 528 | | | | 520,333 | |
Series 2007-1, Class A3, (1 mo. LIBOR US + 0.24%), 2.20%, 07/25/30 | | | | | | | 576 | | | | 566,330 | |
| | | | | | | | | | | | |
| Security | | Par
(000) | | | Value | |
| Asset-Backed Securities (continued) | |
Santander Drive Auto Receivables Trust: | | | | | | | | | | | | |
Series 2016-1, Class C, 3.09%, 04/15/22 | | | USD | | | | 750 | | | $ | 751,643 | |
Series 2017-2, Class B, 2.21%, 10/15/21 | | | | | | | 1,300 | | | | 1,293,336 | |
Series 2017-2, Class C, 2.79%, 08/15/22 | | | | | | | 730 | | | | 726,885 | |
SLM Private Education Loan Trust, Series 2011-B, Class A2, 3.74%, 02/15/29(d) | | | | | | | 192 | | | | 192,645 | |
SoFi Consumer Loan Program LLC, Class A(d): | | | | | | | | | | | | |
Series 2017-3, 2.77%, 05/25/26 | | | | | | | 371 | | | | 368,664 | |
Series 2017-4, 2.50%, 05/26/26 | | | | | | | 491 | | | | 484,460 | |
Trafigura Securitisation Finance PLC, Series 2017-1A, Class A1, (1 mo. LIBOR US + 0.85%), 2.77%, 12/15/20(c)(d) | | | | | | | 750 | | | | 753,758 | |
| | | | | | | | |
Total Asset-Backed Securities — 14.2%
(Cost — $14,502,834) | | | | 14,509,712 | |
| | | | | | | | |
|
Corporate Bonds — 50.8% | |
|
| Aerospace & Defense — 1.5% | |
General Dynamics Corp., 2.63%, 11/15/27 | | | | | | | 200 | | | | 184,919 | |
L-3 Communications Corp., 4.75%, 07/15/20 | | | | | | | 500 | | | | 517,330 | |
L3 Technologies, Inc., 3.85%, 06/15/23 | | | | | | | 195 | | | | 195,114 | |
Northrop Grumman Corp., 2.93%, 01/15/25 | | | | | | | 205 | | | | 195,320 | |
Rockwell Collins, Inc., 2.80%, 03/15/22 | | | | | | | 290 | | | | 283,595 | |
Spirit AeroSystems, Inc., 3.95%, 06/15/23 | | | | | | | 125 | | | | 126,260 | |
| | | | | | | | |
| | | | | | | | | | | 1,502,538 | |
| Auto Components — 0.7% | |
Fiat Chrysler Automobiles NV, 4.50%, 04/15/20 | | | | | | | 200 | | | | 201,060 | |
Ford Motor Credit Co. LLC, 4.14%, 02/15/23 | | | | | | | 200 | | | | 201,509 | |
Lear Corp., 3.80%, 09/15/27 | | | | | | | 300 | | | | 286,821 | |
| | | | | | | | |
| | | | | | | | | | | 689,390 | |
| Banks — 5.1% | |
Banco Santander SA, 3.50%, 04/11/22 | | | | | | | 400 | | | | 391,994 | |
Barclays Bank PLC, 2.65%, 01/11/21 | | | | | | | 200 | | | | 196,161 | |
Barclays PLC: | | | | | | | | | | | | |
4.34%, 05/16/24(e) | | | | | | | 200 | | | | 200,048 | |
4.34%, 01/10/28 | | | | | | | 200 | | | | 191,298 | |
Capital One Financial Corp.: | | | | | | | | | | | | |
2.50%, 05/12/20 | | | | | | | 125 | | | | 123,462 | |
2.40%, 10/30/20 | | | | | | | 175 | | | | 171,425 | |
3.45%, 04/30/21 | | | | | | | 106 | | | | 106,065 | |
Capital One NA/Mclean VA, 2.65%, 08/08/22 | | | | | | | 300 | | | | 288,608 | |
Discover Bank, 3.10%, 06/04/20 | | | | | | | 1,000 | | | | 996,495 | |
HSBC Bank USA NA, 4.88%, 08/24/20 | | | | | | | 400 | | | | 414,810 | |
HSBC Holdings PLC: | | | | | | | | | | | | |
3.60%, 05/25/23 | | | | | | | 800 | | | | 797,482 | |
4.30%, 03/08/26 | | | | | | | 400 | | | | 404,279 | |
Santander Holdings USA, Inc.: | | | | | | | | | | | | |
3.40%, 01/18/23 | | | | | | | 75 | | | | 72,880 | |
4.40%, 07/13/27 | | | | | | | 43 | | | | 41,522 | |
Synchrony Bank, 3.65%, 05/24/21 | | | | | | | 250 | | | | 250,773 | |
Westpac Banking Corp., 2.25%, 11/09/20(d) | | | | | | | 600 | | | | 590,298 | |
| | | | | | | | |
| | | | | | | | | | | 5,237,600 | |
| Beverages — 0.5% | |
Anheuser-Busch InBev Worldwide, Inc., 3.50%, 01/12/24 | | | | | | | 45 | | | | 44,992 | |
Constellation Brands, Inc., 3.70%, 12/06/26 | | | | | | | 300 | | | | 292,564 | |
Maple Escrow Subsidiary, Inc.(d): | | | | | | | | | | | | |
3.55%, 05/25/21 | | | | | | | 110 | | | | 110,499 | |
4.60%, 05/25/28 | | | | | | | 65 | | | | 65,521 | |
| | | | | | | | |
| | | | | | | | | | | 513,576 | |
| | | | |
| SCHEDULES OF INVESTMENTS | | | 17 | |
| | |
Schedule of Investments (continued) May 31, 2018 | | FDP BlackRock CoreAlpha Bond Fund (Percentages shown are based on Net Assets) |
| | | | | | | | | | | | |
| Security | | Par
(000) | | | Value | |
| Biotechnology — 0.8% | |
Baxalta, Inc., 3.60%, 06/23/22 | | | USD | | | | 400 | | | $ | 398,008 | |
Celgene Corp., 2.25%, 08/15/21 | | | | | | | 400 | | | | 386,773 | |
| | | | | | | | |
| | | | | | | | | | | 784,781 | |
| Capital Markets — 2.4% | |
Goldman Sachs Group, Inc.: | | | | | | | | | | | | |
3.75%, 05/22/25 | | | | | | | 300 | | | | 294,243 | |
3.27%, 09/29/25(e) | | | | | | | 200 | | | | 190,991 | |
3.75%, 02/25/26 | | | | | | | 700 | | | | 678,857 | |
Jefferies Group LLC, 4.85%, 01/15/27 | | | | | | | 329 | | | | 325,940 | |
Morgan Stanley: | | | | | | | | | | | | |
2.75%, 05/19/22 | | | | | | | 200 | | | | 195,008 | |
3.88%, 01/27/26 | | | | | | | 600 | | | | 594,423 | |
4.30%, 01/27/45 | | | | | | | 200 | | | | 192,420 | |
| | | | | | | | |
| | | | | | | | | | | 2,471,882 | |
| Chemicals — 1.0% | |
LYB International Finance BV, 4.00%, 07/15/23 | | | | | | | 700 | | | | 707,636 | |
Westlake Chemical Corp., 3.60%, 08/15/26 | | | | | | | 300 | | | | 287,526 | |
| | | | | | | | |
| | | | | | | | | | | 995,162 | |
| Commercial Services & Supplies — 0.5% | |
Aviation Capital Group Corp., 6.75%, 04/06/21(d) | | | | | | | 300 | | | | 327,093 | |
Park Aerospace Holdings Ltd., 5.50%, 02/15/24(d) | | | | | | | 200 | | | | 196,250 | |
| | | | | | | | |
| | | | | | | | | | | 523,343 | |
| Communications Equipment — 0.4% | |
CommScope Technologies LLC, 5.00%, 03/15/27(d) | | | | | | | 400 | | | | 374,000 | |
| | | | | | | | |
| Construction Materials — 0.2% | |
Allegion US Holding Co., Inc., 3.55%, 10/01/27 | | | | | | | 225 | | | | 209,498 | |
| | | | | | | | |
| Consumer Discretionary — 0.1% | |
Royal Caribbean Cruises Ltd., 2.65%, 11/28/20 | | | | | | | 65 | | | | 64,034 | |
| | | | | | | | |
| Consumer Finance — 3.1% | |
American Express Co., 2.50%, 08/01/22 | | | | | | | 250 | | | | 240,401 | |
Autodesk, Inc., 3.50%, 06/15/27 | | | | | | | 230 | | | | 217,814 | |
Ford Motor Credit Co. LLC: | | | | | | | | | | | | |
2.43%, 06/12/20 | | | | | | | 245 | | | | 241,102 | |
3.16%, 08/04/20 | | | | | | | 1,000 | | | | 996,240 | |
Synchrony Financial, 2.70%, 02/03/20 | | | | | | | 900 | | | | 893,123 | |
Total System Services, Inc., 4.00%, 06/01/23 | | | | | | | 200 | | | | 201,561 | |
Visa, Inc., 4.15%, 12/14/35 | | | | | | | 400 | | | | 419,624 | |
| | | | | | | | |
| | | | | | | | | | | 3,209,865 | |
| Containers & Packaging — 0.2% | |
Reynolds Group Issuer, Inc./Reynolds Group Issuer LLC/Reynolds Group Issuer Lu(d): | | | | | | | | | | | | |
5.13%, 07/15/23 | | | | | | | 100 | | | | 98,250 | |
7.00%, 07/15/24 | | | | | | | 100 | | | | 102,620 | |
| | | | | | | | |
| | | | | | | | | | | 200,870 | |
| Diversified Financial Services — 6.5% | |
AerCap Ireland Capital DAC/AerCap Global Aviation Trust, 3.30%, 01/23/23 | | | | | | | 200 | | | | 193,822 | |
AerCap Ireland Capital Ltd./AerCap Global Aviation Trust, 4.25%, 07/01/20 | | | | | | | 250 | | | | 254,329 | |
Bank of America Corp.(e): | | | | | | | | | | | | |
3.50%, 05/17/22 | | | | | | | 200 | | | | 200,504 | |
3.00%, 12/20/23 | | | | | | | 542 | | | | 527,154 | |
3.42%, 12/20/28 | | | | | | | 315 | | | | 297,599 | |
Citigroup, Inc., 4.08%, 04/23/29(e) | | | | | | | 300 | | | | 295,043 | |
Credit Suisse Group AG, 4.28%, 01/09/28(d) | | | | | | | 400 | | | | 389,783 | |
Deutsche Bank AG: | | | | | | | | | | | | |
3.15%, 01/22/21 | | | | | | | 200 | | | | 195,647 | |
3.30%, 11/16/22 | | | | | | | 300 | | | | 285,456 | |
| | | | | | | | | | | | |
| Security | | Par
(000) | | | Value | |
| Diversified Financial Services (continued) | |
General Motors Financial Co., Inc.: | | | | | | | | | | | | |
2.65%, 04/13/20 | | | USD | | | | 400 | | | $ | 396,074 | |
3.20%, 07/13/20 | | | | | | | 400 | | | | 399,145 | |
5.25%, 03/01/26 | | | | | | | 1,000 | | | | 1,047,484 | |
HSBC Holdings PLC, 3.03%, 11/22/23(e) | | | | | | | 200 | | | | 194,662 | |
JPMorgan Chase & Co.: | | | | | | | | | | | | |
(3 mo. LIBOR US + 1.16%), 3.22%, 03/01/25(f) | | | | | | | 300 | | | | 290,709 | |
3.30%, 04/01/26 | | | | | | | 1,300 | | | | 1,246,028 | |
Lloyds Banking Group PLC, 4.45%, 05/08/25 | | | | | | | 200 | | | | 202,486 | |
Mitsubishi UFJ Financial Group, Inc., 3.46%, 03/02/23 | | | | | | | 200 | | | | 199,008 | |
ORIX Corp., 2.90%, 07/18/22 | | | | | | | 80 | | | | 77,868 | |
| | | | | | | | |
| | | | | | | | | | | 6,692,801 | |
| Diversified Telecommunication Services — 0.7% | |
AT&T, Inc., 3.95%, 01/15/25 | | | | | | | 400 | | | | 394,648 | |
Verizon Communications, Inc., 4.50%, 08/10/33 | | | | | | | 300 | | | | 294,311 | |
| | | | | | | | |
| | | | | | | | | | | 688,959 | |
| Electric Utilities — 1.7% | |
Dominion Resources, Inc., 3.90%, 10/01/25 | | | | | | | 600 | | | | 593,429 | |
Eversource Energy, Series L, 2.90%, 10/01/24 | | | | | | | 170 | | | | 161,738 | |
Public Service Electric & Gas Co., 3.00%, 05/15/27 | | | | | | | 500 | | | | 478,139 | |
Southern Co., 3.25%, 07/01/26 | | | | | | | 500 | | | | 472,952 | |
Virginia Electric & Power Co., Series C, 2.75%, 03/15/23 | | | | | | | 60 | | | | 58,203 | |
| | | | | | | | |
| | | | | | | | | | | 1,764,461 | |
| Electronic Equipment, Instruments & Components — 0.1% | |
Arrow Electronics, Inc., 3.25%, 09/08/24 | | | | | | | 85 | | | | 79,940 | |
Tyco Electronics Group SA, 3.13%, 08/15/27 | | | | | | | 40 | | | | 37,612 | |
| | | | | | | | |
| | | | | | | | | | | 117,552 | |
| Energy Equipment & Services — 0.5% | |
CNOOC Finance 2013 Ltd., 3.00%, 05/09/23 | | | | | | | 500 | | | | 483,150 | |
| | | | | | | | |
| Food & Staples Retailing — 0.4% | |
Lamb Weston Holdings, Inc.(d): | | | | | | | | | | | | |
4.63%, 11/01/24 | | | | | | | 100 | | | | 98,250 | |
4.88%, 11/01/26 | | | | | | | 100 | | | | 99,125 | |
McCormick & Co., Inc., 2.70%, 08/15/22 | | | | | | | 180 | | | | 174,187 | |
| | | | | | | | |
| | | | | | | | | | | 371,562 | |
| Food Products — 0.5% | |
Kraft Heinz Foods Co., 3.50%, 07/15/22 | | | | | | | 500 | | | | 497,422 | |
| | | | | | | | |
| Health Care Equipment & Supplies — 1.7% | |
Baxter International, Inc., 2.60%, 08/15/26 | | | | | | | 250 | | | | 228,827 | |
Becton Dickinson & Co.: | | | | | | | | | | | | |
2.40%, 06/05/20 | | | | | | | 110 | | | | 108,127 | |
2.89%, 06/06/22 | | | | | | | 105 | | | | 102,060 | |
3.36%, 06/06/24 | | | | | | | 667 | | | | 644,671 | |
Boston Scientific Corp., 6.00%, 01/15/20 | | | | | | | 500 | | | | 522,306 | |
Stryker Corp., 3.50%, 03/15/26 | | | | | | | 100 | | | | 98,593 | |
Zimmer Biomet Holdings, Inc., 3.70%, 03/19/23 | | | | | | | 55 | | | | 54,816 | |
| | | | | | | | |
| | | | | | | | | | | 1,759,400 | |
| Health Care Providers & Services — 1.4% | |
Anthem, Inc.: | | | | | | | | | | | | |
3.35%, 12/01/24 | | | | | | | 285 | | | | 277,015 | |
4.10%, 03/01/28 | | | | | | | 75 | | | | 73,854 | |
HCA, Inc., 5.88%, 05/01/23 | | | | | | | 200 | | | | 208,000 | |
Humana, Inc., 2.90%, 12/15/22 | | | | | | | 155 | | | | 151,477 | |
MPH Acquisition Holdings LLC, 7.13%, 06/01/24(d) | | | | | | | 100 | | | | 103,750 | |
UnitedHealth Group, Inc., 3.10%, 03/15/26 | | | | | | | 600 | | | | 578,211 | |
| | | | | | | | |
| | | | | | | | | | | 1,392,307 | |
| | |
| 18 | | 2018 BLACKROCK ANNUAL REPORTTO SHAREHOLDERS |
| | |
Schedule of Investments (continued) May 31, 2018 | | FDP BlackRock CoreAlpha Bond Fund (Percentages shown are based on Net Assets) |
| | | | | | | | | | | | |
| Security | | Par
(000) | | | Value | |
| Hotels, Restaurants & Leisure — 2.1% | |
KFC Holding Co./Pizza Hut Holdings LLC/Taco Bell of America LLC, 5.00%, 06/01/24(d) | | | USD | | | | 200 | | | $ | 197,500 | |
McDonald’s Corp., 2.63%, 01/15/22 | | | | | | | 2,000 | | | | 1,975,137 | |
| | | | | | | | |
| | | | | | | | | | | 2,172,637 | |
| Household Durables — 0.3% | |
PulteGroup, Inc., 5.00%, 01/15/27 | | | | | | | 300 | | | | 286,500 | |
| | | | | | | | |
| Household Products — 0.2% | |
Procter & Gamble Co., 2.45%, 11/03/26 | | | | | | | 250 | | | | 232,664 | |
| | | | | | | | |
| Industrial Conglomerates — 0.2% | |
Vertiv Group Corp., 9.25%, 10/15/24(d) | | | | | | | 200 | | | | 196,000 | |
| | | | | | | | |
| Insurance — 0.7% | |
Aflac, Inc., 3.63%, 06/15/23 | | | | | | | 500 | | | | 505,285 | |
Willis North America, Inc., 3.60%, 05/15/24 | | | | | | | 200 | | | | 194,307 | |
| | | | | | | | |
| | | | | | | | | | | 699,592 | |
| Internet Software & Services — 0.7% | |
Baidu, Inc., 3.88%, 09/29/23 | | | | | | | 200 | | | | 200,025 | |
eBay, Inc., 2.75%, 01/30/23 | | | | | | | 300 | | | | 290,331 | |
Priceline Group, Inc., 3.55%, 03/15/28 | | | | | | | 200 | | | | 190,924 | |
| | | | | | | | |
| | | | | | | | | | | 681,280 | |
| IT Services — 1.3% | |
Alibaba Group Holding Ltd., 4.50%, 11/28/34 | | | | | | | 300 | | | | 304,619 | |
Dell International LLC/EMC Corp., 3.48%, 06/01/19(d) | | | | | | | 500 | | | | 501,998 | |
DXC Technology Co., 4.25%, 04/15/24 | | | | | | | 300 | | | | 302,364 | |
First Data Corp., 5.00%, 01/15/24(d) | | | | | | | 200 | | | | 199,800 | |
| | | | | | | | |
| | | | | | | | | | | 1,308,781 | |
| Machinery — 0.2% | |
CNH Industrial Capital LLC, 3.88%, 10/15/21 | | | | | | | 100 | | | | 99,875 | |
Terex Corp., 5.63%, 02/01/25(d) | | | | | | | 100 | | | | 99,250 | |
| | | | | | | | |
| | | | | | | | | | | 199,125 | |
| Media — 2.2% | |
21st Century Fox America, Inc., 6.15%, 02/15/41 | | | | | | | 50 | | | | 61,426 | |
Altice US Finance I Corp., 5.50%, 05/15/26(d) | | | | | | | 300 | | | | 288,090 | |
Charter Communications Operating LLC/Charter Communications Operating Capital, 3.58%, 07/23/20 | | | | | | | 1,000 | | | | 1,002,354 | |
Hughes Satellite Systems Corp., 6.63%, 08/01/26 | | | | | | | 200 | | | | 194,000 | |
Nexstar Broadcasting, Inc., 5.63%, 08/01/24(d) | | | | | | | 100 | | | | 97,815 | |
Time Warner, Inc., 4.05%, 12/15/23 | | | | | | | 600 | | | | 609,350 | |
| | | | | | | | |
| | | | | | | | | | | 2,253,035 | |
| Metals & Mining — 0.7% | |
ArcelorMittal, 5.75%, 03/01/21 | | | | | | | 200 | | | | 208,000 | |
Southern Copper Corp., 5.88%, 04/23/45 | | | | | | | 100 | | | | 108,168 | |
Vale Overseas Ltd., 6.25%, 08/10/26 | | | | | | | 400 | | | | 433,480 | |
| | | | | | | | |
| | | | | | | | | | | 749,648 | |
| Multi-Utilities — 0.4% | |
Dominion Energy, Inc., 2.58%, 07/01/20 | | | | | | | 40 | | | | 39,437 | |
Sempra Energy: | | | | | | | | | | | | |
2.90%, 02/01/23 | | | | | | | 30 | | | | 29,316 | |
3.75%, 11/15/25 | | | | | | | 400 | | | | 392,502 | |
| | | | | | | | |
| | | | | | | | | | | 461,255 | |
| Office Supplies & Equipment — 0.6% | |
VMware, Inc.: | | | | | | | | | | | | |
2.30%, 08/21/20 | | | | | | | 80 | | | | 78,203 | |
2.95%, 08/21/22 | | | | | | | 250 | | | | 240,639 | |
3.90%, 08/21/27 | | | | | | | 300 | | | | 281,062 | |
| | | | | | | | |
| | | | | | | | | | | 599,904 | |
| | | | | | | | | | | | |
| Security | | Par
(000) | | | Value | |
| Oil, Gas & Consumable Fuels — 2.7% | |
Andeavor, 3.80%, 04/01/28 | | | USD | | | | 145 | | | $ | 139,591 | |
Cheniere Corpus Christi Holdings LLC: | | | | | | | | | | | | |
7.00%, 06/30/24 | | | | | | | 100 | | | | 109,501 | |
5.88%, 03/31/25 | | | | | | | 100 | | | | 104,375 | |
Enable Oklahoma Intrastate Transmission LLC, 6.25%, 03/15/20(d) | | | | | | | 400 | | | | 418,178 | |
Energy Transfer Equity LP, 7.50%, 10/15/20 | | | | | | | 200 | | | | 215,500 | |
MPLX LP, 4.88%, 06/01/25 | | | | | | | 200 | | | | 206,958 | |
ONEOK, Inc., 4.00%, 07/13/27 | | | | | | | 225 | | | | 220,053 | |
Petroleos Mexicanos, 6.75%, 09/21/47 | | | | | | | 100 | | | | 94,490 | |
Phillips 66, 3.90%, 03/15/28 | | | | | | | 200 | | | | 198,928 | |
Sabine Pass Liquefaction LLC: | | | | | | | | | | | | |
5.75%, 05/15/24 | | | | | | | 200 | | | | 214,939 | |
5.88%, 06/30/26 | | | | | | | 50 | | | | 54,225 | |
Valero Energy Corp., 3.40%, 09/15/26 | | | | | | | 250 | | | | 239,974 | |
Williams Partners LP, 4.30%, 03/04/24 | | | | | | | 500 | | | | 504,605 | |
| | | | | | | | |
| | | | | | | | | | | 2,721,317 | |
| Paper & Forest Products — 0.1% | |
Masco Corp., 3.50%, 11/15/27 | | | | | | | 162 | | | | 152,384 | |
| | | | | | | | |
| Pharmaceuticals — 2.4% | |
Actavis Funding SCS, 3.00%, 03/12/20 | | | | | | | 400 | | | | 398,069 | |
CVS Health Corp., 4.10%, 03/25/25 | | | | | | | 285 | | | | 286,028 | |
Johnson & Johnson, 2.95%, 03/03/27 | | | | | | | 452 | | | | 437,583 | |
Novartis Capital Corp., 3.40%, 05/06/24 | | | | | | | 1,000 | | | | 1,002,434 | |
Pfizer, Inc., 4.13%, 12/15/46 | | | | | | | 100 | | | | 101,624 | |
Valeant Pharmaceuticals International, Inc., 6.13%, 04/15/25(d) | | | | | | | 200 | | | | 185,000 | |
| | | | | | | | |
| | | | | | | | | | | 2,410,738 | |
| Professional Services — 0.2% | |
Verisk Analytics, Inc., 4.00%, 06/15/25 | | | | | | | 200 | | | | 198,260 | |
| | | | | | | | |
| Real Estate Investment Trusts (REITs) — 0.5% | |
Hospitality Properties Trust, 4.50%, 06/15/23 | | | | | | | 135 | | | | 136,588 | |
MPT Operating Partnership LP/MPT Finance Corp., 5.25%, 08/01/26 | | | | | | | 100 | | | | 97,000 | |
Omega Healthcare Investors, Inc., 4.95%, 04/01/24 | | | | | | | 300 | | | | 305,395 | |
| | | | | | | | |
| | | | | | | | | | | 538,983 | |
| Semiconductors & Semiconductor Equipment — 1.8% | |
Broadcom Corp./Broadcom Cayman Finance Ltd., 3.63%, 01/15/24 | | | | | | | 700 | | | | 681,301 | |
Maxim Integrated Products, Inc., 3.38%, 03/15/23 | | | | | | | 1,000 | | | | 994,531 | |
NVIDIA Corp., 3.20%, 09/16/26 | | | | | | | 200 | | | | 193,138 | |
| | | | | | | | |
| | | | | | | | | | | 1,868,970 | |
| Software — 0.1% | |
CDK Global, Inc., 4.88%, 06/01/27 | | | | | | | 60 | | | | 56,550 | |
MSCI, Inc., 4.75%, 08/01/26(d) | | | | | | | 100 | | | | 97,750 | |
| | | | | | | | |
| | | | | | | | | | | 154,300 | |
| Technology Hardware, Storage & Peripherals — 1.0% | |
Hewlett Packard Enterprise Co., 3.60%, 10/15/20 | | | | | | | 1,000 | | | | 1,007,738 | |
| | | | | | | | |
| Tobacco — 0.3% | |
Altria Group, Inc., 3.88%, 09/16/46 | | | | | | | 100 | | | | 89,464 | |
BAT Capital Corp., 2.76%, 08/15/22(d) | | | | | | | 255 | | | | 246,019 | |
| | | | | | | | |
| | | | | | | | | | | 335,483 | |
| Wireless Telecommunication Services — 2.1% | |
American Tower Corp.: | | | | | | | | | | | | |
3.50%, 01/31/23 | | | | | | | 500 | | | | 495,627 | |
4.40%, 02/15/26 | | | | | | | 400 | | | | 399,797 | |
Crown Castle International Corp.: | | | | | | | | | | | | |
5.25%, 01/15/23 | | | | | | | 600 | | | | 631,836 | |
3.20%, 09/01/24 | | | | | | | 125 | | | | 119,343 | |
| | | | |
| SCHEDULES OF INVESTMENTS | | | 19 | |
| | |
Schedule of Investments (continued) May 31, 2018 | | FDP BlackRock CoreAlpha Bond Fund (Percentages shown are based on Net Assets) |
| | | | | | | | | | | | |
| Security | | Par
(000) | | | Value | |
| Wireless Telecommunication Services (continued) | |
Sprint Communications, Inc., 6.00%, 11/15/22 | | | USD | | | | 300 | | | $ | 298,500 | |
Vodafone Group PLC: | | | | | | | | | | | | |
3.75%, 01/16/24 | | | | | | | 115 | | | | 114,396 | |
4.13%, 05/30/25 | | | | | | | 80 | | | | 79,929 | |
| | | | | | | | |
| | | | | | | | | | | 2,139,428 | |
| | | | | | | | |
Total Corporate Bonds — 50.8%
(Cost — $52,923,956) | | | | 51,912,175 | |
| | | | | | | | |
|
Floating Rate Loan Interests — 0.0% | |
|
| Pharmaceuticals — 0.0% | |
Valeant Pharmaceuticals International, Inc., Series F4 Term Loan B, (1 mo. LIBOR + 3.50%), 5.42%, 04/01/22(g) | | | | | | | 16 | | | | 15,990 | |
| | | | | | | | |
Total Floating Rate Loan Interests — 0.0%
(Cost — $16,022) | | | | 15,990 | |
| | | | | | | | |
|
Foreign Agency Obligations — 0.6% | |
Mexico Government International Bond, 4.15%, 03/28/27 | | | | | | | 575 | | | | 564,938 | |
Uruguay Government International Bond, 4.98%, 04/20/55 | | | | | | | 80 | | | | 77,000 | |
| | | | | | | | |
Total Foreign Agency Obligations — 0.6%
(Cost — $657,874) | | | | 641,938 | |
| | | | | | | | |
|
| Municipal Bonds — 0.8% | |
Port Authority of New York & New Jersey, ARB, 192nd Series, 4.81%, 10/15/65 | | | | | | | 200 | | | | 230,066 | |
Port Authority of New York & New Jersey, RB, 4.82%, 06/01/45 | | | | | | | 200 | | | | 211,650 | |
University of California, Refunding RB, Series J, 4.13%, 05/15/45 | | | | | | | 350 | | | | 356,121 | |
| | | | | | | | |
Total Municipal Bonds — 0.8%
(Cost — $750,000) | | | | 797,837 | |
| | | | | | | | |
|
| Non-Agency Mortgage-Backed Securities — 2.1% | |
|
| Collateralized Mortgage Obligations — 0.5% | |
American Home Mortgage Investment Trust, Series 2004-3, Class 4A, (6 mo. LIBOR US + 1.50%), 3.89%, 10/25/34(c) | | | | | | | 83 | | | | 82,605 | |
Bear Stearns Alternative A Trust, Series 2004-13, Class A2, (1 mo. LIBOR US + 0.88%), 2.84%, 11/25/34(c) | | | | | | | 16 | | | | 16,043 | |
Citigroup Mortgage Loan Trust, Series 2013-A, Class A, 3.00%, 05/25/42(d)(e) | | | | | | | 40 | | | | 39,579 | |
Credit Suisse First Boston Mortgage Securities Corp., Series 2004-6, Class 3A1, 5.00%, 09/25/19 | | | | | | | 14 | | | | 14,035 | |
Credit Suisse Mortgage Capital Certificates, Series 2009-15R, Class 3A1, 3.97%, 03/26/36(d)(e) | | | | | | | 67 | | | | 66,710 | |
STACR Trust, Series 2018-HRP1, Class M2, 3.59%, 04/25/43(d)(e) | | | | | | | 250 | | | | 251,926 | |
Wells Fargo Mortgage-Backed Securities Trust: | | | | | | | | | | | | |
Series 2004-W, Class A9, 3.71%, 11/25/34(e) | | | | | | | 54 | | | | 55,318 | |
Series 2007-3, Class 3A1, 5.50%, 04/25/22 | | | | | | | 7 | | | | 6,696 | |
| | | | | | | | |
| | | | | | | | | | | 532,912 | |
| Commercial Mortgage-Backed Securities — 1.6% | |
Citigroup Commercial Mortgage Trust, Series 2006-C5, Class AJ, 5.48%, 10/15/49 | | | | | | | 71 | | | | 67,497 | |
Colony Multifamily Mortgage Trust, Series 2014-1, Class A, 2.54%, 04/20/50(d) | | | | | | | 70 | | | | 69,995 | |
| | | | | | | | | | | | |
| Security | | Par
(000) | | | Value | |
| Commercial Mortgage-Backed Securities (continued) | |
Core Industrial Trust, Series 2015-CALW, Class A, 3.04%, 02/10/34(d) | | | USD | | | | 400 | | | $ | 398,650 | |
Eleven Madison Avenue Mortgage Trust, Series 2015-11MD, Class A, 3.55%, 09/10/35(d)(e) | | | | | | | 150 | | | | 150,414 | |
GE Commercial Mortgage Corp., Series 2007-C1, Class AM, 5.61%, 12/10/49(e) | | | | | | | 164 | | | | 162,799 | |
Greenwich Capital Commercial Funding Corp. Commercial Mortgage Trust, Series 2006-GG7(e): | | | | | | | | | | | | |
Class AJ, 5.75%, 07/10/38 | | | | | | | 382 | | | | 350,671 | |
Class AM, 5.75%, 07/10/38 | | | | | | | 63 | | | | 62,857 | |
JPMBB Commercial Mortgage Securities Trust, Series 2014-C22, Class A4, 3.80%, 09/15/47 | | | | | | | 200 | | | | 203,623 | |
JPMorgan Chase Commercial Mortgage Securities Trust, Series 2006-CB16, Class B, 5.67%, 05/12/45(e) | | | | | | | 210 | | | | 19,662 | |
Wells Fargo Commercial Mortgage Trust, Series 2014-LC16, Class A5, 3.82%, 08/15/50 | | | | | | | 90 | | | | 91,766 | |
| | | | | | | | |
| | | | | | | | | | | 1,577,934 | |
| | | | | | | | |
Total Non-Agency Mortgage-Backed Securities — 2.1%
(Cost — $2,234,791) | | | | 2,110,846 | |
| | | | | | | | |
|
| U.S. Government Sponsored Agency Securities — 40.5% | |
|
| Collateralized Mortgage Obligations — 8.0% | |
Fannie Mae Connecticut Avenue Securities: | | | | | | | | | | | | |
Series 2017-C05, Class 1M2A, (1 mo. LIBOR US + 2.20%), 4.16%, 01/25/30(c) | | | | | | | 250 | | | | 257,578 | |
Series 2017-C07, Class 2M2A, 4.46%, 05/25/30(e) | | | | | | | 250 | | | | 257,225 | |
Series 2014-C03, Class 2M2, (1 mo. LIBOR US + 2.90%), 4.86%, 07/25/24(c) | | | | | | | 106 | | | | 113,461 | |
Series 2016-C05, Class 2M2, (1 mo. LIBOR US + 4.45%), 6.41%, 01/25/29(c) | | | | | | | 120 | | | | 134,480 | |
Series 2015-C01, Class 2M2, (1 mo. LIBOR US + 4.55%), 6.51%, 02/25/25(c) | | | | | | | 471 | | | | 511,490 | |
Series 2014-C04, Class 1M2, (1 mo. LIBOR US + 4.90%), 6.86%, 11/25/24(c) | | | | | | | 94 | | | | 107,262 | |
Series 2014-C04, Class 1M2, (1 mo. LIBOR US + 5.00%), 6.96%, 11/25/24(c) | | | | | | | 182 | | | | 204,799 | |
Freddie Mac Structured Agency Credit Risk Debt Notes: | | | | | | | | | | | | |
Series 2016-DNA1, Class M2, (1 mo. LIBOR US + 2.90%), 4.86%, 07/25/28(c) | | | | | | | 245 | | | | 251,229 | |
Series 2017-DNA3, Class M1, 2.71%, 03/25/30(e) | | | | | | | 335 | | | | 335,925 | |
Series 2016-HQA3, Class M2, (1 mo. LIBOR US + 1.35%), 3.31%, 03/25/29(c) | | | | | | | 250 | | | | 253,412 | |
Series 2014-DN1, Class M2, (1 mo. LIBOR US + 2.20%), 4.16%, 02/25/24(c) | | | | | | | 192 | | | | 197,711 | |
Series 2016-DNA2, Class M2, (1 mo. LIBOR US + 2.20%), 4.16%, 10/25/28(c) | | | | | | | 857 | | | | 867,552 | |
Series 2016-HQA2, Class M2, (1 mo. LIBOR US + 2.25%), 4.21%, 11/25/28(c) | | | | | | | 681 | | | | 697,858 | |
Series 2015-HQA1, Class M2, (1 mo. LIBOR US + 2.65%), 4.61%, 03/25/28(c) | | | | | | | 722 | | | | 735,382 | |
Series 2016-HQA1, Class M2, (1 mo. LIBOR US + 2.75%), 4.71%, 09/25/28(c) | | | | | | | 559 | | | | 572,104 | |
Series 2015-HQA2, Class M2, (1 mo. LIBOR US + 2.80%), 4.76%, 05/25/28(c) | | | | | | | 141 | | | | 145,419 | |
Series 2015-DNA3, Class M2, (1 mo. LIBOR US + 2.85%), 4.81%, 04/25/28(c) | | | | | | | 739 | | | | 766,848 | |
Series 2015-HQ1, Class M3, (1 mo. LIBOR US + 3.80%), 5.76%, 03/25/25(c) | | | | | | | 980 | | | | 1,052,711 | |
Series 2015-DN1, Class M3, (1 mo. LIBOR US + 4.15%), 6.11%, 01/25/25(c) | | | | | | | 448 | | | | 482,503 | |
Series 2014-DN4, Class M3, (1 mo. LIBOR US + 4.55%), 6.51%, 10/25/24(c) | | | | | | | 205 | | | | 228,028 | |
| | | | | | | | |
| | | | | | | | | | | 8,172,977 | |
| | |
| 20 | | 2018 BLACKROCK ANNUAL REPORTTO SHAREHOLDERS |
| | |
Schedule of Investments (continued) May 31, 2018 | | FDP BlackRock CoreAlpha Bond Fund (Percentages shown are based on Net Assets) |
| | | | | | | | | | | | |
| Security | | Par
(000) | | | Value | |
| Commercial Mortgage-Backed Securities — 0.8% | |
Freddie Mac Multifamily Structured Pass-Through Certificates, Class A2: | | | | | | | | | | | | |
Series K057, 2.57%, 07/25/26 | | | USD | | | | 250 | | | $ | 238,100 | |
Series K062, 3.41%, 12/25/26 | | | | | | | 520 | | | | 525,315 | |
| | | | | | | | |
| | | | | | | | | | | 763,415 | |
| Mortgage-Backed Securities — 31.7% | |
Fannie Mae Mortgage-Backed Securities: | | | | | | | | | | | | |
(11th District Cost of Funds + 1.25%), 2.03%, 09/01/34(c) | | | | | | | 201 | | | | 200,574 | |
(6 mo. LIBOR US + 1.10%), 2.82%, 05/01/33(c) | | | | | | | 10 | | | | 10,235 | |
3.00%, 06/01/48(h) | | | | | | | 1,350 | | | | 1,310,344 | |
(6 mo. LIBOR US + 1.36%), 3.30%, 10/01/32(c) | | | | | | | 33 | | | | 33,243 | |
(12 mo. LIBOR US + 1.36%), 3.47%, 04/01/35 (c) | | | | | | | 106 | | | | 110,017 | |
3.50%, 02/01/45-06/01/48(h) | | | | | | | 3,322 | | | | 3,321,810 | |
(1 year CMT + 1.94%), 3.81%, 04/01/35(c) | | | | | | | 17 | | | | 16,744 | |
4.00%, 01/01/48 - 06/01/48(h) | | | | | | | 474 | | | | 484,741 | |
4.50%, 02/01/48 - 06/01/48(h) | | | | | | | 5,846 | | | | 6,154,071 | |
5.00%, 08/01/35 - 06/01/48(h) | | | | | | | 2,314 | | | | 2,460,856 | |
5.50%, 11/01/34 - 01/01/47 | | | | | | | 1,155 | | | | 1,258,111 | |
6.00%, 06/01/21 - 09/01/38 | | | | | | | 335 | | | | 370,223 | |
6.50%, 01/01/36 | | | | | | | 26 | | | | 28,436 | |
Freddie Mac Mortgage-Backed Securities: | | | | | | | | | | | | |
(11th District Cost of Funds + 1.25%), 2.06%, 11/01/27(c) | | | | | | | 105 | | | | 104,540 | |
3.00%, 06/01/48(h) | | | | | | | 250 | | | | 242,540 | |
3.50%, 07/01/47 - 06/01/48(h) | | | | | | | 3,390 | | | | 3,382,882 | |
(12 mo. LIBOR US + 1.79%), 3.54%, 09/01/32(c) | | | | | | | 7 | | | | 7,207 | |
4.00%, 06/01/46 - 08/01/46 | | | | | | | 6,826 | | | | 7,007,561 | |
(1 year CMT + 2.34%), 4.20%, 04/01/32(c) | | | | | | | 36 | | | | 37,806 | |
4.50%, 09/01/20 - 06/01/48(h) | | | | | | | 455 | | | | 475,437 | |
5.00%, 07/01/23 - 04/01/48 | | | | | | | 907 | | | | 963,662 | |
5.50%, 11/01/37 | | | | | | | 1 | | | | 966 | |
6.00%, 10/01/21 - 04/01/38 | | | | | | | 40 | | | | 41,596 | |
6.50%, 09/01/38 | | | | | | | 2 | | | | 2,420 | |
Ginnie Mae Mortgage-Backed Securities: | | | | | | | | | | | | |
3.00%, 05/20/45 - 06/01/48(h) | | | | | | | 671 | | | | 658,687 | |
3.50%, 12/20/45 - 06/01/48(h) | | | | | | | 3,235 | | | | 3,257,332 | |
4.00%, 03/20/48 - 06/01/48(h) | | | | | | | 150 | | | | 153,960 | |
4.50%, 04/20/48 - 06/01/48(h) | | | | | | | 200 | | | | 208,990 | |
6.50%, 12/20/37 - 07/15/38 | | | | | | | 87 | | | | 99,189 | |
| | | | | | | | |
| | | | | | | | | | | 32,404,180 | |
| | | | | | | | |
Total U.S. Government Sponsored Agency Securities — 40.5%
(Cost — $41,425,275) | | | | 41,340,572 | |
| | | | | | | | |
Total Long-Term Investments — 109.0%
(Cost — $112,510,752) | | | | 111,329,070 | |
| | | | | | | | |
| | |
| | | Shares | | | | |
| Short-Term Securities — 1.5% | |
|
| Money Market Funds — 1.4% | |
BlackRock Liquidity Funds, T-Fund,
Institutional Class, 1.61%(i)(j) | | | | | | | 1,425,386 | | | | 1,425,386 | |
| | | | | | | | |
Total Money Market — 1.4%
(Cost — $1,425,386) | | | | 1,425,386 | |
| | | | | | | | |
| | | | | | | | | | | | |
| Security | | Par
(000) | | | Value | |
| Time Deposits — 0.1% | |
|
| Europe — 0.1% | |
Brown Brother Harriman & Co., (0.58%), 06/01/18 | | | EUR | | | | 109 | | | $ | 127,768 | |
| | | | | | | | |
Total Time Deposits — 0.1%
(Cost — $127,768) | | | | 127,768 | |
| | | | | | | | |
Total Short-Term Securities — 1.5%
(Cost — $1,553,154) | | | | 1,553,154 | |
| | | | | | | | |
Total Investments Before TBA Sale Commitments — 110.5%
(Cost — $114,063,906) | | | | 112,882,224 | |
| | | | | | | | |
|
TBA Sale Commitments — (2.1%) | |
|
| Mortgage-Backed Securities — (2.1%) | |
Fannie Mae Mortgage-Backed Securities(h): | | | | | | | | | | | | |
3.00%, 06/13/48 | | | USD | | | | 175 | | | | (169,859 | ) |
3.50%, 06/13/48 | | | | | | | 580 | | | | (578,641 | ) |
4.50%, 06/13/48 | | | | | | | 400 | | | | (417,734 | ) |
Freddie Mac Mortgage-Backed Securities, 3.50%, 06/13/48(h) | | | | | | | 460 | | | | (458,976 | ) |
Ginnie Mae Mortgage-Backed Securities, 3.50%, 06/21/48(h) | | | | | | | 522 | | | | (525,161 | ) |
| | | | | | | | |
Total TBA Sale Commitments — (2.1%)
(Proceeds — $2,136,666) | | | | (2,150,371 | ) |
| | | | | | | | |
| |
Total Investments, Net of TBA Sale Commitments — 108.4%
(Cost — $111,927,240) | | | | 110,731,853 | |
Liabilities in Excess of Other Assets — (8.4)% | | | | (8,562,183 | ) |
| | | | | | | | |
Net Assets — 100.0% | | | $ | 102,169,670 | |
| | | | | | | | |
| (a) | Security is valued using significant unobservable inputs and is classified as Level 3 in the fair value hierarchy. |
| (b) | Non-income producing security. |
| (c) | Floating rate security. Rate shown is the rate in effect as of period end. |
| (d) | Security exempt from registration pursuant to Rule 144A under the Securities Act of 1933, as amended. These securities may be resold in transactions exempt from registration to qualified institutional investors. |
| (e) | Variable or floating rate security, which interest rate adjusts periodically based on changes in current interest rates and prepayments on the underlying pool of assets. Rate shown is the rate in effect as of period end. |
| (f) | Variable rate security. Security may be issued at a fixed coupon rate, which converts to a variable rate at a specified date. Rate shown is the rate in effect as of period end. |
| (g) | Variable rate security. Rate shown is the rate in effect as of period end. |
| (h) | Represents or includes a TBA transaction. |
| (i) | Annualized 7-day yield as of period end. |
| | | | |
| SCHEDULES OF INVESTMENTS | | | 21 | |
| | |
Schedule of Investments (continued) May 31, 2018 | | FDP BlackRock CoreAlpha Bond Fund |
| (j) | During the year ended May 31, 2018, investments in issuers considered to be an affiliate of the Fund for purposes of Section 2(a)(3) of the Investment Company Act of 1940, as amended, were as follows: |
| | | | | | | | | | | | | | | | | | | | | | | | | | | | |
| Affiliated | | Shares
Held at
05/31/17 | | | Net
Activity | | | Shares
Held at
05/31/18 | | | Value at
05/31/18 | | | Income | | | Net
Realized
Gain (Loss) (a) | | | Change in
Unrealized
Appreciation
(Depreciation) | |
BlackRock Liquidity Funds, T-Fund, Institutional Class | | | 14,010,343 | | | | (12,584,957 | ) | | | 1,425,386 | | | $ | 1,425,386 | | | $ | 20,764 | | | $ | 4 | | | $ | — | |
| | | | | | | | | | | | | | | | | | | | | | | | | | | | |
| | (a) | Includes net capital gain distributions, if applicable. | |
For Fund compliance purposes, the Fund’s industry classifications refer to any one or more of the industry sub-classifications used by one or more widely recognized market indexes or rating group indexes, and/or as defined by the investment adviser. These definitions may not apply for purposes of this report, which may combine such industry sub-classifications for reporting ease.
Derivative Financial Instruments Outstanding as of Period End
Futures Contracts
| | | | | | | | | | | | | | | | |
| Description | | Number of
Contracts | | | Expiration
Date | | | Notional
Amount (000) | | | Value/
Unrealized
Appreciation
(Depreciation) | |
Long Contracts: | | | | | | | | | | | | | | | | |
10-Year U.S. Treasury Note | | | 4 | | | | 09/19/18 | | | $ | 482 | | | $ | 3,525 | |
Long U.S. Treasury Bond | | | 23 | | | | 09/19/18 | | | | 3,338 | | | | (3,315 | ) |
Ultra Long U.S. Treasury Bond | | | 59 | | | | 09/19/18 | | | | 9,411 | | | | (21,999 | ) |
2-Year U.S. Treasury Note | | | 1 | | | | 09/28/18 | | | | 212 | | | | (387 | ) |
5-Year U.S. Treasury Note | | | 29 | | | | 09/28/18 | | | | 3,303 | | | | (9,101 | ) |
| | | | | | | | | | | | | | | | |
| | | | | | | | | | | | | | | (31,277 | ) |
Short Contracts: | | | | | | | | | | | | | | | | |
10-Year U.S. Ultra Long Treasury Note | | | 7 | | | | 09/19/18 | | | | 898 | | | | 526 | |
| | | | | | | | | | | | | | | | |
| | | | | | | | | | | | | | $ | (30,751 | ) |
| | | | | | | | | | | | | | | | |
OTC Inflation Swaps
| | | | | | | | | | | | | | | | | | | | | | | | | | | | | | | | | | |
| Paid by the Fund | | Received by the Fund | | Counterparty | | Termination
Date | | | Notional
Amount (000) | | | Value | | | Upfront
Premium
Paid
(Received) | | | Unrealized
Appreciation
(Depreciation) | |
| Reference/Rate | | Frequency | | Reference/Rate | | | Frequency | | | | | | |
| 2.03% | | At Termination | |
| U.S. CPI Urban
Consumers NAS |
| | At Termination | | Barclays Bank PLC | | | 12/19/22 | | | | USD | | | | 2,540 | | | $ | 30,282 | | | $ | — | | | $ | 30,282 | |
| 2.14 | | At Termination | |
| U.S. CPI Urban
Consumers NAS |
| | At Termination | | Citibank N.A. | | | 02/15/23 | | | | USD | | | | 2,340 | | | | 14,989 | | | | — | | | | 14,989 | |
| | | | | | | | | | | | | | | | | | | | | | | | | | | | | | | | | | |
| | | | | | | | | | | | | | | | | | | | | | | | $ | 45,271 | | | $ | — | | | $ | 45,271 | |
| | | | | | | | | | | | | | | | | | | | | | | | | | | | | | | | | | |
Balances Reported in the Statements of Assets and Liabilities for OTC Swaps
| | | | | | | | | | | | | | | | | | | | |
| | | Swap
Premiums
Paid | | | Swap
Premiums
Received | | | Unrealized
Appreciation | | | Unrealized
Depreciation | | | Value | |
OTC Swaps | | $ | — | | | $ | — | | | $ | 45,271 | | | $ | — | | | $ | — | |
| | |
| 22 | | 2018 BLACKROCK ANNUAL REPORTTO SHAREHOLDERS |
| | |
Schedule of Investments (continued) May 31, 2018 | | FDP BlackRock CoreAlpha Bond Fund |
Derivative Financial Instruments Categorized by Risk Exposure
As of period end, the fair values of derivative financial instruments located in the Statements of Assets and Liabilities were as follows:
| | | | | | | | | | | | | | | | | | | | | | | | | | | | |
| | | Commodity
Contracts | | | Credit
Contracts | | | Equity
Contracts | | | Foreign
Currency
Exchange
Contracts | | | Interest
Rate
Contracts | | | Other
Contracts | | | Total | |
Assets — Derivative Financial Instruments | | | | | | | | | | | | | | | | | | | | | | | | | | | | |
Futures contracts | | | | | | | | | | | | | | | | | | | | | | | | | | | | |
Net unrealized appreciation(a) | | $ | — | | | $ | — | | | $ | — | | | $ | — | | | $ | 4,051 | | | $ | — | | | $ | 4,051 | |
Swaps — OTC | | | | | | | | | | | | | | | | | | | | | | | | | | | | |
Unrealized appreciation on OTC swaps; Swap premiums paid | | | — | | | | — | | | | — | | | | — | | | | — | | | | 45,271 | | | | 45,271 | |
| | | | | | | | | | | | | | | | | | | | | | | | | | | | |
| | $ | — | | | $ | — | | | $ | — | | | $ | — | | | $ | 4,051 | | | $ | 45,271 | | | $ | 49,322 | |
| | | | | | | | | | | | | | | | | | | | | | | | | | | | |
Liabilities — Derivative Financial Instruments | | | | | | | | | | | | | | | | | | | | | | | | | | | | |
Futures contracts | | | | | | | | | | | | | | | | | | | | | | | | | | | | |
Net unrealized depreciation(a) | | $ | — | | | $ | — | | | $ | — | | | $ | — | | | $ | 34,802 | | | $ | — | | | $ | 34,802 | |
| | | | | | | | | | | | | | | | | | | | | | | | | | | | |
| | (a) | Includes cumulative appreciation (depreciation) on futures contracts, as reported in the Schedule of Investments. Only current day’s variation margin is reported within the Statements of Assets and Liabilities. | |
For the year ended May 31, 2018, the effect of derivative financial instruments in the Statements of Operations was as follows:
| | | | | | | | | | | | | | | | | | | | | | | | | | | | |
| | | Commodity
Contracts | | | Credit
Contracts | | | Equity
Contracts | | | Foreign
Currency
Exchange
Contracts | | | Interest
Rate
Contracts | | | Other
Contracts | | | Total | |
Net Realized Gain (Loss) from: | | | | | | | | | | | | | | | | | | | | | | | | | | | | |
Futures contracts | | $ | — | | | $ | — | | | $ | — | | | $ | — | | | $ | (270,433 | ) | | $ | — | | | $ | (270,433 | ) |
| | | | | | | | | | | | | | | | | | | | | | | | | | | | |
| Net Change in Unrealized Appreciation (Depreciation) on: | | | | | | | | | | | | | | | | | | | | | |
Futures contracts | | $ | — | | | $ | — | | | $ | — | | | $ | — | | | $ | (36,678 | ) | | $ | — | | | $ | (36,678 | ) |
Swaps | | | — | | | | — | | | | — | | | | — | | | | — | | | | 45,271 | | | | 45,271 | |
| | | | | | | | | | | | | | | | | | | | | | | | | | | | |
| | $ | — | | | $ | — | | | $ | — | | | $ | — | | | $ | (36,678 | ) | | $ | 45,271 | | | $ | 8,593 | |
| | | | | | | | | | | | | | | | | | | | | | | | | | | | |
Average Quarterly Balances of Outstanding Derivative Financial Instruments
| | | | |
Futures contracts: | | | | |
Average notional value of contracts — long | | $ | 18,727,643 | |
Average notional value of contracts — short | | $ | 2,898,051 | |
Inflation Swaps | | | | |
Average notional amount — pays | | $ | 2,440,000 | |
For more information about the Fund’s investment risks regarding derivative financial instruments, refer to the Notes to Financial Statements.
Derivative Financial Instruments — Offsetting as of Period End
| | | | | | | | |
| | | Assets | | | Liabilities | |
Futures contracts | | $ | 61,172 | | | $ | 3,545 | |
Swaps — OTC(a) | | | 45,271 | | | | — | |
| | | | | | | | |
Total derivative assets and liabilities in the Statements of Assets and Liabilities | | $ | 106,443 | | | $ | 3,545 | |
Derivatives not subject to a Master Netting Agreement or similar agreement (“MNA”) | | | (61,172 | ) | | | (3,545 | ) |
| | | | | | | | |
Total derivative assets and liabilities subject to an MNA | | $ | 45,271 | | | $ | — | |
| | | | | | | | |
| | (a) | Includes unrealized appreciation (depreciation) on OTC swaps and swap premiums (paid/received) in the Statements of Assets and Liabilities. | |
The following table presents the Fund’s derivative assets (and liabilities) by counterparty net of amounts available for offset under a Master Netting Agreement (“MNA”) and net of the related collateral received (and pledged) by the Fund:
| | | | | | | | | | | | | | | | | | | | |
| Counterparty | | Derivative
Assets
Subject to
an MNA by
Counterparty | | | Derivatives
Available
for Offset | | | Non-cash
Collateral
Received | | | Cash
Collateral
Received | | | Net Amount
of Derivative
Assets (a) | |
Barclays Bank PLC | | $ | 30,282 | | | $ | — | | | $ | — | | | $ | — | | | $ | 30,282 | |
Citibank N.A. | | | 14,989 | | | | — | | | | — | | | | — | | | | 14,989 | |
| | | | | | | | | | | | | | | | | | | | |
| | $ | 45,271 | | | $ | — | | | $ | — | | | $ | — | | | $ | 45,271 | |
| | | | | | | | | | | | | | | | | | | | |
| | (a) | Net amount represents the net amount receivable from the counterparty in the event of default. | |
| | | | |
| SCHEDULES OF INVESTMENTS | | | 23 | |
| | |
Schedule of Investments (continued) May 31, 2018 | | FDP BlackRock CoreAlpha Bond Fund |
Fair Value Hierarchy as of Period End
Various inputs are used in determining the fair value of investments and derivative financial instruments. For information about the Fund’s policy regarding valuation of investments and derivative financial instruments, refer to the Notes to Financial Statements.
The following tables summarize the Fund’s investments and derivative financial instruments categorized in the disclosure hierarchy:
| | | | | | | | | | | | | | | | |
| | | Level 1 | | | Level 2 | | | Level 3 | | | Total | |
Assets: | | | | | | | | | | | | | | | | |
Investments: | | | | | | | | | | | | | | | | |
Asset-Backed Securities | | $ | — | | | $ | 14,509,712 | | | $ | — | | | $ | 14,509,712 | |
Corporate Bonds | | | — | | | | 51,912,175 | | | | — | | | | 51,912,175 | |
Floating Rate Loan Interests | | | — | | | | 15,990 | | | | — | | | | 15,990 | |
Foreign Agency Obligations | | | — | | | | 641,938 | | | | — | | | | 641,938 | |
Municipal Bonds | | | — | | | | 797,837 | | | | — | | | | 797,837 | |
Non-Agency Mortgage-Backed Securities | | | — | | | | 2,110,846 | | | | — | | | | 2,110,846 | |
U.S. Government Sponsored Agency Securities | | | — | | | | 41,340,572 | | | | — | | | | 41,340,572 | |
Short-Term Securities: | | | | | | | | | | | | | | | | |
Money Market Funds | | | 1,425,386 | | | | — | | | | — | | | | 1,425,386 | |
Time Deposits | | | — | | | | 127,768 | | | | — | | | | 127,768 | |
Liabilities: | | | | | | | | | | | | | | | | |
Investments: | | | | | | | | | | | | | | | | |
TBA Sale Commitments | | | — | | | | (2,150,371 | ) | | | — | | | | (2,150,371 | ) |
| | | | | | | | | | | | | | | | |
| | $ | 1,425,386 | | | $ | 109,306,467 | | | $ | — | | | $ | 110,731,853 | |
| | | | | | | | | | | | | | | | |
Derivative Financial Instruments(a) | | | | | | | | | | | | | | | | |
Assets: | | | | | | | | | | | | | | | | |
Interest rate contracts | | $ | 4,051 | | | $ | — | | | $ | — | | | $ | 4,051 | |
Other Contracts | | | — | | | | 45,271 | | | | — | | | | 45,271 | |
Liability: | | | | | | | | | | | | | | | | |
Interest rate contracts | | | (34,802 | ) | | | — | | | | — | | | | (34,802 | ) |
| | | | | | | | | | | | | | | | |
| | $ | (30,751 | ) | | $ | 45,271 | | | $ | — | | | $ | 14,520 | |
| | | | | | | | | | | | | | | | |
| | (a) | Derivative financial instruments are swaps and futures contracts. Swaps and futures contracts which are valued at the unrealized appreciation (depreciation) on the instrument. | |
During the year ended May 31, 2018, there were no transfers between levels.
See notes to financial statements.
| | |
| 24 | | 2018 BLACKROCK ANNUAL REPORTTO SHAREHOLDERS |
| | |
Schedule of Investments May 31, 2018 | | FDP BlackRock Equity Dividend Fund (Percentages shown are based on Net Assets) |
| | | | | | | | | | | | |
| Security | | Shares | | | Value | |
| Common Stocks — 95.6% | |
|
| Aerospace & Defense — 1.2% | |
Lockheed Martin Corp. | | | | | | | 842 | | | $ | 264,842 | |
Northrop Grumman Corp. | | | | | | | 1,847 | | | | 604,431 | |
| | | | | | | | | | | | |
| | | | 869,273 | |
| Banks — 17.0% | |
Bank of America Corp. | | | | | | | 100,408 | | | | 2,915,848 | |
Citigroup, Inc. | | | | | | | 36,152 | | | | 2,410,977 | |
JPMorgan Chase & Co. | | | | | | | 27,991 | | | | 2,995,317 | |
KeyCorp | | | | | | | 17,531 | | | | 340,803 | |
SunTrust Banks, Inc. | | | | | | | 11,791 | | | | 796,010 | |
U.S. Bancorp | | | | | | | 18,769 | | | | 938,262 | |
Wells Fargo & Co. | | | | | | | 39,395 | | | | 2,126,936 | |
| | | | | | | | | | | | |
| | | | 12,524,153 | |
| Beverages — 2.3% | |
Diageo PLC | | | | | | | 27,006 | | | | 992,288 | |
Dr. Pepper Snapple Group, Inc. | | | | | | | 3,174 | | | | 378,658 | |
PepsiCo, Inc. | | | | | | | 3,360 | | | | 336,840 | |
| | | | | | | | | | | | |
| | | | 1,707,786 | |
| Capital Markets — 3.3% | |
Charles Schwab Corp. | | | | | | | 6,584 | | | | 366,202 | |
Goldman Sachs Group, Inc. | | | | | | | 3,822 | | | | 863,313 | |
Morgan Stanley | | | | | | | 24,547 | | | | 1,230,787 | |
| | | | | | | | | | | | |
| | | | 2,460,302 | |
| Chemicals — 1.1% | |
DowDuPont, Inc. | | | | | | | 12,761 | | | | 818,108 | |
| | | | | | | | | | | | |
| Communications Equipment — 1.4% | |
Cisco Systems, Inc. | | | | | | | 8,735 | | | | 373,072 | |
Motorola Solutions, Inc. | | | | | | | 6,004 | | | | 644,469 | |
| | | | | | | | | | | | |
| | | | 1,017,541 | |
| Construction Materials — 0.8% | |
CRH PLC | | | | | | | 15,182 | | | | 560,579 | |
| | | | | | | | | | | | |
| Containers & Packaging — 0.3% | |
International Paper Co. | | | | | | | 4,669 | | | | 249,791 | |
| | | | | | | | | | | | |
| Diversified Financial Services — 0.3% | |
AXA Equitable Holdings, Inc.(a) | | | | | | | 11,093 | | | | 236,946 | |
| | | | | | | | | | | | |
| Diversified Telecommunication Services — 2.5% | |
BCE, Inc. | | | | | | | 4,381 | | | | 182,556 | |
Verizon Communications, Inc. | | | | | | | 35,353 | | | | 1,685,278 | |
| | | | | | | | | | | | |
| | | | 1,867,834 | |
| Electrical Equipment — 0.2% | |
nVent Electric PLC(a) | | | | | | | 4,450 | | | | 120,506 | |
| | | | | | | | | | | | |
| Electric Utilities — 3.6% | |
Edison International | | | | | | | 3,215 | | | | 199,844 | |
FirstEnergy Corp. | | | | | | | 25,225 | | | | 868,245 | |
NextEra Energy, Inc. | | | | | | | 4,719 | | | | 782,457 | |
PG&E Corp. | | | | | | | 18,927 | | | | 820,107 | |
| | | | | | | | | | | | |
| | | | 2,670,653 | |
| Electronic Equipment, Instruments & Components — 0.7% | |
CDW Corp. | | | | | | | 6,537 | | | | 523,287 | |
| | | | | | | | | | | | |
| Food & Staples Retailing — 0.6% | |
Kroger Co. | | | | | | | 17,730 | | | | 431,371 | |
| | | | | | | | | | | | |
| Food Products — 1.3% | |
Danone SA | | | | | | | 2,367 | | | | 181,257 | |
General Mills, Inc. | | | | | | | 7,623 | | | | 322,377 | |
Kellogg Co. | | | | | | | 6,463 | | | | 416,153 | |
| | | | | | | | | | | | |
| | | | 919,787 | |
| Health Care Equipment & Supplies — 3.0% | |
Koninklijke Philips NV | | | | | | | 28,075 | | | | 1,156,177 | |
Medtronic PLC | | | | | | | 11,793 | | | | 1,017,972 | |
| | | | | | | | | | | | |
| | | | 2,174,149 | |
| | | | | | | | | | | | |
| Security | | Shares | | | Value | |
| Health Care Providers & Services — 7.9% | |
Aetna, Inc. | | | | | | | 6,554 | | | $ | 1,154,356 | |
Anthem, Inc. | | | | | | | 7,758 | | | | 1,717,776 | |
Cardinal Health, Inc. | | | | | | | 6,641 | | | | 345,930 | |
CVS Health Corp. | | | | | | | 7,772 | | | | 492,667 | |
Humana, Inc. | | | | | | | 1,112 | | | | 323,570 | |
McKesson Corp. | | | | | | | 4,583 | | | | 650,511 | |
Quest Diagnostics, Inc. | | | | | | | 3,100 | | | | 330,243 | |
UnitedHealth Group, Inc. | | | | | | | 3,080 | | | | 743,851 | |
| | | | | | | | | | | | |
| | | | 5,758,904 | |
| Household Products — 0.7% | |
Procter & Gamble Co. | | | | | | | 7,368 | | | | 539,117 | |
| | | | | | | | | | | | |
| Industrial Conglomerates — 2.9% | |
3M Co. | | | | | | | 1,810 | | | | 356,987 | |
General Electric Co. | | | | | | | 61,941 | | | | 872,129 | |
Honeywell International, Inc. | | | | | | | 5,944 | | | | 879,177 | |
| | | | | | | | | | | | |
| | | | 2,108,293 | |
| Insurance — 5.8% | |
American International Group, Inc. | | | | | | | 25,418 | | | | 1,341,816 | |
Brighthouse Financial, Inc.(a) | | | | | | | 1,591 | | | | 74,952 | |
Lincoln National Corp. | | | | | | | 1,874 | | | | 124,227 | |
Marsh & McLennan Cos., Inc. | | | | | | | 6,711 | | | | 539,363 | |
MetLife, Inc. | | | | | | | 23,541 | | | | 1,082,651 | |
Prudential Financial, Inc. | | | | | | | 2,695 | | | | 260,984 | |
Travelers Cos., Inc. | | | | | | | 6,342 | | | | 815,074 | |
| | | | | | | | | | | | |
| | | | 4,239,067 | |
| IT Services — 0.3% | |
Cognizant Technology Solutions Corp., Class A | | | | | | | 3,352 | | | | 252,573 | |
| | | | | | | | | | | | |
| Leisure Products — 0.5% | |
Mattel, Inc. | | | | | | | 22,626 | | | | 351,156 | |
| | | | | | | | | | | | |
| Machinery — 0.3% | |
Pentair PLC | | | | | | | 4,440 | | | | 193,762 | |
| | | | | | | | | | | | |
| Media — 2.4% | |
Comcast Corp., Class A | | | | | | | 33,846 | | | | 1,055,318 | |
Interpublic Group of Cos., Inc. | | | | | | | 16,013 | | | | 361,894 | |
Publicis Groupe SA | | | | | | | 1,675 | | | | 116,909 | |
Time Warner, Inc. | | | | | | | 2,316 | | | | 218,074 | |
| | | | | | | | | | | | |
| | | | 1,752,195 | |
| Multi-Utilities — 1.2% | |
Public Service Enterprise Group, Inc. | | | | | | | 16,074 | | | | 851,600 | |
| | | | | | | | | | | | |
| Multiline Retail — 0.3% | |
Dollar General Corp. | | | | | | | 2,210 | | | | 193,331 | |
| | | | | | | | | | | | |
| Oil, Gas & Consumable Fuels — 12.4% | |
Anadarko Petroleum Corp. | | | | | | | 2,120 | | | | 147,976 | |
BP PLC | | | | | | | 109,499 | | | | 837,471 | |
Chevron Corp. | | | | | | | 4,771 | | | | 593,035 | |
Devon Energy Corp. | | | | | | | 21,867 | | | | 909,011 | |
Enterprise Products Partners LP | | | | | | | 15,743 | | | | 454,973 | |
Hess Corp. | | | | | | | 14,726 | | | | 889,745 | |
Marathon Oil Corp. | | | | | | | 6,970 | | | | 149,367 | |
Marathon Petroleum Corp. | | | | | | | 7,936 | | | | 627,182 | |
ONEOK, Inc. | | | | | | | 2,703 | | | | 184,236 | |
Royal Dutch Shell PLC — ADR, Class A | | | | | | | 18,006 | | | | 1,252,858 | |
Suncor Energy, Inc. | | | | | | | 45,779 | | | | 1,821,089 | |
TOTAL SA — ADR | | | | | | | 16,368 | | | | 992,719 | |
Williams Cos., Inc. | | | | | | | 8,282 | | | | 222,455 | |
| | | | | | | | | | | | |
| | | | 9,082,117 | |
| Personal Products — 0.7% | |
Unilever NV — NY Shares | | | | | | | 9,690 | | | | 540,411 | |
| | | | | | | | | | | | |
| Pharmaceuticals — 8.3% | |
AstraZeneca PLC | | | | | | | 18,965 | | | | 1,383,609 | |
Bayer AG, Registered Shares | | | | | | | 3,175 | | | | 378,948 | |
Merck & Co., Inc. | | | | | | | 18,721 | | | | 1,114,461 | |
| | | | |
| SCHEDULES OF INVESTMENTS | | | 25 | |
| | |
Schedule of Investments (continued) May 31, 2018 | | FDP BlackRock Equity Dividend Fund (Percentages shown are based on Net Assets) |
| | | | | | | | | | | | |
| Security | | Shares | | | Value | |
| Pharmaceuticals (continued) | |
Novo Nordisk A/S — ADR | | | | | | | 11,655 | | | $ | 554,079 | |
Pfizer, Inc. | | | | | | | 74,868 | | | | 2,690,007 | |
| | | | | | | | | | | | |
| | | | 6,121,104 | |
| Professional Services — 1.2% | |
Experian PLC | | | | | | | 21,755 | | | | 532,942 | |
Nielsen Holdings PLC | | | | | | | 12,455 | | | | 375,767 | |
| | | | | | | | | | | | |
| | | | 908,709 | |
| Road & Rail — 0.7% | |
Union Pacific Corp. | | | | | | | 3,379 | | | | 482,386 | |
| | | | | | | | | | | | |
| Semiconductors & Semiconductor Equipment — 1.7% | |
QUALCOMM, Inc. | | | | | | | 15,734 | | | | 914,460 | |
Taiwan Semiconductor Manufacturing Co. Ltd. — ADR | | | | | | | 9,495 | | | | 367,457 | |
| | | | | | | | | | | | |
| | | | 1,281,917 | |
| Software — 6.1% | |
Constellation Software, Inc. | | | | | | | 597 | | | | 470,206 | |
Microsoft Corp. | | | | | | | 19,168 | | | | 1,894,565 | |
Oracle Corp. | | | | | | | 45,003 | | | | 2,102,540 | |
| | | | | | | | | | | | |
| | | | 4,467,311 | |
| Specialty Retail — 0.7% | |
Lowe’s Cos., Inc. | | | | | | | 5,332 | | | | 506,593 | |
| | | | | | | | | | | | |
| Technology Hardware, Storage & Peripherals — 0.8% | |
Lenovo Group Ltd. | | | | | | | 464,000 | | | | 245,011 | |
Samsung Electronics Co. Ltd., — GDR | | | | | | | 320 | | | | 379,520 | |
| | | | | | | | | | | | |
| | | | 624,531 | |
| Tobacco — 1.1% | |
Altria Group, Inc. | | | | | | | 11,166 | | | | 622,393 | |
British American Tobacco PLC | | | | | | | 4,295 | | | | 220,465 | |
| | | | | | | | | | | | |
| | | | 842,858 | |
| | | | | | | | | | | | |
Total Long-Term Investments — 95.6%
(Cost — $56,880,168) | | | | 70,250,001 | |
| | | | | | | | | | | | |
| | | | | | | | | | | | |
| Security | | Shares | | | Value | |
Short-Term Securities — 4.4% | |
|
| Money Market Funds — 4.4% | |
BlackRock Liquidity Funds, T-Fund,
Institutional Class, 1.61%(b)(c) | | | | | | | 3,268,362 | | | $ | 3,268,362 | |
| | | | | | | | | | | | |
Total Money Market Funds — 4.4%
(Cost — $3,268,362) | | | | 3,268,362 | |
| | | | | | | | | | | | |
| | |
| | | Par
(000) | | | | |
Time Deposits — 0.0% | |
|
| Europe — 0.0% | |
Brown Brother Harriman & Co., (0.58%), 06/01/18 | | | EUR | | | | 10 | | | | 12,202 | |
| | | | | | | | | | | | |
Total Time Deposits — 0.00%
(Cost — $12,202) | | | | 12,202 | |
| | | | | | | | | | | | |
Total Short-Term Securities — 4.4%
(Cost — $3,280,564) | | | | 3,280,564 | |
| | | | | | | | | | | | |
| |
Total Investments — 100.0%
(Cost — $60,160,732) | | | | 73,530,565 | |
Liabilities in Excess of Other Assets — (0.0)% | | | | (32,661 | ) |
| | | | | | | | | | | | |
Net Assets — 100.0% | | | $ | 73,497,904 | |
| | | | | | | | | | | | |
| (a) | Non-income producing security. |
| (b) | Annualized 7-day yield as of period end. |
| (c) | During the year ended May 31, 2018, investments in issuers considered to be affiliates of the Fund for purposes of Section 2(a)(3) of the Investment Company Act of 1940, as amended, and/or related parties of the Fund, were as follows: |
| | | | | | | | | | | | | | | | | | | | | | | | | | | | | | | | |
| Affiliate Persons and/or Related Parties | | Shares
Held at
05/31/17 | | | Shares
Purchased | | | Shares
Sold | | | Shares Held at
05/31/18 | | | Value at
05/31/18 | | | Income | | | Net
Realized
Gain (Loss) (a) | | | Change in
Unrealized
Appreciation
(Depreciation) | |
BlackRock Liquidity Funds, T-Fund, Institutional Class | | | — | | | | 3,268,362 | (b) | | | — | | | | 3,268,362 | | | $ | 3,268,362 | | | $ | 24,825 | | | $ | 10 | | | $ | — | |
PNC Financial Services Group, Inc. | | | 500 | | | | — | | | | (500 | ) | | | — | | | | — | | | | 750 | | | | 40,418 | | | | (31,958 | ) |
| | | | | | | | | | | | | | | | | | | | | | | | | | | | | | | | |
| | | $ | 3,268,362 | | | $ | 25,575 | | | $ | 40,428 | | | $ | (31,958 | ) |
| | | | | | | | | | | | | | | | | |
| | (a) | Includes net capital gain distributions, if applicable. | |
| | (b) | Represents net shares purchased. | |
For Fund compliance purposes, the Fund’s industry classifications refer to one or more of the industry sub-classifications used by one or more widely recognized market indexes or rating group indexes, and/or as defined by the investment adviser. These definitions may not apply for purposes of this report, which may combine such industry sub-classifications for reporting ease.
Derivative Financial Instruments Categorized by Risk Exposure
For the year ended May 31, 2018, the effect of derivative financial instruments in the Statements of Operations was as follows:
| | | | | | | | | | | | | | | | | | | | | | | | | | | | |
| | | Commodity
Contracts | | | Credit
Contracts | | | Equity
Contracts | | | Foreign
Currency
Exchange
Contracts | | | Interest
Rate
Contracts | | | Other
Contracts | | | Total | |
Net Realized Gain (Loss) from: | | | | | | | | | | | | | | | | | | | | | | | | | | | | |
Forward foreign currency exchange contracts | | $ | — | | | $ | — | | | $ | — | | | $ | (476,900 | ) | | $ | — | | | $ | — | | | $ | (476,900 | ) |
| | | | | | | | | | | | | | | | | | | | | | | | | | | | |
| Net Change in Unrealized Appreciation (Depreciation) on: | | | | | | | | | | | | | | | | | | | | | |
Forward foreign currency exchange contracts | | $ | — | | | $ | — | | | $ | — | | | $ | 161,751 | | | $ | — | | | $ | — | | | $ | 161,751 | |
| | | | | | | | | | | | | | | | | | | | | | | | | | | | |
| | |
| 26 | | 2018 BLACKROCK ANNUAL REPORTTO SHAREHOLDERS |
| | |
Schedule of Investments (continued) May 31, 2018 | | FDP BlackRock Equity Dividend Fund |
Average Quarterly Balances of Outstanding Derivative Financial Instruments
| | | | |
Forward foreign currency exchange contracts: | |
Average amounts purchased — in USD | | $ | 2,737,903 | |
Average amounts sold — in USD | | $ | 52,821 | |
For more information about the Fund’s investment risks regarding derivative financial instruments, refer to the Notes to Financial Statements.
Fair Value Hierarchy as of Period End
Various inputs are used in determining the fair value of investments. For information about the Fund’s policy regarding valuation of investments and derivative financial instruments, refer to the Notes to Financial Statements.
The following tables summarizes the Fund’s investments categorized in the disclosure hierarchy:
| | | | | | | | | | | | | | | | |
| | | Level 1 | | | Level 2 | | | Level 3 | | | Total | |
Assets: | |
Investments: | |
Common Stocks: | |
Aerospace & Defense | | $ | 869,273 | | | $ | — | | | $ | — | | | $ | 869,273 | |
Banks | | | 12,524,153 | | | | — | | | | — | | | | 12,524,153 | |
Beverages | | | 715,498 | | | | 992,288 | | | | — | | | | 1,707,786 | |
Capital Markets | | | 2,460,302 | | | | — | | | | — | | | | 2,460,302 | |
Chemicals | | | 818,108 | | | | — | | | | — | | | | 818,108 | |
Communications Equipment | | | 1,017,541 | | | | — | | | | — | | | | 1,017,541 | |
Construction Materials | | | — | | | | 560,579 | | | | — | | | | 560,579 | |
Containers & Packaging | | | 249,791 | | | | — | | | | — | | | | 249,791 | |
Diversified Financial Services | | | 236,946 | | | | — | | | | — | | | | 236,946 | |
Diversified Telecommunication Services | | | 1,867,834 | | | | — | | | | — | | | | 1,867,834 | |
Electric Utilities | | | 2,670,653 | | | | — | | | | — | | | | 2,670,653 | |
Electronic Equipment | | | 120,506 | | | | — | | | | — | | | | 120,506 | |
Electronic Equipment, Instruments & Components | | | 523,287 | | | | — | | | | — | | | | 523,287 | |
Food & Staples Retailing | | | 431,371 | | | | — | | | | — | | | | 431,371 | |
Food Products | | | 738,530 | | | | 181,257 | | | | — | | | | 919,787 | |
Health Care Equipment & Supplies | | | 1,017,972 | | | | 1,156,177 | | | | — | | | | 2,174,149 | |
Health Care Providers & Services | | | 5,758,904 | | | | — | | | | — | | | | 5,758,904 | |
Household Products | | | 539,117 | | | | — | | | | — | | | | 539,117 | |
Industrial Conglomerates | | | 2,108,293 | | | | — | | | | — | | | | 2,108,293 | |
Insurance | | | 4,239,067 | | | | — | | | | — | | | | 4,239,067 | |
IT Services | | | 252,573 | | | | — | | | | — | | | | 252,573 | |
Leisure Products | | | 351,156 | | | | — | | | | — | | | | 351,156 | |
Machinery | | | 193,762 | | | | — | | | | — | | | | 193,762 | |
Media | | | 1,635,286 | | | | 116,909 | | | | — | | | | 1,752,195 | |
Multi-Utilities | | | 851,600 | | | | — | | | | — | | | | 851,600 | |
Multiline Retail | | | 193,331 | | | | — | | | | — | | | | 193,331 | |
Oil, Gas & Consumable Fuels | | | 8,244,646 | | | | 837,471 | | | | — | | | | 9,082,117 | |
Personal Products | | | 540,411 | | | | — | | | | — | | | | 540,411 | |
Pharmaceuticals | | | 4,358,547 | | | | 1,762,557 | | | | — | | | | 6,121,104 | |
Professional Services | | | 375,767 | | | | 532,942 | | | | — | | | | 908,709 | |
Road & Rail | | | 482,386 | | | | — | | | | — | | | | 482,386 | |
Semiconductors & Semiconductor Equipment | | | 1,281,917 | | | | — | | | | — | | | | 1,281,917 | |
Software | | | 4,467,311 | | | | — | | | | — | | | | 4,467,311 | |
Specialty Retail | | | 506,593 | | | | — | | | | — | | | | 506,593 | |
Technology Hardware, Storage & Peripherals | | | 379,520 | | | | 245,011 | | | | — | | | | 624,531 | |
Tobacco | | | 622,393 | | | | 220,465 | | | | — | | | | 842,858 | |
Short-Term Securities: | | | | | | | | | | | | | | | | |
Money Market Funds | | | 3,268,362 | | | | — | | | | — | | | | 3,268,362 | |
Time Deposits | | | — | | | | 12,202 | | | | — | | | | 12,202 | |
| | | | | | | | | | | | | | | | |
| | $ | 66,912,707 | | | $ | 6,617,858 | | | $ | — | | | $ | 73,530,565 | |
| | | | | | | | | | | | | | | | |
During the year ended May 31, 2018, there were no transfers between levels.
See notes to financial statements.
| | | | |
| SCHEDULES OF INVESTMENTS | | | 27 | |
| | |
Schedule of Investments May 31, 2018 | | FDP BlackRock International Fund (Percentages shown are based on Net Assets) |
| | | | | | | | | | | | |
| Security | | Shares | | | Value | |
Common Stocks — 96.1% | |
|
| China — 14.0% | |
Baidu, Inc. — ADR(a) | | | | | | | 10,418 | | | $ | 2,526,990 | |
Bank of China Ltd., Class H | | | | | | | 5,330,000 | | | | 2,783,285 | |
NetEase, Inc. — ADR | | | | | | | 12,265 | | | | 2,800,345 | |
Ping An Insurance Group Co. of China Ltd., Class H | | | | | | | 338,500 | | | | 3,297,597 | |
| | | | | | | | |
| | | | 11,408,217 | |
| France — 9.2% | |
Arkema SA | | | | | | | 22,431 | | | | 2,735,809 | |
AXA SA | | | | | | | 63,271 | | | | 1,585,287 | |
Engie SA | | | | | | | 199,800 | | | | 3,151,809 | |
| | | | | | | | |
| | | | 7,472,905 | |
| Germany — 7.4% | |
BASF SE | | | | | | | 25,098 | | | | 2,478,053 | |
Bayer AG, Registered Shares | | | | | | | 29,425 | | | | 3,511,984 | |
| | | | | | | | |
| | | | 5,990,037 | |
| Hong Kong — 1.7% | |
Nine Dragons Paper Holdings Ltd. | | | | | | | 891,000 | | | | 1,407,466 | |
| | | | | | | | |
| India — 3.7% | |
ICICI Bank Ltd. | | | | | | | 704,865 | | | | 2,979,174 | |
| | | | | | | | |
| Italy — 1.5% | |
Intesa Sanpaolo SpA | | | | | | | 420,447 | | | | 1,240,797 | |
| | | | | | | | |
| Japan — 14.3% | |
Mitsui Fudosan Co. Ltd. | | | | | | | 106,400 | | | | 2,660,496 | |
Omron Corp. | | | | | | | 37,500 | | | | 1,959,992 | |
Sony Corp. | | | | | | | 90,100 | | | | 4,250,816 | |
Trend Micro, Inc. | | | | | | | 48,500 | | | | 2,741,990 | |
| | | | | | | | |
| | | | 11,613,294 | |
| Mexico — 2.0% | |
Fomento Economico Mexicano SAB de CV | | | | | | | 191,639 | | | | 1,597,420 | |
| | | | | | | | |
| Netherlands — 3.1% | |
Aegon NV | | | | | | | 401,533 | | | | 2,495,777 | |
| | | | | | | | |
| Portugal — 2.0% | |
Banco Comercial Portugues SA, Class R(a) | | | | | | | 5,485,179 | | | | 1,607,852 | |
| | | | | | | | |
| Singapore — 1.9% | |
Sea Ltd. ADR(a) | | | | | | | 102,322 | | | | 1,513,342 | |
| | | | | | | | |
| Spain — 9.8% | |
Banco Bilbao Vizcaya Argentaria SA | | | | | | | 499,948 | | | | 3,433,509 | |
CaixaBank SA | | | | | | | 456,962 | | | | 1,966,289 | |
Industria de Diseno Textil SA | | | | | | | 80,588 | | | | 2,547,305 | |
| | | | | | | | |
| | | | 7,947,103 | |
| Switzerland — 2.5% | |
Cie Financiere Richemont SA, Registered Shares | | | | | | | 22,226 | | | | 2,035,412 | |
| | | | | | | | |
| | | | | | | | | | | | |
| Security | | Shares | | | Value | |
| United Kingdom — 16.7% | |
British American Tobacco PLC | | | | | | | 32,365 | | | $ | 1,661,314 | |
Burberry Group PLC | | | | | | | 93,356 | | | | 2,564,825 | |
Diageo PLC | | | | | | | 75,329 | | | | 2,767,832 | |
Imperial Brands PLC | | | | | | | 48,398 | | | | 1,741,694 | |
ITV PLC | | | | | | | 1,467,318 | | | | 3,164,966 | |
TechnipFMC PLC | | | | | | | 52,038 | | | | 1,620,984 | |
| | | | | | | | |
| | | | 13,521,615 | |
| United States — 6.3% | |
BioMarin Pharmaceutical, Inc.(a) | | | | | | | 31,117 | | | | 2,811,110 | |
Schlumberger Ltd. | | | | | | | 34,098 | | | | 2,341,509 | |
| | | | | | | | |
| | | | 5,152,619 | |
| | | | | | | | |
Total Long-Term Investments — 96.1%
(Cost — $79,488,029) | | | | 77,983,030 | |
| | | | | | | | |
|
Short-Term Securities — 3.7% | |
|
| Money Market Funds — 3.6% | |
BlackRock Liquidity Funds, T-Fund,
Institutional Class, | | | | | | | | | | | | |
1.61%(b)(c) | | | | | | | 2,966,946 | | | | 2,966,946 | |
| | | | | | | | |
Total Money Market funds — 3.6%
(Cost — $2,966,946) | | | | 2,966,946 | |
| | | | | | | | |
| | |
| | | | Par (000) | | | | |
| Time Deposits — 0.1% | |
|
| Europe — 0.1% | |
Brown Brother Harriman & Co., (0.58%), 06/01/18 | | | EUR | | | | 61 | | | | 70,914 | |
| | | | | | | | |
| Japan — 0.0% | |
Sumitomo Bank Tokyo, (0.22%), 06/01/18 | | | JPY | | | | 1,274 | | | | 11,715 | |
| | | | | | | | |
Total Time Deposits — 0.1%
(Cost — $82,629) | | | | 82,629 | |
| | | | | | | | |
Total Short-Term Securities — 3.7%
(Cost — $3,049,575) | | | | 3,049,575 | |
| | | | | | | | |
| |
Total Investments — 99.8%
(Cost — $82,537,604) | | | | 81,032,605 | |
Other Assets Less Liabilities — 0.2% | | | | 144,790 | |
| | | | | | | | |
Net Assets — 100.0% | | | $ | 81,177,395 | |
| | | | | | | | |
| (a) | Non-income producing security. |
| (b) | Annualized 7-day yield as of period end. |
| (c) | During the year ended May 31, 2018, investments in issuers considered to be an affiliate of the Fund for purposes of Section 2(a)(3) of the Investment Company Act of 1940, as amended, were as follows: |
| | | | | | | | | | | | | | | | | | | | | | | | | | | | |
| Affiliated | | Shares
Held at
05/31/17 | | | Net
Activity | | | Shares
Held at
05/31/18 | | | Value at
05/31/18 | | | Income | | | Net
Realized
Gain (Loss) (a) | | | Change in
Unrealized
Appreciation
(Depreciation) | |
BlackRock Liquidity Funds, T-Fund, Institutional Class | | | — | | | | 2,966,946 | | | | 2,966,946 | | | $ | 2,966,946 | | | $ | 14,048 | | | $ | 4 | | | $ | — | |
| | | | | | | | | | | | | | | | | | | | | | | | | | | | |
| | (a) | Includes net capital gain distributions, if applicable. | |
| | |
| 28 | | 2018 BLACKROCK ANNUAL REPORTTO SHAREHOLDERS |
| | |
Schedule of Investments (continued) May 31, 2018 | | FDP BlackRock International Fund |
Fair Value Hierarchy as of Period End
Various inputs are used in determining the fair value of investments. For information about the Fund’s policy regarding valuation of investments, refer to the Notes to Financial Statements.
The following table summarizes the Fund’s investments categorized in the disclosure hierarchy:
| | | | | | | | | | | | | | | | |
| | | Level 1 | | | Level 2 | | | Level 3 | | | Total | |
Assets: | |
Investments: | |
Common Stocks: | |
China | | $ | 5,327,335 | | | $ | 6,080,882 | | | $ | — | | | $ | 11,408,217 | |
France | | | — | | | | 7,472,905 | | | | — | | | | 7,472,905 | |
Germany | | | — | | | | 5,990,037 | | | | — | | | | 5,990,037 | |
Hong Kong | | | — | | | | 1,407,466 | | | | — | | | | 1,407,466 | |
India | | | — | | | | 2,979,174 | | | | — | | | | 2,979,174 | |
Italy | | | — | | | | 1,240,797 | | | | — | | | | 1,240,797 | |
Japan | | | — | | | | 11,613,294 | | | | — | | | | 11,613,294 | |
Mexico | | | 1,597,420 | | | | — | | | | — | | | | 1,597,420 | |
Netherlands | | | — | | | | 2,495,777 | | | | — | | | | 2,495,777 | |
Portugal | | | — | | | | 1,607,852 | | | | — | | | | 1,607,852 | |
Singapore | | | 1,513,342 | | | | — | | | | — | | | | 1,513,342 | |
Spain | | | — | | | | 7,947,103 | | | | — | | | | 7,947,103 | |
Switzerland | | | — | | | | 2,035,412 | | | | — | | | | 2,035,412 | |
United Kingdom | | | 1,620,984 | | | | 11,900,631 | | | | — | | | | 13,521,615 | |
United States | | | 5,152,619 | | | | — | | | | — | | | | 5,152,619 | |
Short-Term Securities: | | | | | | | | | | | | | | | | |
Money Market Funds | | | 2,966,946 | | | | — | | | | — | | | | 2,966,946 | |
Time Deposits | | | — | | | | 82,629 | | | | — | | | | 82,629 | |
| | | | | | | | | | | | | | | | |
| | $ | 18,178,646 | | | $ | 62,853,959 | | | $ | — | | | $ | 81,032,605 | |
| | | | | | | | | | | | | | | | |
During the year ended May 31, 2018, there were no transfers between levels.
See notes to financial statements.
| | | | |
| SCHEDULES OF INVESTMENTS | | | 29 | |
Statements of Assets and Liabilities
May 31, 2018
| | | | | | | | | | | | | | | | |
| | | FDP BlackRock
Capital Appreciation
Fund | | | FDP BlackRock
CoreAlpha Bond
Fund | | | FDP BlackRock
Equity Dividend
Fund | | | FDP BlackRock
International
Fund | |
| | | | |
ASSETS | | | | | | | | | | | | | | | | |
Investments at value — unaffiliated(a) | | $ | 80,490,277 | | | $ | 111,456,838 | | | $ | 70,262,203 | | | $ | 78,065,659 | |
Investments at value — affiliated(b) | | | 562,638 | | | | 1,425,386 | | | | 3,268,362 | | | | 2,966,946 | |
Cash pledged for futures contracts | | | — | | | | 244,000 | | | | — | | | | — | |
Foreign currency at value(c) | | | 82 | | | | 49,481 | | | | — | | | | 67 | |
Receivables: | | | | | | | | | | | | | | | | |
Dividends — unaffiliated | | | 78,162 | | | | — | | | | 242,546 | | | | 470,629 | |
Dividends — affiliated | | | 739 | | | | 2,075 | | | | — | | | | — | |
TBA sale commitments | | | — | | | | 2,136,666 | | | | — | | | | — | |
Interest — unaffiliated | | | — | | | | 663,722 | | | | 4,452 | | | | 2,709 | |
Capital shares sold | | | — | | | | 176,738 | | | | — | | | | — | |
Variation margin on futures contracts | | | — | | | | 61,172 | | | | — | | | | — | |
Reimbursed by the Manager | | | — | | | | 20,481 | | | | — | | | | — | |
Investments sold | | | — | | | | 2,953 | | | | 209,243 | | | | — | |
Principal paydowns | | | — | | | | 1,052 | | | | — | | | | — | |
Unrealized appreciation on OTC derivatives | | | — | | | | 45,271 | | | | — | | | | — | |
Prepaid expenses | | | 38,942 | | | | 38,039 | | | | 38,952 | | | | 39,410 | |
| | | | | | | | | | | | | | | | |
Total assets | | | 81,170,840 | | | | 116,323,874 | | | | 74,025,758 | | | | 81,545,420 | |
| | | | | | | | | | | | | | | | |
| | | | |
LIABILITIES | | | | | | | | | | | | | | | | |
Foreign bank overdraft(c) | | | — | | | | — | | | | 6,085 | | | | — | |
Payables: | | | | | | | | | | | | | | | | |
Investments purchased | | | 380,284 | | | | 11,336,857 | | | | 225,559 | | | | 138 | |
Capital shares redeemed | | | 137,498 | | | | 162,970 | | | | 121,949 | | | | 121,808 | |
Investment advisory fees | | | 44,426 | | | | 27,807 | | | | 37,893 | | | | 53,886 | |
Service and distribution fees | | | 30,895 | | | | 37,274 | | | | 28,582 | | | | 32,364 | |
Board consolidation | | | 3,854 | | | | 20,481 | | | | 3,830 | | | | 3,889 | |
Directors’ and Officer’s fees | | | 1,937 | | | | 2,026 | | | | 1,944 | | | | 1,967 | |
Income dividend distributions | | | — | | | | 212,031 | | | | — | | | | — | |
Variation margin on futures contracts | | | — | | | | 3,545 | | | | — | | | | — | |
Other affiliates | | | 239 | | | | 345 | | | | 227 | | | | 287 | |
Other accrued expenses | | | 90,533 | | | | 200,497 | | | | 101,785 | | | | 153,686 | |
TBA sale commitments at value(d) | | | — | | | | 2,150,371 | | | | — | | | | — | |
| | | | | | | | | | | | | | | | |
Total liabilities | | | 689,666 | | | | 14,154,204 | | | | 527,854 | | | | 368,025 | |
| | | | | | | | | | | | | | | | |
| | | | |
NET ASSETS | | $ | 80,481,174 | | | $ | 102,169,670 | | | $ | 73,497,904 | | | $ | 81,177,395 | |
| | | | | | | | | | | | | | | | |
| | | | |
NET ASSETS CONSIST OF | | | | | | | | | | | | | | | | |
Paid-in capital | | $ | 46,976,062 | | | $ | 107,528,975 | | | $ | 42,775,987 | | | $ | 81,222,431 | |
Undistributed (distributions in excess of) net investment income | | | — | | | | (212,031 | ) | | | 205,213 | | | | 353,279 | |
Accumulated net realized gain (loss) | | | 14,225,525 | | | | (3,964,234 | ) | | | 17,147,482 | | | | 1,107,955 | |
Net unrealized appreciation (depreciation) | | | 19,279,587 | | | | (1,183,040 | ) | | | 13,369,222 | | | | (1,506,270 | ) |
| | | | | | | | | | | | | | | | |
NET ASSETS | | $ | 80,481,174 | | | $ | 102,169,670 | | | $ | 73,497,904 | | | $ | 81,177,395 | |
| | | | | | | | | | | | | | | | |
| | | | |
(a) Investments at cost — unaffiliated | | $ | 61,210,695 | | | $ | 112,638,520 | | | $ | 56,892,370 | | | $ | 79,570,658 | |
(b) Investments at cost — affiliated | | $ | 562,638 | | | $ | 1,425,386 | | | $ | 3,268,362 | | | $ | 2,966,946 | |
(c) Foreign currency at cost | | $ | 82 | | | $ | 51,733 | | | $ | (6,085 | ) | | $ | 67 | |
(d) Proceeds from TBA sale commitments. | | $ | — | | | $ | 2,136,666 | | | $ | — | | | $ | — | |
See notes to financial statements.
| | |
| 30 | | 2018 BLACKROCK ANNUAL REPORTTO SHAREHOLDERS |
Statements of Assets and Liabilities (continued)
May 31, 2018
| | | | | | | | | | | | | | | | |
| | | FDP BlackRock
Capital Appreciation
Fund | | | FDP BlackRock
CoreAlpha Bond
Fund | | | FDP BlackRock
Equity Dividend
Fund | | | FDP BlackRock
International
Fund | |
| | | | |
Institutional | | | | | | | | | | | | | | | | |
Net assets | | $ | 4,024,952 | | | $ | 4,791,870 | | | $ | 3,633,639 | | | $ | 4,005,773 | |
| | | | | | | | | | | | | | | | |
Shares outstanding(e) | | | 226,179 | | | | 483,605 | | | | 222,875 | | | | 300,826 | |
| | | | | | | | | | | | | | | | |
Net asset value | | $ | 17.80 | | | $ | 9.91 | | | $ | 16.30 | | | $ | 13.32 | |
| | | | | | | | | | | | | | | | |
| | | | |
Investor A | | | | | | | | | | | | | | | | |
Net assets | | $ | 52,880,126 | | | $ | 62,903,925 | | | $ | 48,646,902 | | | $ | 53,715,436 | |
| | | | | | | | | | | | | | | | |
Shares outstanding(e) | | | 3,090,252 | | | | 6,346,300 | | | | 3,018,072 | | | | 4,064,162 | |
| | | | | | | | | | | | | | | | |
Net asset value | | $ | 17.11 | | | $ | 9.91 | | | $ | 16.12 | | | $ | 13.22 | |
| | | | | | | | | | | | | | | | |
| | | | |
Investor C | | | | | | | | | | | | | | | | |
Net assets | | $ | 23,576,096 | | | $ | 34,473,875 | | | $ | 21,217,363 | | | $ | 23,456,186 | |
| | | | | | | | | | | | | | | | |
Shares outstanding(e) | | | 1,557,461 | | | | 3,477,742 | | | | 1,350,869 | | | | 1,787,729 | |
| | | | | | | | | | | | | | | | |
Net asset value | | $ | 15.14 | | | $ | 9.91 | | | $ | 15.71 | | | $ | 13.12 | |
| | | | | | | | | | | | | | | | |
| (e) | 100 million shares authorized, $0.10 par value. |
See notes to financial statements.
Statements of Operations
Year Ended May 31, 2018
| | | | | | | | | | | | | | | | |
| | | FDP BlackRock
Capital Appreciation
Fund | | | FDP BlackRock
CoreAlpha Bond
Fund | | | FDP BlackRock
Equity Dividend
Fund | | | FDP BlackRock
International
Fund | |
| | | | |
INVESTMENT INCOME | | | | | | | | | | | | | | | | |
Dividends — unaffiliated | | $ | 800,144 | | | $ | — | | | $ | 2,024,693 | | | $ | 2,315,540 | |
Interest — unaffiliated | | | — | | | | 4,006,941 | | | | — | | | | — | |
Dividends — affiliated | | | 3,982 | | | | 20,764 | | | | 25,575 | | | | 14,048 | |
Foreign taxes withheld | | | (1,593 | ) | | | (257 | ) | | | (57,136 | ) | | | (200,509 | ) |
| | | | | | | | | | | | | | | | |
Total investment income | | | 802,533 | | | | 4,027,448 | | | | 1,993,132 | | | | 2,129,079 | |
| | | | | | | | | | | | | | | | |
| | | | |
EXPENSES | | | | | | | | | | | | | | | | |
Investment advisory | | | 718,390 | | | | 519,763 | | | | 613,913 | | | | 926,056 | |
Service and distribution — class specific | | | 437,475 | | | | 576,924 | | | | 426,270 | | | | 500,895 | |
Transfer agent — class specific | | | 119,592 | | | | 150,059 | | | | 105,511 | | | | 122,701 | |
Professional | | | 83,100 | | | | 129,262 | | | | 68,573 | | | | 90,755 | |
Registration | | | 49,151 | | | | 54,168 | | | | 49,064 | | | | 49,421 | |
Accounting services | | | 22,473 | | | | 28,213 | | | | 23,725 | | | | 30,043 | |
Custodian | | | 21,210 | | | | 23,813 | | | | 26,393 | | | | 156,151 | |
Directors and Officer | | | 17,970 | | | | 18,406 | | | | 17,907 | | | | 18,152 | |
Printing | | | 10,578 | | | | 32,907 | | | | 6,127 | | | | 6,546 | |
Board consolidation | | | 3,854 | | | | 20,481 | | | | 3,830 | | | | 3,889 | |
Miscellaneous | | | 15,304 | | | | 51,098 | | | | 15,200 | | | | 19,304 | |
| | | | | | | | | | | | | | | | |
Total expenses | | | 1,499,097 | | | | 1,605,094 | | | | 1,356,513 | | | | 1,923,913 | |
Less: | | | | | | | | | | | | | | | | |
Fees waived and/or reimbursed by the Manager | | | (87,719 | ) | | | (128,908 | ) | | | (65,807 | ) | | | (127,499 | ) |
Fees paid indirectly | | | (1,180 | ) | | | (25,402 | ) | | | (3,972 | ) | | | (1,017 | ) |
| | | | | | | | | | | | | | | | |
Total expenses after fees waived and/or reimbursed and paid indirectly | | | 1,410,198 | | | | 1,450,784 | | | | 1,286,734 | | | | 1,795,397 | |
| | | | | | | | | | | | | | | | |
Net investment income (loss) | | | (607,665 | ) | | | 2,576,664 | | | | 706,398 | | | | 333,682 | |
| | | | | | | | | | | | | | | | |
| | | | |
REALIZED AND UNREALIZED GAIN (LOSS) | | | | | | | | | | | | | | | | |
Net realized gain (loss) from: | | | | | | | | | | | | | | | | |
Investments — unaffiliated | | | 23,587,573 | | | | (1,207,814 | ) | | | 31,291,552 | | | | 40,484,479 | |
Investments — affiliated | | | — | | | | — | | | | 40,418 | | | | — | |
Futures contracts | | | — | | | | (270,433 | ) | | | — | | | | — | |
Forward foreign currency exchange contracts | | | — | | | | — | | | | (476,900 | ) | | | — | |
Foreign currency transactions | | | 591 | | | | (1,137 | ) | | | (92,475 | ) | | | 253,456 | |
Capital gain distributions from investment companies — affiliated | | | 4 | | | | 4 | | | | 10 | | | | 4 | |
| | | | | | | | | | | | | | | | |
| | | 23,588,168 | | | | (1,479,380 | ) | | | 30,762,605 | | | | 40,737,939 | |
| | | | | | | | | | | | | | | | |
Net change in unrealized appreciation (depreciation) on: | | | | | | | | | | | | | | | | |
Investments — unaffiliated | | | (5,981,282 | ) | | | (2,438,587 | ) | | | (19,451,345 | ) | | | (35,941,429 | ) |
Investments — affiliated | | | — | | | | — | | | | (31,958 | ) | | | — | |
Futures contracts | | | — | | | | (36,678 | ) | | | — | | | | — | |
Forward foreign currency exchange contracts | | | — | | | | — | | | | 161,751 | | | | — | |
Foreign currency translations | | | 5 | | | | (3,506 | ) | | | (969 | ) | | | (7,532 | ) |
Swaps | | | — | | | | 45,271 | | | | — | | | | — | |
Unfunded floating rate loan interests | | | — | | | | 3,808 | | | | — | | | | — | |
| | | | | | | | | | | | | | | | |
| | | (5,981,277 | ) | | | (2,429,692 | ) | | | (19,322,521 | ) | | | (35,948,961 | ) |
| | | | | | | | | | | | | | | | |
Net realized and unrealized gain (loss) | | | 17,606,891 | | | | (3,909,072 | ) | | | 11,440,084 | | | | 4,788,978 | |
| | | | | | | | | | | | | | | | |
NET INCREASE (DECREASE) IN NET ASSETS RESULTING FROM OPERATIONS | | $ | 16,999,226 | | | $ | (1,332,408 | ) | | $ | 12,146,482 | | | $ | 5,122,660 | |
| | | | | | | | | | | | | | | | |
See notes to financial statements.
| | |
| 32 | | 2018 BLACKROCK ANNUAL REPORTTO SHAREHOLDERS |
Statements of Changes in Net Assets
| | | | | | | | | | | | | | | | | | | | |
| | | FDP BlackRock Capital
Appreciation Fund | | | | | | FDP BlackRock CoreAlpha
Bond Fund | |
| | | Year Ended May 31, | | | | | | Year Ended May 31, | |
| | | 2018 | | | 2017 | | | | | | 2018 | | | 2017 | |
| |
INCREASE (DECREASE) IN NET ASSETS | | | | | |
| |
OPERATIONS | | | | | |
Net investment income (loss) | | $ | (607,665 | ) | | $ | (612,529 | ) | | | | | | $ | 2,576,664 | | | $ | 4,147,636 | |
Net realized gain (loss) | | | 23,588,168 | | | | 8,648,688 | | | | | | | | (1,479,380 | ) | | | (2,065,770 | ) |
Net change in unrealized appreciation (depreciation) | | | (5,981,277 | ) | | | 9,154,926 | | | | | | | | (2,429,692 | ) | | | 3,321,245 | |
| | | | | | | | | | | | | | | | | | | | |
Net increase (decrease) in net assets resulting from operations | | | 16,999,226 | | | | 17,191,085 | | | | | | | | (1,332,408 | ) | | | 5,403,111 | |
| | | | | | | | | | | | | | | | | | | | |
| |
DISTRIBUTIONS TO SHAREHOLDERS(a) | | | | | |
From net investment income: | | | | | | | | | | | | | | | | | | | | |
Institutional | | | — | | | | — | | | | | | | | (95,073 | ) | | | (103,956 | ) |
Investor A | | | — | | | | — | | | | | | | | (1,160,153 | ) | | | (1,079,778 | ) |
Investor C | | | — | | | | — | | | | | | | | (581,449 | ) | | | (1,124,895 | ) |
From net realized gain: | | | | | |
Institutional | | | (506,731 | ) | | | (304,459 | ) | | | | | | | — | | | | — | |
Investor A | | | (6,689,015 | ) | | | (3,175,609 | ) | | | | | | | — | | | | — | |
Investor C | | | (3,707,198 | ) | | | (4,797,952 | ) | | | | | | | — | | | | — | |
From return of capital: | | | | | | | | | | | | | | | | | | | | |
Institutional | | | — | | | | — | | | | | | | | (62,106 | ) | | | (81,411 | ) |
Investor A | | | — | | | | — | | | | | | | | (757,874 | ) | | | (835,787 | ) |
Investor C | | | — | | | | — | | | | | | | | (379,833 | ) | | | (787,081 | ) |
| | | | | | | | | | | | | | | | | | | | |
Decrease in net assets resulting from distributions to shareholders | | | (10,902,944 | ) | | | (8,278,020 | ) | | | | | | | (3,036,488 | ) | | | (4,012,908 | ) |
| | | | | | | | | | | | | | | | | | | | |
| |
CAPITAL SHARE TRANSACTIONS | | | | | |
Net decrease in net assets derived from capital share transactions | | | (34,987,351 | ) | | | (35,307,275 | ) | | | | | | | (64,470,638 | ) | | | (50,248,713 | ) |
| | | | | | | | | | | | | | | | | | | | |
| |
NET ASSETS | | | | | |
Total decrease in net assets | | | (28,891,069 | ) | | | (26,394,210 | ) | | | | | | | (68,839,534 | ) | | | (48,858,510 | ) |
Beginning of year | | | 109,372,243 | | | | 135,766,453 | | | | | | | | 171,009,204 | | | | 219,867,714 | |
| | | | | | | | | | | | | | | | | | | | |
End of year | | $ | 80,481,174 | | | $ | 109,372,243 | | | | | | | $ | 102,169,670 | | | $ | 171,009,204 | |
| | | | | | | | | | | | | | | | | | | | |
Undistributed (distributions in excess) net investment income, end of year | | $ | — | | | $ | 52,095 | | | | | | | $ | (212,031 | ) | | $ | (1,387,924 | ) |
| | | | | | | | | | | | | | | | | | | | |
| (a) | Distributions for annual periods determined in accordance with U.S. federal income tax regulations. |
See notes to financial statements.
Statements of Changes in Net Assets (continued)
| | | | | | | | | | | | | | | | | | | | |
| | | FDP BlackRock Equity
Dividend Fund | | | | | | FDP BlackRock
International Fund | |
| | | Year Ended May 31, | | | | | | Year Ended May 31, | |
| | | 2018 | | | 2017 | | | | | | 2018 | | | 2017 | |
| |
INCREASE (DECREASE) IN NET ASSETS | | | | | |
| |
OPERATIONS | | | | | |
Net investment income | | $ | 706,398 | | | $ | 899,574 | | | | | | | $ | 333,682 | | | $ | 957,455 | |
Net realized gain | | | 30,762,605 | | | | 9,771,819 | | | | | | | | 40,737,939 | | | | 2,125,312 | |
Net change in unrealized appreciation (depreciation) | | | (19,322,521 | ) | | | 9,417,528 | | | | | | | | (35,948,961 | ) | | | 16,325,270 | |
| | | | | | | | | | | | | | | | | | | | |
Net increase in net assets resulting from operations | | | 12,146,482 | | | | 20,088,921 | | | | | | | | 5,122,660 | | | | 19,408,037 | |
| | | | | | | | | | | | | | | | | | | | |
| |
DISTRIBUTIONS TO SHAREHOLDERS(a) | | | | | |
From net investment income: | | | | | |
Institutional | | | (25,640 | ) | | | (129,685 | ) | | | | | | | (65,456 | ) | | | (81,732 | ) |
Investor A | | | (221,690 | ) | | | (1,195,590 | ) | | | | | | | (838,346 | ) | | | (702,227 | ) |
Investor C | | | — | | | | (1,096,409 | ) | | | | | | | — | | | | (287,407 | ) |
From net realized gain: | | | | | |
Institutional | | | (629,251 | ) | | | (160,090 | ) | | | | | | | — | | | | — | |
Investor A | | | (8,478,759 | ) | | | (1,638,629 | ) | | | | | | | — | | | | — | |
Investor C | | | (4,683,495 | ) | | | (2,251,146 | ) | | | | | | | — | | | | — | |
| | | | | | | | | | | | | | | | | | | | |
Decrease in net assets resulting from distributions to shareholders | | | (14,038,835 | ) | | | (6,471,549 | ) | | | | | | | (903,802 | ) | | | (1,071,366 | ) |
| | | | | | | | | | | | | | | | | | | | |
| |
CAPITAL SHARE TRANSACTIONS | | | | | |
Net decrease in net assets derived from capital share transactions | | | (28,684,402 | ) | | | (45,893,229 | ) | | | | | | | (50,601,102 | ) | | | (44,737,219 | ) |
| | | | | | | | | | | | | | | | | | | | |
| |
NET ASSETS | | | | | |
Total decrease in net assets | | | (30,576,755 | ) | | | (32,275,857 | ) | | | | | | | (46,382,244 | ) | | | (26,400,548 | ) |
Beginning of year | | | 104,074,659 | | | | 136,350,516 | | | | | | | | 127,559,639 | | | | 153,960,187 | |
| | | | | | | | | | | | | | | | | | | | |
End of year | | $ | 73,497,904 | | | $ | 104,074,659 | | | | | | | $ | 81,177,395 | | | $ | 127,559,639 | |
| | | | | | | | | | | | | | | | | | | | |
Undistributed net investment income, end of year | | $ | 205,213 | | | $ | 254,438 | | | | | | | $ | 353,279 | | | $ | 882,978 | |
| | | | | | | | | | | | | | | | | | | | |
| (a) | Distributions for annual periods determined in accordance with U.S. federal income tax regulations. |
See notes to financial statements.
| | |
| 34 | | 2018 BLACKROCK ANNUAL REPORTTO SHAREHOLDERS |
Financial Highlights
(For a share outstanding throughout each period)
| | | | | | | | | | | | | | | | | | | | |
| | | FDP BlackRock Capital Appreciation Fund | |
| | | Institutional | |
| | | Year Ended May 31, | |
| | | 2018 | | | 2017 | | | 2016 | | | 2015 | | | 2014 | |
Net asset value, beginning of year | | $ | 16.48 | | | $ | 15.01 | | | $ | 17.66 | | | $ | 17.11 | | | $ | 15.23 | |
| | | | | | | | | | | | | | | | | | | | |
Net investment income (loss)(a) | | | (0.03 | ) | | | 0.02 | | | | (0.08 | ) | | | (0.02 | ) | | | (0.02 | ) |
Net realized and unrealized gain (loss) | | | 3.34 | | | | 2.34 | | | | (0.30 | ) | | | 1.60 | | | | 2.67 | |
| | | | | | | | | | | | | | | | | | | | |
Net increase (decrease) from investment operations | | | 3.31 | | | | 2.36 | | | | (0.38 | ) | | | 1.58 | | | | 2.65 | |
| | | | | | | | | | | | | | | | | | | | |
Distributions from net realized gain(b) | | | (1.99 | ) | | | (0.89 | ) | | | (2.27 | ) | | | (1.03 | ) | | | (0.77 | ) |
| | | | | | | | | | | | | | | | | | | | |
Net asset value, end of year | | $ | 17.80 | | | $ | 16.48 | | | $ | 15.01 | | | $ | 17.66 | | | $ | 17.11 | |
| | | | | | | | | | | | | | | | | | | | |
|
Total Return(c) | |
Based on net asset value | | | 21.93 | % | | | 16.48 | % | | | (2.81 | )% | | | 9.55 | % | | | 17.70 | % |
| | | | | | | | | | | | | | | | | | | | |
|
Ratios to Average Net Assets | |
Total expenses | | | 1.18 | % | | | 1.10 | % | | | 1.35 | % | | | 1.10 | % | | | 1.07 | % |
| | | | | | | | | | | | | | | | | | | | |
Total expenses after fees waived and/or reimbursed and paid indirectly | | | 1.08 | % | | | 1.05 | % | | | 1.30 | % | | | 1.05 | % | | | 1.02 | % |
| | | | | | | | | | | | | | | | | | | | |
Net investment income (loss) | | | (0.19 | )% | | | 0.15 | % | | | (0.54 | )% | | | (0.09 | )% | | | (0.10 | )% |
| | | | | | | | | | | | | | | | | | | | |
|
Supplemental Data | |
Net assets, end of year (000) | | $ | 4,025 | | | $ | 4,787 | | | $ | 5,397 | | | $ | 5,959 | | | $ | 5,597 | |
| | | | | | | | | | | | | | | | | | | | |
Portfolio turnover rate | | | 106 | % | | | 48 | % | | | 128 | % | | | 86 | % | | | 101 | % |
| | | | | | | | | | | | | | | | | | | | |
| (a) | Based on average shares outstanding. |
| (b) | Distributions for annual periods determined in accordance with U.S. federal income tax regulations. |
| (c) | Where applicable, assumes the reinvestment of distributions. |
See notes to financial statements.
Financial Highlights (continued)
(For a share outstanding throughout each period)
| | | | | | | | | | | | | | | | | | | | |
| | | FDP BlackRock Capital Appreciation Fund (continued) | |
| | | Investor A | |
| | | Year Ended May 31, | |
| | | 2018 | | | 2017 | | | 2016 | | | 2015 | | | 2014 | |
Net asset value, beginning of year | | $ | 15.91 | | | $ | 14.55 | | | $ | 17.23 | | | $ | 16.75 | | | $ | 14.94 | |
| | | | | | | | | | | | | | | | | | | | |
Net investment loss(a) | | | (0.07 | ) | | | (0.01 | ) | | | (0.12 | ) | | | (0.06 | ) | | | (0.06 | ) |
Net realized and unrealized gain (loss) | | | 3.21 | | | | 2.26 | | | | (0.29 | ) | | | 1.57 | | | | 2.62 | |
| | | | | | | | | | | | | | | | | | | | |
Net increase (decrease) from investment operations | | | 3.14 | | | | 2.25 | | | | (0.41 | ) | | | 1.51 | | | | 2.56 | |
| | | | | | | | | | | | | | | | | | | | |
Distributions from net realized gain(b) | | | (1.94 | ) | | | (0.89 | ) | | | (2.27 | ) | | | (1.03 | ) | | | (0.75 | ) |
| | | | | | | | | | | | | | | | | | | | |
Net asset value, end of year | | $ | 17.11 | | | $ | 15.91 | | | $ | 14.55 | | | $ | 17.23 | | | $ | 16.75 | |
| | | | | | | | | | | | | | | | | | | | |
|
Total Return(c) | |
Based on net asset value | | | 21.56 | % | | | 16.24 | % | | | (3.08 | )% | | | 9.32 | % | | | 17.42 | % |
| | | | | | | | | | | | | | | | | | | | |
|
Ratios to Average Net Assets | |
Total expenses | | | 1.43 | % | | | 1.35 | % | | | 1.60 | % | | | 1.35 | % | | | 1.32 | % |
| | | | | | | | | | | | | | | | | | | | |
Total expenses after fees waived and/or reimbursed and paid indirectly | | | 1.33 | % | | | 1.30 | % | | | 1.55 | % | | | 1.30 | % | | | 1.27 | % |
| | | | | | | | | | | | | | | | | | | | |
Net investment loss | | | (0.44 | )% | | | (0.09 | )% | | | (0.79 | )% | | | (0.34 | )% | | | (0.35 | )% |
| | | | | | | | | | | | | | | | | | | | |
|
Supplemental Data | |
Net assets, end of year (000) | | $ | 52,880 | | | $ | 64,535 | | | $ | 53,675 | | | $ | 61,289 | | | $ | 55,133 | |
| | | | | | | | | | | | | | | | | | | | |
Portfolio turnover rate | | | 106 | % | | | 48 | % | | | 128 | % | | | 86 | % | | | 101 | % |
| | | | | | | | | | | | | | | | | | | | |
| (a) | Based on average shares outstanding. |
| (b) | Distributions for annual periods determined in accordance with U.S. federal income tax regulations. |
| (c) | Where applicable, excludes the effects of any sales charges and assumes the reinvestment of distributions. |
See notes to financial statements.
| | |
| 36 | | 2018 BLACKROCK ANNUAL REPORTTO SHAREHOLDERS |
Financial Highlights (continued)
(For a share outstanding throughout each period)
| | | | | | | | | | | | | | | | | | | | |
| | | FDP BlackRock Capital Appreciation Fund (continued) | |
| | | Investor C | |
| | | Year Ended May 31, | |
| | | 2018 | | | 2017 | | | 2016 | | | 2015 | | | 2014 | |
Net asset value, beginning of year | | $ | 14.22 | | | $ | 13.19 | | | $ | 15.93 | | | $ | 15.68 | | | $ | 14.08 | |
| | | | | | | | | | | | | | | | | | | | |
Net investment loss(a) | | | (0.17 | ) | | | (0.11 | ) | | | (0.21 | ) | | | (0.17 | ) | | | (0.17 | ) |
Net realized and unrealized gain (loss) | | | 2.86 | | | | 2.03 | | | | (0.26 | ) | | | 1.45 | | | | 2.46 | |
| | | | | | | | | | | | | | | | | | | | |
Net increase (decrease) from investment operations | | | 2.69 | | | | 1.92 | | | | (0.47 | ) | | | 1.28 | | | | 2.29 | |
| | | | | | | | | | | | | | | | | | | | |
Distributions from net realized gain(b) | | | (1.77 | ) | | | (0.89 | ) | | | (2.27 | ) | | | (1.03 | ) | | | (0.69 | ) |
| | | | | | | | | | | | | | | | | | | | |
Net asset value, end of year | | $ | 15.14 | | | $ | 14.22 | | | $ | 13.19 | | | $ | 15.93 | | | $ | 15.68 | |
| | | | | | | | | | | | | | | | | | | | |
|
Total Return(c) | |
Based on net asset value | | | 20.66 | % | | | 15.37 | % | | | (3.85 | )% | | | 8.46 | % | | | 16.48 | % |
| | | | | | | | | | | | | | | | | | | | |
|
Ratios to Average Net Assets | |
Total expenses | | | 2.19 | % | | | 2.12 | % | | | 2.36 | % | | | 2.11 | % | | | 2.08 | % |
| | | | | | | | | | | | | | | | | | | | |
Total expenses after fees waived and/or reimbursed and paid indirectly | | | 2.09 | % | | | 2.06 | % | | | 2.31 | % | | | 2.06 | % | | | 2.03 | % |
| | | | | | | | | | | | | | | | | | | | |
Net investment loss | | | (1.19 | )% | | | (0.86 | )% | | | (1.55 | )% | | | (1.10 | )% | | | (1.11 | )% |
| | | | | | | | | | | | | | | | | | | | |
|
Supplemental Data | |
Net assets, end of year (000) | | $ | 23,576 | | | $ | 40,050 | | | $ | 76,694 | | | $ | 92,669 | | | $ | 93,094 | |
| | | | | | | | | | | | | | | | | | | | |
Portfolio turnover rate | | | 106 | % | | | 48 | % | | | 128 | % | | | 86 | % | | | 101 | % |
| | | | | | | | | | | | | | | | | | | | |
| (a) | Based on average shares outstanding. |
| (b) | Distributions for annual periods determined in accordance with U.S. federal income tax regulations. |
| (c) | Where applicable, excludes the effects of any sales charges and assumes the reinvestment of distributions. |
See notes to financial statements.
Financial Highlights (continued)
(For a share outstanding throughout each period)
| | | | | | | | | | | | | | | | | | | | |
| | | FDP BlackRock CoreAlpha Bond Fund | |
| | | Institutional | |
| | | Year Ended May 31, | |
| | | 2018 | | | 2017 | | | 2016 | | | 2015 | | | 2014 | |
Net asset value, beginning of year | | $ | 10.27 | | | $ | 10.20 | | | $ | 10.67 | | | $ | 10.75 | | | $ | 10.71 | |
| | | | | | | | | | | | | | | | | | | | |
Net investment income(a) | | | 0.25 | | | | 0.27 | | | | 0.23 | | | | 0.23 | | | | 0.28 | |
Net realized and unrealized gain (loss) | | | (0.33 | ) | | | 0.06 | | | | (0.24 | ) | | | 0.05 | | | | 0.06 | |
| | | | | | | | | | | | | | | | | | | | |
Net increase (decrease) from investment operations | | | (0.08 | ) | | | 0.33 | | | | (0.01 | ) | | | 0.28 | | | | 0.34 | |
| | | | | | | | | | | | | | | | | | | | |
| Distributions(b) | |
From net investment income | | | (0.17 | ) | | | (0.14 | ) | | | (0.23 | ) | | | (0.23 | ) | | | (0.29 | ) |
From net realized gain | | | — | | | | — | | | | (0.23 | ) | | | (0.13 | ) | | | (0.01 | ) |
From return of capital | | | (0.11 | ) | | | (0.12 | ) | | | — | | | | — | | | | — | |
| | | | | | | | | | | | | | | | | | | | |
Total distributions | | | (0.28 | ) | | | (0.26 | ) | | | (0.46 | ) | | | (0.36 | ) | | | (0.30 | ) |
| | | | | | | | | | | | | | | | | | | | |
Net asset value, end of year | | $ | 9.91 | | | $ | 10.27 | | | $ | 10.20 | | | $ | 10.67 | | | $ | 10.75 | |
| | | | | | | | | | | | | | | | | | | | |
|
Total Return(c) | |
Based on net asset value | | | (0.79 | )% | | | 3.31 | % | | | 0.05 | % | | | 2.61 | % | | | 3.18 | % |
| | | | | | | | | | | | | | | | | | | | |
|
Ratios to Average Net Assets | |
Total expenses | | | 0.79 | % | | | 0.67 | % | | | 0.82 | % | | | 0.69 | % | | | 0.68 | % |
| | | | | | | | | | | | | | | | | | | | |
Total expenses after fees waived and/or reimbursed and paid indirectly | | | 0.68 | % | | | 0.64 | % | | | 0.81 | % | | | 0.69 | % | | | 0.68 | % |
| | | | | | | | | | | | | | | | | | | | |
Net investment income | | | 2.42 | % | | | 2.63 | % | | | 2.26 | % | | | 2.12 | % | | | 2.71 | % |
| | | | | | | | | | | | | | | | | | | | |
|
Supplemental Data | |
Net assets, end of year (000) | | $ | 4,792 | | | $ | 6,868 | | | $ | 7,507 | | | $ | 7,455 | | | $ | 6,791 | |
| | | | | | | | | | | | | | | | | | | | |
Portfolio turnover rate(d) | | | 301 | % | | | 277 | % | | | 315 | % | | | 283 | % | | | 296 | % |
| | | | | | | | | | | | | | | | | | | | |
| (a) | Based on average shares outstanding. |
| (b) | Distributions for annual periods determined in accordance with U.S. federal income tax regulations. |
| (c) | Where applicable, assumes the reinvestment of distributions. |
| (d) | Includes mortgage dollar roll transactions (“MDRs”). Additional information regarding portfolio turnover rate is as follows: |
| | | | | | | | | | | | | | | | | | | | | | | | | | | | | | | | | | | | | | | | |
| | | Year Ended May 31, | |
| | | 2018 | | | | | | 2017 | | | | | | 2016 | | | | | | 2015 | | | | | | 2014 | | | | |
Portfolio turnover rate (excluding MDRs) | | | 164 | % | | | | | | | 175 | % | | | | | | | 115 | % | | | | | | | 80 | % | | | | | | | 137 | % | | | | |
| | | | | | | | | | | | | | | | | | | | | | | | | | | | | | | | | | | | | | | | |
See notes to financial statements.
| | |
| 38 | | 2018 BLACKROCK ANNUAL REPORTTO SHAREHOLDERS |
Financial Highlights (continued)
(For a share outstanding throughout each period)
| | | | | | | | | | | | | | | | | | | | |
| | | FDP BlackRock CoreAlpha Bond Fund (continued) | |
| | | Investor A | |
| | | Year Ended May 31, | |
| | | 2018 | | | 2017 | | | 2016 | | | 2015 | | | 2014 | |
Net asset value, beginning of year | | $ | 10.28 | | | $ | 10.20 | | | $ | 10.67 | | | $ | 10.76 | | | $ | 10.71 | |
| | | | | | | | | | | | | | | | | | | | |
Net investment income(a) | | | 0.22 | | | | 0.24 | | | | 0.21 | | | | 0.20 | | | | 0.26 | |
Net realized and unrealized gain (loss) | | | (0.33 | ) | | | 0.08 | | | | (0.25 | ) | | | 0.04 | | | | 0.06 | |
| | | | | | | | | | | | | | | | | | | | |
Net increase (decrease) from investment operations | | | (0.11 | ) | | | 0.32 | | | | (0.04 | ) | | | 0.24 | | | | 0.32 | |
| | | | | | | | | | | | | | | | | | | | |
| Distributions(b) | |
From net investment income | | | (0.16 | ) | | | (0.14 | ) | | | (0.20 | ) | | | (0.20 | ) | | | (0.26 | ) |
From net realized gain | | | — | | | | — | | | | (0.23 | ) | | | (0.13 | ) | | | (0.01 | ) |
From return of capital | | | (0.10 | ) | | | (0.10 | ) | | | — | | | | — | | | | — | |
| | | | | | | | | | | | | | | | | | | | |
Total distributions | | | (0.26 | ) | | | (0.24 | ) | | | (0.43 | ) | | | (0.33 | ) | | | (0.27 | ) |
| | | | | | | | | | | | | | | | | | | | |
Net asset value, end of year | | $ | 9.91 | | | $ | 10.28 | | | $ | 10.20 | | | $ | 10.67 | | | $ | 10.76 | |
| | | | | | | | | | | | | | | | | | | | |
|
Total Return(c) | |
Based on net asset value | | | (1.13 | )% | | | 3.16 | % | | | (0.20 | )% | | | 2.26 | % | | | 3.03 | % |
| | | | | | | | | | | | | | | | | | | | |
|
Ratios to Average Net Assets | |
Total expenses | | | 1.04 | % | | | 0.92 | % | | | 1.07 | % | | | 0.94 | % | | | 0.93 | % |
| | | | | | | | | | | | | | | | | | | | |
Total expenses after fees waived and/or reimbursed and paid indirectly | | | 0.92 | % | | | 0.89 | % | | | 1.06 | % | | | 0.94 | % | | | 0.93 | % |
| | | | | | | | | | | | | | | | | | | | |
Net investment income | | | 2.18 | % | | | 2.38 | % | | | 2.01 | % | | | 1.87 | % | | | 2.46 | % |
| | | | | | | | | | | | | | | | | | | | |
|
Supplemental Data | |
Net assets, end of year (000) | | $ | 62,904 | | | $ | 95,020 | | | $ | 86,870 | | | $ | 97,067 | | | $ | 86,986 | |
| | | | | | | | | | | | | | | | | | | | |
Portfolio turnover rate(d) | | | 301 | % | | | 277 | % | | | 315 | % | | | 283 | % | | | 296 | % |
| | | | | | | | | | | | | | | | | | | | |
| (a) | Based on average shares outstanding. |
| (b) | Distributions for annual periods determined in accordance with U.S. federal income tax regulations. |
| (c) | Where applicable, excludes the effects of any sales charges and assumes the reinvestment of distributions. |
| (d) | Includes MDRs. Additional information regarding portfolio turnover rate is as follows: |
| | | | | | | | | | | | | | | | | | | | | | | | | | | | | | | | | | | | | | | | |
| | | Year Ended May 31, | |
| | | 2018 | | | | | | 2017 | | | | | | 2016 | | | | | | 2015 | | | | | | 2014 | | | | |
Portfolio turnover rate (excluding MDRs) | | | 164 | % | | | | | | | 175 | % | | | | | | | 115 | % | | | | | | | 80 | % | | | | | | | 137 | % | | | | |
| | | | | | | | | | | | | | | | | | | | | | | | | | | | | | | | | | | | | | | | |
See notes to financial statements.
Financial Highlights (continued)
(For a share outstanding throughout each period)
| | | | | | | | | | | | | | | | | | | | |
| | | FDP BlackRock CoreAlpha Bond Fund (continued) | |
| | | Investor C | |
| | | Year Ended May 31, | |
| | | 2018 | | | 2017 | | | 2016 | | | 2015 | | | 2014 | |
Net asset value, beginning of year | | $ | 10.28 | | | $ | 10.20 | | | $ | 10.67 | | | $ | 10.76 | | | $ | 10.71 | |
| | | | | | | | | | | | | | | | | | | | |
Net investment income(a) | | | 0.17 | | | | 0.19 | | | | 0.15 | | | | 0.14 | | | | 0.20 | |
Net realized and unrealized gain (loss) | | | (0.34 | ) | | | 0.07 | | | | (0.24 | ) | | | 0.04 | | | | 0.06 | |
| | | | | | | | | | | | | | | | | | | | |
Net increase (decrease) from investment operations | | | (0.17 | ) | | | 0.26 | | | | (0.09 | ) | | | 0.18 | | | | 0.26 | |
| | | | | | | | | | | | | | | | | | | | |
| Distributions(b) | |
From net investment income | | | (0.12 | ) | | | (0.11 | ) | | | (0.15 | ) | | | (0.14 | ) | | | (0.20 | ) |
From net realized gain | | | — | | | | — | | | | (0.23 | ) | | | (0.13 | ) | | | (0.01 | ) |
From return of capital | | | (0.08 | ) | | | (0.07 | ) | | | — | | | | — | | | | — | |
| | | | | | | | | | | | | | | | | | | | |
Total distributions | | | (0.20 | ) | | | (0.18 | ) | | | (0.38 | ) | | | (0.27 | ) | | | (0.21 | ) |
| | | | | | | | | | | | | | | | | | | | |
Net asset value, end of year | | $ | 9.91 | | | $ | 10.28 | | | $ | 10.20 | | | $ | 10.67 | | | $ | 10.76 | |
| | | | | | | | | | | | | | | | | | | | |
|
Total Return(c) | |
Based on net asset value | | | (1.68 | )% | | | 2.58 | % | | | (0.76 | )% | | | 1.69 | % | | | 2.45 | % |
| | | | | | | | | | | | | | | | | | | | |
|
Ratios to Average Net Assets | |
Total expenses | | | 1.59 | % | | | 1.48 | % | | | 1.63 | % | | | 1.50 | % | | | 1.49 | % |
| | | | | | | | | | | | | | | | | | | | |
Total expenses after fees waived and/or reimbursed and paid indirectly | | | 1.47 | % | | | 1.45 | % | | | 1.62 | % | | | 1.50 | % | | | 1.49 | % |
| | | | | | | | | | | | | | | | | | | | |
Net investment income | | | 1.63 | % | | | 1.84 | % | | | 1.45 | % | | | 1.31 | % | | | 1.90 | % |
| | | | | | | | | | | | | | | | | | | | |
|
Supplemental Data | |
Net assets, end of year (000) | | $ | 34,474 | | | $ | 69,120 | | | $ | 125,490 | | | $ | 142,617 | | | $ | 138,904 | |
| | | | | | | | | | | | | | | | | | | | |
Portfolio turnover rate(d) | | | 301 | % | | | 277 | % | | | 315 | % | | | 283 | % | | | 296 | % |
| | | | | | | | | | | | | | | | | | | | |
| (a) | Based on average shares outstanding. |
| (b) | Distributions for annual periods determined in accordance with U.S. federal income tax regulations. |
| (c) | Where applicable, excludes the effects of any sales charges and assumes the reinvestment of distributions. |
| (d) | Includes MDRs. Additional information regarding portfolio turnover rate is as follows: |
| | | | | | | | | | | | | | | | | | | | | | | | | | | | | | | | | | | | | | | | |
| | | Year Ended May 31, | |
| | | 2018 | | | | | | 2017 | | | | | | 2016 | | | | | | 2015 | | | | | | 2014 | | | | |
Portfolio turnover rate (excluding MDRs) | | | 164 | % | | | | | | | 175 | % | | | | | | | 115 | % | | | | | | | 80 | % | | | | | | | 137 | % | | | | |
| | | | | | | | | | | | | | | | | | | | | | | | | | | | | | | | | | | | | | | | |
See notes to financial statements.
| | |
| 40 | | 2018 BLACKROCK ANNUAL REPORTTO SHAREHOLDERS |
Financial Highlights (continued)
(For a share outstanding throughout each period)
| | | | | | | | | | | | | | | | | | | | |
| | | FDP BlackRock Equity Dividend Fund | |
| | | Institutional | |
| | | Year Ended May 31, | |
| | | 2018 | | | 2017 | | | 2016 | | | 2015 | | | 2014 | |
Net asset value, beginning of year | | $ | 16.76 | | | $ | 15.12 | | | $ | 16.68 | | | $ | 15.78 | | | $ | 13.36 | |
| | | | | | | | | | | | | | | | | | | | |
Net investment income(a) | | | 0.22 | | | | 0.22 | | | | 0.23 | | | | 0.18 | | | | 0.21 | |
Net realized and unrealized gain (loss) | | | 2.07 | | | | 2.33 | | | | (1.47 | ) | | | 0.99 | | | | 2.30 | |
| | | | | | | | | | | | | | | | | | | | |
Net increase (decrease) from investment operations | | | 2.29 | | | | 2.55 | | | | (1.24 | ) | | | 1.17 | | | | 2.51 | |
| | | | | | | | | | | | | | | | | | | | |
| Distributions(b) | |
From net investment income | | | (0.11 | ) | | | (0.40 | ) | | | (0.32 | ) | | | (0.27 | ) | | | (0.09 | ) |
From net realized gain | | | (2.64 | ) | | | (0.51 | ) | | | — | | | | — | | | | — | |
| | | | | | | | | | | | | | | | | | | | |
Total distributions | | | (2.75 | ) | | | (0.91 | ) | | | (0.32 | ) | | | (0.27 | ) | | | (0.09 | ) |
| | | | | | | | | | | | | | | | | | | | |
Net asset value, end of year | | $ | 16.30 | | | $ | 16.76 | | | $ | 15.12 | | | $ | 16.68 | | | $ | 15.78 | |
| | | | | | | | | | | | | | | | | | | | |
|
Total Return(c) | |
Based on net asset value | | | 14.13 | % | | | 17.03 | % | | | (7.54 | )% | | | 7.49 | % | | | 18.89 | % |
| | | | | | | | | | | | | | | | | | | | |
|
Ratios to Average Net Assets | |
Total expenses | | | 1.06 | % | | | 0.99 | % | | | 1.20 | % | | | 1.00 | % | | | 0.98 | % |
| | | | | | | | | | | | | | | | | | | | |
Total expenses after fees waived and/or reimbursed and paid indirectly | | | 0.98 | % | | | 0.94 | % | | | 1.20 | % | | | 1.00 | % | | | 0.98 | % |
| | | | | | | | | | | | | | | | | | | | |
Net investment income | | | 1.30 | % | | | 1.36 | % | | | 1.54 | % | | | 1.13 | % | | | 1.43 | % |
| | | | | | | | | | | | | | | | | | | | |
|
Supplemental Data | |
Net assets, end of year (000) | | $ | 3,634 | | | $ | 4,522 | | | $ | 5,376 | | | $ | 5,890 | | | $ | 5,373 | |
| | | | | | | | | | | | | | | | | | | | |
Portfolio turnover rate | | | 81 | % | | | 14 | % | | | 15 | % | | | 19 | % | | | 14 | % |
| | | | | | | | | | | | | | | | | | | | |
| (a) | Based on average shares outstanding. |
| (b) | Distributions for annual periods determined in accordance with U.S. federal income tax regulations. |
| (c) | Where applicable, assumes the reinvestment of distributions. |
See notes to financial statements.
Financial Highlights (continued)
(For a share outstanding throughout each period)
| | | | | | | | | | | | | | | | | | | | |
| | | FDP BlackRock Equity Dividend Fund (continued) | |
| | | Investor A | |
| | | Year Ended May 31, | |
| | | 2018 | | | 2017 | | | 2016 | | | 2015 | | | 2014 | |
Net asset value, beginning of year | | $ | 16.60 | | | $ | 14.98 | | | $ | 16.53 | | | $ | 15.63 | | | $ | 13.26 | |
| | | | | | | | | | | | | | | | | | | | |
Net investment income(a) | | | 0.17 | | | | 0.18 | | | | 0.19 | | | | 0.14 | | | | 0.17 | |
Net realized and unrealized gain (loss) | | | 2.06 | | | | 2.31 | | | | (1.46 | ) | | | 0.97 | | | | 2.28 | |
| | | | | | | | | | | | | | | | | | | | |
Net increase (decrease) from investment operations | | | 2.23 | | | | 2.49 | | | | (1.27 | ) | | | 1.11 | | | | 2.45 | |
| | | | | | | | | | | | | | | | | | | | |
| Distributions(b) | |
From net investment income | | | (0.07 | ) | | | (0.36 | ) | | | (0.28 | ) | | | (0.21 | ) | | | (0.08 | ) |
From net realized gain | | | (2.64 | ) | | | (0.51 | ) | | | — | | | | — | | | | — | |
| | | | | | | | | | | | | | | | | | | | |
Total distributions | | | (2.71 | ) | | | (0.87 | ) | | | (0.28 | ) | | | (0.21 | ) | | | (0.08 | ) |
| | | | | | | | | | | | | | | | | | | | |
Net asset value, end of year | | $ | 16.12 | | | $ | 16.60 | | | $ | 14.98 | | | $ | 16.53 | | | $ | 15.63 | |
| | | | | | | | | | | | | | | | | | | | |
|
Total Return(c) | |
Based on net asset value | | | 13.89 | % | | | 16.77 | % | | | (7.78 | )% | | | 7.19 | % | | | 18.56 | % |
| | | | | | | | | | | | | | | | | | | | |
|
Ratios to Average Net Assets | |
Total expenses | | | 1.31 | % | | | 1.24 | % | | | 1.45 | % | | | 1.25 | % | | | 1.22 | % |
| | | | | | | | | | | | | | | | | | | | |
Total expenses after fees waived and/or reimbursed and paid indirectly | | | 1.23 | % | | | 1.19 | % | | | 1.45 | % | | | 1.25 | % | | | 1.22 | % |
| | | | | | | | | | | | | | | | | | | | |
Net investment income | | | 1.04 | % | | | 1.11 | % | | | 1.29 | % | | | 0.88 | % | | | 1.19 | % |
| | | | | | | | | | | | | | | | | | | | |
|
Supplemental Data | |
Net assets, end of year (000) | | $ | 48,647 | | | $ | 61,471 | | | $ | 53,623 | | | $ | 60,815 | | | $ | 54,119 | |
| | | | | | | | | | | | | | | | | | | | |
Portfolio turnover rate | | | 81 | % | | | 14 | % | | | 15 | % | | | 19 | % | | | 14 | % |
| | | | | | | | | | | | | | | | | | | | |
| (a) | Based on average shares outstanding. |
| (b) | Distributions for annual periods determined in accordance with U.S. federal income tax regulations. |
| (c) | Where applicable, excludes the effects of any sales charges and assumes the reinvestment of distributions. |
See notes to financial statements.
| | |
| 42 | | 2018 BLACKROCK ANNUAL REPORTTO SHAREHOLDERS |
Financial Highlights (continued)
(For a share outstanding throughout each period)
| | | | | | | | | | | | | | | | | | | | |
| | | FDP BlackRock Equity Dividend Fund (continued) | |
| | | Investor C | |
| | | Year Ended May 31, | |
| | | 2018 | | | 2017 | | | 2016 | | | 2015 | | | 2014 | |
Net asset value, beginning of year | | $ | 16.29 | | | $ | 14.71 | | | $ | 16.24 | | | $ | 15.37 | | | $ | 13.09 | |
| | | | | | | | | | | | | | | | | | | | |
Net investment income(a) | | | 0.05 | | | | 0.06 | | | | 0.08 | | | | 0.02 | | | | 0.06 | |
Net realized and unrealized gain (loss) | | | 2.01 | | | | 2.27 | | | | (1.45 | ) | | | 0.96 | | | | 2.26 | |
| | | | | | | | | | | | | | | | | | | | |
Net increase (decrease) from investment operations | | | 2.06 | | | | 2.33 | | | | (1.37 | ) | | | 0.98 | | | | 2.32 | |
| | | | | | | | | | | | | | | | | | | | |
| Distributions(b) | |
From net investment income | | | — | | | | (0.24 | ) | | | (0.16 | ) | | | (0.11 | ) | | | (0.04 | ) |
From net realized gain | | | (2.64 | ) | | | (0.51 | ) | | | — | | | | — | | | | — | |
| | | | | | | | | | | | | | | | | | | | |
Total distributions | | | (2.64 | ) | | | (0.75 | ) | | | (0.16 | ) | | | (0.11 | ) | | | (0.04 | ) |
| | | | | | | | | | | | | | | | | | | | |
Net asset value, end of year | | $ | 15.71 | | | $ | 16.29 | | | $ | 14.71 | | | $ | 16.24 | | | $ | 15.37 | |
| | | | | | | | | | | | | | | | | | | | |
|
Total Return(c) | |
Based on net asset value | | | 13.03 | % | | | 15.90 | % | | | (8.51 | )% | | | 6.40 | % | | | 17.76 | % |
| | | | | | | | | | | | | | | | | | | | |
|
Ratios to Average Net Assets | |
Total expenses | | | 2.06 | % | | | 2.01 | % | | | 2.21 | % | | | 2.01 | % | | | 1.98 | % |
| | | | | | | | | | | | | | | | | | | | |
Total expenses after fees waived and/or reimbursed and paid indirectly | | | 1.99 | % | | | 1.95 | % | | | 2.21 | % | | | 2.01 | % | | | 1.98 | % |
| | | | | | | | | | | | | | | | | | | | |
Net investment income | | | 0.28 | % | | | 0.37 | % | | | 0.53 | % | | | 0.12 | % | | | 0.41 | % |
| | | | | | | | | | | | | | | | | | | | |
|
Supplemental Data | |
Net assets, end of year (000) | | $ | 21,217 | | | $ | 38,081 | | | $ | 77,352 | | | $ | 92,568 | | | $ | 92,201 | |
| | | | | | | | | | | | | | | | | | | | |
Portfolio turnover rate | | | 81 | % | | | 14 | % | | | 15 | % | | | 19 | % | | | 14 | % |
| | | | | | | | | | | | | | | | | | | | |
| (a) | Based on average shares outstanding. |
| (b) | Distributions for annual periods determined in accordance with U.S. federal income tax regulations. |
| (c) | Where applicable, excludes the effects of any sales charges and assumes the reinvestment of distributions. |
See notes to financial statements.
Financial Highlights (continued)
(For a share outstanding throughout each period)
| | | | | | | | | | | | | | | | | | | | |
| | | FDP BlackRock International Fund | |
| | | Institutional | |
| | | Year Ended May 31, | |
| | | 2018 | | | 2017 | | | 2016 | | | 2015 | | | 2014 | |
Net asset value, beginning of year | | $ | 12.98 | | | $ | 11.28 | | | $ | 13.05 | | | $ | 13.32 | | | $ | 11.77 | |
| | | | | | | | | | | | | | | | | | | | |
Net investment income(a) | | | 0.12 | | | | 0.16 | | | | 0.16 | | | | 0.17 | | | | 0.28 | |
Net realized and unrealized gain (loss) | | | 0.40 | | | | 1.70 | | | | (1.78 | ) | | | (0.18 | ) | | | 1.45 | |
| | | | | | | | | | | | | | | | | | | | |
Net increase (decrease) from investment operations | | | 0.52 | | | | 1.86 | | | | (1.62 | ) | | | (0.01 | ) | | | 1.73 | |
| | | | | | | | | | | | | | | | | | | | |
Distributions from net investment income(b) | | | (0.18 | ) | | | (0.16 | ) | | | (0.15 | ) | | | (0.26 | ) | | | (0.18 | ) |
| | | | | | | | | | | | | | | | | | | | |
Net asset value, end of year | | $ | 13.32 | | | $ | 12.98 | | | $ | 11.28 | | | $ | 13.05 | | | $ | 13.32 | |
| | | | | | | | | | | | | | | | | | | | |
|
Total Return(c) | |
Based on net asset value | | | 4.02 | % | | | 16.74 | % | | | (12.57 | )% | | | (0.04 | )% | | | 14.88 | % |
| | | | | | | | | | | | | | | | | | | | |
|
Ratios to Average Net Assets | |
Total expenses | | | 1.38 | % | | | 1.30 | % | | | 1.44 | % | | | 1.26 | % | | | 1.23 | % |
| | | | | | | | | | | | | | | | | | | | |
Total expenses after fees waived and/or reimbursed and paid indirectly | | | 1.26 | % | | | 1.20 | % | | | 1.34 | % | | | 1.26 | % | | | 1.23 | % |
| | | | | | | | | | | | | | | | | | | | |
Net investment income | | | 0.86 | % | | | 1.40 | % | | | 1.37 | % | | | 1.32 | % | | | 2.21 | % |
| | | | | | | | | | | | | | | | | | | | |
|
Supplemental Data | |
Net assets, end of year (000) | | $ | 4,006 | | | $ | 5,311 | | | $ | 5,817 | | | $ | 6,478 | | | $ | 5,961 | |
| | | | | | | | | | | | | | | | | | | | |
Portfolio turnover rate | | | 144 | % | | | 30 | % | | | 37 | % | | | 27 | % | | | 29 | % |
| | | | | | | | | | | | | | | | | | | | |
| (a) | Based on average shares outstanding. |
| (b) | Distributions for annual periods determined in accordance with U.S. federal income tax regulations. |
| (c) | Where applicable, assumes the reinvestment of distributions. |
See notes to financial statements.
| | |
| 44 | | 2018 BLACKROCK ANNUAL REPORTTO SHAREHOLDERS |
Financial Highlights (continued)
(For a share outstanding throughout each period)
| | | | | | | | | | | | | | | | | | | | |
| | | FDP BlackRock International Fund (continued) | |
| | | Investor A | |
| | | Year Ended May 31, | |
| | | 2018 | | | 2017 | | | 2016 | | | 2015 | | | 2014 | |
Net asset value, beginning of year | | $ | 12.90 | | | $ | 11.20 | | | $ | 12.97 | | | $ | 13.24 | | | $ | 11.70 | |
| | | | | | | | | | | | | | | | | | | | |
Net investment income(a) | | | 0.08 | | | | 0.13 | | | | 0.13 | | | | 0.14 | | | | 0.25 | |
Net realized and unrealized gain (loss) | | | 0.40 | | | | 1.70 | | | | (1.78 | ) | | | (0.17 | ) | | | 1.45 | |
| | | | | | | | | | | | | | | | | | | | |
Net increase (decrease) from investment operations | | | 0.48 | | | | 1.83 | | | | (1.65 | ) | | | (0.03 | ) | | | 1.70 | |
| | | | | | | | | | | | | | | | | | | | |
Distributions from net investment income(b) | | | (0.16 | ) | | | (0.13 | ) | | | (0.12 | ) | | | (0.24 | ) | | | (0.16 | ) |
| | | | | | | | | | | | | | | | | | | | |
Net asset value, end of year | | $ | 13.22 | | | $ | 12.90 | | | $ | 11.20 | | | $ | 12.97 | | | $ | 13.24 | |
| | | | | | | | | | | | | | | | | | | | |
|
Total Return(c) | |
Based on net asset value | | | 3.71 | % | | | 16.55 | % | | | (12.85 | )% | | | (0.25 | )% | | | 14.67 | % |
| | | | | | | | | | | | | | | | | | | | |
|
Ratios to Average Net Assets | |
Total expenses | | | 1.63 | % | | | 1.55 | % | | | 1.68 | % | | | 1.51 | % | | | 1.48 | % |
| | | | | | | | | | | | | | | | | | | | |
Total expenses after fees waived and/or reimbursed and paid indirectly | | | 1.51 | % | | | 1.45 | % | | | 1.58 | % | | | 1.51 | % | | | 1.48 | % |
| | | | | | | | | | | | | | | | | | | | |
Net investment income | | | 0.59 | % | | | 1.15 | % | | | 1.12 | % | | | 1.09 | % | | | 2.00 | % |
| | | | | | | | | | | | | | | | | | | | |
|
Supplemental Data | |
Net assets, end of year (000) | | $ | 53,715 | | | $ | 75,800 | | | $ | 60,141 | | | $ | 70,702 | | | $ | 62,636 | |
| | | | | | | | | | | | | | | | | | | | |
Portfolio turnover rate | | | 144 | % | | | 30 | % | | | 37 | % | | | 27 | % | | | 29 | % |
| | | | | | | | | | | | | | | | | | | | |
| (a) | Based on average shares outstanding. |
| (b) | Distributions for annual periods determined in accordance with U.S. federal income tax regulations. |
| (c) | Where applicable, excludes the effects of any sales charges and assumes the reinvestment of distributions. |
See notes to financial statements.
Financial Highlights (continued)
(For a share outstanding throughout each period)
| | | | | | | | | | | | | | | | | | | | |
| | | FDP BlackRock International Fund (continued) | |
| | | Investor C | |
| | | Year Ended May 31, | |
| | | 2018 | | | 2017 | | | 2016 | | | 2015 | | | 2014 | |
Net asset value, beginning of year | | $ | 12.75 | | | $ | 11.06 | | | $ | 12.81 | | | $ | 13.08 | | | $ | 11.57 | |
| | | | | | | | | | | | | | | | | | | | |
Net investment income (loss)(a) | | | (0.03 | ) | | | 0.03 | | | | 0.04 | | | | 0.04 | | | | 0.14 | |
Net realized and unrealized gain (loss) | | | 0.40 | | | | 1.70 | | | | (1.77 | ) | | | (0.17 | ) | | | 1.44 | |
| | | | | | | | | | | | | | | | | | | | |
Net increase (decrease) from investment operations | | | 0.37 | | | | 1.73 | | | | (1.73 | ) | | | (0.13 | ) | | | 1.58 | |
| | | | | | | | | | | | | | | | | | | | |
Distributions from net investment income(b) | | | — | | | | (0.04 | ) | | | (0.02 | ) | | | (0.14 | ) | | | (0.07 | ) |
| | | | | | | | | | | | | | | | | | | | |
Net asset value, end of year | | $ | 13.12 | | | $ | 12.75 | | | $ | 11.06 | | | $ | 12.81 | | | $ | 13.08 | |
| | | | | | | | | | | | | | | | | | | | |
|
Total Return(c) | |
Based on net asset value | | | 2.90 | % | | | 15.67 | % | | | (13.52 | )% | | | (0.97 | )% | | | 13.72 | % |
| | | | | | | | | | | | | | | | | | | | |
|
Ratios to Average Net Assets | |
Total expenses | | | 2.39 | % | | | 2.31 | % | | | 2.44 | % | | | 2.26 | % | | | 2.24 | % |
| | | | | | | | | | | | | | | | | | | | |
Total expenses after fees waived and/or reimbursed and paid indirectly | | | 2.27 | % | | | 2.21 | % | | | 2.34 | % | | | 2.26 | % | | | 2.24 | % |
| | | | | | | | | | | | | | | | | | | | |
Net investment income (loss) | | | (0.26 | )% | | | 0.29 | % | | | 0.34 | % | | | 0.29 | % | | | 1.16 | % |
| | | | | | | | | | | | | | | | | | | | |
|
Supplemental Data | |
Net assets, end of year (000) | | $ | 23,456 | | | $ | 46,449 | | | $ | 88,002 | | | $ | 109,093 | | | $ | 108,426 | |
| | | | | | | | | | | | | | | | | | | | |
Portfolio turnover rate | | | 144 | % | | | 30 | % | | | 37 | % | | | 27 | % | | | 29 | % |
| | | | | | | | | | | | | | | | | | | | |
| (a) | Based on average shares outstanding. |
| (b) | Distributions for annual periods determined in accordance with U.S. federal income tax regulations. |
| (c) | Where applicable, excludes the effects of any sales charges and assumes the reinvestment of distributions. |
See notes to financial statements.
| | |
| 46 | | 2018 BLACKROCK ANNUAL REPORTTO SHAREHOLDERS |
Notes to Financial Statements
FDP Series, Inc. (the “Corporation”) is registered under the Investment Company Act of 1940, as amended (the “1940 Act”), as open-end management investment company. The corporation is organized as a Maryland corporation. Each fund is a series of the Corporation.
The following are referred to herein collectively as the “Funds” or individually as a “Fund”:
| | | | |
| Fund Name | | Herein Referred To As | | Diversification
Classification |
FDP BlackRock Capital Appreciation Fund | | Capital Appreciation Fund | | Diversified |
FDP BlackRock CoreAlpha Bond Fund | | CoreAlpha Bond Fund | | Diversified |
FDP BlackRock Equity Dividend Fund | | Equity Dividend Fund | | Diversified |
FDP BlackRock International Fund | | International Fund | | Diversified |
Each Fund offers multiple classes of shares. All classes of shares have identical voting, dividend, liquidation and other rights and are subject to the same terms and conditions, except that certain classes bear expenses related to the shareholder servicing and distribution of such shares, and may be subject to a contingent deferred sales charge (“CDSC”). Each class has exclusive voting rights with respect to matters relating to its shareholder servicing and distribution expenditures
| | | | | | | | |
| Share Class | | Initial Sales Charge | | CDSC | | | Conversion Privilege |
Institutional Shares | | No | | | No | | | None |
Investor A Shares | | Yes | | | No | (a) | | None |
Investor C Shares | | No | | | Yes | | | None |
| | (a) | Investor A Shares may be subject to a contingent deferred sales charge (“CDSC”) for certain redemptions where no initial sales charge was paid at the time of purchase. | |
On September 12, 2017, the Board of Directors of the Corporation (the “Board”) approved a proposal to change the name of the Capital Appreciation Fund from “FDP BlackRock Janus Growth Fund” and certain changes to the Fund’s investment objective and strategies. The Board also approved the termination of the Fund’s sub-advisory agreement with Janus Capital Management LLC. In addition, the Fund’s Manager determined to change the benchmark index against which the Fund compares its performance. All of these changes became effective on November 28, 2017.
On September 12, 2017, the Board approved a proposal to change the name of the Equity Dividend Fund from “FDP BlackRock Invesco Value Fund” and certain changes to the Fund’s investment objective and strategies. The Board also approved the termination of the Fund’s sub-advisory agreement with Invesco Advisers, Inc. All of these changes became effective on November 28, 2017.
On September 12, 2017, the Board approved a proposal to change the name of the International Fund from “FDP BlackRock MFS Research International Fund” and certain changes to the Fund’s investment objective and strategies. The Board also approved the termination of the Fund’s sub-advisory agreement with Massachusetts Financial Services Company. In addition, the Fund’s Manager determined to remove a benchmark index against which the Fund compares its performance. All of these changes became effective on November 28, 2017.
The Funds, together with certain other registered investment companies advised by BlackRock Advisors, LLC (the “Manager”) or its affiliates, are included in a complex of open-end funds referred to as the Equity-Bond Complex.
| 2. | SIGNIFICANT ACCOUNTING POLICIES |
The financial statements are prepared in conformity with accounting principles generally accepted in the United States of America (“U.S. GAAP”), which may require management to make estimates and assumptions that affect the reported amounts of assets and liabilities in the financial statements, disclosure of contingent assets and liabilities at the date of the financial statements and the reported amounts of increases and decreases in net assets from operations during the reporting period. Actual results could differ from those estimates. Each Fund is considered an investment company under U.S. GAAP and follows the accounting and reporting guidance applicable to investment companies. Below is a summary of significant accounting policies:
Investment Transactions and Income Recognition: For financial reporting purposes, investment transactions are recorded on the dates the transactions are entered into (the “trade dates”). Realized gains and losses on investment transactions are determined on the identified cost basis. Dividend income is recorded on the ex-dividend date. Dividends from foreign securities where the ex-dividend date may have passed are subsequently recorded when the Funds are informed of the ex-dividend date. Under the applicable foreign tax laws, a withholding tax at various rates may be imposed on capital gains, dividends and interest. Upon notification from issuers, a portion of the dividend income received from a real estate investment trust may be redesignated as a reduction of cost of the related investment and/or realized gain. Interest income, including amortization and accretion of premiums and discounts on debt securities, is recognized on an accrual basis. Income, expenses and realized and unrealized gains and losses are allocated daily to each class based on its relative net assets.
Foreign Currency Translation: Each Fund’s books and records are maintained in U.S. dollars. Securities and other assets and liabilities denominated in foreign currencies are translated into U.S. dollars using exchange rates determined as of the close of trading on the New York Stock Exchange (“NYSE”). Purchases and sales of investments are recorded at the rates of exchange prevailing on the respective dates of such transactions. Generally, when the U.S. dollar rises in value against a foreign currency, the investments denominated in that currency will lose value; the opposite effect occurs if the U.S. dollar falls in relative value.
Each Fund does not isolate the portion of the results of operations arising as a result of changes in the exchange rates from the changes in the market prices of investments held or sold for financial reporting purposes. Accordingly, the effects of changes in exchange rates on investments are not segregated in the Statements of
| | | | |
| NOTESTO FINANCIAL STATEMENTS | | | 47 | |
Notes to Financial Statements (continued)
Operations from the effects of changes in market prices of those investments, but are included as a component of net realized and unrealized gain (loss) from investments. Each Fund reports realized currency gains (losses) on foreign currency related transactions as components of net realized gain (loss) for financial reporting purposes, whereas such components are generally treated as ordinary income for U.S. federal income tax purposes.
Segregation and Collateralization: In cases where a Fund enters into certain investments (e.g., dollar rolls, To-be-announced (“TBA”) sale commitments, futures contracts, forward foreign currency exchange contracts, and swaps.) that would be treated as “senior securities” for 1940 Act purposes, a Fund may segregate or designate on its books and records cash or liquid assets having a market value at least equal to the amount of its future obligations under such investments. Doing so allows the investment to be excluded from treatment as a “senior security.” Furthermore, if required by an exchange or counterparty agreement, the Funds may be required to deliver/deposit cash and/or securities to/with an exchange, or broker-dealer or custodian as collateral for certain investments or obligations.
Distributions: For Capital Appreciation Fund, Equity Dividend Fund and International Fund, distributions paid by the Funds are recorded on the ex-dividend date. For CoreAlpha Bond Fund, distributions from net investment income are declared daily and paid monthly. Distributions of capital gains are recorded on the ex-dividend date and made at least annually. The portion of distributions, if any, that exceeds a fund’s current and accumulated earnings and profits, as measured on a tax basis, constitute a non-taxable return of capital. The character and timing of distributions are determined in accordance with U.S. federal income tax regulations, which may differ from U.S. GAAP.
Recent Accounting Standards: In March 2017, the Financial Accounting Standards Board issued Accounting Standards Update “Premium Amortization of Purchased Callable Debt Securities” which amends the amortization period for certain purchased callable debt securities. Under the new guidance, the premium amortization of purchased callable debt securities that have explicit, non-contingent call features and are callable at fixed prices will be amortized to the earliest call date. The guidance will be applied on a modified retrospective basis and is effective for fiscal years, and their interim periods, beginning after December 15, 2018. Management is currently evaluating the impact of this guidance to the Funds.
Indemnifications: In the normal course of business, a Fund enters into contracts that contain a variety of representations that provide general indemnification. A Fund’s maximum exposure under these arrangements is unknown because it involves future potential claims against a Fund, which cannot be predicted with any certainty.
Other: Expenses directly related to a Fund or its classes are charged to that Fund or the applicable class. Other operating expenses shared by several funds, including other funds managed by the Manager, are prorated among those funds on the basis of relative net assets or other appropriate methods. Expenses directly related to the Funds and other shared expenses prorated to the Funds are allocated daily to each class based on their relative net assets or other appropriate methods.
The Funds have an arrangement with their custodian whereby credits are earned on uninvested cash balances, which could be used to reduce custody fees and/or overdraft charges. The Funds may incur charges on certain uninvested cash balances and overdrafts, subject to certain conditions.
| 3. | INVESTMENT VALUATION AND FAIR VALUE MEASUREMENTS |
Investment Valuation Policies: The Funds’ investments are valued at fair value (also referred to as “market value” within the financial statements) as of the close of trading on the NYSE (generally 4:00 p.m., Eastern time). U.S. GAAP defines fair value as the price the Funds would receive to sell an asset or pay to transfer a liability in an orderly transaction between market participants at the measurement date. The Funds determine the fair values of their financial instruments using various independent dealers or pricing services under policies approved by the Board. The BlackRock Global Valuation Methodologies Committee (the “Global Valuation Committee”) is the committee formed by management to develop global pricing policies and procedures and to oversee the pricing function for all financial instruments.
Fair Value Inputs and Methodologies: The following methods and inputs are used to establish the fair value of each Fund’s assets and liabilities:
| | • | | Equity investments traded on a recognized securities exchange are valued at the official closing price each day, if available. For equity investments traded on more than one exchange, the official closing price on the exchange where the stock is primarily traded is used. Equity investments traded on a recognized exchange for which there were no sales on that day may be valued at the last available bid (long positions) or ask (short positions) price. |
| | • | | Fixed-income securities for which market quotations are readily available are generally valued using the last available bid prices or current market quotations provided by independent dealers or third party pricing services. Floating rate loan interests are valued at the mean of the bid prices from one or more independent brokers or dealers as obtained from a third party pricing service. Pricing services generally value fixed-income securities assuming orderly transactions of an institutional round lot size, but a fund may hold or transact in such securities in smaller, odd lot sizes. Odd lots may trade at lower prices than institutional round lots. The pricing services may use matrix pricing or valuation models that utilize certain inputs and assumptions to derive values, including transaction data (e.g., recent representative bids and offers), credit quality information, perceived market movements, news, and other relevant information. Certain fixed-income securities, including asset-backed and mortgage related securities may be valued based on valuation models that consider the estimated cash flows of each tranche of the entity, establish a benchmark yield and develop an estimated tranche specific spread to the benchmark yield based on the unique attributes of the tranche. The amortized cost method of valuation may be used with respect to debt obligations with sixty days or less remaining to maturity unless the Manager determines such method does not represent fair value. |
Generally, trading in foreign instruments is substantially completed each day at various times prior to the close of trading on the NYSE. Occasionally, events affecting the values of such instruments may occur between the foreign market close and the close of trading on the NYSE that may not be reflected in the computation of the Funds’ net assets. Each business day, the Funds use a pricing service to assist with the valuation of certain foreign exchange-traded equity securities and foreign exchange-traded and over-the-counter (“OTC”) options (the “Systematic Fair Value Price”). Using current market factors, the Systematic Fair Value Price is designed to value such foreign securities and foreign options at fair value as of the close of trading on the NYSE, which follows the close of the local markets.
| | |
| 48 | | 2018 BLACKROCK ANNUAL REPORTTO SHAREHOLDERS |
Notes to Financial Statements (continued)
| | • | | Municipal investments (including commitments to purchase such investments on a “when-issued” basis) are valued on the basis of prices provided by dealers or pricing services. In determining the value of a particular investment, pricing services may use certain information with respect to transactions in such investments, quotations from dealers, pricing matrixes, market transactions in comparable investments and information with respect to various relationships between investments. |
| | • | | Investments in open-end U.S. mutual funds are valued at net asset value (“NAV”) each business day. |
| | • | | Futures contracts traded on exchanges are valued at their last sale price. |
| | • | | Forward foreign currency exchange contracts are valued at the mean between the bid and ask prices and are determined as of the close of trading on the NYSE. Interpolated values are derived when the settlement date of the contract is an interim date for which quotations are not available. |
| | • | | Swap agreements are valued utilizing quotes received daily by the Funds’ pricing service or through brokers, which are derived using daily swap curves and models that incorporate a number of market data factors, such as discounted cash flows, trades and values of the underlying reference instruments. |
| | • | | TBA commitments are valued on the basis of last available bid prices or current market quotations provided by pricing services. |
If events (e.g., a company announcement, market volatility or a natural disaster) occur that are expected to materially affect the value of such investments, or in the event that the application of these methods of valuation results in a price for an investment that is deemed not to be representative of the market value of such investment, or if a price is not available, the investment will be valued by the Global Valuation Committee, or its delegate, in accordance with a policy approved by the Board as reflecting fair value (“Fair Valued Investments”). The fair valuation approaches that may be used by the Global Valuation Committee will include market approach, income approach and cost approach. Valuation techniques such as discounted cash flow, use of market comparables and matrix pricing are types of valuation approaches and are typically used in determining fair value. When determining the price for Fair Valued Investments, the Global Valuation Committee, or its delegate, seeks to determine the price that each Fund might reasonably expect to receive or pay from the current sale or purchase of that asset or liability in an arm’s-length transaction. Fair value determinations shall be based upon all available factors that the Global Valuation Committee, or its delegate, deems relevant and consistent with the principles of fair value measurement.
The Global Valuation Committee, or its delegate, employs various methods for calibrating valuation approaches for investments where an active market does not exist, including regular due diligence of each Fund’s pricing vendors, regular reviews of key inputs and assumptions, transactional back-testing or disposition analysis to compare unrealized gains and losses to realized gains and losses, reviews of missing or stale prices and large movements in market values and reviews of any market related activity. The pricing of all Fair Valued Investments is subsequently reported to the Board or a committee thereof on a quarterly basis. As a result of the inherent uncertainty in valuation of these investments, the fair values may differ from the values that would have been used had an active market existed.
For investments in equity or debt issued by privately held companies or funds (“Private Company” or collectively, the “Private Companies”) and other Fair Valued Investments, the fair valuation approaches that are used by third party pricing services utilize one or a combination of, but not limited to, the following inputs.
| | |
| | | Standard Inputs Generally Considered By Third Party Pricing Services |
Market approach | | (i) recent market transactions, including subsequent rounds of financing, in the underlying investment or comparable issuers; (ii) recapitalizations and other transactions across the capital structure; and (iii) market multiples of comparable issuers. |
Income approach | | (i) future cash flows discounted to present and adjusted as appropriate for liquidity, credit, and/or market risks; (ii) quoted prices for similar investments or assets in active markets; and (iii) other risk factors, such as interest rates, yield curves, volatilities, prepayment speeds, loss severities, credit risks, recovery rates, liquidation amounts and/or default rates. |
Cost approach | | (i) audited or unaudited financial statements, investor communications and financial or operational metrics issued by the Private Company; (ii) changes in the valuation of relevant indices or publicly traded companies comparable to the Private Company; (iii) relevant news and other public sources; and (iv) known secondary market transactions in the Private Company’s interests and merger or acquisition activity in companies comparable to the Private Company. |
Investments in series of preferred stock issued by Private Companies are typically valued utilizing market approach in determining the enterprise value of the company. Such investments often contain rights and preferences that differ from other series of preferred and common stock of the same issuer. Valuation techniques such as an option pricing model (“OPM”), a probability weighted expected return model (“PWERM”) or a hybrid of those techniques are used in allocating enterprise value of the company, as deemed appropriate under the circumstances. The use of OPM and PWERM techniques involve a determination of the exit scenarios of the investment in order to appropriately allocate the enterprise value of the company among the various parts of its capital structure.
The Private Companies are not subject to the public company disclosure, timing, and reporting standards as other investments held by a Fund. Typically, the most recently available information by a Private Company is as of a date that is earlier than the date a Fund is calculating its NAV. This factor may result in a difference between the value of the investment and the price a Fund could receive upon the sale of the investment.
Fair Value Hierarchy: Various inputs are used in determining the fair value of investments and derivative financial instruments. These inputs to valuation techniques are categorized into a fair value hierarchy consisting of three broad levels for financial statement purposes as follows:
| | • | | Level 1 — Unadjusted price quotations in active markets/exchanges for identical assets or liabilities that each Fund has the ability to access |
| | • | | Level 2 — Other observable inputs (including, but not limited to, quoted prices for similar assets or liabilities in markets that are active, quoted prices for identical or similar assets or liabilities in markets that are not active, inputs other than quoted prices that are observable for the assets or liabilities (such as interest rates, yield curves, volatilities, prepayment speeds, loss severities, credit risks and default rates) or other market-corroborated inputs) |
| | | | |
| NOTESTO FINANCIAL STATEMENTS | | | 49 | |
Notes to Financial Statements (continued)
| | • | | Level 3 — Unobservable inputs based on the best information available in the circumstances, to the extent observable inputs are not available (including each Fund’s own assumptions used in determining the fair value of investments and derivative financial instruments) |
The hierarchy gives the highest priority to unadjusted quoted prices in active markets for identical assets or liabilities (Level 1 measurements) and the lowest priority to unobservable inputs (Level 3 measurements). Accordingly, the degree of judgment exercised in determining fair value is greatest for instruments categorized in Level 3. The inputs used to measure fair value may fall into different levels of the fair value hierarchy. In such cases, for disclosure purposes, the fair value hierarchy classification is determined based on the lowest level input that is significant to the fair value measurement in its entirety. Investments classified within Level 3 have significant unobservable inputs used by the Global Valuation Committee in determining the price for Fair Valued Investments. Level 3 investments include equity or debt issued by Private Companies. There may not be a secondary market, and/or there are a limited number of investors. Level 3 investments may also be adjusted to reflect illiquidity and/or non-transferability, with the amount of such discount estimated by the Global Valuation Committee in the absence of market information.
Changes in valuation techniques may result in transfers into or out of an assigned level within the hierarchy. In accordance with each Fund’s policy, transfers between different levels of the fair value hierarchy are deemed to have occurred as of the beginning of the reporting period. The categorization of a value determined for investments and derivative financial instruments is based on the pricing transparency of the investments and derivative financial instruments and is not necessarily an indication of the risks associated with investing in those securities.
| 4. | SECURITIES AND OTHER INVESTMENTS |
Asset-Backed and Mortgage-Backed Securities: Asset-backed securities are generally issued as pass-through certificates or as debt instruments. Asset-backed securities issued as pass-through certificates represent undivided fractional ownership interests in an underlying pool of assets. Asset-backed securities issued as debt instruments, which are also known as collateralized obligations, are typically issued as the debt of a special purpose entity organized solely for the purpose of owning such assets and issuing such debt. Asset-backed securities are often backed by a pool of assets representing the obligations of a number of different parties. The yield characteristics of certain asset-backed securities may differ from traditional debt securities. One such major difference is that all or a principal part of the obligations may be prepaid at any time because the underlying assets (i.e., loans) may be prepaid at any time. As a result, a decrease in interest rates in the market may result in increases in the level of prepayments as borrowers, particularly mortgagors, refinance and repay their loans. An increased prepayment rate with respect to an asset-backed security will have the effect of shortening the maturity of the security. In addition, a fund may subsequently have to reinvest the proceeds at lower interest rates. If a fund has purchased such an asset-backed security at a premium, a faster than anticipated prepayment rate could result in a loss of principal to the extent of the premium paid
For mortgage pass-through securities (the “Mortgage Assets”) there are a number of important differences among the agencies and instrumentalities of the U.S. Government that issue mortgage-related securities and among the securities that they issue. For example, mortgage-related securities guaranteed by Ginnie Mae are guaranteed as to the timely payment of principal and interest by Ginnie Mae and such guarantee is backed by the full faith and credit of the United States. However, mortgage-related securities issued by Freddie Mac and Fannie Mae, including Freddie Mac and Fannie Mae guaranteed mortgage pass-through certificates, which are solely the obligations of Freddie Mac and Fannie Mae, are not backed by or entitled to the full faith and credit of the United States, but are supported by the right of the issuer to borrow from the U.S. Treasury.
Non-agency mortgage-backed securities are securities issued by non-governmental issuers and have no direct or indirect government guarantees of payment and are subject to various risks. Non-agency mortgage loans are obligations of the borrowers thereunder only and are not typically insured or guaranteed by any other person or entity. The ability of a borrower to repay a loan is dependent upon the income or assets of the borrower. A number of factors, including a general economic downturn, acts of God, terrorism, social unrest and civil disturbances, may impair a borrower’s ability to repay its loans
Inflation-Indexed Bonds: Inflation-indexed bonds (other than municipal inflation-indexed and certain corporate inflation-indexed bonds) are fixed-income securities whose principal value is periodically adjusted according to the rate of inflation. If the index measuring inflation rises or falls, the principal value of inflation-indexed bonds (other than municipal inflation-indexed and certain corporate inflation-indexed bonds) will be adjusted upward or downward, and consequently the interest payable on these securities (calculated with respect to a larger or smaller principal amount) will be increased or reduced, respectively. Any upward or downward adjustment in the principal amount of an inflation-indexed bond will be included as interest income in the Statements of Operations, even though investors do not receive their principal until maturity. Repayment of the original bond principal upon maturity (as adjusted for inflation) is guaranteed in the case of U.S. Treasury inflation-indexed bonds. For bonds that do not provide a similar guarantee, the adjusted principal value of the bond repaid at maturity may be less than the original principal. With regard to municipal inflation-indexed bonds and certain corporate inflation-indexed bonds, the inflation adjustment is typically reflected in the semi-annual coupon payment. As a result, the principal value of municipal inflation-indexed bonds and such corporate inflation-indexed bonds does not adjust according to the rate of inflation.
Multiple Class Pass-Through Securities: Multiple class pass-through securities, including collateralized mortgage obligations (“CMOs”) and commercial mortgage-backed securities, may be issued by Ginnie Mae, U.S. Government agencies or instrumentalities or by trusts formed by private originators of, or investors in, mortgage loans. In general, CMOs are debt obligations of a legal entity that are collateralized by a pool of residential or commercial mortgage loans or Mortgage Assets. The payments on these are used to make payments on the CMOs or multiple pass-through securities. Multiple class pass-through securities represent direct ownership interests in the Mortgage Assets. Classes of CMOs include interest only (“IOs”), principal only (“POs”), planned amortization classes and targeted amortization classes. IOs and POs are stripped mortgage-backed securities representing interests in a pool of mortgages, the cash flow from which has been separated into interest and principal components. IOs receive the interest portion of the cash flow while POs receive the principal portion. IOs and POs can be extremely volatile in response to changes in interest rates. As interest rates rise and fall, the value of IOs tends to move in the same direction as interest rates. POs perform best when prepayments on the underlying mortgages rise since this increases the rate at which the principal is returned and the yield to maturity on the PO. When payments on mortgages underlying a PO are slower than anticipated, the life of the PO is lengthened and the yield to maturity is reduced. If the underlying Mortgage Assets experience greater than anticipated prepayments of principal, a fund’s initial investment in the IOs may not fully recoup.
| | |
| 50 | | 2018 BLACKROCK ANNUAL REPORTTO SHAREHOLDERS |
Notes to Financial Statements (continued)
Capital Securities and Trust Preferred Securities: Capital securities, including trust preferred securities, are typically issued by corporations, generally in the form of interest-bearing notes with preferred securities characteristics. In the case of trust preferred securities, an affiliated business trust of a corporation issues these securities, generally in the form of beneficial interests in subordinated debentures or similarly structured securities. The securities can be structured with either a fixed or adjustable coupon that can have either a perpetual or stated maturity date. For trust preferred securities, the issuing bank or corporation pays interest to the trust, which is then distributed to holders of these securities as a dividend. Dividends can be deferred without creating an event of default or acceleration, although maturity cannot take place unless all cumulative payment obligations have been met. The deferral of payments does not affect the purchase or sale of these securities in the open market. These securities generally are rated below that of the issuing company’s senior debt securities and are freely callable at the issuer’s option.
Preferred Stocks: Preferred stock has a preference over common stock in liquidation (and generally in receiving dividends as well), but is subordinated to the liabilities of the issuer in all respects. As a general rule, the market value of preferred stock with a fixed dividend rate and no conversion element varies inversely with interest rates and perceived credit risk, while the market price of convertible preferred stock generally also reflects some element of conversion value. Because preferred stock is junior to debt securities and other obligations of the issuer, deterioration in the credit quality of the issuer will cause greater changes in the value of a preferred stock than in a more senior debt security with similar stated yield characteristics. Unlike interest payments on debt securities, preferred stock dividends are payable only if declared by the issuer’s board of directors. Preferred stock also may be subject to optional or mandatory redemption provisions.
Floating Rate Loan Interests: Floating rate loan interests are typically issued to companies (the “borrower”) by banks, other financial institutions, or privately and publicly offered corporations (the “lender”). Floating rate loan interests are generally non-investment grade, often involve borrowers whose financial condition is troubled or uncertain and companies that are highly leveraged or in bankruptcy proceedings. In addition, transactions in floating rate loan interests may settle on a delayed basis, which may result in proceeds from the sale not being readily available for a fund to make additional investments or meet its redemption obligations. Floating rate loan interests may include fully funded term loans or revolving lines of credit. Floating rate loan interests are typically senior in the corporate capital structure of the borrower. Floating rate loan interests generally pay interest at rates that are periodically determined by reference to a base lending rate plus a premium. Since the rates reset only periodically, changes in prevailing interest rates (and particularly sudden and significant changes) can be expected to cause some fluctuations in the NAV of a fund to the extent that it invests in floating rate loan interests. The base lending rates are generally the lending rate offered by one or more European banks, such as the London Interbank Offered Rate (“LIBOR”), the prime rate offered by one or more U.S. banks or the certificate of deposit rate. Floating rate loan interests may involve foreign borrowers, and investments may be denominated in foreign currencies. These investments are treated as investments in debt securities for purposes of a fund’s investment policies.
When a fund purchases a floating rate loan interest, it may receive a facility fee and when it sells a floating rate loan interest, it may pay a facility fee. On an ongoing basis, a fund may receive a commitment fee based on the undrawn portion of the underlying line of credit amount of a floating rate loan interest. Facility and commitment fees are typically amortized to income over the term of the loan or term of the commitment, respectively. Consent and amendment fees are recorded to income as earned. Prepayment penalty fees, which may be received by a fund upon the prepayment of a floating rate loan interest by a borrower, are recorded as realized gains. A fund may invest in multiple series or tranches of a loan. A different series or tranche may have varying terms and carry different associated risks.
Floating rate loan interests are usually freely callable at the borrower’s option. A fund may invest in such loans in the form of participations in loans (“Participations”) or assignments (“Assignments”) of all or a portion of loans from third parties. Participations typically will result in a fund having a contractual relationship only with the lender, not with the borrower. A fund has the right to receive payments of principal, interest and any fees to which it is entitled only from the lender selling the Participation and only upon receipt by the lender of the payments from the borrower. In connection with purchasing Participations, a fund generally will have no right to enforce compliance by the borrower with the terms of the loan agreement, nor any rights of offset against the borrower. A fund may not benefit directly from any collateral supporting the loan in which it has purchased the Participation. As a result, a fund assumes the credit risk of both the borrower and the lender that is selling the Participation. A fund’s investment in loan participation interests involves the risk of insolvency of the financial intermediaries who are parties to the transactions. In the event of the insolvency of the lender selling the Participation, a fund may be treated as a general creditor of the lender and may not benefit from any offset between the lender and the borrower. Assignments typically result in a fund having a direct contractual relationship with the borrower, and a fund may enforce compliance by the borrower with the terms of the loan agreement.
In connection with floating rate loan interests, certain Funds may also enter into unfunded floating rate loan interests (“commitments”). In connection with these commitments, a Fund earns a commitment fee, typically set as a percentage of the commitment amount. Such fee income, which is included in interest income in the Statements of Operations, is recognized ratably over the commitment period. Unfunded floating rate loan interests are marked-to-market daily, and any unrealized appreciation (depreciation) is included in the Statements of Assets and Liabilities and Statements of Operations. As of period end, the Funds had no unfunded floating rate loan interests.
Forward Commitments and When-Issued Delayed Delivery Securities: Certain Funds may purchase securities on a when-issued basis and may purchase or sell securities on a forward commitment basis. Settlement of such transactions normally occurs within a month or more after the purchase or sale commitment is made. A Fund may purchase securities under such conditions with the intention of actually acquiring them, but may enter into a separate agreement to sell the securities before the settlement date. Since the value of securities purchased may fluctuate prior to settlement, a Fund may be required to pay more at settlement than the security is worth. In addition, a Fund is not entitled to any of the interest earned prior to settlement. When purchasing a security on a delayed delivery basis, a Fund assumes the rights and risks of ownership of the security, including the risk of price and yield fluctuations. In the event of default by the counterparty, a Fund’s maximum amount of loss is the unrealized appreciation of unsettled when-issued transactions.
TBA Commitments: TBA commitments are forward agreements for the purchase or sale of mortgage-backed securities for a fixed price, with payment and delivery on an agreed upon future settlement date. The specific securities to be delivered are not identified at the trade date. However, delivered securities must meet specified terms, including issuer, rate and mortgage terms. When entering into TBA commitments, a fund may take possession of or deliver the underlying mortgage-backed securities but can extend the settlement or roll the transaction. TBA commitments involve a risk of loss if the value of the security to be purchased or sold declines or increases, respectively, prior to settlement date.
In order to better define contractual rights and to secure rights that will help a fund mitigate their counterparty risk, TBA commitments may be entered into by a fund under Master Securities Forward Transaction Agreements (each, an “MSFTA”). An MSFTA typically contains, among other things, collateral posting terms and netting provisions
| | | | |
| NOTESTO FINANCIAL STATEMENTS | | | 51 | |
Notes to Financial Statements (continued)
in the event of default and/or termination event. The collateral requirements are typically calculated by netting the mark-to-market amount for each transaction under such agreement and comparing that amount to the value of the collateral currently pledged by a fund and the counterparty. Cash collateral that has been pledged to cover the obligations of a fund and cash collateral received from the counterparty, if any, is reported separately on the Statements of Assets and Liabilities as cash pledged as collateral for TBA commitments or cash received as collateral for TBA commitments, respectively. Non-cash collateral pledged by a fund, if any, is noted in the Schedules of Investments. Typically, a fund is permitted to sell, re-pledge or use the collateral it receives; however, the counterparty is not permitted to do so. To the extent amounts due to a fund is not fully collateralized, contractually or otherwise, a fund bears the risk of loss from counterparty non-performance.
Mortgage Dollar Roll Transactions: Certain Funds may sell TBA mortgage-backed securities and simultaneously contract to repurchase substantially similar (i.e., same type, coupon and maturity) securities on a specific future date at an agreed upon price. During the period between the sale and repurchase, a fund is not entitled to receive interest and principal payments on the securities sold. Mortgage dollar roll transactions are treated as purchases and sales and realize gains and losses on these transactions. Mortgage dollar rolls involve the risk that the market value of the securities that a fund is required to purchase may decline below the agreed upon repurchase price of those securities.
Securities Lending: Certain Funds may lend its securities to approved borrowers, such as brokers, dealers and other financial institutions. The borrower pledges and maintains with the Funds collateral consisting of cash, an irrevocable letter of credit issued by a bank, or securities issued or guaranteed by the U.S. Government. The initial collateral received by each Fund is required to have a value of at least 102% of the current value of the loaned securities for securities traded on U.S. exchanges and a value of at least 105% for all other securities. The collateral is maintained thereafter at a value equal to at least 100% of the current market value of the securities on loan. The market value of the loaned securities is determined at the close of each business day of the Fund and any additional required collateral is delivered to the Fund, or excess collateral returned by the Fund, on the next business day. During the term of the loan, the Funds are entitled to all distributions made on or in respect of the loaned securities, but do not receive interest income on securities received as collateral. Loans of securities are terminable at any time and the borrower, after notice, is required to return borrowed securities within the standard time period for settlement of securities transactions.
The market value of any securities on loan, all of which were classified as common stocks in the Fund’s Schedule of Investments, and the value of any related collateral are shown separately in the Statements of Assets and Liabilities as a component of investments at value — unaffiliated, and collateral on securities loaned at value, respectively. As of period end, any securities on loan were collateralized by cash and/or U.S. Government obligations. Cash collateral invested by the securities lending agent, BlackRock Investment Management, LLC (“BIM”), if any, is disclosed in the Schedule of Investments.
Securities lending transactions are entered into by the Funds under Master Securities Lending Agreements (each, an “MSLA”), which provide the right, in the event of default (including bankruptcy or insolvency), for the non-defaulting party to liquidate the collateral and calculate a net exposure to the defaulting party or request additional collateral. In the event that a borrower defaults, the Funds, as lender, would offset the market value of the collateral received against the market value of the securities loaned. When the value of the collateral is greater than that of the market value of the securities loaned, the lender is left with a net amount payable to the defaulting party. However, bankruptcy or insolvency laws of a particular jurisdiction may impose restrictions on or prohibitions against such a right of offset in the event of an MSLA counterparty’s bankruptcy or insolvency. Under the MSLA, absent an event of default, the borrower can resell or re-pledge the loaned securities, and the Fund can reinvest cash collateral received in connection with loaned securities. Upon an event of default, the parties’ obligations to return the securities or collateral to the other party are extinguished, and the parties can resell or re-pledge the loaned securities or the collateral received in connection with the loaned securities in order to satisfy the defaulting party’s net payment obligation for all transactions under the MSLA. The defaulting party remains liable for any deficiency.
The risks of securities lending include the risk that the borrower may not provide additional collateral when required or may not return the securities when due. To mitigate these risks, the Funds benefit from a borrower default indemnity provided by BIM. BIM’s indemnity allows for full replacement of the securities loaned if the collateral received does not cover the value on the securities loaned in the event of borrower default. Each Fund could incur a loss if the value of an investment purchased with cash collateral falls below the market value of loaned securities or if the value of an investment purchased with cash collateral falls below the value of the original cash collateral received.
| 5. | DERIVATIVE FINANCIAL INSTRUMENTS |
The Funds engage in various portfolio investment strategies using derivative contracts both to increase the returns of the Funds and/or to manage their exposure to certain risks such as credit risk, equity risk, interest rate risk, foreign currency exchange rate risk, commodity price risk or other risks (e.g., inflation risk). Derivative financial instruments categorized by risk exposure are included in the Schedules of Investments. These contracts may be transacted on an exchange or OTC.
Futures Contracts: Futures contracts are purchased or sold to gain exposure to, or manage exposure to, changes in interest rates (interest rate risk), and changes in the value of equity securities (equity risk) or foreign currencies (foreign currency exchange rate risk).
Futures contracts are agreements between the Funds and a counterparty to buy or sell a specific quantity of an underlying instrument at a specified price and on a specified date. Depending on the terms of a contract, it is settled either through physical delivery of the underlying instrument on the settlement date or by payment of a cash amount on the settlement date. Upon entering into a futures contract, the Funds are required to deposit initial margin with the broker in the form of cash or securities in an amount that varies depending on a contract’s size and risk profile. The initial margin deposit must then be maintained at an established level over the life of the contract.
Securities deposited as initial margin are designated in the Schedules of Investments and cash deposited, if any, is shown as cash pledged for futures contracts in the Statements of Assets and Liabilities. Pursuant to the contract, the Funds agree to receive from or pay to the broker an amount of cash equal to the daily fluctuation in market value of the contract (“variation margin”). Variation margin is recorded as unrealized appreciation (depreciation) and, if any, shown as variation margin receivable (or payable) on futures contracts in the Statements of Assets and Liabilities. When the contract is closed, a realized gain or loss is recorded in the Statements of Operations equal to the difference between the notional amount of the contract at the time it was opened and the notional amount at the time it was closed. The use of futures contracts involves the risk of an imperfect correlation in the movements in the price of futures contracts and interest, foreign currency exchange rates or underlying assets.
| | |
| 52 | | 2018 BLACKROCK ANNUAL REPORTTO SHAREHOLDERS |
Notes to Financial Statements (continued)
Forward Foreign Currency Exchange Contracts: Forward foreign currency exchange contracts are entered into to gain or reduce exposure to foreign currencies (foreign currency exchange rate risk).
A forward foreign currency exchange contract is an agreement between two parties to buy and sell a currency at a set exchange rate on a specified date. These contracts help to manage the overall exposure to the currencies in which some of the investments held by the Funds are denominated and in some cases, may be used to obtain exposure to a particular market.
The contract is marked-to-market daily and the change in market value is recorded as unrealized appreciation (depreciation) in the Statements of Assets and Liabilities. When a contract is closed, a realized gain or loss is recorded in the Statements of Operations equal to the difference between the value at the time it was opened and the value at the time it was closed. Non-deliverable forward foreign currency exchange contracts are settled with the counterparty in cash without the delivery of foreign currency. The use of forward foreign currency exchange contracts involves the risk that the value of a forward foreign currency exchange contract changes unfavorably due to movements in the value of the referenced foreign currencies.
Swaps: Swap contracts are entered into to manage exposure to issuers, markets and securities. Such contracts are agreements between the Funds and a counterparty to make periodic net payments on a specified notional amount or a net payment upon termination. Swap agreements are privately negotiated in the OTC market and may be entered into as a bilateral contract (“OTC swaps”) or centrally cleared (“centrally cleared swaps”).
For OTC swaps, any upfront premiums paid and any upfront fees received are shown as swap premiums paid and swap premiums received, respectively, in the Statements of Assets and Liabilities and amortized over the term of the contract. The daily fluctuation in market value is recorded as unrealized appreciation (depreciation) on OTC Swaps in the Statements of Assets and Liabilities. Payments received or paid are recorded in the Statements of Operations as realized gains or losses, respectively. When an OTC swap is terminated, a realized gain or loss is recorded in the Statements of Operations equal to the difference between the proceeds from (or cost of) the closing transaction and the Funds’ basis in the contract, if any. Generally, the basis of the contract is the premium received or paid.
In a centrally cleared swap, immediately following execution of the swap contract, the swap contract is novated to a central counterparty (the “CCP”) and the Fund’s counterparty on the swap agreement becomes the CCP. The Funds are required to interface with the CCP through the broker. Upon entering into a centrally cleared swap, the Funds are required to deposit initial margin with the broker in the form of cash or securities in an amount that varies depending on the size and risk profile of the particular swap. Securities deposited as initial margin are designated in the Schedules of Investments and cash deposited is shown as cash pledged for centrally cleared swaps in the Statements of Assets and Liabilities. Pursuant to the contract, the Funds agree to receive from or pay to the broker an amount of cash equal to the daily fluctuation in market value of the contract (“variation margin”). Variation margin is recorded as unrealized appreciation (depreciation) and shown as variation margin receivable (or payable) on centrally cleared swaps in the Statements of Assets and Liabilities. Payments received from (paid to) the counterparty, including at termination, are recorded as realized gains (losses) in the Statements of Operations.
| • | | Inflation swaps — Inflation swaps are entered into to gain or reduce exposure to inflation (inflation risk). In an inflation swap, one party makes fixed interest payments on a notional principal amount in exchange for another party’s variable payments based on an inflation index, such as the Consumer Price Index. |
Master Netting Arrangements: In order to define their contractual rights and to secure rights that will help them mitigate their counterparty risk, the Funds may enter into an International Swaps and Derivatives Association, Inc. Master Agreement (“ISDA Master Agreement”) or similar agreement with their counterparties. An ISDA Master Agreement is a bilateral agreement between each Fund and a counterparty that governs certain OTC derivatives and typically contains, among other things, collateral posting terms and netting provisions in the event of a default and/or termination event. Under an ISDA Master Agreement, each Fund may, under certain circumstances, offset with the counterparty certain derivative financial instruments’ payables and/or receivables with collateral held and/or posted and create one single net payment. The provisions of the ISDA Master Agreement typically permit a single net payment in the event of default including the bankruptcy or insolvency of the counterparty. Bankruptcy or insolvency laws of a particular jurisdiction may restrict or prohibit the right of offset in bankruptcy, insolvency or other events.
Collateral Requirements: For derivatives traded under an ISDA Master Agreement, the collateral requirements are typically calculated by netting the mark-to-market amount for each transaction under such agreement and comparing that amount to the value of any collateral currently pledged by the Fund and the counterparty.
Cash collateral that has been pledged to cover obligations of the Funds and cash collateral received from the counterparty, if any, is reported separately on the Statements of Assets and Liabilities as cash pledged as collateral and cash received as collateral, respectively. Non-cash collateral pledged by the Funds, if any, is noted in the Schedules of Investments. Generally, the amount of collateral due from or to a counterparty is subject to a certain minimum transfer amount threshold before a transfer is required, which is determined at the close of business of the Funds. Any additional required collateral is delivered to/pledged by the Funds on the next business day. Typically, the counterparty is not permitted to sell, re-pledge or use cash and non-cash collateral it receives. A Fund generally agrees not to use non-cash collateral that it receives but may, absent default or certain other circumstances defined in the underlying ISDA Master Agreement, be permitted to use cash collateral received. In such cases, interest may be paid pursuant to the collateral arrangement with the counterparty. To the extent amounts due to the Funds from their counterparties are not fully collateralized, they bear the risk of loss from counterparty non-performance. Likewise, to the extent the Funds have delivered collateral to a counterparty and stand ready to perform under the terms of their agreement with such counterparty, they bear the risk of loss from a counterparty in the amount of the value of the collateral in the event the counterparty fails to return such collateral. Based on the terms of agreements, collateral may not be required for all derivative contracts.
For financial reporting purposes, the Funds do not offset derivative assets and derivative liabilities that are subject to netting arrangements, if any, in the Statements of Assets and Liabilities.
| 6. | INVESTMENT ADVISORY AGREEMENT AND OTHER TRANSACTIONS WITH AFFILIATES |
The PNC Financial Services Group, Inc. is the largest stockholder and an affiliate of BlackRock, Inc. (“BlackRock”) for 1940 Act purposes.
| | | | |
| NOTESTO FINANCIAL STATEMENTS | | | 53 | |
Notes to Financial Statements (continued)
Investment Advisory: The Corporation, on behalf of the Funds, entered into an Investment Advisory Agreement with the Manager, the Funds’ investment adviser, an indirect, wholly-owned subsidiary of BlackRock, to provide investment advisory and administrative services. The Manager is responsible for the management of each Fund’s portfolio and provides the personnel, facilities, equipment and certain other services necessary to the operations of each Fund.
For such services, each Fund pays the Manager a monthly fee at an annual rate equal to the following percentages of the average daily value of each Fund’s net assets.
| | | | | | | | | | | | | | | | |
| Average Daily Net Assets | | Capital Appreciation Fund | | | CoreAlpha Bond Fund | | | Equity Dividend Fund | | | International Fund | |
Not exceeding $1 Billion | | | 0.80 | % | | | 0.40 | % | | | 0.70 | % | | | 0.90 | % |
$1 Billion — $3 Billion | | | 0.75 | | | | 0.38 | | | | 0.66 | | | | 0.85 | |
$3 Billion — $5 Billion | | | 0.72 | | | | 0.36 | | | | 0.63 | | | | 0.81 | |
$5 Billion — $10 Billion | | | 0.70 | | | | 0.35 | | | | 0.61 | | | | 0.78 | |
Greater than $10 Billion | | | 0.68 | | | | 0.34 | | | | 0.60 | | | | 0.77 | |
Prior to November 28, 2017, with respect to Capital Appreciation Fund, Equity Dividend Fund and International Fund, the Manager entered into separate sub-advisory agreements. The Manager paid each sub-adviser for services it provided a monthly fee at the following annual rates, based on each Fund’s average daily net assets:
| | | | |
| | | Sub-Adviser | | Sub-Advisory Fee |
Capital Appreciation Fund | | Janus Capital Management LLC | | 0.40% of first $200 million |
| | | | 0.35% above $200 million |
Equity Dividend Fund | | Invesco Advisers, Inc. | | 0.35% |
International Fund | | Massachusetts Financial
Services Company | | 0.45% |
Effective November 28, 2017, the sub-advisory agreements between the Manager and Invesco Advisers, Inc., Janus Capital Management LLC and Massachusetts
Financial Services Company were terminated.
Effective November 28, 2017, with respect to the International Fund, the Manager entered into a separate sub-advisory agreement with BlackRock International Limited (“BIL”), an affiliate of the Manager. The Manager pays BIL for services it provides for that portion of the International Fund for which BIL acts as sub-adviser, a monthly fee that is equal to a percentage of the investment advisory fees paid by the Fund to the Manager.
Service and Distribution Fees: The Corporation, on behalf of the Funds, entered into a Distribution Agreement and a Distribution and Service Plans with BlackRock Investments, LLC (“BRIL”), an affiliate of the Manager. Pursuant to the Distribution and Service Plan and in accordance with Rule 12b-1 under the 1940 Act, each Fund pays BRIL ongoing service and distribution fees. The fees are accrued daily and paid monthly at annual rates based upon the average daily net assets of the relevant share class of each Fund as follows:
| | | | | | | | | | | | | | | | |
| | | Distribution Fees | |
| | | Capital Appreciation Fund | | | CoreAlpha Bond Fund | | | Equity Dividend Fund | | | International Fund | |
Investor C | | | 0.75 | % | | | 0.55 | % | | | 0.75 | % | | | 0.75 | % |
| | | Service Fees | |
Investor A | | | 0.25 | % | | | 0.25 | % | | | 0.25 | % | | | 0.25 | % |
Investor C | | | 0.25 | | | | 0.25 | | | | 0.25 | | | | 0.25 | |
BRIL and broker-dealers, pursuant to sub-agreements with BRIL, provide shareholder servicing and distribution services to the Funds. The ongoing service and/or distribution fee compensates BRIL and each broker-dealer for providing shareholder servicing and/or distribution related services to shareholders.
For the year ended May 31, 2018, the following table shows the class specific service and distribution fees borne directly by each share class of each Fund:
| | | | | | | | | | | | |
| Service and Distribution Fees | | | | | | | | | |
| | | Investor A | | | Investor C | | | Total | |
Capital Appreciation Fund | | $ | 140,065 | | | $ | 297,410 | | | $ | 437,475 | |
CoreAlpha Bond Fund | | | 189,738 | | | | 387,186 | | | | 576,924 | |
Equity Dividend Fund | | | 137,333 | | | | 288,937 | | | | 426,270 | |
International Fund | | | 161,292 | | | | 339,603 | | | | 500,895 | |
Transfer Agent: For the year ended May 31, 2018, the following table shows the class specific transfer agent fees borne directly by each share class of each Fund:
| | | | | | | | | | | | | | | | |
| | | Institutional | | | Investor A | | | Investor C | | | Total | |
Capital Appreciation Fund | | $ | 5,643 | | | $ | 72,405 | | | $ | 41,544 | | | $ | 119,592 | |
CoreAlpha Bond Fund | | | 6,541 | | | | 83,808 | | | | 59,710 | | | | 150,059 | |
Equity Dividend Fund | | | 4,812 | | | | 65,198 | | | | 35,501 | | | | 105,511 | |
International Fund | | | 5,642 | | | | 74,306 | | | | 42,753 | | | | 122,701 | |
| | |
| 54 | | 2018 BLACKROCK ANNUAL REPORTTO SHAREHOLDERS |
Notes to Financial Statements (continued)
In addition, the Funds pay the transfer agent, which is not an affiliate, a fee for the issuance, transfer and redemption of shares and the opening and maintenance of shareholder accounts, which is included in transfer agent in the Statements of Operations.
Other Fees: For the year ended May 31, 2018, affiliates earned underwriting discounts, direct commissions and dealer concessions on sales of each Fund’s Investor A Shares as follows:
| | | | | | | | | | | | | | | | |
| | | Capital Appreciation Fund | | | CoreAlpha Bond Fund | | | Equity Dividend Fund | | | International Fund | |
Investor A | | $ | 35 | | | $ | 17 | | | $ | 40 | | | $ | 63 | |
For the year ended May 31, 2018, affiliates received CDSCs as follows:
| | | | | | | | | | | | | | | | |
| | | Capital Appreciation Fund | | | CoreAlpha Bond Fund | | | Equity Dividend Fund | | | International Fund | |
Investor A | | $ | 16 | | | $ | 123 | | | $ | — | | | $ | — | |
Investor C | | | 601 | | | | 1,665 | | | | 583 | | | | 900 | |
Expense Limitations, Waivers and Reimbursements: Effective November 28, 2017 through September 30, 2019, the Manager, for the following Funds, contractually agreed to waive a portion of its investment advisory fees so that the annual management fee rate of each Fund’s average daily net assets is as follows:
| | | | | | | | | | | | | | |
| Capital Appreciation Fund | | | | | Equity Dividend Fund | | | | | International Fund | |
| | 0.65 | % | | | | | 0.60 | % | | | | | 0.75 | % |
Each contractual agreement may be terminated upon 90 days’ notice by a majority of the directors who are not “interested persons” of the Funds, as defined in the 1940 Act (“Independent Directors”), or by a vote of a majority of the outstanding voting securities of the relevant Fund.
Prior to November 28, 2017, the Manager, for the following Funds, voluntarily agreed to waive a portion of its investment advisory fees equal to the annual rate of each Fund’s average daily net assets as follows:
| | | | | | | | | | | | | | |
| Capital Appreciation Fund | | | | | Equity Dividend Fund | | | | | International Fund | |
| | 0.05 | % | | | | | 0.05 | % | | | | | 0.10 | % |
Prior to November 28, 2017, with respect to Capital Appreciation Fund, the Manager contractually agreed to waive a portion of its investment advisory fee equal to 0.05% of the Fund’s average daily net assets over $200 million. Effective November 28, 2017, this contractual waiver was terminated by the Manager.
With respect to CoreAlpha Bond Fund, the Manager contractually agreed to waive a portion of its investment advisory fee as a percentage of the Fund’s average daily net assets as to limit the advisory fee to 0.32% through September 30, 2018. The contractual agreement may be terminated upon 90 days’ notice by a majority of the Independent Directors or by a vote of a majority of the outstanding voting securities of the Fund. These amounts are shown as fees waived by the Manager in the Statements of Operations. For the year ended May 31, 2018, the amounts waived were as follows:
| | | | | | | | | | | | | | | | |
| | | Capital Appreciation Fund | | | CoreAlpha Bond Fund | | | Equity Dividend Fund | | | International Fund | |
Amount waived | | $ | 87,488 | | | $ | 103,952 | | | $ | 64,438 | | | $ | 126,781 | |
With respect to each Fund, the Manager voluntarily agreed to waive its investment advisory fees by the amount of investment advisory fees each Fund pays to the Manager indirectly through its investment in affiliated money market funds (the “affiliated money market fund waiver”). The amount of waivers and/or reimbursements of fees and expenses made pursuant to the expense limitation described below will be reduced by the amount of the affiliated money market fund waiver. These amounts are included in fees waived and/or reimbursed by the Manager in the Statements of Operations. For the year ended May 31, 2018, the amounts waived were as follows:
| | | | | | | | | | | | | | | | |
| | | Capital Appreciation Fund | | | CoreAlpha Bond Fund | | | Equity Dividend Fund | | | International Fund | |
Amount waived | | $ | 231 | | | $ | 4,475 | | | $ | 1,369 | | | $ | 718 | |
The Manager has contractually agreed to waive its investment advisory fee with respect to any portion of each Fund’ assets invested in affiliated equity and fixed-income mutual funds and exchange-traded funds that have a contractual management fee through September 30, 2019, except with respect to CoreAlpha Bond Fund, for which the contractual arrangement is in effect through September 30, 2018. The contractual agreement may be terminated upon 90 days’ notice by a majority of the Independent Directors or by a vote of a majority of the outstanding voting securities of a Fund. For the year ended May 31, 2018, there were no fees waived by the Manager under this arrangement.
| | | | |
| NOTESTO FINANCIAL STATEMENTS | | | 55 | |
Notes to Financial Statements (continued)
For the year ended May 31, 2018, the Funds reimbursed the Manager for certain accounting services, which is included in accounting services in the Statements of Operations. The reimbursements were as follows:
| | | | | | | | | | | | | | | | |
| | | Capital Appreciation Fund | | | CoreAlpha Bond Fund | | | Equity Dividend Fund | | | International Fund | |
Amount reimbursed | | $ | 973 | | | $ | 1,452 | | | $ | 973 | | | $ | 1,136 | |
The Funds have begun to incur expenses in connection with a potential reconfiguration of the boards of directors of certain BlackRock-advised funds, including the Funds. The Manager has voluntarily agreed to reimburse certain Funds for all or a portion of such expenses, which amounts are included in fees waived and/or reimbursed by the Manager in the Statements of Operations. For the year ended May 31, 2018, the amount reimbursed for CoreAlpha Bond Fund was $20,481.
With respect to each Fund, the Manager contractually agreed to waive and/or reimburse fees or expenses in order to limit expenses, excluding interest expense, dividend expense, tax expense, acquired fund fees and expenses, and certain other fund expenses, which constitute extraordinary expenses not incurred in the ordinary course of each Fund’s business (“expense limitation”). The expense limitation as a percentage of average daily net assets are as follows:
| | | | | | | | | | | | | | | | |
| | | Capital Appreciation Fund | | | CoreAlpha Bond Fund | | | Equity Dividend Fund | | | International Fund | |
Institutional | | | 1.95 | % | | | 1.95 | % | | | 1.95 | % | | | 1.95 | % |
Investor A | | | 2.20 | | | | 2.20 | | | | 2.20 | | | | 2.20 | |
Investor C | | | 2.95 | | | | 2.75 | | | | 2.95 | | | | 2.95 | |
The Manager has agreed not to reduce or discontinue these contractual expense limitations through September 30, 2019, except with respect to CoreAlpha Bond Fund the contractual expense limitations are in effect through September 30, 2018, unless approved by a majority of the Independent Directors or by a vote of a majority of the outstanding voting securities of the Fund. For the year ended May 31, 2018, there were no fees waived and/or reimbursed by the Manager pursuant to this agreement.
Securities Lending: The SEC has issued an exemptive order which permits BIM, an affiliate of the Manager, to serve as securities lending agent for the Funds, subject to applicable conditions. As securities lending agent, BIM bears all operational costs directly related to securities lending. The Funds are responsible for expenses in connection with the investment of cash collateral received for securities on loan (the “collateral investment expenses”). The cash collateral is invested in a private investment company managed by the Manager or its affiliates. However, BIM has agreed to cap the collateral investment expenses of the private investment company to an annual rate of 0.04%. The investment adviser to the private investment company will not charge any advisory fees with respect to shares purchased by the Funds. The private investment company in which the cash collateral has been invested may, under certain circumstances, impose a liquidity fee of up to 2% of the value withdrawn or temporarily restrict withdrawals for up to 10 business days during a 90 day period, in the event that the private investment company’s weekly liquid assets fall below certain thresholds.
Securities lending income is equal to the total of income earned from the reinvestment of cash collateral, net of fees and other payments to and from borrowers of securities, and less the collateral investment expenses. Equity Dividend Fund retains a portion of securities lending income and remits a remaining portion to BIM as compensation for its services as securities lending agent.
Pursuant to a securities lending agreement, Equity Dividend Fund retains 71.5% of securities lending income, and this amount retained can never be less than 65% of the total of securities lending income plus the collateral investment expenses.
In addition, commencing the business day following the date that the aggregate securities lending income earned across the Equity-Bond Complex in a calendar year exceeds a specified threshold, Equity Dividend Fund, pursuant to the securities lending agreement, will retain for the remainder of that calendar year securities lending income in an amount equal to 75% of securities lending income, and this amount retained can never be less than 65% of the total of securities lending income plus the collateral investment expenses.
The share of securities lending income earned by Equity Dividend Fund is shown as securities lending income — affiliated — net in the Statements of Operations. For the year ended May 31, 2018, Equity Dividend Fund paid BIM $0 for securities lending agent services.
Interfund Lending: In accordance with an exemptive order (the “Order”) from the U.S. Securities and Exchange Commission, each Fund may participate in a joint lending and borrowing facility for temporary purposes (the “Interfund Lending Program”), subject to compliance with the terms and conditions of the Order, and to the extent permitted by each Fund’s investment policies and restrictions. Each Fund is currently permitted to borrow and lend under the Interfund Lending Program.
A lending BlackRock fund may lend in aggregate up to 15% of its net assets, but may not lend more than 5% of its net assets to any one borrowing fund through the Interfund Lending Program. A borrowing BlackRock fund may not borrow through the Interfund Lending Program or from any other source more than 33 1/3% of its total assets (or any lower threshold provided for by the fund’s investment restrictions). If a borrowing BlackRock fund’s total outstanding borrowings exceed 10% of its total assets, each of its outstanding interfund loans will be subject to collateralization of at least 102% of the outstanding principal value of the loan. All interfund loans are for temporary or emergency purposes and the interest rate to be charged will be the average of the highest current overnight repurchase agreement rate available to a lending fund and the bank loan rate, as calculated according to a formula established by the Board.
During the year ended May 31, 2018, the Funds did not participate in the Interfund Lending Program.
Directors and Officers: Certain Directors and/or officers of the Funds are directors and/or officers of BlackRock or its affiliates. The Funds reimburse the Manager for a portion of the compensation paid to the Funds’ Chief Compliance Officer, which is included in Directors and Officer in the Statements of Operations.
| | |
| 56 | | 2018 BLACKROCK ANNUAL REPORTTO SHAREHOLDERS |
Notes to Financial Statements (continued)
Other Transactions: The Funds may purchase securities from, or sell securities to, an affiliated fund provided the affiliation is due solely to having a common investment adviser, common officers, or common directors. For the year ended May 31, 2018, the purchase and sale transactions and any net realized gains (losses) with an affiliated funds in compliance with Rule 17a-7 under the 1940 Act were as follows:
| | | | | | | | | | | | |
| | | Purchases | | | Sales | | | Net Realized Gain(Loss) | |
Equity Dividend Fund | | $ | 252,252 | | | $ | — | | | $ | — | |
International Fund | | | 1,422 | | | | 488,780 | | | | 101,123 | |
7. PURCHASES AND SALES
For the year ended May 31, 2018, purchases and sales of investments, including TBA transactions and mortgage dollar rolls and excluding short-term securities were as follows:
| | | | | | | | | | | | | | | | |
| Purchases | | Capital Appreciation Fund | | | CoreAlpha Bond Fund | | | Equity Dividend Fund | | | International Fund | |
Non-U.S. Government Securities | | $ | 95,285,926 | | | $ | 433,568,782 | | | $ | 69,283,296 | | | $ | 145,451,876 | |
U.S. Government Securities | | | — | | | | 5,652,593 | | | | — | | | | — | |
| | | | | | | | | | | | | | | | |
| | $ | 95,285,926 | | | $ | 439,221,375 | | | $ | 69,283,296 | | | $ | 145,451,876 | |
| | | | | | | | | | | | | | | | |
| | | | | | | | | | | | | | | | |
Sales | | Capital Appreciation Fund | | | CoreAlpha Bond Fund | | | Equity Dividend Fund | | | International Fund | |
Non-U.S. Government Securities (includes paydowns) | | $ | 142,554,669 | | | $ | 478,442,523 | | | $ | 114,736,140 | | | $ | 199,107,834 | |
U.S. Government Securities | | | — | | | | 30,141,385 | | | | — | | | | — | |
| | | | | | | | | | | | | | | | |
| | $ | 142,554,669 | | | $ | 508,583,908 | | | $ | 114,736,140 | | | $ | 199,107,834 | |
| | | | | | | | | | | | | | | | |
For the year ended May 31, 2018, purchases and sales related to mortgage dollar rolls for CoreAlpha Bond Fund were $200,517,767 and $201,413,445, respectively.
It is each Fund’s policy to comply with the requirements of the Internal Revenue Code of 1986, as amended, applicable to regulated investment companies, and to distribute substantially all of its taxable income to its shareholders. Therefore, no U.S. federal income tax provision is required.
Each Fund files U.S. federal and various state and local tax returns. No income tax returns are currently under examination. The statute of limitations on each Fund’s U.S. federal tax returns generally remains open for each of the four years ended May 31, 2018. The statutes of limitations on each Fund’s state and local tax returns may remain open for an additional year depending upon the jurisdiction.
Management has analyzed tax laws and regulations and their application to the Funds as of May 31, 2018, inclusive of the open tax return years, and does not believe that there are any uncertain tax positions that require recognition of a tax liability in the Funds’ financial statements.
U.S. GAAP requires that certain components of net assets be adjusted to reflect permanent differences between financial and tax reporting. These reclassifications have no effect on net assets or net asset values per share. As of period end, the following permanent difference attributable to net operating losses, income recognized from pass-through entities, the use of equalization, the sale of stock of passive foreign investment companies, the classification of investments, net paydown losses and foreign currency transactions were reclassified to the following accounts:
| | | | | | | | | | | | | | | | |
| | | Capital
Appreciation
Fund | | | CoreAlpha
Bond
Fund | | | Equity
Dividend
Fund | | | International
Fund | |
Paid-in capital | | $ | 1,426,440 | | | $ | — | | | $ | 3,672,721 | | | $ | — | |
Undistributed (distributions in excess of) net investment income | | | 555,570 | | | | 435,904 | | | | (508,293 | ) | | | 40,421 | |
Accumulated net realized gain (loss) | | | (1,982,010 | ) | | | (435,904 | ) | | | (3,164,428 | ) | | | (40,421 | ) |
The tax character of distributions paid was as follows:
| | | | | | | | | | | | | | | | | | | | |
| | | | | | Capital
Appreciation
Fund | | | CoreAlpha
Bond
Fund | | | Equity
Dividend
Fund | | | International
Fund | |
Ordinary income(a) | | | 05/31/18 | | | $ | 1,273,607 | | | $ | 1,836,675 | | | $ | 321,874 | | | $ | 903,802 | |
| | | 05/31/17 | | | | 2,059,836 | | | | 2,308,629 | | | | 3,000,104 | | | | 1,071,366 | |
Long-term capital gains(a) | | | 05/31/18 | | | | 11,055,777 | | | | — | | | | 17,389,682 | | | | — | |
| | | 05/31/17 | | | | 6,218,184 | | | | — | | | | 4,376,450 | | | | — | |
| | | | |
| NOTESTO FINANCIAL STATEMENTS | | | 57 | |
Notes to Financial Statements (continued)
| | | | | | | | | | | | | | | | | | | | |
| | | | | | Capital
Appreciation
Fund | | | CoreAlpha
Bond
Fund | | | Equity
Dividend
Fund | | | International
Fund | |
Return of capital | | | 05/31/18 | | | $ | — | | | $ | 1,199,813 | | | $ | — | | | $ | — | |
| | | 05/31/17 | | | | — | | | | 1,704,279 | | | | — | | | | — | |
| | | | | | | | | | | | | | | | | | | | |
Total | | | 05/31/18 | | | $ | 12,329,384 | | | $ | 3,036,488 | | | $ | 17,711,556 | | | $ | 903,802 | |
| | | | | | | | | | | | | | | | | | | | |
| | | 05/31/17 | | | $ | 8,278,020 | | | $ | 4,012,908 | | | $ | 7,376,554 | | | $ | 1,071,366 | |
| | | | | | | | | | | | | | | | | | | | |
| | (a) | Distribution amounts may include a portion of the proceeds from redeemed shares. | |
As of period end, the tax components of accumulated net earnings (losses) were as follows:
| | | | | | | | | | | | | | | | |
| | | Capital
Appreciation
Fund | | | CoreAlpha
Bond
Fund | | | Equity
Dividend
Fund | | | International
Fund | |
Undistributed ordinary income | | $ | 1,915,580 | | | $ | — | | | $ | 571,554 | | | $ | 353,141 | |
Undistributed long-term capital gains | | | 12,355,085 | | | | — | | | | 17,683,168 | | | | 1,463,871 | |
Capital loss carryforwards | | | — | | | | (3,987,301 | ) | | | — | | | | — | |
Net unrealized gains (losses)(a) | | | 19,234,447 | | | | (1,372,004 | ) | | | 12,467,195 | | | | (1,862,048 | ) |
| | | | | | | | | | | | | | | | |
Total | | $ | 33,505,112 | | | $ | (5,359,305 | ) | | $ | 30,721,917 | | | $ | (45,036 | ) |
| | | | | | | | | | | | | | | | |
| | (a) | The differences between book-basis and tax-basis net unrealized gains were attributable primarily to the tax deferral of losses on wash sales, and the realization for tax purposes of unrealized gains/losses on certain futures and foreign currency contracts. | |
As of May 31, 2018, the CoreAlpha Bond Fund had $3,987,301 of non-expiring capital loss carryforwards available to offset future realized capital gains.
During the year ended May 31, 2018, International Fund utilized $37,091,429 of their respective capital loss carryforward.
As of May 31, 2018, gross unrealized appreciation and depreciation for investments and derivatives based on cost for U.S. federal income tax purposes were as follows:
| | | | | | | | | | | | | | | | |
| | | Capital
Appreciation
Fund | | | CoreAlpha
Bond
Fund | | | Equity Dividend
Fund | | | International
Fund | |
Tax cost | | $ | 61,818,473 | | | $ | 114,071,591 | | | $ | 61,062,759 | | | $ | 82,893,520 | |
| | | | | | | | | | | | | | | | |
Gross unrealized appreciation | | $ | 19,762,345 | | | $ | 713,964 | | | $ | 14,646,230 | | | $ | 3,099,632 | |
Gross unrealized depreciation | | | (527,903 | ) | | | (1,871,764 | ) | | | (2,178,424 | ) | | | (4,960,547 | ) |
| | | | | | | | | | | | | | | | |
Net unrealized appreciation (depreciation) | | $ | 19,234,442 | | | $ | (1,157,800 | ) | | $ | 12,467,806 | | | $ | (1,860,915 | ) |
| | | | | | | | | | | | | | | | |
The Tax Cuts and Jobs Act (the “Act”) was enacted on December 22, 2017. Certain provisions of the Act were effective upon enactment with the remainder becoming effective for tax years beginning after December 31, 2017. Although the Act does not amend any provisions directly related to the qualification or taxation of regulated investment companies (“RICs”), the Act does change the taxation of entities in which some RICs invest, the tax treatment of income derived from those entities and the taxation of RIC shareholders. While management does not anticipate significant impact to the Funds or to their shareholders, there is uncertainty in the application of certain provisions in the Act. Specifically, provisions in the Act may increase the amount of or accelerate the recognition of taxable income and may limit the deductibility of certain expenses by RICs. Until full clarity around these provisions is obtained, the impact on the Funds’ financial statements, if any, cannot be fully determined.
The Corporation, on behalf of the Funds, along with certain other funds managed by the Manager and its affiliates (“Participating Funds”), is a party to a 364-day, $2.25 billion credit agreement with a group of lenders. Under this agreement, the Funds may borrow to fund shareholder redemptions. Excluding commitments designated for certain individual funds, the Participating Funds, including the Funds, can borrow up to an aggregate commitment amount of $1.75 billion at any time outstanding, subject to asset coverage and other limitations as specified in the agreement. The credit agreement has the following terms: a fee of 0.10% per annum on unused commitment amounts and interest at a rate equal to the higher of (a) one-month LIBOR (but, in any event, not less than 0.00%) on the date the loan is made plus 0.80% per annum or (b) the Fed Funds rate (but, in any event, not less than 0.00%) in effect from time to time plus 0.80% per annum on amounts borrowed. The agreement expires in April 2019 unless extended or renewed. Prior to April 19, 2018, the aggregate commitment amount was $2.1 billion and the fee was 0.12% per annum. Participating Funds paid an upfront commitment fee of 0.02% on the total commitment amounts, in addition to administration, legal and arrangement fees, which are included in miscellaneous expenses in the Statements of Operations. These fees were allocated among such funds based upon portions of the aggregate commitment available to them and relative net assets of Participating Funds. During the year ended May 31, 2018, the Funds did not borrow under the credit agreement.
Many municipalities insure repayment of their bonds, which may reduce the potential for loss due to credit risk. The market value of these bonds may fluctuate for other reasons, including market perception of the value of such insurance, and there is no guarantee that the insurer will meet its obligation.
Inventories of municipal bonds held by brokers and dealers may decrease, which would lessen their ability to make a market in these securities. Such a reduction in market making capacity could potentially decrease a Fund’s ability to buy or sell bonds. As a result, a Fund may sell a security at a lower price, sell other securities to raise cash,
| | |
| 58 | | 2018 BLACKROCK ANNUAL REPORTTO SHAREHOLDERS |
Notes to Financial Statements (continued)
or give up an investment opportunity, any of which could have a negative impact on performance. If a Fund needed to sell large blocks of bonds, those sales could further reduce the bonds’ prices and impact performance.
In the normal course of business, certain Funds invest in securities or other instruments and may enter into certain transactions and such activities subject each Fund to various risks, including among others, fluctuations in the market (market risk) or failure of an issuer to meet all of its obligations. The value of securities or other instruments may also be affected by various factors, including, without limitation: (i) the general economy; (ii) the overall market as well as local, regional or global political and/or social instability; (iii) regulation, taxation or international tax treaties between various countries; or (iv) currency, interest rate and price fluctuations. Each Fund’s prospectus provides details of the risks to which each Fund is subject.
Each Fund may be exposed to prepayment risk, which is the risk that borrowers may exercise their option to prepay principal earlier than scheduled during periods of declining interest rates, which would force each Fund to reinvest in lower yielding securities. Each Fund may also be exposed to reinvestment risk, which is the risk that income from each Fund’s portfolio will decline if each Fund invests the proceeds from matured, traded or called fixed-income securities at market interest rates that are below each Fund portfolio’s current earnings rate
Valuation Risk: The market values of equities, such as common stocks and preferred securities or equity related investments, such as futures and options, may decline due to general market conditions which are not specifically related to a particular company. They may also decline due to factors which affect a particular industry or industries. A Fund may invest in illiquid investments and may experience difficulty in selling those investments in a timely manner at the price that it believes the investments are worth. Prices may fluctuate widely over short or extended periods in response to company, market or economic news. Markets also tend to move in cycles, with periods of rising and falling prices. This volatility may cause each Fund’s NAV to experience significant increases or decreases over short periods of time. If there is a general decline in the securities and other markets, the NAV of a Fund may lose value, regardless of the individual results of the securities and other instruments in which a Fund invests.
The price a Fund could receive upon the sale of any particular portfolio investment may differ from a Fund’s valuation of the investment, particularly for securities that trade in thin or volatile markets or that are valued using a fair valuation technique or a price provided by an independent pricing service. Changes to significant unobservable inputs and assumptions (i.e., publicly traded company multiples, growth rate, time to exit) due to the lack of observable inputs may significantly impact the resulting fair value and therefore a Fund’s results of operations. As a result, the price received upon the sale of an investment may be less than the value ascribed by a Fund, and a Fund could realize a greater than expected loss or lesser than expected gain upon the sale of the investment. A Fund’s ability to value its investments may also be impacted by technological issues and/or errors by pricing services or other third party service providers.
Counterparty Credit Risk: The Funds may be exposed to counterparty credit risk, or the risk that an entity may fail to or be unable to perform on its commitments related to unsettled or open transactions. The Funds manage counterparty credit risk by entering into transactions only with counterparties that the Manager believes have the financial resources to honor their obligations and by monitoring the financial stability of those counterparties. Financial assets, which potentially expose the Funds to market, issuer and counterparty credit risks, consist principally of financial instruments and receivables due from counterparties. The extent of the Funds’ exposure to market, issuer and counterparty credit risks with respect to these financial assets is approximately their value recorded in the Statements of Assets and Liabilities, less any collateral held by the Funds.
A derivative contract may suffer a mark-to-market loss if the value of the contract decreases due to an unfavorable change in the market rates or values of the underlying instrument. Losses can also occur if the counterparty does not perform under the contract.
A Fund’s risk of loss from counterparty credit risk on OTC derivatives is generally limited to the aggregate unrealized gain less the value of any collateral held by such Fund
With exchange-traded futures, there is less counterparty credit risk to the Funds since the exchange or clearinghouse, as counterparty to such instruments, guarantees against a possible default. The clearinghouse stands between the buyer and the seller of the contract; therefore, credit risk is limited to failure of the clearinghouse. While offset rights may exist under applicable law, a Fund does not have a contractual right of offset against a clearing broker or clearinghouse in the event of a default (including the bankruptcy or insolvency). Additionally, credit risk exists in exchange-traded futures with respect to initial and variation margin that is held in a clearing broker’s customer accounts. While clearing brokers are required to segregate customer margin from their own assets, in the event that a clearing broker becomes insolvent or goes into bankruptcy and at that time there is a shortfall in the aggregate amount of margin held by the clearing broker for all its clients, typically the shortfall would be allocated on a pro rata basis across all the clearing broker’s customers, potentially resulting in losses to the Funds.
Concentration Risk: As of period end, Capital Appreciation Fund invested a significant portion of its assets in securities in the information technology sector. As of period end, Equity Dividend Fund invested a significant portion of its assets in securities in the financials sector. Changes in economic conditions affecting such sectors would have a greater impact on the Funds and could affect the value, income and/or liquidity of positions in such securities.
CoreAlpha Bond Fund invests a significant portion of its assets in fixed-income securities and/or uses derivatives tied to the fixed-income markets. Changes in market interest rates or economic conditions may affect the value and/or liquidity of such investments. Interest rate risk is the risk that prices of bonds and other fixed-income securities will increase as interest rates fall and decrease as interest rates rise.
International Fund invests a substantial amount of its assets in issuers located in a single country or a limited number of countries. When the Fund concentrates its investments in this manner, it assumes the risk that economic, political and social conditions in those countries may have a significant impact on their investment performance. Foreign issuers may not be subject to the same uniform accounting, auditing and financial reporting standards and practices as used in the United States. Foreign securities markets may also be less liquid, more volatile, and less subject to governmental supervision not typically associated with investing in U.S. securities. Investment percentages in specific countries are presented in the Schedule of Investments.
International Fund invests a significant portion of its assets in securities of issuers located in Europe or with significant exposure to European issuers or countries. The European financial markets have recently experienced volatility and adverse trends due to concerns about economic downturns in, or rising government debt levels of, several European countries. These events may spread to other countries in Europe and may affect the value and liquidity of certain of the Fund’s investments.
| | | | |
| NOTESTO FINANCIAL STATEMENTS | | | 59 | |
Notes to Financial Statements (continued)
The United Kingdom voted on June 23, 2016 to withdraw from the European Union, which may introduce significant new uncertainties and instability in the financial markets across Europe.
International Fund invests a significant portion of its assets in securities of issuers located in Asia or with significant exposure to Asian issuers or countries. The Asian financial markets have recently experienced volatility and adverse trends due to concerns in several Asian countries regarding monetary policy, government intervention in the markets, rising government debt levels or economic downturns. These events may spread to other countries in Asia and may affect the value and liquidity of certain of the Fund’s investments.
| 11. | CAPITAL SHARE TRANSACTIONS |
Transactions in capital shares for each class were as follows:
| | | | | | | | | | | | | | | | |
| | | Year Ended
05/31/18 | | | Year Ended
05/31/17 | |
| Capital Appreciation Fund | | Shares | | | Amount | | | Shares | | | Amount | |
Institutional | | | | | | | | | | | | | | | | |
Shares sold | | | 2,451 | | | $ | 39,589 | | | | 24,535 | | | $ | 368,235 | |
Shares issued in reinvestment of distributions | | | 26,673 | | | | 424,183 | | | | 18,043 | | | | 267,519 | |
Shares redeemed | | | (93,431 | ) | | | (1,558,246 | ) | | | (111,748 | ) | | | (1,694,294 | ) |
| | | | | | | | | | | | | | | | |
Net decrease | | | (64,307 | ) | | $ | (1,094,474 | ) | | | (69,170 | ) | | $ | (1,058,540 | ) |
| | | | | | | | | | | | | | | | |
| | | | |
Investor A | | | | | | | | | | | | | | | | |
Shares sold | | | 222,871 | | | $ | 3,614,894 | | | | 1,201,434 | | | $ | 18,782,465 | |
Shares issued in reinvestment of distributions | | | 379,488 | | | | 5,818,785 | | | | 198,963 | | | | 2,853,634 | |
Shares redeemed | | | (1,569,298 | ) | | | (25,162,984 | ) | | | (1,032,825 | ) | | | (15,150,403 | ) |
| | | | | | | | | | | | | | | | |
Net increase (decrease) | | | (966,939 | ) | | $ | (15,729,305 | ) | | | 367,572 | | | $ | 6,485,696 | |
| | | | | | | | | | | | | | | | |
| | | | |
Investor C | | | | | | | | | | | | | | | | |
Shares sold | | | 11,857 | | | $ | 168,977 | | | | 255,933 | | | $ | 3,335,242 | |
Shares issued in reinvestment of distributions | | | 234,801 | | | | 3,203,862 | | | | 320,018 | | | | 4,133,904 | |
Shares redeemed | | | (1,506,559 | ) | | | (21,536,411 | ) | | | (3,573,476 | ) | | | (48,203,577 | ) |
| | | | | | | | | | | | | | | | |
Net decrease | | | (1,259,901 | ) | | $ | (18,163,572 | ) | | | (2,997,525 | ) | | $ | (40,734,431 | ) |
| | | | | | | | | | | | | | | | |
Total Net Decrease | | | (2,291,147 | ) | | $ | (34,987,351 | ) | | | (2,699,123 | ) | | $ | (35,307,275 | ) |
| | | | | | | | | | | | | | | | |
| | | | |
| CoreAlpha Bond Fund | | Shares | | | Amount | | | Shares | | | Amount | |
Institutional | | | | | | | | | | | | | | | | |
Shares sold | | | 1,642 | | | $ | 16,766 | | | | 108,774 | | | $ | 1,115,796 | |
Shares issued in reinvestment of distributions | | | 12,954 | | | | 131,309 | | | | 15,011 | | | | 153,769 | |
Shares redeemed | | | (199,473 | ) | | | (2,025,574 | ) | | | (191,645 | ) | | | (1,961,167 | ) |
| | | | | | | | | | | | | | | | |
Net decrease | | | (184,877 | ) | | $ | (1,877,499 | ) | | | (67,860 | ) | | $ | (691,602 | ) |
| | | | | | | | | | | | | | | | |
| | | | |
Investor A | | | | | | | | | | | | | | | | |
Shares sold | | | 420,594 | | | $ | 4,258,505 | | | | 2,724,501 | | | $ | 27,921,810 | |
Shares issued in reinvestment of distributions | | | 161,071 | | | | 1,634,127 | | | | 162,113 | | | | 1,661,463 | |
Shares redeemed | | | (3,480,161 | ) | | | (35,430,975 | ) | | | (2,158,779 | ) | | | (22,106,039 | ) |
| | | | | | | | | | | | | | | | |
Net increase (decrease) | | | (2,898,496 | ) | | $ | (29,538,343 | ) | | | 727,835 | | | $ | 7,477,234 | |
| | | | | | | | | | | | | | | | |
| | | | |
Investor C | | | | | | | | | | | | | | | | |
Shares sold | | | 37,606 | | | $ | 383,663 | | | $ | 999,804 | | | $ | 10,235,950 | |
Shares issued in reinvestment of distributions | | | 76,655 | | | | 778,393 | | | | 153,159 | | | | 1,569,733 | |
Shares redeemed | | | (3,360,893 | ) | | | (34,216,852 | ) | | | (6,732,186 | ) | | | (68,840,028 | ) |
| | | | | | | | | | | | | | | | |
Net decrease | | | (3,246,632 | ) | | $ | (33,054,796 | ) | | $ | (5,579,223 | ) | | $ | (57,034,345 | ) |
| | | | | | | | | | | | | | | | |
Total Net Decrease | | | (6,330,005 | ) | | $ | (64,470,638 | ) | | $ | (4,919,248 | ) | | $ | (50,248,713 | ) |
| | | | | | | | | | | | | | | | |
| | | | |
| Equity Dividend Fund | | Shares | | | Amount | | | Shares | | | Amount | |
Institutional | | | | | | | | | | | | | | | | |
Shares sold | | | 1,289 | | | $ | 21,423 | | | | 19,138 | | | $ | 304,512 | |
Shares issued in reinvestment of distributions | | | 34,389 | | | | 563,801 | | | | 15,217 | | | | 250,270 | |
Shares redeemed | | | (82,671 | ) | | | (1,383,510 | ) | | | (120,083 | ) | | | (1,953,413 | ) |
| | | | | | | | | | | | | | | | |
Net decrease | | | (46,993 | ) | | $ | (798,286 | ) | | | (85,728 | ) | | $ | (1,398,631 | ) |
| | | | | | | | | | | | | | | | |
| | | | |
Investor A | | | | | | | | | | | | | | | | |
Shares sold | | | 245,232 | | | $ | 4,070,163 | | | | 1,107,273 | | | $ | 18,364,034 | |
Shares issued in reinvestment of distributions | | | 445,156 | | | | 7,225,509 | | | | 150,075 | | | | 2,449,109 | |
Shares redeemed | | | (1,375,753 | ) | | | (22,957,224 | ) | | | (1,132,968 | ) | | | (18,310,260 | ) |
| | | | | | | | | | | | | | | | |
Net increase (decrease) | | | (685,365 | ) | | $ | (11,661,552 | ) | | | 124,380 | | | $ | 2,502,883 | |
| | | | | | | | | | | | | | | | |
| | |
| 60 | | 2018 BLACKROCK ANNUAL REPORTTO SHAREHOLDERS |
Notes to Financial Statements (continued)
| | | | | | | | | | | | | | | | |
| | | Year Ended
05/31/18 | | | Year Ended
05/31/17 | |
| Equity Dividend Fund | | Shares | | | Amount | | | Shares | | | Amount | |
| | | | |
Investor C | | | | | | | | | | | | | | | | |
Shares sold | | | 17,496 | | | $ | 286,983 | | | | 165,827 | | | $ | 2,548,972 | |
Shares issued in reinvestment of distributions | | | 248,270 | | | | 3,944,978 | | | | 170,041 | | | | 2,737,667 | |
Shares redeemed | | | (1,253,246 | ) | | | (20,456,525 | ) | | | (3,254,931 | ) | | | (52,284,120 | ) |
| | | | | | | | | | | | | | | | |
Net decrease | | | (987,480 | ) | | $ | (16,224,564 | ) | | | (2,919,063 | ) | | $ | (46,997,481 | ) |
| | | | | | | | | | | | | | | | |
Total Net Decrease | | | (1,719,838 | ) | | $ | (28,684,402 | ) | | | (2,880,411 | ) | | $ | (45,893,229 | ) |
| | | | | | | | | | | | | | | | |
| | | | |
| International Fund | | Shares | | | Amount | | | Shares | | | Amount | |
Institutional | | | | | | | | | | | | | | | | |
Shares sold | | | 740 | | | $ | 9,729 | | | | 46,893 | | | $ | 532,671 | |
Shares issued in reinvestment of distributions | | | 3,807 | | | | 49,794 | | | | 6,464 | | | | 71,875 | |
Shares redeemed | | | (112,790 | ) | | | (1,524,997 | ) | | | (160,013 | ) | | | (1,848,542 | ) |
| | | | | | | | | | | | | | | | |
Net decrease | | | (108,243 | ) | | $ | (1,465,474 | ) | | | (106,656 | ) | | $ | (1,243,996 | ) |
| | | | | | | | | | | | | | | | |
| | | | |
Investor A | | | | | | | | | | | | | | | | |
Shares sold | | | 317,746 | | | $ | 4,318,977 | | | | 1,986,670 | | | $ | 24,815,183 | |
Shares issued in reinvestment of distributions | | | 62,438 | | | | 812,324 | | | | 56,966 | | | | 630,613 | |
Shares redeemed | | | (2,192,886 | ) | | | (29,463,982 | ) | | | (1,534,616 | ) | | | (17,645,886 | ) |
| | | | | | | | | | | | | | | | |
Net increase (decrease) | | | (1,812,702 | ) | | $ | (24,332,681 | ) | | | 509,020 | | | $ | 7,799,910 | |
| | | | | | | | | | | | | | | | |
| | | | |
Investor C | | | | | | | | | | | | | | | | |
Shares sold | | | 9,452 | | | $ | 128,467 | | | | 536,056 | | | $ | 5,975,626 | |
Shares issued in reinvestment of distributions | | | — | | | | — | | | | 22,389 | | | | 246,496 | |
Shares redeemed | | | (1,865,292 | ) | | | (24,931,414 | ) | | | (4,868,252 | ) | | | (57,515,255 | ) |
| | | | | | | | | | | | | | | | |
Net decrease | | | (1,855,840 | ) | | $ | (24,802,947 | ) | | | (4,309,807 | ) | | $ | (51,293,133 | ) |
| | | | | | | | | | | | | | | | |
Total Net Decrease | | | (3,776,785 | ) | | $ | (50,601,102 | ) | | | (3,907,443 | ) | | $ | (44,737,219 | ) |
| | | | | | | | | | | | | | | | |
Management’s evaluation of the impact of all subsequent events on the Funds’ financial statements was completed through the date the financial statements were issued and the following items were noted:
The Funds paid net investment income, short-term capital gain and long-term capital gain distributions in the following amounts per share on July 20, 2018 to the shareholders of record on July 18, 2018:
| | | | | | | | | | | | |
| | | Net Investment Income | | | Short-Term Capital Gain | | | Long-Term Capital Gain | |
Capital Appreciation Fund | | | | | | | | | | | | |
Institutional | | $ | — | | | $ | 0.441024 | | | $ | 2.627544 | |
Investor A | | | — | | | | 0.422884 | | | | 2.627544 | |
Investor C | | | — | | | | 0.370633 | | | | 2.627544 | |
Equity Dividend Fund | | | | | | | | | | | | |
Institutional | | | 0.080823 | | | | 0.082372 | | | | 3.976034 | |
Investor A | | | 0.062200 | | | | 0.082372 | | | | 3.976034 | |
Investor C | | | 0.003120 | | | | 0.082372 | | | | 3.976034 | |
International Fund | | | | | | | | | | | | |
Institutional | | | 0.120680 | | | | — | | | | 0.246605 | |
Investor A | | | 0.080506 | | | | — | | | | 0.246605 | |
Investor C | | | — | | | | — | | | | 0.246605 | |
The Board has approved an Agreement and Plan of Reorganization (the “Plan”) with respect to CoreAlpha Bond Fund, pursuant to which the Fund will reorganize into a newly created series (the “New Fund”) of a newly organized Maryland corporation. This reorganization with respect to CoreAlpha Bond Fund Fund (the “Reorganization”) is expected to close in the third quarter of 2018. The Reorganization is not subject to approval by shareholders of CoreAlpha Bond Fund Fund.
The New Fund will have the same investment objective, strategies and policies, investment adviser, portfolio management team and service providers as CoreAlpha Bond. CoreAlpha Bond Fund will be the performance and accounting survivor of the Reorganization, meaning that the New Fund will assume the performance and financial history of the Fund at the completion of the Reorganization. In addition, the New Fund will be subject to the same contractual arrangements, including the same contractual fees and expenses, as those of CoreAlpha Bond. The Reorganization is intended to be tax-free meaning that CoreAlpha Bond Fund’s shareholders will become shareholders of the New Fund without realizing any gain or loss for federal income tax purposes.
Upon the consummation of the Reorganization, shareholders of CoreAlpha Bond Fund will become shareholders of the New Fund. If you are a shareholder of CoreAlpha Bond, the cash value of your investment will not change. You will receive New Fund shares with a total dollar value equal to CoreAlpha Bond Fund shares that you own at the time of the Reorganization.
| | | | |
| NOTESTO FINANCIAL STATEMENTS | | | 61 | |
Report of Independent Registered Public Accounting Firm
To the Shareholders of FDP BlackRock Capital Appreciation Fund, FDP BlackRock CoreAlpha Bond Fund, FDP BlackRock Equity Dividend Fund, and FDP BlackRock International Fund, and the Board of Directors of FDP Series, Inc.:
Opinion on the Financial Statements and Financial Highlights
We have audited the accompanying statements of assets and liabilities of FDP BlackRock Capital Appreciation Fund (formerly FDP BlackRock Janus Growth Fund), FDP BlackRock CoreAlpha Bond Fund, FDP BlackRock Equity Dividend Fund (formerly FDP BlackRock Invesco Value Fund), and FDP BlackRock International Fund (formerly FDP BlackRock MFS Research International Fund) of FDP Series, Inc., (the “Funds”), including the schedules of investments, as of May 31, 2018, the related statements of operations for the year then ended, the statements of changes in net assets for each of the two years in the period then ended, the financial highlights for each of the five years in the period then ended, and the related notes. In our opinion, the financial statements and financial highlights present fairly, in all material respects, the financial position of the Funds as of May 31, 2018, and the results of their operations and for the year then ended, the changes in their net assets for each of the two years in the period then ended, and the financial highlights for each of the five years in the period then ended, in conformity with accounting principles generally accepted in the United States of America.
Basis for Opinion
These financial statements and financial highlights are the responsibility of the Funds’ management. Our responsibility is to express an opinion on the Funds’ financial statements and financial highlights based on our audits. We are a public accounting firm registered with the Public Company Accounting Oversight Board (United States) (PCAOB) and are required to be independent with respect to the Funds in accordance with the U.S. federal securities laws and the applicable rules and regulations of the Securities and Exchange Commission and the PCAOB.
We conducted our audits in accordance with the standards of the PCAOB. Those standards require that we plan and perform the audit to obtain reasonable assurance about whether the financial statements and financial highlights are free of material misstatement, whether due to error or fraud. The Funds are not required to have, nor were we engaged to perform, an audit of their internal control over financial reporting. As part of our audits we are required to obtain an understanding of internal control over financial reporting but not for the purpose of expressing an opinion on the effectiveness of the Funds’ internal control over financial reporting. Accordingly, we express no such opinion.
Our audits included performing procedures to assess the risks of material misstatement of the financial statements and financial highlights, whether due to error or fraud, and performing procedures that respond to those risks. Such procedures included examining, on a test basis, evidence regarding the amounts and disclosures in the financial statements and financial highlights. Our audits also included evaluating the accounting principles used and significant estimates made by management, as well as evaluating the overall presentation of the financial statements and financial highlights. Our procedures included confirmation of securities owned as of May 31, 2018, by correspondence with the custodian and brokers; when replies were not received from brokers, we performed other auditing procedures. We believe that our audits provide a reasonable basis for our opinion.
Deloitte & Touche LLP
Boston, Massachusetts
July 23, 2018
We have served as the auditor of one or more BlackRock investment companies since 1992.
Important Tax Information (Unaudited)
During fiscal year ended May 31, 2018, the following information is provided with respect to the ordinary income distributions paid by the FDP Series, Inc.
| | | | | | | | | | | | | | | | | | |
| | | Payable Date/ Months Paid | | Capital
Appreciation Fund | | | CoreAlpha
Bond Fund | | | Equity
Dividend Fund | | | International
Fund | |
Qualified Dividend Income for Individuals(a) | | 07/21/2017 | | | 100.00% | | | | — | | | | 100.00% | | | | 100.00% | (b) |
| | 12/12/2017 | | | 74.97% | | | | — | | | | 100.00% | | | | — | |
| | June 2017 — December 2017 | | | — | | | | — | | | | — | | | | — | |
Dividends Qualifying for the Dividend Received Deduction for Corporations(a) | | June 2017 — December 2017 | | | 82.46% | | | | — | | | | 100.00% | | | | — | |
Foreign Source Income(a)(b) | | 07/21/2017 | | | — | | | | — | | | | — | | | | 100.00% | |
Interest Related Dividends and Short-Term Capital Gain for Non-U.S. Residents(c) | | June 2017 — December 2017 | | | 100.00% | | | | 80.67% | | | | — | | | | — | |
Federal Obligation Interest(d) | | June 2017 — December 2017 | | | — | | | | 13.86% | | | | — | | | | — | |
Foreign Taxes Paid Per Share(e) | | 07/21/2017 | | | — | | | | — | | | | — | | | $ | 0.040998 | |
Long-term capital gains per share | | 07/21/2017 | | $ | 0.548726 | | | | — | | | $ | 0.834769 | | | | — | |
| | | 12/12/2017 | | $ | 1.144324 | | | | — | | | $ | 1.803157 | | | | — | |
| | (a) | The Funds hereby designate the percentage indicated above or the maximum allowable by law. | |
| | (b) | Expressed as a percentage of the cash distribution grossed-up for foreign taxes. | |
| | (c) | Represents the portion of the taxable ordinary income dividends eligible for exemption from U.S. withholding tax for nonresident aliens and foreign corporations. | |
| | (d) | The law varies in each state as to whether and what percentage of dividend income attributable to Federal Obligations is exempt from state income tax. We recommend that you consult your tax advisor to determine if any portion of the dividends you received is exempt from state income taxes. | |
| | (e) | The foreign taxes paid represent taxes incurred by the Fund on income received by the Fund from foreign sources. Foreign taxes paid may be included in taxable income with an offsetting deduction from gross income or may be taken as a credit for taxes paid to foreign governments. You should consult your tax advisor regarding the appropriate treatment of foreign taxes paid. | |
| | |
| 62 | | 2018 BLACKROCK ANNUAL REPORTTO SHAREHOLDERS |
Disclosure of Investment Advisory Agreement and Sub-Advisory Agreement
The Board of Directors (the “Board,” the members of which are referred to as “Board Members”) of FDP Series, Inc. (the “Corporation”) met in person on April 10, 2018 (the “April Meeting”) and May 8, 2018 (the “May Meeting”) to consider the approval of the investment advisory agreement (the “Advisory Agreement”) between the Corporation, on behalf of FDP BlackRock Capital Appreciation Fund (the “Capital Appreciation Fund”), FDP BlackRock CoreAlpha Bond Fund (the “CoreAlpha Bond Fund”), FDP BlackRock Equity Dividend Fund (the “Equity Dividend Fund”) and FDP BlackRock International Fund (the “International Fund”) (each, a “Fund”) and BlackRock Advisors, LLC (the “Manager”), each Fund’s investment advisor. The Board also considered the approval of the sub-advisory agreement (the “Sub-Advisory Agreement”) between the Manager and BlackRock International Limited (the “Sub-Advisor”), with respect to the International Fund. The Manager and the Sub-Advisor are referred to herein as “BlackRock.” The Advisory Agreement and the Sub-Advisory Agreement are referred to herein as the “Agreements.”
Activities and Composition of the Board
On the date of the May Meeting, the Board consisted of eleven individuals, nine of whom were not “interested persons” of the Corporation as defined in the Investment Company Act of 1940, as amended (the “1940 Act”) (the “Independent Board Members”). The Board Members are responsible for the oversight of the operations of each Fund and perform the various duties imposed on the directors of investment companies by the 1940 Act. The Independent Board Members have retained independent legal counsel to assist them in connection with their duties. The Chair of the Board is an Independent Board Member. The Board has established five standing committees: an Audit Committee, a Governance and Nominating Committee, a Compliance Committee, a Performance Oversight Committee and an Executive Committee, each of which is chaired by an Independent Board Member and composed of Independent Board Members (except for the Performance Oversight Committee and the Executive Committee, each of which also has one interested Board Member).
The Agreements
Pursuant to the 1940 Act, the Board is required to consider the continuation of the Agreements on an annual basis. The Board has four quarterly meetings per year, each typically extending for two days, and additional in-person and telephonic meetings throughout the year, as needed. The Board also has a fifth one-day meeting to consider specific information surrounding the consideration of renewing the Agreements. The Board’s consideration of the Agreements is a year-long deliberative process, during which the Board assessed, among other things, the nature, extent and quality of the services provided to each Fund by BlackRock, BlackRock’s personnel and affiliates, including (as applicable): investment management; accounting, administrative and shareholder services; oversight of each Fund’s service providers; marketing and promotional services; risk management and oversight; legal and compliance services; and ability to meet applicable legal and regulatory requirements.
The Board, acting directly and through its committees, considers at each of its meetings, and from time to time as appropriate, factors that are relevant to its annual consideration of the renewal of the Agreements, including the services and support provided by BlackRock to each Fund and its shareholders. BlackRock also furnished additional information to the Board in response to specific questions from the Board. This additional information is discussed further below in the section titled “Board Considerations in Approving the Agreements.” Among the matters the Board considered were: (a) investment performance for one-year, three-year, five-year, ten-year, and/or since inception periods, as applicable, against peer funds, applicable benchmark, and performance metrics, as applicable, as well as senior management’s and portfolio managers’ analysis of the reasons for any over-performance or underperformance relative to its peers, benchmarks, and other performance metrics, as applicable; (b) fees, including advisory, administration, if applicable, and other amounts paid to BlackRock and its affiliates by each Fund for services; (c) Fund operating expenses and how BlackRock allocates expenses to each Fund; (d) the resources devoted to, risk oversight of, and compliance reports relating to, implementation of each Fund’s investment objective(s), policies and restrictions, and meeting regulatory requirements; (e) each Fund’s adherence to its compliance policies and procedures; (f) the nature, character and scope of non-investment management services provided by BlackRock and its affiliates and the estimated cost of such services; (g) BlackRock’s and other service providers’ internal controls and risk and compliance oversight mechanisms; (h) BlackRock’s implementation of the proxy voting policies approved by the Board; (i) execution quality of portfolio transactions or the use of brokerage commissions and execution quality of portfolio transactions, as applicable; (j) BlackRock’s implementation of each Fund’s valuation and liquidity procedures; (k) an analysis of management fees for products with similar investment mandates across the open-end fund, exchange-traded fund (“ETF”), closed-end fund, sub-advised mutual fund, separately managed account, collective investment trust, and institutional separate account product channels, as applicable, and the similarities and differences between these products and the services provided as compared to each Fund; (l) BlackRock’s compensation methodology for its investment professionals and the incentives and accountability it creates, along with investment professionals’ investments in the fund(s) they manage; and (m) periodic updates on BlackRock’s business.
Board Considerations in Approving the Agreements
The Approval Process: Prior to the April Meeting, the Board requested and received materials specifically relating to the Agreements. The Board is continuously engaged in a process with its independent legal counsel and BlackRock to review the nature and scope of the information provided to better assist its deliberations. The materials provided in connection with the April Meeting included, among other things: (a) information independently compiled and prepared by Broadridge Financial Solutions, Inc. (“Broadridge”), based on either a Lipper classification or Morningstar category, regarding each Fund’s fees and expenses as compared with a peer group of funds as determined by Broadridge (“Expense Peers”), the investment performance of each Fund as compared with a peer group of funds (“Performance Peers”) and other metrics, as applicable; (b) information on the composition of the Expense Peers and Performance Peers, and a description of Broadridge’s methodology; (c) information on the estimated profits realized by BlackRock and its affiliates pursuant to the Agreements and a discussion of fall-out benefits to BlackRock and its affiliates; (d) a general analysis provided by BlackRock concerning investment management fees received in connection with other types of investment products, such as institutional accounts, sub-advised mutual funds, ETFs, closed-end funds, open-end funds, and separately managed accounts, under similar investment mandates, as well as the performance of such other products, as applicable; (e) review of non-management fees; (f) the existence and impact of potential economies of scale, if any, and the sharing of potential economies of scale with each Fund; (g) a summary of aggregate amounts paid by each Fund to BlackRock; (h) sales and redemption data regarding each Fund’s shares; and (i) various additional information requested by the Board as appropriate regarding BlackRock’s and each Fund’s operations.
At the April Meeting, the Board reviewed materials relating to its consideration of the Agreements. As a result of the discussions that occurred during the April Meeting, and as a culmination of the Board’s year-long deliberative process, the Board presented BlackRock with questions and requests for additional information. BlackRock responded to these requests with additional written information in advance of the May Meeting.
| | | | |
| DISCLOSUREOF INVESTMENT ADVISORY AGREEMENTAND SUB-ADVISORY AGREEMENT | | | 63 | |
Disclosure of Investment Advisory Agreement and Sub-Advisory Agreement (continued)
At the May Meeting, the Board considered, among other things: (a) the nature, extent and quality of the services provided by BlackRock; (b) the investment performance of each Fund as compared with Performance Peers and other metrics, as applicable; (c) the advisory fee and the estimated cost of the services and estimated profits realized by BlackRock and its affiliates from their relationship with each Fund; (d) each Fund’s fees and expenses compared to Expense Peers; (e) the sharing of potential economies of scale; (f) fall-out benefits to BlackRock and its affiliates as a result of BlackRock’s relationship with each Fund; and (g) other factors deemed relevant by the Board Members.
The Board also considered other matters it deemed important to the approval process, such as other payments made to BlackRock or its affiliates, securities lending and cash management, services related to the valuation and pricing of Fund portfolio holdings, and advice from independent legal counsel with respect to the review process and materials submitted for the Board’s review. The Board noted the willingness of BlackRock personnel to engage in open, candid discussions with the Board. The Board did not identify any particular information as determinative, and each Board Member may have attributed different weights to the various items considered.
A. Nature, Extent and Quality of the Services Provided by BlackRock The Board, including the Independent Board Members, reviewed the nature, extent and quality of services provided by BlackRock, including the investment advisory services and the resulting performance of each Fund. Throughout the year, the Board compared Fund performance to the performance of a comparable group of mutual funds, a relevant benchmark, and performance metrics, as applicable. The Board met with BlackRock’s senior management personnel responsible for investment activities, including the senior investment officers. The Board also reviewed the materials provided by each Fund’s portfolio management team discussing each Fund’s performance and each Fund’s investment objective(s), strategies and outlook.
The Board considered, among other factors, with respect to BlackRock: the number, education and experience of investment personnel generally and each Fund’s portfolio management team; BlackRock’s research capabilities; investments by portfolio managers in the funds they manage; portfolio trading capabilities; use of technology; commitment to compliance; credit analysis capabilities; risk analysis and oversight capabilities; and the approach to training and retaining portfolio managers and other research, advisory and management personnel. The Board also considered BlackRock’s overall risk management program, including the continued efforts of BlackRock and its affiliates to address cybersecurity risks and the role of BlackRock’s Risk & Quantitative Analysis Group. The Board engaged in a review of BlackRock’s compensation structure with respect to each Fund’s portfolio management team and BlackRock’s ability to attract and retain high-quality talent and create performance incentives.
In addition to investment advisory services, the Board considered the quality of the administrative and other non-investment advisory services provided to each Fund. BlackRock and its affiliates provide each Fund with certain administrative, shareholder and other services (in addition to any such services provided to each Fund by third parties) and officers and other personnel as are necessary for the operations of each Fund. In particular, BlackRock and its affiliates provide each Fund with administrative services including, among others: (i) responsibility for disclosure documents, such as the prospectus, the summary prospectus (as applicable), the statement of additional information and periodic shareholder reports; (ii) oversight of daily accounting and pricing; (iii) responsibility for periodic filings with regulators; (iv) overseeing and coordinating the activities of other service providers including, among others, each Fund’s custodian, fund accountant, transfer agent, and auditor; (v) organizing Board meetings and preparing the materials for such Board meetings; (vi) providing legal and compliance support; (vii) furnishing analytical and other support to assist the Board in its consideration of strategic issues such as the merger, consolidation or repurposing of certain open-end funds; and (viii) performing administrative functions necessary for the operation of each Fund, such as tax reporting, expense management, fulfilling regulatory filing requirements, overseeing each Fund’s distribution partners, and shareholder call center and other services. The Board reviewed the structure and duties of BlackRock’s fund administration, shareholder services, and legal & compliance departments and considered BlackRock’s policies and procedures for assuring compliance with applicable laws and regulations.
B. The Investment Performance of each Fund and BlackRock The Board, including the Independent Board Members, also reviewed and considered the performance history of each Fund. In preparation for the April Meeting, the Board was provided with reports independently prepared by Broadridge, which included a comprehensive analysis of each Fund’s performance as of December 31, 2017. Broadridge ranks funds in quartiles, ranging from first to fourth, where first is the most desirable quartile position and fourth is the least desirable. In connection with its review, the Board received and reviewed information regarding the investment performance of each Fund as compared to its Performance Peers. The Board and its Performance Oversight Committee regularly review, and meet with Fund management to discuss, the performance of each Fund throughout the year.
In evaluating performance, the Board recognized that the performance data reflects a snapshot of a period as of a particular date and that selecting a different performance period could produce significantly different results. Further, the Board recognized that it is possible that long-term performance can be impacted by even one period of significant outperformance or underperformance, so that a single investment theme has the ability to affect long-term performance disproportionately.
The Board noted that for the one-, three- and five-year periods reported, the Capital Appreciation Fund ranked in the third, fourth, and fourth quartiles, respectively, against its Performance Peers. The Board and BlackRock reviewed the Capital Appreciation Fund’s underperformance during the applicable periods. Effective November 28, 2017, the Board terminated Janus Capital Management LLC as sub-adviser to the Fund and the Fund changed its name from FDP BlackRock Janus Growth Fund to FDP BlackRock Capital Appreciation Fund. Both BlackRock and the Board expect these changes to result in improved performance going forward, although there can be no assurance that will be the case. The Board will continue to monitor the Capital Appreciation Fund’s performance.
The Board noted that for the one-, three- and five-year periods reported, the CoreAlpha Bond Fund ranked in the second, fourth and third quartiles, respectively, against its Performance Peers. The Board and BlackRock reviewed the CoreAlpha Bond Fund’s underperformance during the applicable periods.
The Board and BlackRock discussed BlackRock’s strategy for improving the CoreAlpha Bond Fund’s investment performance. Discussions covered topics such as performance attribution, the CoreAlpha Bond Fund’s investment personnel, and the resources appropriate to support the CoreAlpha Bond Fund’s investment processes. Effective March 10, 2017, the Board terminated Franklin Templeton as sub-adviser to the Fund and the Fund changed its name from FDP BlackRock Franklin Templeton Total Return Fund to FDP BlackRock CoreAlpha Bond Fund. Both BlackRock and the Board expect these changes to result in improved performance going forward, although there can be no assurance that will be the case. The Board will continue to monitor the CoreAlpha Bond Fund’s performance.
The Board noted that for the one-, three- and five-year periods reported, the Equity Dividend Fund ranked in the third, third and second quartiles, respectively, against its Performance Peers. The Board and BlackRock reviewed the Equity Dividend Fund’s underperformance during the applicable periods. Effective November 28, 2017, the
| | |
| 64 | | 2018 BLACKROCK ANNUAL REPORTTO SHAREHOLDERS |
Disclosure of Investment Advisory Agreement and Sub-Advisory Agreement (continued)
Board terminated Invesco Advisers, Inc. as sub-adviser to the Fund and the Fund changed its name from FDP Invesco Value Fund to FDP Equity Dividend Fund. Both BlackRock and the Board expect these changes to result in improved performance going forward, although there can be no assurance that will be the case. The Board will continue to monitor the Equity Dividend Fund’s performance.
The Board noted that for the one-, three- and five-year periods reported, the International Fund ranked in the first, third, and fourth quartiles, respectively, against its Performance Peers. The Board and BlackRock reviewed the International Fund’s underperformance during the applicable periods. Effective November 28, 2017, the Board terminated Massachusetts Financial Services Company as sub-adviser to the Fund, appointed BlackRock International Limited as sub-adviser and the Fund changed its name from FDP MFS Research International Fund to FDP International Fund. Both BlackRock and the Board expect these changes to result in improved performance going forward, although there can be no assurance that will be the case. The Board will continue to monitor the International Fund’s performance.
C. Consideration of the Advisory/Management Fees and the Estimated Cost of the Services and Estimated Profits Realized by BlackRock and its Affiliates from their Relationship with each Fund The Board, including the Independent Board Members, reviewed each Fund’s contractual management fee rate compared with those of its Expense Peers. The contractual management fee rate represents a combination of the advisory fee and any administrative fees, before taking into account any reimbursements or fee waivers. The Board also compared each Fund’s total expense ratio, as well as its actual management fee rate, to those of its Expense Peers. The total expense ratio represents a fund’s total net operating expenses, including any 12b-1 or non 12b-1 service fees. The total expense ratio gives effect to any expense reimbursements or fee waivers that benefit a fund, and the actual management fee rate gives effect to any management fee reimbursements or waivers that benefit a fund. The Board considered the services provided and the fees charged by BlackRock and its affiliates to other types of clients with similar investment mandates, as applicable, including institutional accounts and sub-advised mutual funds (including mutual funds sponsored by third parties).
The Board received and reviewed statements relating to BlackRock’s financial condition. The Board reviewed BlackRock’s profitability methodology and was also provided with an estimated profitability analysis that detailed the revenues earned and the expenses incurred by BlackRock for services provided to each Fund. The Board reviewed BlackRock’s estimated profitability with respect to each Fund and other funds the Board currently oversees for the year ended December 31, 2017 compared to available aggregate estimated profitability data provided for the prior two years. The Board reviewed BlackRock’s estimated profitability with respect to certain other U.S. fund complexes managed by the Manager and/or its affiliates. The Board reviewed BlackRock’s assumptions and methodology of allocating expenses in the estimated profitability analysis, noting the inherent limitations in allocating costs among various advisory products. The Board recognized that profitability may be affected by numerous factors including, among other things, fee waivers and expense reimbursements by the Manager, the types of funds managed, precision of expense allocations and business mix. As a result, calculating and comparing profitability at individual fund levels is difficult.
The Board noted that, in general, individual fund or product line profitability of other advisors is not publicly available. The Board reviewed BlackRock’s overall operating margin, in general, compared to that of certain other publicly-traded asset management firms. The Board considered the differences between BlackRock and these other firms, including the contribution of technology at BlackRock, BlackRock’s expense management, and the relative product mix.
In addition, the Board considered the estimated cost of the services provided to each Fund by BlackRock, and BlackRock’s and its affiliates’ estimated profits relating to the management and distribution of each Fund and the other funds advised by BlackRock and its affiliates. As part of its analysis, the Board reviewed BlackRock’s methodology in allocating its costs of managing the Funds, to each Fund. The Board considered whether BlackRock has the financial resources necessary to attract and retain high quality investment management personnel to perform its obligations under the Agreements and to continue to provide the high quality of services that is expected by the Board. The Board further considered factors including but not limited to BlackRock’s commitment of time, assumption of risk, and liability profile in servicing each Fund in contrast to what is required of BlackRock with respect to other products with similar investment mandates across the open-end fund, ETF, closed-end fund, sub-advised mutual fund, separately managed account, collective investment trust, and institutional separate account product channels, as applicable.
The Board noted that the Capital Appreciation Fund’s contractual management fee rate ranked in the third quartile, and that the actual management fee rate and total expense ratio each ranked in the second quartile, relative to the Capital Appreciation Fund’s Expense Peers. The Board also noted that the Capital Appreciation Fund has an advisory fee arrangement that includes breakpoints that adjust the fee rate downward as the size of the Capital Appreciation Fund increases above certain contractually specified levels. The Board further noted that BlackRock and the Board have contractually agreed to a cap on the Capital Appreciation Fund’s total expenses as a percentage of the Capital Appreciation Fund’s average daily net assets on a class-by-class basis. In addition, the Board noted that BlackRock proposed, and the Board agreed to, a contractual advisory fee waiver. This waiver was implemented on November 28, 2017.
The Board noted that the CoreAlpha Bond Fund’s contractual management fee rate ranked in the second quartile, and that the actual management fee rate and total expense ratio ranked in the second and third quartiles, respectively, relative to the CoreAlpha Bond Fund’s Expense Peers. The Board also noted that the CoreAlpha Bond Fund has an advisory fee arrangement that includes breakpoints that adjust the fee rate downward as the size of the CoreAlpha Bond Fund increases above certain contractually specified levels. The Board further noted that BlackRock and the Board have contractually agreed to a cap on the CoreAlpha Bond Fund’s total expenses as a percentage of the CoreAlpha Bond Fund’s average daily net assets on a class-by-class basis. In addition, the Board noted that BlackRock proposed, and the Board agreed to, a contractual advisory fee waiver. This waiver was implemented on March 10, 2017.
The Board noted that the Equity Dividend Fund’s contractual management fee rate ranked in the first quartile, and that the actual management fee rate and total expense ratio each ranked in the second quartile, relative to the Equity Dividend Fund’s Expense Peers. The Board also noted that the Equity Dividend Fund has an advisory fee arrangement that includes breakpoints that adjust the fee rate downward as the size of the Equity Dividend Fund increases above certain contractually specified levels. The Board further noted that BlackRock and the Board have contractually agreed to a cap on the Equity Dividend Fund’s total expenses as a percentage of the Equity Dividend Fund’s average daily net assets on a class-by-class basis. In addition, the Board noted that BlackRock proposed, and the Board agreed to, a contractual advisory fee waiver. This waiver was implemented on November 28, 2017.
The Board noted that the International Fund’s contractual management fee rate ranked in the third quartile, and that the actual management fee rate and total expense ratio ranked in the fourth and second quartiles, respectively, relative to the International Fund’s Expense Peers. The Board also noted that the International Fund has an advisory fee arrangement that includes breakpoints that adjust the fee rate downward as the size of the International Fund increases above certain contractually specified
| | | | |
| DISCLOSUREOF INVESTMENT ADVISORY AGREEMENTAND SUB-ADVISORY AGREEMENT | | | 65 | |
Disclosure of Investment Advisory Agreement and Sub-Advisory Agreement (continued)
levels. The Board further noted that BlackRock and the Board have contractually agreed to a cap on the International Fund’s total expenses as a percentage of the International Fund’s average daily net assets on a class-by-class basis. In addition, the Board noted that BlackRock proposed, and the Board agreed to, a contractual advisory fee waiver. This waiver was implemented on November 28, 2017.
D. Economies of Scale The Board, including the Independent Board Members, considered the extent to which economies of scale might be realized as the assets of each Fund increase, including the existence of fee waivers and/or expense caps, as applicable, noting that any contractual fee waivers and expense caps had been approved by the Board. The Board also considered the extent to which each Fund benefits from such economies in a variety of ways, and whether there should be changes in the advisory fee rate or breakpoint structure in order to enable each Fund to more fully participate in these economies of scale. The Board considered each Fund’s asset levels and whether the current fee schedule was appropriate. In its consideration, the Board Members took into account the existence of any expense caps and further considered the continuation and/or implementation, as applicable, of such caps.
E. Other Factors Deemed Relevant by the Board Members The Board, including the Independent Board Members, also took into account other ancillary or “fall-out” benefits that BlackRock or its affiliates may derive from BlackRock’s respective relationships with each Fund, both tangible and intangible, such as BlackRock’s ability to leverage its investment professionals who manage other portfolios and risk management personnel, an increase in BlackRock’s profile in the investment advisory community, and the engagement of BlackRock’s affiliates as service providers to each Fund, including for administrative, distribution, securities lending and cash management services. The Board also considered BlackRock’s overall operations and its efforts to expand the scale of, and improve the quality of, its operations. The Board also noted that, subject to applicable law, BlackRock may use and benefit from third party research obtained by soft dollars generated by certain registered fund transactions to assist in managing all or a number of its other client accounts.
In connection with its consideration of the Agreements, the Board also received information regarding BlackRock’s brokerage and soft dollar practices. The Board received reports from BlackRock which included information on brokerage commissions and trade execution practices throughout the year.
The Board noted the competitive nature of the open-end fund marketplace, and that shareholders are able to redeem their Fund shares if they believe that each Fund’s fees and expenses are too high or if they are dissatisfied with the performance of each Fund.
Conclusion
The Board, including the Independent Board Members, approved the continuation of the Advisory Agreement between the Manager and the Corporation, on behalf of each Fund for a one-year term ending June 30, 2019, and the Sub-Advisory Agreement between the Manager and the Sub-Advisor, with respect to the International Fund, for a one-year term ending June 30, 2019. Based upon its evaluation of all of the aforementioned factors in their totality, as well as other information, the Board, including the Independent Board Members, was satisfied that the terms of the Agreements were fair and reasonable and in the best interest of each Fund and its shareholders. In arriving at its decision to approve the Agreements, the Board did not identify any single factor or group of factors as all-important or controlling, but considered all factors together, and different Board Members may have attributed different weights to the various factors considered. The Independent Board Members were also assisted by the advice of independent legal counsel in making this determination.
| | |
| 66 | | 2018 BLACKROCK ANNUAL REPORTTO SHAREHOLDERS |
Director and Officer Information
| | | | | | | | |
| Independent Directors (a) |
| | | | | |
Name
Year of Birth (b) | | Position(s) Held
(Length of Service) (c) | | Principal Occupation(s) During Past Five Years | | Number of BlackRock-Advised
Registered Investment Companies
(“RICs”) Consisting of Investment
Portfolios (“Portfolios”) Overseen | | Public Company and
Other Investment
Company Directorships
Held During
Past Five Years |
Robert M. Hernandez 1944 | | Chair of the Board and Director (Since 2007) | | Director, Vice Chairman and Chief Financial Officer of USX Corporation (energy and steel business) from 1991 to 2001; Director and non-executive Chairman, RTI International Metals, Inc. from 1990 to 2015; Director, TE Connectivity (electronics) from 2006 to 2012. | | 27 RICs consisting of 97 Portfolios | | Chubb Limited (insurance company); Eastman Chemical Company |
James H. Bodurtha 1944 | | Director (Since 2007) | | Director, The China Business Group, Inc. (consulting and investing firm) from 1996 to 2013 and Executive Vice President thereof from 1996 to 2003; Chairman of the Board, Berkshire Holding Corporation since 1980; Director, ICI Mutual since 2010. | | 27 RICs consisting of 97 Portfolios | | None |
Bruce R. Bond 1946 | | Director (Since 2007) | | Trustee and Member of the Governance Committee, State Street Research Mutual Funds from 1997 to 2005; Board Member of Governance, Audit and Finance Committee, Avaya Inc. (computer equipment) from 2003 to 2007. | | 27 RICs consisting of 97 Portfolios | | None |
Honorable Stuart E. Eizenstat 1943 | | Director (Since 2007) | | Senior Counsel of Covington and Burling LLP (law firm) since 2016, Head of International Practice thereof since 2001, and Partner thereof from 2001 to 2016; Advisory Board Member, OCP S.A. (phosphates) since 2010; International Advisory Board Member, The Coca-Cola Company from 2002 to 2011; Advisory Board Member, Veracity Worldwide, LLC (risk management) from 2007 to 2012; Member of the International Advisory Board, GML Ltd. (energy) since 2003; Board of Directors, Ferroglobe (silicon metals) since 2016. | | 27 RICs consisting of 97 Portfolios | | Alcatel-Lucent (telecommunications); Global Specialty Metallurgical; UPS Corporation (delivery service). |
Henry Gabbay 1947 | | Director (Since 2007) | | Consultant, BlackRock, Inc. from 2007 to 2008; Managing Director, BlackRock, Inc. from 1989 to 2007; Chief Administrative Officer, BlackRock Advisors, LLC from 1998 to 2007; President of BlackRock Funds and BlackRock Allocation Target Shares (formerly, BlackRock Bond Allocation Target Shares) from 2005 to 2007 and Treasurer of certain closed-end funds in the BlackRock fund complex from 1989 to 2006. | | 27 RICs consisting of 97 Portfolios | | None |
Lena G. Goldberg 1949 | | Director (Since 2016) | | Senior Lecturer, Harvard Business School since 2008; Executive Vice President, FMR LLC/Fidelity Investments (financial services) from 2007 to 2008, Executive Vice President and General Counsel thereof from 2002 to 2007, Senior Vice President and General Counsel thereof from 1999 to 2002, Vice President and General Counsel thereof from 1997 to 1999, Senior Vice President and Deputy General Counsel thereof in 1997, and Vice President and Corporate Counsel thereof from 1996 to 1997; Partner, Sullivan & Worcester LLP from 1985 to 1996 and Associate thereof from 1979 to 1985. | | 27 RICs consisting of 97 Portfolios | | None |
| | | | |
| DIRECTORAND OFFICER INFORMATION | | | 67 | |
Director and Officer Information (continued)
| | | | | | | | |
| Independent Directors (a) (continued) |
| | | | | |
Name
Year of Birth (b) | | Position(s) Held
(Length of Service) (c) | | Principal Occupation(s) During Past Five Years | | Number of BlackRock-Advised
Registered Investment Companies
(“RICs”) Consisting of Investment
Portfolios (“Portfolios”) Overseen | | Public Company and
Other Investment
Company Directorships
Held During
Past Five Years |
Henry R. Keizer 1956 | | Director (Since 2016) | | Director, Park Indemnity Ltd. (captive insurer) since 2010; Director, MUFG Americas Holdings Corporation and MUFG Union Bank, N.A. (financial and bank holding company) from 2014 to 2016; Director, Montpelier Re Holdings, Ltd. (publicly held property and casual reinsurance) from 2013 to 2015; Director, American Institute of Certified Public Accountants from 2009 to 2011; Director, KPMG LLP (audit, tax and advisory services) from 2004 to 2005 and 2010 to 2012; Director, KPMG International in 2012, Deputy Chairman and Chief Operating Officer thereof from 2010 to 2012 and U.S. Vice Chairman of Audit thereof from 2005 to 2010; Global Head of Audit, KPMGI (consortium of KPMG firms) from 2006 to 2010; Director, YMCA of Greater New York from 2006 to 2010. | | 27 RICs consisting of 97 Portfolios | | Hertz Global Holdings (car rental); WABCO (commercial vehicle safety systems); Sealed Air Corp. (packaging). |
John F. O'Brien 1943 | | Director (Since 2007) | | Trustee, Woods Hole Oceanographic Institute since 2003 and Chairman thereof from 2009 to 2015; Co-Founder and Managing Director, Board Leaders LLC (director education) since 2005. | | 27 RICs consisting of 97 Portfolios | | Cabot Corporation (chemicals); LKQ Corporation (auto parts manufacturing); TJX Companies, Inc. (retailer) |
Donald C. Opatrny 1952 | | Director (Since 2015) | | Trustee, Member of the Executive Committee and Chair of the Investment Committee, Cornell University since 2004; Member of the Board and Investment Committee, University School since 2007; Member of the Investment Committee, Mellon Foundation from 2009 to 2015; President and Trustee, the Center for the Arts, Jackson Hole since 2011; Director, Athena Capital Advisors LLC (investment management firm) since 2013; Trustee and Chair of the Investment Committee, Community Foundation of Jackson Hole since 2014; Trustee, Artstor (a Mellon Foundation affiliate) from 2010 to 2015; President, Trustee and Member of the Investment Committee, The Aldrich Contemporary Art Museum from 2007 to 2014. | | 27 RICs consisting of 97 Portfolios | | None |
|
| Interested Directors (a)(d) |
| | | | | |
Name
Year of Birth (b) | | Position(s) Held
(Length of Service) (c) | | Principal Occupation(s) During Past Five Years | | Number of BlackRock-Advised
Registered Investment Companies
(“RICs”) Consisting of Investment
Portfolios (“Portfolios”) Overseen | | Public Company and
Other Investment
Company Directorships
Held During
Past Five Years |
Robert Fairbairn 1965 | | Director (Since 2015) | | Senior Managing Director of BlackRock, Inc. since 2010; oversees BlackRock's Strategic Partner Program and Strategic Product Management Group; Member of BlackRock’s Global Executive and Global Operating Committees; Co-Chair of BlackRock's Human Capital Committee; Global Head of BlackRock's Retail and iShares® businesses from 2012 to 2016; Head of BlackRock’s Global Client Group from 2009 to 2012; Chairman of BlackRock’s international businesses from 2007 to 2010. | | 127 RICs consisting of 313 Portfolios | | None |
| | |
| 68 | | 2018 BLACKROCK ANNUAL REPORTTO SHAREHOLDERS |
Director and Officer Information (continued)
| | | | | | | | |
| Interested Directors (a)(d) (continued) |
| | | | | |
Name
Year of Birth (b) | | Position(s) Held
(Length of Service) (c) | | Principal Occupation(s) During Past Five Years | | Number of BlackRock-Advised
Registered Investment Companies
(“RICs”) Consisting of Investment
Portfolios (“Portfolios”) Overseen | | Public Company and
Other Investment
Company Directorships
Held During
Past Five Years |
John M. Perlowski 1964 | | Director (Since 2015); President and Chief Executive Officer (Since 2010) | | Managing Director of BlackRock, Inc. since 2009; Head of BlackRock Global Accounting and Product Services since 2009; Advisory Director of Family Resource Network (charitable foundation) since 2009. | | 127 RICs consisting of 313 Portfolios | | None |
(a) The address of each Director is c/o BlackRock, Inc., 55 East 52nd Street, New York, NY 10055. (b) Each Independent Director holds office until his or her successor is duly elected and qualifies or until his or her earlier death, resignation, retirement or removal as provided by the Corporation’s by-laws or charter or statute, or until December 31 of the year in which he or she turns 75. The Board may determine to extend the terms of Independent Directors on a case-by-case basis, as appropriate. Interested Directors serve until their successor is duly elected and qualifies or until their earlier death, resignation, retirement or removal as provided by the Corporation’s by-laws or statute, or until December 31 of the year in which they turn 72. (c) Following the combination of Merrill Lynch Investment Managers, L.P. (“MLIM”) and BlackRock, Inc. in September 2006, the various legacy MLIM and legacy BlackRock fund boards were realigned and consolidated into three new fund boards in 2007. As a result, although the chart shows certain Independent Directors as joining the Corporation’s board in 2007, those Directors first became members of the boards of other legacy MLIM or legacy BlackRock funds as follows: James H. Bodurtha, 1995; Bruce R. Bond, 2005; Honorable Stuart E. Eizenstat, 2001; Robert M. Hernandez, 1996; and John F. O’Brien, 2005. (d) Mr. Fairbairn and Mr. Perlowski are both “interested persons,” as defined in the 1940 Act, of the Corporation based on their positions with BlackRock, Inc. and its affiliates. Mr. Fairbairn and Mr. Perlowski are also board members of the BlackRock Closed-End Complex and the BlackRock Equity-Liquidity Complex. |
| | | | |
| DIRECTORAND OFFICER INFORMATION | | | 69 | |
Director and Officer Information (continued)
| | | | |
| Officers Who Are Not Directors (a) |
| | | |
Name
Year of Birth (b) | | Position(s) Held
(Length of Service) | | Principal Occupation(s) During Past Five Years |
Jennifer McGovern 1977 | | Vice President (Since 2014) | | Managing Director of BlackRock, Inc. since 2016; Director of BlackRock, Inc. from 2011 to 2015; Head of Product Structure and Oversight for BlackRock’s U.S. Wealth Advisory Group since 2013. |
Neal J. Andrews 1966 | | Chief Financial Officer (Since 2007) | | Managing Director of BlackRock, Inc. since 2006. |
Jay M. Fife 1970 | | Treasurer (Since 2007) | | Managing Director of BlackRock, Inc. since 2007. |
Charles Park 1967 | | Chief Compliance Officer (Since 2014) | | Anti-Money Laundering Compliance Officer for the BlackRock-advised Funds in the Equity-Bond Complex, the Equity-Liquidity Complex and the Closed-End Complex from 2014 to 2015; Chief Compliance Officer of BlackRock Advisors, LLC and the BlackRock-advised Funds in the Equity-Bond Complex, the Equity-Liquidity Complex and the Closed-End Complex since 2014; Principal of and Chief Compliance Officer for iShares® Delaware Trust Sponsor LLC since 2012 and BlackRock Fund Advisors (“BFA”) since 2006; Chief Compliance Officer for the BFA-advised iShares® exchange traded funds since 2006; Chief Compliance Officer for BlackRock Asset Management International Inc. since 2012. |
John MacKessy 1972 | | Anti-Money Laundering Compliance Officer (Since 2018) | | Director of BlackRock, Inc. since 2017; Global Head of Anti-Money Laundering at BlackRock, Inc. since 2017; Director of AML Monitoring and Investigations Group of Citibank from 2015 to 2017; Global Anti-Money Laundering and Economic Sanctions Officer for MasterCard from 2011 to 2015. |
Benjamin Archibald 1975 | | Secretary (Since 2012) | | Managing Director of BlackRock, Inc. since 2014; Director of BlackRock, Inc. from 2010 to 2013; Secretary of the iShares® exchange traded funds since 2015; Secretary of the BlackRock-advised mutual funds since 2012. |
(a) The address of each Officer is c/o BlackRock, Inc., 55 East 52nd Street, New York, NY 10055. (b) Officers of the Corporation serve at the pleasure of the Board. |
Further information about the Corporation's Officers and Directors is available in the Corporation's Statement of Additional Information, which can be obtained without charge by calling (800) 441-7762.
Effective May 8, 2018, John MacKessy replaced Fernanda Piedra as the Anti-Money Laundering Compliance Officer of the Corporation.
Investment Adviser
BlackRock Advisors, LLC
Wilmington, DE 19809
Sub-Adviser
BlackRock International Limited(a)
Edinburgh, EH3 8BL
United Kingdom
Accounting Agent
State Street Bank and Trust Company
Boston, MA 02111
Custodian
Brown Brothers Harriman & Co.
Boston, MA 02109
Transfer Agent
BNY Mellon Investment Servicing (US) Inc.
Wilmington, DE 19809
Independent Registered Public Accounting Firm
Deloitte & Touche LLP
Boston, MA 02116
Distributor
BlackRock Investments, LLC
New York, NY 10022
Legal Counsel
Willkie Farr & Gallagher LLP
New York, NY 10019
Address of the Funds
100 Bellevue Parkway
Wilmington, DE 19809
| (a) | For FDP BlackRock International Fund. |
| | |
| 70 | | 2018 BLACKROCK ANNUAL REPORTTO SHAREHOLDERS |
Additional Information
General Information
Householding
The Funds will mail only one copy of shareholder documents, including prospectuses, annual and semi-annual reports and proxy statements, to shareholders with multiple accounts at the same address. This practice is commonly called “householding” and is intended to reduce expenses and eliminate duplicate mailings of shareholder documents. Mailings of your shareholder documents may be householded indefinitely unless you instruct us otherwise. If you do not want the mailing of these documents to be combined with those for other members of your household, please call the Funds at (800) 441-7762.
Availability of Quarterly Schedule of Investments
The Funds file their complete schedule of portfolio holdings with the SEC for the first and third quarters of each fiscal year on Form N-Q. The Funds’ Forms N-Q are available on the SEC’s website at http://www.sec.gov and may also be reviewed and copied at the SEC’s Public Reference Room in Washington, D.C. Information on the operation of the Public Reference Room or how to access documents on the SEC’s website without charge may be obtained by calling (800) SEC-0330. The Funds’ Forms N-Q may also be obtained upon request and without charge by calling (800) 441-7762.
Availability of Proxy Voting Policies and Procedures
A description of the policies and procedures that the Funds use to determine how to vote proxies relating to portfolio securities is available upon request and without charge (1) by calling (800) 441-7762; (2) at http://www.blackrock.com; and (3) on the SEC’s website at http://www.sec.gov.
Availability of Proxy Voting Record
Information about how the Funds voted proxies relating to securities held in the Funds’ portfolios during the most recent 12-month period ended June 30 is available upon request and without charge (1) at http://www.blackrock.com; or by calling (800) 441-7762 and (2) on the SEC’s website at http://www.sec.gov.
BlackRock’s Mutual Fund Family
BlackRock offers a diverse lineup of open-end mutual funds crossing all investment styles and managed by experts in equity, fixed income and tax-exempt investing. Visit http://www.blackrock.com for more information.
Shareholder Privileges
Account Information
Call us at (800) 441-7762 from 8:00 AM to 6:00 PM ET on any business day to get information about your account balances, recent transactions and share prices. You can also reach us on the Web at http://www.blackrock.com.
Automatic Investment Plans
Investor Class shareholders who want to invest regularly can arrange to have $50 or more automatically deducted from their checking or savings account and invested in any of the BlackRock funds.
Systematic Withdrawal Plans
Investor Class shareholders can establish a systematic withdrawal plan and receive periodic payments of $50 or more from their BlackRock funds, as long as their account balance is at least $10,000.
Retirement Plans
Shareholders may make investments in conjunction with Traditional, Rollover, Roth, Coverdell, Simple IRAs, SEP IRAs and 403(b) Plans.
| | | | |
| ADDITIONAL INFORMATION | | | 71 | |
Additional Information (continued)
BlackRock Privacy Principles
BlackRock is committed to maintaining the privacy of its current and former fund investors and individual clients (collectively, “Clients”) and to safe-guarding their non-public personal information. The following information is provided to help you understand what personal information BlackRock collects, how we protect that information and why in certain cases we share such information with select parties.
If you are located in a jurisdiction where specific laws, rules or regulations require BlackRock to provide you with additional or different privacy-related rights beyond what is set forth below, then BlackRock will comply with those specific laws, rules or regulations.
BlackRock obtains or verifies personal non-public information from and about you from different sources, including the following: (i) information we receive from you or, if applicable, your financial intermediary, on applications, forms or other documents; (ii) information about your transactions with us, our affiliates, or others; (iii) information we receive from a consumer reporting agency; and (iv) from visits to our websites.
BlackRock does not sell or disclose to non-affiliated third parties any non-public personal information about its Clients, except as permitted by law or as is necessary to respond to regulatory requests or to service Client accounts. These non-affiliated third parties are required to protect the confidentiality and security of this information and to use it only for its intended purpose.
We may share information with our affiliates to service your account or to provide you with information about other BlackRock products or services that may be of interest to you. In addition, BlackRock restricts access to non-public personal information about its Clients to those BlackRock employees with a legitimate business need for the information. BlackRock maintains physical, electronic and procedural safeguards that are designed to protect the non-public personal information of its Clients, including procedures relating to the proper storage and disposal of such information.
| | |
| 72 | | 2018 BLACKROCK ANNUAL REPORTTO SHAREHOLDERS |
Glossary of Terms Used in this Report
| | |
| Currency |
| |
| EUR | | Euro |
| JPY | | Japanese Yen |
| | |
| Portfolio Abbreviations |
| |
| ABS | | Asset-Backed Security |
| ADR | | American Depositary Receipts |
| ARB | | Airport Revenue Bonds |
| MSCI | | Morgan Stanley Capital International |
| RB | | Revenue Bonds |
| | | | |
| GLOSSARYOF TERMS USEDINTHIS REPORT | | | 73 | |
This report is intended for current holders. It is not authorized for use as an offer of sale or a solicitation of an offer to buy shares of a Fund unless preceded or accompanied by the Funds’ current prospectus. Past performance results shown in this report should not be considered a representation of future performance. Investment returns and principal value of shares will fluctuate so that shares, when redeemed, may be worth more or less than their original cost. Statements and other information herein are as dated and are subject to change.

| | |
| FDPS-5/18-AR | |  |
| Item 2 – | Code of Ethics – The registrant (or the “Fund”) has adopted a code of ethics, as of the end of the period covered by this report, applicable to the registrant’s principal executive officer, principal financial officer, principal accounting officer or controller, or persons performing similar functions. During the period covered by this report, the code of ethics was amended to clarify an inconsistency as to whom persons covered by the code should report suspected violations of the code. The amendment clarifies that such reporting should be made to BlackRock Advisors, LLC’s (“Investment Adviser” or “BlackRock”) General Counsel, and retains the alternative option of anonymous reporting following “whistleblower” policies. Other non-material changes were also made in connection with this amendment. During the period covered by this report, there have been no waivers granted under the code of ethics. The registrant undertakes to provide a copy of the code of ethics to any person upon request, without charge, who calls 1-800-441-7762. |
| Item 3 – | Audit Committee Financial Expert – The registrant’s board of trustees (the “board of trustees”), has determined that (i) the registrant has the following audit committee financial experts serving on its audit committee and (ii) each audit committee financial expert is independent: |
Robert M. Hernandez
Henry R. Keizer
Bruce R. Bond
Under applicable securities laws, a person determined to be an audit committee financial expert will not be deemed an “expert” for any purpose, including without limitation for the purposes of Section 11 of the Securities Act of 1933, as a result of being designated or identified as an audit committee financial expert. The designation or identification of a person as an audit committee financial expert does not impose on such person any duties, obligations, or liabilities greater than the duties, obligations, and liabilities imposed on such person as a member of the audit committee and board of trustees in the absence of such designation or identification.
| Item 4 – | Principal Accountant Fees and Services |
The following table presents fees billed by Deloitte & Touche LLP (“D&T”) in each of the last two fiscal years for the services rendered to the Fund:
| | | | | | | | | | | | | | | | |
| | | (a) Audit Fees | | (b) Audit-Related Fees1 | | (c) Tax Fees2 | | (d) All Other Fees |
| Entity Name | | Current
Fiscal
Year End | | Previous
Fiscal
Year End | | Current
Fiscal
Year End | | Previous
Fiscal
Year End | | Current
Fiscal
Year End | | Previous
Fiscal
Year End | | Current
Fiscal
Year End | | Previous
Fiscal
Year End |
| FDP BlackRock Capital Appreciation Fund | | $29,580 | | $30,566 | | $0 | | $2,000 | | $14,600 | | $13,140 | | $0 | | $0 |
FDP BlackRock CoreAlpha Bond Fund | | $40,800 | | $48,425 | | $0 | | $2,000 | | $16,000 | | $15,402 | | $0 | | $0 |
FDP BlackRock Equity Dividend Fund | | $29,580 | | $30,566 | | $0 | | $2,000 | | $14,600 | | $13,140 | | $0 | | $0 |
| FDP BlackRock International Fund | | $31,620 | | $32,912 | | $0 | | $2,000 | | $15,400 | | $14,160 | | $0 | | $0 |
2
The following table presents fees billed by D&T that were required to be approved by the registrant’s audit committee (the “Committee”) for services that relate directly to the operations or financial reporting of the Fund and that are rendered on behalf of BlackRock and entities controlling, controlled by, or under common control with BlackRock (not including any sub-adviser whose role is primarily portfolio management and is subcontracted with or overseen by another investment adviser) that provide ongoing services to the Fund (“Affiliated Service Providers”):
| | | | |
| | | Current Fiscal Year End | | Previous Fiscal Year End |
(b) Audit-Related Fees1 | | $0 | | $0 |
(c) Tax Fees2 | | $0 | | $0 |
(d) All Other Fees3 | | $2,274,000 | | $2,129,000 |
1 The nature of the services includes assurance and related services reasonably related to the performance of the audit or review of financial statements not included in Audit Fees, including accounting consultations, agreed-upon procedure reports, attestation reports, comfort letters, out-of-pocket expenses and internal control reviews not required by regulators.
2 The nature of the services includes tax compliance and/or tax preparation, including services relating to the filing or amendment of federal, state or local income tax returns, regulated investment company qualification reviews, taxable income and tax distribution calculations.
3 Non-audit fees of $2,274,000 and $2,129,000 for the current fiscal year and previous fiscal year, respectively, were paid to the Fund’s principal accountant in their entirety by BlackRock, in connection with services provided to the Affiliated Service Providers of the Fund and of certain other funds sponsored and advised by BlackRock or its affiliates for a service organization review and an accounting research tool subscription. These amounts represent aggregate fees paid by BlackRock and were not allocated on a per fund basis.
(e)(1) Audit Committee Pre-Approval Policies and Procedures:
The Committee has adopted policies and procedures with regard to the pre-approval of services. Audit, audit-related and tax compliance services provided to the registrant on an annual basis require specific pre-approval by the Committee. The Committee also must approve other non-audit services provided to the registrant and those non-audit services provided to the Investment Adviser and Affiliated Service Providers that relate directly to the operations and the financial reporting of the registrant. Certain of these non-audit services that the Committee believes are (a) consistent with the SEC’s auditor independence rules and (b) routine and recurring services that will not impair the independence of the independent accountants may be approved by the Committee without consideration on a specific case-by-case basis (“general pre-approval”). The term of any general pre-approval is 12 months from the date of the pre-approval, unless the Committee provides for a different period. Tax or other non-audit services provided to the registrant which have a direct impact on the operations or financial reporting of the registrant will only be deemed pre-approved provided that any individual project does not exceed $10,000 attributable to the registrant or $50,000 per project. For this purpose, multiple projects will be aggregated to determine if they exceed the previously mentioned cost levels.
Any proposed services exceeding the pre-approved cost levels will require specific pre-approval by the Committee, as will any other services not subject to general pre-approval (e.g., unanticipated but permissible services). The Committee is informed of each service approved subject to general pre-approval at the next regularly scheduled in-person board meeting. At this meeting, an analysis of such services is presented to the Committee for ratification. The Committee may delegate to the Committee Chairman the authority to approve the provision of and fees for any specific engagement of permitted non-audit services, including services exceeding pre-approved cost levels.
3
(e)(2) None of the services described in each of Items 4(b) through (d) were approved by the Committee pursuant to the de minimis exception in paragraph (c)(7)(i)(C) of Rule 2-01 of Regulation S-X.
(f) Not Applicable
(g) The aggregate non-audit fees, defined as the sum of the fees shown under “Audit-Related Fees,” “Tax Fees” and “All Other Fees,” paid to the accountant for services rendered by the accountant to the registrant, the Investment Adviser and the Affiliated Service Providers were:
| | | | | | |
| Entity Name | | Current Fiscal Year
End | | Previous Fiscal
Year End | | |
FDP BlackRock Capital Appreciation Fund | | $14,600 | | $15,140 | | |
FDP BlackRock CoreAlpha Bond Fund | | $16,000 | | $17,402 | | |
| FDP BlackRock Equity Dividend Fund | | $14,600 | | $15,140 | | |
| FDP BlackRock International Fund | | $15,400 | | $16,160 | | |
Additionally, the amounts billed by D&T in connection with services provided to the Affiliated Service Providers of the Fund and of other funds sponsored and advised by BlackRock or its affiliates during the current and previous fiscal years for a service organization review and an accounting research tool subscription were:
| | |
Current Fiscal Year End | | Previous Fiscal Year End |
$2,274,000 | | $2,129,000 |
These amounts represent aggregate fees paid by BlackRock and were not allocated on a per fund basis.
(h) The Committee has considered and determined that the provision of non-audit services that were rendered to the Investment Adviser and the Affiliated Service Providers that were not pre-approved pursuant to paragraph (c)(7)(ii) of Rule 2-01 of Regulation S-X is compatible with maintaining the principal accountant’s independence.
| Item 5 – | Audit Committee of Listed Registrants – Not Applicable |
(a) The registrant’s Schedule of Investments is included as part of the Report to Stockholders filed under Item 1 of this Form.
(b) Not Applicable due to no such divestments during the semi-annual period covered since the previous Form N-CSR filing.
4
| Item 7 – | Disclosure of Proxy Voting Policies and Procedures for Closed-End Management Investment Companies – Not Applicable |
| Item 8 – | Portfolio Managers of Closed-End Management Investment Companies – Not Applicable |
| Item 9 – | Purchases of Equity Securities by Closed-End Management Investment Company and Affiliated Purchasers – Not Applicable |
| Item 10 – | Submission of Matters to a Vote of Security Holders – There have been no material changes to these procedures. |
| Item 11 – | Controls and Procedures |
(a) The registrant’s principal executive and principal financial officers, or persons performing similar functions, have concluded that the registrant’s disclosure controls and procedures (as defined in Rule 30a-3(c) under the Investment Company Act of 1940, as amended (the “1940 Act”)) are effective as of a date within 90 days of the filing of this report based on the evaluation of these controls and procedures required by Rule 30a-3(b) under the 1940 Act and Rule 15d-15(b) under the Securities Exchange Act of 1934, as amended.
(b) There were no changes in the registrant’s internal control over financial reporting (as defined in Rule 30a-3(d) under the 1940 Act) that occurred during the second fiscal quarter of the period covered by this report that have materially affected, or are reasonably likely to materially affect, the registrant’s internal control over financial reporting.
| Item 12 – | Disclosure of Securities Lending Activities for Closed-End Management Investment Companies – Not Applicable |
| Item 13 – | Exhibits attached hereto |
(a)(1) Code of Ethics – See Item 2
(a)(2) Certifications – Attached hereto
(a)(3) Not Applicable
(a)(4) Not Applicable
(b) Certifications – Attached hereto
5
Pursuant to the requirements of the Securities Exchange Act of 1934 and the Investment Company Act of 1940, the registrant has duly caused this report to be signed on its behalf by the undersigned, thereunto duly authorized.
| | |
| FDP Series, Inc. |
| |
| By: | | /s/ John M. Perlowski |
| | John M. Perlowski |
| | Chief Executive Officer (principal executive officer) of |
| | FDP Series, Inc. |
Date: August 3, 2018
Pursuant to the requirements of the Securities Exchange Act of 1934 and the Investment Company Act of 1940, this report has been signed below by the following persons on behalf of the registrant and in the capacities and on the dates indicated.
| | |
| By: | | /s/ John M. Perlowski |
| | John M. Perlowski |
| | Chief Executive Officer (principal executive officer) of |
| | FDP Series, Inc. |
Date: August 3, 2018
| | |
| By: | | /s/ Neal J. Andrews |
| | Neal J. Andrews |
| | Chief Financial Officer (principal financial officer) of |
| | FDP Series, Inc. |
Date: August 3, 2018
6