UNITED STATES
SECURITIES AND EXCHANGE COMMISSION
Washington, D.C. 20549
FORM N-CSR
CERTIFIED SHAREHOLDER REPORT OF REGISTERED MANAGEMENT
INVESTMENT COMPANIES
Investment Company Act file number: 811-21744
Name of Fund: FDP Series, Inc.
FDP BlackRock Franklin Templeton Total Return Fund
FDP BlackRock Invesco Value Fund
FDP BlackRock Janus Growth Fund
FDP BlackRock MFS Research International Fund
Fund Address: 100 Bellevue Parkway, Wilmington, DE 19809
Name and address of agent for service: John M. Perlowski, Chief Executive Officer, FDP Series, Inc., 55 East 52nd Street, New York, NY 10055
Registrant’s telephone number, including area code: (800) 441-7762
Date of fiscal year end: 05/31/2016
Date of reporting period: 05/31/2016
Item 1 – Report to Stockholders
MAY 31, 2016
| | | | |
ANNUAL REPORT | | | |  |
FDP Series, Inc.
| Ø | FDP BlackRock MFS Research International Fund |
| Ø | FDP BlackRock Janus Growth Fund |
| Ø | FDP BlackRock Invesco Value Fund |
| Ø | FDP BlackRock Franklin Templeton Total Return Fund |
|
| Not FDIC Insured • May Lose Value • No Bank Guarantee |
FDP Series, Inc. is part of the Funds Diversified PortfoliosSM (“FDP”) Service. You may receive separate shareholder reports for other funds available through the Service.

| | | | | | |
| | | | | | | |
| 2 | | FDP SERIES, INC. | | MAY 31, 2016 | | |
Dear Shareholder,
Diverging monetary policies and shifting economic outlooks across regions have been the overarching themes driving financial markets over the past couple of years. Investors spent most of 2015 anticipating the end of the Federal Reserve’s (the “Fed”) near-zero interest rate policy as U.S. growth outpaced other developed markets. The Fed ultimately hiked rates in December, whereas the European Central Bank and the Bank of Japan took additional steps to stimulate growth, even introducing negative interest rates. The U.S. dollar had strengthened considerably ahead of these developments, causing profit challenges for U.S. companies that generate revenues overseas, and pressuring emerging market currencies and commodities prices.
Global market volatility increased in the latter part of 2015 and spilled over into early 2016. Oil prices were a key factor behind the instability after collapsing in mid-2015 due to excess global supply. China, one of the world’s largest consumers of oil, was another notable source of stress for financial markets. Signs of slowing economic growth, a depreciating yuan and declining confidence in the country’s policymakers stoked investors’ worries about the potential impact of China’s weakness on the global economy. Risk assets (such as equities and high yield bonds) suffered in this environment.
After a painful start to the new year, fears of a global recession began to fade as the first quarter wore on, allowing markets to calm and risk assets to rebound. Central bank stimulus in Europe and Japan, combined with a more tempered outlook for rate hikes in the United States, helped bolster financial markets. A softening in U.S. dollar strength offered some relief to U.S. exporters and emerging market economies. Oil prices found firmer footing as global supply showed signs of leveling off.
By the end of the 12-month period, stock valuations appeared elevated and easy central bank policies, particularly in Europe and Japan, had pushed global yields to ever-lower levels. Given generally high prices across most asset classes, investors remained wary of a resurgence in volatility against a backdrop of looming global risks — notably, uncertainty leading up to the United Kingdom’s referendum on the nation’s membership in the European Union.
At BlackRock, we believe investors need to think globally, extend their scope across a broad array of asset classes and be prepared to adjust accordingly as market conditions change over time. We encourage you to talk with your financial advisor and visit blackrock.com for further insight about investing in today’s markets.
Sincerely,

Rob Kapito
President, BlackRock Advisors, LLC

Rob Kapito
President, BlackRock Advisors, LLC
| | | | | | | | |
| Total Returns as of May 31, 2016 | |
| | | 6-month | | | 12-month | |
U.S. large cap equities
(S&P 500® Index) | | | 1.93 | % | | | 1.72 | % |
U.S. small cap equities
(Russell 2000® Index) | | | (2.86 | ) | | | (5.97 | ) |
International equities
(MSCI Europe, Australasia,
Far East Index) | | | (2.44 | ) | | | (9.68 | ) |
Emerging market equities
(MSCI Emerging Markets Index) | | | 0.04 | | | | (17.63 | ) |
3-month Treasury bills
(BofA Merrill Lynch 3-Month
U.S. Treasury Bill Index) | | | 0.14 | | | | 0.15 | |
U.S. Treasury securities
(BofA Merrill Lynch
10-Year U.S. Treasury
Index) | | | 4.20 | | | | 3.97 | |
U.S. investment grade bonds
(Barclays U.S.
Aggregate Bond Index) | | | 3.12 | | | | 2.99 | |
Tax-exempt municipal
bonds (S&P Municipal
Bond Index) | | | 3.40 | | | | 5.72 | |
U.S. high yield bonds
(Barclays U.S. Corporate
High Yield 2% Issuer
Capped Index) | | | 5.34 | | | | (0.77 | ) |
| Past performance is no guarantee of future results. Index performance is shown for illustrative purposes only. You cannot invest directly in an index. | |
| | | | | | |
| | | | | | | |
| | THIS PAGE NOT PART OF YOUR FUND REPORT | | | | 3 |
| | | | |
| Fund Summary as of May 31, 2016 | | FDP BlackRock MFS Research International Fund |
FDP BlackRock MFS Research International Fund’s (the “Fund”) investment objective is to seek to provide shareholders with capital appreciation.
At a special meeting on November 25, 2015, shareholders of the Fund approved the use of a manager of managers structure for the Fund. These changes took effect at the close of business on January 29, 2016.
|
| Portfolio Management Commentary |
How did the Fund perform?
| • | | For the 12-month period ended May 31, 2016, the Fund underperformed its primary benchmark, the MSCI Europe, Australasia and Far East (“EAFE”) Index, and its secondary benchmark, the MSCI All Country World (excluding U.S.) Index. The following discussion of relative performance pertains to the MSCI EAFE Index. |
What factors influenced performance?
| • | | In terms of sectors, stock selection in health care and consumer staples detracted from performance relative to the benchmark. In particular, the Fund’s positions in Valeant Pharmaceuticals International, Inc. (Canada) and Bayer AG (Germany) detracted from returns. In addition, positions in Mediatek, Inc. (Taiwan), Rio Tinto PLC (U.K.), Barclays PLC (U.K.), Mitsubishi UFJ Financial Group, Inc. (Japan), Orica Ltd. (Australia), GKN PLC (U.K.), Denso Corp. (Japan), and HSBC Holdings PLC (U.K.) weighed on relative results. Additionally, although the sub-advisor does not actively manage currency within its strategy, the Fund’s currency exposure had a negative impact on relative performance. |
| • | | Conversely, stock selection in consumer cyclicals contributed to relative results. Within this area, positions in Sundrug Co. Ltd. (Japan) and RELX Group (U.K./Netherlands) benefited performance. In addition, selection in telecommunication services/cable TV added to returns, in particular the Fund’s holdings in KDDI Corp. (Japan). The Fund’s positions in Terumo Corp. (Japan), Nippon Paint Holdings Co., Ltd. (Japan), Reckitt Benckiser Group PLC (U.K.), Taiwan Semiconductor Manufacturing Co. Ltd., Japan Tobacco, Inc., Danone SA (France), and a lack of holdings in Toyota Motor Corporation contributed to relative performance. |
Describe recent portfolio activity.
| • | | Within capital goods, the Fund added to specialty chemicals companies and made a number of trades within the equipment and machinery sub-sector, seeking companies with above-average and relatively stable growth. In addition, within mining, the sub-advisor retained a preference for large, efficient, and lower geopolitical risk names. In energy, there were more changes to the portfolio than in recent time periods, introducing companies with more flexibility to deal with the bottom of the commodity cycle. Elsewhere, within technology, share price volatility in the first few months of 2016 provided the Fund with opportunities to position itself slightly more toward higher growth software & services businesses. In financials, the Fund sold a U.K. bank and increased its non-lending exposure by adding to insurance, wealth management and real estate positions. |
Describe portfolio positioning at period end.
| • | | The Fund is a sector-neutral portfolio that emphasizes bottom-up fundamental analysis and therefore, regional and industry allocations are strictly a by-product of where the Fund’s sub-advisor finds the most attractive opportunities. Relative to the MSCI EAFE Index, the Fund ended the period underweight in Europe ex-U.K., Japan, Asia-Pacific ex-Japan, and the United Kingdom, while overweight in emerging markets and North America. |
The views expressed reflect the opinions of the Fund’s sub-advisor as of the date of this report and are subject to change based on changes in market, economic or other conditions. These views are not intended to be a forecast of future events and are no guarantee of future results.
| | | | | | |
| | | | | | | |
| 4 | | FDP SERIES, INC. | | MAY 31, 2016 | | |
| | |
| | | FDP BlackRock MFS Research International Fund |
|
| Total Return Based on a $10,000 Investment |
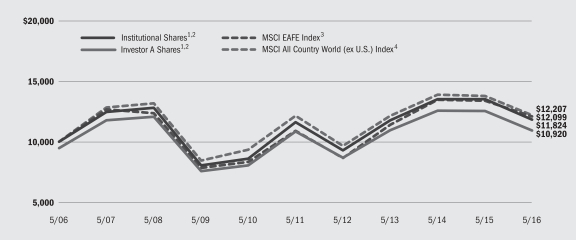
| | 1 | | Assuming maximum sales charges, if any, transaction costs and other operating expenses, including advisory fees. Institutional Shares do not have a sales charge. |
| | 2 | | The Fund invests, under normal market conditions, at least 65% of its assets in equity securities of foreign companies, including emerging market issuers. |
| | 3 | | The index is an unmanaged broad-based index that measures the total returns of developed foreign stock markets in Europe, Australasia and the Far East. |
| | 4 | | The Index is a market capitalization index that measures performance in the developed and emerging market, excluding the United States. |
|
| Performance Summary for the Period Ended May 31, 2016 |
| | | | | | | | | | | | | | | | | | | | | | | | | | | | |
| | | | | | Average Annual Total Returns5 | |
| | | | | | 1 Year | | | 5 Years | | | 10 Years | |
| | | 6-Month
Total Returns | | | w/o sales
charge | | | w/sales
charge | | | w/o sales
charge | | | w/sales
charge | | | w/o sales
charge | | | w/sales
charge | |
Institutional | | | (3.43 | )% | | | (12.57 | )% | | | N/A | | | | 0.37 | % | | | N/A | | | | 1.69 | % | | | N/A | |
Investor A | | | (3.61 | ) | | | (12.85 | ) | | | (17.42 | )% | | | 0.11 | | | | (0.96 | )% | | | 1.43 | | | | 0.88 | % |
Investor C | | | (3.99 | ) | | | (13.52 | ) | | | (14.38 | ) | | | (0.65 | ) | | | (0.65 | ) | | | 0.66 | | | | 0.66 | |
MSCI EAFE Index | | | (2.44 | ) | | | (9.68 | ) | | | N/A | | | | 2.12 | | | | N/A | | | | 1.92 | | | | N/A | |
MSCI All Country World (ex U.S.) Index | | | (1.37 | ) | | | (11.39 | ) | | | N/A | | | | 0.12 | | | | N/A | | | | 2.01 | | | | N/A | |
| | 5 | | Assuming maximum sales charges, if any. Average annual total returns with and without sales charges reflect reductions for distribution and service fees. See “About Fund Performance” on page 12 for a detailed description of share classes, including any related sales charges and fees. |
| | | | N/A — Not applicable as share class and index do not have a sales charge. |
| | | | Past performance is not indicative of future results. |
| | | | | | | | | | | | | | | | | | | | | | | | | | | | |
| | | Actual | | | Hypothetical7 | | | | |
| | | Beginning
Account Value December 1, 2015 | | | Ending
Account Value
May 31, 2016 | | | Expenses Paid
During the
Period6 | | | Beginning
Account Value December 1, 2015 | | | Ending
Account Value May 31, 2016 | | | Expenses Paid
During the
Period6 | | | Annualized
Expense Ratio | |
Institutional | | $ | 1,000.00 | | | $ | 965.70 | | | $ | 6.59 | | | $ | 1,000.00 | | | $ | 1,018.30 | | | $ | 6.76 | | | | 1.34 | % |
Investor A | | $ | 1,000.00 | | | $ | 963.90 | | | $ | 7.76 | | | $ | 1,000.00 | | | $ | 1,017.10 | | | $ | 7.97 | | | | 1.58 | % |
Investor C | | $ | 1,000.00 | | | $ | 960.10 | | | $ | 11.47 | | | $ | 1,000.00 | | | $ | 1,013.30 | | | $ | 11.78 | | | | 2.34 | % |
| | 6 | | For each class of the Fund, expenses are equal to the annualized net expense ratio for the class, multiplied by the average account value over the period, multiplied by 183/366 (to reflect the one-half year period shown). |
| | 7 | | Hypothetical 5% annual return before expenses is calculated by prorating the number of days in the most recent fiscal half year divided by 366. |
| | | | See “Disclosure of Expenses” on page 13 for further information on how expenses were calculated. |
| | | | | | |
| | | | | | | |
| | FDP SERIES, INC. | | MAY 31, 2016 | | 5 |
| | | | |
| Fund Summary as of May 31, 2016 | | FDP BlackRock Janus Growth Fund |
FDP BlackRock Janus Growth Fund’s (the “Fund”) investment objective is to seek to provide shareholders with long-term growth of capital.
At a special meeting on December 17, 2015, shareholders of the Fund approved both the replacement of the sub-advisor and the use of a manager of managers structure for the Fund. These changes took effect at the close of business on January 29, 2016.
|
| Portfolio Management Commentary |
How did the Fund perform?
| • | | For the 12-month period ended May 31, 2016, the Fund underperformed its new benchmark as of March 1, 2016, the Russell 1000® Growth Index, as well as its former benchmark, the S&P 500® Index. |
What factors influenced performance?
| • | | On December 17, 2015, shareholders of the Fund approved the replacement of Marsico Capital Management, LLC (“Marsico Capital”) with Janus Capital Management, LLC (“Janus Capital”) as sub-advisor of the Fund. Marsico Capital managed the Fund’s portfolio for the period from June 1, 2015 to the close of business on January 29, 2016, while Janus Capital managed the Fund’s portfolio for the period from January 30, 2016 through May 31, 2016. Janus Capital will manage the Fund going forward. |
| • | | For the period from June 1, 2015 to the close of business on January 29, 2016, stock selection in the biotechnology & life sciences sub-sector within pharmaceuticals, and an overweight position in the weak performing health care sector, represented the main detractors from performance. The genome sequencing company Illumina, Inc. was the largest individual detractor from performance during that period. For the period from January 30, 2016 through May 31, 2016, stock selection in the industrials and consumer discretionary sectors were the primary detractors. In particular, the Fund’s position in United Continental Holdings, Inc. weighed on performance within industrials, as did its position in CSX Corporation. Within consumer discretionary, holdings in NIKE, Inc., Class B and Chipotle Mexican Grill, Inc. hindered results the most from relative performance during the period from January 30, 2016 through May 31, 2016. On an individual stock basis, Allergan PLC was the largest detractor from overall performance over the period from January 30, 2016 through May 31, 2016, followed by United Continental Holdings, Inc. |
| • | | During the period from June 1, 2015 to the close of business on January 29, 2016, stock selection and an overweight posture toward two of the better-performing sectors in the benchmark index, information technology (“IT”) and consumer discretionary, were the primary sources of outperformance. Within IT, positions in the social networking company Facebook, Inc., Class A, the electronic payments firm Visa Inc., Class A and the customer relationship management company Salesforce.com, Inc. posted solid returns. For the period from January 30, 2016 through May 31, 2016, the primary sources of positive performance were stock selection in the IT and telecommunication services (“telecom”) sectors. Within IT, the Fund’s positions in Facebook, Inc., Class A, Alphabet Inc., and NetSuite Inc. were the largest contributors. Within telecom, holding T-Mobile International AG benefited relative performance. On an individual stock basis, positions in Amazon.com, Inc. and Lowe’s Companies, Inc. added the most to overall returns during the final three months of the period. |
Describe recent portfolio activity.
| • | | Given the inception of a new strategy on January 30, 2016 under Janus Capital, recent portfolio activity focused largely on investing in alignment with the sub-advisor’s investment strategies for the Fund. |
Describe portfolio positioning at period end.
| • | | Relative to the Russell 1000® Growth Index, the Fund ended the period underweight in consumer staples, industrials and telecom, and overweight in health care, materials and IT. |
The views expressed reflect the opinions of the Fund’s sub-advisor as of the date of this report and are subject to change based on changes in market, economic or other conditions. These views are not intended to be a forecast of future events and are no guarantee of future results.
| | | | | | |
| | | | | | | |
| 6 | | FDP SERIES, INC. | | MAY 31, 2016 | | |
| | |
| | | FDP BlackRock Janus Growth Fund |
|
| Total Return Based on a $10,000 Investment |
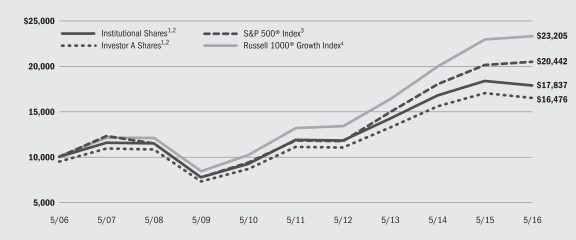
| | 1 | | Assuming maximum sales charges, if any, transaction costs and other operating expenses, including advisory fees. Institutional Shares do not have a sales charge. |
| | 2 | | The Fund pursues its investment objective by investing primarily in common stocks of U.S. companies that have potential for growth. The Fund’s total return prior to January 30, 2016 are the returns of the Fund when it followed different investment strategies under the name Marsico Growth FDP Fund. |
| | 3 | | This unmanaged broad-based index that is comprised of 500 leading companies and captures approximately 80% coverage of available market capitalization. |
| | 4 | | This unmanaged index measures the performance of the large cap growth segment of the U.S. equity universe and consists of those Russell 1000® securities with higher price-to-book ratios and higher forecasted growth values. |
|
| Performance Summary for the Period Ended May 31, 2016 |
| | | | | | | | | | | | | | | | | | | | | | | | | | | | |
| | | | | | Average Annual Total Returns2,5 | |
| | | | | | 1 Year | | | 5 Years | | | 10 Years | |
| | | 6-Month
Total Returns | | | w/o sales
charge | | | w/sales
charge | | | w/o
sales charge | | | w/sales
charge | | | w/o sales
charge | | | w/sales
charge | |
Institutional | | | (2.70 | )% | | | (2.81 | )% | | | N/A | | | | 8.52 | % | | | N/A | | | | 5.96 | % | | | N/A | |
Investor A | | | (2.85 | ) | | | (3.08 | ) | | | (8.16 | )% | | | 8.26 | | | | 7.10 | % | | | 5.69 | | | | 5.12 | % |
Investor C | | | (3.20 | ) | | | (3.85 | ) | | | (4.67 | ) | | | 7.43 | | | | 7.43 | | | | 4.89 | | | | 4.89 | |
S&P 500® Index | | | 1.93 | | | | 1.72 | | | | N/A | | | | 11.67 | | | | N/A | | | | 7.41 | | | | N/A | |
Russell 1000® Growth Index | | | 0.27 | | | | 1.61 | | | | N/A | | | | 12.11 | | | | N/A | | | | 8.78 | | | | N/A | |
| | 5 | | Assuming maximum sales charges, if any. Average annual total returns with and without sales charges reflect reductions for distribution and service fees. See “About Fund Performance” on page 12 for a detailed description of share classes, including any related sales charges and fees. |
| | | | N/A — Not applicable as share class and index do not have a sales charge. |
| | | | Past performance is not indicative of future results. |
| | | | | | | | | | | | | | | | | | | | | | | | | | | | |
| | | Actual | | | Hypothetical7 | | | | |
| | | Beginning
Account Value
December 1, 2015 | | | Ending
Account Value
May 31, 2016 | | | Expenses Paid
During the
Period6 | | | Beginning
Account Value
December 1, 2015 | | | Ending
Account Value
May 31, 2016 | | | Expenses Paid
During the
Period6 | | | Annualized
Expense Ratio | |
Institutional | | $ | 1,000.00 | | | $ | 973.00 | | | $ | 6.56 | | | $ | 1,000.00 | | | $ | 1,018.35 | | | $ | 6.71 | | | | 1.33 | % |
Investor A | | $ | 1,000.00 | | | $ | 971.50 | | | $ | 7.79 | | | $ | 1,000.00 | | | $ | 1,017.10 | | | $ | 7.97 | | | | 1.58 | % |
Investor C | | $ | 1,000.00 | | | $ | 968.00 | | | $ | 11.51 | | | $ | 1,000.00 | | | $ | 1,013.30 | | | $ | 11.78 | | | | 2.34 | % |
| | 6 | | For each class of the Fund, expenses are equal to the annualized net expense ratio for the class, multiplied by the average account value over the period, multiplied by 183/366 (to reflect the one-half year period shown). |
| | 7 | | Hypothetical 5% annual return before expenses is calculated by prorating the number of days in the most recent fiscal half year divided by 366. |
| | | | See “Disclosure of Expenses” on page 13 for further information on how expenses were calculated. |
| | | | | | |
| | | | | | | |
| | FDP SERIES, INC. | | MAY 31, 2016 | | 7 |
| | | | |
| Fund Summary as of May 31, 2016 | | FDP BlackRock Invesco Value Fund |
FDP BlackRock Invesco Value Fund’s (the “Fund”) investment objective is to seek to provide shareholders with capital growth and income.
As a special meeting on December 17, 2015, shareholders of the Fund approved the use of a manager of managers structure for the Fund. These changes took effect at the close of business on January 29, 2016.
|
| Portfolio Management Commentary |
How did the Fund perform?
| • | | For the 12-month period ended May 31, 2016, the Fund underperformed its benchmark, the Russell 1000® Value Index. |
What factors influenced performance?
| • | | During the period, stock selection in the financials sector detracted from the Fund’s performance. Within the banking sub-sector, Citigroup, Inc. significantly underperformed, as did Morgan Stanley within diversified financials. In addition, stock selection and the Fund’s overweight exposure to the energy sector detracted from relative performance. Within energy, holdings in Weatherford International PLC and Murphy Oil Corp. were two of the largest detractors. Weak stock selection in health care also weighed on returns. Specifically, the Fund’s positions in the European pharmaceutical firms Sanofi – ADR and Novartis AG were significant detractors. Additionally, an overweight position in and stock selection within the consumer discretionary sector subtracted from returns. Two examples were positions in the retailer Kohl’s Corp. and the cable company Viacom, Inc. A material underweight to the utilities sector also negatively impacted relative performance. Utilities represented the benchmark’s top-performing sector as investors searched for yield in a low interest rate environment. Lastly, a material underweight to telecommunication services (“telecom”) hindered from returns, as that sector was the benchmark’s second best performer for the 12-month period. |
| • | | Stock selection in the consumer staples sector contributed to relative performance. Within the food, beverage & tobacco sub-sector, Coca-Cola |
| | | Co. and ConAgra Foods, Inc. were notable contributors. ConAgra Foods, Inc. performed strongly after an activist investor took a large stake in the company and sought seats on the company’s board of directors. In addition, the Fund’s foreign currency forward contracts, used for the sole purpose of managing the risk of foreign currency exposure, had a positive impact on the Fund’s performance relative to the Russell 1000® Value Index for the reporting period. This was mainly due to the strength of the U.S. dollar compared to the foreign currencies in which the Fund’s non-U.S. holdings were denominated. |
Describe recent portfolio activity.
| • | | Within energy, the Fund took advantage of weakness in the sector to add to select holdings, mainly within integrated oil & gas stocks, and to a lesser degree exploration & production stocks. The Fund has also been looking to reduce its positions in oil services as prices recover there. Overall, portfolio activity was consistent with the Fund’s process and philosophy of purchasing deeply discounted companies and holding them for the long term, when most other investors are focused on the short-term prospects for these companies. |
Describe portfolio positioning at period end.
| • | | Relative to the Russell 1000® Value Index, the Fund ended the period overweight in energy, consumer discretionary, financials and information technology, and underweight in utilities, consumer staples, industrials, health care, materials and telecom. |
The views expressed reflect the opinions of the Fund’s sub-advisor as of the date of this report and are subject to change based on changes in market, economic or other conditions. These views are not intended to be a forecast of future events and are no guarantee of future results.
| | | | | | |
| | | | | | | |
| 8 | | FDP SERIES, INC. | | MAY 31, 2016 | | |
| | |
| | | FDP BlackRock Invesco Value Fund |
|
| Total Return Based on a $10,000 Investment |
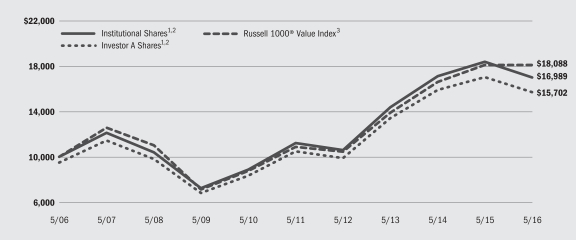
| | 1 | | Assuming maximum sales charges, if any, transaction costs and other operating expenses, including advisory fees. Institutional Shares do not have a sales charge. |
| | 2 | | The Fund invests, under normal market conditions, at least 80% of its net assets (plus any borrowings for investment purposes) in common stocks at the time of investment. The Fund invests in equity securities, including common stocks, preferred stocks, and securities convertible into common and preferred stocks (convertible securities). |
| | 3 | | This unmanaged broad-based index is a subset of the Russell 1000® Index consisting of those Russell 1000® securities with lower price/ book ratios and lower forecasted growth values. |
|
| Performance Summary for the Period Ended May 31, 2016 |
| | | | | | | | | | | | | | | | | | | | | | | | | | | | |
| | | | | | Average Annual Total Returns4 | |
| | | | | | 1 Year | | | 5 Years | | | 10 Years | |
| | | 6-Month
Total Returns | | | w/o sales
charge | | | w/sales
charge | | | w/o sales
charge | | | w/sales
charge | | | w/o sales
charge | | | w/sales
charge | |
Institutional | | | (2.37 | )% | | | (7.54 | )% | | | N/A | | | | 8.70 | % | | | N/A | | | | 5.44 | % | | | N/A | |
Investor A | | | (2.47 | ) | | | (7.78 | ) | | | (12.62 | )% | | | 8.42 | | | | 7.26 | % | | | 5.18 | | | | 4.62 | % |
Investor C | | | (2.90 | ) | | | (8.51 | ) | | | (9.41 | ) | | | 7.61 | | | | 7.61 | | | | 4.38 | | | | 4.38 | |
Russell 1000® Value Index | | | 3.12 | | | | (0.06 | ) | | | N/A | | | | 10.70 | | | | N/A | | | | 6.11 | | | | N/A | |
| | 4 | | Assuming maximum sales charges, if any. Average annual total returns with and without sales charges reflect reductions for distribution and service fees. See “About Fund Performance” on page 12 for a detailed description of share classes, including any related sales charges and fees. |
| | | | N/A — Not applicable as share class and index do not have a sales charge. |
| | | | Past performance is not indicative of future results. |
| | | | | | | | | | | | | | | | | | | | | | | | | | | | |
| | | Actual | | | Hypothetical6 | | | | |
| | | Beginning
Account Value December 1, 2015 | | | Ending
Account Value
May 31, 2016 | | | Expenses Paid
During the
Period5 | | | Beginning
Account Value December 1, 2015 | | | Ending
Account Value
May 31, 2016 | | | Expenses Paid
During the
Period5 | | | Annualized
Expense Ratio | |
Institutional | | $ | 1,000.00 | | | $ | 976.30 | | | $ | 5.88 | | | $ | 1,000.00 | | | $ | 1,019.05 | | | $ | 6.01 | | | | 1.19 | % |
Investor A | | $ | 1,000.00 | | | $ | 975.30 | | | $ | 7.11 | | | $ | 1,000.00 | | | $ | 1,017.80 | | | $ | 7.26 | | | | 1.44 | % |
Investor C | | $ | 1,000.00 | | | $ | 971.00 | | | $ | 10.84 | | | $ | 1,000.00 | | | $ | 1,014.00 | | | $ | 11.08 | | | | 2.20 | % |
| | 5 | | For each class of the Fund, expenses are equal to the annualized net expense ratio for the class, multiplied by the average account value over the period, multiplied by 183/366 (to reflect the one-half year period shown). |
| | 6 | | Hypothetical 5% annual return before expenses is calculated by prorating the number of days in the most recent fiscal half year divided by 366. |
| | | | See “Disclosure of Expenses” on page 13 for further information on how expenses were calculated. |
| | | | | | |
| | | | | | | |
| | FDP SERIES, INC. | | MAY 31, 2016 | | 9 |
| | | | |
| Fund Summary as of May 31, 2016 | | FDP BlackRock Franklin Templeton Total Return Fund |
FDP BlackRock Franklin Templeton Total Return Fund’s (the “Fund”) investment objective is to seek to provide shareholders with high current income, consistent with preservation of capital. The Fund’s secondary objective is capital appreciation over the long-term.
At a special meeting on November 25, 2015, shareholders of the Fund approved the use of a manager of managers structure for the Fund. These changes took effect at the close of business on January 29, 2016.
|
| Portfolio Management Commentary |
How did the Fund perform?
| • | | For the 12-month period ended May 31, 2016, the Fund underperformed the benchmark, the Barclays U.S. Aggregate Bond Index. |
What factors influenced performance?
| • | | During the period, the Fund’s positioning within foreign currencies detracted from performance. Exposure to U.S. yield curve movements also hindered results. Fund holdings in investment-grade and high yield corporate credit represented additional detractors. |
| • | | Conversely, exposure to non-U.S. yield curves had a positive impact on results during the period. The Fund’s sovereign emerging market bond and fixed-rate agency mortgage-backed securities (“MBS”) positions also added to results. Additionally, the Fund’s allocation within non-agency residential MBS contributed to returns. |
Describe recent portfolio activity.
| • | | During the period, the Fund increased its allocation within fixed-rate agency MBS at what were considered to be attractive valuations. The Fund also increased its allocations in investment-grade corporate credit and corporate loans. Exposure to U.S. Treasuries was reduced. |
| • | | The Fund transacts in mortgage dollar rolls, which require future mortgage settlements. To meet forward liabilities, the Fund holds cash or invests in high quality, liquid assets. The Fund’s allocation in cash and cash equivalents did not materially impact performance during the period. |
| • | | The Fund uses derivatives, which may include options, futures, swaps and forward contracts both to enhance returns of the Fund and to protect against adverse movements in currency exchange rates, interest rates and movements in the securities markets. During the period, derivatives were employed as an integral part of the Fund’s broad strategy, which produced positive returns for the period. However, when taken in isolation, the derivatives had negative returns for the period. |
Describe portfolio positioning at period end.
| • | | Relative to the Barclays U.S. Aggregate Bond Index, the Fund ended the period overweight compared with the benchmark in many of the credit sectors, including most corporate credit, as well as securitized products such as commercial mortgage-backed securities and non-agency residential MBS. This was based on the sub-advisor’s belief that valuations remained relatively attractive on a longer-term basis. The Fund also maintained a slight overweight to international bonds. Lastly, the Fund was significantly underweight in U.S. Treasuries. |
The views expressed reflect the opinions of the Fund’s sub-advisor as of the date of this report and are subject to change based on changes in market, economic or other conditions. These views are not intended to be a forecast of future events and are no guarantee of future results.
| | | | | | |
| | | | | | | |
| 10 | | FDP SERIES, INC. | | MAY 31, 2016 | | |
| | |
| | | FDP BlackRock Franklin Templeton Total Return Fund |
|
| Total Return Based on a $10,000 Investment |
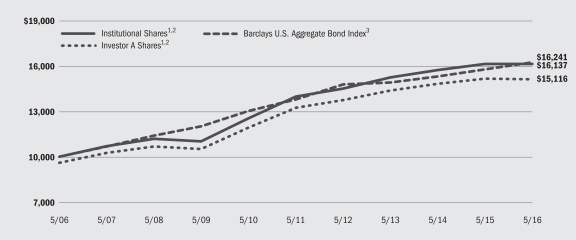
| | 1 | | Assuming maximum sales charges, if any, transaction costs and other operating expenses, including advisory fees. Institutional Shares do not have a sales charge. |
| | 2 | | The Fund invests, under normal market conditions, at least 80% of its assets in investment grade debt securities and investments, including government and corporate debt securities, mortgage- and asset-backed securities, investment grade corporate loans, municipal securities and futures with reference securities that are investment grade. |
| | 3 | | A widely recognized unmanaged market-weighted index which is comprised of investment-grade corporate bonds rated BBB or better, mortgages and U.S. Treasury and U.S. Government agency issues with at least one year to maturity. |
|
| Performance Summary for the Period Ended May 31, 2016 |
| | | | | | | | | | | | | | | | | | | | | | | | | | | | | | | | |
| | | | | | | | | Average Annual Total Returns4 | |
| | | | | | | | | 1 Year | | | 5 Years | | | 10 Years | |
| | | Standardized
30-Day Yields | | | 6-Month
Total Returns | | | w/o sales
charge | | | w/sales
charge | | | w/o sales
charge | | | w/sales
charge | | | w/o sales
charge | | | w/sales
charge | |
Institutional | | | 2.07 | % | | | 1.83 | % | | | 0.05 | % | | | N/A | | | | 2.94 | % | | | N/A | | | | 4.90 | % | | | N/A | |
Investor A | | | 1.77 | | | | 1.70 | | | | (0.20 | ) | | | (4.20 | )% | | | 2.69 | | | | 1.85 | % | | | 4.64 | | | | 4.22 | % |
Investor C | | | 1.29 | | | | 1.41 | | | | (0.76 | ) | | | (1.71 | ) | | | 2.11 | | | | 2.11 | | | | 4.06 | | | | 4.06 | |
Barclays U.S. Aggregate Bond Index | | | — | | | | 3.12 | | | | 2.99 | | | | N/A | | | | 3.33 | | | | N/A | | | | 4.97 | | | | N/A | |
| | 4 | | Assuming maximum sales charges, if any. Average annual total returns with and without sales charges reflect reductions for distribution and service fees. See “About Fund Performance” on page 12 for a detailed description of share classes, including any related sales charges and fees. |
| | | | N/A — Not applicable as share class and index do not have a sales charge. |
| | | | Past performance is not indicative of future results. |
| | | | | | | | | | | | | | | | | | | | | | | | | | | | |
| | | Actual | | | Hypothetical6 | | | | |
| | | Beginning
Account Value
December 1, 2015 | | | Ending Account Value
May 31, 2016 | | | Expenses Paid
During the
Period5 | | | Beginning
Account Value
December 1, 2015 | | | Ending
Account Value
May 31, 2016 | | | Expenses Paid
During the
Period5 | | | Annualized
Expense Ratio | |
Institutional | | $ | 1,000.00 | | | $ | 1,018.30 | | | $ | 4.09 | | | $ | 1,000.00 | | | $ | 1,020.95 | | | $ | 4.09 | | | | 0.81 | % |
Investor A | | $ | 1,000.00 | | | $ | 1,017.00 | | | $ | 5.35 | | | $ | 1,000.00 | | | $ | 1,019.70 | | | $ | 5.35 | | | | 1.06 | % |
Investor C | | $ | 1,000.00 | | | $ | 1,014.10 | | | $ | 8.16 | | | $ | 1,000.00 | | | $ | 1,016.90 | | | $ | 8.17 | | | | 1.62 | % |
| | 5 | | For each class of the Fund, expenses are equal to the annualized net expense ratio for the class, multiplied by the average account value over the period, multiplied by 183/366 (to reflect the one-half year period shown). |
| | 6 | | Hypothetical 5% annual return before expenses is calculated by prorating the number of days in the most recent fiscal half year divided by 366. |
| | | | See “Disclosure of Expenses” on page 13 for further information on how expenses were calculated. |
| | | | | | |
| | | | | | | |
| | FDP SERIES, INC. | | MAY 31, 2016 | | 11 |
Shares are only available for purchase through the FDP Service.
| • | | Institutional Shares are not subject to any sales charge. These shares bear no ongoing distribution or service fees and are available only to eligible investors. |
| • | | Investor A Shares (for all Funds except FDP BlackRock Franklin Templeton Total Return Fund) are subject to a maximum initial sales charge (front-end load) of 5.25% and a service fee of 0.25% per year (but no distribution fee). Investor A Shares for FDP BlackRock Franklin Templeton Total Return Fund are subject to a maximum initial sales charge (front-end load) of 4.00% and a service fee of 0.25% per year (but no distribution fee). Certain redemptions of these shares may be subject to a contingent deferred sales charge (“CDSC”) where no initial sales charge was paid at the time of purchase. These shares are generally available through financial intermediaries. |
| • | | Investor C Shares (for all Funds except FDP BlackRock Franklin Templeton Total Return Fund) are subject to a distribution fee of 0.75% per year and a service fee of 0.25% per year. Investor C Shares for FDP BlackRock Franklin Templeton Total Return Fund are subject to a distribution fee of 0.55% per year and a service fee of 0.25% per year. In addition, these shares for all Funds are subject to a 1.00% CDSC if redeemed within one year of purchase. These shares are generally available through financial intermediaries. |
| • | | Performance information reflects past performance and does not guarantee future results. Current performance may be lower or higher than the performance data quoted. Refer to www.blackrock.com/funds to obtain performance data current to the most recent month end. Performance results do not reflect the deduction of taxes that a shareholder would pay on fund distributions or the redemption of fund shares. |
| | | Figures shown in the performance tables on the previous pages assume reinvestment of all distributions, if any, at net asset value (“NAV”) on the ex-dividend/payable date. Investment return and principal value of shares will fluctuate so that shares, when redeemed, may be worth more or less than their original cost. Distributions paid to each class of shares will vary because of the different levels of service, distribution and transfer agency fees applicable to each class, which are deducted from the income available to be paid to shareholders. |
| • | | BlackRock Advisors, LLC (the “Manager”), the Funds’ investment advisor, has contractually agreed to waive and/or reimburse a portion of the Funds’ expenses. Without such waiver and/or reimbursement, the Funds’ performance would have been lower. The Manager did not waive or reimburse any fees or expenses under these arrangements during the year ended May 31, 2016. The Manager is under no obligation to continue waiving and/or reimbursing its fees after the applicable termination date of such agreement. The Manager has agreed to voluntarily waive, as a percentage of average daily net assets, 0.10% and 0.05% of its advisory fee payable by FDP BlackRock MFS Research International Fund and by FDP BlackRock Janus Growth Fund, respectively. In addition, effective January 30, 2016, the Manager has agreed to contractually waive its management fee payable by FDP BlackRock Janus Growth Fund in an amount equal to 0.05% of the FDP BlackRock Janus Growth Fund’s average daily net assets over $200 million. Without such waiver, the performance of FDP BlackRock MFS Research International Fund and FDP BlackRock Janus Growth Fund would have been lower. The Manager is under no obligation to waive or to continue waiving its fees and such voluntary waiver may be reduced or discontinued at any time. See Note 6 of the Notes to Financial Statements for additional information on waivers and reimbursements. |
| | | | | | |
| | | | | | | |
| 12 | | FDP SERIES, INC. | | MAY 31, 2016 | | |
Shareholders of these Funds may incur the following charges: (a) transactional expenses, such as sales charges; and (b) operating expenses, including investment advisory fees, service and distribution fees, including 12b-1 fees, acquired fund fees and expenses and other Fund expenses. The expense examples on previous pages (which are based on a hypothetical investment of $1,000 invested on December 1, 2015 and held through May 31, 2016) are intended to assist shareholders both in calculating expenses based on an investment in each Fund and in comparing these expenses with similar costs of investing in other mutual funds.
The expense examples provide information about actual account values and actual expenses. In order to estimate the expenses a shareholder paid during the period covered by this report, shareholders can divide their account value by $1,000 and then multiply the result by the number corresponding to their Fund and share class under the heading entitled “Expenses Paid During the Period.”
The expense examples also provide information about hypothetical account values and hypothetical expenses based on a Fund’s actual expense ratio and an assumed rate of return of 5% per year before expenses. In order to assist shareholders in comparing the ongoing expenses of investing in these Funds and other funds, compare the 5% hypothetical examples with the 5% hypothetical examples that appear in shareholder reports of other funds.
The expenses shown in the expense examples are intended to highlight shareholders’ ongoing costs only and do not reflect any transactional expenses, such as sales charges, if any. Therefore, the hypothetical examples are useful in comparing ongoing expenses only, and will not help shareholders determine the relative total expenses of owning different funds. If these transactional expenses were included, shareholder expenses would have been higher.
| | |
| Derivative Financial Instruments | | |
The Funds may invest in various derivative financial instruments. These instruments are used to obtain exposure to a security, commodity, index, market, and/or other asset without owning or taking physical custody of securities, commodities and/or other referenced assets or to manage market, equity, credit, interest rate, foreign currency exchange rate, commodity and/or other risks. Derivative financial instruments may give rise to a form of economic leverage and involve risks, including the imperfect correlation between the value of a derivative financial instrument and the underlying asset, possible default of the counterparty to the
transaction or illiquidity of the instrument. The Funds’ successful use of a derivative financial instrument depends on the investment advisor’s ability to predict pertinent market movements accurately, which cannot be assured. The use of these instruments may result in losses greater than if they had not been used, may limit the amount of appreciation a Fund can realize on an investment and/or may result in lower distributions paid to shareholders. The Funds’ investments in these instruments, if any, are discussed in detail in the Notes to Financial Statements.
| | | | | | |
| | | | | | | |
| | FDP SERIES, INC. | | MAY 31, 2016 | | 13 |
| | | | |
| Portfolio Information as of May 31, 2016 | | |
| | |
| FDP BlackRock MFS Research International Fund |
| Ten Largest Holdings | | Percent of
Net Assets |
| | | | |
Roche Holding AG | | | 4 | % |
Nestle SA, Registered Shares | | | 4 | |
Novartis AG, Registered Shares | | | 3 | |
KDDI Corp. | | | 2 | |
Schneider Electric SE | | | 2 | |
Reckitt Benckiser Group PLC | | | 2 | |
AIA Group Ltd. | | | 2 | |
Danone SA | | | 2 | |
BP PLC | | | 2 | |
UBS Group AG | | | 2 | |
| | |
| Geographic Allocation | | Percent of
Net Assets |
| | | | |
Japan | | | 21 | % |
United Kingdom | | | 18 | |
Switzerland | | | 16 | |
France | | | 10 | |
Germany | | | 6 | |
Australia | | | 5 | |
Hong Kong | | | 4 | |
United States | | | 4 | |
Italy | | | 3 | |
Netherlands | | | 3 | |
Other1 | | | 10 | |
| | 1 | | Other includes a 1% holding or less in each of the following countries: Belgium, Bermuda, Brazil, Canada, China, Denmark, Greece, India, Israel, Norway, Portugal, Russia, Singapore, South Korea, Spain, Sweden, Taiwan and Thailand. |
| | |
| FDP BlackRock Janus Growth Fund |
| Ten Largest Holdings | | Percent of
Net Assets |
| | | | |
Alphabet, Inc., Class A | | | 6 | % |
Apple, Inc. | | | 4 | |
Amazon.com, Inc. | | | 3 | |
Facebook, Inc., Class A | | | 3 | |
Comcast Corp., Class A | | | 2 | |
Lowe’s Cos., Inc. | | | 2 | |
Amgen, Inc. | | | 2 | |
Bristol-Myers Squibb Co. | | | 2 | |
Visa, Inc., Class A | | | 2 | |
American Tower Corp. | | | 2 | |
| | |
| Sector Allocation | | Percent of
Net Assets |
| | | | |
Information Technology | | | 29 | % |
Consumer Discretionary | | | 22 | |
Health Care | | | 17 | |
Industrials | | | 10 | |
Consumer Staples | | | 9 | |
Financials | | | 6 | |
Materials | | | 5 | |
Telecommunication Services | | | 1 | |
Energy | | | 1 | |
For Fund compliance purposes, the Fund’s sector classifications refer to one or more of the sector sub-classifications used by one or more widely recognized market indexes or rating group indexes, and/or as defined by the investment advisor. These definitions may not apply for purposes of this report, which may combine such sector sub-classifications for reporting ease.
| | | | | | |
| | | | | | | |
| 14 | | FDP SERIES, INC. | | MAY 31, 2016 | | |
| | |
| Portfolio Information as of May 31, 2016 (concluded) | | |
| | |
| FDP BlackRock Invesco Value Fund |
| Ten Largest Holdings | | Percent of
Net Assets |
| | | | |
Citigroup, Inc. | | | 5 | % |
JPMorgan Chase & Co. | | | 4 | |
Bank of America Corp. | | | 3 | |
Carnival Corp. | | | 3 | |
Cisco Systems, Inc. | | | 3 | |
Suncor Energy, Inc. | | | 2 | |
Pfizer, Inc. | | | 2 | |
Wells Fargo & Co. | | | 2 | |
Royal Dutch Shell PLC — ADR, Class A | | | 2 | |
Johnson Controls, Inc. | | | 2 | |
| | |
| Sector Allocation | | Percent of
Net Assets |
| | | | |
Financials | | | 29 | % |
Energy | | | 16 | |
Consumer Discretionary | | | 15 | |
Information Technology | | | 13 | |
Health Care | | | 12 | |
Industrials | | | 6 | |
Consumer Staples | | | 4 | |
Materials | | | 2 | |
Telecommunication Services | | | 1 | |
Utilities | | | 1 | |
Other Assets Less Liabilities | | | 1 | |
For Fund compliance purposes, the Fund’s sector classifications refer to one or more of the sector sub-classifications used by one or more widely recognized market indexes or rating group indexes, and/or as defined by the investment advisor. These definitions may not apply for purposes of this report, which may combine such sector sub-classifications for reporting ease.
| | |
| FDP BlackRock Franklin Templeton Total Return Fund |
| Portfolio Composition | | Percent of
Total Investments1 |
| | | | |
Corporate Bonds | | | 39 | % |
U.S. Government Sponsored Agency Securities | | | 24 | |
Asset-Backed Securities | | | 12 | |
U.S. Treasury Obligations | | | 11 | |
Non-Agency Mortgage-Backed Securities | | | 5 | |
Foreign Agency Obligations | | | 4 | |
Floating Rate Loan Interests | | | 2 | |
Municipal Bonds | | | 2 | |
Preferred Securities | | | 1 | |
Common Stocks | | | — | 2 |
| | 1 | | Total investments exclude options purchased and short-term securities. |
| | 2 | | Represents less than 1% of total investments. |
| | | | | | |
| | | | | | | |
| | FDP SERIES, INC. | | MAY 31, 2016 | | 15 |
| | |
Schedule of Investments May 31, 2016 | | FDP BlackRock MFS Research International Fund (Percentages shown are based on Net Assets) |
| | | | | | | | |
| Common Stocks | | Shares | | | Value | |
Australia — 4.6% | |
AMP Ltd. | | | 212,395 | | | $ | 863,844 | |
APA Group (a) | | | 173,486 | | | | 1,097,546 | |
Brambles Ltd. | | | 119,286 | | | | 1,105,474 | |
Iluka Resources Ltd. | | | 151,041 | | | | 703,726 | |
Oil Search Ltd. | | | 173,700 | | | | 848,580 | |
Orica Ltd. | | | 89,464 | | | | 877,201 | |
Westpac Banking Corp. | | | 74,492 | | | | 1,647,163 | |
| | | | | | | | |
| | | | | 7,143,534 | |
Belgium — 0.8% | |
KBC Groep NV (b) | | | 20,059 | | | | 1,186,482 | |
Bermuda — 0.7% | |
Hiscox Ltd. | | | 78,109 | | | | 1,111,682 | |
Brazil — 0.5% | | | | | | | | |
AMBEV SA — ADR | | | 146,275 | | | | 769,407 | |
Canada — 0.6% | | | | | | | | |
Enbridge, Inc. | | | 22,360 | | | | 891,433 | |
China — 1.5% | | | | | | | | |
Alibaba Group Holding Ltd. — SP ADR (b) | | | 14,077 | | | | 1,154,314 | |
China Resources Gas Group Ltd. | | | 392,000 | | | | 1,096,729 | |
| | | | | | | | |
| | | | | 2,251,043 | |
Denmark — 0.3% | | | | | | | | |
TDC A/S | | | 101,228 | | | | 506,920 | |
France — 9.8% | | | | | | | | |
BNP Paribas SA (b) | | | 40,743 | | | | 2,257,850 | |
Danone SA | | | 39,334 | | | | 2,763,299 | |
Dassault Systemes SA | | | 7,835 | | | | 624,142 | |
Engie SA | | | 87,133 | | | | 1,343,242 | |
L’Oreal SA | | | 13,151 | | | | 2,474,572 | |
Legrand SA | | | 9,708 | | | | 533,836 | |
LVMH Moet Hennessy Louis Vuitton SA | | | 10,229 | | | | 1,637,576 | |
Schneider Electric SE | | | 45,799 | | | | 2,960,785 | |
Technip SA | | | 8,078 | | | | 442,704 | |
| | | | | | | | |
| | | | | 15,038,006 | |
Germany — 5.6% | | | | | | | | |
Bayer AG, Registered Shares | | | 24,147 | | | | 2,299,678 | |
Deutsche Wohnen AG, Bearer Shares | | | 29,028 | | | | 932,874 | |
GEA Group AG | | | 21,436 | | | | 994,618 | |
LEG Immobilien AG (b) | | | 12,460 | | | | 1,112,266 | |
Linde AG | | | 15,326 | | | | 2,295,721 | |
Symrise AG | | | 16,903 | | | | 1,060,653 | |
| | | | | | | | |
| | | | | 8,695,810 | |
Greece — 0.4% | | | | | | | | |
Hellenic Telecommunications Organization SA | | | 62,031 | | | | 622,765 | |
Hong Kong — 3.4% | | | | | | | | |
AIA Group Ltd. | | | 473,600 | | | | 2,781,029 | |
BOC Hong Kong Holdings Ltd. | | | 239,500 | | | | 737,405 | |
CK Hutchison Holdings Ltd. | | | 115,500 | | | | 1,339,858 | |
Esprit Holdings Ltd. (b) | | | 393,400 | | | | 317,226 | |
| | | | | | | | |
| | | | | 5,175,518 | |
India — 0.6% | | | | | | | | |
HDFC Bank Ltd. — ADR | | | 14,622 | | | | 941,072 | |
| | | | | | | | |
| Common Stocks | | Shares | | | Value | |
Israel — 0.4% | | | | | | | | |
Mellanox Technologies, Ltd. (b) | | | 11,746 | | | $ | 556,760 | |
Italy — 3.3% | | | | | | | | |
Cerved Information Solutions SpA | | | 36,294 | | | | 302,233 | |
Enel SpA | | | 350,414 | | | | 1,588,898 | |
Eni SpA | | | 95,699 | | | | 1,459,505 | |
Intesa Sanpaolo SpA | | | 656,996 | | | | 1,686,033 | |
| | | | | | | | |
| | | | | 5,036,669 | |
Japan — 20.7% | | | | | | | | |
ABC-Mart, Inc. | | | 10,300 | | | | 663,764 | |
AEON Financial Service Co. Ltd. | | | 37,400 | | | | 820,328 | |
Daikin Industries Ltd. | | | 22,500 | | | | 1,911,670 | |
Denso Corp. | | | 37,500 | | | | 1,465,972 | |
Japan Tobacco, Inc. | | | 61,700 | | | | 2,433,175 | |
KDDI Corp. | | | 103,200 | | | | 2,993,901 | |
Koito Manufacturing Co. Ltd. | | | 3,800 | | | | 177,933 | |
Kubota Corp. | | | 143,700 | | | | 2,091,591 | |
Mitsubishi Corp. | | | 48,800 | | | | 859,712 | |
Mitsubishi UFJ Financial Group, Inc. | | | 261,400 | | | | 1,291,452 | |
Mitsui Fudosan Co. Ltd. | | | 45,000 | | | | 1,095,995 | |
Nippon Paint Holdings Co. Ltd. | | | 78,000 | | | | 2,203,267 | |
Nomura Research Institute Ltd. | | | 18,200 | | | | 683,446 | |
Santen Pharmaceutical Co. Ltd. | | | 154,900 | | | | 2,264,512 | |
Shionogi & Co. Ltd. | | | 18,700 | | | | 1,045,452 | |
Softbank Group Corp. | | | 23,700 | | | | 1,320,424 | |
Sony Financial Holdings, Inc. | | | 93,900 | | | | 1,136,332 | |
Sumitomo Mitsui Financial Group, Inc. | | | 45,600 | | | | 1,473,310 | |
Sundrug Co. Ltd. | | | 17,700 | | | | 1,454,915 | |
Terumo Corp. | | | 27,400 | | | | 1,144,432 | |
Toto Ltd. | | | 2,900 | | | | 109,261 | |
USS Co. Ltd. | | | 64,300 | | | | 1,011,166 | |
Yamato Holdings Co. Ltd. | | | 107,600 | | | | 2,173,450 | |
| | | | | | | | |
| | | | | 31,825,460 | |
Netherlands — 2.6% | | | | | | | | |
ABN AMRO Group NV (c) | | | 75,328 | | | | 1,533,969 | |
Akzo Nobel NV | | | 35,935 | | | | 2,436,630 | |
| | | | | | | | |
| | | | | 3,970,599 | |
Norway — 0.7% | | | | | | | | |
DNB ASA | | | 82,928 | | | | 1,060,832 | |
Portugal — 0.7% | | | | | | | | |
Galp Energia SGPS SA | | | 83,260 | | | | 1,089,300 | |
Russia — 0.2% | | | | | | | | |
Magnit PJSC (b) | | | 2,368 | | | | 331,985 | |
Singapore — 0.4% | | | | | | | | |
Broadcom Ltd. | | | 4,354 | | | | 672,083 | |
South Korea — 0.7% | | | | | | | | |
NAVER Corp. | | | 1,817 | | | | 1,095,925 | |
Spain — 0.7% | | | | | | | | |
Amadeus IT Holding SA, Class A | | | 24,264 | | | | 1,123,389 | |
Sweden — 0.5% | | | | | | | | |
Telefonaktiebolaget LM Ericsson, Class B | | | 91,739 | | | | 708,160 | |
Switzerland — 16.1% | | | | | | | | |
Dufry AG (b) | | | 4,105 | | | | 551,587 | |
| | | | | | | | | | |
| ABS | | Asset-Backed Security | | CLO | | Collateralized Loan Obligation | | JPY | | Japanese Yen |
| ADR | | American Depositary Receipts | | EDA | | Economic Development Authority | | MXN | | Mexican Peso |
| ARB | | Airport Revenue Bonds | | EUR | | Euro | | MYR | | Malaysian Ringgit |
| AUD | | Australian Dollar | | GBP | | British Pound | | NZD | | New Zealand Dollar |
| BRL | | Brazilian Real | | GO | | General Obligation Bonds | | PHP | | Philippine Peso |
| CAD | | Canadian Dollar | | IDR | | Indonesian Rupiah | | RB | | Revenue Bonds |
| CHF | | Swiss Franc | | INR | | Indian Rupee | | USD | | U.S. Dollar |
See Notes to Financial Statements.
| | | | | | |
| | | | | | | |
| 16 | | FDP SERIES, INC. | | MAY 31, 2016 | | |
| | |
Schedule of Investments (continued) | | FDP BlackRock MFS Research International Fund |
| | | | | | | | |
| Common Stocks | | Shares | | | Value | |
Switzerland (continued) | |
Julius Baer Group Ltd. (b) | | | 23,171 | | | $ | 1,033,250 | |
Nestle SA, Registered Shares | | | 74,468 | | | | 5,503,157 | |
Novartis AG, Registered Shares | | | 67,120 | | | | 5,334,191 | |
Roche Holding AG | | | 21,027 | | | | 5,522,867 | |
Schindler Holding AG, Participation Certificates | | | 9,754 | | | | 1,807,306 | |
Swiss Re AG | | | 9,363 | | | | 841,364 | |
UBS Group AG | | | 172,696 | | | | 2,668,011 | |
Zurich Insurance Group AG (b) | | | 6,181 | | | | 1,495,937 | |
| | | | | | | | |
| | | | | 24,757,670 | |
Taiwan — 1.4% | |
Taiwan Semiconductor Manufacturing Co. Ltd. | | | 453,439 | | | | 2,169,578 | |
Thailand — 0.4% | |
Kasikornbank PCL — NVDR | | | 136,700 | | | | 664,800 | |
United Kingdom — 18.3% | |
ARM Holdings PLC | | | 85,657 | | | | 1,226,936 | |
Barclays PLC | | | 666,126 | | | | 1,753,083 | |
BHP Billiton PLC | | | 116,034 | | | | 1,367,553 | |
BP PLC | | | 529,636 | | | | 2,731,562 | |
BT Group PLC | | | 154,747 | | | | 989,735 | |
Cairn Energy PLC (b) | | | 169,518 | | | | 477,360 | |
Croda International PLC | | | 35,385 | | | | 1,504,214 | |
GKN PLC | | | 562,421 | | | | 2,237,000 | |
| | | | | | | | |
| Common Stocks | | Shares | | | Value | |
United Kingdom (continued) | |
Just Eat PLC (b) | | | 68,968 | | | $ | 454,095 | |
Lloyds Banking Group PLC | | | 2,218,353 | | | | 2,309,186 | |
Next PLC | | | 7,557 | | | | 594,594 | |
Reckitt Benckiser Group PLC | | | 28,738 | | | | 2,861,135 | |
RELX NV | | | 138,542 | | | | 2,398,387 | |
Rio Tinto PLC | | | 66,971 | | | | 1,866,328 | |
Vodafone Group PLC | | | 533,171 | | | | 1,780,644 | |
Whitbread PLC | | | 30,762 | | | | 1,874,676 | |
WPP PLC | | | 79,178 | | | | 1,825,992 | |
| | | | | | | | |
| | | | | 28,252,480 | |
United States — 3.7% | |
Aon PLC | | | 11,006 | | | | 1,202,626 | |
Cognizant Technology Solutions Corp., Class A (b) | | | 34,434 | | | | 2,115,625 | |
MasterCard, Inc., Class A | | | 12,095 | | | | 1,159,910 | |
Pricesmart, Inc. | | | 6,159 | | | | 545,626 | |
Yum! Brands, Inc. | | | 7,740 | | | | 635,377 | |
| | | | | | | | |
| | | | | 5,659,164 | |
| Total Investments (Cost — $135,173,843) — 99.6% | | | | 153,308,526 | |
| Other Assets Less Liabilities — 0.4% | | | | 651,661 | |
| | | | | | | | |
| Net Assets — 100.0% | | | $ | 153,960,187 | |
| | | | | | | | |
|
| Notes to Schedule of Investments |
| (a) | | A security contractually bound to one or more other securities to form a single saleable unit which cannot be sold separately. |
| (b) | | Non-income producing security. |
| (c) | | Security exempt from registration pursuant to Rule 144A under the Securities Act of 1933, as amended. These securities may be resold in transactions exempt from registration to qualified institutional investors. |
|
| Derivative Financial Instruments Categorized by Risk Exposure |
The following is a summary of the Fund’s derivative financial instruments categorized by risk exposure.
For the year ended May 31, 2016, the effect of derivative financial instruments in the Statements of Operations was as follows:
| | | | | | | | | | | | | | | | | | | | | | | | |
| Net Realized Gain (Loss) from: | | Commodity
Contracts | | | Credit
Contracts | | | Equity
Contracts | | | Foreign
Currency
Exchange
Contracts | | Interest
Rate
Contracts | | | Other
Contracts | | | Total |
Forward foreign currency exchange contracts | | | — | | | | — | | | | — | | | $293 | | | — | | | | — | | | $293 |
|
| Average Quarterly Balances of Outstanding Derivative Financial Instruments |
| | | | |
| Forward foreign currency exchange contracts: | | | | |
Average amounts purchased — in USD | | $ | 62,067 | 1 |
1 Actual amounts for the period are shown due to limited outstanding derivative financial instruments as of each quarter. | | | | |
For more information about the Fund’s investment risks regarding derivative financial instruments, refer to the Notes to Financial Statements.
See Notes to Financial Statements.
| | | | | | |
| | | | | | | |
| | FDP SERIES, INC. | | MAY 31, 2016 | | 17 |
| | |
Schedule of Investments (concluded) | | FDP BlackRock MFS Research International Fund |
|
| Fair Value Hierarchy as of Period End |
Various inputs are used in determining the fair value of investments. For information about the Fund’s policy regarding valuation of investments, refer to the Notes to Financial Statements.
The following tables summarize the Fund’s investments categorized in the disclosure hierarchy:
| | | | | | | | | | | | | | | | |
| | | Level 1 | | | Level 2 | | | Level 3 | | | Total | |
Assets: | | | | | | | | | | | | | | | | |
| Investments: | | | | | | | | | | | | | | | | |
Common Stocks: | | | | | | | | | | | | | | | | |
Australia | | | — | | | $ | 7,143,534 | | | | — | | | $ | 7,143,534 | |
Belgium | | | — | | | | 1,186,482 | | | | — | | | | 1,186,482 | |
Bermuda | | | — | | | | 1,111,682 | | | | — | | | | 1,111,682 | |
Brazil | | $ | 769,407 | | | | — | | | | — | | | | 769,407 | |
Canada | | | 891,433 | | | | — | | | | — | | | | 891,433 | |
China | | | 1,154,314 | | | | 1,096,729 | | | | — | | | | 2,251,043 | |
Denmark | | | — | | | | 506,920 | | | | — | | | | 506,920 | |
France | | | — | | | | 15,038,006 | | | | — | | | | 15,038,006 | |
Germany | | | — | | | | 8,695,810 | | | | — | | | | 8,695,810 | |
Greece | | | — | | | | 622,765 | | | | — | | | | 622,765 | |
Hong Kong | | | — | | | | 5,175,518 | | | | — | | | | 5,175,518 | |
India | | | 941,072 | | | | — | | | | — | | | | 941,072 | |
Israel | | | 556,760 | | | | — | | | | — | | | | 556,760 | |
Italy | | | — | | | | 5,036,669 | | | | — | | | | 5,036,669 | |
Japan | | | — | | | | 31,825,460 | | | | — | | | | 31,825,460 | |
Netherlands | | | — | | | | 3,970,599 | | | | — | | | | 3,970,599 | |
Norway | | | — | | | | 1,060,832 | | | | — | | | | 1,060,832 | |
Portugal | | | — | | | | 1,089,300 | | | | — | | | | 1,089,300 | |
Russia | | | — | | | | 331,985 | | | | — | | | | 331,985 | |
Singapore | | | 672,083 | | | | — | | | | — | | | | 672,083 | |
South Korea | | | — | | | | 1,095,925 | | | | — | | | | 1,095,925 | |
Spain | | | — | | | | 1,123,389 | | | | — | | | | 1,123,389 | |
Sweden | | | — | | | | 708,160 | | | | — | | | | 708,160 | |
Switzerland | | | — | | | | 24,757,670 | | | | — | | | | 24,757,670 | |
Taiwan | | | — | | | | 2,169,578 | | | | — | | | | 2,169,578 | |
Thailand | | | — | | | | 664,800 | | | | — | | | | 664,800 | |
United Kingdom | | | — | | | | 28,252,480 | | | | — | | | | 28,252,480 | |
United States | | | 5,659,164 | | | | — | | | | — | | | | 5,659,164 | |
| | | | |
Total | | $ | 10,644,233 | | | $ | 142,664,293 | | | | — | | | $ | 153,308,526 | |
| | | | |
The Fund may hold assets and/or liabilities in which the fair value approximates the carrying amount for financial statement purposes. As of period end, a foreign bank overdraft of $432 is categorized as Level 2 within the disclosure hierarchy.
During the year ended May 31, 2016, there were no transfers between levels.
See Notes to Financial Statements.
| | | | | | |
| | | | | | | |
| 18 | | FDP SERIES, INC. | | MAY 31, 2016 | | |
| | |
Schedule of Investments May 31, 2016 | | FDP BlackRock Janus Growth Fund (Percentages shown are based on Net Assets) |
| | | | | | | | |
| Common Stocks | | Shares | | | Value | |
Aerospace & Defense — 3.1% | |
Honeywell International, Inc. | | | 14,992 | | | $ | 1,706,539 | |
Northrop Grumman Corp. | | | 7,167 | | | | 1,524,206 | |
Teledyne Technologies, Inc. (a) | | | 9,909 | | | | 972,370 | |
| | | | | | | | |
| | | | | 4,203,115 | |
Airlines — 1.0% | |
United Continental Holdings, Inc. (a) | | | 28,949 | | | | 1,305,310 | |
Auto Components — 0.8% | |
Delphi Automotive PLC | | | 16,119 | | | | 1,095,447 | |
Banks — 0.3% | | | | | | | | |
PacWest Bancorp | | | 10,481 | | | | 436,848 | |
Beverages — 2.2% | |
Brown-Forman Corp., Class B | | | 7,057 | | | | 692,080 | |
Coca-Cola Co. | | | 52,357 | | | | 2,335,122 | |
| | | | | | | | |
| | | | | 3,027,202 | |
Biotechnology — 8.3% | |
AbbVie, Inc. | | | 33,487 | | | | 2,107,337 | |
Alder Biopharmaceuticals, Inc. (a) | | | 22,820 | | | | 686,198 | |
Amgen, Inc. | | | 17,214 | | | | 2,718,951 | |
Biogen, Inc. (a) | | | 5,392 | | | | 1,562,224 | |
Celgene Corp. (a) | | | 21,962 | | | | 2,317,430 | |
Ironwood Pharmaceuticals, Inc. (a) | | | 67,347 | | | | 841,164 | |
Regeneron Pharmaceuticals, Inc. (a) | | | 2,743 | | | | 1,094,265 | |
| | | | | | | | |
| | | | | 11,327,569 | |
Building Products — 1.1% | |
Allegion PLC | | | 10,759 | | | | 727,739 | |
AO Smith Corp. | | | 9,294 | | | | 764,896 | |
| | | | | | | | |
| | | | | 1,492,635 | |
Capital Markets — 0.9% | |
Blackstone Group LP | | | 21,854 | | | | 572,356 | |
E*Trade Financial Corp. (a) | | | 25,345 | | | | 706,872 | |
| | | | | | | | |
| | | | | 1,279,228 | |
Chemicals — 2.3% | |
Air Products & Chemicals, Inc. | | | 12,237 | | | | 1,745,486 | |
PPG Industries, Inc. | | | 13,274 | | | | 1,429,344 | |
| | | | | | | | |
| | | | | 3,174,830 | |
Communications Equipment — 0.6% | |
CommScope Holding Co., Inc. (a) | | | 25,327 | | | | 788,936 | |
Construction Materials — 1.1% | |
Vulcan Materials Co. | | | 12,308 | | | | 1,436,959 | |
Consumer Finance — 0.7% | |
Synchrony Financial (a) | | | 28,620 | | | | 892,944 | |
Containers & Packaging — 1.7% | |
Crown Holdings, Inc. (a) | | | 25,330 | | | | 1,321,466 | |
Sealed Air Corp. | | | 21,824 | | | | 1,013,507 | |
| | | | | | | | |
| | | | | 2,334,973 | |
Diversified Consumer Services — 0.5% | |
ServiceMaster Global Holdings, Inc. (a) | | | 18,943 | | | | 724,380 | |
Diversified Financial Services — 1.1% | |
Intercontinental Exchange, Inc. | | | 3,351 | | | | 908,523 | |
S&P Global, Inc. | | | 4,584 | | | | 512,537 | |
| | | | | | | | |
| | | | | 1,421,060 | |
Electrical Equipment — 0.8% | |
Sensata Technologies Holding NV (a) | | | 30,933 | | | | 1,143,902 | |
Electronic Equipment, Instruments & Components — 2.8% | |
Amphenol Corp., Class A | | | 35,309 | | | | 2,073,344 | |
National Instruments Corp. | | | 22,196 | | | | 634,140 | |
TE Connectivity Ltd. | | | 17,179 | | | | 1,030,740 | |
| | | | | | | | |
| | | | | 3,738,224 | |
| | | | | | | | |
| Common Stocks | | Shares | | | Value | |
Energy Equipment & Services — 0.1% | |
Halliburton Co. | | | 4,315 | | | $ | 182,007 | |
Food & Staples Retailing — 3.2% | |
Costco Wholesale Corp. | | | 6,491 | | | | 965,666 | |
Diplomat Pharmacy, Inc. (a) | | | 24,488 | | | | 797,819 | |
Kroger Co. | | | 42,951 | | | | 1,535,928 | |
Sysco Corp. | | | 20,233 | | | | 973,410 | |
| | | | | | | | |
| | | | | 4,272,823 | |
Food Products — 1.2% | |
Hershey Co. | | | 17,530 | | | | 1,627,661 | |
Health Care Equipment & Supplies — 0.9% | |
Boston Scientific Corp. (a) | | | 53,942 | | | | 1,225,023 | |
Health Care Providers & Services — 2.1% | |
Express Scripts Holding Co. (a) | | | 22,913 | | | | 1,731,077 | |
Universal Health Services, Inc., Class B | | | 8,444 | | | | 1,138,758 | |
| | | | | | | | |
| | | | | 2,869,835 | |
Health Care Technology — 0.7% | |
athenahealth, Inc. (a) | | | 7,138 | | | | 905,598 | |
Hotels, Restaurants & Leisure — 3.8% | |
Aramark | | | 22,393 | | | | 745,463 | |
Chipotle Mexican Grill, Inc. (a) | | | 1,664 | | | | 735,421 | |
Dunkin’ Brands Group, Inc. | | | 18,421 | | | | 797,445 | |
Hilton Worldwide Holdings, Inc. | | | 19,612 | | | | 407,537 | |
Norwegian Cruise Line Holdings Ltd. (a) | | | 18,984 | | | | 881,048 | |
Starbucks Corp. | | | 29,277 | | | | 1,607,015 | |
| | | | | | | | |
| | | | | 5,173,929 | |
Household Products — 0.9% | |
Colgate-Palmolive Co. | | | 17,919 | | | | 1,261,677 | |
Industrial Conglomerates — 0.6% | |
Roper Technologies, Inc. | | | 4,795 | | | | 820,329 | |
Internet & Catalog Retail — 4.8% | |
Amazon.com, Inc. (a) | | | 5,626 | | | | 4,066,417 | |
Liberty Interactive Corp QVC Group, Series A (a) | | | 26,492 | | | | 714,754 | |
Priceline Group, Inc. (a) | | | 1,395 | | | | 1,763,740 | |
| | | | | | | | |
| | | | | 6,544,911 | |
Internet Software & Services — 8.9% | |
Alphabet, Inc., Class A (a) | | | 9,991 | | | | 7,481,760 | |
CoStar Group, Inc. (a) | | | 3,494 | | | | 721,825 | |
Facebook, Inc., Class A (a) | | | 32,623 | | | | 3,875,939 | |
| | | | | | | | |
| | | | | 12,079,524 | |
IT Services — 4.6% | |
Amdocs Ltd. | | | 15,680 | | | | 909,283 | |
Cognizant Technology Solutions Corp., Class A (a) | | | 13,620 | | | | 836,813 | |
MasterCard, Inc., Class A | | | 21,246 | | | | 2,037,491 | |
Visa, Inc., Class A | | | 31,536 | | | | 2,489,452 | |
| | | | | | | | |
| | | | | 6,273,039 | |
Leisure Products — 1.2% | |
Mattel, Inc. | | | 19,158 | | | | 610,757 | |
Polaris Industries, Inc. | | | 12,284 | | | | 1,044,386 | |
| | | | | | | | |
| | | | | 1,655,143 | |
Machinery — 1.2% | |
Dover Corp. | | | 10,395 | | | | 693,866 | |
Rexnord Corp. (a) | | | 42,424 | | | | 879,874 | |
| | | | | | | | |
| | | | | 1,573,740 | |
Media — 3.9% | |
Comcast Corp., Class A | | | 50,498 | | | | 3,196,523 | |
Walt Disney Co. | | | 21,125 | | | | 2,096,023 | |
| | | | | | | | |
| | | | | 5,292,546 | |
See Notes to Financial Statements.
| | | | | | |
| | | | | | | |
| | FDP SERIES, INC. | | MAY 31, 2016 | | 19 |
| | |
Schedule of Investments (concluded) | | FDP BlackRock Janus Growth Fund |
| | | | | | | | |
| Common Stocks | | Shares | | | Value | |
Multiline Retail — 1.4% | |
Dollar Tree, Inc. (a) | | | 20,240 | | | $ | 1,832,530 | |
Oil, Gas & Consumable Fuels — 0.4% | |
Anadarko Petroleum Corp. | | | 4,400 | | | | 228,184 | |
Enterprise Products Partners LP | | | 7,891 | | | | 219,054 | |
Phillips 66 | | | 1,812 | | | | 145,612 | |
| | | | | | | | |
| | | | | 592,850 | |
Personal Products — 1.2% | |
Estee Lauder Cos., Inc., Class A | | | 17,379 | | | | 1,595,045 | |
Pharmaceuticals — 4.8% | |
Allergan PLC (a) | | | 7,110 | | | | 1,676,183 | |
Bristol-Myers Squibb Co. | | | 36,782 | | | | 2,637,269 | |
Eli Lilly & Co. | | | 12,975 | | | | 973,514 | |
Mallinckrodt PLC (a) | | | 18,791 | | | | 1,190,598 | |
| | | | | | | | |
| | | | | 6,477,564 | |
Professional Services — 1.3% | |
Nielsen Holdings PLC | | | 17,469 | | | | 932,670 | |
Verisk Analytics, Inc. (a) | | | 10,680 | | | | 847,885 | |
| | | | | | | | |
| | | | | 1,780,555 | |
Real Estate Investment Trusts (REITs) — 2.3% | |
American Tower Corp. | | | 22,795 | | | | 2,411,255 | |
Simon Property Group, Inc. | | | 3,781 | | | | 747,277 | |
| | | | | | | | |
| | | | | 3,158,532 | |
Real Estate Management & Development — 0.6% | |
Jones Lang LaSalle, Inc. | | | 6,567 | | | | 773,987 | |
Road & Rail — 0.7% | |
CSX Corp. | | | 36,397 | | | | 961,973 | |
Semiconductors & Semiconductor Equipment — 1.6% | |
Broadcom Ltd. | | | 8,162 | | | | 1,259,886 | |
Texas Instruments, Inc. | | | 15,876 | | | | 962,086 | |
| | | | | | | | |
| | | | | 2,221,972 | |
| | | | | | | | |
| Common Stocks | | Shares | | | Value | |
Software — 6.7% | |
Activision Blizzard, Inc. | | | 21,769 | | | $ | 854,651 | |
Adobe Systems, Inc. (a) | | | 16,782 | | | | 1,669,305 | |
ANSYS, Inc. (a) | | | 7,679 | | | | 684,199 | |
Cadence Design Systems, Inc. (a) | | | 39,917 | | | | 986,748 | |
NetSuite, Inc. (a) | | | 15,131 | | | | 1,200,040 | |
salesforce.com, Inc. (a) | | | 13,856 | | | | 1,159,886 | |
SS&C Technologies Holdings, Inc. | | | 11,585 | | | | 713,520 | |
Tyler Technologies, Inc. (a) | | | 6,070 | | | | 930,470 | |
Ultimate Software Group, Inc. (a) | | | 4,681 | | | | 957,171 | |
| | | | | | | | |
| | | | | 9,155,990 | |
Specialty Retail — 3.5% | |
AutoZone, Inc. (a) | | | 983 | | | | 749,243 | |
Lowe’s Cos., Inc. | | | 37,376 | | | | 2,994,939 | |
Tractor Supply Co. | | | 10,690 | | | | 1,027,309 | |
| | | | | | | | |
| | | | | 4,771,491 | |
Technology Hardware, Storage & Peripherals — 3.8% | |
Apple, Inc. | | | 51,380 | | | | 5,130,807 | |
Textiles, Apparel & Luxury Goods — 1.7% | |
Carter’s, Inc. | | | 10,097 | | | | 1,015,152 | |
NIKE, Inc., Class B | | | 22,403 | | | | 1,237,094 | |
| | | | | | | | |
| | | | | 2,252,246 | |
Thrifts & Mortgage Finance — 0.3% | |
MGIC Investment Corp. (a) | | | 49,145 | | | | 346,472 | |
Tobacco — 1.2% | |
Altria Group, Inc. | | | 25,641 | | | | 1,631,793 | |
Wireless Telecommunication Services — 1.0% | |
T-Mobile U.S., Inc. (a) | | | 32,208 | | | | 1,377,214 | |
| Total Investments (Cost — $119,536,430) — 99.9% | | | | 135,642,368 | |
| Other Assets Less Liabilities — 0.1% | | | | 124,085 | |
| | | | | | | | |
| Net Assets — 100.0% | | | $ | 135,766,453 | |
| | | | | | | | |
|
| Notes to Schedule of Investments |
| (a) | | Non-income producing security. |
| • | | For Fund compliance purposes, the Fund’s sector classifications refer to one or more of the sector sub-classifications used by one or more widely recognized market indexes or rating group indexes, and/or as defined by the investment advisor. These definitions may not apply for purposes of this report, which may combine such sector sub-classifications for reporting ease. |
|
| Fair Value Hierarchy as of Period End |
Various inputs are used in determining the fair value of investments. For information about the Fund’s policy regarding valuation of investments, refer to the Notes to Financial Statements.
The following tables summarize the Fund’s investments categorized in the disclosure hierarchy:
| | | | | | | | | | | | | | | | |
| | | Level 1 | | | Level 2 | | | Level 3 | | | Total | |
Assets: | | | | | | | | | | | | | | | | |
| Investments: | | | | | | | | | | | | | | | | |
Long-Term Investments1 | | $ | 135,642,368 | | | | — | | | | — | | | $ | 135,642,368 | |
1 See above Schedule of Investments for values in each industry. | |
The Fund may hold assets and/or liabilities in which the fair value approximates the carrying amount for financial statement purposes. As of period end, a bank overdraft of $419,111 is categorized as Level 2 within the disclosure hierarchy.
During the year ended May 31, 2016, there were no transfers between levels.
See Notes to Financial Statements.
| | | | | | |
| | | | | | | |
| 20 | | FDP SERIES, INC. | | MAY 31, 2016 | | |
| | |
Schedule of Investments May 31, 2016 | | FDP BlackRock Invesco Value Fund (Percentages shown are based on Net Assets) |
| | | | | | | | |
| Common Stocks | | Shares | | | Value | |
Aerospace & Defense — 1.3% | |
Textron, Inc. | | | 46,129 | | | $ | 1,755,670 | |
Auto Components — 1.9% | |
Johnson Controls, Inc. | | | 59,788 | | | | 2,639,640 | |
Automobiles — 1.9% | |
General Motors Co. | | | 81,486 | | | | 2,548,882 | |
Banks — 16.8% | |
Bank of America Corp. | | | 281,613 | | | | 4,165,056 | |
Citigroup, Inc. | | | 143,618 | | | | 6,688,290 | |
Citizens Financial Group, Inc. | | | 49,182 | | | | 1,158,236 | |
Fifth Third Bancorp | | | 105,586 | | | | 1,992,408 | |
JPMorgan Chase & Co. | | | 84,826 | | | | 5,536,593 | |
PNC Financial Services Group, Inc. (a) | | | 500 | | | | 44,870 | |
US Bancorp | | | 14,230 | | | | 609,329 | |
Wells Fargo & Co. | | | 54,405 | | | | 2,759,422 | |
| | | | | | | | |
| | | | | 22,954,204 | |
Beverages — 1.0% | |
Coca-Cola Co. | | | 30,612 | | | | 1,365,295 | |
Biotechnology — 1.5% | |
AbbVie, Inc. | | | 20,990 | | | | 1,320,901 | |
Biogen, Inc. (b) | | | 2,447 | | | | 708,969 | |
| | | | | | | | |
| | | | | 2,029,870 | |
Capital Markets — 5.3% | |
Bank of New York Mellon Corp. | | | 39,348 | | | | 1,654,977 | |
Goldman Sachs Group, Inc. | | | 8,907 | | | | 1,420,488 | |
Morgan Stanley | | | 72,444 | | | | 1,982,792 | |
State Street Corp. | | | 34,862 | | | | 2,198,398 | |
| | | | | | | | |
| | | | | 7,256,655 | |
Communications Equipment — 2.8% | |
Cisco Systems, Inc. | | | 127,681 | | | | 3,709,133 | |
QUALCOMM, Inc. | | | 2,677 | | | | 147,021 | |
| | | | | | | | |
| | | | | 3,856,154 | |
Consumer Finance — 1.3% | |
Ally Financial, Inc. (b) | | | 96,315 | | | | 1,727,891 | |
Diversified Telecommunication Services — 0.9% | |
Frontier Communications Corp. | | | 247,670 | | | | 1,280,454 | |
Electric Utilities — 0.5% | |
FirstEnergy Corp. | | | 19,825 | | | | 650,458 | |
Electrical Equipment — 1.1% | |
Emerson Electric Co. | | | 29,097 | | | | 1,513,626 | |
Energy Equipment & Services — 2.7% | |
Halliburton Co. | | | 34,685 | | | | 1,463,013 | |
Noble Corp. PLC | | | 61,816 | | | | 515,545 | |
Weatherford International PLC (b) | | | 289,970 | | | | 1,626,732 | |
| | | | | | | | |
| | | | | 3,605,290 | |
Food & Staples Retailing — 1.6% | |
CVS Health Corp. | | | 6,854 | | | | 661,068 | |
Wal-Mart Stores, Inc. | | | 21,561 | | | | 1,526,088 | |
| | | | | | | | |
| | | | | 2,187,156 | |
Food Products — 1.0% | |
Mondelez International, Inc., Class A | | | 12,892 | | | | 573,565 | |
Unilever NV — NY Shares | | | 17,153 | | | | 767,768 | |
| | | | | | | | |
| | | | | 1,341,333 | |
Health Care Equipment & Supplies — 0.9% | |
Medtronic PLC | | | 14,401 | | | | 1,158,993 | |
Health Care Providers & Services — 2.0% | |
Anthem, Inc. | | | 11,093 | | | | 1,466,051 | |
Express Scripts Holding Co. (b) | | | 16,848 | | | | 1,272,866 | |
| | | | | | | | |
| | | | | 2,738,917 | |
| | | | | | | | |
| Common Stocks | | Shares | | | Value | |
Hotels, Restaurants & Leisure — 2.7% | |
Carnival Corp. | | | 78,070 | | | $ | 3,727,062 | |
Industrial Conglomerates — 1.6% | |
General Electric Co. | | | 70,212 | | | | 2,122,509 | |
Insurance — 5.3% | |
Aflac, Inc. | | | 28,745 | | | | 1,996,628 | |
Allstate Corp. | | | 29,854 | | | | 2,015,443 | |
American International Group, Inc. | | | 17,686 | | | | 1,023,666 | |
MetLife, Inc. | | | 49,145 | | | | 2,238,555 | |
| | | | | | | | |
| | | | | 7,274,292 | |
Internet Software & Services — 1.9% | |
eBay, Inc. (b) | | | 77,459 | | | | 1,894,647 | |
Yahoo!, Inc. (b) | | | 17,308 | | | | 656,666 | |
| | | | | | | | |
| | | | | 2,551,313 | |
IT Services — 0.7% | |
PayPal Holdings, Inc. (b) | | | 25,429 | | | | 960,962 | |
Leisure Products — 0.3% | |
Mattel, Inc. | | | 14,586 | | | | 465,002 | |
Machinery — 2.4% | |
Caterpillar, Inc. | | | 31,543 | | | | 2,287,183 | |
Ingersoll-Rand PLC | | | 14,175 | | | | 947,032 | |
| | | | | | | | |
| | | | | 3,234,215 | |
Media — 6.3% | |
CBS Corp., Class B | | | 13,161 | | | | 726,487 | |
Charter Communications, Inc. (b) | | | 3,858 | | | | 844,671 | |
Comcast Corp., Class A | | | 40,599 | | | | 2,569,917 | |
Time Warner, Inc. | | | 9,147 | | | | 692,062 | |
Twenty-First Century Fox, Inc., Class B | | | 59,622 | | | | 1,743,347 | |
Viacom, Inc., Class B | | | 45,974 | | | | 2,039,866 | |
| | | | | | | | |
| | | | | 8,616,350 | |
Metals & Mining — 0.9% | |
Alcoa, Inc. | | | 137,596 | | | | 1,275,515 | |
Multi-Utilities — 0.6% | |
PG&E Corp. | | | 12,443 | | | | 747,575 | |
Multiline Retail — 1.8% | |
Kohl’s Corp. | | | 27,559 | | | | 993,226 | |
Target Corp. | | | 21,834 | | | | 1,501,743 | |
| | | | | | | | |
| | | | | 2,494,969 | |
Oil, Gas & Consumable Fuels — 13.4% | |
BP PLC — ADR | | | 73,515 | | | | 2,308,371 | |
Canadian Natural Resources Ltd. | | | 39,710 | | | | 1,180,081 | |
Chevron Corp. | | | 23,736 | | | | 2,397,336 | |
Devon Energy Corp. | | | 56,086 | | | | 2,024,144 | |
Hess Corp. | | | 29,145 | | | | 1,746,660 | |
Marathon Oil Corp. | | | 2,663 | | | | 34,805 | |
Occidental Petroleum Corp. | | | 18,983 | | | | 1,432,077 | |
QEP Resources, Inc. | | | 67,517 | | | | 1,257,842 | |
Royal Dutch Shell PLC — ADR, Class A | | | 55,945 | | | | 2,712,773 | |
Suncor Energy, Inc. | | | 116,357 | | | | 3,217,271 | |
| | | | | | | | |
| | | | | 18,311,360 | |
Paper & Forest Products — 1.1% | |
International Paper Co. | | | 36,859 | | | | 1,553,975 | |
Pharmaceuticals — 7.4% | |
Merck & Co., Inc. | | | 43,529 | | | | 2,448,942 | |
Novartis AG, Registered Shares | | | 22,544 | | | | 1,791,627 | |
Pfizer, Inc. | | | 91,355 | | | | 3,170,018 | |
Roche Holding AG — ADR | | | 40,041 | | | | 1,316,548 | |
Sanofi — ADR | | | 32,661 | | | | 1,345,633 | |
| | | | | | | | |
| | | | | 10,072,768 | |
See Notes to Financial Statements.
| | | | | | |
| | | | | | | |
| | FDP SERIES, INC. | | MAY 31, 2016 | | 21 |
| | |
Schedule of Investments (continued) | | FDP BlackRock Invesco Value Fund |
| | | | | | | | |
| Common Stocks | | Shares | | | Value | |
Semiconductors & Semiconductor Equipment ��� 1.6% | |
Intel Corp. | | | 66,865 | | | $ | 2,112,265 | |
Software — 3.5% | | | | | | | | |
Citrix Systems, Inc. (b) | | | 13,893 | | | | 1,179,794 | |
Microsoft Corp. | | | 41,687 | | | | 2,209,411 | |
Symantec Corp. | | | 78,848 | | | | 1,368,801 | |
| | | | | | | | |
| | | | | 4,758,006 | |
Specialty Retail — 0.3% | |
Advance Auto Parts, Inc. | | | 2,738 | | | | 421,214 | |
| | | | | | | | |
| Common Stocks | | Shares | | | Value | |
Technology Hardware, Storage & Peripherals — 2.1% | |
HP, Inc. | | | 60,028 | | | $ | 803,175 | |
NetApp, Inc. | | | 81,572 | | | | 2,082,533 | |
| | | | | | | | |
| | | | | 2,885,708 | |
Wireless Telecommunication Services — 0.4% | |
Vodafone Group PLC | | | 173,761 | | | | 580,314 | |
| Total Investments (Cost — $111,675,198) — 98.8% | | | | 134,775,862 | |
| Other Assets Less Liabilities — 1.2% | | | | 1,574,654 | |
| | | | | | | | |
| Net Assets — 100.0% | | | $ | 136,350,516 | |
| | | | | | | | |
|
| Notes to Schedule of Investments |
| (a) | | During the year ended May 31, 2016, investments in issuers considered to be affiliates of the Fund for purposes of Section 2(a)(3) of the Investment Company Act of 1940, as amended, were as follows: |
| | | | | | | | | | | | | | | | | | | | | | |
| Affiliate | | Shares Held
at May 31,
2015 | | | Shares
Purchased | | Shares
Sold | | Shares Held
at May 31,
2016 | | | Value at
May 31, 2016 | | | Income | | | Realized
Gain (Loss) |
PNC Financial Services Group, Inc. | | | 500 | | | — | | — | | | 500 | | | $ | 44,870 | | | $ | 1,020 | | | — |
| (b) | | Non-income producing security. |
| • | | For Fund compliance purposes, the Fund’s industry classifications refer to one or more of the industry sub-classifications used by one or more widely recognized market indexes or rating group indexes, and/or as defined by the investment advisor. These definitions may not apply for purposes of this report, which may combine such industry sub-classifications for reporting ease. |
|
| Derivative Financial Instruments Outstanding as of Period End |
Forward Foreign Currency Exchange Contracts
| | | | | | | | | | | | | | | | | | | | | | | | | | |
Currency Purchased | | | Currency Sold | | | Counterparty | | Settlement
Date | | | Unrealized
Appreciation
(Depreciation) | | | | |
| USD | | | 915,377 | | | | CAD | | | | 1,180,745 | | | Canadian Imperial Bank of Commerce | | | 6/24/16 | | | $ | 14,996 | | | | | |
| USD | | | 915,169 | | | | CAD | | | | 1,180,751 | | | Deutsche Bank AG | | | 6/24/16 | | | | 14,784 | | | | | |
| USD | | | 915,313 | | | | CAD | | | | 1,180,745 | | | Goldman Sachs International | | | 6/24/16 | | | | 14,933 | | | | | |
| USD | | | 915,481 | | | | CAD | | | | 1,180,745 | | | Royal Bank of Canada | | | 6/24/16 | | | | 15,100 | | | | | |
| USD | | | 628,867 | | | | CHF | | | | 613,875 | | | Canadian Imperial Bank of Commerce | | | 6/24/16 | | | | 10,675 | | | | | |
| USD | | | 628,830 | | | | CHF | | | | 613,876 | | | Deutsche Bank AG | | | 6/24/16 | | | | 10,636 | | | | | |
| USD | | | 628,943 | | | | CHF | | | | 613,874 | | | Goldman Sachs International | | | 6/24/16 | | | | 10,752 | | | | | |
| USD | | | 628,929 | | | | CHF | | | | 613,875 | | | Royal Bank of Canada | | | 6/24/16 | | | | 10,737 | | | | | |
| USD | | | 837,224 | | | | EUR | | | | 738,341 | | | Barclays Bank PLC | | | 6/24/16 | | | | 15,084 | | | | | |
| USD | | | 836,343 | | | | EUR | | | | 737,571 | | | Canadian Imperial Bank of Commerce | | | 6/24/16 | | | | 15,061 | | | | | |
| USD | | | 836,295 | | | | EUR | | | | 737,571 | | | Deutsche Bank AG | | | 6/24/16 | | | | 15,013 | | | | | |
| USD | | | 836,360 | | | | EUR | | | | 737,571 | | | Goldman Sachs International | | | 6/24/16 | | | | 15,078 | | | | | |
| USD | | | 836,309 | | | | EUR | | | | 737,572 | | | Royal Bank of Canada | | | 6/24/16 | | | | 15,026 | | | | | |
| USD | | | 619,459 | | | | GBP | | | | 427,985 | | | Barclays Bank PLC | | | 6/24/16 | | | | (507 | ) | | | | |
| USD | | | 619,594 | | | | GBP | | | | 427,985 | | | Canadian Imperial Bank of Commerce | | | 6/24/16 | | | | (372 | ) | | | | |
| USD | | | 619,490 | | | | GBP | | | | 427,996 | | | Deutsche Bank AG | | | 6/24/16 | | | | (492 | ) | | | | |
| USD | | | 619,645 | | | | GBP | | | | 427,985 | | | Goldman Sachs International | | | 6/24/16 | | | | (320 | ) | | | | |
| Total | | | | | | | | | | | | | | | | | | | | $ | 176,184 | | | | | |
| | | | | | | | | | | | | | | | | | | | | | |
|
| Derivative Financial Instruments Categorized by Risk Exposure |
The following is a summary of the Fund’s derivative financial instruments categorized by risk exposure.
As of period end, the fair values of derivative financial instruments located in the Statements of Assets and Liabilities were as follows:
| | | | | | | | | | | | | | | | | | | | | | | | | | | | | | |
| Assets — Derivative Financial Instruments | | Commodity
Contracts | | | Credit
Contracts | | | Equity
Contracts | | | Foreign
Currency
Exchange
Contracts | | | Interest
Rate
Contracts | | | Other
Contracts | | | Total | |
Forward foreign currency exchange contracts | | Unrealized appreciation on forward foreign currency exchange contracts | | | — | | | | — | | | | — | | | $ | 177,875 | | | | — | | | | — | | | $ | 177,875 | |
See Notes to Financial Statements.
| | | | | | |
| | | | | | | |
| 22 | | FDP SERIES, INC. | | MAY 31, 2016 | | |
| | |
Schedule of Investments (continued) | | FDP BlackRock Invesco Value Fund |
| | | | | | | | | | | | | | | | | | | | | | | | | | | | | | |
| Liabilities — Derivative Financial Instruments | | Commodity
Contracts | | | Credit
Contracts | | | Equity
Contracts | | | Foreign
Currency
Exchange
Contracts | | | Interest
Rate
Contracts | | | Other
Contracts | | | Total | |
Forward foreign currency exchange contracts | | Unrealized depreciation on forward foreign currency exchange contracts | | | — | | | | — | | | | — | | | $ | 1,691 | | | | — | | | | — | | | $ | 1,691 | |
For the year ended May 31, 2016, the effect of derivative financial instruments in the Statements of Operations was as follows:
| | | | | | | | | | | | | | | | | | | | | | | | | | | | |
| Net Realized Gain (Loss) from: | | Commodity
Contracts | | | Credit
Contracts | | | Equity
Contracts | | | Foreign
Currency
Exchange
Contracts | | | Interest
Rate
Contracts | | | Other
Contracts | | | Total | |
Forward foreign currency exchange contracts | | | — | | | | — | | | | — | | | $ | 311,497 | | | | — | | | | — | | | $ | 311,497 | |
| | | | | | | |
| Net Change in Unrealized Appreciation (Depreciation) on: | | | | | | | | | | | | | | | | | | | | | |
Forward foreign currency exchange contracts | | | — | | | | — | | | | — | | | $ | (175,090 | ) | | | — | | | | — | | | $ | (175,090 | ) |
|
| Average Quarterly Balances of Outstanding Derivative Financial Instruments |
| | | | |
| Forward foreign currency exchange contracts: | | | | |
Average amounts purchased — in USD | | $ | 12,811,972 | |
Average amounts sold — in USD | | $ | 652,800 | |
For more information about the Fund’s investment risks regarding derivative financial instruments, refer to the Notes to Financial Statements.
|
| Derivative Financial Instruments — Offsetting as of Period End |
The Fund’s derivative assets and liabilities (by type) were as follows:
| | | | | | | | |
| | | Assets | | | Liabilities | |
| Derivative Financial Instruments: | | | | | | | | |
Forward foreign currency exchange contracts | | $ | 177,875 | | | $ | 1,691 | |
| | | | |
Derivatives not subject to a Master Netting Agreement or similar agreement (“MNA”) | | | — | | | | — | |
| | | | |
Total derivative assets and liabilities subject to an MNA | | $ | 177,875 | | | $ | 1,691 | |
| | | | |
The following table presents the Fund’s derivative assets and liabilities by counterparty net of amounts available for offset under an MNA and net of the related collateral received and pledged by the Fund:
| | | | | | | | | | | | | | | | | | | | |
| Counterparty | | Derivative Assets
Subject to an MNA
by Counterparty | | | Derivatives
Available
for Offset1 | | | Non-cash
Collateral
Received | | | Cash Collateral
Received | | | Net Amount of
Derivative Assets2 | |
Barclays Bank PLC | | $ | 15,084 | | | $ | (507 | ) | | | — | | | | — | | | $ | 14,577 | |
Canadian Imperial Bank of Commerce | | | 40,732 | | | | (372 | ) | | | — | | | | — | | | | 40,360 | |
Deutsche Bank AG | | | 40,433 | | | | (492 | ) | | | — | | | | — | | | | 39,941 | |
Goldman Sachs International | | | 40,763 | | | | (320 | ) | | | — | | | | — | | | | 40,443 | |
Royal Bank of Canada | | | 40,863 | | | | — | | | | — | | | | — | | | | 40,863 | |
| | | | |
Total | | $ | 177,875 | | | $ | (1,691 | ) | | | — | | | | — | | | $ | 176,184 | |
| | | | |
| | | | | | | | | | | | | | | | | | | | |
| Counterparty | | Derivative Liabilities
Subject to an MNA
by Counterparty | | | Derivatives
Available
for Offset1 | | | Non-cash
Collateral
Pledged | | | Cash Collateral
Pledged | | | Net Amount of
Derivative Liabilities | |
Barclays Bank PLC | | $ | 507 | | | $ | (507 | ) | | | — | | | | — | | | | — | |
Canadian Imperial Bank of Commerce | | | 372 | | | | (372 | ) | | | — | | | | — | | | | — | |
Deutsche Bank AG | | | 492 | | | | (492 | ) | | | — | | | | — | | | | — | |
Goldman Sachs International | | | 320 | | | | (320 | ) | | | — | | | | — | | | | — | |
| | | | |
Total | | $ | 1,691 | | | $ | (1,691 | ) | | | — | | | | — | | | | — | |
| | | | |
1 The amount of derivatives available for offset is limited to the amount of derivative assets and/or liabilities that are subject to an MNA. | | | | | |
2 Net amount represents the net amount receivable from the counterparty in the event of default. | | | | | |
See Notes to Financial Statements.
| | | | | | |
| | | | | | | |
| | FDP SERIES, INC. | | MAY 31, 2016 | | 23 |
| | |
Schedule of Investments (concluded) | | FDP BlackRock Invesco Value Fund |
|
| Fair Value Hierarchy as of Period End |
Various inputs are used in determining the fair value of investments. For information about the Fund’s policy regarding valuation of investments and derivative financial instruments, refer to the Notes to Financial Statements.
The following tables summarize the Fund’s investments and derivative financial instruments categorized in the disclosure hierarchy:
| | | | | | | | | | | | | | | | |
| | | Level 1 | | | Level 2 | | | Level 3 | | | Total | |
Assets: | | | | | | | | | | | | | | | | |
| Investments: | | | | | | | | | | | | | | | | |
Common Stocks: | | | | | | | | | | | | | | | | |
Aerospace & Defense | | $ | 1,755,670 | | | | — | | | | — | | | $ | 1,755,670 | |
Auto Components | | | 2,639,640 | | | | — | | | | — | | | | 2,639,640 | |
Automobiles | | | 2,548,882 | | | | — | | | | — | | | | 2,548,882 | |
Banks | | | 22,954,204 | | | | — | | | | — | | | | 22,954,204 | |
Beverages | | | 1,365,295 | | | | — | | | | — | | | | 1,365,295 | |
Biotechnology | | | 2,029,870 | | | | — | | | | — | | | | 2,029,870 | |
Capital Markets | | | 7,256,655 | | | | — | | | | — | | | | 7,256,655 | |
Communications Equipment | | | 3,856,154 | | | | — | | | | — | | | | 3,856,154 | |
Consumer Finance | | | 1,727,891 | | | | — | | | | — | | | | 1,727,891 | |
Diversified Telecommunication Services | | | 1,280,454 | | | | — | | | | — | | | | 1,280,454 | |
Electric Utilities | | | 650,458 | | | | — | | | | — | | | | 650,458 | |
Electrical Equipment | | | 1,513,626 | | | | — | | | | — | | | | 1,513,626 | |
Energy Equipment & Services | | | 3,605,290 | | | | — | | | | — | | | | 3,605,290 | |
Food & Staples Retailing | | | 2,187,156 | | | | — | | | | — | | | | 2,187,156 | |
Food Products | | | 1,341,333 | | | | — | | | | — | | | | 1,341,333 | |
Health Care Equipment & Supplies | | | 1,158,993 | | | | — | | | | — | | | | 1,158,993 | |
Health Care Providers & Services | | | 2,738,917 | | | | — | | | | — | | | | 2,738,917 | |
Hotels, Restaurants & Leisure | | | 3,727,062 | | | �� | — | | | | — | | | | 3,727,062 | |
Industrial Conglomerates | | | 2,122,509 | | | | — | | | | — | | | | 2,122,509 | |
Insurance | | | 7,274,292 | | | | — | | | | — | | | | 7,274,292 | |
Internet Software & Services | | | 2,551,313 | | | | — | | | | — | | | | 2,551,313 | |
IT Services | | | 960,962 | | | | — | | | | — | | | | 960,962 | |
Leisure Products | | | 465,002 | | | | — | | | | — | | | | 465,002 | |
Machinery | | | 3,234,215 | | | | — | | | | — | | | | 3,234,215 | |
Media | | | 8,616,350 | | | | — | | | | — | | | | 8,616,350 | |
Metals & Mining | | | 1,275,515 | | | | — | | | | — | | | | 1,275,515 | |
Multi-Utilities | | | 747,575 | | | | — | | | | — | | | | 747,575 | |
Multiline Retail | | | 2,494,969 | | | | — | | | | — | | | | 2,494,969 | |
Oil, Gas & Consumable Fuels | | | 18,311,360 | | | | — | | | | — | | | | 18,311,360 | |
Paper & Forest Products | | | 1,553,975 | | | | — | | | | — | | | | 1,553,975 | |
Pharmaceuticals | | | 8,281,141 | | | $ | 1,791,627 | | | | — | | | | 10,072,768 | |
Semiconductors & Semiconductor Equipment | | | 2,112,265 | | | | — | | | | — | | | | 2,112,265 | |
Software | | | 4,758,006 | | | | — | | | | — | | | | 4,758,006 | |
Specialty Retail | | | 421,214 | | | | — | | | | — | | | | 421,214 | |
Technology Hardware, Storage & Peripherals | | | 2,885,708 | | | | — | | | | — | | | | 2,885,708 | |
Wireless Telecommunication Services | | | — | | | | 580,314 | | | | — | | | | 580,314 | |
| | | | |
Total | | $ | 132,403,921 | | | $ | 2,371,941 | | | | — | | | $ | 134,775,862 | |
| | | | |
| | | | | | | | | | | | | | | | |
| Derivative Financial Instruments1 | | | | | | | | | | | | | | | | |
Assets: | | | | | | | | | | | | | | | | |
Forward foreign currency exchange contracts | | | — | | | $ | 177,875 | | | | — | | | $ | 177,875 | |
Liabilities: | | | | | | | | | | | | | | | | |
Forward foreign currency exchange contracts | | | — | | | | (1,691 | ) | | | — | | | | (1,691 | ) |
| | | | |
Total | | | — | | | $ | 176,184 | | | | — | | | $ | 176,184 | |
| | | | |
1 Derivative financial instruments are forward foreign currency exchange contracts, which are valued at the unrealized appreciation (depreciation) on the instrument. | |
During the year ended May 31, 2016, there were no transfers between levels.
See Notes to Financial Statements.
| | | | | | |
| | | | | | | |
| 24 | | FDP SERIES, INC. | | MAY 31, 2016 | | |
| | |
Schedule of Investments May 31, 2016 | | FDP BlackRock Franklin Templeton Total Return Fund (Percentages shown are based on Net Assets) |
| | | | | | | | | | | | |
| Asset-Backed Securities | | Par (000) | | | Value | |
Asset-Backed Securities — 11.8% | |
ALM VIII Ltd., Series 2013-8A, Class A1A, 2.08%, 1/20/26 (a)(b) | | | USD | | | | 1,000 | | | $ | 995,002 | |
American Express Credit Account Master Trust, Class A (a): | | | | | | | | | | | | |
Series 2008-2, 1.69%, 9/15/20 | | | | | | | 780 | | | | 794,006 | |
Series 2012-1, 0.70%, 1/15/20 | | | | | | | 410 | | | | 410,524 | |
American Express Credit Account Secured Note Trust, Series 2012-4, Class A, 0.67%, 5/15/20 (a) | | | | | | | 560 | | | | 560,442 | |
American Homes 4 Rent, Series 2014-SFR1, Class A, 1.43%, 6/17/31 (a)(b) | | | | | | | 126 | | | | 124,187 | |
Ameriquest Mortgage Securities, Inc., Series 2004-R4, Class M1, 1.26%, 6/25/34 (a) | | | | | | | 242 | | | | 236,473 | |
Argent Securities, Inc., Series 2005-W2, Class A2C, 0.81%, 10/25/35 (a) | | | | | | | 181 | | | | 171,904 | |
Atrium IX, Series 9A, Class A, 1.97%, 2/28/24 (a)(b) | | | | | | | 600 | | | | 595,576 | |
BlueMountain CLO Ltd., Series 2013-3A, Class A, 2.04%, 10/29/25 (a)(b) | | | | | | | 499 | | | | 495,980 | |
Capital One Multi-Asset Execution Trust (a): | | | | | | | | | | | | |
Series 2007-A1, Class A1, 0.48%, 11/15/19 | | | | | | | 210 | | | | 209,871 | |
Series 2007-A2, Class A2, 0.51%, 12/16/19 | | | | | | | 1,290 | | | | 1,289,512 | |
Cent CLO, Series 2013-17A, Class A1, 1.94%, 1/30/25 (a)(b) | | | | | | | 3,071 | | | | 3,011,157 | |
Chase Funding Mortgage Loan Asset-Backed Certificates, Series 2004-2, Class 2A2, 0.95%, 2/26/35 (a) | | | | | | | 119 | | | | 104,122 | |
Chase Issuance Trust, Series 2013-A6, Class A6, 0.85%, 7/15/20 (a) | | | | | | | 880 | | | | 880,996 | |
Citibank Credit Card Issuance Trust (a): | | | | | | | | | | | | |
Series 2013-A12, Class A12, 0.86%, 11/07/18 | | | | | | | 350 | | | | 350,213 | |
Series 2013-A7, Class A7, 0.87%, 9/10/20 | | | | | | | 560 | | | | 561,722 | |
Colony American Homes (a)(b): | | | | | | | | | | | | |
Series 2014-1A, Class A, 1.58%, 5/17/31 | | | | | | | 579 | | | | 575,512 | |
Series 2014-2A, Class C, 2.33%, 7/17/31 | | | | | | | 480 | | | | 470,622 | |
Conseco Financial Corp., Series 1996-9, Class M1, 7.63%, 8/15/27 (a) | | | | | | | 100 | | | | 108,688 | |
Countryplace Manufactured Housing Contract Trust, Series 2005-1, Class A3, 4.80%, 12/15/35 (a)(b) | | | | | | | 4 | | | | 4,363 | |
Countrywide Asset-Backed Certificates (a): | | | | | | | | | | | | |
Series 2004-1, Class M1, 1.20%, 3/25/34 | | | | | | | 70 | | | | 67,411 | |
Series 2005-11, Class AF4, 4.76%, 2/25/36 | | | | | | | 700 | | | | 698,445 | |
Dryden 33 Senior Loan Fund, Series 2014-33A, Class A, 2.11%, 7/15/26 (a)(b) | | | | | | | 1,170 | | | | 1,168,233 | |
Eaton Vance CLO Ltd., Series 2014-1A, Class A, 2.08%, 7/15/26 (a)(b) | | | | | | | 1,814 | | | | 1,800,734 | |
Galaxy XV CLO Ltd., Series 2013-15A, Class A, 1.88%, 4/15/25 (a)(b) | | | | | | | 2,887 | | | | 2,829,260 | |
Greenpoint Manufactured Housing, Series 1999-3, Class 1A7, 7.27%, 6/15/29 | | | | | | | 451 | | | | 445,716 | |
GSAA Trust, Series 2005-5, Class M3,
1.38%, 2/25/35 (a) | | | | | | | 210 | | | | 198,647 | |
Home Equity Mortgage Trust, Series 2004-4, Class M3, 1.42%, 12/25/34 (a) | | | | | | | 168 | | | | 156,919 | |
Invitation Homes Trust (a)(b): | | | | | | | | | | | | |
Series 2015-SFR1, Class B, 2.28%, 3/17/32 | | | | | | | 350 | | | | 348,093 | |
Series 2015-SFR2, Class C, 2.43%, 6/17/32 | | | | | | | 110 | | | | 107,606 | |
Series 2015-SFR3, Class C, 2.43%, 8/17/32 | | | | | | | 500 | | | | 488,706 | |
Morgan Stanley ABS Capital I Trust, Inc. (a): | | | | | | | | | | | | |
Series 2003-HE1, Class M1, 1.65%, 5/25/33 | | | | | | | 162 | | | | 153,638 | |
Series 2005-WMC1, Class M2, 1.18%, 1/25/35 | | | | | | | 70 | | | | 68,022 | |
Octagon Investment Partners XXIII Ltd., Series 2015-1A (a)(b): | | | | | | | | | | | | |
Class A1, 2.05%, 7/15/27 | | | | | | | 1,433 | | | | 1,418,460 | |
Class A2, 2.05%, 7/15/27 | | | | | | | 1,360 | | | | 1,346,639 | |
Progress Residential Trust, Series 2015-SFR1, Class A, 1.84%, 2/17/32 (a)(b) | | | | | | | 529 | | | | 527,071 | |
Tricon American Homes Trust, Series 2015-SFR1, Class C, 2.33%, 5/17/32 (a)(b) | | | | | | | 400 | | | | 386,133 | |
| | | | | | | | | | | | |
| Asset-Backed Securities | | Par (000) | | | Value | |
Asset-Backed Securities (continued) | |
Voya CLO Ltd. (a)(b): | | | | | | | | | | | | |
Series 2014-4A, Class A1, 2.13%, 10/14/26 | | | USD | | | | 1,160 | | | $ | 1,156,053 | |
Series 2015-1A, Class A1, 2.11%, 4/18/27 | | | | | | | 670 | | | | 668,122 | |
| Total Asset-Backed Securities - 11.8% | | | | | | | | | | | 25,984,780 | |
| | | | | | | | | | | | |
| | | | | | | | | | | | | |
| | | |
| Corporate Bonds | | | | | | | | | |
Aerospace & Defense — 0.5% | | | | | | | | | | | | |
Lockheed Martin Corp., 4.70%, 5/15/46 | | | | | | | 700 | | | | 784,924 | |
United Technologies Corp., 1.13%, 12/15/21 | | | EUR | | | | 300 | | | | 340,623 | |
| | | | | | | | | | | | |
| | | | | 1,125,547 | |
Air Freight & Logistics — 0.4% | | | | | | | | | | | | |
FedEx Corp., 3.20%, 2/01/25 | | | USD | | | | 900 | | | | 921,602 | |
Airlines — 0.2% | | | | | | | | | | | | |
American Airlines Pass Through Trust, Series 2016-2, Class AA, 3.20%, 12/15/29 | | | | | | | 400 | | | | 407,500 | |
Auto Components — 0.4% | | | | | | | | | | | | |
BorgWarner, Inc., 4.38%, 3/15/45 | | | | | | | 400 | | | | 389,702 | |
Delphi Corp., 4.15%, 3/15/24 | | | | | | | 200 | | | | 210,340 | |
Fiat Chrysler Automobiles NV, 4.50%, 4/15/20 | | | | | | | 400 | | | | 404,000 | |
| | | | | | | | | | | | |
| | | | | | | | | | | | 1,004,042 | |
Automobiles — 0.2% | | | | | | | | | | | | |
Ford Motor Co., 4.75%, 1/15/43 | | | | | | | 400 | | | | 408,909 | |
Banks — 6.5% | | | | | | | | | | | | |
Banca Monte dei Paschi di Siena SpA, 2.88%, 4/16/59 | | | EUR | | | | 600 | | | | 736,279 | |
Banco Comercial Portugues SA, 4.75%, 6/22/17 | | | | | | | 100 | | | | 116,454 | |
Bankinter SA, 1.75%, 6/10/19 | | | | | | | 600 | | | | 693,682 | |
CIT Group, Inc.: | | | | | | | | | | | | |
5.38%, 5/15/20 | | | USD | | | | 100 | | | | 104,750 | |
5.00%, 8/15/22 | | | | | | | 250 | | | | 255,938 | |
Depfa ACS Bank, 1.65%, 12/20/16 | | | JPY | | | | 120,000 | | | | 1,091,537 | |
HSBC Holdings PLC: | | | | | | | | | | | | |
3.60%, 5/25/23 | | | USD | | | | 800 | | | | 805,441 | |
4.30%, 3/08/26 | | | | | | | 600 | | | | 628,314 | |
Intesa Sanpaolo SpA: | | | | | | | | | | | | |
2.38%, 1/13/17 | | | | | | | 1,100 | | | | 1,105,026 | |
3.88%, 1/16/18 | | | | | | | 300 | | | | 307,579 | |
5.71%, 1/15/26 (b) | | | | | | | 900 | | | | 885,383 | |
Mizuho Financial Group Cayman 3 Ltd., 4.60%, 3/27/24 (b) | | | | | | | 1,100 | | | | 1,179,256 | |
Norddeutsche Landesbank Girozentrale, 2.00%, 2/05/19 (b) | | | | | | | 600 | | | | 604,618 | |
Royal Bank of Canada, 2.10%, 10/14/20 | | | | | | | 600 | | | | 603,696 | |
Royal Bank of Scotland Group PLC: | | | | | | | | | | | | |
6.93%, 4/09/18 | | | EUR | | | | 150 | | | | 183,266 | |
6.13%, 12/15/22 | | | USD | | | | 100 | | | | 106,200 | |
Shinhan Bank, 1.88%, 7/30/18 (b) | | | | | | | 300 | | | | 300,500 | |
SVB Financial Group, 3.50%, 1/29/25 | | | | | | | 300 | | | | 298,324 | |
Unione di Banche Italiane SCpA, 2.88%, 2/18/19 | | | EUR | | | | 500 | | | | 591,668 | |
Wells Fargo & Co.: | | | | | | | | | | | | |
3.00%, 4/22/26 | | | USD | | | | 2,000 | | | | 2,001,578 | |
4.65%, 11/04/44 | | | | | | | 500 | | | | 517,793 | |
Westpac Banking Corp., 2.25%, 11/09/20 (b) | | | | | | | 600 | | | | 608,341 | |
Woori Bank Co. Ltd., 4.75%, 4/30/24 (b) | | | | | | | 450 | | | | 466,724 | |
| | | | | | | | | | | | |
| | | | | 14,192,347 | |
Beverages — 0.7% | | | | | | | | | | | | |
Anheuser-Busch InBev Worldwide, Inc., 3.75%, 7/15/42 | | | | | | | 600 | | | | 573,556 | |
Constellation Brands, Inc., 7.25%, 5/15/17 | | | | | | | 800 | | | | 841,000 | |
Pernod Ricard SA, 2.13%, 9/27/24 | | | EUR | | | | 200 | | | | 238,370 | |
| | | | | | | | | | | | |
| | | | | 1,652,926 | |
See Notes to Financial Statements.
| | | | | | |
| | | | | | | |
| | FDP SERIES, INC. | | MAY 31, 2016 | | 25 |
| | |
Schedule of Investments (continued) | | FDP BlackRock Franklin Templeton Total Return Fund |
| | | | | | | | | | | | |
| Corporate Bonds | | Par (000) | | | Value | |
Biotechnology — 0.9% | | | | | | | | | | | | |
Baxalta, Inc., 3.60%, 6/23/22 (c) | | | USD | | | | 400 | | | | 403,292 | |
Biogen, Inc., 5.20%, 9/15/45 | | | | | | | 500 | | | | 550,133 | |
Gilead Sciences, Inc.: | | | | | | | | | | | | |
4.50%, 2/01/45 | | | | | | | 300 | | | | 307,638 | |
4.75%, 3/01/46 | | | | | | | 600 | | | | 642,077 | |
| | | | | | | | | | | | |
| | | | | | | | | | | | 1,903,140 | |
Capital Markets — 0.8% | |
Goldman Sachs Group, Inc.: | | | | | | | | | | | | |
3.75%, 5/22/25 | | | | | | | 300 | | | | 308,959 | |
3.75%, 2/25/26 | | | | | | | 500 | | | | 514,803 | |
Morgan Stanley, 4.30%, 1/27/45 | | | | | | | 1,000 | | | | 1,017,932 | |
| | | | | | | | | | | | |
| | | | | | | | | | | | 1,841,694 | |
Chemicals — 0.5% | |
Arkema SA, 1.50%, 1/20/25 | | | EUR | | | | 500 | | | | 564,294 | |
LyondellBasell Industries NV, 4.63%, 2/26/55 | | | USD | | | | 700 | | | | 619,552 | |
| | | | | | | | | | | | |
| | | | | | | | | | | | 1,183,846 | |
Commercial Services & Supplies — 0.1% | |
Aviation Capital Group Corp., 6.75%, 4/06/21 (b) | | | | | | | 300 | | | | 339,750 | |
Communications Equipment — 0.3% | |
Juniper Networks, Inc.: | | | | | | | | | | | | |
4.50%, 3/15/24 | | | | | | | 300 | | | | 306,222 | |
4.35%, 6/15/25 | | | | | | | 400 | | | | 401,911 | |
| | | | | | | | | | | | |
| | | | | | | | | | | | 708,133 | |
Construction Materials — 0.3% | |
Cemex Finance LLC, 9.38%, 10/12/22 (b) | | | | | | | 200 | | | | 218,020 | |
Cemex SAB de CV, 5.70%, 1/11/25 (b) | | | | | | | 400 | | | | 378,000 | |
| | | | | | | | | | | | |
| | | | | | | | | | | | 596,020 | |
Consumer Finance — 0.2% | |
Discover Financial Services, 3.85%, 11/21/22 | | | | | | | 400 | | | | 405,454 | |
Containers & Packaging — 0.5% | |
Amcor Finance USA, Inc., 3.63%, 4/28/26 (b) | | | | | | | 500 | | | | 501,729 | |
Owens-Illinois, Inc., 7.80%, 5/15/18 | | | | | | | 500 | | | | 545,000 | |
Verso Paper Holdings LLC/Verso Paper, Inc., 11.75%, 1/15/19 (d) | | | | | | | 18 | | | | 2,970 | |
| | | | | | | | | | | | |
| | | | | | | | | | | | 1,049,699 | |
Diversified Financial Services — 4.5% | |
AerCap Ireland Capital Ltd./AerCap Global Aviation Trust, 4.25%, 7/01/20 | | | | | | | 400 | | | | 410,000 | |
Bank of America Corp.: | | | | | | | | | | | | |
3.88%, 8/01/25 | | | | | | | 300 | | | | 313,274 | |
3.50%, 4/19/26 | | | | | | | 1,200 | | | | 1,217,694 | |
Barclays PLC, 4.38%, 9/11/24 | | | | | | | 600 | | | | 589,298 | |
Capital One Bank USA NA, 3.38%, 2/15/23 | | | | | | | 1,000 | | | | 1,002,896 | |
Citigroup, Inc., 3.40%, 5/01/26 | | | | | | | 1,000 | | | | 1,007,328 | |
Deutsche Bank AG, 4.30%, 5/24/28 (a) | | | | | | | 500 | | | | 442,427 | |
Ford Motor Credit Co. LLC, 4.13%, 8/04/25 | | | | | | | 400 | | | | 419,414 | |
International Lease Finance Corp., 8.75%, 3/15/17 | | | | | | | 1,000 | | | | 1,047,500 | |
JPMorgan Chase & Co.: | | | | | | | | | | | | |
3.30%, 4/01/26 | | | | | | | 1,600 | | | | 1,622,710 | |
3.20%, 6/15/26 | | | | | | | 800 | | | | 799,656 | |
Morgan Stanley, 3.88%, 1/27/26 | | | | | | | 200 | | | | 208,335 | |
Navient LLC, 5.50%, 1/15/19 | | | | | | | 300 | | | | 300,000 | |
UniCredit SpA, 1.75%, 10/31/17 (a) | | | EUR | | | | 500 | | | | 565,504 | |
| | | | | | | | | | | | |
| | | | | | | | | | | | 9,946,036 | |
Diversified Telecommunication Services — 1.2% | |
AT&T, Inc.: | | | | | | | | | | | | |
3.95%, 1/15/25 | | | USD | | | | 400 | | | | 415,182 | |
4.50%, 5/15/35 | | | | | | | 700 | | | | 701,003 | |
Intelsat Jackson Holdings SA: | | | | | | | | | | | | |
7.50%, 4/01/21 | | | | | | | 100 | | | | 68,000 | |
6.63%, 12/15/22 | | | | | | | 200 | | | | 134,500 | |
| | | | | | | | | | | | |
| Corporate Bonds | | Par (000) | | | Value | |
Diversified Telecommunication Services (continued) | |
Telefonica Emisiones SAU, 4.57%, 4/27/23 | | | USD | | | | 500 | | | $ | 542,809 | |
Verizon Communications, Inc.: | | | | | | | | | | | | |
6.40%, 9/15/33 | | | | | | | 382 | | | | 476,023 | |
4.52%, 9/15/48 | | | | | | | 400 | | | | 403,966 | |
| | | | | | | | | | | | |
| | | | | | | | | | | | 2,741,483 | |
Electric Utilities — 1.4% | |
Dominion Resources, Inc., 3.90%, 10/01/25 | | | | | | | 1,000 | | | | 1,035,366 | |
Georgia Power Co., 4.30%, 3/15/42 | | | | | | | 300 | | | | 321,131 | |
Southern Co., 3.25%, 7/01/26 | | | | | | | 800 | | | | 809,279 | |
State Grid Overseas Investment 2013 Ltd., 3.13%, 5/22/23 (b) | | | | | | | 300 | | | | 306,191 | |
Three Gorges Finance I Cayman Islands Ltd., 3.70%, 6/10/25 (b) | | | | | | | 500 | | | | 526,872 | |
| | | | | | | | | | | | |
| | | | | | | | | | | | 2,998,839 | |
Energy Equipment & Services — 1.0% | |
CGG SA, 6.50%, 6/01/21 | | | | | | | 200 | | | | 85,000 | |
CNOOC Finance 2013 Ltd., 3.00%, 5/09/23 | | | | | | | 500 | | | | 484,928 | |
CNOOC Nexen Finance 2014 ULC, 4.25%, 4/30/24 | | | | | | | 700 | | | | 725,633 | |
Lukoil International Finance BV, 4.56%, 4/24/23 (b) | | | | | | | 250 | | | | 246,414 | |
Oceaneering International, Inc., 4.65%, 11/15/24 | | | | | | | 400 | | | | 373,981 | |
Petrofac Ltd., 3.40%, 10/10/18 (b) | | | | | | | 300 | | | | 290,647 | |
| | | | | | | | | | | | |
| | | | | | | | | | | | 2,206,603 | |
Food & Staples Retailing — 1.0% | |
Cencosud SA, 4.88%, 1/20/23 (b) | | | | | | | 500 | | | | 506,436 | |
Dollar General Corp., 4.15%, 11/01/25 | | | | | | | 600 | | | | 637,651 | |
Kroger Co., 4.00%, 2/01/24 | | | | | | | 1,000 | | | | 1,086,045 | |
| | | | | | | | | | | | |
| | | | | | | | | | | | 2,230,132 | |
Food Products — 0.8% | |
Kraft Heinz Foods Co., 3.50%, 7/15/22 (b) | | | | | | | 1,000 | | | | 1,042,989 | |
Tyson Foods, Inc., 3.95%, 8/15/24 | | | | | | | 600 | | | | 641,699 | |
| | | | | | | | | | | | |
| | | | | | | | | | | | 1,684,688 | |
Health Care Equipment & Supplies — 0.5% | |
PerkinElmer, Inc., 5.00%, 11/15/21 | | | | | | | 600 | | | | 661,703 | |
Stryker Corp., 3.50%, 3/15/26 | | | | | | | 100 | | | | 103,845 | |
Zimmer Holdings, Inc., 4.25%, 8/15/35 | | | | | | | 300 | | | | 302,152 | |
| | | | | | | | | | | | |
| | | | | | | | | | | | 1,067,700 | |
Health Care Providers & Services — 1.0% | |
Express Scripts Holding Co., 3.50%, 6/15/24 | | | | | | | 800 | | | | 808,638 | |
HCA, Inc., 5.88%, 5/01/23 | | | | | | | 400 | | | | 423,500 | |
MPH Acquisition Holdings LLC,
7.13%, 6/01/24 (b)(c) | | | | | | | 100 | | | | 102,750 | |
Tenet Healthcare Corp.: | | | | | | | | | | | | |
5.00%, 3/01/19 | | | | | | | 400 | | | | 387,524 | |
5.50%, 3/01/19 | | | | | | | 500 | | | | 488,750 | |
| | | | | | | | | | | | |
| | | | | | | | | | | | 2,211,162 | |
Hotels, Restaurants & Leisure — 0.5% | |
Yum! Brands, Inc., 6.25%, 3/15/18 | | | | | | | 1,000 | | | | 1,061,250 | |
Industrial Conglomerates — 0.2% | |
Hutchison Whampoa International Ltd. (b): | | | | | | | | | | | | |
3.50%, 1/13/17 | | | | | | | 300 | | | | 303,478 | |
7.45%, 11/24/33 | | | | | | | 50 | | | | 71,276 | |
| | | | | | | | | | | | |
| | | | | | | | | | | | 374,754 | |
Insurance — 1.4% | |
Aflac, Inc., 3.63%, 6/15/23 | | | | | | | 500 | | | | 529,680 | |
Liberty Mutual Group, Inc., 4.95%, 5/01/22 (b) | | | | | | | 600 | | | | 654,356 | |
MetLife, Inc.: | | | | | | | | | | | | |
3.60%, 4/10/24 | | | | | | | 600 | | | | 628,414 | |
3.00%, 3/01/25 | | | | | | | 100 | | | | 100,107 | |
Teachers Insurance & Annuity Association of America, 4.90%, 9/15/44 (b) | | | | | | | 1,000 | | | | 1,086,573 | |
| | | | | | | | | | | | |
| | | | | | | | | | | | 2,999,130 | |
See Notes to Financial Statements.
| | | | | | |
| | | | | | | |
| 26 | | FDP SERIES, INC. | | MAY 31, 2016 | | |
| | |
Schedule of Investments (continued) | | FDP BlackRock Franklin Templeton Total Return Fund |
| | | | | | | | | | | | |
| Corporate Bonds | | Par (000) | | | Value | |
IT Services — 1.0% | |
Alibaba Group Holding Ltd., 4.50%, 11/28/34 | | | USD | | | | 300 | | | $ | 306,740 | |
Diamond 1 Finance Corp. / Diamond 2 Finance Corp., 3.48%, 6/01/19 (b)(c) | | | | | | | 500 | | | | 506,495 | |
First Data Corp., 5.00%, 1/15/24 (b) | | | | | | | 300 | | | | 299,811 | |
Fiserv, Inc., 3.85%, 6/01/25 | | | | | | | 500 | | | | 525,086 | |
Western Digital Corp., 10.50%, 4/01/24 (b) | | | | | | | 500 | | | | 517,500 | |
| | | | | | | | | | | | |
| | | | | | | | | | | | 2,155,632 | |
Media — 2.1% | |
21st Century Fox America, Inc.: | | | | | | | | | | | | |
3.00%, 9/15/22 | | | | | | | 600 | | | | 615,890 | |
3.70%, 10/15/25 | | | | | | | 100 | | | | 106,317 | |
Altice US Finance I Corp., 5.50%, 5/15/26 (b) | | | | | | | 300 | | | | 306,000 | |
CSC Holdings LLC, 8.63%, 2/15/19 | | | | | | | 500 | | | | 555,625 | |
NBCUniversal Media LLC, 4.45%, 1/15/43 | | | | | | | 400 | | | | 425,366 | |
Time Warner, Inc.: | | | | | | | | | | | | |
4.05%, 12/15/23 | | | | | | | 1,000 | | | | 1,074,776 | |
6.10%, 7/15/40 | | | | | | | 200 | | | | 237,267 | |
Viacom, Inc., 4.25%, 9/01/23 | | | | | | | 800 | | | | 817,813 | |
Virgin Media Secured Finance PLC, 5.50%, 8/15/26 (b) | | | | | | | 200 | | | | 202,000 | |
Wind Acquisition Finance SA, 7.38%, 4/23/21 (b) | | | | | | | 400 | | | | 378,500 | |
| | | | | | | | | | | | |
| | | | | | | | | | | | 4,719,554 | |
Metals & Mining — 0.3% | |
ArcelorMittal, 6.50%, 3/01/21 | | | | | | | 400 | | | | 414,000 | |
FMG Resources August 2006 Property Ltd., 9.75%, 3/01/22 (b) | | | | | | | 50 | | | | 53,250 | |
Reliance Steel & Aluminum Co., 4.50%, 4/15/23 | | | | | | | 200 | | | | 203,800 | |
| | | | | | | | | | | | |
| | | | | | | | | | | | 671,050 | |
Multi-Utilities — 0.5% | |
Sempra Energy, 3.75%, 11/15/25 | | | | | | | 400 | | | | 419,491 | |
Veolia Environnement SA, 4.63%, 3/30/27 | | | EUR | | | | 400 | | | | 593,137 | |
| | | | | | | | | | | | |
| | | | | | | | | | | | 1,012,628 | |
Oil, Gas & Consumable Fuels — 3.7% | |
California Resources Corp., 8.00%, 12/15/22 (b) | | | USD | | | | 200 | | | | 146,000 | |
Calumet Specialty Products Partners LP / Calumet Finance Corp., 11.50%, 1/15/21 (b) | | | | | | | 100 | | | | 108,500 | |
Canadian Natural Resources Ltd., 5.70%, 5/15/17 | | | | | | | 1,000 | | | | 1,028,350 | |
Cheniere Corpus Christi Holdings LLC, 7.00%, 6/30/24 (b) | | | | | | | 100 | | | | 102,500 | |
Chesapeake Energy Corp., 8.00%, 12/15/22 (b) | | | | | | | 75 | | | | 60,375 | |
Enable Midstream Partners LP: | | | | | | | | | | | | |
3.90%, 5/15/24 | | | | | | | 150 | | | | 127,158 | |
5.00%, 5/15/44 | | | | | | | 50 | | | | 37,399 | |
Enable Oklahoma Intrastate Transmission LLC, 6.25%, 3/15/20 (b) | | | | | | | 400 | | | | 365,391 | |
Energy Transfer Equity LP, 7.50%, 10/15/20 | | | | | | | 300 | | | | 306,000 | |
Energy Transfer Partners LP: | | | | | | | | | | | | |
4.90%, 3/15/35 | | | | | | | 600 | | | | 494,881 | |
5.15%, 2/01/43 | | | | | | | 200 | | | | 166,008 | |
Energy XXI Gulf Coast, Inc., 11.00%, 3/15/20 (b)(d) | | | | | | | 300 | | | | 120,000 | |
EnLink Midstream Partners LP, 5.05%, 4/01/45 | | | | | | | 300 | | | | 221,634 | |
Ensco PLC, 5.75%, 10/01/44 | | | | | | | 200 | | | | 116,500 | |
Enterprise Products Operating LLC, 4.45%, 2/15/43 | | | | | | | 100 | | | | 93,111 | |
Exxon Mobil Corp., 2.71%, 3/06/25 | | | | | | | 800 | | | | 808,922 | |
Halcon Resources Corp.: | | | | | | | | | | | | |
9.75%, 7/15/20 | | | | | | | 100 | | | | 19,750 | |
13.00%, 2/15/22 (b) | | | | | | | 130 | | | | 71,175 | |
Kinder Morgan Energy Partners LP, 5.95%, 2/15/18 | | | | | | | 500 | | | | 525,714 | |
Linn Energy LLC/Linn Energy Finance Corp., 12.00%, 12/15/20 (b)(d) | | | | | | | 175 | | | | 48,125 | |
MPLX LP, 4.00%, 2/15/25 | | | | | | | 200 | | | | 179,597 | |
Peabody Energy Corp., 10.00%, 3/15/22 (b)(d) | | | | | | | 300 | | | | 43,500 | |
| | | | | | | | | | | | |
| Corporate Bonds | | Par (000) | | | Value | |
Oil, Gas & Consumable Fuels (continued) | |
Petrobras Global Finance BV, 3.52%, 3/17/20 (a) | | | USD | | | | 900 | | | $ | 774,000 | |
Sanchez Energy Corp., 6.13%, 1/15/23 | | | | | | | 150 | | | | 108,000 | |
Sinopec Group Overseas Development Ltd. (b): | | | | | | | | | | | | |
4.38%, 4/10/24 | | | | | | | 400 | | | | 423,160 | |
3.25%, 4/28/25 | | | | | | | 700 | | | | 689,097 | |
Sunoco Logistics Partners Operations LP, 4.25%, 4/01/24 | | | | | | | 400 | | | | 388,283 | |
Valero Energy Corp., 4.90%, 3/15/45 | | | | | | | 300 | | | | 261,132 | |
Weatherford International Ltd., 5.95%, 4/15/42 | | | | | | | 400 | | | | 255,000 | |
| | | | | | | | | | | | |
| | | | | | | | | | | | 8,089,262 | |
Personal Products — 0.5% | |
Avon Products, Inc., 6.35%, 3/15/20 | | | | | | | 1,200 | | | | 1,017,312 | |
Pharmaceuticals — 0.8% | |
Actavis Funding SCS, 4.55%, 3/15/35 | | | | | | | 600 | | | | 593,068 | |
Valeant Pharmaceuticals International, Inc., 6.13%, 4/15/25 (b) | | | | | | | 400 | | | | 334,500 | |
Zoetis, Inc., 4.70%, 2/01/43 | | | | | | | 900 | | | | 883,443 | |
| | | | | | | | | | | | |
| | | | | | | | | | | | 1,811,011 | |
Real Estate Investment Trusts (REITs) — 1.5% | |
American Tower Corp., 3.50%, 1/31/23 | | | | | | | 500 | | | | 509,686 | |
ERP Operating LP, 5.75%, 6/15/17 | | | | | | | 221 | | | | 230,937 | |
HCP, Inc., 3.88%, 8/15/24 | | | | | | | 900 | | | | 891,305 | |
Marriott International, Inc., 3.75%, 10/01/25 | | | | | | | 1,000 | | | | 1,034,972 | |
Realty Income Corp., 4.13%, 10/15/26 | | | | | | | 600 | | | | 624,117 | |
| | | | | | | | | | | | |
| | | | | | | | | | | | 3,291,017 | |
Semiconductors & Semiconductor Equipment — 0.5% | |
Maxim Integrated Products, Inc., 3.38%, 3/15/23 | | | | | | | 1,000 | | | | 1,007,943 | |
Specialty Retail — 1.1% | |
Bed Bath & Beyond, Inc., 5.17%, 8/01/44 | | | | | | | 900 | | | | 782,266 | |
Edcon Proprietary Ltd., 9.50%, 3/01/18 (b) | | | EUR | | | | 200 | | | | 65,758 | |
Tiffany & Co., 4.90%, 10/01/44 | | | USD | | | | 500 | | | | 494,250 | |
Toys R US, Inc., 7.38%, 10/15/18 | | | | | | | 1,500 | | | | 1,185,000 | |
| | | | | | | | | | | | |
| | | | | | | | | | | | 2,527,274 | |
Thrifts & Mortgage Finance — 0.7% | |
PHH Corp., 7.38%, 9/01/19 | | | | | | | 1,500 | | | | 1,470,000 | |
Tobacco — 0.2% | |
Reynolds American, Inc., 5.70%, 8/15/35 | | | | | | | 400 | | | | 470,602 | |
Transportation Infrastructure — 0.4% | |
DP World Ltd., 6.85%, 7/02/37 (b) | | | | | | | 380 | | | | 399,863 | |
Sydney Airport Finance Co. Property Ltd., 3.90%, 3/22/23 (b) | | | | | | | 200 | | | | 209,437 | |
Transurban Finance Co., 4.13%, 2/02/26 (b) | | | | | | | 300 | | | | 311,937 | |
| | | | | | | | | | | | |
| | | | | | | | | | | | 921,237 | |
Wireless Telecommunication Services — 0.3% | |
American Tower Corp., 4.40%, 2/15/26 | | | | | | | 400 | | | | 428,294 | |
Sprint Communications, Inc., 6.00%, 11/15/22 | | | | | | | 300 | | | | 225,000 | |
| | | | | | | | | | | | |
| | | | | | | | | | | | 653,294 | |
| Total Corporate Bonds — 39.6% | | | | 87,080,202 | |
| | | | | | | | | | | | |
| | | | | | | | | | | | | |
|
| Floating Rate Loan Interests (a) | |
Auto Components — 0.1% | |
Autoparts Holdings Ltd., 1st Lien Term Loan, 7.00%, 7/29/17 | | | | | | | 236 | | | | 217,919 | |
Capital Markets — 0.1% | |
First Eagle Investment Management LLC, Term Loan, 4.75%, 12/01/22 | | | | | | | 167 | | | | 166,546 | |
Navios Partners Finance (US), Inc., Term Loan B, 5.25%, 6/27/18 | | | | | | | 7 | | | | 5,646 | |
| | | | | | | | | | | | |
| | | | | | | | | | | | 172,192 | |
See Notes to Financial Statements.
| | | | | | |
| | | | | | | |
| | FDP SERIES, INC. | | MAY 31, 2016 | | 27 |
| | |
Schedule of Investments (continued) | | FDP BlackRock Franklin Templeton Total Return Fund |
| | | | | | | | | | | | |
Floating Rate Loan Interests (a) | | Par (000) | | | Value | |
Chemicals — 0.1% | |
Nexeo Solutions LLC: | | | | | | | | | | | | |
Term Loan B, 5.00%, 9/08/17 | | | USD | | | | 7 | | | $ | 6,647 | |
Term Loan B3, 5.00%, 9/08/17 | | | | | | | 10 | | | | 10,448 | |
OCI Beaumont LLC, Term Loan B3, 7.75%, 8/20/19 | | | | | | | 149 | | | | 149,428 | |
| | | | | | | | | | | | |
| | | | | | | | | | | | 166,523 | |
Commercial Services & Supplies — 0.1% | |
Onsite US Finco LLC, Term Loan, 5.50%, 7/30/21 | | | | | | | 254 | | | | 188,880 | |
Diversified Consumer Services — 0.1% | |
SunGard Availability Services Capital, Inc., Term Loan B, 6.00%, 3/31/19 | | | | | | | 308 | | | | 275,149 | |
Diversified Telecommunication Services — 0.1% | |
Intelsat Jackson Holdings SA, Term Loan B2, 3.75%, 6/30/19 | | | | | | | 59 | | | | 54,344 | |
Windstream Corp., Term Loan B5, 3.50%, 8/08/19 | | | | | | | 60 | | | | 59,477 | |
| | | | | | | | | | | | |
| | | | | | | | | | | | 113,821 | |
Health Care Management Services — 0.0% | |
New Millennium HoldCo, Inc., Exit Term Loan, 7.50%, 12/21/20 (d) | | | | | | | 17 | | | | 12,457 | |
Machinery — 0.5% | |
Navistar International Corp., Term Loan B, 6.50%, 8/07/20 | | | | | | | 1,273 | | | | 1,201,869 | |
Media — 0.3% | |
Cumulus Media Holdings, Inc., 2013 Term Loan, 4.25%, 12/23/20 | | | | | | | 50 | | | | 35,153 | |
Radio One, Inc., 2015 Term Loan, 5.14%, 4/02/18 | | | | | | | 686 | | | | 679,304 | |
| | | | | | | | | | | | |
| | | | | | | | | | | | 714,457 | |
Metals & Mining — 0.1% | |
FMG Resources August 2006 Property Ltd., Term Loan B, 4.25%, 6/30/19 | | | | | | | 402 | | | | 376,881 | |
Oil, Gas & Consumable Fuels — 0.4% | |
Bowie Resource Holdings LLC, 1st Lien Term Loan, 6.75%, 8/14/20 | | | | | | | 233 | | | | 202,998 | |
Fieldwood Energy LLC, 1st Lien Term Loan, 3.88%, 10/01/18 | | | | | | | 419 | | | | 341,177 | |
McDermott Finance LLC, Term Loan B, 5.25%, 4/16/19 | | | | | | | 15 | | | | 15,188 | |
Peabody Energy Corp., Term Loan B,
4.25%, 9/24/20 (d) | | | | | | | 167 | | | | 65,793 | |
UTEX Industries, Inc., 2014 1st Lien Term Loan, 5.00%, 5/22/21 | | | | | | | 344 | | | | 241,579 | |
| | | | | | | | | | | | |
| | | | | | | | | | | | 866,735 | |
Paper & Forest Products — 0.1% | |
Appvion, Inc., Term Loan, 6.25%, 6/28/19 | | | | | | | 148 | | | | 140,094 | |
Personal Products — 0.2% | |
FGI Operating Co. LLC, Term Loan, 5.50%, 4/19/19 | | | | | | | 518 | | | | 422,376 | |
Specialty Retail — 0.1% | |
Evergreen Acqco 1 LP, Term Loan, 5.00%, 7/09/19 | | | | | | | 294 | | | | 252,519 | |
Transportation — 0.1% | | | | | | | | | | | | |
OSG International, Inc., Exit Term Loan B, 5.75%, 8/05/19 | | | | | | | 205 | | | | 203,915 | |
Total Floating Rate Loan Interests — 2.4% | | | | | | | | 5,325,787 | |
| | | | | | | | | | | | |
| | | | | | | | | | | | | |
|
| Foreign Agency Obligations | |
Brazil Notas do Tesouro Nacional (e): | | | | | | | | | | | | |
10.00%, 1/01/17 | | | BRL | | | | 1,200 | | | | 325,926 | |
10.00%, 1/01/21 | | | | | | | 1,300 | | | | 327,953 | |
Export-Import Bank of Korea, 2.25%, 1/21/20 | | | USD | | | | 800 | | | | 805,910 | |
Hungary Government Bond: | | | | | | | | | | | | |
6.00%, 1/11/19 | | | EUR | | | | 120 | | | | 152,277 | |
3.88%, 2/24/20 | | | | | | | 40 | | | | 49,757 | |
| | | | | | | | | | | | |
| Foreign Agency Obligations | | Par (000) | | | Value | |
Indonesia Trasury Bond, 8.25%, 7/15/21 | | | IDR | | | | 7,000,000 | | | $ | 527,801 | |
Italy Buoni Poliennali Del Tesoro, 2.50%, 12/01/24 | | | EUR | | | | 275 | | | | 338,015 | |
Lithuania Government International Bond, 7.38%, 2/11/20 (b) | | | USD | | | | 310 | | | | 366,315 | |
Malaysia Government Bond: | | | | | | | | | | | | |
3.17%, 7/15/16 | | | MYR | | | | 2,500 | | | | 605,345 | |
4.26%, 9/15/16 | | | | | | | 1,000 | | | | 243,133 | |
4.01%, 9/15/17 | | | | | | | 1,870 | | | | 458,991 | |
4.24%, 2/07/18 | | | | | | | 3,050 | | | | 754,418 | |
Mexican Bonos (f): | | | | | | | | | | | | |
6.25%, 6/16/16 | | | MXN | | | | 18,907 | | | | 1,025,198 | |
7.25%, 12/15/16 | | | | | | | 21,721 | | | | 1,195,183 | |
7.75%, 12/14/17 | | | | | | | 15,500 | | | | 882,272 | |
Republic of Hungary: | | | | | | | | | | | | |
3.50%, 7/18/16 | | | EUR | | | | 20 | | | | 22,342 | |
4.38%, 7/04/17 | | | | | | | 45 | | | | 52,436 | |
5.75%, 6/11/18 | | | | | | | 95 | | | | 117,003 | |
Republic of Serbia, 4.88%, 2/25/20 (b) | | | USD | | | | 300 | | | | 308,250 | |
Spain Government Bond, 2.75%, 10/31/24 (b) | | | EUR | | | | 275 | | | | 342,387 | |
Ukraine Government International Bond (b): | | | | | | | | | | | | |
7.75%, 9/01/19 | | | USD | | | | — | (g) | | | 341 | |
7.75%, 9/01/20 | | | | | | | 160 | | | | 152,632 | |
0.00%, 5/31/40 (a) | | | | | | | 40 | | | | 12,408 | |
Vietnam Government International Bond, 6.75%, 1/29/20 (b) | | | | | | | 320 | | | | 355,089 | |
| Total Foreign Agency Obligations — 4.3% | | | | | | | | | | | 9,421,382 | |
| | | | | | | | | | | | |
| | | | | | | | | | | | | |
|
| Municipal Bonds | |
California Industry Public Facilities Authority, Refunding, Tax Allocation Bonds, 4.29%, 1/01/23 | | | | | | | 400 | | | | 422,496 | |
New Jersey EDA, Refunding RB, School Facilities Construction, Series NN, 5.00%, 3/01/30 | | | | | | | 120 | | | | 129,299 | |
Port Authority of New York & New Jersey, ARB, Consolidated, Series 192, 4.81%, 10/15/65 | | | | | | | 800 | | | | 931,848 | |
Port Authority of New York & New Jersey, RB, 4.82%, 6/01/45 | | | | | | | 485 | | | | 515,516 | |
Puerto Rico Electric Power Authority, RB, Series A, 6.75%, 7/01/36 | | | | | | | 425 | | | | 254,992 | |
Puerto Rico Sales Tax Financing Corp., RB, First Sub-Series A, 6.50%, 8/01/44 | | | | | | | 240 | | | | 98,117 | |
State of California, GO, Various Purposes, 6.00%, 11/01/39 | | | | | | | 210 | | | | 245,721 | |
State of Minnesota, GO, Refunding Series F, 4.00%, 10/01/24 | | | | | | | 200 | | | | 233,952 | |
University of California, Refunding RB, Series J, 4.13%, 5/15/45 | | | | | | | 450 | | | | 471,613 | |
Total Municipal Bonds — 1.5% | | | | | | | | 3,303,554 | |
| | | | | | | | | | | | |
| | | | | | | | | | | | | |
|
| Non-Agency Mortgage-Backed Securities | |
Collateralized Mortgage Obligations — 0.3% | |
American Home Mortgage Investment Trust, Series 2004-3, Class 4A, 2.37%, 10/25/34 (a) | | | | | | | 144 | | | | 140,089 | |
Bear Stearns Alternative A Trust, Series 2004-13, Class A2, 1.33%, 11/25/34 (a) | | | | | | | 57 | | | | 54,261 | |
Citigroup Mortgage Loan Trust, Series 2013-A, Class A, 3.00%, 5/25/42 (a)(b) | | | | | | | 100 | | | | 98,838 | |
Credit Suisse First Boston Mortgage Securities Corp., Series 2004-6, Class 3A1, 5.00%, 9/25/19 | | | | | | | 49 | | | | 49,901 | |
Credit Suisse Mortgage Capital Certificates, Series 2009-15R, Class 3A1, 2.96%,
3/26/36 (a)(b) | | | | | | | 139 | | | | 137,163 | |
See Notes to Financial Statements.
| | | | | | |
| | | | | | | |
| 28 | | FDP SERIES, INC. | | MAY 31, 2016 | | |
| | |
Schedule of Investments (continued) | | FDP BlackRock Franklin Templeton Total Return Fund |
| | | | | | | | | | | | |
| Non-Agency Mortgage-Backed Securities | | Par (000) | | | Value | |
Collateralized Mortgage Obligations (continued) | |
Wells Fargo Mortgage-Backed Securities Trust: | | | | | | | | | | | | |
Series 2004-W, Class A9, 2.75%, 11/25/34 (a) | | | USD | | | | 107 | | | $ | 108,585 | |
Series 2007-3, Class 3A1, 5.50%, 4/25/22 | | | | | | | 16 | | | | 16,285 | |
| | | | | | | | | | | | |
| | | | | | | | | | | | 605,122 | |
Commercial Mortgage-Backed Securities — 5.2% | |
Banc of America Commercial Mortgage Trust, Series 2007-3, Class AM, 5.72%, 6/10/49 (a) | | | | | | | 735 | | | | 754,023 | |
Banc of America Merrill Lynch Commercial Mortgage, Inc., Series 2006-4: | | | | | | | | | | | | |
Class AJ, 5.70%, 7/10/46 (a) | | | | | | | 732 | | | | 727,587 | |
Class AM, 5.68%, 7/10/46 | | | | | | | 500 | | | | 500,178 | |
Bear Stearns Commercial Mortgage Securities Trust (a): | | | | | | | | | | | | |
Series 2005-T20, Class E, 5.14%, 10/12/42 | | | | | | | 800 | | | | 790,369 | |
Series 2006-PW11, Class AJ, 5.43%, 3/11/39 | | | | | | | 694 | | | | 670,939 | |
Series 2006-PW12, Class AJ, 5.88%, 9/11/38 | | | | | | | 39 | | | | 38,892 | |
Series 2006-PW13, Class AJ, 5.61%, 9/11/41 | | | | | | | 470 | | | | 468,864 | |
Series 2007-PW16, Class AM, 5.72%, 6/11/40 | | | | | | | 950 | | | | 973,877 | |
Citigroup Commercial Mortgage Trust, Series 2006-C5, Class AJ, 5.48%, 10/15/49 | | | | | | | 135 | | | | 120,630 | |
Citigroup/Deutsche Bank Commercial Mortgage Trust, Series 2006-CD3, Class AJ, 5.69%, 10/15/48 | | | | | | | 615 | | | | 383,755 | |
Colony Multifamily Mortgage Trust, Series 2014-1, Class A, 2.54%, 4/20/50 (b) | | | | | | | 711 | | | | 706,454 | |
Core Industrial Trust, Series 2015-CALW, Class A, 3.04%, 2/10/34 (b) | | | | | | | 730 | | | | 755,263 | |
Eleven Madison Avenue Mortgage Trust, Series 2015-11MD, Class A,
3.67%, 9/10/35 (a)(b) | | | | | | | 150 | | | | 159,842 | |
GMAC Commercial Mortgage Securities, Inc., Series 2005-C1, Class B, 4.94%, 5/10/43 | | | | | | | 678 | | | | 108,030 | |
Greenwich Capital Commercial Funding Corp. Commercial Mortgage Trust: | | | | | | | | | | | | |
Series 2005-GG5, Class AJ, 5.64%, 4/10/37 (a) | | | | | | | 24 | | | | 24,078 | |
Series 2006-GG7, Class AJ, 6.06%, 7/10/38 (a) | | | | | | | 640 | | | | 575,697 | |
Series 2006-GG7, Class AM, 6.06%, 7/10/38 (a) | | | | | | | 190 | | | | 189,780 | |
Series 2007-GG9, Class A4, 5.44%, 3/10/39 | | | | | | | 764 | | | | 773,834 | |
JPMorgan Chase Commercial Mortgage Securities Trust: | | | | | | | | | | | | |
Series 2006-CB16, Class B, 5.67%, 5/12/45 (a) | | | | | | | 210 | | | | 82,799 | |
Series 2006-CB17, Class AM, 5.46%, 12/12/43 | | | | | | | 700 | | | | 688,739 | |
Series 2006-LDP7, Class AJ, 5.98%, 4/17/45 (a) | | | | | | | 245 | | | | 181,400 | |
LB-UBS Commercial Mortgage Trust, Series 2006-C4, Class AJ, 5.94%, 6/15/38 (a) | | | | | | | 790 | | | | 788,992 | |
Morgan Stanley Capital I Trust (a): | | | | | | | | | | | | |
Series 2006-HQ8, Class AJ, 5.42%, 3/12/44 | | | | | | | 115 | | | | 115,094 | |
Series 2007-IQ16, Class AM, 6.05%, 12/12/49 | | | | | | | 850 | | | | 883,783 | |
Wachovia Bank Commercial Mortgage Trust, Series 2006-C25, Class AJ, 5.84%, 5/15/43 (a) | | | | | | | 70 | | | | 70,404 | |
| | | | | | | | | | | | |
| | | | | | | | | 11,533,303 | |
| Total Non-Agency Mortgage-Backed Securities — 5.5% | | | | 12,138,425 | |
| | | | | | | | | | | | |
| | | | | | | | | | | | |
| | | | | | | | | | | | | |
| | | |
| Other Interests — 0.0% | | | | | Beneficial
Interest
(000) | | | | |
General Motors II (h) | | | | | | | 7 | | | | — | |
| | | | | | | | | | | | |
| | | | | | | | | | | | | |
| | | |
| Preferred Securities | | | | | | | | | |
| | |
| Capital Trusts | | Par (000) | | | | |
Banks — 0.3% | |
Industrial & Commercial Bank of China Ltd., 4.88% (b)(h)(i) | | | | | | | 600 | | | | 613,101 | |
Diversified Financial Services — 0.3% | | | | | | | | | | | | |
JPMorgan Chase & Co., Series X,
6.10% (a)(h)(i) | | | | | | | 600 | | | | 624,750 | |
| | | | | | | | | | | | |
| Capital Trusts | | Par (000) | | | Value | |
Electric Utilities — 0.2% | | | | | | | | | | | | |
Electricite de France SA, 5.25% (a)(b)(h)(i) | | | USD | | | | 500 | | | $ | 477,500 | |
| Total Capital Trusts — 0.8% | | | | | | | | 1,715,351 | |
| | | | | | | | | | | | |
| | | | | | | | | | | | | |
| | | |
| Preferred Stock — 0.3% | | | | | Shares | | | | |
Banks — 0.3% | | | | | | | | | | | | |
U.S. Bancorp, 6.00% (a)(h) | | | | | | | 24,000 | | | | 635,280 | |
| Total Preferred Securities — 1.1% | | | | | | | | 2,350,631 | |
| | | | | | | | | | | | |
| | | | | | | | | | | | | |
| | |
| U.S. Government Sponsored Agency Securities | | Par (000) | | | | |
Agency Obligations — 1.0% | | | | | | | | | | | | |
Fannie Mae, 5.38%, 6/12/17 | | | USD | | | | 1,000 | | | | 1,046,591 | |
Freddie Mac, 6.25%, 7/15/32 | | | | | | | 800 | | | | 1,166,070 | |
| | | | | | | | | | | | |
| | | | | | | | | | | | 2,212,661 | |
Collateralized Mortgage Obligations — 1.0% | | | | | |
Fannie Mae Mortgage-Backed Securities, Series 2007-1, Class NF, 0.70%, 2/25/37 (a) | | | | | | | 293 | | | | 291,119 | |
Freddie Mac, Class M3 (a): | | | | | | | | | | | | |
Series 2015-DNA1, 3.75%, 10/25/27 | | | | | | | 250 | | | | 244,475 | |
Series 2015-HQ1, 4.25%, 3/25/25 | | | | | | | 250 | | | | 252,333 | |
Series 2015-DN1, 4.60%, 1/25/25 | | | | | | | 500 | | | | 527,941 | |
Series 2014-DN1, 4.95%, 2/25/24 | | | | | | | 550 | | | | 566,339 | |
Series 2014-DN4, 5.00%, 10/25/24 | | | | | | | 250 | | | | 258,164 | |
| | | | | | | | | | | | |
| | | | | | | | | | | | 2,140,371 | |
Mortgage-Backed Securities — 22.7% | | | | | | | | | | | | |
Fannie Mae Mortgage-Backed Securities: | | | | | | | | | | | | |
1.89%, 5/01/33 (a) | | | | | | | 11 | | | | 11,591 | |
1.92%, 9/01/34 (a) | | | | | | | 286 | | | | 302,042 | |
2.14%, 10/01/32 (a) | | | | | | | 69 | | | | 71,465 | |
2.55%, 4/01/35 (a) | | | | | | | 146 | | | | 151,831 | |
2.56%, 4/01/35 (a) | | | | | | | 18 | | | | 18,340 | |
3.00%, 6/01/40 (j) | | | | | | | 5,000 | | | | 5,120,705 | |
3.50%, 6/01/46 (j) | | | | | | | 5,300 | | | | 5,547,157 | |
4.00%, 6/01/46 (j) | | | | | | | 7,025 | | | | 7,501,105 | |
4.50%, 6/01/46 (j) | | | | | | | 2,100 | | | | 2,286,811 | |
5.00%, 8/01/35 — 4/01/37 | | | | | | | 142 | | | | 157,277 | |
5.50%, 11/01/34 — 3/01/36 | | | | | | | 1,337 | | | | 1,526,256 | |
6.00%, 6/01/21 — 9/01/38 | | | | | | | 504 | | | | 575,219 | |
6.50%, 1/01/36 | | | | | | | 40 | | | | 46,253 | |
Freddie Mac Mortgage-Backed Securities: | | | | | | | | | | | | |
1.93%, 11/01/27 (a) | | | | | | | 139 | | | | 143,122 | |
2.54%, 9/01/32 (a) | | | | | | | 9 | | | | 9,737 | |
2.94%, 4/01/32 (a) | | | | | | | 44 | | | | 46,958 | |
3.00%, 6/01/46 (j) | | | | | | | 5,000 | | | | 5,118,185 | |
3.50%, 6/01/46 (j) | | | | | | | 3,750 | | | | 3,921,679 | |
4.00%, 2/01/44 — 6/01/46 (j) | | | | | | | 6,650 | | | | 7,091,082 | |
4.50%, 9/01/20 | | | | | | | 16 | | | | 16,231 | |
5.00%, 7/01/23 — 2/01/39 | | | | | | | 626 | | | | 688,150 | |
5.50%, 11/01/37 | | | | | | | 3 | | | | 3,511 | |
6.00%, 10/01/21 — 4/01/38 | | | | | | | 63 | | | | 68,704 | |
6.50%, 9/01/38 | | | | | | | 7 | | | | 7,925 | |
Ginnie Mae Mortgage-Backed Securities: | | | | | | | | | | | | |
3.00%, 6/01/40 (j) | | | | | | | 3,900 | | | | 4,036,348 | |
3.50%, 6/01/46 (j) | | | | | | | 5,000 | | | | 5,277,735 | |
6.50%, 12/20/37 — 7/15/38 | | | | | | | 135 | | | | 160,238 | |
| | | | | | | | | | | | |
| | | | | | | | | | | | 49,905,657 | |
| Total U.S. Government Sponsored Agency Securities — 24.7% | | | | 54,258,689 | |
See Notes to Financial Statements.
| | | | | | |
| | | | | | | |
| | FDP SERIES, INC. | | MAY 31, 2016 | | 29 |
| | |
Schedule of Investments (continued) | | FDP BlackRock Franklin Templeton Total Return Fund |
| | | | | | | | | | | | |
| U.S. Treasury Obligations | | Par (000) | | | Value | |
U.S. Treasury Bonds: | | | | | | | | | | | | |
4.75%, 2/15/37 | | | USD | | | | 275 | | | $ | 387,997 | |
3.50%, 2/15/39 | | | | | | | 100 | | | | 118,914 | |
4.63%, 2/15/40 | | | | | | | 1,200 | | | | 1,669,172 | |
3.88%, 8/15/40 | | | | | | | 1,900 | | | | 2,380,046 | |
4.75%, 2/15/41 | | | | | | | 1,100 | | | | 1,560,582 | |
4.38%, 5/15/41 | | | | | | | 100 | | | | 134,840 | |
3.13%, 11/15/41 | | | | | | | 100 | | | | 111,078 | |
3.13%, 2/15/42 | | | | | | | 100 | | | | 111,035 | |
3.00%, 5/15/42 | | | | | | | 100 | | | | 108,398 | |
3.13%, 2/15/43 | | | | | | | 725 | | | | 802,598 | |
2.88%, 5/15/43 | | | | | | | 3,300 | | | | 3,479,438 | |
U.S. Treasury Inflation Indexed Bonds: | | | | | | | | | | | | |
0.63%, 1/15/24 | | | | | | | 2,143 | | | | 2,210,420 | |
0.13%, 7/15/24 | | | | | | | 2,226 | | | | 2,213,496 | |
U.S. Treasury Notes: | | | | | | | | | | | | |
3.13%, 5/15/21 | | | | | | | 3,500 | | | | 3,792,170 | |
2.00%, 8/31/21 | | | | | | | 1,200 | | | | 1,234,406 | |
2.00%, 10/31/21 | | | | | | | 3,250 | | | | 3,341,533 | |
| Total U.S. Treasury Obligations — 10.7% | | | | | | | | | | | 23,656,123 | |
Total Long-Term Investments
(Cost — $225,200,925) — 101.6% | | | | | | | | | | | 223,519,573 | |
Options Purchased
(Cost — $1,471,583) — 0.7% | | | | | | | | | | | 1,494,260 | |
| Total Investments (Cost — $226,672,508) — 102.3% | | | | | | | | 225,013,833 | |
| Liabilities in Excess of Other Assets — (2.3)% | | | | | | | | (5,146,119 | ) |
| | | | | | | | | | | | |
| Net Assets — 100.0% | | | | | | | | | | $ | 219,867,714 | |
| | | | | | | | | | | | |
|
| Notes to Schedule of Investments |
| (a) | | Variable rate security. Rate as of period end. |
| (b) | | Security exempt from registration pursuant to Rule 144A under the Securities Act of 1933, as amended. These securities may be resold in transactions exempt from registration to qualified institutional investors. |
| (c) | | When-issued security. |
| (d) | | Issuer filed for bankruptcy and/or is in default of interest payments. |
| (e) | | Security trades in units with each unit equal to a par amount of BRL 1,000. |
| (f) | | Security trades in units with each unit equal to a par amount of MXN 100. |
| (g) | | Amount is less than $500. |
| (h) | | Other interests represent beneficial interests in liquidation trusts and other reorganization or private entities. |
| (i) | | Perpetual security with no stated maturity date. |
| (j) | | Represents or includes a TBA transaction. As of period end, unsettled TBA transactions were as follows: |
| | | | | | | | |
| Counterparty | | Value | | | Unrealized
Depreciation | |
Bank of America Securities LLC | | $ | 18,088,516 | | | $ | (17,093 | ) |
Barclays Capital Inc. | | $ | 10,238,891 | | | $ | (22,828 | ) |
JP Morgan Securities LLC | | $ | 9,386,409 | | | $ | (9,634 | ) |
Wells Fargo Securities LLC | | $ | 3,921,679 | | | $ | (6,446 | ) |
| • | | For Fund compliance purposes, the Fund’s industry classifications refer to one or more of the industry sub-classifications used by one or more widely recognized market indexes or rating group indexes, and/or as defined by the investment advisor. These definitions may not apply for purposes of this report, which may combine such industry sub-classifications for reporting ease. |
See Notes to Financial Statements.
| | | | | | |
| | | | | | | |
| 30 | | FDP SERIES, INC. | | MAY 31, 2016 | | |
| | |
Schedule of Investments (continued) | | FDP BlackRock Franklin Templeton Total Return Fund |
|
| Derivative Financial Instruments Outstanding as of Period End |
Futures Contracts
| | | | | | | | | | | | | | | | | | | | |
Contracts
Long | | | Issue | | Expiration | | | Notional Value | | | Unrealized
Appreciation | | | | |
| | 32 | | | 10-Year Australian T-Bond | | | June 2016 | | | | $3,073,375 | | | $ | 73,344 | | | | | |
| | 10 | | | 10-Year Canadian T-Bond | | | September 2016 | | | | $1,105,197 | | | | 4,888 | | | | | |
| | Total | | | | | | | | | | | | | $ | 78,232 | | | | | |
| | | | | | | | | | | | | | | | |
Forward Foreign Currency Exchange Contracts
| | | | | | | | | | | | | | | | | | | | | | | | | | |
Currency Purchased | | | Currency
Sold | | | Counterparty | | Settlement
Date | | | Unrealized
Appreciation (Depreciation) | | | | |
| AUD | | | 945,000 | | | | USD | | | | 683,726 | | | Deutsche Bank AG | | | 6/16/16 | | | $ | (1,087 | ) | | | | |
| EUR | | | 2,267,181 | | | | USD | | | | 2,472,565 | | | Deutsche Bank AG | | | 6/16/16 | | | | 51,199 | | | | | |
| USD | | | 703,978 | | | | AUD | | | | 945,000 | | | Deutsche Bank AG | | | 6/16/16 | | | | 21,338 | | | | | |
| USD | | | 2,496,619 | | | | EUR | | | | 2,267,181 | | | Deutsche Bank AG | | | 6/16/16 | | | | (27,144 | ) | | | | |
| USD | | | 120,365 | | | | EUR | | | | 109,303 | | | Deutsche Bank AG | | | 6/16/16 | | | | (1,309 | ) | | | | |
| USD | | | 897,154 | | | | JPY | | | | 102,150,000 | | | Deutsche Bank AG | | | 6/16/16 | | | | (25,703 | ) | | | | |
| USD | | | 291,038 | | | | EUR | | | | 220,000 | | | Deutsche Bank AG | | | 8/05/16 | | | | 45,719 | | | | | |
| USD | | | 218,625 | | | | EUR | | | | 165,000 | | | Deutsche Bank AG | | | 8/05/16 | | | | 34,636 | | | | | |
| EUR | | | 617,454 | | | | USD | | | | 695,686 | | | Deutsche Bank AG | | | 8/18/16 | | | | (6,857 | ) | | | | |
| EUR | | | 950,000 | | | | USD | | | | 1,060,390 | | | Deutsche Bank AG | | | 8/18/16 | | | | (575 | ) | | | | |
| INR | | | 33,975,000 | | | | USD | | | | 495,624 | | | Deutsche Bank AG | | | 8/18/16 | | | | 3,517 | | | | | |
| NZD | | | 4,498,342 | | | | USD | | | | 3,128,147 | | | Deutsche Bank AG | | | 8/18/16 | | | | (96,411 | ) | | | | |
| NZD | | | 900,000 | | | | USD | | | | 594,351 | | | Deutsche Bank AG | | | 8/18/16 | | | | 12,220 | | | | | |
| USD | | | 40,453 | | | | EUR | | | | 36,980 | | | Barclays Bank PLC | | | 8/18/16 | | | | (801 | ) | | | | |
| USD | | | 2,660,134 | | | | EUR | | | | 2,430,345 | | | Deutsche Bank AG | | | 8/18/16 | | | | (51,145 | ) | | | | |
| USD | | | 90,951 | | | | EUR | | | | 83,000 | | | Deutsche Bank AG | | | 8/18/16 | | | | (1,643 | ) | | | | |
| USD | | | 199,436 | | | | EUR | | | | 182,000 | | | Deutsche Bank AG | | | 8/18/16 | | | | (3,603 | ) | | | | |
| USD | | | 207,753 | | | | EUR | | | | 182,000 | | | Deutsche Bank AG | | | 8/18/16 | | | | 4,715 | | | | | |
| USD | | | 90,743 | | | | EUR | | | | 82,955 | | | JPMorgan Chase Bank N.A. | | | 8/18/16 | | | | (1,801 | ) | | | | |
| USD | | | 3,539,693 | | | | NZD | | | | 5,398,342 | | | Deutsche Bank AG | | | 8/18/16 | | | | (98,614 | ) | | | | |
| JPY | | | 61,450,000 | | | | USD | | | | 499,630 | | | JPMorgan Chase Bank N.A. | | | 9/02/16 | | | | 56,969 | | | | | |
| JPY | | | 62,810,500 | | | | USD | | | | 532,468 | | | JPMorgan Chase Bank N.A. | | | 9/02/16 | | | | 36,454 | | | | | |
| USD | | | 1,218,240 | | | | JPY | | | | 124,260,500 | | | JPMorgan Chase Bank N.A. | | | 9/02/16 | | | | 92,719 | | | | | |
| INR | | | 13,000,000 | | | | USD | | | | 189,809 | | | Deutsche Bank AG | | | 10/20/16 | | | | (598 | ) | | | | |
| PHP | | | 12,276,300 | | | | USD | | | | 258,830 | | | JPMorgan Chase Bank N.A. | | | 10/20/16 | | | | 1,539 | | | | | |
| USD | | | 181,053 | | | | EUR | | | | 159,652 | | | Barclays Bank PLC | | | 10/20/16 | | | | 2,527 | | | | | |
| USD | | | 74,957 | | | | EUR | | | | 66,164 | | | Citibank N.A. | | | 10/20/16 | | | | 971 | | | | | |
| USD | | | 2,841,475 | | | | EUR | | | | 2,500,000 | | | JPMorgan Chase Bank N.A. | | | 10/20/16 | | | | 45,916 | | | | | |
| USD | | | 83,859 | | | | EUR | | | | 74,000 | | | JPMorgan Chase Bank N.A. | | | 10/20/16 | | | | 1,110 | | | | | |
| Total | | | | | | | | | | | | | | | | | | | | $ | 94,258 | | | | | |
| | | | | | | | | | | | | | | | | | | | | | |
OTC Options Purchased
| | | | | | | | | | | | | | | | | | | | | | | | | | | | | | | | |
| Description | | Put/
Call | | | Counterparty | | | Expiration
Date | | | Strike
Price | | | Notional Amount (000) | | | Value | |
USD Currency | | | Call | | | | Citibank N.A. | | | | 9/09/16 | | | | JPY | | | | 101.00 | | | | USD | | | | 6,000 | | | $ | 524,220 | |
AUD Currency | | | Put | | | | Citibank N.A. | | | | 8/13/16 | | | | USD | | | | 0.78 | | | | AUD | | | | 4,200 | | | | 243,609 | |
EUR Currency | | | Put | | | | Citibank N.A. | | | | 8/17/16 | | | | USD | | | | 1.22 | | | | EUR | | | | 7,000 | | | | 726,431 | |
Total | | | | | | | | | | | | | | | | | | | | | | | | | | | | | | $ | 1,494,260 | |
| | | | | | | | | | | | | | | | | | | | | | | | | | | | | | | | |
Centrally Cleared Credit Default Swaps — Sold Protection
| | | | | | | | | | | | | | | | | | | | | | | | | | |
| Issuer/Index | | Receive
Fixed
Rate | | | Expiration
Date | | | Credit
Rating1 | | | Notional
Amount
(000)2 | | | Unrealized
Appreciation
(Depreciation) | | | | |
Markit CDX North America Investment Grade, Series 26 | | | 1.00 | % | | | 6/21/21 | | | | BBB+ | | | USD | | | 3,000 | | | $ | (2,188 | ) | | | | |
Markit iTraxx Europe, Senior Financial, Series 25 | | | 1.00 | % | | | 6/21/21 | | | | BBB+ | | | EUR | | | 500 | | | | 2,482 | | | | | |
Markit iTraxx Europe, Senior Financial, Series 25 | | | 1.00 | % | | | 6/21/21 | | | | BBB+ | | | EUR | | | 2,775 | | | | (3,264 | ) | | | | |
See Notes to Financial Statements.
| | | | | | |
| | | | | | | |
| | FDP SERIES, INC. | | MAY 31, 2016 | | 31 |
| | |
Schedule of Investments (continued) | | FDP BlackRock Franklin Templeton Total Return Fund |
Centrally Cleared Credit Default Swaps — Sold Protection (continued)
| | | | | | | | | | | | | | | | | | | | | | | | | | | | |
| Issuer/Index | | Receive
Fixed
Rate | | | Expiration
Date | | | Credit
Rating1 | | | Notional
Amount
(000)2 | | | Unrealized
Appreciation
(Depreciation) | | | | |
Markit iTraxx Europe, Series 25 | | | 1.00 | % | | | 6/21/21 | | | | BBB+ | | | | EUR | | | | 1,000 | | | $ | 4,112 | | | | | |
Markit CDX North America Investment Grade, Series 24, Version 1 | | | 1.00 | % | | | 6/21/25 | | | | BBB+ | | | | USD | | | | 1,250 | | | | (24,990 | ) | | | | |
Total | | | | | | | | | | | | | | | | | | | | | | $ | (23,848 | ) | | | | |
| | | | | | | | | | | | | | | | | | | | | | | | |
1 Using S&P’s rating of the issuer or the underlying securities of the index, as applicable. | |
2 The maximum potential amount the Fund may pay should a negative credit event take place as defined under the terms of the agreement. | |
OTC Credit Default Swaps — Buy Protection
| | | | | | | | | | | | | | | | | | | | | | | | | | | | | | | | |
| Issuer/Index | | Pay
Fixed
Rate | | | Counterparty | | | Expiration
Date | | | Notional
Amount
(000) | | | Value | | | Premiums
Paid
(Received) | | | Unrealized
Appreciation
(Depreciation) | |
Talen Energy | | | 5.00% | | | | Morgan Stanley & Co. LLC | | | | 6/21/16 | | | | USD | | | | 600 | | | $ | (7,205 | ) | | $ | (1,395 | ) | | $ | (5,810 | ) |
Talen Energy | | | 5.00% | | | | JPMorgan Chase Bank N.A. | | | | 6/21/16 | | | | USD | | | | 600 | | | | (7,205 | ) | | | (1,400 | ) | | | (5,805 | ) |
Tenet Healthcare Corp. | | | 5.00% | | | | Barclays Bank PLC | | | | 12/21/16 | | | | USD | | | | 400 | | | | (13,539 | ) | | | (6,820 | ) | | | (6,719 | ) |
International Lease Finance Corp. | | | 5.00% | | | | Goldman Sachs International | | | | 3/21/17 | | | | USD | | | | 250 | | | | (10,902 | ) | | | (7,353 | ) | | | (3,549 | ) |
International Lease Finance Corp. | | | 5.00% | | | | Goldman Sachs International | | | | 3/21/17 | | | | USD | | | | 250 | | | | (10,902 | ) | | | (7,375 | ) | | | (3,527 | ) |
International Lease Finance Corp. | | | 5.00% | | | | Goldman Sachs International | | | | 3/21/17 | | | | USD | | | | 500 | | | | (21,803 | ) | | | (15,341 | ) | | | (6,462 | ) |
Canadian Natural Resources, Ltd. | | | 5.00% | | | | Goldman Sachs International | | | | 6/21/17 | | | | USD | | | | 1,000 | | | | (55,194 | ) | | | (38,338 | ) | | | (16,856 | ) |
Constellation Brands, Inc. | | | 5.00% | | | | Deutsche Bank AG | | | | 6/21/17 | | | | USD | | | | 800 | | | | (48,744 | ) | | | (26,395 | ) | | | (22,349 | ) |
Bank of America Corp. | | | 1.00% | | | | Credit Suisse International | | | | 9/21/17 | | | | USD | | | | 700 | | | | (7,071 | ) | | | 4,791 | | | | (11,862 | ) |
Kinder Morgan Energy Partners LP | | | 5.00% | | | | Citibank N.A. | | | | 3/21/18 | | | | USD | | | | 500 | | | | (41,582 | ) | | | (34,977 | ) | | | (6,605 | ) |
Yum! Brands Inc. | | | 5.00% | | | | Citibank N.A. | | | | 3/21/18 | | | | USD | | | | 500 | | | | (43,735 | ) | | | (32,180 | ) | | | (11,555 | ) |
Yum! Brands Inc. | | | 5.00% | | | | Credit Suisse International | | | | 3/21/18 | | | | USD | | | | 500 | | | | (43,735 | ) | | | (34,084 | ) | | | (9,651 | ) |
Owens-Illinois INC | | | 5.00% | | | | Citibank N.A. | | | | 6/21/18 | | | | USD | | | | 500 | | | | (53,527 | ) | | | (40,047 | ) | | | (13,480 | ) |
Toys R Us Inc. | | | 5.00% | | | | Goldman Sachs International | | | | 12/21/18 | | | | USD | | | | 500 | | | | 55,265 | | | | 112,765 | | | | (57,500 | ) |
Toys R Us Inc. | | | 5.00% | | | | Goldman Sachs International | | | | 12/21/18 | | | | USD | | | | 500 | | | | 55,265 | | | | 129,867 | | | | (74,602 | ) |
Toys R Us Inc. | | | 5.00% | | | | Goldman Sachs International | | | | 12/21/18 | | | | USD | | | | 200 | | | | 22,106 | | | | 32,835 | | | | (10,729 | ) |
Toys R Us Inc. | | | 5.00% | | | | JPMorgan Chase Bank N.A. | | | | 12/21/18 | | | | USD | | | | 300 | | | | 33,159 | | | | 52,529 | | | | (19,370 | ) |
CSC Holdings LLC | | | 5.00% | | | | Goldman Sachs International | | | | 3/21/19 | | | | USD | | | | 500 | | | | (45,136 | ) | | | (23,095 | ) | | | (22,041 | ) |
Tenet Healthcare Corp. | | | 5.00% | | | | Goldman Sachs International | | | | 3/21/19 | | | | USD | | | | 400 | | | | (27,814 | ) | | | (32,339 | ) | | | 4,525 | |
Tenet Healthcare Corp. | | | 5.00% | | | | Goldman Sachs International | | | | 3/21/19 | | | | USD | | | | 500 | | | | (34,767 | ) | | | (30,995 | ) | | | (3,772 | ) |
Lennar Corp. | | | 5.00% | | | | Citibank N.A. | | | | 9/21/19 | | | | USD | | | | 200 | | | | (25,907 | ) | | | (15,146 | ) | | | (10,761 | ) |
PHH Corp. | | | 5.00% | | | | Goldman Sachs International | | | | 9/21/19 | | | | USD | | | | 1,500 | | | | (14,839 | ) | | | 2,550 | | | | (17,389 | ) |
Lennar Corp. | | | 5.00% | | | | Citibank N.A. | | | | 12/21/19 | | | | USD | | | | 300 | | | | (40,174 | ) | | | (27,280 | ) | | | (12,894 | ) |
Avon Products, Inc. | | | 5.00% | | | | Goldman Sachs International | | | | 3/21/20 | | | | USD | | | | 500 | | | | 40,368 | | | | 47,760 | | | | (7,392 | ) |
Avon Products, Inc. | | | 5.00% | | | | Goldman Sachs International | | | | 3/21/20 | | | | USD | | | | 250 | | | | 20,184 | | | | 29,380 | | | | (9,196 | ) |
Avon Products, Inc. | | | 5.00% | | | | Goldman Sachs International | | | | 3/21/20 | | | | USD | | | | 250 | | | | 20,184 | | | | 26,172 | | | | (5,988 | ) |
Avon Products, Inc. | | | 5.00% | | | | Goldman Sachs International | | | | 3/21/20 | | | | USD | | | | 200 | | | | 16,147 | | | | 37,239 | | | | (21,092 | ) |
LANXESS AG | | | 1.00% | | | | Citibank N.A. | | | | 12/21/20 | | | | EUR | | | | 500 | | | | (10,693 | ) | | | 4,087 | | | | (14,780 | ) |
Hartford Financial Services Group, Inc. | | | 1.00% | | | | Citibank N.A. | | | | 12/22/20 | | | | USD | | | | 350 | | | | (8,314 | ) | | | (3,743 | ) | | | (4,571 | ) |
Hartford Financial Services Group, Inc. | | | 1.00% | | | | Citibank N.A. | | | | 12/22/20 | | | | USD | | | | 300 | | | | (7,126 | ) | | | (2,875 | ) | | | (4,251 | ) |
Lennar Corp. | | | 5.00% | | | | Goldman Sachs International | | | | 12/22/20 | | | | USD | | | | 200 | | | | (29,323 | ) | | | (18,511 | ) | | | (10,812 | ) |
Rite Aid Corp. | | | 5.00% | | | | JPMorgan Chase Bank N.A. | | | | 12/22/20 | | | | USD | | | | 350 | | | | (56,925 | ) | | | (57,676 | ) | | | 751 | |
Rite Aid Corp. | | | 5.00% | | | | Citibank N.A. | | | | 6/21/21 | | | | USD | | | | 220 | | | | (36,837 | ) | | | (34,148 | ) | | | (2,689 | ) |
Total | | | | | | | | | | | | | | | | | | | | | | $ | (440,321 | ) | | $ | (11,538 | ) | | $ | (428,783 | ) |
| | | | | | | | | | | | | | | | | | | | | | | | |
OTC Credit Default Swaps — Sell Protection
| | | | | | | | | | | | | | | | | | | | | | | | | | | | | | | | |
| Issuer/Index | | Receive
Fixed
Rate | | | Counterparty | | Expiration
Date | | | Credit
Rating1 | | Notional
Amount
(000)2 | | | Value | | | Premiums
Paid
(Received) | | | Unrealized
Appreciation
(Depreciation) | |
Bank of America Corp. | | | 1.00 | % | | Credit Suisse International | | | 9/21/17 | | | A- | | | USD | | | | 700 | | | $ | 7,071 | | | $ | (4,791 | ) | | $ | 11,862 | |
iHeartCommunications, Inc. | | | 5.00 | % | | Barclays Bank PLC | | | 6/21/18 | | | CCC | | | USD | | | | 250 | | | | (111,692 | ) | | | (36,722 | ) | | | (74,970 | ) |
Markit LCDX North America Index, Series 21, Version 3 | | | 2.50 | % | | Credit Suisse International | | | 12/21/18 | | | B+ | | | USD | | | | 294 | | | | 9,233 | | | | 5,929 | | | | 3,304 | |
Tenet Healthcare Corp. | | | 5.00 | % | | Barclays Bank PLC | | | 12/21/18 | | | CCC+ | | | USD | | | | 400 | | | | 28,989 | | | | 13,973 | | | | 15,016 | |
Beazer Homes USA, Inc. | | | 5.00 | % | | Citibank N.A. | | | 9/21/19 | | | CCC | | | USD | | | | 200 | | | | (5,570 | ) | | | 2,734 | | | | (8,304 | ) |
Beazer Homes USA, Inc. | | | 5.00 | % | | Citibank N.A. | | | 12/21/19 | | | CCC | | | USD | | | | 300 | | | | (12,200 | ) | | | 6,111 | | | | (18,311 | ) |
United Mexican States | | | 1.00 | % | | Citibank N.A. | | | 6/23/20 | | | BBB+ | | | USD | | | | 400 | | | | (5,868 | ) | | | (3,984 | ) | | | (1,884 | ) |
EDF S.A. | | | 1.00 | % | | Barclays Bank PLC | | | 9/22/20 | | | A | | | EUR | | | | 500 | | | | 5,740 | | | | 11,843 | | | | (6,103 | ) |
See Notes to Financial Statements.
| | | | | | |
| | | | | | | |
| 32 | | FDP SERIES, INC. | | MAY 31, 2016 | | |
| | |
Schedule of Investments (continued) | | FDP BlackRock Franklin Templeton Total Return Fund |
OTC Credit Default Swaps — Sell Protection (continued)
| | | | | | | | | | | | | | | | | | | | | | | | | | | | | | | | | | |
| Issuer/Index | | Receive
Fixed
Rate | | | Counterparty | | | Expiration
Date | | | Credit
Rating1 | | Notional
Amount
(000)2 | | | Value | | | Premiums
Paid
(Received) | | | Unrealized
Appreciation
(Depreciation) | |
Engie S.A. | | | 1.00 | % | | | Barclays Bank PLC | | | | 9/22/20 | | | A- | | | EUR | | | | 500 | | | $ | 13,573 | | | $ | 14,717 | | | $ | (1,144 | ) |
Orange S.A. | | | 1.00 | % | | | Citibank N.A. | | | | 9/22/20 | | | BBB+ | | | EUR | | | | 500 | | | | 12,150 | | | | 9,512 | | | | 2,638 | |
Solvay S.A. | | | 1.00 | % | | | Citibank N.A. | | | | 12/21/20 | | | BBB- | | | EUR | | | | 500 | | | | 6,096 | | | | (12,325 | ) | | | 18,421 | |
Beazer Homes USA, Inc. | | | 5.00 | % | | | Goldman Sachs International | | | | 12/22/20 | | | CCC | | | USD | | | | 200 | | | | (17,744 | ) | | | (21,288 | ) | | | 3,544 | |
MetLife, Inc. | | | 1.00 | % | | | Citibank N.A. | | | | 12/22/20 | | | A- | | | USD | | | | 350 | | | | 1,080 | | | | (9,555 | ) | | | 10,635 | |
MetLife, Inc. | | | 1.00 | % | | | Citibank N.A. | | | | 12/22/20 | | | A- | | | USD | | | | 300 | | | | 926 | | | | (8,189 | ) | | | 9,115 | |
Freeport-McMoRan Copper & Gold, Inc. | | | 1.00 | % | | | Deutsche Bank AG | | | | 3/21/23 | | | BB | | | USD | | | | 500 | | | | (116,172 | ) | | | (25,725 | ) | | | (90,447 | ) |
Total | | | | | | | | | | | | | | | | | | | | | | | | $ | (184,388 | ) | | $ | (57,760 | ) | | $ | (126,628 | ) |
| | | | | | | | | | | | | | | | | | | | | | | | | | |
1 Using S&P’s rating of the issuer or the underlying securities of the index, as applicable. | | | | | | | | | |
2 The maximum potential amount the Fund may pay should a negative credit event take place as defined under the terms of the agreement. | | | | | | | | | |
| | | | | | | | | | | | | | | | | | | | | | | | | | | | | | | | | | | | | | | | | | |
| OTC Currency Swaps | | | | | | | | | | | | | | | | | | | |
| | | | | | | | Notional Amount (000) | | | | | | | | | | | | | | | | |
| Fund Pays | | Fund
Receives | | | Fund
Pays | | | Fund
Receives | | | Counterparty | | | Expiration
Date | | | Value | | | Premiums
Paid
(Received) | | | Unrealized
Appreciation | |
1.125% | | | 3.045 | % | | | EUR | | | | 300 | | | | USD | | | | 336 | | | | Citibank N.A. | | | | 12/15/21 | | | $ | 1,378 | | | | — | | | $ | 1,378 | |
|
| Transactions in Options Written for the Year Ended May 31, 2016 |
| | | | | | | | | | | | |
| | | Calls | |
| | | Notional (000) | |
| | | Contracts | | | USD | | | Premiums
Received | |
Outstanding options, beginning of year | | | — | | | | — | | | | — | |
Options written | | | — | | | | 820 | | | $ | 5,059 | |
Options exercised | | | — | | | | — | | | | — | |
Options expired | | | — | | | | — | | | | — | |
Options closed | | | — | | | | (820 | ) | | | (5,059 | ) |
| | | | |
Outstanding options, end of year | | | — | | | | — | | | | — | |
| | | | |
|
| Derivative Financial Instruments Categorized by Risk Exposure |
The following is a summary of the Fund’s derivative financial instruments categorized by risk exposure. For more information about the Fund’s investment risks regarding derivative financial instruments, refer to the Notes to Financial Statements.
As of period end, the fair values of derivative financial instruments located in the Statements of Assets and Liabilities were as follows:
| | | | | | | | | | | | | | | | | | | | | | | | | | | | | | |
| Assets — Derivative Financial Instruments | | Commodity
Contracts | | | Credit
Contracts | | | Equity
Contracts | | | Foreign
Currency
Exchange
Contracts | | | Interest
Rate
Contracts | | | Other
Contracts | | | Total | |
Futures contracts | | Net unrealized appreciation1 | | | — | | | | — | | | | — | | | | — | | | $ | 78,232 | | | | — | | | $ | 78,232 | |
Forward foreign currency exchange contracts | | Unrealized appreciation on forward foreign currency exchange contracts | | | — | | | | — | | | | — | | | $ | 411,549 | | | | — | | | | — | | | | 411,549 | |
Options purchased | | Investments at value — unaffiliated2 | | | — | | | | — | | | | — | | | | 1,494,260 | | | | — | | | | — | | | | 1,494,260 | |
Swaps — OTC | | Unrealized appreciation on OTC swaps; Swap premiums paid | | | — | | | $ | 624,605 | | | | — | | | | — | | | | 1,378 | | | | — | | | | 625,983 | |
Swaps — centrally cleared | | Net unrealized appreciation1 | | | — | | | | 6,594 | | | | — | | | | — | | | | — | | | | — | | | | 6,594 | |
| Total | | | | | — | | | $ | 631,199 | | | | — | | | $ | 1,905,809 | | | $ | 79,610 | | | | — | | | $ | 2,616,618 | |
| | | | | | |
See Notes to Financial Statements.
| | | | | | |
| | | | | | | |
| | FDP SERIES, INC. | | MAY 31, 2016 | | 33 |
| | |
Schedule of Investments (continued) | | FDP BlackRock Franklin Templeton Total Return Fund |
| | | | | | | | | | | | | | | | | | | | | | | | | | | | | | |
| Liabilities — Derivative Financial Instruments | | Commodity
Contracts | | | Credit
Contracts | | | Equity
Contracts | | | Foreign
Currency
Exchange
Contracts | | | Interest
Rate
Contracts | | | Other
Contracts | | | Total | |
Forward foreign currency exchange contracts | | Unrealized depreciation on forward foreign currency exchange contracts | | | — | | | | — | | | | — | | | $ | 317,291 | | | | — | | | | — | | | $ | 317,291 | |
Swaps — OTC | | Unrealized depreciation on OTC swaps; Swap premiums received | | | — | | | $ | 1,249,314 | | | | — | | | | — | | | | — | | | | — | | | | 1,249,314 | |
Swaps — centrally cleared | | Net unrealized depreciation1 | | | — | | | | 30,442 | | | | — | | | | — | | | | — | | | | — | | | | 30,442 | |
| Total | | | | | — | | | $ | 1,279,756 | | | | — | | | $ | 317,291 | | | | — | | | | — | | | $ | 1,597,047 | |
| | | | | | |
1 Includes cumulative appreciation (depreciation) on futures contracts and centrally cleared swaps, if any, as reported in the Schedule of Investments. Only current day’s variation margin is reported within the Statements of Assets and Liabilities. | |
2 Includes options purchased at value as reported in the Schedule of Investments. | |
For the year ended May 31, 2016, the effect of derivative financial instruments in the Statements of Operation was as follows:
| | | | | | | | | | | | | | | | | | | | | | | | | | | | |
| Net Realized Gain (Loss) from: | | Commodity
Contracts | | | Credit
Contracts | | | Equity
Contracts | | | Foreign
Currency
Exchange
Contracts | | | Interest
Rate
Contracts | | | Other
Contracts | | | Total | |
Financial futures contracts | | | — | | | | — | | | | — | | | | — | | | $ | 243,741 | | | | — | | | $ | 243,741 | |
Forward foreign currency exchange contracts | | | — | | | | — | | | | — | | | $ | 1,133,035 | | | | — | | | | — | | | | 1,133,035 | |
Options purchased1 | | | — | | | | — | | | | — | | | | (461,670 | ) | | | | | | | — | | | | (461,670 | ) |
Options written | | | — | | | | — | | | | — | | | | 8,883 | | | | — | | | | — | | | | 8,883 | |
Swaps | | | — | | | $ | (369,448 | ) | | | — | | | | — | | | | — | | | | — | | | | (369,448 | ) |
| | | | | | | | | | | | | | | | | | | | | | | | | | | | |
| Total | | | — | | | $ | (369,448 | ) | | | — | | | $ | 680,248 | | | $ | 243,741 | | | | — | | | $ | 554,541 | |
| | | | | | | | | | | | | | | | | | | | | | | | | | | | |
1 Options purchased are included in the net realized gain (loss) from investments | | | | | |
| Net Change in Unrealized Appreciation (Depreciation) on: | |
Futures contracts | | | — | | | | — | | | | — | | | | — | | | $ | 179,241 | | | | — | | | $ | 179,241 | |
Forward foreign currency exchange contracts | | | — | | | | — | | | | — | | | $ | (1,321,337 | ) | | | — | | | | — | | | | (1,321,337 | ) |
Options purchased2 | | | — | | | | — | | | | — | | | | (824,614 | ) | | | — | | | | — | | | | (824,614 | ) |
Swaps | | | — | | | $ | (470,281 | ) | | | — | | | | — | | | | 1,378 | | | | — | | | | (468,903 | ) |
| | | | | | | | | | | | | | | | | | | | | | | | | | | | |
| Total | | | — | | | $ | (470,281 | ) | | | — | | | $ | (2,145,951 | ) | | $ | 180,619 | | | | — | | | $ | (2,435,613 | ) |
| | | | | | | | | | | | | | | | | | | | | | | | | | | | |
2 Options purchased are included in net change in unrealized appreciation (depreciation) on investments. | |
|
| Average Quarterly Balances of Outstanding Derivative Financial Instruments |
| | | | |
| Futures contracts: | | | | |
Average notional value of contracts — long | | $ | 7,887,285 | |
Average notional value of contracts — short | | $ | 3,979,250 | |
| Forward foreign currency exchange contracts: | | | | |
Average amounts purchased — in USD | | $ | 16,498,538 | |
Average amounts sold — in USD | | $ | 6,119,835 | |
| Options: | | | | |
Average value of option contracts purchased | | $ | 1,855,283 | |
Average value of option contracts written | | $ | 1,659 | |
| Credit default swaps: | | | | |
Average notional value — buy protection | | $ | 18,486,581 | |
Average notional value — sell protection | | $ | 15,048,848 | |
| Currency swaps: | | | | |
Average notional value — receives | | $ | 84,000 | |
For information about the Fund’s investment risks regarding derivative financial instruments, refer to the Notes to Financial Statements.
|
| Derivative Financial Instruments — Offsetting as of Period End |
The Fund’s derivative assets and liabilities (by type) were as follows:
| | | | | | | | |
| | | Assets | | | Liabilities | |
| Derivative Financial Instruments: | | | | | | | | |
Financial futures contracts | | $ | 3,653 | | | $ | 5,416 | |
Forward foreign currency exchange contracts | | | 411,549 | | | | 317,291 | |
Options1 | | | 1,494,260 | | | | — | |
See Notes to Financial Statements.
| | | | | | |
| | | | | | | |
| 34 | | FDP SERIES, INC. | | MAY 31, 2016 | | |
| | |
Schedule of Investments (continued) | | FDP BlackRock Franklin Templeton Total Return Fund |
| | | | | | | | |
| | | Assets | | | Liabilities | |
| Derivative Financial Instruments (concluded): | | | | | | | | |
Swaps — Centrally cleared | | $ | — | | | $ | 6,470 | |
Swaps — OTC2 | | | 625,983 | | | | 1,249,314 | |
| | | | |
Total derivative assets and liabilities in the Statements of Assets and Liabilities | | | 2,535,445 | | | | 1,578,491 | |
| | | | |
Derivatives not subject to a Master Netting Agreement or similar agreement (“MNA”) | | | (3,653 | ) | | | (11,886 | ) |
| | | | |
Total derivative assets and liabilities subject to an MNA | | $ | 2,531,792 | | | $ | 1,566,605 | |
| | | | |
1 Includes options purchased at value which is included in Investments at value — unaffiliated in the Statements of Assets and Liabilities and reported in the Schedules of Investments. 2 Includes unrealized appreciation (depreciation) on OTC swaps and swap premiums paid/received in the Statements of Assets and Liabilities. The following table presents the Fund’s derivative assets and liabilities by counterparty net of amounts available for offset under an MNA and net of the related collateral received and pledged by the Fund: | |
| | | | | | | | | | | | | | | | | | | | |
| Counterparty | | Derivative Assets
Subject to an MNA
by Counterparty | | | Derivatives
Available
for Offset1 | | | Non-cash
Collateral
Received | | | Cash Collateral
Received | | | Net Amount of
Derivative Assets2 | |
Barclays Bank PLC | | $ | 58,076 | | | $ | (58,076 | ) | | | — | | | | — | | | | — | |
Citibank N.A. | | | 1,559,862 | | | | (334,534 | ) | | | — | | | | — | | | $ | 1,225,328 | |
Credit Suisse International | | | 25,886 | | | | (25,886 | ) | | | — | | | | — | | | | — | |
Deutsche Bank AG | | | 173,344 | | | | (173,344 | ) | | | — | | | | — | | | | — | |
Goldman Sachs International | | | 426,637 | | | | (426,637 | ) | | | — | | | | — | | | | — | |
JPMorgan Chase Bank N.A. | | | 287,987 | | | | (86,052 | ) | | | — | | | | — | | | | 201,935 | |
| | | | |
Total | | $ | 2,531,792 | | | $ | (1,104,529 | ) | | | — | | | | — | | | $ | 1,427,263 | |
| | | | |
| Counterparty | | Derivative Liabilities
Subject to an MNA
by Counterparty | | | Derivatives
Available
for Offset1 | | | Non-cash
Collateral
Pledged | | | Cash Collateral
Pledged3 | | | Net Amount of
Derivative Liabilities4 | |
Barclays Bank PLC | | $ | 133,279 | | | $ | (58,076 | ) | | | — | | | | — | | | $ | 75,203 | |
Citibank N.A. | | | 334,534 | | | | (334,534 | ) | | | — | | | | — | | | | — | |
Credit Suisse International | | | 60,388 | | | | (25,886 | ) | | | — | | | | — | | | | 34,502 | |
Deutsche Bank AG | | | 479,605 | | | | (173,344 | ) | | | — | | | $ | (306,261 | ) | | | — | |
Goldman Sachs International | | | 465,542 | | | | (426,637 | ) | | | — | | | | — | | | | 38,905 | |
JPMorgan Chase Bank N.A. | | | 86,052 | | | | (86,052 | ) | | | — | | | | — | | | | — | |
Morgan Stanley & Co. LLC | | | 7,205 | | | | — | | | | — | | | | — | | | | 7,205 | |
| | | | |
Total | | $ | 1,566,605 | | | $ | (1,104,529 | ) | | | — | | | $ | (306,261 | ) | | $ | 155,815 | |
| | | | |
1 The amount of derivatives available for offset is limited to the amount of derivative assets and/or liabilities that are subject to an MNA. 2 Net amount represents the net amount receivable from the counterparty in the event of default. 3 Excess of collateral pledged to the individual counterparty is not shown for financial reporting purposes. 4 Net amount represents the net amount payable due to the counterparty in the event of default. | |
|
| Fair Value Hierarchy as of Period End |
Various inputs are used in determining the fair value of investments and derivative financial instruments. For information about the Fund’s policy regarding valuation of investments and derivative financial instruments, refer to the Notes to Financial Statements.
The following tables summarize the Fund’s investments and derivative financial instruments categorized in the disclosure hierarchy:
| | | | | | | | | | | | | | | | |
| | | Level 1 | | | Level 2 | | | Level 3 | | | Total | |
Assets: | | | | | | | | | | | | | | | | |
| Investments: | | | | | | | | | | | | | | | | |
Asset-Backed Securities | | | — | | | $ | 23,155,520 | | | $ | 2,829,260 | | | $ | 25,984,780 | |
Corporate Bonds | | | — | | | | 87,080,202 | | | | — | | | | 87,080,202 | |
Floating Rate Loan Interests | | | — | | | | 4,933,910 | | | | 391,877 | | | | 5,325,787 | |
Foreign Agency Obligations | | | — | | | | 9,421,382 | | | | — | | | | 9,421,382 | |
Municipal Bonds | | | — | | | | 3,303,554 | | | | — | | | | 3,303,554 | |
Non-Agency Mortgage-Backed Securities | | | — | | | | 12,138,425 | | | | — | | | | 12,138,425 | |
Other Interest | | | — | | | | — | | | | — | | | | — | |
Preferred Securities | | $ | 635,280 | | | | 1,715,351 | | | | — | | | | 2,350,631 | |
U.S. Government Sponsored Agency Securities | | | — | | | | 54,258,689 | | | | — | | | | 54,258,689 | |
U.S. Treasury Obligations | | | — | | | | 23,656,123 | | | | — | | | | 23,656,123 | |
See Notes to Financial Statements.
| | | | | | |
| | | | | | | |
| | FDP SERIES, INC. | | MAY 31, 2016 | | 35 |
| | |
Schedule of Investments (concluded) | | FDP BlackRock Franklin Templeton Total Return Fund |
| | | | | | | | | | | | | | | | |
| | | Level 1 | | | Level 2 | | | Level 3 | | | Total | |
Assets (concluded): | | | | | | | | | | | | | | | | |
Options Purchased: | | | | | | | | | | | | | | | | |
Foreign currency exchange contracts | | | — | | | $ | 1,494,260 | | | | — | | | $ | 1,494,260 | |
Liabilities: | | | | | | | | | | | | | | | | |
Unfunded floating rate loan interests 1 | | | — | | | | — | | | $ | (8,960 | ) | | | (8,960 | ) |
| | | | |
Total | | $ | 635,280 | | | $ | 221,157,416 | | | $ | 3,212,177 | | | $ | 225,004,873 | |
| | | | |
| Derivative Financial Instruments 2 | | | | | | | | | | | | | | | | |
Assets: | | | | | | | | | | | | | | | | |
Credit contracts | | | — | | | $ | 86,405 | | | | — | | | $ | 86,405 | |
Interest rate contracts | | $ | 78,232 | | | | 1,378 | | | | — | | | | 79,610 | |
Foreign currency exchange contracts | | | — | | | | 411,549 | | | | — | | | | 411,549 | |
Liabilities: | | | | | | | | | | | | | | | | |
Credit contracts | | | — | | | | (665,664 | ) | | | — | | | | (665,664 | ) |
Foreign currency exchange contracts | | | — | | | | (317,291 | ) | | | — | | | | (317,291 | ) |
| | | | |
Total | | $ | 78,232 | | | $ | (483,623 | ) | | | — | | | $ | (405,391 | ) |
| | | | |
1 Unfunded floating rate loan interests are valued at the unrealized appreciation (depreciation) on the commitment. 2 Derivative financial instruments are swaps, futures contracts and forward foreign currency contracts, which are valued at the unrealized appreciation (depreciation) on the instrument. | |
| The Fund may hold assets and/or liabilities in which the fair value approximates the carrying amount for financial statement purposes. As of period end, such assets and/or liabilities are categorized within the disclosure hierarchy as follows: | |
| | | Level 1 | | | Level 2 | | | Level 3 | | | Total | |
Assets: | | | | | | | | | | | | | | | | |
Foreign currency at value | | $ | 34,264 | | | | — | | | | — | | | $ | 34,264 | |
Cash Pledged: | | | | | | | | | | | | | | | | |
Centrally cleared swaps | | | 324,938 | | | | — | | | | — | | | | 324,938 | |
Collateral — OTC derivatives | | | 590,000 | | | | — | | | | — | | | | 590,000 | |
Futures contracts | | | 75,700 | | | | — | | | | — | | | | 75,700 | |
Liabilities: | | | | | | | | | | | | | | | | |
Bank overdraft | | | — | | | $ | (3,523 | ) | | | — | | | | (3,523 | ) |
| | | | |
Total | | $ | 1,024,902 | | | $ | (3,523 | ) | | | — | | | $ | 1,021,379 | |
| | | | |
During the year ended May 31, 2016, there were no transfers between Level 1 and Level 2.
A reconciliation of Level 3 investments is presented when the Fund had a significant amount of Level 3 investments at the beginning and/or end of the period in relation to net assets. The following table is a reconciliation of Level 3 investments for which significant unobservable inputs were used in determining fair value:
| | | | | | | | | | | | | | | | |
| Values | | Asset-Backed
Securities | | | Floating
Rate Loan
Interests | | | Unfunded
Floating
Rate
Interests | | | Total | |
Opening Balance, as of May 31, 2015 | | | — | | | $ | 955,576 | | | $ | (4,351 | ) | | $ | 951,225 | |
Transfers into Level 3 | | | — | | | | — | | | | — | | | | — | |
Transfers out of Level 3 | | | — | | | | (362,624 | ) | | | — | | | | (362,624 | ) |
Accrued discounts/premiums | | | — | | | | 1,542 | | | | — | | | | 1,542 | |
Net realized gain (loss) | | | — | | | | 270 | | | | — | | | | 270 | |
Net change in unrealized appreciation (depreciation)1,2 | | $ | (25,160 | ) | | | (80,752 | ) | | | (4,609 | ) | | | (110,521 | ) |
Purchases | | | 2,854,420 | | | | 63,679 | | | | — | | | | 2,918,099 | |
Sales | | | — | | | | (185,814 | ) | | | — | | | | (185,814 | ) |
| | | | |
Closing Balance, as of May 31, 2016 | | $ | 2,829,260 | | | $ | 391,877 | | | $ | (8,960 | ) | | $ | 3,212,177 | |
| | | | |
Net change in unrealized appreciation/depreciation on investments still held at May 31, 20162 | | $ | (25,160 | ) | | $ | (80,427 | ) | | $ | (4,609 | ) | | $ | (110,196 | ) |
| | | | |
1 Included in the related net change in unrealized appreciation (depreciation) in the Statements of Operations. 2 Any difference between net change in unrealized appreciation (depreciation) on investments still held at May 31, 2016 is generally due to investments no longer held or categorized as Level 3 at period end. | |
See Notes to Financial Statements.
| | | | | | |
| | | | | | | |
| 36 | | FDP SERIES, INC. | | MAY 31, 2016 | | |
| | |
| Statements of Assets and Liabilities | | |
| | | | | | | | | | | | | | | | |
| May 31, 2016 | | FDP BlackRock
MFS Research
International
Fund | | | FDP BlackRock
Janus Growth
Fund | | | FDP BlackRock
Invesco Value
Fund | | | FDP BlackRock
Franklin
Templeton Total
Return Fund | |
| | | | | | | | | | | | | | | | |
| Assets | | | | | | | | | | | | | | | | |
Investments at value — unaffiliated1 | | $ | 153,308,526 | | | $ | 135,642,368 | | | $ | 134,730,992 | | | $ | 225,013,833 | |
Investments at value — affiliated2 | | | — | | | | — | | | | 44,870 | | | | — | |
| Cash pledged: | | | | | | | | | | | | | | | | |
Collateral — OTC derivatives | | | — | | | | — | | | | — | | | | 590,000 | |
Futures contracts | | | — | | | | — | | | | — | | | | 75,700 | |
Centrally cleared swaps | | | — | | | | — | | | | — | | | | 324,938 | |
Foreign currency at value3 | | | — | | | | — | | | | — | | | | 34,264 | |
| Receivables: | | | | | | | | | | | | | | | | |
Investments sold | | | 3,532,221 | | | | 2,546,685 | | | | 2,662,700 | | | | 41,377,456 | |
Dividends | | | 877,615 | | | | 131,053 | | | | 441,116 | | | | — | |
Capital shares sold | | | 275,915 | | | | 254,783 | | | | 231,745 | | | | 699,786 | |
Interest | | | — | | | | — | | | | — | | | | 1,477,354 | |
Swaps | | | — | | | | — | | | | — | | | | 36,283 | |
Variation margin on futures contracts | | | — | | | | — | | | | — | | | | 3,653 | |
Principal paydowns | | | — | | | | — | | | | — | | | | 1,294 | |
Swap premiums paid | | | — | | | | — | | | | — | | | | 544,794 | |
Unrealized appreciation on: | | | | | | | | | | | | | | | | |
Forward foreign currency exchange contracts | | | — | | | | — | | | | 177,875 | | | | 411,549 | |
OTC derivatives | | | — | | | | — | | | | — | | | | 81,189 | |
Prepaid expenses | | | 15,047 | | | | 14,373 | | | | 14,633 | | | | 15,510 | |
| | | | |
Total assets | | | 158,009,324 | | | | 138,589,262 | | | | 138,303,931 | | | | 270,687,603 | |
| | | | |
| | | | | | | | | | | | | | | | |
| Liabilities | | | | | | | | | | | | | | | | |
Bank overdraft | | | — | | | | 419,111 | | | | — | | | | 3,523 | |
Foreign bank overdraft3 | | | 432 | | | | — | | | | — | | | | — | |
Payables: | | | | | | | | | | | | | | | | |
Investments purchased | | | 3,096,715 | | | | 1,635,879 | | | | 1,137,106 | | | | 47,942,479 | |
Capital shares redeemed | | | 608,623 | | | | 478,428 | | | | 523,900 | | | | 600,497 | |
Investment advisory fees | | | 103,829 | | | | 85,183 | | | | 79,970 | | | | 74,793 | |
Service and distribution fees | | | 86,957 | | | | 75,477 | | | | 76,123 | | | | 104,041 | |
Other affiliates | | | 453 | | | | — | | | | — | | | | 639 | |
Income dividends | | | — | | | | — | | | | — | | | | 257,082 | |
Variation margin on centrally cleared swaps | | | — | | | | — | | | | — | | | | 6,470 | |
Variation margin on futures contracts | | | — | | | | — | | | | — | | | | 5,416 | |
Other accrued expenses | | | 152,128 | | | | 128,731 | | | | 134,625 | | | | 249,384 | |
Swap premiums received | | | — | | | | — | | | | — | | | | 614,092 | |
| Unrealized depreciation on: | | | | | | | | | | | | | | | | |
Forward foreign currency exchange contracts | | | — | | | | — | | | | 1,691 | | | | 317,291 | |
OTC derivatives | | | — | | | | — | | | | — | | | | 635,222 | |
Unfunded floating rate loan interests | | | — | | | | — | | | | — | | | | 8,960 | |
| | | | |
Total liabilities | | | 4,049,137 | | | | 2,822,809 | | | | 1,953,415 | | | | 50,819,889 | |
| | | | |
Net Assets | | $ | 153,960,187 | | | $ | 135,766,453 | | | $ | 136,350,516 | | | $ | 219,867,714 | |
| | | | |
| | | | | | | | | | | | | | | | |
| Net Assets Consist of | | | | | | | | | | | | | | | | |
Paid-in capital | | $ | 176,817,980 | | | $ | 115,844,248 | | | $ | 112,775,892 | | | $ | 225,152,418 | |
Undistributed (accumulated) net investment income (loss) | | | 1,046,314 | | | | (523,896 | ) | | | 838,812 | | | | (1,551,185 | ) |
Undistributed net realized gain (loss) | | | (42,021,528 | ) | | | 4,340,163 | | | | (538,403 | ) | | | (1,658,926 | ) |
Net unrealized appreciation (depreciation) | | | 18,117,421 | | | | 16,105,938 | | | | 23,274,215 | | | | (2,074,593 | ) |
| | | | |
Net Assets | | $ | 153,960,187 | | | $ | 135,766,453 | | | $ | 136,350,516 | | | $ | 219,867,714 | |
| | | | |
1 Investments at cost — unaffiliated | | $ | 135,173,843 | | | $ | 119,536,430 | | | $ | 111,647,806 | | | $ | 226,672,508 | |
2 Investments at cost — affiliated | | | — | | | | — | | | $ | 27,392 | | | | — | |
3 Foreign currency at cost | | $ | (432 | ) | | | — | | | | — | | | $ | 33,771 | |
| | | | | | |
| See Notes to Financial Statements. | | | | |
| | | | | | | |
| | FDP SERIES, INC. | | MAY 31, 2016 | | 37 |
| | |
| Statements of Assets and Liabilities (concluded) | | |
| | | | | | | | | | | | | | | | |
| May 31, 2016 | | FDP BlackRock
MFS Research
International
Fund | | | FDP BlackRock
Janus Growth
Fund | | | FDP BlackRock
Invesco Value
Fund | | | FDP BlackRock
Franklin
Templeton Total
Return Fund | |
| | | | | | | | | | | | | | | | |
| Net Asset Value | | | | | | | | | | | | | | | | |
| Institutional | | | | | | | | | | | | | | | | |
Net assets | | $ | 5,817,107 | | | $ | 5,397,000 | | | $ | 5,375,774 | | | $ | 7,507,416 | |
| | | | | | | | | | | | | | | | |
Shares outstanding, 100 million shares authorized, $0.10 par value | | | 515,725 | | | | 359,656 | | | | 355,596 | | | | 736,342 | |
| | | | | | | | | | | | | | | | |
Net asset value | | $ | 11.28 | | | $ | 15.01 | | | $ | 15.12 | | | $ | 10.20 | |
| | | | | | | | | | | | | | | | |
| Investor A | | | | | | | | | | | | | | | | |
Net assets | | $ | 60,141,290 | | | $ | 53,675,361 | | | $ | 53,623,225 | | | $ | 86,870,276 | |
| | | | | | | | | | | | | | | | |
Shares outstanding, 100 million shares authorized, $0.10 par value | | | 5,367,844 | | | | 3,689,619 | | | | 3,579,057 | | | | 8,516,961 | |
| | | | | | | | | | | | | | | | |
Net asset value | | $ | 11.20 | | | $ | 14.55 | | | $ | 14.98 | | | $ | 10.20 | |
| | | | | | | | | | | | | | | | |
| Investor C | | | | | | | | | | | | | | | | |
Net assets | | $ | 88,001,790 | | | $ | 76,694,092 | | | $ | 77,351,517 | | | $ | 125,490,022 | |
| | | | | | | | | | | | | | | | |
Shares outstanding, 100 million shares authorized, $0.10 par value | | | 7,953,376 | | | | 5,814,887 | | | | 5,257,412 | | | | 12,303,597 | |
| | | | | | | | | | | | | | | | |
Net asset value | | $ | 11.06 | | | $ | 13.19 | | | $ | 14.71 | | | $ | 10.20 | |
| | | | | | | | | | | | | | | | |
| | | | | | |
| See Notes to Financial Statements. | | | | |
| | | | | | | |
| 38 | | FDP SERIES, INC. | | MAY 31, 2016 | | |
| | | | | | | | | | | | | | | | |
| Year Ended May 31, 2016 | | FDP BlackRock
MFS Research
International
Fund | | | FDP BlackRock
Janus Growth
Fund | | | FDP BlackRock
Invesco Value
Fund | | | FDP BlackRock
Franklin
Templeton Total
Return Fund | |
| | | | | | | | | | | | | | | | |
| Investment Income | | | | | | | | | | | | | | | | |
Dividends — unaffiliated | | $ | 4,805,003 | | | $ | 1,113,511 | | | $ | 4,001,752 | | | $ | 55,971 | |
Dividends — affiliated | | | — | | | | — | | | | 1,020 | | | | — | |
Interest | | | — | | | | — | | | | — | | | | 7,164,068 | |
Foreign taxes withheld | | | (385,149 | ) | | | (825 | ) | | | (76,332 | ) | | | (28,002 | ) |
| | | | |
Total income | | | 4,419,854 | | | | 1,112,686 | | | | 3,926,440 | | | | 7,192,037 | |
| | | | |
| | | | | | | | | | | | | | | | |
| Expenses | | | | | | | | | | | | | | | | |
Investment advisory | | | 1,479,576 | | | | 1,168,178 | | | | 1,002,522 | | | | 937,061 | |
Service and distribution — class specific | | | 1,112,791 | | | | 980,443 | | | | 963,628 | | | | 1,309,997 | |
Transfer agent — class specific | | | 200,144 | | | | 177,697 | | | | 172,731 | | | | 270,064 | |
Printing | | | 337,292 | | | | 344,134 | | | | 319,324 | | | | 322,231 | |
Professional | | | 119,396 | | | | 158,917 | | | | 94,490 | | | | 140,651 | |
Custodian | | | 79,002 | | | | 13,441 | | | | 16,598 | | | | 62,476 | |
Accounting services | | | 53,440 | | | | 38,753 | | | | 37,609 | | | | 56,935 | |
Registration | | | 50,957 | | | | 48,129 | | | | 48,590 | | | | 53,218 | |
Officer and Directors | | | 22,523 | | | | 22,244 | | | | 22,156 | | | | 23,466 | |
Miscellaneous | | | 22,947 | | | | 16,570 | | | | 17,145 | | | | 65,662 | |
| | | | |
Total expenses | | | 3,478,068 | | | | 2,968,506 | | | | 2,694,793 | | | | 3,241,761 | |
| Less: | | | | | | | | | | | | | | | | |
Fees waived by the Manager | | | (164,397 | ) | | | (73,011 | ) | | | — | | | | — | |
Fees paid indirectly | | | (692 | ) | | | (4,191 | ) | | | (4,280 | ) | | | (22,139 | ) |
| | | | |
Total expenses after fees waived and paid indirectly | | | 3,312,979 | | | | 2,891,304 | | | | 2,690,513 | | | | 3,219,622 | |
| | | | |
Net investment income (loss) | | | 1,106,875 | | | | (1,778,618 | ) | | | 1,235,927 | | | | 3,972,415 | |
| | | | |
| | | | | | | | | | | | | | | | |
| Realized and Unrealized Gain (Loss) | | | | | | | | | | | | | | | | |
Net realized gain (loss) from: | | | | | | | | | | | | | | | | |
Investments | | | (8,170,014 | ) | | | 10,334,884 | | | | 6,147,792 | | | | (3,101,590 | ) |
Futures contracts | | | — | | | | — | | | | — | | | | 243,741 | |
Foreign currency transactions | | | (32,676 | ) | | | (257 | ) | | | 562,411 | | | | 1,111,853 | |
Options written | | | — | | | | — | | | | — | | | | 8,883 | |
Swaps | | | — | | | | — | | | | — | | | | (369,448 | ) |
| | | | |
| | | (8,202,690 | ) | | | 10,334,627 | | | | 6,710,203 | | | | (2,106,561 | ) |
| | | | |
| Net change in unrealized appreciation (depreciation) on: | | | | | | | | | | | | | | | | |
Investments — unaffiliated | | | (17,461,903 | ) | | | (14,186,494 | ) | | | (20,917,712 | ) | | | (2,173,559 | ) |
Investments — affiliated | | | — | | | | — | | | | (2,974 | ) | | | — | |
Futures contracts | | | — | | | | — | | | | — | | | | 179,241 | |
Foreign currency translations | | | 5,146 | | | | — | | | | (177,209 | ) | | | (1,308,206 | ) |
Swaps | | | — | | | | — | | | | — | | | | (468,903 | ) |
Unfunded floating rate loan interests | | | — | | | | — | | | | — | | | | (4,609 | ) |
| | | | |
| | | (17,456,757 | ) | | | (14,186,494 | ) | | | (21,097,895 | ) | | | (3,776,036 | ) |
| | | | |
Net realized and unrealized loss | | | (25,659,447 | ) | | | (3,851,867 | ) | | | (14,387,692 | ) | | | (5,882,597 | ) |
| | | | |
Net Decrease in Net Assets Resulting from Operations | | $ | (24,552,572 | ) | | $ | (5,630,485 | ) | | $ | (13,151,765 | ) | | $ | (1,910,182 | ) |
| | | | |
| | | | | | |
| See Notes to Financial Statements. | | | | |
| | | | | | | |
| | FDP SERIES, INC. | | MAY 31, 2016 | | 39 |
| | |
| Statements of Changes in Net Assets | | |
| | | | | | | | | | | | | | | | | | | | |
| | | FDP BlackRock MFS Research
International Fund | | | | | | FDP BlackRock Janus
Growth Fund | |
| | | Year Ended May 31, | | | | | | Year Ended May 31, | |
Increase (Decrease) in Net Assets: | | 2016 | | | 2015 | | | | | | 2016 | | | 2015 | |
| | | | | | | | | | | | | | | | | | | | |
| Operations | | | | | | | | | | | | | | | | | | | | |
Net investment income (loss) | | $ | 1,106,875 | | | $ | 1,103,062 | | | | | | | $ | (1,778,618 | ) | | $ | (1,248,429 | ) |
Net realized gain (loss) | | | (8,202,690 | ) | | | 917,898 | | | | | | | | 10,334,627 | | | | 22,235,531 | |
Net change in unrealized appreciation (depreciation) | | | (17,456,757 | ) | | | (2,635,470 | ) | | | | | | | (14,186,494 | ) | | | (7,524,160 | ) |
| | | | | | | | | | | | |
Net increase (decrease) in net assets resulting from operations | | | (24,552,572 | ) | | | (614,510 | ) | | | | | | | (5,630,485 | ) | | | 13,462,942 | |
| | | | | | | | | | | | |
| | | | | | | | | | | | | | | | | | | | |
| Distributions to Shareholders1 | | | | | | | | | | | | | | | | | | | | |
From net investment income: | | | | | | | | | | | | | | | | | | | | |
Institutional | | | (74,484 | ) | | | (120,250 | ) | | | | | | | — | | | | — | |
Investor A | | | (640,771 | ) | | | (1,127,458 | ) | | | | | | | — | | | | — | |
Investor C | | | (180,101 | ) | | | (1,199,330 | ) | | | | | | | — | | | | — | |
From net realized gain: | | | | | | | | | | | | | | | | | | | | |
Institutional | | | — | | | | — | | | | | | | | (788,811 | ) | | | (340,920 | ) |
Investor A | | | — | | | | — | | | | | | | | (8,197,706 | ) | | | (3,481,405 | ) |
Investor C | | | — | | | | — | | | | | | | | (13,286,818 | ) | | | (6,067,639 | ) |
| | | | | | | | | | | | |
Decrease in net assets resulting from distributions to shareholders | | | (895,356 | ) | | | (2,447,038 | ) | | | | | | | (22,273,335 | ) | | | (9,889,964 | ) |
| | | | | | | | | | | | |
| | | | | | | | | | | | | | | | | | | | |
| Capital Share Transactions | | | | | | | | | | | | | | | | | | | | |
Net increase (decrease) in net assets derived from capital share transactions | | | (6,864,839 | ) | | | 12,311,091 | | | | | | | | 3,752,179 | | | | 2,521,219 | |
| | | | | | | | | | | | |
| | | | | | | | | | | | | | | | | | | | |
| Net Assets | | | | | | | | | | | | | | | | | | | | |
Total increase (decrease) in net assets | | | (32,312,767 | ) | | | 9,249,543 | | | | | | | | (24,151,641 | ) | | | 6,094,197 | |
Beginning of year | | | 186,272,954 | | | | 177,023,411 | | | | | | | | 159,918,094 | | | | 153,823,897 | |
| | | | | | | | | | | | |
End of year | | $ | 153,960,187 | | | $ | 186,272,954 | | | | | | | $ | 135,766,453 | | | $ | 159,918,094 | |
| | | | | | | | | | | | |
Undistributed (accumulated) net investment income (loss), end of year | | $ | 1,046,314 | | | $ | 882,068 | | | | | | | $ | (523,896 | ) | | $ | (621,153 | ) |
| | | | | | | | | | | | |
| | | | |
1 Distributions for annual periods determined in accordance with federal income tax regulations. |
| | | | | | |
| See Notes to Financial Statements. | | | | |
| | | | | | | |
| 40 | | FDP SERIES, INC. | | MAY 31, 2016 | | |
| | |
| Statements of Changes in Net Assets | | |
| | | | | | | | | | | | | | | | | | | | |
| | | FDP BlackRock Invesco
Value Fund | | | | | | FDP BlackRock Franklin
Templeton Total Return Fund | |
| | | Year Ended May 31, | | | | | | Year Ended May 31, | |
Increase (Decrease) in Net Assets: | | 2016 | | | 2015 | | | | | | 2016 | | | 2015 | |
| | | | | | | | | | | | | | | | | | | | |
| Operations | | | | | | | | | | | | | | | | | | | | |
Net investment income | | $ | 1,235,927 | | | $ | 681,038 | | | | | | | $ | 3,972,415 | | | $ | 3,759,144 | |
Net realized gain (loss) | | | 6,710,203 | | | | 13,837,824 | | | | | | | | (2,106,561 | ) | | | 6,270,854 | |
Net change in unrealized appreciation (depreciation) | | | (21,097,895 | ) | | | (4,352,913 | ) | | | | | | | (3,776,036 | ) | | | (5,246,109 | ) |
| | | | | | | | | | | | |
Net increase (decrease) in net assets resulting from operations | | | (13,151,765 | ) | | | 10,165,949 | | | | | | | | (1,910,182 | ) | | | 4,783,889 | |
| | | | | | | | | | | | |
| | | | | | | | | | | | | | | | | | | | |
| Distributions to Shareholders1 | | | | | | | | | | | | | | | | | | | | |
From net investment income: | | | | | | | | | | | | | | | | | | | | |
Institutional | | | (113,866 | ) | | | (93,350 | ) | | | | | | | (281,287 | ) | | | (175,515 | ) |
Investor A | | | (1,025,859 | ) | | | (765,507 | ) | | | | | | | (3,207,475 | ) | | | (2,034,844 | ) |
Investor C | | | (900,855 | ) | | | (631,733 | ) | | | | | | | (3,948,736 | ) | | | (2,295,990 | ) |
From net realized gain: | | | | | | | | | | | | | | | | | | | | |
Institutional | | | — | | | | — | | | | | | | | (58,428 | ) | | | (64,201 | ) |
Investor A | | | — | | | | — | | | | | | | | (711,340 | ) | | | (832,897 | ) |
Investor C | | | — | | | | — | | | | | | | | (1,043,502 | ) | | | (1,252,640 | ) |
| | | | | | | | | | | | |
Decrease in net assets resulting from distributions to shareholders | | | (2,040,580 | ) | | | (1,490,590 | ) | | | | | | | (9,250,768 | ) | | | (6,656,087 | ) |
| | | | | | | | | | | | |
| | | | | | | | | | | | | | | | | | | | |
| Capital Share Transactions | | | | | | | | | | | | | | | | | | | | |
Net increase (decrease) in net assets derived from capital share transactions | | | (7,730,707 | ) | | | (1,094,960 | ) | | | | | | | (16,110,459 | ) | | | 16,330,634 | |
| | | | | | | | | | | | |
| | | | | | | | | | | | | | | | | | | | |
| Net Assets | | | | | | | | | | | | | | | | | | | | |
Total increase (decrease) in net assets | | | (22,923,052 | ) | | | 7,580,399 | | | | | | | | (27,271,409 | ) | | | 14,458,436 | |
Beginning of year | | | 159,273,568 | | | | 151,693,169 | | | | | | | | 247,139,123 | | | | 232,680,687 | |
| | | | | | | | | | | | |
End of year | | $ | 136,350,516 | | | $ | 159,273,568 | | | | | | | $ | 219,867,714 | | | $ | 247,139,123 | |
| | | | | | | | | | | | |
Undistributed (accumulated) net investment income (loss), end of year | | $ | 838,812 | | | $ | 1,114,299 | | | | | | | $ | (1,551,185 | ) | | $ | 2,554,120 | |
| | | | | | | | | | | | |
| | | | | | | | |
1 Distributions for annual periods determined in accordance with federal income tax regulations. |
| | | | | | |
| See Notes to Financial Statements. | | | | |
| | | | | | | |
| | FDP SERIES, INC. | | MAY 31, 2016 | | 41 |
| | |
| Financial Highlights | | FDP BlackRock MFS Research International Fund |
| | | | | | | | | | | | | | | | | | | | | | | | | | | | | | | | | | | | | | | | | | | | |
| | | Institutional | | | | | | Investor A | |
| | | Year Ended May 31, | | | | | | Year Ended May 31, | |
| | | 2016 | | | 2015 | | | 2014 | | | 2013 | | | 2012 | | | | | | 2016 | | | 2015 | | | 2014 | | | 2013 | | | 2012 | |
| | | | | | | | | | | | | | | | | | | | | | | | | | | | | | | | | | | | | | | | | | | | |
| Per Share Operating Performance | | | | | | | | | | | | | | | | | | | | | | | | | | | | | | | | | | | | | | | | | | | | |
Net asset value, beginning of year | | $ | 13.05 | | | $ | 13.32 | | | $ | 11.77 | | | $ | 9.45 | | | $ | 11.98 | | | | | | | $ | 12.97 | | | $ | 13.24 | | | $ | 11.70 | | | $ | 9.41 | | | $ | 11.93 | |
| | | | | | | | | | | | |
Net investment income1 | | | 0.16 | | | | 0.17 | | | | 0.28 | | | | 0.19 | | | | 0.20 | | | | | | | | 0.13 | | | | 0.14 | | | | 0.25 | | | | 0.16 | | | | 0.17 | |
Net realized and unrealized gain (loss) | | | (1.78 | ) | | | (0.18 | ) | | | 1.45 | | | | 2.31 | | | | (2.56 | ) | | | | | | | (1.78 | ) | | | (0.17 | ) | | | 1.45 | | | | 2.29 | | | | (2.55 | ) |
| | | | | | | | | | | | |
Net increase (decrease) from investment operations | | | (1.62 | ) | | | (0.01 | ) | | | 1.73 | | | | 2.50 | | | | (2.36 | ) | | | | | | | (1.65 | ) | | | (0.03 | ) | | | 1.70 | | | | 2.45 | | | | (2.38 | ) |
| | | | | | | | | | | | |
Distributions from net investment income2 | | | (0.15 | ) | | | (0.26 | ) | | | (0.18 | ) | | | (0.18 | ) | | | (0.17 | ) | | | | | | | (0.12 | ) | | | (0.24 | ) | | | (0.16 | ) | | | (0.16 | ) | | | (0.14 | ) |
| | | | | | | | | | | | |
Net asset value, end of year | | $ | 11.28 | | | $ | 13.05 | | | $ | 13.32 | | | $ | 11.77 | | | $ | 9.45 | | | | | | | $ | 11.20 | | | $ | 12.97 | | | $ | 13.24 | | | $ | 11.70 | | | $ | 9.41 | |
| | | | | | | | | | | | |
| | | | | | | | | | | | | | | | | | | | | | | | | | | | | | | | | | | | | | | | | | | | |
| Total Return3 | | | | | | | | | | | | | | | | | | | | | | | | | | | | | | | | | | | | | | | | | | | | |
Based on net asset value | | | (12.57)% | | | | (0.04)% | | | | 14.88% | | | | 26.81% | | | | (19.97)% | | | | | | | | (12.85)% | | | | (0.25)% | | | | 14.67% | | | | 26.34% | | | | (20.15)% | |
| | | | | | | | | | | | |
| | | | | | | | | | | | | | | | | | | | | | | | | | | | | | | | | | | | | | | | | | | | |
| Ratios to Average Net Assets | | | | | | | | | | | | | | | | | | | | | | | | | | | | | | | | | | | | | | | | | | | | |
Total expenses | | | 1.44% | | | | 1.26% | | | | 1.23% | | | | 1.27% | | | | 1.31% | | | | | | | | 1.68% | | | | 1.51% | | | | 1.48% | | | | 1.51% | | | | 1.55% | |
| | | | | | | | | | | | |
Total expenses after fees waived and/or paid indirectly | | | 1.34% | | | | 1.26% | | | | 1.23% | | | | 1.27% | | | | 1.31% | | | | | | | | 1.58% | | | | 1.51% | | | | 1.48% | | | | 1.51% | | | | 1.55% | |
| | | | | | | | | | | | |
Net investment income | | | 1.37% | | | | 1.32% | | | | 2.21% | | | | 1.73% | | | | 1.89% | | | | | | | | 1.12% | | | | 1.09% | | | | 2.00% | | | | 1.51% | | | | 1.67% | |
| | | | | | | | | | | | |
| | | | | | | | | | | | | | | | | | | | | | | | | | | | | | | | | | | | | | | | | | | | |
| Supplemental Data | | | | | | | | | | | | | | | | | | | | | | | | | | | | | | | | | | | | | | | | | | | | |
Net assets, end of year (000) | | $ | 5,817 | | | $ | 6,478 | | | $ | 5,961 | | | $ | 4,768 | | | $ | 3,761 | | | | | | | $ | 60,141 | | | $ | 70,702 | | | $ | 62,636 | | | $ | 43,560 | | | $ | 30,343 | |
| | | | | | | | | | | | |
Portfolio turnover rate | | | 37% | | | | 27% | | | | 29% | | | | 34% | | | | 39% | | | | | | | | 37% | | | | 27% | | | | 29% | | | | 34% | | | | 39% | |
| | | | | | | | | | | | |
| | 1 | | Based on average shares outstanding. |
| | 2 | | Distributions for annual periods determined in accordance with federal income tax regulations. |
| | 3 | | Where applicable, excludes the effects of any sales charges and assumes the reinvestment of distributions. |
| | | | | | |
| See Notes to Financial Statements. | | | | |
| | | | | | | |
| 42 | | FDP SERIES, INC. | | MAY 31, 2016 | | |
| | |
| Financial Highlights (concluded) | | FDP BlackRock MFS Research International Fund |
| | | | | | | | | | | | | | | | | | | | |
| | | Investor C | |
| | | Year Ended May 31, | |
| | | 2016 | | | 2015 | | | 2014 | | | 2013 | | | 2012 | |
| | | | | | | | | | | | | | | | | | | | |
| Per Share Operating Performance | | | | | | | | | | | | | | | | | | | | |
Net asset value, beginning of year | | $ | 12.81 | | | $ | 13.08 | | | $ | 11.57 | | | $ | 9.29 | | | $ | 11.78 | |
| | | | |
Net investment income1 | | | 0.04 | | | | 0.04 | | | | 0.14 | | | | 0.07 | | | | 0.08 | |
Net realized and unrealized gain (loss) | | | (1.77 | ) | | | (0.17 | ) | | | 1.44 | | | | 2.28 | | | | (2.52 | ) |
| | | | |
Net increase (decrease) from investment operations | | | (1.73 | ) | | | (0.13 | ) | | | 1.58 | | | | 2.35 | | | | (2.44 | ) |
| | | | |
Distributions from net investment income2 | | | (0.02 | ) | | | (0.14 | ) | | | (0.07 | ) | | | (0.07 | ) | | | (0.05 | ) |
| | | | |
Net asset value, end of year | | $ | 11.06 | | | $ | 12.81 | | | $ | 13.08 | | | $ | 11.57 | | | $ | 9.29 | |
| | | | |
| | | | | | | | | | | | | | | | | | | | |
| Total Return3 | | | | | | | | | | | | | | | | | | | | |
Based on net asset value | | | (13.52)% | | | | (0.97)% | | | | 13.72% | | | | 25.46% | | | | (20.77)% | |
| | | | |
| | | | | | | | | | | | | | | | | | | | |
| Ratios to Average Net Assets | | | | | | | | | | | | | | | | | | | | |
Total expenses | | | 2.44% | | | | 2.26% | | | | 2.24% | | | | 2.27% | | | | 2.31% | |
| | | | |
Total expenses after fees waived and/or paid indirectly | | | 2.34% | | | | 2.26% | | | | 2.24% | | | | 2.27% | | | | 2.31% | |
| | | | |
Net investment income | | | 0.34% | | | | 0.29% | | | | 1.16% | | | | 0.69% | | | | 0.79% | |
| | | | |
| | | | | | | | | | | | | | | | | | | | |
| Supplemental Data | | | | | | | | | | | | | | | | | | | | |
Net assets, end of year (000) | | $ | 88,002 | | | $ | 109,093 | | | $ | 108,426 | | | $ | 89,448 | | | $ | 77,861 | |
| | | | |
Portfolio turnover rate | | | 37% | | | | 27% | | | | 29% | | | | 34% | | | | 39% | |
| | | | |
| | 1 | | Based on average shares outstanding. |
| | 2 | | Distributions for annual periods determined in accordance with federal income tax regulations. |
| | 3 | | Where applicable, excludes the effects of any sales charges and assumes the reinvestment of distributions. |
| | | | | | |
| See Notes to Financial Statements. | | | | |
| | | | | | | |
| | FDP SERIES, INC. | | MAY 31, 2016 | | 43 |
| | |
| Financial Highlights | | FDP BlackRock Janus Growth Fund |
| | | | | | | | | | | | | | | | | | | | | | | | | | | | | | | | | | | | | | | | | | | | |
| | | Institutional | | | | | | Investor A | |
| | | Year Ended May 31, | | | | | | Year Ended May 31, | |
| | | 2016 | | | 2015 | | | 2014 | | | 2013 | | | 2012 | | | | | | 2016 | | | 2015 | | | 2014 | | | 2013 | | | 2012 | |
| | | | | | | | | | | | | | | | | | | | | | | | | | | | | | | | | | | | | | | | | | | | |
| Per Share Operating Performance | | | | | | | | | | | | | | | | | | | | | | | | | | | | | | | | | | | | | | | | | | | | |
Net asset value, beginning of year | | $ | 17.66 | | | $ | 17.11 | | | $ | 15.23 | | | $ | 12.63 | | | $ | 12.68 | | | | | | | $ | 17.23 | | | $ | 16.75 | | | $ | 14.94 | | | $ | 12.43 | | | $ | 12.50 | |
| | | | | | | | | | | | |
Net investment income (loss)1 | | | (0.08 | ) | | | (0.02 | ) | | | (0.02 | ) | | | 0.07 | | | | 0.03 | | | | | | | | (0.12 | ) | | | (0.06 | ) | | | (0.06 | ) | | | 0.04 | | | | 0.00 | 2 |
Net realized and unrealized gain (loss) | | | (0.30 | ) | | | 1.60 | | | | 2.67 | | | | 2.53 | | | | (0.08 | ) | | | | | | | (0.29 | ) | | | 1.57 | | | | 2.62 | | | | 2.47 | | | | (0.07 | ) |
| | | | | | | | | | | | |
Net increase (decrease) from investment operations | | | (0.38 | ) | | | 1.58 | | | | 2.65 | | | | 2.60 | | | | (0.05 | ) | | | | | | | (0.41 | ) | | | 1.51 | | | | 2.56 | | | | 2.51 | | | | (0.07 | ) |
| | | | | | | | | | | | |
Distributions from net realized gain3 | | | (2.27 | ) | | | (1.03 | ) | | | (0.77 | ) | | | — | | | | — | | | | | | | | (2.27 | ) | | | (1.03 | ) | | | (0.75 | ) | | | — | | | | — | |
| | | | | | | | | | | | |
Net asset value, end of year | | $ | 15.01 | | | $ | 17.66 | | | $ | 17.11 | | | $ | 15.23 | | | $ | 12.63 | | | | | | | $ | 14.55 | | | $ | 17.23 | | | $ | 16.75 | | | $ | 14.94 | | | $ | 12.43 | |
| | | | | | | | | | | | |
| | | | | | | | | | | | | | | | | | | | | | | | | | | | | | | | | | | | | | | | | | | | |
| Total Return4 | | | | | | | | | | | | | | | | | | | | | | | | | | | | | | | | | | | | | | | | | | | | |
Based on net asset value | | | (2.81)% | | | | 9.55% | | | | 17.70% | | | | 20.59% | | | | (0.39)% | | | | | | | | (3.08)% | | | | 9.32% | | | | 17.42% | | | | 20.19% | | | | (0.56)% | |
| | | | | | | | | | | | |
| | | | | | | | | | | | | | | | | | | | | | | | | | | | | | | | | | | | | | | | | | | | |
| Ratios to Average Net Assets | | | | | | | | | | | | | | | | | | | | | | | | | | | | | | | | | | | | | | | | | | | | |
Total expenses | | | 1.35% | | | | 1.10% | | | | 1.07% | | | | 1.13% | | | | 1.14% | | | | | | | | 1.60% | | | | 1.35% | | | | 1.32% | | | | 1.38% | | | | 1.39% | |
| | | | | | | | | | | | |
Total expenses after fees waived and/or paid indirectly | | | 1.30% | | | | 1.05% | | | | 1.02% | | | | 1.08% | | | | 1.14% | | | | | | | | 1.55% | | | | 1.30% | | | | 1.27% | | | | 1.33% | | | | 1.39% | |
| | | | | | | | | | | | |
Net investment income (loss) | | | (0.54)% | | | | (0.09)% | | | | (0.10)% | | | | 0.54% | | | | 0.27% | | | | | | | | (0.79)% | | | | (0.34)% | | | | (0.35)% | | | | 0.30% | | | | 0.02% | |
| | | | | | | | | | | | |
| | | | | | | | | | | | | | | | | | | | | | | | | | | | | | | | | | | | | | | | | | | | |
| Supplemental Data | | | | | | | | | | | | | | | | | | | | | | | | | | | | | | | | | | | | | | | | | | | | |
Net assets, end of year (000) | | $ | 5,397 | | | $ | 5,959 | | | $ | 5,597 | | | $ | 4,789 | | | $ | 3,787 | | | | | | | $ | 53,675 | | | $ | 61,289 | | | $ | 55,133 | | | $ | 40,097 | | | $ | 28,104 | |
| | | | | | | | | | | | |
Portfolio turnover rate | | | 128% | | | | 86% | | | | 101% | | | | 127% | | | | 61% | | | | | | | | 128% | | | | 86% | | | | 101% | | | | 127% | | | | 61% | |
| | | | | | | | | | | | |
| | 1 | | Based on average shares outstanding. |
| | 2 | | Amount is less than $0.005 per share. |
| | 3 | | Distributions for annual periods determined in accordance with federal income tax regulations. |
| | 4 | | Where applicable, excludes the effects of any sales charges and assumes the reinvestment of distributions. |
| | | | | | |
| See Notes to Financial Statements. | | | | |
| | | | | | | |
| 44 | | FDP SERIES, INC. | | MAY 31, 2016 | | |
| | |
| Financial Highlights (concluded) | | FDP BlackRock Janus Growth Fund |
| | | | | | | | | | | | | | | | | | | | |
| | | Investor C | |
| | | Year Ended May 31, | |
| | | 2016 | | | 2015 | | | 2014 | | | 2013 | | | 2012 | |
| | | | | | | | | | | | | | | | | | | | |
| Per Share Operating Performance | | | | | | | | | | | | | | | | | | | | |
Net asset value, beginning of year | | $ | 15.93 | | | $ | 15.68 | | | $ | 14.08 | | | $ | 11.79 | | | $ | 11.96 | |
| | | | |
Net investment loss1 | | | (0.21 | ) | | | (0.17 | ) | | | (0.17 | ) | | | (0.06 | ) | | | (0.09 | ) |
Net realized and unrealized gain (loss) | | | (0.26 | ) | | | 1.45 | | | | 2.46 | | | | 2.35 | | | | (0.08 | ) |
| | | | |
Net increase (decrease) from investment operations | | | (0.47 | ) | | | 1.28 | | | | 2.29 | | | | 2.29 | | | | (0.17 | ) |
| | | | |
Distributions from net realized gain2 | | | (2.27 | ) | | | (1.03 | ) | | | (0.69 | ) | | | — | | | | — | |
| | | | |
Net asset value, end of year | | $ | 13.19 | | | $ | 15.93 | | | $ | 15.68 | | | $ | 14.08 | | | $ | 11.79 | |
| | | | |
| | | | | | | | | | | | | | | | | | | | |
| Total Return3 | | | | | | | | | | | | | | | | | | | | |
Based on net asset value | | | (3.85)% | | | | 8.46% | | | | 16.48% | | | | 19.42% | | | | (1.42)% | |
| | | | |
| | | | | | | | | | | | | | | | | | | | |
| Ratios to Average Net Assets | | | | | | | | | | | | | | | | | | | | |
Total expenses | | | 2.36% | | | | 2.11% | | | | 2.08% | | | | 2.13% | | | | 2.15% | |
| | | | |
Total expenses after fees waived and/or paid indirectly | | | 2.31% | | | | 2.06% | | | | 2.03% | | | | 2.08% | | | | 2.15% | |
| | | | |
Net investment loss | | | (1.55)% | | | | (1.10)% | | | | (1.11)% | | | | (0.46)% | | | | (0.75)% | |
| | | | |
| | | | | | | | | | | | | | | | | | | | |
| Supplemental Data | | | | | | | | | | | | | | | | | | | | |
Net assets, end of year (000) | | $ | 76,694 | | | $ | 92,669 | | | $ | 93,094 | | | $ | 80,148 | | | $ | 72,267 | |
| | | | |
Portfolio turnover rate | | | 128% | | | | 86% | | | | 101% | | | | 127% | | | | 61% | |
| | | | |
| | 1 | | Based on average shares outstanding. |
| | 2 | | Distributions for annual periods determined in accordance with federal income tax regulations. |
| | 3 | | Where applicable, excludes the effects of any sales charges and assumes the reinvestment of distributions. |
| | | | | | |
| See Notes to Financial Statements. | | | | |
| | | | | | | |
| | FDP SERIES, INC. | | MAY 31, 2016 | | 45 |
| | |
| Financial Highlights | | FDP BlackRock Invesco Value Fund |
| | | | | | | | | | | | | | | | | | | | | | | | | | | | | | | | | | | | | | | | | | | | |
| | | Institutional | | | | | | Investor A | |
| | | Year Ended May 31, | | | | | | Year Ended May 31, | |
| | | 2016 | | | 2015 | | | 2014 | | | 2013 | | | 2012 | | | | | | 2016 | | | 2015 | | | 2014 | | | 2013 | | | 2012 | |
| | | | | | | | | | | | | | | | | | | | | | | | | | | | | | | | | | | | | | | | | | | | |
| Per Share Operating Performance | | | | | | | | | | | | | | | | | | | | | | | | | | | | | | | | | | | | | | | | | | | | |
Net asset value, beginning of year | | $ | 16.68 | | | $ | 15.78 | | | $ | 13.36 | | | $ | 9.97 | | | $ | 10.69 | | | | | | | $ | 16.53 | | | $ | 15.63 | | | $ | 13.26 | | | $ | 9.89 | | | $ | 10.61 | |
| | | | | | | | | | | | |
Net investment income1 | | | 0.23 | | | | 0.18 | | | | 0.21 | | | | 0.16 | | | | 0.15 | | | | | | | | 0.19 | | | | 0.14 | | | | 0.17 | | | | 0.13 | | | | 0.12 | |
Net realized and unrealized gain (loss) | | | (1.47 | ) | | | 0.99 | | | | 2.30 | | | | 3.36 | | | | (0.72 | ) | | | | | | | (1.46 | ) | | | 0.97 | | | | 2.28 | | | | 3.35 | | | | (0.72 | ) |
| | | | | | | | | | | | |
Net increase (decrease) from investment operations | | | (1.24 | ) | | | 1.17 | | | | 2.51 | | | | 3.52 | | | | (0.57 | ) | | | | | | | (1.27 | ) | | | 1.11 | | | | 2.45 | | | | 3.48 | | | | (0.60 | ) |
| | | | | | | | | | | | |
Distributions from net investment income2 | | | (0.32 | ) | | | (0.27 | ) | | | (0.09 | ) | | | (0.13 | ) | | | (0.15 | ) | | | | | | | (0.28 | ) | | | (0.21 | ) | | | (0.08 | ) | | | (0.11 | ) | | | (0.12 | ) |
| | | | | | | | | | | | |
Net asset value, end of year | | $ | 15.12 | | | $ | 16.68 | | | $ | 15.78 | | | $ | 13.36 | | | $ | 9.97 | | | | | | | $ | 14.98 | | | $ | 16.53 | | | $ | 15.63 | | | $ | 13.26 | | | $ | 9.89 | |
| | | | | | | | | | | | |
| | | | | | | | | | | | | | | | | | | | | | | | | | | | | | | | | | | | | | | | | | | | |
| Total Return3 | | | | | | | | | | | | | | | | | | | | | | | | | | | | | | | | | | | | | | | | | | | | |
Based on net asset value | | | (7.54)% | | | | 7.49% | | | | 18.89% | | | | 35.68% | | | | (5.36)% | | | | | | | | (7.78)% | | | | 7.19% | | | | 18.56% | | | | 35.47% | | | | (5.63)% | |
| | | | | | | | | | | | |
| | | | | | | | | | | | | | | | | | | | | | | | | | | | | | | | | | | | | | | | | | | | |
| Ratios to Average Net Assets | | | | | | | | | | | | | | | | | | | | | | | | | | | | | | | | | | | | | | | | | | | | |
Total expenses | | | 1.20% | | | | 1.00% | | | | 0.98% | | | | 1.06% | | | | 1.05% | | | | | | | | 1.45% | | | | 1.25% | | | | 1.22% | | | | 1.30% | | | | 1.30% | |
| | | | | | | | | | | | |
Total expenses after fees waived and/or paid indirectly | | | 1.20% | | | | 1.00% | | | | 0.98% | | | | 1.06% | | | | 1.05% | | | | | | | | 1.45% | | | | 1.25% | | | | 1.22% | | | | 1.30% | | | | 1.30% | |
| | | | | | | | | | | | |
Net investment income | | | 1.54% | | | | 1.13% | | | | 1.43% | | | | 1.37% | | | | 1.46% | | | | | | | | 1.29% | | | | 0.88% | | | | 1.19% | | | | 1.13% | | | | 1.22% | |
| | | | | | | | | | | | |
| | | | | | | | | | | | | | | | | | | | | | | | | | | | | | | | | | | | | | | | | | | | |
| Supplemental Data | | | | | | | | | | | | | | | | | | | | | | | | | | | | | | | | | | | | | | | | | | | | |
Net assets, end of year (000) | | $ | 5,376 | | | $ | 5,890 | | | $ | 5,373 | | | $ | 4,330 | | | $ | 3,347 | | | | | | | $ | 53,623 | | | $ | 60,815 | | | $ | 54,119 | | | $ | 38,807 | | | $ | 26,457 | |
| | | | | | | | | | | | |
Portfolio turnover rate | | | 15% | | | | 19% | | | | 14% | | | | 13% | | | | 17% | | | | | | | | 15% | | | | 19% | | | | 14% | | | | 13% | | | | 17% | |
| | | | | | | | | | | | |
| | 1 | | Based on average shares outstanding. |
| | 2 | | Distributions for annual periods determined in accordance with federal income tax regulations. |
| | 3 | | Where applicable, excludes the effects of any sales charges and assumes the reinvestment of distributions. |
| | | | | | |
| See Notes to Financial Statements. | | | | |
| | | | | | | |
| 46 | | FDP SERIES, INC. | | MAY 31, 2016 | | |
| | |
| Financial Highlights (concluded) | | FDP BlackRock Invesco Value Fund |
| | | | | | | | | | | | | | | | | | | | |
| | | Investor C | |
| | | Year Ended May 31, | |
| | | 2016 | | | 2015 | | | 2014 | | | 2013 | | | 2012 | |
| | | | | | | | | | | | | | | | | | | | |
| Per Share Operating Performance | | | | | | | | | | | | | | | | | | | | |
Net asset value, beginning of year | | $ | 16.24 | | | $ | 15.37 | | | $ | 13.09 | | | $ | 9.77 | | | $ | 10.47 | |
| | | | |
Net investment income1 | | | 0.08 | | | | 0.02 | | | | 0.06 | | | | 0.04 | | | | 0.04 | |
Net realized and unrealized gain (loss) | | | (1.45 | ) | | | 0.96 | | | | 2.26 | | | | 3.30 | | | | (0.70 | ) |
| | | | |
Net increase (decrease) from investment operations | | | (1.37 | ) | | | 0.98 | | | | 2.32 | | | | 3.34 | | | | (0.66 | ) |
| | | | |
Distributions from net investment income2 | | | (0.16 | ) | | | (0.11 | ) | | | (0.04 | ) | | | (0.02 | ) | | | (0.04 | ) |
| | | | |
Net asset value, end of year | | $ | 14.71 | | | $ | 16.24 | | | $ | 15.37 | | | $ | 13.09 | | | $ | 9.77 | |
| | | | |
| | | | | | | | | | | | | | | | | | | | |
| Total Return3 | | | | | | | | | | | | | | | | | | | | |
Based on net asset value | | | (8.51)% | | | | 6.40% | | | | 17.76% | | | | 34.30% | | | | (6.28)% | |
| | | | |
| | | | | | | | | | | | | | | | | | | | |
| Ratios to Average Net Assets | | | | | | | | | | | | | | | | | | | | |
Total expenses | | | 2.21% | | | | 2.01% | | | | 1.98% | | | | 2.06% | | | | 2.05% | |
| | | | |
Total expenses after fees waived and/or paid indirectly | | | 2.21% | | | | 2.01% | | | | 1.98% | | | | 2.06% | | | | 2.05% | |
| | | | |
Net investment income | | | 0.53% | | | | 0.12% | | | | 0.41% | | | | 0.37% | | | | 0.46% | |
| | | | |
| | | | | | | | | | | | | | | | | | | | |
| Supplemental Data | | | | | | | | | | | | | | | | | | | | |
Net assets, end of year (000) | | $ | 77,352 | | | $ | 92,568 | | | $ | 92,201 | | | $ | 79,259 | | | $ | 67,211 | |
| | | | |
Portfolio turnover rate | | | 15% | | | | 19% | | | | 14% | | | | 13% | | | | 17% | |
| | | | |
| | 1 | | Based on average shares outstanding. |
| | 2 | | Distributions for annual periods determined in accordance with federal income tax regulations. |
| | 3 | | Where applicable, excludes the effects of any sales charges and assumes the reinvestment of distributions. |
| | | | | | |
| See Notes to Financial Statements. | | | | |
| | | | | | | |
| | FDP SERIES, INC. | | MAY 31, 2016 | | 47 |
| | |
| Financial Highlights | | FDP BlackRock Franklin Templeton Total Return Fund |
| | | | | | | | | | | | | | | | | | | | | | | | | | | | | | | | | | | | | | | | | | | | |
| | | Institutional | | | | | | Investor A | |
| | | Year Ended May 31, | | | | | | Year Ended May 31, | |
| | | 2016 | | | 2015 | | | 2014 | | | 2013 | | | 2012 | | | | | | 2016 | | | 2015 | | | 2014 | | | 2013 | | | 2012 | |
| | | | | | | | | | | | | | | | | | | | | | | | | | | | | | | | | | | | | | | | | | | | |
| Per Share Operating Performance | | | | | | | | | | | | | | | | | | | | | | | | | | | | | | | | | | | | | | | | | | | | |
Net asset value, beginning of year | | $ | 10.67 | | | $ | 10.75 | | | $ | 10.71 | | | $ | 10.56 | | | $ | 10.50 | | | | | | | $ | 10.67 | | | $ | 10.76 | | | $ | 10.71 | | | $ | 10.57 | | | $ | 10.50 | |
| | | | | | | | | | | | |
Net investment income1 | | | 0.23 | | | | 0.23 | | | | 0.28 | | | | 0.30 | | | | 0.33 | | | | | | | | 0.21 | | | | 0.20 | | | | 0.26 | | | | 0.27 | | | | 0.30 | |
Net realized and unrealized gain (loss) | | | (0.24 | ) | | | 0.05 | | | | 0.06 | | | | 0.23 | | | | 0.08 | | | | | | | | (0.25 | ) | | | 0.04 | | | | 0.06 | | | | 0.23 | | | | 0.09 | |
| | | | | | | | | | | | |
Net increase (decrease) from investment operations | | | (0.01 | ) | | | 0.28 | | | | 0.34 | | | | 0.53 | | | | 0.41 | | | | | | | | (0.04 | ) | | | 0.24 | | | | 0.32 | | | | 0.50 | | | | 0.39 | |
| | | | | | | | | | | | |
| Distributions:2 | | | | | | | | | | | | | | | | | | | | | | | | | | | | | | | | | | | | | | | | | | | | |
From net investment income | | | (0.23 | ) | | | (0.23 | ) | | | (0.29 | ) | | | (0.38 | ) | | | (0.35 | ) | | | | | | | (0.20 | ) | | | (0.20 | ) | | | (0.26 | ) | | | (0.36 | ) | | | (0.32 | ) |
From net realized gain | | | (0.23 | ) | | | (0.13 | ) | | | (0.01 | ) | | | — | | | | — | | | | | | | | (0.23 | ) | | | (0.13 | ) | | | (0.01 | ) | | | — | | | | — | |
| | | | | | | | | | | | |
Total distributions | | | (0.46 | ) | | | (0.36 | ) | | | (0.30 | ) | | | (0.38 | ) | | | (0.35 | ) | | | | | | | (0.43 | ) | | | (0.33 | ) | | | (0.27 | ) | | | (0.36 | ) | | | (0.32 | ) |
| | | | | | | | | | | | |
Net asset value, end of year | | $ | 10.20 | | | $ | 10.67 | | | $ | 10.75 | | | $ | 10.71 | | | $ | 10.56 | | | | | | | $ | 10.20 | | | $ | 10.67 | | | $ | 10.76 | | | $ | 10.71 | | | $ | 10.57 | |
| | | | | | | | | | | | |
| | | | | | | | | | | | | | | | | | | | | | | | | | | | | | | | | | | | | | | | | | | | |
| Total Return3 | | | | | | | | | | | | | | | | | | | | | | | | | | | | | | | | | | | | | | | | | | | | |
Based on net asset value | | | 0.05% | | | | 2.61% | | | | 3.18% | | | | 5.03% | | | | 3.89% | | | | | | | | (0.20)% | | | | 2.26% | | | | 3.03% | | | | 4.67% | | | | 3.74% | |
| | | | | | | | | | | | |
| | | | | | | | | | | | | | | | | | | | | | | | | | | | | | | | | | | | | | | | | | | | |
| Ratios to Average Net Assets | | | | | | | | | | | | | | | | | | | | | | | | | | | | | | | | | | | | | | | | | | | | |
Total expenses | | | 0.82% | | | | 0.69% | | | | 0.68% | | | | 0.71% | | | | 0.74% | | | | | | | | 1.07% | | | | 0.94% | | | | 0.93% | | | | 0.95% | | | | 0.99% | |
| | | | | | | | | | | | |
Total expenses after fees paid indirectly | | | 0.81% | | | | 0.69% | | | | 0.68% | | | | 0.71% | | | | 0.74% | | | | | | | | 1.06% | | | | 0.94% | | | | 0.93% | | | | 0.95% | | | | 0.99% | |
| | | | | | | | | | | | |
Net investment income | | | 2.26% | | | | 2.12% | | | | 2.71% | | | | 2.76% | | | | 3.16% | | | | | | | | 2.01% | | | | 1.87% | | | | 2.46% | | | | 2.51% | | | | 2.90% | |
| | | | | | | | | | | | |
| | | | | | | | | | | | | | | | | | | | | | | | | | | | | | | | | | | | | | | | | | | | |
| Supplemental Data | | | | | | | | | | | | | | | | | | | | | | | | | | | | | | | | | | | | | | | | | | | | |
Net assets, end of year (000) | | $ | 7,507 | | | $ | 7,455 | | | $ | 6,791 | | | $ | 5,506 | | | $ | 4,809 | | | | | | | $ | 86,870 | | | $ | 97,067 | | | $ | 86,986 | | | $ | 63,283 | | | $ | 48,467 | |
| | | | | | | | | | | | |
Portfolio turnover rate4 | | | 315% | | | | 283% | | | | 296% | | | | 322% | | | | 292% | | | | | | | | 315% | | | | 283% | | | | 296% | | | | 322% | | | | 292% | |
| | | | | | | | | | | | |
| | 1 | | Based on average shares outstanding. |
| | 2 | | Distributions for annual periods determined in accordance with federal income tax regulations. |
| | 3 | | Where applicable, excludes the effects of any sales charges and assumes the reinvestment of distributions. |
| | 4 | | Includes mortgage dollar roll transactions (“MDRs”). Additional information regarding portfolio turnover rate is as follows: |
| | | | | | | | | | | | | | | | | | | | | | | | | | | | | | | | | | | | | | | | | | | | |
| | | Year Ended May 31, | | | | | | Year Ended May 31, | |
| | | 2016 | | | 2015 | | | 2014 | | | 2013 | | | 2012 | | | | | | 2016 | | | 2015 | | | 2014 | | | 2013 | | | 2012 | |
| | | | | | | | | | | | | | | | | | | | | | | | | | | | | | | | | | | | | | | | | | | | |
Portfolio turnover rate (excluding MDRs) | | | 115% | | | | 80% | | | | 137% | | | | 128% | | | | 137% | | | | | | | | 115% | | | | 80% | | | | 137% | | | | 128% | | | | 137% | |
| | | | | | | | | | | | |
| | | | | | |
| See Notes to Financial Statements. | | | | |
| | | | | | | |
| 48 | | FDP SERIES, INC. | | MAY 31, 2016 | | |
| | |
| Financial Highlights (concluded) | | FDP BlackRock Franklin Templeton Total Return Fund |
| | | | | | | | | | | | | | | | | | | | |
| | | Investor C | |
| | | Year Ended May 31, | |
| | | 2016 | | | 2015 | | | 2014 | | | 2013 | | | 2012 | |
| | | | | | | | | | | | | | | | | | | | |
| Per Share Operating Performance | | | | | | | | | | | | | | | | | | | | |
Net asset value, beginning of year | | $ | 10.67 | | | $ | 10.76 | | | $ | 10.71 | | | $ | 10.57 | | | $ | 10.50 | |
| | | | |
Net investment income1 | | | 0.15 | | | | 0.14 | | | | 0.20 | | | | 0.21 | | | | 0.24 | |
Net realized and unrealized gain (loss) | | | (0.24 | ) | | | 0.04 | | | | 0.06 | | | | 0.23 | | | | 0.09 | |
| | | | |
Net increase (decrease) from investment operations | | | (0.09 | ) | | | 0.18 | | | | 0.26 | | | | 0.44 | | | | 0.33 | |
| | | | |
| Distributions:2 | | | | | | | | | | | | | | | | | | | | |
From net investment income | | | (0.15 | ) | | | (0.14 | ) | | | (0.20 | ) | | | (0.30 | ) | | | (0.26 | ) |
From net realized gain | | | (0.23 | ) | | | (0.13 | ) | | | (0.01 | ) | | | — | | | | — | |
| | | | |
Total distributions | | | (0.38 | ) | | | (0.27 | ) | | | (0.21 | ) | | | (0.30 | ) | | | (0.26 | ) |
| | | | |
Net asset value, end of year | | $ | 10.20 | | | $ | 10.67 | | | $ | 10.76 | | | $ | 10.71 | | | $ | 10.57 | |
| | | | |
| | | | | | | | | | | | | | | | | | | | |
| Total Return3 | | | | | | | | | | | | | | | | | | | | |
Based on net asset value | | | (0.76)% | | | | 1.69% | | | | 2.45% | | | | 4.10% | | | | 3.16% | |
| | | | |
| | | | | | | | | | | | | | | | | | | | |
| Ratios to Average Net Assets | | | | | | | | | | | | | | | | | | | | |
Total expenses | | | 1.63% | | | | 1.50% | | | | 1.49% | | | | 1.51% | | | | 1.54% | |
| | | | |
Total expenses after fees paid indirectly | | | 1.62% | | | | 1.50% | | | | 1.49% | | | | 1.51% | | | | 1.54% | |
| | | | |
Net investment income | | | 1.45% | | | | 1.31% | | | | 1.90% | | | | 1.96% | | | | 2.35% | |
| | | | |
| | | | | | | | | | | | | | | | | | | | |
| Supplemental Data | | | | | | | | | | | | | | | | | | | | |
Net assets, end of year (000) | | $ | 125,490 | | | $ | 142,617 | | | $ | 138,904 | | | $ | 116,996 | | | $ | 113,271 | |
| | | | |
Portfolio turnover rate4 | | | 315% | | | | 283% | | | | 296% | | | | 322% | | | | 292% | |
| | | | |
| | 1 | | Based on average shares outstanding. |
| | 2 | | Distributions for annual periods determined in accordance with federal income tax regulations. |
| | 3 | | Where applicable, excludes the effects of any sales charges and assumes the reinvestment of distributions. |
| | 4 | | Includes MDRs. Additional information regarding portfolio turnover rate is as follows: |
| | | | | | | | | | | | | | | | | | | | |
| | | Year Ended May 31, | |
| | | 2016 | | | 2015 | | | 2014 | | | 2013 | | | 2012 | |
| | | | | | | | | | | | | | | | | | | | |
Portfolio turnover rate (excluding MDRs) | | | 115% | | | | 80% | | | | 137% | | | | 128% | | | | 137% | |
| | | | |
| | | | | | |
| See Notes to Financial Statements. | | | | |
| | | | | | | |
| | FDP SERIES, INC. | | MAY 31, 2016 | | 49 |
| | |
| Notes to Financial Statements | | |
1. Organization:
FDP Series, Inc. (the “Corporation”) is registered under the Investment Company Act of 1940, as amended (the “1940 Act”), as an open-end management investment company. The Corporation is organized as a Maryland corporation. The following are referred to herein collectively as the “Funds” or individually, a “Fund”:
| | | | |
| Fund Name | | Herein Referred To As | | Diversification
Classification |
FDP BlackRock MFS Research International Fund (formerly MFS Research International FDP Fund) | | MFS Fund | | Diversified |
FDP BlackRock Janus Growth Fund (formerly Marsico Growth FDP Fund) | | Janus Fund | | Diversified |
FDP BlackRock Invesco Value Fund (formerly Invesco Value FDP Fund) | | Invesco Fund | | Diversified |
FDP BlackRock Franklin Templeton Total Return Fund (formerly Franklin Templeton Total Return FDP Fund) | | Franklin Templeton Fund | | Diversified |
Each Fund offers multiple classes of shares. All classes of shares have identical voting, dividend, liquidation and other rights and are subject to the same terms and conditions, except that certain classes bear expenses related to the shareholder servicing and distribution of such shares, and may be subject to a contingent deferred sales charge (“CDSC”). Each class has exclusive voting rights with respect to matters relating to its shareholder servicing and distribution expenditures.
| | | | | | |
| Share Name | | Initial Sales Charge | | CDSC | | Conversion Privilege |
Institutional Shares | | No | | No | | None |
Investor A Shares | | Yes | | Yes1 | | None |
Investor C Shares | | No | | Yes | | None |
| | 1 | | Investor A Shares may be subject to a CDSC where no initial sales charge was paid at the time of purchase. |
The Funds, together with certain other registered investment companies advised by BlackRock Advisors, LLC (the “Manager”) or its affiliates, are included in a complex of open-end funds referred to as the Equity-Bond Complex.
2. Significant Accounting Policies:
The financial statements are prepared in conformity with accounting principles generally accepted in the United States of America (“U.S. GAAP”), which may require management to make estimates and assumptions that affect the reported amounts of assets and liabilities in the financial statements, disclosure of contingent assets and liabilities at the date of the financial statements and the reported amounts of increases and decreases in net assets from operations during the reporting period. Actual results could differ from those estimates. Each Fund is considered an investment company under U.S. GAAP and follows the accounting and reporting guidance applicable to investment companies. Below is a summary of significant accounting policies:
Foreign Currency: Each Fund’s books and records are maintained in U.S. dollars. Purchases and sales of investments are recorded at the rates of exchange prevailing on the respective dates of such transactions. Generally, when the U.S. dollar rises in value against a foreign currency, the investments denominated in that currency will lose value; the opposite effect occurs if the U.S. dollar falls in relative value.
Each Fund does not isolate changes in the exchange rates from the changes in the market prices of investments held or sold for financial reporting purposes. Accordingly, the effects of changes in exchange rates on investments are not segregated in the Statements of Operations from the effects of changes in market prices of those investments, but are included as a component of net realized and unrealized gain (loss) from investments. Each Fund reports realized currency gains (losses) on foreign currency related transactions as components of net realized gain (loss) for financial reporting purposes, whereas such components are generally treated as ordinary income for federal income tax purposes.
Segregation and Collateralization: In cases where a Fund enters into certain investments (e.g., dollar rolls, to-be-announced (“TBA”) sale commitments, futures contracts, forward foreign currency exchange contracts, options written and swaps) that would be treated as “senior securities” for 1940 Act purposes, a Fund may segregate or designate on its books and records cash or liquid assets having a market value at least equal to the amount of its future obligations under such investments. Doing so allows the investment to be excluded from treatment as a “senior security.” Furthermore, if required by an exchange or counterparty agreement, the Funds may be required to deliver/deposit cash and/or securities to/with an exchange, or broker-dealer or custodian as collateral for certain investments or obligations.
Investment Transactions and Investment Income: For financial reporting purposes, investment transactions are recorded on the dates the transactions are entered into (the trade dates). Realized gains and losses on investment transactions are determined on the identified cost basis. Dividend income is recorded on the ex-dividend date. Dividends from foreign securities where the ex-dividend date may have passed are subsequently recorded when the Funds are informed of the ex-dividend date. Under the applicable foreign tax laws, a withholding tax at various rates may be imposed on capital gains, dividends and interest. Upon notification from issuers, some of the dividend income received from a real estate investment trust may be redesignated as a reduction of cost of the related investment and/or realized gain. Interest income, including amortization and accretion of premiums and discounts on debt securities, is recognized on the accrual basis. Income, expenses and realized and unrealized gains and losses are allocated daily to each class based on its relative net assets.
| | | | | | |
| | | | | | | |
| 50 | | FDP SERIES, INC. | | MAY 31, 2016 | | |
| | | | |
| Notes to Financial Statements (continued) | | |
Distributions: For MFS Fund, Janus Fund and Invesco Fund, distributions paid by the Funds are recorded on the ex-dividend date. For Franklin Templeton Fund, distributions from net investment income are declared daily and paid monthly. Distributions of capital gains are recorded on the ex-dividend date and made at least annually. The character and timing of distributions are determined in accordance with federal income tax regulations, which may differ from U.S. GAAP.
Indemnifications: In the normal course of business, a Fund enters into contracts that contain a variety of representations that provide general indemnification. A Fund’s maximum exposure under these arrangements is unknown because it involves future potential claims against a Fund, which cannot be predicted with any certainty.
Other: Expenses directly related to a Fund or its classes are charged to that Fund or the applicable class. Other operating expenses shared by several funds, including other funds managed by the Manager, are prorated among those funds on the basis of relative net assets or other appropriate methods. Expenses directly related to the Funds and other shared expenses prorated to the Funds are allocated daily to each class based on its relative net assets or other appropriate methods.
The Funds have an arrangement with their custodian whereby fees may be reduced by credits earned on uninvested cash balances, which, if applicable, are shown as fees paid indirectly in the Statements of Operations. The custodian imposes fees on overdrawn cash balances, which can be offset by accumulated credits earned or may result in additional custody charges.
3. Investment Valuation and Fair Value Measurements:
Investment Valuation Policies: The Funds’ investments are valued at fair value (also referred to as “market value” within the financial statements) as of the close of trading on the New York Stock Exchange (“NYSE”) (generally 4:00 p.m., Eastern time). U.S. GAAP defines fair value as the price the Funds would receive to sell an asset or pay to transfer a liability in an orderly transaction between market participants at the measurement date. The Funds determine the fair values of their financial instruments using various independent dealers or pricing services under policies approved by the Board of Directors of each Fund (the “Board”). The BlackRock Global Valuation Methodologies Committee (the “Global Valuation Committee”) is the committee formed by management to develop global pricing policies and procedures and to oversee the pricing function for all financial instruments.
Fair Value Inputs and Methodologies: The following methods (or “techniques”) and inputs are used to establish the fair value of each Fund’s assets and liabilities:
| • | | Equity investments traded on a recognized securities exchange are valued at the official closing price each day, if available. For equity investments traded on more than one exchange, the official close price on the exchange where the stock is primarily traded is used. Equity investments traded on a recognized exchange for which there were no sales on that day may be valued at the last available bid (long positions) or ask (short positions) price. |
| • | | Bond investments are valued on the basis of last available bid prices or current market quotations provided by dealers or pricing services. Floating rate loan interests are valued at the mean of the bid prices from one or more brokers or dealers as obtained from a pricing service. In determining the value of a particular investment, pricing services may use certain information with respect to transactions in such investments, quotations from dealers, pricing matrixes, market transactions in comparable investments, various relationships observed in the market between investments and calculated yield measures. Asset-backed and mortgage-backed securities are valued by independent pricing services using models that consider estimated cash flows of each tranche of the security, establish a benchmark yield and develop an estimated tranche-specific spread to the benchmark yield based on the unique attributes of the tranche. |
| • | | Generally, trading in foreign instruments is substantially completed each day at various times prior to the close of business on the NYSE. Occasionally, events affecting the values of such instruments may occur between the foreign market close and the close of business on the NYSE that may not be reflected in the computation of the Funds’ net assets. Each business day, the Funds use a pricing service to assist with the valuation of certain foreign exchange-traded equity securities and foreign exchange-traded and over-the-counter (“OTC”) options (the “Systematic Fair Value Price”). Using current market factors, the Systematic Fair Value Price is designed to value such foreign securities and foreign options at fair value as of the close of business on the NYSE, which follows the close of the local markets. |
| • | | Municipal investments (including commitments to purchase such investments on a “when-issued” basis) are valued on the basis of prices provided by dealers or pricing services. In determining the value of a particular investment, pricing services may use certain information with respect to transactions in such investments, quotations from dealers, pricing matrixes, market transactions in comparable investments and information with respect to various relationships between investments. |
| • | | TBA commitments are valued on the basis of last available bid prices or current market quotations provided by pricing services. |
| • | | Investments in open-end U.S. mutual funds are valued at net asset value (“NAV”) each business day. |
| • | | Futures contracts traded on exchanges are valued at their last sale price. |
| | | | | | |
| | | | | | | |
| | FDP SERIES, INC. | | MAY 31, 2016 | | 51 |
| | |
| Notes to Financial Statements (continued) | | |
| • | | Securities and other assets and liabilities denominated in foreign currencies are translated into U.S. dollars using exchange rates determined as of the close of business on the NYSE. Forward foreign currency exchange contracts are valued at the mean between the bid and ask prices and are determined as of the close of business on the NYSE. Interpolated values are derived when the settlement date of the contract is an interim date for which quotations are not available. |
| • | | Exchange-traded options are valued at the mean between the last bid and ask prices at the close of the options market in which the options trade. An exchange-traded option for which there is no mean price is valued at the last bid (long positions) or ask (short positions) price. If no bid or ask price is available, the prior day’s price will be used, unless it is determined that the prior day’s price no longer reflects the fair value of the option. OTC options are valued by an independent pricing service using a mathematical model, which incorporates a number of market data factors, such as the trades and prices of the underlying instruments. |
| • | | Swap agreements are valued utilizing quotes received daily by the Funds’ pricing service or through brokers, which are derived using daily swap curves and models that incorporate a number of market data factors, such as discounted cash flows, trades and values of the underlying reference instruments. |
If events (e.g., a company announcement, market volatility or a natural disaster) occur that are expected to materially affect the value of such instruments, or in the event that the application of these methods of valuation results in a price for an investment that is deemed not to be representative of the market value of such investment, or if a price is not available, the investment will be valued by the Global Valuation Committee, or its delegate, in accordance with a policy approved by the Board as reflecting fair value (“Fair Valued Investments”). When determining the price for Fair Valued Investments, the Global Valuation Committee, or its delegate, seeks to determine the price that each Fund might reasonably expect to receive or pay from the current sale or purchase of that asset or liability in an arm’s-length transaction. Fair value determinations shall be based upon all available factors that the Global Valuation Committee, or its delegate, deems relevant consistent with the principles of fair value measurement, which include the market approach, income approach and/or in the case of recent investments, the cost approach, as appropriate. The market approach generally consists of using comparable market transactions. The income approach generally is used to discount future cash flows to present value and is adjusted for liquidity as appropriate. These factors include but are not limited to: (i) attributes specific to the investment or asset; (ii) the principal market for the investment or asset; (iii) the customary participants in the principal market for the investment or asset; (iv) data assumptions by market participants for the investment or asset, if reasonably available; (v) quoted prices for similar investments or assets in active markets; and (vi) other factors, such as future cash flows, interest rates, yield curves, volatilities, prepayment speeds, loss severities, credit risks, recovery rates, liquidation amounts and/or default rates. Due to the inherent uncertainty of valuations of such investments, the fair values may differ from the values that would have been used had an active market existed. The Global Valuation Committee, or its delegate, employs various methods for calibrating valuation approaches for investments where an active market does not exist, including regular due diligence of each Fund’s pricing vendors, regular reviews of key inputs and assumptions, transactional back-testing or disposition analysis to compare unrealized gains and losses to realized gains and losses, reviews of missing or stale prices and large movements in market values and reviews of any market related activity. The pricing of all Fair Valued Investments is subsequently reported to the Board or a committee thereof on a quarterly basis.
Fair Value Hierarchy: Various inputs are used in determining the fair value of investments and derivative financial instruments. These inputs to valuation techniques are categorized into a fair value hierarchy consisting of three broad levels for financial statement purposes as follows:
| • | | Level 1 — unadjusted price quotations in active markets/exchanges for identical assets or liabilities that each Fund has the ability to access |
| • | | Level 2 — other observable inputs (including, but not limited to, quoted prices for similar assets or liabilities in markets that are active, quoted prices for identical or similar assets or liabilities in markets that are not active, inputs other than quoted prices that are observable for the assets or liabilities (such as interest rates, yield curves, volatilities, prepayment speeds, loss severities, credit risks and default rates) or other market–corroborated inputs) |
| • | | Level 3 — unobservable inputs based on the best information available in the circumstances, to the extent observable inputs are not available (including each Fund’s own assumptions used in determining the fair value of investments and derivative financial instruments) |
The hierarchy gives the highest priority to unadjusted quoted prices in active markets for identical assets or liabilities (Level 1 measurements) and the lowest priority to unobservable inputs (Level 3 measurements). Accordingly, the degree of judgment exercised in determining fair value is greatest for instruments categorized in Level 3. The inputs used to measure fair value may fall into different levels of the fair value hierarchy. In such cases, for disclosure purposes, the fair value hierarchy classification is determined based on the lowest level input that is significant to the fair value measurement in its entirety. The significant unobservable inputs used by the Global Valuation Committee in determining the price for Fair Valued Investments are typically categorized as Level 3. The fair value hierarchy for each Fund’s investments and derivative financial instruments has been included in the Schedules of Investments.
Changes in valuation techniques may result in transfers into or out of an assigned level within the hierarchy. In accordance with each Fund’s policy, transfers between different levels of the fair value hierarchy are deemed to have occurred as of the beginning of the reporting period. The categorization of a value determined for investments and derivative financial instruments is based on the pricing transparency of the investments and derivative financial instruments and is not necessarily an indication of the risks associated with investing in those securities.
| | | | | | |
| | | | | | | |
| 52 | | FDP SERIES, INC. | | MAY 31, 2016 | | |
| | | | |
| Notes to Financial Statements (continued) | | |
4. Securities and Other Investments:
Asset-Backed and Mortgage-Backed Securities: Asset-backed securities are generally issued as pass-through certificates or as debt instruments. Asset-backed securities issued as pass-through certificates represent undivided fractional ownership interests in an underlying pool of assets. Asset-backed securities issued as debt instruments, which are also known as collateralized obligations are typically issued as the debt of a special purpose entity organized solely for the purpose of owning such assets and issuing such debt. Asset-backed securities are often backed by a pool of assets representing the obligations of a number of different parties. The yield characteristics of certain asset-backed securities may differ from traditional debt securities. One such major difference is that all or a principal part of the obligations may be prepaid at any time because the underlying assets (i.e., loans) may be prepaid at any time. As a result, a decrease in interest rates in the market may result in increases in the level of prepayments as borrowers, particularly mortgagors, refinance and repay their loans. An increased prepayment rate with respect to an asset-backed security will have the effect of shortening the maturity of the security. In addition, a Fund may subsequently have to reinvest the proceeds at lower interest rates. If a Fund has purchased such an asset-backed security at a premium, a faster than anticipated prepayment rate could result in a loss of principal to the extent of the premium paid.
For mortgage pass-through securities (the “Mortgage Assets”), there are a number of important differences among the agencies and instrumentalities of the U.S. Government that issue mortgage-related securities and among the securities that they issue. For example, mortgage-related securities guaranteed by Ginnie Mae are guaranteed as to the timely payment of principal and interest by Ginnie Mae and such guarantee is backed by the full faith and credit of the United States. However, mortgage-related securities issued by Freddie Mac and Fannie Mae, including Freddie Mac and Fannie Mae guaranteed mortgage pass-through certificates, which are solely the obligations of Freddie Mac and Fannie Mae, are not backed by or entitled to the full faith and credit of the United States, but are supported by the right of the issuer to borrow from the U.S. Treasury.
Non-agency mortgage-backed securities are securities issued by non-governmental issuers and have no direct or indirect government guarantees of payment and are subject to various risks. Non-agency mortgage loans are obligations of the borrowers thereunder only and are not typically insured or guaranteed by any other person or entity. The ability of a borrower to repay a loan is dependent upon the income or assets of the borrower. A number of factors, including a general economic downturn, acts of God, terrorism, social unrest and civil disturbances, may impair a borrower’s ability to repay its loans.
Inflation-Indexed Bonds: Inflation-indexed bonds are fixed income securities whose principal value is periodically adjusted according to the rate of inflation. If the index measuring inflation rises or falls, the principal value of inflation-indexed bonds will be adjusted upward or downward, and consequently the interest payable on these securities (calculated with respect to a larger or smaller principal amount) will be increased or reduced, respectively. Any upward or downward adjustment in the principal amount of an inflation-indexed bond will be included as interest income in the Statements of Operations, even though investors do not receive their principal until maturity. Repayment of the original bond principal upon maturity (as adjusted for inflation) is guaranteed in the case of U.S. Treasury inflation-indexed bonds. For bonds that do not provide a similar guarantee, the adjusted principal value of the bond repaid at maturity may be less than the original principal.
Multiple Class Pass-Through Securities: Multiple class pass-through securities, including collateralized mortgage obligations (“CMOs”) and commercial mortgage-backed securities, may be issued by Ginnie Mae, U.S. Government agencies or instrumentalities or by trusts formed by private originators of, or investors in, mortgage loans. In general, CMOs are debt obligations of a legal entity that are collateralized by a pool of residential or commercial mortgage loans or mortgage pass-through securities Mortgage Assets. The payments on these are used to make payments on the CMOs or multiple pass-through securities. Multiple class pass-through securities represent direct ownership interests in the Mortgage Assets. Classes of CMOs include interest only (“IOs”), principal only (“POs”), planned amortization classes and targeted amortization classes. IOs and POs are stripped mortgage-backed securities representing interests in a pool of mortgages, the cash flow from which has been separated into interest and principal components. IOs receive the interest portion of the cash flow while POs receive the principal portion. IOs and POs can be extremely volatile in response to changes in interest rates. As interest rates rise and fall, the value of IOs tends to move in the same direction as interest rates. POs perform best when prepayments on the underlying mortgages rise since this increases the rate at which the principal is returned and the yield to maturity on the PO. When payments on mortgages underlying a PO are slower than anticipated, the life of the PO is lengthened and the yield to maturity is reduced. If the underlying Mortgage Assets experience greater than anticipated prepayments of principal, a Fund’s initial investment in the IOs may not fully recoup.
Capital Securities and Trust Preferred Securities: Capital securities, including trust preferred securities, are typically issued by corporations, generally in the form of interest-bearing notes with preferred securities characteristics. In the case of trust preferred securities, an affiliated business trust of a corporation issues these securities, generally in the form of beneficial interests in subordinated debentures or similarly structured securities. The securities can be structured with either a fixed or adjustable coupon that can have either a perpetual or stated maturity date. For trust preferred securities, the issuing bank or corporation pays interest to the trust, which is then distributed to holders of these securities as a dividend. Dividends can be deferred without creating an event of default or acceleration, although maturity cannot take place unless all cumulative payment obligations have been met. The deferral of payments does not affect the purchase or sale of these securities in the open market. Payments on these securities are treated as interest rather than dividends for federal income tax purposes. These securities generally are rated below that of the issuing company’s senior debt securities and are freely callable at the issuer’s option.
Preferred Stock: Preferred stock has a preference over common stock in liquidation (and generally in receiving dividends as well) but is subordinated to the liabilities of the issuer in all respects. As a general rule, the market value of preferred stock with a fixed dividend rate and no conversion element varies
| | | | | | |
| | | | | | | |
| | FDP SERIES, INC. | | MAY 31, 2016 | | 53 |
| | |
| Notes to Financial Statements (continued) | | |
inversely with interest rates and perceived credit risk, while the market price of convertible preferred stock generally also reflects some element of conversion value. Because preferred stock is junior to debt securities and other obligations of the issuer, deterioration in the credit quality of the issuer will cause greater changes in the value of a preferred stock than in a more senior debt security with similar stated yield characteristics. Unlike interest payments on debt securities, preferred stock dividends are payable only if declared by the issuer’s board of directors. Preferred stock also may be subject to optional or mandatory redemption provisions.
Floating Rate Loan Interests: Floating rate loan interests are typically issued to companies (the “borrower”) by banks, other financial institutions, or privately and publicly offered corporations (the “lender”). Floating rate loan interests are generally non-investment grade, often involve borrowers whose financial condition is troubled or uncertain and companies that are highly leveraged. A Fund may invest in obligations of borrowers who are in bankruptcy proceedings. In addition, transactions in floating rate loan interests may settle on a delayed basis, which may result in proceeds from the sale to not be readily available for a Fund to make additional investments or meet its redemption obligations. Floating rate loan interests may include fully funded term loans or revolving lines of credit. Floating rate loan interests are typically senior in the corporate capital structure of the borrower. Floating rate loan interests generally pay interest at rates that are periodically determined by reference to a base lending rate plus a premium. The base lending rates are generally the lending rate offered by one or more European banks, such as the London Interbank Offered Rate (“LIBOR”), the prime rate offered by one or more U.S. banks or the certificate of deposit rate. Floating rate loan interests may involve foreign borrowers, and investments may be denominated in foreign currencies. These investments are treated as investments in debt securities for purposes of a Fund’s investment policies.
When a Fund purchases a floating rate loan interest, it may receive a facility fee and when it sells a floating rate loan interest, it may pay a facility fee. On an ongoing basis, a Fund may receive a commitment fee based on the undrawn portion of the underlying line of credit amount of a floating rate loan interest. Facility and commitment fees are typically amortized to income over the term of the loan or term of the commitment, respectively. Consent and amendment fees are recorded to income as earned. Prepayment penalty fees, which may be received by a Fund upon the prepayment of a floating rate loan interest by a borrower, are recorded as realized gains. A Fund may invest in multiple series or tranches of a loan. A different series or tranche may have varying terms and carry different associated risks.
Floating rate loan interests are usually freely callable at the borrower’s option. A Fund may invest in such loans in the form of participations in loans (“Participations”) or assignments (“Assignments”) of all or a portion of loans from third parties. Participations typically will result in a Fund having a contractual relationship only with the lender, not with the borrower. A Fund has the right to receive payments of principal, interest and any fees to which it is entitled only from the lender selling the Participation and only upon receipt by the lender of the payments from the borrower. In connection with purchasing Participations, a Fund generally will have no right to enforce compliance by the borrower with the terms of the loan agreement, nor any rights of offset against the borrower. A Fund may not benefit directly from any collateral supporting the loan in which it has purchased the Participation. As a result, a Fund assumes the credit risk of both the borrower and the lender that is selling the Participation. A Fund’s investment in loan participation interests involves the risk of insolvency of the financial intermediaries who are parties to the transactions. In the event of the insolvency of the lender selling the Participation, a Fund may be treated as a general creditor of the lender and may not benefit from any offset between the lender and the borrower. Assignments typically result in a Fund having a direct contractual relationship with the borrower, and a Fund may enforce compliance by the borrower with the terms of the loan agreement.
In connection with floating rate loan interests, certain Funds may also enter into unfunded floating rate loan interests (“commitments”). In connection with these commitments, a Fund earns a commitment fee, typically set as a percentage of the commitment amount. Such fee income, which is included in interest income in the Statements of Operations, is recognized ratably over the commitment period. Unfunded floating rate loan interests are marked-to-market daily, and any unrealized appreciation (depreciation) is included in the Statements of Assets and Liabilities and Statements of Operations. As of period end, the Franklin Templeton Fund had the following unfunded floating rate loan interests:
| | | | | | | | | | | | | | | | |
| Borrower | | Par | | | Commitment
Amount | | | Value | | | Unrealized
Depreciation | |
BMC Software Finance, Inc. | | $ | 288,534 | | | $ | 275,133 | | | $ | 266,173 | | | $ | (8,960 | ) |
Forward Commitments and When-Issued Delayed Delivery Securities: Certain Funds may purchase securities on a when-issued basis and may purchase or sell securities on a forward commitment basis. Settlement of such transactions normally occurs within a month or more after the purchase or sale commitment is made. A Fund may purchase securities under such conditions with the intention of actually acquiring them, but may enter into a separate agreement to sell the securities before the settlement date. Since the value of securities purchased may fluctuate prior to settlement, a Fund may be required to pay more at settlement than the security is worth. In addition, a Fund is not entitled to any of the interest earned prior to settlement. When purchasing a security on a delayed delivery basis, a Fund assumes the rights and risks of ownership of the security, including the risk of price and yield fluctuations. In the event of default by the counterparty, a Fund’s maximum amount of loss is the unrealized appreciation of unsettled when-issued transactions.
TBA Commitments: TBA commitments are forward agreements for the purchase or sale of mortgage-backed securities for a fixed price, with payment and delivery on an agreed upon future settlement date. The specific securities to be delivered are not identified at the trade date. However, delivered securities must meet specified terms, including issuer, rate and mortgage terms. When entering into TBA commitments, a Fund may take possession of or deliver the
| | | | | | |
| | | | | | | |
| 54 | | FDP SERIES, INC. | | MAY 31, 2016 | | |
| | | | |
| Notes to Financial Statements (continued) | | |
underlying mortgage-backed securities but can extend the settlement or roll the transaction. TBA commitments involve a risk of loss if the value of the security to be purchased or sold declines or increases, respectively, prior to settlement date.
In order to better define contractual rights and to secure rights that will help a Fund mitigate their counterparty risk, TBA commitments may be entered into by a Fund under Master Securities Forward Transaction Agreements (each, an “MSFTA”). An MSFTA typically contains, among other things, collateral posting terms and netting provisions in the event of default and/or termination event. The collateral requirements are typically calculated by netting the mark-to-market amount for each transaction under such agreement and comparing that amount to the value of the collateral currently pledged by a Fund and the counterparty. Cash collateral that has been pledged to cover the obligations of a Fund and cash collateral received from the counterparty, if any, is reported separately on the Statements of Assets and Liabilities as cash pledged as collateral for TBA commitments or cash received as collateral for TBA commitments, respectively. Non-cash collateral pledged by a Fund, if any, is noted in the Schedules of Investments. Typically, a Fund is permitted to sell, repledge or use the collateral it receives; however, the counterparty is not permitted to do so. To the extent amounts due to a Fund are not fully collateralized, contractually or otherwise, a Fund bears the risk of loss from counterparty non-performance.
Mortgage Dollar Roll Transactions: Certain Funds may sell TBA mortgage-backed securities and simultaneously contract to repurchase substantially similar (i.e., same type, coupon and maturity) securities on a specific future date at an agreed upon price. During the period between the sale and repurchase, a Fund is not entitled to receive interest and principal payments on the securities sold. Mortgage dollar roll transactions are treated as purchases and sales and realize gains and losses on these transactions. Mortgage dollar rolls involve the risk that the market value of the securities that a Fund is required to purchase may decline below the agreed upon repurchase price of those securities.
5. Derivative Financial Instruments:
The Funds engage in various portfolio investment strategies using derivative contracts both to seek to increase the returns of the Funds and/or to manage their exposure to certain risks such as credit risk, equity risk, interest rate risk, foreign currency exchange rate risk, commodity price risk or other risks (e.g., inflation risk). Derivative financial instruments categorized by risk exposure are included in the Schedules of Investments. These contracts may be transacted on an exchange or OTC.
Futures Contracts: Certain Funds invest in long and/or short positions in futures and options on futures contracts to gain exposure to, or manage exposure to, changes in interest rates (interest rate risk), changes in the value of equity securities (equity risk) or foreign currencies (foreign currency exchange rate risk).
Futures contracts are agreements between the Funds and a counterparty to buy or sell a specific quantity of an underlying instrument at a specified price and on a specified date. Depending on the terms of a contract, it is settled either through physical delivery of the underlying instrument on the settlement date or by payment of a cash amount on the settlement date. Upon entering into a futures contract, the Funds are required to deposit initial margin with the broker in the form of cash or securities in an amount that varies depending on a contract’s size and risk profile. The initial margin deposit must then be maintained at an established level over the life of the contract.
Securities deposited as initial margin are designated in the Schedules of Investments and cash deposited, if any, is shown as cash pledged for futures contracts in the Statements of Assets and Liabilities. Pursuant to the contract, the Funds agree to receive from or pay to the broker an amount of cash equal to the daily fluctuation in market value of the contract (“variation margin”). Variation margin is recorded as unrealized appreciation (depreciation) and, if any, shown as variation margin receivable (or payable) on futures contracts in the Statements of Assets and Liabilities. When the contract is closed, a realized gain or loss is recorded in the Statements of Operations equal to the difference between the value of the contract at the time it was opened and the value at the time it was closed. The use of futures contracts involves the risk of an imperfect correlation in the movements in the price of futures contracts and interest, foreign currency exchange rates or underlying assets.
Forward Foreign Currency Exchange Contracts: Certain Funds enter into forward foreign currency exchange contracts to gain or reduce exposure to foreign currencies (foreign currency exchange rate risk).
A forward foreign currency exchange contract is an agreement between two parties to buy and sell a currency at a set exchange rate on a specified date. These contracts help to manage the overall exposure to the currencies in which some of the investments held by the Funds are denominated and in some cases, may be used to obtain exposure to a particular market.
The daily change in market value is recorded as unrealized appreciation (depreciation) in the Statements of Assets and Liabilities. When a contract is closed, a realized gain or loss is recorded in the Statements of Operations equal to the difference between the value at the time it was opened and the value at the time it was closed. Non-deliverable forward foreign currency exchange contracts are settled with the counterparty in cash without delivery of foreign currency. The use of forward foreign currency exchange contracts involves the risk that the value of a forward foreign currency exchange contract changes unfavorably due to movements in the value of the referenced foreign currencies.
Options: Certain Funds purchase and write call and put options to increase or decrease their exposure to the risks of underlying instruments, including equity risk, interest rate risk and/or commodity price risk and/or, in the case of options written, to generate gains from options premiums.
| | | | | | |
| | | | | | | |
| | FDP SERIES, INC. | | MAY 31, 2016 | | 55 |
| | |
| Notes to Financial Statements (continued) | | |
A call option gives the purchaser (holder) of the option the right (but not the obligation) to buy, and obligates the seller (writer) to sell (when the option is exercised) the underlying instrument at the exercise or strike price at any time or at a specified time during the option period. A put option gives the holder the right to sell and obligates the writer to buy the underlying instrument at the exercise or strike price at any time or at a specified time during the option period.
Premiums paid on options purchased and premiums received on options written, as well as the daily fluctuations in market value, are include in investments at value — unaffiliated and options written at value, respectively, in the Statements of Assets and Liabilities. When an instrument is purchased or sold through the exercise of an option, the premium is offset against the cost or proceeds of the underlying instrument. When an option expires, a realized gain or loss is recorded in the Statements of Operations to the extent of the premiums received or paid. When an option is closed or sold, a gain or loss is recorded in the Statements of Operations to the extent the cost of the closing transaction exceeds the premiums received or paid. When the Funds write a call option, such option is typically “covered,” meaning that they hold the underlying instrument subject to being called by the option counterparty. When the Funds write a put option, such option is covered by cash in an amount sufficient to cover the obligation.
| • | | Swaptions — Certain Funds purchase and write options on swaps (“swaptions”) primarily to preserve a return or spread on a particular investment or portion of the Funds’ holdings, as a duration management technique or to protect against an increase in the price of securities it anticipates purchasing at a later date. The purchaser and writer of a swaption is buying or granting the right to enter into a previously agreed upon interest rate or credit default swap agreement (interest rate risk and/or credit risk) at any time before the expiration of the option. |
| • | | Foreign Currency options — Certain Funds purchase and write foreign currency options, foreign currency futures and options on foreign currency futures to gain or reduce exposure to foreign currencies (foreign currency exchange rate risk). Foreign currency options give the purchaser the right to buy from or sell to the writer a foreign currency at any time before the expiration of the option. |
In purchasing and writing options, the Funds bear the risk of an unfavorable change in the value of the underlying instrument or the risk that they may not be able to enter into a closing transaction due to an illiquid market. Exercise of a written option could result in the Funds purchasing or selling a security when it otherwise would not, or at a price different from the current market value.
Swaps: Certain Funds enter into swap contracts to manage exposure to issuers, markets and securities. Such contracts are agreements between the Funds and a counterparty to make periodic net payments on a specified notional amount or a net payment upon termination. Swap agreements are privately negotiated in the OTC market and may be entered into as a bilateral contract (“OTC swaps”) or centrally cleared (“centrally cleared swaps”).
For OTC swaps, any upfront premiums paid and any upfront fees received are shown as swap premiums paid and swap premiums received, respectively, in the Statements of Assets and Liabilities and amortized over the term of the contract. The daily fluctuation in market value is recorded as unrealized appreciation (depreciation) on OTC Swaps in the Statements of Assets and Liabilities. Payments received or paid are recorded in the Statements of Operations as realized gains or losses, respectively. When an OTC swap is terminated, a realized gain or loss is recorded in the Statements of Operations equal to the difference between the proceeds from (or cost of) the closing transaction and the Fund’s basis in the contract, if any. Generally, the basis of the contract is the premium received or paid.
In a centrally cleared swap, immediately following execution of the swap contract, the swap contract is novated to a central counterparty (the “CCP”) and the Funds’ counterparty on the swap agreement becomes the CCP. The Funds are required to interface with the CCP through the broker. Upon entering into a centrally cleared swap, the Funds are required to deposit initial margin with the broker in the form of cash or securities in an amount that varies depending on the size and risk profile of the particular swap. Securities deposited as initial margin are designated in the Schedules of Investments and cash deposited is shown as cash pledged for centrally cleared swaps in the Statements of Assets and Liabilities. Pursuant to the contract, the Funds agree to receive from or pay to the broker an amount of cash equal to the daily fluctuation in market value of the contract (“variation margin”). Variation margin is recorded as unrealized appreciation (depreciation) and shown as variation margin receivable (or payable) on centrally cleared swaps in the Statements of Assets and Liabilities. Payments received from (paid to) the counterparty, including at termination, are recorded as realized gains (losses) in the Statements of Operations.
| • | | Credit default swaps — Certain Funds enter into credit default swaps to manage their exposure to the market or certain sectors of the market, to reduce their risk exposure to defaults of corporate and/or sovereign issuers or to create exposure to corporate and/or sovereign issuers to which they are not otherwise exposed (credit risk). |
The Funds may either buy or sell (write) credit default swaps on single-name issuers (corporate or sovereign), a combination or basket of single-name issuers or traded indexes. Credit default swaps are agreements in which the protection buyer pays fixed periodic payments to the seller in consideration for a promise from the protection seller to make a specific payment should a negative credit event take place with respect to the referenced entity (e.g., bankruptcy, failure to pay, obligation acceleration, repudiation, moratorium or restructuring). As a buyer, if an underlying credit event occurs, the Funds will either (i) receive from the seller an amount equal to the notional amount of the swap and deliver the referenced security or underlying securities comprising the index, or (ii) receive a net settlement of cash equal to the notional amount of the swap less the recovery value of the security or underlying securities comprising the index. As a seller (writer), if an underlying credit event occurs, the Funds will either pay the buyer an amount equal to the notional amount
| | | | | | |
| | | | | | | |
| 56 | | FDP SERIES, INC. | | MAY 31, 2016 | | |
| | | | |
| Notes to Financial Statements (continued) | | |
of the swap and take delivery of the referenced security or underlying securities comprising the index or pay a net settlement of cash equal to the notional amount of the swap less the recovery value of the security or underlying securities comprising the index.
| • | | Currency swaps — Certain Funds enter into currency swaps to gain or reduce exposure to foreign currencies (foreign currency exchange rate risk). Currency swaps are interest rate swaps in which one party pays a stream of interest payments, either fixed or floating, in exchange for another party’s stream of interest payments, either fixed or floating, based on the notional amounts of two different currencies. The notional amounts are typically determined based on the spot exchange rates at the inception of the trade. Currency swaps may also involve an exchange of notional amounts at the start, during and/or at expiration of the contract, either at the current spot rate or another specified rate. |
Master Netting Arrangements: In order to define their contractual rights and to secure rights that will help them mitigate their counterparty risk, the Funds may enter into an International Swaps and Derivatives Association, Inc. Master Agreement (“ISDA Master Agreement”) or similar agreement with their counterparties. An ISDA Master Agreement is a bilateral agreement between each Fund and a counterparty that governs certain OTC derivatives and typically contains, among other things, collateral posting terms and netting provisions in the event of a default and/or termination event. Under an ISDA Master Agreement, each Fund may, under certain circumstances, offset with the counterparty certain derivative financial instruments’ payables and/or receivables with collateral held and/or posted and create one single net payment. The provisions of the ISDA Master Agreement typically permit a single net payment in the event of default including the bankruptcy or insolvency of the counterparty. Bankruptcy or insolvency laws of a particular jurisdiction may restrict or prohibit the right of offset in bankruptcy, insolvency or other events. In addition, certain ISDA Master Agreements allow counterparties to terminate derivative contracts prior to maturity in the event the Funds’ net assets decline by a stated percentage or the Funds fail to meet the terms of their ISDA Master Agreements. The result would cause the Funds to accelerate payment of any net liability owed to the counterparty.
Collateral Requirements: For derivatives traded under an ISDA Master Agreement, the collateral requirements are typically calculated by netting the mark-to-market amount for each transaction under such agreement and comparing that amount to the value of any collateral currently pledged by the Fund and the counterparty.
Cash collateral that has been pledged to cover obligations of the Funds and cash collateral received from the counterparty, if any, is reported separately on the Statements of Assets and Liabilities as cash pledged as collateral and cash received as collateral, respectively. Non-cash collateral pledged by the Funds, if any, is noted in the Schedules of Investments. Generally, the amount of collateral due from or to a counterparty is subject to a certain minimum transfer amount threshold before a transfer is required, which is determined at the close of business of the Funds. Any additional required collateral is delivered to/pledged by the Funds on the next business day. Typically, the counterparty is not permitted to sell, re-pledge or use cash and non-cash collateral it receives. A Fund generally agrees not to use non-cash collateral that it receives but may, absent default or certain other circumstances defined in the underlying ISDA Master Agreement, be permitted to use cash collateral received. In such cases, interest may be paid pursuant to the collateral arrangement with the counterparty. To the extent amounts due to the Funds from their counterparties are not fully collateralized they bear the risk of loss from counterparty non-performance. Likewise, to the extent the Funds have delivered collateral to a counterparty and stand ready to perform under the terms of their agreement with such counterparty, they bear the risk of loss from a counterparty in the amount of the value of the collateral in the event the counterparty fails to return such collateral. Based on the terms of agreements, collateral may not be required for all derivative contracts.
For financial reporting purposes, the Funds do not offset derivative assets and derivative liabilities that are subject to netting arrangements, if any, in the Statements of Assets and Liabilities.
6. Investment Advisory Agreement and Other Transactions with Affiliates:
The PNC Financial Services Group, Inc. is the largest stockholder and an affiliate of BlackRock, Inc. (“BlackRock”) for 1940 Act purposes.
Investment Advisory
The Corporation, on behalf of the Funds, entered into an Investment Advisory Agreement with the Manager, the Funds’ investment advisor, an indirect, wholly owned subsidiary of BlackRock, to provide investment advisory and administration services. The Manager is responsible for the management of each Fund’s portfolio and provides the personnel, facilities, equipment and certain other services necessary to the operations of each Fund. For such services, each Fund pays the Manager a monthly fee, which is determined by calculating a percentage of each Fund’s average daily net assets, based on the following annual rates:
| | | | | | | | | | | | | | | | |
| | | MFS
Fund | | | Janus
Fund | | | Invesco
Fund | | | Franklin
Templeton
Fund | |
Not exceeding $1 Billion | | | 0.90% | | | | 0.80% | | | | 0.70% | | | | 0.40% | |
In excess of $1 Billion but not more than $3 Billion | | | 0.85% | | | | 0.75% | | | | 0.66% | | | | 0.38% | |
In excess of $3 Billion but not more than $5 Billion | | | 0.81% | | | | 0.72% | | | | 0.63% | | | | 0.36% | |
In excess of $5 Billion but not more than $10 Billion | | | 0.78% | | | | 0.70% | | | | 0.61% | | | | 0.35% | |
In excess of $10 Billion | | | 0.77% | | | | 0.68% | | | | 0.60% | | | | 0.34% | |
| | | | | | |
| | | | | | | |
| | FDP SERIES, INC. | | MAY 31, 2016 | | 57 |
| | |
| Notes to Financial Statements (continued) | | |
The Manager entered into sub-advisory agreements on behalf of each Fund. Pursuant to the sub-advisory agreements, the Manager pays each sub-advisor for services they provide a monthly fee that is a percentage of the Manager’s investment advisory fee at the following annual rates, based on each Fund’s average daily net assets:
| | | | |
| | | Sub-Advisor | | Sub-Advisory Fee |
MFS Fund | | Massachusetts Financial Services Company | | 0.45% |
Janus Fund | | Janus Capital Management, LLC | | 0.40% of first $200 million
0.35% above $200 million |
Invesco Fund | | Invesco Advisers, Inc. | | 0.35% |
Franklin Templeton Fund | | Franklin Advisers, Inc. | | 0.25% |
Prior to January 30, 2016, Marsico Capital Management LLC served as a sub-advisor to Janus Fund pursuant to a sub-advisory agreement with the Manager, and received for its services a monthly fee from the Manager at an annual rate of 0.40% of the Fund’s average daily net assets. Effective at the close of business January 29, 2016, the sub-advisory agreement between the Manager and Marsico Capital Management LLC, with respect to Janus Fund, was terminated.
Service and Distribution Fees
The Corporation , on behalf of the Funds, entered into a Distribution Agreement and a Distribution and Service Plan with BlackRock Investments, LLC (“BRIL”), an affiliate of the Manager. Pursuant to the Distribution and Service Plan and in accordance with Rule 12b-1 under the 1940 Act, each Fund pays BRIL ongoing service and distribution fees. The fees are accrued daily and paid monthly at annual rates based upon the average daily net assets of the relevant share class of each Fund as follows:
| | | | | | | | | | | | | | | | |
| | | Service Fees | |
| | | MFS
Fund | | | Janus
Fund | | | Invesco
Fund | | | Franklin
Templeton
Fund | |
Investor A | | | 0.25% | | | | 0.25% | | | | 0.25% | | | | 0.25% | |
Investor C | | | 0.25% | | | | 0.25% | | | | 0.25% | | | | 0.25% | |
| | | Distribution Fees | |
Investor C | | | 0.75% | | | | 0.75% | | | | 0.75% | | | | 0.55% | |
BRIL and broker-dealers, pursuant to sub-agreements with BRIL, provide shareholder servicing and distribution services to the Funds. The ongoing service and/or distribution fee compensates BRIL and each broker-dealer for providing shareholder servicing and/or distribution related services to the shareholders.
For the year ended May 31, 2016, the following table shows the class specific service and distribution fees borne directly by each share class of each Fund:
| | | | | | | | | | | | |
| Service and Distribution Fees | | | | | | | | | |
| | | Investor A | | | Investor C | | | Total | |
MFS Fund | | $ | 158,212 | | | $ | 954,579 | | | $ | 1,112,791 | |
Janus Fund | | $ | 142,114 | | | $ | 838,329 | | | $ | 980,443 | |
Invesco Fund | | $ | 138,906 | | | $ | 824,722 | | | $ | 963,628 | |
Franklin Templeton Fund | | $ | 230,306 | | | $ | 1,079,691 | | | $ | 1,309,997 | |
Transfer Agent
For the year ended May 31, 2016, the following table shows the class specific transfer agent fees borne directly by each class of each Fund:
| | | | | | | | | | | | | | | | |
| | | Institutional | | | Investor A | | | Investor C | | | Total | |
MFS Fund | | $ | 7,111 | | | $ | 73,807 | | | $ | 119,226 | | | $ | 200,144 | |
Janus Fund | | $ | 6,592 | | | $ | 66,156 | | | $ | 104,949 | | | $ | 177,697 | |
Invesco Fund | | $ | 6,471 | | | $ | 64,087 | | | $ | 102,173 | | | $ | 172,731 | |
Franklin Templeton Fund | | $ | 8,423 | | | $ | 101,604 | | | $ | 160,037 | | | $ | 270,064 | |
In addition, the Funds pay the transfer agent, which is not an affiliate, a fee for issuance, transfer and redemption of shares and the opening and maintenance of shareholder accounts, which is included in transfer agent in the Statements of Operations.
| | | | | | |
| | | | | | | |
| 58 | | FDP SERIES, INC. | | MAY 31, 2016 | | |
| | | | |
| Notes to Financial Statements (continued) | | |
Other Fees
For the year ended May 31, 2016, affiliates earned underwriting discounts, direct commissions and dealer concessions on sales of each Fund’s Investor A Shares as follows:
| | | | | | | | | | | | | | | | |
| | | MFS
Fund | | | Janus
Fund | | | Invesco
Fund | | | Franklin
Templeton
Fund | |
Investor A | | $ | 12,184 | | | $ | 11,223 | | | $ | 10,972 | | | $ | 19,047 | |
For the year ended May 31, 2016, affiliates received CDSCs as follows:
| | | | | | | | | | | | | | | | |
| | | MFS
Fund | | | Janus
Fund | | | Invesco
Fund | | | Franklin
Templeton
Fund | |
Investor A | | $ | 1,710 | | | $ | 984 | | | $ | 1,138 | | | $ | 1,272 | |
Investor C | | $ | 14,746 | | | $ | 11,170 | | | $ | 11,955 | | | $ | 26,519 | |
Expense Limitations & Waivers
The Manager, with respect to each Fund, contractually agreed to waive and/or reimburse fees or expenses in order to limit expenses, excluding interest expense, dividend expense, tax expense, acquired fund fees and expenses, and certain other fund expenses, which constitute extraordinary expenses not incurred in the ordinary course of each Fund’s business. The expense limitation as a percentage of average daily net assets is as follows:
| | | | | | | | | | | | | | | | |
| Share Class | | MFS
Fund | | | Janus
Fund | | | Invesco
Fund | | | Franklin
Templeton
Fund | |
Institutional | | | 1.95% | | | | 1.95% | | | | 1.95% | | | | 1.95% | |
Investor A | | | 2.20% | | | | 2.20% | | | | 2.20% | | | | 2.20% | |
Investor C | | | 2.95% | | | | 2.95% | | | | 2.95% | | | | 2.75% | |
The Manager has agreed not to reduce or discontinue this contractual expense limitation prior to October 1, 2016, unless approved by the Board, including a majority of the Independent Directors or by a majority of the outstanding voting securities of the Funds. For the year ended May 31, 2016, there were no fees waived and/or reimbursed by the Manager.
Effective January 30, 2016, the Manager has agreed to contractually waive the management fee payable by FDP BlackRock Janus Growth Fund in an amount equal to 0.05% of the Fund’s average daily net assets over $200 million.
The Manager has agreed to voluntarily waive, as a percentage of average daily net assets, 0.10% and 0.05% of its advisory fees payable by MFS Fund and Janus Fund, respectively. This voluntary waiver may be reduced or discontinued at any time without notice. For the year ended May 31, 2016, the amounts included in fees waived by the Manager were as follows:
| | | | | | | | |
| | | MFS
Fund | | | Janus
Fund | |
Amount waived | | $ | 164,397 | | | $ | 73,011 | |
For the year ended May 31, 2016, the Funds reimbursed the Manager for certain accounting services, which is included in accounting services in the Statements of Operations. The reimbursements were as follows:
| | | | | | | | | | | | | | | | |
| | | MFS
Fund | | | Janus
Fund | | | Invesco
Fund | | | Franklin
Templeton
Fund | |
Amount reimbursed | | $ | 1,865 | | | $ | 1,644 | | | $ | 1,609 | | | $ | 2,613 | |
Officers and Directors
Certain officers and/or directors of the Corporation are officers and/or directors of BlackRock or its affiliates. The Funds reimburse the Manager for a portion of the compensation paid to the Funds’ Chief Compliance Officer, which is included in Officer and Directors in the Statements of Operations.
Other Transactions
The Funds may purchase securities from, or sell securities to, an affiliated fund provided the affiliation is due solely to having a common investment advisor, common officers, or common directors. For the year ended May 31, 2016, the purchase and sale transactions with an affiliated fund in compliance with Rule 17a-7 under the 1940 Act were as follows:
| | | | | | | | |
| | | Purchases | | | Sales | |
MFS Fund | | $ | 214,367 | | | $ | 963,449 | |
| | | | | | |
| | | | | | | |
| | FDP SERIES, INC. | | MAY 31, 2016 | | 59 |
| | |
| Notes to Financial Statements (continued) | | |
7. Purchases and Sales:
For the year ended May 31, 2016, purchases and sales of investments, including mortgage dollar rolls and excluding short-term securities and, were as follows:
| | | | | | | | | | | | | | | | |
| Purchase | | MFS
Fund | | | Janus
Fund | | | Invesco
Fund | | | Franklin
Templeton
Fund | |
Non-U.S. Government Securities | | $ | 61,206,264 | | | $ | 179,933,151 | | | $ | 21,141,938 | | | | 692,572,400 | |
U.S. Government Securities | | | — | | | | — | | | | — | | | | 26,354,816 | |
| | | | |
Total | | $ | 61,206,264 | | | $ | 179,933,151 | | | $ | 21,141,938 | | | | 718,927,216 | |
| | | | |
| | | | | | | | | | | | | | | | |
| Sales | | MFS
Fund | | | Janus
Fund | | | Invesco
Fund | | | Franklin
Templeton
Fund | |
Non-U.S. Government Securities | | $ | 66,141,976 | | | $ | 189,612,742 | | | $ | 24,346,101 | | | | 690,867,765 | |
U.S. Government Securities | | | — | | | | — | | | | — | | | | 5,446,735 | |
| | | | |
Total | | $ | 66,141,976 | | | $ | 189,612,742 | | | $ | 24,346,101 | | | | 696,314,500 | |
| | | | |
For the year ended May 31, 2016, purchases and sales related to mortgage dollar rolls for Franklin Templeton Fund were $447,270,025 and $448,151,471, respectively.
8. Income Tax Information:
It is the Funds’ policy to comply with the requirements of the Internal Revenue Code of 1986, as amended, applicable to regulated investment companies, and to distribute substantially all of their taxable income to their shareholders. Therefore, no federal income tax provision is required.
Each Fund files U.S. federal and various state and local tax returns. No income tax returns are currently under examination. The statute of limitations on each Fund’s U.S. federal tax returns remains open for each of the four years ended May 31, 2016. The statutes of limitations on each Fund’s state and local tax returns may remain open for an additional year depending upon the jurisdiction.
Management has analyzed tax laws and regulations and their application to the Funds as of May 31, 2016, inclusive of the open tax return years, and does not believe there are any uncertain tax positions that require recognition of a tax liability in the Funds’ financial statements.
Permanent Differences
U.S. GAAP requires that certain components of net assets be adjusted to reflect permanent differences between financial and tax reporting. These reclassifications have no effect on net assets or net asset values per share. As period end, the following permanent difference attributable to net operating losses, the use of equalization, the accounting for swap agreements, the sale of stock of passive foreign investment companies and foreign currency transactions were reclassified to the following accounts:
| | | | | | | | | | | | | | | | |
| | | MFS
Fund | | | Janus
Fund | | | Invesco
Fund | | | Franklin
Templeton
Fund | |
Paid-in Capital | | | — | | | $ | (1,876,134 | ) | | $ | 578,358 | | | $ | 93 | |
Undistributed (accumulated) net investment income (loss) | | $ | (47,273 | ) | | $ | 1,875,875 | | | $ | 529,166 | | | $ | (640,222 | ) |
Accumulated net realized gain (loss) | | $ | 47,273 | | | $ | 259 | | | $ | (1,107,524 | ) | | $ | 640,129 | |
Tax Character of Distributions
The tax character of distributions paid was as follows:
| | | | | | | | | | | | | | | | | | | | |
| | | | | | MFS
Fund | | | Janus
Fund | | | Invesco
Fund | | | Franklin
Templeton
Fund | |
Ordinary income | | | 5/31/16 | | | $ | 895,356 | | | | — | | | $ | 2,040,580 | | | $ | 8,202,561 | |
| | | 5/31/15 | | | $ | 2,447,038 | | | | — | | | $ | 1,490,590 | | | $ | 5,554,612 | |
Long-term capital gains1 | | | 5/31/16 | | | | — | | | $ | 22,273,335 | | | $ | 578,358 | | | $ | 1,048,207 | |
| | | 5/31/15 | | | | — | | | $ | 9,889,964 | | | | — | | | $ | 1,101,475 | |
| | | | |
Total | | | 5/31/16 | | | $ | 895,356 | | | $ | 22,273,335 | | | $ | 2,618,938 | | | $ | 9,250,768 | |
| | | �� | |
| | | 5/31/15 | | | $ | 2,447,038 | | | $ | 9,889,964 | | | $ | 1,490,590 | | | $ | 6,656,087 | |
| | | | |
| | 1 | | Distribution amounts may include a portion of the proceeds from redeemed shares. |
| | | | | | |
| | | | | | | |
| 60 | | FDP SERIES, INC. | | MAY 31, 2016 | | |
| | | | |
| Notes to Financial Statements (continued) | | |
Tax Components of Accumulated Net Earnings
As of period end, the tax components of accumulated net earnings were as follows:
| | | | | | | | | | | | | | | | |
| | | MFS
Fund | | | Janus
Fund | | | Invesco
Fund | | | Franklin
Templeton
Fund | |
Undistributed ordinary income | | $ | 1,071,356 | | | | — | | | $ | 951,683 | | | | — | |
Undistributed long-term capital gains | | | — | | | $ | 4,899,604 | | | | 514,149 | | | | — | |
| | | | | | | | | | | | | | | | |
Capital loss carryforwards | | | (30,730,733 | ) | | | — | | | | — | | | $ | (1,319,792 | ) |
Net unrealized gains (losses)1 | | | 16,061,079 | | | | 15,546,497 | | | | 22,108,792 | | | | (2,775,750 | ) |
Qualified late-year losses2 | | | (9,259,495 | ) | | | (523,896 | ) | | | — | | | | (1,189,162 | ) |
| | | | | | | | | | | | | | | | |
Total | | $ | (22,857,793 | ) | | $ | 19,922,205 | | | $ | 23,574,624 | | | $ | (5,284,704 | ) |
| | | | | | | | | | | | | | | | |
| | 1 | | The differences between book-basis and tax-basis net unrealized gains were attributable primarily to the tax deferral of losses on wash sales and straddles, the accounting for swap agreements, amortization methods for premiums and discounts on fixed income securities, the realization for tax purposes of unrealized gains on investments in passive foreign investment companies, the classification of investments and the realization for tax purposes of unrealized gains/losses on futures and foreign currency contracts. |
| | 2 | | The Funds have elected to defer certain qualified late-year losses and recognize such losses in the next taxable year. |
Capital Loss Carryforwards
As of May 31, 2016, the Funds had capital loss carryforwards available to offset future realized capital gains through the indicated expiration dates as follows:
| | | | | | | | |
| Expires May 31, | | MFS
Fund | | | Franklin
Templeton
Fund | |
No expiration date1 | | | — | | | $ | 1,319,792 | |
2017 | | $ | 257,228 | | | | — | |
2018 | | | 30,473,505 | | | | — | |
| | | | | | | | |
Total | | $ | 30,730,733 | | | $ | 1,319,792 | |
| | | | | | | | |
| | 1 | | Must be utilized prior to losses subject to expiration. |
During the year ended May 31, 2016, the Funds listed below utilized the following amounts of their respective capital loss carryforward:
| | | | |
MFS Fund | | $ | 480,859 | |
Invesco Fund | | $ | 5,010,275 | |
Tax Cost
As of May 31, 2016, gross unrealized appreciation and depreciation based on cost for federal income tax purposes were as follows:
| | | | | | | | | | | | | | | | |
| | | MFS
Fund | | | Janus
Fund | | | Invesco
Fund | | | Franklin
Templeton
Fund | |
Tax cost | | $ | 137,233,201 | | | $ | 120,095,871 | | | $ | 112,664,437 | | | $ | 226,748,079 | |
| | | | | | | | | | | | | | | | |
Gross unrealized appreciation | | $ | 26,503,852 | | | $ | 16,977,565 | | | $ | 32,026,459 | | | | 5,023,875 | |
Gross unrealized depreciation | | | (10,428,527 | ) | | | (1,431,068 | ) | | | (9,915,034 | ) | | | (6,758,121 | ) |
| | | | | | | | | | | | | | | | |
Net unrealized appreciation (depreciation) | | $ | 16,075,325 | | | $ | 15,546,497 | | | $ | 22,111,425 | | | | (1,734,246 | ) |
| | | | | | | | | | | | | | | | |
9. Bank Borrowings:
The Corporation, on behalf of the Funds, along with certain other funds managed by the Manager and its affiliates (“Participating Funds”), is a party to a 364-day, $2.1 billion credit agreement with a group of lenders. Under this agreement, the Funds may borrow to fund shareholder redemptions. Excluding commitments designated for certain individual funds, the Participating Funds, including the Funds, can borrow up to an aggregate commitment amount of $1.6 billion at any time outstanding, subject to asset coverage and other limitations as specified in the agreement. The credit agreement has the following terms: a fee of 0.12% per annum on unused commitment amounts and interest at a rate equal to the higher of (a) one-month LIBOR (but, in any event, not less than 0.00%) on the date the loan is made plus 0.80% per annum or (b) the Fed Funds rate (but, in any event, not less than 0.00%) in effect from time to time plus 0.80% per annum on amounts borrowed. The agreement expires in April 2017 unless extended or renewed. Prior to April 21, 2016, the credit agreement had a fee per annum of 0.06% on unused commitment amounts and interest at a rate equal to the higher of (a) one-month LIBOR (but, in any event, not less than 0.00%) on the date the loan is made plus 0.80% per annum or (b) the Fed Funds rate (but, in any event, not less than 0.00%) in effect from time to time plus 0.80% per annum on amounts borrowed. Participating Funds paid administration, legal and arrangement fees, which, if applicable, are included in miscellaneous expenses in the Statements of Operations. These fees were allocated among such funds based upon portions of the aggregate commitment available to them and relative net assets of Participating Funds. During the year ended May 31, 2016, the Funds did not borrow under the credit agreement.
| | | | | | |
| | | | | | | |
| | FDP SERIES, INC. | | MAY 31, 2016 | | 61 |
| | |
| Notes to Financial Statements (continued) | | |
10. Principal Risks:
Many municipalities insure repayment of their bonds, which may reduce the potential for loss due to credit risk. The market value of these bonds may fluctuate for other reasons, including market perception of the value of such insurance, and there is no guarantee that the insurer will meet its obligation.
Inventories of municipal bonds held by brokers and dealers may decrease, which would lessen their ability to make a market in these securities. Such a reduction in market making capacity could potentially decrease a Fund’s ability to buy or sell bonds. As a result, a Fund may sell a security at a lower price, sell other securities to raise cash, or give up an investment opportunity, any of which could have a negative impact on performance. If a Fund needed to sell large blocks of bonds, those sales could further reduce the bonds’ prices and impact performance.
In the normal course of business, the Funds invest in securities and enter into transactions where risks exist due to fluctuations in the market (market risk) or failure of the issuer to meet all its obligations, including the ability to pay principal and interest when due (issuer credit risk). The value of securities held by the Funds may decline in response to certain events, including those directly involving the issuers of securities owned by the Funds. Changes arising from the general economy, the overall market and local, regional or global political and/or social instability, as well as currency, interest rate and price fluctuations, may also affect the securities’ value.
Franklin Templeton Fund may be exposed to prepayment risk, which is the risk that borrowers may exercise their option to prepay principal earlier than scheduled during periods of declining interest rates, which would force the Fund to reinvest in lower yielding securities. The Fund may also be exposed to reinvestment risk, which is the risk that income from the Fund’s portfolio will decline if the Fund invests the proceeds from matured, traded or called fixed income securities at market interest rates that are below the Fund portfolio’s current earnings rate.
Counterparty Credit Risk: Similar to issuer credit risk, the Funds may be exposed to counterparty credit risk, or the risk that an entity may fail to or be unable to perform on its commitments related to unsettled or open transactions. The Funds manage counterparty credit risk by entering into transactions only with counterparties that the Manager believes have the financial resources to honor their obligations and by monitoring the financial stability of those counterparties. Financial assets, which potentially expose the Funds to market, issuer and counterparty credit risks, consist principally of financial instruments and receivables due from counterparties. The extent of the Funds’ exposure to market, issuer and counterparty credit risks with respect to these financial assets is approximately their value recorded in the Statements of Assets and Liabilities, less any collateral held by the Funds.
A derivative contract may suffer a mark-to-market loss if the value of the contract decreases due to an unfavorable change in the market rates or values of the underlying instrument. Losses can also occur if the counterparty does not perform under the contract.
A Fund’s risk of loss from counterparty credit risk on OTC derivatives is generally limited to the aggregate unrealized gain less the value of any collateral held by such Fund.
For OTC options purchased, each Fund bears the risk of loss of the amount of the premiums paid plus the positive change in market values net of any collateral held by the Fund should the counterparty fail to perform under the contracts. Options written by the Funds do not typically give rise to counterparty credit risk, as options written generally obligate the Funds, and not the counterparty, to perform, though the Funds may be exposed to counterparty credit risk with respect to options written to the extent the Funds deposit collateral with their counterparty to a written option.
With exchange-traded futures and centrally cleared swaps, there is less counterparty credit risk to the Funds since the exchange or clearinghouse, as counterparty to such instruments, guarantees against a possible default. The clearinghouse stands between the buyer and the seller of the contract; therefore, credit risk is limited to failure of the clearinghouse. While offset rights may exist under applicable law, a Fund does not have a contractual right of offset against a clearing broker or clearinghouse in the event of a default (including the bankruptcy or insolvency). Additionally, credit risk exists in exchange-traded futures and centrally cleared swaps with respect to initial and variation margin that is held in a clearing broker’s customer accounts. While clearing brokers are required to segregate customer margin from their own assets, in the event that a clearing broker becomes insolvent or goes into bankruptcy and at that time there is a shortfall in the aggregate amount of margin held by the clearing broker for all its clients, typically the shortfall would be allocated on a pro rata basis across all the clearing broker’s customers, potentially resulting in losses to the Funds.
Concentration Risk:
As of period end, Janus Fund invested a significant portion of its assets in securities in the information technology sectors. Invesco Fund invested a significant portion of its assets in the financial sector. Changes in economic conditions affecting such sectors would have a greater impact on the Funds and could affect the value, income and/or liquidity of positions in such securities.
Franklin Templeton Fund invests a significant portion of its assets in fixed-income securities and/or uses derivatives tied to the fixed-income markets. Changes in market interest rates or economic conditions may affect the value and/or liquidity of such investments. Interest rate risk is the risk that prices of bonds and other fixed-income securities will increase as interest rates fall and decrease as interest rates rise. The Fund may be subject to a greater risk of rising interest rates due to the current period of historically low rates.
MFS Fund invests a substantial amount of its assets in issuers located in a single country or a limited number of countries. When the Fund concentrates its investments in this manner, it assumes the risk that economic, political and social conditions in those countries may have a significant impact on their investment performance. Foreign issuers may not be subject to the same uniform accounting, auditing and financial reporting standards and practices as
| | | | | | |
| | | | | | | |
| 62 | | FDP SERIES, INC. | | MAY 31, 2016 | | |
| | |
| Notes to Financial Statements (continued) | | |
used in the United States. Foreign securities markets may also be less liquid, more volatile and less subject to governmental supervision not typically associated with investing in U.S. securities. Investment percentages in specific countries are presented in the Schedule of Investments.
MFS Fund invests a significant portion of its assets in securities of issuers located in Europe or with significant exposure to European issuers or countries. The European financial markets have recently experienced volatility and adverse trends due to concerns about economic downturns in, or rising government debt levels of, several European countries. These events may spread to other countries in Europe and may affect the value and liquidity of certain of the Fund’s investments.
The United Kingdom has voted to withdraw from the European Union on June 23, 2016, which may introduce significant new uncertainties and instability in the financial markets across Europe.
MFS Fund invests a significant portion of its assets in securities of issuers located in Asia or with significant exposure to Asian issuers or countries. The Asian financial markets have recently experienced volatility and adverse trends due to concerns in several Asian countries regarding monetary policy, government intervention in the markets, rising government debt levels or economic downturns. These events may spread to other countries in Asia and may affect the value and liquidity of certain of the Fund’s investments.
Franklin Templeton Fund invests a significant portion of its assets in securities backed by commercial or residential mortgage loans or in issuers that hold mortgage and other asset-backed securities. Investment percentages in these securities are presented in the Schedule of Investments. Changes in economic conditions, including delinquencies and/or defaults on assets underlying these securities, can affect the value, income and/or liquidity of such positions.
11. Capital Share Transactions:
Transactions in capital shares for each class were as follows:
| | | | | | | | | | | | | | | | | | | | |
| | | Year Ended
May 31, 2016 | | | | | | Year Ended
May 31, 2015 | |
| MFS Fund | | Shares | | | Amount | | | | | | Shares | | | Amount | |
| Institutional | | | | | | | | | | | | | | | | | | | | |
Shares sold | | | 107,256 | | | $ | 1,247,272 | | | | | | | | 130,782 | | | $ | 1,650,101 | |
Shares issued to shareholders in reinvestment of distributions | | | 5,067 | | | | 64,961 | | | | | | | | 7,890 | | | | 102,173 | |
Shares redeemed | | | (93,030 | ) | | | (1,062,952 | ) | | | | | | | (89,869 | ) | | | (1,137,477 | ) |
| | | | | | | | | | | | | | | | | | | | |
Net increase | | | 19,293 | | | $ | 249,281 | | | | | | | | 48,803 | | | $ | 614,797 | |
| | | | | | | | | | | | | | | | | | | | |
| | | | | | | | | | | | | | | | | | | | |
| Investor A | | | | | | | | | | | | | | | | | | | | |
Shares sold | | | 1,063,939 | | | $ | 12,193,856 | | | | | | | | 1,581,521 | | | $ | 19,716,326 | |
Shares issued to shareholders in reinvestment of distributions | | | 44,728 | | | | 570,735 | | | | | | | | 76,828 | | | | 990,311 | |
Shares redeemed | | | (1,194,053 | ) | | | (13,627,319 | ) | | | | | | | (937,111 | ) | | | (11,806,429 | ) |
| | | | | | | | | | | | | | | | | | | | |
Net increase (decrease) | | | (85,386 | ) | | $ | (862,728 | ) | | | | | | | 721,238 | | | $ | 8,900,208 | |
| | | | | | | | | | | | | | | | | | | | |
| | | | | | | | | | | | | | | | | | | | |
| Investor C | | | | | | | | | | | | | | | | | | | | |
Shares sold | | | 1,470,672 | | | $ | 16,758,629 | | | | | | | | 2,075,935 | | | $ | 25,608,885 | |
Shares issued to shareholders in reinvestment of distributions | | | 12,141 | | | | 154,075 | | | | | | | | 78,589 | | | | 1,007,500 | |
Shares redeemed | | | (2,048,960 | ) | | | (23,164,096 | ) | | | | | | | (1,923,434 | ) | | | (23,820,299 | ) |
| | | | | | | | | | | | | | | | | | | | |
Net increase (decrease) | | | (566,147 | ) | | $ | (6,251,392 | ) | | | | | | | 231,090 | | | $ | 2,796,086 | |
| | | | | | | | | | | | | | | | | | | | |
Total Net Increase (Decrease) | | | (632,240 | ) | | $ | (6,864,839 | ) | | | | | | | 1,001,131 | | | $ | 12,311,091 | |
| | | | | | | | | | | | | | | | | | | | |
| | | | | | | | | | | | | | | | | | | | |
| | | Year Ended
May 31, 2016 | | | | | | Year Ended
May 31, 2015 | |
| Janus Fund | | Shares | | | Amount | | | | | | Shares | | | Amount | |
| Institutional | | | | | | | | | | | | | | | | | | | | |
Shares sold | | | 58,140 | | | $ | 902,872 | | | | | | | | 61,736 | | | $ | 1,078,693 | |
Shares issued to shareholders in reinvestment of distributions | | | 42,063 | | | | 680,048 | | | | | | | | 16,631 | | | | 282,264 | |
Shares redeemed | | | (77,968 | ) | | | (1,180,018 | ) | | | | | | | (68,164 | ) | | | (1,191,034 | ) |
| | | | | | | | | | | | | | | | | | | | |
Net increase | | | 22,235 | | | $ | 402,902 | | | | | | | | 10,203 | | | $ | 169,923 | |
| | | | | | | | | | | | | | | | | | | | |
| | | | | | |
| | | | | | | |
| | FDP SERIES, INC. | | MAY 31, 2016 | | 63 |
| | |
| Notes to Financial Statements (concluded) | | |
| | | | | | | | | | | | | | | | | | | | |
| | | Year Ended
May 31, 2016 | | | | | | Year Ended
May 31, 2015 | |
| Janus Fund (concluded) | | Shares | | | Amount | | | | | | Shares | | | Amount | |
| Investor A | | | | | | | | | | | | | | | | | | | | |
Shares sold | | | 565,573 | | | $ | 8,499,400 | | | | | | | | 808,977 | | | $ | 13,797,548 | |
Shares issued to shareholders in reinvestment of distributions | | | 469,745 | | | | 7,381,175 | | | | | | | | 185,510 | | | | 3,077,888 | |
Shares redeemed | | | (903,098 | ) | | | (13,394,207 | ) | | | | | | | (728,417 | ) | | | (12,439,670 | ) |
| | | | | | | | | | | | | | | | | | | | |
Net increase | | | 132,220 | | | $ | 2,486,368 | | | | | | | | 266,070 | | | $ | 4,435,766 | |
| | | | | | | | | | | | | | | | | | | | |
| | | | | | | | | | | | | | | | | | | | |
| Investor C | | | | | | | | | | | | | | | | | | | | |
Shares sold | | | 847,883 | | | $ | 11,673,847 | | | | | | | | 1,045,778 | | | $ | 16,585,793 | |
Shares issued to shareholders in reinvestment of distributions | | | 796,813 | | | | 11,447,573 | | | | | | | | 333,443 | | | | 5,147,251 | |
Shares redeemed | | | (1,645,532 | ) | | | (22,258,511 | ) | | | | | | | (1,500,370 | ) | | | (23,817,514 | ) |
| | | | | | | | | | | | | | | | | | | | |
Net increase (decrease) | | | (836 | ) | | $ | 862,909 | | | | | | | | (121,149 | ) | | $ | (2,084,470 | ) |
| | | | | | | | | | | | | | | | | | | | |
Total Net Increase | | | 153,619 | | | $ | 3,752,179 | | | | | | | | 155,124 | | | $ | 2,521,219 | |
| | | | | | | | | | | | | | | | | | | | |
| | | | | | | | | | | | | | | | | | | | |
| | | Year Ended
May 31, 2016 | | | | | | Year Ended
May 31, 2015 | |
| Invesco Value FDP Fund | | Shares | | | Amount | | | | | | Shares | | | Amount | |
| Institutional | | | | | | | | | | | | | | | | | | | | |
Shares sold | | | 64,673 | | | $ | 973,501 | | | | | | | | 71,851 | | | $ | 1,166,352 | |
Shares issued to shareholders in reinvestment of distributions | | | 6,130 | | | | 96,909 | | | | | | | | 4,771 | | | | 76,103 | |
Shares redeemed | | | (68,331 | ) | | | (1,013,223 | ) | | | | | | | (63,909 | ) | | | (1,039,696 | ) |
| | | | | | | | | | | | | | | | | | | | |
Net increase | | | 2,472 | | | $ | 57,187 | | | | | | | | 12,713 | | | $ | 202,759 | |
| | | | | | | | | | | | | | | | | | | | |
| | | | | | | | | | | | | | | | | | | | |
| Investor A | | | | | | | | | | | | | | | | | | | | |
Shares sold | | | 651,803 | | | $ | 9,666,575 | | | | | | | | 842,338 | | | $ | 13,533,565 | |
Shares issued to shareholders in reinvestment of distributions | | | 56,706 | | | | 891,701 | | | | | | | | 41,562 | | | | 656,946 | |
Shares redeemed | | | (807,927 | ) | | | (11,966,910 | ) | | | | | | | (667,242 | ) | | | (10,748,350 | ) |
| | | | | | | | | | | | | | | | | | | | |
Net increase (decrease) | | | (99,418 | ) | | $ | (1,408,634 | ) | | | | | | | 216,658 | | | $ | 3,442,161 | |
| | | | | | | | | | | | | | | | | | | | |
| | | | | | | | | | | | | | | | | | | | |
| Investor C | | | | | | | | | | | | | | | | | | | | |
Shares sold | | | 868,609 | | | $ | 12,716,424 | | | | | | | | 1,045,096 | | | $ | 16,505,004 | |
Shares issued to shareholders in reinvestment of distributions | | | 47,315 | | | | 744,417 | | | | | | | | 33,225 | | | | 516,349 | |
Shares redeemed | | | (1,359,216 | ) | | | (19,840,101 | ) | | | | | | | (1,376,014 | ) | | | (21,761,233 | ) |
| | | | | | | | | | | | | | | | | | | | |
Net decrease | | | (443,292 | ) | | $ | (6,379,260 | ) | | | | | | | (297,693 | ) | | $ | (4,739,880 | ) |
| | | | | | | | | | | | | | | | | | | | |
Total Net Decrease | | | (540,238 | ) | | $ | (7,730,707 | ) | | | | | | | (68,322 | ) | | $ | (1,094,960 | ) |
| | | | | | | | | | | | | | | | | | | | |
| | | | | | | | | | | | | | | | | | | | |
| | | Year Ended
May 31, 2016 | | | | | | Year Ended
May 31, 2015 | |
| Franklin Templeton Fund | | Shares | | | Amount | | | | | | Shares | | | Amount | |
| Institutional | | | | | | | | | | | | | | | | | | | | |
Shares sold | | | 161,858 | | | $ | 1,667,732 | | | | | | | | 173,664 | | | $ | 1,861,098 | |
Shares issued to shareholders in reinvestment of distributions | | | 29,413 | | | | 297,292 | | | | | | | | 19,217 | | | | 205,224 | |
Shares redeemed | | | (153,615 | ) | | | (1,572,102 | ) | | | | | | | (125,615 | ) | | | (1,345,758 | ) |
| | | | | | | | | | | | | | | | |
Net increase | | | 37,656 | | | $ | 392,922 | | | | | | | | 67,266 | | | $ | 720,564 | |
| | | | | | | | | | | | |
| | | | | | | | | | | | | | | | | | | | |
| Investor A | | | | | | | | | | | | | | | | | | | | |
Shares sold | | | 1,517,546 | | | $ | 15,666,221 | | | | | | | | 2,342,192 | | | $ | 25,109,933 | |
Shares issued to shareholders in reinvestment of distributions | | | 350,078 | | | | 3,539,570 | | | | | | | | 240,626 | | | | 2,569,545 | |
Shares redeemed | | | (2,444,267 | ) | | | (25,012,644 | ) | | | | | | | (1,574,463 | ) | | | (16,880,039 | ) |
| | | | | | | | | | | | |
Net increase (decrease) | | | (576,643 | ) | | $ | (5,806,853 | ) | | | | | | | 1,008,355 | | | $ | 10,799,439 | |
| | | | | | | | | | | | |
| | | | | | | | | | | | | | | | | | | | |
| Investor C | | | | | | | | | | | | | | | | | | | | |
Shares sold | | | 2,302,481 | | | $ | 23,771,602 | | | | | | | | 3,156,689 | | | $ | 33,842,775 | |
Shares issued to shareholders in reinvestment of distributions | | | 430,754 | | | | 4,345,876 | | | | | | | | 287,490 | | | | 3,067,147 | |
Shares redeemed | | | (3,790,876 | ) | | | (38,814,006 | ) | | | | | | | (2,994,181 | ) | | | (32,099,291 | ) |
| | | | | | | | | | | | |
Net increase (decrease) | | | (1,057,641 | ) | | $ | (10,696,528 | ) | | | | | | | 449,998 | | | $ | 4,810,631 | |
| | | | | | | | | | | | | | | | | | | | |
Total Net Increase (Decrease) | | | (1,596,628 | ) | | $ | (16,110,459 | ) | | | | | | | 1,525,619 | | | $ | 16,330,634 | |
| | | | | | | | | | | | |
12. Subsequent Events:
Management has evaluated the impact of all subsequent events on the Funds through the date the financial statements were issued and has determined that there were no subsequent events requiring adjustment or additional disclosure in the financial statements.
| | | | | | |
| | | | | | | |
| 64 | | FDP SERIES, INC. | | MAY 31, 2016 | | |
| | |
| Report of Independent Registered Public Accounting Firm | | |
To the Shareholders of FDP BlackRock MFS Research International Fund, FDP BlackRock Janus Growth Fund, FDP BlackRock Invesco Value Fund and FDP BlackRock Franklin Templeton Total Return Fund and the Board of Directors of FDP Series, Inc.:
We have audited the accompanying statements of assets and liabilities, including the schedules of investments, of FDP BlackRock MFS Research International Fund (formerly MFS Research International FDP Fund), FDP BlackRock Janus Growth Fund (formerly Marsico Growth FDP Fund), FDP BlackRock Invesco Value Fund (formerly Invesco Value FDP Fund) and FDP BlackRock Franklin Templeton Total Return Fund (formerly Franklin Templeton Total Return FDP Fund), each a series of FDP Series, Inc., (the “Corporation”) as of May 31, 2016, the related statements of operations for the year then ended, the statements of changes in net assets for each of the two years in the period then ended, and the financial highlights for each of the five years in the period then ended. These financial statements and financial highlights are the responsibility of the Corporation’s management. Our responsibility is to express an opinion on these financial statements and financial highlights based on our audits.
We conducted our audits in accordance with the standards of the Public Company Accounting Oversight Board (United States). Those standards require that we plan and perform the audit to obtain reasonable assurance about whether the financial statements and financial highlights are free of material misstatement. The Corporation is not required to have, nor were we engaged to perform, an audit of its internal control over financial reporting. Our audits included consideration of internal control over financial reporting as a basis for designing audit procedures that are appropriate in the circumstances, but not for the purpose of expressing an opinion on the effectiveness of the Corporation’s internal control over financial reporting. Accordingly, we express no such opinion. An audit also includes examining, on a test basis, evidence supporting the amounts and disclosures in the financial statements, assessing the accounting principles used and significant estimates made by management, as well as evaluating the overall financial statement presentation. Our procedures included confirmation of securities owned as of May 31, 2016, by correspondence with the custodian, brokers and other financial intermediaries; where replies were not received from brokers and other financial intermediaries, we performed other auditing procedures. We believe that our audits provide a reasonable basis for our opinion.
In our opinion, the financial statements and financial highlights referred to above present fairly, in all material respects, the financial positions of FDP BlackRock MFS Research International Fund, FDP BlackRock Janus Growth Fund, FDP BlackRock Invesco Value Fund and FDP BlackRock Franklin Templeton Total Return Fund, each a series of FDP Series, Inc., as of May 31, 2016, the results of their operations for the year then ended, the changes in their net assets for each of the two years in the period then ended, and the financial highlights for each of the five years in the period then ended, in conformity with accounting principles generally accepted in the United States of America.
Deloitte & Touche LLP
Boston, Massachusetts
July 26, 2016
| | |
| Important Tax Information (Unaudited) | | |
During the fiscal year ended May 31, 2016, the following information is provided with respect to the ordinary income distributions paid by the FDP Series, Inc.
| | | | | | | | | | | | | | | | | | | | |
| | | Payable Date/
Months Paid | | | MFS Research
International | | | Janus
Growth | | | Invesco
Value | | | Franklin
Templeton Total
Return | |
Qualified Dividend Income for Individuals1 | | | 7/17/2015 | | | | 100.00% | | | | — | | | | 100.00% | | | | — | |
| | | 12/10/2015 | | | | — | | | | — | | | | 100.00% | | | | — | |
| | | 12/23/2015 | | | | — | | | | — | | | | — | | | | 3.37% | |
| | | 12/31/2015 | | | | — | | | | — | | | | — | | | | 8.39% | |
Dividends Qualifying for the Dividend Received Deduction for Corporations1 | | | 7/17/2015 | | | | 8.98% | | | | — | | | | 76.23% | | | | — | |
| | | 12/10/2015 | | | | — | | | | — | | | | 100.00% | | | | — | |
| | | 12/23/2015 | | | | — | | | | — | | | | — | | | | 3.09% | |
| | | 12/31/2015 | | | | — | | | | — | | | | — | | | | 7.69% | |
Foreign Source Income | | | | | | | 100.00%2 | | | | — | | | | — | | | | — | |
Interest Related Dividends for Non-U.S. Residents3 | | | June 2015 - November 2015 | | | | — | | | | — | | | | — | | | | 37.00% | |
| | | December 2015 | | | | — | | | | — | | | | — | | | | 53.33% | |
| | | | January 2016 - May 2016 | | | | — | | | | — | | | | — | | | | — | |
Federal Obligation Interest4 | | | June 2015 - May 2016 | | | | — | | | | — | | | | — | | | | — | |
Foreign Taxes Paid Per Share5 | | | 7/17/2015 | | | | $0.029619 | | | | — | | | | — | | | | — | |
Long-term capital gains per share | | | 7/17/2015 | | | | — | | | | $1.778462 | | | | — | | | | — | |
| | | 12/10/2015 | | | | — | | | | $0.488527 | | | | — | | | | — | |
| | | 12/23/2015 | | | | — | | | | — | | | | — | | | | $0.045955 | |
| | 1 | | The Funds hereby designate the percentage indicated above or the maximum allowable by law. |
| | 2 | | Expressed as a percentage of the cash distribution grossed-up for foreign taxes. |
| | 3 | | Represents the portion of the taxable ordinary income dividends eligible for exemption from U.S. withholding tax for nonresident aliens and foreign corporations. |
| | 4 | | The law varies in each state as to whether and what percentage of dividend income attributable to Federal Obligations is exempt from state income tax. We recommend that you consult your tax advisor to determine if any portion of the dividends you received is exempt from state income taxes. |
| | 5 | | The foreign taxes paid represent taxes incurred by the Fund on income received by the Fund from foreign sources. Foreign taxes paid may be included in taxable income with an offsetting deduction from gross income or may be taken as a credit for taxes paid to foreign governments. You should consult your tax advisor regarding the appropriate treatment of foreign taxes paid. |
| | | | | | |
| | | | | | | |
| | FDP SERIES, INC. | | MAY 31, 2016 | | 65 |
| | | | |
| Disclosure of Investment Advisory Agreement and Sub-Advisory Agreements | | |
The Board of Directors (the “Board,” the members of which are referred to as “Board Members”) of FDP Series, Inc. (the “Corporation”) met in person on April 12, 2016 (the “April Meeting”) and May 10-11, 2016 (the “May Meeting”) to consider the approval of the investment advisory agreement (the “Advisory Agreement”) between the Corporation, on behalf of FDP BlackRock Franklin Templeton Total Return Fund (the “Franklin Templeton Fund”), FDP BlackRock Invesco Value Fund (the “Invesco Fund”), FDP BlackRock Janus Growth Fund (the “Janus Fund”), and FDP BlackRock MFS Research International Fund (the “MFS Fund”) (each, a “Fund”), each a series of the Corporation, and BlackRock Advisors, LLC (the “Manager” or “BlackRock”), each Fund’s investment advisor. The Board also considered the approval of the sub-advisory agreements (collectively, the “Sub-Advisory Agreements”) between the Manager and each of (i) Franklin Advisers, Inc. (“Franklin”); (ii) Invesco Advisers, Inc. (“Invesco”); (iii) Janus Capital Management LLC (“Janus”); and (iv) Massachusetts Financial Services Company (“MFS”) (collectively, the “Sub-Advisors”), with respect to the respective Fund. The Advisory Agreement and the Sub-Advisory Agreements are referred to herein as the “Agreements.”
Activities and Composition of the Board
On the date of the May Meeting, the Board consisted of thirteen individuals, ten of whom were not “interested persons” of the Corporation as defined in the Investment Company Act of 1940, as amended (the “1940 Act”) (the “Independent Board Members”). One of the Board Members is a non-management interested Board Member by virtue of his former positions with BlackRock, Inc. and its affiliates. The Board Members are responsible for the oversight of the operations of each Fund and perform the various duties imposed on the directors of investment companies by the 1940 Act. The Independent Board Members have retained independent legal counsel to assist them in connection with their duties. The Chair of the Board is an Independent Board Member. The Board has established five standing committees: an Audit Committee, a Governance and Nominating Committee, a Compliance Committee, a Performance Oversight Committee and an Executive Committee, each of which is chaired by an Independent Board Member and composed of Independent Board Members (except for the Performance Oversight Committee and the Executive Committee, each of which also has one interested Board Member).
The Agreements
Pursuant to the 1940 Act, the Board is required to consider the continuation of the Agreements on an annual basis. The Board has four quarterly meetings per year, each extending over two days, a fifth one-day meeting to consider specific information surrounding the consideration of renewing the Agreements and additional in-person and telephonic meetings as needed. In connection with this year-long deliberative process, the Board assessed, among other things, the nature, extent and quality of the services provided to each Fund by BlackRock, BlackRock personnel and affiliates, and the Sub-Advisors, including (as applicable): investment management; administrative and shareholder services; the oversight of service providers; marketing; risk oversight; compliance and ability to meet applicable legal and regulatory requirements.
The Board, acting directly and through its committees, considers at each of its meetings, and from time to time as appropriate, factors that are relevant to its annual consideration of the renewal of the Agreements, including the services and support provided by BlackRock and the Sub-Advisors to each Fund and its shareholders. BlackRock also furnished additional information to the Board in response to specific questions from the Board. This additional information is discussed further below in the section titled “Board Considerations in Approving the Agreements.” Among the matters the Board considered were: (a) investment performance for one-year, three-year, five-year, ten-year, and/or since inception periods, as applicable, against peer funds, applicable benchmark, and performance metrics, as applicable, as well as senior management’s and portfolio managers’ analysis of the reasons for any over-performance or underperformance relative to its peers, benchmarks, and other performance metrics, as applicable; (b) fees, including advisory, administration, if applicable, and other amounts paid to BlackRock and its affiliates by each Fund for services; (c) Fund operating expenses and how BlackRock allocates expenses to each Fund; (d) the resources devoted to, risk oversight of, and compliance reports relating to, implementation of each Fund’s investment objective(s), policies and restrictions, and meeting regulatory requirements; (e) each Fund’s compliance with its compliance policies and procedures; (f) the nature, cost and character of non-investment management services provided by BlackRock and its affiliates; (g) BlackRock’s, the Sub-Advisors’ and other service providers’ internal controls and risk and compliance oversight mechanisms; (h) BlackRock’s implementation of the proxy voting policies approved by the Board; (i) the use of brokerage commissions, as applicable, and execution quality of portfolio transactions; (j) BlackRock’s implementation of each Fund’s valuation and liquidity procedures; (k) an analysis of management fees for products with similar investment mandates across the open-end fund, exchange-traded fund (“ETF”), closed-end fund and institutional account product channels, as applicable, and the similarities and differences between these products and the services provided as compared to each Fund; (l) BlackRock’s compensation methodology for its investment professionals and the incentives and accountability it creates along with investment professionals’ investments in the fund(s) they manage; (m) periodic updates on BlackRock’s and the Sub-Advisors’ businesses; and (n) sub-advisory fees paid by the Manager to the Sub-Advisors, the division of responsibilities among the Manager and the Sub-Advisors, and the oversight of the Sub-Advisors provided by the Manager.
Board Considerations in Approving the Agreements
The Approval Process: Prior to the April Meeting, the Board requested and received materials specifically relating to the Agreements. The Board is continuously engaged in a process with its independent legal counsel, BlackRock, and the Sub-Advisors to review the nature and scope of the information provided to better assist its deliberations. The materials provided in connection with the April Meeting included (a) information independently compiled and prepared by Broadridge Financial Solutions, Inc. (“Broadridge”) on Fund fees and expenses as compared with a peer group of funds as determined by
| | | | | | |
| | | | | | | |
| 66 | | FDP SERIES, INC. | | MAY 31, 2016 | | |
| | | | |
| Disclosure of Investment Advisory Agreement and Sub-Advisory Agreements (continued) | | |
Broadridge (“Expense Peers”) and the investment performance of each Fund as compared with a peer group of funds as determined by Broadridge1; (b) information on the profits realized by BlackRock and its affiliates, and the Sub-Advisors pursuant to the Agreements and a discussion of fall-out benefits to BlackRock and its affiliates; (c) a general analysis provided by BlackRock concerning investment management fees charged to other clients, such as institutional clients, sub-advised mutual funds, ETFs and closed-end funds, under similar investment mandates, as well as the performance of such other clients, as applicable; (d) review of non-management fees; (e) the existence, impact and sharing of potential economies of scale; (f) a summary of aggregate amounts paid by each Fund to BlackRock; and (g) sales and redemption data regarding each Fund’s shares.
At the April Meeting, the Board reviewed materials relating to its consideration of the Agreements. As a result of the discussions that occurred during the April Meeting, and as a culmination of the Board’s year-long deliberative process, the Board presented BlackRock and the Sub-Advisors with questions and requests for additional information. BlackRock and the Sub-Advisors responded to these requests with additional written information in advance of the May Meeting.
At the May Meeting, the Board, including the Independent Board Members, approved the continuation of the Advisory Agreement between the Manager and the Corporation, on behalf of each Fund, and the Sub-Advisory Agreements between the Manager and the Sub-Advisors, with respect to each Fund, each for a one-year term ending June 30, 2017. In approving the continuation of the Agreements, the Board considered: (a) the nature, extent and quality of the services provided by BlackRock and the Sub-Advisors; (b) the investment performance of each Fund; (c) the advisory fee and the cost of the services and profits to be realized by BlackRock and its affiliates from their relationship with each Fund; (d) each Fund’s costs to investors compared to the costs of Expense Peers and performance compared to the relevant performance metrics as previously discussed; (e) the sharing of potential economies of scale; (f) fall-out benefits to BlackRock and its affiliates as a result of its relationship with each Fund; and (g) other factors deemed relevant by the Board Members.
The Board also considered other matters it deemed important to the approval process, such as other payments made to BlackRock or its affiliates, securities lending and cash management, services related to the valuation and pricing of Fund portfolio holdings, and materials submitted for the Board’s review. The Board noted the willingness of BlackRock personnel and the investment personnel of each Sub-Advisor to engage in open, candid discussions with the Board. The Board did not identify any particular information as determinative, and each Board Member may have attributed different weights to the various items considered.
A. Nature, Extent and Quality of the Services Provided by BlackRock and the Sub-Advisors: The Board, including the Independent Board Members, reviewed the nature, extent and quality of services provided by BlackRock and the Sub-Advisors, including the investment advisory and sub-advisory services and the resulting performance of each Fund. Throughout the year, the Board compared Fund performance to the performance of a comparable group of mutual funds, a relevant benchmark, and performance metrics, as applicable. The Board met with BlackRock’s senior management personnel responsible for investment activities, including the senior investment officers, and the investment personnel of each Sub-Advisor. The Board also reviewed the materials provided by each Fund’s portfolio management team discussing each Fund’s performance and each Fund’s investment objective(s), strategies and outlook.
The Board considered, among other factors, with respect to BlackRock and the Sub-Advisors: the number, education and experience of investment personnel generally and each Fund’s portfolio management team; BlackRock’s research capabilities; investments by portfolio managers in the funds they manage; portfolio trading capabilities; use of technology; commitment to compliance; credit analysis capabilities; and risk analysis and oversight capabilities.
In addition to investment advisory services, the Board considered the quality of the administrative and other non-investment advisory services provided to each Fund. BlackRock and its affiliates provide each Fund with certain administrative, shareholder and other services (in addition to any such services provided to each Fund by third parties) and officers and other personnel as are necessary for the operations of each Fund. In particular, BlackRock and its affiliates provide each Fund with administrative services including, among others: (i) preparing disclosure documents, such as the prospectus, the summary prospectus (as applicable), the statement of additional information and periodic shareholder reports; (ii) oversight of daily accounting and pricing; (iii) preparing periodic filings with regulators; (iv) overseeing and coordinating the activities of other service providers; (v) organizing Board meetings and preparing the materials for such Board meetings; (vi) providing legal and compliance support; (vii) furnishing analytical and other support to assist the Board in its consideration of strategic issues such as the merger, consolidation or repurposing of certain open-end funds; and (viii) performing other administrative functions necessary for the operation of each Fund, such as tax reporting, fulfilling regulatory filing requirements and call center services. The Board reviewed the structure and duties of BlackRock’s fund administration, shareholder services, and legal & compliance departments and considered BlackRock’s policies and procedures for assuring compliance with applicable laws and regulations.
B. The Investment Performance of each Fund, BlackRock and the Sub-Advisors: The Board, including the Independent Board Members, also reviewed and considered the performance history of each Fund. In preparation for the April Meeting, the Board was provided with reports independently prepared by Broadridge, which included a comprehensive analysis of each Fund’s performance. The Board also reviewed a narrative and statistical analysis of the
| 1 | | Funds are ranked by Broadridge in quartiles, ranging from first to fourth, where first is the most desirable quartile position and fourth is the least desirable. |
| | | | | | |
| | | | | | | |
| | FDP SERIES, INC. | | MAY 31, 2016 | | 67 |
| | | | |
| Disclosure of Investment Advisory Agreement and Sub-Advisory Agreements (continued) | | |
Broadridge data that was prepared by BlackRock. In connection with its review, the Board received and reviewed information regarding the investment performance of each Fund as compared to other funds in its applicable Broadridge category. The Board was provided with a description of the methodology used by Broadridge to select peer funds and periodically meets with Broadridge representatives to review its methodology. The Board was provided with information on the composition of the Broadridge performance universes and expense universes. The Board and its Performance Oversight Committee regularly review, and meet with Fund management to discuss, the performance of each Fund throughout the year.
In evaluating performance, the Board recognized that the performance data reflects a snapshot of a period as of a particular date and that selecting a different performance period could produce significantly different results. Further, the Board recognized that it is possible that long-term performance can be adversely affected by even one period of significant underperformance so that a single investment decision or theme has the ability to affect long-term performance disproportionately.
The Board noted that for the one-, three- and five-year periods reported, the Franklin Templeton Fund ranked in the third, fourth and fourth quartiles, respectively, against its Broadridge Performance Universe. The Board and BlackRock reviewed and discussed the reasons for the Franklin Templeton Fund’s underperformance during these periods.
The Board noted that for the one-, three- and five-year periods reported, the Invesco Fund ranked in the fourth, fourth and third quartiles, respectively, against its Broadridge Performance Universe. The Board and BlackRock reviewed and discussed the reasons for the Invesco Fund’s underperformance during these periods. In response to the Board’s concerns about continued underperformance, among other factors, the Board and BlackRock agreed to a voluntary advisory fee waiver, as detailed in Section C.
The Board noted that for each of the one-, three- and five-year periods reported, the Janus Fund ranked in the fourth quartile against its Broadridge Performance Universe. The Board and BlackRock reviewed and discussed the reasons for the Janus Fund’s underperformance during these periods. Effective at the close of business on January 29, 2016 the Janus Fund transitioned sub-advisers from Marsico Capital Management, LLC to Janus, and became the FDP BlackRock Janus Growth Fund.
The Board noted that for each of the one-, three- and five-year periods reported, the MFS Fund ranked in the third quartile against its Broadridge Performance Universe. The Board and BlackRock reviewed and discussed the reasons for the MFS Fund’s underperformance during these periods. In response to the Board’s ongoing concerns about continued underperformance, among other factors, the Board and BlackRock agreed to a continuation of the voluntary advisory fee waiver, as detailed in Section C.
C. Consideration of the Advisory/Management Fees and the Cost of the Services and Profits to be Realized by BlackRock and its Affiliates and the Sub-Advisors from their Relationship with each Fund: The Board, including the Independent Board Members, reviewed each Fund’s contractual management fee rate compared with the other funds in its Broadridge category. The contractual management fee rate represents a combination of the advisory fee and any administrative fees, before taking into account any reimbursements or fee waivers. The Board also compared each Fund’s total expense ratio, as well as its actual management fee rate, to those of other funds in its Broadridge category. The total expense ratio represents a fund’s total net operating expenses, including any 12b-1 or non 12b-1 service fees. The total expense ratio gives effect to any expense reimbursements or fee waivers that benefit a fund, and the actual management fee rate gives effect to any management fee reimbursements or waivers that benefit a fund. The Board considered the services provided and the fees charged by BlackRock and its affiliates to other types of clients with similar investment mandates, as applicable, including institutional accounts and sub-advised mutual funds (including mutual funds sponsored by third parties).
The Board received and reviewed statements relating to BlackRock’s financial condition. The Board reviewed BlackRock’s profitability methodology and was also provided with a profitability analysis that detailed the revenues earned and the expenses incurred by BlackRock for services provided to each Fund. The Board reviewed BlackRock’s profitability with respect to each Fund and other funds the Board currently oversees for the year ended December 31, 2015 compared to available aggregate profitability data provided for the prior two years. The Board reviewed BlackRock’s profitability with respect to certain other U.S. fund complexes managed by the Manager and/or its affiliates. The Board reviewed BlackRock’s assumptions and methodology of allocating expenses in the profitability analysis, noting the inherent limitations in allocating costs among various advisory products. The Board recognized that profitability may be affected by numerous factors including, among other things, fee waivers and expense reimbursements by the Manager, the types of funds managed, precision of expense allocations and business mix. As a result, calculating and comparing profitability at individual fund levels is difficult.
The Board noted that, in general, individual fund or product line profitability of other advisors is not publicly available. The Board reviewed BlackRock’s overall operating margin, in general, compared to that of certain other publicly-traded asset management firms. The Board considered the differences between BlackRock and these other firms, including the contribution of technology at BlackRock, BlackRock’s expense management, and the relative product mix.
In addition, the Board considered the cost of the services provided to each Fund by BlackRock, and BlackRock’s and its affiliates’ profits relating to the management and distribution of each Fund and the other funds advised by BlackRock and its affiliates. As part of its analysis, the Board reviewed BlackRock’s methodology in allocating its costs of managing the Funds, to each Fund. The Board may receive and review information from independent third parties as part of its annual evaluation. The Board considered whether BlackRock and the Sub-Advisors have the financial resources necessary to
| | | | | | |
| | | | | | | |
| 68 | | FDP SERIES, INC. | | MAY 31, 2016 | | |
| | |
| Disclosure of Investment Advisory Agreement and Sub-Advisory Agreements (continued) | | |
attract and retain high quality investment management personnel to perform its obligations under the Agreements and to continue to provide the high quality of services that is expected by the Board. The Board further considered factors including but not limited to BlackRock’s commitment of time, assumption of risk and liability profile in servicing the Fund in contrast to what is required of BlackRock with respect to other products with similar investment mandates across the open-end fund, ETF, closed-end fund, sub-advised mutual fund and institutional account product channels, as applicable.
The Board noted that the Franklin Templeton Fund’s contractual management fee rate ranked in the first quartile, and that the actual management fee rate and total expense ratio ranked in the second and fourth quartiles, respectively, relative to the Fund’s Expense Peers. The Board also noted that the Franklin Templeton Fund has an advisory fee arrangement that includes breakpoints that adjust the fee rate downward as the size of the Fund increases above certain contractually specified levels. The Board further noted that BlackRock has contractually agreed to a cap on the Franklin Templeton Fund’s total expenses as a percentage of the Fund’s average daily net assets on a class-by-class basis.
The Board noted that the Invesco Fund’s contractual management fee rate ranked in the second quartile, and that the actual management fee rate and total expense ratio ranked in the third and fourth quartiles, respectively, relative to the Fund’s Expense Peers. The Board also noted that the Invesco Fund has an advisory fee arrangement that includes breakpoints that adjust the fee rate downward as the size of the Fund increases above certain contractually specified levels. The Board further noted that BlackRock has contractually agreed to a cap on the Invesco Fund’s total expenses as a percentage of the Fund’s average daily net assets on a class-by-class basis. In addition, after discussions between the Board, including the Independent Board Members, and BlackRock, the Board and BlackRock agreed to a voluntary advisory fee waiver. The waiver was implemented on June 15, 2016.
The Board noted that the Janus Fund’s contractual management fee rate ranked in the second quartile, and that the actual management fee rate and total expense ratio each ranked in the fourth quartile, relative to the Fund’s Expense Peers. The Board also noted that the Janus Fund has an advisory fee arrangement that includes breakpoints that adjust the fee rate downward as the size of the Fund increases above certain contractually specified levels. The Board further noted that BlackRock has contractually agreed to a cap on the Janus Fund’s total expenses as a percentage of the Fund’s average daily net assets on a class-by-class basis. The Board also noted that BlackRock has contractually agreed to waive a portion of the advisory fee for the Janus Fund. In addition, the Board noted that BlackRock has voluntarily agreed to waive a portion of the advisory fee payable by the Janus Fund. The waiver was implemented on June 1, 2012. After discussions between the Board, including the Independent Board Members, and BlackRock, the Board and BlackRock agreed to a continuation of the voluntary advisory fee reduction.
The Board noted that the MFS Fund’s contractual management fee rate ranked in the second quartile, and that the actual management fee rate and total expense ratio ranked in the second and third quartiles, respectively, relative to the Fund’s Expense Peers. The Board also noted that the MFS Fund has an advisory fee arrangement that includes breakpoints that adjust the fee rate downward as the size of the Fund increases above certain contractually specified levels. The Board further noted that BlackRock has contractually agreed to a cap on the MFS Fund’s total expenses as a percentage of the Fund’s average daily net assets on a class-by-class basis. In addition, the Board noted that BlackRock has voluntarily agreed to waive a portion of the advisory fee payable by the MFS Fund. The waiver was implemented on June 1, 2015. After discussions between the Board, including the Independent Board Members, and BlackRock, the Board and BlackRock agreed to a continuation of the voluntary advisory fee reduction.
D. Economies of Scale: The Board, including the Independent Board Members, considered the extent to which economies of scale might be realized as the assets of each Fund increase, as well as the existence of expense caps, as applicable. The Board also considered the extent to which each Fund benefits from such economies in a variety of ways, and whether there should be changes in the advisory fee rate or breakpoint structure in order to enable each Fund to more fully participate in these economies of scale. The Board considered each Fund’s asset levels and whether the current fee schedule was appropriate. In its consideration, the Board Members took into account the existence of any expense caps and further considered the continuation and/or implementation, as applicable, of such caps.
E. Other Factors Deemed Relevant by the Board Members: The Board, including the Independent Board Members, also took into account other ancillary or “fall-out” benefits that BlackRock or its affiliates may derive from their respective relationships with each Fund, both tangible and intangible, such as BlackRock’s ability to leverage its investment professionals who manage other portfolios and risk management personnel, an increase in BlackRock’s profile in the investment advisory community, and the engagement of BlackRock’s affiliates as service providers to each Fund, including for administrative, distribution, securities lending and cash management services. The Board also considered BlackRock’s and the Sub-Advisors’ overall operations and BlackRock’s efforts to expand the scale of, and improve the quality of, its operations. The Board also noted that BlackRock and the Sub-Advisors may use and benefit from third party research obtained by soft dollars generated by certain registered fund transactions to assist in managing all or a number of their other client accounts. The Board further noted that it had considered the investment by BlackRock’s funds in affiliated ETFs without any offset against the management fees payable by the funds to BlackRock.
In connection with its consideration of the Agreements, the Board also received information regarding BlackRock’s and the Sub-Advisors’ brokerage and soft dollar practices. The Board received reports from BlackRock which included information on brokerage commissions and trade execution practices throughout the year.
The Board noted the competitive nature of the open-end fund marketplace, and that shareholders are able to redeem their Fund shares if they believe that each Fund’s fees and expenses are too high or if they are dissatisfied with the performance of each Fund.
| | | | | | |
| | | | | | | |
| | FDP SERIES, INC. | | MAY 31, 2016 | | 69 |
| | | | |
| Disclosure of Investment Advisory Agreement and Sub-Advisory Agreements (concluded) | | |
Conclusion
The Board, including the Independent Board Members, approved the continuation of the Advisory Agreement between the Manager and the Corporation, on behalf of each Fund, for a one-year term ending June 30, 2017, and the Sub-Advisory Agreements between the Manager and each Sub-Advisor, with respect to each Fund, for a one-year term ending June 30, 2017. Based upon its evaluation of all of the aforementioned factors in their totality, as well as other information, the Board, including the Independent Board Members, was satisfied that the terms of the Agreements were fair and reasonable and in the best interest of each Fund and its shareholders. In arriving at its decision to approve the Agreements, the Board did not identify any single factor or group of factors as all-important or controlling, but considered all factors together, and different Board Members may have attributed different weights to the various factors considered. The Independent Board Members were also assisted by the advice of independent legal counsel in making this determination. The contractual fee arrangements for each Fund reflect the results of several years of review by the Board Members and predecessor Board Members, and discussions between such Board Members (and predecessor Board Members) and BlackRock and the Sub-Advisors. As a result, the Board Members’ conclusions may be based in part on their consideration of these arrangements in prior years.
| | | | | | |
| | | | | | | |
| 70 | | FDP SERIES, INC. | | MAY 31, 2016 | | |
| | | | | | | | | | |
Name, Address1 and Year of Birth | | Position(s) Held with
the Corporation | | Length of Time Served2,3 | | Principal Occupation(s) During Past Five Years | | Number of BlackRock-
Advised Registered
Investment Companies
(“RICs”) Consisting of
Investment Portfolios
(“Portfolios”) Overseen | | Public Company and
Other Investment
Company Directorships
Held During Past
Five Years |
| Independent Directors |
Robert M. Hernandez 1944 | | Chair of the Board and Director | | Since 2007 | | Director, Vice Chairman and Chief Financial Officer of USX Corporation (energy and steel business) from 1991 to 2001; Director, RTI International Metals, Inc. from 1990 to 2015; Director, TE Connectivity (electronics) from 2006 to 2012. | | 28 RICs consisting of 98 Portfolios | | Chubb Limited (insurance company); Eastman Chemical Company |
Fred G. Weiss 1941 | | Vice Chair of the Board and Director | | Since 2007 | | Managing Director, FGW Consultancy LLC (consulting and investment company) since 1997; Director and Treasurer, Michael J. Fox Foundation for Parkinson’s Research since 2000. | | 28 RICs consisting of 98 Portfolios | | Allergan plc (pharmaceuticals) |
James H. Bodurtha 1944 | | Director | | Since 2007 | | Director, The China Business Group, Inc. (consulting and investing firm) from 1996 to 2013 and Executive Vice President thereof from 1996 to 2003; Chairman of the Board, Berkshire Holding Corporation since 1980; Director, ICI Mutual since 2010. | | 28 RICs consisting of 98 Portfolios | | None |
Bruce R. Bond 1946 | | Director | | Since 2007 | | Trustee and Member of the Governance Committee, State Street Research Mutual Funds from 1997 to 2005; Board Member of Governance, Audit and Finance Committee, Avaya Inc. (computer equipment) from 2003 to 2007. | | 28 RICs consisting of 98 Portfolios | | None |
Donald W. Burton 1944 | | Director | | Since 2007 | | Managing General Partner, The Burton Partnership, LP (an investment partnership) since 1979; Managing General Partner, The Burton Partnership (QP), LP (an investment partnership) since 2000; Managing General Partner, The South Atlantic Venture Funds from 1983 to 2012; Director, IDology, Inc. (technology solutions) since 2006; Director, Knology, Inc. (telecommunications) from 1996 to 2012; Director, Capital Southwest (financial) from 2006 to 2012; Director, Besito (restaurant) since 2013; Director, PDQ South Texas (restaurant) since 2013; Director, ITC/Talon (data) since 2015. | | 28 RICs consisting of 98 Portfolios | | None |
Honorable Stuart E. Eizenstat 1943 | | Director | | Since 2007 | | Partner and Head of International Practice, Covington and Burling LLP (law firm) since 2001; International Advisory Board Member, The Coca-Cola Company from 2002 to 2011; Advisory Board Member, Veracity Worldwide, LLC (risk management) from 2007 to 2012; Member of the International Advisory Board GML Ltd. (energy) since 2003; Advisory Board Member, BT Americas (telecommunications) from 2004 to 2009. | | 28 RICs consisting of 98 Portfolios | | Alcatel-Lucent (tele- communications); Global Specialty Metallurgical; UPS Corporation (delivery service) |
John F. O’Brien 1943 | | Director | | Since 2007 | | Trustee, Woods Hole Oceanographic Institute since 2003 and Chairman thereof from 2009 to 2015; Co-Founder and Managing Director, Board Leaders LLC (director education) since 2005. | | 28 RICs consisting of 98 Portfolios | | Cabot Corporation (chemicals); LKQ Corporation (auto parts manufacturing); TJX Companies, Inc. (retailer) |
Donald C. Opatrny 1952 | | Director | | Since 2015 | | Trustee, Member of the Executive Committee and Chair of the Investment Committee, Cornell University since 2004; Member of the Board and Investment Committee, University School since 2007; Member of the Investment Committee, Mellon Foundation from 2009 to 2015; President and Trustee, the Center for the Arts, Jackson Hole since 2011; Director, Athena Capital Advisors LLC (investment management firm) since 2013; Trustee and Chair of the Investment Committee, Community Foundation of Jackson Hole since 2014; Trustee, Artstor (a Mellon Foundation affiliate) from 2010 to 2015; President, Trustee and Member of the Investment Committee, The Aldrich Contemporary Art Museum from 2007 to 2014. | | 28 RICs consisting of 98 Portfolios | | None |
Roberta Cooper Ramo 1942 | | Director | | Since 2007 | | Shareholder and Attorney, Modrall, Sperling, Roehl, Harris & Sisk, P.A. (law firm) since 1993; Chairman of the Board, Cooper’s Inc. (retail) since 1999; Director, ECMC Group (service provider to students, schools and lenders) since 2001; President, The American Law Institute (non-profit) since 2008; Vice President, Santa Fe Opera (non-profit) since 2011; Chair, Think New Mexico (non-profit) since 2013; Chairman of the Board, Cooper’s Inc. (retail) from 1999 to 2011. | | 28 RICs consisting of 98 Portfolios | | None |
| | | | | | |
| | | | | | | |
| | FDP SERIES, INC. | | MAY 31, 2016 | | 71 |
| | |
| Officers and Directors (continued) | | |
| | | | | | | | | | |
Name, Address1 and Year of Birth | | Position(s) Held with
the Corporation | | Length of Time Served2,3 | | Principal Occupation(s) During Past Five Years | | Number of BlackRock-
Advised Registered
Investment Companies
(“RICs”) Consisting of
Investment Portfolios
(“Portfolios”) Overseen | | Public Company and
Other Investment
Company Directorships
Held During Past
Five Years |
| Independent Directors (concluded) |
David H. Walsh 1941 | | Director | | Since 2007 | | Director, National Museum of Wildlife Art since 2007; Trustee, University of Wyoming Foundation from 2008 to 2012; Director, The American Museum of Fly Fishing since 1997. | | 28 RICs consisting of 98 Portfolios | | None |
| Interested Directors4 |
Robert Fairbairn 1965 | | Director | | Since 2015 | | Senior Managing Director of BlackRock since 2010; Global Head of BlackRock’s Retail and iShares businesses since 2012; Member of BlackRock’s Global Executive and Global Operating Committees; Head of BlackRock’s Global Client Group from 2009 to 2012; Chairman of BlackRock’s international businesses from 2007 to 2010. | | 28 RICs consisting of 98 Portfolios | | None |
Henry Gabbay 1947 | | Director | | Since 2007 | | Consultant, BlackRock from 2007 to 2008; Managing Director, BlackRock from 1989 to 2007; Chief Administrative Officer, BlackRock Advisors, LLC from 1998 to 2007; President of BlackRock Funds and BlackRock Allocation Target Shares (formerly BlackRock Bond Allocation Target Shares) from 2005 to 2007 and Treasurer of certain closed-end funds in the BlackRock fund complex from 1989 to 2006. | | 28 RICs consisting of 98 Portfolios | | None |
John M. Perlowski 1964 | | Director, President and Chief Executive Officer | | Since 2015, (Director); Since 2010, (President and Chief Executive Officer) | | Managing Director of BlackRock since 2009; Head of BlackRock Global Fund Services since 2009; Managing Director and Chief Operating Officer of the Global Product Group at Goldman Sachs Asset Management, L.P. from 2003 to 2009; Treasurer of Goldman Sachs Mutual Funds from 2003 to 2009 and Senior Vice President thereof from 2007 to 2009; Director of Goldman Sachs Offshore Funds from 2002 to 2009; Director of Family Resource Network (charitable foundation) since 2009. | | 136 RICs consisting of 326 Portfolios | | None |
| | 1 The address of each Director is c/o BlackRock, Inc., 55 East 52nd Street, New York, NY 10055. |
| | 2 Each Independent Director holds office until his or her successor is duly elected and qualifies or until his or her earlier death, resignation, retirement or removal as provided by the Corporation’s by-laws or charter or statute, or, in the case of an Independent Director, until December 31 of the year in which he or she turns 75. The Board has determined to extend the terms of Independent Directors on a case-by-case basis, as appropriate. The Board has unanimously approved extending the mandatory retirement age for Messrs. Walsh and Weiss until January 31, 2017, which the Board believes to be in the best interests of shareholders of the Corporation. Interested Directors serve until their successor is duly elected and qualifies or until their earlier death, resignation, retirement or removal as provided by the Corporation’s by-laws or statute, or until December 31 of the year in which they turn 72. |
| | 3 Following the combination of Merrill Lynch Investment Managers, L.P. (“MLIM”) and BlackRock, Inc. (“BlackRock”) in September 2006, the various legacy MLIM and legacy BlackRock fund boards were realigned and consolidated into three new fund boards in 2007. As a result, although the chart shows certain Directors as joining the Corporation’s board in 2007, those Directors first became members of the boards of other legacy MLIM or legacy BlackRock funds as follows: James H. Bodurtha, 1995; Bruce R. Bond, 2005; Donald W. Burton, 2002; Honorable Stuart E. Eizenstat, 2001; Robert M. Hernandez, 1996; John F. O’Brien, 2005; Roberta Cooper Ramo, 1999; David H. Walsh, 2003; and Fred G. Weiss, 1998. |
| | 4 Messrs. Fairbairn and Perlowski are both “interested persons,” as defined in the 1940 Act, of the Corporation based on their positions with BlackRock and its affiliates. Mr. Perlowski is also a board member of the BlackRock Equity-Bond Complex and the BlackRock Equity-Liquidity Complex. Mr. Gabbay may be deemed an “interested person” of the Corporation based on his former positions with BlackRock and its affiliates. Mr. Gabbay does not currently serve as an officer or employee of BlackRock or its affiliates or own any securities of BlackRock or the PNC Financial Services Group, Inc. Mr. Gabbay is a non-management Interested Director. |
| | | | | | |
| | | | | | | |
| 72 | | FDP SERIES, INC. | | MAY 31, 2016 | | |
| | | | |
| Officers and Directors (concluded) | | |
| | | | | | |
Name, Address1 and Year of Birth | | Position(s) Held with
the Corporation | | Length of Time Served as
an Officer | | Principal Occupation(s) During Past Five Years |
| Officers Who Are Not Directors2 |
Jennifer McGovern 1977 | | Vice President | | Since 2014 | | Managing Director of BlackRock since 2016; Director of BlackRock from 2011 to 2015; Head of Product Structure and Oversight for BlackRock’s U.S. Wealth Advisory Group since 2013; Vice President of BlackRock from 2008 to 2010. |
Neal J. Andrews 1966 | | Chief Financial Officer | | Since 2007 | | Managing Director of BlackRock since 2006; Senior Vice President and Line of Business Head of Fund Accounting and Administration at PNC Global Investment Servicing (U.S.) Inc. from 1992 to 2006. |
Jay M. Fife 1970 | | Treasurer | | Since 2007 | | Managing Director of BlackRock since 2007; Director of BlackRock in 2006; Assistant Treasurer of the MLIM and Fund Asset Management, L.P. advised funds from 2005 to 2006; Director of MLIM Fund Services Group from 2001 to 2006. |
Charles Park 1967 | | Chief Compliance Officer | | Since 2014 | | Anti-Money Laundering Compliance Officer for the BlackRock-advised Funds in the Equity-Bond Complex, the Equity-Liquidity Complex and the Closed-End Complex from 2014 to 2015; Chief Compliance Officer of BlackRock Advisors, LLC and the BlackRock-advised Funds in the Equity-Bond Complex, the Equity-Liquidity Complex and the Closed-End Complex since 2014; Principal of and Chief Compliance Officer for iShares® Delaware Trust Sponsor LLC since 2012 and BlackRock Fund Advisors (“BFA”) since 2006; Chief Compliance Officer for the BFA-advised iShares exchange traded funds since 2006; Chief Compliance Officer for BlackRock Asset Management International Inc. since 2012. |
Fernanda Piedra 1969 | | Anti-Money Laundering Compliance Officer | | Since 2015 | | Director of BlackRock since 2014; Anti-Money Laundering Compliance Officer and Regional Head of Financial Crime for the Americas at BlackRock since 2014; Head of Regulatory Changes and Remediation for the Asset Wealth Management Division of Deutsche Bank from 2010 to 2014; Vice President of Goldman Sachs (Anti-Money Laundering/Suspicious Activities Group) from 2004 to 2010. |
Benjamin Archibald 1975 | | Secretary | | Since 2012 | | Managing Director of BlackRock since 2014; Director of BlackRock from 2010 to 2013; Secretary of the iShares exchange traded funds since 2015; Secretary of the BlackRock-advised mutual funds since 2012. |
| | 1 The address of each Officer is c/o BlackRock, Inc., 55 East 52nd Street, New York, NY 10055. |
| | 2 Officers of the Corporation serve at the pleasure of the Board. |
| | Further information about the Corporation’s Officers and Directors is available in the Corporation’s Statement of Additional Information, which can be obtained without charge by calling (800) 441-7762. |
Effective May 6, 2016, Valerie G. Brown resigned as a Director of the Corporation.
Effective May 10, 2016, Kenneth A. Froot resigned as a Director of the Corporation.
On June 2, 2016, the Board appointed Henry R. Keizer as a Director of the Corporation effective July 28, 2016.
| | | | | | |
| | | | |
Investment Advisor BlackRock Advisors, LLC Wilmington, DE 19809 | | Custodian Brown Brothers Harriman & Co. Boston, MA 02109 | | Distributor BlackRock Investments, LLC
New York, NY 10022 | | Legal Counsel Willkie Farr & Gallagher LLP New York, NY 10019 |
| | | |
Sub-Advisors Massachusetts Financial Services
Company Boston, MA 02199 Janus Capital Management, LLC Denver, CO 80206 Invesco Advisers, Inc. Atlanta, GA 30309 Franklin Advisers, Inc. San Mateo, CA 94403 | | Transfer Agent BNY Mellon Investment
Servicing (US)
Inc. Wilmington, DE 19809 Accounting Agent State Street Bank and Trust Company Boston, MA 02110 | | Independent Registered
Public Accounting Firm Deloitte & Touche LLP Boston, MA 02116 | | Address of the Funds 100 Bellevue Parkway Wilmington, DE 19809 |
| | | | | | |
| | | | | | | |
| | FDP SERIES, INC. | | MAY 31, 2016 | | 73 |
At the Special Meeting of Shareholders of BlackRock Janus Growth Fund held on December 17, 2015, shareholders were asked to vote on the following proposals:
Proposal 1. To approve the use of a manager of managers structure with respect to the Fund.
With respect to this Proposal, the shares of the Fund were voted as follows:
| | | | | | | | | | |
| For | | | Against | | | Abstain | |
| | 4,948,556 | | | | 198,739 | | | | 302,562 | |
Proposal 2. To approve a new subadvisory agreement between BlackRock Advisors, LLC and Janus Capital Management LLC with respect to the Fund.
With respect to this Proposal, the shares of the Fund were voted as follows:
| | | | | | | | | | |
| For | | | Against | | | Abstain | |
| | 5,004,108 | | | | 146,059 | | | | 299,690 | |
At the Special Meeting of Shareholders of BlackRock Invesco Value Fund held on December 17, 2015, shareholders were asked to vote on the following proposal:
Proposal 1. To approve the use of a manager of managers structure with respect to the Fund.
With respect to this Proposal, the shares of the Fund were voted as follows:
| | | | | | | | | | |
| For | | | Against | | | Abstain | |
| | 4,575,946 | | | | 184,029 | | | | 247,589 | |
Householding
The Funds will mail only one copy of shareholder documents, including prospectuses, annual and semi-annual reports and proxy statements, to shareholders with multiple accounts at the same address. This practice is commonly called “householding” and is intended to reduce expenses and eliminate duplicate mailings of shareholder documents. Mailings of your shareholder documents may be householded indefinitely unless you instruct us otherwise. If you do not want the mailing of these documents to be combined with those for other members of your household, please call the Funds at (800) 441-7762.
Availability of Quarterly Schedule of Investments
The Funds file their complete schedule of portfolio holdings with the SEC for the first and third quarters of each fiscal year on Form N-Q. The Funds’ Forms N-Q are available on the SEC’s website at http://www.sec.gov and may also be reviewed and copied at the SEC’s Public Reference Room in Washington, D.C. Information on how to access documents on the SEC’s website without charge may be obtained by calling (800) SEC-0330. The Funds’ Forms N-Q may also be obtained upon request and without charge by calling (800) 441-7762.
Availability of Proxy Voting Policies and Procedures
A description of the policies and procedures that the Funds use to determine how to vote proxies relating to portfolio securities is available upon request and without charge (1) by calling (800) 441-7762; (2) at http://www.blackrock.com; and (3) on the SEC’s website at http://www.sec.gov.
Availability of Proxy Voting Record
Information about how the Funds voted proxies relating to securities held in the Funds’ portfolios during the most recent 12-month period ended June 30 is available upon request and without charge (1) at http://www.blackrock.com; or by calling (800) 441-7762 and (2) on the SEC’s website at http://www.sec.gov.
BlackRock’s Mutual Fund Family
BlackRock offers a diverse lineup of open-end mutual funds crossing all investment styles and managed by experts in equity, fixed income and tax-exempt investing. Visit http://www.blackrock.com for more information.
| | | | | | |
| | | | | | | |
| 74 | | FDP SERIES, INC. | | MAY 31, 2016 | | |
| | | | |
| Additional Information (concluded) | | |
Account Information
Call us at (800) 441-7762 from 8:00 AM to 6:00 PM EST on any business day to get information about your account balances, recent transactions and share prices. You can also reach us on the Web at http://www.blackrock.com/funds.
Automatic Investment Plans
Investor Class shareholders who want to invest regularly can arrange to have $50 or more automatically deducted from their checking or savings account and invested in any of the BlackRock funds.
Systematic Withdrawal Plans
Investor Class shareholders can establish a systematic withdrawal plan and receive periodic payments of $50 or more from their BlackRock funds, as long as their account balance is at least $10,000.
Retirement Plans
Shareholders may make investments in conjunction with Traditional, Rollover, Roth, Coverdell, Simple IRAs, SEP IRAs and 403(b) Plans.
|
| BlackRock Privacy Principles |
BlackRock is committed to maintaining the privacy of its current and former fund investors and individual clients (collectively, “Clients”) and to safe-guarding their non-public personal information. The following information is provided to help you understand what personal information BlackRock collects, how we protect that information and why in certain cases we share such information with select parties.
If you are located in a jurisdiction where specific laws, rules or regulations require BlackRock to provide you with additional or different privacy-related rights beyond what is set forth below, then BlackRock will comply with those specific laws, rules or regulations.
BlackRock obtains or verifies personal non-public information from and about you from different sources, including the following: (i) information we receive from you or, if applicable, your financial intermediary, on applications, forms or other documents; (ii) information about your transactions with us, our affiliates, or others; (iii) information we receive from a consumer reporting agency; and (iv) from visits to our websites.
BlackRock does not sell or disclose to non-affiliated third parties any non-public personal information about its Clients, except as permitted by law or as is necessary to respond to regulatory requests or to service Client accounts. These non-affiliated third parties are required to protect the confidentiality and security of this information and to use it only for its intended purpose.
We may share information with our affiliates to service your account or to provide you with information about other BlackRock products or services that may be of interest to you. In addition, BlackRock restricts access to non-public personal information about its Clients to those BlackRock employees with a legitimate business need for the information. BlackRock maintains physical, electronic and procedural safeguards that are designed to protect the non-public personal information of its Clients, including procedures relating to the proper storage and disposal of such information.
| | | | | | |
| | | | | | | |
| | FDP SERIES, INC. | | MAY 31, 2016 | | 75 |
This report is intended for current holders. It is not authorized for use as an offer of sale or a solicitation of an offer to buy shares of the Funds unless preceded or accompanied by the Funds’ current prospectus. Past performance results shown in this report should not be considered a representation of future performance. Investment returns and principal value of shares will fluctuate so that shares, when redeemed, may be worth more or less than their original cost. Statements and other information herein are as dated and are subject to change.

| | |
| FDPS-5/16-AR | |  |
| | |
| Item 2 – | | Code of Ethics – The registrant (or the “Fund”) has adopted a code of ethics, as of the end of the period covered by this report, applicable to the registrant’s principal executive officer, principal financial officer, principal accounting officer or controller, or persons performing similar functions. During the period covered by this report, the code of ethics was amended to update certain information and to make other non-material changes. During the period covered by this report, there have been no waivers granted under the code of ethics. The registrant undertakes to provide a copy of the code of ethics to any person upon request, without charge, by calling 1-800-441-7762. |
| |
| Item 3 – | | Audit Committee Financial Expert – The registrant’s board of trustees (the “board of trustees”), has determined that (i) the registrant has the following audit committee financial experts serving on its audit committee and (ii) each audit committee financial expert is independent: |
| |
| | Robert M. Hernandez |
| | Fred G. Weiss |
| | Stuart E. Eizenstat |
| | Bruce R. Bond |
| |
| | Under applicable securities laws, a person determined to be an audit committee financial expert will not be deemed an “expert” for any purpose, including without limitation for the purposes of Section 11 of the Securities Act of 1933, as a result of being designated or identified as an audit committee financial expert. The designation or identification of a person as an audit committee financial expert does not impose on such person any duties, obligations, or liabilities greater than the duties, obligations, and liabilities imposed on such person as a member of the audit committee and board of trustees in the absence of such designation or identification. |
| |
| Item 4 – | | Principal Accountant Fees and Services |
| |
| | The following table presents fees billed by Deloitte & Touche LLP (“D&T”) in each of the last two fiscal years for the services rendered to the Fund: |
| | | | | | | | | | | | | | | | |
| | | (a) Audit Fees | | (b) Audit-Related Fees1 | | (c) Tax Fees2 | | (d) All Other Fees3 |
| Entity Name | | Current Fiscal Year End | | Previous Fiscal Year End | | Current Fiscal Year End | | Previous Fiscal Year End | | Current Fiscal Year End | | Previous Fiscal Year End | | Current Fiscal Year End | | Previous
Fiscal Year End |
FDP BlackRock Franklin Templeton Total Return Fund | | $51,738 | | $51,738 | | $0 | | $0 | | $15,402 | | $15,402 | | $0 | | $0 |
FDP BlackRock Invesco Value Fund | | $31,163 | | $31,163 | | $0 | | $0 | | $12,240 | | $12,240 | | $0 | | $0 |
FDP BlackRock Janus Growth Fund | | $31,163 | | $31,163 | | $0 | | $0 | | $12,240 | | $12,240 | | $0 | | $0 |
FDP BlackRock MFS Research International Fund | | $33,463 | | $33,463 | | $0 | | $0 | | $13,260 | | $13,260 | | $0 | | $0 |
The following table presents fees billed by D&T that were required to be approved by the registrant’s audit committee (the “Committee”) for services that relate directly to the operations or financial
2
reporting of the Fund and that are rendered on behalf of BlackRock Advisors, LLC (“Investment Adviser” or “BlackRock”) and entities controlling, controlled by, or under common control with BlackRock (not including any sub-adviser whose role is primarily portfolio management and is subcontracted with or overseen by another investment adviser) that provide ongoing services to the Fund (“Fund Service Providers”):
| | | | |
| | | Current Fiscal Year End | | Previous Fiscal Year End |
(b) Audit-Related Fees1 | | $0 | | $0 |
(c) Tax Fees2 | | $0 | | $0 |
(d) All Other Fees3 | | $2,129,000 | | $2,391,000 |
1 The nature of the services includes assurance and related services reasonably related to the performance of the audit of financial statements not included in Audit Fees.
2 The nature of the services includes tax compliance, tax advice and tax planning.
3 Aggregate fees borne by BlackRock in connection with the review of compliance procedures and attestation thereto performed by D&T with respect to all of the registered closed-end funds and some of the registered open-end funds advised by BlackRock.
| (e)(1) | Audit Committee Pre-Approval Policies and Procedures: |
The Committee has adopted policies and procedures with regard to the pre-approval of services. Audit, audit-related and tax compliance services provided to the registrant on an annual basis require specific pre-approval by the Committee. The Committee also must approve other non-audit services provided to the registrant and those non-audit services provided to the Investment Adviser and Fund Service Providers that relate directly to the operations and the financial reporting of the registrant. Certain of these non-audit services that the Committee believes are (a) consistent with the SEC’s auditor independence rules and (b) routine and recurring services that will not impair the independence of the independent accountants may be approved by the Committee without consideration on a specific case-by-case basis (“general pre-approval”). The term of any general pre-approval is 12 months from the date of the pre-approval, unless the Committee provides for a different period. Tax or other non-audit services provided to the registrant which have a direct impact on the operations or financial reporting of the registrant will only be deemed pre-approved provided that any individual project does not exceed $10,000 attributable to the registrant or $50,000 per project. For this purpose, multiple projects will be aggregated to determine if they exceed the previously mentioned cost levels.
Any proposed services exceeding the pre-approved cost levels will require specific pre-approval by the Committee, as will any other services not subject to general pre-approval (e.g., unanticipated but permissible services). The Committee is informed of each service approved subject to general pre-approval at the next regularly scheduled in-person board meeting. At this meeting, an analysis of such services is presented to the Committee for ratification. The Committee may delegate to the Committee Chairman the authority to approve the provision of and fees for any specific engagement of permitted non-audit services, including services exceeding pre-approved cost levels.
| (e)(2) | None of the services described in each of Items 4(b) through (d) were approved by the Committee pursuant to the de minimis exception in paragraph (c)(7)(i)(C) of Rule 2-01 of Regulation S-X. |
3
| | |
| | (f) Not Applicable |
| |
| | (g) The aggregate non-audit fees paid to the accountant for services rendered by the accountant to the registrant, the Investment Adviser and the Fund Service Providers were: |
| | | | |
| Entity Name | | Current Fiscal Year End | | Previous Fiscal Year End |
| FDP BlackRock Franklin Templeton Total Return Fund | | $15,402 | | $15,402 |
FDP BlackRock Invesco Value Fund | | $12,240 | | $12,240 |
FDP BlackRock Janus Growth Fund | | $12,240 | | $12,240 |
| FDP BlackRock MFS Research International Fund | | $13,260 | | $13,260 |
| | | | |
| | Additionally, SSAE 16 Review (Formerly, SAS No. 70) fees for the current and previous fiscal years of $2,129,000 and $2,391,000, respectively, were billed by D&T to the Investment Adviser. |
| |
| | (h) The Committee has considered and determined that the provision of non-audit services that were rendered to the Investment Adviser and the Fund Service Providers that were not pre-approved pursuant to paragraph (c)(7)(ii) of Rule 2-01 of Regulation S-X is compatible with maintaining the principal accountant’s independence. |
| |
| Item 5 – | | Audit Committee of Listed Registrants – Not Applicable |
| |
| Item 6 – | | Investments |
| | (a) The registrant’s Schedule of Investments is included as part of the Report to Stockholders filed under Item 1 of this Form. |
| |
| | (b) Not Applicable due to no such divestments during the semi-annual period covered since the previous Form N-CSR filing. |
| |
| Item 7 – | | Disclosure of Proxy Voting Policies and Procedures for Closed-End Management Investment Companies – Not Applicable |
| |
| Item 8 – | | Portfolio Managers of Closed-End Management Investment Companies – Not Applicable |
| |
| Item 9 – | | Purchases of Equity Securities by Closed-End Management Investment Company and Affiliated Purchasers – Not Applicable |
| |
| Item 10 – | | Submission of Matters to a Vote of Security Holders – There have been no material changes to these procedures. |
| |
| Item 11 – | | Controls and Procedures |
| |
| | (a) The registrant’s principal executive and principal financial officers, or persons performing similar functions, have concluded that the registrant’s disclosure controls and procedures (as defined |
4
| | |
| | in Rule 30a-3(c) under the Investment Company Act of 1940, as amended (the “1940 Act”)) are effective as of a date within 90 days of the filing of this report based on the evaluation of these controls and procedures required by Rule 30a-3(b) under the 1940 Act and Rule 15d-15(b) under the Securities Exchange Act of 1934, as amended. |
| |
| | (b) There were no changes in the registrant’s internal control over financial reporting (as defined in Rule 30a-3(d) under the 1940 Act) that occurred during the second fiscal quarter of the period covered by this report that have materially affected, or are reasonably likely to materially affect, the registrant’s internal control over financial reporting. |
| |
| Item 12 – | | Exhibits attached hereto |
| |
| | (a)(1) Code of Ethics – See Item 2 |
| |
| | (a)(2) Certifications – Attached hereto |
| |
| | (a)(3) Not Applicable |
| |
| | (b) Certifications – Attached hereto |
5
Pursuant to the requirements of the Securities Exchange Act of 1934 and the Investment Company Act of 1940, the registrant has duly caused this report to be signed on its behalf by the undersigned, thereunto duly authorized.
| | |
| FDP Series, Inc. |
| |
| By: | | /s/ John M. Perlowski |
| | John M. Perlowski |
| | Chief Executive Officer (principal executive officer) of |
| | FDP Series, Inc. |
| |
| Date: | | August 4, 2016 |
Pursuant to the requirements of the Securities Exchange Act of 1934 and the Investment Company Act of 1940, this report has been signed below by the following persons on behalf of the registrant and in the capacities and on the dates indicated.
| | |
| By: | | /s/ John M. Perlowski |
| | John M. Perlowski |
| | Chief Executive Officer (principal executive officer) of |
| | FDP Series, Inc. |
| |
| Date: | | August 4, 2016 |
| |
| By: | | /s/ Neal J. Andrews |
| | Neal J. Andrews |
| | Chief Financial Officer (principal financial officer) of |
| | FDP Series, Inc. |
| |
| Date: | | August 4, 2016 |
6