UNITED STATES
SECURITIES AND EXCHANGE COMMISSION
Washington, D.C. 20549
FORM N-CSR
CERTIFIED SHAREHOLDER REPORT OF REGISTERED MANAGEMENT INVESTMENT COMPANIES
Investment Company Act file number: 811-21744
Name of Fund: FDP Series, Inc.
Franklin Templeton Total Return FDP Fund
Invesco Value FDP Fund
Marsico Growth FDP Fund
MFS Research International FDP Fund
Fund Address: 100 Bellevue Parkway, Wilmington, DE 19809
Name and address of agent for service: John M. Perlowski, Chief Executive Officer, FDP Series, Inc., 55 East 52nd Street, New York, NY 10055
Registrant’s telephone number, including area code: (800) 441-7762
Date of fiscal year end: 05/31/2014
Date of reporting period: 05/31/2014
Item 1 – Report to Stockholders
MAY 31, 2014
| ANNUAL REPORT | |  |
FDP Series, Inc.
| > | | MFS Research International FDP Fund |
> | | Marsico Growth FDP Fund |
> | | Franklin Templeton Total Return FDP Fund |
Not FDIC Insured • May Lose Value • No Bank Guarantee | | | |
Table of Contents
| | | | | Page | |
Shareholder Letter | | | | | 3 | |
Annual Report:
| | | | | | |
Fund Summaries | | | | | 4 | |
About Fund Performance | | | | | 12 | |
Disclosure of Expenses | | | | | 13 | |
Derivative Financial Instruments | | | | | 13 | |
Portfolio Information | | | | | 14 | |
Financial Statements:
| | | | | | |
Schedules of Investments | | | | | 16 | |
Statements of Assets and Liabilities | | | | | 36 | |
Statements of Operations | | | | | 38 | |
Statements of Changes in Net Assets | | | | | 39 | |
Financial Highlights | | | | | 41 | |
Notes to Financial Statements | | | | | 49 | |
Report of Independent Registered Public Accounting Firm | | | | | 63 | |
Important Tax Information | | | | | 63 | |
Disclosure of Investment Advisory Agreement and Sub-Advisory Agreements | | | | | 64 | |
Officers and Directors | | | | | 69 | |
Additional Information | | | | | 72 | |
A World-Class Mutual Fund Family | | | | | 74 | |
FDP Series, Inc. is part of the Funds Diversified PortfoliosSM (FDP) Service. You may receive separate shareholder reports for other funds available through the Service. | | | |
| 2 | FDP SERIES, INC. | MAY 31, 2014
|
Dear Shareholder,
Most asset classes performed well for the 12-month period ended May 31, 2014. The period began with financial markets reacting to a spate of interest rate volatility sparked by the Federal Reserve’s first mention of gradually reducing (or “tapering”) the central bank’s asset purchase programs earlier than originally expected. After a sharp sell-off, markets broadly rebounded in late June as the Fed’s tone turned more dovish. At the same time, improving economic indicators and better corporate earnings helped extend gains through most of the summer. Although the tone of economic and financial news became mixed last autumn, it was a surprisingly positive period for the markets. Early on, the Fed defied investors’ expectations with its decision to delay tapering, but higher volatility returned in late September when the U.S. Treasury Department warned that the national debt would soon breach its statutory maximum. The ensuing political brinksmanship led to a partial government shutdown, roiling global financial markets through the first half of October. Equities and other so-called “risk assets” managed to resume their rally when politicians finally engineered a compromise to reopen the government and extend the debt ceiling.
The remainder of 2013 was a generally positive period for stock markets in the developed world, although investors continued to grapple with uncertainty about when and how much the Fed would scale back on stimulus — a condition that caused fixed income investments to struggle. When the Fed ultimately announced its tapering plans in mid-December, markets reacted positively, as this action signaled the Fed’s perception of real improvement in the economy, and investors were finally released from the anxiety that had gripped them for quite some time.
The start of the new year brought a stark change in sentiment. Heightened volatility in emerging markets — driven by concerns about reduced global liquidity, severe currency weakness, high levels of debt and uneven growth — combined with mixed U.S. economic data caused global equities to weaken in January while bond markets found renewed strength from investors seeking relatively safer assets. Although these headwinds persisted, equities were back on the rise in February as investors were encouraged by a one-year extension of the U.S. debt ceiling and market-friendly comments from new Fed Chair Janet Yellen. While it was clear that U.S. economic data had softened, investors were assuaged by increasing evidence that this was a temporary trend resulting from an unusually harsh winter.
In the months that followed, signs of decelerating growth in China and geopolitical tensions in Russia and Ukraine made for a bumpy ride, but markets were resilient as investors focused on improving U.S. economic data, stronger corporate earnings and a still-dovish central bank. Within developed markets, investors shifted from growth to value stocks as the strong performance of growth stocks in 2013 had pushed valuations higher in many of these sectors. Broadly speaking, the strongest performers of 2013 struggled most in 2014 and vice versa. Emerging markets particularly benefited from this broad rotation into cheaper valuations. For investors in these markets, technical factors heartily outweighed the growing list of geopolitical issues. Emerging market equities ended the period with a strong rally through May even as a military coup was underway in Thailand. May was a strong month for most of the world’s equity and fixed income markets. U.S. large cap stocks touched record highs while volatility trended to unusually low levels. In fixed income, investor appetite for bonds persevered as interest rate volatility remained contained against a strong supply-and-demand backdrop.
On the whole, equity markets in the developed world posted robust gains for the 12-month period ended May 31. Emerging markets generated positive, but less dramatic returns due to increased volatility amid heightened risks for the asset class. In fixed income, higher quality sectors including U.S. Treasury bonds, tax-exempt municipals and investment grade corporate bonds, were challenged by interest rate uncertainty, but produced positive results for the 12-month period as the rate market calmed in 2014. High yield bonds delivered strong performance as they benefited from income-oriented investors’ ongoing search for yield in the overall low-rate environment. Short-term interest rates remained near zero, keeping yields on money market securities close to historic lows.
At BlackRock, we believe investors need to think globally, extend their scope across a broad array of asset classes and be prepared to move freely as market conditions change over time. We encourage you to talk with your financial advisor and visit www.blackrock.com for further insight about investing in today’s world.
Sincerely,
Rob Kapito
President, BlackRock Advisors, LLC
 Financial markets moved higher over the period despite modest global growth and a shift toward tighter monetary policy in the United States.
Rob Kapito
President, BlackRock Advisors, LLC
Total Returns as of May 31, 2014| | 6-month | 12-month |
U.S. large cap equities
(S&P 500® Index) | | 7.63 | % | | 20.45 | % |
U.S. small cap equities
(Russell 2000® Index) | | (0.10 | ) | | 16.79 | |
International equities
(MSCI Europe, Australasia,
Far East Index) | | 5.33 | | | 18.04 | |
Emerging market equities
(MSCI Emerging Markets
Index) | | 1.89 | | | 4.27 | |
3-month Treasury bill
(BofA Merrill Lynch
3-Month U.S. Treasury
Bill Index) | | 0.03 | | | 0.06 | |
U.S. Treasury securities
(BofA Merrill Lynch
10-Year U.S. Treasury Index) | | 4.32 | | | 0.46 | |
U.S. investment grade
bonds (Barclays U.S.
Aggregate Bond Index) | | 3.28 | | | 2.71 | |
Tax-exempt municipal
bonds (S&P Municipal
Bond Index) | | 5.86 | | | 2.97 | |
U.S. high yield bonds
(Barclays U.S. Corporate
High Yield 2% Issuer
Capped Index) | | 5.14 | | | 7.88 | |
Past performance is no guarantee of future results. Index performance is shown for illustrative purposes only. You cannot invest directly in an index.
| | THIS PAGE NOT PART OF YOUR FUND REPORT | 3 |
| |
| Fund Summary as of May 31, 2014 | MFS Research International FDP Fund
|
Investment Objective
MFS Research International FDP Fund’s (the “Fund”) investment objective is to seek to provide shareholders with capital appreciation.
Portfolio Management Commentary
How did the Fund perform?
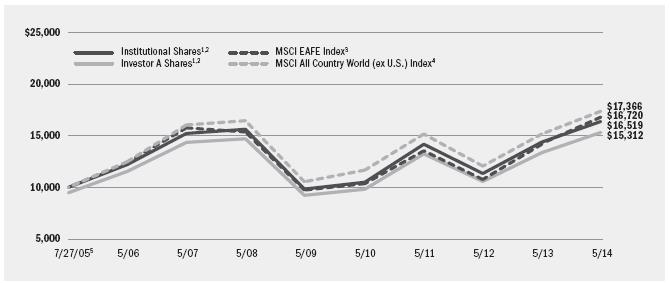
| • | | For the 12-month period ended May 31, 2014, the Fund generated strong, positive returns, although it underperformed its primary benchmark, the MSCI Europe, Australasia and Far East (“EAFE”) Index. For the same period, the Fund’s Institutional and Investor A Share Classes outperformed the secondary benchmark, the MSCI All Country World (excluding U.S.) Index, while the Investor C Shares underperformed the secondary benchmark. The following discussion of relative performance pertains to the MSCI EAFE Index. |
What factors influenced performance?
| • | | Stock selection detracted from the Fund’s performance relative to the benchmark index, with notable detractors within financials including real estate management & development company Mitsubishi Estate Co., Ltd. (Japan) and global banking and financial services firm HSBC Holdings PLC (United Kingdom). Within industrials, the Fund’s holdings in the capital goods industry hurt relative returns including mining company Iluka Resources Ltd. (Australia), Honda Motor Co. Ltd. (Japan) and engineering company JGC Corporation (Japan). In the consumer staples sector, the Fund’s position in Danone SA (France) had a negative impact. In other sectors, individual positions that detracted from relative performance included McDonald’s franchisee Arcos Dorados Holdings, Inc. (Argentina) and electric utility company Energias do Brasil SA (Brazil), while not owning French energy company Total SA proved to be a disadvantage. Additionally, the Fund’s currency exposure detracted from results. |
| • | | Conversely, stock selection in the health care sector had a positive impact on relative results, with strong performance from holdings in Santen Pharmaceutical Co. Ltd. (Japan) and Novartis AG (Switzerland). Stock selection also contributed positively in the information technology (“IT”) sector, where a position in Cognizant Technology Solutions Corp. (United States) boosted returns. Elsewhere in the Fund, notable individual contributors included hotel & restaurant chain operator Whitbread PLC (United Kingdom), banking firm KBC Groep NV (Belgium), diversified financial services company ING Groep NV CVA (Netherlands), casino resorts operator Sands China Ltd. (Hong Kong), telecommunications company KDDI Corporation (Japan) and natural gas distributor GDF Suez (France). The Fund also benefited from not holding Toyota Motor (Japan). |
Describe recent portfolio activity.
| • | | During the 12-month period, the Fund increased exposure in financials with the addition of new positions in Royal Bank of Scotland Group PLC (United Kingdom) and Zurich Insurance Group AG (Switzerland), while increasing an existing position in HSBC Holdings PLC. In other sectors, the Fund added to its holding of telecommunications services company Vodafone Group PLC (United Kingdom) and initiated a position in IT company Mediatek Inc. (Taiwan). The Fund eliminated positions in energy company BP PLC (United Kingdom), financial services firm Barclays PLC (United Kingdom) and two consumer cyclical stocks Publicis Groupe SA (France) and Hennes & Mauritz AB (Sweden). In health care, the Fund trimmed its position in Roche Holding AG (Switzerland). |
Describe portfolio positioning at period end.
| • | | The Fund is a sector-neutral portfolio that emphasizes bottom-up fundamental analysis and therefore, regional and industry allocations are strictly a by-product of where Fund management finds the most attractive opportunities. On an individual security basis, the Fund’s largest overweight positions relative to the MSCI EAFE Index as of period end included Royal Dutch Shell PLC (United Kingdom), Novartis AG, KDDI Corporation, Schneider Electric SA (France) and Rio Tinto PLC (United Kingdom). |
The views expressed reflect the opinions of the Fund’s sub-advisor as of the date of this report and are subject to change based on changes in market, economic or other conditions. These views are not intended to be a forecast of future events and are no guarantee of future results.
| 4 | FDP SERIES, INC. | MAY 31, 2014
|
| |
| | MFS Research International FDP Fund
|
Total Return Based on a $10,000 Investment
| 1 | | Assuming maximum sales charges, if any, transaction costs and other operating expenses, including advisory fees. Institutional Shares do not have a sales charge. |
| 2 | | The Fund invests, under normal market conditions, at least 65% of its assets in equity securities of foreign companies, including emerging market issuers. |
| 3 | | This unmanaged broad-based index measures the total returns of developed foreign stock markets in Europe, Australasia and the Far East. |
| 4 | | This market capitalization index is designed to measure equity market performance in the developed and emerging markets, excluding the US. |
| 5 | | Commencement of operations. |
Performance Summary for the Period Ended May 31, 2014
| | | | | | Average Annual Total Returns6
|
| | | | | | 1 Year
| | 5 Years
| | Since Inception7
|
|
|
|
| 6-Month
Total Returns
|
| w/o sales
charge
|
| w/sales
charge
|
| w/o sales
charge
|
| w/sales
charge
|
| w/o sales
charge
|
| w/sales
charge
|
Institutional | | | | | 3.58 | % | | | 14.88 | % | | | N/A | | | | 10.94 | % | | | N/A | | | | 5.84 | % | | | N/A | |
Investor A | | | | | 3.44 | | | | 14.67 | | | | 8.65 | % | | | 10.67 | | | | 9.48 | % | | | 5.58 | | | | 4.94 | % |
Investor C | | | | | 2.99 | | | | 13.72 | | | | 12.72 | | | | 9.84 | | | | 9.84 | | | | 4.78 | | | | 4.78 | |
MSCI EAFE Index | | | | | 5.33 | | | | 18.04 | | | | N/A | | | | 11.42 | | | | N/A | | | | 5.99 | | | | N/A | |
MSCI All Country World (ex U.S.) Index | | | | | 4.73 | | | | 14.54 | | | | N/A | | | | 10.49 | | | | N/A | | | | 6.44 | | | | N/A | |
| 6 | | Assuming maximum sales charges, if any. Average annual total returns with and without sales charges reflect reductions for distribution and service fees. See “About Fund Performance” on page 12 for a detailed description of share classes, including any related sales charges and fees. |
| 7 | | The Fund commenced operations on July 27, 2005. |
| | N/A — Not applicable as share class and index do not have a sales charge. |
| | Past performance is not indicative of future results. |
Expense Example
| Actual
| | Hypothetical9
|
|
| Beginning
Account Value
December 1, 2013
|
| Ending
Account Value
May 31, 2014
|
| Expenses Paid
During the Period8
|
| Beginning
Account Value
December 1, 2013
|
| Ending
Account Value
May 31, 2014
|
| Expenses Paid
During the Period8
|
| Annualized
Expense
Ratio
|
| Institutional | $ | 1,000.00 | | | $ | 1,035.80 | | | $ | 6.29 | | | $ | 1,000.00 | | | $ | 1,018.75 | | | $ | 6.24 | | | | 1.24 | % |
| Investor A | $ | 1,000.00 | | | $ | 1,034.40 | | | $ | 7.56 | | | $ | 1,000.00 | | | $ | 1,017.50 | | | $ | 7.49 | | | | 1.49 | % |
| Investor C | $ | 1,000.00 | | | $ | 1,029.90 | | | $ | 11.34 | | | $ | 1,000.00 | | | $ | 1,013.76 | | | $ | 11.25 | | | | 2.24 | % |
| 8 | | For each class of the Fund, expenses are equal to the annualized net expense ratio for the class, multiplied by the average account value over the period, multiplied by 182/365 (to reflect the one-half year period shown). |
| 9 | | Hypothetical 5% annual return before expenses is calculated by pro rating the number of days in the most recent fiscal half year divided by 365. |
| | See “Disclosure of Expenses” on page 13 for further information on how expenses were calculated. |
| FDP SERIES, INC. | MAY 31, 2014 | 5
|
| |
| Fund Summary as of May 31, 2014 | Marsico Growth FDP Fund
|
Investment Objective
Marsico Growth FDP Fund’s (the “Fund”) investment objective is to seek to provide shareholders with long-term growth of capital.
Portfolio Management Commentary
How did the Fund perform?
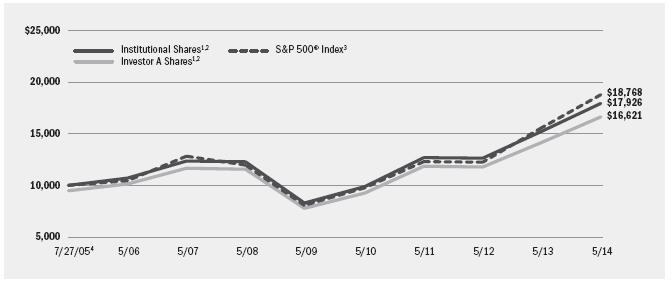
| • | | For the 12-month period ended May 31, 2014, the Fund generated strong, positive returns, but underperformed its benchmark, the S&P 500® Index. |
What factors influenced performance?
| • | | The main cause of the Fund’s underperformance relative to the benchmark index was stock selection in the information technology (“IT”), financials and industrials sectors. Although the Fund’s IT holdings posted strong returns, they lagged the sector return in the benchmark index, thereby hampering relative performance. Notable laggards included semiconductor equipment manufacturer ASML Holding NV, professional social networking website operator LinkedIn Corp., and cloud-based customer relationship management service provider Salesforce.com Inc. In financials, underperformance came from positions in Citigroup, Inc., Charles Schwab Corp. and Wells Fargo & Co. Within industrials, the Fund’s positions in the capital goods industry hurt returns as Rolls-Royce Holdings PLC and Boeing Co. posted disappointing results. On an individual security basis, the largest detractor from performance was athletic apparel manufacturer Lululemon Athletica, Inc. (consumer discretionary), which lowered its revenue and earnings forecasts after experiencing problems with quality control and supply chain management. The Fund sold its positions in LinkedIn Corp., Citigroup, Inc., Wells Fargo & Co., Rolls-Royce Holdings PLC, Boeing Co. and Lululemon Athletica, Inc. during the period. |
| • | | Contributing positively to the Fund’s performance was stock selection in the health care sector, particularly in the biotechnology industry, with Gilead Sciences, Inc. and Biogen Idec, Inc. producing strong returns. Both companies benefited from the introduction of new drugs in the period. The Fund’s underweight to consumer staples had a positive impact on relative results as the sector was generally weak during the period; however, a select holding in Green Mountain Coffee Roasters, Inc. was a notable contributor to Fund performance as the stock soared after an announcement that Coca-Cola Co. had purchased a stake in the company. In consumer discretionary, stock selection within the consumer services industry boosted results, led by the Fund’s position in Wynn Resorts Ltd., which continued to benefit from strong business results in the Macau market. |
Describe recent portfolio activity.
| • | | During the 12-month period, the Fund decreased exposure to financials given a number of headwinds negatively impacting the banking industry. Within IT, the Fund reduced some of its higher valuation positions in favor of stocks with better earnings visibility, but the overall sector allocation was increased during the period. The Fund increased its allocation to the energy sector while repositioning to gain more exposure to opportunities relating to the energy renaissance in North America, which appears to be gaining traction. The Fund added to existing holdings in the materials sector given increasing potential for price appreciation in these companies. |
| • | | The Fund’s cash position was at times elevated due in part to transitioning to new positions during the period. Holding cash hindered performance relative to the benchmark index given the strong equity market during the period. |
Describe portfolio positioning at period end.
| • | | On an absolute basis, the Fund’s largest sector allocations at period end were consumer discretionary, IT, industrials and health care. Relative to the S&P 500® Index, the Fund was overweight in consumer discretionary, industrials and materials, and underweight in financials, consumer staples and energy. The Fund held no exposure to telecommunication services or utilities. |
The views expressed reflect the opinions of the Fund’s sub-advisor as of the date of this report and are subject to change based on changes in market, economic or other conditions. These views are not intended to be a forecast of future events and are no guarantee of future results.
| 6 | FDP SERIES, INC. | MAY 31, 2014
|
Total Return Based on a $10,000 Investment
| 1 | | Assuming maximum sales charges, if any, transaction costs and other operating expenses, including advisory fees. Institutional Shares do not have a sales charge. |
| 2 | | The Fund invests primarily in equity securities of large cap companies that are selected for their growth potential. |
| 3 | | This unmanaged broad-based index is comprised of 500 industrial, utility, transportation and financial companies of the U.S. markets (mostly New York Stock Exchange (“NYSE”) issues), representing about 75% of NYSE capitalization and 30% of NYSE issues. |
| 4 | | Commencement of operations. |
Performance Summary for the Period Ended May 31, 2014
| | | | | | Average Annual Total Returns5
|
| | | | | | 1 Year
| | 5 Years
| | Since Inception6
|
|
|
|
| 6-Month
Total Returns
|
| w/o sales
charge
|
| w/sales
charge
|
| w/o sales
charge
|
| w/sales
charge
|
| w/o sales
charge
|
| w/sales
charge
|
Institutional | | | | | 4.46 | % | | | 17.70 | % | | | N/A | | | | 16.68 | % | | | N/A | | | | 6.82 | % | | | N/A | |
Investor A | | | | | 4.30 | | | | 17.42 | | | | 11.25 | % | | | 16.40 | | | | 15.15 | % | | | 6.56 | | | | 5.91 | % |
Investor C | | | | | 3.93 | | | | 16.48 | | | | 15.48 | | | | 15.53 | | | | 15.53 | | | | 5.75 | | | | 5.75 | |
S&P 500® Index | | | | | 7.63 | | | | 20.45 | | | | N/A | | | | 18.40 | | | | N/A | | | | 7.38 | | | | N/A | |
| 5 | | Assuming maximum sales charges, if any. Average annual total returns with and without sales charges reflect reductions for distribution and service fees. See “About Fund Performance” on page 12 for a detailed description of share classes, including any related sales charges and fees. |
| 6 | | The Fund commenced operations on July 27, 2005. |
| | N/A — Not applicable as share class and index do not have a sales charge. |
| | Past performance is not indicative of future results. |
Expense Example
| Actual
| | Hypothetical8
|
|
| Beginning
Account Value
December 1, 2013
|
| Ending
Account Value
May 31, 2014
|
| Expenses Paid
During the Period7
|
| Beginning
Account Value
December 1, 2013
|
| Ending
Account Value
May 31, 2014
|
| Expenses Paid
During the Period7
|
| Annualized
Expense
Ratio
|
| Institutional | $ | 1,000.00 | | | $ | 1,044.60 | | | $ | 5.25 | | | $ | 1,000.00 | | | $ | 1,019.80 | | | $ | 5.19 | | | | 1.03 | % |
| Investor A | $ | 1,000.00 | | | $ | 1,043.00 | | | $ | 6.52 | | | $ | 1,000.00 | | | $ | 1,018.55 | | | $ | 6.44 | | | | 1.28 | % |
| Investor C | $ | 1,000.00 | | | $ | 1,039.30 | | | $ | 10.37 | | | $ | 1,000.00 | | | $ | 1,014.76 | | | $ | 10.25 | | | | 2.04 | % |
| 7 | | For each class of the Fund, expenses are equal to the annualized net expense ratio for the class, multiplied by the average account value over the period, multiplied by 182/365 (to reflect the one-half year period shown). |
| 8 | | Hypothetical 5% annual return before expenses is calculated by pro rating the number of days in the most recent fiscal half year divided by 365. |
| | See “Disclosure of Expenses” on page 13 for further information on how expenses were calculated. |
| FDP SERIES, INC. | MAY 31, 2014 | 7
|
| |
| Fund Summary as of May 31, 2014 | Invesco Value FDP Fund
|
Investment Objective
Invesco Value FDP Fund’s (the “Fund”) investment objective is to seek to provide shareholders with capital growth and income.
Portfolio Management Commentary
How did the Fund perform?
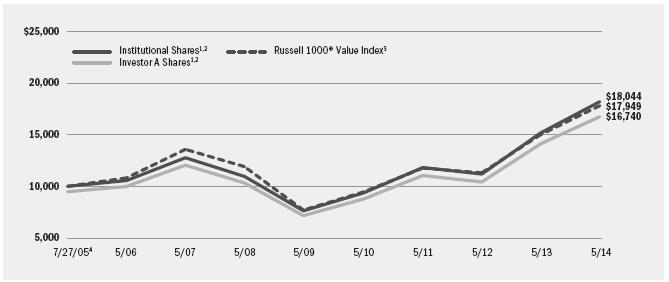
| • | | For the 12-month period ended May 31, 2014, the Fund generated strong, positive returns, but underperformed its benchmark, the Russell 1000® Value Index. |
What factors influenced performance?
| • | | Stock selection in information technology (“IT”) hurt results, mainly from not owning Apple, Inc. and from a non-benchmark holding in eBay, Inc. Stock selection within financials also detracted from performance, mostly due to a material overweight to Citigroup, Inc. Within health care, select pharmaceutical stocks, such as Sanofi negatively impacted performance. The Fund’s underweight in the industrials sector hindered relative returns for the period. The Fund’s small cash position detracted from performance relative to the benchmark index given the strong equity market during the period. |
| • | | Contributing positively to the Fund’s performance was stock selection in the energy sector, mainly within oil and gas service providers. An overweight to consumer discretionary had a positive impact, as did stock selection within the sector, especially in the media industry. Stock selection in the consumer staples sector also helped performance, notably due to a material underweight in Procter & Gamble Co. coupled with an overweight in Tyson Foods, Inc. Stock selection and an underweight in telecommunication services (“telecom”) proved beneficial. Most notably, the Fund’s meaningful underweight in AT&T, Inc. contributed positively to relative results, as did a non-benchmark holding in Vodafone Group PLC. Finally, stock selection in materials and a material underweight to the utilities sector enhanced performance. |
Describe recent portfolio activity.
| • | | During the 12-month period, the Fund maintained a relatively low level of portfolio turnover; however, the Fund added to positions in health care, energy and consumer staples companies. Conversely, the Fund continued to trim select insurance stocks within financials, as well as exiting positions in IT stocks. The majority of the trading activity occurred in the consumer discretionary sector, where the Fund continued to reduce holdings in media and select retail companies that had performed well. |
Describe portfolio positioning at period end.
| • | | Relative to the Russell 1000® Value Index, the Fund ended the period overweight in consumer discretionary, IT, energy and health care, and underweight in financials, utilities, industrials, consumer staples, telecom and materials. |
The views expressed reflect the opinions of the Fund’s sub-advisor as of the date of this report and are subject to change based on changes in market, economic or other conditions. These views are not intended to be a forecast of future events and are no guarantee of future results.
| 8 | FDP SERIES, INC. | MAY 31, 2014
|
Total Return Based on a $10,000 Investment
| 1 | | Assuming maximum sales charges, if any, transaction costs and other operating expenses, including advisory fees. Institutional Shares do not have a sales charge. |
| 2 | | The Fund invests, under normal market conditions, at least 80% of its net assets (plus any borrowings for investment purposes) in common stocks at the time of investment. The Fund invests in equity securities, including common stocks, preferred stocks, and securities convertible into common and preferred stocks (convertible securities). |
| 3 | | This unmanaged broad-based index is a subset of the Russell 1000® Index consisting of those Russell 1000® securities with lower price/book ratios and lower forecasted growth values. |
| 4 | | Commencement of operations. |
Performance Summary for the Period Ended May 31, 2014
| | | | | | Average Annual Total Returns5
|
| | | | | | 1 Year
| | 5 Years
| | Since Inception6
|
|
|
|
| 6-Month
Total Returns
|
| w/o sales
charge
|
| w/sales
charge
|
| w/o sales
charge
|
| w/sales
charge
|
| w/o sales
charge
|
| w/sales
charge
|
Institutional | | | | | 6.48 | % | | | 18.89 | % | | | N/A | | | | 18.78 | % | | | N/A | | | | 6.90 | % | | | N/A | |
Investor A | | | | | 6.33 | | | | 18.56 | | | | 12.34 | % | | | 18.50 | | | | 17.23 | % | | | 6.65 | | | | 6.00 | % |
Investor C | | | | | 5.93 | | | | 17.76 | | | | 16.76 | | | | 17.61 | | | | 17.61 | | | | 5.84 | | | | 5.84 | |
Russell 1000® Value Index | | | | | 8.20 | | | | 19.60 | | | | N/A | | | | 18.44 | | | | N/A | | | | 6.84 | | | | N/A | |
| 5 | | Assuming maximum sales charges, if any. Average annual total returns with and without sales charges reflect reductions for distribution and service fees. See “About Fund Performance” on page 12 for a detailed description of share classes, including any related sales charges and fees. |
| 6 | | The Fund commenced operations on July 27, 2005. |
| | N/A — Not applicable as share class and index do not have a sales charge. |
| | Past performance is not indicative of future results. |
Expense Example
| Actual
| | Hypothetical8
|
|
| Beginning
Account Value
December 1, 2013
|
| Ending
Account Value
May 31, 2014
|
| Expenses Paid
During the Period7
|
| Beginning
Account Value
December 1, 2013
|
| Ending
Account Value
May 31, 2014
|
| Expenses Paid
During the Period7
|
| Annualized
Expense
Ratio
|
| Institutional | $ | 1,000.00 | | | $ | 1,064.80 | | | $ | 5.04 | | | $ | 1,000.00 | | | $ | 1,020.04 | | | $ | 4.94 | | | | 0.98 | % |
| Investor A | $ | 1,000.00 | | | $ | 1,063.30 | | | $ | 6.33 | | | $ | 1,000.00 | | | $ | 1,018.80 | | | $ | 6.19 | | | | 1.23 | % |
| Investor C | $ | 1,000.00 | | | $ | 1,059.30 | | | $ | 10.17 | | | $ | 1,000.00 | | | $ | 1,015.06 | | | $ | 9.95 | | | | 1.98 | % |
| 7 | | For each class of the Fund, expenses are equal to the annualized net expense ratio for the class, multiplied by the average account value over the period, multiplied by 182/365 (to reflect the one-half year period shown). |
| 8 | | Hypothetical 5% annual return before expenses is calculated by pro rating the number of days in the most recent fiscal half year divided by 365. |
| | See “Disclosure of Expenses” on page 13 for further information on how expenses were calculated. |
| FDP SERIES, INC. | MAY 31, 2014 | 9
|
| |
| Fund Summary as of May 31, 2014 | Franklin Templeton Total Return FDP Fund
|
Investment Objective
Franklin Templeton Total Return FDP Fund’s (the “Fund”) investment objective is to seek to provide shareholders with high current income, consistent with preservation of capital. The Fund’s secondary objective is capital appreciation over the long term.
Portfolio Management Commentary
How did the Fund perform?
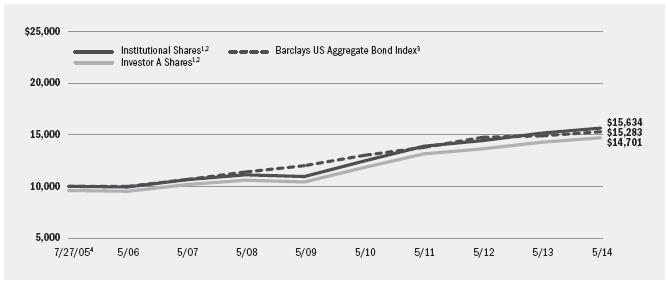
| • | | For the 12-month period ended May 31, 2014, the Fund’s Institutional and Investor A Share Classes outperformed the benchmark, the Barclays U.S. Aggregate Bond Index, while the Investor C Share Class underperformed the benchmark index. |
What factors influenced performance?
| • | | The Fund’s corporate credit holdings including high yield bonds and investment grade debt contributed positively to performance, resulting mainly from sector allocation. An underweight in agency mortgage-backed securities (“MBS”) had a positive impact on relative results, as did security selection within the sector. The Fund’s positions in commercial mortgage-backed securities (“CMBS”) and non-agency residential MBS added to returns, especially attributable to security selection within CMBS. The Fund’s municipal bond exposure also contributed positively. Many of the Fund’s non-U.S. dollar-denominated bonds as well as yield curve positioning in non-U.S. markets further enhanced results. |
| • | | Conversely, yield curve positioning in the United States detracted from the Fund’s performance during the period. Exposure to non-U.S. currencies also had a negative impact on results. |
Describe recent portfolio activity.
| • | | During the 12-month period, the Fund remained slightly overweight compared to the benchmark in many of the credit sectors, including corporate credit and securitized products, as valuations continued to appear relatively attractive on a longer term basis. The Fund reduced exposure, however, to the high yield and floating rate loan sectors. The Fund increased its allocation to CMBS and municipal bonds as valuations appeared attractive in these sectors. The investment advisor continued to find that many of the best opportunities in global bond markets were outside of the United States and accordingly, maintained the Fund’s strong exposure to international bonds and currencies. |
| • | | The Fund transacts in mortgage dollar rolls, which require future mortgage settlements. To meet forward liabilities, the Fund holds cash or invests in high-quality, liquid assets. The Fund’s allocation to cash and cash equivalents did not materially impact performance during the period. |
Describe portfolio positioning at period end.
| • | | Relative to the Barclays U.S. Aggregate Bond Index, the Fund ended the period slightly overweight in many of the credit sectors, including corporate credit and securitized products such as CMBS and non-agency residential MBS. The Fund also maintained significant exposure to international bonds and foreign currencies. |
The views expressed reflect the opinions of the Fund’s sub-advisor as of the date of this report and are subject to change based on changes in market, economic or other conditions. These views are not intended to be a forecast of future events and are no guarantee of future results.
| 10 | FDP SERIES, INC. | MAY 31, 2014
|
| |
| | Franklin Templeton Total Return FDP Fund
|
Total Return Based on a $10,000 Investment
| 1 | | Assuming maximum sales charges, if any, transaction costs and other operating expenses, including advisory fees. Institutional Shares do not have a sales charge. |
| 2 | | The Fund invests, under normal market conditions, at least 80% of its assets in investment grade debt securities and investments, including government and corporate debt securities, mortgage- and asset-backed securities, investment grade corporate loans and futures with reference securities that are investment grade. |
| 3 | | This unmanaged market-weighted index is comprised of investment grade corporate bonds (rated BBB or better), mortgages and U.S. Treasury and government agency issues with at least one year to maturity. |
| 4 | | Commencement of operations. |
Performance Summary for the Period Ended May 31, 2014
| | | | | | Average Annual Total Returns5
|
| | | | | | 1 Year
| | 5 Years
| | Since Inception6
|
|
| Standardized
30-Day Yields
|
| 6-Month
Total Returns
|
| w/o sales
charge
|
| w/sales
charge
|
| w/o sales
charge
|
| w/sales
charge
|
| w/o sales
charge
|
| w/sales
charge
|
Institutional | | | 2.10 | % | | | 3.58 | % | | | 3.18 | % | | | N/A | | | | 7.39 | % | | | N/A | | | | 5.18 | % | | | N/A | |
Investor A | | | 1.77 | | | | 3.55 | | | | 3.03 | | | | (1.10 | )% | | | 7.12 | | | | 6.25 | % | | | 4.94 | | | | 4.45 | % |
Investor C | | | 1.30 | | | | 3.26 | | | | 2.45 | | | | 1.45 | | | | 6.53 | | | | 6.53 | | | | 4.35 | | | | 4.35 | |
Barclays US Aggregate Bond Index | | | — | | | | 3.28 | | | | 2.71 | | | | N/A | | | | 4.96 | | | | N/A | | | | 4.91 | | | | N/A | |
| 5 | | Assuming maximum sales charges, if any. Average annual total returns with and without sales charges reflect reductions for distribution and service fees. See “About Fund Performance” on page 12 for a detailed description of share classes, including any related sales charges and fees. |
| 6 | | The Fund commenced operations on July 27, 2005. |
| | N/A — Not applicable as share class and index do not have a sales charge. |
| | Past performance is not indicative of future results. |
Expense Example
| Actual
| | Hypothetical8
|
|
| Beginning
Account Value
December 1, 2013
|
| Ending
Account Value
May 31, 2014
|
| Expenses Paid
During the Period7
|
| Beginning
Account Value
December 1, 2013
|
| Ending
Account Value
May 31, 2014
|
| Expenses Paid
During the Period7
|
| Annualized
Expense
Ratio
|
| Institutional | $ | 1,000.00 | | | $ | 1,035.80 | | | $ | 3.45 | | | $ | 1,000.00 | | | $ | 1,021.54 | | | $ | 3.43 | | | | 0.68 | % |
| Investor A | $ | 1,000.00 | | | $ | 1,035.50 | | | $ | 4.77 | | | $ | 1,000.00 | | | $ | 1,020.24 | | | $ | 4.73 | | | | 0.94 | % |
| Investor C | $ | 1,000.00 | | | $ | 1,032.60 | | | $ | 7.55 | | | $ | 1,000.00 | | | $ | 1,017.50 | | | $ | 7.49 | | | | 1.49 | % |
| 7 | | For each class of the Fund, expenses are equal to the annualized net expense ratio for the class, multiplied by the average account value over the period, multiplied by 182/365 (to reflect the one-half year period shown). |
| 8 | | Hypothetical 5% annual return before expenses is calculated by pro rating the number of days in the most recent fiscal half year divided by 365. |
| | See “Disclosure of Expenses” on page 13 for further information on how expenses were calculated. |
| FDP SERIES, INC. | MAY 31, 2014 | 11
|
Shares are only available for purchase through the FDP Service.
| • | | Institutional Shares are not subject to any sales charge. These shares bear no ongoing distribution or service fees and are available only to eligible investors. |
| • | | Investor A Shares (for all Funds except Franklin Templeton Total Return FDP Fund) are subject to a maximum initial sales charge (front-end load) of 5.25% and a service fee of 0.25% per year (but no distribution fee). Investor A Shares for Franklin Templeton Total Return FDP Fund incur a maximum initial sales charge (front-end load) of 4.00% and a service fee of 0.25% per year (but no distribution fee). Certain redemptions of these shares may be subject to a contingent deferred sales charge (“CDSC”) where no initial sales charge was paid at the time of purchase. On June 10, 2013, all issued and outstanding Investor B Shares of the Funds were converted into Investor A Shares with the same relative aggregate net asset value. |
| • | | Investor C Shares (for all Funds except Franklin Templeton Total Return FDP Fund) are subject to a distribution fee of 0.75% per year and a service fee of 0.25% per year. Investor C Shares for Franklin Templeton Total Return FDP Fund are subject to a distribution fee of 0.55% per year and a service fee of 0.25% per year. In addition, these shares for all Funds are subject to a 1.00% CDSC if redeemed within one year of purchase. |
| • | | Performance information reflects past performance and does not guarantee future results. Current performance may be lower or higher than the performance data quoted. Refer to www.blackrock.com/funds to obtain performance data current to the most recent month end. Performance results do not reflect the deduction of taxes that a shareholder would pay on fund distributions or the redemption of fund shares. Figures shown in the performance tables on the previous pages assume reinvestment of all dividends and capital gain distributions, if any, at net asset value on the ex-dividend date. Investment return and principal value of shares will fluctuate so that shares, when redeemed, may be worth more or less than their original cost. Dividends paid to each class of shares will vary because of the different levels of service, distribution and transfer agency fees applicable to each class, which are deducted from the income available to be paid to shareholders. In certain periods, the Funds’ investment advisor waived a portion of its fees. Without such waiver, the Funds’ performance would have been lower. |
| 12 | FDP SERIES, INC. | MAY 31, 2014
|
Shareholders of these Funds may incur the following charges: (a) transactional expenses, such as sales charges; and (b) operating expenses, including investment advisory fees, service and distribution fees, including 12b-1 fees, and other Fund expenses. The expense examples on the previous pages (which are based on a hypothetical investment of $1,000 invested on December 1, 2013 and held through May 31, 2014) are intended to assist shareholders both in calculating expenses based on an investment in each Fund and in comparing these expenses with similar costs of investing in other mutual funds.
The expense examples provide information about actual account values and actual expenses. In order to estimate the expenses a shareholder paid during the period covered by this report, shareholders can divide their account value by $1,000 and then multiply the result by the number corresponding to their Fund and share class under the heading entitled “Expenses Paid During the Period.”
The expense examples also provide information about hypothetical account values and hypothetical expenses based on each Fund’s actual expense ratio and an assumed rate of return of 5% per year before expenses. In order to assist shareholders in comparing the ongoing expenses of investing in these Funds and other funds, compare the 5% hypothetical examples with the 5% hypothetical examples that appear in other funds’ shareholder reports.
The expenses shown in the expense examples are intended to highlight shareholders’ ongoing costs only and do not reflect any transactional expenses, such as sales charges, if any. Therefore, the hypothetical examples are useful in comparing ongoing expenses only, and will not help shareholders determine the relative total expenses of owning different funds. If these transactional expenses were included, shareholder expenses would have been higher.
| |
| Derivative Financial Instruments |
|
The Funds may invest in various derivative financial instruments, including financial futures contracts, foreign currency exchange contracts, options and swaps, as specified in Note 4 of the Notes to Financial Statements, which may constitute forms of economic leverage. Such derivative financial instruments are used to obtain exposure to a security, index and/or market without owning or taking physical custody of securities or to hedge market, equity, credit, interest rate and/or foreign currency exchange rate risks. Derivative financial instruments involve risks, including the imperfect correlation between the value of a derivative financial instrument and the underlying asset, possible default of the counterparty to the transaction or illiquidity of the derivative financial instrument. The Funds’ ability to use a derivative financial instrument successfully depends on the investment advisor’s and/or sub-advisor’s ability to predict pertinent market movements accurately, which cannot be assured. The use of derivative financial instruments may result in losses greater than if they had not been used, may require a Fund to sell or purchase portfolio investments at inopportune times or for distressed values, may limit the amount of appreciation a Fund can realize on an investment, may result in lower dividends paid to shareholders and/or may cause a Fund to hold an investment that it might otherwise sell. The Funds’ investments in these instruments are discussed in detail in the Notes to Financial Statements.
| FDP SERIES, INC. | MAY 31, 2014 | 13
|
| |
| Portfolio Information as of May 31, 2014 |
|
MFS Research International FDP Fund
Ten Largest Holdings | Percent of
Long-Term Investments |
Novartis AG, Registered Shares | | 4 | % |
Royal Dutch Shell PLC, Class A | | 3 | |
Nestle SA, Registered Shares | | 3 | |
HSBC Holdings PLC | | 3 | |
Rio Tinto PLC | | 2 | |
Schneider Electric SA | | 2 | |
Bayer AG, Registered Shares | | 2 | |
Westpac Banking Corp. | | 2 | |
GlaxoSmithKline PLC | | 2 | |
UBS AG, Registered Shares | | 2 | |
Geographic Allocation | Percent of
Long-Term Investments |
Japan | | 18 | % |
United Kingdom | | 16 | |
Switzerland | | 13 | |
France | | 11 | |
Germany | | 7 | |
Netherlands | | 7 | |
Hong Kong | | 5 | |
Australia | | 4 | |
United States | | 2 | |
Sweden | | 2 | |
Brazil | | 2 | |
Taiwan | | 2 | |
Other1 | | 11 | |
| 1 | | Other includes a 1% holding or less in each of the following countries: Canada, Belgium, Austria, Italy, Singapore, South Korea, India, Turkey, Ireland, Spain, Denmark, Bermuda, Thailand, Russia, Portugal, Israel. |
Marsico Growth FDP Fund
Ten Largest Holdings | Percent of
Long-Term Investments |
Gilead Sciences, Inc. | | 6 | % |
priceline.com, Inc. | | 6 | |
Monsanto Co. | | 5 | |
Biogen Idec, Inc. | | 4 | |
Facebook, Inc., Class A | | 4 | |
Starwood Hotels & Resorts Worldwide, Inc. | | 4 | |
Canadian Pacific Railway Ltd. | | 4 | |
Union Pacific Corp. | | 4 | |
The Sherwin-Williams Co. | | 4 | |
Wynn Resorts Ltd. | | 4 | |
Sector Allocation | Percent of
Long-Term Investments |
Consumer Discretionary | | 29 | % |
Information Technology | | 20 | |
Industrials | | 16 | |
Health Care | | 14 | |
Materials | | 8 | |
Energy | | 7 | |
Consumer Staples | | 4 | |
Financials | | 2 | |
| | For Fund compliance purposes, the Fund’s sector classifications refer to any one or more of the sector sub-classifications used by one or more widely recognized market indexes or rating group indexes, and/or as defined by the investment advisor. These definitions may not apply for purposes of this report, which may combine such sector sub-classifications for reporting ease. |
| 14 | FDP SERIES, INC. | MAY 31, 2014
|
| |
| Portfolio Information as of May 31, 2014 (concluded) |
|
Invesco Value FDP Fund
Ten Largest Holdings | Percent of
Long-Term Investments |
Citigroup, Inc. | | 4 | % |
Weatherford International Ltd. | | 3 | |
JPMorgan Chase & Co. | | 3 | |
Wells Fargo & Co. | | 2 | |
Merck & Co., Inc. | | 2 | |
Viacom, Inc., Class B | | 2 | |
Royal Dutch Shell PLC — ADR | | 2 | |
Suncor Energy, Inc. | | 2 | |
The Bank of New York Mellon Corp. | | 2 | |
General Electric Co. | | 2 | |
Sector Allocation | Percent of
Long-Term Investments |
Financials | | 23 | % |
Energy | | 18 | |
Health Care | | 15 | |
Consumer Discretionary | | 14 | |
Information Technology | | 11 | |
Industrials | | 7 | |
Consumer Staples | | 5 | |
Utilities | | 3 | |
Materials | | 2 | |
Telecommunication Services | | 2 | |
| | For Fund compliance purposes, the Fund’s sector classifications refer to any one or more of the sector sub-classifications used by one or more widely recognized market indexes or rating group indexes, and/or as defined by the investment advisor. These definitions may not apply for purposes of this report, which may combine such sector sub-classifications for reporting ease. |
Franklin Templeton Total Return FDP Fund
Portfolio Composition | Percent of
Long-Term Investments |
Corporate Bonds | | 31 | % |
U.S. Treasury Obligations | | 21 | |
U.S. Government Sponsored Agency Securities | | 20 | |
Foreign Agency Obligations | | 9 | |
Non-Agency Mortgage-Backed Securities | | 6 | |
Floating Rate Loan Interests | | 5 | |
Municipal Bonds | | 4 | |
Asset-Backed Securities | | 2 | |
Preferred Securities | | 2 | |
| FDP SERIES, INC. | MAY 31, 2014 | 15
|
| |
| Schedule of Investments May 31, 2014 | MFS Research International FDP Fund
(Percentages shown are based on Net Assets)
|
| Common Stocks | | | | | |
Shares | | Value |
Australia — 3.7% | | | | | | | | | | | | | | |
APA Group | | | | | | | | | 106,098 | | | $ | 691,036 | |
Computershare Ltd. | | | | | | | | | 63,871 | | | | 758,134 | |
Iluka Resources Ltd. | | | | | | | | | 152,462 | | | | 1,237,584 | |
Oil Search Ltd. | | | | | | | | | 59,650 | | | | 524,413 | |
Westpac Banking Corp. | | | | | | | | | 105,470 | | | | 3,380,923 | |
| | | | | | | | | | | | | 6,592,090 | |
Austria — 1.1% | | | | | | | | | | | | | | |
Erste Group Bank AG | | | | | | | | | 56,494 | | | | 1,964,136 | |
Belgium — 1.2% | | | | | | | | | | | | | | |
KBC Groep NV (a) | | | | | | | | | 34,985 | | | | 2,084,119 | |
Bermuda — 0.4% | | | | | | | | | | | | | | |
Hiscox Ltd. | | | | | | | | | 64,810 | | | | 739,257 | |
Brazil — 2.0% | | | | | | | | | | | | | | |
EDP — Energias do Brasil SA | | | | | | | | | 78,797 | | | | 330,270 | |
Gerdau SA — ADR | | | | | | | | | 110,610 | | | | 657,023 | |
M Dias Branco SA | | | | | | | | | 20,900 | | | | 899,233 | |
Odontoprev SA | | | | | | | | | 101,000 | | | | 428,291 | |
Petroleo Brasileiro SA — ADR | | | | | | | | | 56,060 | | | | 790,446 | |
Telefonica Brasil SA — ADR | | | | | | | | | 23,118 | | | | 464,903 | |
| | | | | | | | | | | | | 3,570,166 | |
Canada — 1.3% | | | | | | | | | | | | | | |
Canadian Utilities Ltd., Class A | | | | | | | | | 19,480 | | | | 705,146 | |
Cenovus Energy, Inc. | | | | | | | | | 18,890 | | | | 562,188 | |
Dollarama, Inc. | | | | | | | | | 11,840 | | | | 998,806 | |
| | | | | | | | | | | | | 2,266,140 | |
Denmark — 0.4% | | | | | | | | | | | | | | |
TDC A/S | | | | | | | | | 79,479 | | | | 773,831 | |
France — 10.6% | | | | | | | | | | | | | | |
BNP Paribas SA | | | | | | | | | 31,755 | | | | 2,223,177 | |
Danone SA | | | | | | | | | 38,235 | | | | 2,851,148 | |
Dassault Systemes SA | | | | | | | | | 8,916 | | | | 1,131,583 | |
GDF Suez | | | | | | | | | 61,385 | | | | 1,713,231 | |
L’Oreal SA | | | | | | | | | 8,160 | | | | 1,424,415 | |
Legrand SA | | | | | | | | | 10,135 | | | | 641,813 | |
LVMH Moet Hennessy Louis Vuitton SA | | | | | | | | | 10,820 | | | | 2,152,292 | |
Pernod Ricard SA | | | | | | | | | 19,226 | | | | 2,357,537 | |
Schneider Electric SA | | | | | | | | | 36,257 | | | | 3,415,581 | |
Technip SA | | | | | | | | | 8,420 | | | | 904,959 | |
| | | | | | | | | | | | | 18,815,736 | |
Germany — 7.1% | | | | | | | | | | | | | | |
Bayer AG, Registered Shares | | | | | | | | | 23,519 | | | | 3,404,392 | |
Deutsche Wohnen AG (a) | | | | | | | | | 32,988 | | | | 712,736 | |
Infineon Technologies AG | | | | | | | | | 80,647 | | | | 1,000,504 | |
Linde AG | | | | | | | | | 13,891 | | | | 2,904,102 | |
ProSiebenSat.1 Media AG, Registered Shares | | | | | | | | | 10,120 | | | | 461,183 | |
| Common Stocks | | | | | |
Shares | | Value |
Germany (concluded) | | | | | | | | | | | | | | |
Siemens AG, Registered Shares | | | | | | | | | 23,273 | | | $ | 3,093,100 | |
Symrise AG | | | | | | | | | 17,062 | | | | 924,857 | |
| | | | | | | | | | | | | 12,500,874 | |
Hong Kong — 4.7% | | | | | | | | | | | | | | |
AIA Group Ltd. | | | | | | | | | 496,200 | | | | 2,491,250 | |
China Resources Gas Group Ltd. | | | | | | | | | 244,000 | | | | 748,880 | |
Esprit Holdings Ltd. | | | | | | | | | 255,400 | | | | 377,433 | |
Hutchison Whampoa Ltd. | | | | | | | | | 118,000 | | | | 1,585,813 | |
Li & Fung Ltd. | | | | | | | | | 1,388,000 | | | | 2,020,045 | |
Sands China Ltd. | | | | | | | | | 138,800 | | | | 1,014,259 | |
| | | | | | | | | | | | | 8,237,680 | |
India — 0.7% | | | | | | | | | | | | | | |
HDFC Bank Ltd. — ADR | | | | | | | | | 15,554 | | | | 700,396 | |
Reliance Industries Ltd. | | | | | | | | | 28,732 | | | | 518,052 | |
| | | | | | | | | | | | | 1,218,448 | |
Ireland — 0.6% | | | | | | | | | | | | | | |
Experian PLC | | | | | | | | | 57,092 | | | | 993,038 | |
Israel — 0.2% | | | | | | | | | | | | | | |
Bezeq The Israeli Telecommunication Corp. Ltd. | | | | | | | | | 169,820 | | | | 304,826 | |
Italy — 1.0% | | | | | | | | | | | | | | |
Telecom Italia SpA, Non-Convertible Savings Shares | | | | | | | | | 715,329 | | | | 683,774 | |
UniCredit SpA | | | | | | | | | 132,134 | | | | 1,153,618 | |
| | | | | | | | | | | | | 1,837,392 | |
Japan — 17.6% | | | | | | | | | | | | | | |
AEON Financial Service Co. Ltd. | | | | | | | | | 34,300 | | | | 866,588 | |
Denso Corp. | | | | | | | | | 56,900 | | | | 2,620,892 | |
Honda Motor Co. Ltd. | | | | | | | | | 77,900 | | | | 2,734,680 | |
Inpex Corp. | | | | | | | | | 61,700 | | | | 893,779 | |
Japan Tobacco, Inc. | | | | | | | | | 60,200 | | | | 2,044,900 | |
JGC Corp. | | | | | | | | | 47,000 | | | | 1,356,796 | |
JSR Corp. | | | | | | | | | 80,700 | | | | 1,362,456 | |
KDDI Corp. | | | | | | | | | 54,500 | | | | 3,256,541 | |
Kobayashi Pharmaceutical Co. Ltd. | | | | | | | | | 7,300 | | | | 470,515 | |
Mitsubishi Corp. | | | | | | | | | 49,100 | | | | 973,157 | |
Mitsubishi Estate Co. Ltd. | | | | | | | | | 21,000 | | | | 512,909 | |
Mitsubishi UFJ Financial Group, Inc. | | | | | | | | | 304,600 | | | | 1,719,257 | |
Mitsui Fudosan Co. Ltd. | | | | | | | | | 24,000 | | | | 759,371 | |
Nippon Television Network Corp. | | | | | | | | | 56,500 | | | | 916,923 | |
Nomura Research Institute Ltd. | | | | | | | | | 26,000 | | | | 876,179 | |
Santen Pharmaceutical Co. Ltd. | | | | | | | | | 44,200 | | | | 2,387,995 | |
Sony Financial Holdings, Inc. | | | | | | | | | 37,800 | | | | 626,116 | |
Sumitomo Mitsui Financial Group, Inc. | | | | | | | | | 57,600 | | | | 2,337,307 | |
Sundrug Co. Ltd. | | | | | | | | | 20,600 | | | | 926,705 | |
Tokyo Gas Co. Ltd. | | | | | | | | | 240,000 | | | | 1,362,272 | |
Yamato Holdings Co. Ltd. | | | | | | | | | 100,900 | | | | 2,155,820 | |
| | | | | | | | | | | | | 31,161,158 | |
Portfolio Abbreviations
ABS
ADR
AGM
BRL
CAB
CAD
CHF
CLP
DKK
EDA | Asset-Backed Security
American Depositary Receipts
Assured Guaranty Municipal Corp.
Brazilian Real
Capital Appreciation Bonds
Canadian Dollar
Swiss Franc
Chilean Peso
Danish Krone
Economic Development Authority | | EUR
GBP
GO
HKD
HUF
KRW
MXN
MYR
NVDR
OTC | | Euro
British Pound
General Obligation Bonds
Hong Kong Dollar
Hungarian Forint
South Korean Won
Mexican Peso
Malaysian Ringgit
Non-voting Depository Receipts
Over-the-Counter | | PEN
PHP
PLN
PSF-GTD
RB
REIT
SEK
SGD
USD | | Peruvian Nuevo Sol
Philippine Peso
Polish Zloty
Permanent School Fund Guaranteed
Revenue Bonds
Real Estate Investment Trust
Swedish Krona
Singapore Dollar
U.S. Dollar |
See Notes to Financial Statements.
| 16 | FDP SERIES, INC. | MAY 31, 2014
|
| |
| Schedule of Investments (continued) | MFS Research International FDP Fund
(Percentages shown are based on Net Assets)
|
| Common Stocks | | | | | |
Shares | | Value |
Netherlands — 7.0% | | | | | | | | | | | | | | |
Akzo Nobel NV | | | | | | | | | 35,931 | | | $ | 2,693,132 | |
Delta Lloyd NV | | | | | | | | | 20,599 | | | | 500,448 | |
ING Groep NV — CVA (a) | | | | | | | | | 137,964 | | | | 1,934,929 | |
Reed Elsevier NV | | | | | | | | | 58,215 | | | | 1,302,155 | |
Royal Dutch Shell PLC, Class A | | | | | | | | | 150,183 | | | | 5,905,660 | |
| | | | | | | | | | | | | 12,336,324 | |
Portugal — 0.2% | | | | | | | | | | | | | | |
Galp Energia SGPS SA | | | | | | | | | 23,879 | | | | 423,198 | |
Russia — 0.3% | | | | | | | | | | | | | | |
Mobile Telesystems OJSC | | | | | | | | | 3,859 | | | | 31,697 | |
Sberbank of Russia — ADR (a) | | | | | | | | | 39,430 | | | | 399,426 | |
| | | | | | | | | | | | | 431,123 | |
Singapore — 1.0% | | | | | | | | | | | | | | |
DBS Group Holdings Ltd. | | | | | | | | | 134,000 | | | | 1,806,641 | |
South Korea — 0.7% | | | | | | | | | | | | | | |
Kia Motors Corp. | | | | | | | | | 21,700 | | | | 1,253,204 | |
Spain — 0.4% | | | | | | | | | | | | | | |
Inditex SA | | | | | | | | | 5,330 | | | | 774,042 | |
Sweden — 2.4% | | | | | | | | | | | | | | |
Atlas Copco AB, Class A | | | | | | | | | 86,700 | | | | 2,545,445 | |
Telefonaktiebolaget LM Ericsson, Class B | | | | | | | | | 139,868 | | | | 1,743,422 | |
| | | | | | | | | | | | | 4,288,867 | |
Switzerland — 12.3% | | | | | | | | | | | | | | |
Julius Baer Group Ltd. (a) | | | | | | | | | 27,777 | | | | 1,203,544 | |
Nestle SA, Registered Shares | | | | | | | | | 58,694 | | | | 4,608,186 | |
Novartis AG, Registered Shares | | | | | | | | | 68,590 | | | | 6,171,324 | |
Roche Holding AG | | | | | | | | | 5,471 | | | | 1,612,589 | |
Schindler Holding AG, Participation Certificates | | | | | | | | | 12,409 | | | | 1,917,854 | |
Sonova Holding AG, Registered Shares (a) | | | | | | | | | 7,242 | | | | 1,105,766 | |
UBS AG, Registered Shares (a) | | | | | | | | | 162,686 | | | | 3,270,889 | |
Zurich Insurance Group AG (a) | | | | | | | | | 6,411 | | | | 1,925,734 | |
| | | | | | | | | | | | | 21,815,886 | |
Taiwan — 1.9% | | | | | | | | | | | | | | |
MediaTek, Inc. | | | | | | | | | 122,000 | | | | 1,984,224 | |
Taiwan Semiconductor Manufacturing Co. Ltd. | | | | | | | | | 333,439 | | | | 1,336,422 | |
| | | | | | | | | | | | | 3,320,646 | |
Thailand — 0.4% | | | | | | | | | | | | | | |
Kasikornbank PCL — NVDR | | | | | | | | | 122,900 | | | | 703,448 | |
Turkey — 0.6% | | | | | | | | | | | | | | |
Turkcell Iletisim Hizmetleri AS (a) | | | | | | | | | 164,510 | | | | 1,027,958 | |
United Kingdom — 16.0% | | | | | | | | | | | | | | |
BG Group PLC | | | | | | | | | 89,191 | | | | 1,828,895 | |
BT Group PLC | | | | | | | | | 119,760 | | | | 797,622 | |
Cairn Energy PLC (a) | | | | | | | | | 80,093 | | | | 265,183 | |
Capital Shopping Centres Group PLC | | | | | | | | | 58,300 | | | | 308,027 | |
| Common Stocks | | | | | |
Shares | | Value |
United Kingdom (concluded) | | | | | | | | | | | | | | |
Centrica PLC | | | | | | | | | 192,162 | | | $ | 1,082,474 | |
Compass Group PLC | | | | | | | | | 77,490 | | | | 1,294,810 | |
GlaxoSmithKline PLC | | | | | | | | | 125,097 | | | | 3,357,159 | |
HSBC Holdings PLC | | | | | | | | | 428,226 | | | | 4,517,091 | |
Prudential PLC | | | | | | | | | 22,541 | | | | 524,346 | |
Reckitt Benckiser Group PLC | | | | | | | | | 20,800 | | | | 1,780,535 | |
Rio Tinto PLC | | | | | | | | | 69,540 | | | | 3,566,327 | |
Royal Bank of Scotland Group PLC (a) | | | | | | | | | 365,603 | | | | 2,126,503 | |
Standard Chartered PLC | | | | | | | | | 76,298 | | | | 1,717,851 | |
Vodafone Group PLC | | | | | | | | | 509,488 | | | | 1,786,288 | |
Whitbread PLC | | | | | | | | | 28,525 | | | | 2,002,741 | |
WPP PLC | | | | | | | | | 62,729 | | | | 1,356,584 | |
| | | | | | | | | | | | | 28,312,436 | |
United States — 2.4% | | | | | | | | | | | | | | |
Autoliv, Inc. | | | | | | | | | 16,460 | | | | 1,744,760 | |
Cognizant Technology Solutions Corp., Class A (a) | | | | | | | | | 25,490 | | | | 1,239,069 | |
Joy Global, Inc. | | | | | | | | | 23,110 | | | | 1,320,736 | |
| | | | | | | | | | | | | 4,304,565 | |
Total Long-Term Investments
(Cost — $135,649,533) — 98.2% | | | | | | | | | | | | | 173,857,229 | |
|
Short-Term Securities | | | | | | | | Par
(000) | | | | |
Time Deposits — 1.4% |
Europe — 0.0% | | | | | | | | | | | | | | |
Wells Fargo Co., 0.04%, 06/02/14 | | | | | EUR | | | | 15 | | | | 20,661 | |
Hong Kong — 0.0% | | | | | | | | | | | | | | |
Brown Brothers Harriman & Co., 0.01%, 6/03/14 | | | | | HKD | | | | 613 | | | | 79,035 | |
Switzerland — 0.1% | | | | | | | | | | | | | | |
Brown Brothers Harriman & Co., 0.00%, 6/02/14 | | | | | CHF | | | | 134 | | | | 149,587 | |
United Kingdom — 0.0% | | | | | | | | | | | | | | |
Wells Fargo Co., 0.08%, 6/02/14 | | | | | GBP | | | | 24 | | | | 39,803 | |
United States — 1.3% | | | | | | | | | | | | | | |
Brown Brothers Harriman & Co., 0.01%, 06/02/14 | | | | | USD | | | | 2,254 | | | | 2,253,877 | |
Total Short-Term Securities
(Cost — $2,542,963) — 1.4% | | | | | | | | | | | | | 2,542,963 | |
Total Investments (Cost — $138,192,496) — 99.6% | | | | | | 176,400,192 | |
Other Assets Less Liabilities — 0.4% | | | | | | | | | | | | | 623,219 | |
Net Assets — 100.0% | | | | | | | | | | | | $ | 177,023,411 | |
See Notes to Financial Statements.
| FDP SERIES, INC. | MAY 31, 2014 | 17
|
| |
| Schedule of Investments (concluded) | MFS Research International FDP Fund
|
Notes to Schedule of Investments
| (a) | | | | Non-income producing security. |
| | | | | |
| • | | | | Fair Value Measurements — Various inputs are used in determining the fair value of investments. These inputs to valuation techniques are categorized into a disclosure hierarchy consisting of three broad levels for financial statement purposes as follows: |
| • | | | | Level 1 — unadjusted price quotations in active markets/exchanges for identical assets or liabilities that the Fund has the ability to access |
| | | | | |
| • | | | | Level 2 — other observable inputs (including, but not limited to, quoted prices for similar assets or liabilities in markets that are active, quoted prices for identical or similar assets or liabilities in markets that are not active, inputs other than quoted prices that are observable for the assets or liabilities (such as interest rates, yield curves, volatilities, prepayment speeds, loss severities, credit risks and default rates) or other market-corroborated inputs) |
| | | | | |
| • | | | | Level 3 — unobservable inputs based on the best information available in the circumstances, to the extent observable inputs are not available (including the Fund’s own assumptions used in determining the fair value of investments) |
| | | | | The hierarchy gives the highest priority to unadjusted quoted prices in active markets for identical assets or liabilities (Level 1 measurements) and the lowest priority to unobservable inputs (Level 3 measurements). Accordingly, the degree of judgment exercised in determining fair value is greatest for instruments categorized in Level 3. The inputs used to measure fair value may fall into different levels of the fair value hierarchy. In such cases, for disclosure purposes, the fair value hierarchy classification is determined based on the lowest level input that is significant to the fair value measurement in its entirety. |
| | | | | |
| | | | | Changes in valuation techniques may result in transfers into or out of an assigned level within the disclosure hierarchy. In accordance with the Fund’s policy, transfers between different levels of the fair value disclosure hierarchy are deemed to have occurred as of the beginning of the reporting period. The categorization of a value determined for investments is based on the pricing transparency of the investment and is not necessarily an indication of the risks associated with investing in those securities. For information about the Fund’s policy regarding valuation of investments, please refer to Note 2 of the Notes to Financial Statements. |
| | | | | |
| | | | | The following table summarizes the Fund’s investments categorized in the disclosure hierarchy as of May 31, 2014: |
| | | | | Level 1 | | Level 2 | | Level 3 | | Total |
Assets:
| | | | | | | | | | | | | | | | | | |
Investments:
| | | | | | | | | | | | | | | | | | |
Long-Term Investments:
| | | | | | | | | | | | | | | | | | |
Common Stocks:
| | | | | | | | | | | | | | | | | | |
Australia | | | | | — | | | $ | 6,592,090 | | | | — | | | $ | 6,592,090 | |
Austria | | | | | — | | | | 1,964,136 | | | | — | | | | 1,964,136 | |
Belgium | | | | | — | | | | 2,084,119 | | | | — | | | | 2,084,119 | |
Bermuda | | | | $ | 739,257 | | | | — | | | | — | | | | 739,257 | |
Brazil | | | | | 3,570,166 | | | | — | | | | — | | | | 3,570,166 | |
Canada | | | | | 2,266,140 | | | | — | | | | — | | | | 2,266,140 | |
Denmark | | | | | — | | | | 773,831 | | | | — | | | | 773,831 | |
France | | | | | — | | | | 18,815,736 | | | | — | | | | 18,815,736 | |
Germany | | | | | 1,637,594 | | | | 10,863,280 | | | | — | | | | 12,500,874 | |
Hong Kong | | | | | — | | | | 8,237,680 | | | | — | | | | 8,237,680 | |
India | | | | | 700,396 | | | | 518,052 | | | | — | | | | 1,218,448 | |
Ireland | | | | | — | | | | 993,038 | | | | — | | | | 993,038 | |
Israel | | | | | — | | | | 304,826 | | | | — | | | | 304,826 | |
Italy | | | | | — | | | | 1,837,392 | | | | — | | | | 1,837,392 | |
Japan | | | | | 759,371 | | | | 30,401,787 | | | | — | | | | 31,161,158 | |
Netherlands | | | | | — | | | | 12,336,324 | | | | — | | | | 12,336,324 | |
Portugal | | | | | — | | | | 423,198 | | | | — | | | | 423,198 | |
Russia | | | | | 399,426 | | | | 31,697 | | | | — | | | | 431,123 | |
Singapore | | | | | — | | | | 1,806,641 | | | | — | | | | 1,806,641 | |
South Korea | | | | | — | | | | 1,253,204 | | | | — | | | | 1,253,204 | |
Spain | | | | | — | | | | 774,042 | | | | — | | | | 774,042 | |
Sweden | | | | | — | | | | 4,288,867 | | | | — | | | | 4,288,867 | |
Switzerland | | | | | — | | | | 21,815,886 | | | | — | | | | 21,815,886 | |
Taiwan | | | | | — | | | | 3,320,646 | | | | — | | | | 3,320,646 | |
Thailand | | | | | — | | | | 703,448 | | | | — | | | | 703,448 | |
Turkey | | | | | — | | | | 1,027,958 | | | | — | | | | 1,027,958 | |
United Kingdom | | | | | — | | | | 28,312,436 | | | | — | | | | 28,312,436 | |
United States | | | | | 4,304,565 | | | | — | | | | — | | | | 4,304,565 | |
Short-Term Securities:
| | | | | | | | | | | | | | | | | | |
Time Deposits | | | | | — | | | | 2,542,963 | | | | — | | | | 2,542,963 | |
Total
| | | | $ | 14,376,915 | | | $ | 162,023,277 | | | | — | | | $ | 176,400,192 | |
| | | | | The Fund may hold assets in which the fair value approximates the carrying amount for financial statement purposes. As of May 31, 2014, foreign currency at value of $6 is categorized as Level 1 within the disclosure hierarchy. |
| | | | | |
| | | | | There were no transfers between levels during the year ended May 31, 2014. |
See Notes to Financial Statements.
| 18 | FDP SERIES, INC. | MAY 31, 2014
|
| |
| Schedule of Investments May 31, 2014 | Marsico Growth FDP Fund
(Percentages shown are based on Net Assets)
|
| Common Stocks | | | |
Shares | | Value |
Aerospace & Defense — 4.0% | | | | | | | | | | |
General Dynamics Corp. | | | | | 40,083 | | | $ | 4,734,604 | |
Safran SA | | | | | 21,110 | | | | 1,433,209 | |
| | | | | | | | | 6,167,813 | |
Auto Components — 1.2% | | | | | | | | | | |
Delphi Automotive PLC | | | | | 26,351 | | | | 1,819,800 | |
Beverages — 2.3% | | | | | | | | | | |
Keurig Green Mountain, Inc. | | | | | 31,414 | | | | 3,542,871 | |
Biotechnology — 13.1% | | | | | | | | | | |
Biogen Idec, Inc. (a) | | | | | 19,769 | | | | 6,313,626 | |
Celgene Corp. (a) | | | | | 29,809 | | | | 4,561,671 | |
Gilead Sciences, Inc. (a) | | | | | 115,056 | | | | 9,343,698 | |
| | | | | | | | | 20,218,995 | |
Chemicals — 7.8% | | | | | | | | | | |
Monsanto Co. | | | | | 54,406 | | | | 6,629,371 | |
The Sherwin-Williams Co. | | | | | 25,899 | | | | 5,299,194 | |
| | | | | | | | | 11,928,565 | |
Diversified Financial Services — 1.6% | | | | | | | | | | |
The Charles Schwab Corp. | | | | | 95,884 | | | | 2,417,236 | |
Energy Equipment & Services — 3.7% | | | | | | | | | | |
Halliburton Co. | | | | | 22,629 | | | | 1,462,739 | |
Schlumberger Ltd. | | | | | 41,026 | | | | 4,268,345 | |
| | | | | | | | | 5,731,084 | |
Food & Staples Retailing — 1.4% | | | | | | | | | | |
CVS Caremark Corp. | | | | | 27,034 | | | | 2,117,303 | |
Hotels, Restaurants & Leisure — 8.9% | | | | | | | | | | |
Starbucks Corp. | | | | | 36,086 | | | | 2,642,939 | |
Starwood Hotels & Resorts Worldwide, Inc. | | | | | 73,172 | | | | 5,842,784 | |
Wynn Resorts Ltd. | | | | | 24,547 | | | | 5,276,868 | |
| | | | | | | | | 13,762,591 | |
Industrial Conglomerates — 3.0% | | | | | | | | | | |
Tyco International Ltd. | | | | | 106,380 | | | | 4,642,423 | |
Internet & Catalog Retail — 5.5% | | | | | | | | | | |
priceline.com, Inc. (a) | | | | | 6,663 | | | | 8,519,512 | |
Internet Software & Services — 8.0% | | | | | | | | | | |
Facebook, Inc., Class A (a) | | | | | 96,248 | | | | 6,092,499 | |
Google, Inc., Class A (a) | | | | | 6,196 | | | | 3,541,943 | |
Google, Inc., Class C (a) | | | | | 4,748 | | | | 2,663,533 | |
| | | | | | | | | 12,297,975 | |
IT Services — 3.7% | | | | | | | | | | |
FleetCor Technologies, Inc. (a) | | | | | 5,321 | | | | 672,628 | |
Visa, Inc., Class A | | | | | 23,135 | | | | 4,970,092 | |
| | | | | | | | | 5,642,720 | |
| Common Stocks | | | |
Shares | | Value |
Media — 8.4% | | | | | | | | | | |
CBS Corp., Class B | | | | | 87,250 | | | $ | 5,200,972 | |
Comcast Corp., Class A | | | | | 57,800 | | | | 3,017,160 | |
The Walt Disney Co. | | | | | 55,690 | | | | 4,678,517 | |
| | | | | | | | | 12,896,649 | |
Oil, Gas & Consumable Fuels — 2.8% | | | | | | | | | | |
Antero Resources Corp. (a) | | | | | 42,433 | | | | 2,609,630 | |
Continental Resources, Inc. (a) | | | | | 12,015 | | | | 1,686,425 | |
| | | | | | | | | 4,296,055 | |
Road & Rail — 7.3% | | | | | | | | | | |
Canadian Pacific Railway Ltd. | | | | | 34,766 | | | | 5,824,000 | |
Union Pacific Corp. | | | | | 27,465 | | | | 5,472,951 | |
| | | | | | | | | 11,296,951 | |
Semiconductors & Semiconductor Equipment — 5.1% |
ASML Holding NV — NY Shares | | | | | 53,356 | | | | 4,582,213 | |
Texas Instruments, Inc. | | | | | 67,862 | | | | 3,188,157 | |
| | | | | | | | | 7,770,370 | |
Software — 2.1% | | | | | | | | | | |
Salesforce.com, Inc. (a) | | | | | 60,280 | | | | 3,172,536 | |
Specialty Retail — 3.6% | | | | | | | | | | |
The Home Depot, Inc. | | | | | 34,163 | | | | 2,740,898 | |
TJX Cos., Inc. | | | | | 52,167 | | | | 2,840,493 | |
| | | | | | | | | 5,581,391 | |
Trading Companies & Distributors — 1.4% | | | | | | | | | | |
W.W. Grainger, Inc. | | | | | 8,370 | | | | 2,162,557 | |
Total Long-Term Investments
(Cost — $108,168,824) — 94.9% | | | | | | | | | 145,985,397 | |
|
Short-Term Securities | | | | | Par
(000 | ) | | | | |
Time Deposits — 5.2% |
United States — 5.2% | | | | | | | | | | |
Brown Brothers Harriman & Co., 0.01%, 6/02/14 | | | | $ | 7,919 | | | | 7,919,439 | |
Total Short-Term Securities
(Cost — $7,919,439) — 5.2% | | | | | | | | | 7,919,439 | |
Total Investments (Cost — $116,088,263) — 100.1% | | 153,904,836 | |
Liabilities in Excess of Other Assets — (0.1)% | | | | | | | | | (80,939 | ) |
Net Assets — 100.0% | | | | | | | | $ | 153,823,897 | |
See Notes to Financial Statements.
| FDP SERIES, INC. | MAY 31, 2014 | 19
|
| |
| Schedule of Investments (concluded) | Marsico Growth FDP Fund
|
Notes to Schedule of Investments
| (a) | | | | Non-income producing security. |
| • | | | | For Fund compliance purposes, the Fund’s industry classifications refer to any one or more of the industry sub-classifications used by one or more widely recognized market indexes or rating group indexes, and/or as defined by the investment advisor. These definitions may not apply for purposes of this report, which may combine such industry sub-classifications for reporting ease. |
| • | | | | Fair Value Measurements — Various inputs are used in determining the fair value of investments. These inputs to valuation techniques are categorized into a disclosure hierarchy consisting of three broad levels for financial statement purposes as follows: |
| • | | | | Level 1 — unadjusted price quotations in active markets/exchanges for identical assets or liabilities that the Fund has the ability to access |
| • | | | | Level 2 — other observable inputs (including, but not limited to, quoted prices for similar assets or liabilities in markets that are active, quoted prices for identical or similar assets or liabilities in markets that are not active, inputs other than quoted prices that are observable for the assets or liabilities (such as interest rates, yield curves, volatilities, prepayment speeds, loss severities, credit risks and default rates) or other market-corroborated inputs) |
| • | | | | Level 3 — unobservable inputs based on the best information available in the circumstances, to the extent observable inputs are not available (including the Fund’s own assumptions used in determining the fair value of investments) |
| | | | | The hierarchy gives the highest priority to unadjusted quoted prices in active markets for identical assets or liabilities (Level 1 measurements) and the lowest priority to unobservable inputs (Level 3 measurements). Accordingly, the degree of judgment exercised in determining fair value is greatest for instruments categorized in Level 3. The inputs used to measure fair value may fall into different levels of the fair value hierarchy. In such cases, for disclosure purposes, the fair value hierarchy classification is determined based on the lowest level input that is significant to the fair value measurement in its entirety. |
| | | | | Changes in valuation techniques may result in transfers into or out of an assigned level within the disclosure hierarchy. In accordance with the Fund’s policy, transfers between different levels of the fair value disclosure hierarchy are deemed to have occurred as of the beginning of the reporting period. The categorization of a value determined for investments is based on the pricing transparency of the investment and is not necessarily an indication of the risks associated with investing in those securities. For information about the Fund’s policy regarding valuation of investments, please refer to Note 2 of the Notes to Financial Statements. |
| | | | | The following table summarizes the Fund’s investments categorized in the disclosure hierarchy as of May 31, 2014: |
| | | | | Level 1 | | Level 2 | | Level 3 | | Total |
Assets:
| | | | | | | | | | | | | | | | | | |
Investments:
| | | | | | | | | | | | | | | | | | |
Long-Term Investments1 | | | | $ | 144,552,188 | | | $ | 1,433,209 | | | | — | | | $ | 145,985,397 | |
Short-Term Securities | | | | | — | | | | 7,919,439 | | | | — | | | | 7,919,439 | |
Total
| | | | $ | 144,552,188 | | | $ | 9,352,648 | | | | — | | | $ | 153,904,836 | |
| 1 | See above Schedule of Investments for values in each industry, excluding Level 2, which includes a portion of Aerospace & Defense within the table. |
| | | | | There were no transfers between levels during the year ended May 31, 2014. |
See Notes to Financial Statements.
| 20 | FDP SERIES, INC. | MAY 31, 2014
|
| |
| Schedule of Investments May 31, 2014 | Invesco Value FDP Fund
(Percentages shown are based on Net Assets)
|
| Common Stocks | | | |
Shares | | Value |
Aerospace & Defense — 2.0% |
Honeywell International, Inc. | | | | | 12,797 | | | $ | 1,192,040 | |
Textron, Inc. | | | | | 46,704 | | | | 1,831,731 | |
| | | | | | | | | 3,023,771 | |
Auto Components — 1.3% |
Johnson Controls, Inc. | | | | | 39,387 | | | | 1,904,755 | |
Automobiles — 1.9% |
General Motors Co. | | | | | 82,155 | | | | 2,840,920 | |
Capital Markets — 5.7% |
The Bank of New York Mellon Corp. | | | | | 96,137 | | | | 3,322,495 | |
The Goldman Sachs Group, Inc. | | | | | 8,980 | | | | 1,435,094 | |
Morgan Stanley | | | | | 73,039 | | | | 2,253,983 | |
State Street Corp. | | | | | 25,189 | | | | 1,644,086 | |
| | | | | | | | | 8,655,658 | |
Commercial Banks — 4.0% |
Fifth Third Bancorp | | | | | 76,972 | | | | 1,592,551 | |
The PNC Financial Services Group, Inc. (a) | | | | | 500 | | | | 42,635 | |
U.S. Bancorp | | | | | 17,899 | | | | 755,159 | |
Wells Fargo & Co. | | | | | 71,470 | | | | 3,629,246 | |
| | | | | | | | | 6,019,591 | |
Communications Equipment — 1.8% |
Cisco Systems, Inc. | | | | | 112,487 | | | | 2,769,430 | |
Computers & Peripherals — 1.9% |
Hewlett-Packard Co. | | | | | 86,259 | | | | 2,889,677 | |
Diversified Financial Services — 8.5% |
Bank of America Corp. | | | | | 155,704 | | | | 2,357,359 | |
Citigroup, Inc. | | | | | 126,086 | | | | 5,997,911 | |
JPMorgan Chase & Co. | | | | | 81,034 | | | | 4,503,059 | |
| | | | | | | | | 12,858,329 | |
Diversified Telecommunication Services — 1.8% |
AT&T, Inc. | | | | | 15,684 | | | | 556,311 | |
Verizon Communications, Inc. | | | | | 32,183 | | | | 1,607,863 | |
Vivendi SA (b) | | | | | 23,962 | | | | 628,316 | |
| | | | | | | | | 2,792,490 | |
Electric Utilities — 1.8% |
FirstEnergy Corp. | | | | | 21,603 | | | | 730,613 | |
PPL Corp. | | | | | 55,031 | | | | 1,931,038 | |
| | | | | | | | | 2,661,651 | |
Electrical Equipment — 1.1% |
Emerson Electric Co. | | | | | 25,599 | | | | 1,708,221 | |
Electronic Equipment, Instruments &
Components — 1.0% |
Corning, Inc. | | | | | 69,839 | | | | 1,487,571 | |
Energy Equipment & Services — 5.7% |
Halliburton Co. | | | | | 49,937 | | | | 3,227,928 | |
Noble Corp. PLC | | | | | 16,537 | | | | 520,254 | |
Weatherford International Ltd. (b) | | | | | 223,761 | | | | 4,853,376 | |
| | | | | | | | | 8,601,558 | |
Food & Staples Retailing — 1.6% |
CVS Caremark Corp. | | | | | 31,438 | | | | 2,462,224 | |
Food Products — 3.2% |
ConAgra Foods, Inc. | | | | | 73,202 | | | | 2,364,424 | |
Mondelez International, Inc., Class A | | | | | 31,618 | | | | 1,189,469 | |
Unilever NV — NY Shares | | | | | 29,660 | | | | 1,287,541 | |
| | | | | | | | | 4,841,434 | |
| Common Stocks | | | |
Shares | | Value |
Health Care Providers & Services — 4.5% |
Cardinal Health, Inc. | | | | | 10,295 | | | $ | 727,136 | |
Express Scripts Holding Co. (b) | | | | | 13,394 | | | | 957,269 | |
UnitedHealth Group, Inc. | | | | | 39,241 | | | | 3,124,761 | |
WellPoint, Inc. | | | | | 19,376 | | | | 2,099,583 | |
| | | | | | | | | 6,908,749 | |
Hotels, Restaurants & Leisure — 1.7% |
Carnival Corp. | | | | | 65,078 | | | | 2,605,072 | |
Household Durables — 0.6% |
Newell Rubbermaid, Inc. | | | | | 28,968 | | | | 848,183 | |
Industrial Conglomerates — 2.2% |
General Electric Co. | | | | | 123,879 | | | | 3,318,718 | |
Insurance — 4.2% |
Aflac, Inc. | | | | | 15,334 | | | | 938,901 | |
The Allstate Corp. | | | | | 50,703 | | | | 2,953,957 | |
MetLife, Inc. | | | | | 36,986 | | | | 1,883,697 | |
The Travelers Cos., Inc. | | | | | 5,737 | | | | 536,122 | |
| | | | | | | | | 6,312,677 | |
Internet Software & Services — 1.8% |
eBay, Inc. (b) | | | | | 38,177 | | | | 1,936,719 | |
Yahoo!, Inc. (b) | | | | | 24,646 | | | | 853,984 | |
| | | | | | | | | 2,790,703 | |
Machinery — 1.3% |
Ingersoll-Rand PLC | | | | | 33,082 | | | | 1,978,965 | |
Media — 7.0% |
Comcast Corp., Class A | | | | | 40,932 | | | | 2,136,651 | |
Time Warner Cable, Inc. | | | | | 13,740 | | | | 1,939,538 | |
Time Warner, Inc. | | | | | 15,199 | | | | 1,061,346 | |
Twenty-First Century Fox, Inc. | | | | | 60,112 | | | | 2,071,460 | |
Viacom, Inc., Class B | | | | | 40,076 | | | | 3,419,685 | |
| | | | | | | | | 10,628,680 | |
Metals & Mining — 1.2% |
Alcoa, Inc. | | | | | 137,707 | | | | 1,874,192 | |
Multi-Utilities — 0.8% |
PG&E Corp. | | | | | 27,564 | | | | 1,264,361 | |
Multiline Retail — 1.7% |
Kohl’s Corp. | | | | | 30,832 | | | | 1,678,494 | |
Target Corp. | | | | | 17,017 | | | | 965,885 | |
| | | | | | | | | 2,644,379 | |
Oil, Gas & Consumable Fuels — 11.5% |
BP PLC — ADR | | | | | 60,550 | | | | 3,054,748 | |
Chevron Corp. | | | | | 15,012 | | | | 1,843,323 | |
Murphy Oil Corp. | | | | | 32,856 | | | | 2,026,230 | |
Occidental Petroleum Corp. | | | | | 19,139 | | | | 1,907,967 | |
QEP Resources, Inc. | | | | | 55,794 | | | | 1,782,060 | |
Royal Dutch Shell PLC — ADR | | | | | 43,249 | | | | 3,399,371 | |
Suncor Energy, Inc. | | | | | 87,850 | | | | 3,384,861 | |
| | | | | | | | | 17,398,560 | |
Paper & Forest Products — 1.0% |
International Paper Co. | | | | | 31,453 | | | | 1,498,106 | |
Pharmaceuticals — 9.8% |
Bristol-Myers Squibb Co. | | | | | 38,751 | | | | 1,927,475 | |
GlaxoSmithKline PLC — ADR | | | | | 14,097 | | | | 760,392 | |
Merck & Co., Inc. | | | | | 59,603 | | | | 3,448,630 | |
Novartis AG, Registered Shares | | | | | 28,511 | | | | 2,565,252 | |
Pfizer, Inc. | | | | | 79,119 | | | | 2,344,296 | |
See Notes to Financial Statements.
| FDP SERIES, INC. | MAY 31, 2014 | 21
|
| |
| Schedule of Investments (continued) | Invesco Value FDP Fund
(Percentages shown are based on Net Assets)
|
| Common Stocks | | | |
Shares | | Value |
Pharmaceuticals (concluded) |
Roche Holding AG — ADR | | | | | 40,370 | | | $ | 1,489,249 | |
Sanofi — ADR | | | | | 44,270 | | | | 2,359,591 | |
| | | | | | | | | 14,894,885 | |
Semiconductors & Semiconductor Equipment — 1.0% |
Intel Corp. | | | | | 53,339 | | | | 1,457,222 | |
Software — 3.3% |
Autodesk, Inc. (b) | | | | | 17,400 | | | | 911,238 | |
Citrix Systems, Inc. (b) | | | | | 24,406 | | | | 1,512,440 | |
Microsoft Corp. | | | | | 64,539 | | | | 2,642,227 | |
| | | | | | | | | 5,065,905 | |
Total Long-Term Investments
(Cost — $98,323,158) — 96.9% | | | | | | | | | 147,006,637 | |
| Short-Term Securities | | | | Par
(000) | | Value |
United States — 2.9% |
Brown Brothers Harriman & Co., 0.01%, 6/02/14 | | | | $ | 4,311 | | | $ | 4,310,942 | |
Total Short-Term Securities
(Cost — $4,310,942) — 2.9% | | | | | | | | | 4,310,942 | |
Total Investments (Cost — $102,634,100) — 99.8% | | 151,317,579 | |
Other Assets Less Liabilities — 0.2% | | | | | | | | | 375,590 | |
Net Assets — 100.0% | | | | | | | | $ | 151,693,169 | |
Notes to Schedule of Investments
| (a) | | | | Investments in issuers considered to be an affiliate of the Fund during the year ended May 31, 2014, for purposes of Section 2(a)(3) of the Investment Company Act of 1940, as amended, were as follows: |
| Affiliate | Shares
Held at
May 31, 2013 | | Shares
Purchased | | Shares Sold | | Shares
Held at
May 31, 2014 | | Value at
May 31, 2014 | | Income | | Realized
Gain (Loss) |
The PNC Financial Services Group, Inc. | 500 | | — | | — | | 500 | | $42,635 | | $900 | | — |
| (b) | | | | Non-income producing security. |
| • | | | | Forward foreign currency exchange contracts outstanding as of May 31, 2014 were as follows: |
| Currency Purchased | | Currency Sold | | Counterparty | | Settlement
Date | | Unrealized
Appreciation
(Depreciation) |
USD | 720,372 | | CAD | 786,352 | | Barclays Bank PLC | | 6/20/14 | | $ | (4,527 | ) |
USD | 736,234 | | CAD | 803,701 | | Canadian Imperial Bank of Commerce | | 6/20/14 | | | (4,659 | ) |
USD | 720,792 | | CAD | 786,352 | | Citibank N.A. | | 6/20/14 | | | (4,107 | ) |
USD | 720,571 | | CAD | 786,352 | | Goldman Sachs International | | 6/20/14 | | | (4,328 | ) |
USD | 854,564 | | CHF | 762,198 | | Barclays Bank PLC | | 6/20/14 | | | 3,276 | |
USD | 868,766 | | CHF | 775,139 | | Canadian Imperial Bank of Commerce | | 6/20/14 | | | 3,024 | |
USD | 869,548 | | CHF | 775,139 | | Citibank N.A. | | 6/20/14 | | | 3,806 | |
USD | 869,175 | | CHF | 775,139 | | Goldman Sachs International | | 6/20/14 | | | 3,434 | |
USD | 1,622,199 | | EUR | 1,184,707 | | Barclays Bank PLC | | 6/20/14 | | | 7,320 | |
USD | 1,622,077 | | EUR | 1,184,707 | | Canadian Imperial Bank of Commerce | | 6/20/14 | | | 7,197 | |
USD | 1,673,233 | | EUR | 1,221,338 | | Citibank N.A. | | 6/20/14 | | | 8,422 | |
USD | 1,623,032 | | EUR | 1,184,708 | | Goldman Sachs International | | 6/20/14 | | | 8,151 | |
USD | 826,859 | | GBP | 491,217 | | Barclays Bank PLC | | 6/20/14 | | | 3,588 | |
USD | 827,023 | | GBP | 491,217 | | Canadian Imperial Bank of Commerce | | 6/20/14 | | | 3,751 | |
USD | 826,871 | | GBP | 491,217 | | Citibank N.A. | | 6/20/14 | | | 3,600 | |
USD | 823,774 | | GBP | 489,523 | | Goldman Sachs International | | 6/20/14 | | | 3,342 | |
Total
| | | | | | | | | | $ | 41,290 | |
| • | | | | For Fund compliance purposes, the Fund’s industry classifications refer to any one or more of the industry sub-classifications used by one or more widely recognized market indexes or rating group indexes, and/or as defined by the investment advisor. These definitions may not apply for purposes of this report, which may combine such industry sub-classifications for reporting ease. |
| | | | | |
| • | | | | Fair Value Measurements — Various inputs are used in determining the fair value of investments and derivative financial instruments. These inputs to valuation techniques are categorized into a disclosure hierarchy consisting of three broad levels for financial statement purposes as follows: |
| • | | | | Level 1 — unadjusted price quotations in active markets/exchanges for identical assets or liabilities that the Fund has the ability to access |
| | | | | |
| • | | | | Level 2 — other observable inputs (including, but not limited to, quoted prices for similar assets or liabilities in markets that are active, quoted prices for identical or similar assets or liabilities in markets that are not active, inputs other than quoted prices that are observable for the assets or liabilities (such as interest rates, yield curves, volatilities, prepayment speeds, loss severities, credit risks and default rates) or other market-corroborated inputs) |
| | | | | |
| • | | | | Level 3 — unobservable inputs based on the best information available in the circumstances, to the extent observable inputs are not available (including the Fund’s own assumptions used in determining the fair value of investments and derivative financial instruments) |
| | | | | The hierarchy gives the highest priority to unadjusted quoted prices in active markets for identical assets or liabilities (Level 1 measurements) and the lowest priority to unobservable inputs (Level 3 measurements). Accordingly, the degree of judgment exercised in determining fair value is greatest for instruments categorized in Level 3. The inputs used to measure fair value may fall into different levels of the fair value hierarchy. In such cases, for disclosure purposes, the fair value hierarchy classification is determined based on the lowest level input that is significant to the fair value measurement in its entirety. |
See Notes to Financial Statements.
| 22 | FDP SERIES, INC. | MAY 31, 2014
|
| |
| Schedule of Investments (concluded) | Invesco Value FDP Fund
|
| | | | | Changes in valuation techniques may result in transfers into or out of an assigned level within the disclosure hierarchy. In accordance with the Fund’s policy, transfers between different levels of the fair value disclosure hierarchy are deemed to have occurred as of the beginning of the reporting period. The categorization of a value determined for investments and derivative financial instruments is based on the pricing transparency of the investment and derivative financial instrument and is not necessarily an indication of the risks associated with investing in those securities. For information about the Fund’s policy regarding valuation of investments and derivative financial instruments, please refer to Note 2 of the Notes to Financial Statements. |
| | | | | |
| | | | | The following tables summarize the Fund’s investments and derivative financial instruments categorized in the disclosure hierarchy as of May 31, 2014: |
| | | Level 1 | | Level 2 | | Level 3 | | Total |
Assets:
| | | | | | | | | | | | | | | | |
Investments:
| | | | | | | | | | | | | | | | |
Long-Term Investments1 | | $ | 143,813,069 | | | $ | 3,193,568 | | | | — | | | $ | 147,006,637 | |
Short-Term Securities | | | — | | | | 4,310,942 | | | | — | | | | 4,310,942 | |
Total
| | $ | 143,813,069 | | | $ | 7,504,510 | | | | — | | | $ | 151,317,579 | |
| 1 | | See above Schedule of Investments for values in each industry, excluding Level 2, which includes a portion of Diversified Telecommunication Services and Pharmaceuticals, within the table. |
| | | Level 1 | | Level 2 | | Level 3 | | Total |
Derivative Financial Instruments2
| | | | | | | | | | | | | | | | |
Assets:
| | | | | | | | | | | | | | | | |
Foreign currency exchange contracts | | | — | | | $ | 58,911 | | | | — | | | $ | 58,911 | |
Liabilities:
| | | | | | | | | | | | | | | | |
Foreign currency exchange contracts | | | — | | | | (17,621 | ) | | | — | | | | (17,621 | ) |
Total
| | | — | | | $ | 41,290 | | | | — | | | $ | 41,290 | |
| 2 | | Derivative financial instruments are forward foreign currency exchange contracts, which are valued at the unrealized appreciation/depreciation on the instrument. |
| | | | | The Fund may hold assets in which the fair value approximates the carrying amount for financial statement purposes. As of May 31, 2014, foreign currency at value of $60 is categorized as Level 1 within the disclosure hierarchy. |
| | | | | |
| | | | | There were no transfers between levels during the year ended May 31, 2014. |
See Notes to Financial Statements.
| FDP SERIES, INC. | MAY 31, 2014 | 23
|
| |
| Schedule of Investments May 31, 2014 | Franklin Templeton Total Return FDP Fund
(Percentages shown are based on Net Assets)
|
| Common Stocks (a) | | | | | |
Shares | | Value |
Automobiles — 0.0% |
General Motors Co. | | | | | | | | | 696 | | | $ | 24,068 | |
Paper & Forest Products — 0.0% |
NewPage Holdings, Inc. | | | | | | | | | 200 | | | | 17,000 | |
Total Common Stocks — 0.0% | | | | | | | | | | | | | 41,068 | |
|
Asset-Backed Securities | | | | | | | | | Par
(000) | | | | | |
Aames Mortgage Investment Trust, Series 2005-4, Class M1, 0.86%, 10/25/35 (a) | | | | | USD | | | | 97 | | | | 96,807 | |
American Homes 4 Rent, 1.25%, 6/17/31 (a)(b) | | | | | | | | | 130 | | | | 130,143 | |
Ameriquest Mortgage Securities, Inc., Series 2004-R4, Class M1, 0.98%, 6/25/34 (a) | | | | | | | | | 354 | | | | 345,046 | |
Argent Securities, Inc., Series 2005-W2, Class A2C, 0.51%, 10/25/35 (a) | | | | | | | | | 225 | | | | 204,979 | |
Bayview Financial Acquisition Trust, Series 2004-D, Class M1, 0.78%, 8/28/44 (a) | | | | | | | | | 252 | | | | 249,249 | |
Chase Funding Mortgage Loan Asset-Backed Certificates, Series 2004-2, Class 2A2, 0.65%, 2/26/35 (a) | | | | | | | | | 129 | | | | 115,440 | |
CitiFinancial Mortgage Securities, Inc., Series 2003-4, Class AF6, 4.49%, 10/25/33 (a) | | | | | | | | | 143 | | | | 146,011 | |
Colony American Homes, Series 2014-1A, Class A, 1.30%, 5/17/31 (a)(b) | | | | | | | | | 609 | | | | 613,666 | |
Conseco Financial Corp., Series 1996-9, Class M1, 7.63%, 8/15/27 (a) | | | | | | | | | 142 | | | | 155,049 | |
Countryplace Manufactured Housing Contract Trust, Series 2005-1, Class A3, 4.80%, 12/15/35 (a)(b) | | | | | | | | | 26 | | | | 26,518 | |
Countrywide Asset-Backed Certificates (a): | | | | | | | | | | | | | | |
Series 2004-1, Class M1, 0.90%, 3/25/34 | | | | | | | | | 116 | | | | 110,843 | |
Series 2005-11, Class AF4, 5.08%, 2/25/36 | | | | | | | | | 700 | | | | 565,942 | |
Greenpoint Manufactured Housing, Series 1999-3, Class 1A7, 7.27%, 6/15/29 | | | | | | | | | 563 | | | | 566,900 | |
GSAA Trust, Series 2005-5, Class M3, 1.10%, 2/25/35 (a) | | | | | | | | | 210 | | | | 191,069 | |
Home Equity Mortgage Trust, Series 2004-4, Class M3, 1.13%, 12/25/34 (a) | | | | | | | | | 178 | | | | 159,878 | |
JPMorgan Mortgage Acquisition Trust, Series 2006-ACC1, Class A4, 0.30%, 5/25/36 (a) | | | | | | | | | 66 | | | | 64,404 | |
Long Beach Mortgage Loan Trust, Series 2005-WL2, Class M1, 0.62%, 8/25/35 (a) | | | | | | | | | 82 | | | | 80,631 | |
Morgan Stanley ABS Capital I Trust, Inc. (a): | | | | | | | | | | | | | | |
Series 2003-HE1, Class M1, 1.35%, 5/25/33 | | | | | | | | | 223 | | | | 208,085 | |
Series 2005-WMC1, Class M2, 0.89%, 1/25/35 | | | | | | | | | 99 | | | | 95,214 | |
Residential Asset Securities Corp., Series 2005-AHL2, Class A2, 0.41%, 10/25/35 (a) | | | | | | | | | 24 | | | | 23,498 | |
Structured Asset Securities Corp. Mortgage Loan Trust, Series 2006-WF1, Class A5, 0.45%, 2/25/36 (a) | | | | | | | | | 331 | | | | 323,189 | |
Total Asset-Backed Securities — 1.9% | | | | | | | | | | | | | 4,472,561 | |
| Corporate Bonds | | | | | | Par
(000) | | Value |
Aerospace & Defense — 0.2% |
United Technologies Corp., 3.10%, 6/01/22 | | | | | USD | | | | 356 | | | $ | 363,415 | |
Beverages — 1.2% |
Anheuser-Busch InBev Worldwide, Inc., 2.50%, 7/15/22 | | | | | | | | | 1,200 | | | | 1,160,658 | |
Constellation Brands, Inc., 7.25%, 5/15/17 | | | | | | | | | 800 | | | | 920,000 | |
Heineken NV, 2.75%, 4/01/23 (b) | | | | | | | | | 700 | | | | 673,984 | |
| | | | | | | | | | | | | 2,754,642 | |
Biotechnology — 0.6% |
Celgene Corp., 4.00%, 8/15/23 | | | | | | | | | 700 | | | | 730,811 | |
Gilead Sciences, Inc., 4.50%, 4/01/21 | | | | | | | | | 600 | | | | 667,788 | |
| | | | | | | | | | | | | 1,398,599 | |
Capital Markets — 0.9% |
The Goldman Sachs Group, Inc., 2.38%, 1/22/18 | | | | | | | | | 200 | | | | 203,408 | |
Merrill Lynch & Co., Inc., 6.88%, 4/25/18 | | | | | | | | | 700 | | | | 828,657 | |
Morgan Stanley, 5.50%, 1/26/20 | | | | | | | | | 1,000 | | | | 1,141,299 | |
| | | | | | | | | | | | | 2,173,364 | |
Chemicals — 0.6% |
LYB International Finance BV, 4.00%, 7/15/23 | | | | | | | | | 400 | | | | 419,071 | |
LyondellBasell Industries NV, 5.75%, 4/15/24 | | | | | | | | | 500 | | | | 590,973 | |
PTT Global Chemical PCL, 4.25%, 9/19/22 (b) | | | | | | | | | 200 | | | | 198,098 | |
RPM United Kingdom GP, 6.70%, 11/01/15 (b) | | | | | | | | | 200 | | | | 213,511 | |
| | | | | | | | | | | | | 1,421,653 | |
Commercial Banks — 3.9% |
Banco do Brasil SA, 5.88%, 1/26/22 (b) | | | | | | | | | 500 | | | | 514,375 | |
Banco Popolare: | | | | | | | | | | | | | | |
4.75%, 3/31/16 | | | | | EUR | | | | 100 | | | | 145,208 | |
3.63%, 3/31/17 | | | | | | | | | 400 | | | | 578,232 | |
Bank of America Corp., 5.63%, 10/14/16 | | | | | USD | | | | 500 | | | | 550,877 | |
Bank of Ireland Mortgage Bank, 3.25%, 6/22/15 | | | | | | | | | 400 | | | | 559,247 | |
CIT Group, Inc.: | | | | | | | | | | | | | | |
5.00%, 5/15/17 | | | | | | | | | 1,500 | | | | 1,603,125 | |
5.38%, 5/15/20 | | | | | | | | | 100 | | | | 107,000 | |
5.00%, 8/15/22 | | | | | | | | | 100 | | | | 103,250 | |
Export-Import Bank of Korea: | | | | | | | | | | | | | | |
1.25%, 11/20/15 | | | | | | | | | 200 | | | | 201,281 | |
4.00%, 1/29/21 | | | | | | | | | 400 | | | | 426,929 | |
Halyk Savings Bank of Kazakhstan, 7.25%, 5/03/17 | | | | | | | | | 400 | | | | 432,000 | |
HSBC Bank Brasil SA — Banco Multiplo, 4.00%, 5/11/16 (b) | | | | | | | | | 200 | | | | 205,750 | |
HSBC Holdings PLC, 6.50%, 9/15/37 | | | | | | | | | 400 | | | | 490,620 | |
ING Bank NV, 1.87%, 9/25/15 (a)(b) | | | | | | | | | 500 | | | | 508,837 | |
Mizuho Financial Group Cayman 3 Ltd., 4.60%, 3/27/24 (b) | | | | | | | | | 1,100 | | | | 1,137,070 | |
Oversea-Chinese Banking Corp. Ltd., 4.00%, 10/15/24 (a)(b) | | | | | | | | | 400 | | | | 405,236 | |
Regions Financial Corp., 7.75%, 11/10/14 | | | | | | | | | 57 | | | | 58,710 | |
The Royal Bank of Scotland Group PLC: | | | | | | | | | | | | | | |
6.93%, 4/09/18 | | | | | EUR | | | | 150 | | | | 237,699 | |
6.13%, 12/15/22 | | | | | USD | | | | 100 | | | | 108,912 | |
Shinhan Bank, 1.88%, 7/30/18 (b) | | | | | | | | | 300 | | | | 295,824 | |
SVB Financial Group, 5.38%, 9/15/20 | | | | | | | | | 300 | | | | 341,836 | |
| | | | | | | | | | | | | 9,012,018 | |
Commercial Services & Supplies — 0.1% |
Aviation Capital Group Corp., 6.75%, 4/06/21 (b) | | | | | | | | | 300 | | | | 335,143 | |
Communications Equipment — 0.1% |
Nokia Siemens Networks Finance BV, 7.13%, 4/15/20 (b) | | | | | EUR | | | | 100 | | | | 159,352 | |
See Notes to Financial Statements.
| 24 | FDP SERIES, INC. | MAY 31, 2014
|
| |
| Schedule of Investments (continued) | Franklin Templeton Total Return FDP Fund
(Percentages shown are based on Net Assets)
|
| Corporate Bonds | | | | | | Par
(000) | | Value |
Computers & Peripherals — 0.1% |
Apple, Inc., 2.40%, 5/03/23 | | | | | USD | | | | 300 | | | $ | 285,166 | |
Construction Materials — 0.1% |
Cemex SAB de CV, 9.00%, 1/11/18 (b) | | | | | | | | | 200 | | | | 216,000 | |
Consumer Finance — 0.7% |
American Express Credit Corp., 5.38%, 10/01/14 | | | | | GBP | | | | 400 | | | | 680,792 | |
Discover Financial Services, 3.85%, 11/21/22 | | | | | USD | | | | 400 | | | | 406,440 | |
Ford Motor Credit Co. LLC: | | | | | | | | | | | | | | |
5.00%, 5/15/18 | | | | | | | | | 150 | | | | 166,892 | |
8.13%, 1/15/20 | | | | | | | | | 200 | | | | 254,994 | |
| | | | | | | | | | | | | 1,509,118 | |
Diversified Financial Services — 1.3% |
Citigroup, Inc., 3.50%, 5/15/23 | | | | | | | | | 1,000 | | | | 970,958 | |
Deutsche Bank AG, 4.30%, 5/24/28 (a) | | | | | | | | | 500 | | | | 494,454 | |
General Electric Capital Corp., 6.00%, 8/07/19 | | | | | | | | | 500 | | | | 593,048 | |
JPMorgan Chase & Co., 4.25%, 10/15/20 | | | | | | | | | 700 | | | | 761,014 | |
SLM Corp.: | | | | | | | | | | | | | | |
8.45%, 6/15/18 | | | | | | | | | 100 | | | | 117,750 | |
5.50%, 1/15/19 | | | | | | | | | 100 | | | | 105,279 | |
| | | | | | | | | | | | | 3,042,503 | |
Diversified Telecommunication Services — 1.1% |
CenturyLink, Inc., Series T, 5.80%, 3/15/22 | | | | | | | | | 200 | | | | 208,000 | |
Frontier Communications Corp.: | | | | | | | | | | | | | | |
8.50%, 4/15/20 | | | | | | | | | 100 | | | | 116,625 | |
7.13%, 1/15/23 | | | | | | | | | 200 | | | | 207,000 | |
Intelsat Jackson Holdings SA: | | | | | | | | | | | | | | |
7.50%, 4/01/21 | | | | | | | | | 100 | | | | 109,500 | |
6.63%, 12/15/22 | | | | | | | | | 200 | | | | 208,500 | |
Telefonica Emisiones SAU: | | | | | | | | | | | | | | |
4.95%, 1/15/15 | | | | | | | | | 250 | | | | 256,383 | |
4.57%, 4/27/23 | | | | | | | | | 500 | | | | 529,700 | |
Verizon Communications, Inc., 6.40%, 9/15/33 | | | | | | | | | 700 | | | | 860,601 | |
Verizon New York, Inc., Series B, 7.38%, 4/01/32 | | | | | | | | | 100 | | | | 124,356 | |
| | | | | | | | | | | | | 2,620,665 | |
Electric Utilities — 1.4% |
Baltimore Gas & Electric Co., 3.35%, 7/01/23 | | | | | | | | | 1,200 | | | | 1,222,866 | |
Dominion Resources, Inc., 8.88%, 1/15/19 | | | | | | | | | 600 | | | | 771,814 | |
Georgia Power Co., 4.30%, 3/15/42 | | | | | | | | | 300 | | | | 301,784 | |
Pacific Gas & Electric Co.: | | | | | | | | | | | | | | |
3.25%, 6/15/23 | | | | | | | | | 300 | | | | 300,763 | |
4.45%, 4/15/42 | | | | | | | | | 400 | | | | 409,478 | |
State Grid Overseas Investment 2013 Ltd., 3.13%, 5/22/23 (b) | | | | | | | | | 300 | | | | 291,241 | |
| | | | | | | | | | | | | 3,297,946 | |
Energy Equipment & Services — 0.9% |
CNOOC Finance 2013 Ltd., 3.00%, 5/09/23 | | | | | | | | | 500 | | | | 470,855 | |
CNOOC Nexen Finance 2014 ULC, 4.25%, 4/30/24 | | | | | | | | | 700 | | | | 722,438 | |
Lukoil International Finance BV, 4.56%, 4/24/23 (b) | | | | | | | | | 500 | | | | 478,750 | |
Peabody Energy Corp., 6.25%, 11/15/21 | | | | | | | | | 200 | | | | 200,000 | |
Petrofac Ltd., 3.40%, 10/10/18 (b) | | | | | | | | | 300 | | | | 312,224 | |
| | | | | | | | | | | | | 2,184,267 | |
Food & Staples Retailing — 1.8% |
Cencosud SA, 4.88%, 1/20/23 (b) | | | | | | | | | 500 | | | | 495,001 | |
CVS Caremark Corp.: | | | | | | | | | | | | | | |
5.75%, 6/01/17 | | | | | | | | | 147 | | | | 166,283 | |
2.75%, 12/01/22 | | | | | | | | | 500 | | | | 484,937 | |
4.00%, 12/05/23 | | | | | | | | | 1,000 | | | | 1,055,682 | |
| Corporate Bonds | | | | | | Par
(000) | | Value |
Food & Staples Retailing (concluded) |
The Kroger Co., 4.00%, 2/01/24 | | | | | USD | | | | 1,000 | | | $ | 1,040,823 | |
Mondelez International, Inc., 4.00%, 2/01/24 | | | | | | | | | 1,000 | | | | 1,035,127 | |
| | | | | | | | | | | | | 4,277,853 | |
Food Products — 1.3% |
Bunge Ltd. Finance Corp., 5.10%, 7/15/15 | | | | | | | | | 400 | | | | 418,172 | |
Dean Foods Co., 7.00%, 6/01/16 | | | | | | | | | 1,328 | | | | 1,455,820 | |
Kraft Foods Group, Inc., 3.50%, 6/06/22 | | | | | | | | | 800 | | | | 820,976 | |
Sigma Alimentos SA de CV, 5.63%, 4/14/18 (b) | | | | | | | | | 200 | | | | 219,500 | |
| | | | | | | | | | | | | 2,914,468 | |
Health Care Equipment & Supplies — 0.7% |
Baxter International, Inc., 3.20%, 6/15/23 | | | | | | | | | 500 | | | | 496,613 | |
DENTSPLY International, Inc., 4.13%, 8/15/21 | | | | | | | | | 500 | | | | 520,775 | |
PerkinElmer, Inc., 5.00%, 11/15/21 | | | | | | | | | 600 | | | | 648,621 | |
| | | | | | | | | | | | | 1,666,009 | |
Health Care Providers & Services — 0.5% |
HCA Holdings, Inc., 6.25%, 2/15/21 | | | | | | | | | 100 | | | | 107,000 | |
HCA, Inc., 5.88%, 5/01/23 | | | | | | | | | 200 | | | | 207,000 | |
Medco Health Solutions, Inc., 7.13%, 3/15/18 | | | | | | | | | 800 | | | | 951,201 | |
| | | | | | | | | | | | | 1,265,201 | |
Hotels, Restaurants & Leisure — 0.1% |
Caesars Entertainment Operating Co., Inc., 11.25%, 6/01/17 | | | | | | | | | 200 | | | | 176,000 | |
Household Durables — 0.5% |
DR Horton, Inc., 5.63%, 1/15/16 | | | | | | | | | 1,000 | | | | 1,062,500 | |
Industrial Conglomerates — 0.3% |
General Electric Co., 2.70%, 10/09/22 | | | | | | | | | 200 | | | | 197,090 | |
Hutchison Whampoa International Ltd. (b): | | | | | | | | | | | | | | |
3.50%, 1/13/17 | | | | | | | | | 300 | | | | 315,383 | |
7.45%, 11/24/33 | | | | | | | | | 50 | | | | 69,071 | |
| | | | | | | | | | | | | 581,544 | |
Insurance — 1.2% |
Aflac, Inc.: | | | | | | | | | | | | | | |
8.50%, 5/15/19 | | | | | | | | | 100 | | | | 129,500 | |
3.63%, 6/15/23 | | | | | | | | | 500 | | | | 512,313 | |
The Allstate Corp.: | | | | | | | | | | | | | | |
3.15%, 6/15/23 | | | | | | | | | 500 | | | | 504,816 | |
5.75%, 8/15/53 (a) | | | | | | | | | 250 | | | | 267,187 | |
Liberty Mutual Group, Inc., 4.95%, 5/01/22 (b) | | | | | | | | | 600 | | | | 659,317 | |
Pricoa Global Funding I, 5.45%, 6/11/14 (b) | | | | | | | | | 300 | | | | 300,295 | |
Prudential Covered Trust, Series 2012-1, 3.00%, 9/30/15 (b) | | | | | | | | | 400 | | | | 410,794 | |
| | | | | | | | | | | | | 2,784,222 | |
IT Services — 0.0% |
First Data Corp., 8.25%, 1/15/21 (b) | | | | | | | | | 100 | | | | 108,500 | |
Media — 1.7% |
21st Century Fox America, 7.25%, 5/18/18 | | | | | | | | | 400 | | | | 483,596 | |
Clear Channel Communications, Inc., 9.00%, 3/01/21 | | | | | | | | | 200 | | | | 213,500 | |
DIRECTV Holdings LLC/DIRECTV Financing Co., Inc., 3.80%, 3/15/22 | | | | | | | | | 500 | | | | 516,415 | |
NBCUniversal Media LLC, 2.88%, 1/15/23 | | | | | | | | | 400 | | | | 397,508 | |
Time Warner, Inc.: | | | | | | | | | | | | | | |
4.05%, 12/15/23 | | | | | | | | | 1,000 | | | | 1,049,433 | |
6.10%, 7/15/40 | | | | | | | | | 200 | | | | 239,033 | |
Viacom, Inc., 4.25%, 9/01/23 | | | | | | | | | 800 | | | | 843,583 | |
Wind Acquisition Finance SA, 7.38%, 4/23/21 (b) | | | | | | | | | 200 | | | | 207,000 | |
| | | | | | | | | | | | | 3,950,068 | |
See Notes to Financial Statements.
| FDP SERIES, INC. | MAY 31, 2014 | 25
|
| |
| Schedule of Investments (continued) | Franklin Templeton Total Return FDP Fund
(Percentages shown are based on Net Assets)
|
| Corporate Bonds | | | | | | Par
(000) | | Value |
Metals & Mining — 0.5% |
ArcelorMittal, 6.00%, 3/01/21 | | | | | USD | | | | 300 | | | $ | 322,500 | |
FMG Resources August 2006 Property Ltd., 6.88%, 4/01/22 (b) | | | | | | | | | 200 | | | | 211,000 | |
Glencore Funding LLC, 4.13%, 5/30/23 (b) | | | | | | | | | 500 | | | | 494,368 | |
Reliance Steel & Aluminum Co., 4.50%, 4/15/23 | | | | | | | | | 200 | | | | 204,920 | |
| | | | | | | | | | | | | 1,232,788 | |
Multi-Utilities — 0.3% |
Sempra Energy, 2.88%, 10/01/22 | | | | | | | | | 600 | | | | 589,401 | |
Oil, Gas & Consumable Fuels — 4.4% |
Apache Corp., 4.25%, 1/15/44 | | | | | | | | | 1,000 | | | | 981,286 | |
Canadian Natural Resources Ltd., 5.90%, 2/01/18 | | | | | | | | | 500 | | | | 574,218 | |
Chesapeake Energy Corp.: | | | | | | | | | | | | | | |
6.63%, 8/15/20 | | | | | | | | | 200 | | | | 230,500 | |
5.75%, 3/15/23 | | | | | | | | | 50 | | | | 55,750 | |
CNPC General Capital Ltd., 3.95%, 4/19/22 (b) | | | | | | | | | 600 | | | | 609,850 | |
El Paso Pipeline Partners Operating Co. LLC, 4.30%, 5/01/24 | | | | | | | | | 800 | | | | 811,562 | |
Enable Midstream Partners LP, 3.90%, 5/15/24 (b) | | | | | | | | | 400 | | | | 401,405 | |
Enable Oklahoma Intrastate Transmission LLC, 6.25%, 3/15/20 (b) | | | | | | | | | 400 | | | | 443,241 | |
Energy Transfer Equity LP, 7.50%, 10/15/20 | | | | | | | | | 200 | | | | 231,000 | |
Energy Transfer Partners LP, 5.20%, 2/01/22 | | | | | | | | | 200 | | | | 222,057 | |
Enterprise Products Operating LLC: | | | | | | | | | | | | | | |
3.35%, 3/15/23 | | | | | | | | | 300 | | | | 300,945 | |
Series B, 7.03%, 1/15/68 (a) | | | | | | | | | 100 | | | | 113,375 | |
Gazprom OAO Via Gaz Capital SA, 6.21%, 11/22/16 (b) | | | | | | | | | 500 | | | | 541,250 | |
Kinder Morgan Energy Partners LP, 3.45%, 2/15/23 | | | | | | | | | 200 | | | | 194,456 | |
Kinder Morgan Finance Co. LLC, 6.00%, 1/15/18 (b) | | | | | | | | | 200 | | | | 219,266 | |
Linn Energy LLC/Linn Energy Finance Corp., 7.25%, 11/01/19 (b) | | | | | | | | | 100 | | | | 105,000 | |
Petrobras Global Finance BV, 3.11%, 3/17/20 (a) | | | | | | | | | 900 | | | | 920,250 | |
Plains Exploration & Production Co., 6.63%, 5/01/21 | | | | | | | | | 65 | | | | 72,475 | |
Sinopec Group Overseas Development 2014, Ltd., 4.38%, 4/10/24 (b) | | | | | | | | | 600 | | | | 628,242 | |
Sunoco Logistics Partners Operations LP, 4.25%, 4/01/24 | | | | | | | | | 400 | | | | 413,448 | |
Valero Energy Corp., 9.38%, 3/15/19 | | | | | | | | | 800 | | | | 1,052,787 | |
Weatherford International Ltd., 5.95%, 4/15/42 | | | | | | | | | 900 | | | | 1,008,842 | |
| | | | | | | | | | | | | 10,131,205 | |
Paper & Forest Products — 0.4% |
Georgia-Pacific LLC, 3.73%, 7/15/23 (b) | | | | | | | | | 1,000 | | | | 1,023,814 | |
NewPage Corp., 11.38%, 12/31/14 (c)(d) | | | | | | | | | 92 | | | | — | |
| | | | | | | | | | | | | 1,023,814 | |
Personal Products — 0.2% |
Avon Products, Inc., 5.00%, 3/15/23 | | | | | | | | | 500 | | | | 504,661 | |
Pharmaceuticals — 0.6% |
AbbVie, Inc.: | | | | | | | | | | | | | | |
2.90%, 11/06/22 | | | | | | | | | 500 | | | | 492,367 | |
4.40%, 11/06/42 | | | | | | | | | 400 | | | | 401,091 | |
Zoetis, Inc., 3.25%, 2/01/23 | | | | | | | | | 500 | | | | 494,504 | |
| | | | | | | | | | | | | 1,387,962 | |
| Corporate Bonds | | | | | | Par
(000) | | Value |
Real Estate Investment Trusts (REITs) — 1.2% |
American Tower Corp.: | | | | | | | | | | | | | | |
3.50%, 1/31/23 | | | | | USD | | | | 500 | | | $ | 490,918 | |
5.00%, 2/15/24 | | | | | | | | | 500 | | | | 543,724 | |
ERP Operating LP, 5.75%, 6/15/17 | | | | | | | | | 500 | | | | 566,423 | |
Health Care REIT, Inc., 4.13%, 4/01/19 | | | | | | | | | 500 | | | | 540,338 | |
Healthcare Realty Trust, Inc., 6.50%, 1/17/17 | | | | | | | | | 500 | | | | 563,864 | |
| | | | | | | | | | | | | 2,705,267 | |
Semiconductors & Semiconductor Equipment — 0.4% |
Maxim Integrated Products, Inc., 3.38%, 3/15/23 | | | | | | | | | 1,000 | | | | 972,330 | |
Specialty Retail — 0.1% |
Edcon Proprietary Ltd., 9.50%, 3/01/18 (b) | | | | | EUR | | | | 200 | | | | 273,366 | |
Tobacco — 0.7% |
Altria Group, Inc.: | | | | | | | | | | | | | | |
9.70%, 11/10/18 | | | | | USD | | | | 111 | | | | 146,878 | |
4.00%, 1/31/24 | | | | | | | | | 900 | | | | 929,266 | |
Lorillard Tobacco Co., 2.30%, 8/21/17 | | | | | | | | | 500 | | | | 512,854 | |
| | | | | | | | | | | | | 1,588,998 | |
Trading Companies & Distributors — 0.9% |
International Lease Finance Corp., 8.63%, 9/15/15 | | | | | | | | | 2,000 | | | | 2,180,200 | |
Transportation Infrastructure — 0.4% |
DP World Ltd., 6.85%, 7/02/37 (b) | | | | | | | | | 380 | | | | 427,880 | |
Sydney Airport Finance Co. Property Ltd., 3.90%, 3/22/23 (b) | | | | | | | | | 500 | | | | 506,035 | |
| | | | | | | | | | | | | 933,915 | |
Wireless Telecommunication Services — 0.1% |
Sprint Communications, Inc., 6.00%, 11/15/22 | | | | | | | | | 200 | | | | 206,500 | |
Total Corporate Bonds — 31.5% | | | | | | | | | | | | | 73,290,623 | |
|
Floating Rate Loan Interests (a) |
Aerospace & Defense — 0.1% | | | | | | | | | | | | | | |
Doncasters Finance US LLC, Term Loan, 4.50%, 4/09/20 | | | | | | | | | 35 | | | | 34,844 | |
Transdigm, Inc.: | | | | | | | | | | | | | | |
Term Loan C, 3.75%, 2/28/20 | | | | | | | | | 189 | | | | 187,438 | |
Term Loan D, 3.75%, 5/31/21 | | | | | | | | | 77 | | | | 76,491 | |
| | | | | | | | | | | | | 298,773 | |
Auto Components — 0.0% |
Autoparts Holdings Ltd., 1st Lien Term Loan, 6.50%, 7/28/17 | | | | | | | | | 37 | | | | 37,032 | |
Grede Holdings LLC, Term Loan B, 6.00%, 5/07/21 | | | | | | | | | 67 | | | | 66,559 | |
| | | | | | | | | | | | | 103,591 | |
Building Products — 0.1% |
Quikrete Holdings, Inc., 1st Lien Term Loan, 4.00%, 9/28/20 | | | | | | | | | 169 | | | | 169,195 | |
Capital Markets — 0.1% |
Guggenheim Partners LLC, Term Loan B, 4.25%, 7/22/20 | | | | | | | | | 293 | | | | 293,714 | |
Chemicals — 0.7% |
Arysta LifeScience Corp., 1st Lien Term Loan, 4.50%, 5/29/20 | | | | | | | | | 536 | | | | 536,635 | |
Axalta Coating Systems US Holdings, Inc., Term Loan, 4.00%, 2/01/20 | | | | | | | | | 202 | | | | 201,576 | |
Cyanco Intermediate Corp., Term Loan, 4.50%, 4/29/20 | | | | | | | | | 146 | | | | 145,804 | |
See Notes to Financial Statements.
| 26 | FDP SERIES, INC. | MAY 31, 2014
|
| |
| Schedule of Investments (continued) | Franklin Templeton Total Return FDP Fund
(Percentages shown are based on Net Assets)
|
| Floating Rate Loan Interests (a) | | | | | | Par
(000) | | Value |
Chemicals (concluded) |
MacDermid, Inc., 1st Lien Term Loan, 4.00%, 6/07/20 | | | | | USD | | | | 275 | | | $ | 274,471 | |
OCI Beaumont LLC, Term Loan B3, 5.00%, 8/20/19 | | | | | | | | | 33 | | | | 33,819 | |
Oxbow Carbon LLC, 1st Lien Term Loan, 4.25%, 7/19/19 | | | | | | | | | 234 | | | | 234,165 | |
Tronox Pigments (Netherlands) BV, Term Loan, 4.00%, 3/19/20 | | | | | | | | | 222 | | | | 222,005 | |
| | | | | | | | | | | | | 1,648,475 | |
Commercial Services & Supplies — 0.2% |
Interactive Data Corp., Term Loan, 4.75%, 4/30/21 | | | | | | | | | 354 | | | | 356,362 | |
Communications Equipment — 0.0% |
Presidio, Inc., Term Loan, 5.00%, 3/31/17 | | | | | | | | | 100 | | | | 100,317 | |
Computers & Peripherals — 0.1% |
Dell, Inc., Term Loan B, 4.50%, 4/29/20 | | | | | | | | | 231 | | | | 230,359 | |
Containers & Packaging — 0.2% |
Exopack LLC, Term Loan B, 5.25%, 5/08/19 | | | | | | | | | 349 | | | | 353,707 | |
Diversified Consumer Services — 0.2% |
Sungard Availability Services Capital, Inc., Term Loan B, 6.00%, 3/25/19 | | | | | | | | | 352 | | | | 349,667 | |
Diversified Financial Services — 0.4% |
Reynolds Group Holdings, Inc., Term Loan, 4.00%, 12/01/18 | | | | | | | | | 586 | | | | 586,381 | |
TransUnion LLC, Term Loan, 4.00%, 3/17/21 | | | | | | | | | 419 | | | | 417,816 | |
| | | | | | | | | | | | | 1,004,197 | |
Diversified Telecommunication Services — 0.1% |
Intelsat Jackson Holdings SA, Term Loan B2, 3.75%, 6/30/19 | | | | | | | | | 193 | | | | 193,113 | |
Electrical Equipment — 0.1% |
WESCO Distribution, Inc., Term Loan B, 3.75%, 12/12/19 | | | | | | | | | 173 | | | | 172,862 | |
Energy Equipment & Services — 0.0% |
Pacific Drilling SA, Term Loan B, 4.50%, 6/04/18 | | | | | | | | | 80 | | | | 79,893 | |
Food Products — 0.1% |
Big Heart Pet Brands, Term Loan B, 3.50%, 3/08/20 | | | | | | | | | 141 | | | | 139,251 | |
Post Holdings, Inc., Term Loan B, 7.50%, 4/17/21 | | | | | | | | | 34 | | | �� | 34,658 | |
| | | | | | | | | | | | | 173,909 | |
Health Care Equipment & Supplies — 0.2% |
Millennium Laboratories, Inc., Term Loan B, 5.25%, 4/16/21 | | | | | | | | | 471 | | | | 473,350 | |
Health Care Providers & Services — 0.4% |
Community Health Systems, Inc., Term Loan D, 4.25%, 1/27/21 | | | | | | | | | 290 | | | | 291,195 | |
Connolly LLC, 1st Lien Term Loan, 5.00%, 1/29/21 | | | | | | | | | 80 | | | | 80,852 | |
DaVita, Inc.: | | | | | | | | | | | | | | |
Term Loan B, 4.50%, 10/20/16 | | | | | | | | | 152 | | | | 151,717 | |
Term Loan B2, 4.00%, 11/01/19 | | | | | | | | | 361 | | | | 362,172 | |
DSI Renal, Inc., 1st Lien Term Loan, 4.75%, 3/31/21 | | | | | | | | | 57 | | | | 56,600 | |
U.S. Renal Care, Inc., Term Loan, 4.25%, 7/03/19 | | | | | | | | | 65 | | | | 65,418 | |
| | | | | | | | | | | | | 1,007,954 | |
Health Care Technology — 0.1% |
Truven Health Analytics, Inc., Term Loan B, 4.50%, 6/06/19 | | | | | | | | | 135 | | | | 133,117 | |
| Floating Rate Loan Interests (a) | | | | | | Par
(000) | | Value |
Hotels, Restaurants & Leisure — 0.1% |
24 Hour Fitness Worldwide, Inc., Term Loan B, 4.00%, 5/28/21 | | | | | USD | | | | 185 | | | $ | 185,182 | |
Diamond Resorts Corp., Term Loan, 5.50%, 4/23/21 | | | | | | | | | 41 | | | | 41,558 | |
Hilton Worldwide Finance LLC, Term Loan B2, 3.50%, 10/26/20 | | | | | | | | | 1 | | | | 568 | |
| | | | | | | | | | | | | 227,308 | |
Internet Software & Services — 0.2% |
BMC Software Finance, Inc., Term Loan, 5.00%, 9/10/20 | | | | | | | | | 552 | | | | 552,968 | |
IT Services — 0.2% |
MoneyGram International, Inc., Term Loan B, 4.25%, 3/27/20 | | | | | | | | | 492 | | | | 483,487 | |
Machinery — 0.1% |
Signode Industrial Group US Inc., Term Loan B, 4.00%, 3/21/21 | | | | | | | | | 145 | | | | 143,850 | |
Media — 0.4% |
Cumulus Media Holdings, Inc., Term Loan, 4.25%, 12/23/20 | | | | | | | | | 53 | | | | 52,792 | |
IMG Worldwide, Inc., 1st Lien Term Loan, 5.25%, 5/06/21 | | | | | | | | | 721 | | | | 724,366 | |
Radio One, Inc., Term Loan, 7.50%, 3/31/16 | | | | | | | | | 16 | | | | 16,218 | |
Zuffa LLC, Term Loan B, 3.75%, 2/25/20 | | | | | | | | | 63 | | | | 62,856 | |
| | | | | | | | | | | | | 856,232 | |
Metals & Mining — 0.0% |
FMG Resources August 2006 Property Ltd., Term Loan B, 3.75%, 6/30/19 | | | | | | | | | 96 | | | | 95,599 | |
Multiline Retail — 0.3% |
Sears Holding Corp., Term Loan, 5.50%, 6/30/18 | | | | | | | | | 590 | | | | 594,056 | |
Oil, Gas & Consumable Fuels — 0.0% |
UTEX Industries, Inc., 1st Lien Term loan, 5.00%, 4/15/21 | | | | | | | | | 11 | | | | 11,350 | |
Personal Products — 0.3% |
FGI Operating Co. LLC, Term Loan, 5.50%, 4/19/19 | | | | | | | | | 391 | | | | 393,889 | |
Otter Products, LLC, Term Loan, 5.25%, 4/29/19 | | | | | | | | | 346 | | | | 345,664 | |
| | | | | | | | | | | | | 739,553 | |
Pharmaceuticals — 0.0% |
Valeant Pharmaceuticals International, Inc., Series E, Term Loan B, 3.75%, 8/05/20 | | | | | | | | | 111 | | | | 110,588 | |
Road & Rail — 0.1% |
Global TIP Finance BV, Term Loan C, 6.50%, 10/23/20 | | | | | | | | | 149 | | | | 148,797 | |
Semiconductors & Semiconductor Equipment — 0.0% |
M/A-COM Technology Solutions Holdings, Inc., Term Loan, 4.50%, 4/14/21 | | | | | | | | | 62 | | | | 61,754 | |
Software — 0.1% |
VISANT Corp., Term Loan B, 5.25%, 12/22/16 | | | | | | | | | 269 | | | | 265,852 | |
Specialty Retail — 0.7% |
BJ’s Wholesale Club, Inc., 1st Lien Term Loan, 4.50%, 9/26/19 | | | | | | | | | 638 | | | | 637,952 | |
Evergreen Acqco 1 LP, Term Loan, 5.00%, 7/09/19 | | | | | | | | | 252 | | | | 252,099 | |
Harbor Freight Tools USA, Inc., 1st Lien Term Loan, 4.75%, 7/26/19 | | | | | | | | | 220 | | | | 221,233 | |
The Men’s Wearhouse, Inc., Term Loan B, 3.50%, 3/11/21 | | | | | | | | | 188 | | | | 188,771 | |
Party City Holdings, Inc., Term Loan, 4.00%, 7/27/19 | | | | | | | | | 273 | | | | 271,013 | |
| | | | | | | | | | | | | 1,571,068 | |
Total Floating Rate Loan Interests — 5.6% | | | | | | | | | | | | | 13,005,017 | |
See Notes to Financial Statements.
| FDP SERIES, INC. | MAY 31, 2014 | 27
|
| |
| Schedule of Investments (continued) | Franklin Templeton Total Return FDP Fund
(Percentages shown are based on Net Assets)
|
| Foreign Agency Obligations | | | | | | Par
(000) | | Value |
Brazil Notas do Tesouro Nacional, 10.00%, 1/01/17 | | | | | BRL | | | | 1,200 | (e) | | $ | 515,933 | |
Hungary Government Bond: | | | | | | | | | | | | | | |
8.00%, 2/12/15 | | | | | HUF | | | | 2,940 | | | | 13,730 | |
7.75%, 8/24/15 | | | | | | | | | 900 | | | | 4,307 | |
5.50%, 12/22/16 | | | | | | | | | 149,300 | | | | 714,982 | |
6.75%, 11/24/17 | | | | | | | | | 890 | | | | 4,466 | |
5.50%, 12/20/18 | | | | | | | | | 52,860 | | | | 257,306 | |
6.00%, 1/11/19 | | | | | EUR | | | | 120 | | | | 186,577 | |
3.88%, 2/24/20 | | | | | | | | | 40 | | | | 56,370 | |
7.50%, 11/12/20 | | | | | HUF | | | | 190 | | | | 1,016 | |
7.00%, 6/24/22 | | | | | | | | | 190 | | | | 998 | |
6.00%, 11/24/23 | | | | | | | | | 250 | | | | 1,246 | |
Iceland Government International Bond, 5.88%, 5/11/22 (b) | | | | | USD | | | | 100 | | | | 109,526 | |
Ireland Government Bond: | | | | | | | | | | | | | | |
4.50%, 4/18/20 | | | | | EUR | | | | 113 | | | | 179,105 | |
5.00%, 10/18/20 | | | | | | | | | 186 | | | | 303,705 | |
5.40%, 3/13/25 | | | | | | | | | 201 | | | | 339,509 | |
Korea Monetary Stabilization Bond: | | | | | | | | | | | | | | |
3.28%, 6/02/14 | | | | | KRW | | | | 519,220 | | | | 508,939 | |
2.82%, 8/02/14 | | | | | | | | | 14,200 | | | | 13,924 | |
2.78%, 10/02/14 | | | | | | | | | 56,600 | | | | 55,510 | |
2.84%, 12/02/14 | | | | | | | | | 247,290 | | | | 242,653 | |
2.74%, 2/02/15 | | | | | | | | | 33,310 | | | | 32,670 | |
2.47%, 4/02/15 | | | | | | | | | 486,000 | | | | 475,611 | |
2.76%, 6/02/15 | | | | | | | | | 606,700 | | | | 595,101 | |
2.80%, 8/02/15 | | | | | | | | | 435,280 | | | | 427,125 | |
2.81%, 10/02/15 | | | | | | | | | 60,000 | | | | 58,881 | |
Korea Treasury Bond: | | | | | | | | | | | | | | |
3.50%, 6/10/14 | | | | | | | | | 332,710 | | | | 326,170 | |
3.25%, 12/10/14 | | | | | | | | | 126,990 | | | | 124,871 | |
3.25%, 6/10/15 | | | | | | | | | 32,100 | | | | 31,640 | |
2.75%, 12/10/15 | | | | | | | | | 250,830 | | | | 245,910 | |
3.00%, 12/10/16 | | | | | | | | | 2,045,500 | | | | 2,013,915 | |
Lithuania Government International Bond (b): | | | | | | | | | | | | | | |
6.75%, 1/15/15 | | | | | USD | | | | 130 | | | | 134,641 | |
7.38%, 2/11/20 | | | | | | | | | 310 | | | | 380,525 | |
Malaysia Government Bond: | | | | | | | | | | | | | | |
3.43%, 8/15/14 | | | | | MYR | | | | 530 | | | | 165,131 | |
3.74%, 2/27/15 | | | | | | | | | 3,260 | | | | 1,018,957 | |
3.84%, 8/12/15 | | | | | | | | | 450 | | | | 141,137 | |
4.72%, 9/30/15 | | | | | | | | | 1,509 | | | | 478,907 | |
3.20%, 10/15/15 | | | | | | | | | 355 | | | | 110,517 | |
3.17%, 7/15/16 | | | | | | | | | 600 | | | | 186,256 | |
4.24%, 2/07/18 | | | | | | | | | 2,250 | | | | 714,995 | |
Mexican Bonos: | | | | | | | | | | | | | | |
7.00%, 6/19/14 | | | | | MXN | | | | 930 | (f) | | | 72,443 | |
9.50%, 12/18/14 | | | | | | | | | 10,460 | (f) | | | 839,098 | |
6.00%, 6/18/15 | | | | | | | | | 137 | (f) | | | 10,910 | |
8.00%, 12/17/15 | | | | | | | | | 10,948 | (f) | | | 904,544 | |
6.25%, 6/16/16 | | | | | | | | | 1,707 | (f) | | | 138,814 | |
7.25%, 12/15/16 | | | | | | | | | 16,521 | (f) | | | 1,382,328 | |
Peru Government Bond, 7.84%, 8/12/20 | | | | | PEN | | | | 615 | (g) | | | 254,017 | |
Poland Government Bond: | | | | | | | | | | | | | | |
0.00%, 7/25/14 (h) | | | | | PLN | | | | 15 | | | | 4,928 | |
5.50%, 4/25/15 | | | | | | | | | 642 | | | | 217,022 | |
0.00%, 7/25/15 (h) | | | | | | | | | 1,457 | | | | 466,497 | |
6.25%, 10/24/15 | | | | | | | | | 535 | | | | 184,820 | |
0.00%, 1/25/16 (h) | | | | | | | | | 3,675 | | | | 1,159,086 | |
5.00%, 4/25/16 | | | | | | | | | 1,235 | | | | 423,831 | |
2.72%, 1/25/17 (a) | | | | | | | | | 376 | | | | 123,795 | |
2.72%, 1/25/21 (a) | | | | | | | | | 381 | | | | 123,984 | |
Poland Government International Bond, 6.38%, 7/15/19 | | | | | USD | | | | 340 | | | | 404,175 | |
Republic of Ghana, 8.50%, 10/04/17 | | | | | | | | | 100 | | | | 105,745 | |
| Foreign Agency Obligations | | | | | | Par
(000) | | Value |
Republic of Hungary: | | | | | | | | | | | | | | |
3.50%, 7/18/16 | | | | | EUR | | | | 20 | | | $ | 28,100 | |
4.38%, 7/04/17 | | | | | | | | | 45 | | | | 65,114 | |
5.75%, 6/11/18 | | | | | | | | | 95 | | | | 144,695 | |
Republic of Serbia, 4.88%, 2/25/20 (b) | | | | | USD | | | | 300 | | | | 309,435 | |
Russian Government International Bond, 7.50%, 3/31/30 (b) | | | | | | | | | 671 | | | | 779,379 | |
Singapore Government Bond, 1.13%, 4/01/16 | | | | | SGD | | | | 700 | | | | 565,276 | |
Ukraine Government International Bond (b): | | | | | | | | | | | | | | |
9.25%, 7/24/17 | | | | | USD | | | | 400 | | | | 395,500 | |
7.95%, 2/23/21 | | | | | | | | | 200 | | | | 189,040 | |
Vietnam Government International Bond, 6.75%, 1/29/20 (b) | | | | | | | | | 320 | | | | 361,200 | |
Total Foreign Agency Obligations — 9.0% | | | | | | | | | | | | | 20,826,538 | |
|
Municipal Bonds |
Alabama Federal Aid Highway Finance Authority, RB, 5.00%, 9/01/25 | | | | | | | | | 575 | | | | 666,845 | |
City of New York New York Municipal Water Finance Authority, Refunding RB, Water & Sewer System, 2nd General Resolution, Fiscal 2014, Series BB, 5.00%, 6/15/46 | | | | | | | | | 160 | | | | 175,086 | |
Coachella Valley Unified School District, GO, Series D (AGM), 5.00%, 8/01/37 | | | | | | | | | 230 | | | | 245,716 | |
Colorado Independent School District, GO (PSF-GTD), 5.00%, 8/15/38 | | | | | | | | | 200 | | | | 226,970 | |
Commonwealth of Massachusetts, GO, Series A, 4.50%, 12/01/43 | | | | | | | | | 160 | | | | 166,616 | |
County of Nassau New York, GO, Series B: | | | | | | | | | | | | | | |
5.00%, 4/01/39 | | | | | | | | | 270 | | | | 290,126 | |
5.00%, 4/01/43 | | | | | | | | | 270 | | | | 289,086 | |
Evansville Local Public Improvement Bond Bank, RB, Series A, 5.00%, 7/01/36 | | | | | | | | | 50 | | | | 55,289 | |
Florida Hurricane Catastrophe Fund Finance Corp., RB, Series A, 3.00%, 7/01/20 | | | | | | | | | 300 | | | | 304,344 | |
JobsOhio Beverage System, Refunding RB, Series A, 5.00%, 1/01/38 | | | | | | | | | 450 | | | | 485,806 | |
Kansas Development Finance Authority, Refunding RB: | | | | | | | | | | | | | | |
5.25%, 6/01/38 | | | | | | | | | 130 | | | | 142,919 | |
5.25%, 6/01/42 | | | | | | | | | 130 | | | | 141,661 | |
Wichita State University Union Corp. Student House Project, Series F-1, 5.00%, 6/01/46 | | | | | | | | | 160 | | | | 168,978 | |
Metropolitan Boston Transit Parking Corp., Refunding RB, 5.00%, 7/01/41 | | | | | | | | | 250 | | | | 271,222 | |
New Jersey EDA, Refunding RB, School Facilities Construction, Series NN, 5.00%, 3/01/30 | | | | | | | | | 120 | | | | 132,986 | |
New York State Urban Development Corp., RB, State Personal Income Tax, Series C, 5.00%, 3/15/29 | | | | | | | | | 800 | | | | 924,816 | |
Puerto Rico Electric Power Authority, RB, Series A, 6.75%, 7/01/36 | | | | | | | | | 425 | | | | 293,773 | |
Puerto Rico Sales Tax Financing Corp., RB: | | | | | | | | | | | | | | |
CAB, Series A, 0.00%, 8/01/25 (h) | | | | | | | | | 350 | | | | 155,936 | |
First Sub-Series A, 6.50%, 8/01/44 | | | | | | | | | 475 | | | | 431,533 | |
State of Arkansas, GO, 3.25%, 6/15/22 | | | | | | | | | 700 | | | | 756,560 | |
State of California, GO, Various Purposes, 6.00%, 11/01/39 | | | | | | | | | 210 | | | | 252,218 | |
State of Hawaii, GO, 5.00%, 8/01/30 | | | | | | | | | 45 | | | | 52,402 | |
State of Illinois, GO, 5.88%, 3/01/19 | | | | | | | | | 495 | | | | 560,691 | |
State of Minnesota, GO, Refunding, Series F, 4.00%, 10/01/24 | | | | | | | | | 200 | | | | 228,324 | |
State of Mississippi, GO, Series B, 5.00%, 12/01/31 | | | | | | | | | 50 | | | | 58,305 | |
See Notes to Financial Statements.
| 28 | FDP SERIES, INC. | MAY 31, 2014
|
| |
| Schedule of Investments (continued) | Franklin Templeton Total Return FDP Fund
(Percentages shown are based on Net Assets)
|
| Municipal Bonds | | | | | | Par
(000) | | Value |
State of South Carolina Public Service Authority, Refunding RB, Santee Cooper, Series B, 5.00%, 12/01/38 | | | | | USD | | | | 150 | | | $ | 164,999 | |
State of Washington, GO, Refunding, 5.00%, 7/01/24 | | | | | | | | | 60 | | | | 72,940 | |
State of Washington, GO, Series D, 5.00%, 2/01/23 | | | | | | | | | 50 | | | | 59,985 | |
University of California, Refunding RB, 5.00%, 5/15/48 (a) | | | | | | | | | 925 | | | | 1,132,496 | |
Total Municipal Bonds — 3.8% | | | | | | | | | | | | | 8,908,628 | |
|
Non-Agency Mortgage-Backed Securities |
Collateralized Mortgage Obligations — 0.6% |
American Home Mortgage Investment Trust, Series 2004-3, Class 4A, 1.84%, 10/25/34 (a) | | | | | | | | | 206 | | | | 205,312 | |
Bear Stearns Alternative-A Trust, Series 2004-13, Class A2, 1.03%, 11/25/34 (a) | | | | | | | | | 85 | | | | 81,050 | |
Citigroup Mortgage Loan Trust, Series 2013-A, Class A, 3.00%, 5/25/42 (a)(b) | | | | | | | | | 185 | | | | 187,471 | |
Credit Suisse First Boston Mortgage Securities Corp., Series 2004-6, Class 3A1, 5.00%, 9/25/19 | | | | | | | | | 110 | | | | 115,119 | |
Credit Suisse Mortgage Capital Certificates, Series 2009-15R, Class 3A1, 5.35%, 3/26/36 (a)(b) | | | | | | | | | 344 | | | | 354,837 | |
Lehman ABS Corp. Mortgage Pass-Through Certificates, Series 2003-1, Class A1, 5.00%, 12/25/33 | | | | | | | | | 125 | | | | 128,842 | |
Wells Fargo Mortgage-Backed Securities Trust: | | | | | | | | | | | | | | |
Series 2004-I, Class 2A1, 2.60%, 7/25/34 (a) | | | | | | | | | 100 | | | | 100,651 | |
Series 2004-W, Class A9, 2.62%, 11/25/34 (a) | | | | | | | | | 161 | | | | 165,954 | |
Series 2007-3, Class 3A1, 5.50%, 4/25/22 | | | | | | | | | 38 | | | | 38,887 | |
| | | | | | | | | | | | | 1,378,123 | |
Commercial Mortgage-Backed Securities — 5.2% |
Banc of America Commercial Mortgage Trust: | | | | | | | | | | | | | | |
Series 2006-4, Class AJ, 5.70%, 7/10/46 (a) | | | | | | | | | 732 | | | | 769,904 | |
Series 2006-4, Class AM, 5.68%, 7/10/46 | | | | | | | | | 500 | | | | 546,044 | |
Series 2007-3, Class AM, 5.59%, 6/10/49 (a) | | | | | | | | | 735 | | | | 814,459 | |
Bear Stearns Commercial Mortgage Securities Trust: | | | | | | | | | | | | | | |
Series 2006-PW11, Class AJ, 5.44%, 3/11/39 (a) | | | | | | | | | 694 | | | | 728,672 | |
Series 2006-PW12, Class AJ, 5.75%, 9/11/38 (a) | | | | | | | | | 112 | | | | 117,258 | |
Series 2006-PW13, Class AJ, 5.61%, 9/11/41 (a) | | | | | | | | | 640 | | | | 669,762 | |
Series 2007-PW15, Class A4, 5.33%, 2/11/44 | | | | | | | | | 376 | | | | 407,334 | |
Series 2007-PW16, Class A4, 5.71%, 6/11/40 (a) | | | | | | | | | 850 | | | | 949,577 | |
Series 2007-PW16, Class AM, 5.71%, 6/11/40 (a) | | | | | | | | | 950 | | | | 1,059,922 | |
Citigroup Commercial Mortgage Trust, Series 2006-C5, Class AJ, 5.48%, 10/15/49 | | | | | | | | | 210 | | | | 211,145 | |
GMAC Commercial Mortgage Securities, Inc., Series 2005-C1, Class B, 4.94%, 5/10/43 | | | | | | | | | 750 | | | | 140,566 | |
| Non-Agency Mortgage-Backed Securities | | | | | | Par
(000) | | Value |
Commercial Mortgage-Backed Securities (concluded) |
Greenwich Capital Commercial Funding Corp.: | | | | | | | | | | | | | | |
Series 2006-GG7, Class AJ, 5.82%, 7/10/38 (a) | | | | | USD | | | | 640 | | | $ | 668,993 | |
Series 2006-GG7, Class AM, 5.82%, 7/10/38 (a) | | | | | | | | | 190 | | | | 206,470 | |
Series 2007-GG9, Class A4, 5.44%, 3/10/39 | | | | | | | | | 908 | | | | 993,995 | |
JPMorgan Chase Commercial Mortgage Securities Trust:: | | | | | | | | | | | | | | |
Series 2006-CB16, Class B, 5.67%, 5/12/45 (a) | | | | | | | | | 210 | | | | 163,242 | |
Series 2006-CB17, Class AM, 5.46%, 12/12/43 | | | | | | | | | 700 | | | | 740,629 | |
Series 2006-LDP7, Class AJ, 5.86%, 4/15/45 (a) | | | | | | | | | 640 | | | | 655,146 | |
LB-UBS Commercial Mortgage Trust, Series 2006-C4, Class AJ, 5.86%, 6/15/38 (a) | | | | | | | | | 390 | | | | 414,496 | |
Morgan Stanley Capital I Trust (a): | | | | | | | | | | | | | | |
Series 2006-HQ8, Class AJ, 5.50%, 3/12/44 | | | | | | | | | 260 | | | | 271,414 | |
Series 2007-IQ16, Class AM, 6.09%, 12/12/49 | | | | | | | | | 850 | | | | 959,508 | |
Talisman Finance PLC, Series 6, Class A, 0.51%, 10/22/16 (a) | | | | | EUR | | | | 513 | | | | 681,373 | |
| | | | | | | | | | | | | 12,169,909 | |
Total Non-Agency Mortgage-Backed Securities — 5.8% | | | | | | 13,548,032 | |
|
U.S. Government Sponsored Agency Securities |
Agency Obligations — 1.8% |
Fannie Mae, 5.38%, 6/12/17 | | | | | USD | | | | 1,000 | | | | 1,134,651 | |
Freddie Mac: | | | | | | | | | | | | | | |
2.88%, 2/09/15 | | | | | | | | | 2,000 | | | | 2,037,114 | |
6.25%, 7/15/32 | | | | | | | | | 800 | | | | 1,106,938 | |
| | | | | | | | | | | | | 4,278,703 | |
Collateralized Mortgage Obligations — 0.5% |
Fannie Mae Mortgage-Backed Securities, Series 2007-1, Class NF, 0.40%, 2/25/37 (a) | | 500 | | | | 498,590 | |
Freddie Mac Mortgage-Backed Securities, Series 2643, Class OG, 5.00%, 7/15/32 | | | | | | | | | 577 | | | | 583,387 | |
| | | | | | | | | | | | | 1,081,977 | |
Mortgage-Backed Securities — 18.0% |
Fannie Mae Mortgage-Backed Securities: | | | | | | | | | | | | | | |
1.50%, 5/01/33 (a) | | | | | | | | | 12 | | | | 12,496 | |
1.74%, 10/01/32 (a) | | | | | | | | | 82 | | | | 86,089 | |
2.02%, 9/01/34 (a) | | | | | | | | | 392 | | | | 413,722 | |
2.06%, 4/01/35 (a) | | | | | | | | | 19 | | | | 19,383 | |
2.08%, 4/01/35 (a) | | | | | | | | | 201 | | | | 214,933 | |
3.00%, 6/01/29 – 6/01/44 (i) | | | | | | | | | 14,200 | | | | 14,565,562 | |
3.50%, 6/01/44 (i) | | | | | | | | | 950 | | | | 979,242 | |
4.00%, 6/01/44 (i) | | | | | | | | | 11,800 | | | | 12,506,157 | |
5.00%, 8/01/35 – 4/01/37 | | | | | | | | | 300 | | | | 332,365 | |
5.50%, 11/01/34 – 3/01/36 | | | | | | | | | 2,068 | | | | 2,335,587 | |
6.00%, 6/01/21 – 9/01/38 | | | | | | | | | 925 | | | | 1,043,503 | |
6.50%, 1/01/36 | | | | | | | | | 71 | | | | 81,317 | |
Freddie Mac Mortgage-Backed Securities: | | | | | | | | | | | | | | |
1.96%, 11/01/27 (a) | | | | | | | | | 182 | | | | 188,275 | |
2.46%, 4/01/32 (a) | | | | | | | | | 69 | | | | 73,171 | |
2.51%, 9/01/32 (a) | | | | | | | | | 11 | | | | 11,816 | |
3.00%, 6/01/44 (i) | | | | | | | | | 3,100 | | | | 3,067,062 | |
4.00%, 6/01/44 (i) | | | | | | | | | 2,200 | | | | 2,328,562 | |
4.50%, 9/01/20 | | | | | | | | | 34 | | | | 35,922 | |
See Notes to Financial Statements.
| FDP SERIES, INC. | MAY 31, 2014 | 29
|
| |
| Schedule of Investments (continued) | Franklin Templeton Total Return FDP Fund
(Percentages shown are based on Net Assets)
|
| U.S. Government Sponsored Agency Securities | Par
(000) | | Value |
Mortgage-Backed Securities (concluded) |
Freddie Mac Mortgage-Backed Securities (concluded): | | | | | | | |
5.00%, 7/01/23 – 2/01/39 | | | | | USD | | | | 1,168 | | | $ | 1,285,629 | |
5.50%, 11/01/37 | | | | | | | | | 5 | | | | 5,776 | |
6.00%, 10/01/21 – 4/01/38 | | | | | | | | | 103 | | | | 111,048 | |
6.50%, 9/01/38 | | | | | | | | | 15 | | | | 17,246 | |
Ginnie Mae Mortgage-Backed Securities: | | | | | | | | | | | | | | |
3.50%, 6/01/44 (i) | | | | | | | | | 1,800 | | | | 1,873,406 | |
6.50%, 12/20/37 – 7/15/38 | | | | | | | | | 221 | | | | 249,789 | |
| | | | | | | | | | | | | 41,838,058 | |
Total U.S. Government Sponsored
Agency Securities — 20.3% | | | | | | 47,198,738 | |
|
U.S. Treasury Obligations |
U.S. Treasury Bonds: | | | | | | | | | | | | | | |
3.50%, 2/15/39 | | | | | | | | | 2,600 | | | | 2,727,561 | |
4.63%, 2/15/40 | | | | | | | | | 2,100 | | | | 2,625,655 | |
4.38%, 5/15/41 | | | | | | | | | 900 | | | | 1,087,313 | |
3.13%, 11/15/41 | | | | | | | | | 700 | | | | 681,516 | |
3.13%, 2/15/42 | | | | | | | | | 1,600 | | | | 1,555,501 | |
3.00%, 5/15/42 | | | | | | | | | 700 | | | | 663,359 | |
2.88%, 5/15/43 | | | | | | | | | 1,800 | | | | 1,652,344 | |
U.S. Treasury Inflation Indexed Bonds: | | | | | | | | | | | | | | |
2.00%, 1/15/16 | | | | | | | | | 1,191 | | | | 1,257,126 | |
0.13%, 4/15/16 | | | | | | | | | 1,606 | | | | 1,647,916 | |
U.S. Treasury Notes: | | | | | | | | | | | | | | |
2.25%, 1/31/15 | | | | | | | | | 1,000 | | | | 1,014,297 | |
4.00%, 2/15/15 | | | | | | | | | 1,000 | | | | 1,027,500 | |
2.50%, 4/30/15 | | | | | | | | | 2,900 | | | | 2,963,211 | |
4.13%, 5/15/15 | | | | | | | | | 500 | | | | 519,024 | |
4.50%, 11/15/15 | | | | | | | | | 400 | | | | 424,984 | |
4.88%, 8/15/16 | | | | | | | | | 1,800 | | | | 1,974,938 | |
4.63%, 11/15/16 | | | | | | | | | 900 | | | | 989,297 | |
4.63%, 2/15/17 | | | | | | | | | 1,000 | | | | 1,106,484 | |
3.13%, 4/30/17 | | | | | | | | | 1,100 | | | | 1,174,852 | |
4.75%, 8/15/17 | | | | | | | | | 3,000 | | | | 3,367,500 | |
2.75%, 12/31/17 | | | | | | | | | 500 | | | | 530,156 | |
3.50%, 2/15/18 | | | | | | | | | 5,000 | | | | 5,437,890 | |
3.75%, 11/15/18 | | | | | | | | | 2,000 | | | | 2,209,532 | |
2.75%, 2/15/19 | | | | | | | | | 2,000 | | | | 2,118,750 | |
3.63%, 8/15/19 | | | | | | | | | 2,000 | | | | 2,205,782 | |
3.63%, 2/15/20 | | | | | | | | | 6,800 | | | | 7,513,470 | |
Total U.S. Treasury Obligations — 20.9% | | | | | | | | | | | | | 48,475,958 | |
|
Other Interests (j) | Beneficial
Interest
(000)
| | | | |
General Motors II | | | | | | | | | 7 | | | | — | |
Motors Liquidation Co. GUC Trust (c) | | | | | | | | | — | (k) | | | 4,147 | |
Total Other Interests — 0.0% | | | | | | | | | | | | | 4,147 | |
|
Preferred Securities | | | | | | | | | Par
(000) | | | | | |
Capital Trusts |
Commercial Banks — 0.6% |
Bank of America Corp., Series M, 8.13% (a)(l) | | | | | | | | | 300 | | | | 340,500 | |
Wachovia Capital Trust III, 5.57% (a)(l) | | | | | | | | | 1,000 | | | | 975,000 | |
| | | | | | | | | | | | | 1,315,500 | |
| Preferred Securities | | Par
(000) | | Value |
Diversified Financial Services — 0.3% |
JPMorgan Chase & Co., Series 1, 7.90% (a)(l) | | | | | USD | | | | 575 | | | $ | 648,313 | |
Electric Utilities — 0.2% |
Electricite de France SA, 5.25% (a)(b)(l) | | | | | | | | | 500 | | | | 514,000 | |
Insurance — 0.3% |
MetLife, Inc., 6.40%, 12/15/66 | | | | | | | | | 600 | | | | 669,330 | |
Mitsui Sumitomo Insurance Co. Ltd., 7.00%, 3/15/72 (a)(b) | | | | | | | | | 100 | | | | 119,000 | |
| | | | | | | | | | | | | 788,330 | |
Total Capital Trusts — 1.4% | | | | | | | | | | | | | 3,266,143 | |
|
Preferred Stocks — 0.3% | | | | | | | | | Shares | | | | | |
Commercial Banks — 0.3% |
U.S. Bancorp, 6.00% (a) | | | | | | | | | 24,000 | | | | 671,520 | |
Total Preferred Securities — 1.7% | | | | | | | | | | | | | 3,937,663 | |
|
Warrants (m) |
Automobiles — 0.0% |
General Motors Co.: | | | | | | | | | | | | | | |
(Issued/Exercisable 11/02/10, 1.0 Share for 1 Warrant, Expires 7/10/16, Strike Price USD 10.00) | | | | | | | | | 631 | | | | 15,485 | |
(Issued/Exercisable 11/02/10, 1.0 Share for 1 Warrant, Expires 7/10/19, Strike Price USD 18.33) | | | | | | | | | 631 | | | | 10,354 | |
Total Warrants — 0.0% | | | | | | | | | | | | | 25,839 | |
Total Long-Term Investments
(Cost — $226,310,778) — 100.5% | | | | | | | | | | | | | 233,734,812 | |
|
Short-Term Securities | | | | | | | | | Par
(000) | | | | | |
Foreign Agency Obligations — 0.3% |
Hungary — 0.0% |
Hungary Treasury Bill, 4.13%, 6/25/14 (n) | | | | | HUF | | | | 2,280,000 | | | | 10,239 | |
Malaysia — 0.3% |
Bank Negara Malaysia Monetary Notes (n): | | | | | | | | | | | | | | |
Series 3313, 2.87%, 6/03/14 | | | | | MYR | | | | 20 | | | | 6,224 | |
Series 3513, 2.86%, 6/05/14 | | | | | | | | | 30 | | | | 9,335 | |
Series 3513, 2.86%, 6/05/14 | | | | | | | | | 30 | | | | 9,335 | |
Series 3713, 2.87%, 6/17/14 | | | | | | | | | 10 | | | | 3,109 | |
Series 3813, 2.95%, 6/19/14 | | | | | | | | | 90 | | | | 27,974 | |
Series 4313, 2.86%, 7/08/14 | | | | | | | | | 10 | | | | 3,104 | |
Series 4313, 2.86%, 7/08/14 | | | | | | | | | 70 | | | | 21,727 | |
Series 4413, 2.87%, 7/15/14 | | | | | | | | | 140 | | | | 43,429 | |
Series 4413, 2.90%, 7/15/14 | | | | | | | | | 30 | | | | 9,306 | |
Series 4613, 2.87%, 7/24/14 | | | | | | | | | 200 | | | | 61,999 | |
Series 4613, 2.90%, 7/24/14 | | | | | | | | | 30 | | | | 9,299 | |
Series 4813, 2.89%, 8/05/14 | | | | | | | | | 230 | | | | 71,217 | |
Series 4913, 2.86%, 8/14/14 | | | | | | | | | 240 | | | | 74,260 | |
Series 5113, 2.87%, 8/21/14 | | | | | | | | | 25 | | | | 7,731 | |
Series 5113, 2.93%, 8/21/14 | | | | | | | | | 60 | | | | 18,555 | |
Series 5513, 2.83%, 9/09/14 | | | | | | | | | 50 | | | | 15,439 | |
Series 5713, 2.83%, 9/18/14 | | | | | | | | | 50 | | | | 15,428 | |
Series 6013, 2.85%, 10/02/14 | | | | | | | | | 90 | | | | 27,739 | |
Series 6213, 2.87%, 10/16/14 | | | | | | | | | 20 | | | | 6,157 | |
Series 6213, 2.90%, 10/16/14 | | | | | | | | | 110 | | | | 33,864 | |
Series 6213, 2.90%, 10/16/14 | | | | | | | | | 60 | | | | 18,471 | |
See Notes to Financial Statements.
| 30 | FDP SERIES, INC. | MAY 31, 2014
|
| |
| Schedule of Investments (continued) | Franklin Templeton Total Return FDP Fund
(Percentages shown are based on Net Assets)
|
| Short-Term Securities | Par
(000) | | Value |
Malaysia (concluded) |
Bank Negara Malaysia Monetary Notes (n) (concluded) | | | | | | | |
Series 6613, 2.95%, 10/28/14 | | | | | MYR | | | | 205 | | | $ | 63,045 | |
Series 6613, 2.95%, 10/28/14 | | | | | | | | | 275 | | | | 84,573 | |
Series 6713, 2.94%, 6/12/14 | | | | | | | | | 80 | | | | 24,879 | |
Series 6713, 2.86%, 11/06/14 | | | | | | | | | 20 | | | | 6,146 | |
Series 6713, 2.88%, 11/06/14 | | | | | | | | | 90 | | | | 27,657 | |
| | | | | | | | | | | | | 700,002 | |
Philippines — 0.0% |
Philippine Treasury Bills (n): | | | | | | | | | | | | | | |
0.73%, 9/03/14 | | | | | PHP | | | | 1,160 | | | | 26,440 | |
1.07%, 3/04/15 | | | | | | | | | 480 | | | | 10,881 | |
| | | | | | | | | | | | | 37,321 | |
Total Foreign Agency Obligations — 0.3% | | | | | | | | | | | | | 747,562 | |
| Time Deposits | | | | | | Par
(000) | | Value |
Europe — 0.1% |
Wells Fargo Co., 0.04%, 6/02/14 | | | | | EUR | | | | 82 | | | $ | 112,426 | |
Singapore — 0.1% |
Brown Brothers Harriman & Co., 0.01%, 6/02/14 | | | | | SGD | | | | 400 | | | | 318,579 | |
United States — 12.1% |
Brown Brothers Harriman & Co., 0.01%, 6/02/14 | | | | | USD | | | | 28,091 | | | | 28,091,118 | |
Total Time Deposits — 12.3% | | | | | | | | | | | | | 28,522,123 | |
Total Short-Term Securities
(Cost — $29,267,395) — 12.6% | | | | | | | | | | | | | 29,269,685 | |
Options Purchased
(Cost — $2,310,472) — 0.9% | | | | | | | | | | | | | 2,155,246 | |
Total Investments (Cost — $257,888,645) — 114.0% | | | | | | 265,159,743 | |
Liabilities in Excess of Other Assets — (14.0)% | | | | | | (32,479,056 | ) |
Net Assets — 100.0% | | | | | | | | | | | | $ | 232,680,687 | |
Notes to Schedule of Investments
| (a) | | | | Variable rate security. Rate shown is as of report date. |
| (b) | | | | Security exempt from registration pursuant to Rule 144A under the Securities Act of 1933, as amended. These securities may be resold in transactions exempt from registration to qualified institutional investors. |
| (c) | | | | Non-income producing security. |
| (d) | | | | Issuer filed for bankruptcy and/or is in default of principal and/or interest payments. |
| (e) | | | | Security trades in units with each unit equal to a par amount of BRL 1,000. |
| (f) | | | | Security trades in units with each unit equal to a par amount of MXN 100. |
| (g) | | | | Security trades in units with each unit equal to a par amount of PEN 1,000. |
| (h) | | | | Zero-coupon bond. |
| (i) | | | | Represents or includes a TBA transaction. Unsettled TBA transactions as of May 31, 2014 were as follows: |
| Counterparty | | | | Value | | Unrealized
Appreciation |
Bank of America Securities LLC | | | | $ | 1,873,406 | | | $ | 22,570 | |
BNP Paribas Securities Corp. | | | | $ | 4,046,305 | | | $ | 47,312 | |
Goldman Sachs & Co. | | | | $ | 2,328,563 | | | $ | 22,000 | |
Morgan Stanley & Co. LLC | | | | $ | 16,665,469 | | | $ | 161,266 | |
Wells Fargo Securities LLC | | | | $ | 10,406,250 | | | $ | 65,625 | |
| (j) | | | | Other interests represent beneficial interests in liquidation trusts and other reorganization or private entities. |
| (k) | | | | Amount is less than $500. |
| (l) | | | | Security is perpetual in nature and has no stated maturity date. |
| (m) | | | | Warrants entitle the Fund to purchase a predetermined number of shares of common stock and are non-income producing. The purchase price and number of shares are subject to adjustment under certain conditions until the expiration date, if any. |
| (n) | | | | Rates shown are discount rates or a range of discount rates paid at the time of purchase. |
| | | | | |
| • | | | | Forward foreign currency exchange contracts outstanding as of May 31, 2014 were as follows: |
| Currency Purchased | | Currency Sold | | Counterparty | | Settlement
Date | | Unrealized
Appreciation
(Depreciation) |
EUR | 29,106 | | USD | 39,454 | | Deutsche Bank AG | | 6/18/14 | | $ | 220 | |
EUR | 108,369 | | USD | 149,160 | | Deutsche Bank AG | | 6/18/14 | | | (1,440 | ) |
SGD | 163,700 | | USD | 130,438 | | Deutsche Bank AG | | 6/18/14 | | | 73 | |
USD | 348,028 | | EUR | 260,578 | | Deutsche Bank AG | | 6/18/14 | | | (7,169 | ) |
SGD | 131,000 | | USD | 104,051 | | HSBC Bank PLC | | 6/20/14 | | | 390 | |
USD | 181,067 | | EUR | 138,600 | | Deutsche Bank AG | | 7/03/14 | | | (7,854 | ) |
EUR | 106,359 | | USD | 144,190 | | Deutsche Bank AG | | 7/17/14 | | | 786 | |
USD | 140,042 | | EUR | 106,359 | | Deutsche Bank AG | | 7/17/14 | | | (4,934 | ) |
USD | 125,810 | | EUR | 95,745 | | Deutsche Bank AG | | 7/23/14 | | | (4,699 | ) |
USD | 509,894 | | EUR | 385,000 | | Barclays Bank PLC | | 7/28/14 | | | (14,900 | ) |
USD | 25,121 | | EUR | 18,969 | | Citibank N.A. | | 7/28/14 | | | (736 | ) |
CLP | 132,465,000 | | USD | 250,335 | | Morgan Stanley & Co. LLC | | 7/29/14 | | | (10,677 | ) |
See Notes to Financial Statements.
| FDP SERIES, INC. | MAY 31, 2014 | 31
|
| |
| Schedule of Investments (continued) | Franklin Templeton Total Return FDP Fund
|
| | | | | Forward foreign currency exchange contracts outstanding as of May 31, 2014 were as follows (continued): |
| Currency Purchased | | Currency Sold | | Counterparty | | Settlement
Date | | Unrealized
Appreciation
(Depreciation) |
USD | 144,590 | | EUR | 108,890 | | Barclays Bank PLC | | 8/04/14 | | $ | (3,839 | ) |
USD | 48,988 | | EUR | 36,797 | | Citibank N.A. | | 8/08/14 | | | (1,171 | ) |
USD | 13,855 | | EUR | 10,398 | | Citibank N.A. | | 8/11/14 | | | (319 | ) |
USD | 110,422 | | EUR | 82,368 | | Barclays Bank PLC | | 8/25/14 | | | (1,858 | ) |
EUR | 223,697 | | USD | 309,563 | | Deutsche Bank AG | | 8/27/14 | | | (4,631 | ) |
SEK | 8,850,000 | | USD | 1,351,228 | | Deutsche Bank AG | | 8/27/14 | | | (30,408 | ) |
USD | 300,000 | | EUR | 223,697 | | Deutsche Bank AG | | 8/27/14 | | | (4,932 | ) |
USD | 1,360,701 | | SEK | 8,850,000 | | Deutsche Bank AG | | 8/27/14 | | | 39,882 | |
EUR | 850,000 | | USD | 1,164,415 | | Deutsche Bank AG | | 8/29/14 | | | (5,736 | ) |
EUR | 305,683 | | USD | 425,434 | | Deutsche Bank AG | | 8/29/14 | | | (8,742 | ) |
EUR | 800,000 | | USD | 1,108,544 | | Deutsche Bank AG | | 8/29/14 | | | (18,023 | ) |
PHP | 52,545,000 | | USD | 1,183,979 | | JPMorgan Chase Bank N.A. | | 8/29/14 | | | 13,976 | |
USD | 2,711,352 | | EUR | 2,030,367 | | Deutsche Bank AG | | 8/29/14 | | | (56,346 | ) |
USD | 27,221 | | EUR | 20,375 | | Barclays Bank PLC | | 9/19/14 | | | (554 | ) |
USD | 68,127 | | EUR | 50,324 | | Barclays Bank PLC | | 9/24/14 | | | (476 | ) |
USD | 100,303 | | EUR | 74,000 | | JPMorgan Chase Bank N.A. | | 10/01/14 | | | (578 | ) |
USD | 657,119 | | GBP | 421,500 | | Deutsche Bank AG | | 10/01/14 | | | (48,721 | ) |
USD | 9,066 | | EUR | 6,585 | | Barclays Bank PLC | | 10/27/14 | | | 89 | |
CLP | 84,164,600 | | USD | 159,654 | | Deutsche Bank AG | | 10/31/14 | | | (8,796 | ) |
USD | 20,747 | | EUR | 15,341 | | Barclays Bank PLC | | 11/05/14 | | | (168 | ) |
EUR | 776,303 | | USD | 1,074,248 | | Deutsche Bank AG | | 11/10/14 | | | (15,861 | ) |
USD | 1,160,249 | | EUR | 857,000 | | Deutsche Bank AG | | 11/10/14 | | | (8,158 | ) |
USD | 5,443 | | EUR | 4,082 | | JPMorgan Chase Bank N.A. | | 11/12/14 | | | (122 | ) |
SGD | 823,234 | | USD | 660,516 | | Morgan Stanley & Co. LLC | | 11/17/14 | | | (4,110 | ) |
USD | 133,596 | | EUR | 98,696 | | JPMorgan Chase Bank N.A. | | 11/20/14 | | | (966 | ) |
CAD | 84,000 | | USD | 76,002 | | Barclays Bank PLC | | 1/09/15 | | | 1,054 | |
CAD | 42,000 | | USD | 38,004 | | Barclays Bank PLC | | 1/09/15 | | | 524 | |
CAD | 59,000 | | USD | 53,389 | | Barclays Bank PLC | | 1/09/15 | | | 734 | |
CAD | 68,000 | | USD | 61,532 | | Barclays Bank PLC | | 1/09/15 | | | 847 | |
CAD | 83,000 | | USD | 74,114 | | Citibank N.A. | | 1/09/15 | | | 2,025 | |
CAD | 62,000 | | USD | 55,439 | | Deutsche Bank AG | | 1/09/15 | | | 1,435 | |
CAD | 41,000 | | USD | 36,864 | | Deutsche Bank AG | | 1/09/15 | | | 747 | |
CAD | 83,000 | | USD | 74,707 | | Deutsche Bank AG | | 1/09/15 | | | 1,431 | |
CAD | 83,000 | | USD | 74,944 | | Deutsche Bank AG | | 1/09/15 | | | 1,195 | |
CAD | 42,000 | | USD | 38,009 | | Deutsche Bank AG | | 1/09/15 | | | 519 | |
CLP | 88,700,000 | | USD | 153,063 | | Barclays Bank PLC | | 1/09/15 | | | 4,829 | |
SGD | 378,780 | | USD | 300,262 | | Deutsche Bank AG | | 1/09/15 | | | 1,784 | |
USD | 50,900 | | EUR | 36,980 | | Barclays Bank PLC | | 1/09/15 | | | 474 | |
USD | 114,136 | | EUR | 82,955 | | JPMorgan Chase Bank N.A. | | 1/09/15 | | | 1,019 | |
USD | 20,855 | | DKK | 120,000 | | Deutsche Bank AG | | 1/15/15 | | | (1,097 | ) |
USD | 10,530 | | DKK | 60,000 | | Deutsche Bank AG | | 1/15/15 | | | (446 | ) |
USD | 238,511 | | EUR | 182,000 | | Deutsche Bank AG | | 2/06/15 | | | (9,682 | ) |
USD | 107,120 | | EUR | 83,000 | | Deutsche Bank AG | | 2/06/15 | | | (6,067 | ) |
CAD | 53,000 | | USD | 47,433 | | Barclays Bank PLC | | 2/09/15 | | | 1,150 | |
CAD | 42,000 | | USD | 37,586 | | HSBC Bank PLC | | 2/09/15 | | | 914 | |
CAD | 47,000 | | USD | 42,061 | | HSBC Bank PLC | | 2/09/15 | | | 1,021 | |
SGD | 152,100 | | USD | 120,095 | | Deutsche Bank AG | | 2/09/15 | | | 1,199 | |
SGD | 174,000 | | USD | 137,401 | | HSBC Bank PLC | | 2/09/15 | | | 1,357 | |
SGD | 108,000 | | USD | 85,293 | | JPMorgan Chase Bank N.A. | | 2/09/15 | | | 833 | |
USD | 132,793 | | EUR | 95,800 | | Deutsche Bank AG | | 2/09/15 | | | 2,150 | |
USD | 66,601 | | EUR | 48,000 | | JPMorgan Chase Bank N.A. | | 2/09/15 | | | 1,143 | |
USD | 39,822 | | EUR | 28,700 | | JPMorgan Chase Bank N.A. | | 2/09/15 | | | 684 | |
USD | 66,965 | | EUR | 48,000 | | JPMorgan Chase Bank N.A. | | 2/09/15 | | | 1,507 | |
USD | 66,741 | | EUR | 48,000 | | JPMorgan Chase Bank N.A. | | 2/09/15 | | | 1,282 | |
USD | 52,836 | | EUR | 38,000 | | JPMorgan Chase Bank N.A. | | 2/09/15 | | | 1,015 | |
CAD | 208,440 | | USD | 190,009 | | Deutsche Bank AG | | 3/09/15 | | | 929 | |
CLP | 25,162,000 | | USD | 43,874 | | JPMorgan Chase Bank N.A. | | 3/09/15 | | | 661 | |
CLP | 34,940,000 | | USD | 61,363 | | Morgan Stanley & Co. LLC | | 3/09/15 | | | 480 | |
CLP | 31,310,000 | | USD | 55,836 | | Morgan Stanley & Co. LLC | | 3/09/15 | | | (418 | ) |
USD | 139,340 | | EUR | 101,235 | | Deutsche Bank AG | | 3/09/15 | | | 1,272 | |
USD | 583,494 | | EUR | 428,064 | | Deutsche Bank AG | | 3/09/15 | | | (316 | ) |
USD | 1,237 | | EUR | 896 | | Deutsche Bank AG | | 3/09/15 | | | 15 | |
USD | 65,288 | | EUR | 47,248 | | JPMorgan Chase Bank N.A. | | 3/09/15 | | | 849 | |
USD | 1,409,939 | | EUR | 1,070,000 | | Deutsche Bank AG | | 6/05/15 | | | (49,993 | ) |
USD | 144,949 | | EUR | 112,766 | | Deutsche Bank AG | | 6/22/15 | | | (8,952 | ) |
USD | 542,986 | | DKK | 3,120,000 | | Deutsche Bank AG | | 1/15/16 | | | (30,623 | ) |
See Notes to Financial Statements.
| 32 | FDP SERIES, INC. | MAY 31, 2014
|
| |
| Schedule of Investments (continued) | Franklin Templeton Total Return FDP Fund
|
| | | | | Forward foreign currency exchange contracts outstanding as of May 31, 2014 were as follows (concluded): |
| Currency Purchased | | Currency Sold | | Counterparty | | Settlement
Date | | Unrealized
Appreciation
(Depreciation) |
USD | 537,880 | | DKK | 3,060,000 | | Deutsche Bank AG | | 1/15/16 | | $ | (24,698 | ) |
USD | 239,330 | | EUR | 182,000 | | Deutsche Bank AG | | 2/05/16 | | | (9,953 | ) |
USD | 107,535 | | EUR | 83,000 | | Deutsche Bank AG | | 2/05/16 | | | (6,149 | ) |
USD | 291,038 | | EUR | 220,000 | | Deutsche Bank AG | | 8/05/16 | | | (11,643 | ) |
USD | 218,625 | | EUR | 165,000 | | Deutsche Bank AG | | 8/05/16 | | | (8,385 | ) |
Total | | | | | | | | | | $ | (352,852 | ) |
| • | | | | OTC options purchased as of May 31, 2014 were as follows: |
| Description | | Counterparty | | Put/
Call | | Strike
Price | | Expiration
Date | | Notional
Amount
(000) | | Market
Value |
| USD Currency | | Barclays Bank PLC | | Call | | EUR | 4.13 | | 10/22/14 | | EUR | 557 | | $ | 7,423 | |
| USD Currency | | Citibank N.A. | | Put | | EUR | 1.49 | | 7/24/14 | | EUR | 4,400 | | | 581,067 | |
| USD Currency | | Citibank N.A. | | Put | | JPY | 90.00 | | 7/24/14 | | JPY | 1,222,500 | | | 1,566,756 | |
| Total | | | | | | | | | | | | | | $ | 2,155,246 | |
| • | | | | OTC credit default swaps — buy protection outstanding as of May 31, 2014 were as follows: |
| Issuer | | Pay
Fixed
Rate | | Counterparty | | Expiration
Date | | Notional
Amount
(000) | | Market
Value | | Premiums
Paid
(Received) | | Unrealized
Depreciation |
| First Data Corp. | | 5.00% | | Deutsche Bank AG | | 3/20/15 | | USD | 130 | | $ | (4,581 | ) | | $ | (2,514 | ) | | $ | (2,067 | ) |
| First Data Corp. | | 5.00% | | Barclays Capital, Inc. | | 3/20/15 | | USD | 370 | | | (13,037 | ) | | | (6,562 | ) | | | (6,475 | ) |
| International Lease Finance Corp. | | 5.00% | | Deutsche Bank AG | | 9/20/15 | | USD | 2,000 | | | (112,770 | ) | | | (112,311 | ) | | | (459 | ) |
| DR Horton, Inc. | | 5.00% | | JPMorgan Chase Bank N.A. | | 3/20/16 | | USD | 1,000 | | | (82,931 | ) | | | (69,630 | ) | | | (13,301 | ) |
| Dean Foods Co. | | 5.00% | | JPMorgan Chase Bank N.A. | | 6/20/16 | | USD | 1,328 | | | (117,170 | ) | | | (80,735 | ) | | | (36,435 | ) |
| Tenet Healthcare Corp. | | 5.00% | | Barclays Capital, Inc. | | 12/20/16 | | USD | 560 | | | (53,250 | ) | | | (43,225 | ) | | | (10,025 | ) |
| Constellation Brands, Inc. | | 5.00% | | Deutsche Bank AG | | 6/20/17 | | USD | 800 | | | (108,757 | ) | | | (75,227 | ) | | | (33,530 | ) |
| CIT Group, Inc. | | 5.00% | | Goldman Sachs International | | 6/20/17 | | USD | 1,500 | | | (173,675 | ) | | | (143,593 | ) | | | (30,082 | ) |
| Merrill Lynch & Co., Inc. | | 1.00% | | Credit Suisse Securities (USA) LLC | | 9/20/17 | | USD | 700 | | | (12,027 | ) | | | 10,855 | | | | (22,882 | ) |
| | | | | | | | | | | | | | | | | | | | | | |
| Total | | | | | | | | | | | $ | (678,198 | ) | | $ | (522,942 | ) | | $ | (155,256 | ) |
| • | | | | OTC credit default swaps — sold protection outstanding as of May 31, 2014 were as follows: |
| Issuer/Index | | Receive
Fixed
Rate | | Counterparty | | Expiration
Date | | Credit
Rating1 | | Notional
Amount
(000)2 | | Market
Value | | Premiums
Paid
(Received) | | Unrealized
Appreciation
(Depreciation) |
| First Data Corp. | | 5.00% | | Deutsche Bank AG | | 3/20/16 | | B | | USD | 100 | | $ | 6,371 | | | $ | (318 | ) | | $ | 6,689 | |
| First Data Corp. | | 5.00% | | Barclays Capital, Inc. | | 3/20/16 | | B | | USD | 100 | | | 6,371 | | | | 2,506 | | | | 3,865 | |
| First Data Corp. | | 5.00% | | Barclays Capital, Inc. | | 3/20/16 | | B | | USD | 300 | | | 19,114 | | | | — | | | | 19,114 | |
| Berkshire Hathaway, Inc. | | 1.00% | | Deutsche Bank AG | | 9/20/17 | | AA | | USD | 350 | | | 8,505 | | | | (2,306 | ) | | | 10,811 | |
| Bank of America Corp. | | 1.00% | | Credit Suisse Securities (USA) LLC | | 9/20/17 | | A- | | USD | 700 | | | 12,028 | | | | (10,855 | ) | | | 22,883 | |
Markit LCDX North America
Index, Series 19 | | 2.50% | | Barclays Capital, Inc. | | 12/20/17 | | NR | | USD | 380 | | | 18,085 | | | | 3,699 | | | | 14,386 | |
Markit LCDX North America
Index, Series 19 | | 2.50% | | Barclays Capital, Inc. | | 12/20/17 | | NR | | USD | 380 | | | 18,099 | | | | 3,713 | | | | 14,386 | |
| Berkshire Hathaway, Inc. | | 1.00% | | Credit Suisse Securities (USA) LLC | | 3/20/18 | | AA | | USD | 400 | | | 10,444 | | | | (1,804 | ) | | | 12,248 | |
Markit LCDX North America
Index, Series 20 | | 2.50% | | Credit Suisse Securities (USA) LLC | | 6/20/18 | | NR | | USD | 194 | | | 8,768 | | | | 5,083 | | | | 3,685 | |
Markit LCDX North America
Index, Series 21 | | 2.50% | | Credit Suisse Securities (USA) LLC | | 12/20/18 | | NR | | USD | 297 | | | 14,317 | | | | 10,423 | | | | 3,894 | |
| Tenet Healthcare Corp. | | 5.00% | | Barclays Capital, Inc. | | 12/20/18 | | B | | USD | 400 | | | 41,663 | | | | 24,420 | | | | 17,243 | |
| Republic of Indonesia | | 1.00% | | Barclays Capital, Inc. | | 3/20/19 | | BB+ | | USD | 300 | | | (5,002 | ) | | | (14,246 | ) | | | 9,244 | |
| Republic of Indonesia | | 1.00% | | Barclays Capital, Inc. | | 3/20/19 | | BB+ | | USD | 450 | | | (7,505 | ) | | | (21,372 | ) | | | 13,867 | |
| PSEG Power LLC | | 1.00% | | JPMorgan Chase Bank N.A. | | 6/20/19 | | BBB+ | | USD | 500 | | | (1,680 | ) | | | (1,895 | ) | | | 215 | |
Freeport-McMoRan Copper
& Gold, Inc. | | 1.00% | | Deutsche Bank AG | | 3/20/23 | | BBB | | USD | 500 | | | (33,460 | ) | | | (31,766 | ) | | | (1,694 | ) |
Markit MCDX North America
Index, Series 22 | | 1.00% | | Goldman Sachs International | | 6/20/24 | | AA | | USD | 700 | | | (11,403 | ) | | | (17,314 | ) | | | 5,911 | |
Markit CMBX North America
AJ Index, Series 2 | | 1.09% | | Credit Suisse Securities (USA) LLC | | 3/15/49 | | B+ | | USD | 200 | | | (15,784 | ) | | | (29,277 | ) | | | 13,493 | |
Markit CMBX North America
AJ Index, Series 2 | | 1.09% | | Credit Suisse Securities (USA) LLC | | 3/15/49 | | B+ | | USD | 50 | | | (3,946 | ) | | | (6,818 | ) | | | 2,872 | |
See Notes to Financial Statements.
| FDP SERIES, INC. | MAY 31, 2014 | 33
|
| |
| Schedule of Investments (continued) | Franklin Templeton Total Return FDP Fund
|
| | | | | OTC credit default swaps — sold protection outstanding as of May 31, 2014 were as follows (concluded): |
| Issuer/Index | | Receive
Fixed
Rate | | Counterparty | | Expiration
Date | | Credit
Rating1 | | Notional
Amount
(000)2 | | Market
Value | | Premiums
Paid
(Received) | | Unrealized
Appreciation
(Depreciation) |
Markit CMBX North America
AM Index, Series 2 | | 0.50% | | Credit Suisse Securities (USA) LLC | | 3/15/49 | | B+ | | USD | 540 | | $ | (7,052 | ) | | $ | (7,566 | ) | | $ | 514 | |
Markit CMBX North America
AM Index, Series 2 | | 0.50% | | Credit Suisse Securities (USA) LLC | | 3/15/49 | | B+ | | USD | 290 | | | (3,787 | ) | | | (4,243 | ) | | | 456 | |
| | | | | | | | | | | | | | | | | | | | | | | | |
| Total | | | | | | | | | | | | | $ | 74,146 | | | $ | (99,936 | ) | | $ | 174,082 | |
| 1 | | Using S&P’s rating of the issuer or the underlying securities of the index, as applicable. |
| 2 | | The maximum potential amount the Fund may pay should a negative credit event take place as defined under the terms of the agreement. |
| • | | | | For Fund compliance purposes, the Fund’s industry classifications refer to any one or more of the industry sub-classifications used by one or more widely recognized market indexes or rating group indexes, and/or as defined by the investment advisor. These definitions may not apply for purposes of this report, which may combine such industry sub-classifications for reporting ease. |
| | | | | |
| • | | | | Fair Value Measurements — Various inputs are used in determining the fair value of investments and derivative financial instruments. These inputs to valuation techniques are categorized into a disclosure hierarchy consisting of three broad levels for financial statement purposes as follows: |
| | | | | |
| • | | | | Level 1 — unadjusted price quotations in active markets/exchanges for identical assets or liabilities that the Fund has the ability to access |
| | | | | |
| • | | | | Level 2 — other observable inputs (including, but not limited to, quoted prices for similar assets or liabilities in markets that are active, quoted prices for identical or similar assets or liabilities in markets that are not active, inputs other than quoted prices that are observable for the assets or liabilities (such as interest rates, yield curves, volatilities, prepayment speeds, loss severities, credit risks and default rates) or other market-corroborated inputs) |
| | | | | |
| • | | | | Level 3 — unobservable inputs based on the best information available in the circumstances, to the extent observable inputs are not available (including the Fund’s own assumptions used in determining the fair value of investments and derivative financial instruments) |
| | | | | The hierarchy gives the highest priority to unadjusted quoted prices in active markets for identical assets or liabilities (Level 1 measurements) and the lowest priority to unobservable inputs (Level 3 measurements). Accordingly, the degree of judgment exercised in determining fair value is greatest for instruments categorized in Level 3. The inputs used to measure fair value may fall into different levels of the fair value hierarchy. In such cases, for disclosure purposes, the fair value hierarchy classification is determined based on the lowest level input that is significant to the fair value measurement in its entirety. |
| | | | | |
| | | | | Changes in valuation techniques may result in transfers into or out of an assigned level within the disclosure hierarchy. In accordance with the Fund’s policy, transfers between different levels of the fair value disclosure hierarchy are deemed to have occurred as of the beginning of the reporting period. The categorization of a value determined for investments and derivative financial instruments is based on the pricing transparency of the investment and derivative financial instrument and is not necessarily an indication of the risks associated with investing in those securities. For information about the Fund’s policy regarding valuation of investments and derivative financial instruments, please refer to Note 2 of the Notes to Financial Statements. |
| | | | | |
| | | | | The following tables summarize the Fund’s investments and derivative financial instruments categorized in the disclosure hierarchy as of May 31, 2014: |
| | | | | Level 1 | | Level 2 | | Level 3 | | Total |
Assets:
| | | | | | | | | | | | | | | | | | |
Investments:
| | | | | | | | | | | | | | | | | | |
Long-Term Investments:
| | | | | | | | | | | | | | | | | | |
Common Stocks | | | | $ | 24,068 | | | | — | | | $ | 17,000 | | | $ | 41,068 | |
Asset-Backed Securities | | | | | — | | | $ | 4,472,561 | | | | — | | | | 4,472,561 | |
Corporate Bonds | | | | | — | | | | 73,290,623 | | | | — | | | | 73,290,623 | |
Floating Rate Loan Interests | | | | | — | | | | 12,867,886 | | | | 137,131 | | | | 13,005,017 | |
Foreign Agency Obligations | | | | | — | | | | 20,826,538 | | | | — | | | | 20,826,538 | |
Municipal Bonds | | | | | — | | | | 8,908,628 | | | | — | | | | 8,908,628 | |
Non-Agency Mortgage-Backed Securities | | | | | — | | | | 13,548,032 | | | | — | | | | 13,548,032 | |
U.S. Government Sponsored Agency Securities | | | | | — | | | | 47,198,738 | | | | — | | | | 47,198,738 | |
U.S. Treasury Obligations | | | | | — | | | | 48,475,958 | | | | — | | | | 48,475,958 | |
Other Interests | | | | | 4,147 | | | | — | | | | — | | | | 4,147 | |
Preferred Securities | | | | | 671,520 | | | | 3,266,143 | | | | — | | | | 3,937,663 | |
Warrants | | | | | 25,839 | | | | — | | | | — | | | | 25,839 | |
Short-Term Investments:
| | | | | | | | | | | | | | | | | | |
Foreign Agency Obligations | | | | | — | | | | 747,562 | | | | — | | | | 747,562 | |
Time Deposits | | | | | — | | | | 28,522,123 | | | | — | | | | 28,522,123 | |
Options Purchased:
| | | | | | | | | | | | | | | | | | |
Foreign Currency Exchange Contracts | | | | | — | | | | 2,155,246 | | | | — | | | | 2,155,246 | |
Total
| | | | $ | 725,574 | | | $ | 264,280,038 | | | $ | 154,131 | | | $ | 265,159,743 | |
See Notes to Financial Statements.
| 34 | FDP SERIES, INC. | MAY 31, 2014
|
| |
| Schedule of Investments (concluded) | Franklin Templeton Total Return FDP Fund
|
| | | | | Level 1 | | Level 2 | | Level 3 | | Total |
Derivative Financial Instruments1 | | | | | | | | | | | | | | | | | | |
Assets:
| | | | | | | | | | | | | | | | | | |
Credit contracts | | | | | — | | | $ | 175,776 | | | | — | | | $ | 175,776 | |
Foreign currency exchange contracts | | | | | — | | | | 92,494 | | | | — | | | | 92,494 | |
Liabilities:
| | | | | — | | | | | | | | | | | | | |
Credit contracts | | | | | — | | | | (156,950 | ) | | | — | | | | (156,950 | ) |
Foreign currency exchange contracts | | | | | — | | | | (445,346 | ) | | | — | | | | (445,346 | ) |
Total
| | | | | — | | | $ | (334,026 | ) | | | — | | | $ | (334,026 | ) |
| 1 | | Derivative financial instruments are swaps and forward foreign currency exchange transactions. Swaps and forward foreign currency exchange contracts are valued at the unrealized appreciation/depreciation on the instrument. |
| | | | | The Fund may hold assets in which the fair value approximates the carrying amount for financial statement purposes. As of May 31, 2014, such assets are categorized within the disclosure hierarchy as follows: |
| | | | | Level 1 | | Level 2 | | Level 3 | | Total |
Assets:
| | | | | | | | | | | | | | | | | | |
Cash pledged as collateral for OTC derivatives | | | | $ | 1,070,000 | | | | — | | | | — | | | $ | 1,070,000 | |
Foreign currency at value | | | | | 556,310 | | | | — | | | | — | | | | 556,310 | |
Total
| | | | $ | 1,626,310 | | | | — | | | | — | | | $ | 1,626,310 | |
| | | | | There were no transfers between levels during the year ended May 31, 2014. |
| | | | | |
| | | | | The Fund’s investments that are categorized as Level 3 were valued utilizing third party pricing information without adjustment. Such valuations are based on unobservable inputs. A significant change in third party information inputs could result in a significantly lower or higher value of such Level 3 investments. |
See Notes to Financial Statements.
| FDP SERIES, INC. | MAY 31, 2014 | 35
|
| |
| Statements of Assets and Liabilities |
|
| May 31, 2014 | | | | MFS
Research
International
FDP Fund | | Marsico
Growth
FDP Fund | | Invesco
Value
FDP Fund | | Franklin
Templeton
Total Return
FDP Fund |
Assets |
Investments at value — unaffiliated1 | | | | $ | 176,400,192 | | | $ | 153,904,836 | | | $ | 151,274,944 | | | $ | 265,159,743 | |
Investments at value — affiliated2 | | | | | — | | | | — | | | | 42,635 | | | | — | |
Cash pledged as collateral for OTC derivatives | | | | | — | | | | — | | | | — | | | | 1,070,000 | |
Foreign currency at value3 | | | | | 6 | | | | — | | | | 60 | | | | 556,310 | |
Investments sold receivable | | | | | 1,595,775 | | | | — | | | | — | | | | 2,211,723 | |
Dividends receivable | | | | | 1,119,694 | | | | 43,078 | | | | 408,266 | | | | — | |
Capital shares sold receivable | | | | | 670,362 | | | | 550,742 | | | | 550,291 | | | | 1,106,381 | |
Interest receivable | | | | | — | | | | — | | | | — | | | | 2,021,965 | |
Unrealized appreciation on OTC swaps | | | | | — | | | | — | | | | — | | | | 175,776 | |
Unrealized appreciation on forward foreign currency exchange contracts | | | | | — | | | | — | | | | 58,911 | | | | 92,494 | |
Swap premiums paid | | | | | — | | | | — | | | | — | | | | 60,699 | |
Swaps receivable | | | | | — | | | | — | | | | — | | | | 28,353 | |
Principal paydowns receivable | | | | | — | | | | — | | | | — | | | | 304 | |
Prepaid expenses | | | | | 17,276 | | | | 16,690 | | | | 16,136 | | | | 19,098 | |
Total assets | | | | | 179,803,305 | | | | 154,515,346 | | | | 152,351,243 | | | | 272,502,846 | |
| |
Liabilities |
Investments purchased payable | | | | | 1,912,515 | | | | — | | | | — | | | | 37,254,457 | |
Capital shares redeemed payable | | | | | 507,484 | | | | 413,925 | | | | 370,260 | | | | 494,294 | |
Swap premiums received | | | | | — | | | | — | | | | — | | | | 683,577 | |
Unrealized depreciation on forward foreign currency exchange contracts | | | | | — | | | | — | | | | 17,621 | | | | 445,346 | |
Investment advisory fees payable | | | | | 133,378 | | | | 94,485 | | | | 88,644 | | | | 78,118 | |
Service and distribution fees payable | | | | | 103,965 | | | | 87,671 | | | | 88,353 | | | | 111,574 | |
Income dividends payable | | | | | — | | | | — | | | | — | | | | 361,743 | |
Unrealized depreciation on OTC swaps | | | | | — | | | | — | | | | — | | | | 156,950 | |
Swaps payable | | | | | — | | | | — | | | | — | | | | 95,078 | |
Officer’s and Directors’ fees payable | | | | | 3,152 | | | | 3,105 | | | | 3,125 | | | | 3,292 | |
Other accrued expenses payable | | | | | 119,400 | | | | 92,263 | | | | 90,071 | | | | 137,730 | |
Total liabilities | | | | | 2,779,894 | | | | 691,449 | | | | 658,074 | | | | 39,822,159 | |
Net Assets | | | | $ | 177,023,411 | | | $ | 153,823,897 | | | $ | 151,693,169 | | | $ | 232,680,687 | |
| |
Net Assets Consist of |
Paid-in capital | | | | $ | 171,371,728 | | | $ | 111,930,783 | | | $ | 121,023,201 | | | $ | 224,932,150 | |
Undistributed (accumulated) net investment income (loss) | | | | | 2,268,067 | | | | (446,198 | ) | | | 99,290 | | | | 240,369 | |
Accumulate net realized gain (loss) | | | | | (34,826,032 | ) | | | 4,522,720 | | | | (18,154,345 | ) | | | 560,616 | |
Net unrealized appreciation/depreciation | | | | | 38,209,648 | | | | 37,816,592 | | | | 48,725,023 | | | | 6,947,552 | |
Net Assets | | | | $ | 177,023,411 | | | $ | 153,823,897 | | | $ | 151,693,169 | | | $ | 232,680,687 | |
1 Investments at cost — unaffiliated | | | | $ | 138,192,496 | | | $ | 116,088,263 | | | $ | 102,606,707 | | | $ | 257,888,645 | |
2 Investments at cost — affiliated | | | | | — | | | | — | | | $ | 27,393 | | | | — | |
3 Foreign currency at cost | | | | $ | 6 | | | | — | | | $ | 60 | | | $ | 551,470 | |
See Notes to Financial Statements.
| 36 | FDP SERIES, INC. | MAY 31, 2014
|
| |
| Statements of Assets and Liabilities (concluded) |
|
| May 31, 2014 | | | | MFS
Research
International
FDP Fund | | Marsico
Growth
FDP Fund | | Invesco
Value
FDP Fund | | Franklin
Templeton
Total Return
FDP Fund |
Net Asset Value |
Institutional: | | | | | | | | | | | | | | | | | | |
Net assets | | | | $ | 5,960,703 | | | $ | 5,597,193 | | | $ | 5,373,312 | | | $ | 6,790,747 | |
Shares outstanding, 100 million shares authorized, $0.10 par value | | | | | 447,629 | | | | 327,218 | | | | 340,411 | | | | 631,420 | |
Net asset value | | | | $ | 13.32 | | | $ | 17.11 | | | $ | 15.78 | | | $ | 10.75 | |
Investor A: | | | | | | | | | | | | | | | | | | |
Net assets | | | | $ | 62,636,229 | | | $ | 55,132,908 | | | $ | 54,118,886 | | | $ | 86,985,722 | |
Shares outstanding, 100 million shares authorized, $0.10 par value | | | | | 4,731,992 | | | | 3,291,329 | | | | 3,461,817 | | | | 8,085,249 | |
Net asset value | | | | $ | 13.24 | | | $ | 16.75 | | | $ | 15.63 | | | $ | 10.76 | |
Investor C: | | | | | | | | | | | | | | | | | | |
Net assets | | | | $ | 108,426,479 | | | $ | 93,093,796 | | | $ | 92,200,971 | | | $ | 138,904,218 | |
Shares outstanding, 100 million shares authorized, $0.10 par value | | | | | 8,288,433 | | | | 5,936,872 | | | | 5,998,397 | | | | 12,911,240 | |
Net asset value | | | | $ | 13.08 | | | $ | 15.68 | | | $ | 15.37 | | | $ | 10.76 | |
See Notes to Financial Statements.
| FDP SERIES, INC. | MAY 31, 2014 | 37
|
| Year Ended May 31, 2014 | | | | MFS
Research
International
FDP Fund | | Marsico
Growth
FDP Fund | | Invesco
Value
FDP Fund | | Franklin
Templeton
Total Return
FDP Fund |
Investment Income |
Dividends — unaffiliated | | | | $ | 5,761,130 | | | $ | 1,301,435 | | | $ | 3,319,885 | | | $ | 43,244 | |
Interest | | | | | 87 | | | | — | | | | — | | | | 6,967,930 | |
Dividends — affiliated | | | | | — | | | | — | | | | 900 | | | | — | |
Foreign taxes withheld | | | | | (373,306 | ) | | | (16,216 | ) | | | (64,928 | ) | | | (18,925 | ) |
Total income | | | | | 5,387,911 | | | | 1,285,219 | | | | 3,255,857 | | | | 6,992,249 | |
| |
Expenses |
Investment advisory | | | | | 1,415,912 | | | | 1,113,754 | | | | 950,811 | | | | 825,117 | |
Service — Investor A | | | | | 133,695 | | | | 119,560 | | | | 116,051 | | | | 187,645 | |
Service and distribution — Investor B | | | | | 330 | | | | 297 | | | | 303 | | | | 314 | |
Service and distribution — Investor C | | | | | 984,551 | | | | 861,781 | | | | 845,794 | | | | 1,001,360 | |
Transfer agent — Institutional | | | | | 6,055 | | | | 5,922 | | | | 5,539 | | | | 6,645 | |
Transfer agent — Investor A | | | | | 58,958 | | | | 54,630 | | | | 52,404 | | | | 80,085 | |
Transfer agent — Investor B | | | | | 40 | | | | 40 | | | | 50 | | | | 48 | |
Transfer agent — Investor C | | | | | 116,883 | | | | 105,952 | | | | 102,707 | | | | 144,714 | |
Professional | | | | | 76,306 | | | | 63,879 | | | | 62,765 | | | | 86,413 | |
Custodian | | | | | 90,489 | | | | 13,240 | | | | 8,259 | | | | 63,991 | |
Registration | | | | | 58,418 | | | | 57,655 | | | | 59,299 | | | | 62,817 | |
Accounting services | | | | | 46,617 | | | | 34,268 | | | | 33,216 | | | | 48,628 | |
Officer and Directors | | | | | 22,194 | | | | 21,926 | | | | 21,922 | | | | 22,931 | |
Printing | | | | | 15,312 | | | | 16,148 | | | | 15,700 | | | | 19,019 | |
Miscellaneous | | | | | 30,900 | | | | 14,094 | | | | 15,777 | | | | 50,583 | |
Total expenses | | | | | 3,056,660 | | | | 2,483,146 | | | | 2,290,597 | | | | 2,600,310 | |
Less fees waived by Manager | | | | | — | | | | (69,610 | ) | | | — | | | | — | |
Total expenses after fees waived | | | | | 3,056,660 | | | | 2,413,536 | | | | 2,290,597 | | | | 2,600,310 | |
Net investment income (loss) | | | | | 2,331,251 | | | | (1,128,317 | ) | | | 965,260 | | | | 4,391,939 | |
| |
Realized and Unrealized Gain (Loss) |
Net realized gain (loss) from: | | | | | | | | | | | | | | | | | | |
Investments | | | | | 4,149,452 | | | | 12,263,693 | | | | 5,648,121 | | | | 265,412 | |
Financial futures contracts | | | | | — | | | | — | | | | — | | | | 4,079 | |
Foreign currency transactions | | | | | (53,637 | ) | | | (5,121 | ) | | | (825,735 | ) | | | (913,692 | ) |
Swaps | | | | | — | | | | — | | | | — | | | | 140,698 | |
| | | | | 4,095,815 | | | | 12,258,572 | | | | 4,822,386 | | | | (503,503 | ) |
Net change in unrealized appreciation/depreciation on: | | | | | | | | | | | | | | | | | | |
Investments | | | | | 14,100,028 | | | | 10,542,160 | | | | 16,838,455 | | | | 2,351,295 | |
Financial futures contracts | | | | | — | | | | — | | | | — | | | | 337 | |
Foreign currency translations | | | | | 36,163 | | | | (430 | ) | | | 1,540 | | | | 87,846 | |
Swaps | | | | | — | | | | — | | | | — | | | | (5,346 | ) |
| | | | | 14,136,191 | | | | 10,541,730 | | | | 16,839,995 | | | | 2,434,132 | |
Total realized and unrealized gain | | | | | 18,232,006 | | | | 22,800,302 | | | | 21,662,381 | | | | 1,930,629 | |
Net Increase in Net Assets Resulting from Operations | | | | $ | 20,563,257 | | | $ | 21,671,985 | | | $ | 22,627,641 | | | $ | 6,322,568 | |
See Notes to Financial Statements.
| 38 | FDP SERIES, INC. | MAY 31, 2014
|
| |
| Statements of Changes in Net Assets |
|
| | | | MFS Research
International FDP Fund
|
| Marsico Growth FDP Fund
|
| | | | Year Ended May 31,
|
| Year Ended May 31,
|
| Increase (Decrease) in Net Assets: | | | | 2014 | | 2013 | | 2014 | | 2013 |
Operations |
Net investment income (loss) | | | | $ | 2,331,251 | | | $ | 1,243,818 | | | | | $ | (1,128,317 | ) | | $ | (219,029 | ) |
Net realized gain | | | | | 4,095,815 | | | | 5,743,813 | | | | | | 12,258,572 | | | | 17,034,234 | |
Net change in unrealized appreciation/depreciation | | | | | 14,136,191 | | | | 21,786,627 | | | | | | 10,541,730 | | | | 3,775,512 | |
Net increase in net assets resulting from operations | | | | | 20,563,257 | | | | 28,774,258 | | | | | | 21,671,985 | | | | 20,590,717 | |
| |
Dividends and Distributions to Shareholders From1 |
Net investment income: | | | | | | | | | | | | | | | | | | | | |
Institutional | | | | | (72,887 | ) | | | (71,397 | ) | | | | | — | | | | — | |
Investor A | | | | | (624,124 | ) | | | (538,219 | ) | | | | | — | | | | — | |
Investor B | | | | | — | | | | (6,967 | ) | | | | | — | | | | — | |
Investor C | | | | | (542,424 | ) | | | (604,433 | ) | | | | | — | | | | — | |
Net realized gain: | | | | | | | | | | | | | | | | | | | | |
Institutional | | | | | — | | | | — | | | | | | (240,319 | ) | | | — | |
Investor A | | | | | — | | | | — | | | | | | (2,231,668 | ) | | | — | |
Investor B | | | | | — | | | | — | | | | | | (3,880,010 | ) | | | — | |
Decrease in net assets resulting from dividends and distributions to shareholders | | | | | (1,239,435 | ) | | | (1,221,016 | ) | | | | | (6,351,997 | ) | | | — | |
| |
Capital Share Transactions |
Net increase (decrease) in net assets derived from capital share transactions | | | | | 18,719,632 | | | | (1,829,580 | ) | | | | | 12,381,919 | | | | 130,336 | |
| |
Net Assets |
Total increase in net assets | | | | | 38,043,454 | | | | 25,723,662 | | | | | | 27,701,907 | | | | 20,721,053 | |
Beginning of year | | | | | 138,979,957 | | | | 113,256,295 | | | | | | 126,121,990 | | | | 105,400,937 | |
End of year | | | | $ | 177,023,411 | | | $ | 138,979,957 | | | | | $ | 153,823,897 | | | $ | 126,121,990 | |
Undistributed (accumulated) net investment income (loss), end of year | | | | $ | 2,268,067 | | | $ | 1,232,677 | | | | | $ | (446,198 | ) | | $ | (270,099 | ) |
| 1 | | Determined in accordance with federal income tax regulations. |
See Notes to Financial Statements.
| FDP SERIES, INC. | MAY 31, 2014 | 39
|
| |
| Statements of Changes in Net Assets (concluded) |
|
| | | | Invesco Value FDP Fund
|
| Franklin Templeton
Total Return FDP Fund
|
| | | | Year Ended May 31,
|
| Year Ended May 31,
|
| Increase (Decrease) in Net Assets: | | | | 2014 | | 2013 | | 2014 | | 2013 |
Operations |
Net investment income | | | | $ | 965,260 | | | $ | 680,936 | | | | | $ | 4,391,939 | | | $ | 3,766,531 | |
Net realized gain (loss) | | | | | 4,822,386 | | | | 7,844,813 | | | | | | (503,503 | ) | | | 4,004,523 | |
Net change in unrealized appreciation/depreciation | | | | | 16,839,995 | | | | 24,058,098 | | | | | | 2,434,132 | | | | (743,558 | ) |
Net increase in net assets resulting from operations | | | | | 22,627,641 | | | | 32,583,847 | | | | | | 6,322,568 | | | | 7,027,496 | |
| |
Dividends and Distributions to Shareholders From1 |
Net investment income: | | | | | | | | | | | | | | | | | | | | |
Institutional | | | | | (29,096 | ) | | | (44,047 | ) | | | | | (162,613 | ) | | | (179,162 | ) |
Investor A | | | | | (244,194 | ) | | | (303,643 | ) | | | | | (1,812,913 | ) | | | (1,777,463 | ) |
Investor B | | | | | — | | | | (1,344 | ) | | | | | (772 | ) | | | (46,794 | ) |
Investor C | | | | | (236,358 | ) | | | (164,801 | ) | | | | | (2,327,630 | ) | | | (3,040,513 | ) |
Net realized gain: | | | | | | | | | | | | | | | | | | | | |
Institutional | | | | | — | | | | — | | | | | | (5,818 | ) | | | — | |
Investor A | | | | | — | | | | — | | | | | | (71,145 | ) | | | — | |
Investor C | | | | | — | | | | — | | | | | | (117,542 | ) | | | — | |
Decrease in net assets resulting from dividends and distributions to shareholders | | | | | (509,648 | ) | | | (513,835 | ) | | | | | (4,498,433 | ) | | | (5,043,932 | ) |
| |
Capital Share Transactions |
Net increase (decrease) in net assets derived from capital share transactions | | | | | 6,073,674 | | | | (6,767,695 | ) | | | | | 43,542,379 | | | | 16,873,819 | |
| |
Net Assets |
Total increase in net assets | | | | | 28,191,667 | | | | 25,302,317 | | | | | | 45,366,514 | | | | 18,857,383 | |
Beginning of year | | | | | 123,501,502 | | | | 98,199,185 | | | | | | 187,314,173 | | | | 168,456,790 | |
End of year | | | | $ | 151,693,169 | | | $ | 123,501,502 | | | | | $ | 232,680,687 | | | $ | 187,314,173 | |
Undistributed net investment income, end of year | | | | $ | 99,290 | | | $ | 469,413 | | | | | $ | 240,369 | | | $ | 1,289,386 | |
| 1 | | Determined in accordance with federal income tax regulations. |
See Notes to Financial Statements.
| 40 | FDP SERIES, INC. | MAY 31, 2014
|
| |
| Financial Highlights | MFS Research International FDP Fund
|
| | Institutional
| | Investor A
|
| | Year Ended May 31,
| | Year Ended May 31,
|
| | | | 2014 | | | | 2013 | | | | 2012 | | | | 2011 | | | | 2010 | | | | 2014 | | | | 2013 | | | | 2012 | | | | 2011 | | | | 2010 | |
Per Share Operating Performance |
| Net asset value, beginning of year | | $ | 11.77 | | | $ | 9.45 | | | $ | 11.98 | | | $ | 9.02 | | | $ | 8.59 | | | $ | 11.70 | | | $ | 9.41 | | | $ | 11.93 | | | $ | 8.97 | | | $ | 8.55 | |
Net investment income1 | | | 0.28 | | | | 0.19 | | | | 0.20 | | | | 0.17 | | | | 0.16 | | | | 0.25 | | | | 0.16 | | | | 0.17 | | | | 0.14 | | | | 0.14 | |
| Net realized and unrealized gain (loss) | | | 1.45 | | | | 2.31 | | | | (2.56 | ) | | | 2.95 | 2 | | | 0.42 | 2 | | | 1.45 | | | | 2.29 | | | | (2.55 | ) | | | 2.95 | 2 | | | 0.40 | 2 |
| Net increase (decrease) from investment operations | | | 1.73 | | | | 2.50 | | | | (2.36 | ) | | | 3.12 | | | | 0.58 | | | | 1.70 | | | | 2.45 | | | | (2.38 | ) | | | 3.09 | | | | 0.54 | |
Dividends from net investment income3 | | | (0.18 | ) | | | (0.18 | ) | | | (0.17 | ) | | | (0.16 | ) | | | (0.15 | ) | | | (0.16 | ) | | | (0.16 | ) | | | (0.14 | ) | | | (0.13 | ) | | | (0.12 | ) |
| Net asset value, end of year | | $ | 13.32 | | | $ | 11.77 | | | $ | 9.45 | | | $ | 11.98 | | | $ | 9.02 | | | $ | 13.24 | | | $ | 11.70 | | | $ | 9.41 | | | $ | 11.93 | | | $ | 8.97 | |
| | | | | | | | | | | | | | | | | | | | | | | | | | | | | | | | | | | | | | | | | |
Total Investment Return4 |
| Based on net asset value | | | 14.88% | | | | 26.81% | | | | (19.97)% | | | | 35.00% | 5 | | | 6.76% | 5 | | | 14.67% | | | | 26.34% | | | | (20.15)% | | | | 34.87% | 5 | | | 6.40% | 5 |
| | | | | | | | | | | | | | | | | | | | | | | | | | | | | | | | | | | | | | | | | |
Ratios to Average Net Assets |
| Total expenses | | | 1.23% | | | | 1.27% | | | | 1.31% | | | | 1.27% | | | | 1.35% | | | | 1.48% | | | | 1.51% | | | | 1.55% | | | | 1.52% | | | | 1.60% | |
| Net investment income | | | 2.21% | | | | 1.73% | | | | 1.89% | | | | 1.62% | | | | 1.67% | | | | 2.00% | | | | 1.51% | | | | 1.67% | | | | 1.29% | | | | 1.42% | |
| | | | | | | | | | | | | | | | | | | | | | | | | | | | | | | | | | | | | | | | | |
Supplemental Data |
| Net assets, end of year (000) | | $ | 5,961 | | | $ | 4,768 | | | $ | 3,761 | | | $ | 3,788 | | | $ | 2,405 | | | $ | 62,636 | | | $ | 43,560 | | | $ | 30,343 | | | $ | 29,747 | | | $ | 21,502 | |
| Portfolio turnover | | | 29% | | | | 34% | | | | 39% | | | | 44% | | | | 61% | | | | 29% | | | | 34% | | | | 39% | | | | 44% | | | | 61% | |
| 1 | | Based on average shares outstanding. |
| 2 | | Includes redemption fees, which are less than $0.005 per share. |
| 3 | | Determined in accordance with federal income tax regulations. |
| 4 | | Where applicable, excludes the effects of any sales charges and assumes the reinvestment of dividends and distributions. |
| 5 | | Includes redemption fees received by the Fund, which had an impact of less than 0.01%. |
See Notes to Financial Statements.
| FDP SERIES, INC. | MAY 31, 2014 | 41
|
| |
| Financial Highlights (concluded) | MFS Research International FDP Fund
|
| | | | Investor C
|
| | | | Year Ended May 31,
|
| | | | 2014 | | 2013 | | 2012 | | 2011 | | 2010 |
Per Share Operating Performance |
Net asset value, beginning of year | | | | $ | 11.57 | | | $ | 9.29 | | | $ | 11.78 | | | $ | 8.86 | | | $ | 8.43 | |
Net investment income1 | | | | | 0.14 | | | | 0.07 | | | | 0.08 | | | | 0.05 | | | | 0.06 | |
Net realized and unrealized gain (loss) | | | | | 1.44 | | | | 2.28 | | | | (2.52 | ) | | | 2.93 | 2 | | | 0.42 | 2 |
Net increase (decrease) from investment operations | | | | | 1.58 | | | | 2.35 | | | | (2.44 | ) | | | 2.98 | | | | 0.48 | |
Dividends from net investment income3 | | | | | (0.07 | ) | | | (0.07 | ) | | | (0.05 | ) | | | (0.06 | ) | | | (0.05 | ) |
Net asset value, end of year | | | | $ | 13.08 | | | $ | 11.57 | | | $ | 9.29 | | | $ | 11.78 | | | $ | 8.86 | |
| |
Total Investment Return4 |
Based on net asset value | | | | | 13.72% | | | | 25.46% | | | | (20.77)% | | | | 33.81% | 5 | | | 5.71% | 5 |
| |
Ratios to Average Net Assets |
Total expenses | | | | | 2.24% | | | | 2.27% | | | | 2.31% | | | | 2.28% | | | | 2.35% | |
Net investment income | | | | | 1.16% | | | | 0.69% | | | | 0.79% | | | | 0.48% | | | | 0.66% | |
| |
Supplemental Data |
Net assets, end of year (000) | | | | $ | 108,426 | | | $ | 89,448 | | | $ | 77,861 | | | $ | 104,687 | | | $ | 85,137 | |
Portfolio turnover | | | | | 29% | | | | 34% | | | | 39% | | | | 44% | | | | 61% | |
| 1 | | Based on average shares outstanding. |
| 2 | | Includes redemption fees, which are less than $0.005 per share. |
| 3 | | Determined in accordance with federal income tax regulations. |
| 4 | | Where applicable, excludes the effects of any sales charges and assumes the reinvestment of dividends and distributions. |
| 5 | | Includes redemption fees received by the Fund, which had an impact of less than 0.01%. |
See Notes to Financial Statements.
| 42 | FDP SERIES, INC. | MAY 31, 2014
|
| |
| Financial Highlights | Marsico Growth FDP Fund
|
| | Institutional
| | Investor A
|
| | Year Ended May 31,
| | Year Ended May 31,
|
| | 2014 | | 2013 | | 2012 | | 2011 | | 2010 | | 2014 | | 2013 | | 2012 | | 2011 | | 2010 |
Per Share Operating Performance |
| Net asset value, beginning of year | | $ | 15.23 | | | $ | 12.63 | | | $ | 12.68 | | | $ | 9.88 | | | $ | 8.29 | | | $ | 14.94 | | | $ | 12.43 | | | $ | 12.50 | | | $ | 9.77 | | | $ | 8.21 | |
Net investment income (loss)1 | | | (0.02 | ) | | | 0.07 | | | | 0.03 | | | | 0.02 | | | | 0.02 | | | | (0.06 | ) | | | 0.04 | | | | 0.00 | 2 | | | (0.01 | ) | | | (0.00 | )3 |
| Net realized and unrealized gain (loss) | | | 2.67 | | | | 2.53 | | | | (0.08 | ) | | | 2.78 | | | | 1.57 | | | | 2.62 | | | | 2.47 | | | | (0.07 | ) | | | 2.74 | | | | 1.56 | |
| Net increase (decrease) from investment operations | | | 2.65 | | | | 2.60 | | | | (0.05 | ) | | | 2.80 | | | | 1.59 | | | | 2.56 | | | | 2.51 | | | | (0.07 | ) | | | 2.73 | | | | 1.56 | |
Distributions from net realized gain4 | | | (0.77 | ) | | | — | | | | — | | | | — | | | | — | | | | (0.75 | ) | | | — | | | | — | | | | — | | | | — | |
| Net asset value, end of year | | $ | 17.11 | | | $ | 15.23 | | | $ | 12.63 | | | $ | 12.68 | | | $ | 9.88 | | | $ | 16.75 | | | $ | 14.94 | | | $ | 12.43 | | | $ | 12.50 | | | $ | 9.77 | |
| | | | | | | | | | | | | | | | | | | | | | | | | | | | | | | | | | | | | | | | | |
Total Investment Return5 |
| Based on net asset value | | | 17.70% | | | | 20.59% | | | | (0.39)% | | | | 28.34% | | | | 19.18% | | | | 17.42% | | | | 20.19% | | | | (0.56)% | | | 27.94% | | | | 19.00% | |
| | | | | | | | | | | | | | | | | | | | | | | | | | | | | | | | | | | | | | | | | |
Ratios to Average Net Assets |
| Total expenses | | | 1.07% | | | | 1.13% | | | | 1.14% | | | | 1.10% | | | | 1.18% | | | | 1.32% | | | | 1.38% | | | | 1.39% | | | | 1.35% | | | | 1.42% | |
| Total expenses after fees waived | | | 1.02% | | | | 1.08% | | | | 1.14% | | | | 1.10% | | | | 1.18% | | | | 1.27% | | | | 1.33% | | | | 1.39% | | | | 1.35% | | | | 1.42% | |
| Net investment income (loss) | | | (0.10)% | | | | 0.54% | | | | 0.27% | | | | 0.19% | | | | 0.22% | | | | (0.35)% | | | 0.30% | | | | 0.02% | | | | (0.06)% | | | (0.03)% |
| | | | | | | | | | | | | | | | | | | | | | | | | | | | | | | | | | | | | | | | | |
Supplemental Data |
| Net assets, end of year (000) | | $ | 5,597 | | | $ | 4,789 | | | $ | 3,787 | | | $ | 3,430 | | | $ | 2,365 | | | $ | 55,133 | | | $ | 40,097 | | | $ | 28,104 | | | $ | 24,809 | | | $ | 19,779 | |
| Portfolio turnover | | | 101% | | | | 127% | | | | 61% | | | | 66% | | | | 72% | | | | 101% | | | | 127% | | | | 61% | | | | 66% | | | | 72% | |
| 1 | | Based on average shares outstanding. |
| 2 | | Amount is less than $0.005 per share. |
| 3 | | Amount is greater than $(0.005) per share. |
| 4 | | Determined in accordance with federal income tax regulations. |
| 5 | | Where applicable, excludes the effects of any sales charges and assumes the reinvestment of dividends and distributions. |
See Notes to Financial Statements.
| FDP SERIES, INC. | MAY 31, 2014 | 43
|
| |
| Financial Highlights (concluded) | Marsico Growth FDP Fund
|
| | | | Investor C
|
| | | | Year Ended May 31,
|
| | | | 2014 | | 2013 | | 2012 | | 2011 | | 2010 |
Per Share Operating Performance |
Net asset value, beginning of year | | | | $ | 14.08 | | | $ | 11.79 | | | $ | 11.96 | | | $ | 9.41 | | | $ | 7.97 | |
Net investment loss1 | | | | | (0.17 | ) | | | (0.06 | ) | | | (0.09 | ) | | | (0.09 | ) | | | (0.07 | ) |
Net realized and unrealized gain (loss) | | | | | 2.46 | | | | 2.35 | | | | (0.08 | ) | | | 2.64 | | | | 1.51 | |
Net increase (decrease) from investment operations | | | | | 2.29 | | | | 2.29 | | | | (0.17 | ) | | | 2.55 | | | | 1.44 | |
Distributions from net realized gain2 | | | | | (0.69 | ) | | | — | | | | — | | | | — | | | | — | |
Net asset value, end of year | | | | $ | 15.68 | | | $ | 14.08 | | | $ | 11.79 | | | $ | 11.96 | | | $ | 9.41 | |
| | | | | | | | | | | | | | | | | | | | | | | |
Total Investment Return3 |
Based on net asset value | | | | | 16.48% | | | | 19.42% | | | | (1.42)% | | | | 27.10% | | | | 18.07% | |
| |
Ratios to Average Net Assets |
Total expenses | | | | | 2.08% | | | | 2.13% | | | | 2.15% | | | | 2.11% | | | | 2.17% | |
Total expenses after fees waived | | | | | 2.03% | | | | 2.08% | | | | 2.15% | | | | 2.11% | | | | 2.17% | |
Net investment loss | | | | | (1.11)% | | | (0.46)% | | | (0.75)% | | | (0.82)% | | | (0.78)% |
| |
Supplemental Data |
Net assets, end of year (000) | | | | $ | 93,094 | | | $ | 80,148 | | | $ | 72,267 | | | $ | 87,554 | | | $ | 77,640 | |
Portfolio turnover | | | | | 101% | | | | 127% | | | | 61% | | | | 66% | | | | 72% | |
| 1 | | Based on average shares outstanding. |
| 2 | | Determined in accordance with federal income tax regulations. |
| 3 | | Where applicable, excludes the effects of any sales charges and assumes the reinvestment of dividends and distributions. |
See Notes to Financial Statements.
| 44 | FDP SERIES, INC. | MAY 31, 2014
|
| |
| Financial Highlights | Invesco Value FDP Fund
|
| | Institutional
| | Investor A
|
| | Year Ended May 31,
| | Year Ended May 31,
|
| | 2014 | | 2013 | | 2012 | | 2011 | | 2010 | | 2014 | | 2013 | | 2012 | | 2011 | | 2010 |
Per Share Operating Performance |
| Net asset value, beginning of year | | $ | 13.36 | | | $ | 9.97 | | | $ | 10.69 | | | $ | 8.53 | | | $ | 7.00 | | | $ | 13.26 | | | $ | 9.89 | | | $ | 10.61 | | | $ | 8.51 | | | $ | 6.99 | |
Net investment income1 | | | 0.21 | | | | 0.16 | | | | 0.15 | | | | 0.12 | | | | 0.08 | | | | 0.17 | | | | 0.13 | | | | 0.12 | | | | 0.10 | | | | 0.07 | |
| Net realized and unrealized gain (loss) | | | 2.30 | | | | 3.36 | | | | (0.72 | ) | | | 2.10 | | | | 1.51 | | | | 2.28 | | | | 3.35 | | | | (0.72 | ) | | | 2.08 | | | | 1.50 | |
| Net increase (decrease) from investment operations | | | 2.51 | | | | 3.52 | | | | (0.57 | ) | | | 2.22 | | | | 1.59 | | | | 2.45 | | | | 3.48 | | | | (0.60 | ) | | | 2.18 | | | | 1.57 | |
Dividends from net investment income2 | | | (0.09 | ) | | | (0.13 | ) | | | (0.15 | ) | | | (0.06 | ) | | | (0.06 | ) | | | (0.08 | ) | | | (0.11 | ) | | | (0.12 | ) | | | (0.08 | ) | | | (0.05 | ) |
| Net asset value, end of year | | $ | 15.78 | | | $ | 13.36 | | | $ | 9.97 | | | $ | 10.69 | | | $ | 8.53 | | | $ | 15.63 | | | $ | 13.26 | | | $ | 9.89 | | | $ | 10.61 | | | $ | 8.51 | |
| | | | | | | | | | | | | | | | | | | | | | | | | | | | | | | | | | | | | | | | | |
Total Investment Return3 |
| Based on net asset value | | | 18.89% | | | | 35.68% | | | | (5.36)% | | | | 26.09% | | | | 22.83% | | | | 18.56% | | | | 35.47% | | | | (5.63)% | | | | 25.72% | | | | 22.61% | |
| | | | | | | | | | | | | | | | | | | | | | | | | | | | | | | | | | | | | | | | | |
Ratios to Average Net Assets |
| Total expenses | | | 0.98% | | | | 1.06% | | | | 1.05% | | | | 1.00% | | | | 1.08% | | | | 1.22% | | | | 1.30% | | | | 1.30% | | | | 1.25% | | | | 1.32% | |
| Net investment income | | | 1.43% | | | | 1.37% | | | | 1.46% | | | | 1.25% | | | | 0.98% | | | | 1.19% | | | | 1.13% | | | | 1.22% | | | | 1.00% | | | | 0.85% | |
| | | | | | | | | | | | | | | | | | | | | | | | | | | | | | | | | | | | | | | | | |
Supplemental Data |
| Net assets, end of year (000) | | $ | 5,373 | | | $ | 4,330 | | | $ | 3,347 | | | $ | 3,226 | | | $ | 2,351 | | | $ | 54,119 | | | $ | 38,807 | | | $ | 26,457 | | | $ | 24,215 | | | $ | 19,197 | |
| Portfolio turnover | | | 14% | | | | 13% | | | | 17% | | | | 24% | | | | 19% | | | | 14% | | | | 13% | | | | 17% | | | | 24% | | | | 19% | |
| 1 | | Based on average shares outstanding. |
| 2 | | Determined in accordance with federal income tax regulations. |
| 3 | | Where applicable, excludes the effects of any sales charge and assumes the reinvestment of dividends and distributions. |
See Notes to Financial Statements.
| FDP SERIES, INC. | MAY 31, 2014 | 45
|
| |
| Financial Highlights (concluded) | Invesco Value FDP Fund
|
| | | | Investor C
|
| | | | Year Ended May 31,
|
| | | | 2014 | | 2013 | | 2012 | | 2011 | | 2010 |
Per Share Operating Performance |
Net asset value, beginning of year | | | | $ | 13.09 | | | $ | 9.77 | | | $ | 10.47 | | | $ | 8.43 | | | $ | 6.95 | |
Net investment income1 | | | | | 0.06 | | | | 0.04 | | | | 0.04 | | | | 0.02 | | | | 0.01 | |
Net realized and unrealized gain (loss) | | | | | 2.26 | | | | 3.30 | | | | (0.70 | ) | | | 2.05 | | | | 1.50 | |
Net increase (decrease) from investment operations | | | | | 2.32 | | | | 3.34 | | | | (0.66 | ) | | | 2.07 | | | | 1.51 | |
Dividends from net investment income2 | | | | | (0.04 | ) | | | (0.02 | ) | | | (0.04 | ) | | | (0.03 | ) | | | (0.03 | ) |
Net asset value, end of year | | | | $ | 15.37 | | | $ | 13.09 | | | $ | 9.77 | | | $ | 10.47 | | | $ | 8.43 | |
| |
Total Investment Return3 |
Based on net asset value | | | | | 17.76% | | | | 34.30% | | | | (6.28)% | | | | 24.61% | | | | 21.84% | |
| |
Ratios to Average Net Assets |
Total expenses | | | | | 1.98% | | | | 2.06% | | | | 2.05% | | | | 2.01% | | | | 2.08% | |
Net investment income | | | | | 0.41% | | | | 0.37% | | | | 0.46% | | | | 0.24% | | | | 0.11% | |
| |
Supplemental Data |
Net assets, end of year (000) | | | | $ | 92,201 | | | $ | 79,259 | | | $ | 67,211 | | | $ | 85,130 | | | $ | 75,817 | |
Portfolio turnover | | | | | 14% | | | | 13% | | | | 17% | | | | 24% | | | | 19% | |
| 1 | | Based on average shares outstanding. |
| 2 | | Determined in accordance with federal income tax regulations. |
| 3 | | Where applicable, excludes the effects of any sales charges and assumes the reinvestment of dividends and distributions. |
See Notes to Financial Statements.
| 46 | FDP SERIES, INC. | MAY 31, 2014
|
| |
| Financial Highlights | Franklin Templeton Total Return FDP Fund
|
| | Institutional
| | Investor A
|
| | Year Ended May 31,
| | Year Ended May 31,
|
| | 2014 | | 2013 | | 2012 | | 2011 | | 2010 | | 2014 | | 2013 | | 2012 | | 2011 | | 2010 |
Per Share Operating Performance |
| Net asset value, beginning of year | | $ | 10.71 | | | $ | 10.56 | | | $ | 10.50 | | | $ | 9.78 | | | $ | 8.97 | | | $ | 10.71 | | | $ | 10.57 | | | $ | 10.50 | | | $ | 9.79 | | | $ | 8.98 | |
Net investment income1 | | | 0.28 | | | | 0.30 | | | | 0.33 | | | | 0.38 | | | | 0.42 | | | | 0.26 | | | | 0.27 | | | | 0.30 | | | | 0.35 | | | | 0.40 | |
| Net realized and unrealized gain | | | 0.06 | | | | 0.23 | | | | 0.08 | | | | 0.72 | | | | 0.81 | | | | 0.06 | | | | 0.23 | | | | 0.09 | | | | 0.71 | | | | 0.81 | |
| Net increase from investment operations | | | 0.34 | | | | 0.53 | | | | 0.41 | | | | 1.10 | | | | 1.23 | | | | 0.32 | | | | 0.50 | | | | 0.39 | | | | 1.06 | | | | 1.21 | |
Dividends and distributions from:2 | | | | | | | | | | | | | | | | | | | | | | | | | | | | | | | | | | | | | | | | |
| Net investment income | | | (0.29 | ) | | | (0.38 | ) | | | (0.35 | ) | | | (0.38 | ) | | | (0.42 | ) | | | (0.26 | ) | | | (0.36 | ) | | | (0.32 | ) | | | (0.35 | ) | | | (0.40 | ) |
| Net realized gain | | | (0.01 | ) | | | — | | | | — | | | | — | | | | — | | | | (0.01 | ) | | | — | | | | — | | | | — | | | | — | |
| Total dividends and distributions | | | (0.30 | ) | | | (0.38 | ) | | | (0.35 | ) | | | (0.38 | ) | | | (0.42 | ) | | | (0.27 | ) | | | (0.36 | ) | | | (0.32 | ) | | | (0.35 | ) | | | (0.40 | ) |
| Net asset value, end of year | | $ | 10.75 | | | $ | 10.71 | | | $ | 10.56 | | | $ | 10.50 | | | $ | 9.78 | | | $ | 10.76 | | | $ | 10.71 | | | $ | 10.57 | | | $ | 10.50 | | | $ | 9.79 | |
| | | | | | | | | | | | | | | | | | | | | | | | | | | | | | | | | | | | | | | | | |
Total Investment Return3 |
| Based on net asset value | | | 3.18% | | | | 5.03% | | | | 3.89% | | | | 11.37% | | | | 13.88% | | | | 3.03% | | | | 4.67% | | | | 3.74% | | | | 10.99% | | | | 13.60% | |
| | | | | | | | | | | | | | | | | | | | | | | | | | | | | | | | | | | | | | | | | |
Ratios to Average Net Assets |
| Total expenses | | | 0.68% | | | | 0.71% | | | | 0.74% | | | | 0.71% | | | | 0.78% | | | | 0.93% | | | | 0.95% | | | | 0.99% | | | | 0.96% | | | | 1.02% | |
| Net investment income | | | 2.71% | | | | 2.76% | | | | 3.16% | | | | 3.71% | | | | 4.39% | | | | 2.46% | | | | 2.51% | | | | 2.90% | | | | 3.47% | | | | 4.15% | |
| | | | | | | | | | | | | | | | | | | | | | | | | | | | | | | | | | | | | | | | | |
Supplemental Data |
| Net assets, end of year (000) | | $ | 6,791 | | | $ | 5,506 | | | $ | 4,809 | | | $ | 3,989 | | | $ | 2,828 | | | $ | 86,986 | | | $ | 63,283 | | | $ | 48,467 | | | $ | 38,482 | | | $ | 31,586 | |
| Portfolio turnover | | | 296% | 4 | | | 322% | 5 | | | 292% | 6 | | | 200% | 7 | | | 206% | 8 | | | 296% | 4 | | | 322% | 5 | | | 292% | 6 | | | 200% | 7 | | | 206% | 8 |
| 1 | | Based on average shares outstanding. |
| 2 | | Determined in accordance with federal income tax regulations. |
| 3 | | Where applicable, excludes the effects of any sales charges and assumes the reinvestment of dividends and distributions. |
| 4 | | Includes mortgage dollar roll transactions. Excluding these transactions, the portfolio turnover would have been 137%. |
| 5 | | Includes mortgage dollar roll transactions. Excluding these transactions, the portfolio turnover would have been 128%. |
| 6 | | Includes mortgage dollar roll transactions. Excluding these transactions, the portfolio turnover would have been 137%. |
| 7 | | Includes mortgage dollar roll transactions. Excluding these transactions, the portfolio turnover would have been 80%. |
| 8 | | Includes mortgage dollar roll transactions. Excluding these transactions, the portfolio turnover would have been 47%. |
See Notes to Financial Statements.
| FDP SERIES, INC. | MAY 31, 2014 | 47
|
| |
| Financial Highlights (concluded) | Franklin Templeton Total Return FDP Fund
|
| | | | Investor C
|
| | | | Year Ended May 31,
|
| | | | 2014 | | 2013 | | 2012 | | 2011 | | 2010 |
Per Share Operating Performance |
Net asset value, beginning of year | | | | $ | 10.71 | | | $ | 10.57 | | | $ | 10.50 | | | $ | 9.79 | | | $ | 8.98 | |
Net investment income1 | | | | | 0.20 | | | | 0.21 | | | | 0.24 | | | | 0.30 | | | | 0.34 | |
Net realized and unrealized gain | | | | | 0.06 | | | | 0.23 | | | | 0.09 | | | | 0.70 | | | | 0.81 | |
Net increase from investment operations | | | | | 0.26 | | | | 0.44 | | | | 0.33 | | | | 1.00 | | | | 1.15 | |
Dividends and distributions from:2 | | | | | | | | | | | | | | | | | | | | | | |
Net investment income | | | | | (0.20 | ) | | | (0.30 | ) | | | (0.26 | ) | | | (0.29 | ) | | | (0.34 | ) |
Net realized gain | | | | | (0.01 | ) | | | — | | | | — | | | | — | | | | — | |
Total dividends and distributions | | | | | (0.21 | ) | | | (0.30 | ) | | | (0.26 | ) | | | (0.29 | ) | | | (0.34 | ) |
Net asset value, end of year | | | | $ | 10.76 | | | $ | 10.71 | | | $ | 10.57 | | | $ | 10.50 | | | $ | 9.79 | |
| |
Total Investment Return3 |
Based on net asset value | | | | | 2.45% | | | | 4.10% | | | | 3.16% | | | | 10.38% | | | | 12.97% | |
| |
Ratios to Average Net Assets |
Total expenses | | | | | 1.49% | | | | 1.51% | | | | 1.54% | | | | 1.52% | | | | 1.57% | |
Net investment income | | | | | 1.90% | | | | 1.96% | | | | 2.35% | | | | 2.92% | | | | 3.60% | |
| |
Supplemental Data |
Net assets, end of year (000) | | | | $ | 138,904 | | | $ | 116,996 | | | $ | 113,271 | | | $ | 131,002 | | | $ | 120,836 | |
Portfolio turnover | | | | | 296% | 4 | | | 322% | 5 | | | 292% | 6 | | | 200% | 7 | | | 206% | 8 |
| 1 | | Based on average shares outstanding. |
| 2 | | Determined in accordance with federal income tax regulations. |
| 3 | | Where applicable, excludes the effects of any sales charges and assumes the reinvestment of dividends and distributions. |
| 4 | | Includes mortgage dollar roll transactions. Excluding these transactions, the portfolio turnover would have been 137%. |
| 5 | | Includes mortgage dollar roll transactions. Excluding these transactions, the portfolio turnover would have been 128%. |
| 6 | | Includes mortgage dollar roll transactions. Excluding these transactions, the portfolio turnover would have been 137%. |
| 7 | | Includes mortgage dollar roll transactions. Excluding these transactions, the portfolio turnover would have been 80%. |
| 8 | | Includes mortgage dollar roll transactions. Excluding these transactions, the portfolio turnover would have been 47%. |
See Notes to Financial Statements.
| 48 | FDP SERIES, INC. | MAY 31, 2014
|
| |
| Notes to Financial Statements |
|
1. Organization:
MFS Research International FDP Fund (“MFS Fund”), Marsico Growth FDP Fund (“Marsico Fund”), Invesco Value FDP Fund (“Invesco Fund”) and Franklin Templeton Total Return FDP Fund (“Franklin Templeton Fund”) (each a “Fund,” collectively, the “Funds”) are each a series of FDP Series, Inc. (the “Corporation”). The Corporation is registered under the Investment Company Act of 1940, as amended (the “1940 Act”). Each Fund is registered as a diversified, open-end management investment company. The Corporation is organized as a Maryland corporation.
Each Fund offers multiple classes of shares. Institutional Shares are sold without a sales charge and only to certain eligible investors. Investor A Shares are generally sold with an initial sales charge, but may be subject to a CDSC for certain redemptions where no initial sales charge was paid at the time of purchase. Investor C Shares may be subject to a CDSC. All classes of shares have identical voting, dividend, liquidation and other rights and are subject to the same terms and conditions, except that Investor A and Investor C Shares bear certain expenses related to the shareholder servicing of such shares and Investor C Shares also bear certain expenses related to the distribution of such shares. On June 10, 2013, all issued and outstanding Investor B Shares of MFS Fund, Marsico Fund, Invesco Fund and Franklin Templeton Fund were converted into Investor A Shares. Each class has exclusive voting rights with respect to matters relating to its shareholder servicing and distribution expenditures.
2. Significant Accounting Policies:
The Funds’ financial statements are prepared in conformity with accounting principles generally accepted in the United States of America (“U.S. GAAP”), which may require management to make estimates and assumptions that affect the reported amounts of assets and liabilities in the financial statements and the reported amounts of increases and decreases in net assets from operations during the reporting period. Actual results could differ from those estimates. The following is a summary of significant accounting policies followed by the Funds:
Valuation: U.S. GAAP defines fair value as the price the Funds would receive to sell an asset or pay to transfer a liability in an orderly transaction between market participants at the measurement date. The Funds determine the fair values of their financial instruments at market value using independent dealers or pricing services under policies approved by the Board of Directors of the Corporation (the “Board”). The BlackRock Global Valuation Methodologies Committee (the “Global Valuation Committee”) is the committee formed by management to develop global pricing policies and procedures and to provide oversight of the pricing function for the Funds for all financial instruments.
Bond investments are valued on the basis of last available bid prices or current market quotations provided by dealers or pricing services. Floating rate loan interests are valued at the mean of the bid prices from one or more brokers or dealers as obtained from a pricing service. In determining the value of a particular investment, pricing services may use certain information with respect to transactions in such investments, quotations from dealers, pricing matrixes, market transactions in comparable investments, various relationships observed in the market between investments and calculated yield measures. Asset-backed and mortgage-backed securities are valued by independent pricing services using models that consider estimated cash flows of each tranche of the security, establish a benchmark yield and develop an estimated tranche-specific spread to the benchmark yield based on the unique attributes of the tranche. Financial futures contracts traded on exchanges are valued at their last sale price. To-be-announced (“TBA”) commitments are valued on the basis of last available bid prices or current market quotations provided by pricing services. Swap agreements are valued utilizing quotes received daily by the Funds’ pricing service or through brokers, which are derived using daily swap curves and models that incorporate a number of market data factors, such as discounted cash flows, trades and values of the underlying reference instruments. Short-term securities with remaining maturities of 60 days or less may be valued at amortized cost, which approximates fair value.
Municipal investments (including commitments to purchase such investments on a “when-issued” basis) are valued on the basis of prices provided by dealers or pricing services. In determining the value of a particular investment, pricing services may use certain information with respect to transactions in such investments, quotations from dealers, pricing matrixes, market transactions in comparable investments and information with respect to various relationships between investments.
Equity investments traded on a recognized securities exchange or the NASDAQ Stock Market (“NASDAQ”) are valued at the last reported sale price that day or the NASDAQ official closing price, if applicable. For equity investments traded on more than one exchange, the last reported sale price on the exchange where the stock is primarily traded is used. Equity investments traded on a recognized exchange for which there were no sales on that day are valued at the last available bid (long positions) or ask (short positions) price.
Securities and other assets and liabilities denominated in foreign currencies are translated into U.S. dollars using exchange rates determined as of the close of business on the New York Stock Exchange (“NYSE”). Foreign currency exchange contracts are valued at the mean between the bid and ask prices and are determined as of the close of business on the NYSE. Interpolated values are derived when the settlement date of the contract is an interim date for which quotations are not available.
Exchange-traded options are valued at the mean between the last bid and ask prices at the close of the options market in which the options trade. An exchange-traded option for which there is no mean price is valued at the last bid (long positions) or ask (short positions) price. If no bid or ask price is available, the prior day’s price will be used, unless it is determined that the prior day’s price no longer reflects the fair value of the option. Over-the-counter (“OTC”) options and swaptions are valued by an independent pricing service using a mathematical model, which incorporates a number of market data factors, such as the trades and prices of the underlying instruments.
In the event that the application of these methods of valuation results in a price for an investment that is deemed not to be representative of the market value of such investment, or if a price is not available, the investment will be valued by the Global Valuation Committee, or its delegate, in accordance with a policy approved by the Board as reflecting fair value (“Fair Value Assets”). When determining the price for Fair Value Assets, the Global Valuation Committee, or its delegate, seeks to
| FDP SERIES, INC. | MAY 31, 2014 | 49
|
| |
| Notes to Financial Statements (continued) |
|
determine the price that each Fund might reasonably expect to receive from the current sale of that asset in an arm’s-length transaction. Fair value determinations shall be based upon all available factors that the Global Valuation Committee, or its delegate, deems relevant consistent with the principles of fair value measurement, which include the market approach, income approach and/or in the case of recent investments, the cost approach, as appropriate. The market approach, generally consists of using comparable market transactions. The income approach generally is used to discount future cash flows to present value and is adjusted for liquidity as appropriate. These factors include but are not limited to: (i) attributes specific to the investment or asset; (ii) the principal market for the investment or asset; (iii) the customary participants in the principal market for the investment or asset; (iv) data assumptions by market participants for the investment or asset, if reasonably available; (v) quoted prices for similar investments or assets in active markets; and (vi) other factors, such as future cash flows, interest rates, yield curves, volatilities, prepayment speeds, loss severities, credit risks, recovery rates, liquidation amounts and/or default rates. Due to the inherent uncertainty of valuations of such investments, the fair values may differ from the values that would have been used had an active market existed. The Global Valuation Committee, or its delegate, employs various methods for calibrating valuation approaches for investments where an active market does not exist, including regular due diligence of each Fund’s pricing vendors, regular reviews of key inputs and assumptions, transactional back-testing or disposition analysis to compare unrealized gains and losses to realized gains and losses, reviews of missing or stale prices and large movements in market values and reviews of any market related activity. The pricing of all Fair Value Assets is subsequently reported to the Board or a committee thereof on a quarterly basis.
Generally, trading in foreign instruments is substantially completed each day at various times prior to the close of business on the NYSE. Occasionally, events affecting the values of such instruments may occur between the foreign market close and the close of business on the NYSE that may not be reflected in the computation of each Fund’s net assets. If events (e.g., a company announcement, market volatility or a natural disaster) occur during such periods that are expected to materially affect the value of such instruments, those instruments may be Fair Value Assets and valued at their fair value, as determined in good faith by the Global Valuation Committee, or its delegate, using a pricing service and/or policies approved by the Board. Each business day, the Funds use a pricing service to assist with the valuation of certain foreign exchange-traded equity securities and foreign exchange-traded and OTC options (the “Systematic Fair Value Price”). Using current market factors, the Systematic Fair Value Price is designed to value such foreign securities and foreign options at fair value as of the close of business on the NYSE, which follows the close of the local markets.
Foreign Currency: The Funds’ books and records are maintained in U.S. dollars. Purchases and sales of investment securities are recorded at the rates of exchange prevailing on the respective date of such transactions. Generally, when the U.S. dollar rises in value against a foreign currency, the Funds’ investments denominated in that currency will lose value because that currency is worth fewer U.S. dollars; the opposite effect occurs if the U.S. dollar falls in relative value.
The Funds do not isolate the portion of the results of operations arising as a result of changes in the foreign exchange rates from the changes in the market prices of investments held or sold for financial reporting purposes. Accordingly, the effects of changes in foreign currency exchange rates on investments are not segregated in the Statements of Operations from the effects of changes in market prices of those investments but are included as a component of net realized and unrealized gain (loss) from investments. The Funds report realized currency gains (losses) on foreign currency related transactions as components of net realized gain (loss) for financial reporting purposes, whereas such components are generally treated as ordinary income for federal income tax purposes.
Segregation and Collateralization: In cases where the Funds enter into certain investments (e.g., dollar rolls, TBA sale commitments, financial futures contracts, forward foreign currency exchange contracts and swaps), that would be “senior securities” for 1940 Act purposes, the Funds may segregate or designate on their books and records cash or liquid securities having a market value at least equal to the amount of the Funds’ future obligations under such investments. Doing so allows the investment to be excluded from treatment as a “senior security.” Furthermore, if required by an exchange or counterparty agreement, the Funds may be required to deliver/deposit cash and/or securities to/with an exchange, or broker-dealer or custodian as collateral for certain investments or obligations.
Investment Transactions and Investment Income: For financial reporting purposes, investment transactions are recorded on the dates the transactions are entered into (the trade dates). Realized gains and losses on investment transactions are determined on the identified cost basis. Dividend income is recorded on the ex-dividend date. Dividends from foreign securities where the ex-dividend date may have passed are subsequently recorded when the Funds are informed of the ex-dividend date. Under the applicable foreign tax laws, a withholding tax at various rates may be imposed on capital gains, dividends and interest. Upon notification from issuers, some of the dividend income received from a real estate investment trust may be redesignated as a reduction of cost of the related investment and/or realized gain. Interest income, including amortization and accretion of premiums and discounts on debt securities, is recognized on the accrual basis. Income, expenses and realized and unrealized gains and losses are allocated daily to each class based on its relative net assets.
Dividends and Distributions: For MFS Fund, Marsico Fund and Invesco Fund, dividends and distributions paid by the Funds are recorded on the ex-dividend dates. For Franklin Templeton Fund, dividends from net investment income are declared daily and paid monthly. Distributions of capital gains are recorded on the ex-dividend date. The character and timing of dividends and distributions are determined in accordance with federal income tax regulations, which may differ from U.S. GAAP.
Income Taxes: It is the Funds’ policy to comply with the requirements of the Internal Revenue Code of 1986, as amended, applicable to regulated investment companies, and to distribute substantially all of their taxable income to their shareholders. Therefore, no federal income tax provision is required.
| 50 | FDP SERIES, INC. | MAY 31, 2014
|
| |
| Notes to Financial Statements (continued) |
|
The Funds file U.S. federal and various state and local tax returns. No income tax returns are currently under examination. The statute of limitations on the Funds’ U.S. federal tax returns remains open for each of the four years ended May 31, 2014. The statutes of limitations on the Funds’ state and local tax returns may remain open for an additional year depending upon the jurisdiction.
Management has analyzed tax laws and regulations and their application to the Funds’ facts and circumstances and does not believe there are any uncertain tax positions that require recognition of a tax liability.
Recent Accounting Standard: In June 2014, the Financial Accounting Standards Board issued guidance to improve the financial reporting of reverse repurchase agreements and other similar transactions. The guidance includes expanded disclosure requirements for entities that enter into reverse repurchase agreements and similar transactions accounted for as secured borrowings. The guidance is effective for financial statements with fiscal years beginning on or after December 15, 2014 and interim periods within those fiscal years. Management is evaluating the impact, if any, of this guidance on the Funds’ financial statement disclosures.
Other: Expenses directly related to a Fund or its classes are charged to that Fund or class. Other operating expenses shared by several funds are pro rated among those funds on the basis of relative net assets or other appropriate methods. Expenses directly related to the Funds and other shared expenses pro rated to the Funds are allocated daily to each class based on its relative net assets or other appropriate methods.
The Funds have an arrangement with the custodian whereby fees may be reduced by credits earned on uninvested cash balances, which, if applicable, are shown as fees paid indirectly in the Statements of Operations. The custodian imposes fees on overdrawn cash balances, which can be offset by accumulated credits earned or may result in additional custody charges.
3. Securities and Other Investments:
Asset-Backed and Mortgage-Backed Securities: Franklin Templeton Fund may invest in asset-backed securities. Asset-backed securities are generally issued as pass-through certificates, which represent undivided fractional ownership interests in an underlying pool of assets, or as debt instruments, which are also known as collateralized obligations, and are generally issued as the debt of a special purpose entity organized solely for the purpose of owning such assets and issuing such debt. Asset-backed securities are often backed by a pool of assets representing the obligations of a number of different parties. The yield characteristics of certain asset-backed securities may differ from traditional debt securities. One such major difference is that all or a principal part of the obligations may be prepaid at any time because the underlying assets (i.e., loans) may be prepaid at any time. As a result, a decrease in interest rates in the market may result in increases in the level of prepayments as borrowers, particularly mortgagors, refinance and repay their loans. An increased prepayment rate with respect to an asset-backed security subject to such a prepayment feature will have the effect of shortening the maturity of the security. In addition, the Fund may subsequently have to reinvest the proceeds at lower interest rates. If the Fund has purchased such an asset-backed security at a premium, a faster than anticipated prepayment rate could result in a loss of principal to the extent of the premium paid.
Franklin Templeton Fund may purchase certain mortgage pass-through securities. There are a number of important differences among the agencies and instrumentalities of the U.S. government that issue mortgage-related securities and among the securities that they issue. For example, mortgage-related securities guaranteed by Ginnie Mae are guaranteed as to the timely payment of principal and interest by Ginnie Mae and such guarantee is backed by the full faith and credit of the United States. However, mortgage-related securities issued by Freddie Mac and Fannie Mae, including Freddie Mac and Fannie Mae guaranteed mortgage pass-through certificates, which are solely the obligations of Freddie Mac and Fannie Mae, are not backed by or entitled to the full faith and credit of the United States, but are supported by the right of the issuer to borrow from the Treasury.
Inflation-Indexed Bonds: Franklin Templeton Fund may invest in inflation-indexed bonds. Inflation-indexed bonds are fixed income securities whose principal value is periodically adjusted according to the rate of inflation. If the index measuring inflation rises or falls, the principal value of inflation-indexed bonds will be adjusted upward or downward, and consequently the interest payable on these securities (calculated with respect to a larger or smaller principal amount) will be increased or reduced, respectively. Any upward or downward adjustment in the principal amount of an inflation-indexed bond will be included as interest income in the Statements of Operations, even though investors do not receive their principal until maturity. Repayment of the original bond principal upon maturity (as adjusted for inflation) is guaranteed in the case of U.S. Treasury inflation-indexed bonds. For bonds that do not provide a similar guarantee, the adjusted principal value of the bond repaid at maturity may be less than the original principal.
Multiple Class Pass-Through Securities: Franklin Templeton Fund may invest in multiple class pass-through securities, including collateralized mortgage obligations (“CMOs”) and commercial mortgage-backed securities. These multiple class securities may be issued by Ginnie Mae, U.S. government agencies or instrumentalities or by trusts formed by private originators of, or investors in, mortgage loans. In general, CMOs are debt obligations of a legal entity that are collateralized by, and multiple class pass-through securities represent direct ownership interests in, a pool of residential or commercial mortgage loans or mortgage pass-through securities (the “Mortgage Assets”), the payments on which are used to make payments on the CMOs or multiple pass-through securities. Classes of CMOs include interest only (“IOs”), principal only (“POs”), planned amortization classes and targeted amortization classes. IOs and POs are stripped mortgage-backed securities representing interests in a pool of mortgages, the cash flow from which has been separated into interest and principal components. IOs receive the interest portion of the cash flow while POs receive the principal portion. IOs and POs can be extremely volatile in response to changes in interest rates. As interest rates rise and fall, the value of IOs tends to move in the same direction as interest rates. POs perform best when prepayments on the underlying mortgages rise since this increases the rate at which the principal is returned and the yield to maturity on the PO. When payments on mortgages underlying a PO are slower than anticipated, the life of the PO is
| FDP SERIES, INC. | MAY 31, 2014 | 51
|
| |
| Notes to Financial Statements (continued) |
|
lengthened and the yield to maturity is reduced. If the underlying Mortgage Assets experience greater than anticipated pre-payments of principal, the Fund may not fully recoup its initial investment in IOs.
Zero-Coupon Bonds: Franklin Templeton Fund may invest in zero-coupon bonds, which are normally issued at a significant discount from face value and do not provide for periodic interest payments. Zero-coupon bonds may experience greater volatility in market value than similar maturity debt obligations which provide for regular interest payments.
Capital Trusts: Franklin Templeton Fund may invest in capital trusts. These securities are typically issued by corporations, generally in the form of interest-bearing notes with preferred securities characteristics, or by an affiliated business trust of a corporation, generally in the form of beneficial interests in subordinated debentures or similarly structured securities. The securities can be structured as either fixed or adjustable coupon securities that can have either a perpetual or stated maturity date. Dividends can be deferred without creating an event of default or acceleration, although maturity cannot take place unless all cumulative payment obligations have been met. The deferral of payments does not affect the purchase or sale of these securities in the open market. Payments on these securities are treated as interest rather than dividends for federal income tax purposes. These securities generally are rated below that of the issuing company’s senior debt securities and are freely callable at the issuer’s option.
Preferred Stock: Certain Funds may invest in preferred stock. Preferred stock has a preference over common stock in liquidation (and generally in receiving dividends as well) but is subordinated to the liabilities of the issuer in all respects. As a general rule, the market value of preferred stock with a fixed dividend rate and no conversion element varies inversely with interest rates and perceived credit risk, while the market price of convertible preferred stock generally also reflects some element of conversion value. Because preferred stock is junior to debt securities and other obligations of the issuer, deterioration in the credit quality of the issuer will cause greater changes in the value of a preferred stock than in a more senior debt security with similar stated yield characteristics. Unlike interest payments on debt securities, preferred stock dividends are payable only if declared by the issuer’s board of directors. Preferred stock also may be subject to optional or mandatory redemption provisions.
Floating Rate Loan Interests: Franklin Templeton Fund may invest in floating rate loan interests. The floating rate loan interests held by the Fund are typically issued to companies (the “borrower”) by banks, other financial institutions, and privately and publicly offered corporations (the “lender”). Floating rate loan interests are generally non-investment grade, often involve borrowers whose financial condition is troubled or uncertain and companies that are highly leveraged. The Fund may invest in obligations of borrowers who are in bankruptcy proceedings. Floating rate loan interests may include fully funded term loans or revolving lines of credit. Floating rate loan interests are typically senior in the corporate capital structure of the borrower. Floating rate loan interests generally pay interest at rates that are periodically determined by reference to a base lending rate plus a premium. The base lending rates are generally the lending rate offered by one or more European banks, such as the London Interbank Offered Rate (“LIBOR”), the prime rate offered by one or more U.S. banks or the certificate of deposit rate. Floating rate loan interests may involve foreign borrowers, and investments may be denominated in foreign currencies. The Fund considers these investments to be investments in debt securities for purposes of their investment policies.
When the Fund purchases a floating rate loan interest it may receive a facility fee and when it sells a floating rate loan interest it may pay a facility fee. On an ongoing basis, the Fund may receive a commitment fee based on the undrawn portion of the underlying line of credit amount of a floating rate loan interest. Facility and commitment fees are typically amortized to income over the term of the loan or term of the commitment, respectively. Consent and amendment fees are recorded to income as earned. Prepayment penalty fees, which may be received by the Fund upon the prepayment of a floating rate loan interest by a borrower, are recorded as realized gains. The Fund may invest in multiple series or tranches of a loan. A different series or tranche may have varying terms and carry different associated risks.
Floating rate loan interests are usually freely callable at the borrower’s option. The Fund may invest in such loans in the form of participations in loans (“Participations”) or assignments (“Assignments”) of all or a portion of loans from third parties. Participations typically will result in the Fund having a contractual relationship only with the lender, not with the borrower. The Fund will have the right to receive payments of principal, interest and any fees to which it is entitled only from the lender selling the Participation and only upon receipt by the lender of the payments from the borrower. In connection with purchasing Participations, the Fund generally will have no right to enforce compliance by the borrower with the terms of the loan agreement, nor any rights of offset against the borrower, and the Fund may not benefit directly from any collateral supporting the loan in which it has purchased the Participation. As a result, the Fund will assume the credit risk of both the borrower and the lender that is selling the Participation. The Fund’s investment in loan participation interests involves the risk of insolvency of the financial intermediaries who are parties to the transactions. In the event of the insolvency of the lender selling the Participation, the Fund may be treated as a general creditor of the lender and may not benefit from any offset between the lender and the borrower. Assignments typically result in the Fund having a direct contractual relationship with the borrower, and the Fund may enforce compliance by the borrower with the terms of the loan agreement.
In connection with floating rate loan interests, Franklin Templeton Fund may also enter into unfunded floating rate loan interests (“commitments”). In connection with these commitments, the Fund earns a commitment fee, typically set as a percentage of the commitment amount. Such fee income, which is included in interest income in the Statements of Operations, is recognized ratably over the commitment period. Unfunded floating rate loan interests are marked-to-market daily, and any unrealized appreciation or depreciation is included in the Statements of Assets and Liabilities and Statements of Operations. As of May 31, 2014, the Fund had no outstanding unfunded floating rate loan interests.
Forward Commitments and When-Issued Delayed Delivery Securities: The Funds may purchase securities on a when-issued basis and may purchase or sell securities on a forward commitment basis. Settlement of such transactions normally occurs within a month or more after the purchase or sale commitment is made. The Funds may purchase securities under such conditions with the intention of actually acquiring them, but
| 52 | FDP SERIES, INC. | MAY 31, 2014
|
| |
| Notes to Financial Statements (continued) |
|
may enter into a separate agreement to sell the securities before the settlement date. Since the value of securities purchased may fluctuate prior to settlement, the Funds may be required to pay more at settlement than the security is worth. In addition, the Funds are not entitled to any of the interest earned prior to settlement. When purchasing a security on a delayed delivery basis, the Funds assume the rights and risks of ownership of the security, including the risk of price and yield fluctuations. In the event of default by the counterparty, the Funds’ maximum amount of loss is the unrealized appreciation of unsettled when-issued transactions, which is shown in the Schedules of Investments.
TBA Commitments: Franklin Templeton Fund may enter into TBA commitments. TBA commitments are forward agreements for the purchase or sale of mortgage-backed securities for a fixed price, with payment and delivery on an agreed upon future settlement date. The specific securities to be delivered are not identified at the trade date. However, delivered securities must meet specified terms, including issuer, rate and mortgage terms. When entering into TBA commitments, the Fund may take possession of or deliver the underlying mortgage-backed securities but can extend the settlement or roll the transaction. TBA commitments involve a risk of loss if the value of the security to be purchased or sold declines or increases, respectively, prior to settlement date.
In order to better define contractual rights and to secure rights that will help the Fund mitigate its counterparty risk, TBA commitments may be entered into by the Fund under Master Securities Forward Transaction Agreements (each, an “MSFTA”). An MSFTA typically contains, among other things, collateral posting terms and netting provisions in the event of default and/or termination event. The collateral requirements are typically calculated by netting the mark to market amount for each transaction under such agreement and comparing that amount to the value of the collateral currently pledged by a Fund and the counterparty. Cash collateral that has been pledged to cover the obligations of a Fund and cash collateral received from the counterparty, if any, is reported separately on the Statements of Assets and Liabilities as cash pledged as collateral for TBA commitments or cash received as collateral for TBA commitments, respectively. Non-cash collateral pledged by a Fund, if any, is noted in the Schedules of Investments. Typically, the Fund is permitted to sell, repledge or use the collateral it receives; however, the counterparty is not. To the extent amounts due to the Fund are not fully collateralized, contractually or otherwise, the Fund bears the risk of loss from counterparty non-performance.
Mortgage Dollar Roll Transactions: Franklin Templeton Fund may sell TBA mortgage-backed securities and simultaneously contract to repurchase substantially similar (i.e., same type, coupon and maturity) securities on a specific future date at an agreed upon price. During the period between the sale and repurchase, the Fund will not be entitled to receive interest and principal payments on the securities sold. The Fund accounts for mortgage dollar roll transactions as purchases and sales and realizes gains and losses on these transactions. These transactions may increase the Fund’s portfolio turnover rate. Mortgage dollar rolls involve the risk that the market value of the securities that the Fund is required to purchase may decline below the agreed upon repurchase price of those securities.
4. Derivative Financial Instruments:
The Funds engage in various portfolio investment strategies using derivative contracts both to increase the returns of the Funds and/or to economically hedge their exposure to certain risks such as credit risk, equity risk, interest rate risk, foreign currency exchange rate risk or other risk (inflation risk). These contracts may be transacted on an exchange or OTC.
Financial Futures Contracts: The Funds purchase and/or sell financial futures contracts and options on financial futures contracts to gain exposure to, or economically hedge against, changes in interest rates (interest rate risk), changes in the value of equity securities (equity risk) or foreign currencies (foreign currency exchange rate risk). Financial futures contracts are agreements between the Funds and counterparties to buy or sell a specific quantity of an underlying instrument at a specified price and at a specified date. Depending on the terms of the particular contract, financial futures contracts are settled either through physical delivery of the underlying instrument on the settlement date or by payment of a cash settlement amount on the settlement date.
Upon entering into a financial futures contract, the Funds are required to deposit initial margin with the broker in the form of cash or securities in an amount that varies depending on a contract’s size and risk profile. The initial margin deposit must then be maintained at an established level over the life of the contract. Securities deposited as initial margin are designated on the Schedules of Investments and cash deposited, if any, is recorded on the Statements of Assets and Liabilities as cash pledged for financial futures contracts. Pursuant to the contract, the Funds agree to receive from or pay to the broker an amount of cash equal to the daily fluctuation in value of the contract. Such receipts or payments are known as variation margin. Variation margin is recorded by the Funds as unrealized appreciation or depreciation and, if applicable, as a receivable or payable for variation margin in the Statements of Assets and Liabilities.
When the contract is closed, the Funds record a realized gain or loss equal to the difference between the value of the contract at the time it was opened and the value at the time it was closed. The use of financial futures contracts involves the risk of an imperfect correlation in the movements in the price of financial futures contracts, interest or foreign currency exchange rates and the underlying assets.
Forward Foreign Currency Exchange Contracts: The Funds enter into forward foreign currency exchange contracts as an economic hedge against either specific transactions or portfolio instruments or to obtain exposure to, or hedge exposure away from, foreign currencies (foreign currency exchange rate risk). A forward foreign currency exchange contract is an agreement between two parties to buy and sell a currency at a set exchange rate on a future date. Forward foreign currency exchange contracts, when used by the Funds, help to manage the overall exposure to the currencies in which some of the investments held by the Funds are denominated. The contract is marked-to-market daily and the change in market value is recorded by the Funds as an unrealized gain or loss. When the contract is closed, the Funds record a realized gain or loss equal to the difference between the value at the time it was opened and the value at the time it was closed. The use of forward foreign currency exchange
| FDP SERIES, INC. | MAY 31, 2014 | 53
|
| |
| Notes to Financial Statements (continued) |
|
contracts involves the risk that the value of a foreign currency exchange contract changes unfavorably due to movements in the value of the referenced foreign currencies.
Options: Certain Funds purchase and write call and put options to increase or decrease their exposure to underlying instruments (including interest rate) and/or, in the case of options written, to generate gains from options premiums. A call option gives the purchaser (holder) of the option the right (but not the obligation) to buy, and obligates the seller (writer) to sell (when the option is exercised) the underlying instrument at the exercise or strike price at any time or at a specified time during the option period. A put option gives the holder the right to sell and obligates the writer to buy the underlying instrument at the exercise or strike price at any time or at a specified time during the option period. When the Funds purchase (write) an option, an amount equal to the premium paid (received) by the Funds is reflected as an asset (liability). The amount of the asset (liability) is subsequently marked-to-market to reflect the current market value of the option purchased (written). When an instrument is purchased or sold through an exercise of an option, the related premium paid (or received) is added to (or deducted from) the basis of the instrument acquired or deducted from (or added to) the proceeds of the instrument sold. When an option expires (or the Funds enter into a closing transaction), the Funds realize a gain or loss on the option to the extent of the premiums received or paid (or gain or loss to the extent the cost of the closing transaction exceeds the premiums received or paid). When the Funds write a call option, such option is “covered,” meaning that the Funds hold the underlying instrument subject to being called by the option counterparty. When the Funds write a put option, such option is covered by cash in an amount sufficient to cover the obligation.
Options on swaps (swaptions) are similar to options on securities except that instead of selling or purchasing the right to buy or sell a security, the writer or purchaser of the swap option is granting or buying the right to enter into a previously agreed upon interest rate or credit default swap agreement (interest rate risk and/or credit risk) at any time before the expiration of the option.
Certain Funds also purchase or sell listed or OTC foreign currency options, foreign currency futures and related options on foreign currency futures as a short or long hedge against possible variations in foreign exchange rates or to gain exposure to foreign currencies (foreign currency exchange rate risk). When foreign currency is purchased or sold through an exercise of a foreign currency option, the related premium paid (or received) is added to (or deducted from) the basis of the foreign currency acquired or deducted from (or added to) the proceeds of the foreign currency sold (receipts from the foreign currency purchased). Such transactions may be effected with respect to hedges on non-U.S. dollar denominated instruments owned by the Funds but not yet delivered, or committed or anticipated to be purchased by the Funds.
In purchasing and writing options, the Funds bear the risk of an unfavorable change in the value of the underlying instrument or the risk that the Funds may not be able to enter into a closing transaction due to an illiquid market. Exercise of a written option could result in the Funds purchasing or selling a security when it otherwise would not, or at a price different from the current market value.
Swaps: Certain Funds enter into swap agreements in which the Funds and a counterparty agree either to make periodic net payments on a specified notional amount or a net payment upon termination. Swap agreements are privately negotiated in the OTC market and may be entered into as a bilateral contract (“OTC swaps”) or centrally cleared (“centrally cleared swaps”). Swaps are marked-to-market daily and changes in value are recorded as unrealized appreciation (depreciation).
For OTC swaps, any upfront premiums paid are recorded as assets and any upfront fees received are recorded as liabilities and are shown as swap premiums paid and swap premiums received, respectively, in the Statements of Assets and Liabilities and amortized over the term of the OTC swap. Payments received or made by the Funds for OTC swaps are recorded in the Statements of Operations as realized gains or losses, respectively. When an OTC swap is terminated, the Funds will record a realized gain or loss equal to the difference between the proceeds from (or cost of) the closing transaction and the Funds’ basis in the contract, if any. Generally, the basis of the contracts is the premium received or paid.
In a centrally cleared swap, immediately following execution of the swap agreement, the swap agreement is novated to a central counterparty (the “CCP”) and the Funds’ counterparty on the swap agreement becomes the CCP. The Funds are required to interface with the CCP through a broker. Upon entering into a centrally cleared swap, the Funds are required to deposit initial margin with the broker in the form of cash or securities in an amount that varies depending on the size and risk profile of the particular swap. Securities deposited as initial margin are designated on the Schedules of Investments and cash deposited is recorded on the Statements of Assets and Liabilities as cash pledged for centrally cleared swaps. The daily change in valuation of centrally cleared swaps is recorded as a receivable or payable for variation margin in the Statements of Assets and Liabilities. Payments received from (paid to) the counterparty, including at termination, are recorded as realized gain (loss) in the Statements of Operations.
Swap transactions involve, to varying degrees, elements of interest rate, credit and market risk in excess of the amounts recognized in the Statements of Assets and Liabilities. Such risks involve the possibility that there will be no liquid market for these agreements, that the counterparty to the agreements may default on its obligation to perform or disagree as to the meaning of the contractual terms in the agreements, and that there may be unfavorable changes in interest rates and/or market values associated with these transactions.
• | | Credit default swaps — The Funds enter into credit default swaps to manage their exposure to the market or certain sectors of the market, to reduce their risk exposure to defaults of corporate and/or sovereign issuers or to create exposure to corporate and/or sovereign issuers to which they are not otherwise exposed (credit risk). The Funds may either buy or sell (write) credit default swaps on single-name issuers (corporate or sovereign), a combination or basket of single-name issuers or traded indexes. Credit default swaps on single-name issuers are agreements in which the protection buyer pays fixed periodic payments to the seller in consideration for a guarantee from the protection seller to make a specific payment should a negative credit event take place with respect to the referenced entity (e.g., bankruptcy, failure to pay, obligation accelerators, repudiation, moratorium or |
| 54 | FDP SERIES, INC. | MAY 31, 2014
|
| |
| Notes to Financial Statements (continued) |
|
| |
restructuring). Credit default swaps on traded indexes are agreements in which the buyer pays fixed periodic payments to the seller in consideration for a guarantee from the seller to make a specific payment should a write-down, principal or interest shortfall or default of all or individual underlying securities included in the index occur. As a buyer, if an underlying credit event occurs, the Funds will either (i) receive from the seller an amount equal to the notional amount of the swap and deliver the referenced security or underlying securities comprising the index, or (ii) receive a net settlement of cash equal to the notional amount of the swap less the recovery value of the security or underlying securities comprising the index. As a seller (writer), if an underlying credit event occurs, the Funds will either pay the buyer an amount equal to the notional amount of the swap and take delivery of the referenced security or underlying securities comprising the index or pay a net settlement of cash equal to the notional amount of the swap less the recovery value of the security or underlying securities comprising the index. |
The following is a summary of the Funds’ derivative financial instruments categorized by risk exposure:
Fair Values of Derivative Financial Instruments as of May 31, 2014
|
Derivative Assets
|
| | | | Statements of Assets and Liabilities Location
|
| Invesco
Fund
|
| Franklin
Templeton
Fund
|
Foreign currency exchange contracts | | | | Unrealized appreciation on forward foreign currency exchange contracts; Investments at value — unaffiliated1 | | $ | 58,911 | | | $ | 2,247,740 | |
Credit contracts | | | | Unrealized appreciation on OTC swaps; Swap premiums paid | | | — | | | | 236,475 | |
| | | | | | | | | | | | |
Total
| | | | | | $ | 58,911 | | | $ | 2,484,215 | |
| | | | | | | | | | | | |
| |
Derivative Liabilities
|
| | | | Statements of Assets and Liabilities Location
|
| Invesco
Fund
|
| Franklin
Templeton
Fund
|
Foreign currency exchange contracts | | | | Unrealized depreciation on forward foreign currency exchange contracts | | $ | (17,621 | ) | | $ | (445,346 | ) |
Credit contracts | | | | Unrealized depreciation on OTC swaps; Swap premiums received | | | — | | | | (840,527 | ) |
| | | | | | | | | | | | |
Total
| | | | | | $ | (17,621 | ) | | $ | (1,285,873 | ) |
| | | | | | | | | | | | |
| 1 | | Includes options purchased at value as reported in the Schedules of Investments. |
The Effect of Derivative Financial Instruments in the Statements of Operations
Year Ended May 31, 2014
|
| | | | Net Realized Gain (Loss) From
|
|
|
|
| MFS
Fund
|
| Invesco
Fund
|
| Franklin
Templeton
Fund
|
Interest rate contracts:
| | | | | | | | | | | | | | |
Financial futures contracts | | | | | — | | | | — | | | $ | 4,079 | |
Foreign currency exchange contracts:
| | | | | | | | | | | | | | |
Foreign currency transactions | | | | $ | 518 | | | $ | (827,789 | ) | | | (907,421 | ) |
Options2 | | | | | — | | | | — | | | | (139,984 | ) |
Credit contracts:
| | | | | | | | | | | | | | |
Swaps | | | | | — | | | | — | | | | 140,698 | |
Equity contracts:
| | | | | | | | | | | | | | |
Options2 | | | | | — | | | | — | | | | 55,563 | |
Total
| | | | $ | 518 | | | $ | (827,789 | ) | | $ | (847,065 | ) |
| | | | Net Change in Unrealized
Appreciation/Depreciation on
|
|
|
|
| Invesco
Fund
|
| Franklin
Templeton
Fund
|
Interest rate contracts:
| | | | | | | | | | |
Financial futures contracts | | | | | — | | | $ | 337 | |
Options2 | | | | | — | | | | (70,434 | ) |
Foreign currency exchange contracts:
| | | | | | | | | | |
Foreign currency translations | | | | $ | 1,060 | | | | 46,082 | |
Options2 | | | | | — | | | | (122,558 | ) |
Credit contracts:
| | | | | | | | | | |
Swaps | | | | | — | | | | (5,346 | ) |
Total
| | | | $ | 1,060 | | | $ | (151,919 | ) |
| 2 | | Options purchased are included in the net realized gain (loss) from investments and net change in unrealized appreciation/depreciation on investments. |
| FDP SERIES, INC. | MAY 31, 2014 | 55
|
| |
| Notes to Financial Statements (continued) |
|
For the year ended May 31, 2014, the average quarterly balances of outstanding derivative financial instruments were as follows:
|
|
|
| MFS
Fund
|
| Invesco
Fund
|
| Franklin
Templeton
Fund
|
Financial futures contracts:
| | | | | | | | | | | | | | |
Average number of contracts purchased | | | | | — | | | | — | | | | 6 | |
Average notional value of contracts purchased | | | | | — | | | | — | | | $ | 1,319,813 | |
Forward foreign currency exchange contracts:
| | | | | | | | | | | | | | |
Average number of contracts — USD purchased | | | | | 1 | | | | 13 | | | | 61 | |
Average number of contracts — USD sold | | | | | 1 | 1 | | | 39 | 1 | | | 48 | |
Average U.S. dollar amounts purchased | | | | $ | 14,687 | | | $ | 14,194,625 | | | $ | 15,029,579 | |
Average U.S. dollar amounts sold | | | | $ | 113,783 | 1 | | $ | 39,266,346 | 1 | | $ | 9,650,144 | |
Options:
| | | | | | | | | | | | | | |
Average number of option contracts purchased | | | | | — | | | | — | | | | 12,759,483 | |
Average notional value of option contracts purchased | | | | | — | | | | — | | | $ | 13,841,018 | |
Credit default swaps:
| | | | | | | | | | | | | | |
Average number of contracts — buy protection | | | | | — | | | | — | | | | 8 | |
Average number of contracts — sell protection | | | | | — | | | | — | | | | 18 | |
Average notional value — buy protection | | | | | — | | | | — | | | $ | 6,751,000 | |
Average notional value — sell protection | | | | | — | | | | — | | | $ | 8,148,500 | |
| 1 | | Actual amounts for the period are shown due to limited outstanding derivative financial instruments as of each quarter. |
Counterparty Credit Risk: A derivative contract may suffer a mark-to-market loss if the value of the contract decreases due to an unfavorable change in the market rates or values of the underlying instrument. Losses can also occur if the counterparty does not perform under the contract.
A Fund’s risk of loss from counterparty credit risk on OTC derivatives purchased is generally limited to the aggregate unrealized gain netted against any collateral held by such Fund. For OTC options purchased, each Fund bears the risk of loss of the amount of the premiums paid plus the positive change in market values net of any collateral held by such Fund should the counterparty fail to perform under the contracts. Options written by the Funds do not typically give rise to counterparty credit risk, as options written generally obligate the Funds, and not the counterparty, to perform.
With exchange-traded purchased options and futures, there is less counterparty credit risk to the Funds since the exchange or clearinghouse, as counterparty to such instruments, guarantees against a possible default. The clearinghouse stands between the buyer and the seller of the contract; therefore, credit risk is limited to failure of the clearinghouse. While offset rights may exist under applicable law, a Fund does not have a contractual right of offset against a clearing broker or clearinghouse in the event of a default (including the bankruptcy or insolvency) of the clearing broker or clearinghouse. Additionally, credit risk exists in exchange-traded futures with respect to initial and variation margin that is held in a clearing broker’s customer accounts. While clearing brokers are required to segregate customer margin from their own assets, in the event that a clearing broker becomes insolvent or goes into bankruptcy and at that time there is a shortfall in the aggregate amount of margin held by the clearing broker for all its clients, typically the shortfall would be allocated on a pro rata basis across all the clearing broker’s customers, potentially resulting in losses to the Funds.
In order to better define its contractual rights and to secure rights that will help the Funds mitigate their counterparty risk, the Funds may enter into an International Swaps and Derivatives Association, Inc. Master Agreement (“ISDA Master Agreement”) or similar agreement with its counterparties. An ISDA Master Agreement is a bilateral agreement between each Fund and a counterparty that governs certain OTC derivatives and typically contains, among other things, collateral posting terms and netting provisions in the event of a default and/or termination event. Under an ISDA Master Agreement, each Fund may, under certain circumstances, offset with the counterparty certain derivative financial instruments’ payables and/or receivables with collateral held and/or posted and create one single net payment. The provisions of the ISDA Master Agreement typically permit a single net payment in the event of default including the bankruptcy or insolvency of the counterparty. Bankruptcy or insolvency laws of a particular jurisdiction may impose restrictions on or prohibitions against the right of offset in bankruptcy, insolvency or other events. In addition, certain ISDA Master Agreements allow counterparties to OTC derivatives to terminate derivative contracts prior to maturity in the event the Funds’ net assets decline by a stated percentage or the Funds fail to meet the terms of their ISDA Master Agreements, which would cause the Funds to accelerate payment of any net liability owed to the counterparty.
Collateral Requirements: For derivatives traded under an ISDA Master Agreement, the collateral requirements are typically calculated by netting the mark-to-market amount for each transaction under such agreement and comparing that amount to the value of any collateral currently pledged by the Funds and the counterparty.
Cash collateral that has been pledged to cover obligations of the Funds and cash collateral received from the counterparty, if any, is reported separately on the Statements of Assets and Liabilities as cash pledged as collateral and cash received as collateral, respectively. Non-cash collateral pledged by the Funds, if any, is noted in the Schedules of Investments. Generally, the amount of collateral due from or to a party has to exceed a minimum transfer amount threshold (typically either $250,000 or $500,000) before a transfer is required, which is determined at the close of business of the Funds and any additional required collateral is delivered to/pledged by the Funds on the next business day. Typically, the Funds and counterparties are not permitted to sell, re-pledge or use the collateral they receive. To the extent amounts due to the Funds from their counterparties are not fully collateralized, contractually or otherwise, the Funds bear the risk of loss from counterparty non-performance.
For financial reporting purposes, the Funds do not offset derivative assets and derivative liabilities that are subject to netting arrangements, if any, in the Statements of Assets and Liabilities.
| 56 | FDP SERIES, INC. | MAY 31, 2014
|
| |
| Notes to Financial Statements (continued) |
|
At May 31, 2014 the Funds’ derivative assets and liabilities (by type) are as follows:
Invesco Fund
|
|
|
| Assets
|
| Liabilities
|
Derivative Financial Instruments:
| | | | | | | | | | |
Forward foreign currency exchange contracts | | | | $ | 58,911 | | | $ | 17,621 | |
Derivatives not subject to an Master Netting Agreement or similar agreement (“MNA”) | | | | | — | | | | — | |
Total derivative assets and liabilities subject to an MNA | | | | $ | 58,911 | | | $ | 17,621 | |
Franklin Templeton Fund
|
|
|
| Assets
|
| Liabilities
|
Derivative Financial Instruments:
| | | | | | | | | | |
Forward foreign currency exchange contracts | | | | $ | 92,494 | | | $ | 445,346 | |
Options | | | | | 2,155,246 | 1 | | | — | |
Swaps — OTC2 | | | | | 236,475 | | | | 840,527 | |
Total derivative assets and liabilities in the Statements of Assets and Liabilities | | | | | 2,484,215 | | | | 1,285,873 | |
Derivatives not subject to an MNA | | | | | — | | | | — | |
Total derivative assets and liabilities subject to an MNA | | | | $ | 2,484,215 | | | $ | 1,285,873 | |
| 1 | | Includes options purchased at value which is included in Investments at value — unaffiliated in the Statements of Assets and Liabilities and reported in the Schedules of Investments. |
| 2 | | Includes unrealized appreciation/depreciation on OTC swaps and swap premiums paid/received in the Statements of Assets and Liabilities. |
The following tables present the Funds’ derivative assets and liabilities by counterparty net of amounts available for offset under an MNA and net of the related collateral received and pledged by the Funds as of May 31, 2014:
Invesco Fund
|
Counterparty
|
|
|
| Derivative Assets
Subject to an MNA
by Counterparty
|
| Derivatives
Available for
Offset3
|
| Non-cash
Collateral
Received
|
| Cash
Collateral
Received
|
| Net Amount of
Derivative
Assets4
|
Barclays Bank PLC | | | | $ | 14,184 | | | $ | (4,527 | ) | | | — | | | | — | | | $ | 9,657 | |
Canadian Imperial Bank of Commerce | | | | | 13,972 | | | | (4,659 | ) | | | — | | | | — | | | | 9,313 | |
Citibank N.A. | | | | | 15,828 | | | | (4,107 | ) | | | — | | | | — | | | | 11,721 | |
Goldman Sachs International | | | | | 14,927 | | | | (4,328 | ) | | | — | | | | — | | | | 10,599 | |
Total
| | | | $ | 58,911 | | | $ | (17,621 | ) | | | — | | | | — | | | $ | 41,290 | |
Invesco Fund
|
Counterparty
|
|
|
| Derivative Liabilities
Subject to an MNA
by Counterparty
|
| Derivatives
Available for
Offset3
|
| Non-cash
Collateral
Pledged
|
| Cash
Collateral
Pledged
|
| Net Amount of
Derivative
Liabilities
|
Barclays Bank PLC | | | | $ | 4,527 | | | $ | (4,527 | ) | | | — | | | | — | | | | — | |
Canadian Imperial Bank of Commerce | | | | | 4,659 | | | | (4,659 | ) | | | — | | | | — | | | | — | |
Citibank N.A. | | | | | 4,107 | | | | (4,107 | ) | | | — | | | | — | | | | — | |
Goldman Sachs International | | | | | 4,328 | | | | (4,328 | ) | | | — | | | | — | | | | — | |
Total
| | | | $ | 17,621 | | | $ | (17,621 | ) | | | — | | | | — | | | | — | |
Franklin Templeton Fund
|
Counterparty
|
|
|
| Derivative Assets
Subject to an MNA
by Counterparty
|
| Derivatives
Available for
Offset3
|
| Non-cash
Collateral
Received5
|
| Cash
Collateral
Received
|
| Net Amount Of
Derivative
Assets4
|
Barclays Bank PLC | | | | $ | 17,124 | | | $ | (17,124 | ) | | | — | | | | — | | | | — | |
Barclays Capital, Inc. | | | | | 126,443 | | | | (101,905 | ) | | | — | | | | — | | | $ | 24,538 | |
Citibank N.A. | | | | | 2,149,848 | | | | (2,226 | ) | | $ | (2,147,622 | ) | | | — | | | | — | |
Credit Suisse Securities (USA) LLC | | | | | 86,406 | | | | (83,445 | ) | | | — | | | | — | | | | 2,961 | |
Deutsche Bank AG | | | | | 71,137 | | | | (71,137 | ) | | | — | | | | — | | | | — | |
Goldman Sachs International | | | | | 5,911 | | | | (5,911 | ) | | | — | | | | — | | | | — | |
HSBC Bank PLC | | | | | 3,682 | | | | — | | | | — | | | | — | | | | 3,682 | |
JPMorgan Chase Bank N.A. | | | | | 23,184 | | | | (23,184 | ) | | | — | | | | — | | | | — | |
Morgan Stanley & Co. LLC | | | | | 480 | | | | (480 | ) | | | — | | | | — | | | | — | |
Total
| | | | $ | 2,484,215 | | | $ | (305,412 | ) | | $ | (2,147,622 | ) | | | — | | | $ | 31,181 | |
| 3 | | The amount of derivatives available for offset is limited to the amount of derivative assets and/or liabilities that are subject to an MNA. |
| 4 | | Net amount represents the net amount receivable from the counterparty in the event of default. |
| 5 | | Excess of collateral received from the individual counterparty is not shown for financial reporting purposes. |
| FDP SERIES, INC. | MAY 31, 2014 | 57
|
| |
| Notes to Financial Statements (continued) |
|
Franklin Templeton Fund
|
Counterparty
|
|
|
| Derivative Liabilities
Subject to an MNA
by Counterparty
|
| Derivatives
Available for
Offset1
|
| Non-cash
Collateral
Pledged
|
| Cash
Collateral
Pledged2
|
| Net Amount of
Derivative
Liabilities3
|
Barclays Bank PLC | | | | $ | 21,795 | | | $ | (17,124 | ) | | | — | | | | — | | | $ | 4,671 | |
Barclays Capital, Inc. | | | | | 101,905 | | | | (101,905 | ) | | | — | | | | — | | | | — | |
Citibank N.A. | | | | | 2,226 | | | | (2,226 | ) | | | — | | | | — | | | | — | |
Credit Suisse Securities (USA) LLC | | | | | 83,445 | | | | (83,445 | ) | | | — | | | | — | | | | — | |
Deutsche Bank AG | | | | | 666,646 | | | | (71,137 | ) | | | — | | | $ | (595,509 | ) | | | — | |
Goldman Sachs International | | | | | 190,989 | | | | (5,911 | ) | | | — | | | | (185,078 | ) | | | — | |
JPMorgan Chase Bank N.A. | | | | | 203,662 | | | | (23,184 | ) | | | — | | | | (180,478 | ) | | | — | |
Morgan Stanley & Co. LLC | | | | | 15,205 | | | | (480 | ) | | | — | | | | — | | | | 14,725 | |
Total
| | | | $ | 1,285,873 | | | $ | (305,412 | ) | | | — | | | $ | (961,065 | ) | | $ | 19,396 | |
| | | | | | | | | | | | | | | | | | | | | | |
| 1 | | The amount of derivatives available for offset is limited to the amount of derivative assets and/or liabilities that are subject to an MNA. |
| 2 | | Excess of collateral pledged to the individual counterparty is not shown for financial reporting purposes. |
| 3 | | Net amount represents the net amount payable due to the counterparty in the event of default. |
5. Investment Advisory Agreement and Other Transactions with Affiliates:
The PNC Financial Services Group, Inc. is the largest stockholder and an affiliate, for 1940 Act purposes, of BlackRock, Inc. (“BlackRock”).
The Corporation, on behalf of the Funds, entered into an Investment Advisory Agreement with BlackRock Advisors, LLC (the “Manager”), the Funds’ investment advisor, an indirect, wholly owned subsidiary of BlackRock, to provide investment advisory and administration services. The Manager is responsible for the management of each Fund’s portfolio and provides the necessary personnel, facilities, equipment and certain other services necessary to the operations of each Fund.
For such services, each Fund pays the Manager a monthly fee based on a percentage of each Fund’s average daily net assets at the following annual rates:
|
|
|
| MFS
Fund
|
| Marsico
Fund
|
| Invesco
Fund
|
| Franklin
Templeton
Fund
|
First $1 Billion | | | | | 0.90 | % | | | 0.80 | % | | | 0.70 | % | | | 0.40 | % |
$1 Billion – $3 Billion | | | | | 0.85 | % | | | 0.75 | % | | | 0.66 | % | | | 0.38 | % |
$3 Billion – $5 Billion | | | | | 0.81 | % | | | 0.72 | % | | | 0.63 | % | | | 0.36 | % |
$5 Billion – $10 Billion | | | | | 0.78 | % | | | 0.70 | % | | | 0.61 | % | | | 0.35 | % |
Greater than $10 Billion | | | | | 0.77 | % | | | 0.68 | % | | | 0.60 | % | | | 0.34 | % |
The Manager entered into sub-advisory agreements with respect to each Fund. Pursuant to the sub-advisory agreements, the Manager pays each sub-advisor for services they provide, a monthly fee that is a percentage of the Manager’s investment advisory fee at the following annual rates, based on each Fund’s average daily net assets:
|
| Sub-Advisor
|
| Sub-Advisory
Fee
|
MFS Fund | | Massachusetts Financial Services Company | | 0.45 | % |
Marsico Fund | | Marsico Capital Management, LLC | | 0.40 | % |
Invesco Fund | | Invesco Advisers, Inc. | | 0.35 | % |
Franklin Templeton Fund | | Franklin Advisers, Inc. | | 0.25 | % |
For the year ended May 31, 2014, the Funds reimbursed the Manager for certain accounting services, which is included in accounting services in the Statements of Operations. The reimbursements were as follows:
MFS Fund | | | $1,611 |
Marsico Fund | | | $1,427 |
Invesco Fund | | | $1,396 |
Franklin Templeton Fund | | | $2,066 |
The Corporation, on behalf of the Funds, entered into a Distribution Agreement and a Distribution and Service Plan with BlackRock Investments, LLC (“BRIL”), an affiliate of the Manager. Pursuant to the Distribution and Service Plan and in accordance with Rule 12b-1 under the 1940 Act, each Fund pays BRIL ongoing service and distribution fees. The fees are accrued daily and paid monthly at annual rates based upon the average daily net assets of the shares of each Fund as follows:
Service Fees
|
| MFS
Fund
| Marsico
Fund
| Invesco
Fund
| Franklin
Templeton
Fund
|
Investor A Shares | | 0.25 | % | 0.25 | % | 0.25 | % | 0.25 | % |
Investor B Shares | | 0.25 | % | 0.25 | % | 0.25 | % | 0.25 | % |
Investor C Shares | | 0.25 | % | 0.25 | % | 0.25 | % | 0.25 | % |
Distribution Fees
|
Investor B Shares | | 0.75 | % | 0.75 | % | 0.75 | % | 0.50 | % |
Investor C Shares | | 0.75 | % | 0.75 | % | 0.75 | % | 0.55 | % |
Pursuant to sub-agreements with BRIL, broker-dealers and BRIL provide shareholder servicing and distribution services to each Fund. The ongoing service and/or distribution fee compensates BRIL and each broker-dealer for providing shareholder servicing and/or distribution related services to Investor A, Investor B and Investor C shareholders.
The Manager has agreed to voluntarily waive, as a percentage of average daily net assets, 0.05% of its advisory fee payable by Marsico Fund. This amount is shown as fees waived by Manager in the Statements of Operations. This voluntary waiver may be reduced or discontinued at any time without notice.
The Manager voluntarily agreed to waive and/or reimburse fees or expenses in order to limit expenses, excluding interest expense, dividend expense, acquired fund fees and expenses and certain other fund expenses, which constitute extraordinary expenses not incurred in the ordinary course of the Funds’ business. The expense limitation as a percentage of average daily net assets is as follows:
|
| MFS
Fund
| Marsico
Fund
| Invesco
Fund
| Franklin
Templeton
Fund
|
Institutional Shares | | 1.95 | % | 1.95 | % | 1.95 | % | 1.95 | % |
Investor A Shares | | 2.20 | % | 2.20 | % | 2.20 | % | 2.20 | % |
Investor B Shares | | 2.95 | % | 2.95 | % | 2.95 | % | 2.70 | % |
Investor C Shares | | 2.95 | % | 2.95 | % | 2.95 | % | 2.75 | % |
| 58 | FDP SERIES, INC. | MAY 31, 2014
|
| |
| Notes to Financial Statements (continued) |
|
The Manager may reduce or discontinue these arrangements at any time without notice. The Manager did not waive or reimburse any fees or expenses under these arrangements during the year ended May 31, 2014.
For the year ended May 31, 2014, affiliates earned underwriting discounts, direct commissions and dealer concessions on sales of the Fund’s Investor A Shares as follows:
| Investor A
|
MFS Fund | $ | 38,884 | |
Marsico Fund | $ | 35,030 | |
Invesco Fund | $ | 33,636 | |
Franklin Templeton Fund | $ | 56,689 | |
For the year ended May 31, 2014, affiliates received CDSCs as follows:
|
|
|
| Investor A
|
| Investor C
|
MFS Fund | | | | $ | 3,398 | | | $ | 12,839 | |
Marsico Fund | | | | $ | 2,017 | | | $ | 10,381 | |
Invesco Fund | | | | $ | 1,944 | | | $ | 9,641 | |
Franklin Templeton Fund | | | | $ | 2,114 | | | $ | 23,014 | |
Certain officers and/or directors of the Corporation are officers and/or directors of BlackRock or its affiliates. The Funds reimburse the Manager for a portion of the compensation paid to the Corporation’s Chief Compliance Officer, which is included in officer and directors in the Statements of Operations.
The Funds may purchase securities from, or sell securities to, an affiliated fund provided the affiliation is due solely to having a common investment adviser, common officers, or common directors. For the year ended May 31, 2014, the purchase and sale transactions with an affiliated fund in compliance with Rule 17a-7 under the 1940 Act were as follows:
|
|
|
| Purchases
|
| Sales
|
MFS Fund | | | | $ | 888,294 | | | $ | 241,219 | |
Invesco Fund | | | | | — | | | $ | 26,096 | |
6. Purchases and Sales:
Purchases and sales of investments, including paydowns, mortgage dollar roll and TBA transactions and excluding short-term securities and U.S. government securities, for the year ended May 31, 2014, were as follows:
|
|
|
| Purchases
|
| Sales
|
MFS Fund | | | | $ | 63,053,673 | | | $ | 44,990,104 | |
Marsico Fund | | | | $ | 136,009,235 | | | $ | 134,296,903 | |
Invesco Fund | | | | $ | 24,763,123 | | | $ | 18,136,150 | |
Franklin Templeton Fund | | | | $ | 625,256,850 | | | $ | 632,880,137 | |
Purchases and sales of U.S. government securities for Franklin Templeton Fund for the year ended May 31, 2014, were $51,209,710 and $46,932,043, respectively.
For the year ended May 31, 2014, purchases and sales related to mortgage dollar rolls for Franklin Templeton Fund were $363,853,037 and $364,944,916, respectively.
7. Income Tax Information:
U.S. GAAP requires that certain components of net assets be adjusted to reflect permanent differences between financial and tax reporting. These reclassifications have no effect on net assets or net asset values per share. The following permanent differences as of May 31, 2014, attributable to net operating losses, the accounting for swap agreements, the sale of stock of passive foreign investment companies and foreign currency transactions were reclassified to the following accounts:
|
|
|
| MFS
Fund
|
| Marsico
Fund
|
| Invesco
Fund
|
| Franklin
Templeton
Fund
|
Undistributed (accumulated) net investment income (loss) | | | | $ | (56,426 | ) | | $ | 953,118 | | | $ | (825,735 | ) | | $ | (1,137,028 | ) |
Accumulated net realized gain (loss) | | | | $ | 56,426 | | | $ | (953,118 | ) | | $ | 825,735 | | | $ | 1,137,028 | |
The tax character of distributions paid during the fiscal years ended May 31, 2014 and May 31, 2013 was as follows:
|
|
|
| MFS
Fund
|
| Marsico
Fund
|
| Invesco
Fund
|
| Franklin
Templeton
Fund
|
Ordinary income
| | | | | | | | | | | | | | | | | | |
5/31/14 | | | | $ | 1,239,435 | | | $ | 2,511,001 | | | $ | 509,648 | | | $ | 4,303,928 | |
5/31/13 | | | | $ | 1,221,016 | | | | — | | | $ | 513,835 | | | $ | 5,043,932 | |
Long-term capital gains
|
5/31/14 | | | | | — | | | $ | 3,840,996 | | | | — | | | $ | 194,505 | |
Total
| | | | | | | | | | | | | | | | | | |
5/31/14 | | | | $ | 1,239,435 | | | $ | 6,351,997 | | | $ | 509,648 | | | $ | 4,498,433 | |
5/31/13 | | | | $ | 1,221,016 | | | | — | | | $ | 513,835 | | | $ | 5,043,932 | |
As of May 31, 2014, the tax components of accumulated net earnings were as follows:
|
|
|
| MFS
Fund
|
| Marsico
Fund
|
| Invesco
Fund
|
| Franklin
Templeton
Fund
|
Undistributed ordinary income | | | | $ | 2,447,037 | | | | — | | | $ | 140,580 | | | | — | |
Undistributed long-term capital gains | | | | | — | | | $ | 4,576,955 | | | | — | | | $ | 587,085 | |
Capital loss carryforwards | | | | | (32,375,656 | ) | | | — | | | | (16,922,713 | ) | | | — | |
Net unrealized gains1 | | | | | 35,580,302 | | | | 37,762,357 | | | | 47,452,101 | | | | 7,161,452 | |
Qualified late-year losses2 | | | | | — | | | | (446,198 | ) | | | — | | | | — | |
Total
| | | | $ | 5,651,683 | | | $ | 41,893,114 | | | $ | 30,669,968 | | | $ | 7,748,537 | |
| 1 | | The differences between book-basis and tax-basis net unrealized gains were attributable primarily to the tax deferral of losses on wash sales and straddles, the accounting for swap agreements, amortization methods for premiums and discounts on fixed income securities, the realization for tax purposes of unrealized gains on investments in passive foreign investment companies, the classification of investments and the realization for tax purposes of unrealized gains/losses on foreign currency contracts. |
| 2 | | The Funds have elected to defer certain qualified late-year losses and recognize such losses in the year ending May 31, 2015. |
| FDP SERIES, INC. | MAY 31, 2014 | 59
|
| |
| Notes to Financial Statements (continued) |
|
As of May 31, 2014, the Funds had capital loss carryforwards available to offset future realized capital gains through the indicated expiration dates as follows:
Expires May 31,
|
|
|
| MFS
Fund
|
| Invesco
Fund
|
2017 | | | | $ | 1,902,151 | | | | — | |
2018 | | | | | 30,473,505 | | | $ | 16,922,713 | |
Total
| | | | $ | 32,375,656 | | | $ | 16,922,713 | |
During the year ended May 31, 2014, the Funds listed below utilized the following amounts of their respective capital loss carryforwards:
MFS Fund | $ | 3,933,665 | |
Marsico Fund | $ | 372,044 | |
Invesco Fund | $ | 5,519,782 | |
As of May 31, 2014, gross unrealized appreciation and depreciation based on cost for federal income tax purposes were as follows:
|
|
|
| MFS
Fund
|
| Marsico
Fund
|
| Invesco
Fund
|
| Franklin
Templeton
Fund
|
Tax cost | | | | $ | 140,821,842 | | | $ | 116,142,498 | | | $ | 103,865,732 | | | $ | 257,926,685 | |
Gross unrealized appreciation | | | | $ | 39,706,232 | | | $ | 38,161,702 | | | $ | 48,890,316 | | | $ | 9,116,500 | |
Gross unrealized depreciation | | | | | (4,127,882 | ) | | | (399,364 | ) | | | (1,438,469 | ) | | | (1,883,442 | ) |
Net unrealized appreciation/depreciation | | | | $ | 35,578,350 | | | $ | 37,762,338 | | | $ | 47,451,847 | | | $ | 7,233,058 | |
8. Borrowings:
The Corporation, on behalf of the Funds, along with certain other funds managed by the Manager and its affiliates (“Participating Funds”), is a party to a 364-day, $1.1 billion credit agreement with a group of lenders, under which the Funds may borrow to fund shareholder redemptions. The agreement expires in April 2015. Excluding commitments designated for a certain individual fund, other Participating Funds, including the Funds, can borrow up to an aggregate commitment amount of $650 million, subject to asset coverage and other limitations as specified in the agreement. The credit agreement has the following terms: a fee of 0.06% per annum on unused commitment amounts and interest at a rate equal to the higher of (a) the one-month LIBOR plus 0.80% per annum or (b) the Fed Funds rate plus 0.80% per annum on amounts borrowed. Participating Funds paid administration and arrangement fees which, along with commitment fees, were allocated among such funds based upon portions of the aggregate commitment available to them and relative net assets of Participating Funds. The Funds did not borrow under the credit agreement during the year ended May 31, 2014.
9. Concentration, Market and Credit Risk:
In the normal course of business, the Funds invest in securities and enter into transactions where risks exist due to fluctuations in the market (market risk) or failure of the issuer of a security to meet all its obligations (issuer credit risk). The value of securities held by the Funds may decline in response to certain events, including those directly involving the issuers whose securities are owned by the Funds; conditions affecting the general economy; overall market changes; local, regional or global political, social or economic instability; and currency and interest rate and price fluctuations. Similar to issuer credit risk, the Funds may be exposed to counterparty credit risk, or the risk that an entity with which the Funds have unsettled or open transactions may fail to or be unable to perform on its commitments. The Funds manage counterparty credit risk by entering into transactions only with counterparties that they believe have the financial resources to honor their obligations and by monitoring the financial stability of those counterparties. Financial assets, which potentially expose the Funds to market, issuer and counterparty credit risks, consist principally of financial instruments and receivables due from counterparties. The extent of the Funds’ exposure to market, issuer and counterparty credit risks with respect to these financial assets is generally approximated by their value recorded in the Statements of Assets and Liabilities, less any collateral held by the Funds.
MFS Fund invests a substantial amount of its assets in issuers located in a single country or a limited number of countries. When MFS Fund concentrates its investments in this manner, it assumes the risk that economic, political and social conditions in those countries may have a significant impact on their investment performance. Foreign issuers may not be subject to the same uniform accounting, auditing and financial reporting standards and practices as used in the United States. Foreign securities markets may also be less liquid, more volatile, and less subject to governmental supervision not typically associated with investing in U.S. securities. Please see the Schedules of Investments for concentrations in specific countries.
MFS Fund invests a significant portion of its assets in securities of issuers located in Europe or with significant exposure to European issuers or countries. The European financial markets have recently experienced volatility and adverse trends due to concerns about economic downturns in, or rising government debt levels of, several European countries. These events may spread to other countries in Europe and may affect the value and liquidity of certain of MFS Fund’s investments.
As of May 31, 2014, Marsico Fund invested a significant portion of its assets in securities in the consumer discretionary and information technology sectors and Invesco Fund invested a significant portion of its assets in securities in the financials sector. Changes in economic conditions affecting the consumer discretionary, financials and information technology sectors would have a greater impact on the Fund and could affect the value, income and/or liquidity of positions in such securities.
As of May 31, 2014, MFS Fund had the following industry classifications:
Industry
| Percent of
Long-Term
Investments
|
Commercial Banks | 15 | % |
Pharmaceuticals | 10 | % |
Oil, Gas & Consumable Fuels | 7 | % |
Other1 | 68 | % |
| 1 | | All other industries held were each less than 5% of long-term investments. |
Franklin Templeton invests a significant portion of its assets in fixed-income securities and/or uses derivatives tied to the fixed income markets. See the Schedules of Investments for these securities and/or derivatives. Changes in market interest rates or economic conditions, including the Federal Reserve’s decision in December 2013 to taper its quantitative easing policy, may affect the value and/or liquidity of such investments. Interest rate risk is the risk that prices of bonds and other fixed-income securities will increase as interest rates fall and decrease as interest rates rise. The Fund may be subject to a greater risk of rising interest rates due to the current period of historically low rates.
| 60 | FDP SERIES, INC. | MAY 31, 2014
|
| |
| Notes to Financial Statements (continued) |
|
Franklin Templeton Fund invests a significant portion of its assets in securities backed by commercial or residential mortgage loans or in issuers that hold mortgage and other asset-backed securities. Please see the Schedule of investments for these securities. Changes in economic conditions, including delinquencies and/or defaults on assets underlying these securities, can affect the value, income and/or liquidity of such positions.
10. Capital Share Transactions:
Transactions in capital shares for each class were as follows:
| | | | Year Ended
May 31, 2014
|
| | | Year Ended
May 31, 2013
|
MFS Fund
|
|
|
| Shares
|
| Amount
|
|
|
| Shares
|
| Amount
|
Institutional
|
Shares sold | | | | | 130,521 | | | $ | 1,637,422 | | | | | | | | 97,313 | | | $ | 1,065,079 | |
Shares issued to shareholders in reinvestment of dividends | | | | | 5,035 | | | | 60,272 | | | | | | | | 5,718 | | | | 56,953 | |
Shares redeemed | | | | | (93,181 | ) | | | (1,170,251 | ) | | | | | | | (95,677 | ) | | | (1,048,672 | ) |
Net increase | | | | | 42,375 | | | $ | 527,443 | | | | | | | | 7,354 | | | $ | 73,360 | |
|
Investor A
|
Shares sold and automatic conversion of shares | | | | | 1,685,661 | | | $ | 20,982,935 | | | | | | | | 1,271,513 | | | $ | 13,815,684 | |
Shares issued to shareholders in reinvestment of dividends | | | | | 43,720 | | | | 521,147 | | | | | | | | 43,076 | | | | 427,322 | |
Shares redeemed | | | | | (719,396 | ) | | | (9,023,804 | ) | | | | | | | (818,013 | ) | | | (8,902,682 | ) |
Net increase | | | | | 1,009,985 | | | $ | 12,480,278 | | | | | | | | 496,576 | | | $ | 5,340,324 | |
|
Investor B
|
Shares sold | | | | | — | | | | — | | | | | | | | 6,026 | | | $ | 63,666 | |
Shares issued to shareholders in reinvestment of dividends | | | | | — | | | | — | | | | | | | | 353 | | | | 3,525 | |
Shares redeemed and automatic conversion of shares | | | | | (102,999 | ) | | $ | (1,212,297 | ) | | | | | | | (41,196 | ) | | | (438,753 | ) |
Net decrease | | | | | (102,999 | ) | | $ | (1,212,297 | ) | | | | | | | (34,817 | ) | | $ | (371,562 | ) |
|
Investor C
|
Shares sold | | | | | 2,029,466 | | | $ | 25,187,884 | | | | | | | | 1,359,244 | | | $ | 14,634,582 | |
Shares issued to shareholders in reinvestment of dividends | | | | | 37,334 | | | | 442,786 | | | | | | | | 49,447 | | | | 488,075 | |
Shares redeemed | | | | | (1,509,944 | ) | | | (18,706,462 | ) | | | | | | | (2,058,899 | ) | | | (21,994,359 | ) |
Net increase (decrease) | | | | | 556,856 | | | $ | 6,924,208 | | | | | | | | (650,208 | ) | | $ | (6,871,702 | ) |
Total Net Increase (Decrease)
| | | | | 1,506,217 | | | $ | 18,719,632 | | | | | | | | (181,095 | ) | | $ | (1,829,580 | ) |
|
|
| | | | Year Ended
May 31, 2014
|
| | | Year Ended
May 31, 2013
|
Marsico Fund
|
|
|
| Shares
|
| Amount
|
|
|
| Shares
|
| Amount
|
Institutional
|
Shares sold | | | | | 75,826 | | | $ | 1,237,044 | | | | | | | | 76,684 | | | $ | 1,036,889 | |
Shares issued to shareholders in reinvestment of distributions | | | | | 11,629 | | | | 188,623 | | | | | | | | — | | | | — | |
Shares redeemed | | | | | (74,703 | ) | | | (1,210,200 | ) | | | | | | | (61,999 | ) | | | (837,133 | ) |
Net increase | | | | | 12,752 | | | $ | 215,467 | | | | | | | | 14,685 | | | $ | 199,756 | |
|
Investor A
|
Shares sold and automatic conversion of shares | | | | | 1,133,043 | | | $ | 17,998,647 | | | | | | | | 951,934 | | | $ | 12,700,143 | |
Shares issued to shareholders in reinvestment of distributions | | | | | 118,453 | | | | 1,883,289 | | | | | | | | — | | | | — | |
Shares redeemed | | | | | (643,233 | ) | | | (10,304,696 | ) | | | | | | | (530,548 | ) | | | (7,101,611 | ) |
Net increase | | | | | 608,263 | | | $ | 9,577,240 | | | | | | | | 421,386 | | | $ | 5,598,532 | |
|
Investor B
|
Shares sold | | | | | — | | | | — | | | | | | | | 4,674 | | | $ | 56,645 | |
Shares redeemed and automatic conversion of shares | | | | | (77,458 | ) | | $ | (1,091,164 | ) | | | | | | | (32,815 | ) | | | (403,377 | ) |
Net decrease | | | | | (77,458 | ) | | $ | (1,091,164 | ) | | | | | | | (28,141 | ) | | $ | (346,732 | ) |
|
Investor C
|
Shares sold | | | | | 1,350,231 | | | $ | 20,259,097 | | | | | | | | 1,000,837 | | | $ | 12,636,190 | |
Shares issued to shareholders in reinvestment of distributions | | | | | 213,831 | | | | 3,194,465 | | | | | | | | — | | | | — | |
Shares redeemed | | | | | (1,320,133 | ) | | | (19,773,186 | ) | | | | | | | (1,434,953 | ) | | | (17,957,410 | ) |
Net increase (decrease) | | | | | 243,929 | | | $ | 3,680,376 | | | | | | | | (434,116 | ) | | $ | (5,321,220 | ) |
Total Net Increase (Decrease)
| | | | | 787,486 | | | $ | 12,381,919 | | | | | | | | (26,186 | ) | | $ | 130,336 | |
| FDP SERIES, INC. | MAY 31, 2014 | 61
|
| |
| Notes to Financial Statements (concluded) |
|
| | | | | | | | | |
| | | | Year Ended
May 31, 2014
|
| | | Year Ended
May 31, 2013
|
Invesco Fund
|
|
|
| Shares
|
| Amount
|
|
|
| Shares
|
| Amount
|
Institutional
|
Shares sold | | | | | 84,156 | | | $ | 1,218,331 | | | | | | | | 68,808 | | | $ | 805,644 | |
Shares issued to shareholders in reinvestment of dividends | | | | | 1,645 | | | | 22,885 | | | | | | | | 3,154 | | | | 33,991 | |
Shares redeemed | | | | | (69,469 | ) | | | (999,760 | ) | | | | | | | (83,722 | ) | | | (962,274 | ) |
Net increase (decrease) | | | | | 16,332 | | | $ | 241,456 | | | | | | | | (11,760 | ) | | $ | (122,639 | ) |
|
Investor A
|
Shares sold and automatic conversion of shares | | | | | 1,192,930 | | | $ | 17,082,721 | | | | | | | | 933,273 | | | $ | 10,763,434 | |
Shares issued to shareholders in reinvestment of dividends | | | | | 14,286 | | | | 197,290 | | | | | | | | 22,032 | | | | 235,602 | |
Shares redeemed | | | | | (673,109 | ) | | | (9,690,999 | ) | | | | | | | (702,991 | ) | | | (8,097,826 | ) |
Net increase | | | | | 534,107 | | | $ | 7,589,012 | | | | | | | | 252,314 | | | $ | 2,901,210 | |
|
Investor B
|
Shares sold | | | | | — | | | | — | | | | | | | | 3,078 | | | $ | 33,489 | |
Shares issued to shareholders in reinvestment of dividends | | | | | — | | | | — | | | | | | | | 58 | | | | 595 | |
Shares redeemed and automatic conversion of shares | | | | | (83,816 | ) | | $ | (1,115,587 | ) | | | | | | | (39,772 | ) | | | (443,417 | ) |
Net decrease | | | | | (83,816 | ) | | $ | (1,115,587 | ) | | | | | | | (36,636 | ) | | $ | (409,333 | ) |
|
Investor C
|
Shares sold | | | | | 1,342,293 | | | $ | 19,102,892 | | | | | | | | 875,426 | | | $ | 10,063,322 | |
Shares issued to shareholders in reinvestment of dividends | | | | | 13,630 | | | | 186,321 | | | | | | | | 12,391 | | | | 129,149 | |
Shares redeemed | | | | | (1,410,493 | ) | | | (19,930,420 | ) | | | | | | | (1,717,188 | ) | | | (19,329,404 | ) |
Net decrease | | | | | (54,570 | ) | | $ | (641,207 | ) | | | | | | | (829,371 | ) | | $ | (9,136,933 | ) |
Total Net Increase (Decrease)
| | | | | 412,053 | | | $ | 6,073,674 | | | | | | | | (625,453 | ) | | $ | (6,767,695 | ) |
|
|
| | | | Year Ended
May 31, 2014
|
| | | Year Ended
May 31, 2013
|
Franklin Templeton Fund
|
|
|
| Shares
|
| Amount
|
|
|
| Shares
|
| Amount
|
Institutional
|
Shares sold | | | | | 204,429 | | | $ | 2,146,812 | | | | | | | | 138,789 | | | $ | 1,506,822 | |
Shares issued to shareholders in reinvestment of dividends and distributions | | | | | 12,237 | | | | 128,968 | | | | | | | | 12,955 | | | | 140,581 | |
Shares redeemed | | | | | (99,491 | ) | | | (1,051,856 | ) | | | | | | | (93,074 | ) | | | (1,007,879 | ) |
Net increase | | | | | 117,175 | | | $ | 1,223,924 | | | | | | | | 58,670 | | | $ | 639,524 | |
|
Investor A
|
Shares sold and automatic conversion of shares | | | | | 3,355,892 | | | $ | 35,320,357 | | | | | | | | 2,202,005 | | | $ | 23,895,788 | |
Shares issued to shareholders in reinvestment of dividends and distributions | | | | | 141,443 | | | | 1,491,174 | | | | | | | | 131,705 | | | | 1,430,039 | |
Shares redeemed | | | | | (1,319,845 | ) | | | (13,899,098 | ) | | | | | | | (1,009,906 | ) | | | (10,940,003 | ) |
Net increase | | | | | 2,177,490 | | | $ | 22,912,433 | | | | | | | | 1,323,804 | | | $ | 14,385,824 | |
|
Investor B
|
Shares sold | | | | | — | | | | — | | | | | | | | 6,309 | | | $ | 68,639 | |
Shares issued to shareholders in reinvestment of dividends | | | | | — | | | | — | | | | | | | | 2,182 | | | | 23,686 | |
Shares redeemed and automatic conversion of shares | | | | | (142,656 | ) | | $ | (1,516,378 | ) | | | | | | | (46,477 | ) | | | (503,529 | ) |
Net decrease | | | | | (142,656 | ) | | $ | (1,516,378 | ) | | | | | | | (37,986 | ) | | $ | (411,204 | ) |
|
Investor C
|
Shares sold | | | | | 4,301,545 | | | $ | 45,250,377 | | | | | | | | 2,456,768 | | | $ | 26,679,394 | |
Shares issued to shareholders in reinvestment of dividends and distributions | | | | | 176,930 | | | | 1,864,576 | | | | | | | | 222,823 | | | | 2,419,179 | |
Shares redeemed | | | | | (2,489,409 | ) | | | (26,192,553 | ) | | | | | | | (2,478,661 | ) | | | (26,838,898 | ) |
Net increase | | | | | 1,989,066 | | | $ | 20,922,400 | | | | | | | | 200,930 | | | $ | 2,259,675 | |
Total Net Increase
| | | | | 4,141,075 | | | $ | 43,542,379 | | | | | | | | 1,545,418 | | | $ | 16,873,819 | |
11. Subsequent Events:
Management has evaluated the impact of all subsequent events on the Funds through the date the financial statements were issued and has determined that there were no subsequent events requiring adjustment or additional disclosure in the financial statements.
| 62 | FDP SERIES, INC. | MAY 31, 2014
|
| |
Report of Independent Registered Public Accounting Firm
|
To the Shareholders of MFS Research International FDP Fund, Marsico Growth FDP Fund, Invesco Value FDP Fund and Franklin Templeton Total Return FDP Fund and the Board of Directors of FDP Series, Inc.:
We have audited the accompanying statements of assets and liabilities, including the schedules of investments, of MFS Research International FDP Fund, Marsico Growth FDP Fund, Invesco Value FDP Fund and Franklin Templeton Total Return FDP Fund, each a series of FDP Series, Inc., (the “Corporation”) as of May 31, 2014, the related statements of operations for the year then ended, the statements of changes in net assets for each of the two years in the period then ended, and the financial highlights for each of the five years in the period then ended. These financial statements and financial highlights are the responsibility of the Corporation’s management. Our responsibility is to express an opinion on these financial statements and financial highlights based on our audits.
We conducted our audits in accordance with the standards of the Public Company Accounting Oversight Board (United States). Those standards require that we plan and perform the audit to obtain reasonable assurance about whether the financial statements and financial highlights are free of material misstatement. The Corporation is not required to have, nor were we engaged to perform, an audit of its internal control over financial reporting. Our audits included consideration of internal control over financial reporting as a basis for designing audit procedures that are appropriate in the circumstances, but not for the purpose of expressing an opinion on the effectiveness of the Corporation’s internal control over financial reporting. Accordingly, we express no such opinion. An audit also includes examining, on a test basis, evidence supporting the amounts and disclosures in the financial statements, assessing the accounting principles used and significant estimates made by management, as well as evaluating the overall financial statement presentation. Our procedures included confirmation of securities owned as of May 31, 2014, by correspondence with the custodian, brokers and other financial intermediaries; where replies were not received from brokers and other financial intermediaries, we performed other auditing procedures. We believe that our audits provide a reasonable basis for our opinion.
In our opinion, the financial statements and financial highlights referred to above present fairly, in all material respects, the financial positions of MFS Research International FDP Fund, Marsico Growth FDP Fund, Invesco Value FDP Fund and Franklin Templeton Total Return FDP Fund, each a series of FDP Series, Inc., as of May 31, 2014, the results of their operations for the year then ended, the changes in their net assets for each of the two years in the period then ended, and the financial highlights for each of the five years in the period then ended, in conformity with accounting principles generally accepted in the United States of America.
Deloitte & Touche LLP
Boston, Massachusetts
July 28, 2014
| |
Important Tax Information (Unaudited)
|
The following information is provided with respect to the ordinary income distributions paid by the FDP Series, Inc. during the fiscal year ended May 31, 2014.
|
| Payable Date/
Months Paid
|
| MFS Fund
| Marsico
Growth
| Invesco
Fund
| Franklin
Templeton Fund
|
| Qualified Dividend Income for Individuals | | 7/19/13 | | | 100.00% | 1 | | — | | | 100.00% | | | — | |
| | | 12/06/13 | | | — | | | 28.02% | | | — | | | — | |
| Dividends Qualifying for the Dividend Received | | 7/19/13 | | | 0.71% | 1 | | — | | | 100.00% | | | — | |
| Deduction for Corporations | | 12/06/13 | | | — | | | 24.20% | | | — | | | — | |
| Foreign Source Income | | 7/19/13 | | | 100.00% | 1 | | — | | | — | | | — | |
| Foreign Taxes Paid Per Share | | 7/19/13 | | $ | 0.027483 | | | — | | | — | | | — | |
Interest Related Dividends for Non-U.S. Residents2 | | June 2013 – December 2013 | | | — | | | — | | | — | | | 100.00% | |
| | | January 2014 – May 2014 | | | — | | | — | | | — | | | 52.75% | |
Federal Obligation Interest3 | | June 2013 – May 2014 | | | — | | | | | | — | | | 9.60% | |
| Long-Term Capital Gains Per Share | | 12/06/2013 | | | — | | $ | 0.430248 | | | — | | | — | |
| | | 12/20/2013 | | | — | | | — | | | — | | $ | 0.005364 | |
| | | 5/31/2014 | | | — | | | — | | | — | | $ | 0.004074 | |
| 1 | | Expressed as a percentage of the cash distribution grossed-up for foreign taxes. |
| | The foreign taxes paid represent taxes incurred by the Fund on income received by the Fund from foreign sources. Foreign taxes paid may be included in taxable income with an offsetting deduction from gross income or may be taken as a credit for taxes paid to foreign governments. You should consult your tax advisor regarding the appropriate treatment of foreign taxes paid. |
| 2 | | Represents the portion of the taxable ordinary income dividends eligible for exemption from U.S. withholding tax for nonresident aliens and foreign corporations. |
| 3 | | The law varies in each state as to whether and what percentage of dividend income attributable to Federal Obligations is exempt from state income tax. We recommend that you consult your tax advisor to determine if any portion of the dividends you received is exempt from state income taxes. |
| FDP SERIES, INC. | MAY 31, 2014 | 63
|
| |
Disclosure of Investment Advisory Agreement and Sub-Advisory Agreements
|
The Board of Directors (the “Board,” and the members of which are referred to as “Board Members”) of FDP Series, Inc. (the “Corporation”) met in person on April 8, 2014 (the “April Meeting”) and May 13-14, 2014 (the “May Meeting”) to consider the approval of the investment advisory agreement (the “Advisory Agreement”) between the Corporation, on behalf of Franklin Templeton Total Return FDP Fund (the “Franklin Templeton Fund”), Invesco Value FDP Fund (the “Invesco Fund”), Marsico Growth FDP Fund (the “Marsico Fund”), and MFS Research International FDP Fund (the “MFS Fund”) (each, a “Fund”), each a series of the Corporation, and BlackRock Advisors, LLC (the “Manager” or “BlackRock”), each Fund’s investment advisor. The Board also considered the approval of the sub-advisory agreements (collectively, the “Sub-Advisory Agreements”) between the Manager and each of (i) Franklin Advisers, Inc. (“Franklin”); (ii) Invesco Advisers, Inc. (“Invesco”); (iii) Marsico Capital Management, LLC (“Marsico”); and (iv) Massachusetts Financial Services Company (“MFS”) (collectively, the “Sub-Advisors”), with respect to the respective Fund. The Advisory Agreement and the Sub-Advisory Agreements are referred to herein as the “Agreements.”
Activities and Composition of the Board
The Board consists of thirteen individuals, ten of whom are not “interested persons” of the Corporation as defined in the Investment Company Act of 1940, as amended (the “1940 Act”) (the “Independent Board Members”). The Board Members are responsible for the oversight of the operations of each Fund and perform the various duties imposed on the directors of investment companies by the 1940 Act. The Independent Board Members have retained independent legal counsel to assist them in connection with their duties. The Chairman of the Board is an Independent Board Member. The Board has established five standing committees: an Audit Committee, a Governance and Nominating Committee, a Compliance Committee, a Performance Oversight Committee and an Executive Committee, each of which is chaired by an Independent Board Member and composed of Independent Board Members (except for the Performance Oversight Committee and the Executive Committee, each of which also has one interested Board Member).
The Agreements
Pursuant to the 1940 Act, the Board is required to consider the continuation of the Agreements on an annual basis. The Board has four quarterly meetings per year, each extending over two days, and a fifth one-day meeting to consider specific information surrounding the consideration of renewing the Agreements. In connection with this process, the Board assessed, among other things, the nature, scope and quality of the services provided to each Fund by BlackRock, its personnel and its affiliates, and the Sub-Advisors, including (as applicable) investment management; administrative and shareholder services; oversight of service providers; marketing services; risk oversight; compliance and assistance in meeting applicable legal and regulatory requirements.
The Board, acting directly and through its committees, considers at each of its meetings, and from time to time as appropriate, factors that are relevant to its annual consideration of the renewal of the Agreements, including the services and support provided by BlackRock and the Sub-Advisors to each Fund and its shareholders. Among the matters the Board considered were: (a) investment performance for one-year, three-year, five-year and/or since inception periods, as applicable, against peer funds, and applicable benchmarks, if any, as well as senior management’s and portfolio managers’ analysis of the reasons for any over-performance or underperformance against its peers and/or benchmark, as applicable; (b) fees, including advisory, administration, if applicable, and other amounts paid to BlackRock and its affiliates by each Fund for services, such as marketing and distribution, call center and fund accounting; (c) Fund operating expenses and how BlackRock allocates expenses to each Fund; (d) the resources devoted to, risk oversight of, and compliance reports relating to, implementation of each Fund’s investment objective, policies and restrictions, and meeting new regulatory requirements; (e) each Fund’s compliance with its Code of Ethics and other compliance policies and procedures; (f) the nature, cost and character of non-investment management services provided by BlackRock and its affiliates; (g) BlackRock’s, the Sub-Advisors’ and other service providers’ internal controls and risk and compliance oversight mechanisms; (h) BlackRock’s implementation of the proxy voting policies approved by the Board; (i) the use of brokerage commissions, as applicable, and execution quality of portfolio transactions; (j) BlackRock’s implementation of each Fund’s valuation and liquidity procedures; (k) an analysis of management fees for products with similar investment objectives across the open-end fund, exchange-traded fund (“ETF”), closed-end fund and institutional account product channels, as applicable, and the similarities and differences between the services provided to these products as compared to each Fund; (l) BlackRock’s compensation methodology for its investment professionals and the incentives it creates; (m) periodic updates on BlackRock’s and the Sub-Advisors’ businesses; and (n) sub-advisory fees paid by the Manager to the Sub-Advisors, the division of responsibilities among the Manager and the Sub-Advisors, and the oversight of the Sub-Advisors provided by the Manager.
The Board has engaged in an ongoing strategic review with BlackRock of opportunities to consolidate funds and of BlackRock’s commitment to investment performance. BlackRock also furnished information to the Board in response to specific questions. These questions covered issues such as: BlackRock’s profitability; investment performance; subadvisory and advisory relationships with other clients (including mutual funds sponsored by third parties); the viability of specific funds; manager capacity and the potential for closing certain funds to new investments; portfolio managers’ investments in funds they manage; supplemental service agreements with third party distribution partners; and management fee levels and breakpoints. The Board further discussed with BlackRock: BlackRock’s management structure; portfolio turnover, execution quality and use of soft dollars; BlackRock’s portfolio manager compensation and performance accountability; marketing support for the funds; services provided to the funds by BlackRock affiliates; and BlackRock’s oversight of relationships with third party service providers.
Board Considerations in Approving the Agreements
The Approval Process: Prior to the April Meeting, the Board requested and received materials specifically relating to the Agreements. The Board is continuously engaged in a process with its independent legal counsel, BlackRock, and the Sub-Advisors to review the nature and scope of the
| 64 | FDP SERIES, INC. | MAY 31, 2014
|
| |
Disclosure of Investment Advisory Agreement and Sub-Advisory Agreements (continued)
|
information provided to better assist its deliberations. The materials provided in connection with the April Meeting included (a) information independently compiled and prepared by Lipper, Inc. (“Lipper”) on Fund fees and expenses as compared with a peer group of funds as determined by Lipper (“Expense Peers”) and the investment performance of each Fund as compared with a peer group of funds as determined by Lipper1; (b) information on the profits realized by BlackRock and its affiliates, and the Sub-Advisors pursuant to the Agreements and a discussion of fall-out benefits to BlackRock and its affiliates; (c) a general analysis provided by BlackRock concerning investment management fees charged to other clients, such as institutional clients, ETFs and closed-end funds, under similar investment mandates, as well as the performance of such other clients, as applicable; (d) review of non-management fees; (e) the existence, impact and sharing of potential economies of scale; (f) a summary of aggregate amounts paid by each Fund to BlackRock; (g) sales and redemption data regarding each Fund’s shares; and (h) if applicable, a comparison of management fees to similar BlackRock open-end funds, as classified by Lipper.
At the April Meeting, the Board reviewed materials relating to its consideration of the Agreements. As a result of the discussions that occurred during the April Meeting, and as a culmination of the Board’s year-long deliberative process, the Board presented BlackRock and the Sub-Advisors with questions and requests for additional information. BlackRock and the Sub-Advisors responded to these requests with additional written information in advance of the May Meeting.
At the May Meeting, the Board, including the Independent Board Members, approved the continuation of the Advisory Agreement between the Manager and the Corporation, on behalf of each Fund, and the Sub-Advisory Agreements between the Manager and the Sub-Advisors with respect to each Fund, each for a one-year term ending June 30, 2015. In approving the continuation of the Agreements, the Board considered: (a) the nature, extent and quality of the services provided by BlackRock and the Sub-Advisors; (b) the investment performance of each Fund, BlackRock and the Sub-Advisors; (c) the advisory fee and the cost of the services and profits to be realized by BlackRock and its affiliates from their relationship with each Fund; (d) each Fund’s costs to investors compared to the costs of Expense Peers and performance compared to the relevant performance comparison as previously discussed; (e) economies of scale; (f) fall-out benefits to BlackRock and its affiliates as a result of its relationship with each Fund; and (g) other factors deemed relevant by the Board Members.
The Board also considered other matters it deemed important to the approval process, such as payments made to BlackRock or its affiliates relating to the distribution of Fund shares and securities lending, services related to the valuation and pricing of Fund portfolio holdings, direct and indirect benefits to BlackRock and its affiliates from their relationship with each Fund and advice from independent legal counsel with respect to the review process and materials submitted for the Board’s review. The Board noted the willingness of BlackRock personnel and the investment personnel of each Sub-Advisor to engage in open, candid discussions with the Board. The Board did not identify any particular information as determinative, and each Board Member may have attributed different weights to the various items considered.
A. Nature, Extent and Quality of the Services Provided by BlackRock and the Sub-Advisors
The Board, including the Independent Board Members, reviewed the nature, extent and quality of services provided by BlackRock and the Sub-Advisors, including the investment advisory and sub-advisory services and the resulting performance of each Fund. Throughout the year, the Board compared Fund performance to the performance of a comparable group of mutual funds and/or the performance of a relevant benchmark, as applicable. The Board met with BlackRock’s senior management personnel responsible for investment activities, including the senior investment officers, and the investment personnel of each Sub-Advisor. The Board also reviewed the materials provided by each Fund’s portfolio management team discussing each Fund’s performance and each Fund’s investment objective, strategies and outlook.
The Board considered, among other factors, with respect to BlackRock and the Sub-Advisors: the number, education and experience of investment personnel generally and each Fund’s portfolio management team; investments by portfolio managers in the funds they manage; portfolio trading capabilities; use of technology; commitment to compliance; credit analysis capabilities; and risk analysis and oversight capabilities.
In addition to advisory services, the Board considered the quality of the administrative and other non-investment advisory services provided to each Fund. BlackRock and its affiliates provide each Fund with certain administrative, shareholder and other services (in addition to any such services provided to each Fund by third parties) and officers and other personnel as are necessary for the operations of each Fund. In particular, BlackRock and its affiliates provide each Fund with the following administrative services including, among others: (i) preparing disclosure documents, such as the prospectus, the summary prospectus (as applicable), the statement of additional information and periodic shareholder reports; (ii) oversight of daily accounting and pricing; (iii) overseeing and coordinating the activities of other service providers; (iv) organizing Board meetings and preparing the materials for such Board meetings; (v) providing legal and compliance support; (vi) furnishing analytical and other support to assist the Board in its consideration of strategic issues such as the merger or consolidation of certain open-end funds; and (vii) performing other administrative functions necessary for the operation of each Fund, such as tax reporting, fulfilling regulatory filing requirements and call center services. The Board reviewed the structure and duties of BlackRock’s fund administration, shareholder services, legal and compliance departments and considered BlackRock’s policies and procedures for assuring compliance with applicable laws and regulations.
| 1 | | Funds are ranked by Lipper in quartiles, ranging from first to fourth, where first is the most desirable quartile position and fourth is the least desirable. |
| FDP SERIES, INC. | MAY 31, 2014 | 65
|
| |
Disclosure of Investment Advisory Agreement and Sub-Advisory Agreements (continued)
|
B. The Investment Performance of each Fund, BlackRock and the Sub-Advisors
The Board, including the Independent Board Members, also reviewed and considered the performance history of each Fund. In preparation for the April Meeting, the Board worked with its independent legal counsel, BlackRock and Lipper to develop a template for, and was provided with, reports independently prepared by Lipper, which included a comprehensive analysis of each Fund’s performance. The Board also reviewed a narrative and statistical analysis of the Lipper data that was prepared by BlackRock, which analyzed various factors that affect Lipper’s rankings. In connection with its review, the Board received and reviewed information regarding the investment performance of each Fund as compared to other funds in its applicable Lipper category. The Board was provided with a description of the methodology used by Lipper to select peer funds and periodically meets with Lipper representatives to review its methodology. The Board and its Performance Oversight Committee regularly review, and meet with Fund management to discuss, the performance of each Fund throughout the year.
The Board noted that for the one-, three- and five-year periods reported, the Franklin Templeton Fund ranked in the third, fourth and third quartiles, respectively, against its Lipper Performance Universe. The Board, BlackRock and Franklin reviewed and discussed the reasons for the Franklin Templeton Fund’s underperformance during these periods. The Board was informed that, the main detractors of performance during these periods was the Franklin Templeton Fund’s underweight position in corporate debt securities and overweight to U.S. Treasuries and agency mortgage backed securities. The corporate investment grade bonds have significantly outperformed the broad fixed income market including U.S. Treasuries and agency MBS during these periods.
The Board, BlackRock and Franklin also discussed Franklin’s strategy for improving the Franklin Templeton Fund’s performance and Franklin’s commitment to providing the resources necessary to assist the Franklin Templeton Fund’s portfolio managers in seeking to improve the Franklin Templeton Fund’s performance.
The Board noted that for the one-, three- and five-year periods reported, the Invesco Fund ranked in the second, first and first quartiles, respectively, against its Lipper Performance Universe.
The Board noted that for the one-, three- and five-year periods reported, the Marsico Fund ranked in the second, third and third quartiles, respectively, against its Lipper Performance Universe. The Board noted the Marsico Fund’s improved performance during the one-year period. The Board, BlackRock, and Marsico reviewed and discussed the reasons for the Marsico Fund’s underperformance during the three- and five-year periods. The Board was informed that, the primary detractors of performance for the three-year period were stock selections made in the consumer cyclical, capital goods and financial sectors and an over weighted posture in industrials. The primary detractor of performance for the five-year period was the Marsico Fund’s high-quality orientation, as lower quality stocks outperformed high-quality stocks. Stock selections made in the energy, health care and consumer staples sectors, along with an underweighted posture in consumer staples and technology, also detracted from performance in the five-year period.
The Board, BlackRock and Marsico also discussed Marsico’s strategy for improving the Marsico Fund’s performance and Marsico’s commitment to providing the resources necessary to assist the Marsico Fund’s portfolio managers in seeking to improve the Marsico Fund’s performance.
The Board noted that for the one-, three- and five-year periods reported, the MFS Fund ranked in the fourth, third and second quartiles, respectively, against its Lipper Performance Universe. The Board, BlackRock, and MFS reviewed and discussed the reasons for the MFS Fund’s underperformance during the one- and three-year periods. The Board was informed that the MFS Fund’s positions in the emerging markets region detracted from performance during the one- and three-year periods as the emerging markets region significantly underperformed international developed markets equities. The MFS Fund’s overweight allocations within the region are a direct result of the bottom-up stock selection process by the MFS Fund’s portfolio management team.
The Board, BlackRock and MFS also discussed MFS’s strategy for improving the MFS Fund’s performance and MFS’s commitment to providing the resources necessary to assist the MFS Fund’s portfolio managers in seeking to improve the MFS Fund’s performance.
C. Consideration of the Advisory/Management Fees and the Cost of the Services and Profits to be Realized by BlackRock and its Affiliates and the Sub-Advisors from their Relationship with each Fund
The Board, including the Independent Board Members, reviewed each Fund’s contractual management fee rate compared with the other funds in its Lipper category. The contractual management fee rate represents a combination of the advisory fee and any administrative fees, before taking into account any reimbursements or fee waivers. The Board also compared each Fund’s total expense ratio, as well as its actual management fee rate, to those of other funds in its Lipper category. The total expense ratio represents a fund’s total net operating expenses, including any 12b-1 or non 12b-1 service fees. The total expense ratio gives effect to any expense reimbursements or fee waivers that benefit a fund, and the actual management fee rate gives effect to any management fee reimbursements or waivers that benefit a fund. The Board considered the services provided and the fees charged by BlackRock and its affiliates to other types of clients with similar investment mandates, as applicable, including institutional accounts.
The Board received and reviewed statements relating to BlackRock’s financial condition. The Board was also provided with a profitability analysis that detailed the revenues earned and the expenses incurred by BlackRock for services provided to each Fund. The Board reviewed BlackRock’s profitability with respect to each Fund and other funds the Board currently oversees for the year ended December 31, 2013 compared to available aggregate profitability data provided for the two prior years. The Board reviewed BlackRock’s profitability with respect to certain other fund complexes managed by the Manager and/or its affiliates. The Board reviewed BlackRock’s assumptions and methodology
| 66 | FDP SERIES, INC. | MAY 31, 2014
|
| |
Disclosure of Investment Advisory Agreement and Sub-Advisory Agreements (continued)
|
of allocating expenses in the profitability analysis, noting the inherent limitations in allocating costs among various advisory products. The Board recognized that profitability may be affected by numerous factors including, among other things, fee waivers and expense reimbursements by the Manager, the types of funds managed, precision of expense allocations and business mix. As a result, calculating and comparing profitability at individual fund levels is difficult.
The Board noted that, in general, individual fund or product line profitability of other advisors is not publicly available. The Board reviewed BlackRock’s overall operating margin, in general, compared to that of certain other publicly-traded asset management firms. The Board considered the differences between BlackRock and these other firms, including the contribution of technology at BlackRock, BlackRock’s expense management, and the relative product mix.
In addition, the Board considered the cost of the services provided to each Fund by BlackRock, and BlackRock’s and its affiliates’ profits relating to the management and distribution of each Fund and the other funds advised by BlackRock and its affiliates. As part of its analysis, the Board reviewed BlackRock’s methodology in allocating its costs to the management of each Fund. The Board also considered whether BlackRock and the Sub-Advisors have the financial resources necessary to attract and retain high quality investment management personnel to perform its obligations under the Agreements and to continue to provide the high quality of services that is expected by the Board. The Board further considered factors including but not limited to BlackRock’s commitment of time, assumption of risk and liability profile in servicing the Fund in contrast to what is required of BlackRock with respect to other products with similar investment objectives across the open-end fund, ETF, closed-end fund and institutional account product channels, as applicable.
The Board noted that the Franklin Templeton Fund’s contractual management fee rate ranked in the first quartile, and that the actual management fee rate and total expense ratio each ranked in the second quartile, relative to the Franklin Templeton Fund’s Expense Peers. The Board also noted that the Franklin Templeton Fund has an advisory fee arrangement that includes breakpoints that adjust the fee rate downward as the size of the Franklin Templeton Fund increases above certain contractually specified levels. The Board further noted that BlackRock has voluntarily agreed to a cap on the Franklin Templeton Fund’s total expenses as a percentage of the Franklin Templeton Fund’s average daily net assets on a class-by-class basis. The Board noted that the voluntary cap is scheduled to convert to a contractual cap.
The Board noted that the Invesco Fund’s contractual management fee rate ranked in the first quartile, and that the actual management fee rate and total expense ratio ranked in the third and second quartiles, respectively, relative to the Invesco Fund’s Expense Peers. The Board determined that the Invesco Fund’s actual management fee rate was appropriate in light of the median actual management fee rate paid by the Invesco Fund’s Expense Peers. The Board also noted that the Invesco Fund has an advisory fee arrangement that includes breakpoints that adjust the fee rate downward as the size of the Invesco Fund increases above certain contractually specified levels. The Board further noted that BlackRock has voluntarily agreed to a cap on the Invesco Fund’s total expenses as a percentage of the Invesco Fund’s average daily net assets on a class-by-class basis. The Board noted that the voluntary cap is scheduled to convert to a contractual cap.
The Board noted that the Marsico Fund’s contractual management fee rate ranked in the third quartile, and that the actual management fee rate and total expense ratio ranked in the fourth and third quartiles, respectively, relative to the Marsico Fund’s Expense Peers. The Board determined that the Marsico Fund’s contractual management fee rate and total expense ratio were appropriate in light of the median contractual management fee rate and total expense ratio paid by the Marsico Fund’s Expense Peers. The Board also noted that the Marsico Fund has an advisory fee arrangement that includes breakpoints that adjust the fee rate downward as the size of the Marsico Fund increases above certain contractually specified levels. The Board further noted that BlackRock has voluntarily agreed to a cap on the Marsico Fund’s total expenses as a percentage of the Marsico Fund’s average daily net assets on a class-by-class basis. The Board noted that the voluntary cap is scheduled to convert to a contractual cap. In addition, the Board noted that BlackRock had voluntarily agreed to waive a portion of the advisory fee payable by the Marsico Fund, which was implemented on June 1, 2012. After discussions between the Board, including the Independent Board Members, and BlackRock, the Board and BlackRock agreed to a continuation of the voluntary advisory fee reduction, which may result in savings to shareholders.
The Board noted that the MFS Fund’s contractual management fee rate ranked in the second quartile, and that the actual management fee rate and total expense ratio each ranked in the third quartile, relative to the MFS Fund’s Expense Peers. The Board determined that the MFS Fund’s actual management fee rate and total expense ratio were appropriate in light of the median actual management fee rate and total expense ratio paid by the MFS Fund’s Expense Peers. The Board also noted that the MFS Fund has an advisory fee arrangement that includes breakpoints that adjust the fee rate downward as the size of the MFS Fund increases above certain contractually specified levels. The Board further noted that BlackRock has voluntarily agreed to a cap on the MFS Fund’s total expenses as a percentage of the MFS Fund’s average daily net assets on a class-by-class basis. The Board noted that the voluntary cap is scheduled to convert to a contractual cap.
D. Economies of Scale
The Board, including the Independent Board Members, considered the extent to which economies of scale might be realized as the assets of each Fund increase, as well as the existence of expense caps, as applicable. The Board also considered the extent to which each Fund benefits from such economies and whether there should be changes in the advisory fee rate or breakpoint structure in order to enable each Fund to participate in these economies of scale, for example through the use of revised breakpoints in the advisory fee based upon the asset level of each Fund. In its consideration, the Board Members took into account the existence of any expense caps and further considered the continuation and/or implementation, as applicable, of such caps.
| FDP SERIES, INC. | MAY 31, 2014 | 67
|
| |
Disclosure of Investment Advisory Agreement and Sub-Advisory Agreements (concluded)
|
E. Other Factors Deemed Relevant by the Board Members
The Board, including the Independent Board Members, also took into account other ancillary or “fall-out” benefits that BlackRock or its affiliates may derive from their respective relationships with each Fund, both tangible and intangible, such as BlackRock’s ability to leverage its investment professionals who manage other portfolios and risk management personnel, an increase in BlackRock’s profile in the investment advisory community, and the engagement of BlackRock’s affiliates as service providers to each Fund, including for administrative, distribution, securities lending and cash management services. The Board also considered BlackRock’s and the Sub-Advisors’ overall operations and BlackRock’s efforts to expand the scale of, and improve the quality of, its operations. The Board also noted that BlackRock and the Sub-Advisors may use and benefit from third party research obtained by soft dollars generated by certain registered fund transactions to assist in managing all or a number of their other client accounts. The Board further noted that it had considered the investment by BlackRock’s funds in ETFs without any offset against the management fees payable by the funds to BlackRock.
In connection with its consideration of the Agreements, the Board also received information regarding BlackRock’s and the Sub-Advisors’ brokerage and soft dollar practices. The Board received reports from BlackRock which included information on brokerage commissions and trade execution practices throughout the year.
The Board noted the competitive nature of the open-end fund marketplace, and that shareholders are able to redeem their Fund shares if they believe that each Fund’s fees and expenses are too high or if they are dissatisfied with the performance of each Fund.
Conclusion
The Board, including the Independent Board Members, approved the continuation of the Advisory Agreement between the Manager and the Corporation, on behalf of each Fund, for a one-year term ending June 30, 2015, and the Sub-Advisory Agreements between the Manager and each Sub-Advisor with respect to each Fund for a one-year term ending June 30, 2015. Based upon its evaluation of all of the aforementioned factors in their totality, the Board, including the Independent Board Members, was satisfied that the terms of the Agreements were fair and reasonable and in the best interest of each Fund and its shareholders. In arriving at its decision to approve the Agreements, the Board did not identify any single factor or group of factors as all-important or controlling, but considered all factors together, and different Board Members may have attributed different weights to the various factors considered. The Independent Board Members were also assisted by the advice of independent legal counsel in making this determination. The contractual fee arrangements for each Fund reflect the results of several years of review by the Board Members and predecessor Board Members, and discussions between such Board Members (and predecessor Board Members) and BlackRock and the Sub-Advisors. As a result, the Board Members’ conclusions may be based in part on their consideration of these arrangements in prior years.
| 68 | FDP SERIES, INC. | MAY 31, 2014
|
| | | | | | | | | | | | | |
Name, Address
and Year of Birth | | | | Position(s)
Held with
Corporation | | Length
of Time
Served as
a Director2 | | Principal Occupation(s) During Past Five Years | | Number of BlackRock-
Advised Registered
Investment Companies
(“RICs”) Consisting of
Investment Portfolios
(“Portfolios”) Overseen | | Public
Directorships |
Independent Directors1 |
| |
Robert M. Hernandez
55 East 52nd Street
New York, NY 10055
1944 | | | | Chairman of the Board
and Director | | Since 2007 | | Director, Vice Chairman and Chief Financial Officer of USX Corporation (energy and steel business) from 1991 to 2001; Director, TE Connectivity (electronics) from 2006 to 2012. | | 29 RICs consisting of
96 Portfolios | | ACE Limited (insurance company); Eastman Chemical Company; RTI International Metals, Inc. |
| |
Fred G. Weiss
55 East 52nd Street
New York, NY 10055
1941 | | | | Vice Chairman of the Board and Director | | Since 2007 | | Managing Director, FGW Associates (consulting and investment company) since 1997; Director and Treasurer, Michael J. Fox Foundation for Parkinson’s Research since 2000; Director, BTG International Plc (medical technology commercialization company) from 2001 to 2007. | | 29 RICs consisting of
96 Portfolios | | Actavis plc (pharmaceuticals) |
| |
James H. Bodurtha
55 East 52nd Street
New York, NY 10055
1944 | | | | Director | | Since 2007 | | Director, The China Business Group, Inc. (consulting and investing firm) from 1996 to 2013 and Executive Vice President thereof from 1996 to 2003; Chairman of the Board, Berkshire Holding Corporation since 1980. | | 29 RICs consisting of
96 Portfolios | | None |
| |
Bruce R. Bond
55 East 52nd Street
New York, NY 10055
1946 | | | | Director | | Since 2007 | | Trustee and Member of the Governance Committee, State Street Research Mutual Funds from 1997 to 2005; Board Member of Governance, Audit and Finance Committee, Avaya Inc. (computer equipment) from 2003 to 2007. | | 29 RICs consisting of
96 Portfolios | | None |
| |
Donald W. Burton
55 East 52nd Street
New York, NY 10055
1944 | | | | Director | | Since 2007 | | Managing General Partner, The Burton Partnership, LP (an investment partnership) since 1979; Managing General Partner, The South Atlantic Venture Funds from 1983 to 2012; Director, IDology, Inc. (technology solutions) since 2006; Director, Knology, Inc. (telecommunications) from 1996 to 2012; Director, Capital Southwest from 2006 to 2012. | | 29 RICs consisting of
96 Portfolios | | None |
| |
Honorable
Stuart E. Eizenstat
55 East 52nd Street
New York, NY 10055
1943 | | | | Director | | Since 2007 | | Partner and Head of International Practice, Covington and Burling LLP (law firm) since 2001; International Advisory Board Member, The Coca-Cola Company from 2002 to 2011; Advisory Board Member, Veracity Worldwide, LLC (risk management) from 2007 to 2012; Member of the International Advisory Board GML Ltd. (energy) since 2003; Advisory Board Member, BT Americas (telecommunications) from 2004 to 2009. | | 29 RICs consisting of
96 Portfolios | | Alcatel-Lucent (telecommunications); Global Specialty Metallurgical; UPS Corporation (delivery service) |
| |
Kenneth A. Froot
55 East 52nd Street
New York, NY 10055
1957 | | | | Director | | Since 2007 | | Professor, Harvard University since 1992. | | 29 RICs consisting of
96 Portfolios | | None |
| |
John F. O’Brien
55 East 52nd Street
New York, NY 10055
1943 | | | | Director | | Since 2007 | | Chairman, Woods Hole Oceanographic Institute since 2009 and Trustee thereof from 2003 to 2009; Director, Ameresco, Inc. (energy solutions company) from 2006 to 2007. | | 29 RICs consisting of
96 Portfolios | | Cabot Corporation (chemicals); LKQ Corporation (auto parts manufacturing); TJX Companies, Inc. (retailer) |
| |
Roberta Cooper Ramo
55 East 52nd Street
New York, NY 10055
1942 | | | | Director | | Since 2007 | | Shareholder and Attorney, Modrall, Sperling, Roehl, Harris & Sisk, P.A. (law firm) since 1993; Chairman of the Board, Cooper’s Inc., (retail) since 1999; Director, ECMC Group (service provider to students, schools and lenders) since 2001; President, The American Law Institute (non-profit) since 2008. | | 29 RICs consisting of
96 Portfolios | | None |
| FDP SERIES, INC. | MAY 31, 2014 | 69
|
| |
| Officers and Directors (continued) |
|
| | | | | | | | | | | | | |
Name, Address
and Year of Birth | | | | Position(s)
Held with
Corporation | | Length
of Time
Served as
a Director2 | | Principal Occupation(s) During Past Five Years | | Number of BlackRock-
Advised Registered
Investment Companies
(“RICs”) Consisting of
Investment Portfolios
(“Portfolios”) Overseen | | Public
Directorships |
Independent Directors1 (concluded) |
| |
David H. Walsh
55 East 52nd Street
New York, NY 10055
1941 | | | | Director | | Since 2007 | | Director, National Museum of Wildlife Art since 2007; Trustee, University of Wyoming Foundation from 2008 to 2012; Director, Ruckelshaus Institute and Haub School of Natural Resources at the University of Wyoming from 2006 to 2008; Director, The American Museum of Fly Fishing since 1997. | | 29 RICs consisting of
96 Portfolios | | None |
| | | | | 1 Each Independent Director holds office until his or her successor is duly elected and qualifies or until his or her earlier death, resignation or removal as provided by the Fund’s by-laws or charter or statute. In no event may an Independent Director hold office beyond December 31 of the year in which he or she turns 74. |
| |
| | | | | 2 Date shown is the earliest date a person has served for the Corporation covered by this annual report. Following the combination of Merrill Lynch Investment Managers, L.P. (“MLIM”) and BlackRock, Inc. (“BlackRock”) in September 2006, the various legacy MLIM and legacy BlackRock fund boards were realigned and consolidated into three new fund boards in 2007. As a result, although the chart shows certain Directors as joining the Funds’ board in 2007, those Directors first became members of the boards of other legacy MLIM or legacy BlackRock funds as follows: James H. Bodurtha, 1995; Bruce R. Bond, 2005; Donald W. Burton, 2002; Honorable Stuart E. Eizenstat, 2001; Kenneth A. Froot, 2005; Robert M. Hernandez, 1996; John F. O’Brien, 2005; Roberta Cooper Ramo, 1999; David H. Walsh, 2003; and Fred G. Weiss, 1998. |
| | | | | | | | | | | | | |
Interested Directors3 |
| |
Paul L. Audet
55 East 52nd Street
New York, NY 10055
1953 | | | | Director | | Since 2011 | | Senior Managing Director of BlackRock and Head of U.S. Mutual Funds since 2011; Chair of the U.S. Mutual Funds Committee reporting to the Global Executive Committee since 2011; Head of BlackRock’s Real Estate business from 2008 to 2011; Member of BlackRock’s Global Operating and Corporate Risk Management Committees and of the BlackRock Alternative Investors Executive Committee and Investment Committee for the Private Equity Fund of Funds business since 2008; Head of BlackRock’s Global Cash Management business from 2005 to 2010; Acting Chief Financial Officer of BlackRock from 2007 to 2008; Chief Financial Officer of BlackRock from 1998 to 2005. | | 144 RICs consisting of
333 Portfolios | | None |
| |
Laurence D. Fink
55 East 52nd Street
New York, NY 10055
1952 | | | | Director | | Since 2007 | | Chairman and Chief Executive Officer of BlackRock since its formation in 1998 and of BlackRock’s predecessor entities since 1988 and Chairman of the Executive and Management Committees; Formerly Managing Director, The First Boston Corporation, Member of its Management Committee, Co-head of its Taxable Fixed Income Division and Head of its Mortgage and Real Estate Products Group; Chairman of the Board of several of BlackRock’s alternative investment vehicles; Director of several of BlackRock’s offshore funds; Member of the Board of Trustees of New York University, Chair of the Financial Affairs Committee and a member of the Executive Committee, the Ad Hoc Committee on Board Governance, and the Committee on Trustees; Co-Chairman of the NYU Hospitals Center Board of Trustees, Chairman of the Development/Trustee Stewardship Committee and Chairman of the Finance Committee; Trustee, The Boys’ Club of New York. | | 29 RICs consisting of
96 Portfolios | | BlackRock, Inc. |
| |
Henry Gabbay
55 East 52nd Street
New York, NY 10055
1947 | | | | Director | | Since 2007 | | Consultant, BlackRock from 2007 to 2008; Managing Director, BlackRock from 1989 to 2007; Chief Administrative Officer, BlackRock Advisors, LLC from 1998 to 2007; President of BlackRock Funds and BlackRock Bond Allocation Target Shares (formerly, BlackRock Bond Allocation Target Shares) from 2005 to 2007 and Treasurer of certain closed-end funds in the BlackRock fund complex from 1989 to 2006. | | 144 RICs consisting of
333 Portfolios | | None |
| | | | | 3 Messrs. Audet and Fink are both “interested persons,” as defined in the 1940 Act, of the Corporation based on their positions with BlackRock and its affiliates. Mr. Gabbay is an “interested person” of the Corporation based on his former positions with BlackRock and its affiliates as well as his ownership of BlackRock and The PNC Financial Services Group, Inc. securities. Mr. Audet and Mr. Gabbay are also Directors of the BlackRock registered closed-end funds and Directors of other BlackRock registered open-end funds. Interested Directors serve until their resignation, removal or death, or until December 31 of the year in which they turn 72. |
| 70 | FDP SERIES, INC. | MAY 31, 2014
|
| |
| Officers and Directors (concluded) |
|
Name, Address
and Year of Birth | | | | Position(s)
Held with
Corporation | | Length of
Time Served | | Principal Occupation(s) During Past Five Years |
Officers1 |
| |
John M. Perlowski
55 East 52nd Street
New York, NY 10055
1964 | | | | President
and Chief
Executive Officer | | Since
2010 | | Managing Director of BlackRock since 2009; Global Head of BlackRock Fund Services since 2009; Managing Director and Chief Operating Officer of the Global Product Group at Goldman Sachs Asset Management, L.P. from 2003 to 2009; Treasurer of Goldman Sachs Mutual Funds from 2003 to 2009 and Senior Vice President thereof from 2007 to 2009; Director of Goldman Sachs Offshore Funds from 2002 to 2009; Director of Family Resource Network (charitable foundation) since 2009. |
| |
Brendan Kyne
55 East 52nd Street
New York, NY 10055
1977 | | | | Vice President | | Since
2009 | | Managing Director of BlackRock since 2010; Director of BlackRock from 2008 to 2009; Head of Product Development and Management for BlackRock’s U.S. Retail Group since 2009 to 2013; and Co-head thereof from 2007 to 2009; Vice President of BlackRock from 2005 to 2008. |
| |
Neal Andrews
55 East 52nd Street
New York, NY 10055
1966 | | | | Chief Financial
Officer | | Since
2007 | | Managing Director of BlackRock since 2006; Senior Vice President and Line of Business Head of Fund Accounting and Administration at PNC Global Investment Servicing (U.S.) Inc. from 1992 to 2006. |
| |
Jay Fife
55 East 52nd Street
New York, NY 10055
1970 | | | | Treasurer | | Since
2007 | | Managing Director of BlackRock since 2007; Director of BlackRock in 2006; Assistant Treasurer of the MLIM and Fund Asset Management, L.P. advised funds from 2005 to 2006; Director of MLIM Fund Services Group from 2001 to 2006. |
| |
Charles Park
55 East 52nd Street
New York, NY 10055
1967 | | | | Chief
Compliance
Officer and
Anti-Money
Laundering Officer | | Since
2014 | | Chief Compliance Officer of BlackRock Advisors, LLC and the BlackRock-advised Funds in the Equity-Bond Complex, the Equity-Liquidity Complex and the Closed-End Complex since 2014; Principal of and Chief Compliance Officer for iShares® Delaware Trust Sponsor LLC since 2012 and BlackRock Fund Advisors (“BFA”) since 2006; Chief Compliance Officer for the BFA-advised iShares exchange traded funds since 2006; Chief Compliance Officer for BlackRock Asset Management International Inc. since 2012. |
| |
Benjamin Archibald
55 East 52nd Street
New York, NY 10055
1975 | | | | Secretary | | Since
2012 | | Managing Director of BlackRock since 2014; Director of BlackRock, Inc. from 2010 to 2013; Assistant Secretary to the BlackRock-advised funds from 2010 to 2012; General Counsel and Chief Operating Officer of Uhuru Capital Management from 2009 to 2010; Executive Director and Counsel of Goldman Sachs Asset Management from 2005 to 2009. |
| | | | 1 Officers of the Corporation serve at the pleasure of the Board. |
| | | | Further information about the Officers and Directors is available in the Corporation’s Statement of Additional Information, which can be obtained without charge by calling (800) 441-7762. |
Investment Advisor
BlackRock Advisors, LLC
Wilmington, DE 19809 | | | | Sub-Advisors
Massachusetts Financial
Services Company
Boston, MA 02116
Marsico Capital
Management, LLC
Denver, CO 80202
Invesco Advisers, Inc.
Atlanta, GA 30309
Franklin Advisers, Inc.
San Mateo, CA 94403 | | Custodian
Brown Brothers
Harriman & Co.
Boston, MA 02109
Transfer Agent
BNY Mellon Investment
Servicing (US) Inc.
Wilmington, DE 19809 | | Accounting Agent
State Street Bank and Trust Company
Boston, MA 02110
Distributor
BlackRock
Investments, LLC
New York, NY 10022 | | Independent Registered
Public Accounting Firm
Deloitte & Touche LLP
Boston, MA 02116
Legal Counsel
Willkie Farr &
Gallagher LLP
New York, NY 10019
Address of the Funds
100 Bellevue Parkway
Wilmington, DE 19809 |
Effective May 14, 2014, Brian Kindelan resigned as Chief Compliance Officer and Anti-Money Laundering Officer of the Funds and Charles Park became Chief Compliance Officer and Anti-Money Laundering Officer of the Funds. |
| FDP SERIES, INC. | MAY 31, 2014 | 71
|
General Information
Electronic Delivery
Electronic copies of most financial reports and prospectuses are available on the Funds’ website or shareholders can sign up for e-mail notifications of quarterly statements, annual and semi-annual reports and prospectuses by enrolling in the Funds’ electronic delivery program.
To enroll:
Shareholders Who Hold Accounts with Investment Advisors, Banks or Brokerages:
Please contact your financial advisor. Please note that not all investment advisors, banks or brokerages may offer this service.
Shareholders Who Hold Accounts Directly with BlackRock:
1) | | Access the BlackRock website at http://www.blackrock.com/edelivery |
2) | | Select “eDelivery” under the “More Information” section |
Householding
The Funds will mail only one copy of shareholder documents, including prospectuses, annual and semi-annual reports and proxy statements, to shareholders with multiple accounts at the same address. This practice is commonly called “householding” and is intended to reduce expenses and eliminate duplicate mailings of shareholder documents. Mailings of your shareholder documents may be householded indefinitely unless you instruct us otherwise. If you do not want the mailing of these documents to be combined with those for other members of your household, please call the Funds at (800) 441-7762.
Availability of Quarterly Schedule of Investments
The Funds file their complete schedule of portfolio holdings with the SEC for the first and third quarters of each fiscal year on Form N-Q. The Funds’ Forms N-Q are available on the SEC’s website at http://www.sec.gov and may also be reviewed and copied at the SEC’s Public Reference Room in Washington, DC. Information on how to access documents on the SEC’s website without charge may be obtained by calling (800) SEC-0330. The Funds’ Forms N-Q may also be obtained upon request and without charge by calling (800) 441-7762.
Availability of Proxy Voting Policies and Procedures
A description of the policies and procedures that the Funds use to determine how to vote proxies relating to portfolio securities is available (1) without charge, upon request, by calling (800) 441-7762; (2) at http://www.blackrock.com; and (3) on the SEC’s website at http://www.sec.gov.
Availability of Proxy Voting Record
Information about how the Funds voted proxies relating to securities held in the Funds’ portfolios during the most recent 12-month period ended June 30 is available upon request and without charge (1) at http://www.blackrock.com or by calling (800) 441-7762 and (2) on the SEC’s website at http://www.sec.gov.
| 72 | FDP SERIES, INC. | MAY 31, 2014
|
| |
| Additional Information (concluded) |
|
Shareholder Privileges
Account Information
Call us at (800) 441-7762 from 8:00 AM to 6:00 PM EST on any business day to get information about your account balances, recent transactions and share prices. You can also reach us on the Web at http://www.blackrock.com/funds.
Automatic Investment Plans
Investor Class shareholders who want to invest regularly can arrange to have $50 or more automatically deducted from their checking or savings account and invested in any of the BlackRock funds.
Systematic Withdrawal Plans
Investor Class shareholders can establish a systematic withdrawal plan and receive periodic payments of $50 or more from their BlackRock funds, as long as their account balance is at least $10,000.
Retirement Plans
Shareholders may make investments in conjunction with Traditional, Rollover, Roth, Coverdell, Simple IRAs, SEP IRAs and 403(b) Plans.
BlackRock Privacy Principles
BlackRock is committed to maintaining the privacy of its current and former fund investors and individual clients (collectively, “Clients”) and to safe-guarding their non-public personal information. The following information is provided to help you understand what personal information BlackRock collects, how we protect that information and why in certain cases we share such information with select parties.
If you are located in a jurisdiction where specific laws, rules or regulations require BlackRock to provide you with additional or different privacy-related rights beyond what is set forth below, then BlackRock will comply with those specific laws, rules or regulations.
BlackRock obtains or verifies personal non-public information from and about you from different sources, including the following: (i) information we receive from you or, if applicable, your financial intermediary, on applications, forms or other documents; (ii) information about your transactions with us, our affiliates, or others; (iii) information we receive from a consumer reporting agency; and (iv) from visits to our websites.
BlackRock does not sell or disclose to non-affiliated third parties any non-public personal information about its Clients, except as permitted by law or as is necessary to respond to regulatory requests or to service Client accounts. These non-affiliated third parties are required to protect the confidentiality and security of this information and to use it only for its intended purpose.
We may share information with our affiliates to service your account or to provide you with information about other BlackRock products or services that may be of interest to you. In addition, BlackRock restricts access to non-public personal information about its Clients to those BlackRock employees with a legitimate business need for the information. BlackRock maintains physical, electronic and procedural safeguards that are designed to protect the non-public personal information of its Clients, including procedures relating to the proper storage and disposal of such information.
| FDP SERIES, INC. | MAY 31, 2014 | 73
|
| |
| A World-Class Mutual Fund Family |
|
BlackRock offers a diverse lineup of open-end mutual funds crossing all investment styles and managed by experts in equity, fixed income and tax-exempt investing.
Equity Funds
BlackRock ACWI ex-US Index Fund BlackRock All-Cap Energy & Resources Portfolio BlackRock Basic Value Fund BlackRock Capital Appreciation Fund BlackRock Commodity Strategies Fund BlackRock Disciplined Small Cap Core Fund BlackRock Emerging Markets Dividend Fund BlackRock Emerging Markets Fund BlackRock Emerging Markets Long/Short
Equity Fund BlackRock Energy & Resources Portfolio BlackRock Equity Dividend Fund BlackRock EuroFund BlackRock Flexible Equity Fund BlackRock Focus Growth Fund | BlackRock Global Dividend Portfolio BlackRock Global Long/Short Equity Fund BlackRock Global Opportunities Portfolio BlackRock Global SmallCap Fund BlackRock Health Sciences Opportunities Portfolio BlackRock International Fund BlackRock International Index Fund BlackRock International Opportunities Portfolio BlackRock Large Cap Core Fund BlackRock Large Cap Core Plus Fund BlackRock Large Cap Growth Fund BlackRock Large Cap Value Fund BlackRock Latin America Fund BlackRock Long-Horizon Equity Fund BlackRock Mid-Cap Growth Equity Portfolio | BlackRock Mid Cap Value Opportunities Fund BlackRock Natural Resources Trust BlackRock Pacific Fund BlackRock Real Estate Securities Fund BlackRock Russell 1000® Index Fund BlackRock Science & Technology
Opportunities Portfolio BlackRock Small Cap Growth Equity Portfolio BlackRock Small Cap Growth Fund II BlackRock Small Cap Index Fund BlackRock S&P 500 Stock Fund BlackRock U.S. Opportunities Portfolio BlackRock Value Opportunities Fund |
Taxable Fixed Income Funds
BlackRock Bond Index Fund BlackRock Core Bond Portfolio BlackRock CoreAlpha Bond Fund BlackRock CoRI Funds 2015 2017 2019 2021 2023 | BlackRock Emerging Markets Flexible Dynamic Bond Portfolio BlackRock Floating Rate Income Portfolio BlackRock Global Long/Short Credit Fund BlackRock GNMA Portfolio BlackRock High Yield Bond Portfolio BlackRock Inflation Protected Bond Portfolio BlackRock Investment Grade Bond Portfolio BlackRock Low Duration Bond Portfolio BlackRock Secured Credit Portfolio | BlackRock Short Obligations Fund BlackRock Short-Term Treasury Fund BlackRock Strategic Income
Opportunities Portfolio BlackRock Total Return Fund BlackRock U.S. Government Bond Portfolio BlackRock U.S. Mortgage Portfolio BlackRock Ultra-Short Obligations Fund BlackRock World Income Fund |
Municipal Fixed Income Funds
BlackRock California Municipal Bond Fund BlackRock High Yield Municipal Fund BlackRock National Municipal Fund | BlackRock New Jersey Municipal Bond Fund BlackRock New York Municipal Bond Fund BlackRock Pennsylvania Municipal Bond Fund | BlackRock Short-Term Municipal Fund BlackRock Strategic Municipal Opportunities Fund |
Mixed Asset Funds
| BlackRock Balanced Capital Fund | LifePath® Active Portfolios
| LifePath® Index Portfolio |
| BlackRock Emerging Market Allocation Portfolio | 2015 | 2040 | Retirement | 2040 |
| BlackRock Global Allocation Fund | 2020 | 2045 | 2020 | 2045 |
| BlackRock Managed Volatility Portfolio | 2025 | 2050 | 2025 | 2050 |
| BlackRock Multi-Asset Income Portfolio | 2030 | 2055 | 2030 | 2055 |
| BlackRock Multi-Asset Real Return Fund | 2035 | | 2035 | |
| BlackRock Strategic Risk Allocation Fund | | | | |
| | | | | |
| BlackRock Prepared Portfolios | LifePath® Portfolios
| | |
| Conservative Prepared Portfolio | Retirement | 2040 | | |
| Moderate Prepared Portfolio | 2020 | 2045 | | |
| Growth Prepared Portfolio | 2025 | 2050 | | |
| Aggressive Growth Prepared Portfolio | 2030 | 2055 | | |
| | 2035 | | | |
BlackRock mutual funds are currently distributed by BlackRock Investments, LLC. You should consider the investment objectives, risks, charges and expenses of the funds under consideration carefully before investing. Each fund’s prospectus contains this and other information and is available at www.blackrock.com or by calling (800) 441-7762 or from your financial advisor. The prospectus should be read carefully before investing.
| 74 | FDP SERIES, INC. | MAY 31, 2014
|
[THIS PAGE INTENTIONALLY LEFT BLANK]
This report is transmitted to shareholders only. It is not authorized for use as an offer of sale or a solicitation of an offer to buy shares of the Fund unless accompanied or preceded by the Fund’s current prospectus. Past performance results shown in this report should not be considered a representation of future performance. Investment returns and principal value of shares will fluctuate so that shares, when redeemed, may be worth more or less than their original cost. Statements and other information herein are as dated and are subject to change.
Investment in foreign securities involves special risks including fluctuating foreign exchange rates, foreign government regulations, differing degrees of liquidity and the possibility of substantial volatility due to adverse political, economic or other developments.
Please see the Fund’s current prospectus for a description of risks associated with global investments.
FDPS-5/14-AR | 
|
Item 2 – Code of Ethics – The registrant (or the “Fund”) has adopted a code of ethics, as of the end of the period covered by this report, applicable to the registrant’s principal executive officer, principal financial officer, principal accounting officer or controller, or persons performing similar functions. During the period covered by this report, there have been no amendments to or waivers granted under the code of ethics. A copy of the code of ethics is available without charge at www.blackrock.com.
Item 3 – Audit Committee Financial Expert – The registrant’s board of trustees (the “board of trustees”), has determined that (i) the registrant has the following audit committee financial experts serving on its audit committee and (ii) each audit committee financial expert is independent:
Robert M. Hernandez
Fred G. Weiss
Stuart E. Eizenstat
Under applicable securities laws, a person determined to be an audit committee financial expert will not be deemed an “expert” for any purpose, including without limitation for the purposes of Section 11 of the Securities Act of 1933, as a result of being designated or identified as an audit committee financial expert. The designation or identification of a person as an audit committee financial expert does not impose on such person any duties, obligations, or liabilities greater than the duties, obligations, and liabilities imposed on such person as a member of the audit committee and board of trustees in the absence of such designation or identification.
Item 4 – Principal Accountant Fees and Services
The following table presents fees billed by Deloitte & Touche LLP (“D&T”) in each of the last two fiscal years for the services rendered to the Fund:
| | (a) Audit Fees | (b) Audit-Related Fees1 | (c) Tax Fees2 | (d) All Other Fees3 |
| Entity Name | Current Fiscal Year End | Previous Fiscal Year End | Current Fiscal Year End | Previous Fiscal Year End | Current Fiscal Year End | Previous Fiscal Year End | Current Fiscal Year End | Previous Fiscal Year End |
| Franklin Templeton Total Return FDP Fund | $43,863 | $43,863 | $0 | $0 | $15,100 | $15,100 | $0 | $0 |
| Invesco Value FDP Fund | $31,163 | $31,163 | $0 | $0 | $12,000 | $12,000 | $0 | $0 |
| Marsico Growth FDP Fund | $31,163 | $31,163 | $0 | $0 | $12,000 | $12,000 | $0 | $0 |
| MFS Research International FDP Fund | $33,463 | $33,463 | $0 | $0 | $13,000 | $13,000 | $0 | $0 |
The following table presents fees billed by D&T that were required to be approved by the registrant’s audit committee (the “Committee”) for services that relate directly to the operations or financial reporting of the Fund and that are rendered on behalf of BlackRock Advisors, LLC (“Investment Adviser” or “BlackRock”) and entities controlling, controlled by, or under common control with BlackRock (not including any sub-adviser whose role is primarily portfolio management and is
subcontracted with or overseen by another investment adviser) that provide ongoing services to the Fund (“Fund Service Providers”):
| | Current Fiscal Year End | Previous Fiscal Year End |
| (b) Audit-Related Fees1 | $0 | $0 |
| (c) Tax Fees2 | $0 | $0 |
| (d) All Other Fees3 | $2,555,000 | $2,865,000 |
1 The nature of the services includes assurance and related services reasonably related to the performance of the audit of financial statements not included in Audit Fees.
2 The nature of the services includes tax compliance, tax advice and tax planning.
3 Aggregate fees borne by BlackRock in connection with the review of compliance procedures and attestation thereto performed by D&T with respect to all of the registered closed-end funds and some of the registered open-end funds advised by BlackRock.
(e)(1) Audit Committee Pre-Approval Policies and Procedures:
The Committee has adopted policies and procedures with regard to the pre-approval of services. Audit, audit-related and tax compliance services provided to the registrant on an annual basis require specific pre-approval by the Committee. The Committee also must approve other non-audit services provided to the registrant and those non-audit services provided to the Investment Adviser and Fund Service Providers that relate directly to the operations and the financial reporting of the registrant. Certain of these non-audit services that the Committee believes are (a) consistent with the SEC’s auditor independence rules and (b) routine and recurring services that will not impair the independence of the independent accountants may be approved by the Committee without consideration on a specific case-by-case basis (“general pre-approval”). The term of any general pre-approval is 12 months from the date of the pre-approval, unless the Committee provides for a different period. Tax or other non-audit services provided to the registrant which have a direct impact on the operations or financial reporting of the registrant will only be deemed pre-approved provided that any individual project does not exceed $10,000 attributable to the registrant or $50,000 per project. For this purpose, multiple projects will be aggregated to determine if they exceed the previously mentioned cost levels.
Any proposed services exceeding the pre-approved cost levels will require specific pre-approval by the Committee, as will any other services not subject to general pre-approval (e.g., unanticipated but permissible services). The Committee is informed of each service approved subject to general pre-approval at the next regularly scheduled in-person board meeting. At this meeting, an analysis of such services is presented to the Committee for ratification. The Committee may delegate to the Committee Chairman the authority to approve the provision of and fees for any specific engagement of permitted non-audit services, including services exceeding pre-approved cost levels.
(e)(2) None of the services described in each of Items 4(b) through (d) were approved by the Committee pursuant to the de minimis exception in paragraph (c)(7)(i)(C) of Rule 2-01 of Regulation S-X.
(f) Not Applicable
(g) The aggregate non-audit fees paid to the accountant for services rendered by the accountant to the registrant, the Investment Adviser and the Fund Service Providers were:
| Entity Name | Current Fiscal
Year End | Previous Fiscal
Year End |
| Franklin Templeton Total Return FDP Fund | $15,100 | $15,100 |
| Invesco Value FDP Fund | $12,000 | $12,000 |
| Marsico Growth FDP Fund | $12,000 | $12,000 |
| MFS Research International FDP Fund | $13,000 | $13,000 |
| | Additionally, SSAE 16 Review (Formerly, SAS No. 70) fees for the current and previous fiscal years of $2,555,000 and $2,865,000, respectively, were billed by D&T to the Investment Adviser. |
| | (h) The Committee has considered and determined that the provision of non-audit services that were rendered to the Investment Adviser and the Fund Service Providers that were not pre-approved pursuant to paragraph (c)(7)(ii) of Rule 2-01 of Regulation S-X is compatible with maintaining the principal accountant’s independence. |
Item 5 – Audit Committee of Listed Registrants – Not Applicable
Item 6 – Investments
(a) The registrant’s Schedule of Investments is included as part of the Report to Stockholders filed under Item 1 of this Form.
(b) Not Applicable due to no such divestments during the semi-annual period covered since the previous Form N-CSR filing.
Item 7 – Disclosure of Proxy Voting Policies and Procedures for Closed-End Management Investment Companies – Not Applicable
Item 8 – Portfolio Managers of Closed-End Management Investment Companies – Not Applicable
Item 9 – Purchases of Equity Securities by Closed-End Management Investment Company and Affiliated Purchasers – Not Applicable
Item 10 – Submission of Matters to a Vote of Security Holders – There have been no material changes to these procedures.
Item 11 – Controls and Procedures
(a) The registrant’s principal executive and principal financial officers, or persons performing similar functions, have concluded that the registrant’s disclosure controls and procedures (as defined in Rule 30a-3(c) under the Investment Company Act of 1940, as amended (the “1940 Act”)) are effective as of a date within 90 days of the filing of this report based on the evaluation of these
controls and procedures required by Rule 30a-3(b) under the 1940 Act and Rule 15d-15(b) under the Securities Exchange Act of 1934, as amended.
(b) There were no changes in the registrant’s internal control over financial reporting (as defined in Rule 30a-3(d) under the 1940 Act) that occurred during the second fiscal quarter of the period covered by this report that have materially affected, or are reasonably likely to materially affect, the registrant’s internal control over financial reporting.
Item 12 – Exhibits attached hereto
| | (a)(1) Code of Ethics – See Item 2 |
| | (a)(2) Certifications – Attached hereto |
(a)(3) Not Applicable
(b) Certifications – Attached hereto
Pursuant to the requirements of the Securities Exchange Act of 1934 and the Investment Company Act of 1940, the registrant has duly caused this report to be signed on its behalf by the undersigned, thereunto duly authorized.
FDP Series, Inc.
By: /s/ John M. Perlowski
John M. Perlowski
Chief Executive Officer (principal executive officer) of
FDP Series, Inc.
Date: July 29, 2014
Pursuant to the requirements of the Securities Exchange Act of 1934 and the Investment Company Act of 1940, this report has been signed below by the following persons on behalf of the registrant and in the capacities and on the dates indicated.
By: /s/ John M. Perlowski
John M. Perlowski
Chief Executive Officer (principal executive officer) of
FDP Series, Inc.
Date: July 29, 2014
By: /s/ Neal J. Andrews
Neal J. Andrews
Chief Financial Officer (principal financial officer) of
FDP Series, Inc.
Date: July 29, 2014