Eagle Bulk Shipping Inc.
September 10, 2007
Wachovia Global Transportation
and Packaging Conference
Forward Looking Statements
This presentation contains certain statements that may be deemed to be “forward-looking statements” within the
meaning of the Securities Acts. Forward-looking statements reflect management’s current views with respect to
future events and financial performance and may include statements concerning plans, objectives, goals,
strategies, future events or performance, and underlying assumptions and other statements, which are other
than statements of historical facts. The forward-looking statements in this presentation are based upon various
assumptions, many of which are based, in turn, upon further assumptions, including without limitation,
management's examination of historical operating trends, data contained in our records and other data available
from third parties. Although Eagle Bulk Shipping Inc. believes that these assumptions were reasonable when
made, because these assumptions are inherently subject to significant uncertainties and contingencies which
are difficult or impossible to predict and are beyond our control, Eagle Bulk Shipping Inc. cannot assure you that
it will achieve or accomplish these expectations, beliefs or projections. Important factors that, in our view, could
cause actual results to differ materially from those discussed in the forward-looking statements include the
strength of world economies and currencies, general market conditions, including changes in charterhire rates
and vessel values, changes in demand that may affect attitudes of time charterers to scheduled and
unscheduled drydocking, changes in our vessel operating expenses, including dry-docking and insurance costs,
or actions taken by regulatory authorities, ability of our counterparties to perform their obligations under sales
agreements and charter contracts on a timely basis, potential liability from future litigation, domestic and
international political conditions, potential disruption of shipping routes due to accidents and political events or
acts by terrorists. Risks and uncertainties are further described in reports filed by Eagle Bulk Shipping Inc. with
the US Securities and Exchange Commission.
1
Agenda
Investment Thesis
The Fleet
Industry View
Financial Overview
Conclusion
2
Eagle Bulk – A Clear, Focused Investment Story
We are one of the largest
Supramax owners in the world
Quality - Consistency - Transparency
Strong contract coverage at
today’s healthy rates
— $1.2 bn in contracts
— 20 profit-sharing charters
— 15 open vessels
Best long term prospects
Stable and visible cash flows for
sustainable dividends
—Target $0.50 per quarter
$70m acquisition in 3Q-05
$105m acquisition in 2Q-06
$67m acquisition in 4Q-06
$205m acquisition in 1Q-07
$1.1 bn acquisition in 3Q-07
Proven growth strategy
— 39 vessels
— $1.5 billion worth of
acquisitions
4
Eagle Bulk – A Growth Story
Sep 07 Financial metrics pro forma for Q3-07 transactions
Target Quarterly Dividend of $0.50 per share
5
Sep 06
Sep 07
Increase
Fleet Size
16 Vessels
49 Vessels
+ 206%
- Supramax
12 Vessels
46 Vessels
+ 283%
- DWT
0.8 million tons
2.7 million tons
+ 238%
Finance
- Enterprise Value
$739 million
$1,618 million
+ 119%
- Market Capitalization
$524 million
$1,095 million
+ 109%
- Dividends Paid to Date
-
$4.10 per share
Acquired a fleet of 26 Supramax vessels for $1.1 billion
Sister-ship fleet consists of 5 vessels of 53,100 dwt each and 21 vessels
of 58,000 dwt each
Vessels to be delivered between 2008 and 2012
21 of 26 vessels secured by long term time charters
Charters until 2018 with average time charter duration of over 10
years from today
Contracted revenue of approximately $1 billion
Uncapped profit sharing on 17 of the charters further enhance
revenue potential
Eagle fleet expands to 49 vessels with contracted revenue of
approximately $1.2 billion
Secured options to build an additional nine 58,000 dwt Supramax sister
vessels
3Q-07 Transformative Acquisition
Eagle Fleet Increases 124% to 2.7 million dwt
6
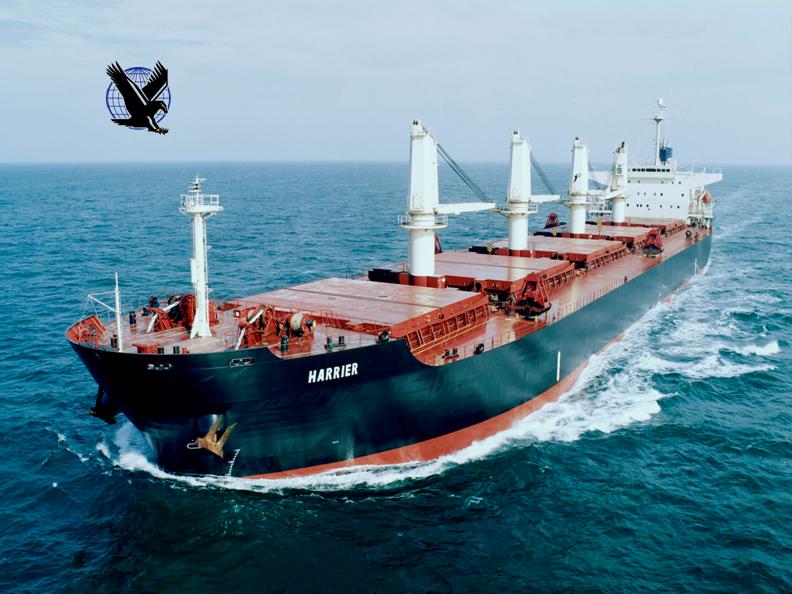
Modern, High Quality Geared Fleet of Supramax Vessels
Vessel
Year Built
Deadweight
Time Charter Employment Expiration
Base Time
Charter Rate
SUPRAMAX:
Cardinal
2004
55,408
May 2008 to August 2008
$28,000
Condor
2001
50,296
May 2009 to August 2009
$20,500
Falcon
2001
50,296
February 2008 to June 2008
$20,950
December 2009 to May 2010
$39,500
Harrier
2001
50,296
June 2009 to September 2009
$24,000
Hawk I
2001
50,296
April 2009 to June 2009
$22,000
Heron
2001
52,827
December 2007 to February 2008
$24,000
Jaeger
2004
52,248
July 2008 to August 2008
$27,500
Kestrel I
2004
50,326
December 2007 to April 2008
$18,750
Merlin
2001
50,296
October 2007 to December 2007
$24,000
Oct - Dec 2007 to Oct - Dec 2010
$25,000
Osprey I
2002
50,206
July 2008 to November 2008
$21,000
Peregrine
2001
50,913
December 2008 to February 2009
$20,500
Tern
2003
50,200
December 2007 to April 2008
$19,000
Shrike
2003
53,343
April 2009 to August 2009
$24,600
Skua
2003
53,350
May 2009 to August 2009
$24,200
Kittiwake
2002
53,146
May 2008 to August 2008
$30,400
HANDYMAX:
Sparrow
2000
48,225
December 2007 to February 2008
$24,000
Dec 2007 - Feb 2008 to Dec 2009 - Feb 2010
$34,500
Kite
1997
47,195
August 2009 to November 2009
$21,000
Griffon
1995
46,635
March 2009 to May 2009
$20,075
SUPRAMAX NEWBUILDINGS
Crowned Eagle
2008
56,000
Expected to be delivered in November 2008
—
Crested Eagle
2009
56,000
Expected to be delivered in February 2009
—
Stellar Eagle
2009
56,000
Expected to be delivered in April 2009
—
Golden Eagle
2010
56,000
Expected to be delivered in January 2010
—
8
Acquisition Fleet
Vessel
Expected
Delivery
Time Charter Employment
Expiration
Base Time
Charter Rate
Profit Share
53,100 dwt Series
Wren
Aug-08
Feb 2012
$24,750
n.a.
Feb 2012 to Dec 2018/Apr 2019
$18,000
50% over $22,000
Woodstar
Oct-08
Jan 2014
$18,300
n.a.
Jan 2014 to Dec 2018/Apr 2019
$18,000
50% over $22,000
Thrush
Sep-09
Charter Free
-
n.a.
Thrasher
$18,400
n.a.
Feb 2016 to Dec 2018/Apr 2019
$18,000
50% over $22,000
Avocet
Dec-09
Mar 2016
$18,400
n.a.
Mar 2016 to Dec 2018/Apr 2019
$18,000
50% over $22,000
58,000 dwt Series
Bittern
Sep-09
Dec 2014
$18,850
n.a.
Dec 2014 to Dec 2018/Apr 2019
$18,000
50% over $22,000
Canary
Oct-09
Jan 2015
$18,850
n.a.
Jan 2015 to Dec 2018/Apr 2019
$18,000
50% over $22,000
Crane
Nov-09
Feb 2015
$18,850
n.a.
Feb 2015 to Dec 2018/Apr 2019
$18,000
50% over $22,000
Egret
Dec-09
Sep 2012 to Jan 2013
$17,650
50% over $20,000
Gannet
Jan-10
Oct 2012 to Feb 2013
$17,650
50% over $20,000
Grebe
Feb-10
Nov 2012 to Mar 2013
$17,650
50% over $20,000
Ibis
Mar-10
Dec 2012 to Apr 2013
$17,650
50% over $20,000
Jay
Apr-10
Sep 2015
$18,500
50% over $21,500
Sep 2015 to Dec 2018/Apr 2019
$18,000
50% over $22,000
Kingfisher
May-10
Oct 2015
$18,500
50% over $21,500
Oct 2015 to Dec 2018/Apr 2019
$18,000
50% over $22,000
Martin
Jun-10
Dec 2016 to Dec 2017
$18,400
n.a.
Nighthawk
Mar-11
Sep 2017 to Sep 2018
$18,400
n.a.
Oriole
Jul-11
Jan 2018 to Jan 2019
$18,400
n.a.
Owl
Aug-11
Feb 2018 to Feb 2019
$18,400
n.a.
Petrel
Sep-11
Jun 2014 to Oct 2014
$17,650
50% over $20,000
Puffin
Oct-11
Jul 2014 to Nov 2014
$17,650
50% over $20,000
Roadrunner
Nov-11
Aug 2014 to Dec 2014
$17,650
50% over $20,000
Sandpiper
Dec-11
Sep 2014 to Jan 2015
$17,650
50% over $20,000
Snipe
Jan-12
Charter Free
n.a.
n.a.
Swift
Feb-12
Charter Free
n.a.
n.a.
Raptor
Mar-12
Charter Free
n.a.
n.a.
Saker
Apr-12
Charter Free
n.a.
n.a.
* Please refer to our press release of July 25, 2007
9
Eagle Captures Today’s Drybulk Values for Extended Periods
Minimum Contracted Revenue on Acquisition Fleet secured at approx. $1 billion
Charter revenue stream insured for three years up to July 2010 with A rated credit
risk underwriter
10
Charter renewals at today’s healthy rates extends high cashflow generation
Period cover extends revenue visibility and predictability and limits spot volatility
SecureCash Flows Provide Stable Dividends
* The new charterer of the FALCON has an option to extend the charter by 11-13onths at a daily rate of $41,000 per day.
New Charters bring in $10.6 million in additional annual revenue:
Vessel
Current Daily
Charter Rate
Current Charter
Ends / New Charter
Commences
New Charter
Daily Rate
Charter Period
(Months)
% Rate
Increase
Increase
in Annual
Revenue
Sparrow
$24,000
Mar-Jun 2008
$34,500
24 - 26 mo.
43.8%
$3.8 m
Falcon *
$20,950
Apr-Jun 2008
$39,500
21 - 23 mo.
88.5%
$6.8 m
Time Charter Contracts Provide Stable and Visible Cashflows
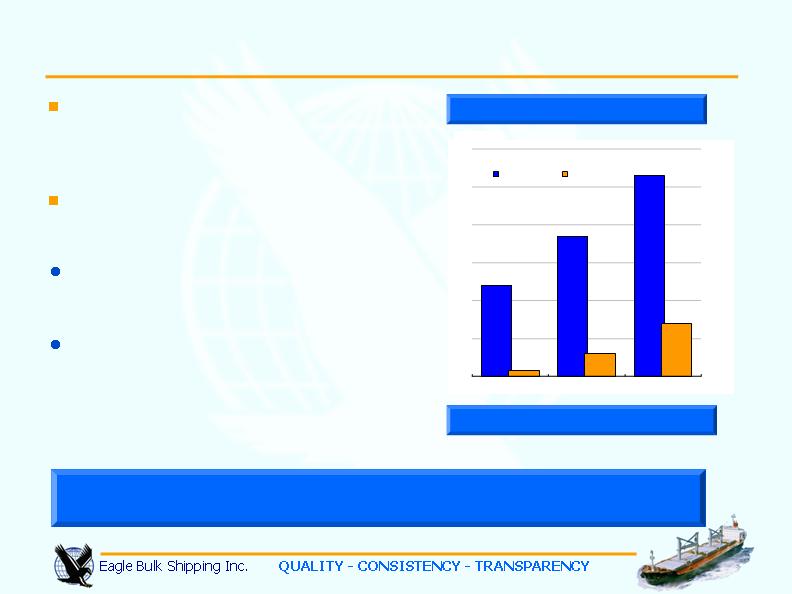
Contracted gross revenues in excess of $1.2 billion
No. of ships in Fleet
-
20
40
60
80
100
120
140
2007
2008
2009
2010
2011
2012
2013
2014
2015
2016
2017
2018
-
2,000
4,000
6,000
8,000
10,000
12,000
14,000
16,000
18,000
20,000
$ m
Owned Days
Contracted Revenues from Fixed Days
18
30
21
38
45
49
49
49
49
49
49
49
11
46 of the 49 vessels in the
Company’s fleet are Supramaxes
Smallest segment of the drybulk
market provides opportunities
Aging Handymax Fleet Provides Opportunities
Source: Clarksons as of August 2007
Aging Handymax fleet — 33% of
capacity > 20 years old
Negligible scrapping since 2003
could see surge of ships removed
from market in 2009-11
Orderbook and Fleet Age
13
World Dry Bulk Fleet
33%
23%
18%
41%
30%
63%
0%
5%
10%
15%
20%
25%
30%
35%
40%
45%
50%
55%
60%
65%
Handymax
Panamax
Capesize
% of Fleet > 20 years
Orderbook as % of Fleet
New Supramax Asset Class Services Growing Global Needs
Imports of sub-Panamax minor bulk cargoes
into China surge – 2007 import rate of 64m
tons double that of 34m tons in 2006.
China’s emergence as largest stainless steel
producer results in development of a new trade
– import of Nickel Ore which surges from
almost nothing in 2005 to an annualized 20m
tons in 2007.
Vessel Gear increases flexibility and broadens customer base
Source: J.E. Hyde, Clarksons, Global Trade Information Services. Mining Weekly
Exports of cement and steel out of China
expected to maintain healthy growth rates in
excess of 20%. Chinese steel output in 2007
to increase 18% to reach 500 million tons.
New mining capacities coming on stream in
2007-09 to increase global iron ore output by
375 million tons per annum.
850m ton sub-Panamax market
New Trades
-
5
10
15
20
25
30
1st Half 2006
2nd Half 2006
1st Half 2007
Minor Bulks
Nickel Ore
m tons
Chinese Imports
14
Charterers Attracted by Versatility of Supramax Vessels
Eagle vessels carried 3.5 million tons of cargo in FH-07 MISC. cargoes include Phosrock, Sugar, HBI, and Concentrates
45% of Eagle’s 1H-07 Cargoes were “Capesize and Panamax cargoes”
IRON
ORE
COAL
GRAINS
OTHER
ORES
CEMENT
COKE
STEELS
SCRAP
IRON
AGGREGATES
MISC.
In m tons
560,702
609,376
392,996
668,989
169,930
304,329
206,976
39,060
10,000
502,326
Cardinal
Condor
Falcon
Griffon
Harrier
Hawk I
Heron
Kite
Merlin
Osprey I
Peregrine
Shrike
Sparrow
Kestrel I
Tern
Jaeger
15
99.5% Fleet Utilization Rate
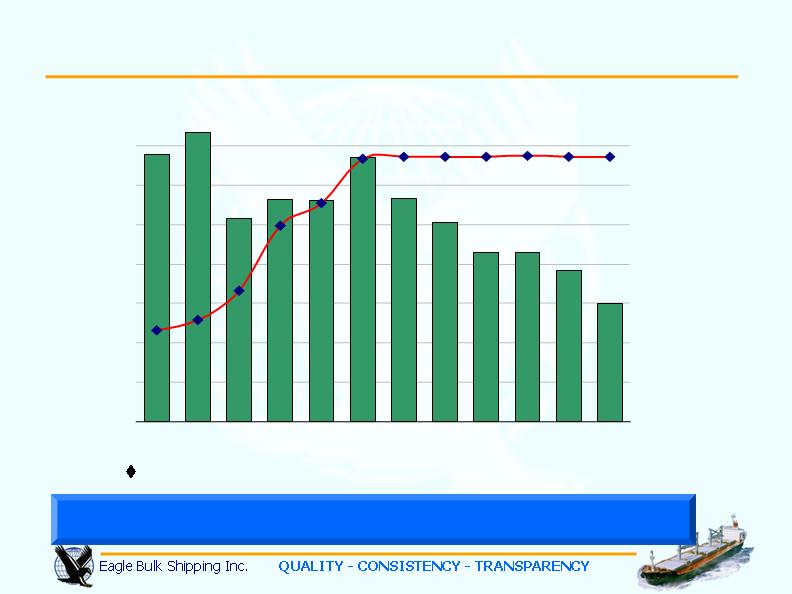
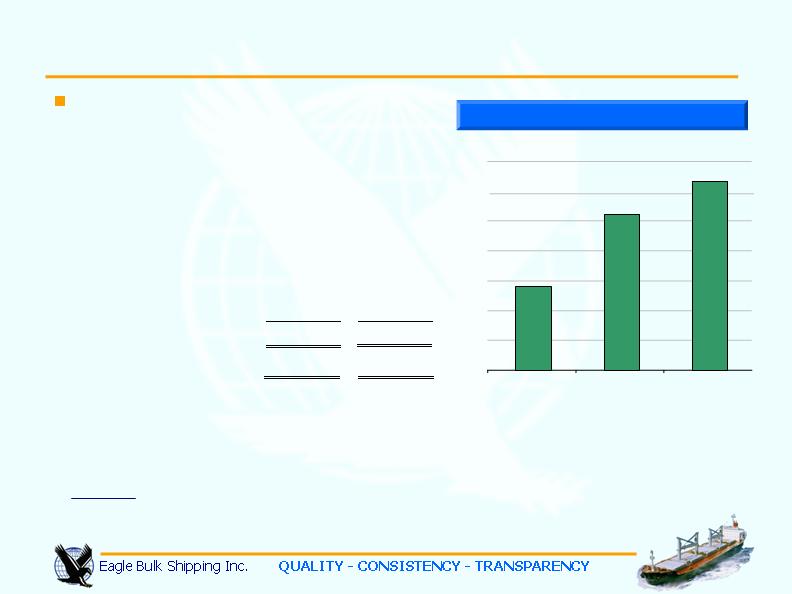
Revenue Growth
Net revenues include billed time charter revenues, deductions
for brokerage commissions and amortization of net prepaid
and deferred charter revenue. Please refer to our financial
statements for a definition of Ownership days, Available days,
Operating days, and Fleet Utilization.
Operating Expenses include Vessel Depreciation
Net Revenues
$ m
2007 (E)
2006
2005
140
120
100
80
60
40
20
Income Statement
Condensed Income Statement:
($ 000's)
Net Time Charter Revenues
55,247
47,895
Operating Expenses
30,668
24,173
Net Interest Expense
4,166
3,538
NET INCOME
20,412
20,184
Diluted Income per Common Share
$0.51
$0.61
Credit Agreement EBITDA
44,106
38,527
EBITDA Margin (% of revenue)
79.8%
80.4%
Jun. 30, 2007
Jun. 30, 2006
Six-months ended
17
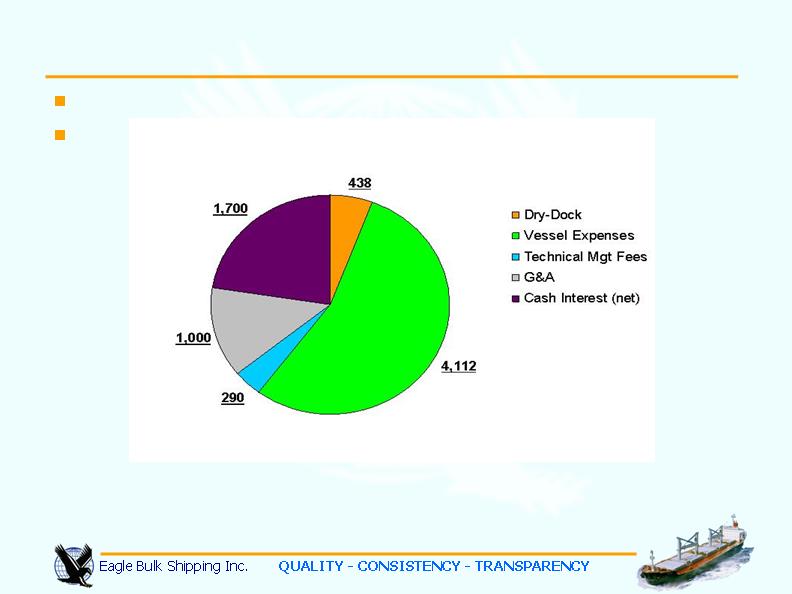
Daily cash breakeven cost of $7,540 per day per vessel (2007E)
No principal repayments until 2012
Low Breakeven Cost Strategy
Vessel expenses include crew wages and related costs, the cost of insurance including credit risk insurance, expenses relating
to repairs and maintenance, the cost of spares and consumable stores and related inventory, tonnage taxes, pre-operating
costs associated with the delivery of acquired vessels including providing the newly acquired vessels with initial provisions and
stores, and other miscellaneous expenses. The Company is anticipating higher crewing costs, higher costs for oil based
supplies including lubes and paints, and increasing drydocking costs due to constraints in global drydocking yard capacity.
18
Strong Balance Sheet
1 Acquisition funding and Initial Construction Progress Payments for the Acquisition vessels.
2 Construction finance costs (interest, deferred finance charges, supervision, etc.) are capitalized
eliminating any impact on current cash flows and income statement.
3 Net Debt is pro forma after taking into effect 2Q-07 Dividend payment of $19.6 million.
Quarterly Dividend Cash Flow Maintained
19
BALANCE SHEET DATA
Jun. 30, 2007
Transactions
1
Pro forma
Jun.30, 2007
(in $ 000's)
(unaudited)
Cash
$22,879
3,000
$25,879
Other Current Assets
3,984
-
3,984
Vessels, net
618,572
-
618,572
Advances for Vessel Construction
2
64,785
316,900
381,685
Restricted Cash
7,325
-
7,325
Other Assets
9,109
-
9,109
TOTAL ASSETS
726,654
1,046,554
Current Liabilities
8,843
-
8,843
Long-term Debt
302,377
319,900
622,277
Other Liabilities
4,693
-
4,693
Stockholders' Equity
410,741
-
410,741
Book Capitalization
1,033,018
Net Debt
3
/ Capitalization
58.9%
20
Liquidity for Growth
* Thereafter semi-annual reduction in availability to Balloon
10-year Revolver Underwritten by The Royal Bank of Scotland
New Facility to Replace Exisiting Facility
$1.6 Billion Commitment at Favorable Terms
Revolver Amount
$1.6 billion
Maturity
July 2017
Interest Only until (at least)
July 2012
Interest Margin
Libor + 80/90
basis points
Commitment Fees on
undrawn revolver
25 basis points
Availability in full until *
July 2012
Balloon (fully drawn)
$850 million
Conclusion - Accretive Growth Strategy
Eagle Bulk – a solid, clear, focused investment story
CLEAR BENEFITS TO SHAREHOLDERS
Secure dividend over long term.
Pay down debt
Paid Dividends of $4.10 per share to date.Intent to grow dividend over time
AFFIRMS EAGLE BULK AS CONSOLIDATOR IN DRYBULK INDUSTRY
Grows fleet to 49 vessels
Increases cargo carrying capacity to 2.7 million dwt
Lowers average age to 2 years
Improves operating efficiencies with 41 sister vessels
HEALTHY DRYBULK MARKET FUNDAMENTALS CONTINUE
Increase contracted revenues with 15 open vessels available to charter
through 2008 and 20 profit sharing charters
22