| Readdressed to Silver Wheaton Corp |
| Peñasquito Project Technical Report |
| December 2007 |
PEÑASQUITO PROJECT TECHNICAL REPORT
Concepción del Oro District, Zacatecas State, México
December 31, 2007
READDRESSED TO SILVER WHEATON CORP
| Prepared by: |
| Robert H Bryson, MMSA |
| FH Brown, CPG,Pr. Sci. Nat. |
| Reynaldo Rivera, AusIMM |
| Steven Ristorcelli, CPG |
i
Peñasquito Project Technical Report December 2007
| Readdressed to Silver Wheaton Corp |
| Peñasquito Project Technical Report |
| December 2007 |
TABLE OF CONTENTS
| SECTION | PAGE |
PEÑASQUITO PROJECT TECHNICAL REPORT
| 1.1 | TITLEPAGE | 9 | |
| 1.2 | TABLEOFCONTENTS | 9 | |
| 1.3 | SUMMARY | 9 | |
| 1.3.1 | Scope | 9 | |
| 1.3.2 | Mining Reserves Metrics | 10 | |
| 1.3.3 | Resources (inclusive of reserves) | 10 | |
| 1.3.4 | Metallurgical Recoveries for Sulphide Ores | 11 | |
| 1.3.5 | Oxide Recoveries | 11 | |
| 1.3.6 | Ore Grades | 11 | |
| 1.3.7 | Property Description and Location | 11 | |
| 1.3.8 | Geology | 12 | |
| 1.3.9 | Development Plan | 14 | |
| 1.3.10 | Resources Tabulation | 14 | |
| 1.3.11 | Reserves Tabulation | 19 | |
| 1.3.12 | Metallurgy Test Program | 23 | |
| 1.3.13 | Smelters and Refineries | 23 | |
| 1.3.14 | Summary and Conclusion | 23 | |
| 1.4 | INTRODUCTION | 24 | |
| 1.5 | RELIANCE ONOTHEREXPERTS | 27 | |
| 1.6 | PROPERTYDESCRIPTION& LOCATION | 27 | |
| 1.7 | ACCESSIBILITY, CLIMATE, LOCALRESOURCES, INFRASTRUCTURE | & | |
| PHYSIOGRAPHY | 29 | ||
| 1.7.1 | Physiography | 29 | |
| 1.7.2 | Infrastructure | 29 | |
| 1.7.3 | Climate | 29 | |
| 1.7.4 | Surface Rights | 30 | |
| 1.7.5 | Water | 30 | |
| 1.8 | HISTORY | 31 | |
| 1.9 | GEOLOGICALSETTING | 32 | |
| 1.10 | DEPOSITTYPES | 33 | |
| 1.11 | MINERALIZATION | 33 | |
| 1.12 | EXPLORATION | 34 | |
| 1.13 | DRILLING | 35 | |
| 1.14 | SAMPLINGMETHODANDAPPROACH | 38 | |
| 1.15 | SAMPLEPREPARATIONANDANALYSESANDSECURITY | 41 | |
| 1.16 | DATAVERIFICATION | 44 | |
| 1.17 | ADJACENTPROPERTIES | 45 | |
| 1.18 | MINERALPROCESSINGANDMETALLURGICALTESTING | 45 | |
| 1.18.1 | Sulphide Metallurgical Testing | 46 | |
| 1.18.2 | Sulphide Process Plant | 49 | |
ii
Peñasquito Project Technical Report December 2007
| Readdressed to Silver Wheaton Corp |
| Peñasquito Project Technical Report |
| December 2007 |
| 1.18.3 | Oxide Metallurgical Testing | 50 | ||
| 1.18.4 | Oxide Process Plant | 52 | ||
| 1.19 | Mineral Resource and Mineral Reserve Estimates | 52 | ||
| 1.19.1 | Mineral Resource Estimate | 52 | ||
| 1.19.2 | Terms of Reference | 52 | ||
| 1.19.3 | Reliance On Other Experts | 53 | ||
| 1.19.4 | Previously Reported Mineral Resources | 53 | ||
| 1.19.5 | Data | 55 | ||
| 1.19.6 | Survey Control | 57 | ||
| 1.19.7 | Composites | 57 | ||
| 1.19.8 | Lithological Model | 58 | ||
| 1.19.9 | Mineralization Model | 59 | ||
| 1.19.10 | Bulk Density | 60 | ||
| 1.19.11 | Exploratory Data Analysis | 60 | ||
| 1.19.12 | Variography | 64 | ||
| 1.19.13 | Estimation | 65 | ||
| 1.19.14 | Mineral Resource Statement | 69 | ||
| 1.19.15 | Validation | 70 | ||
| 1.19.16 | Mineral Reserves | 71 | ||
| 1.20 | OTHERRELEVANTDATAANDINFORMATION | 77 | ||
| 1.20.1 | Geotechnical | 77 | ||
| 1.20.2 | Tailings Design | 77 | ||
| 1.20.3 | Leach Pad | 78 | ||
| 1.21 | INTERPRETATIONANDCONCLUSIONS | 78 | ||
| 1.22 | RECOMMENDATIONS | 79 | ||
| 1.23 | REFERENCES | 79 | ||
| 1.24 | DATE | 85 | ||
| 1.25 | ADDITIONALREQUIREMENTSFORTECHNICALREPORTSON | |||
| DEVELOPMENTPROPERTIESANDPRODUCTIONPROPERTIES | 86 | |||
| 1.25.1 | Mine Operations | 86 | ||
| 1.25.2 | Process Operations | 90 | ||
| 1.25.3 | Recoveries | 95 | ||
| 1.25.4 | Markets | 95 | ||
| 1.25.5 | Contracts | 96 | ||
| 1.25.6 | Environmental Considerations | 96 | ||
| 1.25.7 | Taxes | 101 | ||
| 1.25.8 | Capital and Operating Costs | 102 | ||
| 1.25.9 | Economics | 102 | ||
| 1.26 | ILLUSTRATIONS | 108 | ||
| APPENDIX A-1: SUMMARY STATISTICS | 0 | |||
| APPENDIX A-2: MEAN & CV PLOTS | 4 | |||
| APPENDIX A-3: VARIOGRAPHY | 9 | |||
| APPENDIX A-4: SWATH PLOTS | 12 | |||
| APPENDIX B – CONSENTS | 1 | |||
iii
Peñasquito Project Technical Report December 2007
| Readdressed to Silver Wheaton Corp |
| Peñasquito Project Technical Report |
| December 2007 |
LIST OF TABLES
| TABLE NO. | DESCRIPTION | |
| Table 1-1 | Peñasquito Mineral Resources Summary Data – June 25, 2007 | |
| Table 1-2a | Peñasquito Project Mineral Resources - Measured Category | |
| Table 1-2b | Peñasquito Project Mineral Resources – Indicated Category | |
| Table 1-2c | Peñasquito Project Mineral Resources – Inferred Category | |
| Table 1-3 | Peñasquito Project Proven and Probable Reserves Summary | |
| Table 1-4a | Peñasquito Project Reserves – Proven Category | |
| Table 1-4b | Peñasquito Project Reserves – Probable Category | |
| Table 1-4c | Peñasquito Project Reserves – Proven + Probable Totals | |
| Table 1-5 | List of Pertinent Claims | |
| Table 1-6 | Summary of Project Drilling at Peñasquito - Through Campaign 18 | |
| Table 1-7 | Summary of Exploration Drilling Campaigns at Peñasquito | |
| Table 1-8 | Summary of Drilling Activity at the Peñasquito Property | |
| Table 1-9 | Geologic Logging | |
| Table 1-10 | Summary of Metallurgical Testing | |
| Table 1-11 | Projections of Mine Head Grades, Concentrate Grades and Recoveries | |
| Table 1-12 | 2007 Oxide Test Results | |
| Table 1-13 | SNC-Lavalin March 2003 mineral resource estimate. | |
| Table 1-14 | SNC-Lavalin March 2004 mineral resource estimate. | |
| Table 1-15 | MC November 2005 mineral resource estimate. | |
| Table 1-16 | IMC July 2006 resource estimate. | |
| Table 1-17 | Drilling database | |
| Table 1-18 | Assay sample lengths. | |
| Table 1-19 | Peñasquito lithological units. | |
| Table 1-20 | Mineralization Domains. | |
| Table 1-21 | Goldcorp specific gravity data. | |
| Table 1-22 | Naïve assay summary statistics. | |
| Table 1-23 | Composite summary statistics. | |
| Table 1-24 | Correlation coefficient table for composite data. | |
| Table 1-25 | Composite data threshold values. | |
| Table 1-26 | Standardized experimental semivariograms. | |
| Table 1-27 | Block model setup parameters. | |
| Table 1-28 | Mill recoveries used in NSR calculations. | |
| Table 1-29 | Mineral resource metal prices used in NSR calculations. | |
| Table 1-30 | Breakeven block cutoff grades. | |
| Table 1-31 | Mineral resource classification criteria. | |
| Table 1-32 | Global Peñasquito mineral resources. | |
| Table 1-33 | Average classification parameters for sulphides. | |
| Table 1-34 | Average classification parameters for oxides. | |
| Table 1-35a | Pit Definition Metal Prices | |
| Table 1-35 | Floating Cone Input Parameters | |
iv
Peñasquito Project Technical Report December 2007
| Readdressed to Silver Wheaton Corp |
| Peñasquito Project Technical Report |
| December 2007 |
LIST OF TABLES (continued)
| TABLE NO. | DESCRIPTION |
| Table 1-36 | Floating Cone Results |
| Table 1-37 | Pit Design Parameters |
| Table 1-38 | Summarizes the results of the smoothed and ramped final pit design for Chile |
| Colorado, Azul and Peñasco. | |
| Table 1-39 | Mine Production Schedule |
| Table 1-40 | Mine Plan Basis |
| Table 1-41 | Mining Equipment Selection |
| Table 1-42 | Capital Cost Estimate |
| Table 1-43 | Metals Pricing for Economic Model |
| Table 1-44 | Cash Flow Summary |
| Table 1-45 | Key Financial Metrics |
| Table 1-46 | Annual Cash Flow Forecast |
| Table 1-47 | Economic Sensitivity |
v
Peñasquito Project Technical Report December 2007
| Readdressed to Silver Wheaton Corp |
| Peñasquito Project Technical Report |
| December 2007 |
Units and Abbreviations
| ADA | azimuth-dip-azimuth |
| Ag | silver |
| Au | gold |
| CIM | Canadian Institute for Mining, Metallurgy and Petroleum |
| CV | coefficient of variation |
| dxf | Drawing Exchange Format CAD data file |
| g/t | grams per tonnes |
| Goldcorp | Goldcorp Inc., Vancouver |
| ID | inverse distance |
| IMC | Independent Mining Consultants Inc. Tucson |
| km | kilometer |
| lb | pound |
| m | meter |
| M3 | M3 Engineering and Technology Corporation |
| MDA | Mine Development Associates, Reno Nevada |
| Mt | million metric tonnes |
| NI43-101 | National Instrument 43-101 |
| NSR | Net Smelter Return |
| OK | ordinary kriging |
| oz | troy ounce |
| Pb | lead |
| ppm | parts per milion |
| QAQC | quality assurance and quality control |
| SG | specific gravity |
| SNC | SNC-Lavalin Inc., Toronto |
| SPH | spherical semivariogram |
| t or T | metric tonne |
| tpd or TPD | metric tonnes per day |
| t/m3 | tonnes per cubic meter |
| TIN | Triangulated Irregular Network |
| USD | US dollar |
| Zn | zinc |
vi
Peñasquito Project Technical Report December 2007
| Readdressed to Silver Wheaton Corp |
| Peñasquito Project Technical Report |
| December 2007 |
LIST OF FIGURES
| FIGURE | DESCRIPTION |
| 1-1 | National Transportation Corridors |
| 1-2 | Project State Plan |
| 1-3 | Project Region Plan |
| 1-4 | Project Vicinity Plan |
| 1-5 | Project Facilities Plan |
| 1-6 | Sulphide Mill |
| 1-7 | Peñasquito Mineral Concessions |
| 1-8 | Private and Ejido Surface Ownership |
| 1-9 | Local Geology |
| 1-10 | Plan Drill Hole Traces |
| 1-11 | Lithological Units |
| 1-12 | Zinc Contact Profile |
| 1-13 | Class Profile |
| 1-14 | Silver Profile |
| 1-15 | Gold Profile |
| 1-16 | Lead Profile |
| 1-17 | Zinc Profile |
| 1-18 | Plan View Ultimate Pit |
| 1-19 | Annual Pit Year 1-4 |
| 1-20 | Annual Pit Year 5-8 |
| 1-21 | Annual Pit Year 9-12 |
| 1-22 | Annual Pit Year 13-16 |
| 1-23 | Annual Pit Year 17-20 |
| 1-24 | Project Perspective |
| 1-25 | Grinding Area Elevation |
vii
Peñasquito Project Technical Report December 2007
| Readdressed to Silver Wheaton Corp |
| Peñasquito Project Technical Report |
| December 2007 |
LIST OF APPENDICES
| APPENDIX | DESCRIPTION |
| A.1 | Summary Statistics |
| A-2 | Mean and CV Plots |
| A-3 | Variography |
| A-4 | Swath Plots |
| B | Professional Qualifications |
- Certificate of Qualified Person and Consent of Author
| Responsibility | Qualified Person | Registration | Company |
| Resource Modeling | Fred H Brown | CPG | Independent |
| Mine Planning & Reserves | |||
| and Overall Preparation | Robert H Bryson | MMSA | Goldcorp |
| Geology | Reynaldo Rivera | AusIMM | Luismin |
| Assay Data Analysis | Steven Ristorcelli | CPG | MDA |
viii
Peñasquito Project Technical Report December 2007
| Readdressed to Silver Wheaton Corp |
| Peñasquito Project Technical Report |
| December 2007 |
| 1.1 | TITLEPAGE |
This report is prepared in accordance with the Canadian Standard NI 43-101 as updated December 23, 2005. The first two items of this 26-item outline are the Title Page and Table of Contents. For ease of reference, the first two subsections of this report (1.1 and 1.2) are incorporated into the format of this report.
| 1.2 | TABLEOFCONTENTS |
See discussion in subsection 1.1.
| 1.3 | SUMMARY |
| 1.3.1 | Scope |
On December 3, 2007, Goldcorp issued a press release summarizing the expansion of its wholly owned Peñasquito Project, Zacatecas, Mexico. This technical report has been prepared by Goldcorp to provide scientific and technical information in consideration of those updated and expanded mine plans, processing rates and costs. This report has been prepared in compliance with Canadian Securities Administrators National Instrument 43-101, under the direct supervision of Robert H Bryson, Vice President Engineering Goldcorp, a qualified person.
As background, a comprehensive feasibility study and technical report was published for the Peñasquito project on August 16, 2006 by M3 Engineering and Technology Corporation of Tucson, AZ (M3 2006a). In August 2007, Goldcorp published an updated Technical Report incorporating increased resources and reserves (GG 2007). In December 2007, M3 completed an updated Capital Cost Estimate (M3 2007) to increase process throughput from 100,000 tpd to 130,000 tpd. In concurrence with the updated capital costs and reserves, Goldcorp then produced an updated mine plan and financial analysis. To provide information on the results of these December 2007 updates, Goldcorp has prepared this December 31, 2007 technical report. Since this current report uses the same resource and reserve numbers of the August 2007 report, most of the updates contained in this current report are contained in Section 1.25: Additional Requirements for Technical Reports on Development Properties and Production Properties.
The Peñasquito project is in development and construction has begun. The project is being built to initially process a nominal 25,000 tpd of oxide ore and 65,000 tpd of sulfide ore. Over the first three years of operation,
9
Peñasquito Project Technical Report December 2007
| Readdressed to Silver Wheaton Corp |
| Peñasquito Project Technical Report |
| December 2007 |
continued construction and expansion of the sulfide plant will provide for a rate increase to a nominal 130,000 tpd. The permitting procedure to increase capacity is in progress. Detailed engineering design is over 70 percent complete, equipment deliveries have commenced, and project infrastructure is being built. Metallurgical testing, exploration drilling and in-fill definition drilling are continuing.
The operating timeline for the project is as follows:
- Receipt of permits and commencement of construction in March 2007
- Pre stripping begins August 2007
- Oxide plant startup in July 1, 2008. Metal production late in 2008.
- Permit mine and mill expansion in 2007 and 2008
- Sulphide SAG Line 1 start up January 1, 2009, with a ramp-up of production to 65,000 TPD by August 2009
- Sulphide SAG Line 2 starts up January 1, 2010, with a ramp-up of production to 65,000 TPD by August 2010 bringing total sulfide production to 130,000 TPD.
| 1.3.2 | Mining Reserves Metrics |
- Metals pricing for determining reserves approximates a 36 month (ending June 2007) historical average, i.e., the geometry for the pit and ore blocks within the geometry were based on the following:
| Gold | $525.00/ounce | |
| Silver | $10.00/ounce | |
| Zinc | $0.80/pound | |
| Lead | $0.40/pound |
- The following mineral reserves have been identified
| Oxide | 110,000,000 | tonnes | |
| Sulphide | 807,000,000 | tonnes | |
| Waste | 2,552,000,000 | tonnes | |
| Total | 3,469,000,000 | tonnes |
| 1.3.3 | Resources (inclusive of reserves) |
- Metal pricing for determining resources are as follows:
| Gold | $650.00/ounce | |
| Silver | $13.00/ounce |
10
Peñasquito Project Technical Report December 2007
| Readdressed to Silver Wheaton Corp |
| Peñasquito Project Technical Report |
| December 2007 |
| Zinc | $1.00/pound | |
| Lead | $0.50/pound |
- The following mineral resources have been identified
| Measured & Indicated Resources | 1,596,000,000 tonnes | |
| Inferred Resources | 1,220,000,000 tonnes |
| 1.3.4 | Metallurgical Recoveries for Sulphide Ores |
| Lead Concentrate | Zinc Concentrate | |||||
| Breccia | Intrusive | Sedimentary | Breccia | Intrusive | Sedimentary | |
| Sulfide Mill Recoveries | ||||||
| Lead | 72.0% | 72.0% | 63.0% | 0.0% | 0.0% | 0.0% |
| Zinc | 0.0% | 0.0% | 0.0% | 75.0% | 60.0% | 60.0% |
| Silver | 65.0% | 63.0% | 58.0% | 15.0% | 14.0% | 5.0% |
| Gold | 62.0% | 64.0% | 20.0% | 13.0% | 10.0% | 5.0% |
| Concentrate Grade | 51.0% | 51.0% | 51.0% | 50.0% | 50.0% | 50.0% |
| Composition of Sulphide Ore at Peñasquito: |
| Breccia | 61% | |
| Intrusives | 6% | |
| Sedimentary | 33% |
| 1.3.5 | Oxide Recoveries |
| Gold | Silver | ||
| Peñasco | 50% | 28% | |
| Chile Colorado | 50% | 22% |
| 1.3.6 | Ore Grades |
| Oxide Ore: | ||
| Gold | 0.18 grams/tonne | |
| Silver | 18.1 grams/tonne | |
| Sulphide Ore: | ||
| Gold | 0.48 grams/tonne | |
| Silver | 30.8 grams/tonne | |
| Lead | 0.33% | |
| Zinc | 0.72% |
| 1.3.7 | Property Description and Location |
The project is located in the state of Zacatecas, Mexico at approximately 24°45’ N latitude / 101°30’ W longitude. Minera Peñasquito, S.A. de C.V. is the operating company and is a wholly owned subsidiary of Goldcorp.
11
Peñasquito Project Technical Report December 2007
| Readdressed to Silver Wheaton Corp |
| Peñasquito Project Technical Report |
| December 2007 |
Goldcorp owns 100% of the mineral rights to a large area covering approximately 39,000 hectares located in the north-eastern portion of the State of Zacatecas (Figures 1-1 and 1-2) in north-central Mexico. As shown on Figures 1-3 and 1-4, the portion of this area referred to as the Peñasquito property lies approximately 27 km west of the town of Concepción del Oro in a wide, generally flat valley covered by coarse grasses and cacti.
Investigations on this property have identified several major sulphide mineralization zones with significant values of silver, gold, zinc and lead (Figure 1-9). This report considers the economic development of three zones, the Peñasco, Azul and the Chile Colorado, which have been the subject of most of the geological and metallurgical investigations to date. In addition to the sulphide mineralization, the three zones also have substantial oxide ore caps which contain recoverable gold and silver. The gold and silver recovered from the oxide ores have been included in the project economic evaluation.
| 1.3.8 | Geology |
The regional geology of the area is well understood and has been extensively mapped (Figure 1-9). The project lies within the Mexico Geosyncline, a 2.5 km thick series of marine sediments deposited during the Jurassic and Cretaceous Periods and consisting of a 2000 meter thick sequence of carbonaceous, calcareous turbidic siltstones and interbedded sandstones underlain by a 1200 meter thick limestone sequence. The two sierras in the area are separated in the western half of the district by the Mazapil Valley which is a synclinal valley underlain by the Upper Cretaceous Caracol Formation. The Caracol siltstone-sandstone section is generally flat lying in the valley with occasional small parasitic anticlines and drag folds along faults. The local geology is dominated almost entirely by the rocks of the Mexico Geosyncline. The oldest rocks in the area are the Upper Jurassic aged limestones and cherts of the Zuloaga Limestone.
There are two dominant styles of sulfide mineralization and recent oxidized mineralization at surface, each of which hosts potentially economic mineralization. The economically important styles of mineralization are:
- Sedimentary-rock-hosted sulfide veinlet/stockwork deposits typified by Chile Colorado;
- Breccia-hosted disseminated and veinlet sulfide deposits typified by Peñasco-Azul; and
- Secondary oxide deposits.
12
Peñasquito Project Technical Report December 2007
| Readdressed to Silver Wheaton Corp |
| Peñasquito Project Technical Report |
| December 2007 |
Sedimentary-hosted Sulfide-Veinlet/Stockwork Deposits:These deposits are hosted in the Caracol Formation and tend to be located proximal to the margin of the phyllic alteration shell. Mineralization consists of sheeted, very narrow to 20-cm wide sphalerite-galena-argentite-tetrahedrite-sulfosalt veins with a pyrite-calcite-rhodochrosite gangue that grades into pyrite-quartz-fluorite at depth in the more intense quartz-sericite-pyrite alteration sub-shell. A similar suite of fine-grained disseminated sulfides occurs in the thin basal sands in the Caracol turbidite beds and in ribbon channel sands. There are occasional zones of weak crackle breccia and breccia dikes that are also mineralized.
Breccia-Hosted Disseminated Sulfide Deposits:The Peñasco deposit extends from surface in the center of the pipe to a drill tested depth of 1,040 meters. In plan view it is ovoid in shape, about 1000-m wide in an east-west direction and 900-m long in a north-south direction, and has formed around a complex series of small concentric quartz-porphyry stocks and dikes with late felsite dikes. The disseminated and veinlet mineralization has medium- to coarse-grained sphalerite/galena/argentite, unidentified silver sulfosalts, minor tetrahedrite-polybasite and gangue of calcite-rhodochrosite-quartz-fluorite. There are columns or bands of mineralization that extend to surface in an intrusive-clast breccia that envelops the intrusive stocks and dikes which cut through the deposit. The intrusive rocks are often mineralized. Mineralization also extends upwards along the south breccia-siltstone contact where it is hosted in sediment-clast breccia; this zone is open to the west. High-grade veins occur in the siltstone just outside of the north and west breccia/siltstone contact. All mineralization types tend to be higher grade close to the breccia-siltstone contact. The most common mineral host is the intrusive-clast hydrothermal breccia. Mineralization also is widely distributed as a halo around the porphyry stocks and dikes near the surface as the porphyry appears to have brecciated as it moved upward. Mineralization is present in quartz-feldspar porphyry intrusive breccia and to a lesser extent the quartz-porphyry dikes. In some places, the felsite dikes are good host rocks for disseminated mineralization. The sulfide mineralization consists of sphalerite-galena-argentite-tetrahedrite-polybasite. Gangue minerals are pyrite-calcite-quartz-fluorite-quartz-rhodochrosite. The mineral habit varies from disseminated sulfides in the matrix and clasts, to cavity fillings and narrow veinlets. The base metal sulfides and sulfosalts replace the matrix, often rimming breccia fragments or partially filling gas cavities. The disseminated sulfides vary from coarse individual crystals to ovoids of fine intergrown crystal aggregates in both the breccias and intrusive rocks. It is common to see sphalerite rimmed by a narrow rind of galena and sulfosalts. Galena and sulfosalt-bearing veins occur in the margins of the porphyry dikes.
13
Peñasquito Project Technical Report December 2007
| Readdressed to Silver Wheaton Corp |
| Peñasquito Project Technical Report |
| December 2007 |
| 1.3.9 | Development Plan |
The Peñasquito Project will be developed by constructing a modern, world class open pit mine and metals extraction facility. Access roads to the site will be improved and bypass routes around affected municipalities will be constructed. Power will be brought in from the 400kV power line National grid system via a tapped-in point in reasonable proximity to the site. From this location, power will be transmitted at 400kV from the 400kV/400kV switchyard tap-in via a new overhead power line to the mine site main 400kV/69kV substation. Process water will be initially obtained from wells to be developed on site and supplemented during later development from pit dewatering.
Ore and waste will be mined using open pit mining utilizing four electric shovels, three large front end loaders, and a fleet of up to 85 diesel/electric haul trucks. The open pit will be mined in a series of 11 phases. (see Figures 1-18 to 1-23)
The sulphide ore will be processed at an initial nominal rate of 65,000 tpd and then, after expansion, to 130,000 tpd rate through a conventional crushing, milling and flotation facility. Haul trucks will deliver ore to a primary crusher; crushed ore will be conveyed to a SAG mill, dual ball mill setup, and pebble crusher facility. Ground and classified sulphide ore will be piped to the flotation circuit where the ore will be processed to produce a lead concentrate and zinc concentrate. The concentrate slurries will first be thickened and then dewatered using pressure filters. The dewatered concentrates will be stockpiled before loading onto highway road vehicles for transport to in-country smelters or to the ports for export to foreign smelters.
| 1.3.10 | Resources Tabulation |
Mineral resource estimates were prepared by Mr. Fred Brown, a Qualified Person as defined by NI43-101 under contract to Goldcorp. Using geologic and analytical data from exploration drilling performed by Goldcorp and predecessor companies, a computer block model for the Peñasco, Azul and Chile Colorado deposits was developed. Assay and geological data available as of June 1, 2007 was used in the resource tabulation.
Resource tabulations for the Peñasquito Project are based on estimates of block metal grades (gold, silver, lead and zinc), classified into measured, indicated or inferred categories and Net Smelter Return (NSR). For sulphide mineral resources, the NSR values were calculated in terms of
14
Peñasquito Project Technical Report December 2007
| Readdressed to Silver Wheaton Corp |
| Peñasquito Project Technical Report |
| December 2007 |
their Zn-concentrate contribution and Pb-concentrate contribution and the contributions were then combined. For oxide mineral resources the NSR values were calculated for Ag and Au only. NSR equals the amount paid by the smelter. It is calculated as the value of metals content less:
- the summation of smelter and refinery charges (including penalty elements) and
- shipping costs (including inland transportation, port handling fees, etc.) and
- any broker transaction costs
The NSR value for the sulphide and oxide mineral resources were calculated using input data on metallurgical recoveries, metal pricing and smelter terms. For resource tabulations, Goldcorp applied gold and silver metal pricing consistent with current spot pricing and applied zinc and lead metal pricing consistent with three year historical averages. The resource metal prices are: $650/oz gold, $13/oz silver, $0.50/lb lead and $1.00/lb zinc.
Resources are tabulated using a NSR cutoff grade equal to projected mill processing costs plus the general and administration costs of the operation. Specifically these values are: $4.55 NSR for Peñasco-Azul sulphide feed and $5.18 NSR for Chile Colorado sulphide feed. A run-of-mine, heap leach process for gold and silver has been defined for the oxide materials at an NSR cutoff of $1.18 for Peñasco-Azul and at $1.30 for Chile Colorado.
The mineral resources inventory is consistent with those reported in June 2006 (M3 2006a) with the notable exception of a significant conversion of inferred mineral resources to measured or indicated mineral resource. The current mineral resources are summarized in Tables 1-1 and 1-2.
15
Peñasquito Project Technical Report December 2007
| Readdressed to Silver Wheaton Corp |
| Peñasquito Project Technical Report |
| December 2007 |
Table 1-1 Peñasquito Mineral Resources Summary Data – June 25, 2007
| June 2006 | Update June 2007 | % Change | |
| Measured & Indicated Resource (inclusive of proven and probable reserves) | |||
| Tonnes (millions) | 872.5 | 1,596.0 | 83% |
| Contained Metals | |||
| Gold (troy ounces - millions) | 12.8 | 17.8 | 39% |
| Silver (troy ounces - millions) | 822 | 1,277 | 55% |
| Lead (tonnes - millions) | 2.4 | 4.0 | 67% |
| Zinc (tonnes - millions) | 5.3 | 9.4 | 77% |
| Inferred Resource | |||
| Tonnes (millions) | 2,577.0 | 1,220.0 | -53% |
| Contained Metals | |||
| Gold (troy ounces – millions) | 14.3 | 8.9 | -38% |
| Silver (troy ounces – million) | 882 | 508 | -42% |
| Lead (tonnes – million) | 2.4 | 0.9 | -63% |
| Zinc (tonnes – millions) | 7.1 | 5.9 | -17% |
In accordance with NI 43-101 guidelines, only material in the measured and indicated categories has been used in the economic evaluation of these deposits.
16
Peñasquito Project Technical Report December 2007
| Readdressed to Silver Wheaton Corp |
| Peñasquito Project Technical Report |
| December 2007 |
Table 1-2aPeñasquitoProjectMineralResources -MeasuredCategory
MEASURED CATEGORY | Tonnes (Millions) | Gold Grade (gpt) | Gold (Ounces) | Silver Grade (gpt) | Silver (Ounces) | Lead Grade (%) | Lead Tonnes (Millions) | Zinc Grade (%) | Zinc Tonnes (Millions) |
| Peñasco Oxide Resource | 39.0 | 0.19 | 243,000 | 19.6 | 24,660,000 | 0.33% | 1.30 | 0.73% | 2.90 |
| Peñasco Sulfide Resource | 396.0 | 0.60 | 7,642,000 | 31.2 | 397,530,000 | ||||
| Chile Colorado Oxide Resource | 11.0 | 0.18 | 59,000 | 15.7 | 5,300,000 | 0.35% | 0.50 | 0.82% | 1.10 |
| Chile Colorado Sulfide Resource | 130.0 | 0.25 | 1,050,000 | 33.7 | 140,725,000 | ||||
| Combined Oxide Measured Resources | 50.0 | 0.19 | 302,000 | 18.8 | 29,960,000 | 0.34% | 1.80 | 0.75% | 4.00 |
| Combined Sulfide Measured Resources | 526.0 | 0.51 | 8,692,000 | 31.8 | 538,255,000 | ||||
| Combined Measured Resources | 576.0 | 0.49 | 8,994,000 | 30.7 | 568,215,000 |
Table 1-2b —PeñasquitoProjectMineralResources –IndicatedCategory
INDICATED CATEGORY | Tonnes (Millions) | Gold Grade (gpt) | Gold (Ounces) | Silver Grade (gpt) | Silver (Ounces) | Lead Grade (%) | Lead Tonnes (Millions) | Zinc Grade (%) | Zinc Tonnes (Millions) |
| Peñasco Oxide Resource | 63.0 | 0.14 | 284,000 | 12.6 | 25,763,000 | 0.23% | 1.50 | 0.58% | 3.80 |
| Peñasco Sulfide Resource | 652.0 | 0.33 | 6,860,000 | 22.2 | 465,972,000 | ||||
| Chile Colorado Oxide Resource | 40.0 | 0.14 | 183,000 | 14.1 | 18,163,000 | 0.27% | 0.70 | 0.64% | 1.70 |
| Chile Colorado Sulfide Resource | 265.0 | 0.17 | 1,459,000 | 23.4 | 199,033,000 | ||||
| Combined Oxide Indicated Resources | 103.0 | 0.14 | 467,000 | 13.2 | 43,926,000 | 0.24% | 2.20 | 0.59% | 5.40 |
| Combined Sulfide Indicated Resources | 917.0 | 0.28 | 8,319,000 | 22.6 | 665,005,000 | ||||
| Combined Indicated Resources | 1,020.0 | 0.27 | 8,786,000 | 21.6 | 708,931,000 |
Table 1-2c —PeñasquitoProjectMineralResources –InferredCategory
INFERRED CATEGORY | Tonnes (Millions) | Gold Grade (gpt) | Gold (Ounces) | Silver Grade (gpt) | Silver (Ounces) | Lead Grade (%) | Lead Tonnes (Millions) | Zinc Grade (%) | Zinc Tonnes (Millions) |
| Peñasco Oxide Resource | 25.0 | 0.13 | 106,000 | 11.7 | 9,288,000 | 0.08% | 0.70 | 0.53% | 4.60 |
| Peñasco Sulfide Resource | 869.0 | 0.25 | 6,900,000 | 12.6 | 351,399,000 | ||||
| Chile Colorado Oxide Resource | 16.0 | 0.11 | 57,000 | 15.2 | 7,819,000 | 0.06% | 0.20 | 0.42% | 1.30 |
| Chile Colorado Sulfide Resource | 310.0 | 0.18 | 1,840,000 | 14.0 | 139,658,000 | ||||
| Combined Oxide Inferred Resources | 41.0 | 0.12 | 163,000 | 13.0 | 17,107,000 | 0.07% | 0.90 | 0.50% | 5.90 |
| Combined Sulfide Inferred Resources | 1,179.0 | 0.23 | 8,740,000 | 13.0 | 491,057,000 | ||||
| Combined Inferred Resources | 1,220.0 | 0.23 | 8,903,000 | 13.0 | 508,164,000 |
Notes:
1)The termsMineralResource andReserves as used hereinconform to thedefinitionscontained in theNationalInstrument 43-101 which adopts thosepublished by theCanadianInstitute ofMining,Metallurgy, &Petroleum (CIM). Theseresource andreservesestimates have beenprepared by Mr. FredBrown, aQualifiedPerson asdefined by NI43-101 and by Robert HBryson, VicePresidentEngineering ofGoldcorp Inc., aQualifiedPerson asdefined byNationalInstrument 43-101.
17
Peñasquito ProjectTechnical ReportDecember 2007
| Readdressed to Silver Wheaton Corp |
| Peñasquito Project Technical Report |
| December 2007 |
| 2)Mineral resource classification was based on kriging variance and the number of informing samples. For the Oxide Domain, classification was based on the |
| gold kriging variance and the number of informing samples. For the sulphide domains classification was based on the zinc kriging variance and the number of |
| informing samples. All mineral resources meet the defined classification criteria and cutoff grades for Peñasquito. |
| 3) Mineral Resources have been calculated using assumed long-term metals prices as follows: Gold - $650 per ounce; Silver - $13.00 per ounce; Zinc - $1.00 |
| per pound and Lead - $0.50 per pound. |
| 4)The M&I Resources have been calculated using NSR (Net Smelter Return) cut-off grades and assuming the long-term Mineral Resource metals prices set |
| forth above. These cutoff grades are: $4.55 NSR for Peñasco-Azul sulphide feed and $5.18 NSR for Chile Colorado sulphide feed. A run-of-mine, heap leach |
| process for gold and silver has been defined for the oxide materials at an NSR cutoff of $1.18 for Peñasco-Azul and at $1.30 for Chile Colorado. |
| 5) Reserves are a subset of Measured and Indicated Resources. |
18
Peñasquito ProjectTechnical ReportDecember 2007
| Readdressed to Silver Wheaton Corp |
| Peñasquito Project Technical Report |
| December 2007 |
Exploration drilling at Peñasquito is currently underway, concentrating on two key areas:
Extension of Mineralized Zones - The mineralization remains open between the Azul and Peñasco deposits as well as at depth in all areas. Step-out drilling will continue in an effort to extend the deposits.
Underground Opportunity - In the Peñasco and Azul deposit, intersections of high grade mineralization have been identified beneath the designed pit. Future drilling will test deeper targets to investigate the possibility of future bulk underground mining.
| 1.3.11 | Reserves Tabulation |
Mineral Reserves were prepared by Independent Mining Consultants of Tucson, AZ (IMC) under the supervision of Robert H Bryson, a Qualified Person as defined by NI43-101. Reserve tabulations for the Peñasquito Project are based on estimates of block metal grades (gold, silver, lead and zinc), use of only measured or indicated resources and Net Smelter Return (NSR). For sulphide mineral reserves, the NSR values were calculated in terms of their Zn-concentrate contribution and Pb-concentrate contribution and the contributions were then combined. For oxide mineral reserves the NSR values were calculated for Ag and Au only. NSR equals the amount paid by the smelter. It is calculated as the value of metals content less:
- the summation of smelter and refinery charges (including penalty elements) and
- shipping costs (including inland transportation, port handling fees, etc.) and
- any broker transaction costs.
The NSR value for the sulphide and oxide mineral reserves was calculated using input data on metallurgical recoveries, metal pricing and smelter terms. For reserve tabulations, Goldcorp applied gold and silver metal pricing consistent with three year historical averages and applied zinc and lead metal pricing at more conservative values somewhat below the three year historical averages. The reserve metal prices are: $525/oz gold, $10/oz silver, $0.40/lb lead and $0.80/lb zinc.
Reserves are tabulated using a NSR cutoff grade equal to projected mill processing costs plus the general and administration costs of the operation. Specifically these values are: $4.55 NSR for Peñasco-Azul sulphide feed and $5.18 NSR for Chile Colorado sulphide feed. A run-of-mine, heap leach process for gold and silver has been defined for the oxide materials at an NSR cutoff of $1.18 for Peñasco-Azul and at $1.30 for Chile Colorado.
19
Peñasquito Project Technical Report December 2007
| Readdressed to Silver Wheaton Corp |
| Peñasquito Project Technical Report |
| December 2007 |
The mineral reserves tonnage and metal content has increased significantly over those reported in June 2006. The average metal grade has decreased. These changes are as a result of:
- higher metals pricing (thus effectively reducing cutoff grade and average grade)
- additional in-fill drilling data which, in combination with higher metals prices has brought the Azul deposit into reserves
- additional in-fill drilling data in Peñasco and Chile Colorado which has converted resources to reserves
The proven and probable reserves for the deposits are contained within engineered pit designs based on a floating cone analysis of the resource block models using only the measured and indicated sulphide and oxide resources. Inferred resources are not included in the reserve estimations. Tables 1-3 and 1-4 summarize the data.
Table 1-3 Peñasquito Proven and Probable Reserves Summary Data
| June 2006 | Update June 2007 | % Change | |
| Ore Tonnes (millions) | |||
| Oxide (heap leach) | 87.1 | 110.4 | 27% |
| Sulfide (flotation) | 476.9 | 807.1 | 69% |
| Total Ore Tonnes (millions) | 564.0 | 917.5 | 63% |
| Oxide Ore Grade | |||
| Gold (grams per tonne) | 0.28 | 0.18 | -35% |
| Silver (grams per tonne) | 23.8 | 18.1 | -24% |
| Sulfide Ore Grade | |||
| Gold (grams per tonne) | 0.60 | 0.48 | -21% |
| Silver (grams per tonne) | 33.2 | 30.8 | -8% |
| Lead (%) | 0.35 | 0.33 | -7% |
| Zinc (%) | 0.76 | 0.72 | -5% |
| Contained Metals | |||
| Gold (troy ounces - millions) | 10.0 | 13.0 | 31% |
| Silver (troy ounces - millions) | 575 | 864 | 50% |
| Lead (tonnes - millions) | 1.77 | 2.67 | 60% |
| Zinc (tonnes - millions) | 3.62 | 5.81 | 60% |
| Stripping Ratio | 2.76 | 2.77 | 0% |
| (tonnes waste: oxide ore plus sulfide ore) |
20
Peñasquito Project Technical Report December 2007
| Readdressed to Silver Wheaton Corp |
| Peñasquito Project Technical Report |
| December 2007 |
Table 1-4aPeñasquitoProjectReserves –ProvenCategory
| PROVEN CATEGORY | Ore Tonnes (Millions) | Gold Grade (gpt) | Gold Ounces | Silver Grade (gpt) | Silver Ounces | Lead Grade (%) | Lead Tonnes (Millions) | Zinc Grade (%) | Zinc Tonnes (Millions) |
| Peñasco Pit Oxide | 34.4 | 0.21 | 232,000 | 21.4 | 23,620,000 | 0.35 | 1.19 | 0.76 | 2.6 |
| Peñasco Pit Sulfide | 337.4 | 0.65 | 7,079,000 | 32.6 | 353,242,000 | ||||
| Chile Colorado Pit Oxide | 7.8 | 0.21 | 51,000 | 18.5 | 4,624,000 | 0.41 | 0.37 | 0.86 | 0.8 |
| Chile Colorado Pit Sulfide | 89.4 | 0.27 | 776,000 | 39.6 | 113,751,000 | ||||
| Combined Pits Oxide Proven Reserves | 42.1 | 0.21 | 283,000 | 20.9 | 28,244,000 | 0.36 | 1.56 | 0.78 | 3.34 |
| Combined Pits Sulfide Proven Reserves | 426.9 | 0.57 | 7,855,000 | 34.0 | 66,993,000 | ||||
| Combined Pits Proven Reserves | 469.0 | 0.54 | 8,138,000 | 32.8 | 495,237,000 |
Table 1-4bPeñasquitoProjectReserves –ProbableCategory
| PROBABLE CATEGORY | Ore Tonnes (Millions) | Gold Grade (gpt) | Gold Ounces | Silver Grade (gpt) | Silver Ounces | Lead Grade (%) | Lead Tonnes (Millions) | Zinc Grade (%) | Zinc Tonnes (Millions) |
| Peñasco Pit Oxide | 42.9 | 0.16 | 228,000 | 15.7 | 21,695,000 | 0.27 | 0.73 | 0.62 | 1.68 |
| Peñasco Pit Sulfide | 271.2 | 0.44 | 3,847,000 | 25.9 | 225,525,000 | ||||
| Chile Colorado Pit Oxide | 25.4 | 0.17 | 139,000 | 17.6 | 14,366,000 | 0.35 | 0.38 | 0.72 | 0.79 |
| Chile Colorado Pit Sulfide | 109.1 | 0.20 | 699,000 | 30.5 | 107,036,000 | ||||
| Combined Pits Oxide Probable Reserves | 68.3 | 0.17 | 367,000 | 16.4 | 36,061,000 | 0.29 | 1.11 | 0.65 | 2.47 |
| Combined Pits Sulfide Probable Reserves | 380.2 | 0.37 | 4,546,000 | 27.2 | 332,561,000 | ||||
| Combined Pits Probable Reserves | 448.6 | 0.34 | 4,913,000 | 25.6 | 368,622,000 |
Table 1-4cPeñasquitoProjectReserves –Proven +Probable Totals
PROVEN + PROBABLE TOTALS | Ore Tonnes (Millions) | Gold Grade (gpt) | Gold Ounces | Silver Grade (gpt) | Silver Ounces | Lead Grade (%) | Lead Tonnes (Millions) | Zinc Grade (%) | Zinc Tonnes (Millions) |
| Peñasco Pit Oxide | 77.3 | 0.19 | 460,000 | 18.2 | 45,315,000 | 0.31% | 1.92 | 0.70% | 4.26 |
| Peñasco Pit Sulfide | 608.6 | 0.56 | 10,926,000 | 29.6 | 578,767,000 | ||||
| Chile Colorado Pit Oxide | 33.1 | 0.18 | 190,000 | 17.8 | 18,990,000 | 0.38% | 0.75 | 0.78% | 1.55 |
| Chile Colorado Pit Sulfide | 198.5 | 0.23 | 1,475,000 | 34.6 | 220,787,000 | ||||
| Combined Pits Oxide P+ P Reserves | 110.4 | 0.18 | 650,000 | 18.1 | 64,305,000 | 0.33% | 2.67 | 0.72% | 5.81 |
| Combined Pits Sulfide P+ P Reserves | 807.1 | 0.48 | 12,401,000 | 30.8 | 799,554,000 | ||||
| Combined Pits P+ P Reserves | 917.5 | 0.44 | 13,051,000 | 29.3 | 863,859,000 |
Notes:
1)The termsMineralResource andReserves as used hereinconform to thedefinitionscontained in theNationalInstrument 43-101 which adopts thosepublished by theCanadianInstitute ofMining,Metallurgy, &Petroleum (CIM). Theseresource andreservesestimates have beenprepared under thesupervision of Robert HBryson, VicePresidentEngineering ofGoldcorp Inc., who is aQualifiedPerson asdefined inNationalInstrument 43-101.
2)MineralReserves have beencalculated usingassumed metals prices asfollows: Gold - $525 per ounce; Silver - $10.00 per ounce; Zinc - $0.80 per pound and Lead - $0.40 perpound.
21
Peñasquito ProjectTechnical ReportDecember 2007
| Readdressed to Silver Wheaton Corp |
| Peñasquito Project Technical Report |
| December 2007 |
3)TheProven andProbableReserves have beencalculated using NSR (NetSmelterReturn) cut-offgrades andassuming theMineralReserves metals prices set forth above. These cutoffgrades are: $4.55 NSR forPeñasco-Azulsulphide feed and $5.18 NSR forChileColoradosulphide feed. A run-of-mine, heap leachprocess for gold and silver has beendefined for the oxidematerials at an NSR cutoff of $1.18 forPeñasco-Azul and at $1.30 for ChileColorado.
4)Proven andProbableReserves are a subset ofMeasured andIndicatedResources.
22
Peñasquito ProjectTechnical ReportDecember 2007
| Readdressed to Silver Wheaton Corp |
| Peñasquito Project Technical Report |
| December 2007 |
| 1.3.12 | Metallurgy Test Program |
Three hundred and sixty-eight (368) development metallurgical tests were undertaken on sulphide ore, and a further 123 were undertaken on oxide ore (M3 2005c). Locked cycle tests on ore from both the Peñasco and Chile Colorado deposits were performed as part of the flotation test program in order to provide a basis for the projected plant recoveries. These tests revealed that recoveries in the Peñasco Pit correlated with three basic lithologic categories: breccia, intrusive and sedimentary. Recoveries in the Chile Colorado tests have not yet revealed an obvious correlation. Work is ongoing to provide additional data for prediction of metal recoveries. Based on the most recent results, the metallurgical recoveries reported in Section 1.3.4 were determined.
| 1.3.13 | Smelters and Refineries |
Concentrates from the plant are expected to be custom processed at both local and overseas smelters. For the purpose of this study it has been assumed that the lead concentrate sales will be largely processed locally within Mexico. Alternatively, lead concentrate could be smelted in Canada, Asia or Europe. Such alternatives may provide for competition in the negotiation of smelter terms. Zinc concentrate treatment will most probably be split between Mexican and overseas markets in Canada, Asia or Europe. Concentrate destined for overseas markets will be hauled to the appropriate port; on the west coast for Asian and Canadian sales and the east coast for European and Canadian sales.
Smelter terms and transportation costs assumed for the project are considered typical and are not the result of negotiations with any particular smelter. The terms and cost assumptions are based on payable metals, deductions and payment terms.
Doré will likely be shipped to either Salt Lake City, Utah or Torreon, Mexico for refining.
| 1.3.14 | Summary and Conclusion |
This project has a number of favorable characteristics:
- An established threshold for NPV and IRR with economics that withstand sensitivity tests.
- The recoveries used for financial analysis are less than those achieved in laboratory testing for Peñasco and Chile Colorado ores. The likelihood exists that laboratory recoveries will eventually be realized by operations.
- A minimum mine life of 19 years. This life significantly exceeds metal pricing cycles. The payback period is 6.1 years.
- A high daily tonnage production.
23
Peñasquito Project Technical Report December 2007
| Readdressed to Silver Wheaton Corp |
| Peñasquito Project Technical Report |
| December 2007 |
- Early revenue from leaching oxide ore to produce silver/gold doré.
- A favorable site with relatively low earthwork costs.
- A potential for more conversion of waste to ore with infill drilling, i.e., reduced stripping ratio.
- A reasonable opportunity to develop underground deposits.
- A favorable business atmosphere in the setting of long established mining district heritage.
- An ideal power provider situation, i.e., tap off of 400 kV national grid.
The conclusion of the Qualified Person is to recommend going forward as quickly as possible with continued construction and operation of the Peñasquito project. Optimization studies should continue as more data becomes available such as metallurgical test results, open pit in-fill and underground deep potential drilling assays, and materials handling tradeoff studies.
| 1.4 | INTRODUCTION |
On December 3, 2007, Goldcorp issued a press release summarizing the expansion of its wholly owned Peñasquito Project, Zacatecas, Mexico. This technical report has been prepared by Goldcorp to provide scientific and technical information in consideration of those updated and expanded mine plans, processing rates and costs. This report has been prepared in compliance with Canadian Securities Administrators National Instrument 43-101, under the direct supervision of Robert H Bryson, Vice President Engineering Goldcorp, a qualified person.
As background, a comprehensive feasibility study and technical report was published for the Peñasquito project on August 16, 2006 by M3 Engineering and Technology Corporation of Tucson, AZ (M3 2006a). The following year in August 2007, Goldcorp published an updated Technical Report incorporating increased resources and reserves (GG 2007). In December 2007, M3 completed an updated Capital Cost Estimate (M3 2007) to increase process throughput from 100,000 tpd to 130,000 tpd. In concurrence with the updated capital costs and reserves, Goldcorp then produced an updated mine plan and financial analysis. To provide information on the results of these December 2007 updates, Goldcorp has prepared this December 31, 2007 technical report.
The Peñasquito project is in development and construction has begun. The project is being built to initially process a nominal 25,000 tpd of oxide ore and 65,000 tpd of sulfide ore. Over the first three years of operation, continued construction and expansion of the sulfide plant will provide for a rate increase to a nominal 130,000 tpd. The permitting procedure to increase capacity is in progress. Detailed engineering design is over 70
24
Peñasquito Project Technical Report December 2007
| Readdressed to Silver Wheaton Corp |
| Peñasquito Project Technical Report |
| December 2007 |
percent complete, equipment deliveries have commenced, and project infrastructure is being built. Metallurgical testing, exploration drilling and in-fill definition drilling are continuing.
In 1998 Western Silver acquired the entire Peñasquito property from Kennecott. Glamis Gold Inc. acquired Western Silver on May 3, 2006. Goldcorp acquired Glamis in November 2006. Since 2002, all three companies have undertaken a continuous series of drilling campaigns on the property. Initially, attention focused on Chile Colorado, and then Peñasco and recently attention shifted to Azul. This Technical report updates the previous August 9, 2007 report in consideration of updated mine plans, processing rates and costs.
In March of 2003 Western Silver completed an internal scoping study on the development of the Chile Colorado deposit. Western Silver requested that M3 review this document and produce a scoping level document of its own. This led to the production in March 2004 of a Pre-feasibility Study which also focused on the development of Chile Colorado.
In April 2004 following the encouraging results of the Pre-feasibility Study, Western Silver requested M3 continue to work on the Peñasquito Project to produce a comprehensive Feasibility Study suitable for financing purposes. With the exception of geology, drilling and assay data, which Western Silver would provide, M3 was assigned full responsibility for all other aspects of the study. The Feasibility Study considered the development of both the Chile Colorado and Peñasco deposits including the oxide caps that had not been evaluated in the Pre-feasibility Study.
In November 2004, M3 Engineering completed a confidential Heap Leach Study for the Peñasquito Project for Western Silver’s internal planning use. This study concluded that the oxide ore bodies were not sufficient on their own to justify a project, but that processing oxide ore in concert with the development of the sulphide ore could add value.
As part of these ongoing earlier efforts, SNC-Lavalin Engineers and Constructors, Inc. (SNC) prepared a report entitled, "Peñasquito Deposit - Mineral Resource Estimate for the Chile Colorado Zone," March 2004, which was an update to the Minera Peñasquito S.A. de C.V. Peñasquito Preliminary Mineral Resource Estimate, March 2003. In addition, SNC prepared a report outlining the mineral resource estimate for the Peñasco zone. In an independent effort during the last quarter of 2004, and to provide further assurance, M3 reviewed the base data and validated and accepted the SNC findings in M3’s Amended and Restated Peñasquito Pre-Feasibility Study, December 10, 2004.
25
Peñasquito Project Technical Report December 2007
| Readdressed to Silver Wheaton Corp |
| Peñasquito Project Technical Report |
| December 2007 |
In February 2005, M3 Engineering completed a confidential Capital Cost Update for the Heap Leach Study, which included a mine fleet cost analysis. This study further substantiated the findings of the November 2004 study, and verified the potential financial worthiness of processing oxide ore given the facilities already being in place for sulphide ores.
In March 2005, M3 completed an Interim Feasibility Study for internal use, based on developing both the Peñasco and Chile Colorado pits. This report concluded that if Peñasco inferred resources could be advanced to the measured and indicated categories, the project NPV would increase. Accordingly, an infill drilling campaign was initiated by Goldcorp.
In November 2005, M3 completed the Feasibility Study for the 50,000 TPD plant and recommended that the project go forward (M3 2005b).
In August 2006, M3 completed the Feasibility Study for the 100,000 TPD plant and recommended that the project go forward (M3 2006a).
During work on the August 2006 study, exploration and in-fill drilling continued. As a result and subsequent to that study, data from an additional 125 drill holes (233 including condemnation holes) became available for use in updating the mineral resource and mineral reserve estimate. A technical report dated August 9, 2007 was published in support of that resources and reserve update.
In December 2007, M3 completed a Capital Cost Estimate (M3 2007) to increase throughput from 100,000 TPD to 130,000 TPD. At the same time, Goldcorp prepared a mine production schedule to support the increased mill feed rate. Annual mining equipment quantities were updated based on the new production schedule. A cash flow analysis was prepared and approval given to proceed with the 130,000 TPD plan.
This technical report is authored by the owner, Goldcorp, and uses as its basis the August 2006 Feasibility Study by M3 (M3 2006a) with changes being to the resources and reserves and subsequently a new mine production schedule, capital cost estimate and economic analysis. The resources, reserves, new mine production schedule and economic analysis were produced by Goldcorp and its consultants, i.e., qualifying persons for this technical report are Goldcorp personnel. Other data and information used in this study have been collected independently by M3 and is explained and/or referenced in further detail in the subsequent sections.
Each of the four authors of this technical report has made personal detailed inspection of the property. The scope and degree of inspection by each author was congruent with their area of responsibility.
26
Peñasquito Project Technical Report December 2007
| Readdressed to Silver Wheaton Corp |
| Peñasquito Project Technical Report |
| December 2007 |
| 1.5 | RELIANCE ONOTHEREXPERTS |
Information and data for the report were obtained during one or more site visits by the following Qualified Persons (QPs): Robert Bryson, FH Brown, Reynaldo Rivera, and Steven Ristorcelli, between the dates of January 2006 and August 2007. In addition, the authors also consulted additional sources of information from Goldcorp’s reports on SEDAR, from personnel at the project site and from various third party consultants under contract to Goldcorp. The relevant reports, geological, mining, metallurgical and financial information were reviewed in sufficient detail to prepare this report. The report expresses the professional opinion of the authors and includes estimates, conclusions, and recommendations that are based on professional judgment and reasonable care. The said estimates, conclusions, and recommendations are consistent with the level of detail of this study, which is based on the information available at the time of report completion.
| 1.6 | PROPERTYDESCRIPTION& LOCATION |
Peñasquito is situated in the western half of the Concepción del Oro district in the northeast corner of Zacatecas State, Mexico, approximately 200 km northeast of the city of Zacatecas, approximately 24°452 N latitude/101°302W longitude. Figure 1-1 shows the general location in Mexico. The closest major town is Concepción del Oro which lies on Mexican highway 54, a well maintained, paved highway which links the major cities of Zacatecas (in the state of Zacatecas), approximately 250 km to the southwest with Saltillo (in the state of Coahuila) approximately 125 km to the northeast. Figure 1-2 shows its location in the state.
Some 20 km to the northeast, on the north side of Sierra el Mascaron, is the Tayahua Mine at Terminal and Concepción del Oro is the site of the Macocozac Mine. The following table lists claims affected by the development of the Peñasquito Project. This table is not a complete list of Goldcorp claims in the area.
Table 1-5 List of Pertinent Claims
CLAIM | TYPE | TITLE | FILE NO. | AREA HECTARES | DATE ISSUED | EXP. DATE |
| EL PEÑASQUITO | EXPLOIT. | 196289 | 43/885 | 2.000 | 1993-07-16 | 2011-07-11 |
| LA PEÑA | EXPLOIT. | 203264 | 07/1.3/547 | 58.000 | 1996-06-28 | 2046-06-27 |
| LAS PEÑAS | EXPLOIT. | 212290 | 8/1.3/00983 | 40.000 | 2000-09-29 | 2050-09-28 |
| ALFA | EXPLOIT. | 201997 | 7/1.3/485 | 1100.000 | 1995-10-11 | 2045-10-10 |
| BETA | EXPLOIT. | 211970 | 8/1.3/01137 | 2054.761 | 2000-08-18 | 2050-08-17 |
| SEGUNDA RED. CONCHA | EXPLOR. | 218920 | 8/2/00018 | 23304.691 | 2000-11-07 | 2006-11-06 |
| MAZAPIL 3 F. I | EXPLOR. | 217001 | 007/13852 | 1950.702 | 2002-06-14 | 2008-06-13 |
| MAZAPIL 10 | EXPLOR | 223327 | 93/26975 | 1073.555 | 2004-10-02 | 2010-10-01 |
27
Peñasquito Project Technical Report December 2007
| Readdressed to Silver Wheaton Corp |
| Peñasquito Project Technical Report |
| December 2007 |
A qualified Mexican attorney, Dr. Francisco Heiras Mancera, has issued an opinion dated December 23, 2004, stating that Goldcorp legally owns the mineral rights and is in full compliance with its legal obligations.
A 2% NSR royalty is owed to Royal Gold on production from both the Chile Colorado and Peñasco locations.
In addition to the Chile Colorado, Peñasco Azul, and El Sotol deposits, further mineralization is known to exist in areas known as Las Palmas, Chamisal, and Northeast Azul targets, some of which are also shown on Figure 1-9. Limited information has been obtained on these latter deposits.
There is no previous mine development of any form in the immediate area of Chile Colorado or Peñasco deposits and as such no environmental liabilities are attached to the property. All drilling pads are cleaned and rehabilitated on an ongoing basis.
Goldcorp has received all permits required for mine and mill construction and 50,000 tpd mill operation of the Peñasquito project in Zacatecas, Mexico. The approvals granted include the primary project MIA (Manifestación de Impacto Ambiental) and the high voltage transmission line MIA. In addition, agreements with the municipality of Mazapil are now in place that allow for construction of the mine and routing of the transmission line feeding the project. Goldcorp has also received the CUS (Cambio de Uso Suelo) for the project. This authorizes a change of land use to allow mining activities on the property.
An MIA extension or modification to increase permitted capacity to 150,000 TPD is progress. Data collection and field work for this modification is complete. The application will be made with SEMARNAT before the end of 2007 with expectations of approval in the first quarter 2008.
Under previously granted construction permits, electric power and water are established to the site, the airstrip has been constructed, concrete foundations have been poured for the site’s medical and construction camp facilities and preparation for mill construction activities is underway. Goldcorp has also added construction management staff for the project.
28
Peñasquito Project Technical Report December 2007
| Readdressed to Silver Wheaton Corp |
| Peñasquito Project Technical Report |
| December 2007 |
| 1.7 | ACCESSIBILITY, CLIMATE, LOCALRESOURCES, INFRASTRUCTURE& PHYSIOGRAPHY |
| 1.7.1 | Physiography |
The deposits occur in a wide valley bounded to the north by the Sierra El Mascaron and the south by the Sierra Las Bocas. Except for one small outcrop, the area is covered by up to 30 meters of alluvium. The terrain is generally flat, rolling hills; vegetation is mostly scrub, with cactus and coarse grasses. The prevailing elevation of the property is approximately 1900 m above sea level.
| 1.7.2 | Infrastructure |
An adequate network of road and rail services exists in the region. Road access to the site is presently gained west out of Concepción del Oro approximately 15 km to the town of Mazapil and then a further 12 km west from Mazapil. The road is very steep immediately west of Concepción del Oro with numerous tight switch-backs. It is either paved or cobbled and maintained to approximately 6 km west of Mazapil. After that, the road is gravel but well maintained. The Chile Colorado deposit is within 2 km of this main road and the Peñasco deposit lies directly beneath the road. Figures 1-4 and 1-5 show the project site plan. A system of gravel roads to the east connects to Cedros and eventually to Torreon and the Torreon/Fresnillo highway.
Additionally there is one railhead close to the site approximately 100 km to the west. Figure 1-3 shows some of the regional corridors.
Goldcorp is in the process of finishing construction of a new road east from Mazapil to join Highway 54 approximately 25km south of Concepción del Oro. The road is approximately 95% complete with only about 3.5 km yet to be finished over the mountain pass north of La Laja. This road will provide superior grade and alignment to the old road from Concepción del Oro. Use of this new road will eliminate the rather steep switchback sections of cobblestone road just west of Concepción del Oro and reduce the impact to the town of Concepción del Oro itself.
| 1.7.3 | Climate |
The climate is generally dry with precipitation being limited for the most part to a rainy season in the months of June and July. Annual precipitation for the area is approximately 700 mm, most of which falls in the rainy season. Temperatures range between 30 deg C and 20 deg C in the summer and 15 deg C to 0 deg C in the winter. Minera Peñasquito has maintained an automatic weather station in the area since August 2003; however, some data has been lost due to power supply problems.
29
Peñasquito Project Technical Report December 2007
| Readdressed to Silver Wheaton Corp |
| Peñasquito Project Technical Report |
| December 2007 |
| 1.7.4 | Surface Rights |
Surface rights in the vicinity of the Chile Colorado and Peñasco pits are held by private individuals and three Ejidos. Signatures indicating agreement have been obtained for all three of the Ejidos and nearly all the private owners. Goldcorp currently is in negotiations to finalize surface rights to the land required for the project, assisted by a Mexican legal firm.
An Ejido is a communal ownership of land recognized by the Federal laws in Mexico. While mineral rights are administered by the Federal government through federally issued mining concessions, an Ejido controls surface rights over communal property through a Board of Directors which is headed by a president. An Ejido may also allow individual members of the Ejido to obtain title to specific parcels of land and thus the right to rent or sell the land.
Relations with the Ejidos through the process have been positive.
Negotiations for the high voltage power line right-of-way are complete.
The project site is generally flat with a gradual fall of 1.5 – 2.5% to the west. There is adequate space for development of the process facilities and the tailings and waste areas. The tailings disposal will be constructed as a four-sided containment area using mine waste for a starter dam and tailings for raising the embankment. In general, this is a very favourable site for development.
Given the mining experience in the area and the high unemployment rate, there is expected to be an adequate pool of mining personnel available.
| 1.7.5 | Water |
The National Water Law and its regulations control all water use in Mexico. Comisión Nacional del Agua (CNA) is the responsible agency. Applications are submitted to this agency indicating the annual water needs for the mine operation and the source of water to be used. The CNA grants water concessions according to the availability in the source area.
The Peñasquito project will apply for permits to pump up to 40 million m³ per year. Presently the required hydro-geological studies are being made that will prove to authorities (CNA), that the aquifers in the region have enough available water to provide this amount.
The first two phases of hydro-geological studies have concluded (ending in December 2006). A third phase is in progress for Cedros Basin and its estimated completion date is in December 2007. Based on the completed studies, a 4.6 million m3 concession was obtained on 26 August 2006.
30
Peñasquito Project Technical Report December 2007
| Readdressed to Silver Wheaton Corp |
| Peñasquito Project Technical Report |
| December 2007 |
Using existing studies, another application for an additional water concession of 9.1 million m3 per year has been applied for.
| 1.8 | HISTORY |
The region has a strong tradition of mining going back to the mid 1500’s when silver mining first started in the region and the city of Zacatecas was founded. On a historical note, up until the 19th century, 20% of all silver mined in the world was reportedly mined from the Zacatecas Region.
Mining remains active in the State of Zacatecas. M3 has provided Engineering & Procurement and Start Up services for the recent Peñoles Fresnillo expansion as well as the greenfields Peñoles F.Y. Madero project. Both of these ongoing operations have polymetallic ore bodies.
Perhaps of greater interest is the recently mined out Real de Angeles property near the city of Zacatecas. This open pit mine operated from June 1982 to November 1998, averaged 17,000 TPD ore, and had life-of-mine ore grades of 0.58% lead, 0.9% zinc, 70 grams/tonne of silver and no appreciable gold. Life-of-mine stripping ratio was approximately 5 to 1. Values of metal contained are similar to the Peñasquito deposit, taking into account the gold prevalent at Peñasquito.
At the Peñasquito project, some limited exploration of the project area had taken place “historically” with a short shaft and two shallow drill holes in the 1950’s. However, it was not until 1994 when Kennecott initiated a comprehensive exploration program that the size and potential of the mineralized system were recognized.
Beginning in 1994, Kennecott consolidated the land position and completed extensive geochemical, geophysical and drilling programs to evaluate the area, primarily for large tonnage porphyry copper/skarn deposits.
During 1996, drilling along the southern edge of the Azul pipe resulted in the discovery of the Chile Colorado silver-lead-zinc-gold zone, which was not of interest to Kennecott on a stand-alone basis.
Western Silver acquired 100% of the Peñasquito project from Kennecott in March 1998. The acquisition was driven by the large size of the alteration-mineralization system (in excess of 9 km sq), the two large breccia pipes, the zone of probable economic Ag-Pb-Zn-Au mineralization at Chile Colorado, and numerous untested targets with potential similar to Chile Colorado. During 1998 Western Silver completed nine core holes
31
Peñasquito Project Technical Report December 2007
| Readdressed to Silver Wheaton Corp |
| Peñasquito Project Technical Report |
| December 2007 |
(3,185 meters) and 13.4 line kilometers of Tensor CSAMT. Most of the work was focused on Chile Colorado and the adjacent Azul breccia pipe.
During the fourth quarter of 2000, Hochschild completed a 14 hole, 4,601 meter drill program, with 11 holes drilled in the Chile Colorado area. However, they returned Peñasquito to Western Silver after spending more than $1 million on drilling and land payments. Hochschild decided not to tackle a bulk tonnage target with potentially large capital costs.
In 2002, Western Silver began actively drilling the Peñasquito property. Glamis Gold Inc. acquired Western Silver on May 3, 2006. Goldcorp acquired Glamis in November 2006. Section 1.13 has summaries of the drilling effort.
Section 1.19.5 provides previously reported mineral resource estimates
| 1.9 | GEOLOGICALSETTING |
The regional geology of the area is well understood and has been extensively mapped (Turner 2006). Concepción del Oro lies within the Mexico Geosyncline, a 2.5 km thick series of marine sediments deposited during the Jurassic and Cretaceous Periods and consisting of a 2000 meter thick sequence of carbonaceous and calcareous turbidic siltstones and interbedded sandstones underlain by a 1200 meter thick limestone sequence. (Figure 1-9).
The two sierras in the area are separated in the western half of the district by the Mazapil Valley which is a synclinal valley underlain by the Upper Cretaceous Caracol Formation. The Caracol siltstone-sandstone section is generally flat lying in the valley with occasional small parasitic anticlines and drag folds along faults.
The local geology is dominated almost entirely by the rocks of the Mexico Geosyncline. The oldest rocks in the area are the Upper Jurassic aged limestones and cherts of the Zuloaga Limestone.
These rocks are overlain by the La Caja Formation, a series of thinly bedded phosphatic cherts and silty to sandy limestones that may be fossiliferous.
The La Caja Formation is overlain by the limestones and argillaceous limestones of the Taraises Formation, which in turn are overlain by the limestones of the Cupido Formation, one of the more favorable host rock units for much of the mineralization previously mined in the area.
32
Peñasquito Project Technical Report December 2007
| Readdressed to Silver Wheaton Corp |
| Peñasquito Project Technical Report |
| December 2007 |
The Cupido limestones are overlain by the cherty limestones of the La Pena Formation, deposited during the Lower Cretaceous Period. These rocks are in turn overlain by the Cuesta del Cura limestone.
The Indidura Formation, a series of shales, calcareous siltstones and argillaceous limestones, overlies the Cuesta del Cura limestone.
Upper Cretaceous Period rocks of the Caracol Formation, consisting primarily of interbedded shales and sandstones, overlie the Indidura Formation. These rocks dominate the geology in the Peñasquito Project area and are overlain by the Tertiary aged Mazapil Conglomerate.
A large granodiorite stock is believed to underlie the entire area and the sediments described above are cut by numerous intrusive dykes, sills and stocks of intermediate to felsic composition. The intrusives are interpreted to have been emplaced from the late Eocene to mid-Oligocene Epochs and have been dated at 30-40 million years in age.
| 1.10 | DEPOSITTYPES |
Both the Caracol sediments and the granodiorite are believed to have been intruded along the western and southern margins of the granodiorite by one or two quartz-feldspar porphyry stocks. The porphyry stocks did not reach surface but are at depth. They are represented at the bedrock surface by two hydrothermal diatreme breccia pipes, the Azul and Outcrop breccia pipes. There is a single outcrop of silicified breccia of the Outcrop breccia, thePeñasco. It is the only outcrop on the property.
Both breccia pipes are believed to have erupted and breached the surface. Their eruption craters and ejecta aprons have since been eroded away, and the current bedrock surface at Peñasquito is estimated to be on the order of 50-75 meters below the paleo-eruption surface. Both of the breccia pipes sit within a hydrothermal alteration shell of propylitic alteration that has largely been overprinted by weak phyllic alteration that intensifies at depth.
| 1.11 | MINERALIZATION |
Sulphide mineralization occurs in the Chile Colorado deposit, in the Peñasco deposit hosted in the Outcrop breccia, in the Luna Azul and Azul NE deposits hosted in the Azul Breccia, and at other smaller targets on the Peñasquito project.
The Peñasco deposit is in the east half of the Outcrop breccia directly above the projected throat of the breccia pipe. In plan view, it is ovoid in
33
Peñasquito Project Technical Report December 2007
| Readdressed to Silver Wheaton Corp |
| Peñasquito Project Technical Report |
| December 2007 |
shape, at least 1000 meters wide in an east direction and 900 meters long in a north direction, and has formed around a complex series of small quartz-porphyry stocks and dikes with some felsite dikes. It is composed of disseminations and veinlets of medium to coarse-grained sphalerite-galena-argentite, other unidentified silver sulfosalts, minor tetrahedrite-polybasite and common gangue of calcite-rhodochrosite-quartz-fluorite.
The intrusive rocks themselves are also often mineralized. Mineralization also extends upwards along the north and south contacts of the Outcrop breccia. At the south contract, it extends upwards in the mixed clast breccia adjacent to the northwest faults that cut the breccia pipe.
The most common mineral host is the intrusive hydrothermal breccia. This breccia is the dominant rock below the 1,600-meter level. It also is widely distributed as a halo around the porphyry stocks and dikes. The porphyry often appears to brecciate into the intrusive hydrothermal breccia as it passes upwards. Mineralization is present in the upper mixed clast breccia along the south contact, the quartz-feldspar porphyry intrusive breccia and, to a lesser extent, the quartz-porphyry dikes. The felsite dikes are at times also good mineral hosts.
The Chile Colorado Ag-Zn-Pb mineralization normally occurs as both veining and narrow fracture filling, hosted in weakly silicified sandstone, siltstone or shale. The mineralization has been interpreted to represent stockworks, localized by a north-south trending fracture zone, extending south from the Azul diatreme.
Sphalerite and galena associated with carbonate and pyrite occur as massive veins. Pyrite, sphalerite and galena have also been observed as discrete crystals and disseminations within sandstone units. Late state carbonates and pyrite fracture fillings occur throughout the sediments.
| 1.12 | EXPLORATION |
Kennecott completed numerous air and ground based geophysical surveys on the Peñasquito claim groups between 1994 and 1997. The aeromagnetic survey of the region defined an 8 km x 4 km, N-S trending magnetic high centered roughly on the Outcrop Breccia. These surveys provided coverage of the area including the Peñasco zone and confirmed the area as a suitable target for drilling.
In 2004, Western Silver initiated additional CSAMT and IP surveys that extended coverage on the older lines, and extended coverage to the east of the pre-existing coverage. The geophysical database for the Peñasquito
34
Peñasquito Project Technical Report December 2007
| Readdressed to Silver Wheaton Corp |
| Peñasquito Project Technical Report |
| December 2007 |
project area now provides a detailed electric cross-section that images changes in geology, and appears to identify specific targets of interest.
Kennecott completed an extensive rapid air blast (“RAB”) drilling campaign across much the Peñasquito project area after the discovery of the Chile Colorado deposit. This program, designed to systematically test the entire project area, consisted of 250 holes. The holes penetrated the extensive overburden cover and collected chip samples from anomalies, which had been discovered during the numerous geophysical surveys as well as outlining other, previously unknown anomalies. Twenty-eight of the RAB holes in this campaign by Kennecott were drilled within and immediately adjacent to the Peñasco zone breccia pipe. The geochemical survey results indicated that further exploration was warranted in this area. Exploration drilling results have subsequently confirmed significant mineralization in the Peñasco zone.
Exploration has continued uninterrupted since 2002. Between one and nine exploration drill rigs have been on site at any given time since then. To the date of this resource estimate, 782 drillholes totaling 396,000 meters have been drilled. Tables 1-6 to 1-9 provide more detail.
| 1.13 | DRILLING |
Drilling at the Peñasquito property has focused on the exploration of three principal areas: Chile Colorado, Azul (Azul Breccia, Azul NE and Luna Azul) and Peñasco including El Sotol adjacent to Peñasco. Work for the latest resource and reserve update concentrated on in-fill exploration drilling of the Peñasco and Azul zones.
The Peñasquito property has been drilled by different operators over several campaigns and phases beginning in 1995 under Minera Kennecott S.A. de C.V.
All drillholes have been downhole surveyed except the 51 Western Silver reverse circulation holes and 11 of the 71 Kennecott holes. The unsurveyed holes represent 8% of the database. Collar coordinates are measured by a third party professional surveyor.
The following tables summarize exploration drilling performed and assayed to date on the Peñasquito property. This data has been used in the preparation of the resource estimates used in this report.
The summaries of the drilling through Campaign 18 are in Tables 1-6, 1-7, and 1-8. Additional exploration drilling is ongoing at both the Peñasquito project and at nearby regional targets.
35
Peñasquito Project Technical Report December 2007
| Readdressed to Silver Wheaton Corp |
| Peñasquito Project Technical Report |
| December 2007 |
Table 1-6 Summary of Project Drilling at Peñasquito - Through Campaign 18
| CATEGORY | TOTAL DRILL HOLES | |
| Number | Meters | |
| Holes in Database(1) | 782 | 396,426 |
| Hochschild Holes Excluded for Resource Estimate | 14 | 4,601 |
| PP (water wells) Series Excluded for Resource Estimate | 7 | 2,064 |
| Holes Used for Resource Estimate including condemnation | 761 | 389,761 |
(1)15,135 meters are reverse circulation drilling; the balance is core.
36
Peñasquito Project Technical Report December 2007
| Readdressed to Silver Wheaton Corp |
| Peñasquito Project Technical Report |
| December 2007 |
Table 1-7 Summary of Exploration Drilling Campaigns at Peñasquito*
Campaign | Period | Drilling Type | Hole IDs | Number of Drill Holes | Meters of Drilling | Average Hole Length (m) |
| Kennecott | 1994-1997 | Reverse Circulation & Diamond Drilling | PN01 - PN71 | 71 | 23,929 | 337 |
| Western Copper | 1998 | Diamond Drilling | WC01 - WC09 | 9 | 3,185 | 354 |
| Mauricio Hochschild | 2000 | Diamond Drilling | MHC01 - MHC14 | 14 | 4,601 | 329 |
| Western Copper | 2002 | Diamond Drilling | WC10 - WC54 | 45 | 19,795 | 440 |
| Western Copper | 2003 | Reverse Circulation | S01 - S57 | 51 | 12,090 | 237 |
| Diamond Drilling | S09Ext*,S24Ext*,S30Ext* | |||||
| Western Copper | 2003 | Diamond Drilling | WC55 - WC100 | 48 | 14,605 | 304 |
| WC67A, PN26Ext* | ||||||
| WC53Ext** | ||||||
| Western Silver - Phase 9 | 2004 | Diamond Drilling | WC101 - WC130 | 31 | 14,842 | 479 |
| WC119A | ||||||
| Western Silver - Phase 10 | 2004 | Diamond Drilling | WC131 - WC179 | 56 | 20,241 | 361 |
| WC131A,WC137A | ||||||
| WC138A,WC146A | ||||||
| WC150A,WC154A | ||||||
| WC156A | ||||||
| Western Silver - Phase 11 | 2004 | Diamond Drilling | WC180 - WC211 | 33 | 21,968 | 666 |
| WC99Ext**, WC189A | ||||||
| Western Silver - Phase 12 | 2005 | Diamond Drilling | WC212 - WC227 | 16 | 11,460 | 716 |
| Western Silver - Phase 13 | 2005 | Diamond Drilling | WC228 - WC256 | 32 | 21,005 | 656 |
| Western Silver - Phase 14 | 2005 | Diamond Drilling | WC257 - WC278 | 22 | 14,226 | 647 |
| Western Silver - Phase 15 | 2005 | Diamond Drilling | WC279 – WC309 | 31 | 19,601 | 632 |
| Western Silver - Phase 16 | 2005 | Diamond Drilling | WC310 – WC346 | 37 | 24,928 | 674 |
| Western Silver - Phase 17 | 2006 | Diamond Drilling | WC347 – WC377 | 32 | 22,944 | 717 |
| Goldcorp – Phase 18 Expl | 2006 to | Diamond Drilling | GP378-GP493 | 117 | 95,715 | 818 |
| 2007 | GP501, GP417A | |||||
| Goldcorp – Phase 18 | 2005 to | Diamond Drilling | C01-05 to C106-06 | 108 | 45,044 | 420 |
| Condemnation | 2007 | |||||
| Met, Oriented Core & PP Series | Various | Diamond Drilling | Met01-Met13 OC1-OC11 PP02-PP09 | 29 | 6,247 | 215 |
| Totals | 782 | 396,426 | 507 | |||
| * - Resource grade modeling excludes all MHC drilling. | ||||||
| Ext*- diamond drill extension of reverse circulation hole | ||||||
| Ext**- diamond drill extension of diamond drill hole | ||||||
37
Peñasquito Project Technical Report December 2007
| Readdressed to Silver Wheaton Corp |
| Peñasquito Project Technical Report |
| December 2007 |
Table 1-8 Summary of Drilling Activity at the Peñasquito Property
| Calendar Year | Number of Drill Holes | Meters of Drilling | Average Hole Length (m) |
| 1994-1997 Drilling | 71 | 23,929 | 337 |
| 1998 Drilling | 9 | 3,185 | 354 |
| 2000 Drilling | 14 | 4,601 | 329 |
| 2002 Drilling | 45 | 19,795 | 440 |
| 2003 Drilling | 99 | 26,695 | 270 |
| 2004 Drilling | 120 | 57,051 | 475 |
| 2005 Drilling | 138 | 91,220 | 661 |
| 2006 Drilling | 223 | 119,261 | 717 |
| 2007 Drilling to June 1 | 63 | 50,689 | 805 |
| Drilling Total | 782 | 396,426 | 507 |
| 1.14 | SAMPLINGMETHODANDAPPROACH |
Due to the alluvial cover at Peñasquito, the vast majority of resource sampling has been done using either reverse circulation or diamond core drilling. Most diamond drilling is HQ size core, but narrowing to NQ diameter at depth in the longer holes. Drillhole spacing is generally on 50 meter sections in the main deposits spreading out to 400 meter spaced sections in the condemnation zones. Drilling covers an area approximately 8000 meters east-west by 4500 meters north-south with the majority of holes concentrated in an area 2100 meters east-west by 2800 meters north-south.
Minera Peñasquito samples drill holes from bedrock to final depth (not all samples are submitted for assay particularly in condemnation areas). The standard sample interval is 2.0 meters. Some samples are limited to geological boundaries and are less than 2.0 meters in length. A senior Goldcorp geologist examines the core, defines the primary sample contacts, and designates the axis along which to cut the core. Special attention in veined areas is taken to ensure representative splits are made perpendicular and not parallel to veins.
Geological logging is very detailed and follows the geological legend on a regional scale. Table 1-9 details the geological logging:
38
Peñasquito Project Technical Report December 2007
| Readdressed to Silver Wheaton Corp |
| Peñasquito Project Technical Report |
| December 2007 |
Table 1-9 Geologic Logging
| Item and Numeric Code | Unit | Description | ||
| Lithology | ||||
| 0 | Casing, No core | |||
| 1 | Sedimentaries | Overburden, Alluvium | ||
| 2 | Kuc Caracol Fm, Siltstone>Sandstone | |||
| 3 | Kuc Caracol Fm, Siltstone<Sandstone | |||
| 4 | Indidura Fm | |||
| 5 | Cuesta del Cura Fm | |||
| 6 | Extrusives | Fesite tuff beds / Felsite tuff mx bx | ||
| 7 | Intrusives | Quartz-Felspar Porphyry intrusive -- Stocks / Dikes -- | ||
| 8 | QFP intrusive bx -- Stocks / Dikes -- | |||
| 9 | Felsite intrusive / Felsite intrusive bx -- Stocks / Dikes | |||
| 10 | FG green QFP dikes (post-mineral) | |||
| 11 | Breccias | Sed clasts / milled sed mx bx | ||
| 12 | Mixed sed>intr clasts / milled sed-intr mx bx / bx-dikes | |||
| Sed-QFP-Fi clasts / milled intrusive mx hydrothermal | ||||
| 13 | bx / bx-dikes | |||
| 14 | Crackle-bx, Sed clasts supported bx | |||
| Oxide Class | ||||
| 20 | No oxidized rock | |||
| 21 | Oxidation Zone (Regular oxidized rock) | |||
| 22 | Irregular oxidation (oxidized / unoxy rock) | |||
| 23 | Fxs only oxidized | |||
| Phase | ||||
| 1 | Western Silver Phase 1 | |||
| 2 | Western Silver Phase 2 | |||
| 3 | Western Silver Phase 3 | |||
| 4 | Western Silver Phase 4 | |||
| 5 | Western Silver Phase 5 | |||
| 6 | Western Silver Phase 6 | |||
| 7 | Western Silver Phase 7 | |||
| 8 | Western Silver Phase 8 | |||
| 9 | Western Silver Phase 9 | |||
| 10 | Western Silver Phase 10 | |||
| 11 | Western Silver Phase 11 | |||
| 12 | Western Silver Phase 12 | |||
| 13 | Western Silver Phase 13 | |||
| 14 | Western Silver Phase 14 | |||
| 15 | Western Silver Phase 15 | |||
| 16 | Western Silver Phase 16 | |||
| Western Silver Phase 17 (some not used in July 06 | ||||
| 17 | feasibility) | |||
| 18 | Glamis/Goldcorp Drilling (all are post July 06 feasibility) | |||
| 19 | �� | |||
| 98 | WC 1998 Holes | |||
39
Peñasquito Project Technical Report December 2007
| Readdressed to Silver Wheaton Corp |
| Peñasquito Project Technical Report |
| December 2007 |
| 100 | Hochschild Holes | ||
| 101 | Kennecott Holes | ||
| Lab | |||
| 1 | Acme as primary Lab | ||
| 2 | Chemex as primary Lab | ||
| COREC | core recovery percent | ||
| CORQD | RQD percent | ||
| Alteration | |||
| 25 | Unaltered rock | ||
| 26 | Phyllic alt | Py+Carbonate alteration | |
| 27 | Wk Qtz-Ser-Py-Ca alteration | ||
| 28 | Mod-Str Qtz-Ser-Py-Ca alteration | ||
| 29 | Qtz-Ser-Py alteration | ||
| 30 | Qtz-Ser-Py-Trem+/-Garnet alteration | ||
| 31 | Silica-Py alteration | ||
| 32 | Str Ser-Py+/-Sil alteration | ||
| 32 | Late Ser-Py-Ca+/-Fluo alteration | ||
| 33 | Potassic Alteration | ||
| 34 | Propylitic alteration | ||
| 35 | Recrystallized / Marble (Kui / Kucc) | ||
| 36 | Skarn (Kui / Kucc) | ||
| 40 | Late alteration | Late argillic+/-Ser alteration | |
| 41 | Late Chlorite-Epidote alteration (Overprint) | ||
| Structure | |||
| 45 | Unfractured to wk Fxd rock | ||
| 46 | Mod-str Fxd / broken rock | ||
| 47 | Fault with gouge (Fault gouge-bx>20 cm wide) | ||
| 48 | Major Fault Zone | ||
| 48 | Dikelets swarm | ||
| RCCOR | |||
| 1 | reverse circulation drilling | ||
| 2 | diamond core drilling | ||
| Company | |||
| 1 | Kennecott | ||
| 2 | Hochschild | ||
| 3 | Western Silver | ||
| 4 | Glamis | ||
| 5 | Goldcorp | ||
| Year | year drilled |
Once the core has been measured, marked, photographed, and logged geotechnically and geologically the core boxes are brought to the diamond saw cutting stations located at the project site. The core is sawed in half by Goldcorp employees. One-half of every sample is placed into a heavy plastic bag. The Splitter’s Helper has previously marked the drillhole and
40
Peñasquito Project Technical Report December 2007
Readdressed to Silver Wheaton Corp
Peñasquito Project Technical Report
December 2007
sample number on the plastic bag and inserted the relative sample tag in the plastic bag.
Standard reference material samples and blanks are inserted into the sample stream going to the assay laboratory in a documented sequence on a frequency of approximately 1 in 20 samples for drilling Phases up to 17. For the current drill Phase 18, one of seven Peñasquito standards (prepared by METCON Research, Tucson, AZ) are being inserted every 30th sample. Blank samples of limestone are being inserted every 50th sample. For check assaying, every 40th pulp is selected by ALS Chemex and shipped to Acme Labs (Vancouver) for re-assay. Also for check assaying, every 50thassay prep coarse reject is selected. ALS Chemex prepares a new pulp of each, and completes a set of analyses (in Vancouver) using the same procedures and methods as in the original assays.
The plastic bags are placed into large sacks and a Minera Peñasquito truck transports the sacks to the ALS Chemex laboratories in Guadalajara approximately once per week. Here the samples are prepped and pulped. Pulps are sent to ALS Chemex labs in Vancouver where they are assayed and checked. At present, ALS Chemex is Minera Peñasquito’s primary assay lab. Check samples are sent to Acme Labs of Vancouver.
The sample preparation procedures on site prior to shipment to the laboratory have been independently reviewed and deemed secure and adequate.
A summary of relevant samples and sample composites used in the estimation process can be found in Section 1.19 of this report. A description of any drilling, sampling, or recovery factors that could materially impact the accuracy and reliability of the results are discussed in Sections 1.15 and 1.16 of this report.
| 1.15 | SAMPLEPREPARATIONANDANALYSESANDSECURITY |
Initial sample preparation is carried out by employees of Goldcorp as discussed in Section 1.15 of this report.
The quality assurance and quality control procedures employed by Minera Peñasquito (“QA/QC”) have been independently reviewed (M3 2005b, M3 2006a, MDA 2007). Minera Peñasquito generally used ALS Chemex as the primary lab and Acme as the check lab. Both Chemex and Acme are ISO9002-certified. Both labs use industry standard sample preparation procedures.
41
Peñasquito Project Technical Report December 2007
Readdressed to Silver Wheaton Corp
Peñasquito Project Technical Report
December 2007
Chemex used the following analytical procedures for their work as the primary laboratory:GOLD: ME-GRA21, which is a fire assay with gravimetric finish on a one-assay-ton (30g) charge.
SILVER: ME-ICP41, which is ½-g charge digested in aqua regia acid and analyzed with an inductively coupled plasma emission spectrometer (“ICP”; ICP-AES, according to Chemex’ schedule) ; and for overlimits ME_GRA21, which is a fire assay with a gravimetric finish on a one-assay-ton charge (30g).
ZINC: ME-ICP41, which is ½ g charge digested in aqua regia acid and analyzed by ICP-AES or inductively coupled plasma (“ICP”; ICP-AES, according to Chemex schedule) ; and for overlimits Zn-AA46, which is 0.4 -g charge digested in aqua regia acid and analyzed by ICP-AES or inductively coupled plasma – mass spectrometer (“ICP-MS”, according to Chemex schedule).
LEAD: ME-ECP41, which is ½ g charge digested in aqua regia acid and analyzed with an inductively coupled plasma emission spectrometer (“ICP”; ICP-AES, according to Chemex schedule) ; and for the overlimits Zn-AA46m which is 0.4 -g charge digested in aqua regia acid and analyzed by ICP-AES or ICP-MS (according to Chemex schedule).
Acme used the following analytical procedures for their work as the umpire laboratory:GOLD: Group 6, which is a fire assay with an inductively coupled plasma emissions spectrometer analytical (“ICPES”) finish on a one-assay-ton charge (30g).
SILVER: Group D, which is ½-g charge digested in aqua regia acid and analyzed with and ICPES; and for overlimits Ag-AA46, which is 0.4 -g charge digested in aqua regia acid and analyzed with an ICPES.
ZINC: Group D, which is 1-g charge digested in aqua regia acid and analyzed with and ICPES; and for overlimits Ag-AA46, which is 0.4 -g charge digested in aqua regia acid and analyzed with an ICPES.
LEAD: Group D, which is ½-g charge digested in aqua regia acid and analyzed with and ICPES; and for overlimits Ag-AA46, which is 0.4 -g charge digested in aqua regia acid and analyzed with an ICPES
In April 2007, Mine Development Associates of Reno, Nevada (MDA) performed an independent analytical review of the Peñasquito check assay data up to and including Phase 17 drilling and as a result stated the analytical work performed on the gold, silver, lead and zinc of the Peñasquito database could be relied upon for resource estimation. MDA did not review the 117 new holes of the Phase 18 drilling. However, Goldcorp review of the data suggests there are no indications this newer sample data is not representative or contains any sample bias. No check assays are available for the Hochschild, 1998 and Minera Peñasquito Phase 4 campaigns.
42
Peñasquito Project Technical Report December 2007
Readdressed to Silver Wheaton Corp
Peñasquito Project Technical Report
December 2007
MDA comments on analytical results:MDA reviewed the Peñasquito analytical data (MDA 2007).Overall, MDA believes that the metal grades given by Chemex and that exist in the Peñasquito database are sufficiently reliable to use for resource estimation on a global basis, but some reservations were noted (MDA,2007).
MDA comments on Gold:The bias noted between Acme and Chemex, with Acme lower, is real and definitive, but occurs in only selected drill campaigns. Using the Standard assaying grades as a guide, it could be assumed that the error lies with Acme, the umpire lab, and not with Chemex. Overall there is excellent correlation and similar mean grades between Chemex and Acme. In spite of this, while there is excellent correlation, there is also extreme variability decreasing with increasing grades. Presently it is unclear if this is caused by problems in sub-sampling the aliquot for assaying, inaccuracies in analytical procedures, or natural material heterogeneity. This is worthy of investigation so as to optimize sub-sampling and analytical procedures for upcoming production. The lack of reproducible assays will lead to unavoidable and blind production losses that will be significant in a project like Peñasquito where the mean grades of much of the material are n ear economic cutoff.
MDA comments on Silver:There is inconsistent evidence with respect to different lab and analytical methods concerning bias. While Chemex ICP is generally high and Chemex “ore-grade” is generally low, the biases noted could be offsetting. Relative to the Standard grades, Chemex is high at the low grade and low at the high grade. Reproducibility is not good under any circumstances and this should be addressed in future studies. MDA concludes, with some reservations because of the conflicting evidence, that the silver analytical data can be used for resource estimation. MDA does suggest that the analytical procedures be addressed in detail by a geochemist in advance of production so as to obtain the most dependable analytical method for production, as the impact of incorrect data during production could be potentially very large.
MDA comments on Zinc:The analyses of zinc in the database are deemed reliable and sufficiently accurate for resource estimation. A case could be made that the ICP values are low, thereby imparting a small conservative bias to the zinc data but it cannot be stated definitively. The zinc values in the database, which are dominated by ICP analytical methods, are biased low relative to the Standards’ grades and duplicated “ore-grade” values. If the database zinc values are low, then they could by low by 1-5%. Second, the reproducibility of zinc grades based on analytical work and sub-sampling the aliquot for analysis, is considered good for the “ore-grade” data and marginal to poor for the ICP data, suggesting that the problem is contributed by ICP analysis, not sub-sampling the aliquot. In all cases Chemex has a lower standard deviation
43
Peñasquito Project Technical Report December 2007
Readdressed to Silver Wheaton Corp
Peñasquito Project Technical Report
December 2007
for the standard samples than does the round robin analysis for the standards. While it is not known which analytical method is better, the differences are not critical for this aspect of the resource estimation. During grade control, when precision is substantially more important, further work should be considered to determine which method is better.
MDA comments on Lead:It could be stated that the lead data in the database (Chemex ICP replaced by “ore-grade” above 10,000 ppm) is biased low when compared to both sets of “ore-grade” analyses and against the Standards’ grades, but Acme ICP is lower grade than Chemex ICP. The reproducibility of lead grades based on analytical work and sub-sampling the aliquot is considered good for the “ore-grade” data and marginal to poor for the ICP data. MDA believes that the analytical work for lead can be relied upon for resource estimation. MDA also believes that further work should be done to determine which method is better for all grades and to improve reproducibility for lead analytical results if ICP is to be used in the future.
Goldcorp comments on Phase 18 analytical results and procedures:
Phase 18 drilling (the current drill phase) is currently being subject to the same systematic injection of standards and blanks along with being subject to check sampling. Specifically, one of seven Peñasquito standards (prepared by METCON Research, Tucson, AZ) is being inserted every 30th sample. Blank samples of limestone are being inserted every 50thsample. For check assaying, every 40th pulp is selected by ALS Chemex and shipped to Acme Labs (Vancouver) for re-assay using approximately the same analytical methods used in the original analyses. Also for check assaying, every 50th assay prep coarse reject is selected. ALS Chemex prepares a new pulp of each, and completes a set of analyses (in Vancouver) using the same procedures and methods as in the original assays.
| 1.16 | DATAVERIFICATION |
Based on a review of Minera Peñasquito’s sample preparation, analysis, security, and QA/QC procedures to date with respect to database verification, the database used for the resource estimates is deemed to be accurately compiled and maintained, and is suitable for use in mineral resource estimation.
No significant problems were identified during reviews of the drilling data by IMC and MDA (M3 2005b, M3 2006a, MDA 2007). The holes appear to have been properly located and downhole-surveyed and to have recovered an adequate sample (core recovery during the later Minera Peñasquito campaigns averaged 97.8%) .
44
Peñasquito Project Technical Report December 2007
Readdressed to Silver Wheaton Corp
Peñasquito Project Technical Report
December 2007
Almost all of the drilled intervals are assayed for gold, silver, lead and zinc. The significant exception here is the condemnation holes which are assayed every 2 meters out of 20 unless geologic inspection dictates otherwise. Data entry errors should be minimal because the bulk of the assay data base is compiled directly from the original lab’s electronic files of assay certificates.
IMC supplemented the check assay data by performing numerous paired comparisons of grades from different drilling and assaying campaigns, including those for which no check assays are available (M3 2005, M3 2005b). The results show no evidence to indicate that any of the Minera Peñasquito and Kennecott data base assays are affected by large analytical or sample preparation biases. However, they do suggest that the Hochschild grades are quite heavily high-biased relative to the Kennecott and Minera Peñasquito grades for gold, silver, and zinc. No Hochschild samples were available for re-assay, so the precautionary decision was taken not to use the Hochschild assays when estimating grades in the model.
The paired-comparison reviews did not detect any biases between core and reverse circulation drilling. (About 10% of the exploration drilling is RC.) No significant problems were identified with other data supplied to IMC, which included sulfur assays (used to define oxidized zones) and lithology, alteration, and oxidation data base coding. Drill logs were of excellent quality. Density data were obtained from core sample measurements and the values are reasonable relative to sample lithology.
| 1.17 | ADJACENTPROPERTIES |
There are no adjacent properties from which exploration and/or mining activities would lead to better understanding of the Chile Colorado or Peñasco open pit deposits.
The Tayahua underground mine operates in the foothills to the northeast of the Peñasquito property. This is a polymetallic zoned Cu-Pb-Zn-Ag-Au skarn ore body hosted in carbonates adjacent to a quartz monzonite intrusion. As such, it might become of interest as Goldcorp pursues its potential underground deposit beneath the Peñasco Pit.
| 1.18 | MINERALPROCESSINGANDMETALLURGICALTESTING |
Metallurgical test work samples discussed in this report are representative of production from at least the first half of the mine life. Geologic inspection and analytical assay results of the later mine life mineralization
45
Peñasquito Project Technical Report December 2007
Readdressed to Silver Wheaton Corp
Peñasquito Project Technical Report
December 2007
provide good correlation to the actual samples tested. However, Goldcorp is continuing to obtain and metallurgically test additional samples.
Metallurgical test work initiated since the 2004 Pre-feasibility Study was completed includes: comminution testing, flotation testing, modal analyses, and gravity testing, all for the sulphide process. For the oxide process, bottle roll and column leach tests have been performed. Additional metallurgical work is in progress for both the sulphide and oxide mineralization. Samples from both Chile Colorado and the Peñasco areas are being tested. Most of the work now in progress utilizes metallurgical diamond drillhole samples produced in late 2004 and early 2005. Metallurgical testing planned for 1st quarter 2008 will be based on a program consisting of 6 metallurgical diamond drill holes which were completed in July 2007 and a bulk sample obtained from an underground drift. The 135m long underground drift is in the Peñasco deposit and was placed to obtain sulfide ore. The bulk sample will be used to run a small scale pilot plant test. The plant capa city will be approximately 100 kg/hr and will run over a period of three days. The purpose of the run will be to provide concentrate samples for further smelter testing as well as tailing samples for geotechnical and environmental testing.
A summary of metallurgical tests run on Chile Colorado and Peñasco ores is given in Table 1-10. This program has been used to determine the recoveries employed in this study.
| Table 1-10 Summary of Metallurgical Testing | ||||||
| Peñasquito Process Development Tests 2004-2006 | ||||||
| Sulphide Tests | Oxide Tests | |||||
| Flotation Tests | 280 | |||||
| Comminution Tests | 73 | Bottle Rolls | 65 | |||
| Process Mineralogy | 13 | Column | 52 | |||
| Leach | 5 | Small Column | 42 | |||
| Settling | 27 | Intermediate Column | 7 | |||
| Pulp Rheology | 8 | Large Column | 3 | |||
| Filtration | 4 | Miscellaneous | 6 | |||
| Analyses | 2 | |||||
| Pilot Plant | 1 | |||||
| Tailing Cyclone Test | 2 | |||||
| Total Number of Tests | 368 | Total Number of Tests | 123 | => | 491 | |
| 1.18.1 | Sulphide Metallurgical Testing |
Comminution test work was performed on 19 samples from the Chile Colorado deposit and 24 samples from the Peñasco deposit. During the first quarter of 2006 an additional 49 samples from Peñasco were tested, |
46
Peñasquito Project Technical Report December 2007
Readdressed to Silver Wheaton Corp
Peñasquito Project Technical Report
December 2007
making a total of 73 Peñasco samples tested. The tests were performed by Minnovex of Toronto, and included the SAG Power Index (SPI), Crusher Index (CI), and the Minnovex Modified Bond Work Index (WI). Three full Bond Work Index determinations were also performed to calibrate the modified procedure,Progressive Grinding Circuit Design for the Western Silver – Peñasquito Project, Minnovex Technologies, Inc., June 2005. Using data from these tests and additional input parameters provided by M3, Minnovex used their proprietary grinding circuit simulation program, CEET, to estimate mill sizes. The CEET data were used by mill vendors to recommend sizing as follows:
- SAG mill: One mill @ 18,690 kW, 11.6 m x 6.1 m (38' x 20')
- Ball Mill: Two mills @ 14,317 kW each, 7.6 m x 10.4 m (25' x 34.5')
- Pebble Crusher: One @ 600 kW, 2.4 m (8') (For this report M3 has selected one MP800 crusher.)
Tests were also performed by SGS Lakefield using the JK Tech drop-weight test method. The JKSimMet simulation method was used to estimate mill sizing, which generally agreed with the Minnovex results.
The primary crusher was sized from the 2004 test work and the required capacity of 100,000 TPD of Peñasco ore. The crusher is a gyratory type, 1524 mm x 2870 mm (60"x113") in size.
Following completion of the pre-feasibility test work, a new campaign of flotation test work was performed in two laboratories, Dawson Metallurgical Laboratories in Salt Lake City and G&T Laboratories in Kamloops BC. In total these test programs resulted in 24 variability scheme tests on Chile Colorado and 34 tests on Peñasco ore. A further 40 tests, approximately, were performed to examine the grind-grade-recovery relationship and to improve the reagent scheme from that developed for the 2004 Pre-Feasibility Study.
Since the Feasibility Study work, five flotation tests have been conducted on Chile Colorado ore including one locked cycle test, and four tests in which dextrin was tested as a carbon depressant. The Peñasco ore has had an additional fifty-six flotation tests, which include 51 variability tests, four locked cycle tests on specific lithology composites, and a large scale locked cycle test to produce concentrates for dewatering tests.
Locked cycle tests on ore from both deposits were performed as part of the flotation test program in order to provide a basis for the projected plant recoveries. These tests revealed that recoveries in the Peñasco Pit correlated with three basic ore categories: breccia, intrusive and sedimentary. Recoveries in the Chile Colorado tests have not yet revealed an obvious correlation. Work is ongoing to determine if any correlation
47
Peñasquito Project Technical Report December 2007
Readdressed to Silver Wheaton Corp
Peñasquito Project Technical Report
December 2007
exists and to improve recoveries. Based on the most recent results, the following metallurgical data has been used for flow sheet development.
Table 1-11Projections of Mine Head Grades, Concentrate Grades and Recoveries as used in the Financial Model
| MINE HEAD GRADES | |||||
| Reserves by Rock Type | Tonnes | Au gpt | Ag gpt | Pb % | Zn % |
| Intrusive | 493,739,000 | 0.53 | 30.73 | 0.33 | 0.73 |
| Breccia | 50,431,000 | 0.53 | 25.91 | 0.26 | 0.54 |
| Sedimentary | 262,942,000 | 0.36 | 31.92 | 0.35 | 0.74 |
| LEAD CONCENTRATES | Con Grades | Recoveries | |||
| Rock Type | Pb | Au | Ag | Pb | Zn |
| Breccia | 51% | 62% | 65% | 72% | 0 |
| Intrusive | 51 | 64 | 63 | 72 | 0 |
| Sedimentary | 51 | 20 | 58 | 63 | 0 |
| ZINC CONCENTRATES | Con Grades | Recoveries | |||
| Rock Type | Zn | Au | Ag | Pb | Zn |
| Breccia | 50% | 13% | 15% | 0 | 75% |
| Intrusive | 50 | 10 | 14 | 0 | 60 |
| Sedimentary | 50 | 5 | 5 | 0 | 60 |
In the first part of 2006, more tests were carried out on the Peñasco ore. These consisted of nine new settling, eight Pulp Rheology, and four filtration tests (Pocock 2006).
A small scale pilot plant test was performed on samples of the Peñasco ore. The plant capacity was approximately 100 kg/hr and was run intermittently over a period of four days. The purpose of the run was to provide concentrate samples for smelter testing as well as tailing samples for geotechnical and environmental testing. Due to the low grade of the ore relative to the size of the pilot plant equipment and the short duration of the test it was not possible to optimize test conditions. The lead first and second cleaners were operated in a locked cycle mode and the zinc concentrate was re-cleaned in the laboratory after the pilot plant run. The pilot plant generally confirmed that the recoveries predicted by locked cycle testing were achievable at larger scale and yielded approximately 9 kg of zinc concentrate and 7 kg of lead concentrate.
Modal analyses and liberation analyses were also performed to support the test work through a better understanding of the mineralogy and liberation characteristics of the samples.
One small scale gravity test was performed on a sample from Peñasco, high in gold and silver. The test products were assayed and evaluated
48
Peñasquito Project Technical Report December 2007
Readdressed to Silver Wheaton Corp
Peñasquito Project Technical Report
December 2007
using an Automated Digital Imaging System (ADIS.) The results indicated that any free gold occurs as particles finer than about 10 microns, meaning gravity recovery of gold is not likely to be successful.
An ADIS analysis of the occurrence of gold in the rougher and cleaner tailing from a locked cycle test on a sample from the Peñasco deposit revealed very little visible gold in either product. In the rougher tailing 275 slides, approximately 30 x 106particles, were examined, and only four gold particles were found at an average mean diameter of 7.2 microns. In the cleaner tailing examination of 75 slides, 11 x 106particles, found 3 particles with an average mean diameter of 15.4 microns.
A gold model was constructed using multiple regression techniques on the locked cycle test products. These results suggest that, for Peñasco the gold and silver track galena in the flotation process. A small amount of the silver tracks sphalerite. For Chile Colorado most of the gold tends to track pyrite, with a small fraction behaving like copper sulphide and galena. Most of the silver tends to track copper sulphide and galena.
| 1.18.2 | Sulphide Process Plant | |
The process plant selected for the project is conventional. Figure 1-6 outlines the plant. The following is a simplified process description for one train of the two train setup for the sulphide ore process: | ||
Run-of-mine ore is discharged from haul trucks to the crusher pocket. | ||
The crusher is a single 60" x 113" (1524 x 2870 mm) gyratory crusher. | ||
Crusher product is conveyed to a 91,700 tonne live capacity stockpile (45,850 tonne per line). | ||
Crushed ore from the stockpile will be reclaimed via five variable speed belt feeders per line located in the reclaim tunnel. | ||
Ore from the stockpile will be conveyed to a one of two SAG mill/two ball mill circuits each designed to produce an average of 50,000 TPD of at 80% passing 125 micron. | ||
A pebble crusher in closed circuit with the SAG mill will crush pebbles to minus 19 mm and return the material to the SAG mill feed conveyor. | ||
High Pressure Grinding Roll (HPGR) crushing of the SAG mill pebble crusher product is expected to increase each of the two SAG mill/two ball mill circuits by 15,000 TPD bring total circuit capacity to 130,000 TPD of ore. | ||
The slurry from the grinding circuit will first pass to the lead flotation circuit. | ||
49
Peñasquito Project Technical Report December 2007
Readdressed to Silver Wheaton Corp
Peñasquito Project Technical Report
December 2007
| Lead flotation consists of two banks of five each rougher flotation cells in parallel followed by regrinding and three stages of cleaner flotation cells. | ||
| The first cell of each row in the lead flotation circuit may be used for carbon pre-float when treating carbonaceous ore from Chile Colorado. Space will be provided to install carbon cleaner flotation cell when needed. | ||
| The zinc flotation circuit consists of two banks of five each rougher flotation cells in parallel followed by regrinding and three stages of cleaner cells. | ||
| Concentrate from the lead and zinc circuits will be pumped to respective thickeners followed by pressure filters. | ||
| Concentrate filter cake from the pressure filters will be discharged to stockpiles from which the material will be reclaimed by loader and loaded onto highway trucks for transport to rail, port, or smelter. |
1.18.3 Oxide Metallurgical Testing
Preliminary metallurgical testing of oxide ore has been performed. Process flow sheets were developed based on results of the test work. All test work on oxide ore to date has been completed by either METCON (METCON 2004, 2005, 2005a, 2005b, 2006) or SGS (SGS 2007).
Initial testing of the oxide ore was performed by means of bottle roll tests. A total of 13 bottle roll tests, of 72 hour duration, were performed using coarse reject material supplied from the Chemex sample preparation facilities in Guadalajara. The samples originated from the Peñasco Deposit diamond drill samples (DDH WC-102 from 16 to 68 m and DDH WC-108, Intervals from 16 to 80 m, downhole.) Test results indicated that the ore leached well with expected reagent consumptions.
Based on the results of the bottle roll tests two column leach tests were performed using the same original samples, but composited into shallow and deep fractions. The tests were performed by agglomerating the ore and curing with cyanide, lime, and Portland cement (METCON 2004).
A second series of bottle roll and column leach tests was completed on six trench samples taken from old dump sites in the Peñasco ore. One bottle roll test was done on each sample (six total). Two column leach tests were done on each sample at different crush sizes (P80=38 mm & P80=9.5 mm) to determine affect of size on recovery and reagent consumption. One bottle roll and one column leach test was completed on a seventh dump sample. This column test was run at ‘as received’ size to determine impact to recovery with no crushing.
50
Peñasquito Project Technical Report December 2007
Readdressed to Silver Wheaton Corp
Peñasquito Project Technical Report
December 2007
A third series of 21 bottle roll and 17 column leach tests were completed using the metallurgical DDH samples. Four of the column tests were run on Chile Colorado ore and 13 of the column tests were run on Peñasco ore. All columns were run on ore that was crushed to 38 mm.
A fourth series of tests, six bottle roll and six column leach, were completed on bulk samples taken from three wells in the Peñasco area. Two column leach tests were done on each sample, one at estimated run-of-mine (ROM) size and one at 38 mm. Results from these tests were used to develop the flow sheets, as well as estimates of extraction and cyanide and lime consumption.
In 2007, a fifth series of tests, 18 bottle roll and 6 column leach, were completed on 3 composite core samples taken from Peñasco, Azul and Chile Colorado. Two column leach tests were done on each sample, one at ½” size and one at 1” size. Four bottle roll tests were done on each sample at 60% and 80% passing 200M and at two different NaCN application quantities. The results of these latest tests are described in Table 1-12.
Table 1-12 2007 Oxide Test Results
June 2007 Ground Bottle Roll Tests
| Sample | % @ -200 M | NaCN g/L | Time (hrs) | Extraction % | |
| Au | Ag | ||||
| 60 | 0.750 | 96 | 68.18 | 13.51 | |
| Brecha Azul | 60 | 1.500 | 96 | 76.92 | 10.81 |
| 80 | 0.750 | 96 | 81.32 | 21.62 | |
| 80 | 1.500 | 96 | 83.15 | 23.68 | |
| 60 | 0.750 | 96 | 64.29 | 61.11 | |
| Peñasco | 60 | 1.500 | 96 | 61.54 | 63.16 |
| 80 | 0.750 | 96 | 64.29 | 69.27 | |
| 80 | 1.500 | 96 | 74.07 | 66.67 | |
| 60 | 0.750 | 96 | 84.21 | 32.10 | |
| Chile Colorado | 60 | 1.500 | 96 | 82.35 | 31.25 |
| 80 | 0.750 | 96 | 82.35 | 32.10 | |
| 80 | 1.500 | 96 | 82.35 | 33.73 | |
June 2007 Coarse Bottle Roll Tests
| Sample | Particle Size | NaCN g/L | Extraction % | |
| Au | Ag | |||
| Brecha Azul | ½” | 0.500 | 67.91 | 11.56 |
| 1” | 0.500 | 65.88 | 8.95 | |
| Peñasco | ½” | 0.500 | 59.70 | 37.74 |
| 1” | 0.500 | 59.57 | 36.57 | |
| Chile Colorado | ½” | 0.500 | 79.80 | 18.56 |
| 1” | 0.500 | 70.22 | 14.53 | |
51
Peñasquito Project Technical Report December 2007
Readdressed to Silver Wheaton Corp
Peñasquito Project Technical Report
December 2007
| June 2007 Column Tests | ||||||||||||
| BRECHA AZUL | PEÑASCO | CHILE COLORADO | ||||||||||
| ½” | 1” | ½” | 1” | ½” | 1” | |||||||
| Au | Ag | Au | Ag | Au | Ag | Au | Ag | Au | Ag | Au | Ag | |
| 65.56 | 6.76 | 53.33 | 4.11 | 59.57 | 36.03 | 57.69 | 19.75 | 64.71 | 19.19 | 64.71 | 14.75 | |
Because of the extremely high ratio of Ag to Au, the Merrill-Crowe (zinc precipitation) process was selected over the carbon adsorption method of recovering the precious metals from solution.
The recoveries for silver and gold from the heap leach are presently estimated for: 1) Peñasco oxide and mixed ores, gold 50%, silver 28%; and 2) Chile Colorado oxide and mixed ores, gold 50%, silver 22%.
| 1.18.4 | Oxide Process Plant | |
The following is a simplified process description for the oxide ore: | ||
ROM ore is discharged from haul trucks onto a heap leach pile. | ||
Lime is added to the ROM ore prior to being placed on the pad. The ore is placed in 10 m lifts. | ||
The ore is leached with cyanide solution. | ||
The pregnant leach solution is clarified, filtered, and de-aerated, then treated with zinc dust to precipitate the precious metals. | ||
The precipitated metals are then pressure filtered. | ||
The resulting filter cake is smelted to doré. | ||
| 1.19 | Mineral Resource and Mineral Reserve Estimates | |
| 1.19.1 | Mineral Resource Estimate | |
Mineral resources estimates were prepared by an independent specialist under contract to Goldcorp, Mr. Fred Brown, a Qualified Person as defined by NI43-101. | ||
| 1.19.2 | Terms of Reference | |
At the request of Mr. Bob Bryson, Vice President Engineering for Goldcorp Inc., Mr. Fred Brown has been engaged to prepare an independent global estimate of the mineral resources for the Peñasquito Project, Mexico. Mr. Bryson requested an independent mineral resource estimate be prepared in accordance with the CIM Definition Standards on Mineral Resources and Mineral Reserves dated 15 December 2005, as required by National Instrument (NI) 43-101 Item 19, Standards of Disclosure for Mineral Projects. | ||
52
Peñasquito Project Technical Report December 2007
Readdressed to Silver Wheaton Corp
Peñasquito Project Technical Report
December 2007
All information used in this report was derived from information related to exploration and production activities, supplied by Goldcorp. The Qualified Person who prepared this mineral resource estimate is Mr. Fred Brown MSc CPG Pr. Sci. Nat. This global mineral resource estimate has an effective date of 25 June 2007.
This report makes reference to Inferred mineral resources. Inferred mineral resources are considered too speculative geologically to have economic considerations applied to them that would enable them to be categorized as mineral reserves.
Conclusions and recommendations in this report are based on information obtained from the client. New data and exploration results subsequent to this date may affect some calculations, conclusions and recommendations going forward. The statement and opinions expressed in this document are given in good faith and in the belief that such statements and opinions are not false and misleading at the date of this report.
| 1.19.3 | Reliance On Other Experts | |
Mr. Fred Brown has relied on information and data supplied by Goldcorp staff and prepared under the supervision Reynaldo Rivera, Chief Geologist, Luismin S.A. de C.V., a Qualified Person as defined under NI43-101. Mr. Fred Brown applied all reasonable diligence in the checking, confirming, testing and application of the information supplied. | ||
| 1.19.4 | Previously Reported Mineral Resources | |
Four mineral resource estimates have been publicly disclosed for the Peñasquito deposit prior to this report: | ||
2003: SNC-Lavalin mineral resource estimate based on data available prior to 28 February 2003 (SNC 2003). See Table 1-13 | ||
2004: SNC-Lavalin mineral resource estimate based on data available prior to 7 January 2004 (SNC 2004). See Table 1-14. | ||
2005: IMC mineral resource estimate based on data available through early 2005 (M3 2005). See Table 1-15. | ||
2006: IMC mineral resource estimate based on data available through July 2006 (M3 2006). See Table 1-16. | ||
53
Peñasquito Project Technical Report December 2007
Readdressed to Silver Wheaton Corp
Peñasquito Project Technical Report
December 2007
| Table 1-13 SNC-Lavalin March 2003 mineral resource estimate. | |||||
| Class | Mt | Ag g/t | Au g/t | Pb% | Zn% |
| Indicated Oxides | 8 | 26.8 | 0.30 | 0.51 | 0.46 |
| Inferred Oxides | 1 | 23.4 | 0.26 | 0.59 | 0.36 |
| Indicated Sulphides | 110 | 42.9 | 0.36 | 0.37 | 0.92 |
| Inferred Sulphides | 57 | 29.1 | 0.31 | 0.23 | 0.70 |
Cutoff USD4.00/t NSR.
Metal prices: Ag USD5.00/oz, Au USD325.00/oz, Pb USD0.23/lb, Zn USD0.45/lb
Note: the above mineral resource estimate was prepared under the supervision of aQualified Person as defined by NI43-101.Mr. Fred Brown has not independently verified the mineral resource estimate, and makes no assurances as to the validity or economic viability of any of the stated mineral resources, in whole or in part.
| Table 1-14 SNC-Lavalin March 2004 mineral resource estimate. | |||||
| Class | Mt | Ag g/t | Au g/t | Pb% | Zn% |
| Measured + Indicated | |||||
| Oxides1 | 25 | 15.3 | 0.15 | 0.26 | 0.30 |
| Inferred Oxides1 | 5 | 11.6 | 0.11 | 0.18 | 0.17 |
| Measured + Indicated | |||||
| Sulphides2 | 149 | 34.3 | 0.34 | 0.29 | 0.84 |
| Inferred Sulphides2 | 29 | 21.9 | 0.23 | 0.18 | 0.50 |
1Cutoff 5.0g/t Ag.
2Cutoff USD3.75/t NSR. Metal prices: Not stated.
Note: the above mineral resource estimate was prepared under the supervision of a Qualified Person as defined by NI43-101.Mr. Fred Brown has not independently verified the mineral resource estimate, and makes no assurances as to the validity or economic viability of any of the stated mineral resources, in whole or in part.
54
Peñasquito Project Technical Report December 2007
Readdressed to Silver Wheaton Corp
Peñasquito Project Technical Report
December 2007
| Table 1-15 IMC November 2005 mineral resource estimate. | |||||
| Class | Mt | Ag g/t | Au g/t | Pb% | Zn% |
| Measured Oxides1 | 51 | 23.1 | 0.24 | ||
| Indicated Oxides1 | 40 | 23.7 | 0.29 | ||
| Inferred Oxides1 | 22 | 18.7 | 0.21 | ||
| Measured Sulphides2 | 223 | 32.6 | 0.39 | 0.34 | 0.78 |
| Indicated Sulphides2 | 358 | 27.1 | 0.45 | 0.28 | 0.65 |
| Inferred Sulphides2 | 225 | 24.8 | 0.37 | 0.25 | 0.60 |
1Cutoff USD1.30 NSR. Oxide + Mixed Oxides.
2Cutoff USD3.60/t NSR Breccia and intrusives; USD4.18 NSR sediments/stockwork. Metal prices: Ag USD7.53/oz, Au USD473.25/oz, Pb USD0.44/lb, Zn USD0.63/lb
Note: the above mineral resource estimate was prepared under the supervision of a Qualified Person as defined by NI43-101. Mr. Fred Brown has not independently verified the mineral resource estimate, and makes no assurances as to the validity or economic viability of any of the stated mineral resources, in whole or in part.
| Table 1-16 IMC July 2006 resource estimate. | |||||
| Mt | Ag g/t | Au g/t | Pb% | Zn% | |
| Measured Oxides1 | 84 | 22.2 | 0.24 | ||
| Indicated Oxides1 | 40 | 19.7 | 0.23 | ||
| Inferred Oxides1 | 172 | 5.7 | 0.7 | ||
| Measured Sulphides2 | 382 | 32.7 | 0.52 | 0.34 | 0.76 |
| Indicated Sulphides2 | 366 | 28.4 | 0.46 | 0.30 | 0.66 |
| Inferred Sulphides2 | 2405 | 11.0 | 0.18 | 0.10 | 0.29 |
1Cutoff USD1.30 NSR.
2Cutoff USD3.60/t NSR Breccia and intrusives; USD4.18 NSR sediments/stockwork. Metal prices: Ag USD10.00/oz, Au USD650.00/oz, Pb USD0.43/lb, Zn USD0.86/lb
Note: the above mineral resource estimate was prepared under the supervision of a Qualified Person as defined by NI43-101. Mr. Fred Brown has not independently verified the mineral resource estimate, and makes no assurances as to the validity or economic viability of any of the stated mineral resources, in whole or in part..
| 1.19.5 | Data |
Software | |
For this mineral resource estimate, Gemcom version 4.11 was used for database analysis, lithological wireframe modeling and mineral resource estimation. Statistics and variography were carried out using Snowden Supervisor version 7.10. | |
Data Verification | |
Data verification is discussed in Section 1.15 and 1.16 of this report. No further independent sampling or validation of the data by Mr. Fred Brown was deemed necessary. This author has assumed that all data supplied are complete, accurate and fairly represented. |
55
Peñasquito Project Technical Report December 2007
Readdressed to Silver Wheaton Corp
Peñasquito Project Technical Report
December 2007
The project site was visited by Mr. Fred Brown between 10 April 2007 and 18 April 2007, where surface mineralization, historical mine workings and drilling activities were observed.
Drilling Database
Drilling data were supplied in the form of a text file containing collar easting, northing and elevation coordinates; downhole survey distance, azimuth and plunge measurements; lithological information; and gold, silver, lead and zinc assay data.
Missing values were flagged in the database with a value of ‘-1’. The database also contained more than 2500 zero value results. Goldcorp confirmed that the zero values in the database represented actual assay results and were not indicative of missing samples or errors. For estimation purposes all zero value assays were replaced with a value of 0.0001.
The database supplied by Goldcorp contained a total of 782 drillholes as of 1 June 2007. SNC-Lavalin (SNC 2003) and IMC (M3 2005) have previously identified the fourteen MHC-series drillholes as being problematically biased, and these were not used for estimation. The PP-series were groundwater drillholes with no associated mineral resource information and were deleted from the supplied database. The total of 761 drillholes was available for mineral resource estimation, including condemnation drillholes (Table 1-17).
| Table 1-17 Drilling database. | ||
| SERIES | COUNT | NOTES |
| C-Series | 108 | Condemnation drillholes |
| GP-series | 119 | Goldcorp/Glamis exploration drillholes |
| MET-series | 13 | Metallurgical test drillholes |
| OC-series | 11 | Oriented Core drillholes |
| PN-series | 71 | Kennecot drillholes |
| S-series | 51 | Western Silver scout drillholes |
| WC-series | 388 | Western Copper drillholes |
| MHC-series | 14 | Hochschild Peru drillholes |
| PP-series | 7 | No data |
| TOTAL | 782 | |
Data Validation
Data were transferred to a Gemcom database and successfully verified using industry-standard validation tests. Drillhole collars were also compared to the supplied topographic data, and no significant discrepancies were noted.
56
Peñasquito Project Technical Report December 2007
Readdressed to Silver Wheaton Corp
Peñasquito Project Technical Report
December 2007
| 1.19.6 | Survey Control |
Topographic Control | |
Digital terrain data were supplied by Eagle Mapping, Vancouver, Canada, from aerial photography completed 13 November 2003. Aerial photography provided a 0.24m resolution and a vertical and horizontal accuracy of +/- 1.0m. | |
Drilling Orientation | |
The average orientation of the drilling shows a marked preference for the ordinal directions, with a majority of the drillholes laid out along a -60 >> 000 axis (Figure 19-1). Although such a layout can bias the interpretation and modeling of three-dimensional features, there is sufficient drilling coverage across the property to minimize this risk. |
Figure 19-1: Peñasquito drilling orientation.
(Condemnation drillholes not included.)
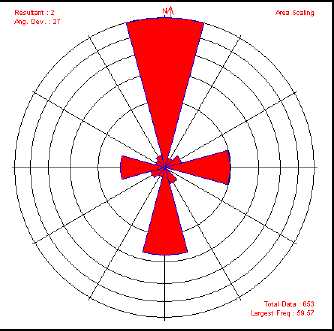
| 1.19.7 | Composites |
Sample lengths for the Peñasquito database ranged from 0.01m to 17.0m (Table 1-18). A total of 74% of the samples were 2.00 meters in length. For mineral resource modeling the sample assay grades were therefore composited to two-meter length-weighted intervals downhole from the collar, in order to achieve uniform sample support. Composites less than 2.00 meters in length were not used for estimation. |
57
Peñasquito Project Technical Report December 2007
Readdressed to Silver Wheaton Corp
Peñasquito Project Technical Report
December 2007
| Table 1-18Assay sample lengths. | |
| Number of Samples | 162356 |
| Minimum Length | 0.01m |
| Maximum Length | 17.0m |
| Average Length | 2.01m |
| Standard Deviation | 0.43 |
| Percent >= 2 m | 2.5% |
| 1.19.8 | Lithological Model |
Goldcorp geologists have developed a comprehensive geological model of the Peñasquito deposit. Geological cross-sections were supplied by Goldcorp as digitized dxf files, outlining the interpreted alteration and geology of the deposit. Goldcorp cross-sections were spaced 50 to 100 meters apart, providing geological coverage across the mineralized area. For modeling purposes a set of lithological units were then defined by this author from the Peñasquito geology (Table 1-19). |
Table 1-19 Peñasquito lithological units.
LITHOLOGICAL UNIT
Overburden
Oxide Domain
Caracol Formation (“Sediments”)
Indidura Formation (“Sediments”)
Cuesta del Cura Formation (“Sediments”)
Peñasco Diatreme Breccia
Azul Diatreme Breccia
Peñasco Porphyry Intrusive
The lithological units were modeled as wireframe surfaces or three-dimensional Triangulated Irregular Network (TIN) wireframes, using cross-sectional polygonal interpretation of the lithology on north-south section lines separated by 25m. Wireframe models of individual lithological units were then created based on successive polygons, and combined into a three-dimensional lithological model. Due to the complexity of the Peñasco Porphyry Intrusive this unit was modeled by assigning the relevant lithological code directly to the rock-type block model. Geological interpretation was based on the supplied geological cross-sections combined with lithological intervals taken from drillhole logs (see Figures 1-11 to 1-17).
58
Peñasquito Project Technical Report December 2007
Readdressed to Silver Wheaton Corp
Peñasquito Project Technical Report
December 2007
1.19.9 Mineralization Model
Mineralization Limits
Examination of the distribution of assay and composite grades indicates a strong break between background values and mineralization at 0.02% Zn. A mineralization shell was constructed by delineating polygons on successive fifteen-meter level plans separating background values and mineralization above and below 0.02% Zn (Figure 19- 2). The 0.02% Zn shell also corresponds to the approximate limits of weak sericite-pyrite-quartz-carbonate alteration.
Figure 19-1: Isometric view of the Zn 0.02% mineralization shell.
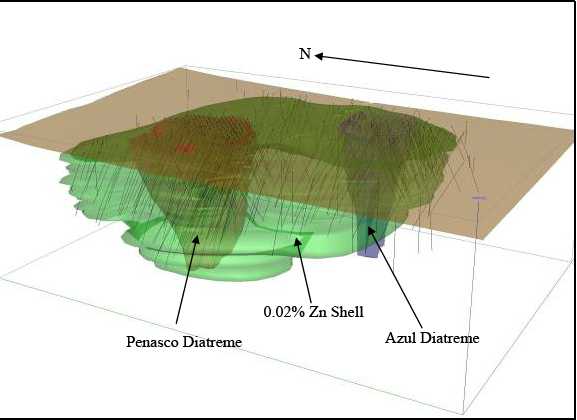
Goldcorp geologists have interpreted the presence of mineralization to be associated with hydrothermal breccias, small-scale veining and narrow fracture-filling stockwork structures cross-cutting lithological boundaries. Economic mineralization is divided into an oxide domain and a stockwork sulphide domain. The mineralization domains have been further separated into the northern Peñasco and southern Chile Colorado components by a sub-vertical fault associated with an east-west trending arroyo cutting through the property. The northern Peñasco sulphide domain is centered on the Peñasco Diatreme Breccia, and the southern Chile Colorado sulphide domain is centered on the Azul Diatreme Breccia. An additional
59
Peñasquito Project Technical Report December 2007
Readdressed to Silver Wheaton Corp
Peñasquito Project Technical Report
December 2007
mineralization domain is formed by a complex porphyritic intrusive cross-cutting the Peñasco Diatreme Breccia (Table 1-20). Assay and composite data were back-coded to the relevant mineralization domain.
| Table 1-120 Mineralization Domains. | |
| DOMAIN | DOMAIN CODE |
| Oxide Domain | 50 |
| Peñasco Sulphide | 80 |
| Chile Colorado Sulphide | 70 |
| Porphyry Intrusive Sulphide | 60 |
| 1.19.10 | Bulk Density |
The SNC-Lavalin 2003 and SNC-Lavalin 2004 mineral resource models used a default bulk density of 2.6 t/m3 for the sulphide domains, but this value was considered conservative and unrepresentative of the deposit (SNC 2003). The IMC 2005 and IMC 2006 mineral resource models assigned bulk densities based on test work of 73 drillhole core samples, as follows (M3 2005):
- Overburden: 2.2 t/m3
- Oxides: 2.3 t/m3
- Mixed Oxides: 2.4 t/m3
- Breccia Sulphide Units: 2.5 t/m3
- Caracol Sulphide Sediments: 2.6 t/m3
For this study an additional 54 bulk density measurements were supplied from Dawson Metallurgical Laboratories Inc. Utah (Dawson 2005). The density data were used to assign bulk density values by lithology (Table 1-21). Goldcorp has recently initiated a comprehensive program to expand their specific gravity database in order to further refine the bulk density values.
| Table 1-21 Goldcorp specific gravity data. | |||
| LITHOLOGY | NUMBER OF SAMPLES | AVERAGE | |
| Peñasco Porphyry Intrusive | 14 | 2.5 | t/m3 |
| Oxides | 19 | 2.4 | t/m3 |
| Sulphide Breccias | 41 | 2.5 | t/m3 |
| Sulphide Sediments | 49 | 2.7 | t/m3 |
| 1.19.11 | Exploratory Data Analysis |
Grade-elements
Gold (Au), silver (Ag), lead (Pb) and zinc (Zn) were analyzed separately as individual grade-elements. Histograms by mineralized domain for each grade-element are given in Appendix A-1.
60
Peñasquito Project Technical Report December 2007
Readdressed to Silver Wheaton Corp
Peñasquito Project Technical Report
December 2007
Summary Statistics
Summary statistics were examined for the total naïve assay data set (Table 10) and for the total two-meter composite data set (Table 1-22). A comparison of the naïve length-weighted means and composite means demonstrates that no bias has occurred due to the compositing process.
An audit by MDA of the Western Silver and Goldcorp/Glamis drilling data and QAQC results prior to 2007 reported a number of issues regarding near-detection limit errors (MDA 2007). SNC-Lavalin (SNC 2003) and IMC (M3 2005) have previously identified the fourteen MHC-series drillholes as being problematically biased, and these drillholes were not used for estimation.
Silver
The average silver oxide grade is 13.37g/t, and the average silver sulphide grade is 18.62g/t. The highest silver grades are clustered along the southern contacts of the Peñasco and Azul diatremes. The total sulphide silver grade sample population displays a potential mix of two lognormal distributions with a high and low-grade component (Appendix A-1). MDA reports that “with some reservations because of conflicting evidence, the silver analytical data can be used for resource estimation” (MDA 2007).
Gold
The average gold oxide grade is 0.13g/t, and the average gold sulphide grade is 0.32g/t. The highest gold grades are associated with the Peñasco diatreme. The total sulphide gold grade sample population displays a lognormal distribution skewed by a large sub-population near the Au lower detection limits (Appendix A-1). MDA has identified a bias in earlier drilling campaigns with gold grades displaying extreme variability, decreasing with increasing grades but considers the gold assay data as suitable for global resource estimation (MDA 2007).
Lead
The average sulphide lead grade is 0.19% . The highest lead grades are associated with the Peñasco diatreme in the north and the stockworks south of the Azul diatreme. The total sulphide Pb grade sample population displays a potential mix of two lognormal distributions with a high and low-grade component (Appendix A-1). MDA believes that “the analytical work for lead can be relied upon for resource estimation” (MDA 2007).
Zinc
The average sulphide zinc grade is 0.44% . The highest zinc grades are associated with the Peñasco diatreme in the north and the stockworks south of the Azul diatreme. The total sulphide Zn grade sample population displays a potential mix of two lognormal distributions with a high and low-grade component (Appendix A-1). MDA reported that the “analyses of zinc in the database are deemed reliable and sufficiently accurate for resource estimation” (MDA 2007).
61
Peñasquito Project Technical Report December 2007
Readdressed to Silver Wheaton Corp
Peñasquito Project Technical Report
December 2007
| Table 1-22 Naïve assay summary statistics. | ||||
| Ag | OXIDES 50 | INTRUSIVE | SOUTH 70 | NORTH 80 |
| 60 | ||||
| Samples | 19708 | 7864 | 36188 | 87720 |
| Minimum | 0.0700 | 0.1000 | 0.1000 | 0.1000 |
| Maximum | 2010.00 | 2850.00 | 4430.00 | 8280.00 |
| Mean | 14.18 | 22.15 | 18.24 | 20.97 |
| Standard Deviation | 37.66 | 67.05 | 60.70 | 86.28 |
| CV | 2.66 | 3.03 | 3.33 | 4.11 |
| Variance | 1418.25 | 4496.26 | 3684.44 | 7444.45 |
| Skewness | 22.37 | 27.79 | 21.61 | 46.50 |
| Length-Weighted Mean | 13.35 | 20.78 | 17.28 | 19.01 |
| Au | OXIDES 50 | INTRUSIVE | SOUTH 70 | NORTH 80 |
| 60 | ||||
| Samples | 19708 | 7864 | 36188 | 87720 |
| Minimum | 0.01 | 0.01 | 0.01 | 0.01 |
| Maximum | 93.10 | 56.20 | 62.50 | 536.00 |
| Mean | 0.14 | 0.43 | 0.17 | 0.40 |
| Standard Deviation | 0.80 | 1.52 | 0.56 | 2.44 |
| CV | 5.66 | 3.54 | 3.39 | 6.03 |
| Variance | 0.63 | 2.31 | 0.32 | 5.95 |
| Skewness | 84.96 | 20.72 | 46.85 | 134.44 |
| Length-Weighted Mean | 0.13 | 0.40 | 0.16 | 0.38 |
| Pb | OXIDES 50 | INTRUSIVE | SOUTH 70 | NORTH 80 |
| 60 | ||||
| Samples | 7864 | 76233 | 87720 | |
| Minimum | 0.0008 | 0.0002 | 0.0002 | |
| Maximum | 30.00 | 49.60 | 28.50 | |
| Mean | 0.22 | 0.24 | 0.22 | |
| Standard Deviation | 0.71 | 0.73 | 0.67 | |
| CV | 3.22 | 3.05 | 3.08 | |
| Variance | 0.50 | 0.54 | 0.45 | |
| Skewness | 29.50 | 17.88 | 16.39 | |
| Length-Weighted Mean | 0.20 | 0.17 | 0.20 | |
| Zn | OXIDES 50 | INTRUSIVE | SOUTH 70 | NORTH 80 |
| 60 | ||||
| Samples | 7864 | 36188 | 87720 | |
| Minimum | 0.0020 | 0.0005 | 0.0007 | |
| Maximum | 15.30 | 30.70 | 30.00 | |
| Mean | 0.43 | 0.44 | 0.49 | |
| Standard Deviation | 0.70 | 1.10 | 1.13 | |
| CV | 1.63 | 2.51 | 2.29 | |
| Variance | 0.50 | 1.22 | 1.27 | |
| Skewness | 5.72 | 8.50 | 8.74 | |
| Length-Weighted Mean | 0.43 | 0.42 | 0.46 | |
62
Peñasquito Project Technical Report December 2007
Readdressed to Silver Wheaton Corp
Peñasquito Project Technical Report
December 2007
| Table 1-23 Composite summary statistics. | ||||
| Ag-2 | OXIDES 50 | INTRUSIVE | SOUTH 70 | NORTH 80 |
| 60 | ||||
| Samples | 20612 | 7970 | 37699 | 90201 |
| Minimum | 0.0001 | 0.1000 | 0.1000 | 0.1000 |
| Maximum | 1597.50 | 1000.00 | 2636.75 | 8280.00 |
| Mean | 13.37 | 20.79 | 17.22 | 19.02 |
| Standard Deviation | 32.06 | 40.21 | 51.92 | 59.52 |
| CV | 2.40 | 1.93 | 3.01 | 3.13 |
| Variance | 1027.89 | 1616.51 | 2695.23 | 3542.17 |
| Skewness | 14.94 | 7.97 | 15.77 | 50.20 |
| Au-2 | OXIDES 50 | INTRUSIVE | SOUTH 70 | NORTH 80 |
| 60 | ||||
| Samples | 20612 | 7970 | 37699 | 90201 |
| Minimum | 0.0001 | 0.0001 | 0.0001 | 0.0001 |
| Maximum | 93.10 | 49.60 | 22.10 | 536.00 |
| Mean | 0.13 | 0.40 | 0.16 | 0.38 |
| Standard Deviation | 0.77 | 1.21 | 0.45 | 2.27 |
| CV | 5.78 | 3.00 | 2.82 | 5.98 |
| Variance | 0.60 | 1.46 | 0.20 | 5.14 |
| Skewness | 88.27 | 15.75 | 18.99 | 152.65 |
| Pb-2 | OXIDES 50 | INTRUSIVE | SOUTH 70 | NORTH 80 |
| 60 | ||||
| Samples | 7970 | 37699 | 90201 | |
| Minimum | 0.0001 | 0.0001 | 0.0001 | |
| Maximum | 10.20 | 30.13 | 22.30 | |
| Mean | 0.20 | 0.17 | 0.20 | |
| Standard Deviation | 0.39 | 0.61 | 0.49 | |
| CV | 1.90 | 3.70 | 2.50 | |
| Variance | 0.15 | 0.38 | 0.24 | |
| Skewness | 9.45 | 15.91 | 9.48 | |
| Zn-2 | OXIDES 50 | INTRUSIVE | SOUTH 70 | NORTH 80 |
| 60 | ||||
| Samples | 7970 | 37699 | 90201 | |
| Minimum | 0.0001 | 0.0001 | 0.0001 | |
| Maximum | 15.30 | 30.70 | 27.20 | |
| Mean | 0.43 | 0.42 | 0.46 | |
| Standard Deviation | 0.67 | 0.98 | 0.93 | |
| CV | 1.58 | 2.36 | 2.04 | |
| Variance | 0.45 | 0.97 | 0.87 | |
| Skewness | 5.00 | 7.55 | 5.91 | |
63
Peñasquito Project Technical Report December 2007
Readdressed to Silver Wheaton Corp
Peñasquito Project Technical Report
December 2007
Metal Correlations
The correlations between metal grades were examined for the total composite data set. Ag and Au displayed a strong correlation, as did Ag, Pb and Zn. No correlation between Au and the base metals is apparent (Table 1-24).
| Table 1-24Correlation coefficient table for composite data. | ||||
| Ag | Au | Pb | Zn | |
| Ag | 1.00 | 0.51 | 0.64 | 0.50 |
| Au | 0.51 | 1.00 | 0.17 | 0.18 |
| Pb | 0.63 | 0.17 | 1.00 | 0.66 |
| Zn | 0.50 | 0.18 | 0.66 | 1.00 |
Capping Thresholds
In order to limit the influence of high-grade outliers during estimation, capping thresholds were determined from the examination of inflection points on Mean & CV graphs for individual grade-elements by Mineralization Domain (Appendix A-1). The selected threshold values are given in Table 1-25.
| Table 1-25 Composite data threshold values. | ||||
| MINERALIZATION DOMAIN | ||||
| Composite | 50 | 60 | 70 | 80 |
| Ag | 200g/t | 270g/t | 320g/t | 300g/t |
| Au | 3.0g.t | 7.0g/t | 3.0g/t | 9.0g/t |
| Pb | NA | 3.0% | 4.0% | 3.0% |
| Zn | NA | 5.0% | 7.0% | 6.0% |
| 1.19.12 | Variography |
Experimental semivariograms
Directional experimental semivariograms were modeled separately for Ag, Au, Pb and Zn composite data in each of the defined mineralization domains (see Appendix A-3). Variogram fans were used to define the direction of maximum grade continuity in the horizontal plane. An across-strike vertical fan was then used to define the direction of maximum grade continuity perpendicular to the horizontal direction, and from this an inclined variogram fan was constructed in order to determine the principal direction of grade continuity. Experimental semivariogram parameters are listed in Table 1-26.
64
Peñasquito Project Technical Report December 2007
Readdressed to Silver Wheaton Corp
Peñasquito Project Technical Report
December 2007
Directional Continuity
Goldcorp geologists have previously identified a strong sub-vertical component to the sulphide mineralization, as well as a regional structural component trending approximately north-west to south-east.
Modeled experimental semivariograms displayed a high degree of anisotropy. Due to the high coefficient-of-variation (CV) values of the composite data and the varied definition of selected experimental semivariograms, additional work on sub-domaining of the principle mineralization domains is recommended.
| Table 1-26 Standardized experimental semivariograms. | |||||||||||||
| DOMAIN | DIRECTION | SEMI-VARIOGRAM | ROTATION (ADA) | ||||||||||
| Ag 50 | -54 | > | 256 | 0.3 | + | SPH(0.3, | 030) | + | SPH(0.4, | 060) | 256 | -54 | 140 |
| Ag 60 | -90 | > | 000 | 0.4 | + | SPH(0.2, | 040) | + | SPH(0.4, | 060) | 000 | -90 | 290 |
| Ag 70 | -60 | > | 000 | 0.2 | + | SPH(0.3, | 140) | + | SPH(0.5, | 600) | 000 | -60 | 180 |
| Ag 80 | -80 | > | 310 | 0.2 | + | SPH(0.5, | 100) | + | SPH(0.3, | 200) | 310 | -80 | 310 |
| Au 50 | -54 | > | 256 | 0.2 | + | SPH(0.3, | 060) | + | SPH(0.5, | 100) | 256 | -54 | 140 |
| Au 60 | -90 | > | 000 | 0.3 | + | SPH(0.3, | 080) | + | SPH(0.4, | 160) | 000 | -90 | 320 |
| Au 70 | -54 | > | 016 | 0.4 | + | SPH(0.3, | 120) | + | SPH(0.3, | 200) | 016 | -54 | 260 |
| Au 80 | -80 | > | 210 | 0.2 | + | SPH(0.3, | 100) | + | SPH(0.5, | 150) | 210 | -80 | 210 |
| Pb 60 | -90 | > | 000 | 0.3 | + | SPH(0.3, | 080) | + | SPH(0.4, | 200) | 000 | -90 | 290 |
| Pb 70 | -65 | > | 000 | 0.3 | + | SPH(0.3, | 060) | + | SPH(0.4, | 120) | 000 | -65 | 180 |
| Pb 80 | -80 | > | 000 | 0.2 | + | SPH(0.2, | 160) | + | SPH(0.4, | 360) | 000 | -80 | 180 |
| Zn 60 | -90 | > | 000 | 0.3 | + | SPH(0.3, | 200) | + | SPH(0.4, | 300) | 000 | -90 | 290 |
| Zn 70 | -80 | > | 070 | 0.4 | + | SPH(0.3, | 050) | + | SPH(0.3, | 150) | 000 | -90 | 250 |
| Zn 80 | -90 | > | 000 | 0.4 | + | SPH(0.3, | 050) | + | SPH(0.3, | 130) | 000 | -90 | 250 |
| 1.19.13 | Estimation |
Introduction
Three-dimensional modeling methods and parameters were used in accordance with principles meeting Canadian Institute of Mining, Metallurgy and Petroleum recommended guidelines (CIM 2005).
Block Model
The block model used for interpolation was constructed from 25mE x 25mN x 15mRL blocks. The block model size was selected as a compromise between mining selectivity, the scale of the deposit, the existing drilling grid and the experimental semivariogram ranges. The block model grid was aligned to conform to potential bench elevations and to the Goldcorp geological sections, in order to facilitate lithological modeling and mine planning. The block model framework contains 1,319,200 blocks covering the defined area of mineralization, to a local depth of 815 meters below sea level.
65
Peñasquito Project Technical Report December 2007
Readdressed to Silver Wheaton Corp
Peñasquito Project Technical Report
December 2007
Separate block models were created for mineralization domains, density, grade-element block estimates, kriging variances and classification. Table 1-27 summarizes the block model setup parameters.
| Table 1-27Block model setup parameters. | |||
| Origin | Block Size | Number of Blocks | |
| Easting | 228357.5 | 25 | 97 |
| Northing | 2726000 | 25 | 160 |
| Elevation | 2090 | 15 | 85 |
Economic Parameters Net Smelter Return
Net Smelter Return (NSR) values for the sulphide and oxide mineral resources were calculated based on economic parameters supplied by Goldcorp (Tables 1-28 and 1-29). Proprietary smelter recovery/payables, treatment and refining charges, penalties, freight costs, etc. are not shown. For sulphide mineral resources the NSR values were calculated in terms of their Zn-concentrate contribution and Pb-concentrate contribution and the contributions were then combined. For oxide mineral resources the NSR values were calculated for Ag and Au only.
| Table 1-28 Mill recoveries used in NSR calculations. | ||||||
| Pb-concentrate | Zn-concentrate | |||||
| Mill | Sediment | Intrusive | Sediment | |||
| Breccias | Intrusive | Breccias | ||||
| Recovery | s | s | s | |||
| Lead | 72% | 72% | 63% | 0% | 0% | 0% |
| Zinc | 0% | 0% | 0% | 75% | 60% | 60% |
| Silver | 65% | 63% | 58% | 15.0% | 14.0% | 5.0% |
| Gold | 62% | 64% | 20% | 13.0% | 10.0% | 5.0% |
| Concentrate | 52% | 51% | 50% | 50.0% | 50.0% | 50.0% |
| Grade | ||||||
| Table 1-29 Mineral resource metal prices used in NSR calculations. | ||
| Commodity | Pb-concentrate | Zn-concentrate |
| Lead | USD 0.50/lb | ----- |
| Zinc | ----- | USD 1.00/lb |
| Silver | USD 13.00/oz | USD 13.00/oz |
| Gold | USD 650.00/oz | USD 650.00/oz |
Breakeven Cutoff Grades
Breakeven cutoff grades as supplied by Goldcorp are given in Table 1-30. Breakeven cutoff grades were calculated for individual blocks based on lithology.
66
Peñasquito Project Technical Report December 2007
Readdressed to Silver Wheaton Corp
Peñasquito Project Technical Report
December 2007
| Table 1-30 Breakeven block cutoff grades. | |
| UNIT | NSR CUTOFF GRADE |
| Breccias and Intrusives | USD 4.55 |
| Sulphide Peñasco Sediments | USD 4.55 |
| Sulphide Chile Colorado Sediments | USD 5.18 |
| North Oxides | USD 1.18 |
| South Oxides | USD 1.30 |
Interpolation
A two pass interpolation procedure was used for grade estimation. During the first pass, block grades were estimated using Ordinary Kriging (OK) with appropriate capping thresholds applied during interpolation. The range of influence of a composite grade that exceeded the capping threshold was restricted to fifty meters.
Kriging estimation parameters were selected based on an examination of the local kriging neighborhood for the defined block size for the Zn-composite data. The following kriging parameters were selected for OK grade estimation:
- Discretization: 3 x 3 x 3
- Minimum number of samples for estimation: 1
- Maximum number of samples for estimation: 20
- Maximum number of samples per drillhole: 6
- Major axis to minor axes anisotrophy ratio: 2/1/1
- Constant search ellipse with a radius of 150m.
During the second pass, additional block grades within the 0.02% Zn mineralization shell were estimated using Inverse Distance Squared (ID2) weighting with a minimum of one and a maximum of three samples and a maximum search range of 500m. All block grades estimated during the second pass were classified as Inferred.
Global mineral resource estimation was restricted to the 0.02% Zn mineralization wireframe. Grade-elements within the mineralized domains were estimated separately, with no sample collection across domain boundaries. The results of the individual estimations were used to calculate a combined NSR value for each block.
67
Peñasquito Project Technical Report December 2007
Readdressed to Silver Wheaton Corp
Peñasquito Project Technical Report
December 2007
Classification
Classification Guidelines
Global mineral resources were classified in accordance with guidelines established by the Canadian Institute of Mining, Metallurgy and Petroleum (CIM 2005):
- Inferred Mineral Resource
“An ‘Inferred Mineral Resource’ is that part of a mineral resource for which quantity and grade or quality can be estimated on the basis of geological evidence and limited sampling and reasonably assumed, but not verified, geological and grade continuity. The estimate is based on limited information and sampling gathered through appropriate techniques from locations such as outcrops, trenches, pits, workings and drillholes.”
- Indicated Mineral Resource
“An ‘Indicated Mineral Resource’ is that part of a mineral resource for which quantity, grade or quality, densities, shape and physical characteristics, can be estimated with a level of confidence sufficient to allow the appropriate application of technical and economic parameters, to support mine planning and evaluation of the economic viability of the deposit. The estimate is based on detailed and reliable exploration and testing information gathered through appropriate techniques from locations such as outcrops, trenches, pits, workings and drillholes that are spaced closely enough for geological and grade continuity to be reasonably assumed.”
- Measured Mineral Resource
“A ‘Measured Mineral Resource’ is that part of a mineral resource for which quantity, grade or quality, densities, shape, and physical characteristics are so well established that they can be estimated with confidence sufficient to allow the appropriate application of technical and economic parameters, to support production planning and evaluation of the economic viability of the deposit. The estimate is based on detailed and reliable exploration, sampling and testing information gathered through appropriate techniques from locations such as outcrops, trenches, pits, workings and drillholes that are spaced closely enough to confirm both geological and grade continuity.”
Classification Criteria
Mineral resource classification was based on kriging variance and the number of informing samples. For the Oxide Domain, classification was based on the Au kriging variance and the number of informing samples. For the sulphide domains classification was based on the Zn kriging variance and the number of informing samples. All mineral resources meet the defined classification criteria and cutoff grades for Peñasquito. Classification criteria are listed in Table 1-31.
68
Peñasquito Project Technical Report December 2007
Readdressed to Silver Wheaton Corp
Peñasquito Project Technical Report
December 2007
| Table 1-31 Mineral resource classification criteria. | |
| CLASS | CRITERIA |
| Measured | Kriging variance < 1/3 of the total sill and the number of composites used for estimation was 19 or higher. |
| Indicated | Kriging variance between 1/3 and 2/3 of the total sill and the number of composites used for estimation was 7 or higher. |
| Kriging variance > 2/3 of the total sill; or | |
| Inferred | Number of informing samples = 1; or |
| All blocks estimated during the second pass. | |
Low Pb-concentrate
In order to accommodate planned metallurgical recoveries over the lifetime of the project the following additional classification criteria were used:
- If the estimated Pb block grade was less than 0.10% and the Zn-component of the NSR block grade was equal to or above the block cutoff grade, the block classification was determined as per Table 1-31.
- If the estimated Pb block grade was less than 0.10% and the Zn-component of the NSR block grade was less than the block cutoff grade but the total NSR block grade was equal to or above the block cutoff grade, the block was classified as Inferred
| 1.19.14 | Mineral Resource Statement |
The global mineral resource estimate given relative to the defined cutoff grade is shown in Table 1-32. Total global mineral resources are restricted to the Zn 0.02% mineralization shell.
69
Peñasquito Project Technical Report December 2007.
Readdressed to Silver Wheaton Corp
Peñasquito Project Technical Report
December 2007
| Table 1-32 Global Peñasquito mineral resources. | |||||||||
| Measured Category | Tonnes | Gold Grade | Gold | Silver Grade | Silver | Lead Grade | Lead Tonnes Zinc Grade | Zinc Tonnes | |
| (Millions) | (gpt) | Ounces | (gpt) | Ounces | (%) | (Millions) | (%) | (Millions) | |
| Peñasco Oxide Resource | 39.0 | 0.19 | 243,000 | 19.6 | 24,660,000 | ||||
| Peñasco Sulfide Resource | 396.0 | 0.60 | 7,642,000 | 31.2 | 397,530,000 | 0.33% | 1.30 | 0.73% | 2.90 |
| Chile Colorado Oxide Resource | 11.0 | 0.18 | 59,000 | 15.7 | 5,300,000 | ||||
| Chile Colorado Sulfide Resource | 130.0 | 0.25 | 1,050,000 | 33.7 | 140,725,000 | 0.35% | 0.50 | 0.82% | 1.10 |
| Combined Oxide Measured Resources | 50.0 | 0.19 | 302,000 | 18.8 | 29,960,000 | ||||
| Combined Sulfide Measured Resources | 526.0 | 0.51 | 8,692,000 | 31.8 | 538,255,000 | 0.34% | 1.80 | 0.75% | 4.00 |
| Combined Measured Resources | 576.0 | 0.49 | 8,994,000 | 30.7 | 568,215,000 | ||||
| Indicated Category | Tonnes | Gold Grade | Gold | Silver Grade | Silver | Lead Grade | Lead Tonnes Zinc Grade | Zinc Tonnes | |
| (Millions) | (gpt) | Ounces | (gpt) | Ounces | (%) | (Millions) | (%) | (Millions) | |
| Peñasco Oxide Resource | 63.0 | 0.14 | 284,000 | 12.6 | 25,763,000 | ||||
| Peñasco Sulfide Resource | 652.0 | 0.33 | 6,860,000 | 22.2 | 465,972,000 | 0.23% | 1.50 | 0.58% | 3.80 |
| Chile Colorado Oxide Resource | 40.0 | 0.14 | 183,000 | 14.1 | 18,163,000 | ||||
| Chile Colorado Sulfide Resource | 265.0 | 0.17 | 1,459,000 | 23.4 | 199,033,000 | 0.27% | 0.70 | 0.64% | 1.70 |
| Combined Oxide Indicated Resources | 103.0 | 0.14 | 467,000 | 13.2 | 43,926,000 | ||||
| Combined Sulfide Indicated Resources | 917.0 | 0.28 | 8,319,000 | 22.6 | 665,005,000 | 0.24% | 2.20 | 0.59% | 5.40 |
| Combined Indicated Resources | 1,020.0 | 0.27 | 8,786,000 | 21.6 | 708,931,000 | ||||
| Combined M&I Resources | 1,596.0 | 0.35 | 17,780,000 | 24.9 | 1,277,146,000 | 0.28% | 4.01 | 0.65% | 9.41 |
| Inferred Category | |||||||||
| Peñasco Oxide Resource | 25.0 | 0.13 | 106,000 | 11.7 | 9,288,000 | ||||
| Peñasco Sulfide Resource | 869.0 | 0.25 | 6,900,000 | 12.58 | 351,399,000 | 0.08% | 0.70 | 0.53% | 4.60 |
| Chile Colorado Oxide Resource | 16.0 | 0.11 | 57,000 | 15.19 | 7,819,000 | ||||
| Chile Colorado Sulfide Resource | 310.0 | 0.18 | 1,840,000 | 14.01 | 139,658,000 | 0.06% | 0.20 | 0.42% | 1.30 |
| Combined Oxide Inferred Resources | 41.0 | 0.12 | 163,000 | 13.0 | 17,107,000 | ||||
| Combined Sulfide Inferred Resources | 1,179.0 | 0.23 | 8,740,000 | 13.0 | 491,057,000 | 0.07% | 0.90 | 0.50% | 5.90 |
| Combined Inferred Resources | 1,220.0 | 0.23 | 8,903,000 | 13.0 | 508,164,000 | ||||
| At Resource Metals Pricing of $650 gold, $13.00 silver, $0.50/lb lead and $1.00/lb zinc | |||||||||
| At $4.55 NSR cutoff for Breccia and Intrusive. At $5.18 NSR cutoff for Sediments. At $1.30 NSR cutoff for south oxides and $1.18 for North oxides | |||||||||
| 1.19.15 | Validation |
Three methods were used to test the validity of the estimation model:
- Visual inspection of rock codes, composite grades and block grades in sections perpendicular to the average trend of the mineralization. No systematic bias was evident in the model estimates from visual inspection (see Figures 12-17).
- Comparison of the OK block grade estimates and a inverse distance to the 5th power (ID5) model. Swath plots comparing ID5 and OK average block grade estimates show no evidence of a systematic bias. (see Appendix A-4). The ID5 model is in general less smooth than the OK model and ID5 block grades fluctuate around the OK block grade estimates, demonstrating that the OK model has adequately reproduced local grades.
- Classification parameters and the average informing distance of the closest sample used for estimation were also examined (Tables 1-33 and
70
Peñasquito Project Technical Report December 2007
Readdressed to Silver Wheaton Corp
Peñasquito Project Technical Report
December 2007
1-34). The parameters used are consistent with industry practice for classification.
| Table 1-33 Average classification parameters for sulphides. | |||
| Avg Informing | Avg Number of | Avg Zn Kriging | |
| Class | Distance | Points | Variance |
| Measured | 17.2 | 20.0 | 0.220 |
| Indicated | 56.6 | 19.0 | 0.452 |
| Inferred | 95.5 | 12.5 | NA |
| Table 1-34 Average classification parameters for oxides. | |||
| Avg Informing | Avg Number of | Avg Au Kriging | |
| Class | Distance | Points | Variance |
| Measured | 11.5 | 20.0 | 0.186 |
| Indicated | 44.4 | 19.8 | 0.551 |
| Inferred | 103.0 | 11.2 | NA |
| 1.19.16 | Mineral Reserves |
The mineral reserves of Peñasquito are based on final pit designs for Peñasco and Chile Colorado/Azul. A modified floating cone algorithm was used to obtain initial pit geometries. The NSR item of each block, in conjunction with costs and pit slope angles is used by the algorithm to determine the optimum pit shape. The NSR value per block is calculated using the metallurgical recovery data discussed in Section 1.19.14 and the pit definition metal prices shown in Table 1-35a.
| Table 1-35a | Pit Definition Metal Prices |
| Metal | Pit Definition Metal Prices |
| Gold | $525/oz |
| Silver | $10.00/oz |
| Lead | $0.40/lb |
| Zinc | $0.80/lb |
Only those blocks of the model classified as measured or indicated were allowed to contribute to the floating cone economics. Inferred blocks were considered waste by the algorithm.
Blocks coded in the model as sulphide used flotation mill economics to determine the net value per block, and blocks coded as oxide used the heap leach economics to determine the net block value. Additional economic input parameters for the cone runs are shown on Table 1-35 and the floating cone results are shown in Table 1-36.
71
Peñasquito Project Technical Report December 2007
Readdressed to Silver Wheaton Corp
Peñasquito Project Technical Report
December 2007
Table 1-35 Floating Cone Input Parameters
| Revenue per model block | Calculated NSR Value |
| Mining Cost | $0.86/tonne for rock and overburden $0.01/tonne per bench additional haul cost below the 1940 bench (thus life-of-mine weighted average mine cost calculate out to be: $0.95 waste and $1.05 ore) |
| Processing Cost | $4.30/tonne milled, Peñasco/Azul $4.93/tonne milled, Chile Colorado $1.18/tonne ROM heap leach Peñasco/Azul $1.30/tonne ROM heap leach Chile Colorado |
| General and Administrative Cost | $0.25/tonne milled |
| Concentrate Freight, Smelting and | Included in NSR value |
| Refining | |
| Average Overall Slope Angles | 37ooverall slope in overburden In Rock: |
41oto 45 | |
38oto 41odepending on sector, Chile |
72
Peñasquito Project Technical Report December 2007
Readdressed to Silver Wheaton Corp
Peñasquito Project Technical Report
December 2007
Table 1-36 Summary results of the floating cone run for Chile Colorado/Azul and Peñasco.
Table 1-36 Floating Cone Results
| Rock | NSR | Waste | Total | |||||||
| Group | Class | Cutoff | ktonnes | Ag, g/t | Au, g/t | Pb, % | Zn, % | NSR, $/t | ktonnes | ktonnes |
| Azul Diatreme | Proven | 41,273 | 30.34 | 0.198 | 0.34 | 0.69 | $13.73 | |||
| Probable | 48,656 | 25.47 | 0.148 | 0.27 | 0.54 | $11.10 | ||||
| Prov+Prob | $4.55 | 89,929 | 27.71 | 0.171 | 0.30 | 0.61 | $12.31 | 128,462 | 218,391 | |
| Peñasco | Proven | 244,547 | 34.24 | 0.693 | 0.37 | 0.82 | $20.32 | |||
| Diatreme | Probable | 158,273 | 27.45 | 0.507 | 0.28 | 0.66 | $15.33 | |||
| Prov+Prob | $4.55 | 402,820 | 31.57 | 0.620 | 0.33 | 0.76 | $18.36 | 326,578 | 729,398 | |
| Peñasco | Proven | 44,789 | 26.63 | 0.557 | 0.27 | 0.55 | $14.69 | |||
| Intrusive | Probable | 5,625 | 20.49 | 0.348 | 0.22 | 0.51 | $10.91 | |||
| Prov+Prob | $4.55 | 50,414 | 25.94 | 0.534 | 0.26 | 0.55 | $14.27 | 27,375 | 77,789 | |
| Combined | Proven | 289,336 | 33.06 | 0.672 | 0.35 | 0.78 | $19.45 | |||
| Peñasco | Probable | 163,898 | 27.21 | 0.502 | 0.28 | 0.65 | $15.18 | |||
| Diatreme & | ||||||||||
| Intrusive | Prov+Prob | $4.55 | 453,234 | 30.95 | 0.610 | 0.33 | 0.73 | $17.90 | ||
| North | Proven | 48,702 | 29.93 | 0.535 | 0.34 | 0.67 | $11.30 | |||
| Sediments | Probable | 109,835 | 24.05 | 0.350 | 0.26 | 0.58 | $8.89 | |||
| ( Peñasco ) | Prov+Prob | $4.55 | 158,537 | 25.86 | 0.407 | 0.28 | 0.61 | $9.63 | 1,022,013 | 1,180,550 |
| South | Proven | 48,212 | 47.67 | 0.341 | 0.48 | 1.02 | $15.29 | |||
| Sediments | Probable | 58,396 | 35.22 | 0.243 | 0.41 | 0.88 | $12.16 | |||
| (Chile) | Prov+Prob | $5.18 | 106,608 | 40.85 | 0.287 | 0.44 | 0.94 | $13.58 | 290,241 | 396,849 |
| Totals | ||||||||||
| Mill Material | Prov+Prob | |||||||||
| 808,308 | 30.89 | 0.479 | 0.33 | 0.72 | $15.09 | |||||
| North Oxides | Proven | 34,498 | 21.32 | 0.210 | $3.61 | |||||
| Peñasco | Probable | 43,593 | 15.58 | 0.164 | $2.73 | |||||
| Prov+Prob | $1.18 | 78,091 | 18.12 | 0.184 | $3.12 | 283,439 | 361,530 | |||
| South Oxides | Proven | 7,851 | 18.39 | 0.204 | $2.97 | |||||
| Chile | Probable | 26,637 | 17.36 | 0.168 | $2.60 | |||||
| Prov+Prob | $1.30 | 34,488 | 17.59 | 0.176 | $2.68 | 117,500 | 151,988 | |||
| Combined | ||||||||||
| Oxides | ||||||||||
| North + South | Prov+Prob | 112,579 | 17.96 | 0.182 | $2.99 | |||||
| Overburden | 383,089 | 383,089 | ||||||||
| Total Pit | 920,887 | 2,578,697 | 3,499,584 | |||||||
| Waste to combined | ||||||||||
| ore ratio: | 2.80 |
Final pits were designed for the Chile Colorado, Azul and Peñasco deposits based on the floating cone geometry discussed in the previous section. Table 1-37 shows the design parameters used for the final pits and the internal mining phases. The bench height is 15 meters (m) to match the block model bench height. The road width for the mine design is 35 meters in both pits. A normal allocation is 3.5 times the truck width plus the berm width on the outside of the road. This results in a minimum
73
Peñasquito Project Technical Report December 2007
Readdressed to Silver Wheaton Corp
Peñasquito Project Technical Report
December 2007
road width allowance in the pit and phase designs of 35 m for a 330t class truck.
The pit design slope angles are based on information provided by Golder Associates (Golder) in three reports:
- Peñasquito Project, Feasibility Pit Slope Design Report, July 15, 2005
- Addendum to the Feasibility Pit Slope Design Report, August 24, 2005
- Technical Memorandum “Peñasquito Pit Slope Recommendation Update”, June 16, 2006
The addendum report focused on the south wall of Chile Colorado after additional geotechnical drilling was completed. The result was an increase to the interramp slope angle from 40o to 45o in the lower portion of the southeast wall. The Technical Memorandum update discussed the continued use of recommended slope angles in Chile Colorado but recommended the Peñasco pit be limited to 47 degrees for slopes above the 1700m elevation.
The oriented core drilling was performed by Major Drilling Co. A geologist was present at the drill rig full-time during drilling. A total 4,126 m of oriented core drilling was completed in eight core holes in the Chile Colorado pit and three core holes in the Peñasco pit. Core hole diameters were typically HQ3 (61 mm ID) but were telescoped down to NQ3 (45 mm ID) if difficult drilling conditions were encountered. Core was recovered in a triple tube core barrel assembly. The holes were oriented at an angle of 60 degrees to the horizontal and were sited to intersect the November 2005 design basis pit wall one-third of the ultimate wall height above the base of the final pit level. Core orientation was accomplished using two independent methods: clay impression and a mechanical downhole system referred to as Corientor™. Field point load tests were completed for each core run to estimate the unconfined compressive strength of the intact rock. Core runs and geot echnical logging were typically completed at 3 m intervals. A total of 20 samples were collected from the geotechnical core holes for laboratory testing. An extensive geotechnical database was developed from the oriented core data as well as from exploration logging data (up to hole WC-250).
The final pit is one contiguous outline at surface but has two distinct pit bottoms – one on the Peñasco zone and one on the Azul/Chile Colorado zone. The pit bottom on the Peñasco side is 1220 elevation making the maximum wall height 800 meters. On the Chile Colorado/Azul side, the pit bottom is at the 1400 elevation making its maximum depth 600 meters. The total pit surface area is 570 hectares.
74
Peñasquito Project Technical Report December 2007
Readdressed to Silver Wheaton Corp
Peñasquito Project Technical Report
December 2007
| Table 1-37 Pit Design Parameters | ||
| Chile Colorado | Peñasco | |
| Bench Height | 15 meters | 15 meters |
| Haul Road: | ||
| Maximum Design Grade | 10% | 10% |
| Width (including berm and ditch) | 35 meters | 35 meters |
| Inter-ramp Slope Angles: | degrees | degrees |
| In Overburden | 37 | 37 |
| In Rock, Oxide | 40 or 45 | 45 |
| In Rock, Sulphide (or mixed) | 40, 45, 48 or 50 | 48 or 50 |
75
Peñasquito Project Technical Report December 2007
Readdressed to Silver Wheaton Corp
Peñasquito Project Technical Report
December 2007
Table 1-38 Summary results of the smoothed and ramped final pit design for Chile Colorado, Azul and Peñasco.
| Rock | NSR | Pb, | Waste | Total | ||||||
| Group | Class | Cutoff | ktonnes | Ag, g/t | Au, g/t | % | Zn, % | NSR, $/t | ktonnes | ktonnes |
| Azul | ||||||||||
| Diatreme | Proven | 41,643 | 30.21 | 0.196 | 0.34 | 0.68 | $13.59 | |||
| Probable | 49,583 | 25.31 | 0.148 | 0.27 | 0.54 | $11.05 | ||||
| Prov+Prob | $4.55 | 91,226 | 27.55 | 0.170 | 0.30 | 0.60 | $12.21 | 131,007 | 222,233 | |
| Peñasco | Proven | 244,121 | 34.19 | 0.692 | 0.37 | 0.82 | $20.32 | |||
| Diatreme | Probable | 158,392 | 27.22 | 0.501 | 0.28 | 0.65 | $15.25 | |||
| Prov+Prob | $4.55 | 402,513 | 31.45 | 0.617 | 0.33 | 0.75 | $18.32 | 331,543 | 734,056 | |
| Peñasco | Proven | 44,796 | 26.62 | 0.558 | 0.27 | 0.55 | $14.69 | |||
| Intrusive | Probable | 5,635 | 20.24 | 0.345 | 0.22 | 0.50 | $10.95 | |||
| Prov+Prob | $4.55 | 50,431 | 25.91 | 0.534 | 0.26 | 0.54 | $14.27 | 28,016 | 78,447 | |
| Combined | Proven | 288,917 | 33.02 | 0.671 | 0.35 | 0.78 | $19.45 | |||
| Peñasco | Probable | 164,027 | 26.98 | 0.496 | 0.28 | 0.64 | $15.10 | |||
| Diatreme & | ||||||||||
| Intrus. | Prov+Prob | $4.55 | 452,944 | 30.83 | 0.608 | 0.33 | 0.73 | $17.87 | ||
| North | Proven | 48,513 | 29.85 | 0.542 | 0.33 | 0.67 | $11.28 | |||
| Sediments | Probable | 107,134 | 24.17 | 0.358 | 0.26 | 0.58 | $8.94 | |||
| ( Peñasco ) | Prov+Prob | $4.55 | 155,647 | 25.94 | 0.415 | 0.28 | 0.61 | $9.67 | 990,161 | 1,145,808 |
| South | Proven | 47,791 | 47.71 | 0.334 | 0.48 | 1.01 | $15.28 | |||
| Sediments | Probable | 59,504 | 34.86 | 0.242 | 0.41 | 0.87 | $12.06 | |||
| (Chile) | Prov+Prob | $5.18 | 107,295 | 40.58 | 0.283 | 0.44 | 0.93 | $13.49 | 275,643 | 382,938 |
| Totals | Proven | 426,864 | 34.03 | 0.572 | 0.36 | 0.78 | $17.48 | |||
| Mill Material | Probable | 380,248 | 27.20 | 0.372 | 0.29 | 0.65 | $12.36 | |||
| Prov+Prob | 807,112 | 30.81 | 0.478 | 0.33 | 0.72 | $15.07 | ||||
| North Oxides | Proven | 34,364 | 21.38 | 0.210 | $3.61 | |||||
| Peñasco | Probable | 42,920 | 15.72 | 0.165 | $2.75 | |||||
| Prov+Prob | $1.18 | 77,284 | 18.24 | 0.185 | $3.13 | 276,136 | 353,420 | |||
| South | ||||||||||
| Oxides | Proven | 7,757 | 18.54 | 0.205 | $2.98 | |||||
| Chile | Probable | 25,389 | 17.60 | 0.170 | $2.63 | |||||
| Prov+Prob | $1.30 | 33,146 | 17.82 | 0.178 | $2.71 | 111,301 | 144,447 | |||
| Combined | Proven | 42,121 | 20.86 | 0.209 | $3.50 | |||||
| Oxides | Probable | 68,309 | 16.42 | 0.167 | $2.70 | |||||
| North + | ||||||||||
| South | Prov+Prob | 110,430 | 18.11 | 0.183 | $3.01 | |||||
| Overburden | 407,948 | 407,948 | ||||||||
| Total Pit | 917,542 | 2,551,755 | 3,469,297 | |||||||
| Waste to combined | ||||||||||
| ore ratio: | 2.78 |
76
Peñasquito Project Technical Report December 2007
Readdressed to Silver Wheaton Corp
Peñasquito Project Technical Report
December 2007
| 1.20 | OTHERRELEVANTDATAANDINFORMATION |
| 1.20.1 | Geotechnical |
a) Geotechnical Drilling and Sampling Program for Foundation Design
Initial geotechnical field investigation was performed by Golder Associates to collect the geotechnical data required to support the design of the heap leach facility, waste rock piles, tailings impoundment and process plant (Golder 2005a). The field investigation was performed from March 2, 2005 to March 23, 2005.
The first-portion of the field investigation included the drilling of thirty-four boreholes within the project site area. The second-portion of the field investigation included excavation of test pits to characterize the superficial foundation and construction materials. This work was performed during late May and early June 2005.
The drilling contractor utilized was Estudios Especializados de Mecánica de Suelos, S.A. de C.V. (EEMSSA) from Monterrey, Nuevo León, Mexico. The contractor used a Foremost Mobil Drill Model B-59 and a CME-55 to perform the drilling.
1.5 m long, 4.50 -inch outside diameter (OD) continuous flight augers were used to advance the borehole through the alluvial soil. Standard Penetration Tests (SPT) were performed in each borehole. The SPT used a standard split-spoon sampler with a 2-inch OD; applicable American Society for Testing and Materials (ASTM) D1586 procedures were followed during the testing. Rock coring techniques were also performed with 1.5 m long, NQ size double barrel equipment to collect samples of the rock materials.
The boreholes were logged by geotechnical field technicians. Borehole logs associated with the field investigation, including sample descriptions, SPT blow counts, sample numbers and visual classifications according to the United Soil Classification System (USCS) were prepared.
Additional geotechnical data collection and analysis will be performed at the site as the project advances to final design, e.g., boreholes drilled at final locations of heavy equipment such as mills and crushers.
| 1.20.2 | Tailings Design |
The tailings impoundment is designed as a zero discharge facility with the capacity to store temporarily excess water from mill operations and expected climatic events including the design storm. Water will be
77
Peñasquito Project Technical Report December 2007
Readdressed to Silver Wheaton Corp
Peñasquito Project Technical Report
December 2007
reclaimed as needed from the tailings facility for use in the mill. The base of the dam and impoundment will rest on native alluvial soils including layers of caliche, silty sand and gravel, sandy silt and sandy clay. Fine tailings will be placed over the alluvial soils and a synthetic liner will be placed from the toe of the starter dam out into the impoundment area to reduce the potential for downward seepage from the tailings pool.
The starter dam will be constructed as an earthfill structure using Peñasco Pit overburden materials. The dam will be raised in a centerline or downstream configuration using cyclone underflow sand tailings. Underdrains will be placed to collect seepage from the sand placement operations and direct it to a seepage collection pond.
Physical properties of the pilot plant tailings have been determined and a subsequent phase of testing has been authorized.
Monitoring wells will be provided downstream from the dam seepage pond.
A tailings storage facility design report was published in June 2006. This recent tailings storage facility design will be finalized based on mine planning. Size, location, and operation of the facility will be updated as required. A future cell will likely be required and has been accounted for financially as an operating cost.
| 1.20.3 | Leach Pad |
The leach pad will be composite-lined in accordance with Mexican regulations. The pregnant solution pond will be designed and constructed with a double-geomembrane liner separated by a leak collection and recovery system. The emergency overflow pond, which would be used intermittently to contain dilute solution during a storm event, will be designed and constructed with a single geomembrane liner placed over a liner bedding layer. Monitoring wells will be provided down gradient from the leach facility. The design concepts proposed herein, are consistent with Mexican regulations and international design standards for heap leach facilities.
| 1.21 | INTERPRETATIONANDCONCLUSIONS |
Technical support for metallurgy, project design, operating cost estimates, capital cost estimates, environmental studies, and permitting are documented in a 2006 Feasibility Study by M3 Engineering and Technology Corporation of Tucson, AZ. The technical basis for mineral resources and mineral reserves meet the requirements of Canadian Institute of Mining, Metallurgy, and Petroleum (CIM) Standards on
78
Peñasquito Project Technical Report December 2007
Readdressed to Silver Wheaton Corp
Peñasquito Project Technical Report
December 2007
Mineral Resources and Reserves (2000) and Canadian National Instrument 43-101.
The conclusion of the Qualified Person is to recommend going forward as quickly as possible with continued construction and operation of the Peñasquito project. Optimization studies should continue as more data becomes available such as metallurgical test results, open pit in-fill and underground deep potential drilling assays, and materials handling tradeoff studies. In addition, it is concluded that this is a large mining project which has considerable economic potential at current spot metal prices and long term projected metal prices. This project will be good for both Goldcorp and the state's economy. The business climate is favorable, the availability of high voltage power is ideal but additional water must be secured.
| 1.22 | RECOMMENDATIONS |
It is recommended to continue development of the Peñasquito project at the expanded production rate of 130,000 TPD.
Given current metal prices, it is recommended that this project be placed into production as quickly as practical.
| 1.23 | REFERENCES | |
CIM (2005). CIM definition standards on mineral resources and mineral reserves, definitions and guidelines. Canadian Institute for Mining, Metallurgy and Petroleum, December 2005. | ||
GG (2007). “Peñasquito Project Technical report, Concepción del Oro District, Zacatecas State, México” dated August 2007 by Goldcorp, Inc. | ||
Dawson (2005). Final report on percent moisture, bulk density and assay results on individual samples from the Chile Colorado and Peñasco deposits within the Peñasquito property in Mexico. Dawson Metallurgical Laboratories Inc. Project No. P-2778C, dated 7 September 2005. | ||
M3 (2005). Peñasquito feasibility study - Volume 1 NI43-101 technical report. Technical Report prepared for Western Silver Corporation by M3 Engineering & Technology Corp., Tucson, dated November 2005. Public document retrieved from SEDAR January 07. | ||
79
Peñasquito Project Technical Report December 2007
Readdressed to Silver Wheaton Corp
Peñasquito Project Technical Report
December 2007
| M3 (2006). Peñasquito feasibility study - 100,000 TPD technical report. Technical Report prepared for Glamis Gold Ltd. by M3 Engineering & Technology Corp., Tucson, dated July 2006. Public document retrieved from SEDAR January 2007. | ||
| M3 (2006a) “Peñasquito Feasibility Study, Volumes 1, II , III, IV, and V” dated August 16, 2006, prepared by M3 Engineering & Technology Corporation. | ||
| M3 (2007) “Minera Peñasquito Project Capital Cost Estimates to Increase Throughput from 100,000 tpd to 130,000 tpd with High Pressure Grinding Rolls” dated December 2007, prepared by M3 Engineering & Technology Corporation. | ||
| MDA (2007). Review of analytical results at Peñasquito, Zacatecas, Mexico. Report prepared for Goldcorp Inc. by Mine Development Associates, Reno, dated 16 April 2007. | ||
| Turner (2006). Geologic and Economic Summary of the Peñasquito Projects, Zacatecas, Mexico, for Western Silver Corporation, dated January 2006, prepared by Tom Turner, consulting exploration geologist. | ||
| SNC (2003). Peñasquito project preliminary mineral resource document. Technical report prepared for Minera Peñasquito S.A. de C.V. by SNC-Lavalin, Toronto, dated March 2003. Public document retrieved from SEDAR January 2007. | ||
| SNC (2004). Mineral resource estimate for the Chile Colorado zone. Report prepared for Minera Peñasquito S.A. de C.V. by SNC-Lavalin, Toronto, dated March 2004. Public document retrieved from SEDAR January 2007. | ||
| SGS (2007) “Determination of the Gold and Silver Recovery by Cyanidation of Three Ore Samples” dated June 11, 2007, prepared by SGS Mexico. | ||
| Dawson (2006) “Addendum to the Final Report (Issued September 30, 2005) on Flotation Test Work Conduction on Individual (Variability Tests) and Master,” dated 20 March 2006, prepared by Dawson Metallurgical Laboratories. | ||
| Golder (2005) “Addendum to Peñasquito Project, Feasibility Pit Slope Design,” dated 24 August 2005, prepared by Golder Associates. | ||
| G&T (2005) “An Assessment of Metallurgical Performance, Concepción del Oro District, Zacatecas State, Mexico, Western Silver, |
80
Peñasquito Project Technical Report December 2007
Readdressed to Silver Wheaton Corp
Peñasquito Project Technical Report
December 2007
KM1652,” dated October 2005, prepared by G&T Metallurgical Services, Ltd.
- G&T (2006) “An Evaluation of Locked Cycle Test Data, Concepción del Oro District, Zacatecas State, Mexico, KM1816,” dated 11 May 2006, prepared by G&T Metallurgical Services Ltd.
- SGS (2006a) “An Investigation into the Grindability Characteristics of Peñasquito Samples, Project 10044-163, Report 1,” dated 21 March 2006, prepared by SGS Lakefield Research Ltd.
- G&T (2004) “Analysis of Carbon Concentrate Peñasquito Project M3 Engineering KM1528,” dated 24 July 2004, prepared by G&T Metallurgical Services Ltd.
- G&T (2006a) “Cyanide Leach of Peñasco Tailing Products, KM1774,” dated 24 January 2006, prepared by G&T Metallurgical Services Ltd.
- Hazen (2006) “Comminution Testing,” dated 5 May 2006, prepared by Hazen Research.
- METCON (2005) “Chile Colorado and Peñasco Areas, Open Cycle Column Leach on Drill Core Samples, Document No. Q653-04- 028.01,” dated December 2005, prepared by METCON Research, Inc.
- M3 (2005a) “Environmental Impact Assessment”, dated November 2005, prepared by M3 Engineering & Technology Corporation.
- Sonora (2004) “Estudio Regional De Evaluación Hidrogeológica del Acuífero Cedros, En El Municipio de Mazapil, En El Estado De Zacatecas,” dated Diciembre del 2004, prepared by Universidad de Sonora, Departamento de Geología.
- Sonora (2004a) “Estudio Regional De Evaluación Hidrogeológica del Acuífero Cedros, En El Municipio de Mazapil, En El Estado De Zacatecas, Informe Que Presenta,” dated Diciembre del 2004, Revisión Febrero de 2006, prepared by Universidad de Sonora, Departamento de Geología.
- Golder (2005a) “Feasibility Study Heap Leach Facility, Waste Rock Pile, Tailings Impoundment, and plant Site Foundation Recommendations,” dated 22 September 2005, prepared by Golder Associates.
- Dawson (2005a) “Final Report on Flotation Test Work Conducted on Individual (Variability Tests) and Master Composite Samples from the Chile Colorado and Peñasco Deposits within the Peñasquito Property
81
Peñasquito Project Technical Report December 2007
Readdressed to Silver Wheaton Corp
Peñasquito Project Technical Report
December 2007
in Mexico,” dated 30 September 2005, prepared by Dawson Metallurgical Laboratories, Inc.
- Pocock (2006) “Flocculant Screening, Gravity Sedimentation, Pulp Rheology, Pressure Filtration, And Vacuum Filtration Studies Conducted For Dawson Metallurgical Laboratories, Inc.,” dated May 2006, prepared by Pocock Industrial, Inc.
- M3 (2004) “Flora and Fauna Study,” dated November 2004, prepared by M3 Engineering & Technology Corporation.
- G&T (2005a) “Gold Occurrences in Peñasco Tailings Products,” dated 2 November 2005, prepared by G&T Metallurgical Services, Ltd.
- Minnovex (2006) “Grinding Circuit Design for the Western Silver - Peñasquito Project, Peñasco Orebody, Based on Geostatistical Distribution of Hardness,” dated March 2006, prepared by Minnovex Technologies, Inc.
- METCON (2005a) “Locked Cycle Column Cyanide Leach Oxide Bulk Samples, Document No. Q653-05-028,” dated December 2005, prepared by METCON Research, Inc.
- Seldon (2004) “Marketing Input into Pre-Feasibility Study for the Peñasquito Project,” dated February 2004, prepared by Neil S. Seldon and Associates.
- G&T (2004a) “Modal Analysis of Test Products, Peñasquito Project, Mexico, M3 Engineering, KM1445,” dated 27 January 2004, prepared by G&T Metallurgical Services, Ltd.
- G&T (2004b) “Modal Analysis of Test Products, Peñasquito Project, Mexico, M3 Engineering, KM1483,” dated 26 February 2004, prepared by G&T Metallurgical Services, Ltd.
- G&T (2006b) “Mineral Liberation Assessments, Peñasquito Project, KM1808,” dated 17 March 2006, prepared by G&T Metallurgical Services Ltd.
- G&T (2005b) “Mineral Liberation Assessments, KM1732,” dated 14 October 2005, prepared by G&T Metallurgical Services, Ltd.
- METCON (2006) “Open Cycle Column Leach Test on Oxide Dump Sample No.,” dated 7 January 2006, prepared by METCON Research, Inc.
82
Peñasquito Project Technical Report December 2007
Readdressed to Silver Wheaton Corp
Peñasquito Project Technical Report
December 2007
- G&T (2006b) “Outstanding Work on Peñasquito Samples, Peñasquito Project, KM 1780,” dated 10 February 2006, prepared by G&T Metallurgical Services Ltd.
- M3 (2005b) “Peñasquito Feasibility Study, Volumes 1, II and III,” dated December 2005, prepared by M3 Engineering & Technology Corporation.
- Hazen (2004) “Peñasquito Grindability Evaluation,” dated 19 January 2004, prepared by Hazen Research, Inc.
- McNulty (2006) “Peñasquito Pb/Zn/Au/Ag Project, Projected Metal Recoveries and Concentrate Grades Prepared for Goldcorp Gold Ltd.,” dated 13 July 2006, prepared by T. P. McNulty and Associates, Inc.
- METCON (2005b) “Peñasquito Project Crush Size Study Open Cycle Column Leach Oxide Dump Samples,” dated July 2005, prepared by METCON Research.
- Golder (2005b) “Peñasquito Project, Feasibility Pit Slope Design,” dated July 2005, prepared by Golder Associates.
- METCON (2004) Cyanide Leach Tests,” dated December 2004, prepared by METCON Research, Inc.
- Golder (2004) “Phase 1 Pit Slope Stability Evaluation Chile Colorado and Peñasco Pits,” dated 3 November 2004, prepared by Golder Associates.
- Mountain States (2004) “Phase II Pilot Plant Testing Program from the Peñasquito Deposit,” dated 20 January 2004, prepared by Mountain States R&D International, Inc.
- Minnovex (2005) “Progressive Grinding Circuit Design for the Goldcorp Gold – Peñasquito Project,” dated June 2005, prepared by Minnovex Technologies, Inc.
- SGS (2005a) “Proposed Grinding System for the Peñasquito Project Using Small-scale Data,” dated 8 July 2005, prepared by SGS Lakefield Research Ltd.
- Dawson (2004) “Report on Metallurgical Testwork Conducted on Composite Samples from the Peñasquito Property in Mexico,” dated 15 March 2004, prepared by Dawson Metallurgical, Inc.
- Dawson (2004a) “Report on Metallurgical Testwork Conducted on a Master Composite (HG + MF) Sample from the Chile Colorado
83
Peñasquito Project Technical Report December 2007
Readdressed to Silver Wheaton Corp
Peñasquito Project Technical Report
December 2007
Deposit Located on the Peñasquito Property,” dated 26 August 2004, prepared by Dawson Metallurgical Laboratories, Inc.
- M3 (2006b) “Report on the Use of Cyanide in Milling and Leaching,” dated February 2006, prepared by M3 Engineering & Technology Corporation.
- Dawson (2004b) “Summaries of Variability Flotation Testing of 50 Samples and Testing of Selected Samples for Gold Recovery from the Peñasquito Project,” dated 3 May 2004, prepared by Dawson Metallurgical, Inc.
- M3 (2005c) “Summary Report, Metallurgical Review,” dated November 2005, prepared by M3 Engineering & Technology Corporation.
- Golder (2006) “Tailings Storage Facility Conceptual Design Report (First Draft), Peñasquito Project, Zacatecas State, Mexico,” dated 20 April 2006, prepared by Golder Associates.
- Golder (2006a) “Tailings Storage Facility Conceptual Design Report, Peñasquito Project, M3 Engineering & Technology Group, Zacatecas State, Mexico,” (Golder has combined the finalized TSF conceptual design report with the geochemical characterization of tailings letter to form a single report.) dated June 2006, prepared by Golder Associates.
- Golder (2006b) “Tailings Storage Facility, Geochemical Characterization of Tailings Materials, Peñasquito Project, Zacatecas State, Mexico,” dated 25 April 2006, prepared by Golder Associates.
- Krebs (2005) “Tailings Testing Information” dated June, July and October 2005 prepared by Krebs Engineers.
84
Peñasquito Project Technical Report December 2007
Readdressed to Silver Wheaton Corp
Peñasquito Project Technical Report
December 2007
| 1.24 | DATE |
The undersigned were involved with various aspects of data and information used in or were responsible for preparation of this Technical report, titled Peñasquito Project Technical Reportdated December 31, 2007, in support of the public disclosure of Goldcorp on December 3, 2007.
Signed
Robert H. Bryson December 31, 2007
Signed and Sealed
F H Brown December 31, 2007
Signed
Reynaldo Rivera December 31, 2007
Signed
Steven Ristorcelli December 31, 2007
The information in this report is current as of December 3, 2007
85
Peñasquito Project Technical Report December 2007
Readdressed to Silver Wheaton Corp
Peñasquito Project Technical Report
December 2007
1.25ADDITIONALREQUIREMENTSFORTECHNICALREPORTSONDEVELOPMENTPROPERTIESANDPRODUCTIONPROPERTIES
| 1.25.1 | Mine Operations |
The Chile Colorado/Azul and Peñasco mine plan will provide sulphide ore to a mill flotation plant that will produce two concentrates for sale: a lead concentrate and a zinc concentrate. Both concentrates will have gold and silver credits. Likewise, the mine plan will provide oxide and mixed ores to a heap leaching facility that will produce a silver and gold doré.
Table 1-39 shows the combined production schedule for both sulphide and oxide ores from both the Peñasco and Chile Colorado/Azul deposits. The calendar year 2007, the start of mining operations, is taken as Year 1 in the mining schedule. Half way through Year 3, sufficient sulphide ore is available such that the mill operation can begin under a 6-month startup and commissioning mode. Commercial mill production begins in Year 4 and continues through Year 20 at an annual mining rate of 46.8 million tonnes of sulphide ore per year. The total material mined per year increases over the first 4 years to peak at 216.0 million (617,000 TPD). The production rate increases correspond to significant increases in the equipment quantities of the mining fleet.
Commercial sulphide production is scheduled for 17 years.
Mining begins in the Peñasco pit, which provides the only sulphide mill feed through Year 11, and continues to provide mill feed through Year 20. Waste stripping begins in Chile Colorado in Year 12 and sulphide ore is mined during Years 12 through 20. The sulphide mill feed is from both pits during Years 12 and 20.
86
Peñasquito Project Technical Report December 2007
Readdressed to Silver Wheaton Corp
Peñasquito Project Technical Report
December 2007
Table 1-39 MineProductionSchedule
| Calendar | Schedule | Mill Ore | Heap Leach Ore (Oxide) | Waste | Total | ||||||||||||||||||||||||||||||||||||||
ktonnes | Ag, g/t | Au, g/t | NSR, $/t | Overbrdn ktonnes | Rock ktonnes | Total ktonnes | |||||||||||||||||||||||||||||||||||||
| Year | Year | ktonnes | Ag, g/t | Au, g/t | Pb, % | Zn, % | NSR, $/t | ktonnes | |||||||||||||||||||||||||||||||||||
| 2007 | 1 | 0 | 1,865 | 23.55 | 0.172 | 3.49 | 9,031 | 1,104 | 10,135 | 12,000 | |||||||||||||||||||||||||||||||||
| 2008 | 2 | 840 | 26.21 | 0.163 | 0.36 | 0.86 | $ | 13.12 | 28,768 | 21.20 | 0.185 | $ | 3.40 | 43,861 | 16,531 | 60,392 | 90,000 | ||||||||||||||||||||||||||
| 2009 | 3 | 14,546 | 24.32 | 0.217 | 0.32 | 0.54 | $ | 11.56 | 25,419 | 17.30 | 0.201 | $ | 3.19 | 42,490 | 65,545 | 108,035 | 148,000 | ||||||||||||||||||||||||||
| 2010 | 4 | 43,173 | 23.15 | 0.262 | 0.31 | 0.51 | $ | 11.45 | 7,809 | 16.23 | 0.190 | $ | 3.00 | 3,437 | 161,581 | 165,018 | 216,000 | ||||||||||||||||||||||||||
| 2011 | 5 | 46,800 | 23.18 | 0.338 | 0.30 | 0.54 | $ | 12.19 | 117 | 18.42 | 0.425 | $ | 5.17 | 59,810 | 109,273 | 169,083 | 216,000 | ||||||||||||||||||||||||||
| 2012 | 6 | 46,800 | 26.31 | 0.449 | 0.29 | 0.65 | $ | 14.16 | 110 | 12.67 | 0.065 | $ | 1.64 | 24,118 | 144,972 | 169,090 | 216,000 | ||||||||||||||||||||||||||
| 2013 | 7 | 46,800 | 30.60 | 0.577 | 0.29 | 0.60 | $ | 16.01 | 1,706 | 11.62 | 0.085 | $ | 1.72 | 10,976 | 156,518 | 167,494 | 216,000 | ||||||||||||||||||||||||||
| 2014 | 8 | 46,800 | 28.79 | 0.698 | 0.29 | 0.65 | $ | 16.64 | 256 | 16.61 | 0.050 | $ | 1.86 | 11,913 | 157,031 | 168,944 | 216,000 | ||||||||||||||||||||||||||
| 2015 | 9 | 46,800 | 26.98 | 0.821 | 0.29 | 0.70 | $ | 18.41 | 1,016 | 19.83 | 0.147 | $ | 2.95 | 53,582 | 114,602 | 168,184 | 216,000 | ||||||||||||||||||||||||||
| 2016 | 10 | 46,800 | 29.37 | 0.751 | 0.33 | 0.74 | $ | 17.61 | 5,663 | 18.02 | 0.185 | $ | 3.12 | 7,301 | 156,236 | 163,537 | 216,000 | ||||||||||||||||||||||||||
| 2017 | 11 | 46,800 | 35.24 | 0.789 | 0.39 | 0.81 | $ | 20.69 | 1,099 | 13.11 | 0.205 | $ | 2.61 | 26,509 | 141,592 | 168,101 | 216,000 | ||||||||||||||||||||||||||
| 2018 | 12 | 46,800 | 35.63 | 0.644 | 0.39 | 0.94 | $ | 20.00 | 17,168 | 19.85 | 0.192 | $ | 2.97 | 32,244 | 119,788 | 152,032 | 216,000 | ||||||||||||||||||||||||||
| 2019 | 13 | 46,800 | 40.44 | 0.563 | 0.37 | 0.85 | $ | 17.57 | 5,827 | 15.51 | 0.195 | $ | 2.69 | 22,585 | 140,788 | 163,373 | 216,000 | ||||||||||||||||||||||||||
| 2020 | 14 | 46,800 | 34.34 | 0.456 | 0.42 | 0.77 | $ | 13.59 | 2,077 | 10.54 | 0.176 | $ | 2.21 | 44,397 | 122,726 | 167,123 | 216,000 | ||||||||||||||||||||||||||
| 2021 | 15 | 46,800 | 33.29 | 0.529 | 0.38 | 0.84 | $ | 15.06 | 9,614 | 12.13 | 0.128 | $ | 1.98 | 16,579 | 143,007 | 159,586 | 216,000 | ||||||||||||||||||||||||||
| 2022 | 16 | 46,800 | 39.58 | 0.496 | 0.35 | 0.91 | $ | 17.21 | 1,902 | 15.50 | 0.126 | $ | 2.13 | - | 80,108 | 80,108 | 128,810 | ||||||||||||||||||||||||||
| 2023 | 17 | 46,800 | 31.89 | 0.271 | 0.27 | 0.66 | $ | 11.99 | 1,045 | 23.65 | 0.187 | $ | 3.19 | - | 86,289 | 86,289 | 134,134 | ||||||||||||||||||||||||||
| 2024 | 18 | 46,800 | 26.95 | 0.166 | 0.22 | 0.54 | $ | 9.62 | - | - | 105,129 | 105,129 | 151,929 | ||||||||||||||||||||||||||||||
| 2025 | 19 | 46,800 | 29.74 | 0.185 | 0.26 | 0.65 | $ | 10.95 | - | - | 88,624 | 88,624 | 135,424 | ||||||||||||||||||||||||||||||
| 2026 | 20 | 46,620 | 29.81 | 0.197 | 0.48 | 0.89 | $ | 13.81 | - | - | 38,580 | 38,580 | 85,200 | ||||||||||||||||||||||||||||||
| 2027 | 21 | ||||||||||||||||||||||||||||||||||||||||||
| Total | 807,179 | 30.81 | 0.478 | 0.33 | 0.72 | $ | 15.07 | 111,461 | 18.02 | 0.182 | $ | 3.00 | 408,833 | 2,150,024 | 2,558,857 | 3,477,497 | |||||||||||||||||||||||||||
87
Peñasquito ProjectTechnical ReportDecember 2007
Readdressed to Silver Wheaton Corp
Peñasquito Project Technical Report
December 2007
Table 1-40 shows the parameters used to determine the mine equipment fleet requirements.
Table 1-40 Mine Plan Basis
| Available Days per Year | d | 365 |
| Available Shifts per Day | shifts / d | 2 |
| Available Shifts per Year | shifts / yr | 730 |
| Scheduled Operating Days / Year | d | 350 |
| Scheduled Operating Shifts / Year | shifts | 700 |
| Shift Duration | hrs | 12 |
| Available Time per Shift | min | 720 |
| Lunch & Breaks Duration | min | 60 |
| Equipment Inspection Duration | min | 10 |
| Shift Change Duration | min | 10 |
| Fuel, Lube and Service Duration | min | 10 |
| Operating Delays per Operating Hour | min / op hr | 10 |
| Operating Delays per Shift | min / shift | 105 |
| Effective Minutes per Shift | min | 525 |
| Sulphide Ore and Waste Rock | ||
| Material – Average In Place Density | kg / bcm | 2,570 |
| Swell % | % | 40.0% |
| Swell Factor | * | 0.71 |
| Material Bulk Density, Dry | kg / lcm | 1,836 |
| Moisture Content | % | 5% |
| Oxide & Mixed Ore and Waste Rock | ||
| Material – Average In Place Density | kg / bcm | 2,400 |
| Swell % | % | 40.0% |
| Swell Factor | * | 0.71 |
| Material Bulk Density, Dry | kg / lcm | 1,714 |
| Moisture Content | % | 5% |
| Overburden | ||
| Material - In Place Density | kg / bcm | 2,200 |
| Swell % | % | 40.0% |
| Swell Factor | * | 0.71 |
| Material Bulk Density, Dry | kg / lcm | 1,570 |
| Moisture Content | % | 5% |
The mine plan incorporates a conventional shovel (55 cubic meters) and truck (290 tonne) open pit mining operation with the basic parameters shown on Table 1-40.
| a) | Mine Equipment Selection |
The mining equipment sized to accommodate the mine plan at a production rate peaking at 617,000 TPD of total material consists of large sized primary
88
Peñasquito Project Technical Report December 2007
Readdressed to Silver Wheaton Corp
Peñasquito Project Technical Report
December 2007
mining equipment and a selection of matched pit/dump support and maintenance equipment.
For the purpose of capacity and cost calculations, it has been assumed that the major mining equipment will be the equivalent of P&H 4100 shovels equipped with a 55 cubic meter bucket, Le Tourneau 1850 Loaders equipped with a 25 cubic meter bucket, P&H 250XP Diesel blast hole drills and Komatsu 930E haul trucks. Support equipment including track dozers, rubber tire dozers, excavator, and graders are assumed to be equivalent to the Caterpillar models.
Drilling for all materials except the heap leach ore will be carried out with crawler mounted, diesel powered, blast hole drills on 15 m benches drilled with 1.5 m of sub-grade. It is assumed that 20% of the overburden will be drilled and blasted using a wider hole pattern. The heap leach ore drill pattern will be adjusted as needed to assure rock fragmentation of about 127 to 152 mm for leaching.
It is assumed that blasting will be carried out primarily with conventional ANFO explosive, supplied by an explosives contractor. The blast holes will be loaded by mine personnel and initiated by the blasting supervisor. A powder factor of 0.20 kg / tonne has been used for explosives consumption estimation in rock, 0.12 kg / tonne for overburden and 0.40 kg / tonne for the heap leach ore.
| b) | Mine Equipment Requirements |
Major mining equipment requirements have been determined on the basis of a two shift per day basis for seven days per week to a total of 350 days per year (assuming 10 holidays and 5 shut down days for weather or other reasons). The mine will operate a total of 700 shifts per year with four mining crews working on a 4 on and 4 off rotation.
A stockpile will allow the mill to operate a scheduled 360 days per year.
Table 1-41 lists the mining and support equipment that has been selected, sized and evaluated for this plan. The list also includes estimated support equipment requirements.
Haul truck productivities over the life-of-mine were calculated on the basis of the fixed and variable components of the hauling cycle and travel distances to the primary crusher truck dump pocket at the 1,968 m elevation, to the run of mine heap leach and to the waste dumps. For this study, the waste material has been segregated into separate dumps for overburden, oxide plus mixed material and sulphide material.
89
Peñasquito Project Technical Report December 2007
Readdressed to Silver Wheaton Corp
Peñasquito Project Technical Report
December 2007
Table 1-41 Mining Equipment Selection*
Equipment | Maximum No. Reqd | General Specification |
| Rotary Blast Hole Drill | 12 | P & H 250XP, 311 mm Diesel |
| Electric Shovel | 4 | P&H 4100XBP, 41 cu m, Electric |
| Wheel Loader | 3 | L-1850 LeTourneau Loader |
| Haul Truck | 85 | Komatsu 930E, Series III 320, End Dump |
Track Dozer | 8 | 6 ea – D10 T, 10SU, 18.5 cu m, Ripper, 2 ea – D9T for Stockpile & Tailings |
| Rubber Tire Dozer | 3 | Cat 854G, Universal Blade |
| Grader | 6 | Cat 16H, 4.9 m |
| Water Truck | 5 | Cat 777, 70,000 liter |
| Auxiliary Wheel Loader | 1 | Cat 988H |
| Auxiliary Rock Drill | 1 | IR ECM 590/YH Rock Drill, |
| Backhoe / Excavator | 3 | Cat 325, 2.2 cu m, with Hammer |
| Fuel / Lube Truck | 2 | 18,500 liter |
| Blast Hole Stemmer | 3 | Cat 416C |
| Flatbed Truck | 2 | 2 tonne |
| ANFO/Slurry Truck | 3 | 18 tonne |
| Cable Reeler | 2 | Cat 966G |
| Crane Truck | 1 | 25 tonne |
| Forklift | 2 | Hyster H100XM |
| Forklift | 2 | Sellick SD-100 |
| Mobile Crane | 1 | 120 tonne Grove |
| Service / Welder / Steam Truck | 6 | 25,000 kg GVW |
| Grader | 1 | Cat 160H |
| Backhoe | 1 | Cat 420 |
| Water Truck | 1 | 4000 gallon |
| Trailer | 1 | 2660 trailer |
| Dump Truck | 1 | 10 yard |
| Loader | 1 | Skidsteer |
| Integrated Tool carrier | 2 | Cat IT-62G, Tire Service / Maintenance |
| Crew Bus | 6 | 20 man |
| Pick-Up Truck | 40 | 4 x 4 |
| Light Plant | 14 | Diesel Generator |
| Mine Communications System | 1 | |
| Mine Radios | 173 | |
| Pumps | 5 | Submersible, Pit Dewatering |
| Mine Dispatch System | 2 | 19 high precision GPS units |
| Generator | 1 | Mounted on trailer |
| Engineering Computers & Software | 1 | Drafting, Plotting, Engineering |
| Surveying Equipment | 1 | GPS Surveying System |
| Mine Maintenance Computers & Software | 1 | Inventory Control, Planning |
* Note the equipment specified is for costing purposes only and may not be the exact equipment actually purchased
| 1.25.2 | Process Operations |
Crushing and Ore Reclaim
Run-of-mine (ROM) ore will be delivered to the crusher dump pocket from the mine by 290 tonne rear dump haul trucks. The pocket will be oriented at 45° and accept delivery from two positions. The Peñasquito crushing circuit is designed to process up to 130,000 TPD of run-of-mine ore to 80% passing 150 mm. The crushing facility will initially consist of a single FFE 1524 x 2870 mm (60 x 113 in) gyratory crusher capable of operating at 92% utilization on a 24-hour-per-day, 365-days-per-year basis. A parallel
90
Peñasquito Project Technical Report December 2007
Readdressed to Silver Wheaton Corp Peñasquito Project Technical Report December 2007
crushing circuit will be designed and adapted to the current system as the pit develops and higher throughput scenarios are achieved.
Product from the crusher will discharge into a 400 tonne surge pocket directly below the crusher and conveyed to a coarse ore stockpile that has a 91,700 metric tonne live capacity when both lines are operational (54,500 for line one) and 238,800 metric tonne total capacity. A “wet spray” system will be installed in the crusher discharge area to suppress dust from the ore feed stream.
Crushed ore will be reclaimed from the coarse ore stockpile via ten 48” x 17’ Metso variable-speed apron feeders (Hagglunds hydraulic drive units); five for each grinding line, located in concrete reclaim tunnels. During normal operation, four of the five feeders for each mill will be in operation to reclaim crushed ore from the stockpile and discharge the ore onto the SAG mill feed conveyors.
A “wet spray” system will be installed in the reclaim tunnel to suppress dust in ore feed streams. The reclaim tunnel will also be equipped with a sump pump for clean-up purposes and will pump material to a water collection sump. The tunnel floor will be sloped to facilitate cleanup.
Grinding and Classification
The two grinding circuits will operate in parallel at forecast 92% availability on a 24-hour-per-day, 365-days-per-year basis. Each grinding circuit will be designed to reduce the crushed ore from 80% passing 150 mm to 80% passing 125 microns. The FFE SAG mills operate in closed circuit with pebble crushers. A trommel screen arrangement has been selected as the most reliable and cost-effective means of classifying the SAG mill discharge. Trommel oversize is conveyed to the transfer point containing a magnet for steel removal and a dewatering screen prior to the pebble crusher circuit. Two Sandvik H8800 crushers are installed for Line One, with provision to install up to four pebble crushers in total when Line Two is brought into production. The crushers will be fed with variable speed belt feeders. The 600 kW pebble crushers will be set to produce a nominal minus 1/2-inch product. The crusher product will be conveyed back to the SAG mill feed conveyors or to Polysius HPGR. The high pressure grinding roll product will be slurried and pumped directly to the grinding sump. Crusher bypass arrangements will be included.
Each 11.6 m dia. x 6.1 m EGL SAG mill will be powered by a Siemens 18,300 kW gearless mill drive system capable of operating with up to a 15% ball charge. Primary ground ore, as a 75% w/w slurry, will discharge via grates with pebble ports onto a trommel screen mounted on the mill discharge trunnion.
91
Peñasquito Project Technical Report December 2007
Readdressed to Silver Wheaton Corp Peñasquito Project Technical Report December 2007
A weigh-scale will be provided on the SAG mill feed conveyor for controlling, monitoring, and recording the concentrator fresh feed rate. A weigh-scale on the SAG mill screen oversize conveyor will be provided to monitor the SAG mill’s circulating load. A mill Expert Control system will be provided to optimize/maximize the feed rate to the SAG mills in response to such variables as mill power draw, bearing pressures, sound/vibration levels, feed size distribution, rates of change, etc.
The SAG pebble crusher product will be directed to High Pressure Grinding Rolls (HPGR). The HPGR will be operated in closed circuit as ball mill feed. Redirection of this product stream from the SAG milling circuit to the ball milling circuit creates a throughput increase of 15,000 TPD per grinding circuit. The HPGR have lower equipment availability than grinding mills but, when configured correctly, the rolls can be bypassed during maintenance and the crushed pebble product returned to the SAG mill feed in a normal SABC operating mode.
Trommel screen undersize (minus 1/2-inch material) discharges to a common sump. Secondary grinding will be performed in four FFE ball mills (two per line) 7.3 m dia. x 11.3 m EGL, each driven by twin 6000 kW low-speed synchronous motors. A GE control system will be provided to maintain a balanced power draw between the two motors on each mill. The mills are operated in closed circuit. Ball mill discharge will be combined with SAG mill trommel screen undersize and the combined slurry is pumped using Weir variable speed horizontal centrifugal slurry pumps to the primary cyclone clusters. Krebs GMax33 cyclone underflow reports back to the ball mills. Cyclone overflow (final grinding circuit product) will flow by gravity to the lead flotation circuit. Cyclone overflow will be sampled for assay, particle size and pulp density ahead of lead flotation. Two uninstalled spare cyclone feed pumps have been included in the capital cost: two required due to difference in discharg e configuration.
Lead Flotation
Dorr Oliver Eimco flotation machines have been selected for this project. All rougher and cleaner cells are mechanically agitated (i.e. no flotation columns are used). The “Line One” flotation plant is sized to accommodate the maximum grinding circuit capacity. “Line Two” is a duplicate of “Line One”: i.e. two independent grinding and flotation circuits installed in parallel. Equipment common to both lines includes the primary and pebble crushing/conveying circuits, the concentrate filtration plant and tailings deposition lines.
Lead Rougher Flotation
92
Peñasquito Project Technical Report December 2007
Readdressed to Silver Wheaton Corp
Peñasquito Project Technical Report
December 2007
“Line One” lead rougher flotation will consist of three rows of Wemco 250m3 rougher flotation machines in parallel: each row consisting of five self-aspirating cells. The size selected is the largest D.O. Eimco manufacture and was witnessed in operation at the Los Pelambres mine in Chile.
Lead rougher concentrate will be pumped to the lead regrind mill circuit or bypassed directly to the lead cleaner conditioning tank. Tailings from the lead rougher cells flows by gravity to the zinc rougher conditioner tanks. This material is conditioned with reagents to activate the sphalerite and associated precious metals. When the carbon pre-float is not required, all cells will be used as lead roughers.
Lead Cleaner Flotation
The rougher lead concentrate will be reground in Metso 650HP Vertimills operating in closed circuit with cyclones. Product at a P80 of 30 microns is cleaned in a three-stage counter-current circuit. D.O. Eimco forced-air type cells are used for the lead cleaners: first stage Pb cleaners are 42.5m3 and second/third stage cells are 2.5m3.
Final lead and zinc concentrates are thickened, pressure filtered and trucked to inland smelters or to ports for overseas shipment. One thickener for each concentrate will initially be installed.
Reagents will be added into the cleaner flotation cells on as required basis.
The final lead concentrate will be pumped to the lead concentrate thickener.
Zinc Flotation
Zinc Rougher Flotation
Tailings from the lead circuit will flow by gravity to zinc rougher conditioner tanks: one installed for each bank of zinc rougher flotation cells. The conditioner tanks provide retention to facilitate pH adjustment with lime and activation of the sphalerite by copper sulphate addition. Sodium isopropyl xanthate (SIPX) is added to collect the zinc associated with activated sphalerite. Frother will be added as required.
“Line One” conditioners overflow to the zinc rougher flotation circuit, which will consist of three banks of six Wemco 250 m3 tank-type rougher flotation cells. The cells are self aerating. The air flow will be controlled by valves and air flow meters located at each cell. SIPX, copper sulphate and frother can be added to individual cells as required.
93
Peñasquito Project Technical Report December 2007
Readdressed to Silver Wheaton Corp
Peñasquito Project Technical Report
December 2007
Tailings from all rows of zinc rougher cells will be combined in a tailings box and will then flow by gravity to a tailings pond.
Zinc Regrind and Cleaner Flotation
The rougher zinc concentrate will be reground in Metso 650HP Vertimills operating in closed circuit with cyclones. Product at a P80 of 30 microns is cleaned in a three-stage counter-current circuit. D.O. Eimco forced-air type cells are used for the lead cleaners: first stage Zn cleaners are 42.5m3 and second/third stage cells are 8.5m3.
Final lead and zinc concentrates are thickened, pressure filtered and trucked to inland smelters or to ports for overseas shipment. One thickener for each concentrate will initially be installed.
Reagents will be added into the cleaner flotation cells on as required basis.
The final zinc concentrate will be pumped to the zinc concentrate thickener.
Lead Concentrate Dewatering and Load Out Facility
Concentrate from the lead cleaner flotation circuit will be pumped to the concentrate dewatering and load-out facility.
The lead concentrate dewatering circuit will consist of an Outotec 10m diameter high rate thickener and an agitated concentrate stock tank, which will provide approximately 12 hours of total storage capacity. Overflow from the concentrate thickener will flow to a standpipe and be pumped to the distribution points in the grinding and flotation areas. Concentrate from the stock tank will be pumped to an automatic Pneumapress pressure filter where the moisture content of the concentrate will be reduced to a nominal 8% in the filter cake for shipping. Filtrate from the concentrate filter will be combined with the thickener feed and will gravity flow to the concentrate thickener feed box. The lead filter frame will be designed to accommodate sufficient chambers for the ultimate production rate, but only half of the total number of chambers will be installed initially. Another “swing” filter will also be provided to handle either lead or zinc concentrate as requi red. In addition to the three identical installed filters a fourth position will be provided in the building for expansion requirements if deemed necessary.
Concentrate filter cake from the pressure filter will discharge directly onto the load-out floor of the concentrate storage building. The concentrate will be reclaimed by front-end loader onto highway haulage trucks.
Zinc Concentrate Dewatering and Load Out Facility
94
Peñasquito Project Technical Report December 2007
Readdressed to Silver Wheaton Corp
Peñasquito Project Technical Report
December 2007
The zinc concentrate dewatering circuit will consist of an Outotec 14m diameter high rate thickener and an agitated concentrate stock tank, which will provide approximately 12 hours of total storage capacity. Overflow from the concentrate thickener will flow to a standpipe and be pumped to the distribution points in the grinding and flotation areas. Concentrate from the stock tank will be pumped to an automatic Pneumapress pressure filter where the moisture content of the concentrate will be reduced to a nominal 8% in the filter cake for shipping. Filtrate from the concentrate filter will be combined with the thickener feed and will gravity flow to the concentrate thickener feed box. The zinc filter frame will be designed to accommodate sufficient chambers for the ultimate production rate, but only half of the total number of chambers will be installed initially. Another “swing” filter will also be provided to handle either lead or zinc concentrate as requi red. In addition to the three identical installed filters a fourth position will be provided in the building for expansion requirements if deemed necessary.
Concentrate filter cake from the pressure filters will discharge directly onto the floor of the load-out facility. The latter will be reclaimed by front-end loader onto highway haulage trucks.
| 1.25.3 | Recoveries |
| LEAD CONCENTRATES | Con Grades | Recoveries | |||||
| Rock Type | Pb | Au | Ag | Pb | Zn | ||
| Breccia | 51% | 62% | 65% | 72% | 0 | ||
| Intrusive | 51 | 64 | 63 | 72 | 0 | ||
| Sedimentary | 51 | 20 | 58 | 63 | 0 | ||
| ZINC CONCENTRATES | Con Grades | Recoveries | |||||
| Rock Type | Zn | Au | Ag | Pb | Zn | ||
| Breccia | 50% | 13% | 15% | 0 | 75% | ||
| Intrusive | 50 | 10 | 14 | 0 | 60 | ||
| Sedimentary | 50 | 5 | 5 | 0 | 60 | ||
| HEAP LEACH | ||||
| Deposit | Au | Ag | ||
| Penasco | 50% | 28% | ||
| Chile Colorado/Azul | 50% | 22% |
| 1.25.4 | Markets |
At the time of this report no agreements have been made with any smelters and no discussions have been entered into with a view to concluding any agreements. Not withstanding this, several smelter operators have expressed interest in entering into discussions. Samples of the concentrates have been provided to those requesting it.
95
Peñasquito Project Technical Report December 2007
Readdressed to Silver Wheaton Corp Peñasquito
Project Technical Report
December 2007
Market research has been performed by a specialist consultant, Neil S. Seldon and Associates Limited. The following is a summary of the findings:
The markets for the lead and zinc concentrate from Peñasquito fall into two categories, smelters within Mexico and smelters overseas. The overseas smelters are further divided into Asian, North American and European markets.
For the purpose of the study, it is assumed that all lead concentrate will be smelted in Mexico but it is also recognized that some will be smelted in overseas smelters. The smelter terms recommended in the consultant’s report for the lead concentrate represent “typical” terms for the market. They represent a forecast of terms based on historical averages with due consideration for projected supply and demand over the foreseeable future.
It is possible that there may be a market for zinc concentrate in Mexico. The report assumes that zinc will be split between local and overseas either Europe or Asia. Again the smelter terms used in the calculations in this report represent an average of the typical terms deduced from the market research.
Transportation cost and port charges in-country have been determined based on a survey of transportation companies and other users. They represent current costs. Ocean freight charges recommended by the consultant are projected future costs based on historical averages and projected supply and demand.
| 1.25.5 | Contracts |
Mining and mill operating costs as discussed later are derived from engineering estimates based on the current level of information available. They are not based on contract prices obtained from third parties. The rates used are viewed as being within the typical range for operations of this size.
As noted in the previous section, no smelting, refining or transportation contracts have yet been entered into, nor have any such discussions been initiated.
| 1.25.6 | Environmental Considerations |
As with any mining venture, a large number of permits will be required in order to bring the Peñasquito project into production. For the most part, federal laws regulate mining in Mexico, but there are some project components subject to state or local approval. The Secretary of Environment and Natural Resources (SEMARNAT) is the chief agency
96
Peñasquito Project Technical Report December 2007
Readdressed to Silver Wheaton Corp
Peñasquito Project Technical Report
December 2007
regulating environmental matters in Mexico. The National Water Commission (CNA), a division of SEMARNAT, has authority over all matters concerning water rights and activities that affect ground and surface water supply and quality, including diversion of floodwaters and construction in the floodplain.
Three SEMARNAT permits are mandatory to begin mine construction: the Environmental Impact Assessment, the Risk Study, and the Land Use Change. A land use license from the municipality of Mazapil and an archaeological release letter from National Institute of Anthropology and History (INAH) are also required before starting construction. An explosives permit from the National Secretary of Defense will be necessary for construction if any blasting is planned as part of the construction work.
Environmental Impact Assessment (Manifiesto de Impacto Ambiental)
Preparation of the MIA for the project is complete and was authorized on 18 December 2006. The EIA document was prepared based on 50,000 TPD of production.The EIA is sometimes referred to with the Spanish acronym—MIA. An EIA is required for all new projects. It is an environmental impact evaluation to establish the project site baseline conditions for plant and animal life, soil, water and air quality. The study also identifies potential impacts of mine operations on the environment and identifies recommended mitigation measures.
An MIA extension or modification to increase permitted capacity to 150,000 TPD is progress. Data collection and field work for this modification is complete. The application will be made with SEMARNAT before the end of 2007 with expectations of approval in the first quarter 2008.
Other required permits, such as the Land Use Change discussed immediately below, require prior approval of the MIA. Also, having an approved MIA facilitates still other approvals.
Risk Study (AR)
The AR covers facilities such as mining that handle reportable quantities of hazardous materials, as well as metallurgical activities involving leaching. In the AR, all environmental risks are identified and evaluated in order to establish the methods that will be used to prevent, respond to, and control potential environmental emergencies. The AR was submitted to SEMARNAT Mexico D.F. and the resolution was authorized on 18 December 2006.
97
Peñasquito Project Technical Report December 2007
Readdressed to Silver Wheaton Corp
Peñasquito Project Technical Report
December 2007
Land Use Change Application (CUS)
All land in Mexico has a designated use. Project site areas are variously designated as forestland, cattle grazing, and agriculture. The CUS is the formal instrument for changing the designation to allow mining. The CUS program stems from the Forestry Law and its regulations. It requires an evaluation of the existing conditions of the land including a plant and wildlife study, an evaluation of the current and proposed use of the land and impacts on natural resources, and an evaluation of the reclamation and revegetation plans. The CUS will also include a rescue and conservation plan of wildlife, plant life and soil. The establishment of agreements with all affected surface land owners is also required. The CUS was submitted through SEMARNAT State offices at Zacatecas and was sent to SEMARNAT Mexico City offices for technical opinion before authorization. Authorization is contingent upon receipt of the MIA. The CUS was based on a production of 50,000 TPD. The resoluti on was authorized on 18 January 2007.
Water Permitting
The National Water Law and its regulations control all water use in Mexico. Comisión Nacional del Agua (CNA) is the responsible agency. Applications are submitted to this agency indicating the annual water needs for the mine operation and the source of water to be used. The CNA grants water concessions according to the availability in the source area.
The national water use permit is being made for 40 million m3 a year. The required hydro-geological studies are either in progress or have been completed. A first phase of the studies has concluded for the granular aquifer and a second phase for the rocky aquifer ended in December 2006. A third phase is in progress for Cedros Basin and its estimated completion date is in December 2007.
Based on the completed studies, a 4.6 million m3 concession was obtained on 26 August 2006. Using existing studies, another application for an additional water concession of 9.1 million m3 per year has been applied for.
Land Use License
This is related to a municipal endorsement to develop the mining project within the municipal land jurisdiction. This procedure is important to avoid any future conflict with the use of the land and derives from the Human Settlement Law and the Municipal Urban Development Plans for each municipality. This license was obtained on 5 January 2007.
98
Peñasquito Project Technical Report December 2007
Readdressed to Silver Wheaton Corp
Peñasquito Project Technical Report
December 2007
Explosive Handling
The Explosive and Firearm Law is the legal instrument regulating the use, storage and manufacture of explosives. SEDENA is the agency that authorizes, supervises and inspects any explosive handling activity. To obtain the explosive permit, it is necessary to have the endorsement from the Zacatecas State government and the Mazapil municipality. An application must be submitted at SEDENA Mexico City offices, indicating the type and amount (annual and monthly consumptions) of explosives. Also the magazine construction drawings must be included in this application. SEDENA will not approve a license without an inspection by a SEDNA inspector of the actual storage magazine. MIA authorization is required for this permit. The explosive permit for the project was issued in November 2007 and is subject to annual renewal.
Cultural Resources
The National Institute of Anthropology and History (INAH) oversees archaeological evaluations and provides clearance for the project once studies and any required mitigation are complete. INAH completed field studies during the spring of 2004. INAH found no evidence of historically significant sites within the project area and have issued a letter of clearance. The power line path was partially authorized on 13 February 2007 and was fully authorized on March 9.
Reclamation Reclamation Plan
Main objectives of the mine reclamation are:
- Prepare the land for long term productive use and/or establishment of wildlife habitat.
- Leave stable and safe mine areas.
- Prevent erosion through vegetation coverage and drainage works.
- Prevent any present and future environment pollution.
Main activities to achieve the above reclamation objectives are briefly described below. The execution of some of the works may start during the mine construction and operation stages.
Topsoil Recovery
99
Peñasquito Project Technical Report December 2007
Readdressed to Silver Wheaton Corp
Peñasquito Project Technical Report
December 2007
Where feasible, native topsoil will be sequestered at a convenient on-site location so that it can be used to establish a soil system on newly reclaimed sites during mine reclamation. The plan recognizes that a good deal of the layer of native topsoil will, by necessity, be incorporated into the subliner for the leach heaps.
Native Plant Salvage
Prior to construction, native plants, especially any sensitive species, will be recovered from areas of disturbance so they can be transplanted away from the disturbance, transplanted for storage and eventual return to the mine site, or be donated to other beneficial uses. Rescue applies only to species protected by law.
Recontouring of Waste Dumps, Leach Pads and Tailings
Waste dumps and leach heaps are specifically designed so that they can be recontoured to minimum outer slope of 2:5:1, horizontal to vertical. This slope can accommodate placement of cover and revegetation. It also allows for inclusion of slope breaks to minimize erosion damage.
Tailings will be recontoured to a minimum outer slope of 4 to 1.
Top slopes will be contoured to shed surface runoff to avoid ponding and possible oversaturation of the cover which could result in failure to store and release properly.
Cover Placement
Once the mine dump and leach pads are recontoured to 2.5 slope, a 40 cm native soil cover will be placed over the entire surface. This cover will form a store and release cover where precipitation will be absorbed during rainfall events, and stored within the soil layer until removed by evapotranspiration. This is the current state of the art system for reclamation of mine dumps and stockpiles.
Revegetation
A selection of native plant seed will be prepared under guidance of local agronomists. The seed mix will be broadcast over the covered surface along with appropriate mulching agents. Any native plants held in storage will be transplanted to the revegetation areas.
100
Peñasquito Project Technical Report December 2007
Readdressed to Silver Wheaton Corp
Peñasquito Project Technical Report
December 2007
Erosion Control Measures
Slope angles and runoff distances will be designed to minimize erosion. The store-and-release system relies upon infiltration of precipitation to maintain the vegetation. It is therefore important to minimize runoff and in so doing, minimize erosion.
Dismantling of Facilities and Equipment
Office and plant facilities will be sold for salvage at the close of operations. Remaining buildings will be demolished or donated to the communitiy for beneficial use.
Environmental Monitoring Plan
During construction and operations, project environmental personnel will help monitor collection of plants and topsoil as needed. At closure, project environmental personnel will monitor placement of cover and revegetation procedures to assure they are performed according to specifications. The PLS have double geomembrane liners with leak detection systems. These installations will be monitored continuously from the SXEW control room. The only other major monitoring will be ground water monitoring. Operations environmental personnel will establish monitoring well locations at strategic locations upgradient and downgradient of the facilities to be monitored (process water ponds, leach heaps, etc.). Wells will be sampled periodically and samples will be analyzed for selected constituents that would, if elevated, signal the presence of subsurface flow.
| 1.25.7 | Taxes |
Taxes have been calculated on a project basis in accordance with published Mexican taxation legislation. Additional details of how taxes have been applied can be found in Volume II of the July 2006 Feasibility Study (M3 2006a). Specialist taxation advice has not been solicited at this stage and no tax planning strategies have been assumed.
IVA (Impuesto Valor Agregado) is a value-added sales tax at the Federal level. This tax has not been included in the estimates.
PITEX (Programa de Importacion Temporal para Producir Articulos de Exportacion) is a federal program allowing a waiver of import duties on imported items that will exported at the end of the project. The cost of administrating this program has been included in the estimate.
101
Peñasquito Project Technical Report December 2007
Readdressed to Silver Wheaton Corp
Peñasquito Project Technical Report
December 2007
Income tax has been applied at a rate of 28% of taxable income after 2007 and an allowance for employee profit sharing has been included.
Total federal income tax paid over the life of the mine is $2.0 billion.
| 1.25.8 | Capital and Operating Costs |
Based on the December 2007 M3 Capital Cost Estimate (M3 2007), the initial project capital cost for 130ktpd mill production is estimated at $1,494 million and the sustaining capital is estimated at $562 million.
Table 1-42 CAPTIAL COST ESTIMATE FOR 130,000 TPD
| Capital Item | |||
| Camp and Roads | $ | 39 million | |
| Mine Equipment | $ | 274 million | |
| Pre-Stripping | $ | 111 million | |
| Power Setup | $ | 53 million | |
| SAG Line #1 / SAG Line #2 / Infrastructure | $ | 742 million | |
| Tailing Dam and Reclaim | $ | 53 million | |
| Merrill-Crowe Plant and Pad | $ | 48 million | |
| Port | $ | 28 million | |
| Owner's Costs | $ | 147 million | |
| Initial Capital Total | $ | 1,494 million | |
| Sustaining Capital | $ | 561 million |
The following life-of-mine costs are anticipated where ore is defined as the combination of oxide and sulphide ore:
| Mining Costs | = | $ | 3.74/tonne ore |
| Sulphide Process Costs | = | 3.71/tonne ore | |
| Oxide Process Costs | = | 0.19/tonne ore | |
| G&A Costs | = | 0.35/tonne ore | |
| Lead Concentrate Shipping and Smelting | = | 1.06/tonne ore | |
| Zinc Concentrate Shipping and Smelting | = | 2.34/tonne ore | |
| Doré Shipping and Refining | = | 0.02/tonne ore | |
| Total | $ | 11.41/tonne ore |
| 1.25.9 | Economics |
| a) | Metal Price Assumptions |
Gold and silver metals pricing for the financial model is based on a 60/40 blend of three years' historical prices and two years’ future prices. Lead and zinc metals pricing is based on three years’ historical pricing. These
102
Peñasquito Project Technical Report December 2007
Readdressed to Silver Wheaton Corp
Peñasquito Project Technical Report
December 2007
economic model price assumptions are not the same prices used in reserve estimation (see section 1.19.17) .
Table 1-43 Metals Pricing for Economic Model
| Gold (per ounce) | $650.00 |
| Silver (per ounce) | $12.00 |
| Lead (per pound) | $0.50 |
| Zinc (per pound) | $0.90 |
| b) | Royalties | |
| The base case includes a 2% NSR royalty payable to Royal Gold on all production. | ||
| c) | Taxes | |
| Taxes are discussed in Section 1.25.7. | ||
| d) | Financing | |
| The economic analysis has been run on a basis of 100% equity. | ||
| e) | Inflation | |
| The economic analysis has been run with no inflation (constant Sept 2007 United States dollars). | ||
| f) | Economic Results | |
| The economic results based on a 100% equity calculation indicate that with an after-tax and mandated profit sharing, an IRR of 17.0% can be achieved. The corresponding after tax NPV is $5.2 billion at a zero discount rate, $2.4 billion at a 5% discount rate, and $1.0 billion at a 10% discount rate. |
103
Peñasquito Project Technical Report December 2007
Readdressed to Silver Wheaton Corp
Peñasquito Project Technical Report
December 2007
Table 1-44 Cash Flow Summary
| After Tax Cash Flows ($000) | LOM |
| Income Statement | |
| Revenues | $20,038,302 |
| Production Cost | 12,894,287 |
| Income Taxes | 2,003,904 |
| Net Income | $5,140,111 |
Table 1-45 Key Financial Metrics
| IRR (100% equity basis) | 17.0% |
| Payback (years, 100% equity basis) | 6.1 |
| After Tax Net Present Value | |
| 0% Discount | $5.2 billion |
| 5% Discount | $2.4billion |
| 10% Discount | $1.0 billion |
104
Peñasquito Project Technical Report December 2007
Readdressed to Silver Wheaton Corp
Peñasquito Project Technical Report
December 2007
Annual Cash Flow Forecast ($000)
| 2006 | $ | (38,815 | ) |
| 2007 | $ | (430,022 | ) |
| 2008 | $ | (738,793 | ) |
| 2009 | $ | (363,634 | ) |
| 2010 | $ | (27,120 | ) |
| 2011 | $ | 178,041 | |
| 2012 | $ | 336,492 | |
| 2013 | $ | 523,290 | |
| 2014 | $ | 520,563 | |
| 2015 | $ | 435,409 | |
| 2016 | $ | 466,444 | |
| 2017 | $ | 511,168 | |
| 2018 | $ | 567,144 | |
| 2019 | $ | 534,574 | |
| 2020 | $ | 431,935 | |
| 2021 | $ | 436,164 | |
| 2022 | $ | 539,297 | |
| 2023 | $ | 353,305 | |
| 2024 | $ | 210,669 | |
| 2025 | $ | 221,733 | |
| 2026 | $ | 324,174 | |
| 2027 | $ | 163,876 | |
| 2028 | $ | (5,784 | ) |
| Total | $ | 5,150,111 |
105
Peñasquito Project Technical Report December 2007
Readdressed to Silver Wheaton Corp
Peñasquito Project Technical Report
December 2007
| g) | Sensitivities |
Fluctuation on Main Model sensitivity of the IRR and NPV to changes in basic factors is reflected in the table below.
Table 1-47ECONOMICSENSITIVITY
| Metal Prices | Payback | NPV @ 0% | NPV @ 5% | NPV @ 10% | |||||||||||||||||||||||
| Lead | Zinc | Gold | Silver | IRR | Years | ($000) | ($000) | ($000) | |||||||||||||||||||
| Base Case | $ | 0.50 | $ | 0.90 | $ | 650.00 | $ | 12.00 | 17.0% | 6.1 | $ | 5,150,111 | $ | 2,425,964 | $ | 1,002,924 | |||||||||||
| Sensitivities 130K TPD | |||||||||||||||||||||||||||
| Metal Prices +15% | $ | 0.58 | $ | 1.04 | $ | 747.50 | $ | 13.80 | 22.2% | 5.0 | $ | 7,269,385 | $ | 3,715,329 | $ | 1,848,389 | |||||||||||
| Metal Prices Price -15% | $ | 0.43 | $ | 0.77 | $ | 552.50 | $ | 10.20 | 11.0% | 7.9 | $ | 3,026,115 | $ | 1,122,656 | $ | 140,280 | |||||||||||
| Capex +15% | $ | 0.50 | $ | 0.90 | $ | 650.00 | $ | 12.00 | 15.3% | 6.5 | $ | 4,957,463 | $ | 2,235,981 | $ | 817,640 | |||||||||||
| Capex -15% | $ | 0.50 | $ | 0.90 | $ | 650.00 | $ | 12.00 | 19.0% | 5.7 | $ | 5,342,757 | $ | 2,614,741 | $ | 1,186,546 | |||||||||||
| Opex +15% | $ | 0.50 | $ | 0.90 | $ | 650.00 | $ | 12.00 | 14.6% | 6.8 | $ | 4,391,864 | $ | 1,940,669 | $ | 666,558 | |||||||||||
| Opex -15% | $ | 0.50 | $ | 0.90 | $ | 650.00 | $ | 12.00 | 19.3% | 5.6 | $ | 5,908,356 | $ | 2,908,981 | $ | 1,336,151 | |||||||||||
| Recovery +15% | $ | 0.50 | $ | 0.90 | $ | 650.00 | $ | 12.00 | 21.1% | 5.2 | $ | 6,895,459 | $ | 3,481,016 | $ | 1,689,022 | |||||||||||
| Recovery -15% | $ | 0.50 | $ | 0.90 | $ | 650.00 | $ | 12.00 | 12.3% | 7.5 | $ | 3,402,615 | $ | 1,362,967 | $ | 306,905 | |||||||||||
106
Peñasquito ProjectTechnical ReportDecember 2007
Readdressed to Silver Wheaton Corp
Peñasquito Project Technical Report
December 2007
| h) | Payback | |
| Based on the cash flow schedule in the previous section it can be seen that the payback of the initial capital investment will be realized in 6.1 years for the base case. | ||
| i) | Mine Life | |
| The proven and probable reserves identified at present, together with the selected production rate result in a mine life of 19 years. | ||
107
Peñasquito Project Technical Report December 2007
| 1.26 | ILLUSTRATIONS |
Figure 1-1
National Transportation Corridors
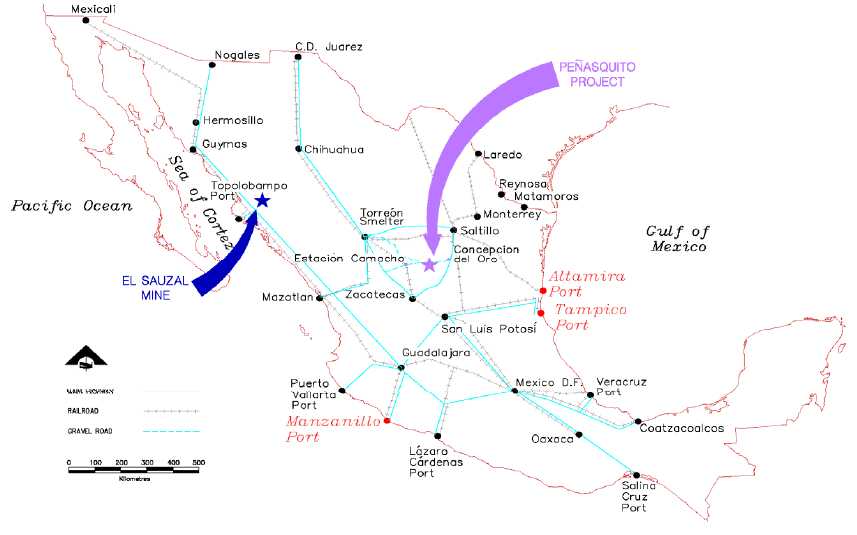
Figure 1-2
Project State Plan
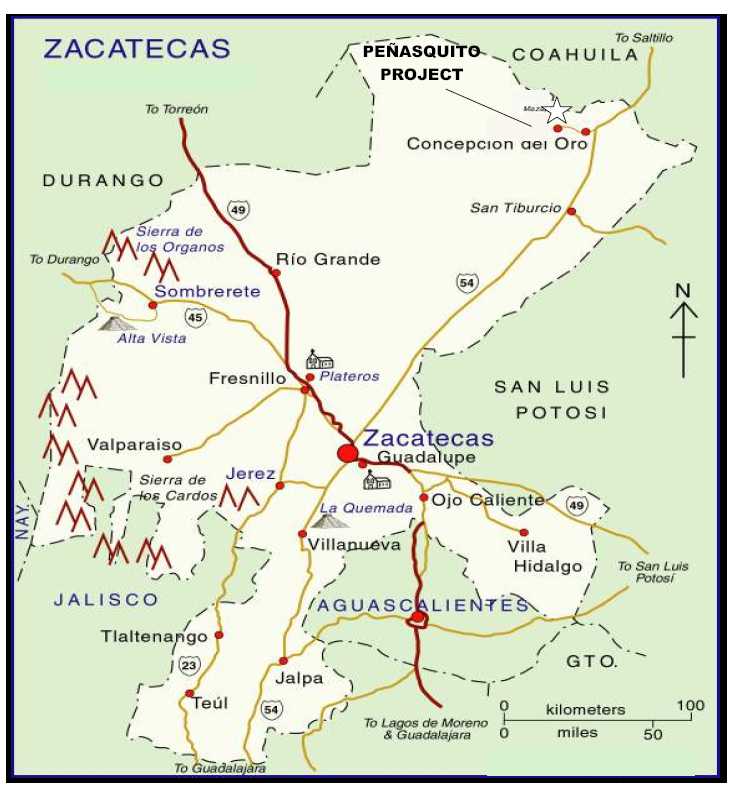
Figure 1-3
Project Region Plan
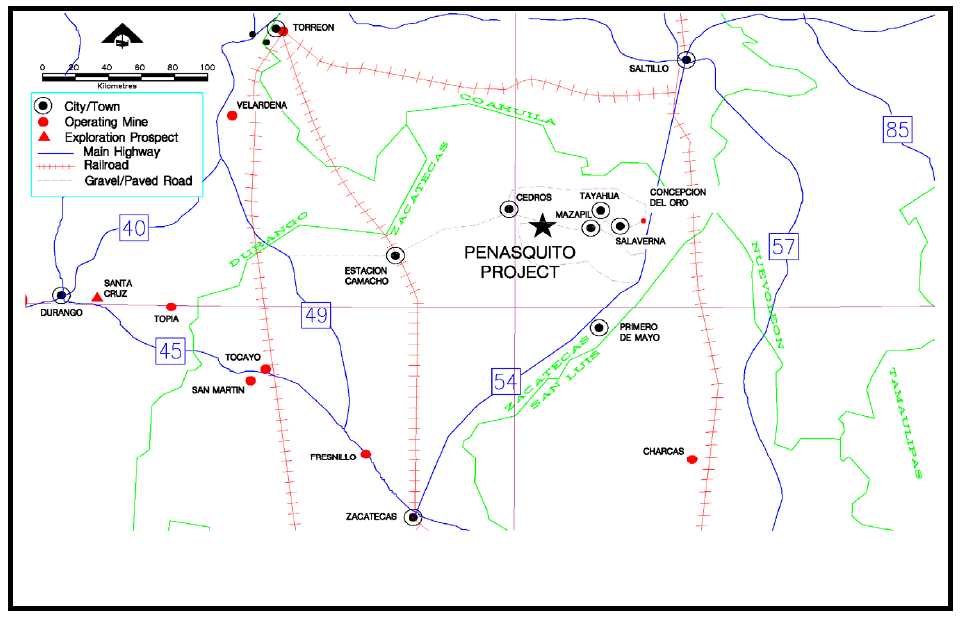
Figure 1-4
Project Vicinity Plan
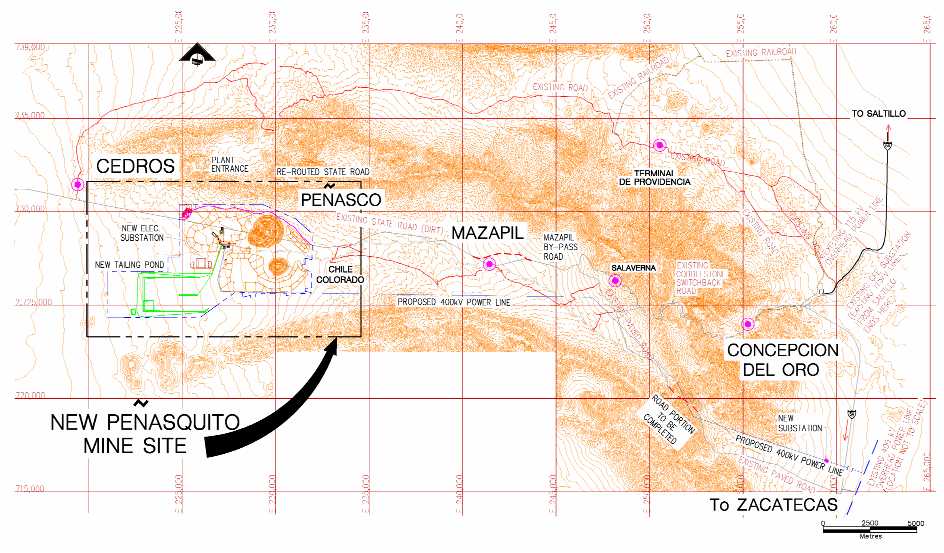
Figure 1-5
Project Facilities Plan
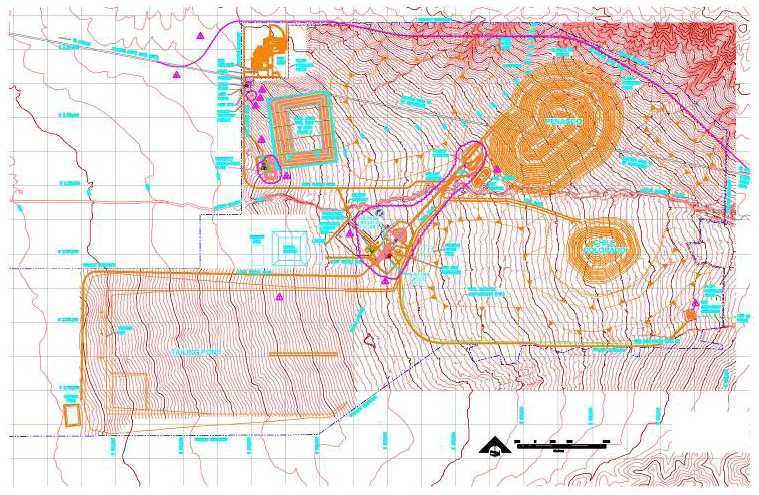
Figure 1-6
Sulphide Mill
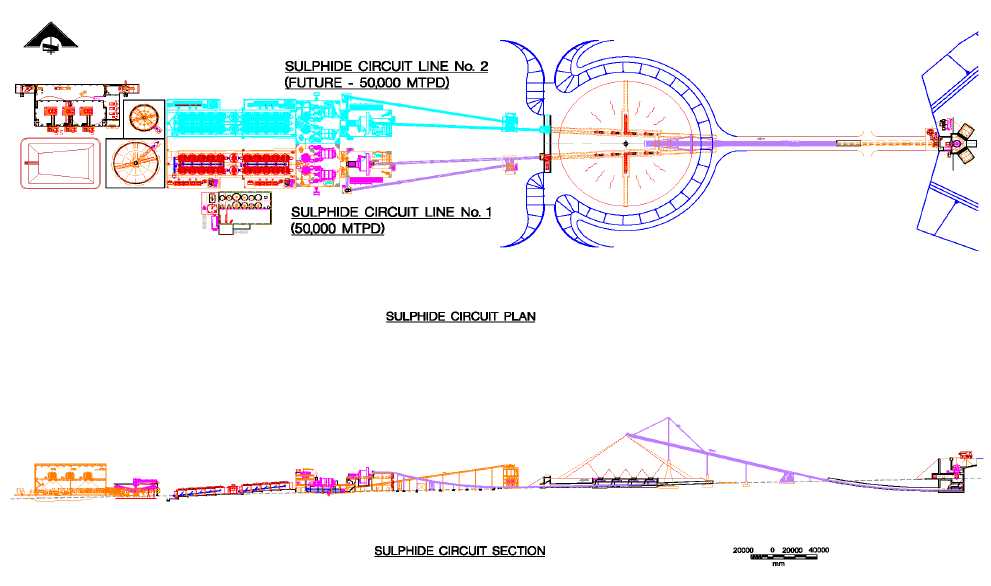
Figure 1-7
Peñasquito Mineral Concessions
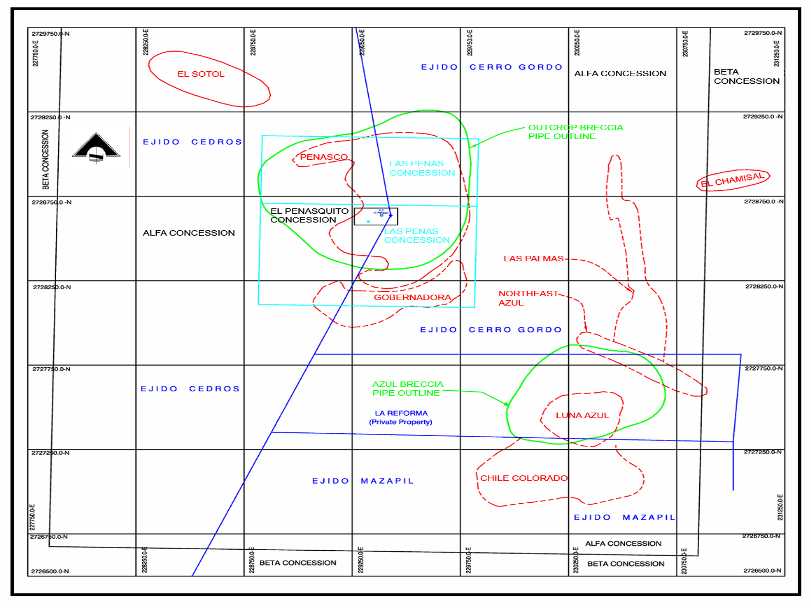
Figure 1-8
Private and Ejido Surface Ownership
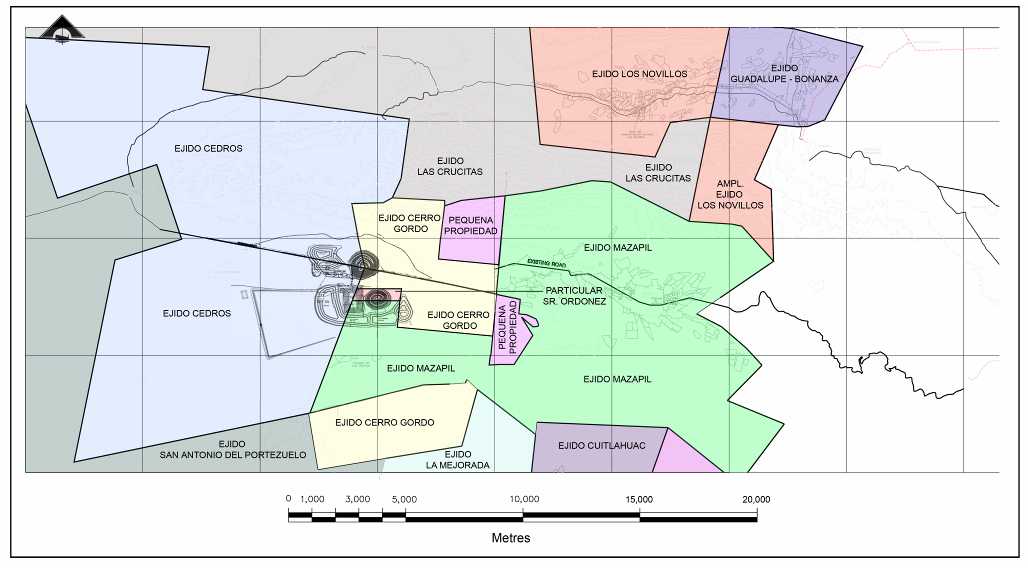
Figure 1-9
Local Geology

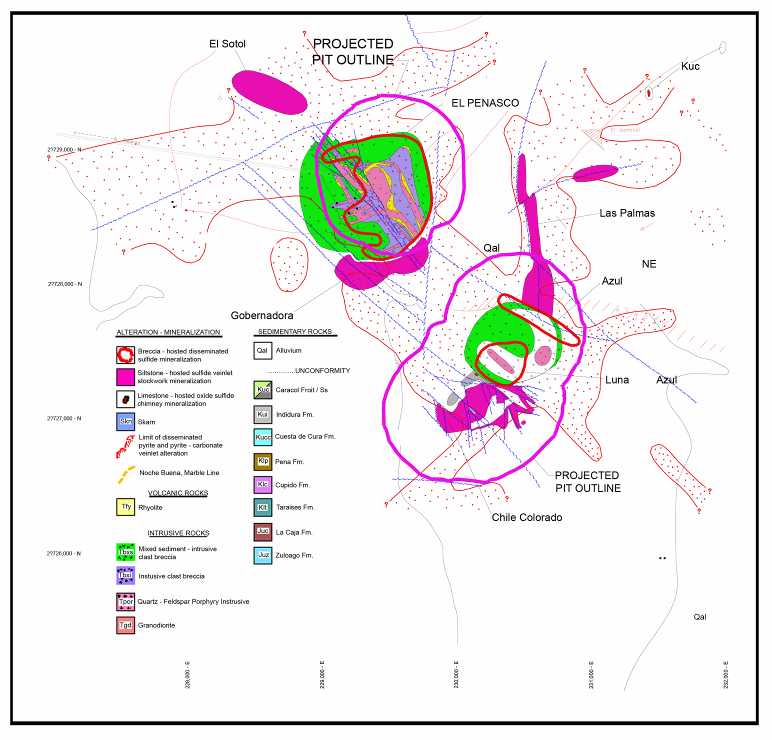
Figure 1-10
Plan View Drill Hole Traces
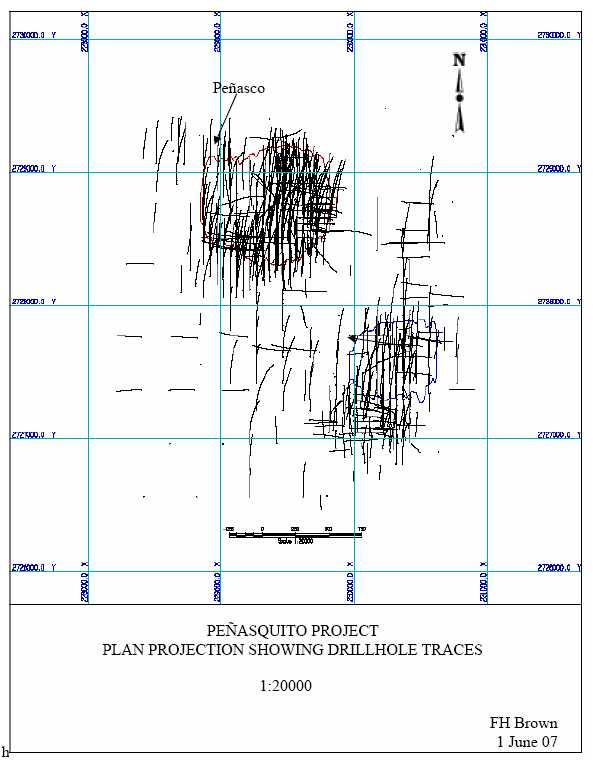
Figure 1-11
Lithological Units
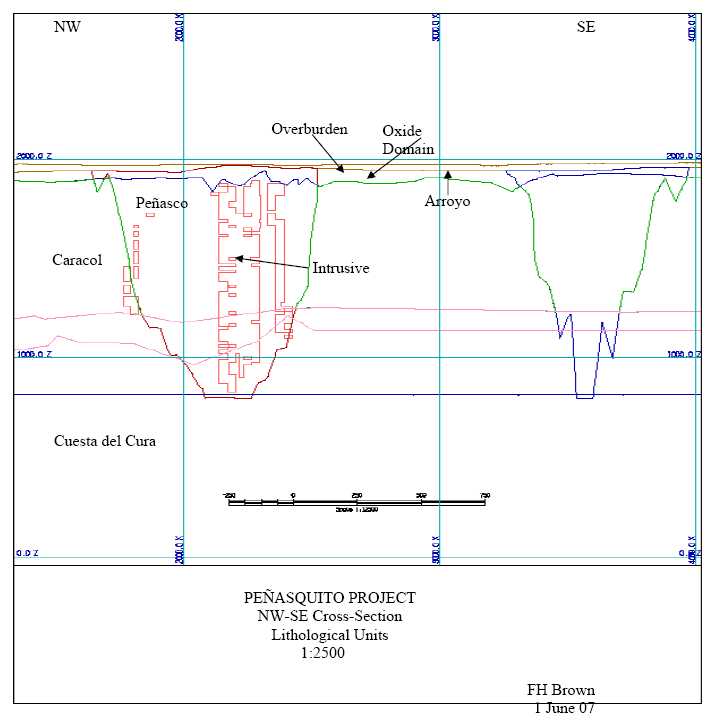
Figure 1-12
Zinc Contact Profile
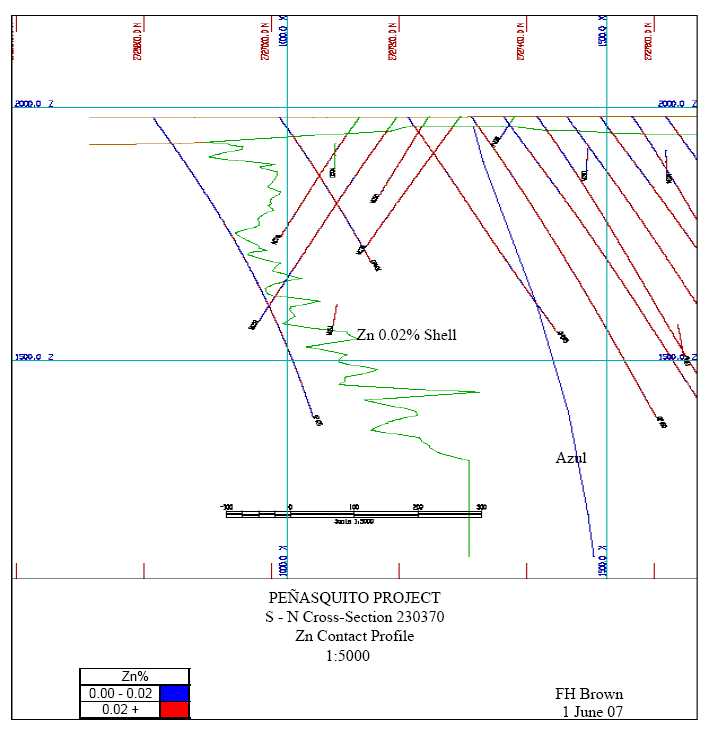
Figure 1-13
Class Profile
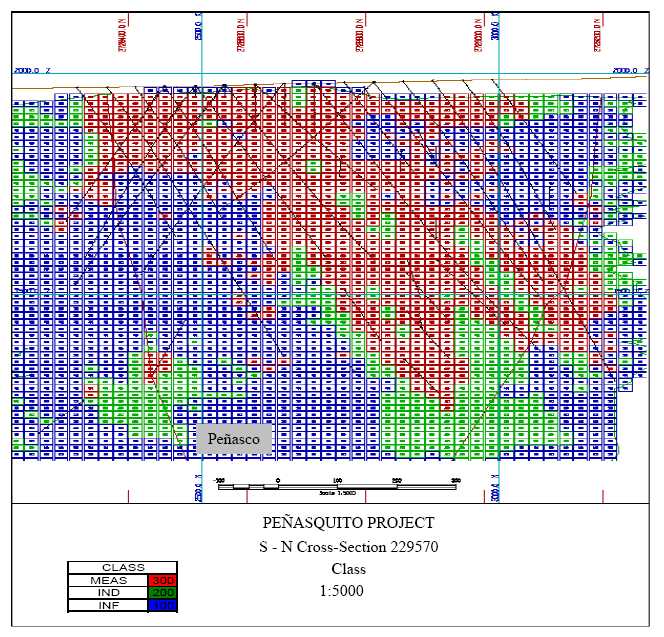
Figure 1-14
Silver Profile
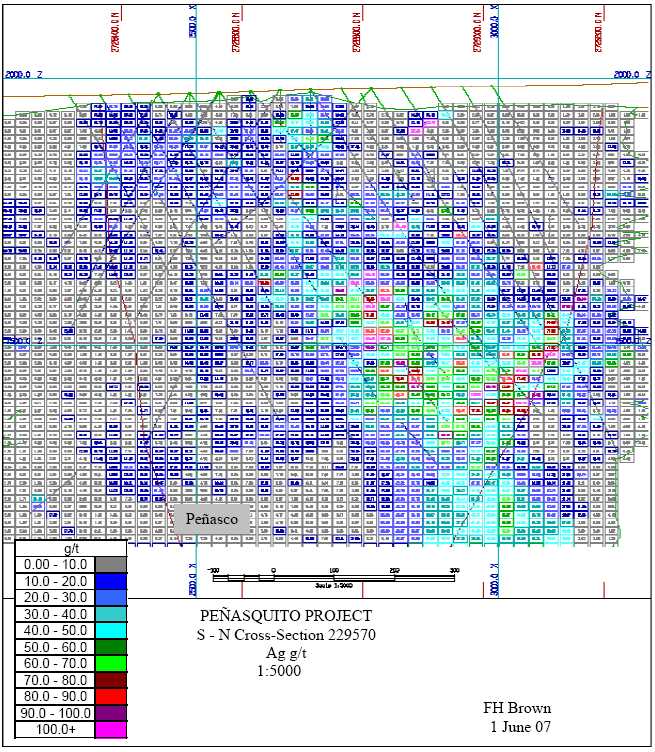
Figure 1-15
Gold Profile
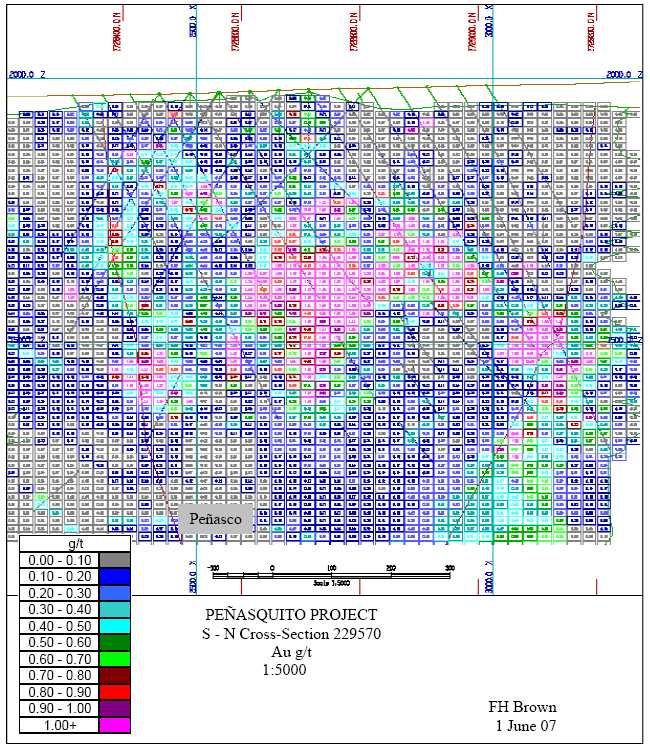
Figure 1-16
Lead Profile

Figure 1-17
Zinc Profile
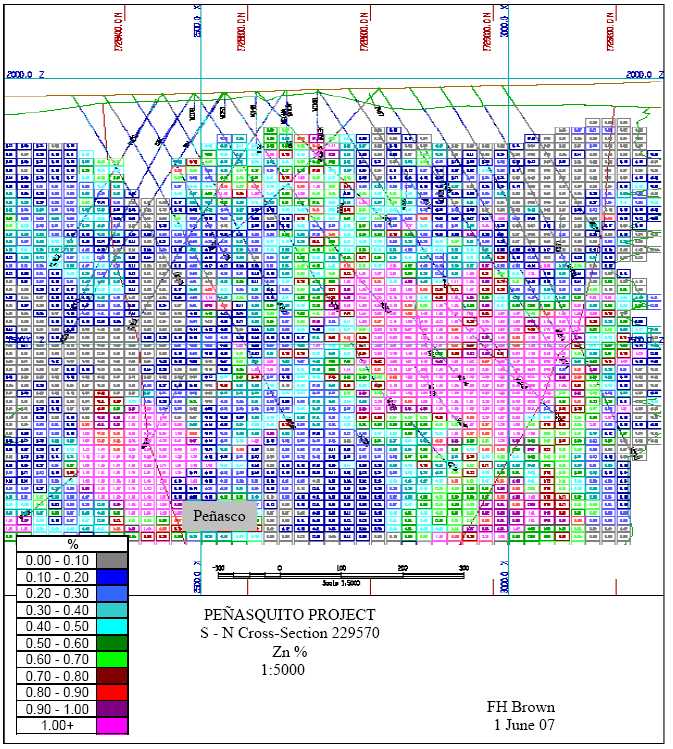
Figure 1-18
Plan View Ultimate Pit
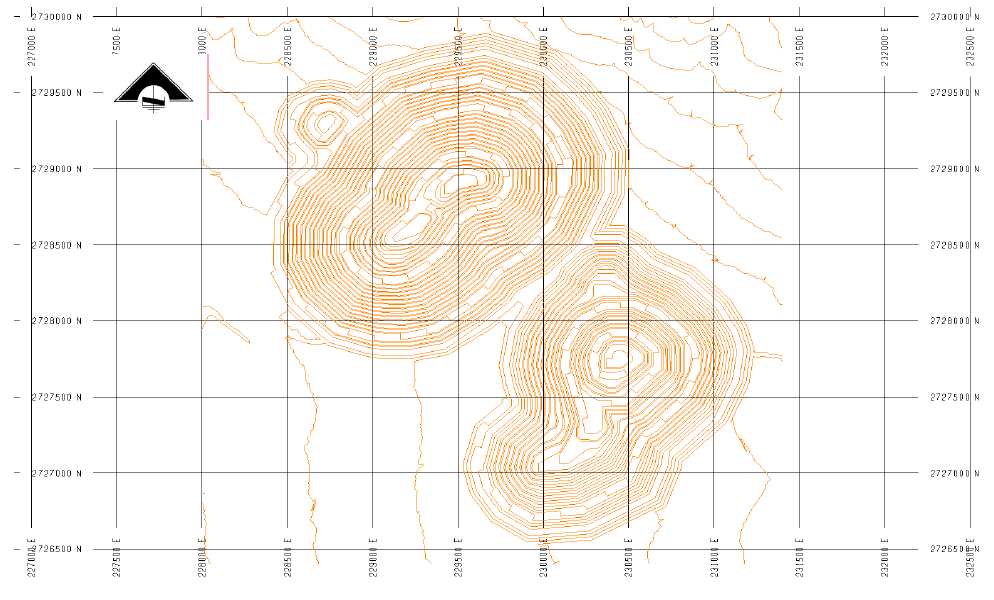
Figure 1-19
Annual Pit Year 1-4
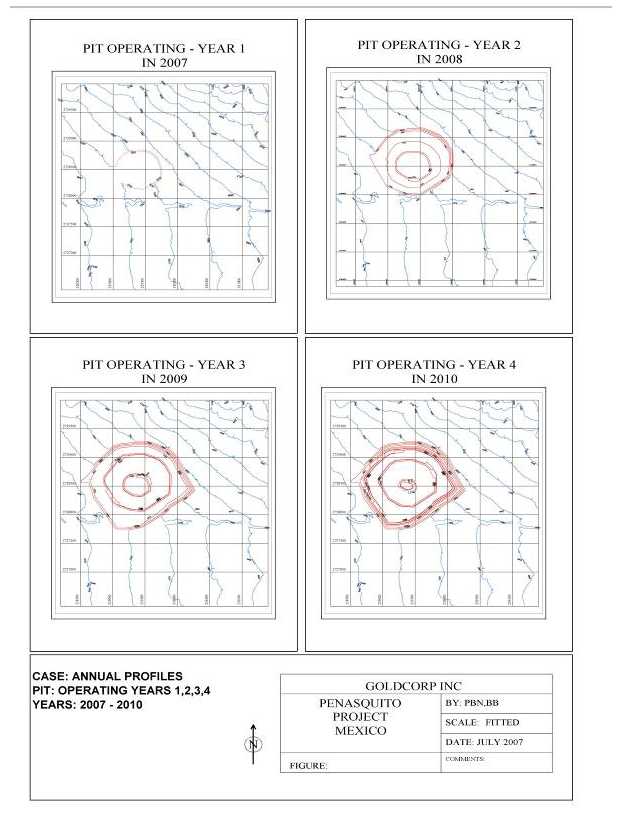
Figure 1-20
Annual Pit Year 5-8
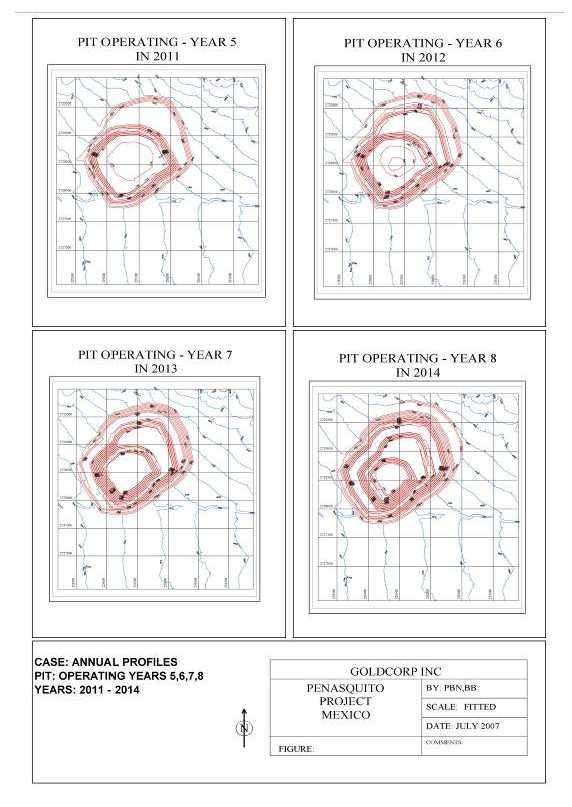
Figure 1-21
Annual Pit Year 9-12
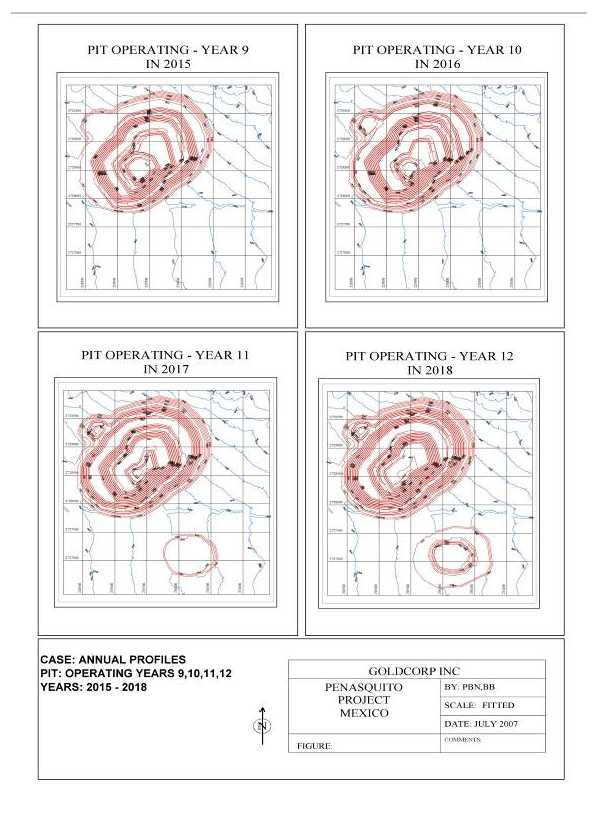
Figure 1-22
Annual Pit Year 13-16
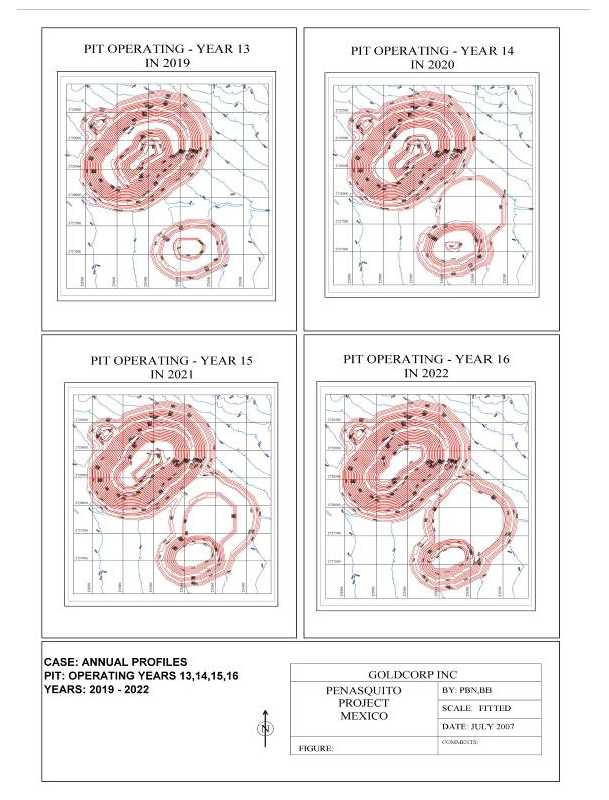
Figure 1-23
Annual Pit Year 17-20
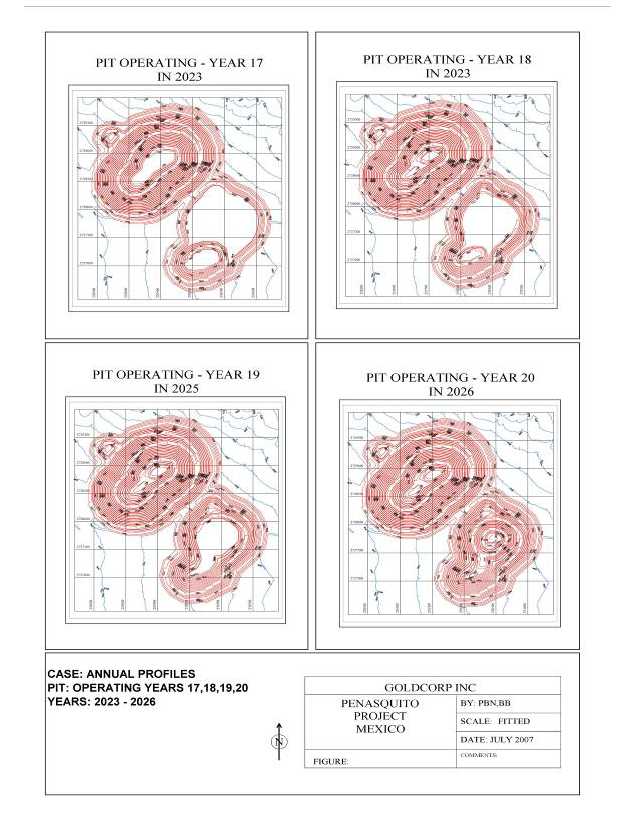
Figure 1-24
Project Perspective
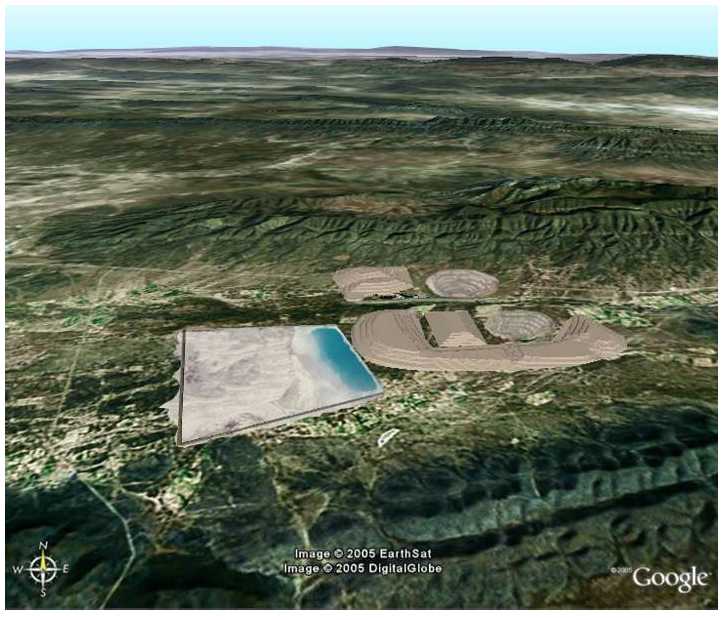
Figure 1-25
Grinding Area Elevation

APPENDIX A-1: SUMMARY STATISTICS
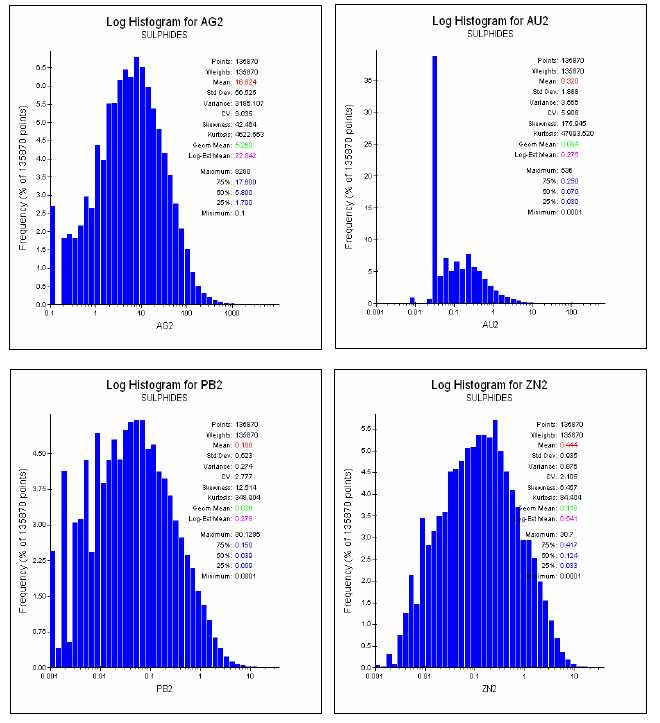
A-0
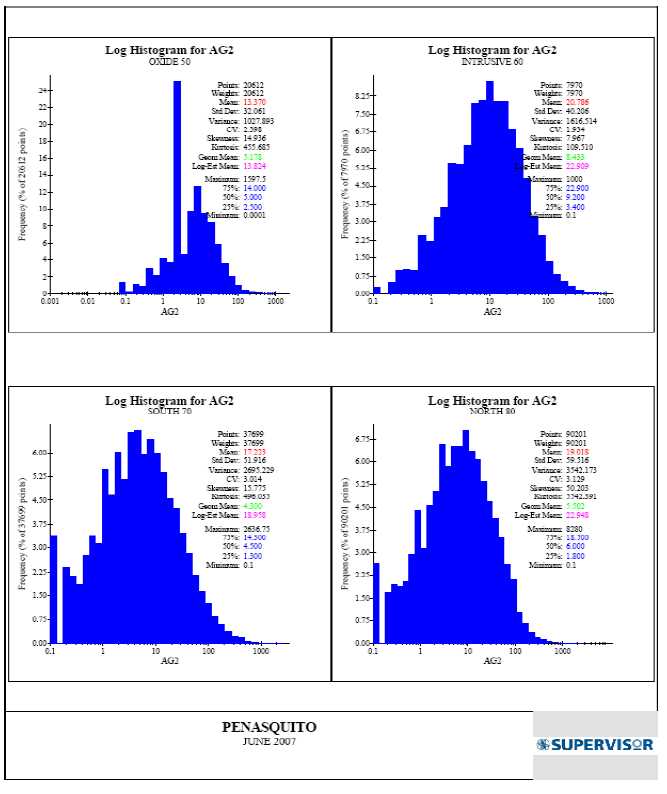
A-1
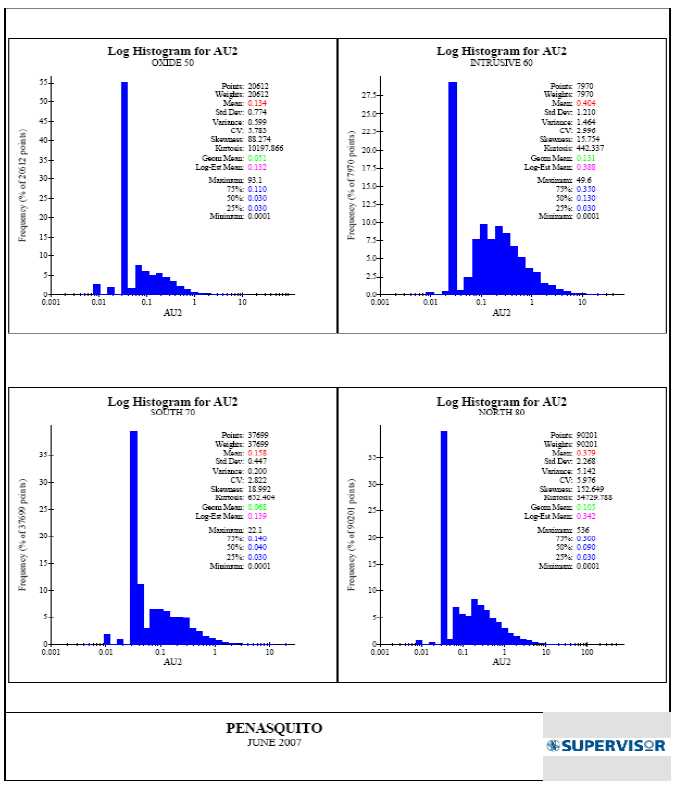
A-2
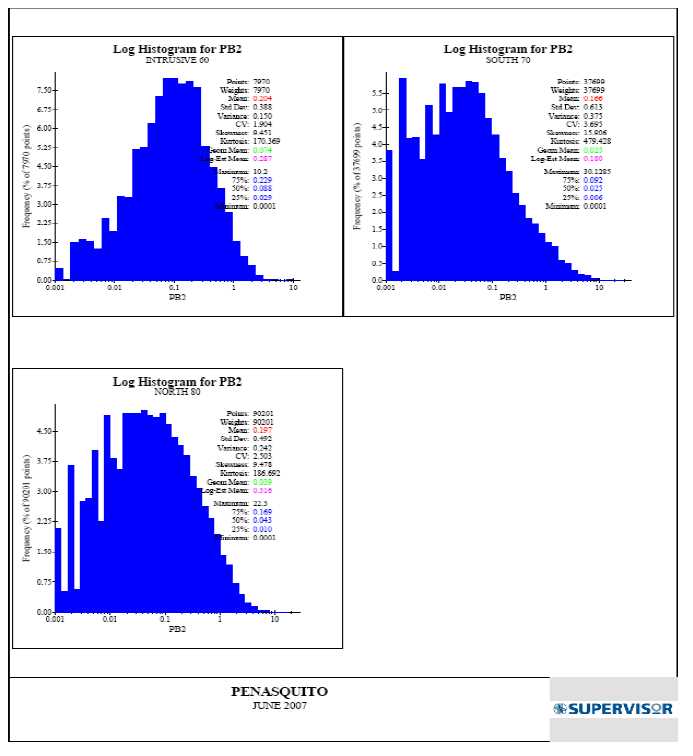
A-3
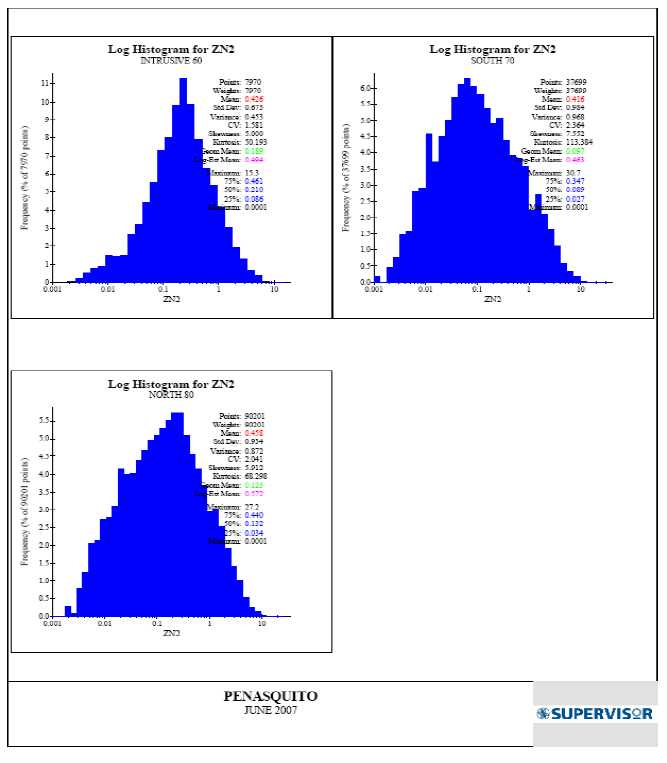
APPENDIX A-2: MEAN & CV PLOTS
A-4
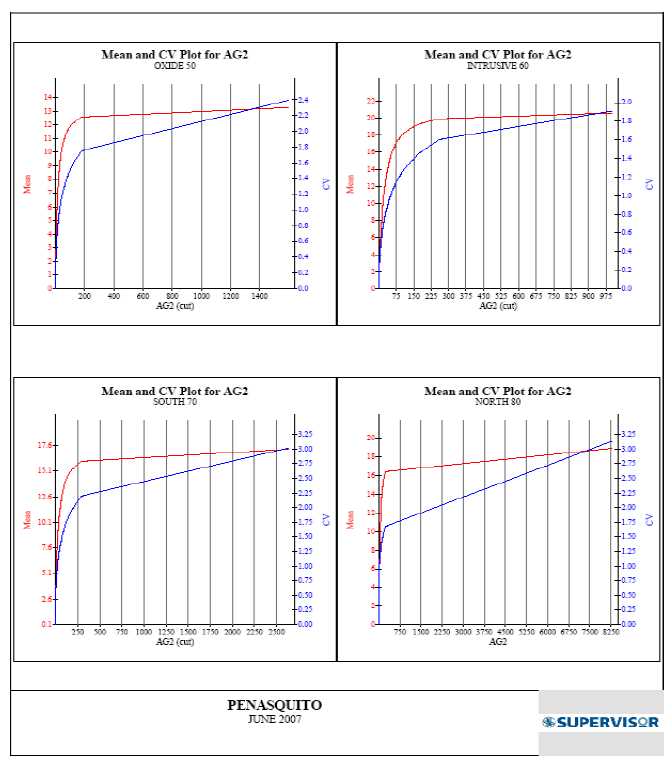
A-5
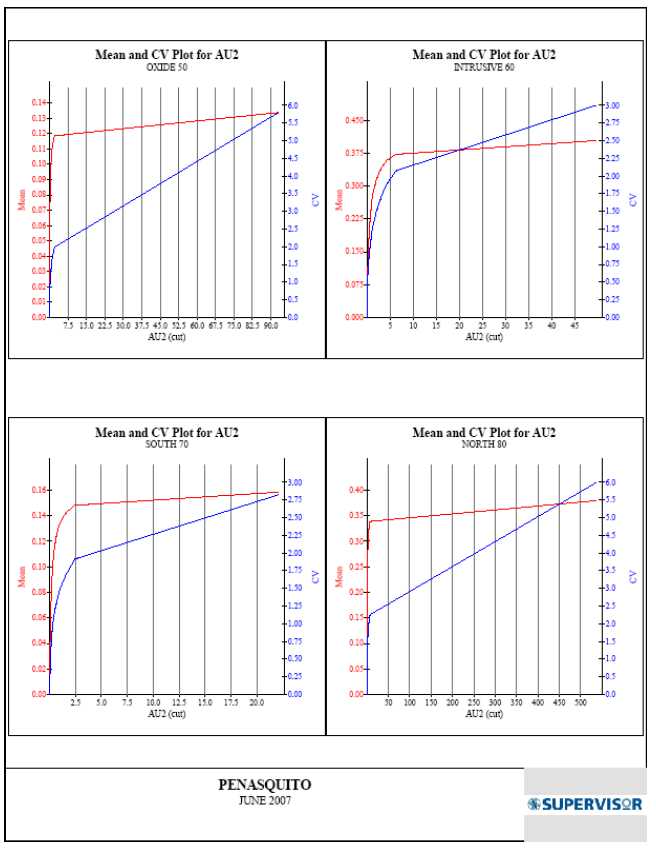
A-6
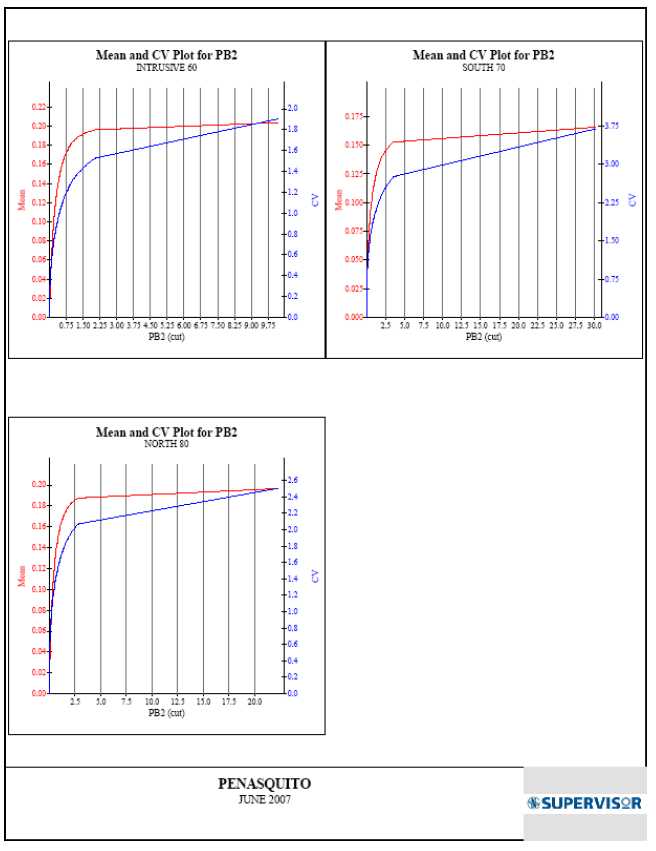
A-7
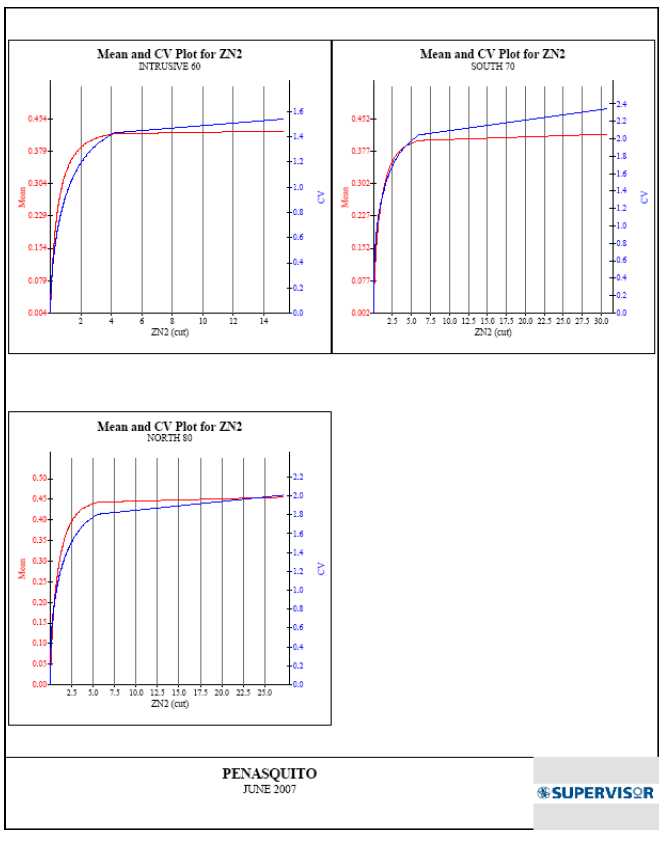
A-8
APPENDIX A-3: VARIOGRAPHY

A-9
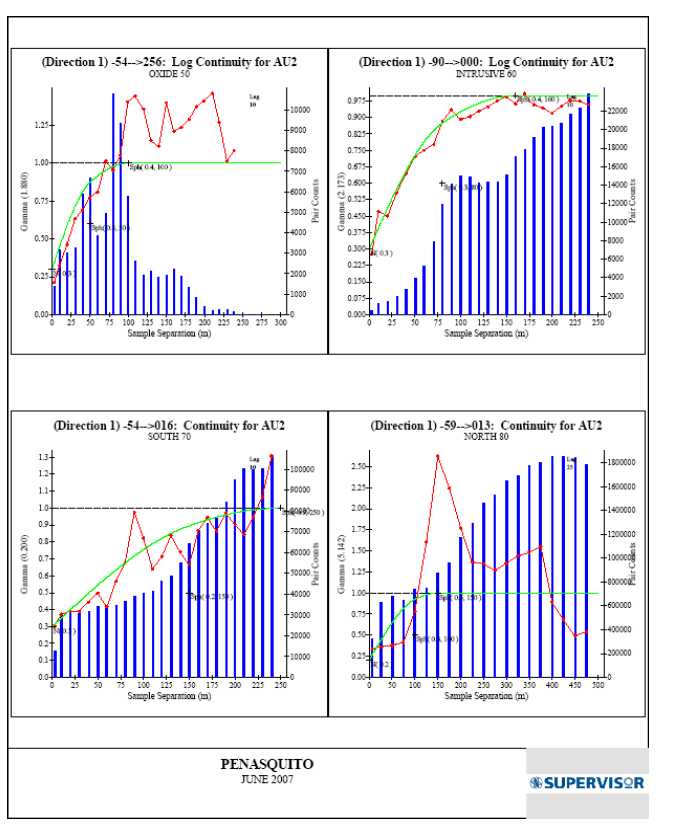
A-10
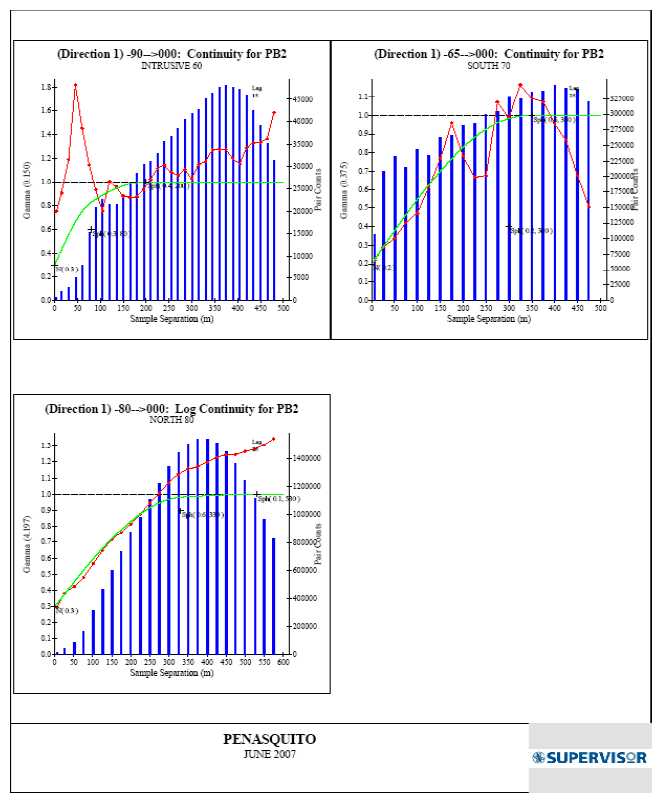
A-11
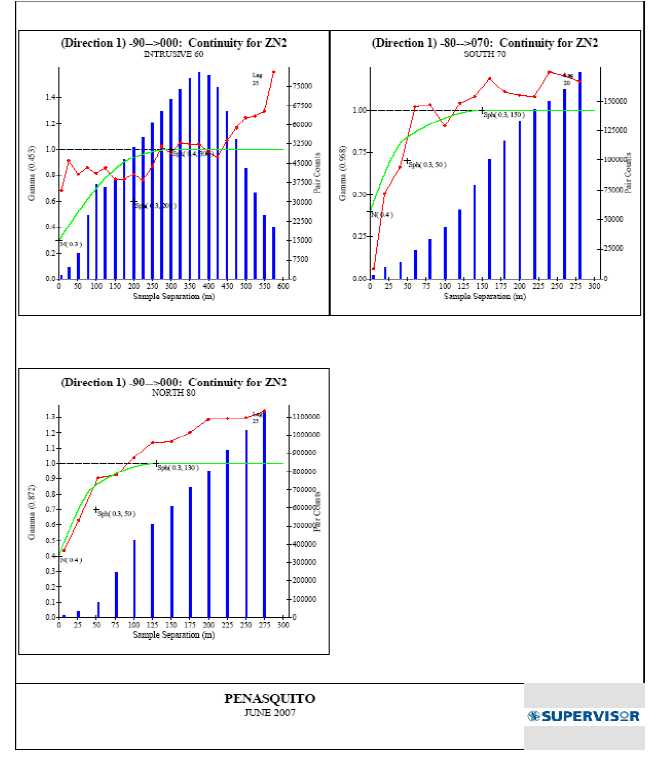
APPENDIX A-4: SWATH PLOTS
A-12
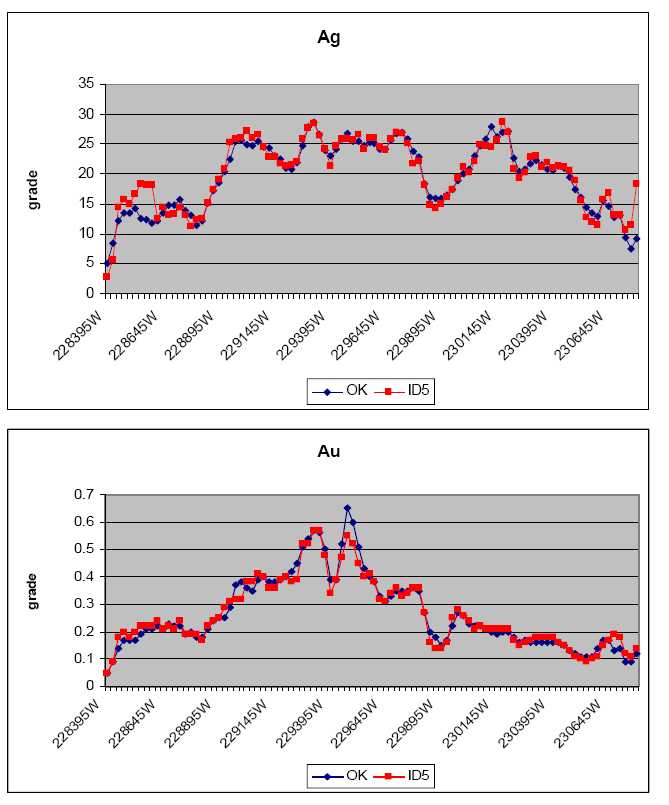
A-13
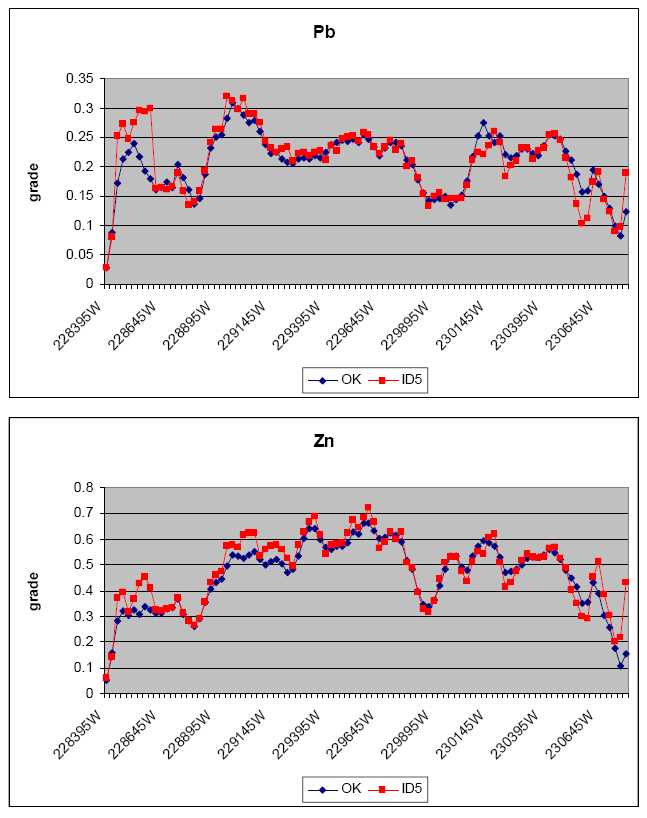
A-14
APPENDIX B – CONSENTS
CERTIFICATES ANDCONSENTS OFAUTHORS
| DESCRIPTION |
Professional Qualifications
- Certificate of Qualified Person
- Consent of Author

