UNITED STATES
SECURITIES AND EXCHANGE COMMISSION
Washington, D.C. 20549
FORM N-CSR
CERTIFIED SHAREHOLDER REPORT OF REGISTERED MANAGEMENT
INVESTMENT COMPANIES
Investment Company Act file number: 811-21763
| Name of Fund: | | Managed Account Series |
| | | BlackRock GA Disciplined Volatility Equity Fund |
| | | BlackRock GA Dynamic Equity Fund |
| Fund Address: | | 100 Bellevue Parkway, Wilmington, DE 19809 |
Name and address of agent for service: John M. Perlowski, Chief Executive Officer, Managed Account Series, 55 East 52nd Street, New York, NY 10055
Registrant’s telephone number, including area code: (800) 441-7762
Date of fiscal year end: 10/31/2020
Date of reporting period: 10/31/2020
Item 1 – Report to Stockholders
| | |

| | OCTOBER 31, 2020 |
Managed Account Series
| · | | BlackRock GA Disciplined Volatility Equity Fund |
| · | | BlackRock GA Dynamic Equity Fund |
Beginning on January 1, 2021, as permitted by regulations adopted by the Securities and Exchange Commission, paper copies of each Fund’s shareholder reports will no longer be sent by mail, unless you specifically request paper copies of the reports from BlackRock or from your financial intermediary, such as a broker-dealer or bank. Instead, the reports will be made available on a website, and you will be notified by mail each time a report is posted and provided with a website link to access the report.
You may elect to receive all future reports in paper free of charge. If you hold accounts directly with BlackRock, you can call (800) 537-4942 to inform BlackRock that you wish to continue receiving paper copies of your shareholder reports. If you hold accounts through a financial intermediary, you can follow the instructions included with this disclosure, if applicable, or contact your financial intermediary to request that you continue to receive paper copies of your shareholder reports. Please note that not all financial intermediaries may offer this service. Your election to receive reports in paper will apply to all funds advised by BlackRock Advisors, LLC, BlackRock Fund Advisors or their affiliates, or all funds held with your financial intermediary, as applicable.
If you already elected to receive shareholder reports electronically, you will not be affected by this change and you need not take any action. You may elect to receive electronic delivery of shareholder reports and other communications by: (i) accessing the BlackRock website at www.blackrock.com/edelivery and logging into your accounts, if you hold accounts directly with BlackRock, or (ii) contacting your financial intermediary, if you hold accounts through a financial intermediary. Please note that not all financial intermediaries may offer this service.
|
| Not FDIC Insured • May Lose Value • No Bank Guarantee |
The Markets in Review
Dear Shareholder,
The 12-month reporting period as of October 31, 2020 has been a time of sudden change in global financial markets, as the emergence and spread of the coronavirus (or “COVID-19”) led to a vast disruption in the global economy and financial markets. Prior to the outbreak of the virus, U.S. equities and bonds both delivered solid returns, despite fears and doubts about the economy that were ultimately laid to rest with unprecedented monetary stimulus and a sluggish yet resolute performance from the U.S. economy. But as the threat from the coronavirus became more apparent throughout February and March 2020, countries around the world took economically disruptive countermeasures. Stay-at-home orders and closures of non-essential businesses became widespread, many workers were laid off, and unemployment claims spiked, causing a global recession and a sharp fall in equity prices.
After markets hit their lowest point of the reporting period in late March 2020, a steady recovery ensued, as businesses began to re-open and governments learned to adapt to life with the virus. Equity prices continued to rise throughout the summer, fed by strong fiscal and monetary support and improving economic indicators. Many equity indices neared or surpassed all-time highs in early September 2020 before retreating amid concerns about a second wave of infections. In the United States, large-capitalization stocks advanced, outperforming small-capitalization stocks, which declined marginally during the reporting period. International equities from developed economies declined, significantly lagging emerging market stocks, which rebounded sharply.
During the market downturn, the performance of different types of fixed-income securities initially diverged due to a reduced investor appetite for risk. U.S. Treasuries benefited from the risk-off environment, and posted solid returns, as the 10-year U.S. Treasury yield (which is inversely related to bond prices) touched an all-time low. In the corporate bond market, support from the U.S. Federal Reserve (the “Fed”) assuaged credit concerns and both investment-grade and high-yield bonds recovered to post positive returns.
The Fed took an accommodative monetary stance in late 2019 to support slowing economic growth. After the coronavirus outbreak, the Fed instituted two emergency interest rate cuts, pushing short-term interest rates close to zero. To stabilize credit markets, the Fed also implemented a new bond-buying program, as did several other central banks around the world, including the European Central Bank and the Bank of Japan.
Looking ahead, while coronavirus-related disruptions have clearly hindered worldwide economic growth, we believe that the global expansion is likely to continue as economic activity resumes. Several risks remain, however, including a potential resurgence of the coronavirus amid loosened restrictions, policy fatigue among governments already deep into deficit spending, and structural damage to the financial system from lengthy economic interruptions.
Overall, we favor a moderately positive stance toward risk, and in particular toward credit given the extraordinary central bank measures taken in recent months. This support extends beyond investment-grade corporates and into high-yield, leading to attractive opportunities in that end of the market. We believe that international diversification and a focus on sustainability can help provide portfolio resilience, and the disruption created by the coronavirus appears to be accelerating the shift toward sustainable investments. We remain neutral on equities overall while favoring emerging market stocks and tilting toward the quality factor for its resilience.
In this environment, our view is that investors need to think globally, extend their scope across a broad array of asset classes, and be nimble as market conditions change. We encourage you to talk with your financial advisor and visit blackrock.com for further insight about investing in today’s markets.
Sincerely,

Rob Kapito
President, BlackRock Advisors, LLC

Rob Kapito
President, BlackRock Advisors, LLC
| | | | |
| Total Returns as of October 31, 2020 |
| | | |
| | | 6-Month | | 12-Month |
U.S. large cap equities
(S&P 500® Index) | | 13.29% | | 9.71% |
U.S. small cap equities
(Russell 2000® Index) | | 18.13 | | (0.14) |
International equities
(MSCI Europe, Australasia,
Far East Index) | | 8.57 | | (6.86) |
Emerging market equities
(MSCI Emerging Markets Index) | | 20.96 | | 8.25 |
3-month Treasury bills
(ICE BofA 3-Month
U.S. Treasury Bill Index) | | 0.06 | | 0.92 |
U.S. Treasury securities
(ICE BofA 10-Year
U.S. Treasury Index) | | (1.63) | | 8.92 |
U.S. investment grade bonds
(Bloomberg Barclays
U.S. Aggregate Bond Index) | | 1.27 | | 6.19 |
Tax-exempt municipal bonds
(S&P Municipal Bond Index) | | 4.87 | | 3.55 |
U.S. high yield bonds
(Bloomberg Barclays
U.S. Corporate High Yield 2% Issuer Capped Index) | | 10.73 | | 3.42 |
Past performance is not an indication of future results. Index performance is shown for illustrative purposes only. You cannot invest directly in an index. |
| | |
| 2 | | THIS PAGEISNOT PARTOF YOUR FUND REPORT |
Table of Contents

| | |
| Fund Summary as of October 31, 2020 | | BlackRock GA Disciplined Volatility Equity Fund |
Investment Objective
BlackRock GA Disciplined Volatility Equity Fund’s (the “Fund”) investment objective is to seek to provide risk-adjusted total return.
Portfolio Management Commentary
How did the Fund perform?
For the 12-month period ended October 31, 2020, the Fund outperformed its benchmark, the MSCI ACWI Minimum Volatility (USD) Index. The following commentary and allocation percentages are based on the economic exposures of the Fund, which reflect adjustments for futures, options (except with respect to fixed-income securities), and convertible bonds, and may vary relative to the market value.
What factors influenced performance?
The Fund’s security selection within information technology (“IT”), communication services and industrials were the primary contributors to relative performance. An underweight to financials also positively impacted performance over the period. A modest positioning to cash during parts of the period also contributed to performance.
The largest detractors from relative performance were an overweight position to consumer discretionary and an underweight to materials and utilities.
Describe recent portfolio activity.
During the 12-month period, the Fund’s overall equity allocation decreased from 98% to 96% of net assets. On a sector basis, the Fund increased its exposure to IT, health care, materials and communication services stocks. Conversely, the Fund decreased its exposure to real estate, financials, utilities, consumer staples, consumer discretionary and industrials.
From a regional perspective, the Fund increased exposure to the United States and France, and decreased its exposure to Hong Kong, Japan and Singapore.
Describe portfolio positioning at period end.
Relative to its benchmark, the Fund ended the period overweight in IT, health care, consumer discretionary and industrials stocks, and was underweight in financials, utilities, consumer staples, communication services and real estate stocks. From a regional perspective, the Fund was overweight in the United States, France and the United Kingdom, and underweight in Japan, Switzerland and select emerging markets.
The views expressed reflect the opinions of BlackRock as of the date of this report and are subject to change based on changes in market, economic or other conditions. These views are not intended to be a forecast of future events and are no guarantee of future results.
TOTAL RETURN BASED ON A $10,000 INVESTMENT
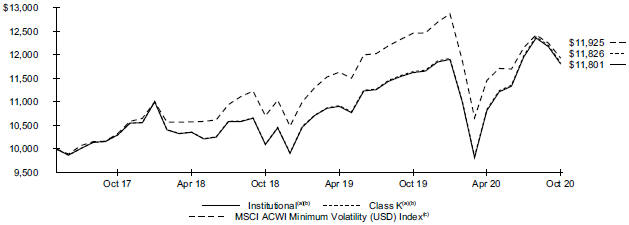
| | The Fund commenced operations on June 1, 2017. |
| (a) | Assuming transaction costs and other operating expenses, including investment advisory fees. |
| (b) | The Fund will, under normal circumstances, invest at least 80% of its net assets (plus borrowings for investment purposes) in equity securities. |
| (c) | This unmanaged index aims to reflect the performance characteristics of a minimum variance strategy applied to large and mid cap equities across 23 developed markets and 26 emerging markets countries. The index is calculated by optimizing the MSCI ACWI Index, its parent index, in USD for the lowest absolute risk (within a given set of constraints). |
| | |
| 4 | | 2020 BLACKROCK ANNUAL REPORTTO SHAREHOLDERS |
| | |
| Fund Summary as of October 31, 2020 (continued) | | BlackRock GA Disciplined Volatility Equity Fund |
Performance Summary for the Period Ended October 31, 2020
| | | | | | | | | | | | | | | | |
| | | 6-Month
Total Returns | | | | | | Average Annual Total Returns(a) | |
| | | | | | | | 1 Year | | |
| Since
Inception |
(b) |
Institutional | | | 9.12 | % | | | | | | | 1.56 | % | | | 4.97 | % |
Class K | | | 9.13 | | | | | | | | 1.60 | | | | 5.03 | |
MSCI ACWI Minimum Volatility (USD) Index | | | 4.11 | | | | | | | | (4.25 | ) | | | 5.29 | |
| | (a) | See “About Fund Performance” for a detailed description of performance related information and, how performance was calculated for certain share classes. | |
| | (b) | The Fund commenced operations on June 1, 2017. | |
Performance results may include adjustments made for financial reporting purposes in accordance with U.S. generally accepted accounting principles. Past performance is not an indication of future results.
Expense Example
| | | | | | | | | | | | | | | | | | | | | | | | | | | | | | | | |
| | | Actual | | | | | | Hypothetical(a) | | | | |
| | |
| Beginning
Account Value
(05/01/20) |
| |
| Ending
Account Value
(10/31/20) |
| |
| Expenses
Paid During
the Period |
(b) | | | | | |
| Beginning
Account Value
(05/01/20) |
| |
| Ending
Account Value
(10/31/20) |
| |
| Expenses
Paid During
the Period |
(b) | |
| Annualized
Expense
Ratio |
|
Institutional | | $ | 1,000.00 | | | $ | 1,091.20 | | | $ | 2.79 | | | | | | | $ | 1,000.00 | | | $ | 1,022.47 | | | $ | 2.69 | | | | 0.53 | % |
Class K | | | 1,000.00 | | | | 1,091.30 | | | | 2.63 | | | | | | | | 1,000.00 | | | | 1,022.62 | | | | 2.54 | | | | 0.50 | |
| | (a) | Hypothetical 5% annual return before expenses is calculated by prorating the number of days in the most recent fiscal half year divided by 366. | |
| | (b) | For each class of the Fund, expenses are equal to the annualized expense ratio for the class, multiplied by the average account value over the period, multiplied by 184/366 (to reflect the six-month period shown). | |
See “Disclosure of Expenses” for further information on how expenses were calculated.
Portfolio Information
TEN LARGEST HOLDINGS
| | | | |
| Security | | Percent of Net Assets | |
iShares Gold Trust | | | 2 | % |
Nestle SA | | | 2 | |
Newmont Corp. | | | 2 | |
PepsiCo, Inc. | | | 1 | |
Microsoft Corp. | | | 1 | |
Barrick Gold Corp. | | | 1 | |
QUALCOMM, Inc. | | | 1 | |
NextEra Energy, Inc. | | | 1 | |
Merck & Co., Inc. | | | 1 | |
salesforce.com, Inc. | | | 1 | |
GEOGRAPHIC ALLOCATION
| | | | |
| Country/Geographic Region | | Percent of Net Assets | |
United States | | | 66 | % |
Japan | | | 8 | |
Canada | | | 5 | |
Switzerland | | | 4 | |
Taiwan | | | 3 | |
France | | | 3 | |
China | | | 3 | |
United Kingdom | | | 2 | |
Denmark | | | 1 | |
Germany | | | 1 | |
Hong Kong | | | 1 | |
Sweden | | | 1 | |
Australia | | | 1 | |
Belgium | | | 1 | |
Singapore | | | 1 | |
Other(a) | | | — | |
Liabilities in Excess of Other Assets | | | (1 | ) |
| (a) | Includes holdings within countries that are 1% or less of net assets. Please refer to the Schedule of Investments for such countries. | |
| | |
| Fund Summary as of October 31, 2020 | | BlackRock GA Dynamic Equity Fund |
Investment Objective
BlackRock GA Dynamic Equity Fund’s (the “Fund”) investment objective is to seek to provide total return.
Portfolio Management Commentary
How did the Fund perform?
For the 12-month period ended October 31, 2020, the Fund outperformed its benchmark, the MSCI World Index. The following commentary and allocation percentages are based on the economic exposures of the Fund, which reflect adjustments for futures, swaps, options (except with respect to fixed-income securities), and convertible bonds, and may vary relative to the market value
What factors influenced performance?
The Fund’s security selection within information technology (“IT”) and consumer discretionary were the primary contributors to performance. Sector positioning, notably through underweight allocations to energy and financials, was also additive.
The most significant detractor from performance came from security selection within the industrials sector. In addition, stock selection in financials weighed on performance over the period, as did the Fund’s tactical positioning to manage exposure to select regions. Currency exposure within the Fund also modestly detracted.
Describe recent portfolio activity.
During the 12-month period, the Fund’s overall equity allocation increased from 99% to 101% of net assets. Within equities, the Fund increased its exposure to IT, materials, consumer discretionary and health care stocks, and decreased exposure to energy, consumer staples, communication services, real estate, industrials, financials, and utilities.
From a regional perspective, the Fund increased exposure to the United States, Canada and select developed countries within Europe. Conversely, the Fund reduced exposure to Japan, the United Kingdom and Hong Kong.
Describe portfolio positioning at period end.
Relative to its benchmark, the Fund ended the period overweight in health care, consumer discretionary, materials, industrials and communication services, and was underweight in consumer staples, real estate, financials and utilities. From a regional perspective, the Fund was overweight in the United States, China and select countries within developed Europe, and was underweight in Japan, Australia and the United Kingdom.
The views expressed reflect the opinions of BlackRock as of the date of this report and are subject to change based on changes in market, economic or other conditions. These views are not intended to be a forecast of future events and are no guarantee of future results.
TOTAL RETURN BASED ON A $10,000 INVESTMENT
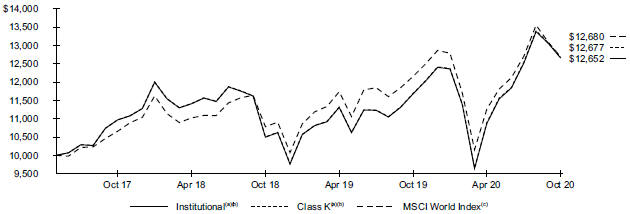
| | The Fund commenced operations on June 1, 2017. |
| (a) | Assuming transaction costs and other operating expenses, including investment advisory fees. |
| (b) | The Fund will, under normal circumstances, invest at least 80% of its net assets (plus borrowings for investment purposes) in equity securities. |
| (c) | This unmanaged index captures large and mid cap representation across 23 developed markets countries. With 1,650 constituents, the index covers approximately 85% of the free float adjusted market capitalization in each country. |
| | |
| 6 | | 2020 BLACKROCK ANNUAL REPORTTO SHAREHOLDERS |
| | |
| Fund Summary as of October 31, 2020 (continued) | | BlackRock GA Dynamic Equity Fund |
Performance Summary for the Period Ended October 31, 2020
| | | | | | | | | | | | | | | | |
| | | 6-Month
Total Returns | | | | | | Average Annual Total Returns(a) | |
| | | | | | | | 1 Year | | |
| Since
Inception |
(b) |
Institutional | | | 16.37 | % | | | | | | | 8.35 | % | | | 7.13 | % |
Class K | | | 16.38 | | | | | | | | 8.49 | | | | 7.19 | |
MSCI World Index | | | 12.57 | | | | | | | | 4.36 | | | | 7.20 | |
| | (a) | See “About Fund Performance” for a detailed description of performance related information and, how performance was calculated for certain share classes. | |
| | (b) | The Fund commenced operations on June 1, 2017. | |
Performance results may include adjustments made for financial reporting purposes in accordance with U.S. generally accepted accounting principles. Past performance is not an indication of future results.
Expense Example
| | | | | | | | | | | | | | | | | | | | | | | | | | | | | | | | |
| | | Actual | | | | | | Hypothetical(a) | | | | |
| | |
| Beginning
Account Value
(05/01/20) |
| |
| Ending
Account Value
(10/31/20) |
| |
| Expenses
Paid During
the Period |
(b) | | | | | |
| Beginning
Account Value
(05/01/20) |
| |
| Ending
Account Value
(10/31/20) |
| |
| Expenses
Paid During
the Period |
(b) | |
| Annualized
Expense
Ratio |
|
Institutional | | $ | 1,000.00 | | | $ | 1,163.70 | | | $ | 2.83 | | | | | | | $ | 1,000.00 | | | $ | 1,022.52 | | | $ | 2.64 | | | | 0.52 | % |
Class K | | | 1,000.00 | | | | 1,163.80 | | | | 2.72 | | | | | | | | 1,000.00 | | | | 1,022.62 | | | | 2.54 | | | | 0.50 | |
| | (a) | Hypothetical 5% annual return before expenses is calculated by prorating the number of days in the most recent fiscal half year divided by 366. | |
| | (b) | For each class of the Fund, expenses are equal to the annualized expense ratio for the class, multiplied by the average account value over the period, multiplied by 184/366 (to reflect the six-month period shown). | |
See “Disclosure of Expenses” for further information on how expenses were calculated.
Portfolio Information
TEN LARGEST HOLDINGS
| | | | |
| Security | | Percent of Net Assets | |
Microsoft Corp. | | | 3 | % |
Amazon.com, Inc. | | | 3 | |
Apple, Inc. | | | 3 | |
Alphabet, Inc., Class C | | | 2 | |
UnitedHealth Group, Inc. | | | 2 | |
Siemens AG | | | 2 | |
JPMorgan Chase & Co. | | | 2 | |
Taiwan Semiconductor Manufacturing Co. Ltd. | | | 1 | |
Johnson & Johnson | | | 1 | |
Union Pacific Corp. | | | 1 | |
GEOGRAPHIC ALLOCATION
| | | | |
| Country/Geographic Region | | Percent of Net Assets | |
United States | | | 66 | % |
Netherlands | | | 5 | |
China | | | 4 | |
Germany | | | 4 | |
France | | | 3 | |
Japan | | | 3 | |
Italy | | | 2 | |
Taiwan | | | 2 | |
United Kingdom | | | 2 | |
Switzerland | | | 2 | |
Hong Kong | | | 1 | |
Sweden | | | 1 | |
Canada | | | 1 | |
Spain | | | 1 | |
Finland | | | 1 | |
Other(a) | | | — | |
Other Assets Less Liabilities | | | 2 | |
| (a) | Includes holdings within countries that are 1% or less of net assets. Please refer to the Schedule of Investments for such countries. | |
About Fund Performance
Institutional and Class K Shares are not subject to any sales charge. These shares bear no ongoing distribution or service fees and are available only to certain eligible investors. On November 30, 2018, all issued and outstanding shares of each Fund were redesignated as Class K Shares. Institutional Shares performance shown prior to the Institutional Shares inception date of November 30, 2018 is that of Class K Shares (which have no distribution or service fees) and was restated to reflect Institutional Shares fees.
Past performance is not an indication of future results. Financial markets have experienced extreme volatility and trading in many instruments has been disrupted. These circumstances may continue for an extended period of time, and may continue to affect adversely the value and liquidity of the fund’s investments. As a result, current performance may be lower or higher than the performance data quoted. Refer to blackrock.com to obtain performance data current to the most recent month-end. Performance results do not reflect the deduction of taxes that a shareholder would pay on Fund distributions or the redemption of Fund shares. Figures shown in the performance tables on the previous pages assume reinvestment of all distributions, if any, at net asset value (“NAV”) on the ex-dividend date or payable date, as applicable. Investment return and principal value of shares will fluctuate so that shares, when redeemed, may be worth more or less than their original cost. Distributions paid to each class of shares will vary because of the different levels of service, distribution and transfer agency fees applicable to each class, which are deducted from the income available to be paid to shareholders.
BlackRock Advisors, LLC (the “Manager”), each Fund’s investment adviser, has contractually and/or voluntarily agreed to waive and/or reimburse a portion of each Fund’s expenses. Without such waivers and/or reimbursements, each Fund’s performance would have been lower. With respect to each Fund’s voluntary waiver(s), if any, the Manager is under no obligation to waive and/or reimburse or to continue waiving and/or reimbursing its fees and such voluntary waiver(s) may be reduced or discontinued at any time. With respect to each Fund’s contractual waiver(s), if any, the Manager is under no obligation to continue waiving and/or reimbursing its fees after the applicable termination date of such agreement. See the Notes to Financial Statements for additional information on waivers and/or reimbursements.
Disclosure of Expenses
Shareholders of each Fund may incur the following charges: (a) transactional expenses and (b) operating expenses, including investment advisory fees,, service and distribution fees, including 12b-1 fees, acquired fund fees and expenses, and other fund expenses. The expense examples shown on the previous pages (which are based on a hypothetical investment of $1,000 invested on May 1, 2020 and held through October 31, 2020) are intended to assist shareholders both in calculating expenses based on an investment in each Fund and in comparing these expenses with similar costs of investing in other mutual funds.
The expense examples provide information about actual account values and actual expenses. In order to estimate the expenses a shareholder paid during the period covered by this report, shareholders can divide their account value by $1,000 and then multiply the result by the number corresponding to their Fund and share class under the heading entitled “Expenses Paid During the Period.”
The expense examples also provide information about hypothetical account values and hypothetical expenses based on a Fund’s actual expense ratio and an assumed rate of return of 5% per year before expenses. In order to assist shareholders in comparing the ongoing expenses of investing in these Funds and other funds, compare the 5% hypothetical examples with the 5% hypothetical examples that appear in shareholder reports of other funds.
The expenses shown in the expense examples are intended to highlight shareholders’ ongoing costs only and do not reflect transactional expenses, such as sales charges, if any. Therefore, the hypothetical examples are useful in comparing ongoing expenses only, and will not help shareholders determine the relative total expenses of owning different funds. If these transactional expenses were included, shareholder expenses would have been higher.
Derivative Financial Instruments
The Funds may invest in various derivative financial instruments. These instruments are used to obtain exposure to a security, commodity, index, market, and/or other assets without owning or taking physical custody of securities, commodities and/or other referenced assets or to manage market, equity, credit, interest rate, foreign currency exchange rate, commodity and/or other risks. Derivative financial instruments may give rise to a form of economic leverage and involve risks, including the imperfect correlation between the value of a derivative financial instrument and the underlying asset, possible default of the counterparty to the transaction or illiquidity of the instrument. The Funds’ successful use of a derivative financial instrument depends on the investment adviser’s ability to predict pertinent market movements accurately, which cannot be assured. The use of these instruments may result in losses greater than if they had not been used, may limit the amount of appreciation a Fund can realize on an investment and/or may result in lower distributions paid to shareholders. The Funds’ investments in these instruments, if any, are discussed in detail in the Notes to Financial Statements.
| | |
| 8 | | 2020 BLACKROCK ANNUAL REPORTTO SHAREHOLDERS |
| | |
Consolidated Schedule of Investments October 31, 2020 | | BlackRock GA Disciplined Volatility Equity Fund (Percentages shown are based on Net Assets) |
| | | | | | | | |
| Security | | Shares | | | Value | |
|
Common Stocks | |
|
| Australia — 0.8% | |
Newcrest Mining Ltd. | | | 1,427 | | | $ | 29,593 | |
Woolworths Group Ltd. | | | 580 | | | | 15,602 | |
| | | | | | | | |
| | | | | | | 45,195 | |
| | |
| Belgium — 0.6% | | | | | | |
Etablissements Franz Colruyt NV | | | 19 | | | | 1,125 | |
Proximus SADP | | | 707 | | | | 13,744 | |
Telenet Group Holding NV | | | 569 | | | | 21,884 | |
| | | | | | | | |
| | | | | | | 36,753 | |
| | |
| Canada — 4.8% | | | | | | |
Agnico Eagle Mines Ltd. | | | 310 | | | | 24,541 | |
Barrick Gold Corp. | | | 2,623 | | | | 70,128 | |
CGI, Inc.(a) | | | 244 | | | | 15,140 | |
Empire Co. Ltd., Class A | | | 579 | | | | 15,797 | |
Fairfax Financial Holdings Ltd. | | | 27 | | | | 7,098 | |
Franco-Nevada Corp. | | | 302 | | | | 41,162 | |
Loblaw Cos. Ltd. | | | 681 | | | | 33,899 | |
Thomson Reuters Corp. | | | 475 | | | | 36,929 | |
Wheaton Precious Metals Corp. | | | 812 | | | | 37,263 | |
| | | | | | | | |
| | | | | | | 281,957 | |
| | |
| China — 2.7% | | | | | | |
Alibaba Group Holding Ltd., ADR(a) | | | 35 | | | | 10,664 | |
Bank of Communications Co. Ltd., Class H | | | 15,000 | | | | 7,380 | |
China Mobile Ltd. | | | 6,500 | | | | 39,757 | |
China Telecom Corp. Ltd., Class H | | | 114,000 | | | | 35,786 | |
China Unicom Hong Kong Ltd. | | | 20,000 | | | | 12,328 | |
Lenovo Group Ltd. | | | 14,000 | | | | 8,790 | |
NetEase, Inc., ADR | | | 120 | | | | 10,415 | |
TAL Education Group, ADR(a) | | | 37 | | | | 2,459 | |
ZTO Express Cayman, Inc., ADR | | | 994 | | | | 28,806 | |
| | | | | | | | |
| | | | | | | 156,385 | |
| | |
| Denmark — 1.3% | | | | | | |
Carlsberg AS, Class B | | | 70 | | | | 8,864 | |
Coloplast A/S, Class B | | | 117 | | | | 17,110 | |
DSV Panalpina AS | | | 156 | | | | 25,310 | |
Genmab A/S(a) | | | 36 | | | | 12,025 | |
Novo Nordisk A/S, Class B | | | 129 | | | | 8,226 | |
Tryg A/S | | | 144 | | | | 3,996 | |
| | | | | | | | |
| | | | | | | 75,531 | |
| | |
| Finland — 0.2% | | | | | | |
Nokia OYJ(a) | | | 3,841 | | | | 12,949 | |
| | | | | | | | |
| | |
| France — 2.8% | | | | | | |
BNP Paribas SA(a) | | | 769 | | | | 26,819 | |
Cie de Saint-Gobain(a) | | | 322 | | | | 12,543 | |
EssilorLuxottica SA(a) | | | 138 | | | | 17,037 | |
Eurazeo SE(a) | | | 333 | | | | 15,144 | |
Kering SA | | | 31 | | | | 18,734 | |
Orange SA | | | 1,656 | | | | 18,596 | |
Pernod Ricard SA | | | 59 | | | | 9,505 | |
Safran SA(a) | | | 65 | | | | 6,856 | |
Sanofi | | | 204 | | | | 18,420 | |
Societe Generale SA(a) | | | 487 | | | | 6,617 | |
Worldline SA(a)(b) | | | 157 | | | | 11,629 | |
| | | | | | | | |
| | | | | | | 161,900 | |
| | |
| Germany — 0.9% | | | | | | |
Deutsche Telekom AG, Registered Shares | | | 1,284 | | | | 19,515 | |
| | | | | | | | |
| Security | | Shares | | | Value | |
| | |
| Germany (continued) | | | | | | |
Telefonica Deutschland Holding AG | | | 1,876 | | | $ | 4,732 | |
Vonovia SE | | | 458 | | | | 29,249 | |
| | | | | | | | |
| | | | | | | 53,496 | |
| | |
| Hong Kong — 0.9% | | | | | | |
CLP Holdings Ltd. | | | 2,000 | | | | 18,429 | |
Dairy Farm International Holdings Ltd. | | | 3,100 | | | | 11,677 | |
HKT Trust & HKT Ltd. | | | 2,000 | | | | 2,587 | |
Power Assets Holdings Ltd. | | | 3,500 | | | | 18,024 | |
| | | | | | | | |
| | | | | | | 50,717 | |
| | |
| Italy — 0.4% | | | | | | |
Assicurazioni Generali SpA | | | 517 | | | | 6,935 | |
Intesa Sanpaolo SpA(a) | | | 879 | | | | 1,459 | |
Snam SpA | | | 3,060 | | | | 14,921 | |
| | | | | | | | |
| | | | | | | 23,315 | |
| | |
| Japan — 8.4% | | | | | | |
Ajinomoto Co., Inc. | | | 1,500 | | | | 30,136 | |
Astellas Pharma, Inc. | | | 800 | | | | 10,970 | |
Canon, Inc. | | | 1,400 | | | | 24,369 | |
Chugai Pharmaceutical Co. Ltd. | | | 200 | | | | 7,720 | |
FUJIFILM Holdings Corp. | | | 100 | | | | 5,099 | |
Japan Post Holdings Co. Ltd.(a) | | | 1,100 | | | | 7,548 | |
KDDI Corp. | | | 1,700 | | | | 45,993 | |
Kirin Holdings Co. Ltd. | | | 300 | | | | 5,408 | |
Kose Corp. | | | 100 | | | | 12,748 | |
Kyushu Railway Co. | | | 600 | | | | 12,763 | |
Lawson, Inc. | | | 200 | | | | 9,189 | |
McDonald’s Holdings Co. Japan Ltd. | | | 200 | | | | 9,484 | |
MEIJI Holdings Co. Ltd. | | | 200 | | | | 14,490 | |
Mitsubishi Estate Co. Ltd. | | | 1,400 | | | | 20,882 | |
Mizuho Financial Group, Inc. | | | 610 | | | | 7,510 | |
NEC Corp. | | | 400 | | | | 20,148 | |
Nippon Telegraph & Telephone Corp. | | | 2,800 | | | | 58,900 | |
Nitori Holdings Co. Ltd. | | | 100 | | | | 20,556 | |
NTT Data Corp. | | | 1,100 | | | | 12,415 | |
NTT DOCOMO, Inc. | | | 1,100 | | | | 40,959 | |
Pan Pacific International Holdings Corp. | | | 100 | | | | 2,122 | |
Recruit Holdings Co. Ltd. | | | 300 | | | | 11,415 | |
Seven & i Holdings Co. Ltd. | | | 400 | | | | 12,158 | |
Shionogi & Co. Ltd. | | | 200 | | | | 9,434 | |
Softbank Corp. | | | 600 | | | | 6,982 | |
Sony Corp. | | | 100 | | | | 8,337 | |
Suntory Beverage & Food Ltd. | | | 500 | | | | 17,244 | |
Toyo Suisan Kaisha Ltd. | | | 100 | | | | 4,977 | |
Yamada Denki Co. Ltd. | | | 4,700 | | | | 22,916 | |
Yamazaki Baking Co. Ltd. | | | 1,200 | | | | 19,711 | |
| | | | | | | | |
| | | | | | | 492,583 | |
| | |
| Luxembourg — 0.1% | | | | | | |
ArcelorMittal SA(a) | | | 480 | | | | 6,509 | |
| | | | | | | | |
| | |
| Netherlands — 0.4% | | | | | | |
Koninklijke Ahold Delhaize NV | | | 788 | | | | 21,604 | |
| | | | | | | | |
| | |
| Norway — 0.1% | | | | | | |
Telenor ASA | | | 269 | | | | 4,157 | |
| | | | | | | | |
| | |
| Singapore — 0.6% | | | | | | |
Singapore Telecommunications Ltd. | | | 23,800 | | | | 35,379 | |
| | | | | | | | |
| | |
| South Korea — 0.5% | | | | | | |
Hyundai Marine & Fire Insurance Co. Ltd. | | | 195 | | | | 4,016 | |
| | |
SCHEDULE OF INVESTMENTS | | 9 |
| | |
Consolidated Schedule of Investments (continued) October 31, 2020 | | BlackRock GA Disciplined Volatility Equity Fund (Percentages shown are based on Net Assets) |
| | | | | | | | |
| Security | | Shares | | | Value | |
| | |
| South Korea (continued) | | | | | | |
Kakao Corp. | | | 30 | | | $ | 8,748 | |
SK Telecom Co. Ltd. | | | 76 | | | | 14,412 | |
| | | | | | | | |
| | | | | | | 27,176 | |
| | |
| Sweden — 0.8% | | | | | | |
Hexagon AB, B Shares(a) | | | 351 | | | | 25,727 | |
Telefonaktiebolaget LM Ericsson, B Shares | | | 153 | | | | 1,708 | |
Volvo AB, B Shares(a) | | | 1,004 | | | | 19,515 | |
| | | | | | | | |
| | | | | | | 46,950 | |
| | |
| Switzerland — 3.6% | | | | | | |
Kuehne + Nagel International AG, Registered Shares | | | 55 | | | | 10,992 | |
Nestle SA, Registered Shares | | | 776 | | | | 87,283 | |
Novartis AG, Registered Shares | | | 152 | | | | 11,844 | |
Roche Holding AG | | | 123 | | | | 39,524 | |
Sika AG, Registered Shares | | | 103 | | | | 25,339 | |
Sonova Holding AG, Registered Shares(a) | | | 33 | | | | 7,833 | |
STMicroelectronics NV | | | 210 | | | | 6,406 | |
Straumann Holding AG, Registered Shares | | | 22 | | | | 22,965 | |
| | | | | | | | |
| | | | | | | 212,186 | |
| | |
| Taiwan — 3.2% | | | | | | |
Asustek Computer, Inc. | | | 4,000 | | | | 33,984 | |
Chang Hwa Commercial Bank Ltd. | | | 5,449 | | | | 3,249 | |
Chicony Electronics Co. Ltd. | | | 4,000 | | | | 12,059 | |
China Development Financial Holding Corp. | | | 52,000 | | | | 15,260 | |
Chunghwa Telecom Co. Ltd. | | | 4,000 | | | | 15,007 | |
CTBC Financial Holding Co. Ltd. | | | 3,000 | | | | 1,895 | |
Lite-On Technology Corp. | | | 24,000 | | | | 39,094 | |
Mega Financial Holding Co. Ltd. | | | 5,000 | | | | 4,818 | |
Quanta Computer, Inc. | | | 3,000 | | | | 7,570 | |
Synnex Technology International Corp. | | | 16,000 | | | | 23,779 | |
Taiwan Cooperative Financial Holding Co. Ltd. | | | 49,481 | | | | 33,238 | |
| | | | | | | | |
| | | | | | | 189,953 | |
| | |
| United Kingdom — 1.7% | | | | | | |
AstraZeneca PLC | | | 63 | | | | 6,326 | |
Berkeley Group Holdings PLC | | | 433 | | | | 22,766 | |
Ferguson PLC | | | 243 | | | | 24,135 | |
GlaxoSmithKline PLC | | | 1,589 | | | | 26,534 | |
RELX PLC | | | 947 | | | | 18,739 | |
Unilever NV | | | 36 | | | | 2,029 | |
| | | | | | | | |
| | | | | | | 100,529 | |
| | |
| United States — 58.7% | | | | | | |
Abbott Laboratories | | | 245 | | | | 25,752 | |
Adobe, Inc.(a) | | | 17 | | | | 7,601 | |
Air Products & Chemicals, Inc. | | | 118 | | | | 32,596 | |
Allstate Corp. | | | 379 | | | | 33,636 | |
Alnylam Pharmaceuticals, Inc.(a) | | | 35 | | | | 4,304 | |
Alphabet, Inc., Class C(a) | | | 13 | | | | 21,073 | |
Altair Engineering, Inc., Class A(a) | | | 685 | | | | 29,476 | |
Altria Group, Inc. | | | 75 | | | | 2,706 | |
Amazon.com, Inc.(a) | | | 8 | | | | 24,289 | |
American Electric Power Co., Inc. | | | 177 | | | | 15,918 | |
American Tower Corp. | | | 185 | | | | 42,485 | |
American Water Works Co., Inc. | | | 164 | | | | 24,684 | |
Amgen, Inc. | | | 43 | | | | 9,328 | |
Aon PLC, Class A | | | 124 | | | | 22,817 | |
Applied Materials, Inc. | | | 614 | | | | 36,367 | |
Arthur J Gallagher & Co. | | | 32 | | | | 3,319 | |
AT&T, Inc. | | | 406 | | | | 10,970 | |
AutoZone, Inc.(a) | | | 29 | | | | 32,740 | |
Baxter International, Inc. | | | 557 | | | | 43,206 | |
| | | | | | | | |
| Security | | Shares | | | Value | |
| | |
| United States (continued) | | | | | | |
Berkshire Hathaway, Inc., Class B(a) | | | 289 | | | $ | 58,349 | |
BioMarin Pharmaceutical, Inc.(a) | | | 56 | | | | 4,168 | |
Booz Allen Hamilton Holding Corp. | | | 349 | | | | 27,396 | |
Boston Scientific Corp.(a) | | | 621 | | | | 21,282 | |
Brown & Brown, Inc. | | | 451 | | | | 19,623 | |
C.H. Robinson Worldwide, Inc. | | | 597 | | | | 52,793 | |
Cadence Design Systems, Inc.(a) | | | 72 | | | | 7,875 | |
Campbell Soup Co. | | | 136 | | | | 6,347 | |
Cboe Global Markets, Inc. | | | 372 | | | | 30,240 | |
Charter Communications, Inc., Class A(a) | | | 78 | | | | 47,098 | |
Church & Dwight Co., Inc. | | | 131 | | | | 11,579 | |
Cisco Systems, Inc. | | | 645 | | | | 23,155 | |
Citrix Systems, Inc. | | | 322 | | | | 36,473 | |
Clorox Co. | | | 128 | | | | 26,528 | |
CME Group, Inc. | | | 136 | | | | 20,498 | |
Coca-Cola Co. | | | 101 | | | | 4,854 | |
Cognizant Technology Solutions Corp., Class A | | | 34 | | | | 2,428 | |
Colgate-Palmolive Co. | | | 758 | | | | 59,799 | |
Comcast Corp., Class A | | | 761 | | | | 32,145 | |
Consolidated Edison, Inc. | | | 335 | | | | 26,294 | |
Coupa Software, Inc.(a) | | | 11 | | | | 2,945 | |
Crowdstrike Holdings, Inc., Class A(a) | | | 314 | | | | 38,886 | |
Crown Castle International Corp. | | | 224 | | | | 34,989 | |
DocuSign, Inc.(a) | | | 103 | | | | 20,832 | |
Dollar General Corp. | | | 223 | | | | 46,542 | |
Duke Realty Corp. | | | 717 | | | | 27,239 | |
Edwards Lifesciences Corp.(a) | | | 57 | | | | 4,086 | |
Eli Lilly & Co. | | | 210 | | | | 27,397 | |
Entergy Corp. | | | 127 | | | | 12,855 | |
Evergy, Inc. | | | 650 | | | | 35,880 | |
F5 Networks, Inc.(a) | | | 42 | | | | 5,583 | |
Facebook, Inc., Class A(a) | | | 24 | | | | 6,315 | |
Fair Isaac Corp.(a) | | | 10 | | | | 3,914 | |
Fiserv, Inc.(a) | | | 126 | | | | 12,029 | |
Fortune Brands Home & Security, Inc. | | | 258 | | | | 20,864 | |
Genuine Parts Co. | | | 27 | | | | 2,442 | |
Gilead Sciences, Inc. | | | 484 | | | | 28,145 | |
Global Payments, Inc. | | | 117 | | | | 18,456 | |
Hilton Worldwide Holdings, Inc.(a) | | | 243 | | | | 21,338 | |
Home Depot, Inc. | | | 163 | | | | 43,474 | |
Humana, Inc. | | | 23 | | | | 9,183 | |
Intel Corp. | | | 179 | | | | 7,926 | |
Intercontinental Exchange, Inc. | | | 86 | | | | 8,118 | |
International Business Machines Corp. | | | 71 | | | | 7,928 | |
Intuit, Inc. | | | 82 | | | | 25,804 | |
Jack Henry & Associates, Inc. | | | 80 | | | | 11,860 | |
Johnson & Johnson | | | 197 | | | | 27,011 | |
JPMorgan Chase & Co. | | | 204 | | | | 20,000 | |
Kellogg Co. | | | 196 | | | | 12,326 | |
Keysight Technologies, Inc.(a) | | | 247 | | | | 25,903 | |
Kimberly-Clark Corp. | | | 312 | | | | 41,368 | |
Liberty Broadband Corp., Class C(a) | | | 29 | | | | 4,110 | |
Livongo Health, Inc.(a)(c) | | | 50 | | | | 6,988 | |
Lowe’s Cos., Inc. | | | 285 | | | | 45,058 | |
Marsh & McLennan Cos., Inc. | | | 455 | | | | 47,074 | |
Masco Corp. | | | 667 | | | | 35,751 | |
Mastercard, Inc., Class A | | | 109 | | | | 31,462 | |
McDonald’s Corp. | | | 82 | | | | 17,466 | |
Medtronic PLC | | | 405 | | | | 40,731 | |
Merck & Co., Inc. | | | 837 | | | | 62,951 | |
Micron Technology, Inc.(a) | | | 937 | | | | 47,169 | |
Microsoft Corp. | | | 352 | | | | 71,269 | |
| | |
| 10 | | 2020 BLACKROCK ANNUAL REPORTTO SHAREHOLDERS |
| | |
Consolidated Schedule of Investments (continued) October 31, 2020 | | BlackRock GA Disciplined Volatility Equity Fund (Percentages shown are based on Net Assets) |
| | | | | | | | |
| Security | | Shares | | | Value | |
| | |
| United States (continued) | | | | | | |
Mondelez International, Inc., Class A | | | 417 | | | $ | 22,151 | |
Netflix, Inc.(a) | | | 68 | | | | 32,350 | |
Neurocrine Biosciences, Inc.(a) | | | 44 | | | | 4,341 | |
New Relic, Inc.(a) | | | 341 | | | | 20,685 | |
Newmont Corp. | | | 1,370 | | | | 86,091 | |
NextEra Energy, Inc. | | | 864 | | | | 63,253 | |
Oracle Corp. | | | 505 | | | | 28,336 | |
O’Reilly Automotive, Inc.(a) | | | 34 | | | | 14,844 | |
Paycom Software, Inc.(a) | | | 73 | | | | 26,579 | |
PayPal Holdings, Inc.(a) | | | 104 | | | | 19,358 | |
PepsiCo, Inc. | | | 547 | | | | 72,910 | |
Pfizer, Inc. | | | 1,120 | | | | 39,738 | |
Procter & Gamble Co. | | | 174 | | | | 23,855 | |
Public Storage | | | 20 | | | | 4,581 | |
QUALCOMM, Inc. | | | 518 | | | | 63,900 | |
Regeneron Pharmaceuticals, Inc.(a) | | | 73 | | | | 39,680 | |
Republic Services, Inc. | | | 475 | | | | 41,881 | |
salesforce.com, Inc.(a) | | | 265 | | | | 61,552 | |
Seagen, Inc.(a) | | | 37 | | | | 6,172 | |
Southern Co. | | | 580 | | | | 33,321 | |
Square, Inc., Class A(a) | | | 80 | | | | 12,390 | |
Starbucks Corp. | | | 205 | | | | 17,827 | |
Stryker Corp. | | | 87 | | | | 17,575 | |
Target Corp. | | | 210 | | | | 31,966 | |
Thermo Fisher Scientific, Inc. | | | 45 | | | | 21,290 | |
TJX Cos., Inc.(a) | | | 331 | | | | 16,815 | |
TransDigm Group, Inc. | | | 115 | | | | 54,902 | |
TransUnion | | | 274 | | | | 21,827 | |
Travelers Cos., Inc. | | | 183 | | | | 22,090 | |
U.S. Bancorp | | | 688 | | | | 26,798 | |
UnitedHealth Group, Inc. | | | 177 | | | | 54,010 | |
Universal Health Services, Inc., Class B(a) | | | 211 | | | | 23,115 | |
VeriSign, Inc.(a) | | | 130 | | | | 24,791 | |
Verizon Communications, Inc. | | | 1,028 | | | | 58,586 | |
Vertex Pharmaceuticals, Inc.(a) | | | 31 | | | | 6,459 | |
Visa, Inc., Class A | | | 190 | | | | 34,525 | |
Vistra Corp. | | | 743 | | | | 12,906 | |
W.R. Berkley Corp. | | | 55 | | | | 3,307 | |
Walmart, Inc. | | | 361 | | | | 50,089 | |
Walt Disney Co.(a) | | | 351 | | | | 42,559 | |
Waste Connections, Inc. | | | 73 | | | | 7,250 | |
Waste Management, Inc. | | | 117 | | | | 12,625 | |
WEC Energy Group, Inc. | | | 175 | | | | 17,596 | |
Western Union Co. | | | 914 | | | | 17,768 | |
Weyerhaeuser Co. | | | 642 | | | | 17,520 | |
Workday, Inc., Class A(a) | | | 143 | | | | 30,047 | |
Xilinx, Inc. | | | 336 | | | | 39,880 | |
| | | | | | | | |
| Security | | Shares | | | Value | |
| | |
| United States (continued) | | | | | | |
Zentalis Pharmaceuticals, Inc.(a) | | | 204 | | | $ | 8,076 | |
Zillow Group, Inc., Class C(a) | | | 458 | | | | 40,588 | |
Zoetis, Inc. | | | 92 | | | | 14,587 | |
| | | | | |
| | | | | | | 3,429,200 | |
| | | | | |
| |
Total Common Stocks — 93.5%
(Cost: $5,048,046) | | | | 5,464,424 | |
| | | | | |
| | |
| Investment Companies | | | | | | |
| | |
| United States — 1.8% | | | | | | |
iShares Gold Trust(a)(d)(e) | | | 5,705 | | | | 102,062 | |
| | | | | |
| |
Total Investment Companies — 1.8%
(Cost: $89,028) | | | | 102,062 | |
| | | | | |
| |
Total Long-Term Investments — 95.3%
(Cost: $5,137,074) | | | | 5,566,486 | |
| | | | | |
| | |
| Short-Term Securities | | | | | | |
| | |
| Money Market Funds — 5.6% | | | | | | |
BlackRock Liquidity Funds, T-Fund, Institutional Class, 0.01%(d)(f) | | | 330,505 | | | | 330,505 | |
| | | | | |
| |
Total Short-Term Securities — 5.6%
(Cost: $330,505) | | | | 330,505 | |
| | | | | |
| |
Options Purchased — 0.0%
(Cost: $1,351) | | | | 1,220 | |
| | | | | |
| |
Total Investments Before Options Written — 100.9%
(Cost: $5,468,930) | | | | 5,898,211 | |
| | | | | |
| |
Options Written — (0.0)%
(Premiums Received: $(680)) | | | | (641 | ) |
| | | | | |
| |
Total Investments, Net of Options Written — 100.9%
(Cost: $5,468,250) | | | | 5,897,570 | |
| |
Liabilities in Excess of Other Assets — (0.9)% | | | | (54,403 | ) |
| | | | | |
| |
Net Assets — 100.0% | | | $ | 5,843,167 | |
| | | | | |
| (a) | Non-income producing security. |
| (b) | Security exempt from registration pursuant to Rule 144A under the Securities Act of 1933, as amended. These securities may be resold in transactions exempt from registration to qualified institutional investors. |
| (c) | Security is valued using significant unobservable inputs and is classified as Level 3 in the fair value hierarchy. |
| (d) | Affiliate of the Fund. |
| (e) | All or a portion of the security is held by a wholly-owned subsidiary. See Note 1 of the Notes to Financial Statements for details on the wholly-owned subsidiary. |
| (f) | Annualized 7-day yield as of period end. |
| | |
SCHEDULE OF INVESTMENTS | | 11 |
| | |
Consolidated Schedule of Investments (continued) October 31, 2020 | | BlackRock GA Disciplined Volatility Equity Fund |
Affiliates
Investments in issuers considered to be affiliate(s) of the Fund during the year ended October 31, 2020 for purposes of Section 2(a)(3) of the 1940 Act, as amended, were as follows:
| | | | | | | | | | | | | | | | | | | | | | | | | | | | | | | | | | | | |
| Affiliated Issuer | | Value at
10/31/19 | | | Purchases
at Cost | | | Proceeds
from Sales | | | Net
Realized
Gain (Loss) | | | Change in
Unrealized
Appreciation
(Depreciation) | | | Value at
10/31/20 | | | Shares
Held at
10/31/20 | | | Income | | | Capital Gain
Distributions
from
Underlying
Funds | |
BlackRock Liquidity Funds, T-Fund, Institutional Class | | $ | 219,979 | | | $ | 110,526 | (a) | | $ | — | | | $ | — | | | $ | — | | | $ | 330,505 | | | | 330,505 | | | $ | 1,607 | | | $ | — | |
iShares Gold Trust | | | — | | | | 116,803 | | | | (30,696 | ) | | | 2,921 | | | | 13,034 | | | | 102,062 | | | | 5,705 | | | | — | | | | 1 | |
| | | | | | | | | | | | | | | | | | | | | | | | | | | | | | | | | | | | |
| | | | | | | | | | | | | | $ | 2,921 | | | $ | 13,034 | | | $ | 432,567 | | | | | | | $ | 1,607 | | | $ | 1 | |
| | | | | | | | | | | | | | | | | | | | | | | | | | | | | | | | | | | | |
| | (a) | Represents net amount purchased (sold). | |
Derivative Financial Instruments Outstanding as of Period End
Futures Contracts
| | | | | | | | | | | | | | | | |
| Description | | Number of
Contracts | | | Expiration
Date | | | Notional
Amount (000) | | | Value/
Unrealized
Appreciation
(Depreciation) | |
Long Contracts | | | | | | | | | | | | | | | | |
SGX Nifty 50 Index | | | 7 | | | | 11/26/20 | | | $ | 163 | | | $ | (3,519 | ) |
| | | | | | | | | | | | | | | | |
Forward Foreign Currency Exchange Contracts
| | | | | | | | | | | | | | | | | | | | |
| Currency Purchased | | | Currency Sold | | | Counterparty | | Settlement Date | | | Unrealized
Appreciation
(Depreciation) | |
| JPY | | | 11,650,000 | | | USD | | | 110,672 | | | UBS AG | | | 12/17/20 | | | $ | 671 | |
| | | | | | | | | | | | | | | | | | | | |
| INR | | | 7,812,000 | | | USD | | | 105,661 | | | Bank of America N.A. | | | 12/08/20 | | | | (1,199 | ) |
| CHF | | | 79 | | | USD | | | 87 | | | BNP Paribas S.A. | | | 12/17/20 | | | | (1 | ) |
| CHF | | | 108,921 | | | USD | | | 120,351 | | | Morgan Stanley & Co. International PLC | | | 12/17/20 | | | | (1,399 | ) |
| | | | | | | | | | | | | | | | | | | | |
| | | | | | | | | | | | | | | | | | | (2,599 | ) |
| | | | | | | | | | | | | | | | | | | | |
| | | | | | | | | | | | | | | | | | $ | (1,928 | ) |
| | | | | |
OTC Options Purchased
| | | | | | | | | | | | | | | | | | | | | | | | | | |
| Description | | Counterparty | | Expiration
Date | | | Exercise Price | | | Notional Amount (000) | | | Value | |
Put | | | | | | | | | | | | | | | | | | | | | | | | | | |
USD Currency | | Morgan Stanley & Co. International PLC | | | 01/21/21 | | | | JPY | | | | 104.00 | | | | USD | | | | 100 | | | $ | 1,220 | |
| | | | | | | | | | | | | | | | | | | | | | | | | | |
OTC Options Written
| | | | | | | | | | | | | | | | | | | | | | |
| Description | | Counterparty | | Expiration
Date | | | Exercise Price | | | Notional
Amount (000) | | | Value | |
Call | | | | | | | | | | | | | | | | | | | | | | |
USD Currency | | Morgan Stanley & Co. International PLC | | | 01/21/21 | | | | JPY 108.00 | | | | USD | | | | 100 | | | $ | (276 | ) |
| | | | | | | | | | | | | | | | | | | | | | |
Put | | | | | | | | | | | | | | | | | | | | | | |
USD Currency | | Morgan Stanley & Co. International PLC | | | 01/21/21 | | | | JPY 100.00 | | | | USD | | | | 100 | | | | (365 | ) |
| | | | | | | | | | | | | | | | | | | | | | |
| | | | | | | | | | | | | | | | | | | | $ | (641 | ) |
| | | | | | | | | | | | | | | | | | | | | | |
| | |
| 12 | | 2020 BLACKROCK ANNUAL REPORTTO SHAREHOLDERS |
| | |
Consolidated Schedule of Investments (continued) October 31, 2020 | | BlackRock GA Disciplined Volatility Equity Fund |
Balances Reported in the Statements of Assets and Liabilities for Options Written
| | | | | | | | | | | | | | | | | | | | |
| Description | | Swap
Premiums
Paid | | | Swap
Premiums
Received | | | Unrealized
Appreciation | | | Unrealized
Depreciation | | | Value | |
Options Written | | $ | — | | | $ | — | | | $ | 65 | | | $ | (26 | ) | | | $ (641 | ) |
Derivative Financial Instruments Categorized by Risk Exposure
As of period end, the fair values of derivative financial instruments located in the Statements of Assets and Liabilities were as follows:
| | | | | | | | | | | | | | | | | | | | | | | | | | | | |
| | | Commodity
Contracts | | | Credit
Contracts | | | Equity
Contracts | | | Foreign
Currency
Exchange
Contracts | | | Interest
Rate
Contracts | | | Other
Contracts | | | Total | |
Assets — Derivative Financial Instruments | | | | | | | | | | | | | | | | | | | | | | | | | | | | |
Forward foreign currency exchange contracts | | | | | | | | | | | | | | | | | | | | | | | | | | | | |
Unrealized appreciation on forward foreign currency exchange contracts | | $ | — | | | $ | — | | | $ | — | | | $ | 671 | | | $ | — | | | $ | — | | | $ | 671 | |
Options purchased | | | | | | | | | | | | | | | | | | | | | | | | | | | | |
Investments at value — unaffiliated(a) | | | — | | | | — | | | | — | | | | 1,220 | | | | — | | | | — | | | | 1,220 | |
| | | | | | | | | | | | | | | | | | | | | | | | | | | | |
| | $ | — | | | $ | — | | | $ | — | | | $ | 1,891 | | | $ | — | | | $ | — | | | $ | 1,891 | |
| | | | | | | | | | | | | | | | | | | | | | | | | | | | |
Liabilities — Derivative Financial Instruments | | | | | | | | | | | | | | | | | | | | | | | | | | | | |
Futures contracts | | | | | | | | | | | | | | | | | | | | | | | | | | | | |
Unrealized depreciation on futures contracts(b) | | $ | — | | | $ | — | | | $ | 3,519 | | | $ | — | | | $ | — | | | $ | — | | | $ | 3,519 | |
Forward foreign currency exchange contracts | | | | | | | | | | | | | | | | | | | | | | | | | | | | |
Unrealized depreciation on forward foreign currency exchange contracts | | | — | | | | — | | | | — | | | | 2,599 | | | | — | | | | — | | | | 2,599 | |
Options written | | | | | | | | | | | | | | | | | | | | | | | | | | | | |
Options written at value | | | — | | | | — | | | | — | | | | 641 | | | | — | | | | — | | | | 641 | |
| | | | | | | | | | | | | | | | | | | | | | | | | | | | |
| | $ | — | | | $ | — | | | $ | 3,519 | | | $ | 3,240 | | | $ | — | | | $ | — | | | $ | 6,759 | |
| | | | | | | | | | | | | | | | | | | | | | | | | | | | |
| | (a) | Includes options purchased at value as reported in the Schedule of Investments. | |
| | (b) | Net cumulative unrealized appreciation (depreciation) on futures contracts and centrally cleared swaps, if any, are reported in the Schedule of Investments. In the Statements of Assets and Liabilities, only current day’s variation margin is reported in receivables or payables and the net cumulative unrealized appreciation (depreciation) is included in accumulated earnings (loss). | |
For the year ended October 31, 2020, the effect of derivative financial instruments in the Statements of Operations was as follows:
| | | | | | | | | | | | | | | | | | | | | | | | | | | | |
| | | Commodity
Contracts | | | Credit
Contracts | | | Equity
Contracts | | | Foreign
Currency
Exchange
Contracts | | | Interest
Rate
Contracts | | | Other Contracts | | | Total | |
Net Realized Gain (Loss) from | | | | | | | | | | | | | | | | | | | | | | | | | | | | |
Futures contracts | | $ | — | | | $ | — | | | $ | (184 | ) | | $ | — | | | $ | — | | | $ | — | | | $ | (184 | ) |
Forward foreign currency exchange contracts | | | — | | | | — | | | | — | | | | 9,046 | | | | — | | | | — | | | | 9,046 | |
| | | | | | | | | | | | | | | | | | | | | | | | | | | | |
| | $ | — | | | $ | — | | | $ | (184 | ) | | $ | 9,046 | | | $ | — | | | $ | — | | | $ | 8,862 | |
| | | | | | | | | | | | | | | | | | | | | | | | | | | | |
| | | | | | | |
| Net Change in Unrealized Appreciation (Depreciation) on | | | | | | | | | | | | | | | | | | | | | |
Futures contracts | | $ | — | | | $ | — | | | $ | (6,625 | ) | | $ | — | | | $ | — | | | $ | — | | | $ | (6,625 | ) |
Forward foreign currency exchange contracts | | | — | | | | — | | | | — | | | | (3,221 | ) | | | — | | | | — | | | | (3,221 | ) |
Options purchased(a) | | | — | | | | — | | | | — | | | | (131 | ) | | | — | | | | — | | | | (131 | ) |
Options written | | | — | | | | — | | | | — | | | | 39 | | | | — | | | | — | | | | 39 | |
| | | | | | | | | | | | | | | | | | | | | | | | | | | | |
| | $ | — | | | $ | — | | | $ | (6,625 | ) | | $ | (3,313 | ) | | $ | — | | | $ | — | | | $ | (9,938 | ) |
| | | | | | | | | | | | | | | | | | | | | | | | | | | | |
| | (a) | Options purchased are included in net change in unrealized appreciation (depreciation) on investments — unaffiliated. | |
Average Quarterly Balances of Outstanding Derivative Financial Instruments
| | | | |
Futures contracts | |
Average notional value of contracts — long | | $ | 155,790 | |
Forward foreign currency exchange contracts | |
Average amounts purchased — in USD | | $ | 51,553 | |
Average amounts sold — in USD | | $ | 309,934 | |
Options | |
Average value of option contracts purchased | | $ | 305 | |
Average value of option contracts written | | $ | 160 | |
| | |
SCHEDULE OF INVESTMENTS | | 13 |
| | |
Consolidated Schedule of Investments (continued) October 31, 2020 | | BlackRock GA Disciplined Volatility Equity Fund |
For more information about the Fund’s investment risks regarding derivative financial instruments, refer to the Notes to Financial Statements.
Derivative Financial Instruments — Offsetting as of Period End
The Fund’s derivative assets and liabilities (by type) were as follows:
| | | | | | | | |
| | | Assets | | | Liabilities | |
Derivative Financial Instruments | | | | | | | | |
Futures contracts | | $ | — | | | $ | 458 | |
Forward foreign currency exchange contracts | | | 671 | | | | 2,599 | |
Options | | | 1,220 | (a) | | | 641 | |
| | | | | | | | |
Total derivative assets and liabilities in the Statements of Assets and Liabilities | | | 1,891 | | | | 3,698 | |
| | | | | | | | |
Derivatives not subject to a Master Netting Agreement or similar agreement (“MNA”) | | | — | | | | (458 | ) |
| | | | | | | | |
Total derivative assets and liabilities subject to an MNA | | $ | 1,891 | | | $ | 3,240 | |
| | | | | | | | |
| | (a) | Includes options purchased at value which is included in Investments at value — unaffiliated in the Statements of Assets and Liabilities and reported in the Schedule of Investments. | |
The following table presents the Fund’s derivative assets (and liabilities) by counterparty net of amounts available for offset under an MNA and net of the related collateral received (and pledged) by the Fund:
| | | | | | | | | | | | | | | | | | | | | | | | |
| Counterparty | | Derivative
Assets
Subject to
an MNA by
Counterparty | | | Derivatives Available for Offset(a) | | Non-Cash
Collateral
Received | | | Cash
Collateral
Received | | | Net Amount of Derivative Assets(b) |
Morgan Stanley & Co. International PLC | | $ | 1,220 | | | $ | (1,220 | ) | | | | $ | — | | | $ | — | | | $ | — | | | |
UBS AG | | | 671 | | | | — | | | | | | — | | | | — | | | | 671 | | | |
| | | | | | | | | | | | | | | | | | | | | | | | |
| | $ | 1,891 | | | $ | (1,220 | ) | | | | $ | — | | | $ | — | | | $ | 671 | | | |
| | | | | | | | | | | | | | | | | | | | | | | | |
| | | | | | | | | | | | | | | | | | | | | | | | |
| Counterparty | | Derivative
Liabilities
Subject to
an MNA by
Counterparty | | | Derivatives Available
for Offset(a) | | Non-Cash
Collateral
Pledged | | | Cash
Collateral
Pledged | | | Net Amount of Derivative
Liabilities(c) |
Bank of America N.A | | $ | 1,199 | | | $ | — | | | | | $ | — | | | $ | — | | | $ | 1,199 | | | |
BNP Paribas S.A | | | 1 | | | | — | | | | | | — | | | | — | | | | 1 | | | |
Morgan Stanley & Co. International PLC | | | 2,040 | | | | (1,220 | ) | | | | | — | | | | — | | | | 820 | | | |
| | | | | | | | | | | | | | | | | | | | | | | | |
| | $ | 3,240 | | | $ | (1,220 | ) | | | | $ | — | | | $ | — | | | $ | 2,020 | | | |
| | | | | | | | | | | | | | | | | | | | | | | | |
| | (a) | The amount of derivatives available for offset is limited to the amount of derivative asset and/or liabilities that are subject to an MNA. | |
| | (b) | Net amount represents the net amount receivable from the counterparty in the event of default. | |
| | (c) | Net amount represents the net amount payable due to counterparty in the event of default. Net amount may be offset further by the options written receivable/payable on the Statements of Assets and Liabilities. | |
Fair Value Hierarchy as of Period End
Various inputs are used in determining the fair value of financial instruments. For description of the input levels and information about the Fund’s policy regarding valuation of financial instruments, refer to the Notes to Financial Statements.
The following table summarizes the Fund’s investments and derivative financial instruments categorized in the disclosure hierarchy. The breakdown of the Fund’s investments into major categories is disclosed in the Schedule of Investments above.
| | | | | | | | | | | | | | | | |
| | | Level 1 | | | Level 2 | | | Level 3 | | | Total | |
Assets | |
Investments | |
Long-Term Investments | |
Common Stocks | | | | | | | | | | | | | | | | |
Australia | | $ | — | | | $ | 45,195 | | | $ | — | | | $ | 45,195 | |
Belgium | | | 1,125 | | | | 35,628 | | | | — | | | | 36,753 | |
Canada | | | 281,957 | | | | — | | | | — | | | | 281,957 | |
China | | | 52,344 | | | | 104,041 | | | | — | | | | 156,385 | |
| | |
| 14 | | 2020 BLACKROCK ANNUAL REPORTTO SHAREHOLDERS |
| | |
Consolidated Schedule of Investments (continued) October 31, 2020 | | BlackRock GA Disciplined Volatility Equity Fund |
Fair Value Hierarchy as of Period End (continued)
| | | | | | | | | | | | | | | | |
| | | Level 1 | | | Level 2 | | | Level 3 | | | Total | |
Common Stocks (continued) | | | | | | | | | | | | | | | | |
Denmark | | $ | — | | | $ | 75,531 | | | $ | — | | | $ | 75,531 | |
Finland | | | — | | | | 12,949 | | | | — | | | | 12,949 | |
France | | | — | | | | 161,900 | | | | — | | | | 161,900 | |
Germany | | | — | | | | 53,496 | | | | — | | | | 53,496 | |
Hong Kong | | | — | | | | 50,717 | | | | — | | | | 50,717 | |
Italy | | | — | | | | 23,315 | | | | — | | | | 23,315 | |
Japan | | | — | | | | 492,583 | | | | — | | | | 492,583 | |
Luxembourg | | | — | | | | 6,509 | | | | — | | | | 6,509 | |
Netherlands | | | — | | | | 21,604 | | | | — | | | | 21,604 | |
Norway | | | — | | | | 4,157 | | | | — | | | | 4,157 | |
Singapore | | | — | | | | 35,379 | | | | — | | | | 35,379 | |
South Korea | | | — | | | | 27,176 | | | | — | | | | 27,176 | |
Sweden | | | — | | | | 46,950 | | | | — | | | | 46,950 | |
Switzerland | | | — | | | | 212,186 | | | | — | | | | 212,186 | |
Taiwan | | | — | | | | 189,953 | | | | — | | | | 189,953 | |
United Kingdom | | | — | | | | 100,529 | | | | — | | | | 100,529 | |
United States | | | 3,422,212 | | | | — | | | | 6,988 | | | | 3,429,200 | |
Investment Companies | | | 102,062 | | | | — | | | | — | | | | 102,062 | |
Short-Term Securities | | | | | | | | | | | | | | | | |
Money Market Funds | | | 330,505 | | | | — | | | | — | | | | 330,505 | |
Options Purchased | | | | | | | | | | | | | | | | |
Foreign Currency Exchange Contracts | | | — | | | | 1,220 | | | | — | | | | 1,220 | |
| | | | | | | | | | | | | | | | |
| | $ | 4,190,205 | | | $ | 1,701,018 | | | $ | 6,988 | | | $ | 5,898,211 | |
| | | | | | | | | | | | | | | | |
Derivative Financial Instruments(a) | |
Assets | |
Foreign Currency Exchange Contracts | | $ | — | | | $ | 671 | | | $ | — | | | $ | 671 | |
Liabilities | |
Equity Contracts | | | (3,519 | ) | | | — | | | | — | | | | (3,519 | ) |
Foreign Currency Exchange Contracts | | | — | | | | (3,240 | ) | | | — | | | | (3,240 | ) |
| | | | | | | | | | | | | | | | |
| | $ | (3,519 | ) | | $ | (2,569 | ) | | $ | — | | | $ | (6,088 | ) |
| | | | | | | | | | | | | | | | |
| | (a) | Derivative financial instruments are futures contracts, forward foreign currency exchange contracts and options written. Futures contracts and forward foreign currency exchange contracts are valued at the unrealized appreciation (depreciation) on the instrument and options written are shown at value. | |
See notes to financial statements.
| | |
SCHEDULE OF INVESTMENTS | | 15 |
| | |
Schedule of Investments October 31, 2020 | | BlackRock GA Dynamic Equity Fund (Percentages shown are based on Net Assets) |
| | | | | | | | |
| Security | | Shares | | | Value | |
|
Common Stocks | |
|
| Argentina — 0.0% | |
Globant SA(a) | | | 15 | | | $ | 2,709 | |
| | | | | | | | |
| | |
| Australia — 0.0% | | | | | | |
BHP Group PLC | | | 144 | | | | 2,790 | |
| | | | | | | | |
| | |
| Brazil — 0.0% | | | | | | |
Vale SA, ADR | | | 185 | | | | 1,956 | |
| | | | | | | | |
| | |
| Canada — 1.0% | | | | | | |
Enbridge, Inc. | | | 2,261 | | | | 62,299 | |
| | | | | | | | |
| | |
| China — 3.7% | | | | | | |
AAC Technologies Holdings, Inc. | | | 500 | | | | 2,628 | |
Aier Eye Hospital Group Co. Ltd., Class A | | | 510 | | | | 4,753 | |
Alibaba Group Holding Ltd.(a) | | | 100 | | | | 3,789 | |
Alibaba Group Holding Ltd., ADR(a) | | | 103 | | | | 31,383 | |
Amoy Diagnostics Co. Ltd., Class A | | | 100 | | | | 1,259 | |
Asymchem Laboratories Tianjin Co. Ltd., Class A | | | 100 | | | | 4,106 | |
Autobio Diagnostics Co. Ltd., Class A | | | 100 | | | | 2,608 | |
Brilliance China Automotive Holdings Ltd. | | | 2,000 | | | | 1,726 | |
BYD Co. Ltd., Class A | | | 100 | | | | 2,387 | |
China Merchants Bank Co. Ltd., Class H | | | 500 | | | | 2,604 | |
Contemporary Amperex Technology Co. Ltd., Class A | | | 100 | | | | 3,675 | |
ENN Energy Holdings Ltd. | | | 100 | | | | 1,266 | |
Ganfeng Lithium Co. Ltd., Class H(b) | | | 200 | | | | 1,163 | |
Glodon Co. Ltd., Class A | | | 200 | | | | 2,131 | |
Gree Electric Appliances, Inc. of Zhuhai, Class A | | | 200 | | | | 1,754 | |
Guangdong Marubi Biotechnology Co. Ltd., Class A | | | 100 | | | | 928 | |
Guangzhou Automobile Group Co. Ltd., Class A | | | 700 | | | | 1,407 | |
Guangzhou Automobile Group Co. Ltd., Class H | | | 2,000 | | | | 2,056 | |
Guangzhou Baiyun International Airport Co. Ltd., Class A | | | 1,400 | | | | 2,631 | |
Haier Smart Home Co. Ltd., Class A | | | 400 | | | | 1,489 | |
Hangzhou Hikvision Digital Technology Co. Ltd., Class A | | | 1,000 | | | | 6,726 | |
Hangzhou Robam Appliances Co. Ltd., Class A | | | 500 | | | | 2,739 | |
Hangzhou Tigermed Consulting Co. Ltd., Class A | | | 100 | | | | 1,858 | |
Hangzhou Tigermed Consulting Co. Ltd., Class H(a)(b) | | | 100 | | | | 1,606 | |
Han’s Laser Technology Industry Group Co. Ltd., Class A | | | 500 | | | | 3,012 | |
Huazhu Group Ltd., ADR | | | 112 | | | | 4,439 | |
Hundsun Technologies, Inc., Class A | | | 60 | | | | 836 | |
Industrial & Commercial Bank of China Ltd., Class H | | | 4,000 | | | | 2,271 | |
Inner Mongolia Yili Industrial Group Co. Ltd., Class A | | | 300 | | | | 1,784 | |
Inspur Electronic Information Industry Co. Ltd., Class A | | | 200 | | | | 914 | |
KE Holdings, Inc.(a) | | | 81 | | | | 5,650 | |
Kingdee International Software Group Co. Ltd.(a) | | | 3,000 | | | | 7,921 | |
Li Auto, Inc., ADR(a) | | | 341 | | | | 6,878 | |
Meituan, Class B(a) | | | 100 | | | | 3,728 | |
NetEase, Inc., ADR | | | 42 | | | | 3,645 | |
New Oriental Education & Technology Group, Inc., ADR(a) | | | 16 | | | | 2,566 | |
Ping An Insurance Group Co. of China Ltd., Class A | | | 200 | | | | 2,329 | |
Shanghai International Airport Co. Ltd., Class A | | | 300 | | | | 2,970 | |
Shenzhen Inovance Technology Co. Ltd., Class A | | | 300 | | | | 2,886 | |
Tencent Holdings Ltd. | | | 800 | | | | 61,125 | |
Trip.com Group Ltd., ADR(a) | | | 156 | | | | 4,487 | |
Venus MedTech Hangzhou, Inc., Class H(a)(b) | | | 500 | | | | 4,821 | |
Venustech Group, Inc., Class A | | | 500 | | | | 2,314 | |
Want Want China Holdings Ltd. | | | 2,000 | | | | 1,324 | |
Wuhan Raycus Fiber Laser Technologies Co. Ltd., Class A | | | 200 | | | | 2,239 | |
WuXi AppTec Co. Ltd., Class A | | | 80 | | | | 1,352 | |
Yifeng Pharmacy Chain Co. Ltd., Class A | | | 180 | | | | 2,743 | |
| | | | | | | | |
| Security | | Shares | | | Value | |
| | |
| China (continued) | | | | | | |
Yonyou Network Technology Co. Ltd., Class A | | | 260 | | | $ | 1,684 | |
Yum China Holdings, Inc. | | | 75 | | | | 3,992 | |
| | | | | | | | |
| | | | | | | 226,582 | |
| | |
| Denmark — 0.1% | | | | | | |
DSV Panalpina AS | | | 24 | | | | 3,894 | |
| | | | | | | | |
| | |
| Finland — 0.5% | | | | | | |
Neste OYJ | | | 566 | | | | 29,519 | |
Nokia OYJ(a) | | | 373 | | | | 1,257 | |
| | | | | | | | |
| | | | | | | 30,776 | |
| | |
| France — 3.5% | | | | | | |
Arkema SA | | | 253 | | | | 24,779 | |
Danone SA | | | 758 | | | | 42,043 | |
EssilorLuxottica SA(a) | | | 160 | | | | 19,753 | |
Kering SA | | | 5 | | | | 3,022 | |
LVMH Moet Hennessy Louis Vuitton SE | | | 58 | | | | 27,187 | |
Safran SA(a) | | | 486 | | | | 51,263 | |
Sanofi | | | 475 | | | | 42,889 | |
| | | | | | | | |
| | | | | | | 210,936 | |
| | |
| Germany — 3.5% | | | | | | |
adidas AG(a) | | | 166 | | | | 49,319 | |
Allianz SE, Registered Shares | | | 102 | | | | 17,968 | |
Deutsche Telekom AG, Registered Shares | | | 2,692 | | | | 40,915 | |
Infineon Technologies AG | | | 120 | | | | 3,341 | |
Siemens AG, Registered Shares | | | 783 | | | | 91,859 | |
Siemens Energy AG(a) | | | 391 | | | | 8,561 | |
| | | | | | | | |
| | | | | | | 211,963 | |
| | |
| Hong Kong — 1.3% | | | | | | |
AIA Group Ltd. | | | 5,400 | | | | 51,393 | |
Hang Lung Properties Ltd. | | | 1,000 | | | | 2,434 | |
HKT Trust & HKT Ltd. | | | 1,000 | | | | 1,293 | |
Jardine Matheson Holdings Ltd. | | | 83 | | | | 3,679 | |
Sun Hung Kai Properties Ltd. | | | 1,500 | | | | 19,308 | |
| | | | | | | | |
| | | | | | | 78,107 | |
| | |
| Indonesia — 0.1% | | | | | | |
Bank Central Asia Tbk PT | | | 1,600 | | | | 3,148 | |
| | | | | | | | |
| | |
| Italy — 2.3% | | | | | | |
Enel SpA | | | 9,961 | | | | 79,195 | |
RAI Way SpA(b) | | | 1,780 | | | | 10,842 | |
UniCredit SpA(a) | | | 7,002 | | | | 52,441 | |
| | | | | | | | |
| | | | | | | 142,478 | |
| | |
| Japan — 2.9% | | | | | | |
Ajinomoto Co., Inc. | | | 1,100 | | | | 22,100 | |
Astellas Pharma, Inc. | | | 1,800 | | | | 24,683 | |
Hoya Corp. | | | 300 | | | | 33,857 | |
Recruit Holdings Co. Ltd. | | | 100 | | | | 3,805 | |
Ryohin Keikaku Co. Ltd. | | | 200 | | | | 4,198 | |
Shin-Etsu Chemical Co. Ltd. | | | 300 | | | | 40,070 | |
Sony Corp. | | | 100 | | | | 8,337 | |
Subaru Corp. | | | 800 | | | | 14,682 | |
Suzuki Motor Corp. | | | 500 | | | | 21,474 | |
| | | | | | | | |
| | | | | | | 173,206 | |
| | |
| Netherlands — 4.7% | | | | | | |
Adyen NV(a)(b) | | | 15 | | | | 25,211 | |
Akzo Nobel NV | | | 620 | | | | 59,637 | |
ASML Holding NV | | | 159 | | | | 57,527 | |
ING Groep NV(a) | | | 6,981 | | | | 47,818 | |
| | |
| 16 | | 2020 BLACKROCK ANNUAL REPORTTO SHAREHOLDERS |
| | |
Schedule of Investments (continued) October 31, 2020 | | BlackRock GA Dynamic Equity Fund (Percentages shown are based on Net Assets) |
| | | | | | | | |
| Security | | Shares | | | Value | |
| | |
| Netherlands (continued) | | | | | | |
Koninklijke Philips NV(a) | | | 1,013 | | | $ | 46,919 | |
NXP Semiconductors NV | | | 337 | | | | 45,535 | |
| | | | | | | | |
| | | | | | | 282,647 | |
| | |
| Norway — 0.0% | | | | | | |
LINK Mobility Group Holding ASA(a) | | | 315 | | | | 1,683 | |
| | | | | | | | |
| | |
| Portugal — 0.0% | | | | | | |
Jeronimo Martins SGPS SA | | | 128 | | | | 2,033 | |
| | | | | | | | |
| | |
| Singapore — 0.3% | | | | | | |
CapitaLand Ltd. | | | 5,200 | | | | 9,785 | |
ComfortDelGro Corp. Ltd. | | | 1,400 | | | | 1,385 | |
DBS Group Holdings Ltd. | | | 200 | | | | 2,979 | |
Singapore Telecommunications Ltd. | | | 300 | | | | 446 | |
United Overseas Bank Ltd. | | | 200 | | | | 2,779 | |
| | | | | | | | |
| | | | | | | 17,374 | |
| | |
| South Africa — 0.0% | | | | | | |
Anglo American PLC | | | 85 | | | | 1,994 | |
| | | | | | | | |
| | |
| South Korea — 0.5% | | | | | | |
Kakao Corp. | | | 23 | | | | 6,707 | |
LG Chem Ltd. | | | 19 | | | | 10,360 | |
NCSoft Corp. | | | 6 | | | | 4,123 | |
POSCO | | | 10 | | | | 1,846 | |
Samsung SDI Co. Ltd. | | | 11 | | | | 4,333 | |
| | | | | | | | |
| | | | | | | 27,369 | |
| | |
| Spain — 0.6% | | | | | | |
Cellnex Telecom SA(b) | | | 592 | | | | 38,001 | |
| | | | | | | | |
| | |
| Sweden — 1.2% | | | | | | |
Atlas Copco AB, A Shares | | | 84 | | | | 3,708 | |
Hexagon AB, B Shares | | | 55 | | | | 4,031 | |
Telefonaktiebolaget LM Ericsson, B Shares | | | 690 | | | | 7,704 | |
Volvo AB, B Shares(a) | | | 2,855 | | | | 55,493 | |
| | | | | | | | |
| | | | | | | 70,936 | |
| | |
| Switzerland — 1.7% | | | | | | |
Alcon, Inc.(a) | | | 73 | | | | 4,149 | |
Nestle SA, Registered Shares | | | 290 | | | | 32,619 | |
Roche Holding AG | | | 187 | | | | 60,089 | |
Sika AG, Registered Shares | | | 15 | | | | 3,690 | |
| | | | | | | | |
| | | | | | | 100,547 | |
| | |
| Taiwan — 1.8% | | | | | | |
Cathay Financial Holding Co. Ltd. | | | 1,000 | | | | 1,344 | |
Chunghwa Telecom Co. Ltd. | | | 1,000 | | | | 3,752 | |
Formosa Chemicals & Fibre Corp. | | | 1,000 | | | | 2,408 | |
Formosa Plastics Corp. | | | 1,000 | | | | 2,768 | |
Fubon Financial Holding Co. Ltd. | | | 1,000 | | | | 1,425 | |
Hon Hai Precision Industry Co. Ltd. | | | 1,000 | | | | 2,712 | |
Nan Ya Plastics Corp. | | | 1,000 | | | | 2,054 | |
Taiwan Semiconductor Manufacturing Co. Ltd. | | | 6,000 | | | | 90,778 | |
Uni-President Enterprises Corp. | | | 1,000 | | | | 2,144 | |
| | | | | | | | |
| | | | | | | 109,385 | |
| | |
| Thailand — 0.1% | | | | | | |
Advanced Info Service PCL, Foreign Registered Shares | | | 400 | | | | 2,222 | |
Intouch Holdings PCL, Class F | | | 1,300 | | | | 2,236 | |
Thai Beverage PCL | | | 1,500 | | | | 638 | |
| | | | | | | | |
| | | | | | | 5,096 | |
| | |
| Turkey — 0.0% | | | | | | |
Tupras Turkiye Petrol Rafinerileri AS(a) | | | 32 | | | | 286 | |
| | | | | | | | |
| | | | | | | | |
| Security | | Shares | | | Value | |
| | |
| United Arab Emirates — 0.0% | | | | | | |
NMC Health PLC(a)(c) | | | 504 | | | $ | — | |
| | | | | | | | |
| | |
| United Kingdom — 1.8% | | | | | | |
RELX PLC | | | 143 | | | | 2,830 | |
Rio Tinto PLC | | | 52 | | | | 2,941 | |
Unilever NV | | | 750 | | | | 42,280 | |
Unilever PLC | | | 392 | | | | 22,340 | |
Vodafone Group PLC | | | 28,654 | | | | 38,223 | |
| | | | | | | | |
| | | | | | | 108,614 | |
| | |
| United States — 62.2% | | | | | | |
Abbott Laboratories | | | 409 | | | | 42,990 | |
AbbVie, Inc. | | | 627 | | | | 53,358 | |
Adobe, Inc.(a) | | | 42 | | | | 18,778 | |
Agilent Technologies, Inc. | | | 301 | | | | 30,729 | |
Air Products & Chemicals, Inc. | | | 253 | | | | 69,889 | |
Akamai Technologies, Inc.(a) | | | 31 | | | | 2,949 | |
Alexion Pharmaceuticals, Inc.(a) | | | 20 | | | | 2,303 | |
Alphabet, Inc., Class C(a) | | | 93 | | | | 150,754 | |
Altair Engineering, Inc., Class A(a) | | | 55 | | | | 2,367 | |
Amazon.com, Inc.(a) | | | 60 | | | | 182,169 | |
Analog Devices, Inc. | | | 12 | | | | 1,422 | |
Anthem, Inc. | | | 203 | | | | 55,378 | |
Apellis Pharmaceuticals, Inc.(a) | | | 60 | | | | 1,914 | |
Apple, Inc. | | | 1,534 | | | | 166,991 | |
Applied Materials, Inc. | | | 686 | | | | 40,632 | |
Aptiv PLC | | | 437 | | | | 42,166 | |
Atlassian Corp. PLC, Class A(a) | | | 31 | | | | 5,940 | |
Autodesk, Inc.(a) | | | 146 | | | | 34,389 | |
Bank of America Corp. | | | 1,910 | | | | 45,267 | |
Becton Dickinson and Co. | | | 145 | | | | 33,514 | |
Booking Holdings, Inc.(a) | | | 1 | | | | 1,623 | |
Boston Scientific Corp.(a) | | | 762 | | | | 26,114 | |
Bristol-Myers Squibb Co. | | | 592 | | | | 34,602 | |
Broadcom, Inc. | | | 9 | | | | 3,147 | |
Cadence Design Systems, Inc.(a) | | | 59 | | | | 6,453 | |
Capital One Financial Corp. | | | 804 | | | | 58,756 | |
Charles Schwab Corp. | | | 453 | | | | 18,623 | |
Charter Communications, Inc., Class A(a) | | | 107 | | | | 64,609 | |
Ciena Corp.(a) | | | 13 | | | | 512 | |
Citigroup, Inc. | | | 182 | | | | 7,538 | |
Comcast Corp., Class A | | | 1,508 | | | | 63,698 | |
ConocoPhillips | | | 387 | | | | 11,076 | |
Costco Wholesale Corp. | | | 88 | | | | 31,471 | |
Crowdstrike Holdings, Inc., Class A(a) | | | 72 | | | | 8,916 | |
D.R. Horton, Inc. | | | 858 | | | | 57,323 | |
Darden Restaurants, Inc. | | | 21 | | | | 1,930 | |
Dell Technologies, Inc., Class C(a) | | | 412 | | | | 24,827 | |
Edwards Lifesciences Corp.(a) | | | 130 | | | | 9,320 | |
Emerson Electric Co. | | | 412 | | | | 26,693 | |
EPAM Systems, Inc.(a) | | | 13 | | | | 4,016 | |
Facebook, Inc., Class A(a) | | | 184 | | | | 48,412 | |
Fortinet, Inc.(a) | | | 51 | | | | 5,629 | |
Fortive Corp. | | | 665 | | | | 40,964 | |
Freeport-McMoRan, Inc. | | | 561 | | | | 9,728 | |
Gilead Sciences, Inc. | | | 136 | | | | 7,908 | |
Global Payments, Inc. | | | 173 | | | | 27,289 | |
Goldman Sachs Group, Inc. | | | 26 | | | | 4,915 | |
GoodRx Holdings, Inc., Class A(a) | | | 31 | | | | 1,500 | |
Guardant Health, Inc.(a) | | | 59 | | | | 6,293 | |
HCA Healthcare, Inc. | | | 355 | | | | 43,999 | |
Hilton Worldwide Holdings, Inc. | | | 75 | | | | 6,586 | |
Home Depot, Inc. | | | 192 | | | | 51,208 | |
| | |
SCHEDULE OF INVESTMENTS | | 17 |
| | |
Schedule of Investments (continued) October 31, 2020 | | BlackRock GA Dynamic Equity Fund (Percentages shown are based on Net Assets) |
| | | | | | | | |
| Security | | Shares | | | Value | |
| | |
| United States (continued) | | | | | | |
Illumina, Inc.(a) | | | 5 | | | $ | 1,464 | |
Inphi Corp.(a) | | | 6 | | | | 839 | |
Insulet Corp.(a) | | | 7 | | | | 1,556 | |
International Flavors & Fragrances, Inc. | | | 324 | | | | 33,262 | |
Intuitive Surgical, Inc.(a) | | | 18 | | | | 12,007 | |
Iovance Biotherapeutics, Inc.(a) | | | 41 | | | | 1,463 | |
Johnson & Johnson | | | 640 | | | | 87,750 | |
JPMorgan Chase & Co. | | | 930 | | | | 91,177 | |
L3Harris Technologies, Inc. | | | 493 | | | | 79,427 | |
Las Vegas Sands Corp. | | | 69 | | | | 3,316 | |
Lennar Corp., Class A | | | 149 | | | | 10,464 | |
Liberty Media Corp. - Liberty SiriusXM, Class A(a) | | | 354 | | | | 12,238 | |
Liberty Media Corp. - Liberty SiriusXM, Class C(a) | | | 552 | | | | 19,099 | |
Live Nation Entertainment, Inc.(a) | | | 35 | | | | 1,708 | |
Lowe’s Cos., Inc. | | | 375 | | | | 59,288 | |
Madison Square Garden Sports Corp.(a) | | | 1 | | | | 142 | |
Marsh & McLennan Cos., Inc. | | | 405 | | | | 41,901 | |
Marvell Technology Group Ltd. | | | 219 | | | | 8,215 | |
Mastercard, Inc., Class A | | | 263 | | | | 75,912 | |
McDonald’s Corp. | | | 263 | | | | 56,019 | |
Merck & Co., Inc. | | | 616 | | | | 46,329 | |
MGM Resorts International | | | 40 | | | | 823 | |
Microchip Technology, Inc. | | | 241 | | | | 25,324 | |
Micron Technology, Inc.(a) | | | 445 | | | | 22,401 | |
Microsoft Corp. | | | 972 | | | | 196,801 | |
MongoDB, Inc.(a) | | | 15 | | | | 3,427 | |
Morgan Stanley | | | 1,538 | | | | 74,055 | |
Nevro Corp.(a) | | | 11 | | | | 1,641 | |
NextEra Energy, Inc. | | | 1,134 | | | | 83,020 | |
NortonLifeLock, Inc. | | | 163 | | | | 3,353 | |
NVIDIA Corp. | | | 100 | | | | 50,136 | |
Okta, Inc.(a) | | | 34 | | | | 7,134 | |
Palantir Technologies, Inc., Class A(a) | | | 1,134 | | | | 11,487 | |
Palo Alto Networks, Inc.(a) | | | 32 | | | | 7,078 | |
PayPal Holdings, Inc.(a) | | | 164 | | | | 30,525 | |
Peloton Interactive, Inc., Class A(a) | | | 311 | | | | 34,275 | |
Pfizer, Inc. | | | 736 | | | | 26,113 | |
PPG Industries, Inc. | | | 456 | | | | 59,152 | |
Proofpoint, Inc.(a) | | | 24 | | | | 2,298 | |
PTC Therapeutics, Inc.(a) | | | 19 | | | | 992 | |
PTC, Inc.(a) | | | 684 | | | | 57,374 | |
QUALCOMM, Inc. | | | 29 | | | | 3,577 | |
Raytheon Technologies Corp. | | | 649 | | | | 35,254 | |
ResMed, Inc. | | | 22 | | | | 4,223 | |
salesforce.com, Inc.(a) | | | 258 | | | | 59,926 | |
Sarepta Therapeutics, Inc.(a) | | | 17 | | | | 2,310 | |
Seagen, Inc.(a) | | | 26 | | | | 4,337 | |
Sensata Technologies Holding PLC(a) | | | 13 | | | | 568 | |
ServiceNow, Inc.(a) | | | 54 | | | | 26,869 | |
Southwest Airlines Co. | | | 229 | | | | 9,052 | |
Splunk, Inc.(a) | | | 47 | | | | 9,308 | |
Starbucks Corp. | | | 560 | | | | 48,698 | |
Thermo Fisher Scientific, Inc. | | | 94 | | | | 44,473 | |
| | | | | | | | |
| Security | | Shares | | | Value | |
| | |
| United States (continued) | | | | | | |
TJX Cos., Inc. | | | 672 | | | $ | 34,138 | |
T-Mobile US, Inc.(a) | | | 49 | | | | 5,369 | |
TransDigm Group, Inc. | | | 7 | | | | 3,342 | |
Truist Financial Corp. | | | 200 | | | | 8,424 | |
Twilio, Inc., Class A(a) | | | 16 | | | | 4,464 | |
U.S. Bancorp. | | | 277 | | | | 10,789 | |
Uber Technologies, Inc.(a) | | | 848 | | | | 28,332 | |
Union Pacific Corp. | | | 481 | | | | 85,228 | |
United Parcel Service, Inc., Class B | | | 70 | | | | 10,998 | |
UnitedHealth Group, Inc. | | | 315 | | | | 96,119 | |
Vail Resorts, Inc. | | | 1 | | | | 232 | |
Valero Energy Corp. | | | 306 | | | | 11,815 | |
Vertex Pharmaceuticals, Inc.(a) | | | 79 | | | | 16,460 | |
Vertiv Holdings Co. | | | 2,254 | | | | 39,783 | |
VMware, Inc., Class A(a) | | | 227 | | | | 29,222 | |
Vontier Corp.(a) | | | 269 | | | | 7,731 | |
Walmart, Inc. | | | 319 | | | | 44,261 | |
Walt Disney Co. | | | 241 | | | | 29,221 | |
Wynn Resorts Ltd. | | | 45 | | | | 3,259 | |
Xilinx, Inc. | | | 95 | | | | 11,276 | |
Zoetis, Inc. | | | 18 | | | | 2,854 | |
Zscaler, Inc.(a) | | | 50 | | | | 6,788 | |
| | | | | | | | |
| | | | | | | 3,779,262 | |
| | |
| Zambia — 0.2% | | | | | | |
First Quantum Minerals Ltd. | | | 812 | | | | 9,331 | |
| | | | | | | | |
| | |
Total Common Stocks — 94.0%
(Cost: $4,698,079) | | | | | | | 5,705,402 | |
| | | | | | | | |
|
Investment Companies | |
|
| United States — 0.2% | |
iShares China Large-Cap ETF(d) | | | 152 | | | | 6,703 | |
KraneShares Bosera MSCI China A ETF | | | 82 | | | | 3,349 | |
KraneShares CSI China Internet ETF | | | 60 | | | | 4,310 | |
| | | | | | | | |
| |
Total Investment Companies — 0.2%
(Cost: $12,803) | | | | 14,362 | |
| | | | | | | | |
|
Preferred Securities | |
|
| Preferred Stocks — 0.4% | |
| | |
| Brazil — 0.0% | | | | | | |
Itau Unibanco Holding SA, Preference Shares | | | 450 | | | | 1,841 | |
| | | | | | | | |
| | |
| United States — 0.4% | | | | | | |
Aptiv PLC, Series A, 06/15/23 | | | 63 | | | | 7,585 | |
| | |
| 18 | | 2020 BLACKROCK ANNUAL REPORTTO SHAREHOLDERS |
| | |
Schedule of Investments (continued) October 31, 2020 | | BlackRock GA Dynamic Equity Fund (Percentages shown are based on Net Assets) |
| | | | | | | | |
| Security | | Shares | | | Value | |
| | |
| United States (continued) | | | | | | |
Becton Dickinson and Co., Series B, 06/01/23 | | | 244 | | | $ | 12,708 | |
Boston Scientific Corp., Series A, 06/01/23 | | | 40 | | | | 4,143 | |
| | | | | |
| | | | | | | 24,436 | |
| | | | | |
| | |
Total Preferred Securities — 0.4%
(Cost: $26,846) | | | | | | | 26,277 | |
| | | | | |
| | |
Total Long-Term Investments — 94.6%
(Cost: $4,737,728) | | | | | | | 5,746,041 | |
| | | | | |
|
Short-Term Securities | |
|
| Money Market Funds — 3.3% | |
BlackRock Liquidity Funds, T-Fund, Institutional Class, 0.01%(d)(e) | | | 197,858 | | | | 197,858 | |
| | | | | |
| |
Total Short-Term Securities — 3.3%
(Cost: $197,858) | | | | 197,858 | |
| | | | | |
| |
Options Purchased — 0.4%
(Cost: $31,949) | | | | 23,099 | |
| | | | | |
| |
Total Investments Before Options Written — 98.3%
(Cost: $4,967,535) | | | | 5,966,998 | |
| | | | | |
| |
Options Written — (0.5)%
(Premiums Received: $(33,503)) | | | | (27,466 | ) |
| | | | | |
| |
Total Investments, Net of Options Written — 97.8%
(Cost: $4,934,032) | | | | 5,939,532 | |
| |
Other Assets Less Liabilities — 2.2% | | | | 132,069 | |
| | | | | |
| |
Net Assets — 100.0% | | | $ | 6,071,601 | |
| | | | | |
| (a) | Non-income producing security. |
| (b) | Security exempt from registration pursuant to Rule 144A under the Securities Act of 1933, as amended. These securities may be resold in transactions exempt from registration to qualified institutional investors. |
| (c) | Security is valued using significant unobservable inputs and is classified as Level 3 in the fair value hierarchy. |
| (d) | Affiliate of the Fund. |
| (e) | Annualized 7-day yield as of period end. |
Affiliates
Investments in issuers considered to be affiliate(s) of the Fund during the year ended October 31, 2020 for purposes of Section 2(a)(3) of the 1940 Act, as amended, were as follows:
| | | | | | | | | | | | | | | | | | | | | | | | | | | | | | | | | | | | |
| Affiliated Issuer | | Value at
10/31/19 | | | Purchases
at Cost | | | Proceeds
from Sales | | | Net
Realized
Gain (Loss) | | | Change in
Unrealized
Appreciation
(Depreciation) | | | Value at
10/31/20 | | | Shares
Held at
10/31/20 | | | Income | | | Capital Gain
Distributions
from
Underlying
Funds | |
BlackRock Liquidity Funds, T-Fund, Institutional Class | | $ | 254,910 | | | $ | — | | | $ | (57,052 | )(a) | | $ | — | | | $ | — | | | $ | 197,858 | | | | 197,858 | | | $ | 1,457 | | | $ | — | |
iShares China Large-Cap ETF | | | — | | | | 12,885 | | | | (5,921 | ) | | | (492 | ) | | | 231 | | | | 6,703 | | | | 152 | | | | 263 | | | | — | |
| | | | | | | | | | | | | | | | | | | | | | | | | | | | | | | | | | | | |
| | | | | | | | | | | | | | $ | (492 | ) | | $ | 231 | | | $ | 204,561 | | | | | | | $ | 1,720 | | | $ | — | |
| | | | | | | | | | | | | | | | | | | | | | | | | | | | | | | | | | | | |
| | (a) | Represents net amount purchased (sold). | |
Derivative Financial Instruments Outstanding as of Period End
Futures Contracts
| | | | | | | | | | | | | | | | |
| Description | | Number of
Contracts | | | Expiration
Date | | | Notional
Amount (000) | | | Value/
Unrealized
Appreciation
(Depreciation) | |
Long Contracts | | | | | | | | | | | | | | | | |
SGX Nifty 50 Index | | | 3 | | | | 11/26/20 | | | $ | 70 | | | $ | (1,047 | ) |
Yen Denom Nikkei Index | | | 1 | | | | 12/10/20 | | | | 111 | | | | 1,650 | |
S&P/TSX 60 Index | | | 1 | | | | 12/17/20 | | | | 139 | | | | (5,960 | ) |
FTSE 100 Index | | | 1 | | | | 12/18/20 | | | | 72 | | | | (5,643 | ) |
S&P 500 E-Mini Index | | | 1 | | | | 12/18/20 | | | | 163 | | | | (2,943 | ) |
| | | | | | | | | | | | | | | | |
| | | | | | | | | | | | | | | (13,943 | ) |
| | | | | | | | | | | | | | | | |
| | |
SCHEDULE OF INVESTMENTS | | 19 |
| | |
Schedule of Investments (continued) October 31, 2020 | | BlackRock GA Dynamic Equity Fund |
Futures Contracts (continued)
| | | | | | | | | | | | | | | | |
| Description | | Number of
Contracts | | | Expiration
Date | | | Notional
Amount (000) | | | Value/
Unrealized
Appreciation
(Depreciation) | |
Short Contracts | | | | | | | | | | | | | | | | |
HSCEI Index | | | 2 | | | | 11/27/20 | | | $ | 126 | | | $ | 2,550 | |
MSCI Taiwan Index | | | 2 | | | | 11/27/20 | | | | 87 | | | | 2,316 | |
KOSPI 200 Index | | | 1 | | | | 12/10/20 | | | | 66 | | | | 2,498 | |
| | | | | | | | | | | | | | | | |
| | | | | | | | | | | | | | | 7,364 | |
| | | | | | | | | | | | | | | | |
| | | | | | | | | | | | | | $ | (6,579 | ) |
| | | | | | | | | | | | | | | | |
Forward Foreign Currency Exchange Contracts
| | | | | | | | | | | | | | | | | | | | |
| Currency Purchased | | | Currency Sold | | | Counterparty | | Settlement Date | | | Unrealized
Appreciation
(Depreciation) | |
| GBP | | | 95,000 | | | USD | | | 122,450 | | | JPMorgan Chase Bank N.A. | | | 12/17/20 | | | $ | 664 | |
| JPY | | | 13,851,000 | | | USD | | | 131,459 | | | Barclays Bank PLC | | | 12/17/20 | | | | 920 | |
| JPY | | | 18,426,000 | | | USD | | | 175,042 | | | UBS AG | | | 12/17/20 | | | | 1,062 | |
| USD | | | 149,636 | | | EUR | | | 128,000 | | | Morgan Stanley & Co. International PLC | | | 01/08/21 | | | | 313 | |
| USD | | | 168,340 | | | EUR | | | 144,000 | | | Morgan Stanley & Co. International PLC | | | 01/08/21 | | | | 352 | |
| | | | | | | | | | | | | | | | | | | | |
| | | | | | | | | | | | | | | | | | | 3,311 | |
| | | | | | | | | | | | | | | | | | | | |
| INR | | | 4,815,000 | | | USD | | | 65,125 | | | Bank of America N.A. | | | 12/08/20 | | | | (739 | ) |
| AUD | | | 155,000 | | | USD | | | 113,493 | | | Bank of America N.A. | | | 12/17/20 | | | | (4,518 | ) |
| CAD | | | 148,000 | | | USD | | | 112,398 | | | Goldman Sachs International | | | 12/17/20 | | | | (1,286 | ) |
| CHF | | | 70,000 | | | USD | | | 77,346 | | | Morgan Stanley & Co. International PLC | | | 12/17/20 | | | | (899 | ) |
| USD | | | 81,876 | | | HKD | | | 635,000 | | | HSBC Bank USA N.A. | | | 12/17/20 | | | | (30 | ) |
| USD | | | 79,762 | | | TWD | | | 2,306,000 | | | JPMorgan Chase Bank N.A. | | | 12/18/20 | | | | (1,807 | ) |
| | | | | | | | | | | | | | | | | | | | |
| | | | | | | | | | | | | | | | | | | (9,279 | ) |
| | | | | | | | | | | | | | | | | | | | |
| | | | | | | | | | | | | | | | | | $ | (5,968 | ) |
| | | | | |
Exchange-Traded Options Purchased
| | | | | | | | | | | | | | | | | | | | | | | | |
| Description | |
| Number of
Contracts |
| |
| Expiration
Date |
| | Exercise Price | | | Notional
Amount (000) | | | | Value | |
| Call | |
Agilent Technologies, Inc. | | | 2 | | | | 11/20/20 | | | USD | | | 105.00 | | | USD | | | 20 | | | $ | 425 | |
Global Payments, Inc. | | | 1 | | | | 11/20/20 | | | USD | | | 185.00 | | | USD | | | 16 | | | | 33 | |
Apple, Inc. | | | 1 | | | | 12/18/20 | | | USD | | | 117.50 | | | USD | | | 11 | | | | 317 | |
Bank of America Corp. | | | 4 | | | | 12/18/20 | | | USD | | | 27.00 | | | USD | | | 10 | | | | 134 | |
Bank of America Corp. | | | 4 | | | | 12/18/20 | | | USD | | | 28.00 | | | USD | | | 10 | | | | 92 | |
Citigroup, Inc. | | | 2 | | | | 12/18/20 | | | USD | | | 52.50 | | | USD | | | 8 | | | | 45 | |
Dow, Inc. | | | 1 | | | | 12/18/20 | | | USD | | | 52.50 | | | USD | | | 5 | | | | 64 | |
Fortive Corp. | | | 2 | | | | 12/18/20 | | | USD | | | 75.00 | | | USD | | | 12 | | | | 545 | |
Global Payments, Inc. | | | 1 | | | | 12/18/20 | | | USD | | | 180.00 | | | USD | | | 16 | | | | 190 | |
L3Harris Technologies, Inc. | | | 1 | | | | 12/18/20 | | | USD | | | 190.00 | | | USD | | | 16 | | | | 95 | |
McDonald’s Corp. | | | 1 | | | | 12/18/20 | | | USD | | | 220.00 | | | USD | | | 21 | | | | 622 | |
Microsoft Corp. | | | 1 | | | | 12/18/20 | | | USD | | | 220.00 | | | USD | | | 20 | | | | 397 | |
Alibaba Group Holding Ltd., ADR | | | 1 | | | | 01/15/21 | | | USD | | | 305.00 | | | USD | | | 30 | | | | 2,527 | |
Bank of America Corp. | | | 4 | | | | 01/15/21 | | | USD | | | 27.00 | | | USD | | | 9 | | | | 226 | |
Citigroup, Inc., Class A | | | 2 | | | | 01/15/21 | | | USD | | | 45.00 | | | USD | | | 8 | | | | 251 | |
Home Depot, Inc. | | | 1 | | | | 01/15/21 | | | USD | | | 300.00 | | | USD | | | 27 | | | | 455 | |
Morgan Stanley | | | 2 | | | | 01/15/21 | | | USD | | | 55.00 | | | USD | | | 10 | | | | 237 | |
PPG Industries, Inc. | | | 1 | | | | 01/15/21 | | | USD | | | 125.00 | | | USD | | | 13 | | | | 1,040 | |
Raytheon Technologies Corp. | | | 2 | | | | 01/15/21 | | | USD | | | 65.00 | | | USD | | | 11 | | | | 261 | |
Starbucks Corp. | | | 1 | | | | 01/15/21 | | | USD | | | 82.50 | | | USD | | | 9 | | | | 782 | |
Starbucks Corp. | | | 1 | | | | 01/15/21 | | | USD | | | 90.00 | | | USD | | | 9 | | | | 390 | |
Union Pacific Corp. | | | 1 | | | | 01/15/21 | | | USD | | | 200.00 | | | USD | | | 18 | | | | 283 | |
Walt Disney Co. | | | 1 | | | | 01/15/21 | | | USD | | | 140.00 | | | USD | | | 12 | | | | 235 | |
Microsoft Corp. | | | 1 | | | | 02/19/21 | | | USD | | | 215.00 | | | USD | | | 20 | | | | 1,060 | |
| | |
| 20 | | 2020 BLACKROCK ANNUAL REPORTTO SHAREHOLDERS |
| | |
Schedule of Investments (continued) October 31, 2020 | | BlackRock GA Dynamic Equity Fund |
Exchange-Traded Options Purchased (continued)
| | | | | | | | | | | | | | | | | | | | | | | | |
| Description | |
| Number of
Contracts |
| |
| Expiration
Date |
| | Exercise Price | | | Notional
Amount (000) | | | | Value | |
| Call (continued) | |
Raytheon Technologies Corp. | | | 2 | | | | 02/19/21 | | | USD | | | 65.00 | | | USD | | | 11 | | | $ | 321 | |
Bank of America Corp. | | | 2 | | | | 03/19/21 | | | USD | | | 25.00 | | | USD | | | 5 | | | | 319 | |
| | | | | | | | | | | | | | | | | | | | | | | | |
| | | | | | | | | | | | | | | | | | | | | | | 11,346 | |
| | | | | | | | | | | | | | | | | | | | | | | | |
| Put | |
Apple, Inc. | | | 1 | | | | 01/15/21 | | | USD | | | 125.00 | | | USD | | | 11 | | | | 1,910 | |
Microsoft Corp. | | | 1 | | | | 01/15/21 | | | USD | | | 215.00 | | | USD | | | 20 | | | | 2,030 | |
Microsoft Corp. | | | 1 | | | | 02/19/21 | | | USD | | | 215.00 | | | USD | | | 20 | | | | 2,315 | |
| | | | | | | | | | | | | | | | | | | | | | | | |
| | | | | | | | | | | | | | | | | | | | | | | 6,255 | |
| | | | | | | | | | | | | | | | | | | | | | | | |
| | | | | | | | | | | | | | | | | | | | | | $ | 17,601 | |
| | | | | | | | | | | | | | | | | | | | | | | | |
OTC Options Purchased
| | | | | | | | | | | | | | | | | | | | | | | | | | |
| Description | | Counterparty | | Number of
Contracts | | | Expiration
Date | | | Exercise Price | | | Notional
Amount (000) | | | Value | |
| Call | |
Boston Scientific Corp. | | Nomura International PLC | | | 164 | | | | 11/20/20 | | | USD | | | 41.00 | | | USD | | | 6 | | | $ | 14 | |
Capital One Financial Corp. | | Nomura International PLC | | | 72 | | | | 11/20/20 | | | USD | | | 55.00 | | | USD | | | 5 | | | | 1,310 | |
Union Pacific Corp. | | Goldman Sachs International | | | 61 | | | | 11/20/20 | | | USD | | | 207.50 | | | USD | | | 11 | | | | 10 | |
adidas AG | | Barclays Bank PLC | | | 31 | | | | 12/18/20 | | | EUR | | | 285.00 | | | EUR | | | 8 | | | | 180 | |
LVMH Moet Hennessy Louis Vuitton SE | | Barclays Bank PLC | | | 42 | | | | 12/18/20 | | | EUR | | | 415.00 | | | EUR | | | 17 | | | | 693 | |
Safran SA | | Barclays Bank PLC | | | 56 | | | | 02/19/21 | | | EUR | | | 86.00 | | | EUR | | | 5 | | | | 809 | |
Safran SA | | UBS AG | | | 65 | | | | 03/19/21 | | | EUR | | | 88.89 | | | EUR | | | 6 | | | | 914 | |
| | | | | | | | | | | | | | | | | | | | | | | | | | |
| | | | | | | | | | | | | | | | | | | | | | | | | 3,930 | |
| | | | | | | | | | | | | | | | | | | | | | | | | | |
| Put | |
Amazon.com, Inc. | | Citibank N.A. | | | 5 | | | | 11/20/20 | | | USD | | | 2,881.58 | | | USD | | | 15 | | | | 399 | |
D.R. Horton, Inc. | | Credit Suisse International | | | 103 | | | | 11/20/20 | | | USD | | | 70.00 | | | USD | | | 7 | | | | 564 | |
Lennar Corp., Class A | | JPMorgan Chase Bank N.A. | | | 47 | | | | 11/20/20 | | | USD | | | 76.00 | | | USD | | | 3 | | | | 337 | |
Walgreens Boots Alliance, Inc. | | Morgan Stanley & Co. International PLC | | | 150 | | | | 12/18/20 | | | USD | | | 33.00 | | | USD | | | 5 | | | | 268 | |
| | | | | | | | | | | | | | | | | | | | | | | | | | |
| | | | | | | | | | | | | | | | | | | | | | | | | 1,568 | |
| | | | | | | | | | | | | | | | | | | | | | | | | | |
| | | | | | | | | | | | | | | | | | | | | | | | $ | 5,498 | |
| | | | | | | | | | | | | | | | | | | | | | | | | | |
Exchange-Traded Options Written
| | | | | | | | | | | | | | | | | | | | | | | | |
| Description | | Number of
Contracts | | | Expiration
Date | | | Exercise Price | | | Notional
Amount (000) | | | Value | |
| Call | |
Abbott Laboratories | | | 1 | | | | 11/20/20 | | | USD | | | 110.00 | | | USD | | | 11 | | | | $ (188 | ) |
Agilent Technologies, Inc. | | | 1 | | | | 11/20/20 | | | USD | | | 110.00 | | | USD | | | 10 | | | | (115 | ) |
Agilent Technologies, Inc. | | | 2 | | | | 11/20/20 | | | USD | | | 115.00 | | | USD | | | 20 | | | | (65 | ) |
Bank of America Corp. | | | 2 | | | | 11/20/20 | | | USD | | | 26.00 | | | USD | | | 5 | | | | (52 | ) |
Citigroup, Inc. | | | 1 | | | | 11/20/20 | | | USD | | | 47.50 | | | USD | | | 4 | | | | (28 | ) |
Edwards Lifesciences Corp. | | | 1 | | | | 11/20/20 | | | USD | | | 85.00 | | | USD | | | 7 | | | | (25 | ) |
JPMorgan Chase & Co. | | | 1 | | | | 11/20/20 | | | USD | | | 105.00 | | | USD | | | 10 | | | | (120 | ) |
Morgan Stanley | | | 2 | | | | 11/20/20 | | | USD | | | 55.00 | | | USD | | | 10 | | | | (36 | ) |
Pfizer, Inc. | | | 4 | | | | 11/20/20 | | | USD | | | 40.00 | | | USD | | | 14 | | | | (124 | ) |
Pfizer, Inc. | | | 2 | | | | 11/20/20 | | | USD | | | 41.00 | | | USD | | | 7 | | | | (46 | ) |
Apple, Inc. | | | 1 | | | | 12/18/20 | | | USD | | | 130.00 | | | USD | | | 11 | | | | (98 | ) |
Fortive Corp. | | | 2 | | | | 12/18/20 | | | USD | | | 85.00 | | | USD | | | 12 | | | | (90 | ) |
McDonald’s Corp. | | | 1 | | | | 12/18/20 | | | USD | | | 240.00 | | | USD | | | 21 | | | | (161 | ) |
Microsoft Corp. | | | 1 | | | | 12/18/20 | | | USD | | | 250.00 | | | USD | | | 20 | | | | (52 | ) |
Truist Financial Corp. | | | 1 | | | | 12/18/20 | | | USD | | | 47.50 | | | USD | | | 4 | | | | (65 | ) |
U.S. Bancorp | | | 1 | | | | 12/18/20 | | | USD | | | 42.50 | | | USD | | | 4 | | | | (101 | ) |
Alibaba Group Holding Ltd., ADR | | | 1 | | | | 01/15/21 | | | USD | | | 350.00 | | | USD | | | 30 | | | | (860 | ) |
Apple, Inc. | | | 1 | | | | 01/15/21 | | | USD | | | 130.00 | | | USD | | | 11 | | | | (200 | ) |
Apple, Inc. | | | 1 | | | | 01/15/21 | | | USD | | | 140.00 | | | USD | | | 11 | | | | (103 | ) |
Applied Materials, Inc. | | | 2 | | | | 01/15/21 | | | USD | | | 70.00 | | | USD | | | 12 | | | | (239 | ) |
Bank of America Corp. | | | 2 | | | | 01/15/21 | | | USD | | | 28.00 | | | USD | | | 5 | | | | (82 | ) |
Bank of America Corp. | | | 4 | | | | 01/15/21 | | | USD | | | 31.00 | | | USD | | | 9 | | | | (62 | ) |
| | |
SCHEDULE OF INVESTMENTS | | 21 |
| | |
Schedule of Investments (continued) October 31, 2020 | | BlackRock GA Dynamic Equity Fund |
Exchange-Traded Options Written (continued)
| | | | | | | | | | | | | | | | | | | | | | | | | | | | |
| Description | | Number of
Contracts | | | Expiration
Date | | | Exercise Price | | | Notional
Amount (000) | | | Value | |
| Call (continued) | | | | | | | | | | | | | | | | | | | | | |
Citigroup, Inc. | | | 1 | | | | 01/15/21 | | | | USD | | | | 50.00 | | | | USD | | | | 4 | | | $ | (73 | ) |
Citigroup, Inc. | | | 1 | | | | 01/15/21 | | | | USD | | | | 55.00 | | | | USD | | | | 4 | | | | (29 | ) |
Citigroup, Inc., Class A | | | 2 | | | | 01/15/21 | | | | USD | | | | 52.50 | | | | USD | | | | 8 | | | | (24 | ) |
Guardant Health, Inc. | | | 1 | | | | 01/15/21 | | | | USD | | | | 120.00 | | | | USD | | | | 11 | | | | (705 | ) |
Home Depot, Inc. | | | 1 | | | | 01/15/21 | | | | USD | | | | 330.00 | | | | USD | | | | 27 | | | | (119 | ) |
JPMorgan Chase & Co. | | | 1 | | | | 01/15/21 | | | | USD | | | | 110.00 | | | | USD | | | | 10 | | | | (212 | ) |
JPMorgan Chase & Co. | | | 1 | | | | 01/15/21 | | | | USD | | | | 120.00 | | | | USD | | | | 10 | | | | (64 | ) |
Lowe’s Cos., Inc. | | | 1 | | | | 01/15/21 | | | | USD | | | | 180.00 | | | | USD | | | | 16 | | | | (362 | ) |
McDonald’s Corp. | | | 1 | | | | 01/15/21 | | | | USD | | | | 240.00 | | | | USD | | | | 21 | | | | (271 | ) |
Morgan Stanley | | | 2 | | | | 01/15/21 | | | | USD | | | | 62.50 | | | | USD | | | | 10 | | | | (54 | ) |
Morgan Stanley | | | 1 | | | | 01/15/21 | | | | USD | | | | 60.00 | | | | USD | | | | 5 | | | | (44 | ) |
Morgan Stanley | | | 1 | | | | 01/15/21 | | | | USD | | | | 57.50 | | | | USD | | | | 5 | | | | (72 | ) |
PPG Industries, Inc. | | | 1 | | | | 01/15/21 | | | | USD | | | | 140.00 | | | | USD | | | | 13 | | | | (350 | ) |
Raytheon Technologies Corp. | | | 2 | | | | 01/15/21 | | | | USD | | | | 75.00 | | | | USD | | | | 11 | | | | (74 | ) |
Starbucks Corp. | | | 1 | | | | 01/15/21 | | | | USD | | | | 92.50 | | | | USD | | | | 9 | | | | (289 | ) |
Starbucks Corp. | | | 1 | | | | 01/15/21 | | | | USD | | | | 100.00 | | | | USD | | | | 9 | | | | (117 | ) |
Truist Financial Corp. | | | 1 | | | | 01/15/21 | | | | USD | | | | 50.00 | | | | USD | | | | 4 | | | | (55 | ) |
U.S. Bancorp | | | 1 | | | | 01/15/21 | | | | USD | | | | 45.00 | | | | USD | | | | 4 | | | | (71 | ) |
Union Pacific Corp. | | | 1 | | | | 01/15/21 | | | | USD | | | | 230.00 | | | | USD | | | | 18 | | | | (41 | ) |
Walt Disney Co. | | | 1 | | | | 01/15/21 | | | | USD | | | | 155.00 | | | | USD | | | | 12 | | | | (78 | ) |
Alibaba Group Holding Ltd., ADR | | | 1 | | | | 02/19/21 | | | | USD | | | | 350.00 | | | | USD | | | | 30 | | | | (1,215 | ) |
Bank of America Corp. | | | 2 | | | | 02/19/21 | | | | USD | | | | 30.00 | | | | USD | | | | 5 | | | | (66 | ) |
Microsoft Corp. | | | 1 | | | | 02/19/21 | | | | USD | | | | 245.00 | | | | USD | | | | 20 | | | | (301 | ) |
Raytheon Technologies Corp. | | | 2 | | | | 02/19/21 | | | | USD | | | | 75.00 | | | | USD | | | | 11 | | | | (111 | ) |
Bank of America Corp. | | | 2 | | | | 03/19/21 | | | | USD | | | | 28.00 | | | | USD | | | | 5 | | | | (160 | ) |
| | | | | | | | | | | | | | | | | | | | | | | | | | | | |
| | | | | | | | | | | | | | | | | | | | | | | | | | | (7,869 | ) |
| | | | | | | | | | | | | | | | | | | | | | | | | | | | |
| Put | | | | | | | | | | | | | | | | | | | | | |
Agilent Technologies, Inc. | | | 1 | | | | 11/20/20 | | | | USD | | | | 90.00 | | | | USD | | | | 10 | | | | (50 | ) |
Bank of America Corp. | | | 2 | | | | 11/20/20 | | | | USD | | | | 22.00 | | | | USD | | | | 5 | | | | (85 | ) |
Bank of America Corp. | | | 2 | | | | 11/20/20 | | | | USD | | | | 21.00 | | | | USD | | | | 5 | | | | (48 | ) |
Citigroup, Inc. | | | 2 | | | | 11/20/20 | | | | USD | | | | 37.50 | | | | USD | | | | 8 | | | | (145 | ) |
Global Payments, Inc. | | | 1 | | | | 11/20/20 | | | | USD | | | | 155.00 | | | | USD | | | | 16 | | | | (530 | ) |
JPMorgan Chase & Co. | | | 1 | | | | 11/20/20 | | | | USD | | | | 85.00 | | | | USD | | | | 10 | | | | (79 | ) |
Microsoft Corp. | | | 1 | | | | 11/20/20 | | | | USD | | | | 185.00 | | | | USD | | | | 20 | | | | (238 | ) |
Morgan Stanley | | | 2 | | | | 11/20/20 | | | | USD | | | | 40.00 | | | | USD | | | | 10 | | | | (49 | ) |
Starbucks Corp. | | | 1 | | | | 11/20/20 | | | | USD | | | | 77.50 | | | | USD | | | | 9 | | | | (77 | ) |
Apple, Inc. | | | 1 | | | | 12/18/20 | | | | USD | | | | 102.50 | | | | USD | | | | 11 | | | | (352 | ) |
Bank of America Corp. | | | 4 | | | | 12/18/20 | | | | USD | | | | 22.00 | | | | USD | | | | 9 | | | | (334 | ) |
Bank of America Corp. | | | 4 | | | | 12/18/20 | | | | USD | | | | 21.00 | | | | USD | | | | 9 | | | | (226 | ) |
Citigroup, Inc. | | | 2 | | | | 12/18/20 | | | | USD | | | | 42.50 | | | | USD | | | | 8 | | | | (665 | ) |
Dow, Inc. | | | 1 | | | | 12/18/20 | | | | USD | | | | 40.00 | | | | USD | | | | 5 | | | | (136 | ) |
Fortive Corp. | | | 2 | | | | 12/18/20 | | | | USD | | | | 65.00 | | | | USD | | | | 12 | | | | (285 | ) |
Global Payments, Inc. | | | 1 | | | | 12/18/20 | | | | USD | | | | 150.00 | | | | USD | | | | 16 | | | | (590 | ) |
L3Harris Technologies, Inc. | | | 1 | | | | 12/18/20 | | | | USD | | | | 155.00 | | | | USD | | | | 16 | | | | (585 | ) |
McDonald’s Corp. | | | 1 | | | | 12/18/20 | | | | USD | | | | 180.00 | | | | USD | | | | 21 | | | | (196 | ) |
Microsoft Corp. | | | 1 | | | | 12/18/20 | | | | USD | | | | 180.00 | | | | USD | | | | 20 | | | | (360 | ) |
Truist Financial Corp. | | | 1 | | | | 12/18/20 | | | | USD | | | | 37.50 | | | | USD | | | | 4 | | | | (128 | ) |
Apple, Inc. | | | 1 | | | | 01/15/21 | | | | USD | | | | 107.50 | | | | USD | | | | 11 | | | | (725 | ) |
Apple, Inc. | | | 1 | | | | 01/15/21 | | | | USD | | | | 102.50 | | | | USD | | | | 11 | | | | (500 | ) |
Applied Materials, Inc. | | | 1 | | | | 01/15/21 | | | | USD | | | | 45.00 | | | | USD | | | | 6 | | | | (89 | ) |
Bank of America Corp. | | | 4 | | | | 01/15/21 | | | | USD | | | | 22.00 | | | | USD | | | | 9 | | | | (440 | ) |
Bank of America Corp. | | | 2 | | | | 01/15/21 | | | | USD | | | | 20.00 | | | | USD | | | | 5 | | | | (120 | ) |
Citigroup, Inc. | | | 2 | | | | 01/15/21 | | | | USD | | | | 37.50 | | | | USD | | | | 8 | | | | (357 | ) |
Citigroup, Inc., Class A | | | 2 | | | | 01/15/21 | | | | USD | | | | 37.50 | | | | USD | | | | 8 | | | | (224 | ) |
Home Depot, Inc. | | | 1 | | | | 01/15/21 | | | | USD | | | | 250.00 | | | | USD | | | | 27 | | | | (1,082 | ) |
JPMorgan Chase & Co. | | | 1 | | | | 01/15/21 | | | | USD | | | | 80.00 | | | | USD | | | | 10 | | | | (181 | ) |
Microsoft Corp. | | | 1 | | | | 01/15/21 | | | | USD | | | | 180.00 | | | | USD | | | | 20 | | | | (505 | ) |
Morgan Stanley | | | 2 | | | | 01/15/21 | | | | USD | | | | 44.00 | | | | USD | | | | 10 | | | | (418 | ) |
Morgan Stanley | | | 2 | | | | 01/15/21 | | | | USD | | | | 40.00 | | | | USD | | | | 10 | | | | (228 | ) |
PPG Industries, Inc. | | | 1 | | | | 01/15/21 | | | | USD | | | | 100.00 | | | | USD | | | | 13 | | | | (152 | ) |
Raytheon Technologies Corp. | | | 2 | | | | 01/15/21 | | | | USD | | | | 55.00 | | | | USD | | | | 11 | | | | (970 | ) |
| | |
| 22 | | 2020 BLACKROCK ANNUAL REPORTTO SHAREHOLDERS |
| | |
Schedule of Investments (continued) October 31, 2020 | | BlackRock GA Dynamic Equity Fund |
Exchange-Traded Options Written (continued)
| | | | | | | | | | | | | | | | | | | | | | | | | | | | |
| Description | | Number of
Contracts | | | Expiration
Date | | | Exercise Price | | | Notional
Amount (000) | | | Value | |
| Put (continued) | | | | | | | | | | | | | | | | | | | | | |
Starbucks Corp. | | | 1 | | | | 01/15/21 | | | | USD | | | | 67.50 | | | | USD | | | | 9 | | | $ | (88 | ) |
Truist Financial Corp. | | | 1 | | | | 01/15/21 | | | | USD | | | | 35.00 | | | | USD | | | | 4 | | | | (125 | ) |
Union Pacific Corp. | | | 1 | | | | 01/15/21 | | | | USD | | | | 165.00 | | | | USD | | | | 18 | | | | (720 | ) |
Walt Disney Co. | | | 1 | | | | 01/15/21 | | | | USD | | | | 110.00 | | | | USD | | | | 12 | | | | (420 | ) |
Walt Disney Co. | | | 1 | | | | 01/15/21 | | | | USD | | | | 100.00 | | | | USD | | | | 12 | | | | (207 | ) |
Bank of America Corp. | | | 2 | | | | 02/19/21 | | | | USD | | | | 20.00 | | | | USD | | | | 5 | | | | (156 | ) |
Microsoft Corp. | | | 1 | | | | 02/19/21 | | | | USD | | | | 185.00 | | | | USD | | | | 20 | | | | (940 | ) |
Raytheon Technologies Corp. | | | 2 | | | | 02/19/21 | | | | USD | | | | 50.00 | | | | USD | | | | 11 | | | | (650 | ) |
Bank of America Corp. | | | 2 | | | | 03/19/21 | | | | USD | | | | 21.00 | | | | USD | | | | 5 | | | | (246 | ) |
| | | | | | | | | | | | | | | | | | | | | | | | | | | | |
| | | | | | | | | | | | | | | | | | | | | | | | | | | (14,701 | ) |
| | | | | | | | | | | | | | | | | | | | | | | | | | | | |
| | | | | | | | | | | | | | | | | | | | | | | | | | $ | (22,570 | ) |
| | | | | | | | | | | | | | | | | | | | | | | | | | | | |
OTC Options Written
| | | | | | | | | | | | | | | | | | | | | | | | | | |
| Description | | Counterparty | | Number of
Contracts | | | Expiration
Date | | | Exercise Price | | | Notional
Amount (000) | | | Value | |
| Call | |
Amazon.com, Inc. | | Citibank N.A. | | | 5 | | | | 11/20/20 | | | USD | | | 3,397.23 | | | USD | | | 15 | | | $ | (147 | ) |
ASML Holding NV | | Credit Suisse International | | | 11 | | | | 11/20/20 | | | EUR | | | 335.00 | | | EUR | | | 3 | | | | (38 | ) |
Autodesk, Inc. | | Nomura International PLC | | | 30 | | | | 11/20/20 | | | USD | | | 260.00 | | | USD | | | 7 | | | | (100 | ) |
Capital One Financial Corp. | | Nomura International PLC | | | 72 | | | | 11/20/20 | | | USD | | | 70.00 | | | USD | | | 5 | | | | (381 | ) |
D.R. Horton, Inc. | | Credit Suisse International | | | 103 | | | | 11/20/20 | | | USD | | | 85.00 | | | USD | | | 7 | | | | (21 | ) |
Lennar Corp., Class A | | JPMorgan Chase Bank N.A. | | | 47 | | | | 11/20/20 | | | USD | | | 86.00 | | | USD | | | 3 | | | | (7 | ) |
Roche Holding AG | | Barclays Bank PLC | | | 12 | | | | 11/20/20 | | | CHF | | | 350.00 | | | CHF | | | 4 | | | | — | |
Sanofi | | Barclays Bank PLC | | | 40 | | | | 11/20/20 | | | EUR | | | 98.00 | | | EUR | | | 3 | | | | — | |
adidas AG | | Barclays Bank PLC | | | 31 | | | | 12/18/20 | | | EUR | | | 325.00 | | | EUR | | | 8 | | | | (26 | ) |
LVMH Moet Hennessy Louis Vuitton SE | | Barclays Bank PLC | | | 42 | | | | 12/18/20 | | | EUR | | | 450.00 | | | EUR | | | 17 | | | | (183 | ) |
Roche Holding AG | | Barclays Bank PLC | | | 13 | | | | 12/18/20 | | | CHF | | | 350.00 | | | CHF | | | 4 | | | | (9 | ) |
Safran SA | | Barclays Bank PLC | | | 56 | | | | 02/19/21 | | | EUR | | | 98.00 | | | EUR | | | 5 | | | | (432 | ) |
Safran SA | | UBS AG | | | 65 | | | | 03/19/21 | | | EUR | | | 103.56 | | | EUR | | | 6 | | | | (458 | ) |
| | | | | | | | | | | | | | | | | | | | | | | | | | |
| | | | | | | | | | | | | | | | | | | | | | | | | (1,802 | ) |
| | | | | | | | | | | | | | | | | | | | | | | | | | |
| Put | |
Boston Scientific Corp. | | Nomura International PLC | | | 82 | | | | 11/20/20 | | | USD | | | 35.00 | | | USD | | | 3 | | | | (150 | ) |
D.R. Horton, Inc. | | Credit Suisse International | | | 103 | | | | 11/20/20 | | | USD | | | 60.00 | | | USD | | | 7 | | | | (141 | ) |
Lennar Corp., Class A | | JPMorgan Chase Bank N.A. | | | 47 | | | | 11/20/20 | | | USD | | | 62.00 | | | USD | | | 3 | | | | (45 | ) |
Roche Holding AG | | Barclays Bank PLC | | | 12 | | | | 11/20/20 | | | CHF | | | 285.00 | | | CHF | | | 4 | | | | (55 | ) |
Sanofi | | Barclays Bank PLC | | | 40 | | | | 11/20/20 | | | EUR | | | 76.00 | | | EUR | | | 3 | | | | (86 | ) |
Union Pacific Corp. | | Goldman Sachs International | | | 61 | | | | 11/20/20 | | | USD | | | 187.50 | | | USD | | | 11 | | | | (753 | ) |
adidas AG | | Barclays Bank PLC | | | 31 | | | | 12/18/20 | | | EUR | | | 245.00 | | | EUR | | | 8 | | | | (441 | ) |
Givaudan REG | | UBS AG | | | 1 | | | | 12/18/20 | | | CHF | | | 3,680.00 | | | CHF | | | 4 | | | | (137 | ) |
LVMH Moet Hennessy Louis Vuitton SE | | Barclays Bank PLC | | | 21 | | | | 12/18/20 | | | EUR | | | 375.00 | | | EUR | | | 8 | | | | (278 | ) |
Roche Holding AG | | Barclays Bank PLC | | | 13 | | | | 12/18/20 | | | CHF | | | 275.00 | | | CHF | | | 4 | | | | (84 | ) |
Walgreens Boots Alliance, Inc. | | Morgan Stanley & Co. International PLC | | | 150 | | | | 12/18/20 | | | USD | | | 30.00 | | | USD | | | 5 | | | | (92 | ) |
Safran SA | | Barclays Bank PLC | | | 56 | | | | 02/19/21 | | | EUR | | | 70.00 | | | EUR | | | 5 | | | | (202 | ) |
Givaudan REG | | UBS AG | | | 1 | | | | 03/19/21 | | | CHF | | | 3,680.00 | | | CHF | | | 4 | | | | (240 | ) |
Safran SA | | UBS AG | | | 65 | | | | 03/19/21 | | | EUR | | | 73.35 | | | EUR | | | 6 | | | | (390 | ) |
| | | | | | | | | | | | | | | | | | | | | | | | | | |
| | | | | | | | | | | | | | | | | | | | | | | | | (3,094 | ) |
| | | | | | | | | | | | | | | | | | | | | | | | | | |
| | | | | | | | | | | | | | | | | | | | | | | | $ | (4,896 | ) |
| | | | | | | | | | | | | | | | | | | | | | | | | | |
| | |
SCHEDULE OF INVESTMENTS | | 23 |
| | |
Schedule of Investments (continued) October 31, 2020 | | BlackRock GA Dynamic Equity Fund |
OTC Total Return Swaps
| | | | | | | | | | | | | | | | | | | | | | | | |
| Reference Entity | | Payment
Frequency | | Counterparty(a) | | Termination Date | | | Net Notional | | | Accrued
Unrealized
Appreciation
(Depreciation) | | | Net Value of
Reference
Entity | | | Gross
Notional
Amount
Net Asset
Percentage | |
Equity Securities Long/Short | | Monthly | | Citibank N.A.(b) | | | 04/09/21 – 02/24/23 | | | $ | (732 | ) | | $ | (1,486 | )(c) | | $ | (2,163 | ) | | | 0.8 | % |
| | Monthly | | JPMorgan Chase Bank N.A.(d) | | | 02/08/23 | | | | (5,649 | ) | | | 308 | (e) | | | (5,332 | ) | | | 0.1 | |
| | | | | | | | | | | | | | | | | | | | | | | | |
| | | | | | | | | | $ | (6,381 | ) | | $ | (1,178 | ) | | $ | (7,495 | ) | | | | |
| | | | | | | | | | | | | | | | | | | | | | | | |
| | (a) | The Fund receives the total return on a portfolio of long positions underlying the total return swap. In addition, the Fund pays or receives a variable rate of interest, based on a specified benchmark. The benchmark and spread are determined based upon the country and/or currency of the individual underlying positions. | |
| | (c) | Amount includes $(55) of net dividends and financing fees. | |
| | (e) | Amount includes $(9) of net dividends and financing fees. | |
| | The following are the specified benchmarks (plus or minus a range) used in determining the variable rate of interest: | |
| | | | |
| | (b) | | (d) |
| Range: | | 18-30 basis points | | 18 basis points |
| Benchmarks: | | USD - 1M US Dollar LIBOR BBA | | USD - 1D Overnight Bank Funding Rate (OBFR01) |
| | USD - 1W US Dollar LIBOR BBA | | |
The following table represents the individual long and short positions and related values of the equity securities underlying the total return swap with Citibank N.A. as of period end, termination dates April 9, 2021 to February 24, 2023:
| | | | | | | | | | | | |
| Security | | Shares | | | Value | | | % of
Basket
Value | |
| | | |
Reference Entity — Long | | | | | | | | | | | | |
| | | |
| Common Stocks | | | | | | | | | |
| | | |
| Italy | | | | | | | | | |
Leonardo SpA, Class A | | | 4,149 | | | $ | 19,783 | | | | (914.6 | )% |
| | | | | | | | | | | | |
| | | |
Total Reference Entity — Long | | | | | | | 19,783 | | | | | |
| | | | | | | | | | | | |
| | | |
Reference Entity — Short | | | | | | | | | | | | |
| | | |
| Common Stocks | | | | | | | | | |
| | | |
| Finland | | | | | | | | | |
UPM-Kymmene Oyj | | | (164 | ) | | | (4,634 | ) | | | 214.2 | |
| | | | | | | | | | | | |
| | | |
| Spain | | | | | | | | | |
Industria De Diseno Textil SA | | | (123 | ) | | | (3,037 | ) | | | 140.4 | |
| | | | | | | | | | | | |
| | | |
| Sweden | | | | | | | | | |
Hennes & Mauritz AB, B Shares | | | (206 | ) | | | (3,349 | ) | | | 154.9 | |
Svenska Cellulosa AB SCA, Class B | | | (387 | ) | | | (5,235 | ) | | | 242.0 | |
| | | | | | | | | | | | |
| | | | | | | (8,584 | ) | | | | |
| | | | | | | | | | | | |
| Security | | Shares | | | Value | | | % of
Basket
Value | |
| | | |
| United States | | | | | | | | | |
Seagate Technology PLC | | | (119 | ) | | $ | (5,691 | ) | | | 263.1 | % |
| | | | | | | | | | | | |
| | | |
Total Reference Entity — Short | | | | | | | (21,946 | ) | | | | |
| | | | | | | | | | | | |
| | | |
Net Value of Reference Entity — Citibank N.A | | | | | | $ | (2,163 | ) | | | | |
| | | | | | | | | | | | |
| |
The following table represents the individual short positions and related values of the equity securities underlying the total return swap with JPMorgan Chase Bank N.A. as of period end, termination date February 8, 2023:
| | | | | | | | | | | | |
| Security | | Shares | | | Value | | | % of
Basket
Value | |
| | | |
Reference Entity — Short | | | | | | | | | | | | |
| | | |
| Common Stocks | | | | | | | | | |
| | | |
| United States | | | | | | | | | |
JM Smucker Co. | | | (25 | ) | | | $ (2,805 | ) | | | 52.6 | % |
McCormick & Co, Inc. | | | (14 | ) | | | (2,527 | ) | | | 47.4 | |
| | | | | | | | | | | | |
| | |
Net Value of Reference Entity — JPMorgan Chase Bank N.A | | | | $ (5,332 | ) | | | | |
| | | | | | | | | | | | |
Balances Reported in the Statements of Assets and Liabilities for OTC Swaps and Options Written
| | | | | | | | | | | | | | | | | | | | |
| Description | | Swap
Premiums
Paid | | | Swap
Premiums
Received | | | Unrealized
Appreciation | | | Unrealized
Depreciation | | | Value | |
OTC Swaps | | $ | — | | | $ | — | | | $ | 308 | | | $ | (1,486 | ) | | $ | — | |
Options Written | | | — | | | | — | | | | 10,411 | | | | (4,374 | ) | | | (27,466 | ) |
| | |
| 24 | | 2020 BLACKROCK ANNUAL REPORTTO SHAREHOLDERS |
| | |
Schedule of Investments (continued) October 31, 2020 | | BlackRock GA Dynamic Equity Fund |
Derivative Financial Instruments Categorized by Risk Exposure
As of period end, the fair values of derivative financial instruments located in the Statements of Assets and Liabilities were as follows:
| | | | | | | | | | | | | | | | | | | | | | | | | | | | |
| | | Commodity
Contracts | | | Credit
Contracts | | | Equity
Contracts | | | Foreign
Currency
Exchange
Contracts | | | Interest
Rate
Contracts | | | Other
Contracts | | | Total | |
Assets — Derivative Financial Instruments | | | | | | | | | | | | | | | | | | | | | | | | | | | | |
Futures contracts | | | | | | | | | | | | | | | | | | | | | | | | | | | | |
Unrealized appreciation on futures contracts(a) | | $ | — | | | $ | — | | | $ | 9,014 | | | $ | — | | | $ | — | | | $ | — | | | $ | 9,014 | |
Forward foreign currency exchange contracts | | | | | | | | | | | | | | | | | | | | | | | | | | | | |
Unrealized appreciation on forward foreign currency exchange contracts | | | — | | | | — | | | | — | | | | 3,311 | | | | — | | | | — | | | | 3,311 | |
Options purchased | | | | | | | | | | | | | | | | | | | | | | | | | | | | |
Investments at value — unaffiliated(b) | | | — | | | | — | | | | 23,099 | | | | — | | | | — | | | | — | | | | 23,099 | |
Swaps — OTC | | | | | | | | | | | | | | | | | | | | | | | | | | | | |
Unrealized appreciation on OTC swaps; Swap premiums paid | | | — | | | | — | | | | 308 | | | | — | | | | — | | | | — | | | | 308 | |
| | | | | | | | | | | | | | | | | | | | | | | | | | | | |
| | $ | — | | | $ | — | | | $ | 32,421 | | | $ | 3,311 | | | $ | — | | | $ | — | | | $ | 35,732 | |
| | | | | | | | | | | | | | | | | | | | | | | | | | | | |
Liabilities — Derivative Financial Instruments | | | | | | | | | | | | | | | | | | | | | | | | | | | | |
Futures contracts | | | | | | | | | | | | | | | | | | | | | | | | | | | | |
Unrealized depreciation on futures contracts(a) | | $ | — | | | $ | — | | | $ | 15,593 | | | $ | — | | | $ | — | | | $ | — | | | $ | 15,593 | |
Forward foreign currency exchange contracts | | | | | | | | | | | | | | | | | | | | | | | | | | | | |
Unrealized depreciation on forward foreign currency exchange contracts | | | — | | | | — | | | | — | | | | 9,279 | | | | — | | | | — | | | | 9,279 | |
Options written | | | | | | | | | | | | | | | | | | | | | | | | | | | | |
Options written at value | | | — | | | | — | | | | 27,466 | | | | — | | | | — | | | | — | | | | 27,466 | |
Swaps — OTC | | | | | | | | | | | | | | | | | | | | | | | | | | | | |
Unrealized depreciation on OTC swaps; Swap premiums received | | | — | | | | — | | | | 1,486 | | | | — | | | | — | | | | — | | | | 1,486 | |
| | | | | | | | | | | | | | | | | | | | | | | | | | | | |
| | $ | — | | | $ | — | | | $ | 44,545 | | | $ | 9,279 | | | $ | — | | | $ | — | | | $ | 53,824 | |
| | | | | | | | | | | | | | | | | | | | | | | | | | | | |
| | (a) | Net cumulative unrealized appreciation (depreciation) on futures contracts and centrally cleared swaps, if any, are reported in the Schedule of Investments. In the Statements of Assets and Liabilities, only current day’s variation margin is reported in receivables or payables and the net cumulative unrealized appreciation (depreciation) is included in accumulated earnings (loss). | |
| | (b) | Includes options purchased at value as reported in the Schedule of Investments. | |
For the year ended October 31, 2020, the effect of derivative financial instruments in the Statements of Operations was as follows:
| | | | | | | | | | | | | | | | | | | | | | | | | | | | |
| | | Commodity
Contracts | | | Credit
Contracts | | | Equity
Contracts | | | Foreign
Currency
Exchange
Contracts | | | Interest
Rate
Contracts | | | Other Contracts | | | Total | |
Net Realized Gain (Loss) from | | | | | | | | | | | | | | | | | | | | | | | | | | | | |
Futures contracts | | $ | — | | | $ | — | | | $ | (13,303 | ) | | $ | — | | | $ | — | | | $ | — | | | $ | (13,303 | ) |
Forward foreign currency exchange contracts | | | — | | | | — | | | | — | | | | 11,124 | | | | — | | | | — | | | | 11,124 | |
Options purchased(a) | | | — | | | | — | | | | 4,746 | | | | — | | | | — | | | | — | | | | 4,746 | |
Options written | | | — | | | | — | | | | 12,421 | | | | — | | | | — | | | | — | | | | 12,421 | |
Swaps | | | — | | | | — | | | | (8,342 | ) | | | — | | | | — | | | | — | | | | (8,342 | ) |
| | | | | | | | | | | | | | | | | | | | | | | | | | | | |
| | $ | — | | | $ | — | | | $ | (4,478 | ) | | $ | 11,124 | | | $ | — | | | $ | — | | | $ | 6,646 | |
| | | | | | | | | | | | | | | | | | | | | | | | | | | | |
| | | | | | | |
| Net Change in Unrealized Appreciation (Depreciation) on | | | | | | | | | | | | | | | | | | | | | |
Futures contracts | | $ | — | | | $ | — | | | $ | (312 | ) | | $ | — | | | $ | — | | | $ | — | | | $ | (312 | ) |
Forward foreign currency exchange contracts | | | — | | | | — | | | | — | | | | (5,452 | ) | | | — | | | | — | | | | (5,452 | ) |
Options purchased(b) | | | — | | | | — | | | | (10,243 | ) | | | — | | | | — | | | | — | | | | (10,243 | ) |
Options written | | | — | | | | — | | | | 2,790 | | | | — | | | | — | | | | — | | | | 2,790 | |
Swaps | | | — | | | | — | | | | (1,178 | ) | | | — | | | | — | | | | — | | | | (1,178 | ) |
| | | | | | | | | | | | | | | | | | | | | | | | | | | | |
| | $ | — | | | $ | — | | | $ | (8,943 | ) | | $ | (5,452 | ) | | $ | — | | | $ | — | | | $ | (14,395 | ) |
| | | | | | | | | | | | | | | | | | | | | | | | | | | | |
| | (a) | Options purchased are included in net realized gain (loss) from investments — unaffiliated. | |
| | (b) | Options purchased are included in net change in unrealized appreciation (depreciation) on investments — unaffiliated. | |
| | |
SCHEDULE OF INVESTMENTS | | 25 |
| | |
Schedule of Investments (continued) October 31, 2020 | | BlackRock GA Dynamic Equity Fund |
Average Quarterly Balances of Outstanding Derivative Financial Instruments
| | | | |
Futures contracts | |
Average notional value of contracts — long | | $ | 528,738 | |
Average notional value of contracts — short | | $ | 273,352 | |
Forward foreign currency exchange contracts | |
Average amounts purchased — in USD | | $ | 528,360 | |
Average amounts sold — in USD | | $ | 826,310 | |
Options | |
Average value of option contracts purchased | | $ | 8,520 | |
Average value of option contracts written | | $ | 10,523 | |
Total return swaps | |
Average notional value | | $ | (1,833 | ) |
For more information about the Fund’s investment risks regarding derivative financial instruments, refer to the Notes to Financial Statements.
Derivative Financial Instruments — Offsetting as of Period End
The Fund’s derivative assets and liabilities (by type) were as follows:
| | | | | | | | |
| | | Assets | | | Liabilities | |
Derivative Financial Instruments | | | | | | | | |
Futures contracts | | $ | 4,759 | | | $ | — | |
Forward foreign currency exchange contracts | | | 3,311 | | | | 9,279 | |
Options | | | 23,099 | (a) | | | 27,466 | |
Swaps — OTC(b) | | | 308 | | | | 1,486 | |
| | | | | | | | |
Total derivative assets and liabilities in the Statements of Assets and Liabilities | | | 31,477 | | | | 38,231 | |
| | | | | | | | |
Derivatives not subject to a Master Netting Agreement or similar agreement (“MNA”) | | | (22,360 | ) | | | (22,570 | ) |
| | | | | | | | |
Total derivative assets and liabilities subject to an MNA | | $ | 9,117 | | | $ | 15,661 | |
| | | | | | | | |
| | (a) | Includes options purchased at value which is included in Investments at value — unaffiliated in the Statements of Assets and Liabilities and reported in the Schedule of Investments. | |
| | (b) | Includes unrealized appreciation (depreciation) on OTC swaps and swap premiums (paid/received) in the Statements of Assets and Liabilities. | |
The following table presents the Fund’s derivative assets (and liabilities) by counterparty net of amounts available for offset under an MNA and net of the related collateral received (and pledged) by the Fund:
| | | | | | | | | | | | | | | | | | | | |
| Counterparty | |
| Derivative
Assets
Subject to
an MNA by
Counterparty |
| |
| Derivatives
Available
for Offset |
(a) | |
| Non-Cash
Collateral
Received |
| |
| Cash
Collateral
Received |
| |
| Net Amount
of Derivative
Assets |
(b) |
Barclays Bank PLC | | $ | 2,602 | | | $ | (1,796 | ) | | $ | — | | | $ | — | | | $ | 806 | |
Citibank N.A | | | 399 | | | | (399 | ) | | | — | | | | — | | | | — | |
Credit Suisse International | | | 564 | | | | (200 | ) | | | — | | | | — | | | | 364 | |
Goldman Sachs International | | | 10 | | | | (10 | ) | | | — | | | | — | | | | — | |
JPMorgan Chase Bank N.A | | | 1,309 | | | | (1,309 | ) | | | — | | | | — | | | | — | |
Morgan Stanley & Co. International PLC | | | 933 | | | | (933 | ) | | | — | | | | — | | | | — | |
Nomura International PLC | | | 1,324 | | | | (631 | ) | | | — | | | | — | | | | 693 | |
UBS AG | | | 1,976 | | | | (1,225 | ) | | | — | | | | — | | | | 751 | |
| | | | | | | | | | | | | | | | | | | | |
| | $ | 9,117 | | | $ | (6,503 | ) | | $ | — | | | $ | — | | | $ | 2,614 | |
| | | | | | | | | | | | | | | | | | | | |
| | | | | | | | | | | | | | | | | | | | |
| Counterparty | |
| Derivative
Liabilities
Subject to
an MNA by
Counterparty |
| |
| Derivatives
Available
for Offset |
(a) | |
| Non-Cash
Collateral
Pledged |
| |
| Cash
Collateral
Pledged |
| |
| Net Amount
of Derivative
Liabilities |
(c) |
Bank of America N.A | | $ | 5,257 | | | $ | — | | | $ | — | | | $ | — | | | $ | 5,257 | |
Barclays Bank PLC | | | 1,796 | | | | (1,796 | ) | | | — | | | | — | | | | — | |
Citibank N.A | | | 1,633 | | | | (399 | ) | | | — | | | | — | | | | 1,234 | |
Credit Suisse International | | | 200 | | | | (200 | ) | | | — | | | | — | | | | — | |
Goldman Sachs International | | | 2,039 | | | | (10 | ) | | | — | | | | — | | | | 2,029 | |
HSBC Bank USA N.A | | | 30 | | | | — | | | | — | | | | — | | | | 30 | |
JPMorgan Chase Bank N.A | | | 1,859 | | | | (1,309 | ) | | | — | | | | — | | | | 550 | |
| | |
| 26 | | 2020 BLACKROCK ANNUAL REPORTTO SHAREHOLDERS |
| | |
Schedule of Investments (continued) October 31, 2020 | | BlackRock GA Dynamic Equity Fund |
| | | | | | | | | | | | | | | | | | | | |
| Counterparty | |
| Derivative
Liabilities
Subject to
an MNA by
Counterparty |
| |
| Derivatives
Available
for Offset |
(a) | |
| Non-Cash
Collateral
Pledged |
| |
| Cash
Collateral
Pledged |
| |
| Net Amount
of Derivative
Liabilities |
(c) |
Morgan Stanley & Co. International PLC | | $ | 991 | | | $ | (933 | ) | | $ | — | | | $ | — | | | $ | 58 | |
Nomura International PLC | | | 631 | | | | (631 | ) | | | — | | | | — | | | | — | |
UBS AG | | | 1,225 | | | | (1,225 | ) | | | — | | | | — | | | | — | |
| | | | | | | | | | | | | | | | | | | | |
| | $ | 15,661 | | | $ | (6,503 | ) | | $ | — | | | $ | — | | | $ | 9,158 | |
| | | | | | | | | | | | | | | | | | | | |
| | (a) | The amount of derivatives available for offset is limited to the amount of derivative asset and/or liabilities that are subject to an MNA. | |
| | (b) | Net amount represents the net amount receivable from the counterparty in the event of default. | |
| | (c) | Net amount represents the net amount payable due to counterparty in the event of default. Net amount may be offset further by the options written receivable/payable on the Statements of Assets and Liabilities. | |
Fair Value Hierarchy as of Period End
Various inputs are used in determining the fair value of financial instruments. For description of the input levels and information about the Fund’s policy regarding valuation of financial instruments, refer to the Notes to Financial Statements.
The following table summarizes the Fund’s investments and derivative financial instruments categorized in the disclosure hierarchy. The breakdown of the Fund’s investments into major categories is disclosed in the Schedule of Investments above.
| | | | | | | | | | | | | | | | |
| | | Level 1 | | | Level 2 | | | Level 3 | | | Total | |
Assets | | | | | | | | | | | | | | | | |
Investments | | | | | | | | | | | | | | | | |
Long-Term Investments | | | | | | | | | | | | | | | | |
Common Stocks | | | | | | | | | | | | | | | | |
Argentina | | $ | 2,709 | | | $ | — | | | $ | — | | | $ | 2,709 | |
Australia | | | — | | | | 2,790 | | | | — | | | | 2,790 | |
Brazil | | | 1,956 | | | | — | | | | — | | | | 1,956 | |
Canada | | | 62,299 | | | | — | | | | — | | | | 62,299 | |
China | | | 64,646 | | | | 161,936 | | | | — | | | | 226,582 | |
Denmark | | | — | | | | 3,894 | | | | — | | | | 3,894 | |
Finland | | | — | | | | 30,776 | | | | — | | | | 30,776 | |
France | | | — | | | | 210,936 | | | | — | | | | 210,936 | |
Germany | | | 8,561 | | | | 203,402 | | | | — | | | | 211,963 | |
Hong Kong | | | — | | | | 78,107 | | | | — | | | | 78,107 | |
Indonesia | | | — | | | | 3,148 | | | | — | | | | 3,148 | |
Italy | | | — | | | | 142,478 | | | | — | | | | 142,478 | |
Japan | | | — | | | | 173,206 | | | | — | | | | 173,206 | |
Netherlands | | | 45,535 | | | | 237,112 | | | | — | | | | 282,647 | |
Norway | | | 1,683 | | | | — | | | | — | | | | 1,683 | |
Portugal | | | — | | | | 2,033 | | | | — | | | | 2,033 | |
Singapore | | | — | | | | 17,374 | | | | — | | | | 17,374 | |
South Africa | | | — | | | | 1,994 | | | | — | | | | 1,994 | |
South Korea | | | — | | | | 27,369 | | | | — | | | | 27,369 | |
Spain | | | — | | | | 38,001 | | | | — | | | | 38,001 | |
Sweden | | | — | | | | 70,936 | | | | — | | | | 70,936 | |
Switzerland | | | 4,149 | | | | 96,398 | | | | — | | | | 100,547 | |
Taiwan | | | — | | | | 109,385 | | | | — | | | | 109,385 | |
Thailand | | | — | | | | 5,096 | | | | — | | | | 5,096 | |
Turkey | | | — | | | | 286 | | | | — | | | | 286 | |
United Arab Emirates | | | — | | | | — | | | | — | | | | — | |
United Kingdom | | | — | | | | 108,614 | | | | — | | | | 108,614 | |
United States | | | 3,779,262 | | | | — | | | | — | | | | 3,779,262 | |
Zambia | | | 9,331 | | | | — | | | | — | | | | 9,331 | |
Investment Companies | | | 14,362 | | | | — | | | | — | | | | 14,362 | |
Preferred Securities | | | | | | | | | | | | | | | | |
Preferred Stocks | | | 26,277 | | | | — | | | | — | | | | 26,277 | |
Short-Term Securities | | | | | | | | | | | | | | | | |
Money Market Funds | | | 197,858 | | | | — | | | | — | | | | 197,858 | |
| | |
SCHEDULE OF INVESTMENTS | | 27 |
| | |
Schedule of Investments (continued) October 31, 2020 | | BlackRock GA Dynamic Equity Fund |
Fair Value Hierarchy as of Period End (continued)
| | | | | | | | | | | | | | | | |
| | | Level 1 | | | Level 2 | | | Level 3 | | | Total | |
Options Purchased | | | | | | | | | | | | | | | | |
Equity Contracts | | $ | 17,601 | | | $ | 5,498 | | | $ | — | | | $ | 23,099 | |
| | | | | | | | | | | | | | | | |
| | $ | 4,236,229 | | | $ | 1,730,769 | | | $ | — | | | $ | 5,966,998 | |
| | | | | | | | | | | | | | | | |
Derivative Financial Instruments(a) | | | | | | | | | | | | | | | | |
Assets | | | | | | | | | | | | | | | | |
Equity Contracts | | $ | 9,014 | | | $ | 308 | | | $ | — | | | $ | 9,322 | |
Foreign Currency Exchange Contracts | | | — | | | | 3,311 | | | | — | | | | 3,311 | |
Liabilities | | | | | | | | | | | | | | | | |
Equity Contracts | | | (38,163 | ) | | | (6,382 | ) | | | — | | | | (44,545 | ) |
Foreign Currency Exchange Contracts | | | — | | | | (9,279 | ) | | | — | | | | (9,279 | ) |
| | | | | | | | | | | | | | | | |
| | $ | (29,149 | ) | | $ | (12,042 | ) | | $ | — | | | $ | (41,191 | ) |
| | | | | | | | | | | | | | | | |
| | (a) | Derivative financial instruments are futures contracts, forward foreign currency exchange contracts and options written. Futures contracts and forward foreign currency exchange contracts are valued at the unrealized appreciation (depreciation) on the instrument and options written are shown at value. | |
See notes to financial statements.
| | |
| 28 | | 2020 BLACKROCK ANNUAL REPORTTO SHAREHOLDERS |
Statements of Assets and Liabilities
October 31, 2020
| | | | | | | | | | | | |
| | | BlackRock GA
Disciplined Volatility
Equity Fund(a) | | | BlackRock GA
Dynamic Equity
Fund | |
| | | |
ASSETS | | | | | | | | | | | | |
Investments at value — unaffiliated(b) | | | | | | $ | 5,465,644 | | | $ | 5,762,437 | |
Investments at value — affiliated(c) | | | | | | | 432,567 | | | | 204,561 | |
Cash pledged: | | | | | | | | | | | | |
Collateral — exchange-traded options written | | | | | | | — | | | | 110,000 | |
Futures contracts | | | | | | | 17,000 | | | | 63,000 | |
Foreign currency at value(d) | | | | | | | 138 | | | | 964 | |
Receivables: | | | | | | | | | | | | |
Investments sold | | | | | | | 10,356 | | | | 60,628 | |
Options written | | | | | | | — | | | | 117 | |
Dividends — unaffiliated | | | | | | | 10,623 | | | | 7,027 | |
Dividends — affiliated | | | | | | | 11 | | | | 6 | |
From the Manager | | | | | | | 41,109 | | | | 39,509 | |
Variation margin on futures contracts | | | | | | | — | | | | 4,759 | |
Unrealized appreciation on: | | | | | | | | | | | | |
Forward foreign currency exchange contracts | | | | | | | 671 | | | | 3,311 | |
OTC swaps | | | | | | | — | | | | 308 | |
Prepaid expenses | | | | | | | 21,770 | | | | 21,770 | |
| | | | | | | | | | | | |
Total assets | | | | | | | 5,999,889 | | | | 6,278,397 | |
| | | | | | | | | | | | |
| | | |
LIABILITIES | | | | | | | | | | | | |
Bank overdraft | | | | | | | — | | | | 1,363 | |
Options written at value(e) | | | | | | | 641 | | | | 27,466 | |
Payables: | | | | | | | | | | | | |
Investments purchased | | | | | | | 5,606 | | | | 136 | |
Accounting services fees | | | | | | | 49,537 | | | | 74,493 | |
Trustees’ and Officer’s fees | | | | | | | 2,771 | | | | 2,773 | |
Options written | | | | | | | — | | | | 303 | |
Other accrued expenses | | | | | | | 17,189 | | | | 18,210 | |
Other affiliates | | | | | | | 33 | | | | 33 | |
Professional fees | | | | | | | 77,888 | | | | 71,254 | |
Variation margin on futures contracts | | | | | | | 458 | | | | — | |
Unrealized depreciation on: | | | | | | | | | | | | |
Forward foreign currency exchange contracts | | | | | | | 2,599 | | | | 9,279 | |
OTC swaps | | | | | | | — | | | | 1,486 | |
| | | | | | | | | | | | |
Total liabilities | | | | | | | 156,722 | | | | 206,796 | |
| | | | | | | | | | | | |
| | | |
NET ASSETS | | | | | | $ | 5,843,167 | | | $ | 6,071,601 | |
| | | | | | | | | | | | |
| | | |
NET ASSETS CONSIST OF | | | | | | | | | | | | |
Paid-in capital | | | | | | $ | 5,377,076 | | | $ | 5,177,840 | |
Accumulated earnings | | | | | | | 466,091 | | | | 893,761 | |
| | | | | | | | | | | | |
NET ASSETS | | | | | | $ | 5,843,167 | | | $ | 6,071,601 | |
| | | | | | | | | | | | |
| | | |
(a) Consolidated Statement of Assets and Liabilities. | | | | | | | | | | | | |
(b) Investments at cost — unaffiliated | | | | | | $ | 5,049,397 | | | $ | 4,763,205 | |
(c) Investments at cost — affiliated | | | | | | $ | 419,533 | | | $ | 204,330 | |
(d) Foreign currency at cost | | | | | | $ | 142 | | | $ | 927 | |
(e) Premiums received | | | | | | $ | 680 | | | $ | 33,503 | |
Statements of Assets and Liabilities (continued)
October 31, 2020
| | | | | | | | | | | | |
| | | BlackRock GA
Disciplined Volatility
Equity Fund(a) | | | BlackRock GA
Dynamic Equity
Fund | |
| | | |
NET ASSET VALUE | | | | | | | | | | | | |
| | | |
| Institutional | | | | | | | | | |
Net assets | | | | | | $ | 78,148 | | | $ | 87,634 | |
| | | | | | | | | | | | |
Shares outstanding | | | | | | | 7,171 | | | | 7,468 | |
| | | | | | | | | | | | |
Net asset value | | | | | | $ | 10.90 | | | $ | 11.73 | |
| | | | | | | | | | | | |
Shares authorized | | | | | | | unlimited | | | | unlimited | |
| | | | | | | | | | | | |
Par value | | | | | | $ | 0.01 | | | $ | 0.01 | |
| | | | | | | | | | | | |
| | | |
| Class K | | | | | | | | | |
Net assets | | | | | | $ | 5,765,019 | | | $ | 5,983,967 | |
| | | | | | | | | | | | |
Shares outstanding | | | | | | | 528,597 | | | | 509,741 | |
| | | | | | | | | | | | |
Net asset value | | | | | | $ | 10.91 | | | $ | 11.74 | |
| | | | | | | | | | | | |
Shares authorized | | | | | | | unlimited | | | | unlimited | |
| | | | | | | | | | | | |
Par value | | | | | | $ | 0.01 | | | $ | 0.01 | |
| | | | | | | | | | | | |
| (a) | Consolidated Statement of Assets and Liabilities. |
See notes to financial statements.
| | |
| 30 | | 2020 BLACKROCK ANNUAL REPORTTO SHAREHOLDERS |
Statements of Operations
Year Ended October 31, 2020
| | | | | | | | | | | | | | | | |
| | | BlackRock GA
Disciplined Volatility
Equity Fund(a) | | | BlackRock GA
Dynamic Equity
Fund | |
|
INVESTMENT INCOME | |
Dividends — unaffiliated | | | | | | $ | 122,439 | | | | | | | $ | 90,655 | |
Dividends — affiliated | | | | | | | 1,607 | | | | | | | | 1,720 | |
Other income | | | | | | | 1,125 | | | | | | | | 1,185 | |
Foreign taxes withheld | | | | | | | (8,152 | ) | | | | | | | (4,521 | ) |
| | | | | | | | | | | | | | | | |
Total investment income | | | | | | | 117,019 | | | | | | | | 89,039 | |
| | | | | | | | | | | | | | | | |
|
EXPENSES | |
Professional | | | | | | | 102,890 | | | | | | | | 100,763 | |
Custodian | | | | | | | 50,723 | | | | | | | | 83,141 | |
Registration | | | | | | | 33,707 | | | | | | | | 34,529 | |
Accounting services | | | | | | | 23,313 | | | | | | | | 28,645 | |
Investment advisory | | | | | | | 22,761 | | | | | | | | 22,947 | |
Printing and postage | | | | | | | 17,211 | | | | | | | | 18,574 | |
Trustees and Officer | | | | | | | 10,146 | | | | | | | | 10,146 | |
Transfer agent — class specific | | | | | | | 207 | | | | | | | | 207 | |
Miscellaneous | | | | | | | 15,836 | | | | | | | | 16,930 | |
| | | | | | | | | | | | | | | | |
Total expenses | | | | | | | 276,794 | | | | | | | | 315,882 | |
Less: | | | | | | | | | | | | | | | | |
Fees waived and/or reimbursed by the Manager | | | | | | | (248,079 | ) | | | | | | | (286,935 | ) |
Transfer agent fees waived and/or reimbursed — class specific | | | | | | | (182 | ) | | | | | | | (180 | ) |
| | | | | | | | | | | | | | | | |
Total expenses after fees waived and/or reimbursed | | | | | | | 28,533 | | | | | | | | 28,767 | |
| | | | | | | | | | | | | | | | |
Net investment income | | | | | | | 88,486 | | | | | | | | 60,272 | |
| | | | | | | | | | | | | | | | |
|
REALIZED AND UNREALIZED GAIN (LOSS) | |
Net realized gain (loss) from: | |
Investments — unaffiliated | | | | | | | 64,326 | | | | | | | | 43,572 | |
Investments — affiliated | | | | | | | 2,921 | | | | | | | | (492 | ) |
Capital gain distributions from underlying funds — affiliated | | | | | | | 1 | | | | | | | | — | |
Foreign currency transactions | | | | | | | 1,466 | | | | | | | | (827 | ) |
Forward foreign currency exchange contracts | | | | | | | 9,046 | | | | | | | | 11,124 | |
Futures contracts | | | | | | | (184 | ) | | | | | | | (13,303 | ) |
Options written | | | | | | | — | | | | | | | | 12,421 | |
Swaps | | | | | | | — | | | | | | | | (8,342 | ) |
| | | | | | | | | | | | | | | | |
| | | | | | | 77,576 | | | | | | | | 44,153 | |
| | | | | | | | | | | | | | | | |
Net change in unrealized appreciation (depreciation) on: | | | | | | | | | | | | | | | | |
Investments — unaffiliated | | | | | | | (76,568 | ) | | | | | | | 372,321 | |
Investments — affiliated | | | | | | | 13,034 | | | | | | | | 231 | |
Foreign currency translations | | | | | | | 311 | | | | | | | | 76 | |
Forward foreign currency exchange contracts | | | | | | | (3,221 | ) | | | | | | | (5,452 | ) |
Futures contracts | | | | | | | (6,625 | ) | | | | | | | (312 | ) |
Options written | | | | | | | 39 | | | | | | | | 2,790 | |
Swaps | | | | | | | — | | | | | | | | (1,178 | ) |
| | | | | | | | | | | | | | | | |
| | | | | | | (73,030 | ) | | | | | | | 368,476 | |
| | | | | | | | | | | | | | | | |
Net realized and unrealized gain | | | | | | | 4,546 | | | | | | | | 412,629 | |
| | | | | | | | | | | | | | | | |
NET INCREASE IN NET ASSETS RESULTING FROM OPERATIONS | | | | | | $ | 93,032 | | | | | | | $ | 472,901 | |
| | | | | | | | | | | | | | | | |
| (a) | Consolidated Statement of Operations. |
See notes to financial statements.
Statements of Changes in Net Assets
| | | | | | | | | | | | | | | | |
| | | BlackRock GA Disciplined
Volatility Equity Fund | | | BlackRock GA
Dynamic Equity Fund | |
| | | Year Ended October 31, | | | Year Ended October 31, | |
| | | 2020(a) | | | 2019 | | | 2020 | | | 2019 | |
| | | | |
INCREASE (DECREASE) IN NET ASSETS | | | | | | | | | | | | | | | | |
| | | | |
OPERATIONS | | | | | | | | | | | | | | | | |
Net investment income | | $ | 88,486 | | | $ | 125,856 | | | $ | 60,272 | | | $ | 95,951 | |
Net realized gain (loss) | | | 77,576 | | | | 176,233 | | | | 44,153 | | | | (105,649 | ) |
Net change in unrealized appreciation (depreciation) | | | (73,030 | ) | | | 447,363 | | | | 368,476 | | | | 580,018 | |
| | | | | | | | | | | | | | | | |
Net increase in net assets resulting from operations | | | 93,032 | | | | 749,452 | | | | 472,901 | | | | 570,320 | |
| | | | | | | | | | | | | | | | |
| | | | |
DISTRIBUTIONS TO SHAREHOLDERS(b) | | | | | | | | | | | | | | | | |
Institutional | | | (2,156 | ) | | | (821 | ) | | | (485 | ) | | | (1,046 | ) |
Class K | | | (243,212 | ) | | | (123,580 | ) | | | (52,516 | ) | | | (188,053 | ) |
| | | | | | | | | | | | | | | | |
Decrease in net assets resulting from distributions to shareholders | | | (245,368 | ) | | | (124,401 | ) | | | (53,001 | ) | | | (189,099 | ) |
| | | | | | | | | | | | | | | | |
| | | | |
CAPITAL SHARE TRANSACTIONS | | | | | | | | | | | | | | | | |
Net increase in net assets derived from capital share transactions | | | 288,456 | | | | 64,737 | | | | 100,959 | | | | 52,019 | |
| | | | | | | | | | | | | | | | |
| | |
NET ASSETS | | | | | | | | | |
Total increase in net assets | | | 136,120 | | | | 689,788 | | | | 520,859 | | | | 433,240 | |
Beginning of year | | | 5,707,047 | | | | 5,017,259 | | | | 5,550,742 | | | | 5,117,502 | |
| | | | | | | | | | | | | | | | |
End of year | | $ | 5,843,167 | | | $ | 5,707,047 | | | $ | 6,071,601 | | | $ | 5,550,742 | |
| | | | | | | | | | | | | | | | |
| (a) | Consolidated Statement of Changes in Net Assets. |
| (b) | Distributions for annual periods determined in accordance with U.S. federal income tax regulations. |
See notes to financial statements.
| | |
| 32 | | 2020 BLACKROCK ANNUAL REPORTTO SHAREHOLDERS |
Financial Highlights
(For a share outstanding throughout each period)
| | | | | | | | | | | | | | | | | | | | | | | | |
| | | BlackRock GA Disciplined Volatility Equity Fund | | | | |
| | | Institutional | | | | |
| | |
| Year Ended
October 31, 2020(b) |
| |
| Period from
11/30/18(a) to 10/31/19 |
|
| | | | | | |
Net asset value, beginning of period | | | | | | $ | 11.20 | | | | | | | | | | | $ | 10.31 | | | | | |
| | | | | | | | | | | | | | | | | | | | | | | | |
Net investment income(c) | | | | | | | 0.16 | | | | | | | | | | | | 0.23 | | | | | |
Net realized and unrealized gain | | | | | | | 0.01 | | | | | | | | | | | | 0.91 | | | | | |
| | | | | | | | | | | | | | | | | | | | | | | | |
Net increase from investment operations | | | | | | | 0.17 | | | | | | | | | | | | 1.14 | | | | | |
| | | | | | | | | | | | | | | | | | | | | | | | |
| | | | | | |
Distributions(d) | | | | | | | | | | | | | | | | | | | | | | | | |
From net investment income | | | | | | | (0.32 | ) | | | | | | | | | | | (0.25 | ) | | | | |
From net realized gain | | | | | | | (0.15 | ) | | | | | | | | | | | — | | | | | |
| | | | | | | | | | | | | | | | | | | | | | | | |
Total distributions | | | | | | | (0.47 | ) | | | | | | | | | | | (0.25 | ) | | | | |
| | | | | | | | | | | | | | | | | | | | | | | | |
| | | | | | |
Net asset value, end of period | | | | | | $ | 10.90 | | | | | | | | | | | $ | 11.20 | | | | | |
| | | | | | | | | | | | | | | | | | | | | | | | |
| | | | | |
Total Return(e) | | | | | | | | | | | | | | | | | | | | | |
Based on net asset value | | | | | | | 1.56 | % | | | | | | | | | | | 11.22 | %(f) | | | | |
| | | | | | | | | | | | | | | | | | | | | | | | |
| | | | | |
Ratios to Average Net Assets(g) | | | | | | | | | | | | | | | | | | | | | |
Total expenses | | | | | | | 5.27 | % | | | | | | | | | | | 6.39 | %(h)(i) | | | | |
| | | | | | | | | | | | | | | | | | | | | | | | |
Total expenses after fees waived and/or reimbursed | | | | | | | 0.54 | % | | | | | | | | | | | 0.55 | %(i) | | | | |
| | | | | | | | | | | | | | | | | | | | | | | | |
Net investment income | | | | | | | 1.51 | % | | | | | | | | | | | 2.39 | %(i) | | | | |
| | | | | | | | | | | | | | | | | | | | | | | | |
| | | | | |
Supplemental Data | | | | | | | | | | | | | | | | | | | | | |
Net assets, end of period (000) | | | | | | $ | 78 | | | | | | | | | | | $ | 33 | | | | | |
| | | | | | | | | | | | | | | | | | | | | | | | |
Portfolio turnover rate | | | | | | | 125 | % | | | | | | | | | | | 125 | % | | | | |
| | | | | | | | | | | | | | | | | | | | | | | | |
| (a) | Commencement of operations. |
| (b) | Consolidated Financial Highlights. |
| (c) | Based on average shares outstanding. |
| (d) | Distributions for annual periods determined in accordance with U.S. federal income tax regulations. |
| (e) | Where applicable, assumes the reinvestment of distributions. |
| (f) | Aggregate total return. |
| (g) | Excludes expenses incurred indirectly as a result of investments in underlying funds as follows: |
| | | | | | | | | | | | | | | | | | | | | | | | |
| | |
| Year Ended October 31,
2020(b) |
| |
| Period from
11/30/18(a) to 10/31/19 |
|
Investments in underlying funds | | | | | | | 0.02 | % | | | | | | | | | | | 0.01 | % | | | | |
| | | | | | | | | | | | | | | | | | | | | | | | |
| (h) | Includes non-recurring expenses of offering costs. Without these costs, total expenses would have been 5.55%. |
See notes to financial statements.
Financial Highlights (continued)
(For a share outstanding throughout each period)
| | | | | | | | | | | | | | | | | | | | |
| | | BlackRock GA Disciplined Volatility Equity Fund (continued) |
| |
| | | Class K |
| | |
| | | Year Ended October 31, | | Period from 06/01/17(a) to 10/31/17 |
| | | 2020(b) | | 2019 | | 2018 |
| | | | |
Net asset value, beginning of period | | | $ | 11.21 | | | | $ | 9.97 | | | | $ | 10.30 | | | | $ | 10.00 | |
| | | | | | | | | | | | | | | | | | | | |
Net investment income(c) | | | | 0.17 | | | | | 0.25 | | | | | 0.20 | | | | | 0.05 | |
Net realized and unrealized gain (loss) | | | | 0.01 | | | | | 1.24 | | | | | (0.38 | ) | | | | 0.25 | |
| | | | | | | | | | | | | | | | | | | | |
Net increase (decrease) from investment operations | | | | 0.18 | | | | | 1.49 | | | | | (0.18 | ) | | | | 0.30 | |
| | | | | | | | | | | | | | | | | | | | |
| | | | |
Distributions(d) | | | | | | | | | | | | | | | | | | | | |
From net investment income | | | | (0.33 | ) | | | | (0.25 | ) | | | | (0.15 | ) | | | | — | |
From net realized gain | | | | (0.15 | ) | | | | — | | | | | — | | | | | — | |
| | | | | | | | | | | | | | | | | | | | |
Total distributions | | | | (0.48 | ) | | | | (0.25 | ) | | | | (0.15 | ) | | | | — | |
| | | | | | | | | | | | | | | | | | | | |
| | | | |
Net asset value, end of period | | | $ | 10.91 | | | | $ | 11.21 | | | | $ | 9.97 | | | | $ | 10.30 | |
| | | | | | | | | | | | | | | | | | | | |
|
Total Return(e) | |
Based on net asset value | | | | 1.60 | % | | | | 15.12 | % | | | | (1.83 | )% | | | | 3.00 | %(f) |
| | | | | | | | | | | | | | | | | | | | |
|
Ratios to Average Net Assets(g) | |
Total expenses | | | | 4.86 | % | | | | 5.66 | % | | | | 3.64 | % | | | | 4.34 | %(h)(i) |
| | | | | | | | | | | | | | | | | | | | |
Total expenses after fees waived and/or reimbursed | | | | 0.50 | % | | | | 0.50 | % | | | | 0.52 | % | | | | 0.50 | %(i) |
| | | | | | | | | | | | | | | | | | | | |
Net investment income | | | | 1.56 | % | | | | 2.35 | % | | | | 1.88 | % | | | | 1.08 | %(i) |
| | | | | | | | | | | | | | | | | | | | |
|
Supplemental Data | |
Net assets, end of period (000) | | | $ | 5,765 | | | | $ | 5,674 | | | | $ | 5,017 | | | | $ | 5,161 | |
| | | | | | | | | | | | | | | | | | | | |
Portfolio turnover rate | | | | 125 | % | | | | 125 | % | | | | 184 | % | | | | 55 | % |
| | | | | | | | | | | | | | | | | | | | |
| (a) | Commencement of operations. |
| (b) | Consolidated Financial Highlights. |
| (c) | Based on average shares outstanding. |
| (d) | Distributions for annual periods determined in accordance with U.S. federal income tax regulations. |
| (e) | Where applicable, assumes the reinvestment of distributions. |
| (f) | Aggregate total return. |
| (g) | Excludes expenses incurred indirectly as a result of investments in underlying funds as follows: |
| | | | | | | | | | | | | | | | | | | | |
| | | Year Ended October 31, | | Period from 06/01/17(a) to 10/31/17 |
| | | 2020(b) | | 2019 | | 2018 |
Investments in underlying funds | | | | 0.02 | % | | | | 0.01 | % | | | | — | % | | | | — | % |
| | | | | | | | | | | | | | | | | | | | |
| (h) | Audit, offering and organization costs were not annualized in the calculation of expense ratio. If these expenses were annualized, the total expenses would have been 7.19%. |
See notes to financial statements.
| | |
| 34 | | 2020 BLACKROCK ANNUAL REPORTTO SHAREHOLDERS |
Financial Highlights (continued)
(For a share outstanding throughout each period)
| | | | | | | | | | | | | | | | | | | | |
| | | BlackRock GA Dynamic Equity Fund |
| | | Institutional |
| | | |
| Year Ended
October 31, 2020 |
| | | | | | | |
| Period from
11/30/18(a) to 10/31/19 |
|
| | | | |
Net asset value, beginning of period | | | | | | | | $ | 10.92 | | | | | | | | | $ | 10.32 | |
| | | | | | | | | | | | | | | | | | | | |
Net investment income(b) | | | | | | | | | 0.11 | | | | | | | | | | 0.17 | |
Net realized and unrealized gain | | | | | | | | | 0.80 | | | | | | | | | | 0.81 | |
| | | | | | | | | | | | | | | | | | | | |
Net increase from investment operations | | | | | | | | | 0.91 | | | | | | | | | | 0.98 | |
| | | | | | | | | | | | | | | | | | | | |
| | | | |
Distributions(c) | | | | | | | | | | | | | | | | | | | | |
From net investment income | | | | | | | | | (0.10 | ) | | | | | | | | | (0.23 | ) |
From net realized gain | | | | | | | | | — | | | | | | | | | | (0.15 | ) |
| | | | | | | | | | | | | | | | | | | | |
Total distributions | | | | | | | | | (0.10 | ) | | | | | | | | | (0.38 | ) |
| | | | | | | | | | | | | | | | | | | | |
| | | | |
Net asset value, end of period | | | | | | | | $ | 11.73 | | | | | | | | | $ | 10.92 | |
| | | | | | | | | | | | | | | | | | | | |
| | | |
Total Return(d) | | | | | | | | | | | | | | | | |
Based on net asset value | | | | | | | | | 8.35 | % | | | | | | | | | 9.97 | %(e) |
| | | | | | | | | | | | | | | | | | | | |
| | | |
Ratios to Average Net Assets(f) | | | | | | | | | | | | | | | | |
Total expenses | | | | | | | | | 5.92 | % | | | | | | | | | 7.07 | %(g)(h) |
| | | | | | | | | | | | | | | | | | | | |
Total expenses after fees waived and/or reimbursed | | | | | | | | | 0.54 | % | | | | | | | | | 0.54 | %(h) |
| | | | | | | | | | | | | | | | | | | | |
Net investment income | | | | | | | | | 1.01 | % | | | | | | | | | 1.83 | %(h) |
| | | | | | | | | | | | | | | | | | | | |
| | | |
Supplemental Data | | | | | | | | | | | | | | | | |
Net assets, end of period (000) | | | | | | | | $ | 88 | | | | | | | | | $ | 34 | |
| | | | | | | | | | | | | | | | | | | | |
Portfolio turnover rate | | | | | | | | | 73 | % | | | | | | | | | 74 | % |
| | | | | | | | | | | | | | | | | | | | |
| (a) | Commencement of operations. |
| (b) | Based on average shares outstanding. |
| (c) | Distributions for annual periods determined in accordance with U.S. federal income tax regulations. |
| (d) | Where applicable, assumes the reinvestment of distributions. |
| (e) | Aggregate total return. |
| (f) | Excludes expenses incurred indirectly as a result of investments in underlying funds as follows: |
| | | | | | | | | | | | | | | | | | | | |
| | |
| Year Ended October 31,
2020 |
| |
| Period from
11/30/18(a) to 10/31/19 |
|
Investments in underlying funds | | | | | | | 0.01 | % | | | | | | | 0.01 | % | | | | |
| | | | | | | | | | | | | | | | | | | | |
| (g) | Includes non-recurring expenses of offering costs. Without these costs, total expenses would have been 6.21%. |
See notes to financial statements.
Financial Highlights (continued)
(For a share outstanding throughout each period)
| | | | | | | | | | | | | | | | | | | | | | | | | |
| | | BlackRock GA Dynamic Equity Fund (continued) |
| |
| | | Class K |
| | |
| | | Year Ended October 31, | | Period from 06/01/17(a) |
| | | 2020 | | 2019 | | 2018 | | | | to 10/31/17 |
| | | | | |
Net asset value, beginning of period | | | $ | 10.92 | | | | $ | 10.17 | | | | $ | 10.97 | | | | | | | | | $ | 10.00 | |
| | | | | | | | | | | | | | | | | | | | | | | | | |
Net investment income(b) | | | | 0.12 | | | | | 0.19 | | | | | 0.13 | | | | | | | | | | 0.03 | |
Net realized and unrealized gain (loss) | | | | 0.80 | | | | | 0.94 | | | | | (0.60 | ) | | | | | | | | | 0.94 | |
| | | | | | | | | | | | | | | | | | | | | | | | | |
Net increase (decrease) from investment operations | | | | 0.92 | | | | | 1.13 | | | | | (0.47 | ) | | | | | | | | | 0.97 | |
| | | | | | | | | | | | | | | | | | | | | | | | | |
| | | | | |
Distributions(c) | | | | | | | | | | | | | | | | | | | | | | | | | |
From net investment income | | | | (0.10 | ) | | | | (0.23 | ) | | | | (0.17 | ) | | | | | | | | | — | |
From net realized gain | | | | — | | | | | (0.15 | ) | | | | (0.16 | ) | | | | | | | | | — | |
| | | | | | | | | | | | | | | | | | | | | | | | | |
Total distributions | | | | (0.10 | ) | | | | (0.38 | ) | | | | (0.33 | ) | | | | | | | | | — | |
| | | | | | | | | | | | | | | | | | | | | | | | | |
| | | | | |
Net asset value, end of period | | | $ | 11.74 | | | | $ | 10.92 | | | | $ | 10.17 | | | | | | | | | $ | 10.97 | |
| | | | | | | | | | | | | | | | | | | | | | | | | |
| |
Total Return(d) | | | | | | |
Based on net asset value | | | | 8.49 | % | | | | 11.58 | % | | | | (4.54 | )% | | | | | | | | | 9.70 | %(e) |
| | | | | | | | | | | | | | | | | | | | | | | | | |
| |
Ratios to Average Net Assets(f) | | | | | | |
Total expenses | | | | 5.50 | % | | | | 6.24 | %(g) | | | | 3.43 | % | | | | | | | | | 4.35 | %(h)(i) |
| | | | | | | | | | | | | | | | | | | | | | | | | |
Total expenses after fees waived and/or reimbursed | | | | 0.50 | % | | | | 0.50 | % | | | | 0.52 | % | | | | | | | | | 0.50 | %(i) |
| | | | | | | | | | | | | | | | | | | | | | | | | |
Net investment income | | | | 1.05 | % | | | | 1.85 | % | | | | 1.16 | % | | | | | | | | | 0.80 | %(i) |
| | | | | | | | | | | | | | | | | | | | | | | | | |
| |
Supplemental Data | | | | | | |
Net assets, end of period (000) | | | $ | 5,984 | | | | $ | 5,517 | | | | $ | 5,118 | | | | | | | | | $ | 5,494 | |
| | | | | | | | | | | | | | | | | | | | | | | | | |
Portfolio turnover rate | | | | 73 | % | | | | 74 | % | | | | 205 | % | | | | | | | | | 70 | % |
| | | | | | | | | | | | | | | | | | | | | | | | | |
| (a) | Commencement of operations. |
| (b) | Based on average shares outstanding. |
| (c) | Distributions for annual periods determined in accordance with U.S. federal income tax regulations. |
| (d) | Where applicable, assumes the reinvestment of distributions. |
| (e) | Aggregate total return. |
| (f) | Excludes expenses incurred indirectly as a result of investments in underlying funds as follows: |
| | | | | | | | | | | | | | | | | | | | | | | | | |
| | | Year Ended October 31, | | Period from 06/01/17(a) to 10/31/17 |
| | | 2020 | | 2019 | | 2018 | | |
Investments in underlying funds | | | | 0.01 | % | | | | 0.01 | % | | | | — | % | | | | | | | | | — | % |
| | | | | | | | | | | | | | | | | | | | | | | | | |
| (g) | Includes non-recurring expenses of offering costs. Without these costs, total expenses would have been 5.44%. |
| (h) | Audit, offering and organization costs were not annualized in the calculation of expense ratio. If these expenses were annualized, the total expenses would have been 7.13%. |
See notes to financial statements.
| | |
| 36 | | 2020 BLACKROCK ANNUAL REPORTTO SHAREHOLDERS |
Notes to Financial Statements
Managed Account Series (the “Trust”) is registered under the Investment Company Act of 1940, as amended (the “1940 Act”), as an open-end management investment company. The Trust is organized as a Delaware statutory trust. The following, each of which is a series of the Trust, are referred to herein collectively as the “Funds” or individually as a “Fund”:
| | | | |
| Fund Name | | Herein Referred To As | | Diversification
Classification |
BlackRock GA Disciplined Volatility Equity Fund | | GA Disciplined Volatility Equity | | Diversified |
BlackRock GA Dynamic Equity Fund | | GA Dynamic Equity | | Diversified |
Each Fund offers multiple classes of shares. All classes of shares have identical voting, dividend, liquidation and other rights and are subject to the same terms and conditions. Institutional and Class K Shares are sold only to certain eligible investors.
| | | | | | |
| Share Class | | Initial Sales Charge | | CDSC | | Conversion Privilege |
Institutional and Class K Shares | | No | | No | | None |
The Funds, together with certain other registered investment companies advised by BlackRock Advisors, LLC (the “Manager”) or its affiliates, are included in a complex of equity, multi-asset, index and money market funds referred to as the BlackRock Multi-Asset Complex.
Basis of Consolidation: The accompanying consolidated financial statements of GA Disciplined Volatility Equity include the account of Cayman GA Disciplined Volatility Equity Fund, Ltd. (the “Subsidiary”), which is a wholly-owned subsidiary of GA Disciplined Volatility Equity and primarily invests in commodity-related instruments. The Subsidiary enables GA Disciplined Volatility Equity to hold these commodity-related instruments and satisfy regulated investment company tax requirements. GA Disciplined Volatility Equity may invest up to 25% of its total assets in the Subsidiary. The net assets of the Subsidiary as of period end were $102,062, which is 1.7% of GA Disciplined Volatility Equity’s consolidated net assets. Intercompany accounts and transactions, if any, have been eliminated. The Subsidiary is subject to the same investment policies and restrictions that apply to GA Disciplined Volatility Equity, except that the Subsidiary may invest without limitation in commodity-related instruments.
| 2. | SIGNIFICANT ACCOUNTING POLICIES |
The financial statements are prepared in conformity with accounting principles generally accepted in the United States of America (“U.S. GAAP”), which may require management to make estimates and assumptions that affect the reported amounts of assets and liabilities in the financial statements, disclosure of contingent assets and liabilities at the date of the financial statements and the reported amounts of increases and decreases in net assets from operations during the reporting period. Actual results could differ from those estimates. Each Fund is considered an investment company under U.S. GAAP and follows the accounting and reporting guidance applicable to investment companies. Below is a summary of significant accounting policies:
Investment Transactions and Income Recognition: For financial reporting purposes, investment transactions are recorded on the dates the transactions are executed. Realized gains and losses on investment transactions are determined using the specific identification method. Dividend income and capital gain distributions, if any, are recorded on the ex-dividend date. Non-cash dividends, if any, are recorded on the ex-dividend date at fair value. Dividends from foreign securities where the ex-dividend date may have passed are subsequently recorded when the Funds are informed of the ex-dividend date. Under the applicable foreign tax laws, a withholding tax at various rates may be imposed on capital gains, dividends and interest. Income, expenses and realized and unrealized gains and losses are allocated daily to each class based on its relative net assets.
Foreign Currency Translation: Each Fund’s books and records are maintained in U.S. dollars. Securities and other assets and liabilities denominated in foreign currencies are translated into U.S. dollars using exchange rates determined as of the close of trading on the New York Stock Exchange (“NYSE”). Purchases and sales of investments are recorded at the rates of exchange prevailing on the respective dates of such transactions. Generally, when the U.S. dollar rises in value against a foreign currency, the investments denominated in that currency will lose value; the opposite effect occurs if the U.S. dollar falls in relative value.
Each Fund does not isolate the effect of fluctuations in foreign exchange rates from the effect of fluctuations in the market prices of investments for financial reporting purposes. Accordingly, the effects of changes in exchange rates on investments are not segregated in the Statements of Operations from the effects of changes in market prices of those investments, but are included as a component of net realized and unrealized gain (loss) from investments. Each Fund reports realized currency gains (losses) on foreign currency related transactions as components of net realized gain (loss) for financial reporting purposes, whereas such components are generally treated as ordinary income for U.S. federal income tax purposes.
Foreign Taxes: Certain Funds may be subject to foreign taxes (a portion of which may be reclaimable) on income, stock dividends, capital gains on investments, or certain foreign currency transactions. All foreign taxes are recorded in accordance with the applicable foreign tax regulations and rates that exist in the foreign jurisdictions in which each Fund invests. These foreign taxes, if any, are paid by each Fund and are reflected in its Statements of Operations as follows: foreign taxes withheld at source are presented as a reduction of income, foreign taxes on securities lending income are presented as a reduction of securities lending income, foreign taxes on stock dividends are presented as “Foreign taxes withheld”, and foreign taxes on capital gains from sales of investments and foreign taxes on foreign currency transactions are included in their respective net realized gain (loss) categories. Foreign taxes payable or deferred as of October 31, 2020, if any, are disclosed in the Statements of Assets and Liabilities.
Segregation and Collateralization: In cases where a Fund enters into certain investments (e.g., futures contracts, forward foreign currency exchange contracts, options written and swaps) that would be treated as “senior securities” for 1940 Act purposes, a Fund may segregate or designate on its books and records cash or liquid assets having
| | |
NOTESTO FINANCIAL STATEMENTS | | 37 |
| | |
Notes to Financial Statements (continued) | | |
a market value at least equal to the amount of its future obligations under such investments. Doing so allows the investment to be excluded from treatment as a “senior security.” Furthermore, if required by an exchange or counterparty agreement, the Funds may be required to deliver/deposit cash and/or securities to/with an exchange, or broker-dealer or custodian as collateral for certain investments or obligations.
Distributions: Distributions paid by the Funds are recorded on the ex-dividend dates. The character and timing of distributions are determined in accordance with U.S. federal income tax regulations, which may differ from U.S. GAAP.
Net income and realized gains from investments held by the Subsidiary are treated as ordinary income for tax purposes. If a net loss is realized by the Subsidiary in any taxable year, the loss will generally not be available to offset the Funds’ ordinary income and/or capital gains for that year.
Indemnifications: In the normal course of business, a Fund enters into contracts that contain a variety of representations that provide general indemnification. A Fund’s maximum exposure under these arrangements is unknown because it involves future potential claims against a Fund, which cannot be predicted with any certainty.
Other: Expenses directly related to a Fund or its classes are charged to that Fund or the applicable class. Expenses directly related to the Funds and other shared expenses prorated to the Funds are allocated daily to each class based on their relative net assets or other appropriate methods. Other operating expenses shared by several funds, including other funds managed by the Manager, are prorated among those funds on the basis of relative net assets or other appropriate methods.
The Funds have an arrangement with their custodian whereby credits are earned on uninvested cash balances, which could be used to reduce custody fees and/or overdraft charges. The Funds may incur charges on overdrafts, subject to certain conditions.
| 3. | INVESTMENT VALUATION AND FAIR VALUE MEASUREMENTS |
Investment Valuation Policies: The Funds’ investments are valued at fair value (also referred to as “market value” within the financial statements) each day that the Fund is open for business and, for financial reporting purposes, as of the report date. U.S. GAAP defines fair value as the price the Funds would receive to sell an asset or pay to transfer a liability in an orderly transaction between market participants at the measurement date. The Funds determine the fair values of their financial instruments using various independent dealers or pricing services under policies approved by the Board of Trustees of each Fund (the “Board”). If a security’s market price is not readily available or does not otherwise accurately represent the fair value of the security, the security will be valued in accordance with a policy approved by the Board as reflecting fair value. The BlackRock Global Valuation Methodologies Committee (the “Global Valuation Committee”) is the committee formed by management to develop global pricing policies and procedures and to oversee the pricing function for all financial instruments.
Fair Value Inputs and Methodologies: The following methods and inputs are used to establish the fair value of each Fund’s assets and liabilities:
| | • | | Equity investments traded on a recognized securities exchange are valued at that day’s official closing price, as applicable, on the exchange where the stock is primarily traded. Equity investments traded on a recognized exchange for which there were no sales on that day may be valued at the last available bid (long positions) or ask (short positions) price. |
Generally, trading in foreign instruments is substantially completed each day at various times prior to the close of trading on the Fund’s listing exchange. Occasionally, events affecting the values of such instruments may occur between the foreign market close and the close of trading on the Fund’s listing exchange that may not be reflected in the computation of the Funds’ net assets. Each business day, the Funds use a pricing service to assist with the valuation of certain foreign exchange-traded equity securities and foreign exchange-traded and over-the-counter (“OTC”) options (the “Systematic Fair Value Price”). Using current market factors, the Systematic Fair Value Price is designed to value such foreign securities and foreign options at fair value as of the close of trading on the NYSE, which follows the close of the local markets.
| | • | | Investments in open-end U.S. mutual funds (including money market funds) are valued at that day’s published net asset value (“NAV”). |
| | • | | Futures contracts are valued based on that day’s last reported settlement price on the exchange where the contract is traded. |
| | • | | Forward foreign currency exchange contracts are valued at the mean between the bid and ask prices and are determined as of the close of trading on the NYSE based on that day’s prevailing forward exchange rate for the underlying currencies. |
| | • | | Exchange-traded equity options for which market quotations are readily available will be valued at the National Best Bid and Offer quotes (“NBBO”). NBBO represents the mean of the bid and ask prices as quoted on the exchange on which such options are traded. In the event that there is no mean price available, the last bid (long positions) or ask (short positions) price will be used. If no bid or ask price is available, the prior day’s price may be used. OTC options and options on swaps (“swaptions”) are valued by an independent pricing service using a mathematical model, which incorporates a number of market data factors, such as the trades and prices of the underlying instruments. |
| | • | | Swap agreements are valued utilizing quotes received daily by independent pricing services or through brokers, which are derived using daily swap curves and models that incorporate a number of market data factors, such as discounted cash flows, trades and values of the underlying reference instruments. |
If events (e.g., a market closure, market volatility, company announcement or a natural disaster) occur that are expected to materially affect the value of such investment, or in the event that the application of these methods of valuation results in a price for an investment that is deemed not to be representative of the market value of such investment, or if a price is not available, the investment will be valued by the Global Valuation Committee, or its delegate, in accordance with a policy approved by the Board as reflecting fair value (“Fair Valued Investments”). The fair valuation approaches that may be used by the Global Valuation Committee will include market approach, income approach and cost approach. Valuation techniques such as discounted cash flow, use of market comparables and matrix pricing are types of valuation approaches and are typically used in determining fair value. When determining the price for Fair Valued Investments, the Global Valuation Committee, or its delegate, seeks to determine the price
| | |
| 38 | | 2020 BLACKROCK ANNUAL REPORTTO SHAREHOLDERS |
Notes to Financial Statements (continued)
that each Fund might reasonably expect to receive or pay from the current sale or purchase of that asset or liability in an arm’s-length transaction. Fair value determinations shall be based upon all available factors that the Global Valuation Committee, or its delegate, deems relevant and consistent with the principles of fair value measurement. The pricing of all Fair Valued Investments is subsequently reported to the Board or a committee thereof on a quarterly basis.
For investments in equity or debt issued by privately held companies or funds (“Private Company” or collectively, the “Private Companies”) and other Fair Valued Investments, the fair valuation approaches that are used by the Global Valuation Committee and third party pricing services utilize one or a combination of, but not limited to, the following inputs.
| | | | |
| | | Standard Inputs Generally Considered By Third Party Pricing Services |
Market approach | | (i) | | recent market transactions, including subsequent rounds of financing, in the underlying investment or comparable issuers; |
| | (ii) | | recapitalizations and other transactions across the capital structure; and |
| | | (iii) | | market multiples of comparable issuers. |
Income approach | | (i) | | future cash flows discounted to present and adjusted as appropriate for liquidity, credit, and/or market risks; |
| | (ii) | | quoted prices for similar investments or assets in active markets; and |
| | | (iii) | | other risk factors, such as interest rates, yield curves, volatilities, prepayment speeds, loss severities, credit risks, recovery rates, liquidation amounts and/or default rates. |
Cost approach | | (i) | | audited or unaudited financial statements, investor communications and financial or operational metrics issued by the Private Company; |
| | (ii) | | changes in the valuation of relevant indices or publicly traded companies comparable to the Private Company; |
| | (iii) | | relevant news and other public sources; and |
| | | (iv) | | known secondary market transactions in the Private Company’s interests and merger or acquisition activity in companies comparable to the Private Company. |
Investments in series of preferred stock issued by Private Companies are typically valued utilizing market approach in determining the enterprise value of the company. Such investments often contain rights and preferences that differ from other series of preferred and common stock of the same issuer. Valuation techniques such as an option pricing model (“OPM”), a probability weighted expected return model (“PWERM”) or a hybrid of those techniques are used in allocating enterprise value of the company, as deemed appropriate under the circumstances. The use of OPM and PWERM techniques involve a determination of the exit scenarios of the investment in order to appropriately allocate the enterprise value of the company among the various parts of its capital structure.
The Private Companies are not subject to the public company disclosure, timing, and reporting standards applicable to other investments held by a Fund. Typically, the most recently available information by a Private Company is as of a date that is earlier than the date a Fund is calculating its NAV. This factor may result in a difference between the value of the investment and the price a Fund could receive upon the sale of the investment.
Fair Value Hierarchy: Various inputs are used in determining the fair value of financial instruments. These inputs to valuation techniques are categorized into a fair value hierarchy consisting of three broad levels for financial reporting purposes as follows:
| | • | | Level 1 – Unadjusted price quotations in active markets/exchanges for identical assets or liabilities that each Fund has the ability to access |
| | • | | Level 2 – Other observable inputs (including, but not limited to, quoted prices for similar assets or liabilities in markets that are active, quoted prices for identical or similar assets or liabilities in markets that are not active, inputs other than quoted prices that are observable for the assets or liabilities (such as interest rates, yield curves, volatilities, prepayment speeds, loss severities, credit risks and default rates) or other market–corroborated inputs) |
| | • | | Level 3 – Unobservable inputs based on the best information available in the circumstances, to the extent observable inputs are not available (including the Global Valuation Committee’s assumptions used in determining the fair value of financial instruments) |
The hierarchy gives the highest priority to unadjusted quoted prices in active markets for identical assets or liabilities (Level 1 measurements) and the lowest priority to unobservable inputs (Level 3 measurements). Accordingly, the degree of judgment exercised in determining fair value is greatest for instruments categorized in Level 3. The inputs used to measure fair value may fall into different levels of the fair value hierarchy. In such cases, for disclosure purposes, the fair value hierarchy classification is determined based on the lowest level input that is significant to the fair value measurement in its entirety. Investments classified within Level 3 have significant unobservable inputs used by the Global Valuation Committee in determining the price for Fair Valued Investments. Level 3 investments include equity or debt issued by Private Companies that may not have a secondary market and/or may have a limited number of investors. The categorization of a value determined for financial instruments is based on the pricing transparency of the financial instruments and is not necessarily an indication of the risks associated with investing in those securities.
| 4. | SECURITIES AND OTHER INVESTMENTS |
Preferred Stocks: Preferred stock has a preference over common stock in liquidation (and generally in receiving dividends as well), but is subordinated to the liabilities of the issuer in all respects. As a general rule, the market value of preferred stock with a fixed dividend rate and no conversion element varies inversely with interest rates and perceived credit risk, while the market price of convertible preferred stock generally also reflects some element of conversion value. Because preferred stock is junior to debt securities and other obligations of the issuer, deterioration in the credit quality of the issuer will cause greater changes in the value of a preferred stock than in a more senior debt security with similar stated yield characteristics. Unlike interest payments on debt securities, preferred stock dividends are payable only if declared by the issuer’s board of directors. Preferred stock also may be subject to optional or mandatory redemption provisions.
| | |
NOTESTO FINANCIAL STATEMENTS | | 39 |
Notes to Financial Statements (continued)
| 5. | DERIVATIVE FINANCIAL INSTRUMENTS |
The Funds engage in various portfolio investment strategies using derivative contracts both to increase the returns of the Funds and/or to manage their exposure to certain risks such as credit risk, equity risk, interest rate risk, foreign currency exchange rate risk, commodity price risk or other risks (e.g., inflation risk). Derivative financial instruments categorized by risk exposure are included in the Schedules of Investments. These contracts may be transacted on an exchange or OTC.
Futures Contracts: Futures contracts are purchased or sold to gain exposure to, or manage exposure to, changes in interest rates (interest rate risk) and changes in the value of equity securities (equity risk) or foreign currencies (foreign currency exchange rate risk).
Futures contracts are exchange-traded agreements between the Funds and a counterparty to buy or sell a specific quantity of an underlying instrument at a specified price and on a specified date. Depending on the terms of a contract, it is settled either through physical delivery of the underlying instrument on the settlement date or by payment of a cash amount on the settlement date. Upon entering into a futures contract, the Funds are required to deposit initial margin with the broker in the form of cash or securities in an amount that varies depending on a contract’s size and risk profile. The initial margin deposit must then be maintained at an established level over the life of the contract. Amounts pledged, which are considered restricted, are included in cash pledged for futures contracts in the Statements of Assets and Liabilities.
Securities deposited as initial margin are designated in the Schedules of Investments and cash deposited, if any, are shown as cash pledged for futures contracts in the Statements of Assets and Liabilities. Pursuant to the contract, the Funds agree to receive from or pay to the broker an amount of cash equal to the daily fluctuation in market value of the contract (“variation margin”). Variation margin is recorded as unrealized appreciation (depreciation) and, if any, shown as variation margin receivable (or payable) on futures contracts in the Statements of Assets and Liabilities. When the contract is closed, a realized gain or loss is recorded in the Statements of Operations equal to the difference between the notional amount of the contract at the time it was opened and the notional amount at the time it was closed. The use of futures contracts involves the risk of an imperfect correlation in the movements in the price of futures contracts and interest, foreign currency exchange rates or underlying assets.
Forward Foreign Currency Exchange Contracts: Forward foreign currency exchange contracts are entered into to gain or reduce exposure to foreign currencies (foreign currency exchange rate risk).
A forward foreign currency exchange contract is an agreement between two parties to buy and sell a currency at a set exchange rate on a specified date. These contracts help to manage the overall exposure to the currencies in which some of the investments held by the Funds are denominated and in some cases, may be used to obtain exposure to a particular market. The contracts are traded OTC and not on an organized exchange.
The contract is marked-to-market daily and the change in market value is recorded as unrealized appreciation (depreciation) in the Statements of Assets and Liabilities. When a contract is closed, a realized gain or loss is recorded in the Statements of Operations equal to the difference between the value at the time it was opened and the value at the time it was closed. Non-deliverable forward foreign currency exchange contracts are settled with the counterparty in cash without the delivery of foreign currency. The use of forward foreign currency exchange contracts involves the risk that the value of a forward foreign currency exchange contract changes unfavorably due to movements in the value of the referenced foreign currencies, and such value may exceed the amount(s) reflected in the Statements of Assets and Liabilities. Cash amounts pledged for forward foreign currency exchange contracts are considered restricted and are included in cash pledged as collateral for OTC derivatives in the Statements of Assets and Liabilities. A Fund’s risk of loss from counterparty credit risk on OTC derivatives is generally limited to the aggregate unrealized gain netted against any collateral held by the Fund.
Options: Certain Funds purchase and write call and put options to increase or decrease their exposure to the risks of underlying instruments, including equity risk, interest rate risk and/or commodity price risk and/or, in the case of options written, to generate gains from options premiums.
A call option gives the purchaser (holder) of the option the right (but not the obligation) to buy, and obligates the seller (writer) to sell (when the option is exercised) the underlying instrument at the exercise or strike price at any time or at a specified time during the option period. A put option gives the holder the right to sell and obligates the writer to buy the underlying instrument at the exercise or strike price at any time or at a specified time during the option period.
Premiums paid on options purchased and premiums received on options written, as well as the daily fluctuation in market value, are included in investments at value –unaffiliated and options written at value, respectively, in the Statements of Assets and Liabilities. When an instrument is purchased or sold through the exercise of an option, the premium is offset against the cost or proceeds of the underlying instrument. When an option expires, a realized gain or loss is recorded in the Statements of Operations to the extent of the premiums received or paid. When an option is closed or sold, a gain or loss is recorded in the Statements of Operations to the extent the cost of the closing transaction exceeds the premiums received or paid. When the Funds write a call option, such option is typically “covered,” meaning that they hold the underlying instrument subject to being called by the option counterparty. When the Funds write a put option, cash is segregated in an amount sufficient to cover the obligation. These amounts, which are considered restricted, are included in cash pledged as collateral for options written in the Statements of Assets and Liabilities.
In purchasing and writing options, the Funds bear the risk of an unfavorable change in the value of the underlying instrument or the risk that they may not be able to enter into a closing transaction due to an illiquid market. Exercise of a written option could result in the Funds purchasing or selling a security when they otherwise would not, or at a price different from the current market value.
Swaps: Swap contracts are entered into to manage exposure to issuers, markets and securities. Such contracts are agreements between the Funds and a counterparty to make periodic net payments on a specified notional amount or a net payment upon termination. Swap agreements are privately negotiated in the OTC market and may be entered into as a bilateral contract (“OTC swaps”) or centrally cleared (“centrally cleared swaps”).
For OTC swaps, any upfront premiums paid and any upfront fees received are shown as swap premiums paid and swap premiums received, respectively, in the Statements of Assets and Liabilities and amortized over the term of the contract. The daily fluctuation in market value is recorded as unrealized appreciation (depreciation) on OTC Swaps in the Statements of Assets and Liabilities. Payments received or paid are recorded in the Statements of Operations as realized gains or losses, respectively. When an OTC swap is terminated, a realized gain or loss is recorded in the Statements of Operations equal to the difference between the proceeds from (or cost of) the closing transaction and the Funds’ basis in the contract, if any. Generally, the basis of the contract is the premium received or paid.
| | |
| 40 | | 2020 BLACKROCK ANNUAL REPORTTO SHAREHOLDERS |
| | |
Notes to Financial Statements (continued) | | |
In a centrally cleared swap, immediately following execution of the swap contract, the swap contract is novated to a central counterparty (the “CCP”) and the CCP becomes the Funds’ counterparty on the swap. Each Fund is required to interface with the CCP through the broker. Upon entering into a centrally cleared swap, each Fund is required to deposit initial margin with the broker in the form of cash or securities in an amount that varies depending on the size and risk profile of the particular swap. Securities deposited as initial margin are designated in the Schedules of Investments and cash deposited is shown as cash pledged for centrally cleared swaps in the Statements of Assets and Liabilities. Amounts pledged, which are considered restricted cash, are included in cash pledged for centrally cleared swaps in the Statements of Assets and Liabilities. Pursuant to the contract, each Fund agrees to receive from or pay to the broker an amount of cash equal to the daily fluctuation in market value of the contract (“variation margin”). Variation margin is recorded as unrealized appreciation (depreciation) and shown as variation margin receivable (or payable) on centrally cleared swaps in the Statements of Assets and Liabilities. Payments received from (paid to) the counterparty are amortized over the term of the contract and recorded as realized gains (losses) in the Statements of Operations, including those at termination.
| | • | | Total return swaps — Total return swaps are entered into to obtain exposure to a security or market without owning such security or investing directly in such market or to exchange the risk/return of one security or market (e.g., fixed-income) with another security or market (e.g., equity or commodity prices) (equity risk, commodity price risk and/or interest rate risk). |
Total return swaps are agreements in which there is an exchange of cash flows whereby one party commits to make payments based on the total return (distributions plus capital gains/losses) of an underlying instrument, or basket of underlying instruments, in exchange for fixed or floating rate interest payments. If the total return of the instrument(s) or index underlying the transaction exceeds or falls short of the offsetting fixed or floating interest rate obligation, the Funds receive payment from or make a payment to the counterparty.
Certain total return swaps are designed to function as a portfolio of direct investments in long and short equity positions. This means that the Fund has the ability to trade in and out of these long and short positions within the swap and will receive the economic benefits and risks equivalent to direct investment in these positions, subject to certain adjustments due to events related to the counterparty. Benefits and risks include capital appreciation (depreciation), corporate actions and dividends received and paid, all of which are reflected in the swap’s market value. The market value also includes interest charges and credits (“financing fees”) related to the notional values of the long and short positions and cash balances within the swap. These interest charges and credits are based on a specified benchmark rate plus or minus a specified spread determined based upon the country and/or currency of the positions in the portfolio.
Positions within the swap and financing fees are reset periodically. During a reset, any unrealized appreciation (depreciation) on positions and accrued financing fees become available for cash settlement between the Funds and the counterparty. The amounts that are available for cash settlement are recorded as realized gains or losses in the Statements of Operations. Cash settlement in and out of the swap may occur at a reset date or any other date, at the discretion of the Funds and the counterparty, over the life of the agreement. Certain swaps have no stated expiration and can be terminated by either party at any time.
Swap transactions involve, to varying degrees, elements of interest rate, credit and market risk in excess of the amounts recognized in the Statements of Assets and Liabilities. Such risks involve the possibility that there will be no liquid market for these agreements, that the counterparty to the agreements may default on its obligation to perform or disagree as to the meaning of the contractual terms in the agreements, and that there may be unfavorable changes in interest rates and/or market values associated with these transactions.
Master Netting Arrangements: In order to define its contractual rights and to secure rights that will help it mitigate its counterparty risk, a Fund may enter into an International Swaps and Derivatives Association, Inc. Master Agreement (“ISDA Master Agreement”) or similar agreement with its counterparties. An ISDA Master Agreement is a bilateral agreement between a Fund and a counterparty that governs certain OTC derivatives and typically contains, among other things, collateral posting terms and netting provisions in the event of a default and/or termination event. Under an ISDA Master Agreement, a Fund may, under certain circumstances, offset with the counterparty certain derivative financial instruments’ payables and/or receivables with collateral held and/or posted and create one single net payment. The provisions of the ISDA Master Agreement typically permit a single net payment in the event of default including the bankruptcy or insolvency of the counterparty. However, bankruptcy or insolvency laws of a particular jurisdiction may impose restrictions on or prohibitions against the right of offset in bankruptcy, insolvency or other events.
Collateral Requirements: For derivatives traded under an ISDA Master Agreement, the collateral requirements are typically calculated by netting the mark-to-market amount for each transaction under such agreement and comparing that amount to the value of any collateral currently pledged by the Fund and the counterparty.
Cash collateral that has been pledged to cover obligations of the Funds and cash collateral received from the counterparty, if any, is reported separately in the Statements of Assets and Liabilities as cash pledged as collateral and cash received as collateral, respectively. Non-cash collateral pledged by the Funds, if any, is noted in the Schedules of Investments. Generally, the amount of collateral due from or to a counterparty is subject to a certain minimum transfer amount threshold before a transfer is required, which is determined at the close of business of the Funds. Any additional required collateral is delivered to/pledged by the Funds on the next business day. Typically, the counterparty is not permitted to sell, re-pledge or use cash and non-cash collateral it receives. A Fund generally agrees not to use non-cash collateral that it receives but may, absent default or certain other circumstances defined in the underlying ISDA Master Agreement, be permitted to use cash collateral received. In such cases, interest may be paid pursuant to the collateral arrangement with the counterparty. To the extent amounts due to the Funds from the counterparties are not fully collateralized, each Fund bears the risk of loss from counterparty non-performance. Likewise, to the extent the Funds have delivered collateral to a counterparty and stand ready to perform under the terms of their agreement with such counterparty, each Fund bears the risk of loss from a counterparty in the amount of the value of the collateral in the event the counterparty fails to return such collateral. Based on the terms of agreements, collateral may not be required for all derivative contracts.
For financial reporting purposes, the Funds do not offset derivative assets and derivative liabilities that are subject to netting arrangements, if any, in the Statements of Assets and Liabilities.
| | |
NOTESTO FINANCIAL STATEMENTS | | 41 |
| | |
Notes to Financial Statements (continued) | | |
| 6. | INVESTMENT ADVISORY AGREEMENT AND OTHER TRANSACTIONS WITH AFFILIATES |
Investment Advisory: The Trust, on behalf of the Funds, entered into an Investment Advisory Agreement with the Manager, the Funds’ investment adviser and an indirect, wholly-owned subsidiary of BlackRock, Inc. (“BlackRock”), to provide investment advisory and administrative services. The Manager is responsible for the management of each Fund’s portfolio and provides the personnel, facilities, equipment and certain other services necessary to the operations of each Fund.
For such services, each Fund pays the Manager a monthly fee at an annual rate equal to the following percentages of the average daily value of each Fund’s net assets.
| | | | | | | | |
| | | Investment Advisory Fees | |
| Average Daily Net Assets | | GA Disciplined Volatility Equity | | | GA Dynamic Equity | |
First $1 billion | | | 0.40 | % | | | 0.40 | % |
$1 billion — $3 billion | | | 0.38 | | | | 0.38 | |
$3 billion — $5 billion | | | 0.36 | | | | 0.36 | |
$5 billion — $10 billion | | | 0.35 | | | | 0.35 | |
Greater than $10 billion | | | 0.34 | | | | 0.34 | |
The Manager provides investment management and other services to the Subsidiary. The Manager does not receive separate compensation from the Subsidiary for providing investment management or administrative services. However, the Funds pay the Manager based on the Funds’ net assets, which includes the assets of the Subsidiary.
Transfer Agent: Pursuant to written agreements, certain financial intermediaries, some of which may be affiliates, provide the Funds with sub-accounting, recordkeeping, sub-transfer agency and other administrative services with respect to servicing of underlying investor accounts. For these services, these entities receive an asset-based fee or an annual fee per shareholder account, which will vary depending on share class and/or net assets. For the year ended October 31, 2020, the Funds did not pay any amounts to affiliates in return for these services.
For the year ended October 31, 2020, the following table shows the class specific transfer agent fees borne directly by each share class of each Fund:
| | | | | | | | | | | | |
| Fund Name | | Institutional | | | Class K | | | Total | |
GA Disciplined Volatility Equity | | $ | 191 | | | $ | 16 | | | $ | 207 | |
GA Dynamic Equity | | | 190 | | | | 17 | | | | 207 | |
Expense Limitations, Waivers, Reimbursements, and Recoupments: With respect to each Fund, the Manager contractually agreed to waive its investment advisory fees by the amount of investment advisory fees each Fund pays to the Manager indirectly through its investment in affiliated money market funds (the “affiliated money market fund waiver”) through February 28, 2021. The contractual agreement may be terminated upon 90 days’ notice by a majority of the trustees who are not “interested persons” of the Trust, as defined in the 1940 Act (“Independent Trustees”), or by a vote of a majority of the outstanding voting securities of a Fund. The amount of waivers and/or reimbursements of fees and expenses made pursuant to the expense limitation described below will be reduced by the amount of the affiliated money market fund waiver. Prior to February 28, 2020, this waiver was voluntary. These amounts are included in fees waived and/or reimbursed by the Manager in the Statements of Operations. For the year ended October 31, 2020, the amounts waived were as follows:
| | | | |
| Fund Name | | Amounts Waived | |
GA Disciplined Volatility Equity | | $ | 210 | |
GA Dynamic Equity | | | 149 | |
The Manager has contractually agreed to waive its investment advisory fee with respect to any portion of each Fund’s assets invested in affiliated equity and fixed-income mutual funds, affiliated and exchange-traded funds that have a contractual management fee through February 28, 2021. The contractual agreement may be terminated upon 90 days’ notice by a majority of the Independent Trustees, or by a vote of a majority of the outstanding voting securities of a Fund. For the year ended October 31, 2020 there were no fees waived and/or reimbursed by the Manager pursuant to these arrangements.
With respect to each Fund, the Manager contractually agreed to waive and/or reimburse fees or expenses in order to limit expenses, excluding interest expense, dividend expense, tax expense, acquired fund fees and expenses, and certain other fund expenses, which constitute extraordinary expenses not incurred in the ordinary course of each Fund’s business (“expense limitation”). The expense limitations as a percentage of average daily net assets are as follows:
| | | | | | | | |
| Fund Name | | Institutional | | | Class K | |
GA Disciplined Volatility Equity | | | 0.55 | % | | | 0.50 | % |
GA Dynamic Equity | | | 0.55 | | | | 0.50 | |
The Manager has agreed not to reduce or discontinue these contractual expense limitations through February 28, 2021, unless approved by the Board, including a majority of the Independent Trustees, or by a vote of a majority of the outstanding voting securities of a Fund. For the year ended October 31, 2020, amounts included in the Statements of Operations were as follows:
| | | | |
| Fund Name | | Amounts Waived | |
GA Disciplined Volatility Equity | | $ | 247,869 | |
GA Dynamic Equity | | | 286,786 | |
| | |
| 42 | | 2020 BLACKROCK ANNUAL REPORTTO SHAREHOLDERS |
Notes to Financial Statements (continued)
These amounts waived and/or reimbursed are included in transfer agent fees waived — class specific in the Statements of Operations. For the year ended October 31, 2020, class specific expense waivers and/or reimbursements are as follows:
| | | | | | | | | | | | |
| Fund Name | | Institutional | | | Class K | | | Total | |
GA Disciplined Volatility Equity | | $ | 166 | | | $ | 16 | | | $ | 182 | |
GA Dynamic Equity | | | 165 | | | | 15 | | | | 180 | |
With respect to the contractual expense limitation, if during a Fund’s fiscal year the operating expenses of a share class, that at any time during the prior two fiscal years received a waiver and/or reimbursement from the Manager, are less than the current expense limitation for that share class, the Manager is entitled to be reimbursed by such share class up to the lesser of: (a) the amount of fees waived and/or expenses reimbursed during those prior two fiscal years under the agreement and (b) an amount not to exceed either the current expense limitation of that share class or the expense limitation of the share class in effect at the time that the share class received the applicable waiver and/or reimbursement, provided that:
(1) each Fund, of which the share class is a part, has more than $50 million in assets for the fiscal year, and
(2) the Manager or an affiliate continues to serve as a Fund’s investment adviser or administrator.
This repayment applies only to the contractual expense limitation on net expenses and does not apply to the contractual investment advisory fee waiver described above or any voluntary waivers that may be in effect from time to time. Effective June 1, 2024, the repayment arrangement between each Fund and the Manager pursuant to which such Fund may be required to repay amounts waived and/or reimbursed under each Fund’s contractual caps on net expenses will be terminated.
As of October 31, 2020, the fund level and class specific waivers and/or reimbursements subject to possible future recoupment under the expense limitation agreement are as follows:
| | | | | | | | |
| | | Expiring | |
| Fund Name/Fund Level/Share Class | | October 31, 2021 | | | October 31, 2022 | |
GA Disciplined Volatility Equity | | | | | | | | |
Fund Level | | $ | 267,858 | | | $ | 247,869 | |
Institutional | | | 350 | | | | 166 | |
Class K | | | 8,126 | | | | 16 | |
GA Dynamic Equity | | | | | | | | |
Fund Level | | | 289,613 | | | | 286,786 | |
Institutional | | | 355 | | | | 165 | |
Class K | | | 8,126 | | | | 15 | |
The following fund level and class specific waivers and/or reimbursements previously recorded by the Funds, which were subject to recoupment by the Manager, expired on October 31, 2020:
| | | | |
| Fund Name/Fund Level/Share Class | | Expired
October 31, 2020 | |
GA Disciplined Volatility Equity | | | | |
Fund Level | | $ | 162,727 | |
Institutional | | | — | |
Class K | | | — | |
GA Dynamic Equity | | | | |
Fund Level | | | 163,445 | |
Institutional | | | — | |
Class K | | | — | |
Interfund Lending: In accordance with an exemptive order (the “Order”) from the U.S. Securities and Exchange Commission (“SEC”), each Fund may participate in a joint lending and borrowing facility for temporary purposes (the “Interfund Lending Program”), subject to compliance with the terms and conditions of the Order, and to the extent permitted by each Fund’s investment policies and restrictions. Each Fund is currently permitted to borrow and lend under the Interfund Lending Program.
A lending BlackRock fund may lend in aggregate up to 15% of its net assets, but may not lend more than 5% of its net assets to any one borrowing fund through the Interfund Lending Program. A borrowing BlackRock fund may not borrow through the Interfund Lending Program or from any other source more than 33 1/3% of its total assets (or any lower threshold provided for by the fund’s investment restrictions). If a borrowing BlackRock fund’s total outstanding borrowings exceed 10% of its total assets, each of its outstanding interfund loans will be subject to collateralization of at least 102% of the outstanding principal value of the loan. All interfund loans are for temporary or emergency purposes and the interest rate to be charged will be the average of the highest current overnight repurchase agreement rate available to a lending fund and the bank loan rate, as calculated according to a formula established by the Board.
During the year ended October 31, 2020, the Funds did not participate in the Interfund Lending Program.
Trustees and Officers: Certain trustees and/or officers of the Trust are directors and/or officers of BlackRock or its affiliates. The Funds reimburse the Manager for a portion of the compensation paid to the Trust’s Chief Compliance Officer, which is included in Trustees and Officer in the Statements of Operations.
| | |
NOTESTO FINANCIAL STATEMENTS | | 43 |
Notes to Financial Statements (continued)
For the year ended October 31, 2020, purchases and sales of investments, excluding short-term investments, were as follows:
| | | | | | | | |
| Fund Name | | Purchases | | | Sales | |
GA Disciplined Volatility Equity | | $ | 6,903,430 | | | $ | 6,745,594 | |
GA Dynamic Equity | | | 4,037,595 | | | | 4,000,050 | |
It is each Fund’s policy to comply with the requirements of the Internal Revenue Code of 1986, as amended, applicable to regulated investment companies, and to distribute substantially all of its taxable income to its shareholders. Therefore, no U.S. federal income tax provision is required.
Each Fund files U.S. federal and various state and local tax returns. No income tax returns are currently under examination. The statute of limitations on each Fund’s U.S. federal tax returns generally remains open for a period of three fiscal years after they are filed. The statutes of limitations on each Fund’s state and local tax returns may remain open for an additional year depending upon the jurisdiction.
Management has analyzed tax laws and regulations and their application to the Funds as of October 31, 2020, inclusive of the open tax return years, and does not believe that there are any uncertain tax positions that require recognition of a tax liability in the Funds’ financial statements.
The tax character of distributions paid was as follows:
| | | | | | | | | | | | |
| | | Periods | | | GA Disciplined Volatility Equity | | | GA Dynamic Equity | |
Ordinary income | | | 10/31/20 | | | $ | 242,763 | | | $ | 53,001 | |
| | | 10/31/19 | | | | 124,401 | | | | 189,099 | |
Long-term capital gains | | | 10/31/20 | | | | 2,605 | | | | — | |
| | | | | | | | | | | | |
Total | | | 10/31/20 | | | $ | 245,368 | | | $ | 53,001 | |
| | | | | | | | | | | | |
| | | 10/31/19 | | | $ | 124,401 | | | $ | 189,099 | |
| | | | | | | | | | | | |
As of period end, the tax components of accumulated earnings (loss) were as follows:
| | | | | | | | |
| | | GA Disciplined Volatility Equity | | | GA Dynamic Equity | |
Undistributed ordinary income | | $ | 15,901 | | | $ | 37,064 | |
Undistributed long-term capital gains | | | 68,459 | | | | — | |
Non-expiring capital loss carryforwards(a) | | | — | | | | (38,021 | ) |
Net unrealized gains(b) | | | 381,731 | | | | 894,718 | |
| | | | | | | | |
| | $ | 466,091 | | | $ | 893,761 | |
| | | | | | | | |
| | (a) | Amounts available to offset future realized capital gains. | |
| | (b) | The difference between book-basis and tax-basis net unrealized gains (losses) was attributable primarily to the tax deferral of losses on wash sales and straddles, the realization for tax purposes of unrealized gains/losses on certain futures and foreign currency contracts and the accounting for swaps. | |
During the year ended October 31, 2020, the GA Dynamic Equity utilized $78,645 of its capital loss carryforward.
As of October 31, 2020, gross unrealized appreciation and depreciation based on cost of investments (including short positions and derivatives, if any) for U.S. federal income tax purposes were as follows:
| | | | | | | | |
| | | GA Disciplined Volatility Equity | | | GA Dynamic Equity | |
Tax cost | | $ | 5,513,305 | | | $ | 5,065,953 | |
| | | | | | | | |
Gross unrealized appreciation | | $ | 601,383 | | | $ | 1,154,059 | |
Gross unrealized depreciation | | | (219,957 | ) | | | (248,467 | ) |
| | | | | | | | |
Net unrealized appreciation (depreciation) | | $ | 381,426 | | | $ | 905,592 | |
| | | | | | | | |
The Trust, on behalf of the Funds, along with certain other funds managed by the Manager and its affiliates (“Participating Funds”), is a party to a 364-day, $2.25 billion credit agreement with a group of lenders. Under this agreement, the Funds may borrow to fund shareholder redemptions. Excluding commitments designated for certain individual funds, the Participating Funds, including the Funds, can borrow up to an aggregate commitment amount of $1.75 billion at any time outstanding, subject to asset coverage and other limitations as specified in the agreement. The credit agreement has the following terms: a fee of 0.10% per annum on unused commitment amounts and interest at a rate equal to the higher of (a) one-month LIBOR (but, in any event, not less than 0.00%) on the date the loan is made plus 0.80% per annum or (b) the Fed Funds rate (but, in any event, not less than 0.00%) in effect from time to time plus 0.80% per annum on amounts borrowed. The agreement expires in April 2021 unless extended or renewed. These fees were allocated among such funds based upon portions of the aggregate commitment available to them and relative net assets of Participating Funds. During the year ended October 31, 2020, the Funds did not borrow under the credit agreement.
| | |
| 44 | | 2020 BLACKROCK ANNUAL REPORTTO SHAREHOLDERS |
| | |
Notes to Financial Statements (continued) | | |
In the normal course of business, certain Funds invest in securities or other instruments and may enter into certain transactions, and such activities subject each Fund to various risks, including among others, fluctuations in the market (market risk) or failure of an issuer to meet all of its obligations. The value of securities or other instruments may also be affected by various factors, including, without limitation: (i) the general economy; (ii) the overall market as well as local, regional or global political and/or social instability; (iii) regulation, taxation or international tax treaties between various countries; or (iv) currency, interest rate and price fluctuations. Local, regional or global events such as war, acts of terrorism, the spread of infectious illness or other public health issues, recessions, or other events could have a significant impact on the Funds and their investments. Each Fund’s prospectus provides details of the risks to which each Fund is subject.
Market Risk: An outbreak of respiratory disease caused by a novel coronavirus has developed into a global pandemic and has resulted in closing borders, quarantines, disruptions to supply chains and customer activity, as well as general concern and uncertainty. The impact of this pandemic, and other global health crises that may arise in the future, could affect the economies of many nations, individual companies and the market in general in ways that cannot necessarily be foreseen at the present time. This pandemic may result in substantial market volatility and may adversely impact the prices and liquidity of a fund’s investments. The duration of this pandemic and its effects cannot be determined with certainty.
Valuation Risk: The market values of equities, such as common stocks and preferred securities or equity related investments, such as futures and options, may decline due to general market conditions which are not specifically related to a particular company. They may also decline due to factors which affect a particular industry or industries. A Fund may invest in illiquid investments. An illiquid investment is any investment that a Fund reasonably expects cannot be sold or disposed of in current market conditions in seven calendar days or less without the sale or disposition significantly changing the market value of the investment. A Fund may experience difficulty in selling illiquid investments in a timely manner at the price that it believes the investments are worth. Prices may fluctuate widely over short or extended periods in response to company, market or economic news. Markets also tend to move in cycles, with periods of rising and falling prices. This volatility may cause each Fund’s NAV to experience significant increases or decreases over short periods of time. If there is a general decline in the securities and other markets, the NAV of a Fund may lose value, regardless of the individual results of the securities and other instruments in which a Fund invests.
The price a Fund could receive upon the sale of any particular portfolio investment may differ from a Fund’s valuation of the investment, particularly for securities that trade in thin or volatile markets or that are valued using a fair valuation technique or a price provided by an independent pricing service. Changes to significant unobservable inputs and assumptions (i.e., publicly traded company multiples, growth rate, time to exit) due to the lack of observable inputs may significantly impact the resulting fair value and therefore a Fund’s results of operations. As a result, the price received upon the sale of an investment may be less than the value ascribed by a Fund, and a Fund could realize a greater than expected loss or lesser than expected gain upon the sale of the investment. A Fund’s ability to value its investments may also be impacted by technological issues and/or errors by pricing services or other third party service providers.
Counterparty Credit Risk: The Funds may be exposed to counterparty credit risk, or the risk that an entity may fail to or be unable to perform on its commitments related to unsettled or open transactions, including making timely interest and/or principal payments or otherwise honoring its obligations. The Funds manage counterparty credit risk by entering into transactions only with counterparties that the Manager believes have the financial resources to honor their obligations and by monitoring the financial stability of those counterparties. Financial assets, which potentially expose the Funds to market, issuer and counterparty credit risks, consist principally of financial instruments and receivables due from counterparties. The extent of the Funds’ exposure to market, issuer and counterparty credit risks with respect to these financial assets is approximately their value recorded in the Statements of Assets and Liabilities, less any collateral held by the Funds.
A derivative contract may suffer a mark-to-market loss if the value of the contract decreases due to an unfavorable change in the market rates or values of the underlying instrument. Losses can also occur if the counterparty does not perform under the contract.
For OTC options purchased, each Fund bears the risk of loss in the amount of the premiums paid plus the positive change in market values net of any collateral held by the Funds should the counterparty fail to perform under the contracts. Options written by the Funds do not typically give rise to counterparty credit risk, as options written generally obligate the Funds, and not the counterparty, to perform. The Funds may be exposed to counterparty credit risk with respect to options written to the extent each Fund deposits collateral with its counterparty to a written option.
With exchange-traded futures, there is less counterparty credit risk to the Funds since the exchange or clearinghouse, as counterparty to such instruments, guarantees against a possible default. The clearinghouse stands between the buyer and the seller of the contract; therefore, credit risk is limited to failure of the clearinghouse. While offset rights may exist under applicable law, a Fund does not have a contractual right of offset against a clearing broker or clearinghouse in the event of a default (including the bankruptcy or insolvency). Additionally, credit risk exists in exchange-traded futures with respect to initial and variation margin that is held in a clearing broker’s customer accounts. While clearing brokers are required to segregate customer margin from their own assets, in the event that a clearing broker becomes insolvent or goes into bankruptcy and at that time there is a shortfall in the aggregate amount of margin held by the clearing broker for all its clients, typically the shortfall would be allocated on a pro rata basis across all the clearing broker’s customers, potentially resulting in losses to the Funds.
Concentration Risk: A diversified portfolio, where this is appropriate and consistent with a fund’s objectives, minimizes the risk that a price change of a particular investment will have a material impact on the NAV of a fund. The investment concentrations within certain Fund’s portfolio are disclosed in its Schedule of Investments.
Certain Funds invest a substantial amount of their assets in issuers located in a single state or limited number of states. When a Fund concentrates its investments in this manner, it assumes the risk that economic, regulatory, political or social conditions affecting that state or group of states could have a significant impact on the fund and could affect the income from, or the value or liquidity of, the fund’s portfolio. Investment percentages in specific states or U.S. territories are presented in the Schedules of Investments.
LIBOR Transition Risk: The United Kingdom’s Financial Conduct Authority announced a phase out of the London Interbank Offered Rate (“LIBOR”) by the end of 2021, and it is expected that LIBOR will cease to be published after that time. The Funds may be exposed to financial instruments tied to LIBOR to determine payment obligations,
| | |
NOTESTO FINANCIAL STATEMENTS | | 45 |
Notes to Financial Statements (continued)
financing terms, hedging strategies or investment value. The transition process away from LIBOR might lead to increased volatility and illiquidity in markets for, and reduce the effectiveness of new hedges placed against, instruments whose terms currently include LIBOR. The ultimate effect of the LIBOR transition process on the Funds is uncertain.
| 11. | CAPITAL SHARE TRANSACTIONS |
Transactions in capital shares for each class were as follows:
| | | | | | | | | | | | | | | | |
| | | Year Ended
10/31/20 | | | Year Ended
10/31/19 | |
| Fund Name / Share Class | | Shares | | | Amounts | | | Shares | | | Amounts | |
GA Disciplined Volatility Equity | | | | | | | | | | | | | | | | |
Institutional(a) | | | | | | | | | | | | | | | | |
Shares sold | | | 4,035 | | | $ | 43,088 | | | | 6,925 | | | $ | 71,073 | |
Shares issued in reinvestment of distributions | | | 197 | | | | 2,155 | | | | 24 | | | | 267 | |
Shares redeemed | | | — | | | | — | | | | (4,010 | ) | | | (44,089 | ) |
| | | | | | | | | | | | | | | | |
| | | 4,232 | | | $ | 45,243 | | | | 2,939 | | | $ | 27,251 | |
| | | | | | | | | | | | | | | | |
Class K | | | | | | | | | | | | | | | | |
Shares sold | | | — | | | | — | | | | 48 | | | | 478 | |
Shares issued in reinvestment of distributions | | | 22,264 | | | | 243,213 | | | | 6,333 | | | | 69,789 | |
Shares redeemed | | | — | | | | — | | | | (3,308 | ) | | | (32,781 | ) |
| | | | | | | | | | | | | | | | |
| | | 22,264 | | | $ | 243,213 | | | | 3,073 | | | $ | 37,486 | |
| | | | | | | | | | | | | | | | |
| | | 26,496 | | | $ | 288,456 | | | | 6,012 | | | $ | 64,737 | |
| | | | | | | | | | | | | | | | |
| | | | | | | | | | | | | | | | |
| | | Year Ended
10/31/20 | | | Year Ended
10/31/19 | |
| Fund Name / Share Class | | Shares | | | Amounts | | | Shares | | | Amounts | |
GA Dynamic Equity | | | | | | | | | | | | | | | | |
Institutional(a) | | | | | | | | | | | | | | | | |
Shares sold | | | 4,352 | | | $ | 47,008 | | | | 6,927 | | | $ | 69,332 | |
Shares issued in reinvestment of distributions | | | 42 | | | | 485 | | | | 19 | | | | 205 | |
Shares redeemed | | | — | | | | — | | | | (3,872 | ) | | | (41,297 | ) |
| | | | | | | | | | | | | | | | |
| | | 4,394 | | | $ | 47,493 | | | | 3,074 | | | $ | 28,240 | |
| | | | | | | | | | | | | | | | |
Class K | | | | | | | | | | | | | | | | |
Shares sold | | | 87 | | | | 950 | | | | 124 | | | | 1,224 | |
Shares issued in reinvestment of distributions | | | 4,590 | | | | 52,516 | | | | 5,064 | | | | 53,777 | |
Shares redeemed | | | — | | | | — | | | | (3,264 | ) | | | (31,222 | ) |
| | | | | | | | | | | | | | | | |
| | | 4,677 | | | $ | 53,466 | | | | 1,924 | | | $ | 23,779 | |
| | | | | | | | | | | | | | | | |
| | | 9,071 | | | $ | 100,959 | | | | 4,998 | | | $ | 52,019 | |
| | | | | | | | | | | | | | | | |
| | (a) | The share class commenced operation on November 30, 2018. | |
As of October 31, 2020, shares owned by BlackRock Financial Management, Inc., an affiliate of the Funds, were as follows:
| | | | | | | | | | | | |
| Fund Name | | Institutional | | | Class K | | | Total | |
GA Disciplined Volatility Equity | | | 2,050 | | | | 528,597 | | | | 530,647 | |
GA Dynamic Equity | | | 1,974 | | | | 509,653 | | | | 511,627 | |
Management has evaluated the impact of all subsequent events on the Funds through the date the financial statements were issued and has determined that there were no subsequent events requiring adjustment or additional disclosure in the financial statements.
| | |
| 46 | | 2020 BLACKROCK ANNUAL REPORTTO SHAREHOLDERS |
Report of Independent Registered Public Accounting Firm
To the Shareholders of BlackRock GA Disciplined Volatility Equity Fund and BlackRock GA Dynamic Equity Fund and the Board of Trustees of Managed Account Series:
Opinion on the Financial Statements and Financial Highlights
We have audited the accompanying statements of assets and liabilities of BlackRock GA Disciplined Volatility Equity Fund and BlackRock GA Dynamic Equity Fund of Managed Account Series (the “Funds”), including the schedules of investments, as of October 31, 2020, the related statements of operations for the year then ended, the statements of changes in net assets for each of the two years in the period then ended, the financial highlights for each of the three years in the period then ended and for the period from June 1, 2017 (commencement of operations) to October 31, 2017, and the related notes. Such financial statements and financial highlights of BlackRock GA Disciplined Volatility Equity Fund as of and for the year ended October 31, 2020 are consolidated. In our opinion, the financial statements and financial highlights present fairly, in all material respects, the financial position of the Funds as of October 31, 2020, and the results of their operations for the year then ended, the changes in their net assets for each of the two years in the period then ended, and the financial highlights for each of the three years in the period then ended and for the period from June 1, 2017 (commencement of operations) to October 31, 2017, in conformity with accounting principles generally accepted in the United States of America.
Basis for Opinion
These financial statements and financial highlights are the responsibility of the Funds’ management. Our responsibility is to express an opinion on the Funds’ financial statements and financial highlights based on our audits. We are a public accounting firm registered with the Public Company Accounting Oversight Board (United States) (PCAOB) and are required to be independent with respect to the Funds in accordance with the U.S. federal securities laws and the applicable rules and regulations of the Securities and Exchange Commission and the PCAOB.
We conducted our audits in accordance with the standards of the PCAOB. Those standards require that we plan and perform the audit to obtain reasonable assurance about whether the financial statements and financial highlights are free of material misstatement, whether due to error or fraud. The Funds are not required to have, nor were we engaged to perform, an audit of their internal control over financial reporting. As part of our audits we are required to obtain an understanding of internal control over financial reporting but not for the purpose of expressing an opinion on the effectiveness of the Funds’ internal control over financial reporting. Accordingly, we express no such opinion.
Our audits included performing procedures to assess the risks of material misstatement of the financial statements and financial highlights, whether due to error or fraud, and performing procedures that respond to those risks. Such procedures included examining, on a test basis, evidence regarding the amounts and disclosures in the financial statements and financial highlights. Our audits also included evaluating the accounting principles used and significant estimates made by management, as well as evaluating the overall presentation of the financial statements and financial highlights. Our procedures included confirmation of securities owned as of October 31, 2020, by correspondence with the custodian and brokers; when replies were not received from brokers, we performed other auditing procedures. We believe that our audits provide a reasonable basis for our opinion.
Deloitte & Touche LLP
Boston, Massachusetts
December 21, 2020
We have served as the auditor of one or more BlackRock investment companies since 1992.
| | |
REPORTOF INDEPENDENT REGISTERED PUBLIC ACCOUNTING FIRM | | 47 |
Important Tax Information (unaudited)
For corporate shareholders, the percentage of ordinary income distributions paid during the fiscal year ended October 31, 2020 that qualified for the dividends-received deduction were as follows:
| | | | |
| Fund Name | | Dividends-Received
Deduction | |
GA Disciplined Volatility Equity | | | 64.20 | % |
GA Dynamic Equity | | | 75.67 | |
The following maximum amounts are hereby designated as qualified dividend income for individuals for the fiscal year ended October 31, 2020:
| | | | |
| Fund Name | | Qualified Dividend
Income | |
GA Disciplined Volatility Equity | | $ | 171,911 | |
GA Dynamic Equity | | | 117,590 | |
For the fiscal year ended October 31, 2020, the Funds hereby designate the following maximum amounts allowable as interest-related dividends eligible for exemption from U.S. withholding tax for nonresident aliens and foreign corporations:
| | | | |
| Fund Name | | Interest-Related
Dividends | |
GA Disciplined Volatility Equity | | $ | 4,552 | |
GA Dynamic Equity | | | 2,381 | |
The Funds hereby designate the following amount of distributions from direct federal obligation interest for the fiscal year ended October 31, 2020:
| | | | |
| Fund Name | | Federal Obligation
Interest | |
GA Disciplined Volatility Equity | | $ | 752 | |
GA Dynamic Equity | | | 630 | |
The law varies in each state as to whether and what percent of ordinary income dividends attribute to federal obligations is exempt from state income tax. Shareholders are advised to check with their tax advisers to determine if any portion of the dividends received is exempt from state income tax.
The following distribution amounts are hereby designated for the fiscal year ended October 31, 2020:
| | | | | | | | |
| Fund Name | | Short-Term
Capital Gain
Dividends | | | 20% Rate
Long-Term
Capital Gain
Dividends | |
GA Disciplined Volatility Equity | | $ | 74,762 | | | $ | 2,605 | |
| | |
| 48 | | 2020 BLACKROCK ANNUAL REPORTTO SHAREHOLDERS |
Disclosure of Investment Advisory Agreement
The Board of Trustees (the “Board,” the members of which are referred to as “Board Members”) of Managed Account Series (the “Trust”) met on April 7, 2020 (the “April Meeting”) and May 11-13, 2020 (the “May Meeting”) to consider the approval of the investment advisory agreement (the “Agreement”) between the Trust, on behalf of BlackRock GA Disciplined Volatility Equity Fund (the “Disciplined Volatility Equity Fund”) and BlackRock GA Dynamic Equity Fund (the “Dynamic Equity Fund”) (each a “Fund” and collectively, the “Funds”), each a series of the Trust, and BlackRock Advisors, LLC (the “Manager” or “BlackRock”), the Trust’s investment advisor.
Activities and Composition of the Board
On the date of the May Meeting, the Board consisted of fourteen individuals, twelve of whom were not “interested persons” of the Trust as defined in the Investment Company Act of 1940, as amended (the “1940 Act”) (the “Independent Board Members”). The Board Members are responsible for the oversight of the operations of the Trust and perform the various duties imposed on the directors of investment companies by the 1940 Act. The Independent Board Members have retained independent legal counsel to assist them in connection with their duties. The Chair of the Board is an Independent Board Member. The Board has established five standing committees: an Audit Committee, a Governance and Nominating Committee, a Compliance Committee, a Performance Oversight Committee and an Ad Hoc Topics Committee, each of which is chaired by an Independent Board Member and composed of Independent Board Members (except for the Ad Hoc Topics Committee, which also has one interested Board Member).
The Agreement
Consistent with the requirements of the 1940 Act, the Board considers the continuation of the Agreement on an annual basis. The Board has four quarterly meetings per year, each typically extending for two days, and additional in-person and telephonic meetings throughout the year, as needed. While the Board also has a fifth one-day meeting to consider specific information surrounding the renewal of the Agreement, the Board’s consideration entails a year-long deliberative process whereby the Board and its committees assess BlackRock’s services to the Funds. In particular, the Board assessed, among other things, the nature, extent and quality of the services provided to each Fund by BlackRock, BlackRock’s personnel and affiliates, including (as applicable): investment management services; accounting oversight; administrative and shareholder services; oversight of each Fund’s service providers; risk management and oversight; and legal, regulatory and compliance services. Throughout the year, including during the contract renewal process, the Independent Board Members were advised by independent legal counsel, and met with independent legal counsel in various executive sessions outside of the presence of BlackRock’s management.
During the year, the Board, acting directly and through its committees, considers information that is relevant to its annual consideration of the renewal of the Agreement, including the services and support provided by BlackRock to each Fund and its shareholders. BlackRock also furnished additional information to the Board in response to specific questions from the Board. This additional information is discussed further below in the section titled “Board Considerations in Approving the Agreement.” Among the matters the Board considered were: (a) with respect to each Fund, investment performance for one-year, three-year, five-year and/or since inception periods, as applicable, against peer funds, an applicable benchmark, and other performance metrics, as applicable, as well as BlackRock senior management’s and portfolio managers’ analyses of the reasons for any outperformance or underperformance relative to the Fund’s peers, benchmarks, and other performance metrics, as applicable; (b) fees, including advisory, administration, if applicable, and other amounts paid to BlackRock and its affiliates by each Fund for services; (c) Fund operating expenses and how BlackRock allocates expenses to each Fund; (d) the resources devoted to risk oversight of, and compliance reports relating to, implementation of each Fund’s investment objective, policies and restrictions, and meeting regulatory requirements; (e) BlackRock’s and the Trust’s adherence to applicable compliance policies and procedures; (f) the nature, character and scope of non-investment management services provided by BlackRock and its affiliates and the estimated cost of such services; (g) BlackRock’s and other service providers’ internal controls and risk and compliance oversight mechanisms; (h) BlackRock’s implementation of the proxy voting policies approved by the Board; (i) the use of brokerage commissions and execution quality of portfolio transactions; (j) BlackRock’s implementation of the Trust’s valuation and liquidity procedures; (k) an analysis of management fees for products with similar investment mandates across the open-end fund, exchange-traded fund (“ETF”), closed-end fund, sub-advised mutual fund, separately managed account, collective investment trust, and institutional separate account product channels, as applicable, and the similarities and differences between these products and the services provided as compared to each Fund; (l) BlackRock’s compensation methodology for its investment professionals and the incentives and accountability it creates, along with investment professionals’ investments in the fund(s) they manage; and (m) periodic updates on BlackRock’s business.
Board Considerations in Approving the Agreement
The Approval Process: Prior to the April Meeting, the Board requested and received materials specifically relating to the Agreement. The Independent Board Members are continuously engaged in a process with their independent legal counsel and BlackRock to review the nature and scope of the information provided to the Board to better assist its deliberations. The materials provided in connection with the April Meeting included, among other things: (a) information independently compiled and prepared by Broadridge Financial Solutions, Inc. (“Broadridge”), based on either a Lipper classification or Morningstar category, regarding each Fund’s fees and expenses as compared with a peer group of funds as determined by Broadridge (“Expense Peers”) and the investment performance of each Fund as compared with a peer group of funds (“Performance Peers”); (b) information on the composition of the Expense Peers and Performance Peers, and a description of Broadridge’s methodology; (c) information on the estimated profits realized by BlackRock and its affiliates pursuant to the Agreement and a discussion of fall-out benefits to BlackRock and its affiliates; (d) a general analysis provided by BlackRock concerning investment management fees received in connection with other types of investment products, such as institutional accounts, sub-advised mutual funds, ETFs, closed-end funds, open-end funds, and separately managed accounts under similar investment mandates, as well as the performance of such other products, as applicable; (e) a review of non-management fees; (f) the existence, impact and sharing of potential economies of scale, if any, with the Funds; (g) a summary of aggregate amounts paid by each Fund to BlackRock; (h) sales and redemption data regarding each Fund’s shares; and (i) various additional information requested by the Board as appropriate regarding BlackRock’s and each Fund’s operations.
At the April Meeting, the Board reviewed materials relating to its consideration of the Agreement. As a result of the discussions that occurred during the April Meeting, and as a culmination of the Board’s year-long deliberative process, the Board presented BlackRock with questions and requests for additional information. BlackRock responded to these questions and requests with additional written information in advance of the May Meeting.
At the May Meeting, the Board concluded its assessment of, among other things: (a) the nature, extent and quality of the services provided by BlackRock; (b) the investment performance of each Fund as compared to its Performance Peers and to other metrics, as applicable; (c) the advisory fee and the estimated cost of the services and estimated profits realized by BlackRock and its affiliates from their relationship with the Funds; (d) each Fund’s fees and expenses compared to its Expense Peers; (e) the existence and
| | |
DISCLOSURE OF INVESTMENT ADVISORY AGREEMENT | | 49 |
Disclosure of Investment Advisory Agreement (continued)
sharing of potential economies of scale; (f) any fall-out benefits to BlackRock and its affiliates as a result of BlackRock’s relationship with the Funds; and (g) other factors deemed relevant by the Board Members.
The Board also considered other matters it deemed important to the approval process, such as other payments made to BlackRock or its affiliates relating to securities lending and cash management, and BlackRock’s services related to the valuation and pricing of each Fund’s portfolio holdings. The Board noted the willingness of BlackRock’s personnel to engage in open, candid discussions with the Board. The Board did not identify any particular information as determinative, and each Board Member may have attributed different weights to the various items considered.
A. Nature, Extent and Quality of the Services Provided by BlackRock
The Board, including the Independent Board Members, reviewed the nature, extent and quality of services provided by BlackRock, including the investment advisory services, and the resulting performance of each Fund. Throughout the year, the Board compared each Fund’s performance to the performance of a comparable group of mutual funds, relevant benchmark, and performance metrics, as applicable. The Board met with BlackRock’s senior management personnel responsible for investment activities, including the senior investment officers. The Board also reviewed the materials provided by each Fund’s portfolio management team discussing the Fund’s performance, investment strategies and outlook.
The Board considered, among other factors, with respect to BlackRock: the number, education and experience of investment personnel generally and each Fund’s portfolio management team; research capabilities; investments by portfolio managers in the funds they manage; portfolio trading capabilities; use of technology; commitment to compliance; credit analysis capabilities; risk analysis and oversight capabilities; and the approach to training and retaining portfolio managers and other research, advisory and management personnel. The Board also considered BlackRock’s overall risk management program, including the continued efforts of BlackRock and its affiliates to address cybersecurity risks and the role of BlackRock’s Risk & Quantitative Analysis Group. The Board engaged in a review of BlackRock’s compensation structure with respect to each Fund’s portfolio management team and BlackRock’s ability to attract and retain high-quality talent and create performance incentives.
In addition to investment advisory services, the Board considered the nature and quality of the administrative and other non-investment advisory services provided to each Fund. BlackRock and its affiliates provide the Funds with certain administrative, shareholder and other services (in addition to any such services provided to the Funds by third parties) and officers and other personnel as are necessary for the operations of the Funds. In particular, BlackRock and its affiliates provide the Funds with administrative services including, among others: (i) responsibility for disclosure documents, such as the prospectus, the summary prospectus (as applicable), the statement of additional information and periodic shareholder reports; (ii) oversight of daily accounting and pricing; (iii) responsibility for periodic filings with regulators; (iv) overseeing and coordinating the activities of third-party service providers, including, among others, each Fund’s custodian, fund accountant, transfer agent, and auditor; (v) organizing Board meetings and preparing the materials for such Board meetings; (vi) providing legal and compliance support; (vii) furnishing analytical and other support to assist the Board in its consideration of strategic issues such as the merger, consolidation or repurposing of certain open-end funds; and (viii) performing or managing administrative functions necessary for the operation of each Fund, such as tax reporting, expense management, fulfilling regulatory filing requirements, overseeing each Fund’s distribution partners, and shareholder call center and other services. The Board reviewed the structure and duties of BlackRock’s fund administration, shareholder services, and legal & compliance departments and considered BlackRock’s policies and procedures for assuring compliance with applicable laws and regulations.
B. The Investment Performance of the Funds and BlackRock
The Board, including the Independent Board Members, also reviewed and considered the performance history of each Fund. In preparation for the April Meeting, the Board was provided with reports independently prepared by Broadridge, which included an analysis of each Fund’s performance as of December 31, 2019, as compared to its Performance Peers. Broadridge ranks funds in quartiles, ranging from first to fourth, where first is the most desirable quartile position and fourth is the least desirable. In connection with its review, the Board received and reviewed information regarding the investment performance of each Fund as compared to its Performance Peers and the performance of the Fund as compared with its benchmark. The Board and its Performance Oversight Committee regularly review, and meet with Fund management to discuss, the performance of each Fund throughout the year.
In evaluating performance, the Board focused particular attention on funds with less favorable performance records. The Board also noted that while it found the data provided by Broadridge generally useful, it recognized the limitations of such data, including in particular, that notable differences may exist between a fund and its Performance Peers (for example, the investment objectives and strategies). Further, the Board recognized that the performance data reflects a snapshot of a period as of a particular date and that selecting a different performance period could produce significantly different results. The Board also acknowledged that long-term performance could be impacted by even one period of significant outperformance or underperformance, and that a single investment theme could have the ability to disproportionately affect long-term performance.
The Board noted that for the one-year and since-inception periods reported, each of Disciplined Volatility Equity Fund and Dynamic Equity Fund underperformed its benchmark. The Board noted that BlackRock believes that net performance relative to the benchmark is an appropriate performance metric for each Fund, and that BlackRock has explained its rationale for this belief to the Board. The Board and BlackRock reviewed each Fund’s underperformance relative to its benchmark during the applicable period.
With respect to Disciplined Volatility Equity Fund, the Board was informed that, among other things, poor stock selection in healthcare, consumer discretionary and communication services detracted from performance over the one-year period. An underweight allocation to, and poor stock selection within, materials also caused the Fund to underperform over the one-year period. An overweight position in materials and consumer discretionary coupled with poor stock selection in industrials and consumer discretionary detracted from performance over the since-inception period. From a regional perspective, an overweight allocation to France and the Netherlands also weighed on returns for the since-inception period.
With respect to Dynamic Equity Fund, the Board was informed that, among other things, poor stock selection in consumer discretionary and industrials coupled with an underweight allocation to information technology detracted from performance over the one-year period. Poor stock selection in information technology and healthcare were the
| | |
| 50 | | 2020 BLACKROCK ANNUAL REPORTTO SHAREHOLDERS |
Disclosure of Investment Advisory Agreement (continued)
primary performance detractors over the since-inception period. From a regional perspective, an overweight allocation to Japan and select emerging markets in Asia and the Middle East detracted from performance over the one-year period while an overweight allocation to Japan and underweight allocation to the U.S. weighed on returns over the since-inception period
The Board and BlackRock discussed BlackRock’s strategy for improving each Fund’s investment performance. Discussions covered topics such as performance attribution, the pertinent Fund’s investment personnel, and the resources appropriate to support each Fund’s investment processes.
C. Consideration of the Advisory/Management Fees and the Estimated Cost of the Services and Estimated Profits Realized by BlackRock and its Affiliates from their Relationship with the Funds
The Board, including the Independent Board Members, reviewed each Fund’s contractual management fee rate compared with those of its Expense Peers. The contractual management fee rate represents a combination of the advisory fee and any administrative fees, before taking into account any reimbursements or fee waivers. The Board also compared each Fund’s total expense ratio, as well as its actual management fee rate, to those of its Expense Peers. The total expense ratio represents a fund’s total net operating expenses, including any 12b-1 or non-12b-1 service fees. The total expense ratio gives effect to any expense reimbursements or fee waivers, and the actual management fee rate gives effect to any management fee reimbursements or waivers. The Board considered the services provided and the fees charged by BlackRock and its affiliates to other types of clients with similar investment mandates, as applicable, including institutional accounts and sub-advised mutual funds (including mutual funds sponsored by third parties).
The Board received and reviewed statements relating to BlackRock’s financial condition. The Board reviewed BlackRock’s profitability methodology and was also provided with an estimated profitability analysis that detailed the revenues earned and the expenses incurred by BlackRock for services provided to each Fund. The Board reviewed BlackRock’s estimated profitability with respect to each Fund and other funds the Board currently oversees for the year ended December 31, 2019 compared to available aggregate estimated profitability data provided for the prior two years. The Board reviewed BlackRock’s estimated profitability with respect to certain other U.S. fund complexes managed by BlackRock and/or its affiliates. The Board reviewed BlackRock’s assumptions and methodology of allocating expenses in the estimated profitability analysis, noting the inherent limitations in allocating costs among various advisory products. The Board recognized that profitability may be affected by numerous factors including, among other things, fee waivers and expense reimbursements by BlackRock, the types of funds managed, precision of expense allocations and business mix. The Board thus recognized that calculating and comparing profitability at the individual fund level is difficult.
The Board noted that, in general, individual fund or product line profitability of other advisors is not publicly available. The Board reviewed BlackRock’s overall operating margin, in general, compared to that of certain other publicly traded asset management firms. The Board considered the differences between BlackRock and these other firms, including the contribution of technology at BlackRock, BlackRock’s expense management, and the relative product mix.
The Board considered whether BlackRock has the financial resources necessary to attract and retain high quality investment management personnel to perform its obligations under the Agreement and to continue to provide the high quality of services that is expected by the Board. The Board further considered factors including but not limited to BlackRock’s commitment of time, assumption of risk, and liability profile in servicing the Funds, including in contrast to what is required of BlackRock with respect to other products with similar investment mandates across the open-end fund, ETF, closed-end fund, sub-advised mutual fund, separately managed account, collective investment trust, and institutional separate account product channels, as applicable.
The Board noted that each Fund’s contractual management fee rate ranked in the first quartile, and that the actual management fee rate and total expense ratio each ranked in the first quartile relative to the Fund’s Expense Peers. The Board also noted that each Fund has an advisory fee arrangement that includes breakpoints that adjust the fee rate downward as the size of the pertinent Fund increases above certain contractually specified levels. The Board noted that if the size of the pertinent Fund were to decrease, the Fund could lose the benefit of one or more breakpoints. The Board further noted that BlackRock and the Board have contractually agreed to a cap on each Fund’s total expenses as a percentage of the Fund’s average daily net assets on a class-by-class basis.
D. Economies of Scale
The Board, including the Independent Board Members, considered the extent to which economies of scale might be realized as the assets of the Funds increase, including the existence of fee waivers and/or expense caps, as applicable, noting that any contractual fee waivers and contractual expense caps had been approved by the Board. In its consideration, the Board further considered the continuation and/or implementation of fee waivers and/or expense caps, as applicable. The Board also considered the extent to which each Fund benefits from such economies of scale in a variety of ways and whether there should be changes in the advisory fee rate or breakpoint structure in order to enable the Funds to more fully participate in these economies of scale. The Board considered each Fund’s asset levels and whether the current fee schedule was appropriate.
E. Other Factors Deemed Relevant by the Board Members
The Board, including the Independent Board Members, also took into account other ancillary or “fall-out” benefits that BlackRock or its affiliates may derive from BlackRock’s respective relationships with the Funds, both tangible and intangible, such as BlackRock’s ability to leverage its investment professionals who manage other portfolios and its risk management personnel, an increase in BlackRock’s profile in the investment advisory community, and the engagement of BlackRock’s affiliates as service providers to the Funds, including for administrative, distribution, securities lending and cash management services. The Board also considered BlackRock’s overall operations and its efforts to expand the scale of, and improve the quality of, its operations. The Board also noted that, subject to applicable law, BlackRock may use and benefit from third-party research obtained by soft dollars generated by certain registered fund transactions to assist in managing all or a number of its other client accounts.
In connection with its consideration of the Agreement, the Board also received information regarding BlackRock’s brokerage and soft dollar practices. The Board received reports from BlackRock which included information on brokerage commissions and trade execution practices throughout the year.
| | |
DISCLOSURE OF INVESTMENT ADVISORY AGREEMENT | | 51 |
Disclosure of Investment Advisory Agreement (continued)
The Board noted the competitive nature of the open-end fund marketplace, and that shareholders are able to redeem their Fund shares if they believe that the pertinent Fund’s fees and expenses are too high or if they are dissatisfied with the performance of the Fund.
Conclusion
The Board, including the Independent Board Members, unanimously approved the continuation of the Agreement between the Manager and the Trust, on behalf of each Fund, for a one-year term ending June 30, 2021. Based upon its evaluation of all of the aforementioned factors in their totality, as well as other information, the Board, including the Independent Board Members, was satisfied that the terms of the Agreement were fair and reasonable and in the best interest of each Fund, as pertinent, and its shareholders. In arriving at its decision to approve the Agreement, the Board did not identify any single factor or group of factors as all-important or controlling, but considered all factors together, and different Board Members may have attributed different weights to the various factors considered. The Independent Board Members were also assisted by the advice of independent legal counsel in making this determination.
| | |
| 52 | | 2020 BLACKROCK ANNUAL REPORTTO SHAREHOLDERS |
Trustee and Officer Information
| | | | | | | | |
| Independent Trustees(a) |
| | | | | |
Name
Year of Birth(b) | | Position(s) Held
(Length of Service)(c) | | Principal Occupation(s) During Past Five Years | | Number of BlackRock-Advised
Registered Investment Companies
(“RICs”) Consisting of
Investment Portfolios
(“Portfolios”) Overseen | | Public Company and Other
Investment
Company
Directorships Held During
Past Five Years |
| | | | | | | | |
Mark Stalnecker 1951 | | Chair of the Board and Trustee (Since 2019) | | Chief Investment Officer, University of Delaware from 1999 to 2013; Trustee and Chair of the Finance and Investment Committees, Winterthur Museum and Country Estate from 2005 to 2016; Member of the Investment Committee, Delaware Public Employees’ Retirement System since 2002; Member of the Investment Committee, Christiana Care Health System from 2009 to 2017; Member of the Investment Committee, Delaware Community Foundation from 2013 to 2014; Director and Chair of the Audit Committee, SEI Private Trust Co. from 2001 to 2014. | | 33 RICs consisting of 156 Portfolios | | None |
| | | | | | | | |
Bruce R. Bond 1946 | | Trustee (Since 2007) | | Board Member, Amsphere Limited (software) since 2018; Trustee and Member of the Governance Committee, State Street Research Mutual Funds from 1997 to 2005; Board Member of Governance, Audit and Finance Committee, Avaya Inc. (computer equipment) from 2003 to 2007. | | 33 RICs consisting of 156 Portfolios | | None |
| | | | | | | | |
Susan J. Carter 1956 | | Trustee (Since 2019) | | Director, Pacific Pension Institute from 2014 to 2018; Advisory Board Member, Center for Private Equity and Entrepreneurship at Tuck School of Business since 1997; Senior Advisor, Commonfund Capital, Inc. (“CCI”) (investment adviser) in 2015; Chief Executive Officer, CCI from 2013 to 2014; President & Chief Executive Officer, CCI from 1997 to 2013; Advisory Board Member, Girls Who Invest from 2015 to 2018 and Board Member thereof since 2018; Advisory Board Member, Bridges Fund Management since 2016; Trustee, Financial Accounting Foundation since 2017; Practitioner Advisory Board Member, Private Capital Research Institute (“PCRI”) since 2017; Lecturer in the Practice of Management, Yale School of Management since 2019. | | 33 RICs consisting of 156 Portfolios | | None |
| | | | | | | | |
Collette Chilton 1958 | | Trustee (Since 2019) | | Chief Investment Officer, Williams College since 2006; Chief Investment Officer, Lucent Asset Management Corporation from 1998 to 2006. | | 33 RICs consisting of 156 Portfolios | | None |
| | | | | | | | |
Neil A. Cotty 1954 | | Trustee (Since 2019) | | Bank of America Corporation from 1996 to 2015, serving in various senior finance leadership roles, including Chief Accounting Officer from 2009 to 2015, Chief Financial Officer of Global Banking, Markets and Wealth Management from 2008 to 2009, Chief Accounting Officer from 2004 to 2008, Chief Financial Officer of Consumer Bank from 2003 to 2004, Chief Financial Officer of Global Corporate Investment Bank from 1999 to 2002. | | 33 RICs consisting of 156 Portfolios | | None |
| | | | | | | | |
Lena G. Goldberg 1949 | | Trustee (Since 2016) | | Senior Lecturer, Harvard Business School, since 2008; Director, Charles Stark Draper Laboratory, Inc. since 2013; FMR LLC/Fidelity Investments (financial services) from 1996 to 2008, serving in various senior roles including Executive Vice President - Strategic Corporate Initiatives and Executive Vice President and General Counsel; Partner, Sullivan & Worcester LLP from 1985 to 1996 and Associate thereof from 1979 to 1985. | | 33 RICs consisting of 156 Portfolios | | None |
| | |
TRUSTEEAND OFFICER INFORMATION | | 53 |
Trustee and Officer Information (continued)
| | | | | | | | |
| Independent Trustees(a) (continued) |
| | | | | |
Name
Year of Birth(b) | | Position(s) Held
(Length of Service)(c) | | Principal Occupation(s) During Past Five Years | | Number of BlackRock-Advised
Registered Investment Companies
(“RICs”) Consisting of
Investment Portfolios
(“Portfolios”) Overseen | | Public Company and Other
Investment
Company
Directorships Held During
Past Five Years |
| | | | | | | | |
Henry R. Keizer 1956 | | Trustee (Since 2016) | | Director, Park Indemnity Ltd. (captive insurer) since 2010; Director, MUFG Americas Holdings Corporation and MUFG Union Bank, N.A. (financial and bank holding company) from 2014 to 2016; Director, American Institute of Certified Public Accountants from 2009 to 2011; Director, KPMG LLP (audit, tax and advisory services) from 2004 to 2005 and 2010 to 2012; Director, KPMG International in 2012, Deputy Chairman and Chief Operating Officer thereof from 2010 to 2012 and U.S. Vice Chairman of Audit thereof from 2005 to 2010; Global Head of Audit, KPMGI (consortium of KPMG firms) from 2006 to 2010; Director, YMCA of Greater New York from 2006 to 2010. | | 33 RICs consisting of 156 Portfolios | | Hertz Global Holdings (car rental); Montpelier Re Holdings, Ltd. (publicly held property and casualty reinsurance) from 2013 until 2015; WABCO (commercial vehicle safety systems); Sealed Air Corp. (packaging) |
| | | | | | | | |
Cynthia A. Montgomery 1952 | | Trustee (Since 2019) | | Professor, Harvard Business School since 1989. | | 33 RICs consisting of 156 Portfolios | | Newell Rubbermaid, Inc. (manufacturing) |
| | | | | | | | |
Donald C. Opatrny 1952 | | Trustee (Since 2015) | | Trustee, Vice Chair, Member of the Executive Committee and Chair of the Investment Committee, Cornell University since 2004; President, Trustee and Member of the Investment Committee, The Aldrich Contemporary Art Museum from 2007 to 2014; Member of the Board and Investment Committee, University School from 2007 to 2018; Member of the Investment Committee, Mellon Foundation from 2009 to 2015; Trustee, Artstor (a Mellon Foundation affiliate) from 2010 to 2015; President and Trustee, the Center for the Arts, Jackson Hole from 2011 to 2018; Director, Athena Capital Advisors LLC (investment management firm) since 2013; Trustee and Chair of the Investment Committee, Community Foundation of Jackson Hole since 2014; Member of Affordable Housing Supply Board of Jackson, Wyoming since 2018; Member, Investment Funds Committee, State of Wyoming since 2017; Trustee, Phoenix Art Museum since 2018; Trustee, Arizona Community Foundation and Member of Investment Committee since 2020. | | 33 RICs consisting of 156 Portfolios | | None |
| | | | | | | | |
Joseph P. Platt 1947 | | Trustee (Since 2019) | | General Partner, Thorn Partners, LP (private investments) since 1998; Director, WQED Multi-Media (public broadcasting not-for-profit) since 2001; Chair, Basic Health International (non-profit) since 2015. | | 33 RICs consisting of 156 Portfolios | | Greenlight Capital Re, Ltd. (reinsurance company); Consol Energy Inc. |
| | | | | | | | |
Kenneth L. Urish 1951 | | Trustee (Since 2019) | | Managing Partner, Urish Popeck & Co., LLC (certified public accountants and consultants) since 1976; Past- Chairman of the Professional Ethics Committee of the Pennsylvania Institute of Certified Public Accountants and Committee Member thereof since 2007; Member of External Advisory Board, The Pennsylvania State University Accounting Department since founding in 2001; Principal, UP Strategic Wealth Investment Advisors, LLC since 2013; Trustee, The Holy Family Institute from 2001 to 2010; President and Trustee, Pittsburgh Catholic Publishing Associates from 2003 to 2008; Director, Inter- Tel from 2006 to 2007. | | 33 RICs consisting of 156 Portfolios | | None |
| | |
| 54 | | 2020 BLACKROCK ANNUAL REPORTTO SHAREHOLDERS |
Trustee and Officer Information (continued)
| | | | | | | | |
| Independent Trustees(a) (continued) |
| | | | | |
Name
Year of Birth(b) | | Position(s) Held
(Length of Service)(c) | | Principal Occupation(s) During Past Five Years | | Number of BlackRock-Advised
Registered Investment Companies
(“RICs”) Consisting of
Investment Portfolios
(“Portfolios”) Overseen | | Public Company and Other
Investment
Company
Directorships Held During
Past Five Years |
| | | | | | | | |
Claire A. Walton 1957 | | Trustee (Since 2019) | | Chief Operating Officer and Chief Financial Officer of Liberty Square Asset Management, LP from 1998 to 2015; General Partner of Neon Liberty Capital Management, LLC since 2003; Director, Boston Hedge Fund Group from 2009 to 2018; Director, Woodstock Ski Runners since 2013; Director, Massachusetts Council on Economic Education from 2013 to 2015. | | 33 RICs consisting of 156 Portfolios | | None |
|
| Interested Trustees(a)(d) |
| | | | | |
Name
Year of Birth(b) | | Position(s) Held
(Length of Service)(c) | | Principal Occupation(s) During Past Five Years | | Number of BlackRock-Advised
Registered Investment Companies
(“RICs”) Consisting of
Investment Portfolios
(“Portfolios”) Overseen | | Public Company
and Other
Investment
Company
Directorships Held During
Past Five Years |
| | | | | | | | |
Robert Fairbairn 1965 | | Trustee (Since 2015) | | Vice Chairman of BlackRock, Inc. since 2019; Member of BlackRock’s Global Executive and Global Operating Committees; Co-Chair of BlackRock’s Human Capital Committee; Senior Managing Director of BlackRock, Inc. from 2010 to 2019; oversaw BlackRock’s Strategic Partner Program and Strategic Product Management Group from 2012 to 2019; Member of the Board of Managers of BlackRock Investments, LLC from 2011 to 2018; Global Head of BlackRock’s Retail and iShares® businesses from 2012 to 2016. | | 119 RICs consisting of 266 Portfolios | | None |
| | | | | | | | |
John M. Perlowski(e) 1964 | | Trustee (Since 2015); President and Chief Executive Officer (Since 2010) | | Managing Director of BlackRock, Inc. since 2009; Head of BlackRock Global Accounting and Product Services since 2009; Advisory Director of Family Resource Network (charitable foundation) since 2009. | | 120 RICs consisting of 267 Portfolios | | None |
(a) The address of each Trustee is c/o BlackRock, Inc., 55 East 52nd Street, New York, New York 10055. |
(b) Each Independent Trustee holds office until his or her successor is duly elected and qualifies or until his or her earlier death, resignation, retirement or removal as provided by the Trust’s by-laws or charter or statute, or until December 31 of the year in which he or she turns 75. Trustees who are “interested persons,” as defined in the 1940 Act, serve until their successor is duly elected and qualifies or until their earlier death, resignation, retirement or removal as provided by the Trust’s by-laws or statute, or until December 31 of the year in which they turn 72. The Board may determine to extend the terms of Independent Trustees on a case-by-case basis, as appropriate. |
(c) Following the combination of Merrill Lynch Investment Managers, L.P. (“MLIM”) and BlackRock, Inc. in September 2006, the various legacy MLIM and legacy BlackRock fund boards were realigned and consolidated into three new fund boards in 2007. In addition, effective January 1, 2019, three BlackRock Fund Complexes were realigned and consolidated into two BlackRock Fund Complexes. As a result, although the chart shows the year that each Independent Trustee joined the Board, certain Independent Trustees first became members of the boards of other BlackRock-advised Funds, legacy MLIM funds or legacy BlackRock funds as follows: Bruce R. Bond, 2005; Susan J. Carter, 2016; Collette Chilton, 2015; Neil A. Cotty, 2016; Cynthia A. Montgomery, 1994; Joseph P. Platt, 1999; Mark Stalnecker, 2015; Kenneth L. Urish, 1999; Claire A. Walton, 2016. |
(d) Mr. Fairbairn and Mr. Perlowski are both “interested persons,” as defined in the 1940 Act, of the Trust based on their positions with BlackRock, Inc. and its affiliates. Mr. Fairbairn and Mr. Perlowski are also board members of the BlackRock Fixed-Income Complex. |
(e) Mr. Perlowski is also a trustee of the BlackRock Credit Strategies Fund. |
| | |
TRUSTEEAND OFFICER INFORMATION | | 55 |
Trustee and Officer Information (continued)
| | | | |
| Officers Who Are Not Trustees(a) |
| | | |
Name
Year of Birth(b) | | Position(s) Held
(Length of Service) | | Principal Occupation(s) During Past Five Years |
| | | | |
Jennifer McGovern 1977 | | Vice President (Since 2014) | | Managing Director of BlackRock, Inc. since 2016; Director of BlackRock, Inc. from 2011 to 2015; Head of Americas Product Development and Governance for BlackRock’s Global Product Group since 2019; Head of Product Structure and Oversight for BlackRock’s U.S. Wealth Advisory Group from 2013 to 2019. |
| | | | |
Neal J. Andrews 1966 | | Chief Financial Officer (Since 2007) | | Chief Financial Officer of the iShares® exchange traded funds from 2019 to 2020; Managing Director of BlackRock, Inc. since 2006. |
| | | | |
Jay M. Fife 1970 | | Treasurer (Since 2007) | | Managing Director of BlackRock, Inc. since 2007. |
| | | | |
Charles Park 1967 | | Chief Compliance Officer (Since 2014) | | Anti-Money Laundering Compliance Officer for certain BlackRock-advised Funds from 2014 to 2015; Chief Compliance Officer of BlackRock Advisors, LLC and the BlackRock-advised Funds in the BlackRock Multi-Asset Complex and the BlackRock Fixed-Income Complex since 2014; Principal of and Chief Compliance Officer for iShares® Delaware Trust Sponsor LLC since 2012 and BlackRock Fund Advisors (“BFA”) since 2006; Chief Compliance Officer for the BFA-advised iShares® exchange traded funds since 2006; Chief Compliance Officer for BlackRock Asset Management International Inc. since 2012. |
| | | | |
Lisa Belle 1968 | | Anti-Money Laundering Compliance Officer (Since 2019) | | Managing Director of BlackRock, Inc. since 2019; Global Financial Crime Head for Asset and Wealth Management of JP Morgan from 2013 to 2019; Managing Director of RBS Securities from 2012 to 2013; Head of Financial Crimes for Barclays Wealth Americas from 2010 to 2012. |
| | | | |
Janey Ahn 1975 | | Secretary (Since 2019) | | Managing Director of BlackRock, Inc. since 2018; Director of BlackRock, Inc. from 2009 to 2017. |
(a) The address of each Officer is c/o BlackRock, Inc., 55 East 52nd Street, New York, New York 10055. |
(b) Officers of the Trust serve at the pleasure of the Board. |
Further information about the Trust’s Trustees and Officers is available in the Trust’s Statement of Additional Information, which can be obtained without charge by calling (800) 537-4942.
| | |
| 56 | | 2020 BLACKROCK ANNUAL REPORTTO SHAREHOLDERS |
Additional Information
General Information
Householding
The Funds will mail only one copy of shareholder documents, including prospectuses, annual and semi-annual reports and proxy statements, to shareholders with multiple accounts at the same address. This practice is commonly called “householding” and is intended to reduce expenses and eliminate duplicate mailings of shareholder documents. Mailings of your shareholder documents may be householded indefinitely unless you instruct us otherwise. If you do not want the mailing of these documents to be combined with those for other members of your household, please call the Funds at (800) 537-4942.
Availability of Quarterly Schedule of Investments
The Funds file their complete schedule of portfolio holdings with the SEC for the first and third quarters of each fiscal year as an exhibit to their reports on Form N-PORT. The Funds’ Forms N-PORT are available on the SEC’s website at sec.gov.
Availability of Proxy Voting Policies and Procedures
A description of the policies and procedures that the Funds use to determine how to vote proxies relating to portfolio securities is available upon request and without charge (1) by calling (800) 441-7762; (2) at blackrock.com; and (3) on the SEC’s website at sec.gov.
Availability of Proxy Voting Record
Information about how the Funds voted proxies relating to securities held in the Funds’ portfolios during the most recent 12-month period ended June 30 is available upon request and without charge (1) at blackrock.com; or by calling (800) 441-7762 and (2) on the SEC’s website at sec.gov.
BlackRock’s Mutual Fund Family
BlackRock offers a diverse lineup of open-end mutual funds crossing all investment styles and managed by experts in equity, fixed-income and tax-exempt investing. Visit blackrock.com for more information.
Shareholder Privileges
Account Information
Call us at (800) 441-7762 from 8:00 AM to 6:00 PM ET on any business day to get information about your account balances, recent transactions and share prices. You can also visit blackrock.com for more information.
Automatic Investment Plans
Investor class shareholders who want to invest regularly can arrange to have $50 or more automatically deducted from their checking or savings account and invested in any of the BlackRock funds.
Systematic Withdrawal Plans
Investor class shareholders can establish a systematic withdrawal plan and receive periodic payments of $50 or more from their BlackRock funds, as long as their account balance is at least $10,000.
Retirement Plans
Shareholders may make investments in conjunction with Traditional, Rollover, Roth, Coverdell, Simple IRAs, SEP IRAs and 403(b) Plans.
BlackRock Privacy Principles
BlackRock is committed to maintaining the privacy of its current and former fund investors and individual clients (collectively, “Clients”) and to safeguarding their non-public personal information. The following information is provided to help you understand what personal information BlackRock collects, how we protect that information and why in certain cases we share such information with select parties.
If you are located in a jurisdiction where specific laws, rules or regulations require BlackRock to provide you with additional or different privacy-related rights beyond what is set forth below, then BlackRock will comply with those specific laws, rules or regulations.
BlackRock obtains or verifies personal non-public information from and about you from different sources, including the following: (i) information we receive from you or, if applicable, your financial intermediary, on applications, forms or other documents; (ii) information about your transactions with us, our affiliates, or others; (iii) information we receive from a consumer reporting agency; and (iv) from visits to our websites.
| | |
ADDITIONAL INFORMATION | | 57 |
Additional Information (continued)
BlackRock does not sell or disclose to non-affiliated third parties any non-public personal information about its Clients, except as permitted by law or as is necessary to respond to regulatory requests or to service Client accounts. These non-affiliated third parties are required to protect the confidentiality and security of this information and to use it only for its intended purpose.
We may share information with our affiliates to service your account or to provide you with information about other BlackRock products or services that may be of interest to you. In addition, BlackRock restricts access to non-public personal information about its Clients to those BlackRock employees with a legitimate business need for the information. BlackRock maintains physical, electronic and procedural safeguards that are designed to protect the non-public personal information of its Clients, including procedures relating to the proper storage and disposal of such information.
Trusts’ and Service Providers
Investment Adviser
BlackRock Advisors, LLC
Wilmington, DE 19809
Accounting Agent
State Street Bank and Trust Company
Boston, MA 02111
Custodian
Brown Brothers Harriman & Co.
Boston, MA 02109
Transfer Agent
BNY Mellon Investment Servicing (US) Inc.
Wilmington, DE 19809
Distributor
BlackRock Investments, LLC
New York, NY 10022
Independent Registered Public Accounting Firm
Deloitte & Touche LLP
Boston, MA 02116
Legal Counsel
Sidley Austin LLP
New York, NY 10019
Address of the Funds
100 Bellevue Parkway
Wilmington, DE 19809
| | |
| 58 | | 2020 BLACKROCK ANNUAL REPORTTO SHAREHOLDERS |
Glossary of Terms Used in this Report
| | |
| Currency Abbreviation |
| |
| AUD | | Australian Dollar |
| |
| CAD | | Canadian Dollar |
| |
| CHF | | Swiss Franc |
| |
| EUR | | Euro |
| |
| GBP | | British Pound |
| |
| HKD | | Hong Kong Dollar |
| |
| INR | | Indian Rupee |
| |
| JPY | | Japanese Yen |
| |
| TWD | | New Taiwan Dollar |
| |
| USD | | United States Dollar |
| |
| | |
| Portfolio Abbreviation |
| |
| ADR | | American Depositary Receipt |
| |
| ETF | | Exchange-Traded Fund |
| |
| FTSE | | Financial Times Stock Exchange |
| |
| MSCI | | Morgan Stanley Capital International |
| |
| PCL | | Public Company Limited |
| |
| S&P | | Standard & Poor’s |
| |
| SCA | | Svenska Celluosa Aktiebolaget |
| | |
GLOSSARYOF TERMS USEDIN THIS REPORT | | 59 |
Want to know more?
blackrock.com | 800-441-7762
This report is intended for current holders. It is not authorized for use as an offer of sale or a solicitation of an offer to buy shares of the Funds unless preceded or accompanied by the Funds’ current prospectus. Past performance results shown in this report should not be considered a representation of future performance. Investment returns and principal value of shares will fluctuate so that shares, when redeemed, may be worth more or less than their original cost. Statements and other information herein are as dated and are subject to change.
MASGA-10/20-AR
| Item 2 – | Code of Ethics – The registrant (or the “Fund”) has adopted a code of ethics, as of the end of the period covered by this report, applicable to the registrant’s principal executive officer, principal financial officer, principal accounting officer or controller, or persons performing similar functions. During the period covered by this report, the code of ethics was amended to update certain information and to make other non-material changes. During the period covered by this report, there have been no waivers granted under the code of ethics. The registrant undertakes to provide a copy of the code of ethics to any person upon request, without charge, who calls 1-800-441-7762. |
| Item 3 – | Audit Committee Financial Expert – The registrant’s board of directors (the “board of directors”), has determined that (i) the registrant has the following audit committee financial experts serving on its audit committee and (ii) each audit committee financial expert is independent: |
Neil A. Cotty
Henry R. Keizer
Kenneth L. Urish
Under applicable securities laws, a person determined to be an audit committee financial expert will not be deemed an “expert” for any purpose, including without limitation for the purposes of Section 11 of the Securities Act of 1933, as a result of being designated or identified as an audit committee financial expert. The designation or identification of a person as an audit committee financial expert does not impose on such person any duties, obligations, or liabilities greater than the duties, obligations, and liabilities imposed on such person as a member of the audit committee and board of directors in the absence of such designation or identification. The designation or identification of a person as an audit committee financial expert does not affect the duties, obligations, or liability of any other member of the audit committee or board of directors.
| Item 4 – | Principal Accountant Fees and Services |
The following table presents fees billed by Deloitte & Touche LLP (“D&T”) in each of the last two fiscal years for the services rendered to the Fund:
| | | | | | | | | | | | | | | | |
| | | (a) Audit Fees | | (b) Audit-Related Fees1 | | (c) Tax Fees2 | | (d) All Other Fees |
| Entity Name | | Current Fiscal
Year End | | Previous Fiscal Year End | | Current Fiscal Year End | | Previous Fiscal Year End | | Current Fiscal Year End | | Previous Fiscal Year End | | Current Fiscal Year End | | Previous Fiscal Year End |
| BlackRock GA Disciplined Volatility Equity Fund | | $40,137 | | $41,004 | | $0 | | $4,000 | | $22,100 | | $22,100 | | $0 | | $0 |
| Black Rock GA Dynamic Equity Fund | | $40,137 | | $42,024 | | $0 | | $4,000 | | $22,100 | | $22,100 | | $0 | | $0 |
The following table presents fees billed by D&T that were required to be approved by the registrant’s audit committee (the “Committee”) for services that relate directly to the operations or financial reporting of the Fund and that are rendered on behalf of BlackRock Advisors, LLC (the “Investment Adviser” or “BlackRock”) and entities controlling, controlled by, or under common control with BlackRock (not including any sub-adviser whose role is primarily portfolio management and is subcontracted with or overseen by another investment adviser) that provide ongoing services to the Fund (“Affiliated Service Providers”):
2
| | | | |
| | | Current Fiscal Year End | | Previous Fiscal Year End |
| (b) Audit-Related Fees1 | | $0 | | $0 |
| (c) Tax Fees2 | | $0 | | $0 |
| (d) All Other Fees3 | | $1,984,000 | | $2,050,500 |
1 The nature of the services includes assurance and related services reasonably related to the performance of the audit or review of financial statements not included in Audit Fees, including accounting consultations, agreed-upon procedure reports, attestation reports, comfort letters, out-of-pocket expenses and internal control reviews not required by regulators.
2 The nature of the services includes tax compliance and/or tax preparation, including services relating to the filing or amendment of federal, state or local income tax returns, regulated investment company qualification reviews, taxable income and tax distribution calculations.
3 Non-audit fees of $1,984,000 and $2,050,500 for the current fiscal year and previous fiscal year, respectively, were paid to the Fund’s principal accountant in their entirety by BlackRock, in connection with services provided to the Affiliated Service Providers of the Fund and of certain other funds sponsored and advised by BlackRock or its affiliates for a service organization review and an accounting research tool subscription. These amounts represent aggregate fees paid by BlackRock and were not allocated on a per fund basis.
(e)(1) Audit Committee Pre-Approval Policies and Procedures:
The Committee has adopted policies and procedures with regard to the pre-approval of services. Audit, audit-related and tax compliance services provided to the registrant on an annual basis require specific pre-approval by the Committee. The Committee also must approve other non-audit services provided to the registrant and those non-audit services provided to the Investment Adviser and Affiliated Service Providers that relate directly to the operations and the financial reporting of the registrant. Certain of these non-audit services that the Committee believes are (a) consistent with the SEC’s auditor independence rules and (b) routine and recurring services that will not impair the independence of the independent accountants may be approved by the Committee without consideration on a specific case-by-case basis (“general pre-approval”). The term of any general pre-approval is 12 months from the date of the pre-approval, unless the Committee provides for a different period. Tax or other non-audit services provided to the registrant which have a direct impact on the operations or financial reporting of the registrant will only be deemed pre-approved provided that any individual project does not exceed $10,000 attributable to the registrant or $50,000 per project. For this purpose, multiple projects will be aggregated to determine if they exceed the previously mentioned cost levels.
Any proposed services exceeding the pre-approved cost levels will require specific pre-approval by the Committee, as will any other services not subject to general pre-approval (e.g., unanticipated but permissible services). The Committee is informed of each service approved subject to general pre-approval at the next regularly scheduled in-person board meeting. At this meeting, an analysis of such services is presented to the Committee for ratification. The Committee may delegate to the Committee Chairman the authority to approve the provision of and fees for any specific engagement of permitted non-audit services, including services exceeding pre-approved cost levels.
(e)(2) None of the services described in each of Items 4(b) through (d) were approved by the Committee pursuant to the de minimis exception in paragraph (c)(7)(i)(C) of Rule 2-01 of Regulation S-X.
(f) Not Applicable
(g) The aggregate non-audit fees, defined as the sum of the fees shown under “Audit-Related Fees,”
3
“Tax Fees” and “All Other Fees,” paid to the accountant for services rendered by the accountant to the registrant, the Investment Adviser and the Affiliated Service Providers were:
| | | | |
| Entity Name | | Current Fiscal Year End | | Previous Fiscal Year End |
BlackRock GA Disciplined Volatility Fund | | $22,100 | | $26,100 |
BlackRock GA Dynamic Equity Fund | | $22,100 | | $26,100 |
Additionally, the amounts billed by D&T in connection with services provided to the Affiliated Service Providers of the Fund and of other funds sponsored and advised by BlackRock or its affiliates during the current and previous fiscal years for a service organization review and an accounting research tool subscription were:
| | |
Current Fiscal Year End | | Previous Fiscal Year End |
$1,984,000 | | $2,050,500 |
These amounts represent aggregate fees paid by BlackRock and were not allocated on a per fund basis.
(h) The Committee has considered and determined that the provision of non-audit services that were rendered to the Investment Adviser and the Affiliated Service Providers that were not pre-approved pursuant to paragraph (c)(7)(ii) of Rule 2-01 of Regulation S-X is compatible with maintaining the principal accountant’s independence.
| Item 5 – | Audit Committee of Listed Registrant – Not Applicable |
(a) The registrant’s Schedule of Investments is included as part of the Report to Stockholders filed under Item 1 of this Form.
(b) Not Applicable due to no such divestments during the semi-annual period covered since the previous Form N-CSR filing.
| Item 7 – | Disclosure of Proxy Voting Policies and Procedures for Closed-End Management Investment Companies – Not Applicable |
| Item 8 – | Portfolio Managers of Closed-End Management Investment Companies – Not Applicable |
| Item 9 – | Purchases of Equity Securities by Closed-End Management Investment Company and Affiliated Purchasers – Not Applicable |
| Item 10 – | Submission of Matters to a Vote of Security Holders – There have been no material changes to these procedures. |
| Item 11 – | Controls and Procedures |
4
(a) – The registrant’s principal executive and principal financial officers, or persons performing similar functions, have concluded that the registrant’s disclosure controls and procedures (as defined in Rule 30a-3(c) under the Investment Company Act of 1940, as amended (the “1940 Act”)) are effective as of a date within 90 days of the filing of this report based on the evaluation of these controls and procedures required by Rule 30a-3(b) under the 1940 Act and Rule 15d-15(b) under the Securities Exchange Act of 1934, as amended.
(b) – There were no changes in the registrant’s internal control over financial reporting (as defined in Rule 30a-3(d) under the 1940 Act) that occurred during the period covered by this report that have materially affected, or are reasonably likely to materially affect, the registrant’s internal control over financial reporting.
| Item 12 – | Disclosure of Securities Lending Activities for Closed-End Management Investment Companies – Not Applicable |
| Item 13 – | Exhibits attached hereto |
(a)(1) Code of Ethics – See Item 2
(a)(2) Section 302 Certifications are attached
(a)(3) Not Applicable
(a)(4) Not Applicable
(b) Section 906 Certifications are attached
5
Pursuant to the requirements of the Securities Exchange Act of 1934 and the Investment Company Act of 1940, the registrant has duly caused this report to be signed on its behalf by the undersigned, thereunto duly authorized.
Managed Account Series
| | | | |
| | By: | | /s/ John M. Perlowski |
| | | | John M. Perlowski |
| | | | Chief Executive Officer (principal executive officer) of |
| | | | Managed Account Series |
Date: December 31, 2020
Pursuant to the requirements of the Securities Exchange Act of 1934 and the Investment Company Act of 1940, this report has been signed below by the following persons on behalf of the registrant and in the capacities and on the dates indicated.
| | | | |
| | By: | | /s/ John M. Perlowski |
| | | | John M. Perlowski |
| | | | Chief Executive Officer (principal executive officer) of |
| | | | Managed Account Series |
Date: December 31, 2020
| | | | |
| | By: | | /s/ Neal J. Andrews |
| | | | Neal J. Andrews |
| | | | Chief Financial Officer (principal financial officer) of |
| | | | Managed Account Series |
Date: December 31, 2020
6