UNITED STATES
SECURITIES AND EXCHANGE COMMISSION
Washington, D.C. 20549
FORM N-CSR
CERTIFIED SHAREHOLDER REPORT OF REGISTERED MANAGEMENT
INVESTMENT COMPANIES
Investment Company Act file number: 811-21763
Name of Fund: Managed Account Series
Advantage Global SmallCap Fund
Mid Cap Dividend Fund
Fund Address: 100 Bellevue Parkway, Wilmington, DE 19809
Name and address of agent for service: John M. Perlowski, Chief Executive Officer, Managed Account Series, 55 East 52nd Street, New York, NY 10055
Registrant’s telephone number, including area code: (800) 441-7762
Date of fiscal year end: 08/31/2018
Date of reporting period: 08/31/2018
Item 1 – Report to Stockholders
AUGUST 31, 2018
ANNUAL REPORT |
|

Managed Account Series
| u | Advantage Global SmallCap Fund |
| u | Mid Cap Dividend Fund |
| Not FDIC Insured ◾ May Lose Value ◾ No Bank Guarantee |
Dear Shareholder,
In the 12 months ended August 31, 2018, the strongest corporate profits in seven years drove the equity market higher, while rising interest rates constrained bond returns. Though the market’s appetite for risk remained healthy, risk-taking was tempered somewhat, as shorter-term, higher-quality securities led the bond market, and U.S. equities outperformed most international stock markets.
Volatility in emerging market stocks rose as U.S.-China trade relations and debt concerns adversely affected the Chinese stock market, while Turkey and Argentina became embroiled in currency crises, largely due to hyperinflation in both countries. An economic slowdown in Europe led to modest performance for European equities.
Short-term U.S. Treasury interest rates rose the fastest, while longer-term rates slightly increased, leading to a negative return for long-term U.S. Treasuries and a substantial flattening of the yield curve. Many investors are concerned with the flattening yield curve as a harbinger of recession, but given the extraordinary monetary measures in the last decade, we believe a more accurate barometer for the economy is the returns along the risk spectrums in stock and bond markets. Although the fundamentals in credit markets remained relatively solid, investment-grade bonds declined slightly, and high-yield bonds posted modest returns.
In response to rising growth and inflation, the U.S. Federal Reserve (the “Fed”) increased short-term interest rates three times during the reporting period. The Fed also reduced its $4.2 trillion balance sheet by approximately $230 billion during the reporting period, gradually reversing the unprecedented stimulus measures it enacted after the financial crisis. Meanwhile, the European Central Bank announced that its bond-purchasing program would conclude at the end of the year, while also expressing its commitment to low interest rates. In contrast, the Bank of Japan continued to expand its balance sheet through bond purchasing while lowering its expectations for inflation.
The U.S. economy continued to gain momentum despite the Fed’s modest reduction of economic stimulus; unemployment declined to 3.9%, wages increased, and the number of job openings reached a record high. Strong economic performance may justify a more rapid pace of rate hikes in 2018, as the headline inflation rate and investors’ expectations for inflation have already surpassed the Fed’s target of 2.0%.
While U.S. monetary policy is seeking to restrain economic growth and inflation, fiscal policy has produced new sources of growth that could nourish the economy for the next few years. Corporate tax cuts and repatriation of capital held abroad could encourage a virtuous cycle of business spending. Lower individual tax rates coupled with the robust job market may refresh consumer spending.
We continue to believe the primary risks to economic expansion are trade protectionism, rapidly rising interest rates, and geopolitical tension. Given the deflationary forces of technology and globalization, a substantial increase in inflation is unlikely to materialize as long as the unemployment rate remains above 3.0%. However, we are closely monitoring trade protectionism and the rise of populism in Western nations. In particular, the outcome of trade negotiations between the United States and China is likely to influence the global growth trajectory and set the tone for free trade in many other nations.
In this environment, investors need to think globally, extend their scope across a broad array of asset classes, and be nimble as market conditions change. We encourage you to talk with your financial advisor and visit blackrock.com for further insight about investing in today’s markets.
Sincerely,

Rob Kapito
President, BlackRock Advisors, LLC

Rob Kapito
President, BlackRock Advisors, LLC
Total Returns as of August 31, 2018
| ||||||||
6-month
| 12-month
| |||||||
U.S. large cap equities (S&P 500® Index)
| 7.96 | % | 19.66 | % | ||||
U.S. small cap equities (Russell 2000® Index)
| 15.84 | 25.45 | ||||||
International equities (MSCI Europe, Australasia, Far East Index)
| (2.55 | ) | 4.39 | |||||
Emerging market equities (MSCI Emerging Markets Index)
| (10.18 | ) | (0.68 | ) | ||||
3-month Treasury bills (ICE BofAML 3-Month U.S. Treasury Bill Index)
| 0.93 | 1.52 | ||||||
U.S. Treasury securities (ICE BofAML 10-Year U.S. Treasury Index)
| 1.42 | (4.13 | ) | |||||
U.S. investment grade bonds (Bloomberg Barclays U.S. Aggregate Bond Index)
| 1.15 | (1.05 | ) | |||||
Tax-exempt municipal bonds (S&P Municipal Bond Index)
| 1.78 | 0.61 | ||||||
U.S. high yield bonds (Bloomberg Barclays U.S. Corporate High Yield 2% Issuer Capped Index)
| 2.26 | 3.40 | ||||||
Past performance is no guarantee of future results. Index performance is shown for illustrative purposes only. You cannot invest directly in an index.
|
| |||||||
| 2 | T H I S P A G E I S N O T P A R T O F Y O U R F U N D R E P O R T |
Page
| ||||
| 2 | ||||
Annual Report: | ||||
| 4 | ||||
| 8 | ||||
| 8 | ||||
| 8 | ||||
Financial Statements: | ||||
| 9 | ||||
| 20 | ||||
| 21 | ||||
| 22 | ||||
| 24 | ||||
| 26 | ||||
| 34 | ||||
| 34 | ||||
| 35 | ||||
| 38 | ||||
| 41 | ||||
| 42 | ||||

| 3 |
| Fund Summary as of August 31, 2018 | Advantage Global SmallCap Fund |
Investment Objective
Advantage Global SmallCap Fund’s (the “Fund”) investment objective is to seek long-term growth of capital.
Portfolio Management Commentary
How did the Fund perform?
For the 12-month period ended August 31, 2018, the Fund outperformed the MSCI All Country World Small Cap Index and the MSCI World Index. Shares of the Fund can be purchased or held only by or on behalf of certain separately managed account clients and represent only a portion of a broader separately managed account. Comparisons of the Fund’s performance versus its benchmarks will differ from comparisons of the benchmarks against the performance of the separately managed accounts. The following discussion of relative performance pertains to the MSCI All Country World Small Cap Index.
What factors influenced performance?
Against a backdrop of strong market performance, sentiment-driven stock selection insights led positive contributions, specifically a proprietary machine-learned signal that uses a multitude of company-specific factors to predict outperformance. Insights gauging trending sentiment from brokers, analysts and company executives also contributed to performance. This was largely felt across materials names in China as market participants grew increasingly cautious around the prospects for the Chinese economy. Within the fundamentals-based composite signal, the Fund’s quality signals were additive, specifically the more traditional measures of company fundamentals including dividend growth and improving cash flows. These insights successfully pushed portfolio positioning away from the more rate-sensitive sectors such as consumer staples, real estate and utilities.
The biggest detractors from relative performance were stock-specific events that were contrary to the Fund’s positioning. For instance, an overweight position in Japanese homebuilder Token Corporation motivated by both value and quality insights constrained performance, as unfavorable demand dynamics in the Japanese real estate market driven by changes in the personal tax code hurt the company’s top line growth. Other meaningful detractors included country positioning as the portfolio was not positioned for the emerging market currency crisis, with an overweight to Turkey detracting most notably from performance. In addition, the Fund’s valuation-based composite signal underperformed, driven by more traditional fundamental value insights such as top line sales, as well as the Fund’s nontraditional measure of relative value that looks to take advantage of price dislocations caused by retail exchange traded fund flows.
Describe recent portfolio activity.
During the 12-month period, the Fund maintained a balanced allocation of risk across all major return drivers. However, three new stock selection insights were added to the Fund. These included an insight capturing consumer purchasing trends, as well as two new ways to screen for stocks trading at attractive valuations by focusing on activity of informed market participants and the growing impact that exchange-traded funds have on individual security pricing.
Describe portfolio positioning at period end.
Relative to the MSCI All Country World Small Cap Index, the Fund remained largely region-neutral with slight overweight positions to North America and Latin America and an underweight to greater Europe. In terms of sectors, the Fund ended the period with overweight positions to the more cyclical materials and consumer discretionary sectors, and underweights to the more rate sensitive utilities, consumer staples and real estate sectors.
The views expressed reflect the opinions of BlackRock as of the date of this report and are subject to change based on changes in market, economic or other conditions. These views are not intended to be a forecast of future events and are no guarantee of future results.
Portfolio Information
TEN LARGEST HOLDINGS
| Security | Percent of Net Assets | |||
WellCare Health Plans, Inc. | 1% | |||
Booz Allen Hamilton Holding Corp. | 1 | |||
Medpace Holdings, Inc. | 1 | |||
Reliance Steel & Aluminum Co. | 1 | |||
Bruker Corp. | 1 | |||
Synovus Financial Corp. | 1 | |||
Medifast, Inc. | 1 | |||
Simpson Manufacturing Co., Inc. | 1 | |||
McGrath RentCorp | 1 | |||
Progress Software Corp. | 1 | |||
GEOGRAPHIC ALLOCATION
| Country | Percent of Net Assets | |||
United States | 55% | |||
Japan | 9 | |||
United Kingdom | 6 | |||
Canada | 3 | |||
India | 3 | |||
Sweden | 2 | |||
Thailand | 2 | |||
Australia | 2 | |||
China | 2 | |||
Brazil | 2 | |||
Other(a) | 14 | |||
(a) Includes holdings within countries that are 1% or less of net assets. Please refer to the Schedule of Investments for such countries. |
| |||
| 4 | 2 0 1 8 B L A C K R O C K A N N U A L R E P O R T T O S H A R E H O L D E R S |
| Fund Summary as of August 31, 2018 (continued) | Advantage Global SmallCap Fund | |
Total Return Based on a $10,000 Investment

| (a) | Assuming transaction costs, if any, and other operating expenses, including investment advisory fees. |
| (b) | Under normal circumstances, the Fund seeks to invest at least 80% of its net assets plus the amount of any borrowings for investment purposes in small cap equity securities and derivatives that have similar economic characteristics to such securities. The Fund’s total returns prior to June 12, 2017, are the returns of the Fund when it followed different investment strategies under the name Global SmallCap Portfolio. |
| (c) | A free float-adjusted market capitalization weighted index that is designed to measure the equity market performance of developed markets. The MSCI World Index consists of the following 23 developed market country indexes: Australia, Austria, Belgium, Canada, Denmark, Finland, France, Germany, Hong Kong, Ireland, Israel, Italy, Japan, the Netherlands, New Zealand, Norway, Portugal, Singapore, Spain, Sweden, Switzerland, the United Kingdom, and the United States. |
| (d) | A free float-adjusted market capitalization index designed to measure equity market results of smaller capitalization companies in both developed and emerging markets. |
Performance Summary for the Period Ended August 31, 2018
| Average Annual Total Returns(a) | ||||||||
| 6-Month Total Returns | 1 Year | 5 Years | 10 Years | |||||
Advantage Global SmallCap Fund | 5.01% | 14.38% | 10.16% | 8.82% | ||||
MSCI World Index | 3.89 | 13.10 | 10.23 | 7.13 | ||||
MSCI All Country World Small Cap Index | 4.91 | 14.31 | 10.67 | 9.17 | ||||
| (a) | See “About Fund Performance” on page 8. |
Past performance is not indicative of future results.
Performance results may include adjustments made for financial reporting purposes in accordance with U.S. generally accepted accounting principles.
Expense Example
| Actual | Hypothetical(b) | |||||||||||||||||||||||||||||||||||||
|
|
|
| |||||||||||||||||||||||||||||||||||
| | Beginning Account Value (03/01/18) | | | Ending Account Value (08/31/18) | | | Expenses Paid During the Period(a) | | | Beginning Account Value (03/01/18) | | | Ending Account Value (08/31/18) | | | Expenses Paid During the Period(a) | | | Annualized Expense Ratio | | ||||||||||||||||||
| | Advantage Global | | $1,000.00 | $1,050.10 | $0.00 | $1,000.00 | $1,025.21 | $0.00 | 0.00% | |||||||||||||||||||||||||||||
| (a) | For shares of the Fund, expenses are equal to the annualized expense ratio, multiplied by the average account value over the period, multiplied by 184/365 (to reflect the one-half year period shown). BlackRock Advisors, LLC has contractually agreed to waive all fees and pay or reimburse all direct expenses, except extraordinary expenses incurred by the Fund. This agreement has no fixed term. |
| (b) | Hypothetical 5% annual return before expenses is calculated by prorating the number of days in the most recent fiscal half year divided by 365. |
See “Disclosure of Expenses” on page 8 for further information on how expenses were calculated.
| F U N D S U M M A R Y | 5 |
| Fund Summary as of August 31, 2018 | Mid Cap Dividend Fund | |
Investment Objective
Mid Cap Dividend Fund’s (the “Fund”) investment objective is to seek capital appreciation and, secondarily, income.
Portfolio Management Commentary
How did the Fund perform?
For the 12-month period ended August 31, 2018, the Fund outperformed its benchmark, the Russell MidCap® Value Index. Shares of the Fund can be purchased or held only by or on behalf of certain separately managed account clients and represent only a portion of a broader separately managed account. Comparisons of the Fund’s performance versus its benchmark index will differ from comparisons of the benchmark index against the performance of the separately managed accounts.
What factors influenced performance?
The largest positive contribution to relative performance for the period came from a combination of stock selection and allocation decisions in the information technology (“IT”) sector. Notably, stock selection decisions in the technology hardware, storage, & peripherals industry proved beneficial, as did overweight exposure to electronic equipment, instruments, & components firms. More specifically, overweight exposure to NetApp Inc. and CDW Corp. enhanced relative performance within the sector. Stock selection in the energy sector was the next largest contributor to relative return, as selection decisions in both the energy equipment & services and oil, gas, & consumable fuels industries contributed significantly. Stock selection in consumer staples also proved favorable, especially in the beverages, household products and personal products industries. Overweight exposure to the real estate sector provided a tailwind to performance as well. Finally, selection decisions within both the utilities and financials sectors boosted relative return.
The largest detractor from relative performance during the period came from stock selection in the industrials sector. More specifically, overweight exposure to Nielsen Holdings PLC in the professional services industry and Owens Corning in the building products industry proved detrimental. Stock selection among health care firms was also challenged, most notably within the biotechnology industry. In the telecommunication services sector, stock selection decisions negatively impacted performance, driven by overweight exposure to BCE Inc. and Telephone & Data Systems, Inc. Stock selection in the materials sector also acted as a constraint on returns, with holdings in the containers & packaging industry accounting for the majority of underperformance.
Describe recent portfolio activity.
During the 12-month period, the Fund’s exposure to the financials, health care and energy sectors was increased, largely due to the identification of opportunities within the insurance, health care equipment & supplies, and oil, gas, & consumable fuels industries, respectively. Conversely, allocations to the IT and utilities sectors were reduced. Within IT, exposure to firms in the semiconductors & semiconductor equipment industry was trimmed, while within utilities exposure to electric utilities was cut back.
Describe portfolio positioning at period end.
As of period end, the Fund’s largest allocations were in the financials, IT and health care sectors. Relative to the benchmark, the largest overweight positions were in financials, healthcare and IT. Conversely, the largest relative underweights were in the real estate, consumer discretionary and industrials sectors.
The views expressed reflect the opinions of BlackRock as of the date of this report and are subject to change based on changes in market, economic or other conditions. These views are not intended to be a forecast of future events and are no guarantee of future results.
Portfolio Information
TEN LARGEST HOLDINGS
| Security | Percent of Net Assets | |
Brighthouse Financial, Inc. | 3% | |
CDW Corp. | 3 | |
Regions Financial Corp. | 2 | |
SunTrust Banks, Inc. | 2 | |
FirstEnergy Corp. | 2 | |
Telephone & Data Systems, Inc. | 2 | |
KeyCorp | 2 | |
Hess Corp. | 2 | |
Lamar Advertising Co., Class A | 2 | |
Humana, Inc. | 2 |
SECTOR ALLOCATION
| Sector | Percent of Net Assets | |
Financials | 23% | |
Information Technology | 12 | |
Health Care | 11 | |
Utilities | 9 | |
Energy | 8 | |
Industrials | 8 | |
Consumer Discretionary | 7 | |
Real Estate | 6 | |
Materials | 5 | |
Consumer Staples | 5 | |
Telecommunication Services | 3 | |
Short-Term Securities | 4 | |
Liabilities in Excess of Other Assets | (1) | |
For Fund compliance purposes, the Fund’s sector classifications refer to one or more of the sector sub-classifications used by one or more widely recognized market indexes or rating group indexes, and/or as defined by the investment adviser. These definitions may not apply for purposes of this report, which may combine such sector sub-classifications for reporting ease. | ||
| 6 | 2 0 1 8 B L A C K R O C K A N N U A L R E P O R T T O S H A R E H O L D E R S |
| Fund Summary as of August 31, 2018 (continued) | Mid Cap Dividend Fund | |
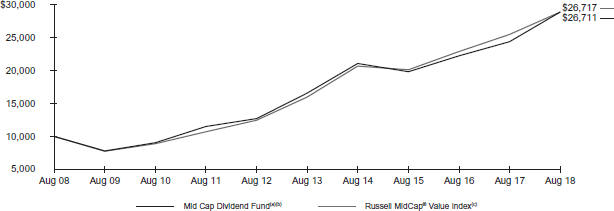
Total Return Based on a $10,000 Investment
| (a) | Assuming transaction costs, if any, and other operating expenses, including investment advisory fees. |
| (b) | Under normal circumstances, the Fund will invest at least 80% of its net assets plus the amount of any borrowings for investment purposes in equity securities of mid cap companies and at least 80% of its net assets plus the amount of any borrowings for investment purposes in dividend-paying securities. The Fund’s total returns prior to June 12, 2017, are the returns of the Fund when it followed different investment strategies under the name Mid Cap Value Opportunities Portfolio. |
| (c) | An unmanaged index that measures the performance of the mid-capitalization value sector of the U.S. equity market. It is a subset of the Russell Midcap® Index, which measures the performance of the mid-capitalization sector of the U.S. equity market. The Russell Midcap® Value Index measures the performance of equity securities of Russell Midcap® Index issuers with relatively lower price-to-book ratios and lower forecasted growth. The Russell Midcap® Index is a float adjusted, capitalization-weighted index that measures the performance of the mid-cap segment of the U.S. equities universe. It is a subset of the Russell 1000® Index including approximately 800 of the smallest issuers based on a combination of their market cap and current index membership. |
Performance Summary for the Period Ended August 31, 2018
| Average Annual Total Returns(a) | ||||||||
| 6-Month Total Returns | 1 Year | 5 Years | 10 Years | |||||
Mid Cap Dividend Fund | 8.36% | 17.58% | 11.06% | 10.32% | ||||
Russell MidCap® Value Index | 6.89 | 12.67 | 11.81 | 10.33 | ||||
| (a) | See “About Fund Performance” on page 8. |
Past performance is not indicative of future results.
Performance results may include adjustments made for financial reporting purposes in accordance with U.S. generally accepted accounting principles.
Expense Example
| Actual | Hypothetical(b) | |||||||||||||||||||||||||||||||||||||
|
|
|
| |||||||||||||||||||||||||||||||||||
| | Beginning Account Value (03/01/18) | | | Ending Account Value (08/31/18) | | | Expenses Paid During the Period(a) | | | Beginning Account Value (03/01/18) | | | Ending Account Value (08/31/18) | | | Expenses Paid During the Period(a) | | | Annualized Expense Ratio | | ||||||||||||||||||
| Mid Cap Dividend Fund | $1,000.00 | $1,083.60 | $0.00 | $1,000.00 | $1,025.21 | $0.00 | 0.00% | |||||||||||||||||||||||||||||||
| (a) | For shares of the Fund, expenses are equal to the Fund’s annualized expense ratio, multiplied by the average account value over the period, multiplied by 184/365 (to reflect the one-half year period shown). BlackRock Advisors, LLC has contractually agreed to waive all fees and pay or reimburse all direct expenses, except extraordinary expenses incurred by the Fund. This agreement has no fixed term. |
| (b) | Hypothetical 5% annual return before expenses is calculated by prorating the number of days in the most recent fiscal half year divided by 365. |
See “Disclosure of Expenses” on page 8 for further information on how expenses were calculated.
| F U N D S U M M A R Y | 7 |
Performance information reflects past performance and does not guarantee future results. Current performance may be lower or higher than the performance data quoted. Refer to www.blackrock.com to obtain performance data current to the most recent month-end. Performance results do not reflect the deduction of taxes that a shareholder would pay on fund distributions or the redemption of fund shares. Figures shown in the performance tables on the previous pages assume reinvestment of all distributions, if any, at net asset value (“NAV”) on the ex-dividend date. Investment return and principal value of shares will fluctuate so that shares, when redeemed, may be worth more or less than their original cost.
BlackRock Advisors, LLC, the Funds’ investment adviser, has contractually agreed to waive all fees and pay or reimburse all operating expenses of each Fund, except extraordinary expenses. This agreement has no fixed termination date. Without such waiver and/or reimbursement, each Fund’s performance would have been lower.
Shareholders of the Funds may incur the following charges: (a) transactional expenses, such as sales charges; and (b) operating expenses, including investment advisory fees, service and distribution fees, including 12b-1 fees, acquired fund fees and expenses, and other fund expenses. The expense examples shown on the previous pages (which are based on a hypothetical investment of $1,000 invested on March 1, 2018 and held through August 31, 2018) are intended to assist shareholders both in calculating expenses based on an investment in each Fund and in comparing these expenses with similar costs of investing in other mutual funds.
The expense examples provide information about actual account values and actual expenses. In order to estimate the expenses a shareholder paid during the period covered by this report, shareholders can divide their account value by $1,000 and then multiply the result by the number corresponding to their Fund and share class under the heading entitled “Expenses Paid During the Period.”
The expense examples also provide information about hypothetical account values and hypothetical expenses based on a Fund’s actual expense ratio and an assumed rate of return of 5% per year before expenses. In order to assist shareholders in comparing the ongoing expenses of investing in these Funds and other funds, compare the 5% hypothetical examples with the 5% hypothetical examples that appear in shareholder reports of other funds.
The expenses shown in the expense examples are intended to highlight shareholders’ ongoing costs only and do not reflect transactional expenses, such as sales charges, if any. Therefore, the hypothetical examples are useful in comparing ongoing expenses only, and will not help shareholders determine the relative total expenses of owning different funds. If these transactional expenses were included, shareholder expenses would have been higher.
Derivative Financial Instruments
The Funds may invest in various derivative financial instruments. These instruments are used to obtain exposure to a security, commodity, index, market, and/or other assets without owning or taking physical custody of securities, commodities and/or other referenced assets or to manage market, equity, credit, interest rate, foreign currency exchange rate, commodity and/or other risks. Derivative financial instruments may give rise to a form of economic leverage and involve risks, including the imperfect correlation between the value of a derivative financial instrument and the underlying asset, possible default of the counterparty to the transaction or illiquidity of the instrument. The Funds’ successful use of a derivative financial instrument depends on the investment adviser’s ability to predict pertinent market movements accurately, which cannot be assured. The use of these instruments may result in losses greater than if they had not been used, may limit the amount of appreciation a Fund can realize on an investment and/or may result in lower distributions paid to shareholders. The Funds’ investments in these instruments, if any, are discussed in detail in the Notes to Financial Statements.
| 8 | 2 0 1 8 B L A C K R O C K A N N U A L R E P O R T T O S H A R E H O L D E R S |
| Schedule of Investments | Advantage Global SmallCap Fund | |
| August 31, 2018 | (Percentages shown are based on Net Assets) |
| Security | Shares | Value | ||||||
Common Stocks — 97.2% | ||||||||
Australia — 1.8% | ||||||||
CSR Ltd. | 52,152 | $ | 161,683 | |||||
IDP Education Ltd. | 635 | 4,962 | ||||||
Iluka Resources Ltd. | 4,265 | 28,480 | ||||||
Nine Entertainment Co. Holdings Ltd. | 50,733 | 88,150 | ||||||
Pendal Group Ltd. | 3,227 | 21,790 | ||||||
Regis Resources Ltd. | 246,221 | 740,618 | ||||||
Sandfire Resources NL | 75,471 | 384,839 | ||||||
Sirtex Medical Ltd. | 1,014 | 23,387 | ||||||
Virtus Health Ltd. | 18,681 | 78,180 | ||||||
|
| |||||||
| 1,532,089 | ||||||||
Austria — 0.6% | ||||||||
Oesterreichische Post AG | 9,845 | 435,038 | ||||||
Schoeller-Bleckmann Oilfield Equipment AG | 565 | 61,211 | ||||||
|
| |||||||
| 496,249 | ||||||||
Belgium — 0.1% | ||||||||
Galapagos NV (a) | 417 | 42,243 | ||||||
Orange Belgium SA | 936 | 14,146 | ||||||
|
| |||||||
| 56,389 | ||||||||
Brazil — 1.6% | ||||||||
Mahle-Metal Leve SA | 2,200 | 13,627 | ||||||
QualiCorp Consultoria e Corretora de Seguros SA | 11,700 | 45,242 | ||||||
SLC AgriCola SA | 62,009 | 1,002,046 | ||||||
Tupy SA | 47,204 | 275,939 | ||||||
|
| |||||||
| 1,336,854 | ||||||||
Canada — 2.9% | ||||||||
Aecon Group, Inc. | 17,175 | 228,342 | ||||||
Canaccord Genuity Group, Inc. | 1,801 | 9,730 | ||||||
Canfor Pulp Products, Inc. | 13,124 | 275,252 | ||||||
Capital Power Corp. | 342 | 7,170 | ||||||
Cineplex, Inc. | 706 | 17,804 | ||||||
Dream Industrial Real Estate Investment Trust | 874 | 6,738 | ||||||
Dream Office Real Estate Investment Trust | 50,907 | 946,363 | ||||||
Enghouse Systems Ltd. | 1,949 | 120,136 | ||||||
Gran Tierra Energy, Inc. (a) | 2,210 | 7,624 | ||||||
Interfor Corp. (a) | 7,081 | 121,869 | ||||||
Martinrea International, Inc. | 5,352 | 57,908 | ||||||
Norbord, Inc. | 226 | 8,600 | ||||||
Pason Systems, Inc. | 382 | 6,235 | ||||||
Surge Energy, Inc. | 3,168 | 5,559 | ||||||
TFI International, Inc. | 6,209 | 230,470 | ||||||
Toromont Industries Ltd. | 136 | 6,799 | ||||||
Trevali Mining Corp. (a) | 649,950 | 388,476 | ||||||
|
| |||||||
| 2,445,075 | ||||||||
China — 1.8% | ||||||||
361 Degrees International Ltd. | 316,000 | 90,694 | ||||||
Beijing Tong Ren Tang Chinese Medicine Co. Ltd. | 86,000 | 168,583 | ||||||
China Aoyuan Property Group Ltd. | 11,000 | 8,227 | ||||||
China Lilang Ltd. | 34,000 | 37,713 | ||||||
China Pioneer Pharma Holdings Ltd. | 64,000 | 15,901 | ||||||
China Shineway Pharmaceutical Group Ltd. | 19,000 | 26,850 | ||||||
China Suntien Green Energy Corp. Ltd., Class H | 252,000 | 75,891 | ||||||
CITIC Telecom International Holdings Ltd. | 64,000 | 19,580 | ||||||
Consun Pharmaceutical Group Ltd. | 18,000 | 15,825 | ||||||
Hua Hong Semiconductor Ltd. (b)(c) | 53,000 | 144,711 | ||||||
Konka Group Co. Ltd., Class B | 100 | 34 | ||||||
Lonking Holdings Ltd. | 1,688,000 | 581,180 | ||||||
Phoenix New Media Ltd. - ADR (a) | 2,151 | 11,013 | ||||||
Qingling Motors Co. Ltd., Class H | 50,000 | 13,638 | ||||||
Shanghai Haohai Biological Technology Co. Ltd., Class H (c) | 1,500 | 11,225 | ||||||
| Security | Shares | Value | ||||||
China (continued) | ||||||||
Shougang Fushan Resources Group Ltd. | 68,000 | $ | 15,184 | |||||
Tianneng Power International Ltd. | 120,000 | 149,157 | ||||||
West China Cement Ltd. | 44,000 | 8,135 | ||||||
Xinyuan Real Estate Co. Ltd. - ADR | 23,576 | 110,100 | ||||||
Yuexiu Transport Infrastructure Ltd. | 8,000 | 6,221 | ||||||
|
| |||||||
| 1,509,862 | ||||||||
Denmark — 0.2% | ||||||||
Alm Brand A/S | 1,557 | 13,352 | ||||||
Bavarian Nordic A/S (a) | 131 | 3,767 | ||||||
Topdanmark A/S | 3,931 | 168,737 | ||||||
|
| |||||||
| 185,856 | ||||||||
Finland — 1.0% | ||||||||
Ramirent OYJ | 29,891 | 246,930 | ||||||
Sanoma OYJ | 53,540 | 555,543 | ||||||
|
| |||||||
| 802,473 | ||||||||
France — 1.2% | ||||||||
Cie des Alpes | 484 | 16,826 | ||||||
Gaztransport Et Technigaz SA | 14,279 | 976,946 | ||||||
|
| |||||||
| 993,772 | ||||||||
Germany — 1.0% | ||||||||
Amadeus Fire AG | �� | 423 | 48,763 | |||||
Jenoptik AG (a) | 8,116 | 319,298 | ||||||
MorphoSys AG (a) | 265 | 31,308 | ||||||
Nemetschek SE | 45 | 7,393 | ||||||
Salzgitter AG | 2,882 | 130,526 | ||||||
Siltronic AG | 2,199 | 318,790 | ||||||
|
| |||||||
| 856,078 | ||||||||
Greece — 0.5% | ||||||||
Motor Oil Hellas Corinth Refineries SA | 19,188 | 452,132 | ||||||
|
| |||||||
Hong Kong — 1.0% | ||||||||
Champion REIT | 45,000 | 33,098 | ||||||
China Water Affairs Group Ltd. | 16,000 | 18,340 | ||||||
CK Life Sciences Int’l Holdings, Inc. | 184,000 | 11,732 | ||||||
Giordano International Ltd. | 542,000 | 304,684 | ||||||
HKBN Ltd. | 291,000 | 432,342 | ||||||
Regal Real Estate Investment Trust | 19,000 | 5,665 | ||||||
Road King Infrastructure Ltd. | 15,000 | 25,486 | ||||||
Sa Sa International Holdings Ltd. | 20,000 | 10,582 | ||||||
Yuexiu Real Estate Investment Trust | 48,000 | 32,605 | ||||||
|
| |||||||
| 874,534 | ||||||||
Hungary — 0.2% | ||||||||
Magyar Telekom Telecommunications PLC | 114,088 | 167,231 | ||||||
|
| |||||||
India — 2.7% | ||||||||
Century Textiles & Industries Ltd. | 852 | 11,774 | ||||||
Gujarat State Petronet Ltd. | 7,829 | 21,284 | ||||||
Indraprastha Gas Ltd. | 2,971 | 12,185 | ||||||
KEC International Ltd. | 29,120 | 124,419 | ||||||
KPIT Technologies Ltd. | 4,543 | 19,440 | ||||||
Mphasis Ltd. | 46,966 | 835,051 | ||||||
NIIT Technologies Ltd. | 49,440 | 982,235 | ||||||
Page Industries Ltd. | 59 | 28,654 | ||||||
Sanofi India Ltd. | 869 | 78,514 | ||||||
Srei Infrastructure Finance Ltd. | 48,599 | 37,813 | ||||||
Sterlite Technologies Ltd. | 23,688 | 121,453 | ||||||
Tata Investment Corp. Ltd. | 525 | 5,975 | ||||||
Uflex Ltd. | 1,291 | 5,484 | ||||||
Vardhman Textiles Ltd. | 526 | 8,158 | ||||||
|
| |||||||
| 2,292,439 | ||||||||
Indonesia — 0.1% | ||||||||
Bukit Asam Tbk PT | 19,800 | 5,445 | ||||||
| S C H E D U L E O F I N V E S T M E N T S | 9 |
| Schedule of Investments (continued) | Advantage Global SmallCap Fund | |
| August 31, 2018 | (Percentages shown are based on Net Assets) |
| Security | Shares | Value | ||||||
Indonesia (continued) | ||||||||
Indo Tambangraya Megah Tbk PT | 47,200 | $ | 90,698 | |||||
|
| |||||||
| 96,143 | ||||||||
Israel — 1.3% | ||||||||
B Communications Ltd. (a) | 692 | 6,937 | ||||||
Mellanox Technologies Ltd. (a) | 108 | 8,986 | ||||||
Radware Ltd. (a) | 23,059 | 638,734 | ||||||
SodaStream International Ltd. (a) | 3,262 | 465,650 | ||||||
|
| |||||||
| 1,120,307 | ||||||||
Italy — 0.0% | ||||||||
Unipol Gruppo SpA | 6,075 | 25,083 | ||||||
|
| |||||||
Japan — 8.5% | ||||||||
ADEKA Corp. | 2,600 | 42,994 | ||||||
Aida Engineering Ltd. | 2,700 | 24,251 | ||||||
Aisan Industry Co. Ltd. | 900 | 7,621 | ||||||
Akita Bank Ltd. | 200 | 5,146 | ||||||
ASKA Pharmaceutical Co. Ltd. | 5,000 | 61,310 | ||||||
Avex, Inc. | 10,400 | 139,386 | ||||||
CMIC Holdings Co. Ltd. | 800 | 17,157 | ||||||
Corona Corp. | 1,100 | 11,980 | ||||||
Daiken Corp. | 300 | 6,044 | ||||||
Dainichiseika Color & Chemicals Manufacturing Co. Ltd. | 1,600 | 49,351 | ||||||
DTS Corp. | 700 | 28,689 | ||||||
Foster Electric Co. Ltd. | 800 | 11,201 | ||||||
France Bed Holdings Co. Ltd. | 7,800 | 65,892 | ||||||
Fukuda Denshi Co. Ltd. | 400 | 27,324 | ||||||
Geo Holdings Corp. | 3,400 | 49,451 | ||||||
Gurunavi, Inc. | 5,100 | 41,993 | ||||||
Hachijuni Bank Ltd. | 129,000 | 576,478 | ||||||
Hankyu Hanshin REIT, Inc. | 5 | 6,312 | ||||||
Hiroshima Bank Ltd. | 3,800 | 26,581 | ||||||
Ines Corp. | 13,700 | 150,778 | ||||||
Itochu-Shokuhin Co. Ltd. | 600 | 31,528 | ||||||
Jafco Co. Ltd. | 1,100 | 40,962 | ||||||
Japan Petroleum Exploration Co. Ltd. | 4,700 | 100,070 | ||||||
JVC Kenwood Corp. | 17,800 | 50,602 | ||||||
Kaga Electronics Co. Ltd. | 1,400 | 27,113 | ||||||
Kasai Kogyo Co. Ltd. | 800 | 8,805 | ||||||
Kissei Pharmaceutical Co. Ltd. | 1,900 | 56,166 | ||||||
KYB Corp. | 200 | 8,198 | ||||||
KYORIN Holdings, Inc. | 900 | 18,705 | ||||||
Leopalace21 Corp. | 185,100 | 981,637 | ||||||
Maruzen Showa Unyu Co. Ltd. | 1,000 | 5,021 | ||||||
Miraca Holdings, Inc. | 8,600 | 237,541 | ||||||
Mitsubishi Research Institute, Inc. | 900 | 34,198 | ||||||
Mixi, Inc. | 27,700 | 678,177 | ||||||
Mori Trust Sogo REIT, Inc. | 189 | 276,075 | ||||||
Morinaga Milk Industry Co. Ltd. | 800 | 21,700 | ||||||
NEC Networks & System Integration Corp. | 3,700 | 86,715 | ||||||
Nippon Soda Co. Ltd. | 15,000 | 85,508 | ||||||
Nissin Corp. | 900 | 18,842 | ||||||
Nittetsu Mining Co. Ltd. | 100 | 4,605 | ||||||
NSD Co. Ltd. | 3,200 | 66,824 | ||||||
Open House Co. Ltd. | 700 | 40,918 | ||||||
PeptiDream, Inc. (a) | 900 | 35,129 | ||||||
Press Kogyo Co. Ltd. | 2,800 | 14,663 | ||||||
Proto Corp. | 1,300 | 18,685 | ||||||
Riken Vitamin Co. Ltd. | 100 | 3,516 | ||||||
Saizeriya Co. Ltd. | 3,100 | 62,109 | ||||||
Sanki Engineering Co. Ltd. | 3,000 | 32,497 | ||||||
SCSK Corp. | 1,200 | 56,968 | ||||||
Senshu Ikeda Holdings, Inc. | 171,800 | 607,433 | ||||||
Shikoku Electric Power Co., Inc. | 2,600 | 34,485 | ||||||
Shinko Electric Industries Co. Ltd. | 39,400 | 370,960 | ||||||
Shizuoka Gas Co. Ltd. | 5,900 | 48,526 | ||||||
Star Micronics Co. Ltd. | 1,100 | 19,844 | ||||||
Sumitomo Warehouse Co. Ltd. | 10,000 | 62,224 | ||||||
| Security | Shares | Value | ||||||
Japan (continued) | ||||||||
Tachi-S Co. Ltd. | 600 | $ | 9,554 | |||||
Takara Bio, Inc. | 500 | 12,448 | ||||||
Takara Leben Co. Ltd. | 97,700 | 324,301 | ||||||
Tamron Co. Ltd. | 1,900 | 37,679 | ||||||
Tenma Corp. | 500 | 8,319 | ||||||
TIS, Inc. | 9,000 | 433,510 | ||||||
TOC Co. Ltd. | 2,100 | 15,260 | ||||||
Toenec Corp. | 800 | 22,779 | ||||||
Toho Holdings Co. Ltd. | 1,000 | 26,331 | ||||||
Token Corp. | 1,100 | 77,855 | ||||||
TS Tech Co. Ltd. | 2,300 | 86,781 | ||||||
Ube Industries Ltd. | 500 | 12,722 | ||||||
Ulvac, Inc. | 7,400 | 306,486 | ||||||
Vital KSK Holdings, Inc. | 2,700 | 30,683 | ||||||
Yurtec Corp. | 2,000 | 15,900 | ||||||
Zeon Corp. | 22,100 | 236,900 | ||||||
|
| |||||||
| 7,254,396 | ||||||||
Malaysia — 0.3% | ||||||||
Bursa Malaysia Bhd | 6,350 | 11,857 | ||||||
IGB Real Estate Investment Trust | 38,300 | 16,136 | ||||||
Malaysian Pacific Industries Bhd | 42,700 | 127,649 | ||||||
Unisem M Bhd | 74,800 | 52,564 | ||||||
|
| |||||||
| 208,206 | ||||||||
Malta — 0.1% | ||||||||
Kindred Group PLC - SDR | 3,994 | 49,118 | ||||||
|
| |||||||
Mexico — 1.2% | ||||||||
Bolsa Mexicana de Valores SAB de CV | 180,624 | 363,796 | ||||||
Concentradora Fibra Danhos SA de CV | 11,200 | 18,560 | ||||||
Corp. Inmobiliaria Vesta SAB de CV | 162,300 | 229,791 | ||||||
Grupo Comercial Chedraui SA de CV | 77,886 | 183,410 | ||||||
Industrias Bachoco SAB de CV, Series B | 47,631 | 231,383 | ||||||
|
| |||||||
| 1,026,940 | ||||||||
Netherlands — 0.5% | ||||||||
Aalberts Industries NV | 10,491 | 450,398 | ||||||
ForFarmers NV | 456 | 5,100 | ||||||
|
| |||||||
| 455,498 | ||||||||
Norway — 1.1% | ||||||||
Entra ASA (c) | 3,348 | 48,540 | ||||||
Europris ASA (c) | 2,198 | 5,321 | ||||||
SpareBank 1 SMN | 1,983 | 21,327 | ||||||
TGS NOPEC Geophysical Co. ASA | 21,728 | 824,028 | ||||||
|
| |||||||
| 899,216 | ||||||||
Poland — 0.1% | ||||||||
Energa SA | 24,485 | 55,382 | ||||||
Tauron Polska Energia SA (a) | 77,821 | 42,056 | ||||||
|
| |||||||
| 97,438 | ||||||||
Portugal — 0.4% | ||||||||
Altri SGPS SA | 28,943 | 266,903 | ||||||
Semapa-Sociedade de Investimento e Gestao | 1,551 | 32,073 | ||||||
Sonae SGPS SA | 54,593 | 58,079 | ||||||
|
| |||||||
| 357,055 | ||||||||
Russia — 0.0% | ||||||||
Unipro PJSC | 136,000 | 5,380 | ||||||
|
| |||||||
Singapore — 0.1% | ||||||||
Yanlord Land Group Ltd. | 108,900 | 120,671 | ||||||
|
| |||||||
South Africa — 1.0% | ||||||||
Adcock Ingram Holdings Ltd. | 13,620 | 66,047 | ||||||
Alexander Forbes Group Holdings Ltd. | 12,514 | 4,505 | ||||||
Astral Foods Ltd. | 39,722 | 699,751 | ||||||
Blue Label Telecoms Ltd. | 195,191 | 95,090 | ||||||
| 10 | 2 0 1 8 B L A C K R O C K A N N U A L R E P O R T T O S H A R E H O L D E R S |
| Schedule of Investments (continued) | Advantage Global SmallCap Fund | |
| August 31, 2018 | (Percentages shown are based on Net Assets) |
| Security | Shares | Value | ||||||
South Africa (continued) | ||||||||
Massmart Holdings Ltd. | 1,640 | $ | 12,361 | |||||
|
| |||||||
| 877,754 | ||||||||
South Korea — 0.3% | ||||||||
Cell Biotech Co. Ltd. | 289 | 9,599 | ||||||
Genexine Co. Ltd. (a) | 53 | 4,751 | ||||||
Green Cross Corp. | 56 | 9,858 | ||||||
Green Cross Holdings Corp. | 484 | 13,319 | ||||||
Hugel, Inc. (a) | 14 | 5,388 | ||||||
Samchully Co. Ltd. | 352 | 33,351 | ||||||
Samjin Pharmaceutical Co. Ltd. | 1,685 | 83,408 | ||||||
Taekwang Industrial Co. Ltd. | 82 | 118,600 | ||||||
|
| |||||||
| 278,274 | ||||||||
Spain — 0.0% | ||||||||
Pharma Mar SA (a) | 5,658 | 10,897 | ||||||
|
| |||||||
Sweden — 2.2% | ||||||||
BioGaia AB, Class B | 375 | 20,052 | ||||||
Biotage AB | 18,325 | 259,373 | ||||||
Nobina AB (c) | 46,595 | 343,593 | ||||||
Nolato AB, Class B | 2,894 | 204,454 | ||||||
SSAB AB, A Shares | 2,550 | 11,114 | ||||||
SSAB AB, B Shares | 32,914 | 114,998 | ||||||
Swedish Orphan Biovitrum AB (a) | 2,135 | 68,039 | ||||||
Vitrolife AB | 1,005 | 14,238 | ||||||
Wihlborgs Fastigheter AB | 66,417 | 801,071 | ||||||
|
| |||||||
| 1,836,932 | ||||||||
Switzerland — 0.5% | ||||||||
CRISPR Therapeutics AG (a) | 97 | 5,497 | ||||||
Galenica AG (c) | 2,407 | 142,724 | ||||||
Idorsia Ltd. (a) | 1,144 | 28,929 | ||||||
Kardex AG, Registered Shares | 248 | 44,419 | ||||||
LEM Holding SA, Registered Shares | 40 | 50,865 | ||||||
Swissquote Group Holding SA, Registered Shares | 2,152 | 159,262 | ||||||
|
| |||||||
| 431,696 | ||||||||
Taiwan — 1.0% | ||||||||
Coretronic Corp. | 335,000 | 630,248 | ||||||
Formosa Advanced Technologies Co. Ltd. | 62,000 | 72,727 | ||||||
Mitac Holdings Corp. | 25,000 | 28,916 | ||||||
Sigurd Microelectronics Corp. | 35,000 | 39,720 | ||||||
Wowprime Corp. | 40,000 | 102,448 | ||||||
|
| |||||||
| 874,059 | ||||||||
Thailand — 2.0% | ||||||||
AP Thailand PCL - NVDR | 610,800 | 175,471 | ||||||
Bangkok Chain Hospital PCL - NVDR | 108,700 | 63,456 | ||||||
Beauty Community PCL | 28,200 | 9,741 | ||||||
Kiatnakin Bank PCL - NVDR | 106,300 | 250,915 | ||||||
Quality Houses PCL - NVDR | 1,206,400 | 127,548 | ||||||
Thanachart Capital PCL - NVDR | 426,500 | 700,628 | ||||||
Tisco Financial Group PCL - NVDR | 154,200 | 386,448 | ||||||
|
| |||||||
| 1,714,207 | ||||||||
Turkey — 1.1% | ||||||||
Albaraka Turk Katilim Bankasi A/S | 25,258 | 4,852 | ||||||
Anadolu Cam Sanayii A/S | 369,728 | 184,492 | ||||||
Aygaz A/S | 21,000 | 38,346 | ||||||
Tekfen Holding A/S | 195,312 | 610,183 | ||||||
Turkiye Sinai Kalkinma Bankasi A/S | 464,403 | 53,864 | ||||||
|
| |||||||
| 891,737 | ||||||||
United Kingdom — 6.0% | ||||||||
Abcam PLC | 2,552 | 50,216 | ||||||
Ashmore Group PLC | 5,855 | 27,036 | ||||||
Big Yellow Group PLC | 632 | 7,732 | ||||||
Bodycote PLC | 3,711 | 45,751 | ||||||
Bovis Homes Group PLC | 65,603 | 958,767 | ||||||
Brewin Dolphin Holdings PLC | 4,311 | 20,313 | ||||||
| Security | Shares | Value | ||||||
United Kingdom (continued) | ||||||||
BTG PLC (a) | 4,707 | $ | 33,301 | |||||
Computacenter PLC | 628 | 11,042 | ||||||
Costain Group PLC | 6,015 | 33,142 | ||||||
Dart Group PLC | 9,931 | 126,046 | ||||||
Derwent London PLC | 302 | 11,926 | ||||||
Drax Group PLC | 43,195 | 214,185 | ||||||
Electrocomponents PLC | 56,760 | 547,107 | ||||||
EMIS Group PLC | 4,106 | 51,316 | ||||||
Fevertree Drinks PLC | 3,866 | 186,902 | ||||||
Games Workshop Group PLC | 1,921 | 88,781 | ||||||
Genus PLC | 950 | 35,128 | ||||||
Go-Ahead Group PLC | 12,140 | 264,258 | ||||||
Grainger PLC | 45,006 | 179,501 | ||||||
Hansteen Holdings PLC | 8,933 | 11,570 | ||||||
HomeServe PLC | 21,707 | 293,119 | ||||||
IG Group Holdings PLC | 36,287 | 426,104 | ||||||
Jupiter Fund Management PLC | 8,677 | 47,241 | ||||||
Moneysupermarket.com Group PLC | 9,880 | 36,384 | ||||||
National Express Group PLC | 8,918 | 45,852 | ||||||
Pagegroup PLC | 3,830 | 30,297 | ||||||
Safestore Holdings PLC | 2,608 | 17,982 | ||||||
Soco International PLC | 3,349 | 3,869 | ||||||
Softcat PLC | 3,376 | 37,203 | ||||||
SSP Group PLC | 24,898 | 224,203 | ||||||
Stock Spirits Group PLC | 15,434 | 38,618 | ||||||
Tate & Lyle PLC | 72,577 | 631,777 | ||||||
Victrex PLC | 536 | 22,035 | ||||||
WH Smith PLC | 360 | 9,648 | ||||||
William Hill PLC | 97,463 | 325,637 | ||||||
|
| |||||||
| 5,093,989 | ||||||||
United States — 52.8% | ||||||||
Aaron’s, Inc. | 2,111 | 104,959 | ||||||
Abercrombie & Fitch Co., Class A | 4,333 | 93,896 | ||||||
ACADIA Pharmaceuticals, Inc. (a) | 782 | 11,120 | ||||||
Acceleron Pharma, Inc. (a) | 293 | 15,828 | ||||||
Achillion Pharmaceuticals, Inc. (a) | 1,807 | 6,234 | ||||||
Acorda Therapeutics, Inc. (a) | 124 | 3,571 | ||||||
Advanced Drainage Systems, Inc. | 4,672 | 146,467 | ||||||
AG Mortgage Investment Trust, Inc. | 4,421 | 83,115 | ||||||
Agios Pharmaceuticals, Inc. (a)(b) | 458 | 36,970 | ||||||
Aimmune Therapeutics, Inc. (a) | 172 | 4,801 | ||||||
Aircastle Ltd. | 10,492 | 219,493 | ||||||
Alder Biopharmaceuticals, Inc. (a) | 264 | 4,778 | ||||||
Allison Transmission Holdings, Inc. | 4,895 | 243,086 | ||||||
AMAG Pharmaceuticals, Inc. (a) | 496 | 12,102 | ||||||
American Eagle Outfitters, Inc. | 13,350 | 346,566 | ||||||
Amicus Therapeutics, Inc. (a) | 1,514 | 20,409 | ||||||
AnaptysBio, Inc. (a) | 51 | 4,521 | ||||||
Applied Industrial Technologies, Inc. | 1,276 | 98,316 | ||||||
Archrock, Inc. | 4,047 | 51,195 | ||||||
Arena Pharmaceuticals, Inc. (a) | 349 | 13,555 | ||||||
Armstrong World Industries, Inc. (a) | 5,200 | 362,960 | ||||||
Array BioPharma, Inc. (a) | 1,944 | 30,268 | ||||||
Arrowhead Pharmaceuticals, Inc. (a) | 339 | 5,004 | ||||||
Atara Biotherapeutics, Inc. (a) | 154 | 6,306 | ||||||
BancFirst Corp. | 195 | 12,441 | ||||||
Beazer Homes U.S.A., Inc. (a) | 11,430 | 146,418 | ||||||
BGC Partners, Inc., Class A | 32,659 | 405,625 | ||||||
BJ’s Restaurants, Inc. | 338 | 25,587 | ||||||
Bloomin’ Brands, Inc. | 52,220 | 1,007,846 | ||||||
Blue Hills Bancorp, Inc. | 984 | 22,632 | ||||||
Bluebird Bio, Inc. (a) | 555 | 93,407 | ||||||
Blueprint Medicines Corp. (a) | 346 | 26,528 | ||||||
Booz Allen Hamilton Holding Corp. | 21,228 | 1,086,024 | ||||||
Brandywine Realty Trust | 4,798 | 80,414 | ||||||
BrightSphere Investment Group PLC | 79,018 | 1,002,738 | ||||||
Brixmor Property Group, Inc. | 3,510 | 63,952 | ||||||
Brown & Brown, Inc. | 29,474 | 898,368 | ||||||
BRP, Inc. | 19,155 | 999,876 | ||||||
| S C H E D U L E O F I N V E S T M E N T S | 11 |
| Schedule of Investments (continued) | Advantage Global SmallCap Fund | |
| August 31, 2018 | (Percentages shown are based on Net Assets) |
| Security | Shares | Value | ||||||
United States (continued) | ||||||||
Bruker Corp. | 29,406 | $ | 1,046,265 | |||||
Burlington Stores, Inc. (a) | 1,463 | 246,047 | ||||||
Cabot Corp. | 9,827 | 637,969 | ||||||
Cabot Microelectronics Corp. | 3,806 | 429,050 | ||||||
Cantel Medical Corp. | 2,738 | 265,586 | ||||||
Chemed Corp. | 2,179 | 704,994 | ||||||
ChemoCentryx, Inc. (a) | 956 | 12,600 | ||||||
Chesapeake Utilities Corp. | 1,676 | 144,136 | ||||||
Choice Hotels International, Inc. | 542 | 42,303 | ||||||
Churchill Downs, Inc. | 136 | 38,434 | ||||||
Citi Trends, Inc. | 3,178 | 98,327 | ||||||
Clovis Oncology, Inc. (a) | 366 | 13,084 | ||||||
CNO Financial Group, Inc. | 5,171 | 111,745 | ||||||
Comfort Systems U.S.A., Inc. | 563 | 32,316 | ||||||
Community Trust Bancorp, Inc. | 242 | 11,955 | ||||||
Concert Pharmaceuticals, Inc. (a) | 554 | 8,737 | ||||||
Continental Building Products, Inc. (a) | 137 | 5,110 | ||||||
Covenant Transportation Group, Inc., Class A (a) | 2,455 | 73,331 | ||||||
Crane Co. | 6,293 | 574,425 | ||||||
CSG Systems International, Inc. | 496 | 18,526 | ||||||
Curtiss-Wright Corp. | 4,759 | 637,468 | ||||||
CytomX Therapeutics, Inc. (a) | 222 | 4,993 | ||||||
Dana, Inc. | 49,683 | 972,296 | ||||||
DiamondRock Hospitality Co. | 5,993 | 71,676 | ||||||
Dine Brands Global, Inc. | 251 | 20,938 | ||||||
Domtar Corp. | 124 | 6,312 | ||||||
Douglas Dynamics, Inc. | 3,874 | 177,429 | ||||||
Dynavax Technologies Corp. (a) | 172 | 2,382 | ||||||
Eagle Bancorp, Inc. (a) | 832 | 44,803 | ||||||
EastGroup Properties, Inc. | 61 | 5,933 | ||||||
Editas Medicine, Inc. (a) | 159 | 5,220 | ||||||
Emergent BioSolutions, Inc. (a) | 326 | 20,212 | ||||||
Employers Holdings, Inc. | 325 | 14,901 | ||||||
Enanta Pharmaceuticals, Inc. (a) | 83 | 7,547 | ||||||
Ennis, Inc. | 10,983 | 239,429 | ||||||
Esperion Therapeutics, Inc. (a) | 104 | 5,147 | ||||||
Evercore, Inc., Class A | 67 | 7,112 | ||||||
Exact Sciences Corp. (a) | 1,232 | 92,264 | ||||||
Exantas Capital Corp. | 3,128 | 37,067 | ||||||
Exelixis, Inc. (a) | 3,608 | 67,794 | ||||||
Extended Stay America, Inc. | 20,078 | 405,174 | ||||||
FibroGen, Inc. (a) | 676 | 41,337 | ||||||
Financial Institutions, Inc. | 7,994 | 258,206 | ||||||
First American Financial Corp. | 1,231 | 69,995 | ||||||
First Industrial Realty Trust, Inc. | 1,294 | 42,003 | ||||||
First of Long Island Corp. | 4,494 | 97,969 | ||||||
Flagstar Bancorp, Inc. (a) | 1,841 | 60,845 | ||||||
Flushing Financial Corp. | 205 | 5,314 | ||||||
G1 Therapeutics, Inc. (a) | 93 | 5,643 | ||||||
Generac Holdings, Inc. (a) | 8,997 | 499,244 | ||||||
Genomic Health, Inc. (a) | 347 | 21,226 | ||||||
Global Blood Therapeutics, Inc. (a) | 365 | 17,867 | ||||||
Great Southern Bancorp, Inc. | 943 | 55,920 | ||||||
H&E Equipment Services, Inc. | 1,195 | 41,598 | ||||||
Halozyme Therapeutics, Inc. (a) | 1,871 | 34,445 | ||||||
Hanmi Financial Corp. | 911 | 23,777 | ||||||
Hanover Insurance Group, Inc. | 7,950 | 973,795 | ||||||
Herbalife Nutrition Ltd. (a) | 1,388 | 78,547 | ||||||
Herc Holdings, Inc. (a) | 237 | 12,461 | ||||||
Heron Therapeutics, Inc. (a) | 409 | 15,767 | ||||||
Hersha Hospitality Trust (b) | 1,102 | 26,007 | ||||||
Highwoods Properties, Inc. (b) | 12,886 | 640,950 | ||||||
Hill-Rom Holdings, Inc. | 8,809 | 856,851 | ||||||
Hilltop Holdings, Inc. | 1,651 | 34,258 | ||||||
Huntsman Corp. | 2,458 | 74,944 | ||||||
IDACORP, Inc. | 804 | 78,671 | ||||||
ImmunoGen, Inc. (a) | 900 | 9,171 | ||||||
Immunomedics, Inc. (a)(b) | 894 | 23,923 | ||||||
Insmed, Inc. (a) | 592 | 11,799 | ||||||
Insperity, Inc. | 6,946 | 832,478 | ||||||
| Security | Shares | Value | ||||||
United States (continued) | ||||||||
Intercept Pharmaceuticals, Inc. (a) | 160 | $ | 17,888 | |||||
InterDigital, Inc. | 601 | 49,643 | ||||||
Interface, Inc. | 422 | 9,938 | ||||||
Intrexon Corp. (a) | 149 | 2,292 | ||||||
Ionis Pharmaceuticals, Inc. (a)(b) | 1,591 | 72,693 | ||||||
Iovance Biotherapeutics, Inc. (a) | 303 | 5,363 | ||||||
Ironwood Pharmaceuticals, Inc. (a)(b) | 1,122 | 21,587 | ||||||
ITT, Inc. | 541 | 31,979 | ||||||
Kadant, Inc. | 36 | 3,638 | ||||||
KAR Auction Services, Inc. | 7,027 | 440,523 | ||||||
KB Home | 17,398 | 432,340 | ||||||
Kearny Financial Corp. | 4,752 | 65,102 | ||||||
Kforce, Inc. | 12,876 | 541,436 | ||||||
Lakeland Financial Corp. | 573 | 28,232 | ||||||
Lamb Weston Holdings, Inc. | 542 | 36,639 | ||||||
Landstar System, Inc. | 1,332 | 154,246 | ||||||
Legg Mason, Inc. | 1,793 | 55,942 | ||||||
Ligand Pharmaceuticals, Inc. (a) | 220 | 57,132 | ||||||
Limelight Networks, Inc. (a) | 1,708 | 8,660 | ||||||
Loxo Oncology, Inc. (a) | 206 | 34,810 | ||||||
MacroGenics, Inc. (a)(b) | 595 | 13,013 | ||||||
Madrigal Pharmaceuticals, Inc. (a) | 48 | 11,482 | ||||||
Masimo Corp. (a) | 4,765 | 561,746 | ||||||
Masonite International Corp. (a) | 168 | 11,248 | ||||||
Materion Corp. | 15,556 | 992,473 | ||||||
McGrath RentCorp | 17,719 | 1,027,702 | ||||||
Medifast, Inc. | 4,516 | 1,033,035 | ||||||
Medpace Holdings, Inc. (a) | 17,640 | 1,054,696 | ||||||
Mercantile Bank Corp. | 1,142 | 40,438 | ||||||
Meritor, Inc. (a) | 13,355 | 289,269 | ||||||
Momenta Pharmaceuticals, Inc. (a) | 492 | 13,038 | ||||||
Movado Group, Inc. | 5,385 | 229,401 | ||||||
MSA Safety, Inc. | 102 | 10,311 | ||||||
Myriad Genetics, Inc. (a) | 991 | 49,342 | ||||||
Natera, Inc. (a) | 789 | 21,808 | ||||||
National Bank Holdings Corp., Class A | 528 | 21,199 | ||||||
National Research Corp. | 196 | 7,673 | ||||||
NCI Building Systems, Inc. (a) | 1,668 | 28,189 | ||||||
Neurocrine Biosciences, Inc. (a) | 910 | 111,885 | ||||||
New Relic, Inc. (a) | 170 | 17,469 | ||||||
NexPoint Residential Trust, Inc. | 917 | 29,619 | ||||||
OMNOVA Solutions, Inc. (a) | 1,877 | 16,987 | ||||||
OPKO Health, Inc. (a)(b) | 2,336 | 13,829 | ||||||
Oshkosh Corp. | 9,448 | 663,816 | ||||||
Otter Tail Corp. | 843 | 40,380 | ||||||
Park Hotels & Resorts, Inc. | 6,342 | 212,140 | ||||||
PDL BioPharma, Inc. (a)(b) | 2,552 | 6,176 | ||||||
Peapack Gladstone Financial Corp. | 276 | 9,221 | ||||||
Peoples Bancorp, Inc. | 2,618 | 93,881 | ||||||
Perficient, Inc. (a) | 979 | 28,127 | ||||||
PGT Innovations, Inc. (a) | 23,025 | 559,507 | ||||||
Phibro Animal Health Corp., Class A | 624 | 29,453 | ||||||
PNM Resources, Inc. | 933 | 36,340 | ||||||
Portola Pharmaceuticals, Inc. (a) | 382 | 11,403 | ||||||
PotlatchDeltic Corp. | 1,436 | 69,359 | ||||||
Progress Software Corp. | 25,037 | 1,024,764 | ||||||
Protective Insurance Corp., Class B | 2,441 | 57,363 | ||||||
PTC Therapeutics, Inc. (a) | 171 | 7,138 | ||||||
Puma Biotechnology, Inc. (a)(b) | 242 | 10,636 | ||||||
Radius Health, Inc. (a) | 230 | 4,731 | ||||||
RE/MAX Holdings, Inc., Class A | 4,293 | 211,430 | ||||||
Regal Beloit Corp. | 1,786 | 149,488 | ||||||
REGENXBIO, Inc. (a) | 198 | 13,949 | ||||||
Reliance Steel & Aluminum Co. | 11,984 | 1,053,274 | ||||||
Repligen Corp. (a) | 280 | 15,366 | ||||||
Republic Bancorp, Inc., Class A | 1,189 | 57,797 | ||||||
Resources Connection, Inc. | 6,803 | 112,590 | ||||||
Retail Properties of America, Inc., Class A | 2,638 | 33,582 | ||||||
Retrophin, Inc. (a) | 126 | 3,993 | ||||||
Rexford Industrial Realty, Inc. | 1,293 | 42,022 | ||||||
| 12 | 2 0 1 8 B L A C K R O C K A N N U A L R E P O R T T O S H A R E H O L D E R S |
| Schedule of Investments (continued) | Advantage Global SmallCap Fund | |
| August 31, 2018 | (Percentages shown are based on Net Assets) |
| Security | Shares | Value | ||||||
United States (continued) | ||||||||
RH (a) | 1,180 | $ | 187,620 | |||||
Ruth’s Hospitality Group, Inc. | 2,002 | 61,662 | ||||||
Ryman Hospitality Properties, Inc. | 266 | 23,602 | ||||||
Sage Therapeutics, Inc. (a) | 469 | 77,038 | ||||||
Sangamo Therapeutics, Inc. (a) | 636 | 11,607 | ||||||
Sarepta Therapeutics, Inc. (a)(b) | 607 | 83,790 | ||||||
Schnitzer Steel Industries, Inc., Class A | 1,273 | 33,544 | ||||||
Shoe Carnival, Inc. | 779 | 34,634 | ||||||
Simpson Manufacturing Co., Inc. | 13,394 | 1,028,257 | ||||||
Spark Therapeutics, Inc. (a) | 255 | 15,711 | ||||||
Spectrum Pharmaceuticals, Inc. (a) | 652 | 14,038 | ||||||
SPS Commerce, Inc. (a) | 5,803 | 570,261 | ||||||
Stoneridge, Inc. (a) | 1,867 | 55,879 | ||||||
Strategic Education, Inc. | 145 | 20,122 | ||||||
Synovus Financial Corp. | 20,781 | 1,040,297 | ||||||
Syntel, Inc. (a) | 9,953 | 405,485 | ||||||
Teledyne Technologies, Inc. (a)(b) | 3,046 | 722,694 | ||||||
Telephone & Data Systems, Inc. | 30,182 | 906,667 | ||||||
Terex Corp. | 1,966 | 76,183 | ||||||
Terreno Realty Corp. | 3,301 | 126,791 | ||||||
Tier REIT, Inc. | 16,584 | 395,363 | ||||||
Timken Co. | 3,556 | 172,999 | ||||||
Tower International, Inc. | 11,394 | 385,117 | ||||||
TriNet Group, Inc. (a) | 3,941 | 232,795 | ||||||
Trinseo SA | 7,817 | 603,082 | ||||||
Ultragenyx Pharmaceutical, Inc. (a) | 433 | 36,688 | ||||||
United Community Financial Corp. | 111 | 1,149 | ||||||
United Natural Foods, Inc. (a) | 1,238 | 43,961 | ||||||
United States Cellular Corp. (a) | 501 | 21,423 | ||||||
Universal Forest Products, Inc. | 406 | 15,209 | ||||||
Universal Logistics Holdings, Inc. | 6,999 | 256,163 | ||||||
Urban Outfitters, Inc. (a) | 14,068 | 653,881 | ||||||
USANA Health Sciences, Inc. (a)(b) | 5,609 | 740,108 | ||||||
Vanda Pharmaceuticals, Inc. (a)(b) | 1,035 | 20,001 | ||||||
Venator Materials PLC (a) | 3,088 | 37,303 | ||||||
Versum Materials, Inc. | 5,337 | 212,359 | ||||||
Vishay Intertechnology, Inc. | 3,616 | 86,061 | ||||||
Washington Federal, Inc. | 3,055 | 104,175 | ||||||
Washington Trust Bancorp, Inc. | 138 | 8,280 | ||||||
Weingarten Realty Investors | 1,355 | 41,910 | ||||||
WellCare Health Plans, Inc. (a) | 3,877 | 1,173,064 | ||||||
Westwood Holdings Group, Inc. | 2,109 | 121,331 | ||||||
WR Grace & Co. | 12,827 | 906,356 | ||||||
Xencor, Inc. (a) | 355 | 14,835 | ||||||
Xenia Hotels & Resorts, Inc. | 5,425 | 131,610 | ||||||
Zebra Technologies Corp., Class A (a) | 3,401 | 584,088 | ||||||
|
| |||||||
| 44,832,478 | ||||||||
Total Long-Term Investments — 97.2% |
| 82,558,507 | ||||||
|
| |||||||
| Security | Shares | Value | ||||||||||
Short-Term Securities — 3.3% |
| |||||||||||
Money Market Funds — 0.4% | ||||||||||||
SL Liquidity Series, LLC, Money Market Series, 2.22% (d)(e)(f) | 344,835 | $ | 344,870 | |||||||||
|
| |||||||||||
Total Money Market Funds — 0.4% |
| 344,870 | ||||||||||
|
| |||||||||||
Par | ||||||||||||
Time Deposits — 2.9% | ||||||||||||
Australia — 0.1% | ||||||||||||
Brown Brothers Harriman & Co., 0.90%, 09/03/18 | AUD | 108 | 77,474 | |||||||||
|
| |||||||||||
Canada — 0.1% | ||||||||||||
Brown Brothers Harriman & Co., 0.59%, 09/04/18 | CAD | 87 | 66,514 | |||||||||
|
| |||||||||||
Hong Kong — 0.2% | ||||||||||||
Brown Brothers Harriman & Co., 0.57%, 09/03/18 | HKD | 1,211 | 154,302 | |||||||||
|
| |||||||||||
Japan — 0.1% | ||||||||||||
Sumitomo, Tokyo, (0.23)%, 09/03/18 | JPY | 7,986 | 71,877 | |||||||||
|
| |||||||||||
United Kingdom — 0.2% | ||||||||||||
Citibank, London, (0.57)%, 09/03/18 | EUR | 64 | 74,467 | |||||||||
Citibank, London, 0.37%, 09/03/18 | GBP | 93 | 120,453 | |||||||||
|
| |||||||||||
| 194,920 | ||||||||||||
United States — 2.2% | ||||||||||||
Deutsche Bank, 1.93%, 09/04/18 | USD | 1,911 | 1,911,454 | |||||||||
|
| |||||||||||
Total Time Deposits — 2.9% | 2,476,541 | |||||||||||
|
| |||||||||||
Total Short-Term Securities — 3.3% |
| 2,821,411 | ||||||||||
|
| |||||||||||
Total Investments — 100.5% | 85,379,918 | |||||||||||
Liabilities in Excess of Other |
| (448,919 | ) | |||||||||
|
| |||||||||||
Net Assets — 100.0% | $ | 84,930,999 | ||||||||||
|
| |||||||||||
| (a) | Non-income producing security. |
| (b) | Security, or a portion of the security, is on loan. |
| (c) | Security exempt from registration pursuant to Rule 144A under the Securities Act of 1933, as amended. These securities may be resold in transactions exempt from registration to qualified institutional investors. |
| (d) | Security was purchased with the cash collateral from loaned securities. |
| (e) | Annualized 7-day yield as of period end. |
| (f) | During the year ended August 31, 2018, investments in issuers considered to be an affiliate of the Fund for purposes of Section 2(a)(3) of the Investment Company Act of 1940, as amended, were as follows: |
| ||||||||||||||||||||||||||||
Shares Held at | Net | Shares Held at | Value at | Net Realized | Change in Unrealized Appreciation | |||||||||||||||||||||||
Affiliate | 08/31/17 | Activity | 08/31/18 | 08/31/18 | Income | Gain (Loss | ) | (Depreciation | ) | |||||||||||||||||||
| ||||||||||||||||||||||||||||
SL Liquidity Series, LLC, Money Market Series | 1,555,085 | (1,210,250 | ) | 344,835 | $ | 344,870 | $ | 5,250 | (a) | $ | (237 | ) | $ | (71 | ) | |||||||||||||
|
|
|
|
|
|
|
| |||||||||||||||||||||
| (a) | Represents securities lending income earned from the reinvestment of cash collateral from loaned securities, net of fees and collateral investment expenses, and other payments to and from borrowers of securities. |
| S C H E D U L E O F I N V E S T M E N T S | 13 |
| Schedule of Investments (continued) | Advantage Global SmallCap Fund | |
| August 31, 2018 |
Derivative Financial Instruments Outstanding as of Period End
Futures Contracts
| Description | Number of Contracts | Expiration Date | Notional Amount (000) | Value/ Unrealized Appreciation (Depreciation) | ||||||||||||
Long Contracts | ||||||||||||||||
Nikkei 225 Yen Index | 3 | 09/13/18 | $ | 308 | $ | 5,997 | ||||||||||
Euro STOXX 50 Index | 9 | 09/21/18 | 354 | (4,731 | ) | |||||||||||
FTSE 100 Index | 2 | 09/21/18 | 192 | (3,990 | ) | |||||||||||
Mini MSCI Emerging Markets Index | 5 | 09/21/18 | 264 | (8,738 | ) | |||||||||||
Russell 2000 E-Mini Index | 15 | 09/21/18 | 1,305 | 36,966 | ||||||||||||
|
| |||||||||||||||
| $ | 25,504 | |||||||||||||||
|
| |||||||||||||||
Derivative Financial Instruments Categorized by Risk Exposure
As of period end, the fair values of derivative financial instruments located in the Statements of Assets and Liabilities were as follows:
| Assets - Derivative Financial Instruments | Commodity Contracts | Credit Contracts | Equity Contracts | Foreign Currency Exchange Contracts | Interest Rate Contracts | Other Contracts | Total | |||||||||||||||||||||
Futures contracts Net unrealized appreciation(a) | $ | — | $ | — | $ | 42,963 | $ | — | $ | — | $ | — | $ | 42,963 | ||||||||||||||
|
|
|
|
|
|
|
|
|
|
|
|
|
| |||||||||||||||
Liabilities - Derivative Financial Instruments | ||||||||||||||||||||||||||||
Futures contracts Net unrealized depreciation(a) | $ | — | $ | — | $ | 17,459 | $ | — | $ | — | $ | — | $ | 17,459 | ||||||||||||||
|
|
|
|
|
|
|
|
|
|
|
|
|
| |||||||||||||||
| (a) | Includes cumulative appreciation (depreciation) on futures contracts as reported in the Schedule of Investments. Only current day’s variation margin is reported within the Statements of Assets and Liabilities. |
For the year ended August 31, 2018, the effect of derivative financial instruments in the Statements of Operations was as follows:
| Net Realized Gain (Loss) from: | Commodity Contracts | Credit Contracts | Equity Contracts | Foreign Currency Exchange Contracts | Interest Rate Contracts | Other Contracts | Total | |||||||||||||||||||||
Futures contracts | $ | — | $ | — | $ | 418,607 | $ | — | $ | — | $ | — | $ | 418,607 | ||||||||||||||
|
|
|
|
|
|
|
|
|
|
|
|
|
| |||||||||||||||
Net Change in Unrealized Appreciation (Depreciation) on: |
| |||||||||||||||||||||||||||
Futures contracts | $ | — | $ | — | $ | (8,923 | ) | $ | — | $ | — | $ | — | $ | (8,923 | ) | ||||||||||||
|
|
|
|
|
|
|
|
|
|
|
|
|
| |||||||||||||||
Average Quarterly Balances of Outstanding Derivative Financial Instruments
Futures contracts: | ||||
Average notional value of contracts - long | $ | 2,318,957 | ||
|
|
For more information about the Fund’s investment risks regarding derivative financial instruments, refer to the Notes to Financial Statements.
Fair Value Hierarchy as of Period End
Various inputs are used in determining the fair value of investments and derivative financial instruments. For information about the Fund’s policy regarding valuation of investments and derivative financial instruments, refer to the Notes to Financial Statements.
The following tables summarize the Fund’s investments and derivative financial instruments categorized in the disclosure hierarchy:
| Level 1 | Level 2 | Level 3 | Total | |||||||||||||
Assets: | ||||||||||||||||
Investments: | ||||||||||||||||
Long-Term Investments: | ||||||||||||||||
Common Stocks: | ||||||||||||||||
Australia | $ | 4,962 | $ | 1,527,127 | $ | — | $ | 1,532,089 | ||||||||
Austria | — | 496,249 | — | 496,249 | ||||||||||||
Belgium | 14,146 | 42,243 | — | 56,389 | ||||||||||||
Brazil | 1,336,854 | — | — | 1,336,854 | ||||||||||||
Canada | 2,445,075 | — | — | 2,445,075 | ||||||||||||
China | 137,014 | 1,372,848 | — | 1,509,862 | ||||||||||||
Denmark | — | 185,856 | — | 185,856 | ||||||||||||
Finland | — | 802,473 | — | 802,473 | ||||||||||||
France | — | 993,772 | — | 993,772 | ||||||||||||
Germany | — | 856,078 | — | 856,078 | ||||||||||||
Greece | 452,132 | — | — | 452,132 | ||||||||||||
| 14 | 2 0 1 8 B L A C K R O C K A N N U A L R E P O R T T O S H A R E H O L D E R S |
| Schedule of Investments (continued) | Advantage Global SmallCap Fund | |
| August 31, 2018 |
| Level 1 | Level 2 | Level 3 | Total | |||||||||||||
Hong Kong | $ | — | $ | 874,534 | $ | — | $ | 874,534 | ||||||||
Hungary | — | 167,231 | — | 167,231 | ||||||||||||
India | 8,158 | 2,284,281 | — | 2,292,439 | ||||||||||||
Indonesia | — | 96,143 | — | 96,143 | ||||||||||||
Israel | 1,120,307 | — | — | 1,120,307 | ||||||||||||
Italy | — | 25,083 | — | 25,083 | ||||||||||||
Japan | 27,324 | 7,227,072 | — | 7,254,396 | ||||||||||||
Malaysia | — | 208,206 | — | 208,206 | ||||||||||||
Malta | — | 49,118 | — | 49,118 | ||||||||||||
Mexico | 1,026,940 | — | — | 1,026,940 | ||||||||||||
Netherlands | — | 455,498 | — | 455,498 | ||||||||||||
Norway | 5,321 | 893,895 | — | 899,216 | ||||||||||||
Poland | — | 97,438 | — | 97,438 | ||||||||||||
Portugal | — | 357,055 | — | 357,055 | ||||||||||||
Russia | — | 5,380 | — | 5,380 | ||||||||||||
Singapore | — | 120,671 | — | 120,671 | ||||||||||||
South Africa | 770,303 | 107,451 | — | 877,754 | ||||||||||||
South Korea | 118,600 | 159,674 | — | 278,274 | ||||||||||||
Spain | — | 10,897 | — | 10,897 | ||||||||||||
Sweden | 20,052 | 1,816,880 | — | 1,836,932 | ||||||||||||
Switzerland | 49,916 | 381,780 | — | 431,696 | ||||||||||||
Taiwan | — | 874,059 | — | 874,059 | ||||||||||||
Thailand | — | 1,714,207 | — | 1,714,207 | ||||||||||||
Turkey | — | 891,737 | — | 891,737 | ||||||||||||
United Kingdom | 301,764 | 4,792,225 | — | 5,093,989 | ||||||||||||
United States | 44,832,478 | — | — | 44,832,478 | ||||||||||||
Short-Term Securities | — | 2,476,541 | — | 2,476,541 | ||||||||||||
|
|
|
|
|
|
|
| |||||||||
Subtotal | $ | 52,671,346 | $ | 32,363,702 | $ | — | $ | 85,035,048 | ||||||||
|
|
|
|
|
|
|
| |||||||||
Investments Valued at NAV(a) | 344,870 | |||||||||||||||
|
| |||||||||||||||
Total Investments | $ | 85,379,918 | ||||||||||||||
|
| |||||||||||||||
Derivative Financial Instruments(b) | ||||||||||||||||
Assets: | ||||||||||||||||
Equity contracts | $ | 42,963 | $ | — | $ | — | $ | 42,963 | ||||||||
Liabilities: | ||||||||||||||||
Equity contracts | (17,459 | ) | — | — | (17,459 | ) | ||||||||||
|
|
|
|
|
|
|
| |||||||||
| $ | 25,504 | $ | — | $ | — | $ | 25,504 | |||||||||
|
|
|
|
|
|
|
| |||||||||
| (a) | As of August 31, 2018, certain investments of the Fund were fair valued using NAV per share as no quoted market value is available and therefore have been excluded from the fair value hierarchy. |
| (b) | Derivative financial instruments are futures contracts, which are valued at the unrealized appreciation (depreciation) on the instrument. |
Transfers between Level 1 and Level 2 were as follows:
| Transfers Into Level 1(a) | Transfers Out of Level 1(b) | Transfers Into Level 2(b) | Transfers Out of Level 2(a) | |||||||||||||
Assets: | ||||||||||||||||
Investments: | ||||||||||||||||
Long-Term Investments: | ||||||||||||||||
Common Stocks: | ||||||||||||||||
Belgium | $ | 12,559 | $ | — | $ | — | $ | (12,559 | ) | |||||||
China | 26,033 | — | — | (26,033 | ) | |||||||||||
Finland | — | (39,139 | ) | 39,139 | — | |||||||||||
France | — | (27,474 | ) | 27,474 | — | |||||||||||
Greece | 508,338 | — | — | (508,338 | ) | |||||||||||
Malaysia | — | (87,513 | ) | 87,513 | — | |||||||||||
Netherlands | — | (6,410 | ) | 6,410 | — | |||||||||||
South Korea | — | (5,529 | ) | 5,529 | — | |||||||||||
Sweden | — | (55,035 | ) | 55,035 | ||||||||||||
Switzerland | — | (23,487 | ) | 23,487 | — | |||||||||||
United Kingdom | 34,792 | (1,500,772 | ) | 1,500,772 | (34,792 | ) | ||||||||||
|
|
|
|
|
|
|
| |||||||||
| $ | 581,722 | $ | (1,745,359 | ) | $ | 1,745,359 | $ | (581,722 | ) | |||||||
|
|
|
|
|
|
|
| |||||||||
| (a) | Systematic Fair Value Prices were not utilized at period end for these investments. |
| (b) | External pricing service used to reflect any significant market movements between the time the Fund valued such foreign securities and the earlier closing of foreign markets. |
| S C H E D U L E O F I N V E S T M E N T S | 15 |
| Schedule of Investments | Mid Cap Dividend Fund | |
| August 31, 2018 | (Percentages shown are based on Net Assets) |
Security | Shares | Value | ||||||
Common Stocks — 97.2% | ||||||||
Auto Components — 0.7% | ||||||||
Adient PLC | 7,973 | $ | 345,151 | |||||
Magna International, Inc. | 4,455 | 241,105 | ||||||
|
| |||||||
| 586,256 | ||||||||
Automobiles — 0.4% | ||||||||
Ford Motor Co. | 34,390 | 326,017 | ||||||
|
| |||||||
Banks — 8.6% | ||||||||
KeyCorp | 78,530 | 1,654,627 | ||||||
Popular, Inc. | 27,566 | 1,387,672 | ||||||
Regions Financial Corp. | 101,571 | 1,976,572 | ||||||
SunTrust Banks, Inc. | 25,977 | 1,910,868 | ||||||
|
| |||||||
| 6,929,739 | ||||||||
Beverages — 0.4% | ||||||||
Keurig Dr. Pepper, Inc. | 4,408 | 100,502 | ||||||
Molson Coors Brewing Co., Class B | 2,890 | 192,879 | ||||||
|
| |||||||
| 293,381 | ||||||||
Building Products — 1.6% | ||||||||
Johnson Controls International PLC | 16,310 | 616,029 | ||||||
Owens Corning | 12,502 | 707,863 | ||||||
|
| |||||||
| 1,323,892 | ||||||||
Capital Markets — 1.3% | ||||||||
Blackstone Group LP | 15,520 | 572,843 | ||||||
Raymond James Financial, Inc. | 4,790 | 445,662 | ||||||
|
| |||||||
| 1,018,505 | ||||||||
Chemicals — 2.2% | ||||||||
Cabot Corp. | 6,840 | 444,053 | ||||||
Eastman Chemical Co. | 8,862 | 859,880 | ||||||
Huntsman Corp. | 15,718 | 479,242 | ||||||
|
| |||||||
| 1,783,175 | ||||||||
Commercial Services & Supplies — 0.8% |
| |||||||
KAR Auction Services, Inc. | 9,860 | 618,123 | ||||||
|
| |||||||
Communications Equipment — 1.2% | ||||||||
Motorola Solutions, Inc. | 5,086 | 652,839 | ||||||
Telefonaktiebolaget LM Ericsson, Class B | 39,610 | 334,221 | ||||||
|
| |||||||
| 987,060 | ||||||||
Construction Materials — 0.6% | ||||||||
CRH PLC | 15,252 | 506,678 | ||||||
|
| |||||||
Containers & Packaging — 2.1% | ||||||||
International Paper Co. | 9,940 | 508,332 | ||||||
Packaging Corp. of America | 3,473 | 381,752 | ||||||
WestRock Co. | 14,935 | 822,620 | ||||||
|
| |||||||
| 1,712,704 | ||||||||
Diversified Consumer Services — 0.5% |
| |||||||
H&R Block, Inc. | 14,770 | 399,676 | ||||||
|
| |||||||
Diversified Financial Services — 1.6% |
| |||||||
AXA Equitable Holdings, Inc. | 11,470 | 263,237 | ||||||
Jefferies Financial Group, Inc. | 43,095 | 1,000,666 | ||||||
|
| |||||||
| 1,263,903 | ||||||||
Diversified Telecommunication Services — 0.4% |
| |||||||
BCE, Inc. | 8,084 | 329,585 | ||||||
|
| |||||||
Electric Utilities — 7.0% | ||||||||
Edison International | 18,981 | 1,247,621 | ||||||
Entergy Corp. | 9,285 | 776,133 | ||||||
Security | Shares | Value | ||||||
Electric Utilities (continued) | ||||||||
Evergy, Inc. | 15,972 | $ | 911,203 | |||||
FirstEnergy Corp. | 49,465 | 1,849,002 | ||||||
PG&E Corp. | 18,360 | 847,865 | ||||||
|
| |||||||
| 5,631,824 | ||||||||
Electrical Equipment — 1.1% | ||||||||
Hubbell, Inc. | 4,650 | 587,574 | ||||||
nVent Electric PLC | 11,181 | 314,074 | ||||||
|
| |||||||
| 901,648 | ||||||||
Electronic Equipment, Instruments & Components — 5.4% |
| |||||||
Avnet, Inc. | 26,639 | 1,289,328 | ||||||
CDW Corp. | 24,777 | 2,169,474 | ||||||
Dolby Laboratories, Inc., Class A | 6,920 | 485,715 | ||||||
TE Connectivity Ltd. | 4,460 | 408,893 | ||||||
|
| |||||||
| 4,353,410 | ||||||||
Energy Equipment & Services — 0.7% | ||||||||
Baker Hughes a GE Co. | 6,877 | 226,735 | ||||||
Halliburton Co. | 8,560 | 341,458 | ||||||
|
| |||||||
| 568,193 | ||||||||
Equity Real Estate Investment Trusts (REITs) — 5.8% |
| |||||||
Crown Castle International Corp. | 6,664 | 759,896 | ||||||
Duke Realty Corp. | 12,819 | 365,213 | ||||||
Lamar Advertising Co., Class A | 20,470 | 1,577,214 | ||||||
Prologis, Inc. | 20,601 | 1,383,975 | ||||||
Rayonier, Inc. (a) | 8,904 | 310,126 | ||||||
Welltower, Inc. (a) | 3,613 | 241,023 | ||||||
|
| |||||||
| 4,637,447 | ||||||||
Food & Staples Retailing — 0.4% | ||||||||
Kroger Co. | 11,020 | 347,130 | ||||||
|
| |||||||
Food Products — 2.3% | ||||||||
Bunge Ltd. | 9,030 | 586,769 | ||||||
Danone SA | 5,070 | 399,263 | ||||||
Ingredion, Inc. | 4,945 | 499,791 | ||||||
Kellogg Co. | 5,442 | 390,681 | ||||||
|
| |||||||
| 1,876,504 | ||||||||
Health Care Equipment & Supplies — 4.0% |
| |||||||
Koninklijke Philips NV | 28,071 | 1,254,276 | ||||||
Smith & Nephew PLC - ADR | 23,073 | 826,706 | ||||||
Zimmer Biomet Holdings, Inc. | 9,128 | 1,128,495 | ||||||
|
| |||||||
| 3,209,477 | ||||||||
Health Care Providers & Services — 5.9% |
| |||||||
AmerisourceBergen Corp. | 2,470 | 222,226 | ||||||
Cardinal Health, Inc. | 8,828 | 460,733 | ||||||
Cigna Corp. | 3,392 | 638,849 | ||||||
Express Scripts Holding Co. (b) | 8,027 | 706,537 | ||||||
Humana, Inc. | 4,249 | 1,416,022 | ||||||
Laboratory Corp. of America Holdings (b) | 2,150 | 371,671 | ||||||
McKesson Corp. | 3,725 | 479,594 | ||||||
Quest Diagnostics, Inc. | 4,146 | 455,977 | ||||||
|
| |||||||
| 4,751,609 | ||||||||
Household Durables — 1.2% | ||||||||
Newell Brands, Inc. | 32,560 | 707,203 | ||||||
Whirlpool Corp. | 2,244 | 280,455 | ||||||
|
| |||||||
| 987,658 | ||||||||
Household Products — 0.9% | ||||||||
Energizer Holdings, Inc. | 11,094 | 705,467 | ||||||
|
| |||||||
| 16 | 2 0 1 8 B L A C K R O C K A N N U A L R E P O R T T O S H A R E H O L D E R S |
| Schedule of Investments (continued) | Mid Cap Dividend Fund | |
| August 31, 2018 | (Percentages shown are based on Net Assets) |
| Security | Shares | Value | ||||||
Independent Power and Renewable Electricity Producers — 0.6% |
| |||||||
AES Corp. | 37,135 | $ | 499,837 | |||||
|
| |||||||
Insurance — 11.3% |
| |||||||
Allstate Corp. | 5,541 | 557,258 | ||||||
Arthur J Gallagher & Co. | 17,139 | 1,236,407 | ||||||
Assurant, Inc. | 10,379 | 1,067,169 | ||||||
Assured Guaranty Ltd. | 29,279 | 1,192,826 | ||||||
Brighthouse Financial, Inc. (a)(b) | 52,377 | 2,174,169 | ||||||
Everest Re Group Ltd. | 1,344 | 299,739 | ||||||
Hartford Financial Services Group, Inc. | 12,828 | 646,146 | ||||||
Marsh & McLennan Cos., Inc. | 6,810 | 576,330 | ||||||
MetLife, Inc. | 16,962 | 778,386 | ||||||
Travelers Cos., Inc. | 1,330 | 175,028 | ||||||
White Mountains Insurance Group Ltd. | 470 | 436,137 | ||||||
|
| |||||||
| 9,139,595 | ||||||||
IT Services — 1.9% |
| |||||||
Cognizant Technology Solutions Corp., Class A | 9,276 | 727,517 | ||||||
Fidelity National Information Services, Inc. | 7,698 | 832,693 | ||||||
|
| |||||||
| 1,560,210 | ||||||||
Leisure Products — 1.1% |
| |||||||
Mattel, Inc. | 22,482 | 346,897 | ||||||
Polaris Industries, Inc. | 4,660 | 505,377 | ||||||
|
| |||||||
| 852,274 | ||||||||
Machinery — 2.6% |
| |||||||
Allison Transmission Holdings, Inc. | 27,560 | 1,368,630 | ||||||
Pentair PLC | 11,061 | 480,932 | ||||||
Stanley Black & Decker, Inc. | 1,525 | 214,308 | ||||||
|
| |||||||
| 2,063,870 | ||||||||
Media — 1.4% |
| |||||||
Discovery, Inc., Class C (b) | 15,548 | 398,651 | ||||||
Interpublic Group of Cos., Inc. | 30,140 | 703,769 | ||||||
|
| |||||||
| 1,102,420 | ||||||||
Metals & Mining — 0.6% |
| |||||||
Nucor Corp. | 8,013 | 500,813 | ||||||
|
| |||||||
Multiline Retail — 0.8% |
| |||||||
Dollar General Corp. | 5,967 | 642,825 | ||||||
|
| |||||||
Multi-Utilities — 1.1% |
| |||||||
Public Service Enterprise Group, Inc. | 16,418 | 859,482 | ||||||
|
| |||||||
Oil, Gas & Consumable Fuels — 7.5% |
| |||||||
Devon Energy Corp. | 23,152 | 993,915 | ||||||
Hess Corp. | 24,103 | 1,623,096 | ||||||
Marathon Oil Corp. | 41,182 | 885,825 | ||||||
Marathon Petroleum Corp. | 11,712 | 963,780 | ||||||
Valero Energy Corp. | �� | 4,210 | 496,275 | |||||
Williams Cos., Inc. | 37,068 | 1,096,842 | ||||||
|
| |||||||
| 6,059,733 | ||||||||
Personal Products — 0.7% |
| |||||||
Nu Skin Enterprises, Inc., Class A | 6,557 | 521,937 | ||||||
|
| |||||||
Pharmaceuticals — 0.8% |
| |||||||
Mylan NV (b) | 15,570 | 609,254 | ||||||
|
| |||||||
Professional Services — 1.5% |
| |||||||
Experian PLC | 23,493 | 585,056 | ||||||
Nielsen Holdings PLC | 23,916 | 621,816 | ||||||
|
| |||||||
| 1,206,872 | ||||||||
Real Estate Management & Development — 0.5% |
| |||||||
Realogy Holdings Corp. | 19,127 | 409,127 | ||||||
|
| |||||||
Road & Rail — 0.6% |
| |||||||
Norfolk Southern Corp. | 2,874 | 499,616 | ||||||
|
| |||||||
| Security | Shares | Value | ||||||||||
Semiconductors & Semiconductor Equipment — 0.4% |
| |||||||||||
Xilinx, Inc. | 4,277 | $ | 332,879 | |||||||||
|
| |||||||||||
Software — 2.3% | ||||||||||||
Constellation Software, Inc. | 1,458 | 1,111,756 | ||||||||||
Dell Technologies, Inc., Class V (b) | 7,680 | 738,586 | ||||||||||
|
| |||||||||||
| 1,850,342 | ||||||||||||
Specialty Retail — 1.0% | ||||||||||||
Signet Jewelers Ltd. | 3,440 | 220,848 | ||||||||||
Williams-Sonoma, Inc. | 8,306 | 583,330 | ||||||||||
|
| |||||||||||
| 804,178 | ||||||||||||
Technology Hardware, Storage & Peripherals — 1.2% |
| |||||||||||
HP, Inc. | 17,970 | 442,961 | ||||||||||
NetApp, Inc. | 5,879 | 510,356 | ||||||||||
|
| |||||||||||
| 953,317 | ||||||||||||
Wireless Telecommunication Services — 2.2% |
| |||||||||||
Telephone & Data Systems, Inc. | 59,061 | 1,774,192 | ||||||||||
|
| |||||||||||
Total Long-Term Investments — 97.2% |
| 78,291,834 | ||||||||||
|
| |||||||||||
Short-Term Securities — 3.6% |
| |||||||||||
Money Market Funds — 0.8% |
| |||||||||||
SL Liquidity Series, LLC, Money Market Series, 2.22% (c)(d)(e) | 667,945 | 668,012 | ||||||||||
|
| |||||||||||
Total Money Market Funds — 0.8% |
| 668,012 | ||||||||||
|
| |||||||||||
Par (000) | ||||||||||||
Time Deposits — 2.8% | ||||||||||||
United States — 2.8% | ||||||||||||
JPMorgan Chase Bank N.A., 1.93%, 09/04/18 | USD | 2,244 | 2,244,304 | |||||||||
|
| |||||||||||
Total Time Deposits — 2.8% |
| 2,244,304 | ||||||||||
|
| |||||||||||
Total Short-Term Securities — 3.6% |
| 2,912,316 | ||||||||||
|
| |||||||||||
Total Investments — 100.8% |
| 81,204,150 | ||||||||||
Liabilities in Excess of Other Assets — (0.8)% |
| (656,269 | ) | |||||||||
|
| |||||||||||
Net Assets — 100.0% |
| $ | 80,547,881 | |||||||||
|
| |||||||||||
| S C H E D U L E O F I N V E S T M E N T S | 17 |
| Schedule of Investments (continued) | Mid Cap Dividend Fund | |
| August 31, 2018 |
| (a) | Security, or a portion of the security, is on loan. |
| (b) | Non-income producing security. |
| (c) | Security was purchased with the cash collateral from loaned securities. |
| (d) | Annualized 7-day yield as of period end. |
| (e) | During the year ended August 31, 2018, investments in issuers considered to be an affiliate of the Fund for purposes of Section 2(a)(3) of the Investment Company Act of 1940, as amended, were as follows: |
| ||||||||||||||||||||||||||||
| Shares Held at | Net | Shares Held at | Value at | Net Realized | Change in Unrealized Appreciation | |||||||||||||||||||||||
Affiliate | 08/31/17 | Activity | 08/31/18 | 08/31/18 | Income | Gain (Loss | ) | (Depreciation | ) | |||||||||||||||||||
| ||||||||||||||||||||||||||||
SL Liquidity Series, LLC, Money Market Series | 213,813 | 454,132 | 667,945 | $ | 668,012 | $ | 2,013 | (a) | $ | (639 | ) | $ | (65 | ) | ||||||||||||||
|
|
|
|
|
|
|
| |||||||||||||||||||||
| (a) | Represents securities lending income earned from the reinvestment of cash collateral from loaned securities, net of fees and collateral investment expenses, and other payments to and from borrowers of securities. |
For Fund compliance purposes, the Fund’s industry classifications refer to one or more of the industry sub-classifications used by one or more widely recognized market indexes or rating group indexes, and/or as defined by the investment adviser. These definitions may not apply for purposes of this report, which may combine such industry sub-classifications for reporting ease.
Fair Value Hierarchy as of Period End
Various inputs are used in determining the fair value of investments. For information about the Fund’s policy regarding valuation of investments, refer to the Notes to Financial Statements.
The following table summarizes the Fund’s investments categorized in the disclosure hierarchy:
| Level 1 | Level 2 | Level 3 | Total | |||||||||||||
Assets: | ||||||||||||||||
Investments: | ||||||||||||||||
Long-Term Investments: | ||||||||||||||||
Common Stocks: | ||||||||||||||||
Auto Components | $ | 586,256 | $ | — | $ | — | $ | 586,256 | ||||||||
Automobiles | 326,017 | — | — | 326,017 | ||||||||||||
Banks | 6,929,739 | — | — | 6,929,739 | ||||||||||||
Beverages | 293,381 | — | — | 293,381 | ||||||||||||
Building Products | 1,323,892 | — | — | 1,323,892 | ||||||||||||
Capital Markets | 1,018,505 | — | — | 1,018,505 | ||||||||||||
Chemicals | 1,783,175 | — | — | 1,783,175 | ||||||||||||
Commercial Services & Supplies | 618,123 | — | — | 618,123 | ||||||||||||
Communications Equipment | 652,839 | 334,221 | — | 987,060 | ||||||||||||
Construction Materials | — | 506,678 | — | 506,678 | ||||||||||||
Containers & Packaging | 1,712,704 | — | — | 1,712,704 | ||||||||||||
Diversified Consumer Services | 399,676 | — | — | 399,676 | ||||||||||||
Diversified Financial Services | 1,263,903 | — | — | 1,263,903 | ||||||||||||
Diversified Telecommunication Services | 329,585 | — | — | 329,585 | ||||||||||||
Electric Utilities | 5,631,824 | — | — | 5,631,824 | ||||||||||||
Electrical Equipment | 901,648 | — | — | 901,648 | ||||||||||||
Electronic Equipment, Instruments & Components | 4,353,410 | — | — | 4,353,410 | ||||||||||||
Energy Equipment & Services | 568,193 | — | — | 568,193 | ||||||||||||
Equity Real Estate Investment Trusts (REITs) | 4,637,447 | — | — | 4,637,447 | ||||||||||||
Food & Staples Retailing | 347,130 | — | — | 347,130 | ||||||||||||
Food Products | 1,477,241 | 399,263 | — | 1,876,504 | ||||||||||||
Health Care Equipment & Supplies | 1,955,201 | 1,254,276 | — | 3,209,477 | ||||||||||||
Health Care Providers & Services | 4,751,609 | — | — | 4,751,609 | ||||||||||||
Household Durables | 987,658 | — | — | 987,658 | ||||||||||||
Household Products | 705,467 | — | — | 705,467 | ||||||||||||
Independent Power and Renewable Electricity Producers | 499,837 | — | — | 499,837 | ||||||||||||
Insurance | 9,139,595 | — | — | 9,139,595 | ||||||||||||
IT Services | 1,560,210 | — | — | 1,560,210 | ||||||||||||
Leisure Products | 852,274 | — | — | 852,274 | ||||||||||||
Machinery | 2,063,870 | — | — | 2,063,870 | ||||||||||||
Media | 1,102,420 | — | — | 1,102,420 | ||||||||||||
Metals & Mining | 500,813 | — | — | 500,813 | ||||||||||||
Multiline Retail | 642,825 | — | — | 642,825 | ||||||||||||
Multi-Utilities | 859,482 | — | — | 859,482 | ||||||||||||
Oil, Gas & Consumable Fuels | 6,059,733 | — | — | 6,059,733 | ||||||||||||
Personal Products | 521,937 | — | — | 521,937 | ||||||||||||
Pharmaceuticals | 609,254 | — | — | 609,254 | ||||||||||||
Professional Services | 621,816 | 585,056 | — | 1,206,872 | ||||||||||||
| 18 | 2 0 1 8 B L A C K R O C K A N N U A L R E P O R T T O S H A R E H O L D E R S |
| Schedule of Investments (continued) | Mid Cap Dividend Fund | |
| August 31, 2018 |
| Level 1 | Level 2 | Level 3 | Total | |||||||||||||
Real Estate Management & Development | $ | 409,127 | $ | — | $ | — | $ | 409,127 | ||||||||
Road & Rail | 499,616 | — | — | 499,616 | ||||||||||||
Semiconductors & Semiconductor Equipment | 332,879 | — | — | 332,879 | ||||||||||||
Software | 1,850,342 | — | — | 1,850,342 | ||||||||||||
Specialty Retail | 804,178 | — | — | 804,178 | ||||||||||||
Technology Hardware, Storage & Peripherals | 953,317 | — | — | 953,317 | ||||||||||||
Wireless Telecommunication Services | 1,774,192 | — | — | 1,774,192 | ||||||||||||
Short-Term Securities | — | 2,244,304 | — | 2,244,304 | ||||||||||||
|
|
|
|
|
|
|
| |||||||||
Subtotal | $ | 75,212,340 | $ | 5,323,798 | $ | — | $ | 80,536,138 | ||||||||
|
|
|
|
|
|
|
| |||||||||
Investments Valued at NAV(a) | 668,012 | |||||||||||||||
|
| |||||||||||||||
Total Investments | $ | 81,204,150 | ||||||||||||||
|
| |||||||||||||||
| (a) | As of August 31, 2018, certain investments of the Fund were fair valued using NAV per share as no quoted market value is available and therefore have been excluded from the fair value hierarchy. |
During the year ended August 31, 2018, there were no transfers between levels.
| S C H E D U L E O F I N V E S T M E N T S | 19 |
| Statements of Assets and Liabilities | ||
| August 31, 2018 |
Advantage Global SmallCap Fund | Mid Cap Dividend Fund | |||||||
ASSETS | ||||||||
Investments at value — unaffiliated(a)(b) | $ | 85,035,048 | $ | 80,536,138 | ||||
Investments at value — affiliated(c) | 344,870 | 668,012 | ||||||
Cash pledged for futures contracts | 114,000 | — | ||||||
Foreign currency at value(d) | 31,861 | — | ||||||
Receivables: | ||||||||
Investments sold | 362,719 | — | ||||||
Securities lending income — affiliated | 161 | 61 | ||||||
Capital shares sold | 1,408 | 1,412 | ||||||
Dividends — unaffiliated | 125,639 | 167,421 | ||||||
From the Manager | 93,136 | 24,980 | ||||||
Variation margin on futures contracts | 6,973 | — | ||||||
Prepaid expenses | 16,259 | 15,849 | ||||||
|
|
|
| |||||
Total assets | 86,132,074 | 81,413,873 | ||||||
|
|
|
| |||||
LIABILITIES | ||||||||
Cash collateral on securities loaned at value | 343,294 | 668,674 | ||||||
Payables: | ||||||||
Investments purchased | 367,961 | — | ||||||
Board realignment and consolidation | 840 | 836 | ||||||
Capital shares redeemed | 154,660 | 84,990 | ||||||
Custodian fees | 89,341 | 14,338 | ||||||
Deferred foreign capital gain tax | 70,383 | — | ||||||
Other accrued expenses | 105,478 | 44,338 | ||||||
Other affiliates | 459 | 396 | ||||||
Professional fees | 57,258 | 47,499 | ||||||
Trustees’ and Officer’s fees | 4,953 | 4,921 | ||||||
Variation margin on futures contracts | 6,448 | — | ||||||
|
|
|
| |||||
Total liabilities | 1,201,075 | 865,992 | ||||||
|
|
|
| |||||
NET ASSETS | $ | 84,930,999 | $ | 80,547,881 | ||||
|
|
|
| |||||
NET ASSETS CONSIST OF | ||||||||
Paid-in capital | $ | 72,178,692 | $ | 70,011,415 | ||||
Undistributed net investment income | 876,896 | 332,515 | ||||||
Undistributed net realized gain | 4,073,602 | 2,751,702 | ||||||
Net unrealized appreciation (depreciation) | 7,801,809 | 7,452,249 | ||||||
|
|
|
| |||||
NET ASSETS | $ | 84,930,999 | $ | 80,547,881 | ||||
|
|
|
| |||||
Net asset value per share | $ | 14.05 | $ | 12.98 | ||||
|
|
|
| |||||
Shares outstanding(e) | 6,043,240 | 6,206,234 | ||||||
(a) Investments at cost — unaffiliated | $ | 77,185,345 | $ | 73,083,833 | ||||
(b) Securities loaned at value | $ | 329,147 | $ | 656,282 | ||||
(c) Investments at cost — affiliated | $ | 344,836 | $ | 668,077 | ||||
(d) Foreign currency at cost | $ | 31,994 | $ | — | ||||
(e) Unlimited number of shares authorized, $0.01 par value | ||||||||
See notes to financial statements.
| 20 | 2 0 1 8 B L A C K R O C K A N N U A L R E P O R T T O S H A R E H O L D E R S |
| Statements of Operations | ||
| Year Ended August 31, 2018 |
Advantage Global SmallCap Fund | Mid Cap Dividend Fund | |||||||
INVESTMENT INCOME | ||||||||
Interest — unaffiliated | $ | 5,060 | $ | 3,468 | ||||
Dividends — unaffiliated | 2,232,782 | 1,922,376 | ||||||
Securities lending income — affiliated — net | 5,250 | 2,013 | ||||||
Foreign taxes withheld | (127,638 | ) | (9,719 | ) | ||||
|
|
|
| |||||
Total investment income | 2,115,454 | 1,918,138 | ||||||
|
|
|
| |||||
EXPENSES | ||||||||
Investment advisory | 771,670 | 541,465 | ||||||
Custodian | 209,147 | 23,288 | ||||||
Professional | 68,677 | 62,237 | ||||||
Accounting services | 34,957 | 33,769 | ||||||
Transfer agent | 30,957 | 30,375 | ||||||
Registration | 29,165 | 32,143 | ||||||
Trustees and Officer | 17,880 | 17,756 | ||||||
Printing | 42,829 | 37,456 | ||||||
Board realignment and consolidation | 840 | 836 | ||||||
Miscellaneous | 92,261 | 10,568 | ||||||
|
|
|
| |||||
Total expenses excluding tax expenses | 1,298,383 | 789,893 | ||||||
Tax Expenses | 10,763 | 86 | ||||||
|
|
|
| |||||
Total expenses | 1,309,146 | 789,979 | ||||||
Less fees waived and/or reimbursed by the Manager | (1,297,543 | ) | (789,057 | ) | ||||
|
|
|
| |||||
Total expenses after fees waived and/or reimbursed | 11,603 | 922 | ||||||
|
|
|
| |||||
Net investment income | 2,103,851 | 1,917,216 | ||||||
|
|
|
| |||||
REALIZED AND UNREALIZED GAIN (LOSS) | ||||||||
Net realized gain (loss) from: | ||||||||
Investments — affiliated | (237 | ) | (639 | ) | ||||
Investments — unaffiliated | 5,598,680 | 3,615,656 | ||||||
Futures contracts | 418,607 | — | ||||||
Foreign currency transactions | (53,335 | ) | (4,963 | ) | ||||
|
|
|
| |||||
| 5,963,715 | 3,610,054 | |||||||
|
|
|
| |||||
Net change in unrealized appreciation (depreciation) on: | ||||||||
Investments — affiliated | (71 | ) | (65 | ) | ||||
Investments — unaffiliated | 4,733,888 | (a) | 8,442,821 | |||||
Futures contracts | (8,923 | ) | — | |||||
Foreign currency translations | (7,150 | ) | 844 | |||||
|
|
|
| |||||
| 4,717,744 | 8,443,600 | |||||||
|
|
|
| |||||
Net realized and unrealized gain | 10,681,459 | 12,053,654 | ||||||
|
|
|
| |||||
NET INCREASE IN NET ASSETS RESULTING FROM OPERATIONS | $ | 12,785,310 | $ | 13,970,870 | ||||
|
|
|
| |||||
(a) Net of $(70,383) foreign capital gain tax. | ||||||||
See notes to financial statements.
| F I N A N C I A L S T A T E M E N T S | 21 |
| Statements of Changes in Net Assets | ||
| Advantage Global SmallCap Fund | ||||||||||||
| | Year Ended 08/31/2018 | | | Period from 05/01/2017 to 08/31/2017 | | | Year Ended 04/30/2017 | | ||||
| ||||||||||||
INCREASE (DECREASE) IN NET ASSETS | ||||||||||||
OPERATIONS | ||||||||||||
Net investment income | $ | 2,103,851 | $ | 1,145,692 | $ | 1,893,785 | ||||||
Net realized gain | 5,963,715 | 21,217,322 | 9,214,045 | |||||||||
Net change in unrealized appreciation (depreciation) | 4,717,744 | (16,045,021 | ) | 7,362,154 | ||||||||
|
|
|
|
|
| |||||||
Net increase in net assets resulting from operations | 12,785,310 | 6,317,993 | 18,469,984 | |||||||||
|
|
|
|
|
| |||||||
DISTRIBUTIONS TO SHAREHOLDERS(a) | ||||||||||||
From net investment income | (3,000,001 | ) | (1,177,618 | ) | (2,437,012 | ) | ||||||
From net realized gain | (1,728,555 | ) | (13,847,318 | ) | — | |||||||
|
|
|
|
|
| |||||||
Decrease in net assets resulting from distributions to shareholders | (4,728,556 | ) | (15,024,936 | ) | (2,437,012 | ) | ||||||
|
|
|
|
|
| |||||||
CAPITAL SHARE TRANSACTIONS | ||||||||||||
Net decrease in net assets derived from capital share transactions | (27,913,586 | ) | (2,673,314 | ) | (12,893,692 | ) | ||||||
|
|
|
|
|
| |||||||
NET ASSETS | ||||||||||||
Total increase (decrease) in net assets | (19,856,832 | ) | (11,380,257 | ) | 3,139,280 | |||||||
Beginning of period | 104,787,831 | 116,168,088 | 113,028,808 | |||||||||
|
|
|
|
|
| |||||||
End of period | $ | 84,930,999 | $ | 104,787,831 | $ | 116,168,088 | ||||||
|
|
|
|
|
| |||||||
Undistributed net investment income, end of period | $ | 876,896 | $ | 1,581,098 | $ | 95,120 | ||||||
|
|
|
|
|
| |||||||
(a) Distributions for annual periods determined in accordance with U.S. federal income tax regulations.
See notes to financial statements.
| 22 | 2 0 1 8 B L A C K R O C K A N N U A L R E P O R T T O S H A R E H O L D E R S |
| Statements of Changes in Net Assets (continued) | ||
| Mid Cap Dividend Fund | ||||||||||||
| | Year Ended 08/31/2018 | | | Period from 05/01/2017 to 08/31/2017 | | | Year Ended 04/30/2017 | | ||||
| ||||||||||||
INCREASE (DECREASE) IN NET ASSETS | ||||||||||||
OPERATIONS | ||||||||||||
Net investment income | $ | 1,917,216 | $ | 831,555 | $ | 1,639,296 | ||||||
Net realized gain | 3,610,054 | 13,481,797 | 13,472,093 | |||||||||
Net change in unrealized appreciation (depreciation) | 8,443,600 | (15,121,935 | ) | 4,081,191 | ||||||||
|
|
|
|
|
| |||||||
Net increase (decrease) in net assets resulting from operations | 13,970,870 | (808,583 | ) | 19,192,580 | ||||||||
|
|
|
|
|
| |||||||
DISTRIBUTIONS TO SHAREHOLDERS(a) | ||||||||||||
From net investment income | (2,495,024 | ) | (415,891 | ) | (1,658,252 | ) | ||||||
From net realized gain | (73,145 | ) | (18,277,021 | ) | (137,079 | ) | ||||||
|
|
|
|
|
| |||||||
Decrease in net assets resulting from distributions to shareholders | (2,568,169 | ) | (18,692,912 | ) | (1,795,331 | ) | ||||||
|
|
|
|
|
| |||||||
CAPITAL SHARE TRANSACTIONS | ||||||||||||
Net increase (decrease) in net assets derived from capital share transactions | (23,463,105 | ) | 5,515,388 | (12,306,072 | ) | |||||||
|
|
|
|
|
| |||||||
NET ASSETS | ||||||||||||
Total increase (decrease) in net assets | (12,060,404 | ) | (13,986,107 | ) | 5,091,177 | |||||||
Beginning of period | 92,608,285 | 106,594,392 | 101,503,215 | |||||||||
|
|
|
|
|
| |||||||
End of period | $ | 80,547,881 | $ | 92,608,285 | $ | 106,594,392 | ||||||
|
|
|
|
|
| |||||||
Undistributed net investment income, end of period | $ | 332,515 | $ | 894,028 | $ | 387,072 | ||||||
|
|
|
|
|
| |||||||
(a) Distributions for annual periods determined in accordance with U.S. federal income tax regulations.
See notes to financial statements.
| F I N A N C I A L S T A T E M E N T S | 23 |
| Financial Highlights | ||
| (For a share outstanding throughout each period) |
Advantage Global SmallCap Fund | ||||||||||||||||||||||||
| Year Ended | | Period from 05/01/2017 to | | Year Ended April 30, | ||||||||||||||||||||
| 08/31/2018 | 08/31/2017 | 2017 | 2016 | 2015 | 2014 | |||||||||||||||||||
| ||||||||||||||||||||||||
Net asset value, beginning of period | $ | 12.88 | $ | 14.16 | $ | 12.32 | $ | 14.49 | $ | 16.29 | $ | 14.09 | ||||||||||||
|
|
|
|
|
|
|
|
|
|
|
| |||||||||||||
Net investment income(a) | 0.31 | 0.14 | 0.22 | 0.15 | 0.22 | 0.21 | ||||||||||||||||||
Net realized and unrealized gain (loss) | 1.49 | 0.64 | 1.90 | (1.53 | ) | 0.40 | 3.58 | |||||||||||||||||
|
|
|
|
|
|
|
|
|
|
|
| |||||||||||||
Net increase (decrease) from investment operations | 1.80 | 0.78 | 2.12 | (1.38 | ) | 0.62 | 3.79 | |||||||||||||||||
|
|
|
|
|
|
|
|
|
|
|
| |||||||||||||
Distributions(b) | ||||||||||||||||||||||||
From net investment income | (0.40 | ) | (0.16 | ) | (0.28 | ) | (0.21 | ) | (0.03 | ) | (0.39 | ) | ||||||||||||
From net realized gain | (0.23 | ) | (1.90 | ) | — | (0.58 | ) | (2.39 | ) | (1.20 | ) | |||||||||||||
|
|
|
|
|
|
|
|
|
|
|
| |||||||||||||
Total distributions | (0.63 | ) | (2.06 | ) | (0.28 | ) | (0.79 | ) | (2.42 | ) | (1.59 | ) | ||||||||||||
|
|
|
|
|
|
|
|
|
|
|
| |||||||||||||
Net asset value, end of period | $ | 14.05 | $ | 12.88 | $ | 14.16 | $ | 12.32 | $ | 14.49 | $ | 16.29 | ||||||||||||
|
|
|
|
|
|
|
|
|
|
|
| |||||||||||||
Total Return(c) | ||||||||||||||||||||||||
Based on net asset value | 14.38 | % | 5.43 | %(d) | 17.33 | %(e) | (9.86 | )% | 4.48 | % | 27.71 | % | ||||||||||||
|
|
|
|
|
|
|
|
|
|
|
| |||||||||||||
Ratios to Average Net Assets | ||||||||||||||||||||||||
Total expenses | 1.44 | % | 1.24 | %(f)(g) | 1.18 | % | 1.14 | % | 1.07 | % | 1.08 | % | ||||||||||||
|
|
|
|
|
|
|
|
|
|
|
| |||||||||||||
Total expenses after fees waived and/or reimbursed | 0.01 | % | 0.00 | %(f) | 0.00 | % | 0.00 | % | 0.00 | % | 0.00 | % | ||||||||||||
|
|
|
|
|
|
|
|
|
|
|
| |||||||||||||
Total expenses after fees waived and/or reimbursed and excluding excise tax | 0.00 | % | 0.00 | %(f) | 0.00 | % | 0.00 | % | 0.00 | % | 0.00 | % | ||||||||||||
|
|
|
|
|
|
|
|
|
|
|
| |||||||||||||
Net investment income | 2.32 | % | 3.09 | %(f) | 1.65 | % | 1.17 | % | 1.46 | % | 1.35 | % | ||||||||||||
|
|
|
|
|
|
|
|
|
|
|
| |||||||||||||
Supplemental Data | ||||||||||||||||||||||||
Net assets, end of period (000) | $ | 84,931 | $ | 104,788 | $ | 116,168 | $ | 113,029 | $ | 175,671 | $ | 171,594 | ||||||||||||
|
|
|
|
|
|
|
|
|
|
|
| |||||||||||||
Portfolio turnover rate | 170 | % | 143 | % | 69 | % | 86 | % | 91 | % | 81 | % | ||||||||||||
|
|
|
|
|
|
|
|
|
|
|
| |||||||||||||
| (a) | Based on average shares outstanding. |
| (b) | Distributions for annual periods determined in accordance with U.S. federal income tax regulations. |
| (c) | Where applicable, assumes the reinvestment of distributions. |
| (d) | Aggregate total return. |
| (e) | Includes proceeds received from a settlement of litigation, which had no impact on the Fund’s total return. |
| (f) | Annualized. |
| (g) | Certain legal and audit expenses were not annualized in the calculation of the total expense ratio. If these expenses were annualized, the total expense ratio would have been 1.35%. |
See notes to financial statements.
| 24 | 2 0 1 8 B L A C K R O C K A N N U A L R E P O R T T O S H A R E H O L D E R S |
| Financial Highlights (continued) | ||
| (For a share outstanding throughout each period) |
Mid Cap Dividend Fund | ||||||||||||||||||||||||
| Year Ended | | Period from 05/01/2017 to | | Year Ended April 30, | ||||||||||||||||||||
| 08/31/2018 | 08/31/2017 | 2017 | 2016 | 2015 | 2014 | |||||||||||||||||||
| ||||||||||||||||||||||||
Net asset value, beginning of period | $ | 11.37 | $ | 14.32 | $ | 12.20 | $ | 14.27 | $ | 15.83 | $ | 14.10 | ||||||||||||
|
|
|
|
|
|
|
|
|
|
|
| |||||||||||||
Net investment income(a) | 0.28 | 0.11 | 0.21 | 0.22 | 0.25 | 0.24 | ||||||||||||||||||
Net realized and unrealized gain (loss) | 1.69 | (0.23 | ) | 2.13 | (0.62 | ) | 0.68 | 2.83 | ||||||||||||||||
|
|
|
|
|
|
|
|
|
|
|
| |||||||||||||
Net increase (decrease) from investment operations | 1.97 | (0.12 | ) | 2.34 | (0.40 | ) | 0.93 | 3.07 | ||||||||||||||||
|
|
|
|
|
|
|
|
|
|
|
| |||||||||||||
Distributions(b) | ||||||||||||||||||||||||
From net investment income | (0.35 | ) | (0.06 | ) | (0.20 | ) | (0.22 | ) | (0.23 | ) | (0.24 | ) | ||||||||||||
From net realized gain | (0.01 | ) | (2.77 | ) | (0.02 | ) | (1.45 | ) | (2.26 | ) | (1.10 | ) | ||||||||||||
|
|
|
|
|
|
|
|
|
|
|
| |||||||||||||
Total distributions | (0.36 | ) | (2.83 | ) | (0.22 | ) | (1.67 | ) | (2.49 | ) | (1.34 | ) | ||||||||||||
|
|
|
|
|
|
|
|
|
|
|
| |||||||||||||
Net asset value, end of period | $ | 12.98 | $ | 11.37 | $ | 14.32 | $ | 12.20 | $ | 14.27 | $ | 15.83 | ||||||||||||
|
|
|
|
|
|
|
|
|
|
|
| |||||||||||||
Total Return(c) | ||||||||||||||||||||||||
Based on net asset value | 17.58 | % | (1.37 | )%(d) | 19.24 | %(e) | (2.62 | )% | 6.58 | % | 22.36 | % | ||||||||||||
|
|
|
|
|
|
|
|
|
|
|
| |||||||||||||
Ratios to Average Net Assets | ||||||||||||||||||||||||
Total expenses | 0.95 | % | 0.92 | %(f)(g) | 0.85 | % | 0.83 | % | 0.81 | % | 0.81 | % | ||||||||||||
|
|
|
|
|
|
|
|
|
|
|
| |||||||||||||
Total expenses after fees waived and/or reimbursed | 0.00 | % | 0.00 | %(f) | 0.00 | % | 0.00 | % | 0.00 | % | 0.00 | % | ||||||||||||
|
|
|
|
|
|
|
|
|
|
|
| |||||||||||||
Net investment income | 2.30 | % | 2.55 | %(f) | 1.53 | % | 1.72 | % | 1.66 | % | 1.58 | % | ||||||||||||
|
|
|
|
|
|
|
|
|
|
|
| |||||||||||||
Supplemental Data | ||||||||||||||||||||||||
Net assets, end of period (000) | $ | 80,548 | $ | 92,608 | $ | 106,594 | $ | 101,503 | $ | 165,931 | $ | 167,656 | ||||||||||||
|
|
|
|
|
|
|
|
|
|
|
| |||||||||||||
Portfolio turnover rate | 42 | % | 144 | % | 82 | % | 91 | % | 83 | % | 61 | % | ||||||||||||
|
|
|
|
|
|
|
|
|
|
|
| |||||||||||||
| (a) | Based on average shares outstanding. |
| (b) | Distributions for annual periods determined in accordance with U.S. federal income tax regulations. |
| (c) | Where applicable, assumes the reinvestment of distributions. |
| (d) | Aggregate total return. |
| (e) | Includes proceeds received from a settlement of litigation, which had no impact on the Fund’s total return. |
| (f) | Annualized. |
| (g) | Certain legal and audit expenses were not annualized in the calculation of the total expense ratio. If these expenses were annualized, the total expense ratio would have been 1.04%. |
See notes to financial statements.
| F I N A N C I A L H I G H L I G H T S | 25 |
| Notes to Financial Statements | ||
| 1. | ORGANIZATION |
Managed Account Series (the “Trust”) is registered under the Investment Company Act of 1940, as amended (the “1940 Act”), as an open-end management investment company. The Trust is organized as a Delaware statutory trust. The following are referred to herein collectively as the “Funds” or individually, a “Fund”:
Fund Name | Herein Referred To As | Diversification Classification | ||||||
Advantage Global SmallCap Fund | Advantage Global SmallCap | Diversified | ||||||
Mid Cap Dividend Fund | Mid Cap Dividend | Diversified |
Investors may only purchase shares in the Funds by entering into a wrap-fee program or other separately managed account. Participants in wrap-fee programs pay a single aggregate fee to the program sponsor for all costs and expenses of the wrap-fee programs including investment advice and portfolio execution.
The Funds, together with certain other registered investment companies advised by BlackRock Advisors, LLC (the “Manager”) or its affiliates, are included in a complex of open-end funds referred to as the Equity-Bond Complex.
| 2. | SIGNIFICANT ACCOUNTING POLICIES |
The financial statements are prepared in conformity with accounting principles generally accepted in the United States of America (“U.S. GAAP”), which may require management to make estimates and assumptions that affect the reported amounts of assets and liabilities in the financial statements, disclosure of contingent assets and liabilities at the date of the financial statements and the reported amounts of increases and decreases in net assets from operations during the reporting period. Actual results could differ from those estimates. Each Fund is considered an investment company under U.S. GAAP and follows the accounting and reporting guidance applicable to investment companies. Below is a summary of significant accounting policies:
Investment Transactions and Income Recognition: For financial reporting purposes, investment transactions are recorded on the dates the transactions are entered into (the “trade dates”). Realized gains and losses on investment transactions are determined on the identified cost basis. Dividend income is recorded on the ex-dividend date. Dividends from foreign securities where the ex-dividend date may have passed are subsequently recorded when the Funds are informed of the ex-dividend date. Under the applicable foreign tax laws, a withholding tax at various rates may be imposed on capital gains, dividends and interest. Upon notification from issuers, a portion of the dividend income received from a real estate investment trust may be redesignated as a reduction of cost of the related investment and/or realized gain.
Foreign Currency Translation: Each Fund’s books and records are maintained in U.S. dollars. Securities and other assets and liabilities denominated in foreign currencies are translated into U.S. dollars using exchange rates determined as of the close of trading on the New York Stock Exchange (“NYSE”). Purchases and sales of investments are recorded at the rates of exchange prevailing on the respective dates of such transactions. Generally, when the U.S. dollar rises in value against a foreign currency, the investments denominated in that currency will lose value; the opposite effect occurs if the U.S. dollar falls in relative value.
Each Fund does not isolate the portion of the results of operations arising as a result of changes in the exchange rates from the changes in the market prices of investments held or sold for financial reporting purposes. Accordingly, the effects of changes in exchange rates on investments are not segregated in the Statements of Operations from the effects of changes in market prices of those investments, but are included as a component of net realized and unrealized gain (loss) from investments. Each Fund reports realized currency gains (losses) on foreign currency related transactions as components of net realized gain (loss) for financial reporting purposes, whereas such components are generally treated as ordinary income for U.S. federal income tax purposes.
Segregation and Collateralization: In cases where a Fund enters into certain investments (e.g., futures contracts) that would be treated as “senior securities” for 1940 Act purposes, a Fund may segregate or designate on its books and records cash or liquid assets having a market value at least equal to the amount of its future obligations under such investments. Doing so allows the investment to be excluded from treatment as a “senior security.” Furthermore, if required by an exchange or counterparty agreement, the Funds may be required to deliver/deposit cash and/or securities to/with an exchange, or broker-dealer or custodian as collateral for certain investments or obligations.
Distributions: Distributions paid by the Funds are recorded on the ex-dividend date. The character and timing of distributions are determined in accordance with U.S. federal income tax regulations, which may differ from U.S. GAAP.
Recent Accounting Standards: In August 2018, the Financial Accounting Standards Board issued Accounting Standards Update 2018-13 “Changes to the Disclosure Requirements for Fair Value Measurement” which modifies disclosure requirements for fair value measurements. The guidance is effective for fiscal years beginning after December 15, 2019 and for interim periods within those fiscal years. Management is currently evaluating the impact of this guidance to the Funds.
Indemnifications: In the normal course of business, a Fund enters into contracts that contain a variety of representations that provide general indemnification. A Fund’s maximum exposure under these arrangements is unknown because it involves future potential claims against a Fund, which cannot be predicted with any certainty.
Other: Expenses directly related to a Fund are charged to that Fund. Other operating expenses shared by several funds, including other funds managed by the Manager, are prorated among those funds on the basis of relative net assets or other appropriate methods.
The Funds have an arrangement with their custodian whereby credits are earned on uninvested cash balances, which could be used to reduce custody fees and/or overdraft charges. The Funds may incur charges on certain uninvested cash balances and overdrafts, subject to certain conditions.
| 3. | INVESTMENT VALUATION AND FAIR VALUE MEASUREMENTS |
Investment Valuation Policies: The Funds’ investments are valued at fair value (also referred to as “market value” within the financial statements) as of the close of trading on the NYSE (generally 4:00 p.m., Eastern time). U.S. GAAP defines fair value as the price the Funds would receive to sell an asset or pay to transfer a liability in an orderly transaction between market participants at the measurement date. The Funds determine the fair values of their financial instruments using various independent
| 26 | 2 0 1 8 B L A C K R O C K A N N U A L R E P O R T T O S H A R E H O L D E R S |
| Notes to Financial Statements (continued) | ||
dealers or pricing services under policies approved by the Board of Trustees of the Trust (the “Board”). The BlackRock Global Valuation Methodologies Committee (the “Global Valuation Committee”) is the committee formed by management to develop global pricing policies and procedures and to oversee the pricing function for all financial instruments.
Fair Value Inputs and Methodologies: The following methods and inputs are used to establish the fair value of each Fund’s assets and liabilities:
| • | Equity investments traded on a recognized securities exchange are valued at the official closing price each day, if available. For equity investments traded on more than one exchange, the official closing price on the exchange where the stock is primarily traded is used. Equity investments traded on a recognized exchange for which there were no sales on that day may be valued at the last available bid (long positions) or ask (short positions) price. |
Generally, trading in foreign instruments is substantially completed each day at various times prior to the close of trading on the NYSE. Occasionally, events affecting the values of such instruments may occur between the foreign market close and the close of trading on the NYSE that may not be reflected in the computation of the Funds’ net assets. Each business day, the Funds use a pricing service to assist with the valuation of certain foreign exchange-traded equity securities and foreign exchange-traded and over-the-counter (“OTC”) options (the “Systematic Fair Value Price”). Using current market factors, the Systematic Fair Value Price is designed to value such foreign securities and foreign options at fair value as of the close of trading on the NYSE, which follows the close of the local markets.
| • | Investments in open-end U.S. mutual funds are valued at net asset value (“NAV”) each business day. |
| • | The Funds value their investment in SL Liquidity Series, LLC, Money Market Series (the “Money Market Series”) at fair value, which is ordinarily based upon their pro rata ownership in the underlying fund’s net assets. The Money Market Series seeks current income consistent with maintaining liquidity and preserving capital. Although the Money Market Series is not registered under the 1940 Act, its investments may follow the parameters of investments by a money market fund that is subject to Rule 2a-7 under the 1940 Act. |
| • | Futures contracts traded on exchanges are valued at their last sale price. |
If events (e.g., a company announcement, market volatility or a natural disaster) occur that are expected to materially affect the value of such investments, or in the event that the application of these methods of valuation results in a price for an investment that is deemed not to be representative of the market value of such investment, or if a price is not available, the investment will be valued by the Global Valuation Committee, or its delegate, in accordance with a policy approved by the Board as reflecting fair value (“Fair Valued Investments”). The fair valuation approaches that may be used by the Global Valuation Committee will include market approach, income approach and cost approach. Valuation techniques such as discounted cash flow, use of market comparables and matrix pricing are types of valuation approaches and are typically used in determining fair value. When determining the price for Fair Valued Investments, the Global Valuation Committee, or its delegate, seeks to determine the price that each Fund might reasonably expect to receive or pay from the current sale or purchase of that asset or liability in an arm’s-length transaction. Fair value determinations shall be based upon all available factors that the Global Valuation Committee, or its delegate, deems relevant and consistent with the principles of fair value measurement. The pricing of all Fair Valued Investments is subsequently reported to the Board or a committee thereof on a quarterly basis.
The Global Valuation Committee, or its delegate, employs various methods for calibrating valuation approaches for investments where an active market does not exist, including regular due diligence of each Fund’s pricing vendors, regular reviews of key inputs and assumptions, transactional back-testing or disposition analysis to compare unrealized gains and losses to realized gains and losses, reviews of missing or stale prices and large movements in market values and reviews of any market related activity. The pricing of all Fair Valued Investments is subsequently reported to the Board or a committee thereof on a quarterly basis. As a result of the inherent uncertainty in valuation of these investments, the fair values may differ from the values that would have been used had an active market existed.
Fair Value Hierarchy: Various inputs are used in determining the fair value of investments and derivative financial instruments. These inputs to valuation techniques are categorized into a fair value hierarchy consisting of three broad levels for financial statement purposes as follows:
| • | Level 1 – Unadjusted price quotations in active markets/exchanges for identical assets or liabilities that each Fund has the ability to access |
| • | Level 2 – Other observable inputs (including, but not limited to, quoted prices for similar assets or liabilities in markets that are active, quoted prices for identical or similar assets or liabilities in markets that are not active, inputs other than quoted prices that are observable for the assets or liabilities (such as interest rates, yield curves, volatilities, prepayment speeds, loss severities, credit risks and default rates) or other market–corroborated inputs) |
| • | Level 3 – Unobservable inputs based on the best information available in the circumstances, to the extent observable inputs are not available (including each Fund’s own assumptions used in determining the fair value of investments and derivative financial instruments) |
The hierarchy gives the highest priority to unadjusted quoted prices in active markets for identical assets or liabilities (Level 1 measurements) and the lowest priority to unobservable inputs (Level 3 measurements). Accordingly, the degree of judgment exercised in determining fair value is greatest for instruments categorized in Level 3. The inputs used to measure fair value may fall into different levels of the fair value hierarchy. In such cases, for disclosure purposes, the fair value hierarchy classification is determined based on the lowest level input that is significant to the fair value measurement in its entirety. Investments classified within Level 3 have significant unobservable inputs used by the Global Valuation Committee in determining the price for Fair Valued Investments. Level 3 investments include equity or debt issued by privatelyheld companies or funds. There may not be a secondary market, and/or there are a limited number of investors. Level 3 investments may also be adjusted to reflect illiquidity and/or non-transferability, with the amount of such discount estimated by the Global Valuation Committee in the absence of market information.
Changes in valuation techniques may result in transfers into or out of an assigned level within the hierarchy. In accordance with each Fund’s policy, transfers between different levels of the fair value hierarchy are deemed to have occurred as of the beginning of the reporting period. The categorization of a value determined for investments and derivative financial instruments is based on the pricing transparency of the investments and derivative financial instruments and is not necessarily an indication of the risks associated with investing in those securities.
As of August 31, 2018, certain investments of the Funds were valued using NAV per share as no quoted market value is available and therefore have been excluded from the fair value hierarchy.
N O T E S T O F I N A N C I A L S T A T E M E N T S | 27 |
| Notes to Financial Statements (continued) | ||
| 4. | SECURITIES AND OTHER INVESTMENTS |
Securities Lending: Certain Funds may lend their securities to approved borrowers, such as brokers, dealers and other financial institutions. The borrower pledges and maintains with the Funds collateral consisting of cash, an irrevocable letter of credit issued by a bank, or securities issued or guaranteed by the U.S. Government. The initial collateral received by each Fund is required to have a value of at least 102% of the current value of the loaned securities for securities traded on U.S. exchanges and a value of at least 105% for all other securities. The collateral is maintained thereafter at a value equal to at least 100% of the current market value of the securities on loan. The market value of the loaned securities is determined at the close of each business day of the Fund and any additional required collateral is delivered to the Fund, or excess collateral returned by the Fund, on the next business day. During the term of the loan, the Funds are entitled to all distributions made on or in respect of the loaned securities, but does not receive interest income on securities received as collateral. Loans of securities are terminable at any time and the borrower, after notice, is required to return borrowed securities within the standard time period for settlement of securities transactions.
The market value of any securities on loan, all of which were classified as common stocks in the Funds’ Schedules of Investments, and the value of any related collateral are shown separately in the Statements of Assets and Liabilities as a component of investments at value — unaffiliated, and collateral on securities loaned at value, respectively. As of period end, any securities on loan were collateralized by cash and/or U.S. Government obligations. Cash collateral invested by the securities lending agent, BlackRock Investment Management, LLC (“BIM”), if any, is disclosed in the Schedules of Investments.
Securities lending transactions are entered into by the Funds under Master Securities Lending Agreements (each, an “MSLA”), which provide the right, in the event of default (including bankruptcy or insolvency), for the non-defaulting party to liquidate the collateral and calculate a net exposure to the defaulting party or request additional collateral. In the event that a borrower defaults, the Funds, as lender, would offset the market value of the collateral received against the market value of the securities loaned. When the value of the collateral is greater than that of the market value of the securities loaned, the lender is left with a net amount payable to the defaulting party. However, bankruptcy or insolvency laws of a particular jurisdiction may impose restrictions on or prohibitions against such a right of offset in the event of an MSLA counterparty’s bankruptcy or insolvency. Under the MSLA, absent an event of default, the borrower can resell or re-pledge the loaned securities, and a Fund can reinvest cash collateral received in connection with loaned securities. Upon an event of default, the parties’ obligations to return the securities or collateral to the other party are extinguished, and the parties can resell or re-pledge the loaned securities or the collateral received in connection with the loaned securities in order to satisfy the defaulting party’s net payment obligation for all transactions under the MSLA. The defaulting party remains liable for any deficiency.
As of period end, the following tables are a summary of the Funds’ securities lending agreements by counterparty which are subject to offset under an MSLA:
| Advantage Global SmallCap | ||||||||||||||||||||
| Counterparty | Securities Loaned at Value | Cash Collateral Received(a) | Net Amount | |||||||||||||||||
Citigroup Global Markets, Inc. | $ | 22,321 | $ | (22,321 | ) | $ | — | |||||||||||||
Credit Suisse Securities (USA) LLC | 103,755 | (103,755 | ) | — | ||||||||||||||||
Deutsche Bank Securities, Inc. | 17,507 | (17,507 | ) | — | ||||||||||||||||
JP Morgan Securities LLC | 8,051 | (8,051 | ) | — | ||||||||||||||||
National Financial Services LLC | 41,772 | (41,772 | ) | — | ||||||||||||||||
State Street Bank & Trust Co. | 135,741 | (135,741 | ) | — | ||||||||||||||||
|
|
|
|
|
| |||||||||||||||
| $ | 329,147 | $ | (329,147 | ) | $ | — | ||||||||||||||
|
|
|
|
|
| |||||||||||||||
| Mid Cap Dividend | ||||||||||||||||||||
| Counterparty | Securities Loaned at Value | Cash Collateral Received(a) | Net Amount | |||||||||||||||||
Citigroup Global Markets, Inc. | $ | 76,626 | $ | (76,626 | ) | $ | — | |||||||||||||
Credit Suisse Securities (USA) LLC | 40,026 | (40,026 | ) | — | ||||||||||||||||
Morgan Stanley | 539,630 | (539,630 | ) | — | ||||||||||||||||
|
|
|
|
|
| |||||||||||||||
| $ | 656,282 | $ | (656,282 | ) | $ | — | ||||||||||||||
|
|
|
|
|
| |||||||||||||||
| (a) | Cash collateral with a value of $343,294 and $668,674 has been received in connection with securities lending agreements for Advantage Global SmallCap and Mid Cap Dividend, respectively. Collateral received in excess of the value of securities loaned from the individual counterparty is not shown for financial reporting purposes in the tables above. |
The risks of securities lending include the risk that the borrower may not provide additional collateral when required or may not return the securities when due. To mitigate these risks, the Funds benefit from a borrower default indemnity provided by BIM. BIM’s indemnity allows for full replacement of the securities loaned if the collateral received does not cover the value on the securities loaned in the event of borrower default. Each Fund could incur a loss if the value of an investment purchased with cash collateral falls below the market value of loaned securities or if the value of an investment purchased with cash collateral falls below the value of the original cash collateral received.
| 5. | DERIVATIVE FINANCIAL INSTRUMENTS |
The Funds engage in various portfolio investment strategies using derivative contracts both to increase the returns of the Funds and/or to manage their exposure to certain risks such as credit risk, equity risk, interest rate risk, foreign currency exchange rate risk, commodity price risk or other risks (e.g., inflation risk). Derivative financial instruments categorized by risk exposure are included in the Schedules of Investments. These contracts may be transacted on an exchange or OTC.
Futures Contracts: Futures contracts are purchased or sold to gain exposure to, or manage exposure to, changes in interest rates (interest rate risk) and changes in the value of equity securities (equity risk) or foreign currencies (foreign currency exchange rate risk).
| 28 | 2 0 1 8 B L A C K R O C K A N N U A L R E P O R T T O S H A R E H O L D E R S |
| Notes to Financial Statements (continued) | ||
Futures contracts are agreements between the Funds and a counterparty to buy or sell a specific quantity of an underlying instrument at a specified price and on a specified date. Depending on the terms of a contract, it is settled either through physical delivery of the underlying instrument on the settlement date or by payment of a cash amount on the settlement date. Upon entering into a futures contract, the Funds are required to deposit initial margin with the broker in the form of cash or securities in an amount that varies depending on a contract’s size and risk profile. The initial margin deposit must then be maintained at an established level over the life of the contract. Amounts pledged, which are considered restricted, are included in cash pledged for futures contracts in the Statements of Assets and Liabilities.
Securities deposited as initial margin are designated in the Schedules of Investments and cash deposited, if any, is shown as cash pledged for futures contracts in the Statements of Assets and Liabilities. Pursuant to the contract, the Funds agree to receive from or pay to the broker an amount of cash equal to the daily fluctuation in market value of the contract (“variation margin”). Variation margin is recorded as unrealized appreciation (depreciation) and, if any, shown as variation margin receivable (or payable) on futures contracts in the Statements of Assets and Liabilities. When the contract is closed, a realized gain or loss is recorded in the Statements of Operations equal to the difference between the notional amount of the contract at the time it was opened and the notional amount at the time it was closed. The use of futures contracts involves the risk of an imperfect correlation in the movements in the price of futures contracts and interest, foreign currency exchange rates or underlying assets.
| 6. | INVESTMENT ADVISORY AGREEMENT AND OTHER TRANSACTIONS WITH AFFILIATES |
The PNC Financial Services Group, Inc. is the largest stockholder and an affiliate of BlackRock, Inc. (“BlackRock”) for 1940 Act purposes.
Investment Advisory: The Trust, on behalf of the Funds, entered into an Investment Advisory Agreement with the Manager, the Funds’ investment adviser and an indirect, wholly-owned subsidiary of BlackRock, to provide investment advisory and administrative services. The Manager is responsible for the management of each Fund’s portfolio and provides the personnel, facilities, equipment and certain other services necessary to the operations of each Fund.
For such services, each Fund pays the Manager a monthly fee at an annual rate equal to the following percentages of the average daily value of each Fund’s net assets:
| ||||||||
| Investment Advisory Fee | ||||||||
|
| |||||||
| Average Daily Net Assets | Advantage Global SmallCap | Mid Cap Dividend | ||||||
| ||||||||
Not exceeding $1 Billion | 0.85 | % | 0.65 | % | ||||
Exceeding $1 Billion but not exceeding $3 Billion | 0.80 | 0.61 | ||||||
Exceeding $3 Billion but not exceeding $5 Billion | 0.77 | 0.59 | ||||||
Exceeding $5 Billion but not exceeding $10 Billion | 0.74 | 0.57 | ||||||
Exceeding $10 Billion | 0.72 | 0.55 | ||||||
| ||||||||
Expense Limitations, Waivers, and Reimbursements: The Manager contractually agreed to waive all fees and pay or reimburse all operating expenses of each Fund, except extraordinary expenses which includes taxes. This agreement has no fixed termination date and will remain in effect for as long as shares of a Fund may be purchased and held only by or on behalf of separately managed account clients who have retained the Manager to manage their accounts pursuant to an investment management agreement with the Manager and/or a managed account program sponsor.
Although the Funds do not compensate the Manager directly for its services under the Investment Advisory Agreement, because each Fund is an investment option for certain wrap-fee or other separately managed account program clients, the Manager may benefit from the fees charged to such clients who have retained the Manager’s affiliates to manage their accounts. The Manager waived fees for each Fund which are included in fees waived and/or reimbursed by the Manager in the Statements of Operations. The waivers were as follows:
Advantage Global SmallCap | $ | 771,670 | ||
Mid Cap Dividend | 541,465 |
The Manager has contractually agreed to waive its investment advisory fee with respect to any portion of each Fund’s assets invested in affiliated equity and fixed-income mutual funds and affiliated exchange-traded funds that have a contractual management fee through December 31, 2018. The contractual agreement may be terminated upon 90 days’ notice by a majority of the trustees who are not “interested persons” of a Fund, as defined in the 1940 Act (“Independent Trustees”), or by a vote of a majority of the outstanding voting securities of a Fund. For the year ended August 31, 2018, there were no fees waived by the Manager.
In addition, the Manager reimbursed each Fund’s operating expenses as follows, which are included in fees waived and/or reimbursed by the Manager in the Statements of Operations:
Advantage Global SmallCap | $ | 525,873 | ||
Mid Cap Dividend | 247,592 |
For the year ended August 31, 2018, the Funds reimbursed the Manager for certain accounting services, which are included in accounting services in the Statements of Operations. The reimbursements were as follows:
Advantage Global SmallCap | $ | 1,169 | ||
Mid Cap Dividend | 1,039 |
Securities Lending: The U.S. Securities and Exchange Commission (“SEC”) has issued an exemptive order which permits BIM, an affiliate of the Manager, to serve as securities lending agent for the Funds, subject to applicable conditions. As securities lending agent, BIM bears all operational costs directly related to securities lending.
N O T E S T O F I N A N C I A L S T A T E M E N T S | 29 |
| Notes to Financial Statements (continued) | ||
The Funds are responsible for expenses in connection with the investment of cash collateral received for securities on loan (the “collateral investment expenses”). The cash collateral is invested in a private investment company managed by the Manager or its affiliates. However, BIM has agreed to cap the collateral investment expenses of the private investment company to an annual rate of 0.04%. The investment adviser to the private investment company will not charge any advisory fees with respect to shares purchased by the Funds. The private investment company in which the cash collateral has been invested may, under certain circumstances, impose a liquidity fee of up to 2% of the value withdrawn or temporarily restrict withdrawals for up to 10 business days during a 90 day period, in the event that the private investment company’s weekly liquid assets fall below certain thresholds.
Securities lending income is equal to the total of income earned from the reinvestment of cash collateral, net of fees and other payments to and from borrowers of securities, and less the collateral investment expenses. Each Fund retains a portion of securities lending income and remits a remaining portion to BIM as compensation for its services as securities lending agent.
Pursuant to a securities lending agreement, Mid Cap Dividend retains 71.5% of securities lending income, and this amount retained can never be less than 65% of the total of securities lending income plus the collateral investment expenses. Pursuant to a securities lending agreement, Advantage Global SmallCap retains 80% of securities lending income, and this amount retained can never be less than 70% of the total of securities lending income plus the collateral investment expenses.
In addition, commencing the business day following the date that the aggregate securities lending income earned across the Equity-Bond Complex in a calendar year exceeds a specified threshold, pursuant to the securities lending agreement, will retain for the remainder of that calendar year securities lending income as follows: Mid Cap Dividend will retain 75% of securities lending income, and this amount retained can never be less than 65% of the total of securities lending income plus the collateral investment expenses. Advantage Global SmallCap will retain 85% of securities lending income, and this amount retained can never be less than 70% of the total of securities lending income plus the collateral investment expenses.
The share of securities lending income earned by each Fund is shown as securities lending income — affiliated — net in the Statements of Operations. For the year ended August 31, 2018, each Fund paid BIM the following amounts for securities lending agent services:
Advantage Global SmallCap | $ | 1,020 | ||
Mid Cap Dividend | 688 |
Interfund Lending: In accordance with an exemptive order (the “Order”) from the SEC, each Fund may participate in a joint lending and borrowing facility for temporary purposes (the “Interfund Lending Program”), subject to compliance with the terms and conditions of the Order, and to the extent permitted by each Fund’s investment policies and restrictions. Each Fund is currently permitted to borrow and lend under the Interfund Lending Program.
A lending BlackRock fund may lend in aggregate up to 15% of its net assets, but may not lend more than 5% of its net assets to any one borrowing fund through the Interfund Lending Program. A borrowing BlackRock fund may not borrow through the Interfund Lending Program or from any other source more than 33 1/3% of its total assets (or any lower threshold provided for by the fund’s investment restrictions). If a borrowing BlackRock fund’s total outstanding borrowings exceed 10% of its total assets, each of its outstanding interfund loans will be subject to collateralization of at least 102% of the outstanding principal value of the loan. All interfund loans are for temporary or emergency purposes and the interest rate to be charged will be the average of the highest current overnight repurchase agreement rate available to a lending fund and the bank loan rate, as calculated according to a formula established by the Board.
During the year ended August 31, 2018, the Funds did not participate in the Interfund Lending Program.
Trustees and Officers: Certain Trustees and/or officers of the Trust are trustees and/or officers of BlackRock or its affiliates. The Funds reimburse the Manager for a portion of the compensation paid to the Trust’s Chief Compliance Officer, which is included in Trustees and Officer in the Statements of Operations.
| 7. | PURCHASES AND SALES |
For the year ended August 31, 2018, purchases and sales of investments excluding short-term securities, were as follows:
Advantage Global SmallCap | Mid Cap Dividend | |||||||
Purchases | $ | 149,758,697 | $ | 34,548,737 | ||||
Sales | 178,367,466 | 59,426,985 | ||||||
| 8. | INCOME TAX INFORMATION |
It is the Funds’ policy to comply with the requirements of the Internal Revenue Code of 1986, as amended, applicable to regulated investment companies, and to distribute substantially all of its taxable income to its shareholders. Therefore, no U.S. federal income tax provision is required.
Each Fund files U.S. federal and various state and local tax returns. No income tax returns are currently under examination. The statute of limitations on each Fund’s U.S. federal tax returns generally remains open for the year ended August 31, 2018, the period ended August 31, 2017 and each of the four years ended April 30, 2017. The statutes of limitations on each Fund’s state and local tax returns may remain open for an additional year depending upon the jurisdiction.
Management has analyzed tax laws and regulations and their application to the Funds as of August 31, 2018, inclusive of the open tax return years, and does not believe that there are any uncertain tax positions that require recognition of a tax liability in the Funds’ financial statements.
| 30 | 2 0 1 8 B L A C K R O C K A N N U A L R E P O R T T O S H A R E H O L D E R S |
| Notes to Financial Statements (continued) | ||
U.S. GAAP requires that certain components of net assets be adjusted to reflect permanent differences between financial and tax reporting. These reclassifications have no effect on net assets or net asset values per share. As of period end, the following permanent differences attributable to foreign currency transactions, the sale of stock of passive foreign investment companies, the use of equalization and income recognized from investments in partnerships were reclassified to the following accounts:
| ||||||||
| Advantage Global SmallCap | Mid Cap Dividend | |||||||
| ||||||||
Paid-in capital | $ | 647,910 | $ | 329,479 | ||||
Undistributed net investment income | 191,948 | 16,295 | ||||||
Undistributed net realized gain | (839,858 | ) | (345,774 | ) | ||||
| ||||||||
The tax character of distributions paid was as follows:
| ||||||||||||
| Advantage Global SmallCap | Mid Cap Dividend | |||||||||||
| ||||||||||||
Ordinary income(a) | 8/31/18 | $ | 4,540,943 | $ | 2,802,641 | |||||||
| 8/31/17 | 2,499,716 | 4,418,493 | ||||||||||
| 4/30/17 | 2,437,012 | 1,658,252 | ||||||||||
Long-term capital gains(a) | 8/31/18 | 835,523 | 95,007 | |||||||||
| 8/31/17 | 12,525,220 | 15,146,211 | ||||||||||
| 4/30/17 | — | 672,617 | ||||||||||
|
|
|
| |||||||||
Total | 8/31/18 | $ | 5,376,466 | $ | 2,897,648 | |||||||
|
|
|
| |||||||||
| 8/31/17 | $ | 15,024,936 | $ | 19,564,704 | ||||||||
|
|
|
| |||||||||
| 4/30/17 | $ | 2,437,012 | $ | 2,330,869 | ||||||||
|
|
|
| |||||||||
| (a) | Distribution amounts may include a portion of the proceeds from redeemed shares. |
As of period end, the tax components of accumulated net earnings (losses) were as follows:
| ||||||||
| Advantage Global SmallCap | Mid Cap Dividend | |||||||
| ||||||||
Undistributed ordinary income | $ | 4,695,208 | $ | 2,694,757 | ||||
Undistributed long term capital gains | 1,057,053 | 986,969 | ||||||
Net unrealized gains(a) | 7,000,046 | 6,854,740 | ||||||
|
|
|
| |||||
| $ | 12,752,307 | $ | 10,536,466 | |||||
|
|
|
| |||||
| (a) | The differences between book-basis and tax-basis net unrealized gains were attributable primarily to the tax deferral of losses on wash sales, the realization for tax purposes of unrealized gains on investments in passive foreign investment companies and the realization for tax purposes of unrealized gains/losses on certain futures and foreign currency contracts. |
As of August 31, 2018, gross unrealized appreciation and depreciation for investments and derivatives based on cost for U.S. federal income tax purposes were as follows:
| ||||||||
| Advantage Global SmallCap | Mid Cap Dividend | |||||||
| ||||||||
Tax cost | $ | 78,307,344 | $ | 74,349,891 | ||||
|
|
|
| |||||
Gross unrealized appreciation | $ | 9,520,205 | $ | 9,382,000 | ||||
Gross unrealized depreciation | (2,447,631 | ) | (2,527,741 | ) | ||||
|
|
|
| |||||
Net unrealized appreciation | $ | 7,072,574 | $ | 6,854,259 | ||||
|
|
|
| |||||
The Tax Cuts and Jobs Act (the “Act”) was enacted on December 22, 2017. Certain provisions of the Act were effective upon enactment with the remainder becoming effective for tax years beginning after December 31, 2017. Although the Act does not amend any provisions directly related to the qualification or taxation of regulated investment companies (“RICs”), the Act does change the taxation of entities in which some RICs invest, the tax treatment of income derived from those entities and the taxation of RIC shareholders. While management does not anticipate significant impact to the Funds or to their shareholders, there is uncertainty in the application of certain provisions in the Act. Specifically, provisions in the Act may increase the amount of or accelerate the recognition of taxable income and may limit the deductibility of certain expenses by RICs. Until full clarity around these provisions is obtained, the impact on the Funds’ financial statements, if any, cannot be fully determined.
| 9. | BANK BORROWINGS |
The Trust, on behalf of the Funds, along with certain other funds managed by the Manager and its affiliates (“Participating Funds”), is a party to a 364-day, $2.25 billion credit agreement with a group of lenders. Under this agreement, the Funds may borrow to fund shareholder redemptions. Excluding commitments designated for certain individual funds, the Participating Funds, including the Funds, can borrow up to an aggregate commitment amount of $1.75 billion at any time outstanding, subject to asset coverage and other limitations as specified in the agreement. The credit agreement has the following terms: a fee of 0.10% per annum on unused commitment amounts and interest at a rate equal to the higher of (a) one-month LIBOR (but, in any event, not less than 0.00%) on the date the loan is made plus 0.80% per annum or (b) the
N O T E S T O F I N A N C I A L S T A T E M E N T S | 31 |
| Notes to Financial Statements (continued) | ||
Fed Funds rate (but, in any event, not less than 0.00%) in effect from time to time plus 0.80% per annum on amounts borrowed. The agreement expires in April 2019 unless extended or renewed. Prior to April 19, 2018, the aggregate commitment amount was $2.1 billion and the fee was 0.12% per annum. Participating Funds paid an upfront commitment fee of 0.02% on the total commitment amounts, in addition to administration, legal and arrangement fees, which are included in miscellaneous expenses in the Statements of Operations. These fees were allocated among such funds based upon portions of the aggregate commitment available to them and relative net assets of Participating Funds. During the year ended August 31, 2018, the Funds did not borrow under the credit agreement.
| 10. | PRINCIPAL RISKS |
In the normal course of business, certain Funds invest in securities or other instruments and may enter into certain transactions, and such activities subject each Fund to various risks, including among others, fluctuations in the market (market risk) or failure of an issuer to meet all of its obligations. The value of securities or other instruments may also be affected by various factors, including, without limitation: (i) the general economy; (ii) the overall market as well as local, regional or global political and/or social instability; (iii) regulation, taxation or international tax treaties between various countries; or (iv) currency, interest rate and price fluctuations. Each Fund’s prospectus provides details of the risks to which each Fund is subject.
The Funds may be exposed to additional risks when reinvesting cash collateral in money market funds that do not seek to maintain a stable NAV per share of $1.00, which may be subject to redemption gates or liquidity fees under certain circumstances.
Valuation Risk: The market values of equities, such as common stocks and preferred securities or equity related investments, such as futures and options, may decline due to general market conditions which are not specifically related to a particular company. They may also decline due to factors which affect a particular industry or industries. A Fund may invest in illiquid investments and may experience difficulty in selling those investments in a timely manner at the price that they believe the investments are worth. Prices may fluctuate widely over short or extended periods in response to company, market or economic news. Markets also tend to move in cycles, with periods of rising and falling prices. This volatility may cause each Fund’s NAV to experience significant increases or decreases over short periods of time. If there is a general decline in the securities and other markets, the NAV of a Fund may lose value, regardless of the individual results of the securities and other instruments in which a Fund invests.
The price a Fund could receive upon the sale of any particular portfolio investment may differ from a Fund’s valuation of the investment, particularly for securities that trade in thin or volatile markets or that are valued using a fair valuation technique or a price provided by an independent pricing service. Changes to significant unobservable inputs and assumptions (i.e., publicly traded company multiples, growth rate, time to exit) due to the lack of observable inputs may significantly impact the resulting fair value and therefore a Fund’s results of operations. As a result, the price received upon the sale of an investment may be less than the value ascribed by a Fund, and a Fund could realize a greater than expected loss or lesser than expected gain upon the sale of the investment. A Fund’s ability to value its investments may also be impacted by technological issues and/or errors by pricing services or other third party service providers.
Counterparty Credit Risk: The Funds may be exposed to counterparty credit risk, or the risk that an entity may fail to or be unable to perform on its commitments related to unsettled or open transactions. The Funds manage counterparty credit risk by entering into transactions only with counterparties that the Manager believes have the financial resources to honor their obligations and by monitoring the financial stability of those counterparties. Financial assets, which potentially expose the Funds to market, issuer and counterparty credit risks, consist principally of financial instruments and receivables due from counterparties. The extent of the Funds’ exposure to market, issuer and counterparty credit risks with respect to these financial assets is approximately their value recorded in the Statements of Assets and Liabilities, less any collateral held by the Funds.
A derivative contract may suffer a mark-to-market loss if the value of the contract decreases due to an unfavorable change in the market rates or values of the underlying instrument. Losses can also occur if the counterparty does not perform under the contract.
With exchange-traded futures, there is less counterparty credit risk to the Funds since the exchange or clearinghouse, as counterparty to such instruments, guarantees against a possible default. The clearinghouse stands between the buyer and the seller of the contract; therefore, credit risk is limited to failure of the clearinghouse. While offset rights may exist under applicable law, a Fund does not have a contractual right of offset against a clearing broker or clearinghouse in the event of a default (including the bankruptcy or insolvency). Additionally, credit risk exists in exchange-traded futures with respect to initial and variation margin that is held in a clearing broker’s customer accounts. While clearing brokers are required to segregate customer margin from their own assets, in the event that a clearing broker becomes insolvent or goes into bankruptcy and at that time there is a shortfall in the aggregate amount of margin held by the clearing broker for all its clients, typically the shortfall would be allocated on a pro rata basis across all the clearing broker’s customers, potentially resulting in losses to the Funds.
Concentration Risk: Advantage Global SmallCap invests a substantial amount of its assets in issuers located in a single country or a limited number of countries. When the Fund concentrates its investments in this manner, it assumes the risk that economic, political and social conditions in those countries may have a significant impact on their investment performance. Foreign issuers may not be subject to the same uniform accounting, auditing and financial reporting standards and practices as used in the United States. Foreign securities markets may also be less liquid, more volatile, and less subject to governmental supervision not typically associated with investing in U.S. securities. Investment percentages in specific countries are presented in the Schedules of Investments.
| 32 | 2 0 1 8 B L A C K R O C K A N N U A L R E P O R T T O S H A R E H O L D E R S |
| Notes to Financial Statements (continued) | ||
| 11. | CAPITAL SHARE TRANSACTIONS |
Transactions in capital shares were as follows:
| Year Ended 08/31/2018 | Period from 05/01/2017 to 08/31/2017 | Year Ended 04/30/2017 | ||||||||||||||||||||||
|
|
|
|
|
| |||||||||||||||||||
| Shares | Amount | Shares | Amount | Shares | Amount | |||||||||||||||||||
| ||||||||||||||||||||||||
Advantage Global SmallCap | ||||||||||||||||||||||||
Shares sold | 441,171 | $ | 5,979,732 | 1,446,707 | $ | 18,703,549 | 1,278,656 | $ | 16,673,214 | |||||||||||||||
Shares redeemed | (2,532,496 | ) | (33,893,318 | ) | (1,515,613 | ) | (21,376,863 | ) | (2,247,301 | ) | (29,566,906 | ) | ||||||||||||
|
|
|
|
|
|
|
|
|
|
|
| |||||||||||||
Net decrease | (2,091,325 | ) | $ | (27,913,586 | ) | (68,906 | ) | $ | (2,673,314 | ) | (968,645 | ) | $ | (12,893,692 | ) | |||||||||
|
|
|
|
|
|
|
|
|
|
|
| |||||||||||||
Mid Cap Dividend | ||||||||||||||||||||||||
Shares sold | 684,027 | $ | 8,329,621 | 2,053,157 | $ | 23,817,315 | 1,067,826 | $ | 14,260,889 | |||||||||||||||
Shares redeemed | (2,622,941 | ) | (31,792,726 | ) | (1,349,372 | ) | (18,301,927 | ) | (1,947,711 | ) | (26,566,961 | ) | ||||||||||||
|
|
|
|
|
|
|
|
|
|
|
| |||||||||||||
Net increase (decrease) | (1,938,914 | ) | $ | (23,463,105 | ) | 703,785 | $ | 5,515,388 | (879,885 | ) | $ | (12,306,072 | ) | |||||||||||
|
|
|
|
|
|
|
|
|
|
|
| |||||||||||||
| 12. | SUBSEQUENT EVENTS |
Management has evaluated the impact of all subsequent events on the Funds through the date the financial statements were issued and has determined that there were no subsequent events requiring adjustment or additional disclosure in the financial statements.
N O T E S T O F I N A N C I A L S T A T E M E N T S | 33 |
| Report of Independent Registered Public Accounting Firm | ||
To the Shareholders of Advantage Global SmallCap Fund and Mid Cap Dividend Fund, and the Board of Trustees of Managed Account Series:
Opinion on the Financial Statements
We have audited the accompanying statements of assets and liabilities of Advantage Global SmallCap Fund and Mid Cap Dividend Fund of Managed Account Series (the “Funds”), including the schedules of investments, as of August 31, 2018, the related statements of operations for the year then ended, the statements of changes in net assets for the year then ended, for the period from May 1, 2017 through August 31, 2017, and for the year ended April 30, 2017, the financial highlights for the year then ended, for the period from May 1, 2017 through August 31, 2017, and for each of the four years in the period ended April 30, 2017, and the related notes. In our opinion, the financial statements and financial highlights present fairly, in all material respects, the financial position of the Funds as of August 31, 2018, and the results of their operations for the year then ended, the changes in their net assets for the year then ended, for the period from May 1, 2017 through August 31, 2017, and for the year ended April 30, 2017, and the financial highlights for the year then ended, for the period from May 1, 2017 through August 31, 2017, and for each of the four years in the period ended April 30, 2017, in conformity with accounting principles generally accepted in the United States of America.
Basis for Opinion
These financial statements and financial highlights are the responsibility of the Funds’ management. Our responsibility is to express an opinion on the Funds’ financial statements and financial highlights based on our audits. We are a public accounting firm registered with the Public Company Accounting Oversight Board (United States) (PCAOB) and are required to be independent with respect to the Funds in accordance with the U.S. federal securities laws and the applicable rules and regulations of the Securities and Exchange Commission and the PCAOB.
We conducted our audits in accordance with the standards of the PCAOB. Those standards require that we plan and perform the audit to obtain reasonable assurance about whether the financial statements and financial highlights are free of material misstatement, whether due to error or fraud. The Funds are not required to have, nor were we engaged to perform, an audit of their internal control over financial reporting. As part of our audits we are required to obtain an understanding of internal control over financial reporting but not for the purpose of expressing an opinion on the effectiveness of the Funds’ internal control over financial reporting. Accordingly, we express no such opinion.
Our audits included performing procedures to assess the risks of material misstatement of the financial statements and financial highlights, whether due to error or fraud, and performing procedures that respond to those risks. Such procedures included examining, on a test basis, evidence regarding the amounts and disclosures in the financial statements and financial highlights. Our audits also included evaluating the accounting principles used and significant estimates made by management, as well as evaluating the overall presentation of the financial statements and financial highlights. Our procedures included confirmation of securities owned as of August 31, 2018, by correspondence with the custodian and brokers; when replies were not received from brokers, we performed other auditing procedures. We believe that our audits provide a reasonable basis for our opinion.
Deloitte & Touche LLP
Boston, Massachusetts
October 23, 2018
We have served as the auditor of one or more BlackRock investment companies since 1992.
Important Tax Information (unaudited)
During the fiscal period ended August 31, 2018, the following information is provided with respect to the ordinary income distributions paid by the Funds:
| Payable Date | Advantage Global SmallCap | Mid Cap Dividend | ||||||||||||||
Qualified Dividend Income for Individuals(a) | 12/12/17 | 21.48 | % | 39.03 | % | |||||||||||
| 04/12/18 | — | 33.04 | ||||||||||||||
| 07/20/18 | — | 33.04 | ||||||||||||||
Dividends Qualifying for the Dividend Received Deduction for Corporations(a) | 8.17 | 31.67 | ||||||||||||||
Qualified Short-Term Capital Gains for Non-U.S. Residents(b) | 12/12/17 | 25.86 | 4.13 | |||||||||||||
20% Long-Term Capital Gains Paid Per Share | 12/12/17 | $ | 0.091514 | $ | — | |||||||||||
| (a) | The Funds hereby designate the percentage indicated above or the maximum amount allowable by law. |
| (b) | Represents the portion of the taxable ordinary income dividends eligible for exemption from U.S. withholding tax for nonresident aliens and foreign corporations. |
| 34 | 2 0 1 8 B L A C K R O C K A N N U A L R E P O R T T O S H A R E H O L D E R S |
| Disclosure of Investment Advisory Agreement | ||
The Board of Trustees (the “Board,” the members of which are referred to as “Board Members”) of Managed Account Series (the “Trust”) met in person on April 10, 2018 (the “April Meeting”) and May 8, 2018 (the “May Meeting”) to consider the approval of the investment advisory agreement (the “Advisory Agreement” or the “Agreement”) between the Trust, on behalf of Advantage Global SmallCap Fund and Mid Cap Dividend Fund (each, a “Fund” and together, the “Funds”), and BlackRock Advisors, LLC (the “Manager” or “BlackRock”), each Fund’s investment advisor.
Activities and Composition of the Board
On the date of the May Meeting, the Board consisted of eleven individuals, nine of whom were not “interested persons” of the Trust as defined in the Investment Company Act of 1940, as amended (the “1940 Act”) (the “Independent Board Members”). The Board Members are responsible for the oversight of the operations of each Fund and perform the various duties imposed on the directors of investment companies by the 1940 Act. The Independent Board Members have retained independent legal counsel to assist them in connection with their duties. The Chair of the Board is an Independent Board Member. The Board has established five standing committees: an Audit Committee, a Governance and Nominating Committee, a Compliance Committee, a Performance Oversight Committee and an Executive Committee, each of which is chaired by an Independent Board Member and composed of Independent Board Members (except for the Performance Oversight Committee and the Executive Committee, each of which also has one interested Board Member).
The Agreement
Pursuant to the 1940 Act, the Board is required to consider the continuation of the Agreement on an annual basis. The Board has four quarterly meetings per year, each typically extending for two days, and additional in-person and telephonic meetings throughout the year, as needed. The Board also has a fifth one-day meeting to consider specific information surrounding the consideration of renewing the Agreement. The Board’s consideration of the Agreement is a year-long deliberative process, during which the Board assessed, among other things, the nature, extent and quality of the services provided to each Fund by BlackRock, BlackRock’s personnel and affiliates, including (as applicable): investment management; accounting, administrative and shareholder services; oversight of each Fund’s service providers; marketing and promotional services; risk management and oversight; legal and compliance services; and ability to meet applicable legal and regulatory requirements.
The Board, acting directly and through its committees, considers at each of its meetings, and from time to time as appropriate, factors that are relevant to its annual consideration of the renewal of the Agreement, including the services and support provided by BlackRock to each Fund and its shareholders. BlackRock also furnished additional information to the Board in response to specific questions from the Board. This additional information is discussed further below in the section titled “Board Considerations in Approving the Agreement.” Among the matters the Board considered were: (a) investment performance for one-year, three-year, five-year, ten-year, and/or since inception periods, as applicable, against peer funds, applicable benchmark, and performance metrics, as applicable, as well as senior management’s and portfolio managers’ analysis of the reasons for any over-performance or underperformance relative to its peers, benchmarks, and other performance metrics, as applicable; (b) fees, including advisory, administration, if applicable, and other amounts paid to BlackRock and its affiliates by each Fund for services; (c) Fund operating expenses and how BlackRock allocates expenses to each Fund; (d) the resources devoted to, risk oversight of, and compliance reports relating to, implementation of each Fund’s investment objective(s), policies and restrictions, and meeting regulatory requirements; (e) each Fund’s adherence to its compliance policies and procedures; (f) the nature, character and scope of non-investment management services provided by BlackRock and its affiliates and the estimated cost of such services; (g) BlackRock’s and other service providers’ internal controls and risk and compliance oversight mechanisms; (h) BlackRock’s implementation of the proxy voting policies approved by the Board; (i) the use of brokerage commissions and execution quality of portfolio transactions; (j) BlackRock’s implementation of each Fund’s valuation and liquidity procedures; (k) an analysis of management fees for products with similar investment mandates across the open-end fund, exchange-traded fund (“ETF”), closed-end fund, sub-advised mutual fund, separately managed account, collective investment trust, and institutional separate account product channels, as applicable, and the similarities and differences between these products and the services provided as compared to each Fund; (l) BlackRock’s compensation methodology for its investment professionals and the incentives and accountability it creates, along with investment professionals’ investments in the fund(s) they manage; and (m) periodic updates on BlackRock’s business.
Board Considerations in Approving the Agreement
The Approval Process: Prior to the April Meeting, the Board requested and received materials specifically relating to the Agreement. The Board is continuously engaged in a process with its independent legal counsel and BlackRock to review the nature and scope of the information provided to better assist its deliberations. The materials provided in connection with the April Meeting included, among other things: (a) information independently compiled and prepared by Broadridge Financial Solutions, Inc. (“Broadridge”), based on either a Lipper classification or Morningstar category, regarding each Fund’s fees and expenses as compared with a peer group of funds as determined by Broadridge (“Expense Peers”), the investment performance of each Fund as compared with a peer group of funds (“Performance Peers”) and other metrics, as applicable; (b) information on the composition of the Expense Peers and Performance Peers, and a description of Broadridge’s methodology; (c) a discussion of fall-out benefits to BlackRock and its affiliates; (d) a general analysis provided by BlackRock concerning investment management fees received in connection with other types of investment products, such as institutional accounts, sub-advised mutual funds, ETFs, closed-end funds, open-end funds, and separately managed accounts, under similar investment mandates, as well as the performance of such other products, as applicable; (e) review of non-management fees; (f) the existence and impact of potential economies of scale, if any, and the sharing of potential economies of scale with each Fund; (g) a summary of aggregate amounts paid by each Fund to BlackRock; and (h) various additional information requested by the Board as appropriate regarding BlackRock’s and each Fund’s operations.
At the April Meeting, the Board reviewed materials relating to its consideration of the Agreement. As a result of the discussions that occurred during the April Meeting, and as a culmination of the Board’s year-long deliberative process, the Board presented BlackRock with questions and requests for additional information. BlackRock responded to these requests with additional written information in advance of the May Meeting.
At the May Meeting, the Board considered, among other things: (a) the nature, extent and quality of the services provided by BlackRock; (b) the investment performance of each Fund as compared with Performance Peers and other metrics, as applicable; (c) the advisory fee and the estimated cost of the services and estimated profits realized by BlackRock and its affiliates from their relationship with each Fund; (d) each Fund’s fees and expenses compared to Expense Peers; (e) the sharing of potential economies of scale; (f) fall-out benefits to BlackRock and its affiliates as a result of BlackRock’s relationship with each Fund; and (g) other factors deemed relevant by the Board Members.
| D I S C L O S U R E O F I N V E S T M E N T A D V I S O R Y A G R E E M E N T | 35 |
| Disclosure of Investment Advisory Agreement (continued) | ||
The Board also considered other matters it deemed important to the approval process, such as other payments made to BlackRock or its affiliates, securities lending and cash management, services related to the valuation and pricing of Fund portfolio holdings, and advice from independent legal counsel with respect to the review process and materials submitted for the Board’s review. The Board noted the willingness of BlackRock personnel to engage in open, candid discussions with the Board. The Board did not identify any particular information as determinative, and each Board Member may have attributed different weights to the various items considered.
A. Nature, Extent and Quality of the Services Provided by BlackRock: The Board, including the Independent Board Members, reviewed the nature, extent and quality of services provided by BlackRock, including the investment advisory services and the resulting performance of each Fund. Throughout the year, the Board compared Fund performance to the performance of a comparable group of mutual funds, a relevant benchmark, and performance metrics, as applicable. The Board met with BlackRock’s senior management personnel responsible for investment activities, including the senior investment officers. The Board also reviewed the materials provided by each Fund’s portfolio management team discussing each Fund’s performance and each Fund’s investment objective(s), strategies and outlook.
The Board considered, among other factors, with respect to BlackRock: the number, education and experience of investment personnel generally and each Fund’s portfolio management team; BlackRock’s research capabilities; investments by portfolio managers in the funds they manage; portfolio trading capabilities; use of technology; commitment to compliance; credit analysis capabilities; risk analysis and oversight capabilities; and the approach to training and retaining portfolio managers and other research, advisory and management personnel. The Board also considered BlackRock’s overall risk management program, including the continued efforts of BlackRock and its affiliates to address cybersecurity risks and the role of BlackRock’s Risk & Quantitative Analysis Group. The Board engaged in a review of BlackRock’s compensation structure with respect to each Fund’s portfolio management team and BlackRock’s ability to attract and retain high-quality talent and create performance incentives.
In addition to investment advisory services, the Board considered the quality of the administrative and other non-investment advisory services provided to each Fund. BlackRock and its affiliates provide each Fund with certain administrative, shareholder and other services (in addition to any such services provided to each Fund by third parties) and officers and other personnel as are necessary for the operations of each Fund. In particular, BlackRock and its affiliates provide each Fund with administrative services including, among others: (i) responsibility for disclosure documents, such as the prospectus, the summary prospectus (as applicable), the statement of additional information and periodic shareholder reports; (ii) oversight of daily accounting and pricing; (iii) responsibility for periodic filings with regulators; (iv) overseeing and coordinating the activities of other service providers including, among others, each Fund’s custodian, fund accountant, transfer agent, and auditor; (v) organizing Board meetings and preparing the materials for such Board meetings; (vi) providing legal and compliance support; (vii) furnishing analytical and other support to assist the Board in its consideration of strategic issues such as the merger, consolidation or repurposing of certain open-end funds; and (viii) performing administrative functions necessary for the operation of each Fund, such as tax reporting, expense management, fulfilling regulatory filing requirements, overseeing each Fund’s distribution partners, and shareholder call center and other services. The Board reviewed the structure and duties of BlackRock’s fund administration, shareholder services, and legal & compliance departments and considered BlackRock’s policies and procedures for assuring compliance with applicable laws and regulations.
B. The Investment Performance of each Fund and BlackRock: The Board, including the Independent Board Members, also reviewed and considered the performance history of each Fund. In preparation for the April Meeting, the Board was provided with reports independently prepared by Broadridge, which included a comprehensive analysis of each Fund’s performance as of December 31, 2017. Broadridge ranks funds in quartiles, ranging from first to fourth, where first is the most desirable quartile position and fourth is the least desirable. In connection with its review, the Board received and reviewed information regarding the investment performance of each Fund as compared to its Performance Peers. The Board and its Performance Oversight Committee regularly review, and meet with Fund management to discuss, the performance of each Fund throughout the year.
In evaluating performance, the Board recognized that the performance data reflects a snapshot of a period as of a particular date and that selecting a different performance period could produce significantly different results. Further, the Board recognized that it is possible that long-term performance can be impacted by even one period of significant outperformance or underperformance, so that a single investment theme has the ability to affect long-term performance disproportionately.
The Board noted that for the one-, three- and five-year periods reported, the Advantage Global SmallCap Fund ranked in the third, third, and second quartiles, respectively, against its Performance Peers. The Board and BlackRock reviewed the Advantage Global SmallCap Fund’s underperformance during the applicable periods.
The Board noted that effective June 12, 2017, the Advantage Global SmallCap Fund had undergone changes in its investment strategy and portfolio management team, and in connection with such changes, the Fund changed its name from Global SmallCap Portfolio of Managed Account Series to Advantage Global SmallCap Fund of Managed Account Series.
The Board noted that for the one-, three- and five-year periods reported, the Mid Cap Dividend Fund ranked in the fourth, third and second quartiles, respectively, against Performance Peers. The Board and BlackRock reviewed the Mid Cap Dividend Fund’s underperformance during the applicable periods.
The Board and BlackRock discussed BlackRock’s strategy for improving the Mid Cap Dividend Fund’s investment performance. Discussions covered topics such as performance attribution, the Mid Cap Dividend Fund’s investment personnel, and the resources appropriate to support the Mid Cap Dividend Fund’s investment processes. The Board noted that effective June 12, 2017, the Mid Cap Dividend Fund had undergone changes in its investment strategy and portfolio management team, and in connection with such changes, the Fund changed its name from Mid Cap Value Opportunities Portfolio of Managed Account Series to Mid Cap Dividend Fund of Managed Account Series.
C. Consideration of the Advisory/Management Fees and the Estimated Cost of the Services and Estimated Profits Realized by BlackRock and its Affiliates from their Relationship with each Fund: The Board, including the Independent Board Members, reviewed each Fund’s contractual management fee rate compared with those of its Expense Peers. The contractual management fee rate represents a combination of the advisory fee and any administrative fees, before taking into account any reimbursements or fee waivers. The Board also compared each Fund’s total expense ratio, as well as its actual management fee rate, to those of its Expense Peers. The total expense ratio represents a fund’s total net operating expenses, including any 12b-1 or non 12b-1 service fees. The total expense ratio gives effect to any expense reimbursements or fee waivers that benefit a fund, and the actual management fee rate gives effect to any management fee reimbursements or waivers that benefit a fund. The Board considered the services provided and the fees charged by BlackRock and its affiliates to other types of clients with similar investment mandates, as applicable, including institutional accounts and sub-advised mutual funds (including mutual funds sponsored by third parties).
| 36 | 2 0 1 8 B L A C K R O C K A N N U A L R E P O R T T O S H A R E H O L D E R S |
| Disclosure of Investment Advisory Agreement (continued) | ||
The Board received and reviewed statements relating to BlackRock’s financial condition. The Board noted that BlackRock does not charge either Fund a net advisory fee. The Board reviewed BlackRock’s estimated profitability with respect to other funds the Board currently oversees for the year ended December 31, 2017 compared to available aggregate estimated profitability data provided for the prior two years. The Board reviewed BlackRock’s estimated profitability with respect to certain other U.S. fund complexes managed by the Manager and/or its affiliates. The Board reviewed BlackRock’s assumptions and methodology of allocating expenses in the estimated profitability analysis, noting the inherent limitations in allocating costs among various advisory products. The Board recognized that profitability may be affected by numerous factors including, among other things, fee waivers and expense reimbursements by the Manager, the types of funds managed, precision of expense allocations and business mix. As a result, calculating and comparing profitability at individual fund levels is difficult.
The Board noted that, in general, individual fund or product line profitability of other advisors is not publicly available. The Board reviewed BlackRock’s overall operating margin, in general, compared to that of certain other publicly-traded asset management firms. The Board considered the differences between BlackRock and these other firms, including the contribution of technology at BlackRock, BlackRock’s expense management, and the relative product mix.
In addition, the Board considered the estimated cost of the services provided to each Fund by BlackRock, and BlackRock’s and its affiliates’ estimated profits relating to the management and distribution of each Fund and the other funds advised by BlackRock and its affiliates. As part of its analysis, the Board reviewed BlackRock’s methodology in allocating its costs of managing the Funds, to each Fund. The Board considered whether BlackRock has the financial resources necessary to attract and retain high quality investment management personnel to perform its obligations under the Agreement and to continue to provide the high quality of services that is expected by the Board. The Board further considered factors including but not limited to BlackRock’s commitment of time, assumption of risk, and liability profile in servicing each Fund in contrast to what is required of BlackRock with respect to other products with similar investment mandates across the open-end fund, ETF, closed-end fund, sub-advised mutual fund, separately managed account, collective investment trust, and institutional separate account product channels, as applicable.
The Manager has contractually agreed to waive all fees and pay or reimburse all expenses of the Advantage Global SmallCap Fund, except extraordinary expenses. Extraordinary expenses may include interest expense, dividend expense and acquired fund fees and expenses. In light of the fee waiver agreement, the Board did not consider the Advantage Global SmallCap Fund’s advisory fee rate as compared to its Expense Peers, but instead recognized that shares of the Advantage Global SmallCap Fund may be purchased and held only by or on behalf of separately managed account clients who have retained BlackRock to manage their accounts pursuant to an investment management agreement with BlackRock and/or a managed account program sponsor. The Board also noted that the Advantage Global SmallCap Fund has an advisory fee arrangement that includes breakpoints that adjust the fee rate downward as the size of the Advantage Global SmallCap Fund increases above certain contractually specified levels.
The Manager has contractually agreed to waive all fees and pay or reimburse all expenses of the Mid Cap Dividend Fund, except extraordinary expenses. Extraordinary expenses may include interest expense, dividend expense and acquired fund fees and expenses. In light of the fee waiver agreement, the Board did not consider the Mid Cap Dividend Fund’s advisory fee rate as compared to its Expense Peers, but instead recognized that shares of the Mid Cap Dividend Fund may be purchased and held only by or on behalf of separately managed account clients who have retained BlackRock to manage their accounts pursuant to an investment management agreement with BlackRock and/or a managed account program sponsor. The Board also noted that the Mid Cap Dividend Fund has an advisory fee arrangement that includes breakpoints that adjust the fee rate downward as the size of the Mid Cap Dividend Fund increases above certain contractually specified levels.
D. Economies of Scale: The Board, including the Independent Board Members, considered the extent to which economies of scale might be realized as the assets of each Fund increase, including the existence of fee waivers and/or expense caps, as applicable, noting that any contractual fee waivers and expense caps had been approved by the Board. The Board also considered the extent to which each Fund benefits from such economies in a variety of ways, and whether there should be changes in the advisory fee rate or breakpoint structure in order to enable each Fund to more fully participate in these economies of scale. The Board considered each Fund’s asset levels and whether the current fee schedule was appropriate. In its consideration, the Board Members took into account the existence of any expense caps and further considered the continuation and/or implementation, as applicable, of such caps.
E. Other Factors Deemed Relevant by the Board Members: The Board, including the Independent Board Members, also took into account other ancillary or “fall-out” benefits that BlackRock or its affiliates may derive from BlackRock’s respective relationships with each Fund, both tangible and intangible, such as BlackRock’s ability to leverage its investment professionals who manage other portfolios and risk management personnel, an increase in BlackRock’s profile in the investment advisory community, and the engagement of BlackRock’s affiliates as service providers to each Fund, including for administrative, distribution, securities lending and cash management services. The Board also considered BlackRock’s overall operations and its efforts to expand the scale of, and improve the quality of, its operations. The Board also noted that, subject to applicable law, BlackRock may use and benefit from third party research obtained by soft dollars generated by certain registered fund transactions to assist in managing all or a number of its other client accounts.
In connection with its consideration of the Agreement, the Board also received information regarding BlackRock’s brokerage and soft dollar practices. The Board received reports from BlackRock which included information on brokerage commissions and trade execution practices throughout the year.
The Board noted the competitive nature of the open-end fund marketplace, and that shareholders are able to redeem their Fund shares if they believe that each Fund’s fees and expenses are too high or if they are dissatisfied with the performance of each Fund.
Conclusion
The Board, including the Independent Board Members, approved the continuation of the Advisory Agreement between the Manager and the Trust, on behalf of each Fund, for a one-year term ending June 30, 2019. Based upon its evaluation of all of the aforementioned factors in their totality, as well as other information, the Board, including the Independent Board Members, was satisfied that the terms of the Agreement were fair and reasonable and in the best interest of each Fund and its shareholders. In arriving at its decision to approve the Agreement, the Board did not identify any single factor or group of factors as all-important or controlling, but considered all factors together, and different Board Members may have attributed different weights to the various factors considered. The Independent Board Members were also assisted by the advice of independent legal counsel in making this determination.
| D I S C L O S U R E O F I N V E S T M E N T A D V I S O R Y A G R E E M E N T | 37 |
| Trustee and Officer Information | ||
Independent Trustees(a) | ||||||||
Name Year of Birth(b) | Position(s) Held (Length of Service)(c) | Principal Occupation(s) During Past Five Years | Number of BlackRock-Advised Registered Investment Companies |
Public Company | ||||
Robert M. Hernandez 1944 | Chair of the Board and Trustee (Since 2007) | Director, Vice Chairman and Chief Financial Officer of USX Corporation (energy and steel business) from 1991 to 2001; Director and non-executive Chairman, RTI International Metals, Inc. from 1990 to 2015; Director, TE Connectivity (electronics) from 2006 to 2012. | 32 RICs consisting of 115 Portfolios | Chubb Limited (insurance company); Eastman Chemical Company | ||||
James H. Bodurtha 1944 | Trustee (Since 2007) | Director, The China Business Group, Inc. (consulting and investing firm) from 1996 to 2013 and Executive Vice President thereof from 1996 to 2003; Chairman of the Board, Berkshire Holding Corporation since 1980; Director, ICI Mutual since 2010. | 32 RICs consisting of 115 Portfolios | None | ||||
Bruce R. Bond 1946 | Trustee (Since 2007) | Board Member, Amsphere Limited (software) since 2018; Trustee, and Member of the Governance Committee, State Street Research Mutual Funds from 1997 to 2005; Board Member of Governance, Audit and Finance Committee, Avaya Inc. (computer equipment) from 2003 to 2007. | 32 RICs consisting of 115 Portfolios | None | ||||
Honorable Stuart E. Eizenstat 1943 | Trustee (Since 2007) | Senior Counsel of Covington and Burling LLP (law firm) since 2016, Head of International Practice thereof since 2001, and Partner thereof from 2001 to 2016; Advisory Board Member, OCP S.A. (phosphates) since 2010; International Advisory Board Member, The Coca-Cola Company from 2002 to 2011; Advisory Board Member, Veracity Worldwide, LLC (risk management) from 2007 to 2012; Member of the International Advisory Board, GML Ltd. (energy) since 2003; Board of Directors, Ferroglobe (silicon metals) since 2016. | 32 RICs consisting of 115 Portfolios | Alcatel-Lucent (telecommunications); Global Specialty Metallurgical; UPS Corporation (delivery service) | ||||
Henry Gabbay 1947 | Trustee (Since 2007) | Consultant, BlackRock, Inc. from 2007 to 2008; Managing Director, BlackRock, Inc. from 1989 to 2007; Chief Administrative Officer, BlackRock Advisors, LLC from 1998 to 2007; President of BlackRock Funds and BlackRock Allocation Target Shares (formerly, BlackRock Bond Allocation Target Shares) from 2005 to 2007 and Treasurer of certain closed-end funds in the BlackRock fund complex from 1989 to 2006; Board Member, Equity-Liquidity and Closed-End Fund Boards from 2007 through 2014. | 32 RICs consisting of 115 Portfolios | None | ||||
| Lena G. Goldberg 1949 | Trustee (Since 2016) | Senior Lecturer, Harvard Business School since 2008; Director, Charles Stark Draper Laboratory, Inc. since 2013; FMR LLC/Fidelity Investments (financial services) from 1996 to 2008, serving in various senior legal roles including General Counsel; Partner, Sullivan & Worcester LLP from 1985 to 1996 and Associate thereof from 1979 to 1985. | 32 RICs consisting of 115 Portfolios | None | ||||
| Henry R. Keizer 1956 | Trustee (Since 2016) | Director, Park Indemnity Ltd. (captive insurer) since 2010; Director, MUFG Americas Holdings Corporation and MUFG Union Bank, N.A. (financial and bank holding company) from 2014 to 2016; Director, Montpelier Re Holdings, Ltd. (publicly held property and casual reinsurance) from 2013 to 2015; Director, American Institute of Certified Public Accountants from 2009 to 2011; Director, KPMG LLP (audit, tax and advisory services) from 2004 to 2005 and 2010 to 2012; Director, KPMG International in 2012, Deputy Chairman and Chief Operating Officer thereof from 2010 to 2012 and U.S. Vice Chairman of Audit thereof from 2005 to 2010; Global Head of Audit, KPMGI (consortium of KPMG firms) from 2006 to 2010; Director, YMCA of Greater New York from 2006 to 2010. | 32 RICs consisting of 115 Portfolios | Hertz Global Holdings (car rental); WABCO (commercial vehicle safety systems); Sealed Air Corp. (packaging) | ||||
| John F. O’Brien 1943 | Trustee (Since 2007) | Trustee, Woods Hole Oceanographic Institute since 2003 and Chairman thereof from 2009 to 2015; Co-Founder and Managing Director, Board Leaders LLC (director education) since 2005. | 32 RICs consisting of 115 Portfolios | Cabot Corporation (chemicals); LKQ Corporation (auto parts manufacturing); TJX Companies, Inc. (retailer) | ||||
| 38 | 2 0 1 8 B L A C K R O C K A N N U A L R E P O R T T O S H A R E H O L D E R S |
| Trustee and Officer Information (continued) | ||
Independent Trustees(a) | ||||||||
Name Year of Birth(b) | Position(s) Held (Length of Service)(c) | Principal Occupation(s) During Past Five Years | Number of BlackRock-Advised Registered Investment Companies (“RICs”) Consisting of Investment Portfolios (“Portfolios”) Overseen |
Public Company | ||||
| Donald C. Opatrny 1952 | Trustee (Since 2015) | Trustee, Member of the Executive Committee and Chair of the Investment Committee, Cornell University since 2004; Member of the Board and Investment Committee, University School since 2007; Member of the Investment Committee, Mellon Foundation from 2009 to 2015; President and Trustee, the Center for the Arts, Jackson Hole since 2011; Director, Athena Capital Advisors LLC (investment management firm) since 2013; Trustee and Chair of the Investment Committee, Community Foundation of Jackson Hole since 2014; Trustee, Artstor (a Mellon Foundation affiliate) from 2010 to 2015; President, Trustee and Member of the Investment Committee, The Aldrich Contemporary Art Museum from 2007 to 2014. | 32 RICs consisting of 115 Portfolios | None | ||||
Interested Trustees(a)(d) | ||||||||
Name Year of Birth(b) | Position(s) Held (Length of Service)(c) | Principal Occupation(s) During Past Five Years | Number of BlackRock-Advised Registered Investment Companies (“RICs”) Consisting of Investment Portfolios (“Portfolios”) Overseen | Public Company and Other Investment Company Directorships Held During Past Five Years | ||||
| Robert Fairbairn 1965 | Trustee (Since 2015) | Senior Managing Director of BlackRock, Inc. since 2010; oversees BlackRock’s Strategic Partner Program and Strategic Product Management Group; Member of BlackRock’s Global Executive and Global Operating Committees; Co-Chair of BlackRock’s Human Capital Committee; Global Head of BlackRock’s Retail and iShares® businesses from 2012 to 2016. | 133 RICs consisting of 333 Portfolios | None | ||||
| John M. Perlowski 1964 | Trustee (Since 2015), and President and Chief Executive Officer (Since 2010) | Managing Director of BlackRock, Inc. since 2009; Head of BlackRock Global Accounting and Product Services since 2009; Advisory Director of Family Resource Network (charitable foundation) since 2009. | 133 RICs consisting of 333 Portfolios | None | ||||
| (a) | The address of each Trustee is c/o BlackRock, Inc., 55 East 52nd Street, New York, NY 10055. |
| (b) | Each Independent Trustee holds office until his or her successor is duly elected and qualifies or until his or her earlier death, resignation, retirement or removal as provided by the Trust’s by-laws or charter or statute, or until December 31 of the year in which he or she turns 75. The Board may determine to extend the terms of Independent Trustees on a case-by-case basis, as appropriate. Interested Trustees serve until their successor is duly elected and qualifies or until their earlier death, resignation, retirement or removal as provided by the Trust’s by-laws or statute, or until December 31 of the year in which they turn 72. |
| (c) | Following the combination of Merrill Lynch Investment Managers, L.P. (“MLIM”) and BlackRock, Inc. in September 2006, the various legacy MLIM and legacy BlackRock fund boards were realigned and consolidated into three new fund boards in 2007. As a result, although the chart shows certain Independent Trustees as joining the Trust’s board in 2007, those Trustees first became members of the boards of other legacy MLIM or legacy BlackRock funds as follows: James H. Bodurtha, 1995; Bruce R. Bond, 2005; Honorable Stuart E. Eizenstat, 2001; Robert M. Hernandez, 1996; and John F. O’Brien, 2005. |
| (d) | Mr. Fairbairn and Mr. Perlowski are both “interested persons,” as defined in the 1940 Act, of the Trust based on their positions with BlackRock, Inc. and its affiliates. Mr. Fairbairn and Mr. Perlowski are also board members of the BlackRock Closed-End Complex and the BlackRock Equity-Liquidity Complex. |
| T R U S T E E A N D O F F I C E R I N F O R M A T I O N | 39 |
| Trustee and Officer Information (continued) | ||
| Officers Who Are Not Trustees(a) | ||||
Name Year of Birth(b) | Position(s) Held (Length of Service) | Principal Occupation(s) During Past Five Years | ||
Jennifer McGovern 1977 | Vice President (Since 2014) | Managing Director of BlackRock, Inc. since 2016; Director of BlackRock, Inc. from 2011 to 2015; Head of Product Structure and Oversight for BlackRock’s U.S. Wealth Advisory Group since 2013. | ||
Neal J. Andrews 1966 | Chief Financial Officer (Since 2007) | Managing Director of BlackRock, Inc. since 2006. | ||
Jay M. Fife 1970 | Treasurer (Since 2007) | Managing Director of BlackRock, Inc. since 2007. | ||
Charles Park 1967 | Chief Compliance Officer (Since 2014) | Anti-Money Laundering Compliance Officer for the BlackRock-advised Funds in the Equity-Bond Complex, the Equity-Liquidity Complex and the Closed-End Complex from 2014 to 2015; Chief Compliance Officer of BlackRock Advisors, LLC and the BlackRock-advised Funds in the Equity-Bond Complex, the Equity-Liquidity Complex and the Closed-End Complex since 2014; Principal of and Chief Compliance Officer for iShares® Delaware Trust Sponsor LLC since 2012 and BlackRock Fund Advisors (“BFA”) since 2006; Chief Compliance Officer for the BFA-advised iShares® exchange traded funds since 2006; Chief Compliance Officer for BlackRock Asset Management International Inc. since 2012. | ||
John MacKessy 1972 | Anti-Money Laundering Compliance Officer (Since 2018) | Director of BlackRock, Inc. since 2017; Global Head of Anti-Money Laundering at BlackRock, Inc. since 2017; Director of AML Monitoring and Investigations Group of Citibank from 2015 to 2017; Global Anti-Money Laundering and Economic Sanctions Officer for MasterCard from 2011 to 2015. | ||
Benjamin Archibald 1975 |
Secretary (Since 2012) |
Managing Director of BlackRock, Inc. since 2014; Director of BlackRock, Inc. from 2010 to 2013; Secretary of the iShares® exchange traded funds since 2015; Secretary of the BlackRock-advised mutual funds since 2012. | ||
| (a) | The address of each Officer is c/o BlackRock, Inc., 55 East 52nd Street, New York, NY 10055. |
| (b) | Officers of the Trust serve at the pleasure of the Board. |
Further information about the Trust’s Officers and Trustees is available in the Funds’ Statement of Additional Information, which can be obtained without charge by calling 1-800-441-7762.
Effective May 8, 2018, John MacKessy replaced Fernanda Piedra as the Anti-Money Laundering Compliance Officer of the Trust.
|
Investment Adviser
BlackRock Advisors, LLC
Wilmington, DE 19809
Accounting Agent and Transfer Agent
BNY Mellon Investment Servicing (US) Inc.
Wilmington, DE 19809
Custodian
Brown Brothers Harriman & Co.
Boston, MA 02109
Independent Registered Public Accounting Firm
Deloitte & Touche LLP
Boston, MA 02116
Distributor
BlackRock Investments, LLC
New York, NY 10022
Legal Counsel
Willkie Farr & Gallagher LLP
New York, NY 10019
Address of the Trust
100 Bellevue Parkway
Wilmington, DE 19809
| 40 | 2 0 1 8 B L A C K R O C K A N N U A L R E P O R T T O S H A R E H O L D E R S |
| Additional Information | ||
General Information
Householding
The Funds will mail only one copy of shareholder documents, including prospectuses, annual and semi-annual reports and proxy statements, to shareholders with multiple accounts at the same address. This practice is commonly called “householding” and is intended to reduce expenses and eliminate duplicate mailings of shareholder documents. Mailings of your shareholder documents may be householded indefinitely unless you instruct us otherwise. If you do not want the mailing of these documents to be combined with those for other members of your household, please call the Funds at (800) 441-7762.
Availability of Quarterly Schedule of Investments
The Funds file their complete schedule of portfolio holdings with the SEC for the first and third quarters of each fiscal year on Form N-Q. The Funds’ Forms N-Q are available on the SEC’s website at http://www.sec.gov and may also be reviewed and copied at the SEC’s Public Reference Room in Washington, D.C. Information on the operation of the Public Reference Room or how to access documents on the SEC’s website without charge may be obtained by calling (800) SEC-0330. The Funds’ Forms N-Q may also be obtained upon request and without charge by calling (800) 441-7762.
Availability of Proxy Voting Policies and Procedures
A description of the policies and procedures that the Funds use to determine how to vote proxies relating to portfolio securities is available upon request and without charge (1) by calling (800) 441-7762; (2) at http://www.blackrock.com; and (3) on the SEC’s website at http://www.sec.gov.
Availability of Proxy Voting Record
Information about how the Funds voted proxies relating to securities held in the Funds’ portfolios during the most recent 12-month period ended June 30 is available, upon request and without charge (1)at http://www.blackrock.com, or by calling (800) 441-7762 and (2) on the SEC’s website at http://www.sec.gov.
BlackRock’s Mutual Fund Family
BlackRock offers a diverse lineup of open-end mutual funds crossing all investment styles and managed by experts in equity, fixed income and tax-exempt investing. Visit BlackRock online at http://www.blackrock.com for more information.
Shareholder Privileges
Account Information
Call us at (800) 441-7762 from 8:00 AM to 6:00 PM ET on any business day to get information about your account balances, recent transactions and share prices. You can also reach us on the Web at http://www.blackrock.com.
Automatic Investment Plans
Investor Class shareholders who want to invest regularly can arrange to have $50 or more automatically deducted from their checking or savings account and invested in any of the BlackRock funds.
Systematic Withdrawal Plans
Investor Class shareholders can establish a systematic withdrawal plan and receive periodic payments of $50 or more from their BlackRock funds, as long as their account balance is at least $10,000.
Retirement Plans
Shareholders may make investments in conjunction with Traditional, Rollover, Roth, Coverdell, Simple IRAs, SEP IRAs and 403(b) Plans.
| ADDITIONAL INFORMATION | 41 |
| Additional Information (continued) | ||
BlackRock Privacy Principles
BlackRock is committed to maintaining the privacy of its current and former fund investors and individual clients (collectively, “Clients”) and to safeguarding their non-public personal information. The following information is provided to help you understand what personal information BlackRock collects, how we protect that information and why in certain cases we share such information with select parties.
If you are located in a jurisdiction where specific laws, rules or regulations require BlackRock to provide you with additional or different privacy-related rights beyond what is set forth below, then BlackRock will comply with those specific laws, rules or regulations.
BlackRock obtains or verifies personal non-public information from and about you from different sources, including the following: (i) information we receive from you or, if applicable, your financial intermediary, on applications, forms or other documents; (ii) information about your transactions with us, our affiliates, or others; (iii) information we receive from a consumer reporting agency; and (iv) from visits to our websites.
BlackRock does not sell or disclose to non-affiliated third parties any non-public personal information about its Clients, except as permitted by law or as is necessary to respond to regulatory requests or to service Client accounts. These non-affiliated third parties are required to protect the confidentiality and security of this information and to use it only for its intended purpose.
We may share information with our affiliates to service your account or to provide you with information about other BlackRock products or services that may be of interest to you. In addition, BlackRock restricts access to non-public personal information about its Clients to those BlackRock employees with a legitimate business need for the information. BlackRock maintains physical, electronic and procedural safeguards that are designed to protect the non-public personal information of its Clients, including procedures relating to the proper storage and disposal of such information.
Glossary of Terms Used in This Report
Currency
| AUD | Australian Dollar | |
| CAD | Canadian Dollar | |
| EUR | Euro | |
| GBP | British Pound | |
| HKD | Hong Kong Dollar | |
| JPY | Japanese Yen | |
| USD | U.S. Dollar | |
Portfolio Abbreviations
| ADR | American Depositary Receipts | |
| NVDR | Non-Voting Depositary Receipts | |
| SDR | Special Drawing Rights | |
| 42 | 2 0 1 8 B L A C K R O C K A N N U A L R E P O R T T O S H A R E H O L D E R S |
THIS PAGE INTENTIONALLY LEFT BLANK.
This report is intended for current holders. It is not authorized for use as an offer of sale or a solicitation of an offer to buy shares of a Fund unless preceded or accompanied by the Fund’s current prospectus. Past performance results shown in this report should not be considered a representation of future performance. Investment returns and principal value of shares will fluctuate so that shares, when redeemed, may be worth more or less than their original cost. Statements and other information herein are as dated and are subject to change.
Shares of each Fund may be purchased and held only by or on behalf of separately managed account clients who have retained BlackRock Advisors, LLC or an affiliate (“BlackRock”) to manage their accounts pursuant to an investment management agreement with BlackRock and/or a managed account program sponsor. | ||||
MAS2-8/18-AR |  | |||

| Item 2 – | Code of Ethics – The registrant (or the “Fund”) has adopted a code of ethics, as of the end of the period covered by this report, applicable to the registrant’s principal executive officer, principal financial officer, principal accounting officer or controller, or persons performing similar functions. During the period covered by this report, the code of ethics was amended to update certain information and to make other non-material changes. During the period covered by this report, there have been no waivers granted under the code of ethics. The registrant undertakes to provide a copy of the code of ethics to any person upon request, without charge, who calls 1-800-441-7762. | |
| Item 3 – | Audit Committee Financial Expert – The registrant’s board of trustees (the “board of trustees”), has determined that (i) the registrant has the following audit committee financial experts serving on its audit committee and (ii) each audit committee financial expert is independent: | |
Robert M. Hernandez Henry R. Keizer Bruce R. Bond | ||
Under applicable securities laws, a person determined to be an audit committee financial expert will not be deemed an “expert” for any purpose, including without limitation for the purposes of Section 11 of the Securities Act of 1933, as a result of being designated or identified as an audit committee financial expert. The designation or identification of a person as an audit committee financial expert does not impose on such person any duties, obligations, or liabilities greater than the duties, obligations, and liabilities imposed on such person as a member of the audit committee and board of trustees in the absence of such designation or identification. | ||
| Item 4 – | Principal Accountant Fees and Services | |
The following table presents fees billed by Deloitte & Touche LLP (“D&T”) in each of the last two fiscal years for the services rendered to the Fund: | ||
| (a) Audit Fees | (b) Audit-Related Fees1 | (c) Tax Fees2 | (d) All Other Fees | |||||||||||||
| Entity Name | Current Fiscal Year | Previous Fiscal Year End4 | Current Fiscal Year | Previous Fiscal Year End4 | Current Fiscal Year | Previous Fiscal Year End4 | Current Fiscal Year | Previous Fiscal Year End4 | ||||||||
| Advantage Global SmallCap Fund | $28,152 | $23,474 | $0 | $2,000 | $13,200 | $9,000 | $0 | $0 | ||||||||
| Mid Cap Dividend Fund | $27,846 | $23,219 | $0 | $2,000 | $13,100 | $9,250 | $0 | $0 | ||||||||
The following table presents fees billed by D&T that were required to be approved by the registrant’s audit committee (the “Committee”) for services that relate directly to the operations or financial reporting of the Fund and that are rendered on behalf of BlackRock Advisors, LLC (“Investment Adviser” or “BlackRock”) and entities controlling, controlled by, or under common control with BlackRock (not including any sub-adviser whose role is primarily portfolio management and is subcontracted with or overseen by another investment adviser) that provide ongoing services to the Fund (“Affiliated Service Providers”): |
2
| Current Fiscal Year End4 | Previous Fiscal Year End | |||
| (b) Audit-Related Fees1 | $0 | $0 | ||
| (c) Tax Fees2 | $0 | $0 | ||
| (d) All Other Fees3 | $2,274,000 | $2,129,000 |
1 The nature of the services includes assurance and related services reasonably related to the performance of the audit or review of financial statements not included in Audit Fees, including accounting consultations, agreed-upon procedure reports, attestation reports, comfort letters, out-of-pocket expenses and internal control reviews not required by regulators.
2 The nature of the services includes tax compliance and/or tax preparation, including services relating to the filing or amendment of federal, state or local income tax returns, regulated investment company qualification reviews, taxable income and tax distribution calculations.
3 Non-audit fees of $2,274,000 and $2,129,000 for the current fiscal year and previous fiscal year, respectively, were paid to the Fund’s principal accountant in their entirety by BlackRock, in connection with services provided to the Affiliated Service Providers of the Fund and of certain other funds sponsored and advised by BlackRock or its affiliates for a service organization review and an accounting research tool subscription. These amounts represent aggregate fees paid by BlackRock and were not allocated on a per fund basis.
4 The Fund changed its fiscal year end from April to August in 2017 whereby this fiscal year consists of the four months ended August 31, 2017.
(e)(1) Audit Committee Pre-Approval Policies and Procedures:
The Committee has adopted policies and procedures with regard to the pre-approval of services. Audit, audit-related and tax compliance services provided to the registrant on an annual basis require specific pre-approval by the Committee. The Committee also must approve other non-audit services provided to the registrant and those non-audit services provided to the Investment Adviser and Affiliated Service Providers that relate directly to the operations and the financial reporting of the registrant. Certain of these non-audit services that the Committee believes are (a) consistent with the SEC’s auditor independence rules and (b) routine and recurring services that will not impair the independence of the independent accountants may be approved by the Committee without consideration on a specific case-by-case basis (“general pre-approval”). The term of any general pre-approval is 12 months from the date of the pre-approval, unless the Committee provides for a different period. Tax or other non-audit services provided to the registrant which have a direct impact on the operations or financial reporting of the registrant will only be deemed pre-approved provided that any individual project does not exceed $10,000 attributable to the registrant or $50,000 per project. For this purpose, multiple projects will be aggregated to determine if they exceed the previously mentioned cost levels.
Any proposed services exceeding the pre-approved cost levels will require specific pre-approval by the Committee, as will any other services not subject to general pre-approval (e.g., unanticipated but permissible services). The Committee is informed of each service approved subject to general pre-approval at the next regularly scheduled in-person board meeting. At this meeting, an analysis of such services is presented to the Committee for ratification. The Committee may delegate to the Committee Chairman the authority to approve the provision of and fees for any specific engagement of permitted non-audit services, including services exceeding pre-approved cost levels.
(e)(2) None of the services described in each of Items 4(b) through (d) were approved by the Committee pursuant to the de minimis exception in paragraph (c)(7)(i)(C) of Rule 2-01 of Regulation S-X.
(f) Not Applicable
(g) The aggregate non-audit fees, defined as the sum of the fees shown under “Audit-Related Fees,” “Tax Fees” and “All Other Fees,” paid to the accountant for services rendered by the accountant to the registrant, the Investment Adviser and the Affiliated Service Providers were:
3
| Entity Name | Current Fiscal Year End | Previous Fiscal Year End1 | ||||
| Advantage Global SmallCap Fund | $13,200 | $11,000 | ||||
| Mid Cap Dividend Fund | $13,100 | $11,250 |
1 The Fund changed its fiscal year end from April to August in 2017 whereby this fiscal year
consists of the four months ended August 31, 2017.
Additionally, the amounts billed by D&T in connection with services provided to the Affiliated Service Providers of the Fund and of other funds sponsored and advised by BlackRock or its affiliates during the current and previous fiscal years for a service organization review and an accounting research tool subscription were:
Current Fiscal Year End | Previous Fiscal Year End | |
| $2,274,000 | $2,129,000 |
These amounts represent aggregate fees paid by BlackRock and were not allocated on a per fund basis.
(h) The Committee has considered and determined that the provision of non-audit services that were rendered to the Investment Adviser and the Affiliated Service Providers that were not pre-approved pursuant to paragraph (c)(7)(ii) of Rule 2-01 of Regulation S-X is compatible with maintaining the principal accountant’s independence.
Item 5 – | Audit Committee of Listed Registrants – Not Applicable | |||
Item 6 – | Investments | |||
| (a) The registrant’s Schedule of Investments is included as part of the Report to Stockholders filed under Item 1 of this Form. | ||||
| (b) Not Applicable due to no such divestments during the semi-annual period covered since the previous Form N-CSR filing. | ||||
Item 7 – | Disclosure of Proxy Voting Policies and Procedures for Closed-End Management Investment Companies – Not Applicable | |||
Item 8 – | Portfolio Managers of Closed-End Management Investment Companies – Not Applicable | |||
Item 9 – | Purchases of Equity Securities by Closed-End Management Investment Company and Affiliated Purchasers – Not Applicable | |||
Item 10 – | Submission of Matters to a Vote of Security Holders – There have been no material changes to these procedures. | |||
Item 11 – | Controls and Procedures
| |||
| (a) The registrant’s principal executive and principal financial officers, or persons performing similar functions, have concluded that the registrant’s disclosure controls and procedures (as defined in Rule 30a-3(c) under the Investment Company Act of 1940, as amended (the “1940 Act”)) are | ||||
4
| effective as of a date within 90 days of the filing of this report based on the evaluation of these controls and procedures required by Rule 30a-3(b) under the 1940 Act and Rule 15d-15(b) under the Securities Exchange Act of 1934, as amended. | ||||
| (b) There were no changes in the registrant’s internal control over financial reporting (as defined in Rule 30a-3(d) under the 1940 Act) that occurred during the second fiscal quarter of the period covered by this report that have materially affected, or are reasonably likely to materially affect, the registrant’s internal control over financial reporting. | ||||
Item 12 – | Disclosure of Securities Lending Activities for Closed-End Management Investment Companies – Not Applicable to the registrant. | |||
Item 13 – | Exhibits attached hereto | |||
(a)(1) Code of Ethics – See Item 2
(a)(2) Certifications – Attached hereto
(a)(3) Not Applicable
(b) Certifications – Attached hereto | ||||
5
Pursuant to the requirements of the Securities Exchange Act of 1934 and the Investment Company Act of 1940, the registrant has duly caused this report to be signed on its behalf by the undersigned, thereunto duly authorized.
Managed Account Series
By: | /s/ John M. Perlowski | |
John M. Perlowski | ||
| Chief Executive Officer (principal executive officer) of Managed Account Series |
Date: November 2, 2018
Pursuant to the requirements of the Securities Exchange Act of 1934 and the Investment Company Act of 1940, this report has been signed below by the following persons on behalf of the registrant and in the capacities and on the dates indicated.
By: | /s/ John M. Perlowski | |
John M. Perlowski | ||
| Chief Executive Officer (principal executive officer) of Managed Account Series |
Date: November 2, 2018
By: | /s/ Neal J. Andrews | |
Neal J. Andrews | ||
| Chief Financial Officer (principal financial officer) of Managed Account Series |
Date: November 2, 2018
6